UNITED STATES
SECURITIES AND EXCHANGE COMMISSION
Washington, D.C. 20549
FORM N-CSR
CERTIFIED SHAREHOLDER REPORT OF REGISTERED MANAGEMENT
INVESTMENT COMPANIES
Investment Company Act file number 811-07257
SEI Institutional Investments Trust
SEI Investments
One Freedom Valley Drive
Oaks, PA 19456
CT Corporation
155 Federal Street
Boston, MA 02110
Registrant’s telephone number, including area code: 1-800-342-5734
Date of fiscal year end: May 31, 2016
Date of reporting period: May 31, 2016
| Item 1. | Reports to Stockholders. |

May 31, 2016
ANNUAL REPORT
SEI Institutional Investments Trust
➤ Large Cap Fund
➤ Large Cap Diversified Alpha Fund
➤ Large Cap Disciplined Equity Fund
➤ Large Cap Index Fund
➤ S&P 500 Index Fund
➤ Extended Market Index Fund
➤ Small Cap Fund
➤ Small Cap II Fund
➤ Small/Mid Cap Equity Fund
➤ U.S. Managed Volatility Fund
➤ Global Managed Volatility Fund
➤ World Equity Ex-US Fund
➤ Screened World Equity Ex-US Fund
➤ Emerging Markets Equity Fund
➤ Opportunistic Income Fund
➤ Core Fixed Income Fund
➤ High Yield Bond Fund
➤ Long Duration Fund
➤ Long Duration Credit Fund
➤ Ultra Short Duration Bond Fund
➤ Emerging Markets Debt Fund
➤ Real Return Fund
➤ Limited Duration Bond Fund
➤ Intermediate Duration Credit Fund
➤ Dynamic Asset Allocation Fund
➤ Multi-Asset Real Return Fund

TABLE OF CONTENTS
The Trust files its complete schedule of portfolio holdings with the Securities and Exchange Commission for the first and third quarter of each fiscal year on Form N-Q within sixty days after the end of the period. The Trust’s Forms N-Q are available on the Commission’s website at http://www.sec.gov, and may be reviewed and copied at the Commission’s Public Reference Room in Washington, DC. Information on the operation of the Public Reference Room may be obtained by calling 1-800-SEC-0330.
A description of the policies and procedures that the Trust uses to determine how to vote proxies relating to portfolio securities, as well as information relating to how a Fund voted proxies relating to portfolio securities during the most recent 12-month period ended June 30, is available (i) without charge, upon request, by calling 1-800-DIAL-SEI; and (ii) on the Commission’s website at http://www.sec.gov.
LETTER TO SHAREHOLDERS
May 31, 2016 (Unaudited)
To Our Shareholders:
The Funds’ fiscal year — June 1, 2015 through May 31, 2016 — was notable for several key themes: energy-sector volatility spread to other areas of the market amid continued oil-price weakness, followed by a partial recovery; major central-bank policies diverged, with the Federal Reserve (Fed) commencing rate increases while the European Central Bank (ECB), Bank of Japan (BOJ) and People’s Bank of China (PBOC) deepened their commitments to monetary accommodation; and, as a result of the diverging policies, major developed-market sovereign bond yields continued to fall, with some edging into negative-rate territory.
Geopolitical Events
Severe unrest continued in certain areas of the Middle East, driven by the sometimes-opposing and sometimes-overlapping interests of Islamic State, the Syrian regime, Syrian nationalists, Kurdish forces and the Iraqi military. Regional superpowers Iran, Saudi Arabia and Turkey also applied varying degrees of indirect influence. Broader involvement escalated, with Russia’s airpower commitment in early fall and a redoubled coalition of Western powers targeting Islamic State after a series of attacks by religious extremists across the globe. A U.S.-Russia-brokered ceasefire between the Syrian regime and nationalist rebels (excluding Islamic State and other terrorist groups) came into effect during late February, maintaining a questionable hold through the end of the reporting period. Iraqi forces, supported by U.S. air and ground resources, began to make notable progress in reversing Islamic State gains as the end of the reporting period approached. While the conflict that originated in Syria and Iraq appears to have influenced destabilizing events elsewhere in the Middle East and Northern Africa, and taken a terrible human toll, it has not had a significant impact on global markets or the economy at this point.
It will be interesting, however, to see the ultimate effects of the resulting Syrian migrant crisis on the European Union (EU). Immigration served as one of the key points of contention leading up to Great Britain’s EU referendum (Brexit) in June 2016, after the end of the reporting period. Immigration-driven ballot-box uncertainty also took center stage in the U.S. presidential election, where the leading primary candidates of the two major political parties were essentially positioned to clinch their nominations at the end of the reporting period.
Despite the considerable aforementioned instability in the Middle East, the price of oil remained mostly insulated from regional developments. Oil-price weakness, which persisted for the first two-thirds of the reporting period, remained primarily attributable to oversupply: members of the Organization of Petroleum Exporting Countries failed to agree on production cuts; U.S. Congress approved the restoration of oil exports in mid-December; and Iran’s multilateral agreement on the scope of its nuclear program paved the way for its post-sanction return as a major low-cost oil supplier. The International Energy Agency, however, projected a return to supply-demand balance in 2017.
Energy-export-dependent Venezuela succumbed to the economically depressive effects of low oil prices during the Fund’s fiscal year. Food shortages and a breakdown of the rule of law appeared to worsen as the reporting period concluded, despite a partial rebound in the price of oil. Brazil’s prospects also paled during the reporting period, as a corruption investigation centering on its lead state-run oil company enveloped a cross-section of political leaders — culminating in the impeachment of President Dilma Rousseff.
Economic Performance
U.S. economic growth in the second quarter of 2015 bordered on impressive, due in large part to strong consumer activity. The pace of growth essentially halved during the third quarter, on modest inventory restocking amid slow sales and lackluster export activity. Fourth-quarter growth decelerated further, as industrial production and manufacturing came under pressure from the effects of U.S. dollar strength. Growth during the first quarter of 2016 slowed more still; although business activity improved toward the end of the quarter and early in the second quarter. Retail sales and consumer spending surged in April 2016, foreshadowing a potential second-quarter rebound in economic growth. The labor market improved consistently for most of the Fund’s fiscal year, with the unemployment rate declining from 5.3% in June 2015 to 4.7% in May 2016. Participation in the labor force bottomed at a 38-year low in September before rising in March to its highest level in two years — only to decline again, ending the reporting period exactly where it started. Average hourly earnings and real personal incomes gained with relative steadiness, bouncing around a rough mean of about 0.2% per month over the reporting period. The Fed raised its target interest rate in mid-December for the first time since 2006, leaving behind a near-zero rate that had been in place since late 2008.
| | | | |
| SEI Institutional Investments Trust / Annual Report / May 31, 2016 | | | 1 | |
LETTER TO SHAREHOLDERS (Continued)
May 31, 2016 (Unaudited)
Europe maintained steady, if modest, economic expansion during the second, third and fourth quarters of 2015, with a slight downtick in the growth rate during the first quarter of 2016. The ECB’s expansion of its asset-purchase program and introduction of a negative deposit rate in early 2015 (prior to the start of the Funds’ fiscal year) was followed during the reporting period by a deeper foray into negative-rate territory and additional asset-purchase commitments. The eurozone contended with negotiations at the beginning of the reporting period regarding the restructuring of Greek public-debt obligations, which pitted Greece’s ruling Syriza Party against other euro-member states, the ECB and the International Monetary Fund. A new round of discussions on Greek debt relief occurred toward the end of the reporting period, but with less conflict among parties. Near the end of the fiscal year, U.K. economic data increasingly depicted moderating conditions or outright slowdown amid growing uncertainty resulting from Brexit.
In the Asia-Pacific region, Japan’s economy faced a small contraction during the second quarter of 2015. A revision to third-quarter gross domestic product (GDP) toggled conditions from what was initially viewed as a recession (two straight quarters of negative growth) to modest growth; although the fourth quarter marked a return to contraction. The first quarter of 2016 was greeted with a return to expansion. The yen remained in a relatively narrow range compared to the U.S. dollar during most of the reporting period, then strengthened substantially starting at the end of 2015 despite the Bank of Japan’s expanded asset-purchase program and adoption of a negative benchmark interest rate. China, meanwhile, experienced steadily declining growth, albeit from levels considerably higher than most other economies. The PBOC loosened its monetary policy stance, reducing benchmark interest rates and bank-reserve requirements at multiple points during the reporting period. The government’s decision to peg its currency (the renminbi ) to a basket of currencies instead of just the U.S. dollar, along with the decline of the renminbi against the U.S. dollar during the third quarter of 2015, had significant global repercussions — especially given the implications for a potential rebalancing of global trade and uncertainty about potential future actions.
Market Developments
Risk assets came under pressure at the start of the Fund’s fiscal year, as China’s mainland stock exchanges gave back a significant portion of their recent gains — with more severe declines in late summer, when China moderately devalued its currency. As 2015 came to a close, the questionable health of U.S. energy companies (which was caused by a persistent, multi-year oil-price decline) raised concerns among high-yield bond investors. This resulted in a sharp selloff that likely discouraged investors’ risk appetite and kept a lid on performance at year end and into the new year. The beginning of 2016 was marked by a global flight to quality, benefitting safe-haven assets at the expense of risk assets. A trend reversal took place in mid-February, with risk assets rallying into April, followed by mixed performance through the end of the reporting period. The price of oil advanced sharply from mid-February through the end of the reporting period.
First-quarter 2016 earnings declined for companies in the S&P 500 Index; although a majority fared better than analysts’ late-quarter average estimates. Analysts forecast another decline in earnings for second-quarter 2016, and estimates of the decline deepened through the end of the Fund’s fiscal year.
China’s decision to devalue the renminbi in late August was arguably the most significant currency surprise of the reporting period; choppy and opaque implementation, coupled with limited commitment to a market-determined exchange rate, has not engendered confidence in the ability of China’s leadership to manage market pressures effectively. The U.S. dollar ended the Funds’ fiscal year 7.6% higher against a broad trade-weighted basket of currencies, having been as much as 11.9% higher as recently as late January.
For the full reporting period, the MSCI All-Country World Index, a proxy for global equities, fell 5.42% in U.S. dollar terms. The MSCI All-Country World ex USA Index fell by 11.39%, more than double the decline of its U.S.-inclusive counterpart. Emerging-market equity returns were more deeply negative in U.S. dollar terms, with the MSCI Emerging Markets Index falling by 17.63%.
U.S. equity returns were saved by dividends, as the S&P 500 Index returned 1.72% when including dividends but was marginally negative on a price-return basis. U.S. large caps (represented by the Russell 1000 Index) continued to outpace small caps (represented by the Russell 2000 Index), returning 0.78% and -5.97%, respectively. The persistence of U.S. large-cap outperformance relative to other equities has been remarkable — both within the U.S. and internationally — with returns topping not just small caps, but also emerging markets, Europe, Japan and the global stock market when annualized over one, three, five and ten years through the end of the reporting period.
| | |
| 2 | | SEI Institutional Investments Trust / Annual Report / May 31, 2016 |
The extended stretch of U.S. large-cap outperformance has coincided with a challenging environment for active U.S. large-cap strategies; conversely, active managers have fared much better in benchmark-relative terms within international and emerging-market equity strategies.
Defensive and less-cyclically sensitive equity sectors (which typically exhibit lower volatility in challenging market environments compared to cyclically sensitive sectors) fared relatively well: consumer staples, utilities and telecommunications were the top-performing sectors in the U.S. and globally. Energy lagged considerably, while materials, financials and healthcare also fared poorly. Accordingly, low- and managed-volatility investment strategies were notable outperformers over the full reporting period.
Global fixed income, as measured by the Barclays Global Aggregate Index, advanced 5.32% in U.S. dollar terms during the Fund’s fiscal year. Interest rates generally declined during the reporting period, with short-term rates depressed globally and intermediate-term rates depressed in Europe and Japan, as major central banks outside of the U.S. guided benchmark rates downward (into negative territory in some cases) and expanded their asset-purchase programs. U.S. Treasury rates fell across most maturities, with only the yields on Treasurys with maturities shorter than three years increasing during the full reporting period.
U.S. Treasurys generally performed well, as the yield curve flattened (bond yields move inversely to prices). Mortgage-backed and asset-backed securities also delivered positive returns during the reporting period. U.S. investment-grade corporate debt advanced, while the high-yield market declined. The BofA Merrill Lynch US High Yield Constrained Index fell by 0.88%, although a sharp advance beginning in mid-February helped minimize its double-digit decline during the reporting period.
Emerging-market debt delivered mixed performance. Local-currency bonds were largely a casualty of U.S. dollar strength: the J.P. Morgan GBI Emerging Markets Global Diversified Index, which tracks local-currency-denominated emerging-market bonds, fell by 4.86% in U.S. dollar terms during the reporting period despite an impressive late-period rally. The J.P. Morgan EMBI Global Diversified Index, which tracks emerging-market debt denominated in external currencies (such as the U.S. dollar), advanced by 4.55%.
A combination of subdued inflation and U.S. dollar strength began to ease in the latter part of the reporting period, reducing headwinds to the performance of inflation-sensitive assets such as Treasury inflation-protected securities and commodities. The latter declined by 16.5% over the Funds’ fiscal year, according to the RJ/CRB Commodities Total Return Index, but dropped by 30.5% as recently as mid-February before staging a steep partial recovery.
Our View
One of our bedrock macroeconomic assumptions has been that the world economy will avoid a generalized recession, and continue muddling through. We believe a synchronized global recession that drags most countries into negative GDP territory remains a low-probability event; if our forecast holds, the rally in risk assets should be able to build on itself.
Another bedrock assumption of ours has been the conviction that central-bank monetary policy will remain highly expansionary on a global basis. Even in the U.S., where economic growth and inflation appear more entrenched than in most other countries, it is unlikely that interest rates will be pushed aggressively higher.
A more interesting question is whether central-bank policies have reached the end of their effectiveness. This issue has come to the forefront in recent months, as the markets reacted negatively to the radical policy prescriptions implemented by the BOJ and the ECB. In both Europe and Japan, government-bond yields now are negative out to 7 and 10 years, respectively. Corporate bond yields also began edging into negative-yield territory after the ECB announced its intention to serve as a buyer in that market starting in June 2016.
Meanwhile, the yen and the euro gained against the U.S. dollar on a year-over-year basis. This resilience runs counter to our expectation that a widening interest-rate differential between the U.S. and those two countries would keep the dollar strong. If U.S. dollar weakness continues, it might have far-reaching consequences for global assets. It could, for example, be positive for commodities as well as emerging-market debt and equity.
| | | | |
| SEI Institutional Investments Trust / Annual Report / May 31, 2016 | | | 3 | |
LETTER TO SHAREHOLDERS (Concluded)
May 31, 2016 (Unaudited)
It’s hard to make a fundamental case for the recent upturn in the fortunes of emerging-market equities. Earnings-per share for the constituents of the MSCI Emerging Markets Index have collapsed over the last two years (in U.S. dollar terms), a performance that correlates closely with the bear market in commodity prices. We need to see stronger global economic growth, improved trade flows and additional supply discipline from commodity producers.
At this point, we see better prospects for a durable earnings revival in the U.S. than elsewhere. The stalling of the dollar’s appreciation against other currencies in the past year suggests that U.S.-based multinational corporations and import-sensitive industries should see some relief from negative currency translations and declining import prices.
Given the economic and political uncertainties, markets will likely remain difficult to navigate. We lean in a bullish direction, mainly because we are confident that the world economy will exhibit modest growth and that central banks around the world will do whatever is necessary to coax their economies to grow and push inflation higher. Defensive equity sectors still look expensive, as do government fixed-income securities. We like U.S. risk assets because the fundamentals seem better than most; although political dysfunction is becoming an increasing worry. Meanwhile, the sharp recovery in emerging-market debt and equity and high-yield securities underscores the fact that beaten-down areas can come roaring back with little advance warning. Under these circumstances, as trends shift back and forth in almost random fashion, diversification seems a better strategy than maintaining concentrated positions.
On behalf of SEI Investments, I want to thank you for your confidence in the Funds. We are working every day to maintain that confidence, and look forward to serving your investment needs in the future.
Sincerely,

William Lawrence, CFA
Managing Director, Portfolio Management Team
| | |
| 4 | | SEI Institutional Investments Trust / Annual Report / May 31, 2016 |
MANAGEMENT’S DISCUSSION AND ANALYSIS OF FUND PERFORMANCE
May 31, 2016 (Unaudited)
Large Cap Fund
I. Objective
The Large Cap Fund (the “Fund”) seeks to provide long-term growth of capital and income.
II. Multi-Manager Approach Statement
The Fund uses a multi-manager approach, relying on a number of sub-advisers with differing investment approaches to manage portions of the Fund’s portfolio, under the general supervision of SEI Investments Management Corporation (SIMC). The Fund utilized the following sub-advisers as of May 31, 2016: AJO, LP; AQR Capital Management, LLC; Brown Advisory LLC; Jackson Square Partners, LLC; LSV Asset Management; and Waddell & Reed Investment Management Company. There were no sub-adviser changes during the year.
III. Return vs. Benchmark
For the fiscal year ending May 31, 2016, the Fund underperformed the Russell 1000® Index (“Index”), returning -2.41% versus an Index return of 0.78%.
IV. Fund Attribution
As noted in the shareholder letter, the period was marked by volatility, principally within the energy sector and emerging markets, as crude-oil prices dropped on excess production, concerns over domestic growth and expectations regarding the degree to which the U.S. could absorb a rate increase while the rest of the developed world continued to pursue monetary easing.
Six out of ten sectors in the Russell 1000® Index posted positive returns. Utilities was the strongest sector, returning 14.73% over the 12 months ending May 31, 2016, followed by telecommunications with a 10.61% return and Consumer Staples with a 9.87% return. Energy was the most deeply negative sector; it declined 12.28% as oil prices fell 18.6% during the period. Healthcare declined 4.43%, and materials dropped by 4.42%.
The Fund’s performance relative to the benchmark was driven largely by poor stock selection, especially in the healthcare and consumer discretionary sectors. The only sector in which the Fund outperformed the benchmark was information technology. An overweight to healthcare and underweight to utilities both detracted from performance as well, although the impact was minor.
Brown Advisory LLC, our aggressive growth manager, turned in the only positive performance during this period. Value managers (including LSV Asset Management and AJO, LP) were disadvantaged during the Fund’s fiscal year due to stock selection within the
energy sector, which has gotten cheaper following the sharp drop in oil prices in the last 12 months. AJO, LP suffered most, followed by Jackson Square Partners, LLC, AQR Capital Management, LLC and Waddell & Reed Investment Management Company.
AVERAGE ANNUAL TOTAL RETURN(1)
| | | | | | | | | | | | | | | | | | | | |
| | | One Year
Return | | | Annualized
3 Year
Return | | | Annualized
5 Year
Return | | | Annualized
10 Year
Return | | | Annualized
Inception
to Date | |
| Large Cap Fund, Class A | | | -2.41% | | | | 9.84% | | | | 10.85% | | | | 7.06% | | | | 7.64% | |
| Russell 1000® Index | | | 0.78% | | | | 10.89% | | | | 11.44% | | | | 7.50% | | | | 8.06% | |
Comparison of Change in the Value of a $100,000 Investment in the Large Cap Fund, Class A, versus the Russell 1000® Index
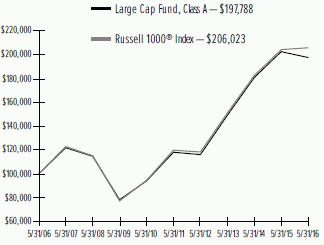
| | 1 | | For the year ended May 31, 2016. Past performance is not an indication of future performance. Class A shares were offered beginning 6/14/96. Returns shown do not reflect the deduction of taxes that a shareholder would pay on fund distributions or the redemption of fund shares. The returns for certain periods reflect fee waivers and reimbursements, performance would have been lower. |
| | | | |
| SEI Institutional Investments Trust / Annual Report / May 31, 2016 | | | 5 | |
MANAGEMENT’S DISCUSSION AND ANALYSIS OF FUND PERFORMANCE
May 31, 2016 (Unaudited)
Large Cap Diversified Alpha Fund
I. Objective
The Large Cap Diversified Alpha Fund (the “Fund”) seeks long-term growth of capital and income.
II. Multi-Manager Approach Statement
The Fund uses a multi-manager approach, relying on a number of sub-advisers with differing investment approaches to manage portions of the Fund’s portfolio, under the general supervision of SEI Investments Management Corporation (SIMC). The Fund utilized the following sub-advisers as of May 31, 2016: AQR Capital Management, LLC; Brandywine Global Investment Management, LLC; Coho Partners, Ltd.; Jackson Square Partners, LLC; and Parametric Portfolio Associates LLC. During the year, AQR Capital Management, LLC and Coho Partners, Ltd. were added while AJO, LP was removed.
III. Return vs. Benchmark
For the fiscal year ending May 31, 2016, the Fund underperformed the Russell 1000® Index (“Index”), returning -3.89% versus an Index return of 0.78%.
IV. Fund Attribution
As noted in the shareholder letter, the period was marked by volatility, principally within the energy sector and emerging markets, as crude-oil prices dropped on excess production, concerns over domestic growth and expectations regarding the degree to which the U.S. could absorb a rate increase while the rest of the developed world continued to pursue monetary easing.
Six out of ten sectors in the Russell® 1000 Index posted positive returns. Utilities was the strongest sector, returning 14.73% over the 12 months ending May 31, 2016, followed by telecommunications with a 10.61% return and Consumer Staples with a 9.87% return. Energy was the most deeply negative sector; it declined 12.28% as oil prices fell 18.6% during the period. Healthcare declined 4.43%, and materials dropped by 4.42%.
Benchmark-relative performance was driven heavily by stock selection during the period, while sector allocation effects generally served as a modest influence. An overweight to healthcare names across both our value and growth managers detracted most from a sector-allocation perspective. Energy was another notable detractor, due primarily to exposure via Brandywine, our value specialist. From a factor point of view, the Fund’s reliance on value, especially early within 2016, was detrimental. Momentum was a generally neutral driver for the year, while stability or safety stocks detracted in
2015 but swung to a modest positive contribution for the full period, as our under-allocation to stability was rewarded.
Brandywine Global Investment Management, LLC was disadvantaged during the period due to its value-oriented and deeper cyclical positioning. Its tendency for negative momentum delivered poor performance within 2015, but turned neutral early in 2016. For Brandywine Global Investment Management, LLC, sector allocation was worst within utilities; its deeper-value positioning left it under-allocated to the defensive sector, which performed well during the period. From a stock selection standpoint, performance was worst within diversified financials and pharmaceutical names.
AVERAGE ANNUAL TOTAL RETURN(1)
| | | | | | | | | | | | | | | | | | | | |
| | | One Year
Return | | | Annualized 3 Year
Return | | | Annualized 5 Year
Return | | | Annualized 10 Year
Return | | | Annualized Inception
to Date | |
| Large Cap Diversified Alpha Fund, Class A | | | -3.89% | | | | 9.76% | | | | 10.63% | | | | 6.03% | | | | 5.83% | |
| Russell 1000® Index | | | 0.78% | | | | 10.89% | | | | 11.44% | | | | 7.50% | | | | 8.06% | |
Comparison of Change in the Value of a $100,000 Investment in the Large Cap Diversified Alpha Fund, Class A, versus the Russell 1000® Index
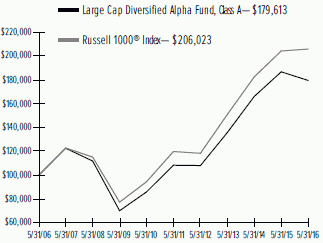
| | 1 | | For the year ended May 31, 2016. Past performance is not an indication of future performance. Class A shares were offered beginning 2/28/06. Returns shown do not reflect the deduction of taxes that a shareholder would pay on fund distributions or the redemption of fund shares. The returns for certain periods reflect fee waivers and reimbursements, performance would have been lower. |
| | |
| 6 | | SEI Institutional Investments Trust / Annual Report / May 31, 2016 |
MANAGEMENT’S DISCUSSION AND ANALYSIS OF FUND PERFORMANCE
May 31, 2016 (Unaudited)
Large Cap Disciplined Equity Fund
I. Objective
The Large Cap Disciplined Equity Fund (the “Fund”) seeks capital appreciation.
II. Multi-Manager Approach Statement
The Fund uses a multi-manager approach, relying on a number of sub-advisers with differing investment approaches to manage portions of the Fund’s portfolio, under the general supervision of SEI Investments Management Corporation (SIMC). The Fund utilized the following sub-advisers as of May 31, 2016: Analytic Investors, LLC; INTECH Investment Management LLC; Lazard Asset Management LLC; OppenheimerFunds, Inc.; and Quantitative Management Associates LLC. There were no sub-adviser changes during the period.
III. Return vs. Benchmark
For the fiscal year ending May 31, 2016, the Fund underperformed the S&P 500 Index (“Index”), returning 1.34% versus and Index return of 1.72%.
IV. Fund Attribution
As noted in the shareholder letter, the period was marked by volatility, principally within the energy sector and emerging markets, as crude-oil prices dropped on excess production, concerns over domestic growth and expectations regarding the degree to which the U.S. could absorb a rate increase while the rest of the developed world continued to pursue monetary easing.
Six out of ten sectors in the S&P 500 Index posted positive returns. Utilities was the strongest sector, returning 14.62% over the 12 months ending May 31, 2016, followed by telecommunications with an 11.8% return and consumer staples with a 10.78% return. Energy was the most deeply negative sector; it declined 10.13% as oil prices declined 18.6% during the period. Materials declined 5.02%, and healthcare fell by 3.29%.
Performance was driven heavily by stock selection during the period, while sector allocation effects were generally not a factor. The Fund benefited by its long momentum early in the period, which it then moderated during the first quarter of 2016, as momentum became expensive. However, a preference for higher-value names during the first quarter of 2016 detracted, as metrics such as cash-flow yield and forward earnings-to-price were punished.
OppenheimerFunds, Inc., one of our fundamental managers, was the best performer during the period, driven by strong stock selection across energy, materials
and biotechnology names. Lazard Asset Management LLC, our multi-sleeve fundamental manager, was disadvantaged by its stock selection focus within the consumer discretionary areas of retailing and media.
AVERAGE ANNUAL TOTAL RETURN(1)
| | | | | | | | | | | | | | | | | | | | |
| | | One Year
Return | | | Annualized 3 Year
Return | | | Annualized 5 Year
Return | | | Annualized 10 Year
Return | | | Annualized Inception
to Date | |
| Large Cap Disciplined Equity Fund, Class A | | | 1.34% | | | | 11.07% | | | | 11.68% | | | | 6.26% | | | | 7.46% | |
| S&P 500 Index | | | 1.72% | | | | 11.06% | | | | 11.67% | | | | 7.41% | | | | 8.15% | |
Comparison of Change in the Value of a $100,000 Investment in the Large Cap Disciplined Equity Fund, Class A, versus the S&P 500 Index
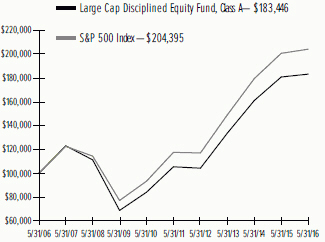
| | 1 | | For the year ended May 31, 2016. Past performance is not an indication of future performance. Class A shares were offered beginning 8/28/03. Returns shown do not reflect the deduction of taxes that a shareholder would pay on fund distributions or the redemption of fund shares. The returns for certain periods reflect fee waivers and reimbursements, performance would have been lower. |
| | | | |
| SEI Institutional Investments Trust / Annual Report / May 31, 2016 | | | 7 | |
MANAGEMENT’S DISCUSSION AND ANALYSIS OF FUND PERFORMANCE
May 31, 2016 (Unaudited)
Large Cap Index Fund
I. Objective
The Large Cap Index Fund (the “Fund”) seeks investment results that correspond to the aggregate price and dividend performance of the securities in the Russell 1000® Index.
II. Multi-Manager Approach Statement
The Fund uses a sub-adviser to manage the Fund under the supervision of SEI Investments Management Corporation (SIMC). The sole sub-adviser as of May 31, 2016 was SSGA Funds Management, Inc. There were no sub-adviser changes during the period.
III. Return vs. Benchmark
For the fiscal year ending May 31, 2016, the Fund underperformed the Russell 1000® Index (“Index”), returning 0.76% versus an Index return of 0.78%.
IV. Fund Attribution
As noted in the shareholder letter, the period was marked by volatility, principally within the energy sector and emerging markets, as crude-oil prices dropped on excess production, concerns over domestic growth and expectations regarding the degree to which the U.S. could absorb a rate increase while the rest of the developed world continued to pursue monetary easing.
Six out of ten sectors in the Russell 1000® Index posted positive returns. Utilities was the strongest sector, returning 14.73% over the 12 months ending May 31, 2016, followed by telecommunications with a 10.61% return and consumer staples with a 9.87% return. Energy was the most deeply negative sector; it declined 12.28% as oil prices fell 18.6% during the period. Healthcare declined 4.43%, and materials dropped by 4.42%.
Derivatives were used for the purposes of equitizing cash flows and hedging back to the Fund’s passive mandate. There was a negligible impact on performance.
AVERAGE ANNUAL TOTAL RETURN(1)
| | | | | | | | | | | | | | | | | | | | |
| | | One Year Return | | | Annualized 3 Year Return | | | Annualized 5 Year Return | | | Annualized 10 Year Return | | | Annualized Inception to Date | |
| Large Cap Index Fund, Class A | | | 0.76% | | | | 10.87% | | | | 11.41% | | | | 7.47% | | | | 6.71% | |
| Russell 1000® Index | | | 0.78% | | | | 10.89% | | | | 11.44% | | | | 7.50% | | | | 8.06% | |
Comparison of Change in the Value of a $100,000 Investment in the Large Cap Index Fund, Class A, versus the Russell 1000® Index
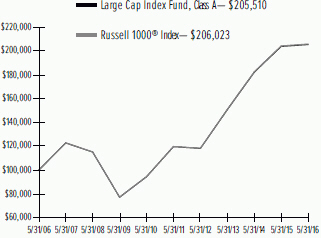
| | 1 | | For the year ended May 31, 2016. Past performance is not an indication of future performance. Class A shares were offered beginning 4/1/02. Returns shown do not reflect the deduction of taxes that a shareholder would pay on fund distributions or the redemption of fund shares. The returns for certain periods reflect fee waivers and reimbursements, performance would have been lower. |
| | |
| 8 | | SEI Institutional Investments Trust / Annual Report / May 31, 2016 |
MANAGEMENT’S DISCUSSION AND ANALYSIS OF FUND PERFORMANCE
May 31, 2016 (Unaudited)
S&P 500 Index Fund
I. Objective
The S&P 500 Index Fund (the “Fund”) seeks investment results that correspond to the aggregate price and dividend performance of the securities in the S&P 500 Index.
II. Multi-Manager Approach Statement
The Fund uses a sub-adviser to manage the Fund under the supervision of SEI Investments Management Corporation (SIMC). The sole sub-adviser as of May 31, 2016 was SSGA Funds Management, Inc. There were no sub-adviser changes during the period.
III. Return vs. Benchmark
For the fiscal year ending May 31, 2016, the Fund underperformed the S&P 500 Index (“Index”), returning 1.66% versus an Index return of 1.72%.
IV. Fund Attribution
As noted in the shareholder letter, the period was marked by volatility, principally within the energy sector and emerging markets, as crude-oil prices dropped on excess production, concerns over domestic growth and expectations regarding the degree to which the U.S. could absorb a rate increase while the rest of the developed world continued to pursue monetary easing.
Six out of ten sectors in the S&P 500 Index posted positive returns. Utilities was the strongest sector, returning 14.62% over the 12 months ending May 31, 2016, followed by telecommunications with an 11.8% return and consumer staples with a 10.78% return. Energy was the most deeply negative sector; it declined 10.13% as oil prices fell 18.6% during the period. Materials declined 5.02%, and healthcare dropped by 3.29%.
Derivatives were used for the purposes of equitizing cash flows and hedging back to the Fund’s passive mandate. There was a negligible impact on performance.
AVERAGE ANNUAL TOTAL RETURN(1)
| | | | | | | | |
| | | One Year Return | | | Annualized Inception to Date | |
| S&P 500 Index Fund, Class A | | | 1.66% | | | | 8.38% | |
| S&P 500 Index | | | 1.72% | | | | 8.43% | |
Comparison of Change in the Value of a $100,000 Investment in the S&P 500 Index Fund, Class A, versus the S&P 500 Index
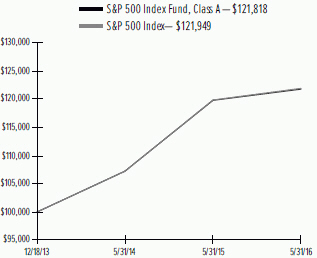
| | 1 | | For the year ended May 31, 2016. Past performance is not an indication of future performance. Class A shares were offered beginning 12/18/13. Returns shown do not reflect the deduction of taxes that a shareholder would pay on fund distributions or the redemption of fund shares. The returns for certain periods reflect fee waivers and reimbursements, performance would have been lower. |
| | | | |
| SEI Institutional Investments Trust / Annual Report / May 31, 2016 | | | 9 | |
MANAGEMENT’S DISCUSSION AND ANALYSIS OF FUND PERFORMANCE
May 31, 2016 (Unaudited)
Extended Market Index Fund
I. Objective
The Extended Market Index Fund (the “Fund”) seeks investment results that approximate, as closely as practicable and before expenses, the performance of the Russell Small Cap Completeness Index.
II. Multi-Manager Approach Statement
The Fund uses a sub-adviser to manage the Fund under the supervision of SEI Investments Management Corporation (SIMC). The sole sub-adviser as of May 31, 2016 was SSgA Funds Management, Inc. There were no sub-adviser changes during the period.
III. Return vs. Benchmark
For the fiscal year ending May 31, 2016, the Fund underperformed the Russell 3000 Index (the “Index”), returning -5.66%, versus the Index return of 0.22%.
IV. Fund Attribution
As noted in the shareholder letter, the period was marked by volatility, principally within the energy sector and emerging markets, as crude-oil prices dropped on excess production, concerns over domestic growth and expectations regarding the degree to which the U.S. could absorb a rate increase while the rest of the developed world continued to pursue monetary easing.
Only three out of ten sectors in the Russell Small Cap Completeness Index posted positive returns. Utilities was the strongest sector, returning 14.5% over the 12 months ending May 31, 2016, followed by financials with a 4.04% return and telecommunications with a 0.43% return. Energy was the most deeply negative sector; it declined 34.93% as oil prices fell 18.6% during the period. Healthcare declined 16.3% due to pressure on pricing concerns and high-flying biotech valuations, consumer discretionary fell by 9.86% and information technology slid 7.37%.
AVERAGE ANNUAL TOTAL RETURN1
| | | | | | | | | | | | |
| | | One Year Return | | | Annualized Three Year Return | | | Annualized Inception to Date | |
| Extended Market Index Fund, Class A | | | -5.66% | | | | 8.28% | | | | 10.15% | |
| Russell 3000 Index | | | 0.22% | | | | 10.57% | | | | 12.36% | |
| Russell Small Cap Completeness Index | | | -5.76% | | | | 8.24% | | | | 10.13% | |
Comparison of Change in the Value of a $100,000 Investment in the Extended Market Index Fund, Class A, versus the Russell 3000 Index and the Russell Small Cap Completeness Index
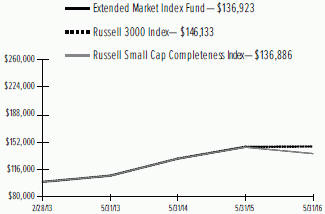
| | 1 | | For the year ended May 31, 2016. Past performance is no indication of future performance. Class A shares were offered beginning 2/28/13. Returns shown do not reflect the deduction of taxes that a shareholder would pay on Fund distributions or the redemption of fund shares. The returns for certain periods reflect fee waivers and/or reimbursements in effect for that period; absent fee waivers and reimbursements, performance would have been lower. |
| | |
| 10 | | SEI Institutional Investments Trust / Annual Report / May 31, 2016 |
MANAGEMENT’S DISCUSSION AND ANALYSIS OF FUND PERFORMANCE
May 31, 2016 (Unaudited)
Small Cap Fund
I. Objective
The Small Cap Fund (the “Fund”) seeks capital appreciation.
II. Multi-Manager Approach Statement
The Fund uses a multi-manager approach, relying on a number of sub-advisers with differing investment approaches to manage portions of the Fund’s portfolio, under the general supervision of SEI Investments Management Corporation (SIMC). The Fund utilized the following sub-advisers as of May 31, 2016: AQR Capital Management, LLC; EAM Investors LLC; Falcon Point Capital, LLC; J.P. Morgan Investment Management Inc.; LSV Asset Management; Robeco Investment Management, Inc.; and William Blair & Company L.L.C. During the year, Falcon Point Capital, LLC was added, while Security Capital Research and Management Incorporated and Montibus Capital Management LLC were removed.
III. Return vs. Benchmark
For the fiscal year ending May 31, 2016, the Fund outperformed the Russell 2000® Index (“Index”) returning -4.99% versus and Index return of -5.97%.
IV. Fund Attribution
As noted in the shareholder letter, the period was marked by volatility, principally within the energy sector and emerging markets, as crude-oil prices dropped on excess production, concerns over domestic growth and expectations regarding the degree to which the U.S. could absorb a rate increase while the rest of the developed world continued to pursue monetary easing.
For the period, energy was the worst-performing sector, declining by 42%, followed by healthcare with a 17% drop on valuation concerns. The defensive sectors led, with utilities, telecommunications and consumer staples returning 12.6%, 10.4% and 6.3%, respectively.
Overall, allocation contributed to the Fund’s benchmark-relative performance. An underweight to healthcare and overweight to financials were the main drivers, although an overweight to energy detracted. Security selection was positive and mainly driven by financials, energy and utilities, while it detracted within healthcare.
Value significantly outperformed growth (by more than 6% as measured by the Russell 2000 Value and Russell 2000 Growth Indexes) and provided a strong tailwind for our value-oriented sub-advisers. William Blair and LSV benefited from value’s favorability and contributed
strong stock selection, mainly in financials. Conversely, our growth-oriented sub-advisers were challenged by a growth headwind. EAM, which pursues a momentum-based strategy, and J.P. Morgan, a traditional growth and momentum manager, were the worst performing managers.
AVERAGE ANNUAL TOTAL RETURN1
| | | | | | | | | | | | | | | | | | | | |
| | | One Year Return | | | Annualized 3 Year Return | | | Annualized 5 Year Return | | | Annualized 10 Year Return | | | Annualized Inception to Date | |
| Small Cap Fund, Class A | | | -4.99% | | | | 7.01% | | | | 7.40% | | | | 5.36% | | | | 7.80% | |
| Russell 2000® Index | | | -5.97% | | | | 6.93% | | | | 7.86% | | | | 6.27% | | | | 7.50% | |
Comparison of Change in the Value of a $100,000 Investment in the Small Cap Fund, Class A, versus the Russell 2000® Index
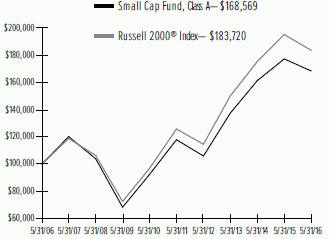
| | 1 | | For the year ended May 31, 2016. Past performance is not an indication of future performance. Class A shares were offered beginning 6/14/96. Returns shown do not reflect the deduction of taxes that a shareholder would pay on fund distributions or the redemption of fund shares. The returns for certain periods reflect fee waivers and/or reimbursements in effect for that year; absent fee waivers and reimbursements, performance would have been lower. |
| | | | |
| SEI Institutional Investments Trust / Annual Report / May 31, 2016 | | | 11 | |
MANAGEMENT’S DISCUSSION AND ANALYSIS OF FUND PERFORMANCE
May 31, 2016 (Unaudited)
Small Cap II Fund
I. Objective
The Small Cap II Fund (the “Fund”) seeks capital appreciation.
II. Multi-Manager Approach Statement
The Fund uses a multi-manager approach, relying on a number of sub-advisers with differing investment approaches to manage portions of the Fund’s portfolio under the general supervision of SEI Investments Management Corporation (SIMC). The Fund utilized the following sub-advisers as of May 31, 2016: Alliance Bernstein L.P.; AQR Capital Management, LLC; EAM Investors, LLC; Falcon Point Capital, LLC; LMCG Investments, LLC; Mesirow Financial Investment Management, Inc. (formerly Fiduciary Management Associates, LLC); and Snow Capital Management L.P. Falcon Point Capital, LLC was added, while Montibus Capital Management LLC was removed.
III. Return vs. Benchmark
For the fiscal year ending May 31, 2016, the Fund underperformed the Russell 2000® Index (“Index”), returning -6.07% versus an index return of -5.97%.
IV. Fund Attribution
As noted in the shareholder letter, the period was marked by volatility, principally within the energy sector and emerging markets, as crude-oil prices dropped on excess production, concerns over domestic growth and expectations regarding the degree to which the U.S. could absorb a rate increase while the rest of the developed world continued to pursue monetary easing.
For the period, energy was the worst performing sector, declining by 42%, followed by healthcare with a 17% drop on valuation concerns. The defensive sectors led, with utilities, telecommunications and consumer staples returning 12.6%, 10.4% and 6.3%, respectively.
Allocation detracted meaningfully, particularly underweights to financials and utilities, and more than offset the contribution from an underweight to materials. Security selection was strong across the board and was positive in eight out of ten sectors. Consumer discretionary and financials helped most, while industrials was the only meaningfully negative sector.
Value significantly outperformed growth (by more than 6% as measured by the Russell 2000 Value and Russell 2000 Growth Indexes) and provided a strong tailwind for our value-oriented sub-advisers. LMCG and Mesirow (formerly Fiduciary Management Associates, LLC) led
performance among our value-oriented sub-advisers. Conversely, our growth-oriented sub-advisers were challenged by a growth headwind. Momentum-oriented EAM and traditional-growth manager AllianceBernstein struggled.
AVERAGE ANNUAL TOTAL RETURN1
| | | | | | | | | | | | |
| | | One Year Return | | | Annualized 3 Year Return | | | Annualized Inception to Date | |
| Small Cap II Fund, Class A | | | -6.07% | | | | 7.46% | | | | 10.90% | |
| Russell 2000® Index | | | -5.97% | | | | 6.93% | | | | 11.32% | |
Comparison of Change in the Value of a $100,000 Investment in the Small Cap II Fund, Class A, versus the Russell 2000® Index
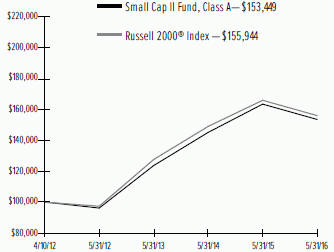
| | 1 | | For the year ended May 31, 2016. Past performance is not an indication of future performance. Class A shares were offered beginning 4/10/12. Returns shown do not reflect the deduction of taxes that a shareholder would pay on fund distributions or the redemption of fund shares. The returns for certain periods reflect fee waivers and/or reimbursements in effect for that period; absent fee waivers and reimbursements, performance would have been lower. |
| | |
| 12 | | SEI Institutional Investments Trust / Annual Report / May 31, 2016 |
MANAGEMENT’S DISCUSSION AND ANALYSIS OF FUND PERFORMANCE
May 31, 2016 (Unaudited)
Small/Mid Cap Equity Fund
I. Objective
The Small/Mid Cap Equity Fund (the “Fund”) seeks long-term capital appreciation.
II. Multi-Manager Approach Statement
The Fund uses a multi-manager approach, relying on a number of sub-advisers with differing investment approaches to manage portions of the Fund’s portfolio, under the general supervision of SEI Investments Management Corporation (SIMC). The Fund utilized the following sub-advisers as of May 31, 2016: AllianceBernstein L.P.; AQR Capital Management, LLC; Arrowpoint Asset Management, LLC; Axiom International Investors, LLC; CastleArk Management LLC.; Integrity Asset Management, LLC; LMCG Investments, LLC; LSV Asset Management; and Robeco Investment Management, Inc. During the year, AQR Capital Management, LLC and Axiom International Investors, LLC were added, while Montibus Capital Management LLC and Security Capital Research and Management Incorporated were removed.
III. Return vs. Benchmark
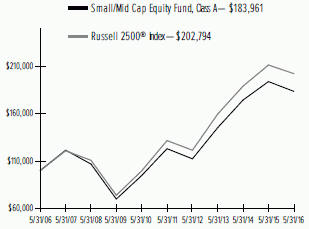
For the fiscal year ending May 31, 2016, the Fund underperformed the Russell 2500® Index (the “Index”), returning -5.33% versus the Index return of -4.30%.
IV. Fund Attribution
As noted in the shareholder letter, the period was marked by volatility, principally within the energy sector and emerging markets, as crude-oil prices dropped on excess production, concerns over domestic growth and expectations regarding the degree to which the U.S. could absorb a rate increase while the rest of the developed world continued to pursue monetary easing.
For the period, energy was the worst-performing sector, declining by 35%, followed by healthcare with a 16% drop on valuation concerns. The defensive sectors led with utilities and telecommunications returning 19% and 6%, respectively.
Allocation detracted most given the Fund’s underweights to utilities and financials, two of the top three best-performing sectors. An overweight to energy also hurt, while an overweight to industrials helped. Security selection was a mild detractor. Financials, industrials and healthcare weighed on relative returns, while technology, energy and staples contributed.
Value significantly outperformed growth (by more than 6% as measured by the Russell 2000 Value and Russell
2000 Growth Indexes) and provided a strong tailwind for our value-oriented sub-advisers. LMCG Investments LLC and LSV Asset Management led among our value-oriented sub-advisers; Arrowpoint Asset Management, LLC, a stability-growth manager, also performed well. All three benefited from owning companies that had somewhat defensive characteristics, such as recurring revenue and stable business models. Growth-oriented sub-advisers Axiom International Investors, LLC and AllianceBernstein L.P. were the weakest performers. Axiom International Investors, LLC was challenged by exposure to momentum, while AllianceBernstein L.P. was set back by stock selection, mainly in healthcare.
AVERAGE ANNUAL TOTAL RETURN1
| | | | | | | | | | | | | | | | | | | | |
| | | One Year Return | | | Annualized 3 Year Return | | | Annualized 5 Year Return | | | Annualized 10 Year Return | | | Annualized Inception to Date | |
| Small/Mid Cap Equity Fund, Class A | | | -5.33% | | | | 8.12% | | | | 8.36% | | | | 6.29% | | | | 8.06% | |
| Russell 2500® Index | | | -4.30% | | | | 8.23% | | | | 9.00% | | | | 7.33% | | | | 8.80% | |
Comparison of Change in the Value of a $100,000 Investment in the Small/Mid Cap Equity Fund, Class A, versus the Russell 2500 Index
| | 1 | | For the year ended May 31, 2016. Past performance is no indication of future performance. Class A shares were offered beginning 12/15/03. Returns shown do not reflect the deduction of taxes that a shareholder would pay on Fund distributions or the redemption of Fund Shares. The returns for certain periods reflect fee waivers and/or reimbursements in effect for that year; absent fee waivers and reimbursements, performance would have been lower. |
| | | | |
| SEI Institutional Investments Trust / Annual Report / May 31, 2016 | | | 13 | |
MANAGEMENT’S DISCUSSION AND ANALYSIS OF FUND PERFORMANCE
May 31, 2016 (Unaudited)
U.S. Managed Volatility Fund
I. Objective
The U.S. Managed Volatility Fund (the “Fund”) seeks capital appreciation with less volatility than the broad U.S. equity markets.
II. Multi-Manager Approach Statement
The Fund uses a multi-manager approach, relying on a number of sub-advisers with differing investment approaches to manage portions of the Fund’s portfolio, under the general supervision of SEI Investments Management Corporation (SIMC). The Fund utilized the following sub-advisers as of May 31, 2016: AJO, LP; Analytic Investors, LLC; and LSV Asset Management. There were no sub-adviser changes made during the year.
III. Return vs. Benchmark
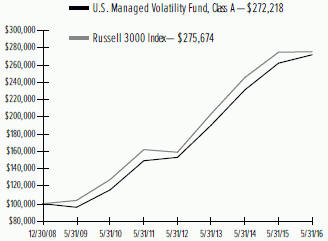
For the fiscal year ending May 31, 2016, the Fund outperformed the Russell 3000 Index (the “Index”), returning 3.71% versus an Index return of 0.22%.
IV. Fund Attribution
The Fund delivered positive returns during the recently completed fiscal year, which was characterized by a volatile and uncertain market environment amid plunging oil prices, worries over a China slowdown and a deceleration of global growth. As noted in the shareholder letter, investors largely sought safe assets, and the rally of low-beta names has been a key market theme over the period. Defensive sectors — namely, staples, utilities and telecommunications — outperformed cyclicals, as the shareholder letter addressed, while energy and materials were by far the worst-performing sectors. The Fund’s absolute performance was captured predominantly by this theme for the period.
The Fund delivered positive benchmark-relative performance over the period. Strong tilts to low-beta names (the Fund’s philosophy by construction) accounted most for this performance. These positive effects were largely achieved via the Fund’s sector positioning; namely, overweights to staples, utilities and telecommunications, but also avoidance of the highly volatile energy and materials sectors. Strong selection within small caps also helped relative performance. Value was out of favor for the year given the underperformance of the cheap energy, commodity-related and financials sectors; therefore, this particular tilt detracted from relative performance. The Fund
favored small caps at the expense of large caps, which also hurt.
Analytic Investors, LLC was the best-performing sub-adviser during the fiscal year. Its outperformance was almost entirely captured by its low-beta bias; namely, via overweights to consumer staples and underweights to energy. Momentum was strong in the defensive names, which helped, as did strong selection effects within small caps. LSV Asset Management also did well in relative terms and, similar to Analytic Investors, LLC, added value mostly through overweights to defensive sectors. However, LSV Asset Management’s value lean did not allow a similar rally as Analytic Investors, LLC enjoyed. Although AJO, LP had positive effects from its low-beta leaning, selection effects within the retailing industry had a material impact, offsetting the benefits of its relative sector positioning and leading to underperformance for the year.
Any frictional cash positions in the portfolio were equitized through index futures in order to be fully invested in the market at all times. This had a negligible impact on performance.
AVERAGE ANNUAL TOTAL RETURN1
| | | | | | | | | | | | | | | | |
| | | One Year Return | | | Annualized 3 Year Return | | | Annualized 5 Year Return | | | Annualized Inception to Date | |
| U.S. Managed Volatility Fund, Class A | | | 3.71% | | | | 12.58% | | | | 12.70% | | | | 14.46% | |
| Russell 3000 Index | | | 0.22% | | | | 10.57% | | | | 11.15% | | | | 14.65% | |
Comparison of Change in the Value of a $100,000 Investment in the U.S. Managed Volatility Fund, Class A, versus the Russell 3000 Index
| | |
| 14 | | SEI Institutional Investments Trust / Annual Report / May 31, 2016 |
| | 1 | | For the year ended May 31, 2016. Past performance is not an indication of future performance. Class A shares were offered beginning 12/31/08. Returns shown do not reflect the deduction of taxes that a shareholder would pay on fund distributions or the redemption of fund shares. The returns for certain periods reflect fee waivers and/or reimbursements in effect for that year; absent fee waivers and reimbursements, performance would have been lower. |
| | | | |
| SEI Institutional Investments Trust / Annual Report / May 31, 2016 | | | 15 | |
MANAGEMENT’S DISCUSSION AND ANALYSIS OF FUND PERFORMANCE
May 31, 2016 (Unaudited)
World Equity Ex-US Fund
I. Objective
The objective of the World Equity Ex-US Fund (the “Fund”) is to provide capital appreciation.
II. Multi-Manager Approach Statement
The Fund uses a multi-manager approach, relying on a number of sub-advisers with differing investment approaches to manage portions of the Fund’s portfolio, under the general supervision of SEI Investments Management Corporation (“SIMC”). The Fund utilized the following sub-advisers as of May 31, 2016: Acadian Asset Management LLC; Baillie Gifford Overseas Ltd; BlackRock International Ltd.; EARNEST Partners LLC; J O Hambro Capital Management Limited; McKinley Capital Management, LLC; and NFJ Investment Group LLC. During the year, BlackRock International Ltd. was added.
III. Return vs. Benchmark
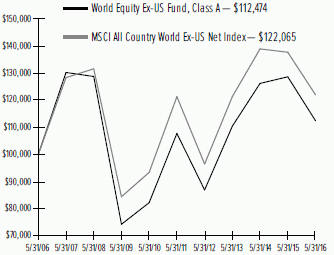
For the fiscal year ended May 31, 2016, the Fund underperformed the MSCI All Country World Ex-US Net Index (the “Index”), returning -12.60% versus the Index return of -11.39%.
IV. Fund Attribution
The Fund’s fiscal year saw macro events dominating market movements around the globe, beginning with Europe’s debate over the terms of Greece’s bailout, which created increased demand for risk-off assets as investors sought shelter from the possible fallout. Volatility continued to rise as China’s stock-market bubble finally burst (an event addressed in the shareholder letter) capturing the attention of investors. Concerns for a hard landing in the slowing Chinese economy and the spillover into other markets persisted, sending commodities prices lower. Supply-and-demand dynamics for oil finally reached a favorable point after oil prices bottomed in February, as noted in the shareholder letter, and markets began to rally on continued central-bank assistance from around the globe as fears of an emerging-market slowdown led by China subsided.
Most markets ended the fiscal year in the red after dealing with macro headwinds for much of the period. Japan’s Nikkei index retreated for the year as slow economic growth prompted the Bank of Japan to send rates into negative territory in an unprecedented move. Europe and the UK ended the year on even weaker notes, with the European Central Bank pledging more support for the region while investors turned their attention to the British vote on whether to leave the eurozone in June. Globally, emerging markets in Asia,
Latin America, and Europe, the Middle East and Africa (EMEA) performed worst as all three regions were heavily affected by China’s slowing growth.
The Fund trailed the benchmark slightly, due primarily to stock selection. From a regional perspective, Europe was an area of strength, with Denmark, Germany, Spain and Switzerland all adding to relative performance via stock selection. Stock selection in Japan and Canada detracted from performance; Japanese holdings in industrials and information technology struggled, while Canadian holdings in consumer discretionary and healthcare fell short of expectations. Emerging markets also produced weakness, with Asia lagging other emerging-market regions. China, India and Taiwan detracted from relative returns, while Korea contributed.
From a sector standpoint, healthcare, information technology and consumer staples detracted most from relative performance. Selection drove underperformance in healthcare and information technology, while an underweight to consumer staples hurt the Fund’s performance. Consumer staples was the only sector with positive absolute returns during the period. On the other end of the spectrum, financials was the weakest absolute performing sector, but the greatest contributor to the Fund’s relative returns, due mostly to selection in the banking industry and an underweight to the sector.
NFJ Investment Group LLC was the poorest performing sub-adviser on poor selection in Europe and Japan. Although selection in Europe helped J O Hambro Capital Management Limited, its efforts were offset by weak selection in Asian emerging markets and in North America. EARNEST Partners LLC also detracted from performance due to poor selection in Asia and the U.K. Acadian Asset Management LLC and Baillie Gifford Overseas Ltd. contributed to relative performance during the period, with both managers benefiting from strong selection in Europe and Asia.
AVERAGE ANNUAL TOTAL RETURN1
| | | | | | | | | | | | | | | | |
| | | One Year Return | | | Annualized 3 Year Return | | | Annualized 5 Year Return | | | Annualized Inception to Date | |
| World Equity Ex-US Fund, Class A | | | -12.60% | | | | 0.61% | | | | 0.86% | | | | 3.53% | |
| MSCI All Country World Ex-US Net Index | | | -11.39% | | | | 0.19% | | | | 0.12% | | | | 4.52% | |
| | |
| 16 | | SEI Institutional Investments Trust / Annual Report / May 31, 2016 |
Comparison of Change in the Value of a $100,000 Investment in the World Equity Ex-US Fund, Class A, versus the MSCI All Country World Ex-US Net Index
| | 1 | | For the year ended May 31, 2016. Past performance is not an indication of future performance. Class A shares were offered beginning 3/28/05. Returns shown do not reflect the deduction of taxes that a shareholder would pay on fund distributions or the redemption of fund shares. The returns for certain periods reflect fee waivers and/or reimbursements in effect for that year; absent fee waivers and reimbursements, performance would have been lower. |
| | | | |
| SEI Institutional Investments Trust / Annual Report / May 31, 2016 | | | 17 | |
MANAGEMENT’S DISCUSSION AND ANALYSIS OF FUND PERFORMANCE
May 31, 2016 (Unaudited)
Screened World Equity Ex-US Fund
I. Objective
The Screened World Equity Ex-US Fund (the “Fund”) seeks to provide capital appreciation.
II. Multi-Manager Approach Statement
The Fund uses a multi-manager approach, relying on a number of sub-advisers with differing investment approaches to manage portions of the Fund’s portfolio, under the general supervision of SEI Investments Management Corporation (“SIMC”). The Fund utilized the following sub-advisers as of May 31, 2016: Acadian Asset Management LLC; Baillie Gifford Overseas Ltd; EARNEST Partners, LLC; and McKinley Capital Management, LLC. There were no sub-adviser changes during the year.
III. Return vs. Benchmark
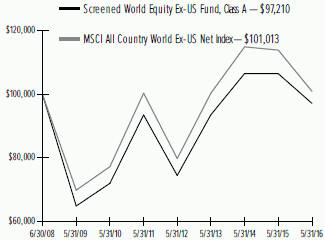
For the fiscal year ended May 31, 2016, the Fund outperformed the MSCI All Country World Ex-US Net Index (the “Index”), returning -8.78% versus the Index return of -11.39%.
IV. Fund Attribution
The Fund’s fiscal year saw macro events dominating market movements around the globe, beginning with Europe’s debate over the terms of Greece’s bailout, which created increased demand for risk-off assets as investors sought shelter from the possible fallout. Volatility continued to rise as China’s stock-market bubble finally burst, as addressed in the shareholder letter, capturing the attention of investors. Concerns for a hard landing in the slowing Chinese economy and the spillover into other markets persisted, sending commodities prices lower. Supply-and-demand dynamics for oil finally reached a favorable point after oil prices bottomed out in February, as noted in the shareholder letter, and markets began to rally on continued central-bank assistance from around the globe and subsiding fears of an emerging-market slowdown led by China.
Most markets ended the fiscal year in the red after dealing with macro headwinds for much of the period. Japan’s Nikkei index retreated for the year as slow economic growth prompted the Bank of Japan to send rates into negative territory in an unprecedented move. Europe and the U.K. ended the year on even weaker notes: the European Central Bank pledged more support for the region while investors turned their attention to the British vote on whether to leave the European Union in June. Globally, emerging markets in Asia, Latin America and Europe, the Middle East and Africa (EMEA)
performed worst, as all three regions were heavily affected by China’s slowing growth.
Most regions contributed to benchmark-relative performance during the period. Europe was one of the top regions in terms of relative performance and also the greatest portfolio contributor by a significant margin. Stock selection in European countries, including Germany and Spain, contributed during the period. Similarly, Canada and China also helped. Japan detracted most from performance during the period.
Most sectors contributed to performance. Strong selection drove relative performance in every sector except telecommunications and utilities. Financials, the weakest sector in the benchmark on an absolute basis, made the largest relative contribution to Fund performance; the Fund was supported by an underweight to the sector. Telecommunications and utilities detracted mainly due to the Fund’s underweights to these sectors.
Three of the Fund’s four sub-advisers contributed to relative returns. Both Acadian Asset Management LLC and Baillie Gifford Overseas Ltd outperformed the benchmark across a wide variety of sectors. Performance in the financial sector (specifically in the banking industry) played a large part in Baillie Gifford Overseas Ltd’s outperformance, and helped EARNEST Partners, LLC as well, although EARNEST Partners, LLC was hurt by poor stock selection across a variety of sectors.
AVERAGE ANNUAL TOTAL RETURN1
| | | | | | | | | | | | | | | | |
| | | One Year Return | | | Annualized 3 Year Return | | | Annualized 5 Year Return | | | Annualized Inception to Date | |
| Screened World Equity Ex-US Fund, Class A | | | -8.78% | | | | 1.26% | | | | 0.77% | | | | -0.36% | |
| MSCI All Country World Ex-US Net Index | | | -11.39% | | | | 0.19% | | | | 0.12% | | | | 0.70% | |
| | |
| 18 | | SEI Institutional Investments Trust / Annual Report / May 31, 2016 |
Comparison of Change in the Value of a $100,000 Investment in the Screened World Ex-US Equity Fund, Class A, versus the MSCI All Country World Ex-US Net Index
| | 1 | | For the year ended May 31, 2016. Past performance is not an indication of future performance. Class A shares were offered beginning 6/30/08. Returns shown do not reflect the deduction of taxes that a shareholder would pay on fund distributions or the redemption of fund shares. The returns for certain periods reflect fee waivers and/or reimbursements in effect for that year; absent fee waivers and reimbursements, performance would have been lower. |
| | | | |
| SEI Institutional Investments Trust / Annual Report / May 31, 2016 | | | 19 | |
MANAGEMENT’S DISCUSSION AND ANALYSIS OF FUND PERFORMANCE
May 31, 2016 (Unaudited)
Emerging Markets Equity Fund
I. Objective
The Emerging Markets Equity Fund (the “Fund”) seeks to provide capital appreciation.
II. Multi-Manager Approach Statement
The Fund uses a multi-manager approach, relying on a number of sub-advisers with differing investment approaches to manage portions of the Fund’s portfolio under the general supervision of SEI Investments Management Corporation (“SIMC”). The Fund utilized the following sub-advisers as of May 31, 2016: AllianceBernstein, L.P.; Causeway Capital Management LLC; J O Hambro Capital Management Limited; Kleinwort Benson Investors International Ltd; RWC Asset Advisers (US) LLC; and WCM Investment Management. There were no sub-adviser changes made during the year.
III. Return vs. Benchmark
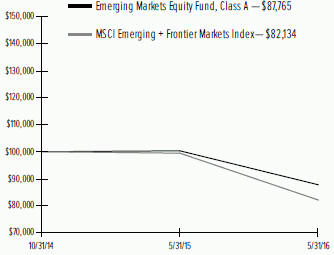
For the fiscal year ending May 31, 2016, the Fund outperformed the MSCI Emerging + Frontier Markets Index (the “Index”), returning -12.53% versus an Index return of -17.43%.
IV. Fund Attribution
The Fund’s fiscal year saw macro events dominating market movements around the globe, beginning with Europe’s debate over the terms of Greece’s bailout, creating increased demand for risk-off assets as investors sought shelter from the possible fallout. Volatility continued to rise as China’s stock market bubble finally burst (an event addressed in the shareholder letter), capturing the attention of investors. Concerns for a hard landing in the slowing Chinese economy and the spillover into other markets persisted, sending commodities prices lower. Supply-and-demand dynamics for oil finally reached a favorable point after oil prices bottomed in February, as noted in the shareholder letter, and markets began to rally on continued central-bank assistance from around the globe and subsiding fears of an emerging-market slowdown led by China.
Emerging markets overall ended the period with double-digit negative returns. Emerging Asia was the poorest performer, followed closely by Europe, the Middle East and Africa (EMEA), while Latin America fared marginally better.
Emerging Asia was by far the strongest contributor to relative results, followed by Latin America. The Fund also benefited from emerging-markets stocks listed on developed exchanges with businesses tied to emerging markets.
Within emerging Asia, China was a strong contributor to relative results. Stock selection helped, but the Fund also benefited from an underweight to the country. India was the opposite; stock selection within and an underweight to the country detracted. Underweights to Korea and Malaysia were also negative. In Latin America, the strongest contribution came from selection within and an overweight to Argentina, and the Fund also benefited from selection in Mexico. In EMEA, the strongest relative contribution came from Poland, through strong stock selection, although a slight overweight detracted at the margin. Exposure to oil-sensitive Saudi Arabia detracted, as did underweights to Russia and South Africa, selection in Turkey and exposure to Greek banks.
Although financials was one of the worst-performing sectors during the period, the Fund’s outperformance leaned quite heavily on it. All industries within financials enhanced relative performance, much of which came from the banking industry. All sectors were negative for the fiscal year, but materials, industrials, healthcare and the consumer sectors contributed to relative performance, with stock selection playing a significant role in each sector’s outperformance. Only energy and information technology detracted.
AllianceBernstein, L.P. contributed to relative performance through stock selection in frontier markets, mostly within the financials sector and banking industry. Causeway Capital Management LLC detracted due to stock selection in Latin America, with the poorest results in Brazil, and EMEA. J O Hambro Capital Management Limited contributed with strong selection in consumer discretionary companies, while Kleinwort Benson Investors International Ltd was essentially a non-factor for performance. RWC Asset Advisers (US) LLC and WCM Investment Management each contributed on positioning in Latin America, North America and Asia, with the latter representing by far the greatest contributions for both managers. RWC Asset Advisers (US) LLC had strong selection within financials and banking, while WCM Investment Management’s success in selection was more broad-based.
| | |
| 20 | | SEI Institutional Investments Trust / Annual Report / May 31, 2016 |
AVERAGE ANNUAL TOTAL RETURN1
| | | | | | | | |
| | | One Year Return | | | Annualized Inception to Date | |
| Emerging Markets Equity Fund, Class A | | | -12.53% | | | | -7.91% | |
| MSCI Emerging + Frontier Markets Index | | | -17.43% | | | | -11.69% | |
Comparison of Change in the Value of a $100,000 Investment in the Emerging Markets Equity Fund, Class A, versus the MSCI Emerging + Frontier Markets Index
| | 1 | | For the year ended May 31, 2016. Past performance is no indication of future performance. Class A shares were offered beginning 10/31/14. Returns shown do not reflect the deduction of taxes that a shareholder would pay on fund distributions or the redemption of fund shares. The returns for certain periods reflect fee waivers and/or reimbursements in effect for that year; absent fee waivers and reimbursements, performance would have been lower. |
| | | | |
| SEI Institutional Investments Trust / Annual Report / May 31, 2016 | | | 21 | |
MANAGEMENT’S DISCUSSION AND ANALYSIS OF FUND PERFORMANCE
May 31, 2016 (Unaudited)
Opportunistic Income Fund
I. Objective
The Opportunistic Income Fund (the “Fund”) seeks capital appreciation and income.
II. Multi-Manager Approach Statement
The Fund uses a multi-manager approach, relying on a number of sub-advisers with differing investment approaches to manage portions of the Fund’s portfolio, under the general supervision of SEI Investments Management Corporation (SIMC). The Fund utilized the following sub-advisers as of May 31, 2016: Ares Management LLC; Brookfield Investment Management Inc.; Declaration Management & Research LLC; and Wellington Management Company LLP. There were no sub-adviser changes during the period.
III. Return vs. Benchmark
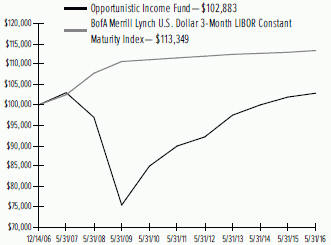
For the fiscal year ending May 31, 2016, the Fund outperformed the BofA Merrill Lynch U.S. Dollar 3-Month LIBOR Constant Maturity Index (“Index”), returning 0.93% versus an Index return of 0.38%.
IV. Fund Attribution
Fixed-income markets were mostly positive during the Fund’s fiscal year. As addressed in the shareholder letter, interest rates generally declined, with short-term rates depressed globally as major central banks outside of the U.S. guided benchmark rates downward and expanded their asset-purchase programs.
The greatest contributors to benchmark-relative performance were allocations to bank loans, asset-backed securities (ABS) and non-agency mortgage-backed securities (MBS) sectors.
Within the bank-loan sector, communications and consumer cyclicals companies drove returns.
Within the ABS sector, allocations to home-equity securitizations performed well as the housing market continued to strengthen. High-quality collateralized loan obligations (CLOs) also helped. Non-agency MBS benefited from the strengthening housing market and a strong technical backdrop. A small cash allocation slightly detracted from relative returns during the period.
All four sub-advisers contributed to the Fund’s outperformance. Ares Management LLC’s focus on bank loans was a meaningful contributor to performance. For Brookfield Investment Management Inc. and Declaration Management & Research LLC, non-agency mortgages and home-equity securitizations were meaningful contributors. Wellington Management Company LLP’s
focus on consumer-related ABS sectors and high-quality CLOs also added to relative performance.
The Fund used to-be-announced (TBA) forward contracts to effectively manage duration, yield-curve and market exposures (TBA contracts confer the obligation to buy or sell future debt obligations of the three U.S. government-sponsored agencies that issue or guarantee MBS — Fannie Mae, Freddie Mac and Ginnie Mae). None of these had a meaningful impact on the Fund’s performance.
AVERAGE ANNUAL TOTAL RETURN1
| | | | | | | | | | | | | | | | |
| | | One Year
Return | | | Annualized
3 Year
Return | | | Annualized
5 Year
Return | | | Annualized
Inception
to Date | |
| Opportunistic Income Fund, Class A | | | 0.93% | | | | 1.81% | | | | 2.73% | | | | 0.30% | |
BofA Merrill Lynch U.S. Dollar 3-Month LIBOR Constant Maturity Index | | | 0.38% | | | | 0.28% | | | | 0.32% | | | | 1.33% | |
Comparison of Change in the Value of a $100,000 Investment in the Opportunistic Income Fund, Class A, versus the BofA Merrill Lynch U.S. Dollar 3-Month LIBOR Constant Maturity Index
| | 1 | | For the year ended May 31, 2016. Past performance is not an indication of future performance. Class A shares were offered beginning 12/14/06. Returns shown do not reflect the deduction of taxes that a shareholder would pay on fund distributions or the redemption of fund shares. The returns for certain periods reflect fee waivers and reimbursements, performance would have been lower. |
| | |
| 22 | | SEI Institutional Investments Trust / Annual Report / May 31, 2016 |
MANAGEMENT’S DISCUSSION AND ANALYSIS OF FUND PERFORMANCE
May 31, 2016 (Unaudited)
Core Fixed Income Fund
I. Objective
The Core Fixed Income Fund (the “Fund”) seeks current income consistent with the preservation of capital.
II. Multi-Manager Approach Statement
The Fund uses a multi-manager approach, relying on a number of sub-advisers with differing investment approaches to manage portions of the Fund’s portfolio, under the general supervision of SEI Investments Management Corporation (SIMC). The Fund utilized the following sub-advisers as of May 31, 2016: Jennison Associates LLC; Metropolitan West Asset Management, LLC; Wells Capital Management, Incorporated; Western Asset Management Company; and Western Asset Management Company Limited. During the year, J.P. Morgan Investment Management Inc. was removed.
III. Return vs. Benchmark
For the fiscal year ended May 31, 2016, the Fund underperformed the Barclays U.S. Aggregate Bond Index (“Index”), returning 2.97% versus an Index return of 2.99%.
IV. Fund Attribution
U.S. Treasury yields were volatile during the fiscal year, with short-term yields rising and long-term yields declining, resulting in generally positive returns for bonds. Returns were positive for non-Treasury bonds as well as for asset-backed, commercial-mortgage securities and agency-mortgage bonds, which all outperformed comparable corporate bonds. While corporate bonds as a whole underperformed comparable Treasury bonds, the utilities and financials sub-sectors outperformed, while industrial bonds underperformed given the decline in commodity prices. Taxable municipal bonds had strong absolute returns and performed well versus comparable Treasury bonds, as increasing wages and higher housing prices led to improved tax receipts.
The yield curve flattened during the period, as noted in the shareholder letter, so the Fund’s yield-curve flattening bias with an overweight to long-term bonds and an underweight to short-term bonds enhanced relative performance. A slightly shorter-duration posture detracted as yields generally declined. A resilient consumer and improving wages two trends addressed in the shareholder letter helped support an overweight to asset-backed securities. While economic growth has been below expectations, it has remained positive, which provided a tailwind for the commercial mortgage
market and the Fund’s associated overweight. A small overweight to corporate credit served as a drag on returns, but was offset by security selection, with an overweight to the outperforming financial sub-sector. An underweight to agency mortgage-backed securities held back returns as they outperformed amid investor demand for extra yield. An improving economy combined with a solid housing market enabled non-agency mortgages to outperform, and the Fund’s overweight benefitted.
Western and Jennison both generated positive relative returns as a result of their yield-curve flattening biases. MetroWest’s short-duration posture was challenged as short-term rates increased. Non-agency mortgage holdings by Western and MetroWest contributed, although the former’s underweight agency mortgages detracted. Overweights to asset-backed and commercial mortgage-backed securities by Wells were beneficial. Jennison’s selection among corporates struggled, while MetroWest’s selection within the financials sub-sector was positive.
The Fund utilized U.S Treasury futures and interest-rate swaps to assist in managing the duration and yield positioning of the Fund. Currency forward contracts were used to manage currency exposures within the Fund. The Treasury futures and interest-rate swap positions did not have a material impact on performance since they were primarily used for risk management purposes. The currency forward positions detracted slightly as they underperformed the U.S. dollar.
AVERAGE ANNUAL TOTAL RETURN1
| | | | | | | | | | | | | | | | | | | | |
| | | One Year
Return | | | Annualized
3 Year
Return | | | Annualized
5 Year
Return | | | Annualized
10 Year
Return | | | Annualized
Inception
to Date | |
| Core Fixed Income Fund, Class A | | | 2.97% | | | | 3.37% | | | | 4.23% | | | | 5.80 | | | | 6.13% | |
| Barclays U.S. Aggregate Bond Index | | | 2.99% | | | | 2.91% | | | | 3.33% | | | | 4.97 | | | | 5.66% | |
| | | | |
| SEI Institutional Investments Trust / Annual Report / May 31, 2016 | | | 23 | |
MANAGEMENT’S DISCUSSION AND ANALYSIS OF FUND PERFORMANCE
May 31, 2016 (Unaudited)
Core Fixed Income Fund (Concluded)
Comparison of Change in the Value of a $100,000 Investment in the Core Fixed Income Fund, Class A, versus the Barclays U.S. Aggregate Bond Index
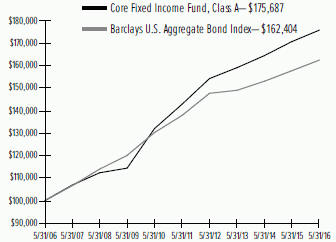
| | 1 | | For the year ended May 31, 2016. Past performance is not an indication of future performance. Class A shares were offered beginning 6/14/96. Returns shown do not reflect the deduction of taxes that a shareholder would pay on fund distributions or the redemption of fund shares. The returns for certain periods reflect fee waivers and/or reimbursements in effect for that year; absent fee waivers and reimbursements, performance would have been lower |
| | |
| 24 | | SEI Institutional Investments Trust / Annual Report / May 31, 2016 |
MANAGEMENT’S DISCUSSION AND ANALYSIS OF FUND PERFORMANCE
May 31, 2016 (Unaudited)
High Yield Bond Fund
I. Objective
The High Yield Bond Fund (the “Fund”) seeks total return.
II. Multi-Manager Approach Statement
The Fund uses a multi-manager approach, relying on a number of sub-advisers with differing investment approaches to manage portions of the Fund’s portfolio, under the general supervision of SEI Investments Management Corporation (SIMC). The Fund utilized the following sub-advisers as of May 31, 2016: Ares Management LLC; Benefit Street Partners LLC; Brigade Capital Management, LP; Delaware Investments Fund Advisers, a Series of Delaware Management Business Trust; and J.P. Morgan Investment Management Inc. SIMC also directly manages a portion of the Fund. There were no sub-advisor changes during the year.
III. Return vs. Benchmark
For the fiscal year ending May 31, 2016, the Fund underperformed the BofA Merrill Lynch U.S. High Yield Constrained Indes (the “Index”), returning -2.17% versus the Index return of
-0.88%.
IV. Fund Attribution
The U.S. high-yield market experienced extended volatility during the Fund’s fiscal year, primarily due to growing concerns about the ability of energy-sector companies to continue servicing their debts in a declining oil-price environment. As noted in the shareholder letter, conditions bottomed out in the first quarter of 2015, and high-yield bonds rallied to close the period slightly below where they began.
The Fund’s allocation to leisure (mostly via the gaming sub-sector) was the primary contributor to absolute performance. While the gaming sector is not a large index component, there is conviction that some credits are undervalued and offer strong total-return potential. The Fund’s allocation to media, primarily cable & satellite TV, also helped. Media is an asset-rich sector with strong cash-flow generation and reasonable amounts of leverage. Both leisure and media are generally less sensitive to changes in macroeconomic conditions.
The Fund’s allocation to energy, in particular exploration and production, was the primary detractor to absolute performance. The sector was down more than 15% for the period, despite rallying more than 18% in the first five months of 2016. The Fund maintains underweights to the energy sector, as well as to the metals/mining excluding steel sector (which is a subsector of basic industry).
At the Fund level, an overweight to and security selection within leisure, along with selection in healthcare and insurance, supported relative performance, but were offset by challenges to a structured-credit allocation and selection within telecommunications and retail.
Overweights to and selection within media, leisure and technology and electronics contributed to Ares Management LLCs’ relative performance, while selection in energy and underweights to and selection within basic industry and consumer goods detracted. Brigade Capital Management, LP benefited from an overweight to and selection within leisure, an underweight to and selection in energy and selection in healthcare, but these could not overcome poor selection in utilities, telecommunications and retail. Benefit Street Partners LLC’s overweight to media, along with selection in insurance and banking, enhanced relative performance, but was somewhat disadvantaged by selection in energy, financial services and telecommunications. An overweight to and selection within leisure, selection in services and an overweight to consumer goods benefitted J.P. Morgan Investment Management Inc.’s relative returns, while selection in telecommunications, retail and technology and electronics detracted. The Fund’s allocation to collateralized loan obligations (CLOs) also detracted. CLO performance is closely tied to that of the loan asset class, which saw its worst performance since the credit crisis – a result of continued deterioration in energy and commodity-related sectors.
The Fund used derivatives throughout the one-year period ending May 31, 2016 to manage duration, yield-curve positioning and spread duration in an efficient manner. Credit-related derivatives and credit-default swaps were used for this purpose, and they had a modestly positive impact on overall Fund performance.
| | | | |
| SEI Institutional Investments Trust / Annual Report / May 31, 2016 | | | 25 | |
MANAGEMENT’S DISCUSSION AND ANALYSIS OF FUND PERFORMANCE
May 31, 2016 (Unaudited)
High Yield Bond Fund (Concluded)
AVERAGE ANNUAL TOTAL RETURN1
| | | | | | | | | | | | | | | | | | | | |
| | | One Year
Return | | | Annualized
3 Year
Return | | | Annualized
5 Year
Return | | | Annualized
10 Year
Return | | | Annualized Inception
to Date | |
| High Yield Bond Fund, Class A | | | -2.17% | | | | 2.66% | | | | 5.59% | | | | 7.31% | | | | 7.44% | |
| BofA Merrill Lynch U.S. High Yield Constrained Index | | | -0.88% | | | | 2.90% | | | | 5.26% | | | | 7.33% | | | | 7.38% | |
Comparison of Change in the Value of a $100,000 Investment in the High Yield Bond Fund, Class A, versus the BofA Merrill Lynch U.S. High Yield Constrained Index
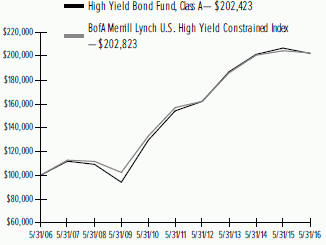
| | 1 | | For the year ended May 31, 2016. Past performance is no indication of future performance. Class A shares were offered beginning 12/5/05. Returns shown do not reflect the deduction of taxes that a shareholder would pay on Fund distributions or the redemption of Fund Shares. The returns for certain periods reflect fee waivers and/or reimbursements in effect for that year; absent fee waivers and reimbursements, performance would have been lower. |
| | |
| 26 | | SEI Institutional Investments Trust / Annual Report / May 31, 2016 |
MANAGEMENT’S DISCUSSION AND ANALYSIS OF FUND PERFORMANCE
May 31, 2016 (Unaudited)
Long Duration Fund
I. Objective
The Long Duration Fund (the “Fund”) seeks return characteristics similar to those of high quality bonds.
II. Multi-Manager Approach Statement
The Fund uses a multi-manager approach, relying on a number of sub-advisers with differing investment approaches to manage portions of the Fund’s portfolio, under the general supervision of SEI Investments Management Corporation (SIMC). The Fund utilized the following sub-advisers as of May 31, 2016: Income Research & Management; Jennison Associates LLC; Legal & General Investment Management America Inc.; and Metropolitan West Asset Management LLC. There were no sub-adviser changes during the period.
III. Return vs. Benchmark
For the fiscal year ending May 31, 2016, the Fund underperformed the Barclays Long U.S. Government/ Credit Index (the “Index”) returning 6.19% versus the Index return of 6.24%.
IV. Fund Attribution
As noted in the shareholder letter, longer-dated Treasurys performed well during the Fund’s fiscal year when long-term yields fell. Ten-year yields fell by 0.27% to end at 1.85%, and 30-year Treasury yields fell 0.23% to end at 2.65%. The Fund’s long-duration strategy benefited from these trends.
The Fund’s relative returns were enhanced by selection within industrials and municipals, as well as an underweight to non-corporates. An underweight to government bonds, overweight to credit, selection within utilities and yield-curve flattening orientation detracted.
Jennison Associate LLC’s selection within industrials (energy, communications, retailers) and an underweight to non-corporates (sovereigns) enhanced relative returns. An underweight to government bonds and overweight to credit, as well as an underweight to and selection within municipals, detracted. Legal & General Investment Management America Inc. benefited from selection within financials (banking) and an underweight to non-corporates (sovereigns), but selection within industrials (technology) and an underweight to municipals challenged relative returns. Metropolitan West Asset Management LLC’s selection within industrials (energy, consumer non-cyclical, communications and consumer cyclicals), as well as an overweight to and selection within municipals contributed, although an underweight to government
bonds, overweight to credit and short-duration posture detracted. Income Research & Managment benefited from selection within financials (banking, insurance), as well as an overweight to and selection within municipals, but relative returns were ultimately challenged by an underweight to government bonds, overweight to credit and selection within industrials (metals and mining, communications).
Derivatives were used on a limited basis. Treasury futures were employed to help manage the risk associated with interest-rate and yield-curve positioning. These had a negligible impact on performance.
AVERAGE ANNUAL TOTAL RETURN1,2
| | | | | | | | | | | | | | | | | | | | |
| | | One Year
Return | | | Annualized
3 Year
Return | | | Annualized
5 Year
Return | | | Annualized
10 Year
Return | | | Annualized
Inception
to Date | |
| Long Duration Fund, Class A | | | 6.19% | | | | 6.09% | | | | 7.93% | | | | 6.59% | | | | 5.95% | |
| Barclays Long U.S. Government/Credit Index | | | 6.24% | | | | 5.94% | | | | 7.73% | | | | 7.96% | | | | 7.22% | |
| | | | |
| SEI Institutional Investments Trust / Annual Report / May 31, 2016 | | | 27 | |
MANAGEMENT’S DISCUSSION AND ANALYSIS OF FUND PERFORMANCE
May 31, 2016 (Unaudited)
Long Duration Fund (Concluded)
Comparison of Change in the Value of a $100,000 Investment in the Long Duration Fund, Class A, versus the Barclays Long U.S. Government/Credit Index, the 60/40 Hybrid of the Barclays Long U.S. Credit & Barclays Long U.S. Government Index
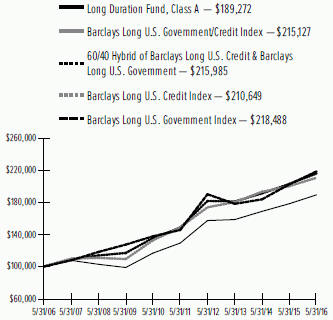
| | 1 | | For the year ended May 31, 2016. Past performance is no indication of future performance. Class A shares were offered beginning 4/21/04. Returns shown do not reflect the deduction of taxes that a shareholder would pay on Fund distributions or the redemption of Fund Shares. The returns for certain periods reflect fee waivers and/or reimbursements in effect for that year; absent fee waivers and reimbursements, performance would have been lower. |
| | 2 | | This table compares the Fund’s average annual total returns to those of a broad-based index and the Fund’s 60/40 Blended Benchmark, which consists of the Barclays U.S. Long Credit Index and the Barclays U.S. Long Government Index. The Fund’s Blended Benchmark is designed to provide a useful comparison to the Fund’s overall performance and more accurately reflects the Fund’s investment strategy than the broad-based index. |
| | |
| 28 | | SEI Institutional Investments Trust / Annual Report / May 31, 2016 |
MANAGEMENT’S DISCUSSION AND ANALYSIS OF FUND PERFORMANCE
May 31, 2016 (Unaudited)
Long Duration Credit Fund
I. Objective
The Long Duration Credit Fund (the “Fund”) seeks return characteristics similar to those of high-quality bonds.
II. Multi-Manager Approach Statement
The Fund uses a multi-manager approach, relying on a number of sub-advisers with differing investment approaches to manage portions of the Fund’s portfolio, under the general supervision of SEI Investments Management Corporation (SIMC). The Fund utilized the following sub-advisers as of May 31, 2016: Income Research & Management; Jennison Associates LLC; Legal & General Investment Management America Inc.; Logan Circle Partners, L.P.; and Metropolitan West Asset Management LLC. There were no sub-adviser changes during the period.
III. Return vs. Benchmark
For the fiscal year ending May 31, 2016, the Fund underperformed the Barclays Long A+ U.S. Credit Index, returning 7.37% versus the Index return of 7.82%.
IV. Fund Attribution
As the shareholder letter noted, longer-dated Treasurys performed well during the Fund’s fiscal year when long-term yields fell. Ten-year yields fell by 0.27% to end at 1.85%, and 30-year Treasury yields fell 0.23% to end at 2.65%. The Fund’s long-duration strategy benefited from these trends.
An allocation to government bonds and selection within industrials and banking contributed to the Fund’s relative returns. An overweight to BBB rated corporates, an underweight to municipals and selection within utilities detracted.
Legal & General Investment Management America Inc.’s selection within industrials (energy, communications and transportation) and financials (specifically banking) contributed, while selection in utilities (electric) and an overweight to banks detracted. Jennison Associates LLC benefited from selection within industrials (energy and communications) and an allocation to government bonds, but was challenged by an underweight to and selection within municipals, as well as selection within utilities (electric). Logan Circle Partners’ allocation to government bonds and selection within financials (banking) contributed, while an overweight to BBB corporates and an underweight to and selection within municipals detracted. Income Research & Management benefited from selection within municipals, but was held back by an overweight to BBB corporates and selection
within industrials (energy, metals and mining and communications). Metropolitan West Asset Management LLC’s allocation to government bonds and selection within municipals were beneficial, but an overweight to BBB corporates and short-duration posture detracted.
Derivatives were used on a limited basis. Treasury futures were employed to help manage the risk associated with interest-rate and yield-curve positioning. These had a negligible impact on performance.
AVERAGE ANNUAL TOTAL RETURN1
| | | | | | | | | | | | |
| | | One Year
Return | | | Annualized
3 Year
Return | | | Annualized
Inception
to Date | |
| Long Duration Credit Fund, Class A | | | 7.37% | | | | 6.49% | | | | 5.92% | |
| Barclays Long A+ U.S. Credit Index | | | 7.82% | | | | 6.28% | | | | 5.24% | |
Comparison of Change in the Value of a $100,000 Investment in the Long Duration Credit Fund, Class A, versus the Barclays Long A+ U.S. Credit Index
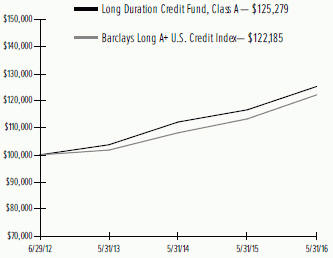
| | 1 | | For the year ended May 31, 2016. Past performance is not an indication of future performance. Class A shares were offered beginning 6/29/12. Returns shown do not reflect the deduction of taxes that a shareholder would pay on fund distributions or the redemption of fund shares. The returns for certain periods reflect fee waivers and/or reimbursements in effect for that year; absent fee waivers and reimbursements, performance would have been lower. |
| | | | |
| SEI Institutional Investments Trust / Annual Report / May 31, 2016 | | | 29 | |
MANAGEMENT’S DISCUSSION AND ANALYSIS OF FUND PERFORMANCE
May 31, 2016 (Unaudited)
Ultra Short Duration Bond Fund
I. Objective
The Ultra Short Duration Bond Fund (the “Fund”) seeks to provide higher current income than that typically offered by a money market fund while maintaining a high degree of liquidity and a correspondingly higher risk of principal volatility.
II. Multi-Manager Approach Statement
The Fund uses a multi-manager approach, relying on a number of sub-advisers with differing investment approaches to manage portions of the Fund’s portfolio, under the general supervision of SEI Investments Management Corporation (SIMC). The Fund utilizes the following sub-advisers as of May 31, 2016: Logan Circle Partners, L.P.; and Wellington Management Company, LLP. There were no sub-adviser changes during the period.
III. Return vs. Benchmark
For the fiscal year ending May 31, 2016, the Fund outperformed the Barclays Short U.S. Treasury 9-12 Month Index (the “Index”), returning 1.01% versus the Index return of 0.41%.
IV. Fund Attribution
As noted in the shareholder letter, the Federal Reserve (Fed) raised its interest-rate target in mid-December 2015, leaving behind a near-zero rate that had been in place since late 2008. The 0.25% increase, however, kept the Fed funds rate significantly below its long-term average and, as a result, served to keep a lid on short-term yields.
The greatest contributors to benchmark-relative performance were allocations to asset-backed securities (ABS), as well as the financials and industrials sectors.
Within ABS, auto-loan securitizations were the greatest contributor to performance as the U.S. auto market exhibited strength over the past few years. Within financials, banking names helped as the heightened regulatory environment has been favorable for bondholders. Within industrials, consumer names were the best-performing segment.
Unfavorable duration and yield-curve positioning detracted modestly from performance during the period.
Both sub-advisers contributed to the Fund’s relative performance. Logan Circle Partners, L.P.’s focus on banking names within the financials sector and autos within the ABS sector contributed most to performance. Wellington Management Company, LLP generated
outperformance across a number of sectors including ABS, industrials and financials, as well as mortgage-backed securities (MBS).
The Fund used Treasury futures and to-be-announced (TBA) forward contracts to effectively manage duration, yield-curve and market exposures (TBA contracts confer the obligation to buy or sell future debt obligations of the three U.S. government-sponsored agencies that issue or guarantee MBS—Fannie Mae, Freddie Mac and Ginnie Mae). None of these had a meaningful impact on the Fund’s performance.
AVERAGE ANNUAL TOTAL RETURN1
| | | | | | | | | | | | | | | | |
| | | One Year
Return | | | Annualized
3 Year
Return | | | Annualized
5 Year
Return | | | Annualized
Inception
to Date | |
| Ultra Short Duration Bond Fund, Class A | | | 1.01% | | | | 0.95% | | | | 1.17% | | | | 1.18% | |
Barclays Short U.S. Treasury 9-12 Month Index | | | 0.41% | | | | 0.30% | | | | 0.29% | | | | 0.31% | |
Comparison of Change in the Value of a $100,000 Investment in the Ultra Short Duration Bond Fund, Class A, versus the Barclays Short U.S. Treasury 9-12 Month Index
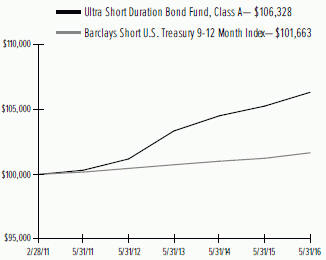
| | 1 | | For the year ended May 31, 2016. Past performance is no indication of future performance. Class A shares were offered beginning 2/28/11. Returns shown do not reflect the deduction of taxes that a shareholder would pay on Fund distributions or the redemption of Fund Shares. The returns for certain periods reflect fee waivers and/or reimbursements in effect for that year; absent fee waivers and reimbursements, performance would have been lower. |
| | |
| 30 | | SEI Institutional Investments Trust / Annual Report / May 31, 2016 |
MANAGEMENT’S DISCUSSION AND ANALYSIS OF FUND PERFORMANCE
May 31, 2016 (Unaudited)
Emerging Markets Debt Fund
I. Objective
The Emerging Markets Debt Fund (the “Fund”) seeks to maximize total return.
II. Multi-Manager Approach Statement
The Fund uses a multi-manager approach, relying on a number of sub-advisers with differing investment approaches to manage portions of the Fund’s portfolio, under the general supervision of SEI Investments Management Corp. (SIMC). The Fund utilized the following sub-advisers as of May 31, 2016: Investec Asset Management Ltd.; Neuberger Berman Fixed Income LLC; and Stone Harbor Investment Partners, LP. There were no sub-adviser changes during the year.
III. Return vs. Benchmark
For the fiscal year ended May 31, 2016, the Fund underperformed the J.P. Morgan EMBI Global Diversified Index (the “Index”), returning -1.77% versus the Index return of 4.55%.
IV. Fund Attribution
Emerging-market debt (EMD) denominated in external currencies returned 4.55% during the Fund’s fiscal year, whereas local-currency EMD returned -4.86% in U.S dollar terms; the decline was driven primarily by emerging-market currency depreciation versus the U.S. dollar.
The threat of and eventual call for an interest-rate hike in the U.S., China’s economic weakness and low commodity prices – themes that have been addressed in the shareholder letter – each weighed on the market. More recently, the threat of Brexit has garnered investor attention.
Ukraine was the best-performing country, with its external debt returning almost 70% during the period. Argentina also had top-performing external debt, returning more than 25%, as the country finally completed its long journey back to the global debt market with a new issuance in April 2016. South Africa was the worst performer, as its local-currency debt lost nearly 22% due to the depreciation of its currency (the rand) as well as questions of financial imprudence rose at top political levels. Colombia also performed poorly; as an energy exporter, the country has been adversely affected by low energy prices and a widening budget deficit, leading to a 15% currency depreciation versus the U.S. dollar.
An overweight to Colombian local debt and selection in Colombian external debt represented the greatest overall detractor during the Fund’s fiscal year, while an underweight to Ukraine’s top-performing external debt also weighed on relative returns. Selection in South African debt also detracted.
Positioning in Russian local debt contributed most over the fiscal year, as the Fund moved from underweight ruble exposure to an overweight as the currency rebounded along with oil prices. Corporate holdings also helped. An overweight to Venezuelan external debt also contributed. Large debt payments by Venezuela’s state-owned oil company and at the sovereign level represented positive news. An overweight to Argentina’s external debt also added to performance.
All three managers – Investec Asset Management Ltd., Stone Harbor Investment Partners, LP and Neuberger Berman Fixed Income LLC – detracted overall, and each was underweight Ukrainian debt. Investec Asset Management Ltd.’s underweights to South African and Malaysian local debt contributed, as did its overweight to Venezuela. An overweight to Colombian local debt and selection within Brazil detracted. Stone Harbor Investment Partners, LP’s overweight to Venezuela contributed, along with its selection in Russia and cash holdings as the U.S. dollar strengthened versus emerging-market currencies. An underweight to Polish external debt detracted, as did an overweight to Colombian local debt.
Neuberger Berman Fixed Income LLC’s cash holdings contributed, along with its overweight to Argentina and selection within Russian local debt. Selection within Colombian external debt and an overweight to Colombian local debt detracted, as did selection within South African debt.
Currency forwards and interest rate swaps were the primary derivatives used within the Fund to efficiently optimize active currency and duration exposures. Currency forwards had a material impact on the Fund during the period as 50% of the benchmark is directly affected by foreign currencies. Positive and negative impacts differed on a country-to-country basis, depending on whether the forward increased or decreased currency exposure and whether the currency strengthened or weakened relative to the U.S. dollar.
| | | | |
| SEI Institutional Investments Trust / Annual Report / May 31, 2016 | | | 31 | |
MANAGEMENT’S DISCUSSION AND ANALYSIS OF FUND PERFORMANCE
May 31, 2016 (Unaudited)
Emerging Markets Debt Fund (Concluded)
AVERAGE ANNUAL TOTAL RETURN1,2
| | | | | | | | | | | | | | | | | | | | |
| | | One Year
Return | | | Annualized
3 Year
Return | | | Annualized
5 Year
Return | | | Annualized
10 Year
Return | | | Annualized
Inception to Date | |
| Emerging Markets Debt Fund, Class A | | | -1.77% | | | | -2.54% | | | | 1.40% | | | | 6.19% | | | | 6.00% | |
| J.P. Morgan EMBI Global Diversified Index (broad based) | | | 4.55% | | | | 4.25% | | | | 5.94% | | | | 7.57% | | | | 7.35% | |
| J.P. Morgan GBI-EM Global Diversified Index | | | -4.86% | | | | -6.71% | | | | -3.26% | | | | 4.84% | | | | 4.90% | |
| 50/50 Hybrid of the J.P. Morgan EMBI Global Diversified Index (broad based) and the J.P. Morgan GBI-EM Global Diversified Index | | | -0.14% | | | | -1.30% | | | | 1.32% | | | | 6.28% | | | | 10.35% | |
Comparison of Change in the Value of a $100,000 Investment in the Emerging Market Debt Fund, Class A, versus a 50/50 Hybrid of the Following Indexes: the J.P. Morgan EMBI Global Diversified Index, and the J.P. Morgan GBI-EM Global Diversified Index
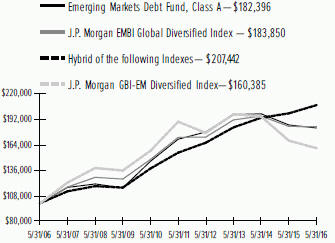
| | 1 | | For the year ended May 31, 2016. Past performance is not an indication of future performance. Class A shares were offered beginning 12/5/05. Returns shown do not reflect the deduction of taxes that a shareholder would pay on fund distributions or the redemption of fund shares. The returns for certain periods reflect fee waivers and/or reimbursements in effect for that year; absent fee waivers and reimbursements, performance would have been lower. |
| | 2 | | This table compares the Fund’s average annual total returns to those of a broad-based index and the Fund’s 50/50 Blended Benchmark, which consists of the J.P. Morgan EMBI Global Diversified Index (broad based) and the J.P. Morgan GBI-EM Diversified Index. The Fund’s Blended Benchmark is designed to provide a useful comparison to the Fund’s overall performance and more accurately reflects the Fund’s investment strategy than the broad-based index. |
| | |
| 32 | | SEI Institutional Investments Trust / Annual Report / May 31, 2016 |
MANAGEMENT’S DISCUSSION AND ANALYSIS OF FUND PERFORMANCE
May 31, 2016 (Unaudited)
Real Return Fund
I. Objective
The Real Return Fund (the “Fund”) seeks a total return exceeding the rate of inflation.
II. Multi-Manager Approach Statement
The Fund is directly managed by SEI Investments Management Corporation (SIMC). There were no manager changes made during the period.
III. Return vs. Benchmark
For the fiscal year ending May 31, 2016, the Fund underperformed the Barclays 1-5 Year U.S. TIPS Index (“Index”), returning 0.52% versus an Index return of 0.68%.
IV. Fund Attribution
The Fund’s performance was within expectations as the Fund manager aims to replicate the performance of the Barclays 1-5 Year U.S. TIPS Index. As noted in the shareholder letter, low inflation and a strong U.S. dollar presented headwinds to Treasury Inflation Protected Securities for much of the period, but began to ease in the latter part.
AVERAGE ANNUAL TOTAL RETURN1
| | | | | | | | | | | | | | | | |
| | | One Year
Return | | | Annualized
3 Year
Return | | | Annualized
5 Year
Return | | | Annualized
Inception
to Date | |
| Real Return Fund, Class A | | | 0.52% | | | | -0.05% | | | | 0.37% | | | | 3.05% | |
| Barclays 1-5 Year U.S. TIPS Index | | | 0.68% | | | | 0.02% | | | | 0.43% | | | | 2.93% | |
Comparison of Change in the Value of a $100,000 Investment in the Real Return Fund, Class A, versus the Barclays 1-5 Year U.S. TIPS Index
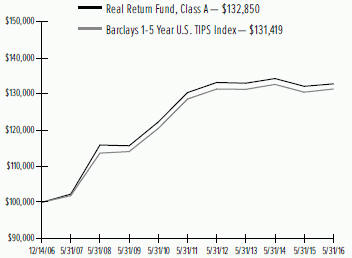
| | 1 | | For the year ended May 31, 2016. Past performance is not an indication of future performance. Class A shares were offered beginning 12/14/06. Returns shown do not reflect the deduction of taxes that a shareholder would pay on fund distributions or the redemption of fund shares. The returns for certain periods reflect fee waivers and/or reimbursements in effect for that year; absent fee waivers and reimbursements, performance would have been lower. |
| | | | |
| SEI Institutional Investments Trust / Annual Report / May 31, 2016 | | | 33 | |
MANAGEMENT’S DISCUSSION AND ANALYSIS OF FUND PERFORMANCE
May 31, 2016 (Unaudited)
Limited Duration Bond Fund
I. Objective
The Limited Duration Bond Fund (the “Fund”) seeks preservation of capital and current income.
II. Multi-Manager Approach Statement
The Fund is managed by a sub-adviser under the general supervision of SEI Investments Management Corporation (SIMC). The Fund utilized the following sub-advisers as of May 31, 2016: Logan Circle Partners, L.P. and Metropolitan West Asset Management LLC. During the year, Metropolitan West Asset Management LLC was added.
III. Return vs. Benchmark
For the fiscal year ending May 31, 2016, the Fund returned 1.26% and the BofA Merrill Lynch 1-3 Year U.S. Treasury Index returned 0.68%.
IV. Fund Attribution
U.S. Treasury yields were volatile during the fiscal year, with short-term yields rising and long-term yields declining, resulting in generally positive bond performance. Returns were positive for non-Treasury bonds, asset-backed and commercial-mortgage securities and agency-mortgage bonds, which all outperformed comparable corporate bonds. While corporate bonds as a whole underperformed comparable Treasury bonds, the utilities and financials sub-sectors outperformed while industrial bonds underperformed, given declining commodity prices.
As noted in the shareholder letter, the yield curve flattened during the period, so the Fund’s yield-curve flattening bias enhanced relative performance. An underweight to government bonds detracted, as did an overweight to corporates, although an allocation the financials sub-sector was beneficial. Overweights to the energy and basic materials sub-sectors detracted from relative performance. A resilient consumer and improving wages – two trends addressed in the shareholder letter – helped support an overweight to asset-backed securities.
Logan Circle benefitted from a yield-curve flattening bias, an allocation to financials (particularly banking) and an allocation to asset-backed securities. An underweight to government bonds, along with an overweight to corporates and energy and basic materials debt detracted. MetWest also enhanced relative performance via exposure to banking debt and an allocation to industrials (autos and retail). An allocation to commercial mortgages challenged relative returns.
AVERAGE ANNUAL TOTAL RETURN1
| | | | | | | | |
| | | One Year
Return | | | Annualized
Inception
to Date | |
| Limited Duration Bond Fund, Class A | | | 1.26% | | | | 1.22% | |
| BofA Merrill Lynch 1-3 Year U.S. Treasury Index | | | 0.68% | | | | 0.87% | |
Comparison of Change in the Value of a $100,000 Investment in the Limited Duration Bond Fund, Class A, versus the BofA Merrill Lynch 1-3 Year U.S. Treasury Index
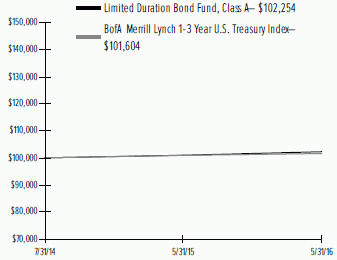
| | 1 | | For the year ended May 31, 2016. Past performance is not an indication of future performance. Class A shares were offered beginning 7/31/14. Returns shown do not reflect the deduction of taxes that a shareholder would pay on fund distributions or the redemption of fund shares. The returns for certain periods reflect fee waivers and/or reimbursements in effect for that year; absent fee waivers and reimbursements, performance would have been lower. |
| | |
| 34 | | SEI Institutional Investments Trust / Annual Report / May 31, 2016 |
MANAGEMENT’S DISCUSSION AND ANALYSIS OF FUND PERFORMANCE
May 31, 2016 (Unaudited)
Intermediate Duration Credit Fund
I. Objective
The Intermediate Duration Fund (the “Fund”) seeks current income consistent with the preservation of capital.
II. Multi-Manager Approach Statement
The Fund uses a multi-manager approach, relying on a number of sub-advisers with differing investment approaches to manage portions of the Fund’s portfolio, under the general supervision of SEI Investments Management Corporation (SIMC). The Fund utilized the following sub-advisers as of May 31, 2016: Income Research & Management; Legal & General Investment Management America Inc.; and Logan Circle Partners, L.P. There were no sub-adviser changes during the period.
III. Return vs. Benchmark
For the fiscal year ending May 31, 2016, the Fund returned 4.16%, and the Barclays A+ U.S. Credit Index returned 4.29%.
IV. Fund Attribution
As noted in the shareholder letter, longer-dated Treasurys performed well during the Fund’s fiscal year when long-term yields fell. Ten-year yields fell by 0.27% to end at 1.85%, and 30-year Treasury yields fell 0.23% to end at 2.65%. The Fund’s long-duration strategy benefited from these trends.
An allocation to government bonds, an underweight to non-corporate securities and an overweight to corporate utilities contributed to the Fund’s relative returns. An overweight to BBB rated corporates, as well as security selection within industrials and financials, detracted.
Logan Circle Partners L.P. contributed to relative returns on strong security selection within consumer non-cyclicals (tobacco, food and beverage) and consumer cyclicals (autos), as well as an underweight to non-corporates, particularly foreign agencies and supranationals. An overweight to BBB corporates and selection with financials (specifically insurance) detracted. Legal & General’s government sector allocation and selection within financials (specifically banking) were beneficial, but ultimately were overcome by selection within industrials (particularly energy and technology) and utilities. An overweight to utilities (electric and natural gas) and underweight to non-corporates (primarily foreign agencies and supranationals) enhanced IRM’s relative performance, but were dragged down by an overweight to BBB corporates and selection within financials (particularly brokerage).
Derivatives were used on a limited basis. Treasury futures were employed to help manage the risk associated with interest-rate and yield-curve positioning. These had a negligible impact on performance.
AVERAGE ANNUAL TOTAL RETURN1
| | | | | | | | |
| | | One Year
Return | | | Annualized
Inception
to Date | |
| Intermediate Duration Credit Fund, Class A | | | 4.16% | | | | 2.26% | |
| Barclays A+ U.S. Credit Index | | | 4.29% | | | | 2.64% | |
Comparison of Change in the Value of a $100,000 Investment in the Intermediate Duration Credit Fund, Class A, versus the Barclays A+ U.S. Credit Index
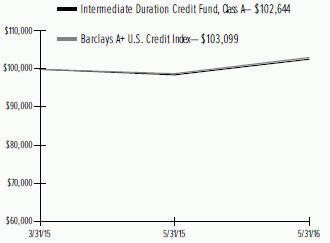
| | 1 | | For the year ended May 31, 2016. Past performance is not an indication of future performance. Class A shares were offered beginning 3/31/15. Returns shown do not reflect the deduction of taxes that a shareholder would pay on fund distributions or the redemption of fund shares. The returns for certain periods reflect fee waivers and/or reimbursements in effect for that year; absent fee waivers and reimbursements, performance would have been lower. |
| | | | |
| SEI Institutional Investments Trust / Annual Report / May 31, 2016 | | | 35 | |
MANAGEMENT’S DISCUSSION AND ANALYSIS OF FUND PERFORMANCE
May 31, 2016 (Unaudited)
Dynamic Asset Allocation Fund
I. Objective
The Dynamic Asset Allocation Fund (the “Fund”) seeks long-term total return.
II. Multi-Manager Approach Statement
The Fund is managed by a sub-adviser under the general supervision of SEI Investments Management Corporation (SIMC). The Fund utilized the following sub-adviser as of May 31, 2016: SSgA Funds Management, Inc. There were no sub-adviser changes during the period.
III. Return vs. Benchmark
For the fiscal year ending May 31, 2016, the Fund returned -0.32%, and the S&P 500 Index returned 1.72%.
IV. Fund Attribution
A majority of the Fund’s volatility is driven by strategic exposure to the S&P 500, which served as the largest driver of the Fund’s return during the period. The negative aggregate performance of the Fund’s tactical trades overwhelmed the S&P 500’s modestly positive performance, resulting in a slightly negative absolute total return.
The largest contributors to relative performance were: a long S&P 500 versus short 10-year U.S. Treasury trade implemented in early 2016, amid the flight to perceived safe havens and selloff in riskier assets addressed in the shareholder letter; a long U.S. inflation versus short U.K. inflation trade, as relative inflation expectations between the two countries normalized; and a long Indian rupee versus short Korean won foreign-currency trade, given the contrast between the former country’s emphasis on reform and fiscal discipline and the latter’s ties to the moderating Chinese economy coupled with a dovish central bank. To a lesser extent, a long U.S. dollar versus short euro foreign-currency trade also contributed, given the divergence of their respective central bank policies.
The largest detractors from relative performance were: long Japanese and European equities versus short S&P 500 trades that closed early 2016 amid the ongoing U.S. equity market leadership noted in the shareholder letter; and a long U.S. dollar versus short Korean won/ Singapore dollar/Taiwan dollar foreign-currency basket trade, as the latter group was expected to come under pressure from China’s economic moderation and currency management challenges. Also detracting from performance was a long rupee versus a short euro foreign-currency trade that was closed in August 2015.
Several long option trades — on the VIX, S&P 500 and global bonds — had been entered as hedged in the portfolio. They have all expired worthless, detracting a nominal amount from performance. A long U.S. dollar versus short Saudi riyal foreign-currency trade, predicated on the latter country’s weakened financial position as a result of low oil prices, has also detracted a nominal amount from the portfolio.
Derivatives are used to obtain the Fund’s tactical exposures. In the past year, these have included futures, foreign-currency forward contracts, options and total-return swaps. The use of derivatives had a material impact on performance, since all active trades are implemented through their use.
AVERAGE ANNUAL TOTAL RETURN1
| | | | | | | | | | | | | | | | |
| | | One Year
Return | | | Annualized 3 Year Return | | | Annualized 5 Year Return | | | Annualized Inception to Date | |
| Dynamic Asset Allocation Fund, Class A | | | -0.32% | | | | 12.08% | | | | 12.57% | | | | 13.30% | |
| S&P 500 Index | | | 1.72% | | | | 11.06% | | | | 11.67% | | | | 14.06% | |
Comparison of Change in the Value of a $100,000 Investment in the Dynamic Asset Allocation Fund, Class A, versus the S&P 500 Index
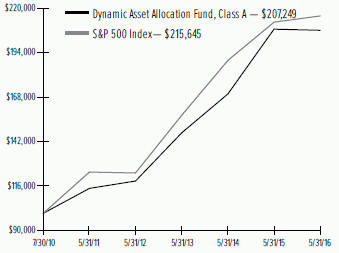
| | 1 | | For the year ended May 31, 2016. Past performance is not an indication of future performance. Class A shares were offered beginning 7/30/10. Returns shown do not reflect the deduction of taxes that a shareholder would pay on fund distributions or the redemption of fund shares. The returns for certain periods reflect fee waivers and/or reimbursements in effect for that year; absent fee waivers and reimbursements, performance would have been lower. |
| | |
| 36 | | SEI Institutional Investments Trust / Annual Report / May 31, 2016 |
MANAGEMENT’S DISCUSSION AND ANALYSIS OF FUND PERFORMANCE
May 31, 2016 (Unaudited)
Multi-Asset Real Return Fund
I. Objective
The Multi-Asset Real Return Fund (the “Fund”) seeks a total return exceeding the rate of inflation.
II. Multi-Manager Approach Statement
The Fund uses a multi-manager approach, relying on a number of sub-advisers with differing investment approaches to manage portions of the Fund’s portfolio, under the general supervision of SEI Investments Management Corporation (SIMC). The Fund utilized the following sub-advisers as of May 31, 2016: AllianceBernstein L.P. (AB); and QS Investors, LLC. There were no sub-adviser changes during the period.
III. Return vs. Benchmark
For the fiscal year ending May 31, 2016, the Fund returned -3.19%, and the Barclays 1-5 Year U.S. TIPS Index returned 0.68%.
IV. Fund Attribution
The Fund’s exposure to commodities and equities detracted from absolute returns. As the shareholder letter addressed, the commodity market declined sharply over the full period. Active sector and security positioning challenged absolute returns within the equity long/short strategy. The Fund’s allocation to Treasury Inflation-Protected Securities (TIPS) contributed to absolute return.
The majority of underperformance was attributable to the Fund’s strategic commodities exposure. While the energy sector continued to struggle, other commodities (such as those in the industrial metals sector) also contributed to poor performance. The Fund’s equity long/short strategy also detracted from relative performance. Within the Fund’s TIPS strategy, sector rotation and selection in investment-grade credit and securitized sectors were the main contributors to relative performance.
Cohen & Steers manages an all-commodity strategy in the Fund, and thus detracted most. QS Investors’ equity long/short strategy also detracted from relative performance. Most of this underperformance occurred in 2016, reversing positive relative performance in 2015. AB manages the U.S. TIPS portion of the Fund, which contributed to relative performance. Sector rotation and selection in investment-grade credit and securitized sectors were the main contributors to relative performance.
The Fund used equity-index futures to hedge broad equity-market exposure, bond futures and interest-rate swaps to hedge duration, and commodity futures to obtain diversified strategic exposure to commodities. While the equity index futures, bond futures and interest-rate swap positions detracted from absolute return, they provided the intended hedging exposures. The exposure obtained via commodity futures detracted significantly from total return.
AVERAGE ANNUAL TOTAL RETURN1
| | | | | | | | | | | | |
| | | One Year
Return | | | Annualized
3 Year
Return | | | Annualized
Inception
to Date | |
| Multi-Asset Real Return Fund, Class A | | | -3.19% | | | | -2.42% | | | | -3.04% | |
| Barclays 1-5 Year U.S. TIPS Index | | | 0.68% | | | | 0.02% | | | | 0.10% | |
Comparison of Change in the Value of a $100,000 Investment in the Multi-Asset Real Return Fund, Class A, versus the Barclays 1-5 Year U.S. TIPS Index
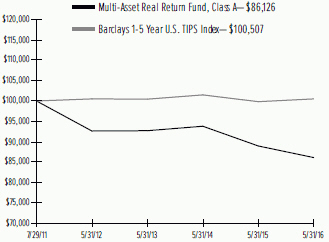
| | 1 | | For the year ended May 31, 2016. Past performance is not an indication of future performance. Class A shares were offered beginning 7/29/11. Returns shown do not reflect the deduction of taxes that a shareholder would pay on fund distributions or the redemption of fund shares. The returns for certain periods reflect fee waivers and/or reimbursements in effect for that year; absent fee waivers and reimbursements, performance would have been lower. |
| | | | |
| SEI Institutional Investments Trust / Annual Report / May 31, 2016 | | | 37 | |
SUMMARY SCHEDULE OF INVESTMENTS
Large Cap Fund
May 31, 2016
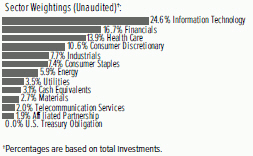
| | | | | | | | | | | | |
| Description | | Percentage of
Net Assets (%) | | | Shares | | | Market Value ($ Thousands) | |
| | | | | | | | | | | | |
|
COMMON STOCK†† — 96.8% | |
| | |
Consumer Discretionary — 10.8% | | | | | | | | | |
Amazon.com* | | | 1.2 | % | | | 35,182 | | | $ | 25,429 | |
Liberty Interactive QVC Group, Cl A* | | | 0.8 | | | | 643,986 | | | | 17,375 | |
Starbucks | | | 0.6 | | | | 213,485 | | | | 11,718 | |
TripAdvisor* | | | 1.0 | | | | 311,097 | | | | 21,074 | |
Other Securities (A) | | | 7.2 | | | | | | | | 150,386 | |
| | | | | | | | | | | | |
| | | | | | | | | | | 225,982 | |
| | | | | | | | | | | | |
| | |
Consumer Staples — 7.6% | | | | | | | | | |
Costco Wholesale | | | 0.7 | | | | 98,429 | | | | 14,643 | |
Estee Lauder, Cl A | | | 0.5 | | | | 116,873 | | | | 10,727 | |
Philip Morris International | | | 0.8 | | | | 169,441 | | | | 16,721 | |
Walgreens Boots Alliance | | | 0.8 | | | | 215,916 | | | | 16,712 | |
Other Securities (A) | | | 4.8 | | | | | | | | 99,522 | |
| | | | | | | | | | | | |
| | | | | | | | | | | 158,325 | |
| | | | | | | | | | | | |
| | |
Energy — 6.0% | | | | | | | | | |
Exxon Mobil | | | 0.8 | | | | 197,390 | | | | 17,572 | |
Valero Energy | | | 0.6 | | | | 226,053 | | | | 12,365 | |
Other Securities (A) | | | 4.6 | | | | | | | | 95,472 | |
| | | | | | | | | | | | |
| | | | | | | | | | | 125,409 | |
| | | | | | | | | | | | |
| | |
Financials — 17.0% | | | | | | | | | |
American International Group | | | 0.9 | | | | 327,998 | | | | 18,985 | |
Bank of America | | | 0.8 | | | | 1,135,514 | | | | 16,794 | |
Citigroup | | | 1.2 | | | | 552,253 | | | | 25,718 | |
Crown Castle International‡ | | | 0.9 | | | | 195,477 | | | | 17,751 | |
Equinix‡ | | | 0.6 | | | | 35,485 | | | | 12,846 | |
Intercontinental Exchange | | | 0.7 | | | | 50,408 | | | | 13,667 | |
JPMorgan Chase | | | 1.7 | | | | 536,557 | | | | 35,021 | |
SunTrust Banks | | | 0.6 | | | | 270,139 | | | | 11,837 | |
Travelers | | | 0.7 | | | | 119,409 | | | | 13,629 | |
Other Securities‡ | | | 8.9 | | | | | | | | 189,139 | |
| | | | | | | | | | | | |
| | | | | | | | | | | 355,387 | |
| | | | | | | | | | | | |
| | |
Health Care — 14.2% | | | | | | | | | |
Alexion Pharmaceuticals* | | | 0.6 | | | | 82,541 | | | | 12,455 | |
Allergan* | | | 1.1 | | | | 99,530 | | | | 23,464 | |
Biogen* | | | 0.7 | | | | 53,370 | | | | 15,463 | |
Bristol-Myers Squibb | | | 0.8 | | | | 229,906 | | | | 16,484 | |
Celgene* | | | 1.1 | | | | 226,201 | | | | 23,869 | |
Johnson & Johnson | | | 1.7 | | | | 321,674 | | | | 36,249 | |
| | | | | | | | | | | | |
| Description | | Percentage of
Net Assets (%) | | | Shares | | | Market Value ($ Thousands) | |
| | | | | | | | | | | | |
Novo Nordisk ADR | | | 0.5 | % | | | 197,866 | | | $ | 11,088 | |
Pfizer | | | 1.3 | | | | 760,835 | | | | 26,401 | |
Other Securities (A) | | | 6.4 | | | | | | | | 129,666 | |
| | | | | | | | | | | | |
| | | | | | | | | | | 295,139 | |
| | | | | | | | | | | | |
| | |
Industrials — 7.8% | | | | | | | | | |
Danaher | | | 0.6 | | | | 120,406 | | | | 11,843 | |
Other Securities (A) | | | 7.2 | | | | | | | | 151,376 | |
| | | | | | | | | | | | |
| | | | | | | | | | | 163,219 | |
| | | | | | | | | | | | |
| | |
Information Technology — 25.1% | | | | | | | | | |
Adobe Systems* | | | 0.7 | | | | 143,171 | | | | 14,241 | |
Alphabet, Cl A* | | | 1.4 | | | | 39,407 | | | | 29,510 | |
Alphabet, Cl C* | | | 1.1 | | | | 31,039 | | | | 22,836 | |
Cisco Systems | | | 0.5 | | | | 375,570 | | | | 10,910 | |
Cognizant Technology Solutions, Cl A* | | | 0.6 | | | | 201,027 | | | | 12,351 | |
eBay* | | | 0.9 | | | | 739,737 | | | | 18,094 | |
Electronic Arts* | | | 0.8 | | | | 229,820 | | | | 17,639 | |
Facebook, Cl A* | | | 1.8 | | | | 309,789 | | | | 36,806 | |
Intel | | | 0.9 | | | | 577,015 | | | | 18,228 | |
MasterCard, Cl A | | | 1.1 | | | | 246,920 | | | | 23,680 | |
Microsoft | | | 1.9 | | | | 763,214 | | | | 40,450 | |
NXP Semiconductor* | | | 0.8 | | | | 179,284 | | | | 16,941 | |
PayPal Holdings* | | | 0.8 | | | | 458,979 | | | | 17,345 | |
Qualcomm | | | 1.1 | | | | 417,107 | | | | 22,908 | |
salesforce.com* | | | 0.5 | | | | 135,519 | | | | 11,344 | |
Visa, Cl A | | | 2.0 | | | | 521,392 | | | | 41,159 | |
Other Securities (A) | | | 8.2 | | | | | | | | 168,495 | |
| | | | | | | | | | | | |
| | | | | | | | | | | 522,937 | |
| | | | | | | | | | | | |
| | |
Materials — 2.8% | | | | | | | | | |
Other Securities (A) | | | 2.8 | | | | | | | | 58,333 | |
| | | | | | | | | | | | |
| | |
Telecommunication Services — 2.0% | | | | | | | | | |
AT&T | | | 0.7 | | | | 369,093 | | | | 14,450 | |
Verizon Communications | | | 0.7 | | | | 277,524 | | | | 14,126 | |
Other Securities | | | 0.6 | | | | | | | | 13,523 | |
| | | | | | | | | | | | |
| | | | | | | | | | | 42,099 | |
| | | | | | | | | | | | |
| | |
Utilities — 3.5% | | | | | | | | | |
American Electric Power | | | 0.6 | | | | 189,458 | | | | 12,264 | |
Edison International | | | 0.5 | | | | 146,786 | | | | 10,514 | |
Entergy | | | 0.5 | | | | 142,431 | | | | 10,813 | |
Public Service Enterprise Group | | | 0.6 | | | | 275,427 | | | | 12,325 | |
Other Securities | | | 1.3 | | | | | | | | 27,715 | |
| | | | | | | | | | | | |
| | | | | | | | | | | 73,631 | |
| | | | | | | | | | | | |
Total Common Stock
(Cost $1,639,317) ($ Thousands) | | | | 2,020,461 | |
| | | | | | | | | | | | |
| | |
| 38 | | SEI Institutional Investments Trust / Annual Report / May 31, 2016 |
| | | | | | | | | | | | |
| Description | | Percentage of
Net Assets (%) | | | Shares | | | Market Value ($ Thousands) | |
| | | | | | | | | | | | |
| |
AFFILIATED PARTNERSHIP — 1.9% | | | | | |
SEI Liquidity Fund, L.P. 0.410%**† (B) | | | 1.9 | % | | | 40,531,934 | | | $ | 40,532 | |
| | | | | | | | | | | | |
Total Affiliated Partnership
(Cost $40,532) ($ Thousands) | | | | 40,532 | |
| | | | | | | | | | | | |
| |
U.S. TREASURY OBLIGATION — 0.0% | | | | | |
Other Securities (C) | | | 0.0 | | | | | | | | 660 | |
| | | | | | | | | | | | |
Total U.S. Treasury Obligation
(Cost $660) ($ Thousands) | | | | 660 | |
| | | | | | | | | | | | |
| |
CASH EQUIVALENTS — 3.2% | | | | | |
SEI Daily Income
Trust, Prime
Obligation Fund, Cl A
0.270%**† | | | 3.0 | | | | 62,127,165 | | | | 62,127 | |
Other Securities | | | 0.2 | | | | | | | | 4,649 | |
| | | | | | | | | | | | |
Total Cash Equivalents
(Cost $66,776) ($ Thousands) | | | | 66,776 | |
| | | | | | | | | | | | |
Total Investments — 101.9%
(Cost $1,747,285) ($ Thousands) | | | $ | 2,128,429 | |
| | | | | | | | | | | | |
Percentages are based on a Net Assets of $2,086,522 ($ Thousands).
| * | | Non-income producing security. |
| ** | | The rate reported is the 7-day effective yield as of May 31, 2016. |
| ‡ | | Real Estate Investment Trust. |
| † | | Investment in Affiliated Security (see Note 6). |
| †† | | Narrow Industries are utilized for compliance purposes, whereas broad sectors are utilized for reporting. |
| (A) | | Certain securities or partial positions of certain securities are on loan at May 31, 2016, (see Note 12). The total market value of securities on loan at May 31, 2016, was $39,531 ($ Thousands). |
| (B) | | This security was purchased with cash collateral held from securities on loan (see Note 12). The total market value of such securities as of May 31, 2016 was $40,532
($ Thousands). |
| (C) | | Security, or portion thereof, has been pledged as collateral on open futures contracts. |
ADR — American Depositary Receipt
Cl — Class
L.P. — Limited Partnership
The Summary Schedule of Investments does not reflect the complete portfolio holdings. It includes the Fund’s 50 largest holdings and each investment of any issuer that exceeds 1% of the Fund’s net assets. “Other Securities” represent all issues not required to be disclosed under the rules adopted by the U.S. Securities and Exchange Commission (“SEC”). In certain instances, securities for which footnotes listed above may otherwise apply are included in the Other Securities caption. The complete schedule of portfolio holdings is available (i) without charge, upon request, by calling (800) 342-5734; and (ii) on the SEC’s website at http://www.sec.gov.
The following is a list of the level of inputs used as of May 31, 2016, in valuing the Fund’s investments carried at value ($ Thousands):
| | | | | | | | | | | | | | | | |
| Investments in Securities | | Level 1 | | | Level 2 | | | Level 3 | | | Total | |
Common Stock | | $ | 2,020,461 | | | $ | — | | | $ | — | | | $ | 2,020,461 | |
Affiliated Partnership | | | — | | | | 40,532 | | | | — | | | | 40,532 | |
U.S. Treasury Obligation | | | — | | | | 660 | | | | — | | | | 660 | |
Cash Equivalents | | | 66,776 | | | | — | | | | — | | | | 66,776 | |
| | | | | | | | | | | | | | | | |
Total Investments in Securities | | $ | 2,087,237 | | | $ | 41,192 | | | $ | — | | | $ | 2,128,429 | |
| | | | | | | | | | | | | | | | |
For the year ended May 31, 2016, there were no transfers between Level 1 and Level 2 assets and liabilities.
For the year ended May 31, 2016, there were no transfers between Level 2 and Level 3 assets and liabilities.
For more information on valuation inputs, see Note 2 — Significant Accounting Policies in Notes to Financial Statements.
Amounts designated as “—” are either $0 or have been rounded to $0.
The accompanying notes are an integral part of the financial statements.
| | | | |
| SEI Institutional Investments Trust / Annual Report / May 31, 2016 | | | 39 | |
SUMMARY SCHEDULE OF INVESTMENTS
Large Cap Diversified Alpha Fund
May 31, 2016
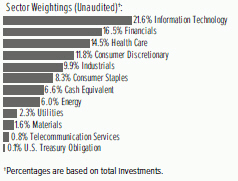
| | | | | | | | | | | | |
| Description | | Percentage of
Net Assets (%) | | | Shares | | | Market Value ($ Thousands) | |
| | | | | | | | | | | | |
|
COMMON STOCK — 93.7% | |
| | |
Consumer Discretionary — 11.8% | | | | | | | | | |
Dollar General | | | 0.6 | % | | | 3,711 | | | $ | 334 | |
General Motors | | | 0.9 | | | | 16,347 | | | | 511 | |
Liberty Global* | | | 0.7 | | | | 10,270 | | | | 371 | |
Liberty Interactive QVC Group, Cl A* | | | 1.0 | | | | 20,344 | | | | 549 | |
Omnicom Group | | | 0.8 | | | | 4,922 | | | | 410 | |
TripAdvisor* | | | 0.7 | | | | 5,987 | | | | 406 | |
Other Securities | | | 7.1 | | | | | | | | 3,842 | |
| | | | | | | | | | | | |
| | | | | | | | | | | 6,423 | |
| | | | | | | | | | | | |
| | |
Consumer Staples — 8.3% | | | | | | | | | |
CVS Health | | | 0.7 | | | | 3,857 | | | | 372 | |
Kimberly-Clark | | | 0.6 | | | | 2,538 | | | | 322 | |
PepsiCo | | | 0.6 | | | | 3,470 | | | | 351 | |
Procter & Gamble | | | 0.7 | | | | 4,800 | | | | 389 | |
Walgreens Boots Alliance | | | 0.8 | | | | 5,368 | | | | 416 | |
Other Securities | | | 4.9 | | | | | | | | 2,657 | |
| | | | | | | | | | | | |
| | | | | | | | | | | 4,507 | |
| | | | | | | | | | | | |
| | |
Energy — 6.1% | | | | | | | | | |
BP PLC ADR | | | 1.0 | | | | 17,933 | | | | 563 | |
Devon Energy | | | 0.7 | | | | 10,603 | | | | 383 | |
Occidental Petroleum | | | 1.2 | | | | 8,276 | | | | 624 | |
Other Securities | | | 3.2 | | | | | | | | 1,723 | |
| | | | | | | | | | | | |
| | | | | | | | | | | 3,293 | |
| | | | | | | | | | | | |
| | |
Financials — 16.6% | | | | | | | | | |
Bank of America | | | 1.4 | | | | 50,013 | | | | 740 | |
Citigroup | | | 1.4 | | | | 16,207 | | | | 755 | |
Crown Castle International‡ | | | 1.5 | | | | 8,703 | | | | 790 | |
Equinix‡ | | | 0.8 | | | | 1,170 | | | | 424 | |
Intercontinental Exchange | | | 0.8 | | | | 1,677 | | | | 455 | |
JPMorgan Chase | | | 1.1 | | | | 8,896 | | | | 581 | |
KKR | | | 0.6 | | | | 24,574 | | | | 332 | |
State Street | | | 0.9 | | | | 7,592 | | | | 479 | |
Other Securities‡ | | | 8.1 | | | | | | | | 4,438 | |
| | | | | | | | | | | | |
| | | | | | | | | | | 8,994 | |
| | | | | | | | | | | | |
| | |
Health Care — 14.5% | | | | | | | | | |
Allergan* | | | 1.4 | | | | 3,150 | | | | 743 | |
Baxter International | | | 0.9 | | | | 10,800 | | | | 466 | |
| | | | | | | | | | | | |
| Description | | Percentage of
Net Assets (%) | | | Shares | | | Market Value ($ Thousands) | |
| | | | | | | | | | | | |
Becton Dickinson | | | 0.7 | % | | | 2,293 | | | $ | 382 | |
Biogen* | | | 1.5 | | | | 2,812 | | | | 815 | |
Celgene* | | | 1.3 | | | | 6,820 | | | | 720 | |
Dentsply Sirona | | | 0.6 | | | | 5,272 | | | | 328 | |
Gilead Sciences | | | 0.8 | | | | 5,286 | | | | 460 | |
Johnson & Johnson | | | 1.1 | | | | 5,167 | | | | 582 | |
Novo Nordisk ADR | | | 1.0 | | | | 9,751 | | | | 546 | |
UnitedHealth Group | | | 0.8 | | | | 3,219 | | | | 430 | |
Other Securities | | | 4.4 | | | | | | | | 2,423 | |
| | | | | | | | | | | | |
| | | | | | | | | | | 7,895 | |
| | | | | | | | | | | | |
| | |
Industrials — 10.0% | | | | | | | | | |
3M | | | 1.1 | | | | 3,467 | | | | 584 | |
Delta Air Lines | | | 0.9 | | | | 11,717 | | | | 509 | |
Illinois Tool Works | | | 0.7 | | | | 3,506 | | | | 372 | |
WW Grainger | | | 1.1 | | | | 2,678 | | | | 612 | |
Other Securities | | | 6.2 | | | | | | | | 3,344 | |
| | | | | | | | | | | | |
| | | | | | | | | | | 5,421 | |
| | | | | | | | | | | | |
| | |
Information Technology — 21.7% | | | | | | | | | |
Alphabet, Cl A* | | | 1.5 | | | | 1,083 | | | | 811 | |
Alphabet, Cl C* | | | 0.8 | | | | 614 | | | | 452 | |
Cisco Systems | | | 0.8 | | | | 14,347 | | | | 417 | |
eBay* | | | 1.1 | | | | 23,772 | | | | 582 | |
Electronic Arts* | | | 1.2 | | | | 8,623 | | | | 662 | |
Facebook, Cl A* | | | 1.2 | | | | 5,466 | | | | 649 | |
Intel | | | 0.6 | | | | 10,410 | | | | 329 | |
Intuit | | | 0.6 | | | | 3,141 | | | | 335 | |
MasterCard, Cl A | | | 0.9 | | | | 4,999 | | | | 479 | |
Micron Technology* | | | 0.7 | | | | 28,878 | | | | 367 | |
Microsoft | | | 1.8 | | | | 18,720 | | | | 992 | |
PayPal Holdings* | | | 1.2 | | | | 16,564 | | | | 626 | |
Qualcomm | | | 1.6 | | | | 15,404 | | | | 846 | |
Visa, Cl A | | | 1.5 | | | | 9,965 | | | | 787 | |
Other Securities | | | 6.2 | | | | | | | | 3,444 | |
| | | | | | | | | | | | |
| | | | | | | | | | | 11,778 | |
| | | | | | | | | | | | |
| | |
Materials — 1.6% | | | | | | | | | |
Other Securities | | | 1.6 | | | | | | | | 894 | |
| | | | | | | | | | | | |
| | |
Telecommunication Services — 0.8% | | | | | | | | | |
Other Securities | | | 0.8 | | | | | | | | 439 | |
| | | | | | | | | | | | |
| | |
Utilities — 2.3% | | | | | | | | | |
Other Securities | | | 2.3 | | | | | | | | 1,267 | |
| | | | | | | | | | | | |
Total Common Stock
(Cost $44,907) ($ Thousands) | | | | | | | | 50,911 | |
| | | | | | | | | | | | |
| |
U.S. TREASURY OBLIGATION — 0.1% | | | | | |
Other Securities (A) | | | 0.1 | | | | | | | | 40 | |
| | | | | | | | | | | | |
Total U.S. Treasury Obligation
(Cost $40) ($ Thousands) | | | | | | | | 40 | |
| | | | | | | | | | | | |
| | |
| 40 | | SEI Institutional Investments Trust / Annual Report / May 31, 2016 |
| | | | | | | | | | | | |
| Description | | Percentage of
Net Assets (%) | | | Shares | | | Market Value ($ Thousands) | |
| | | | | | | | | | | | |
| | |
CASH EQUIVALENT — 6.6% | | | | | | | | | |
SEI Daily Income Trust, Prime
Obligation Fund, Cl A
0.270%**† | | | 6.6 | % | | | 3,567,514 | | | $ | 3,568 | |
| | | | | | | | | | | | |
Total Cash Equivalent
(Cost $3,568) ($ Thousands) | | | | | | | | 3,568 | |
| | | | | | | | | | | | |
Total Investments — 100.4%
(Cost $48,515) ($ Thousands) | | | | | | | $ | 54,519 | |
| | | | | | | | | | | | |
A list of the open futures contracts held by the Fund at May 31, 2016, is as follows:
| | | | | | | | | | | | |
| Type of Contract | |
| Number of
Contracts
Long |
| |
| Expiration
Date |
| |
| Unrealized
Appreciation
($ Thousands) |
|
S&P 500 Index E-MINI | | | 6 | | | | Jun-2016 | | | $ | 11 | |
| | | | | | | | | | | | |
For the year ended May 31, 2016, the total amount of all open futures contracts, as presented in the table above, are representative of the volume of activity for this derivative type during the year.
Percentages are based on a Net Assets of $54,335 ($ Thousands).
| * | | Non-income producing security. |
| ** | | The rate reported is the 7-day effective yield as of May 31, 2016. |
| ‡ | | Real Estate Investment Trust |
| † | | Investment in Affiliated Security (see Note 6). |
| (A) | | Security, or portion thereof, has been pledged as collateral on open futures contracts. |
ADR — American Depositary Receipt
Cl — Class
PLC — Public Limited Company
S&P — Standard & Poor’s
The Summary Schedule of Investments does not reflect the complete portfolio holdings. It includes the Fund’s 50 largest holdings and each investment of any issuer that exceeds 1% of the Fund’s net assets. “Other Securities” represent all issues not required to be disclosed under the rules adopted by the U.S. Securities and Exchange Commission (“SEC”). In certain instances, securities for which footnotes listed above may otherwise apply are included in the Other Securities caption. The complete schedule of portfolio holdings is available (i) without charge, upon request, by calling (800) 342-5734; and (ii) on the SEC’s website at http://www.sec.gov.
The following is a list of the level of inputs used as of May 31, 2016, in valuing the Fund’s investments and other financial instruments carried at value ($ Thousands):
| | | | | | | | | | | | | | | | |
| Investments in Securities | | Level 1 | | | Level 2 | | | Level 3 | | | Total | |
Common Stock | | $ | 50,911 | | | $ | — | | | $ | — | | | $ | 50,911 | |
U.S. Treasury Obligation | | | — | | | | 40 | | | | — | | | | 40 | |
Cash Equivalent | | | 3,568 | | | | — | | | | — | | | | 3,568 | |
| | | | | | | | | | | | | | | | |
Total Investments in Securities | | $ | 54,479 | | | $ | 40 | | | $ | — | | | $ | 54,519 | |
| | | | | | | | | | | | | | | | |
| | | | | | | | | | | | | | | | |
| Other Financial Instruments | | Level 1 | | | Level 2 | | | Level 3 | | | Total | |
Futures Contracts* | | | | | | | | | | | | | | | | |
Unrealized Appreciation | | $ | 11 | | | $ | — | | | $ | — | | | $ | 11 | |
| | | | | | | | | | | | | | | | |
| * | | Futures contracts are valued at the unrealized appreciation on the instrument. |
For the year ended May 31, 2016, there were no transfers between Level 1 and Level 2 assets and liabilities.
For the year ended May 31, 2016, there were no transfers between Level 2 and Level 3 assets and liabilities.
For more information on valuation inputs, see Note 2 — Significant Accounting Policies in Notes to Financial Statements.
Amounts designated as “—” are either $0 or have been rounded to $0.
The accompanying notes are an integral part of the financial statements.
| | | | |
| SEI Institutional Investments Trust / Annual Report / May 31, 2016 | | | 41 | |
SUMMARY SCHEDULE OF INVESTMENTS
Large Cap Disciplined Equity Fund
May 31, 2016
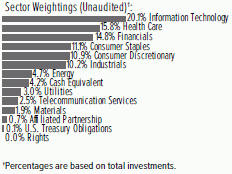
| | | | | | | | | | | | |
| Description | | Percentage of
Net Assets (%) | | | Shares | | | Market Value
($ Thousands) | |
| | | | | | | | | | | | |
| | |
COMMON STOCK — 95.9% | | | | | | | | | |
| |
Consumer Discretionary — 11.0% | | | | | |
Amazon.com* | | | 0.8 | % | | | 39,781 | | | $ | 28,753 | |
AutoZone* | | | 0.5 | | | | 23,107 | | | | 17,612 | |
Comcast, Cl A | | | 1.3 | | | | 751,050 | | | | 47,541 | |
Home Depot | | | 1.0 | | | | 282,237 | | | | 37,289 | |
McDonald’s | | | 0.8 | | | | 234,596 | | | | 28,635 | |
Other Securities (A) | | | 6.6 | | | | | | | | 235,958 | |
| | | | | | | | | | | | |
| | | | | | | | | | | 395,788 | |
| | | | | | | | | | | | |
| |
Consumer Staples — 11.2% | | | | | |
Altria Group | | | 1.0 | | | | 557,076 | | | | 35,452 | |
Kraft Heinz | | | 0.6 | | | | 273,452 | | | | 22,748 | |
Mondelez International, Cl A | | | 0.7 | | | | 532,860 | | | | 23,707 | |
PepsiCo | | | 1.5 | | | | 533,023 | | | | 53,926 | |
Philip Morris International | | | 1.1 | | | | 404,802 | | | | 39,946 | |
Procter & Gamble | | | 1.3 | | | | 569,823 | | | | 46,178 | |
Wal-Mart Stores | | | 0.6 | | | | 292,632 | | | | 20,712 | |
Other Securities | | | 4.4 | | | | | | | | 160,554 | |
| | | | | | | | | | | | |
| | | | | | | | | | | 403,223 | |
| | | | | | | | | | | | |
| |
Energy — 4.7% | | | | | |
Chevron | | | 0.8 | | | | 262,365 | | | | 26,499 | |
Exxon Mobil | | | 0.5 | | | | 197,774 | | | | 17,606 | |
Other Securities (A) | | | 3.4 | | | | | | | | 125,106 | |
| | | | | | | | | | | | |
| | | | | | | | | | | 169,211 | |
| | | | | | | | | | | | |
| |
Financials — 15.0% | | | | | |
Bank of America | | | 1.2 | | | | 2,987,594 | | | | 44,187 | |
Bank of New York Mellon | | | 0.6 | | | | 520,389 | | | | 21,888 | |
Berkshire Hathaway, Cl B* | | | 1.1 | | | | 275,539 | | | | 38,724 | |
Citigroup | | | 1.0 | | | | 752,432 | | | | 35,041 | |
CME Group, Cl A | | | 0.7 | | | | 267,699 | | | | 26,205 | |
JPMorgan Chase | | | 1.0 | | | | 566,453 | | | | 36,972 | |
Wells Fargo | | | 1.0 | | | | 701,725 | | | | 35,591 | |
Other Securities‡ (A) | | | 8.4 | | | | | | | | 299,078 | |
| | | | | | | | | | | | |
| | | | | | | | | | | 537,686 | |
| | | | | | | | | | | | |
| |
Health Care — 15.9% | | | | | |
Amgen | | | 0.8 | | | | 168,808 | | | | 26,663 | |
Bristol-Myers Squibb | | | 1.3 | | | | 621,725 | | | | 44,578 | |
Celgene* | | | 0.5 | | | | 182,325 | | | | 19,239 | |
Express Scripts Holding* | | | 0.7 | | | | 326,158 | | | | 24,641 | |
Johnson & Johnson | | | 2.2 | | | | 689,661 | | | | 77,718 | |
| | | | | | | | | | | | |
| Description | | Percentage of
Net Assets (%) | | | Shares | | | Market Value
($ Thousands) | |
| | | | | | | | | | | | |
McKesson | | | 0.6 | % | | | 119,197 | | | $ | 21,830 | |
Merck | | | 0.7 | | | | 422,234 | | | | 23,755 | |
Pfizer | | | 1.4 | | | | 1,406,638 | | | | 48,810 | |
UnitedHealth Group | | | 1.0 | | | | 270,673 | | | | 36,181 | |
Zoetis, Cl A | | | 0.6 | | | | 462,695 | | | | 21,941 | |
Other Securities (A) | | | 6.1 | | | | | | | | 226,143 | |
| | | | | | | | | | | | |
| | | | | | | | | | | 571,499 | |
| | | | | | | | | | | | |
| |
Industrials — 10.3% | | | | | |
General Electric | | | 1.2 | | | | 1,425,310 | | | | 43,087 | |
Honeywell International | | | 0.6 | | | | 179,703 | | | | 20,456 | |
Raytheon | | | 0.5 | | | | 135,751 | | | | 17,603 | |
Tyco International | | | 0.5 | | | | 420,419 | | | | 17,918 | |
Union Pacific | | | 0.5 | | | | 207,580 | | | | 17,476 | |
United Technologies | | | 0.5 | | | | 176,571 | | | | 17,760 | |
Other Securities (A) | | | 6.5 | | | | | | | | 237,387 | |
| | | | | | | | | | | | |
| | | | | | | | | | | 371,687 | |
| | | | | | | | | | | | |
| |
Information Technology — 20.3% | | | | | |
Alphabet, Cl A* | | | 1.3 | | | | 59,919 | | | | 44,870 | |
Alphabet, Cl C* | | | 1.5 | | | | 72,675 | | | | 53,468 | |
Amdocs | | | 0.5 | | | | 303,796 | | | | 17,617 | |
Apple | | | 3.1 | | | | 1,121,496 | | | | 111,993 | |
Cisco Systems | | | 1.1 | | | | 1,380,380 | | | | 40,100 | |
eBay* | | | 0.6 | | | | 835,765 | | | | 20,443 | |
Facebook, Cl A* | | | 1.4 | | | | 406,527 | | | | 48,299 | |
Intel | | | 0.8 | | | | 938,200 | | | | 29,638 | |
Microsoft | | | 1.9 | | | | 1,307,886 | | | | 69,318 | |
Oracle | | | 0.6 | | | | 515,683 | | | | 20,730 | |
Texas Instruments | | | 0.6 | | | | 337,595 | | | | 20,458 | |
Other Securities (A) | | | 6.9 | | | | | | | | 251,090 | |
| | | | | | | | | | | | |
| | | | | | | | | | | 728,024 | |
| | | | | | | | | | | | |
| |
Materials — 1.9% | | | | | |
Other Securities | | | 1.9 | | | | | | | | 67,999 | |
| | | | | | | | | | | | |
| |
Telecommunication Services — 2.6% | | | | | |
AT&T | | | 1.1 | | | | 983,054 | | | | 38,487 | |
Verizon Communications | | | 1.5 | | | | 1,038,257 | | | | 52,847 | |
Other Securities (A) | | | 0.0 | | | | | | | | 197 | |
| | | | | | | | | | | | |
| | | | | | | | | | | 91,531 | |
| | | | | | | | | | | | |
| |
Utilities — 3.0% | | | | | |
Other Securities | | | 3.0 | | | | | | | | 107,102 | |
| | | | | | | | | | | | |
Total Common Stock
(Cost $2,930,780) ($ Thousands) | | | | | | | | 3,443,750 | |
| | | | | | | | | | | | |
| | | |
RIGHTS — 0.0% | | | | | | | | | | | | |
| | | |
United States — 0.0% | | | | | | | | | | | | |
Other Securities | | | 0.0 | | | | | | | | 91 | |
| | | | | | | | | | | | |
Total Rights
(Cost $–) ($ Thousands) | | | | | | | | 91 | |
| | | | | | | | | | | | |
| | |
| 42 | | SEI Institutional Investments Trust / Annual Report / May 31, 2016 |
| | | | | | | | | | | | |
| Description | | Percentage of
Net Assets (%) | | | Shares | | | Market Value
($ Thousands) | |
| | | | | | | | | | | | |
| |
AFFILIATED PARTNERSHIP — 0.7% | | | | | |
SEI Liquidity Fund, L.P.
0.410%**† (B) | | | 0.7 | % | | | 24,483,147 | | | $ | 24,483 | |
| | | | | | | | | | | | |
Total Affiliated Partnership
(Cost $24,483) ($ Thousands) | | | | 24,483 | |
| | | | | | | | | | | | |
| | |
U.S. TREASURY OBLIGATIONS — 0.1% | | | | | | | | | |
Other Securities (C) | | | 0.1 | | | | | | | | 5,177 | |
| | | | | | | | | | | | |
Total U.S. Treasury Obligations
(Cost $5,175) ($ Thousands) | | | | 5,177 | |
| | | | | | | | | | | | |
| |
CASH EQUIVALENT — 4.2% | | | | | |
SEI Daily Income Trust, Prime
Obligation Fund, Cl A
0.270%**† | | | 4.2 | | | | 151,912,001 | | | | 151,912 | |
| | | | | | | | | | | | |
Total Cash Equivalent
(Cost $151,912) ($ Thousands) | | | | | | | | 151,912 | |
| | | | | | | | | | | | |
Total Investments — 100.9%
(Cost $3,112,350) ($ Thousands) | | | | | | | $ | 3,625,413 | |
| | | | | | | | | | | | |
A list of the open futures contracts held by the Fund at May 31, 2016, is as follows:
| | | | | | | | | | | | |
| Type of Contract | | Number of
Contracts
Long | | | Expiration
Date | | | Unrealized Appreciation ($ Thousands) | |
S&P 500 Index E-MINI | | | 941 | | | | Jun-2016 | | | $ | 3,840 | |
| | | | | | | | | | | | |
For the year ended May 31, 2016, the total amount of all open futures contracts, as presented in the table above, are representative of the volume of activity for this derivative type during the year.
Percentages are based on a Net Assets of $3,592,226 ($ Thousands).
| * | | Non-income producing security. |
| ** | | The rate reported is the 7-day effective yield as of May 31, 2016. |
| ‡ | | Real Estate Investment Trust |
| † | | Investment in Affiliated Security (see Note 6). |
| (A) | | Certain securities or partial positions of certain securities are on loan at May 31, 2016, (see Note 12). The total market value of securities on loan at May 31, 2016, was $23,966 ($ Thousands). |
| (B) | | This security was purchased with cash collateral held from securities on loan (see Note 12). The total market value of such securities as of May 31, 2016 was $24,483
($ Thousands). |
| (C) | | Security, or portion thereof, has been pledged as collateral on open futures contracts. |
Cl — Class
L.P. — Limited Partnership
S&P — Standard & Poor’s
The Summary Schedule of Investments does not reflect the complete portfolio holdings. It includes the Fund’s 50 largest holdings and each investment of any issuer that exceeds 1% of the Fund’s net assets. “Other Securities” represent all issues not required to be disclosed under the rules adopted by the U.S. Securities and Exchange Commission (“SEC”). In certain instances, securities for which footnotes listed above may otherwise apply are included in the Other Securities caption. The complete schedule of portfolio holdings is available (i) without charge, upon request, by calling (800) 342-5734; and (ii) on the SEC’s website at http://www.sec.gov.
The following is a list of the level of inputs used as of May 31, 2016, in valuing the Fund’s investments and other financial instruments carried at value ($ Thousands):
| | | | | | | | | | | | | | | | |
| Investments in Securities | | Level 1 | | | Level 2 | | | Level 3 | | | Total | |
Common Stock | | $ | 3,443,750 | | | $ | — | | | $ | — | | | $ | 3,443,750 | |
Rights | | | — | | | | 91 | | | | — | | | | 91 | |
Affiliated Partnership | | | — | | | | 24,483 | | | | — | | | | 24,483 | |
U.S. Treasury Obligations | | | — | | | | 5,177 | | | | — | | | | 5,177 | |
Cash Equivalent | | | 151,912 | | | | — | | | | — | | | | 151,912 | |
| | | | | | | | | | | | | | | | |
Total Investments in Securities | | $ | 3,595,662 | | | $ | 29,751 | | | $ | — | | | $ | 3,625,413 | |
| | | | | | | | | | | | | | | | |
| | | | | | | | | | | | | | | | |
| Other Financial Instruments | | Level 1 | | | Level 2 | | | Level 3 | | | Total | |
Futures Contracts* | | | | | | | | | | | | | | | | |
Unrealized Appreciation | | $ | 3,840 | | | $ | — | | | $ | — | | | $ | 3,840 | |
| | | | | | | | | | | | | | | | |
| * | | Futures contracts are valued at the unrealized appreciation on the instrument. |
For the year ended May 31, 2016, there were no transfers between Level 1 and Level 2 assets and liabilities.
For the year ended May 31, 2016, there were no transfers between Level 2 and Level 3 assets and liabilities.
For more information on valuation inputs, see Note 2 — Significant Accounting Policies in Notes to Financial Statements.
Amounts designated as “—” are either $0 or have been rounded to $0.
The accompanying notes are an integral part of the financial statements.
| | | | |
| SEI Institutional Investments Trust / Annual Report / May 31, 2016 | | | 43 | |
SUMMARY SCHEDULE OF INVESTMENTS
Large Cap Index Fund
May 31, 2016
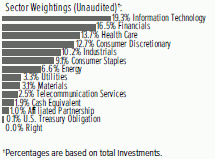
| | | | | | | | | | | | |
| Description | | Percentage of
Net Assets (%) | | | Shares | | | Market Value
($ Thousands) | |
| | | | | | | | | | | | |
| | |
COMMON STOCK — 97.4% | | | | | | | | | |
| |
Consumer Discretionary — 12.8% | | | | | |
Amazon.com* | | | 1.3 | % | | | 37,289 | | | $ | 26,952 | |
Comcast, Cl A | | | 0.8 | | | | 245,325 | | | | 15,529 | |
Home Depot | | | 0.8 | | | | 127,215 | | | | 16,808 | |
McDonald’s | | | 0.5 | | | | 85,480 | | | | 10,434 | |
Starbucks | | | 0.4 | | | | 147,912 | | | | 8,119 | |
Walt Disney | | | 0.8 | | | | 166,172 | | | | 16,488 | |
Other Securities (A) | | | 8.2 | | | | | | | | 168,694 | |
| | | | | | | | | | | | |
| | | | | | | | | | | 263,024 | |
| | | | | | | | | | | | |
| |
Consumer Staples — 9.2% | | | | | |
Altria Group | | | 0.6 | | | | 190,240 | | | | 12,107 | |
Coca-Cola | | | 0.8 | | | | 383,940 | | | | 17,124 | |
CVS Health | | | 0.5 | | | | 109,252 | | | | 10,537 | |
PepsiCo | | | 0.7 | | | | 144,652 | | | | 14,634 | |
Philip Morris International | | | 0.7 | | | | 151,768 | | | | 14,976 | |
Procter & Gamble | | | 1.1 | | | | 265,274 | | | | 21,498 | |
Wal-Mart Stores | | | 0.5 | | | | 155,179 | | | | 10,984 | |
Other Securities (A) | | | 4.3 | | | | | | | | 87,372 | |
| | | | | | | | | | | | |
| | | | | | | | | | | 189,232 | |
| | | | | | | | | | | | |
| |
Energy — 6.6% | | | | | |
Chevron | | | 0.9 | | | | 184,002 | | | | 18,584 | |
Exxon Mobil | | | 1.8 | | | | 408,038 | | | | 36,324 | |
Schlumberger | | | 0.5 | | | | 138,255 | | | | 10,549 | |
Other Securities (A) | | | 3.4 | | | | | | | | 71,669 | |
| | | | | | | | | | | | |
| | | | | | | | | | | 137,126 | |
| | | | | | | | | | | | |
| |
Financials — 16.6% | | | | | |
Bank of America | | | 0.8 | | | | 1,028,963 | | | | 15,218 | |
Berkshire Hathaway, Cl B* | | | 1.3 | | | | 181,700 | | | | 25,536 | |
Citigroup | | | 0.7 | | | | 297,504 | | | | 13,855 | |
JPMorgan Chase | | | 1.2 | | | | 362,734 | | | | 23,676 | |
SEI† | | | 0.0 | | | | 11,742 | | | | 604 | |
Wells Fargo | | | 1.1 | | | | 455,466 | | | | 23,101 | |
Other Securities‡ (A) | | | 11.5 | | | | | | | | 240,038 | |
| | | | | | | | | | | | |
| | | | | | | | | | | 342,028 | |
| | | | | | | | | | | | |
| |
Health Care — 13.8% | | | | | |
AbbVie | | | 0.5 | | | | 162,761 | | | | 10,243 | |
Allergan* | | | 0.4 | | | | 38,654 | | | | 9,113 | |
Amgen | | | 0.6 | | | | 74,658 | | | | 11,792 | |
Bristol-Myers Squibb | | | 0.6 | | | | 163,659 | | | | 11,734 | |
| | | | | | | | | | | | |
| Description | | Percentage of
Net Assets (%) | | | Shares | | | Market Value
($ Thousands) | |
| | | | | | | | | | | | |
Celgene* | | | 0.4 | % | | | 76,360 | | | $ | 8,058 | |
Gilead Sciences | | | 0.6 | | | | 132,134 | | | | 11,504 | |
Johnson & Johnson | | | 1.5 | | | | 270,809 | | | | 30,517 | |
Medtronic | | | 0.6 | | | | 139,926 | | | | 11,261 | |
Merck | | | 0.8 | | | | 276,743 | | | | 15,570 | |
Pfizer | | | 1.0 | | | | 602,222 | | | | 20,897 | |
UnitedHealth Group | | | 0.6 | | | | 93,420 | | | | 12,487 | |
Other Securities (A) | | | 6.2 | | | | | | | | 130,982 | |
| | | | | | | | | | | | |
| | | | | | | | | | | 284,158 | |
| | | | | | | | | | | | |
| | |
Industrials — 10.2% | | | | | | | | | |
3M | | | 0.5 | | | | 62,333 | | | | 10,492 | |
Boeing | | | 0.4 | | | | 63,191 | | | | 7,972 | |
General Electric | | | 1.4 | | | | 918,706 | | | | 27,772 | |
Honeywell International | | | 0.4 | | | | 76,990 | | | | 8,764 | |
United Technologies | | | 0.4 | | | | 82,390 | | | | 8,287 | |
Other Securities (A) | | | 7.1 | | | | | | | | 146,913 | |
| | | | | | | | | | | | |
| | | | | | | | | | | 210,200 | |
| | | | | | | | | | | | |
| | |
Information Technology — 19.3% | | | | | | | | | |
Alphabet, Cl A* | | | 1.0 | | | | 28,229 | | | | 21,139 | |
Alphabet, Cl C* | | | 1.0 | | | | 28,799 | | | | 21,188 | |
Apple | | | 2.7 | | | | 561,715 | | | | 56,093 | |
Cisco Systems | | | 0.7 | | | | 498,527 | | | | 14,482 | |
Facebook, Cl A* | | | 1.2 | | | | 211,500 | | | | 25,128 | |
Intel | | | 0.7 | | | | 464,958 | | | | 14,688 | |
International Business Machines | | | 0.7 | | | | 88,998 | | | | 13,683 | |
MasterCard, Cl A | | | 0.5 | | | | 98,300 | | | | 9,427 | |
Microsoft | | | 2.0 | | | | 789,300 | | | | 41,833 | |
Oracle | | | 0.6 | | | | 306,520 | | | | 12,322 | |
Visa, Cl A | | | 0.7 | | | | 191,800 | | | | 15,141 | |
Other Securities (A) | | | 7.5 | | | | | | | | 153,852 | |
| | | | | | | | | | | | |
| | | | | | | | | | | 398,976 | |
| | | | | | | | | | | | |
| | |
Materials — 3.1% | | | | | | | | | |
Other Securities (A) | | | 3.1 | | | | | | | | 64,605 | |
| | | | | | | | | | | | |
| | |
Telecommunication Services — 2.5% | | | | | | | | | |
AT&T | | | 1.1 | | | | 595,051 | | | | 23,296 | |
Verizon Communications | | | 1.0 | | | | 398,976 | | | | 20,308 | |
Other Securities (A) | | | 0.4 | | | | | | | | 7,941 | |
| | | | | | | | | | | | |
| | | | | | | | | | | 51,545 | |
| | | | | | | | | | | | |
| | |
Utilities — 3.3% | | | | | | | | | |
Other Securities (A) | | | 3.3 | | | | | | | | 67,284 | |
| | | | | | | | | | | | |
Total Common Stock
(Cost $1,203,182) ($ Thousands) | | | | 2,008,178 | |
| | | | | | | | | | | | |
| |
RIGHT — 0.0% | | | | | |
| | |
United States — 0.0% | | | | | | | | | |
Other Securities | | | 0.0 | | | | | | | | 3 | |
| | | | | | | | | | | | |
Total Right
(Cost $–) ($ Thousands) | | | | 3 | |
| | | | | | | | | | | | |
| | |
| 44 | | SEI Institutional Investments Trust / Annual Report / May 31, 2016 |
| | | | | | | | | | | | |
| Description | | Percentage of
Net Assets (%) | | | Shares | | | Market Value
($ Thousands) | |
| | | | | | | | | | | | |
| |
AFFILIATED PARTNERSHIP — 1.0% | | | | | |
SEI Liquidity Fund, L.P.
0.410%**† (B) | | | 1.0 | % | | | 20,889,946 | | | $ | 20,890 | |
| | | | | | | | | | | | |
Total Affiliated Partnership
(Cost $20,890) ($ Thousands) | | | | 20,890 | |
| | | | | | | | | | | | |
| |
U.S. TREASURY OBLIGATION — 0.1% | | | | | |
Other Securities (C) | | | 0.1 | | | | | | | | 2,363 | |
| | | | | | | | | | | | |
Total U.S. Treasury Obligation
(Cost $2,362) ($ Thousands) | | | | | | | | 2,363 | |
| | | | | | | | | | | | |
| |
CASH EQUIVALENT — 1.9% | | | | | |
SEI Daily Income Trust, Prime
Obligation Fund, Cl A
0.270%**† | | | 1.9 | | | | 39,573,220 | | | | 39,573 | |
| | | | | | | | | | | | |
Total Cash Equivalent
(Cost $39,573) ($ Thousands) | | | | | | | | 39,573 | |
| | | | | | | | | | | | |
Total Investments — 100.4%
(Cost $1,266,007) ($ Thousands) | | | | | | | $ | 2,071,007 | |
| | | | | | | | | | | | |
A list of the open futures contracts held by the Fund at May 31, 2016, is as follows:
| | | | | | | | | | | | |
| Type of Contract | | Number of
Contracts
Long | | | Expiration
Date | | | Unrealized
Appreciation
($ Thousands) | |
S&P 500 Index E-MINI | | | 457 | | | | Jun-2016 | | | $ | 1,523 | |
S&P Mid Cap 400 Index E-MINI | | | 37 | | | | Jun-2016 | | | | 278 | |
| | | | | | | | | | | | |
| | | | | | | | | | $ | 1,801 | |
| | | | | | | | | | | | |
For the year ended May 31, 2016, the total amount of all open futures contracts, as presented in the table above, are representative of the volume of activity for this derivative type during the year.
Percentages are based on a Net Assets of $2,061,670 ($ Thousands).
| * | | Non-income producing security. |
| ** | | The rate reported is the 7-day effective yield as of May 31, 2016. |
| ‡ | | Real Estate Investment Trust |
| † | | Investment in Affiliated Security (see Note 6). |
| (A) | | Certain securities or partial positions of certain securities are on loan at May 31, 2016, (see Note 12). The total market value of securities on loan at May 31, 2016, was $20,437 ($ Thousands). |
| (B) | | This security was purchased with cash collateral held from securities on loan (see Note 12). The total market value of such securities as of May 31, 2016 was $20,890
($ Thousands). |
| (C) | | Security, or portion thereof, has been pledged as collateral on open futures contracts. |
L.P. — Limited Partnership
S&P — Standard & Poor’s
The Summary Schedule of Investments does not reflect the complete portfolio holdings. It includes the Fund’s 50 largest holdings and each investment of any issuer that exceeds 1% of the Fund’s net assets. “Other Securities” represent all issues not required to be disclosed under the rules adopted by the U.S. Securities and Exchange Commission (“SEC”). In certain instances, securities for which footnotes listed above may otherwise apply are included in the Other Securities caption. The complete schedule of portfolio holdings is available (i) without charge, upon request, by calling (800) 342-5734; and (ii) on the SEC’s website at http://www.sec.gov.
The following is a list of the level of inputs used as of May 31, 2016, in valuing the Fund’s investments and other financial instruments carried at value ($ Thousands):
| | | | | | | | | | | | | | | | |
| Investments in Securities | | Level 1 | | | Level 2 | | | Level 3 | | | Total | |
Common Stock | | $ | 2,008,178 | | | $ | — | | | $ | — | | | $ | 2,008,178 | |
Right | | | — | | | | 3 | | | | — | | | | 3 | |
Affiliated Partnership | | | — | | | | 20,890 | | | | — | | | | 20,890 | |
U.S. Treasury Obligation | | | — | | | | 2,363 | | | | — | | | | 2,363 | |
Cash Equivalent | | | 39,573 | | | | — | | | | — | | | | 39,573 | |
| | | | | | | | | | | | | | | | |
Total Investments in Securities | | $ | 2,047,751 | | | $ | 23,256 | | | $ | — | | | $ | 2,071,007 | |
| | | | | | | | | | | | | | | | |
| | | | | | | | | | | | | | | | |
| Other Financial Instruments | | Level 1 | | | Level 2 | | | Level 3 | | | Total | |
Futures Contracts* | | | | | | | | | | | | | | | | |
Unrealized Appreciation | | $ | 1,801 | | | $ | — | | | $ | — | | | $ | 1,801 | |
| | | | | | | | | | | | | | | | |
| * | | Futures contracts are valued at the unrealized appreciation on the instrument. |
For the year ended May 31, 2016, there were no transfers between Level 1 and Level 2 assets and liabilities.
For the year ended May 31, 2016, there were no transfers between Level 2 and Level 3 assets and liabilities.
For more information on valuation inputs, see Note 2 — Significant Accounting Policies in Notes to Financial Statements.
Amounts designated as “—” are either $0 or have been rounded to $0.
The accompanying notes are an integral part of the financial statements.
| | | | |
| SEI Institutional Investments Trust / Annual Report / May 31, 2016 | | | 45 | |
SUMMARY SCHEDULE OF INVESTMENTS
S&P 500 Index Fund
May 31, 2016
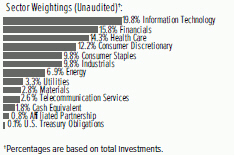
| | | | | | | | | | | | |
| Description | | Percentage of Net Assets (%) | | | Shares | | | Market Value
($ Thousands) | |
| | | | | | | | | | | | |
| | |
COMMON STOCK — 97.9% | | | | | | | | | |
| |
Consumer Discretionary — 12.3% | | | | | |
Amazon.com* | | | 1.5 | % | | | 70,060 | | | $ | 50,639 | |
Comcast, Cl A | | | 0.8 | | | | 441,474 | | | | 27,945 | |
Home Depot | | | 0.9 | | | | 230,087 | | | | 30,399 | |
McDonald’s | | | 0.6 | | | | 163,587 | | | | 19,967 | |
Starbucks | | | 0.4 | | | | 268,282 | | | | 14,726 | |
Walt Disney | | | 0.8 | | | | 272,383 | | | | 27,026 | |
Other Securities (A) | | | 7.3 | | | | | | | | 244,499 | |
| | | | | | | | | | | | |
| | | | | | | | | | | 415,201 | |
| | | | | | | | | | | | |
| |
Consumer Staples — 9.9% | | | | | |
Altria Group | | | 0.7 | | | | 355,283 | | | | 22,610 | |
Coca-Cola | | | 0.9 | | | | 706,957 | | | | 31,530 | |
CVS Health | | | 0.6 | | | | 199,383 | | | | 19,230 | |
PepsiCo | | | 0.8 | | | | 262,278 | | | | 26,535 | |
Philip Morris International | | | 0.8 | | | | 281,178 | | | | 27,747 | |
Procter & Gamble | | | 1.1 | | | | 481,270 | | | | 39,002 | |
Wal-Mart Stores | | | 0.6 | | | | 284,783 | | | | 20,157 | |
Other Securities | | | 4.4 | | | | | | | | 147,116 | |
| | | | | | | | | | | | |
| | | | | | | | | | | 333,927 | |
| | | | | | | | | | | | |
| |
Energy — 7.0% | | | | | |
Chevron | | | 1.0 | | | | 341,678 | | | | 34,509 | |
Exxon Mobil | | | 2.0 | | | | 753,300 | | | | 67,059 | |
Schlumberger | | | 0.6 | | | | 252,366 | | | | 19,256 | |
Other Securities (A) | | | 3.4 | | | | | | | | 115,422 | |
| | | | | | | | | | | | |
| | | | | | | | | | | 236,246 | |
| | | | | | | | | | | | |
| |
Financials — 15.9% | | | | | |
Bank of America | | | 0.8 | | | | 1,873,583 | | | | 27,710 | |
Berkshire Hathaway, Cl B* | | | 1.4 | | | | 339,928 | | | | 47,773 | |
Citigroup | | | 0.7 | | | | 534,957 | | | | 24,913 | |
JPMorgan Chase | | | 1.3 | | | | 665,857 | | | | 43,461 | |
Wells Fargo | | | 1.3 | | | | 838,148 | | | | 42,511 | |
Other Securities‡ (A) | | | 10.4 | | | | | | | | 352,920 | |
| | | | | | | | | | | | |
| | | | | | | | | | | 539,288 | |
| | | | | | | | | | | | |
| |
Health Care — 14.4% | | | | | |
AbbVie | | | 0.6 | | | | 292,478 | | | | 18,406 | |
Allergan* | | | 0.5 | | | | 71,599 | | | | 16,879 | |
Amgen | | | 0.6 | | | | 136,491 | | | | 21,559 | |
Bristol-Myers Squibb | | | 0.6 | | | | 302,983 | | | | 21,724 | |
Celgene* | | | 0.4 | | | | 141,887 | | | | 14,972 | |
| | | | | | | | | | | | |
| Description | | Percentage of Net Assets (%) | | | Shares | | | Market Value
($ Thousands) | |
| | | | | | | | | | | | |
Gilead Sciences | | | 0.6 | % | | | 248,078 | | | $ | 21,598 | |
Johnson & Johnson | | | 1.7 | | | | 500,570 | | | | 56,409 | |
Medtronic | | | 0.6 | | | | 255,161 | | | | 20,535 | |
Merck | | | 0.8 | | | | 503,570 | | | | 28,331 | |
Pfizer | | | 1.1 | | | | 1,097,335 | | | | 38,078 | |
UnitedHealth Group | | | 0.7 | | | | 172,487 | | | | 23,056 | |
Other Securities (A) | | | 6.2 | | | | | | | | 205,584 | |
| | | | | | | | | | | | |
| | | | | | | | | | | 487,131 | |
| | | | | | | | | | | | |
| |
Industrials — 9.8% | | | | | |
3M | | | 0.5 | | | | 109,791 | | | | 18,480 | |
Boeing | | | 0.4 | | | | 113,091 | | | | 14,266 | |
General Electric | | | 1.5 | | | | 1,692,688 | | | | 51,170 | |
Honeywell International | | | 0.5 | | | | 139,687 | | | | 15,901 | |
Other Securities (A) | | | 6.9 | | | | | | | | 232,354 | |
| | | | | | | | | | | | |
| | | | | | | | | | | 332,171 | |
| | | | | | | | | | | | |
| |
Information Technology — 19.9% | | | | | |
Alphabet, Cl A* | | | 1.2 | | | | 53,041 | | | | 39,720 | |
Alphabet, Cl C* | | | 1.2 | | | | 53,963 | | | | 39,702 | |
Apple | | | 3.0 | | | | 1,005,746 | | | | 100,434 | |
Cisco Systems | | | 0.8 | | | | 913,143 | | | | 26,527 | |
Facebook, Cl A* | | | 1.5 | | | | 416,378 | | | | 49,470 | |
Intel | | | 0.8 | | | | 857,152 | | | | 27,077 | |
International Business | | | | | | | | | | | | |
Machines | | | 0.7 | | | | 160,451 | | | | 24,668 | |
MasterCard, Cl A | | | 0.5 | | | | 177,947 | | | | 17,065 | |
Microsoft | | | 2.2 | | | | 1,434,704 | | | | 76,039 | |
Oracle | | | 0.7 | | | | 571,765 | | | | 22,985 | |
Qualcomm | | | 0.4 | | | | 271,378 | | | | 14,904 | |
Visa, Cl A | | | 0.8 | | | | 348,270 | | | | 27,492 | |
Other Securities (A) | | | 6.1 | | | | | | | | 208,742 | |
| | | | | | | | | | | | |
| | | | | | | | | | | 674,825 | |
| | | | | | | | | | | | |
| |
Materials — 2.8% | | | | | |
Other Securities (A) | | | 2.8 | | | | | | | | 94,474 | |
| | | | | | | | | | | | |
| |
Telecommunication Services — 2.6% | | | | | |
AT&T | | | 1.3 | | | | 1,115,943 | | | | 43,689 | |
Verizon Communications | | | 1.1 | | | | 739,152 | | | | 37,623 | |
Other Securities (A) | | | 0.2 | | | | | | | | 6,571 | |
| | | | | | | | | | | | |
| | | | | | | | | | | 87,883 | |
| | | | | | | | | | | | |
| |
Utilities — 3.3% | | | | | |
Other Securities | | | 3.3 | | | | | | | | 110,729 | |
| | | | | | | | | | | | |
Total Common Stock
(Cost $3,128,919) ($ Thousands) | | | | 3,311,875 | |
| | | | | | | | | | | | |
| | |
| 46 | | SEI Institutional Investments Trust / Annual Report / May 31, 2016 |
| | | | | | | | | | | | |
| Description | | Percentage of Net Assets (%) | | | Shares | | | Market Value
($ Thousands) | |
| | | | | | | | | | | | |
| |
AFFILIATED PARTNERSHIP — 0.8% | | | | | |
SEI Liquidity Fund, L.P.
0.410%**† (B) | | | 0.8 | % | | | 26,532,492 | | | $ | 26,532 | |
| | | | | | | | | | | | |
Total Affiliated Partnership
(Cost $26,532) ($ Thousands) | | | | 26,532 | |
| | | | | | | | | | | | |
|
U.S. TREASURY OBLIGATIONS — 0.1% | |
Other Securities (C) | | | 0.1 | | | | | | | | 3,899 | |
| | | | | | | | | | | | |
Total U.S. Treasury Obligations
(Cost $3,898) ($ Thousands) | | | | 3,899 | |
| | | | | | | | | | | | |
|
CASH EQUIVALENT — 1.8% | |
SEI Daily Income Trust, Prime
Obligation Fund, Cl A
0.270%**† | | | 1.8 | | | | 60,897,951 | | | | 60,898 | |
| | | | | | | | | | | | |
Total Cash Equivalent
(Cost $60,898) ($ Thousands) | | | | 60,898 | |
| | | | | | | | | | | | |
Total Investments — 100.6%
(Cost $3,220,247) ($ Thousands) | | | $ | 3,403,204 | |
| | | | | | | | | | | | |
A list of the open futures contracts held by the Fund at May 31, 2016, is as follows:
| | | | | | | | | | | | |
| Type of Contract | | Number of
Contracts
Long | | | Expiration
Date | | | Unrealized
Appreciation
($ Thousands) | |
S&P 500 Index E-MINI | | | 691 | | | | Jun-2016 | | | $ | 3,016 | |
| | | | | | | | | | | | |
For the year ended May 31, 2016, the total amount of all open futures contracts, as presented in the table above, are representative of the volume of activity for this derivative type during the year.
Percentages are based on a Net Assets of $3,384,560 ($ Thousands).
| * | | Non-income producing security. |
| ** | | The rate reported is the 7-day effective yield as of May 31, 2016. |
| ‡ | | Real Estate Investment Trust |
| † | | Investment in Affiliated Security (see Note 6). |
| (A) | | Certain securities or partial positions of certain securities are on loan at May 31, 2016, (see Note 12). The total market value of securities on loan at May 31, 2016, was $25,973 ($ Thousands). |
| (B) | | This security was purchased with cash collateral held from securities on loan (see Note 12). The total market value of such securities as of May 31, 2016 was $26,532
($ Thousands). |
| (C) | | Security, or portion thereof, has been pledged as collateral on open futures contracts. |
Cl — Class
L.P. — Limited Partnership
S&P — Standard & Poor’s
The Summary Schedule of Investments does not reflect the complete portfolio holdings. It includes the Fund’s 50 largest holdings and each investment of any issuer that exceeds 1% of the Fund’s net assets. “Other Securities” represent all issues not required to be disclosed under the rules adopted by the U.S. Securities and Exchange Commission (“SEC”). In certain instances, securities for which footnotes listed above may otherwise apply are included in the Other Securities caption. The complete schedule of portfolio holdings is available (i) without charge, upon request, by calling (800) 342-5734; and (ii) on the SEC’s website at http://www.sec.gov.
The following is a list of the level of inputs used as of May 31, 2016, in valuing the Fund’s investments and other financial instruments carried at value ($ Thousands):
| | | | | | | | | | | | | | | | |
| Investments in Securities | | Level 1 | | | Level 2 | | | Level 3 | | | Total | |
Common Stock | | $ | 3,311,875 | | | $ | – | | | $ | — | | | $ | 3,311,875 | |
Affiliated Partnership | | | — | | | | 26,532 | | | | — | | | | 26,532 | |
U.S. Treasury Obligations | | | — | | | | 3,899 | | | | — | | | | 3,899 | |
Cash Equivalent | | | 60,898 | | | | — | | | | — | | | | 60,898 | |
| | | | | | | | | | | | | | | | |
Total Investments in Securities | | $ | 3,372,773 | | | $ | 30,431 | | | $ | — | | | $ | 3,403,204 | |
| | | | | | | | | | | | | | | | |
| | | | | | | | | | | | | | | | |
| Other Financial Instruments | | Level 1 | | | Level 2 | | | Level 3 | | | Total | |
Futures Contracts* | | | | | | | | | | | | | | | | |
Unrealized Appreciation | | $ | 3,016 | | | $ | — | | | $ | — | | | $ | 3,016 | |
| | | | | | | | | | | | | | | | |
| * | | Futures contracts are valued at the unrealized appreciation on the instrument. |
For the year ended May 31, 2016, there were no transfers between Level 1 and Level 2 assets and liabilities.
For the year ended May 31, 2016, there were no transfers between Level 2 and Level 3 assets and liabilities.
For more information on valuation inputs, see Note 2 – Significant Accounting Policies in Notes to Financial Statements.
Amounts designated as “—” are either $0 or have been rounded to $0.
The accompanying notes are an integral part of the financial statements.
| | | | |
| SEI Institutional Investments Trust / Annual Report / May 31, 2016 | | | 47 | |
SUMMARY SCHEDULE OF INVESTMENTS
Extended Market Index Fund
May 31, 2016
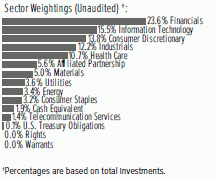
| | | | | | | | | | | | |
| Description | | Percentage of Net Assets (%) | | | Shares | | | Market Value
($ Thousands) | |
| | | | | | | | | | | | |
| | |
COMMON STOCK — 97.5% | | | | | | | | | |
| | |
Consumer Discretionary — 14.6% | | | | | | | | | |
Charter Communications, Cl A* | | | 1.1 | % | | | 36,614 | | | $ | 8,016 | |
DISH Network, Cl A* | | | 0.3 | | | | 39,019 | | | | 1,947 | |
Hilton Worldwide Holdings | | | 0.3 | | | | 92,900 | | | | 1,931 | |
Las Vegas Sands | | | 0.4 | | | | 64,504 | | | | 2,983 | |
Lear | | | 0.2 | | | | 12,771 | | | | 1,517 | |
Liberty Interactive, Cl A* | | | 0.3 | | | | 82,744 | | | | 2,232 | |
MGM Resorts International* | | | 0.3 | | | | 79,874 | | | | 1,825 | |
Sirius XM Holdings* | | | 0.2 | | | | 385,179 | | | | 1,548 | |
Tesla Motors* (A) | | | 0.6 | | | | 19,879 | | | | 4,438 | |
Thomson Reuters | | | 0.4 | | | | 57,985 | | | | 2,438 | |
Other Securities (A) | | | 10.5 | | | | | | | | 75,515 | |
| | | | | | | | | | | | |
| | | | | | | | | | | 104,390 | |
| | | | | | | | | | | | |
| | |
Consumer Staples — 3.4% | | | | | | | | | |
Bunge | | | 0.3 | | | | 25,843 | | | | 1,733 | |
Ingredion | | | 0.2 | | | | 12,865 | | | | 1,511 | |
Other Securities (A) | | | 2.9 | | | | | | | | 20,951 | |
| | | | | | | | | | | | |
| | | | | | | | | | | 24,195 | |
| | | | | | | | | | | | |
| | |
Energy — 3.6% | | | | | | | | | |
Other Securities (A) | | | 3.6 | | | | | | | | 25,797 | |
| | | | | | | | | | | | |
| | |
Financials — 24.9% | | | | | | | | | |
Alleghany* | | | 0.2 | | | | 2,867 | | | | 1,562 | |
Ally Financial* | | | 0.2 | | | | 86,600 | | | | 1,554 | |
Annaly Capital Management‡ | | | 0.3 | | | | 169,914 | | | | 1,798 | |
Arch Capital Group* | | | 0.2 | | | | 22,336 | | | | 1,623 | |
Duke Realty‡ | | | 0.2 | | | | 62,195 | | | | 1,472 | |
First Republic Bank | | | 0.3 | | | | 25,543 | | | | 1,850 | |
FNF Group | | | 0.3 | | | | 50,358 | | | | 1,760 | |
Markel* | | | 0.3 | | | | 2,513 | | | | 2,395 | |
SEI† | | | 0.2 | | | | 24,219 | | | | 1,246 | |
TD Ameritrade Holding | | | 0.2 | | | | 48,073 | | | | 1,571 | |
VEREIT‡ | | | 0.2 | | | | 163,000 | | | | 1,563 | |
Other Securities‡ (A) | | | 22.3 | | | | | | | | 159,065 | |
| | | | | | | | | | | | |
| | | | | | | | | | | 177,459 | |
| | | | | | | | | | | | |
| | |
Health Care — 11.3% | | | | | | | | | |
BioMarin Pharmaceutical* | | | 0.4 | | | | 28,246 | | | | 2,532 | |
Idexx Laboratories* | | | 0.2 | | | | 17,102 | | | | 1,498 | |
| | | | | | | | | | | | |
| Description | | Percentage of Net Assets (%) | | | Shares | | | Market Value
($ Thousands) | |
| | | | | | | | | | | | |
Incyte* | | | 0.3 | % | | | 27,971 | | | $ | 2,361 | |
Jazz Pharmaceuticals* | | | 0.2 | | | | 10,934 | | | | 1,657 | |
Medivation* | | | 0.3 | | | | 28,408 | | | | 1,718 | |
Mettler Toledo International* | | | 0.3 | | | | 4,982 | | | | 1,870 | |
ResMed | | | 0.2 | | | | 25,399 | | | | 1,500 | |
Other Securities (A) | | | 9.4 | | | | | | | | 67,677 | |
| | | | | | | | | | | | |
| | | | | | | | | | | 80,813 | |
| | | | | | | | | | | | |
| | |
Industrials — 12.9% | | | | | | | | | |
Fortune Brands Home & | | | | | | | | | | | | |
Security | | | 0.2 | | | | 27,873 | | | | 1,635 | |
IHS, Cl A* | | | 0.2 | | | | 12,399 | | | | 1,524 | |
TransDigm Group* | | | 0.4 | | | | 9,405 | | | | 2,479 | |
Other Securities (A) | | | 12.1 | | | | | | | | 86,527 | |
| | | | | | | | | | | | |
| | | | | | | | | | | 92,165 | |
| | | | | | | | | | | | |
| | |
Information Technology — 16.3% | | | | | | | | | |
Amdocs | | | 0.2 | | | | 27,768 | | | | 1,610 | |
Ansys* | | | 0.2 | | | | 16,217 | | | | 1,445 | |
CDK Global | | | 0.2 | | | | 28,900 | | | | 1,598 | |
FleetCor Technologies* | | | 0.3 | | | | 16,173 | | | | 2,408 | |
Gartner* | | | 0.2 | | | | 14,937 | | | | 1,518 | |
LinkedIn, Cl A* | | | 0.4 | | | | 19,306 | | | | 2,635 | |
Maxim Integrated Products | | | 0.3 | | | | 50,904 | | | | 1,932 | |
Palo Alto Networks* | | | 0.3 | | | | 13,733 | | | | 1,792 | |
ServiceNow* | | | 0.3 | | | | 29,069 | | | | 2,082 | |
Synopsys* | | | 0.2 | | | | 27,952 | | | | 1,444 | |
Twitter* | | | 0.2 | | | | 101,400 | | | | 1,543 | |
Workday, Cl A* | | | 0.2 | | | | 19,089 | | | | 1,448 | |
Other Securities (A) | | | 13.3 | | | | | | | | 94,725 | |
| | | | | | | | | | | | |
| | | | | | | | | | | 116,180 | |
| | | | | | | | | | | | |
| | |
Materials — 5.2% | | | | | | | | | |
Albemarle | | | 0.2 | | | | 20,264 | | | | 1,591 | |
Celanese, Cl A | | | 0.3 | | | | 27,492 | | | | 1,938 | |
Valspar | | | 0.2 | | | | 14,226 | | | | 1,541 | |
Other Securities (A) | | | 4.5 | | | | | | | | 32,327 | |
| | | | | | | | | | | | |
| | | | | | | | | | | 37,397 | |
| | | | | | | | | | | | |
| | |
Telecommunication Services — 1.5% | | | | | | | | | |
SBA Communications, Cl A* | | | 0.3 | | | | 22,719 | | | | 2,258 | |
T-Mobile US* | | | 0.3 | | | | 49,105 | | | | 2,100 | |
Other Securities (A) | | | 0.9 | | | | | | | | 6,446 | |
| | | | | | | | | | | | |
| | | | | | | | | | | 10,804 | |
| | | | | | | | | | | | |
| | |
Utilities — 3.8% | | | | | | | | | |
Alliant Energy | | | 0.2 | | | | 40,636 | | | | 1,506 | |
Other Securities (A) | | | 3.6 | | | | | | | | 25,360 | |
| | | | | | | | | | | | |
| | | | | | | | | | | 26,866 | |
| | | | | | | | | | | | |
| | |
| 48 | | SEI Institutional Investments Trust / Annual Report / May 31, 2016 |
| | | | | | | | | | | | |
| Description | | Percentage of Net Assets (%) | | | Shares | | | Market Value
($ Thousands) | |
| | | | | | | | | | | | |
Total Common Stock
(Cost $676,859) ($ Thousands) | | | $ | 696,066 | |
| | | | | | | | | | | | |
|
RIGHTS — 0.0% | |
|
Bermuda — 0.0% | |
Other Securities | | | 0.0 | | | | | | | | — | |
| | | | | | | | | | | | |
| | | |
United States — 0.0% | | | | | | | | | | | | |
Other Securities | | | 0.0 | | | | | | | | 8 | |
| | | | | | | | | | | | |
Total Rights
(Cost $–) ($ Thousands) | | | | 8 | |
| | | | | | | | | | | | |
| | | |
WARRANT — 0.0% | | | | | | | | | | | | |
Other Securities | | | 0.0 | | | | | | | | — | |
| | | | | | | | | | | | |
Total Warrant
(Cost $–) ($ Thousands) | | | | — | |
| | | | | | | | | | | | |
|
AFFILIATED PARTNERSHIP — 6.0% | |
SEI Liquidity Fund, L.P.
0.410%**† (B) | | | 6.0 | | | | 42,597,677 | | | | 42,598 | |
| | | | | | | | | | | | |
Total Affiliated Partnership
(Cost $42,598) ($ Thousands) | | | | 42,598 | |
| | | | | | | | | | | | |
|
U.S. TREASURY OBLIGATIONS — 0.1% | |
Other Securities (C) | | | 0.1 | | | | | | | | 1,009 | |
| | | | | | | | | | | | |
Total U.S. Treasury Obligations
(Cost $1,009) ($ Thousands) | | | | 1,009 | |
| | | | | | | | | | | | |
|
CASH EQUIVALENT — 2.0% | |
SEI Daily Income Trust, Prime
Obligation Fund, Cl A
0.270%**† | | | 2.0 | | | | 14,579,354 | | | | 14,579 | |
| | | | | | | | | | | | |
Total Cash Equivalent
(Cost $14,579) ($ Thousands) | | | | 14,579 | |
| | | | | | | | | | | | |
Total Investments — 105.6%
(Cost $735,045) ($ Thousands) | | | $ | 754,260 | |
| | | | | | | | | | | | |
A list of the open futures contracts held by the Fund at May 31, 2016, is as follows:
| | | | | | | | | | | | |
| Type of Contract | | Number of
Contracts
Long (Short) | | | Expiration
Date | | | Unrealized
Appreciation
($ Thousands) | |
Russell 2000 Index
E-MINI | | | 59 | | | | Jun-2016 | | | $ | 421 | |
S&P Mid Cap 400 Index
E-MINI | | | 67 | | | | Jun-2016 | | | | 645 | |
| | | | | | | | | | | | |
| | | | | | | | | | $ | 1,066 | |
| | | | | | | | | | | | |
For the year ended May 31, 2016, the total amount of all open futures contracts, as presented in the table above, are representative of the volume of activity for this derivative type during the year.
Percentages are based on a Net Assets of $714,258 ($ Thousands).
| * | | Non-income producing security. |
| ** | | The rate reported is the 7-day effective yield as of May 31, 2016. |
| ‡ | | Real Estate Investment Trust. |
| † | | Investment in Affiliated Security (see Note 6). |
| (A) | | Certain securities or partial positions of certain securities are on loan at May 31, 2016 (see Note 12). The total market value of securities on loan at May 31, 2016 was $41,654 ($ Thousands). |
| (B) | | This security was purchased with cash collateral held from securities on loan (see Note 12). The total market value of such securities as of May 31, 2016 was $42,598
($ Thousands). |
| (C) | | Security, or portion thereof, has been pledged as collateral on open futures contracts. |
L.P. — Limited Partnership
S&P — Standard & Poor’s
The Summary Schedule of Investments does not reflect the complete portfolio holdings. It includes the Fund’s 50 largest holdings and each investment of any issuer that exceeds 1% of the Fund’s net assets. “Other Securities” represent all issues not required to be disclosed under the rules adopted by the U.S. Securities and Exchange Commission (“SEC”). In certain instances, securities for which footnotes listed above may otherwise apply are included in the Other Securities caption. The complete schedule of portfolio holdings is available (i) without charge, upon request, by calling (800) 342-5734; and (ii) on the SEC’s website at http://www.sec.gov.
The following is a list of the level of inputs used as of May 31, 2016, in valuing the Fund’s investments and other financial instruments carried at value ($ Thousands):
| | | | | | | | | | | | | | | | |
| Investments in Securities | | Level 1 | | | Level 2 | | | Level 3 | | | Total | |
Common Stock | | $ | 696,066 | | | $ | — | | | $ | — | | | $ | 696,066 | |
Rights | | | 8 | | | | — | | | | — | | | | 8 | |
Warrant | | | — | | | | — | | | | — | | | | – | |
Affiliated Partnership | | | — | | | | 42,598 | | | | — | | | | 42,598 | |
U.S. Treasury Obligations | | | — | | | | 1,009 | | | | — | | | | 1,009 | |
Cash Equivalent | | | 14,579 | | | | — | | | | — | | | | 14,579 | |
| | | | | | | | | | | | | | | | |
Total Investments in Securities | | $ | 710,653 | | | $ | 43,607 | | | $ | — | | | $ | 754,260 | |
| | | | | | | | | | | | | | | | |
| | | | | | | | | | | | | | | | |
| Other Financial Instruments | | Level 1 | | | Level 2 | | | Level 3 | | | Total | |
Futures Contracts* | | | | | | | | | | | | | | | | |
Unrealized Appreciation | | $ | 1,066 | | | $ | — | | | $ | — | | | $ | 1,066 | |
| | | | | | | | | | | | | | | | |
Total Other Financial Instruments | | $ | 1,066 | | | $ | — | | | $ | — | | | $ | 1,066 | |
| | | | | | | | | | | | | | | | |
| * | | Futures contracts are valued at the unrealized appreciation on the instrument. |
For the year ended May 31, 2016, there were no transfers between Level 1 and Level 2 assets and liabilities.
For the year ended May 31, 2016, there were no transfers between Level 2 and Level 3 assets and liabilities.
For more information on valuation inputs, see Note 2 — Significant Accounting Policies in Notes to Financial Statements.
Amounts designated as “—” are either $0 or have been rounded to $0.
The accompanying notes are an integral part of the financial statements.
| | | | |
| SEI Institutional Investments Trust / Annual Report / May 31, 2016 | | | 49 | |
SUMMARY SCHEDULE OF INVESTMENTS
Small Cap Fund
May 31, 2016
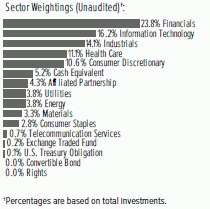
| | | | | | | | | | | | |
| Description | | Percentage of
Net Assets (%) | | | Shares | | | Market Value
($ Thousands) | |
| | | | | | | | | | | | |
| |
COMMON STOCK — 93.2% | | | | | |
| |
Consumer Discretionary — 11.0% | | | | | |
Fiesta Restaurant Group* | | | 0.5 | % | | | 101,374 | | | $ | 2,547 | |
Jack in the Box | | | 0.6 | | | | 34,257 | | | | 2,919 | |
Libbey | | | 0.4 | | | | 117,484 | | | | 2,008 | |
MDC Partners, Cl A (A) | | | 0.9 | | | | 255,104 | | | | 4,577 | |
Other Securities (A) | | | 8.6 | | | | | | | | 42,918 | |
| | | | | | | | | | | | |
| | | | | | | | | | | 54,969 | |
| | | | | | | | | | | | |
| |
Consumer Staples — 2.9% | | | | | |
Other Securities (A) | | | 2.9 | | | | | | | | 14,731 | |
| | | | | | | | | | | | |
| |
Energy — 3.9% | | | | | |
Other Securities (A) | | | 3.9 | | | | | | | | 19,727 | |
| | | | | | | | | | | | |
| |
Financials — 24.6% | | | | | |
Central Pacific Financial | | | 0.4 | | | | 80,118 | | | | 1,920 | |
CNO Financial Group | | | 0.5 | | | | 129,220 | | | | 2,622 | |
Equity Commonwealth*‡ | | | 0.4 | | | | 77,372 | | | | 2,235 | |
Fulton Financial | | | 0.4 | | | | 129,122 | | | | 1,840 | |
GEO Group‡ | | | 0.5 | | | | 77,781 | | | | 2,587 | |
Gramercy Property Trust‡ | | | 0.3 | | | | 194,702 | | | | 1,739 | |
Hanover Insurance Group | | | 0.4 | | | | 20,526 | | | | 1,779 | |
LaSalle Hotel Properties‡ | | | 0.4 | | | | 93,114 | | | | 2,152 | |
National Bank Holdings, Cl A | | | 0.3 | | | | 81,905 | | | | 1,741 | |
Popular | | | 0.4 | | | | 61,751 | | | | 1,935 | |
State Bank Financial | | | 0.4 | | | | 82,000 | | | | 1,783 | |
Wintrust Financial | | | 0.4 | | | | 39,109 | | | | 2,083 | |
Other Securities‡ (A) | | | 19.8 | | | | | | | | 99,056 | |
| | | | | | | | | | | | |
| | | | | | | | | | | 123,472 | |
| | | | | | | | | | | | |
| |
Health Care — 11.5% | | | | | |
ABIOMED* | | | 0.4 | | | | 20,284 | | | | 2,014 | |
Accuray* (A) | | | 0.4 | | | | 393,600 | | | | 2,145 | |
AMAG Pharmaceuticals* | | | 0.5 | | | | 110,670 | | | | 2,373 | |
AMN Healthcare Services* | | | 0.5 | | | | 63,714 | | | | 2,379 | |
Capital Senior Living* | | | 0.4 | | | | 114,657 | | | | 2,097 | |
Cynosure, Cl A* | | | 0.7 | | | | 68,886 | | | | 3,291 | |
Flamel Technologies ADR* | | | 0.4 | | | | 183,241 | | | | 1,950 | |
| | | | | | | | | | | | |
| Description | | Percentage of
Net Assets (%) | | | Shares | | | Market Value
($ Thousands) | |
| | | | | | | | | | | | |
Globus Medical, Cl A* | | | 0.5 | % | | | 99,709 | | | $ | 2,417 | |
Integra LifeSciences Holdings* | | | 0.5 | | | | 31,106 | | | | 2,324 | |
Molina Healthcare* | | | 0.4 | | | | 41,502 | | | | 2,010 | |
Prestige Brands Holdings* | | | 0.4 | | | | 34,391 | | | | 1,858 | |
Other Securities (A) | | | 6.4 | | | | | | | | 32,751 | |
| | | | | | | | | | | | |
| | | | | | | | | | | 57,609 | |
| | | | | | | | | | | | |
| |
Industrials — 14.6% | | | | | |
Apogee Enterprises | | | 0.7 | | | | 73,309 | | | | 3,315 | |
Great Lakes Dredge & Dock* | | | 0.4 | | | | 474,000 | | | | 2,161 | |
Huron Consulting Group* | | | 0.5 | | | | 41,779 | | | | 2,446 | |
ICF International* | | | 0.4 | | | | 54,800 | | | | 2,235 | |
MasTec* | | | 0.5 | | | | 112,860 | | | | 2,596 | |
On Assignment* | | | 0.5 | | | | 72,004 | | | | 2,712 | |
Steelcase, Cl A | | | 0.5 | | | | 143,612 | | | | 2,292 | |
Tutor Perini* | | | 0.4 | | | | 90,700 | | | | 2,052 | |
WageWorks* | | | 0.7 | | | | 61,629 | | | | 3,454 | |
Other Securities (A) | | | 10.0 | | | | | | | | 50,176 | |
| | | | | | | | | | | | |
| | | | | | | | | | | 73,439 | |
| | | | | | | | | | | | |
| |
Information Technology — 16.7% | | | | | |
Acxiom* | | | 0.7 | | | | 154,702 | | | | 3,277 | |
CalAmp* | | | 0.6 | | | | 202,348 | | | | 3,041 | |
Callidus Software* | | | 0.5 | | | | 146,305 | | | | 2,715 | |
Cardtronics* | | | 0.4 | | | | 52,366 | | | | 2,058 | |
Cavium* | | | 0.5 | | | | 53,160 | | | | 2,645 | |
Cornerstone OnDemand* | | | 0.7 | | | | 91,407 | | | | 3,657 | |
Exar* | | | 0.4 | | | | 268,967 | | | | 1,837 | |
Marketo* | | | 0.9 | | | | 133,960 | | | | 4,719 | |
MAXIMUS | | | 0.7 | | | | 58,310 | | | | 3,362 | |
PDF Solutions* | | | 0.4 | | | | 125,988 | | | | 1,853 | |
Perficient* | | | 0.4 | | | | 99,696 | | | | 2,089 | |
Proofpoint* | | | 0.5 | | | | 40,394 | | | | 2,368 | |
Other Securities (A) | | | 10.0 | | | | | | | | 50,362 | |
| | | | | | | | | | | | |
| | | | | | | | | | | 83,983 | |
| | | | | | | | | | | | |
| |
Materials — 3.4% | | | | | |
Berry Plastics Group* | | | 0.5 | | | | 66,997 | | | | 2,624 | |
Other Securities (A) | | | 2.9 | | | | | | | | 14,449 | |
| | | | | | | | | | | | |
| | | | | | | | | | | 17,073 | |
| | | | | | | | | | | | |
| |
Telecommunication Services — 0.7% | | | | | |
Other Securities (A) | | | 0.7 | | | | | | | | 3,486 | |
| | | | | | | | | | | | |
| |
Utilities — 3.9% | | | | | |
Portland General Electric | | | 0.4 | | | | 50,914 | | | | 2,097 | |
Other Securities (A) | | | 3.5 | | | | | | | | 17,659 | |
| | | | | | | | | | | | |
| | | | | | | | | | | 19,756 | |
| | | | | | | | | | | | |
Total Common Stock
(Cost $420,875) ($ Thousands) | | | | 468,245 | |
| | | | | | | | | | | | |
| |
EXCHANGE TRADED FUND — 0.2% | | | | | |
Other Securities(A) | | | 0.2 | | | | | | | | 940 | |
| | | | | | | | | | | | |
Total Exchange Traded Fund
(Cost $874) ($ Thousands) | | | | 940 | |
| | | | | | | | | | | | |
| | |
| 50 | | SEI Institutional Investments Trust / Annual Report / May 31, 2016 |
| | | | | | | | | | | | |
| Description | | Percentage of
Net Assets (%) | | | Shares | | | Market Value
($ Thousands) | |
| | | | | | | | | | | | |
|
CONVERTIBLE BOND — 0.0% | |
|
Consumer Discretionary — 0.0% | |
Other Securities | | | 0.0 | % | | | | | | | 4 | |
| | | | | | | | | | | | |
Total Convertible Bond
(Cost $445) ($ Thousands) | | | | 4 | |
| | | | | | | | | | | | |
|
RIGHTS — 0.0% | |
|
United States — 0.0% | |
Other Securities | | | 0.0 | | | | | | | | — | |
| | | | | | | | | | | | |
Total Rights
(Cost $–) ($ Thousands) | | | | — | |
| | | | | | | | | | | | |
|
AFFILIATED PARTNERSHIP — 4.4% | |
SEI Liquidity Fund, L.P.
0.410%**† (B) | | | 4.4 | | | | 22,227,345 | | | | 22,227 | |
| | | | | | | | | | | | |
Total Affiliated Partnership
(Cost $22,227) ($ Thousands) | | | | 22,227 | |
| | | | | | | | | | | | |
|
U.S. TREASURY OBLIGATION — 0.1% | |
Other Securities (C) | | | 0.1 | | | | | | | | 363 | |
| | | | | | | | | | | | |
Total U.S. Treasury Obligation
(Cost $363) ($ Thousands) | | | | 363 | |
| | | | | | | | | | | | |
|
CASH EQUIVALENT — 5.4% | |
SEI Daily Income Trust, Prime
Obligation Fund, Cl A
0.270%**† | | | 5.4 | | | | 26,893,306 | | | | 26,893 | |
| | | | | | | | | | | | |
Total Cash Equivalent
(Cost $26,893) ($ Thousands) | | | | 26,893 | |
| | | | | | | | | | | | |
Total Investments — 103.3%
(Cost $471,677) ($ Thousands) | | | $ | 518,672 | |
| | | | | | | | | | | | |
A list of the open futures contracts held by the Fund at May 31, 2016, is as follows:
| | | | | | | | | | | | |
| Type of Contract | | Number of
Contracts
Long | | | Expiration Date | | | Unrealized
Appreciation
($ Thousands) | |
Russell 2000 Index
E-MINI | | | 52 | | | | Jun-2016 | | | $ | 161 | |
| | | | | | | | | | | | |
For the year ended May 31, 2016, the total amount of all open futures contracts, as presented in the table above, are representative of the volume of activity for this derivative type during the year.
Percentages are based on a Net Assets of $502,222 ($ Thousands).
| * | | Non-income producing security. |
| ** | | The rate reported is the 7-day effective yield as of May 31, 2016. |
| ‡ | | Real Estate Investment Trust. |
| † | | Investment in Affiliated Security (see Note 6). |
| (A) | | Certain securities or partial positions of certain securities are on loan at May 31, 2016, (see Note 12). The total market value of securities on loan at May 31, 2016, was $21,631 ($ Thousands). |
| (B) | | This security was purchased with cash collateral held from securities on loan (see Note 10). The total market value of such securities as of May 31, 2016 was $22,227
($ Thousands). |
| (C) | | All or a portion of this security has been pledged as collateral for open future contracts. |
ADR — American Depositary Receipt
Cl — Class
L.P. — Limited Partnership
The Summary Schedule of Investments does not reflect the complete portfolio holdings. It includes the Fund’s 50 largest holdings and each investment of any issuer that exceeds 1% of the Fund’s net assets. “Other Securities” represent all issues not required to be disclosed under the rules adopted by the U.S. Securities and Exchange Commission (“SEC”). In certain instances, securities for which footnotes listed above may otherwise apply are included in the Other Securities caption. The complete schedule of portfolio holdings is available (i) without charge, upon request, by calling (800) 342-5734; and (ii) on the SEC’s website at http://www.sec.gov.
The following is a list of the level of inputs used as of May 31, 2016, in valuing the Fund’s investments and other financial instruments carried at value ($ Thousands):
| | | | | | | | | | | | | | | | |
| Investments in Securities | | Level 1 | | | Level 2 | | | Level 3(1) | | | Total | |
Common Stock | | $ | 468,245 | | | $ | — | | | $ | — | | | $ | 468,245 | |
Exchange Traded Fund | | | 940 | | | | — | | | | — | | | | 940 | |
Convertible Bond | | | — | | | | — | | | | 4 | | | | 4 | |
Rights | | | — | | | | — | | | | — | | | | — | |
Affiliated Partnership | | | — | | | | 22,227 | | | | — | | | | 22,227 | |
U.S. Treasury Obligation | | | — | | | | 363 | | | | — | | | | 363 | |
Cash Equivalent | | | 26,893 | | | | — | | | | — | | | | 26,893 | |
| | | | | | | | | | | | | | | | |
Total Investments in Securities | | $ | 496,078 | | | $ | 22,590 | | | $ | 4 | | | $ | 518,672 | |
| | | | | | | | | | | | | | | | |
| | | | | | | | | | | | | | | | |
| Other Financial Instruments | | Level 1 | | | Level 2 | | | Level 3 | | | Total | |
Futures Contracts* | | | | | | | | | | | | | | | | |
Unrealized Appreciation | | $ | 161 | | | $ | — | | | $ | — | | | $ | 161 | |
| | | | | | | | | | | | | | | | |
| (1) | | A reconciliation of Level 3 investments is presented when the Fund has a significant amount of Level 3 investments at the beginning and/or end of the period in relation to the net assets. |
| * | | Futures contracts are valued at the unrealized appreciation on the instrument. |
For the year ended May 31, 2016, there were no transfers between Level 1 and Level 2 assets and liabilities.
For the year ended May 31, 2016, there were no transfers between Level 2 and Level 3 assets and liabilities.
For more information on valuation inputs, see Note 2 — Significant Accounting Policies in Notes to Financial Statements.
Amounts designated as “—” are either $0 or have been rounded to $0.
The accompanying notes are an integral part of the financial statements.
| | | | |
| SEI Institutional Investments Trust / Annual Report / May 31, 2016 | | | 51 | |
SUMMARY SCHEDULE OF INVESTMENTS
Small Cap II Fund
May 31, 2016
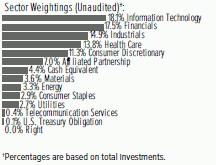
| | | | | | | | | | | | |
| Description | | Percentage of
Net Assets (%) | | | Shares | | | Market Value
($ Thousands) | |
| | | | | | | | | | | | |
| |
COMMON STOCK — 94.2% | | | | | |
| | |
Consumer Discretionary — 12.0% | | | | | | | | | |
Big Lots (A) | | | 0.4 | % | | | 36,175 | | | $ | 1,892 | |
Fiesta Restaurant Group* | | | 0.5 | | | | 81,916 | | | | 2,059 | |
Jack in the Box | | | 0.6 | | | | 29,556 | | | | 2,518 | |
MDC Partners, Cl A (A) | | | 0.7 | | | | 173,744 | | | | 3,117 | |
Pool | | | 0.4 | | | | 21,167 | | | | 1,938 | |
Steven Madden* | | | 0.5 | | | | 61,152 | | | | 2,098 | |
Other Securities (A) | | | 8.9 | | | | | | | | 41,271 | |
| | | | | | | | | | | | |
| | | | | | | | | | | 54,893 | |
| | | | | | | | | | | | |
| | |
Consumer Staples — 3.0% | | | | | | | | | |
Omega Protein* | | | 0.4 | | | | 93,442 | | | | 1,845 | |
Other Securities (A) | | | 2.6 | | | | | | | | 11,961 | |
| | | | | | | | | | | | |
| | | | | | | | | | | 13,806 | |
| | | | | | | | | | | | |
| | |
Energy — 3.5% | | | | | | | | | |
Carrizo Oil & Gas* | | | 0.5 | | | | 54,487 | | | | 2,098 | |
PBF Energy, Cl A | | | 0.5 | | | | 83,063 | | | | 2,190 | |
Other Securities (A) | | | 2.5 | | | | | | | | 11,888 | |
| | | | | | | | | | | | |
| | | | | | | | | | | 16,176 | |
| | | | | | | | | | | | |
| | |
Financials — 18.7% | | | | | | | | | |
Argo Group International Holdings | | | 0.4 | | | | 36,390 | | | | 1,916 | |
Green Dot, Cl A* | | | 0.7 | | | | 148,903 | | | | 3,285 | |
Highwoods Properties‡ | | | 0.4 | | | | 39,921 | | | | 1,943 | |
OFG Bancorp (A) | | | 0.9 | | | | 426,760 | | | | 3,901 | |
Western Alliance Bancorp* | | | 0.4 | | | | 53,427 | | | | 2,014 | |
Wintrust Financial | | | 0.7 | | | | 55,158 | | | | 2,938 | |
Other Securities‡ (A) | | | 15.2 | | | | | | | | 69,048 | |
| | | | | | | | | | | | |
| | | | | | | | | | | 85,045 | |
| | | | | | | | | | | | |
| | |
Health Care — 14.6% | | | | | | | | | |
AMAG Pharmaceuticals* | | | 0.4 | | | | 89,428 | | | | 1,917 | |
AMN Healthcare Services* | | | 0.4 | | | | 52,525 | | | | 1,961 | |
Amsurg, Cl A* | | | 0.5 | | | | 32,188 | | | | 2,407 | |
Analogic | | | 0.5 | | | | 29,287 | | | | 2,402 | |
Community Health Systems* (A) | | | 0.4 | | | | 137,928 | | | | 1,854 | |
Cynosure, Cl A* | | | 0.8 | | | | 72,955 | | | | 3,485 | |
Globus Medical, Cl A* | | | 0.7 | | | | 123,141 | | | | 2,985 | |
Integra LifeSciences Holdings* | | | 1.2 | | | | 73,151 | | | | 5,465 | |
Lannett* (A) | | | 0.5 | | | | 97,900 | | | | 2,388 | |
| | | | | | | | | | | | |
| Description | | Percentage of
Net Assets (%) | | | Shares | | | Market Value
($ Thousands) | |
| | | | | | | | | | | | |
Ligand Pharmaceuticals, Cl B* (A) | | | 0.4 | % | | | 15,901 | | | $ | 1,902 | |
Prestige Brands Holdings* | | | 0.5 | | | | 44,528 | | | | 2,406 | |
Other Securities (A) | | | 8.3 | | | | | | | | 37,482 | |
| | | | | | | | | | | | |
| | | | | | | | | | | 66,654 | |
| | | | | | | | | | | | |
| | |
Industrials — 15.9% | | | | | | | | | |
ACCO Brands* | | | 0.5 | | | | 232,322 | | | | 2,309 | |
Apogee Enterprises | | | 0.6 | | | | 58,718 | | | | 2,655 | |
Atlas Air Worldwide Holdings* | | | 0.7 | | | | 70,600 | | | | 3,095 | |
Crane | | | 0.5 | | | | 41,200 | | | | 2,365 | |
EMCOR Group | | | 0.4 | | | | 41,082 | | | | 1,953 | |
Huron Consulting Group* | | | 0.5 | | | | 42,534 | | | | 2,490 | |
MasTec* | | | 0.5 | | | | 92,610 | | | | 2,130 | |
On Assignment* | | | 0.5 | | | | 58,049 | | | | 2,187 | |
Triumph Group | | | 0.9 | | | | 104,554 | | | | 3,945 | |
WageWorks* | | | 0.6 | | | | 50,360 | | | | 2,823 | |
Wesco Aircraft Holdings* | | | 0.7 | | | | 218,840 | | | | 3,084 | |
Other Securities (A) | | | 9.5 | | | | | | | | 43,220 | |
| | | | | | | | | | | | |
| | | | | | | | | | | 72,256 | |
| | | | | | | | | | | | |
| | |
Information Technology — 19.3% | | | | | | | | | |
Acxiom* | | | 0.5 | | | | 100,047 | | | | 2,119 | |
CalAmp* | | | 0.5 | | | | 163,390 | | | | 2,456 | |
Callidus Software* | | | 0.5 | | | | 117,694 | | | | 2,184 | |
Cavium* | | | 0.4 | | | | 39,996 | | | | 1,990 | |
Cornerstone OnDemand* | | | 0.6 | | | | 66,637 | | | | 2,666 | |
ExlService Holdings* | | | 0.4 | | | | 35,925 | | | | 1,861 | |
Marketo* | | | 0.8 | | | | 105,427 | | | | 3,714 | |
MAXIMUS | | | 0.6 | | | | 47,113 | | | | 2,716 | |
Open Text (A) | | | 0.7 | | | | 54,500 | | | | 3,198 | |
OSI Systems* | | | 0.6 | | | | 47,521 | | | | 2,532 | |
Proofpoint* | | | 0.5 | | | | 35,980 | | | | 2,109 | |
Other Securities (A) | | | 13.2 | | | | | | | | 60,284 | |
| | | | | | | | | | | | |
| | | | | | | | | | | 87,829 | |
| | | | | | | | | | | | |
| | |
Materials — 3.9% | | | | | | | | | |
Berry Plastics Group* | | | 0.5 | | | | 63,566 | | | | 2,490 | |
Other Securities (A) | | | 3.4 | | | | | | | | 15,176 | |
| | | | | | | | | | | | |
| | | | | | | | | | | 17,666 | |
| | | | | | | | | | | | |
| | |
Telecommunication Services — 0.4% | | | | | | | | | |
Other Securities (A) | | | 0.4 | | | | | | | | 1,862 | |
| | | | | | | | | | | | |
| | |
Utilities — 2.9% | | | | | | | | | |
Portland General Electric | | | 0.4 | | | | 47,140 | | | | 1,941 | |
Other Securities | | | 2.5 | | | | | | | | 11,251 | |
| | | | | | | | | | | | |
| | | | | | | | | | | 13,192 | |
| | | | | | | | | | | | |
Total Common Stock
(Cost $389,660) ($ Thousands) | | | | 429,379 | |
| | | | | | | | | | | | |
| | |
RIGHT — 0.0% | | | | | | | | | |
| | |
United States — 0.0% | | | | | | | | | |
Other Securities | | | 0.0 | | | | | | | | — | |
| | | | | | | | | | | | |
Total Right
(Cost $–) ($ Thousands) | | | | — | |
| | | | | | | | | | | | |
| | |
| 52 | | SEI Institutional Investments Trust / Annual Report / May 31, 2016 |
| | | | | | | | | | | | |
| Description | | Percentage of
Net Assets (%) | | | Shares | | | Market Value
($ Thousands) | |
| | | | | | | | | | | | |
| |
AFFILIATED PARTNERSHIP — 7.4% | | | | | |
SEI Liquidity Fund, L.P.
0.410%**† (B) | | | 7.4 | % | | | 33,837,493 | | | $ | 33,837 | |
| | | | | | | | | | | | |
Total Affiliated Partnership
(Cost $33,837) ($ Thousands) | | | | 33,837 | |
| | | | | | | | | | | | |
| |
U.S. TREASURY OBLIGATION — 0.1% | | | | | |
Other Securities (C) | | | 0.1 | | | | | | | | 460 | |
| | | | | | | | | | | | |
Total U.S. Treasury Obligation
(Cost $460) ($ Thousands) | | | | 460 | |
| | | | | | | | | | | | |
| |
CASH EQUIVALENT — 4.6% | | | | | |
SEI Daily Income Trust, Prime
Obligation Fund, Cl A
0.270%**† | | | 4.6 | | | | 21,068,541 | | | | 21,069 | |
| | | | | | | | | | | | |
Total Cash Equivalent
(Cost $21,069) ($ Thousands) | | | | 21,069 | |
| | | | | | | | | | | | |
Total Investments — 106.3%
(Cost $445,026) ($ Thousands) | | | $ | 484,745 | |
| | | | | | | | | | | | |
A list of the open futures contracts held by the Fund at May 31, 2016, is as follows:
| | | | | | | | | | | | |
| Type of Contract | | Number of
Contracts
Long | | | Expiration Date | | | Unrealized
Appreciation
($ Thousands) | |
Russell 2000 Index
E-MINI | | | 67 | | | | Jun-2016 | | | $ | 469 | |
| | | | | | | | | | | | |
For the year ended May 31, 2016, the total amount of all open futures contracts, as presented in the table above, are representative of the volume of activity for this derivative type during the year.
Percentages are based on a Net Assets of $455,742 ($ Thousands).
| * | | Non-income producing security. |
| ** | | The rate reported is the 7-day effective yield as of May 31, 2016. |
| ‡ | | Real Estate Investment Trust |
| † | | Investment in Affiliated Security (see Note 6). |
| (A) | | Certain securities or partial positions of certain securities are on loan at May 31, 2016 (see Note 12). The total market value of securities on loan at May 31, 2016 was $33,133 ($ Thousands). |
| (B) | | This security was purchased with cash collateral held from securities on loan (see Note 12). The total market value of such securities as of May 31, 2016 was $33,837 ($ Thousands). |
| (C) | | All or a portion of this security has been pledged as collateral for open futures contracts. |
Cl — Class
L.P. — Limited Partnership
The Summary Schedule of Investments does not reflect the complete portfolio holdings. It includes the Fund’s 50 largest holdings and each investment of any issuer that exceeds 1% of the Fund’s net assets. “Other Securities” represent all issues not required to be disclosed under the rules adopted by the U.S. Securities and Exchange Commission (“SEC”). In certain instances, securities for which footnotes listed above may otherwise apply are included in the Other Securities caption. The complete schedule of portfolio holdings is available (i) without charge, upon request, by calling (800) 342-5734; and (ii) on the SEC’s website at http://www.sec.gov.
The following is a list of the level of inputs used as of May 31, 2016, in valuing the Fund’s investments and other financial instruments carried at value ($ Thousands):
| | | | | | | | | | | | | | | | |
| Investments in Securities | | Level 1 | | | Level 2 | | | Level 3 | | | Total | |
Common Stock | | $ | 429,379 | | | $ | — | | | $ | — | | | $ | 429,379 | |
Rights | | | — | | | | — | | | | — | | | | — | |
Affiliated Partnership | | | — | | | | 33,837 | | | | — | | | | 33,837 | |
U.S. Treasury Obligation | | | — | | | | 460 | | | | — | | | | 460 | |
Cash Equivalent | | | 21,069 | | | | — | | | | — | | | | 21,069 | |
| | | | | | | | | | | | | | | | |
Total Investments in Securities | | $ | 450,448 | | | $ | 34,297 | | | $ | — | | | $ | 484,745 | |
| | | | | | | | | | | | | | | | |
| | | | | | | | | | | | | | | | |
| Other Financial Instruments | | Level 1 | | | Level 2 | | | Level 3 | | | Total | |
Futures Contracts* | | | | | | | | | | | | | | | | |
Unrealized Appreciation | | $ | 469 | | | $ | — | | | $ | — | | | $ | 469 | |
| | | | | | | | | | | | | | | | |
| * | | Futures contracts are valued at the unrealized appreciation on the instrument. |
For the year ended May 31, 2016, there were no transfers between Level 1 and Level 2 assets and liabilities.
For the year ended May 31, 2016, there were no transfers between Level 2 and Level 3 assets and liabilities.
For more information on valuation inputs, see Note 2 — Significant Accounting Policies in Notes to Financial Statements.
Amounts designated as “—” are either $0 or have been rounded to $0.
The accompanying notes are an integral part of the financial statements.
| | | | |
| SEI Institutional Investments Trust / Annual Report / May 31, 2016 | | | 53 | |
SUMMARY SCHEDULE OF INVESTMENTS
Small/Mid Cap Equity Fund
May 31, 2016
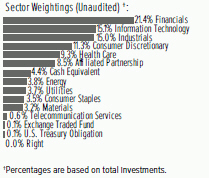
| | | | | | | | | | | | |
| Description | | Percentage of
Net Assets (%) | | | Shares | | | Market Value
($ Thousands) | |
| | | | | | | | | | | | |
| | |
COMMON STOCK — 95.3% | | | | | | | | | |
| | |
Consumer Discretionary — 12.4% | | | | | | | | | |
2U* (A) | | | 0.4 | % | | | 244,903 | | | $ | 6,818 | |
Bright Horizons Family Solutions* | | | 0.3 | | | | 75,093 | | | | 4,865 | |
Carter’s | | | 0.3 | | | | 54,338 | | | | 5,463 | |
Five Below* | | | 0.3 | | | | 118,415 | | | | 4,957 | |
Hibbett Sports* (A) | | | 0.3 | | | | 142,238 | | | | 4,913 | |
National CineMedia | | | 0.5 | | | | 604,830 | | | | 8,831 | |
Sally Beauty Holdings* | | | 0.5 | | | | 259,115 | | | | 7,442 | |
ServiceMaster Global Holdings* | | | 0.5 | | | | 206,421 | | | | 7,894 | |
Other Securities (A) | | | 9.3 | | | | | | | | 152,430 | |
| | | | | | | | | | | | |
| | | | | | | | | | | 203,613 | |
| | | | | | | | | | | | |
| | |
Consumer Staples — 3.8% | | | | | | | | | |
Spectrum Brands
Holdings (A) | | | 0.5 | | | | 73,386 | | | | 8,555 | |
TreeHouse Foods* | | | 0.4 | | | | 60,882 | | | | 5,766 | |
Other Securities (A) | | | 2.9 | | | | | | | | 48,063 | |
| | | | | | | | | | | | |
| | | | | | | | | | | 62,384 | |
| | | | | | | | | | | | |
| | |
Energy — 4.1% | | | | | | | | | |
Other Securities (A) | | | 4.1 | | | | | | | | 67,581 | |
| | | | | | | | | | | | |
| | |
Financials — 23.6% | | | | | | | | | |
American Financial Group | | | 0.4 | | | | 97,803 | | | | 7,167 | |
Central Pacific Financial | | | 0.3 | | | | 202,572 | | | | 4,856 | |
CNO Financial Group | | | 0.5 | | | | 403,504 | | | | 8,187 | |
Equity Commonwealth*‡ | | | 0.3 | | | | 164,126 | | | | 4,742 | |
Geo Group‡ | | | 0.4 | | | | 172,766 | | | | 5,746 | |
Hanover Insurance Group | | | 0.3 | | | | 64,216 | | | | 5,566 | |
Huntington Bancshares | | | 0.4 | | | | 565,429 | | | | 5,909 | |
KeyCorp | | | 0.3 | | | | 373,896 | | | | 4,793 | |
LPL Financial Holdings (A) | | | 0.3 | | | | 194,097 | | | | 5,413 | |
Synovus Financial | | | 0.3 | | | | 155,757 | | | | 5,011 | |
United Community Banks | | | 0.4 | | | | 294,870 | | | | 5,936 | |
Other Securities‡ (A) | | | 19.7 | | | | | | | | 323,885 | |
| | | | | | | | | | | | |
| | | | | | | | | | | 387,211 | |
| | | | | | | | | | | | |
| | |
Health Care — 10.2% | | | | | | | | | |
Accuray* (A) | | | 0.3 | | | | 939,200 | | | | 5,119 | |
Align Technology* | | | 0.3 | | | | 66,403 | | | | 5,235 | |
Cooper | | | 0.4 | | | | 35,644 | | | | 5,803 | |
| | | | | | | | | | | | |
| Description | | Percentage of
Net Assets (%) | | | Shares | | | Market Value
($ Thousands) | |
| | | | | | | | | | | | |
Ligand Pharmaceuticals, Cl B* (A) | | | 0.4 | % | | | 47,635 | | | $ | 5,697 | |
STERIS | | | 0.3 | | | | 71,739 | | | | 4,981 | |
Other Securities (A) | | | 8.5 | | | | | | | | 141,020 | |
| | | | | | | | | | | | |
| | | | | | | | | | | 167,855 | |
| | | | | | | | | | | | |
| | |
Industrials — 16.4% | | | | | | | | | |
CEB | | | 0.4 | | | | 98,529 | | | | 6,282 | |
Clean Harbors* | | | 0.6 | | | | 186,401 | | | | 9,598 | |
Deluxe | | | 0.4 | | | | 110,280 | | | | 7,183 | |
Forward Air | | | 0.3 | | | | 116,429 | | | | 5,296 | |
Great Lakes Dredge & Dock* | | | 0.3 | | | | 1,129,500 | | | | 5,151 | |
Heartland Express (A) | | | 0.3 | | | | 303,256 | | | | 5,604 | |
HEICO, Cl A | | | 0.3 | | | | 88,886 | | | | 4,904 | |
Huntington Ingalls Industries | | | 0.3 | | | | 34,864 | | | | 5,349 | |
ICF International* | | | 0.3 | | | | 131,724 | | | | 5,372 | |
Kirby* | | | 0.4 | | | | 92,631 | | | | 6,492 | |
MSC Industrial Direct, Cl A | | | 0.3 | | | | 74,378 | | | | 5,575 | |
Sensata Technologies Holding* | | | 0.4 | | | | 159,134 | | | | 5,885 | |
TriNet Group* | | | 0.4 | | | | 312,360 | | | | 6,294 | |
Tutor Perini* | | | 0.3 | | | | 210,900 | | | | 4,771 | |
Other Securities (A) | | | 11.4 | | | | | | | | 185,696 | |
| | | | | | | | | | | | |
| | | | | | | | | | | 269,452 | |
| | | | | | | | | | | | |
| | |
Information Technology — 16.6% | | | | | | | | | |
Cadence Design Systems* | | | 0.6 | | | | 413,093 | | | | 10,212 | |
Cimpress* (A) | | | 0.3 | | | | 55,871 | | | | 5,597 | |
DST Systems | | | 0.3 | | | | 45,269 | | | | 5,474 | |
Euronet Worldwide* | | | 0.5 | | | | 101,230 | | | | 8,079 | |
Gartner* | | | 0.3 | | | | 49,313 | | | | 5,011 | |
Littelfuse | | | 0.4 | | | | 57,938 | | | | 6,636 | |
Trimble Navigation* | | | 0.4 | | | | 278,619 | | | | 7,127 | |
Other Securities (A) | | | 13.7 | | | | | | | | 223,595 | |
| | | | | | | | | | | | |
| | | | | | | | | | | 271,731 | |
| | | | | | | | | | | | |
| | |
Materials — 3.5% | | | | | | | | | |
Berry Plastics Group* | | | 0.3 | | | | 133,127 | | | | 5,215 | |
Other Securities (A) | | | 3.2 | | | | | | | | 52,823 | |
| | | | | | | | | | | | |
| | | | | | | | | | | 58,038 | |
| | | | | | | | | | | | |
|
Telecommunication Services — 0.7% | |
Other Securities (A) | | | 0.7 | | | | | | | | 11,029 | |
| | | | | | | | | | | | |
| | |
Utilities — 4.0% | | | | | | | | | |
Pinnacle West Capital | | | 0.4 | | | | 77,487 | | | | 5,702 | |
Portland General Electric | | | 0.3 | | | | 129,569 | | | | 5,336 | |
Other Securities (A) | | | 3.3 | | | | | | | | 54,818 | |
| | | | | | | | | | | | |
| | | | | | | | | | | 65,856 | |
| | | | | | | | | | | | |
Total Common Stock
(Cost $1,365,825) ($ Thousands) | | | | 1,564,750 | |
| | | | | | | | | | | | |
| | |
| 54 | | SEI Institutional Investments Trust / Annual Report / May 31, 2016 |
| | | | | | | | | | | | |
| Description | | Percentage of
Net Assets (%) | | | Shares | | | Market Value
($ Thousands) | |
| | | | | | | | | | | | |
| |
EXCHANGE TRADED FUND — 0.1% | | | | | |
Other Securities | | | 0.1 | % | | | | | | $ | 2,249 | |
| | | | | | | | | | | | |
Total Exchange Traded Fund
(Cost $2,085) ($ Thousands) | | | | | | | | 2,249 | |
| | | | | | | | | | | | |
| |
RIGHT — 0.0% | | | | | |
| | |
United States — 0.0% | | | | | | | | | |
Other Securities | | | 0.0 | | | | | | | | — | |
| | | | | | | | | | | | |
Total Right
(Cost $–) ($ Thousands) | | | | | | | | — | |
| | | | | | | | | | | | |
| |
AFFILIATED PARTNERSHIP — 9.3% | | | | | |
SEI Liquidity Fund, L.P.
0.410%**† (B) | | | 9.3 | | | | 152,985,404 | | | | 152,985 | |
| | | | | | | | | | | | |
Total Affiliated Partnership
(Cost $152,985) ($ Thousands) | | | | | | | | 152,985 | |
| | | | | | | | | | | | |
| |
U.S. TREASURY OBLIGATION — 0.1% | | | | | |
Other Securities (C) | | | 0.1 | | | | | | | | 1,014 | |
| | | | | | | | | | | | |
Total U.S. Treasury Obligation
(Cost $1,014) ($ Thousands) | | | | | | | | 1,014 | |
| | | | | | | | | | | | |
| |
CASH EQUIVALENT — 4.8% | | | | | |
SEI Daily Income Trust, Prime
Obligation Fund, Cl A
0.270%**† | | | 4.8 | | | | 78,824,896 | | | | 78,825 | |
| | | | | | | | | | | | |
Total Cash Equivalent
(Cost $78,825) ($ Thousands) | | | | | | | | 78,825 | |
| | | | | | | | | | | | |
Total Investments — 109.6%
(Cost $1,600,734) ($ Thousands) | | | | | | | $ | 1,799,823 | |
| | | | | | | | | | | | |
A list of the open futures contracts held by the Fund at May 31, 2016, is as follows:
| | | | | | | | | | | | |
| Type of Contract | | Number of
Contracts
Long (Short) | | | Expiration Date | | | Unrealized
Appreciation
($ Thousands) | |
Russell 2000 Index
E-MINI | | | 31 | | | | Jun-2016 | | | $ | 189 | |
S&P Mid Cap 400 Index
E-MINI | | | 28 | | | | Jun-2016 | | | | 187 | |
| | | | | | | | | | | | |
| | | | | | | | | | $ | 376 | |
| | | | | | | | | | | | |
For the year ended May 31, 2016, the total amount of all open futures contracts, as presented in the table above, are representative of the volume of activity for this derivative type during the year.
Percentages are based on a Net Assets of $1,642,784 ($ Thousands).
| * | | Non-income producing security. |
| ** | | The rate reported is the 7-day effective yield as of May 31, 2016. |
| ‡ | | Real Estate Investment Trust. |
| † | | Investment in Affiliated Security (see Note 6). |
| (A) | | Certain securities or partial positions of certain securities are on loan at May 31, 2016 (see Note 12). The total market value of securities on loan at May 31, 2016 was $149,493 ($ Thousands). |
| (B) | | This security was purchased with cash collateral held from securities on loan (see Note 12). The total market value of such securities as of May 31, 2016 was $152,985
($ Thousands). |
| (C) | | Security, or portion thereof, has been pledged as collateral on open futures contracts. |
Cl — Class
L.P. — Limited Partnership
S&P — Standard & Poor’s
The Summary Schedule of Investments does not reflect the complete portfolio holdings. It includes the Fund’s 50 largest holdings and each investment of any issuer that exceeds 1% of the Fund’s net assets. “Other Securities” represent all issues not required to be disclosed under the rules adopted by the U.S. Securities and Exchange Commission (“SEC”). In certain instances, securities for which footnotes listed above may otherwise apply are included in the Other Securities caption. The complete schedule of portfolio holdings is available (i) without charge, upon request, by calling (800) 342-5734; and (ii) on the SEC’s website at http://www.sec.gov.
The following is a list of the level of inputs used as of May 31, 2016, in valuing the Fund’s investments and other financial instruments carried at value ($ Thousands):
| | | | | | | | | | | | | | | | |
| Investments in Securities | | Level 1 | | | Level 2 | | | Level 3 | | | Total | |
Common Stock | | $ | 1,564,750 | | | $ | — | | | $ | — | | | $ | 1,564,750 | |
Exchange Traded Fund | | | 2,249 | | | | — | | | | — | | | | 2,249 | |
Rights | | | — | | | | — | | | | — | | | | — | |
U.S. Treasury Obligation | | | — | | | | 1,014 | | | | — | | | | 1,014 | |
Affiliated Partnership | | | — | | | | 152,985 | | | | — | | | | 152,985 | |
Cash Equivalent | | | 78,825 | | | | — | | | | — | | | | 78,825 | |
| | | | | | | | | | | | | | | | |
Total Investments in Securities | | $ | 1,645,824 | | | $ | 153,999 | | | $ | — | | | $ | 1,799,823 | |
| | | | | | | | | | | | | | | | |
| | | | | | | | | | | | | | | | |
| Other Financial Instruments | | Level 1 | | | Level 2 | | | Level 3 | | | Total | |
Futures Contracts* | | | | | | | | | | | | | | | | |
Unrealized Appreciation | | $ | 376 | | | $ | — | | | $ | — | | | $ | 376 | |
| | | | | | | | | | | | | | | | |
Total Other Financial Instruments | | $ | 376 | | | $ | — | | | $ | — | | | $ | 376 | |
| | | | | | | | | | | | | | | | |
| * | | Futures contracts are valued at the unrealized appreciation on the instrument. |
For the year ended May 31, 2016, there were no transfers between Level 1 and Level 2 assets and liabilities.
For the year ended May 31, 2016, there were no transfers between Level 2 and Level 3 assets and liabilities.
For more information on valuation inputs, see Note 2 — Significant Accounting Policies in Notes to Financial Statements.
Amounts designated as “—” are either $0 or have been rounded to $0.
The accompanying notes are an integral part of the financial statements.
| | | | |
| SEI Institutional Investments Trust / Annual Report / May 31, 2016 | | | 55 | |
SUMMARY SCHEDULE OF INVESTMENTS
U.S. Managed Volatility Fund
May 31, 2016
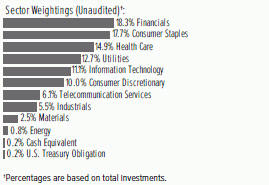
| | | | | | | | | | | | |
| Description | | Percentage of Net Assets (%) | | | Shares | | | Market Value ($ Thousands) | |
| |
COMMON STOCK — 98.5% | | | | | |
| |
Consumer Discretionary — 9.9% | | | | | |
Target | | | 1.1 | % | | | 232,529 | | | $ | 15,993 | |
Other Securities | | | 8.8 | | | | | | | | 134,312 | |
| | | | | | | | | | | | |
| | | | | | | | | | | 150,305 | |
| | | | | | | | | | | | |
|
Consumer Staples — 17.5% | |
Altria Group | | | 1.6 | | | | 378,949 | | | | 24,116 | |
Bunge | | | 0.6 | | | | 132,400 | | | | 8,880 | |
Clorox | | | 0.7 | | | | 82,191 | | | | 10,565 | |
Dr. Pepper Snapple Group | | | 1.0 | | | | 166,980 | | | | 15,262 | |
General Mills | | | 0.7 | | | | 156,000 | | | | 9,794 | |
Ingredion | | | 0.6 | | | | 78,059 | | | | 9,165 | |
Kimberly-Clark | | | 0.6 | | | | 75,617 | | | | 9,606 | |
Kroger | | | 1.2 | | | | 496,469 | | | | 17,754 | |
PepsiCo | | | 0.7 | | | | 106,325 | | | | 10,757 | |
Philip Morris International | | | 0.7 | | | | 111,215 | | | | 10,975 | |
Sysco | | | 0.7 | | | | 217,124 | | | | 10,446 | |
Tyson Foods, Cl A | | | 1.0 | | | | 233,907 | | | | 14,919 | |
Wal-Mart Stores | | | 1.5 | | | | 330,760 | | | | 23,411 | |
Other Securities | | | 5.9 | | | | | | | | 91,255 | |
| | | | | | | | | | | | |
| | | | | | | | | | | 266,905 | |
| | | | | | | | | | | | |
|
Energy — 0.8% | |
Exxon Mobil | | | 0.7 | | | | 115,600 | | | | 10,291 | |
Other Securities | | | 0.1 | | | | | | | | 2,318 | |
| | | | | | | | | | | | |
| | | | | | | | | | | 12,609 | |
| | | | | | | | | | | | |
| | | |
Financials — 18.1% | | | | | | | | | | | | |
Allstate | | | 0.8 | | | | 186,711 | | | | 12,605 | |
American Financial Group | | | 0.7 | | | | 137,852 | | | | 10,102 | |
Axis Capital Holdings | | | 0.9 | | | | 238,048 | | | | 13,128 | |
CBOE Holdings | | | 0.7 | | | | 156,030 | | | | 9,931 | |
Endurance Specialty Holdings | | | 0.7 | | | | 143,363 | | | | 9,737 | |
Everest Re Group | | | 1.2 | | | | 99,649 | | | | 17,848 | |
MFA Financial‡ | | | 0.6 | | | | 1,182,993 | | | | 8,529 | |
PNC Financial Services Group | | | 0.8 | | | | 125,700 | | | | 11,280 | |
RenaissanceRe Holdings | | | 0.7 | | | | 96,961 | | | | 11,200 | |
Travelers | | | 1.4 | | | | 184,538 | | | | 21,063 | |
Validus Holdings | | | 1.0 | | | | 313,104 | | | | 15,245 | |
Other Securities‡ | | | 8.6 | | | | | | | | 135,491 | |
| | | | | | | | | | | | |
| | | | | | | | | | | 276,159 | |
| | | | | | | | | | | | |
| | | | | | | | | | | | |
| Description | | Percentage of Net Assets (%) | | | Shares | | | Market Value ($ Thousands) | |
|
Health Care — 14.8% | |
Cardinal Health | | | 1.0 | % | | | 187,600 | | | $ | 14,811 | |
Johnson & Johnson | | | 2.4 | | | | 323,143 | | | | 36,415 | |
McKesson | | | 0.6 | | | | 51,221 | | | | 9,381 | |
Merck | | | 1.6 | | | | 444,586 | | | | 25,012 | |
Pfizer | | | 1.6 | | | | 679,575 | | | | 23,581 | |
Quest Diagnostics | | | 0.7 | | | | 127,199 | | | | 9,816 | |
Other Securities | | | 6.9 | | | | | | | | 106,095 | |
| | | | | | | | | | | | |
| | | | | | | | | | | 225,111 | |
| | | | | | | | | | | | |
| | | |
Industrials — 5.4% | | | | | | | | | | | | |
Deere | | | 0.6 | | | | 116,700 | | | | 9,603 | |
Northrop Grumman | | | 0.7 | | | | 47,700 | | | | 10,144 | |
United Technologies | | | 0.6 | | | | 92,000 | | | | 9,253 | |
Other Securities | | | 3.5 | | | | | | | | 53,413 | |
| | | | | | | | | | | | |
| | | | | | | | | | | 82,413 | |
| | | | | | | | | | | | |
| | |
Information Technology — 11.0% | | | | | | | | | |
Amdocs | | | 1.5 | | | | 397,432 | | | | 23,047 | |
Cisco Systems | | | 1.0 | | | | 495,700 | | | | 14,400 | |
Intel | | | 0.7 | | | | 327,900 | | | | 10,358 | |
International Business Machines | | | 0.8 | | | | 77,400 | | | | 11,900 | |
Other Securities | | | 7.0 | | | | | | | | 108,341 | |
| | | | | | | | | | | | |
| | | | | | | | | | | 168,046 | |
| | | | | | | | | | | | |
| | | |
Materials — 2.4% | | | | | | | | | | | | |
Other Securities | | | 2.4 | | | | | | | | 36,866 | |
| | | | | | | | | | | | |
| |
Telecommunication Services — 6.0% | | | | | |
AT&T | | | 1.8 | | | | 720,736 | | | | 28,217 | |
Verizon Communications | | | 2.2 | | | | 661,291 | | | | 33,660 | |
Other Securities | | | 2.0 | | | | | | | | 29,927 | |
| | | | | | | | | | | | |
| | | | | | | | | | | 91,804 | |
| | | | | | | | | | | | |
| | |
Utilities — 12.6% | | | | | | | | | |
American Electric Power | | | 1.1 | | | | 266,804 | | | | 17,270 | |
Consolidated Edison | | | 1.0 | | | | 211,386 | | | | 15,486 | |
Edison International | | | 1.3 | | | | 265,593 | | | | 19,024 | |
Entergy | | | 1.0 | | | | 201,443 | | | | 15,294 | |
Exelon | | | 0.8 | | | | 343,184 | | | | 11,761 | |
FirstEnergy | | | 0.8 | | | | 371,556 | | | | 12,191 | |
PG&E | | | 0.6 | | | | 160,651 | | | | 9,652 | |
Pinnacle West Capital | | | 0.8 | | | | 156,705 | | | | 11,532 | |
Public Service Enterprise Group | | | 1.1 | | | | 387,616 | | | | 17,346 | |
Other Securities | | | 4.1 | | | | | | | | 61,729 | |
| | | | | | | | | | | | |
| | | | | | | | | | | 191,285 | |
| | | | | | | | | | | | |
Total Common Stock
(Cost $1,276,417) ($ Thousands) | | | | | | | | 1,501,503 | |
| | | | | | | | | | | | |
|
U.S. TREASURY OBLIGATION — 0.2% | |
Other Securities (A) | | | 0.2 | | | | | | | | 3,538 | |
| | | | | | | | | | | | |
Total U.S. Treasury Obligation
(Cost $3,538) ($ Thousands) | | | | | | | | 3,538 | |
| | | | | | | | | | | | |
| | |
| 56 | | SEI Institutional Investments Trust / Annual Report / May 31, 2016 |
| | | | | | | | | | | | |
| Description | | Percentage of Net Assets (%) | | | Shares | | | Market Value ($ Thousands) | |
|
CASH EQUIVALENT — 0.2% | |
SEI Daily Income Trust, Prime Obligation Fund, Cl A 0.270%**† | | | 0.2 | % | | | 3,593,737 | | | $ | 3,594 | |
| | | | | | | | | | | | |
Total Cash Equivalent
(Cost $3,594) ($ Thousands) | | | | 3,594 | |
| | | | | | | | | | | | |
Total Investments — 98.9%
(Cost $1,283,549) ($ Thousands) | | | $ | 1,508,635 | |
| | | | | | | | | | | | |
A list of the open futures contracts held by the Fund at May 31, 2016, is as follows:
| | | | | | | | | | | | |
| Type of Contract | | Number of
Contracts
Long | | | Expiration
Date | | | Unrealized
Appreciation
($ Thousands) | |
S&P 500 Index E-MINI | | | 80 | | | | Jun-2016 | | | $ | 249 | |
| | | | | | | | | | | | |
For the year ended May 31, 2016, the total amount of all open futures contracts, as presented in the table above, are representative of the volume of activity for this derivative type during the year.
Percentages are based on a Net Assets of $1,524,568 ($ Thousands).
| ** | | The rate reported is the 7-day effective yield as of May 31, 2016. |
| ‡ | | Real Estate Investment Trust. |
| † | | Investment in Affiliated Security (see Note 6). |
| (A) | | Security, or portion thereof, has been pledged as collateral on open futures contracts. |
Cl — Class
S&P — Standard & Poor’s
The Summary Schedule of Investments does not reflect the complete portfolio holdings. It includes the Fund’s 50 largest holdings and each investment of any issuer that exceeds 1% of the Fund’s net assets. “Other Securities” represent all issues not required to be disclosed under the rules adopted by the U.S. Securities and Exchange Commission (“SEC”). In certain instances, securities for which footnotes listed above may otherwise apply are included in the Other Securities caption. The complete schedule of portfolio holdings is available (i) without charge, upon request, by calling (800) 342-5734; and (ii) on the SEC’s website at http://www.sec.gov.
The following is a list of the level of inputs used as of May 31, 2016, in valuing the Fund’s investments and other financial instruments carried at value ($ Thousands):
| | | | | | | | | | | | | | | | |
| Investments in Securities | | Level 1 | | | Level 2 | | | Level 3 | | | Total | |
Common Stock | | $ | 1,501,503 | | | $ | — | | | $ | — | | | $ | 1,501,503 | |
U.S. Treasury Obligation | | | — | | | | 3,538 | | | | — | | | | 3,538 | |
Cash Equivalent | | | 3,594 | | | | — | | | | — | | | | 3,594 | |
| | | | | | | | | | | | | | | | |
Total Investments in Securities | | $ | 1,505,097 | | | $ | 3,538 | | | $ | — | | | $ | 1,508,635 | |
| | | | | | | | | | | | | | | | |
| | | | | | | | | | | | | | | | |
| Other Financial Instruments | | Level 1 | | | Level 2 | | | Level 3 | | | Total | |
Futures Contracts* | | | | | | | | | | | | | | | | |
Unrealized Appreciation | | $ | 249 | | | $ | — | | | $ | — | | | $ | 249 | |
| | | | | | | | | | | | | | | | |
| * | Futures contracts are valued at the unrealized appreciation on the instrument. |
For the year ended May 31, 2016, there were no transfers between Level 1 and Level 2 assets and liabilities.
For the year ended May 31, 2016, there were no transfers between Level 2 and Level 3 assets and liabilities.
For more information on valuation inputs, see Note 2 — Significant Accounting Policies in Notes to Financial Statements.
Amounts designated as “—” are either $0 or have been rounded to $0.
The accompanying notes are an integral part of the financial statements.
| | | | |
| SEI Institutional Investments Trust / Annual Report / May 31, 2016 | | | 57 | |
SUMMARY SCHEDULE OF INVESTMENTS
Global Managed Volatility Fund
May 31, 2016
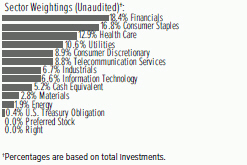
| | | | | | | | | | | | |
| Description | | Percentage of
Net Assets (%) | | | Shares | | | Market Value
($ Thousands) | |
| | | | | | | | | | | | |
| | |
COMMON STOCK — 93.5% | | | | | | | | | |
| | |
Australia — 3.7% | | | | | | | | | |
Other Securities‡ | | | 3.7 | % | | | | | | $ | 39,310 | |
| | | | | | | | | | | | |
| | |
Austria — 0.3% | | | | | | | | | |
Other Securities | | | 0.3 | | | | | | | | 3,718 | |
| | | | | | | | | | | | |
| | |
Belgium — 0.5% | | | | | | | | | |
Other Securities | | | 0.5 | | | | | | | | 5,019 | |
| | | | | | | | | | | | |
| | |
Canada — 8.9% | | | | | | | | | |
Bank of Montreal | | | 0.6 | | | | 102,193 | | | | 6,430 | |
BCE | | | 0.6 | | | | 139,491 | | | | 6,422 | |
Canadian Imperial Bank of Commerce | | | 0.5 | | | | 62,918 | | | | 4,894 | |
Canadian Tire, Cl A | | | 0.8 | | | | 79,932 | | | | 8,750 | |
Rogers Communications, Cl B | | | 0.5 | | | | 134,063 | | | | 5,124 | |
Shaw Communications, Cl B | | | 0.5 | | | | 264,044 | | | | 5,063 | |
Other Securities‡ | | | 5.4 | | | | | | | | 57,508 | |
| | | | | | | | | | | | |
| | | | | | | | | | | 94,191 | |
| | | | | | | | | | | | |
| | |
Denmark — 0.2% | | | | | | | | | |
Other Securities | | | 0.2 | | | | | | | | 1,726 | |
| | | | | | | | | | | | |
| | |
Finland — 0.0% | | | | | | | | | |
Other Securities | | | 0.0 | | | | | | | | 128 | |
| | | | | | | | | | | | |
| | |
France — 1.3% | | | | | | | | | |
Sanofi-Aventis | | | 0.5 | | | | 62,000 | | | | 5,086 | |
TOTAL | | | 0.5 | | | | 100,300 | | | | 4,877 | |
Other Securities | | | 0.3 | | | | | | | | 3,741 | |
| | | | | | | | | | | | |
| | | | | | | | | | | 13,704 | |
| | | | | | | | | | | | |
| | |
Germany — 0.9% | | | | | | | | | |
Other Securities | | | 0.9 | | | | | | | | 9,127 | |
| | | | | | | | | | | | |
| | |
Hong Kong — 2.8% | | | | | | | | | |
CLP Holdings | | | 1.0 | | | | 1,154,301 | | | | 10,892 | |
Other Securities‡ (A) | | | 1.8 | | | | | | | | 18,423 | |
| | | | | | | | | | | | |
| | | | | | | | | | | 29,315 | |
| | | | | | | | | | | | |
| | | | | | | | | | | | |
| Description | | Percentage of
Net Assets (%) | | | Shares | | | Market Value
($ Thousands) | |
| | | | | | | | | | | | |
| | |
Ireland — 0.1% | | | | | | | | | |
Other Securities‡ | | | 0.1 | % | | | | | | $ | 592 | |
| | | | | | | | | | | | |
| | |
Israel — 1.9% | | | | | | | | | |
Bank Hapoalim | | | 0.6 | | | | 1,171,644 | | | | 6,055 | |
Other Securities | | | 1.3 | | | | | | | | 13,703 | |
| | | | | | | | | | | | |
| | | | | | | | | | | 19,758 | |
| | | | | | | | | | | | |
| | |
Italy — 0.5% | | | | | | | | | |
Other Securities | | | 0.5 | | | | | | | | 5,320 | |
| | | | | | | | | | | | |
| | |
Japan — 7.2% | | | | | | | | | |
Canon | | | 0.5 | | | | 184,400 | | | | 5,341 | |
Nippon Telegraph & Telephone | | | 1.0 | | | | 235,200 | | | | 10,296 | |
NTT DoCoMo | | | 0.6 | | | | 243,550 | | | | 6,103 | |
Other Securities | | | 5.1 | | | | | | | | 54,238 | |
| | | | | | | | | | | | |
| | | | | | | | | | | 75,978 | |
| | | | | | | | | | | | |
| | |
Luxembourg — 0.0% | | | | | | | | | |
Other Securities | | | 0.0 | | | | | | | | 308 | |
| | | | | | | | | | | | |
| | |
Netherlands — 0.4% | | | | | | | | | |
Other Securities | | | 0.4 | | | | | | | | 4,772 | |
| | | | | | | | | | | | |
| | |
New Zealand — 2.2% | | | | | | | | | |
Spark New Zealand | | | 0.5 | | | | 1,980,773 | | | | 4,958 | |
Other Securities‡ | | | 1.7 | | | | | | | | 18,953 | |
| | | | | | | | | | | | |
| | | | | | | | | | | 23,911 | |
| | | | | | | | | | | | |
| | |
Norway — 0.9% | | | | | | | | | |
Other Securities | | | 0.9 | | | | | | | | 9,983 | |
| | | | | | | | | | | | |
| | |
Portugal — 0.2% | | | | | | | | | |
Other Securities | | | 0.2 | | | | | | | | 2,097 | |
| | | | | | | | | | | | |
| | |
Singapore — 2.1% | | | | | | | | | |
Other Securities‡ | | | 2.1 | | | | | | | | 21,922 | |
| | | | | | | | | | | | |
| | |
Spain — 0.9% | | | | | | | | | |
Other Securities | | | 0.9 | | | | | | | | 9,613 | |
| | | | | | | | | | | | |
| | |
Sweden — 0.7% | | | | | | | | | |
Other Securities | | | 0.7 | | | | | | | | 7,916 | |
| | | | | | | | | | | | |
| | |
Switzerland — 2.4% | | | | | | | | | |
Other Securities | | | 2.4 | | | | | | | | 25,116 | |
| | | | | | | | | | | | |
| | |
United Kingdom — 6.7% | | | | | | | | | |
Imperial Brands | | | 0.9 | | | | 175,722 | | | | 9,619 | |
National Grid | | | 0.6 | | | | 420,772 | | | | 6,167 | |
SSE | | | 0.6 | | | | 306,196 | | | | 6,828 | |
Other Securities‡ (A) | | | 4.6 | | | | | | | | 48,403 | |
| | | | | | | | | | | | |
| | | | | | | | | | | 71,017 | |
| | | | | | | | | | | | |
| | |
| 58 | | SEI Institutional Investments Trust / Annual Report / May 31, 2016 |
| | | | | | | | | | | | |
| Description | | Percentage of
Net Assets (%) | | | Shares | | | Market Value
($ Thousands) | |
| | | | | | | | | | | | |
| | |
United States — 48.7% | | | | | | | | | |
Altria Group | | | 0.7 | % | | | 116,722 | | | $ | 7,428 | |
Amdocs | | | 1.0 | | | | 177,243 | | | | 10,278 | |
American Electric Power | | | 0.6 | | | | 92,907 | | | | 6,014 | |
Annaly Capital Management‡ | | | 0.5 | | | | 492,054 | | �� | | 5,206 | |
AT&T | | | 1.4 | | | | 386,494 | | | | 15,131 | |
Bunge | | | 0.5 | | | | 81,760 | | | | 5,484 | |
Cardinal Health | | | 0.6 | | | | 83,340 | | | | 6,580 | |
Cisco Systems | | | 0.5 | | | | 191,600 | | | | 5,566 | |
Clorox | | | 0.5 | | | | 42,603 | | | | 5,476 | |
Consolidated Edison | | | 0.8 | | | | 120,347 | | | | 8,817 | |
Edison International | | | 0.7 | | | | 95,600 | | | | 6,848 | |
Entergy | | | 0.6 | | | | 86,052 | | | | 6,533 | |
Everest Re Group | | | 0.6 | | | | 34,100 | | | | 6,108 | |
FirstEnergy | | | 0.6 | | | | 199,500 | | | | 6,546 | |
General Mills | | | 0.6 | | | | 102,863 | | | | 6,458 | |
Intel | | | 0.5 | | | | 150,500 | | | | 4,754 | |
International Business Machines | | | 0.5 | | | | 36,200 | | | | 5,565 | |
Johnson & Johnson | | | 1.8 | | | | 171,087 | | | | 19,280 | |
Kaiser Aluminum | | | 0.5 | | | | 59,374 | | | | 5,089 | |
Merck | | | 1.1 | | | | 203,800 | | | | 11,466 | |
Owens & Minor | | | 0.5 | | | | 135,169 | | | | 5,040 | |
Pfizer | | | 0.7 | | | | 209,700 | | | | 7,277 | |
Philip Morris International | | | 0.6 | | | | 67,734 | | | | 6,684 | |
Procter & Gamble | | | 0.5 | | | | 61,888 | | | | 5,015 | |
Public Service Enterprise Group | | | 0.6 | | | | 152,900 | | | | 6,842 | |
Quest Diagnostics | | | 0.5 | | | | 66,222 | | | | 5,110 | |
Republic Services, Cl A | | | 0.5 | | | | 103,827 | | | | 5,013 | |
Senior Housing Properties Trust‡ | | | 0.5 | | | | 268,100 | | | | 5,008 | |
Sysco | | | 0.9 | | | | 204,226 | | | | 9,825 | |
Target | | | 0.9 | | | | 137,233 | | | | 9,439 | |
Travelers | | | 0.8 | | | | 77,500 | | | | 8,846 | |
Verizon Communications | | | 1.1 | | | | 230,900 | | | | 11,753 | |
Wal-Mart Stores | | | 1.4 | | | | 203,442 | | | | 14,400 | |
Other Securities‡ | | | 24.6 | | | | | | | | 262,208 | |
| | | | | | | | | | | | |
| | | | | | | | | | | 517,087 | |
| | | | | | | | | | | | |
Total Common Stock
(Cost $923,221) ($ Thousands) | | | | 991,628 | |
| | | | | | | | | | | | |
| | |
PREFERRED STOCK — 0.0% | | | | | | | | | |
| | |
Sweden — 0.0% | | | | | | | | | |
Other Securities | | | 0.0 | | | | | | | | 351 | |
| | | | | | | | | | | | |
Total Preferred Stock
(Cost $326) ($ Thousands) | | | | 351 | |
| | | | | | | | | | | | |
| | |
RIGHT — 0.0% | | | | | | | | | |
| | |
New Zealand — 0.0% | | | | | | | | | |
Other Securities | | | 0.0 | | | | | | | | 30 | |
| | | | | | | | | | | | |
Total Right
(Cost $–) ($ Thousands) | | | | 30 | |
| | | | | | | | | | | | |
| | | | | | | | | | | | |
| Description | | Percentage of
Net Assets (%) | | | Shares | | | Market Value
($ Thousands) | |
|
U.S. TREASURY OBLIGATION — 0.4% | |
Other Securities (B) | | | 0.4 | % | | | | | | $ | 4,397 | |
| | | | | | | | | | | | |
Total U.S. Treasury Obligation
(Cost $4,396) ($ Thousands) | | | | 4,397 | |
| | | | | | | | | | | | |
|
CASH EQUIVALENT — 5.1% | |
SEI Daily Income Trust, Prime Obligation Fund, Cl A
0.270%**† | | | 5.1 | | | | 54,497,840 | | | | 54,498 | |
| | | | | | | | | | | | |
Total Cash Equivalent
(Cost $54,498) ($ Thousands) | | | | 54,498 | |
| | | | | | | | | | | | |
Total Investments — 99.0%
(Cost $982,441) ($ Thousands) | | | $ | 1,050,904 | |
| | | | | | | | | | | | |
A list of the open futures contracts held by the Fund at May 31, 2016, is as follows:
| | | | | | | | | | | | |
| Type of Contract | | Number of
Contracts
Long | | | Expiration
Date | | | Unrealized
Appreciation
($ Thousands) | |
DJ Euro Stoxx 50 Index | | | 146 | | | | Jun-2016 | | | $ | 224 | |
FTSE 100 Index | | | 38 | | | | Jun-2016 | | | | 40 | |
Hang Seng Index | | | 6 | | | | Jun-2016 | | | | 19 | |
S&P 500 Index E-MINI | | | 216 | | | | Jun-2016 | | | | 377 | |
SPI 200 Index | | | 17 | | | | Jun-2016 | | | | 24 | |
Topix Index | | | 27 | | | | Jun-2016 | | | | 85 | |
| | | | | | | | | | | | |
| | | | | | | | | | $ | 769 | |
| | | | | | | | | | | | |
For the period ended May 31, 2016, the total amount of all open futures contracts, as presented in the table above, are representative of the volume of activity for this derivative type during the period.
A list of the open forward foreign currency contracts held by the Fund at May 31, 2016, is as follows:
| | | | | | | | | | | | | | | | | | | | |
| Settlement Date | | Currency to
Deliver
(Thousands) | | | Currency To
Receive
(Thousands) | | | Unrealized
Appreciation
(Depreciation)
($ Thousands) | |
06/30/16 | | | USD | | | | 2 | | | | DKK | | | | 12 | | | $ | — | |
06/30/16 | | | USD | | | | 15 | | | | SGD | | | | 20 | | | | — | |
06/30/16 | | | USD | | | | 28 | | | | NOK | | | | 232 | | | | — | |
06/30/16 | | | USD | | | | 59 | | | | AUD | | | | 81 | | | | — | |
06/30/16 | | | USD | | | | 82 | | | | EUR | | | | 74 | | | | — | |
06/30/16 | | | USD | | | | 174 | | | | JPY | | | | 19,103 | | | | (2 | ) |
06/30/16 | | | USD | | | | 347 | | | | CAD | | | | 451 | | | | (3 | ) |
06/30/16 | | | DKK | | | | 5,726 | | | | USD | | | | 859 | | | | 1 | |
06/30/16 | | | CHF | | | | 13,956 | | | | USD | | | | 14,091 | | | | 26 | |
06/30/16 | | | NZD | | | | 17,814 | | | | USD | | | | 12,016 | | | | (11 | ) |
06/30/16 | | | SGD | | | | 18,074 | | | | USD | | | | 13,097 | | | | (29 | ) |
06/30/16 | | | GBP | | | | 25,814 | | | | USD | | | | 37,992 | | | | 416 | |
06/30/16 | | | AUD | | | | 28,696 | | | | USD | | | | 20,605 | | | | (155 | ) |
06/30/16 | | | EUR | | | | 35,564 | | | | USD | | | | 39,669 | | | | 38 | |
06/30/16 | | | NOK | | | | 43,909 | | | | USD | | | | 5,272 | | | | 20 | |
06/30/16 | | | SEK | | | | 53,456 | | | | USD | | | | 6,444 | | | | 33 | |
| | | | |
| SEI Institutional Investments Trust / Annual Report / May 31, 2016 | | | 59 | |
SUMMARY SCHEDULE OF INVESTMENTS
Global Managed Volatility Fund (Concluded)
May 31, 2016
| | | | | | | | | | | | | | | | | | | | |
| Settlement Date | | Currency to
Deliver
(Thousands) | | | Currency To
Receive
(Thousands) | | | Unrealized
Appreciation
(Depreciation)
($ Thousands) | |
06/30/16 | | | CAD | | | | 62,128 | | | | USD | | | | 47,488 | | | $ | (14 | ) |
06/30/16 | | | HKD | | | | 119,719 | | | | USD | | | | 15,420 | | | | 1 | |
06/30/16 | | | JPY | | | | 4,568,205 | | | | USD | | | | 41,447 | | | | 202 | |
| | | | | | | | | | | | | | | | | | | | |
| | | | | | | | | | | | | | | | | | $ | 523 | |
| | | | | | | | | | | | | | | | | | | | |
A list of the counterparties for the open forward foreign currency contracts held by the Fund at May 31, 2016, is as follows:
| | | | | | | | | | | | |
| Counterparty | | Currency to
Deliver
($ Thousands) | | | Currency to
Receive
($ Thousands) | | | Unrealized
Appreciation
($ Thousands) | |
Brown Brothers Harriman | | $ | (254,579 | ) | | $ | 255,102 | | | $ | 523 | |
| | | | | | | | | | | | |
For the period ended May 31, 2016, the total amount of all open forward foreign currency contracts, as presented in the table above, are representative of the volume of activity for this derivative type during the period.
Percentages are based on a Net Assets of $1,061,014 ($ Thousands).
| ** | | The rate reported is the 7-day effective yield as of May 31, 2016. |
| ‡ | | Real Estate Investment Trust. |
| † | | Investment in Affiliated Security (see Note 6). |
| (A) | | Security exempt from registration under Rule 144A of the Securities Act of 1933. These securities may be resold in transactions exempt from registration normally to qualified institutions. On May 31, 2016, the value of these securities amounted to $1,044 ($ Thousands), representing 0.0% of the net assets of the Fund. |
| (B) | | Security, or portion thereof, has been pledged as collateral on open futures contracts. |
AUD — Australian Dollar
CAD — Canadian Dollar
CHF — Swiss Franc
Cl — Class
DJ — Dow Jones
DKK — Danish Krone
EUR — Euro
FTSE — Financial Times and Stock Exchange
GBP — British Pound Sterling
HKD — Hong Kong Dollar
JPY — Japanese Yen
NOK — Norwegian Krone
NZD — New Zealand Dollar
S&P — Standard & Poor’s
SGD — Singapore Dollar
SEK — Swedish Krona
SPI — Share Price Index
USD — United States Dollar
The Summary Schedule of Investments does not reflect the complete portfolio holdings. It includes the Fund’s 50 largest holdings and each investment of any issuer that exceeds 1% of the Fund’s net assets. “Other Securities” represent all issues not required to be disclosed under the rules adopted by the U.S. Securities and Exchange Commission (“SEC”). In certain instances, securities for which footnotes listed above may otherwise apply are included in the Other Securities caption. The complete schedule of portfolio holdings is available (i) without charge, upon request, by calling (800) 342-5734; and (ii) on the SEC’s website at http://www.sec.gov.
The following is a list of the level of inputs used as of May 31, 2016, in valuing the Fund’s investments and other financial instruments carried at value ($ Thousands):
| | | | | | | | | | | | | | | | |
| Investments in Securities | | Level 1 | | | Level 2 | | | Level 3 | | | Total | |
Common Stock | | $ | 991,628 | | | $ | — | | | $ | — | | | $ | 991,628 | |
Preferred Stock | | | 351 | | | | — | | | | — | | | | 351 | |
Right | | | 30 | | | | — | | | | — | | | | 30 | |
U.S. Treasury Obligation | | | — | | | | 4,397 | | | | — | | | | 4,397 | |
Cash Equivalent | | | 54,498 | | | | — | | | | — | | | | 54,498 | |
| | | | | | | | | | | | | | | | |
Total Investments in Securities | | $ | 1,046,507 | | | $ | 4,397 | | | $ | — | | | $ | 1,050,904 | |
| | | | | | | | | | | | | | | | |
| | | | | | | | | | | | | | | | |
| Other Financial Instruments | | Level 1 | | | Level 2 | | | Level 3 | | | Total | |
Futures Contracts* | | | | | | | | | | | | | | | | |
Unrealized Appreciation | | $ | 769 | | | $ | — | | | $ | — | | | $ | 769 | |
Forwards Contracts* | | | | | | | | | | | | | | | | |
Unrealized Appreciation | | | — | | | | 737 | | | | — | | | | 737 | |
Unrealized Depreciation | | | — | | | | (214 | ) | | | — | | | | (214 | ) |
| | | | | | | | | | | | | | | | |
Total Other Financial Instruments | | $ | 769 | | | $ | 523 | | | $ | — | | | $ | 1,292 | |
| | | | | | | | | | | | | | | | |
| * | | Futures contracts and forwards contracts are valued at the unrealized appreciation (depreciation) on the instrument. |
For the period ended May 31, 2016, there were no transfers between Level 1 and Level 2 assets and liabilities.
For the period ended May 31, 2016, there were no transfers between Level 2 and Level 3 assets and liabilities.
For more information on valuation inputs, see Note 2 — Significant Accounting Policies in Notes to Financial Statements.
Amounts designated as “—” are either $0 or have been rounded to $0.
The accompanying notes are an integral part of the financial statements.
| | |
| 60 | | SEI Institutional Investments Trust / Annual Report / May 31, 2016 |
SUMMARY SCHEDULE OF INVESTMENTS
World Equity Ex-US Fund
May 31, 2016
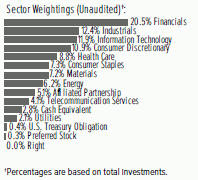
| | | | | | | | | | | | |
| Description | | Percentage of
Net Assets (%) | | | Shares | | | Market Value
($ Thousands) | |
|
COMMON STOCK — 93.5% | |
| | | |
Argentina — 0.6% | | | | | | | | | | | | |
Other Securities | | | 0.6 | % | | | | | | $ | 44,068 | |
| | | | | | | | | | | | |
| | | |
Australia — 3.5% | | | | | | | | | | | | |
Other Securities‡ (A) | | | 3.5 | | | | | | | | 239,907 | |
| | | | | | | | | | | | |
| | | |
Austria — 1.0% | | | | | | | | | | | | |
Other Securities (A) | | | 1.0 | | | | | | | | 68,479 | |
| | | | | | | | | | | | |
| | | |
Belgium — 0.6% | | | | | | | | | | | | |
Other Securities | | | 0.6 | | | | | | | | 41,650 | |
| | | | | | | | | | | | |
| | | |
Brazil — 1.6% | | | | | | | | | | | | |
Other Securities (A) | | | 1.6 | | | | | | | | 108,283 | |
| | | | | | | | | | | | |
| | | |
Canada — 5.5% | | | | | | | | | | | | |
Bank of Montreal | | | 0.5 | | | | 506,700 | | | | 31,879 | |
Magna International, Cl A | | | 0.5 | | | | 923,941 | | | | 37,612 | |
Other Securities (A) | | | 4.5 | | | | | | | | 310,644 | |
| | | | | | | | | | | | |
| | | | | | | | | | | 380,135 | |
| | | | | | | | | | | | |
| | | |
Chile — 0.0% | | | | | | | | | | | | |
Other Securities | | | 0.0 | | | | | | | | 3,064 | |
| | | | | | | | | | | | |
| | | |
China — 1.6% | | | | | | | | | | | | |
Other Securities (A) | | | 1.6 | | | | | | | | 110,896 | |
| | | | | | | | | | | | |
| | | |
Colombia — 0.2% | | | | | | | | | | | | |
Other Securities (A) | | | 0.2 | | | | | | | | 14,507 | |
| | | | | | | | | | | | |
| | | |
Czech Republic — 0.2% | | | | | | | | | | | | |
Other Securities | | | 0.2 | | | | | | | | 12,929 | |
| | | | | | | | | | | | |
| | | |
Denmark — 1.4% | | | | | | | | | | | | |
Other Securities | | | 1.4 | | | | | | | | 96,878 | |
| | | | | | | | | | | | |
| | | | | | | | | | | | |
| Description | | Percentage of
Net Assets (%) | | | Shares | | | Market Value
($ Thousands) | |
| | | |
Finland — 1.0% | | | | | | | | | | | | |
Other Securities (A) | | | 1.0 | % | | | | | | $ | 67,313 | |
| | | | | | | | | | | | |
| | | |
France — 5.2% | | | | | | | | | | | | |
Atos | | | 0.4 | | | | 321,258 | | | | 29,706 | |
AXA | | | 0.5 | | | | 1,507,844 | | | | 37,903 | |
TOTAL | | | 0.5 | | | | 696,454 | | | | 33,863 | |
Other Securities (A) | | | 3.8 | | | | | | | | 258,695 | |
| | | | | | | | | | | | |
| | | | | | | | | | | 360,167 | |
| | | | | | | | | | | | |
| | | |
Germany — 5.8% | | | | | | | | | | | | |
adidas | | | 0.4 | | | | 223,317 | | | | 28,627 | |
Continental | | | 0.5 | | | | 146,865 | | | | 31,522 | |
Deutsche Boerse | | | 0.8 | | | | 624,803 | | | | 54,776 | |
Deutsche Lufthansa (A) | | | 0.6 | | | | 3,008,938 | | | | 42,190 | |
SAP | | | 0.6 | | | | 508,869 | | | | 41,332 | |
Other Securities (A) | | | 2.9 | | | | | | | | 201,665 | |
| | | | | | | | | | | | |
| | | | | | | | | | | 400,112 | |
| | | | | | | | | | | | |
| | | |
Hong Kong — 4.4% | | | | | | | | | | | | |
China Mobile | | | 0.6 | | | | 3,672,100 | | | | 41,882 | |
Hong Kong Exchanges and Clearing | | | 0.6 | | | | 1,615,631 | | | | 38,685 | |
Tencent Holdings | | | 0.5 | | | | 1,418,009 | | | | 31,634 | |
Other Securities (A) | | | 2.7 | | | | | | | | 195,616 | |
| | | | | | | | | | | | |
| | | | | | | | | | | 307,817 | |
| | | | | | | | | | | | |
| | | |
Hungary — 0.1% | | | | | | | | | | | | |
Other Securities | | | 0.1 | | | | | | | | 8,162 | |
| | | | | | | | | | | | |
| | | |
India — 1.3% | | | | | | | | | | | | |
HDFC Bank ADR | | | 0.4 | | | | 472,003 | | | | 30,378 | |
ICICI Bank ADR | | | 0.6 | | | | 6,151,634 | | | | 44,230 | |
Other Securities | | | 0.3 | | | | | | | | 16,574 | |
| | | | | | | | | | | | |
| | | | | | | | | | | 91,182 | |
| | | | | | | | | | | | |
| | | |
Indonesia — 0.7% | | | | | | | | | | | | |
Other Securities (A) | | | 0.7 | | | | | | | | 45,098 | |
| | | | | | | | | | | | |
| | | |
Ireland — 1.3% | | | | | | | | | | | | |
Ryanair Holdings ADR | | | 0.4 | | | | 354,564 | | | | 30,989 | |
Shire ADR (A) | | | 0.3 | | | | 100,262 | | | | 18,665 | |
Other Securities | | | 0.6 | | | | | | | | 43,869 | |
| | | | | | | | | | | | |
| | | | | | | | | | | 93,523 | |
| | | | | | | | | | | | |
| | | |
Israel — 1.3% | | | | | | | | | | | | |
Teva Pharmaceutical Industries ADR | | | 0.9 | | | | 1,167,701 | | | | 60,569 | |
Other Securities (A) | | | 0.4 | | | | | | | | 31,598 | |
| | | | | | | | | | | | |
| | | | | | | | | | | 92,167 | |
| | | | | | | | | | | | |
| | | |
Italy — 1.1% | | | | | | | | | | | | |
Other Securities (A) | | | 1.1 | | | | | | | | 74,171 | |
| | | | | | | | | | | | |
| | | |
Japan — 12.2% | | | | | | | | | | | | |
Denso | | | 0.7 | | | | 1,235,300 | | | | 48,664 | |
Isuzu Motors | | | 0.4 | | | | 2,332,800 | | | | 28,102 | |
| | | | |
| SEI Institutional Investments Trust / Annual Report / May 31, 2016 | | | 61 | |
SUMMARY SCHEDULE OF INVESTMENTS
World Equity Ex-US Fund (Continued)
May 31, 2016
| | | | | | | | | | | | |
| Description | | Percentage of
Net Assets (%) | | | Shares | | | Market Value
($ Thousands) | |
Japan Exchange Group | | | 0.6 | % | | | 3,085,408 | | | $ | 42,009 | |
KDDI | | | 0.7 | | | | 1,667,585 | | | | 48,672 | |
Secom | | | 0.6 | | | | 500,200 | | | | 39,171 | |
Other Securities | | | 9.2 | | | | | | | | 635,172 | |
| | | | | | | | | | | | |
| | | | | | | | | | | 841,790 | |
| | | | | | | | | | | | |
|
Malaysia — 0.4% | |
Other Securities | | | 0.4 | | | | | | | | 25,701 | |
| | | | | | | | | | | | |
|
Mexico — 0.3% | |
Other Securities (A) | | | 0.3 | | | | | | | | 24,096 | |
| | | | | | | | | | | | |
|
Netherlands — 2.6% | |
Unilever | | | 0.5 | | | | 710,086 | | | | 31,909 | |
Other Securities (B) | | | 2.1 | | | | | | | | 146,783 | |
| | | | | | | | | | | | |
| | | | | | | | | | | 178,692 | |
| | | | | | | | | | | | |
|
Norway — 1.3% | |
DnB | | | 0.6 | | | | 3,214,656 | | | | 41,244 | |
Other Securities (A) | | | 0.7 | | | | | | | | 49,790 | |
| | | | | | | | | | | | |
| | | | | | | | | | | 91,034 | |
| | | | | | | | | | | | |
|
Panama — 0.1% | |
Other Securities (A) | | | 0.1 | | | | | | | | 7,539 | |
| | | | | | | | | | | | |
|
Peru — 0.4% | |
Other Securities | | | 0.4 | | | | | | | | 25,062 | |
| | | | | | | | | | | | |
|
Poland — 0.1% | |
Other Securities | | | 0.1 | | | | | | | | 7,007 | |
| | | | | | | | | | | | |
|
Portugal — 0.4% | |
Other Securities | | | 0.4 | | | | | | | | 25,582 | |
| | | | | | | | | | | | |
|
Qatar — 0.0% | |
Other Securities | | | 0.0 | | | | | | | | 3,172 | |
| | | | | | | | | | | | |
|
Russia — 0.8% | |
Other Securities (A) | | | 0.8 | | | | | | | | 58,086 | |
| | | | | | | | | | | | |
|
Singapore — 1.1% | |
DBS Group Holdings | | | 0.5 | | | | 2,835,000 | | | | 31,918 | |
Other Securities | | | 0.6 | | | | | | | | 44,230 | |
| | | | | | | | | | | | |
| | | | | | | | | | | 76,148 | |
| | | | | | | | | | | | |
|
South Africa — 1.6% | |
Naspers, Cl N | | | 0.6 | | | | 256,094 | | | | 37,639 | |
Other Securities (A) | | | 1.0 | | | | | | | | 73,545 | |
| | | | | | | | | | | | |
| | | | | | | | | | | 111,184 | |
| | | | | | | | | | | | |
|
South Korea — 3.5% | |
Korea Electric Power ADR | | | 0.6 | | | | 1,469,911 | | | | 38,820 | |
Samsung Electronics | | | 1.2 | | | | 73,422 | | | | 79,595 | |
Other Securities | | | 1.7 | | | | | | | | 121,356 | |
| | | | | | | | | | | | |
| | | | | | | | | | | 239,771 | |
| | | | | | | | | | | | |
| | | | | | | | | | | | |
| Description | | Percentage of
Net Assets (%) | | | Shares | | | Market Value
($ Thousands) | |
|
Spain — 1.7% | |
Amadeus IT Holding, Cl A | | | 0.7 | % | | | 1,039,986 | | | $ | 48,204 | |
Other Securities | | | 1.0 | | | | | | | | 72,629 | |
| | | | | | | | | | | | |
| | | | | | | | | | | 120,833 | |
| | | | | | | | | | | | |
|
Sweden — 2.5% | |
Other Securities (A) | | | 2.5 | | | | | | | | 176,118 | |
| | | | | | | | | | | | |
|
Switzerland — 4.3% | |
Actelion | | | 0.5 | | | | 201,996 | | | | 33,138 | |
Nestle | | | 0.5 | | | | 462,378 | | | | 34,137 | |
Novartis ADR | | | 0.4 | | | | 381,352 | | | | 30,321 | |
Roche Holding | | | 0.5 | | | | 132,984 | | | | 34,898 | |
Other Securities (A) | | | 2.4 | | | | | | | | 161,962 | |
| | | | | | | | | | | | |
| | | | | | | | | | | 294,456 | |
| | | | | | | | | | | | |
|
Taiwan — 3.0% | |
Taiwan Semiconductor Manufacturing | | | 0.3 | | | | 4,807,000 | | | | 23,068 | |
Taiwan Semiconductor Manufacturing ADR | | | 1.0 | | | | 2,930,744 | | | | 72,448 | |
Other Securities (A) | | | 1.7 | | | | | | | | 115,426 | |
| | | | | | | | | | | | |
| | | | | | | | | | | 210,942 | |
| | | | | | | | | | | | |
|
Thailand — 0.4% | |
Other Securities | | | 0.4 | | | | | | | | 24,442 | |
| | | | | | | | | | | | |
|
Turkey — 0.8% | |
Other Securities | | | 0.8 | | | | | | | | 57,044 | |
| | | | | | | | | | | | |
|
United Arab Emirates — 0.3% | |
Other Securities | | | 0.3 | | | | | | | | 19,942 | |
| | | | | | | | | | | | |
|
United Kingdom — 13.9% | |
ARM Holdings | | | 0.4 | | | | 1,778,722 | | | | 25,553 | |
ARM Holdings ADR | | | 0.7 | | | | 1,178,458 | | | | 50,792 | |
AstraZeneca | | | 0.5 | | | | 599,399 | | | | 35,141 | |
Diageo | | | 0.4 | | | | 1,113,676 | | | | 30,320 | |
Imperial Brands | | | 0.5 | | | | 643,422 | | | | 35,222 | |
ITV | | | 0.6 | | | | 12,986,799 | | | | 40,602 | |
Persimmon | | | 0.5 | | | | 1,225,782 | | | | 37,502 | |
Rio Tinto | | | 0.5 | | | | 1,233,280 | | | | 34,869 | |
Royal Dutch Shell, Cl A | | | 0.7 | | | | 2,040,893 | | | | 49,894 | |
Royal Dutch Shell, Cl A (GBP) | | | 0.1 | | | | 120,089 | | | | 2,897 | |
Royal Dutch Shell ADR, Cl A (A) | | | 0.4 | | | | 627,200 | | | | 30,413 | |
Shire | | | 1.0 | | | | 1,058,538 | | | | 65,634 | |
Vodafone Group | | | 0.5 | | | | 10,196,290 | | | | 34,260 | |
WPP | | | 0.4 | | | | 1,200,141 | | | | 27,809 | |
Other Securities (A) | | | 6.7 | | | | | | | | 458,459 | |
| | | | | | | | | | | | |
| | | | | | | | | | | 959,367 | |
| | | | | | | | | | | | |
|
United States — 3.4% | |
Carnival, Cl A | | | 0.5 | | | | 730,900 | | | | 34,893 | |
Core Laboratories (A) | | | 0.5 | | | | 306,587 | | | | 37,174 | |
Everest Re Group | | | 0.6 | | | | 226,031 | | | | 40,484 | |
ICON* | | | 0.8 | | | | 826,090 | | | | 58,190 | |
| | |
| 62 | | SEI Institutional Investments Trust / Annual Report / May 31, 2016 |
| | | | | | | | | | | | |
| Description | | Percentage of
Net Assets (%) | | | Shares | | | Market Value
($ Thousands) | |
Other Securities (A) | | | 1.0 | % | | | | | | $ | 61,335 | |
| | | | | | | | | | | | |
| | | | | | | | | | | 232,076 | |
| | | | | | | | | | | | |
Total Common Stock
(Cost $6,347,727) ($ Thousands) | | | | 6,470,592 | |
| | | | | | | | | | | | |
|
PREFERRED STOCK — 0.4% | |
| | | |
Brazil — 0.4% | | | | | | | | | | | | |
Other Securities (A) | | | 0.4 | | | | | | | | 23,386 | |
| | | | | | | | | | | | |
Total Preferred Stock
(Cost $39,158) ($ Thousands) | | | | 23,386 | |
| | | | | | | | | | | | |
|
RIGHT — 0.0% | |
|
United Arab Emirates — 0.0% | |
Other Securities | | | 0.0 | | | | | | | | 1,766 | |
| | | | | | | | | | | | |
Total Right
(Cost $–) ($ Thousands) | | | | 1,766 | |
| | | | | | | | | | | | |
|
AFFILIATED PARTNERSHIP — 5.2% | |
SEI Liquidity Fund, L.P.
0.410%**† (C) | | | 5.2 | | | | 362,212,338 | | | | 362,212 | |
| | | | | | | | | | | | |
Total Affiliated Partnership
(Cost $362,212) ($ Thousands) | | | | 362,212 | |
| | | | | | | | | | | | |
|
U.S. TREASURY OBLIGATION — 0.4% | |
Other Securities (D) | | | 0.4 | | | | | | | | 27,747 | |
| | | | | | | | | | | | |
Total U.S. Treasury Obligation
(Cost $27,743) ($ Thousands) | | | | 27,747 | |
| | | | | | | | | | | | |
|
CASH EQUIVALENT — 2.8% | |
SEI Daily Income Trust, Prime Obligation Fund, Cl A 0.270%**† | | | 2.8 | | | | 197,214,725 | | | | 197,215 | |
| | | | | | | | | | | | |
Total Cash Equivalent
(Cost $197,215) ($ Thousands) | | | | 197,215 | |
| | | | | | | | | | | | |
Total Investments — 102.3%
(Cost $6,974,055) ($ Thousands) | | | $ | 7,082,918 | |
| | | | | | | | | | | | |
A list of the open futures contracts held by the Fund at May 31, 2016, is as follows:
| | | | | | | | | | | | |
| Type of Contract | | Number of
Contracts
Long | | | Expiration
Date | | | Unrealized
Appreciation
($ Thousands) | |
DJ Euro Stoxx 50 Index | | | 1,940 | | | | Jun-2016 | | | $ | 2,955 | |
FTSE 100 Index | | | 466 | | | | Jun-2016 | | | | 254 | |
Hang Seng Index | | | 269 | | | | Jun-2016 | | | | 809 | |
S&P TSX 60 Index | | | 198 | | | | Jun-2016 | | | | 698 | |
SPI 200 Index | | | 219 | | | | Jun-2016 | | | | 950 | |
Topix Index | | | 346 | | | | Jun-2016 | | | | 2,139 | |
| | | | | | | | | | | | |
| | | | | | | | | | $ | 7,805 | |
| | | | | | | | | | | | |
For the year ended May 31, 2016, the total amount of all open futures contracts, as presented in the table above, are representative of the volume of activity for this derivative type during the year.
Percentages are based on a Net Assets of $6,923,937 ($ Thousands).
| * | | Non-income producing security. |
| ** | | The rate reported is the 7-day effective yield as of May 31, 2016. |
| † | | Investment in Affiliated Security (see Note 6). |
| ‡ | | Real Estate Investment Trust. |
| (A) | | Certain securities or partial positions of certain securities are on loan at May 31, 2016, (see Note 12). The total market value of securities on loan at May 31, 2016, was $344,379 ($ Thousands). |
| (B) | | Security exempt from registration under Rule 144A of the Securities Act of 1933. These securities may be resold in transactions exempt from registration normally to qualified institutions. On May 31, 2016, the value of these securities amounted to $19,688
($ Thousands), representing 0.3% of the net assets of the Fund. |
| (C) | | This security was purchased with cash collateral held from securities on loan (see Note 12). The total market value of such securities as of May 31, 2016 was $362,212
($ Thousands). |
| (D) | | Security, or portion thereof, has been pledged as collateral on open futures contracts. |
ADR — American Depositary Receipt
Cl — Class
DJ — Dow Jones
FTSE — Financial Times and Stock Exchange
GBP — British Pound Sterling
L.P. — Limited Partnership
S&P — Standard & Poor’s
SPI — Share Price Index
TSX — Toronto Stock Exchange
The Summary Schedule of Investments does not reflect the complete portfolio holdings. It includes the Fund’s 50 largest holdings and each investment of any issuer that exceeds 1% of the Fund’s net assets. “Other Securities” represent all issues not required to be disclosed under the rules adopted by the U.S. Securities and Exchange Commission (“SEC”). In certain instances, securities for which footnotes listed above may otherwise apply are included in the Other Securities caption. The complete schedule of portfolio holdings is available (i) without charge, upon request, by calling (800) 342-5734; and (ii) on the SEC’s website at http://www.sec.gov.
| | | | |
| SEI Institutional Investments Trust / Annual Report / May 31, 2016 | | | 63 | |
SUMMARY SCHEDULE OF INVESTMENTS
World Equity Ex-US Fund (Concluded)
May 31, 2016
The following is a list of the level of inputs used as of May 31, 2016, in valuing the Fund’s investments and other financial instruments carried at value ($ Thousands):
| | | | | | | | | | | | | | | | |
| Investments in Securities | | Level 1 | | | Level 2 | | | Level 3 | | | Total | |
Common Stock | | $ | 6,470,592 | | | $ | — | | | $ | — | | | $ | 6,470,592 | |
Preferred Stock | | | 23,386 | | | | — | | | | — | | | | 23,386 | |
Right | | | 1,766 | | | | — | | | | — | | | | 1,766 | |
Affiliated Partnership | | | — | | | | 362,212 | | | | — | | | | 362,212 | |
U.S. Treasury Obligation | | | — | | | | 27,747 | | | | — | | | | 27,747 | |
Cash Equivalent | | | 197,215 | | | | — | | | | — | | | | 197,215 | |
| | | | | | | | | | | | | | | | |
Total Investments in Securities | | $ | 6,692,959 | | | $ | 389,959 | | | $ | — | | | $ | 7,082,918 | |
| | | | | | | | | | | | | | | | |
| | | | | | | | | | | | | | | | |
| Other Financial Instruments | | Level 1 | | | Level 2 | | | Level 3 | | | Total | |
Futures Contracts* | | | | | | | | | | | | | | | | |
Unrealized Appreciation | | $ | 7,805 | | | $ | — | | | $ | — | | | $ | 7,805 | |
| | | | | | | | | | | | | | | | |
| * | | Futures contracts are valued at the unrealized appreciation on the instrument. |
For the year ended May 31, 2016, there were no transfers between Level 1 and Level 2 assets and liabilities.
For the year ended May 31, 2016, there were no transfers between Level 2 and Level 3 assets and liabilities.
For more information on valuation inputs, see Note 2 — Significant Accounting Policies in Notes to Financial Statements.
Amounts designated as “—” are either $0 or have been rounded to $0.
The accompanying notes are an integral part of the financial statements.
| | |
| 64 | | SEI Institutional Investments Trust / Annual Report / May 31, 2016 |
SUMMARY SCHEDULE OF INVESTMENTS
Screened World Equity Ex-US Fund
May 31, 2016
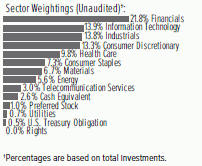
| | | | | | | | | | | | |
| Description | | Percentage of
Net Assets (%) | | | Shares | | | Market Value
($ Thousands) | |
|
COMMON STOCK — 92.3% | |
| | | |
Argentina — 0.5% | | | | | | | | | | | | |
MercadoLibre | | | 0.5 | % | | | 2,936 | | | $ | 401 | |
Other Securities | | | 0.0 | | | | | | | | 20 | |
| | | | | | | | | | | | |
| | | | | | | | | | | 421 | |
| | | | | | | | | | | | |
| | | |
Australia — 2.8% | | | | | | | | | | | | |
Cochlear | | | 0.6 | | | | 6,093 | | | | 533 | |
Commonwealth Bank of Australia | | | 0.5 | | | | 7,214 | | | | 405 | |
Other Securities‡ | | | 1.7 | | | | | | | | 1,351 | |
| | | | | | | | | | | | |
| | | | | | | | | | | 2,289 | |
| | | | | | | | | | | | |
| | | |
Austria — 2.1% | | | | | | | | | | | | |
Other Securities | | | 2.1 | | | | | | | | 1,741 | |
| | | | | | | | | | | | |
| | | |
Belgium — 0.2% | | | | | | | | | | | | |
Other Securities | | | 0.2 | | | | | | | | 163 | |
| | | | | | | | | | | | |
| | | |
Brazil — 0.8% | | | | | | | | | | | | |
Other Securities | | | 0.8 | | | | | | | | 655 | |
| | | | | | | | | | | | |
| | | |
Canada — 6.1% | | | | | | | | | | | | |
Fairfax Financial Holdings | | | 0.5 | | | | 840 | | | | 433 | |
Magna International, Cl A | | | 0.5 | | | | 9,360 | | | | 381 | |
Royal Bank of Canada | | | 0.6 | | | | 7,800 | | | | 470 | |
Toronto-Dominion Bank | | | 0.5 | | | | 10,400 | | | | 454 | |
Other Securities | | | 4.0 | | | | | | | | 3,347 | |
| | | | | | | | | | | | |
| | | | | | | | | | | 5,085 | |
| | | | | | | | | | | | |
| | | |
Chile — 0.1% | | | | | | | | | | | | |
Other Securities | | | 0.1 | | | | | | | | 91 | |
| | | | | | | | | | | | |
| | | |
China — 1.4% | | | | | | | | | | | | |
Alibaba Group Holding
ADR* | | | 0.5 | | | | 4,611 | | | | 378 | |
Other Securities | | | 0.9 | | | | | | | | 806 | |
| | | | | | | | | | | | |
| | | | | | | | | | | 1,184 | |
| | | | | | | | | | | | |
| | | | | | | | | | | | |
| Description | | Percentage of
Net Assets (%) | | | Shares | | | Market Value
($ Thousands) | |
| | | |
Colombia — 0.3% | | | | | | | | | | | | |
Other Securities | | | 0.3 | % | | | | | | $ | 274 | |
| | | | | | | | | | | | |
| | | |
Czech Republic — 0.3% | | | | | | | | | | | | |
Other Securities | | | 0.3 | | | | | | | | 240 | |
| | | | | | | | | | | | |
| | | |
Denmark — 1.8% | | | | | | | | | | | | |
Other Securities | | | 1.8 | | | | | | | | 1,462 | |
| | | | | | | | | | | | |
| | | |
Finland — 1.8% | | | | | | | | | | | | |
Kone, Cl B | | | 0.5 | | | | 8,131 | | | | 385 | |
Neste Oil | | | 0.5 | | | | 11,654 | | | | 393 | |
Other Securities | | | 0.8 | | | | | | | | 703 | |
| | | | | | | | | | | | |
| | | | | | | | | | | 1,481 | |
| | | | | | | | | | | | |
| | | |
France — 4.9% | | | | | | | | | | | | |
Sodexo | | | 0.5 | | | | 3,634 | | | | 382 | |
Other Securities | | | 4.4 | | | | | | | | 3,672 | |
| | | | | | | | | | | | |
| | | | | | | | | | | 4,054 | |
| | | | | | | | | | | | |
| | | |
Germany — 4.6% | | | | | | | | | | | | |
Allianz | | | 0.7 | | | | 3,539 | | | | 578 | |
Continental | | | 0.7 | | | | 2,802 | | | | 601 | |
Deutsche Boerse | | | 0.5 | | | | 4,877 | | | | 428 | |
Other Securities | | | 2.7 | | | | | | | | 2,166 | |
| | | | | | | | | | | | |
| | | | | | | | | | | 3,773 | |
| | | | | | | | | | | | |
| | | |
Hong Kong — 3.4% | | | | | | | | | | | | |
China Mobile | | | 0.5 | | | | 33,500 | | | | 382 | |
Other Securities | | | 2.9 | | | | | | | | 2,406 | |
| | | | | | | | | | | | |
| | | | | | | | | | | 2,788 | |
| | | | | | | | | | | | |
| | | |
Hungary — 0.1% | | | | | | | | | | | | |
Other Securities | | | 0.1 | | | | | | | | 119 | |
| | | | | | | | | | | | |
| | | |
India — 1.2% | | | | | | | | | | | | |
HDFC Bank ADR | | | 0.7 | | | | 8,522 | | | | 548 | |
ICICI Bank ADR | | | 0.5 | | | | 58,826 | | | | 423 | |
| | | | | | | | | | | | |
| | | | | | | | | | | 971 | |
| | | | | | | | | | | | |
| | | |
Indonesia — 0.6% | | | | | | | | | | | | |
Other Securities | | | 0.6 | | | | | | | | 535 | |
| | | | | | | | | | | | |
| | | |
Ireland — 1.1% | | | | | | | | | | | | |
Ryanair Holdings ADR | | | 0.6 | | | | 6,690 | | | | 585 | |
Other Securities | | | 0.5 | | | | | | | | 329 | |
| | | | | | | | | | | | |
| | | | | | | | | | | 914 | |
| | | | | | | | | | | | |
| | | |
Israel — 1.1% | | | | | | | | | | | | |
Teva Pharmaceutical Industries ADR | | | 0.7 | | | | 11,446 | | | | 594 | |
Other Securities | | | 0.4 | | | | | | | | 312 | |
| | | | | | | | | | | | |
| | | | | | | | | | | 906 | |
| | | | | | | | | | | | |
| | | |
Italy — 0.8% | | | | | | | | | | | | |
Other Securities | | | 0.8 | | | | | | | | 644 | |
| | | | | | | | | | | | |
| | | |
Japan — 11.5% | | | | | | | | | | | | |
Denso | | | 1.1 | | | | 23,600 | | | | 930 | |
| | | | |
| SEI Institutional Investments Trust / Annual Report / May 31, 2016 | | | 65 | |
SUMMARY SCHEDULE OF INVESTMENTS
Screened World Equity Ex-US Fund (Concluded)
May 31, 2016
| | | | | | | | | | | | |
| Description | | Percentage of
Net Assets (%) | | | Shares | | | Market Value
($ Thousands) | |
Japan Exchange Group | | | 0.5 | % | | | 29,900 | | | $ | 407 | |
Mitsui Sumitomo Insurance Group Holdings | | | 0.5 | | | | 13,300 | | | | 379 | |
Secom | | | 0.9 | | | | 9,400 | | | | 736 | |
Toyota Motor | | | 0.5 | | | | 8,100 | | | | 422 | |
Other Securities | | | 8.0 | | | | | | | | 6,655 | |
| | | | | | | | | | | | |
| | | | | | | | | | | 9,529 | |
| | | | | | | | | | | | |
| | | |
Malaysia — 0.5% | | | | | | | | | | | | |
Other Securities | | | 0.5 | | | | | | | | 451 | |
| | | | | | | | | | | | |
| | | |
Mexico — 0.3% | | | | | | | | | | | | |
Other Securities | | | 0.3 | | | | | | | | 231 | |
| | | | | | | | | | | | |
| | | |
Netherlands — 2.4% | | | | | | | | | | | | |
Heineken Holding | | | 0.5 | | | | 4,800 | | | | 394 | |
Unilever | | | 1.4 | | | | 26,375 | | | | 1,185 | |
Other Securities | | | 0.5 | | | | | | | | 380 | |
| | | | | | | | | | | | |
| | | | | | | | | | | 1,959 | |
| | | | | | | | | | | | |
| | | |
New Zealand — 0.2% | | | | | | | | | | | | |
Other Securities | | | 0.2 | | | | | | | | 191 | |
| | | | | | | | | | | | |
| | | |
Norway — 1.4% | | | | | | | | | | | | |
DnB | | | 0.6 | | | | 41,581 | | | | 534 | |
Other Securities | | | 0.8 | | | | | | | | 640 | |
| | | | | | | | | | | | |
| | | | | | | | | | | 1,174 | |
| | | | | | | | | | | | |
| | | |
Panama — 0.2% | | | | | | | | | | | | |
Other Securities | | | 0.2 | | | | | | | | 145 | |
| | | | | | | | | | | | |
| | | |
Peru — 0.2% | | | | | | | | | | | | |
Other Securities | | | 0.2 | | | | | | | | 176 | |
| | | | | | | | | | | | |
| | | |
Philippines — 0.1% | | | | | | | | | | | | |
Other Securities | | | 0.1 | | | | | | | | 38 | |
| | | | | | | | | | | | |
| | | |
Poland — 0.2% | | | | | | | | | | | | |
Other Securities | | | 0.2 | | | | | | | | 170 | |
| | | | | | | | | | | | |
| | | |
Portugal — 0.5% | | | | | | | | | | | | |
Other Securities | | | 0.5 | | | | | | | | 372 | |
| | | | | | | | | | | | |
| | | |
Qatar — 0.3% | | | | | | | | | | | | |
Other Securities | | | 0.3 | | | | | | | | 268 | |
| | | | | | | | | | | | |
| | | |
Russia — 1.2% | | | | | | | | | | | | |
Other Securities | | | 1.2 | | | | | | | | 1,011 | |
| | | | | | | | | | | | |
| | | |
Singapore — 1.7% | | | | | | | | | | | | |
DBS Group Holdings | | | 0.5 | | | | 37,400 | | | | 421 | |
Other Securities | | | 1.2 | | | | | | | | 1,019 | |
| | | | | | | | | | | | |
| | | | | | | | | | | 1,440 | |
| | | | | | | | | | | | |
| | | |
South Africa — 2.3% | | | | | | | | | | | | |
Naspers, Cl N | | | 0.9 | | | | 4,831 | | | | 710 | |
Other Securities | | | 1.4 | | | | | | | | 1,150 | |
| | | | | | | | | | | | |
| | | | | | | | | | | 1,860 | |
| | | | | | | | | | | | |
| | | | | | | | | | | | |
| Description | | Percentage of
Net Assets (%) | | | Shares | | | Market Value
($ Thousands) | |
| | | |
South Korea — 3.3% | | | | | | | | | | | | |
Samsung Electronics | | | 1.8 | % | | | 1,354 | | | $ | 1,468 | |
Other Securities | | | 1.5 | | | | | | | | 1,263 | |
| | | | | | | | | | | | |
| | | | | | | | | | | 2,731 | |
| | | | | | | | | | | | |
| | | |
Spain — 2.0% | | | | | | | | | | | | |
Amadeus IT Holding, Cl A | | | 0.9 | | | | 16,084 | | | | 746 | |
Industria de Diseno Textil | | | 0.5 | | | | 12,785 | | | | 432 | |
Other Securities | | | 0.6 | | | | | | | | 461 | |
| | | | | | | | | | | | |
| | | | | | | | | | | 1,639 | |
| | | | | | | | | | | | |
| | | |
Sweden — 2.5% | | | | | | | | | | | | |
Atlas Copco, Cl B | | | 0.5 | | | | 18,313 | | | | 436 | |
Getinge, Cl B | | | 0.5 | | | | 19,739 | | | | 421 | |
Svenska Handelsbanken, Cl A | | | 0.6 | | | | 37,335 | | | | 477 | |
Other Securities | | | 0.9 | | | | | | | | 774 | |
| | | | | | | | | | | | |
| | | | | | | | | | | 2,108 | |
| | | | | | | | | | | | |
| | | |
Switzerland — 4.4% | | | | | | | | | | | | |
Nestle | | | 0.9 | | | | 10,287 | | | | 760 | |
Novartis ADR | | | 0.7 | | | | 7,202 | | | | 573 | |
Roche Holding | | | 0.8 | | | | 2,511 | | | | 659 | |
Other Securities | | | 2.0 | | | | | | | | 1,620 | |
| | | | | | | | | | | | |
| | | | | | | | | | | 3,612 | |
| | | | | | | | | | | | |
| | | |
Taiwan — 3.5% | | | | | | | | | | | | |
Advanced Semiconductor Engineering | | | 0.6 | | | | 435,000 | | | | 492 | |
Taiwan Semiconductor Manufacturing ADR | | | 1.6 | | | | 52,810 | | | | 1,306 | |
Taiwan Semiconductor Manufacturing | | | 0.7 | | | | 117,000 | | | | 562 | |
Other Securities | | | 0.6 | | | | | | | | 563 | |
| | | | | | | | | | | | |
| | | | | | | | | | | 2,923 | |
| | | | | | | | | | | | |
| | | |
Thailand — 0.9% | | | | | | | | | | | | |
Other Securities | | | 0.9 | | | | | | | | 777 | |
| | | | | | | | | | | | |
| | | |
Turkey — 0.6% | | | | | | | | | | | | |
Other Securities | | | 0.6 | | | | | | | | 496 | |
| | | | | | | | | | | | |
| | | |
United Kingdom — 12.3% | | | | | | | | | | | | |
ARM Holdings | | | 0.6 | | | | 33,617 | | | | 483 | |
ARM Holdings ADR | | | 1.2 | | | | 22,290 | | | | 961 | |
Carnival | | | 0.3 | | | | 4,740 | | | | 235 | |
Diageo | | | 0.7 | | | | 21,032 | | | | 573 | |
HSBC Holdings | | | 0.5 | | | | 64,087 | | | | 415 | |
Shire | | | 1.2 | | | | 15,482 | | | | 960 | |
Other Securities | | | 7.8 | | | | | | | | 6,594 | |
| | | | | | | | | | | | |
| | | | | | | | | | | 10,221 | |
| | | | | | | | | | | | |
| | | |
United States — 3.8% | | | | | | | | | | | | |
Carnival, Cl A | | | 0.8 | | | | 13,803 | | | | 659 | |
Core Laboratories | | | 0.9 | | | | 5,721 | | | | 694 | |
Everest Re Group | | | 0.9 | | | | 4,275 | | | | 766 | |
ICON* | | | 1.0 | | | | 11,712 | | | | 825 | |
| | |
| 66 | | SEI Institutional Investments Trust / Annual Report / May 31, 2016 |
| | | | | | | | | | | | |
| Description | | Percentage of
Net Assets (%) | | | Shares | | | Market Value
($ Thousands) | |
Other Securities | | | 0.2 | % | | | | | | $ | 226 | |
| | | | | | | | | | | | |
| | | | | | | | | | | 3,170 | |
| | | | | | | | | | | | |
Total Common Stock
(Cost $78,103) ($ Thousands) | | | | 76,482 | |
| | | | | | | | | | | | |
| |
PREFERRED STOCK — 1.0% | | | | | |
| |
Brazil — 1.0% | | | | | |
Other Securities | | | 1.0 | | | | | | | | 789 | |
| | | | | | | | | | | | |
| | | |
Germany — 0.0% | | | | | | | | | | | | |
Other Securities | | | 0.0 | | | | | | | | 13 | |
| | | | | | | | | | | | |
Total Preferred Stock
(Cost $1,230) ($ Thousands) | | | | 802 | |
| | | | | | | | | | | | |
RIGHTS — 0.0% | | | | | |
| |
Italy — 0.0% | | | | | |
Other Securities | | | 0.0 | | | | | | | | — | |
| | | | | | | | | | | | |
Total Rights
(Cost $–) ($ Thousands) | | | | — | |
| | | | | | | | | | | | |
U.S. TREASURY OBLIGATION — 0.5% | | | | | |
Other Securities (A) | | | 0.5 | | | | | | | | 370 | |
| | | | | | | | | | | | |
Total U.S. Treasury Obligation
(Cost $370) ($ Thousands) | | | | 370 | |
| | | | | | | | | | | | |
| |
CASH EQUIVALENT — 2.5% | | | | | |
SEI Daily Income Trust, Prime Obligation Fund, Cl A
0.270%**† | | | 2.5 | | | | 2,083,935 | | | | 2,084 | |
| | | | | | | | | | | | |
Total Cash Equivalent
(Cost $2,084) ($ Thousands) | | | | 2,084 | |
| | | | | | | | | | | | |
Total Investments — 96.3%
(Cost $81,787) ($ Thousands) | | | $ | 79,738 | |
| | | | | | | | | | | | |
A list of the open futures contracts held by the Fund at May 31, 2016, is as follows:
| | | | | | | | | | | | |
| Type of Contract | | Number of
Contracts
Long | | | Expiration
Date | | | Unrealized
Appreciation
(Depreciation)
($ Thousands) | |
DJ Euro Stoxx 50 Index | | | 19 | | | | Jun-2016 | | | $ | 20 | |
FTSE 100 Index | | | 4 | | | | Jun-2016 | | | | — | |
Hang Seng Index | | | 3 | | | | Jun-2016 | | | | 8 | |
S&P TSX 60 Index | | | 3 | | | | Jun-2016 | | | | 1 | |
SPI 200 Index | | | 2 | | | | Jun-2016 | | | | (1 | ) |
Topix Index | | | 3 | | | | Jun-2016 | | | | 13 | |
| | | | | | | | | | | | |
| | | | | | | | | | $ | 41 | |
| | | | | | | | | | | | |
For the year ended May 31, 2016, the total amount of all open futures contracts, as presented in the table above, are representative of the volume of activity for this derivative type during the year.
Percentages are based on a Net Assets of $82,836 ($ Thousands).
| * | | Non-income producing security. |
| ** | | The rate reported is the 7-day effective yield as of May 31, 2016. |
| ‡ | | Real Estate Investment Trust. |
| † | | Investment in Affiliated Security (see Note 6). |
| (A) | | Security, or portion thereof, has been pledged as collateral on open futures contracts. |
ADR — American Depositary Receipt
Cl — Class
DJ — Dow Jones
FTSE — Financial Times and Stock Exchange
S&P — Standard & Poor’s
SPI — Share Price Index
The Summary Schedule of Investments does not reflect the complete portfolio holdings. It includes the Fund’s 50 largest holdings and each investment of any issuer that exceeds 1% of the Fund’s net assets. “Other Securities” represent all issues not required to be disclosed under the rules adopted by the U.S. Securities and Exchange Commission (“SEC”). In certain instances, securities for which footnotes listed above may otherwise apply are included in the Other Securities caption. The complete schedule of portfolio holdings is available (i) without charge, upon request, by calling (800) 342-5734; and (ii) on the SEC’s website at http://www.sec.gov.
The following is a list of the level of inputs used as of May 31, 2016, in valuing the Fund’s investments and other financial instruments carried at value ($ Thousands):
| | | | | | | | | | | | | | | | |
| Investments in Securities | | Level 1 | | | Level 2 | | | Level 3 | | | Total | |
Common Stock | | $ | 76,482 | | | $ | — | | | $ | — | | | $ | 76,482 | |
Preferred Stock | | | 802 | | | | — | | | | — | | | | 802 | |
Rights | | | — | | | | — | | | | — | | | | — | |
U.S. Treasury Obligation | | | — | | | | 370 | | | | — | | | | 370 | |
Cash Equivalent | | | 2,084 | | | | — | | | | — | | | | 2,084 | |
| | | | | | | | | | | | | | | | |
Total Investments in Securities | | $ | 79,368 | | | $ | 370 | | | $ | — | | | $ | 79,738 | |
| | | | | | | | | | | | | | | | |
| | | | | | | | | | | | | | | | |
| Other Financial Instruments | | Level 1 | | | Level 2 | | | Level 3 | | | Total | |
Futures Contracts* | | | | | | | | | | | | | | | | |
Unrealized Appreciation | | $ | 42 | | | $ | — | | | $ | — | | | $ | 42 | |
Unrealized Depreciation | | | (1 | ) | | | — | | | | — | | | | (1 | ) |
| | | | | | | | | | | | | | | | |
Total Other Financial Instruments | | $ | 41 | | | $ | — | | | $ | — | | | $ | 41 | |
| | | | | | | | | | | | | | | | |
| * | | Futures contracts are valued at the unrealized appreciation (depreciation) on the instrument. |
For the year ended May 31, 2016, there were no transfers between Level 1 and Level 2 assets and liabilities.
For the year ended May 31, 2016, there were no transfers between Level 2 and Level 3 assets and liabilities.
For more information on valuation inputs, see Note 2 — Significant Accounting Policies in Notes to Financial Statements.
Amounts designated as “—” are either $0 or have been rounded to $0.
The accompanying notes are an integral part of the financial statements.
| | | | |
| SEI Institutional Investments Trust / Annual Report / May 31, 2016 | | | 67 | |
SUMMARY SCHEDULE OF INVESTMENTS
Emerging Markets Equity Fund
May 31, 2016
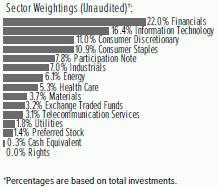
| | | | | | | | | | | | |
| Description | | Percentage of
Net Assets (%) | | | Shares | | | Market Value
($ Thousands) | |
COMMON STOCK — 84.7% | | | | | |
| |
Argentina — 2.6% | | | | | |
Grupo Financiero Galicia ADR | | | 0.6 | % | | | 205,192 | | | $ | 5,830 | |
MercadoLibre | | | 0.7 | | | | 50,580 | | | | 6,904 | |
YPF ADR | | | 0.5 | | | | 226,037 | | | | 4,726 | |
Other Securities | | | 0.8 | | | | | | | | 6,463 | |
| | | | | | | | | | | | |
| | | | | | | | | | | 23,923 | |
| | | | | | | | | | | | |
| |
Bangladesh — 0.4% | | | | | |
Other Securities | | | 0.4 | | | | | | | | 3,927 | |
| | | | | | | | | | | | |
| |
Botswana — 0.0% | | | | | |
Other Securities | | | 0.0 | | | | | | | | 296 | |
| | | | | | | | | | | | |
| |
Brazil — 3.2% | | | | | |
Ambev | | | 0.7 | | | | 1,241,640 | | | | 6,531 | |
Raia Drogasil | | | 0.6 | | | | 339,665 | | | | 5,398 | |
Other Securities | | | 1.9 | | | | | | | | 17,664 | |
| | | | | | | | | | | | |
| | | | | | | | | | | 29,593 | |
| | | | | | | | | | | | |
| |
Canada — 0.9% | | | | | |
Other Securities | | | 0.9 | | | | | | | | 8,757 | |
| | | | | | | | | | | | |
| |
Chile — 0.7% | | | | | |
Other Securities | | | 0.7 | | | | | | | | 6,318 | |
| | | | | | | | | | | | |
| |
China — 6.9% | | | | | |
China Biologic Products* | | | 0.5 | | | | 42,380 | | | | 4,999 | |
Ctrip.com International ADR* | | | 0.7 | | | | 152,145 | | | | 6,962 | |
NetEase ADR | | | 0.5 | | | | 27,243 | | | | 4,845 | |
Other Securities (A) | | | 5.2 | | | | | | | | 47,712 | |
| | | | | | | | | | | | |
| | | | | | | | | | | 64,518 | |
| | | | | | | | | | | | |
| |
Colombia — 1.3% | | | | | |
Bancolombia ADR, Cl R | | | 0.4 | | | | 119,033 | | | | 3,876 | |
Other Securities | | | 0.9 | | | | | | | | 7,942 | |
| | | | | | | | | | | | |
| | | | | | | | | | | 11,818 | |
| | | | | | | | | | | | |
| |
Czech Republic — 0.2% | | | | | |
Other Securities (A) | | | 0.2 | | | | | | | | 1,556 | |
| | | | | | | | | | | | |
| | | | | | | | | | | | |
| Description | | Percentage of
Net Assets (%) | | | Shares | | | Market Value
($ Thousands) | |
| |
Egypt — 0.4% | | | | | |
Other Securities (A) | | | 0.4 | % | | | | | | $ | 3,794 | |
| | | | | | | | | | | | |
| |
Georgia — 0.4% | | | | | |
Other Securities | | | 0.4 | | | | | | | | 3,795 | |
| | | | | | | | | | | | |
| |
Greece — 0.7% | | | | | |
Other Securities | | | 0.7 | | | | | | | | 6,697 | |
| | | | | | | | | | | | |
| |
Hong Kong — 9.2% | | | | | |
Bank of China | | | 1.0 | | | | 22,792,000 | | | | 9,272 | |
China Construction Bank | | | 0.8 | | | | 11,270,000 | | | | 7,269 | |
Industrial & Commercial Bank of China | | | 0.5 | | | | 9,587,000 | | | | 5,085 | |
Tencent Holdings | | | 1.6 | | | | 658,400 | | | | 14,688 | |
Other Securities (A) | | | 5.3 | | | | | | | | 49,692 | |
| | | | | | | | | | | | |
| | | | | | | | | | | 86,006 | |
| | | | | | | | | | | | |
| |
Hungary — 0.4% | | | | | |
Other Securities | | | 0.4 | | | | | | | | 3,840 | |
| | | | | | | | | | | | |
| |
India — 1.9% | | | | | |
Dr Reddy’s Laboratories ADR | | | 0.4 | | | | 83,100 | | | | 3,919 | |
HDFC Bank ADR | | | 0.7 | | | | 96,390 | | | | 6,204 | |
Other Securities | | | 0.8 | | | | | | | | 7,696 | |
| | | | | | | | | | | | |
| | | | | | | | | | | 17,819 | |
| | | | | | | | | | | | |
| |
Indonesia — 4.1% | | | | | |
Kalbe Farma* | | | 0.6 | | | | 50,223,995 | | | | 5,258 | |
Pakuwon Jati | | | 0.4 | | | | 101,768,603 | | | | 4,098 | |
Other Securities | | | 3.1 | | | | | | | | 28,670 | |
| | | | | | | | | | | | |
| | | | | | | | | | | 38,026 | |
| | | | | | | | | | | | |
| |
Ivory Coast — 0.2% | | | | | |
Other Securities | | | 0.2 | | | | | | | | 1,515 | |
| | | | | | | | | | | | |
| |
Kashmiri — 0.0% | | | | | |
Other Securities | | | 0.0 | | | | | | | | 389 | |
| | | | | | | | | | | | |
| |
Kazakhstan — 0.4% | | | | | |
Other Securities | | | 0.4 | | | | | | | | 4,149 | |
| | | | | | | | | | | | |
| |
Kenya — 0.5% | | | | | |
Other Securities | | | 0.5 | | | | | | | | 4,362 | |
| | | | | | | | | | | | |
| |
Malaysia — 0.7% | | | | | |
Other Securities | | | 0.7 | | | | | | | | 6,754 | |
| | | | | | | | | | | | |
| |
Mauritius — 0.2% | | | | | |
Other Securities | | | 0.2 | | | | | | | | 1,431 | |
| | | | | | | | | | | | |
| |
Mexico — 4.0% | | | | | |
Banregio Grupo Financiero | | | 0.5 | | | | 888,280 | | | | 4,878 | |
Grupo Televisa ADR | | | 0.5 | | | | 169,795 | | | | 4,540 | |
| | |
| 68 | | SEI Institutional Investments Trust / Annual Report / May 31, 2016 |
| | | | | | | | | | | | |
| Description | | Percentage of
Net Assets (%) | | | Shares | | | Market Value
($ Thousands) | |
Kimberly-Clark de Mexico, Cl A | | | 0.6 | % | | | 2,203,145 | | | $ | 5,246 | |
Wal-Mart de Mexico | | | 0.8 | | | | 3,070,730 | | | | 7,167 | |
Other Securities | | | 1.6 | | | | | | | | 15,674 | |
| | | | | | | | | | | | |
| | | | | | | | | | | 37,505 | |
| | | | | | | | | | | | |
| |
Morocco — 0.4% | | | | | |
Other Securities | | | 0.4 | | | | | | | | 3,350 | |
| | | | | | | | | | | | |
| |
Nigeria — 0.4% | | | | | |
Other Securities | | | 0.4 | | | | | | | | 3,318 | |
| | | | | | | | | | | | |
| |
Oman — 0.1% | | | | | |
Other Securities | | | 0.1 | | | | | | | | 852 | |
| | | | | | | | | | | | |
| |
Pakistan — 0.9% | | | | | |
Other Securities | | | 0.9 | | | | | | | | 8,606 | |
| | | | | | | | | | | | |
| |
Panama — 0.4% | | | | | |
Other Securities | | | 0.4 | | | | | | | | 4,030 | |
| | | | | | | | | | | | |
| |
Peru — 1.3% | | | | | |
Other Securities (A) | | | 1.3 | | | | | | | | 12,283 | |
| | | | | | | | | | | | |
| |
Philippines — 3.5% | | | | | |
BDO Unibank | | | 0.4 | | | | 1,731,081 | | | | 3,739 | |
Megaworld | | | 0.4 | | | | 43,552,007 | | | | 4,191 | |
Robinsons Land | | | 0.4 | | | | 6,743,600 | | | | 4,182 | |
Universal Robina | | | 0.7 | | | | 1,512,105 | | | | 6,305 | |
Other Securities | | | 1.6 | | | | | | | | 14,744 | |
| | | | | | | | | | | | |
| | | | | | | | | | | 33,161 | |
| | | | | | | | | | | | |
| |
Poland — 1.8% | | | | | |
Eurocash | | | 0.9 | | | | 643,949 | | | | 7,998 | |
Other Securities | | | 0.9 | | | | | | | | 9,250 | |
| | | | | | | | | | | | |
| | | | | | | | | | | 17,248 | |
| | | | | | | | | | | | |
| |
Qatar — 0.6% | | | | | |
Other Securities | | | 0.6 | | | | | | | | 5,420 | |
| | | | | | | | | | | | |
| |
Romania — 1.0% | | | | | |
Banca Transilvania | | | 0.7 | | | | 12,758,303 | | | | 6,696 | |
Other Securities | | | 0.3 | | | | | | | | 2,678 | |
| | | | | | | | | | | | |
| | | | | | | | | | | 9,374 | |
| | | | | | | | | | | | |
| |
Russia — 2.3% | | | | | |
Yandex, Cl A* | | | 1.0 | | | | 432,375 | | | | 8,907 | |
Other Securities | | | 1.3 | | | | | | | | 12,897 | |
| | | | | | | | | | | | |
| | | | | | | | | | | 21,804 | |
| | | | | | | | | | | | |
| |
Singapore — 0.2% | | | | | |
Other Securities | | | 0.2 | | | | | | | | 1,900 | |
| | | | | | | | | | | | |
| |
South Africa — 3.1% | | | | | |
Mr Price Group | | | 0.4 | | | | 342,430 | | | | 4,017 | |
Other Securities | | | 2.7 | | | | | | | | 24,568 | |
| | | | | | | | | | | | |
| | | | | | | | | | | 28,585 | |
| | | | | | | | | | | | |
| | | | | | | | | | | | |
| Description | | Percentage of
Net Assets (%) | | | Shares | | | Market Value
($ Thousands) | |
| |
South Korea — 8.8% | | | | | |
Amorepacific | | | 0.7 | % | | | 17,544 | | | $ | 6,146 | |
Kia Motors | | | 0.5 | | | | 116,300 | | | | 4,552 | |
Korea Electric Power ADR | | | 0.5 | | | | 170,400 | | | | 4,500 | |
KT&G | | | 0.6 | | | | 53,839 | | | | 5,760 | |
Medy-Tox | | | 0.5 | | | | 12,735 | | | | 4,691 | |
Samsung Electronics | | | 1.2 | | | | 10,736 | | | | 11,639 | |
Other Securities | | | 4.8 | | | | | | | | 45,412 | |
| | | | | | | | | | | | |
| | | | | | | | | | | 82,700 | |
| | | | | | | | | | | | |
| |
Switzerland — 0.1% | | | | | |
Other Securities (A) | | | 0.1 | | | | | | | | 1,034 | |
| | | | | | | | | | | | |
| |
Taiwan — 9.7% | | | | | |
Hon Hai Precision Industry | | | 0.8 | | | | 3,026,250 | | | | 7,433 | |
Pegatron | | | 0.5 | | | | 2,373,000 | | | | 4,941 | |
Powertech Technology | | | 0.4 | | | | 1,569,000 | | | | 3,382 | |
Taiwan Semiconductor Manufacturing ADR | | | 1.5 | | | | 583,325 | | | | 14,420 | |
Taiwan Semiconductor Manufacturing | | | 0.4 | | | | 743,000 | | | | 3,566 | |
Other Securities | | | 6.1 | | | | | | | | 57,090 | |
| | | | | | | | | | | | |
| | | | | | | | | | | 90,832 | |
| | | | | | | | | | | | |
| |
Thailand — 3.3% | | | | | |
Other Securities | | | 3.3 | | | | | | | | 30,837 | |
| | | | | | | | | | | | |
| |
Turkey — 2.1 % | | | | | |
Coca-Cola Icecek | | | 0.4 | | | | 302,725 | | | | 3,692 | |
Other Securities‡ | | | 1.7 | | | | | | | | 15,596 | |
| | | | | | | | | | | | |
| | | | | | | | | | | 19,288 | |
| | | | | | | | | | | | |
| |
Ukraine — 0.1% | | | | | |
Other Securities | | | 0.1 | | | | | | | | 559 | |
| | | | | | | | | | | | |
| |
United Arab Emirates — 2.1% | | | | | |
Emaar Properties | | | 0.8 | | | | 4,492,619 | | | | 7,645 | |
Other Securities | | | 1.3 | | | | | | | | 12,389 | |
| | | | | | | | | | | | |
| | | | | | | | | | | 20,034 | |
| | | | | | | | | | | | |
| |
United Kingdom — 0.8% | | | | | |
Other Securities (A) | | | 0.8 | | | | | | | | 7,799 | |
| | | | | | | | | | | | |
| |
United States — 2.4% | | | | | |
Kansas City Southern | | | 0.6 | | | | 57,010 | | | | 5,308 | |
PriceSmart | | | 0.9 | | | | 93,755 | | | | 8,306 | |
Other Securities | | | 0.9 | | | | | | | | 8,722 | |
| | | | | | | | | | | | |
| | | | | | | | | | | 22,336 | |
| | | | | | | | | | | | |
Total Common Stock | | | | | | | | | | | | |
(Cost $815,802) ($ Thousands) | | | | | | | | | | | 792,138 | |
| | | | | | | | | | | | |
| | | | |
| SEI Institutional Investments Trust / Annual Report / May 31, 2016 | | | 69 | |
SUMMARY SCHEDULE OF INVESTMENTS
Emerging Markets Equity Fund (Concluded)
May 31, 2016
| | | | | | | | | | | | |
| Description | | Percentage of
Net Assets (%) | | | Number of Participation Notes | | | Market Value
($ Thousands) | |
| | | | | | | | | | | | |
|
PARTICIPATION NOTES* — 7.5% | |
| |
Africa — 0.3% | | | | | |
Other Securities | | | 0.3 | % | | | | | | $ | 2,276 | |
| | | | | | | | | | | | |
| | | |
Chile — 0.2% | | | | | | | | | | | | |
Other Securities | | | 0.2 | | | | | | | | 2,094 | |
| | | | | | | | | | | | |
| | | |
China — 0.2% | | | | | | | | | | | | |
Other Securities | | | 0.2 | | | | | | | | 2,160 | |
| | | | | | | | | | | | |
| | | |
Colombia — 0.1% | | | | | | | | | | | | |
Other Securities | | | 0.1 | | | | | | | | 718 | |
| | | | | | | | | | | | |
| | | |
Egypt — 0.3% | | | | | | | | | | | | |
Emaar Misr for Development, Expires 05/02/18 | | | 0.1 | | | | 1,685 | | | | 446 | |
Palm Hills Developments, Expires 05/02/18 | | | 0.2 | | | | 8,970 | | | | 2,484 | |
| | | | | | | | | | | | |
| | | |
| | | | | | | | | | | 2,930 | |
| | | | | | | | | | | | |
| | | |
India — 1.2% | | | | | | | | | | | | |
LIC Housing Finance, Expires 03/08/19 | | | 0.2 | | | | 215 | | | | 1,505 | |
Shriram Transport Finance, Expires 01/30/19 | | | 0.2 | | | | 96 | | | | 1,693 | |
SKS Microfinance, Expires 11/05/18 | | | 0.4 | | | | 378 | | | | 3,661 | |
Other Securities | | | 0.4 | | | | | | | | 4,536 | |
| | | | | | | | | | | | |
| | | |
| | | | | | | | | | | 11,395 | |
| | | | | | | | | | | | |
| | | |
Japan — 0.0% | | | | | | | | | | | | |
Other Securities | | | 0.0 | | | | | | | | 123 | |
| | | | | | | | | | | | |
| | | |
Kuwait — 0.9% | | | | | | | | | | | | |
Kuwait Food Americana SAK, Expires 02/14/19 | | | 0.1 | | | | 121 | | | | 930 | |
Mezzan Holding, Expires 05/02/18 | | | 0.3 | | | | 698 | | | | 2,388 | |
National Bank of Kuwait, Expires 11/20/18 | | | 0.1 | | | | 318 | | | | 659 | |
Other Securities | | | 0.4 | | | | | | | | 4,741 | |
| | | | | | | | | | | | |
| | | |
| | | | | | | | | | | 8,718 | |
| | | | | | | | | | | | |
| | | |
Pakistan — 0.6% | | | | | | | | | | | | |
United Bank, Expires 10/31/16 | | | 0.4 | | | | 2,526 | | | | 4,077 | |
Other Securities | | | 0.2 | | | | | | | | 1,582 | |
| | | | | | | | | | | | |
| | | |
| | | | | | | | | | | 5,659 | |
| | | | | | | | | | | | |
| | | |
Saudi Arabia — 1.7% | | | | | | | | | | | | |
Bupa Arabia for Cooperative Insurance, Expires 04/05/17 | | | 0.0 | | | | 6 | | | | 206 | |
Bupa Arabia for Cooperative Insurance, Expires 04/05/17 | | | 0.3 | | | | 76 | | | | 2,847 | |
| | | | | | | | | | | | |
| Description | | Percentage of
Net Assets (%) | | | Number of Participation Notes | | | Market Value
($ Thousands) | |
| | | | | | | | | | | | |
Fawaz Abdulaziz Al Hokair, Expires 03/02/17 | | | 0.1 | % | | | 54 | | | $ | 669 | |
Mouwasat Medical Services, Expires 09/20/17 | | | 0.2 | | | | 60 | | | | 2,083 | |
National Industrialization, Expires 07/12/17 | | | 0.1 | | | | 236 | | | | 794 | |
National Industrialization, Expires 07/12/17 | | | 0.3 | | | | 841 | | | | 2,833 | |
Samba Financial Group, Expires 03/02/17 | | | 0.2 | | | | 244 | | | | 1,378 | |
Other Securities | | | 0.5 | | | | | | | | 4,768 | |
| | | | | | | | | | | | |
| | | |
| | | | | | | | | | | 15,578 | |
| | | | | | | | | | | | |
| | | |
Singapore — 0.1% | | | | | | | | | | | | |
Other Securities | | | 0.1 | | | | | | | | 957 | |
| | | | | | | | | | | | |
| | | |
Spain — 0.1% | | | | | | | | | | | | |
Other Securities | | | 0.1 | | | | | | | | 844 | |
| | | | | | | | | | | | |
| | | |
Sri Lanka — 0.3% | | | | | | | | | | | | |
Other Securities | | | 0.3 | | | | | | | | 3,120 | |
| | | | | | | | | | | | |
| | | |
Turkey — 0.1% | | | | | | | | | | | | |
Other Securities | | | 0.1 | | | | | | | | 1,232 | |
| | | | | | | | | | | | |
| | | |
Vietnam — 1.4% | | | | | | | | | | | | |
Other Securities | | | 1.4 | | | | | | | | 12,942 | |
| | | | | | | | | | | | |
| | | |
Total Participation Notes (Cost $72,947) ($ Thousands) | | | | | | | | | | | 70,746 | |
| | | | | | | | | | | | |
| | | | | | Shares | | | | |
| |
EXCHANGE TRADED FUNDS — 3.1% | | | | | |
| |
United States — 3.1% | | | | | |
iPath MSCI India Index ETN | | | 0.6 | | | | 77 | | | | 4,963 | |
iShares MSCI Emerging Markets Index Fund | | | 1.0 | | | | 285 | | | | 9,426 | |
| | | |
iShares MSCI Frontier 100 ETF | | | 0.1 | | | | 41 | | | | 1,042 | |
iShares MSCI India ETF | | | 0.5 | | | | 180 | | | | 4,962 | |
WisdomTree India Earnings Fund | | | 0.9 | | | | 422 | | | | 8,345 | |
| | | | | | | | | | | | |
| | | |
Total Exchange Traded Funds
(Cost $30,516) ($ Thousands) | | | | | | | | | | | 28,738 | |
| | | | | | | | | | | | |
| | | |
PREFERRED STOCK — 1.4% | | | | | | | | | | | | |
| | | |
Brazil — 1.0% | | | | | | | | | | | | |
Other Securities | | | 1.0 | | | | | | | | 8,704 | |
| | | | | | | | | | | | |
| | | |
Colombia — 0.3% | | | | | | | | | | | | |
Other Securities | | | 0.3 | | | | | | | | 3,020 | |
| | | | | | | | | | | | |
| | |
| 70 | | SEI Institutional Investments Trust / Annual Report / May 31, 2016 |
| | | | | | | | | | | | |
| Description | | Percentage of
Net Assets (%) | | | Shares | | | Market Value
($ Thousands) | |
| | | | | | | | | | | | |
| | | |
South Korea — 0.1% | | | | | | | | | | | | |
Other Securities | | | 0.1 | % | | | | | | $ | 1,147 | |
| | | | | | | | | | | | |
Total Preferred Stock (Cost $12,745) ($ Thousands) | | | | | | | | 12,871 | |
| | | | | | | | | | | | |
| | | |
RIGHTS — 0.0% | | | | | | | | | | | | |
| | | |
Brazil — 0.0% | | | | | | | | | | | | |
Other Securities | | | 0.0 | | | | | | | | 5 | |
| | | | | | | | | | | | |
| | |
United Arab Emirates — 0.0% | | | | | | | | | |
Other Securities | | | 0.0 | | | | | | | | 253 | |
| | | | | | | | | | | | |
Total Rights
(Cost $–) ($ Thousands) | | | | | | | | | | | 258 | |
| | | | | | | | | | | | |
| | |
CASH EQUIVALENT — 0.3% | | | | | | | | | |
SEI Daily Income Trust, Prime Obligation Fund, Cl A 0.270%**† | | | 0.3 | | | | 2,804,047 | | | | 2,804 | |
| | | | | | | | | | | | |
Total Cash Equivalent (Cost $2,804) ($ Thousands) | | | | | | | | 2,804 | |
| | | | | | | | | | | | |
Total Investments — 97.0%
(Cost $934,814) ($ Thousands) | | | $ | 907,555 | |
| | | | | | | | | | | | |
Percentages are based on a Net Assets of $935,399 ($ Thousands).
| * | | Non-income producing security. |
| ** | | The rate reported is the 7-day effective yield as of May 31, 2016. |
| ‡ | | Real Estate Investment Trust. |
| † | | Investment in Affiliated Security (see Note 6). |
| (A) | | Security exempt from registration under Rule 144A of the Securities Act of 1933. These securities may be resold in transactions exempt from registration normally to qualified institutions. On May 31, 2016, the value of these securities amounted to $9,873 ($ Thousands), representing 1.1% of the net assets of the Fund. |
ADR — American Depositary Receipt
Cl — Class
ETN — Exchange Traded Note
ETF — Exchange Traded Fund
MSCI — Morgan Stanley Capital International
The Summary Schedule of Investments does not reflect the complete portfolio holdings. It includes the Fund’s 50 largest holdings and each investment of any issuer that exceeds 1% of the Fund’s net assets. “Other Securities” represent all issues not required to be disclosed under the rules adopted by the U.S. Securities and Exchange Commission (“SEC”). In certain instances, securities for which footnotes listed above may otherwise apply are included in the Other Securities caption. The complete schedule of portfolio holdings is available (i) without charge, upon request, by calling (800) 342-5734; and (ii) on the SEC’s website at http://www.sec.gov.
The following is a list of the level of inputs used as of May 31, 2016, in valuing the Fund’s investments carried at value ($ Thousands):
| | | | | | | | | | | | | | | | |
| Investments in Securities | | Level 1 | | | Level 2 | | | Level 3 | | | Total | |
Common Stock | | $ | 792,138 | | | $ | — | | | $ | — | | | $ | 792,138 | |
Participation Notes | | | — | | | | 70,746 | | | | — | | | | 70,746 | |
Exchange Traded Funds | | | 28,738 | | | | — | | | | — | | | | 28,738 | |
Preferred Stock | | | 12,871 | | | | — | | | | — | | | | 12,871 | |
Rights | | | 258 | | | | — | | | | — | | | | 258 | |
Cash Equivalent | | | 2,804 | | | | — | | | | — | | | | 2,804 | |
| | | | | | | | | | | | | | | | |
Total Investments in Securities | | $ | 836,809 | | | $ | 70,746 | | | $ | — | | | $ | 907,555 | |
| | | | | | | | | | | | | | | | |
For the year ended May 31, 2016, there were no transfers between Level 1 and Level 2 assets and liabilities.
For the year ended May 31, 2016, there were no transfers between Level 2 and Level 3 assets and liabilities.
For more information on valuation inputs, see Note 2 — Significant Accounting Policies in Notes to Financial Statements.
Amounts designated as “—” are either $0 or have been rounded to $0.
The accompanying notes are an integral part of the financial statements.
| | | | |
| SEI Institutional Investments Trust / Annual Report / May 31, 2016 | | | 71 | |
SCHEDULE OF INVESTMENTS
Opportunistic Income Fund
May 31, 2016
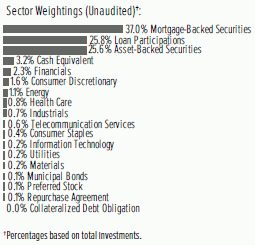
| | | | | | | | |
| Description | | Face Amount
($ Thousands) | | | Market Value
($ Thousands) | |
| | | | | | | | |
| | | | | | | | |
|
MORTGAGE-BACKED SECURITIES — 37.1% | |
|
Agency Mortgage-Backed Obligations — 5.8% | |
FHLMC ARM | | | | | | | | |
3.367%, 03/01/2036 (A) | | $ | 2,522 | | | $ | 2,688 | |
2.519%, 06/01/2035 (A) | | | 2,278 | | | | 2,402 | |
2.378%, 10/01/2035 (A) | | | 1,191 | | | | 1,241 | |
FHLMC CMO, Ser 2007-3311, Cl FN | | | | | | | | |
0.735%, 05/15/2037 (A) | | | 833 | | | | 827 | |
FHLMC CMO, Ser 2010-3721, Cl FB | | | | | | | | |
0.934%, 09/15/2040 (A) | | | 2,806 | | | | 2,824 | |
FHLMC CMO, Ser 2011-3891, Cl BF | | | | | | | | |
0.984%, 07/15/2041 (A) | | | 1,933 | | | | 1,935 | |
FHLMC Multifamily Structured Pass-Through Certificates CMO, Ser 2011-K010, Cl A1 | | | | | | | | |
3.320%, 07/25/2020 | | | 1,064 | | | | 1,090 | |
FHLMC Multifamily Structured Pass-Through Certificates, Ser K011, Cl X1, IO | | | | | | | | |
0.293%, 11/25/2020 (A) | | | 113,155 | | | | 1,264 | |
FHLMC Multifamily Structured Pass-Through Certificates, Ser K703, Cl X1, IO | | | | | | | | |
2.022%, 05/25/2018 (A) | | | 29,166 | | | | 970 | |
FHLMC Multifamily Structured Pass-Through Certificates, Ser K708, Cl X1, IO | | | | | | | | |
1.464%, 01/25/2019 (A) | | | 83,148 | | | | 2,771 | |
FHLMC Multifamily Structured Pass-Through Certificates, Ser K710, Cl X1, IO | | | | | | | | |
1.897%, 05/25/2019 (A) | | | 30,375 | | | | 1,317 | |
FHLMC REMIC, Ser 2007-3335, Cl BF | | | | | | | | |
0.584%, 07/15/2019 (A) | | | 246 | | | | 245 | |
FHLMC REMIC, Ser 2010-83, Cl BA | | | | | | | | |
5.000%, 08/25/2040 | | | 670 | | | | 720 | |
FNMA | | | | | | | | |
6.000%, 09/01/2039 to 04/01/2040 | | | 1,158 | | | | 1,321 | |
4.500%, 10/01/2024 | | | 1,978 | | | | 2,120 | |
3.000%, 05/01/2022 to 12/01/2030 | | | 4,904 | | | | 5,149 | |
FNMA ARM | | | | | | | | |
| | | | | | | | |
| Description | | Face Amount
($ Thousands) | | | Market Value
($ Thousands) | |
| | | | | | | | |
2.770%, 04/01/2034 (A) | | $ | 1,329 | | | $ | 1,403 | |
2.766%, 05/01/2035 (A) | | | 1,235 | | | | 1,302 | |
2.759%, 04/01/2033 (A) | | | 304 | | | | 323 | |
2.675%, 10/01/2033 (A) | | | 319 | | | | 332 | |
2.634%, 10/01/2033 (A) | | | 542 | | | | 574 | |
2.601%, 07/01/2036 (A) | | | 2,044 | | | | 2,156 | |
2.560%, 09/01/2033 (A) | | | 1,201 | | | | 1,245 | |
2.554%, 05/01/2035 (A) | | | 844 | | | | 891 | |
2.553%, 10/01/2024 (A) | | | 227 | | | | 242 | |
2.550%, 05/01/2034 (A) | | | 541 | | | | 566 | |
2.543%, 10/01/2033 (A) | | | 456 | | | | 483 | |
2.527%, 09/01/2034 (A) | | | 779 | | | | 826 | |
2.519%, 10/01/2033 (A) | | | 889 | | | | 940 | |
2.504%, 06/01/2035 (A) | | | 921 | | | | 970 | |
2.493%, 08/01/2034 (A) | | | 1,397 | | | | 1,479 | |
2.481%, 01/01/2034 (A) | | | 864 | | | | 905 | |
2.439%, 05/01/2037 (A) | | | 2,693 | | | | 2,817 | |
2.354%, 06/01/2035 (A) | | | 581 | | | | 601 | |
2.282%, 03/01/2035 (A) | | | 2,084 | | | | 2,159 | |
2.256%, 10/01/2035 (A) | | | 1,539 | | | | 1,625 | |
2.155%, 07/01/2034 (A) | | | 642 | | | | 674 | |
2.127%, 07/01/2034 (A) | | | 1,428 | | | | 1,493 | |
2.097%, 02/01/2035 (A) | | | 1,581 | | | | 1,639 | |
FNMA CMO, Ser 2005-92, Cl UF | | | | | | | | |
0.796%, 10/25/2025 (A) | | | 1,674 | | | | 1,672 | |
FNMA CMO, Ser 2010-87, Cl PF | | | | | | | | |
0.846%, 06/25/2040 (A) | | | 2,352 | | | | 2,352 | |
FNMA CMO, Ser 2011-63, Cl FG | | | | | | | | |
0.896%, 07/25/2041 (A) | | | 1,839 | | | | 1,841 | |
FNMA CMO, Ser 2011-88, Cl AB | | | | | | | | |
2.500%, 09/25/2026 | | | 1,486 | | | | 1,500 | |
FNMA CMO, Ser 2012-112, Cl BI, IO | | | | | | | | |
3.000%, 09/25/2031 | | | 11,905 | | | | 1,113 | |
FNMA CMO, Ser 2013-96, Cl FW | | | | | | | | |
0.846%, 09/25/2043 (A) | | | 1,944 | | | | 1,950 | |
FNMA REMIC, Ser 2011-406, Cl 6, IO | | | | | | | | |
4.000%, 01/25/2041 (A) | | | 1,009 | | | | 161 | |
FNMA TBA | | | | | | | | |
3.500%, 06/15/2026 | | | 1,150 | | | | 1,214 | |
FNMA, Ser M7, Cl A2 | | | | | | | | |
2.578%, 09/25/2018 | | | 2,628 | | | | 2,685 | |
GNMA ARM | | | | | | | | |
2.187%, 12/20/2060 (A) | | | 3,005 | | | | 3,124 | |
1.970%, 09/20/2060 to 11/20/2060 (A) | | | 3,042 | | | | 3,101 | |
1.703%, 11/20/2060 (A) | | | 2,582 | | | | 2,623 | |
1.520%, 12/20/2060 (A) | | | 3,103 | | | | 3,159 | |
GNMA CMO, Ser 2002-66, Cl FC | | | | | | | | |
0.835%, 07/16/2031 (A) | | | 1,178 | | | | 1,182 | |
Mortgage-Linked Amortizing Notes CMO, Ser 2012-1, Cl A10 | | | | | | | | |
2.060%, 01/15/2022 | | | 1,355 | | | | 1,376 | |
| | |
| 72 | | SEI Institutional Investments Trust / Annual Report / May 31, 2016 |
| | | | | | | | |
| Description | | Face Amount
($ Thousands) | | | Market Value
($ Thousands) | |
| | | | | | | | |
NCUA Guaranteed Notes CMO, Ser 2010-A1, Cl A | | | | | | | | |
0.788%, 12/07/2020 (A) | | $ | 5,592 | | | $ | 5,577 | |
NCUA Guaranteed Notes CMO, Ser 2010-R1, Cl 1A | | | | | | | | |
0.890%, 10/07/2020 (A) | | | 6,160 | | | | 6,173 | |
NCUA Guaranteed Notes CMO, Ser 2010-R2, Cl 2A | | | | | | | | |
0.906%, 11/05/2020 (A) | | | 6,507 | | | | 6,505 | |
NCUA Guaranteed Notes CMO, Ser 2010-R3, Cl 1A | | | | | | | | |
0.996%, 12/08/2020 (A) | | | 7,281 | | | | 7,294 | |
NCUA Guaranteed Notes CMO, Ser 2010-R3, Cl 2A | | | | | | | | |
0.996%, 12/08/2020 (A) | | | 439 | | | | 440 | |
NCUA Guaranteed Notes CMO, Ser 2011-R1, Cl 1A | | | | | | | | |
0.890%, 01/08/2020 (A) | | | 4,119 | | | | 4,128 | |
NCUA Guaranteed Notes CMO, Ser 2011-R2, Cl 1A | | | | | | | | |
0.836%, 02/06/2020 (A) | | | 4,889 | | | | 4,891 | |
NCUA Guaranteed Notes CMO, Ser 2011-R3, Cl 1A | | | | | | | | |
0.838%, 03/11/2020 (A) | | | 4,986 | | | | 4,978 | |
NCUA Guaranteed Notes CMO, Ser 2011-R4, Cl 1A | | | | | | | | |
0.816%, 03/06/2020 (A) | | | 540 | | | | 541 | |
| | | | | | | | |
| | | | | | | 124,109 | |
| | | | | | | | |
|
Non-Agency Mortgage-Backed Obligations — 31.3% | |
A10 Term Asset Financing LLC, Ser 2013-2, Cl A | | | | | | | | |
2.620%, 11/15/2027 (B) | | | 1,513 | | | | 1,501 | |
Adjustable Rate Mortgage Trust,
Ser 2005-2, Cl 1A2 | | | | | | | | |
2.680%, 06/25/2035 (A) | | | 584 | | | | 539 | |
Adjustable Rate Mortgage Trust, Ser 2005-4, Cl 7A2 | | | | | | | | |
0.906%, 08/25/2035 (A) | | | 240 | | | | 236 | |
American General Mortgage Loan Trust, Ser 2010-1A, Cl A4 | | | | | | | | |
5.650%, 03/25/2058 (A) (B) | | | 1,513 | | | | 1,528 | |
American Home Mortgage Investment Trust, Ser 2005-2, Cl 4A1 | | | | | | | | |
2.405%, 09/25/2045 (A) | | | 1,490 | | | | 1,437 | |
BAMLL Commercial Mortgage Securities Trust, Ser 2013-DSNY, Cl E | | | | | | | | |
3.035%, 09/15/2026 (A) (B) | | | 2,180 | | | | 2,165 | |
BAMLL Commercial Mortgage Securities Trust, Ser 2014-ICTS, Cl D | | | | | | | | |
2.334%, 06/15/2028 (A) (B) | | | 2,500 | | | | 2,410 | |
| | | | | | | | |
| Description | | Face Amount
($ Thousands) | | | Market Value
($ Thousands) | |
| | | | | | | | |
Banc of America Commercial Mortgage Trust, Ser 2006-6, Cl A4 | | | | | | | | |
5.356%, 10/10/2045 | | $ | 3,470 | | | $ | 3,485 | |
Banc of America Commercial Mortgage Trust, Ser 2007-1, Cl A4 | | | | | | | | |
5.451%, 01/15/2049 | | | 2,610 | | | | 2,654 | |
Banc of America Commercial Mortgage Trust, Ser 2007-4, Cl AM | | | | | | | | |
5.808%, 02/10/2051 (A) | | | 600 | | | | 625 | |
Banc of America Commercial Mortgage, Ser 2006-4, Cl AM | | | | | | | | |
5.675%, 07/10/2046 | | | 3,165 | | | | 3,166 | |
Banc of America Commercial Mortgage, Ser 2006-6, Cl AJ | | | | | | | | |
5.421%, 10/10/2045 | | | 2,600 | | | | 2,589 | |
Banc of America Commercial Mortgage, Ser 2007-3, Cl AJ | | | | | | | | |
5.539%, 06/10/2049 (A) | | | 4,030 | | | | 4,043 | |
Banc of America Commercial Mortgage, Ser 2007-3, Cl AM | | | | | | | | |
5.539%, 06/10/2049 (A) | | | 500 | | | | 513 | |
Banc of America Commercial Mortgage, Ser 2007-3, Cl AMF | | | | | | | | |
5.317%, 06/10/2049 | | | 4,125 | | | | 4,224 | |
Banc of America Commercial Mortgage, Ser 2007-4, Cl A4 | | | | | | | | |
5.741%, 02/10/2051 (A) | | | 2,018 | | | | 2,076 | |
Banc of America Funding, Ser 2004-C, Cl 2A2 | | | | | | | | |
2.985%, 12/20/2034 (A) | | | 627 | | | | 607 | |
Banc of America Funding, Ser 2005-F, Cl 4A1 | | | | | | | | |
2.837%, 09/20/2035 (A) | | | 187 | | | | 159 | |
Banc of America Funding, Ser 2006-D, Cl 3A1 | | | | | | | | |
3.279%, 05/20/2036 (A) | | | 126 | | | | 111 | |
Banc of America Funding, Ser 2006-I, Cl 1A1 | | | | | | | | |
2.597%, 12/20/2036 (A) | | | 6,945 | | | | 6,963 | |
Banc of America Funding, Ser 2010-R5, Cl 4A3 | | | | | | | | |
2.683%, 08/26/2036 (A) (B) | | | 1,912 | | | | 1,879 | |
Banc of America Mortgage Securities, Ser 2003-E, Cl 2A2 | | | | | | | | |
3.097%, 06/25/2033 (A) | | | 4,601 | | | | 4,576 | |
Banc of America Mortgage Securities, Ser 2003-I, Cl 2A6 | | | | | | | | |
2.984%, 10/25/2033 (A) | | | 5,520 | | | | 5,582 | |
Banc of America Mortgage Securities, Ser 2005-A, Cl 2A1 | | | | | | | | |
2.949%, 02/25/2035 (A) | | | 64 | | | | 61 | |
Banc of America Mortgage Trust, Ser 2003-F, Cl 2A3 | | | | | | | | |
2.748%, 07/25/2033 (A) | | | 2,629 | | | | 2,626 | |
Banc of America Mortgage Trust, Ser 2003-K, Cl 2A1 | | | | | | | | |
2.972%, 12/25/2033 (A) | | | 2,736 | | | | 2,692 | |
| | | | |
| SEI Institutional Investments Trust / Annual Report / May 31, 2016 | | | 73 | |
SCHEDULE OF INVESTMENTS
Opportunistic Income Fund (Continued)
May 31, 2016
| | | | | | | | |
| Description | | Face Amount
($ Thousands) | | | Market Value
($ Thousands) | |
| | | | | | | | |
Banc of America Mortgage Trust, Ser 2004-A, Cl 2A2 | | | | | | | | |
2.945%, 02/25/2034 (A) | | $ | 3,753 | | | $ | 3,556 | |
Banc of America Mortgage Trust, Ser 2004-C, Cl 2A1 | | | | | | | | |
3.198%, 04/25/2034 (A) | | | 1,380 | | | | 1,370 | |
Banc of America Mortgage Trust, Ser 2004-L, Cl 1A1 | | | | | | | | |
2.928%, 01/25/2035 (A) | | | 837 | | | | 829 | |
Bayview Commercial Asset Trust, Ser 2003-2, Cl A | | | | | | | | |
1.316%, 12/25/2033 (A)(B) | | | 1,979 | | | | 1,815 | |
Bayview Commercial Asset Trust, Ser 2004-1, Cl A | | | | | | | | |
0.806%, 04/25/2034 (A)(B) | | | 4,324 | | | | 4,055 | |
Bayview Commercial Asset Trust, Ser 2004-2, Cl A | | | | | | | | |
0.876%, 08/25/2034 (A)(B) | | | 2,602 | | | | 2,367 | |
Bayview Commercial Asset Trust, Ser 2005-1A, Cl A2 | | | | | | | | |
0.796%, 04/25/2035 (A)(B) | | | 2,845 | | | | 2,551 | |
BCAP LLC Trust, Ser 2009-RR2, Cl A1 | | | | | | | | |
3.162%, 01/21/2038 (A)(B) | | | 225 | | | | 225 | |
Bear Stearns Alt-A Trust, Ser 2003-5, Cl 2A1 | | | | | | | | |
2.741%, 12/25/2033 (A) | | | 3,062 | | | | 3,059 | |
Bear Stearns Alt-A Trust, Ser 2004-7, Cl 2A1 | | | | | | | | |
2.777%, 08/25/2034 (A) | | | 4,021 | | | | 4,027 | |
Bear Stearns ARM Trust, Ser 2003-8, Cl 4A1 | | | | | | | | |
2.904%, 01/25/2034 (A) | | | 5,169 | | | | 5,137 | |
Bear Stearns ARM Trust, Ser 2004-1, Cl 12A3 | | | | | | | | |
2.855%, 04/25/2034 (A) | | | 2,999 | | | | 2,956 | |
Bear Stearns ARM Trust, Ser 2004-1, Cl 21A1 | | | | | | | | |
2.673%, 04/25/2034 (A) | | | 890 | | | | 881 | |
Bear Stearns ARM Trust, Ser 2004-5, Cl 2A | | | | | | | | |
3.271%, 07/25/2034 (A) | | | 3,451 | | | | 3,436 | |
Bear Stearns ARM Trust, Ser 2004-9, Cl 22A1 | | | | | | | | |
3.271%, 11/25/2034 (A) | | | 1,156 | | | | 1,111 | |
Bear Stearns ARM Trust, Ser 2005-2, Cl A2 | | | | | | | | |
2.924%, 03/25/2035 (A) | | | 2,892 | | | | 2,911 | |
Bear Stearns ARM Trust, Ser 2005-2, Cl A1 | | | | | | | | |
3.090%, 03/25/2035 (A) | | | 3,275 | | | | 3,266 | |
Bear Stearns ARM Trust, Ser 2005-5, Cl A2 | | | | | | | | |
2.460%, 08/25/2035 (A) | | | 6,211 | | | | 6,186 | |
Bear Stearns Commercial Mortgage Securities Trust, Ser 2006-PW11, Cl AM | | | | | | | | |
5.621%, 03/11/2039 (A) | | | 68 | | | | 67 | |
Bear Stearns Commercial Mortgage Securities Trust, Ser 2006-PW13, Cl A4 | | | | | | | | |
5.540%, 09/11/2041 | | | 109 | | | | 109 | |
Bear Stearns Commercial Mortgage Securities Trust, Ser 2006-PW14, Cl A4 | | | | | | | | |
5.201%, 12/11/2038 | | | 488 | | | | 492 | |
| | | | | | | | |
| Description | | Face Amount
($ Thousands) | | | Market Value
($ Thousands) | |
| | | | | | | | |
Bear Stearns Commercial Mortgage Securities Trust, Ser 2007-T26, Cl AM | | | | | | | | |
5.513%, 01/12/2045 (A) | | $ | 4,000 | | | $ | 4,078 | |
Bear Stearns Mortgage Funding Trust, Ser 2006-SL5, Cl 1A | | | | | | | | |
0.739%, 12/25/2036 (A) | | | 37 | | | | 67 | |
BHMS Mortgage Trust,
Ser 2014-ATLS, Cl BFL | | | | | | | | |
2.386%, 07/05/2033 (A) (B) | | | 2,000 | | | | 1,962 | |
BOCA Hotel Portfolio Trust, Ser 2013-BOCA, Cl C | | | | | | | | |
2.585%, 08/15/2026 (A) (B) | | | 3,600 | | | | 3,603 | |
BXHTL Mortgage Trust,
Ser 2015-JWRZ, Cl GL1 | | | | | | | | |
3.285%, 05/15/2029 (A) (B) | | | 5,800 | | | | 5,572 | |
Carefree Portfolio Trust,
Ser 2014-CARE, Cl B | | | | | | | | |
2.284%, 11/15/2019 (A) (B) | | | 3,000 | | | | 2,994 | |
Carefree Portfolio Trust, Ser 2014-CARE, Cl A | | | | | | | | |
1.754%, 11/15/2019 (A) (B) | | | 4,077 | | | | 4,069 | |
CD Mortgage Trust,
Ser 2007-CD5, Cl A4 | | | | | | | | |
5.886%, 11/15/2044 (A) | | | 786 | | | | 813 | |
CGBAM Commercial Mortgage Trust, Ser 2014- HD, Cl D | | | | | | | | |
2.434%, 02/15/2031 (A) (B) | | | 2,000 | | | | 1,943 | |
Chase Mortgage Finance Trust, Ser 2005-A1, Cl 2A3 | | | | | | | | |
2.673%, 12/25/2035 (A) | | | 1,464 | | | | 1,327 | |
Chase Mortgage Finance Trust, Ser 2007-A1, Cl 1A3 | | | | | | | | |
2.846%, 02/25/2037 (A) | | | 1,296 | | | | 1,276 | |
Chase Mortgage Finance Trust, Ser 2007-A1, Cl 7A1 | | | | | | | | |
2.765%, 02/25/2037 (A) | | | 1,396 | | | | 1,391 | |
Chase Mortgage Finance Trust, Ser 2007-A2, Cl 2A3 | | | | | | | | |
2.713%, 07/25/2037 (A) | | | 1,911 | | | | 1,922 | |
CHL Mortgage Pass-Through Trust, Ser 2003-46, Cl 2A1 | | | | | | | | |
2.871%, 01/19/2034 (A) | | | 2,712 | | | | 2,677 | |
CHL Mortgage Pass-Through Trust, Ser 2004-11, Cl 2A1 | | | | | | | | |
2.472%, 07/25/2034 (A) | | | 767 | | | | 755 | |
CHL Mortgage Pass-Through Trust, Ser 2004-8, Cl 2A1 | | | | | | | | |
4.500%, 06/25/2019 | | | 353 | | | | 359 | |
Citicorp Mortgage Securities REMIC Pass- Through Certificates Trust,
Ser 2005-4, Cl 2A1 | | | | | | | | |
5.000%, 07/25/2020 | | | 70 | | | | 72 | |
Citigroup Commercial Mortgage Trust, Ser 2008-C7, Cl A4 | | | | | | | | |
6.140%, 12/10/2049 (A) | | | 636 | | | | 662 | |
Citigroup Commercial Mortgage Trust, Ser 2012-GC8, Cl A1 | | | | | | | | |
0.685%, 09/10/2045 | | | 25 | | | | 25 | |
| | |
| 74 | | SEI Institutional Investments Trust / Annual Report / May 31, 2016 |
| | | | | | | | |
| Description | | Face Amount
($ Thousands) | | | Market Value
($ Thousands) | |
| | | | | | | | |
Citigroup Commercial Mortgage Trust, Ser 2014-388G, Cl A | | | | | | | | |
1.185%, 06/15/2033 (A) (B) | | $ | 6,875 | | | $ | 6,875 | |
Citigroup Commercial Mortgage Trust, Ser 2014-388G, Cl F | | | | | | | | |
3.585%, 06/15/2033 (A) (B) | | | 500 | | | | 498 | |
Citigroup Commercial Mortgage Trust, Ser 2014-388G, Cl D | | | | | | | | |
2.185%, 06/15/2033 (A) (B) | | | 7,000 | | | | 6,758 | |
Citigroup Deutsche Bank Commercial Mortgage,
Ser 2007-CD4, Cl A4 | | | | | | | | |
5.322%, 12/11/2049 | | | 784 | | | | 794 | |
Citigroup Mortgage Loan Trust, Ser 2007-AR5, Cl 1A2A | | | | | | | | |
2.992%, 04/25/2037 (A) | | | 971 | | | | 878 | |
Citigroup Mortgage Loan Trust, Ser 2008-AR4, Cl 2A1A | | | | | | | | |
3.631%, 11/25/2038 (A) (B) | | | 2,148 | | | | 2,151 | |
COBALT CMBS Commercial Mortgage Trust, Ser 2007-C2, Cl AMFX | | | | | | | | |
5.526%, 04/15/2047 (A) | | | 1,800 | | | | 1,844 | |
COMM Mortgage Trust, Ser 2006-C8, Cl AM | | | | | | | | |
5.347%, 12/10/2046 | | | 5,450 | | | | 5,518 | |
COMM Mortgage Trust, Ser 2006-C8, Cl A4 | | | | | | | | |
5.306%, 12/10/2046 | | | 2,037 | | | | 2,056 | |
COMM Mortgage Trust, Ser 2007-C9, Cl AJFL | | | | | | | | |
1.128%, 12/10/2049 (A) (B) | | | 11,710 | | | | 11,042 | |
COMM Mortgage Trust, Ser 2012-CR4, Cl A1 | | | | | | | | |
0.704%, 10/15/2045 | | | 23 | | | | 23 | |
COMM Mortgage Trust, Ser 2013-CR10, Cl XA, IO | | | | | | | | |
0.955%, 08/10/2046 (A) | | | 47,583 | | | | 1,952 | |
COMM Mortgage Trust, Ser 2013-CR10, Cl A1 | | | | | | | | |
1.278%, 08/10/2046 | | | 124 | | | | 123 | |
COMM Mortgage Trust, Ser 2013-CR9, Cl A1 | | | | | | | | |
1.344%, 07/10/2045 | | | 9 | | | | 9 | |
COMM Mortgage Trust, Ser 2014-BBG, Cl A | | | | | | | | |
1.235%, 03/15/2029 (A) (B) | | | 4,480 | | | | 4,396 | |
COMM Mortgage Trust, Ser 2014-CR15, Cl A2 | | | | | | | | |
2.928%, 02/10/2047 | | | 1,325 | | | | 1,360 | |
COMM Mortgage Trust, Ser 2014-KYO, Cl C | | | | | | | | |
2.089%, 06/11/2027 (A) (B) | | | 2,270 | | | | 2,241 | |
COMM Mortgage Trust, Ser 2014-PAT, Cl C | | | | | | | | |
2.085%, 08/13/2027 (A) (B) | | | 2,000 | | | | 1,944 | |
COMM Mortgage Trust, Ser 2014-TWC, Cl D | | | | | | | | |
2.686%, 02/13/2032 (A) (B) | | | 3,435 | | | | 3,331 | |
Commercial Mortgage Pass-Through Certificates, Ser 2007-C9, Cl A4 | | | | | | | | |
5.813%, 12/10/2049 (A) | | | 5,457 | | | | 5,646 | |
Commercial Mortgage Pass-Through Certificates, Ser 2014-CR14, Cl XA, IO | | | | | | | | |
1.006%, 02/10/2047 (A) | | | 36,370 | | | | 1,332 | |
| | | | | | | | |
| Description | | Face Amount
($ Thousands) | | | Market Value
($ Thousands) | |
| | | | | | | | |
Commercial Mortgage Pass-Through Certificates, Ser TWC, Cl A | | | | | | | | |
1.286%, 02/13/2032 (A) (B) | | $ | 5,000 | | | $ | 4,959 | |
Commercial Mortgage Trust, Ser 2007-GG11, Cl AM | | | | | | | | |
5.867%, 12/10/2049 (A) | | | 3,300 | | | | 3,381 | |
Commercial Mortgage Trust, Ser 2007-GG9, Cl A4 | | | | | | | | |
5.444%, 03/10/2039 | | | 2,258 | | | | 2,288 | |
Credit Suisse Commercial Mortgage Trust, Ser 2007-C2, Cl AMFL | | | | | | | | |
0.664%, 01/15/2049 (A) | | | 7,110 | | | | 6,837 | |
Credit Suisse Commercial Mortgage Trust, Ser 2007-C2, Cl AM | | | | | | | | |
5.604%, 01/15/2049 (A) | | | 2,652 | | | | 2,701 | |
Credit Suisse Commercial Mortgage Trust, Ser 2007-C4, Cl A4 | | | | | | | | |
5.942%, 09/15/2039 (A) | | | 1,279 | | | | 1,320 | |
Credit Suisse First Boston Mortgage Securities, Ser 2004-AR5, Cl 6A1 | | | | | | | | |
2.917%, 06/25/2034 (A) | | | 7,489 | | | | 7,435 | |
Credit Suisse First Boston Mortgage Securities, Ser 2004-AR8, Cl 6A1 | | | | | | | | |
2.550%, 09/25/2034 (A) | | | 2,054 | | | | 2,026 | |
Credit Suisse Mortgage Capital Certificates, Ser 2006-C3, Cl AM | | | | | | | | |
5.807%, 06/15/2038 (A) | | | 1,773 | | | | 1,770 | |
Credit Suisse Mortgage Capital Certificates, Ser 2006-C4, Cl AM | | | | | | | | |
5.509%, 09/15/2039 | | | 5,000 | | | | 5,022 | |
Credit Suisse Mortgage Capital Certificates, Ser 2006-C4, Cl A3 | | | | | | | | |
5.467%, 09/15/2039 | | | 140 | | | | 140 | |
CSMC Trust, Ser 2015-SAND, Cl C | | | | | | | | |
2.585%, 08/15/2030 (A) (B) | | | 1,000 | | | | 973 | |
CSMC Trust, Ser 2015-SAND, Cl D | | | | | | | | |
3.284%, 08/15/2030 (A) (B) | | | 1,847 | | | | 1,791 | |
DBUBS Mortgage Trust, Ser 2011-LC1A, Cl A1 | | | | | | | | |
3.742%, 11/10/2046 (B) | | | 6 | | | | 6 | |
DBUBS Mortgage Trust, Ser 2011-LC2A, Cl XA, IO | | | | | | | | |
1.327%, 07/10/2044 (A) (B) | | | 31,934 | | | | 1,174 | |
Deutsche Mortgage Securities Mortgage Loan | | | | | | | | |
Trust, Ser 2004-4, Cl 2AR1 | | | | | | | | |
0.716%, 06/25/2034 (A) | | | 4,165 | | | | 3,935 | |
DSLA Mortgage Loan Trust, Ser 2004-AR1, Cl A2A | | | | | | | | |
1.259%, 09/19/2044 (A) | | | 2,242 | | | | 2,128 | |
DSLA Mortgage Loan Trust, Ser 2004-AR1, Cl A1A | | | | | | | | |
1.279%, 09/19/2044 (A) | | | 863 | | | | 794 | |
| | | | |
| SEI Institutional Investments Trust / Annual Report / May 31, 2016 | | | 75 | |
SCHEDULE OF INVESTMENTS
Opportunistic Income Fund (Continued)
May 31, 2016
| | | | | | | | |
| Description | | Face Amount
($ Thousands) | | | Market Value
($ Thousands) | |
| | | | | | | | |
DSLA Mortgage Loan Trust, Ser 2004-AR4, Cl 2A1A | | | | | | | | |
0.799%, 01/19/2045 (A) | | $ | 1,481 | | | $ | 1,261 | |
FDIC Guaranteed Notes Trust, Ser 2010-S1, Cl 1A | | | | | | | | |
0.985%, 02/25/2048 (A) (B) | | | 2,141 | | | | 2,141 | |
FDIC Guaranteed Notes Trust, Ser 2010-S2, Cl 1A | | | | | | | | |
0.937%, 11/29/2037 (A) (B) | | | 709 | | | | 707 | |
FHLMC Structured Agency Credit Risk Debt Notes,
Ser 2013-DN1, Cl M1 | | | | | | | | |
3.846%, 07/25/2023 (A) | | | 578 | | | | 590 | |
FHLMC Structured Agency Credit Risk Debt Notes,
Ser 2014-DN2, Cl M1 | | | | | | | | |
1.296%, 04/25/2024 (A) | | | 212 | | | | 212 | |
FHLMC Structured Agency Credit Risk Debt Notes,
Ser 2015-DNA3, Cl M1 | | | | | | | | |
1.796%, 04/25/2028 (A) | | | 2,822 | | | | 2,827 | |
FHLMC Structured Agency Credit Risk Debt Notes,
Ser 2015-HQA1, Cl M1 | | | | | | | | |
1.696%, 03/25/2028 (A) | | | 257 | | | | 257 | |
FHLMC Structured Agency Credit Risk Debt Notes,
Ser 2016-DNA2, Cl M1 | | | | | | | | |
1.696%, 10/25/2028 (A) | | | 3,966 | | | | 3,969 | |
FHLMC Structured Agency Credit Risk Debt Notes,
Ser 2016-HQA1, Cl M1 | | | | | | | | |
2.196%, 09/25/2028 (A) | | | 3,940 | | | | 3,954 | |
FHLMC Structured Agency Credit Risk Debt Notes,
Ser 2016-HQA2, Cl M1 | | | | | | | | |
1.646%, 11/25/2028 (A) | | | 2,500 | | | | 2,501 | |
First Horizon Alternative Mortgage Securities Trust,
Ser 2005-AA3, Cl 3A1 | | | | | | | | |
2.730%, 05/25/2035 (A) | | | 352 | | | | 316 | |
FNMA Connecticut Avenue Securities,
Ser 2014-C02, Cl 1M1 | | | | | | | | |
1.396%, 05/25/2024 (A) | | | 305 | | | | 302 | |
FNMA Connecticut Avenue Securities,
Ser 2014-C02,Cl 2M1 | | | | | | | | |
1.396%, 05/25/2024 (A) | | | 191 | | | | 190 | |
FNMA Connecticut Avenue Securities, Ser 2014-C03, Cl 1M1 | | | | | | | | |
1.646%, 07/25/2024 (A) | | | 1,721 | | | | 1,718 | |
FNMA Connecticut Avenue Securities, Ser 2014- C03, Cl 2M1 | | | | | | | | |
1.646%, 07/25/2024 (A) | | | 2,956 | | | | 2,956 | |
FNMA Connecticut Avenue Securities, Ser 2015-C02, Cl 1M1 | | | | | | | | |
1.596%, 05/25/2025 (A) | | | 137 | | | | 137 | |
FNMA Connecticut Avenue Securities, Ser 2015-C04, Cl 1M1 | | | | | | | | |
2.046%, 04/25/2028 (A) | | | 3,349 | | | | 3,352 | |
| | | | | | | | |
| Description | | Face Amount
($ Thousands) | | | Market Value
($ Thousands) | |
| | | | | | | | |
FNMA Connecticut Avenue Securities, Ser 2016-C01, Cl 1M1 | | | | | | | | |
2.396%, 08/25/2028 (A) | | $ | 5,907 | | | $ | 5,927 | |
FNMA Connecticut Avenue Securities, Ser 2016-C03, Cl 1M1 | | | | | | | | |
2.446%, 10/25/2028 (A) | | | 2,987 | | | | 3,001 | |
GAHR Commercial Mortgage Trust, Ser 2015- NRF, Cl AFL1 | | | | | | | | |
1.735%, 12/15/2016 (A) (B) | | | 7,629 | | | | 7,632 | |
GMAC Mortgage Loan Trust, Ser 2003-AR2, Cl 4A1 | | | | | | | | |
3.281%, 12/19/2033 (A) | | | 815 | | | | 804 | |
GS Mortgage Securities II, Ser 2012-GCJ9, Cl A1 | | | | | | | | |
0.662%, 11/10/2045 | | | 13 | | | | 13 | |
GS Mortgage Securities Trust, Ser 2010-C2, Cl A1 | | | | | | | | |
3.849%, 12/10/2043 (B) | | | 16 | | | | 17 | |
GS Mortgage Securities Trust, Ser 2010-C2, Cl XA, IO | | | | | | | | |
0.165%, 12/10/2043 (A) (B) | | | 36,467 | | | | 241 | |
GS Mortgage Securities Trust, Ser 2011-GC3, Cl X, IO | | | | | | | | |
0.686%, 03/10/2044 (A) (B) | | | 27,337 | | | | 710 | |
GS Mortgage Securities Trust, Ser 2013-GC13, Cl A1 | | | | | | | | |
1.206%, 07/10/2046 | | | 70 | | | | 70 | |
GS Mortgage Securities Trust, Ser 2013-GC14, Cl A1 | | | | | | | | |
1.217%, 08/10/2046 | | | 132 | | | | 131 | |
GS Mortgage Securities Trust, Ser 2016-ICE2, Cl A | | | | | | | | |
2.365%, 02/15/2033 (A) (B) | | | 4,000 | | | | 4,009 | |
GSR Mortgage Loan Trust, Ser 2003-7F, Cl 5A1 | | | | | | | | |
0.846%, 10/25/2032 (A) | | | 21 | | | | 21 | |
GSR Mortgage Loan Trust, Ser 2005-AR1, Cl 1A1 | | | | | | | | |
2.990%, 01/25/2035 (A) | | | 410 | | | | 385 | |
GSR Mortgage Loan Trust, Ser 2005-AR2, Cl 1A2 | | | | | | | | |
2.974%, 04/25/2035 (A) | | | 829 | | | | 787 | |
GSR Mortgage Loan Trust, Ser 2005-AR6, Cl 3A1 | | | | | | | | |
3.058%, 09/25/2035 (A) | | | 888 | | | | 883 | |
GSR Mortgage Loan Trust, Ser 2006-AR1, Cl 2A1 | | | | | | | | |
2.931%, 01/25/2036 (A) | | | 2,048 | | | | 1,894 | |
HarborView Mortgage Loan Trust, Ser 2004-6, Cl 4A | | | | | | | | |
2.864%, 08/19/2034 (A) | | | 3,649 | | | | 3,679 | |
HarborView Mortgage Loan Trust, Ser 2004-7, Cl 2A1 | | | | | | | | |
2.551%, 11/19/2034 (A) | | | 123 | | | | 109 | |
| | |
| 76 | | SEI Institutional Investments Trust / Annual Report / May 31, 2016 |
| | | | | | | | |
| Description | | Face Amount
($ Thousands) | | | Market Value
($ Thousands) | |
| | | | | | | | |
HarborView Mortgage Loan Trust, Ser 2005-9, Cl 2A1A | | | | | | | | |
0.778%, 06/20/2035 (A) | | $ | 3,516 | | | $ | 3,107 | |
Hilton USA Trust, Ser 2013-HLF, Cl AFL | | | | | | | | |
1.436%, 11/05/2030 (A) (B) | | | 340 | | | | 340 | |
Hilton USA Trust, Ser 2013-HLF, Cl DFL | | | | | | | | |
3.186%, 11/05/2030 (A) (B) | | | 4,647 | | | | 4,644 | |
Hilton USA Trust, Ser 2013-HLF, Cl BFL | | | | | | | | |
1.936%, 11/05/2030 (A) (B) | | | 2,720 | | | | 2,720 | |
Hilton USA Trust, Ser 2013-HLF, Cl CFL | | | | | | | | |
2.336%, 11/05/2030 (A) (B) | | | 2,267 | | | | 2,267 | |
HSI Asset Securitization Trust, Ser 2005-NC1, Cl 2A4 | | | | | | | | |
1.086%, 07/25/2035 (A) | | | 858 | | | | 858 | |
Hudsons Bay Simon JV Trust, Ser 2015-HBFL, Cl BFL | | | | | | | | |
2.586%, 08/05/2034 (A) (B) | | | 2,000 | | | | 1,963 | |
Hudsons Bay Simon JV Trust, Ser 2015-HBFL, Cl CFL | | | | | | | | |
2.986%, 08/05/2034 (A) (B) | | | 2,500 | | | | 2,436 | |
Hyatt Hotel Portfolio Trust, Ser 2015-HYT, Cl E | | | | | | | | |
4.234%, 11/15/2029 (A) (B) | | | 4,780 | | | | 4,698 | |
Impac CMB Trust, Ser 2004-10, Cl 4M1 | | | | | | | | |
1.346%, 03/25/2035 (A) | | | 200 | | | | 163 | |
Impac Secured Assets Trust, Ser 2007-2, Cl 2A | | | | | | | | |
0.696%, 04/25/2037 (A) | | | 1,363 | | | | 1,260 | |
IndyMac INDA Mortgage Loan Trust, Ser 2007- AR3, Cl 1A1 | | | | | | | | |
3.161%, 07/25/2037 (A) | | | 3,045 | | | | 2,692 | |
JPMorgan Chase Commercial Mortgage Securities Trust, Ser 2007-LD12, Cl A4 | | | | | | | | |
5.882%, 02/15/2051 (A) | | | 620 | | | | 637 | |
JPMorgan Chase Commercial Mortgage Securities, Ser 2006-LDP8, Cl AM | | | | | | | | |
5.440%, 05/15/2045 | | | 5,894 | | | | 5,911 | |
JPMorgan Chase Commercial Mortgage Securities, Ser 2007-CB18, Cl A4 | | | | | | | | |
5.440%, 06/12/2047 | | | 6,065 | | | | 6,154 | |
JPMorgan Chase Commercial Mortgage Securities, Ser 2010-C1, Cl A1 | | | | | | | | |
3.853%, 06/15/2043 (B) | | | 2 | | | | 2 | |
JPMorgan Chase Commercial Mortgage Securities, Ser 2010-C2, Cl A1 | | | | | | | | |
2.749%, 11/15/2043 (B) | | | 4 | | | | 5 | |
JPMorgan Chase Commercial Mortgage Securities, Ser 2010-CNTR, Cl XA, IO | | | | | | | | |
1.991%, 08/05/2032 (A) (B) | | | 13,959 | | | | 822 | |
JPMorgan Chase Commercial Mortgage Securities, Ser 2011-C3, Cl XA, IO | | | | | | | | |
1.046%, 02/15/2046 (A) (B) | | | 28,318 | | | | 914 | |
JPMorgan Chase Commercial Mortgage Securities, Ser 2012-C8, Cl XA, IO | | | | | | | | |
2.035%, 10/15/2045 (A) | | | 13,574 | | | | 1,044 | |
| | | | | | | | |
| Description | | Face Amount
($ Thousands) | | | Market Value
($ Thousands) | |
| | | | | | | | |
JPMorgan Chase Commercial Mortgage Securities, Ser 2013-C13, Cl A1 | | | | | | | | |
1.303%, 01/15/2046 | | $ | 90 | | | $ | 90 | |
JPMorgan Chase Commercial Mortgage Securities, Ser 2014-BXH, Cl A | | | | | | | | |
1.335%, 04/15/2027 (A) (B) | | | 3,340 | | | | 3,257 | |
JPMorgan Chase Commercial Mortgage Securities, Ser 2014-INN, Cl D | | | | | | | | |
2.784%, 06/15/2029 (A) (B) | | | 3,000 | | | | 2,916 | |
JPMorgan Chase Commercial Mortgage Securities, Ser 2015-CSMO, Cl A | | | | | | | | |
1.685%, 01/15/2032 (A) (B) | | | 2,115 | | | | 2,109 | |
JPMorgan Mortgage Trust, Ser 2004-S1, Cl 1A4 | | | | | | | | |
4.500%, 09/25/2034 | | | 408 | | | | 414 | |
JPMorgan Mortgage Trust, Ser 2005-A3, Cl 6A5 | | | | | | | | |
3.000%, 06/25/2035 (A) | | | 1,468 | | | | 1,423 | |
JPMorgan Mortgage Trust, Ser 2005-A3, Cl 6A2 | | | | | | | | |
3.000%, 06/25/2035 (A) | | | 1,454 | | | | 1,409 | |
JPMorgan Mortgage Trust, Ser 2005-A4, Cl 2A1 | | | | | | | | |
2.933%, 07/25/2035 (A) | | | 274 | | | | 271 | |
JPMorgan Mortgage Trust, Ser 2005-A4, Cl 4A2 | | | | | | | | |
2.939%, 07/25/2035 (A) | | | 5,530 | | | | 5,459 | |
JPMorgan Mortgage Trust, Ser 2006-A2, Cl 5A3 | | | | | | | | |
2.680%, 11/25/2033 (A) | | | 692 | | | | 693 | |
JPMorgan Mortgage Trust, Ser 2007-A1, Cl 1A1 | | | | | | | | |
2.789%, 07/25/2035 (A) | | | 3,818 | | | | 3,782 | |
JPMorgan Mortgage Trust, Ser 2007-A1, Cl 4A2 | | | | | | | | |
2.714%, 07/25/2035 (A) | | | 975 | | | | 973 | |
JPMorgan Mortgage Trust, Ser 2007-A1, Cl 5A2 | | | | | | | | |
2.827%, 07/25/2035 (A) | | | 1,051 | | | | 1,061 | |
JPMorgan Mortgage Trust, Ser 2007-A4, Cl 1A1 | | | | | | | | |
2.919%, 06/25/2037 (A) | | | 113 | | | | 98 | |
JPMorgan Resecuritization Trust, Ser 2009-12, Cl 6A1 | | | | | | | | |
2.900%, 10/26/2035 (A) (B) | | | 1,958 | | | | 1,965 | |
LB Commercial Mortgage Trust, Ser 2007-C3, Cl A4 | | | | | | | | |
5.923%, 07/15/2044 (A) | | | 644 | | | | 669 | |
LB-UBS Commercial Mortgage Trust, Ser 2006- C4, Cl AM | | | | | | | | |
5.878%, 06/15/2038 (A) | | | 5,550 | | | | 5,550 | |
LB-UBS Commercial Mortgage Trust, Ser 2007- C1, Cl A4 | | | | | | | | |
5.424%, 02/15/2040 | | | 3,748 | | | | 3,799 | |
LB-UBS Commercial Mortgage Trust, Ser 2007- C2, Cl A3 | | | | | | | | |
5.430%, 02/15/2040 | | | 2,352 | | | | 2,390 | |
LB-UBS Commercial Mortgage Trust, Ser 2007- C2, Cl AM | | | | | | | | |
5.493%, 02/15/2040 (A) | | | 1,927 | | | | 1,952 | |
| | | | |
| SEI Institutional Investments Trust / Annual Report / May 31, 2016 | | | 77 | |
SCHEDULE OF INVESTMENTS
Opportunistic Income Fund (Continued)
May 31, 2016
| | | | | | | | |
| Description | | Face Amount
($ Thousands) | | | Market Value
($ Thousands) | |
| | | | | | | | |
LB-UBS Commercial Mortgage Trust, Ser 2007- C6, Cl A4 | | | | | | | | |
5.858%, 07/15/2040 (A) | | $ | 695 | | | $ | 708 | |
LB-UBS Commercial Mortgage Trust, Ser 2008-C1, Cl A2 | | | | | | | | |
6.085%, 04/15/2041 (A) | | | 519 | | | | 546 | |
LB-UBS Commercial Mortgage Trust, Ser 2009-C7, Cl A3 | | | | | | | | |
5.347%, 11/15/2038 | | | 920 | | | | 924 | |
MASTR Adjustable Rate Mortgages Trust, Ser 2005-6, Cl 5A1 | | | | | | | | |
2.820%, 07/25/2035 (A) | | | 114 | | | | 99 | |
MASTR Alternative Loan Trust, Ser 2003-5, Cl 4A1 | | | | | | | | |
5.500%, 07/25/2033 | | | 3,426 | | | | 3,572 | |
Mellon Residential Funding, Ser 1999-TBC3, Cl A2 | | | | | | | | |
2.610%, 10/20/2029 (A) | | | 411 | | | | 409 | |
Mellon Residential Funding, Ser 2001-TBC1, Cl A1 | | | | | | | | |
1.135%, 11/15/2031 (A) | | | 2,857 | | | | 2,647 | |
Merrill Lynch Mortgage Investors Trust, Ser 2003-D, Cl A | | | | | | | | |
1.066%, 08/25/2028 (A) | | | 2,458 | | | | 2,343 | |
Merrill Lynch Mortgage Investors Trust, Ser 2003-G, Cl A1 | | | | | | | | |
1.086%, 01/25/2029 (A) | | | 909 | | | | 865 | |
Merrill Lynch Mortgage Investors Trust, Ser 2004-1, Cl 2A1 | | | | | | | | |
2.459%, 12/25/2034 (A) | | | 1,786 | | | | 1,783 | |
Merrill Lynch Mortgage Investors Trust, Ser 2005-2, Cl 2A | | | | | | | | |
2.520%, 10/25/2035 (A) | | | 2,707 | | | | 2,555 | |
Merrill Lynch Mortgage Investors Trust, Ser 2005-A2, Cl A2 | | | | | | | | |
2.644%, 02/25/2035 (A) | | | 2,682 | | | | 2,674 | |
Merrill Lynch Mortgage Investors Trust, Ser 2005-A4, Cl 1A | | | | | | | | |
2.804%, 07/25/2035 (A) | | | 915 | | | | 721 | |
ML-CFC Commercial Mortgage Trust, Ser 2006-4, Cl A3 | | | | | | | | |
5.172%, 12/12/2049 | | | 824 | | | | 829 | |
ML-CFC Commercial Mortgage Trust, Ser 2006-4, Cl AM | | | | | | | | |
5.204%, 12/12/2049 | | | 3,000 | | | | 3,031 | |
ML-CFC Commercial Mortgage Trust, Ser 2007-5, Cl A4 | | | | | | | | |
5.378%, 08/12/2048 | | | 3,103 | | | | 3,146 | |
ML-CFC Commercial Mortgage Trust, Ser 2007-5, Cl AMFL | | | | | | | | |
0.615%, 08/12/2048 (A) (B) | | | 2,690 | | | | 2,581 | |
| | | | | | | | |
| Description | | Face Amount
($ Thousands) | | | Market Value
($ Thousands) | |
| | | | | | | | |
Morgan Stanley Capital I Trust, Ser 2007-IQ14, Cl A1A | | | | | | | | |
5.665%, 04/15/2049 (A) | | $ | 3,926 | | | $ | 4,033 | |
Morgan Stanley Capital I Trust, Ser 2015-XLF1, Cl B | | | | | | | | |
2.185%, 08/14/2031 (A) (B) | | | 2,750 | | | | 2,740 | |
Morgan Stanley Capital I,
Ser 2006-IQ12, Cl A4 | | | | | | | | |
5.332%, 12/15/2043 | | | 770 | | | | 774 | |
Morgan Stanley Capital I,
Ser 2007-IQ14, Cl A4 | | | | | | | | |
5.692%, 04/15/2049 (A) | | | 1,208 | | | | 1,233 | |
Morgan Stanley Capital I,
Ser 2007-T25, Cl A3 | | | | | | | | |
5.514%, 11/12/2049 (A) | | | 786 | | | | 794 | |
Morgan Stanley Capital I, Ser 2007-T25, Cl AJ | | | | | | | | |
5.574%, 11/12/2049 (A) | | | 5,000 | | | | 4,931 | |
Morgan Stanley Mortgage Loan Trust, Ser 2004-10AR, Cl 1A | | | | | | | | |
3.172%, 11/25/2034 (A) | | | 1,625 | | | | 1,599 | |
Morgan Stanley Mortgage Loan Trust, Ser 2005-5AR, Cl 1A1 | | | | | | | | |
0.716%, 09/25/2035 (A) | | | 300 | | | | 296 | |
Morgan Stanley Re-REMIC Trust, Ser 2012-IO, Cl AXA | | | | | | | | |
1.000%, 03/27/2051 (B) | | | 49 | | | | 49 | |
MRFC Mortgage Pass-Through Trust, Ser 2002-TBC2, Cl A | | | | | | | | |
1.294%, 08/15/2032 (A) | | | 1,009 | | | | 953 | |
Nomura Asset Acceptance Alternative Loan Trust,
Ser 2004-AP3, Cl A6 | | | | | | | | |
4.793%, 10/25/2034 | | | 622 | | | | 638 | |
Nomura Asset Acceptance Alternative Loan Trust, Ser 2004-AR4, Cl M1 | | | | | | | | |
1.046%, 12/25/2034 (A) | | | 4,806 | | | | 4,462 | |
Nomura Resecuritization Trust, Ser 2014-6R, Cl 5A1 | | | | | | | | |
2.565%, 04/26/2037 (A) (B) | | | 2,786 | | | | 2,800 | |
Nomura Resecuritization Trust, Ser 2015-1R, Cl 5A1 | | | | | | | | |
1.366%, 06/26/2046 (A) (B) | | | 4,595 | | | | 4,434 | |
Nomura Resecuritization Trust, Ser 2015-2R, Cl 5A1 | | | | | | | | |
1.146%, 04/26/2047 (A) (B) | | | 2,083 | | | | 1,980 | |
Nomura Resecuritization Trust, Ser 2015-4R, Cl 3A2 | | | | | | | | |
2.475%, 01/26/2036 (A) (B) | | | 6,384 | | | | 6,246 | |
PHH Mortgage Capital LLC, Ser 2008-CIM2, Cl 1A1 | | | | | | | | |
2.689%, 07/25/2038 (A) | | | 1,770 | | | | 1,713 | |
Provident Funding Mortgage Loan Trust, Ser 2003-1, Cl A | | | | | | | | |
2.745%, 08/25/2033 (A) | | | 2,294 | | | | 2,347 | |
Provident Funding Mortgage Loan Trust, Ser 2005-2, Cl 3A | | | | | | | | |
2.731%, 10/25/2035 (A) | | | 1,834 | | | | 1,814 | |
| | |
| 78 | | SEI Institutional Investments Trust / Annual Report / May 31, 2016 |
| | | | | | | | |
| Description | | Face Amount
($ Thousands) | | | Market Value
($ Thousands) | |
| | | | | | | | |
Provident Funding Mortgage Loan Trust, Ser 2005-2, Cl 2A1A | | | | | | | | |
2.812%, 10/25/2035 (A) | | $ | 1,867 | | | $ | 1,848 | |
RALI Trust, Ser 2006-QO10, Cl A1 | | | | | | | | |
0.606%, 01/25/2037 (A) | | | 5,042 | | | | 3,958 | |
RALI Trust, Ser 2007-QO3, Cl A1 | | | | | | | | |
0.606%, 03/25/2047 (A) | | | 1,480 | | | | 1,213 | |
RBSSP Resecuritization Trust, Ser 2009-7, Cl 2A5 | | | | | | | | |
3.785%, 09/26/2035 (A) (B) | | | 2,014 | | | | 2,023 | |
Residential Asset Securitization Trust, Ser 2007-A8, Cl 3A1 | | | | | | | | |
6.236%, 08/25/2022 (A) | | | 908 | | | | 792 | |
Sequoia Mortgage Trust, Ser 2002-10, Cl 1A | | | | | | | | |
1.239%, 10/20/2027 (A) | | | 1,127 | | | | 1,098 | |
Sequoia Mortgage Trust, Ser 2002-9, Cl 1A | | | | | | | | |
1.138%, 09/20/2032 (A) | | | 439 | | | | 411 | |
Sequoia Mortgage Trust, Ser 2004-3, Cl A | | | | | | | | |
1.401%, 05/20/2034 (A) | | | 3,355 | | | | 3,181 | |
Sequoia Mortgage Trust, Ser 2004-5, Cl A1 | | | | | | | | |
2.058%, 06/20/2034 (A) | | | 2,389 | | | | 2,305 | |
Sequoia Mortgage Trust, Ser 2012-1, Cl 1A1 | | | | | | | | |
2.865%, 01/25/2042 (A) | | | 1,116 | | | | 1,122 | |
Sequoia Mortgage Trust, Ser 2013-1, Cl 1A1 | | | | | | | | |
1.450%, 02/25/2043 (A) | | | 2,064 | | | | 1,980 | |
Springleaf Mortgage Loan Trust, Ser 2013-1A, Cl A | | | | | | | | |
1.270%, 06/25/2058 (A) (B) | | | 625 | | | | 622 | |
Springleaf Mortgage Loan Trust, Ser 2013-2A, Cl A | | | | | | | | |
1.780%, 12/25/2065 (A) (B) | | | 3,087 | | | | 3,085 | |
Springleaf Mortgage Loan Trust, Ser 2013-3A, Cl A | | | | | | | | |
1.870%, 09/25/2057 (A) (B) | | | 10,103 | | | | 10,119 | |
Structured Adjustable Rate Mortgage Loan Trust, Ser 2004-2, Cl 4A2 | | | | | | | | |
2.824%, 03/25/2034 (A) | | | 2,600 | | | | 2,532 | |
Structured Adjustable Rate Mortgage Loan Trust, Ser 2004-3AC, Cl A1 | | | | | | | | |
2.711%, 03/25/2034 (A) | | | 2,329 | | | | 2,313 | |
Structured Adjustable Rate Mortgage Loan Trust, Ser 2004-9XS, Cl A | | | | | | | | |
0.816%, 07/25/2034 (A) | | | 3,926 | | | | 3,761 | |
Structured Adjustable Rate Mortgage Loan Trust, Ser 2005-7, Cl 1A3 | | | | | | | | |
2.917%, 04/25/2035 (A) | | | 2,199 | | | | 2,028 | |
Structured Asset Mortgage Investments, Ser 2004-AR5, Cl 1A1 | | | | | | | | |
1.099%, 10/19/2034 (A) | | | 2,179 | | | | 2,073 | |
Structured Asset Securities Mortgage Pass- Through Certificates, Ser 2003-17A, Cl 2A1 | | | | | | | | |
2.863%, 05/25/2033 (A) | | | 3,714 | | | | 3,712 | |
| | | | | | | | |
| Description | | Face Amount
($ Thousands) | | | Market Value
($ Thousands) | |
| | | | | | | | |
Thornburg Mortgage Securities Trust, Ser 2003-4, Cl A1 | | | | | | | | |
1.086%, 09/25/2043 (A) | | $ | 2,150 | | | $ | 2,063 | |
Thornburg Mortgage Securities Trust, Ser 2007-1, Cl A2B | | | | | | | | |
2.603%, 03/25/2037 (A) | | | 2,412 | | | | 2,096 | |
Towd Point Mortgage Trust, Ser 2015-2, Cl 2A1 | | | | | | | | |
3.750%, 11/25/2057 (A) (B) | | | 2,926 | | | | 2,999 | |
Towd Point Mortgage Trust, Ser 2015-4, Cl A1B | | | | | | | | |
2.750%, 04/25/2055 (A) (B) | | | 211 | | | | 212 | |
Towd Point Mortgage Trust, Ser 2015-5, Cl A1B | | | | | | | | |
2.750%, 05/25/2055 (A) (B) | | | 245 | | | | 246 | |
Towd Point Mortgage Trust, Ser 2016-1, Cl A1B | | | | | | | | |
2.750%, 02/25/2055 (A) (B) | | | 210 | | | | 210 | |
UBS Commercial Mortgage Trust, Ser 2012-C1, Cl XA, IO | | | | | | | | |
2.172%, 05/10/2045 (A) (B) | | | 11,824 | | | | 1,086 | |
UBS-Barclays Commercial Mortgage Trust, Ser 2012-C3, Cl A1 | | | | | | | | |
0.726%, 08/10/2049 | | | 35 | | | | 35 | |
UBS-Barclays Commercial Mortgage Trust, Ser 2012-C4, Cl A1 | | | | | | | | |
0.673%, 12/10/2045 | | | 17 | | | | 17 | |
UBS-Barclays Commercial Mortgage Trust, Ser 2013-C5, Cl A1 | | | | | | | | |
0.779%, 03/10/2046 | | | 105 | | | | 104 | |
Wachovia Bank Commercial Mortgage Trust, Ser 2006-C26, Cl A3 | | | | | | | | |
6.011%, 06/15/2045 (A) | | | 161 | | | | 160 | |
Wachovia Bank Commercial Mortgage Trust, Ser 2006-C28, Cl AM | | | | | | | | |
5.603%, 10/15/2048 (A) | | | 5,390 | | | | 5,434 | |
Wachovia Bank Commercial Mortgage Trust, Ser 2007-C30, Cl AM | | | | | | | | |
5.383%, 12/15/2043 | | | 1,028 | | | | 1,046 | |
Wachovia Bank Commercial Mortgage Trust, Ser 2007-C30, Cl A5 | | | | | | | | |
5.342%, 12/15/2043 | | | 2,799 | | | | 2,848 | |
Wachovia Bank Commercial Mortgage Trust, Ser 2007-C31, Cl AM | | | | | | | | |
5.591%, 04/15/2047 (A) | | | 3,000 | | | | 3,067 | |
Wachovia Bank Commercial Mortgage Trust, Ser 2007-C33, Cl AJ | | | | | | | | |
5.948%, 02/15/2051 (A) | | | 4,130 | | | | 4,071 | |
WaMu Mortgage Pass-Through Certificates, Ser 2003-AR10, Cl A7 | | | | | | | | |
2.536%, 10/25/2033 (A) | | | 3,302 | | | | 3,348 | |
WaMu Mortgage Pass-Through Certificates, Ser 2003-AR7, Cl A7 | | | | | | | | |
2.426%, 08/25/2033 (A) | | | 2,294 | | | | 2,291 | |
WaMu Mortgage Pass-Through Certificates, Ser 2003-AR9, Cl 1A6 | | | | | | | | |
2.523%, 09/25/2033 (A) | | | 1,705 | | | | 1,713 | |
| | | | |
| SEI Institutional Investments Trust / Annual Report / May 31, 2016 | | | 79 | |
SCHEDULE OF INVESTMENTS
Opportunistic Income Fund (Continued)
MAY 31, 2016
| | | | | | | | |
| Description | | Face Amount
($ Thousands) | | | Market Value
($ Thousands) | |
| | | | | | | | |
WaMu Mortgage Pass-Through Certificates, Ser 2004-AR1, Cl A | | | | | | | | |
2.770%, 03/25/2034 (A) | | $ | 5,696 | | | $ | 5,699 | |
WaMu Mortgage Pass-Through Certificates, Ser 2004-AR10, Cl A1B | | | | | | | | |
0.866%, 07/25/2044 (A) | | | 4,202 | | | | 3,966 | |
WaMu Mortgage Pass-Through Certificates, Ser 2004-AR11, Cl A | | | | | | | | |
2.552%, 10/25/2034 (A) | | | 2,234 | | | | 2,241 | |
WaMu Mortgage Pass-Through Certificates, Ser 2004-AR13, Cl A1A | | | | | | | | |
1.166%, 11/25/2034 (A) | | | 2,081 | | | | 1,873 | |
WaMu Mortgage Pass-Through Certificates, Ser 2004-AR13, Cl A2A | | | | | | | | |
1.186%, 11/25/2034 (A) | | | 2,883 | | | | 2,562 | |
WaMu Mortgage Pass-Through Certificates, Ser 2004-AR14, Cl A1 | | | | | | | | |
2.591%, 01/25/2035 (A) | | | 4,500 | | | | 4,491 | |
WaMu Mortgage Pass-Through Certificates, Ser 2004-AR2, Cl A | | | | | | | | |
1.810%, 04/25/2044 (A) | | | 5,372 | | | | 5,169 | |
WaMu Mortgage Pass-Through Certificates, Ser 2004-AR8, Cl A2 | | | | | | | | |
0.846%, 06/25/2044 (A) | | | 2,807 | | | | 2,583 | |
WaMu Mortgage Pass-Through Certificates, Ser 2004-CB2, Cl 1A | | | | | | | | |
5.000%, 07/25/2034 | | | 1,260 | | | | 1,309 | |
WaMu Mortgage Pass-Through Certificates, Ser 2004-CB4, Cl 22A | | | | | | | | |
6.000%, 12/25/2019 | | | 165 | | | | 169 | |
WaMu Mortgage Pass-Through Certificates, Ser 2005-AR1, Cl A1A | | | | | | | | |
1.086%, 01/25/2045 (A) | | | 2,121 | | | | 1,974 | |
WaMu Mortgage Pass-Through Certificates, Ser 2005-AR1, Cl A2A3 | | | | | | | | |
1.246%, 01/25/2045 (A) | | | 1,113 | | | | 1,014 | |
WaMu Mortgage Pass-Through Certificates, Ser 2005-AR11, Cl A1A | | | | | | | | |
0.766%, 08/25/2045 (A) | | | 2,835 | | | | 2,605 | |
WaMu Mortgage Pass-Through Certificates, Ser 2005-AR13, Cl A1A1 | | | | | | | | |
0.736%, 10/25/2045 (A) | | | 2,981 | | | | 2,749 | |
WaMu Mortgage Pass-Through Certificates, Ser 2005-AR13, Cl A1A2 | | | | | | | | |
1.860%, 10/25/2045 (A) | | | 549 | | | | 540 | |
WaMu Mortgage Pass-Through Certificates, Ser 2005-AR14, Cl 1A4 | | | | | | | | |
2.528%, 12/25/2035 (A) | | | 146 | | | | 140 | |
WaMu Mortgage Pass-Through Certificates, Ser 2005-AR17, Cl A1A1 | | | | | | | | |
0.716%, 12/25/2045 (A) | | | 2,900 | | | | 2,702 | |
| | | | | | | | |
| Description | | Face Amount
($ Thousands) | | | Market Value
($ Thousands) | |
| | | | | | | | |
WaMu Mortgage Pass-Through Certificates,
Ser 2005-AR19, Cl A1A1 | | | | | | | | |
0.716%, 12/25/2045 (A) | | $ | 252 | | | $ | 231 | |
WaMu Mortgage Pass-Through Certificates, Ser 2005-AR2, Cl 2A21 | | | | | | | | |
0.776%, 01/25/2045 (A) | | | 1,564 | | | | 1,433 | |
WaMu Mortgage Pass-Through Certificates, Ser 2005-AR6, Cl 2A1A | | | | | | | | |
0.676%, 04/25/2045 (A) | | | 5,812 | | | | 5,417 | |
WaMu Mortgage Pass-Through Certificates, Ser 2005-AR8, Cl 2A1A | | | | | | | | |
0.736%, 07/25/2045 (A) | | | 3,331 | | | | 3,113 | |
WaMu Mortgage Pass-Through Certificates, Ser 2005-AR9, Cl A1A | | | | | | | | |
1.086%, 07/25/2045 (A) | | | 2,309 | | | | 2,167 | |
WaMu Mortgage Pass-Through Certificates, Ser 2006-AR1, Cl 2A1A | | | | | | | | |
1.480%, 01/25/2046 (A) | | | 2,444 | | | | 2,328 | |
WaMu Mortgage Pass-Through Certificates, Ser 2006-AR17, Cl 1A | | | | | | | | |
1.196%, 12/25/2046 (A) | | | 1,201 | | | | 929 | |
WaMu Mortgage Pass-Through Certificates, Ser 2007-OA3, Cl 5A | | | | | | | | |
1.928%, 04/25/2047 (A) | | | 3,903 | | | | 2,937 | |
Wells Fargo Commercial Mortgage Trust, Ser 2012-LC5, Cl A1 | | | | | | | | |
0.687%, 10/15/2045 | | | 31 | | | | 31 | |
Wells Fargo Commercial Mortgage Trust, Ser 2013-C15, Cl A1 | | | | | | | | |
1.264%, 08/15/2046 | | | 68 | | | | 68 | |
Wells Fargo Mortgage-Backed Securities Trust, Ser 2003-H, Cl A1 | | | | | | | | |
2.744%, 09/25/2033 (A) | | | 1,891 | | | | 1,879 | |
Wells Fargo Mortgage-Backed Securities Trust, Ser 2003-K, Cl 1A1 | | | | | | | | |
2.615%, 11/25/2033 (A) | | | 1,208 | | | | 1,207 | |
Wells Fargo Mortgage-Backed Securities Trust, Ser 2004-E, Cl A1 | | | | | | | | |
3.079%, 05/25/2034 (A) | | | 303 | | | | 306 | |
Wells Fargo Mortgage-Backed Securities Trust, Ser 2004-K, Cl 1A2 | | | | | | | | |
2.762%, 07/25/2034 (A) | | | 1,218 | | | | 1,213 | |
Wells Fargo Mortgage-Backed Securities Trust, Ser 2004-N, Cl A7 | | | | | | | | |
2.730%, 08/25/2034 (A) | | | 3,279 | | | | 3,266 | |
Wells Fargo Mortgage-Backed Securities Trust, Ser 2004-O, Cl A1 | | | | | | | | |
2.743%, 08/25/2034 (A) | | | 2,300 | | | | 2,280 | |
Wells Fargo Mortgage-Backed Securities Trust, Ser 2004-Q, Cl 1A2 | | | | | | | | |
2.743%, 09/25/2034 (A) | | | 2,901 | | | | 2,920 | |
| | |
| 80 | | SEI Institutional Investments Trust / Annual Report / May 31, 2016 |
| | | | | | | | |
| Description | | Face Amount
($ Thousands) | | | Market Value
($ Thousands) | |
| | | | | | | | |
Wells Fargo Mortgage-Backed Securities Trust, Ser 2004-R, Cl 1A1 | | | | | | | | |
2.740%, 09/25/2034 (A) | | $ | 3,553 | | | $ | 3,578 | |
Wells Fargo Mortgage-Backed Securities Trust, Ser 2004-S, Cl A1 | | | | | | | | |
2.785%, 09/25/2034 (A) | | | 761 | | | | 773 | |
Wells Fargo Mortgage-Backed Securities Trust, Ser 2004-U, Cl A1 | | | | | | | | |
2.857%, 10/25/2034 (A) | | | 5,119 | | | | 5,076 | |
Wells Fargo Mortgage-Backed Securities Trust, Ser 2004-Y, Cl 3A1 | | | | | | | | |
2.799%, 11/25/2034 (A) | | | 3,826 | | | | 3,831 | |
Wells Fargo Mortgage-Backed Securities Trust, Ser 2004-Z, Cl 2A1 | | | | | | | | |
2.852%, 12/25/2034 (A) | | | 1,487 | | | | 1,478 | |
Wells Fargo Mortgage-Backed Securities Trust, Ser 2005-AR1, Cl 1A1 | | | | | | | | |
2.765%, 02/25/2035 (A) | | | 4,813 | | | | 4,779 | |
Wells Fargo Mortgage-Backed Securities Trust, Ser 2005-AR10, Cl 2A2 | | | | | | | | |
2.849%, 06/25/2035 (A) | | | 3,216 | | | | 3,324 | |
Wells Fargo Mortgage-Backed Securities Trust, Ser 2005-AR10, Cl 1A1 | | | | | | | | |
2.857%, 06/25/2035 (A) | | | 4,578 | | | | 4,640 | |
Wells Fargo Mortgage-Backed Securities Trust, Ser 2005-AR10, Cl 2A17 | | | | | | | | |
2.849%, 06/25/2035 (A) | | | 1,062 | | | | 1,073 | |
Wells Fargo Mortgage-Backed Securities Trust, Ser 2005-AR11, Cl 1A1 | | | | | | | | |
2.777%, 06/25/2035 (A) | | | 822 | | | | 811 | |
Wells Fargo Mortgage-Backed Securities Trust, Ser 2005-AR12, Cl 2A5 | | | | | | | | |
2.880%, 06/25/2035 (A) | | | 1,016 | | | | 1,032 | |
Wells Fargo Mortgage-Backed Securities Trust, Ser 2005-AR16, Cl 2A1 | | | | | | | | |
2.853%, 02/25/2034 (A) | | | 905 | | | | 909 | |
Wells Fargo Mortgage-Backed Securities Trust, Ser 2005-AR3, Cl 2A1 | | | | | | | | |
2.793%, 03/25/2035 (A) | | | 1,462 | | | | 1,469 | |
Wells Fargo Mortgage-Backed Securities Trust, Ser 2005-AR7, Cl 2A1 | | | | | | | | |
3.087%, 05/25/2035 (A) | | | 340 | | | | 335 | |
Wells Fargo Mortgage-Backed Securities Trust, Ser 2005-AR8, Cl 3A2 | | | | | | | | |
2.959%, 06/25/2035 (A) | | | 939 | | | | 960 | |
Wells Fargo Mortgage-Backed Securities Trust, Ser 2005-AR8, Cl 1A1 | | | | | | | | |
2.947%, 06/25/2035 (A) | | | 1,608 | | | | 1,626 | |
Wells Fargo Mortgage-Backed Securities Trust, Ser 2005-AR9, Cl 3A1 | | | | | | | | |
2.907%, 06/25/2034 (A) | | | 1,530 | | | | 1,555 | |
| | | | | | | | |
| Description | | Face Amount
($ Thousands) | | | Market Value
($ Thousands) | |
| | | | | | | | |
Wells Fargo Mortgage-Backed Securities Trust, Ser 2006-4, Cl 2A2 | | | | | | | | |
5.500%, 04/25/2036 | | $ | 873 | | | $ | 808 | |
WFCG Commercial Mortgage Trust, Ser 2015- BXRP, Cl C | | | | | | | | |
2.206%, 11/15/2029 (A)(B) | | | 1,607 | | | | 1,560 | |
WFRBS Commercial Mortgage Trust, Ser 2011- C2, Cl XA, IO | | | | | | | | |
0.806%, 02/15/2044 (A)(B) | | | 18,256 | | | | 551 | |
WFRBS Commercial Mortgage Trust, Ser 2012- C6, Cl A2 | | | | | | | | |
2.191%, 04/15/2045 | | | 502 | | | | 504 | |
WFRBS Commercial Mortgage Trust, Ser 2012- C9, Cl A1 | | | | | | | | |
0.673%, 11/15/2045 | | | 32 | | | | 32 | |
| | | | | | | | |
| | | | | | | 665,197 | |
| | | | | | | | |
Total Mortgage-Backed Securities
(Cost $797,407) ($ Thousands) | | | | 789,306 | |
| | | | | | | | |
|
LOAN PARTICIPATIONS — 25.8% | |
Acadia Healthcare Company, 1st Lien | | | | | | | | |
4.500%, 02/16/2023 | | | 3,292 | | | | 3,306 | |
3.750%, 02/11/2022 | | | 1,383 | | | | 1,386 | |
Acosta, Term Loan B, 1st Lien | | | | | | | | |
4.250%, 09/26/2021 | | | 1,967 | | | | 1,956 | |
Activision Blizzard, Term Loan B | | | | | | | | |
3.250%, 10/13/2020 | | | 320 | | | | 321 | |
Advance Pierre Foods, Cov-Lite, 1st Lien | | | | | | | | |
0.000%, 05/26/2023 (C) | | | 1,900 | | | | 1,906 | |
Affinion Group Holdings | | | | | | | | |
6.750%, 04/30/2018 | | | 6 | | | | 5 | |
Affinion Group Holdings, Tranche B | | | | | | | | |
6.750%, 04/30/2018 | | | 2,987 | | | | 2,725 | |
Air Medical, Cov-Lite, Term Loan, 1st Lien | | | | | | | | |
4.250%, 04/28/2022 | | | 5,785 | | | | 5,722 | |
Alere, Term Loan B, 1st Lien | | | | | | | | |
4.250%, 06/20/2022 | | | 6,012 | | | | 5,994 | |
Alinta Energy Finance, Delayed Term Loan | | | | | | | | |
6.375%, 08/13/2018 | | | 193 | | | | 192 | |
Alinta Ltd., Cov-Lite, 1st Lien | | | | | | | | |
6.375%, 08/13/2019 | | | 2,904 | | | | 2,883 | |
Allison Transmission, Term Loan B-3 | | | | | | | | |
3.500%, 08/23/2019 | | | 4,152 | | | | 4,163 | |
Altice France S.A., USD Term Loan B-7, 1st Lien | | | | | | | | |
5.000%, 01/15/2024 | | | 1,740 | | | | 1,744 | |
AMC Entertainment, Term Loan | | | | | | | | |
4.000%, 12/15/2022 | | | 6,338 | | | | 6,360 | |
American Builders & Contract Supply, Term Loan B | | | | | | | | |
3.500%, 04/16/2020 | | | 5,306 | | | | 5,309 | |
| | | | |
| SEI Institutional Investments Trust / Annual Report / May 31, 2016 | | | 81 | |
SCHEDULE OF INVESTMENTS
Opportunistic Income Fund (Continued)
May 31, 2016
| | | | | | | | |
| Description | | Face Amount
($ Thousands) | | | Market Value
($ Thousands) | |
| | | | | | | | |
American Renal Holdings, Term Loan, 1st Lien | | | | | | | | |
4.500%, 08/20/2019 | | $ | 5,143 | | | $ | 5,146 | |
American Tire Distributors, Cov-Lite, 2nd Lien | | | | | | | | |
5.250%, 09/01/2021 | | | 1,891 | | | | 1,836 | |
Amsurg, Cov-Lite, Term Loan | | | | | | | | |
3.500%, 07/16/2021 | | | 4,068 | | | | 4,075 | |
Applied Systems, Initial Term Loan, 1st Lien | | | | | | | | |
5.750%, 01/25/2021 | | | 40 | | | | 40 | |
Applied Systems, Term Loan, 1st Lien | | | | | | | | |
4.250%, 01/25/2021 | | | 5,677 | | | | 5,665 | |
Aramark, 1st Lien, Term Loan F | | | | | | | | |
3.937%, 02/24/2021 (A) | | | 5,023 | | | | 5,029 | |
Ardagh Holdings USA, Term Loan, 1st Lien | | | | | | | | |
4.000%, 12/17/2019 | | | 5,942 | | | | 5,952 | |
Aricent Technologies, 1st Lien | | | | | | | | |
5.500%, 04/14/2021 | | | 628 | | | | 577 | |
Aricent Technologies, Term Loan, 1st Lien | | | | | | | | |
5.500%, 04/14/2021 | | | 2,039 | | | | 1,870 | |
Asurion, LLC, Incremental Term Loan B-4, 1st Lien | | | | | | | | |
5.000%, 08/04/2022 | | | 1,576 | | | | 1,571 | |
Asurion, LLC, Term Loan B | | | | | | | | |
4.250%, 07/08/2020 | | | 990 | | | | 975 | |
Asurion, LLC, Term Loan B-1 | | | | | | | | |
5.000%, 05/24/2019 | | | 1,549 | | | | 1,550 | |
Asurion, LLC, Term Loan, 2nd Lien | | | | | | | | |
8.500%, 03/03/2021 | | | 5,650 | | | | 5,517 | |
Auris Luxembourg II, Term Loan B-4 | | | | | | | | |
4.250%, 01/17/2022 | | | 2,786 | | | | 2,788 | |
Avago Technologies, Ltd., 1st Lien | | | | | | | | |
4.250%, 02/01/2023 (A) | | | 5,744 | | | | 5,757 | |
Avago Technologies, Ltd., 2nd Lien | | | | | | | | |
4.250%, 02/01/2023 | | | 1,256 | | | | 1,259 | |
B&G Foods, 1st Lien | | | | | | | | |
3.750%, 11/02/2022 | | | 2 | | | | 2 | |
B&G Foods, Term Loan B, 1st Lien | | | | | | | | |
3.750%, 11/02/2022 | | | 841 | | | | 844 | |
B/E Aerospace, Term Loan | | | | | | | | |
4.000%, 12/16/2021 | | | 1,021 | | | | 1,025 | |
B/E Aerospace, Term Loan, 1st Lien | | | | | | | | |
4.000%, 12/16/2021 | | | 510 | | | | 512 | |
Beacon Roofing, Cov-Lite, Term Loan, 1st Lien | | | | | | | | |
4.000%, 10/01/2022 | | | 1,890 | | | | 1,893 | |
Berry Plastics, Term Loan | | | | | | | | |
3.750%, 01/06/2021 | | | 1,000 | | | | 1,003 | |
Berry Plastics, Term Loan D | | | | | | | | |
3.500%, 02/08/2020 | | | 1,940 | | | | 1,940 | |
Berry Plastics, Term Loan, 1st Lien | | | | | | | | |
4.000%, 10/03/2022 | | | 1,164 | | | | 1,168 | |
Black Knight, Cov-Lite, Term Loan, 1st Lien | | | | | | | | |
3.750%, 05/27/2022 | | | 439 | | | | 441 | |
| | | | | | | | |
| Description | | Face Amount
($ Thousands) | | | Market Value
($ Thousands) | |
| | | | | | | | |
Booz Allen Hamilton, Term Loan B1, 1st Lien | | | | | | | | |
3.750%, 07/31/2019 | | $ | 1,643 | | | $ | 1,648 | |
Boyd Acquisition, Term Loan B | | | | | | | | |
4.250%, 11/20/2017 | | | 732 | | | | 732 | |
Boyd Gaming, Term Loan B | | | | | | | | |
4.000%, 08/14/2020 | | | 3,228 | | | | 3,233 | |
Bright Horizons Family Solutions LLC, Term Loan | | | | | | | | |
5.250%, 01/30/2020 | | | — | | | | — | |
Bright Horizons Family Solutions LLC, Term Loan B | | | | | | | | |
3.750%, 01/30/2020 | | | 339 | | | | 340 | |
Burger King, Term Loan B-2, 1st Lien | | | | | | | | |
3.750%, 12/10/2021 | | | 1,499 | | | | 1,504 | |
Calpine, Term Loan, 1st Lien | | | | | | | | |
3.500%, 05/27/2022 | | | 5,060 | | | | 5,020 | |
Catalina Marketing, Cov-Lite, Term Loan | | | | | | | | |
4.500%, 04/09/2021 | | | 990 | | | | 871 | |
CCM Merger, Term Loan | | | | | | | | |
4.500%, 08/06/2021 | | | 1,784 | | | | 1,792 | |
CDW, Term Loan | | | | | | | | |
3.250%, 04/29/2020 | | | 5,157 | | | | 5,163 | |
Ceramtec Acquisition, Term Loan B1 | | | | | | | | |
4.250%, 08/30/2020 | | | 1,999 | | | | 1,999 | |
Ceramtec Acquisition, Term Loan B2 | | | | | | | | |
4.250%, 08/30/2020 | | | 217 | | | | 217 | |
Ceramtec Acquisition, Term Loan B3 | | | | | | | | |
4.250%, 08/30/2020 | | | 610 | | | | 610 | |
Ceridian, Cov-Lite | | | | | | | | |
4.500%, 09/15/2020 | | | 1 | | | | 1 | |
Ceridian, Cov-Lite, 1st Lien | | | | | | | | |
4.500%, 09/15/2020 | | | 99 | | | | 96 | |
Charter Communication Operating LLC, Term Loan E | | | | | | | | |
3.000%, 07/01/2020 | | | 2,990 | | | | 2,990 | |
Charter Communications Operating, LLC (aka CCO Safari LLC), Term I Loan (2016), 1st Lien | | | | | | | | |
3.500%, 01/24/2023 | | | 90 | | | | 90 | |
Chief Exploration, Term Loan | | | | | | | | |
7.500%, 05/16/2021 | | | 2,026 | | | | 1,631 | |
Clubcorp Club Operations, Term Loan, 1st Lien | | | | | | | | |
4.250%, 12/15/2022 | | | 1,832 | | | | 1,836 | |
Commscope, Term Loan, 1st Lien | | | | | | | | |
3.828%, 12/29/2022 | | | 3,965 | | | | 3,972 | |
Communication Sales and Leasing, Term Loan, 1st Lien | | | | | | | | |
5.000%, 10/24/2022 | | | 1,639 | | | | 1,626 | |
Constantia Flexibles, Cov-Lite, 1st Lien | | | | | | | | |
4.750%, 04/30/2022 | | | 290 | | | | 290 | |
Constantia Flexibles, Cov-Lite, Term Loan | | | | | | | | |
4.750%, 04/30/2022 | | | 1,492 | | | | 1,488 | |
ConvaTec Dollar, Term Loan | | | | | | | | |
4.250%, 06/15/2020 | | | 1,301 | | | | 1,300 | |
| | |
| 82 | | SEI Institutional Investments Trust / Annual Report / May 31, 2016 |
| | | | | | | | |
| Description | | Face Amount
($ Thousands) | | | Market Value
($ Thousands) | |
| | | | | | | | |
COTY, Term Loan | | | | | | | | |
3.750%, 01/26/2023 | | $ | 3,552 | | | $ | 3,551 | |
COTY, Term Loan B | | | | | | | | |
3.750%, 10/27/2022 | | | 1,776 | | | | 1,778 | |
Cumulus Media, 1st Lien | | | | | | | | |
4.250%, 12/23/2020 | | | 4,163 | | | | 2,945 | |
DaVita HealthCare Partners, Term Loan B | | | | | | | | |
3.500%, 06/24/2021 | | | 3,967 | | | | 3,991 | |
Dex Media West, Term Loan | | | | | | | | |
8.000%, 12/30/2016 | | | 1,730 | | | | 701 | |
Diebold, Dollar Term Loan B, 1st Lien | | | | | | | | |
5.250%, 11/06/2023 | | | 1,810 | | | | 1,812 | |
Digital Globe, Term Loan B, 1st Lien | | | | | | | | |
4.750%, 01/25/2020 | | | 728 | | | | 732 | |
Dollar Tree, Cov-Lite, Term
Loan B-1 | | | | | | | | |
3.500%, 07/06/2022 | | | 3,799 | | | | 3,817 | |
EFS Cogen, Term Loan B, 1st Lien | | | | | | | | |
3.750%, 12/17/2020 | | | 1,244 | | | | 1,244 | |
Emerald Performance Materials, LLC, Term Loan, 1st Lien | | | | | | | | |
4.500%, 07/30/2021 | | | 3,881 | | | | 3,901 | |
Emergency Medical Services, Cov-Lite, Term Loan | | | | | | | | |
4.250%, 05/25/2018 | | | 194 | | | | 194 | |
Emergency Medical Services, Initial Term Loan | | | | | | | | |
4.250%, 05/25/2018 | | | 4,170 | | | | 4,173 | |
EMI Music Publishing, Ltd., Term Loan | | | | | | | | |
4.000%, 08/19/2022 | | | 2,559 | | | | 2,557 | |
Endurance International, Term Loan B, 1st Lien | | | | | | | | |
6.480%, 11/09/2019 | | | 3,760 | | | | 3,625 | |
Energy & Exploration Partners, 1st Lien | | | | | | | | |
13.000%, 11/10/2021 | | | 376 | | | | 376 | |
5.000%, 05/13/2022 | | | 210 | | | | 210 | |
0.000%, 11/10/2021 (C)(D) | | | 145 | | | | — | |
Energy Transfer Equity, Term Loan B, 1st Lien | | | | | | | | |
3.250%, 12/02/2019 | | | 4,685 | | | | 4,514 | |
Entegris, Term Loan B, 1st Lien | | | | | | | | |
3.500%, 04/30/2021 | | | 6,599 | | | | 6,599 | |
Environmental Resources | | | | | | | | |
5.000%, 05/14/2021 | | | 435 | | | | 410 | |
Epicor, Cov-Lite, Term Loan, 1st Lien | | | | | | | | |
4.750%, 06/01/2022 | | | 1,817 | | | | 1,781 | |
Equinix | | | | | | | | |
4.000%, 01/06/2023 | | | 122 | | | | 122 | |
Equinox Fitness Clubs, Term
Loan B | | | | | | | | |
5.000%, 01/31/2020 | | | 6,393 | | | | 6,393 | |
Evergreen Skillsoft, 1st Lien | | | | | | | | |
5.750%, 04/28/2021 | | | 5,236 | | | | 4,212 | |
First Data, 2021 Extended Dollar Term Loan | | | | | | | | |
4.443%, 03/24/2021 | | | 4,792 | | | | 4,812 | |
First Data, Term Loan, 1st Lien | | | | | | | | |
4.193%, 07/08/2022 | | | 500 | | | | 501 | |
| | | | | | | | |
| Description | | Face Amount
($ Thousands) | | | Market Value
($ Thousands) | |
| | | | | | | | |
Four Seasons Holdings, Term Loan | | | | | | | | |
3.500%, 06/27/2020 | | $ | 4,878 | | | $ | 4,884 | |
Generac Power Systems, Term Loan B | | | | | | | | |
3.500%, 05/31/2020 | | | 2,416 | | | | 2,407 | |
Genesys Telecom, Term Loan | | | | | | | | |
4.000%, 02/08/2020 | | | 5,654 | | | | 5,626 | |
GNC, Term Loan, 1st Lien | | | | | | | | |
3.250%, 03/04/2019 | | | 5,188 | | | | 5,170 | |
GO Daddy, Cov-Lite, Term Loan B, 1st Lien | | | | | | | | |
4.250%, 05/13/2021 | | | 1,179 | | | | 1,183 | |
Gray Television, Cov-Lite, Term B, 1st Lien | | | | | | | | |
3.938%, 06/13/2021 | | | 632 | | | | 632 | |
Greeneden US Holdings, Delayed Draw, Term Loan, 1st Lien, Ser 2 | | | | | | | | |
4.500%, 11/13/2020 | | | 1,711 | | | | 1,713 | |
Grifols Worldwide Operations, Term Loan B, 2nd Lien | | | | | | | | |
3.454%, 02/27/2021 | | | 3,672 | | | | 3,680 | |
Harbor Freight Tools, Cov-Lite, Term Loan | | | | | | | | |
4.750%, 07/26/2019 | | | 79 | | | | 80 | |
Harbor Freight Tools, Term Loan | | | | | | | | |
4.750%, 07/26/2019 | | | 3,350 | | | | 3,366 | |
Headwaters, Term Loan B | | | | | | | | |
4.500%, 03/24/2022 | | | 2,665 | | | | 2,685 | |
Hill-Rom Holdings, Term Loan, 1st Lien | | | | | | | | |
3.500%, 09/08/2022 | | | 4,461 | | | | 4,488 | |
Hilton Hotels, Cov-Lite, Term Loan B, 1st Lien | | | | | | | | |
3.500%, 10/25/2020 (A) | | | 166 | | | | 167 | |
3.500%, 10/26/2020 (A) | | | 886 | | | | 888 | |
Hilton Worldwide Finance, Term Loan | | | | | | | | |
3.500%, 10/26/2020 | | | 709 | | | | 711 | |
Hilton Worldwide, Term Loan B, 1st Lien | | | | | | | | |
3.500%, 10/26/2020 | | | 111 | | | | 111 | |
Houghton Mifflin Harcourt Publishers, Term Loan, 1st Lien | | | | | | | | |
4.000%, 05/28/2021 | | | 2,878 | | | | 2,840 | |
HUB International, Ltd., Term Loan | | | | | | | | |
4.250%, 10/02/2020 | | | 22 | | | | 21 | |
HUB International, Ltd., Term Loan B, 1st Lien | | | | | | | | |
4.250%, 10/02/2020 | | | 8,416 | | | | 8,354 | |
Hyperion Insurance, Term Loan, 1st Lien | | | | | | | | |
5.500%, 04/29/2022 | | | 2,475 | | | | 2,401 | |
IMS Health, Term Loan B | | | | | | | | |
3.500%, 03/17/2021 | | | 4,012 | | | | 4,013 | |
Ina Beteiligungs, Term Loan, 1st Lien | | | | | | | | |
4.250%, 05/15/2020 | | | 264 | | | | 265 | |
Ineos Holdings Ltd, Cov-Lite, Term Loan, 1st Lien | | | | | | | | |
4.250%, 03/31/2022 | | | 891 | | | | 890 | |
Ineos US Finance LLC, 2020 Dollar Term Loan | | | | | | | | |
3.750%, 12/15/2020 | | | 1,480 | | | | 1,467 | |
| | | | |
| SEI Institutional Investments Trust / Annual Report / May 31, 2016 | | | 83 | |
SCHEDULE OF INVESTMENTS
Opportunistic Income Fund (Continued)
May 31, 2016
| | | | | | | | |
| Description | | Face Amount
($ Thousands) | | | Market Value
($ Thousands) | |
| | | | | | | | |
| | | | | | | | |
Infinity Acquisition, 1st Lien | | | | | | | | |
4.000%, 08/06/2021 | | $ | 12 | | | $ | 12 | |
Infinity Acquisition, LLC, Term Loan B, 1st Lien | | | | | | | | |
4.000%, 08/06/2021 | | | 1,649 | | | | 1,575 | |
Informatica, Term Loan B, 1st Lien | | | | | | | | |
4.500%, 08/05/2022 | | | 2,324 | | | | 2,296 | |
Intelsat Jackson Holdings, Term Loan B-2 | | | | | | | | |
3.750%, 06/30/2019 (A) | | | 1,798 | | | | 1,654 | |
Inventiv Health, Incremental Term Loan B-3 | | | | | | | | |
7.750%, 05/15/2018 | | | 265 | | | | 263 | |
ION Trading Technologies, Term Loan, Tranche B-1 | | | | | | | | |
4.250%, 06/10/2021 | | | 5,886 | | | | 5,871 | |
Jeld-Wen, Cov-Lite, Term Loan B, 1st Lien | | | | | | | | |
5.250%, 10/15/2021 | | | 5,728 | | | | 5,744 | |
4.750%, 07/01/2022 | | | 746 | | | | 747 | |
Kenan Advantage, Cov-Lite, Initial Term Loan, 1st Lien | | | | | | | | |
4.000%, 07/29/2022 | | | 1,196 | | | | 1,191 | |
Kenan Advantage, Delayed Draw Term Loan | | | | | | | | |
1.500%, 01/23/2017 (E) | | | 160 | | | | (1 | ) |
Kenan Advantage, Initial Term Loan B | | | | | | | | |
4.000%, 07/29/2022 | | | 389 | | | | 388 | |
Klockner Pentaplast, Term Loan, 1st Lien | | | | | | | | |
5.000%, 04/28/2020 | | | 894 | | | | 895 | |
Kronos, Incremental Term Loan, 1st Lien | | | | | | | | |
4.500%, 10/30/2019 | | | 4,071 | | | | 4,075 | |
Language Line, LLC, Term Loan, 1st Lien | | | | | | | | |
6.500%, 07/07/2021 | | | 4,508 | | | | 4,510 | |
Lee Enterprises, Term Loan B | | | | | | | | |
7.250%, 03/31/2019 | | | 1,302 | | | | 1,293 | |
Leslie’s Poolmart, Cov-Lite, 1st Lien | | | | | | | | |
4.250%, 10/16/2019 | | | 4,967 | | | | 4,967 | |
Level 3 Financing, Term
Loan B-I | | | | | | | | |
4.000%, 01/15/2020 | | | 2,500 | | | | 2,508 | |
Level 3 Financing, Term
Loan B-II | | | | | | | | |
3.500%, 05/31/2022 | | | 1,071 | | | | 1,071 | |
Level 3 Financing, Term
Loan B-III | | | | | | | | |
4.000%, 08/01/2019 | | | 2,000 | | | | 2,004 | |
Life Time Fitness, Closing Date Term Loan | | | | | | | | |
4.250%, 06/10/2022 | | | 11 | | | | 11 | |
Life Time Fitness, Term Loan B | | | | | | | | |
4.250%, 06/10/2022 | | | 4,370 | | | | 4,348 | |
Light Tower Fiber, LLC, Term Loan B | | | | | | | | |
4.000%, 04/13/2020 | | | 4,899 | | | | 4,884 | |
LPL Holdings, 2021 Tranche B Term Loan | | | | | | | | |
4.250%, 03/29/2021 | | | 1,702 | | | | 1,689 | |
Mallinckrodt, Cov-Lite, Term Loan | | | | | | | | |
3.250%, 03/19/2021 | | | 1,990 | | | | 1,965 | |
Mattress Firm Holding, 1st Lien | | | | | | | | |
6.250%, 10/20/2021 | | | 1,062 | | | | 1,063 | |
| | | | | | | | |
| Description | | Face Amount
($ Thousands) | | | Market Value
($ Thousands) | |
| | | | | | | | |
Media General, Delayed Term Loan | | | | | | | | |
4.000%, 07/31/2020 | | $ | 617 | | | $ | 617 | |
Mediacom Broadbank, 1st Lien | | | | | | | | |
3.250%, 01/29/2021 | | | 3,056 | | | | 3,045 | |
Mediacom Communications, Term Loan H | | | | | | | | |
3.250%, 01/29/2021 | | | 8 | | | | 8 | |
MEG Energy, Term Loan | | | | | | | | |
3.750%, 03/21/2020 | | | 1,608 | | | | 1,431 | |
MGM Growth Properties Operating Partnership LP, Term B Loan, 1st Lien | | | | | | | | |
4.000%, 04/25/2023 | | | 843 | | | | 849 | |
Michaels Stores, Term Loan B | | | | | | | | |
3.750%, 01/28/2020 (A) | | | 5,886 | | | | 5,893 | |
Millennium Labs | | | | | | | | |
7.500%, 12/21/2020 | | | 1,806 | | | | 1,353 | |
Minimax GmbH, Term Loan B, 1st Lien | | | | | | | | |
4.000%, 08/14/2020 | | | 3,823 | | | | 3,815 | |
MKS Instruments,Term Loan, 1st Lien | | | | | | | | |
4.750%, 05/01/2023 | | | 1,225 | | | | 1,236 | |
Mohegan Tribal Gaming Authority, Term Loan A, 1st Lien | | | | | | | | |
4.454%, 06/15/2018 | | | 1,889 | | | | 1,850 | |
Mohegan Tribal Gaming Authority, Term Loan B, 1st Lien | | | | | | | | |
5.500%, 06/15/2018 | | | 4,469 | | | | 4,450 | |
Mueller Water Products, Term Loan, 1st Lien | | | | | | | | |
4.000%, 11/19/2021 | | | 579 | | | | 582 | |
Multiplan Cov-Lite, 1st Lien | | | | | | | | |
0.000%, 05/25/2023 (C) | | | 2,919 | | | | 2,939 | |
Murray Energy, Cov-Lite, Term Loan B, 2nd Lien | | | | | | | | |
7.500%, 04/16/2020 | | | 1,637 | | | | 1,121 | |
NBTY, 1st Lien | | | | | | | | |
5.000%, 04/26/2023 | | | 3,815 | | | | 3,836 | |
NCI Building Systems, Term Loan | | | | | | | | |
4.250%, 06/24/2019 | | | 1,175 | | | | 1,167 | |
Nelson Education | | | | | | | | |
0.000%, 10/01/2020 (C)(D) | | | 92 | | | | — | |
Nelson Education, 1st Lien | | | | | | | | |
12.000%, 10/01/2020 | | | 554 | | | | 198 | |
NXP, Cov-Lite, Term Loan B, 1st Lien | | | | | | | | |
3.750%, 12/07/2020 | | | 725 | | | | 727 | |
ON Semiconductor, Closing Date Term Loan, 1st Lien | | | | | | | | |
5.250%, 03/31/2023 | | | 3,416 | | | | 3,438 | |
Peabody Energy, Commitment, 1st Lien | | | | | | | | |
10.000%, 04/18/2017 | | | 664 | | | | 671 | |
Peabody Energy, Cov-Lite, Term Loan B, 1st Lien | | | | | | | | |
4.250%, 09/24/2020 | | | 671 | | | | 265 | |
Penn Products Terminals, Term Loan, Tranche B | | | | | | | | |
4.750%, 04/13/2022 | | | 961 | | | | 935 | |
| | |
| 84 | | SEI Institutional Investments Trust / Annual Report / May 31, 2016 |
| | | | | | | | |
| Description | | Face Amount
($ Thousands) | | | Market Value
($ Thousands) | |
| | | | | | | | |
PetSmart Tranche B-1 Loan | | | | | | | | |
4.250%, 03/10/2022 | | $ | 464 | | | $ | 464 | |
PetSmart, 1st Lien | | | | | | | | |
4.250%, 03/11/2022 | | | 464 | | | | 464 | |
PetSmart, 5/15 Cov-Lite, Term Loan B-1 | | | | | | | | |
4.250%, 03/11/2022 | | | 467 | | | | 467 | |
Pharmaceutical Product, Cov-Lite, Initial Term Loan, 1st Lien | | | | | | | | |
4.250%, 08/18/2022 | | | 6,180 | | | | 6,185 | |
Pinnacle Foods Group, LLC, Term Loan G | | | | | | | | |
3.250%, 04/29/2020 | | | 498 | | | | 498 | |
Pinnacle Foods Group, LLC, Term Loan H | | | | | | | | |
3.250%, 04/29/2020 | | | 1,287 | | | | 1,288 | |
Post Holdings, Term Loan B, 1st Lien, Ser A | | | | | | | | |
3.750%, 06/02/2021 | | | 539 | | | | 543 | |
PQ, Tranche B-1 Term Loan, 1st Lien | | | | | | | | |
5.750%, 11/04/2022 | | | 908 | | | | 915 | |
Quebecor Media, Term Loan B | | | | | | | | |
3.250%, 08/17/2020 | | | 1,123 | | | | 1,115 | |
Quintiles Transnational, Term Loan, 1st Lien | | | | | | | | |
3.250%, 05/12/2022 | | | 2,464 | | | | 2,462 | |
Radnet, Term Loan, 1st Lien | | | | | | | | |
5.750%, 10/10/2018 | | | 64 | | | | 64 | |
4.250%, 10/10/2018 | | | 2,224 | | | | 2,220 | |
RE/MAX International, Term Loan | | | | | | | | |
4.250%, 07/31/2020 | | | 2,356 | | | | 2,351 | |
Realogy, Extended Synthetic Term Loan | | | | | | | | |
0.150%, 10/10/2016 | | | 40 | | | | 40 | |
Redtop Acquisitions, Ltd., Term Loan, 1st Lien | | | | | | | | |
4.500%, 12/03/2020 | | | 611 | | | | 610 | |
Regal Cinemas, Term Loan | | | | | | | | |
3.750%, 04/01/2022 | | | 2,085 | | | | 2,090 | |
Rexnord, LLC, Cov-Lite, Term Loan B, 1st Lien | | | | | | | | |
4.000%, 08/21/2020 | | | 639 | | | | 636 | |
Rexnord, LLC, Term Loan B | | | | | | | | |
4.000%, 08/21/2020 | | | 2,054 | | | | 2,042 | |
Royal Adhesives & Sealants, Cov-Lite, Initial | | | | | | | | |
Term Loan, 1st Lien | | | | | | | | |
4.500%, 06/20/2022 | | | 5,707 | | | | 5,703 | |
Ryman Hospitality Properties, Cov-Lite, Term Loan | | | | | | | | |
3.750%, 01/15/2021 | | | 521 | | | | 522 | |
Salem Communications, Term Loan B | | | | | | | | |
4.500%, 03/12/2020 | | | 635 | | | | 618 | |
Samsonite International S.A., Initial Tranche B Term Loan | | | | | | | | |
4.000%, 04/13/2023 | | | 857 | | | | 864 | |
SBA Finance, Incremental Term Loan, 1st Lien | | | | | | | | |
3.250%, 06/10/2022 | | | 5,475 | | | | 5,455 | |
Seadrill Partners, LLC, Term Loan B, 1st Lien | | | | | | | | |
4.000%, 02/21/2021 | | | 4,840 | | | | 2,295 | |
Seaworld, Term Loan B-2 | | | | | | | | |
| | | | | | | | |
| Description | | Face Amount
($ Thousands) | | | Market Value
($ Thousands) | |
| | | | | | | | |
3.000%, 05/14/2020 | | $ | 2,003 | | | $ | 1,956 | |
Seminole Hard Rock Entertainment, Term Loan B | | | | | | | | |
3.500%, 05/14/2020 | | | 3,191 | | | | 3,178 | |
Serta Simmons Holdings, Term Loan B | | | | | | | | |
4.250%, 10/01/2019 | | | 5,716 | | | | 5,724 | |
Signode (USD) Cov-Lite, Term Loan | | | | | | | | |
3.750%, 05/01/2021 | | | 2,018 | | | | 2,005 | |
Signode Industrial | | | | | | | | |
3.750%, 05/01/2021 | | | 596 | | | | 592 | |
Sinclair Television Group, Term Loan B1, 1st Lien | | | | | | | | |
3.500%, 07/30/2021 | | | 3,001 | | | | 3,008 | |
Six Flags Theme Parks, Term Loan, 1st Lien | | | | | | | | |
3.500%, 06/30/2022 | | | 6,449 | | | | 6,473 | |
Six Flags Theme Parks, Term Loan, 3rd Lien | | | | | | | | |
3.500%, 06/30/2022 | | | 2 | | | | 2 | |
Smart & Final, Cov-Lite, Term Loan | | | | | | | | |
4.000%, 11/08/2019 | | | 825 | | | | 823 | |
Smart Technologies, Term Loan | | | | | | | | |
10.500%, 01/31/2018 | | | 113 | | | | 113 | |
Spectrum Brands, Cov-Lite, Term Loan, 1st Lien | | | | | | | | |
3.500%, 06/23/2022 | | | 3,510 | | | | 3,523 | |
SS&C Technologies, Term
Loan B-1 | | | | | | | | |
4.083%, 07/08/2022 | | | 107 | | | | 107 | |
4.000%, 07/08/2022 | | | 2,933 | | | | 2,943 | |
SS&C Technologies, Term
Loan B-2 | | | | | | | | |
4.000%, 07/08/2022 | | | 483 | | | | 484 | |
SS&C Technologies, Term Loan, 1st Lien | | | | | | | | |
4.083%, 07/08/2022 | | | 283 | | | | 283 | |
Starwood Property Trust, Term Loan B | | | | | | | | |
3.500%, 04/17/2020 | | | 2,811 | | | | 2,804 | |
Station Casinos, 1st Lien | | | | | | | | |
0.000%, 06/25/2023 (C) | | | 2,775 | | | | 2,778 | |
Sterigenics-Nordion, Cov-Lite, Term Loan, 1st Lien | | | | | | | | |
4.250%, 05/16/2022 | | | 2,220 | | | | 2,209 | |
Syncreon Holdings Ltd., Term Loan B, 1st Lien | | | | | | | | |
5.250%, 10/28/2020 | | | 4,684 | | | | 3,958 | |
Syniverse Holdings | | | | | | | | |
4.000%, 04/23/2019 | | | 1,150 | | | | 865 | |
Syniverse Holdings, 1st Lien | | | | | | | | |
4.000%, 04/23/2019 | | | 696 | | | | 521 | |
TASC, Term Loan, 1st Lien | | | | | | | | |
7.000%, 05/22/2020 | | | 1,265 | | | | 1,262 | |
TASC, Term Loan, 2nd Lien | | | | | | | | |
7.000%, 05/22/2020 | | | 26 | | | | 26 | |
Telesat Canada, Term Loan B | | | | | | | | |
3.500%, 03/28/2019 (A) | | | 1,689 | | | | 1,688 | |
Templar Energy, Cov-Lite, 2nd Lien | | | | | | | | |
8.500%, 11/25/2020 | | | 4,227 | | | | 690 | |
| | | | |
| SEI Institutional Investments Trust / Annual Report / May 31, 2016 | | | 85 | |
SCHEDULE OF INVESTMENTS
Opportunistic Income Fund (Continued)
May 31, 2016
| | | | | | | | |
| Description | | Face Amount
($ Thousands) | | | Market Value
($ Thousands) | |
| | | | | | | | |
Texas Competitive, Extended Term Loan | | | | | | | | |
4.917%, 10/10/2017 (D) | | $ | 2,323 | | | $ | 726 | |
The Neiman Marcus Group, Term Loan, 1st Lien | | | | | | | | |
4.250%, 10/25/2020 | | | 2,903 | | | | 2,658 | |
Townsquare Media, Term Loan | | | | | | | | |
4.250%, 03/25/2022 | | | 2,121 | | | | 2,127 | |
Trans Union LLC, Replacement Term Loan | | | | | | | | |
3.500%, 04/09/2021 | | | 7,379 | | | | 7,377 | |
TransDigm, Term Loan C, 1st Lien | | | | | | | | |
3.750%, 02/25/2020 | | | 3,460 | | | | 3,459 | |
TransDigm, Term Loan D, 1st Lien | | | | | | | | |
3.750%, 06/04/2021 | | | 1,005 | | | | 1,005 | |
Tribune Media, Term Loan, 1st Lien | | | | | | | | |
3.750%, 12/27/2020 | | | 2,691 | | | | 2,696 | |
Tronox, Term Loan B | | | | | | | | |
4.500%, 03/19/2020 | | | 971 | | | | 940 | |
True Religion Apparel, 1st Lien | | | | | | | | |
5.875%, 07/30/2019 | | | 1,005 | | | | 432 | |
True Religion Apparel, Term Loan, 1st Lien | | | | | | | | |
5.875%, 07/30/2019 | | | 347 | | | | 149 | |
Univar, Cov-Lite, Initial Term Loan | | | | | | | | |
4.250%, 07/01/2022 | | | 2,192 | | | | 2,186 | |
Univar, Term Loan, 1st Lien | | | | | | | | |
4.250%, 07/01/2022 | | | 2,215 | | | | 2,208 | |
Univision Communications, Extended Term Loan C-3 | | | | | | | | |
4.000%, 03/01/2020 (A) | | | 1,554 | | | | 1,552 | |
Univision Communications, Term Loan, 1st Lien | | | | | | | | |
4.000%, 03/01/2020 | | | 4,860 | | | | 4,857 | |
UPC Finance Partnership | | | | | | | | |
3.250%, 06/30/2021 | | | 1,000 | | | | 999 | |
US Renal Care, Cov-Lite, 1st Lien | | | | | | | | |
5.250%, 12/30/2022 | | | 4,615 | | | | 4,575 | |
Valeant Pharmaceuticals International, Term Loan B, 1st Lien, Ser C-2 | | | | | | | | |
5.500%, 12/11/2019 | | | 1,260 | | | | 1,242 | |
Valeant Pharmaceuticals International, Term Loan B, 1st Lien, Ser D-2 | | | | | | | | |
5.250%, 02/13/2019 | | | 126 | | | | 124 | |
Valeant Pharmaceuticals International, Term Loan B, 1st Lien, Ser E-1 | | | | | | | | |
4.750%, 06/26/2020 | | | 1,575 | | | | 1,550 | |
Valeant, Term Loan B | | | | | | | | |
4.000%, 04/01/2022 | | | 888 | | | | 876 | |
Vantiv, LLC, Term Loan B, 1st Lien | | | | | | | | |
3.500%, 06/13/2021 | | | 1,190 | | | | 1,193 | |
Verint Systems, Term Loan B, 1st Lien | | | | | | | | |
3.500%, 09/06/2019 | | | 2,524 | | | | 2,521 | |
Vertafore, Term Loan B, 1st Lien | | | | | | | | |
4.250%, 10/03/2019 | | | 3,000 | | | | 2,998 | |
Virgin Media, Term Loan, 1st Lien | | | | | | | | |
3.649%, 06/30/2023 | | | 6,024 | | | | 6,026 | |
| | | | | | | | |
| Description | | Face Amount
($ Thousands) | | | Market Value
($ Thousands) | |
| | | | | | | | |
Warner Music Group, Term Loan | | | | | | | | |
3.750%, 07/01/2020 | | $ | 5,433 | | | $ | 5,402 | |
Waste Industries USA, Cov-Lite, 1st Lien | | | | | | | | |
4.250%, 02/27/2020 | | | 2,822 | | | | 2,832 | |
WaveDivision Holdings, Term Loan, 2nd Lien | | | | | | | | |
4.000%, 10/15/2019 | | | 8 | | | | 8 | |
WaveDivision Holdings, Term Loan, Tranche 1 | | | | | | | | |
4.000%, 10/15/2019 | | | 3,261 | | | | 3,255 | |
WCA Waste Systems, Term Loan | | | | | | | | |
4.000%, 03/23/2018 | | | 2,697 | | | | 2,694 | |
Weight Watchers International, Term Loan B2, 1st Lien | | | | | | | | |
4.000%, 04/02/2020 | | | 3 | | | | 3 | |
Weight Watchers International, Term Loan, Tranche B-2 | | | | | | | | |
4.000%, 04/02/2020 | | | 1,320 | | | | 979 | |
West, Term Loan B-10 | | | | | | | | |
3.250%, 06/30/2018 | | | 4,293 | | | | 4,288 | |
Western Digital Corporation, U.S. Term B Loan, 1st Lien | | | | | | | | |
6.250%, 04/29/2023 | | | 1,235 | | | | 1,230 | |
Wide Open West, Term Loan, 1st Lien | | | | | | | | |
4.500%, 04/01/2019 | | | 5,822 | | | | 5,814 | |
Wilsonart International Holdings LLC, Term Loan, 1st Lien | | | | | | | | |
4.000%, 10/24/2019 | | | 6,381 | | | | 6,370 | |
XPO Logistics, Cov-Lite, Term Loan, 1st Lien | | | | | | | | |
5.500%, 11/01/2021 | | | 3,449 | | | | 3,475 | |
York Risk Services Holding, Term Loan B | | | | | | | | |
4.750%, 10/01/2021 | | | 4,762 | | | | 4,203 | |
York Risk Services, Cov-Lite, 1st Lien | | | | | | | | |
4.750%, 10/01/2021 | | | 626 | | | | 553 | |
Ziggo, Term Loan B1, 1st Lien | | | | | | | | |
3.652%, 01/15/2022 | | | 2,022 | | | | 2,019 | |
Ziggo, Term Loan B2, 1st Lien | | | | | | | | |
3.652%, 01/15/2022 | | | 1,198 | | | | 1,197 | |
3.601%, 01/15/2022 | | | 105 | | | | 104 | |
Ziggo, Term Loan B3, 1st Lien | | | | | | | | |
3.601%, 01/15/2022 | | | 2,143 | | | | 2,140 | |
Zuffa, Term Loan | | | | | | | | |
3.750%, 02/25/2020 | | | 1,791 | | | | 1,786 | |
| | | | | | | | |
Total Loan Participations
(Cost $564,891) ($ Thousands) | | | | 550,052 | |
| | | | | | | | |
|
ASSET-BACKED SECURITIES — 25.6% | |
Automotive — 2.8% | | | | | | | | |
Ally Auto Receivables Trust, Ser 2013-2, Cl A3 | | | | | | | | |
0.790%, 01/15/2018 | | | 936 | | | | 936 | |
Ally Auto Receivables Trust, Ser 2014-SN1, Cl A3 | | | | | | | | |
0.750%, 02/21/2017 | | | 3 | | | | 3 | |
| | |
| 86 | | SEI Institutional Investments Trust / Annual Report / May 31, 2016 |
| | | | | | | | |
| Description | | Face Amount
($ Thousands) | | | Market Value
($ Thousands) | |
| | | | | | | | |
Ally Auto Receivables Trust, Ser 2014-SN1, Cl A4 | | | | | | | | |
0.950%, 06/20/2018 | | $ | 850 | | | $ | 850 | |
Ally Auto Receivables Trust, Ser 2015-SN1, Cl A3 | | | | | | | | |
1.210%, 12/20/2017 | | | 701 | | | | 701 | |
American Credit Acceptance Receivables Trust, Ser 2014-4, Cl A | | | | | | | | |
1.330%, 07/10/2018 (B) | | | 39 | | | | 39 | |
AmeriCredit Automobile Receivables Trust, Ser 2013-1, Cl B | | | | | | | | |
1.070%, 03/08/2018 | | | 91 | | | | 91 | |
AmeriCredit Automobile Receivables Trust, Ser 2013-4, Cl C | | | | | | | | |
2.720%, 09/09/2019 | | | 1,150 | | | | 1,162 | |
AmeriCredit Automobile Receivables Trust, Ser 2014-2, Cl A3 | | | | | | | | |
0.940%, 02/08/2019 | | | 1,568 | | | | 1,565 | |
AmeriCredit Automobile Receivables Trust, Ser 2014-3, Cl A3 | | | | | | | | |
1.150%, 06/10/2019 | | | 1,590 | | | | 1,589 | |
AmeriCredit Automobile Receivables Trust, Ser 2015-1, Cl A2A | | | | | | | | |
0.770%, 04/09/2018 | | | 118 | | | | 118 | |
AmeriCredit Automobile Receivables Trust, Ser 2015-1, Cl A3 | | | | | | | | |
1.260%, 11/08/2019 | | | 925 | | | | 922 | |
AmeriCredit Automobile Receivables Trust, Ser 2015-4, Cl A2A | | | | | | | | |
1.260%, 04/08/2019 | | | 429 | | | | 429 | |
AmeriCredit Automobile Receivables Trust, Ser 2015-4, Cl A2B | | | | | | | | |
1.187%, 04/08/2019 (A) | | | 2,995 | | | | 2,997 | |
AmeriCredit Automobile Receivables Trust, Ser 2016-1, Cl A2A | | | | | | | | |
1.520%, 06/10/2019 | | | 450 | | | | 450 | |
AmeriCredit Automobile Receivables Trust, Ser 2016-1, Cl A2B | | | | | | | | |
1.187%, 06/10/2019 (A) | | | 2,780 | | | | 2,782 | |
AmeriCredit Automobile Receivables Trust, Ser 2016-2, Cl A2A | | | | | | | | |
1.420%, 10/08/2019 | | | 2,878 | | | | 2,875 | |
ARI Fleet Lease Trust, Ser 2014-A, Cl A2 | | | | | | | | |
0.810%, 11/15/2022 (B) | | | 72 | | | | 72 | |
BMW Vehicle Owner Trust, Ser 2013-A, Cl A3 | | | | | | | | |
0.670%, 11/27/2017 | | | 384 | | | | 383 | |
Capital Auto Receivables Asset Trust, Ser 2013-1, Cl A4 | | | | | | | | |
0.970%, 01/22/2018 | | | 163 | | | | 163 | |
Capital Auto Receivables Asset Trust, Ser 2014-1, Cl A3 | | | | | | | | |
1.320%, 06/20/2018 | | | 2,380 | | | | 2,379 | |
| | | | | | | | |
| Description | | Face Amount
($ Thousands) | | | Market Value
($ Thousands) | |
| | | | | | | | |
Capital Auto Receivables Asset Trust, Ser 2015-4, Cl A2 | | | | | | | | |
1.620%, 03/20/2019 | | $ | 750 | | | $ | 750 | |
CarMax Auto Owner Trust, Ser 2012-3, Cl C | | | | | | | | |
1.500%, 08/15/2018 | | | 55 | | | | 55 | |
CarMax Auto Owner Trust, Ser 2013-2, Cl A4 | | | | | | | | |
0.840%, 11/15/2018 | | | 1,000 | | | | 996 | |
CarMax Auto Owner Trust, Ser 2015-4, Cl A2A | | | | | | | | |
1.090%, 04/15/2019 | | | 782 | | | | 782 | |
Chesapeake Funding LLC, Ser 2012-2A, Cl A | | | | | | | | |
0.887%, 05/07/2024 (A) (B) | | | 234 | | | | 234 | |
Chesapeake Funding LLC, Ser 2015-1A, Cl A | | | | | | | | |
0.937%, 02/07/2027 (A) (B) | | | 869 | | | | 866 | |
Chrysler Capital Auto Receivables Trust, Ser 2013-AA, Cl A3 | | | | | | | | |
0.910%, 04/16/2018 (B) | | | 82 | | | | 82 | |
Chrysler Capital Auto Receivables Trust, Ser 2014-AA, Cl A4 | | | | | | | | |
1.310%, 05/15/2019 (B) | | | 125 | | | | 125 | |
CPS Auto Receivables Trust, Ser 2013-D, Cl A | | | | | | | | |
1.540%, 07/16/2018 (B) | | | 107 | | | | 107 | |
CPS Auto Receivables Trust, Ser 2014-A, Cl A | | | | | | | | |
1.210%, 08/15/2018 (B) | | | 66 | | | | 66 | |
Credit Acceptance Auto Loan Trust, Ser 2013- 2A, Cl A | | | | | | | | |
1.500%, 04/15/2021 (B) | | | 103 | | | | 104 | |
Credit Acceptance Auto Loan Trust, Ser 2014-1A, Cl A | | | | | | | | |
1.550%, 10/15/2021 (B) | | | 610 | | | | 609 | |
DT Auto Owner Trust, Ser 2015-2A, Cl A | | | | | | | | |
1.240%, 09/17/2018 (B) | | | 402 | | | | 402 | |
Enterprise Fleet Financing LLC, Ser 2013-2, Cl A2 | | | | | | | | |
1.060%, 03/20/2019 (B) | | | 42 | | | | 42 | |
Enterprise Fleet Financing LLC, Ser 2013-2, Cl A3 | | | | | | | | |
1.510%, 03/20/2019 (B) | | | 300 | | | | 300 | |
Fifth Third Auto Trust, Ser 2013-A, Cl A3 | | | | | | | | |
0.880%, 10/16/2017 | | | 49 | | | | 49 | |
First Investors Auto Owner Trust, Ser 2013-2A, Cl A2 | | | | | | | | |
1.230%, 03/15/2019 (B) | | | 32 | | | | 32 | |
First Investors Auto Owner Trust, Ser 2014-1A, Cl A3 | | | | | | | | |
1.490%, 01/15/2020 (B) | | | 656 | | | | 655 | |
First Investors Auto Owner Trust, Ser 2014-3A, Cl A2 | | | | | | | | |
1.060%, 11/15/2018 (B) | | | 213 | | | | 213 | |
Flagship Credit Auto Trust, Ser 2014-2, Cl A | | | | | | | | |
1.430%, 12/16/2019 (B) | | | 1,020 | | | | 1,017 | |
Ford Credit Auto Lease Trust, Ser 2014-A, Cl A4 | | | | | | | | |
0.900%, 06/15/2017 | | | 316 | | | | 316 | |
| | | | |
| SEI Institutional Investments Trust / Annual Report / May 31, 2016 | | | 87 | |
SCHEDULE OF INVESTMENTS
Opportunistic Income Fund (Continued)
May 31, 2016
| | | | | | | | |
| Description | | Face Amount
($ Thousands) | | | Market Value
($ Thousands) | |
| | | | | | | | |
Ford Credit Auto Lease Trust, Ser 2014-B, Cl A4 | | | | | | | | |
1.100%, 11/15/2017 | | $ | 600 | | | $ | 600 | |
Ford Credit Auto Lease Trust, Ser 2015-B, Cl B | | | | | | | | |
1.920%, 03/15/2019 | | | 465 | | | | 463 | |
Ford Credit Auto Owner Trust, Ser 2012-B, Cl D | | | | | | | | |
2.930%, 10/15/2018 | | | 1,000 | | | | 1,003 | |
Ford Credit Floorplan Master Owner Trust, Ser 2014-1, Cl B | | | | | | | | |
1.400%, 02/15/2019 | | | 135 | | | | 135 | |
GLS Auto Receivables Trust, Ser 2016-1A, Cl A | | | | | | | | |
2.730%, 10/15/2020 (B) | | | 450 | | | | 450 | |
GM Financial Automobile Leasing Trust, Ser 2015-2, Cl A2A | | | | | | | | |
1.180%, 04/20/2018 | | | 974 | | | | 975 | |
GM Financial Automobile Leasing Trust, Ser 2015-3, Cl A2A | | | | | | | | |
1.170%, 06/20/2018 | | | 947 | | | | 947 | |
GM Financial Automobile Leasing Trust, Ser 2016-2, Cl A3 | | | | | | | | |
1.620%, 09/20/2019 | | | 325 | | | | 324 | |
Harley-Davidson Motorcycle Trust, Ser 2013-1, Cl A3 | | | | | | | | |
0.650%, 07/16/2018 | | | 23 | | | | 23 | |
Hertz Fleet Lease Funding, Ser 2013-3, Cl A | | | | | | | | |
0.988%, 12/10/2027 (A) (B) | | | 963 | | | | 962 | |
Hertz Fleet Lease Funding, Ser 2014-1, Cl A | | | | | | | | |
0.838%, 04/10/2028 (A) (B) | | | 995 | | | | 996 | |
Honda Auto Receivables Owner Trust, Ser 2013-4, Cl A3 | | | | | | | | |
0.690%, 09/18/2017 | | | 1,350 | | | | 1,350 | |
Huntington Auto Trust, Ser 2015-1, Cl A3 | | | | | | | | |
1.240%, 09/16/2019 | | | 1,000 | | | | 1,001 | |
Hyundai Auto Lease Securitization Trust, Ser 2016-B, Cl A3 | | | | | | | | |
1.520%, 10/15/2019 (B) | | | 265 | | | | 265 | |
Hyundai Auto Receivables Trust, Ser 2012-C, Cl B | | | | | | | | |
1.060%, 06/15/2018 | | | 1,000 | | | | 998 | |
Hyundai Auto Receivables Trust, Ser 2013-C, Cl A3 | | | | | | | | |
1.010%, 02/15/2018 | | | 1,182 | | | | 1,183 | |
M&T Bank Auto Receivables Trust, Ser 2013-1A, Cl A3 | | | | | | | | |
1.060%, 11/15/2017 (B) | | | 361 | | | | 361 | |
Mercedes Benz Auto Lease Trust, Ser 2015-A, Cl A4 | | | | | | | | |
1.210%, 10/15/2020 | | | 250 | | | | 250 | |
Mercedes Benz Auto Lease Trust, Ser 2015-B, Cl A3 | | | | | | | | |
1.340%, 07/16/2018 | | | 755 | | | | 755 | |
Prestige Auto Receivables Trust, Ser 2013-1A, Cl A3 | | | | | | | | |
1.330%, 05/15/2019 (B) | | | 302 | | | | 302 | |
| | | | | | | | |
| Description | | Face Amount
($ Thousands) | | | Market Value
($ Thousands) | |
| | | | | | | | |
Prestige Auto Receivables Trust, Ser 2014-1A, Cl A2 | | | | | | | | |
0.970%, 03/15/2018 (B) | | $ | 17 | | | $ | 18 | |
Prestige Auto Receivables Trust, Ser 2015-1, Cl A2 | | | | | | | | |
1.090%, 02/15/2019 (B) | | | 138 | | | | 138 | |
Prestige Auto Receivables Trust, Ser 2016-1A, Cl A2 | | | | | | | | |
1.780%, 08/15/2019 (B) | | | 490 | | | | 490 | |
Santander Drive Auto Receivables Trust, Ser 2012-3, Cl D | | | | | | | | |
3.640%, 05/15/2018 | | | 785 | | | | 792 | |
Santander Drive Auto Receivables Trust, Ser 2014-1, Cl B | | | | | | | | |
1.590%, 10/15/2018 | | | 539 | | | | 540 | |
Santander Drive Auto Receivables Trust, Ser 2015-1, Cl A2A | | | | | | | | |
0.910%, 07/16/2018 | | | 870 | | | | 870 | |
Santander Drive Auto Receivables Trust, Ser 2015-5, Cl A3 | | | | | | | | |
1.580%, 09/16/2019 | | | 535 | | | | 534 | |
Santander Drive Auto Receivables Trust, Ser 2016-1, Cl A2B | | | | | | | | |
1.215%, 07/15/2019 (A) | | | 4,040 | | | | 4,040 | |
Toyota Auto Receivables Owner Trust, Ser 2016-B, Cl A3 | | | | | | | | |
1.300%, 04/15/2020 | | | 130 | | | | 130 | |
Toyota Auto Receivables Owner Trust,
Ser 2016-B, Cl A2A | | | | | | | | |
1.020%, 10/15/2018 | | | 4,000 | | | | 3,997 | |
Volvo Financial Equipment LLC, Ser 2014-1A, Cl A3 | | | | | | | | |
0.820%, 04/16/2018 (B) | | | 267 | | | | 266 | |
Westlake Automobile Receivables Trust, Ser 2014-2A, Cl A2 | | | | | | | | |
0.970%, 10/16/2017 (B) | | | 36 | | | | 36 | |
Westlake Automobile Receivables Trust, Ser 2015-1A, Cl A2 | | | | | | | | |
1.170%, 03/15/2018 (B) | | | 393 | | | | 392 | |
Westlake Automobile Receivables Trust, Ser 2015-2A, Cl A2A | | | | | | | | |
1.280%, 07/16/2018 (B) | | | 582 | | | | 581 | |
Wheels SPV 2 LLC, Ser 2015-1A, Cl A2 | | | | | | | | |
1.270%, 04/22/2024 (B) | | | 2,267 | | | | 2,269 | |
Wheels SPV LLC, Ser 2014-1A, Cl A2 | | | | | | | | |
0.840%, 03/20/2023 (B) | | | 2,433 | | | | 2,431 | |
World Omni Auto Receivables Trust, Ser 2012-B, Cl A4 | | | | | | | | |
0.810%, 01/15/2019 | | | 584 | | | | 584 | |
| | |
| 88 | | SEI Institutional Investments Trust / Annual Report / May 31, 2016 |
| | | | | | | | |
| Description | | Face Amount
($ Thousands) | | | Market Value
($ Thousands) | |
| | | | | | | | |
World Omni Auto Receivables Trust, Ser 2015-B, Cl A2A | | | | | | | | |
0.960%, 07/15/2019 | | $ | 800 | | | $ | 799 | |
| | | | | | | | |
| | | | | | | 60,558 | |
| | | | | | | | |
| | |
Credit Cards — 5.2% | | | | | | | | |
American Express Credit Account Master Trust, Ser 2013-1, Cl A | | | | | | | | |
0.854%, 02/16/2021 (A) | | | 310 | | | | 311 | |
American Express Credit Account Master Trust, Ser 2013-3, Cl A | | | | | | | | |
0.980%, 05/15/2019 | | | 305 | | | | 305 | |
American Express Credit Account Master Trust, Ser 2014-1, Cl A | | | | | | | | |
0.804%, 12/15/2021 (A) | | | 5,000 | | | | 5,005 | |
American Express Credit Account Master Trust, Ser 2014-2, Cl A | | | | | | | | |
1.260%, 01/15/2020 | | | 4,500 | | | | 4,509 | |
American Express Credit Account Master Trust, Ser 2014-5, Cl A | | | | | | | | |
0.724%, 05/15/2020 (A) | | | 1,650 | | | | 1,653 | |
BA Credit Card Trust, Ser 2014-A1, Cl A | | | | | | | | |
0.814%, 06/15/2021 (A) | | | 4,000 | | | | 4,007 | |
BA Credit Card Trust, Ser 2014-A2, Cl A | | | | | | | | |
0.705%, 09/16/2019 (A) | | | 5,000 | | | | 5,006 | |
BA Credit Card Trust, Ser 2015-A1, Cl A | | | | | | | | |
0.764%, 06/15/2020 (A) | | | 5,000 | | | | 5,010 | |
Cabela’s Credit Card Master Note Trust, Ser 2011-4A, Cl A2 | | | | | | | | |
0.985%, 10/15/2019 (A) (B) | | | 860 | | | | 860 | |
Cabela’s Credit Card Master Note Trust, Ser 2012-2A, Cl A2 | | | | | | | | |
0.915%, 06/15/2020 (A) (B) | | | 3,500 | | | | 3,496 | |
Cabela’s Credit Card Master Note Trust, Ser 2013-2A, Cl A2 | | | | | | | | |
1.084%, 08/16/2021 (A) (B) | | | 210 | | | | 210 | |
Cabela’s Credit Card Master Note Trust, Ser 2014-1, Cl A | | | | | | | | |
0.785%, 03/16/2020 (A) | | | 2,670 | | | | 2,669 | |
Cabela’s Credit Card Master Note Trust, Ser 2014-2, Cl A | | | | | | | | |
0.885%, 07/15/2022 (A) | | | 5,000 | | | | 4,954 | |
Capital One Multi-Asset Execution Trust, Ser 2007-A5, Cl A5 | | | | | | | | |
0.475%, 07/15/2020 (A) | | | 6,000 | | | | 5,987 | |
Capital One Multi-Asset Execution Trust, Ser 2014-A4, Cl A | | | | | | | | |
0.793%, 06/15/2022 | | | 4,000 | | | | 3,979 | |
Capital One Multi-Asset Execution Trust, Ser 2015-A3, Cl A3 | | | | | | | | |
0.833%, 03/15/2023 (A) | | | 4,895 | | | | 4,865 | |
Chase Issuance Trust, Ser 2007-A12, Cl A12 | | | | | | | | |
0.484%, 08/15/2019 (A) | | | 3,500 | | | | 3,494 | |
| | | | | | | | |
| Description | | Face Amount
($ Thousands) | | | Market Value
($ Thousands) | |
| | | | | | | | |
Chase Issuance Trust,
Ser 2007-A2, Cl A2 | | | | | | | | |
0.484%, 04/15/2019 (A) | | $ | 6,000 | | | $ | 5,999 | |
Chase Issuance Trust,
Ser 2012-A10, Cl A10 | | | | | | | | |
0.695%, 12/16/2019 (A) | | | 2,700 | | | | 2,702 | |
Chase Issuance Trust,
Ser 2013-A9, Cl A | | | | | | | | |
0.854%, 11/16/2020 (A) | | | 4,850 | | | | 4,870 | |
Chase Issuance Trust,
Ser 2014-A5, Cl A5 | | | | | | | | |
0.805%, 04/15/2021 (A) | | | 5,620 | | | | 5,620 | |
Chase Issuance Trust,
Ser 2014-A6, Cl A6 | | | | | | | | |
1.260%, 07/15/2019 | | | 6,100 | | | | 6,107 | |
Citibank Credit Card Issuance Trust, Ser 2008-A2, Cl A2 | | | | | | | | |
1.593%, 01/23/2020 (A) | | | 8,100 | | | | 8,228 | |
Citibank Credit Card Issuance Trust, Ser 2013-A2, Cl A2 | | | | | | | | |
0.723%, 05/26/2020 (A) | | | 6,915 | | | | 6,923 | |
Citibank Credit Card Issuance Trust, Ser 2014-A7, Cl A7 | | | | | | | | |
0.643%, 08/24/2018 (A) | | | 2,250 | | | | 2,250 | |
Discover Card Execution Note Trust, Ser 2012-A4, Cl A4 | | | | | | | | |
0.805%, 11/15/2019 (A) | | | 4,000 | | | | 4,002 | |
Discover Card Execution Note Trust, Ser 2014-A1, Cl A1 | | | | | | | | |
0.865%, 07/15/2021 (A) | | | 5,000 | | | | 5,013 | |
Evergreen Credit Card Trust Series, Ser 2016-1, Cl A | | | | | | | | |
1.155%, 04/15/2020 (A)(B) | | | 800 | | | | 800 | |
Synchrony Credit Card Master Note Trust, Ser 2014-1, Cl A | | | | | | | | |
1.610%, 11/15/2020 | | | 1,000 | | | | 1,003 | |
World Financial Network Credit Card Master Trust,
Ser 2015-C, Cl A | | | | | | | | |
1.260%, 03/15/2021 | | | 985 | | | | 984 | |
| | | | | | | | |
| | | | | | | 110,821 | |
| | | | | | | | |
|
Mortgage Related Securities — 2.4% | |
ABFC Trust, Ser 2005-OPT1, Cl M1 | | | | | | | | |
0.906%, 07/25/2035 (A) | | | 3,967 | | | | 3,854 | |
ABFC Trust, Ser 2005-WF1, Cl A2C | | | | | | | | |
1.066%, 12/25/2034 (A) | | | 2,678 | | | | 2,672 | |
Accredited Mortgage Loan Trust, Ser 2005-2, Cl M1 | | | | | | | | |
0.846%, 07/25/2035 (A) | | | 1,430 | | | | 1,420 | |
Accredited Mortgage Loan Trust, Ser 2005-2, Cl M2 | | | | | | | | |
0.886%, 07/25/2035 (A) | | | 3,000 | | | | 2,927 | |
Aegis Asset-Backed Securities Trust Mortgage Pass-Through Certificates, Ser 2005-3, Cl M1 | | | | | | | | |
0.916%, 08/25/2035 (A) | | | 3,225 | | | | 3,185 | |
| | | | |
| SEI Institutional Investments Trust / Annual Report / May 31, 2016 | | | 89 | |
SCHEDULE OF INVESTMENTS
Opportunistic Income Fund (Continued)
May 31, 2016
| | | | | | | | |
| Description | | Face Amount
($ Thousands) | | | Market Value
($ Thousands) | |
| | | | | | | | |
Bear Stearns Second Lien Trust, Ser 2007- SV1A, Cl A2 | | | | | | | | |
1.086%, 12/25/2036 (A)(B) | | $ | 1,434 | | | $ | 1,393 | |
BNC Mortgage Loan Trust, Ser 2007-2, Cl A2 | | | | | | | | |
0.546%, 05/25/2037 (A) | | | 343 | | | | 335 | |
Countrywide Asset-Backed Certificates, Ser 2006-S8, Cl A3 | | | | | | | | |
5.555%, 04/25/2036 (A) | | | 2,789 | | | | 2,771 | |
Home Equity Asset Trust, Ser 2005-7, Cl M1 | | | | | | | | |
0.896%, 01/25/2036 (A) | | | 4,660 | | | | 4,436 | |
Home Equity Asset Trust, Ser 2006-3, Cl M1 | | | | | | | | |
0.836%, 07/25/2036 (A) | | | 4,060 | | | | 3,184 | |
IXIS Real Estate Capital Trust, Ser 2005-HE1, Cl M3 | | | | | | | | |
1.226%, 06/25/2035 (A) | | | 916 | | | | 916 | |
Master Asset Backed Securities Trust, Ser 2005-NC2, Cl A3 | | | | | | | | |
0.946%, 11/25/2035 (A) | | | 5,689 | | | | 3,657 | |
Master Asset Backed Securities Trust, Ser 2005-WF1, Cl M2 | | | | | | | | |
0.876%, 06/25/2035 (A) | | | 6,100 | | | | 5,965 | |
Merrill Lynch Mortgage Investors Trust, Ser 2006-FF1, Cl A1 | | | | | | | | |
0.551%, 08/25/2036 (A) | | | 2,999 | | | | 2,988 | |
Morgan Stanley Home Equity Loan Trust, Ser 2005-4, Cl A2C | | | | | | | | |
1.086%, 09/25/2035 (A) | | | 2,817 | | | | 2,770 | |
New Century Home Equity Loan Trust, Ser 2005-3, Cl M1 | | | | | | | | |
0.926%, 07/25/2035 (A) | | | 244 | | | | 244 | |
New Century Home Equity Loan Trust, Ser 2005-4, Cl M2 | | | | | | | | |
0.956%, 09/25/2035 (A) | | | 5,000 | | | | 4,668 | |
RASC Trust, Ser 2005-EMX3, Cl M3 | | | | | | | | |
0.906%, 09/25/2035 (A) | | | 3,000 | | | | 2,894 | |
RASC Trust, Ser 2005-KS6, Cl M3 | | | | | | | | |
0.926%, 07/25/2035 (A) | | | 353 | | | | 353 | |
| | | | | | | | |
| | | | | | | 50,632 | |
| | | | | | | | |
|
Other Asset-Backed Securities — 15.2% | |
1776 CLO, Ser 2006-1A, Cl B | | | | | | | | |
1.082%, 05/08/2020 (A)(B) | | | 5,000 | | | | 4,839 | |
Aames Mortgage Investment Trust, Ser 2005- 4, Cl M1 | | | | | | | | |
1.144%, 10/25/2035 (A) | | | 158 | | | | 158 | |
AB CLO, Ser 2007-1A, Cl D | | | | | | | | |
4.528%, 04/15/2021 (A)(B) | | | 1,930 | | | | 1,904 | |
AB CLO, Ser 2007-1A, Cl B | | | | | | | | |
1.372%, 04/15/2021 | | | 188 | | | | 187 | |
ABFC Trust, Ser 2004-OPT5, Cl M1 | | | | | | | | |
1.571%, 03/25/2034 (A) | | | 226 | | | | 192 | |
ACAS CLO, Ser 2007-1A, Cl D | | | | | | | | |
4.884%, 04/20/2021 (A)(B) | | | 1,500 | | | | 1,486 | |
| | | | | | | | |
| Description | | Face Amount
($ Thousands) | | | Market Value
($ Thousands) | |
| | | | | | | | |
Accredited Mortgage Loan Trust, Ser 2004-4, Cl A1A | | | | | | | | |
1.119%, 01/25/2035 (A) | | $ | 109 | | | $ | 107 | |
Accredited Mortgage Loan Trust, Ser 2006-2, Cl A4 | | | | | | | | |
0.706%, 09/25/2036 (A) | | | 8,100 | �� | | | 6,900 | |
Aegis Asset-Backed Securities Trust Mortgage Pass-Through Certificates, Ser 2004-3, Cl A2B | | | | | | | | |
1.546%, 09/25/2034 (A) | | | 256 | | | | 253 | |
Aegis Asset-Backed Securities Trust Mortgage Pass-Through Certificates, Ser 2004-4, Cl A1 | | | | | | | | |
1.166%, 10/25/2034 (A) | | | 406 | | | | 400 | |
Aegis Asset-Backed Securities Trust Mortgage Pass-Through Certificates, Ser 2005-4, Cl M1 | | | | | | | | |
0.896%, 10/25/2035 (A) | | | 2,914 | | | | 2,662 | |
Aircraft Lease Securitisation Ltd., Ser 2007-1A, Cl G3 | | | | | | | | |
0.696%, 05/10/2032 (A)(B) | | | 473 | | | | 467 | |
Ally Master Owner Trust, Ser 2014-5, Cl A2 | | | | | | | | |
1.600%, 10/15/2019 | | | 1,000 | | | | 1,001 | |
Alterna Funding I LLC, Ser 2014-1A, Cl Note | | | | | | | | |
1.639%, 02/15/2021 (B) | | | 910 | | | | 882 | |
Ameriquest Mortgage Securities Asset-Backed Pass-Through Certificates, Ser 2004-R11, Cl A1 | | | | | | | | |
1.044%, 11/25/2034 (A) | | | 1,231 | | | | 1,225 | |
Ameriquest Mortgage Securities Asset-Backed Pass-Through Certificates, Ser 2005-R11, Cl M1 | | | | | | | | |
0.896%, 01/25/2036 (A) | | | 3,310 | | | | 3,094 | |
Ameriquest Mortgage Securities Asset-Backed Pass-Through Certificates, Ser 2005-R5, Cl M1 | | | | | | | | |
0.876%, 07/25/2035 (A) | | | 804 | | | | 803 | |
Ameriquest Mortgage Securities Asset-Backed Pass-Through Certificates, Ser 2005-R7, Cl M2 | | | | | | | | |
0.946%, 09/25/2035 (A) | | | 1,645 | | | | 1,496 | |
Ameriquest Mortgage Securities Asset-Backed Pass-Through Certificates, Ser 2005-R9, Cl AF6 | | | | | | | | |
5.325%, 11/25/2035 | | | 361 | | | | 367 | |
Apidos CLO XII, Ser 2013-12A, Cl A | | | | | | | | |
1.728%, 04/15/2025 (A)(B) | | | 500 | | | | 495 | |
Apidos CLO XVII, Ser 2014-17A, Cl A1A | | | | | | | | |
2.133%, 04/17/2026 (A)(B) | | | 995 | | | | 995 | |
Ares XXII CLO, Ser 2007-22A, Cl B | | | | | | | | |
1.578%, 08/15/2019 (A)(B) | | | 1,375 | | | | 1,323 | |
Argent Securities, Ser 2006-W2, Cl A2B | | | | | | | | |
0.636%, 03/25/2036 (A) | | | 1,331 | | | | 663 | |
| | |
| 90 | | SEI Institutional Investments Trust / Annual Report / May 31, 2016 |
| | | | | | | | |
| Description | | Face Amount
($ Thousands) | | | Market Value
($ Thousands) | |
| | | | | | | | |
ARL First LLC, Ser 2012-1A, Cl A1 | | | | | | | | |
2.185%, 12/15/2042 (A)(B) | | $ | 1,898 | | | $ | 1,839 | |
Asset-Backed Pass-Through Certificates, Ser 2004-R2, Cl A1A | | | | | | | | |
1.129%, 04/25/2034 (A) | | | 3,063 | | | | 3,014 | |
Atrium V, Ser 5A, Cl B | | | | | | | | |
1.326%, 07/20/2020 (A)(B) | | | 6,000 | | | | 5,830 | |
Avalon IV Capital, Ser 2014-1AR, Cl AR | | | | | | | | |
1.803%, 04/17/2023 (A)(B) | | | 645 | | | | 641 | |
Babson CLO, Ser 2007-1A, Cl B1 | | | | | | | | |
1.183%, 01/18/2021 (A)(B) | | | 3,000 | | | | 2,825 | |
Baker Street CLO II,
Ser 2006-1A, Cl C | | | | | | | | |
1.358%, 10/15/2019 (A)(B) | | | 3,000 | | | | 2,896 | |
Battalion CLO, Ser 2007-1A, Cl D | | | | | | | | |
2.780%, 07/14/2022 (A)(B) | | | 1,500 | | | | 1,465 | |
Battalion CLO, Ser 2007-1A, Cl C | | | | | | | | |
1.430%, 07/14/2022 (A)(B) | | | 2,500 | | | | 2,396 | |
Bear Stearns Asset-Backed Securities I Trust, Ser 2006-EC1, Cl M1 | | | | | | | | |
0.856%, 12/25/2035 (A) | | | 2,372 | | | | 2,338 | |
BlueMountain CLO, Ser 2015-1A, Cl A1 | | | | | | | | |
2.140%, 04/13/2027 (A)(B) | | | 1,280 | | | | 1,277 | |
BlueMountain CLO, Ser 2015-4A, Cl A1 | | | | | | | | |
2.174%, 11/30/2026 (A)(B) | | | 3,500 | | | | 3,501 | |
Canaras Summit CLO, Ser 2007-1A, Cl E | | | | | | | | |
4.973%, 06/19/2021 (A)(B) | | | 1,500 | | | | 1,397 | |
Canaras Summit CLO, Ser 2007-1A, Cl D | | | | | | | | |
2.873%, 06/19/2021 (A)(B) | | | 1,000 | | | | 954 | |
Cannington Funding, Ser 2006-1A, Cl C | | | | | | | | |
2.131%, 11/24/2020 (A)(B) | | | 2,000 | | | | 1,851 | |
Carlyle High Yield Partners IX, Ser 2006-9A, Cl A1 | | | | | | | | |
0.872%, 08/01/2021 (A)(B) | | | 2,565 | | | | 2,531 | |
Carlyle High Yield Partners VIII, Ser 2006-8A, Cl A1 | | | | | | | | |
0.904%, 05/21/2021 (A)(B) | | | 1,948 | | | | 1,911 | |
Cent CLO, Ser 2014-20A, Cl A | | | | | | | | |
2.118%, 01/25/2026 (A)(B) | | | 1,250 | | | | 1,244 | |
Cent CLO, Ser 2014-22A, Cl A1 | | | | | | | | |
2.112%, 11/07/2026 (A)(B) | | | 3,100 | | | | 3,087 | |
CIFC Funding, Ser 2013-1A, Cl A1 | | | | | | | | |
1.783%, 04/16/2025 (A)(B) | | | 265 | | | | 263 | |
CIT Equipment Collateral, Ser 2014-VT1, Cl A2 | | | | | | | | |
0.860%, 05/22/2017 (B) | | | 293 | | | | 293 | |
CNH Equipment Trust 2016-B, Ser 2016-B, Cl A2A | | | | | | | | |
1.310%, 10/15/2019 | | | 315 | | | | 315 | |
CNH Wholesale Master Note Trust, Ser 2013- 2A, Cl A | | | | | | | | |
1.034%, 08/15/2019 (A)(B) | | | 425 | | | | 425 | |
Conseco Financial, Ser 1995-6, Cl B1 | | | | | | | | |
7.700%, 09/15/2026 | | | 1,445 | | | | 1,530 | |
| | | | | | | | |
| Description | | Face Amount
($ Thousands) | | | Market Value
($ Thousands) | |
| | | | | | | | |
Conseco Financial, Ser 1997-2, Cl A6 | | | | | | | | |
7.240%, 06/15/2028 (A) | | $ | 551 | | | $ | 549 | |
Conseco Financial, Ser 1997-3, Cl A5 | | | | | | | | |
7.140%, 03/15/2028 | | | 142 | | | | 148 | |
Conseco Financial, Ser 1997-3, Cl A6 | | | | | | | | |
7.320%, 03/15/2028 | | | 47 | | | | 49 | |
Conseco Financial, Ser 1997-6, Cl A9 | | | | | | | | |
7.550%, 01/15/2029 (A) | | | 666 | | | | 673 | |
Conseco Financial, Ser 1997-7, Cl A7 | | | | | | | | |
6.960%, 07/15/2028 (A) | | | 138 | | | | 140 | |
Conseco Financial, Ser 1997-8, Cl A | | | | | | | | |
6.780%, 10/15/2027 | | | 2,619 | | | | 2,720 | |
CWABS Asset-Backed Certificates Trust, Ser 2004-5, Cl 3A | | | | | | | | |
0.906%, 09/25/2034 (A) | | | 17 | | | | 17 | |
CWHEQ Revolving Home Equity Loan Trust, Ser 2007-GW, Cl A | | | | | | | | |
0.985%, 08/15/2037 (A) | | | 1,306 | | | | 1,301 | |
Dryden XI-Leveraged Loan CDO, Ser 2006-11A, Cl B | | | | | | | | |
1.331%, 04/12/2020 (A)(B) | | | 2,000 | | | | 1,998 | |
Dryden XXXI Senior Loan Fund, Ser 2014-31A, Cl A | | | | | | | | |
1.983%, 04/18/2026 (A)(B) | | | 1,215 | | | | 1,209 | |
Encore Credit Receivables Trust, Ser 2005-3, Cl M3 | | | | | | | | |
1.211%, 10/25/2035 (A) | | | 2,600 | | | | 2,400 | |
FFMLT Trust, Ser 2005-FF8, Cl M1 | | | | | | | | |
0.936%, 09/25/2035 (A) | | | 3,983 | | | | 3,903 | |
Fieldstone Mortgage Investment Trust, Ser 2004-3, Cl M4 | | | | | | | | |
2.291%, 08/25/2034 (A) | | | 30 | | | | 30 | |
First Franklin Mortgage Loan Trust, Ser 2005- FF3, Cl M4 | | | | | | | | |
1.346%, 04/25/2035 (A) | | | 2,188 | | | | 2,101 | |
First Franklin Mortgage Loan Trust, Ser 2006- FF1, Cl 2A3 | | | | | | | | |
0.686%, 01/25/2036 (A) | | | 365 | | | | 360 | |
First Franklin Mortgage Loan Trust, Ser 2006- FF9, Cl M1 | | | | | | | | |
0.696%, 06/25/2036 (A) | | | 10,538 | | | | 529 | |
First Franklin Mortgage Loan Trust, Ser 2006- FFA, Cl A3 | | | | | | | | |
0.686%, 09/25/2026 (A) | | | 240 | | | | 124 | |
First Franklin Mortgage Loan Trust, Ser 2006- FFB, Cl A2 | | | | | | | | |
0.706%, 12/25/2026 (A) | | | 74 | | | | 50 | |
Franklin CLO VI, Ser 2007-6A, Cl A | | | | | | | | |
0.862%, 08/09/2019 (A)(B) | | | 4,446 | | | | 4,340 | |
Fraser Sullivan CLO II, Ser 2006-2A, Cl D | | | | | | | | |
2.123%, 12/20/2020 (A)(B) | | | 2,500 | | | | 2,378 | |
Fraser Sullivan CLO II, Ser 2006-2A, Cl B | | | | | | | | |
1.023%, 12/20/2020 (A)(B) | | | 152 | | | | 151 | |
| | | | |
| SEI Institutional Investments Trust / Annual Report / May 31, 2016 | | | 91 | |
SCHEDULE OF INVESTMENTS
Opportunistic Income Fund (Continued)
May 31, 2016
| | | | | | | | |
| Description | | Face Amount
($ Thousands) | | | Market Value
($ Thousands) | |
| | | | | | | | |
Gale Force CLO, Ser 2007-3A, Cl A1 | | | | | | | | |
0.873%, 04/19/2021 (A)(B) | | $ | 1,108 | | | $ | 1,095 | |
GE Equipment Small Ticket LLC, Ser 2014-1A, Cl A3 | | | | | | | | |
0.950%, 09/25/2017 (B) | | | 325 | | | | 325 | |
Gleneagles CLO, Ser 2005-1A, Cl D | | | | | | | | |
2.537%, 11/01/2017 (A)(B) | | | 582 | | | | 573 | |
GMACM Home Equity Loan Trust, Ser 2007- HE2, Cl A3 | | | | | | | | |
6.193%, 12/25/2037 (A) | | | 719 | | | | 706 | |
GMACM Home Equity Loan Trust, Ser 2007- HE2, Cl A2 | | | | | | | | |
6.054%, 12/25/2037 (A) | | | 1,929 | | | | 1,884 | |
GMF Floorplan Owner Revolving Trust, Ser 2015-1, Cl A2 | | | | | | | | |
0.933%, 05/15/2020 (A)(B) | | | 575 | | | | 571 | |
Golub Capital Management CLO, Ser 2007-A1, Cl B | | | | | | | | |
1.157%, 07/31/2021 (A)(B) | | | 708 | | | | 699 | |
Gramercy Park CLO, Ser 2014-1AR, Cl A1R | | | | | | | | |
1.933%, 07/17/2023 (A)(B) | | | 750 | | | | 748 | |
GreatAmerica Leasing Receivables Funding LLC, Ser 2015-1, Cl A2 | | | | | | | | |
1.120%, 06/20/2017 (B) | | | 517 | | | | 516 | |
GreatAmerica Leasing Receivables Funding LLC, Ser 2016-1, Cl A2 | | | | | | | | |
1.570%, 05/21/2018 (B) | | | 635 | | | | 636 | |
Green Tree Agency Advance Funding Trust I, Ser 2015-T1, Cl AT1 | | | | | | | | |
2.302%, 10/15/2046 (B) | | | 350 | | | | 350 | |
GSAMP Trust, Ser 2006-HE8, Cl A2C | | | | | | | | |
0.616%, 01/25/2037 (A) | | | 4,175 | | | | 3,385 | |
Gulf Stream - Sextant CLO, Ser 2007-1A, Cl C | | | | | | | | |
1.489%, 06/17/2021 (A)(B) | | | 2,250 | | | | 2,249 | |
HarbourView CLO, Ser 2006-6A, Cl A2 | | | | | | | | |
1.010%, 12/27/2019 (A)(B) | | | 5,075 | | | | 4,948 | |
Hilton Grand Vacations Trust, Ser 2014-AA, Cl A | | | | | | | | |
1.770%, 11/25/2026 (B) | | | 2,893 | | | | 2,868 | |
Home Equity Mortgage Loan Asset-Backed Trust Series INABS, Ser 2005-C, Cl AII3 | | | | | | | | |
0.816%, 10/25/2035 (A) | | | 1,859 | | | | 1,842 | |
Home Equity Mortgage Trust, Ser 2006-5, Cl A1 | | | | | | | | |
6.000%, 01/25/2037 | | | 10,455 | | | | 4,824 | |
HSBC Home Equity Loan Trust, Ser 2007-2, Cl AS | | | | | | | | |
0.628%, 07/20/2036 (A) | | | 2,747 | | | | 2,728 | |
HSI Asset Securitization Trust, Ser 2005-I1, Cl 2A3 | | | | | | | | |
0.736%, 11/25/2035 (A) | | | 890 | | | | 844 | |
HSI Asset Securitization Trust, Ser 2006-OPT2, Cl 2A3 | | | | | | | | |
0.636%, 01/25/2036 (A) | | | 2,045 | | | | 2,040 | |
| | | | | | | | |
| Description | | Face Amount
($ Thousands) | | | Market Value
($ Thousands) | |
| | | | | | | | |
Irwin Home Equity Loan Trust, Ser 2006-1, Cl 2A3 | | | | | | | | |
5.770%, 09/25/2035 (B) | | $ | 3,699 | | | $ | 3,743 | |
Kubota Credit Owner Trust, Ser 2015-1A, Cl A2 | | | | | | | | |
0.940%, 12/15/2017 (B) | | | 340 | | | | 339 | |
KVK CLO, Ser 2012-1A, Cl A | | | | | | | | |
1.998%, 07/15/2023 (A)(B) | | | 1,733 | | | | 1,728 | |
LCM IX, Ser 2011-9A, Cl C | | | | | | | | |
3.480%, 07/14/2022 (A)(B) | | | 3,500 | | | | 3,504 | |
Lehman Asset-Backed Security Manufactured Housing Contract Trust, Ser 2001-B, Cl A6 | | | | | | | | |
6.467%, 04/15/2040 (A) | | | 252 | | | | 262 | |
Lehman Asset-Backed Security Manufactured Housing Contract Trust, Ser 2001-B, Cl A4 | | | | | | | | |
5.270%, 04/15/2040 | | | 151 | | | | 155 | |
Lehman Asset-Backed Security Manufactured Housing Contract Trust, Ser 2001-B, Cl A3 | | | | | | | | |
4.350%, 04/15/2040 | | | 1,103 | | | | 1,117 | |
Limerock CLO I, Ser 2007-1A, Cl B | | | | | | | | |
1.268%, 04/24/2023 (A)(B) | | | 3,000 | | | | 2,817 | |
Limerock CLO II, Ser 2014-2A, Cl A | | | | | | | | |
2.133%, 04/18/2026 (A)(B) | | | 850 | | | | 846 | |
Magnetite CLO IX, Ser 2014-9A, Cl A1 | | | | | | | | |
2.058%, 07/25/2026 (A)(B) | | | 940 | | | | 939 | |
Master Asset-Backed Securities Trust, Ser 2005-AB1, Cl A3B | | | | | | | | |
5.233%, 11/25/2035 | | | 1,813 | | | | 1,818 | |
Master Asset-Backed Securities Trust, Ser 2006-HE5, Cl A3 | | | | | | | | |
0.606%, 11/25/2036 (A) | | | 768 | | | | 479 | |
Master Asset-Backed Securities Trust, Ser 2006-NC3, Cl A3 | | | | | | | | |
0.546%, 10/25/2036 (A) | | | 3,178 | | | | 1,873 | |
Master Asset-Backed Securities Trust, Ser 2006-NC3, Cl A5 | | | | | | | | |
0.656%, 10/25/2036 (A) | | | 1,894 | | | | 1,136 | |
Merrill Lynch CLO, Ser 2007-1A, Cl E | | | | | | | | |
4.880%, 04/14/2021 (A)(B) | | | 221 | | | | 221 | |
Michigan Finance Authority, Ser 2015-1, Cl A1 | | | | | | | | |
1.188%, 04/29/2030 (A) | | | 4,907 | | | | 4,761 | |
Mid-State Capital Trust, Ser 2004-1, Cl M1 | | | | | | | | |
6.497%, 08/15/2037 | | | 1,185 | | | | 1,264 | |
MMAF Equipment Finance LLC, Ser 2014-AA, Cl A3 | | | | | | | | |
0.870%, 01/08/2019 (B) | | | 1,010 | | | | 1,007 | |
MMAF Equipment Finance LLC, Ser 2015-AA, Cl A2 | | | | | | | | |
0.960%, 09/18/2017 (B) | | | 268 | | | | 268 | |
Morgan Stanley Asset-Backed Security Capital I Trust, Ser 2005-HE6, Cl A2C | | | | | | | | |
0.766%, 11/25/2035 (A) | | | 1,750 | | | | 1,747 | |
| | |
| 92 | | SEI Institutional Investments Trust / Annual Report / May 31, 2016 |
| | | | | | | | |
| Description | | Face Amount
($ Thousands) | | | Market Value
($ Thousands) | |
| | | | | | | | |
Morgan Stanley Asset-Backed Security Capital I Trust, Ser 2005-NC2, Cl M2 | | | | | | | | |
1.076%, 03/25/2035 (A) | | $ | 2,507 | | | $ | 2,495 | |
Morgan Stanley Asset-Backed Security Capital I Trust, Ser 2005-WMC2, Cl M2 | | | | | | | | |
1.091%, 02/25/2035 (A) | | | 1,665 | | | | 1,636 | |
Morgan Stanley Asset-Backed Security Capital I Trust, Ser 2006-HE8, Cl A2B | | | | | | | | |
0.546%, 10/25/2036 (A) | | | 2,852 | | | | 1,526 | |
Morgan Stanley Capital I Trust, Ser 2003-NC4, Cl M2 | | | | | | | | |
3.446%, 04/25/2033 (A) | | | 15 | | | | 15 | |
Morgan Stanley Dean Witter Capital I Trust, Ser 2002-AM3, Cl M1 | | | | | | | | |
1.871%, 02/25/2033 (A) | | | 35 | | | | 34 | |
MVW Owner Trust, Ser 2014-1A, Cl A | | | | | | | | |
2.250%, 09/22/2031 (B) | | | 4,103 | | | | 4,099 | |
MVW Owner Trust, Ser 2015-1A, Cl A | | | | | | | | |
2.520%, 12/20/2032 (B) | | | 6,841 | | | | 6,865 | |
Nantucket CLO, Ser 2006-1A, Cl C | | | | | | | | |
1.361%, 11/24/2020 (A)(B) | | | 3,000 | | | | 2,926 | |
Nationstar HECM Loan Trust, Ser 2015-2A, Cl A | | | | | | | | |
2.883%, 11/25/2025 (B) | | | 187 | | | | 186 | |
Nationstar HECM Loan Trust, Ser 2016-1A, Cl A | | | | | | | | |
2.981%, 02/25/2026 (B) | | | 180 | | | | 180 | |
Nationstar Home Equity Loan Trust, Ser 2006- B, Cl AV4 | | | | | | | | |
0.726%, 09/25/2036 (A) | | | 5,739 | | | | 5,364 | |
Navient Student Loan Trust, Ser 2014-1, Cl A2 | | | | | | | | |
0.756%, 03/27/2023 (A) | | | 3,000 | | | | 2,963 | |
Navigare Funding II CLO, Ser 2007-2A, Cl D | | | | | | | | |
2.333%, 04/17/2021 (A)(B) | | | 5,000 | | | | 4,956 | |
Neuberger Berman CLO, Ser 2014-16A, Cl A1 | | | | | | | | |
2.098%, 04/15/2026 (A)(B) | | | 625 | | | | 625 | |
New Century Home Equity Loan Trust, Ser 2005-C, Cl A2C | | | | | | | | |
0.696%, 12/25/2035 (A) | | | 4,467 | | | | 4,371 | |
NewMark Capital Funding CLO, Ser 2013-1A, Cl A2 | | | | | | | | |
1.753%, 06/02/2025 (A)(B) | | | 3,553 | | | | 3,489 | |
NOB Hill CLO, Ser 2006-1A, Cl C | | | | | | | | |
1.426%, 08/15/2018 (A)(B) | | | 1,793 | | | | 1,784 | |
NRZ Advance Receivables Trust Advance Receivables Backed, Ser 2015-T3, Cl AT3 | | | | | | | | |
2.540%, 11/15/2046 (B) | | | 850 | | | | 850 | |
NYCTL Trust, Ser 2015-A, Cl A | | | | | | | | |
1.340%, 11/10/2028 (B) | | | 404 | | | | 402 | |
Octagon Investment Partners XI, Ser 2007-1A, Cl C | | | | | | | | |
2.662%, 08/25/2021 (A)(B) | | | 3,000 | | | | 2,723 | |
Octagon Investment Partners XVI, Ser 2013- 1A, Cl A | | | | | | | | |
1.753%, 07/17/2025 (A)(B) | | | 300 | | | | 297 | |
| | | | | | | | |
| Description | | Face Amount
($ Thousands) | | | Market Value
($ Thousands) | |
| | | | | | | | |
Octagon Investment Partners XX, Ser 2014-1A, Cl A | | | | | | | | |
2.068%, 08/12/2026 (A)(B) | | $ | 3,230 | | | $ | 3,199 | |
Ocwen Master Advance Receivables Trust, Ser 2015-T1, Cl AT1 | | | | | | | | |
2.537%, 09/17/2046 (B) | | | 380 | | | | 380 | |
Ocwen Master Advance Receivables Trust, Ser 2015-T2, Cl AT2 | | | | | | | | |
2.532%, 11/15/2046 (B) | | | 310 | | | | 310 | |
OHA Credit Partners VIII, Ser 2013-8A, Cl A | | | | | | | | |
1.754%, 04/20/2025 (A)(B) | | | 200 | | | | 198 | |
One Wall Street CLO II, Ser 2007-2A, Cl D | | | | | | | | |
2.085%, 04/22/2019 (A)(B) | | | 5,200 | | | | 5,084 | |
Option One Mortgage Loan Trust Asset-Backed Certificates, Ser 2005-5, Cl A3 | | | | | | | | |
0.656%, 12/25/2035 (A) | | | 698 | | | | 693 | |
Option One Mortgage Loan Trust, Ser 2005-1, Cl A1A | | | | | | | | |
0.946%, 02/25/2035 (A) | | | 239 | | | | 236 | |
Option One Mortgage Loan Trust, Ser 2006-3, Cl 2A2 | | | | | | | | |
0.546%, 02/25/2037 (A) | | | 552 | | | | 308 | |
Origen Manufactured Housing Contract Trust, Ser 2005-B, Cl A4 | | | | | | | | |
5.910%, 01/15/2037 | | | 588 | | | | 609 | |
Origen Manufactured Housing Contract Trust, Ser 2005-B, Cl M1 | | | | | | | | |
5.990%, 01/15/2037 | | | 67 | | | | 69 | |
Park Place Securities Asset-Backed Pass- Through Certificates, Ser 2004-WHQ2, Cl M2 | | | | | | | | |
1.391%, 02/25/2035 (A) | | | 1,385 | | | | 1,380 | |
Park Place Securities Asset-Backed Pass- Through Certificates, Ser 2005-WHQ1, Cl M5 | | | | | | | | |
1.571%, 03/25/2035 (A) | | | 4,242 | | | | 3,588 | |
Prospect Park CDO, Ser 2006-1A, Cl B | | | | | | | | |
1.298%, 07/15/2020 (A)(B) | | | 5,000 | | | | 4,843 | |
Race Point VI CLO, Ser 2014-6RA, Cl BR | | | | | | | | |
2.811%, 05/24/2023 (A)(B) | | | 725 | | | | 721 | |
RAMP Trust, Ser 2004-RS6, Cl MII1 | | | | | | | | |
1.369%, 06/25/2034 (A) | | | 2,335 | | | | 2,208 | |
RASC Trust, Ser 2005-KS12, Cl A3 | | | | | | | | |
0.766%, 01/25/2036 (A) | | | 1,203 | | | | 1,193 | |
SACO I, Ser 2005-9, Cl A1 | | | | | | | | |
0.946%, 12/25/2035 (A) | | | 872 | | | | 826 | |
SACO I, Ser 2005-WM3, Cl A1 | | | | | | | | |
0.966%, 09/25/2035 (A) | | | 594 | | | | 548 | |
Saxon Asset Securities Trust, Ser 2003-3, Cl AF6 | | | | | | | | |
5.010%, 12/25/2033 | | | 167 | | | | 168 | |
| | | | |
| SEI Institutional Investments Trust / Annual Report / May 31, 2016 | | | 93 | |
SCHEDULE OF INVESTMENTS
Opportunistic Income Fund (Continued)
May 31, 2016
| | | | | | | | |
| Description | | Face Amount
($ Thousands) | | | Market Value
($ Thousands) | |
| | | | | | | | |
Saxon Asset Securities Trust, Ser 2006-2, Cl A3C | | | | | | | | |
0.596%, 09/25/2036 (A) | | $ | 3,398 | | | $ | 3,230 | |
Saxon Asset Securities Trust, Ser 2007-2, Cl A2A | | | | | | | | |
0.546%, 05/25/2047 (A) | | | 847 | | | | 570 | |
Securitized Asset-Backed Receivables LLC, Ser 2006-NC3, Cl A2B | | | | | | | | |
0.596%, 09/25/2036 (A) | | | 4,093 | | | | 1,909 | |
Securitized Asset-Backed Receivables LLC, Ser 2007-BR5, Cl A2A | | | | | | | | |
0.576%, 05/25/2037 (A) | | | 1,024 | | | | 665 | |
Shinnecock CLO, Ser 2006-1A, Cl C | | | | | | | | |
1.528%, 07/15/2018 (A)(B) | | | 1,500 | | | | 1,479 | |
Sierra Timeshare Receivables Funding LLC, Ser 2013-3A, Cl A | | | | | | | | |
2.200%, 10/20/2030 (B) | | | 943 | | | | 947 | |
Sierra Timeshare Receivables Funding LLC, Ser 2014-1A, Cl A | | | | | | | | |
2.070%, 03/20/2030 (B) | | | 1,553 | | | | 1,547 | |
Sierra Timeshare Receivables Funding LLC, Ser 2014-2A, Cl A | | | | | | | | |
2.050%, 06/20/2031 (B) | | | 1,097 | | | | 1,094 | |
Sierra Timeshare Receivables Funding LLC, Ser 2014-3A, Cl A | | | | | | | | |
2.300%, 10/20/2031 (B) | | | 871 | | | | 872 | |
Sierra Timeshare Receivables Funding LLC, Ser 2015-1A, Cl A | | | | | | | | |
2.400%, 03/22/2032 (B) | | | 2,524 | | | | 2,519 | |
SLM Private Education Loan Trust, Ser 2011-B, Cl A1 | | | | | | | | |
1.285%, 12/16/2024 (A)(B) | | | 4 | | | | 4 | |
SLM Student Loan Trust, Ser 2013-3, Cl A2 | | | | | | | | |
0.746%, 05/26/2020 (A) | | | 3,049 | | | | 3,030 | |
SLM Student Loan Trust, Ser 2013-6, Cl A2 | | | | | | | | |
0.946%, 02/25/2021 (A) | | | 2,988 | | | | 2,980 | |
SLM Student Loan Trust, Ser 2014-1, Cl A2 | | | | | | | | |
0.819%, 07/26/2021 (A) | | | 1,833 | | | | 1,825 | |
Soundview Home Equity Loan Trust, Ser 2005- 4, Cl M2 | | | | | | | | |
0.916%, 03/25/2036 (A) | | | 3,458 | | | | 3,000 | |
Soundview Home Equity Loan Trust, Ser 2006-EQ1, Cl A3 | | | | | | | | |
0.606%, 10/25/2036 (A) | | | 1,574 | | | | 1,400 | |
Specialty Underwriting & Residential Finance Trust, Ser 2005-AB1, Cl M1 | | | | | | | | |
1.091%, 03/25/2036 (A) | | | 1,608 | | | | 1,588 | |
SpringCastle America Funding LLC, Ser 2014- AA, Cl A | | | | | | | | |
2.700%, 05/25/2023 (B) | | | 725 | | | | 727 | |
Springleaf Funding Trust, Ser 2014-AA, Cl A | | | | | | | | |
2.410%, 12/15/2022 (B) | | | 569 | | | | 569 | |
| | | | | | | | |
| Description | | Face Amount
($ Thousands) | | | Market Value
($ Thousands) | |
| | | | | | | | |
SPS Servicer Advance Receivables Trust Advance Receivables Backed Notes, Ser 2015-T2, Cl AT2 | | | | | | | | |
2.620%, 01/15/2047 (B) | | $ | 665 | | | $ | 665 | |
Stone Tower CLO VI, Ser 2007-6A, Cl C | | | | | | | | |
1.983%, 04/17/2021 (A)(B) | | | 1,500 | | | | 1,396 | |
Stone Tower CLO VII, Ser 2007-7A, Cl A3 | | | | | | | | |
1.784%, 08/30/2021 (A)(B) | | | 1,771 | | | | 1,756 | |
Stoney Lane Funding I, Ser 2007-1A, Cl A1 | | | | | | | | |
0.873%, 04/18/2022 (A)(B) | | | 855 | | | | 842 | |
Structured Asset Investment Loan Trust, Ser 2006-2, Cl A3 | | | | | | | | |
0.626%, 04/25/2036 (A) | | | 1,857 | | | | 1,653 | |
Structured Asset Securities Mortgage Loan Trust, Ser 2005-WF3, Cl M1 | | | | | | | | |
0.926%, 07/25/2035 (A) | | | 1,500 | | | | 1,426 | |
Structured Asset Securities Mortgage Loan Trust, Ser 2006-GEL3, Cl A2 | | | | | | | | |
0.676%, 07/25/2036 (A)(B) | | | 481 | | | | 479 | |
Structured Asset Securities Mortgage Loan Trust, Ser 2006-WF1, Cl A1 | | | | | | | | |
0.596%, 02/25/2036 (A) | | | 126 | | | | 126 | |
Structured Asset Securities Mortgage Loan Trust, Ser 2006-WF3, Cl A4 | | | | | | | | |
0.756%, 09/25/2036 (A) | | | 1,820 | | | | 1,703 | |
Structured Asset Securities Mortgage Loan Trust, Ser 2007-BC1, Cl A4 | | | | | | | | |
0.576%, 02/25/2037 (A) | | | 5,370 | | | | 4,798 | |
Structured Asset Securities Mortgage Loan Trust, Ser 2008-BC4, Cl A3 | | | | | | | | |
0.696%, 11/25/2037 (A) | | | 575 | | | | 574 | |
Symphony CLO III, Ser 2007-3A, Cl C | | | | | | | | |
1.286%, 05/15/2019 (A)(B) | | | 2,500 | | | | 2,398 | |
Symphony CLO IV, Ser 2007-4A, Cl B | | | | | | | | |
1.233%, 07/18/2021 (A)(B) | | | 2,250 | | | | 2,220 | |
Symphony CLO V, Ser 2007-5A, Cl A1 | | | | | | | | |
1.378%, 01/15/2024 (A)(B) | | | 1,649 | | | | 1,618 | |
Telos CLO, Ser 2007-2A, Cl D | | | | | | | | |
2.828%, 04/15/2022 (A)(B) | | | 3,000 | | | | 2,782 | |
Tralee CDO, Ser 2007-1A, Cl B | | | | | | | | |
1.333%, 04/16/2022 (A)(B) | | | 4,800 | | | | 4,492 | |
Trimaran CLO VII, Ser 2007-1A, Cl A2L | | | | | | | | |
1.004%, 06/15/2021 (A)(B) | | | 5,500 | | | | 5,231 | |
Venture VIII CDO, Ser 2007-8A, Cl B | | | | | | | | |
1.055%, 07/22/2021 (A)(B) | | | 5,000 | | | | 4,681 | |
Veritas CLO II, Ser 2006-2A, Cl D | | | | | | | | |
2.329%, 07/11/2021 (A)(B) | | | 1,075 | | | | 1,065 | |
Volvo Financial Equipment LLC, Ser 2015-1A, Cl A2 | | | | | | | | |
0.950%, 11/15/2017 (B) | | | 714 | | | | 714 | |
Voya CLO II, Ser 2006-2A, Cl C | | | | | | | | |
1.337%, 08/01/2020 (A)(B) | | | 3,000 | | | | 2,913 | |
| | |
| 94 | | SEI Institutional Investments Trust / Annual Report / May 31, 2016 |
| | | | | | | | |
| Description | | Face Amount
($ Thousands) | | | Market Value
($ Thousands) | |
| | | | | | | | |
Voya CLO II, Ser 2006-2A, Cl A2 | | | | | | | | |
0.977%, 08/01/2020 (A)(B) | | $ | 1,121 | | | $ | 1,114 | |
Voya CLO III, Ser 2006-3A, Cl C | | | | | | | | |
2.083%, 12/13/2020 (A)(B) | | | 2,000 | | | | 1,925 | |
Voya CLO, Ser 2013-1A, Cl A1 | | | | | | | | |
1.768%, 04/15/2024 (A)(B) | | | 3,555 | | | | 3,528 | |
Voya CLO, Ser 2014-1A, Cl A1 | | | | | | | | |
2.133%, 04/18/2026 (A)(B) | | | 970 | | | | 966 | |
Voya CLO, Ser 2014-1RA, Cl A1R | | | | | | | | |
1.832%, 03/14/2022 (A)(B) | | | 619 | | | | 618 | |
Voya CLO, Ser 2014-1RA, Cl A2R | | | | | | | | |
2.482%, 03/14/2022 (A)(B) | | | 600 | | | | 600 | |
Westgate Resorts LLC, Ser 2015-1A, Cl A | | | | | | | | |
2.750%, 05/20/2027 (B) | | | 1,930 | | | | 1,932 | |
Westgate Resorts LLC, Ser 2015-2A, Cl B | | | | | | | | |
4.000%, 07/20/2028 (B) | | | 590 | | | | 586 | |
| | | | | | | | |
| | | | | | | 323,850 | |
| | | | | | | | |
Total Asset-Backed Securities
(Cost $545,127) ($ Thousands) | | | | | | | 545,861 | |
| | | | | | | | |
| |
CORPORATE OBLIGATIONS — 8.2% | | | | | |
Consumer Discretionary — 1.6% | | | | | | | | |
AutoZone | | | | | | | | |
1.625%, 04/21/2019 | | | 90 | | | | 90 | |
CCO Holdings LLC | | | | | | | | |
5.250%, 09/30/2022 | | | 2,750 | | | | 2,826 | |
5.125%, 02/15/2023 | | | 700 | | | | 712 | |
Cedar Fair | | | | | | | | |
5.250%, 03/15/2021 | | | 1,000 | | | | 1,040 | |
Charter Communications Operating LLC | | | | | | | | |
4.908%, 07/23/2025 (B) | | | 500 | | | | 535 | |
CSC Holdings | | | | | | | | |
8.625%, 02/15/2019 | | | 1,090 | | | | 1,211 | |
Daimler Finance North America LLC | | | | | | | | |
1.375%, 08/01/2017 (B) | | | 625 | | | | 625 | |
1.053%, 03/02/2018 (A)(B) | | | 1,000 | | | | 990 | |
Dollar Tree | | | | | | | | |
5.750%, 03/01/2023 (B) | | | 1,015 | | | | 1,072 | |
Ford Motor Credit LLC | | | | | | | | |
1.724%, 12/06/2017 | | | 500 | | | | 500 | |
1.569%, 01/09/2018 (A) | | | 750 | | | | 751 | |
1.462%, 03/12/2019 (A) | | | 500 | | | | 497 | |
General Motors Financial | | | | | | | | |
2.400%, 04/10/2018 | | | 1,000 | | | | 1,004 | |
Hyundai Capital America | | | | | | | | |
1.875%, 08/09/2016 (B) | | | 200 | | | | 200 | |
NBCUniversal Enterprise | | | | | | | | |
1.313%, 04/15/2018 (A)(B) | | | 400 | | | | 401 | |
Nissan Motor Acceptance MTN | | | | | | | | |
1.500%, 03/02/2018 (B) | | | 550 | | | | 549 | |
| | | | | | | | |
| Description | | Face Amount
($ Thousands) | | | Market Value
($ Thousands) | |
| | | | | | | | |
Seminole Hard Rock Entertainment | | | | | | | | |
5.875%, 05/15/2021 (B) | | $ | 1,023 | | | $ | 1,033 | |
Sinclair Television Group | | | | | | | | |
5.625%, 08/01/2024 (B) | | | 2,600 | | | | 2,665 | |
5.375%, 04/01/2021 | | | 1,000 | | | | 1,035 | |
Sirius XM Radio | | | | | | | | |
5.875%, 10/01/2020 (B) | | | 4,000 | | | | 4,135 | |
5.375%, 04/15/2025 (B) | | | 385 | | | | 386 | |
5.375%, 07/15/2026 (B) | | | 1,665 | | | | 1,653 | |
4.625%, 05/15/2023 (B) | | | 800 | | | | 786 | |
4.250%, 05/15/2020 (B) | | | 1,000 | | | | 1,019 | |
Six Flags Entertainment | | | | | | | | |
5.250%, 01/15/2021 (B) | | | 2,000 | | | | 2,071 | |
Time Warner Cable | | | | | | | | |
5.850%, 05/01/2017 | | | 350 | | | | 363 | |
Tribune Media | | | | | | | | |
5.875%, 07/15/2022 | | | 2,400 | | | | 2,424 | |
Volkswagen Group of America Finance LLC | | | | | | | | |
1.250%, 05/23/2017 (B) | | | 500 | | | | 498 | |
1.124%, 05/22/2018 (A)(B) | | | 500 | | | | 492 | |
William Carter | | | | | | | | |
5.250%, 08/15/2021 | | | 2,615 | | | | 2,706 | |
| | | | | | | | |
| | | | | | | 34,269 | |
| | | | | | | | |
| | |
Consumer Staples — 0.4% | | | | | | | | |
Anheuser-Busch InBev Finance | | | | | | | | |
1.900%, 02/01/2019 | | | 360 | | | | 362 | |
1.897%, 02/01/2021 (A) | | | 450 | | | | 464 | |
BAT International Finance | | | | | | | | |
1.144%, 06/15/2018 (A)(B) | | | 800 | | | | 799 | |
Bayer US Finance LLC | | | | | | | | |
0.910%, 10/06/2017 (A)(B) | | | 700 | | | | 700 | |
CVS Health | | | | | | | | |
1.900%, 07/20/2018 | | | 500 | | | | 505 | |
JM Smucker | | | | | | | | |
1.750%, 03/15/2018 | | | 265 | | | | 266 | |
Kroger | | | | | | | | |
2.000%, 01/15/2019 | | | 245 | | | | 246 | |
Mondelez International | | | | | | | | |
1.157%, 02/01/2019 (A) | | | 1,000 | | | | 997 | |
Reynolds American | | | | | | | | |
2.300%, 06/12/2018 | | | 890 | | | | 903 | |
SABMiller Holdings | | | | | | | | |
1.327%, 08/01/2018 (A)(B) | | | 600 | | | | 600 | |
Spectrum Brands | | | | | | | | |
5.750%, 07/15/2025 | | | 765 | | | | 799 | |
Sutter Health | | | | | | | | |
1.090%, 08/15/2053 | | | 525 | | | | 523 | |
Walgreens Boots Alliance | | | | | | | | |
1.750%, 05/30/2018 | | | 600 | | | | 601 | |
| | | | | | | | |
| | | | | | | 7,765 | |
| | | | | | | | |
| | | | |
| SEI Institutional Investments Trust / Annual Report / May 31, 2016 | | | 95 | |
SCHEDULE OF INVESTMENTS
Opportunistic Income Fund (Continued)
May 31, 2016
| | | | | | | | |
| Description | | Face Amount
($ Thousands) | | | Market Value
($ Thousands) | |
| | | | | | | | |
Energy — 1.1% | | | | | | | | |
Atwood Oceanics | | | | | | | | |
6.500%, 02/01/2020 | | $ | 1,700 | | | $ | 1,020 | |
Blue Racer Midstream LLC | | | | | | | | |
6.125%, 11/15/2022 (B) | | | 917 | | | | 825 | |
BP Capital Markets | | | | | | | | |
1.260%, 09/26/2018 (A) | | | 850 | | | | 847 | |
1.140%, 05/10/2018 (A) | | | 400 | | | | 397 | |
1.052%, 02/13/2018 (A) | | | 600 | | | | 598 | |
Canadian Natural Resources | | | | | | | | |
5.700%, 05/15/2017 | | | 150 | | | | 154 | |
ConocoPhillips | | | | | | | | |
1.500%, 05/15/2018 | | | 525 | | | | 521 | |
Enbridge | | | | | | | | |
1.083%, 06/02/2017 (A) | | | 900 | | | | 883 | |
Energy Transfer Partners | | | | | | | | |
2.500%, 06/15/2018 | | | 525 | | | | 518 | |
Genesis Energy | | | | | | | | |
6.750%, 08/01/2022 | | | 2,654 | | | | 2,521 | |
6.000%, 05/15/2023 | | | 795 | | | | 732 | |
Gibson Energy | | | | | | | | |
6.750%, 07/15/2021 (B) | | | 599 | | | | 595 | |
Halcon Resources | | | | | | | | |
8.625%, 02/01/2020 (B) | | | 1,360 | | | | 1,284 | |
Hess | | | | | | | | |
1.300%, 06/15/2017 | | | 510 | | | | 507 | |
Kinder Morgan | | | | | | | | |
2.000%, 12/01/2017 | | | 345 | | | | 341 | |
Noble Energy | | | | | | | | |
8.250%, 03/01/2019 | | | 325 | | | | 365 | |
Regency Energy Partners | | | | | | | | |
5.000%, 10/01/2022 | | | 2,500 | | | | 2,454 | |
Sabine Pass Liquefaction LLC | | | | | | | | |
6.250%, 03/15/2022 | | | 2,500 | | | | 2,556 | |
5.625%, 02/01/2021 | | | 1,300 | | | | 1,328 | |
Schlumberger Holdings | | | | | | | | |
1.900%, 12/21/2017 (B) | | | 800 | | | | 803 | |
Shell International Finance | | | | | | | | |
1.375%, 05/10/2019 | | | 600 | | | | 596 | |
Suncor Energy | | | | | | | | |
6.100%, 06/01/2018 | | | 475 | | | | 509 | |
Targa Resources Partners | | | | | | | | |
6.750%, 03/15/2024 (B) | | | 1,500 | | | | 1,481 | |
Total Capital International | | | | | | | | |
1.200%, 08/10/2018 (A) | | | 400 | | | | 398 | |
TransCanada PipeLines | | | | | | | | |
1.421%, 01/12/2018 (A) | | | 1,100 | | | | 1,085 | |
| | | | | | | | |
| | | | | | | 23,318 | |
| | | | | | | | |
| | |
Financials — 2.3% | | | | | | | | |
ABN AMRO Bank | | | | | | | | |
4.250%, 02/02/2017 (B) | | | 565 | | | | 576 | |
| | | | | | | | |
| Description | | Face Amount
($ Thousands) | | | Market Value
($ Thousands) | |
| | | | | | | | |
American Honda Finance MTN | | | | | | | | |
1.500%, 03/13/2018 | | $ | 600 | | | $ | 603 | |
Australia & New Zealand Banking Group | | | | | | | | |
1.186%, 05/15/2018 (A) | | | 250 | | | | 250 | |
Bank of America MTN | | | | | | | | |
1.700%, 08/25/2017 | | | 800 | | | | 801 | |
1.668%, 01/15/2019 (A) | | | 700 | | | | 703 | |
1.086%, 06/05/2017 (A) | | | 500 | | | | 501 | |
Bank of Montreal MTN | | | | | | | | |
1.229%, 04/09/2018 (A) | | | 350 | | | | 350 | |
Bank of New York Mellon MTN | | | | | | | | |
1.076%, 03/06/2018 (A) | | | 325 | | | | 325 | |
Bank of Tokyo-Mitsubishi UFJ | | | | | | | | |
1.236%, 03/05/2018 (A) (B) | | | 900 | | | | 896 | |
0.944%, 09/08/2017 (A) (B) | | | 500 | | | | 498 | |
Barclays Bank MTN | | | | | | | | |
6.050%, 12/04/2017 (B) | | | 575 | | | | 608 | |
Boart Longyear Management | | | | | | | | |
10.000%, 10/01/2018 (B) | | | 2,417 | | | | 1,456 | |
Branch Banking & Trust | | | | | | | | |
1.450%, 05/10/2019 | | | 425 | | | | 423 | |
1.350%, 10/01/2017 | | | 450 | | | | 450 | |
Capital One | | | | | | | | |
1.313%, 02/05/2018 (A) | | | 750 | | | | 749 | |
Capital One Bank USA | | | | | | | | |
1.300%, 06/05/2017 | | | 850 | | | | 851 | |
Citigroup | | | | | | | | |
1.550%, 08/14/2017 | | | 500 | | | | 500 | |
1.401%, 04/08/2019 (A) | | | 650 | | | | 646 | |
1.324%, 04/27/2018 (A) | | | 450 | | | | 450 | |
Citizens Bank MTN | | | | | | | | |
1.600%, 12/04/2017 | | | 1,000 | | | | 995 | |
Commonwealth Bank of Australia MTN | | | | | | | | |
1.032%, 03/12/2018 (A) (B) | | | 850 | | | | 847 | |
Credit Agricole MTN | | | | | | | | |
1.605%, 06/10/2020 (A) (B) | | | 1,000 | | | | 997 | |
Credit Suisse NY | | | | | | | | |
1.700%, 04/27/2018 | | | 850 | | | | 851 | |
Daimler Finance North America LLC | | | | | | | | |
1.650%, 05/18/2018 (B) | | | 300 | | | | 300 | |
Deutsche Bank | | | | | | | | |
1.307%, 02/13/2018 (A) | | | 650 | | | | 644 | |
Equinix | | | | | | | | |
5.750%, 01/01/2025 | | | 3,535 | | | | 3,676 | |
General Electric MTN | | | | | | | | |
1.339%, 04/02/2018 (A) | | | 275 | | | | 277 | |
Goldman Sachs Group MTN | | | | | | | | |
1.838%, 04/30/2018 (A) | | | 180 | | | | 182 | |
1.798%, 04/23/2020 (A) | | | 725 | | | | 725 | |
1.726%, 11/15/2018 (A) | | | 750 | | | | 754 | |
Hartford Financial Services Group | | | | | | | | |
5.375%, 03/15/2017 | | | 1,000 | | | | 1,030 | |
| | |
| 96 | | SEI Institutional Investments Trust / Annual Report / May 31, 2016 |
| | | | | | | | |
| Description | | Face Amount
($ Thousands) | | | Market Value
($ Thousands) | |
| | | | | | | | |
HSBC Bank | | | | | | | | |
1.266%, 05/15/2018 (A) (B) | | $ | 200 | | | $ | 199 | |
HSBC USA | | | | | | | | |
1.508%, 09/24/2018 (A) | | | 300 | | | | 300 | |
Huntington National Bank | | | | | | | | |
1.700%, 02/26/2018 | | | 800 | | | | 800 | |
Hutchison Whampoa International | | | | | | | | |
1.625%, 10/31/2017 (B) | | | 600 | | | | 601 | |
Hyundai Capital America MTN | | | | | | | | |
2.000%, 03/19/2018 (B) | | | 375 | | | | 376 | |
ING Bank | | | | | | | | |
1.800%, 03/16/2018 (B) | | | 390 | | | | 390 | |
1.315%, 10/01/2019 (A)(B) | | | 500 | | | | 493 | |
Jackson National Life Global Funding | | | | | | | | |
1.875%, 10/15/2018 (B) | | | 600 | | | | 604 | |
JPMorgan Chase | | | | | | | | |
1.593%, 01/23/2020 (A) | | | 500 | | | | 501 | |
1.538%, 01/25/2018 (A) | | | 200 | | | | 201 | |
1.264%, 01/28/2019 (A) | | | 700 | | | | 697 | |
JPMorgan Chase Capital XXI | | | | | | | | |
1.587%, 02/02/2037 (A) | | | 250 | | | | 191 | |
KeyBank | | | | | | | | |
2.350%, 03/08/2019 | | | 1,000 | | | | 1,012 | |
Lloyds Bank | | | | | | | | |
1.160%, 03/16/2018 (A) | | | 1,250 | | | | 1,242 | |
Manufacturers & Traders Trust | | | | | | | | |
1.400%, 07/25/2017 | | | 700 | | | | 699 | |
Metropolitan Life Global Funding I | | | | | | | | |
1.500%, 01/10/2018 (B) | | | 260 | | | | 261 | |
Mizuho Bank | | | | | | | | |
1.270%, 03/26/2018 (A)(B) | | | 800 | | | | 797 | |
Morgan Stanley | | | | | | | | |
5.950%, 12/28/2017 | | | 245 | | | | 261 | |
1.488%, 01/24/2019 (A) | | | 650 | | | | 649 | |
MSCI | | | | | | | | |
5.750%, 08/15/2025 (B) | | | 1,117 | | | | 1,176 | |
5.250%, 11/15/2024 (B) | | | 955 | | | | 986 | |
PNC Bank MTN | | | | | | | | |
1.850%, 07/20/2018 | | | 500 | | | | 504 | |
1.055%, 06/01/2018 (A) | | | 850 | | | | 848 | |
Principal Life Global Funding II | | | | | | | | |
1.500%, 04/18/2019 (B) | | | 650 | | | | 643 | |
Protective Life Global Funding | | | | | | | | |
1.722%, 04/15/2019 (B) | | | 515 | | | | 514 | |
Prudential Financial MTN | | | | | | | | |
1.406%, 08/15/2018 (A) | | | 700 | | | | 698 | |
Reinsurance Group of America | | | | | | | | |
5.625%, 03/15/2017 | | | 200 | | | | 206 | |
RHP Hotel Properties | | | | | | | | |
5.000%, 04/15/2023 | | | 1,035 | | | | 1,038 | |
Royal Bank of Canada MTN | | | | | | | | |
1.335%, 12/10/2018 (A) | | | 650 | | | | 650 | |
| | | | | | | | |
| Description | | Face Amount
($ Thousands) | | | Market Value
($ Thousands) | |
| | | | | | | | |
Santander Bank | | | | | | | | |
1.561%, 01/12/2018 (A) | | $ | 1,250 | | | $ | 1,244 | |
Societe Generale MTN | | | | | | | | |
1.705%, 10/01/2018 (A) | | | 500 | | | | 502 | |
Standard Chartered MTN | | | | | | | | |
1.273%, 04/17/2018 (A)(B) | | | 1,000 | | | | 990 | |
Sumitomo Mitsui Banking | | | | | | | | |
1.213%, 01/16/2018 (A) | | | 500 | | | | 498 | |
Synchrony Financial | | | | | | | | |
1.875%, 08/15/2017 | | | 455 | | | | 455 | |
1.867%, 02/03/2020 (A) | | | 1,000 | | | | 968 | |
Toronto-Dominion Bank MTN | | | | | | | | |
0.932%, 03/13/2018 (A) | | | 700 | | | | 697 | |
UBS MTN | | | | | | | | |
1.485%, 06/01/2020 (A) | | | 1,000 | | | | 999 | |
Unitrin | | | | | | | | |
6.000%, 05/15/2017 | | | 110 | | | | 114 | |
US Bank MTN | | | | | | | | |
1.450%, 01/29/2018 | | | 500 | | | | 502 | |
Ventas Realty | | | | | | | | |
1.550%, 09/26/2016 | | | 400 | | | | 400 | |
1.250%, 04/17/2017 | | | 170 | | | | 170 | |
WEA Finance LLC | | | | | | | | |
1.750%, 09/15/2017 (B) | | | 350 | | | | 350 | |
Wells Fargo MTN | | | | | | | | |
1.318%, 01/30/2020 (A) | | | 1,000 | | | | 998 | |
Westpac Banking | | | | | | | | |
1.243%, 01/17/2019 (A) | | | 550 | | | | 549 | |
| | | | | | | | |
| | | | | | | 49,887 | |
| | | | | | | | |
| | |
Health Care — 0.8% | | | | | | | | |
AbbVie | | | | | | | | |
1.800%, 05/14/2018 | | | 650 | | | | 651 | |
Actavis Funding SCS | | | | | | | | |
1.712%, 03/12/2018 (A) | | | 4,100 | | | | 4,116 | |
1.300%, 06/15/2017 | | | 800 | | | | 797 | |
Baxalta | | | | | | | | |
1.404%, 06/22/2018 (A)(B) | | | 850 | | | | 840 | |
Becton Dickinson | | | | | | | | |
1.800%, 12/15/2017 | | | 1,000 | | | | 1,004 | |
Catholic Health Initiatives | | | | | | | | |
2.600%, 08/01/2018 | | | 430 | | | | 437 | |
Celgene | | | | | | | | |
2.125%, 08/15/2018 | | | 400 | | | | 404 | |
DaVita HealthCare Partners | | | | | | | | |
5.000%, 05/01/2025 | | | 2,325 | | | | 2,305 | |
ExamWorks Group | | | | | | | | |
5.625%, 04/15/2023 | | | 785 | | | | 842 | |
LifePoint Health | | | | | | | | |
5.500%, 12/01/2021 | | | 1,225 | | | | 1,274 | |
Mallinckrodt International Finance | | | | | | | | |
5.625%, 10/15/2023 (B) | | | 1,150 | | | | 1,081 | |
| | | | |
| SEI Institutional Investments Trust / Annual Report / May 31, 2016 | | | 97 | |
SCHEDULE OF INVESTMENTS
Opportunistic Income Fund (Continued)
May 31, 2016
| | | | | | | | |
| Description | | Face Amount
($ Thousands) | | | Market Value
($ Thousands) | |
| | | | | | | | |
4.875%, 04/15/2020 (B) | | $ | 288 | | | $ | 280 | |
Medtronic | | | | | | | | |
1.500%, 03/15/2018 | | | 425 | | | | 428 | |
Mylan | | | | | | | | |
1.350%, 11/29/2016 | | | 650 | | | | 649 | |
Providence Health & Services Obligated Group | | | | | | | | |
1.425%, 10/01/2016 (A) | | | 650 | | | | 650 | |
Thermo Fisher Scientific | | | | | | | | |
1.300%, 02/01/2017 | | | 225 | | | | 225 | |
Zimmer Holdings | | | | | | | | |
1.450%, 04/01/2017 | | | 950 | | | | 950 | |
| | | | | | | | |
| | | | | | | 16,933 | |
| | | | | | | | |
| | |
Industrials — 0.7% | | | | | | | | |
Air Lease | | | | | | | | |
2.125%, 01/15/2018 | | | 310 | | | | 310 | |
Ardagh Packaging Finance | | | | | | | | |
4.625%, 05/15/2023 (B) | | | 2,325 | | | | 2,313 | |
Clean Harbors | | | | | | | | |
5.250%, 08/01/2020 | | | 301 | | | | 307 | |
GATX | | | | | | | | |
1.250%, 03/04/2017 | | | 345 | | | | 344 | |
General Electric MTN | | | | | | | | |
1.249%, 01/09/2020 (A) | | | 1,000 | | | | 1,005 | |
1.140%, 01/14/2019 (A) | | | 400 | | | | 400 | |
International Lease Finance | | | | | | | | |
6.750%, 09/01/2016 (B) | | | 650 | | | | 657 | |
Nielsen Finance LLC | | | | | | | | |
5.000%, 04/15/2022 (B) | | | 5,040 | | | | 5,153 | |
Norbord | | | | | | | | |
5.375%, 12/01/2020 (B) | | | 3,409 | | | | 3,524 | |
PACCAR Financial MTN | | | | | | | | |
1.300%, 05/10/2019 | | | 255 | | | | 254 | |
Sensata Technologies | | | | | | | | |
5.000%, 10/01/2025 (B) | | | 1,426 | | | | 1,430 | |
TTX MTN | | | | | | | | |
2.250%, 02/01/2019 (B) | | | 270 | | | | 273 | |
| | | | | | | | |
| | | | | | | 15,970 | |
| | | | | | | | |
| | |
Information Technology — 0.3% | | | | | | | | |
Bankrate | | | | | | | | |
6.125%, 08/15/2018 (B) | | | 3,145 | | | | 3,153 | |
eBay | | | | | | | | |
2.500%, 03/09/2018 | | | 400 | | | | 406 | |
Fidelity National Information Services | | | | | | | | |
2.850%, 10/15/2018 | | | 400 | | | | 407 | |
1.450%, 06/05/2017 | | | 295 | | | | 293 | |
Hewlett Packard Enterprise | | | | | | | | |
2.450%, 10/05/2017 (B) | | | 850 | | | | 858 | |
Hughes Satellite Systems | | | | | | | | |
6.500%, 06/15/2019 | | | 224 | | | | 240 | |
| | | | | | | | |
| | | | | | | 5,357 | |
| | | | | | | | |
| | | | | | | | |
| Description | | Face Amount
($ Thousands) | | | Market Value
($ Thousands) | |
| | | | | | | | |
Materials — 0.2% | | | | | | | | |
Ball | | | | | | | | |
5.250%, 07/01/2025 | | $ | 1,054 | | | $ | 1,097 | |
Owens-Brockway Glass Container | | | | | | | | |
6.375%, 08/15/2025 (B) | | | 1,195 | | | | 1,273 | |
5.875%, 08/15/2023 (B) | | | 920 | | | | 975 | |
| | | | | | | | |
| | | | | | | 3,345 | |
| | | | | | | | |
| |
Telecommunication Services — 0.6% | | | | | |
AT&T | | | | | | | | |
1.559%, 06/30/2020 (A) | | | 750 | | | | 749 | |
British Telecommunications | | | | | | | | |
1.250%, 02/14/2017 | | | 415 | | | | 415 | |
CommScope | | | | | | | | |
5.000%, 06/15/2021 (B) | | | 1,000 | | | | 1,015 | |
Level 3 Financing | | | | | | | | |
5.125%, 05/01/2023 | | | 1,900 | | | | 1,909 | |
Numericable-SFR | | | | | | | | |
7.375%, 05/01/2026 (B) | | | 3,000 | | | | 3,026 | |
SoftBank Group | | | | | | | | |
4.500%, 04/15/2020 (B) | | | 1,751 | | | | 1,808 | |
Thomson Reuters | | | | | | | | |
1.650%, 09/29/2017 | | | 395 | | | | 396 | |
1.300%, 02/23/2017 | | | 400 | | | | 400 | |
Verizon Communications | | | | | | | | |
2.382%, 09/14/2018 (A) | | | 435 | | | | 447 | |
2.164%, 09/15/2016 (A) | | | 3,000 | | | | 3,012 | |
| | | | | | | | |
| | | | | | | 13,177 | |
| | | | | | | | |
| | |
Utilities — 0.2% | | | | | | | | |
Eversource Energy | | | | | | | | |
1.600%, 01/15/2018 | | | 290 | | | | 290 | |
Exelon | | | | | | | | |
1.550%, 06/09/2017 | | | 270 | | | | 270 | |
Southern | | | | | | | | |
1.550%, 07/01/2018 | | | 450 | | | | 451 | |
1.300%, 08/15/2017 | | | 545 | | | | 545 | |
Talen Energy Supply LLC | | | | | | | | |
4.625%, 07/15/2019 (B) | | | 2,045 | | | | 1,881 | |
WEC Energy Group | | | | | | | | |
1.650%, 06/15/2018 | | | 700 | | | | 703 | |
| | | | | | | | |
| | | | | | | 4,140 | |
| | | | | | | | |
Total Corporate Obligations
(Cost $174,794) ($ Thousands) | | | | | | | 174,161 | |
| | | | | | | | |
| | |
| 98 | | SEI Institutional Investments Trust / Annual Report / May 31, 2016 |
| | | | | | | | |
| Description | | Face Amount
($ Thousands)/Shares | | | Market Value
($ Thousands) | |
| | | | | | | | |
MUNICIPAL BONDS — 0.1% | |
| | |
California — 0.0% | | | | | | | | |
University of California, Ser Y-1, RB Callable 01/01/2017 @ 100 | | | | | | | | |
0.957%, 07/01/2041 (A) | | $ | 755 | | | $ | 755 | |
| | | | | | | | |
| | |
Florida — 0.1% | | | | | | | | |
Florida State, Board of Administration Finance, Ser A, RB | | | | | | | | |
2.163%, 07/01/2019 | | | 500 | | | | 509 | |
Florida State, Hurricane Catastrophe Fund Finance, Ser A, RB | | | | | | | | |
1.298%, 07/01/2016 | | | 345 | | | | 345 | |
| | | | | | | | |
| | | | | | | 854 | |
| | | | | | | | |
| | |
North Carolina — 0.0% | | | | | | | | |
North Carolina State, Eastern Municipal Power Agency, RB | | | | | | | | |
1.561%, 07/01/2017 | | | 655 | | | | 659 | |
| | | | | | | | |
Total Municipal Bonds
(Cost $2,255) ($ Thousands) | | | | 2,268 | |
| | | | | | | | |
PREFERRED STOCK — 0.1% | |
Public Storage, 5.900% | | | 75,000 | | | | 1,959 | |
| | | | | | | | |
Total Preferred Stock
(Cost $1,714) ($ Thousands) | | | | 1,959 | |
| | | | | | | | |
| | | | | | | | |
|
COLLATERALIZED DEBT OBLIGATION — 0.0% | |
Battalion CLO, Ser 2007-1A, Cl E | | | | | | | | |
4.880%, 07/14/2022 (A)(B) | | | 600 | | | | 565 | |
| | | | | | | | |
Total Collateralized Debt Obligation
(Cost $565) ($ Thousands) | | | | 565 | |
| | | | | | | | |
COMMON STOCK — 0.0% | | | | | | | | |
Energy & Exploration Partners* | | | 100 | | | | 55 | |
Millennium Private Equity* | | | 52,886 | | | | 205 | |
| | | | | | | | |
Total Common Stock
(Cost $986) ($ Thousands) | | | | 260 | |
| | | | | | | | |
| | | | | | | | |
| Description | | Face Amount
($ Thousands)/Shares | | | Market Value
($ Thousands) | |
| | | | | | | | |
CASH EQUIVALENT — 3.2% | |
SEI Daily Income Trust, Prime Obligation Fund, Cl A | | | | | | | | |
0.270%**† | | | 67,572,845 | | | $ | 67,573 | |
| | | | | | | | |
Total Cash Equivalent
(Cost $67,573) ($ Thousands) | | | | 67,573 | |
| | | | | | | | |
| | | | | | | | |
REPURCHASE AGREEMENT(F) — 0.1% | |
BNP Paribas 0.310%, dated 05/31/2016, to be repurchased on 06/01/2016, repurchase price $1,100,009 (collateralized by U.S. government obligations, 2.750% - 7.000%, 11/01/2022 - 03/01/2038, par value ranging from $1 - $7,678,953; total market value $1,122,000) | | $ | 1,100 | | | | 1,100 | |
| | | | | | | | |
Total Repurchase Agreement
(Cost $1,100) ($ Thousands) | | | | 1,100 | |
| | | | | | | | |
Total Investments — 100.2%
(Cost $2,156,412) ($ Thousands) | | | $ | 2,133,105 | |
| | | | | | | | |
A list of the open futures contracts held by the Fund at May 31, 2016, is as follows:
| | | | | | | | | | | | |
| Type of Contract | | Number of
Contracts
Long
(Short) | | | Expiration Date | | | Unrealized
Appreciation
(Depreciation)
($ Thousands) | |
U.S. 10-Year Treasury Note | | | 5 | | | | Sep-2016 | | | $ | – | |
U.S. 10-Year Treasury Note | | | (18 | ) | | | Sep-2016 | | | | (4 | ) |
U.S. 2-Year Treasury Note | | | (107 | ) | | | Sep-2016 | | | | (10 | ) |
U.S. 5-Year Treasury Note | | | 71 | | | | Sep-2016 | | | | 3 | |
U.S. Long Treasury Bond | | | (1 | ) | | | Sep-2016 | | | | (1 | ) |
| | | | | | | | | | | | |
| | | | | | | | | | $ | (12 | ) |
| | | | | | | | | | | | |
For the year ended May 31, 2016, the total amount of all open futures contracts, as presented in the table above, are representative of the volume of activity for the derivative type during the year.
Percentages are based on a Net Assets of $2,129,669 ($ Thousands).
| * | | Non-income producing security. |
| ** | | Rate shown is the 7-day effective yield as of May 31, 2016. |
| † | | Investment in Affiliated Security (see Note 6). |
| (A) | | Variable Rate Security — The rate reported on the Schedule of Investments is the rate in effect as of May 31, 2016. |
| (B) | | Security exempt from registration under Rule 144A of the Securities Act of 1933. These securities may be resold in transactions exempt from registration normally to qualified institutions. On May 31, 2016, the value of these securities amounted to $459,856 ($ Thousands), 21.6% representing of the net assets of the Fund. |
| (C) | | Unsettled bank loan. Interest rate not available. |
| (D) | | Security is in default on interest payment. |
| (F) | | Tri-Party Repurchase Agreement. |
| | | | |
| SEI Institutional Investments Trust / Annual Report / May 31, 2016 | | | 99 | |
SCHEDULE OF INVESTMENTS
Opportunistic Income Fund (Concluded)
May 31, 2016
ARM — Adjustable Rate Mortgage
CDO — Collateralized Debt Obligation
Cl — Class
CLO — Collateralized Loan Obligation
CMBS — Commercial Mortgage-Backed Securities
CMO — Collateralized Mortgage Obligation
FDIC — Federal Deposit Insurance Company
FHLMC — Federal Home Loan Mortgage Corporation
FNMA — Federal National Mortgage Association
GNMA — Government National Mortgage Association
IO — Interest Only – face amount represents notional amount
LLC — Limited Liability Company
Ltd — Limited
MTN — Medium Term Note
NCUA — National Credit Union Association
RB — Revenue Bond
REMIC — Real Estate Mortgage Investment Conduit
Re-REMIC — Resecuritization of Real Estate Mortgage Investment Conduit
Ser — Series
TBA — To Be Announced
USD — U.S. Dollar
The following is a list of the level of inputs used as of May 31, 2016, in valuing the Fund’s investments and other financial instruments carried at value ($ Thousands):
| | | | | | | | | | | | | | | | |
| Investments in Securities | | Level 1 | | | Level 2 | | | Level 3 | | | Total | |
Mortgage-Backed Securities | | $ | – | | | $ | 789,306 | | | $ | – | | | $ | 789,306 | |
Loan Participations | | | – | | | | 549,939 | | | | 113 | | | | 550,052 | |
Asset-Backed Securities | | | – | | | | 543,483 | | | | 2,378 | | | | 545,861 | |
Corporate Obligations | | | – | | | | 174,161 | | | | – | | | | 174,161 | |
Municipal Bonds | | | – | | | | 2,268 | | | | – | | | | 2,268 | |
Preferred Stock | | | 1,959 | | | | – | | | | – | | | | 1,959 | |
Repurchase Agreement | | | – | | | | 1,100 | | | | – | | | | 1,100 | |
Collateralized Debt Obligation | | | – | | | | – | | | | 565 | | | | 565 | |
Common Stock | | | 260 | | | | – | | | | – | | | | 260 | |
Cash Equivalent | | | 67,573 | | | | – | | | | – | | | | 67,573 | |
| | | | | | | | | | | | | | | | |
Total Investments in Securities | | $ | 69,792 | | | $ | 2,060,257 | | | $ | 3,056 | | | $ | 2,133,105 | |
| | | | | | | | | | | | | | | | |
| | | | | | | | | | | | | | | | |
| Other Financial Instruments | | Level 1 | | | Level 2 | | | Level 3 | | | Total | |
Futures Contracts* | | | | | | | | | | | | | | | | |
Unrealized Appreciation | | $ | 3 | | | $ | — | | | $ | — | | | $ | 3 | |
Unrealized Depreciation | | | (15 | ) | | | — | | | | — | | | | (15 | ) |
| | | | | | | | | | | | | | | | |
Total Other Financial Instruments | | $ | (12 | ) | | $ | — | | | $ | — | | | $ | (12 | ) |
| | | | | | | | | | | | | | | | |
| † | | A reconciliation of Level 3 investments and disclosures of significant unobservable inputs are presented when the Fund has significant amount of Level 3 investments at the beginning and/or end of the period in relation to net assets. Management has concluded that Level 3 investments are not material in relation to net assets. |
| * | | Futures contracts are valued at the unrealized depreciation on the instrument. |
For the year ended May 31, 2016, there were no transfers between Level 1 and Level 2 assets and liabilities.
For the year ended May 31, 2016, there were transfers between Level 2 and Level 3 assets and liabilities. The transfers were due to changes in the availability of observable inputs used to determine fair value.
For more information on valuation inputs, see Note 2 – Significant Accounting Policies in Notes to Financial Statements.
Amounts designated as “—” are $0 or have been rounded to $0.
The accompanying notes are an integral part of the financial statements.
| | |
| 100 | | SEI Institutional Investments Trust / Annual Report / May 31, 2016 |
SCHEDULE OF INVESTMENTS
Core Fixed Income Fund
May 31, 2016
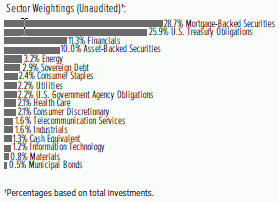
| | | | | | | | |
| Description | | Face Amount
($ Thousands) | | | Market Value
($ Thousands) | |
|
MORTGAGE-BACKED SECURITIES — 29.7% | |
|
Agency Mortgage-Backed Obligations — 24.9% | |
FHLMC | | | | | | | | |
10.000%, 03/17/2026 | | $ | 244 | | | $ | 255 | |
8.250%, 06/01/2016 | | | 570 | | | | 570 | |
7.500%, 08/01/2030 to 12/01/2036 | | | 790 | | | | 942 | |
7.000%, 05/01/2024 to 03/01/2039 | | | 234 | | | | 267 | |
6.500%, 06/01/2017 to 09/01/2039 | | | 2,302 | | | | 2,669 | |
6.000%, 11/01/2017 to 08/01/2038 | | | 2,977 | | | | 3,327 | |
5.500%, 02/01/2035 to 12/01/2038 | | | 4,267 | | | | 4,873 | |
5.000%, 04/01/2020 to 06/01/2044 | | | 6,092 | | | | 6,620 | |
4.500%, 08/01/2020 to 03/01/2044 | | | 22,347 | | | | 24,384 | |
4.000%, 10/01/2025 to 04/01/2046 | | | 98,582 | | | | 106,141 | |
3.500%, 11/01/2029 to 05/01/2046 | | | 151,025 | | | | 159,430 | |
3.000%, 03/01/2031 to 04/01/2046 | | | 29,378 | | | | 30,162 | |
1.000%, 03/08/2017 to 07/28/2017 | | | 310 | | | | 311 | |
0.875%, 10/14/2016 | | | 85 | | | | 85 | |
0.750%, 01/12/2018 | | | 250 | | | | 250 | |
FHLMC ARM | | | | | | | | |
3.094%, 02/01/2045 (A) | | | 1,335 | | | | 1,384 | |
3.041%, 05/01/2036 (A) | | | 205 | | | | 217 | |
2.898%, 01/01/2044 (A) | | | — | | | | — | |
2.885%, 12/01/2036 (A) | | | 242 | | | | 258 | |
2.627%, 12/01/2042 (A) | | | 22 | | | | 23 | |
2.615%, 01/01/2037 (A) | | | 859 | | | | 913 | |
2.474%, 10/01/2036 (A) | | | 748 | | | | 795 | |
2.402%, 09/01/2036 (A) | | | 2,979 | | | | 3,144 | |
2.354%, 10/01/2036 (A) | | | 76 | | | | 80 | |
2.276%, 05/01/2037 (A) | | | 1,953 | | | | 2,029 | |
1.888%, 08/01/2037 (A) | | | 570 | | | | 592 | |
1.747%, 08/01/2037 (A) | | | 727 | | | | 767 | |
FHLMC CMO, Ser 1988-1, Cl Z | | | | | | | | |
9.300%, 04/15/2019 | | | 1 | | | | 1 | |
FHLMC CMO, Ser 1999-2174, Cl PN | | | | | | | | |
6.000%, 07/15/2029 | | | 28 | | | | 31 | |
FHLMC CMO, Ser 2001-2312, Cl Z | | | | | | | | |
6.500%, 05/15/2031 | | | 278 | | | | 319 | |
| | | | | | | | |
| Description | | Face Amount
($ Thousands) | | | Market Value
($ Thousands) | |
FHLMC CMO, Ser 2002-2399, Cl XG | | | | | | | | |
6.500%, 01/15/2032 | | $ | 83 | | | $ | 93 | |
FHLMC CMO, Ser 2003-2671, Cl S | | | | | | | | |
13.962%, 09/15/2033 (A) | | | 113 | | | | 151 | |
FHLMC CMO, Ser 2003-2684, Cl ZN | | | | | | | | |
4.000%, 10/15/2033 | | | 251 | | | | 268 | |
FHLMC CMO, Ser 2004-2733, Cl ME | | | | | | | | |
5.000%, 01/15/2034 | | | 561 | | | | 620 | |
FHLMC CMO, Ser 2005-2945, Cl SA | | | | | | | | |
11.512%, 03/15/2020 (A) | | | 269 | | | | 292 | |
FHLMC CMO, Ser 2005-2950, Cl JO, PO | | | | | | | | |
0.000%, 03/15/2020 (B) | | | 30 | | | | 29 | |
FHLMC CMO, Ser 2007-3316, Cl JO, PO | | | | | | | | |
0.000%, 05/15/2037 (B) | | | 27 | | | | 26 | |
FHLMC CMO, Ser 2007-3346, Cl FA | | | | | | | | |
0.664%, 02/15/2019 (A) | | | 868 | | | | 867 | |
FHLMC CMO, Ser 2008-3451, Cl SB, IO | | | | | | | | |
5.596%, 05/15/2038 (A) | | | 736 | | | | 97 | |
FHLMC CMO, Ser 2009-3546, Cl A | | | | | | | | |
2.162%, 02/15/2039 (A) | | | 173 | | | | 177 | |
FHLMC CMO, Ser 2010-3621, Cl SB, IO | | | | | | | | |
5.796%, 01/15/2040 (A) | | | 221 | | | | 36 | |
FHLMC CMO, Ser 2012-4030, Cl HS, IO | | | | | | | | |
6.176%, 04/15/2042 (A) | | | 131 | | | | 26 | |
FHLMC CMO, Ser 2012-4076, Cl SW, IO | | | | | | | | |
5.616%, 07/15/2042 (A) | | | 280 | | | | 68 | |
FHLMC CMO, Ser 2012-4092, Cl AI, IO | | | | | | | | |
3.000%, 09/15/2031 | | | 2,550 | | | | 248 | |
FHLMC CMO, Ser 2012-4097, Cl ST, IO | | | | | | | | |
5.616%, 08/15/2042 (A) | | | 338 | | | | 62 | |
FHLMC CMO, Ser 2012-4102, Cl TC | | | | | | | | |
2.500%, 09/15/2041 | | | 4,937 | | | | 5,086 | |
FHLMC CMO, Ser 2012-4119, Cl IN, IO | | | | | | | | |
3.500%, 10/15/2032 | | | 1,085 | | | | 137 | |
FHLMC CMO, Ser 2012-4136, Cl SJ, IO | | | | | | | | |
5.716%, 11/15/2042 (A) | | | 294 | | | | 55 | |
FHLMC CMO, Ser 2012-4136, Cl SE, IO | | | | | | | | |
5.716%, 11/15/2042 (A) | | | 272 | | | | 56 | |
FHLMC CMO, Ser 2012-4136, Cl SQ, IO | | | | | | | | |
5.716%, 11/15/2042 (A) | | | 418 | | | | 87 | |
FHLMC CMO, Ser 2013-4161, Cl BA | | | | | | | | |
2.500%, 12/15/2041 | | | 10,760 | | | | 10,891 | |
FHLMC CMO, Ser 2013-4194, Cl BI, IO | | | | | | | | |
3.500%, 04/15/2043 | | | 826 | | | | 106 | |
FHLMC CMO, Ser 2013-4206, Cl CZ | | | | | | | | |
3.000%, 05/15/2043 | | | 766 | | | | 769 | |
FHLMC CMO, Ser 2013-4210, Cl Z | | | | | | | | |
3.000%, 05/15/2043 | | | 1,500 | | | | 1,478 | |
FHLMC CMO, Ser 2013-4226, Cl GZ | | | | | | | | |
3.000%, 07/15/2043 | | | 980 | | | | 966 | |
FHLMC CMO, Ser 2013-4227, Cl VA | | | | | | | | |
3.500%, 10/15/2037 | | | 1,300 | | | | 1,375 | |
| | | | |
| SEI Institutional Investments Trust / Annual Report / May 31, 2016 | | | 101 | |
SCHEDULE OF INVESTMENTS
Core Fixed Income Fund (Continued)
May 31, 2016
| | | | | | | | |
| Description | | Face Amount
($ Thousands) | | | Market Value
($ Thousands) | |
FHLMC CMO, Ser 2015-4425, Cl A | | | | | | | | |
4.000%, 09/15/2040 | | $ | 1,887 | | | $ | 2,009 | |
FHLMC Multifamily Structured Pass Through Certificates, Ser KJ03, Cl A2 | | | | | | | | |
2.328%, 06/25/2021 | | | 950 | | | | 970 | |
FHLMC Multifamily Structured Pass-Through Certificates CMO, Ser K015, Cl X1, IO | | | | | | | | |
1.793%, 07/25/2021 (A) | | | 2,938 | | | | 199 | |
FHLMC Multifamily Structured Pass-Through Certificates CMO, Ser K016, Cl X1, IO | | | | | | | | |
1.705%, 10/25/2021 (A) | | | 524 | | | | 35 | |
FHLMC Multifamily Structured Pass-Through Certificates, Ser K027, Cl A2 | | | | | | | | |
2.637%, 01/25/2023 | | | 1,030 | | | | 1,068 | |
FHLMC Multifamily Structured Pass-Through Certificates, Ser K151, Cl A3 | | | | | | | | |
3.511%, 04/25/2030 | | | 3,220 | | | | 3,455 | |
FHLMC Reference REMIC CMO, Ser 2006-R007, Cl ZA | | | | | | | | |
6.000%, 05/15/2036 | | | 787 | | | | 891 | |
FHLMC STRIPS CMO, Ser 2012-271, Cl 30 | | | | | | | | |
3.000%, 08/15/2042 | | | 1,509 | | | | 1,542 | |
FHLMC STRIPS CMO, Ser 2013-300, Cl 300 | | | | | | | | |
3.000%, 01/15/2043 | | | 5,468 | | | | 5,576 | |
FHLMC STRIPS CMO, Ser 2015-342, Cl 300 | | | | | | | | |
3.000%, 02/15/2045 | | | 7,733 | | | | 7,886 | |
FHLMC TBA | | | | | | | | |
4.000%, 07/15/2041 | | | 7,300 | | | | 7,775 | |
3.500%, 07/15/2041 to 06/01/2042 | | | 30,800 | | | | 32,134 | |
FNMA | | | | | | | | |
8.000%, 05/01/2023 to 06/01/2031 | | | 79 | | | | 94 | |
7.500%, 06/01/2030 to 04/01/2039 | | | 718 | | | | 886 | |
7.000%, 11/01/2017 to 02/01/2039 | | | 2,222 | | | | 2,585 | |
6.500%, 05/01/2017 to 10/01/2037 | | | 1,365 | | | | 1,559 | |
6.000%, 10/01/2019 to 10/01/2040 | | | 6,754 | | | | 7,716 | |
5.500%, 06/01/2020 to 08/01/2038 | | | 9,483 | | | | 10,385 | |
5.000%, 02/01/2020 to 11/01/2040 | | | 11,981 | | | | 13,393 | |
4.540%, 01/01/2020 to 05/01/2021 | | | 2,808 | | | | 3,089 | |
4.500%, 01/01/2020 to 02/01/2046 | | | 42,927 | | | | 46,930 | |
4.338%, 11/01/2021 | | | 5,593 | | | | 6,150 | |
4.250%, 04/01/2021 | | | 2,000 | | | | 2,210 | |
4.120%, 04/01/2020 | | | 1,102 | | | | 1,193 | |
4.060%, 07/01/2021 | | | 2,240 | | | | 2,458 | |
4.050%, 01/01/2021 | | | 1,430 | | | | 1,562 | |
4.040%, 10/01/2020 | | | 2,120 | | | | 2,312 | |
4.000%, 07/01/2020 to 04/01/2046 | | | 178,832 | | | | 192,248 | |
3.980%, 08/01/2021 | | | 4,482 | | | | 4,897 | |
3.850%, 08/01/2025 | | | 3,468 | | | | 3,844 | |
3.766%, 12/01/2020 | | | 2,529 | | | | 2,726 | |
3.740%, 07/01/2020 | | | 1,297 | | | | 1,393 | |
3.619%, 12/01/2020 | | | 3,531 | | | | 3,794 | |
3.500%, 12/01/2029 to 04/01/2046 | | | 97,830 | | | | 103,401 | |
3.290%, 10/01/2020 | | | 957 | | | | 1,019 | |
| | | | | | | | |
| Description | | Face Amount
($ Thousands) | | | Market Value
($ Thousands) | |
3.230%, 11/01/2020 | | $ | 1,411 | | | $ | 1,496 | |
3.010%, 05/01/2028 | | | 2,970 | | | | 3,102 | |
3.000%, 09/01/2033 to 08/01/2043 | | | 45,720 | | | | 47,120 | |
2.950%, 05/01/2031 | | | 3,415 | | | | 3,491 | |
2.830%, 06/01/2022 | | | 2,529 | | | | 2,651 | |
2.820%, 06/01/2022 | | | 2,877 | | | | 3,015 | |
2.810%, 04/01/2025 | | | 620 | | | | 642 | |
2.500%, 10/01/2042 | | | 4,724 | | | | 4,699 | |
FNMA, IO | | | | | | | | |
3.583%, 09/01/2020 | | | 6,386 | | | | 6,841 | |
FNMA ARM | | | | | | | | |
5.858%, 05/01/2037 (A) | | | 16 | | | | 16 | |
4.779%, 12/01/2035 (A) | | | 36 | | | | 38 | |
4.373%, 04/01/2040 (A) | | | 901 | | | | 955 | |
2.823%, 05/01/2043 (A) | | | 562 | | | | 583 | |
2.788%, 03/01/2037 (A) | | | 1,279 | | | | 1,352 | |
2.744%, 01/01/2045 (A) | | | 1,314 | | | | 1,361 | |
2.722%, 01/01/2045 (A) | | | 2,318 | | | | 2,394 | |
2.609%, 05/01/2038 (A) | | | 2,627 | | | | 2,777 | |
2.429%, 02/01/2042 (A) | | | 3,147 | | | | 3,294 | |
2.210%, 05/01/2037 (A) | | | 1,140 | | | | 1,179 | |
FNMA CMO, Ser 1992-143, Cl M | | | | | | | | |
8.000%, 09/25/2022 | | | 176 | | | | 195 | |
FNMA CMO, Ser 1992-69, Cl Z | | | | | | | | |
8.000%, 05/25/2022 | | | 160 | | | | 178 | |
FNMA CMO, Ser 1992-96, Cl B, PO | | | | | | | | |
0.000%, 05/25/2022 (B) | | | 0 | | | | — | |
FNMA CMO, Ser 1993-149, Cl SH | | | | | | | | |
11.500%, 08/25/2023 (A) | | | 80 | | | | 100 | |
FNMA CMO, Ser 1993-99, Cl Z | | | | | | | | |
7.000%, 07/25/2023 | | | 377 | | | | 411 | |
FNMA CMO, Ser 1994-31, Cl ZC | | | | | | | | |
6.500%, 02/25/2024 | | | 328 | | | | 376 | |
FNMA CMO, Ser 1994-63, Cl PK | | | | | | | | |
7.000%, 04/25/2024 | | | 272 | | | | 305 | |
FNMA CMO, Ser 1997-32, Cl PG | | | | | | | | |
6.500%, 04/25/2027 | | | 226 | | | | 259 | |
FNMA CMO, Ser 1999-11, Cl Z | | | | | | | | |
5.500%, 03/25/2029 | | | 181 | | | | 200 | |
FNMA CMO, Ser 2001-52, Cl YZ | | | | | | | | |
6.500%, 10/25/2031 | | | 31 | | | | 35 | |
FNMA CMO, Ser 2002-10, Cl SB | | | | | | | | |
18.130%, 03/25/2017 (A) | | | 4 | | | | 4 | |
FNMA CMO, Ser 2003-124, Cl TS | | | | | | | | |
9.800%, 01/25/2034 (A) | | | 19 | | | | 23 | |
FNMA CMO, Ser 2005-29, Cl ZA | | | | | | | | |
5.500%, 04/25/2035 | | | 555 | | | | 621 | |
FNMA CMO, Ser 2005-74, Cl CS | | | | | | | | |
18.794%, 05/25/2035 (A) | | | 199 | | | | 282 | |
FNMA CMO, Ser 2006-104, Cl MI, IO | | | | | | | | |
6.304%, 11/25/2036 (A) | | | 2,089 | | | | 289 | |
| | |
| 102 | | SEI Institutional Investments Trust / Annual Report / May 31, 2016 |
| | | | | | | | |
| Description | | Face Amount
($ Thousands) | | | Market Value
($ Thousands) | |
FNMA CMO, Ser 2006-125, Cl SM, IO | | | | | | | | |
6.754%, 01/25/2037 (A) | | $ | 904 | | | $ | 168 | |
FNMA CMO, Ser 2006-33, Cl LS | | | | | | | | |
28.143%, 05/25/2036 (A) | | | 133 | | | | 245 | |
FNMA CMO, Ser 2006-46, Cl SW | | | | | | | | |
22.564%, 06/25/2036 (A) | | | 113 | | | | 157 | |
FNMA CMO, Ser 2006-51, Cl SP, IO | | | | | | | | |
6.204%, 03/25/2036 (A) | | | 163 | | | | 28 | |
FNMA CMO, Ser 2007-108, Cl AN | | | | | | | | |
8.187%, 11/25/2037 (A) | | | 369 | | | | 437 | |
FNMA CMO, Ser 2007-64, Cl FA | | | | | | | | |
0.916%, 07/25/2037 (A) | | | 26 | | | | 26 | |
FNMA CMO, Ser 2007-68, Cl SC, IO | | | | | | | | |
6.254%, 07/25/2037 (A) | | | 421 | | | | 69 | |
FNMA CMO, Ser 2008-22, Cl SI, IO | | | | | | | | |
5.984%, 03/25/2037 (A) | | | 4,121 | | | | 275 | |
FNMA CMO, Ser 2008-24, Cl NA | | | | | | | | |
6.750%, 06/25/2037 | | | 87 | | | | 96 | |
FNMA CMO, Ser 2009-103, Cl MB | | | | | | | | |
2.534%, 12/25/2039 (A) | | | 438 | | | | 463 | |
FNMA CMO, Ser 2009-86, Cl BO, PO | | | | | | | | |
0.000%, 03/25/2037 (B) | | | 3,171 | | | | 2,913 | |
FNMA CMO, Ser 2010-123, Cl PM | | | | | | | | |
4.000%, 07/25/2040 | | | 3,600 | | | | 3,927 | |
FNMA CMO, Ser 2010-150, Cl SK, IO | | | | | | | | |
6.345%, 01/25/2041 (A) | | | 1,230 | | | | 230 | |
FNMA CMO, Ser 2010-27, Cl AS, IO | | | | | | | | |
6.034%, 04/25/2040 (A) | | | 1,568 | | | | 300 | |
FNMA CMO, Ser 2011-2, Cl WA | | | | | | | | |
5.819%, 02/25/2051 (A) | | | 223 | | | | 245 | |
FNMA CMO, Ser 2011-75, Cl FA | | | | | | | | |
0.996%, 08/25/2041 (A) | | | 283 | | | | 286 | |
FNMA CMO, Ser 2011-90, Cl QI, IO | | | | | | | | |
5.000%, 05/25/2034 | | | 2,117 | | | | 180 | |
FNMA CMO, Ser 2011-96, Cl SA, IO | | | | | | | | |
6.104%, 10/25/2041 (A) | | | 2,856 | | | | 487 | |
FNMA CMO, Ser 2012-112, Cl DA | | | | | | | | |
3.000%, 10/25/2042 | | | 8,000 | | | | 8,152 | |
FNMA CMO, Ser 2012-128, Cl SQ, IO | | | | | | | | |
5.704%, 11/25/2042 (A) | | | 878 | | | | 203 | |
FNMA CMO, Ser 2012-128, Cl SL, IO | | | | | | | | |
5.704%, 11/25/2042 (A) | | | 666 | | | | 136 | |
FNMA CMO, Ser 2012-133, Cl CS, IO | | | | | | | | |
5.704%, 12/25/2042 (A) | | | 1,647 | | | | 304 | |
FNMA CMO, Ser 2012-133, Cl SA, IO | | | | | | | | |
5.704%, 12/25/2042 (A) | | | 287 | | | | 57 | |
FNMA CMO, Ser 2012-134, Cl MS, IO | | | | | | | | |
5.704%, 12/25/2042 (A) | | | 801 | | | | 184 | |
FNMA CMO, Ser 2012-134, Cl LC | | | | | | | | |
3.000%, 12/25/2042 | | | 1,699 | | | | 1,753 | |
FNMA CMO, Ser 2012-139, Cl DI, IO | | | | | | | | |
3.000%, 12/25/2027 | | | 1,648 | | | | 155 | |
| | | | | | | | |
| Description | | Face Amount
($ Thousands) | | | Market Value
($ Thousands) | |
FNMA CMO, Ser 2012-28, Cl B | | | | | | | | |
6.500%, 06/25/2039 | | $ | 91 | | | $ | 101 | |
FNMA CMO, Ser 2012-46, Cl BA | | | | | | | | |
6.000%, 05/25/2042 | | | 1,171 | | | | 1,335 | |
FNMA CMO, Ser 2012-70, Cl YS, IO | | | | | | | | |
6.204%, 02/25/2041 (A) | | | 522 | | | | 73 | |
FNMA CMO, Ser 2012-70, Cl HS, IO | | | | | | | | |
5.554%, 07/25/2042 (A) | | | 6,001 | | | | 1,258 | |
FNMA CMO, Ser 2012-74, Cl SA, IO | | | | | | | | |
6.204%, 03/25/2042 (A) | | | 1,377 | | | | 243 | |
FNMA CMO, Ser 2012-74, Cl OA, PO | | | | | | | | |
0.000%, 03/25/2042 (B) | | | 95 | | | | 86 | |
FNMA CMO, Ser 2012-75, Cl AO, PO | | | | | | | | |
0.000%, 03/25/2042 (B) | | | 190 | | | | 171 | |
FNMA CMO, Ser 2012-75, Cl NS, IO | | | | | | | | |
6.154%, 07/25/2042 (A) | | | 520 | | | | 98 | |
FNMA CMO, Ser 2012-93, Cl SG, IO | | | | | | | | |
5.654%, 09/25/2042 (A) | | | 844 | | | | 156 | |
FNMA CMO, Ser 2012-93, Cl IB, IO | | | | | | | | |
3.000%, 09/25/2027 | | | 6,467 | | | | 659 | |
FNMA CMO, Ser 2012-M14, Cl X1, IO | | | | | | | | |
4.211%, 02/25/2017 (A) | | | 5,913 | | | | 83 | |
FNMA CMO, Ser 2013-101, Cl BO, PO | | | | | | | | |
0.000%, 10/25/2043 (B) | | | 1,863 | | | | 1,505 | |
FNMA CMO, Ser 2013-101, Cl CO, PO | | | | | | | | |
0.000%, 10/25/2043 (B) | | | 4,276 | | | | 3,599 | |
FNMA CMO, Ser 2013-26, Cl HI, IO | | | | | | | | |
3.000%, 04/25/2032 | | | 1,654 | | | | 160 | |
FNMA CMO, Ser 2013-9, Cl CB | | | | | | | | |
5.500%, 04/25/2042 | | | 2,770 | | | | 3,120 | |
FNMA CMO, Ser 2013-9, Cl BC | | | | | | | | |
6.500%, 07/25/2042 | | | 2,663 | | | | 3,069 | |
FNMA CMO, Ser 2014-M12, Cl FA | | | | | | | | |
0.755%, 10/25/2021 (A) | | | 3,073 | | | | 3,064 | |
FNMA CMO, Ser 2014-M3, Cl X2, IO | | | | | | | | |
0.217%, 01/25/2024 (A) | | | 66,487 | | | | 409 | |
FNMA CMO, Ser 2015-60, Cl SA, IO | | | | | | | | |
5.704%, 08/25/2045 (A) | | | 841 | | | | 182 | |
FNMA CMO, Ser 2015-M8, Cl X2, IO | | | | | | | | |
0.181%, 01/25/2025 (A) | | | 89,439 | | | | 1,152 | |
FNMA Interest STRIPS CMO, Ser
2002-323, Cl 16, IO | | | | | | | | |
7.000%, 01/25/2032 | | | 314 | | | | 63 | |
FNMA Interest STRIPS CMO, Ser
2003-334, Cl 16, IO | | | | | | | | |
6.500%, 02/01/2033 | | | 431 | | | | 82 | |
FNMA Interest STRIPS CMO, Ser
2011-3866, Cl SA, IO | | | | | | | | |
5.516%, 05/15/2041 (A) | | | 1,374 | | | | 190 | |
FNMA Interest STRIPS CMO, Ser
2012-409, Cl C1, IO | | | | | | | | |
3.000%, 11/25/2026 | | | 3,479 | | | | 301 | |
| | | | |
| SEI Institutional Investments Trust / Annual Report / May 31, 2016 | | | 103 | |
SCHEDULE OF INVESTMENTS
Core Fixed Income Fund (Continued)
May 31, 2016
| | | | | | | | |
| Description | | Face Amount
($ Thousands) | | | Market Value
($ Thousands) | |
FNMA Interest STRIPS CMO, Ser 2012-409, Cl C2, IO | | | | | | | | |
3.000%, 04/25/2027 | | $ | 2,474 | | | $ | 237 | |
FNMA Interest STRIPS CMO, Ser 2012-409, Cl C22, IO | | | | | | | | |
4.500%, 11/25/2039 | | | 1,813 | | | | 321 | |
FNMA Interest STRIPS CMO, Ser 2012-409, Cl C13, IO | | | | | | | | |
3.500%, 11/25/2041 | | | 1,518 | | | | 246 | |
FNMA Interest STRIPS CMO, Ser 2012-409, Cl C17, IO | | | | | | | | |
4.000%, 11/25/2041 | | | 1,733 | | | | 314 | |
FNMA Interest STRIPS CMO, Ser 2012-411, Cl A3 | | | | | | | | |
3.000%, 08/25/2042 | | | 943 | | | | 951 | |
FNMA Multifamily Megas, Ser 141, Cl 1 | | | | | | | | |
2.965%, 05/01/2027 (A) | | | 4,958 | | | | 5,160 | |
FNMA TBA | | | | | | | | |
4.500%, 07/01/2037 to 06/14/2042 | | | 1,905 | | | | 2,074 | |
4.000%, 07/13/2039 to 06/15/2045 | | | 21,645 | | | | 23,097 | |
3.500%, 08/01/2040 to 06/15/2045 | | | 20,510 | | | | 21,432 | |
3.000%, 06/25/2027 to 06/13/2042 | | | 7,830 | | | | 8,026 | |
2.500%, 06/25/2027 | | | 15,665 | | | | 16,064 | |
GNMA | | | | | | | | |
9.500%, 12/15/2020 | | | 1 | | | | 1 | |
7.000%, 12/20/2017 to 05/15/2033 | | | 1,049 | | | | 1,173 | |
6.500%, 01/15/2024 to 07/15/2035 | | | 2,343 | | | | 2,700 | |
6.000%, 12/15/2023 to 10/20/2040 | | | 7,788 | | | | 8,956 | |
5.000%, 07/20/2040 to 11/20/2045 | | | 870 | | | | 963 | |
4.500%, 01/20/2040 to 05/15/2046 | | | 14,070 | | | | 15,400 | |
4.000%, 10/15/2041 to 05/20/2046 | | | 39,839 | | | | 42,712 | |
3.500%, 03/20/2046 to 04/20/2046 | | | 11,719 | | | | 12,392 | |
3.000%, 04/15/2045 to 04/20/2046 | | | 19,421 | | | | 20,130 | |
GNMA ARM | | | | | | | | |
1.900%, 01/20/2060 (A) | | | 1,065 | | | | 1,092 | |
1.875%, 07/20/2034 (A) | | | 14 | | | | 14 | |
GNMA CMO, Ser 2001-22, Cl PS | | | | | | | | |
19.880%, 03/17/2031 (A) | | | 332 | | | | 551 | |
GNMA CMO, Ser 2002-57, Cl SB | | | | | | | | |
105.983%, 08/16/2032 | | | 40 | | | | 174 | |
GNMA CMO, Ser 2003-60, Cl GS | | | | | | | | |
11.693%, 05/16/2033 (A) | | | 39 | | | | 47 | |
GNMA CMO, Ser 2004-93, Cl PC | | | | | | | | |
5.000%, 04/16/2034 | | | 34 | | | | 35 | |
GNMA CMO, Ser 2005-7, Cl JM | | | | | | | | |
15.764%, 05/18/2034 (A) | | | 12 | | | | 15 | |
GNMA CMO, Ser 2006-16, Cl GS, IO | | | | | | | | |
6.551%, 04/20/2036 (A) | | | 893 | | | | 167 | |
GNMA CMO, Ser 2007-78, Cl SA, IO | | | | | | | | |
6.096%, 12/16/2037 (A) | | | 5,121 | | | | 896 | |
GNMA CMO, Ser 2009-106, Cl KS, IO | | | | | | | | |
5.961%, 11/20/2039 (A) | | | 6,808 | | | | 1,234 | |
| | | | | | | | |
| Description | | Face Amount
($ Thousands) | | | Market Value
($ Thousands) | |
GNMA CMO, Ser 2009-66, Cl XS, IO | | | | | | | | |
6.366%, 07/16/2039 (A) | | $ | 66 | | | $ | 10 | |
GNMA CMO, Ser 2009-66, Cl LC | | | | | | | | |
6.000%, 08/16/2039 | | | 2,245 | | | | 2,641 | |
GNMA CMO, Ser 2009-8, Cl PS, IO | | | | | | | | |
5.866%, 08/16/2038 (A) | | | 61 | | | | 8 | |
GNMA CMO, Ser 2010-14, Cl AO, PO | | | | | | | | |
0.000%, 12/20/2032 (B) | | | 166 | | | | 161 | |
GNMA CMO, Ser 2010-31, Cl GS, IO | | | | | | | | |
6.062%, 03/20/2039 (A) | | | 309 | | | | 25 | |
GNMA CMO, Ser 2010-4, Cl NS, IO | | | | | | | | |
5.956%, 01/16/2040 (A) | | | 9,416 | | | | 1,640 | |
GNMA CMO, Ser 2010-4, Cl SL, IO | | | | | | | | |
5.966%, 01/16/2040 (A) | | | 197 | | | | 39 | |
GNMA CMO, Ser 2010-59, Cl LB | | | | | | | | |
4.500%, 10/20/2039 | | | 2,842 | | | | 3,021 | |
GNMA CMO, Ser 2010-74, Cl C | | | | | | | | |
4.244%, 05/16/2041 (A) | | | 2,545 | | | | 2,562 | |
GNMA CMO, Ser 2010-85, Cl HS, IO | | | | | | | | |
6.212%, 01/20/2040 (A) | | | 778 | | | | 96 | |
GNMA CMO, Ser 2010-H10, Cl FC | | | | | | | | |
1.435%, 05/20/2060 (A) | | | 3,769 | | | | 3,808 | |
GNMA CMO, Ser 2010-H26, Cl LF | | | | | | | | |
0.788%, 08/20/2058 (A) | | | 5,010 | | | | 4,959 | |
GNMA CMO, Ser 2011-142, Cl IO, IO | | | | | | | | |
0.836%, 09/16/2046 (A) | | | 31,898 | | | | 1,098 | |
GNMA CMO, Ser 2011-146, Cl EI, IO | | | | | | | | |
5.000%, 11/16/2041 | | | 94 | | | | 20 | |
GNMA CMO, Ser 2011-H09, Cl AF | | | | | | | | |
0.937%, 03/20/2061 (A) | | | 1,405 | | | | 1,396 | |
GNMA CMO, Ser 2012-112, Cl IO, IO | | | | | | | | |
0.364%, 02/16/2053 (A) | | | 8,137 | | | | 265 | |
GNMA CMO, Ser 2012-124, Cl AS, IO | | | | | | | | |
5.764%, 10/16/2042 (A) | | | 1,299 | | | | 249 | |
GNMA CMO, Ser 2012-142, Cl IO, IO | | | | | | | | |
1.082%, 04/16/2054 (A) | | | 20,681 | | | | 1,091 | |
GNMA CMO, Ser 2012-27, Cl IO, IO | | | | | | | | |
1.154%, 04/16/2053 (A) | | | 12,505 | | | | 658 | |
GNMA CMO, Ser 2012-66, Cl CI, IO | | | | | | | | |
3.500%, 02/20/2038 | | | 1,671 | | | | 153 | |
GNMA CMO, Ser 2012-98, Cl SA, IO | | | | | | | | |
5.666%, 08/16/2042 (A) | | | 1,124 | | | | 178 | |
GNMA CMO, Ser 2013-145, Cl IO, IO | | | | | | | | |
1.069%, 09/16/2044 (A) | | | 10,826 | | | | 670 | |
GNMA CMO, Ser 2013-163, Cl IO, IO | | | | | | | | |
1.173%, 02/16/2046 (A) | | | 13,280 | | | | 889 | |
GNMA CMO, Ser 2013-178, Cl IO, IO | | | | | | | | |
0.917%, 06/16/2055 (A) | | | 6,612 | | | | 343 | |
GNMA CMO, Ser 2013-63, Cl IO, IO | | | | | | | | |
0.765%, 09/16/2051 (A) | | | 8,964 | | | | 515 | |
GNMA CMO, Ser 2013-H01, Cl TA | | | | | | | | |
0.937%, 01/20/2063 (A) | | | 1,457 | | | | 1,456 | |
| | |
| 104 | | SEI Institutional Investments Trust / Annual Report / May 31, 2016 |
| | | | | | | | |
| Description | | Face Amount
($ Thousands) | | | Market Value ($ Thousands) | |
GNMA CMO, Ser 2013-H01, Cl JA | | | | | | | | |
0.757%, 01/20/2063 (A) | | $ | 1,197 | | | $ | 1,180 | |
GNMA CMO, Ser 2014-124, Cl IE, IO | | | | | | | | |
0.798%, 05/16/2054 (A) | | | 11,153 | | | | 598 | |
GNMA CMO, Ser 2014-47, Cl IA, IO | | | | | | | | |
1.185%, 02/16/2048 (A) | | | 4,462 | | | | 250 | |
GNMA CMO, Ser 2014-50, Cl IO, IO | | | | | | | | |
0.950%, 09/16/2055 (A) | | | 9,915 | | | | 617 | |
GNMA CMO, Ser 2014-H04, Cl FB | | | | | | | | |
1.087%, 02/20/2064 (A) | | | 2,616 | | | | 2,613 | |
GNMA CMO, Ser 2015-167, Cl OI, IO | | | | | | | | |
4.000%, 04/16/2045 | | | 758 | | | | 153 | |
GNMA TBA | | | | | | | | |
4.000%, 06/01/2039 | | | 3,000 | | | | 3,209 | |
3.500%, 06/15/2041 to 08/15/2041 | | | 40,670 | | | | 42,841 | |
3.000%, 08/15/2042 to 06/01/2043 | | | 37,200 | | | | 38,380 | |
GNMA, Ser 2012-44, Cl A | | | | | | | | |
2.170%, 04/16/2041 | | | 1,070 | | | | 1,074 | |
GNMA, Ser 2014-186, Cl IO, IO | | | | | | | | |
0.840%, 08/16/2054 (A) | | | 16,723 | | | | 1,053 | |
GNMA, Ser 2015-47, Cl AC | | | | | | | | |
2.500%, 05/16/2055 | | | 1,187 | | | | 1,195 | |
GNMA, Ser 2015-73, Cl IO, IO | | | | | | | | |
0.891%, 11/16/2055 (A) | | | 14,565 | | | | 980 | |
GNMA, Ser 2015-85, Cl AB | | | | | | | | |
2.800%, 02/16/2047 (A) | | | 3,449 | | | | 3,527 | |
NCUA Guaranteed Notes CMO, Ser 2010-C1, Cl APT | | | | | | | | |
2.650%, 10/29/2020 | | | 144 | | | | 144 | |
NCUA Guaranteed Notes CMO, Ser 2010-R1, Cl 1A | | | | | | | | |
0.890%, 10/07/2020 (A) | | | 5,823 | | | | 5,835 | |
NCUA Guaranteed Notes CMO, Ser 2010-R2, Cl 1A | | | | | | | | |
0.803%, 11/06/2017 (A) | | | 2,177 | | | | 2,178 | |
NCUA Guaranteed Notes CMO, Ser 2010-R3, Cl 1A | | | | | | | | |
0.996%, 12/08/2020 (A) | | | 401 | | | | 402 | |
NCUA Guaranteed Notes CMO, Ser 2010-R3, Cl 2A | | | | | | | | |
0.996%, 12/08/2020 (A) | | | 357 | | | | 358 | |
NCUA Guaranteed Notes CMO, Ser 2011-R1, Cl 1A | | | | | | | | |
0.890%, 01/08/2020 (A) | | | 45 | | | | 45 | |
NCUA Guaranteed Notes CMO, Ser 2011-R2, Cl 1A | | | | | | | | |
0.836%, 02/06/2020 (A) | | | 546 | | | | 546 | |
| | | | | | | | |
| | | | | | | 1,308,911 | |
| | | | | | | | |
|
Non-Agency Mortgage-Backed Obligations — 4.8% | |
Alternative Loan Trust, Ser 2004-J6, PO | | | | | | | | |
0.000%, 11/25/2031 (B) | | | 99 | | | | 86 | |
| | | | | | | | |
| Description | | Face Amount
($ Thousands) | | | Market Value ($ Thousands) | |
ASG Resecuritization Trust, Ser 2009-3, Cl A65 | | | | | | | | |
2.346%, 03/26/2037 (A) (C) | | $ | 394 | | | $ | 391 | |
ASG Resecuritization Trust, Ser 2011-1, Cl 3A50 | | | | | | | | |
2.904%, 11/28/2035 (A) (C) | | | 238 | | | | 233 | |
Banc of America Alternative Loan Trust, Ser 2003-7, Cl 1CB1 | | | | | | | | |
5.500%, 09/25/2033 | | | 226 | | | | 228 | |
Banc of America Alternative Loan Trust, Ser 2006-8, Cl 3A1 | | | | | | | | |
6.072%, 11/25/2021 (A) | | | 65 | | | | 59 | |
Banc of America Alternative Loan Trust, Ser 2007-1, Cl 2A1 | | | | | | | | |
6.176%, 04/25/2037 (A) | | | 203 | | | | 174 | |
Banc of America Funding, Ser 2003-2, Cl 1A1 | | | | | | | | |
6.500%, 06/25/2032 | | | 15 | | | | 16 | |
Banc of America Funding, Ser 2004-2, Cl 1CB1 | | | | | | | | |
5.750%, 09/20/2034 | | | 193 | | | | 200 | |
Banc of America Funding, Ser 2004-C, Cl 1A1 | | | | | | | | |
3.085%, 12/20/2034 (A) | | | 74 | | | | 73 | |
Banc of America Funding, Ser 2005-B, Cl 2A1 | | | | | | | | |
3.185%, 04/20/2035 (A) | | | 2,661 | | | | 2,333 | |
Banc of America Funding, Ser 2010-R11A, Cl 1A6 | | | | | | | | |
5.121%, 08/26/2035 (A) (C) | | | 141 | | | | 141 | |
Banc of America Funding, Ser 2015-R2, Cl 9A1 | | | | | | | | |
0.648%, 03/27/2036 (A) (C) | | | 5,876 | | | | 5,652 | |
Banc of America Mortgage Securities, Ser 2003-3, Cl 1A7 | | | | | | | | |
5.500%, 05/25/2033 | | | 189 | | | | 192 | |
Banc of America Mortgage Securities, Ser 2003-A, Cl 2A2 | | | | | | | | |
3.431%, 02/25/2033 (A) | | | 2 | | | | 2 | |
Banc of America Mortgage Securities, Ser 2003-E, Cl 2A2 | | | | | | | | |
3.097%, 06/25/2033 (A) | | | 131 | | | | 130 | |
Banc of America Mortgage Securities, Ser 2003-I, Cl 2A6 | | | | | | | | |
2.984%, 10/25/2033 (A) | | | 5,528 | | | | 5,590 | |
Bayview Commercial Asset Trust, Ser 2006- 4A, Cl A1 | | | | | | | | |
0.676%, 12/25/2036 (A) (C) | | | 1,399 | | | | 1,229 | |
BB-UBS Trust, Ser 2012-TFT, Cl A | | | | | | | | |
2.892%, 06/05/2030 (C) | | | 1,500 | | | | 1,514 | |
BCAP LLC Trust, Ser 2009-RR5, Cl 8A1 | | | | | | | | |
5.500%, 11/26/2034 (C) | | | 246 | | | | 255 | |
BCAP LLC Trust, Ser 2010-RR7, Cl 1A5 | | | | | | | | |
3.015%, 04/26/2035 (A) (C) | | | 31 | | | | 31 | |
BCAP LLC Trust, Ser 2010-RR8, Cl 3A4 | | | | | | | | |
3.043%, 05/26/2035 (A) (C) | | | 467 | | | | 458 | |
BCAP LLC Trust, Ser 2011-RR5, Cl 11A3 | | | | | | | | |
0.583%, 05/28/2036 (A) (C) | | | 122 | | | | 122 | |
| | | | |
| SEI Institutional Investments Trust / Annual Report / May 31, 2016 | | | 105 | |
SCHEDULE OF INVESTMENTS
Core Fixed Income Fund (Continued)
May 31, 2016
| | | | | | | | |
| Description | | Face Amount
($ Thousands) | | | Market Value
($ Thousands) | |
Bear Stearns Adjustable Rate Mortgage Trust, Ser 2004-2, Cl 14A | | | | | | | | |
3.343%, 05/25/2034 (A) | | $ | 52 | | | $ | 51 | |
Bear Stearns Adjustable Rate Mortgage Trust, Ser 2004-2, Cl 24A | | | | | | | | |
2.805%, 05/25/2034 (A) | | | 191 | | | | 179 | |
Bear Stearns Adjustable Rate Mortgage Trust, Ser 2005-5, Cl A1 | | | | | | | | |
2.380%, 08/25/2035 (A) | | | 185 | | | | 186 | |
Bear Stearns Alt-A Trust, Ser 2004-13, Cl A1 | | | | | | | | |
1.179%, 11/25/2034 (A) | | | 23 | | | | 23 | |
Bear Stearns Commercial Mortgage Securities, Ser 2005-PWR8, Cl X1, IO | | | | | | | | |
0.393%, 06/11/2041 (A)(C) | | | 450 | | | | — | |
CD Commercial Mortgage Trust, Ser 2006- CD2, Cl AM | | | | | | | | |
5.326%, 01/15/2046 (A) | | | 10 | | | | 10 | |
CD Commercial Mortgage Trust, Ser 2006-CD2, Cl X, IO | | | | | | | | |
0.027%, 01/15/2046 (A)(C) | | | 8,837 | | | | — | |
CD Commercial Mortgage Trust, Ser 2007-CD4, Cl XC, IO | | | | | | | | |
0.577%, 12/11/2049 (A)(C) | | | 23,526 | | | | 44 | |
CFCRE Commercial Mortgage Trust, Ser 2011-C1, Cl A4 | | | | | | | | |
4.961%, 04/15/2044 (A)(C) | | | 2,670 | | | | 2,937 | |
CFCRE Commercial Mortgage Trust, Ser 2016-C4, Cl ASB | | | | | | | | |
3.091%, 05/10/2058 | | | 665 | | | | 682 | |
CG-CCRE Commercial Mortgage Trust, Ser 2014-FL1, Cl A | | | | | | | | |
1.383%, 06/15/2031 (A)(C) | | | 1,360 | | | | 1,358 | |
Chase Mortgage Finance, Ser 2007-A1, Cl 2A1 | | | | | | | | |
2.651%, 02/25/2037 (A) | | | 122 | | | | 122 | |
Chase Mortgage Finance, Ser 2007-A1, Cl 9A1 | | | | | | | | |
2.750%, 02/25/2037 (A) | | | 104 | | | | 102 | |
Chase Mortgage Finance, Ser 2007-A2, Cl 1A1 | | | | | | | | |
2.894%, 07/25/2037 (A) | | | 207 | | | | 205 | |
Chevy Chase Funding LLC Mortgage-Backed Certificates, Ser 2003-4X, Cl A2 | | | | | | | | |
0.836%, 10/25/2034 (A) | | | 4,476 | | | | 4,131 | |
Chevy Chase Funding LLC Mortgage-Backed Certificates, Ser 2004-1A, Cl A2 | | | | | | | | |
0.776%, 01/25/2035 (A)(C) | | | 3,974 | | | | 3,568 | |
CHL Mortgage Pass-Through Trust, Ser 2004-14, Cl 4A1 | | | | | | | | |
2.584%, 08/25/2034 (A) | | | 298 | | | | 287 | |
CHL Mortgage Pass-Through Trust, Ser 2005- 20, Cl A7 | | | | | | | | |
5.250%, 12/25/2027 | | | 336 | | | | 312 | |
Citigroup Commercial Mortgage Trust, Ser 2013-375P, Cl A | | | | | | | | |
3.251%, 05/10/2035 (C) | | | 1,465 | | | | 1,528 | |
| | | | | | | | |
| Description | | Face Amount
($ Thousands) | | | Market Value
($ Thousands) | |
Citigroup Commercial Mortgage Trust, Ser 2014-388G, Cl A | | | | | | | | |
1.185%, 06/15/2033 (A)(C) | | $ | 1,070 | | | $ | 1,070 | |
Citigroup Commercial Mortgage Trust, Ser 2014-GC25, Cl AS | | | | | | | | |
4.017%, 10/10/2047 | | | 1,290 | | | | 1,394 | |
Citigroup Commercial Mortgage Trust, Ser 2016-GC36, Cl A5 | | | | | | | | |
3.616%, 02/10/2049 | | | 1,642 | | | | 1,743 | |
Citigroup Global Markets Mortgage Securities VII, Ser 2003-HYB1, Cl A | | | | | | | | |
2.740%, 09/25/2033 (A) | | | 218 | | | | 215 | |
Citigroup Mortgage Loan Trust, Ser 2004- HYB1, Cl A41 | | | | | | | | |
3.179%, 02/25/2034 (A) | | | 42 | | | | 41 | |
Citigroup Mortgage Loan Trust, Ser 2004-RR2, Cl A2 | | | | | | | | |
2.970%, 05/25/2034 (A)(C) | | | 298 | | | | 300 | |
Citigroup Mortgage Loan Trust, Ser 2004-UST1, Cl A6 | | | | | | | | |
2.513%, 08/25/2034 (A) | | | 99 | | | | 94 | |
Citigroup Mortgage Loan Trust, Ser 2008-AR4, Cl 1A1A | | | | | | | | |
2.909%, 11/25/2038 (A)(C) | | | 324 | | | | 321 | |
Citigroup Mortgage Loan Trust, Ser 2009-10, Cl 1A1 | | | | | | | | |
2.522%, 09/25/2033 (A)(C) | | | 257 | | | | 259 | |
COMM Mortgage Trust, Ser 2010-C1, Cl A3 | | | | | | | | |
4.205%, 07/10/2046 (C) | | | 2,313 | | | | 2,500 | |
COMM Mortgage Trust, Ser 2010-C1, Cl A2 | | | | | | | | |
3.830%, 07/10/2046 (C) | | | 238 | | | | 244 | |
COMM Mortgage Trust, Ser 2012-CCRE4, Cl A2 | | | | | | | | |
1.801%, 10/15/2045 | | | 465 | | | | 464 | |
COMM Mortgage Trust, Ser 2012-CR1, Cl A2 | | | | | | | | |
2.350%, 05/15/2045 | | | 1,683 | | | | 1,693 | |
COMM Mortgage Trust, Ser 2012-CR2, Cl A4 | | | | | | | | |
3.147%, 08/15/2045 | | | 209 | | | | 219 | |
COMM Mortgage Trust, Ser 2013-300P, Cl A1 | | | | | | | | |
4.353%, 08/10/2030 (C) | | | 1,345 | | | | 1,500 | |
COMM Mortgage Trust, Ser 2013-CCRE12, Cl A4 | | | | | | | | |
4.046%, 10/10/2046 | | | 155 | | | | 170 | |
COMM Mortgage Trust, Ser 2013-CR10, Cl A2 | | | | | | | | |
2.972%, 08/10/2046 | | | 533 | | | | 546 | |
COMM Mortgage Trust, Ser 2013-CR12, Cl C | | | | | | | | |
5.084%, 10/10/2046 (A) | | | 90 | | | | 94 | |
COMM Mortgage Trust, Ser 2013-CR12, Cl B | | | | | | | | |
4.762%, 10/10/2046 (A) | | | 190 | | | | 209 | |
COMM Mortgage Trust, Ser 2013-CR12, Cl AM | | | | | | | | |
4.300%, 10/10/2046 | | | 440 | | | | 479 | |
COMM Mortgage Trust, Ser 2013-CR6, Cl A1 | | | | | | | | |
0.719%, 03/10/2046 | | | 252 | | | | 251 | |
COMM Mortgage Trust, Ser 2013-LC13, Cl B | | | | | | | | |
5.009%, 08/10/2046 (A)(C) | | | 1,150 | | | | 1,274 | |
| | |
| 106 | | SEI Institutional Investments Trust / Annual Report / May 31, 2016 |
| | | | | | | | |
| Description | | Face Amount
($ Thousands) | | | Market Value
($ Thousands) | |
COMM Mortgage Trust, Ser 2014-CCRE18, Cl ASB | | | | | | | | |
3.452%, 07/15/2047 | | $ | 808 | | | $ | 855 | |
COMM Mortgage Trust, Ser 2014-CR15, Cl A2 | | | | | | | | |
2.928%, 02/10/2047 | | | 119 | | | | 122 | |
COMM Mortgage Trust, Ser 2014-SAVA, Cl A | | | | | | | | |
1.583%, 06/15/2034 (A)(C) | | | 1,066 | | | | 1,050 | |
COMM Mortgage Trust, Ser 2014-SAVS, Cl D | | | | | | | | |
3.533%, 06/15/2034 (A)(C) | | | 2,080 | | | | 2,036 | |
COMM Mortgage Trust, Ser 2014-UBS2, Cl XA, IO | | | | | | | | |
1.404%, 03/10/2047 (A) | | | 15,390 | | | | 1,072 | |
COMM Mortgage Trust, Ser 2014-UBS4, Cl A5 | | | | | | | | |
3.694%, 08/10/2047 | | | 502 | | | | 534 | |
COMM Mortgage Trust, Ser 2014-UBS5, Cl ASB | | | | | | | | |
3.548%, 09/10/2047 | | | 504 | | | | 532 | |
COMM Mortgage Trust, Ser 2014-UBS6, Cl AM | | | | | | | | |
4.048%, 12/10/2047 | | | 1,653 | | | | 1,767 | |
COMM Mortgage Trust, Ser 2014-UBS6, Cl ASB | | | | | | | | |
3.387%, 12/10/2047 | | | 292 | | | | 307 | |
COMM Mortgage Trust, Ser 2015-3BP, Cl A | | | | | | | | |
3.178%, 02/10/2035 (C) | | | 1,460 | | | | 1,504 | |
COMM Mortgage Trust, Ser 2015-DC1, Cl A2 | | | | | | | | |
2.870%, 02/10/2048 | | | 135 | | | | 139 | |
COMM Mortgage Trust, Ser 2016-787S, Cl A | | | | | | | | |
3.545%, 02/10/2036 (A)(C) | | | 1,470 | | | | 1,560 | |
Commercial Mortgage Pass-Through Certificates, Ser 2012-CR3, Cl A3 | | | | | | | | |
2.822%, 11/15/2045 | | | 90 | | | | 92 | |
Commercial Mortgage Pass-Through Certificates, Ser 2013-CR12, Cl A1 | | | | | | | | |
1.295%, 10/10/2046 | | | 133 | | | | 133 | |
Commercial Mortgage Pass-Through Certificates, Ser 2013-WWP, Cl A2 | | | | | | | | |
3.424%, 03/10/2031 (C) | | | 471 | | | | 495 | |
Commercial Mortgage Pass-Through Certificates, Ser 2014-277P, Cl A | | | | | | | | |
3.732%, 08/10/2049 (A)(C) | | | 1,350 | | | | 1,440 | |
Commercial Mortgage Trust, Ser 2013-CR11, Cl A1 | | | | | | | | |
1.468%, 10/10/2046 | | | 372 | | | | 372 | |
Countrywide Alternative Loan Trust, Ser 2004- 27CB, Cl A1 | | | | | | | | |
6.000%, 12/25/2034 | | | 1,044 | | | | 1,038 | |
Countrywide Alternative Loan Trust, Ser 2004- J1, Cl 1A1 | | | | | | | | |
6.000%, 02/25/2034 | | | 92 | | | | 93 | |
Countrywide Alternative Loan Trust, Ser 2004- J6, Cl 2A1 | | | | | | | | |
6.500%, 11/25/2031 | | | 396 | | | | 411 | |
Countrywide Alternative Loan Trust, Ser 2005- 27, Cl 3A2 | | | | | | | | |
1.477%, 08/25/2035 (A) | | | 446 | | | | 320 | |
| | | | | | | | |
| Description | | Face Amount
($ Thousands) | | | Market Value
($ Thousands) | |
Credit Suisse Commercial Mortgage Trust, Ser 2007-C2, Cl AM | | | | | | | | |
5.604%, 01/15/2049 (A) | | $ | 732 | | | $ | 746 | |
Credit Suisse First Boston Mortgage Securities, Ser 2003-27, Cl 5A3 | | | | | | | | |
5.250%, 11/25/2033 | | | 318 | | | | 321 | |
Credit Suisse First Boston Mortgage Securities, Ser 2003-29, Cl 5A1 | | | | | | | | |
7.000%, 12/25/2033 | | | 149 | | | | 157 | |
Credit Suisse Mortgage Capital Certificates, Ser 2011-16R, Cl 7A3 | | | | | | | | |
3.500%, 12/27/2036 (A)(C) | | | 62 | | | | 62 | |
Credit Suisse Mortgage Capital Certificates, Ser 2011-6R, Cl 3A1 | | | | | | | | |
2.870%, 07/28/2036 (A)(C) | | | 165 | | | | 166 | |
CSAIL Commercial Mortgage Trust, Ser 2015- C4, Cl ASB | | | | | | | | |
3.617%, 11/15/2048 | | | 1,492 | | | | 1,584 | |
CSAIL Commercial Mortgage Trust, Ser 2015- C4, Cl A4 | | | | | | | | |
3.808%, 11/15/2048 | | | 639 | | | | 688 | |
CSAIL Commercial Mortgage Trust, Ser 2016- C5, Cl ASB | | | | | | | | |
3.533%, 11/15/2048 | | | 327 | | | | 347 | |
CSMC Trust, Ser 2010-16, Cl A3 | | | | | | | | |
3.358%, 06/25/2050 (A)(C) | | | 23 | | | | 23 | |
CSMC Trust, Ser 2015-5R, Cl 1A1 | | | | | | | | |
1.066%, 09/27/2046 (C) | | | 6,153 | | | | 5,971 | |
CSMC Trust, Ser 2015-GLPA, Cl A | | | | | | | | |
3.881%, 11/15/2037 (C) | | | 420 | | | | 443 | |
DBRR Trust, Ser 2011-LC2, Cl A4A | | | | | | | | |
4.537%, 07/12/2044 (A)(C) | | | 2,845 | | | | 3,101 | |
DBUBS Mortgage Trust, Ser 2011-LC1A, Cl A1 | | | | | | | | |
3.742%, 11/10/2046 (C) | | | 42 | | | | 42 | |
DBUBS Mortgage Trust, Ser 2011-LC2A, Cl A4 | | | | | | | | |
4.537%, 07/10/2044 (C) | | | 1,120 | | | | 1,234 | |
DSLA Mortgage Loan Trust, Ser 2004-AR2, Cl A2B | | | | | | | | |
1.236%, 11/19/2044 (A) | | | 1,081 | | | | 931 | |
Extended Stay America Trust, Ser 2013-ESH7, Cl A27 | | | | | | | | |
2.958%, 12/05/2031 (C) | | | 1,250 | | | | 1,254 | |
FHLMC Structured Agency Credit Risk Debt Notes, Ser 2014-DN2, Cl M2 | | | | | | | | |
2.089%, 04/25/2024 (A) | | | 13,900 | | | | 13,864 | |
FHLMC Structured Agency Credit Risk Debt Notes, Ser 2014-DN3, Cl M2 | | | | | | | | |
2.839%, 08/25/2024 (A) | | | 2,527 | | | | 2,547 | |
FHLMC Structured Agency Credit Risk Debt Notes, Ser 2014-HQ1, Cl M1 | | | | | | | | |
2.089%, 08/25/2024 (A) | | | 430 | | | | 431 | |
| | | | |
| SEI Institutional Investments Trust / Annual Report / May 31, 2016 | | | 107 | |
SCHEDULE OF INVESTMENTS
Core Fixed Income Fund (Continued)
May 31, 2016
| | | | | | | | |
| Description | | Face Amount
($ Thousands) | | | Market Value
($ Thousands) | |
FHLMC Structured Agency Credit Risk Debt Notes, Ser 2016-DNA1, Cl M2 | | | | | | | | |
3.339%, 07/25/2028 (A) | | $ | 3,030 | | | $ | 3,108 | |
First Horizon Alternative Mortgage Securities, Ser 2004-AA3, Cl A1 | | | | | | | | |
2.432%, 09/25/2034 (A) | | | 242 | | | | 234 | |
FNMA Connecticut Avenue Securities, Ser 2014- C03, Cl 1M1 | | | | | | | | |
1.646%, 07/25/2024 (A) | | | 693 | | | | 692 | |
FREMF Mortgage Trust, Ser 2012-K20, Cl X2A, IO | | | | | | | | |
0.200%, 05/25/2045 (C) | | | 27,644 | | | | 258 | |
FREMF Mortgage Trust, Ser 2014-K714, Cl C | | | | | | | | |
3.981%, 01/25/2047 (A) (C) | | | 390 | | | | 377 | |
FREMF Mortgage Trust, Ser 2015-K44, Cl B | | | | | | | | |
3.811%, 01/25/2048 (A) (C) | | | 1,090 | | | | 1,030 | |
GE Business Loan Trust, Ser 2007-1A, Cl A 0.605%, | | | | | | | | |
04/16/2035 (A) (C) | | | 1,080 | | | | 993 | |
GMAC Commercial Mortgage Securities, Ser 2006-C1, Cl AM | | | | | | | | |
5.290%, 11/10/2045 (A) | | | 1,032 | | | | 1,031 | |
GS Mortgage Securities II,
Ser 2011-GC5, Cl A2 | | | | | | | | |
2.999%, 08/10/2044 | | | 608 | | | | 608 | |
GS Mortgage Securities Trust,
Ser 2006-GG8, Cl X, IO | | | | | | | | |
0.756%, 11/10/2039 (A) (C) | | | 6,093 | | | | 1 | |
GS Mortgage Securities Trust,
Ser 2011-GC5, Cl XA, IO | | | | | | | | |
1.454%, 08/10/2044 (A) (C) | | | 1,421 | | | | 72 | |
GS Mortgage Securities Trust,
Ser 2012-GCJ7, Cl A2 | | | | | | | | |
2.318%, 05/10/2045 | | | 1,482 | | | | 1,488 | |
GS Mortgage Securities Trust,
Ser 2012-GCJ7, Cl AAB | | | | | | | | |
2.935%, 05/10/2045 | | | 206 | | | | 212 | |
GS Mortgage Securities Trust,
Ser 2013-GC16, Cl A1 | | | | | | | | |
1.264%, 11/10/2046 | | | 81 | | | | 81 | |
GS Mortgage Securities Trust,
Ser 2013-GC16, Cl B | | | | | | | | |
5.161%, 11/10/2046 (A) | | | 390 | | | | 439 | |
GS Mortgage Securities Trust,
Ser 2014-GC18, Cl AAB | | | | | | | | |
3.648%, 01/10/2047 | | | 865 | | | | 922 | |
GS Mortgage Securities Trust,
Ser 2014-GC20, Cl AAB | | | | | | | | |
3.655%, 04/10/2047 | | | 1,021 | | | | 1,090 | |
GS Mortgage Securities Trust,
Ser 2014-GC26, Cl AAB | | | | | | | | |
3.365%, 11/10/2047 | | | 439 | | | | 462 | |
GS Mortgage Securities Trust,
Ser 2015-GC32, Cl XA, IO | | | | | | | | |
0.899%, 07/10/2048 (A) | | | 38,923 | | | | 2,083 | |
| | | | | | | | |
| Description | | Face Amount
($ Thousands) | | | Market Value
($ Thousands) | |
GS Mortgage Securities Trust, Ser 2015-GC34, Cl AAB | | | | | | | | |
3.278%, 10/10/2048 | | $ | 760 | | | $ | 795 | |
GS Mortgage Securities Trust, Ser 2015-GS1, Cl A3 | | | | | | | | |
3.734%, 11/10/2048 | | | 2,248 | | | | 2,427 | |
GS Mortgage Securities, Ser
2013-KING, Cl A | | | | | | | | |
2.706%, 12/10/2027 (C) | | | 272 | | | | 276 | |
GSMPS Mortgage Loan Trust, Ser 1998-1, Cl A | | | | | | | | |
8.000%, 09/19/2027 (A) (C) | | | 2 | | | | 2 | |
GSMPS Mortgage Loan Trust, Ser 2005-RP3, Cl 1AS, IO | | | | | | | | |
4.328%, 09/25/2035 (A) (C) | | | 297 | | | | 41 | |
GSR Mortgage Loan Trust, Ser
2004-8F, Cl 2A3 | | | | | | | | |
6.000%, 09/25/2034 | | | 181 | | | | 185 | |
GSR Mortgage Loan Trust, Ser
2007-1F, Cl 2A4 | | | | | | | | |
5.500%, 01/25/2037 | | | 44 | | | | 43 | |
Homestar Mortgage Acceptance, Ser 2004-5, Cl A1 | | | | | | | | |
0.889%, 10/25/2034 (A) | | | 308 | | | | 303 | |
Impac CMB Trust, Ser 2005-4, Cl 2A1 | | | | | | | | |
1.039%, 05/25/2035 (A) | | | 176 | | | | 171 | |
Impac CMB Trust, Ser 2007-A, Cl M1 | | | | | | | | |
0.839%, 05/25/2037 (A) (C) | | | 2,183 | | | | 2,020 | |
Impac Secured Assets Trust, Ser 2006-2, Cl 2A1 | | | | | | | | |
0.789%, 08/25/2036 (A) | | | 257 | | | | 250 | |
Impact Funding Affordable Multifamily Housing Mortgage Loan Trust, Ser 2010-1, Cl A1 | | | | | | | | |
5.314%, 01/25/2051 (C) | | | 4,280 | | | | 4,956 | |
Indymac Index Mortgage Loan Trust, Ser 2004-AR7, Cl A2 | | | | | | | | |
1.299%, 09/25/2034 (A) | | | 26 | | | | 24 | |
Indymac Index Mortgage Loan Trust, Ser 2004-AR8, Cl 2A2A | | | | | | | | |
1.239%, 11/25/2034 (A) | | | 44 | | | | 37 | |
JPMBB Commercial Mortgage Securities Trust, Ser 2013-C15, Cl C | | | | | | | | |
5.215%, 11/15/2045 (A) | | | 410 | | | | 432 | |
JPMBB Commercial Mortgage Securities Trust, Ser 2013-C15, Cl A2 | | | | | | | | |
2.977%, 11/15/2045 | | | 639 | | | | 656 | |
JPMBB Commercial Mortgage Securities Trust, Ser 2013-C17, Cl B | | | | | | | | |
4.887%, 01/15/2047 (A) | | | 230 | | | | 254 | |
JPMBB Commercial Mortgage Securities Trust, Ser 2014-C22, Cl C | | | | | | | | |
4.560%, 09/15/2047 (A) | | | 750 | | | | 731 | |
JPMBB Commercial Mortgage Securities Trust, Ser 2014-C25, Cl ASB | | | | | | | | |
3.407%, 11/15/2047 | | | 149 | | | | 157 | |
JPMBB Commercial Mortgage Securities Trust, Ser 2015-C28, Cl A3 | | | | | | | | |
2.912%, 10/15/2048 | | | 1,652 | | | | 1,672 | |
| | |
| 108 | | SEI Institutional Investments Trust / Annual Report / May 31, 2016 |
| | | | | | | | |
| Description | | Face Amount
($ Thousands) | | | Market Value
($ Thousands) | |
JPMBB Commercial Mortgage Securities Trust, Ser 2015-C30, Cl A5 | | | | | | | | |
3.822%, 07/15/2048 | | $ | 1,330 | | | $ | 1,430 | |
JPMBB Commercial Mortgage Securities Trust, Ser 2015-C30, Cl AS | | | | | | | | |
4.226%, 07/15/2048 (A) | | | 1,272 | | | | 1,378 | |
JPMBB Commercial Mortgage Securities Trust, Ser 2015-C31, Cl A3 | | | | | | | | |
3.801%, 08/15/2048 | | | 4,260 | | | | 4,582 | |
JPMBB Commercial Mortgage Securities Trust, Ser 2015-C31, Cl ASB | | | | | | | | |
3.540%, 08/15/2048 | | | 519 | | | | 551 | |
JPMBB Commercial Mortgage Securities Trust, Ser 2016-C1, Cl ASB | | | | | | | | |
3.316%, 03/15/2049 | | | 1,391 | | | | 1,457 | |
JPMDB Commercial Mortgage Securities Trust, Ser 2016-C2, Cl ASB | | | | | | | | |
2.954%, 06/15/2049 | | | 1,340 | | | | 1,372 | |
JPMorgan Chase Commercial Mortgage Securities Trust, Ser 2004-LN2, Cl A2 | | | | | | | | |
5.115%, 07/15/2041 | | | 27 | | | | 27 | |
JPMorgan Chase Commercial Mortgage Securities Trust, Ser 2006-CB15, Cl X1, IO | | | | | | | | |
0.513%, 06/12/2043 (A) | | | 14,907 | | | | 9 | |
JPMorgan Chase Commercial Mortgage Securities Trust, Ser 2006-LDP9, Cl A3SF | | | | | | | | |
0.589%, 05/15/2047 (A) | | | 265 | | | | 264 | |
JPMorgan Chase Commercial Mortgage Securities Trust, Ser 2006-LDP9, Cl AM | | | | | | | | |
5.372%, 05/15/2047 | | | 4,460 | | | | 4,444 | |
JPMorgan Chase Commercial Mortgage Securities Trust, Ser 2010-C2, Cl A3 | | | | | | | | |
4.070%, 11/15/2043 (C) | | | 593 | | | | 631 | |
JPMorgan Chase Commercial Mortgage Securities Trust, Ser 2010-CNTR, Cl A1 | | | | | | | | |
3.300%, 08/05/2032 (C) | | | 594 | | | | 607 | |
JPMorgan Chase Commercial Mortgage Securities Trust, Ser 2010-CNTR, Cl A2 | | | | | | | | |
4.311%, 08/05/2032 (C) | | | 945 | | | | 1,010 | |
JPMorgan Chase Commercial Mortgage Securities Trust, Ser 2011-C3, Cl A2 | | | | | | | | |
3.673%, 02/15/2046 (C) | | | 80 | | | | 80 | |
JPMorgan Chase Commercial Mortgage Securities Trust, Ser 2011-C4, Cl A3 | | | | | | | | |
4.106%, 07/15/2046 (C) | | | 3,108 | | | | 3,237 | |
JPMorgan Chase Commercial Mortgage Securities Trust, Ser 2011-C5, Cl A2 | | | | | | | | |
3.149%, 08/15/2046 | | | 418 | | | | 418 | |
JPMorgan Chase Commercial Mortgage Securities Trust, Ser 2012-LC9, Cl A2 | | | | | | | | |
1.677%, 12/15/2047 | | | 559 | | | | 560 | |
| | | | | | | | |
| Description | | Face Amount
($ Thousands) | | | Market Value
($ Thousands) | |
JPMorgan Chase Commercial Mortgage Securities Trust, Ser 2015-JP1, Cl ASB | | | | | | | | |
3.733%, 01/15/2049 | | $ | 315 | | | $ | 338 | |
JPMorgan Mortgage Trust, Ser 2004-A3, Cl SF3 | | | | | | | | |
2.347%, 06/25/2034 (A) | | | 855 | | | | 842 | |
JPMorgan Mortgage Trust, Ser 2005-A1, Cl 3A4 | | | | | | | | |
2.857%, 02/25/2035 (A) | | | 288 | | | | 292 | |
JPMorgan Mortgage Trust, Ser 2005-A2, Cl 5A2 | | | | | | | | |
2.739%, 04/25/2035 (A) | | | 128 | | | | 127 | |
JPMorgan Mortgage Trust, Ser 2006-A2, Cl 5A3 | | | | | | | | |
2.680%, 11/25/2033 (A) | | | 475 | | | | 476 | |
JPMorgan Mortgage Trust, Ser 2006-A2, Cl 4A1 | | | | | | | | |
2.716%, 08/25/2034 (A) | | | 471 | | | | 472 | |
JPMorgan Resecuritization Trust, Ser 2009-6, Cl 4A1 | | | | | | | | |
2.677%, 09/26/2036 (A)(C) | | | 81 | | | | 81 | |
LB-UBS Commercial Mortgage Trust, Ser 2006- C1, Cl XCL, IO | | | | | | | | |
0.341%, 02/15/2041 (A)(C) | | | 3,849 | | | | 1 | |
LB-UBS Commercial Mortgage Trust, Ser 2007- C1, Cl A4 | | | | | | | | |
5.424%, 02/15/2040 | | | 126 | | | | 127 | |
LB-UBS Commercial Mortgage Trust, Ser 2008- C1, Cl A2 | | | | | | | | |
6.085%, 04/15/2041 (A) | | | 88 | | | | 92 | |
Liberty Street Trust, Ser 2016-225L, Cl A | | | | | | | | |
3.597%, 02/10/2036 (C) | | | 1,465 | | | | 1,559 | |
Master Adjustable Rate Mortgages Trust, Ser 2004-13, Cl 3A7 | | | | | | | | |
2.782%, 11/21/2034 (A) | | | 696 | | | | 707 | |
Master Adjustable Rate Mortgages Trust, Ser 2004-13, Cl 3A7A | | | | | | | | |
2.782%, 11/21/2034 (A) | | | 5,114 | | | | 5,226 | |
Master Alternative Loans Trust, Ser 2004-4, Cl 1A1 | | | | | | | | |
5.500%, 05/25/2034 | | | 809 | | | | 808 | |
Master Resecuritization Trust, Ser 2005-PO, Cl 3PO, PO | | | | | | | | |
0.000%, 05/28/2035 (B)(C) | | | 47 | | | | 37 | |
MASTR Adjustable Rate Mortgages Trust, Ser 2004-5, Cl 3A1 | | | | | | | | |
2.599%, 06/25/2034 (A) | | | 8 | | | | 7 | |
MASTR Alternative Loan Trust, Ser 2006-3, Cl 1A3 | | | | | | | | |
6.250%, 07/25/2036 | | | 395 | | | | 334 | |
MASTR Reperforming Loan Trust, Ser 2005-1, Cl 1A1 | | | | | | | | |
6.000%, 08/25/2034 (C) | | | 1,842 | | | | 1,765 | |
MASTR Reperforming Loan Trust, Ser 2005-2, Cl 1A1F | | | | | | | | |
0.789%, 05/25/2035 (A)(C) | | | 365 | | | | 287 | |
| | | | |
| SEI Institutional Investments Trust / Annual Report / May 31, 2016 | | | 109 | |
SCHEDULE OF INVESTMENTS
Core Fixed Income Fund (Continued)
May 31, 2016
| | | | | | | | |
| Description | | Face Amount
($ Thousands) | | | Market Value
($ Thousands) | |
MASTR Seasoned Securitization Trust, Ser 2004-1, Cl 4A1 | | | | | | | | |
2.659%, 10/25/2032 (A) | | $ | 8 | | | $ | 8 | |
MASTR Seasoned Securitization Trust, Ser 2005-1, Cl 4A1 | | | | | | | | |
2.573%, 10/25/2032 (A) | | | 68 | | | | 68 | |
Merrill Lynch Mortgage Investors Trust, Ser 2003-A4, Cl 2A | | | | | | | | |
2.861%, 07/25/2033 (A) | | | 80 | | | | 73 | |
Merrill Lynch Mortgage Investors Trust, Ser 2004-1, Cl 2A1 | | | | | | | | |
2.459%, 12/25/2034 (A) | | | 298 | | | | 297 | |
Merrill Lynch Mortgage Investors Trust, Ser 2004-A1, Cl 4A | | | | | | | | |
2.875%, 02/25/2034 (A) | | | 500 | | | | 501 | |
Merrill Lynch Mortgage Investors Trust, Ser 2004-A1, Cl 2A1 | | | | | | | | |
2.765%, 02/25/2034 (A) | | | 96 | | | | 97 | |
Merrill Lynch Mortgage Investors Trust, Ser 2004-A4, Cl A2 | | | | | | | | |
2.665%, 08/25/2034 (A) | | | 150 | | | | 152 | |
Merrill Lynch Mortgage Investors Trust, Ser 2004-D, Cl A2 | | | | | | | | |
1.250%, 09/25/2029 (A) | | | 201 | | | | 192 | |
Merrill Lynch Mortgage Investors Trust, Ser 2006-1, Cl 1A | | | | | | | | |
2.667%, 02/25/2036 (A) | | | 203 | | | | 186 | |
ML-CFC Commercial Mortgage Trust, Ser 2006-4, Cl XC, IO | | | | | | | | |
0.798%, 12/12/2049 (A) (C) | | | 10,157 | | | | 23 | |
Morgan Stanley Bank of America Merrill Lynch Trust, Ser 2012-C5, Cl XA, IO | | | | | | | | |
1.732%, 08/15/2045 (A) (C) | | | 4,625 | | | | 286 | |
Morgan Stanley Bank of America Merrill Lynch Trust,
Ser 2013-C10, Cl A1 | | | | | | | | |
1.394%, 07/15/2046 | | | 655 | | | | 655 | |
Morgan Stanley Bank of America Merrill Lynch Trust,
Ser 2013-C10, Cl A4 | | | | | | | | |
4.083%, 07/15/2046 (A) | | | 1,600 | | | | 1,762 | |
Morgan Stanley Bank of America Merrill Lynch Trust,
Ser 2013-C7, Cl AS | | | | | | | | |
3.214%, 02/15/2046 | | | 207 | | | | 214 | |
Morgan Stanley Bank of America Merrill Lynch Trust,
Ser 2013-C9, Cl A2 | | | | | | | | |
1.970%, 05/15/2046 | | | 564 | | | | 566 | |
Morgan Stanley Bank of America Merrill Lynch Trust,
Ser 2015-C23, Cl A3 | | | | | | | | |
3.451%, 07/15/2050 | | | 401 | | | | 422 | |
Morgan Stanley Bank of America Merrill Lynch Trust,
Ser 2015-C25, Cl ASB | | | | | | | | |
3.383%, 10/15/2048 | | | 1,032 | | | | 1,086 | |
| | | | | | | | |
| Description | | Face Amount
($ Thousands) | | | Market Value
($ Thousands) | |
Morgan Stanley Bank of America Merrill Lynch Trust, Ser 2016-C28, Cl ASB | | | | | | | | |
3.288%, 01/15/2049 | | $ | 1,425 | | | $ | 1,488 | |
Morgan Stanley Capital I Trust,
Ser 2011-C2, Cl A2 | | | | | | | | |
3.476%, 06/15/2044 (C) | | | 320 | | | | 321 | |
Morgan Stanley Capital I Trust,
Ser 2014-CPT, Cl AM | | | | | | | | |
3.402%, 07/13/2029 (A) (C) | | | 4,570 | | | | 4,772 | |
Morgan Stanley Capital I Trust,
Ser 2014-CPT, Cl B | | | | | | | | |
3.446%, 07/13/2029 (A) (C) | | | 3,870 | | | | 3,991 | |
Morgan Stanley Capital I Trust,
Ser 2016-UBS9, Cl A1 | | | | | | | | |
1.711%, 03/15/2049 | | | 963 | | | | 962 | |
Morgan Stanley Capital I, Ser 2007-HQ11, Cl X, IO | | | | | | | | |
0.380%, 02/12/2044 (A) (C) | | | 31,286 | | | | 33 | |
Morgan Stanley Capital I, Ser 2011-C3, Cl A2 | | | | | | | | |
3.224%, 07/15/2049 | | | 3,947 | | | | 3,951 | |
Morgan Stanley Mortgage Loan Trust, Ser 2004-3, Cl 4A | | | | | | | | |
5.687%, 04/25/2034 (A) | | | 282 | | | | 295 | |
Morgan Stanley Mortgage Loan Trust, Ser 2007-3XS, Cl 2A3S | | | | | | | | |
5.838%, 01/25/2047 | | | 21 | | | | 13 | |
MSCG Trust, Ser 2015-ALDR, Cl A2 | | | | | | | | |
3.577%, 06/07/2035 (A) (C) | | | 2,030 | | | | 2,070 | |
New York Mortgage Trust, Ser
2006-1, Cl 2A2 | | | | | | | | |
2.952%, 05/25/2036 (A) | | | 286 | | | | 255 | |
Nomura Resecuritization Trust,
Ser 2010-6RA, Cl 1A5 | | | | | | | | |
2.999%, 03/26/2036 (A) (C) | | | 113 | | | | 111 | |
Nomura Resecuritization Trust, Ser 2014-1R, Cl 3A1 | | | | | | | | |
0.583%, 07/26/2036 (A) (C) | | | 1,253 | | | | 1,241 | |
OBP Depositor LLC Trust, Ser 2010-OBP, Cl A | | | | | | | | |
4.646%, 07/15/2045 (C) | | | 1,195 | | | | 1,302 | |
Opteum Mortgage Acceptance Asset Backed Pass-Through Certificates, Ser 2005-1, Cl M6 | | | | | | | | |
1.751%, 02/25/2035 (A) | | | 4,462 | | | | 4,053 | |
Prime Mortgage Trust, Ser 2004-CL1, Cl 1A1 | | | | | | | | |
6.000%, 02/25/2034 | | | 110 | | | | 114 | |
Prime Mortgage Trust, Ser 2004-CL1, Cl 1PO, PO | | | | | | | | |
0.000%, 02/25/2034 (B) | | | 23 | | | | 19 | |
Prime Mortgage Trust, Ser 2006-DR1, Cl 2A1 | | | | | | | | |
5.500%, 05/25/2035 (C) | | | 1,693 | | | | 1,587 | |
Province of Ontario Canada | | | | | | | | |
2.500%, 04/27/2026 | | | 1,642 | | | | 1,648 | |
RALI Trust, Ser 2003-QS15, Cl A7 | | | | | | | | |
5.500%, 08/25/2033 | | | 805 | | | | 806 | |
| | |
| 110 | | SEI Institutional Investments Trust / Annual Report / May 31, 2016 |
| | | | | | | | |
| Description | | Face Amount
($ Thousands) | | | Market Value
($ Thousands) | |
RALI Trust, Ser 2003-QS19, Cl A1 | | | | | | | | |
5.750%, 10/25/2033 | | $ | 211 | | | $ | 221 | |
RALI Trust, Ser 2004-QS7, Cl A4 | | | | | | | | |
5.500%, 05/25/2034 | | | 1,141 | | | | 1,158 | |
RALI Trust, Ser 2005-QO2, Cl A1 | | | | | | | | |
1.737%, 09/25/2045 (A) | | | 626 | | | | 504 | |
RALI Trust, Ser 2005-QO5, Cl A1 | | | | | | | | |
1.377%, 01/25/2046 (A) | | | 910 | | | | 621 | |
RAMP Trust, Ser 2004-SL1, Cl A8 | | | | | | | | |
6.500%, 11/25/2031 | | | 298 | | | | 302 | |
RAMP Trust, Ser 2005-SL1, Cl A5 | | | | | | | | |
6.500%, 05/25/2032 | | | 30 | | | | 29 | |
RBS Commercial Funding Trust, Ser 2013-GSP, Cl A | | | | | | | | |
3.961%, 01/13/2032 (A) (C) | | | 1,380 | | | | 1,493 | |
RCMC LLC, Ser 2012-CRE1, Cl A | | | | | | | | |
5.624%, 11/15/2044 (C) | | | 216 | | | | 216 | |
Residential Asset Mortgage Products, Ser 2004-SL1, Cl A7 | | | | | | | | |
7.000%, 11/25/2031 | | | 73 | | | | 77 | |
Residential Asset Mortgage Products, Ser 2004-SL3, Cl A2 | | | | | | | | |
6.500%, 12/25/2031 | | | 376 | | | | 383 | |
Residential Asset Securitization Trust, Ser 2004-IP2, Cl 2A1 | | | | | | | | |
2.820%, 12/25/2034 (A) | | | 713 | | | | 711 | |
RFMSI Trust, Ser 2003-S4, Cl A4 | | | | | | | | |
5.750%, 03/25/2033 | | | 133 | | | | 135 | |
Sequoia Mortgage Trust, Ser 2004-12, Cl A3 | | | | | | | | |
0.763%, 01/20/2035 (A) | | | 334 | | | | 306 | |
Springleaf Mortgage Loan Trust, Ser 2013-2A, Cl A | | | | | | | | |
1.780%, 12/25/2065 (A) (C) | | | 582 | | | | 581 | |
Structured Adjustable Rate Mortgage Loan Trust, Ser 2004-6, Cl 5A4 | | | | | | | | |
2.473%, 06/25/2034 (A) | | | 69 | | | | 69 | |
Structured Adjustable Rate Mortgage Loan Trust, Ser 2005-19XS, Cl 1A1 | | | | | | | | |
0.766%, 10/25/2035 (A) | | | 2,642 | | | | 2,157 | |
Structured Agency Credit Risk Debt Notes, Ser 2014-DN1, Cl M2 | | | | | | | | |
2.639%, 02/25/2024 (A) | | | 1,580 | | | | 1,597 | |
Structured Asset Mortgage Investments II Trust, Ser 2005-AR1, Cl A1 | | | | | | | | |
0.916%, 04/19/2035 (A) | | | 2,749 | | | | 2,604 | |
Structured Asset Mortgage Investments, Ser 2004-AR5, Cl 1A1 | | | | | | | | |
1.099%, 10/19/2034 (A) | | | 194 | | | | 184 | |
Structured Asset Securities Mortgage Pass-Through Certificates, Ser 2001-15A, Cl 4A1 | | | | | | | | |
2.654%, 10/25/2031 (A) | | | 45 | | | | 45 | |
| | | | | | | | |
| Description | | Face Amount
($ Thousands) | | | Market Value
($ Thousands) | |
Structured Asset Securities Mortgage Pass- Through Certificates, Ser 2003-32, Cl 1A1 | | | | | | | | |
5.243%, 11/25/2033 (A) | | $ | 53 | | | $ | 53 | |
Structured Asset Securities Mortgage Pass- Through Certificates, Ser 2004-5H, Cl A4 | | | | | | | | |
5.540%, 12/25/2033 | | | 371 | | | | 381 | |
Structured Asset Securities, Ser 2003-31A, Cl 2A7 | | | | | | | | |
2.811%, 10/25/2033 (A) | | | 4,302 | | | | 4,219 | |
Structured Asset Securities, Ser 2003-37A, Cl 2A | | | | | | | | |
6.039%, 12/25/2033 (A) | | | 110 | | | | 109 | |
Thornburg Mortgage Securities Trust, Ser 2003-4, Cl A1 | | | | | | | | |
1.086%, 09/25/2043 (A) | | | 424 | | | | 407 | |
UBS Commercial Mortgage Trust, Ser 2012-C1, Cl XA, IO | | | | | | | | |
2.172%, 05/10/2045 (A) (C) | | | 5,212 | | | | 479 | |
UBS-BAMLL Trust, Ser 2012-WRM, Cl A | | | | | | | | |
3.663%, 06/10/2030 (C) | | | 400 | | | | 416 | |
UBS-Barclays Commercial Mortgage Trust, Ser 2012-C2, Cl A2 | | | | | | | | |
2.113%, 05/10/2063 | | | 964 | | | | 969 | |
UBS-Barclays Commercial Mortgage Trust, Ser 2013-C6, Cl A2 | | | | | | | | |
2.067%, 04/10/2046 | | | 250 | | | | 251 | |
VNO Mortgage Trust,
Ser 2012-6AVE, Cl A | | | | | | | | |
2.996%, 11/15/2030 (C) | | | 100 | | | | 103 | |
Wachovia Bank Commercial Mortgage Trust, Ser 2006-C26, Cl XC, IO | | | | | | | | |
0.177%, 06/15/2045 (A) (C) | | | 42,526 | | | | — | |
WaMu Mortgage Pass-Through Certificates Trust,
Ser 2002-AR18, Cl A | | | | | | | | |
2.750%, 01/25/2033 (A) | | | 181 | | | | 182 | |
WaMu Mortgage Pass-Through Certificates Trust,
Ser 2003-AR10, Cl A7 | | | | | | | | |
2.536%, 10/25/2033 (A) | | | 220 | | | | 223 | |
WaMu Mortgage Pass-Through Certificates Trust, Ser 2003-AR6, Cl A1 | | | | | | | | |
2.565%, 06/25/2033 (A) | | | 205 | | | | 204 | |
WaMu Mortgage Pass-Through Certificates Trust, Ser 2003-AR7, Cl A7 | | | | | | | | |
2.426%, 08/25/2033 (A) | | | 179 | | | | 179 | |
WaMu Mortgage Pass-Through Certificates Trust, Ser 2003-AR8, Cl A | | | | | | | | |
2.476%, 08/25/2033 (A) | | | 121 | | | | 122 | |
WaMu Mortgage Pass-Through Certificates Trust, Ser 2003-AR9, Cl 1A6 | | | | | | | | |
2.523%, 09/25/2033 (A) | | | 386 | | | | 388 | |
WaMu Mortgage Pass-Through Certificates Trust, Ser 2003-AR9, Cl 2A | | | | | | | | |
2.561%, 09/25/2033 (A) | | | 127 | | | | 123 | |
| | | | |
| SEI Institutional Investments Trust / Annual Report / May 31, 2016 | | | 111 | |
SCHEDULE OF INVESTMENTS
Core Fixed Income Fund (Continued)
May 31, 2016
| | | | | | | | |
| Description | | Face Amount
($ Thousands) | | | Market Value
($ Thousands) | |
WaMu Mortgage Pass-Through Certificates Trust,
Ser 2003-MS1, Cl 1A | | | | | | | | |
5.000%, 02/25/2018 | | $ | 21 | | | $ | 21 | |
WaMu Mortgage Pass-Through Certificates Trust, Ser 2003-S4, Cl 2A10 | | | | | | | | |
16.236%, 06/25/2033 (A) | | | 27 | | | | 34 | |
WaMu Mortgage Pass-Through Certificates Trust, Ser 2003-S9, Cl A8 | | | | | | | | |
5.250%, 10/25/2033 | | | 612 | | | | 624 | |
WaMu Mortgage Pass-Through Certificates Trust, Ser 2004-AR3, Cl A2 | | | | | | | | |
2.636%, 06/25/2034 (A) | | | 140 | | | | 141 | |
WaMu Mortgage Pass-Through Certificates Trust, Ser 2004-S2, Cl 2A4 | | | | | | | | |
5.500%, 06/25/2034 | | | 15 | | | | 15 | |
WaMu Mortgage Pass-Through Certificates Trust,
Ser 2005-AR19, Cl A1A2 | | | | | | | | |
0.729%, 12/25/2045 (A) | | | 3,107 | | | | 2,697 | |
WaMu Mortgage Pass-Through Certificates Trust, Ser 2006-AR1, Cl 1A1B | | | | | | | | |
1.447%, 01/25/2046 (A) | | | 2,242 | | | | 889 | |
WaMu Mortgage Pass-Through Certificates Trust,
Ser 2006-AR13, Cl 2A | | | | | | | | |
2.170%, 10/25/2046 (A) | | | 741 | | | | 655 | |
WaMu Mortgage Pass-Through Certificates Trust,
Ser 2006-AR14, Cl 1A4 | | | | | | | | |
2.192%, 11/25/2036 (A) | | | 235 | | | | 203 | |
WaMu Mortgage Pass-Through Certificates Trust,
Ser 2006-AR17, Cl 2A | | | | | | | | |
2.164%, 12/25/2046 (A) | | | 332 | | | | 300 | |
WaMu Mortgage Pass-Through Certificates Trust,
Ser 2006-AR17, Cl 1A1B | | | | | | | | |
1.160%, 12/25/2046 (A) | | | 323 | | | | 155 | |
WaMu Mortgage Pass-Through Certificates Trust,
Ser 2007-HY1, Cl 1A1 | | | | | | | | |
2.411%, 02/25/2037 (A) | | | 2,549 | | | | 2,211 | |
Washington Mutual Mortgage Pass-Through Certificates Trust, Ser 2005-3, Cl CX, IO | | | | | | | | |
5.500%, 05/25/2035 | | | 383 | | | | 79 | |
Washington Mutual MSC Mortgage
Pass-Through Certificates Trust, Ser 2003-MS2, Cl 1A1 | | | | | | | | |
5.750%, 02/25/2033 | | | 46 | | | | 48 | |
Washington Mutual MSC Mortgage Pass-Through Certificates Trust, Ser 2003-MS8, Cl 1P, PO | | | | | | | | |
0.000%, 05/25/2033 (B) | | | 52 | | | | 45 | |
Washington Mutual MSC Mortgage Pass-Through Certificates Trust, Ser 2003-MS9, Cl 2P, PO | | | | | | | | |
0.000%, 04/25/2033 (B) | | | 102 | | | | 96 | |
| | | | | | | | |
| Description | | Face Amount
($ Thousands) | | | Market Value
($ Thousands) | |
Wells Fargo Mortgage-Backed Securities Trust, Ser 2004-B, Cl A1 | | | | | | | | |
2.720%, 02/25/2034 (A) | | $ | 145 | | | $ | 143 | |
Wells Fargo Mortgage-Backed Securities Trust, Ser 2004-E, Cl A2 | | | | | | | | |
2.990%, 05/25/2034 (A) | | | 32 | | | | 33 | |
Wells Fargo Mortgage-Backed Securities Trust, Ser 2004-EE, Cl 3A2 | | | | | | | | |
2.722%, 12/25/2034 (A) | | | 143 | | | | 147 | |
Wells Fargo Mortgage-Backed Securities Trust, Ser 2004-EE, Cl 2A1 | | | | | | | | |
2.763%, 12/25/2034 (A) | | | 248 | | | | 250 | |
Wells Fargo Mortgage-Backed Securities Trust, Ser 2004-I, Cl 1A1 | | | | | | | | |
2.830%, 07/25/2034 (A) | | | 338 | | | | 341 | |
Wells Fargo Mortgage-Backed Securities Trust, Ser 2004-O, Cl A1 | | | | | | | | |
2.743%, 08/25/2034 (A) | | | 69 | | | | 68 | |
Wells Fargo Mortgage-Backed Securities Trust, Ser 2005-AR14, Cl A1 | | | | | | | | |
2.751%, 08/25/2035 (A) | | | 165 | | | | 162 | |
Wells Fargo Mortgage-Backed Securities Trust, Ser 2005-AR8, Cl 2A1 | | | | | | | | |
2.850%, 06/25/2035 (A) | | | 347 | | | | 353 | |
Wells Fargo Mortgage-Backed Securities Trust, Ser 2005-AR9, Cl 2A1 | | | | | | | | |
2.744%, 10/25/2033 (A) | | | 109 | | | | 109 | |
Wells Fargo Mortgage-Backed Securities Trust, Ser 2006-AR18, Cl 1A1 | | | | | | | | |
5.811%, 11/25/2036 (A) | | | 277 | | | | 264 | |
Wells Fargo Mortgage-Backed Securities Trust, Ser 2006-AR8, Cl 1A3 | | | | | | | | |
2.841%, 04/25/2036 (A) | | | 306 | | | | 302 | |
Wells Fargo Mortgage-Backed Securities Trust, Ser 2006-AR8, Cl 3A1 | | | | | | | | |
2.853%, 04/25/2036 (A) | | | 5,416 | | | | 5,468 | |
Wells Fargo Re-REMIC Trust, Ser 2012-IO, Cl A | | | | | | | | |
1.750%, 08/20/2021 (C) | | | 48 | | | | 48 | |
WFRBS Commercial Mortgage Trust, Ser 2012- C10, Cl XA, IO | | | | | | | | |
1.881%, 12/15/2045 (A)(C) | | | 7,112 | | | | 549 | |
WFRBS Commercial Mortgage Trust, Ser 2012- C7, Cl XA, IO | | | | | | | | |
1.671%, 06/15/2045 (A)(C) | | | 2,964 | | | | 199 | |
WFRBS Commercial Mortgage Trust, Ser 2012- C7, Cl A2 | | | | | | | | |
3.431%, 06/15/2045 | | | 2,420 | | | | 2,569 | |
WFRBS Commercial Mortgage Trust, Ser 2012- C8, Cl A3 | | | | | | | | |
3.001%, 08/15/2045 | | | 3,740 | | | | 3,880 | |
WFRBS Commercial Mortgage Trust, Ser 2013- C12, Cl XA, IO | | | | | | | | |
1.400%, 03/15/2048 (A) (C) | | | 14,187 | | | | 880 | |
| | |
| 112 | | SEI Institutional Investments Trust / Annual Report / May 31, 2016 |
| | | | | | | | |
| Description | | Face Amount
($ Thousands) | | | Market Value
($ Thousands) | |
WFRBS Commercial Mortgage Trust, Ser 2013-C15, Cl A4 | | | | | | | | |
4.153%, 08/15/2046 (A) | | $ | 150 | | | $ | 166 | |
WFRBS Commercial Mortgage Trust, Ser 2013-C17, Cl A4 | | | | | | | | |
4.023%, 12/15/2046 | | | 120 | | | | 132 | |
WFRBS Commercial Mortgage Trust, Ser 2014-C19, Cl B | | | | | | | | |
4.723%, 03/15/2047 (A) | | | 210 | | | | 230 | |
WFRBS Commercial Mortgage Trust, Ser 2014-C19, Cl XA, IO | | | | | | | | |
1.431%, 03/15/2047 (A) | | | 5,209 | | | | 327 | |
WFRBS Commercial Mortgage Trust, Ser 2014-C21, Cl B | | | | | | | | |
4.213%, 08/15/2047 (A) | | | 2,180 | | | | 2,314 | |
WFRBS Commercial Mortgage Trust, Ser 2014-C21, Cl XA, IO | | | | | | | | |
1.172%, 08/15/2047 (A) | | | 15,877 | | | | 1,028 | |
WFRBS Commercial Mortgage Trust, Ser 2014-C21, Cl AS | | | | | | | | |
3.891%, 08/15/2047 | | | 1,320 | | | | 1,411 | |
WFRBS Commercial Mortgage Trust, Ser 2014-C23, Cl XA, IO | | | | | | | | |
0.702%, 10/15/2057 (A) | | | 27,504 | | | | 1,054 | |
WFRBS Commercial Mortgage Trust, Ser 2014-C24, Cl AS | | | | | | | | |
3.931%, 11/15/2047 | | | 1,330 | | | | 1,414 | |
WFRBS Commercial Mortgage Trust, Ser 2014-C24, Cl A5 | | | | | | | | |
3.607%, 11/15/2047 | | | 110 | | | | 117 | |
| | | | | | | | |
| | | | | | | 255,938 | |
| | | | | | | | |
| | |
Total Mortgage-Backed Securities
(Cost $1,545,605) ($ Thousands) | | | | | | | 1,564,849 | |
| | | | | | | | |
| | |
CORPORATE OBLIGATIONS — 29.7% | | | | | | | | |
| | |
Consumer Discretionary — 2.2% | | | | | | | | |
21st Century Fox America | | | | | | | | |
8.875%, 04/26/2023 | | | 150 | | | | 200 | |
6.650%, 11/15/2037 | | | 310 | | | | 396 | |
6.200%, 12/15/2034 | | | 265 | | | | 320 | |
Advance Auto Parts | | | | | | | | |
5.750%, 05/01/2020 | | | 175 | | | | 193 | |
Amazon.com | | | | | | | | |
4.950%, 12/05/2044 | | | 600 | | | | 701 | |
4.800%, 12/05/2034 | | | 187 | | | | 212 | |
AutoZone | | | | | | | | |
2.500%, 04/15/2021 | | | 44 | | | | 44 | |
BMW US Capital | | | | | | | | |
2.800%, 04/11/2026 (C) | | | 1,620 | | | | 1,616 | |
1.500%, 04/11/2019 (C) | | | 2,832 | | | | 2,828 | |
| | | | | | | | |
| Description | | Face Amount
($ Thousands) | | | Market Value
($ Thousands) | |
Charter Communications Operating | |
4.464%, 07/23/2022 (C) | | $ | 3,840 | | | $ | 4,047 | |
Charter Communications Operating LLC | | | | | | | | |
6.484%, 10/23/2045 (C) | | | 4,310 | | | | 4,949 | |
6.384%, 10/23/2035 (C) | | | 408 | | | | 467 | |
4.908%, 07/23/2025 (C) | | | 2,018 | | | | 2,159 | |
Comcast | | | | | | | | |
6.950%, 08/15/2037 | | | 1,040 | | | | 1,460 | |
6.550%, 07/01/2039 | | | 30 | | | | 41 | |
6.400%, 03/01/2040 | | | 280 | | | | 379 | |
4.400%, 08/15/2035 | | | 4,015 | | | | 4,371 | |
4.250%, 01/15/2033 | | | 420 | | | | 449 | |
4.200%, 08/15/2034 | | | 720 | | | | 765 | |
3.375%, 02/15/2025 | | | 800 | | | | 840 | |
Comcast Cable Communications Holdings | | | | | | | | |
9.455%, 11/15/2022 | | | 660 | | | | 923 | |
Cox Communications | | | | | | | | |
4.700%, 12/15/2042 (C) | | | 10 | | | | 9 | |
CVS Health | | | | | | | | |
2.750%, 12/01/2022 | | | 230 | | | | 232 | |
CVS Pass-Through Trust | | | | | | | | |
5.880%, 01/10/2028 | | | 135 | | | | 148 | |
5.789%, 01/10/2026 (C) | | | 1,213 | | | | 1,314 | |
Daimler Finance North America LLC | | | | | | | | |
2.375%, 08/01/2018 (C) | | | 2,620 | | | | 2,659 | |
1.125%, 03/10/2017 (C) | | | 2,585 | | | | 2,583 | |
Discovery Communications LLC | | | | | | | | |
4.900%, 03/11/2026 | | | 1,170 | | | | 1,235 | |
4.875%, 04/01/2043 | | | 460 | | | | 408 | |
Ford Motor | | | | | | | | |
4.750%, 01/15/2043 | | | 2,480 | | | | 2,535 | |
Ford Motor Credit | | | | | | | | |
5.000%, 05/15/2018 | | | 206 | | | | 218 | |
Ford Motor Credit LLC | | | | | | | | |
8.125%, 01/15/2020 | | | 520 | | | | 618 | |
5.875%, 08/02/2021 | | | 3,110 | | | | 3,538 | |
3.336%, 03/18/2021 | | | 2,000 | | | | 2,049 | |
3.219%, 01/09/2022 | | | 1,565 | | | | 1,589 | |
3.200%, 01/15/2021 | | | 1,550 | | | | 1,583 | |
3.157%, 08/04/2020 | | | 200 | | | | 205 | |
2.597%, 11/04/2019 | | | 2,520 | | | | 2,559 | |
General Motors | | | | | | | | |
6.750%, 04/01/2046 | | | 370 | | | | 434 | |
6.600%, 04/01/2036 | | | 1,510 | | | | 1,731 | |
6.250%, 10/02/2043 | | | 940 | | | | 1,034 | |
5.000%, 04/01/2035 | | | 885 | | | | 865 | |
General Motors Financial | | | | | | | | |
5.250%, 03/01/2026 | | | 1,925 | | | | 2,067 | |
4.750%, 08/15/2017 | | | 2,250 | | | | 2,324 | |
4.200%, 03/01/2021 | | | 1,970 | | | | 2,059 | |
3.700%, 05/09/2023 | | | 2,455 | | | | 2,430 | |
3.450%, 04/10/2022 | | | 1,605 | | | | 1,592 | |
| | | | |
| SEI Institutional Investments Trust / Annual Report / May 31, 2016 | | | 113 | |
SCHEDULE OF INVESTMENTS
Core Fixed Income Fund (Continued)
May 31, 2016
| | | | | | | | |
| Description | | Face Amount
($ Thousands) | | | Market Value
($ Thousands) | |
3.200%, 07/13/2020 | | $ | 159 | | | $ | 161 | |
0.035%, 05/09/2019 | | | 2,860 | | | | 2,858 | |
Grupo Televisa | | | | | | | | |
6.125%, 01/31/2046 | | | 850 | | | | 894 | |
Hyundai Capital America | | | | | | | | |
2.875%, 08/09/2018 (C) | | | 95 | | | | 97 | |
2.125%, 10/02/2017 (C) | | | 650 | | | | 653 | |
Lowe’s MTN | | | | | | | | |
7.110%, 05/15/2037 | | | 250 | | | | 343 | |
5.125%, 11/15/2041 | | | 48 | | | | 56 | |
McDonald’s MTN | | | | | | | | |
4.875%, 12/09/2045 | | | 1,565 | | | | 1,739 | |
3.700%, 01/30/2026 | | | 1,818 | | | | 1,934 | |
2.750%, 12/09/2020 | | | 870 | | | | 894 | |
NBCUniversal Media LLC | | | | | | | | |
4.375%, 04/01/2021 | | | 820 | | | | 910 | |
Newell Brands | | | | | | | | |
5.500%, 04/01/2046 | | | 1,754 | | | | 2,004 | |
4.200%, 04/01/2026 | | | 950 | | | | 1,007 | |
3.850%, 04/01/2023 | | | 700 | | | | 729 | |
3.150%, 04/01/2021 | | | 4,170 | | | | 4,277 | |
QVC | | | | | | | | |
5.950%, 03/15/2043 | | | 50 | | | | 45 | |
Scripps Networks Interactive | | | | | | | | |
3.900%, 11/15/2024 | | | 1,130 | | | | 1,155 | |
3.500%, 06/15/2022 | | | 770 | | | | 789 | |
2.800%, 06/15/2020 | | | 890 | | | | 897 | |
Time Warner | | | | | | | | |
7.700%, 05/01/2032 | | | 2,530 | | | | 3,379 | |
7.625%, 04/15/2031 | | | 2,985 | | | | 3,976 | |
6.250%, 03/29/2041 | | | 355 | | | | 432 | |
5.375%, 10/15/2041 | | | 37 | | | | 40 | |
4.850%, 07/15/2045 | | | 333 | | | | 349 | |
4.750%, 03/29/2021 | | | 780 | | | | 864 | |
4.700%, 01/15/2021 | | | 670 | | | | 737 | |
2.950%, 07/15/2026 | | | 1,450 | | | | 1,424 | |
Time Warner Cable | | | | | | | | |
8.250%, 04/01/2019 | | | 2,890 | | | | 3,344 | |
7.300%, 07/01/2038 | | | 100 | | | | 120 | |
6.550%, 05/01/2037 | | | 2,131 | | | | 2,403 | |
5.500%, 09/01/2041 | | | 19 | | | | 19 | |
Time Warner Entertainment | | | | | | | | |
8.375%, 07/15/2033 | | | 1,380 | | | | 1,797 | |
Viacom | | | | | | | | |
5.250%, 04/01/2044 | | | 300 | | | | 270 | |
4.850%, 12/15/2034 | | | 841 | | | | 748 | |
4.250%, 09/01/2023 | | | 200 | | | | 205 | |
3.875%, 04/01/2024 | | | 230 | | | | 229 | |
Volkswagen Group of America Finance LLC | | | | | | | | |
2.400%, 05/22/2020 (C) | | | 844 | | | | 837 | |
Volkswagen International Finance | | | | | | | | |
1.125%, 11/18/2016 (C) | | | 2,835 | | | | 2,835 | |
| | | | | | | | |
| Description | | Face Amount
($ Thousands) | | | Market Value
($ Thousands) | |
Walgreens Boots Alliance | | | | | | | | |
4.800%, 11/18/2044 | | $ | 1,430 | | | $ | 1,474 | |
Wal-Mart Stores | | | | | | | | |
4.300%, 04/22/2044 | | | 3,240 | | | | 3,571 | |
3.300%, 04/22/2024 | | | 175 | | | | 188 | |
| | | | | | | | |
| | | | | | | 116,061 | |
| | | | | | | | |
| | |
Consumer Staples — 2.5% | | | | | | | | |
Altria Group | | | | | | | | |
9.950%, 11/10/2038 | | | 290 | | | | 514 | |
9.250%, 08/06/2019 | | | 2,120 | | | | 2,609 | |
5.375%, 01/31/2044 | | | 880 | | | | 1,071 | |
4.750%, 05/05/2021 | | | 1,260 | | | | 1,417 | |
2.850%, 08/09/2022 | | | 1,690 | | | | 1,740 | |
Anheuser-Busch InBev Finance | | | | | | | | |
4.900%, 02/01/2046 | | | 7,272 | | | | 8,118 | |
3.650%, 02/01/2026 | | | 15,385 | | | | 16,000 | |
3.300%, 02/01/2023 | | | 5,080 | | | | 5,224 | |
2.650%, 02/01/2021 | | | 2,738 | | | | 2,786 | |
Anheuser-Busch InBev Worldwide | | | | | | | | |
7.750%, 01/15/2019 | | | 105 | | | | 121 | |
5.375%, 01/15/2020 | | | 2,360 | | | | 2,643 | |
2.500%, 07/15/2022 | | | 2,086 | | | | 2,077 | |
Bayer US Finance LLC | | | | | | | | |
3.375%, 10/08/2024 (C) | | | 200 | | | | 205 | |
Coca-Cola | | | | | | | | |
3.300%, 09/01/2021 | | | 52 | | | | 56 | |
Coca-Cola Femsa | | | | | | | | |
2.375%, 11/26/2018 | | | 2,020 | | | | 2,043 | |
CVS Health | | | | | | | | |
5.125%, 07/20/2045 | | | 1,656 | | | | 1,926 | |
3.875%, 07/20/2025 | | | 549 | | | | 590 | |
3.500%, 07/20/2022 | | | 325 | | | | 343 | |
2.875%, 06/01/2026 | | | 880 | | | | 876 | |
CVS Pass-Through Trust | | | | | | | | |
6.036%, 12/10/2028 | | | 2,022 | | | | 2,252 | |
5.926%, 01/10/2034 (C) | | | 178 | | | | 199 | |
Diageo Capital | | | | | | | | |
1.125%, 04/29/2018 | | | 150 | | | | 150 | |
Diageo Investment | | | | | | | | |
2.875%, 05/11/2022 | | | 3,730 | | | | 3,874 | |
EMD Finance LLC | | | | | | | | |
2.400%, 03/19/2020 (C) | | | 3,365 | | | | 3,384 | |
ERAC USA Finance LLC | | | | | | | | |
4.500%, 02/15/2045 (C) | | | 400 | | | | 406 | |
3.300%, 12/01/2026 (C) | | | 1,865 | | | | 1,864 | |
2.600%, 12/01/2021 (C) | | | 1,855 | | | | 1,856 | |
Imperial Brands Finance | | | | | | | | |
2.050%, 02/11/2018 (C) | | | 790 | | | | 794 | |
Kraft Heinz Foods | | | | | | | | |
6.500%, 02/09/2040 | | | 700 | | | | 896 | |
6.125%, 08/23/2018 | | | 100 | | | | 110 | |
| | |
| 114 | | SEI Institutional Investments Trust / Annual Report / May 31, 2016 |
| | | | | | | | |
| Description | | Face Amount
($ Thousands) | | | Market Value
($ Thousands) | |
5.375%, 02/10/2020 | | $ | 847 | | | $ | 943 | |
5.200%, 07/15/2045 (C) | | | 140 | | | | 157 | |
5.000%, 07/15/2035 (C) | | | 560 | | | | 617 | |
5.000%, 06/04/2042 | | | 100 | | | | 109 | |
4.375%, 06/01/2046 (C) | | | 2,830 | | | | 2,863 | |
3.950%, 07/15/2025 (C) | | | 170 | | | | 181 | |
3.500%, 06/06/2022 | | | 3,495 | | | | 3,645 | |
3.500%, 07/15/2022 (C) | | | 1,595 | | | | 1,664 | |
3.000%, 06/01/2026 (C) | | | 2,975 | | | | 2,942 | �� |
2.800%, 07/02/2020 (C) | | | 2,575 | | | | 2,643 | |
1.600%, 06/30/2017 (C) | | | 2,190 | | | | 2,198 | |
Kroger | | | | | | | | |
7.500%, 04/01/2031 | | | 280 | | | | 383 | |
6.900%, 04/15/2038 | | | 570 | | | | 755 | |
5.400%, 07/15/2040 | | | 45 | | | | 52 | |
2.950%, 11/01/2021 | | | 1,215 | | | | 1,258 | |
Molson Coors Brewing | | | | | | | | |
3.500%, 05/01/2022 | | | 220 | | | | 228 | |
Mondelez International | | | | | | | | |
4.000%, 02/01/2024 | | | 4,090 | | | | 4,441 | |
Novartis Capital | | | | | | | | |
4.000%, 11/20/2045 | | | 3,000 | | | | 3,234 | |
PepsiCo | | | | | | | | |
7.900%, 11/01/2018 | | | 449 | | | | 519 | |
3.600%, 03/01/2024 | | | 150 | | | | 163 | |
Pernod Ricard | | | | | | | | |
5.500%, 01/15/2042 (C) | | | 1,400 | | | | 1,580 | |
4.450%, 01/15/2022 (C) | | | 1,890 | | | | 2,050 | |
Philip Morris International | | | | | | | | |
5.650%, 05/16/2018 | | | 265 | | | | 288 | |
4.250%, 11/10/2044 | | | 2,090 | | | | 2,185 | |
2.900%, 11/15/2021 | | | 1,750 | | | | 1,817 | |
2.500%, 08/22/2022 | | | 1,530 | | | | 1,546 | |
2.125%, 05/10/2023 | | | 1,390 | | | | 1,366 | |
Reynolds American | | | | | | | | |
8.125%, 06/23/2019 | | | 570 | | | | 673 | |
6.150%, 09/15/2043 | | | 640 | | | | 790 | |
5.850%, 08/15/2045 | | | 3,395 | | | | 4,151 | |
5.700%, 08/15/2035 | | | 1,215 | | | | 1,430 | |
3.250%, 06/12/2020 | | | 386 | | | | 402 | |
Tyson Foods | | | | | | | | |
5.150%, 08/15/2044 | | | 1,750 | | | | 1,985 | |
4.875%, 08/15/2034 | | | 24 | | | | 26 | |
3.950%, 08/15/2024 | | | 680 | | | | 727 | |
UBM | | | | | | | | |
5.750%, 11/03/2020 (C) | | | 850 | | | | 907 | |
Walgreen | | | | | | | | |
5.250%, 01/15/2019 | | | 50 | | | | 54 | |
Walgreens Boots Alliance | | | | | | | | |
3.450%, 06/01/2026 | | | 1,425 | | | | 1,425 | |
3.300%, 11/18/2021 | | | 2,003 | | | | 2,071 | |
2.600%, 06/01/2021 | | | 2,140 | | | | 2,148 | |
| | | | | | | | |
| Description | | Face Amount
($ Thousands) | | | Market Value
($ Thousands) | |
Wm Wrigley Jr | | | | | | | | |
3.375%, 10/21/2020 (C) | | $ | 1,905 | | | $ | 1,999 | |
2.900%, 10/21/2019 (C) | | | 2,843 | | | | 2,929 | |
2.400%, 10/21/2018 (C) | | | 1,085 | | | | 1,102 | |
2.000%, 10/20/2017 (C) | | | 550 | | | | 555 | |
| | | | | | | | |
| | | | | | | 129,345 | |
| | | | | | | | |
| | |
Energy — 3.3% | | | | | | | | |
Anadarko Petroleum | | | | | | | | |
6.600%, 03/15/2046 | | | 1,670 | | | | 1,861 | |
6.375%, 09/15/2017 | | | 307 | | | | 323 | |
5.550%, 03/15/2026 | | | 1,625 | | | | 1,733 | |
4.500%, 07/15/2044 | | | 1,000 | | | | 852 | |
Apache | | | | | | | | |
6.900%, 09/15/2018 | | | 180 | | | | 196 | |
5.100%, 09/01/2040 | | | 520 | | | | 519 | |
4.250%, 01/15/2044 | | | 1,800 | | | | 1,627 | |
3.250%, 04/15/2022 | | | 56 | | | | 56 | |
Baker Hughes | | | | | | | | |
7.500%, 11/15/2018 | | | 2,020 | | | | 2,292 | |
BG Energy Capital | | | | | | | | |
4.000%, 10/15/2021 (C) | | | 2,775 | | | | 2,954 | |
BP Capital Markets | | | | | | | | |
3.561%, 11/01/2021 | | | 110 | | | | 116 | |
3.506%, 03/17/2025 | | | 490 | | | | 507 | |
3.245%, 05/06/2022 | | | 950 | | | | 979 | |
3.119%, 05/04/2026 | | | 400 | | | | 399 | |
3.062%, 03/17/2022 | | | 1,859 | | | | 1,901 | |
2.248%, 11/01/2016 | | | 159 | | | | 160 | |
1.674%, 02/13/2018 | | | 434 | | | | 435 | |
Canadian Natural Resources | | | | | | | | |
6.450%, 06/30/2033 | | | 200 | | | | 196 | |
6.250%, 03/15/2038 | | | 655 | | | | 637 | |
3.900%, 02/01/2025 | | | 646 | | | | 597 | |
Canadian Oil Sands | | | | | | | | |
6.000%, 04/01/2042 (C) | | | 573 | | | | 547 | |
Chevron | | | | | | | | |
3.191%, 06/24/2023 | | | 95 | | | | 99 | |
2.954%, 05/16/2026 | | | 4,775 | | | | 4,798 | |
2.355%, 12/05/2022 | | | 290 | | | | 288 | |
2.100%, 05/16/2021 | | | 3,920 | | | | 3,920 | |
1.961%, 03/03/2020 | | | 81 | | | | 81 | |
1.561%, 05/16/2019 | | | 2,900 | | | | 2,900 | |
CNOOC Finance 2013 | | | | | | | | |
3.000%, 05/09/2023 | | | 253 | | | | 245 | |
CNOOC Finance 2015 USA LLC | | | | | | | | |
3.500%, 05/05/2025 | | | 2,900 | | | | 2,858 | |
Conoco Funding | | | | | | | | |
6.950%, 04/15/2029 | | | 995 | | | | 1,195 | |
ConocoPhillips | | | | | | | | |
5.750%, 02/01/2019 | | | 175 | | | | 191 | |
4.150%, 11/15/2034 | | | 2,118 | | | | 2,044 | |
| | | | |
| SEI Institutional Investments Trust / Annual Report / May 31, 2016 | | | 115 | |
SCHEDULE OF INVESTMENTS
Core Fixed Income Fund (Continued)
May 31, 2016
| | | | | | | | |
| Description | | Face Amount
($ Thousands) | | | Market Value
($ Thousands) | |
3.350%, 05/15/2025 | | $ | 100 | | | $ | 100 | |
Continental Resources | | | | | | | | |
5.000%, 09/15/2022 | | | 60 | | | | 57 | |
Devon Energy | | | | | | | | |
6.300%, 01/15/2019 | | | 100 | | | | 106 | |
5.850%, 12/15/2025 | | | 880 | | | | 917 | |
5.600%, 07/15/2041 | | | 510 | | | | 447 | |
5.000%, 06/15/2045 | | | 1,070 | | | | 906 | |
4.750%, 05/15/2042 | | | 127 | | | | 104 | |
3.250%, 05/15/2022 | | | 670 | | | | 608 | |
Devon Financing | | | | | | | | |
7.875%, 09/30/2031 | | | 520 | | | | 557 | |
Ecopetrol | | | | | | | | |
5.875%, 05/28/2045 | | | 1,770 | | | | 1,427 | |
5.375%, 06/26/2026 | | | 760 | | | | 708 | |
4.125%, 01/16/2025 | | | 167 | | | | 146 | |
Enbridge Energy Partners | | | | | | | | |
5.875%, 10/15/2025 | | | 1,500 | | | | 1,597 | |
Energy Transfer Partners | | | | | | | | |
8.250%, 11/15/2029 | | | 4,295 | | | | 4,972 | |
6.125%, 12/15/2045 | | | 1,000 | | | | 944 | |
5.200%, 02/01/2022 | | | 4 | | | | 4 | |
5.150%, 03/15/2045 | | | 67 | | | | 57 | |
4.900%, 02/01/2024 | | | 250 | | | | 239 | |
4.750%, 01/15/2026 | | | 755 | | | | 721 | |
4.150%, 10/01/2020 | | | 620 | | | | 612 | |
3.654%, 11/01/2066 (A) | | | 485 | | | | 288 | |
2.500%, 06/15/2018 | | | 1,190 | | | | 1,174 | |
Enterprise Products Operating LLC | | | | | | | | |
6.300%, 09/15/2017 | | | 75 | | | | 79 | |
5.950%, 02/01/2041 | | | 270 | | | | 300 | |
5.100%, 02/15/2045 | | | 445 | | | | 453 | |
4.050%, 02/15/2022 | | | 14 | | | | 15 | |
1.650%, 05/07/2018 | | | 58 | | | | 58 | |
EOG Resources | | | | | | | | |
4.150%, 01/15/2026 | | | 1,781 | | | | 1,897 | |
Exxon Mobil | | | | | | | | |
4.114%, 03/01/2046 | | | 3,130 | | | | 3,322 | |
3.567%, 03/06/2045 | | | 1,500 | | | | 1,461 | |
3.043%, 03/01/2026 | | | 1,610 | | | | 1,660 | |
2.222%, 03/01/2021 | | | 2,275 | | | | 2,306 | |
1.708%, 03/01/2019 | | | 1,090 | | | | 1,098 | |
Florida Gas Transmission LLC | | | | | | | | |
7.900%, 05/15/2019 (C) | | | 1,850 | | | | 2,078 | |
3.875%, 07/15/2022 (C) | | | 2,170 | | | | 2,155 | |
Gulfstream Natural Gas System LLC | | | | | | | | |
5.950%, 10/15/2045 (C) | | | 800 | | | | 813 | |
Halliburton | | | | | | | | |
5.000%, 11/15/2045 | | | 780 | | | | 799 | |
3.800%, 11/15/2025 | | | 1,070 | | | | 1,083 | |
Hess | | | | | | | | |
8.125%, 02/15/2019 | | | 1,020 | | | | 1,133 | |
| | | | | | | | |
| Description | | Face Amount
($ Thousands) | | | Market Value
($ Thousands) | |
Kerr-McGee | | | | | | | | |
6.950%, 07/01/2024 | | $ | 1,665 | | | $ | 1,846 | |
Kinder Morgan | | | | | | | | |
6.950%, 06/01/2028 | | | 2,250 | | | | 2,336 | |
5.550%, 06/01/2045 | | | 1,025 | | | | 944 | |
5.300%, 12/01/2034 | | | 680 | | | | 616 | |
4.300%, 06/01/2025 | | | 5,330 | | | | 5,221 | |
3.050%, 12/01/2019 | | | 93 | | | | 93 | |
Kinder Morgan Energy Partners | | | | | | | | |
6.500%, 04/01/2020 | | | 3,327 | | | | 3,614 | |
5.000%, 03/01/2043 | | | 50 | | | | 43 | |
Magellan Midstream Partners | | | | | | | | |
5.000%, 03/01/2026 | | | 560 | | | | 616 | |
Marathon Petroleum | | | | | | | | |
5.850%, 12/15/2045 | | | 605 | | | | 567 | |
5.000%, 09/15/2054 | | | 170 | | | | 135 | |
Noble Energy | | | | | | | | |
5.250%, 11/15/2043 | | | 150 | | | | 143 | |
5.050%, 11/15/2044 | | | 186 | | | | 177 | |
4.150%, 12/15/2021 | | | 2,080 | | | | 2,127 | |
3.900%, 11/15/2024 | | | 1,200 | | | | 1,185 | |
Occidental Petroleum | | | | | | | | |
4.625%, 06/15/2045 | | | 400 | | | | 428 | |
3.400%, 04/15/2026 | | | 100 | | | | 102 | |
3.125%, 02/15/2022 | | | 810 | | | | 840 | |
2.700%, 02/15/2023 | | | 150 | | | | 149 | |
Panhandle Eastern Pipeline | | | | | | | | |
8.125%, 06/01/2019 | | | 1,161 | | | | 1,252 | |
Petrobras Global Finance | | | | | | | | |
6.850%, 06/05/2115 | | | 1,290 | | | | 884 | |
6.250%, 03/17/2024 | | | 1,930 | | | | 1,622 | |
Petrobras International Finance | | | | | | | | |
5.750%, 01/20/2020 | | | 1,127 | | | | 1,057 | |
5.375%, 01/27/2021 | | | 6,010 | | | | 5,319 | |
Petroleos Mexicanos | | | | | | | | |
6.875%, 08/04/2026 (C) | | | 970 | | | | 1,054 | |
6.625%, 06/15/2035 | | | 5,602 | | | | 5,489 | |
5.625%, 01/23/2046 | | | 1,145 | | | | 972 | |
4.875%, 01/18/2024 | | | 81 | | | | 80 | |
3.500%, 01/30/2023 | | | 785 | | | | 714 | |
2.460%, 12/15/2025 | | | 3,131 | | | | 3,199 | |
2.378%, 04/15/2025 | | | 1,566 | | | | 1,595 | |
Plains All American Pipeline | | | | | | | | |
3.650%, 06/01/2022 | | | 100 | | | | 94 | |
Pride International | | | | | | | | |
6.875%, 08/15/2020 | | | 150 | | | | 133 | |
Sabine Pass LNG | | | | | | | | |
7.500%, 11/30/2016 (C) | | | 940 | | | | 961 | |
Schlumberger Holdings | | | | | | | | |
4.000%, 12/21/2025 (C) | | | 1,773 | | | | 1,849 | |
3.000%, 12/21/2020 (C) | | | 4,860 | | | | 4,985 | |
| | |
| 116 | | SEI Institutional Investments Trust / Annual Report / May 31, 2016 |
| | | | | | | | |
| Description | | Face Amount
($ Thousands) | | | Market Value
($ Thousands) | |
Schlumberger Investment | | | | | | | | |
3.650%, 12/01/2023 | | $ | 100 | | | $ | 106 | |
3.300%, 09/14/2021 (C) | | | 317 | | | | 330 | |
Shell International Finance | | | | | | | | |
6.375%, 12/15/2038 | | | 840 | | | | 1,074 | |
4.375%, 03/25/2020 | | | 70 | | | | 76 | |
4.375%, 05/11/2045 | | | 990 | | | | 1,023 | |
4.300%, 09/22/2019 | | | 500 | | | | 540 | |
4.125%, 05/11/2035 | | | 7,830 | | | | 7,994 | |
4.000%, 05/10/2046 | | | 1,265 | | | | 1,231 | |
3.400%, 08/12/2023 | | | 2,145 | | | | 2,234 | |
2.875%, 05/10/2026 | | | 1,936 | | | | 1,915 | |
1.875%, 05/10/2021 | | | 3,225 | | | | 3,182 | |
Sinopec Group Overseas Development 2012 | | | | | | | | |
2.750%, 05/17/2017 (C) | | | 900 | | | | 909 | |
Sinopec Group Overseas Development 2014 | | | | | | | | |
4.375%, 04/10/2024 (C) | | | 2,700 | | | | 2,856 | |
Spectra Energy Partners | | | | | | | | |
4.500%, 03/15/2045 | | | 1,700 | | | | 1,604 | |
Statoil | | | | | | | | |
5.250%, 04/15/2019 | | | 200 | | | | 219 | |
3.700%, 03/01/2024 | | | 1,085 | | | | 1,148 | |
Suncor Energy | | | | | | | | |
3.600%, 12/01/2024 | | | 3,621 | | | | 3,671 | |
TC PipeLines | | | | | | | | |
4.650%, 06/15/2021 | | | 412 | | | | 400 | |
Tennessee Gas Pipeline | | | | | | | | |
8.375%, 06/15/2032 | | | 2,000 | | | | 2,209 | |
Texas Eastern Transmission | | | | | | | | |
2.800%, 10/15/2022 (C) | | | 375 | | | | 354 | |
Total Capital International | | | | | | | | |
2.875%, 02/17/2022 | | | 2,515 | | | | 2,573 | |
TransCanada PipeLines | | | | | | | | |
4.625%, 03/01/2034 | | | 2,405 | | | | 2,471 | |
Transcontinental Gas Pipe Line LLC | | | | | | | | |
7.850%, 02/01/2026 (C) | | | 1,380 | | | | 1,655 | |
Transocean | | | | | | | | |
5.800%, 12/15/2016 | | | 360 | | | | 362 | |
3.750%, 10/15/2017 | | | 1,720 | | | | 1,673 | |
Valero Energy | | | | | | | | |
4.900%, 03/15/2045 | | | 775 | | | | 675 | |
Western Gas Partners | | | | | | | | |
5.450%, 04/01/2044 | | | 275 | | | | 239 | |
5.375%, 06/01/2021 | | | 429 | | | | 432 | |
Williams | | | | | | | | |
8.750%, 03/15/2032 | | | 1,284 | | | | 1,326 | |
7.875%, 09/01/2021 | | | 1,334 | | | | 1,407 | |
7.750%, 06/15/2031 | | | 339 | | | | 334 | |
7.500%, 01/15/2031 | | | 9 | | | | 9 | |
Williams Partners | | | | | | | | |
5.100%, 09/15/2045 | | | 195 | | | | 158 | |
4.000%, 09/15/2025 | | | 555 | | | | 479 | |
| | | | | | | | |
| Description | | Face Amount
($ Thousands) | | | Market Value
($ Thousands) | |
3.600%, 03/15/2022 | | $ | 124 | | | $ | 109 | |
XTO Energy | | | | | | | | |
5.500%, 06/15/2018 | | | 500 | | | | 542 | |
| | | | | | | | |
| | | | | | | 174,867 | |
| | | | | | | | |
| | |
Financials — 11.7% | | | | | | | | |
Aegon | | | | | | | | |
1.740%, 07/29/2049 (A) | | | 2,180 | | | | 1,299 | |
AIA Group MTN | | | | | | | | |
4.500%, 03/16/2046 (C) | | | 945 | | | | 969 | |
AIG Global Funding MTN | | | | | | | | |
1.650%, 12/15/2017 (C) | | | 97 | | | | 97 | |
Allstate | | | | | | | | |
3.150%, 06/15/2023 | | | 1,375 | | | | 1,430 | |
American Express Credit MTN | | | | | | | | |
2.375%, 03/24/2017 | | | 120 | | | | 121 | |
2.250%, 08/15/2019 | | | 3,165 | | | | 3,210 | |
1.800%, 07/31/2018 | | | 195 | | | | 196 | |
American International Group | | | | | | | | |
6.250%, 03/15/2037 | | | 2,578 | | | | 2,649 | |
4.800%, 07/10/2045 | | | 200 | | | | 200 | |
4.375%, 01/15/2055 | | | 190 | | | | 169 | |
3.900%, 04/01/2026 | | | 4,955 | | | | 5,025 | |
American Tower | | | | | | | | |
3.450%, 09/15/2021 | | | 1,750 | | | | 1,803 | |
3.300%, 02/15/2021 | | | 840 | | | | 861 | |
2.800%, 06/01/2020 | | | 775 | | | | 783 | |
Anadarko Finance | | | | | | | | |
7.500%, 05/01/2031 | | | 240 | | | | 272 | |
Australia & New Zealand Banking Group | | | | | | | | |
1.054%, 10/29/2049 (A) | | | 1,400 | | | | 751 | |
AvalonBay Communities MTN | | | | | | | | |
3.950%, 01/15/2021 | | | 1,500 | | | | 1,613 | |
Bank of America | | | | | | | | |
6.875%, 11/15/2018 | | | 125 | | | | 139 | |
6.500%, 08/01/2016 | | | 4,875 | | | | 4,918 | |
6.400%, 08/28/2017 | | | 350 | | | | 370 | |
6.100%, 06/15/2017 | | | 6,825 | | | | 7,157 | |
6.000%, 09/01/2017 | | | 1,760 | | | | 1,852 | |
5.750%, 12/01/2017 | | | 235 | | | | 249 | |
5.700%, 05/02/2017 | | | 1,870 | | | | 1,940 | |
5.650%, 05/01/2018 | | | 1,040 | | | | 1,112 | |
5.625%, 10/14/2016 | | | 200 | | | | 203 | |
5.625%, 07/01/2020 | | | 180 | | | | 201 | |
5.420%, 03/15/2017 | | | 4,230 | | | | 4,361 | |
5.300%, 03/15/2017 | | | 1,995 | | | | 2,056 | |
5.000%, 05/13/2021 | | | 75 | | | | 83 | |
5.000%, 01/21/2044 | | | 3,620 | | | | 4,041 | |
4.875%, 04/01/2044 | | | 790 | | | | 875 | |
4.450%, 03/03/2026 | | | 5,087 | | | | 5,246 | |
4.200%, 08/26/2024 | | | 3,720 | | | | 3,806 | |
4.100%, 07/24/2023 | | | 305 | | | | 324 | |
| | | | |
| SEI Institutional Investments Trust / Annual Report / May 31, 2016 | | | 117 | |
SCHEDULE OF INVESTMENTS
Core Fixed Income Fund (Continued)
May 31, 2016
| | | | | | | | |
| Description | | Face Amount
($ Thousands) | | | Market Value
($ Thousands) | |
4.000%, 04/01/2024 | | $ | 6,110 | | | $ | 6,434 | |
4.000%, 01/22/2025 | | | 1,825 | | | | 1,830 | |
3.875%, 08/01/2025 | | | 1,180 | | | | 1,232 | |
3.500%, 04/19/2026 | | | 4,815 | | | | 4,886 | |
3.300%, 01/11/2023 | | | 1,313 | | | | 1,337 | |
2.625%, 04/19/2021 | | | 6,395 | | | | 6,424 | |
2.000%, 01/11/2018 | | | 70 | | | | 70 | |
0.934%, 06/15/2017 (A) | | | 2,710 | | | | 2,700 | |
0.914%, 06/15/2016 (A) | | | 1,995 | | | | 1,995 | |
Bank of Montreal MTN | | | | | | | | |
2.550%, 11/06/2022 | | | 200 | | | | 201 | |
2.375%, 01/25/2019 | | | 50 | | | | 51 | |
1.400%, 09/11/2017 | | | 50 | | | | 50 | |
1.148%, 07/15/2016 (A) | | | 500 | | | | 501 | |
Bank of New York Mellon | | | | | | | | |
3.650%, 02/04/2024 | | | 150 | | | | 161 | |
3.550%, 09/23/2021 | | | 144 | | | | 154 | |
3.400%, 05/15/2024 | | | 5,665 | | | | 5,974 | |
3.250%, 09/11/2024 | | | 270 | | | | 282 | |
1.969%, 06/20/2017 (D) | | | 20 | | | | 20 | |
Bank of Nova Scotia | | | | | | | | |
1.875%, 04/26/2021 | | | 1,900 | | | | 1,886 | |
1.450%, 04/25/2018 | | | 300 | | | | 300 | |
Bank of Tokyo-Mitsubishi UFJ | | | | | | | | |
2.350%, 02/23/2017 (C) | | | 295 | | | | 297 | |
Barclays Bank MTN | | | | | | | | |
6.050%, 12/04/2017 (C) | | | 850 | | | | 899 | |
5.000%, 09/22/2016 | | | 512 | | | | 519 | |
3.650%, 03/16/2025 | | | 283 | | | | 274 | |
2.250%, 05/10/2017 (C) | | | 221 | | | | 223 | |
1.125%, 08/07/2049 (A) | | | 380 | | | | 207 | |
BB&T MTN | | | | | | | | |
2.050%, 05/10/2021 | | | 4,195 | | | | 4,182 | |
Bear Stearns | | | | | | | | |
7.250%, 02/01/2018 | | | 3,670 | | | | 4,000 | |
6.400%, 10/02/2017 | | | 3,370 | | | | 3,584 | |
4.650%, 07/02/2018 | | | 3,000 | | | | 3,168 | |
Berkshire Hathaway | | | | | | | | |
4.500%, 02/11/2043 | | | 2,200 | | | | 2,448 | |
3.750%, 08/15/2021 | | | 488 | | | | 534 | |
3.125%, 03/15/2026 | | | 4,980 | | | | 5,152 | |
1.550%, 02/09/2018 | | | 85 | | | | 86 | |
BNP Paribas MTN | | | | | | | | |
4.375%, 09/28/2025 (C) | | | 200 | | | | 203 | |
4.375%, 05/12/2026 (C) | | | 1,705 | | | | 1,720 | |
2.375%, 09/14/2017 | | | 1,490 | | | | 1,506 | |
Boston Properties | | | | | | | | |
3.800%, 02/01/2024 | | | 2,000 | | | | 2,110 | |
BPCE | | | | | | | | |
5.150%, 07/21/2024 (C) | | | 1,550 | | | | 1,599 | |
1.625%, 01/26/2018 | | | 300 | | | | 300 | |
| | | | | | | | |
| Description | | Face Amount
($ Thousands) | | | Market Value
($ Thousands) | |
Branch Banking & Trust | | | | | | | | |
5.625%, 09/15/2016 | | $ | 325 | | | $ | 329 | |
3.800%, 10/30/2026 | | | 250 | | | | 267 | |
Capital One Bank USA | | | | | | | | |
3.375%, 02/15/2023 | | | 300 | | | | 301 | |
1.150%, 11/21/2016 | | | 2,150 | | | | 2,151 | |
Capital One Financial | | | | | | | | |
4.200%, 10/29/2025 | | | 1,520 | | | | 1,554 | |
Chase Capital VI | | | | | | | | |
1.262%, 08/01/2028 (A) | | | 1,050 | | | | 854 | |
Chubb INA Holdings | | | | | | | | |
4.350%, 11/03/2045 | | | 1,185 | | | | 1,297 | |
3.350%, 05/03/2026 | | | 1,956 | | | | 2,050 | |
2.300%, 11/03/2020 | | | 310 | | | | 316 | |
Citigroup | | | | | | | | |
8.125%, 07/15/2039 | | | 1,307 | | | | 1,979 | |
5.850%, 08/02/2016 | | | 300 | | | | 302 | |
5.500%, 09/13/2025 | | | 1,370 | | | | 1,510 | |
5.300%, 05/06/2044 | | | 220 | | | | 231 | |
4.650%, 07/30/2045 | | | 3,340 | | | | 3,557 | |
4.600%, 03/09/2026 | | | 4,795 | | | | 4,977 | |
4.500%, 01/14/2022 | | | 50 | | | | 54 | |
4.450%, 09/29/2027 | | | 4,975 | | | | 5,048 | |
4.400%, 06/10/2025 | | | 2,040 | | | | 2,091 | |
4.300%, 11/20/2026 | | | 590 | | | | 598 | |
3.875%, 10/25/2023 | | | 151 | | | | 159 | |
3.700%, 01/12/2026 | | | 4,060 | | | | 4,197 | |
3.500%, 05/15/2023 | | | 930 | | | | 938 | |
2.500%, 09/26/2018 | | | 395 | | | | 401 | |
2.150%, 07/30/2018 | | | 164 | | | | 165 | |
1.550%, 08/14/2017 | | | 2,505 | | | | 2,507 | |
1.212%, 08/25/2036 (A) | | | 3,239 | | | | 2,151 | |
Citigroup Capital III | | | | | | | | |
7.625%, 12/01/2036 | | | 2,000 | | | | 2,468 | |
CME Group | | | | | | | | |
3.000%, 09/15/2022 | | | 400 | | | | 416 | |
Commonwealth Bank of Australia | | | | | | | | |
5.000%, 10/15/2019 (C) | | | 900 | | | | 986 | |
2.850%, 05/18/2026 (C) | | | 1,695 | | | | 1,674 | |
Compass Bank | | | | | | | | |
3.875%, 04/10/2025 | | | 910 | | | | 858 | |
Cooperatieve Rabobank UA | | | | | | | | |
11.000%, 12/31/2049 (A) (C) | | | 2,043 | | | | 2,500 | |
5.750%, 12/01/2043 | | | 710 | | | | 838 | |
5.250%, 08/04/2045 | | | 630 | | | | 691 | |
4.625%, 12/01/2023 | | | 2,060 | | | | 2,183 | |
4.375%, 08/04/2025 | | | 1,330 | | | | 1,385 | |
3.875%, 02/08/2022 | | | 300 | | | | 324 | |
Credit Agricole | | | | | | | | |
8.375%, 12/31/2049 (A) (C) | | | 2,270 | | | | 2,559 | |
Credit Suisse Group Funding Guernsey | | | | | | | | |
4.875%, 05/15/2045 | | | 1,340 | | | | 1,341 | |
| | |
| 118 | | SEI Institutional Investments Trust / Annual Report / May 31, 2016 |
| | | | | | | | |
| Description | | Face Amount
($ Thousands) | | | Market Value
($ Thousands) | |
4.550%, 04/17/2026 (C) | | $ | 2,370 | | | $ | 2,439 | |
3.800%, 09/15/2022 | | | 2,770 | | | | 2,794 | |
3.450%, 04/16/2021 (C) | | | 2,598 | | | | 2,619 | |
Credit Suisse NY MTN | | | | | | | | |
6.000%, 02/15/2018 | | | 990 | | | | 1,047 | |
5.400%, 01/14/2020 | | | 130 | | | | 141 | |
3.625%, 09/09/2024 | | | 1,610 | | | | 1,676 | |
DDR | | | | | | | | |
4.625%, 07/15/2022 | | | 1,820 | | | | 1,938 | |
3.375%, 05/15/2023 | | | 1,525 | | | | 1,494 | |
Deutsche Bank | | | | | | | | |
1.350%, 05/30/2017 | | | 2,440 | | | | 2,431 | |
Discover Bank | | | | | | | | |
4.200%, 08/08/2023 | | | 1,000 | | | | 1,048 | |
3.100%, 06/04/2020 | | | 1,000 | | | | 1,018 | |
2.000%, 02/21/2018 | | | 2,000 | | | | 1,996 | |
DNB Bank MTN | | | | | | | | |
2.375%, 06/02/2021 (C) | | | 3,455 | | | | 3,465 | |
ERP Operating | | | | | | | | |
5.750%, 06/15/2017 | | | 100 | | | | 104 | |
4.625%, 12/15/2021 | | | 200 | | | | 224 | |
Farmers Exchange Capital | | | | | | | | |
7.200%, 07/15/2048 (C) | | | 1,788 | | | | 2,086 | |
Farmers Exchange Capital II | | | | | | | | |
6.151%, 11/01/2053 (A) (C) | | | 5,120 | | | | 5,293 | |
Fifth Third Bank | | | | | | | | |
2.875%, 10/01/2021 | | | 200 | | | | 205 | |
First Industrial MTN | | | | | | | | |
7.500%, 12/01/2017 | | | 1,765 | | | | 1,901 | |
General Electric MTN | | | | | | | | |
6.875%, 01/10/2039 | | | 786 | | | | 1,150 | |
6.150%, 08/07/2037 | | | 537 | | | | 730 | |
5.875%, 01/14/2038 | | | 574 | | | | 753 | |
5.550%, 05/04/2020 | | | 269 | | | | 308 | |
5.500%, 01/08/2020 | | | 288 | | | | 325 | |
5.300%, 02/11/2021 | | | 230 | | | | 264 | |
4.650%, 10/17/2021 | | | 543 | | | | 615 | |
4.625%, 01/07/2021 | | | 328 | | | | 368 | |
4.375%, 09/16/2020 | | | 60 | | | | 66 | |
2.100%, 12/11/2019 | | | 356 | | | | 364 | |
1.106%, 08/15/2036 (A) | | | 3,035 | | | | 2,540 | |
1.013%, 05/05/2026 (A) | | | 1,600 | | | | 1,489 | |
Goldman Sachs Capital II | | | | | | | | |
4.000%, 06/01/2043 (A) | | | 7,061 | | | | 5,225 | |
Goldman Sachs Group | | | | | | | | |
7.500%, 02/15/2019 | | | 1,520 | | | | 1,732 | |
6.750%, 10/01/2037 | | | 5,487 | | | | 6,672 | |
6.250%, 02/01/2041 | | | 2,290 | | | | 2,916 | |
6.150%, 04/01/2018 | | | 7,500 | | | | 8,086 | |
6.000%, 06/15/2020 | | | 2,795 | | | | 3,172 | |
5.750%, 10/01/2016 | | | 1,505 | | | | 1,528 | |
5.250%, 07/27/2021 | | | 9,460 | | | | 10,588 | |
| | | | | | | | |
| Description | | Face Amount
($ Thousands) | | | Market Value
($ Thousands) | |
5.150%, 05/22/2045 | | $ | 880 | | | $ | 906 | |
4.750%, 10/21/2045 | | | 2,172 | | | | 2,327 | |
4.250%, 10/21/2025 | | | 2,445 | | | | 2,492 | |
3.750%, 02/25/2026 | | | 1,445 | | | | 1,483 | |
3.625%, 01/22/2023 | | | 508 | | | | 527 | |
2.625%, 01/31/2019 | | | 100 | | | | 102 | |
2.625%, 04/25/2021 | | | 2,955 | | | | 2,963 | |
Guardian Life Global Funding MTN | | | | | | | | |
2.000%, 04/26/2021 (C) | | | 4,000 | | | | 3,974 | |
HBOS MTN | | | | | | | | |
6.750%, 05/21/2018 (C) | | | 5,100 | | | | 5,486 | |
HCP | | | | | | | | |
3.875%, 08/15/2024 | | | 4,611 | | | | 4,566 | |
2.625%, 02/01/2020 | | | 100 | | | | 100 | |
Health Care | | | | | | | | |
4.500%, 01/15/2024 | | | 183 | | | | 194 | |
Healthcare Realty Trust | | | | | | | | |
5.750%, 01/15/2021 | | | 60 | | | | 67 | |
3.750%, 04/15/2023 | | | 75 | | | | 74 | |
Highwoods Properties | | | | | | | | |
7.500%, 04/15/2018 | | | 1,339 | | | | 1,463 | |
Hongkong & Shanghai Banking | | | | | | | | |
0.875%, 07/22/2049 (A) | | | 195 | | | | 111 | |
HSBC Bank | | | | | | | | |
4.750%, 01/19/2021 (C) | | | 250 | | | | 275 | |
4.125%, 08/12/2020 (C) | | | 261 | | | | 279 | |
1.500%, 05/15/2018 (C) | | | 100 | | | | 100 | |
0.600%, 06/29/2049 (A) | | | 1,160 | | | | 657 | |
HSBC Finance | | | | | | | | |
6.676%, 01/15/2021 | | | 1,010 | | | | 1,145 | |
HSBC Holdings | | | | | | | | |
5.250%, 03/14/2044 | | | 4,200 | | | | 4,417 | |
5.100%, 04/05/2021 | | | 170 | | | | 187 | |
4.300%, 03/08/2026 | | | 5,615 | | | | 5,880 | |
4.250%, 03/14/2024 | | | 1,715 | | | | 1,737 | |
4.250%, 08/18/2025 | | | 1,520 | | | | 1,522 | |
4.000%, 03/30/2022 | | | 390 | | | | 410 | |
3.900%, 05/25/2026 | | | 3,200 | | | | 3,242 | |
3.400%, 03/08/2021 | | | 3,023 | | | | 3,095 | |
ING Bank | | | | | | | | |
5.800%, 09/25/2023 (C) | | | 1,800 | | | | 1,987 | |
3.750%, 03/07/2017 (C) | | | 457 | | | | 466 | |
International Lease Finance | | | | | | | | |
6.750%, 09/01/2016 (C) | | | 5,590 | | | | 5,646 | |
Intesa Sanpaolo MTN | | | | | | | | |
5.017%, 06/26/2024 (C) | | | 3,370 | | | | 3,195 | |
Jackson National Life Global Funding | | | | | | | | |
3.050%, 04/29/2026 (C) | | | 3,800 | | | | 3,769 | |
2.600%, 12/09/2020 (C) | | | 2,180 | | | | 2,222 | |
John Deere Capital | | | | | | | | |
2.250%, 04/17/2019 | | | 150 | | | | 153 | |
1.700%, 01/15/2020 | | | 340 | | | | 339 | |
| | | | |
| SEI Institutional Investments Trust / Annual Report / May 31, 2016 | | | 119 | |
SCHEDULE OF INVESTMENTS
Core Fixed Income Fund (Continued)
May 31, 2016
| | | | | | | | |
| Description | | Face Amount
($ Thousands) | | | Market Value
($ Thousands) | |
JPMorgan Chase | | | | | | | | |
6.400%, 05/15/2038 | | $ | 385 | | | $ | 515 | |
6.000%, 07/05/2017 | | | 3,365 | | | | 3,530 | |
6.000%, 10/01/2017 | | | 9,155 | | | | 9,690 | |
4.950%, 06/01/2045 | | | 1,510 | | | | 1,618 | |
4.500%, 01/24/2022 | | | 1,287 | | | | 1,414 | |
4.350%, 08/15/2021 | | | 510 | | | | 555 | |
4.125%, 12/15/2026 | | | 3,220 | | | | 3,336 | |
3.875%, 09/10/2024 | | | 1,800 | | | | 1,844 | |
3.625%, 05/13/2024 | | | 1,490 | | | | 1,562 | |
3.375%, 05/01/2023 | | | 1,240 | | | | 1,248 | |
3.300%, 04/01/2026 | | | 2,316 | | | | 2,349 | |
3.250%, 09/23/2022 | | | 80 | | | | 82 | |
3.200%, 06/15/2026 | | | 2,215 | | | | 2,214 | |
2.700%, 05/18/2023 | | | 2,625 | | | | 2,601 | |
2.550%, 03/01/2021 | | | 2,298 | | | | 2,317 | |
2.400%, 06/07/2021 | | | 2,215 | | | | 2,211 | |
2.250%, 01/23/2020 | | | 3,345 | | | | 3,359 | |
0.962%, 06/13/2016 (A) | | | 4,250 | | | | 4,251 | |
JPMorgan Chase Capital XXIII | | | | | | | | |
1.626%, 05/15/2047 (A) | | | 4,697 | | | | 3,479 | |
KKR Group Finance II | | | | | | | | |
5.500%, 02/01/2043 (C) | | | 120 | | | | 123 | |
Lazard Group LLC | | | | | | | | |
4.250%, 11/14/2020 | | | 1,210 | | | | 1,272 | |
3.750%, 02/13/2025 | | | 2,080 | | | | 2,022 | |
Liberty Mutual Group | | | | | | | | |
4.850%, 08/01/2044 (C) | | | 1,370 | | | | 1,341 | |
Lloyds Bank MTN | | | | | | | | |
5.800%, 01/13/2020 (C) | | | 200 | | | | 224 | |
3.500%, 05/14/2025 | | | 100 | | | | 105 | |
M&T Bank | | | | | | | | |
6.875%, 12/29/2049 | | | 3,540 | | | | 3,544 | |
Macquarie Bank MTN | | | | | | | | |
5.000%, 02/22/2017 (C) | | | 150 | | | | 154 | |
1.266%, 10/27/2017 (A) (C) | | | 2,605 | | | | 2,600 | |
Macquarie Group | | | | | | | | |
6.250%, 01/14/2021 (C) | | | 200 | | | | 227 | |
Marsh & McLennan | | | | | | | | |
3.750%, 03/14/2026 | | | 1,265 | | | | 1,303 | |
Massachusetts Mutual Life Insurance | | | | | | | | |
8.875%, 06/01/2039 (C) | | | 1,650 | | | | 2,418 | |
MassMutual Global Funding II | | | | | | | | |
2.500%, 10/17/2022 (C) | | | 261 | | | | 259 | |
MetLife | | | | | | | | |
7.717%, 02/15/2019 | | | 1,750 | | | | 2,017 | |
6.750%, 06/01/2016 | | | 251 | | | | 251 | |
6.400%, 12/15/2036 | | | 4,360 | | | | 4,682 | |
4.600%, 05/13/2046 | | | 580 | | | | 609 | |
4.368%, 09/15/2023 | | | 510 | | | | 558 | |
Metropolitan Life Global Funding I | | | | | | | | |
3.875%, 04/11/2022 (C) | | | 1,125 | | | | 1,202 | |
| | | | | | | | |
| Description | | Face Amount
($ Thousands) | | | Market Value
($ Thousands) | |
2.500%, 12/03/2020 (C) | | $ | 1,175 | | | $ | 1,193 | |
Mid-America Apartments | | | | | | | | |
4.300%, 10/15/2023 | | | 625 | | | | 661 | |
4.000%, 11/15/2025 | | | 695 | | | | 721 | |
3.750%, 06/15/2024 | | | 1,350 | | | | 1,384 | |
Morgan Stanley MTN | | | | | | | | |
7.300%, 05/13/2019 | | | 1,875 | | | | 2,146 | |
6.625%, 04/01/2018 | | | 4,710 | | | | 5,117 | |
5.950%, 12/28/2017 | | | 550 | | | | 586 | |
5.750%, 10/18/2016 | | | 190 | | | | 193 | |
5.750%, 01/25/2021 | | | 545 | | | | 618 | |
5.625%, 09/23/2019 | | | 1,145 | | | | 1,268 | |
5.550%, 04/27/2017 | | | 514 | | | | 534 | |
5.500%, 07/24/2020 | | | 2,080 | | | | 2,324 | |
5.500%, 07/28/2021 | | | 200 | | | | 226 | |
5.450%, 01/09/2017 | | | 1,600 | | | | 1,641 | |
4.350%, 09/08/2026 | | | 235 | | | | 242 | |
4.100%, 05/22/2023 | | | 110 | | | | 114 | |
4.000%, 07/23/2025 | | | 6,301 | | | | 6,623 | |
3.950%, 04/23/2027 | | | 1,540 | | | | 1,534 | |
3.875%, 04/29/2024 | | | 1,250 | | | | 1,314 | |
3.750%, 02/25/2023 | | | 179 | | | | 187 | |
2.500%, 04/21/2021 | | | 5,899 | | | | 5,879 | |
1.875%, 01/05/2018 | | | 172 | | | | 173 | |
1.083%, 10/18/2016 (A) | | | 2,500 | | | | 2,502 | |
Murray Street Investment Trust I | | | | | | | | |
4.647%, 03/09/2017 (D) | | | 2,705 | | | | 2,775 | |
National Bank of Canada | | | | | | | | |
2.200%, 10/19/2016 (C) | | | 4,350 | | | | 4,370 | |
National City Bank | | | | | | | | |
5.800%, 06/07/2017 | | | 525 | | | | 547 | |
1.006%, 06/07/2017 (A) | | | 3,000 | | | | 2,994 | |
Nationwide Financial Services | | | | | | | | |
5.375%, 03/25/2021 (C) | | | 150 | | | | 165 | |
Nationwide Mutual Insurance | | | | | | | | |
2.924%, 12/15/2024 (A) (C) | | | 4,407 | | | | 4,363 | |
Navient MTN | | | | | | | | |
8.450%, 06/15/2018 | | | 530 | | | | 571 | |
New York Life Global Funding | | | | | | | | |
2.150%, 06/18/2019 (C) | | | 293 | | | | 298 | |
2.100%, 01/02/2019 (C) | | | 1,625 | | | | 1,651 | |
1.550%, 11/02/2018 (C) | | | 2,500 | | | | 2,510 | |
New York Life Insurance | | | | | | | | |
6.750%, 11/15/2039 (C) | | | 1,355 | | | | 1,802 | |
Nordea Bank MTN | | | | | | | | |
4.875%, 05/13/2021 (C) | | | 1,730 | | | | 1,885 | |
2.250%, 05/27/2021 (C) | | | 4,150 | | | | 4,148 | |
Northern Trust | | | | | | | | |
2.375%, 08/02/2022 | | | 300 | | | | 302 | |
Northwestern Mutual Life Insurance | | | | | | | | |
6.063%, 03/30/2040 (C) | | | 2,470 | | | | 3,053 | |
| | |
| 120 | | SEI Institutional Investments Trust / Annual Report / May 31, 2016 |
| | | | | | | | |
| Description | | Face Amount
($ Thousands) | | | Market Value
($ Thousands) | |
Pacific Life Global Funding MTN | | | | | | | | |
5.000%, 05/15/2017 (C) | | $ | 170 | | | $ | 175 | |
Piedmont Operating Partnership | | | | | | | | |
4.450%, 03/15/2024 | | | 125 | | | | 128 | |
PNC Bank MTN | | | | | | | | |
6.875%, 04/01/2018 | | | 250 | | | | 273 | |
2.400%, 10/18/2019 | | | 2,140 | | | | 2,180 | |
2.250%, 07/02/2019 | | | 1,600 | | | | 1,625 | |
Post Apartment Homes | | | | | | | | |
4.750%, 10/15/2017 | | | 70 | | | | 72 | |
Pricoa Global Funding I MTN | | | | | | | | |
2.550%, 11/24/2020 (C) | | | 2,875 | | | | 2,922 | |
1.600%, 05/29/2018 (C) | | | 150 | | | | 151 | |
Private Export Funding | | | | | | | | |
4.375%, 03/15/2019 | | | 4,660 | | | | 5,052 | |
2.125%, 07/15/2016 | | | 4,760 | | | | 4,769 | |
Protective Life Global Funding | | | | | | | | |
2.700%, 11/25/2020 (C) | | | 1,500 | | | | 1,512 | |
1.722%, 04/15/2019 (C) | | | 2,800 | | | | 2,795 | |
Prudential Insurance of America | | | | | | | | |
8.300%, 07/01/2025 (C) | | | 250 | | | | 331 | |
Realty Income | | | | | | | | |
3.250%, 10/15/2022 | | | 150 | | | | 150 | |
2.000%, 01/31/2018 | | | 115 | | | | 116 | |
Reliance Standard Life Global Funding II MTN | | | | | | | | |
2.150%, 10/15/2018 (C) | | | 2,885 | | | | 2,894 | |
Royal Bank of Canada | | | | | | | | |
2.300%, 03/22/2021 | | | 2,230 | | | | 2,257 | |
1.875%, 02/05/2020 | | | 3,200 | | | | 3,212 | |
1.200%, 09/19/2017 | | | 300 | | | | 299 | |
0.875%, 06/29/2085 (A) | | | 860 | | | | 564 | |
Royal Bank of Scotland | | | | | | | | |
4.650%, 06/04/2018 | | | 2,280 | | | | 2,351 | |
Royal Bank of Scotland Group MTN | | | | | | | | |
6.400%, 10/21/2019 | | | 2,950 | | | | 3,298 | |
6.100%, 06/10/2023 | | | 1,650 | | | | 1,728 | |
4.800%, 04/05/2026 | | | 1,230 | | | | 1,264 | |
Santander Holdings USA | | | | | | | | |
3.450%, 08/27/2018 | | | 55 | | | | 56 | |
Santander UK Group Holdings MTN | | | | | | | | |
5.625%, 09/15/2045 (C) | | | 210 | | | | 206 | |
4.750%, 09/15/2025 (C) | | | 1,580 | | | | 1,557 | |
SL Green Realty | | | | | | | | |
7.750%, 03/15/2020 | | | 2,000 | | | | 2,317 | |
Societe Generale | | | | | | | | |
1.052%, 11/29/2049 (A) | | | 860 | | | | 487 | |
Stadshypotek | | | | | | | | |
1.875%, 10/02/2019 (C) | | | 1,910 | | | | 1,915 | |
Standard Chartered | | | | | | | | |
5.700%, 03/26/2044 (C) | | | 4,237 | | | | 4,144 | |
5.200%, 01/26/2024 (C) | | | 410 | | | | 434 | |
| | | | | | | | |
| Description | | Face Amount
($ Thousands) | | | Market Value
($ Thousands) | |
State Street | | | | | | | | |
4.956%, 03/15/2018 | | $ | 2,390 | | | $ | 2,503 | |
3.300%, 12/16/2024 | | | 310 | | | | 326 | |
Svenska Handelsbanken | | | | | | | | |
3.125%, 07/12/2016 | | | 282 | | | | 283 | |
Synchrony Financial | | | | | | | | |
4.500%, 07/23/2025 | | | 1,705 | | | | 1,786 | |
Tanger Properties | | | | | | | | |
3.875%, 12/01/2023 | | | 790 | | | | 809 | |
3.750%, 12/01/2024 | | | 755 | | | | 763 | |
Teachers Insurance & Annuity Association of America | | | | | | | | |
6.850%, 12/16/2039 (C) | | | 1,740 | | | | 2,261 | |
4.900%, 09/15/2044 (C) | | | 850 | | | | 923 | |
Toronto-Dominion Bank | | | | | | | | |
2.250%, 03/15/2021 (C) | | | 4,350 | | | | 4,393 | |
Travelers | | | | | | | | |
4.600%, 08/01/2043 | | | 50 | | | | 57 | |
Trinity Acquisition | | | | | | | | |
4.400%, 03/15/2026 | | | 465 | | | | 476 | |
3.500%, 09/15/2021 | | | 870 | | | | 886 | |
UBS Group Funding Jersey | | | | | | | | |
4.125%, 09/24/2025 (C) | | | 1,010 | | | | 1,037 | |
4.125%, 04/15/2026 (C) | | | 2,070 | | | | 2,123 | |
3.000%, 04/15/2021 (C) | | | 3,050 | | | | 3,056 | |
US Bancorp MTN | | | | | | | | |
3.600%, 09/11/2024 | | | 160 | | | | 169 | |
2.950%, 07/15/2022 | | | 497 | | | | 510 | |
US Bank | | | | | | | | |
2.125%, 10/28/2019 | | | 1,320 | | | | 1,339 | |
Ventas Realty | | | | | | | | |
4.125%, 01/15/2026 | | | 45 | | | | 47 | |
2.700%, 04/01/2020 | | | 2,950 | | | | 2,967 | |
Visa | | | | | | | | |
4.300%, 12/14/2045 | | | 810 | | | | 895 | |
Voya Financial | | | | | | | | |
2.900%, 02/15/2018 | | | 350 | | | | 355 | |
Wachovia Capital Trust III | | | | | | | | |
5.570%, 12/31/2049 (A) | | | 4,442 | | | | 4,411 | |
WEA Finance LLC | | | | | | | | |
4.750%, 09/17/2044 (C) | | | 750 | | | | 770 | |
3.750%, 09/17/2024 (C) | | | 1,370 | | | | 1,396 | |
3.250%, 10/05/2020 (C) | | | 1,990 | | | | 2,035 | |
1.750%, 09/15/2017 (C) | | | 2,100 | | | | 2,099 | |
Wells Fargo MTN | | | | | | | | |
6.000%, 11/15/2017 | | | 3,370 | | | | 3,589 | |
5.875%, 12/31/2049 (A) | | | 805 | | | | 861 | |
5.625%, 12/11/2017 | | | 830 | | | | 882 | |
5.606%, 01/15/2044 | | | 1,700 | | | | 1,996 | |
5.375%, 11/02/2043 | | | 220 | | | | 250 | |
4.900%, 11/17/2045 | | | 1,310 | | | | 1,412 | |
4.650%, 11/04/2044 | | | 410 | | | | 425 | |
| | | | |
| SEI Institutional Investments Trust / Annual Report / May 31, 2016 | | | 121 | |
SCHEDULE OF INVESTMENTS
Core Fixed Income Fund (Continued)
May 31, 2016
| | | | | | | | |
| Description | | Face Amount
($ Thousands) | | | Market Value
($ Thousands) | |
| | | | | | | | |
4.600%, 04/01/2021 | | $ | 500 | | | $ | 552 | |
4.480%, 01/16/2024 | | | 1,392 | | | | 1,506 | |
4.300%, 07/22/2027 | | | 2,880 | | | | 3,053 | |
4.100%, 06/03/2026 | | | 359 | | | | 379 | |
3.676%, 06/15/2016 (D) | | | 256 | | | | 256 | |
3.500%, 03/08/2022 | | | 250 | | | | 265 | |
3.450%, 02/13/2023 | | | 1,785 | | | | 1,827 | |
3.000%, 01/22/2021 | | | 3,020 | | | | 3,117 | |
3.000%, 04/22/2026 | | | 2,075 | | | | 2,077 | |
1.650%, 01/22/2018 | | | 3,635 | | | | 3,656 | |
Wells Fargo Capital X | | | | | | | | |
5.950%, 12/15/2036 | | | 520 | | | | 539 | |
Welltower | | | | | | | | |
5.250%, 01/15/2022 | | | 1,825 | | | | 2,011 | |
4.950%, 01/15/2021 | | | 6,340 | | | | 6,906 | |
4.700%, 09/15/2017 | | | 225 | | | | 233 | |
Westpac Banking | | | | | | | | |
2.850%, 05/13/2026 | | | 970 | | | | 965 | |
2.100%, 05/13/2021 | | | 2,580 | | | | 2,568 | |
ZFS Finance USA Trust II | | | | | | | | |
6.450%, 12/15/2065 (A) (C) | | | 6,290 | | | | 6,299 | |
| | | | | | | | |
| | | | | | | 615,688 | |
| | | | | | | | |
| | |
Health Care — 2.2% | | | | | | | | |
AbbVie | | | | | | | | |
4.700%, 05/14/2045 | | | 34 | | | | 35 | |
4.500%, 05/14/2035 | | | 1,800 | | | | 1,830 | |
4.450%, 05/14/2046 | | | 1,090 | | | | 1,082 | |
4.400%, 11/06/2042 | | | 1,700 | | | | 1,683 | |
3.600%, 05/14/2025 | | | 2,435 | | | | 2,507 | |
3.200%, 05/14/2026 | | | 2,610 | | | | 2,591 | |
2.900%, 11/06/2022 | | | 350 | | | | 352 | |
2.500%, 05/14/2020 | | | 2,489 | | | | 2,513 | |
1.750%, 11/06/2017 | | | 120 | | | | 120 | |
Actavis | | | | | | | | |
3.250%, 10/01/2022 | | | 112 | | | | 113 | |
Actavis Funding SCS | | | | | | | | |
4.750%, 03/15/2045 | | | 4,976 | | | | 4,916 | |
4.550%, 03/15/2035 | | | 20 | | | | 20 | |
3.800%, 03/15/2025 | | | 8,211 | | | | 8,327 | |
3.450%, 03/15/2022 | | | 5,460 | | | | 5,547 | |
2.350%, 03/12/2018 | | | 1,070 | | | | 1,079 | |
Aetna | | | | | | | | |
2.200%, 03/15/2019 | | | 945 | | | | 955 | |
AmerisourceBergen | | | | | | | | |
3.500%, 11/15/2021 | | | 125 | | | | 132 | |
3.250%, 03/01/2025 | | | 28 | | | | 29 | |
Amgen | | | | | | | | |
5.650%, 06/15/2042 | | | 3,205 | | | | 3,771 | |
5.375%, 05/15/2043 | | | 90 | | | | 102 | |
5.150%, 11/15/2041 | | | 985 | | | | 1,080 | |
4.400%, 05/01/2045 | | | 1,740 | | | | 1,738 | |
| | | | | | | | |
| Description | | Face Amount
($ Thousands) | | | Market Value
($ Thousands) | |
| | | | | | | | |
3.875%, 11/15/2021 | | $ | 200 | | | $ | 215 | |
3.625%, 05/22/2024 | | | 220 | | | | 231 | |
2.125%, 05/01/2020 | | | 84 | | | | 84 | |
Anthem | | | | | | | | |
5.875%, 06/15/2017 | | | 350 | | | | 366 | |
5.100%, 01/15/2044 | | | 325 | | | | 356 | |
4.625%, 05/15/2042 | | | 219 | | | | 226 | |
3.700%, 08/15/2021 | | | 290 | | | | 306 | |
3.300%, 01/15/2023 | | | 133 | | | | 135 | |
3.125%, 05/15/2022 | | | 740 | | | | 747 | |
AstraZeneca | | | | | | | | |
5.900%, 09/15/2017 | | | 100 | | | | 106 | |
3.375%, 11/16/2025 | | | 1,000 | | | | 1,029 | |
Baxalta | | | | | | | | |
5.250%, 06/23/2045 (C) | | | 1,640 | | | | 1,677 | |
4.000%, 06/23/2025 (C) | | | 735 | | | | 735 | |
3.600%, 06/23/2022 (C) | | | 2,920 | | | | 2,946 | |
Becton Dickinson | | | | | | | | |
4.875%, 05/15/2044 | | | 95 | | | | 105 | |
4.685%, 12/15/2044 | | | 668 | | | | 732 | |
3.734%, 12/15/2024 | | | 989 | | | | 1,049 | |
2.675%, 12/15/2019 | | | 1,551 | | | | 1,584 | |
Biogen | | | | | | | | |
5.200%, 09/15/2045 | | | 900 | | | | 990 | |
3.625%, 09/15/2022 | | | 815 | | | | 850 | |
Catholic Health Initiatives | | | | | | | | |
4.350%, 11/01/2042 | | | 190 | | | | 188 | |
Celgene | | | | | | | | |
5.000%, 08/15/2045 | | | 4,967 | | | | 5,279 | |
3.875%, 08/15/2025 | | | 1,030 | | | | 1,078 | |
3.625%, 05/15/2024 | | | 166 | | | | 170 | |
3.550%, 08/15/2022 | | | 1,035 | | | | 1,076 | |
2.875%, 08/15/2020 | | | 929 | | | | 952 | |
1.900%, 08/15/2017 | | | 175 | | | | 176 | |
Forest Laboratories | | | | | | | | |
5.000%, 12/15/2021 (C) | | | 173 | | | | 190 | |
Gilead Sciences | | | | | | | | |
4.750%, 03/01/2046 | | | 1,540 | | | | 1,648 | |
4.500%, 02/01/2045 | | | 95 | | | | 97 | |
3.700%, 04/01/2024 | | | 2,660 | | | | 2,825 | |
3.650%, 03/01/2026 | | | 890 | | | | 942 | |
3.250%, 09/01/2022 | | | 1,344 | | | | 1,405 | |
GlaxoSmithKline Capital | | | | | | | | |
5.650%, 05/15/2018 | | | 1,590 | | | | 1,726 | |
2.850%, 05/08/2022 | | | 410 | | | | 425 | |
Humana | | | | | | | | |
7.200%, 06/15/2018 | | | 1,950 | | | | 2,154 | |
3.850%, 10/01/2024 | | | 2,530 | | | | 2,631 | |
Johnson & Johnson | | | | | | | | |
4.500%, 12/05/2043 | | | 1,500 | | | | 1,792 | |
3.700%, 03/01/2046 | | | 970 | | | | 1,027 | |
3.550%, 03/01/2036 | | | 1,500 | | | | 1,566 | |
| | |
| 122 | | SEI Institutional Investments Trust / Annual Report / May 31, 2016 |
| | | | | | | | |
| Description | | Face Amount
($ Thousands) | | | Market Value
($ Thousands) | |
| | | | | | | | |
Medtronic | | | | | | | | |
4.625%, 03/15/2045 | | $ | 860 | | | $ | 965 | |
4.375%, 03/15/2035 | | | 176 | | | | 191 | |
3.625%, 03/15/2024 | | | 1,140 | | | | 1,222 | |
3.500%, 03/15/2025 | | | 700 | | | | 747 | |
3.150%, 03/15/2022 | | | 150 | | | | 158 | |
Merck | | | | | | | | |
2.750%, 02/10/2025 | | | 850 | | | | 867 | |
2.350%, 02/10/2022 | | | 2,245 | | | | 2,279 | |
Mylan | | | | | | | | |
5.250%, 06/15/2046 (C) | | | 1,035 | | | | 1,035 | |
3.950%, 06/15/2026 | | | 1,715 | | | | 1,702 | |
3.150%, 06/15/2021 (C) | | | 2,100 | | | | 2,098 | |
2.550%, 03/28/2019 | | | 1,555 | | | | 1,550 | |
1.800%, 06/24/2016 | | | 77 | | | | 76 | |
Novartis Securities Investment | | | | | | | | |
5.125%, 02/10/2019 | | | 94 | | | | 103 | |
Perrigo Finance Unlimited | | | | | | | | |
4.375%, 03/15/2026 | | | 1,274 | | | | 1,296 | |
3.900%, 12/15/2024 | | | 1,655 | | | | 1,628 | |
3.500%, 12/15/2021 | | | 555 | | | | 561 | |
Pfizer | | | | | | | | |
6.200%, 03/15/2019 | | | 65 | | | | 73 | |
4.400%, 05/15/2044 | | | 1,590 | | | | 1,767 | |
2.750%, 06/03/2026 | | | 1,905 | | | | 1,914 | |
Teva Pharmaceutical Finance | | | | | | | | |
3.650%, 11/10/2021 | | | 184 | | | | 191 | |
Thermo Fisher Scientific | | | | | | | | |
3.600%, 08/15/2021 | | | 710 | | | | 746 | |
3.300%, 02/15/2022 | | | 905 | | | | 928 | |
UnitedHealth Group | | | | | | | | |
6.625%, 11/15/2037 | | | 200 | | | | 275 | |
5.800%, 03/15/2036 | | | 560 | | | | 708 | |
4.625%, 07/15/2035 | | | 2,235 | | | | 2,507 | |
3.875%, 10/15/2020 | | | 870 | | | | 938 | |
3.375%, 11/15/2021 | | | 400 | | | | 423 | |
3.100%, 03/15/2026 | | | 2,225 | | | | 2,279 | |
2.875%, 12/15/2021 | | | 1,895 | | | | 1,963 | |
2.875%, 03/15/2023 | | | 150 | | | | 153 | |
2.125%, 03/15/2021 | | | 1,610 | | | | 1,616 | |
Wyeth | | | | | | | | |
5.950%, 04/01/2037 | | | 320 | | | | 414 | |
Wyeth LLC | | | | | | | | |
6.450%, 02/01/2024 | | | 365 | | | | 459 | |
Zimmer Biomet Holdings | | | | | | | | |
2.700%, 04/01/2020 | | | 70 | | | | 71 | |
| | | | | | | | |
| | | | | | | 116,241 | |
| | | | | | | | |
| | |
Industrials — 1.7% | | | | | | | | |
ABB Finance USA | | | | | | | | |
4.375%, 05/08/2042 | | | 180 | | | | 193 | |
| | | | | | | | |
| Description | | Face Amount
($ Thousands) | | | Market Value
($ Thousands) | |
| | | | | | | | |
Air 2 US | | | | | | | | |
8.027%, 10/01/2019 (C) | | $ | 466 | | | $ | 494 | |
American Airlines, Pass-Through Trust, Ser 2011-1, Cl A | | | | | | | | |
5.250%, 01/31/2021 | | | 64 | | | | 68 | |
American Airlines, Pass-Through Trust, Ser 2013-2, Cl A | | | | | | | | |
4.950%, 01/15/2023 | | | 4,832 | | | | 5,194 | |
AP Moeller - Maersk | | | | | | | | |
3.875%, 09/28/2025 (C) | | | 1,169 | | | | 1,145 | |
Aviation Capital Group | | | | | | | | |
6.750%, 04/06/2021 (C) | | | 1,040 | | | | 1,178 | |
BAE Systems | | | | | | | | |
4.750%, 10/11/2021 (C) | | | 3,955 | | | | 4,340 | |
Boeing | | | | | | | | |
7.250%, 06/15/2025 | | | 107 | | | | 144 | |
4.875%, 02/15/2020 | | | 2,440 | | | | 2,722 | |
0.950%, 05/15/2018 | | | 40 | | | | 40 | |
Burlington Northern Santa Fe LLC | | | | | | | | |
7.290%, 06/01/2036 | | | 200 | | | | 277 | |
4.900%, 04/01/2044 | | | 115 | | | | 132 | |
4.700%, 09/01/2045 | | | 1,005 | | | | 1,137 | |
4.550%, 09/01/2044 | | | 1,115 | | | | 1,218 | |
4.150%, 04/01/2045 | | | 1,140 | | | | 1,188 | |
4.100%, 06/01/2021 | | | 449 | | | | 490 | |
3.050%, 09/01/2022 | | | 300 | | | | 314 | |
Canadian Pacific Railway | | | | | | | | |
6.125%, 09/15/2115 | | | 34 | | | | 40 | |
Caterpillar | | | | | | | | |
7.900%, 12/15/2018 | | | 50 | | | | 58 | |
4.300%, 05/15/2044 | | | 50 | | | | 52 | |
Caterpillar Financial Services MTN | | | | | | | | |
2.750%, 08/20/2021 | | | 1,915 | | | | 1,986 | |
1.250%, 11/06/2017 | | | 21 | | | | 21 | |
Continental Airlines, Pass-Through Trust, Ser 1997-4, Cl A | | | | | | | | |
6.900%, 01/02/2018 | | | 31 | | | | 31 | |
Continental Airlines, Pass-Through Trust,
Ser 1999-1, Cl A | | | | | | | | |
6.545%, 02/02/2019 | | | 320 | | | | 339 | |
Continental Airlines, Pass-Through Trust,
Ser 1999-2, Cl A | | | | | | | | |
7.256%, 03/15/2020 | | | 648 | | | | 695 | |
Continental Airlines, Pass-Through Trust, Ser 2000-1, Cl A | | | | | | | | |
8.048%, 11/01/2020 | | | 1,229 | | | | 1,345 | |
Continental Airlines, Pass-Through Trust,
Ser 2007-1, Cl A | | | | | | | | |
5.983%, 04/19/2022 | | | 2,259 | | | | 2,516 | |
CSX | | | | | | | | |
7.375%, 02/01/2019 | | | 150 | | | | 172 | |
4.250%, 06/01/2021 | | | 65 | | | | 71 | |
| | | | |
| SEI Institutional Investments Trust / Annual Report / May 31, 2016 | | | 123 | |
SCHEDULE OF INVESTMENTS
Core Fixed Income Fund (Continued)
May 31, 2016
| | | | | | | | |
| Description | | Face Amount
($ Thousands) | | | Market Value
($ Thousands) | |
| | | | | | | | |
Delta Air Lines, Pass-Through Trust, Ser 2007-1, Cl A | | | | | | | | |
6.821%, 08/10/2022 | | $ | 1,225 | | | $ | 1,421 | |
Delta Air Lines, Pass-Through Trust, Ser 2010-2, Cl A | | | | | | | | |
4.950%, 05/23/2019 | | | 40 | | | | 42 | |
Eaton | | | | | | | | |
7.625%, 04/01/2024 | | | 325 | | | | 407 | |
4.150%, 11/02/2042 | | | 530 | | | | 545 | |
4.000%, 11/02/2032 | | | 99 | | | | 101 | |
2.750%, 11/02/2022 | | | 2,460 | | | | 2,477 | |
1.500%, 11/02/2017 | | | 82 | | | | 82 | |
FedEx | | | | | | | | |
4.550%, 04/01/2046 | | | 1,150 | | | | 1,186 | |
GE Capital International Funding Unlimited | | | | | | | | |
4.418%, 11/15/2035 (C) | | | 6,420 | | | | 6,984 | |
2.342%, 11/15/2020 (C) | | | 1,670 | | | | 1,703 | |
General Electric | | | | | | | | |
5.250%, 12/06/2017 | | | 91 | | | | 97 | |
4.500%, 03/11/2044 | | | 1,310 | | | | 1,461 | |
4.125%, 10/09/2042 | | | 91 | | | | 96 | |
ILFC E-Capital Trust II | | | | | | | | |
4.490%, 12/21/2065 (A) (C) | | | 1,200 | | | | 972 | |
Ingersoll-Rand Luxembourg Finance | | | | | | | | |
2.625%, 05/01/2020 | | | 133 | | | | 134 | |
International Lease Finance | | | | | | | | |
7.125%, 09/01/2018 (C) | | | 2,675 | | | | 2,922 | |
JetBlue Airways Private Trust,
Ser 2004-2, Cl G1 | | | | | | | | |
1.001%, 08/15/2016 (A) | | | 609 | | | | 607 | |
L-3 Communications | | | | | | | | |
4.950%, 02/15/2021 | | | 212 | | | | 229 | |
Lockheed Martin | | | | | | | | |
4.700%, 05/15/2046 | | | 960 | | | | 1,077 | |
3.550%, 01/15/2026 | | | 7,939 | | | | 8,429 | |
3.350%, 09/15/2021 | | | 1,885 | | | | 1,988 | |
3.100%, 01/15/2023 | | | 110 | | | | 114 | |
2.500%, 11/23/2020 | | | 1,585 | | | | 1,614 | |
Northrop Grumman | | | | | | | | |
3.850%, 04/15/2045 | | | 613 | | | | 611 | |
3.250%, 08/01/2023 | | | 7,070 | | | | 7,423 | |
Penske Truck Leasing Lp | | | | | | | | |
3.375%, 02/01/2022 (C) | | | 1,882 | | | | 1,870 | |
3.200%, 07/15/2020 (C) | | | 1,920 | | | | 1,943 | |
3.050%, 01/09/2020 (C) | | | 425 | | | | 428 | |
Raytheon | | | | | | | | |
3.125%, 10/15/2020 | | | 720 | | | | 762 | |
Siemens Financieringsmaatschappij | | | | | | | | |
2.900%, 05/27/2022 (C) | | | 2,940 | | | | 3,053 | |
Union Pacific | | | | | | | | |
4.050%, 03/01/2046 | | | 1,200 | | | | 1,249 | |
| | | | | | | | |
| Description | | Face Amount
($ Thousands) | | | Market Value
($ Thousands) | |
| | | | | | | | |
United Parcel Service | | | | | | | | |
3.125%, 01/15/2021 | | $ | 90 | | | $ | 96 | |
United Technologies | | | | | | | | |
9.075%, 11/15/2019 | | | 400 | | | | 486 | |
5.400%, 05/01/2035 | | | 640 | | | | 772 | |
1.800%, 06/01/2017 | | | 350 | | | | 353 | |
US Airways, Pass-Through Trust,
Ser 2012-1, Cl A | | | | | | | | |
5.900%, 10/01/2024 | | | 40 | | | | 45 | |
US Airways, Pass-Through Trust,
Ser 2012-2, Cl A | | | | | | | | |
4.625%, 06/03/2025 | | | 4,370 | | | | 4,675 | |
Valmont Industries | | | | | | | | |
5.250%, 10/01/2054 | | | 920 | | | | 811 | |
Waste Management | | | | | | | | |
3.900%, 03/01/2035 | | | 39 | | | | 40 | |
3.500%, 05/15/2024 | | | 650 | | | | 693 | |
| | | | | | | | |
| | | | | | | 87,598 | |
| | | | | | | | |
| | |
Information Technology — 1.3% | | | | | | | | |
Alibaba Group Holding | | | | | | | | |
3.600%, 11/28/2024 | | | 1,575 | | | | 1,575 | |
Apple | | | | | | | | |
4.650%, 02/23/2046 | | | 5,325 | | | | 5,846 | |
4.375%, 05/13/2045 | | | 1,625 | | | | 1,721 | |
3.850%, 05/04/2043 | | | 1,750 | | | | 1,710 | |
3.450%, 05/06/2024 | | | 350 | | | | 372 | |
3.450%, 02/09/2045 | | | 156 | | | | 142 | |
2.250%, 02/23/2021 | | | 2,576 | | | | 2,616 | |
2.150%, 02/09/2022 | | | 90 | | | | 90 | |
0.887%, 05/03/2018 (A) | | | 273 | | | | 273 | |
Diamond 1 Finance | | | | | | | | |
6.020%, 06/15/2026 (C) | | | 3,555 | | | | 3,594 | |
4.420%, 06/15/2021 (C) | | | 1,860 | | | | 1,897 | |
3.480%, 06/01/2019 (C) | | | 2,570 | | | | 2,603 | |
Fidelity National Information Services | | | | | | | | |
5.000%, 10/15/2025 | | | 1,010 | | | | 1,125 | |
4.500%, 10/15/2022 | | | 755 | | | | 810 | |
3.625%, 10/15/2020 | | | 1,250 | | | | 1,305 | |
2.850%, 10/15/2018 | | | 1,810 | | | | 1,840 | |
Harris | | | | | | | | |
5.054%, 04/27/2045 | | | 390 | | | | 429 | |
Hewlett Packard Enterprise | | | | | | | | |
6.350%, 10/15/2045 (C) | | | 1,745 | | | | 1,670 | |
4.900%, 10/15/2025 (C) | | | 1,590 | | | | 1,627 | |
HP | | | | | | | | |
4.650%, 12/09/2021 | | | 58 | | | | 62 | |
Intel | | | | | | | | |
4.900%, 07/29/2045 | | | 110 | | | | 123 | |
3.700%, 07/29/2025 | | | 300 | | | | 328 | |
3.300%, 10/01/2021 | | | 75 | | | | 80 | |
3.100%, 07/29/2022 | | | 75 | | | | 79 | |
| | |
| 124 | | SEI Institutional Investments Trust / Annual Report / May 31, 2016 |
| | | | | | | | |
Description | | Face Amount
($ Thousands) | | | Market Value
($ Thousands) | |
| | | | | | | | |
International Business Machines | | | | | | | | |
5.700%, 09/14/2017 | | $ | 210 | | | $ | 222 | |
3.625%, 02/12/2024 | | | 355 | | | | 385 | |
KLA-Tencor | | | | | | | | |
4.125%, 11/01/2021 | | | 2,450 | | | | 2,591 | |
Lam Research | | | | | | | | |
3.900%, 06/15/2026 | | | 1,600 | | | | 1,628 | |
3.800%, 03/15/2025 | | | 150 | | | | 151 | |
2.800%, 06/15/2021 | | | 1,425 | | | | 1,438 | |
2.750%, 03/15/2020 | | | 95 | | | | 96 | |
MasterCard | | | | | | | | |
3.375%, 04/01/2024 | | | 1,720 | | | | 1,832 | |
Microsoft | | | | | | | | |
4.450%, 11/03/2045 | | | 1,000 | | | | 1,116 | |
4.200%, 11/03/2035 | | | 2,700 | | | | 2,995 | |
3.750%, 02/12/2045 | | | 2,195 | | | | 2,193 | |
3.500%, 02/12/2035 | | | 2,983 | | | | 3,007 | |
2.375%, 02/12/2022 | | | 50 | | | | 51 | |
2.375%, 05/01/2023 | | | 50 | | | | 50 | |
0.875%, 11/15/2017 | | | 54 | | | | 54 | |
National Semiconductor | | | | | | | | |
6.600%, 06/15/2017 | | | 280 | | | | 295 | |
Oracle | | | | | | | | |
5.750%, 04/15/2018 | | | 200 | | | | 217 | |
3.900%, 05/15/2035 | | | 3,995 | | | | 4,067 | |
1.200%, 10/15/2017 | | | 104 | | | | 104 | |
Total System Services | | | | | | | | |
4.800%, 04/01/2026 | | | 650 | | | | 686 | |
3.800%, 04/01/2021 | | | 715 | | | | 742 | |
TSMC Global | | | | | | | | |
1.625%, 04/03/2018 (C) | | | 3,415 | | | | 3,405 | |
Visa | | | | | | | | |
3.150%, 12/14/2025 | | | 4,010 | | | | 4,155 | |
2.800%, 12/14/2022 | | | 3,915 | | | | 4,053 | |
2.200%, 12/14/2020 | | | 480 | | | | 488 | |
| | | | | | | | |
| | | | | | | 67,938 | |
| | | | | | | | |
| | |
Materials — 0.8% | | | | | | | | |
Albemarle | | | | | | | | |
5.450%, 12/01/2044 | | | 905 | | | | 901 | |
Barrick Gold | | | | | | | | |
6.950%, 04/01/2019 | | | 662 | | | | 735 | |
4.100%, 05/01/2023 | | | 477 | | | | 483 | |
Barrick North America Finance LLC | | | | | | | | |
5.700%, 05/30/2041 | | | 190 | | | | 179 | |
4.400%, 05/30/2021 | | | 1,885 | | | | 1,975 | |
BHP Billiton Finance USA | | | | | | | | |
6.750%, 10/19/2075 (A) (C) | | | 1,610 | | | | 1,668 | |
6.500%, 04/01/2019 | | | 445 | | | | 501 | |
5.000%, 09/30/2043 | | | 1,815 | | | | 1,928 | |
3.850%, 09/30/2023 | | | 1,585 | | | | 1,655 | |
3.250%, 11/21/2021 | | | 2,850 | | | | 2,944 | |
| | | | | | | | |
| Description | | Face Amount
($ Thousands) | | | Market Value
($ Thousands) | |
| | | | | | | | |
2.875%, 02/24/2022 | | $ | 160 | | | $ | 161 | |
1.875%, 11/21/2016 | | | 400 | | | | 402 | |
0.879%, 09/30/2016 (A) | | | 34 | | | | 34 | |
Celulosa Arauco y Constitucion | | | | | | | | |
4.750%, 01/11/2022 | | | 1,050 | | | | 1,110 | |
Dow Chemical | | | | | | | | |
8.550%, 05/15/2019 | | | 113 | | | | 134 | |
4.125%, 11/15/2021 | | | 219 | | | | 238 | |
3.000%, 11/15/2022 | | | 3,630 | | | | 3,694 | |
Eastman Chemical | | | | | | | | |
2.700%, 01/15/2020 | | | 2,295 | | | | 2,333 | |
Ecolab | | | | | | | | |
4.350%, 12/08/2021 | | | 420 | | | | 466 | |
Freeport-McMoRan | | | | | | | | |
4.000%, 11/14/2021 | | | 1,280 | | | | 1,110 | |
Freeport-McMoran Oil & Gas LLC | | | | | | | | |
6.875%, 02/15/2023 | | | 49 | | | | 46 | |
6.500%, 11/15/2020 | | | 227 | | | | 218 | |
Glencore Finance Canada | | | | | | | | |
5.800%, 11/15/2016 (C) | | | 390 | | | | 397 | |
2.700%, 10/25/2017 (C) | | | 1,900 | | | | 1,891 | |
Glencore Funding LLC | | | | | | | | |
2.875%, 04/16/2020 (C) | | | 1,180 | | | | 1,083 | |
International Paper | | | | | | | | |
5.150%, 05/15/2046 | | | 1,455 | | | | 1,520 | |
5.000%, 09/15/2035 | | | 2,245 | | | | 2,357 | |
LYB International Finance | | | | | | | | |
4.875%, 03/15/2044 | | | 690 | | | | 676 | |
Mosaic | | | | | | | | |
5.625%, 11/15/2043 | | | 400 | | | | 422 | |
OCP | | | | | | | | |
4.500%, 10/22/2025 (C) | | | 1,860 | | | | 1,797 | |
Potash Corp of Saskatchewan | | | | | | | | |
4.875%, 03/30/2020 | | | 10 | | | | 11 | |
PPG Industries | | | | | | | | |
6.650%, 03/15/2018 | | | 94 | | | | 102 | |
Praxair | | | | | | | | |
4.050%, 03/15/2021 | | | 73 | | | | 80 | |
Rio Tinto Finance USA | | | | | | | | |
7.125%, 07/15/2028 | | | 20 | | | | 25 | |
6.500%, 07/15/2018 | | | 435 | | | | 475 | |
3.750%, 09/20/2021 | | | 290 | | | | 304 | |
3.750%, 06/15/2025 | | | 2,525 | | | | 2,516 | |
Rock-Tenn | | | | | | | | |
4.000%, 03/01/2023 | | | 330 | | | | 339 | |
3.500%, 03/01/2020 | | | 570 | | | | 585 | |
Southern Copper | | | | | | | | |
5.250%, 11/08/2042 | | | 3,610 | | | | 2,979 | |
Stauffer Chemical | | | | | | | | |
8.635%, 04/15/2018 (B) (E) (F) (G) | | | 860 | | | | 591 | |
8.372%, 04/15/2017 (B) (E) (F) (G) | | | 350 | | | | 245 | |
| | | | |
| SEI Institutional Investments Trust / Annual Report / May 31, 2016 | | | 125 | |
SCHEDULE OF INVESTMENTS
Core Fixed Income Fund (Continued)
May 31, 2016
| | | | | | | | |
| Description | | Face Amount
($ Thousands) | | | Market Value
($ Thousands) | |
| | | | | | | | |
Vale Overseas | | | | | | | | |
6.875%, 11/21/2036 | | $ | 3,323 | | | $ | 2,758 | |
| | | | | | | | |
| | | | | | | 44,068 | |
| | | | | | | | |
| |
Telecommunication Services — 1.7% | | | | | |
America Movil | | | | | | | | |
5.625%, 11/15/2017 | | | 1,450 | | | | 1,530 | |
5.000%, 03/30/2020 | | | 540 | | | | 594 | |
2.375%, 09/08/2016 | | | 238 | | | | 239 | |
AT&T | | | | | | | | |
6.300%, 01/15/2038 | | | 1,400 | | | | 1,652 | |
6.000%, 08/15/2040 | | | 2,220 | | | | 2,513 | |
5.800%, 02/15/2019 | | | 675 | | | | 746 | |
5.550%, 08/15/2041 | | | 360 | | | | 393 | |
5.500%, 02/01/2018 | | | 130 | | | | 138 | |
4.800%, 06/15/2044 | | | 385 | | | | 384 | |
4.750%, 05/15/2046 | | | 4,750 | | | | 4,718 | |
4.450%, 05/15/2021 | | | 440 | | | | 477 | |
4.450%, 04/01/2024 | | | 1,670 | | | | 1,788 | |
4.350%, 06/15/2045 | | | 652 | | | | 614 | |
4.125%, 02/17/2026 | | | 3,475 | | | | 3,657 | |
3.950%, 01/15/2025 | | | 2,275 | | | | 2,361 | |
3.875%, 08/15/2021 | | | 350 | | | | 371 | |
3.800%, 03/15/2022 | | | 1,210 | | | | 1,262 | |
3.600%, 02/17/2023 | | | 1,580 | | | | 1,622 | |
3.400%, 05/15/2025 | | | 12,434 | | | | 12,455 | |
3.000%, 02/15/2022 | | | 700 | | | | 704 | |
3.000%, 06/30/2022 | | | 2,891 | | | | 2,896 | |
2.800%, 02/17/2021 | | | 1,610 | | | | 1,633 | |
2.450%, 06/30/2020 | | | 64 | | | | 64 | |
1.750%, 01/15/2018 | | | 150 | | | | 151 | |
Bharti Airtel | | | | | | | | |
4.375%, 06/10/2025 (C) | | | 1,870 | | | | 1,911 | |
British Telecommunications | | | | | | | | |
5.950%, 01/15/2018 | | | 1,011 | | | | 1,083 | |
Comcast Cable Holdings LLC | | | | | | | | |
10.125%, 04/15/2022 | | | 190 | | | | 253 | |
Cox Communications | | | | | | | | |
4.800%, 02/01/2035 (C) | | | 840 | | | | 761 | |
Deutsche Telekom International Finance | | | | | | | | |
2.250%, 03/06/2017 (C) | | | 3,130 | | | | 3,158 | |
Grupo Televisa | | | | | | | | |
5.000%, 05/13/2045 | | | 735 | | | | 680 | |
Nippon Telegraph & Telephone | | | | | | | | |
1.400%, 07/18/2017 | | | 200 | | | | 200 | |
Rogers Communications | | | | | | | | |
4.100%, 10/01/2023 | | | 133 | | | | 145 | |
Sky | | | | | | | | |
3.750%, 09/16/2024 (C) | | | 1,790 | | | | 1,815 | |
Sprint Capital | | | | | | | | |
8.750%, 03/15/2032 | | | 390 | | | | 316 | |
| | | | | | | | |
| Description | | Face Amount
($ Thousands) | | | Market Value
($ Thousands) | |
| | | | | | | | |
Telefonica Emisiones SAU | | | | | | | | |
6.421%, 06/20/2016 | | $ | 100 | | | $ | 100 | |
6.221%, 07/03/2017 | | | 100 | | | | 105 | |
5.877%, 07/15/2019 | | | 180 | | | | 199 | |
5.462%, 02/16/2021 | | | 69 | | | | 78 | |
5.134%, 04/27/2020 | | | 1,160 | | | | 1,273 | |
Verizon Communications | | | | | | | | |
6.550%, 09/15/2043 | | | 1,012 | | | | 1,325 | |
6.400%, 09/15/2033 | | | 2,264 | | | | 2,821 | |
5.850%, 09/15/2035 | | | 150 | | | | 177 | |
5.150%, 09/15/2023 | | | 3,620 | | | | 4,152 | |
5.050%, 03/15/2034 | | | 308 | | | | 336 | |
4.862%, 08/21/2046 | | | 5,231 | | | | 5,585 | |
4.522%, 09/15/2048 | | | 1,230 | | | | 1,242 | |
4.400%, 11/01/2034 | | | 8,075 | | | | 8,190 | |
4.272%, 01/15/2036 | | | 3,830 | | | | 3,837 | |
4.150%, 03/15/2024 | | | 880 | | | | 952 | |
2.164%, 09/15/2016 (A) | | | 942 | | | | 946 | |
Vodafone Group | | | | | | | | |
2.950%, 02/19/2023 | | | 3,245 | | | | 3,211 | |
| | | | | | | | |
| | | | | | | 87,813 | |
| | | | | | | | |
| | |
Utilities — 2.3% | | | | | | | | |
AGL Capital | | | | | | | | |
6.375%, 07/15/2016 | | | 200 | | | | 201 | |
Alabama Power | | | | | | | | |
5.500%, 10/15/2017 | | | 100 | | | | 105 | |
Alabama Power Capital Trust V | | | | | | | | |
3.725%, 10/01/2042 (A) | | | 100 | | | | 88 | |
American Electric Power | | | | | | | | |
1.650%, 12/15/2017 | | | 1,920 | | | | 1,920 | |
Appalachian Power | | | | | | | | |
4.450%, 06/01/2045 | | | 1,600 | | | | 1,678 | |
Berkshire Hathaway Energy | | | | | | | | |
6.500%, 09/15/2037 | | | 3,200 | | | | 4,303 | |
4.500%, 02/01/2045 | | | 1,500 | | | | 1,636 | |
3.750%, 11/15/2023 | | | 488 | | | | 524 | |
Boston Gas | | | | | | | | |
4.487%, 02/15/2042 (C) | | | 140 | | | | 147 | |
CenterPoint Energy Resources | | | | | | | | |
6.125%, 11/01/2017 | | | 320 | | | | 337 | |
4.500%, 01/15/2021 | | | 246 | | | | 260 | |
Cleco Corporate Holdings LLC | | | | | | | | |
4.973%, 05/01/2046 (C) | | | 850 | | | | 851 | |
3.743%, 05/01/2026 (C) | | | 1,145 | | | | 1,144 | |
Commonwealth Edison | | | | | | | | |
3.700%, 03/01/2045 | | | 355 | | | | 351 | |
Consolidated Edison of New York | | | | | | | | |
6.650%, 04/01/2019 | | | 650 | | | | 738 | |
5.850%, 04/01/2018 | | | 236 | | | | 255 | |
4.450%, 03/15/2044 | | | 2,475 | | | | 2,729 | |
| | |
| 126 | | SEI Institutional Investments Trust / Annual Report / May 31, 2016 |
| | | | | | | | |
| Description | | Face Amount
($ Thousands) | | | Market Value
($ Thousands) | |
| | | | | | | | |
Dominion Resources | | | | | | | | |
4.700%, 12/01/2044 | | $ | 1,070 | | | $ | 1,120 | |
3.900%, 10/01/2025 | | | 415 | | | | 430 | |
2.928%, 07/01/2019 (D) | | | 630 | | | | 631 | |
2.500%, 12/01/2019 | | | 1,985 | | | | 2,012 | |
1.950%, 08/15/2016 | | | 56 | | | | 56 | |
Duke Energy | | | | | | | | |
4.800%, 12/15/2045 | | | 655 | | | | 726 | |
3.750%, 04/15/2024 | | | 675 | | | | 714 | |
3.550%, 09/15/2021 | | | 722 | | | | 761 | |
Duke Energy Carolinas LLC | | | | | | | | |
5.250%, 01/15/2018 | | | 326 | | | | 347 | |
4.250%, 12/15/2041 | | | 1,000 | | | | 1,078 | |
4.000%, 09/30/2042 | | | 1,512 | | | | 1,591 | |
3.875%, 03/15/2046 | | | 670 | | | | 687 | |
2.500%, 03/15/2023 | | | 1,275 | | | | 1,290 | |
Duke Energy Florida LLC | | | | | | | | |
3.850%, 11/15/2042 | | | 1,360 | | | | 1,388 | |
Duke Energy Progress LLC | | | | | | | | |
3.250%, 08/15/2025 | | | 935 | | | | 984 | |
Duquesne Light Holdings | | | | | | | | |
6.400%, 09/15/2020 (C) | | | 2,525 | | | | 2,873 | |
Electricite de France | | | | | | | | |
6.000%, 01/22/2114 (C) | | | 310 | | | | 319 | |
5.250%, 10/13/2055 (C) | | | 1,050 | | | | 1,064 | |
Entergy Louisiana LLC | | | | | | | | |
6.500%, 09/01/2018 | | | 500 | | | | 554 | |
3.050%, 06/01/2031 | | | 1,265 | | | | 1,241 | |
Exelon | | | | | | | | |
5.625%, 06/15/2035 | | | 2,065 | | | | 2,402 | |
3.950%, 06/15/2025 | | | 1,840 | | | | 1,931 | |
3.400%, 04/15/2026 | | | 2,275 | | | | 2,298 | |
FirstEnergy | | | | | | | | |
4.250%, 03/15/2023 | | | 2,040 | | | | 2,107 | |
2.750%, 03/15/2018 | | | 650 | | | | 655 | |
FirstEnergy, Ser C | | | | | | | | |
7.375%, 11/15/2031 | | | 4,905 | | | | 5,982 | |
Florida Power & Light | | | | | | | | |
4.050%, 10/01/2044 | | | 3,600 | | | | 3,869 | |
3.250%, 06/01/2024 | | | 360 | | | | 383 | |
Georgia Power | | | | | | | | |
5.950%, 02/01/2039 | | | 50 | | | | 63 | |
Indiana Michigan Power | | | | | | | | |
4.550%, 03/15/2046 | | | 670 | | | | 715 | |
IPALCO Enterprises | | | | | | | | |
5.000%, 05/01/2018 | | | 2,380 | | | | 2,487 | |
Jersey Central Power & Light | | | | | | | | |
7.350%, 02/01/2019 | | | 100 | | | | 112 | |
Kansas City Power & Light | | | | | | | | |
5.300%, 10/01/2041 | | | 250 | | | | 289 | |
KCP&L Greater Missouri Operations | | | | | | | | |
8.270%, 11/15/2021 | | | 2,894 | | | | 3,517 | |
| | | | | | | | |
| Description | | Face Amount
($ Thousands) | | | Market Value
($ Thousands) | |
| | | | | | | | |
KeySpan Gas East | | | | | | | | |
5.819%, 04/01/2041 (C) | | $ | 2,500 | | | $ | 2,963 | |
Majapahit Holding BV | | | | | | | | |
7.750%, 01/20/2020 | | | 660 | | | | 750 | |
Metropolitan Edison | | | | | | | | |
3.500%, 03/15/2023 (C) | | | 5,050 | | | | 5,134 | |
MidAmerican Energy | | | | | | | | |
4.250%, 05/01/2046 | | | 905 | | | | 994 | |
3.500%, 10/15/2024 | | | 910 | | | | 976 | |
2.400%, 03/15/2019 | | | 115 | | | | 118 | |
NiSource Finance | | | | | | | | |
6.800%, 01/15/2019 | | | 3,547 | | | | 3,983 | |
5.800%, 02/01/2042 | | | 471 | | | | 571 | |
Oncor Electric Delivery | | | | | | | | |
6.800%, 09/01/2018 | | | 4,135 | | | | 4,595 | |
Pacific Gas & Electric | | | | | | | | |
8.250%, 10/15/2018 | | | 1,570 | | | | 1,809 | |
6.050%, 03/01/2034 | | | 630 | | | | 826 | |
5.800%, 03/01/2037 | | | 560 | | | | 711 | |
5.400%, 01/15/2040 | | | 156 | | | | 191 | |
4.450%, 04/15/2042 | | | 2,360 | | | | 2,569 | |
3.250%, 09/15/2021 | | | 35 | | | | 37 | |
2.950%, 03/01/2026 | | | 1,128 | | | | 1,148 | |
PacifiCorp | | | | | | | | |
5.650%, 07/15/2018 | | | 500 | | | | 546 | |
PECO Energy | | | | | | | | |
4.150%, 10/01/2044 | | | 1,985 | | | | 2,161 | |
3.150%, 10/15/2025 | | | 1,410 | | | | 1,479 | |
PPL Capital Funding | | | | | | | | |
3.100%, 05/15/2026 | | | 2,485 | | | | 2,461 | |
PPL Electric Utilities | | | | | | | | |
4.150%, 10/01/2045 | | | 855 | | | | 908 | |
Progress Energy | | | | | | | | |
6.000%, 12/01/2039 | | | 200 | | | | 247 | |
PSEG Power LLC | | | | | | | | |
2.750%, 09/15/2016 | | | 1,055 | | | | 1,060 | |
Public Service of New Hampshire | | | | | | | | |
3.500%, 11/01/2023 | | | 960 | | | | 1,008 | |
Public Service of New Mexico | | | | | | | | |
7.950%, 05/15/2018 | | | 3,000 | | | | 3,338 | |
Puget Energy | | | | | | | | |
6.000%, 09/01/2021 | | | 2,075 | | | | 2,359 | |
Sempra Energy | | | | | | | | |
2.850%, 11/15/2020 | | | 1,665 | | | | 1,703 | |
Sierra Pacific Power | | | | | | | | |
2.600%, 05/01/2026 (C) | | | 1,440 | | | | 1,427 | |
Southern | | | | | | | | |
4.400%, 07/01/2046 | | | 1,240 | | | | 1,262 | |
2.150%, 09/01/2019 | | | 1,920 | | | | 1,934 | |
Southern California Edison | | | | | | | | |
3.500%, 10/01/2023 | | | 1,015 | | | | 1,088 | |
| | | | |
| SEI Institutional Investments Trust / Annual Report / May 31, 2016 | | | 127 | |
SCHEDULE OF INVESTMENTS
Core Fixed Income Fund (Continued)
May 31, 2016
| | | | | | | | |
| Description | | Face Amount
($ Thousands) | | | Market Value
($ Thousands) | |
| | | | | | | | |
Southern California Gas | | | | | | | | |
2.600%, 06/15/2026 | | $ | 1,780 | | | $ | 1,777 | |
Southern Star Central Gas Pipeline | | | | | | | | |
6.000%, 06/01/2016 (C) | | | 655 | | | | 655 | |
Southwestern Electric Power | | | | | | | | |
6.450%, 01/15/2019 | | | 672 | | | | 745 | |
3.900%, 04/01/2045 | | | 825 | | | | 777 | |
Virginia Electric & Power | | | | | | | | |
4.650%, 08/15/2043 | | | 1,475 | | | | 1,666 | |
3.150%, 01/15/2026 | | | 985 | | | | 1,020 | |
Virginia Electric and Power | | | | | | | | |
2.950%, 01/15/2022 | | | 1,720 | | | | 1,785 | |
| | | | | | | | |
| | | | | | | 122,724 | |
| | | | | | | | |
Total Corporate Obligations
(Cost $1,507,778) ($ Thousands) | | | | | | | 1,562,343 | |
| | | | | | | | |
| |
U.S. TREASURY OBLIGATIONS — 26.8% | | | | | |
U.S. Treasury Bills (H) | | | | | | | | |
0.266%, 08/11/2016 | | | 17,550 | | | | 17,540 | |
0.225%, 07/21/2016 (J) | | | 540 | | | | 540 | |
U.S. Treasury Bonds | | | | | | | | |
4.250%, 05/15/2039 | | | 230 | | | | 304 | |
3.875%, 08/15/2040 | | | 150 | | | | 188 | |
3.750%, 11/15/2043 | | | 5,520 | | | | 6,843 | |
3.000%, 11/15/2044 | | | 4,923 | | | | 5,302 | |
3.000%, 05/15/2045 | | | 60,551 | | | | 65,186 | |
3.000%, 11/15/2045 | | | 30,210 | | | | 32,518 | |
2.875%, 08/15/2045 | | | 94,224 | | | | 98,946 | |
2.750%, 08/15/2042 | | | 12,025 | | | | 12,429 | |
2.750%, 11/15/2042 | | | 90 | | | | 93 | |
2.500%, 02/15/2045 (J) | | | 104,288 | | | | 101,461 | |
2.500%, 02/15/2046 | | | 42,487 | | | | 41,304 | |
2.500%, 05/15/2046 | | | 72,137 | | | | 70,207 | |
U.S. Treasury Inflation-Protected Securities | | | | | | | | |
2.500%, 07/15/2016 | | | 10,371 | | | | 10,462 | |
2.375%, 01/15/2025 | | | 581 | | | | 684 | |
1.750%, 01/15/2028 | | | 2,580 | | | | 2,959 | |
1.375%, 02/15/2044 | | | 25,933 | | | | 28,647 | |
1.000%, 02/15/2046 | | | 1,176 | | | | 1,203 | |
0.750%, 02/15/2042 | | | 759 | | | | 727 | |
0.750%, 02/15/2045 | | | 2,134 | | | | 2,037 | |
0.625%, 01/15/2024 | | | 2,379 | | | | 2,454 | |
0.625%, 01/15/2026 | | | 20 | | | | 21 | |
0.625%, 02/15/2043 | | | 19,648 | | | | 18,249 | |
0.375%, 07/15/2023 | | | 1,535 | | | | 1,564 | |
0.375%, 07/15/2025 | | | 7,054 | | | | 7,138 | |
0.250%, 01/15/2025 | | | 10,034 | | | | 10,015 | |
0.125%, 07/15/2024 | | | 10,134 | | | | 10,077 | |
U.S. Treasury Notes | | | | | | | | |
3.500%, 05/15/2020 | | | 31,880 | | | | 34,658 | |
2.750%, 11/15/2023 | | | 500 | | | | 538 | |
| | | | | | | | |
| Description | | Face Amount
($ Thousands) | | | Market Value
($ Thousands) | |
| | | | | | | | |
2.625%, 08/15/2020 | | $ | 10,630 | | | $ | 11,209 | |
2.625%, 11/15/2020 | | | 39,990 | | | | 42,227 | |
2.500%, 08/15/2023 | | | 120 | | | | 127 | |
2.375%, 08/15/2024 | | | 110 | | | | 115 | |
2.125%, 08/31/2020 | | | 8,025 | | | | 8,299 | |
2.000%, 10/31/2021 | | | 47,295 | | | | 48,627 | |
2.000%, 02/15/2025 | | | 500 | | | | 508 | |
1.875%, 08/31/2017 | | | 51,505 | | | | 52,197 | |
1.875%, 09/30/2017 | | | 13,695 | | | | 13,890 | |
1.875%, 05/31/2022 | | | 660 | | | | 673 | |
1.750%, 03/31/2022 | | | 90 | | | | 91 | |
1.625%, 06/30/2020 | | | 5,505 | | | | 5,583 | |
1.625%, 11/30/2020 | | | 25,214 | | | | 25,545 | |
1.625%, 11/15/2022 | | | 250 | | | | 250 | |
1.625%, 05/31/2023 | | | 4,993 | | | | 4,971 | |
1.625%, 02/15/2026 | | | 29,635 | | | | 29,048 | |
1.625%, 05/15/2026 | | | 10,646 | | | | 10,444 | |
1.375%, 10/31/2020 | | | 110 | | | | 110 | |
1.375%, 01/31/2021 | | | 70,315 | | | | 70,375 | |
1.375%, 05/31/2021 | | | 120,570 | | | | 120,655 | |
1.250%, 03/31/2021 | | | 4,016 | | | | 3,994 | |
1.000%, 12/15/2017 | | | 1,095 | | | | 1,098 | |
1.000%, 05/15/2018 | | | 12,414 | | | | 12,441 | |
0.875%, 08/15/2017 | | | 6,555 | | | | 6,563 | |
0.875%, 11/30/2017 | | | 8,168 | | | | 8,176 | |
0.875%, 03/31/2018 | | | 47,401 | | | | 47,407 | |
0.875%, 05/31/2018 | | | 12,162 | | | | 12,162 | |
0.875%, 04/15/2019 | | | 68,381 | | | | 68,111 | |
0.875%, 05/15/2019 | | | 61,076 | | | | 60,809 | |
0.750%, 10/31/2017 | | | 27,825 | | | | 27,802 | |
0.750%, 01/31/2018 | | | 38,323 | | | | 38,262 | |
0.750%, 02/28/2018 | | | 30,915 | | | | 30,858 | |
0.750%, 04/30/2018 | | | 14,306 | | | | 14,274 | |
0.625%, 08/31/2017 | | | 36,445 | | | | 36,378 | |
0.625%, 09/30/2017 | | | 2,960 | | | | 2,953 | |
U.S. Treasury STRIPS | | | | | | | | |
2.765%, 08/15/2045 (B) | | | 7,195 | | | | 3,210 | |
2.736%, 05/15/2045 (B) | | | 13,375 | | | | 6,013 | |
| | | | | | | | |
Total U.S. Treasury Obligations
(Cost $1,390,890) ($ Thousands) | | | | | | | 1,409,749 | |
| | | | | | | | |
| |
ASSET-BACKED SECURITIES — 10.3% | | | | | |
Automotive — 2.1% | | | | | | | | |
Ally Auto Receivables Trust, Ser 2014-1, Cl A4 | | | | | | | | |
1.530%, 04/15/2019 | | | 1,290 | | | | 1,295 | |
Ally Auto Receivables Trust, Ser 2015-1, Cl A3 | | | | | | | | |
1.390%, 09/16/2019 | | | 1,985 | | | | 1,986 | |
Ally Auto Receivables Trust, Ser 2016-1, Cl A2A | | | | | | | | |
1.200%, 08/15/2018 | | | 2,685 | | | | 2,685 | |
| | |
| 128 | | SEI Institutional Investments Trust / Annual Report / May 31, 2016 |
| | | | | | | | |
| Description | | Face Amount
($ Thousands) | | | Market Value
($ Thousands) | |
| | | | | | | | |
Avis Budget Rental Car Funding AESOP LLC,
Ser 2012-3A, Cl A | | | | | | | | |
2.100%, 03/20/2019 (C) | | $ | 1,421 | | | $ | 1,419 | |
Avis Budget Rental Car Funding AESOP LLC,
Ser 2013-1A, Cl A | | | | | | | | |
1.920%, 09/20/2019 (C) | | | 4,150 | | | | 4,132 | |
Avis Budget Rental Car Funding AESOP LLC,
Ser 2013-2A, Cl A | | | | | | | | |
2.970%, 02/20/2020 (C) | | | 590 | | | | 602 | |
Avis Budget Rental Car Funding AESOP LLC,
Ser 2014-2A, Cl A | | | | | | | | |
2.500%, 02/20/2021 (C) | | | 1,135 | | | | 1,135 | |
Avis Budget Rental Car Funding AESOP LLC,
Ser 2016-1A, Cl A | | | | | | | | |
2.990%, 06/20/2022 (C) | | | 2,130 | | | | 2,130 | |
Avis Budget Rental Car Funding AESOP LLC,
Ser 2016-2A, Cl A | | | | | | | | |
2.720%, 11/20/2022 (C) | | | 2,591 | | | | 2,606 | |
Bank of The West Auto Trust, Ser 2014-1, Cl A3 | | | | | | | | |
1.090%, 03/15/2019 (C) | | | 1,046 | | | | 1,046 | |
California Republic Auto Receivables Trust,
Ser 2014-2, Cl A4 | | | | | | | | |
1.570%, 12/16/2019 | | | 729 | | | | 729 | |
California Republic Auto Receivables Trust,
Ser 2014-3, Cl A4 | | | | | | | | |
1.790%, 03/16/2020 | | | 729 | | | | 733 | |
California Republic Auto Receivables Trust,
Ser 2015-1, Cl A4 | | | | | | | | |
1.820%, 09/15/2020 | | | 1,665 | | | | 1,665 | |
California Republic Auto Receivables Trust,
Ser 2015-2, Cl A3 | | | | | | | | |
1.310%, 08/15/2019 | | | 795 | | | | 795 | |
California Republic Auto Receivables Trust,
Ser 2015-4, Cl A4 | | | | | | | | |
2.580%, 06/15/2021 (C) | | | 1,358 | | | | 1,371 | |
California Republic Auto Receivables Trust,
Ser 2015-4, Cl A2 | | | | | | | | |
1.600%, 09/17/2018 (C) | | | 1,009 | | | | 1,011 | |
California Republic Auto Receivables Trust,
Ser 2016-1, Cl A4 | | | | | | | | |
2.240%, 10/15/2021 | | | 1,116 | | | | 1,118 | |
California Republic Auto Receivables Trust,
Ser 2016-1, Cl A3 | | | | | | | | |
1.890%, 05/15/2020 | | | 2,005 | | | | 2,008 | |
Capital Auto Receivables Asset
Trust, Ser 2013- 2, Cl A4 | | | | | | | | |
1.560%, 07/20/2018 | | | 1,281 | | | | 1,281 | |
Capital Auto Receivables Asset Trust, Ser 2013- 3, Cl A4 | | | | | | | | |
1.680%, 04/20/2018 | | | 714 | | | | 715 | |
Capital Auto Receivables Asset Trust, Ser 2013- 4, Cl A4 | | | | | | | | |
1.470%, 07/20/2018 | | | 1,265 | | | | 1,266 | |
| | | | | | | | |
| Description | | Face Amount
($ Thousands) | | | Market Value
($ Thousands) | |
| | | | | | | | |
Capital Auto Receivables Asset Trust, Ser 2014- 1, Cl A4 | | | | | | | | |
1.690%, 10/22/2018 | | $ | 1,629 | | | $ | 1,631 | |
Capital Auto Receivables Asset
Trust, Ser 2014- 2, Cl A4 | | | | | | | | |
1.620%, 10/22/2018 | | | 736 | | | | 736 | |
Capital Auto Receivables Asset
Trust, Ser 2014- 3, Cl A4 | | | | | | | | |
1.830%, 04/22/2019 | | | 295 | | | | 295 | |
Capital Auto Receivables Asset
Trust, Ser 2015- 1, Cl A3 | | | | | | | | |
1.610%, 06/20/2019 | | | 1,614 | | | | 1,617 | |
Capital Auto Receivables Asset
Trust, Ser 2015- 1, Cl A4 | | | | | | | | |
1.860%, 10/21/2019 | | | 1,329 | | | | 1,337 | |
Capital Auto Receivables Asset
Trust, Ser 2015- 2, Cl A3 | | | | | | | | |
1.730%, 09/20/2019 | | | 1,622 | | | | 1,627 | |
Capital Auto Receivables Asset
Trust, Ser 2015- 2, Cl A4 | | | | | | | | |
1.970%, 01/21/2020 | | | 2,404 | | | | 2,402 | |
Capital Auto Receivables Asset
Trust, Ser 2015- 2, Cl A2 | | | | | | | | |
1.390%, 09/20/2018 | | | 924 | | | | 924 | |
Capital Auto Receivables Asset
Trust, Ser 2015- 3, Cl A3 | | | | | | | | |
1.940%, 01/21/2020 | | | 1,731 | | | | 1,746 | |
Capital Auto Receivables Asset
Trust, Ser 2015- 3, Cl A1A | | | | | | | | |
1.390%, 02/20/2018 (C) | | | 4,064 | | | | 4,062 | |
Capital Auto Receivables Asset
Trust, Ser 2015- 4, Cl A2 | | | | | | | | |
1.620%, 03/20/2019 | | | 1,065 | | | | 1,065 | |
Capital Auto Receivables Asset
Trust, Ser 2015- 4, Cl A4 | | | | | | | | |
2.010%, 07/20/2020 | | | 874 | | | | 869 | |
Capital Auto Receivables Asset
Trust, Ser 2015- 4, Cl A3 | | | | | | | | |
1.830%, 03/20/2020 | | | 2,117 | | | | 2,120 | |
Capital Auto Receivables Asset
Trust, Ser 2016- 1, Cl A3 | | | | | | | | |
1.730%, 04/20/2020 | | | 2,120 | | | | 2,114 | |
Capital Auto Receivables Asset Trust, Ser 2016- 1, Cl A2A | | | | | | | | |
1.500%, 11/20/2018 | | | 2,605 | | | | 2,604 | |
Capital Auto Receivables Asset Trust, Ser 2016- 1, Cl A4 | | | | | | | | |
1.980%, 10/20/2020 | | | 955 | | | | 954 | |
Chrysler Capital Auto Receivables Trust,
Ser 2016-AA, Cl A3 | | | | | | | | |
1.770%, 10/15/2020 (C) | | | 3,302 | | | | 3,310 | |
| | | | |
| SEI Institutional Investments Trust / Annual Report / May 31, 2016 | | | 129 | |
SCHEDULE OF INVESTMENTS
Core Fixed Income Fund (Continued)
May 31, 2016
| | | | | | | | |
| Description | | Face Amount
($ Thousands) | | | Market Value
($ Thousands) | |
| | | | | | | | |
Ford Credit Auto Owner Trust, Ser 2013-B, Cl A3 | | | | | | | | |
0.570%, 10/15/2017 | | $ | 30 | | | $ | 30 | |
Ford Credit Auto Owner Trust, Ser 2013-C, Cl A3 | | | | | | | | |
0.820%, 12/15/2017 | | | 56 | | | | 56 | |
Ford Credit Auto Owner Trust, Ser 2014-1, Cl A | | | | | | | | |
2.260%, 11/15/2025 (C) | | | 6,212 | | | | 6,298 | |
Ford Credit Auto Owner
Trust, Ser 2014-C, Cl A3 | | | | | | | | |
1.060%, 05/15/2019 | | | 1,713 | | | | 1,713 | |
Ford Credit Auto Owner Trust, Ser 2015-1, Cl A | | | | | | | | |
2.120%, 07/15/2026 (C) | | | 3,465 | | | | 3,490 | |
Ford Credit Auto Owner
Trust, Ser 2015-2, Cl A | | | | | | | | |
2.440%, 01/15/2027 (C) | | | 3,487 | | | | 3,553 | |
Ford Credit Auto Owner Trust, Ser 2016-1, Cl A | | | | | | | | |
2.310%, 08/15/2027 (C) | | | 5,877 | | | | 5,940 | |
Ford Credit Auto Owner Trust, Ser 2016-A, Cl A2A | | | | | | | | |
1.120%, 12/15/2018 | | | 1,787 | | | | 1,787 | |
Ford Credit Auto Owner Trust, Ser 2016-B, Cl A4 | | | | | | | | |
1.520%, 08/15/2021 | | | 911 | | | | 908 | |
Ford Credit Floorplan Master Owner Trust,
Ser 2012-2, Cl A | | | | | | | | |
1.920%, 01/15/2019 | | | 2,653 | | | | 2,666 | |
Ford Credit Floorplan Master Owner Trust,
Ser 2013-5, Cl A1 | | | | | | | | |
1.500%, 09/15/2018 | | | 830 | | | | 831 | |
Ford Credit Floorplan Master Owner Trust,
Ser 2014-1, Cl A1 | | | | | | | | |
1.200%, 02/15/2019 | | | 767 | | | | 767 | |
Ford Credit Floorplan Master Owner Trust,
Ser 2014-2, Cl A | | | | | | | | |
0.935%, 02/15/2021 (A) | | | 180 | | | | 179 | |
Ford Credit Floorplan Master Owner Trust,
Ser 2014-4, Cl A1 | | | | | | | | |
1.400%, 08/15/2019 | | | 3,800 | | | | 3,801 | |
Ford Credit Floorplan Master Owner Trust,
Ser 2015-2, Cl A2 | | | | | | | | |
1.003%, 01/15/2022 (A) | | | 2,001 | | | | 1,988 | |
Harley-Davidson Motorcycle Trust, Ser 2013-1, Cl A3 | | | | | | | | |
0.650%, 07/16/2018 | | | 23 | | | | 23 | |
Hertz Vehicle Financing, Ser 2015-1A, Cl A | | | | | | | | |
2.730%, 03/25/2021 (C) | | | 6,137 | | | | 6,148 | |
Honda Auto Receivables Owner Trust,
Ser 2016-2, Cl A2 | | | | | | | | |
1.130%, 09/15/2018 | | | 2,645 | | | | 2,645 | |
Hyundai Auto Receivables Trust, Ser 2013-A, Cl A4 | | | | | | | | |
0.750%, 09/17/2018 | | | 452 | | | | 452 | |
| | | | | | | | |
| Description | | Face Amount
($ Thousands) | | | Market Value
($ Thousands) | |
| | | | | | | | |
Hyundai Auto Receivables Trust, Ser 2013-B, Cl A4 | | | | | | | | |
1.010%, 02/15/2019 | | $ | 568 | | | $ | 568 | |
Nissan Auto Receivables Owner Trust,
Ser 2013-C, Cl A3 | | | | | | | | |
0.670%, 08/15/2018 | | | 66 | | | | 66 | |
Nissan Auto Receivables Owner Trust,
Ser 2015-C, Cl A2A | | | | | | | | |
0.870%, 11/15/2018 | | | 3,600 | | | | 3,597 | |
Santander Drive Auto Receivables Trust,
Ser 2016-2, Cl A2A | | | | | | | | |
1.380%, 07/15/2019 | | | 2,782 | | | | 2,781 | |
| | | | | | | | |
| | | | | | | 111,428 | |
| | | | | | | | |
| | |
Credit Cards — 0.4% | | | | | | | | |
Capital One Multi-Asset Execution Trust,
Ser 2015-A1, Cl A1 | | | | | | | | |
1.390%, 01/15/2021 | | | 198 | | | | 198 | |
Capital One Multi-Asset Execution Trust,
Ser 2016-A1, Cl A1 | | | | | | | | |
0.900%, 02/15/2022 (A) | | | 6,768 | | | | 6,785 | |
Capital One Multi-Asset Execution Trust,
Ser 2016-A2, Cl A2 | | | | | | | | |
1.066%, 02/15/2024 (A) | | | 3,580 | | | | 3,589 | |
Citibank Credit Card Issuance Trust,
Ser 2014- A2, Cl A2 | | | | | | | | |
1.020%, 02/22/2019 | | | 250 | | | | 250 | |
Discover Card Execution Note Trust,
Ser 2016- A2, Cl A2 | | | | | | | | |
0.975%, 09/15/2021 (A) | | | 6,332 | | | | 6,369 | |
Synchrony Credit Card Master Note Trust,
Ser 2016-2, Cl A | | | | | | | | |
2.210%, 05/15/2024 | | | 4,698 | | | | 4,711 | |
World Financial Network Credit Card Master Trust, Ser 2014-C, Cl A | | | | | | | | |
1.540%, 08/16/2021 | | | 332 | | | | 333 | |
| | | | | | | | |
| | | | | | | 22,235 | |
| | | | | | | | |
| |
Mortgage Related Securities — 0.6% | | | | | |
Aames Mortgage Trust, Ser 2002-1, Cl A3 | | | | | | | | |
6.896%, 06/25/2032 | | | 42 | | | | 41 | |
Argent Securities Asset-Backed Pass-Through Certificates,
Ser 2004-W5, Cl AV2 | | | | | | | | |
1.479%, 04/25/2034 (A) | | | 1,113 | | | | 1,008 | |
Argent Securities Asset-Backed Pass-Through
Certificates, Ser 2005-W2, Cl A1 | | | | | | | | |
0.706%, 10/25/2035 (A) | | | 5,627 | | | | 5,367 | |
Asset-Backed Funding Certificates, Ser 2005- AQ1, Cl A4 | | | | | | | | |
5.010%, 06/25/2035 | | | 373 | | | | 381 | |
Asset-Backed Securities Home Equity Loan Trust,
Ser 2003-HE7, Cl M1 | | | | | | | | |
1.408%, 12/15/2033 (A) | | | 1,833 | | | | 1,758 | |
| | |
| 130 | | SEI Institutional Investments Trust / Annual Report / May 31, 2016 |
| | | | | | | | |
| Description | | Face Amount
($ Thousands) | | | Market Value
($ Thousands) | |
| | | | | | | | |
Asset-Backed Securities Home Equity Loan Trust,
Ser 2005-HE6, Cl M2 | | | | | | | | |
1.204%, 07/25/2035 (A) | | $ | 335 | | | $ | 333 | |
Centex Home Equity, Ser 2003-B, Cl AF6 | | | | | | | | |
3.173%, 06/25/2033 (A) | | | 21 | | | | 21 | |
Centex Home Equity, Ser 2003-B, Cl AF4 | | | | | | | | |
3.850%, 02/25/2032 | | | 95 | | | | 95 | |
Centex Home Equity, Ser 2005-A, Cl M1 | | | | | | | | |
0.926%, 01/25/2035 (A) | | | 5,346 | | | | 4,891 | |
Centex Home Equity, Ser 2006-A, Cl AV4 | | | | | | | | |
0.696%, 06/25/2036 (A) | | | 75 | | | | 70 | |
Citigroup Global Markets Mortgage Securities VII,
Ser 2003-UP1, Cl A | | | | | | | | |
3.950%, 04/25/2032 (C) | | | 53 | | | | 53 | |
Contimortgage Home Equity Trust,
Ser 1997-2, Cl A9 | | | | | | | | |
7.090%, 04/15/2028 | | | 0 | | | | — | |
Delta Funding Home Equity Loan Trust, Ser 1999-3, Cl A1A | | | | | | | | |
1.254%, 09/15/2029 (A) | | | 259 | | | | 237 | |
EMC Mortgage Loan Trust, Ser 2002-AA, Cl A1 | | | | | | | | |
1.386%, 05/25/2039 (A) (C) | | | 248 | | | | 237 | |
GSAA Trust, Ser 2005-6, Cl A3 | | | | | | | | |
0.809%, 06/25/2035 (A) | | | 1,842 | | | | 1,751 | |
JPMorgan Mortgage Acquisition, Ser 05-OPT1, Cl M1 | | | | | | | | |
0.889%, 06/25/2035 (A) | | | 2,020 | | | | 2,012 | |
Master Asset-Backed Securities Trust, | | | | | | | | |
Ser 2006-WMC3, Cl A4 | | | | | | | | |
0.599%, 08/25/2036 (A) | | | 954 | | | | 422 | |
Morgan Stanley ABS Capital I Trust,
Ser 2005-WMC3, Cl M4 | | | | | | | | |
1.369%, 03/25/2035 (A) | | | 5,500 | | | | 5,415 | |
Renaissance Home Equity Loan Trust,
Ser 2005-2, Cl AF3 | | | | | | | | |
4.499%, 08/25/2035 | | | 155 | | | | 155 | |
Saxon Asset Securities Trust,
Ser 2003-1, Cl AF6 | | | | | | | | |
4.795%, 06/25/2033 | | | 85 | | | | 85 | |
Security National Mortgage Loan Trust,
Ser 2007-1A, Cl 2A | | | | | | | | |
0.783%, 04/25/2037 (A) (C) | | | 404 | | | | 346 | |
Structured Asset Security Pass-Through Certificates, Ser 2002-AL1, Cl A2 | | | | | | | | |
3.450%, 02/25/2032 | | | 173 | | | | 172 | |
UCFC Home Equity Loan,
Ser 1998-D, Cl MF1 | | | | | | | | |
6.905%, 04/15/2030 | | | 313 | | | | 319 | |
Wells Fargo Home Equity Asset-Backed Securities Trust, Ser 2004-2, Cl A33 | | | | | | | | |
1.439%, 10/25/2034 (A) | | | 6,668 | | | | 6,478 | |
| | | | | | | | |
| | | | | | | 31,647 | |
| | | | | | | | |
| | | | | | | | |
| Description | | Face Amount
($ Thousands) | | | Market Value
($ Thousands) | |
| | | | | | | | |
| |
Other Asset-Backed Securities — 7.2% | | | | | |
Academic Loan Funding Trust, Ser 2012-1A, Cl A1 | | | | | | | | |
1.239%, 12/27/2022 (A) (C) | | $ | 194 | | | $ | 194 | |
Academic Loan Funding Trust, Ser 2013-1A, Cl A | | | | | | | | |
1.239%, 12/26/2044 (A) (C) | | | 521 | | | | 501 | |
Access Group, Ser 2006-1, Cl A2 | | | | | | | | |
0.503%, 08/25/2023 (A) | | | 718 | | | | 708 | |
Ally Master Owner Trust,
Ser 2012-4, Cl A | | | | | | | | |
1.720%, 07/15/2019 | | | 125 | | | | 125 | |
Ally Master Owner Trust, Ser 2012-5, Cl A | | | | | | | | |
1.540%, 09/15/2019 | | | 9,187 | | | | 9,198 | |
Ally Master Owner Trust, Ser 2014-3, Cl A | | | | | | | | |
1.330%, 03/15/2019 | | | 100 | | | | 100 | |
Ally Master Owner Trust, Ser 2014-4, Cl A2 | | | | | | | | |
1.430%, 06/17/2019 | | | 9,337 | | | | 9,343 | |
Ally Master Owner Trust, Ser 2014-5, Cl A1 | | | | | | | | |
0.925%, 10/15/2019 (A) | | | 3,384 | | | | 3,382 | |
Ally Master Owner Trust, Ser 2015-2, Cl A1 | | | | | | | | |
1.003%, 01/15/2021 (A) | | | 1,618 | | | | 1,608 | |
Ameriquest Mortgage Securities Asset-Backed Pass-Through Certificates,
Ser 2005-R5, Cl M1 | | | | | | | | |
0.876%, 07/25/2035 (A) | | | 75 | | | | 75 | |
Apidos CLO XVI, Ser 2014-16A, Cl B | | | | | | | | |
3.420%, 01/19/2025 (A) (C) | | | 500 | | | | 492 | |
Apidos CLO XVIII, Ser 2014-18A, Cl A1 | | | | | | | | |
2.033%, 07/22/2026 (A) (C) | | | 1,500 | | | | 1,497 | |
Arrowpoint CLO, Ser 2014-2A, Cl A1L | | | | | | | | |
2.002%, 03/12/2026 (A) (C) | | | 1,900 | | | | 1,887 | |
Babson CLO, Ser 2014-IIA, Cl A | | | | | | | | |
2.010%, 10/17/2026 (A) (C) | | | 1,000 | | | | 994 | |
Ballyrock CLO, Ser 2014-1A, Cl A1 | | | | | | | | |
2.104%, 10/20/2026 (A) (C) | | | 1,620 | | | | 1,610 | |
Bear Stearns Asset-Backed Securities Trust, Ser 2005-SD1, Cl 1A3 | | | | | | | | |
0.839%, 08/25/2043 (A) | | | 1,406 | | | | 1,386 | |
Brazos Education Loan Authority, Ser 2012-1, Cl A1 | | | | | | | | |
1.139%, 12/26/2035 (A) | | | 3,152 | | | | 3,061 | |
Brazos Higher Education Authority, Ser 2010-1, Cl A2 | | | | | | | | |
1.829%, 02/25/2035 (A) | | | 4,835 | | | | 4,662 | |
Brazos Higher Education Authority,
Ser 2011-1, Cl A2 | | | | | | | | |
1.429%, 02/25/2030 (A) | | | 1,705 | | | | 1,693 | |
Brazos Higher Education Authority,
Ser 2011-2, Cl A3 | | | | | | | | |
1.638%, 10/27/2036 (A) | | | 3,520 | | | | 3,308 | |
Business Loan Express Business Loan Trust, Ser 2004-A, Cl A | | | | | | | | |
0.876%, 02/25/2031 (A) (C) | | | 1,084 | | | | 1,032 | |
| | | | |
| SEI Institutional Investments Trust / Annual Report / May 31, 2016 | | | 131 | |
SCHEDULE OF INVESTMENTS
Core Fixed Income Fund (Continued)
May 31, 2016
| | | | | | | | |
| Description | | Face Amount
($ Thousands) | | | Market Value
($ Thousands) | |
| | | | | | | | |
Carlyle Global Market Strategies CLO,
Ser 2013-4A, Cl C | | | | | | | | |
3.422%, 10/15/2025 (A) (C) | | $ | 300 | | | $ | 297 | |
Carlyle Global Market Strategies Commodities Funding, Ser 2014-1A, Cl A | | | | | | | | |
2.221%, 10/15/2021 (A) (C) | | | 816 | | | | 808 | |
Cent CLO 17, Ser 2013-17A, Cl A1 | | | | | | | | |
1.937%, 01/30/2025 (A) (C) | | | 500 | | | | 497 | |
CenterPoint Energy Transition Bond LLC,
Ser 2008-A, Cl A1 | | | | | | | | |
4.192%, 02/01/2020 | | | 401 | | | | 403 | |
Chase Funding Mortgage Loan Asset-Backed Certificates, Ser 2003-6, Cl 1A5 | | | | | | | | |
5.199%, 11/25/2034 | | | 372 | | | | 386 | |
Chase Funding Mortgage Loan Asset-Backed Certificates, Ser 2003-6, Cl 1A7 | | | | | | | | |
4.277%, 11/25/2034 | | | 368 | | | | 375 | |
CIFC Funding, Ser 2014-1A, Cl B1 | | | | | | | | |
2.315%, 04/18/2025 (A) (C) | | | 1,500 | | | | 1,464 | |
CIFC Funding, Ser 2014-2A, Cl A1L | | | | | | | | |
2.105%, 05/24/2026 (A) (C) | | | 1,000 | | | | 996 | |
CIT Education Loan Trust,
Ser 2007-1, Cl A | | | | | | | | |
0.720%, 03/25/2042 (A) (C) | | | 2,692 | | | | 2,503 | |
Citicorp Residential Mortgage Securities,
Ser 2006-2, Cl A4 | | | | | | | | |
5.775%, 09/25/2036 | | | 1,821 | | | | 1,879 | |
Citicorp Residential Mortgage Securities,
Ser 2006-2, Cl A5 | | | | | | | | |
5.919%, 09/25/2036 | | | 6,465 | | | | 6,431 | |
Citicorp Residential Mortgage Securities,
Ser 2007-1, Cl A5 | | | | | | | | |
5.770%, 03/25/2037 | | | 990 | | | | 1,026 | |
Commonbond Student Loan Trust, Ser 2015-A, Cl A | | | | | | | | |
3.200%, 06/25/2032 (C) | | | 518 | | | | 519 | |
Community Funding CLO,
Ser 2015-1A, Cl A | | | | | | | | |
5.750%, 11/01/2027 (C) | | | 2,990 | | | | 2,864 | |
Conseco Financial, Ser 1997-2, Cl A6 | | | | | | | | |
7.240%, 06/15/2028 (A) | | | 3 | | | | 3 | |
Conseco Financial, Ser 1998-2, Cl A5 | | | | | | | | |
6.240%, 12/01/2028 (A) | | | 55 | | | | 57 | |
Consumer Credit Origination Loan Trust,
Ser 2015-1, Cl A | | | | | | | | |
2.820%, 03/15/2021 (C) | | | 115 | | | | 115 | |
COOF Securitization Trust, Ser 2014-1, Cl A, IO | | | | | | | | |
2.914%, 06/25/2040 (A) (C) | | | 951 | | | | 116 | |
Countrywide Asset-Backed Certificates,
Ser 2003-BC2, Cl 2A1 | | | | | | | | |
1.039%, 06/25/2033 (A) | | | 115 | | | | 99 | |
Countrywide Asset-Backed Certificates,
Ser 2004-6, Cl 1A1 | | | | | | | | |
0.979%, 12/25/2034 (A) | | | 4,763 | | | | 4,478 | |
| | | | | | | | |
| Description | | Face Amount
($ Thousands) | | | Market Value
($ Thousands) | |
| | | | | | | | |
Countrywide Asset-Backed Certificates,
Ser 2005-11, Cl MV1 | | | | | | | | |
0.909%, 02/25/2036 (A) | | $ | 3,361 | | | $ | 3,344 | |
Countrywide Asset-Backed Certificates,
Ser 2006-15, Cl A3 | | | | | | | | |
5.016%, 10/25/2046 (A) | | | 144 | | | | 138 | |
Countrywide Asset-Backed Certificates, Ser 2006-SD3, Cl A1 | | | | | | | | |
0.769%, 07/25/2036 (A) (C) | | | 244 | | | | 198 | |
Countrywide Asset-Backed Certificates,
Ser 2007-13, Cl 2A1 | | | | | | | | |
1.339%, 10/25/2047 (A) | | | 591 | | | | 505 | |
Countrywide Asset-Backed Certificates,
Ser 2007-4, Cl A4W | | | | | | | | |
5.260%, 04/25/2047 | | | 3,045 | | | | 2,929 | |
Credit-Based Asset Servicing and Securitization LLC, Ser 2003-CB3, Cl AF1 | | | | | | | | |
3.379%, 12/25/2032 | | | 60 | | | | 58 | |
Credit-Based Asset Servicing and Securitization LLC, Ser 2006-CB2, Cl AF2 | | | | | | | | |
3.544%, 12/25/2036 | | | 529 | | | | 359 | |
Credit-Based Asset Servicing and Securitization LLC, Ser 2006-CB2, Cl AF4 | | | | | | | | |
3.544%, 12/25/2036 | | | 793 | | | | 561 | |
CWABS Revolving Home Equity Loan Trust,
Ser 2004-K, Cl 2A | | | | | | | | |
0.735%, 02/15/2034 (A) | | | 246 | | | | 223 | |
CWHEQ Revolving Home Equity Loan Trust,
Ser 2007-A, Cl A | | | | | | | | |
0.555%, 04/15/2037 (A) | | | 6,098 | | | | 5,273 | |
Dryden 37 Senior Loan Fund,
Ser 2015-37A, Cl A | | | | | | | | |
2.128%, 04/15/2027 (A) (C) | | | 3,860 | | | | 3,860 | |
Educational Funding of the South,
Ser 2011-1, Cl A2 | | | | | | | | |
1.288%, 04/25/2035 (A) | | | 2,686 | | | | 2,631 | |
EFS Volunteer No. 3 LLC,
Ser 2012-1, Cl A3 | | | | | | | | |
1.439%, 04/25/2033 (A) (C) | | | 4,600 | | | | 4,413 | |
Equity One Mortgage Pass-Through Trust,
Ser 2003-2, Cl M1 | | | | | | | | |
5.050%, 09/25/2033 (A) | | | 92 | | | | 92 | |
First Franklin Mortgage Loan Trust,
Ser 2005- FFH3, Cl M1 | | | | | | | | |
0.956%, 09/25/2035 (A) | | | 3,453 | | | | 3,440 | |
Flatiron CLO, Ser 2013-1A, Cl B | | | | | | | | |
3.383%, 01/17/2026 (A) (C) | | | 500 | | | | 482 | |
Flatiron CLO, Ser 2014-1A, Cl A1 | | | | | | | | |
2.000%, 07/17/2026 (A) (C) | | | 3,510 | | | | 3,494 | |
Ford Credit Floorplan Master Owner Trust,
Ser 2012-5, Cl A | | | | | | | | |
1.490%, 09/15/2019 | | | 274 | | | | 275 | |
| | |
| 132 | | SEI Institutional Investments Trust / Annual Report / May 31, 2016 |
| | | | | | | | |
| Description | | Face Amount
($ Thousands) | | | Market Value
($ Thousands) | |
| | | | | | | | |
Ford Credit Floorplan Master Owner Trust,
Ser 2015-1, Cl A1 | | | | | | | | |
1.420%, 01/15/2020 | | $ | 119 | | | $ | 119 | |
Ford Credit Floorplan Master Owner Trust,
Ser 2016-1, Cl A2 | | | | | | | | |
1.335%, 02/15/2021 (A) | | | 1,365 | | | | 1,372 | |
Galaxy XIX CLO, Ser 2015-19A, Cl A1A | | | | | | | | |
2.169%, 01/24/2027 (A) (C) | | | 1,750 | | | | 1,747 | |
Global SC Finance II SRL, Ser 2014-1A, Cl A2 | | | | | | | | |
3.090%, 07/17/2029 (C) | | | 2,250 | | | | 2,097 | |
Green Tree Financial,
Ser 2008-MH1, Cl A2 | | | | | | | | |
8.970%, 04/25/2038 (A) (C) | | | 537 | | | | 544 | |
Green Tree Financial,
Ser 2008-MH1, Cl A3 | | | | | | | | |
8.970%, 04/25/2038 (A) (C) | | | 447 | | | | 454 | |
Greenpoint Manufactured Housing,
Ser 2001- 2, Cl IA2 | | | | | | | | |
3.942%, 02/20/2032 (A) | | | 675 | | | | 594 | |
Greenpoint Manufactured Housing,
Ser 2001- 2, Cl IIA2 | | | | | | | | |
3.936%, 03/13/2032 (A) | | | 1,100 | | | | 968 | |
GSAMP Trust,
Ser 2006-HE2, Cl A3 | | | | | | | | |
0.706%, 03/25/2046 (A) | | | 8,000 | | | | 7,430 | |
GT Loan Financing I,
Ser 2013-1A, Cl A | | | | | | | | |
1.904%, 10/28/2024 (A) (C) | | | 1,250 | | | | 1,241 | |
Higher Education Funding I,
Ser 2014-1, Cl A | | | | | | | | |
1.679%, 05/25/2034 (A) (C) | | | 3,405 | | | | 3,304 | |
HSI Asset Securitization Trust,
Ser 2006-OPT3, Cl 3A3 | | | | | | | | |
0.619%, 02/25/2036 (A) | | | 896 | | | | 854 | |
ING IM CLO, Ser 2014-1A, Cl A1 | | | | | | | | |
2.133%, 04/18/2026 (A) (C) | | | 3,900 | | | | 3,883 | |
JGWPT XXX LLC, Ser 2013-3A, Cl A | | | | | | | | |
4.080%, 01/17/2073 (C) | | | 2,026 | | | | 2,096 | |
JGWPT XXXI LLC, Ser 2014-1A, Cl A | | | | | | | | |
3.960%, 03/15/2063 (C) | | | 1,031 | | | | 1,063 | |
JGWPT XXXII LLC, Ser 2014-2A, Cl A | | | | | | | | |
3.610%, 01/17/2073 (C) | | | 2,704 | | | | 2,643 | |
JGWPT XXXIII LLC, Ser 2014-3A, Cl A | | | | | | | | |
3.500%, 06/15/2077 (C) | | | 1,260 | | | | 1,245 | |
KGS-Alpha SBA COOF Trust,
Ser 2012-A, Cl A, IO | | | | | | | | |
0.976%, 08/25/2038 (A) (C) | | | 4,707 | | | | 129 | |
KGS-Alpha SBA COOF Trust,
Ser 2014-2, Cl A, IO | | | | | | | | |
3.055%, 04/25/2040 (A) (C) | | | 728 | | | | 92 | |
Lehman ABS Manufactured Housing Contract Trust, Ser 2001-B, Cl A4 | | | | | | | | |
5.270%, 04/15/2040 | | | 126 | | | | 130 | |
Long Beach Mortgage Loan Trust,
Ser 2005-1, Cl M2 | | | | | | | | |
1.234%, 02/25/2035 (A) | | | 4,697 | | | | 4,690 | |
Magnetite VI, Ser 2015-6A, Cl CR | | | | | | | | |
3.234%, 09/15/2023 (A) (C) | | | 1,500 | | | | 1,488 | |
Mid-State Trust,
Ser 2003-11, Cl A1 | | | | | | | | |
4.864%, 07/15/2038 | | | 2,571 | | | | 2,738 | |
| | | | | | | | |
| Description | | Face Amount
($ Thousands) | | | Market Value
($ Thousands) | |
| | | | | | | | |
Mid-State Trust, Ser 2004-1, Cl A | | | | | | | | |
6.005%, 08/15/2037 | | $ | 378 | | | $ | 402 | |
Mid-State Trust, Ser 2006-1, Cl A | | | | | | | | |
5.787%, 10/15/2040 (C) | | | 4,513 | | | | 4,826 | |
Navient Private Education Loan Trust,
Ser 2014-AA, Cl A2B | | | | | | | | |
1.685%, 02/15/2029 (A) (C) | | | 1,410 | | | | 1,403 | |
Navient Private Education Loan Trust,
Ser 2014-CTA, Cl A | | | | | | | | |
1.135%, 09/16/2024 (A) (C) | | | 1,879 | | | | 1,862 | |
Navient Private Education Loan Trust,
Ser 2015-AA, Cl A2A | | | | | | | | |
2.650%, 12/15/2028 (C) | | | 1,191 | | | | 1,170 | |
Navient Private Education Loan Trust,
Ser 2015-AA, Cl A2B | | | | | | | | |
1.635%, 12/15/2028 (A) (C) | | | 548 | | | | 534 | |
Navient Private Education Loan Trust,
Ser 2015-CA, Cl B | | | | | | | | |
3.250%, 05/15/2040 (C) | | | 1,035 | | | | 1,007 | |
Navient Private Education Loan Trust,
Ser 2015-CA, Cl A | | | | | | | | |
1.933%, 01/16/2035 (A)(C) | | | 1,559 | | | | 1,564 | |
Navient Private Education Loan Trust,
Ser 2016-AA, Cl A2A | | | | | | | | |
3.910%, 12/15/2045 (C) | | | 2,418 | | | | 2,429 | |
Navient Private Education Loan Trust,
Ser 2016-AA, Cl A1 | | | | | | | | |
1.533%, 12/15/2025 (A) (C) | | | 1,674 | | | | 1,674 | |
Navient Private Education Loan Trust,
Ser 2016-AA, Cl A2B | | | | | | | | |
2.583%, 12/15/2045 (A)(C) | | | 1,889 | | | | 1,860 | |
Navient Student Loan Trust,
Ser 2014-1, Cl A3 | | | | | | | | |
0.949%, 06/25/2031 (A) | | | 5,330 | | | | 5,107 | |
Navient Student Loan Trust, Ser 2014-2, Cl A | | | | | | | | |
1.079%, 03/25/2083 (A) | | | 6,133 | | | | 5,835 | |
Navient Student Loan Trust, Ser 2014-3, Cl A | | | | | | | | |
1.059%, 03/25/2083 (A) | | | 6,165 | | | | 5,825 | |
Navient Student Loan Trust, Ser 2014-4, Cl A | | | | | | | | |
1.059%, 03/25/2083 (A) | | | 4,354 | | | | 4,112 | |
Navient Student Loan Trust, Ser 2014-8, Cl A3 | | | | | | | | |
1.046%, 05/27/2031 (A) | | | 300 | | | | 283 | |
Navient Student Loan Trust, Ser 2014-8, Cl B | | | | | | | | |
1.939%, 07/26/2049 (A) | | | 134 | | | | 118 | |
Navient Student Loan Trust, Ser 2014-8, Cl A2 | | | | | | | | |
0.879%, 04/25/2023 (A) | | | 1,162 | | | | 1,150 | |
Nelnet Student Loan Trust, Ser 2004-3, Cl A5 | | | | | | | | |
0.818%, 10/27/2036 (A) | | | 1,999 | | | | 1,906 | |
Nelnet Student Loan Trust, Ser 2004-4, Cl A5 | | | | | | | | |
0.798%, 01/25/2037 (A) | | | 1,712 | | | | 1,635 | |
Nelnet Student Loan Trust, Ser 2005-1, Cl A5 | | | | | | | | |
0.748%, 10/25/2033 (A) | | | 2,231 | | | | 2,085 | |
Nelnet Student Loan Trust, Ser 2005-2, Cl A5 | | | | | | | | |
0.724%, 03/23/2037 (A) | | | 1,848 | | | | 1,735 | |
| | | | |
| SEI Institutional Investments Trust / Annual Report / May 31, 2016 | | | 133 | |
SCHEDULE OF INVESTMENTS
Core Fixed Income Fund (Continued)
May 31, 2016
| | | | | | | | |
| Description | | Face Amount
($ Thousands) | | | Market Value
($ Thousands) | |
| | | | | | | | |
Nelnet Student Loan Trust, Ser 2005-3, Cl A5 | | | | | | | | |
0.744%, 12/24/2035 (A) | | $ | 6,032 | | | $ | 5,672 | |
Nelnet Student Loan Trust, Ser 2005-4, Cl A4 | | | | | | | | |
0.804%, 03/22/2032 (A) | | | 742 | | | | 655 | |
Nelnet Student Loan Trust, Ser 2010-4A, Cl A | | | | | | | | |
1.239%, 04/25/2046 (A) (C) | | | 747 | | | | 740 | |
Nelnet Student Loan Trust, Ser 2014-4A, Cl A2 | | | | | | | | |
1.389%, 11/25/2043 (A) (C) | | | 3,735 | | | | 3,359 | |
Nelnet Student Loan Trust, Ser 2015-2A, Cl A2 | | | | | | | | |
1.046%, 09/25/2042 (A) (C) | | | 6,575 | | | | 6,198 | |
OHA Loan Funding, Ser 2014-1A, Cl A1 | | | | | | | | |
2.164%, 10/20/2026 (A) (C) | | | 1,500 | | | | 1,500 | |
OZLM VII, Ser 2014-7A, Cl A1A | | | | | | | | |
2.053%, 07/17/2026 (A) (C) | | | 2,000 | | | | 1,983 | |
OZLM VIII, Ser 2014-8A, Cl A1A | | | | | | | | |
2.060%, 10/17/2026 (A) (C) | | | 2,000 | | | | 1,987 | |
Park Place Securities Asset-Backed Pass- Through Certificates, Ser 2004-WCW1, Cl M2 | | | | | | | | |
1.459%, 09/25/2034 (A) | | | 132 | | | | 132 | |
Park Place Securities Asset-Backed Pass- Through Certificates, Ser 2005-WCH1, Cl M2 | | | | | | | | |
1.219%, 01/25/2036 (A) | | | 1,201 | | | | 1,195 | |
Park Place Securities Asset-Backed Pass- Through Certificates, Ser 2005-WCW2, Cl M1 | | | | | | | | |
0.939%, 07/25/2035 (A) | | | 7,063 | | | | 6,983 | |
RAMP Trust, Ser 2002-RS4, Cl AI5 | | | | | | | | |
6.163%, 08/25/2032 | | | 3 | | | | 3 | |
RAMP Trust, Ser 2003-RS10, Cl AI6 | | | | | | | | |
5.801%, 11/25/2033 | | | 415 | | | | 439 | |
RAMP Trust, Ser 2003-RS11, Cl AI6A | | | | | | | | |
5.965%, 12/25/2033 | | | 381 | | | | 410 | |
RAMP Trust, Ser 2006-RZ1, Cl A3 | | | | | | | | |
0.739%, 03/25/2036 (A) | | | 324 | | | | 321 | |
RAMP Trust, Ser 2006-RZ3, Cl A2 | | | | | | | | |
0.606%, 08/25/2036 (A) | | | 1,418 | | | | 1,408 | |
RSB BondCo LLC, Ser 2007-A, Cl A3 | | | | | | | | |
5.820%, 06/28/2019 | | | 1,681 | | | | 1,726 | |
Saranac CLO II, Ser 2014-2A, Cl B | | | | | | | | |
2.686%, 02/20/2025 (A) (C) | | | 1,750 | | | | 1,694 | |
SBA Small Business Investment,
Ser 2015-10A, Cl 1 | | | | | | | | |
2.517%, 03/10/2025 | | | 654 | | | | 668 | |
Shackleton CLO, Ser 2013-4A, Cl B1 | | | | | | | | |
2.622%, 01/13/2025 (A) (C) | | | 1,450 | | | | 1,424 | |
SLC Student Loan Trust,
Ser 2007-2, Cl A2 | | | | | | | | |
0.762%, 05/15/2028 (A) | | | 689 | | | | 680 | |
SLM Private Education Loan Trust,
Ser 2012-B, Cl A2 | | | | | | | | |
3.480%, 10/15/2030 (C) | | | 917 | | | | 933 | |
| | | | | | | | |
| Description | | Face Amount
($ Thousands) | | | Market Value
($ Thousands) | |
| | | | | | | | |
SLM Private Education Loan Trust, Ser 2012-D, Cl A2 | | | | | | | | |
2.950%, 02/15/2046 (C) | | $ | 3,042 | | | $ | 3,063 | |
SLM Private Education Loan Trust,
Ser 2013-A, Cl A2B | | | | | | | | |
1.483%, 05/17/2027 (A)(C) | | | 1,342 | | | | 1,342 | |
SLM Private Education Loan Trust,
Ser 2013-B, Cl A2A | | | | | | | | |
1.850%, 06/17/2030 (C) | | | 2,622 | | | | 2,601 | |
SLM Private Education Loan Trust,
Ser 2013-B, Cl A1 | | | | | | | | |
1.083%, 07/15/2022 (A)(C) | | | 668 | | | | 668 | |
SLM Private Education Loan Trust,
Ser 2013-C, Cl A2A | | | | | | | | |
2.940%, 10/15/2031 (C) | | | 669 | | | | 683 | |
SLM Private Education Loan Trust,
Ser 2014-A, Cl A2A | | | | | | | | |
2.590%, 01/15/2026 (C) | | | 1,128 | | | | 1,132 | |
SLM Private Education Loan Trust,
Ser 2014-A, Cl A1 | | | | | | | | |
1.034%, 07/15/2022 (A) (C) | | | 1,222 | | | | 1,222 | |
SLM Student Loan Trust, Ser 2003-12, Cl B | | | | | | | | |
1.224%, 03/15/2038 (A) | | | 1,590 | | | | 1,279 | |
SLM Student Loan Trust, Ser 2003-4, Cl A5D | | | | | | | | |
1.384%, 03/15/2033 (A) (C) | | | 1,669 | | | | 1,585 | |
SLM Student Loan Trust, Ser 2004-10, Cl A6A | | | | | | | | |
1.188%, 04/27/2026 (A) (C) | | | 3,200 | | | | 3,169 | |
SLM Student Loan Trust, Ser 2004-3, Cl A5 | | | | | | | | |
0.808%, 07/25/2023 (A) | | | 2,144 | | | | 2,095 | |
SLM Student Loan Trust, Ser 2004-8, Cl B | | | | | | | | |
1.098%, 01/25/2040 (A) | | | 421 | | | | 363 | |
SLM Student Loan Trust, Ser 2004-8A, Cl A5 | | | | | | | | |
1.138%, 04/25/2024 (A) (C) | | | 4,539 | | | | 4,503 | |
SLM Student Loan Trust, Ser 2005-5, Cl A3 | | | | | | | | |
0.738%, 04/25/2025 (A) | | | 199 | | | | 198 | |
SLM Student Loan Trust, Ser 2005-5, Cl A4 | | | | | | | | |
0.778%, 10/25/2028 (A) | | | 2,900 | | | | 2,731 | |
SLM Student Loan Trust, Ser 2005-6, Cl A6 | | | | | | | | |
0.778%, 10/27/2031 (A) | | | 4,167 | | | | 3,894 | |
SLM Student Loan Trust, Ser 2005-6, Cl A5B | | | | | | | | |
1.838%, 07/27/2026 (A) | | | 789 | | | | 793 | |
SLM Student Loan Trust, Ser 2005-7, Cl A4 | | | | | | | | |
0.788%, 10/25/2029 (A) | | | 1,657 | | | | 1,569 | |
SLM Student Loan Trust, Ser 2005-9, Cl A5 | | | | | | | | |
0.758%, 01/27/2025 (A) | | | 450 | | | | 449 | |
SLM Student Loan Trust, Ser 2006-2, Cl A6 | | | | | | | | |
0.808%, 01/25/2041 (A) | | | 4,250 | | | | 3,827 | |
SLM Student Loan Trust, Ser 2006-3, Cl A5 | | | | | | | | |
0.738%, 01/25/2021 (A) | | | 2,551 | | | | 2,428 | |
SLM Student Loan Trust, Ser 2006-8, Cl A6 | | | | | | | | |
0.798%, 01/25/2041 (A) | | | 4,250 | | | | 3,662 | |
SLM Student Loan Trust, Ser 2007-2, Cl A4 | | | | | | | | |
0.698%, 07/25/2022 (A) | | | 2,920 | | | | 2,723 | |
| | |
| 134 | | SEI Institutional Investments Trust / Annual Report / May 31, 2016 |
| | | | | | | | |
| Description | | Face Amount
($ Thousands) | | | Market Value
($ Thousands) | |
| | | | | | | | |
SLM Student Loan Trust, Ser 2007-2, Cl B | | | | | | | | |
0.808%, 07/25/2025 (A) | | $ | 934 | | | $ | 740 | |
SLM Student Loan Trust, Ser 2007-2, Cl A3 | | | | | | | | |
0.678%, 01/25/2019 (A) | | | 3,171 | | | | 3,118 | |
SLM Student Loan Trust, Ser 2007-3, Cl A3 | | | | | | | | |
0.678%, 04/25/2019 (A) | | | 3,355 | | | | 3,323 | |
SLM Student Loan Trust, Ser 2007-5, Cl A5 | | | | | | | | |
0.718%, 01/25/2024 (A) | | | 896 | | | | 887 | |
SLM Student Loan Trust, Ser 2007-6, Cl B | | | | | | | | |
1.488%, 04/27/2043 (A) | | | 943 | | | | 803 | |
SLM Student Loan Trust, Ser 2008-2, Cl B | | | | | | | | |
1.838%, 01/25/2083 (A) | | | 1,155 | | | | 996 | |
SLM Student Loan Trust, Ser 2008-3, Cl B | | | | | | | | |
1.838%, 04/26/2083 (A) | | | 1,155 | | | | 980 | |
SLM Student Loan Trust, Ser 2008-4, Cl B | | | | | | | | |
2.488%, 04/25/2029 (A) | | | 1,155 | | | | 1,039 | |
SLM Student Loan Trust, Ser 2008-5, Cl A4 | | | | | | | | |
2.338%, 07/25/2023 (A) | | | 2,887 | | | | 2,900 | |
SLM Student Loan Trust, Ser 2008-5, Cl B | | | | | | | | |
2.488%, 07/25/2029 (A) | | | 1,155 | | | | 1,042 | |
SLM Student Loan Trust, Ser 2008-6, Cl B | | | | | | | | |
2.488%, 07/26/2083 (A) | | | 1,155 | | | | 1,084 | |
SLM Student Loan Trust, Ser 2008-7, Cl B | | | | | | | | |
2.488%, 07/26/2083 (A) | | | 1,155 | | | | 1,015 | |
SLM Student Loan Trust, Ser 2008-8, Cl B | | | | | | | | |
2.888%, 10/25/2029 (A) | | | 1,155 | | | | 1,108 | |
SLM Student Loan Trust, Ser 2008-9, Cl A | | | | | | | | |
2.138%, 04/25/2023 (A) | | | 5,301 | | | | 5,275 | |
SLM Student Loan Trust, Ser 2008-9, Cl B | | | | | | | | |
2.888%, 10/25/2083 (A) | | | 1,155 | | | | 1,100 | |
SLM Student Loan Trust, Ser 2010-1, Cl A | | | | | | | | |
0.846%, 03/25/2025 (A) | | | 270 | | | | 262 | |
SLM Student Loan Trust, Ser 2011-2, Cl A2 | | | | | | | | |
1.639%, 10/25/2034 (A) | | | 495 | | | | 479 | |
SLM Student Loan Trust, Ser 2012-6, Cl A3 | | | | | | | | |
1.189%, 05/26/2026 (A) | | | 1,094 | | | | 1,061 | |
SLM Student Loan Trust, Ser 2012-6, Cl B | | | | | | | | |
1.446%, 04/27/2043 (A) | | | 1,862 | | | | 1,662 | |
SLM Student Loan Trust, Ser 2012-C, Cl A1 | | | | | | | | |
1.536%, 08/15/2023 (A) (C) | | | 290 | | | | 290 | |
SLM Student Loan Trust, Ser 2012-E, Cl A2B | | | | | | | | |
2.183%, 06/15/2045 (A) (C) | | | 1,009 | | | | 1,017 | |
SLM Student Loan Trust, Ser 2012-E, Cl A1 | | | | | | | | |
1.183%, 10/16/2023 (A) (C) | | | 384 | | | | 384 | |
SLM Student Loan Trust, Ser 2013-1, Cl B | | | | | | | | |
2.246%, 11/25/2043 (A) | | | 487 | | | | 440 | |
SLM Student Loan Trust, Ser 2013-3, Cl B | | | | | | | | |
1.946%, 09/25/2043 (A) | | | 768 | | | | 697 | |
SLM Student Loan Trust, Ser 2013-4, Cl A | | | | | | | | |
0.989%, 06/25/2027 (A) | | | 2,235 | | | | 2,142 | |
SLM Student Loan Trust, Ser 2013-6, Cl A3 | | | | | | | | |
1.089%, 06/25/2055 (A) | | | 2,974 | | | | 2,893 | |
| | | | | | | | |
| Description | | Face Amount
($ Thousands) | | | Market Value
($ Thousands) | |
| | | | | | | | |
SLM Student Loan Trust, Ser 2013-A, Cl A2A | | | | | | | | |
1.770%, 05/17/2027 (C) | | $ | 621 | | | $ | 616 | |
SLM Student Loan Trust, Ser 2013-M1, Cl M1 | | | | | | | | |
3.500%, 10/28/2029 (C) | | | 2,750 | | | | 2,700 | |
SLM Student Loan Trust, Ser 2014-2, Cl A3 | | | | | | | | |
1.036%, 03/25/2055 (A) | | | 9,222 | | | | 8,961 | |
SMB Private Education Loan Trust,
Ser 2015-A, Cl A2A | | | | | | | | |
2.490%, 06/15/2027 (C) | | | 2,370 | | | | 2,318 | |
SMB Private Education Loan Trust, Ser 2015-A, Cl A2B | | | | | | | | |
1.433%, 06/15/2027 (A) (C) | | | 2,190 | | | | 2,103 | |
SMB Private Education Loan Trust,
Ser 2015-A, Cl A1 | | | | | | | | |
1.033%, 07/17/2023 (A) (C) | | | 409 | | | | 408 | |
SMB Private Education Loan Trust,
Ser 2015-B, Cl A2A | | | | | | | | |
2.980%, 07/15/2027 (C) | | | 3,367 | | | | 3,433 | |
SMB Private Education Loan Trust,
Ser 2015-B, Cl A2B | | | | | | | | |
1.633%, 07/15/2027 (A) (C) | | | 2,233 | | | | 2,212 | |
SMB Private Education Loan Trust,
Ser 2015-C, Cl A2A | | | | | | | | |
2.750%, 07/15/2027 (C) | | | 2,823 | | | | 2,823 | |
SMB Private Education Loan Trust,
Ser 2015-C, Cl A1 | | | | | | | | |
1.333%, 07/15/2022 (A) (C) | | | 1,613 | | | | 1,615 | |
SMB Private Education Loan Trust,
Ser 2015-C, Cl A2B | | | | | | | | |
1.833%, 07/15/2027 (A) (C) | | | 954 | | | | 950 | |
SMB Private Education Loan
Trust, Ser 2016-A, Cl A2A | | | | | | | | |
2.700%, 05/15/2031 (C) | | | 3,903 | | | | 3,904 | |
SMB Private Education Loan Trust,
Ser 2016-A, Cl A2B | | | | | | | | |
1.936%, 05/15/2031 (A) (C) | | | 2,981 | | | | 2,981 | |
SMB Private Education Loan Trust,
Ser 2016-A, Cl A1 | | | | | | | | |
1.136%, 05/15/2023 (A) (C) | | | 2,054 | | | | 2,054 | |
Structured Asset Investment Loan Trust,
Ser 2004-8, Cl A2 | | | | | | | | |
0.989%, 09/25/2034 (A) | | | 3,364 | | | | 3,217 | |
Structured Asset Securities Mortgage Loan Trust,
Ser 2005-WF2, Cl A3 | | | | | | | | |
1.039%, 05/25/2035 (A) | | | 5,828 | | | | 5,827 | |
Symphony CLO XVII,
Ser 2016-17A, Cl A1 | | | | | | | | |
2.222%, 04/15/2028 (A) (C) | | | 1,250 | | | | 1,245 | |
Trade MAPS 1,
Ser 2013-1A, Cl A | | | | | | | | |
1.138%, 12/10/2018 (A) (C) | | | 3,109 | | | | 3,096 | |
Truman Capital Mortgage Loan Trust,
Ser 2014- NPL2, Cl A2 | | | | | | | | |
4.250%, 06/25/2054 (C) | | | 79 | | | | 79 | |
| | | | |
| SEI Institutional Investments Trust / Annual Report / May 31, 2016 | | | 135 | |
SCHEDULE OF INVESTMENTS
Core Fixed Income Fund (Continued)
May 31, 2016
| | | | | | | | |
| Description | | Face Amount
($ Thousands) | | | Market Value
($ Thousands) | |
| | | | | | | | |
U.S. Small Business Administration,
Ser 2013-20L, Cl 1 | | | | | | | | |
3.380%, 12/01/2033 | | $ | 1,068 | | | $ | 1,135 | |
Venture XV CLO, Ser 2013-15A, Cl B1 | | | | | | | | |
2.672%, 07/15/2025 (A)(C) | | | 800 | | | | 795 | |
Venture XVI CLO, Ser 2014-16A, Cl A1L | | | | | | | | |
2.122%, 04/15/2026 (A)(C) | | | 4,020 | | | | 3,999 | |
Voya CLO, Ser 2014-2A, Cl A1 | | | | | | | | |
2.083%, 07/17/2026 (A)(C) | | | 500 | | | | 498 | |
Zais CLO 2, Ser 2014-2A, Cl A1B | | | | | | | | |
3.570%, 07/25/2026 (C) | | | 3,000 | | | | 2,998 | |
Ziggurat CLO, Ser 2014-1A, Cl B1 | | | | | | | | |
2.733%, 10/17/2026 (A)(C) | | | 1,000 | | | | 965 | |
| | | | | | | | |
| | | | | | | 377,648 | |
| | | | | | | | |
Total Asset-Backed Securities
(Cost $543,985) ($ Thousands) | | | | | | | 542,958 | |
| | | | | | | | |
| |
SOVEREIGN DEBT(C) — 3.0% | | | | | |
Abu Dhabi Government International Bond | | | | | | | | |
3.125%, 05/03/2026 (B)(C) | | | 2,925 | | | | 2,933 | |
2.125%, 05/03/2021 (B)(C) | | | 2,890 | | | | 2,850 | |
China Government Bond | | | | | | | | |
3.390%, 05/21/2025 | | CNY | 5,000 | | | | 743 | |
3.380%, 11/21/2024 | | | 3,000 | | | | 446 | |
3.310%, 11/30/2025 | | | 23,000 | | | | 3,350 | |
FMS Wertmanagement AoeR | | | | | | | | |
1.000%, 11/21/2017 | | $ | 1,660 | | | | 1,658 | |
Hashemite Kingdom of
Jordan Government AID Bond | | | | | | | | |
2.578%, 06/30/2022 | | | 2,176 | | | | 2,279 | |
Israel Government AID Bond | | | | | | | | |
5.500%, 09/18/2033 | | | 1,000 | | | | 1,361 | |
3.630%, 11/01/2024 (B) | | | 1,000 | | | | 816 | |
3.098%, 02/15/2025 (B) | | | 1,000 | | | | 808 | |
3.058%, 08/15/2025 (B) | | | 1,000 | | | | 794 | |
Israel Government International Bond | | | | | | | | |
4.500%, 01/30/2043 | | | 955 | | | | 1,025 | |
2.875%, 03/16/2026 | | | 925 | | | | 929 | |
Japan Finance Organization for Municipalities | | | | | | | | |
4.000%, 01/13/2021 | | | 3,600 | | | | 3,915 | |
Japan Treasury Discount Bill | | | | | | | | |
0.000%, 06/10/2016 (B) | | JPY | 940,000 | | | | 8,476 | |
0.000%, 06/27/2016 (B) | | | 850,000 | | | | 7,666 | |
0.000%, 07/19/2016 (B) | | | 820,000 | | | | 7,395 | |
0.000%, 07/25/2016 (B) | | | 830,000 | | | | 7,486 | |
0.000%, 08/01/2016 (B) | | | 840,000 | | | | 7,577 | |
0.000%, 08/08/2016 (B) | | | 830,000 | | | | 7,487 | |
Province of Ontario Canada | | | | | | | | |
1.625%, 01/18/2019 | | $ | 2,250 | | | | 2,263 | |
| | | | | | | | |
| Description | | Face Amount
($ Thousands) | | | Market Value
($ Thousands) | |
| | | | | | | | |
Province of Quebec Canada | | | | | | | | |
2.625%, 02/13/2023 | | $ | 5,600 | | | $ | 5,767 | |
2.500%, 04/20/2026 | | | 1,605 | | | | 1,604 | |
Qatar Government International Bond | | | | | | | | |
4.625%, 06/02/2046 (C) | | | 660 | | | | 663 | |
3.250%, 06/02/2026 (C) | | | 2,710 | | | | 2,670 | |
2.375%, 06/02/2021 (C) | | | 2,765 | | | | 2,731 | |
Republic of Colombia | | | | | | | | |
5.625%, 02/26/2044 | | | 6,830 | | | | 6,762 | |
5.000%, 06/15/2045 | | | 200 | | | | 185 | |
Republic of Indonesia MTN | | | | | | | | |
5.875%, 03/13/2020 | | | 190 | | | | 210 | |
5.875%, 01/15/2024 (C) | | | 1,264 | | | | 1,429 | |
4.875%, 05/05/2021 | | | 500 | | | | 535 | |
3.750%, 04/25/2022 (C) | | | 360 | | | | 366 | |
3.750%, 04/25/2022 | | | 500 | | | | 507 | |
Republic of Paraguay | | | | | | | | |
6.100%, 08/11/2044 (C) | | | 500 | | | | 510 | |
5.000%, 04/15/2026 (C) | | | 1,425 | | | | 1,464 | |
Republic of Peru | | | | | | | | |
6.550%, 03/14/2037 | | | 300 | | | | 377 | |
5.625%, 11/18/2050 | | | 2,460 | | | | 2,798 | |
Republic of Poland | | | | | | | | |
5.000%, 03/23/2022 | | | 380 | | | | 425 | |
4.000%, 01/22/2024 | | | 7,630 | | | | 8,156 | |
Republic of Slovenia | | | | | | | | |
5.850%, 05/10/2023 (C) | | | 1,560 | | | | 1,798 | |
5.500%, 10/26/2022 (C) | | | 996 | | | | 1,127 | |
5.250%, 02/18/2024 (C) | | | 3,600 | | | | 4,046 | |
Republic of Turkey | | | | | | | | |
5.625%, 03/30/2021 | | | 562 | | | | 600 | |
Russian Foreign Bond - Eurobond | | | | | | | | |
7.500%, 03/31/2030 | | | 2,953 | | | | 3,599 | |
4.500%, 04/04/2022 | | | 2,400 | | | | 2,493 | |
United Mexican States MTN | | | | | | | | |
6.050%, 01/11/2040 | | | 394 | | | | 463 | |
5.750%, 10/12/2110 | | | 1,857 | | | | 1,866 | |
5.550%, 01/21/2045 | | | 20,210 | | | | 22,484 | |
4.750%, 03/08/2044 | | | 726 | | | | 720 | |
4.125%, 01/21/2026 | | | 3,787 | | | | 3,948 | |
4.000%, 10/02/2023 | | | 84 | | | | 88 | |
3.600%, 01/30/2025 | | | 3,190 | | | | 3,218 | |
| | | | | | | | |
Total Sovereign Debt
(Cost $150,485) ($ Thousands) | | | | | | | 155,866 | |
| | | | | | | | |
|
U.S. GOVERNMENT AGENCY OBLIGATIONS — 2.3% | |
FHLB | | | | | | | | |
5.625%, 06/13/2016 | | | 740 | | | | 741 | |
1.875%, 03/13/2020 | | | 75 | | | | 77 | |
1.250%, 06/28/2030 (D) | | | 7,510 | | | | 7,507 | |
| | |
| 136 | | SEI Institutional Investments Trust / Annual Report / May 31, 2016 |
| | | | | | | | |
| Description | | Face Amount
($ Thousands) | | | Market Value
($ Thousands) | |
| | | | | | | | |
0.875%, 05/24/2017 | | $ | 100 | | | $ | 100 | |
FHLB DN (H) | | | | | | | | |
0.350%, 07/07/2016 | | | 31,050 | | | | 31,040 | |
0.340%, 08/12/2016 | | | 26,480 | | | | 26,458 | |
FICO STRIPS, PO | | | | | | | | |
1.386%, 11/02/2018 (B) | | | 9,315 | | | | 9,087 | |
1.315%, 05/11/2018 (B) | | | 3,620 | | | | 3,550 | |
1.302%, 04/06/2018 (B) | | | 2,920 | | | | 2,867 | |
FNMA | | | | | | | | |
1.750%, 06/08/2018 to 08/17/2018 | | | 1,375 | | | | 1,376 | |
1.486%, 10/09/2019 (B) | | | 13,505 | | | | 12,823 | |
1.250%, 01/30/2017 | | | 200 | | | | 201 | |
1.125%, 04/27/2017 | | | 150 | | | | 150 | |
0.875%, 05/21/2018 | | | 250 | | | | 250 | |
FNMA DN (H) | | | | | | | | |
0.441%, 10/17/2016 | | | 10,910 | | | | 10,892 | |
Residual Funding Principal STRIPS | | | | | | | | |
1.996%, 10/15/2020 (B) | | | 4,950 | | | | 4,624 | |
Tennessee Valley Authority | | | | | | | | |
4.250%, 09/15/2065 | | | 1,904 | | | | 2,034 | |
3.875%, 02/15/2021 | | | 3,090 | | | | 3,414 | |
2.875%, 09/15/2024 | | | 3,748 | | | | 3,964 | |
Tennessee Valley Authority Principal STRIPS, PO | | | | | | | | |
0.000%, 11/01/2025 (B) | | | 1,000 | | | | 782 | |
| | | | | | | | |
Total U.S. Government
Agency Obligations (Cost $118,528) ($ Thousands) | | | | | | | 121,937 | |
| | | | | | | | |
| | |
MUNICIPAL BONDS — 0.5% | | | | | | | | |
California — 0.1% | | | | | | | | |
California State, Build
America Project, GO | | | | | | | | |
7.600%, 11/01/2040 | | | 1,405 | | | | 2,195 | |
6.650%, 03/01/2022 | | | 70 | | | | 86 | |
Los Angeles, Community College District, Build America Project, GO | | | | | | | | |
6.750%, 08/01/2049 | | | 1,545 | | | | 2,376 | |
| | | | | | | | |
| | | | | | | 4,657 | |
| | | | | | | | |
| | |
Minnesota — 0.0% | | | | | | | | |
Northstars Education Finance Authority,
Ser 2007-1, Cl A2, RB | | | | | | | | |
1.371%, 01/29/2046 (A) | | | 50 | | | | 47 | |
| | | | | | | | |
| | |
Nevada — 0.1% | | | | | | | | |
County of Clark, Airport System Revenue,
Ser C-BUILD, RB | | | | | | | | |
6.820%, 07/01/2045 | | | 2,175 | | | | 3,266 | |
| | | | | | | | |
| | | | | | | | |
| Description | | Face Amount
($ Thousands) | | | Market Value
($ Thousands) | |
| | | | | | | | |
| | |
New Jersey — 0.0% | | | | | | | | |
New Jersey State, Turnpike Authority, Build America Project, RB | | | | | | | | |
7.102%, 01/01/2041 | | $ | 1,759 | | | $ | 2,597 | |
| | | | | | | | |
| | |
New York — 0.2% | | | | | | | | |
City of New York, Build America Project, GO Callable 12/01/2020 @ 100 | | | | | | | | |
6.646%, 12/01/2031 | | | 2,000 | | | | 2,352 | |
City of New York, Build America Project, GO | | | | | | | | |
5.047%, 10/01/2024 | | | 4,000 | | | | 4,677 | |
New York City, Municipal Water Finance Authority, Build America Project, RB | | | | | | | | |
5.440%, 06/15/2043 | | | 1,000 | | | | 1,308 | |
Port Authority of New York & New Jersey, RB | | | | | | | | |
4.458%, 10/01/2062 | | | 1,805 | | | | 1,984 | |
| | | | | | | | |
| | | | | | | 10,321 | |
| | | | | | | | |
| | |
Ohio — 0.0% | | | | | | | | |
Ohio State University, Build America Project, Ser A, RB | | | | | | | | |
4.800%, 06/01/2111 | | | 639 | | | | 690 | |
| | | | | | | | |
| | |
Texas — 0.1% | | | | | | | | |
Brazos, Higher Education Authority, Ser 2006- 2, Cl A9, RB | | | | | | | | |
0.640%, 12/26/2024 (A) | | | 1,155 | | | | 1,080 | |
North Texas, Tollway Authority, Build America Project, RB | | | | | | | | |
6.718%, 01/01/2049 | | | 1,574 | | | | 2,329 | |
| | | | | | | | |
| | | | | | | 3,409 | |
| | | | | | | | |
| | |
Virginia — 0.0% | | | | | | | | |
Virginia State, Housing Development Authority, Ser C, RB | | | | | | | | |
6.000%, 06/25/2034 | | | 205 | | | | 214 | |
| | | | | | | | |
Total Municipal Bonds
(Cost $21,058) ($ Thousands) | | | | | | | 25,201 | |
| | | | | | | | |
| | | Shares | | | | |
| | |
CASH EQUIVALENT — 1.3% | | | | | | | | |
SEI Daily Income Trust, Prime Obligation Fund, Cl A | | | | | | | | |
0.270% **† | | | 69,172,133 | | | | 69,172 | |
| | | | | | | | |
Total Cash Equivalent
(Cost $69,172) ($ Thousands) | | | | | | | 69,172 | |
| | | | | | | | |
Total Investments — 103.6%
(Cost $5,347,501) ($ Thousands) | | | | | | $ | 5,452,075 | |
| | | | | | | | |
| | | | |
| SEI Institutional Investments Trust / Annual Report / May 31, 2016 | | | 137 | |
SCHEDULE OF INVESTMENTS
Core Fixed Income Fund (Continued)
May 31, 2016
| | | | | | | | |
| Description | | Contracts | | | Market Value
($ Thousands) | |
| | | | | | | | |
| | |
PURCHASED OPTIONS (I) — 0.0% | | | | | | | | |
June 2016, U.S. 10 Year Future
Option Call, Expires 06/18/2016, Strike Price $164.00* | | | 25 | | | $ | 11 | |
June 2016, U.S. 10 Year Future
Option Call, Expires 06/18/2016, Strike Price $130.00* | | | 300 | | | | 56 | |
June 2016, U.S. 10 Year Future
Option Put, Expires 06/18/2016, Strike Price $120.00* | | | 507 | | | | 186 | |
June 2016, U.S. 10 Year Future
Option Put, Expires 06/18/2016, Strike Price $160.00* | | | 25 | | | | 1 | |
June 2016, U.S. 10 Year Future
Option Put, Expires 06/18/2016, Strike Price $128.75* | | | 300 | | | | 14 | |
| | | | | | | | |
Total Purchased Options
(Cost $454) ($ Thousands) | | | | 268 | |
| | | | | | | | |
| | |
WRITTEN OPTIONS (I) — 0.0% | | | | | | | | |
June 2016, U.S. 10 Year Future
Option Call, Expires 06/18/2016 Strike Price $132.50* | | | (49 | ) | | | (3 | ) |
June 2016, U.S. 10 Year Future
Option Call, Expires 06/18/2016 Strike Price $131.50* | | | (136 | ) | | | (19 | ) |
June 2016, U.S. 10 Year Future
Option Put, Expires 06/18/2016
Strike Price $127.00* | | | (136 | ) | | | (7 | ) |
| | | | | | | | |
Total Written Options
(Premiums Received $100) ($ Thousands) | | | | (29 | ) |
| | | | | | | | |
A list of the open futures contracts held by the Fund at May 31, 2016, is as follows:
| | | | | | | | | | | | |
| Type of Contract | | Number of
Contracts
Long
(Short) | | | Expiration
Date | | | Unrealized
Appreciation
(Depreciation)
($ Thousands) | |
90-Day Euro$ | | | (113 | ) | | | Mar-2018 | | | $ | (3 | ) |
90-Day Euro$ | | | (272 | ) | | | Jun-2016 | | | | (23 | ) |
90-Day Euro$ | | | (345 | ) | | | Dec-2017 | | | | (123 | ) |
90-Day Euro$ | | | 310 | | | | Mar-2017 | | | | 135 | |
90-Day Euro$ | | | (2,022 | ) | | | Dec-2016 | | | | 226 | |
Euro | | | (40 | ) | | | Jun-2016 | | | | (47 | ) |
Euro-Bobl | | | (38 | ) | | | Jun-2016 | | | | (1 | ) |
Euro-Bund Index | | | (165 | ) | | | Jun-2016 | | | | (165 | ) |
U.S. 10-Year Treasury Note | | | 1,199 | | | | Sep-2016 | | | | 72 | |
U.S. 2-Year Treasury Note | | | 223 | | | | Sep-2016 | | | | 6 | |
U.S. 2-Year Treasury Note | | | (25 | ) | | | Sep-2016 | | | | (2 | ) |
U.S. 5-Year Treasury Note | | | 2,443 | | | | Sep-2016 | | | | 252 | |
U.S. Long Treasury Bond | | | (1,513 | ) | | | Sep-2016 | | | | (521 | ) |
U.S. Ultra Long Treasury Bond | | | 458 | | | | Sep-2016 | | | | 184 | |
U.S. Ultra Long Treasury Bond | | | (526 | ) | | | Sep-2016 | | | | (345 | ) |
Ultra 10-Year U.S. Treasury Bond | | | (44 | ) | | | Sep-2016 | | | | (30 | ) |
| | | | | | | | | | | | |
| | | | | | | | | | $ | (385 | ) |
| | | | | | | | | | | | |
For the year ended May 31, 2016, the total amount of all open futures contracts, as presented in the table above, are representative of the volume of activity for the derivative type during the year.
A list of the open forward foreign currency contracts held by the Fund at May 31, 2016, is as follows:
| | | | | | | | | | | | | | | | | | | | |
| Settlement Date | | Currency to
Deliver
(Thousands) | | | Currency To
Receive
(Thousands) | | | Unrealized
Appreciation
(Depreciation)
($ Thousands) | |
06/10/16-08/08/16 | | | JPY | | | | 8,152,996 | | | | USD | | | | 73,275 | | | $ | (361 | ) |
07/05/16 | | | USD | | | | 7,658 | | | | JPY | | | | 830,000 | | | | (164 | ) |
07/14/16-07/14/16 | | | CNH | | | | 30,890 | | | | USD | | | | 4,743 | | | | 60 | |
07/14/16-08/12/16 | | | EUR | | | | 31,316 | | | | USD | | | | 35,836 | | | | 908 | |
08/12/16 | | | USD | | | | 1,858 | | | | EUR | | | | 1,618 | | | | (52 | ) |
| | | | | | | | | | | | | | | | | | | | |
| | | | | | | | | | | | | | | | | | $ | 391 | |
| | | | | | | | | | | | | | | | | | | | |
A list of the counterparties for the outstanding forward foreign currency contracts held by the Fund at May 31, 2016, is as follows:
| | | | | | | | | | | | |
| Counterparty | | Currency to
Deliver ($ Thousands) | | | Currency to
Receive ($ Thousands) | | | Unrealized
Appreciation
(Depreciation)
($ Thousands) | |
Bank of America | | $ | (9,865 | ) | | $ | 9,863 | | | $ | (2 | ) |
Barclays PLC | | | (33,558 | ) | | | 33,020 | | | | (538 | ) |
Citigroup | | | (39,080 | ) | | | 39,679 | | | | 599 | |
JPMorgan Chase Bank | | | (37,654 | ) | | | 37,913 | | | | 259 | |
UBS | | | (2,607 | ) | | | 2,680 | | | | 73 | |
| | | | | | | | | | | | |
| | | | | | | | | | $ | 391 | |
| | | | | | | | | | | | |
For the year ended May 31, 2016 the total amount of all open forward foreign currency contracts, as presented in the table above, are representative of the volume of activity for the derivative type during the year.
| | |
| 138 | | SEI Institutional Investments Trust / Annual Report / May 31, 2016 |
A list of the open OTC swap agreements held by the Fund at May 31, 2016 is as follows:
| | | | | | | | | | | | | | |
Interest Rate Swaps | |
| Counterparty | | Fund
Pays | | Fund Receives | | Termination Date | | Notional Amount
($ Thousands) | | | Net Unrealized
(Depreciation)
($ Thousands) | |
| Citigroup | | 2.71% | | 3 Month USD - LIBOR | | 08/15/42 | | $ | 8,210 | | | $ | (1,094 | ) |
| | | | | | | | | | | | | | |
| | | | | | | | | | | | $ | (1,094 | ) |
| | | | | | | | | | | | | | |
| | | | | | | | | | | | | | | | |
| Credit Default Swaps | |
| Counterparty | | Reference
Entity/
Obligation | | Buy/Sell Protection | | (Pays)/Receives Rate | | Termination Date | | Notional Amount
($ Thousands) | | | Net Unrealized
Appreciation
Depreciation
($ Thousands) | |
| Deutsche Bank | | Berkshire Hathaway Inc. | | SELL | | 1.00% | | 03/20/24 | | $ | (2,660 | ) | | $ | (1 | ) |
| Deutsche Bank | | Brazil CDS | | SELL | | 1.00% | | 12/20/20 | | | (1,079 | ) | | | 153 | |
| Goldman Sachs | | Metlife Inc. | | SELL | | 1.00% | | 06/20/21 | | | (1,660 | ) | | | (23 | ) |
| Goldman Sachs | | Metlife Inc. | | SELL | | 1.00% | | 06/20/21 | | | (1,900 | ) | | | (25 | ) |
| | | | | | | | | | | | | | | | |
| | | | | | | | | | | | | | $ | 104 | |
| | | | | | | | | | | | | | | | |
A list of the open centrally cleared swap agreements held by the Fund at May 31, 2016 is as follows:
| | | | | | | | | | | | | | |
| Interest Rate Swaps | |
| Counterparty | | Fund
Pays | | Fund Receives | | Termination Date | | Notional Amount
($ Thousands) | | | Net Unrealized Appreciation (Depreciation)
($ Thousands) | |
| Citigroup | | 3.68% | | REC 3 Month USD LIBOR | | 11/15/43 | | $ | 5,080 | | | | (1,689 | ) |
| UBS | | 2.76% | | REC 3-Month USD LIBOR | | 02/15/41 | | | 14,124 | | | | (1,784 | ) |
| UBS | | 1.90% | | REC 3-Month USD LIBOR | | 11/30/22 | | | 69,440 | | | | (1,892 | ) |
| UBS | | 1.90% | | REC 3-Month USD LIBOR | | 08/31/22 | | | 45,600 | | | | (1,253 | ) |
| UBS | | 0.55% | | 1-DAY FED FUNDS | | 07/27/16 | | | 403,910 | | | | (51 | ) |
| | | | | | | | | | | | | | |
| | | | | | | | | | | | | (6,669 | ) |
| | | | | | | | | | | | | | |
For the year ended May 31, 2016, the total amount of open swap agreements, as presented in the tables above, are representative of the volume of activity for this derivative type during the year.
Percentages are based on a Net Assets of $5,264,859 ($ Thousands).
| * | | Non-income producing security. |
| ** | | Rate shown is the 7-day effective yield as of May 31, 2016. |
| † | | Investment in Affiliated Security (see Note 6). |
| (A) | | Variable Rate Security — The rate reported on the Schedule of Investments is the rate in effect as of May 31, 2016. |
| (B) | | Zero coupon security. The rate shown on the Schedule of Investments represents the security’s effective yield at the time of purchase. |
| (C) | | Security exempt from registration under Rule 144A of the Securities Act of 1933. These securities may be resold in transactions exempt from registration normally to qualified institutions. On May 31, 2016, the value of these securities amounted to $614,195 ($ Thousands), representing 11.7% of the net assets of the Fund. |
| (D) | | Step Bonds – The rate reflected on the Schedule of Investments is the effective yield on May 31, 2016. The coupon on a step bond changes on a specified date. |
| (E) | | Security fair valued using methods determined in good faith by the Valuation Committee of the Board of Trustees. The total market value of such securities as of May 31, 2016 was $836 ($ Thousands) and represented 0.0% of Net Assets. |
| (F) | | Securities considered illiquid. The total value of such securities as of May 31, 2016 was $836 ($ Thousands) and represented 0.0% of Net Assets. |
| (G) | | Securities considered restricted. The total market value of such securities as of May 31, 2016 was $836 ($ Thousands) and represented 0.0% of Net Assets. |
| (H) | | The rate reported is the effective yield at time of purchase. |
| (I) | | For the year ended May 31, 2016, the total amount of open purchased options and written options, as presented in the Schedule of Investments, are representative of the volume of activity for these derivative types during the year. |
| (J) | | Security, or portion thereof, has been pledged as collateral on open futures contracts |
ABS — Asset-Based Security
AID — Agency for International Development
ARM — Adjustable Rate Mortgage
Cl — Class
CLO — Collateralized Loan Obligation
CMO — Collateralized Mortgage Obligation
CNY — Chinese Yuen
CNH — Chinese Offshore Yen
EUR — Euro
FHLB — Federal Home Loan Bank
FHLMC — Federal Home Loan Mortgage Corporation
FICO — Financing Corporation
FNMA — Federal National Mortgage Association
GNMA — Government National Mortgage Association
GO — General Obligation
IO — Interest Only — face amount represents notional amount
JPY — Japanese Yen
LIBOR — London Interbank Offered Rate
LLC — Limited Liability Company
MTN — Medium Term Note
NCUA — National Credit Union Association
PLC — Public Limited Company
PO — Principal Only
| | | | |
| SEI Institutional Investments Trust / Annual Report / May 31, 2016 | | | 139 | |
SCHEDULE OF INVESTMENTS
Core Fixed Income Fund (Concluded)
May 31, 2016
RB — Revenue Bond
REMIC — Real Estate Mortgage Investment Conduit
Ser — Series
STRIPS — Separately Traded Registered Interest and Principal Securities
TBA — To Be Announced
USD — United States Dollar
The following is a list of the level of inputs used as of May 31, 2016, in valuing the Fund’s investments and other financial instruments carried at value ($ Thousands):
| | | | | | | | | | | | | | | | |
| Investments in Securities | | Level 1 | | | Level 2 | | | Level 3(1) | | | Total | |
Mortgage-Backed Securities | | $ | — | | | $ | 1,564,849 | | | $ | — | | | $ | 1,564,849 | |
Corporate Obligations | | | — | | | | 1,561,507 | | | | 836 | | | | 1,562,343 | |
U.S. Treasury Obligations | | | — | | | | 1,409,749 | | | | — | | | | 1,409,749 | |
Asset-Backed Securities | | | — | | | | 542,958 | | | | — | | | | 542,958 | |
Sovereign Debt | | | — | | | | 155,866 | | | | — | | | | 155,866 | |
U.S. Government Agency Obligations | | | — | | | | 121,937 | | | | — | | | | 121,937 | |
Municipal Bonds | | | — | | | | 25,201 | | | | — | | | | 25,201 | |
Cash Equivalent | | | 69,172 | | | | — | | | | — | | | | 69,172 | |
| | | | | | | | | | | | | | | | |
Total Investments in Securities | | $ | 69,172 | | | $ | 5,382,067 | | | $ | 836 | | | $ | 5,452,075 | |
| | | | | | | | | | | | | | | | |
| | | | | | | | | | | | | | | | |
| Other Financial Instruments | | Level 1 | | | Level 2 | | | Level 3 | | | Total | |
Purchased Options | | $ | 268 | | | $ | — | | | $ | — | | | $ | 268 | |
Written Options | | | (29 | ) | | | — | | | | — | | | | (29 | ) |
Futures Contracts * | | | | | | | | | | | | | | | | |
Unrealized Appreciation | | | 875 | | | | — | | | | — | | | | 875 | |
Unrealized Depreciation | | | (1,260 | ) | | | — | | | | — | | | | (1,260 | ) |
Forwards Contracts * | | | | | | | | | | | | | | | | |
Unrealized Appreciation | | | — | | | | 968 | | | | — | | | | 968 | |
Unrealized Depreciation | | | — | | | | (577 | ) | | | — | | | | (577 | ) |
OTC Swaps | | | | | | | | | | | | | | | | |
Interest Rate Swaps * | | | | | | | | | | | | | | | | |
Unrealized Depreciation | | | — | | | | (1,094 | ) | | | — | | | | (1,094 | ) |
Credit Default Swaps * | | | | | | | | | | | | | | | | |
Unrealized Appreciation | | | — | | | | 153 | | | | — | | | | 153 | |
Unrealized Depreciation | | | — | | | | (49 | ) | | | — | | | | (49 | ) |
Centrally Cleared Swaps | | | | | | | | | | | | | | | | |
Interest Rate Swaps * | | | | | | | | | | | | | | | | |
Unrealized Depreciation | | | — | | | | (6,669 | ) | | | — | | | | (6,669 | ) |
| | | | | | | | | | | | | | | | |
Total Other Financial Instruments | | $ | (146 | ) | | $ | (7,268 | ) | | $ | — | | | $ | (7,414 | ) |
| | | | | | | | | | | | | | | | |
| (1) | | A reconciliation of Level 3 investments is presented when the Fund has a significant amount of Level 3 investments at the beginning and/or end of the period in relation to net assets. Management has concluded that Level 3 investments are not material in relation to net assets. |
| * | | Futures contracts, forward contracts and swaps are valued at the unrealized appreciation (depreciation) on the instrument. |
For the year ended May 31, 2016, there were no transfers between Level 1 and Level 2 assets and liabilities.
For the year ended May 31, 2016, there were no transfers between Level 2 and Level 3 assets and liabilities.
For more information on valuation inputs, see Note 2 – Significant Accounting Policies in Notes to Financial Statements.
Amounts designated as “—” are $0 or have been rounded to $0.
The accompanying notes are an integral part of the financial statements.
| | |
| 140 | | SEI Institutional Investments Trust / Annual Report / May 31, 2016 |
SCHEDULE OF INVESTMENTS
High Yield Bond Fund
May 31, 2016
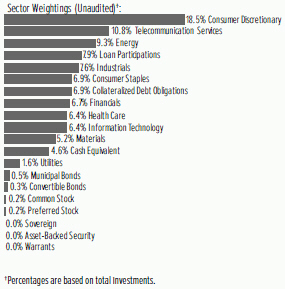
| | | | | | | | |
| Description | | Face Amount
($ Thousands) | | | Market Value ($ Thousands) | |
|
CORPORATE OBLIGATIONS — 79.1% | |
|
Consumer Discretionary — 18.3% | |
Adelphia Communications (escrow security) | | | | | | | | |
10.250%, 06/15/2011 (A) | | $ | 125 | | | $ | 1 | |
7.875%, 01/15/2009 (A) | | | 250 | | | | 1 | |
7.750%, 05/01/2009 (A) | | | 75 | | | | — | |
Adelphia Communications (escrow security), Ser B | | | | | | | | |
9.500%, 02/15/2004 | | | 25 | | | | — | |
Affinity Gaming LLC | | | | | | | | |
9.000%, 05/15/2018 | | | 7,205 | | | | 7,385 | |
Algeco Scotsman Global Finance | | | | | | | | |
8.500%, 10/15/2018 (B) | | | 3,805 | | | | 3,206 | |
AMC Entertainment | | | | | | | | |
5.875%, 02/15/2022 | | | 1,000 | | | | 1,010 | |
5.750%, 06/15/2025 | | | 2,880 | | | | 2,858 | |
AMC Networks | | | | | | | | |
5.000%, 04/01/2024 | | | 1,220 | | | | 1,223 | |
American Axle & Manufacturing | | | | | | | | |
6.625%, 10/15/2022 | | | 685 | | | | 720 | |
6.250%, 03/15/2021 | | | 605 | | | | 629 | |
American Builders & Contractors Supply | | | | | | | | |
5.750%, 12/15/2023 (B) | | | 900 | | | | 934 | |
5.625%, 04/15/2021 (B) | | | 1,210 | | | | 1,255 | |
American Tire Distributors | | | | | | | | |
10.250%, 03/01/2022 (B) | | | 1,610 | | | | 1,395 | |
Aramark Services | | | | | | | | |
5.750%, 03/15/2020 | | | 3,450 | | | | 3,560 | |
Argos Merger Sub | | | | | | | | |
7.125%, 03/15/2023 (B) | | | 2,595 | | | | 2,627 | |
Beazer Homes USA | | | | | | | | |
5.750%, 06/15/2019 | | | 1,560 | | | | 1,416 | |
Belo | | | | | | | | |
7.750%, 06/01/2027 | | | 2,025 | | | | 2,136 | |
| | | | | | | | |
| Description | | Face Amount
($ Thousands) | | | Market Value ($ Thousands) | |
Bon-Ton Department Stores | | | | | | | | |
8.000%, 06/15/2021 | | $ | 12,012 | | | $ | 4,865 | |
Boyd Gaming | | | | | | | | |
6.875%, 05/15/2023 | | | 1,325 | | | | 1,389 | |
6.375%, 04/01/2026 (B) | | | 3,290 | | | | 3,389 | |
Brookfield Residential Properties | | | | | | | | |
6.375%, 05/15/2025 (B) | | | 632 | | | | 577 | |
Burger King Worldwide | | | | | | | | |
6.000%, 04/01/2022 (B) | | | 3,855 | | | | 3,995 | |
Cablevision Systems | | | | | | | | |
7.750%, 04/15/2018 | | | 4,595 | | | | 4,893 | |
5.875%, 09/15/2022 | | | 1,947 | | | | 1,738 | |
Caesars Entertainment Operating | | | | | | | | |
11.250%, 06/01/2017 (A) | | | 1,645 | | | | 1,538 | |
9.000%, 02/15/2020 (A) | | | 4,990 | | | | 4,666 | |
8.500%, 02/15/2020 (A) | | | 1,595 | | | | 1,491 | |
Caesars Entertainment Resort Properties LLC | | | | | | | | |
8.000%, 10/01/2020 | | | 3,310 | | | | 3,335 | |
CCO Holdings LLC | | | | | | | | |
6.625%, 01/31/2022 | | | 1,585 | | | | 1,682 | |
5.875%, 04/01/2024 (B) | | | 3,485 | | | | 3,633 | |
5.875%, 05/01/2027 (B) | | | 1,776 | | | | 1,818 | |
5.750%, 02/15/2026 (B) | | | 5,279 | | | | 5,411 | |
5.500%, 05/01/2026 (B) | | | 1,405 | | | | 1,419 | |
5.375%, 05/01/2025 (B) | | | 2,468 | | | | 2,505 | |
5.250%, 09/30/2022 | | | 2,565 | | | | 2,635 | |
5.125%, 02/15/2023 | | | 2,000 | | | | 2,035 | |
5.125%, 05/01/2023 (B) | | | 1,419 | | | | 1,437 | |
CEC Entertainment | | | | | | | | |
8.000%, 02/15/2022 | | | 1,901 | | | | 1,792 | |
Cedar Fair | | | | | | | | |
5.375%, 06/01/2024 | | | 2,070 | | | | 2,153 | |
5.250%, 03/15/2021 | | | 2,000 | | | | 2,080 | |
Cengage Learning | | | | | | | | |
9.500%, 06/15/2024 (B) | | | 2,020 | | | | 2,045 | |
Century Communities | | | | | | | | |
6.875%, 05/15/2022 | | | 2,605 | | | | 2,520 | |
Charter Communications Operating LLC | | | | | | | | |
6.384%, 10/23/2035 (B) | | | 425 | | | | 486 | |
4.908%, 07/23/2025 (B) | | | 1,860 | | | | 1,990 | |
Chester Downs & Marina LLC | | | | | | | | |
9.250%, 02/01/2020 (B) | | | 8,105 | | | | 7,092 | |
Chinos Intermediate Holdings A, Cl A | | | | | | | | |
7.750%, 05/01/2019 (B) | | | 3,821 | | | | 1,567 | |
Cinemark USA | | | | | | | | |
5.125%, 12/15/2022 | | | 1,100 | | | | 1,127 | |
4.875%, 06/01/2023 | | | 1,420 | | | | 1,406 | |
Claire’s Stores | | | | | | | | |
9.000%, 03/15/2019 (B) | | | 5,305 | | | | 3,263 | |
8.875%, 03/15/2019 | | | 4,540 | | | | 908 | |
Clear Channel Worldwide Holdings | | | | | | | | |
7.625%, 03/15/2020 | | | 7,215 | | | | 6,901 | |
| | | | |
| SEI Institutional Investments Trust / Annual Report / May 31, 2016 | | | 141 | |
SCHEDULE OF INVESTMENTS
High Yield Bond Fund (Continued)
May 31, 2016
| | | | | | | | |
| Description | | Face Amount
($ Thousands) | | | Market Value ($ Thousands) | |
6.500%, 11/15/2022 | | $ | 5,110 | | | $ | 5,100 | |
ClubCorp Club Operations | | | | | | | | |
8.250%, 12/15/2023 (B) | | | 2,350 | | | | 2,362 | |
CSC Holdings LLC | | | | | | | | |
8.625%, 02/15/2019 | | | 2,375 | | | | 2,639 | |
6.750%, 11/15/2021 | | | 1,000 | | | | 1,028 | |
5.250%, 06/01/2024 | | | 3,373 | | | | 3,036 | |
CST Brands | | | | | | | | |
5.000%, 05/01/2023 | | | 350 | | | | 350 | |
Cumulus Media Holdings | | | | | | | | |
7.750%, 05/01/2019 | | | 5,505 | | | | 2,378 | |
Dana Holding | | | | | | | | |
6.750%, 02/15/2021 | | | 1,432 | | | | 1,482 | |
6.000%, 09/15/2023 | | | 1,555 | | | | 1,567 | |
5.500%, 12/15/2024 | | | 1,060 | | | | 1,020 | |
DISH DBS | | | | | | | | |
6.750%, 06/01/2021 | | | 1,530 | | | | 1,585 | |
5.875%, 07/15/2022 | | | 7,059 | | | | 6,830 | |
5.875%, 11/15/2024 | | | 6,765 | | | | 6,261 | |
5.000%, 03/15/2023 | | | 5,665 | | | | 5,155 | |
Dollar Tree | | | | | | | | |
5.750%, 03/01/2023 (B) | | | 2,460 | | | | 2,598 | |
DreamWorks Animation SKG | | | | | | | | |
6.875%, 08/15/2020 (B) | | | 1,505 | | | | 1,597 | |
EMI Music Publishing Group North America | | | | | | | | |
Holdings | | | | | | | | |
7.625%, 06/15/2024 (B) | | | 2,053 | | | | 2,102 | |
Empire Today LLC | | | | | | | | |
11.375%, 02/01/2017 (B) | | | 1,841 | | | | 1,804 | |
ESH Hospitality | | | | | | | | |
5.250%, 05/01/2025 (B) | | | 5,515 | | | | 5,350 | |
Ferrellgas | | | | | | | | |
6.500%, 05/01/2021 | | | 2,650 | | | | 2,504 | |
Fiat Chrysler Automobiles | | | | | | | | |
5.250%, 04/15/2023 | | | 775 | | | | 771 | |
Fontainebleau Las Vegas | | | | | | | | |
10.250%, 06/15/2015 (A) (B) | | | 3,481 | | | | — | |
Gap | | | | | | | | |
5.950%, 04/12/2021 | | | 1,401 | | | | 1,427 | |
General Motors | | | | | | | | |
4.875%, 10/02/2023 | | | 965 | | | | 1,025 | |
General Motors Financial | | | | | | | | |
4.250%, 05/15/2023 | | | 575 | | | | 588 | |
3.450%, 04/10/2022 | | | 520 | | | | 516 | |
Gibson Brands | | | | | | | | |
8.875%, 08/01/2018 (B) | | | 1,436 | | | | 758 | |
Goodyear Tire & Rubber | | | | | | | | |
8.750%, 08/15/2020 | | | 580 | | | | 692 | |
6.500%, 03/01/2021 | | | 2,490 | | | | 2,611 | |
5.125%, 11/15/2023 | | | 2,815 | | | | 2,878 | |
5.000%, 05/31/2026 | | | 405 | | | | 410 | |
| | | | | | | | |
| Description | | Face Amount
($ Thousands) | | | Market Value ($ Thousands) | |
Group 1 Automotive | | | | | | | | |
5.250%, 12/15/2023 (B) | | $ | 1,530 | | | $ | 1,507 | |
Guitar Center | | | | | | | | |
9.625%, 04/15/2020 (B) | | | 7,067 | | | | 5,124 | |
6.500%, 04/15/2019 (B) | | | 6,195 | | | | 5,498 | |
Hanesbrands | | | | | | | | |
4.875%, 05/15/2026 (B) | | | 1,885 | | | | 1,887 | |
4.625%, 05/15/2024 (B) | | | 455 | | | | 455 | |
HD Supply | | | | | | | | |
7.500%, 07/15/2020 | | | 1,175 | | | | 1,240 | |
5.750%, 04/15/2024 (B) | | | 1,805 | | | | 1,877 | |
5.250%, 12/15/2021 (B) | | | 1,025 | | | | 1,079 | |
Hillman Group | | | | | | | | |
6.375%, 07/15/2022 (B) | | | 1,180 | | | | 1,065 | |
Hilton Worldwide Finance LLC | | | | | | | | |
5.625%, 10/15/2021 | | | 420 | | | | 435 | |
Hot Topic | | | | | | | | |
9.250%, 06/15/2021 (B) | | | 4,340 | | | | 4,373 | |
iHeartCommunications | | | | | | | | |
14.000%, 02/01/2021 | | | 4,869 | | | | 1,911 | |
10.625%, 03/15/2023 | | | 1,305 | | | | 966 | |
9.000%, 12/15/2019 | | | 2,776 | | | | 2,179 | |
9.000%, 03/01/2021 | | | 970 | | | | 724 | |
9.000%, 09/15/2022 | | | 3,846 | | | | 2,836 | |
Inn of the Mountain Gods Resort & Casino | | | | | | | | |
9.250%, 11/30/2020 (B) (C) | | | 6,153 | | | | 5,599 | |
International Game Technology | | | | | | | | |
6.500%, 02/15/2025 (B) | | | 1,320 | | | | 1,320 | |
6.250%, 02/15/2022 (B) | | | 1,120 | | | | 1,140 | |
Interval Acquisition | | | | | | | | |
5.625%, 04/15/2023 (B) | | | 3,560 | | | | 3,631 | |
Isle of Capri Casinos | | | | | | | | |
5.875%, 03/15/2021 | | | 740 | | | | 772 | |
JC Penney | | | | | | | | |
8.125%, 10/01/2019 | | | 655 | | | | 670 | |
7.950%, 04/01/2017 | | | 998 | | | | 1,027 | |
6.375%, 10/15/2036 | | | 1,160 | | | | 858 | |
5.750%, 02/15/2018 | | | 987 | | | | 1,002 | |
L Brands | | | | | | | | |
6.950%, 03/01/2033 | | | 1,174 | | | | 1,183 | |
6.875%, 11/01/2035 | | | 3,310 | | | | 3,492 | |
6.625%, 04/01/2021 | | | 1,225 | | | | 1,364 | |
5.625%, 02/15/2022 | | | 1,995 | | | | 2,132 | |
Landry’s | | | | | | | | |
9.375%, 05/01/2020 (B) | | | 1,867 | | | | 1,960 | |
Lear | | | | | | | | |
5.375%, 03/15/2024 | | | 204 | | | | 216 | |
5.250%, 01/15/2025 | | | 810 | | | | 862 | |
Liberty Interactive LLC | | | | | | | | |
8.250%, 02/01/2030 | | | 2,725 | | | | 2,814 | |
LIN Television | | | | | | | | |
5.875%, 11/15/2022 | | | 1,089 | | | | 1,101 | |
| | |
| 142 | | SEI Institutional Investments Trust / Annual Report / May 31, 2016 |
| | | | | | | | |
| Description | | Face Amount
($ Thousands) | | | Market Value ($ Thousands) | |
LKQ | | | | | | | | |
4.750%, 05/15/2023 | | $ | 1,810 | | | $ | 1,778 | |
LTF Merger Sub | | | | | | | | |
8.500%, 06/15/2023 (B) | | | 4,603 | | | | 4,407 | |
M/I Homes | | | | | | | | |
6.750%, 01/15/2021 | | | 1,775 | | | | 1,784 | |
McClatchy | | | | | | | | |
9.000%, 12/15/2022 | | | 4,460 | | | | 4,237 | |
MGM Growth Properties Operating Partnership | |
5.625%, 05/01/2024 (B) | | | 4,805 | | | | 5,045 | |
MGM Resorts International | | | | | | | | |
7.750%, 03/15/2022 | | | 4,835 | | | | 5,439 | |
6.625%, 12/15/2021 | | | 3,625 | | | | 3,910 | |
6.000%, 03/15/2023 | | | 5,488 | | | | 5,735 | |
5.250%, 03/31/2020 | | | 1,645 | | | | 1,703 | |
Mohegan Tribal Gaming Authority | | | | | | | | |
9.750%, 09/01/2021 | | | 14,973 | | | | 15,778 | |
Monitronics International | | | | | | | | |
9.125%, 04/01/2020 | | | 9,745 | | | | 7,991 | |
Murphy Oil USA | | | | | | | | |
6.000%, 08/15/2023 | | | 1,415 | | | | 1,468 | |
Neiman Marcus Group LLC PIK | | | | | | | | |
8.750%, 10/15/2021 (B) | | | 1,215 | | | | 854 | |
Neiman Marcus Group LLC | | | | | | | | |
8.000%, 10/15/2021 (B) | | | 1,545 | | | | 1,166 | |
Neptune Finco | | | | | | | | |
10.125%, 01/15/2023 (B) | | | 8,226 | | | | 9,213 | |
6.625%, 10/15/2025 (B) | | | 400 | | | | 427 | |
Netflix | | | | | | | | |
5.875%, 02/15/2025 | | | 2,315 | | | | 2,425 | |
5.500%, 02/15/2022 | | | 544 | | | | 568 | |
New Albertsons | | | | | | | | |
8.700%, 05/01/2030 | | | 1,870 | | | | 1,851 | |
8.000%, 05/01/2031 | | | 9,580 | | | | 9,436 | |
7.750%, 06/15/2026 | | | 135 | | | | 132 | |
7.450%, 08/01/2029 | | | 3,095 | | | | 2,987 | |
Nexstar Broadcasting | | | | | | | | |
6.875%, 11/15/2020 | | | 3,475 | | | | 3,631 | |
6.125%, 02/15/2022 (B) | | | 4,384 | | | | 4,395 | |
Nine West Holdings | | | | | | | | |
8.250%, 03/15/2019 (B) | | | 7,880 | | | | 1,615 | |
PF Chang’s China Bistro | | | | | | | | |
10.250%, 06/30/2020 (B) | | | 2,769 | | | | 2,575 | |
Pinnacle Entertainment | | | | | | | | |
5.625%, 05/01/2024 (B) | | | 1,100 | | | | 1,075 | |
PulteGroup | | | | | | | | |
5.500%, 03/01/2026 | | | 410 | | | | 418 | |
Quebecor Media (escrow security) | | | | | | | | |
0.000%, 11/15/2013 (A) | | | 1,800 | | | | 2 | |
0.000%, 03/15/2016 (A) | | | 2,175 | | | | 3 | |
QVC | | | | | | | | |
4.375%, 03/15/2023 | | | 2,000 | | | | 1,970 | |
| | | | | | | | |
| Description | | Face Amount
($ Thousands) | | | Market Value ($ Thousands) | |
Radio One | | | | | | | | |
9.250%, 02/15/2020 (B) | | $ | 4,785 | | | $ | 4,139 | |
7.375%, 04/15/2022 (B) | | | 4,626 | | | | 4,418 | |
Radio Systems | | | | | | | | |
8.375%, 11/01/2019 (B) | | | 1,520 | | | | 1,596 | |
Regal Entertainment Group | | | | | | | | |
5.750%, 03/15/2022 | | | 1,705 | | | | 1,756 | |
5.750%, 06/15/2023 | | | 190 | | | | 194 | |
RSI Home Products | | | | | | | | |
6.500%, 03/15/2023 (B) | | | 1,535 | | | | 1,581 | |
Sally Holdings LLC | | | | | | | | |
5.750%, 06/01/2022 | | | 730 | | | | 759 | |
5.625%, 12/01/2025 | | | 3,170 | | | | 3,317 | |
Schaeffler Finance BV | | | | | | | | |
4.750%, 05/15/2023 (B) | | | 865 | | | | 886 | |
Schaeffler Holding Finance PIK | | | | | | | | |
6.750%, 11/15/2022 (B) | | | 1,310 | | | | 1,445 | |
Scientific Games | | | | | | | | |
8.125%, 09/15/2018 | | | 345 | | | | 335 | |
Scientific Games International | | | | | | | | |
10.000%, 12/01/2022 | | | 3,706 | | | | 3,002 | |
Serta Simmons Bedding LLC | | | | | | | | |
8.125%, 10/01/2020 (B) | | | 2,845 | | | | 3,001 | |
Service International | | | | | | | | |
7.500%, 04/01/2027 | | | 1,265 | | | | 1,480 | |
5.375%, 05/15/2024 | | | 287 | | | | 297 | |
Shingle Springs Tribal Gaming Authority | | | | | | | | |
9.750%, 09/01/2021 (B) | | | 810 | | | | 889 | |
Sinclair Television Group | | | | | | | | |
6.375%, 11/01/2021 | | | 150 | | | | 158 | |
6.125%, 10/01/2022 | | | 1,260 | | | | 1,323 | |
5.875%, 03/15/2026 (B) | | | 365 | | | | 377 | |
5.625%, 08/01/2024 (B) | | | 5,437 | | | | 5,573 | |
5.375%, 04/01/2021 | | | 4,435 | | | | 4,590 | |
Sirius XM Radio | | | | | | | | |
6.000%, 07/15/2024 (B) | | | 740 | | | | 775 | |
5.875%, 10/01/2020 (B) | | | 2,000 | | | | 2,068 | |
5.750%, 08/01/2021 (B) | | | 395 | | | | 413 | |
5.375%, 04/15/2025 (B) | | | 6,840 | | | | 6,866 | |
5.375%, 07/15/2026 (B) | | | 1,790 | | | | 1,777 | |
4.625%, 05/15/2023 (B) | | | 2,500 | | | | 2,456 | |
4.250%, 05/15/2020 (B) | | | 1,400 | | | | 1,426 | |
Six Flags Entertainment | | | | | | | | |
5.250%, 01/15/2021 (B) | | | 4,850 | | | | 5,023 | |
Spanish Broadcasting System | | | | | | | | |
12.500%, 04/15/2017 (B) | | | 1,641 | | | | 1,608 | |
Taylor Morrison Communities | | | | | | | | |
5.625%, 03/01/2024 (B) | | | 2,460 | | | | 2,411 | |
Tegna | | | | | | | | |
5.500%, 09/15/2024 (B) | | | 510 | | | | 527 | |
4.875%, 09/15/2021 (B) | | | 565 | | | | 576 | |
| | | | |
| SEI Institutional Investments Trust / Annual Report / May 31, 2016 | | | 143 | |
SCHEDULE OF INVESTMENTS
High Yield Bond Fund (Continued)
May 31, 2016
| | | | | | | | |
| Description | | Face Amount
($ Thousands) | | | Market Value ($ Thousands) | |
Tempur Sealy International | | | | | | | | |
6.875%, 12/15/2020 | | $ | 915 | | | $ | 973 | |
5.625%, 10/15/2023 | | | 760 | | | | 788 | |
5.500%, 06/15/2026 (B) | | | 665 | | | | 668 | |
TI Group Automotive Systems LLC | | | | | | | | |
8.750%, 07/15/2023 (B) | | | 8,383 | | | | 8,278 | |
Time | | | | | | | | |
5.750%, 04/15/2022 (B) | | | 1,190 | | | | 1,133 | |
Time Warner Cable | | | | | | | | |
6.750%, 06/15/2039 | | | 720 | | | | 818 | |
5.500%, 09/01/2041 | | | 975 | | | | 983 | |
Townsquare Media | | | | | | | | |
6.500%, 04/01/2023 (B) | | | 4,460 | | | | 4,293 | |
Toys R Us | | | | | | | | |
10.375%, 08/15/2017 | | | 8,705 | | | | 7,856 | |
7.375%, 10/15/2018 | | | 2,650 | | | | 2,094 | |
Tribune Media | | | | | | | | |
5.875%, 07/15/2022 | | | 3,665 | | | | 3,702 | |
UCI International LLC | | | | | | | | |
8.625%, 02/15/2019 (A) | | | 1,645 | | | | 457 | |
Univar USA | | | | | | | | |
6.750%, 07/15/2023 (B) | | | 547 | | | | 551 | |
Univision Communications | | | | | | | | |
5.125%, 02/15/2025 (B) | | | 5,574 | | | | 5,532 | |
Viking Cruises | | | | | | | | |
8.500%, 10/15/2022 (B) | | | 805 | | | | 716 | |
6.250%, 05/15/2025 (B) | | | 5,790 | | | | 4,560 | |
Vista Outdoor | | | | | | | | |
5.875%, 10/01/2023 (B) | | | 1,080 | | | | 1,129 | |
VTR Finance | | | | | | | | |
6.875%, 01/15/2024 (B) | | | 2,365 | | | | 2,332 | |
WMG Acquisition | | | | | | | | |
6.000%, 01/15/2021 (B) | | | 873 | | | | 899 | |
5.625%, 04/15/2022 (B) | | | 550 | | | | 561 | |
Wynn Las Vegas LLC | | | | | | | | |
5.500%, 03/01/2025 (B) | | | 3,300 | | | | 3,185 | |
4.250%, 05/30/2023 (B) | | | 487 | | | | 454 | |
Yum! Brands | | | | | | | | |
6.875%, 11/15/2037 | | | 3,750 | | | | 3,609 | |
5.350%, 11/01/2043 | | | 180 | | | | 146 | |
ZF North America Capital | | | | | | | | |
4.750%, 04/29/2025 (B) | | | 1,545 | | | | 1,545 | |
4.500%, 04/29/2022 (B) | | | 795 | | | | 799 | |
| | | | | | | | |
| | | | | | | 481,981 | |
| | | | | | | | |
| | |
Consumer Staples — 6.8% | | | | | | | | |
21st Century Oncology | | | | | | | | |
11.000%, 05/01/2023 (B) | | | 870 | | | | 731 | |
Albea Beauty Holdings | | | | | | | | |
8.375%, 11/01/2019 (B) | | | 1,185 | | | | 1,247 | |
Albertsons LLC | | | | | | | | |
6.625%, 06/15/2024 (B) | | | 1,480 | | | | 1,515 | |
| | | | | | | | |
| Description | | Face Amount
($ Thousands) | | | Market Value ($ Thousands) | |
APX Group | | | | | | | | |
8.750%, 12/01/2020 | | $ | 9,545 | | | $ | 8,686 | |
7.875%, 12/01/2022 (B) | | | 1,850 | | | | 1,859 | |
Ashtead Capital | | | | | | | | |
6.500%, 07/15/2022 (B) | | | 4,540 | | | | 4,756 | |
B&G Foods | | | | | | | | |
4.625%, 06/01/2021 | | | 700 | | | | 707 | |
Bumble Bee Holdco PIK | | | | | | | | |
9.625%, 03/15/2018 (B) | | | 3,022 | | | | 2,992 | |
Bumble Bee Holdings | | | | | | | | |
9.000%, 12/15/2017 (B) | | | 964 | | | | 976 | |
Central Garden & Pet | | | | | | | | |
6.125%, 11/15/2023 | | | 754 | | | | 782 | |
Ceridian HCM Holding | | | | | | | | |
11.000%, 03/15/2021 (B) | | | 991 | | | | 994 | |
Concordia Healthcare | | | | | | | | |
9.500%, 10/21/2022 (B) | | | 1,400 | | | | 1,397 | |
Constellation Brands | | | | | | | | |
4.750%, 11/15/2024 | | | 770 | | | | 809 | |
Cott Beverages | | | | | | | | |
5.375%, 07/01/2022 | | | 2,597 | | | | 2,607 | |
Crimson Merger Sub | | | | | | | | |
6.625%, 05/15/2022 (B) | | | 5,240 | | | | 4,277 | |
CVS Health | | | | | | | | |
5.000%, 12/01/2024 (B) | | | 800 | | | | 910 | |
4.750%, 12/01/2022 (B) | | | 1,400 | | | | 1,559 | |
Darling Ingredients | | | | | | | | |
5.375%, 01/15/2022 | | | 1,000 | | | | 1,035 | |
Dean Foods | | | | | | | | |
6.500%, 03/15/2023 (B) | | | 1,590 | | | | 1,658 | |
DJO Finco | | | | | | | | |
8.125%, 06/15/2021 (B) | | | 2,080 | | | | 1,867 | |
DPx Holdings BV | | | | | | | | |
7.500%, 02/01/2022 (B) | | | 777 | | | | 796 | |
Elizabeth Arden | | | | | | | | |
7.375%, 03/15/2021 | | | 2,571 | | | | 1,928 | |
Energizer Holdings | | | | | | | | |
5.500%, 06/15/2025 (B) | | | 1,170 | | | | 1,152 | |
Fresenius Medical Care US Finance II | |
5.625%, 07/31/2019 (B) | | | 1,650 | | | | 1,776 | |
4.750%, 10/15/2024 (B) | | | 800 | | | | 831 | |
4.125%, 10/15/2020 (B) | | | 2,250 | | | | 2,312 | |
Fresh Market | | | | | | | | |
9.750%, 05/01/2023 (B) | | | 2,020 | | | | 1,843 | |
Global A&T Electronics | | | | | | | | |
10.000%, 02/01/2019 (B) | | | 415 | | | | 291 | |
Grifols Worldwide Operations | | | | | | | | |
5.250%, 04/01/2022 | | | 3,165 | | | | 3,236 | |
Harland Clarke Holdings | | | | | | | | |
9.750%, 08/01/2018 (B) | | | 295 | | | | 296 | |
9.250%, 03/01/2021 (B) | | | 11,721 | | | | 9,728 | |
| | |
| 144 | | SEI Institutional Investments Trust / Annual Report / May 31, 2016 |
| | | | | | | | |
| Description | | Face Amount
($ Thousands) | | | Market Value ($ Thousands) | |
Herc Spinoff Escrow Issuer LLC | | | | | | | | |
7.750%, 06/01/2024 (B) | | $ | 840 | | | $ | 842 | |
7.500%, 06/01/2022 (B) | | | 735 | | | | 739 | |
HRG Group | | | | | | | | |
7.750%, 01/15/2022 | | | 2,041 | | | | 2,000 | |
Innovation Ventures LLC | | | | | | | | |
9.500%, 08/15/2019 (B) | | | 2,320 | | | | 2,430 | |
inVentiv Health PIK | | | | | | | | |
10.000%, 08/15/2018 (B) | | | 732 | | | | 745 | |
inVentiv Health | | | | | | | | |
10.000%, 08/15/2018 | | | 445 | | | | 438 | |
Jaguar Holding II | | | | | | | | |
6.375%, 08/01/2023 (B) | | | 716 | | | | 731 | |
JBS Investments GmbH | | | | | | | | |
7.750%, 10/28/2020 (B) | | | 704 | | | | 737 | |
JBS USA LLC | | | | | | | | |
5.875%, 07/15/2024 (B) | | | 718 | | | | 706 | |
5.750%, 06/15/2025 (B) | | | 2,260 | | | | 2,158 | |
JLL PIK | | | | | | | | |
8.750%, 05/01/2020 (B) | | | 2,394 | | | | 2,388 | |
KeHE Distributors LLC | | | | | | | | |
7.625%, 08/15/2021 (B) | | | 1,900 | | | | 1,862 | |
Kinetic Concepts | | | | | | | | |
7.875%, 02/15/2021 (B) | | | 1,207 | | | | 1,295 | |
Kronos Acquisition Holdings | | | | | | | | |
9.000%, 08/15/2023 (B) | | | 1,960 | | | | 1,896 | |
Laureate Education | | | | | | | | |
9.250%, 09/01/2019 (B) | | | 3,225 | | | | 2,967 | |
MPH Acquisition Holdings LLC | | | | | | | | |
7.125%, 06/01/2024 (B) | | | 968 | | | | 995 | |
NBTY | | | | | | | | |
7.625%, 05/15/2021 (B) | | | 2,405 | | | | 2,453 | |
Opal Acquisition | | | | | | | | |
8.875%, 12/15/2021 (B) | | | 4,600 | | | | 3,600 | |
Post Holdings | | | | | | | | |
8.000%, 07/15/2025 (B) | | | 595 | | | | 661 | |
7.750%, 03/15/2024 (B) | | | 2,405 | | | | 2,612 | |
7.375%, 02/15/2022 | | | 2,710 | | | | 2,862 | |
6.750%, 12/01/2021 (B) | | | 155 | | | | 164 | |
6.000%, 12/15/2022 (B) | | | 1,645 | | | | 1,678 | |
Prestige Brands | | | | | | | | |
5.375%, 12/15/2021 (B) | | | 1,755 | | | | 1,777 | |
Prime Security Services Borrower LLC | | | | | | | | |
9.250%, 05/15/2023 (B) | | | 9,794 | | | | 10,210 | |
Quintiles Transnational | | | | | | | | |
4.875%, 05/15/2023 (B) | | | 2,680 | | | | 2,714 | |
Quorum Health | | | | | | | | |
11.625%, 04/15/2023 (B) | | | 731 | | | | 731 | |
RegionalCare Hospital Partners Holdings | | | | | | | | |
8.250%, 05/01/2023 (B) | | | 1,617 | | | | 1,665 | |
Rite Aid | | | | | | | | |
7.700%, 02/15/2027 | | | 3,225 | | | | 3,878 | |
| | | | | | | | |
| Description | | Face Amount
($ Thousands) | | | Market Value ($ Thousands) | |
6.875%, 12/15/2028 (B) | | $ | 210 | | | $ | 241 | |
6.125%, 04/01/2023 (B) | | | 6,757 | | | | 7,146 | |
Spectrum Brands | | | | | | | | |
6.625%, 11/15/2022 | | | 2,240 | | | | 2,387 | |
6.375%, 11/15/2020 | | | 480 | | | | 503 | |
6.125%, 12/15/2024 | | | 1,930 | | | | 2,041 | |
5.750%, 07/15/2025 | | | 1,285 | | | | 1,343 | |
Sterigenics-Nordion Holdings LLC | | | | | | | | |
6.500%, 05/15/2023 (B) | | | 1,790 | | | | 1,821 | |
SuperValu | | | | | | | | |
7.750%, 11/15/2022 | | | 3,335 | | | | 2,897 | |
6.750%, 06/01/2021 | | | 5,985 | | | | 5,132 | |
TreeHouse Foods | | | | | | | | |
6.000%, 02/15/2024 (B) | | | 415 | | | | 437 | |
Valeant Pharmaceuticals International | | | | | | | | |
7.250%, 07/15/2022 (B) | | | 2,095 | | | | 1,834 | |
7.000%, 10/01/2020 (B) | | | 4,300 | | | | 3,881 | |
6.750%, 08/15/2021 (B) | | | 1,165 | | | | 1,025 | |
6.125%, 04/15/2025 (B) | | | 10,492 | | | | 8,774 | |
5.875%, 05/15/2023 (B) | | | 3,127 | | | | 2,634 | |
5.500%, 03/01/2023 (B) | | | 3,967 | | | | 3,293 | |
5.375%, 03/15/2020 (B) | | | 1,532 | | | | 1,352 | |
Valeant Pharmaceuticals International (escrow security) | | | | | | | | |
7.500%, 07/15/2021 (B) | | | 6,075 | | | | 5,498 | |
6.750%, 08/15/2018 (B) | | | 1,355 | | | | 1,324 | |
Vector Group | | | | | | | | |
7.750%, 02/15/2021 | | | 2,030 | | | | 2,116 | |
Vizient | | | | | | | | |
10.375%, 03/01/2024 (B) | | | 1,387 | | | | 1,484 | |
| | | | | | | | |
| | | | | | | 180,650 | |
| | | | | | | | |
| | |
Energy — 9.3% | | | | | | | | |
Alberta Energy | | | | | | | | |
8.125%, 09/15/2030 | | | 200 | | | | 198 | |
7.375%, 11/01/2031 | | | 165 | | | | 158 | |
American Energy-Permian Basin LLC | | | | | | | | |
8.000%, 06/15/2020 (B) | | | 2,628 | | | | 2,431 | |
American Greetings | | | | | | | | |
7.375%, 12/01/2021 | | | 390 | | | | 399 | |
Anadarko Petroleum | | | | | | | | |
3.450%, 07/15/2024 | | | 923 | | | | 873 | |
Antero Resources | | | | | | | | |
5.625%, 06/01/2023 | | | 3,440 | | | | 3,354 | |
5.125%, 12/01/2022 | | | 825 | | | | 790 | |
Antero Resources Finance | | | | | | | | |
6.000%, 12/01/2020 | | | 495 | | | | 491 | |
5.375%, 11/01/2021 | | | 1,160 | | | | 1,131 | |
Archrock Partners | | | | | | | | |
6.000%, 04/01/2021 | | | 525 | | | | 454 | |
Atlas Energy Holdings Operating LLC | | | | | | | | |
9.250%, 08/15/2021 | | | 1,950 | | | | 234 | |
| | | | |
| SEI Institutional Investments Trust / Annual Report / May 31, 2016 | | | 145 | |
SCHEDULE OF INVESTMENTS
High Yield Bond Fund (Continued)
May 31, 2016
| | | | | | | | |
| Description | | Face Amount
($ Thousands) | | | Market Value ($ Thousands) | |
7.750%, 01/15/2021 | | $ | 1,350 | | | $ | 162 | |
Atwood Oceanics | | | | | | | | |
6.500%, 02/01/2020 | | | 438 | | | | 263 | |
Basic Energy Services | | | | | | | | |
7.750%, 02/15/2019 | | | 3,640 | | | | 1,265 | |
7.750%, 10/15/2022 | | | 1,210 | | | | 402 | |
Bellatrix Exploration | | | | | | | | |
8.500%, 05/15/2020 (B) | | | 2,206 | | | | 1,268 | |
Berry Petroleum LLC | | | | | | | | |
6.750%, 11/01/2020 (A) | | | 1,408 | | | | 338 | |
6.375%, 09/15/2022 | | | 2,999 | | | | 720 | |
Blue Racer Midstream LLC | | | | | | | | |
6.125%, 11/15/2022 (B) | | | 5,762 | | | | 5,186 | |
Boardwalk Pipelines | | | | | | | | |
5.950%, 06/01/2026 | | | 480 | | | | 481 | |
BreitBurn Energy Partners | | | | | | | | |
8.625%, 10/15/2020 (A) | | | 495 | | | | 68 | |
7.875%, 04/15/2022 (A) | | | 2,880 | | | | 396 | |
Calfrac Holdings | | | | | | | | |
7.500%, 12/01/2020 (B) | | | 2,764 | | | | 1,375 | |
California Resources | | | | | | | | |
8.000%, 12/15/2022 (B) | | | 1,736 | | | | 1,267 | |
Calumet Specialty Products Partners | | | | | | | | |
7.625%, 01/15/2022 | | | 1,300 | | | | 861 | |
Carrizo Oil & Gas | | | | | | | | |
7.500%, 09/15/2020 | | | 400 | | | | 401 | |
6.250%, 04/15/2023 | | | 396 | | | | 387 | |
CHC Helicopter | | | | | | | | |
9.250%, 10/15/2020 (A) | | | 501 | | | | 222 | |
Chesapeake Energy | | | | | | | | |
8.000%, 12/15/2022 (B) | | | 2,095 | | | | 1,687 | |
7.250%, 12/15/2018 | | | 906 | | | | 772 | |
3.878%, 04/15/2019 (E) | | | 330 | | | | 242 | |
Cloud Peak Energy Resources LLC | | | | | | | | |
8.500%, 12/15/2019 | | | 1,223 | | | | 547 | |
Comstock Resources | | | | | | | | |
10.000%, 03/15/2020 (B) | | | 940 | | | | 691 | |
Concho Resources | | | | | | | | |
5.500%, 10/01/2022 | | | 815 | | | | 815 | |
5.500%, 04/01/2023 | | | 2,705 | | | | 2,705 | |
Consol Energy | | | | | | | | |
5.875%, 04/15/2022 | | | 5,640 | | | | 4,597 | |
Continental Resources | | | | | | | | |
5.000%, 09/15/2022 | | | 2,688 | | | | 2,540 | |
4.500%, 04/15/2023 | | | 959 | | | | 873 | |
Crestwood Midstream Partners | | | | | | | | |
6.250%, 04/01/2023 (B) | | | 490 | | | | 458 | |
6.125%, 03/01/2022 | | | 360 | | | | 340 | |
CSI Compressco | | | | | | | | |
7.250%, 08/15/2022 | | | 215 | | | | 174 | |
DCP Midstream LLC | | | | | | | | |
5.850%, 05/21/2043 (B) (E) | | | 511 | | | | 347 | |
| | | | | | | | |
| Description | | Face Amount
($ Thousands) | | | Market Value ($ Thousands) | |
5.350%, 03/15/2020 (B) | | $ | 2,763 | | | $ | 2,660 | |
Denbury Resources | | | | | | | | |
5.500%, 05/01/2022 | | | 1,175 | | | | 834 | |
4.625%, 07/15/2023 | | | 1,933 | | | | 1,305 | |
Encana | | | | | | | | |
7.200%, 11/01/2031 | | | 315 | | | | 301 | |
6.625%, 08/15/2037 | | | 785 | | | | 691 | |
Encana, Ser 2004 | | | | | | | | |
6.500%, 08/15/2034 | | | 1,817 | | | | 1,610 | |
Endeavor Energy Resources | | | | | | | | |
7.000%, 08/15/2021 (B) | | | 2,148 | | | | 2,094 | |
Energy Transfer Equity | | | | | | | | |
7.500%, 10/15/2020 | | | 1,511 | | | | 1,541 | |
5.875%, 01/15/2024 | | | 5,445 | | | | 5,050 | |
5.500%, 06/01/2027 | | | 1,541 | | | | 1,337 | |
Energy Transfer Partners | | | | | | | | |
6.625%, 10/15/2036 | | | 920 | | | | 885 | |
6.500%, 02/01/2042 | | | 155 | | | | 150 | |
6.125%, 12/15/2045 | | | 1,705 | | | | 1,609 | |
6.050%, 06/01/2041 | | | 160 | | | | 145 | |
5.150%, 02/01/2043 | | | 255 | | | | 212 | |
4.900%, 03/15/2035 | | | 840 | | | | 693 | |
EnLink Midstream Partners | | | | | | | | |
5.050%, 04/01/2045 | | | 2,303 | | | | 1,701 | |
4.400%, 04/01/2024 | | | 480 | | | | 419 | |
4.150%, 06/01/2025 | | | 2,278 | | | | 1,952 | |
2.700%, 04/01/2019 | | | 1,195 | | | | 1,111 | |
Ensco | | | | | | | | |
5.750%, 10/01/2044 | | | 2,274 | | | | 1,325 | |
EP Energy LLC | | | | | | | | |
9.375%, 05/01/2020 | | | 2,228 | | | | 1,431 | |
7.750%, 09/01/2022 | | | 700 | | | | 368 | |
EXCO Resources | | | | | | | | |
8.500%, 04/15/2022 | | | 555 | | | | 94 | |
FTS International | | | | | | | | |
8.134%, 06/15/2020 (B) (E) | | | 1,613 | | | | 1,354 | |
Genesis Energy | | | | | | | | |
6.750%, 08/01/2022 | | | 3,531 | | | | 3,354 | |
6.000%, 05/15/2023 | | | 2,294 | | | | 2,111 | |
5.750%, 02/15/2021 | | | 370 | | | | 344 | |
Gibson Energy | | | | | | | | |
6.750%, 07/15/2021 (B) | | | 5,200 | | | | 5,161 | |
Halcon Resources | | | | | | | | |
13.000%, 02/15/2022 (B) | | | 1,387 | | | | 759 | |
8.625%, 02/01/2020 (B) | | | 2,368 | | | | 2,235 | |
Hess | | | | | | | | |
7.300%, 08/15/2031 | | | 914 | | | | 989 | |
Hiland Partners Holdings LLC | | | | | | | | |
7.250%, 10/01/2020 (B) | | | 2,035 | | | | 2,124 | |
5.500%, 05/15/2022 (B) | | | 2,569 | | | | 2,517 | |
Hilcorp Energy I | | | | | | | | |
5.750%, 10/01/2025 (B) | | | 903 | | | | 871 | |
| | |
| 146 | | SEI Institutional Investments Trust / Annual Report / May 31, 2016 |
| | | | | | | | |
| Description | | Face Amount
($ Thousands) | | | Market Value ($ Thousands) | |
5.000%, 12/01/2024 (B) | | $ | 969 | | | $ | 921 | |
IronGate Energy Services LLC | | | | | | | | |
11.000%, 07/01/2018 (B) | | | 500 | | | | 120 | |
Jupiter Resources | | | | | | | | |
8.500%, 10/01/2022 (B) | | | 5,000 | | | | 3,125 | |
Kinder Morgan | | | | | | | | |
5.000%, 02/15/2021 (B) | | | 580 | | | | 599 | |
Kosmos Energy | | | | | | | | |
7.875%, 08/01/2021 | | | 4,505 | | | | 4,145 | |
Laredo Petroleum | | | | | | | | |
7.375%, 05/01/2022 | | | 585 | | | | 589 | |
Legacy Reserves | | | | | | | | |
8.000%, 12/01/2020 | | | 1,530 | | | | 566 | |
6.625%, 12/01/2021 | | | 1,525 | | | | 503 | |
Linn Energy LLC | | | | | | | | |
6.250%, 11/01/2019 (A) | | | 5,110 | | | | 818 | |
MEG Energy | | | | | | | | |
7.000%, 03/31/2024 (B) | | | 6,330 | | | | 4,874 | |
6.500%, 03/15/2021 (B) | | | 326 | | | | 257 | |
6.375%, 01/30/2023 (B) | | | 3,450 | | | | 2,639 | |
Memorial Production Partners | | | | | | | | |
7.625%, 05/01/2021 | | | 3,600 | | | | 1,782 | |
6.875%, 08/01/2022 | | | 5,840 | | | | 2,745 | |
Midstates Petroleum | | | | | | | | |
10.750%, 10/01/2020 (A) | | | 3,459 | | | | 35 | |
10.000%, 06/01/2020 (A) | | | 1,250 | | | | 681 | |
9.250%, 06/01/2021 | | | 485 | | | | 5 | |
Milagro Oil & Gas | | | | | | | | |
10.500%, 05/15/2016 (A) | | | 1,950 | | | | 644 | |
MPLX | | | | | | | | |
5.500%, 02/15/2023 (B) | | | 970 | | | | 954 | |
4.875%, 12/01/2024 (B) | | | 3,735 | | | | 3,531 | |
4.875%, 06/01/2025 (B) | | | 2,800 | | | | 2,654 | |
Murphy Oil | | | | | | | | |
4.700%, 12/01/2022 | | | 999 | | | | 906 | |
Murray Energy | | | | | | | | |
11.250%, 04/15/2021 (B) | | | 4,075 | | | | 784 | |
Newfield Exploration | | | | | | | | |
5.750%, 01/30/2022 | | | 590 | | | | 595 | |
5.625%, 07/01/2024 | | | 1,325 | | | | 1,318 | |
5.375%, 01/01/2026 | | | 2,820 | | | | 2,750 | |
Noble Holding International | | | | | | | | |
5.000%, 03/16/2018 | | | 3,260 | | | | 3,160 | |
NuStar Logistics | | | | | | | | |
6.750%, 02/01/2021 | | | 1,480 | | | | 1,487 | |
Oasis Petroleum | | | | | | | | |
6.875%, 03/15/2022 | | | 2,550 | | | | 2,346 | |
6.875%, 01/15/2023 | | | 680 | | | | 614 | |
ONEOK | | | | | | | | |
7.500%, 09/01/2023 | | | 1,720 | | | | 1,776 | |
Parker Drilling | | | | | | | | |
6.750%, 07/15/2022 | | | 5,875 | | | | 4,201 | |
| | | | | | | | |
| Description | | Face Amount
($ Thousands) | | | Market Value ($ Thousands) | |
Parsley Energy LLC | | | | | | | | |
6.250%, 06/01/2024 (B) | | $ | 120 | | | $ | 122 | |
PBF Holding LLC | | | | | | | | |
7.000%, 11/15/2023 (B) | | | 1,073 | | | | 1,026 | |
Peabody Energy | | | | | | | | |
6.250%, 11/15/2021 (A) | | | 660 | | | | 92 | |
Petrobras Global Finance | | | | | | | | |
6.850%, 06/05/2115 | | | 955 | | | | 654 | |
Petrobras International Finance | | | | | | | | |
6.750%, 01/27/2041 | | | 1,940 | | | | 1,396 | |
Pride International | | | | | | | | |
8.500%, 06/15/2019 | | | 1,359 | | | | 1,341 | |
Range Resources | | | | | | | | |
4.875%, 05/15/2025 | | | 1,895 | | | | 1,791 | |
Regency Energy Partners | | | | | | | | |
5.875%, 03/01/2022 | | | 2,825 | | | | 2,884 | |
5.500%, 04/15/2023 | | | 1,972 | | | | 1,929 | |
5.000%, 10/01/2022 | | | 1,845 | | | | 1,811 | |
Rice Energy | | | | | | | | |
7.250%, 05/01/2023 | | | 1,700 | | | | 1,717 | |
Rose Rock Midstream | | | | | | | | |
5.625%, 07/15/2022 | | | 6,671 | | | | 5,754 | |
5.625%, 11/15/2023 | | | 200 | | | | 166 | |
Rowan | | | | | | | | |
5.850%, 01/15/2044 | | | 2,184 | | | | 1,370 | |
RSP Permian | | | | | | | | |
6.625%, 10/01/2022 | | | 340 | | | | 351 | |
Sabine Pass Liquefaction LLC | | | | | | | | |
6.250%, 03/15/2022 | | | 1,955 | | | | 1,999 | |
5.750%, 05/15/2024 | | | 6,100 | | | | 6,130 | |
5.625%, 02/01/2021 | | | 4,920 | | | | 5,025 | |
5.625%, 04/15/2023 | | | 2,070 | | | | 2,091 | |
5.625%, 03/01/2025 | | | 3,050 | | | | 3,050 | |
Sanchez Energy | | | | | | | | |
7.750%, 06/15/2021 | | | 150 | | | | 115 | |
6.125%, 01/15/2023 | | | 875 | | | | 630 | |
SandRidge Energy | | | | | | | | |
8.750%, 01/15/2020 | | | 280 | | | | 17 | |
8.750%, 06/01/2020 (A) (B) | | | 3,366 | | | | 1,330 | |
8.125%, 10/15/2022 | | | 2,535 | | | | 152 | |
7.500%, 02/15/2023 | | | 4,790 | | | | 299 | |
SemGroup | | | | | | | | |
7.500%, 06/15/2021 | | | 1,970 | | | | 1,867 | |
SESI LLC | | | | | | | | |
7.125%, 12/15/2021 | | | 3,300 | | | | 2,974 | |
Seventy Seven Energy | | | | | | | | |
6.500%, 07/15/2022 | | | 395 | | | | 23 | |
Seventy Seven Operating LLC | | | | | | | | |
0.000%, 11/15/2019 (C) | | | 2,787 | | | | 1,275 | |
SM Energy | | | | | | | | |
6.500%, 01/01/2023 | | | 2,094 | | | | 1,906 | |
6.125%, 11/15/2022 | | | 1,357 | | | | 1,242 | |
| | | | |
| SEI Institutional Investments Trust / Annual Report / May 31, 2016 | | | 147 | |
SCHEDULE OF INVESTMENTS
High Yield Bond Fund (Continued)
May 31, 2016
| | | | | | | | |
| Description | | Face Amount
($ Thousands) | | | Market Value ($ Thousands) | |
5.625%, 06/01/2025 | | $ | 524 | | | $ | 450 | |
Southwestern Energy | | | | | | | | |
7.500%, 02/01/2018 | | | 2,359 | | | | 2,371 | |
4.950%, 01/23/2025 | | | 1,845 | | | | 1,545 | |
Summit Midstream Holdings LLC | | | | | | | | |
7.500%, 07/01/2021 | | | 1,200 | | | | 1,113 | |
5.500%, 08/15/2022 | | | 1,302 | | | | 1,068 | |
Sunoco | | | | | | | | |
6.250%, 04/15/2021 (B) | | | 995 | | | | 995 | |
Targa Resources Partners | | | | | | | | |
6.875%, 02/01/2021 | | | 1,581 | | | | 1,601 | |
6.750%, 03/15/2024 (B) | | | 3,270 | | | | 3,229 | |
6.625%, 10/01/2020 | | | 2,180 | | | | 2,224 | |
5.250%, 05/01/2023 | | | 1,050 | | | | 987 | |
4.250%, 11/15/2023 | | | 1,000 | | | | 895 | |
4.125%, 11/15/2019 | | | 225 | | | | 219 | |
Tesoro Logistics | | | | | | | | |
6.375%, 05/01/2024 | | | 465 | | | | 479 | |
6.250%, 10/15/2022 | | | 355 | | | | 367 | |
6.125%, 10/15/2021 | | | 1,207 | | | | 1,246 | |
5.875%, 10/01/2020 | | | 969 | | | | 998 | |
5.500%, 10/15/2019 | | | 355 | | | | 369 | |
Transocean | | | | | | | | |
6.000%, 03/15/2018 | | | 1,340 | | | | 1,300 | |
Trinidad Drilling | | | | | | | | |
7.875%, 01/15/2019 (B) | | | 880 | | | | 730 | |
Unit | | | | | | | | |
6.625%, 05/15/2021 | | | 2,719 | | | | 1,964 | |
Walter Energy | | | | | | | | |
9.875%, 12/15/2020 (A) | | | 4,200 | | | | 1 | |
8.500%, 04/15/2021 (A) | | | 2,060 | | | | — | |
Weatherford International | | | | | | | | |
5.950%, 04/15/2042 | | | 5,515 | | | | 3,516 | |
Western Refining | | | | | | | | |
6.250%, 04/01/2021 | | | 455 | | | | 411 | |
Western Refining Logistics | | | | | | | | |
7.500%, 02/15/2023 | | | 1,565 | | | | 1,522 | |
Whiting Petroleum | | | | | | | | |
6.500%, 10/01/2018 | | | 670 | | | | 620 | |
6.250%, 04/01/2023 | | | 1,550 | | | | 1,279 | |
5.750%, 03/15/2021 | | | 4,673 | | | | 3,960 | |
Williams | | | | | | | | |
7.500%, 01/15/2031 | | | 260 | | | | 255 | |
4.550%, 06/24/2024 | | | 1,193 | | | | 1,041 | |
Williams Partners | | | | | | | | |
6.300%, 04/15/2040 | | | 350 | | | | 322 | |
6.125%, 07/15/2022 | | | 625 | | | | 612 | |
5.800%, 11/15/2043 | | | 670 | | | | 558 | |
5.400%, 03/04/2044 | | | 415 | | | | 339 | |
4.900%, 01/15/2045 | | | 1,455 | | | | 1,126 | |
4.875%, 05/15/2023 | | | 120 | | | | 110 | |
4.875%, 03/15/2024 | | | 2,094 | | | | 1,894 | |
| | | | | | | | |
| Description | | Face Amount
($ Thousands) | | | Market Value ($ Thousands) | |
4.000%, 09/15/2025 | | $ | 500 | | | $ | 432 | |
3.900%, 01/15/2025 | | | 765 | | | | 661 | |
3.600%, 03/15/2022 | | | 295 | | | | 260 | |
WPX Energy | | | | | | | | |
8.250%, 08/01/2023 | | | 1,689 | | | | 1,651 | |
6.000%, 01/15/2022 | | | 1,910 | | | | 1,719 | |
5.250%, 09/15/2024 | | | 510 | | | | 444 | |
| | | | | | | | |
| | | | | | | 245,236 | |
| | | | | | | | |
| | |
Financials — 6.7% | | | | | | | | |
AAF Holdings LLC PIK | | | | | | | | |
12.000%, 07/01/2019 (B) | | | 1,072 | | | | 1,056 | |
Ally Financial | | | | | | | | |
8.000%, 03/15/2020 | | | 1,699 | | | | 1,937 | |
8.000%, 11/01/2031 | | | 500 | | | | 587 | |
5.750%, 11/20/2025 | | | 3,225 | | | | 3,265 | |
5.125%, 09/30/2024 | | | 12,254 | | | | 12,637 | |
4.625%, 05/19/2022 | | | 1,150 | | | | 1,166 | |
4.625%, 03/30/2025 | | | 1,540 | | | | 1,536 | |
4.125%, 03/30/2020 | | | 1,330 | | | | 1,337 | |
3.500%, 01/27/2019 | | | 3,150 | | | | 3,142 | |
American Equity Investment Life Holding | | | | | | | | |
6.625%, 07/15/2021 | | | 1,900 | | | | 1,943 | |
Aventine (escrow security) | | | | | | | | |
0.000%, 10/15/2049 (D) (F) (G) | | | 2,600 | | | | 1 | |
Bank of America | | | | | | | | |
8.000%, 12/29/2049 (E) | | | 2,290 | | | | 2,296 | |
6.500%, 12/31/2049 (E) | | | 3,435 | | | | 3,624 | |
5.125%, 12/31/2049 (E) | | | 1,947 | | | | 1,830 | |
Boart Longyear Management | | | | | | | | |
10.000%, 10/01/2018 (B) | | | 2,500 | | | | 1,506 | |
7.000%, 04/01/2021 (B) | | | 4,040 | | | | 849 | |
CIT Group | | | | | | | | |
6.625%, 04/01/2018 (B) | | | 300 | | | | 316 | |
5.500%, 02/15/2019 (B) | | | 3,591 | | | | 3,753 | |
3.875%, 02/19/2019 | | | 1,445 | | | | 1,452 | |
Citigroup | | | | | | | | |
6.250%, 12/29/2049 (E) | | | 1,235 | | | | 1,276 | |
5.950%, 12/29/2049 (E) | | | 1,950 | | | | 1,952 | |
City National Bank | | | | | | | | |
9.000%, 08/12/2019 | | | 4,062 | | | | 4,841 | |
Communications Sales & Leasing | | | | | | | | |
8.250%, 10/15/2023 | | | 3,035 | | | | 2,860 | |
6.000%, 04/15/2023 (B) | | | 3,609 | | | | 3,591 | |
Corrections Corp of America | | | | | | | | |
5.000%, 10/15/2022 | | | 340 | | | | 357 | |
4.625%, 05/01/2023 | | | 1,575 | | | | 1,599 | |
4.125%, 04/01/2020 | | | 695 | | | | 717 | |
Credit Acceptance | | | | | | | | |
7.375%, 03/15/2023 | | | 5,395 | | | | 5,193 | |
6.125%, 02/15/2021 | | | 640 | | | | 617 | |
| | |
| 148 | | SEI Institutional Investments Trust / Annual Report / May 31, 2016 |
| | | | | | | | |
| Description | | Face Amount
($ Thousands) | | | Market Value ($ Thousands) | |
Credit Suisse Group | | | | | | | | |
7.500%, 12/11/2048 (B) (E) | | $ | 1,365 | | | $ | 1,402 | |
CTR Partnership | | | | | | | | |
5.875%, 06/01/2021 | | | 2,680 | | | | 2,713 | |
CyrusOne | | | | | | | | |
6.375%, 11/15/2022 | | | 65 | | | | 69 | |
Denali International LLC | | | | | | | | |
5.625%, 10/15/2020 (B) | | | 1,210 | | | | 1,272 | |
Equinix | | | | | | | | |
5.875%, 01/15/2026 | | | 2,165 | | | | 2,257 | |
5.750%, 01/01/2025 | | | 1,060 | | | | 1,102 | |
5.375%, 01/01/2022 | | | 255 | | | | 263 | |
5.375%, 04/01/2023 | | | 600 | | | | 617 | |
4.875%, 04/01/2020 | | | 2,785 | | | | 2,890 | |
FelCor Lodging | | | | | | | | |
6.000%, 06/01/2025 | | | 148 | | | | 153 | |
First Data | | | | | | | | |
5.375%, 08/15/2023 (B) | | | 2,499 | | | | 2,561 | |
Genworth Holdings | | | | | | | | |
7.625%, 09/24/2021 | | | 6,130 | | | | 5,134 | |
6.500%, 06/15/2034 | | | 315 | | | | 212 | |
GEO Group | | | | | | | | |
6.000%, 04/15/2026 | | | 1,745 | | | | 1,762 | |
5.875%, 01/15/2022 | | | 1,715 | | | | 1,741 | |
5.875%, 10/15/2024 | | | 810 | | | | 819 | |
5.125%, 04/01/2023 | | | 705 | | | | 686 | |
GLP Capital | | | | | | | | |
5.375%, 04/15/2026 | | | 1,005 | | | | 1,048 | |
4.875%, 11/01/2020 | | | 429 | | | | 449 | |
4.375%, 04/15/2021 | | | 80 | | | | 82 | |
HUB International | | | | | | | | |
9.250%, 02/15/2021 (B) | | | 1,710 | | | | 1,778 | |
7.875%, 10/01/2021 (B) | | | 5,470 | | | | 5,361 | |
Infinity Acquisition LLC | | | | | | | | |
7.250%, 08/01/2022 (B) | | | 805 | | | | 704 | |
Iron Mountain | | | | | | | | |
6.000%, 08/15/2023 | | | 790 | | | | 824 | |
4.375%, 06/01/2021 (B) | | | 600 | | | | 598 | |
James Hardie International Finance | | | | | | | | |
5.875%, 02/15/2023 (B) | | | 2,255 | | | | 2,289 | |
Jefferies Finance LLC | | | | | | | | |
6.875%, 04/15/2022 (B) | | | 3,785 | | | | 3,331 | |
JPMorgan Chase | | | | | | | | |
7.900%, 04/29/2049 (E) | | | 1,967 | | | | 2,011 | |
6.750%, 08/29/2049 (E) | | | 3,515 | | | | 3,902 | |
6.000%, 12/29/2049 (E) | | | 4,870 | | | | 5,027 | |
5.150%, 12/29/2049 (E) | | | 395 | | | | 388 | |
Kennedy-Wilson | | | | | | | | |
5.875%, 04/01/2024 | | | 500 | | | | 489 | |
Lamar Media | | | | | | | | |
5.750%, 02/01/2026 (B) | | | 1,689 | | | | 1,778 | |
| | | | | | | | |
| Description | | Face Amount
($ Thousands) | | | Market Value ($ Thousands) | |
Lloyds Banking Group | | | | | | | | |
7.500%, 12/01/2099 (E) | | $ | 9,055 | | | $ | 9,078 | |
Mattamy Group | | | | | | | | |
6.500%, 11/15/2020 (B) | | | 1,635 | | | | 1,590 | |
Millennium (escrow security) | | | | | | | | |
7.625%, 11/15/2026 (A) | | | 200 | | | | — | |
Morgan Stanley | | | | | | | | |
5.550%, 12/29/2049 (E) | | | 2,490 | | | | 2,490 | |
MPT Operating Partnership | | | | | | | | |
6.375%, 03/01/2024 | | | 1,542 | | | | 1,650 | |
MSCI | | | | | | | | |
5.750%, 08/15/2025 (B) | | | 918 | | | | 966 | |
5.250%, 11/15/2024 (B) | | | 1,670 | | | | 1,724 | |
National Life Insurance | | | | | | | | |
10.500%, 09/15/2039 (B) | | | 1,100 | | | | 1,646 | |
Nationstar Mortgage LLC | | | | | | | | |
6.500%, 08/01/2018 | | | 1,350 | | | | 1,316 | |
6.500%, 07/01/2021 | | | 1,000 | | | | 866 | |
6.500%, 06/01/2022 | | | 2,000 | | | | 1,695 | |
Popular | | | | | | | | |
7.000%, 07/01/2019 | | | 2,718 | | | | 2,698 | |
Quicken Loans | | | | | | | | |
5.750%, 05/01/2025 (B) | | | 4,430 | | | | 4,197 | |
Realogy Group LLC | | | | | | | | |
4.875%, 06/01/2023 (B) | | | 3,052 | | | | 3,025 | |
RHP Hotel Properties | | | | | | | | |
5.000%, 04/15/2021 | | | 2,671 | | | | 2,724 | |
5.000%, 04/15/2023 | | | 1,100 | | | | 1,104 | |
Royal Bank of Scotland Group | | | | | | | | |
8.000%, 12/29/2049 (E) | | | 2,020 | | | | 1,987 | |
5.125%, 05/28/2024 | | | 780 | | | | 771 | |
Santander Issuances | | | | | | | | |
5.179%, 11/19/2025 | | | 400 | | | | 398 | |
US Bancorp | | | | | | | | |
5.125%, 12/29/2049 (E) | | | 1,860 | | | | 1,911 | |
USI | | | | | | | | |
7.750%, 01/15/2021 (B) | | | 1,690 | | | | 1,682 | |
Voya Financial | | | | | | | | |
5.650%, 05/15/2053 (E) | | | 2,050 | | | | 1,925 | |
Walter Investment Management | | | | | | | | |
7.875%, 12/15/2021 | | | 1,363 | | | | 784 | |
Wells Fargo | | | | | | | | |
7.980%, 03/29/2049 (E) | | | 1,950 | | | | 2,052 | |
Wilton Re Finance LLC | | | | | | | | |
5.875%, 03/30/2033 (B) (E) | | | 2,400 | | | | 2,441 | |
XL Capital | | | | | | | | |
6.500%, 12/31/2049 (E) | | | 1,530 | | | | 1,081 | |
York Risk Services Holding | | | | | | | | |
8.500%, 10/01/2022 (B) | | | 2,000 | | | | 1,470 | |
| | | | | | | | |
| | | | | | | 176,219 | |
| | | | | | | | |
| | | | |
| SEI Institutional Investments Trust / Annual Report / May 31, 2016 | | | 149 | |
SCHEDULE OF INVESTMENTS
High Yield Bond Fund (Continued)
May 31, 2016
| | | | | | | | |
| Description | | Face Amount
($ Thousands) | | | Market Value ($ Thousands) | |
| | |
Health Care — 6.4% | | | | | | | | |
Acadia Healthcare | | | | | | | | |
6.500%, 03/01/2024 (B) | | $ | 930 | | | $ | 965 | |
6.125%, 03/15/2021 | | | 1,100 | | | | 1,130 | |
5.625%, 02/15/2023 | | | 2,315 | | | | 2,353 | |
5.125%, 07/01/2022 | | | 2,080 | | | | 2,090 | |
Alere | | | | | | | | |
6.500%, 06/15/2020 | | | 230 | | | | 231 | |
6.375%, 07/01/2023 (B) | | | 570 | | | | 594 | |
Amsurg | | | | | | | | |
5.625%, 11/30/2020 | | | 4,375 | | | | 4,495 | |
5.625%, 07/15/2022 | | | 2,385 | | | | 2,421 | |
Aurora Diagnostics Holdings LLC | | | | | | | | |
10.750%, 01/15/2018 | | | 6,040 | | | | 5,134 | |
Centene | | | | | | | | |
6.125%, 02/15/2024 (B) | | | 1,383 | | | | 1,457 | |
5.625%, 02/15/2021 (B) | | | 1,377 | | | | 1,432 | |
CHS | | | | | | | | |
8.000%, 11/15/2019 | | | 2,791 | | | | 2,756 | |
7.125%, 07/15/2020 | | | 1,300 | | | | 1,206 | |
6.875%, 02/01/2022 | | | 2,063 | | | | 1,773 | |
5.125%, 08/01/2021 | | | 2,000 | | | | 1,997 | |
DaVita HealthCare Partners | | | | | | | | |
5.125%, 07/15/2024 | | | 4,405 | | | | 4,465 | |
5.000%, 05/01/2025 | | | 7,513 | | | | 7,447 | |
Endo | | | | | | | | |
6.000%, 07/15/2023 (B) | | | 1,935 | | | | 1,694 | |
Endo Finance LLC | | | | | | | | |
6.000%, 02/01/2025 (B) | | | 2,862 | | | | 2,483 | |
ExamWorks Group | | | | | | | | |
5.625%, 04/15/2023 | | | 2,350 | | | | 2,520 | |
HCA | | | | | | | | |
7.500%, 02/15/2022 | | | 7,391 | | | | 8,380 | |
5.875%, 03/15/2022 | | | 2,050 | | | | 2,214 | |
5.875%, 05/01/2023 | | | 4,995 | | | | 5,288 | |
5.875%, 02/15/2026 | | | 3,910 | | | | 4,047 | |
5.375%, 02/01/2025 | | | 9,361 | | | | 9,501 | |
5.250%, 04/15/2025 | | | 2,885 | | | | 2,972 | |
5.250%, 06/15/2026 | | | 2,869 | | | | 2,948 | |
5.000%, 03/15/2024 | | | 2,900 | | | | 2,976 | |
HCA Holdings | | | | | | | | |
6.250%, 02/15/2021 | | | 15 | | | | 16 | |
HealthSouth | | | | | | | | |
5.750%, 11/01/2024 | | | 3,746 | | | | 3,798 | |
5.750%, 09/15/2025 | | | 2,986 | | | | 3,016 | |
5.125%, 03/15/2023 | | | 620 | | | | 604 | |
Hill-Rom Holdings | | | | | | | | |
5.750%, 09/01/2023 (B) | | | 3,921 | | | | 4,009 | |
Hologic | | | | | | | | |
5.250%, 07/15/2022 (B) | | | 980 | | | | 1,025 | |
IASIS Healthcare LLC | | | | | | | | |
8.375%, 05/15/2019 | | | 6,256 | | | | 6,006 | |
| | | | | | | | |
| Description | | Face Amount
($ Thousands) | | | Market Value ($ Thousands) | |
inVentiv Health | | | | | | | | |
9.000%, 01/15/2018 (B) | | $ | 1,360 | | | $ | 1,391 | |
Ironwood Pharmaceuticals | | | | | | | | |
11.000%, 06/15/2024 (B) | | | 3,615 | | | | 3,650 | |
Kindred Healthcare | | | | | | | | |
8.750%, 01/15/2023 | | | 1,175 | | | | 1,150 | |
8.000%, 01/15/2020 | | | 765 | | | | 764 | |
6.375%, 04/15/2022 | | | 5,620 | | | | 5,058 | |
Kinetic Concepts | | | | | | | | |
12.500%, 11/01/2019 | | | 860 | | | | 789 | |
10.500%, 11/01/2018 | | | 2,780 | | | | 2,773 | |
LifePoint Health | | | | | | | | |
5.500%, 12/01/2021 | | | 4,000 | | | | 4,160 | |
Mallinckrodt International Finance | | | | | | | | |
5.750%, 08/01/2022 (B) | | | 2,720 | | | | 2,571 | |
5.625%, 10/15/2023 (B) | | | 1,795 | | | | 1,687 | |
5.500%, 04/15/2025 (B) | | | 2,623 | | | | 2,367 | |
4.875%, 04/15/2020 (B) | | | 568 | | | | 551 | |
4.750%, 04/15/2023 | | | 2,100 | | | | 1,730 | |
MEDNAX | | | | | | | | |
5.250%, 12/01/2023 (B) | | | 2,112 | | | | 2,161 | |
Molina Healthcare | | | | | | | | |
5.375%, 11/15/2022 (B) | | | 533 | | | | 532 | |
MPH Acquisition Holdings LLC | | | | | | | | |
6.625%, 04/01/2022 (B) | | | 1,525 | | | | 1,662 | |
Prestige Brands | | | | | | | | |
6.375%, 03/01/2024 (B) | | | 330 | | | | 347 | |
Select Medical | | | | | | | | |
6.375%, 06/01/2021 | | | 2,905 | | | | 2,796 | |
Surgical Care Affiliates | | | | | | | | |
6.000%, 04/01/2023 (B) | | | 894 | | | | 919 | |
Team Health | | | | | | | | |
7.250%, 12/15/2023 (B) | | | 2,013 | | | | 2,159 | |
Tenet Healthcare | | | | | | | | |
8.125%, 04/01/2022 | | | 5,280 | | | | 5,313 | |
8.000%, 08/01/2020 | | | 1,960 | | | | 2,003 | |
6.750%, 02/01/2020 | | | 1,997 | | | | 1,962 | |
6.750%, 06/15/2023 | | | 7,280 | | | | 6,843 | |
6.000%, 10/01/2020 | | | 550 | | | | 579 | |
5.500%, 03/01/2019 | | | 2,704 | | | | 2,643 | |
4.750%, 06/01/2020 | | | 245 | | | | 251 | |
4.500%, 04/01/2021 | | | 510 | | | | 513 | |
4.134%, 06/15/2020 (B) (E) | | | 733 | | | | 729 | |
Universal Health Services | | | | | | | | |
5.000%, 06/01/2026 (B) | | | 610 | | | | 613 | |
4.750%, 08/01/2022 (B) | | | 727 | | | | 740 | |
Valeant Pharmaceuticals International | | | | | | | | |
6.375%, 10/15/2020 (B) | | | 1,000 | | | | 890 | |
| | | | | | | | |
| | | | | | | 167,739 | |
| | | | | | | | |
| | |
| 150 | | SEI Institutional Investments Trust / Annual Report / May 31, 2016 |
| | | | | | | | |
| Description | | Face Amount
($ Thousands) | | | Market Value ($ Thousands) | |
| | |
Industrials — 7.6% | | | | | | | | |
ACCO Brands | | | | | | | | |
6.750%, 04/30/2020 | | $ | 1,360 | | | $ | 1,436 | |
Actuant | | | | | | | | |
5.625%, 06/15/2022 | | | 4,000 | | | | 4,080 | |
ADT | | | | | | | | |
6.250%, 10/15/2021 | | | 930 | | | | 974 | |
3.500%, 07/15/2022 | | | 1,400 | | | | 1,285 | |
Advanced Disposal Services | | | | | | | | |
8.250%, 10/01/2020 | | | 2,640 | | | | 2,719 | |
AECOM | | | | | | | | |
5.875%, 10/15/2024 | | | 445 | | | | 460 | |
5.750%, 10/15/2022 | | | 175 | | | | 181 | |
AerCap Ireland Capital | | | | | | | | |
4.625%, 10/30/2020 | | | 420 | | | | 435 | |
4.625%, 07/01/2022 | | | 380 | | | | 389 | |
4.500%, 05/15/2021 | | | 3,780 | | | | 3,889 | |
3.750%, 05/15/2019 | | | 375 | | | | 380 | |
Aerojet Rocketdyne Holdings | | | | | | | | |
7.125%, 03/15/2021 | | | 1,595 | | | | 1,679 | |
Air Medical Merger Sub | | | | | | | | |
6.375%, 05/15/2023 (B) | | | 4,405 | | | | 4,306 | |
Aircastle | | | | | | | | |
7.625%, 04/15/2020 | | | 720 | | | | 817 | |
5.125%, 03/15/2021 | | | 165 | | | | 174 | |
5.000%, 04/01/2023 | | | 370 | | | | 378 | |
Allegion | | | | | | | | |
5.875%, 09/15/2023 | | | 645 | | | | 682 | |
Allegion US Holding | | | | | | | | |
5.750%, 10/01/2021 | | | 1,120 | | | | 1,173 | |
Apex Tool Group LLC | | | | | | | | |
7.000%, 02/01/2021 (B) | | | 2,165 | | | | 1,927 | |
Ardagh Finance Holdings | | | | | | | | |
8.625%, 06/15/2019 (B) | | | 2,162 | | | | 2,227 | |
Ardagh Packaging Finance | | | | | | | | |
9.125%, 10/15/2020 (B) | | | 2,555 | | | | 2,677 | |
7.250%, 05/15/2024 (B) | | | 5,976 | | | | 6,095 | |
7.000%, 11/15/2020 (B) | | | 47 | | | | 46 | |
6.750%, 01/31/2021 (B) | | | 235 | | | | 237 | |
6.000%, 06/30/2021 (B) | | | 4,814 | | | | 4,742 | |
4.625%, 05/15/2023 (B) | | | 1,970 | | | | 1,960 | |
3.634%, 12/15/2019 (B) (E) | | | 715 | | | | 717 | |
Associated Materials LLC | | | | | | | | |
9.125%, 11/01/2017 | | | 525 | | | | 469 | |
Avis Budget Car Rental LLC | | | | | | | | |
6.375%, 04/01/2024 (B) | | | 1,065 | | | | 1,022 | |
5.500%, 04/01/2023 | | | 1,397 | | | | 1,296 | |
5.250%, 03/15/2025 (B) | | | 1,700 | | | | 1,492 | |
Beacon Roofing Supply | | | | | | | | |
6.375%, 10/01/2023 | | | 1,345 | | | | 1,426 | |
Bombardier | | | | | | | | |
7.750%, 03/15/2020 (B) | | | 250 | | | | 249 | |
| | | | | | | | |
| Description | | Face Amount
($ Thousands) | | | Market Value ($ Thousands) | |
7.500%, 03/15/2025 (B) | | $ | 1,605 | | | $ | 1,412 | |
6.000%, 10/15/2022 (B) | | | 3,235 | | | | 2,766 | |
Builders FirstSource | | | | | | | | |
10.750%, 08/15/2023 (B) | | | 1,970 | | | | 2,142 | |
7.625%, 06/01/2021 (B) | | | 1,574 | | | | 1,653 | |
BWAY Holding | | | | | | | | |
9.125%, 08/15/2021 (B) | | | 2,104 | | | | 2,025 | |
CEB | | | | | | | | |
5.625%, 06/15/2023 (B) | | | 274 | | | | 272 | |
Cemex | | | | | | | | |
7.750%, 04/16/2026 (B) | | | 625 | | | | 657 | |
7.250%, 01/15/2021 (B) | | | 2,105 | | | | 2,200 | |
Cenveo | | | | | | | | |
8.500%, 09/15/2022 (B) | | | 6,335 | | | | 4,435 | |
6.000%, 08/01/2019 (B) | | | 6,192 | | | | 5,077 | |
CEVA Group | | | | | | | | |
7.000%, 03/01/2021 (B) | | | 950 | | | | 862 | |
Clean Harbors | | | | | | | | |
5.250%, 08/01/2020 | | | 1,871 | | | | 1,911 | |
5.125%, 06/01/2021 (B) | | | 380 | | | | 381 | |
CNH Industrial Capital LLC | | | | | | | | |
4.875%, 04/01/2021 | | | 1,075 | | | | 1,075 | |
4.375%, 11/06/2020 | | | 1,005 | | | | 997 | |
DigitalGlobe | | | | | | | | |
5.250%, 02/01/2021 (B) | | | 4,900 | | | | 4,496 | |
FGI Operating LLC | | | | | | | | |
7.875%, 05/01/2020 | | | 1,590 | | | | 1,153 | |
Florida East Coast Holdings | | | | | | | | |
6.750%, 05/01/2019 (B) | | | 2,955 | | | | 2,940 | |
Gardner Denver | | | | | | | | |
6.875%, 08/15/2021 (B) | | | 2,666 | | | | 2,293 | |
GCP Applied Technologies | | | | | | | | |
9.500%, 02/01/2023 (B) | | | 755 | | | | 838 | |
General Cable | | | | | | | | |
5.750%, 10/01/2022 | | | 1,535 | | | | 1,435 | |
Gibraltar Industries | | | | | | | | |
6.250%, 02/01/2021 | | | 661 | | | | 671 | |
Great Lakes Dredge & Dock | | | | | | | | |
7.375%, 02/01/2019 | | | 1,625 | | | | 1,544 | |
H&E Equipment Services | | | | | | | | |
7.000%, 09/01/2022 | | | 1,145 | | | | 1,179 | |
Hertz | | | | | | | | |
7.375%, 01/15/2021 | | | 610 | | | | 623 | |
6.250%, 10/15/2022 | | | 1,995 | | | | 1,982 | |
5.875%, 10/15/2020 | | | 505 | | | | 512 | |
Huntington Ingalls Industries | | | | | | | | |
5.000%, 11/15/2025 (B) | | | 294 | | | | 309 | |
Icahn Enterprises | | | | | | | | |
6.000%, 08/01/2020 | | | 3,400 | | | | 3,291 | |
5.875%, 02/01/2022 | | | 3,650 | | | | 3,358 | |
4.875%, 03/15/2019 | | | 2,961 | | | | 2,861 | |
| | | | |
| SEI Institutional Investments Trust / Annual Report / May 31, 2016 | | | 151 | |
SCHEDULE OF INVESTMENTS
High Yield Bond Fund (Continued)
May 31, 2016
| | | | | | | | |
| Description | | Face Amount
($ Thousands) | | | Market Value ($ Thousands) | |
International Lease Finance | | | | | | | | |
6.250%, 05/15/2019 | | $ | 675 | | | $ | 729 | |
5.875%, 04/01/2019 | | | 2,110 | | | | 2,255 | |
4.625%, 04/15/2021 | | | 180 | | | | 186 | |
Jack Cooper Enterprises PIK | | | | | | | | |
10.500%, 03/15/2019 (B) | | | 570 | | | | 245 | |
Jack Cooper Holdings | | | | | | | | |
10.250%, 06/01/2020 (B) | | | 1,510 | | | | 997 | |
KLX | | | | | | | | |
5.875%, 12/01/2022 (B) | | | 3,020 | | | | 2,975 | |
Kratos Defense & Security Solutions | | | | | | | | |
7.000%, 05/15/2019 | | | 1,057 | | | | 835 | |
Manitowoc Foodservice | | | | | | | | |
9.500%, 02/15/2024 (B) | | | 360 | | | | 396 | |
Masonite International | | | | | | | | |
5.625%, 03/15/2023 (B) | | | 1,135 | | | | 1,186 | |
NCI Building Systems | | | | | | | | |
8.250%, 01/15/2023 (B) | | | 1,615 | | | | 1,728 | |
Nielsen Finance LLC | | | | | | | | |
5.000%, 04/15/2022 (B) | | | 6,844 | | | | 6,998 | |
4.500%, 10/01/2020 | | | 1,425 | | | | 1,459 | |
Nielsen Luxembourg | | | | | | | | |
5.500%, 10/01/2021 (B) | | | 300 | | | | 312 | |
Nortek | | | | | | | | |
8.500%, 04/15/2021 | | | 1,950 | | | | 2,035 | |
Novelis | | | | | | | | |
8.375%, 12/15/2017 | | | 1,000 | | | | 1,022 | |
Orbital ATK | | | | | | | | |
5.250%, 10/01/2021 | | | 620 | | | | 647 | |
Oshkosh | | | | | | | | |
5.375%, 03/01/2022 | | | 575 | | | | 594 | |
5.375%, 03/01/2025 | | | 588 | | | | 604 | |
Plastipak Holdings | | | | | | | | |
6.500%, 10/01/2021 (B) | | | 1,650 | | | | 1,693 | |
Reynolds Group Issuer | | | | | | | | |
9.875%, 08/15/2019 | | | 2,449 | | | | 2,544 | |
9.000%, 04/15/2019 | | | 2,865 | | | | 2,922 | |
8.250%, 02/15/2021 | | | 4,759 | | | | 4,944 | |
6.875%, 02/15/2021 | | | 1,225 | | | | 1,271 | |
5.750%, 10/15/2020 | | | 8,878 | | | | 9,155 | |
RR Donnelley & Sons | | | | | | | | |
7.625%, 06/15/2020 | | | 1,297 | | | | 1,352 | |
Sensata Technologies | | | | | | | | |
5.000%, 10/01/2025 (B) | | | 2,421 | | | | 2,427 | |
4.875%, 10/15/2023 (B) | | | 1,115 | | | | 1,128 | |
Sensata Technologies UK Financing | | | | | | | | |
6.250%, 02/15/2026 (B) | | | 3,030 | | | | 3,181 | |
Standard Industries | | | | | | | | |
6.000%, 10/15/2025 (B) | | | 516 | | | | 548 | |
5.500%, 02/15/2023 (B) | | | 245 | | | | 253 | |
StandardAero Aviation Holdings | | | | | | | | |
10.000%, 07/15/2023 (B) | | | 6,660 | | | | 6,660 | |
| | | | | | | | |
| Description | | Face Amount
($ Thousands) | | | Market Value ($ Thousands) | |
Summit Materials LLC | | | | | | | | |
8.500%, 04/15/2022 (B) | | $ | 800 | | | $ | 850 | |
6.125%, 07/15/2023 | | | 1,710 | | | | 1,719 | |
Terex | | | | | | | | |
6.500%, 04/01/2020 | | | 975 | | | | 970 | |
6.000%, 05/15/2021 | | | 3,750 | | | | 3,708 | |
TransDigm | | | | | | | | |
6.500%, 07/15/2024 | | | 915 | | | | 933 | |
6.500%, 05/15/2025 | | | 1,435 | | | | 1,457 | |
6.375%, 06/15/2026 (B) | | | 929 | | | | 930 | |
Triumph Group | | | | | | | | |
4.875%, 04/01/2021 | | | 1,040 | | | | 978 | |
United Airlines, Pass-Through Trust, Ser 2013- 1, Cl B | | | | | | | | |
5.375%, 08/15/2021 | | | 475 | | | | 494 | |
United Rentals North America | | | | | | | | |
7.625%, 04/15/2022 | | | 645 | | | | 686 | |
6.125%, 06/15/2023 | | | 1,020 | | | | 1,053 | |
5.875%, 09/15/2026 | | | 3,565 | | | | 3,512 | |
5.750%, 11/15/2024 | | | 2,610 | | | | 2,616 | |
5.500%, 07/15/2025 | | | 805 | | | | 790 | |
USG | | | | | | | | |
5.500%, 03/01/2025 (B) | | | 2,702 | | | | 2,871 | |
West | | | | | | | | |
5.375%, 07/15/2022 (B) | | | 980 | | | | 887 | |
XPO Logistics | | | | | | | | |
6.500%, 06/15/2022 (B) | | | 1,240 | | | | 1,190 | |
Zekelman Industries | | | | | | | | |
8.250%, 03/15/2018 (B) | | | 2,432 | | | | 2,481 | |
| | | | | | | | |
| | | | | | | 200,775 | |
| | | | | | | | |
| | |
Information Technology — 6.4% | | | | | | | | |
ACI Worldwide | | | | | | | | |
6.375%, 08/15/2020 (B) | | | 830 | | | | 858 | |
Activision Blizzard | | | | | | | | |
5.625%, 09/15/2021 (B) | | | 2,500 | | | | 2,625 | |
Advanced Micro Devices | | | | | | | | |
7.750%, 08/01/2020 | | | 5,635 | | | | 4,903 | |
7.500%, 08/15/2022 | | | 3,325 | | | | 2,743 | |
7.000%, 07/01/2024 | | | 3,380 | | | | 2,670 | |
6.750%, 03/01/2019 | | | 1,372 | | | | 1,235 | |
Amkor Technology | | | | | | | | |
6.625%, 06/01/2021 | | | 1,090 | | | | 1,073 | |
6.375%, 10/01/2022 | | | 3,035 | | | | 2,944 | |
Anixter | | | | | | | | |
5.500%, 03/01/2023 | | | 1,390 | | | | 1,418 | |
5.125%, 10/01/2021 | | | 3,432 | | | | 3,500 | |
Aspect Software | | | | | | | | |
10.625%, 05/15/2017 (A) | | | 915 | | | | 1 | |
3.000%, 05/23/2023 | | | 402 | | | | 402 | |
Bankrate | | | | | | | | |
6.125%, 08/15/2018 (B) | | | 3,170 | | | | 3,178 | |
| | |
| 152 | | SEI Institutional Investments Trust / Annual Report / May 31, 2016 |
| | | | | | | | |
| Description | | Face Amount
($ Thousands) | | | Market Value ($ Thousands) | |
Belden | | | | | | | | |
5.500%, 09/01/2022 (B) | | $ | 1,190 | | | $ | 1,202 | |
Blackboard | | | | | | | | |
7.750%, 11/15/2019 (B) | | | 450 | | | | 358 | |
BMC Software Finance | | | | | | | | |
8.125%, 07/15/2021 (B) | | | 10,780 | | | | 7,950 | |
Boxer Parent PIK | | | | | | | | |
9.000%, 10/15/2019 (B) | | | 7,460 | | | | 5,427 | |
Cardtronics | | | | | | | | |
5.125%, 08/01/2022 | | | 2,226 | | | | 2,209 | |
CDW LLC | | | | | | | | |
5.500%, 12/01/2024 | | | 1,650 | | | | 1,696 | |
5.000%, 09/01/2023 | | | 2,250 | | | | 2,261 | |
Change Healthcare Holdings | | | | | | | | |
6.000%, 02/15/2021 (B) | | | 1,758 | | | | 1,767 | |
Cimpress | | | | | | | | |
7.000%, 04/01/2022 (B) | | | 1,078 | | | | 1,086 | |
CommScope Technologies Finance LLC | | | | | | | | |
6.000%, 06/15/2025 (B) | | | 3,940 | | | | 4,009 | |
Diamond 1 Finance | | | | | | | | |
8.350%, 07/15/2046 (B) | | | 2,010 | | | | 2,046 | |
8.100%, 07/15/2036 (B) | | | 2,885 | | | | 2,951 | |
6.020%, 06/15/2026 (B) | | | 2,111 | | | | 2,134 | |
5.450%, 06/15/2023 (B) | | | 1,350 | | | | 1,373 | |
EarthLink Holdings | | | | | | | | |
7.375%, 06/01/2020 | | | 1,950 | | | | 2,050 | |
Entegris | | | | | | | | |
6.000%, 04/01/2022 (B) | | | 3,725 | | | | 3,846 | |
First Data | | | | | | | | |
7.000%, 12/01/2023 (B) | | | 5,235 | | | | 5,307 | |
6.750%, 11/01/2020 (B) | | | 3,735 | | | | 3,931 | |
5.750%, 01/15/2024 (B) | | | 7,960 | | | | 7,960 | |
5.000%, 01/15/2024 (B) | | | 5,118 | | | | 5,115 | |
IMS Health | | | | | | | | |
6.000%, 11/01/2020 (B) | | | 1,585 | | | | 1,623 | |
Infor Software Parent LLC | | | | | | | | |
7.125%, 05/01/2021 (B) | | | 3,264 | | | | 2,725 | |
Infor US | | | | | | | | |
6.500%, 05/15/2022 | | | 6,826 | | | | 6,263 | |
Informatica LLC | | | | | | | | |
7.125%, 07/15/2023 (B) | | | 1,165 | | | | 1,110 | |
Magnachip Semiconductor | | | | | | | | |
6.625%, 07/15/2021 | | | 1,170 | | | | 924 | |
Micron Technology | | | | | | | | |
7.500%, 09/15/2023 (B) | | | 7,725 | | | | 8,111 | |
5.875%, 02/15/2022 | | | 1,784 | | | | 1,624 | |
5.500%, 02/01/2025 | | | 1,705 | | | | 1,428 | |
5.250%, 01/15/2024 (B) | | | 1,425 | | | | 1,197 | |
Microsemi | | | | | | | | |
9.125%, 04/15/2023 (B) | | | 1,105 | | | | 1,213 | |
NCR | | | | | | | | |
5.000%, 07/15/2022 | | | 2,731 | | | | 2,683 | |
| | | | | | | | |
| Description | | Face Amount
($ Thousands) | | | Market Value ($ Thousands) | |
NeuStar | | | | | | | | |
4.500%, 01/15/2023 | | $ | 2,365 | | | $ | 2,028 | |
NXP | | | | | | | | |
5.750%, 02/15/2021 (B) | | | 3,050 | | | | 3,176 | |
5.750%, 03/15/2023 (B) | | | 905 | | | | 948 | |
4.625%, 06/01/2023 (B) | | | 2,591 | | | | 2,604 | |
4.125%, 06/01/2021 (B) | | | 1,563 | | | | 1,574 | |
Open Text | | | | | | | | |
5.875%, 06/01/2026 (B) | | | 2,048 | | | | 2,053 | |
Plantronics | | | | | | | | |
5.500%, 05/31/2023 (B) | | | 810 | | | | 806 | |
PTC | | | | | | | | |
6.000%, 05/15/2024 | | | 1,005 | | | | 1,046 | |
Qorvo | | | | | | | | |
7.000%, 12/01/2025 (B) | | | 1,787 | | | | 1,849 | |
6.750%, 12/01/2023 (B) | | | 1,429 | | | | 1,472 | |
Riverbed Technology | | | | | | | | |
8.875%, 03/01/2023 (B) | | | 1,530 | | | | 1,576 | |
Sabre Global | | | | | | | | |
5.375%, 04/15/2023 (B) | | | 895 | | | | 915 | |
5.250%, 11/15/2023 (B) | | | 4,870 | | | | 4,974 | |
Solera LLC | | | | | | | | |
10.500%, 03/01/2024 (B) | | | 3,937 | | | | 4,272 | |
VeriSign | | | | | | | | |
4.625%, 05/01/2023 | | | 2,777 | | | | 2,812 | |
Western Digital | | | | | | | | |
10.500%, 04/01/2024 (B) | | | 5,589 | | | | 5,785 | |
7.375%, 04/01/2023 (B) | | | 3,983 | | | | 4,142 | |
WEX | | | | | | | | |
4.750%, 02/01/2023 (B) | | | 1,164 | | | | 1,071 | |
Zebra Technologies | | | | | | | | |
7.250%, 10/15/2022 | | | 4,674 | | | | 4,984 | |
| | | | | | | | |
| | | | | | | 169,216 | |
| | | | | | | | |
| | |
Materials — 5.2% | | | | | | | | |
AK Steel | | | | | | | | |
8.750%, 12/01/2018 | | | 2,777 | | | | 2,832 | |
7.625%, 05/15/2020 | | | 1,832 | | | | 1,475 | |
Alcoa | | | | | | | | |
5.125%, 10/01/2024 | | | 1,560 | | | | 1,505 | |
Aleris International | | | | | | | | |
9.500%, 04/01/2021 (B) | | | 566 | | | | 582 | |
7.875%, 11/01/2020 | | | 452 | | | | 395 | |
ArcelorMittal | | | | | | | | |
7.250%, 02/25/2022 | | | 835 | | | | 873 | |
6.500%, 03/01/2021 | | | 923 | | | | 955 | |
Ashland | | | | | | | | |
4.750%, 08/15/2022 | | | 2,510 | | | | 2,539 | |
Axalta Coating Systems US Holdings | | | | | | | | |
7.375%, 05/01/2021 (B) | | | 885 | | | | 937 | |
Ball | | | | | | | | |
5.250%, 07/01/2025 | | | 4,774 | | | | 4,971 | |
| | | | |
| SEI Institutional Investments Trust / Annual Report / May 31, 2016 | | | 153 | |
SCHEDULE OF INVESTMENTS
High Yield Bond Fund (Continued)
May 31, 2016
| | | | | | | | |
| Description | | Face Amount
($ Thousands) | | | Market Value ($ Thousands) | |
5.000%, 03/15/2022 | | $ | 3,050 | | | $ | 3,187 | |
Berry Plastics | | | | | | | | |
6.000%, 10/15/2022 (B) | | | 265 | | | | 272 | |
5.125%, 07/15/2023 | | | 75 | | | | 75 | |
Blue Cube Spinco | | | | | | | | |
9.750%, 10/15/2023 (B) | | | 4,842 | | | | 5,593 | |
BlueScope Steel Finance | | | | | | | | |
6.500%, 05/15/2021 (B) | | | 940 | | | | 966 | |
Chemours | | | | | | | | |
7.000%, 05/15/2025 | | | 865 | | | | 758 | |
6.625%, 05/15/2023 | | | 1,380 | | | | 1,239 | |
Constellium | | | | | | | | |
7.875%, 04/01/2021 (B) | | | 2,750 | | | | 2,791 | |
5.750%, 05/15/2024 (B) | | | 250 | | | | 195 | |
Cornerstone Chemical | | | | | | | | |
9.375%, 03/15/2018 (B) | | | 8,520 | | | | 8,094 | |
East Dubuque Nitrogen Partners | | | | | | | | |
6.500%, 04/15/2021 (B) | | | 380 | | | | 385 | |
Eldorado | | | | | | | | |
6.125%, 12/15/2020 (B) | | | 1,350 | | | | 1,269 | |
First Quantum Minerals | | | | | | | | |
7.250%, 10/15/2019 (B) | | | 1,833 | | | | 1,540 | |
6.750%, 02/15/2020 (B) | | | 2,425 | | | | 1,940 | |
FMG Resources | | | | | | | | |
6.875%, 04/01/2022 (B) | | | 870 | | | | 789 | |
Freeport-McMoRan Oil & Gas LLC | | | | | | | | |
6.500%, 11/15/2020 | | | 4,190 | | | | 4,022 | |
5.450%, 03/15/2043 | | | 5,245 | | | | 3,958 | |
3.550%, 03/01/2022 | | | 1,185 | | | | 993 | |
Graphic Packaging International | | | | | | | | |
4.750%, 04/15/2021 | | | 1,346 | | | | 1,407 | |
Hecla Mining | | | | | | | | |
6.875%, 05/01/2021 | | | 2,127 | | | | 2,010 | |
Hexion | | | | | | | | |
10.000%, 04/15/2020 | | | 5,828 | | | | 5,449 | |
Hexion US Finance | | | | | | | | |
8.875%, 02/01/2018 | | | 905 | | | | 769 | |
6.625%, 04/15/2020 | | | 7,408 | | | | 6,297 | |
Huntsman International LLC | | | | | | | | |
5.125%, 11/15/2022 | | | 1,370 | | | | 1,380 | |
4.875%, 11/15/2020 | | | 685 | | | | 697 | |
IAMGOLD | | | | | | | | |
6.750%, 10/01/2020 (B) | | | 6,115 | | | | 5,137 | |
Ineos Group Holdings | | | | | | | | |
5.875%, 02/15/2019 (B) | | | 2,578 | | | | 2,610 | |
Joseph T Ryerson & Son | | | | | | | | |
11.000%, 05/15/2022 (B) | | | 1,335 | | | | 1,372 | |
Kaiser Aluminum | | | | | | | | |
5.875%, 05/15/2024 (B) | | | 195 | | | | 200 | |
Kraton Polymers LLC | | | | | | | | |
10.500%, 04/15/2023 (B) | | | 870 | | | | 920 | |
| | | | | | | | |
| Description | | Face Amount
($ Thousands) | | | Market Value ($ Thousands) | |
LSB Industries | | | | | | | | |
7.750%, 08/01/2019 | | $ | 1,590 | | | $ | 1,622 | |
Mirabela Nickel | | | | | | | | |
1.000%, 07/31/2044 | | | 23 | | | | — | |
New Gold | | | | | | | | |
7.000%, 04/15/2020 (B) | | | 1,425 | | | | 1,430 | |
6.250%, 11/15/2022 (B) | | | 2,658 | | | | 2,519 | |
Nexeo Solutions LLC | | | | | | | | |
8.375%, 03/01/2018 | | | 874 | | | | 874 | |
Noranda Aluminum Acquisition | | | | | | | | |
11.000%, 06/01/2019 | | | 385 | | | | 2 | |
NOVA Chemicals | | | | | | | | |
5.000%, 05/01/2025 (B) | | | 7,570 | | | | 7,475 | |
Owens-Brockway Glass Container | | | | | | | | |
6.375%, 08/15/2025 (B) | | | 815 | | | | 868 | |
5.875%, 08/15/2023 (B) | | | 1,275 | | | | 1,351 | |
Platform Specialty Products | | | | | | | | |
10.375%, 05/01/2021 (B) | | | 91 | | | | 93 | |
6.500%, 02/01/2022 (B) | | | 2,690 | | | | 2,389 | |
PQ | | | | | | | | |
6.750%, 11/15/2022 (B) | | | 2,280 | | | | 2,377 | |
Rain CII Carbon LLC | | | | | | | | |
8.250%, 01/15/2021 (B) | | | 8,545 | | | | 6,558 | |
8.000%, 12/01/2018 (B) | | | 2,640 | | | | 2,294 | |
Reichhold Holdings | | | | | | | | |
15.000%, 03/13/2017 (F) | | | 600 | | | | 600 | |
12.000%, 03/31/2017 (F) | | | 989 | | | | 989 | |
Reichhold Industries | | | | | | | | |
12.000%, 03/31/2017 (F) | | | 385 | | | | 385 | |
9.000%, 05/08/2017 (A) (B) | | | 1,056 | | | | — | |
Sappi Papier Holding GmbH | | | | | | | | |
7.750%, 07/15/2017 (B) | | | 400 | | | | 414 | |
Scotts Miracle-Gro | | | | | | | | |
6.000%, 10/15/2023 (B) | | | 790 | | | | 837 | |
Sealed Air | | | | | | | | |
5.125%, 12/01/2024 (B) | | | 500 | | | | 514 | |
4.875%, 12/01/2022 (B) | | | 431 | | | | 440 | |
Signode Industrial Group Lux | | | | | | | | |
6.375%, 05/01/2022 (B) | | | 7,705 | | | | 7,349 | |
Smurfit Kappa Acquisitions | | | | | | | | |
4.875%, 09/15/2018 (B) | | | 1,400 | | | | 1,466 | |
Steel Dynamics | | | | | | | | |
5.500%, 10/01/2024 | | | 1,140 | | | | 1,172 | |
Teck Resources | | | | | | | | |
8.500%, 06/01/2024 (B) | | | 1,221 | | | | 1,252 | |
8.000%, 06/01/2021 (B) | | | 1,221 | | | | 1,245 | |
2.500%, 02/01/2018 | | | 1,362 | | | | 1,372 | |
TPC Group | | | | | | | | |
8.750%, 12/15/2020 (B) | | | 1,291 | | | | 994 | |
Trinseo Materials Operating SCA | | | | | | | | |
6.750%, 05/01/2022 (B) | | | 200 | | | | 207 | |
| | |
| 154 | | SEI Institutional Investments Trust / Annual Report / May 31, 2016 |
| | | | | | | | |
| Description | | Face Amount
($ Thousands) | | | Market Value ($ Thousands) | |
U.S. Steel | | | | | | | | |
8.375%, 07/01/2021 (B) | | $ | 2,262 | | | $ | 2,336 | |
US Concrete | | | | | | | | |
6.375%, 06/01/2024 (B) | | | 436 | | | | 436 | |
WR Grace | | | | | | | | |
5.625%, 10/01/2024 (B) | | | 105 | | | | 111 | |
5.125%, 10/01/2021 (B) | | | 2,048 | | | | 2,124 | |
| | | | | | | | |
| | | | | | | 137,473 | |
| | | | | | | | |
| | |
Sovereign — 0.0% | | | | | | | | |
Seminole Tribe | | | | | | | | |
6.535%, 10/01/2020 (B) | | | 1,095 | | | | 1,150 | |
| | | | | | | | |
|
Telecommunication Services — 10.8% | |
Aegis Merger Sub | | | | | | | | |
10.250%, 02/15/2023 (B) | | | 2,642 | | | | 2,642 | |
Altice Financing | | | | | | | | |
7.500%, 05/15/2026 (B) | | | 6,816 | | | | 6,799 | |
6.625%, 02/15/2023 (B) | | | 998 | | | | 998 | |
6.500%, 01/15/2022 (B) | | | 1,930 | | | | 1,964 | |
Altice Finco | | | | | | | | |
8.125%, 01/15/2024 (B) | | | 840 | | | | 831 | |
7.625%, 02/15/2025 (B) | | | 280 | | | | 263 | |
Altice Luxembourg | | | | | | | | |
7.750%, 05/15/2022 (B) | | | 5,955 | | | | 6,100 | |
7.625%, 02/15/2025 (B) | | | 490 | | | | 484 | |
Altice US Finance I | | | | | | | | |
5.375%, 07/15/2023 (B) | | | 4,875 | | | | 4,962 | |
Avaya | | | | | | | | |
10.500%, 03/01/2021 (B) | | | 699 | | | | 197 | |
9.000%, 04/01/2019 (B) | | | 1,560 | | | | 1,147 | |
7.000%, 04/01/2019 (B) | | | 1,495 | | | | 1,084 | |
CenturyLink | | | | | | | | |
7.500%, 04/01/2024 | | | 2,544 | | | | 2,517 | |
6.750%, 12/01/2023 | | | 5,985 | | | | 5,835 | |
5.800%, 03/15/2022 | | | 1,220 | | | | 1,177 | |
5.625%, 04/01/2020 | | | 2,754 | | | | 2,823 | |
5.625%, 04/01/2025 | | | 2,001 | | | | 1,771 | |
Cequel Communications Holdings I LLC | | | | | | | | |
7.750%, 07/15/2025 (B) | | | 2,050 | | | | 2,127 | |
Clearwire Communications LLC | | | | | | | | |
8.250%, 12/01/2040 (B) | | | 759 | | | | 769 | |
Cogeco Cable | | | | | | | | |
4.875%, 05/01/2020 (B) | | | 1,050 | | | | 1,075 | |
Cogent Communications Finance | | | | | | | | |
5.625%, 04/15/2021 (B) | | | 2,500 | | | | 2,488 | |
Cogent Communications Group | | | | | | | | |
5.375%, 03/01/2022 (B) | | | 2,144 | | | | 2,155 | |
Columbus International | | | | | | | | |
7.375%, 03/30/2021 (B) | | | 830 | | | | 867 | |
CommScope | | | | | | | | |
5.500%, 06/15/2024 (B) | | | 1,693 | | | | 1,706 | |
| | | | | | | | |
| Description | | Face Amount
($ Thousands) | | | Market Value ($ Thousands) | |
5.000%, 06/15/2021 (B) | | $ | 1,000 | | | $ | 1,015 | |
Digicel Group | | | | | | | | |
8.250%, 09/30/2020 (B) | | | 5,361 | | | | 4,651 | |
7.125%, 04/01/2022 (B) | | | 400 | | | | 309 | |
6.750%, 03/01/2023 (B) | | | 3,775 | | | | 3,322 | |
6.000%, 04/15/2021 (B) | | | 2,170 | | | | 1,922 | |
Emerald Expositions Holding | | | | | | | | |
9.000%, 06/15/2021 (B) | | | 3,262 | | | | 3,270 | |
Frontier Communications | | | | | | | | |
11.000%, 09/15/2025 (B) | | | 13,992 | | | | 14,237 | |
10.500%, 09/15/2022 (B) | | | 7,537 | | | | 7,848 | |
8.875%, 09/15/2020 (B) | | | 1,356 | | | | 1,441 | |
7.625%, 04/15/2024 | | | 2,498 | | | | 2,204 | |
7.125%, 01/15/2023 | | | 1,255 | | | | 1,120 | |
6.875%, 01/15/2025 | | | 440 | | | | 366 | |
6.250%, 09/15/2021 | | | 200 | | | | 187 | |
GCI | | | | | | | | |
6.750%, 06/01/2021 | | | 919 | | | | 928 | |
Gray Television | | | | | | | | |
7.500%, 10/01/2020 | | | 2,505 | | | | 2,627 | |
Hughes Satellite Systems | | | | | | | | |
7.625%, 06/15/2021 | | | 2,029 | | | | 2,196 | |
Inmarsat Finance | | | | | | | | |
4.875%, 05/15/2022 (B) | | | 1,755 | | | | 1,549 | |
Intelsat Jackson Holdings | | | | | | | | |
8.000%, 02/15/2024 (B) | | | 1,400 | | | | 1,426 | |
7.500%, 04/01/2021 | | | 4,291 | | | | 2,918 | |
7.250%, 04/01/2019 | | | 670 | | | | 499 | |
7.250%, 10/15/2020 | | | 8,525 | | | | 5,946 | |
6.625%, 12/15/2022 | | | 625 | | | | 421 | |
5.500%, 08/01/2023 | | | 4,067 | | | | 2,613 | |
Intelsat Luxembourg | | | | | | | | |
7.750%, 06/01/2021 | | | 5,225 | | | | 1,554 | |
Level 3 Communications | | | | | | | | |
5.750%, 12/01/2022 | | | 705 | | | | 721 | |
Level 3 Financing | | | | | | | | |
5.625%, 02/01/2023 | | | 100 | | | | 102 | |
5.375%, 08/15/2022 | | | 360 | | | | 366 | |
5.375%, 01/15/2024 | | | 1,618 | | | | 1,647 | |
5.375%, 05/01/2025 | | | 5,935 | | | | 6,040 | |
5.125%, 05/01/2023 | | | 2,870 | | | | 2,884 | |
McGraw-Hill Global Education Holdings LLC | | | | | | | | |
7.875%, 05/15/2024 (B) | | | 240 | | | | 250 | |
Midcontinent Communications & Midcontinent Finance | | | | | | | | |
6.875%, 08/15/2023 (B) | | | 4,182 | | | | 4,349 | |
6.250%, 08/01/2021 (B) | | | 440 | | | | 456 | |
Neptune Finco | | | | | | | | |
10.875%, 10/15/2025 (B) | | | 3,562 | | | | 4,052 | |
Nortel Networks | | | | | | | | |
0.000%, 07/15/2011 (A) | | | 2,209 | | | | 1,944 | |
| | | | |
| SEI Institutional Investments Trust / Annual Report / May 31, 2016 | | | 155 | |
SCHEDULE OF INVESTMENTS
High Yield Bond Fund (Continued)
May 31, 2016
| | | | | | | | |
| Description | | Face Amount
($ Thousands) | | | Market Value ($ Thousands) | |
Numericable-SFR | | | | | | | | |
7.375%, 05/01/2026 (B) | | $ | 11,476 | | | $ | 11,577 | |
6.250%, 05/15/2024 (B) | | | 4,028 | | | | 3,917 | |
6.000%, 05/15/2022 (B) | | | 6,655 | | | | 6,625 | |
Outfront Media Capital LLC | | | | | | | | |
5.875%, 03/15/2025 | | | 2,800 | | | | 2,912 | |
5.250%, 02/15/2022 | | | 395 | | | | 401 | |
Quebecor Media | | | | | | | | |
5.750%, 01/15/2023 | | | 2,160 | | | | 2,214 | |
Qwest Capital Funding | | | | | | | | |
7.750%, 02/15/2031 | | | 730 | | | | 622 | |
RCN Telecom Services LLC | | | | | | | | |
8.500%, 08/15/2020 (B) | | | 1,175 | | | | 1,210 | |
Sable International Finance | | | | | | | | |
6.875%, 08/01/2022 (B) | | | 935 | | | | 956 | |
SBA Communications | | | | | | | | |
4.875%, 07/15/2022 | | | 945 | | | | 947 | |
SBA Telecommunications | | | | | | | | |
5.750%, 07/15/2020 | | | 634 | | | | 653 | |
SoftBank Group | | | | | | | | |
6.000%, 07/30/2025 | | | 515 | | | | 549 | |
5.375%, 07/30/2022 | | | 245 | | | | 260 | |
4.500%, 04/15/2020 (B) | | | 3,056 | | | | 3,155 | |
Sprint | | | | | | | | |
7.875%, 09/15/2023 | | | 15,535 | | | | 12,117 | |
7.625%, 02/15/2025 | | | 8,503 | | | | 6,396 | |
7.250%, 09/15/2021 | | | 4,069 | | | | 3,296 | |
7.125%, 06/15/2024 | | | 4,865 | | | | 3,661 | |
Sprint Capital | | | | | | | | |
8.750%, 03/15/2032 | | | 5,020 | | | | 4,066 | |
6.900%, 05/01/2019 | | | 545 | | | | 509 | |
6.875%, 11/15/2028 | | | 8,346 | | | | 6,228 | |
Sprint Communications | | | | | | | | |
9.000%, 11/15/2018 (B) | | | 1,780 | | | | 1,893 | |
7.000%, 03/01/2020 (B) | | | 655 | | | | 676 | |
Telecom Italia | | | | | | | | |
5.303%, 05/30/2024 (B) | | | 1,125 | | | | 1,133 | |
T-Mobile USA | | | | | | | | |
6.731%, 04/28/2022 | | | 2,695 | | | | 2,826 | |
6.633%, 04/28/2021 | | | 595 | | | | 626 | |
6.625%, 04/01/2023 | | | 5,255 | | | | 5,570 | |
6.542%, 04/28/2020 | | | 665 | | | | 687 | |
6.500%, 01/15/2026 | | | 8,767 | | | | 9,271 | |
6.375%, 03/01/2025 | | | 3,440 | | | | 3,603 | |
6.000%, 03/01/2023 | | | 565 | | | | 589 | |
6.000%, 04/15/2024 | | | 1,960 | | | | 2,043 | |
U.S. Cellular | | | | | | | | |
6.700%, 12/15/2033 | | | 955 | | | | 873 | |
Unitymedia GmbH | | | | | | | | |
6.125%, 01/15/2025 (B) | | | 1,195 | | | | 1,226 | |
Unitymedia Hessen GmbH & KG | | | | | | | | |
5.500%, 01/15/2023 (B) | | | 2,500 | | | | 2,578 | |
| | | | | | | | |
| Description | | Face Amount
($ Thousands) | | | Market Value ($ Thousands) | |
Univision Communications | | | | | | | | |
8.500%, 05/15/2021 (B) | | $ | 2,200 | | | $ | 2,299 | |
UPCB Finance IV | | | | | | | | |
5.375%, 01/15/2025 (B) | | | 3,240 | | | | 3,302 | |
UPCB Finance VI | | | | | | | | |
6.875%, 01/15/2022 (B) | | | 591 | | | | 624 | |
Videotron | | | | | | | | |
5.375%, 06/15/2024 (B) | | | 420 | | | | 437 | |
5.000%, 07/15/2022 | | | 3,705 | | | | 3,853 | |
Virgin Media Finance | | | | | | | | |
5.750%, 01/15/2025 (B) | | | 869 | | | | 867 | |
Virgin Media Secured Finance | | | | | | | | |
5.500%, 08/15/2026 (B) | | | 755 | | | | 763 | |
5.375%, 04/15/2021 (B) | | | 2,876 | | | | 2,990 | |
5.250%, 01/15/2026 (B) | | | 4,195 | | | | 4,195 | |
Wave Holdco LLC PIK | | | | | | | | |
8.250%, 07/15/2019 (B) | | | 793 | | | | 793 | |
WideOpenWest Finance LLC | | | | | | | | |
10.250%, 07/15/2019 | | | 1,975 | | | | 2,057 | |
Wind Acquisition Finance | | | | | | | | |
7.375%, 04/23/2021 (B) | | | 2,755 | | | | 2,607 | |
4.750%, 07/15/2020 (B) | | | 1,490 | | | | 1,460 | |
Windstream | | | | | | | | |
7.750%, 10/01/2021 | | | 2,585 | | | | 2,255 | |
7.500%, 06/01/2022 | | | 1,465 | | | | 1,220 | |
7.500%, 04/01/2023 | | | 185 | | | | 150 | |
Windstream Services LLC | | | | | | | | |
6.375%, 08/01/2023 | | | 810 | | | | 623 | |
Zayo Group LLC | | | | | | | | |
6.375%, 05/15/2025 | | | 745 | | | | 775 | |
6.000%, 04/01/2023 | | | 6,732 | | | | 6,917 | |
Ziggo Bond Finance BV | | | | | | | | |
5.875%, 01/15/2025 (B) | | | 435 | | | | 431 | |
| | | | | | | | |
| | | | | | | 284,644 | |
| | | | | | | | |
| | |
Utilities — 1.6% | | | | | | | | |
AES | | | | | | | | |
7.375%, 07/01/2021 | | | 800 | | | | 912 | |
6.000%, 05/15/2026 | | | 305 | | | | 309 | |
5.500%, 03/15/2024 | | | 500 | | | | 505 | |
5.500%, 04/15/2025 | | | 1,730 | | | | 1,717 | |
4.875%, 05/15/2023 | | | 1,555 | | | | 1,536 | |
AmeriGas Finance LLC | | | | | | | | |
7.000%, 05/20/2022 | | | 4,974 | | | | 5,241 | |
Calpine | | | | | | | | |
5.750%, 01/15/2025 | | | 920 | | | | 890 | |
5.500%, 02/01/2024 | | | 810 | | | | 784 | |
5.375%, 01/15/2023 | | | 965 | | | | 943 | |
5.250%, 06/01/2026 (B) | | | 4,770 | | | | 4,770 | |
Dynegy | | | | | | | | |
7.625%, 11/01/2024 | | | 2,880 | | | | 2,765 | |
7.375%, 11/01/2022 | | | 1,015 | | | | 979 | |
| | |
| 156 | | SEI Institutional Investments Trust / Annual Report / May 31, 2016 |
| | | | | | | | |
| Description | | Face Amount
($ Thousands) | | | Market Value ($ Thousands) | |
5.875%, 06/01/2023 | | $ | 903 | | | $ | 797 | |
Enel | | | | | | | | |
8.750%, 09/24/2073 (B) (E) | | | 1,044 | | | | 1,203 | |
Ferrellgas | | | | | | | | |
6.750%, 01/15/2022 | | | 97 | | | | 91 | |
GenOn Americas Generation LLC | | | | | | | | |
9.125%, 05/01/2031 | | | 615 | | | | 433 | |
8.500%, 10/01/2021 | | | 4,725 | | | | 3,544 | |
GenOn Energy | | | | | | | | |
9.500%, 10/15/2018 | | | 1,617 | | | | 1,273 | |
7.875%, 06/15/2017 | | | 1,056 | | | | 890 | |
LBC Tank Terminals Holding Netherlands | | | | | |
6.875%, 05/15/2023 (B) | | | 2,800 | | | | 2,702 | |
NRG Energy | | | | | | | | |
8.250%, 09/01/2020 | | | 185 | | | | 192 | |
7.875%, 05/15/2021 | | | 264 | | | | 274 | |
7.250%, 05/15/2026 (B) | | | 323 | | | | 322 | |
6.250%, 07/15/2022 | | | 530 | | | | 520 | |
6.250%, 05/01/2024 | | | 2,638 | | | | 2,565 | |
NRG Yield Operating LLC | | | | | | | | |
5.375%, 08/15/2024 | | | 917 | | | | 883 | |
NSG Holdings LLC | | | | | | | | |
7.750%, 12/15/2025 (B) | | | 1,882 | | | | 2,019 | |
Talen Energy Supply LLC | | | | | | | | |
6.500%, 06/01/2025 | | | 221 | | | | 194 | |
4.625%, 07/15/2019 (B) | | | 1,800 | | | | 1,656 | |
TerraForm Power Operating LLC | | | | | | | | |
6.125%, 06/15/2025 (B) | | | 1,405 | | | | 1,212 | |
| | | | | | | | |
| | | | | | | 42,121 | |
| | | | | | | | |
Total Corporate Obligations
(Cost $2,181,146) ($ Thousands) | | | | | | | 2,087,204 | |
| | | | | | | | |
|
LOAN PARTICIPATIONS — 8.0% | |
21st Century Oncology, 1st Lien | | | | | | | | |
6.500%, 04/30/2022 | | | 1,265 | | | | 1,161 | |
Acadia Healthcare Company, 1st Lien | | | | | | | | |
3.750%, 02/11/2022 | | | 988 | | | | 990 | |
Accudyne Industries | | | | | | | | |
4.000%, 12/13/2019 (E) | | | 1,099 | | | | 990 | |
Affinion 4/10, Term Loan B | | | | | | | | |
6.750%, 04/30/2018 | | | 4 | | | | 4 | |
Affinion Group Holdings, Tranche B | | | | | | | | |
6.750%, 04/30/2018 | | | 2,208 | | | | 2,014 | |
Air Medical, Cov-Lite, Term Loan, 1st Lien | | | | | | | | |
4.250%, 04/28/2022 | | | 1,995 | | | | 1,973 | |
Albertson’s, Term Loan B4, 1st Lien | | | | | | | | |
5.500%, 08/25/2021 | | | 1,601 | | | | 1,600 | |
Alinta Energy Finance, Delayed Term Loan | | | | | | | | |
6.375%, 08/13/2018 | | | 165 | | | | 164 | |
Alinta Ltd., Cov-Lite, 1st Lien | | | | | | | | |
6.375%, 08/13/2019 | | | 2,489 | | | | 2,471 | |
| | | | | | | | |
| Description | | Face Amount
($ Thousands) | | | Market Value ($ Thousands) | |
Amaya, Term Loan | | | | | | | | |
5.000%, 08/01/2021 | | $ | 1,880 | | | $ | 1,820 | |
American Renal Holdings, Term Loan, 1st Lien | | | | | | | | |
4.500%, 08/20/2019 | | | 2,000 | | | | 2,001 | |
American Tire Distributors, Cov-Lite, 2nd Lien | | | | | | | | |
5.250%, 09/01/2021 | | | 1,317 | | | | 1,278 | |
ANVS Merger, 1st Lien | | | | | | | | |
9.250%, 08/18/2021 | | | 1,300 | | | | 1,186 | |
5.500%, 02/18/2021 | | | 566 | | | | 519 | |
Applied Systems, 2nd Lien | | | | | | | | |
7.500%, 01/24/2022 | | | 1,825 | | | | 1,812 | |
Ascena Retail Group, Cov-Lite, 1st Lien | | | | | | | | |
5.250%, 08/21/2022 | | | 248 | | | | 239 | |
Ascena Retail Group, Cov-Lite, Term Loan, 1st Lien | | | | | | | | |
5.250%, 08/21/2022 | | | 2,025 | | | | 1,952 | |
Aspect Software | | | | | | | | |
10.250%, 05/07/2016 | | | — | | | | 5 | |
Asurion, LLC, Incremental Term Loan B-4, 1st Lien | | | | | | | | |
5.000%, 08/04/2022 | | | 985 | | | | 982 | |
Asurion, LLC, Term Loan B-1 | | | | | | | | |
5.000%, 05/24/2019 | | | 457 | | | | 457 | |
Asurion, LLC, Term Loan, 2nd Lien | | | | | | | | |
8.500%, 03/03/2021 | | | 4,240 | | | | 4,140 | |
Avago Technologies, Ltd., 1st Lien | | | | | | | | |
4.250%, 02/01/2023 (E) | | | 3,487 | | | | 3,496 | |
Avago Technologies, Term Loan B-1 | | | | | |
4.250%, 02/01/2023 | | | 763 | | | | 765 | |
BJ’s Wholesale Club, 2nd Lien | | | | | | | | |
8.500%, 03/26/2020 | | | 1,915 | | | | 1,847 | |
Blount International | | | | | | | | |
7.250%, 04/12/2023 | | | 1,820 | | | | 1,838 | |
Blue Ribbon, LLC, 1st Lien | | | | | | | | |
5.000%, 11/15/2021 | | | 1,825 | | | | 1,823 | |
BMC Foreign Holding | | | | | | | | |
5.000%, 09/10/2020 | | | 1,494 | | | | 1,325 | |
Bway Intermediate, 1st Lien | | | | | | | | |
5.500%, 08/14/2020 | | | 659 | | | | 659 | |
Bway Intermediate, Initial Term Loan | | | | | | | | |
5.500%, 08/14/2020 | | | 29 | | | | 29 | |
Carestream Health, Cov-Lite, 2nd Lien | | | | | | | | |
9.500%, 12/05/2019 | | | 7,964 | | | | 7,466 | |
CD&R Millennium, Term Loan | | | | | | | | |
8.750%, 07/31/2022 | | | 700 | | | | 642 | |
Cengage Term Loan B | | | | | | | | |
0.000%, 05/27/2023 (H) | | | 1,862 | | | | 1,860 | |
Ceva Group, PLC, 1st Lien | | | | | | | | |
6.500%, 03/19/2021 | | | 493 | | | | 420 | |
Ceva Intercompany, 1st Lien | | | | | | | | |
6.500%, 03/19/2021 | | | 210 | | | | 179 | |
| | | | |
| SEI Institutional Investments Trust / Annual Report / May 31, 2016 | | | 157 | |
SCHEDULE OF INVESTMENTS
High Yield Bond Fund (Continued)
May 31, 2016
| | | | | | | | |
| Description | | Face Amount
($ Thousands) | | | Market Value ($ Thousands) | |
Ceva Logistics Canada, 1st Lien | | | | | | | | |
6.500%, 03/19/2021 | | $ | 36 | | | $ | 31 | |
Chief Exploration, Term Loan | | | | | | | | |
7.500%, 05/16/2021 | | | 654 | | | | 527 | |
Clear Channel Communications, Extended | | | | | | | | |
Term Loan, 1st Lien | | | | | | | | |
7.204%, 01/22/2019 | | | 7,258 | | | | 5,557 | |
Clubcorp, 1st Lien | | | | | | | | |
4.250%, 12/15/2022 | | | 387 | | | | 388 | |
Cowlitz Tribal Gaming Authority | | | | | | | | |
11.500%, 12/06/2021 (E) | | | 4,500 | | | | 4,208 | |
CTI Foods, 2nd Lien | | | | | | | | |
8.250%, 06/28/2021 | | | 950 | | | | 869 | |
Cumulus Media, 1st Lien | | | | | | | | |
4.250%, 12/23/2020 | | | 4,971 | | | | 3,517 | |
Dex Media West, Term Loan | | | | | | | | |
8.000%, 12/30/2016 | | | 1,478 | | | | 599 | |
Diebold | | | | | | | | |
5.250%, 11/06/2023 | | | 1,225 | | | | 1,226 | |
Dollar Tree, Cov-Lite, Term Loan B-1 | | | | | | | | |
3.500%, 07/06/2022 | | | 570 | | | | 573 | |
Dollar Tree, Cov-Lite, Term Loan B-2 | | | | | | | | |
4.250%, 07/06/2022 | | | 330 | | | | 330 | |
Empire Generating, Term Loan | | | | | | | | |
5.250%, 03/12/2021 | | | 2,054 | | | | 1,643 | |
Endurance International, Term Loan B, 1st Lien | | | | | | | | |
6.480%, 11/09/2019 | | | 1,618 | | | | 1,560 | |
Energy & Exploration Partners | | | | | | | | |
13.000%, 11/10/2021 | | | 244 | | | | 244 | |
5.000%, 05/13/2022 | | | 136 | | | | 137 | |
0.000%, 11/10/2021 (H) | | | 94 | | | | — | |
Energy & Exploration Partners, Term Loan B, 1st Lien | |
7.750%, 01/22/2019 | | | — | | | | — | |
Energy Transfer Equity, Term Loan B, 1st Lien | |
3.250%, 12/02/2019 | | | 500 | | | | 482 | |
Evergreen Skillsoft, 1st Lien | | | | | | | | |
5.750%, 04/28/2021 | | | 2,301 | | | | 1,851 | |
Expert Global, Term Loan B | | | | | | | | |
8.500%, 04/02/2018 | | | 935 | | | | 932 | |
FMG Resources (August 2006) Pty Ltd. | |
4.250%, 06/30/2019 (E) | | | 3,925 | | | | 3,676 | |
Foxwoods, 1st Lien | | | | | | | | |
5.000%, 07/01/2018 | | | 1,572 | | | | 1,385 | |
Gardner Denver | | | | | | | | |
4.250%, 07/30/2020 (E) | | | 349 | | | | 323 | |
Gardner Denver, Inc., Initial Dollar Term Loan | | | | | | | | |
4.250%, 07/30/2020 | | | 1 | | | | 1 | |
Global Aviation Holdings, 2nd Lien | | | | | | | | |
10.000%, 07/13/2017 (A) | | | — | | | | — | |
Greenway Medical Technologies, 1st Lien | | | | | | | | |
6.000%, 11/04/2020 | | | 975 | | | | 929 | |
| | | | | | | | |
| Description | | Face Amount
($ Thousands) | | | Market Value ($ Thousands) | |
Greenway Medical Technologies, Term Loan, 1st Lien | | | | | | | | |
6.000%, 11/04/2020 | | $ | 3 | | | $ | 2 | |
Gymboree, Cov-Lite, 1st Lien | | | | | | | | |
5.000%, 02/23/2018 | | | 4,689 | | | | 3,587 | |
Hanson Building, Term Loan B, 1st Lien | | | | | | | | |
6.500%, 03/14/2022 | | | 1,394 | | | | 1,392 | |
Indivior 12/14 (USD), Term Loan | | | | | | | | |
7.000%, 12/19/2019 | | | 28 | | | | 27 | |
Indivior Finance, Initial Term Loan | | | | | | | | |
7.000%, 12/19/2019 | | | 2,069 | | | | 1,997 | |
Integra Telecom, 1st Lien | | | | | | | | |
5.250%, 08/14/2020 | | | 1,266 | | | | 1,219 | |
Intelsat Jackson Holdings, Term Loan B-2 | | | | | | | | |
3.750%, 06/30/2019 (E) | | | 880 | | | | 809 | |
Internet Brands, Cov-Lite, 2nd Lien | | | | | | | | |
8.500%, 07/08/2022 | | | 2,347 | | | | 2,282 | |
J. Crew Group, 1st Lien | | | | | | | | |
4.000%, 03/05/2021 | | | 2,163 | | | | 1,605 | |
J. Crew Group, Term Loan B | | | | | | | | |
4.000%, 03/05/2021 | | | 2,387 | | | | 1,771 | |
JCPenney, Cov-Lite, 1st Lien | | | | | | | | |
6.000%, 05/22/2018 | | | 1,594 | | | | 1,594 | |
KAR Auction Services | | | | | | | | |
4.250%, 03/09/2023 | | | 1,800 | | | | 1,810 | |
KCA Deutag Drilling Ltd., Term Loan B, 1st Lien | | | | | | | | |
6.250%, 05/18/2020 | | | 1,000 | | | | 728 | |
KCA Deutag Drilling, Ltd., Term Loan B, 1st Lien | | | | | | | | |
6.250%, 05/18/2020 | | | 3 | | | | 2 | |
KIK Custom Products, Initial Loans | | | | | | | | |
6.000%, 08/26/2022 | | | 1,330 | | | | 1,312 | |
Kraton Polymers, Ist Lien | | | | | | | | |
6.000%, 01/06/2022 | | | 345 | | | | 340 | |
Laureate Education, 1st Lien | | | | | | | | |
5.000%, 06/15/2018 | | | 540 | | | | 523 | |
Ligado Networks, LLC, 2nd Lien | | | | | | | | |
13.500%, 12/07/2020 | | | 3,033 | | | | 2,133 | |
LightSquared L.P., 1st Lien | | | | | | | | |
9.750%, 06/15/2020 | | | 2,693 | | | | 2,477 | |
Lions Gate, 2nd Lien | | | | | | | | |
5.000%, 03/17/2022 | | | 2,109 | | | | 2,098 | |
Maple, Cov-Lite, Term Loan B, 1st Lien | | | | | | | | |
5.250%, 03/03/2023 | | | 3,364 | | | | 3,371 | |
Marina District Finance, 1st Lien | | | | | | | | |
6.500%, 08/15/2018 | | | 1,183 | | | | 1,182 | |
Mashantucket Pequot Tribe, 1st Lien | | | | | | | | |
9.375%, 06/30/2020 | | | 9,886 | | | | 8,625 | |
Medical Card System, Term Loan | | | | | | | | |
1.500%, 05/31/2019 | | | 1,975 | | | | 1,215 | |
Medical Card Systems | | | | | | | | |
0.000%, 04/15/2022 (H) | | | 368 | | | | — | |
| | |
| 158 | | SEI Institutional Investments Trust / Annual Report / May 31, 2016 |
| | | | | | | | |
| Description | | Face Amount
($ Thousands) | | | Market Value ($ Thousands) | |
Metroflag, 2nd Lien | | | | | | | | |
14.000%, 01/06/2009 (A) | | $ | 325 | | | $ | — | |
MGM Growth Properties, 1st Lien | | | | | | | | |
4.000%, 04/25/2023 | | | 579 | | | | 583 | |
Misys, 1st Lien | | | | | | | | |
5.000%, 12/12/2018 | | | 972 | | | | 976 | |
Misys, 2nd Lien | | | | | | | | |
12.000%, 06/12/2019 | | | 1,550 | | | | 1,620 | |
MKS Instruments, 1st Lien | | | | | | | | |
4.750%, 05/01/2023 | | | 849 | | | | 856 | |
MMI, Term Loan | | | | | | | | |
9.000%, 01/31/2020 | | | 3,110 | | | | 2,597 | |
Mohegan Tribal Gaming Authority, Term Loan B, 1st Lien | | | | | | | | |
5.500%, 06/15/2018 | | | 4,040 | | | | 4,023 | |
Murray Energy, Cov-Lite, Term Loan B, 2nd Lien | | | | | | | | |
7.500%, 04/16/2020 | | | 738 | | | | 506 | |
Nana Development, 1st Lien | | | | | | | | |
8.000%, 03/13/2018 | | | 200 | | | | 184 | |
Nelson Education Equity | | | | | | | | |
0.000%, 03/15/2021 (A) (H) | | | 173 | | | | — | |
Nelson Education, 1st Lien | | | | | | | | |
12.000%, 10/01/2020 | | | 1,039 | | | | 371 | |
New Millennium Holdco, LLC, Term Loan | |
7.500%, 12/21/2020 | | | 316 | | | | 237 | |
Nexstar Broadcasting | | | | | | | | |
0.000%, 12/31/2049 (E) (H) | | | 4,365 | | | | 4,365 | |
Nine West, Cov-Lite, Unsecured Guaranteed Term Loan | | | | | | | | |
6.250%, 01/08/2020 | | | 8,228 | | | | 1,838 | |
NXP, Cov-Lite, Term Loan B, 1st Lien | | | | | | | | |
3.750%, 12/07/2020 | | | 1,088 | | | | 1,091 | |
Ocean Rig, Term Loan B | | | | | | | | |
5.500%, 07/25/2021 | | | 2,580 | | | | 1,660 | |
Ocean, Cov-Lite, Term Loan B1, 1st Lien | | | | | | | | |
6.000%, 03/31/2021 | | | 2,148 | | | | 938 | |
ON Semiconductor | | | | | | | | |
5.250%, 03/31/2023 | | | 2,330 | | | | 2,345 | |
Ortho-Clinical Diagnostics, 1st Lien | | | | | | | | |
4.750%, 06/30/2021 | | | 146 | | | | 138 | |
Ortho-Clinical Diagnostics, Term Loan B | |
4.750%, 06/30/2021 | | | 310 | | | | 294 | |
Ortho-Clinical Diagnostics, Term Loan B, 1st Lien | | | | | | | | |
4.750%, 06/30/2021 | | | 468 | | | | 443 | |
Oxbow Carbon & Minerals Holdings, 2nd Lien | | | | | | | | |
8.000%, 01/17/2020 | | | 1,908 | | | | 1,765 | |
P2 Energy, 1st Lien | | | | | | | | |
5.000%, 10/30/2020 | | | 1,084 | | | | 973 | |
Panda Temple Power, 1st Lien | | | | | | | | |
7.250%, 04/03/2019 | | | 349 | | | | 304 | |
| | | | | | | | |
| Description | | Face Amount
($ Thousands) | | | Market Value ($ Thousands) | |
Peak, Cov-Lite, 2nd Lien | | | | | | | | |
8.250%, 06/17/2022 | | $ | 2,335 | | | $ | 1,915 | |
Penton Media, Cov-Lite, 2nd Lien | | | | | | | | |
9.000%, 10/02/2020 | | | 2,743 | | | | 2,681 | |
Petco Animal Supplies, Term Loan B-1, 1st Lien | | | | | | | | |
5.750%, 01/26/2023 | | | 3,192 | | | | 3,212 | |
Pierre Food, 2nd Lien | | | | | | | | |
9.500%, 10/10/2017 | | | 3,340 | | | | 3,365 | |
PQ Corporation, 1st Lien | | | | | | | | |
5.750%, 11/04/2022 | | | 625 | | | | 630 | |
Quorum Health, 1st Lien | | | | | | | | |
6.750%, 04/29/2022 | | | 359 | | | | 359 | |
Riverbed Technology, 1st Lien | | | | | | | | |
5.000%, 04/24/2022 | | | 1,698 | | | | 1,703 | |
Road Infrastructure Investment LLC, 2nd Lien | | | | | | | | |
7.750%, 09/30/2021 | | | 300 | | | | 296 | |
Royal Holdings Inc, 2nd Lien | | | | | | | | |
8.500%, 06/19/2023 | | | 436 | | | | 414 | |
Rue 21, Term Loan B, 1st Lien | | | | | | | | |
5.625%, 10/09/2020 | | | 2,094 | | | | 1,242 | |
Seadrill Partners, LLC, Term Loan B, 1st Lien | | | | | | | | |
4.000%, 02/21/2021 | | | 344 | | | | 163 | |
Skillsoft, Cov-Lite, 2nd Lien | | | | | | | | |
9.250%, 04/28/2022 | | | 930 | | | | 462 | |
Solarwinds, Term Loan | | | | | | | | |
6.500%, 02/03/2023 | | | 2,109 | | | | 2,108 | |
Solera, LLC, Term Loan B, 1st Lien | | | | | | | | |
5.750%, 02/28/2023 | | | 645 | | | | 649 | |
Starwood Property Trust, Term Loan B | | | | | | | | |
3.500%, 04/17/2020 | | | 1,975 | | | | 1,970 | |
Steinway Musical Instruments, 1st Lien | | | | | | | | |
4.750%, 09/19/2019 | | | 1,170 | | | | 1,123 | |
Syncreon Holdings Ltd., Term Loan B, 1st Lien | | | | | | | | |
5.250%, 10/28/2020 | | | 1,092 | | | | 922 | |
Syniverse Holdings, 1st Lien | | | | | | | | |
4.000%, 04/23/2019 | | | 497 | | | | 372 | |
4.000%, 04/23/2019 | | | 915 | | | | 689 | |
Templar Energy, Cov-Lite, 2nd Lien | | | | | | | | |
8.500%, 11/25/2020 | | | 2,793 | | | | 456 | |
Texas Competitive, Extended Term Loan | | | | | | | | |
4.917%, 10/10/2017 (A) | | | 4,218 | | | | 1,318 | |
Texas Competitive, Non-extended Term Loan | | | | | | | | |
4.917%, 06/30/2016 (A) | | | 13,711 | | | | 4,193 | |
The Hillman Companies, Term Loan B, 1st Lien | | | | | | | | |
4.500%, 06/30/2021 | | | 309 | | | | 306 | |
The Neiman Marcus Group, Term Loan, 1st Lien | | | | | | | | |
4.250%, 10/25/2020 | | | 1,878 | | | | 1,720 | |
Toys R Us, Term Loan | | | | | | | | |
9.750%, 04/24/2020 | | | 1,719 | | | | 1,430 | |
Trans Union LLC, Replacement Term Loan | | | | | | | | |
3.500%, 04/09/2021 | | | 3,484 | | | | 3,483 | |
| | | | |
| SEI Institutional Investments Trust / Annual Report / May 31, 2016 | | | 159 | |
SCHEDULE OF INVESTMENTS
High Yield Bond Fund (Continued)
May 31, 2016
| | | | | | | | |
| Description | | Face Amount
($ Thousands) | | | Market Value ($ Thousands) | |
Travelport, Term Loan | | | | | | | | |
5.750%, 09/02/2021 | | $ | 4,202 | | | $ | 4,211 | |
True Religion Apparel, 1st Lien | | | | | | | | |
5.875%, 07/30/2019 | | | 582 | | | | 250 | |
True Religion Apparel, Initial 1st Lien | | | | | | | | |
5.875%, 07/30/2019 | | | 201 | | | | 86 | |
TSAM LLC, 1st Lien | | | | | | | | |
7.750%, 09/12/2019 | | | 787 | | | | 783 | |
US Renal Care, Cov-Lite, 1st Lien | | | | | | | | |
5.250%, 12/30/2022 | | | 2,867 | | | | 2,842 | |
Valeant, Term Loan B | | | | | | | | |
4.000%, 04/01/2022 | | | 984 | | | | 971 | |
Varsity Brands, Cov-Lite, 1st Lien | | | | | | | | |
5.000%, 12/10/2021 | | | 1,514 | | | | 1,515 | |
VAT, Cov-Lite, Term Loan | | | | | | | | |
4.250%, 02/11/2021 | | | 784 | | | | 778 | |
Vertafore, Term Loan | | | | | | | | |
9.750%, 10/27/2017 | | | 780 | | | | 782 | |
Vizient, Cov-Lite, 1st Lien | | | | | | | | |
6.250%, 02/13/2023 | | | 1,810 | | | | 1,832 | |
Walter Investment Management, Term Loan B, 1st Lien | | | | | | | | |
4.750%, 12/18/2020 | | | 1,530 | | | | 1,293 | |
Weight Watchers International, Term Loan B2 | | | | | | | | |
4.000%, 04/02/2020 | | | 603 | | | | 447 | |
Weight Watchers International, Term Loan B2, 1st Lien | | | | | | | | |
4.000%, 04/02/2020 | | | 2 | | | | 1 | |
Western Digital, 1st Lien | | | | | | | | |
6.250%, 04/29/2023 | | | 2,431 | | | | 2,421 | |
Wilton Brands, 1st Lien | | | | | | | | |
8.500%, 08/30/2018 | | | 4,044 | | | | 3,592 | |
Windstream Services, 1st lien | | | | | | | | |
5.750%, 03/29/2021 | | | 893 | | | | 894 | |
York Risk Services Holding, Term Loan B | |
4.750%, 10/01/2021 | | | 1,071 | | | | 945 | |
York Risk Services, Cov-Lite, 1st Lien | | | | | | | | |
4.750%, 10/01/2021 | | | 141 | | | | 124 | |
| | | | | | | | |
Total Loan Participations
(Cost $235,875) ($ Thousands) | | | | | | | 212,251 | |
| | | | | | | | |
|
COLLATERALIZED DEBT OBLIGATIONS — 6.9% | |
B&M CLO Ltd., Ser 2014-1A, Cl D | | | | | | | | |
5.383%, 04/16/2026 (B) (E) | | | 3,529 | | | | 2,548 | |
B&M CLO Ltd., Ser 2014-1A, Cl C | | | | | | | | |
4.383%, 04/16/2026 (B) (E) | | | 2,142 | | | | 1,874 | |
B&M CLO Ltd., Ser 2014-1A, Cl E | | | | | | | | |
6.383%, 04/16/2026 (B) (E) | | | 2,520 | | | | 1,423 | |
Battalion CLO III Ltd., Ser 2012-3A, Cl SUB | | | | | | | | |
0.000%, 01/18/2025 (B) | | | 2,697 | | | | 1,377 | |
| | | | | | | | |
| Description | | Face Amount
($ Thousands) | | | Market Value ($ Thousands) | |
Battalion CLO IV Ltd., Ser 2013-4A, Cl SUB | | | | | | | | |
0.000%, 10/22/2025 (B) | | $ | 1,560 | | | $ | 468 | |
Battalion CLO V Ltd., Ser 2014-5A, Cl SUB | | | | | | | | |
0.000%, 04/17/2026 (B) | | | 3,445 | | | | 1,033 | |
Battalion CLO VII Ltd., Ser 2014-7A, Cl D | | | | | | | | |
5.933%, 10/17/2026 (B) (E) | | | 2,323 | | | | 1,554 | |
Battalion CLO VII Ltd., Ser 2014-7A, Cl SUB | | | | | | | | |
0.000%, 10/17/2026 (B) | | | 4,118 | | | | 1,688 | |
Battalion CLO VIII Ltd., Ser 2015-8A, Cl SUB | | | | | | | | |
0.000%, 04/18/2027 (B) | | | 4,720 | | | | 3,634 | |
Battalion CLO VIII Ltd., Ser 2015-8A, Cl D | | | | | | | | |
6.083%, 04/18/2027 (B) (E) | | | 1,268 | | | | 983 | |
Battalion CLO X Ltd. | | | | | | | | |
0.000%, 06/15/2022 | | | 7 | | | | 822 | |
Benefit Street Partners CLO III, Ser 2013-IIIA, Cl SUB | | | | | | | | |
0.000%, 01/20/2026 (B) (F) | | | 3,615 | | | | 1,952 | |
Benefit Street Partners CLO IV | | | | | | | | |
0.000%, 07/20/2026 (B) | | | 3 | | | | 2,156 | |
Benefit Street Partners CLO V | | | | | | | | |
0.000%, 10/20/2026 (B) | | | 6,413 | | | | 3,623 | |
Benefit Street Partners CLO VIII | | | | | | | | |
0.000%, 01/20/2028 (B) | | | 90 | | | | 8,100 | |
Benefit Street Partners CLO, Ser 2015-IA, Cl DR | | | | | | | | |
7.128%, 10/15/2025 (B) (E) | | | 1,556 | | | | 1,338 | |
Benefit Street Partners CLO, Ser 2015-VIA | | | | | | | | |
0.000%, 04/18/2027 | | | 9,535 | | | | 7,151 | |
Benefit Street Partners CLO, Ser 2015-VII, Cl SUB | | | | | | | | |
0.000%, 07/18/2027 | | | 9,035 | | | | 6,627 | |
Carlyle Global Market Strategies CLO Ltd., Ser 14-3A, Cl SUB | | | | | | | | |
0.000%, 07/27/2026 (B) | | | 4,812 | | | | 3,068 | |
Cathedral Lake CLO III Ltd. | | | | | | | | |
0.000%, 01/15/2026 (B) | | | 2,506 | | | | 2,030 | |
Cathedral Lake CLO Ltd., Ser 2015-3A, Cl E | | | | | | | | |
8.178%, 01/15/2026 (B) (E) | | | 1,575 | | | | 1,473 | |
Cathedral Lake CLO Ltd., Ser 2015-3A, Cl D | | | | | | | | |
6.128%, 01/15/2026 (B) (E) | | | 1,718 | | | | 1,709 | |
Cedar Funding V CLO, Ser 2016-5A, Cl SUB | | | | | | | | |
0.000%, 07/17/2028 (B) (E) | | | 28 | | | | 2,370 | |
CIFC Funding, Ser 2012-2A, Cl SUB | | | | | | | | |
0.000%, 12/05/2024 (B) | | | 23 | | | | 1,110 | |
CVP Cascade CLO Ltd., Ser 2014-2A, Cl D | | | | | | | | |
5.433%, 07/18/2026 (B) (E) | | | 1,752 | | | | 1,065 | |
CVP Cascade CLO Ltd., Ser 2014-2A, Cl E | | | | | | | | |
6.420%, 07/18/2026 (B) (E) | | | 2,531 | | | | 1,402 | |
Fifth Street Senior Loan Fund I LLC, Ser 2015- 1A, Cl E | | | | | | | | |
7.834%, 01/20/2027 (B) (E) | | | 5,110 | | | | 4,382 | |
Fifth Street SLF II, Ser 2015-2A, Cl SUB | |
0.000%, 09/29/2027 (B) | | | 6,200 | | | | 5,348 | |
| | |
| 160 | | SEI Institutional Investments Trust / Annual Report / May 31, 2016 |
| | | | | | | | |
| Description | | Face Amount
($ Thousands) | | | Market Value ($ Thousands) | |
Fifth Street SLF II, Ser 2015-2A, Cl D | | | | | | | | |
7.938%, 09/29/2027 (B) (E) | | $ | 6,350 | | | $ | 5,454 | |
Figueroa CLO, Ser 2013-1I, Cl SUB | | | | | | | | |
0.000%, 03/21/2024 | | | 7,644 | | | | 4,195 | |
Figueroa CLO, Ser 2013-2A, Cl SUB | | | | | | | | |
0.000%, 12/18/2025 (B) | | | 3,070 | | | | 1,982 | |
Fortress Credit Opportunities III CLO LP, | | | | | | | | |
Ser 2014-3A, Cl E | | | | | | | | |
6.877%, 04/28/2026 (B) (E) | | | 3,518 | | | | 3,070 | |
Fortress Credit Opportunities VI CLO, Ser 2015- 6A, Cl F | | | | | | | | |
7.385%, 03/31/2027 (B) (E) | | | 2,270 | | | | 2,038 | |
Great Lakes CLO Ltd, Ser 2015-1, Cl SUB | | | | | | | | |
0.000%, 07/15/2026 (B) (E) | | | 5,593 | | | | 4,195 | |
Great Lakes CLO Ltd., Ser 2012-1A, Cl SUB | | | | | | | | |
0.000%, 01/15/2023 (B) | | | 2,877 | | | | 1,956 | |
Great Lakes CLO Ltd., Ser 2012-1A, Cl E | | | | | | | | |
6.128%, 01/15/2023 (B) (E) | | | 3,292 | | | | 2,601 | |
Great Lakes CLO Ltd., Ser 2014-1A, Cl SUB | | | | | | | | |
0.000%, 04/15/2025 (B) (E) | | | 7,057 | | | | 5,010 | |
Great Lakes CLO Ltd., Ser 2014-1A, Cl F | | | | | | | | |
6.628%, 04/15/2025 (B) (E) | | | 2,520 | | | | 1,336 | |
Great Lakes CLO Ltd., Ser 2015-1A, Cl F | | | | | | | | |
8.128%, 07/15/2026 (B) (E) | | | 1,756 | | | | 957 | |
Great Lakes CLO Ltd., Ser 2015-1A, Cl E | | | | | | | | |
7.328%, 07/15/2026 (B) (E) | | | 3,854 | | | | 2,852 | |
Hildene CLO Ltd., Ser 2014-2A, Cl E | | | | | | | | |
5.733%, 07/19/2026 (B) (E) | | | 2,013 | | | | 1,548 | |
Hildene CLO Ltd., Ser 2014-2A, Cl D | | | | | | | | |
4.333%, 07/19/2026 (B) (E) | | | 2,013 | | | | 1,826 | |
Jamestown CLO VII, Ser 2015-7A, Cl D | | | | | | | | |
6.138%, 07/25/2027 (B) (E) | | | 2,291 | | | | 1,781 | |
Jamestown CLO VII, Ser 2015-7A, Cl E | | | | | | | | |
7.388%, 07/25/2027 (B) (E) | | | 2,291 | | | | 1,600 | |
JFIN CLO 2015-II, Ser 2015-2A, Cl E | | | | | | | | |
7.633%, 10/19/2026 (B) (E) | | | 5,000 | | | | 4,325 | |
JFIN Revolver CLO Ltd., Ser 2013-1A, Cl B | | | | | | | | |
2.634%, 01/20/2021 (B) (E) | | | 2,010 | | | | 1,995 | |
JFIN Revolver CLO Ltd., Ser 2014-2A, Cl C | | | | | | | | |
3.386%, 02/20/2022 (B) (E) | | | 2,049 | | | | 1,982 | |
KVK CLO, Ser 2012-2A, Cl SUB | | | | | | | | |
0.000%, 02/10/2025 (B) | | | 2,956 | | | | 931 | |
Lockwood Grove CLO Ltd., Ser 2014-1A, Cl SUB | | | | | | | | |
0.000%, 01/25/2024 (B) | | | 4,865 | | | | 3,308 | |
Lockwood Grove CLO Ltd., Ser 2014-1A, Cl E | | | | | | | | |
7.198%, 01/25/2024 (B) (E) | | | 2,809 | | | | 2,584 | |
MidOcean Credit CLO III, Ser 2014-3A, Cl F | | | | | | | | |
6.635%, 07/21/2026 (B) (E) | | | 2,032 | | | | 1,345 | |
Nelder Grove CLO Ltd., Ser 2014-1A, Cl E | | | | | | | | |
7.424%, 08/28/2026 (B) (E) | | | 3,074 | | | | 2,306 | |
Nelder Grove CLO Ltd., Ser 2014-1A, Cl D1 | | | | | | | | |
5.194%, 08/28/2026 (B) (E) | | | 2,049 | | | | 1,849 | |
| | | | | | | | |
| Description | | Face Amount
($ Thousands) | | | Market Value ($ Thousands) | |
Neuberger Berman CLO XIII, Ser 2012-13A, Cl SUB | | | | | | | | |
0.000%, 01/23/2024 (B) | | $ | 542 | | | $ | 146 | |
Neuberger Berman CLO XVI, Ser 2014-16A, Cl SUB | | | | | | | | |
0.000%, 04/15/2026 (B) | | | 2,625 | | | | 1,208 | |
Neuberger Berman CLO XVI, Ser 2014-16A, Cl SFN | | | | | | | | |
0.150%, 04/15/2026 (B) | | | 175 | | | | 82 | |
NewStar Arlington Senior Loan Program LLC, Ser 2014-1A, Cl E | | | | | | | | |
6.738%, 07/25/2025 (B) (E) | | | 2,026 | | | | 1,650 | |
NewStar Clarendon Fund CLO LLC, Ser 2015-1A, Cl E | | | | | | | | |
6.688%, 01/25/2027 (B) (E) | | | 4,470 | | | | 3,487 | |
NXT Capital CLO LLC, Ser 2012-1A, Cl E | | | | | | | | |
8.134%, 07/20/2022 (B) (E) | | | 3,047 | | | | 2,864 | |
OCP CLO, Ser 2012-2A, Cl SUB | | | | | | | | |
0.000%, 11/22/2023 (B) | | | 2,940 | | | | 1,029 | |
Peaks CLO Ltd., Ser 2014-1A, Cl D | | | | | | | | |
5.128%, 06/15/2026 (B) (E) | | | 1,015 | | | | 891 | |
Rockwall CDO, Ser 2007-1A, Cl A1LA | | | | | | | | |
0.887%, 08/01/2024 (B) (E) | | | 13,235 | | | | 12,871 | |
Shackleton CLO Ltd., Ser 2014-6A, Cl SUB | | | | | | | | |
0.000%, 07/17/2026 (B) (E) | | | 7,965 | | | | 2,788 | |
Trinitas CLO Ltd., Ser 2014-1A, Cl SUB | | | | | | | | |
0.000%, 04/15/2026 (B) | | | 3,530 | | | | 1,659 | |
Trinitas CLO Ltd., Ser 2014-2A, Cl D | | | | | | | | |
4.428%, 07/15/2026 (B) (E) | | | 2,481 | | | | 1,861 | |
Venture X CLO, Ser 2012-10A, Cl SUB | | | | | | | | |
0.000%, 07/20/2022 (B) | | | 7,029 | | | | 3,163 | |
Venture XI CLO, Ser 2012-11A, Cl SUB | | | | | | | | |
0.000%, 11/14/2022 (B) | | | 7,097 | | | | 2,555 | |
Venture XII CLO, Ser 2013-12A, Cl SUB | | | | | | | | |
0.000%, 02/28/2024 (B) | | | 3,764 | | | | 1,656 | |
Venture XIV CLO, Ser 2013-14A, Cl SFN | | | | | | | | |
0.100%, 08/28/2025 (B) | | | 113 | | | | 51 | |
Venture XIV CLO, Ser 2013-14A, Cl SUB | | | | | | | | |
0.000%, 08/28/2025 (B) | | | 1,842 | | | | 801 | |
Venture XV CLO, Ser 2013-15A, Cl SUB | | | | | | | | |
0.000%, 07/15/2025 (B) | | | 3,475 | | | | 1,703 | |
Venture XXII CLO, Ser 2016-22A, Cl E | | | | | | | | |
7.371%, 01/15/2028 (B) (E) | | | 1,589 | | | | 1,454 | |
Venture XXII CLO, Ser 2016-22A, Cl SUB | | | | | | | | |
0.000%, 01/15/2028 (B) (E) | | | 30 | | | | 2,499 | |
Venture XXII CLO, Ser 2016-22A, Cl F | | | | | | | | |
8.471%, 01/15/2028 (B) (E) | | | 1,108 | | | | 881 | |
| | | | | | | | |
Total Collateralized Debt Obligations
(Cost $188,672) ($ Thousands) | | | | | | | 180,633 | |
| | | | | | | | |
| | | | |
| SEI Institutional Investments Trust / Annual Report / May 31, 2016 | | | 161 | |
SCHEDULE OF INVESTMENTS
High Yield Bond Fund (Continued)
May 31, 2016
| | | | | | | | |
| Description | | Face Amount
($ Thousands)/Shares | | | Market Value ($ Thousands) | |
| | |
MUNICIPAL BONDS — 0.5% | | | | | | | | |
| | |
Connecticut — 0.2% | | | | | | | | |
Mohegan Tribal Finance Authority, RB Callable 02/01/2023 @ 100 | | | | | | | | |
7.000%, 02/01/2045 (B) | | $ | 4,850 | | | $ | 4,872 | |
| | | | | | | | |
| | |
Puerto Rico — 0.1% | | | | | | | | |
Commonwealth of Puerto Rico, Ser A, GO | | | | | | | | |
Callable 07/01/2017 @ 100 | | | | | | | | |
5.250%, 07/01/2037 | | | 185 | | | | 113 | |
Commonwealth of Puerto Rico, Ser A, GO | | | | | | | | |
Callable 07/01/2022 @ 100 | | | | | | | | |
5.125%, 07/01/2037 | | | 1,065 | | | | 649 | |
5.000%, 07/01/2041 | | | 1,075 | | | | 654 | |
Commonwealth of Puerto Rico, Ser A, GO
Callable 07/01/2020 @ 100 | | | | | | | | |
8.000%, 07/01/2035 | | | 2,690 | | | | 1,755 | |
| | | | | | | | |
| | | | | | | 3,171 | |
| | | | | | | | |
| | |
Texas — 0.2% | | | | | | | | |
Texas State, Public Finance Authority, TX | | | | | | | | |
Windstorm Insurance, RB Callable 07/01/2019 @ 100 | | | | | | | | |
8.250%, 07/01/2024 | | | 5,455 | | | | 5,604 | |
| | | | | | | | |
Total Municipal Bonds
(Cost $14,238) ($ Thousands) | | | | | | | 13,647 | |
| | | | | | | | |
| | |
CONVERTIBLE BONDS — 0.3% | | | | | | | | |
Cheniere Energy CV to 7.2265 | | | | | | | | |
4.250%, 03/15/45 | | | 908 | | | | 513 | |
Liberty Media CV to 16.7764 | | | | | | | | |
3.750%, 02/15/30 | | | 7,885 | | | | 4,529 | |
Liberty Media CV to 22.9469 | | | | | | | | |
4.000%, 11/15/29 | | | 3,912 | | | | 2,279 | |
Mirabela Nickel | | | | | | | | |
9.500%, 06/24/19 (B) (D) (F) | | | 1,082 | | | | 270 | |
Mirant CV to 14.7167 | | | | | | | | |
0.000%, 06/15/21 (A) | | | 1,950 | | | | — | |
Walter Investment Management CV to 17.0068 | | | | | | | | |
4.500%, 11/01/19 | | | 1,566 | | | | 754 | |
Whiting Petroleum CV to 25.6410 | | | | | | | | |
1.250%, 04/01/20 (B) | | | 395 | | | | 300 | |
| | | | | | | | |
Total Convertible Bonds (Cost $11,009) ($ Thousands) | | | | | | | 8,645 | |
| | | | | | | | |
| | |
COMMON STOCK — 0.2% | | | | | | | | |
Aspect Software CR1* (G) | | | 40,500 | | | | 376 | |
Aspect Software CR2* (G) | | | 2,248 | | | | 21 | |
Cengage Learning Holdings II* | | | 2,860 | | | | 59 | |
Ceva Holdings* | | | 561 | | | | 224 | |
| | | | | | | | |
| Description | | Face Amount
($ Thousands)/Shares | | | Market Value ($ Thousands) | |
CUI Acquisition* | | | 3 | | | $ | 244 | |
Dana Holding | | | 118,652 | | | | 1,426 | |
Energy & Exploration* | | | 65 | | | | 36 | |
Global Aviation Holdings, Cl A* | | | 101,199 | | | | — | |
Houghton Mifflin Harcourt* | | | 37,762 | | | | 650 | |
Millennium* | | | 9,243 | | | | 36 | |
Mirabela Nickel* (F) | | | 4,317,306 | | | | — | |
MModal* | | | 43,639 | | | | 524 | |
NII Holdings* | | | 109,107 | | | | 405 | |
Quad, Cl A | | | 1,125 | | | | 22 | |
Reichhold Industries* (F) | | | 1,755 | | | | 1,093 | |
| | | | | | | | |
Total Common Stock
(Cost $8,304) ($ Thousands) | | | | 5,116 | |
| | | | | | | | |
| | |
PREFERRED STOCK — 0.2% | | | | | | | | |
Aspen Insurance Holdings, 5.950% (E) | | | 92,000 | | | | 2,544 | |
Ceva Holdings, 0.000%* | | | 1,214 | | | | 486 | |
GMAC Capital Trust I, 8.125% (E) | | | 28,000 | | | | 701 | |
SLM, 2.037% (E) | | | 22,927 | | | | 1,114 | |
| | | | | | | | |
Total Preferred Stock (Cost $5,612) ($ Thousands) | | | | | | | 4,845 | |
| | | | | | | | |
| |
ASSET-BACKED SECURITY — 0.0% | | | | | |
| |
Other Asset-Backed Securities — 0.0% | | | | | |
Airplanes, Pass-Through Trust, Ser 2001-1A, Cl A9 | | | | | | | | |
0.984%, 03/15/2019 (B) (E) | | | 1,509 | | | | 379 | |
| | | | | | | | |
Total Asset-Backed Security
(Cost $1,258) ($ Thousands) | | | | 379 | |
| | | | | | | | |
| | |
| | | Number of Warrants | | | | |
| | |
WARRANTS — 0.0% | | | | | | | | |
MModal A, Expires 07/31/17 | | | | | | | | |
Strike Price $40.00* | | | 15,753 | | | | — | |
MModal B, Expires 07/31/17 | | | | | | | | |
Strike Price $47.50* | | | 20,773 | | | | — | |
| | | | | | | | |
| | | | | | | — | |
| | | | | | | | |
Total Warrants
(Cost $15) ($ Thousands) | | | | — | |
| | | | | | | | |
| | |
| 162 | | SEI Institutional Investments Trust / Annual Report / May 31, 2016 |
| | | | | | | | |
| Description | | Shares | | | Market Value
($ Thousands) | |
| | |
CASH EQUIVALENT — 4.6% | | | | | | | | |
SEI Daily Income Trust, Prime Obligation Fund, Cl A | | | | | | | | |
0.270%**† | | | 120,669,040 | | | $ | 120,669 | |
| | | | | | | | |
Total Cash Equivalent
(Cost $120,669) ($ Thousands) | | | | 120,669 | |
| | | | | | | | |
Total Investments — 99.8%
(Cost $2,766,798) ($ Thousands) | | | $ | 2,633,389 | |
| | | | | | | | |
| Percentages | | are based on a Net Assets of $2,639,919 ($ Thousands). |
| * | | Non-income producing security. |
| ** | | Rate shown is the 7-day effective yield as of May 31, 2016. |
| † | | Investment in Affiliated Security (see Note 6). |
| (A) | | Security is in default on interest payment. |
| (B) | | Security exempt from registration under Rule 144A of the Securities Act of 1933. These securities may be resold in transactions exempt from registration normally to qualified institutions. On May 31, 2016, the value of these securities amounted to $1,134,063 ($ Thousands), 43.0% representing of the net assets of the Fund. |
| (C) | | Step Bonds — The rate reflected on the Schedule of Investments is the effective yield on May 31, 2016. The coupon on a step bond changes on a specified date. |
| (D) | | Securities considered illiquid. The total value of such securities as of May 31, 2016 was $273 ($ Thousands) and represented 0.0% of Net Assets. |
| (E) | | Variable Rate Security — The rate reported on the Schedule of Investments is the rate in effect as of May 31, 2016. |
| (F) | | Security fair valued using methods determined in good faith by the Valuation Committee of the Board of Trustees. The total market value of such securities as of May 31, 2016 was $5,291 ($ Thousands) and represented 0.2% of Net Assets. |
| (G) | | Securities considered restricted. The total market value of such securities as of May 31, 2016 was $398 ($ Thousands) and represented 0.0% of Net Assets. |
| (H) | | Unsettled bank loan. Interest rate not available. |
Cl — Class
CDO — Collateralized Debt Obligation
CLO — Collateralized Loan Obligation
CV — Convertible Security
GO — General Obligation
LLC — Limited Liability Company
L.P. — Limited Partnership
Ltd — Limited
PIK — Payment-in-Kind
PLC — Public Limited Company
Pty — Proprietary
RB — Revenue Bond
Ser — Series
USD — U.S. Dollar
The following is a list of the level of inputs used as of May 31, 2016, in valuing the Fund’s investments and other financial instruments carried at value ($ Thousands):
| | | | | | | | | | | | | | | | |
| Investments in Securities | | Level 1 | | | Level 2 | | | Level 3 | | | Total | |
Corporate Obligations | | $ | — | | | $ | 2,076,730 | | | $ | 10,474 | | | $ | 2,087,204 | |
Loan Participations | | | — | | | | 204,403 | | | | 7,848 | | | | 212,251 | |
Collateralized Debt Obligations | | | — | | | | — | | | | 180,633 | | | | 180,633 | |
Municipal Bonds | | | — | | | | 3,171 | | | | 10,476 | | | | 13,647 | |
Convertible Bonds | | | — | | | | 8,375 | | | | 270 | | | | 8,645 | |
Common Stock | | | 3,030 | | | | — | | | | 2,086 | | | | 5,116 | |
Preferred Stock | | | 3,245 | | | | 1,114 | | | | 486 | | | | 4,845 | |
Asset-Backed Security | | | — | | | | 379 | | | | — | | | | 379 | |
Warrants | | | — | | | | — | | | | — | | | | — | |
Cash Equivalent | | | 120,669 | | | | — | | | | — | | | | 120,669 | |
| | | | | | | | | | | | | | | | |
Total Investments in Securities | | $ | 126,944 | | | $ | 2,294,172 | | | $ | 212,273 | | | $ | 2,633,389 | |
| | | | | | | | | | | | | | | | |
| | | | |
| SEI Institutional Investments Trust / Annual Report / May 31, 2016 | | | 163 | |
SCHEDULE OF INVESTMENTS
High Yield Bond Fund (Concluded)
May 31, 2016
The following is a reconciliation of investments in which significant unobservable inputs (Level 3) were used in determining value ($ Thousands).
| | | | | | | | | | | | | | | | | | | | | | | | | | | | | | | | |
| | | Investments in Corporate
Obligations | | | Investments in
Collateralized Debt
Obligations | | | Investments in
Loan Participations | | | Investments in
Convertible Bonds | | | Investments in
Common Stock | | | Investments in
Warrants | | | Investments in
Preferred Stock | | | Investments in
Municipal Bonds | |
Balance as of May 31, 2015 | | $ | 1,936 | | | $ | 173,964 | | | $ | 5,686 | | | $ | 986 | | | $ | 1,406 | | | $ | 13 | | | $ | — | | | $ | — | |
Accrued discounts/premiums | | | 50 | | | | 242 | | | | 24 | | | | (2 | ) | | | — | | | | — | | | | — | | | | — | |
Realized gain/(loss) | | | 5 | | | | 5,851 | | | | (562 | ) | | | — | | | | 36 | | | | 8 | | | | — | | | | — | |
Change in unrealized appreciation/depreciation | | | (53 | ) | | | (20,947 | ) | | | (348 | ) | | | (809 | ) | | | 156 | | | | (13 | ) | | | — | | | | — | |
Purchases | | | 98 | | | | 68,442 | | | | 1,632 | | | | 95 | | | | — | | | | — | | | | — | | | | — | |
Sales | | | (5 | ) | | | (52,374 | ) | | | (2,009 | ) | | | — | | | | (36 | ) | | | (8 | ) | | | — | | | | — | |
Net transfer into Level 3 | | | 8,443 | | | | 5,455 | | | | 4,208 | | | | — | | | | 524 | | | | — | | | | 486 | | | | 10,476 | |
Net transfer out of Level 3 | | | — | | | | — | | | | (783 | ) | | | — | | | | — | | | | — | | | | — | | | | — | |
| | | | | | | | | | | | | | | | | | | | | | | | | | | | | | | | |
Ending Balance as of May 31, 2016 | | $ | 10,474 | | | $ | 180,633 | | | $ | 7,848 | | | $ | 270 | | | $ | 2,086 | | | $ | — | | | $ | 486 | | | $ | 10,476 | |
| | | | | | | | | | | | | | | | | | | | | | | | | | | | | | | | |
Changes in unrealized gains/(losses) included in earnings related to securities still held at reporting date | | $ | (3,380 | ) | | $ | (20,947 | ) | | $ | (429 | ) | | $ | (1,272 | ) | | $ | (165 | ) | | $ | (13 | ) | | $ | (607 | ) | | $ | 234 | |
| | | | | | | | | | | | | | | | | | | | | | | | | | | | | | | | |
For the period ended May 31, 2016, there were no transfers between Level 1 and Level 2 assets and liabilities.
For the period ended May 31, 2016, there were transfers between Level 2 and Level 3 assets and liabilities. The transfers were due to changes in the availability of observable inputs used to determine fair value.
For more information on valuation inputs, see Note 2 — Significant Accounting Policies in Notes to Financial Statements.
Amounts designated as “—” are either $0 or have been rounded to $0.
The accompanying notes are an integral part of the financial statements
| | |
| 164 | | SEI Institutional Investments Trust / Annual Report / May 31, 2016 |
SCHEDULE OF INVESTMENTS
Long Duration Fund
May 31, 2016
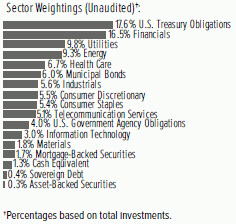
| | | | | | | | |
| Description | | Face Amount
($ Thousands) | | | Market Value
($ Thousands) | |
| | | | | | | | |
|
CORPORATE OBLIGATIONS — 68.4% | |
| |
Consumer Discretionary — 5.5% | | | | | |
21st Century Fox America | | | | | | | | |
8.150%, 10/17/2036 | | $ | 2,015 | | | $ | 2,743 | |
7.850%, 03/01/2039 | | | 3,900 | | | | 5,545 | |
7.750%, 01/20/2024 | | | 125 | | | | 160 | |
7.625%, 11/30/2028 | | | 2,411 | | | | 3,211 | |
7.430%, 10/01/2026 | | | 775 | | | | 973 | |
6.900%, 08/15/2039 | | | 2,450 | | | | 3,199 | |
6.750%, 01/09/2038 | | | 360 | | | | 445 | |
6.550%, 03/15/2033 | | | 2,170 | | | | 2,615 | |
6.400%, 12/15/2035 | | | 875 | | | | 1,080 | |
6.150%, 02/15/2041 | | | 3,000 | | | | 3,670 | |
4.950%, 10/15/2045 | | | 650 | | | | 708 | |
Amazon.com | | | | | | | | |
4.950%, 12/05/2044 | | | 2,015 | | | | 2,355 | |
AutoZone | | | | | | | | |
3.125%, 07/15/2023 | | | 785 | | | | 799 | |
Bed Bath & Beyond | | | | | | | | |
4.915%, 08/01/2034 | | | 505 | | | | 469 | |
Charter Communications Operating LLC | | | | | | | | |
6.484%, 10/23/2045 (A) | | | 1,510 | | | | 1,734 | |
6.384%, 10/23/2035 (A) | | | 6,370 | | | | 7,290 | |
Comcast | | | | | | | | |
6.950%, 08/15/2037 | | | 1,655 | | | | 2,323 | |
6.450%, 03/15/2037 | | | 3,470 | | | | 4,613 | |
6.400%, 05/15/2038 | | | 7,298 | | | | 9,743 | |
5.700%, 07/01/2019 | | | 100 | | | | 112 | |
5.650%, 06/15/2035 | | | 1,035 | | | | 1,300 | |
4.650%, 07/15/2042 | | | 1,650 | | | | 1,808 | |
4.600%, 08/15/2045 | | | 1,645 | | | | 1,812 | |
4.400%, 08/15/2035 | | | 500 | | | | 544 | |
4.250%, 01/15/2033 | | | 4,805 | | | | 5,141 | |
4.200%, 08/15/2034 | | | 1,910 | | | | 2,030 | |
Cox Communications | | | | | | | | |
7.625%, 06/15/2025 | | | 300 | | | | 342 | |
6.950%, 06/01/2038 (A) | | | 3,183 | | | | 3,211 | |
4.700%, 12/15/2042 (A) | | | 900 | | | | 776 | |
| | | | | | | | |
| Description | | Face Amount
($ Thousands) | | | Market Value
($ Thousands) | |
| | | | | | | | |
Cox Enterprises | | | | | | | | |
7.375%, 07/15/2027 (A) | | $ | 1,300 | | | $ | 1,526 | |
Discovery Communications LLC | | | | | | | | |
4.875%, 04/01/2043 | | | 1,070 | | | | 949 | |
General Motors | | | | | | | | |
6.750%, 04/01/2046 | | | 2,785 | | | | 3,263 | |
6.600%, 04/01/2036 | | | 1,075 | | | | 1,233 | |
6.250%, 10/02/2043 | | | 2,005 | | | | 2,205 | |
Grupo Televisa | | | | | | | | |
6.125%, 01/31/2046 | | | 1,965 | | | | 2,068 | |
Home Depot | | | | | | | | |
4.250%, 04/01/2046 | | | 1,545 | | | | 1,680 | |
4.200%, 04/01/2043 | | | 1,035 | | | | 1,099 | |
3.350%, 09/15/2025 | | | 1,020 | | | | 1,089 | |
Johnson Controls | | | | | | | | |
4.950%, 07/02/2064 | | | 1,645 | | | | 1,530 | |
4.625%, 07/02/2044 | | | 770 | | | | 769 | |
3.625%, 07/02/2024 | | | 1,095 | | | | 1,126 | |
Lowe’s | | | | | | | | |
5.125%, 11/15/2041 | | | 2,825 | | | | 3,318 | |
4.375%, 09/15/2045 | | | 975 | | | | 1,053 | |
Macy’s Retail Holdings | | | | | | | | |
4.500%, 12/15/2034 | | | 1,755 | | | | 1,492 | |
McDonald’s MTN | | | | | | | | |
4.700%, 12/09/2035 | | | 1,165 | | | | 1,254 | |
4.600%, 05/26/2045 | | | 850 | | | | 908 | |
NBCUniversal Media LLC | | | | | | | | |
6.400%, 04/30/2040 | | | 1,006 | | | | 1,343 | |
5.950%, 04/01/2041 | | | 2,075 | | | | 2,637 | |
Newell Brands | | | | | | | | |
5.500%, 04/01/2046 | | | 2,000 | | | | 2,285 | |
Target | | | | | | | | |
6.650%, 08/01/2028 | | | 435 | | | | 548 | |
TCI Communications | | | | | | | | |
7.875%, 02/15/2026 | | | 3,070 | | | | 4,287 | |
Thomson Reuters | | | | | | | | |
4.300%, 11/23/2023 | | | 1,075 | | | | 1,155 | |
Tiffany | | | | | | | | |
4.900%, 10/01/2044 | | | 805 | | | | 796 | |
Time Warner | | | | | | | | |
7.700%, 05/01/2032 | | | 4,322 | | | | 5,772 | |
7.625%, 04/15/2031 | | | 8,420 | | | | 11,215 | |
6.250%, 03/29/2041 | | | 3,400 | | | | 4,135 | |
6.100%, 07/15/2040 | | | 1,220 | | | | 1,448 | |
Time Warner Cable | | | | | | | | |
7.300%, 07/01/2038 | | | 755 | | | | 909 | |
6.750%, 06/15/2039 | | | 775 | | | | 880 | |
6.550%, 05/01/2037 | | | 1,000 | | | | 1,127 | |
5.875%, 11/15/2040 | | | 855 | | | | 894 | |
5.500%, 09/01/2041 | | | 2,935 | | | | 2,960 | |
4.500%, 09/15/2042 | | | 595 | | | | 531 | |
| | | | |
| SEI Institutional Investments Trust / Annual Report / May 31, 2016 | | | 165 | |
SCHEDULE OF INVESTMENTS
Long Duration Fund (Continued)
May 31, 2016
| | | | | | | | |
| Description | | Face Amount
($ Thousands) | | | Market Value
($ Thousands) | |
| | | | | | | | |
Viacom | | | | | | | | |
5.850%, 09/01/2043 | | $ | 3,755 | | | $ | 3,572 | |
5.250%, 04/01/2044 | | | 255 | | | | 230 | |
4.850%, 12/15/2034 | | | 2,180 | | | | 1,939 | |
4.375%, 03/15/2043 | | | 6,078 | | | | 4,649 | |
Walt Disney | | | | | | | | |
4.125%, 12/01/2041 | | | 475 | | | | 508 | |
| | | | | | | | |
| | | | | | | 151,133 | |
| | | | | | | | |
| | |
Consumer Staples — 5.4% | | | | | | | | |
Ahold Finance USA | | | | | | | | |
6.875%, 05/01/2029 | | | 600 | | | | 770 | |
Altria Group | | | | | | | | |
5.375%, 01/31/2044 | | | 1,710 | | | | 2,080 | |
Anheuser-Busch InBev Finance | | | | | | | | |
4.900%, 02/01/2046 | | | 23,441 | | | | 26,168 | |
4.700%, 02/01/2036 | | | 8,195 | | | | 8,871 | |
Anheuser-Busch InBev Worldwide | | | | | | | | |
6.375%, 01/15/2040 | | | 1,075 | | | | 1,391 | |
3.750%, 07/15/2042 | | | 1,200 | | | | 1,147 | |
Bestfoods | | | | | | | | |
7.250%, 12/15/2026 | | | 170 | | | | 239 | |
Bowdoin College | | | | | | | | |
4.693%, 07/01/2112 | | | 8,007 | | | | 8,242 | |
Coca-Cola Femsa | | | | | | | | |
3.875%, 11/26/2023 | | | 3,310 | | | | 3,473 | |
CVS Health | | | | | | | | |
5.125%, 07/20/2045 | | | 6,415 | | | | 7,460 | |
3.875%, 07/20/2025 | | | 155 | | | | 167 | |
2.875%, 06/01/2026 | | | 2,760 | | | | 2,746 | |
CVS Pass-Through Trust | | | | | | | | |
8.353%, 07/10/2031 (A) | | | 6,785 | | | | 8,676 | |
General Mills | | | | | | | | |
5.400%, 06/15/2040 | | | 815 | | | | 978 | |
Kraft Heinz Foods | | | | | | | | |
6.875%, 01/26/2039 | | | 865 | | | | 1,143 | |
5.200%, 07/15/2045 (A) | | | 2,780 | | | | 3,125 | |
5.000%, 07/15/2035 (A) | | | 660 | | | | 727 | |
5.000%, 06/04/2042 | | | 3,430 | | | | 3,738 | |
4.375%, 06/01/2046 (A) | | | 5,485 | | | | 5,550 | |
Massachusetts Institute of Technology | | | | | | | | |
5.600%, 07/01/2111 | | | 665 | | | | 878 | |
4.678%, 07/01/2114 | | | 4,365 | | | | 4,922 | |
Mondelez International | | | | | | | | |
4.000%, 02/01/2024 | | | 2,965 | | | | 3,220 | |
Northwestern University | | | | | | | | |
4.643%, 12/01/2044 | | | 150 | | | | 182 | |
Pepsi Bottling Group | | | | | | | | |
7.000%, 03/01/2029 | | | 350 | | | | 489 | |
PepsiCo | | | | | | | | |
3.600%, 08/13/2042 | | | 1,010 | | | | 972 | |
| | | | | | | | |
| Description | | Face Amount
($ Thousands) | | | Market Value
($ Thousands) | |
| | | | | | | | |
Pernod Ricard | | | | | | | | |
5.500%, 01/15/2042 (A) | | $ | 880 | | | $ | 993 | |
4.450%, 01/15/2022 (A) | | | 675 | | | | 732 | |
Philip Morris International | | | | | | | | |
6.375%, 05/16/2038 | | | 325 | | | | 431 | |
4.500%, 03/20/2042 | | | 3,665 | | | | 3,956 | |
4.250%, 11/10/2044 | | | 1,245 | | | | 1,302 | |
4.125%, 03/04/2043 | | | 1,125 | | | | 1,151 | |
3.875%, 08/21/2042 | | | 1,710 | | | | 1,685 | |
SABMiller Holdings | | | | | | | | |
4.950%, 01/15/2042 (A) | | | 1,380 | | | | 1,533 | |
Tufts University | | | | | | | | |
5.017%, 04/15/2112 | | | 2,982 | | | | 3,384 | |
University of Southern California | | | | | | | | |
5.250%, 10/01/2111 | | | 1,590 | | | | 1,946 | |
Walgreens Boots Alliance | | | | | | | | |
4.800%, 11/18/2044 | | | 3,980 | | | | 4,101 | |
4.650%, 06/01/2046 | | | 1,640 | | | | 1,663 | |
3.450%, 06/01/2026 | | | 3,800 | | | | 3,799 | |
Wal-Mart Stores | | | | | | | | |
6.200%, 04/15/2038 | | | 2,650 | | | | 3,630 | |
5.625%, 04/01/2040 | | | 3,040 | | | | 3,911 | |
5.625%, 04/15/2041 | | | 1,635 | | | | 2,107 | |
5.000%, 10/25/2040 | | | 430 | | | | 516 | |
4.750%, 10/02/2043 | | | 5,045 | | | | 5,887 | |
4.300%, 04/22/2044 | | | 7,700 | | | | 8,485 | |
| | | | | | | | |
| | | | | | | 148,566 | |
| | | | | | | | |
| | |
Energy — 9.2% | | | | | | | | |
Alta Wind Holdings | | | | | | | | |
7.000%, 06/30/2035 (A) | | | 1,523 | | | | 1,651 | |
Anadarko Finance | | | | | | | | |
7.500%, 05/01/2031 | | | 1,465 | | | | 1,659 | |
Anadarko Holding | | | | | | | | |
7.150%, 05/15/2028 | | | 3,290 | | | | 3,501 | |
Anadarko Petroleum | | | | | | | | |
6.600%, 03/15/2046 | | | 970 | | | | 1,081 | |
6.450%, 09/15/2036 | | | 590 | | | | 633 | |
4.610%, 10/10/2036 (B) | | | 18,000 | | | | 6,728 | |
4.500%, 07/15/2044 | | | 3,575 | | | | 3,044 | |
Apache | | | | | | | | |
5.250%, 02/01/2042 | | | 310 | | | | 307 | |
5.100%, 09/01/2040 | | | 400 | | | | 399 | |
4.750%, 04/15/2043 | | | 2,945 | | | | 2,842 | |
4.250%, 01/15/2044 | | | 1,045 | | | | 945 | |
BG Energy Capital | | | | | | | | |
5.125%, 10/15/2041 (A) | | | 2,430 | | | | 2,618 | |
BP Capital Markets | | | | | | | | |
3.814%, 02/10/2024 | | | 3,300 | | | | 3,469 | |
3.535%, 11/04/2024 | | | 100 | | | | 102 | |
Burlington Resources Finance | | | | | | | | |
7.200%, 08/15/2031 | | | 25 | | | | 30 | |
| | |
| 166 | | SEI Institutional Investments Trust / Annual Report / May 31, 2016 |
| | | | | | | | |
| Description | | Face Amount
($ Thousands) | | | Market Value
($ Thousands) | |
| | | | | | | | |
Canadian Natural Resources | | | | | | | | |
5.850%, 02/01/2035 | | $ | 150 | | | $ | 140 | |
3.900%, 02/01/2025 | | | 1,500 | | | | 1,385 | |
Cenovus Energy | | | | | | | | |
5.200%, 09/15/2043 | | | 1,030 | | | | 815 | |
3.800%, 09/15/2023 | | | 250 | | | | 223 | |
Columbia Pipeline Group | | | | | | | | |
5.800%, 06/01/2045 | | | 570 | | | | 617 | |
4.500%, 06/01/2025 | | | 1,045 | | | | 1,081 | |
Conoco Funding | | | | | | | | |
7.250%, 10/15/2031 | | | 620 | | | | 752 | |
6.950%, 04/15/2029 | | | 1,700 | | | | 2,042 | |
ConocoPhillips | | | | | | | | |
6.500%, 02/01/2039 | | | 4,315 | | | | 5,328 | |
5.950%, 03/15/2046 | | | 2,560 | | | | 3,042 | |
5.900%, 05/15/2038 | | | 4,038 | | | | 4,632 | |
4.300%, 11/15/2044 | | | 5,080 | | | | 4,916 | |
Devon Energy | | | | | | | | |
7.950%, 04/15/2032 | | | 285 | | | | 307 | |
5.600%, 07/15/2041 | | | 2,160 | | | | 1,893 | |
4.750%, 05/15/2042 | | | 2,790 | | | | 2,283 | |
Ecopetrol | | | | | | | | |
5.875%, 05/28/2045 | | | 2,050 | | | | 1,652 | |
El Paso Natural Gas | | | | | | | | |
8.375%, 06/15/2032 | | | 475 | | | | 522 | |
7.500%, 11/15/2026 | | | 2,580 | | | | 2,743 | |
Encana | | | | | | | | |
6.500%, 02/01/2038 | | | 3,350 | | | | 2,960 | |
Energy Transfer Partners | | | | | | | | |
8.250%, 11/15/2029 | | | 1,825 | | | | 2,113 | |
6.500%, 02/01/2042 | | | 3,000 | | | | 2,899 | |
6.125%, 12/15/2045 | | | 3,493 | | | | 3,297 | |
5.950%, 10/01/2043 | | | 5,795 | | | | 5,247 | |
5.150%, 02/01/2043 | | | 1,000 | | | | 830 | |
5.150%, 03/15/2045 | | | 884 | | | | 752 | |
Eni | | | | | | | | |
5.700%, 10/01/2040 (A) | | | 2,930 | | | | 2,859 | |
EnLink Midstream Partners | | | | | | | | |
5.600%, 04/01/2044 | | | 2,750 | | | | 2,103 | |
5.050%, 04/01/2045 | | | 500 | | | | 369 | |
Ensco | | | | | | | | |
5.750%, 10/01/2044 | | | 1,720 | | | | 1,002 | |
Enterprise Products Operating LLC | | | | | | | | |
6.650%, 10/15/2034 | | | 2,140 | | | | 2,460 | |
6.125%, 10/15/2039 | | | 360 | | | | 396 | |
5.700%, 02/15/2042 | | | 2,722 | | | | 2,952 | |
5.100%, 02/15/2045 | | | 2,775 | | | | 2,822 | |
4.950%, 10/15/2054 | | | 1,130 | | | | 1,050 | |
4.900%, 05/15/2046 | | | 3,610 | | | | 3,602 | |
4.850%, 03/15/2044 | | | 1,955 | | | | 1,924 | |
4.450%, 02/15/2043 | | | 2,780 | | | | 2,589 | |
3.750%, 02/15/2025 | | | 2,565 | | | | 2,617 | |
| | | | | | | | |
| Description | | Face Amount
($ Thousands) | | | Market Value
($ Thousands) | |
| | | | | | | | |
Exxon Mobil | | | | | | | | |
3.567%, 03/06/2045 | | $ | 1,555 | | | $ | 1,515 | |
Halliburton | | | | | | | | |
5.000%, 11/15/2045 | | | 850 | | | | 871 | |
4.850%, 11/15/2035 | | | 750 | | | | 771 | |
Hess | | | | | | | | |
5.600%, 02/15/2041 | | | 1,960 | | | | 1,895 | |
Kinder Morgan | | | | | | | | |
5.550%, 06/01/2045 | | | 1,830 | | | | 1,685 | |
5.300%, 12/01/2034 | | | 4,891 | | | | 4,432 | |
Kinder Morgan Energy Partners | | | | | | | | |
6.375%, 03/01/2041 | | | 6,875 | | | | 6,722 | |
3.950%, 09/01/2022 | | | 2,560 | | | | 2,509 | |
Lasmo | | | | | | | | |
7.300%, 11/15/2027 | | | 3,835 | | | | 4,578 | |
Marathon Oil | | | | | | | | |
6.600%, 10/01/2037 | | | 3,820 | | | | 3,668 | |
5.200%, 06/01/2045 | | | 1,475 | | | | 1,239 | |
Marathon Petroleum | | | | | | | | |
6.500%, 03/01/2041 | | | 4,198 | | | | 4,190 | |
Motiva Enterprises | | | | | | | | |
6.850%, 01/15/2040 (A) | | | 3,515 | | | | 4,092 | |
Nexen Energy ULC | | | | | | | | |
7.400%, 05/01/2028 | | | 2,105 | | | | 2,711 | |
Noble Energy | | | | | | | | |
5.250%, 11/15/2043 | | | 4,390 | | | | 4,183 | |
5.050%, 11/15/2044 | | | 4,310 | | | | 4,100 | |
Panhandle Eastern Pipeline | | | | | | | | |
8.125%, 06/01/2019 | | | 725 | | | | 782 | |
Petro-Canada | | | | | | | | |
7.875%, 06/15/2026 | | | 45 | | | | 56 | |
6.800%, 05/15/2038 | | | 1,510 | | | | 1,805 | |
5.950%, 05/15/2035 | | | 760 | | | | 824 | |
Petroleos Mexicanos MTN | | | | | | | | |
6.875%, 08/04/2026 (A) | | | 1,310 | | | | 1,424 | |
6.500%, 06/02/2041 | | | 4,980 | | | | 4,706 | |
6.375%, 01/23/2045 | | | 8,330 | | | | 7,799 | |
5.625%, 01/23/2046 | | | 1,840 | | | | 1,562 | |
5.500%, 06/27/2044 | | | 1,820 | | | | 1,520 | |
Phillips 66 | | | | | | | | |
5.875%, 05/01/2042 | | | 1,860 | | | | 2,091 | |
4.875%, 11/15/2044 | | | 4,560 | | | | 4,738 | |
Pride International | | | | | | | | |
7.875%, 08/15/2040 | | | 2,147 | | | | 1,470 | |
Schlumberger Holdings | | | | | | | | |
4.000%, 12/21/2025 (A) | | | 2,800 | | | | 2,920 | |
Shell International Finance | | | | | | | | |
6.375%, 12/15/2038 | | | 2,427 | | | | 3,105 | |
4.550%, 08/12/2043 | | | 6,405 | | | | 6,685 | |
4.375%, 05/11/2045 | | | 1,365 | | | | 1,410 | |
4.125%, 05/11/2035 | | | 1,905 | | | | 1,945 | |
4.000%, 05/10/2046 | | | 3,110 | | | | 3,027 | |
| | | | |
| SEI Institutional Investments Trust / Annual Report / May 31, 2016 | | | 167 | |
SCHEDULE OF INVESTMENTS
Long Duration Fund (Continued)
May 31, 2016
| | | | | | | | |
| Description | | Face Amount
($ Thousands) | | | Market Value
($ Thousands) | |
| | | | | | | | |
Southern Natural Gas | | | | | | | | |
7.350%, 02/15/2031 | | $ | 1,223 | | | $ | 1,252 | |
Spectra Energy Capital | | | | | | | | |
6.750%, 02/15/2032 | | | 1,510 | | | | 1,537 | |
3.300%, 03/15/2023 | | | 2,540 | | | | 2,342 | |
Spectra Energy Partners | | | | | | | | |
4.500%, 03/15/2045 | | | 500 | | | | 472 | |
Statoil | | | | | | | | |
6.800%, 01/15/2028 | | | 360 | | | | 464 | |
6.500%, 12/01/2028 (A) | | | 1,140 | | | | 1,504 | |
4.800%, 11/08/2043 | | | 455 | | | | 511 | |
3.950%, 05/15/2043 | | | 1,875 | | | | 1,831 | |
Suncor Energy | | | | | | | | |
6.500%, 06/15/2038 | | | 1,465 | | | | 1,741 | |
Sunoco Logistics Partners Operations | | | | | | | | |
5.350%, 05/15/2045 | | | 1,375 | | | | 1,238 | |
5.300%, 04/01/2044 | | | 1,750 | | | | 1,549 | |
TC PipeLines | | | | | | | | |
4.375%, 03/13/2025 | | | 1,000 | | | | 914 | |
Tennessee Gas Pipeline | | | | | | | | |
8.375%, 06/15/2032 | | | 2,705 | | | | 2,988 | |
7.000%, 10/15/2028 | | | 6,717 | | | | 7,012 | |
Texas Eastern Transmission | | | | | | | | |
7.000%, 07/15/2032 | | | 2,010 | | | | 2,406 | |
TransCanada PipeLines | | | | | | | | |
7.250%, 08/15/2038 | | | 1,395 | | | | 1,759 | |
4.625%, 03/01/2034 | | | 5,930 | | | | 6,093 | |
Transcontinental Gas Pipe Line | | | | | | | | |
7.250%, 12/01/2026 | | | 1,450 | | | | 1,653 | |
5.400%, 08/15/2041 | | | 1,695 | | | | 1,603 | |
4.450%, 08/01/2042 | | | 1,075 | | | | 913 | |
Transcontinental Gas Pipe Line LLC | | | | | | | | |
7.850%, 02/01/2026 (A) | | | 2,690 | | | | 3,227 | |
Valero Energy | | | | | | | | |
10.500%, 03/15/2039 | | | 3,740 | | | | 5,265 | |
Williams Partners | | | | | | | | |
4.300%, 03/04/2024 | | | 3,000 | | | | 2,692 | |
| | | | | | | | |
| | | | | | | 256,221 | |
| | | | | | | | |
| | |
Financials — 16.5% | | | | | | | | |
Aflac | | | | | | | | |
6.900%, 12/17/2039 | | | 1,423 | | | | 1,924 | |
AIG SunAmerica Global Financing X | | | | | | | | |
6.900%, 03/15/2032 (A) | | | 3,412 | | | | 4,312 | |
Alexandria Real Estate Equities | | | | | | | | |
3.900%, 06/15/2023 | | | 3,050 | | | | 3,120 | |
American International Group | | | | | | | | |
4.800%, 07/10/2045 | | | 1,040 | | | | 1,039 | |
4.700%, 07/10/2035 | | | 845 | | | | 862 | |
4.500%, 07/16/2044 | | | 5,800 | | | | 5,529 | |
3.875%, 01/15/2035 | | | 4,186 | | | | 3,874 | |
| | | | | | | | |
| Description | | Face Amount
($ Thousands) | | | Market Value
($ Thousands) | |
| | | | | | | | |
Assurant | | | | | | | | |
6.750%, 02/15/2034 | | $ | 1,659 | | | $ | 1,989 | |
Bank of America | | | | | | | | |
8.950%, 05/18/2017 (C) | | | 1,340 | | | | 1,305 | |
8.680%, 05/02/2017 (C) | | | 1,305 | | | | 1,267 | |
7.800%, 09/15/2016 | | | 65 | | | | 66 | |
6.110%, 01/29/2037 | | | 2,405 | | | | 2,785 | |
6.000%, 10/15/2036 | | | 5,225 | | | | 6,494 | |
5.875%, 02/07/2042 | | | 2,000 | | | | 2,458 | |
5.750%, 12/01/2017 | | | 5,750 | | | | 6,084 | |
5.625%, 07/01/2020 | | | 675 | | | | 754 | |
5.000%, 01/21/2044 | | | 2,250 | | | | 2,511 | |
4.875%, 04/01/2044 | | | 1,770 | | | | 1,960 | |
4.450%, 03/03/2026 | | | 2,270 | | | | 2,341 | |
4.100%, 07/24/2023 | | | 5,180 | | | | 5,501 | |
4.000%, 01/22/2025 | | | 225 | | | | 226 | |
3.500%, 04/19/2026 | | | 935 | | | | 949 | |
3.300%, 01/11/2023 | | | 725 | | | | 738 | |
Barclays | | | | | | | | |
5.250%, 08/17/2045 | | | 720 | | | | 756 | |
4.375%, 01/12/2026 | | | 1,560 | | | | 1,593 | |
Berkshire Hathaway | | | | | | | | |
4.500%, 02/11/2043 | | | 3,358 | | | | 3,737 | |
Berkshire Hathaway Finance | | | | | | | | |
4.400%, 05/15/2042 | | | 1,300 | | | | 1,418 | |
Blackstone Holdings Finance LLC | | | | | | | | |
6.250%, 08/15/2042 (A) | | | 5,042 | | | | 6,060 | |
Carlyle Holdings II Finance | | | | | | | | |
5.625%, 03/30/2043 (A) | | | 5,886 | | | | 6,359 | |
CDP Financial | | | | | | | | |
5.600%, 11/25/2039 (A) | | | 3,655 | | | | 4,721 | |
Chase Capital VI | | | | | | | | |
1.262%, 08/01/2028 (C) | | | 2,435 | | | | 1,980 | |
Chubb | | | | | | | | |
6.500%, 05/15/2038 | | | 1,174 | | | | 1,632 | |
Chubb INA Holdings | | | | | | | | |
6.700%, 05/15/2036 | | | 1,527 | | | | 2,114 | |
Cincinnati Financial | | | | | | | | |
6.920%, 05/15/2028 | | | 4,484 | | | | 5,726 | |
Citigroup | | | | | | | | |
8.125%, 07/15/2039 | | | 1,131 | | | | 1,713 | |
6.875%, 02/15/2098 | | | 2,752 | | | | 3,591 | |
6.625%, 06/15/2032 | | | 2,070 | | | | 2,498 | |
4.750%, 05/18/2046 | | | 5,930 | | | | 5,814 | |
4.600%, 03/09/2026 | | | 1,430 | | | | 1,484 | |
4.450%, 09/29/2027 | | | 2,755 | | | | 2,795 | |
4.400%, 06/10/2025 | | | 4,310 | | | | 4,417 | |
3.400%, 05/01/2026 | | | 1,805 | | | | 1,818 | |
1.212%, 08/25/2036 (C) | | | 850 | | | | 565 | |
Cooperatieve Rabobank UA | | | | | | | | |
5.800%, 09/30/2110 (A) | | | 5,033 | | | | 5,860 | |
| | |
| 168 | | SEI Institutional Investments Trust / Annual Report / May 31, 2016 |
| | | | | | | | |
| Description | | Face Amount
($ Thousands) | | | Market Value
($ Thousands) | |
| | | | | | | | |
Credit Suisse Group Funding Guernsey | | | | | | | | |
4.550%, 04/17/2026 (A) | | $ | 1,165 | | | $ | 1,199 | |
Devon OEI Operating | | | | | | | | |
7.500%, 09/15/2027 | | | 1,160 | | | | 1,261 | |
Discover Bank | | | | | | | | |
8.700%, 11/18/2019 | | | 1,014 | | | | 1,183 | |
Discover Financial Services | | | | | | | | |
3.850%, 11/21/2022 | | | 3,261 | | | | 3,305 | |
Farmers Exchange Capital | | | | | | | | |
7.200%, 07/15/2048 (A) | | | 1,000 | | | | 1,167 | |
Farmers Exchange Capital II | | | | | | | | |
6.151%, 11/01/2053 (A) (C) | | | 10,040 | | | | 10,378 | |
FMR | | | | | | | | |
5.150%, 02/01/2043 (A) | | | 2,750 | | | | 2,955 | |
Ford Holdings | | | | | | | | |
9.300%, 03/01/2030 | | | 2,525 | | | | 3,491 | |
Ford Motor | | | | | | | | |
7.450%, 07/16/2031 | | | 2,908 | | | | 3,796 | |
7.400%, 11/01/2046 | | | 1,890 | | | | 2,545 | |
4.750%, 01/15/2043 | | | 745 | | | | 761 | |
General Electric MTN | | | | | | | | |
6.875%, 01/10/2039 | | | 2,199 | | | | 3,218 | |
5.875%, 01/14/2038 | | | 3,535 | | | | 4,638 | |
1.106%, 08/15/2036 (C) | | | 1,250 | | | | 1,046 | |
Goldman Sachs Group | | | | | | | | |
6.750%, 10/01/2037 | | | 9,500 | | | | 11,552 | |
6.250%, 02/01/2041 | | | 6,934 | | | | 8,830 | |
6.125%, 02/15/2033 | | | 7,095 | | | | 8,724 | |
5.150%, 05/22/2045 | | | 2,225 | | | | 2,290 | |
4.800%, 07/08/2044 | | | 2,305 | | | | 2,471 | |
4.750%, 10/21/2045 | | | 3,150 | | | | 3,375 | |
Guardian Life Insurance of America | | | | | | | | |
4.875%, 06/19/2064 (A) | | | 5,845 | | | | 5,695 | |
Hartford Financial Services Group | | | | | | | | |
6.625%, 03/30/2040 | | | 725 | | | | 905 | |
HBOS MTN | | | | | | | | |
6.750%, 05/21/2018 (A) | | | 4,050 | | | | 4,356 | |
HCP | | | | | | | | |
4.250%, 11/15/2023 | | | 4,370 | | | | 4,477 | |
3.875%, 08/15/2024 | | | 1,460 | | | | 1,446 | |
Healthcare Realty Trust | | | | | | | | |
5.750%, 01/15/2021 | | | 525 | | | | 583 | |
Highmark | | | | | | | | |
6.125%, 05/15/2041 (A) | | | 3,705 | | | | 3,612 | |
HSBC Bank USA MTN | | | | | | | | |
7.000%, 01/15/2039 | | | 910 | | | | 1,167 | |
5.625%, 08/15/2035 | | | 1,100 | | | | 1,270 | |
HSBC Holdings | | | | | | | | |
6.500%, 09/15/2037 | | | 4,550 | | | | 5,420 | |
5.250%, 03/14/2044 | | | 2,175 | | | | 2,287 | |
International Lease Finance | | | | | | | | |
7.125%, 09/01/2018 (A) | | | 95 | | | | 104 | |
| | | | | | | | |
| Description | | Face Amount
($ Thousands) | | | Market Value
($ Thousands) | |
| | | | | | | | |
JPMorgan Chase | | | | | | | | |
6.300%, 04/23/2019 | | $ | 1,775 | | | $ | 1,991 | |
5.600%, 07/15/2041 | | | 4,985 | | | | 6,190 | |
4.950%, 06/01/2045 | | | 1,455 | | | | 1,559 | |
4.250%, 10/01/2027 | | | 920 | | | | 952 | |
3.900%, 07/15/2025 | | | 2,200 | | | | 2,337 | |
3.875%, 09/10/2024 | | | 2,000 | | | | 2,048 | |
3.200%, 06/15/2026 | | | 2,680 | | | | 2,679 | |
JPMorgan Chase Capital XIII | | | | | | | | |
1.579%, 09/30/2034 (C) | | | 3,900 | | | | 3,120 | |
JPMorgan Chase Capital XXIII | | | | | | | | |
1.626%, 05/15/2047 (C) | | | 1,907 | | | | 1,412 | |
KKR Group Finance II | | | | | | | | |
5.500%, 02/01/2043 (A) | | | 11,149 | | | | 11,419 | |
KKR Group Finance III | | | | | | | | |
5.125%, 06/01/2044 (A) | | | 1,300 | | | | 1,266 | |
Liberty Mutual Group | | | | | | | | |
6.500%, 03/15/2035 (A) | | | 265 | | | | 314 | |
6.500%, 05/01/2042 (A) | | | 5,443 | | | | 6,467 | |
Macquarie Bank MTN | | | | | | | | |
6.625%, 04/07/2021 (A) | | | 2,670 | | | | 3,040 | |
Marsh & McLennan | | | | | | | | |
3.500%, 06/03/2024 | | | 1,635 | | | | 1,664 | |
Massachusetts Mutual Life Insurance | | | | | | | | |
8.875%, 06/01/2039 (A) | | | 1,820 | | | | 2,668 | |
MetLife | | | | | | | | |
6.400%, 12/15/2036 | | | 4,686 | | | | 5,032 | |
5.875%, 02/06/2041 | | | 1,240 | | | | 1,508 | |
4.875%, 11/13/2043 | | | 3,465 | | | | 3,762 | |
4.050%, 03/01/2045 | | | 2,431 | | | | 2,347 | |
Metropolitan Life Global Funding I | | | | | |
3.875%, 04/11/2022 (A) | | | 435 | | | | 465 | |
3.000%, 01/10/2023 (A) | | | 1,845 | | | | 1,866 | |
Metropolitan Life Insurance | | | | | | | | |
7.800%, 11/01/2025 (A) | | | 3,520 | | | | 4,569 | |
Moody’s | | | | | | | | |
5.250%, 07/15/2044 | | | 8,726 | | | | 10,019 | |
Morgan Stanley MTN | | | | | | | | |
6.375%, 07/24/2042 | | | 2,984 | | | | 3,888 | |
6.250%, 08/09/2026 | | | 4,210 | | | | 5,144 | |
5.625%, 09/23/2019 | | | 5,775 | | | | 6,397 | |
4.300%, 01/27/2045 | | | 4,090 | | | | 4,163 | |
3.875%, 04/29/2024 | | | 2,195 | | | | 2,308 | |
3.700%, 10/23/2024 | | | 1,410 | | | | 1,455 | |
Nationwide Health Properties MTN | | | | | | | | |
6.590%, 07/07/2038 | | | 1,310 | | | | 1,612 | |
Nationwide Mutual Insurance | | | | | | | | |
8.250%, 12/01/2031 (A) | | | 1,000 | | | | 1,368 | |
7.875%, 04/01/2033 (A) | | | 4,016 | | | | 5,245 | |
4.950%, 04/22/2044 (A) | | | 2,455 | | | | 2,392 | |
New York Life Insurance | | | | | | | | |
6.750%, 11/15/2039 (A) | | | 5,515 | | | | 7,334 | |
| | | | |
| SEI Institutional Investments Trust / Annual Report / May 31, 2016 | | | 169 | |
SCHEDULE OF INVESTMENTS
Long Duration Fund (Continued)
May 31, 2016
| | | | | | | | |
| Description | | Face Amount
($ Thousands) | | | Market Value
($ Thousands) | |
| | | | | | | | |
5.875%, 05/15/2033 (A) | | $ | 3,852 | | | $ | 4,620 | |
Northwestern Mutual Life Insurance | | | | | | | | |
6.063%, 03/30/2040 (A) | | | 2,216 | | | | 2,739 | |
Piedmont Operating Partnership | | | | | | | | |
4.450%, 03/15/2024 | | | 1,740 | | | | 1,775 | |
Prudential Financial MTN | | | | | | | | |
6.625%, 12/01/2037 | | | 328 | | | | 408 | |
5.800%, 11/16/2041 | | | 995 | | | | 1,158 | |
5.700%, 12/14/2036 | | | 4,739 | | | | 5,440 | |
Prudential Insurance of America | | | | | | | | |
8.300%, 07/01/2025 (A) | | | 4,500 | | | | 5,952 | |
Royal Bank of Scotland Group | | | | | | | | |
4.800%, 04/05/2026 | | | 775 | | | | 797 | |
Santander UK Group Holdings | | | | | | | | |
5.625%, 09/15/2045 (A) | | | 1,200 | | | | 1,177 | |
Simon Property Group | | | | | | | | |
6.750%, 02/01/2040 | | | 1,634 | | | | 2,270 | |
4.750%, 03/15/2042 | | | 1,385 | | | | 1,550 | |
3.300%, 01/15/2026 | | | 1,230 | | | | 1,276 | |
SL Green Realty | | | | | | | | |
7.750%, 03/15/2020 | | | 775 | | | | 898 | |
5.000%, 08/15/2018 | | | 1,000 | | | | 1,045 | |
Teachers Insurance & Annuity Association of | | | | | | | | |
America | | | | | | | | |
6.850%, 12/16/2039 (A) | | | 4,225 | | | | 5,489 | |
4.900%, 09/15/2044 (A) | | | 5,965 | | | | 6,482 | |
TIAA Asset Management Finance LLC | | | | | | | | |
4.125%, 11/01/2024 (A) | | | 1,925 | | | | 1,983 | |
UBS Group Funding Jersey | | | | | | | | |
4.125%, 09/24/2025 (A) | | | 4,960 | | | | 5,090 | |
Ventas Realty | | | | | | | | |
5.700%, 09/30/2043 | | | 5,465 | | | | 6,126 | |
4.375%, 02/01/2045 | | | 3,750 | | | | 3,483 | |
VEREIT Operating Partnership | | | | | | | | |
4.600%, 02/06/2024 | | | 4,150 | | | | 4,176 | |
Visa | | | | | | | | |
4.300%, 12/14/2045 | | | 3,215 | | | | 3,553 | |
4.150%, 12/14/2035 | | | 3,275 | | | | 3,571 | |
WEA Finance LLC | | | | | | | | |
4.750%, 09/17/2044 (A) | | | 3,400 | | | | 3,488 | |
Wells Fargo MTN | | | | | | | | |
4.900%, 11/17/2045 | | | 1,115 | | | | 1,201 | |
4.650%, 11/04/2044 | | | 3,010 | | | | 3,117 | |
4.300%, 07/22/2027 | | | 1,125 | | | | 1,193 | |
3.900%, 05/01/2045 | | | 2,905 | | | | 2,937 | |
3.000%, 04/22/2026 | | | 1,295 | | | | 1,296 | |
Wells Fargo Bank | | | | | | | | |
6.000%, 11/15/2017 | | | 300 | | | | 320 | |
5.950%, 08/26/2036 | | | 1,000 | | | | 1,237 | |
5.850%, 02/01/2037 | | | 5,620 | | | | 6,811 | |
Welltower | | | | | | | | |
5.125%, 03/15/2043 | | | 6,564 | | | | 6,813 | |
| | | | | | | | |
| Description | | Face Amount
($ Thousands) | | | Market Value
($ Thousands) | |
| | | | | | | | |
4.250%, 04/01/2026 | | $ | 960 | | | $ | 1,005 | |
4.000%, 06/01/2025 | | | 100 | | | | 102 | |
ZFS Finance USA Trust II | | | | | | | | |
6.450%, 12/15/2065 (A) (C) | | | 1,939 | | | | 1,942 | |
| | | | | | | | |
| | | | | | | 456,766 | |
| | | | | | | | |
| | |
Health Care — 6.6% | | | | | | | | |
AbbVie | | | | | | | | |
4.700%, 05/14/2045 | | | 6,410 | | | | 6,537 | |
4.500%, 05/14/2035 | | | 1,655 | | | | 1,683 | |
4.450%, 05/14/2046 | | | 2,345 | | | | 2,328 | |
4.400%, 11/06/2042 | | | 1,670 | | | | 1,653 | |
Actavis | | | | | | | | |
4.625%, 10/01/2042 | | | 1,790 | | | | 1,756 | |
Actavis Funding SCS | | | | | | | | |
4.750%, 03/15/2045 | | | 7,710 | | | | 7,617 | |
4.550%, 03/15/2035 | | | 545 | | | | 539 | |
3.850%, 06/15/2024 | | | 2,160 | | | | 2,203 | |
Aetna | | | | | | | | |
4.750%, 03/15/2044 | | | 1,220 | | | | 1,321 | |
Amgen | | | | | | | | |
6.400%, 02/01/2039 | | | 3,400 | | | | 4,290 | |
5.150%, 11/15/2041 | | | 2,495 | | | | 2,735 | |
4.950%, 10/01/2041 | | | 825 | | | | 876 | |
4.400%, 05/01/2045 | | | 2,150 | | | | 2,147 | |
Anthem | | | | | | | | |
4.850%, 08/15/2054 | | | 1,590 | | | | 1,624 | |
4.650%, 01/15/2043 | | | 2,080 | | | | 2,135 | |
4.650%, 08/15/2044 | | | 250 | | | | 257 | |
3.500%, 08/15/2024 | | | 4,360 | | | | 4,449 | |
AstraZeneca | | | | | | | | |
6.450%, 09/15/2037 | | | 3,107 | | | | 4,129 | |
Baxalta | | | | | | | | |
5.250%, 06/23/2045 (A) | | | 3,460 | | | | 3,538 | |
Baylor Scott & White Holdings | | | | | | | | |
4.185%, 11/15/2045 | | | 2,545 | | | | 2,684 | |
Becton Dickinson | | | | | | | | |
4.875%, 05/15/2044 | | | 400 | | | | 442 | |
4.685%, 12/15/2044 | | | 1,630 | | | | 1,787 | |
3.875%, 05/15/2024 | | | 1,750 | | | | 1,864 | |
Biogen | | | | | | | | |
5.200%, 09/15/2045 | | | 1,280 | | | | 1,408 | |
4.050%, 09/15/2025 | | | 735 | | | | 785 | |
Cardinal Health | | | | | | | | |
4.900%, 09/15/2045 | | | 925 | | | | 1,009 | |
4.500%, 11/15/2044 | | | 1,830 | | | | 1,863 | |
Celgene | | | | | | | | |
5.700%, 10/15/2040 | | | 4,184 | | | | 4,943 | |
5.000%, 08/15/2045 | | | 1,905 | | | | 2,025 | |
4.625%, 05/15/2044 | | | 3,600 | | | | 3,593 | |
Cleveland Clinic Foundation | | | | | | | | |
4.858%, 01/01/2114 | | | 3,588 | | | | 3,929 | |
| | |
| 170 | | SEI Institutional Investments Trust / Annual Report / May 31, 2016 |
| | | | | | | | |
| Description | | Face Amount
($ Thousands) | | | Market Value
($ Thousands) | |
| | | | | | | | |
EMD Finance LLC | | | | | | | | |
3.250%, 03/19/2025 (A) | | $ | 3,690 | | | $ | 3,708 | |
Gilead Sciences | | | | | | | | |
4.800%, 04/01/2044 | | | 2,460 | | | | 2,636 | |
4.750%, 03/01/2046 | | | 3,930 | | | | 4,206 | |
4.600%, 09/01/2035 | | | 1,845 | | | | 1,972 | |
4.500%, 02/01/2045 | | | 2,055 | | | | 2,107 | |
3.650%, 03/01/2026 | | | 2,090 | | | | 2,213 | �� |
GlaxoSmithKline Capital | | | | | | | | |
6.375%, 05/15/2038 | | | 1,870 | | | | 2,569 | |
Hartford HealthCare | | | | | | | | |
5.746%, 04/01/2044 | | | 6,630 | | | | 7,748 | |
Humana | | | | | | | | |
4.950%, 10/01/2044 | | | 3,065 | | | | 3,259 | |
4.625%, 12/01/2042 | | | 385 | | | | 384 | |
Johnson & Johnson | | | | | | | | |
4.500%, 12/05/2043 | | | 1,700 | | | | 2,030 | |
McKesson | | | | | | | | |
4.883%, 03/15/2044 | | | 1,000 | | | | 1,101 | |
Mead Johnson Nutrition | | | | | | | | |
4.600%, 06/01/2044 | | | 825 | | | | 843 | |
Medtronic | | | | | | | | |
4.625%, 03/15/2045 | | | 3,255 | | | | 3,652 | |
4.375%, 03/15/2035 | | | 4,807 | | | | 5,228 | |
Merck | | | | | | | | |
4.150%, 05/18/2043 | | | 3,895 | | | | 4,157 | |
3.600%, 09/15/2042 | | | 1,595 | | | | 1,589 | |
Merck Sharp & Dohme MTN | | | | | | | | |
5.760%, 05/03/2037 | | | 2,236 | | | | 2,774 | |
North Shore-Long Island Jewish Health Care | | | | | | | | |
6.150%, 11/01/2043 | | | 320 | | | | 420 | |
4.800%, 11/01/2042 | | | 4,615 | | | | 4,785 | |
Novartis Capital | | | | | | | | |
4.400%, 05/06/2044 | | | 5,815 | | | | 6,693 | |
NYU Hospitals Center | | | | | | | | |
5.750%, 07/01/2043 | | | 710 | | | | 902 | |
4.428%, 07/01/2042 | | | 4,230 | | | | 4,426 | |
Perrigo Finance Unlimited | | | | | | | | |
3.900%, 12/15/2024 | | | 4,125 | | | | 4,057 | |
Pfizer | | | | | | | | |
7.200%, 03/15/2039 | | | 590 | | | | 861 | |
4.400%, 05/15/2044 | | | 1,780 | | | | 1,979 | |
Providence Health & Services Obligated Group | | | | | | | | |
4.379%, 10/01/2023 | | | 705 | | | | 778 | |
St. Barnabas | | | | | | | | |
4.000%, 07/01/2028 | | | 4,375 | | | | 4,484 | |
Stryker | | | | | | | | |
4.625%, 03/15/2046 | | | 1,885 | | | | 2,033 | |
4.100%, 04/01/2043 | | | 1,425 | | | | 1,420 | |
3.375%, 05/15/2024 | | | 1,145 | | | | 1,190 | |
Thermo Fisher Scientific | | | | | | | | |
3.150%, 01/15/2023 | | | 3,020 | | | | 3,041 | |
| | | | | | | | |
| Description | | Face Amount
($ Thousands) | | | Market Value
($ Thousands) | |
| | | | | | | | |
Toledo Hospital | | | | | | | | |
4.982%, 11/15/2045 | | $ | 2,371 | | | $ | 2,866 | |
UnitedHealth Group | | | | | | | | |
6.875%, 02/15/2038 | | | 2,010 | | | | 2,861 | |
6.625%, 11/15/2037 | | | 555 | | | | 762 | |
4.750%, 07/15/2045 | | | 2,000 | | | | 2,290 | |
4.625%, 07/15/2035 | | | 1,265 | | | | 1,419 | |
Wyeth | | | | | | | | |
6.000%, 02/15/2036 | | | 2,985 | | | | 3,827 | |
5.950%, 04/01/2037 | | | 936 | | | | 1,210 | |
Zimmer Biomet Holdings | | | | | | | | |
4.450%, 08/15/2045 | | | 1,670 | | | | 1,673 | |
| | | | | | | | |
| | | | | | | 184,302 | |
| | | | | | | | |
| | |
Industrials — 5.5% | | | | | | | | |
American Airlines, Pass-Through Trust,
Ser 2011-1, Cl A | | | | | | | | |
5.250%, 01/31/2021 | | | 3 | | | | 3 | |
American Airlines, Pass-Through Trust,
Ser 2013-2, Cl A | | | | | | | | |
4.950%, 01/15/2023 | | | 1,554 | | | | 1,671 | |
American Airlines, Pass-Through Trust,
Ser 2014-1, Cl A | | | | | | | | |
3.700%, 10/01/2026 | | | 2,523 | | | | 2,595 | |
BAE Systems Holdings | | | | | | | | |
4.750%, 10/07/2044 (A) | | | 6,620 | | | | 6,871 | |
BAE Systems PLC | | | | | | | | |
5.800%, 10/11/2041 (A) | | | 1,145 | | | | 1,342 | |
Boeing | | | | | | | | |
3.375%, 06/15/2046 | | | 3,470 | | | | 3,348 | |
Burlington Northern Santa Fe LLC | | | | | | | | |
6.200%, 08/15/2036 | | | 3,150 | | | | 4,071 | |
6.150%, 05/01/2037 | | | 985 | | | | 1,284 | |
5.750%, 05/01/2040 | | | 555 | | | | 697 | |
5.150%, 09/01/2043 | | | 1,365 | | | | 1,613 | |
4.900%, 04/01/2044 | | | 1,920 | | | | 2,215 | |
4.550%, 09/01/2044 | | | 1,150 | | | | 1,257 | |
4.400%, 03/15/2042 | | | 3,270 | | | | 3,488 | |
4.375%, 09/01/2042 | | | 1,430 | | | | 1,523 | |
Canadian Pacific Railway | | | | | | | | |
6.125%, 09/15/2115 | | | 4,970 | | | | 5,914 | |
Caterpillar | | | | | | | | |
4.750%, 05/15/2064 | | | 2,765 | | | | 2,965 | |
3.803%, 08/15/2042 | | | 5,968 | | | | 5,764 | |
Continental Airlines, Pass-Through Trust,
Ser 2007-1, Cl A | | | | | | | | |
5.983%, 04/19/2022 | | | 4,564 | | | | 5,083 | |
Continental Airlines, Pass-Through Trust,
Ser 2009-1 | | | | | | | | |
9.000%, 07/08/2016 | | | 4,247 | | | | 4,303 | |
CSX | | | | | | | | |
4.750%, 05/30/2042 | | | 3,410 | | | | 3,754 | |
| | | | |
| SEI Institutional Investments Trust / Annual Report / May 31, 2016 | | | 171 | |
SCHEDULE OF INVESTMENTS
Long Duration Fund (Continued)
May 31, 2016
| | | | | | | | |
| Description | | Face Amount
($ Thousands) | | | Market Value
($ Thousands) | |
| | | | | | | | |
Deere | | | | | | | | |
3.900%, 06/09/2042 | | $ | 2,220 | | | $ | 2,280 | |
Delta Air Lines, Pass-Through Trust, Ser 2011-1, Cl A | | | | | | | | |
5.300%, 04/15/2019 | | | 5 | | | | 5 | |
FedEx | | | | | | | | |
7.600%, 07/01/2097 | | | 2,095 | | | | 2,959 | |
5.100%, 01/15/2044 | | | 275 | | | | 306 | |
4.100%, 02/01/2045 | | | 275 | | | | 266 | |
4.000%, 01/15/2024 | | | 515 | | | | 560 | |
3.900%, 02/01/2035 | | | 700 | | | | 689 | |
3.875%, 08/01/2042 | | | 2,715 | | | | 2,529 | |
GE Capital International Funding Unlimited | | | | | | | | |
4.418%, 11/15/2035 (A) | | | 27,791 | | | | 30,234 | |
Lockheed Martin | | | | | | | | |
4.700%, 05/15/2046 | | | 1,620 | | | | 1,817 | |
4.500%, 05/15/2036 | | | 565 | | | | 622 | |
4.070%, 12/15/2042 | | | 3,743 | | | | 3,794 | |
3.600%, 03/01/2035 | | | 4,155 | | | | 4,081 | |
Norfolk Southern | | | | | | | | |
6.000%, 03/15/2105 | | | 3,403 | | | | 3,932 | |
6.000%, 05/23/2111 | | | 4,332 | | | | 5,014 | |
4.800%, 08/15/2043 | | | 1,410 | | | | 1,566 | |
4.650%, 01/15/2046 | | | 1,165 | | | | 1,289 | |
4.450%, 06/15/2045 | | | 480 | | | | 514 | |
3.850%, 01/15/2024 | | | 2,115 | | | | 2,268 | |
Northrop Grumman | | | | | | | | |
4.750%, 06/01/2043 | | | 5,330 | | | | 6,048 | |
Northwest Airlines, Pass-Through Trust, | | | | | | | | |
Ser 2001-1, Cl A1 | | | | | | | | |
7.041%, 04/01/2022 | | | 220 | | | | 249 | |
Parker-Hannifin MTN | | | | | | | | |
4.450%, 11/21/2044 | | | 1,145 | | | | 1,273 | |
Republic Services | | | | | | | | |
3.550%, 06/01/2022 | | | 995 | | | | 1,051 | |
Siemens Financieringsmaatschappij 4.400%, 05/27/2045 (A) | | | 4,025 | | | | 4,406 | |
Union Pacific | | | | | | | | |
4.050%, 03/01/2046 | | | 2,120 | | | | 2,206 | |
United Airlines, Pass-Through Trust, Ser 2014-2, Cl A | | | | | | | | |
3.750%, 09/03/2026 | | | 3,243 | | | | 3,340 | |
United Technologies | | | | | | | | |
5.700%, 04/15/2040 | | | 2,565 | | | | 3,238 | |
4.500%, 06/01/2042 | | | 3,985 | | | | 4,359 | |
US Airways, Pass-Through Trust, Ser 2011-1A, Cl A | | | | | | | | |
7.125%, 10/22/2023 | | | 1,450 | | | | 1,698 | |
WW Grainger | | | | | | | | |
4.600%, 06/15/2045 | | | 1,170 | | | | 1,323 | |
| | | | | | | | |
| | | | | | | 153,677 | |
| | | | | | | | |
| | | | | | | | |
| Description | | Face Amount
($ Thousands) | | | Market Value
($ Thousands) | |
| | | | | | | | |
|
Information Technology — 3.0% | |
Analog Devices | | | | | | | | |
3.900%, 12/15/2025 | | $ | 1,380 | | | $ | 1,485 | |
Apple | | | | | | | | |
4.650%, 02/23/2046 | | | 910 | | | | 999 | |
4.500%, 02/23/2036 | | | 3,260 | | | | 3,537 | |
4.450%, 05/06/2044 | | | 1,150 | | | | 1,206 | |
4.375%, 05/13/2045 | | | 7,500 | | | | 7,943 | |
CDK Global | | | | | | | | |
4.500%, 10/15/2024 | | | 3,680 | | | | 3,671 | |
Cisco Systems | | | | | | | | |
5.900%, 02/15/2039 | | | 2,620 | | | | 3,463 | |
Diamond 1 Finance | | | | | | | | |
8.350%, 07/15/2046 (A) | | | 4,125 | | | | 4,199 | |
Hewlett Packard Enterprise | | | | | | | | |
6.350%, 10/15/2045 (A) | | | 3,774 | | | | 3,611 | |
Intel | | | | | | | | |
4.900%, 07/29/2045 | | | 5,548 | | | | 6,207 | |
4.800%, 10/01/2041 | | | 1,755 | | | | 1,949 | |
4.000%, 12/15/2032 | | | 655 | | | | 689 | |
Juniper Networks | | | | | | | | |
5.950%, 03/15/2041 | | | 4,430 | | | | 4,318 | |
Microsoft | | | | | | | | |
4.875%, 12/15/2043 | | | 3,822 | | | | 4,521 | |
4.750%, 11/03/2055 | | | 1,320 | | | | 1,478 | |
4.450%, 11/03/2045 | | | 1,000 | | | | 1,117 | |
4.000%, 02/12/2055 | | | 5,461 | | | | 5,361 | |
3.750%, 02/12/2045 | | | 895 | | | | 894 | |
3.500%, 02/12/2035 | | | 1,475 | | | | 1,487 | |
3.500%, 11/15/2042 | | | 1,765 | | | | 1,687 | |
Oracle | | | | | | | | |
6.500%, 04/15/2038 | | | 4,924 | | | | 6,682 | |
4.500%, 07/08/2044 | | | 1,805 | | | | 1,950 | |
4.375%, 05/15/2055 | | | 4,180 | | | | 4,191 | |
4.300%, 07/08/2034 | | | 6,360 | | | | 6,787 | |
4.125%, 05/15/2045 | | | 870 | | | | 896 | |
Qualcomm | | | | | | | | |
4.650%, 05/20/2035 | | | 2,795 | | | | 2,913 | |
Seagate HDD Cayman | | | | | | | | |
5.750%, 12/01/2034 | | | 1,295 | | | | 894 | |
| | | | | | | | |
| | | | | | | 84,135 | |
| | | | | | | | |
| | |
Materials — 1.8% | | | | | | | | |
Barrick North America Finance LLC | | | | | | | | |
5.750%, 05/01/2043 | | | 3,540 | | | | 3,463 | |
BHP Billiton Finance USA | | | | | | | | |
5.000%, 09/30/2043 | | | 2,420 | | | | 2,570 | |
CF Industries | | | | | | | | |
5.150%, 03/15/2034 | | | 1,205 | | | | 1,146 | |
Dow Chemical | | | | | | | | |
4.625%, 10/01/2044 | | | 1,000 | | | | 1,003 | |
4.375%, 11/15/2042 | | | 5,845 | | | | 5,642 | |
| | |
| 172 | | SEI Institutional Investments Trust / Annual Report / May 31, 2016 |
| | | | | | | | |
| Description | | Face Amount
($ Thousands) | | | Market Value
($ Thousands) | |
| | | | | | | | |
4.250%, 10/01/2034 | | $ | 2,110 | | | $ | 2,088 | |
Eastman Chemical | | | | | | | | |
4.650%, 10/15/2044 | | | 1,305 | | | | 1,288 | |
Glencore Finance Canada | | | | | | | | |
6.000%, 11/15/2041 (A) | | | 5,144 | | | | 4,173 | |
International Paper | | | | | | | | |
5.150%, 05/15/2046 | | | 1,290 | | | | 1,348 | |
5.000%, 09/15/2035 | | | 1,310 | | | | 1,375 | |
LYB International Finance | | | | | | | | |
4.875%, 03/15/2044 | | | 2,575 | | | | 2,522 | |
LyondellBasell Industries | | | | | | | | |
4.625%, 02/26/2055 | | | 1,000 | | | | 885 | |
Monsanto | | | | | | | | |
4.200%, 07/15/2034 | | | 745 | | | | 720 | |
3.950%, 04/15/2045 | | | 500 | | | | 439 | |
Nacional del Cobre de Chile | | | | | | | | |
4.875%, 11/04/2044 (A) | | | 2,355 | | | | 2,233 | |
4.500%, 09/16/2025 (A) | | | 855 | | | | 870 | |
4.250%, 07/17/2042 (A) | | | 1,845 | | | | 1,586 | |
Newcrest Finance | | | | | | | | |
5.750%, 11/15/2041 (A) | | | 4,154 | | | | 3,695 | |
Newmont Mining | | | | | | | | |
6.250%, 10/01/2039 | | | 1,135 | | | | 1,164 | |
5.875%, 04/01/2035 | | | 395 | | | | 392 | |
4.875%, 03/15/2042 | | | 2,195 | | | | 1,975 | |
Rio Tinto Finance USA | | | | | | | | |
4.125%, 08/21/2042 | | | 120 | | | | 110 | |
Rohm & Haas | | | | | | | | |
7.850%, 07/15/2029 | | | 3,710 | | | | 4,960 | |
Southern Copper | | | | | | | | |
7.500%, 07/27/2035 | | | 2,974 | | | | 3,116 | |
5.875%, 04/23/2045 | | | 1,500 | | | | 1,307 | |
| | | | | | | | |
| | | | | | | 50,070 | |
| | | | | | | | |
|
Telecommunication Services — 5.1% | |
America Movil | | | | | | | | |
6.375%, 03/01/2035 | | | 480 | | | | 571 | |
4.375%, 07/16/2042 | | | 2,805 | | | | 2,723 | |
AT&T | | | | | | | | |
6.500%, 09/01/2037 | | | 2,758 | | | | 3,322 | |
6.300%, 01/15/2038 | | | 1,500 | | | | 1,770 | |
6.000%, 08/15/2040 | | | 5,845 | | | | 6,617 | |
5.650%, 02/15/2047 | | | 1,935 | | | | 2,171 | |
5.550%, 08/15/2041 | | | 4,000 | | | | 4,369 | |
5.350%, 09/01/2040 | | | 5,519 | | | | 5,873 | |
4.800%, 06/15/2044 | | | 5,903 | | | | 5,892 | |
4.750%, 05/15/2046 | | | 3,484 | | | | 3,460 | |
4.500%, 05/15/2035 | | | 9,360 | | | | 9,373 | |
4.350%, 06/15/2045 | | | 8,200 | | | | 7,717 | |
4.300%, 12/15/2042 | | | 2,841 | | | | 2,660 | |
British Telecommunications | | | | | | | | |
9.625%, 12/15/2030 | | | 2,070 | | | | 3,259 | |
| | | | | | | | |
| Description | | Face Amount
($ Thousands) | | | Market Value
($ Thousands) | |
| | | | | | | | |
Deutsche Telekom International Finance | | | | | | | | |
9.250%, 06/01/2032 | | $ | 670 | | | $ | 1,048 | |
8.750%, 06/15/2030 | | | 610 | | | | 903 | |
4.875%, 03/06/2042 (A) | | | 1,255 | | | | 1,405 | |
Koninklijke | | | | | | | | |
8.375%, 10/01/2030 | | | 1,620 | | | | 2,209 | |
Rogers Communications | | | | | | | | |
5.000%, 03/15/2044 | | | 2,845 | | | | 3,159 | |
SES GLOBAL Americas Holdings GP | | | | | | | | |
5.300%, 03/25/2044 (A) | | | 6,578 | | | | 5,955 | |
Verizon Communications | | | | | | | | |
6.400%, 09/15/2033 | | | 86 | | | | 107 | |
6.250%, 04/01/2037 | | | 760 | | | | 910 | |
6.000%, 04/01/2041 | | | 1,500 | | | | 1,800 | |
5.850%, 09/15/2035 | | | 69 | | | | 81 | |
5.050%, 03/15/2034 | | | 4,175 | | | | 4,552 | |
5.012%, 08/21/2054 | | | 7,888 | | | | 8,140 | |
4.862%, 08/21/2046 | | | 10,777 | | | | 11,506 | |
4.750%, 11/01/2041 | | | 825 | | | | 848 | |
4.672%, 03/15/2055 | | | 13,780 | | | | 13,504 | |
4.522%, 09/15/2048 | | | 13,158 | | | | 13,288 | |
4.400%, 11/01/2034 | | | 1,750 | | | | 1,775 | |
4.272%, 01/15/2036 | | | 4,385 | | | | 4,393 | |
3.850%, 11/01/2042 | | | 3,450 | | | | 3,163 | |
Vodafone Group | | | | | | | | |
4.375%, 02/19/2043 | | | 2,290 | | | | 2,116 | |
| | | | | | | | |
| | | | | | | 140,639 | |
| | | | | | | | |
| | |
Utilities — 9.8% | | | | | | | | |
AEP Texas Central | | | | | | | | |
3.850%, 10/01/2025 (A) | | | 1,000 | | | | 1,043 | |
AGL Capital | | | | | | | | |
5.875%, 03/15/2041 | | | 2,593 | | | | 3,042 | |
4.400%, 06/01/2043 | | | 1,000 | | | | 999 | |
Appalachian Power | | | | | | | | |
4.450%, 06/01/2045 | | | 560 | | | | 587 | |
Baltimore Gas & Electric | | | | | | | | |
5.200%, 06/15/2033 | | | 3,178 | | | | 3,627 | |
Berkshire Hathaway Energy | | | | | | | | |
6.500%, 09/15/2037 | | | 1,715 | | | | 2,306 | |
6.125%, 04/01/2036 | | | 6,910 | | | | 8,880 | |
5.150%, 11/15/2043 | | | 2,250 | | | | 2,651 | |
Bruce Mansfield Unit 1 2007 Pass-Through Trust | | | | | | | | |
6.850%, 06/01/2034 | | | 1,279 | | | | 1,224 | |
CenterPoint Energy Resources | | | | | | | | |
6.250%, 02/01/2037 | | | 2,991 | | | | 3,496 | |
Commonwealth Edison | | | | | | | | |
3.700%, 03/01/2045 | | | 3,149 | | | | 3,116 | |
Consolidated Edison of New York | | | | | | | | |
6.750%, 04/01/2038 | | | 1,725 | | | | 2,374 | |
6.300%, 08/15/2037 | | | 1,440 | | | | 1,858 | |
| | | | |
| SEI Institutional Investments Trust / Annual Report / May 31, 2016 | | | 173 | |
SCHEDULE OF INVESTMENTS
Long Duration Fund (Continued)
May 31, 2016
| | | | | | | | |
| Description | | Face Amount
($ Thousands) | | | Market Value
($ Thousands) | |
| | | | | | | | |
4.450%, 03/15/2044 | | $ | 2,000 | | | $ | 2,205 | |
Dominion Resources | | | | | | | | |
5.250%, 08/01/2033 | | | 3,830 | | | | 4,149 | |
4.900%, 08/01/2041 | | | 2,715 | | | | 2,859 | |
Duke Energy | | | | | | | | |
3.750%, 04/15/2024 | | | 535 | | | | 565 | |
3.050%, 08/15/2022 | | | 1,420 | | | | 1,450 | |
Duke Energy Carolinas | | | | | | | | |
6.100%, 06/01/2037 | | | 3,090 | | | | 4,003 | |
5.300%, 02/15/2040 | | | 7,420 | | | | 9,163 | |
4.000%, 09/30/2042 | | | 1,890 | | | | 1,989 | |
Duke Energy Carolinas LLC | | | | | | | | |
4.250%, 12/15/2041 | | | 1,500 | | | | 1,616 | |
Duke Energy Florida | | | | | | | | |
6.400%, 06/15/2038 | | | 450 | | | | 619 | |
6.350%, 09/15/2037 | | | 900 | | | | 1,236 | |
Duke Energy Indiana | | | | | | | | |
6.350%, 08/15/2038 | | | 800 | | | | 1,097 | |
4.900%, 07/15/2043 | | | 1,395 | | | | 1,637 | |
Duke Energy Progress LLC | | | | | | | | |
4.375%, 03/30/2044 | | | 3,320 | | | | 3,635 | |
Duquesne Light Holdings | | | | | | | | |
6.250%, 08/15/2035 | | | 3,125 | | | | 3,410 | |
5.900%, 12/01/2021 (A) | | | 750 | | | | 846 | |
Electricite de France | | | | | | | | |
6.000%, 01/22/2114 (A) | | | 5,945 | | | | 6,118 | |
4.950%, 10/13/2045 (A) | | | 3,095 | | | | 3,310 | |
4.750%, 10/13/2035 (A) | | | 1,385 | | | | 1,455 | |
Elm Road Generating Station Supercritical | | | | | | | | |
5.848%, 01/19/2041 (A) | | | 2,007 | | | | 2,416 | |
Entergy Louisiana | | | | | | | | |
4.440%, 01/15/2026 | | | 2,990 | | | | 3,297 | |
Eversource Energy | | | | | | | | |
2.800%, 05/01/2023 | | | 2,120 | | | | 2,146 | |
Exelon | | | | | | | | |
5.625%, 06/15/2035 | | | 1,250 | | | | 1,454 | |
4.950%, 06/15/2035 | | | 2,800 | | | | 3,036 | |
Exelon Generation LLC | | | | | | | | |
6.250%, 10/01/2039 | | | 200 | | | | 219 | |
5.750%, 10/01/2041 | | | 4,531 | | | | 4,645 | |
5.600%, 06/15/2042 | | | 4,070 | | | | 4,148 | |
FirstEnergy Transmission LLC | | | | | | | | |
5.450%, 07/15/2044 (A) | | | 2,670 | | | | 2,813 | |
Florida Power & Light | | | | | | | | |
5.960%, 04/01/2039 | | | 2,920 | | | | 3,906 | |
5.690%, 03/01/2040 | | | 4,600 | | | | 5,990 | |
5.650%, 02/01/2037 | | | 2,500 | | | | 3,197 | |
5.400%, 09/01/2035 | | | 3,200 | | | | 3,921 | |
Georgia Power | | | | | | | | |
5.950%, 02/01/2039 | | | 3,850 | | | | 4,864 | |
5.400%, 06/01/2040 | | | 5,780 | | | | 6,999 | |
4.300%, 03/15/2042 | | | 1,660 | | | | 1,777 | |
| | | | | | | | |
| Description | | Face Amount
($ Thousands) | | | Market Value
($ Thousands) | |
| | | | | | | | |
Indianapolis Power & Light | | | | | | | | |
6.050%, 10/01/2036 (A) | | $ | 1,291 | | | $ | 1,620 | |
4.875%, 11/01/2041 (A) | | | 1,860 | | | | 1,997 | |
4.700%, 09/01/2045 (A) | | | 3,230 | | | | 3,564 | |
4.500%, 06/01/2044 (A) | | | 2,375 | | | | 2,494 | |
ITC Holdings | | | | | | | | |
5.300%, 07/01/2043 | | | 1,970 | | | | 2,127 | |
Jersey Central Power & Light | | | | | | | | |
6.400%, 05/15/2036 | | | 1,425 | | | | 1,668 | |
KCP&L Greater Missouri Operations | | | | | | | | |
8.270%, 11/15/2021 | | | 2,600 | | | | 3,159 | |
Kentucky Utilities | | | | | | | | |
5.125%, 11/01/2040 | | | 1,835 | | | | 2,205 | |
KeySpan Gas East | | | | | | | | |
5.819%, 04/01/2041 (A) | | | 7,485 | | | | 8,872 | |
Metropolitan Edison | | | | | | | | |
7.700%, 01/15/2019 | | | 350 | | | | 395 | |
MidAmerican Energy | | | | | | | | |
6.750%, 12/30/2031 | | | 720 | | | | 978 | |
5.800%, 10/15/2036 | | | 765 | | | | 979 | |
4.800%, 09/15/2043 | | | 1,725 | | | | 2,041 | |
4.400%, 10/15/2044 | | | 1,450 | | | | 1,609 | |
MidAmerican Funding | | | | | | | | |
6.927%, 03/01/2029 | | | 170 | | | | 227 | |
Monongahela Power | | | | | | | | |
5.400%, 12/15/2043 (A) | | | 740 | | | | 898 | |
4.100%, 04/15/2024 (A) | | | 2,890 | | | | 3,106 | |
Narragansett Electric | | | | | | | | |
4.170%, 12/10/2042 (A) | | | 1,990 | | | | 2,040 | |
NextEra Energy Capital Holdings | | | | | | | | |
6.000%, 03/01/2019 | | | 2,470 | | | | 2,710 | |
Niagara Mohawk Power | | | | | | | | |
4.119%, 11/28/2042 (A) | | | 2,000 | | | | 2,045 | |
2.721%, 11/28/2022 (A) | | | 700 | | | | 707 | |
NiSource Finance | | | | | | | | |
5.950%, 06/15/2041 | | | 545 | | | | 661 | |
Northern States Power | | | | | | | | |
6.250%, 06/01/2036 | | | 1,813 | | | | 2,461 | |
5.350%, 11/01/2039 | | | 2,695 | | | | 3,394 | |
3.400%, 08/15/2042 | | | 920 | | | | 884 | |
NSTAR Electric | | | | | | | | |
4.400%, 03/01/2044 | | | 655 | | | | 724 | |
Oncor Electric Delivery | | | | | | | | |
7.500%, 09/01/2038 | | | 600 | | | | 845 | |
5.300%, 06/01/2042 | | | 6,645 | | | | 8,001 | |
Pacific Gas & Electric | | | | | | | | |
6.350%, 02/15/2038 | | | 1,000 | | | | 1,328 | |
6.250%, 03/01/2039 | | | 1,910 | | | | 2,522 | |
6.050%, 03/01/2034 | | | 4,540 | | | | 5,952 | |
4.600%, 06/15/2043 | | | 1,770 | | | | 1,963 | |
4.500%, 12/15/2041 | | | 1,660 | | | | 1,855 | |
| | |
| 174 | | SEI Institutional Investments Trust / Annual Report / May 31, 2016 |
| | | | | | | | |
| Description | | Face Amount
($ Thousands) | | | Market Value
($ Thousands) | |
| | | | | | | | |
PacifiCorp | | | | | | | | |
6.000%, 01/15/2039 | | $ | 1,010 | | | $ | 1,333 | |
5.750%, 04/01/2037 | | | 2,972 | | | | 3,768 | |
Pennsylvania Electric | | | | | | | | |
6.150%, 10/01/2038 | | | 2,690 | | | | 2,984 | |
PSEG Power LLC | | | | | | | | |
8.625%, 04/15/2031 | | | 4,340 | | | | 5,226 | |
Public Service Electric & Gas MTN | | | | | | | | |
4.000%, 06/01/2044 | | | 1,000 | | | | 1,075 | |
Public Service of Colorado | | | | | | | | |
6.500%, 08/01/2038 | | | 725 | | | | 1,023 | |
6.250%, 09/01/2037 | | | 1,500 | | | | 2,055 | |
4.300%, 03/15/2044 | | | 1,825 | | | | 2,000 | |
Sempra Energy | | | | | | | | |
6.000%, 10/15/2039 | | | 3,565 | | | | 4,285 | |
Southaven Combined Cycle Generation | | | | | | | | |
3.846%, 08/15/2033 | | | 2,240 | | | | 2,412 | |
Southern California Edison | | | | | | | | |
6.050%, 03/15/2039 | | | 4,355 | | | | 5,782 | |
4.500%, 09/01/2040 | | | 2,295 | | | | 2,550 | |
Southern California Gas | | | | | | | | |
3.750%, 09/15/2042 | | | 1,180 | | | | 1,186 | |
Southwestern Electric Power | | | | | | | | |
6.200%, 03/15/2040 | | | 3,335 | | | | 4,065 | |
3.900%, 04/01/2045 | | | 2,000 | | | | 1,885 | |
Texas-New Mexico Power | | | | | | | | |
6.950%, 04/01/2043 (A) | | | 1,082 | | | | 1,396 | |
Tucson Electric Power | | | | | | | | |
5.000%, 03/15/2044 | | | 5,025 | | | | 5,126 | |
Union Electric | | | | | | | | |
8.450%, 03/15/2039 | | | 2,010 | | | | 3,248 | |
Virginia Electric & Power | | | | | | | | |
4.450%, 02/15/2044 | | | 2,500 | | | | 2,720 | |
3.450%, 02/15/2024 | | | 530 | | | | 562 | |
| | | | | | | | |
| | | | | | | 272,105 | |
| | | | | | | | |
Total Corporate Obligations
(Cost $1,784,582) ($ Thousands) | | | | 1,897,614 | |
| | | | | | | | |
|
U.S. TREASURY OBLIGATIONS — 17.7% | |
U.S. Treasury Bills | | | | | | | | |
0.250%, 06/09/2016 (B) | | | 11,290 | | | | 11,290 | |
0.226%, 07/21/2016 (B) (E) | | | 2,970 | | | | 2,969 | |
U.S. Treasury Bonds | | | | | | | | |
4.500%, 02/15/2036 | | | 6,485 | | | | 8,873 | |
4.250%, 05/15/2039 | | | 3,610 | | | | 4,772 | |
3.875%, 08/15/2040 | | | 4,075 | | | | 5,105 | |
3.750%, 08/15/2041 | | | 10,845 | | | | 13,339 | |
3.750%, 11/15/2043 | | | 16,080 | | | | 19,934 | |
3.625%, 08/15/2043 | | | 14,522 | | | | 17,603 | |
3.625%, 02/15/2044 | | | 9,821 | | | | 11,891 | |
3.375%, 05/15/2044 | | | 9,440 | | | | 10,921 | |
| | | | | | | | |
| Description | | Face Amount
($ Thousands) | | | Market Value
($ Thousands) | |
| | | | | | | | |
3.125%, 11/15/2041 | | $ | 13,150 | | | $ | 14,607 | |
3.125%, 02/15/2043 | | | 26,570 | | | | 29,414 | |
3.000%, 05/15/2045 | | | 86,269 | | | | 92,874 | |
3.000%, 11/15/2045 | | | 46,200 | | | | 49,730 | |
2.875%, 08/15/2045 (E) | | | 44,280 | | | | 46,499 | |
2.750%, 08/15/2042 | | | 5,780 | | | | 5,974 | |
2.500%, 02/15/2045 | | | 27,281 | | | | 26,541 | |
2.500%, 02/15/2046 | | | 31,555 | | | | 30,676 | |
2.500%, 05/15/2046 | | | 17,890 | | | | 17,411 | |
U.S. Treasury Inflation Indexed Bonds | | | | | | | | |
1.375%, 02/15/2044 | | | 2,350 | | | | 2,652 | |
0.750%, 02/15/2045 | | | 7,473 | | | | 7,134 | |
U.S. Treasury Notes | | | | | | | | |
2.125%, 05/15/2025 | | | 20,635 | | | | 21,177 | |
1.625%, 05/15/2026 | | | 7,765 | | | | 7,617 | |
U.S. Treasury STRIPS | | | | | | | | |
2.739%, 05/15/2039 (B) | | | 43,500 | | | | 24,325 | |
0.000%, 05/15/2045 (B) | | | 8,160 | | | | 3,668 | |
0.000%, 08/15/2045 (B) | | | 6,740 | | | | 3,007 | |
| | | | | | | | |
Total U.S. Treasury Obligations
(Cost $456,916) ($ Thousands) | | | | 490,003 | |
| | | | | | | | |
|
MUNICIPAL BONDS — 6.0% | |
| | |
California — 2.3% | | | | | | | | |
Bay Area, Toll Authority, Build America Project, RB | | | | | | | | |
6.263%, 04/01/2049 | | | 1,200 | | | | 1,769 | |
California State, Build America Project, GO | | | | | | | | |
7.550%, 04/01/2039 | | | 295 | | | | 454 | |
7.500%, 04/01/2034 | | | 5,300 | | | | 7,921 | |
City of Sacramento, Municipal Utility District, Build America Project, RB | | | | | | | | |
6.156%, 05/15/2036 | | | 100 | | | | 129 | |
City of San Francisco, Public Utilities Commission Water Revenue, Build America Project, Ser DE, RB | | | | | | | | |
6.000%, 11/01/2040 | | | 3,705 | | | | 4,782 | |
Los Angeles Unified School District, Build America Project, GO | | | | | | | | |
5.750%, 07/01/2034 | | | 1,875 | | | | 2,426 | |
Los Angeles, Community College District, Build America Project, GO | | | | | | | | |
6.750%, 08/01/2049 | | | 990 | | | | 1,522 | |
Los Angeles, Community College District, Ser D, GO | | | | | | | | |
6.680%, 08/01/2036 | | | 2,965 | | | | 4,142 | |
Los Angeles, Department of Water & Power, Build America Project, RB | | | | | | | | |
6.574%, 07/01/2045 | | | 600 | | | | 884 | |
6.008%, 07/01/2039 | | | 5,000 | | | | 6,535 | |
| | | | |
| SEI Institutional Investments Trust / Annual Report / May 31, 2016 | | | 175 | |
SCHEDULE OF INVESTMENTS
Long Duration Fund (Continued)
May 31, 2016
| | | | | | | | |
| Description | | Face Amount
($ Thousands) | | | Market Value
($ Thousands) | |
| | | | | | | | |
Los Angeles, Unified School District, Build America Project, Ser RY, GO | | | | | | | | |
6.758%, 07/01/2034 | | $ | 2,360 | | | $ | 3,325 | |
Regents of the University of California Medical Center Pooled Revenue, Build America Project, Ser H, RB | | | | | | | | |
6.548%, 05/15/2048 | | | 1,480 | | | | 2,078 | |
San Diego County, Water Authority, Build America Project, RB | | | | | | | | |
6.138%, 05/01/2049 | | | 1,175 | | | | 1,646 | |
Santa Clara Valley, Transportation Authority, Build America Project, RB | | | | | | | | |
5.876%, 04/01/2032 | | | 1,580 | | | | 2,005 | |
State of California, Build America Project, GO | | | | | | | | |
7.625%, 03/01/2040 | | | 1,540 | | | | 2,364 | |
7.350%, 11/01/2039 | | | 5,330 | | | | 7,864 | |
7.300%, 10/01/2039 | | | 1,000 | | | | 1,466 | |
University of California, Ser AD, RB | | | | | | | | |
4.858%, 05/15/2112 | | | 11,775 | | | | 12,561 | |
| | | | | | | | |
| | | | | | | 63,873 | |
| | | | | | | | |
| | |
District of Columbia — 0.1% | | | | | | | | |
District of Columbia Water & Sewer Authority, RB | | | | | | | | |
4.814%, 10/01/2114 | | | 2,005 | | | | 2,221 | |
| | | | | | | | |
| | |
Florida — 0.2% | | | | | | | | |
City of Gainesville, Build America Project, RB | | | | | | | | |
6.024%, 10/01/2040 | | | 3,650 | | | | 4,675 | |
| | | | | | | | |
| | |
Georgia — 0.2% | | | | | | | | |
Municipal Electric Authority of Georgia, Build America Project, RB | | | | | | | | |
6.637%, 04/01/2057 | | | 3,511 | | | | 4,559 | |
| | | | | | | | |
| | |
Illinois — 0.4% | | | | | | | | |
Illinois State, GO | | | | | | | | |
5.100%, 06/01/2033 | | | 8,680 | | | | 8,303 | |
Illinois, Finance Authority, RB Callable 06/01/2022 @ 100 | | | | | | | | |
4.000%, 06/01/2047 | | | 1,260 | | | | 1,308 | |
Metropolitan Water Reclamation District of Greater Chicago, GO | | | | | | | | |
5.720%, 12/01/2038 | | | 2,630 | | | | 3,211 | |
| | | | | | | | |
| | | | | | | 12,822 | |
| | | | | | | | |
| | |
Indiana — 0.1% | | | | | | | | |
Indianapolis, Local Public Improvement Bond Bank, Build America Project, RB | | | | | | | | |
6.116%, 01/15/2040 | | | 1,860 | | | | 2,502 | |
| | | | | | | | |
| | | | | | | | |
| Description | | Face Amount
($ Thousands) | | | Market Value
($ Thousands) | |
| | | | | | | | |
| | |
Massachusetts — 0.1% | | | | | | | | |
Commonwealth of Massachusetts, Build America Project, GO | | | | | | | | |
4.910%, 05/01/2029 | | $ | 1,210 | | | $ | 1,452 | |
Commonwealth of Massachusetts, Build America Project, RB | | | | | | | | |
5.731%, 06/01/2040 | | | 1,080 | | | | 1,435 | |
| | | | | | | | |
| | | | | | | 2,887 | |
| | | | | | | | |
| | |
Michigan — 0.1% | | | | | | | | |
Michigan State University, Build America Project, Ser B, RB | | | | | | | | |
Callable 02/15/2030 @ 100 | | | | | | | | |
6.173%, 02/15/2050 | | | 2,000 | | | | 2,440 | |
| | | | | | | | |
| | |
Missouri — 0.0% | | | | | | | | |
Missouri, Joint Municipal Electric Utility Commission, Build America Project, Ser A, RB | | | | | | | | |
6.890%, 01/01/2042 | | | 600 | | | | 765 | |
| | | | | | | | |
| | |
New Jersey — 0.1% | | | | | | | | |
New Jersey State, Turnpike Authority, Build | | | | | | | | |
America Project, RB | | | | | | | | |
7.414%, 01/01/2040 | | | 60 | | | | 91 | |
7.102%, 01/01/2041 | | | 1,300 | | | | 1,920 | |
| | | | | | | | |
| | | | | | | 2,011 | |
| | | | | | | | |
| | |
New York — 1.7% | | | | | | | | |
City of New York, Build America Project, GO Callable 10/01/2020 @ 100 | | | | | | | | |
5.817%, 10/01/2031 | | | 2,950 | | | | 3,370 | |
City of New York, Build America Project, GO | | | | | | | | |
5.517%, 10/01/2037 | | | 1,000 | | | | 1,260 | |
New York City, Municipal Water Finance | | | | | | | | |
Authority, Build America Project, RB Callable 06/15/2020 @ 100 | | | | | | | | |
6.491%, 06/15/2042 | | | 6,630 | | | | 7,548 | |
New York City, Municipal Water Finance Authority, Build America Project, RB | | | | | | | | |
5.440%, 06/15/2043 | | | 2,360 | | | | 3,086 | |
New York City, Municipal Water Finance | | | | | | | | |
Authority, RB Callable 12/15/2020 @ 100 | | | | | | | | |
5.375%, 06/15/2043 | | | 600 | | | | 703 | |
New York City, Municipal Water Finance | | | | | | | | |
Authority, Ser GG, RB Callable 06/15/2021 @ 100 | | | | | | | | |
5.000%, 06/15/2043 | | | 710 | | | | 821 | |
New York City, Transitional Finance Authority, Build America Project, RB | | | | | | | | |
5.572%, 11/01/2038 | | | 2,195 | | | | 2,799 | |
| | |
| 176 | | SEI Institutional Investments Trust / Annual Report / May 31, 2016 |
| | | | | | | | |
| Description | | Face Amount
($ Thousands) | | | Market Value
($ Thousands) | |
| | | | | | | | |
New York State, Dormitory Authority, Build America Project, RB | | | | | | | | |
5.500%, 03/15/2030 | | $ | 3,295 | | | $ | 4,109 | |
5.289%, 03/15/2033 | | | 1,550 | | | | 1,902 | |
Port Authority of New York & New Jersey, RB | | | | | | | | |
4.926%, 10/01/2051 | | | 725 | | | | 871 | |
4.458%, 10/01/2062 | | | 5,635 | | | | 6,195 | |
Port Authority of New York & New Jersey, Ser 192, RB | | | | | | | | |
4.810%, 10/15/2065 | | | 2,460 | | | | 2,865 | |
State of New York, Build America Project, RB | | | | | | | | |
5.770%, 03/15/2039 | | | 8,820 | | | | 11,082 | |
| | | | | | | | |
| | | | | | | 46,611 | |
| | | | | | | | |
| | |
Ohio — 0.1% | | | | | | | | |
American Municipal Power, Build America Project, RB | | | | | | | | |
6.053%, 02/15/2043 | | | 2,940 | | | | 3,625 | |
Ohio State University, Build America Project, Ser A, RB | | | | | | | | |
4.800%, 06/01/2111 | | | 115 | | | | 124 | |
| | | | | | | | |
| | | | | | | 3,749 | |
| | | | | | | | |
| | |
Pennsylvania — 0.1% | | | | | | | | |
Commonwealth of Pennsylvania, Build America Project, Ser B, GO | | | | | | | | |
5.450%, 02/15/2030 | | | 1,915 | | | | 2,258 | |
| | | | | | | | |
| | |
Texas — 0.5% | | | | | | | | |
City of Houston, Combined Utility System Revenue, AGC Pre-Refunded @ 100 | | | | | | | | |
5.250%, 11/15/2033 (D) | | | 300 | | | | 338 | |
City of Houston, Combined Utility System Revenue, Ser S, AGC Callable 05/15/2019 @ 100 | | | | | | | | |
5.250%, 11/15/2033 | | | 20 | | | | 22 | |
Dallas, Convention Center Hotel Development, Build America Project, RB | | | | | | | | |
7.088%, 01/01/2042 | | | 600 | | | | 821 | |
Grand Parkway Transportation, Sub-Ser E, RB | | | | | | | | |
5.184%, 10/01/2042 | | | 930 | | | | 1,183 | |
North Texas, Tollway Authority, Build America Project, RB | | | | | | | | |
6.718%, 01/01/2049 | | | 4,796 | | | | 7,096 | |
Texas Transportation Commission State Highway Fund, Build America Project, Ser B, RB | | | | | | | | |
5.178%, 04/01/2030 | | | 2,725 | | | | 3,358 | |
| | | | | | | | |
| Description | | Face Amount
($ Thousands) | | | Market Value
($ Thousands) | |
| | | | | | | | |
University of Texas Permanent University Fund, Build America Project, RB | | | | | | | | |
5.262%, 07/01/2039 | | $ | 1,505 | | | $ | 1,932 | |
| | | | | | | | |
| | | | | | | 14,750 | |
| | | | | | | | |
Total Municipal Bonds
(Cost $144,354) ($ Thousands) | | | | 166,123 | |
| | | | | | | | |
|
U.S. GOVERNMENT AGENCY OBLIGATIONS — 4.0% | |
FHLB | | | | | | | | |
5.625%, 06/11/2021 | | | 960 | | | | 1,149 | |
FHLB DN | | | | | | | | |
0.451%, 10/03/2016 (B) | | | 7,605 | | | | 7,594 | |
FHLMC | | | | | | | | |
6.750%, 03/15/2031 | | | 7,545 | | | | 11,282 | |
FHLMC MTN | | | | | | | | |
6.250%, 07/15/2032 | | | 6,735 | | | | 9,817 | |
FNMA | | | | | | | | |
2.625%, 09/06/2024 | | | 12,405 | | | | 13,012 | |
FNMA, PO MTN | | | | | | | | |
0.000%, 05/15/2030 (B) | | | 8,380 | | | | 5,528 | |
Residual Funding STRIPS | | | | | | | | |
3.286%, 04/15/2030 (B) | | | 17,770 | | | | 12,112 | |
Tennessee Valley Authority | | | | | | | | |
5.500%, 06/15/2038 | | | 305 | | | | 408 | |
5.375%, 04/01/2056 | | | 12,593 | | | | 16,284 | |
5.250%, 09/15/2039 | | | 7,900 | | | | 10,311 | |
4.875%, 01/15/2048 | | | 635 | | | | 751 | |
4.625%, 09/15/2060 | | | 7,645 | | | | 8,835 | |
4.250%, 09/15/2065 | | | 6,898 | | | | 7,370 | |
3.500%, 12/15/2042 | | | 5,480 | | | | 5,571 | |
Tennessee Valley Authority STRIPS, PO | | | | | | | | |
0.000%, 01/15/2038 (B) | | | 3,700 | | | | 1,680 | |
| | | | | | | | |
Total U.S. Government Agency Obligations
(Cost $106,420) ($ Thousands) | | | | 111,704 | |
| | | | | | | | |
|
MORTGAGE-BACKED SECURITIES — 1.7% | |
|
Agency Mortgage-Backed Obligations — 1.6% | |
FHLMC CMO, Ser 2004-2733, Cl ME | | | | | | | | |
5.000%, 01/15/2034 | | | 226 | | | | 250 | |
FHLMC CMO, Ser 2004-2748, Cl ZT | | | | | | | | |
5.500%, 02/15/2024 | | | 738 | | | | 836 | |
FHLMC CMO, Ser 2010-3756, Cl PZ | | | | | | | | |
4.000%, 11/15/2040 | | | 6,228 | | | | 6,870 | |
FHLMC CMO, Ser 2013-4150, Cl JZ | | | | | | | | |
3.000%, 01/15/2043 | | | 3,094 | | | | 2,969 | |
FHLMC CMO, Ser 3770, Cl ZB | | | | | | | | |
5.000%, 12/15/2040 | | | 3,812 | | | | 4,349 | |
| | | | |
| SEI Institutional Investments Trust / Annual Report / May 31, 2016 | | | 177 | |
SCHEDULE OF INVESTMENTS
Long Duration Fund (Continued)
May 31, 2016
| | | | | | | | |
| Description | | Face Amount
($ Thousands) | | | Market Value
($ Thousands) | |
| | | | | | | | |
FHLMC Multifamily Structured Pass-Through Certificates, Ser K027, Cl A2 | | | | | | | | |
2.637%, 01/25/2023 | | $ | 4,380 | | | $ | 4,544 | |
FNMA | | | | | | | | |
3.841%, 09/01/2020 | | | 3,645 | | | | 3,936 | |
3.762%, 12/01/2020 | | | 3,486 | | | | 3,758 | |
3.665%, 10/01/2020 | | | 3,371 | | | | 3,615 | |
3.583%, 09/01/2020 | | | 1,877 | | | | 2,011 | |
FNMA CMO, Ser 2004-12, Cl ZX | | | | | | | | |
6.000%, 03/25/2034 | | | 999 | | | | 1,223 | |
FNMA CMO, Ser 2004-80, Cl XZ | | | | | | | | |
5.000%, 11/25/2034 | | | 552 | | | | 635 | |
FNMA CMO, Ser 2007-68, Cl SC, IO | | | | | | | | |
6.254%, 07/25/2037 (C) | | | 58 | | | | 9 | |
GNMA ARM | | | | | | | | |
1.750%, 06/20/2032 (C) | | | 79 | | | | 82 | |
GNMA CMO, Ser 2004-93, Cl PC | | | | | | | | |
5.000%, 04/16/2034 | | | 75 | | | | 77 | |
GNMA CMO, Ser 2009-8, Cl PS, IO | | | | | | | | |
5.866%, 08/16/2038 (C) | | | 134 | | | | 17 | |
GNMA CMO, Ser 2010-4, Cl NS, IO | | | | | | | | |
5.956%, 01/16/2040 (C) | | | 157 | | | | 27 | |
GNMA CMO, Ser 2011-70, Cl BO, PO | | | | | | | | |
0.000%, 05/20/2041 (B) | | | 10,425 | | | | 9,705 | |
| | | | | | | | |
| | | | | | | 44,913 | |
| | | | | | | | |
|
Non-Agency Mortgage-Backed Obligations — 0.1% | |
Countrywide Home Loans, Ser 2005-2, Cl 1A1 | | | | | | | | |
1.086%, 03/25/2035 (C) | | | 116 | | | | 87 | |
DSLA Mortgage Loan Trust, Ser 2005-AR2, Cl 2A1A | | | | | | | | |
0.646%, 03/19/2045 (C) | | | 148 | | | | 132 | |
Harborview Mortgage Loan Trust, Ser 2004-8, Cl 2A4A | | | | | | | | |
1.236%, 11/19/2034 (C) | | | 215 | | | | 190 | |
Harborview Mortgage Loan Trust, Ser 2005-11, Cl 2A1A | | | | | | | | |
0.746%, 08/19/2045 (C) | | | 293 | | | | 269 | |
Indymac Index Mortgage Loan Trust, Ser 2004- AR12, Cl A1 | | | | | | | | |
1.219%, 12/25/2034 (C) | | | 115 | | | | 95 | |
Indymac Index Mortgage Loan Trust, Ser 2004- AR5, Cl 2A1B | | | | | | | | |
1.239%, 08/25/2034 (C) | | | 52 | | | | 43 | |
Indymac Index Mortgage Loan Trust, Ser 2004- AR6, Cl 6A1 | | | | | | | | |
2.938%, 10/25/2034 (C) | | | 67 | | | | 64 | |
Indymac Index Mortgage Loan Trust, Ser 2004- AR7, Cl A2 | | | | | | | | |
1.299%, 09/25/2034 (C) | | | 24 | | | | 22 | |
| | | | | | | | |
| Description | | Face Amount
($ Thousands) | | | Market Value
($ Thousands) | |
| | | | | | | | |
Indymac Index Mortgage Loan Trust, Ser 2005- AR18, Cl 2A1A | | | | | | | | |
0.749%, 10/25/2036 (C) | | $ | 15 | | | $ | 10 | |
Residential Asset Mortgage Products, Ser 2004-SL1, Cl A7 | | | | | | | | |
7.000%, 11/25/2031 | | | 21 | | | | 22 | |
Residential Asset Mortgage Products, Ser 2004-SL3, Cl A2 | | | | | | | | |
6.500%, 12/25/2031 | | | 25 | | | | 25 | |
Residential Asset Securitization Trust, Ser 2004-IP2, Cl 2A1 | | | | | | | | |
2.820%, 12/25/2034 (C) | | | 49 | | | | 49 | |
WaMu Mortgage Pass-Through Certificates, Ser 2005-AR2, Cl 2A21 | | | | | | | | |
0.776%, 01/25/2045 (C) | | | 143 | | | | 131 | |
Wells Fargo Mortgage-Backed Securities Trust, Ser 2006-AR8, Cl 1A3 | | | | | | | | |
2.841%, 04/25/2036 (C) | | | 119 | | | | 118 | |
| | | | | | | | |
| | | | | | | 1,257 | |
| | | | | | | | |
Total Mortgage-Backed Securities
(Cost $38,205) ($ Thousands) | | | | 46,170 | |
| | | | | | | | |
| | |
SOVEREIGN DEBT — 0.4% | | | | | | | | |
Israel Government AID Bond | | | | | | | | |
5.500%, 09/18/2033 | | | 1,400 | | | | 1,906 | |
Republic of Colombia | | | | | | | | |
5.625%, 02/26/2044 | | | 1,215 | | | | 1,203 | |
Republic of Uruguay | | | | | | | | |
5.100%, 06/18/2050 | | | 2,095 | | | | 1,953 | |
United Mexican States | | | | | | | | |
6.050%, 01/11/2040 | | | 236 | | | | 277 | |
5.750%, 10/12/2110 | | | 504 | | | | 507 | |
5.550%, 01/21/2045 | | | 1,670 | | | | 1,858 | |
4.750%, 03/08/2044 | | | 780 | | | | 774 | |
4.600%, 01/23/2046 | | | 135 | | | | 131 | |
4.000%, 10/02/2023 | | | 1,936 | | | | 2,018 | |
| | | | | | | | |
Total Sovereign Debt
(Cost $10,264) ($ Thousands) | | | | 10,627 | |
| | | | | | | | |
|
ASSET-BACKED SECURITIES — 0.3% | |
|
Mortgage Related Securities — 0.0% | |
Conseco Financial, Ser 1998-2, Cl A5 | | | | | | | | |
6.240%, 12/01/2028 (C) | | | 47 | | | | 49 | |
| | |
| 178 | | SEI Institutional Investments Trust / Annual Report / May 31, 2016 |
| | | | | | | | |
| Description | | Face Amount
($ Thousands) | | | Market Value
($ Thousands) | |
| | | | | | | | |
Other Asset-Backed Securities — 0.3% | |
Citicorp Residential Mortgage Securities, Ser 2007-1, Cl A5 | | | | | | | | |
5.770%, 03/25/2037 | | $ | 180 | | | $ | 187 | |
Education Loan Asset-Backed Trust I, Ser 2013- 1, Cl A2 | | | | | | | | |
1.239%, 04/26/2032 (A) (C) | | | 2,765 | | | | 2,658 | |
JGWPT XXX LLC, Ser 2013-3A, Cl A | | | | | | | | |
4.080%, 01/17/2073 (A) | | | 1,369 | | | | 1,416 | |
Nelnet Student Loan Trust, Ser 2014-2A, Cl A3 | | | | | | | | |
1.289%, 07/27/2037 (A) (C) | | | 2,745 | | | | 2,509 | |
SLM Student Loan Trust, Ser 2011-1, Cl A2 | | | | | | | | |
1.589%, 10/25/2034 (C) | | | 2,620 | | | | 2,531 | |
| | | | | | | | |
| | | | | | | 9,301 | |
| | | | | | | | |
Total Asset-Backed Securities
(Cost $9,682) ($ Thousands) | | | | 9,350 | |
| | | | | | | | |
| | | | | | | | |
| Description | | Shares | | | Market Value
($ Thousands) | |
| | | | | | | | |
CASH EQUIVALENT — 1.3% | | | | | | | | |
SEI Daily Income Trust, Prime Obligation Fund, Cl A | | | | | | | | |
0.270% **† | | | 37,360,327 | | | $ | 37,360 | |
| | | | | | | | |
Total Cash Equivalent (Cost $37,360) ($ Thousands) | | | | | | | 37,360 | |
| | | | | | | | |
Total Investments — 99.8% (Cost $2,587,783) ($ Thousands) | | | | | | $ | 2,768,951 | |
| | | | | | | | |
A list of the open futures contracts held by the Fund at May 31, 2016, is as follows:
| | | | | | | | | | | | |
| Type of Contract | | Number of
Contracts
Long
(Short) | | | Expiration
Date | | | Unrealized
Appreciation
(Depreciation)
($ Thousands) | |
U.S. 10-Year Treasury Note | | | (310 | ) | | | Sep-2016 | | | $ | (25 | ) |
U.S. 5-Year Treasury Note | | | 159 | | | | Sep-2016 | | | | 31 | |
U.S. Long Treasury Bond | | | (434 | ) | | | Sep-2016 | | | | (176 | ) |
U.S. Ultra Long Treasury Bond | | | 1,011 | | | | Sep-2016 | | | | 689 | |
Ultra 10-Year U.S. Treasury Bond | | | (18 | ) | | | Sep-2016 | | | | (12 | ) |
| | | | | | | | | | | | |
| | | | | | | | | | $ | 507 | |
| | | | | | | | | | | | |
For the year ended May 31, 2016, the total amount of all open futures contracts, as presented in the table above, are representative of the volume of activity for the derivative type during the year.
A list of the OTC swap agreements held by the Fund at May 31, 2016, is as follows:
| | | | | | | | | | | | | | | | |
| Interest Rate Swaps | |
| Counterparty | | Fund Pays | | Fund Receives | | Termination Date | | Currency | | Notional Amount | | | Net Unrealized
(Depreciation)
($ Thousands) | |
| Citigroup | | 2.71% | | 3 Month USD - LIBOR | | 08/15/42 | | USD | | | 5,255 | | | $ | (700 | ) |
| | | | | | | | | | | | | | | | |
A list of the open centrally cleared swap agreements held by the Fund at May 31, 2016, is as follows:
| | | | | | | | | | | | | | | | |
| Interest Rate Swaps | |
| Counterparty | | Fund Pays | | Fund Receives | | Termination Date | | Currency | | Notional Amount | | | Net Unrealized
(Depreciation)
($ Thousands) | |
| Citigroup | | 3.68% | | 3 Month USD - LIBOR | | 11/15/43 | | USD | | | 3,570 | | | $ | (1,187 | ) |
| | | | | | | | | | | | | | | | |
For the year ended May 31, 2016, the total amount of all swap agreements, as presented in the table above, are representative of the volume of activity for this derivative type during the year
Percentages are based on a Net Assets of $2,775,237 ($ Thousands).
| ** | | Rate shown is the 7-day effective yield as of May 31, 2016. |
| † | | Investment in Affiliated Security (see Note 6). |
| (A) | | Security exempt from registration under Rule 144A of the Securities Act of 1933. These securities may be resold in transactions exempt from registration normally to qualified institutions. On May 31, 2016, the value of these securities amounted to $331,470 ($ Thousands), representing 11.9% of the net assets of the Fund. |
| (B) | | The rate reported is the effective yield at time of purchase. |
| (C) | | Variable Rate Security — The rate reported on the Schedule of Investments is the rate in effect as of May 31, 2016. |
| (D) | | Pre-Refunded Securities — The maturity date shown is the pre-refunded date. |
| (E) | | Security, or portion thereof, has been pledged as collateral on open futures contracts. |
AGC — Assured Guaranty Corp
AID — Agency for International Development
ARM — Adjustable Rate Mortgage
Cl — Class
CMO — Collateralized Mortgage Obligation
DN — Discount Note
FHLB — Federal Home Loan Bank
FHLMC — Federal Home Loan Mortgage Corporation
FNMA — Federal National Mortgage Association
GNMA — Government National Mortgage Association
GO — General Obligation
| | | | |
| SEI Institutional Investments Trust / Annual Report / May 31, 2016 | | | 179 | |
SCHEDULE OF INVESTMENTS
Long Duration Fund (Concluded)
May 31, 2016
IO — Interest Only
LIBOR — London Interbank Offered Rate
LLC — Limited Liability Company
MTN — Medium Term Note
PLC — Public Limited Company
PO — Principal Only
RB — Revenue Bond
Ser — Series
STRIPS — Separately Traded Registered Interest and Principal Securities
ULC — Unlimited Liability Corporation
USD — United States Dollar
The following is a list of the level of inputs used as of May 31, 2016, in valuing the Fund’s investments and other financial instruments carried at value ($ Thousands):
| | | | | | | | | | | | | | | | |
| Investments in Securities | | Level 1 | | | Level 2 | | | Level 3 | | | Total | |
Corporate Obligations | | $ | — | | | $ | 1,897,614 | | | $ | — | | | $ | 1,897,614 | |
U.S. Treasury Obligations | | | — | | | | 490,003 | | | | — | | | | 490,003 | |
Municipal Bonds | | | — | | | | 166,123 | | | | — | | | | 166,123 | |
U.S. Government Agency Obligations | | | — | | | | 111,704 | | | | — | | | | 111,704 | |
Mortgage-Backed Securities | | | — | | | | 46,170 | | | | — | | | | 46,170 | |
Sovereign Debt | | | — | | | | 10,627 | | | | — | | | | 10,627 | |
Asset-Backed Securities | | | — | | | | 9,350 | | | | — | | | | 9,350 | |
Cash Equivalent | | | 37,360 | | | | — | | | | — | | | | 37,360 | |
| | | | | | | | | | | | | | | | |
Total Investments in Securities | | $ | 37,360 | | | $ | 2,731,591 | | | $ | — | | | $ | 2,768,951 | |
| | | | | | | | | | | | | | | | |
| | | | | | | | | | | | | | | | |
| Other Financial Instruments | | Level 1 | | | Level 2 | | | Level 3 | | | Total | |
Futures Contracts * | | | | | | | | | | | | | | | | |
Unrealized Appreciation | | $ | 720 | | | $ | — | | | $ | — | | | $ | 720 | |
Unrealized Depreciation | | | (213 | ) | | | — | | | | — | | | | (213 | ) |
OTC Swaps | | | | | | | | | | | | | | | | |
Interest Rate Swaps * | | | | | | | | | | | | | | | | |
Unrealized Depreciation | | | — | | | | (700 | ) | | | — | | | | (700 | ) |
Centrally Cleared Swaps | | | | | | | | | | | | | | | | |
Interest Rate Swaps * | | | | | | | | | | | | | | | | |
Unrealized Depreciation | | | — | | | | (1,187 | ) | | | — | | | | (1,187 | ) |
| | | | | | | | | | | | | | | | |
Total Other Financial Instruments | | $ | 507 | | | $ | (1,887 | ) | | $ | — | | | $ | (1,380 | ) |
| | | | | | | | | | | | | | | | |
| * | | Futures contracts and swaps are valued at the unrealized appreciation (depreciation) on the instrument. |
For the year ended May 31, 2016, there were no transfers between Level 1 and Level 2 assets and liabilities.
For the year ended May 31, 2016, there were no transfers between Level 2 and Level 3 assets and liabilities.
For more information on valuation inputs, see Note 2 — Significant Accounting Policies in Notes to Financial Statements.
Amounts designated as “—” are $0 or have been rounded to $0.
The accompanying notes are an integral part of the financial statements.
| | |
| 180 | | SEI Institutional Investments Trust / Annual Report / May 31, 2016 |
SCHEDULE OF INVESTMENTS
Long Duration Credit Fund
May 31, 2016
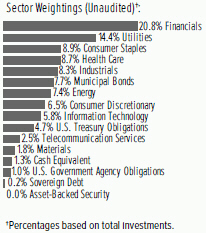
| | | | | | | | |
| Description | | Face Amount
($ Thousands) | | | Market Value
($ Thousands) | |
| |
CORPORATE OBLIGATIONS — 84.5% | | | | | |
| |
Consumer Discretionary — 6.5% | | | | | |
21st Century Fox America | | | | | | | | |
7.125%, 04/08/2028 | | $ | 400 | | | $ | 504 | |
6.900%, 08/15/2039 | | | 1,500 | | | | 1,959 | |
6.750%, 01/09/2038 | | | 3,385 | | | | 4,180 | |
6.650%, 11/15/2037 | | | 2,280 | | | | 2,909 | |
6.200%, 12/15/2034 | | | 2,114 | | | | 2,556 | |
Amazon.com | | | | | | | | |
4.950%, 12/05/2044 | | | 2,900 | | | | 3,389 | |
CBS | | | | | | | | |
5.900%, 10/15/2040 | | | 40 | | | | 44 | |
Charter Communications Operating LLC | | | | | | | | |
6.834%, 10/23/2055 (A) | | | 2,494 | | | | 2,739 | |
6.484%, 10/23/2045 (A) | | | 635 | | | | 729 | |
6.384%, 10/23/2035 (A) | | | 380 | | | | 435 | |
Comcast | | | | | | | | |
6.950%, 08/15/2037 | | | 9,029 | | | | 12,673 | |
6.550%, 07/01/2039 | | | 295 | | | | 398 | |
6.450%, 03/15/2037 | | | 4,030 | | | | 5,357 | |
6.400%, 05/15/2038 | | | 14,110 | | | | 18,838 | |
5.650%, 06/15/2035 | | | 4,455 | | | | 5,593 | |
4.750%, 03/01/2044 | | | 500 | | | | 554 | |
4.650%, 07/15/2042 | | | 3,580 | | | | 3,923 | |
4.600%, 08/15/2045 | | | 8,600 | | | | 9,473 | |
4.500%, 01/15/2043 | | | 3,700 | | | | 4,037 | |
4.250%, 01/15/2033 | | | 6,375 | | | | 6,821 | |
4.200%, 08/15/2034 | | | 19,886 | | | | 21,136 | |
Cox Communications | | | | | | | | |
8.375%, 03/01/2039 (A) | | | 2,528 | | | | 2,966 | |
4.700%, 12/15/2042 (A) | | | 350 | | | | 302 | |
Cox Enterprises | | | | | | | | |
7.375%, 07/15/2027 (A) | | | 500 | | | | 587 | |
Darden Restaurants | | | | | | | | |
6.800%, 10/15/2037 | | | 2,005 | | | | 2,261 | |
Discovery Communications LLC | | | | | | | | |
4.875%, 04/01/2043 | | | 460 | | | | 408 | |
| | | | | | | | |
| Description | | Face Amount
($ Thousands) | | | Market Value
($ Thousands) | |
Grupo Televisa | | | | | | | | |
6.625%, 01/15/2040 | | $ | 20 | | | $ | 22 | |
Home Depot | | | | | | | | |
5.875%, 12/16/2036 | | | 1,600 | | | | 2,080 | |
4.875%, 02/15/2044 | | | 855 | | | | 1,001 | |
4.400%, 03/15/2045 | | | 7,390 | | | | 8,159 | |
4.250%, 04/01/2046 | | | 1,035 | | | | 1,126 | |
4.200%, 04/01/2043 | | | 4,575 | | | | 4,857 | |
3.750%, 02/15/2024 | | | 4,660 | | | | 5,110 | |
3.350%, 09/15/2025 | | | 2,200 | | | | 2,349 | |
Johnson Controls | | | | | | | | |
5.700%, 03/01/2041 | | | 55 | | | | 61 | |
4.950%, 07/02/2064 | | | 695 | | | | 647 | |
Kohl’s | | | | | | | | |
5.550%, 07/17/2045 | | | 1,669 | | | | 1,413 | |
Lowe’s MTN | | | | | | | | |
7.110%, 05/15/2037 | | | 3,092 | | | | 4,239 | |
6.650%, 09/15/2037 | | | 2,360 | | | | 3,219 | |
5.800%, 10/15/2036 | | | 1,260 | | | | 1,563 | |
5.125%, 11/15/2041 | | | 2,525 | | | | 2,965 | |
5.000%, 09/15/2043 | | | 1,050 | | | | 1,234 | |
4.375%, 09/15/2045 | | | 2,490 | | | | 2,691 | |
4.250%, 09/15/2044 | | | 3,750 | | | | 3,981 | |
NBCUniversal Media LLC | | | | | | | | |
5.950%, 04/01/2041 | | | 1,950 | | | | 2,478 | |
4.450%, 01/15/2043 | | | 1,750 | | | | 1,861 | |
4.375%, 04/01/2021 | | | 65 | | | | 72 | |
2.875%, 01/15/2023 | | | 225 | | | | 231 | |
Newell Brands | | | | | | | | |
5.375%, 04/01/2036 | | | 3,060 | | | | 3,405 | |
NIKE | | | | | | | | |
3.625%, 05/01/2043 | | | 4,560 | | | | 4,567 | |
QVC | | | | | | | | |
5.950%, 03/15/2043 | | | 2,290 | | | | 2,036 | |
5.450%, 08/15/2034 | | | 2,160 | | | | 1,927 | |
Target | | | | | | | | |
6.650%, 08/01/2028 | | | 355 | | | | 447 | |
6.500%, 10/15/2037 | | | 2,601 | | | | 3,577 | |
4.000%, 07/01/2042 | | | 5,930 | | | | 6,130 | |
3.625%, 04/15/2046 | | | 5,025 | | | | 4,919 | |
Thomson Reuters | | | | | | | | |
4.500%, 05/23/2043 | | | 290 | | | | 275 | |
Time Warner | | | | | | | | |
7.700%, 05/01/2032 | | | 2,332 | | | | 3,114 | |
7.625%, 04/15/2031 | | | 2,100 | | | | 2,797 | |
6.500%, 11/15/2036 | | | 1,450 | | | | 1,759 | |
6.200%, 03/15/2040 | | | 260 | | | | 310 | |
6.100%, 07/15/2040 | | | 1,480 | | | | 1,756 | |
5.375%, 10/15/2041 | | | 2,580 | | | | 2,834 | |
Time Warner Cable | | | | | | | | |
6.550%, 05/01/2037 | | | 10 | | | | 11 | |
5.875%, 11/15/2040 | | | 150 | | | | 157 | |
| | | | |
| SEI Institutional Investments Trust / Annual Report / May 31, 2016 | | | 181 | |
SCHEDULE OF INVESTMENTS
Long Duration Credit Fund (Continued)
May 31, 2016
| | | | | | | | |
| Description | | Face Amount
($ Thousands) | | | Market Value
($ Thousands) | |
Time Warner Entertainment | | | | | | | | |
8.375%, 07/15/2033 | | $ | 1,040 | | | $ | 1,354 | |
Viacom | | | | | | | | |
4.875%, 06/15/2043 | | | 190 | | | | 163 | |
4.850%, 12/15/2034 | | | 300 | | | | 267 | |
4.500%, 02/27/2042 | | | 615 | | | | 492 | |
4.375%, 03/15/2043 | | | 4,401 | | | | 3,366 | |
Walt Disney MTN | | | | | | | | |
4.125%, 12/01/2041 | | | 40 | | | | 43 | |
4.125%, 06/01/2044 | | | 4,440 | | | | 4,843 | |
| | | | | | | | |
| | | | | | | 216,679 | |
| | | | | | | | |
| | |
Consumer Staples — 8.9% | | | | | | | | |
Altria Group | | | | | | | | |
10.200%, 02/06/2039 | | | 2,236 | | | | 4,042 | |
9.950%, 11/10/2038 | | | 952 | | | | 1,689 | |
4.250%, 08/09/2042 | | | 420 | | | | 437 | |
Anheuser-Busch | | | | | | | | |
6.450%, 09/01/2037 | | | 1,975 | | | | 2,544 | |
Anheuser-Busch InBev Finance | | | | | | | | |
4.900%, 02/01/2046 | | | 52,683 | | | | 58,812 | |
4.700%, 02/01/2036 | | | 35,471 | | | | 38,399 | |
Anheuser-Busch InBev Worldwide | | | | | | | | |
8.200%, 01/15/2039 | | | 1,245 | | | | 1,928 | |
8.000%, 11/15/2039 | | | 300 | | | | 458 | |
6.375%, 01/15/2040 | | | 210 | | | | 272 | |
3.750%, 07/15/2042 | | | 3,995 | | | | 3,819 | |
Board of Trustees of The Leland Stanford Junior University | | | | | | | | |
3.460%, 05/01/2047 | | | 1,375 | | | | 1,378 | |
Bowdoin College | | | | | | | | |
4.693%, 07/01/2112 | | | 4,071 | | | | 4,191 | |
Brown-Forman | | | | | | | | |
4.500%, 07/15/2045 | | | 1,675 | | | | 1,839 | |
California Institute of Technology | | | | | | | | |
4.700%, 11/01/2111 | | | 1,000 | | | | 1,052 | |
Coca-Cola Femsa | | | | | | | | |
5.250%, 11/26/2043 | | | 3,070 | | | | 3,507 | |
CVS Health | | | | | | | | |
5.125%, 07/20/2045 | | | 1,000 | | | | 1,163 | |
CVS Pass-Through Trust | | | | | | | | |
8.353%, 07/10/2031 (A) | | | 2,971 | | | | 3,799 | |
Diageo Capital | | | | | | | | |
5.875%, 09/30/2036 | | | 485 | | | | 620 | |
3.875%, 04/29/2043 | | | 4,560 | | | | 4,647 | |
Hamilton College | | | | | | | | |
4.750%, 07/01/2113 | | | 3,516 | | | | 3,236 | |
Kimberly-Clark | | | | | | | | |
5.300%, 03/01/2041 | | | 555 | | | | 708 | |
Kraft Heinz Foods | | | | | | | | |
5.200%, 07/15/2045 (A) | | | 2,115 | | | | 2,378 | |
5.000%, 06/04/2042 | | | 1,690 | | | | 1,842 | |
| | | | | | | | |
| Description | | Face Amount
($ Thousands) | | | Market Value
($ Thousands) | |
4.375%, 06/01/2046 (A) | | $ | 1,890 | | | $ | 1,912 | |
Land O’ Lakes | | | | | | | | |
6.000%, 11/15/2022 (A) | | | 880 | | | | 928 | |
Massachusetts Institute of Technology | | | | | | | | |
5.600%, 07/01/2111 | | | 3,400 | | | | 4,488 | |
4.678%, 07/01/2114 | | | 3,280 | | | | 3,699 | |
3.959%, 07/01/2038 | | | 1,927 | | | | 2,114 | |
Northwestern University | | | | | | | | |
3.688%, 12/01/2038 | | | 1,570 | | | | 1,648 | |
Pepsi Bottling Group | | | | | | | | |
7.000%, 03/01/2029 | | | 1,320 | | | | 1,843 | |
PepsiCo | | | | | | | | |
4.600%, 07/17/2045 | | | 4,280 | | | | 4,796 | |
4.250%, 10/22/2044 | | | 1,000 | | | | 1,060 | |
3.600%, 03/01/2024 | | | 3,445 | | | | 3,734 | |
3.600%, 08/13/2042 | | | 3,135 | | | | 3,016 | |
3.000%, 08/25/2021 | | | 16 | | | | 17 | |
Pernod Ricard | | | | | | | | |
5.500%, 01/15/2042 (A) | | | 150 | | | | 169 | |
Philip Morris International | | | | | | | | |
6.375%, 05/16/2038 | | | 420 | | | | 557 | |
4.875%, 11/15/2043 | | | 765 | | | | 879 | |
4.500%, 03/20/2042 | | | 8,840 | | | | 9,542 | |
4.375%, 11/15/2041 | | | 1,750 | | | | 1,853 | |
4.125%, 03/04/2043 | | | 7,895 | | | | 8,077 | |
3.875%, 08/21/2042 | | | 2,795 | | | | 2,754 | |
President and Fellows of Harvard College | | | | | | | | |
6.500%, 01/15/2039 (A) | | | 1,700 | | | | 2,543 | |
3.619%, 10/01/2037 | | | 400 | | | | 415 | |
Princeton University | | | | | | | | |
5.700%, 03/01/2039 | | | 1,399 | | | | 1,906 | |
Procter & Gamble | | | | | | | | |
5.550%, 03/05/2037 | | | 3,540 | | | | 4,740 | |
Reynolds American | | | | | | | | |
7.250%, 06/15/2037 | | | 325 | | | | 432 | |
6.150%, 09/15/2043 | | | 20 | | | | 25 | |
5.700%, 08/15/2035 | | | 820 | | | | 965 | |
SABMiller Holdings | | | | | | | | |
4.950%, 01/15/2042 (A) | | | 1,805 | | | | 2,005 | |
SC Johnson & Son | | | | | | | | |
4.750%, 10/15/2046 (A) | | | 3,321 | | | | 3,799 | |
Tufts University | | | | | | | | |
5.017%, 04/15/2112 | | | 3,212 | | | | 3,645 | |
University of Chicago | | | | | | | | |
4.411%, 10/01/2044 | | | 715 | | | | 791 | |
Walgreen | | | | | | | | |
4.400%, 09/15/2042 | | | 30 | | | | 29 | |
Walgreens Boots Alliance | | | | | | | | |
4.800%, 11/18/2044 | | | 2,240 | | | | 2,308 | |
4.650%, 06/01/2046 | | | 945 | | | | 958 | |
Wal-Mart Stores | | | | | | | | |
6.500%, 08/15/2037 | | | 8,094 | | | | 11,353 | |
| | |
| 182 | | SEI Institutional Investments Trust / Annual Report / May 31, 2016 |
| | | | | | | | |
| Description | | Face Amount
($ Thousands) | | | Market Value
($ Thousands) | |
6.200%, 04/15/2038 | | $ | 4,480 | | | $ | 6,137 | |
5.625%, 04/01/2040 | | | 5,750 | | | | 7,398 | |
5.625%, 04/15/2041 | | | 1,800 | | | | 2,320 | |
5.000%, 10/25/2040 | | | 18,725 | | | | 22,465 | |
4.750%, 10/02/2043 | | | 7,200 | | | | 8,401 | |
4.300%, 04/22/2044 | | | 5,445 | | | | 6,000 | |
4.000%, 04/11/2043 | | | 7,960 | | | | 8,370 | |
Wesleyan University | | | | | | | | |
4.781%, 07/01/2116 | | | 3,550 | | | | 3,579 | |
| | | | | | | | |
| | | | | | | 296,430 | |
| | | | | | | | |
| | |
Energy — 7.4% | | | | | | | | |
Anadarko Petroleum | | | | | | | | |
6.450%, 09/15/2036 | | | 4,490 | | | | 4,820 | |
6.200%, 03/15/2040 | | | 263 | | | | 273 | |
4.873%, 10/10/2036 (B) | | | 15,000 | | | | 5,606 | |
Apache | | | | | | | | |
6.900%, 09/15/2018 | | | 10 | | | | 11 | |
Baker Hughes | | | | | | | | |
5.125%, 09/15/2040 | | | 65 | | | | 70 | |
BG Energy Capital | | | | | | | | |
5.125%, 10/15/2041 (A) | | | 5,840 | | | | 6,291 | |
BP Capital Markets | | | | | | | | |
3.994%, 09/26/2023 | | | 2,035 | | | | 2,171 | |
3.535%, 11/04/2024 | | | 4,890 | | | | 5,001 | |
Buckeye Partners | | | | | | | | |
5.850%, 11/15/2043 | | | 70 | | | | 63 | |
Canadian Oil Sands | | | | | | | | |
6.000%, 04/01/2042 (A) | | | 985 | | | | 940 | |
Cenovus Energy | | | | | | | | |
5.200%, 09/15/2043 | | | 1,145 | | | | 906 | |
Chevron | | | | | | | | |
2.954%, 05/16/2026 | | | 1,430 | | | | 1,437 | |
Conoco Funding | | | | | | | | |
6.950%, 04/15/2029 | | | 3,188 | | | | 3,830 | |
ConocoPhillips | | | | | | | | |
6.500%, 02/01/2039 | | | 12,862 | | | | 15,881 | |
5.950%, 03/15/2046 | | | 495 | | | | 588 | |
5.900%, 05/15/2038 | | | 2,400 | | | | 2,753 | |
4.300%, 11/15/2044 | | | 9,120 | | | | 8,825 | |
ConocoPhillips Canada Funding I | | | | | | | | |
5.950%, 10/15/2036 | | | 1,040 | | | | 1,171 | |
Devon Energy | | | | | | | | |
6.300%, 01/15/2019 | | | 50 | | | | 53 | |
5.600%, 07/15/2041 | | | 900 | | | | 789 | |
4.750%, 05/15/2042 | | | 200 | | | | 163 | |
Devon Financing | | | | | | | | |
7.875%, 09/30/2031 | | | 1,800 | | | | 1,927 | |
El Paso Natural Gas | | | | | | | | |
8.375%, 06/15/2032 | | | 1,530 | | | | 1,680 | |
Energy Transfer Partners | | | | | | | | |
8.250%, 11/15/2029 | | | 750 | | | | 868 | |
| | | | | | | | |
| Description | | Face Amount
($ Thousands) | | | Market Value
($ Thousands) | |
6.050%, 06/01/2041 | | $ | 1,010 | | | $ | 917 | |
5.150%, 03/15/2045 | | | 660 | | | | 561 | |
Eni | | | | | | | | |
5.700%, 10/01/2040 (A) | | | 2,620 | | | | 2,557 | |
EnLink Midstream Partners | | | | | | | | |
5.600%, 04/01/2044 | | | 1,000 | | | | 765 | |
5.050%, 04/01/2045 | | | 400 | | | | 295 | |
Enterprise Products Operating LLC | | | | | | | | |
6.450%, 09/01/2040 | | | 705 | | | | 801 | |
5.950%, 02/01/2041 | | | 1,970 | | | | 2,190 | |
5.750%, 03/01/2035 | | | 185 | | | | 197 | |
5.700%, 02/15/2042 | | | 3,102 | | | | 3,364 | |
EOG Resources | | | | | | | | |
3.900%, 04/01/2035 | | | 5,669 | | | | 5,389 | |
Exxon Mobil | | | | | | | | |
4.114%, 03/01/2046 | | | 7,780 | | | | 8,256 | |
3.567%, 03/06/2045 | | | 12,045 | | | | 11,734 | |
Halliburton | | | | | | | | |
6.700%, 09/15/2038 | | | 1,635 | | | | 1,977 | |
4.750%, 08/01/2043 | | | 1,185 | | | | 1,179 | |
3.800%, 11/15/2025 | | | 7,170 | | | | 7,256 | |
Kinder Morgan | | | | | | | | |
5.550%, 06/01/2045 | | | 1,845 | | | | 1,699 | |
5.300%, 12/01/2034 | | | 4,178 | | | | 3,786 | |
5.050%, 02/15/2046 | | | 3,467 | | | | 3,049 | |
Kinder Morgan Energy Partners | | | | | | | | |
5.500%, 03/01/2044 | | | 1,330 | | | | 1,203 | |
Marathon Petroleum | | | | | | | | |
6.500%, 03/01/2041 | | | 3,368 | | | | 3,361 | |
5.000%, 09/15/2054 | | | 1,030 | | | | 817 | |
Motiva Enterprises | | | | | | | | |
6.850%, 01/15/2040 (A) | | | 5,710 | | | | 6,648 | |
Nexen Energy ULC | | | | | | | | |
7.500%, 07/30/2039 | | | 900 | | | | 1,171 | |
Noble Energy | | | | | | | | |
6.000%, 03/01/2041 | | | 360 | | | | 355 | |
5.250%, 11/15/2043 | | | 3,484 | | | | 3,319 | |
5.050%, 11/15/2044 | | | 600 | | | | 571 | |
Occidental Petroleum | | | | | | | | |
4.625%, 06/15/2045 | | | 400 | | | | 428 | |
4.400%, 04/15/2046 | | | 3,060 | | | | 3,195 | |
Petro-Canada | | | | | | | | |
6.800%, 05/15/2038 | | | 2,140 | | | | 2,558 | |
Petroleos Mexicanos MTN | | | | | | | | |
5.625%, 01/23/2046 | | | 656 | | | | 557 | |
Phillips 66 | | | | | | | | |
4.650%, 11/15/2034 | | | 2,642 | | | | 2,673 | |
Pride International | | | | | | | | |
7.875%, 08/15/2040 | | | 1,010 | | | | 691 | |
Schlumberger Holdings | | | | | | | | |
4.000%, 12/21/2025 (A) | | | 3,000 | | | | 3,129 | |
| | | | |
| SEI Institutional Investments Trust / Annual Report / May 31, 2016 | | | 183 | |
SCHEDULE OF INVESTMENTS
Long Duration Credit Fund (Continued)
May 31, 2016
| | | | | | | | |
| Description | | Face Amount
($ Thousands) | | | Market Value
($ Thousands) | |
Shell International Finance | | | | | | | | |
6.375%, 12/15/2038 | | $ | 10,636 | | | $ | 13,605 | |
5.500%, 03/25/2040 | | | 2,500 | | | | 2,936 | |
4.550%, 08/12/2043 | | | 6,145 | | | | 6,414 | |
4.375%, 05/11/2045 | | | 5,450 | | | | 5,629 | |
4.125%, 05/11/2035 | | | 4,631 | | | | 4,728 | |
4.000%, 05/10/2046 | | | 8,750 | | | | 8,518 | |
Southern Natural Gas | | | | | | | | |
7.350%, 02/15/2031 | | | 2,215 | | | | 2,268 | |
Spectra Energy Capital | | | | | | | | |
6.750%, 02/15/2032 | | | 800 | | | | 814 | |
Spectra Energy Partners | | | | | | | | |
5.950%, 09/25/2043 | | | 160 | | | | 179 | |
4.500%, 03/15/2045 | | | 500 | | | | 472 | |
Statoil | | | | | | | | |
6.500%, 12/01/2028 (A) | | | 2,325 | | | | 3,068 | |
5.250%, 04/15/2019 | | | 50 | | | | 55 | |
5.100%, 08/17/2040 | | | 1,415 | | | | 1,610 | |
4.800%, 11/08/2043 | | | 1,534 | | | | 1,721 | |
3.950%, 05/15/2043 | | | 1,430 | | | | 1,397 | |
Suncor Energy | | | | | | | | |
6.500%, 06/15/2038 | | | 4,290 | | | | 5,098 | |
5.950%, 12/01/2034 | | | 2,205 | | | | 2,446 | |
Sunoco Logistics Partners Operations | | | | | | | | |
5.350%, 05/15/2045 | | | 2,447 | | | | 2,203 | |
5.300%, 04/01/2044 | | | 1,309 | | | | 1,159 | |
TC PipeLines | | | | | | | | |
4.375%, 03/13/2025 | | | 1,300 | | | | 1,188 | |
Tennessee Gas Pipeline | | | | | | | | |
8.375%, 06/15/2032 | | | 2,775 | | | | 3,065 | |
TransCanada PipeLines | | | | | | | | |
7.250%, 08/15/2038 | | | 1,765 | | | | 2,225 | |
6.100%, 06/01/2040 | | | 1,660 | | | | 1,946 | |
5.000%, 10/16/2043 | | | 1,275 | | | | 1,323 | |
4.625%, 03/01/2034 | | | 12,148 | | | | 12,483 | |
Valero Energy | | | | | | | | |
10.500%, 03/15/2039 | | | 2,476 | | | | 3,486 | |
Williams Partners | | | | | | | | |
6.300%, 04/15/2040 | | | 50 | | | | 46 | |
5.800%, 11/15/2043 | | | 1,435 | | | | 1,196 | |
5.400%, 03/04/2044 | | | 1,600 | | | | 1,307 | |
5.100%, 09/15/2045 | | | 945 | | | | 764 | |
| | | | | | | | |
| | | | | | | 246,114 | |
| | | | | | | | |
| | |
Financials — 20.5% | | | | | | | | |
Aflac | | | | | | | | |
6.900%, 12/17/2039 | | | 6,185 | | | | 8,364 | |
AIA Group MTN | | | | | | | | |
4.875%, 03/11/2044 (A) | | | 2,572 | | | | 2,778 | |
AIG SunAmerica Global Financing X | | | | | | | | |
6.900%, 03/15/2032 (A) | | | 5,570 | | | | 7,040 | |
| | | | | | | | |
| Description | | Face Amount
($ Thousands) | | | Market Value
($ Thousands) | |
Alexandria Real Estate Equities | | | | | | | | |
3.900%, 06/15/2023 | | $ | 400 | | | $ | 409 | |
American Express | | | | | | | | |
4.050%, 12/03/2042 | | | 750 | | | | 760 | |
American International Group | | | | | | | | |
4.700%, 07/10/2035 | | | 1,100 | | | | 1,122 | |
3.875%, 01/15/2035 | | | 1,996 | | | | 1,847 | |
American Tower Trust I | | | | | | | | |
3.070%, 03/15/2023 (A) | | | 3,034 | | | | 3,033 | |
Apollo Management Holdings | | | | | | | | |
4.000%, 05/30/2024 (A) | | | 1,685 | | | | 1,699 | |
Assurant | | | | | | | | |
6.750%, 02/15/2034 | | | 1,754 | | | | 2,103 | |
Bank of America | | | | | | | | |
7.750%, 05/14/2038 | | | 1,275 | | | | 1,756 | |
6.500%, 07/15/2018 | | | 265 | | | | 289 | |
6.110%, 01/29/2037 | | | 4,195 | | | | 4,857 | |
6.000%, 10/15/2036 | | | 2,590 | | | | 3,219 | |
5.875%, 02/07/2042 | | | 4,200 | | | | 5,161 | |
5.000%, 01/21/2044 | | | 4,455 | | | | 4,973 | |
4.875%, 04/01/2044 | | | 1,985 | | | | 2,198 | |
4.750%, 04/21/2045 | | | 1,315 | | | | 1,320 | |
4.450%, 03/03/2026 | | | 3,225 | | | | 3,326 | |
4.100%, 07/24/2023 | | | 4,540 | | | | 4,822 | |
3.950%, 04/21/2025 | | | 300 | | | | 299 | |
3.500%, 04/19/2026 | | | 1,285 | | | | 1,304 | |
3.300%, 01/11/2023 | | | 710 | | | | 723 | |
Bank of New York Mellon MTN | | | | | | | | |
4.600%, 01/15/2020 | | | 50 | | | | 55 | |
Bank One Capital III | | | | | | | | |
8.750%, 09/01/2030 | | | 620 | | | | 896 | |
Barclays | | | | | | | | |
5.250%, 08/17/2045 | | | 800 | | | | 840 | |
Berkshire Hathaway | | | | | | | | |
4.500%, 02/11/2043 | | | 8,988 | | | | 10,003 | |
3.400%, 01/31/2022 | | | 56 | | | | 60 | |
Berkshire Hathaway Finance | | | | | | | | |
5.750%, 01/15/2040 | | | 2,080 | | | | 2,685 | |
4.400%, 05/15/2042 | | | 2,250 | | | | 2,454 | |
4.300%, 05/15/2043 | | | 2,390 | | | | 2,574 | |
Blackstone Holdings Finance | | | | | | | | |
5.000%, 06/15/2044 (A) | | | 5,935 | | | | 6,176 | |
4.450%, 07/15/2045 (A) | | | 700 | | | | 672 | |
Blackstone Holdings Finance LLC | | | | | | | | |
6.250%, 08/15/2042 (A) | | | 4,839 | | | | 5,816 | |
Carlyle Holdings II Finance | | | | | | | | |
5.625%, 03/30/2043 (A) | | | 7,854 | | | | 8,485 | |
CDP Financial | | | | | | | | |
5.600%, 11/25/2039 (A) | | | 8,215 | | | | 10,610 | |
Chubb | | | | | | | | |
6.500%, 05/15/2038 | | | 2,485 | | | | 3,454 | |
| | |
| 184 | | SEI Institutional Investments Trust / Annual Report / May 31, 2016 |
| | | | | | | | |
| Description | | Face Amount
($ Thousands) | | | Market Value
($ Thousands) | |
Chubb INA Holdings | | | | | | | | |
6.700%, 05/15/2036 | | $ | 4,870 | | | $ | 6,744 | |
4.350%, 11/03/2045 | | | 5,000 | | | | 5,474 | |
Cincinnati Financial | | | | | | | | |
6.920%, 05/15/2028 | | | 2,063 | | | | 2,634 | |
6.125%, 11/01/2034 | | | 3,553 | | | | 4,218 | |
Citigroup | | | | | | | | |
8.125%, 07/15/2039 | | | 1,673 | | | | 2,533 | |
6.875%, 02/15/2098 | | | 2,435 | | | | 3,177 | |
6.675%, 09/13/2043 | | | 2,601 | | | | 3,215 | |
4.750%, 05/18/2046 | | | 1,760 | | | | 1,726 | |
4.650%, 07/30/2045 | | | 2,910 | | | | 3,099 | |
4.600%, 03/09/2026 | | | 1,260 | | | | 1,308 | |
4.450%, 09/29/2027 | | | 8,595 | | | | 8,721 | |
4.400%, 06/10/2025 | | | 500 | | | | 512 | |
3.400%, 05/01/2026 | | | 1,975 | | | | 1,990 | |
Citigroup Capital III | | | | | | | | |
7.625%, 12/01/2036 | | | 895 | | | | 1,105 | |
CME Group | | | | | | | | |
5.300%, 09/15/2043 | | | 5,030 | | | | 6,160 | |
Cooperatieve Rabobank UA | | | | | | | | |
11.000%, 12/31/2049 (A) (C) | | | 970 | | | | 1,187 | |
5.800%, 09/30/2110 (A) | | | 5,720 | | | | 6,661 | |
5.250%, 05/24/2041 | | | 115 | | | | 140 | |
5.250%, 08/04/2045 | | | 3,795 | | | | 4,160 | |
4.625%, 12/01/2023 | | | 1,670 | | | | 1,770 | |
4.375%, 08/04/2025 | | | 1,200 | | | | 1,250 | |
3.875%, 02/08/2022 | | | 55 | | | | 59 | |
Credit Suisse Group Funding Guernsey | | | | | | | | |
4.875%, 05/15/2045 | | | 1,375 | | | | 1,376 | |
4.550%, 04/17/2026 (A) | | | 1,310 | | | | 1,348 | |
Credit Suisse NY MTN | | | | | | | | |
3.625%, 09/09/2024 | | | 250 | | | | 260 | |
Crown Castle Towers LLC | | | | | | | | |
3.663%, 05/15/2025 (A) | | | 4,075 | | | | 4,170 | |
Daimler Finance North America LLC | | | | | | | | |
1.450%, 08/01/2016 (A) | | | 5,200 | | | | 5,204 | |
1.375%, 08/01/2017 (A) | | | 9,450 | | | | 9,443 | |
DaimlerChrysler | | | | | | | | |
8.500%, 01/18/2031 | | | 150 | | | | 239 | |
Devon OEI Operating | | | | | | | | |
7.500%, 09/15/2027 | | | 10 | | | | 11 | |
ERP Operating | �� | | | | | | | |
4.625%, 12/15/2021 | | | 33 | | | | 37 | |
4.500%, 07/01/2044 | | | 4,000 | | | | 4,311 | |
4.500%, 06/01/2045 | | | 1,450 | | | | 1,568 | |
Farmers Exchange Capital | | | | | | | | |
7.200%, 07/15/2048 (A) | | | 800 | | | | 934 | |
Farmers Exchange Capital II | | | | | | | | |
6.151%, 11/01/2053 (A) (C) | | | 5,720 | | | | 5,913 | |
Farmers Exchange Capital III | | | | | | | | |
5.454%, 10/15/2054 (A) (C) | | | 1,000 | | | | 967 | |
| | | | | | | | |
| Description | | Face Amount
($ Thousands) | | | Market Value
($ Thousands) | |
First Union Capital II | | | | | | | | |
7.950%, 11/15/2029 | | $ | 355 | | | $ | 469 | |
FMR | | | | | | | | |
5.150%, 02/01/2043 (A) | | | 260 | | | | 280 | |
4.950%, 02/01/2033 (A) | | | 250 | | | | 265 | |
Ford Holdings | | | | | | | | |
9.300%, 03/01/2030 | | | 2,279 | | | | 3,151 | |
General Electric MTN | | | | | | | | |
6.875%, 01/10/2039 | | | 3,661 | | | | 5,358 | |
6.750%, 03/15/2032 | | | 106 | | | | 147 | |
6.150%, 08/07/2037 | | | 81 | | | | 110 | |
5.875%, 01/14/2038 | | | 9,189 | | | | 12,055 | |
General Motors | | | | | | | | |
5.200%, 04/01/2045 | | | 3,025 | | | | 2,943 | |
Goldman Sachs Group MTN | | | | | | | | |
6.750%, 10/01/2037 | | | 9,465 | | | | 11,510 | |
6.345%, 02/15/2034 | | | 2,015 | | | | 2,335 | |
6.250%, 02/01/2041 | | | 7,564 | | | | 9,632 | |
6.125%, 02/15/2033 | | | 16,195 | | | | 19,914 | |
5.750%, 10/01/2016 | | | 345 | | | | 350 | |
5.375%, 03/15/2020 | | | 175 | | | | 193 | |
4.800%, 07/08/2044 | | | 3,850 | | | | 4,127 | |
4.750%, 10/21/2045 | | | 4,660 | | | | 4,993 | |
3.750%, 05/22/2025 | | | 2,250 | | | | 2,317 | |
3.625%, 01/22/2023 | | | 215 | | | | 223 | |
Guardian Life Insurance of America | | | | | | | | |
4.875%, 06/19/2064 (A) | | | 7,070 | | | | 6,888 | |
Hartford Financial Services Group | | | | | | | | |
6.625%, 03/30/2040 | | | 1,794 | | | | 2,239 | |
HCP | | | | | | | | |
6.750%, 02/01/2041 | | | 525 | | | | 630 | |
4.250%, 11/15/2023 | | | 740 | | | | 758 | |
3.875%, 08/15/2024 | | | 835 | | | | 827 | |
Health Care | | | | | | | | |
3.750%, 03/15/2023 | | | 180 | | | | 183 | |
Highmark | | | | | | | | |
6.125%, 05/15/2041 (A) | | | 1,560 | | | | 1,521 | |
4.750%, 05/15/2021 (A) | | | 1,330 | | | | 1,339 | |
HSBC Bank USA | | | | | | | | |
7.650%, 05/01/2025 | | | 2,115 | | | | 2,611 | |
7.000%, 01/15/2039 | | | 2,840 | | | | 3,642 | |
5.875%, 11/01/2034 | | | 8,720 | | | | 10,411 | |
HSBC Holdings | | | | | | | | |
6.800%, 06/01/2038 | | | 2,240 | | | | 2,757 | |
6.500%, 09/15/2037 | | | 7,640 | | | | 9,101 | |
6.100%, 01/14/2042 | | | 965 | | | | 1,245 | |
5.250%, 03/14/2044 | | | 11,305 | | | | 11,888 | |
3.900%, 05/25/2026 | | | 920 | | | | 932 | |
Intercontinental Exchange | | | | | | | | |
3.750%, 12/01/2025 | | | 2,460 | | | | 2,549 | |
Jackson National Life Global Funding | | | | | | | | |
3.050%, 04/29/2026 (A) | | | 2,100 | | | | 2,083 | |
| | | | |
| SEI Institutional Investments Trust / Annual Report / May 31, 2016 | | | 185 | |
SCHEDULE OF INVESTMENTS
Long Duration Credit Fund (Continued)
May 31, 2016
| | | | | | | | |
| Description | | Face Amount
($ Thousands) | | | Market Value
($ Thousands) | |
JPMorgan Chase | | | | | | | | |
6.400%, 05/15/2038 | | $ | 10,223 | | | $ | 13,667 | |
5.600%, 07/15/2041 | | | 6,880 | | | | 8,543 | |
5.500%, 10/15/2040 | | | 5,900 | | | | 7,239 | |
5.400%, 01/06/2042 | | | 11,160 | | | | 13,613 | |
4.950%, 06/01/2045 | | | 6,130 | | | | 6,569 | |
4.850%, 02/01/2044 | | | 3,000 | | | | 3,471 | |
4.250%, 10/15/2020 | | | 300 | | | | 324 | |
4.250%, 10/01/2027 | | | 740 | | | | 765 | |
3.900%, 07/15/2025 | | | 500 | | | | 531 | |
3.875%, 09/10/2024 | | | 750 | | | | 768 | |
3.375%, 05/01/2023 | | | 250 | | | | 252 | |
3.200%, 01/25/2023 | | | 200 | | | | 205 | |
3.200%, 06/15/2026 | | | 7,420 | | | | 7,417 | |
JPMorgan Chase Capital XXIII | | | | | | | | |
1.626%, 05/15/2047 (C) | | | 2,000 | | | | 1,481 | |
KKR Group Finance II LLC | | | | | | | | |
5.500%, 02/01/2043 (A) | | | 8,622 | | | | 8,831 | |
KKR Group Finance III | | | | | | | | |
5.125%, 06/01/2044 (A) | | | 6,747 | | | | 6,570 | |
Liberty Mutual Group | | | | | | | | |
6.500%, 05/01/2042 (A) | | | 3,132 | | | | 3,721 | |
Lincoln National | | | | | | | | |
6.300%, 10/09/2037 | | | 100 | | | | 115 | |
6.150%, 04/07/2036 | | | 45 | | | | 51 | |
Lloyds Banking Group | | | | | | | | |
5.300%, 12/01/2045 (A) | | | 2,519 | | | | 2,601 | |
Macquarie Bank | | | | | | | | |
5.000%, 02/22/2017 (A) | | | 65 | | | | 67 | |
Macquarie Group | | | | | | | | |
6.250%, 01/14/2021 (A) | | | 40 | | | | 45 | |
6.000%, 01/14/2020 (A) | | | 100 | | | | 111 | |
Massachusetts Mutual Life Insurance | | | | | | | | |
8.875%, 06/01/2039 (A) | | | 2,010 | | | | 2,946 | |
MetLife | | | | | | | | |
10.750%, 08/01/2039 | | | 1,160 | | | | 1,799 | |
6.500%, 12/15/2032 | | | 350 | | | | 444 | |
5.875%, 02/06/2041 | | | 2,315 | | | | 2,816 | |
5.700%, 06/15/2035 | | | 8,595 | | | | 10,257 | |
4.875%, 11/13/2043 | | | 6,990 | | | | 7,589 | |
4.721%, 12/15/2044 | | | 3,910 | | | | 4,110 | |
4.600%, 05/13/2046 | | | 1,110 | | | | 1,166 | |
MetLife Capital Trust IV | | | | | | | | |
7.875%, 12/15/2037 (A) | | | 220 | | | | 261 | |
Metropolitan Life Insurance | | | | | | | | |
7.800%, 11/01/2025 (A) | | | 2,000 | | | | 2,596 | |
Morgan Stanley MTN | | | | | | | | |
7.250%, 04/01/2032 | | | 155 | | | | 210 | |
6.375%, 07/24/2042 | | | 1,935 | | | | 2,521 | |
6.250%, 08/09/2026 | | | 8,221 | | | | 10,044 | |
4.350%, 09/08/2026 | | | 510 | | | | 526 | |
4.300%, 01/27/2045 | | | 9,115 | | | | 9,278 | |
| | | | | | | | |
| Description | | Face Amount
($ Thousands) | | | Market Value
($ Thousands) | |
4.000%, 07/23/2025 | | $ | 5,665 | | | $ | 5,955 | |
3.875%, 04/29/2024 | | | 835 | | | | 878 | |
3.875%, 01/27/2026 | | | 1,920 | | | | 2,000 | |
3.700%, 10/23/2024 | | | 3,405 | | | | 3,514 | |
Mutual of Omaha Insurance | | | | | | | | |
4.297%, 07/15/2054 (A) (C) | | | 1,300 | | | | 1,297 | |
National Rural Utilities Cooperative Finance | | | | | | | | |
4.023%, 11/01/2032 | | | 4,517 | | | | 4,711 | |
Nationwide Building Society MTN | | | | | | | | |
3.900%, 07/21/2025 (A) | | | 1,105 | | | | 1,181 | |
Nationwide Financial Services | | | | | | | | |
5.300%, 11/18/2044 (A) | | | 1,450 | | | | 1,507 | |
Nationwide Health Properties MTN | | | | | | | | |
6.900%, 10/01/2037 | | | 1,600 | | | | 2,014 | |
Nationwide Mutual Insurance | | | | | | | | |
9.375%, 08/15/2039 (A) | | | 1,510 | | | | 2,247 | |
7.875%, 04/01/2033 (A) | | | 1,027 | | | | 1,341 | |
4.950%, 04/22/2044 (A) | | | 1,905 | | | | 1,856 | |
New York Life Global Funding | | | | | | | | |
2.450%, 07/14/2016 (A) | | | 50 | | | | 50 | |
New York Life Insurance | | | | | | | | |
6.750%, 11/15/2039 (A) | | | 5,615 | | | | 7,466 | |
5.875%, 05/15/2033 (A) | | | 4,447 | | | | 5,334 | |
Northwestern Mutual Life Insurance | | | | | | | | |
6.063%, 03/30/2040 (A) | | | 4,415 | | | | 5,457 | |
Pacific Life Insurance | | | | | | | | |
9.250%, 06/15/2039 (A) | | | 1,040 | | | | 1,487 | |
PNC Bank MTN | | | | | | | | |
3.800%, 07/25/2023 | | | 450 | | | | 476 | |
3.250%, 06/01/2025 | | | 4,615 | | | | 4,784 | |
PNC Funding | | | | | | | | |
6.700%, 06/10/2019 | | | 100 | | | | 114 | |
Prudential Financial MTN | | | | | | | | |
6.625%, 06/21/2040 | | | 285 | | | | 357 | |
5.700%, 12/14/2036 | | | 6,294 | | | | 7,225 | |
Prudential Insurance of America | | | | | | | | |
8.300%, 07/01/2025 (A) | | | 1,000 | | | | 1,323 | |
Royal Bank of Canada MTN | | | | | | | | |
4.650%, 01/27/2026 | | | 1,385 | | | | 1,447 | |
Simon Property Group | | | | | | | | |
6.750%, 02/01/2040 | | | 4,465 | | | | 6,203 | |
4.750%, 03/15/2042 | | | 3,805 | | | | 4,260 | |
4.375%, 03/01/2021 | | | 40 | | | | 44 | |
4.250%, 10/01/2044 | | | 210 | | | | 219 | |
3.300%, 01/15/2026 | | | 560 | | | | 581 | |
Swiss Re Treasury US | | | | | | | | |
4.250%, 12/06/2042 (A) | | | 6,581 | | | | 6,564 | |
Teachers Insurance & Annuity Association of America | | | | | | | | |
6.850%, 12/16/2039 (A) | | | 3,187 | | | | 4,141 | |
4.900%, 09/15/2044 (A) | | | 3,980 | | | | 4,324 | |
| | |
| 186 | | SEI Institutional Investments Trust / Annual Report / May 31, 2016 |
| | | | | | | | |
| Description | | Face Amount
($ Thousands) | | | Market Value
($ Thousands) | |
Travelers | | | | | | | | |
6.750%, 06/20/2036 | | $ | 3,148 | | | $ | 4,395 | |
6.250%, 06/15/2037 | | | 125 | | | | 169 | |
5.350%, 11/01/2040 | | | 1,565 | | | | 1,951 | |
3.750%, 05/15/2046 | | | 2,340 | | | | 2,333 | |
Trinity Acquisition | | | | | | | | |
6.125%, 08/15/2043 | | | 50 | | | | 54 | |
UBS Group Funding Jersey | | | | | | | | |
4.125%, 09/24/2025 (A) | | | 2,200 | | | | 2,257 | |
4.125%, 04/15/2026 (A) | | | 685 | | | | 703 | |
US Bancorp MTN | | | | | | | | |
4.125%, 05/24/2021 | | | 22 | | | | 24 | |
Validus Holdings | | | | | | | | |
8.875%, 01/26/2040 | | | 1,335 | | | | 1,763 | |
Ventas Realty | | | | | | | | |
5.700%, 09/30/2043 | | | 3,910 | | | | 4,383 | |
Visa | | | | | | | | |
4.300%, 12/14/2045 | | | 5,220 | | | | 5,769 | |
4.150%, 12/14/2035 | | | 3,835 | | | | 4,182 | |
Wachovia | | | | | | | | |
5.750%, 06/15/2017 | | | 150 | | | | 157 | |
WEA Finance LLC | | | | | | | | |
4.750%, 09/17/2044 (A) | | | 2,400 | | | | 2,462 | |
Wells Fargo MTN | | | | | | | | |
5.606%, 01/15/2044 | | | 11,048 | | | | 12,972 | |
5.375%, 11/02/2043 | | | 1,845 | | | | 2,094 | |
4.900%, 11/17/2045 | | | 2,440 | | | | 2,629 | |
4.600%, 04/01/2021 | | | 40 | | | | 44 | |
4.300%, 07/22/2027 | | | 3,485 | | | | 3,695 | |
3.900%, 05/01/2045 | | | 5,425 | | | | 5,484 | |
3.500%, 03/08/2022 | | | 235 | | | | 249 | |
3.300%, 09/09/2024 | | | 750 | | | | 774 | |
3.000%, 04/22/2026 | | | 1,410 | | | | 1,411 | |
Wells Fargo Bank | | | | | | | | |
6.600%, 01/15/2038 | | | 5,445 | | | | 7,314 | |
5.950%, 08/26/2036 | | | 1,750 | | | | 2,165 | |
5.850%, 02/01/2037 | | | 7,831 | | | | 9,490 | |
Welltower | | | | | | | | |
6.500%, 03/15/2041 | | | 775 | | | | 936 | |
5.125%, 03/15/2043 | | | 1,020 | | | | 1,058 | |
XLIT | | | | | | | | |
5.250%, 12/15/2043 | | | 2,770 | | | | 2,874 | |
ZFS Finance USA Trust I | | | | | | | | |
6.500%, 05/09/2037 (A) (C) | | | 640 | | | | 642 | |
ZFS Finance USA Trust II | | | | | | | | |
6.450%, 12/15/2065 (A) (C) | | | 2,675 | | | | 2,679 | |
| | | | | | | | |
| | | | | | | 684,771 | |
| | | | | | | | |
| | |
Health Care — 8.7% | | | | | | | | |
AbbVie | | | | | | | | |
4.700%, 05/14/2045 | | | 1,080 | | | | 1,101 | |
4.500%, 05/14/2035 | | | 3,655 | | | | 3,716 | |
| | | | | | | | |
| Description | | Face Amount
($ Thousands) | | | Market Value
($ Thousands) | |
4.450%, 05/14/2046 | | $ | 1,290 | | | $ | 1,281 | |
4.400%, 11/06/2042 | | | 5,020 | | | | 4,970 | |
Actavis | | | | | | | | |
4.625%, 10/01/2042 | | | 25 | | | | 25 | |
Actavis Funding SCS | | | | | | | | |
4.850%, 06/15/2044 | | | 625 | | | | 626 | |
4.750%, 03/15/2045 | | | 2,445 | | | | 2,416 | |
4.550%, 03/15/2035 | | | 6,290 | | | | 6,217 | |
Aetna | | | | | | | | |
4.750%, 03/15/2044 | | | 2,750 | | | | 2,977 | |
4.125%, 11/15/2042 | | | 1,885 | | | | 1,888 | |
Allina Health System | | | | | | | | |
4.805%, 11/15/2045 | | | 1,616 | | | | 1,884 | |
Amgen | | | | | | | | |
6.900%, 06/01/2038 | | | 2,190 | | | | 2,951 | |
5.650%, 06/15/2042 | | | 515 | | | | 606 | |
4.400%, 05/01/2045 | | | 2,060 | | | | 2,057 | |
Anthem | | | | | | | | |
4.650%, 01/15/2043 | | | 2,780 | | | | 2,853 | |
4.650%, 08/15/2044 | | | 1,600 | | | | 1,645 | |
4.625%, 05/15/2042 | | | 300 | | | | 310 | |
2.375%, 02/15/2017 | | | 20 | | | | 20 | |
Ascension Health | | | | | | | | |
4.847%, 11/15/2053 | | | 520 | | | | 623 | |
3.945%, 11/15/2046 | | | 2,105 | | | | 2,167 | |
AstraZeneca | | | | | | | | |
6.450%, 09/15/2037 | | | 5,790 | | | | 7,694 | |
4.000%, 09/18/2042 | | | 1,435 | | | | 1,422 | |
Baxalta | | | | | | | | |
5.250%, 06/23/2045 (A) | | | 2,620 | | | | 2,679 | |
Bayer US Finance LLC | | | | | | | | |
3.375%, 10/08/2024 (A) | | | 750 | | | | 768 | |
Baylor Scott & White Holdings | | | | | | | | |
4.185%, 11/15/2045 | | | 3,435 | | | | 3,623 | |
Becton Dickinson | | | | | | | | |
4.875%, 05/15/2044 | | | 1,000 | | | | 1,105 | |
4.685%, 12/15/2044 | | | 65 | | | | 71 | |
Biogen | | | | | | | | |
4.050%, 09/15/2025 | | | 715 | | | | 763 | |
Bristol-Myers Squibb | | | | | | | | |
4.500%, 03/01/2044 | | | 125 | | | | 145 | |
Celgene | | | | | | | | |
5.700%, 10/15/2040 | | | 3,242 | | | | 3,830 | |
5.250%, 08/15/2043 | | | 670 | | | | 730 | |
5.000%, 08/15/2045 | | | 2,650 | | | | 2,817 | |
4.625%, 05/15/2044 | | | 780 | | | | 779 | |
Cigna | | | | | | | | |
5.875%, 03/15/2041 | | | 65 | | | | 77 | |
City of Hope | | | | | | | | |
5.623%, 11/15/2043 | | | 850 | | | | 1,049 | |
Cleveland Clinic Foundation | | | | | | | | |
4.858%, 01/01/2114 | | | 3,656 | | | | 4,004 | |
| | | | |
| SEI Institutional Investments Trust / Annual Report / May 31, 2016 | | | 187 | |
SCHEDULE OF INVESTMENTS
Long Duration Credit Fund (Continued)
May 31, 2016
| | | | | | | | |
| Description | | Face Amount
($ Thousands) | | | Market Value
($ Thousands) | |
Express Scripts Holding | | | | | | | | |
4.500%, 02/25/2026 | | $ | 1,060 | | | $ | 1,137 | |
Gilead Sciences | | | | | | | | |
4.800%, 04/01/2044 | | | 3,940 | | | | 4,222 | |
4.750%, 03/01/2046 | | | 11,225 | | | | 12,012 | |
4.600%, 09/01/2035 | | | 4,360 | | | | 4,660 | |
4.500%, 02/01/2045 | | | 8,410 | | | | 8,624 | |
GlaxoSmithKline Capital | | | | | | | | |
6.375%, 05/15/2038 | | | 7,534 | | | | 10,351 | |
Hartford HealthCare | | | | | | | | |
5.746%, 04/01/2044 | | | 2,480 | | | | 2,898 | |
Humana | | | | | | | | |
8.150%, 06/15/2038 | | | 1,510 | | | | 2,114 | |
4.625%, 12/01/2042 | | | 55 | | | | 55 | |
Johnson & Johnson | | | | | | | | |
5.950%, 08/15/2037 | | | 4,045 | | | | 5,701 | |
4.500%, 12/05/2043 | | | 2,000 | | | | 2,389 | |
4.375%, 12/05/2033 | | | 7,300 | | | | 8,390 | |
3.700%, 03/01/2046 | | | 1,885 | | | | 1,995 | |
3.550%, 03/01/2036 | | | 865 | | | | 903 | |
McKesson | | | | | | | | |
4.883%, 03/15/2044 | | | 800 | | | | 881 | |
Medtronic | | | | | | | | |
4.625%, 03/15/2044 | | | 6,416 | | | | 7,129 | |
4.625%, 03/15/2045 | | | 12,540 | | | | 14,068 | |
4.375%, 03/15/2035 | | | 13,466 | | | | 14,646 | |
Memorial Sloan-Kettering Cancer Center | | | | | | | | |
5.000%, 07/01/2042 | | | 1,000 | | | | 1,206 | |
Merck | | | | | | | | |
4.150%, 05/18/2043 | | | 3,050 | | | | 3,255 | |
3.700%, 02/10/2045 | | | 14,700 | | | | 14,765 | |
3.600%, 09/15/2042 | | | 850 | | | | 847 | |
2.750%, 02/10/2025 | | | 2,035 | | | | 2,077 | |
Merck Sharp & Dohme MTN | | | | | | | | |
5.760%, 05/03/2037 | | | 1,276 | | | | 1,583 | |
Mylan | | | | | | | | |
5.250%, 06/15/2046 (A) | | | 1,135 | | | | 1,135 | |
North Shore-Long Island Jewish Health Care | | | | | | | | |
6.150%, 11/01/2043 | | | 630 | | | | 828 | |
4.800%, 11/01/2042 | | | 2,400 | | | | 2,488 | |
Novartis Capital | | | | | | | | |
4.400%, 05/06/2044 | | | 6,200 | | | | 7,136 | |
NYU Hospitals Center | | | | | | | | |
4.428%, 07/01/2042 | | | 2,650 | | | | 2,773 | |
Perrigo Finance Unlimited | | | | | | | | |
4.375%, 03/15/2026 | | | 1,960 | | | | 1,994 | |
Pfizer | | | | | | | | |
7.200%, 03/15/2039 | | | 2,150 | | | | 3,139 | |
4.400%, 05/15/2044 | | | 4,095 | | | | 4,551 | |
4.300%, 06/15/2043 | | | 2,640 | | | | 2,870 | |
Pharmacia | | | | | | | | |
6.600%, 12/01/2028 | | | 1,145 | | | | 1,517 | |
| | | | | | | | |
| Description | | Face Amount
($ Thousands) | | | Market Value
($ Thousands) | |
Providence Health & Services Obligated Group | | | | | | | | |
4.379%, 10/01/2023 | | $ | 2,400 | | | $ | 2,647 | |
Roche Holdings | | | | | | | | |
4.000%, 11/28/2044 (A) | | | 230 | | | | 248 | |
Shands Teaching Hospital and Clinics | | | | | | | | |
4.741%, 12/01/2042 | | | 1,750 | | | | 1,764 | |
St. Barnabas | | | | | | | | |
4.000%, 07/01/2028 | | | 2,240 | | | | 2,296 | |
Stryker | | | | | | | | |
4.625%, 03/15/2046 | | | 615 | | | | 663 | |
4.375%, 05/15/2044 | | | 1,220 | | | | 1,247 | |
4.100%, 04/01/2043 | | | 785 | | | | 782 | |
Sutter Health | | | | | | | | |
2.286%, 08/15/2053 | | | 2,000 | | | | 1,954 | |
Toledo Hospital | | | | | | | | |
4.982%, 11/15/2045 | | | 3,425 | | | | 4,140 | |
Trinity Health | | | | | | | | |
4.125%, 12/01/2045 | | | 2,524 | | | | 2,670 | |
UnitedHealth Group | | | | | | | | |
6.875%, 02/15/2038 | | | 1,251 | | | | 1,780 | |
6.625%, 11/15/2037 | | | 4,315 | | | | 5,929 | |
6.500%, 06/15/2037 | | | 3,210 | | | | 4,394 | |
5.950%, 02/15/2041 | | | 95 | | | | 123 | |
5.800%, 03/15/2036 | | | 325 | | | | 411 | |
5.700%, 10/15/2040 | | | 1,005 | | | | 1,260 | |
4.750%, 07/15/2045 | | | 14,030 | | | | 16,063 | |
4.625%, 07/15/2035 | | | 1,100 | | | | 1,234 | |
4.375%, 03/15/2042 | | | 30 | | | | 32 | |
3.950%, 10/15/2042 | | | 1,310 | | | | 1,336 | |
Wyeth | | | | | | | | |
5.950%, 04/01/2037 | | | 4,425 | | | | 5,721 | |
Wyeth LLC | | | | | | | | |
6.500%, 02/01/2034 | | | 3,390 | | | | 4,559 | |
Zimmer Biomet Holdings | | | | | | | | |
4.450%, 08/15/2045 | | | 2,285 | | | | 2,289 | |
| | | | | | | | |
| | | | | | | 289,770 | |
| | | | | | | | |
| | |
Industrials — 8.2% | | | | | | | | |
3M MTN | | | | | | | | |
3.875%, 06/15/2044 | | | 4,360 | | | | 4,628 | |
Air Canada, Pass-Through Trust, Ser 2013-1, Cl A | | | | | | | | |
4.125%, 05/15/2025 (A) | | | 476 | | | | 487 | |
Air Canada, Pass-Through Trust, Ser 2015-1, Cl A | | | | | | | | |
3.600%, 03/15/2027 (A) | | | 5,414 | | | | 5,482 | |
American Airlines, Pass-Through Trust, Ser 2013-2, Cl A | | | | | | | | |
4.950%, 01/15/2023 | | | 1,617 | | | | 1,739 | |
American Airlines, Pass-Through Trust, Ser 2014-1, Cl A | | | | | | | | |
3.700%, 10/01/2026 | | | 2,007 | | | | 2,065 | |
| | |
| 188 | | SEI Institutional Investments Trust / Annual Report / May 31, 2016 |
| | | | | | | | |
| Description | | Face Amount
($ Thousands) | | | Market Value
($ Thousands) | |
American Airlines, Pass-Through Trust, Ser 2016-2, Cl AA | | | | | | | | |
3.200%, 06/15/2028 | | $ | 3,765 | | | $ | 3,803 | |
BAE Systems Holdings | | | | | | | | |
4.750%, 10/07/2044 (A) | | | 3,098 | | | | 3,215 | |
Boeing | | | | | | | | |
6.875%, 03/15/2039 | | | 620 | | | | 903 | |
6.625%, 02/15/2038 | | | 870 | | | | 1,219 | |
3.375%, 06/15/2046 | | | 605 | | | | 584 | |
3.300%, 03/01/2035 | | | 5,670 | | | | 5,547 | |
Burlington Northern Santa Fe LLC | | | | | | | | |
5.150%, 09/01/2043 | | | 495 | | | | 585 | |
4.950%, 09/15/2041 | | | 140 | | | | 160 | |
4.900%, 04/01/2044 | | | 2,810 | | | | 3,241 | |
4.550%, 09/01/2044 | | | 5,100 | | | | 5,573 | |
4.450%, 03/15/2043 | | | 1,250 | | | | 1,351 | |
4.400%, 03/15/2042 | | | 2,825 | | | | 3,014 | |
3.900%, 08/01/2046 | | | 3,000 | | | | 3,007 | |
Canadian National Railway | | | | | | | | |
6.250%, 08/01/2034 | | | 2,393 | | | | 3,145 | |
6.200%, 06/01/2036 | | | 5,665 | | | | 7,542 | |
4.500%, 11/07/2043 | | | 3,800 | | | | 4,276 | |
Caterpillar | | | | | | | | |
5.200%, 05/27/2041 | | | 640 | | | | 749 | |
4.750%, 05/15/2064 | | | 4,770 | | | | 5,116 | |
3.803%, 08/15/2042 | | | 7,145 | | | | 6,900 | |
CSX | | | | | | | | |
4.750%, 05/30/2042 | | | 3,415 | | | | 3,760 | |
4.500%, 08/01/2054 | | | 900 | | | | 921 | |
Deere | | | | | | | | |
3.900%, 06/09/2042 | | | 12,095 | | | | 12,420 | |
Eaton | | | | | | | | |
4.000%, 11/02/2032 | | | 2,780 | | | | 2,837 | |
FedEx | | | | | | | | |
7.600%, 07/01/2097 | | | 1,403 | | | | 1,982 | |
3.875%, 08/01/2042 | | | 1,641 | | | | 1,528 | |
GE Capital International Funding Unlimited | | | | | | | | |
4.418%, 11/15/2035 (A) | | | 66,159 | | | | 71,974 | |
General Electric | | | | | | | | |
4.500%, 03/11/2044 | | | 4,615 | | | | 5,146 | |
2.700%, 10/09/2022 | | | 1,010 | | | | 1,042 | |
Honeywell International | | | | | | | | |
5.700%, 03/15/2037 | | | 300 | | | | 385 | |
5.375%, 03/01/2041 | | | 4,435 | | | | 5,577 | |
Koninklijke Philips | | | | | | | | |
6.875%, 03/11/2038 | | | 80 | | | | 101 | |
Lockheed Martin | | | | | | | | |
3.600%, 03/01/2035 | | | 4,125 | | | | 4,051 | |
Norfolk Southern | | | | | | | | |
6.000%, 03/15/2105 | | | 2,536 | | | | 2,930 | |
6.000%, 05/23/2111 | | | 345 | | | | 399 | |
| | | | | | | | |
| Description | | Face Amount
($ Thousands) | | | Market Value
($ Thousands) | |
Parker-Hannifin MTN | | | | | | | | |
4.450%, 11/21/2044 | | $ | 1,755 | | | $ | 1,952 | |
Raytheon | | | | | | | | |
4.700%, 12/15/2041 | | | 560 | | | | 644 | |
Republic Services | | | | | | | | |
5.700%, 05/15/2041 | | | 2,100 | | | | 2,516 | |
Siemens Financieringsmaatschappij | | | | | | | | |
6.125%, 08/17/2026 (A) | | | 100 | | | | 129 | |
4.400%, 05/27/2045 (A) | | | 9,350 | | | | 10,235 | |
Stanley Black & Decker | | | | | | | | |
5.200%, 09/01/2040 | | | 280 | | | | 320 | |
Tyco International Finance | | | | | | | | |
5.125%, 09/14/2045 | | | 1,300 | | | | 1,429 | |
Union Pacific | | | | | | | | |
4.850%, 06/15/2044 | | | 1,855 | | | | 2,127 | |
4.750%, 09/15/2041 | | | 1,635 | | | | 1,844 | |
4.750%, 12/15/2043 | | | 1,715 | | | | 1,949 | |
4.375%, 11/15/2065 | | | 13,433 | | | | 13,728 | |
4.050%, 03/01/2046 | | | 1,395 | | | | 1,452 | |
3.875%, 02/01/2055 | | | 4,730 | | | | 4,662 | |
United Airlines, Pass-Through Trust, Ser 2014-2, Cl A | | | | | | | | |
3.750%, 09/03/2026 | | | 2,645 | | | | 2,724 | |
United Parcel Service | | | | | | | | |
8.375%, 04/01/2030 (D) | | | 710 | | | | 1,026 | |
6.200%, 01/15/2038 | | | 3,152 | | | | 4,349 | |
3.625%, 10/01/2042 | | | 5,000 | | | | 5,091 | |
United Technologies | | | | | | | | |
5.700%, 04/15/2040 | | | 1,520 | | | | 1,919 | |
4.500%, 06/01/2042 | | | 17,520 | | | | 19,165 | |
4.150%, 05/15/2045 | | | 3,410 | | | | 3,552 | |
US Airways, Pass-Through Trust, Ser 2012-1, Cl A | | | | | | | | |
5.900%, 10/01/2024 | | | 1,999 | | | | 2,269 | |
WW Grainger | | | | | | | | |
4.600%, 06/15/2045 | | | 1,185 | | | | 1,339 | |
| | | | | | | | |
| | | | | | | 273,805 | |
| | | | | | | | |
| | |
Information Technology — 5.7% | | | | | | | | |
Apple | | | | | | | | |
4.650%, 02/23/2046 | | | 8,420 | | | | 9,243 | |
4.500%, 02/23/2036 | | | 6,090 | | | | 6,608 | |
4.450%, 05/06/2044 | | | 780 | | | | 818 | |
4.375%, 05/13/2045 | | | 15,845 | | | | 16,781 | |
3.850%, 05/04/2043 | | | 3,350 | | | | 3,273 | |
3.450%, 02/09/2045 | | | 6,800 | | | | 6,201 | |
Applied Materials | | | | | | | | |
5.850%, 06/15/2041 | | | 90 | | | | 108 | |
Automatic Data Processing | | | | | | | | |
3.375%, 09/15/2025 | | | 2,040 | | | | 2,182 | |
Cisco Systems | | | | | | | | |
5.900%, 02/15/2039 | | | 7,439 | | | | 9,834 | |
| | | | |
| SEI Institutional Investments Trust / Annual Report / May 31, 2016 | | | 189 | |
SCHEDULE OF INVESTMENTS
Long Duration Credit Fund (Continued)
May 31, 2016
| | | | | | | | |
| Description | | Face Amount
($ Thousands) | | | Market Value
($ Thousands) | |
5.500%, 01/15/2040 | | $ | 7,095 | | | $ | 9,025 | |
Diamond 1 Finance | | | | | | | | |
8.350%, 07/15/2046 (A) | | | 1,355 | | | | 1,379 | |
Hewlett Packard Enterprise | | | | | | | | |
6.200%, 10/15/2035 (A) | | | 4,155 | | | | 4,047 | |
Intel | | | | | | | | |
4.900%, 07/29/2045 | | | 15,860 | | | | 17,745 | |
4.800%, 10/01/2041 | | | 6,095 | | | | 6,768 | |
4.100%, 05/19/2046 | | | 3,624 | | | | 3,634 | |
4.000%, 12/15/2032 | | | 520 | | | | 547 | |
International Business Machines | | | | | | | | |
3.625%, 02/12/2024 | | | 4,160 | | | | 4,507 | |
Intuit | | | | | | | | |
5.750%, 03/15/2017 | | | 25 | | | | 26 | |
Microsoft | | | | | | | | |
5.300%, 02/08/2041 | | | 515 | | | | 635 | |
4.875%, 12/15/2043 | | | 1,470 | | | | 1,739 | |
4.750%, 11/03/2055 | | | 3,545 | | | | 3,970 | |
4.450%, 11/03/2045 | | | 7,450 | | | | 8,318 | |
4.200%, 11/03/2035 | | | 825 | | | | 915 | |
4.000%, 02/12/2055 | | | 7,959 | | | | 7,813 | |
3.750%, 02/12/2045 | | | 10,610 | | | | 10,599 | |
3.500%, 02/12/2035 | | | 4,590 | | | | 4,627 | |
3.500%, 11/15/2042 | | | 670 | | | | 640 | |
Motorola Solutions | | | | | | | | |
7.500%, 05/15/2025 | | | 400 | | | | 465 | |
Oracle | | | | | | | | |
6.500%, 04/15/2038 | | | 7,067 | | | | 9,591 | |
6.125%, 07/08/2039 | | | 2,870 | | | | 3,756 | |
4.500%, 07/08/2044 | | | 980 | | | | 1,059 | |
4.375%, 05/15/2055 | | | 4,735 | | | | 4,747 | |
4.300%, 07/08/2034 | | | 15,695 | | | | 16,748 | |
4.125%, 05/15/2045 | | | 8,810 | | | | 9,073 | |
Qualcomm | | | | | | | | |
4.650%, 05/20/2035 | | | 2,890 | | | | 3,012 | |
Seagate HDD Cayman | | | | | | | | |
4.750%, 06/01/2023 | | | 1,590 | | | | 1,329 | |
| | | | | | | | |
| | | | | | | 191,762 | |
| | | | | | | | |
| | |
Materials — 1.8% | | | | | | | | |
Albemarle | | | | | | | | |
5.450%, 12/01/2044 | | | 1,449 | | | | 1,442 | |
Barrick North America Finance LLC | | | | | | | | |
7.500%, 09/15/2038 | | | 15 | | | | 16 | |
5.750%, 05/01/2043 | | | 2,085 | | | | 2,039 | |
5.700%, 05/30/2041 | | | 1,380 | | | | 1,298 | |
5.250%, 04/01/2042 | | | 550 | | | | 504 | |
BHP Billiton Finance USA | | | | | | | | |
6.750%, 10/19/2075 (A) (C) | | | 2,255 | | | | 2,336 | |
5.000%, 09/30/2043 | | | 12,350 | | | | 13,118 | |
Dow Chemical | | | | | | | | |
5.250%, 11/15/2041 | | | 755 | | | | 804 | |
| | | | | | | | |
| Description | | Face Amount
($ Thousands) | | | Market Value
($ Thousands) | |
4.625%, 10/01/2044 | | $ | 825 | | | $ | 827 | |
4.250%, 10/01/2034 | | | 2,870 | | | | 2,840 | |
Georgia-Pacific LLC | | | | | | | | |
8.875%, 05/15/2031 | | | 3,255 | | | | 5,049 | |
7.250%, 06/01/2028 | | | 330 | | | | 435 | |
Glencore Finance Canada | | | | | | | | |
6.000%, 11/15/2041 (A) | | | 2,878 | | | | 2,335 | |
International Paper | | | | | | | | |
8.700%, 06/15/2038 | | | 1,000 | | | | 1,425 | |
LYB International Finance | | | | | | | | |
5.250%, 07/15/2043 | | | 775 | | | | 803 | |
LyondellBasell Industries | | | | | | | | |
4.625%, 02/26/2055 | | | 1,215 | | | | 1,075 | |
Monsanto | | | | | | | | |
4.700%, 07/15/2064 | | | 2,310 | | | | 2,048 | |
4.400%, 07/15/2044 | | | 2,090 | | | | 1,994 | |
4.200%, 07/15/2034 | | | 3,550 | | | | 3,431 | |
Nacional del Cobre de Chile | | | | | | | | |
4.500%, 09/16/2025 (A) | | | 2,015 | | | | 2,051 | |
Newmont Mining | | | | | | | | |
5.875%, 04/01/2035 | | | 100 | | | | 99 | |
Nucor | | | | | | | | |
6.400%, 12/01/2037 | | | 40 | | | | 47 | |
Rio Tinto Alcan | | | | | | | | |
7.250%, 03/15/2031 | | | 4,290 | | | | 5,026 | |
Rio Tinto Finance USA | | | | | | | | |
9.000%, 05/01/2019 | | | 150 | | | | 178 | |
5.200%, 11/02/2040 | | | 20 | | | | 21 | |
4.750%, 03/22/2042 | | | 120 | | | | 119 | |
4.125%, 08/21/2042 | | | 6,910 | | | | 6,361 | |
3.500%, 11/02/2020 | | | 20 | | | | 20 | |
Southern Copper | | | | | | | | |
5.875%, 04/23/2045 | | | 1,070 | | | | 932 | |
Union Carbide | | | | | | | | |
7.750%, 10/01/2096 | | | 25 | | | | 29 | |
| | | | | | | | |
| | | | | | | 58,702 | |
| | | | | | | | |
| |
Telecommunication Services — 2.5% | | | | | |
America Movil | | | | | | | | |
6.375%, 03/01/2035 | | | 50 | | | | 59 | |
6.125%, 11/15/2037 | | | 50 | | | | 58 | |
6.125%, 03/30/2040 | | | 2,375 | | | | 2,787 | |
4.375%, 07/16/2042 | | | 3,320 | | | | 3,223 | |
AT&T | | | | | | | | |
8.250%, 11/15/2031 | | | 2,625 | | | | 3,693 | |
6.375%, 03/01/2041 | | | 1,495 | | | | 1,757 | |
6.350%, 03/15/2040 | | | 1,830 | | | | 2,147 | |
5.600%, 05/15/2018 | | | 40 | | | | 43 | |
5.550%, 08/15/2041 | | | 2,005 | | | | 2,190 | |
5.350%, 09/01/2040 | | | 4,145 | | | | 4,411 | |
4.800%, 06/15/2044 | | | 4,130 | | | | 4,122 | |
4.750%, 05/15/2046 | | | 2,566 | | | | 2,548 | |
| | |
| 190 | | SEI Institutional Investments Trust / Annual Report / May 31, 2016 |
| | | | | | | | |
| Description | | Face Amount
($ Thousands) | | | Market Value
($ Thousands) | |
4.500%, 05/15/2035 | | $ | 6,735 | | | $ | 6,745 | |
4.350%, 06/15/2045 | | | 2,389 | | | | 2,248 | |
3.000%, 02/15/2022 | | | 20 | | | | 20 | |
Bellsouth Capital Funding | | | | | | | | |
7.875%, 02/15/2030 | | | 2,855 | | | | 3,572 | |
Centel Capital | | | | | | | | |
9.000%, 10/15/2019 | | | 25 | | | | 29 | |
Deutsche Telekom International Finance | | | | | | | | |
9.250%, 06/01/2032 | | | 2,536 | | | | 3,965 | |
Koninklijke | | | | | | | | |
8.375%, 10/01/2030 | | | 130 | | | | 177 | |
Rogers Communications | | | | | | | | |
5.450%, 10/01/2043 | | | 4,000 | | | | 4,603 | |
SES Global Americas Holdings | | | | | | | | |
5.300%, 03/25/2044 (A) | | | 6,621 | | | | 5,994 | |
Verizon Communications | | | | | | | | |
7.350%, 04/01/2039 | | | 2,275 | | | | 3,091 | |
6.000%, 04/01/2041 | | | 1,420 | | | | 1,704 | |
5.012%, 08/21/2054 | | | 8,271 | | | | 8,535 | |
4.672%, 03/15/2055 | | | 2,755 | | | | 2,700 | |
4.522%, 09/15/2048 | | | 5,172 | | | | 5,223 | |
4.272%, 01/15/2036 | | | 4,535 | | | | 4,544 | |
Vodafone Group | | | | | | | | |
7.875%, 02/15/2030 | | | 1,470 | | | | 1,902 | |
| | | | | | | | |
| | | | | | | 82,090 | |
| | | | | | | | |
| | |
Utilities — 14.3% | | | | | | | | |
AGL Capital | | | | | | | | |
6.375%, 07/15/2016 | | | 100 | | | | 101 | |
4.400%, 06/01/2043 | | | 665 | | | | 664 | |
3.500%, 09/15/2021 | | | 68 | | | | 71 | |
Alabama Power | | | | | | | | |
5.200%, 06/01/2041 | | | 155 | | | | 187 | |
5.125%, 02/15/2019 | | | 195 | | | | 209 | |
4.150%, 08/15/2044 | | | 135 | | | | 142 | |
Appalachian Power | | | | | �� | | | |
6.700%, 08/15/2037 | | | 50 | | | | 63 | |
5.800%, 10/01/2035 | | | 125 | | | | 146 | |
4.600%, 03/30/2021 | | | 70 | | | | 76 | |
Arizona Public Service | | | | | | | | |
8.750%, 03/01/2019 | | | 455 | | | | 539 | |
5.050%, 09/01/2041 | | | 50 | | | | 59 | |
4.500%, 04/01/2042 | | | 12 | | | | 14 | |
Baltimore Gas & Electric | | | | | | | | |
6.350%, 10/01/2036 | | | 125 | | | | 165 | |
5.200%, 06/15/2033 | | | 1,620 | | | | 1,849 | |
Berkshire Hathaway Energy | | | | | | | | |
6.500%, 09/15/2037 | | | 800 | | | | 1,076 | |
6.125%, 04/01/2036 | | | 2,301 | | | | 2,957 | |
5.950%, 05/15/2037 | | | 635 | | | | 801 | |
5.150%, 11/15/2043 | | | 470 | | | | 553 | |
| | | | | | | | |
| Description | | Face Amount
($ Thousands) | | | Market Value
($ Thousands) | |
Boston Gas | | | | | | | | |
4.487%, 02/15/2042 (A) | | $ | 3,472 | | | $ | 3,642 | |
CenterPoint Energy Houston Electric | | | | | | | | |
4.500%, 04/01/2044 | | | 2,310 | | | | 2,573 | |
CenterPoint Energy Resources | | | | | | | | |
6.250%, 02/01/2037 | | | 1,095 | | | | 1,280 | |
4.500%, 01/15/2021 | | | 40 | | | | 42 | |
Cleco Power | | | | | | | | |
6.000%, 12/01/2040 | | | 1,150 | | | | 1,388 | |
Commonwealth Edison | | | | | | | | |
4.700%, 01/15/2044 | | | 2,870 | | | | 3,344 | |
3.700%, 03/01/2045 | | | 11,570 | | | | 11,449 | |
Connecticut Light & Power | | | | | | | | |
4.150%, 06/01/2045 | | | 4,250 | | | | 4,504 | |
Consolidated Edison of New York | | | | | | | | |
6.750%, 04/01/2038 | | | 5,026 | | | | 6,918 | |
6.200%, 06/15/2036 | | | 65 | | | | 82 | |
5.850%, 04/01/2018 | | | 180 | | | | 195 | |
5.700%, 06/15/2040 | | | 40 | | | | 50 | |
5.500%, 12/01/2039 | | | 75 | | | | 91 | |
4.625%, 12/01/2054 | | | 1,075 | | | | 1,193 | |
4.450%, 03/15/2044 | | | 650 | | | | 717 | |
3.950%, 03/01/2043 | | | 5,840 | | | | 5,964 | |
Consumers Energy | | | | | | | | |
4.350%, 08/31/2064 | | | 4,250 | | | | 4,462 | |
Dominion Resources | | | | | | | | |
5.250%, 08/01/2033 | | | 20 | | | | 22 | |
4.900%, 08/01/2041 | | | 2,885 | | | | 3,037 | |
4.050%, 09/15/2042 | | | 450 | | | | 432 | |
DTE Electric | | | | | | | | |
3.950%, 06/15/2042 | | | 80 | | | | 83 | |
3.900%, 06/01/2021 | | | 30 | | | | 33 | |
3.700%, 03/15/2045 | | | 7,575 | | | | 7,596 | |
Duke Energy | | | | | | | | |
3.550%, 09/15/2021 | | | 17 | | | | 18 | |
2.150%, 11/15/2016 | | | 25 | | | | 25 | |
Duke Energy Carolinas LLC | | | | | | | | |
6.450%, 10/15/2032 | | | 110 | | | | 145 | |
6.100%, 06/01/2037 | | | 2,010 | | | | 2,604 | |
6.050%, 04/15/2038 | | | 2,035 | | | | 2,719 | |
5.300%, 02/15/2040 | | | 4,260 | | | | 5,261 | |
4.250%, 12/15/2041 | | | 2,000 | | | | 2,155 | |
4.000%, 09/30/2042 | | | 14,915 | | | | 15,695 | |
3.900%, 06/15/2021 | | | 50 | | | | 55 | |
3.875%, 03/15/2046 | | | 3,500 | | | | 3,587 | |
3.750%, 06/01/2045 | | | 500 | | | | 504 | |
Duke Energy Florida | | | | | | | | |
6.400%, 06/15/2038 | | | 3,035 | | | | 4,178 | |
Duke Energy Indiana LLC | | | | | | | | |
6.450%, 04/01/2039 | | | 4,275 | | | | 5,862 | |
6.350%, 08/15/2038 | | | 3,185 | | | | 4,368 | |
4.900%, 07/15/2043 | | | 930 | | | | 1,091 | |
| | | | |
| SEI Institutional Investments Trust / Annual Report / May 31, 2016 | | | 191 | |
SCHEDULE OF INVESTMENTS
Long Duration Credit Fund (Continued)
May 31, 2016
| | | | | | | | |
| Description | | Face Amount
($ Thousands) | | | Market Value
($ Thousands) | |
Duke Energy Progress LLC | | | | | | | | |
4.375%, 03/30/2044 | | $ | 2,270 | | | $ | 2,485 | |
4.200%, 08/15/2045 | | | 4,810 | | | | 5,161 | |
4.150%, 12/01/2044 | | | 1,250 | | | | 1,333 | |
4.100%, 05/15/2042 | | | 530 | | | | 557 | |
Duquesne Light Holdings | | | | | | | | |
6.250%, 08/15/2035 | | | 2,500 | | | | 2,728 | |
El Paso Electric | | | | | | | | |
5.000%, 12/01/2044 | | | 350 | | | | 388 | |
Electricite de France | | | | | | | | |
6.000%, 01/22/2114 (A) | | | 9,903 | | | | 10,191 | |
4.950%, 10/13/2045 (A) | | | 3,625 | | | | 3,877 | |
4.750%, 10/13/2035 (A) | | | 1,625 | | | | 1,707 | |
Elm Road Generating Station Supercritical | | | | | | | | |
5.848%, 01/19/2041 (A) | | | 1,000 | | | | 1,204 | |
Entergy Louisiana LLC | | | | | | | | |
4.440%, 01/15/2026 | | | 1,510 | | | | 1,665 | |
3.250%, 04/01/2028 | | | 3,475 | | | | 3,592 | |
Entergy Mississippi | | | | | | | | |
2.850%, 06/01/2028 | | | 4,370 | | | | 4,319 | |
Exelon | | | | | | | | |
4.950%, 06/15/2035 | | | 1,685 | | | | 1,827 | |
Exelon Generation LLC | | | | | | | | |
6.250%, 10/01/2039 | | | 4,340 | | | | 4,758 | |
5.600%, 06/15/2042 | | | 1,220 | | | | 1,244 | |
5.200%, 10/01/2019 | | | 100 | | | | 109 | |
Florida Power & Light | | | | | | | | |
5.960%, 04/01/2039 | | | 2,570 | | | | 3,438 | |
5.690%, 03/01/2040 | | | 5,728 | | | | 7,459 | |
5.650%, 02/01/2037 | | | 1,000 | | | | 1,279 | |
4.050%, 06/01/2042 | | | 3,460 | | | | 3,685 | |
4.050%, 10/01/2044 | | | 3,215 | | | | 3,455 | |
3.800%, 12/15/2042 | | | 4,720 | | | | 4,874 | |
Georgia Power | | | | | | | | |
5.650%, 03/01/2037 | | | 105 | | | | 126 | |
5.400%, 06/01/2040 | | | 11,470 | | | | 13,889 | |
4.300%, 03/15/2042 | | | 10,330 | | | | 11,058 | |
4.300%, 03/15/2043 | | | 2,945 | | | | 3,082 | |
Gulf Power | | | | | | | | |
4.550%, 10/01/2044 | | | 1,500 | | | | 1,547 | |
Indianapolis Power & Light | | | | | | | | |
4.700%, 09/01/2045 (A) | | | 3,870 | | | | 4,270 | |
4.650%, 06/01/2043 (A) | | | 4,250 | | | | 4,529 | |
International Transmission | | | | | | | | |
4.625%, 08/15/2043 (A) | | | 1,975 | | | | 2,174 | |
Jersey Central Power & Light | | | | | | | | |
6.150%, 06/01/2037 | | | 275 | | | | 314 | |
John Sevier Combined Cycle Generation | | | | | | | | |
4.626%, 01/15/2042 | | | 6,870 | | | | 7,490 | |
Kansas Gas & Electric | | | | | | | | |
4.300%, 07/15/2044 (A) | | | 3,275 | | | | 3,537 | |
| | | | | | | | |
| Description | | Face Amount
($ Thousands) | | | Market Value
($ Thousands) | |
Kentucky Utilities | | | | | | | | |
5.125%, 11/01/2040 | | $ | 2,565 | | | $ | 3,082 | |
KeySpan Gas East | | | | | | | | |
5.819%, 04/01/2041 (A) | | | 4,951 | | | | 5,869 | |
Louisville Gas & Electric | | | | | | | | |
4.650%, 11/15/2043 | | | 3,390 | | | | 3,907 | |
MidAmerican Energy | | | | | | | | |
4.800%, 09/15/2043 | | | 5,260 | | | | 6,222 | |
4.400%, 10/15/2044 | | | 7,655 | | | | 8,493 | |
Monongahela Power | | | | | | | | |
5.400%, 12/15/2043 (A) | | | 2,930 | | | | 3,556 | |
Narragansett Electric | | | | | | | | |
4.170%, 12/10/2042 (A) | | | 1,000 | | | | 1,025 | |
Nevada Power | | | | | | | | |
6.650%, 04/01/2036 | | | 100 | | | | 134 | |
Niagara Mohawk Power | | | | | | | | |
4.278%, 10/01/2034 (A) | | | 5,244 | | | | 5,526 | |
4.119%, 11/28/2042 (A) | | | 2,000 | | | | 2,045 | |
NiSource Finance | | | | | | | | |
5.950%, 06/15/2041 | | | 220 | | | | 267 | |
5.800%, 02/01/2042 | | | 900 | | | | 1,091 | |
Northern States Power | | | | | | | | |
6.250%, 06/01/2036 | | | 1,176 | | | | 1,596 | |
6.200%, 07/01/2037 | | | 3,640 | | | | 4,897 | |
4.850%, 08/15/2040 | | | 3,400 | | | | 3,986 | |
3.400%, 08/15/2042 | | | 464 | | | | 446 | |
Oglethorpe Power | | | | | | | | |
5.375%, 11/01/2040 | | | 2,735 | | | | 3,177 | |
5.250%, 09/01/2050 | | | 1,205 | | | | 1,332 | |
4.250%, 04/01/2046 | | | 1,630 | | | | 1,639 | |
4.200%, 12/01/2042 | | | 3,740 | | | | 3,718 | |
Ohio Edison | | | | | | | | |
8.250%, 10/15/2038 | | | 395 | | | | 585 | |
Oklahoma Gas & Electric | | | | | | | | |
4.550%, 03/15/2044 | | | 1,395 | | | | 1,545 | |
Oncor Electric Delivery | | | | | | | | |
7.500%, 09/01/2038 | | | 200 | | | | 282 | |
7.000%, 09/01/2022 | | | 85 | | | | 106 | |
6.800%, 09/01/2018 | | | 35 | | | | 39 | |
5.300%, 06/01/2042 | | | 1,450 | | | | 1,746 | |
5.250%, 09/30/2040 | | | 1,650 | | | | 1,953 | |
4.550%, 12/01/2041 | | | 4,700 | | | | 5,109 | |
One Gas | | | | | | | | |
4.658%, 02/01/2044 | | | 1,420 | | | | 1,580 | |
Pacific Gas & Electric | | | | | | | | |
6.250%, 03/01/2039 | | | 4,640 | | | | 6,126 | |
6.050%, 03/01/2034 | | | 7,504 | | | | 9,838 | |
4.600%, 06/15/2043 | | | 8,520 | | | | 9,449 | |
4.450%, 04/15/2042 | | | 5,495 | | | | 5,981 | |
4.300%, 03/15/2045 | | | 2,505 | | | | 2,700 | |
3.250%, 09/15/2021 | | | 18 | | | | 19 | |
| | |
| 192 | | SEI Institutional Investments Trust / Annual Report / May 31, 2016 |
| | | | | | | | |
| Description | | Face Amount
($ Thousands) | | | Market Value
($ Thousands) | |
PacifiCorp | | | | | | | | |
6.250%, 10/15/2037 | | $ | 3,475 | | | $ | 4,647 | |
6.000%, 01/15/2039 | | | 5,065 | | | | 6,687 | |
4.100%, 02/01/2042 | | | 2,725 | | | | 2,887 | |
PECO Energy | | | | | | | | |
4.800%, 10/15/2043 | | | 1,505 | | | | 1,795 | |
Pennsylvania Electric | | | | | | | | |
6.150%, 10/01/2038 | | | 100 | | | | 111 | |
6.050%, 09/01/2017 | | | 50 | | | | 53 | |
Piedmont Natural Gas | | | | | | | | |
4.650%, 08/01/2043 | | | 830 | | | | 910 | |
Potomac Electric Power | | | | | | | | |
4.950%, 11/15/2043 | | | 950 | | | | 1,097 | |
PPL Electric Utilities | | | | | | | | |
5.200%, 07/15/2041 | | | 1,100 | | | | 1,355 | |
4.750%, 07/15/2043 | | | 3,600 | | | | 4,204 | |
Progress Energy | | | | | | | | |
4.400%, 01/15/2021 | | | 25 | | | | 27 | |
PSEG Power LLC | | | | | | | | |
8.625%, 04/15/2031 | | | 4,493 | | | | 5,411 | |
5.125%, 04/15/2020 | | | 50 | | | | 54 | |
4.300%, 11/15/2023 | | | 980 | | | | 1,007 | |
Public Service Electric & Gas MTN | | | | | | | | |
4.150%, 11/01/2045 | | | 700 | | | | 756 | |
4.050%, 05/01/2045 | | | 1,800 | | | | 1,934 | |
4.000%, 06/01/2044 | | | 695 | | | | 747 | |
3.650%, 09/01/2042 | | | 1,905 | | | | 1,921 | |
Public Service of Colorado | | | | | | | | |
6.250%, 09/01/2037 | | | 1,960 | | | | 2,685 | |
4.300%, 03/15/2044 | | | 1,780 | | | | 1,951 | |
3.950%, 03/15/2043 | | | 5,845 | | | | 6,156 | |
2.900%, 05/15/2025 | | | 4,730 | | | | 4,872 | |
Public Service of Oklahoma | | | | | | | | |
4.400%, 02/01/2021 | | | 27 | | | | 29 | |
Puget Sound Energy | | | | | | | | |
5.795%, 03/15/2040 | | | 130 | | | | 167 | |
San Diego Gas & Electric | | | | | | | | |
6.000%, 06/01/2026 | | | 625 | | | | 802 | |
Sempra Energy | | | | | | | | |
9.800%, 02/15/2019 | | | 50 | | | | 60 | |
6.000%, 10/15/2039 | | | 3,390 | | | | 4,075 | |
South Carolina Electric & Gas | | | | | | | | |
5.450%, 02/01/2041 | | | 605 | | | | 739 | |
5.100%, 06/01/2065 | | | 5,915 | | | | 6,665 | |
Southern California Edison | | | | | | | | |
6.000%, 01/15/2034 | | | 175 | | | | 227 | |
5.950%, 02/01/2038 | | | 510 | | | | 670 | |
5.500%, 03/15/2040 | | | 70 | | | | 88 | |
5.350%, 07/15/2035 | | | 2,240 | | | | 2,731 | |
4.650%, 10/01/2043 | | | 6,895 | | | | 7,935 | |
4.050%, 03/15/2042 | | | 7,405 | | | | 7,805 | |
| | | | | | | | |
| Description | | Face Amount
($ Thousands) | | | Market Value
($ Thousands) | |
Southern California Gas | | | | | | | | |
3.750%, 09/15/2042 | | $ | 3,150 | | | $ | 3,166 | |
Southwestern Electric Power | | | | | | | | |
6.200%, 03/15/2040 | | | 1,204 | | | | 1,468 | |
Southwestern Public Service | | | | | | | | |
8.750%, 12/01/2018 | | | 40 | | | | 46 | |
4.500%, 08/15/2041 | | | 10,725 | | | | 11,947 | |
Tampa Electric | | | | | | | | |
4.350%, 05/15/2044 | | | 1,225 | | | | 1,298 | |
Texas-New Mexico Power | | | | | | | | |
6.950%, 04/01/2043 (A) | | | 2,000 | | | | 2,580 | |
Union Electric | | | | | | | | |
8.450%, 03/15/2039 | | | 2,780 | | | | 4,493 | |
Virginia Electric & Power | | | | | | | | |
6.350%, 11/30/2037 | | | 630 | | | | 842 | |
4.650%, 08/15/2043 | | | 2,530 | | | | 2,858 | |
4.450%, 02/15/2044 | | | 4,500 | | | | 4,896 | |
4.200%, 05/15/2045 | | | 1,750 | | | | 1,859 | |
Wisconsin Electric Power | | | | | | | | |
4.250%, 06/01/2044 | | | 850 | | | | 925 | |
3.650%, 12/15/2042 | | | 3,930 | | | | 3,846 | |
2.950%, 09/15/2021 | | | 3 | | | | 3 | |
Wisconsin Power & Light | | | | | | | | |
4.100%, 10/15/2044 | | | 325 | | | | 337 | |
Wisconsin Public Service | | | | | | | | |
4.752%, 11/01/2044 | | | 3,615 | | | | 4,214 | |
| | | | | | | | |
| | | | | | | 477,491 | |
| | | | | | | | |
Total Corporate Obligations
(Cost $2,725,832) ($ Thousands) | | | | | | | 2,817,614 | |
| | | | | | | | |
| | |
MUNICIPAL BONDS — 7.7% | | | | | | | | |
| | |
Arizona — 0.0% | | | | | | | | |
Arizona, Health Facilities Authority, Ser B, RB Callable 01/01/2017 @ 100 | | | | | | | | |
1.229%, 01/01/2037 (C) | | | 380 | | | | 345 | |
| | | | | | | | |
| | |
California — 3.6% | | | | | | | | |
Bay Area, Toll Authority, Build America Project, RB | | | | | | | | |
6.263%, 04/01/2049 | | | 6,745 | | | | 9,942 | |
California State, Build America Project, GO | | | | | | | | |
7.550%, 04/01/2039 | | | 10,155 | | | | 15,642 | |
7.500%, 04/01/2034 | | | 13,085 | | | | 19,556 | |
Los Angeles, Community College District, Ser D, GO | | | | | | | | |
6.680%, 08/01/2036 | | | 500 | | | | 699 | |
Los Angeles, Department of Water & Power, Build America Project, RB | | | | | | | | |
6.574%, 07/01/2045 | | | 4,530 | | | | 6,673 | |
Los Angeles, Department of Water & Power, RB | | | | | | | | |
5.716%, 07/01/2039 | | | 1,510 | | | | 1,941 | |
| | | | |
| SEI Institutional Investments Trust / Annual Report / May 31, 2016 | | | 193 | |
SCHEDULE OF INVESTMENTS
Long Duration Credit Fund (Continued)
May 31, 2016
| | | | | | | | |
| Description | | Face Amount
($ Thousands) | | | Market Value
($ Thousands) | |
Los Angeles, Department of Water & Power, Ser C, RB | | | | | | | | |
5.516%, 07/01/2027 | | $ | 955 | | | $ | 1,175 | |
Los Angeles, Unified School District, Build America Project, Ser RY, GO | | | | | | | | |
6.758%, 07/01/2034 | | | 7,000 | | | | 9,863 | |
San Diego County, Water Authority, Build America Project, RB | | | | | | | | |
6.138%, 05/01/2049 | | | 1,750 | | | | 2,451 | |
Santa Clara Valley, Transportation Authority, Build America Project, RB | | | | | | | | |
5.876%, 04/01/2032 | | | 4,860 | | | | 6,168 | |
State of California, Build America Project, GO | | | | | | | | |
7.625%, 03/01/2040 | | | 1,570 | | | | 2,409 | |
7.300%, 10/01/2039 | | | 15,050 | | | | 22,070 | |
University of California, Build America Project, RB | | | | | | | | |
5.770%, 05/15/2043 | | | 5,100 | | | | 6,686 | |
University of California, Ser AD, RB | | | | | | | | |
4.858%, 05/15/2112 | | | 6,337 | | | | 6,760 | |
University of California, Ser AP, RB | | | | | | | | |
3.931%, 05/15/2045 | | | 950 | | | | 987 | |
University of California, Ser AQ, RB | | | | | | | | |
4.767%, 05/15/2115 | | | 4,529 | | | | 4,692 | |
University of California, Ser J, RB | | | | | | | | |
4.131%, 05/15/2045 | | | 1,000 | | | | 1,048 | |
| | | | | | | | |
| | | | | | | 118,762 | |
| | | | | | | | |
| | |
District of Columbia — 0.0% | | | | | | | | |
District of Columbia, Water & Sewer Authority, RB | | | | | | | | |
4.814%, 10/01/2114 | | | 530 | | | | 587 | |
| | | | | | | | |
| | |
Georgia — 0.2% | | | | | | | | |
Municipal Electric Authority of Georgia, Build America Project, RB | | | | | | | | |
7.055%, 04/01/2057 | | | 2,235 | | | | 2,622 | |
6.637%, 04/01/2057 | | | 3,909 | | | | 5,107 | |
| | | | | | | | |
| | | | | | | 7,729 | |
| | | | | | | | |
| | |
Illinois — 0.1% | | | | | | | | |
Illinois State, GO | | | | | | | | |
5.100%, 06/01/2033 | | | 2,285 | | | | 2,186 | |
Metropolitan Water Reclamation District of Greater Chicago, Build America Project, GO | | | | | | | | |
5.720%, 12/01/2038 | | | 2,420 | | | | 2,954 | |
| | | | | | | | |
| | | | | | | 5,140 | |
| | | | | | | | |
| | |
Kansas — 0.2% | | | | | | | | |
Kansas State, Development Finance Authority, Ser H, RB | | | | | | | | |
4.727%, 04/15/2037 | | | 6,300 | | | | 6,810 | |
| | | | | | | | |
| | | | | | | | |
| Description | | Face Amount
($ Thousands) | | | Market Value
($ Thousands) | |
Massachusetts — 0.2% | | | | | | | | |
Commonwealth of Massachusetts, GO | | | | | | | | |
5.456%, 12/01/2039 | | $ | 5,085 | | | $ | 6,712 | |
Commonwealth of Massachusetts, Ser D, GO | | | | | | | | |
4.500%, 08/01/2031 | | | 330 | | | | 382 | |
| | | | | | | | |
| | | | | | | 7,094 | |
| | | | | | | | |
| | |
Michigan — 0.0% | | | | | | | | |
Michigan State University, Build America Project, RB Callable 02/15/2030 @ 100 | | | | | | | | |
6.173%, 02/15/2050 | | | 850 | | | | 1,037 | |
| | | | | | | | |
| | |
New Jersey — 0.5% | | | | | | | | |
New Jersey Turnpike Authority, RB | | | | | | | | |
7.414%, 01/01/2040 | | | 2,895 | | | | 4,407 | |
7.102%, 01/01/2041 | | | 7,735 | | | | 11,422 | |
| | | | | | | | |
| | | | | | | 15,829 | |
| | | | | | | | |
| | |
New York — 1.2% | | | | | | | | |
City of New York, Build America Project, GO | | | | | | | | |
5.985%, 12/01/2036 | | | 1,175 | | | | 1,537 | |
5.206%, 10/01/2031 | | | 750 | | | | 902 | |
New York City Transitional Finance Authority Future Tax Secured Revenue, RB | | | | | | | | |
5.767%, 08/01/2036 | | | 3,140 | | | | 4,015 | |
5.508%, 08/01/2037 | | | 1,890 | | | | 2,404 | |
New York City, Municipal Water Finance Authority, Build America Project, RB | | | | | | | | |
6.011%, 06/15/2042 | | | 750 | | | | 1,049 | |
5.882%, 06/15/2044 | | | 500 | | | | 692 | |
5.724%, 06/15/2042 | | | 3,720 | | | | 4,994 | |
5.440%, 06/15/2043 | | | 5,500 | | | | 7,191 | |
New York City, Transitional Finance Authority, Build America Project, RB | | | | | | | | |
5.572%, 11/01/2038 | | | 900 | | | | 1,147 | |
New York State, Urban Development, Build America Project, RB | | | | | | | | |
5.770%, 03/15/2039 | | | 1,970 | | | | 2,475 | |
Port Authority of New York & New Jersey, RB | | | | | | | | |
4.926%, 10/01/2051 | | | 245 | | | | 295 | |
4.458%, 10/01/2062 | | | 10,725 | | | | 11,791 | |
| | | | | | | | |
| | | | | | | 38,492 | |
| | | | | | | | |
| | |
North Carolina — 0.1% | | | | | | | | |
University of North Carolina at Chapel Hill, Ser C, RB | | | | | | | | |
3.327%, 12/01/2036 | | | 3,660 | | | | 3,757 | |
| | | | | | | | |
| | |
Ohio — 0.3% | | | | | | | | |
American Municipal Power, RB | | | | | | | | |
6.053%, 02/15/2043 | | | 2,200 | | | | 2,713 | |
| | |
| 194 | | SEI Institutional Investments Trust / Annual Report / May 31, 2016 |
| | | | | | | | |
| Description | | Face Amount
($ Thousands) | | | Market Value
($ Thousands) | |
Ohio State University, Ser A, RB | | | | | | | | |
4.048%, 12/01/2056 | | $ | 4,150 | | | $ | 4,428 | |
Ohio Water Development Authority Water Pollution Control Loan Fund, RB | | | | | | | | |
4.879%, 12/01/2034 | | | 1,795 | | | | 2,122 | |
| | | | | | | | |
| | | | | | | 9,263 | |
| | | | | | | | |
| | |
Texas — 1.1% | | | | | | | | |
City Public Service Board of San Antonio Texas, RB | | | | | | | | |
5.808%, 02/01/2041 | | | 5,500 | | | | 7,393 | |
Grand Parkway Transportation, Sub-Ser E, RB | | | | | | | | |
5.184%, 10/01/2042 | | | 1,350 | | | | 1,717 | |
State of Texas, Build America Project, Ser A, GO | | | | | | | | |
4.631%, 04/01/2033 | | | 1,500 | | | | 1,821 | |
Texas State, Build America Project, GO | | | | | | | | |
5.517%, 04/01/2039 | | | 4,350 | | | | 5,889 | |
Texas Transportation Commission State Highway Fund, Ser B, RB | | | | | | | | |
5.178%, 04/01/2030 | | | 4,025 | | | | 4,960 | |
5.028%, 04/01/2026 | | | 6,600 | | | | 7,944 | |
University of Texas Permanent University Fund, Build America Project, RB | | | | | | | | |
5.262%, 07/01/2039 | | | 4,540 | | | | 5,828 | |
University of Texas, Build America Project, Ser B, RB Callable 08/15/2019 @ 100 | | | | | | | | |
6.276%, 08/15/2041 | | | 60 | | | | 68 | |
| | | | | | | | |
| | | | | | | 35,620 | |
| | | | | | | | |
| | |
Virginia — 0.0% | | | | | | | | |
Virginia Commonwealth University, Health System Authority, Ser A, RB | | | | | | | | |
4.956%, 01/01/2044 | | | 475 | | | | 534 | |
| | | | | | | | |
| | |
Washington — 0.2% | | | | | | | | |
State of Washington, GO | | | | | | | | |
5.140%, 08/01/2040 | | | 4,495 | | | | 5,747 | |
| | | | | | | | |
Total Municipal Bonds
(Cost $249,319) ($ Thousands) | | | | | | | 256,746 | |
| | | | | | | | |
| | |
U.S. TREASURY OBLIGATIONS — 4.7% | | | | | | | | |
U.S. Treasury Bills | | | | | | | | |
0.332%, 10/13/2016 (B) | | | 2,180 | | | | 2,177 | |
0.320%, 10/06/2016 (B) | | | 2,895 | | | | 2,891 | |
0.250%, 06/09/2016 (B) | | | 2,360 | | | | 2,360 | |
U.S. Treasury Bonds | | | | | | | | |
4.500%, 02/15/2036 | | | 1,908 | | | | 2,610 | |
3.000%, 05/15/2045 | | | 7,377 | | | | 7,942 | |
3.000%, 11/15/2045 (E) | | | 31,090 | | | | 33,466 | |
2.500%, 02/15/2046 (E) | | | 56,715 | | | | 55,135 | |
| | | | | | | | |
| Description | | Face Amount
($ Thousands) | | | Market Value
($ Thousands) | |
2.500%, 05/15/2046 | | $ | 22,720 | | | $ | 22,112 | |
U.S. Treasury Inflation Indexed Bonds | | | | | | | | |
1.375%, 02/15/2044 | | | 613 | | | | 677 | |
0.750%, 02/15/2045 | | | 1,517 | | | | 1,448 | |
U.S. Treasury Notes | | | | | | | | |
1.625%, 02/15/2026 | | | 10,340 | | | | 10,135 | |
1.625%, 05/15/2026 | | | 16,725 | | | | 16,408 | |
| | | | | | | | |
Total U.S. Treasury Obligations
(Cost $157,503) ($ Thousands) | | | | | | | 157,361 | |
| | | | | | | | |
|
U.S. GOVERNMENT AGENCY OBLIGATIONS — 1.0% | |
FHLB DN | | | | | | | | |
0.501%, 09/06/2016 (B) | | | 4,237 | | | | 4,232 | |
0.340%, 08/12/2016 (B) | | | 16,283 | | | | 16,269 | |
Tennessee Valley Authority | | | | | | | | |
5.880%, 04/01/2036 | | | 1,200 | | | | 1,659 | |
5.375%, 04/01/2056 | | | 2,160 | | | | 2,793 | |
4.250%, 09/15/2065 | | | 7,502 | | | | 8,015 | |
| | | | | | | | |
Total U.S. Government Agency Obligations
(Cost $32,353) ($ Thousands) | | | | | | | 32,968 | |
| | | | | | | | |
| | |
SOVEREIGN DEBT — 0.2% | | | | | | | | |
Asian Development Bank | | | | | | | | |
5.820%, 06/16/2028 | | | 3,310 | | | | 4,379 | |
Qatar Government International Bond | | | | | | | | |
4.625%, 06/02/2046 (A) | | | 3,140 | | | | 3,155 | |
| | | | | | | | |
Total Sovereign Debt
(Cost $7,475) ($ Thousands) | | | | | | | 7,534 | |
| | | | | | | | |
| | |
ASSET-BACKED SECURITY — 0.0% | | | | | | | | |
| | |
Other Asset-Backed Securities — 0.0%
| | | | | | | | |
321 Henderson Receivables LLC, Ser 2013-3A, Cl A | | | | | | | | |
4.080%, 01/17/2073 (A) | | | 489 | | | | 506 | |
| | | | | | | | |
Total Asset-Backed Security
(Cost $489) ($ Thousands) | | | | | | | 506 | |
| | | | | | | | |
| | | | |
| SEI Institutional Investments Trust / Annual Report / May 31, 2016 | | | 195 | |
SCHEDULE OF INVESTMENTS
Long Duration Credit Fund (Concluded)
May 31, 2016
| | | | | | | | |
| Description | | Shares | | | Market Value
($ Thousands) | |
| | |
CASH EQUIVALENT — 1.3% | | | | | | | | |
SEI Daily Income Trust, Prime Obligation Fund, Cl A | | | | | | | | |
0.270%**† | | | 41,860,814 | | | $ | 41,861 | |
| | | | | | | | |
Total Cash Equivalent
(Cost $41,861) ($ Thousands) | | | | | | | 41,861 | |
| | | | | | | | |
Total Investments — 99.4%
(Cost $3,214,832) ($ Thousands) | | | | | | $ | 3,314,590 | |
| | | | | | | | |
The open futures contracts held by the Fund at May 31, 2016, are as follows:
| | | | | | | | | | | | |
| Type of Contract | | Number of
Contracts
Long
(Short) | | | Expiration
Date | | | Unrealized
Appreciation
(Depreciation)
($ Thousands) | |
U.S. 10-Year Treasury Note | | | 46 | | | | Sep-2016 | | | $ | 13 | |
U.S. 5-Year Treasury Note | | | 279 | | | | Sep-2016 | | | | 54 | |
U.S. 5-Year Treasury Note | | | (187 | ) | | | Sep-2016 | | | | (39 | ) |
U.S. Long Treasury Bond | | | (689 | ) | | | Sep-2016 | | | | (279 | ) |
U.S. Ultra Long Treasury Bond | | | 412 | | | | Sep-2016 | | | | 456 | |
Ultra 10-Year U.S. Treasury Bond | | | (13 | ) | | | Sep-2016 | | | | (9 | ) |
| | | | | | | | | | | | |
| | | | | | | | | | $ | 196 | |
| | | | | | | | | | | | |
For the year ended May 31, 2016, the total amount of all open futures contracts, as presented in the table above, are representative of the volume of activity for the derivative type during the year.
Percentages are based on a Net Assets of $3,333,806 ($ Thousands).
| ** | | Rate shown is the 7-day effective yield as of May 31, 2016. |
| † | | Investment in Affiliated Security (see Note 6). |
| (A) | | Security exempt from registration under Rule 144A of the Securities Act of 1933. These securities may be resold in transactions exempt from registration normally to qualified institutions. On May 31, 2016, the value of these securities amounted to $398,390 ($ Thousands), representing 12.0% of the net assets of the Fund. |
| (B) | | The rate reported is the effective yield at time of purchase. |
| (C) | | Variable Rate Security — The rate reported on the Schedule of Investments is the rate in effect as of May 31, 2016. |
| (D) | | Step Bonds – The rate reflected on the Schedule of Investments is the effective yield on May 31, 2016. The coupon on a step bond changes on a specified date. |
| (E) | | Security, or portion thereof, has been pledged as collateral on open futures contracts. |
Cl — Class
DN — Discount Note
FHLB — Federal Home Loan Bank
GO — General Obligation
LLC — Limited Liability Company
MTN — Medium Term Note
RB — Revenue Bond
Ser — Series
ULC — Unlimited Liability Corporation
The following is a list of the level of inputs used as of May 31, 2016, in valuing the Fund’s investments and other financial instruments carried at value ($ Thousands):
| | | | | | | | | | | | | | | | |
| Investments in Securities | | Level 1 | | | Level 2 | | | Level 3 | | | Total | |
Corporate Obligations | | $ | — | | | $ | 2,817,614 | | | $ | — | | | $ | 2,817,614 | |
Municipal Bonds | | | — | | | | 256,746 | | | | — | | | | 256,746 | |
U.S. Treasury Obligations | | | — | | | | 157,361 | | | | — | | | | 157,361 | |
U.S. Government Agency Obligations | | | — | | | | 32,968 | | | | — | | | | 32,968 | |
Sovereign Debt | | | — | | | | 7,534 | | | | �� | | | | 7,534 | |
Asset-Backed Security | | | — | | | | 506 | | | | — | | | | 506 | |
Cash Equivalent | | | 41,861 | | | | — | | | | — | | | | 41,861 | |
| | | | | | | | | | | | | | | | |
Total Investments in Securities | | $ | 41,861 | | | $ | 3,272,729 | | | $ | — | | | $ | 3,314,590 | |
| | | | | | | | | | | | | | | | |
| | | | | | | | | | | | | | | | |
| Other Financial Instruments | | Level 1 | | | Level 2 | | | Level 3 | | | Total | |
Futures Contracts* | | | | | | | | | | | | | | | | |
Unrealized Appreciation | | $ | 523 | | | $ | — | | | $ | — | | | $ | 523 | |
Unrealized Depreciation | | | (327 | ) | | | — | | | | — | | | | (327 | ) |
| | | | | | | | | | | | | | | | |
Total Other Financial Instruments | | $ | 196 | | | $ | — | | | $ | — | | | $ | 196 | |
| | | | | | | | | | | | | | | | |
| * | | Futures contracts are valued at the unrealized appreciation (depreciation) on the instrument. |
For the year ended May 31, 2016, there were no transfers between Level 1 and Level 2 assets and liabilities.
For the year ended May 31, 2016, there were no transfers between Level 2 and Level 3 assets and liabilities.
For more information on valuation inputs, see Note 2 – Significant Accounting Policies in Notes to Financial Statements.
Amounts designated as “—” are $0 or have been rounded to $0.
The accompanying notes are an integral part of the financial statements.
| | |
| 196 | | SEI Institutional Investments Trust / Annual Report / May 31, 2016 |
SCHEDULE OF INVESTMENTS
Ultra Short Duration Bond Fund
May 31, 2016
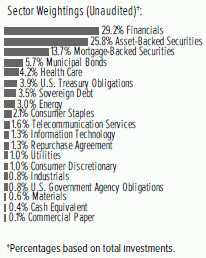
| | | | | | | | |
| Description | | Face Amount
($ Thousands) | | | Market Value
($ Thousands) | |
|
CORPORATE OBLIGATIONS — 46.0% | |
|
Consumer Discretionary — 1.0% | |
AutoZone | | | | | | | | |
1.625%, 04/21/2019 | | $ | 160 | | | $ | 159 | |
NBCUniversal Enterprise | | | | | | | | |
1.313%, 04/15/2018 (A) (B) | | | 1,400 | | | | 1,403 | |
Scripps Networks Interactive | | | | | | | | |
2.700%, 12/15/2016 | | | 1,800 | | | | 1,815 | |
Thomson Reuters | | | | | | | | |
1.650%, 09/29/2017 | | | 1,190 | | | | 1,192 | |
Time Warner Cable | | | | | | | | |
5.850%, 05/01/2017 | | | 950 | | | | 985 | |
| | | | | | | | |
| | | | | | | 5,554 | |
| | | | | | | | |
| | |
Consumer Staples — 2.2% | | | | | | | | |
Anheuser-Busch InBev Finance | | | | | | | | |
1.900%, 02/01/2019 | | | 640 | | | | 643 | |
1.897%, 02/01/2021 (A) | | | 800 | | | | 826 | |
Catholic Health Initiatives | | | | | | | | |
1.600%, 11/01/2017 | | | 1,215 | | | | 1,219 | |
CVS Health | | | | | | | | |
1.900%, 07/20/2018 | | | 1,000 | | | | 1,010 | |
JM Smucker | | | | | | | | |
1.750%, 03/15/2018 | | | 380 | | | | 382 | |
Kroger | | | | | | | | |
2.000%, 01/15/2019 | | | 290 | | | | 291 | |
Mondelez International | | | | | | | | |
1.157%, 02/01/2019 (A) | | | 1,500 | | | | 1,496 | |
Providence Health & Services Obligated Group | | | | | | | | |
5.800%, 10/01/2016 | | | 1,500 | | | | 1,521 | |
Reynolds American | | | | | | | | |
2.300%, 06/12/2018 | | | 1,070 | | | | 1,086 | |
SABMiller Holdings | | | | | | | | |
1.327%, 08/01/2018 (A) (B) | | | 750 | | | | 749 | |
Walgreens Boots Alliance | | | | | | | | |
1.750%, 11/17/2017 | | | 1,700 | | | | 1,707 | |
| | | | | | | | |
| Description | | Face Amount
($ Thousands) | | | Market Value
($ Thousands) | |
1.750%, 05/30/2018 | | $ | 850 | | | $ | 851 | |
| | | | | | | | |
| | | | | | | 11,781 | |
| | | | | | | | |
| | |
Energy — 3.1% | | | | | | | | |
BP Capital Markets | | | | | | | | |
1.140%, 05/10/2018 (A) | | | 1,500 | | | | 1,487 | |
1.052%, 02/13/2018 (A) | | | 1,000 | | | | 997 | |
ConocoPhillips | | | | | | | | |
1.500%, 05/15/2018 | | | 790 | | | | 785 | |
Devon Energy | | | | | | | | |
1.174%, 12/15/2016 (A) | | | 1,450 | | | | 1,441 | |
Enbridge | | | | | | | | |
1.083%, 06/02/2017 (A) | | | 1,575 | | | | 1,545 | |
Energy Transfer Partners | | | | | | | | |
2.500%, 06/15/2018 | | | 800 | | | | 789 | |
Hess | | | | | | | | |
1.300%, 06/15/2017 | | | 810 | | | | 805 | |
Kinder Morgan | | | | | | | | |
2.000%, 12/01/2017 | | | 785 | | | | 776 | |
Noble Energy | | | | | | | | |
8.250%, 03/01/2019 | | | 595 | | | | 669 | |
Schlumberger Holdings | | | | | | | | |
1.900%, 12/21/2017 (B) | | | 1,250 | | | | 1,254 | |
Schlumberger Norge | | | | | | | | |
1.250%, 08/01/2017 (B) | | | 205 | | | | 204 | |
Shell International Finance | | | | | | | | |
1.375%, 05/10/2019 | | | 750 | | | | 745 | |
Statoil | | | | | | | | |
0.832%, 11/09/2017 (A) | | | 1,350 | | | | 1,346 | |
Suncor Energy | | | | | | | | |
6.100%, 06/01/2018 | | | 875 | | | | 937 | |
TransCanada PipeLines | | | | | | | | |
1.421%, 01/12/2018 (A) | | | 2,600 | | | | 2,565 | |
| | | | | | | | |
| | | | | | | 16,345 | |
| | | | | | | | |
| | |
Financials — 30.1% | | | | | | | | |
ABN AMRO Bank | | | | | | | | |
4.250%, 02/02/2017 (B) | | | 705 | | | | 718 | |
American Express Credit MTN | | | | | | | | |
1.875%, 11/05/2018 | | | 1,100 | | | | 1,106 | |
0.951%, 06/05/2017 (A) | | | 1,720 | | | | 1,716 | |
0.924%, 09/22/2017 (A) | | | 925 | | | | 922 | |
American Honda Finance MTN | | | | | | | | |
1.479%, 02/22/2019 (A) | | | 1,150 | | | | 1,162 | |
1.090%, 07/13/2018 (A) | | | 1,500 | | | | 1,502 | |
Australia & New Zealand Banking Group | | | | | | | | |
1.186%, 05/15/2018 (A) | | | 625 | | �� | | 624 | |
Banco Santander Chile | | | | | | | | |
1.529%, 04/11/2017 (A) (B) | | | 1,200 | | | | 1,197 | |
Bank Nederlandse Gemeenten MTN | | | | | | | | |
0.700%, 07/14/2017 (A) (B) | | | 3,150 | | | | 3,148 | |
| | | | |
| SEI Institutional Investments Trust / Annual Report / May 31, 2016 | | | 197 | |
SCHEDULE OF INVESTMENTS
Ultra Short Duration Bond Fund (Continued)
May 31, 2016
| | | | | | | | |
| Description | | Face Amount
($ Thousands) | | | Market Value
($ Thousands) | |
Bank of America MTN | | | | | | | | |
5.650%, 05/01/2018 | | $ | 305 | | | $ | 326 | |
5.300%, 03/15/2017 | | | 900 | | | | 928 | |
2.000%, 01/11/2018 | | | 545 | | | | 547 | |
1.700%, 08/25/2017 | | | 1,100 | | | | 1,101 | |
1.668%, 01/15/2019 (A) | | | 1,000 | | | | 1,004 | |
1.272%, 08/25/2017 (A) | | | 1,790 | | | | 1,785 | |
0.934%, 06/15/2017 (A) | | | 2,060 | | | | 2,053 | |
Bank of Montreal MTN | | | | | | | | |
1.400%, 04/10/2018 | | | 925 | | | | 926 | |
1.229%, 04/09/2018 (A) | | | 1,000 | | | | 999 | |
Bank of New York Mellon MTN | | | | | | | | |
1.115%, 09/11/2019 (A) | | | 2,000 | | | | 1,969 | |
1.076%, 03/06/2018 (A) | | | 700 | | | | 700 | |
Bank of Nova Scotia | | | | | | | | |
1.458%, 01/15/2019 (A) | | | 1,470 | | | | 1,472 | |
Bank of Tokyo-Mitsubishi UFJ | | | | | | | | |
1.450%, 09/08/2017 (B) | | | 1,000 | | | | 998 | |
0.944%, 09/08/2017 (A) (B) | | | 1,025 | | | | 1,021 | |
Barclays Bank MTN | | | | | | | | |
6.050%, 12/04/2017 (B) | | | 1,500 | | | | 1,586 | |
BB&T MTN | | | | | | | | |
1.494%, 06/15/2018 (A) | | | 890 | | | | 895 | |
1.297%, 02/01/2019 (A) | | | 800 | | | | 803 | |
Berkshire Hathaway Finance | | | | | | | | |
1.450%, 03/07/2018 | | | 1,100 | | | | 1,107 | |
0.931%, 01/12/2018 (A) | | | 2,345 | | | | 2,351 | |
BPCE MTN | | | | | | | | |
1.480%, 02/10/2017 (A) | | | 1,000 | | | | 1,004 | |
Capital One | | | | | | | | |
1.778%, 08/17/2018 (A) | | | 1,150 | | | | 1,157 | |
1.313%, 02/05/2018 (A) | | | 1,100 | | | | 1,099 | |
Capital One Bank USA | | | | | | | | |
1.300%, 06/05/2017 | | | 2,500 | | | | 2,502 | |
Citigroup | | | | | | | | |
1.700%, 04/27/2018 | | | 850 | | | | 849 | |
1.550%, 08/14/2017 | | | 750 | | | | 750 | |
1.401%, 04/08/2019 (A) | | | 1,000 | | | | 994 | |
1.361%, 11/24/2017 (A) | | | 2,580 | | | | 2,581 | |
1.324%, 04/27/2018 (A) | | | 2,180 | | | | 2,178 | |
Citizens Bank MTN | | | | | | | | |
1.600%, 12/04/2017 | | | 2,000 | | | | 1,990 | |
Commonwealth Bank of Australia MTN | | | | | | | | |
0.904%, 09/08/2017 (A) (B) | | | 1,250 | | | | 1,249 | |
Cooperatieve Rabobank UA | | | | | | | | |
3.375%, 01/19/2017 | | | 1,250 | | | | 1,269 | |
Credit Agricole MTN | | | | | | | | |
1.605%, 06/10/2020 (A) (B) | | | 500 | | | | 499 | |
Credit Suisse NY | | | | | | | | |
1.700%, 04/27/2018 | | | 1,275 | | | | 1,276 | |
1.328%, 01/29/2018 (A) | | | 1,100 | | | | 1,098 | |
1.155%, 05/26/2017 (A) | | | 980 | | | | 979 | |
| | | | | | | | |
| Description | | Face Amount
($ Thousands) | | | Market Value
($ Thousands) | |
Daimler Finance North America | | | | | | | | |
1.375%, 08/01/2017 (B) | | $ | 1,470 | | | $ | 1,469 | |
Daimler Finance North America LLC | | | | | | | | |
1.650%, 05/18/2018 (B) | | | 800 | | | | 799 | |
Deutsche Bank | | | | | | | | |
1.350%, 05/30/2017 | | | 1,250 | | | | 1,245 | |
1.307%, 02/13/2018 (A) | | | 1,100 | | | | 1,091 | |
Fifth Third Bank MTN | | | | | | | | |
1.546%, 08/20/2018 (A) | | | 1,250 | | | | 1,255 | |
1.350%, 06/01/2017 | | | 2,000 | | | | 2,000 | |
Ford Motor Credit LLC | | | | | | | | |
2.021%, 05/03/2019 | | | 1,300 | | | | 1,296 | |
1.724%, 12/06/2017 | | | 750 | | | | 749 | |
1.534%, 06/15/2018 (A) | | | 1,940 | | | | 1,926 | |
1.462%, 03/12/2019 (A) | | | 1,000 | | | | 995 | |
1.154%, 09/08/2017 (A) | | | 1,480 | | | | 1,475 | |
General Electric MTN | | | | | | | | |
1.339%, 04/02/2018 (A) | | | 500 | | | | 503 | |
General Motors Financial | | | | | | | | |
2.400%, 04/10/2018 | | | 1,600 | | | | 1,606 | |
Goldman Sachs Group | | | | | | | | |
2.375%, 01/22/2018 | | | 2,300 | | | | 2,325 | |
1.838%, 04/30/2018 (A) | | | 215 | | | | 217 | |
1.798%, 04/23/2020 (A) | | | 875 | | | | 875 | |
1.726%, 11/15/2018 (A) | | | 1,375 | | | | 1,383 | |
1.434%, 12/15/2017 (A) | | | 1,730 | | | | 1,730 | |
HSBC Bank | | | | | | | | |
1.266%, 05/15/2018 (A) (B) | | | 2,655 | | | | 2,647 | |
HSBC USA | | | | | | | | |
1.300%, 06/23/2017 | | | 1,850 | | | | 1,847 | |
Huntington National Bank | | | | | | | | |
2.200%, 11/06/2018 | | | 1,225 | | | | 1,236 | |
1.375%, 04/24/2017 | | | 850 | | | | 851 | |
Hyundai Capital America MTN | | | | | | | | |
2.000%, 03/19/2018 (B) | | | 560 | | | | 561 | |
ING Bank | | | | | | | | |
1.315%, 10/01/2019 (A) (B) | | | 1,300 | | | | 1,281 | |
JPMorgan Chase MTN | | | | | | | | |
1.593%, 01/23/2020 (A) | | | 700 | | | | 701 | |
1.538%, 01/25/2018 (A) | | | 2,205 | | | | 2,216 | |
1.264%, 01/28/2019 (A) | | | 1,000 | | | | 996 | |
1.145%, 03/01/2018 (A) | | | 1,100 | | | | 1,098 | |
KeyBank | | | | | | | | |
2.350%, 03/08/2019 | | | 750 | | | | 759 | |
1.155%, 06/01/2018 (A) | | | 1,300 | | | | 1,297 | |
1.152%, 11/25/2016 (A) | | | 1,490 | | | | 1,492 | |
Lloyds Bank | | | | | | | | |
1.408%, 05/14/2025 (A) | | | 1,200 | | | | 1,198 | |
1.160%, 03/16/2018 (A) | | | 1,250 | | | | 1,242 | |
Macquarie Group | | | | | | | | |
1.637%, 01/31/2017 (A) (B) | | | 1,000 | | | | 1,002 | |
| | |
| 198 | | SEI Institutional Investments Trust / Annual Report / May 31, 2016 |
| | | | | | | | |
| Description | | Face Amount
($ Thousands) | | �� | Market Value
($ Thousands) | |
Manufacturers & Traders Trust | | | | | | | | |
1.400%, 07/25/2017 | | $ | 1,150 | | | $ | 1,148 | |
1.013%, 01/30/2017 (A) | | | 900 | | | | 900 | |
0.938%, 07/25/2017 (A) | | | 950 | | | | 948 | |
Metropolitan Life Global Funding I | | | | | | | | |
1.500%, 01/10/2018 (B) | | | 740 | | | | 742 | |
Mizuho Bank | | | | | | | | |
1.080%, 09/25/2017 (A) (B) | | | 3,240 | | | | 3,226 | |
Morgan Stanley MTN | | | | | | | | |
5.950%, 12/28/2017 | | | 550 | | | | 586 | |
1.918%, 04/25/2018 (A) | | | 1,000 | | | | 1,010 | |
1.488%, 01/24/2019 (A) | | | 750 | | | | 749 | |
1.083%, 10/18/2016 (A) | | | 1,000 | | | | 1,001 | |
Nissan Motor Acceptance MTN | | | | | | | | |
1.330%, 09/26/2016 (A) (B) | | | 985 | | | | 987 | |
1.182%, 03/03/2017 (A) (B) | | | 615 | | | | 615 | |
PNC Bank | | | | | | | | |
1.800%, 11/05/2018 | | | 2,565 | | | | 2,585 | |
Pricoa Global Funding I | | | | | | | | |
1.350%, 08/18/2017 (B) | | | 1,200 | | | | 1,201 | |
1.150%, 11/25/2016 (B) | | | 800 | | | | 800 | |
Principal Life Global Funding II | | | | | | | | |
1.500%, 04/18/2019 (B) | | | 500 | | | | 495 | |
1.200%, 05/19/2017 (B) | | | 1,000 | | | | 1,000 | |
1.125%, 02/24/2017 (B) | | | 550 | | | | 550 | |
Protective Life Global Funding | | | | | | | | |
1.722%, 04/15/2019 (B) | | | 1,065 | | | | 1,063 | |
Prudential Financial MTN | | | | | | | | |
1.406%, 08/15/2018 (A) | | | 1,649 | | | | 1,645 | |
Royal Bank of Canada MTN | | | | | | | | |
1.625%, 04/15/2019 | | | 1,000 | | | | 1,002 | |
Santander Bank | | | | | | | | |
1.561%, 01/12/2018 (A) | | | 1,250 | | | | 1,244 | |
Santander UK MTN | | | | | | | | |
1.511%, 08/24/2018 (A) | | | 1,250 | | | | 1,247 | |
1.040%, 09/29/2017 (A) | | | 1,500 | | | | 1,494 | |
Simon Property Group | | | | | | | | |
1.500%, 02/01/2018 (B) | | | 1,345 | | | | 1,346 | |
Societe Generale MTN | | | | | | | | |
1.705%, 10/01/2018 (A) | | | 2,500 | | | | 2,512 | |
Standard Chartered MTN | | | | | | | | |
1.273%, 04/17/2018 (A) (B) | | | 2,000 | | | | 1,980 | |
Sumitomo Mitsui Banking MTN | | | | | | | | |
1.573%, 01/18/2019 (A) | | | 1,550 | | | | 1,553 | |
Synchrony Financial | | | | | | | | |
1.875%, 08/15/2017 | | | 760 | | | | 760 | |
1.867%, 02/03/2020 (A) | | | 1,750 | | | | 1,694 | |
Toronto-Dominion Bank MTN | | | | | | | | |
1.475%, 01/22/2019 (A) | | | 1,180 | | | | 1,187 | |
1.178%, 07/23/2018 (A) | | | 1,500 | | | | 1,500 | |
0.877%, 05/02/2017 (A) | | | 690 | | | | 689 | |
| | | | | | | | |
| Description | | Face Amount
($ Thousands) | | | Market Value
($ Thousands) | |
Toyota Motor Credit MTN | | | | | | | | |
1.550%, 07/13/2018 | | $ | 1,500 | | | $ | 1,510 | |
UBS MTN | | | | | | | | |
1.330%, 03/26/2018 (A) | | | 1,250 | | | | 1,251 | |
1.266%, 08/14/2019 (A) | | | 1,750 | | | | 1,737 | |
Union Bank | | | | | | | | |
1.380%, 09/26/2016 (A) | | | 1,400 | | | | 1,402 | |
US Bancorp MTN | | | | | | | | |
1.038%, 04/25/2019 (A) | | | 1,400 | | | | 1,393 | |
US Bank MTN | | | | | | | | |
1.218%, 01/29/2018 (A) | | | 700 | | | | 703 | |
Ventas Realty | | | | | | | | |
1.550%, 09/26/2016 | | | 750 | | | | 751 | |
1.250%, 04/17/2017 | | | 285 | | | | 284 | |
Volkswagen Group of America Finance | | | | | | | | |
1.250%, 05/23/2017 (B) | | | 750 | | | | 747 | |
Volkswagen Group of America Finance LLC | | | | | | | | |
1.124%, 05/22/2018 (A) (B) | | | 750 | | | | 738 | |
1.076%, 11/20/2017 (A) (B) | | | 3,000 | | | | 2,967 | |
Volkswagen International Finance | | | | | | | | |
1.125%, 11/18/2016 (B) | | | 1,090 | | | | 1,090 | |
1.066%, 11/18/2016 (A) (B) | | | 1,260 | | | | 1,257 | |
Voya Financial | | | | | | | | |
2.900%, 02/15/2018 | | | 650 | | | | 659 | |
WEA Finance LLC | | | | | | | | |
1.750%, 09/15/2017 (B) | | | 700 | | | | 700 | |
Wells Fargo MTN | | | | | | | | |
1.400%, 09/08/2017 | | | 1,000 | | | | 1,002 | |
1.375%, 01/22/2018 (A) | | | 500 | | | | 502 | |
1.318%, 01/30/2020 (A) | | | 1,250 | | | | 1,247 | |
1.268%, 04/23/2018 (A) | | | 1,290 | | | | 1,293 | |
Westpac Banking | | | | | | | | |
1.243%, 01/17/2019 (A) | | | 800 | | | | 799 | |
| | | | | | | | |
| | | | | | | 160,994 | |
| | | | | | | | |
| | |
Health Care — 4.3% | | | | | | | | |
AbbVie | | | | | | | | |
1.800%, 05/14/2018 | | | 1,200 | | | | 1,202 | |
Actavis Funding SCS | | | | | | | | |
2.350%, 03/12/2018 | | | 1,730 | | | | 1,744 | |
1.712%, 03/12/2018 (A) | | | 2,025 | | | | 2,033 | |
1.300%, 06/15/2017 | | | 1,250 | | | | 1,246 | |
Amgen | | | | | | | | |
1.034%, 05/22/2017 (A) | | | 2,280 | | | | 2,281 | |
Baxalta | | | | | | | | |
1.404%, 06/22/2018 (A) (B) | | | 3,300 | | | | 3,262 | |
Catholic Health Initiatives | | | | | | | | |
2.600%, 08/01/2018 | | | 740 | | | | 751 | |
Celgene | | | | | | | | |
2.125%, 08/15/2018 | | | 750 | | | | 758 | |
Express Scripts Holding | | | | | | | | |
2.650%, 02/15/2017 | | | 2,860 | | | | 2,889 | |
| | | | |
| SEI Institutional Investments Trust / Annual Report / May 31, 2016 | | | 199 | |
SCHEDULE OF INVESTMENTS
Ultra Short Duration Bond Fund (Continued)
May 31, 2016
| | | | | | | | |
| Description | | Face Amount
($ Thousands) | | | Market Value ($ Thousands) | |
| | | | | | | | |
1.250%, 06/02/2017 | | $ | 1,750 | | | $ | 1,747 | |
Mylan | | | | | | | | |
1.350%, 11/29/2016 | | | 950 | | | | 949 | |
Perrigo | | | | | | | | |
1.300%, 11/08/2016 | | | 265 | | | | 264 | |
Thermo Fisher Scientific | | | | | | | | |
1.300%, 02/01/2017 | | | 415 | | | | 415 | |
UnitedHealth Group | | | | | | | | |
1.083%, 01/17/2017 (A) | | | 2,005 | | | | 2,009 | |
Zimmer Holdings | | | | | | | | |
1.450%, 04/01/2017 | | | 1,400 | | | | 1,400 | |
| | | | | | | | |
| | | | | | | 22,950 | |
| | | | | | | | |
|
Industrials — 0.8% | |
Air Lease | | | | | | | | |
2.125%, 01/15/2018 | | | 385 | | | | 385 | |
Caterpillar Financial Services MTN | | | | | | | | |
1.354%, 02/23/2018 (A) | | | 1,435 | | | | 1,446 | |
GATX | | | | | | | | |
1.250%, 03/04/2017 | | | 525 | | | | 524 | |
Hutchison Whampoa International | | | | | | | | |
1.625%, 10/31/2017 (B) | | | 1,400 | | | | 1,401 | |
TTX MTN | | | | | | | | |
2.250%, 02/01/2019 (B) | | | 465 | | | | 470 | |
| | | | | | | | |
| | | | | | | 4,226 | |
| | | | | | | | |
|
Information Technology — 1.3% | |
Apple | | | | | | | | |
1.474%, 02/22/2019 (A) | | | 1,375 | | | | 1,394 | |
Cisco Systems | | | | | | | | |
1.254%, 02/21/2018 (A) | | | 550 | | | | 554 | |
eBay | | | | | | | | |
2.500%, 03/09/2018 | | | 800 | | | | 812 | |
Fidelity National Information Services | | | | | | | | |
1.450%, 06/05/2017 | | | 470 | | | | 468 | |
Hewlett Packard Enterprise | | | | | | | | |
2.450%, 10/05/2017 (B) | | | 1,750 | | | | 1,766 | |
2.369%, 10/05/2017 (A) (B) | | | 2,215 | | | | 2,229 | |
| | | | | | | | |
| | | | | | | 7,223 | |
| | | | | | | | |
|
Materials — 0.6% | |
Monsanto | | | | | | | | |
1.150%, 06/30/2017 | | | 1,425 | | | | 1,426 | |
0.832%, 11/07/2016 (A) | | | 1,059 | | | | 1,058 | |
Rio Tinto Finance USA | | | | | | | | |
1.482%, 06/17/2016 (A) | | | 910 | | | | 910 | |
| | | | | | | | |
| | | | | | | 3,394 | |
| | | | | | | | |
|
Telecommunication Services — 1.6% | |
AT&T | | | | | | | | |
5.500%, 02/01/2018 | | | 1,700 | | | | 1,809 | |
1.559%, 06/30/2020 (A) | | | 1,250 | | | | 1,248 | |
| | | | | | | | |
| Description | | Face Amount
($ Thousands) | | | Market Value ($ Thousands) | |
| | | | | | | | |
British Telecommunications | | | | | | | | |
1.250%, 02/14/2017 | | $ | 655 | | | $ | 655 | |
Verizon Communications | | | | | | | | |
2.382%, 09/14/2018 (A) | | | 935 | | | | 961 | |
1.350%, 06/09/2017 | | | 3,150 | | | | 3,155 | |
1.036%, 06/09/2017 (A) | | | 720 | | | | 721 | |
| | | | | | | | |
| | | | | | | 8,549 | |
| | | | | | | | |
|
Utilities — 1.0% | |
Duke Energy | | | | | | | | |
1.009%, 04/03/2017 (A) | | | 2,000 | | | | 1,998 | |
Exelon | | | | | | | | |
1.550%, 06/09/2017 | | | 1,200 | | | | 1,200 | |
Southern | | | | | | | | |
1.550%, 07/01/2018 | | | 650 | | | | 651 | |
1.300%, 08/15/2017 | | | 780 | | | | 780 | |
Xcel Energy | | | | | | | | |
1.200%, 06/01/2017 | | | 670 | | | | 669 | |
| | | | | | | | |
| | | | | | | 5,298 | |
| | | | | | | | |
Total Corporate Obligations
(Cost $246,329) ($ Thousands) | | | | 246,314 | |
| | | | | | | | |
|
ASSET-BACKED SECURITIES — 26.4% | |
|
Automotive — 13.1% | |
Ally Auto Receivables Trust,
Ser 2014-SN1, Cl A3 | | | | | | | | |
0.750%, 02/21/2017 | | | 4 | | | | 4 | |
Ally Master Owner Trust,
Ser 2014-4, Cl A1 | | | | | | | | |
0.835%, 06/17/2019 (A) | | | 945 | | | | 944 | |
Ally Master Owner Trust,
Ser 2014-4, Cl A2 | | | | | | | | |
1.430%, 06/17/2019 | | | 3,485 | | | | 3,487 | |
Ally Master Owner Trust,
Ser 2014-5, Cl A2 | | | | | | | | |
1.600%, 10/15/2019 | | | 2,245 | | | | 2,247 | |
American Credit Acceptance Receivables Trust,
Ser 2014-4, Cl A | | | | | | | | |
1.330%, 07/10/2018 (B) | | | 88 | | | | 88 | |
AmeriCredit Automobile Receivables Trust, Ser 2013-2, Cl B | | | | | | | | |
1.190%, 05/08/2018 | | | 706 | | | | 706 | |
AmeriCredit Automobile Receivables Trust,
Ser 2013-4, Cl C | | | | | | | | |
2.720%, 09/09/2019 | | | 1,850 | | | | 1,870 | |
AmeriCredit Automobile Receivables Trust,
Ser 2014-4, Cl A3 | | | | | | | | |
1.270%, 07/08/2019 | | | 875 | | | | 874 | |
AmeriCredit Automobile Receivables Trust,
Ser 2015-1, Cl B | | | | | | | | |
1.880%, 03/09/2020 | | | 1,290 | | | | 1,292 | |
| | |
| 200 | | SEI Institutional Investments Trust / Annual Report / May 31, 2016 |
| | | | | | | | |
| Description | | Face Amount
($ Thousands) | | | Market Value
($ Thousands) | |
AmeriCredit Automobile Receivables Trust,
Ser 2016-1, Cl A2B | | | | | | | | |
1.187%, 06/10/2019 (A) | | $ | 1,155 | | | $ | 1,156 | |
AmeriCredit Automobile Receivables Trust,
Ser 2016-1, Cl A2A | | | | | | | | |
1.520%, 06/10/2019 | | | 480 | | | | 480 | |
AmeriCredit Automobile Receivables Trust,
Ser 2016-2, Cl A3 | | | | | | | | |
1.600%, 11/09/2020 | | | 470 | | | | 468 | |
ARI Fleet Lease Trust, Ser 2013-A, Cl A3 | | | | | | | | |
0.920%, 07/15/2021 (B) | | | 192 | | | | 192 | |
ARI Fleet Lease Trust, Ser 2014-A, Cl A2 | | | | | | | | |
0.810%, 11/15/2022 (B) | | | 118 | | | | 118 | |
Bank of The West Auto Trust, Ser 2015-1, Cl A2B | | | | | | | | |
0.783%, 04/16/2018 (A) (B) | | | 919 | | | | 920 | |
California Republic Auto Receivables Trust,
Ser 2013-1, Cl A2 | | | | | | | | |
1.410%, 09/17/2018 (B) | | | 446 | | | | 446 | |
Capital Auto Receivables Asset Trust,
Ser 2013- 1, Cl A4 | | | | | | | | |
0.970%, 01/22/2018 | | | 60 | | | | 59 | |
Capital Auto Receivables Asset Trust,
Ser 2013- 3, Cl B | | | | | | | | |
2.320%, 07/20/2018 | | | 1,225 | | | | 1,229 | |
Capital Auto Receivables Asset Trust,
Ser 2014- 3, Cl A2 | | | | | | | | |
1.180%, 12/20/2017 | | | 1,180 | | | | 1,179 | |
Capital Auto Receivables Asset Trust,
Ser 2015- 3, Cl A2 | | | | | | | | |
1.720%, 01/22/2019 | | | 890 | | | | 890 | |
CarMax Auto Owner Trust,
Ser 2012-3, Cl C | | | | | | | | |
1.500%, 08/15/2018 | | | 225 | | | | 225 | |
CarMax Auto Owner Trust,
Ser 2015-3, Cl A2A | | | | | | | | |
1.100%, 11/15/2018 | | | 980 | | | | 980 | |
CarMax Auto Owner Trust,
Ser 2016-2, Cl A2A | | | | | | | | |
1.240%, 06/17/2019 | | | 1,350 | | | | 1,342 | |
Chesapeake Funding LLC,
Ser 2011-2A, Cl A | | | | | | | | |
1.689%, 04/07/2024 (A) (B) | | | 133 | | | | 133 | |
Chesapeake Funding LLC,
Ser 2012-2A, Cl A | | | | | | | | |
0.887%, 05/07/2024 (A) (B) | | | 42 | | | | 42 | |
Chesapeake Funding,
Ser 2014-1A, Cl A | | | | | | | | |
0.859%, 03/07/2026 (A) (B) | | | 1,812 | | | | 1,808 | |
Chesapeake Funding,
Ser 2015-1A, Cl B | | | | | | | | |
1.387%, 02/07/2027 (A) (B) | | | 1,330 | | | | 1,329 | |
Chrysler Capital Auto Receivables Trust,
Ser 2015-BA, Cl A2 | | | | | | | | |
1.460%, 12/17/2018 (B) | | | 1,038 | | | | 1,039 | |
CPS Auto Receivables Trust,
Ser 2013-D, Cl A | | | | | | | | |
1.540%, 07/16/2018 (B) | | | 610 | | | | 609 | |
CPS Auto Receivables Trust,
Ser 2014-A, Cl A | | | | | | | | |
1.210%, 08/15/2018 (B) | | | 180 | | | | 180 | |
CPS Auto Receivables Trust,
Ser 2015-A, Cl A | | | | | | | | |
1.530%, 07/15/2019 (B) | | | 1,464 | | | | 1,461 | |
| | | | | | | | |
| Description | | Face Amount
($ Thousands) | | | Market Value
($ Thousands) | |
CPS Auto Trust, Ser 2012-C, Cl A | | | | | | | | |
1.820%, 12/16/2019 (B) | | $ | 634 | | | $ | 634 | |
Credit Acceptance Auto Loan Trust,
Ser 2013- 2A, Cl A | | | | | | | | |
1.500%, 04/15/2021 (B) | | | 202 | | | | 202 | |
Credit Acceptance Auto Loan Trust, Ser 2014- 1A, Cl A | | | | | | | | |
1.550%, 10/15/2021 (B) | | | 1,069 | | | | 1,068 | |
Credit Acceptance Auto Loan Trust,
Ser 2014- 2A, Cl A | | | | | | | | |
1.880%, 03/15/2022 (B) | | | 2,250 | | | | 2,252 | |
DT Auto Owner Trust,
Ser 2015-3A, Cl A | | | | | | | | |
1.660%, 03/15/2019 (B) | | | 1,411 | | | | 1,412 | |
Enterprise Fleet Financing LLC,
Ser 2014-1, Cl A3 | | | | | | | | |
1.380%, 09/20/2019 (B) | | | 700 | | | | 699 | |
Enterprise Fleet Financing,
Ser 2014-1, Cl A2 | | | | | | | | |
0.870%, 09/20/2019 (B) | | | 151 | | | | 150 | |
Enterprise Fleet Financing,
Ser 2014-2, Cl A2 | | | | | | | | |
1.050%, 03/20/2020 (B) | | | 2,436 | | | | 2,424 | |
First Investors Auto Owner Trust,
Ser 2013-1A, Cl B | | | | | | | | |
1.810%, 10/15/2018 (B) | | | 667 | | | | 667 | |
First Investors Auto Owner Trust,
Ser 2013-2A, Cl A2 | | | | | | | | |
1.230%, 03/15/2019 (B) | | | 109 | | | | 109 | |
First Investors Auto Owner Trust,
Ser 2014-2A, Cl A2 | | | | | | | | |
0.860%, 08/15/2018 (B) | | | 171 | | | | 171 | |
First Investors Auto Owner Trust,
Ser 2014-3A, Cl A2 | | | | | | | | |
1.060%, 11/15/2018 (B) | | | 380 | | | | 380 | |
First Investors Auto Owner Trust,
Ser 2014-3A, Cl A3 | | | | | | | | |
1.670%, 11/16/2020 (B) | | | 1,055 | | | | 1,054 | |
First Investors Auto Owner Trust,
Ser 2015-1A, Cl A2 | | | | | | | | |
1.210%, 04/15/2019 (B) | | | 790 | | | | 788 | |
Flagship Credit Auto Trust, Ser 2013-2, Cl A | | | | | | | | |
1.940%, 01/15/2019 (B) | | | 351 | | | | 352 | |
Ford Credit Auto Lease Trust,
Ser 2014-B, Cl A4 | | | | | | | | |
1.100%, 11/15/2017 | | | 260 | | | | 260 | |
Ford Credit Auto Lease Trust,
Ser 2015-B, Cl B | | | | | | | | |
1.920%, 03/15/2019 | | | 765 | | | | 762 | |
Ford Credit Auto Owner Trust,
Ser 2012-B, Cl D | | | | | | | | |
2.930%, 10/15/2018 | | | 1,500 | | | | 1,505 | |
Ford Credit Floorplan Master Owner Trust,
Ser 2012-2, Cl A | | | | | | | | |
1.920%, 01/15/2019 | | | 4,414 | | | | 4,436 | |
Ford Credit Floorplan Master Owner Trust,
Ser 2013-5, Cl A2 | | | | | | | | |
0.903%, 09/15/2018 (A) | | | 655 | | | | 655 | |
| | | | |
| SEI Institutional Investments Trust / Annual Report / May 31, 2016 | | | 201 | |
SCHEDULE OF INVESTMENTS
Ultra Short Duration Bond Fund (Continued)
May 31, 2016
| | | | | | | | |
| Description | | Face Amount
($ Thousands) | | | Market Value
($ Thousands) | |
| | | | | | | | |
Ford Credit Floorplan Master Owner Trust,
Ser 2014-1, Cl A2 | | | | | | | | |
0.835%, 02/15/2019 (A) | | $ | 850 | | | $ | 850 | |
Ford Credit Floorplan Master Owner Trust, Ser 2014-1, Cl B | | | | | | | | |
1.400%, 02/15/2019 | | | 205 | | | | 205 | |
Ford Credit Floorplan Master Owner Trust, Ser 2015-4, Cl A2 | | | | | | | | |
1.035%, 08/15/2020 (A) | | | 170 | | | | 170 | |
GLS Auto Receivables Trust, Ser 2016-1A, Cl A | | | | | | | | |
2.730%, 10/15/2020 (B) | | | 700 | | | | 700 | |
GM Financial Automobile Leasing Trust, Ser 2014-1A, Cl A3 | | | | | | | | |
1.010%, 05/22/2017 (B) | | | 420 | | | | 420 | |
GM Financial Automobile Leasing Trust, Ser 2015-1, Cl B | | | | | | | | |
2.140%, 06/20/2019 | | | 1,895 | | | | 1,880 | |
GM Financial Automobile Leasing Trust, Ser 2016-2, Cl A3 | | | | | | | | |
1.620%, 09/20/2019 | | | 580 | | | | 578 | |
GMF Floorplan Owner Revolving Trust, Ser 2015-1, Cl A2 | | | | | | | | |
0.933%, 05/15/2020 (A) (B) | | | 1,600 | | | | 1,589 | |
Harley-Davidson Motorcycle Trust, Ser 2013-1, Cl A3 | | | | | | | | |
0.650%, 07/16/2018 | | | 78 | | | | 78 | |
Hertz Fleet Lease Funding, Ser 2013-3, Cl B | | | | | | | | |
1.487%, 12/10/2027 (A) (B) | | | 1,825 | | | | 1,826 | |
Mercedes-Benz Auto Receivables Trust, Ser 2013-1, Cl A4 | | | | | | | | |
1.130%, 11/15/2019 | | | 1,000 | | | | 1,001 | |
Oscar US Funding Trust, Ser 2014-1A, Cl A2 | | | | | | | | |
1.000%, 08/15/2017 (B) | | | 169 | | | | 169 | |
Porsche Innovative Lease Owner Trust, Ser 2014-1, Cl A3 | | | | | | | | |
1.030%, 11/20/2017 (B) | | | 1,275 | | | | 1,276 | |
Prestige Auto Receivables Trust, Ser 2013-1A, Cl A3 | | | | | | | | |
1.330%, 05/15/2019 (B) | | | 589 | | | | 589 | |
Prestige Auto Receivables Trust, Ser 2014-1A, Cl A2 | | | | | | | | |
0.970%, 03/15/2018 (B) | | | 150 | | | | 150 | |
Prestige Auto Receivables Trust, Ser 2015-1, Cl A2 | | | | | | | | |
1.090%, 02/15/2019 (B) | | | 228 | | | | 228 | |
Prestige Auto Receivables Trust, Ser 2016-1A, Cl A2 | | | | | | | | |
1.780%, 08/15/2019 (B) | | | 900 | | | | 900 | |
Santander Drive Auto Receivables Trust, Ser 2012-2, Cl D | | | | | | | | |
3.870%, 02/15/2018 | | | 1,106 | | | | 1,111 | |
| | | | | | | | |
| Description | | Face Amount
($ Thousands) | | | Market Value
($ Thousands) | |
| | | | | | | | |
Santander Drive Auto Receivables Trust, Ser 2012-3, Cl D | | | | | | | | |
3.640%, 05/15/2018 | | $ | 1,175 | | | $ | 1,185 | |
Santander Drive Auto Receivables Trust, Ser 2013-4, Cl B | | | | | | | | |
2.160%, 01/15/2020 | | | 428 | | | | 429 | |
Susquehanna Auto Receivables Trust, Ser 2014-1A, Cl A3 | | | | | | | | |
1.000%, 02/15/2018 (B) | | | 586 | | | | 585 | |
Toyota Auto Receivables Owner Trust, Ser 2016-B, Cl A3 | | | | | | | | |
1.300%, 04/15/2020 | | | 240 | | | | 240 | |
USAA Auto Owner Trust, Ser 2015-1, Cl A3 | | | | | | | | |
1.200%, 06/17/2019 | | | 565 | | | | 566 | |
Volkswagen Credit Auto Master Trust, Ser 2014-1A, Cl A1 | | | | | | | | |
0.789%, 07/22/2019 (A) (B) | | | 1,250 | | | | 1,241 | |
Volvo Financial Equipment LLC, Ser 2014-1A, Cl A3 | | | | | | | | |
0.820%, 04/16/2018 (B) | | | 398 | | | | 398 | |
Westlake Automobile Receivables Trust, Ser 2014-2A, Cl C | | | | | | | | |
2.240%, 04/15/2020 (B) | | | 555 | | | | 553 | |
Westlake Automobile Receivables Trust, Ser 2014-2A, Cl A2 | | | | | | | | |
0.970%, 10/16/2017 (B) | | | 156 | | | | 156 | |
Westlake Automobile Receivables Trust, Ser 2015-1A, Cl B | | | | | | | | |
1.680%, 11/16/2020 (B) | | | 1,365 | | | | 1,359 | |
Westlake Automobile Receivables Trust, Ser 2015-1A, Cl A2 | | | | | | | | |
1.170%, 03/15/2018 (B) | | | 204 | | | | 204 | |
Westlake Automobile Receivables Trust, Ser 2015-2A, Cl A2A | | | | | | | | |
1.280%, 07/16/2018 (B) | | | 348 | | | | 348 | |
Wheels SPV LLC, Ser 2014-1A, Cl A2 | | | | | | | | |
0.840%, 03/20/2023 (B) | | | 741 | | | | 741 | |
World Omni Automobile Lease Securitization Trust, Ser 2015-A, Cl A2A | | | | | | | | |
1.060%, 05/15/2018 | | | 587 | | | | 587 | |
| | | | | | | | |
| | | | | | | 70,089 | |
| | | | | | | | |
|
Credit Cards — 3.7% | |
Barclays Dryrock Issuance Trust, Ser 2014-1, Cl A | | | | | | | | |
0.793%, 12/16/2019 (A) | | | 600 | | | | 600 | |
Cabela’s Credit Card Master Note Trust, Ser 2013-2A, Cl A2 | | | | | | | | |
1.085%, 08/16/2021 (A) (B) | | | 395 | | | | 395 | |
Capital One Multi-Asset Execution Trust, Ser 2007-A1, Cl A1 | | | | | | | | |
0.485%, 11/15/2019 (A) | | | 625 | | | | 625 | |
| | |
| 202 | | SEI Institutional Investments Trust / Annual Report / May 31, 2016 |
| | | | | | | | |
| Description | | Face Amount
($ Thousands) | | | Market Value
($ Thousands) | |
| | | | | | | | |
Capital One Multi-Asset Execution Trust, Ser 2014-A2, Cl A2 | | | | | | | | |
1.260%, 01/15/2020 | | $ | 3,037 | | | $ | 3,043 | |
Chase Issuance Trust, Ser 2012-A2, Cl A2 | | | | | | | | |
0.705%, 05/15/2019 (A) | | | 200 | | | | 200 | |
Chase Issuance Trust, Ser 2014-A1, Cl A1 | | | | | | | | |
1.150%, 01/15/2019 | | | 3,869 | | | | 3,874 | |
Citibank Credit Card Issuance Trust, Ser 2013- A2, Cl A2 | | | | | | | | |
0.723%, 05/26/2020 (A) | | | 1,015 | | | | 1,016 | |
Citibank Credit Card Issuance Trust, Ser 2013- A6, Cl A6 | | | | | | | | |
1.320%, 09/07/2018 | | | 1,775 | | | | 1,777 | |
Citibank Credit Card Issuance Trust, Ser 2014- A2, Cl A2 | | | | | | | | |
1.020%, 02/22/2019 | | | 2,134 | | | | 2,135 | |
Citibank Credit Card Issuance Trust, Ser 2014- A7, Cl A7 | | | | | | | | |
0.643%, 08/24/2018 (A) | | | 595 | | | | 595 | |
Discover Card Execution Note Trust, Ser 2014- A3, Cl A3 | | | | | | | | |
1.220%, 10/15/2019 | | | 2,270 | | | | 2,272 | |
Discover Card Execution Note Trust, Ser 2016- A2, Cl A2 | | | | | | | | |
0.975%, 09/15/2021 (A) | | | 1,335 | | | | 1,343 | |
Synchrony Credit Card Master Note Trust, Ser 2014-1, Cl A | | | | | | | | |
1.610%, 11/15/2020 | | | 2,250 | | | | 2,257 | |
| | | | | | | | |
| | | | | | | 20,132 | |
| | | | | | | | |
| |
Mortgage Related Securities — 0.7% | | | | | |
Accredited Mortgage Loan Trust,
Ser 2004-4, Cl A1A | | | | | |
1.119%, 01/25/2035 (A) | | | 392 | | | | 385 | |
Aegis Asset-Backed Securities Trust Mortgage Pass-Through Certificates, Ser 2004-4, Cl A1 | | | | | | | | |
1.166%, 10/25/2034 (A) | | | 1,268 | | | | 1,252 | |
Bear Stearns Asset-Backed Securities I Trust, Ser 2005-HE3, Cl M2 | | | | | | | | |
1.459%, 03/25/2035 (A) | | | 1,006 | | | | 997 | |
Bear Stearns Asset-Backed Securities Trust,
Ser 2004-2, Cl A1 | | | | | | | | |
1.439%, 08/25/2034 (A) | | | 259 | | | | 259 | |
HSBC Home Equity Loan Trust,
Ser 2007-3, Cl APT | | | | | | | | |
1.639%, 11/20/2036 (A) | | | 458 | | | | 456 | |
Option One Mortgage Loan Trust Asset-Backed Certificates, Ser 2005-4, Cl A3 | | | | | | | | |
0.699%, 11/25/2035 (A) | | | 86 | | | | 85 | |
| | | | | | | | |
| Description | | Face Amount
($ Thousands) | | | Market Value
($ Thousands) | |
| | | | | | | | |
Option One Mortgage Loan Trust,
Ser 2005-1, Cl A1A | | | | | | | | |
0.946%, 02/25/2035 (A) | | $ | 344 | | | $ | 340 | |
| | | | | | | | |
| | | | | | | 3,774 | |
| | | | | | | | |
| |
Other Asset-Backed Securities — 8.9% | | | | | |
Apidos CLO XII, Ser 2013-12A, Cl A | | | | | | | | |
1.728%, 04/15/2025 (A) (B) | | | 1,100 | | | | 1,089 | |
Avalon IV Capital,
Ser 2014-1AR, Cl AR | | | | | | | | |
1.803%, 04/17/2023 (A) (B) | | | 703 | | | | 699 | |
Carlyle Global Market Strategies CLO, Ser 2013-2A, Cl A | | | | | | | | |
1.770%, 04/18/2025 (A) (B) | | | 325 | | | | 323 | |
Carlyle Global Market Strategies CLO, Ser 2014-2AR, Cl A1R | | | | | | | | |
1.920%, 07/20/2023 (A) (B) | | | 745 | | | | 743 | |
Cent CLO, Ser 2014-16AR, Cl A1AR | | | | | | | | |
1.866%, 08/01/2024 (A) (B) | | | 2,220 | | | | 2,212 | |
Cent CLO, Ser 2014-20A, Cl A | | | | | | | | |
2.118%, 01/25/2026 (A) (B) | | | 1,850 | | | | 1,841 | |
CIFC Funding, Ser 2013-1A, Cl A1 | | | | | | | | |
1.783%, 04/16/2025 (A) (B) | | | 1,060 | | | | 1,050 | |
CIT Equipment Collateral, Ser 2014-VT1, Cl A2 | | | | | | | | |
0.860%, 05/22/2017 (B) | | | 879 | | | | 879 | |
CNH Equipment Trust, Ser 2016-B, Cl A2A | | | | | | | | |
1.310%, 10/15/2019 | | | 495 | | | | 495 | |
Credit-Based Asset Servicing and Securitization, Ser 2005-CB3, Cl M2 | | | | | | | | |
1.369%, 05/25/2035 (A) | | | 1,835 | | | | 1,814 | |
Dell Equipment Finance Trust, Ser 2014-1, Cl A3 | | | | | | | | |
0.940%, 06/22/2020 (B) | | | 206 | | | | 206 | |
Dryden XXXI Senior Loan Fund, Ser 2014-31A, Cl A | | | | | | | | |
1.983%, 04/18/2026 (A) (B) | | | 1,315 | | | | 1,309 | |
Gramercy Park CLO,
Ser 2014-1AR, Cl A1R | | | | | | | | |
1.933%, 07/17/2023 (A) (B) | | | 1,000 | | | | 998 | |
GreatAmerica Leasing Receivables Funding LLC, Ser 2015-1, Cl A3 | | | | | | | | |
1.540%, 07/20/2018 (B) | | | 2,440 | | | | 2,449 | |
GreatAmerica Leasing Receivables Funding LLC, Ser 2016-1, Cl A2 | | | | | | | | |
1.570%, 05/21/2018 (B) | | | 1,135 | | | | 1,136 | |
Green Tree Agency Advance Funding Trust, Ser 2015-T1, Cl AT1 | | | | | | | | |
2.302%, 10/15/2046 (B) | | | 605 | | | | 604 | |
GSAMP Trust, Ser 2006-HE1, Cl A2D | | | | | | | | |
0.756%, 01/25/2036 (A) | | | 2,200 | | | | 2,136 | |
ING IM CLO, Ser 2014-1A, Cl A1 | | | | | | | | |
2.133%, 04/18/2026 (A) (B) | | | 1,310 | | | | 1,304 | |
ING IM CLO, Ser 2014-1RA, Cl A1R | | | | | | | | |
1.832%, 03/14/2022 (A) (B) | | | 495 | | | | 494 | |
Limerock CLO II, Ser 2014-2A, Cl A | | | | | | | | |
2.133%, 04/18/2026 (A) (B) | | | 1,250 | | | | 1,244 | |
| | | | |
| SEI Institutional Investments Trust / Annual Report / May 31, 2016 | | | 203 | |
SCHEDULE OF INVESTMENTS
Ultra Short Duration Bond Fund (Continued)
May 31, 2016
| | | | | | | | |
| Description | | Face Amount
($ Thousands) | | | Market Value
($ Thousands) | |
| | | | | | | | |
Madison Park Funding,
Ser 2007-4A, Cl A1B | | | | | | | | |
0.886%, 03/22/2021 (A) (B) | | $ | 580 | | | $ | 560 | |
Magnetite CLO IX, Ser 2014-9A, Cl A1 | | | | | | | | |
2.058%, 07/25/2026 (A) (B) | | | 1,265 | | | | 1,264 | |
MMAF Equipment Finance LLC,
Ser 2011-AA, Cl A4 | | | | | | | | |
2.100%, 07/15/2017 (B) | | | 190 | | | | 190 | |
MMAF Equipment Finance LLC,
Ser 2013-AA, Cl A3 | | | | | | | | |
1.030%, 12/11/2017 (B) | | | 197 | | | | 197 | |
Nationstar HECM Loan Trust,
Ser 2016-1A, Cl A | | | | | | | | |
2.981%, 02/25/2026 (B) | | | 275 | | | | 275 | |
Navient Student Loan Trust,
Ser 2014-1, Cl A1 | | | | | | | | |
0.689%, 03/25/2021 (A) | | | 1,328 | | | | 1,325 | |
Navient Student Loan Trust,
Ser 2015-1, Cl A1 | | | | | | | | |
0.746%, 09/26/2022 (A) | | | 1,131 | | | | 1,126 | |
Nelnet Student Loan Trust,
Ser 2015-2A, Cl A1 | | | | | | | | |
0.716%, 01/25/2017 (A) (B) | | | 190 | | | | 190 | |
Neuberger Berman CLO XVI,
Ser 2014-16A, Cl A1 | | | | | | | | |
2.098%, 04/15/2026 (A) (B) | | | 955 | | | | 955 | |
NRZ Advance Receivables Trust Advance Receivables Backed, Ser 2015-T2, Cl AT2 | | | | | | | | |
3.302%, 08/15/2048 (B) | | | 755 | | | | 757 | |
NRZ Advance Receivables Trust Advance Receivables Backed, Ser 2015-T3, Cl AT3 | | | | | | | | |
2.540%, 11/15/2046 (B) | | | 1,500 | | | | 1,500 | |
NYCTL Trust, Ser 2015-A, Cl A | | | | | | | | |
1.340%, 11/10/2028 (B) | | | 706 | | | | 702 | |
Octagon Investment Partners XVI,
Ser 2013- 1A, Cl A | | | | | | | | |
1.753%, 07/17/2025 (A) (B) | | | 1,000 | | | | 989 | |
Ocwen Master Advance Receivables Trust, Ser 2015-T1, Cl AT1 | | | | | | | | |
2.537%, 09/17/2046 (B) | | | 735 | | | | 735 | |
Ocwen Master Advance Receivables Trust, Ser 2015-T2, Cl AT2 | | | | | | | | |
2.532%, 11/15/2046 (B) | | | 505 | | | | 505 | |
OHA Credit Partners VIII, Ser 2013-8A, Cl A | | | | | | | | |
1.754%, 04/20/2025 (A) (B) | | | 690 | | | | 684 | |
Race Point VI CLO, Ser 2014-6RA, Cl BR | | | | | | | | |
2.811%, 05/24/2023 (A) (B) | | | 1,650 | | | | 1,642 | |
SLM Private Education Loan Trust,
Ser 2011-B, Cl A1 | | | | | | | | |
1.285%, 12/16/2024 (A) (B) | | | 33 | | | | 33 | |
SLM Student Loan Trust, Ser 2003-14, Cl A5 | | | | | | | | |
0.868%, 01/25/2023 (A) | | | 231 | | | | 229 | |
SLM Student Loan Trust, Ser 2005-6, Cl A5A | | | | | | | | |
0.748%, 07/27/2026 (A) | | | 687 | | | | 679 | |
SLM Student Loan Trust,
Ser 2005-9, Cl A5 | | | | | | | | |
0.758%, 01/27/2025 (A) | | | 567 | | | | 565 | |
SLM Student Loan Trust,
Ser 2006-1, Cl A4 | | | | | | | | |
0.728%, 07/25/2019 (A) | | | 245 | | | | 244 | |
| | | | | | | | |
| Description | | Face Amount
($ Thousands) | | | Market Value
($ Thousands) | |
| | | | | | | | |
SLM Student Loan Trust,
Ser 2006-4, Cl A5 | | | | | | | | |
0.738%, 10/27/2025 (A) | | $ | 825 | | | $ | 821 | |
SLM Student Loan Trust,
Ser 2011-A, Cl A1 | | | | | | | | |
1.433%, 10/15/2024 (A) (B) | | | 2 | | | | 2 | |
SpringCastle America Funding LLC,
Ser 2014- AA, Cl A | | | | | | | | |
2.700%, 05/25/2023 (B) | | | 1,450 | | | | 1,453 | |
Springleaf Funding Trust,
Ser 2014-AA, Cl A | | | | | | | | |
2.410%, 12/15/2022 (B) | | | 836 | | | | 836 | |
SPS Servicer Advance Receivables Trust Advance Receivables Backed Notes, Ser 2015-T2, Cl AT2 | | | | | | | | |
2.620%, 01/15/2047 (B) | | | 1,110 | | | | 1,110 | |
Structured Asset Securities Mortgage Loan Trust, Ser 2006-GEL3, Cl A2 | | | | | | | | |
0.676%, 07/25/2036 (A) (B) | | | 773 | | | | 771 | |
Structured Asset Securities Mortgage Loan Trust, Ser 2006-WF1, Cl A1 | | | | | | | | |
0.596%, 02/25/2036 (A) | | | 284 | | | | 283 | |
Symphony CLO VIII,
Ser 2014-8AR, Cl BR | | | | | | | | |
2.367%, 01/09/2023 (A) (B) | | | 1,660 | | | | 1,645 | |
Voya CLO, Ser 2014-1RA, Cl A2R | | | | | | | | |
2.482%, 03/14/2022 (A) (B) | | | 1,400 | | | | 1,400 | |
Voya CLO, Ser 2014-3A, Cl A1 | | | | | | | | |
2.039%, 07/25/2026 (A) (B) | | | 910 | | | | 905 | |
| | | | | | | | |
| | | | | | | 47,597 | |
| | | | | | | | |
Total Asset-Backed Securities (Cost $141,763) ($ Thousands) | | | | | | | 141,592 | |
| | | | | | | | |
|
MORTGAGE-BACKED SECURITIES — 14.1% | |
| |
Agency Mortgage-Backed Obligations — 4.5% | | | | | |
FHLB | | | | | | | | |
1.450%, 12/22/2017 | | | 2,300 | | | | 2,297 | |
FHLMC | | | | | | | | |
5.000%, 06/01/2026 | | | 696 | | | | 725 | |
FHLMC ARM | | | | | | | | |
2.413%, 02/01/2022 (A) | | | 92 | | | | 95 | |
2.375%, 05/01/2036 (A) | | | 141 | | | | 149 | |
2.360%, 02/01/2030 (A) | | | 111 | | | | 117 | |
FNMA | | | | | | | | |
6.000%, 01/01/2027 to 04/01/2040 | | | 381 | | | | 435 | |
5.000%, 04/01/2020 to 03/01/2025 | | | 1,383 | | | | 1,444 | |
4.500%, 05/01/2023 | | | 454 | | | | 478 | |
FNMA ARM | | | | | | | | |
2.965%, 01/01/2029 (A) | | | 15 | | | | 15 | |
2.445%, 09/01/2024 (A) | | | 115 | | | | 119 | |
2.419%, 11/01/2023 (A) | | | 23 | | | | 24 | |
2.410%, 11/01/2025 (A) | | | 9 | | | | 9 | |
2.343%, 09/01/2024 (A) | | | 45 | | | | 47 | |
2.320%, 05/01/2028 (A) | | | 34 | | | | 35 | |
1.544%, 11/01/2021 (A) | | | 17 | | | | 18 | |
| | |
| 204 | | SEI Institutional Investments Trust / Annual Report / May 31, 2016 |
| | | | | | | | |
| Description | | Face Amount
($ Thousands) | | | Market Value
($ Thousands) | |
| | | | | | | | |
FNMA CMO, Ser 1993-58, Cl H | | | | | | | | |
5.500%, 04/25/2023 | | $ | 40 | | | $ | 43 | |
FNMA CMO, Ser 2001-33, Cl FA | | | | | | | | |
0.896%, 07/25/2031 (A) | | | 25 | | | | 26 | |
FNMA CMO, Ser 2002-56, Cl MC | | | | | | | | |
5.500%, 09/25/2017 | | | 95 | | | | 96 | |
FNMA CMO, Ser 2002-64, Cl FG | | | | | | | | |
0.686%, 10/18/2032 (A) | | | 31 | | | | 31 | |
FNMA CMO, Ser 2002-77, Cl CB | | | | | | | | |
5.000%, 12/25/2017 | | | 60 | | | | 61 | |
FNMA CMO, Ser 2008-18, Cl HD | | | | | | | | |
4.000%, 12/25/2018 | | | 96 | | | | 98 | |
FNMA CMO, Ser 2008-47, Cl FA | | | | | | | | |
0.946%, 06/25/2023 (A) | | | 123 | | | | 124 | |
FNMA CMO, Ser 2010-64, Cl EH | | | | | | | | |
5.000%, 10/25/2035 | | | 1 | | | | 1 | |
FNMA CMO, Ser 2011-70, Cl AD | | | | | | | | |
3.000%, 06/25/2030 | | | 1,277 | | | | 1,300 | |
FNMA TBA | | | | | | | | |
3.500%, 06/15/2026 | | | 3,850 | | | | 4,064 | |
3.000%, 06/25/2031 | | | 8,028 | | | | 8,368 | |
GNMA ARM | | | | | | | | |
1.875%, 09/20/2039 (A) | | | 167 | | | | 170 | |
GNMA CMO, Ser 2006-47, Cl AC | | | | | | | | |
5.000%, 02/16/2033 | | | 170 | | | | 174 | |
GNMA CMO, Ser 2009-10, Cl JA | | | | | | | | |
4.500%, 03/16/2034 | | | 158 | | | | 162 | |
GNMA CMO, Ser 2009-113, Cl MJ | | | | | | | | |
4.000%, 03/16/2023 | | | 233 | | | | 236 | |
GNMA CMO, Ser 2010-86, Cl PG | | | | | | | | |
3.000%, 01/20/2036 | | | 20 | | | | 20 | |
GNMA CMO, Ser 2011-106, Cl ME | | | | | | | | |
3.000%, 06/20/2038 | | | 133 | | | | 133 | |
GNMA CMO, Ser 2011-110, Cl A | | | | | | | | |
2.237%, 03/16/2033 | | | 21 | | | | 21 | |
GNMA CMO, Ser 2011-62, Cl PA | | | | | | | | |
3.000%, 01/20/2040 | | | 584 | | | | 589 | |
Mortgage-Linked Amortizing Notes CMO, Ser 2012-1, Cl A10 | | | | | | | | |
2.060%, 01/15/2022 | | | 238 | | | | 242 | |
NCUA Guaranteed Notes CMO, Ser 2010-R1, Cl 1A | | | | | | | | |
0.890%, 10/07/2020 (A) | | | 1,271 | | | | 1,274 | |
NCUA Guaranteed Notes CMO, Ser 2010-R2, Cl 1A | | | | | | | | |
0.803%, 11/06/2017 (A) | | | 70 | | | | 70 | |
NCUA Guaranteed Notes CMO, Ser 2011-R1, Cl 1A | | | | | | | | |
0.890%, 01/08/2020 (A) | | | 613 | | | | 614 | |
NCUA Guaranteed Notes CMO, Ser 2011-R2, Cl 1A | | | | | | | | |
0.836%, 02/06/2020 (A) | | | 133 | | | | 133 | |
| | | | | | | | |
| Description | | Face Amount
($ Thousands) | | | Market Value
($ Thousands) | |
| | | | | | | | |
NCUA Guaranteed Notes CMO, Ser 2011-R4, Cl 1A | | | | | | | | |
0.816%, 03/06/2020 (A) | | $ | 68 | | | $ | 68 | |
| | | | | | | | |
| | | | | | | 24,125 | |
| | | | | | | | |
| |
Non-Agency Mortgage-Backed Obligations — 9.6% | | | | | |
BAMLL Commercial Mortgage Securities Trust,
Ser 2014-ICTS, Cl A | | | | | | | | |
1.233%, 06/15/2028 (A) (B) | | | 1,000 | | | | 986 | |
Banc of America Mortgage Securities, Ser 2005-F, Cl 2A2 | | | | | | | | |
2.807%, 07/25/2035 (A) | | | 312 | | | | 287 | |
Banc of America Mortgage Securities, Ser 2005-J, Cl 2A1 | | | | | | | | |
2.919%, 11/25/2035 (A) | | | 41 | | | | 37 | |
Bear Stearns Adjustable Rate Mortgage Trust,
Ser 2005-12, Cl 11A1 | | | | | | | | |
2.796%, 02/25/2036 (A) | | | 111 | | | | 85 | |
Bear Stearns Adjustable Rate Mortgage Trust, Ser 2005-3, Cl 2A1 | | | | | | | | |
2.978%, 06/25/2035 (A) | | | 145 | | | | 134 | |
Bear Stearns Adjustable Rate Mortgage Trust, Ser 2005-6, Cl 3A1 | | | | | | | | |
2.783%, 08/25/2035 (A) | | | 247 | | | | 222 | |
Bear Stearns Commercial Mortgage Securities Trust, Ser 2006-PW14, Cl A4 | | | | | | | | |
5.201%, 12/11/2038 | | | 656 | | | | 662 | |
Bear Stearns Commercial Mortgage Securities, Ser 2006-PW13, Cl A4 | | | | | | | | |
5.540%, 09/11/2041 | | | 174 | | | | 174 | |
BLCP Hotel Trust, Ser 2014-CLRN, Cl A | | | | | | | | |
1.384%, 08/15/2029 (A) (B) | | | 960 | | | | 948 | |
CD Mortgage Trust, Ser 2007-CD5, Cl A4 | | | | | | | | |
5.886%, 11/15/2044 (A) | | | 1,276 | | | | 1,319 | |
CHL Mortgage Pass-Through Trust, Ser 2004- 29, Cl 1A1 | | | | | | | | |
0.979%, 02/25/2035 (A) | | | 35 | | | | 33 | |
CHL Mortgage Pass-Through Trust, Ser 2005- HY10, Cl 3A1A | | | | | | | | |
2.730%, 02/20/2036 (A) | | | 211 | | | | 179 | |
Citigroup Commercial Mortgage Trust, Ser 2007-C6, Cl A4 | | | | | | | | |
5.899%, 12/10/2049 (A) | | | 1,650 | | | | 1,704 | |
Citigroup Commercial Mortgage Trust, Ser 2008-C7, Cl A4 | | | | | | | | |
6.140%, 12/10/2049 (A) | | | 1,060 | | | | 1,103 | |
Citigroup Commercial Mortgage Trust, Ser 2012-GC8, Cl A1 | | | | | | | | |
0.685%, 09/10/2045 | | | 105 | | | | 105 | |
Citigroup Commercial Mortgage Trust, Ser 2014-388G, Cl A | | | | | | | | |
1.185%, 06/15/2033 (A) (B) | | | 645 | | | | 645 | |
| | | | |
| SEI Institutional Investments Trust / Annual Report / May 31, 2016 | | | 205 | |
SCHEDULE OF INVESTMENTS
Ultra Short Duration Bond Fund (Continued)
May 31, 2016
| | | | | | | | |
| Description | | Face Amount
($ Thousands) | | | Market Value
($ Thousands) | |
| | | | | | | | |
Citigroup Deutsche Bank Commercial Mortgage, Ser 2007-CD4, Cl A4 | | | | | | | | |
5.322%, 12/11/2049 | | $ | 1,262 | | | $ | 1,277 | |
Citigroup Mortgage Loan Trust,
Ser 2004- HYB3, Cl 1A | | | | | | | | |
2.718%, 09/25/2034 (A) | | | 58 | | | | 58 | |
Citigroup Mortgage Loan Trust, Ser 2006-AR2, Cl 1A1 | | | | | | | | |
2.925%, 03/25/2036 (A) | | | 236 | | | | 214 | |
COBALT CMBS Commercial Mortgage Trust, Ser 2006-C1, Cl A4 | | | | | | | | |
5.223%, 08/15/2048 | | | 1,137 | | | | 1,142 | |
COMM Mortgage Trust, Ser 2012-9W57, Cl A | | | | | | | | |
2.365%, 02/10/2029 (B) | | | 745 | | | | 748 | |
COMM Mortgage Trust, Ser 2012-CR4, Cl A1 | | | | | | | | |
0.704%, 10/15/2045 | | | 144 | | | | 144 | |
COMM Mortgage Trust, Ser 2013-CR10, Cl A1 | | | | | | | | |
1.278%, 08/10/2046 | | | 340 | | | | 339 | |
COMM Mortgage Trust, Ser 2013-CR9, Cl A1 | | | | | | | | |
1.344%, 07/10/2045 | | | 141 | | | | 141 | |
COMM Mortgage Trust, Ser 2014-BBG, Cl A | | | | | | | | |
1.235%, 03/15/2029 (A) (B) | | | 2,970 | | | | 2,914 | |
Commercial Mortgage Pass-Through Certificates, Ser 2012-CR3, Cl A1 | | | | | | | | |
0.666%, 11/15/2045 | | | 19 | | | | 19 | |
Credit Suisse Commercial Mortgage Trust, Ser 2006-C4, Cl A3 | | | | | | | | |
5.467%, 09/15/2039 | | | 250 | | | | 250 | |
CSMC Trust, Ser 2014-TIKI, Cl A | | | | | | | | |
1.383%, 09/15/2038 (A) (B) | | | 700 | | | | 688 | |
DBUBS Mortgage Trust,
Ser 2011-LC1A, Cl A1 | | | | | | | | |
3.742%, 11/10/2046 (B) | | | 14 | | | | 14 | |
FDIC Guaranteed Notes Trust, Ser 2010-S1, Cl 1A | | | | | | | | |
0.985%, 02/25/2048 (A) (B) | | | 248 | | | | 248 | |
FHLMC Structured Agency Credit Risk Debt Notes, Ser 2013-DN1, Cl M1 | | | | | | | | |
3.846%, 07/25/2023 (A) | | | 1,011 | | | | 1,033 | |
FHLMC Structured Agency Credit Risk Debt Notes, Ser 2014-DN1, Cl M1 | | | | | | | | |
1.439%, 02/25/2024 (A) | | | 227 | | | | 227 | |
FHLMC Structured Agency Credit Risk Debt Notes, Ser 2014-DN2, Cl M1 | | | | | | | | |
1.296%, 04/25/2024 (A) | | | 401 | | | | 402 | |
FHLMC Structured Agency Credit Risk Debt Notes, Ser 2015-HQA1, Cl M1 | | | | | | | | |
1.696%, 03/25/2028 (A) | | | 530 | | | | 531 | |
FNMA Connecticut Avenue Securities, Ser 2014- C02, Cl 2M1 | | | | | | | | |
1.396%, 05/25/2024 (A) | | | 313 | | | | 312 | |
FNMA Connecticut Avenue Securities, Ser 2014- C02, Cl 1M1 | | | | | | | | |
1.396%, 05/25/2024 (A) | | | 493 | | | | 489 | |
| | | | | | | | |
| Description | | Face Amount
($ Thousands) | | | Market Value
($ Thousands) | |
| | | | | | | | |
FNMA Connecticut Avenue Securities, Ser 2014- C03, Cl 1M1 | | | | | | | | |
1.646%, 07/25/2024 (A) | | $ | 1,139 | | | $ | 1,137 | |
FNMA Connecticut Avenue Securities, Ser 2015-C02, Cl 1M1 | | | | | | | | |
1.596%, 05/25/2025 (A) | | | 208 | | | | 208 | |
GMAC Mortgage Loan Trust,
Ser 2005-AR6, Cl 2A1 | | | | | | | | |
3.254%, 11/19/2035 (A) | | | 264 | | | | 242 | |
GS Mortgage Securities II,
Ser 2012-GCJ9, Cl A1 | | | | | | | | |
0.662%, 11/10/2045 | | | 68 | | | | 67 | |
GS Mortgage Securities Trust,
Ser 2006-GG8, Cl A4 | | | | | | | | |
5.560%, 11/10/2039 | | | 552 | | | | 553 | |
GS Mortgage Securities Trust,
Ser 2010-C2, Cl A1 | | | | | | | | |
3.849%, 12/10/2043 (B) | | | 100 | | | | 104 | |
GS Mortgage Securities Trust, Ser 2013-GC13, Cl A1 | | | | | | | | |
1.206%, 07/10/2046 | | | 236 | | | | 236 | |
GSR Mortgage Loan Trust, Ser 2005-AR4, Cl 2A1 | | | | | | | | |
2.991%, 07/25/2035 (A) | | | 312 | | | | 286 | |
GSR Mortgage Loan Trust,
Ser 2006-AR1, Cl 2A1 | | | | | | | | |
2.931%, 01/25/2036 (A) | | | 332 | | | | 307 | |
GSR Mortgage Loan Trust, Ser 2007-AR2, Cl 1A1 | | | | | | | | |
3.111%, 05/25/2047 (A) | | | 311 | | | | 253 | |
HILT Mortgage Trust,
Ser 2014-ORL, Cl A | | | | | | | | |
1.333%, 07/15/2029 (A) (B) | | | 1,600 | | | | 1,572 | |
Hilton USA Trust, Ser 2013-HLF, Cl AFL | | | | | | | | |
1.436%, 11/05/2030 (A) (B) | | | 512 | | | | 512 | |
Impac CMB Trust, Ser 2004-9, Cl 1A1 | | | | | | | | |
1.199%, 01/25/2035 (A) | | | 89 | | | | 80 | |
Impac CMB Trust, Ser 2005-2, Cl 1A1 | | | | | | | | |
0.959%, 04/25/2035 (A) | | | 92 | | | | 84 | |
Impac CMB Trust, Ser 2005-3, Cl A1 | | | | | | | | |
0.919%, 08/25/2035 (A) | | | 85 | | | | 75 | |
Impac CMB Trust, Ser 2005-5, Cl A1 | | | | | | | | |
1.079%, 08/25/2035 (A) | | | 70 | | | | 61 | |
Impac CMB Trust, Ser 2005-8, Cl 1A | | | | | | | | |
0.959%, 02/25/2036 (A) | | | 223 | | | | 191 | |
JPMBB Commercial Mortgage Securities Trust, Ser 2013-C15, Cl A2 | | | | | | | | |
2.977%, 11/15/2045 | | | 1,281 | | | | 1,315 | |
JPMBB Commercial Mortgage Securities Trust, Ser 2014-C19, Cl A1 | | | | | | | | |
1.266%, 04/15/2047 | | | 1,667 | | | | 1,660 | |
JPMorgan Chase Commercial Mortgage Securities Trust, Ser 2013-C13, Cl A1 | | | | | | | | |
1.303%, 01/15/2046 | | | 302 | | | | 302 | |
| | |
| 206 | | SEI Institutional Investments Trust / Annual Report / May 31, 2016 |
| | | | | | | | |
| Description | | Face Amount
($ Thousands) | | | Market Value
($ Thousands) | |
| | | | | | | | |
JPMorgan Chase Commercial Mortgage Securities Trust, Ser 2014-CBM, Cl A | | | | | | | | |
1.334%, 10/15/2029 (A) (B) | | $ | 3,005 | | | $ | 2,942 | |
JPMorgan Chase Commercial Mortgage Securities Trust, Ser 2014-PHH, Cl A | | | | | | | | |
1.633%, 08/15/2027 (A) (B) | | | 1,225 | | | | 1,223 | |
JPMorgan Chase Commercial Mortgage Securities Trust, Ser 2015-CSMO, Cl A | | | | | | | | |
1.685%, 01/15/2032 (A) (B) | | | 2,550 | | | | 2,543 | |
JPMorgan Chase Commercial Mortgage Securities, Ser 2010-C1, Cl A1 | | | | | | | | |
3.853%, 06/15/2043 (B) | | | 14 | | | | 14 | |
JPMorgan Chase Commercial Mortgage Securities, Ser 2010-C2, Cl A1 | | | | | | | | |
2.749%, 11/15/2043 (B) | | | 20 | | | | 20 | |
JPMorgan Mortgage Trust,
Ser 2005-A6, Cl 7A1 | | | | | | | | |
2.739%, 08/25/2035 (A) | | | 142 | | | | 134 | |
JPMorgan Mortgage Trust,
Ser 2007-A3, Cl 1A1 | | | | | | | | |
3.006%, 05/25/2037 (A) | | | 183 | | | | 154 | |
LB-UBS Commercial Mortgage Trust, Ser 2007- C6, Cl A4 | | | | | | | | |
5.858%, 07/15/2040 (A) | | | 965 | | | | 983 | |
LB-UBS Commercial Mortgage Trust, Ser 2008- C1, Cl A2 | | | | | | | | |
6.085%, 04/15/2041 (A) | | | 782 | | | | 824 | |
LB-UBS Commercial Mortgage Trust, Ser C7, Cl A3 | | | | | | | | |
5.347%, 11/15/2038 | | | 1,334 | | | | 1,339 | |
Merrill Lynch Mortgage Investors, Ser 2005- A3, Cl A1 | | | | | | | | |
0.709%, 04/25/2035 (A) | | | 75 | | | | 71 | |
Merrill Lynch Mortgage-Backed Securities Trust, Ser 2007-3, Cl 2A1 | | | | | | | | |
2.949%, 06/25/2037 (A) | | | 329 | | | | 273 | |
ML-CFC Commercial Mortgage Trust, Ser 2007- 5, Cl A4 | | | | | | | | |
5.378%, 08/12/2048 | | | 285 | | | | 289 | |
Morgan Stanley Bank of America Merrill Lynch Trust, Ser 2013-C11, Cl A2 | | | | | | | | |
3.085%, 08/15/2046 | | | 1,380 | | | | 1,424 | |
Morgan Stanley Capital I Trust, Ser 2012-C4, Cl A2 | | | | | | | | |
2.111%, 03/15/2045 | | | 969 | | | | 971 | |
Morgan Stanley Capital I, Ser T25, Cl A3 | | | | | | | | |
5.514%, 11/12/2049 (A) | | | 420 | | | | 425 | |
Morgan Stanley Re-REMIC Trust, Ser 2012-IO, Cl AXA | | | | | | | | |
1.000%, 03/27/2051 (B) | | | 242 | | | | 239 | |
MortgageIT Trust, Ser 2005-5, Cl A1 | | | | | | | | |
0.699%, 12/25/2035 (A) | | | 318 | | | | 284 | |
Nationstar HECM Loan Trust, Ser 2015-2A, Cl A | | | | | | | | |
2.883%, 11/25/2025 (B) | | | 243 | | | | 243 | |
| | | | | | | | |
| Description | | Face Amount
($ Thousands) | | | Market Value
($ Thousands) | |
| | | | | | | | |
Paragon Mortgages, Ser 2006-12A, Cl A2C | | | | | | | | |
0.846%, 11/15/2038 (A) (B) | | $ | 143 | | | $ | 128 | |
Paragon Mortgages, Ser 2007-15A, Cl A2C | | | | | | | | |
0.854%, 12/15/2039 (A) (B) | | | 359 | | | | 320 | |
Residential Funding Mortgage Securities, Ser 2007-SA3, Cl 2A1 | | | | | | | | |
4.090%, 07/27/2037 (A) | | | 252 | | | | 205 | |
Sequoia Mortgage Trust, Ser 2004-12, Cl A1 | | | | | | | | |
0.979%, 01/20/2035 (A) | | | 35 | | | | 32 | |
Springleaf Mortgage Loan Trust, Ser 2013-1A, Cl A | | | | | | | | |
1.270%, 06/25/2058 (A) (B) | | | 1,080 | | | | 1,076 | |
Towd Point Mortgage Trust,
Ser 2015-4, Cl A1B | | | | | | | | |
2.750%, 04/25/2055 (A) (B) | | | 423 | | | | 423 | |
Towd Point Mortgage Trust,
Ser 2015-5, Cl A1B | | | | | | | | |
2.750%, 05/25/2055 (A) (B) | | | 409 | | | | 409 | |
Towd Point Mortgage Trust,
Ser 2016-1, Cl A1B | | | | | | | | |
2.750%, 02/25/2055 (A) (B) | | | 415 | | | | 416 | |
UBS-Barclays Commercial Mortgage Trust, Ser 2012-C3, Cl A1 | | | | | | | | |
0.726%, 08/10/2049 | | | 147 | | | | 146 | |
UBS-Barclays Commercial Mortgage Trust, Ser 2012-C4, Cl A1 | | | | | | | | |
0.673%, 12/10/2045 | | | 80 | | | | 80 | |
UBS-Barclays Commercial Mortgage Trust,
Ser 2013-C5, Cl A1 | | | | | | | | |
0.779%, 03/10/2046 | | | 383 | | | | 380 | |
Wachovia Bank Commercial Mortgage Trust, Ser 2006-C26, Cl A3 | | | | | | | | |
6.011%, 06/15/2045 (A) | | | 321 | | | | 321 | |
Wachovia Bank Commercial Mortgage Trust, Ser 2006-C27, Cl A1A | | | | | | | | |
5.749%, 07/15/2045 (A) | | | 587 | | | | 587 | |
WaMu Mortgage Pass-Through Certificates, Ser 2006-AR2, Cl 1A1 | | | | | | | | |
2.513%, 03/25/2036 (A) | | | 357 | | | | 324 | |
Wells Fargo Commercial Mortgage Trust, Ser 2012-LC5, Cl A1 | | | | | | | | |
0.687%, 10/15/2045 | | | 129 | | | | 128 | |
Wells Fargo Commercial Mortgage Trust, Ser 2013-C15, Cl A1 | | | | | | | | |
1.264%, 08/15/2046 | | | 145 | | | | 144 | |
Wells Fargo Mortgage-Backed Securities Trust, Ser 2004-BB, Cl A2 | | | | | | | | |
2.848%, 01/25/2035 (A) | | | 136 | | | | 135 | |
Wells Fargo Mortgage-Backed Securities Trust, Ser 2006-AR10, Cl 2A1 | | | | | | | | |
2.851%, 07/25/2036 (A) | | | 281 | | | | 274 | |
Wells Fargo Mortgage-Backed Securities Trust, Ser 2006-AR12, Cl 1A1 | | | | | | | | |
2.740%, 09/25/2036 (A) | | | 154 | | | | 144 | |
| | | | |
| SEI Institutional Investments Trust / Annual Report / May 31, 2016 | | | 207 | |
SCHEDULE OF INVESTMENTS
Ultra Short Duration Bond Fund (Continued)
May 31, 2016
| | | | | | | | |
| Description | | Face Amount
($ Thousands) | | | Market Value
($ Thousands) | |
| | | | | | | | |
WFRBS Commercial Mortgage Trust, Ser 2011- C3, Cl A2 | | | | | | | | |
3.240%, 03/15/2044 (B) | | $ | 61 | | | $ | 61 | |
WFRBS Commercial Mortgage Trust, Ser 2011- C5, Cl A2 | | | | | | | | |
2.684%, 11/15/2044 | | | 588 | | | | 590 | |
WFRBS Commercial Mortgage Trust, Ser 2012- C10, Cl A1 | | | | | | | | |
0.734%, 12/15/2045 | | | 326 | | | | 325 | |
WFRBS Commercial Mortgage Trust, Ser 2012- C9, Cl A1 | | | | | | | | |
0.673%, 11/15/2045 | | | 211 | | | | 211 | |
WFRBS Commercial Mortgage Trust, Ser C10, Cl A2 | | | | | | | | |
1.765%, 12/15/2045 | | | 925 | | | | 926 | |
| | | | | | | | |
| | | | | | | 51,238 | |
| | | | | | | | |
Total Mortgage-Backed Securities (Cost $75,608) ($ Thousands) | | | | | | | 75,363 | |
| | | | | | | | |
|
MUNICIPAL BONDS — 5.9% | |
| |
California — 0.7% | | | | | |
Los Angeles, Municipal Improvement Corp, Ser A, RB | | | | | | | | |
1.924%, 11/01/2017 | | | 1,455 | | | | 1,472 | |
Riverside, Pension Obligation, Ser A, BAN, RB | | | | | | | | |
0.980%, 06/01/2017 | | | 1,005 | | | | 1,005 | |
University of California, Ser Y-1, RB Callable 01/01/2017 @ 100 | | | | | | | | |
0.957%, 07/01/2041 (A) | | | 1,310 | | | | 1,310 | |
| | | | | | | | |
| | | | | | | 3,787 | |
| | | | | | | | |
| |
Colorado — 0.1% | | | | | |
Denver, City and County Taxable Refunding Improvement, Ser B, RB | | | | | | | | |
2.700%, 08/01/2017 | | | 395 | | | | 402 | |
1.543%, 08/01/2018 | | | 350 | | | | 351 | |
| | | | | | | | |
| | | | | | | 753 | |
| | | | | | | | |
| |
Florida — 0.4% | | | | | |
Florida State, Board of Administration Finance, Ser A, RB | | | | | | | | |
2.163%, 07/01/2019 | | | 1,200 | | | | 1,221 | |
Miami Beach, Redevelopment
Agency, GO | | | | | | | | |
1.926%, 02/01/2017 | | | 900 | | | | 904 | |
| | | | | | | | |
| | | | | | | 2,125 | |
| | | | | | | | |
| |
Illinois — 0.6% | | | | | |
Chicago, Midway International Airport, Sub- Ser C, RB | | | | | | | | |
1.796%, 01/01/2017 | | | 1,080 | | | | 1,086 | |
| | | | | | | | |
| Description | | Face Amount
($ Thousands) | | | Market Value ($ Thousands) | |
| | | | | | | | |
Saint Clair County High School District No. 201 Belleville, BAM, GO | | | | | | | | |
3.500%, 04/01/2017 | | $ | 1,830 | | | $ | 1,863 | |
| | | | | | | | |
| | | | | | | 2,949 | |
| | | | | | | | |
| |
Kentucky — 0.2% | | | | | |
Kentucky State Property & Building Commission, RB | | | | | | | | |
4.440%, 11/01/2016 | | | 1,130 | | | | 1,147 | |
| | | | | | | | |
| |
Maine — 0.3% | | | | | |
Maine Municipal Bond Bank, RB | | | | | | | | |
2.404%, 06/01/2017 | | | 1,550 | | | | 1,570 | |
| | | | | | | | |
| |
Massachusetts — 0.3% | | | | | |
Town of Belmont, RB | | | | | | | | |
1.250%, 05/05/2017 | | | 1,565 | | | | 1,570 | |
| | | | | | | | |
| |
Minnesota — 0.2% | | | | | |
Saint Paul, Housing and Redevelopment Authority, RB | | | | | | | | |
1.041%, 07/01/2016 | | | 980 | | | | 980 | |
| | | | | | | | |
| |
New Jersey — 1.7% | | | | | |
New Jersey State, Economic Development Authority, Ser Q, RB | | | | | | | | |
1.096%, 06/15/2016 | | | 5,290 | | | | 5,290 | |
New Jersey State, Rutgers University, Ser K, RB | | | | | | | | |
1.709%, 05/01/2017 | | | 955 | | | | 962 | |
New Jersey State, Transportation Trust Fund Authority, Ser B, RB | | | | | | | | |
1.087%, 12/15/2016 | | | 2,800 | | | | 2,805 | |
| | | | | | | | |
| | | | | | | 9,057 | |
| | | | | | | | |
| |
North Carolina — 0.4% | | �� | | | |
North Carolina State, Eastern Municipal Power Agency, RB | | | | | | | | |
1.561%, 07/01/2017 | | | 2,090 | | | | 2,101 | |
| | | | | | | | |
| |
Texas — 0.7% | | | | | |
El Paso, GO | | | | | | | | |
1.049%, 08/15/2016 | | | 1,090 | | | | 1,091 | |
Harris County-Houston Sports Authority, Ser B, RB | | | | | | | | |
1.324%, 11/15/2016 | | | 2,640 | | | | 2,646 | |
| | | | | | | | |
| | | | | | | 3,737 | |
| | | | | | | | |
| |
Utah — 0.3% | | | | | |
Intermountain Power Agency, Sub-Ser B, RB | | | | | | | | |
0.785%, 07/01/2016 | | | 1,655 | | | | 1,655 | |
| | | | | | | | |
| | |
| 208 | | SEI Institutional Investments Trust / Annual Report / May 31, 2016 |
| | | | | | | | |
| Description | | Face Amount
($ Thousands) | | | Market Value
($ Thousands) | |
| | | | | | | | |
Total Municipal Bonds
(Cost $31,375) ($ Thousands) | | | | | | $ | 31,431 | |
| | | | | | | | |
| |
U.S. TREASURY OBLIGATIONS — 4.0% | | | | | |
U.S. Treasury Notes | | | | | | | | |
1.375%, 06/30/2018 | | $ | 9,125 | | | | 9,213 | |
1.125%, 12/31/2019 | | | 3,700 | | | | 3,696 | |
0.625%, 11/30/2017 | | | 8,700 | | | | 8,675 | |
| | | | | | | | |
Total U.S. Treasury Obligations (Cost $21,548) ($ Thousands) | | | | | | | 21,584 | |
| | | | | | | | |
| |
SOVEREIGN DEBT— 3.6% | | | | | |
European Investment Bank | | | | | | | | |
0.875%, 04/18/2017 | | | 2,600 | | | | 2,600 | |
Export-Import Bank of Korea | | | | | | | | |
1.380%, 01/14/2017 (A) | | | 2,200 | | | | 2,203 | |
Hydro-Quebec | | | | | | | | |
1.375%, 06/19/2017 | | | 675 | | | | 677 | |
Inter-American Development Bank MTN | | | | | | | | |
0.622%, 12/12/2016 (A) | | | 5,500 | | | | 5,497 | |
International Finance MTN | | | | | | | | |
0.477%, 08/01/2016 (A) | | | 1,875 | | | | 1,875 | |
Korea Development Bank | | | | | | | | |
1.260%, 01/22/2017 (A) | | | 2,950 | | | | 2,950 | |
Province of Ontario | | | | | | | | |
1.600%, 09/21/2016 | | | 750 | | | | 752 | |
Province of Quebec Canada MTN | | | | | | | | |
0.865%, 09/04/2018 (A) | | | 2,701 | | | | 2,694 | |
| | | | | | | | |
Total Sovereign Debt
(Cost $19,251) ($ Thousands) | | | | 19,248 | |
| | | | | | | | |
| | |
U.S. GOVERNMENT AGENCY OBLIGATIONS — 0.8% | | | | | | | | |
FFCB | | | | | | | | |
0.495%, 08/29/2017 (A) | | | 3,000 | | | | 2,999 | |
FNMA | | | | | | | | |
1.250%, 06/20/2018 | | | 1,600 | | | | 1,598 | |
| | | | | | | | |
Total U.S. Government Agency Obligations (Cost $4,603) ($ Thousands) | | | | | | | 4,597 | |
| | | | | | | | |
| | | | | | | | |
| Description | | Face Amount
($ Thousands)/Shares | | | Market Value
($ Thousands) | |
| | | | | | | | |
| |
COMMERCIAL PAPER(C)(D) — 0.1% | | | | | |
Chevron Phillips Chemical | | | | | | | | |
0.600%, 06/07/2016 | | $ | 800 | | | $ | 800 | |
| | | | | | | | |
Total Commercial Paper
(Cost $800) ($ Thousands) | | | | | | | 800 | |
| | | | | | | | |
| |
CASH EQUIVALENT — 0.4% | | | | | |
| | |
SEI Daily Income Trust, Prime Obligation Fund, Cl A | | | | | | | | |
0.270%**† | | | 1,968,327 | | | | 1,968 | |
| | | | | | | | |
Total Cash Equivalent
(Cost $1,968) ($ Thousands) | | | | 1,968 | |
| | | | | | | | |
| |
REPURCHASE AGREEMENT(E) — 1.3% | | | | | |
BNP Paribas | | | | | | | | |
0.310%, dated 05/31/2016, to be repurchased on 06/01/2016, repurchase price $6,900,059 (collateralized by U.S. government obligations, 1.750% - 8.000%, 05/01/2018 - 05/01/2046, par value ranging from $2 - $31,094,750; total market value $7,038,000) | | | 6,900 | | | | 6,900 | |
| | | | | | | | |
Total Repurchase Agreement
(Cost $6,900) ($ Thousands) | | | | 6,900 | |
| | | | | | | | |
Total Investments — 102.6%
(Cost $550,145) ($ Thousands) | | | $ | 549,797 | |
| | | | | | | | |
The open futures contracts held by the Fund at May 31, 2016, is as follows:
| | | | | | | | | | | | |
| Type of Contract | | Number of
Contracts
Long
(Short) | | | Expiration
Date | | | Unrealized
Appreciation
(Depreciation)
($ Thousands) | |
U.S. 10-Year Treasury Note | | | (44 | ) | | | Sep-2016 | | | $ | (10 | ) |
U.S. 5-Year Treasury Note | | | 30 | | | | Sep-2016 | | | | 6 | |
U.S. Long Treasury Bond | | | (1 | ) | | | Sep-2016 | | | | (1 | ) |
| | | | | | | | | | | | |
| | | | | | | | | | $ | (5 | ) |
| | | | | | | | | | | | |
For the year ended May 31, 2016, the total amount of all open futures contracts, as presented in the table above, are representative of the volume of activity for the derivative type during the year.
| Percentages | | are based on a Net Assets of $535,629 ($ Thousands). |
| ** | | Rate shown is the 7-day effective yield as of May 31, 2016. |
| † | | Investment in Affiliated Security (see Note 6). |
| (A) | | Variable Rate Security — The rate reported on the Schedule of Investments is the rate in effect as of May 31, 2016. |
| (B) | | Security exempt from registration under Rule 144A of the Securities Act of 1933. These securities may be resold in transactions exempt from registration normally to qualified institutions. On May 31, 2016, the value of these securities amounted to $145,087 ($ Thousands), representing 27.1% of the net assets of the Fund. |
| | | | |
| SEI Institutional Investments Trust / Annual Report / May 31, 2016 | | | 209 | |
SCHEDULE OF INVESTMENTS
Ultra Short Duration Bond Fund (Concluded)
May 31, 2016
| (C) | | The rate reported is the effective yield at time of purchase. |
| (D) | | Securities are held in connection with a letter of credit issued by a major bank. |
| (E) | | Tri-Party Repurchase Agreement. |
ARM — Adjustable Rate Mortgage
BAM — Build America Mutual
BAN — Bond Anticipation Note
Cl — Class
CLO — Collateralized Loan Obligation
CMBS — Commercial Mortgage-Backed Securities
CMO — Collateralized Mortgage Obligation
FDIC — Federal Deposit Insurance Corporation
FFCB — Federal Farm Credit Bank
FHLB — Federal Home Loan Bank
FHLMC — Federal Home Loan Mortgage Corporation
FNMA — Federal National Mortgage Association
GNMA — Government National Mortgage Association
GO — General Obligation
LLC — Limited Liability Company
MTN — Medium Term Note
NCUA — National Credit Union Association
RB — Revenue Bond
REMIC — Real Estate Mortgage Investment Conduit
Re-REMIC — Resecuritization of Real Estate Mortgage Investment Conduit
Ser — Series
TBA — To Be Announced
The following is a list of the level of inputs used as of May 31, 2016, in valuing the Fund’s investments and other financial instruments carried at value ($ Thousands):
| | | | | | | | | | | | | | | | |
| Investments in Securities | | Level 1 | | | Level 2 | | | Level 3 | | | Total | |
Corporate Obligations | | $ | — | | | $ | 246,314 | | | $ | — | | | $ | 246,314 | |
Asset-Backed Securities | | | — | | | | 141,592 | | | | — | | | | 141,592 | |
Mortgage-Backed Securities | | | — | | | | 75,363 | | | | — | | | | 75,363 | |
Municipal Bonds | | | — | | | | 31,431 | | | | — | | | | 31,431 | |
U.S. Treasury Obligations | | | — | | | | 21,584 | | | | — | | | | 21,584 | |
Sovereign Debt | | | — | | | | 19,248 | | | | — | | | | 19,248 | |
U.S. Government Agency Obligations | | | — | | | | 4,597 | | | | — | | | | 4,597 | |
Commercial Paper | | | — | | | | 800 | | | | — | | | | 800 | |
Cash Equivalent | | | 1,968 | | | | — | | | | — | | | | 1,968 | |
Repurchase Agreement | | | — | | | | 6,900 | | | | — | | | | 6,900 | |
| | | | | | | | | | | | | | | | |
Total Investments in Securities | | $ | 1,968 | | | $ | 547,829 | | | $ | — | | | $ | 549,797 | |
| | | | | | | | | | | | | | | | |
| | | | | | | | | | | | | | | | |
| Other Financial Instruments | | Level 1 | | | Level 2 | | | Level 3 | | | Total | |
Futures Contracts* | | | | | | | | | | | | | | | | |
Unrealized Appreciation | | $ | 6 | | | $ | — | | | $ | — | | | $ | 6 | |
Unrealized Depreciation | | | (11 | ) | | | — | | | | — | | | | (11 | ) |
| | | | | | | | | | | | | | | | |
Total Other Financial Instruments | | $ | (5 | ) | | $ | — | | | $ | — | | | $ | (5 | ) |
| | | | | | | | | | | | | | | | |
| * | | Futures contracts are valued at the unrealized appreciation (depreciation) on the instrument. For the year ended May 31, 2016, there were no transfers between Level 1 and Level 2 assets and liabilities. |
For the year ended May 31, 2016, there were no transfers between Level 2 and Level 3 assets and liabilities.
For more information on valuation inputs, see Note 2 — Significant Accounting Policies in Notes to Financial Statements.
Amounts designated as “—” are $0 or have been rounded to $0.
The accompanying notes are an integral part of the financial statements.
| | |
| 210 | | SEI Institutional Investments Trust / Annual Report / May 31, 2016 |
SCHEDULE OF INVESTMENTS
Emerging Markets Debt Fund
MAY 31, 2016
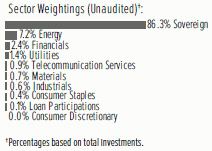
| | | | | | | | | | | | |
| Description | | | | | Face Amount (Thousands) | | | Market Value
($ Thousands) | |
| | | | | | | | | | | | |
| | | |
GLOBAL BONDS — 94.8% | | | | | | | | | | | | |
Angola — 0.3% | | | | | | | | | | | | |
Republic of Angola | | | | | | | | | | | | |
9.500%, 11/12/2025 (A) | | | $ | | | | 2,038 | | | $ | 1,980 | |
9.500%, 11/12/2025 | | | | | | | 3,879 | | | | 3,772 | |
Republic of Angola via Northern Lights III | | | | | | | | | | | | |
7.000%, 08/16/2019 | | | | | | | 587 | | | | 594 | |
| | | | | | | | | | | | |
| | | | | | | | | | | 6,346 | |
| | | | | | | | | | | | |
| | | |
Argentina — 3.5% | | | | | | | | | | | | |
Argentina Bonar Bonds | | | | | | | | | | | | |
33.868%, 10/09/2017 (B) | | | ARS | | | | 6,490 | | | | 495 | |
32.974%, 03/01/2018 (B) | | | | | | | 6,258 | | | | 458 | |
8.750%, 05/07/2024 | | | $ | | | | 3,140 | | | | 3,498 | |
Argentine Bonad Bonds | | | | | | | | | | | | |
2.400%, 03/18/2018 | | | | | | | 5,903 | | | | 5,481 | |
0.750%, 02/22/2017 | | | | | | | 356 | | | | 342 | |
City of Buenos Aires Argentina | | | | | | | | | | | | |
7.500%, 06/01/2027 (A) | | | | | | | 1,298 | | | | 1,311 | |
Letras del Banco Central de la Republica Argentina | | | | | | | | | | | | |
34.926%, 06/15/2016 (C) | | | ARS | | | | 14,530 | | | | 1,023 | |
26.342%, 01/18/2017 (C) | | | | | | | 35,291 | | | | 2,122 | |
Republic of Argentina | | | | | | | | | | | | |
12.079%, 12/15/2035 (B) | | | $ | | | | 2,062 | | | | 203 | |
8.750%, 06/02/2017 | | | | | | | 2,170 | | | | 2,278 | |
8.280%, 12/31/2033 | | | | | | | 12,858 | | | | 14,015 | |
8.280%, 12/31/2033 | | | | | | | 4,262 | | | | 4,582 | |
7.820%, 12/31/2033 | | | EUR | | | | 9,990 | | | | 11,310 | |
7.820%, 12/31/2033 | | | | | | | 3,198 | | | | 3,596 | |
7.500%, 04/22/2026 | | | $ | | | | 1,156 | | | | 1,213 | |
7.500%, 04/22/2026 | | | | | | | 1,001 | | | | 1,051 | |
6.875%, 04/22/2021 | | | | | | | 931 | | | | 975 | |
6.875%, 04/22/2021 | | | | | | | 969 | | | | 1,015 | |
6.250%, 04/22/2019 | | | | | | | 450 | | | | 470 | |
6.250%, 04/22/2019 | | | | | | | 150 | | | | 157 | |
4.191%, 12/15/2035 (B) | | | EUR | | | | 27,520 | | | | 3,165 | |
2.500%, 03/31/2019 (D) | | | $ | | | | 4,638 | | | | 2,957 | |
0.044%, 12/15/2035 (B) | | | | | | | 20,188 | | | | 2,124 | |
YPF | | | | | | | | | | | | |
8.750%, 04/04/2024 (A) | | | | | | | 702 | | | | 731 | |
8.500%, 07/28/2025 (A) | | | | | | | 3,178 | | | | 3,258 | |
| | | | | | | | | | | | |
| | | | | | | | | | | 67,830 | |
| | | | | | | | | | | | |
| | | | | | | | | | | | |
| Description | | | | | Face Amount (Thousands) | | | Market Value
($ Thousands) | |
| | | | | | | | | | | | |
| | | |
Armenia — 0.2% | | | | | | | | | | | | |
Republic of Armenia | | | | | | | | | | | | |
7.150%, 03/26/2025 (A) | | | $ | | | | 3,222 | | | $ | 3,139 | |
| | | | | | | | | | | | |
| | | |
Azerbaijan — 1.2% | | | | | | | | | | | | |
Republic of Azerbaijan | | | | | | | | | | | | |
4.750%, 03/18/2024 | | | | | | | 2,200 | | | | 2,118 | |
4.750%, 03/18/2024 (A) | | | | | | | 3,180 | | | | 3,061 | |
Southern Gas Corridor | | | | | | | | | | | | |
6.875%, 03/24/2026 | | | | | | | 2,483 | | | | 2,558 | |
State Oil of the Azerbaijan Republic | | | | | | | | | | | | |
6.950%, 03/18/2030 | | | | | | | 2,060 | | | | 2,005 | |
6.950%, 03/18/2030 | | | | | | | 6,028 | | | | 5,832 | |
4.750%, 03/13/2023 | | | | | | | 7,811 | | | | 7,093 | |
| | | | | | | | | | | | |
| | | | | | | | | | | 22,667 | |
| | | | | | | | | | | | |
| | | |
Bahrain — 0.0% | | | | | | | | | | | | |
Republic of Bahrain | | | | | | | | | | | | |
7.000%, 01/26/2026 (A) | | | | | | | 815 | | | | 812 | |
| | | | | | | | | | | | |
| | | |
Belize — 0.1% | | | | | | | | | | | | |
Republic of Belize | | | | | | | | | | | | |
5.000%, 02/20/2038 (D) | | | | | | | 3,437 | | | | 2,011 | |
| | | | | | | | | | | | |
| | | |
Bermuda — 0.2% | | | | | | | | | | | | |
Government of Bermuda | | | | | | | | | | | | |
4.854%, 02/06/2024 | | | | | | | 2,950 | | | | 3,127 | |
| | | | | | | | | | | | |
| | | |
Brazil — 8.8% | | | | | | | | | | | | |
Banco Nacional de Desenvolvimento Economico e Social | | | | | | | | | | | | |
6.500%, 06/10/2019 (A) | | | | | | | 720 | | | | 744 | |
6.500%, 06/10/2019 | | | | | | | 100 | | | | 103 | |
Braskem Finance | | | | | | | | | | | | |
5.750%, 04/15/2021 | | | | | | | 2,472 | | | | 2,432 | |
Brazil Letras do Tesouro Nacional | | | | | | | | | | | | |
17.752%, 07/01/2019 (C) | | | BRL | | | | 16,870 | | | | 3,234 | |
15.621%, 01/01/2019 (C) | | | | | | | 209,715 | | | | 42,650 | |
14.882%, 01/01/2020 (C) | | | | | | | 26,000 | | | | 4,676 | |
13.447%, 10/01/2016 (C) | | | | | | | 26,427 | | | | 7,009 | |
12.114%, 01/01/2018 (C) | | | | | | | 97,489 | | | | 22,331 | |
11.448%, 07/01/2018 (C) | | | | | | | 25,343 | | | | 5,466 | |
2.147%, 01/01/2019 (C) | | | | | | | 3,701 | | | | 753 | |
Brazil Loan Trust 1 | | | | | | | | | | | | |
5.477%, 07/24/2023 (A) | | | $ | | | | 1,056 | | | | 974 | |
Brazil Minas SPE via State of Minas Gerais | | | | | | | | | | | | |
5.333%, 02/15/2028 | | | | | | | 2,028 | | | | 1,734 | |
Brazil Notas do Tesouro Nacional Serie B | | | | | | | | | | | | |
6.000%, 05/15/2035 | | | BRL | | | | 1,000 | | | | 787 | |
Brazil Notas do Tesouro Nacional Serie F | | | | | | | | | | | | |
10.000%, 01/01/2018 | | | | | | | 51,766 | | | | 13,837 | |
10.000%, 01/01/2019 | | | | | | | 1,314 | | | | 345 | |
10.000%, 01/01/2021 | | | | | | | 25,497 | | | | 6,462 | |
10.000%, 01/01/2023 | | | | | | | 9,628 | | | | 2,360 | |
| | | | |
| SEI Institutional Investments Trust / Annual Report / May 31, 2016 | | | 211 | |
SCHEDULE OF INVESTMENTS
Emerging Markets Debt Fund (Continued)
May 31, 2016
| | | | | | | | | | |
| Description | | | | Face Amount (Thousands) | | | Market Value
($ Thousands) | |
| | | | | | | | | | |
10.000%, 01/01/2025 | | BRL | | | 39,897 | | | $ | 9,507 | |
Brazil Notas do Tesouro Nacional, Ser F | | | | | | | | | | |
10.000%, 01/01/2017 | | | | | 5,917 | | | | 1,609 | |
BRF | | | | | | | | | | |
4.750%, 05/22/2024 | | $ | | | 2,100 | | | | 2,068 | |
Caixa Economica Federal | | | | | | | | | | |
4.250%, 05/13/2019 | | | | | 300 | | | | 286 | |
Cosan Luxembourg | | | | | | | | | | |
5.000%, 03/14/2023 (A) | | | | | 750 | | | | 685 | |
ESAL GmbH | | | | | | | | | | |
6.250%, 02/05/2023 (A) | | | | | 468 | | | | 454 | |
Federal Republic of Brazil | | | | | | | | | | |
10.125%, 05/15/2027 | | | | | 1,309 | | | | 1,777 | |
8.875%, 04/15/2024 | | | | | 445 | | | | 538 | |
8.250%, 01/20/2034 | | | | | 6,750 | | | | 7,492 | |
7.125%, 01/20/2037 | | | | | 4,866 | | | | 4,915 | |
6.000%, 04/07/2026 | | | | | 623 | | | | 629 | |
5.625%, 01/07/2041 | | | | | 2,170 | | | | 1,861 | |
5.000%, 01/27/2045 | | | | | 783 | | | | 611 | |
4.875%, 01/22/2021 | | | | | 5,993 | | | | 6,053 | |
2.625%, 01/05/2023 | | | | | 1,326 | | | | 1,134 | |
GTL Trade Finance | | | | | | | | | | |
5.893%, 04/29/2024 (A) | | | | | 425 | | | | 355 | |
Klabin Finance | | | | | | | | | | |
5.250%, 07/16/2024 | | | | | 735 | | | | 726 | |
Marfrig Holdings Europe | | | | | | | | | | |
8.000%, 06/08/2023 (A) | | | | | 359 | | | | 360 | |
Marfrig Overseas | | | | | | | | | | |
9.500%, 05/04/2020 (A) | | | | | 1,505 | | | | 1,546 | |
Minerva Luxembourg | | | | | | | | | | |
7.750%, 01/31/2023 | | | | | 2,100 | | | | 2,121 | |
Petrobras Global Finance | | | | | | | | | | |
8.375%, 05/23/2021 | | | | | 5,645 | | | | 5,587 | |
Petrobras International Finance | | | | | | | | | | |
5.750%, 01/20/2020 | | | | | 1,913 | | | | 1,795 | |
5.375%, 01/27/2021 | | | | | 3,020 | | | | 2,673 | |
| | | | | | | | | | |
| | | | | | | | | 170,679 | |
| | | | | | | | | | |
| | | |
Cameroon — 0.2% | | | | | | | | | | |
Republic of Cameroon | | | | | | | | | | |
9.500%, 11/19/2025 | | | | | 4,875 | | | | 4,778 | |
| | | | | | | | | | |
| | | |
Chile — 1.5% | | | | | | | | | | |
Banco del Estado de Chile | | | | | | | | | | |
4.125%, 10/07/2020 (A) | | | | | 300 | | | | 317 | |
4.125%, 10/07/2020 | | | | | 160 | | | | 169 | |
3.875%, 02/08/2022 (A) | | | | | 250 | | | | 262 | |
Bonos de la Tesoreria de la Republica en pesos | | | | | | | | | | |
6.000%, 01/01/2020 | | CLP | | | 90,000 | | | | 142 | |
6.000%, 01/01/2022 | | | | | 1,170,000 | | | | 1,889 | |
Bonos del Banco Central de Chile en Pesos | | | | | | | | | | |
6.000%, 02/01/2021 | | | | | 1,050,000 | | | | 1,669 | |
6.000%, 03/01/2022 | | | | | 980,000 | | | | 1,572 | |
| | | | | | | | | | |
| Description | | | | Face Amount (Thousands) | | | Market Value
($ Thousands) | |
| | | | | | | | | | |
Empresa Electrica Angamos | | | | | | | | | | |
4.875%, 05/25/2029 (A) | | $ | | | 1,732 | | | $ | 1,643 | |
Empresa Nacional del Petroleo | | | | | | | | | | |
6.250%, 07/08/2019 | | | | | 200 | | | | 219 | |
6.250%, 07/08/2019 (A) | | | | | 30 | | | | 33 | |
5.250%, 08/10/2020 (A) | | | | | 280 | | | | 301 | |
5.250%, 08/10/2020 | | | | | 120 | | | | 129 | |
4.375%, 10/30/2024 (A) | | | | | 716 | | | | 727 | |
Nacional del Cobre de Chile | | | | | | | | | | |
6.150%, 10/24/2036 | | | | | 958 | | | | 1,058 | |
6.150%, 10/24/2036 (A) | | | | | 569 | | | | 628 | |
5.625%, 09/21/2035 | | | | | 1,760 | | | | 1,841 | |
5.625%, 10/18/2043 | | | | | 380 | | | | 406 | |
4.875%, 11/04/2044 (A) | | | | | 2,820 | | | | 2,674 | |
4.500%, 09/16/2025 (A) | | | | | 954 | | | | 971 | |
3.875%, 11/03/2021 | | | | | 426 | | | | 443 | |
3.000%, 07/17/2022 (A) | | | | | 1,310 | | | | 1,272 | |
Republic of Chile | | | | | | | | | | |
5.500%, 08/05/2020 | | CLP | | | 413,000 | | | | 631 | |
3.125%, 03/27/2025 | | $ | | | 950 | | | | 983 | |
3.125%, 01/21/2026 | | | | | 2,982 | | | | 3,027 | |
2.250%, 10/30/2022 | | | | | 4,717 | | | | 4,670 | |
VTR Finance | | | | | | | | | | |
6.875%, 01/15/2024 (A) | | | | | 540 | | | | 533 | |
| | | | | | | | | | |
| | | | | | | | | 28,209 | |
| | | | | | | | | | |
| | | |
China — 0.9% | | | | | | | | | | |
CNOOC Curtis Funding No. 1 | | | | | | | | | | |
4.500%, 10/03/2023 | | | | | 1,100 | | | | 1,176 | |
CNOOC Finance 2015 | | | | | | | | | | |
3.500%, 05/05/2025 | | | | | 297 | | | | 293 | |
Sinochem Overseas Capital | | | | | | | | | | |
4.500%, 11/12/2020 | | | | | 4,192 | | | | 4,430 | |
Sinopec Capital 2013 | | | | | | | | | | |
3.125%, 04/24/2023 (A) | | | | | 515 | | | | 507 | |
Sinopec Group Overseas Development 2014 | | | | | | | | | | |
4.375%, 04/10/2024 (A) | | | | | 1,000 | | | | 1,058 | |
Sinopec Group Overseas Development 2015 | | | | | | | | | | |
3.250%, 04/28/2025 | | | | | 4,775 | | | | 4,700 | |
Sinopec Group Overseas Development 2016 | | | | | | | | | | |
3.500%, 05/03/2026 (A) | | | | | 1,634 | | | | 1,614 | |
2.750%, 05/03/2021 (A) | | | | | 1,634 | | | | 1,641 | |
State Grid Overseas Investment 2014 | | | | | | | | | | |
4.125%, 05/07/2024 (A) | | | | | 1,457 | | | | 1,585 | |
Three Gorges Finance I Cayman Islands | | | | | | | | | | |
3.150%, 06/02/2026 (A) | | | | | 620 | | | | 620 | |
| | | | | | | | | | |
| | | | | | | | | 17,624 | |
| | | | | | | | | | |
| | | |
Colombia — 4.9% | | | | | | | | | | |
Bogota Distrito Capital | | | | | | | | | | |
9.750%, 07/26/2028 (A) | | COP | | | 10,018,000 | | | | 3,262 | |
9.750%, 07/26/2028 | | | | | 794,000 | | | | 259 | |
Colombian TES | | | | | | | | | | |
10.000%, 07/24/2024 | | | | | 11,725,800 | | | | 4,257 | |
| | |
| 212 | | SEI Institutional Investments Trust / Annual Report / May 31, 2016 |
| | | | | | | | | | |
| Description | | | | Face Amount (Thousands) | | | Market Value
($ Thousands) | |
| | | | | | | | | | |
7.750%, 09/18/2030 | | COP | | | 35,002,400 | | | $ | 10,798 | |
7.500%, 08/26/2026 | | | | | 25,728,500 | | | | 7,964 | |
7.000%, 05/04/2022 | | | | | 27,994,600 | | | | 8,735 | |
Ecopetrol | | | | | | | | | | |
7.375%, 09/18/2043 | | $ | | | 1,178 | | | | 1,104 | |
5.875%, 09/18/2023 | | | | | 1,567 | | | | 1,568 | |
5.875%, 05/28/2045 | | | | | 903 | | | | 728 | |
5.375%, 06/26/2026 | | | | | 933 | | | | 870 | |
Emgesa ESP | | | | | | | | | | |
8.750%, 01/25/2021 | | COP | | | 1,640,000 | | | | 504 | |
Empresas Publicas de Medellin ESP | | | | | | | | | | |
8.375%, 02/01/2021 | | | | | 5,072,000 | | | | 1,544 | |
7.625%, 09/10/2024 (A) | | | | | 2,224,000 | | | | 622 | |
7.625%, 09/10/2024 (A) | | | | | 1,827,000 | | | | 511 | |
Financiera de Desarrollo Territorial Findeter | | | | | | | | | | |
7.875%, 08/12/2024 (A) | | | | | 2,046,000 | | | | 581 | |
7.875%, 08/12/2024 | | | | | 1,095,000 | | | | 311 | |
Pacific Exploration and Production | | | | | | | | | | |
5.625%, 01/19/2025 (A) (E) | | $ | | | 2,820 | | | | 430 | |
5.375%, 01/26/2019 (E) | | | | | 1,370 | | | | 209 | |
Republic of Colombia MTN | | | | | | | | | | |
9.850%, 06/28/2027 | | COP | | | 994,000 | | | | 360 | |
9.850%, 06/28/2027 | | | | | 7,914,000 | | | | 2,864 | |
8.125%, 05/21/2024 | | $ | | | 300 | | | | 374 | |
7.750%, 04/14/2021 | | COP | | | 4,013,000 | | | | 1,293 | |
7.375%, 01/27/2017 | | $ | | | 4,610 | | | | 4,783 | |
7.375%, 09/18/2037 | | | | | 4,558 | | | | 5,424 | |
6.125%, 01/18/2041 | | | | | 6,106 | | | | 6,411 | |
6.000%, 04/28/2028 | | COP | | | 24,176,900 | | | | 6,544 | |
5.625%, 02/26/2044 | | $ | | | 2,052 | | | | 2,031 | |
5.000%, 11/21/2018 | | COP | | | 14,982,300 | | | | 4,606 | |
5.000%, 06/15/2045 | | $ | | | 1,874 | | | | 1,738 | |
4.500%, 01/28/2026 | | | | | 3,570 | | | | 3,615 | |
4.375%, 07/12/2021 | | | | | 3,012 | | | | 3,125 | |
4.375%, 03/21/2023 | | COP | | | 7,927,000 | | | | 2,102 | |
4.000%, 02/26/2024 | | $ | | | 3,044 | | | | 3,013 | |
3.875%, 03/22/2026 | | EUR | | | 2,056 | | | | 2,356 | |
2.625%, 03/15/2023 | | $ | | | 599 | | | | 551 | |
| | | | | | | | | | |
| | | | | | | | | 95,447 | |
| | | | | | | | | | |
| | | |
Costa Rica — 0.8% | | | | | | | | | | |
Banco Nacional de Costa Rica | | | | | | | | | | |
6.250%, 11/01/2023 (A) | | | | | 290 | | | | 289 | |
5.875%, 04/25/2021 (A) | | | | | 799 | | | | 804 | |
Instituto Costarricense de Electricidad | | | | | | | | | | |
6.950%, 11/10/2021 | | | | | 400 | | | | 411 | |
6.375%, 05/15/2043 | | | | | 290 | | | | 221 | |
Republic of Costa Rica | | | | | | | | | | |
7.158%, 03/12/2045 | | | | | 3,939 | | | | 3,624 | |
7.158%, 03/12/2045 (A) | | | | | 1,585 | | | | 1,458 | |
7.000%, 04/04/2044 (A) | | | | | 2,831 | | | | 2,590 | |
7.000%, 04/04/2044 | | | | | 3,707 | | | | 3,392 | |
4.375%, 04/30/2025 (A) | | | | | 571 | | | | 508 | |
| | | | | | | | | | |
| Description | | | | Face Amount (Thousands) | | | Market Value
($ Thousands) | |
| | | | | | | | | | |
4.375%, 04/30/2025 | | $ | | | 376 | | | $ | 335 | |
4.250%, 01/26/2023 | | | | | 2,399 | | | | 2,207 | |
| | | | | | | | | | |
| | | | | | | | | 15,839 | |
| | | | | | | | | | |
| | | |
Croatia — 1.1% | | | | | | | | | | |
Republic of Croatia | | | | | | | | | | |
6.750%, 11/05/2019 | | | | | 755 | | | | 823 | |
6.625%, 07/14/2020 | | | | | 2,762 | | | | 3,008 | |
6.375%, 03/24/2021 (A) | | | | | 3,670 | | | | 3,990 | |
6.375%, 03/24/2021 | | | | | 4,436 | | | | 4,823 | |
6.000%, 01/26/2024 (A) | | | | | 378 | | | | 408 | |
6.000%, 01/26/2024 | | | | | 1,300 | | | | 1,403 | |
5.875%, 07/09/2018 | | EUR | | | 170 | | | | 207 | |
5.500%, 04/04/2023 (A) | | $ | | | 858 | | | | 901 | |
5.500%, 04/04/2023 | | | | | 2,200 | | | | 2,310 | |
3.000%, 03/11/2025 | | EUR | | | 2,910 | | | | 3,036 | |
| | | | | | | | | | |
| | | | | | | | | 20,909 | |
| | | | | | | | | | |
| | | |
Dominican Republic — 1.2% | | | | | | | | | | |
Republic of Dominican Republic | | | | | | | | | | |
15.950%, 06/04/2021 | | DOP | | | 4,500 | | | | 119 | |
11.500%, 05/10/2024 | | | | | 67,000 | | | | 1,555 | |
11.000%, 01/05/2018 | | | | | 7,560 | | | | 168 | |
11.000%, 07/30/2021 (A) | | | | | 67,030 | | | | 1,491 | |
9.040%, 01/23/2018 | | $ | | | 1,004 | | | | 1,052 | |
8.625%, 04/20/2027 | | | | | 1,748 | | | | 2,028 | |
7.500%, 05/06/2021 | | | | | 440 | | | | 483 | |
7.500%, 05/06/2021 (A) | | | | | 520 | | | | 571 | |
7.450%, 04/30/2044 (A) | | | | | 2,143 | | | | 2,261 | |
7.450%, 04/30/2044 | | | | | 1,324 | | | | 1,400 | |
6.875%, 01/29/2026 | | | | | 1,000 | | | | 1,075 | |
6.850%, 01/27/2045 | | | | | 525 | | | | 521 | |
6.850%, 01/27/2045 (A) | | | | | 2,162 | | | | 2,146 | |
5.875%, 04/18/2024 | | | | | 380 | | | | 388 | |
5.875%, 04/18/2024 (A) | | | | | 6,474 | | | | 6,604 | |
5.500%, 01/27/2025 | | | | | 1,620 | | | | 1,612 | |
| | | | | | | | | | |
| | | | | | | | | 23,474 | |
| | | | | | | | | | |
| | | |
Ecuador — 0.7% | | | | | | | | | | |
EP PetroEcuador via Noble Sovereign Funding I | | | | | | | | | | |
6.258%, 09/24/2019 (B) | | | | | 1,858 | | | | 1,756 | |
Republic of Ecuador | | | | | | | | | | |
10.500%, 03/24/2020 | | | | | 2,714 | | | | 2,721 | |
10.500%, 03/24/2020 (A) | | | | | 4,979 | | | | 4,991 | |
7.950%, 06/20/2024 | | | | | 5,700 | | | | 5,102 | |
| | | | | | | | | | |
| | | | | | | | | 14,570 | |
| | | | | | | | | | |
| | | |
Egypt — 0.6% | | | | | | | | | | |
Arab Republic of Egypt | | | | | | | | | | |
5.875%, 06/11/2025 (A) | | | | | 2,788 | | | | 2,394 | |
5.875%, 06/11/2025 | | | | | 9,347 | | | | 8,027 | |
Egypt Government International Bond | | | | | | | | | | |
6.875%, 04/30/2040 (A) | | | | | 882 | | | | 728 | |
| | | | |
| SEI Institutional Investments Trust / Annual Report / May 31, 2016 | | | 213 | |
SCHEDULE OF INVESTMENTS
Emerging Markets Debt Fund (Continued)
May 31, 2016
| | | | | | | | | | |
| Description | | | | Face Amount (Thousands) | | | Market Value
($ Thousands) | |
| | | | | | | | | | |
5.750%, 04/29/2020 | | $ | | | 394 | | | $ | 395 | |
| | | | | | | | | | |
| | | | | | | | | 11,544 | |
| | | | | | | | | | |
| | | |
El Salvador — 1.1% | | | | | | | | | | |
Republic of El Salvador | | | | | | | | | | |
8.250%, 04/10/2032 | | | | | 1,093 | | | | 1,022 | |
8.250%, 04/10/2032 | | | | | 888 | | | | 831 | |
7.750%, 01/24/2023 | | | | | 3,216 | | | | 3,120 | |
7.650%, 06/15/2035 | | | | | 144 | | | | 124 | |
7.650%, 06/15/2035 | | | | | 8,597 | | | | 7,415 | |
7.625%, 02/01/2041 | | | | | 1,470 | | | | 1,253 | |
7.375%, 12/01/2019 | | | | | 1,390 | | | | 1,376 | |
6.375%, 01/18/2027 (A) | | | | | 2,162 | | | | 1,865 | |
6.375%, 01/18/2027 | | | | | 2,871 | | | | 2,476 | |
5.875%, 01/30/2025 | | | | | 545 | | | | 463 | |
5.875%, 01/30/2025 (A) | | | | | 828 | | | | 704 | |
| | | | | | | | | | |
| | | | | | | | | 20,649 | |
| | | | | | | | | | |
| | | |
Ethiopia — 0.1% | | | | | | | | | | |
Federal Democratic Republic of Ethiopia | | | | | | | | | | |
6.625%, 12/11/2024 (A) | | | | | 1,411 | | | | 1,286 | |
| | | | | | | | | | |
| | | |
Gabon — 0.2% | | | | | | | | | | |
Republic of Gabon | | | | | | | | | | |
8.200%, 12/12/2017 | | | | | 520 | | | | 536 | |
6.950%, 06/16/2025 (A) | | | | | 858 | | | | 723 | |
6.375%, 12/12/2024 (A) | | | | | 2,452 | | | | 2,048 | |
6.375%, 12/12/2024 | | | | | 321 | | | | 268 | |
| | | | | | | | | | |
| | | | | | | | | 3,575 | |
| | | | | | | | | | |
| | | |
Georgia — 0.0% | | | | | | | | | | |
Republic of Georgia | | | | | | | | | | |
6.875%, 04/12/2021 (A) | | | | | 888 | | | | 976 | |
| | | | | | | | | | |
| | | |
Ghana — 0.7% | | | | | | | | | | |
Republic of Ghana | | | | | | | | | | |
10.750%, 10/14/2030 | | | | | 6,732 | | | | 6,733 | |
10.750%, 10/14/2030 (A) | | | | | 310 | | | | 310 | |
8.500%, 10/04/2017 (A) | | | | | 300 | | | | 301 | |
8.125%, 01/18/2026 | | | | | 560 | | | | 456 | |
8.125%, 01/18/2026 (A) | | | | | 261 | | | | 213 | |
7.875%, 08/07/2023 | | | | | 6,053 | | | | 4,995 | |
| | | | | | | | | | |
| | | | | | | | | 13,008 | |
| | | | | | | | | | |
| | | |
Guatemala — 0.1% | | | | | | | | | | |
Comcel Trust | | | | | | | | | | |
6.875%, 02/06/2024 (A) | | | | | 1,370 | | | | 1,276 | |
| | | | | | | | | | |
| | | |
Hungary — 3.4% | | | | | | | | | | |
Magyar Export-Import Bank Zrt | | | | | | | | | | |
4.000%, 01/30/2020 (A) | | | | | 1,144 | | | | 1,161 | |
Republic of Hungary | | | | | | | | | | |
7.625%, 03/29/2041 | | | | | 8,510 | | | | 11,946 | |
7.500%, 11/12/2020 | | HUF | | | 220,000 | | | | 954 | |
7.000%, 06/24/2022 | | | | | 1,028,690 | | | | 4,524 | |
| | | | | | | | | | |
| Description | | | | Face Amount (Thousands) | | | Market Value
($ Thousands) | |
| | | | | | | | | | |
6.750%, 10/22/2028 | | HUF | | | 1,065,450 | | | $ | 4,986 | |
6.375%, 03/29/2021 | | $ | | | 7,113 | | | | 8,073 | |
6.250%, 01/29/2020 | | | | | 1,650 | | | | 1,837 | |
6.000%, 11/24/2023 | | HUF | | | 2,065,460 | | | | 8,751 | |
5.750%, 11/22/2023 | | $ | | | 6,393 | | | | 7,223 | |
5.500%, 06/24/2025 | | HUF | | | 2,871,450 | | | | 11,962 | |
5.375%, 02/21/2023 | | $ | | | 3,406 | | | | 3,747 | |
5.375%, 03/25/2024 | | | | | 1,229 | | | | 1,361 | |
| | | | | | | | | | |
| | | | | | | | | 66,525 | |
| | | | | | | | | | |
| | | |
India — 0.2% | | | | | | | | | | |
ABJA Investment | | | | | | | | | | |
5.950%, 07/31/2024 | | | | | 309 | | | | 292 | |
Bharti Airtel International Netherlands | | | | | | | | | | |
5.125%, 03/11/2023 | | | | | 3,975 | | | | 4,261 | |
| | | | | | | | | | |
| | | | | | | | | 4,553 | |
| | | | | | | | | | |
| | | |
Indonesia — 8.1% | | | | | | | | | | |
Indonesia Treasury Bond | | | | | | | | | | |
8.250%, 07/15/2021 | | IDR | | | 16,999,000 | | | | 1,282 | |
Majapahit Holding | | | | | | | | | | |
7.875%, 06/29/2037 | | $ | | | 387 | | | | 467 | |
7.875%, 06/29/2037 (A) | | | | | 215 | | | | 260 | |
Pelabuhan Indonesia III | | | | | | | | | | |
4.875%, 10/01/2024 | | | | | 1,858 | | | | 1,919 | |
Pertamina Persero MTN | | | | | | | | | | |
6.500%, 05/27/2041 (A) | | | | | 820 | | | | 833 | |
6.450%, 05/30/2044 (A) | | | | | 1,285 | | | | 1,291 | |
6.000%, 05/03/2042 (A) | | | | | 1,344 | | | | 1,289 | |
5.625%, 05/20/2043 | | | | | 5,257 | | | | 4,833 | |
5.250%, 05/23/2021 | | | | | 575 | | | | 605 | |
4.875%, 05/03/2022 (A) | | | | | 550 | | | | 568 | |
Perusahaan Listrik Negara MTN | | | | | | | | | | |
5.250%, 10/24/2042 | | | | | 1,080 | | | | 999 | |
Republic of Indonesia | | | | | | | | | | |
12.800%, 06/15/2021 | | IDR | | | 230,000 | | | | 21 | |
11.625%, 03/04/2019 (A) | | $ | | | 2,500 | | | | 3,103 | |
11.625%, 03/04/2019 | | | | | 258 | | | | 320 | |
11.625%, 03/04/2019 | | | | | 1,006 | | | | 1,249 | |
11.000%, 09/15/2025 | | IDR | | | 2,000,000 | | | | 176 | |
9.000%, 03/15/2029 | | | | | 253,606,000 | | | | 20,004 | |
8.750%, 05/15/2031 | | | | | 49,043,000 | | | | 3,789 | |
8.500%, 10/12/2035 | | $ | | | 800 | | | | 1,109 | |
8.375%, 03/15/2024 | | IDR | | | 359,246,000 | | | | 27,212 | |
8.375%, 09/15/2026 | | | | | 60,896,000 | | | | 4,618 | |
8.375%, 03/15/2034 | | | | | 157,217,000 | | | | 11,871 | |
8.250%, 06/15/2032 | | | | | 5,900,000 | | | | 440 | |
8.250%, 05/15/2036 | | | | | 87,843,000 | | | | 6,572 | |
7.875%, 04/15/2019 | | | | | 61,864,000 | | | | 4,582 | |
7.750%, 01/17/2038 | | $ | | | 1,793 | | | | 2,328 | |
7.750%, 01/17/2038 | | | | | 6,451 | | | | 8,374 | |
7.000%, 05/15/2022 | | IDR | | | 168,500,000 | | | | 11,937 | |
7.000%, 05/15/2027 | | | | | 2,500,000 | | | | 171 | |
6.750%, 01/15/2044 | | $ | | | 500 | | | | 611 | |
| | |
| 214 | | SEI Institutional Investments Trust / Annual Report / May 31, 2016 |
| | | | | | | | | | |
| Description | | | | Face Amount (Thousands) | | | Market Value
($ Thousands) | |
| | | | | | | | | | |
6.625%, 05/15/2033 | | IDR | | | 45,270,000 | | | $ | 2,883 | |
6.625%, 02/17/2037 | | $ | | | 2,082 | | | | 2,459 | |
6.125%, 05/15/2028 | | IDR | | | 18,170,000 | | | | 1,146 | |
5.950%, 01/08/2046 | | $ | | | 281 | | | | 315 | |
5.875%, 01/15/2024 (A) | | | | | 1,500 | | | | 1,695 | |
5.875%, 01/15/2024 | | | | | 4,183 | | | | 4,727 | |
5.625%, 05/15/2023 | | IDR | | | 71,594,000 | | | | 4,642 | |
5.250%, 01/17/2042 | | $ | | | 867 | | | | 883 | |
5.125%, 01/15/2045 (A) | | | | | 1,022 | | | | 1,035 | |
4.875%, 05/05/2021 (A) | | | | | 200 | | | | 214 | |
4.875%, 05/05/2021 | | | | | 2,640 | | | | 2,825 | |
4.750%, 01/08/2026 (A) | | | | | 2,651 | | | | 2,811 | |
4.125%, 01/15/2025 | | | | | 2,405 | | | | 2,442 | |
3.375%, 04/15/2023 (A) | | | | | 3,263 | | | | 3,211 | |
3.375%, 07/30/2025 | | EUR | | | 2,570 | | | | 2,890 | |
| | | | | | | | | | |
| | | | | | | | | 157,011 | |
| | | | | | | | | | |
| | | |
Iraq — 0.4% | | | | | | | | | | |
Republic of Iraq | | | | | | | | | | |
5.800%, 01/15/2028 | | $ | | | 10,506 | | | | 7,643 | |
| | | | | | | | | | |
| | | |
Ivory Coast — 1.1% | | | | | | | | | | |
Government of Ivory Coast | | | | | | | | | | |
11.660%, 12/31/2032 | | | | | 13,130 | | | | 11,851 | |
11.660%, 12/31/2032 | | | | | 3,527 | | | | 3,183 | |
6.375%, 03/03/2028 (A) | | | | | 3,446 | | | | 3,248 | |
5.375%, 07/23/2024 (A) | | | | | 3,203 | | | | 2,923 | |
| | | | | | | | | | |
| | | | | | | | | 21,205 | |
| | | | | | | | | | |
| | | |
Jamaica — 0.4% | | | | | | | | | | |
Digicel Group | | | | | | | | | | |
8.250%, 09/30/2020 | | | | | 1,750 | | | | 1,518 | |
7.125%, 04/01/2022 (A) | | | | | 1,222 | | | | 942 | |
Government of Jamaica | | | | | | | | | | |
7.875%, 07/28/2045 | | | | | 918 | | | | 964 | |
7.625%, 07/09/2025 | | | | | 1,860 | | | | 2,062 | |
6.750%, 04/28/2028 | | | | | 1,732 | | | | 1,793 | |
| | | | | | | | | | |
| | | | | | | | | 7,279 | |
| | | | | | | | | | |
| | | |
Kazakhstan — 1.1% | | | | | | | | | | |
Development Bank of Kazakhstan | | | | | | | | | | |
4.125%, 12/10/2022 | | | | | 880 | | | | 812 | |
KazAgro National Management Holding MTN | | | | | | | | | | |
4.625%, 05/24/2023 | | | | | 420 | | | | 363 | |
Kazakhstan Temir Zholy Finance | | | | | | | | | | |
6.950%, 07/10/2042 (A) | | | | | 551 | | | | 517 | |
6.950%, 07/10/2042 | | | | | 500 | | | | 469 | |
6.375%, 10/06/2020 (A) | | | | | 660 | | | | 671 | |
KazMunaiGaz Finance Sub | | | | | | | | | | |
9.125%, 07/02/2018 | | | | | 1,273 | | | | 1,395 | |
7.000%, 05/05/2020 | | | | | 2,262 | | | | 2,432 | |
6.375%, 04/09/2021 (A) | | | | | 1,862 | | | | 1,967 | |
6.375%, 04/09/2021 | | | | | 4,247 | | | | 4,486 | |
| | | | | | | | | | | | |
| Description | | | | | Face Amount (Thousands) | | | Market Value
($ Thousands) | |
| | | | | | | | | | | | |
KazMunayGas National | | | | | | | | | | | | |
7.000%, 05/05/2020 (A) | | | $ | | | | 1,093 | | | $ | 1,175 | |
Republic of Kazakhstan MTN | | | | | | | | | | | | |
6.500%, 07/21/2045 | | | | | | | 1,270 | | | | 1,370 | |
6.500%, 07/21/2045 (A) | | | | | | | 435 | | | | 470 | |
5.125%, 07/21/2025 | | | | | | | 930 | | | | 981 | |
5.125%, 07/21/2025 (A) | | | | | | | 2,514 | | | | 2,645 | |
Samruk-Energy MTN | | | | | | | | | | | | |
3.750%, 12/20/2017 | | | | | | | 700 | | | | 691 | |
Zhaikmunai LLP | | | | | | | | | | | | |
6.375%, 02/14/2019 (A) | | | | | | | 458 | | | | 377 | |
Zhaikmunai Via Zhaikmunai International | | | | | | | | | | | | |
7.125%, 11/13/2019 (A) | | | | | | | 595 | | | | 492 | |
| | | | | | | | | | | | |
| | | | | | | | | | | 21,313 | |
| | | | | | | | | | | | |
| | | |
Kenya — 0.6% | | | | | | | | | | | | |
Kenya Infrastructure Bond | | | | | | | | | | | | |
12.500%, 05/12/2025 | | | KES | | | | 40,000 | | | | 386 | |
11.000%, 09/15/2025 | | | | | | | 295,000 | | | | 2,766 | |
11.000%, 10/12/2026 | | | | | | | 40,000 | | | | 370 | |
11.000%, 03/15/2027 | | | | | | | 161,850 | | | | 1,498 | |
Republic of Kenya | | | | | | | | | | | | |
6.875%, 06/24/2024 (A) | | | $ | | | | 3,409 | | | | 3,128 | |
6.875%, 06/24/2024 | | | | | | | 850 | | | | 780 | |
5.875%, 06/24/2019 (A) | | | | | | | 1,843 | | | | 1,795 | |
| | | | | | | | | | | | |
| | | | | | | | | | | 10,723 | |
| | | | | | | | | | | | |
| | | |
Lithuania — 0.0% | | | | | | | | | | | | |
Republic of Lithuania | | | | | | | | | | | | |
7.375%, 02/11/2020 (A) | | | | | | | 251 | | | | 297 | |
| | | | | | | | | | | | |
| | | |
Malaysia — 3.8% | | | | | | | | | | | | |
1MDB Global Investments | | | | | | | | | | | | |
4.400%, 03/09/2023 | | | | | | | 6,000 | | | | 5,070 | |
Government of Malaysia | | | | | | | | | | | | |
5.248%, 09/15/2028 | | | MYR | | | | 1,050 | | | | 278 | |
4.935%, 09/30/2043 | | | | | | | 4,500 | | | | 1,122 | |
4.498%, 04/15/2030 | | | | | | | 1,540 | | | | 381 | |
4.392%, 04/15/2026 | | | | | | | 12,223 | | | | 3,061 | |
4.378%, 11/29/2019 | | | | | | | 1,800 | | | | 450 | |
4.262%, 09/15/2016 | | | | | | | 11,900 | | | | 2,893 | |
4.181%, 07/15/2024 | | | | | | | 17,412 | | | | 4,268 | |
4.160%, 07/15/2021 | | | | | | | 9,850 | | | | 2,441 | |
4.048%, 09/30/2021 | | | | | | | 5,020 | | | | 1,238 | |
4.012%, 09/15/2017 | | | | | | | 600 | | | | 147 | |
3.955%, 09/15/2025 | | | | | | | 52,416 | | | | 12,748 | |
3.892%, 03/15/2027 | | | | | | | 2,325 | | | | 552 | |
3.889%, 07/31/2020 | | | | | | | 10,760 | | | | 2,638 | |
3.844%, 04/15/2033 | | | | | | | 1,960 | | | | 443 | |
3.800%, 08/17/2023 | | | | | | | 3,000 | | | | 723 | |
3.795%, 09/30/2022 | | | | | | | 19,000 | | | | 4,582 | |
3.654%, 10/31/2019 | | | | | | | 22,840 | | | | 5,573 | |
3.580%, 09/28/2018 | | | | | | | 10,125 | | | | 2,476 | |
3.502%, 05/31/2027 | | | | | | | 1,050 | | | | 239 | |
| | | | |
| SEI Institutional Investments Trust / Annual Report / May 31, 2016 | | | 215 | |
SCHEDULE OF INVESTMENTS
Emerging Markets Debt Fund (Continued)
May 31, 2016
| | | | | | | | | | |
| Description | | | | Face Amount (Thousands) | | | Market Value
($ Thousands) | |
| | | | | | | | | | |
3.492%, 03/31/2020 | | MYR | | | 7,580 | | | $ | 1,836 | |
3.480%, 03/15/2023 | | | | | 19,004 | | | | 4,491 | |
3.418%, 08/15/2022 | | | | | 10,253 | | | | 2,417 | |
3.314%, 10/31/2017 | | | | | 17,958 | | | | 4,372 | |
3.260%, 03/01/2018 | | | | | 25,790 | | | | 6,281 | |
Petronas Capital MTN | | | | | | | | | | |
4.500%, 03/18/2045 (A) | | $ | | | 351 | | | | 370 | |
3.500%, 03/18/2025 (A) | | | | | 3,031 | | | | 3,107 | |
| | | | | | | | | | |
| | | | | | | | | 74,197 | |
| | | | | | | | | | |
| | | |
Mexico — 8.3% | | | | | | | | | | |
Alfa | | | | | | | | | | |
6.875%, 03/25/2044 | | | | | 2,325 | | | | 2,368 | |
America Movil | | | | | | | | | | |
7.125%, 12/09/2024 | | MXN | | | 23,310 | | | | 1,217 | |
6.000%, 06/09/2019 | | | | | 14,350 | | | | 769 | |
BBVA Bancomer | | | | | | | | | | |
6.750%, 09/30/2022 (A) | | $ | | | 500 | | | | 551 | |
Cemex | | | | | | | | | | |
7.750%, 04/16/2026 (A) | | | | | 675 | | | | 710 | |
6.125%, 05/05/2025 (A) | | | | | 229 | | | | 223 | |
5.700%, 01/11/2025 (A) | | | | | 245 | | | | 231 | |
Cemex Finance | | | | | | | | | | |
9.375%, 10/12/2022 (A) | | | | | 473 | | | | 515 | |
Comision Federal de Electricidad | | | | | | | | | | |
7.350%, 11/25/2025 | | MXN | | | 27,455 | | | | 1,423 | |
5.750%, 02/14/2042 (A) | | $ | | | 570 | | | | 556 | |
4.875%, 01/15/2024 (A) | | | | | 288 | | | | 295 | |
Fermaca Enterprises S de RL | | | | | | | | | | |
6.375%, 03/30/2038 (A) | | | | | 723 | | | | 704 | |
Mexican Bonos, Ser M10 | | | | | | | | | | |
7.250%, 12/15/2016 | | MXN | | | 31,167 | | | | 1,720 | |
Mexican Bonos, Ser M20 | | | | | | | | | | |
8.000%, 12/07/2023 | | | | | 17,846 | | | | 1,089 | |
Mexican Bonos | | | | | | | | | | |
10.000%, 12/05/2024 | | | | | 315,982 | | | | 21,744 | |
10.000%, 11/20/2036 | | | | | 21,866 | | | | 1,606 | |
8.500%, 12/13/2018 | | | | | 86,343 | | | | 5,080 | |
8.500%, 05/31/2029 | | | | | 45,738 | | | | 2,921 | |
8.500%, 11/18/2038 | | | | | 144,652 | | | | 9,335 | |
7.750%, 05/29/2031 | | | | | 141,559 | | | | 8,501 | |
7.750%, 11/23/2034 | | | | | 30,849 | | | | 1,849 | |
7.750%, 11/13/2042 | | | | | 14,083 | | | | 848 | |
7.500%, 06/03/2027 | | | | | 32,192 | | | | 1,916 | |
6.500%, 06/10/2021 | | | | | 18,630 | | | | 1,052 | |
6.500%, 06/09/2022 | | | | | 134,701 | | | | 7,591 | |
5.750%, 03/05/2026 | | | | | 12,964 | | | | 685 | |
5.000%, 12/11/2019 | | | | | 150,340 | | | | 8,095 | |
4.750%, 06/14/2018 | | | | | 137,010 | | | | 7,432 | |
Mexican Udibonos | | | | | | | | | | |
2.000%, 06/09/2022 | | | | | 1,752 | | | | 491 | |
Petroleos Mexicanos | | | | | | | | | | |
9.500%, 09/15/2027 | | $ | | | 215 | | | | 256 | |
| | | | | | | | | | | | |
| Description | | | | | Face Amount (Thousands) | | | Market Value
($ Thousands) | |
| | | | | | | | | | | | |
7.190%, 09/12/2024 | | | MXN | | | | 102,190 | | | $ | 4,873 | |
6.875%, 08/04/2026 (A) | | | $ | | | | 1,551 | | | | 1,685 | |
6.875%, 08/04/2026 | | | | | | | 6,279 | | | | 6,823 | |
6.625%, 06/15/2035 | | | | | | | 7,650 | | | | 7,496 | |
6.625%, 06/15/2038 | | | | | | | 2,871 | | | | 2,749 | |
6.500%, 06/02/2041 | | | | | | | 1,655 | | | | 1,564 | |
6.375%, 02/04/2021 (A) | | | | | | | 441 | | | | 473 | |
6.375%, 01/23/2045 (A) | | | | | | | 1,016 | | | | 951 | |
6.375%, 01/23/2045 | | | | | | | 500 | | | | 468 | |
6.000%, 03/05/2020 | | | | | | | 452 | | | | 480 | |
5.750%, 03/01/2018 | | | | | | | 670 | | | | 698 | |
5.625%, 01/23/2046 | | | | | | | 873 | | | | 741 | |
5.625%, 01/23/2046 | | | | | | | 1,378 | | | | 1,169 | |
5.500%, 01/21/2021 | | | | | | | 17 | | | | 18 | |
5.500%, 06/27/2044 | | | | | | | 257 | | | | 215 | |
4.875%, 01/24/2022 | | | | | | | 370 | | | | 370 | |
4.875%, 01/18/2024 | | | | | | | 2,252 | | | | 2,210 | |
4.500%, 01/23/2026 | | | | | | | 403 | | | | 378 | |
4.250%, 01/15/2025 | | | | | | | 4,725 | | | | 4,418 | |
4.250%, 01/15/2025 | | | | | | | 4,081 | | | | 3,816 | |
3.500%, 01/30/2023 | | | | | | | 47 | | | | 43 | |
2.750%, 04/21/2027 | | | EUR | | | | 1,500 | | | | 1,368 | |
Sixsigma Networks Mexico | | | | | | | | | | | | |
8.250%, 11/07/2021 (A) | | | $ | | | | 668 | | | | 648 | |
United Mexican States MTN | | | | | | | | | | | | |
7.500%, 04/08/2033 | | | | | | | 468 | | | | 639 | |
6.050%, 01/11/2040 | | | | | | | 880 | | | | 1,034 | |
5.750%, 10/12/2110 | | | | | | | 478 | | | | 480 | |
5.550%, 01/21/2045 | | | | | | | 640 | | | | 712 | |
4.750%, 03/08/2044 | | | | | | | 3,819 | | | | 3,790 | |
4.600%, 01/23/2046 | | | | | | | 5,225 | | | | 5,068 | |
4.125%, 01/21/2026 | | | | | | | 6,820 | | | | 7,110 | |
4.000%, 10/02/2023 | | | | | | | 2,661 | | | | 2,774 | |
3.600%, 01/30/2025 | | | | | | | 4,626 | | | | 4,667 | |
| | | | | | | | | | | | |
| | | | | | | | | | | 161,701 | |
| | | | | | | | | | | | |
| | | |
Mongolia — 0.6% | | | | | | | | | | | | |
Development Bank of Mongolia MTN | | | | | | | | | | | | |
5.750%, 03/21/2017 | | | | | | | 1,138 | | | | 1,129 | |
Government of Mongolia MTN | | | | | | | | | | | | |
10.875%, 04/06/2021 (A) | | | | | | | 1,613 | | | | 1,656 | |
5.125%, 12/05/2022 | | | | | | | 8,612 | | | | 6,870 | |
4.125%, 01/05/2018 | | | | | | | 998 | | | | 958 | |
Trade & Development Bank of Mongolia MTN | | | | | | | | | | | | |
9.375%, 05/19/2020 | | | | | | | 470 | | | | 442 | |
9.375%, 05/19/2020 (A) | | | | | | | 453 | | | | 426 | |
| | | | | | | | | | | | |
| | | | | | | | | | | 11,481 | |
| | | | | | | | | | | | |
| | | |
Montenegro — 0.1% | | | | | | | | | | | | |
Republic of Montenegro | | | | | | | | | | | | |
5.750%, 03/10/2021 (A) | | | EUR | | | | 742 | | | | 832 | |
5.750%, 03/10/2021 | | | | | | | 525 | | | | 589 | |
| | |
| 216 | | SEI Institutional Investments Trust / Annual Report / May 31, 2016 |
| | | | | | | | | | | | |
| Description | | | | | Face Amount (Thousands) | | | Market Value
($ Thousands) | |
| | | | | | | | | | | | |
5.375%, 05/20/2019 | | | EUR | | | | 481 | | | $ | 548 | |
| | | | | | | | | | | | |
| | | | | | | | | | | 1,969 | |
| | | | | | | | | | | | |
| | | |
Morocco — 0.2% | | | | | | | | | | | | |
Kingdom of Morocco | | | | | | | | | | | | |
5.500%, 12/11/2042 | | | $ | | | | 1,300 | | | | 1,348 | |
4.250%, 12/11/2022 (A) | | | | | | | 632 | | | | 651 | |
OCP | | | | | | | | | | | | |
6.875%, 04/25/2044 (A) | | | | | | | 1,508 | | | | 1,523 | |
| | | | | | | | | | | | |
| | | | | | | | | | | 3,522 | |
| | | | | | | | | | | | |
| | | |
Namibia — 0.1% | | | | | | | | | | | | |
Namibia International Bonds | | | | | | | | | | | | |
5.250%, 10/29/2025 (A) | | | | | | | 1,529 | | | | 1,495 | |
| | | | | | | | | | | | |
| | | |
Netherlands — 0.1% | | | | | | | | | | | | |
GTH Finance | | | | | | | | | | | | |
7.250%, 04/26/2023 (A) | | | | | | | 929 | | | | 939 | |
6.250%, 04/26/2020 (A) | | | | | | | 337 | | | | 340 | |
| | | | | | | | | | | | |
| | | | | | | | | | | 1,279 | |
| | | | | | | | | | | | |
| | | |
Nigeria — 0.1% | | | | | | | | | | | | |
Republic of Nigeria | | | | | | | | | | | | |
6.750%, 01/28/2021 | | | | | | | 1,765 | | | | 1,730 | |
| | | | | | | | | | | | |
| | | |
Pakistan — 0.3% | | | | | | | | | | | | |
Republic of Pakistan | | | | | | | | | | | | |
8.250%, 04/15/2024 | | | | | | | 4,780 | | | | 5,079 | |
| | | | | | | | | | | | |
| | | |
Panama — 1.1% | | | | | | | | | | | | |
Panama Notas del Tesoro | | | | | | | | | | | | |
4.875%, 02/05/2021 | | | | | | | 840 | | | | 889 | |
Republic of Panama | | | | | | | | | | | | |
9.375%, 01/16/2023 | | | | | | | 595 | | | | 786 | |
9.375%, 04/01/2029 | | | | | | | 5,438 | | | | 7,994 | |
8.875%, 09/30/2027 | | | | | | | 1,963 | | | | 2,782 | |
8.125%, 04/28/2034 | | | | | | | 2,249 | | | | 3,059 | |
7.125%, 01/29/2026 | | | | | | | 100 | | | | 127 | |
6.700%, 01/26/2036 | | | | | | | 1,095 | | | | 1,374 | |
4.300%, 04/29/2053 | | | | | | | 140 | | | | 132 | |
3.875%, 03/17/2028 | | | | | | | 319 | | | | 321 | |
3.750%, 03/16/2025 | | | | | | | 3,084 | | | | 3,138 | |
| | | | | | | | | | | | |
| | | | | | | | | | | 20,602 | |
| | | | | | | | | | | | |
| | | |
Paraguay — 0.4% | | | | | | | | | | | | |
Republic of Paraguay | | | | | | | | | | | | |
6.100%, 08/11/2044 (A) | | | | | | | 1,280 | | | | 1,306 | |
6.100%, 08/11/2044 | | | | | | | 1,187 | | | | 1,211 | |
5.000%, 04/15/2026 | | | | | | | 1,281 | | | | 1,307 | |
4.625%, 01/25/2023 | | | | | | | 3,579 | | | | 3,659 | |
Telefonica Celular del Paraguay | | | | | | | | | | | | |
6.750%, 12/13/2022 | | | | | | | 900 | | | | 898 | |
6.750%, 12/13/2022 | | | | | | | 200 | | | | 199 | |
| | | | | | | | | | | | |
| | | | | | | | | | | 8,580 | |
| | | | | | | | | | | | |
| | | | | | | | | | | | |
| Description | | | | | Face Amount (Thousands) | | | Market Value
($ Thousands) | |
| | | | | | | | | | | | |
| | | |
Peru — 2.2% | | | | | | | | | | | | |
Abengoa Transmission Sur | | | | | | | | | | | | |
6.875%, 04/30/2043 (A) | | | | | | | 327 | | | $ | 338 | |
Peru Enhanced Pass-Through Finance | | | | | | | | | | | | |
4.926%, 06/02/2025 (A) (C) | | | | | | | 1,000 | | | | 772 | |
1.259%, 05/31/2018 (C) | | | | | | | 108 | | | | 104 | |
1.211%, 05/31/2018 (A) (C) | | | | | | | 122 | | | | 117 | |
Republic of Peru | | | | | | | | | | | | |
8.750%, 11/21/2033 | | | | | | | 2,745 | | | | 4,090 | |
8.200%, 08/12/2026 | | | PEN | | | | 9,555 | | | | 3,223 | |
7.350%, 07/21/2025 | | | $ | | | | 2,372 | | | | 3,128 | |
6.950%, 08/12/2031 | | | PEN | | | | 11,546 | | | | 3,501 | |
6.950%, 08/12/2031 | | | | | | | 10,193 | | | | 3,091 | |
6.850%, 02/12/2042 | | | | | | | 882 | | | | 254 | |
6.550%, 03/14/2037 | | | $ | | | | 3,846 | | | | 4,836 | |
5.700%, 08/12/2024 (A) | | | PEN | | | | 14,227 | | | | 4,156 | |
5.700%, 08/12/2024 | | | | | | | 4,658 | | | | 1,358 | |
5.625%, 11/18/2050 | | | $ | | | | 307 | | | | 349 | |
4.125%, 08/25/2027 | | | | | | | 611 | | | | 644 | |
3.750%, 03/01/2030 | | | EUR | | | | 9,268 | | | | 11,066 | |
Southern Copper | | | | | | | | | | | | |
3.875%, 04/23/2025 | | | $ | | | | 873 | | | | 840 | |
| | | | | | | | | | | | |
| | | | | | | | | | | 41,867 | |
| | | | | | | | | | | | |
| | | |
Philippines — 0.1% | | | | | | | | | | | | |
Development Bank of Philippines | | | | | | | | | | | | |
5.500%, 03/25/2021 | | | | | | | 370 | | | | 418 | |
Republic of Philippines | | | | | | | | | | | | |
3.900%, 11/26/2022 | | | PHP | | | | 52,000 | | | | 1,102 | |
| | | | | | | | | | | | |
| | | | | | | | | | | 1,520 | |
| | | | | | | | | | | | |
| | | |
Poland — 4.7% | | | | | | | | | | | | |
Poland Government International Bond | | | | | | | | | | | | |
3.250%, 04/06/2026 | | | $ | | | | 1,299 | | | | 1,303 | |
Republic of Poland | | | | | | | | | | | | |
5.750%, 10/25/2021 | | | PLN | | | | 8,183 | | | | 2,425 | |
5.750%, 09/23/2022 | | | | | | | 28,514 | | | | 8,552 | |
5.250%, 10/25/2020 | | | | | | | 27,025 | | | | 7,739 | |
5.125%, 04/21/2021 | | | $ | | | | 2,555 | | | | 2,860 | |
5.000%, 03/23/2022 | | | | | | | 2,108 | | | | 2,358 | |
4.000%, 10/25/2023 | | | PLN | | | | 7,540 | | | | 2,062 | |
4.000%, 01/22/2024 | | | $ | | | | 609 | | | | 651 | |
3.250%, 07/25/2025 | | | PLN | | | | 74,414 | | | | 19,304 | |
3.000%, 03/17/2023 | | | $ | | | | 832 | | | | 839 | |
2.750%, 08/25/2023 | | | PLN | | | | 23,725 | | | | 6,652 | |
2.500%, 07/25/2018 | | | | | | | 16,730 | | | | 4,317 | |
2.500%, 07/25/2026 | | | | | | | 41,655 | | | | 10,013 | |
1.750%, 07/25/2021 | | | | | | | 17,595 | | | | 4,314 | |
1.567%, 10/25/2018 (C) | | | | | | | 12,240 | | | | 2,981 | |
1.500%, 04/25/2020 | | | | | | | 45,274 | | | | 11,229 | |
0.826%, 07/25/2017 (C) | | | | | | | 12,470 | | | | 3,109 | |
| | | | | | | | | | | | |
| | | | | | | | | | | 90,708 | |
| | | | | | | | | | | | |
| | | | |
| SEI Institutional Investments Trust / Annual Report / May 31, 2016 | | | 217 | |
SCHEDULE OF INVESTMENTS
Emerging Markets Debt Fund (Continued)
May 31, 2016
| | | | | | | | | | |
| Description | | | | Face Amount (Thousands) | | | Market Value
($ Thousands) | |
| | | | | | | | | | |
| | | |
Qatar — 0.5% | | | | | | | | | | |
Ooredoo International Finance | | | | | | | | | | |
7.875%, 06/10/2019 | | $ | | | 873 | | | $ | 1,017 | |
State of Qatar | | | | | | | | | | |
9.750%, 06/15/2030 | | | | | 2,962 | | | | 4,803 | |
6.400%, 01/20/2040 | | | | | 2,763 | | | | 3,537 | |
4.625%, 06/02/2046 | | | | | 1,130 | | | | 1,135 | |
| | | | | | | | | | |
| | | | | | | | | 10,492 | |
| | | | | | | | | | |
| | | |
Romania — 1.0% | | | | | | | | | | |
Government of Romania MTN | | | | | | | | | | |
6.750%, 02/07/2022 | | | | | 2,026 | | | | 2,390 | |
6.750%, 02/07/2022 (A) | | | | | 1,771 | | | | 2,089 | |
6.125%, 01/22/2044 (A) | | | | | 1,018 | | | | 1,228 | |
5.850%, 04/26/2023 | | RON | | | 17,150 | | | | 4,895 | |
4.875%, 01/22/2024 | | $ | | | 296 | | | | 322 | |
4.875%, 01/22/2024 (A) | | | | | 284 | | | | 309 | |
4.750%, 02/24/2025 | | RON | | | 21,095 | | | | 5,622 | |
4.375%, 08/22/2023 | | $ | | | 540 | | | | 570 | |
Romania Government Bond | | | | | | | | | | |
3.500%, 12/19/2022 | | RON | | | 4,965 | | | | 1,246 | |
| | | | | | | | | | |
| | | | | | | | | 18,671 | |
| | | | | | | | | | |
| | | |
Russia — 5.3% | | | | | | | | | | |
Alfa Bank via Alfa Bond Issuance | | | | | | | | | | |
7.750%, 04/28/2021 | | $ | | | 2,600 | | | | 2,898 | |
Gazprom OAO Via Gaz Capital | | | | | | | | | | |
9.250%, 04/23/2019 | | | | | 1,000 | | | | 1,148 | |
4.950%, 02/06/2028 (A) | | | | | 1,155 | | | | 1,091 | |
Ritekro | | | | | | | | | | |
14.189%, 11/07/2022 (C) (F) (G) | | | | | 538 | | | | 269 | |
Rosneft Oil via Rosneft International Finance | | | | | | | | | | |
4.199%, 03/06/2022 (A) | | | | | 594 | | | | 573 | |
Russian Federal Bond – OFZ | | | | | | | | | | |
8.150%, 02/03/2027 | | RUB | | | 233,856 | | | | 3,407 | |
7.600%, 04/14/2021 | | | | | 714,396 | | | | 10,240 | |
7.600%, 07/20/2022 | | | | | 640,116 | | | | 9,087 | |
7.500%, 03/15/2018 | | | | | 373,896 | | | | 5,497 | |
7.500%, 02/27/2019 | | | | | 519,075 | | | | 7,532 | |
7.400%, 04/19/2017 | | | | | 153,340 | | | | 2,281 | |
7.050%, 01/19/2028 | | | | | 487,360 | | | | 6,502 | |
7.000%, 01/25/2023 | | | | | 274,986 | | | | 3,781 | |
7.000%, 08/16/2023 | | | | | 379,117 | | | | 5,193 | |
6.900%, 08/03/2016 | | | | | 52,216 | | | | 786 | |
6.800%, 12/11/2019 | | | | | 31,646 | | | | 446 | |
6.700%, 05/15/2019 | | | | | 773,452 | | | | 10,969 | |
6.500%, 11/24/2021 (D) | | | | | 24,270 | | | | 335 | |
6.400%, 05/27/2020 | | | | | 376,160 | | | | 5,191 | |
6.200%, 01/31/2018 | | | | | 395,093 | | | | 5,696 | |
Russian Foreign Bond – Eurobond | | | | | | | | | | |
5.875%, 09/16/2043 | | | | $ | 1,000 | | | | 1,081 | |
5.625%, 04/04/2042 | | | | | 3,400 | | | | 3,563 | |
5.000%, 04/29/2020 (A) | | | | | 1,182 | | | | 1,247 | |
4.875%, 09/16/2023 | | | | | 3,400 | | | | 3,604 | |
| | | | | | | | | | | | |
| Description | | | | | Face Amount (Thousands) | | | Market Value
($ Thousands) | |
| | | | | | | | | | | | |
3.250%, 04/04/2017 | | | $ | | | | 800 | | | $ | 808 | |
Vnesheconombank via VEB Finance | | | | | | | | | | | | |
6.902%, 07/09/2020 | | | | | | | 1,635 | | | | 1,741 | |
6.800%, 11/22/2025 | | | | | | | 2,476 | | | | 2,644 | |
6.800%, 11/22/2025 (A) | | | | | | | 600 | | | | 641 | |
5.450%, 11/22/2017 (A) | | | | | | | 340 | | | | 349 | |
5.450%, 11/22/2017 | | | | | | | 110 | | | | 113 | |
Vnesheconombank Via VEB Finance | | | | | | | | | | | | |
6.902%, 07/09/2020 | | | | | | | 1,990 | | | | 2,119 | |
6.800%, 11/22/2025 | | | | | | | 2,035 | | | | 2,173 | |
| | | | | | | | | | | | |
| | | | | | | | | | | 103,005 | |
| | | | | | | | | | | | |
| | | |
Senegal — 0.3% | | | | | | | | | | | | |
Republic of Senegal | | | | | | | | | | | | |
8.750%, 05/13/2021 | | | | | | | 1,390 | | | | 1,484 | |
8.750%, 05/13/2021 (A) | | | | | | | 200 | | | | 214 | |
6.250%, 07/30/2024 (A) | | | | | | | 530 | | | | 488 | |
6.250%, 07/30/2024 | | | | | | | 4,670 | | | | 4,296 | |
| | | | | | | | | | | | |
| | | | | | | | | | | 6,482 | |
| | | | | | | | | | | | |
| | | |
Serbia — 0.9% | | | | | | | | | | | | |
Republic of Serbia | | | | | | | | | | | | |
7.250%, 09/28/2021 (A) | | | | | | | 300 | | | | 342 | |
7.250%, 09/28/2021 | | | | | | | 10,751 | | | | 12,243 | |
5.875%, 12/03/2018 (A) | | | | | | | 640 | | | | 678 | |
4.875%, 02/25/2020 | | | | | | | 3,597 | | | | 3,696 | |
| | | | | | | | | | | | |
| | | | | | | | | | | 16,959 | |
| | | | | | | | | | | | |
| | | |
Slovenia — 1.1% | | | | | | | | | | | | |
Republic of Slovenia | | | | | | | | | | | | |
5.850%, 05/10/2023 | | | | | | | 1,730 | | | | 1,994 | |
5.850%, 05/10/2023 | | | | | | | 4,520 | | | | 5,209 | |
5.250%, 02/18/2024 | | | | | | | 13,396 | | | | 15,054 | |
| | | | | | | | | | | | |
| | | | | | | | | | | 22,257 | |
| | | | | | | | | | | | |
| | | |
South Africa — 5.3% | | | | | | | | | | | | |
Eskom Holdings | | | | | | | | | | | | |
6.750%, 08/06/2023 | | | | | | | 2,125 | | | | 1,942 | |
5.750%, 01/26/2021 | | | | | | | 1,775 | | | | 1,633 | |
Eskom Holdings SOC | | | | | | | | | | | | |
7.125%, 02/11/2025 | | | | | | | 2,691 | | | | 2,459 | |
7.125%, 02/11/2025 (A) | | | | | | | 7,302 | | | | 6,672 | |
Republic of South Africa | | | | | | | | | | | | |
10.500%, 12/21/2026 | | | ZAR | | | | 265,248 | | | | 18,105 | |
8.875%, 02/28/2035 | | | | | | | 33,600 | | | | 1,954 | |
8.750%, 01/31/2044 | | | | | | | 18,377 | | | | 1,032 | |
8.750%, 02/28/2048 | | | | | | | 122,768 | | | | 6,865 | |
8.500%, 06/23/2017 | | | $ | | | | 2,100 | | | | 2,244 | |
8.500%, 01/31/2037 | | | ZAR | | | | 62,325 | | | | 3,465 | |
8.250%, 03/31/2032 | | | | | | | 73,355 | | | | 4,070 | |
8.000%, 12/21/2018 | | | | | | | 37,142 | | | | 2,338 | |
8.000%, 01/31/2030 | | | | | | | 197,828 | | | | 10,936 | |
7.750%, 02/28/2023 | | | | | | | 152,091 | | | | 8,997 | |
7.250%, 01/15/2020 | | | | | | | 20,323 | | | | 1,233 | |
7.000%, 02/28/2031 | | | | | | | 137,144 | | | | 6,838 | |
| | |
| 218 | | SEI Institutional Investments Trust / Annual Report / May 31, 2016 |
| | | | | | | | | | | | |
| Description | | | | | Face Amount (Thousands) | | | Market Value
($ Thousands) | |
| | | | | | | | | | | | |
6.875%, 05/27/2019 | | | $ | | | | 940 | | | $ | 1,033 | |
6.750%, 03/31/2021 | | | ZAR | | | | 86,203 | | | | 5,026 | |
6.500%, 02/28/2041 | | | | | | | 41,359 | | | | 1,802 | |
6.250%, 03/31/2036 | | | | | | | 115,150 | | | | 5,048 | |
5.875%, 09/16/2025 | | | $ | | | | 3,950 | | | | 4,200 | |
4.875%, 04/14/2026 | | | | | | | 1,923 | | | | 1,885 | |
Transnet SOC | | | | | | | | | | | | |
9.500%, 05/13/2021 (A) | | | ZAR | | | | 16,660 | | | | 963 | |
4.000%, 07/26/2022 | | | $ | | | | 875 | | | | 796 | |
ZAR Sovereign Capital Fund Propriety | | | | | | | | | | | | |
3.903%, 06/24/2020 (A) | | | | | | | 1,305 | | | | 1,305 | |
| | | | | | | | | | | | |
| | | | | | | | | | | 102,841 | |
| | | | | | | | | | | | |
| | | |
Sri Lanka — 0.9% | | | | | | | | | | | | |
Democratic Socialist Republic of Sri Lanka | | | | | | | | | | | | |
6.850%, 11/03/2025 (A) | | | | | | | 2,375 | | | | 2,275 | |
6.850%, 11/03/2025 | | | | | | | 8,115 | | | | 7,772 | |
6.250%, 07/27/2021 | | | | | | | 3,724 | | | | 3,669 | |
5.875%, 07/25/2022 (A) | | | | | | | 2,334 | | | | 2,206 | |
5.875%, 07/25/2022 | | | | | | | 1,300 | | | | 1,229 | |
| | | | | | | | | | | | |
| | | | | | | | | | | 17,151 | |
| | | | | | | | | | | | |
| | | |
Supranational — 0.1% | | | | | | | | | | | | |
European Investment Bank MTN | | | | | | | | | | | | |
8.500%, 09/17/2024 | | | ZAR | | | | 11,350 | | | | 681 | |
Inter-American Development Bank MTN | | | | | | | | | | | | |
7.350%, 09/12/2018 | | | IDR | | | | 24,590,000 | | | | 1,763 | |
| | | | | | | | | | | | |
| | | | | | | | | | | 2,444 | |
| | | | | | | | | | | | |
| | | |
Thailand — 2.6% | | | | | | | | | | | | |
Government of Thailand | | | | | | | | | | | | |
5.670%, 03/13/2028 | | | THB | | | | 3,000 | | | | 111 | |
4.875%, 06/22/2029 | | | | | | | 211,651 | | | | 7,450 | |
3.875%, 06/13/2019 | | | | | | | 43,000 | | | | 1,278 | |
3.850%, 12/12/2025 | | | | | | | 229,998 | | | | 7,300 | |
3.650%, 12/17/2021 | | | | | | | 470,849 | | | | 14,266 | |
3.625%, 06/16/2023 | | | | | | | 329,763 | | | | 10,073 | |
3.580%, 12/17/2027 | | | | | | | 82,270 | | | | 2,561 | |
3.400%, 06/17/2036 | | | | | | | 80,500 | | | | 2,510 | |
2.550%, 06/26/2020 | | | | | | | 75,000 | | | | 2,151 | |
1.250%, 03/12/2028 | | | | | | | 28,811 | | | | 761 | |
1.200%, 07/14/2021 | | | | | | | 67,416 | | | | 1,852 | |
| | | | | | | | | | | | |
| | | | | | | | | | | 50,313 | |
| | | | | | | | | | | | |
| | | |
Trinidad & Tobago — 0.0% | | | | | | | | | | | | |
Republic of Trinidad & Tobago | | | | | | | | | | | | |
4.375%, 01/16/2024 (A) | | | $ | | | | 387 | | | | 393 | |
| | | | | | | | | | | | |
| | | |
Tunisia — 0.2% | | | | | | | | | | | | |
Banque Centrale de Tunisie | | | | | | | | | | | | |
5.750%, 01/30/2025 (A) | | | | | | | 4,072 | | | | 3,650 | |
| | | | | | | | | | | | |
| | | |
Turkey — 7.0% | | | | | | | | | | | | |
Export Credit Bank of Turkey MTN | | | | | | | | | | | | |
5.875%, 04/24/2019 (A) | �� | | | | | | 200 | | | | 210 | |
| | | | | | | | | | | | |
| Description | | | | | Face Amount (Thousands) | | | Market Value
($ Thousands) | |
| | | | | | | | | | | | |
5.375%, 02/08/2021 (A) | | | $ | | | | 1,206 | | | $ | 1,230 | |
5.000%, 09/23/2021 (A) | | | | | | | 674 | | | | 675 | |
KOC Holding | | | | | | | | | | | | |
5.250%, 03/15/2023 | | | | | | | 2,210 | | | | 2,211 | |
Republic of Turkey | | | | | | | | | | | | |
11.875%, 01/15/2030 | | | | | | | 1,050 | | | | 1,767 | |
10.700%, 02/17/2021 | | | TRY | | | | 19,162 | | | | 6,769 | |
10.600%, 02/11/2026 | | | | | | | 4,230 | | | | 1,508 | |
10.500%, 01/15/2020 | | | | | | | 22,350 | | | | 7,814 | |
10.400%, 03/27/2019 | | | | | | | 8,790 | | | | 3,052 | |
10.400%, 03/20/2024 | | | | | | | 2,700 | | | | 947 | |
9.500%, 01/12/2022 | | | | | | | 9,830 | | | | 3,304 | |
9.400%, 07/08/2020 | | | | | | | 73,777 | | | | 24,858 | |
9.000%, 03/08/2017 | | | | | | | 7,020 | | | | 2,375 | |
9.000%, 07/24/2024 | | | | | | | 18,953 | | | | 6,142 | |
8.800%, 11/14/2018 | | | | | | | 11,483 | | | | 3,849 | |
8.500%, 07/10/2019 | | | | | | | 4,290 | | | | 1,415 | |
8.500%, 09/14/2022 | | | | | | | 16,527 | | | | 5,263 | |
8.300%, 06/20/2018 | | | | | | | 6,606 | | | | 2,202 | |
8.000%, 03/12/2025 | | | | | | | 4,211 | | | | 1,278 | |
8.000%, 02/14/2034 | | | $ | | | | 900 | | | | 1,154 | |
7.400%, 02/05/2020 | | | TRY | | | | 61,179 | | | | 19,359 | |
7.375%, 02/05/2025 | | | $ | | | | 1,676 | | | | 1,989 | |
7.100%, 03/08/2023 | | | TRY | | | | 8,160 | | | | 2,401 | |
7.000%, 06/05/2020 | | | $ | | | | 3,036 | | | | 3,403 | |
6.875%, 03/17/2036 | | | | | | | 3,155 | | | | 3,640 | |
6.750%, 04/03/2018 | | | | | | | 1,886 | | | | 2,017 | |
6.750%, 05/30/2040 | | | | | | | 2,590 | | | | 2,965 | |
6.625%, 02/17/2045 | | | | | | | 590 | | | | 670 | |
6.300%, 02/14/2018 | | | TRY | | | | 4,490 | | | | 1,454 | |
6.250%, 09/26/2022 | | | $ | | | | 2,517 | | | | 2,772 | |
6.000%, 01/14/2041 | | | | | | | 1,236 | | | | 1,296 | |
5.625%, 03/30/2021 | | | | | | | 769 | | | | 821 | |
5.125%, 03/25/2022 | | | | | | | 3,450 | | | | 3,597 | |
4.875%, 04/16/2043 | | | | | | | 850 | | | | 768 | |
4.250%, 04/14/2026 | | | | | | | 2,639 | | | | 2,566 | |
3.000%, 08/02/2023 | | | TRY | | | | 8,323 | | | | 2,948 | |
TC Ziraat Bankasi | | | | | | | | | | | | |
4.750%, 04/29/2021 (A) | | | $ | | | | 756 | | | | 754 | |
4.250%, 07/03/2019 (A) | | | | | | | 1,710 | | | | 1,717 | |
Turk Telekomunikasyon | | | | | | | | | | | | |
4.875%, 06/19/2024 | | | | | | | 2,300 | | | | 2,242 | |
| | | | | | | | | | | | |
| | | | | | | | | | | 135,402 | |
| | | | | | | | | | | | |
| | | |
Ukraine — 1.7% | | | | | | | | | | | | |
Government of Ukraine | | | | | | | | | | | | |
7.750%, 09/01/2019 (A) | | | | | | | 1,487 | | | | 1,436 | |
7.750%, 09/01/2019 | | | | | | | 141 | | | | 136 | |
7.750%, 09/01/2020 (A) | | | | | | | 2,731 | | | | 2,605 | |
7.750%, 09/01/2020 | | | | | | | 655 | | | | 625 | |
7.750%, 09/01/2021 (A) | | | | | | | 1,541 | | | | 1,453 | |
7.750%, 09/01/2021 | | | | | | | 632 | | | | 596 | |
7.750%, 09/01/2022 | | | | | | | 632 | | | | 591 | |
| | | | |
| SEI Institutional Investments Trust / Annual Report / May 31, 2016 | | | 219 | |
SCHEDULE OF INVESTMENTS
Emerging Markets Debt Fund (Continued)
May 31, 2016
| | | | | | | | | | | | |
| Description | | | | | Face Amount (Thousands) | | | Market Value
($ Thousands) | |
| | | | | | | | | | | | |
7.750%, 09/01/2022 (A) | | $ | | | | | 1,345 | | | $ | 1,258 | |
7.750%, 09/01/2023 (A) | | | | | | | 1,151 | | | | 1,071 | |
7.750%, 09/01/2023 | | | | | | | 632 | | | | 588 | |
7.750%, 09/01/2024 (A) | | | | | | | 4,867 | | | | 4,503 | |
7.750%, 09/01/2024 | | | | | | | 3,922 | | | | 3,629 | |
7.750%, 09/01/2025 (A) | | | | | | | 3,386 | | | | 3,124 | |
7.750%, 09/01/2025 | | | | | | | 632 | | | | 583 | |
7.750%, 09/01/2026 (A) | | | | | | | 1,234 | | | | 1,129 | |
7.750%, 09/01/2026 | | | | | | | 2,396 | | | | 2,193 | |
7.750%, 09/01/2027 (A) | | | | | | | 3,301 | | | | 3,005 | |
7.750%, 09/01/2027 | | | | | | | 1,456 | | | | 1,325 | |
3.269%, 05/31/2040 (A) (B) | | | | | | | 1,832 | | | | 568 | |
3.246%, 05/31/2040 (B) | | | | | | | 1,216 | | | | 377 | |
Ukreximbank Via Biz Finance | | | | | | | | | | | | |
9.625%, 04/27/2022 (A) | | | | | | | 2,211 | | | | 2,068 | |
| | | | | | | | | | | | |
| | | | | | | | | | | 32,863 | |
| | | | | | | | | | | | |
| | | |
United Arab Emirates — 0.3% | | | | | | | | | | | | |
DP World MTN | | | | | | | | | | | | |
6.850%, 07/02/2037 | | | | | | | 2,350 | | | | 2,473 | |
MAF Global Securities | | | | | | | | | | | | |
7.125%, 10/29/2049 (B) | | | | | | | 3,300 | | | | 3,440 | |
| | | | | | | | | | | | |
| | | | | | | | | | | 5,913 | |
| | | | | | | | | | | | |
| | | |
Uruguay — 0.4% | | | | | | | | | | | | |
Republic of Uruguay | | | | | | | | | | | | |
5.100%, 06/18/2050 | | | | | | | 5,377 | | | | 5,014 | |
4.500%, 08/14/2024 | | | | | | | 124 | | | | 132 | |
4.375%, 10/27/2027 | | | | | | | 2,549 | | | | 2,632 | |
4.125%, 11/20/2045 | | | | | | | 517 | | | | 438 | |
| | | | | | | | | | | | |
| | | | | | | | | | | 8,216 | |
| | | | | | | | | | | | |
| | | |
Venezuela — 1.0% | | | | | | | | | | | | |
Petroleos de Venezuela | | | | | | | | | | | | |
8.500%, 11/02/2017 | | | | | | | 161 | | | | 104 | |
8.500%, 11/02/2017 | | | | | | | 330 | | | | 213 | |
6.000%, 05/16/2024 | | | | | | | 2,072 | | | | 680 | |
6.000%, 05/16/2024 | | | | | | | 8,870 | | | | 2,866 | |
6.000%, 11/15/2026 | | | | | | | 1,982 | | | | 639 | |
6.000%, 11/15/2026 | | | | | | | 1,942 | | | | 626 | |
5.500%, 04/12/2037 | | | | | | | 6,225 | | | | 2,017 | |
5.250%, 04/12/2017 | | | | | | | 3,896 | | | | 2,366 | |
Republic of Venezuela | | | | | | | | | | | | |
13.625%, 08/15/2018 | | | | | | | 1,493 | | | | 956 | |
13.625%, 08/15/2018 | | | | | | | 497 | | | | 293 | |
11.950%, 08/05/2031 | | | | | | | 525 | | | | 219 | |
11.750%, 10/21/2026 | | | | | | | 1,000 | | | | 419 | |
11.750%, 10/21/2026 | | | | | | | 1,875 | | | | 785 | |
9.375%, 01/13/2034 | | | | | | | 8,487 | | | | 3,195 | |
9.250%, 09/15/2027 | | | | | | | 1,546 | | | | 653 | |
9.250%, 05/07/2028 | | | | | | | 693 | | | | 262 | |
8.250%, 10/13/2024 | | | | | | | 1,273 | | | | 471 | |
8.250%, 10/13/2024 | | | | | | | 2,350 | | | | 869 | |
7.650%, 04/21/2025 | | | | | | | 3,743 | | | | 1,352 | |
| | | | | | | | | | | | |
| Description | | | | | Face Amount (Thousands) | | | Market Value
($ Thousands) | |
| | | | | | | | | | | | |
7.650%, 04/21/2025 | | | $ | | | | 279 | | | $ | 101 | |
| | | | | | | | | | | | |
| | | | | | | | | | | 19,086 | |
| | | | | | | | | | | | |
| | | |
Vietnam — 0.1% | | | | | | | | | | | | |
Socialist Republic of Vietnam | | | | | | | | | | | | |
4.800%, 11/19/2024 (A) | | | | | | | 1,446 | | | | 1,474 | |
| | | | | | | | | | | | |
| | | |
Zambia — 0.3% | | | | | | | | | | | | |
Republic of Zambia | | | | | | | | | | | | |
8.970%, 07/30/2027 (A) | | | | | | | 1,686 | | | | 1,378 | |
8.970%, 07/30/2027 | | | | | | | 3,722 | | | | 3,061 | |
8.500%, 04/14/2024 (A) | | | | | | | 750 | | | | 617 | |
5.375%, 09/20/2022 | | | | | | | 282 | | | | 209 | |
| | | | | | | | | | | | |
| | | | | | | | | | | 5,265 | |
| | | | | | | | | | | | |
Total Global Bonds
(Cost $1,980,992) ($ Thousands) | | | | | | | | | | | 1,834,931 | |
| | | | | | | | | | | | |
| | | |
LOAN PARTICIPATIONS — 0.1% | | | | | | | | | | | | |
Singapore — 0.0% | | | | | | | | | | | | |
Morton Bay Senior | | | | | | | | | | | | |
6.220%, 01/02/2049 (E) | | | | | | | 3,020 | | | | — | |
| | | | | | | | | | | | |
| | | |
Venezuela — 0.1% | | | | | | | | | | | | |
Bolivarian Republic of Venezuela | | | | | | | | | | | | |
6.250%, 01/10/2018 | | | | | | | 1,700 | | | | 1,711 | |
| | | | | | | | | | | | |
Total Loan Participations (Cost $4,720) ($ Thousands) | | | | | | | | | | | 1,711 | |
| | | | | | | | | | | | |
Total Investments — 94.9% (Cost $1,985,712) ($ Thousands) | | | | | | | | | | $ | 1,836,642 | |
| | | | | | | | | | | | |
A list of the open futures contracts held by the Fund at May 31, 2016, is as follows:
| | | | | | | | | | | | |
| Type of Contract | | Number of
Contracts
Long
(Short) | | | Expiration Date | | | Unrealized
Appreciation
(Depreciation)
($ Thousands) | |
Euro-Bund Index | | | (88 | ) | | | Sep-2016 | | | $ | 5 | |
Euro-Buxl Index | | | (33 | ) | | | Sep-2016 | | | | 7 | |
JSE Bond Future R186 | | | 134 | | | | Aug-2016 | | | | (17 | ) |
JSE Bond Future R207 | | | 810 | | | | Aug-2016 | | | | (26 | ) |
JSE Bond Future R208 | | | 962 | | | | Aug-2016 | | | | (41 | ) |
Korea 10-Year Bond | | | 53 | | | | Jun-2016 | | | | 46 | |
Korea 3-Year Bond | | | 171 | | | | Jun-2016 | | | | 15 | |
U.S. 10-Year Treasury Note | | | (28 | ) | | | Sep-2016 | | | | (9 | ) |
U.S. 10-Year Treasury Note | | | (143 | ) | | | Sep-2016 | | | | (21 | ) |
U.S. 10-Year Treasury Note | | | (43 | ) | | | Sep-2016 | | | | (17 | ) |
U.S. 5-Year Treasury Note | | | (36 | ) | | | Sep-2016 | | | | (10 | ) |
U.S. Long Treasury Bond | | | (13 | ) | | | Sep-2016 | | | | (14 | ) |
U.S. Ultra Long Treasury Bond | | | 18 | | | | Sep-2016 | | | | 25 | |
| | | | | | | | | | | | |
| | | | | | | | | | $ | (57 | ) |
| | | | | | | | | | | | |
For the year ended May 31, 2016, the total amount of all open futures contracts, as presented in the table above, are representative of the volume of activity for the derivative type during the year.
| | |
| 220 | | SEI Institutional Investments Trust / Annual Report / May 31, 2016 |
A list of the open forward foreign currency contracts held by the Fund at May 31, 2016, is as follows:
| | | | | | | | | | | | | | | | | | | | |
| Settlement Date | | | | | Currency
to Deliver
(Thousands) | | | | | | Currency
To Receive
(Thousands) | | | Unrealized
Appreciation
(Depreciation)
($ Thousands) | |
06/01/16-09/21/16 | | | USD | | | | 85,949 | | | | EUR | | | | 75,866 | | | $ | (1,431 | ) |
06/01/16-09/21/16 | | | EUR | | | | 118,931 | | | | USD | | | | 134,589 | | | | 2,117 | |
06/02/16-08/17/16 | | | USD | | | | 7,105 | | | | NGN | | | | 1,720,120 | | | | (36 | ) |
06/02/16-03/15/17 | | | USD | | | | 16,051 | | | | RUB | | | | 1,096,440 | | | | 292 | |
06/02/16-09/21/16 | | | USD | | | | 19,530 | | | | HUF | | | | 5,371,088 | | | | (462 | ) |
06/02/16-09/21/16 | | | USD | | | | 23,016 | | | | PLN | | | | 88,875 | | | | (489 | ) |
06/02/16-08/10/16 | | | USD | | | | 30,593 | | | | BRL | | | | 112,319 | | | | 213 | |
06/02/16-09/21/16 | | | PLN | | | | 71,055 | | | | USD | | | | 18,459 | | | | 448 | |
06/02/16-09/02/16 | | | BRL | | | | 323,386 | | | | USD | | | | 87,727 | | | | (1,145 | ) |
06/02/16-08/17/16 | | | NGN | | | | 1,638,774 | | | | USD | | | | 6,436 | | | | (340 | ) |
06/02/16-07/06/16 | | | HUF | | | | 7,054,655 | | | | USD | | | | 25,355 | | | | 309 | |
06/03/16-05/23/17 | | | IDR | | | | 406,120,490 | | | | USD | | | | 29,946 | | | | 496 | |
06/06/16-07/25/16 | | | EUR | | | | 27,702 | | | | RON | | | | 124,307 | | | | (213 | ) |
06/06/16-07/25/16 | | | RON | | | | 79,465 | | | | EUR | | | | 17,671 | | | | 90 | |
06/07/16-08/10/16 | | | USD | | | | 71,734 | | | | MXN | | | | 1,293,579 | | | | (1,682 | ) |
06/07/16-09/21/16 | | | MXN | | | | 962,738 | | | | USD | | | | 53,434 | | | | 1,270 | |
06/09/16-06/15/16 | | | USD | | | | 13,512 | | | | RON | | | | 53,282 | | | | (379 | ) |
06/09/16-07/26/16 | | | USD | | | | 18,187 | | | | CLP | | | | 12,346,971 | | | | (323 | ) |
06/09/16-09/21/16 | | | TRY | | | | 131,746 | | | | USD | | | | 43,445 | | | | (367 | ) |
06/09/16-07/26/16 | | | CLP | | | | 13,181,846 | | | | USD | | | | 19,269 | | | | 210 | |
06/10/16-07/06/16 | | | USD | | | | 18,786 | | | | KRW | | | | 21,952,407 | | | | (353 | ) |
06/10/16-07/26/16 | | | USD | | | | 25,437 | | | | MYR | | | | 102,399 | | | | (564 | ) |
06/10/16-06/28/16 | | | MYR | | | | 33,929 | | | | USD | | | | 8,381 | | | | 144 | |
06/10/16-07/06/16 | | | KRW | | | | 30,359,819 | | | | USD | | | | 25,803 | | | | 312 | |
06/13/16-08/10/16 | | | USD | | | | 9,491 | | | | PEN | | | | 31,576 | | | | (162 | ) |
06/13/16-08/10/16 | | | PEN | | | | 89,703 | | | | USD | | | | 26,622 | | | | 114 | |
06/15/16-09/21/16 | | | USD | | | | 8,051 | | | | PHP | | | | 377,959 | | | | 4 | |
06/15/16 | | | USD | | | | 13,217 | | | | TWD | | | | 427,890 | | | | (96 | ) |
06/15/16-09/21/16 | | | EUR | | | | 17,591 | | | | HUF | | | | 5,551,160 | | | | 90 | |
06/15/16-09/21/16 | | | USD | | | | 20,183 | | | | TRY | | | | 59,094 | | | | (383 | ) |
06/15/16-09/21/16 | | | RON | | | | 20,460 | | | | USD | | | | 5,071 | | | | 20 | |
06/15/16-06/16/16 | | | SGD | | | | 26,018 | | | | USD | | | | 18,892 | | | | (5 | ) |
06/15/16-09/21/16 | | | USD | | | | 27,715 | | | | ZAR | | | | 439,883 | | | | (124 | ) |
06/15/16-08/31/16 | | | USD | | | | 28,268 | | | | IDR | | | | 379,649,583 | | | | (559 | ) |
06/15/16-09/21/16 | | | USD | | | | 29,667 | | | | THB | | | | 1,044,906 | | | | (422 | ) |
06/15/16-09/21/16 | | | USD | | | | 46,602 | | | | COP | | | | 142,598,450 | | | | (771 | ) |
| | | | | | | | | | | | | | | | | | | | |
| Settlement Date | | | | | Currency
to Deliver
(Thousands) | | | | | | Currency
To Receive
(Thousands) | | | Unrealized
Appreciation
(Depreciation)
($ Thousands) | |
06/15/16-09/21/16 | | | PLN | | | | 54,788 | | | | EUR | | | | 12,624 | | | $ | 193 | |
06/15/16-08/26/16 | | | ILS | | | | 71,865 | | | | USD | | | | 18,783 | | | | 100 | |
06/15/16-02/15/17 | | | CNY | | | | 93,521 | | | | USD | | | | 13,857 | | | | (156 | ) |
06/15/16-09/21/16 | | | ZAR | | | | 441,148 | | | | USD | | | | 28,071 | | | | 290 | |
06/15/16-09/21/16 | | | TWD | | | | 1,040,990 | | | | USD | | | | 31,761 | | | | (161 | ) |
06/15/16-09/21/16 | | | RUB | | | | 1,418,294 | | | | USD | | | | 20,299 | | | | (938 | ) |
06/15/16-06/24/16 | | | COP | | | | 50,174,253 | | | | USD | | | | 16,173 | | | | (6 | ) |
06/20/16 | | | CAD | | | | 4,903 | | | | USD | | | | 3,771 | | | | 22 | |
06/20/16 | | | HUF | | | | 5,213,823 | | | | EUR | | | | 16,752 | | | | 150 | |
06/21/16-07/13/16 | | | USD | | | | 11,426 | | | | INR | | | | 769,762 | | | | (23 | ) |
06/21/16-07/01/16 | | | INR | | | | 514,300 | | | | USD | | | | 7,665 | | | | 40 | |
06/30/16-09/21/16 | | | EUR | | | | 17,948 | | | | PLN | | | | 77,814 | | | | (298 | ) |
07/25/16-07/25/16 | | | THB | | | | 342,552 | | | | USD | | | | 9,581 | | | | (5 | ) |
07/29/16 | | | KES | | | | 168,000 | | | | USD | | | | 1,484 | | | | (166 | ) |
08/26/16 | | | USD | | | | 7,278 | | | | ILS | | | | 27,990 | | | | 8 | |
11/30/16 | | | ARS | | | | 20,301 | | | | USD | | | | 1,117 | | | | (176 | ) |
| | | | | | | | | | | | | | | | | | | | |
| | | | | | | | | | | | | | | | | | $ | (5,303 | ) |
| | | | | | | | | | | | | | | | | | | | |
A list of the counterparties for the outstanding forward foreign currency contracts held by the Fund at May 31, 2016, is as follows:
| | | | | | | | | | | | |
| Counterparty | | Currency to Deliver ($ Thousands) | | | Currency to Receive ($ Thousands) | | | Unrealized
Appreciation
(Depreciation)
($ Thousands) | |
Barclays PLC | | $ | (18,731 | ) | | $ | 18,457 | | | $ | (274 | ) |
Citigroup | | | (271,768 | ) | | | 269,770 | | | | (1,998 | ) |
Deutsche Bank | | | (5,035 | ) | | | 5,045 | | | | 10 | |
Goldman Sachs | | | (373,289 | ) | | | 372,456 | | | | (833 | ) |
HSBC | | | (47,356 | ) | | | 47,068 | | | | (288 | ) |
JPMorgan Chase Bank | | | (563,920 | ) | | | 562,710 | | | | (1,210 | ) |
Standard Chartered | | | (24,739 | ) | | | 24,039 | | | | (700 | ) |
UBS | | | (2,995 | ) | | | 2,985 | | | | (10 | ) |
| | | | | | | | | | | | |
| | | | | | | | | | $ | (5,303 | ) |
| | | | | | | | | | | | |
For the year ended May 31, 2016, the total amount of all open forward foreign currency contracts, as presented in the tables above, are representative of the volume of activity for this derivative type during the year.
A list of open OTC swap agreements held by the Fund at May 31, 2016, is as follows:
| | | | |
| SEI Institutional Investments Trust / Annual Report / May 31, 2016 | | | 221 | |
SCHEDULE OF INVESTMENTS
Emerging Markets Debt Fund (Concluded)
MAY 31, 2016
| | | | | | | | | | | | | | | | |
| Interest Rate Swaps | |
| Counterparty | | Fund Pays | | Fund Receives | | Termination Date | | Currency | | Notional Amount
(Thousands) | | | Net Unrealized
Appreciation
(Depreciation)
($ Thousands) | |
| Goldman Sachs | | 3-Month ZAR - JIBAR | | 8.76% | | 01/16/29 | | ZAR | | | 65,000 | | | $ | (96 | ) |
| Goldman Sachs | | 1-Day COP - COOIS | | 7.23% | | 05/04/26 | | COP | | | 11,358,824 | | | | 11 | |
| Goldman Sachs | | 6-Month PLN -WIBOR | | 2.76% | | 03/15/26 | | PLN | | | 34,000 | | | | (69 | ) |
| Goldman Sachs | | 28-Day MXN - TIIE | | 6.17% | | 03/05/26 | | MXN | | | 63,199 | | | | (34 | ) |
| Goldman Sachs | | 28-Day MXN - TIIE | | 6.21% | | 12/08/25 | | MXN | | | 21,174 | | | | (5 | ) |
| Goldman Sachs | | 2.46% | | 6-Month PLN - WIBOR | | 09/22/25 | | PLN | | | 7,000 | | | | (40 | ) |
| Goldman Sachs | | 4.63% | | 1-Day CLP - CLICP | | 08/21/25 | | CLP | | | 275,000 | | | | (2 | ) |
| Goldman Sachs | | 28-Day MXN - TIIE | | 6.36% | | 05/21/25 | | MXN | | | 29,801 | | | | 19 | |
| Goldman Sachs | | 4.53% | | 1-Day CLP - CLICP | | 03/11/25 | | CLP | | | 1,015,968 | | | | (5 | ) |
| Goldman Sachs | | 3-Month ZAR - JIBAR | | 8.30% | | 01/16/24 | | ZAR | | | 25,000 | | | | (47 | ) |
| Goldman Sachs | | 3-Month ZAR - JIBAR | | 8.19% | | 12/20/23 | | ZAR | | | 16,000 | | | | (35 | ) |
| Goldman Sachs | | 1-Year BRL - CDI | | 10.84% | | 01/03/23 | | BRL | | | 6,139 | | | | (301 | ) |
| Goldman Sachs | | 1-Day BRL - CETIP | | 11.99% | | 01/02/23 | | BRL | | | 3,000 | | | | (69 | ) |
| Goldman Sachs | | 28-Day MXN - TIIE | | 5.90% | | 09/12/22 | | MXN | | | 99,662 | | | | 7 | |
| Goldman Sachs | | 0.45% | | 6-Month CZK - PRIBOR | | 05/24/21 | | CZK | | | 37,000 | | | | 4 | |
| Goldman Sachs | | 3-Month MYR - KLIBOR | | 3.74% | | 03/23/21 | | MYR | | | 13,700 | | | | (4 | ) |
| Goldman Sachs | | 28-Day MXN - TIIE | | 5.37% | | 03/17/21 | | MXN | | | 62,000 | | | | (33 | ) |
| Goldman Sachs | | 7-Day CNY - CNRR007 | | 2.49% | | 02/04/21 | | CNY | | | 25,500 | | | | (52 | ) |
| Goldman Sachs | | 1-Day BRL - CETIP | | 12.73% | | 01/04/21 | | BRL | | | 13,491 | | | | (72 | ) |
| Goldman Sachs | | 0.57% | | 6-Month CZK -PRIBOR | | 12/16/20 | | CZK | | | 151,000 | | | | (32 | ) |
| Goldman Sachs | | 3-Month MYR - KLIBOR | | 4.37% | | 12/15/20 | | MYR | | | 20,000 | | | | 134 | |
| Goldman Sachs | | 0.42% | | 6-Month CZK - PRIBOR | | 10/23/20 | | CZK | | | 55,000 | | | | 1 | |
| Goldman Sachs | | 1-Day BRL - CETIP | | 13.39% | | 01/02/19 | | BRL | | | 18,383 | | | | 52 | |
| Goldman Sachs | | 1-Day BRL - CETIP | | 13.42% | | 01/02/19 | | BRL | | | 25,101 | | | | 78 | |
| Goldman Sachs | | 7-Day CNY - CNRR007 | | 2.64% | | 04/27/18 | | CNY | | | 65,000 | | | | 8 | |
| Goldman Sachs | | 1-Year BRL - CDI | | 11.81% | | 01/02/18 | | BRL | | | 12,298 | | | | (138 | ) |
| Goldman Sachs | | 1-Year BRL - CDI | | 11.98% | | 01/02/18 | | BRL | | | 11,341 | | | | (114 | ) |
| Goldman Sachs | | 1-Day BRL - CETIP | | 12.86% | | 01/02/18 | | BRL | | | 47,206 | | | | (129 | ) |
| Goldman Sachs | | 1-Day BRL - CETIP | | 13.27% | | 01/02/17 | | BRL | | | 35,880 | | | | (98 | ) |
| Goldman Sachs | | 2.45% | | 6-Month HUF - BUBOR | | 07/11/16 | | HUF | | | 3,518,440 | | | | (222 | ) |
| JPMorgan Chase Bank | | 4.72% | | 1-Day CLP - CLICP | | 06/05/25 | | CLP | | | 1,670,898 | | | | (40 | ) |
| Goldman Sachs | | 3.45% | | 6-Month HUF - BUBOR | | 05/11/25 | | HUF | | | 900,000 | | | | (333 | ) |
| JPMorgan Chase Bank | | 4.29% | | 6-Month HUF - BUBOR | | 08/04/24 | | HUF | | | 600,000 | | | | (425 | ) |
| JPMorgan Chase Bank | | 7-Day CNY - CNRR007 | | 2.83% | | 05/09/21 | | CNY | | | 8,000 | | | | 1 | |
| JPMorgan Chase Bank | | 0.39% | | 6-Month CZK - PRIBOR | | 04/04/21 | | CZK | | | 30,000 | | | | 7 | |
| JPMorgan Chase Bank | | 6-Month PLN - WIBOR | | 1.79% | | 03/24/21 | | PLN | | | 12,000 | | | | (22 | ) |
| JPMorgan Chase Bank | | 3-Month ZAR - JIBAR | | 8.45% | | 03/23/21 | | ZAR | | | 58,600 | | | | (5 | ) |
| JPMorgan Chase Bank | | 0.30% | | 6-Month CZK - PRIBOR | | 02/26/21 | | CZK | | | 83,000 | | | | 33 | |
| JPMorgan Chase Bank | | 7.16% | | Colombia IBR Overnight Interbank | | 02/11/21 | | COP | | | 15,000,000 | | | | (82 | ) |
| JPMorgan Chase Bank | | 7-Day CNY - CNRR007 | | 2.44% | | 01/26/21 | | CNY | | | 23,000 | | | | (55 | ) |
| JPMorgan Chase Bank | | 7.11% | | Colombia IBR Overnight Interbank | | 01/22/21 | | COP | | | 13,433,034 | | | | (66 | ) |
| JPMorgan Chase Bank | | 0.44% | | 6-Month CZK - PRIBOR | | 11/20/20 | | CZK | | | 30,000 | | | | (1 | ) |
| JPMorgan Chase Bank | | 0.50% | | 6-Month CZK - PRIBOR | | 05/05/20 | | CZK | | | 180,000 | | | | (18 | ) |
| JPMorgan Chase Bank | | 0.59% | | 6-Month CZK - PRIBOR | | 03/13/20 | | CZK | | | 30,000 | | | | (8 | ) |
| JPMorgan Chase Bank | | 0.54% | | 6-Month CZK - PRIBOR | | 02/16/20 | | CZK | | | 320,000 | | | | (59 | ) |
| JPMorgan Chase Bank | | 1-Day COP - COOIS | | 6.96% | | 11/17/17 | | COP | | | 38,467,587 | | | | 26 | |
| JPMorgan Chase Bank | | 1.77% | | 3-Month HUF -BUBOR | | 07/17/17 | | HUF | | | 7,146,976 | | | | (205 | ) |
| | | | | | | | | | | | | | | | |
| | | | | | | | | | | | | | $ | (2,535 | ) |
| | | | | | | | | | | | | | | | |
| | | | | | | | | | | | | | | | |
| Credit Default Swaps | |
| Counterparty | | Reference Entity/Obligation | | Buy/Sell Protection | | (Pays) Receives Rate | | Termination Date | | Notional
Amount
($ Thousands) | | | Net Unrealized
Depreciation
($ Thousands) | |
| JPMorgan Chase Bank | | CDX.EM.25.V1 | | BUY | | 1.00% | | 6/20/21 | | $ | 18,500 | | | $ | (72 | ) |
| | | | | | | | | | | | | | | | |
A list of open centrally cleared swap agreements held by the Fund at May 31, 2016, is as follows:
| | | | | | | | | | | | | | | | |
| Interest Rate Swaps | |
| Counterparty | | Fund Pays | | Fund Receives | | Termination Date | | Currency | | Notional Amount (Thousands) | | | Net Unrealized
Depreciation ($ Thousands) | |
| Citibank | | 2.34% | | 3 Month USD - LIBOR | | 02/06/45 | | USD | | | 320 | | | $ | (14 | ) |
| Citibank | | 2.08% | | 3-Month USD - LIBOR | | 01/13/25 | | USD | | | 7,056 | | | | (312 | ) |
| Citibank | | 2.14% | | 3-Month USD - LIBOR | | 01/12/25 | | USD | | | 9,306 | | | | (462 | ) |
| | | | | | | | | | | | | | | | |
| | | | | | | | | | | | | | $ | (788 | ) |
| | | | | | | | | | | | | | | | |
For the year ended May 31, 2016, the total amount of all open swap agreements, as presented in the tables above, are representative of the volume of activity for the derivative type during the year.
Percentages are based on a Net Assets of $1,935,751 ($ Thousands).
| (A) | | Security exempt from registration under Rule 144A of the Securities Act of 1933. These securities may be resold in transactions exempt from registration normally to qualified institutions. On May 31, 2016, the value of these securities amounted to $203,714 ($ Thousands), 10.5% representing of the net assets of the Fund. |
| (B) | | Variable Rate Security — The rate reported on the Schedule of Investments is the rate in effect as of May 31, 2016. |
| (C) | | Zero coupon security. The rate shown on the schedule of investments represents the security’s effective yield at the time of purchase. |
| (D) | | Step Bonds — The rate reflected on the Schedule of Investments is the effective yield on May 31, 2016. The coupon on a step bond changes on a specified date. |
| (E) | | Security is in default on interest payment. |
| (F) | | Security fair valued using methods determined in good faith by the Valuation Committee of the Board of Trustees. The total market value of such securities as of May 31, 2016 was $269 ($ Thousands) and represented 0.0% of Net Assets. |
| (G) | | Securities considered illiquid. The total value of such securities as of May 31, 2016 was $269 ($ Thousands) and represented 0.0% of Net Assets. |
| | |
| 222 | | SEI Institutional Investments Trust / Annual Report / May 31, 2016 |
ARS — Argentine Peso
BRL — Brazilian Real
BUBOR — Budapest Interbank Offered Rate
CAD — Canadian Dollar
CDI — Average One-Day Interbank Deposit Rate
CLICP — Colombian IBR Overnight Interbank Reference Rate
CLP — Chilean Peso
CNY — Chinese Yuan
COP — Colombian Peso
CZK — Czech Koruna
DOP — Dominican Peso
EUR — Euro
HUF — Hungarian Forint
IDR — Indonesian Rupiah
INR — Indian Rupee
ILS — Israeli New Sheckels
JIBAR — Johannesburg Interbank Offered Rate
KES — Kenyan Shilling
KLIBOR — Kuala Lumpur Interbank Offered Rate
KRW — Korean Won
LIBOR — London Interbank Offered Rate
MTN — Medium Term Note
MXN — Mexican Peso
MYR — Malaysian Ringgit
NGN — Nigerian Naira
PEN — Peruvian Inca
PHP — Philippine Peso
PLN — Polish Zloty
PRIBOR — Prague Interbank Offered Rate
RON — Romanian Leu
RUB — Russian Ruble
SGD — Singapore Dollar
Ser — Series
THB — Thai Bhat
TIIE — Equilibrium Interbank Offered Rate
TWD — Taiwan Dollar
TRY — New Turkish Lira
USD — United States Dollar
WIBOR — Warsaw Interbank Offered Rate
ZAR — South African Rand
The following is a list of the level of inputs used as of May 31, 2016, in valuing the Fund’s investments and other financial instruments carried at value ($ Thousands):
| | | | | | | | | | | | | | | | |
| Investments in Securities | | Level 1 | | | Level 2 | | | Level 3(1) | | | Total | |
Global Bonds | | $ | — | | | $ | 1,834,662 | | | $ | 269 | | | $ | 1,834,931 | |
Loan Participation | | | — | | | | 1,711 | | | | — | | | | 1,711 | |
| | | | | | | | | | | | | | | | |
Total Investments in Securities | | $ | — | | | $ | 1,836,373 | | | $ | 269 | | | $ | 1,836,642 | |
| | | | | | | | | | | | | | | | |
| | | | | | | | | | | | | | | | |
| | | | | | | | | | | | | | | | |
| Other Financial Instruments | | Level 1 | | | Level 2 | | | Level 3 | | | Total | |
Futures Contracts* | | | | | | | | | | | | | | | | |
Unrealized Appreciation | | $ | 98 | | | $ | — | | | $ | — | | | $ | 98 | |
Unrealized Depreciation | | | (155 | ) | | | — | | | | — | | | | (155 | ) |
Forwards Contracts* | | | | | | | | | | | | | | | | |
Unrealized Appreciation | | | — | | | | 6,932 | | | | — | | | | 6,932 | |
Unrealized Depreciation | | | — | | | | (12,235 | ) | | | — | | | | (12,235 | ) |
OTC Swaps | | | | | | | | | | | | | | | | |
Interest Rate Swaps* | | | | | | | | | | | | | | | | |
Unrealized Appreciation | | | — | | | | 381 | | | | — | | | | 381 | |
Unrealized Depreciation | | | — | | | | (2,916 | ) | | | — | | | | (2,916 | ) |
Credit Default Swaps* | | | | | | | | | | | | | | | | |
Unrealized Depreciation | | | — | | | | (72 | ) | | | — | | | | (72 | ) |
Centrally Cleared Swaps | | | | | | | | | | | | | | | | |
Interest Rate Swaps* | | | | | | | | | | | | | | | | |
Unrealized Depreciation | | | — | | | | (788 | ) | | | — | | | | (788 | ) |
| | | | | | | | | | | | | | | | |
Total Other Financial Instruments | | $ | (57 | ) | | $ | (8,698 | ) | | $ | — | | | $ | (8,755 | ) |
| | | | | | | | | | | | | | | | |
| (1) | | A reconciliation of Level 3 instruments is presented when the Fund has a significant amount of Level 3 investments at the beginning and/or end of the period in relation to net assets. Management has concluded that Level 3 investments are not material in relation to net assets. |
| * | | Futures contracts, forwards contracts and swaps are valued at the unrealized appreciation (depreciation) on the instrument. |
For the year ended May 31, 2016, there were no transfers between Level 1 and Level 2 assets and liabilities.
For the year ended May 31, 2016, there were no transfers between Level 2 and Level 3 assets and liabilities.
For more information on valuation inputs, see Note 2 — Significant Accounting Policies in Notes to Financial Statements.
Amounts designated as “—” are $0 or have been rounded to $0.
The accompanying notes are an integral part of the financial statements.
| | | | |
| SEI Institutional Investments Trust / Annual Report / May 31, 2016 | | | 223 | |
SCHEDULE OF INVESTMENTS
Real Return Fund
May 31, 2016
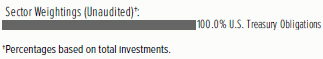
| | | | | | | | |
| Description | | Face Amount ($ Thousands) | | | Market Value ($ Thousands) | |
| |
U.S. TREASURY OBLIGATIONS — 99.6% | | | | | |
U.S. Treasury Inflation Indexed Bonds | | | | | | | | |
0.125%, 04/15/2021 | | $ | 6,992 | | | $ | 7,073 | |
U.S. Treasury Inflation-Protected Securities | | | | | | | | |
2.625%, 07/15/2017 | | | 6,679 | | | | 6,973 | |
2.125%, 01/15/2019 | | | 6,455 | | | | 6,904 | |
1.875%, 07/15/2019 | | | 7,006 | | | | 7,545 | |
1.625%, 01/15/2018 | | | 6,751 | | | | 7,009 | |
1.375%, 07/15/2018 | | | 6,837 | | | | 7,161 | |
1.375%, 01/15/2020 | | | 8,933 | | | | 9,472 | |
1.250%, 07/15/2020 | | | 13,160 | | | | 14,020 | |
1.125%, 01/15/2021 | | | 15,073 | | | | 15,948 | |
0.125%, 04/15/2018 | | | 22,252 | | | | 22,538 | |
0.125%, 04/15/2019 | | | 22,021 | | | | 22,352 | |
0.125%, 04/15/2020 | | | 22,049 | | | | 22,347 | |
| | | | | | | | |
Total U.S. Treasury Obligations
(Cost $147,791) ($ Thousands) | | | | 149,342 | |
| | | | | | | | |
Total Investments — 99.6%
(Cost $147,791) ($ Thousands) | | | $ | 149,342 | |
| | | | | | | | |
Percentages are based on a Net Assets of $149,972 ($ Thousands).
As of May 31, 2016, all of the Fund’s investments were considered Level 2, in accordance with the authoritative guidance on fair value measurements and disclosure under U.S. GAAP.
For the year ended May 31, 2016, there were no transfers between Level 1 and Level 2 assets and liabilities.
For the year ended May 31, 2016, there were no transfers between Level 2 and Level 3 assets and liabilities.
For more information on valuation inputs, see Note 2 — Significant Accounting Policies in Notes to Financial Statements.
The accompanying notes are an integral part of the financial statements.
| | |
| 224 | | SEI Institutional Investments Trust / Annual Report / May 31, 2016 |
SCHEDULE OF INVESTMENTS
Limited Duration Bond Fund
May 31, 2016
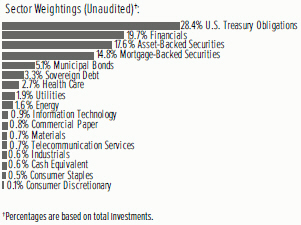
| | | | | | | | |
| Description | | Face Amount
($ Thousands) | | | Market Value
($ Thousands) | |
| | | | | | | | |
|
CORPORATE OBLIGATIONS — 28.5% | |
|
Consumer Discretionary — 0.1% | |
McDonald’s MTN | | | | | | | | |
2.100%, 12/07/2018 | | $ | 1,000 | | | $ | 1,015 | |
| | | | | | | | |
| | |
Consumer Staples — 0.4% | | | | | | | | |
Walgreens Boots Alliance | | | | | | | | |
1.750%, 11/17/2017 | | | 5,084 | | | | 5,106 | |
| | | | | | | | |
| | |
Energy — 1.6% | | | | | | | | |
Enbridge | | | | | | | | |
1.083%, 06/02/2017 (A) | | | 3,250 | | | | 3,188 | |
Enterprise Products Operating | | | | | | | | |
6.650%, 04/15/2018 | | | 2,092 | | | | 2,270 | |
Kinder Morgan | | | | | | | | |
7.000%, 06/15/2017 | | | 1,665 | | | | 1,738 | |
ONEOK Partners | | | | | | | | |
2.000%, 10/01/2017 | | | 4,685 | | | | 4,653 | |
Regency Energy Partners | | | | | | | | |
5.875%, 03/01/2022 | | | 500 | | | | 510 | |
Statoil | | | | | | | | |
0.832%, 11/09/2017 (A) | | | 2,200 | | | | 2,193 | |
TransCanada PipeLines | | | | | | | | |
1.875%, 01/12/2018 | | | 1,605 | | | | 1,604 | |
1.421%, 01/12/2018 (A) | | | 2,000 | | | | 1,973 | |
| | | | | | | | |
| | | | | | | 18,129 | |
| | | | | | | | |
| | |
Financials — 19.0% | | | | | | | | |
AIG Global Funding MTN | | | | | | | | |
1.650%, 12/15/2017 (B) | | | 1,965 | | | | 1,969 | |
American Express Bank | | | | | | | | |
6.000%, 09/13/2017 | | | 2,450 | | | | 2,592 | |
American Express Credit MTN | | | | | | | | |
1.875%, 11/05/2018 | | | 4,900 | | | | 4,926 | |
American Honda Finance MTN | | | | | | | | |
1.479%, 02/22/2019 (A) | | | 3,705 | | | | 3,744 | |
| | | | | | | | |
| Description | | Face Amount
($ Thousands) | | | Market Value
($ Thousands) | |
| | | | | | | | |
Bank Nederlandse Gemeenten MTN | | | | | | | | |
0.700%, 07/14/2017 (A) (B) | | $ | 12,474 | | | $ | 12,464 | |
Bank of America | | | | | | | | |
5.300%, 03/15/2017 | | | 850 | | | | 876 | |
1.700%, 08/25/2017 | | | 1,570 | | | | 1,572 | |
1.650%, 03/26/2018 | | | 3,600 | | | | 3,601 | |
1.250%, 02/14/2017 | | | 650 | | | | 651 | |
0.934%, 06/15/2017 (A) | | | 6,650 | | | | 6,626 | |
Barclays | | | | | | | | |
2.000%, 03/16/2018 | | | 2,250 | | | | 2,246 | |
BB&T MTN | | | | | | | | |
1.494%, 06/15/2018 (A) | | | 1,140 | | | | 1,147 | |
Citigroup | | | | | | | | |
1.850%, 11/24/2017 | | | 960 | | | | 963 | |
1.800%, 02/05/2018 | | | 5,110 | | | | 5,115 | |
Citizens Bank MTN | | | | | | | | |
2.300%, 12/03/2018 | | | 5,075 | | | | 5,101 | |
Credit Suisse NY MTN | | | | | | | | |
1.155%, 05/26/2017 (A) | | | 3,500 | | | | 3,497 | |
Daimler Finance North America LLC | | | | | | | | |
1.375%, 08/01/2017 (B) | | | 6,583 | | | | 6,578 | |
Deutsche Bank MTN | | | | | | | | |
2.850%, 05/10/2019 | | | 1,960 | | | | 1,959 | |
1.237%, 02/13/2017 (A) | | | 715 | | | | 714 | |
Discover Bank | | | | | | | | |
3.100%, 06/04/2020 | | | 1,000 | | | | 1,018 | |
Essex Portfolio | | | | | | | | |
5.500%, 03/15/2017 | | | 1,000 | | | | 1,029 | |
Fifth Third Bank | | | | | | | | |
1.450%, 02/28/2018 | | | 4,424 | | | | 4,416 | |
Ford Motor Credit | | | | | | | | |
5.000%, 05/15/2018 | | | 3,750 | | | | 3,973 | |
1.154%, 09/08/2017 (A) | | | 2,650 | | | | 2,641 | |
Goldman Sachs Group | | | | | | | | |
2.900%, 07/19/2018 | | | 3,035 | | | | 3,101 | |
2.375%, 01/22/2018 | | | 1,700 | | | | 1,719 | |
Harley-Davidson Financial Services MTN | | | | | | | | |
1.550%, 11/17/2017 (B) | | | 3,000 | | | | 3,009 | |
HCP | | | | | | | | |
3.750%, 02/01/2019 | | | 600 | | | | 617 | |
HSBC Bank USA NY | | | | | | | | |
6.000%, 08/09/2017 | | | 500 | | | | 523 | |
HSBC USA | | | | | | | | |
1.700%, 03/05/2018 | | | 5,300 | | | | 5,303 | |
Huntington National Bank | | | | | | | | |
2.200%, 11/06/2018 | | | 3,200 | | | | 3,227 | |
Hyundai Capital America MTN | | | | | | | | |
2.000%, 03/19/2018 (B) | | | 1,385 | | | | 1,387 | |
JPMorgan Chase | | | | | | | | |
6.000%, 10/01/2017 | | | 2,150 | | | | 2,276 | |
1.700%, 03/01/2018 | | | 8,690 | | | | 8,708 | |
| | | | |
| SEI Institutional Investments Trust / Annual Report / May 31, 2016 | | | 225 | |
SCHEDULE OF INVESTMENTS
Limited Duration Bond Fund (Continued)
May 31, 2016
| | | | | | | | |
| Description | | Face Amount
($ Thousands) | | | Market Value
($ Thousands) | |
| | | | | | | | |
KeyBank | | | | | | | | |
1.700%, 06/01/2018 | | $ | 3,225 | | | $ | 3,229 | |
1.650%, 02/01/2018 | | | 2,578 | | | | 2,578 | |
1.100%, 11/25/2016 | | | 2,167 | | | | 2,168 | |
KFW | | | | | | | | |
0.500%, 07/15/2016 | | | 8,000 | | | | 7,999 | |
Lloyds Bank | | | | | | | | |
1.635%, 01/22/2019 (A) | | | 1,000 | | | | 1,000 | |
MassMutual Global Funding | | | | | | | | |
2.000%, 04/05/2017 (B) | | | 1,350 | | | | 1,363 | |
Metropolitan Life Global Funding I | | | | | | | | |
1.875%, 06/22/2018 (B) | | | 1,120 | | | | 1,129 | |
1.500%, 01/10/2018 (B) | | | 3,850 | | | | 3,861 | |
Morgan Stanley MTN | | | | | | | | |
4.750%, 03/22/2017 | | | 6,980 | | | | 7,174 | |
1.918%, 04/25/2018 (A) | | | 2,150 | | | | 2,172 | |
MUFG Union Bank | | | | | | | | |
1.500%, 09/26/2016 | | | 2,200 | | | | 2,204 | |
New York Life Global Funding | | | | | | | | |
2.000%, 04/13/2021 (B) | | | 1,000 | | | | 998 | |
1.550%, 11/02/2018 (B) | | | 4,540 | | | | 4,557 | |
PNC Bank | | | | | | | | |
1.800%, 11/05/2018 | | | 6,505 | | | | 6,557 | |
Pricoa Global Funding I | | | | | | | | |
1.350%, 08/18/2017 (B) | | | 4,250 | | | | 4,254 | |
1.150%, 11/25/2016 (B) | | | 1,380 | | | | 1,380 | |
Realty Income | | | | | | | | |
2.000%, 01/31/2018 | | | 1,000 | | | | 1,004 | |
Reliance Standard Life Global Funding II MTN | | | | | | | | |
2.150%, 10/15/2018 (B) | | | 1,000 | | | | 1,003 | |
Santander Bank | | | | | | | | |
2.000%, 01/12/2018 | | | 6,718 | | | | 6,701 | |
Santander UK | | | | | | | | |
1.375%, 03/13/2017 | | | 1,700 | | | | 1,702 | |
Simon Property Group | | | | | | | | |
1.500%, 02/01/2018 (B) | | | 3,765 | | | | 3,768 | |
Sumitomo Mitsui Banking MTN | | | | | | | | |
1.573%, 01/18/2019 (A) | | | 5,250 | | | | 5,261 | |
Synchrony Financial | | | | | | | | |
1.875%, 08/15/2017 | | | 2,190 | | | | 2,189 | |
Toronto-Dominion Bank MTN | | | | | | | | |
1.475%, 01/22/2019 (A) | | | 4,315 | | | | 4,341 | |
Travelers MTN | | | | | | | | |
5.750%, 12/15/2017 | | | 875 | | | | 933 | |
UBS MTN | | | | | | | | |
1.330%, 03/26/2018 (A) | | | 5,060 | | | | 5,065 | |
US Bancorp MTN | | | | | | | | |
1.650%, 05/15/2017 | | | 1,270 | | | | 1,277 | |
Volkswagen Group of America Finance | | | | | | | | |
1.600%, 11/20/2017 (B) | | | 2,600 | | | | 2,585 | |
Volkswagen International Finance | | | | | | | | |
2.375%, 03/22/2017 (B) | | | 2,400 | | | | 2,414 | |
| | | | | | | | |
| Description | | Face Amount
($ Thousands) | | | Market Value
($ Thousands) | |
| | | | | | | | |
Voya Financial | | | | | | | | |
2.900%, 02/15/2018 | | $ | 4,950 | | | $ | 5,017 | |
Wells Fargo MTN | | | | | | | | |
1.400%, 09/08/2017 | | | 4,400 | | | | 4,408 | |
1.268%, 04/23/2018 (A) | | | 5,765 | | | | 5,778 | |
Wells Fargo Bank MTN | | | | | | | | |
1.375%, 01/22/2018 (A) | | | 3,550 | | | | 3,567 | |
Welltower | | | | | | | | |
4.700%, 09/15/2017 | | | 1,230 | | | | 1,274 | |
| | | | | | | | |
| | | | | | | 220,198 | |
| | | | | | | | |
| | |
Health Care — 2.7% | | | | | | | | |
AbbVie | | | | | | | | |
2.300%, 05/14/2021 | | | 735 | | | | 732 | |
Actavis Funding SCS | | | | | | | | |
2.350%, 03/12/2018 | | | 4,730 | | | | 4,769 | |
Anthem | | | | | | | | |
2.300%, 07/15/2018 | | | 1,214 | | | | 1,226 | |
1.875%, 01/15/2018 | | | 2,570 | | | | 2,579 | |
Baxalta | | | | | | | | |
2.000%, 06/22/2018 (B) | | | 1,115 | | | | 1,109 | |
Becton Dickinson | | | | | | | | |
1.800%, 12/15/2017 | | | 3,850 | | | | 3,866 | |
Biogen | | | | | | | | |
6.875%, 03/01/2018 | | | 1,630 | | | | 1,773 | |
Dignity Health | | | | | | | | |
2.637%, 11/01/2019 | | | 990 | | | | 1,011 | |
Express Scripts Holding | | | | | | | | |
2.650%, 02/15/2017 | | | 7,244 | | | | 7,316 | |
Forest Laboratories | | | | | | | | |
5.000%, 12/15/2021 (B) | | | 500 | | | | 549 | |
McLaren Health Care | | | | | | | | |
1.964%, 05/15/2018 | | | 1,270 | | | | 1,274 | |
Mylan | | | | | | | | |
2.500%, 06/07/2019 (B) | | | 1,950 | | | | 1,948 | |
1.350%, 11/29/2016 | | | 1,200 | | | | 1,199 | |
Perrigo | | | | | | | | |
1.300%, 11/08/2016 | | | 1,480 | | | | 1,476 | |
| | | | | | | | |
| | | | | | | 30,827 | |
| | | | | | | | |
| | |
Industrials — 0.6% | | | | | | | | |
America West Airlines Pass-Through Trust, Ser 1999-1 | | | | | | | | |
7.930%, 01/02/2019 | | | 744 | | | | 799 | |
International Lease Finance | | | | | | | | |
6.750%, 09/01/2016 (B) | | | 1,250 | | | | 1,263 | |
MUFG Americas Holdings | | | | | | | | |
1.625%, 02/09/2018 | | | 2,805 | | | | 2,797 | |
Penske Truck Leasing LP | | | | | | | | |
3.750%, 05/11/2017 (B) | | | 2,090 | | | | 2,132 | |
| | | | | | | | |
| | | | | | | 6,991 | |
| | | | | | | | |
| | |
| 226 | | SEI Institutional Investments Trust / Annual Report / May 31, 2016 |
| | | | | | | | |
| Description | | Face Amount
($ Thousands) | | | Market Value
($ Thousands) | |
| | | | | | | | |
|
Information Technology — 0.9% | |
Apple | | | | | | | | |
1.474%, 02/22/2019 (A) | | $ | 4,465 | | | $ | 4,526 | |
Diamond 1 Finance | | | | | | | | |
3.480%, 06/01/2019 (B) | | | 735 | | | | 745 | |
Hewlett Packard Enterprise | | | | | | | | |
2.559%, 10/05/2018 (A) (B) | | | 3,165 | | | | 3,210 | |
2.369%, 10/05/2017 (A) (B) | | | 1,495 | | | | 1,504 | |
| | | | | | | | |
| | | | | | | 9,985 | |
| | | | | | | | |
| | |
Materials — 0.7% | | | | | | | | |
Chevron Phillips Chemical | | | | | | | | |
1.700%, 05/01/2018 (B) | | | 4,535 | | | | 4,507 | |
Ecolab | | | | | | | | |
1.450%, 12/08/2017 | | | 1,565 | | | | 1,565 | |
Rio Tinto Finance USA | | | | | | | | |
1.482%, 06/17/2016 (A) | | | 1,970 | | | | 1,971 | |
| | | | | | | | |
| | | | | | | 8,043 | |
| | | | | | | | |
|
Telecommunication Services — 0.6% | |
AT&T | | | | | | | | |
5.500%, 02/01/2018 | | | 3,800 | | | | 4,044 | |
Verizon Communications | | | | | | | | |
1.350%, 06/09/2017 | | | 1,800 | | | | 1,803 | |
1.036%, 06/09/2017 (A) | | | 1,700 | | | | 1,701 | |
| | | | | | | | |
| | | | | | | 7,548 | |
| | | | | | | | |
| | |
Utilities — 1.9% | | | | | | | | |
Berkshire Hathaway Energy | | | | | | | | |
5.750%, 04/01/2018 | | | 6,500 | | | | 7,004 | |
Entergy Texas | | | | | | | | |
7.125%, 02/01/2019 | | | 750 | | | | 846 | |
Exelon | | | | | | | | |
2.450%, 04/15/2021 | | | 590 | | | | 591 | |
1.550%, 06/09/2017 | | | 3,530 | | | | 3,530 | |
Oncor Electric Delivery | | | | | | | | |
5.750%, 09/30/2020 | | | 500 | | | | 567 | |
5.000%, 09/30/2017 | | | 2,660 | | | | 2,783 | |
Southern Power | | | | | | | | |
1.500%, 06/01/2018 | | | 4,700 | | | | 4,700 | |
West Penn Power | | | | | | | | |
5.950%, 12/15/2017 (B) | | | 470 | | | | 497 | |
Xcel Energy | | | | | | | | |
1.200%, 06/01/2017 | | | 1,145 | | | | 1,144 | |
| | | | | | | | |
| | | | | | | 21,662 | |
| | | | | | | | |
Total Corporate Obligations
(Cost $328,893) ($ Thousands) | | | | 329,504 | |
| | | | | | | | |
| | | | | | | | |
| Description | | Face Amount
($ Thousands) | | | Market Value
($ Thousands) | |
| | | | | | | | |
|
U.S. TREASURY OBLIGATIONS — 27.5% | |
U.S. Treasury Inflation-Protected Securities | | | | | | | | |
0.125%, 04/15/2020 | | $ | 30,913 | | | $ | 31,331 | |
U.S. Treasury Notes | | | | | | | | |
3.125%, 05/15/2019 | | | 15,765 | | | | 16,729 | |
2.750%, 02/15/2019 | | | 66,450 | | | | 69,614 | |
2.125%, 01/31/2021 | | | 17,500 | | | | 18,112 | |
1.375%, 06/30/2018 | | | 47,910 | | | | 48,372 | |
1.125%, 12/31/2019 | | | 49,250 | | | | 49,196 | |
1.000%, 03/15/2019 | | | 1,655 | | | | 1,655 | |
0.750%, 02/28/2018 | | | 58,550 | | | | 58,443 | |
0.625%, 11/30/2017 | | | 20,000 | | | | 19,943 | |
0.625%, 04/30/2018 | | | 5,000 | | | | 4,977 | |
| | | | | | | | |
Total U.S. Treasury Obligations
(Cost $317,301) ($ Thousands) | | | | 318,372 | |
| | | | | | | | |
|
ASSET-BACKED SECURITIES — 17.0% | |
| | |
Automotive — 8.6% | | | | | | | | |
Ally Master Owner Trust, Ser 2012-5, Cl A | | | | | | | | |
1.540%, 09/15/2019 | | | 3,000 | | | | 3,004 | |
Ally Master Owner Trust, Ser 2015-3, Cl A | | | | | | | | |
1.630%, 05/15/2020 | | | 2,000 | | | | 1,998 | |
AmeriCredit Automobile Receivables Trust, Ser 2013-2, Cl D | | | | | | | | |
2.420%, 05/08/2019 | | | 3,070 | | | | 3,078 | |
AmeriCredit Automobile Receivables Trust, Ser 2013-3, Cl D | | | | | | | | |
3.000%, 07/08/2019 | | | 2,700 | | | | 2,726 | |
AmeriCredit Automobile Receivables Trust, Ser 2014-2, Cl B | | | | | | | | |
1.600%, 07/08/2019 | | | 2,525 | | | | 2,527 | |
AmeriCredit Automobile Receivables Trust, Ser 2016-1, Cl A2B | | | | | | | | |
1.187%, 06/10/2019 (A) | | | 3,850 | | | | 3,852 | |
ARI Fleet Lease Trust, Ser 2013-A, Cl A3 | | | | | | | | |
0.920%, 07/15/2021 (B) | | | 52 | | | | 52 | |
Capital Auto Receivables Asset Trust, Ser 2013- 3, Cl B | | | | | | | | |
2.320%, 07/20/2018 | | | 6,095 | | | | 6,114 | |
CarMax Auto Owner Trust, Ser 2016-2, Cl A2B | | | | | | | | |
0.905%, 06/17/2019 (A) | | | 3,710 | | | | 3,719 | |
Chesapeake Funding, Ser 2014-1A, Cl A | | | | | | | | |
0.859%, 03/07/2026 (A) (B) | | | 1,983 | | | | 1,979 | |
Chesapeake Funding, Ser 2015-1A, Cl B | | | | | | | | |
1.387%, 02/07/2027 (A) (B) | | | 1,430 | | | | 1,429 | |
CPS Auto Receivables Trust, Ser 2013-B, Cl A | | | | | | | | |
1.820%, 09/15/2020 (B) | | | 185 | | | | 183 | |
CPS Auto Receivables Trust, Ser 2013-C, Cl A | | | | | | | | |
1.640%, 04/16/2018 (B) | | | 106 | | | | 106 | |
CPS Auto Receivables Trust, Ser 2013-D, Cl A | | | | | | | | |
1.540%, 07/16/2018 (B) | | | 198 | | | | 198 | |
| | | | |
| SEI Institutional Investments Trust / Annual Report / May 31, 2016 | | | 227 | |
SCHEDULE OF INVESTMENTS
Limited Duration Bond Fund (Continued)
May 31, 2016
| | | | | | | | |
| Description | | Face Amount
($ Thousands) | | | Market Value
($ Thousands) | |
| | | | | | | | |
CPS Auto Receivables Trust, Ser 2014-A, Cl A | | | | | | | | |
1.210%, 08/15/2018 (B) | | $ | 175 | | | $ | 174 | |
CPS Auto Receivables Trust, Ser 2014-B, Cl A | | | | | | | | |
1.110%, 11/15/2018 (B) | | | 417 | | | | 415 | |
CPS Auto Receivables Trust, Ser 2014-C, Cl A | | | | | | | | |
1.310%, 02/15/2019 (B) | | | 820 | | | | 819 | |
CPS Auto Trust, Ser 2012-B, Cl A | | | | | | | | |
2.520%, 09/16/2019 (B) | | | 195 | | | | 196 | |
Credit Acceptance Auto Loan Trust, Ser 2015- 1A, Cl A | | | | | | | | |
2.000%, 07/15/2022 (B) | | | 1,395 | | | | 1,394 | |
DT Auto Owner Trust, Ser 2015-2A, Cl B | | | | | | | | |
1.880%, 05/15/2019 (B) | | | 125 | | | | 124 | |
DT Auto Owner Trust, Ser 2015-3A, Cl A | | | | | | | | |
1.660%, 03/15/2019 (B) | | | 950 | | | | 950 | |
Enterprise Fleet Financing, Ser 2014-2, Cl A2 | | | | | | | | |
1.050%, 03/20/2020 (B) | | | 1,595 | | | | 1,587 | |
Ford Credit Auto Owner Trust, Ser 2014-1, Cl A | | | | | | | | |
2.260%, 11/15/2025 (B) | | | 3,350 | | | | 3,396 | |
Ford Credit Floorplan Master Owner Trust, Ser 2012-2, Cl A | | | | | | | | |
1.920%, 01/15/2019 | | | 4,995 | | | | 5,020 | |
Ford Credit Floorplan Master Owner Trust, Ser 2014-4, Cl A1 | | | | | | | | |
1.400%, 08/15/2019 | | | 1,350 | | | | 1,350 | |
Ford Credit Floorplan Master Owner Trust, Ser 2015-4, Cl A2 | | | | | | | | |
1.033%, 08/15/2020 (A) | | | 5,250 | | | | 5,247 | |
GM Financial Automobile Leasing Trust, Ser 2014-1A, Cl A4 | | | | | | | | |
1.300%, 05/21/2018 (B) | | | 1,140 | | | | 1,141 | |
GM Financial Automobile Leasing Trust, Ser 2015-1, Cl B | | | | | | | | |
2.140%, 06/20/2019 | | | 2,845 | | | | 2,823 | |
GMF Floorplan Owner Revolving Trust, Ser 2015-1, Cl A1 | | | | | | | | |
1.650%, 05/15/2020 (B) | | | 2,405 | | | | 2,405 | |
GMF Floorplan Owner Revolving Trust, Ser 2015-1, Cl B | | | | | | | | |
1.970%, 05/15/2020 (B) | | | 1,320 | | | | 1,304 | |
Harley-Davidson Motorcycle Trust, Ser 2013-1, Cl A4 | | | | | | | | |
0.870%, 07/15/2019 | | | 250 | | | | 250 | |
Hertz Fleet Lease Funding, Ser 2013-3, Cl B | | | | | | | | |
1.487%, 12/10/2027 (A) (B) | | | 1,355 | | | | 1,355 | |
Honda Auto Receivables Owner Trust, Ser 2015-4, Cl A2 | | | | | | | | |
0.820%, 07/23/2018 | | | 745 | | | | 743 | |
Mercedes Benz Auto Lease Trust, Ser 2015-B, Cl A3 | | | | | | | | |
1.340%, 07/16/2018 | | | 7,045 | | | | 7,049 | |
| | | | | | | | |
| Description | | Face Amount
($ Thousands) | | | Market Value
($ Thousands) | |
| | | | | | | | |
Mercedes-Benz Auto Receivables Trust, Ser 2013-1, Cl A4 | | | | | | | | |
1.130%, 11/15/2019 | | $ | 325 | | | $ | 325 | |
NextGear Floorplan Master Owner Trust, Ser 2014-1A, Cl A | | | | | | | | |
1.920%, 10/15/2019 (B) | | | 2,250 | | | | 2,236 | |
Nissan Auto Lease Trust, Ser 2016-A, Cl A3 | | | | | | | | |
1.490%, 03/15/2019 | | | 3,795 | | | | 3,795 | |
Nissan Auto Receivables Owner Trust, Ser 2015-A, Cl A3 | | | | | | | | |
1.050%, 10/15/2019 | | | 710 | | | | 709 | |
Nissan Auto Receivables Owner Trust, Ser 2015-B, Cl A2B | | | | | | | | |
0.715%, 07/16/2018 (A) | | | 812 | | | | 813 | |
Nissan Auto Receivables Owner Trust, Ser 2016-B, Cl A2A | | | | | | | | |
1.050%, 04/15/2019 | | | 705 | | | | 704 | |
Porsche Innovative Lease Owner Trust, Ser 2014-1, Cl A4 | | | | | | | | |
1.260%, 09/21/2020 (B) | | | 375 | | | | 375 | |
Prestige Auto Receivables Trust, Ser 2013-1A, Cl A3 | | | | | | | | |
1.330%, 05/15/2019 (B) | | | 397 | | | | 397 | |
Prestige Auto Receivables Trust, Ser 2013-1A, Cl B | | | | | | | | |
1.740%, 05/15/2019 (B) | | | 900 | | | | 897 | |
Prestige Auto Receivables Trust, Ser 2014-1A, Cl A3 | | | | | | | | |
1.520%, 04/15/2020 (B) | | | 250 | | | | 250 | |
Prestige Auto Receivables Trust, Ser 2014-1A, Cl A2 | | | | | | | | |
0.970%, 03/15/2018 (B) | | | 41 | | | | 41 | |
Prestige Auto Receivables Trust, Ser 2014-1A, Cl B | | | | | | | | |
1.910%, 04/15/2020 (B) | | | 2,370 | | | | 2,349 | |
Prestige Auto Receivables Trust, Ser 2015-1, Cl A3 | | | | | | | | |
1.530%, 02/15/2021 (B) | | | 1,360 | | | | 1,355 | |
Santander Drive Auto Receivables Trust, Ser 2012-2, Cl D | | | | | | | | |
3.870%, 02/15/2018 | | | 2,705 | | | | 2,718 | |
Santander Drive Auto Receivables Trust, Ser 2012-3, Cl C | | | | | | | | |
3.010%, 04/16/2018 | | | 76 | | | | 76 | |
Santander Drive Auto Receivables Trust, Ser 2012-4, Cl C | | | | | | | | |
2.940%, 12/15/2017 | | | 322 | | | | 322 | |
Santander Drive Auto Receivables Trust, Ser 2012-5, Cl C | | | | | | | | |
2.700%, 08/15/2018 | | | 1,969 | | | | 1,972 | |
Santander Drive Auto Receivables Trust, Ser 2012-6, Cl C | | | | | | | | |
1.940%, 06/15/2016 | | | 494 | | | | 495 | |
| | |
| 228 | | SEI Institutional Investments Trust / Annual Report / May 31, 2016 |
| | | | | | | | |
| Description | | Face Amount
($ Thousands) | | | Market Value
($ Thousands) | |
| | | | | | | | |
Santander Drive Auto Receivables Trust, Ser 2012-AA, Cl C | | | | | | | | |
1.780%, 11/15/2018 (B) | | $ | 266 | | | $ | 267 | |
Santander Drive Auto Receivables Trust, Ser 2013-1, Cl C | | | | | | | | |
1.760%, 01/15/2019 | | | 1,753 | | | | 1,756 | |
Santander Drive Auto Receivables Trust, Ser 2013-2, Cl D | | | | | | | | |
2.570%, 03/15/2019 | | | 2,985 | | | | 2,997 | |
SMART Trust, Ser 2012-4US, Cl A4A | | | | | | | | |
1.250%, 08/14/2018 | | | 215 | | | | 214 | |
Susquehanna Auto Receivables Trust, Ser 2014-1A, Cl A3 | | | | | | | | |
1.000%, 02/15/2018 (B) | | | 269 | | | | 268 | |
Toyota Auto Receivables Owner Trust, Ser 2015-A, Cl A3 | | | | | | | | |
1.120%, 02/15/2019 | | | 740 | | | | 740 | |
Toyota Auto Receivables Owner Trust, Ser 2016-B, Cl A2A | | | | | | | | |
1.020%, 10/15/2018 | | | 720 | | | | 719 | |
Volkswagen Auto Lease Trust, Ser 2014-A, Cl A4 | | | | | | | | |
0.990%, 07/20/2018 | | | 740 | | | | 740 | |
Westlake Automobile Receivables Trust, Ser 2014-2A, Cl C | | | | | | | | |
2.240%, 04/15/2020 (B) | | | 575 | | | | 573 | |
Westlake Automobile Receivables Trust, Ser 2014-2A, Cl A2 | | | | | | | | |
0.970%, 10/16/2017 (B) | | | 272 | | | | 272 | |
Westlake Automobile Receivables Trust, Ser 2014-2A, Cl B | | | | | | | | |
1.580%, 04/15/2020 (B) | | | 500 | | | | 500 | |
Westlake Automobile Receivables Trust, Ser 2015-1A, Cl B | | | | | | | | |
1.680%, 11/16/2020 (B) | | | 1,845 | | | | 1,836 | |
| | | | | | | | |
| | | | | | | 99,418 | |
| | | | | | | | |
| | |
Credit Cards — 3.6% | | | | | | | | |
Barclays Dryrock Issuance Trust, Ser 2014-1, Cl A | | | | | | | | |
0.793%, 12/16/2019 (A) | | | 8,000 | | | | 8,003 | |
Capital One Multi-Asset Execution Trust, Ser 2014-A1, Cl A1 | | | | | | | | |
0.828%, 11/15/2019 (A) | | | 3,850 | | | | 3,848 | |
Chase Issuance Trust, Ser 2007-A12, Cl A12 | | | | | | | | |
0.485%, 08/15/2019 (A) | | | 900 | | | | 898 | |
Chase Issuance Trust, Ser 2013-A1, Cl A1 | | | | | | | | |
1.300%, 02/18/2020 | | | 550 | | | | 551 | |
Chase Issuance Trust, Ser 2014, Cl A1 | | | | | | | | |
1.150%, 01/15/2019 | | | 6,260 | | | | 6,268 | |
Chase Issuance Trust, Ser 2014-A8, Cl A8 | | | | | | | | |
0.685%, 11/15/2018 (A) | | | 1,780 | | | | 1,781 | |
| | | | | | | | |
| Description | | Face Amount
($ Thousands) | | | Market Value
($ Thousands) | |
| | | | | | | | |
Citibank Credit Card Issuance Trust, Ser 2008-A2, Cl A2 | | | | | | | | |
1.593%, 01/23/2020 (A) | | $ | 1,970 | | | $ | 2,001 | |
Citibank Credit Card Issuance Trust, Ser 2014-A2, Cl A2 | | | | | | | | |
1.020%, 02/22/2019 | | | 7,011 | | | | 7,015 | |
Discover Card Execution Note Trust, Ser 2014-A3, Cl A3 | | | | | | | | |
1.220%, 10/15/2019 | | | 4,195 | | | | 4,199 | |
Discover Card Execution Note Trust, Ser 2014-A5, Cl A | | | | | | | | |
1.390%, 04/15/2020 | | | 2,650 | | | | 2,656 | |
GE Capital Credit Card Master Note Trust, Ser 2012-7, Cl A | | | | | | | | |
1.760%, 09/15/2022 | | | 2,000 | | | | 1,998 | |
Golden Credit Card Trust, Ser 2012-2A, Cl A1 | | | | | | | | |
1.770%, 01/15/2019 (B) | | | 1,000 | | | | 1,003 | |
Synchrony Credit Card Master Note Trust, Ser 2012-6, Cl A | | | | | | | | |
1.360%, 08/17/2020 | | | 1,656 | | | | 1,656 | |
| | | | | | | | |
| | | | | | | 41,877 | |
| | | | | | | | |
| | |
Mortgage Related Securities — 0.8% | | | | | | | | |
Accredited Mortgage Loan Trust, Ser 2005-3, Cl M1 | | | | | | | | |
0.890%, 09/25/2035 (A) | | | 1,400 | | | | 1,379 | |
Aegis Asset Backed Securities Trust Mortgage Pass-Through Certificates, Ser 2004-2, Cl A1 | | | | | | | | |
1.039%, 06/25/2034 (A) | | | 177 | | | | 176 | |
Aegis Asset-Backed Securities Trust Mortgage Pass-Through Certificates, Ser 2004-4, Cl A1 | | | | | | | | |
1.166%, 10/25/2034 (A) | | | 1,032 | | | | 1,019 | |
Asset Backed Securities Home Equity Loan Trust, Ser 2004-HE6, Cl A2 | | | | | | | | |
1.166%, 09/25/2034 (A) | | | 1,062 | | | | 1,051 | |
Bear Stearns Asset-Backed Securities Trust, Ser 2004-2, Cl A1 | | | | | | | | |
1.439%, 08/25/2034 (A) | | | 176 | | | | 176 | |
First NLC Trust, Ser 2005-2, Cl M1 | | | | | | | | |
0.926%, 09/25/2035 (A) | | | 1,232 | | | | 1,206 | |
Merrill Lynch Mortgage Investors Trust, Ser 2006-FF1, Cl M1 | | | | | | | | |
0.659%, 08/25/2036 (A) | | | 3,400 | | | | 3,342 | |
Option One Mortgage Loan Trust, Ser 2005-3, Cl M1 | | | | | | | | |
0.916%, 08/25/2035 (A) | | | 1,299 | | | | 1,289 | |
| | | | | | | | |
| | | | | | | 9,638 | |
| | | | | | | | |
|
Other Asset-Backed Securities — 4.0% | |
Bear Stearns Asset-Backed Securities Trust, Ser 2004-SD3, Cl A3 | | | | | | | | |
1.009%, 09/25/2034 (A) | | | 204 | | | | 201 | |
| | | | |
| SEI Institutional Investments Trust / Annual Report / May 31, 2016 | | | 229 | |
SCHEDULE OF INVESTMENTS
Limited Duration Bond Fund (Continued)
May 31, 2016
| | | | | | | | |
| Description | | Face Amount
($ Thousands) | | | Market Value
($ Thousands) | |
| | | | | | | | |
CenterPoint Energy Restoration Bond, Ser 2009-1, Cl A2 | | | | | | | | |
3.460%, 08/15/2019 | | $ | 998 | | | $ | 1,020 | |
CIT Equipment Collateral, Ser 2014-VTI, Cl A3 | | | | | | | | |
1.690%, 10/21/2019 (B) | | | 870 | | | | 866 | |
CNH Equipment Trust, Ser 2014-C, Cl A3 | | | | | | | | |
1.050%, 11/15/2019 | | | 3,530 | | | | 3,527 | |
Credit-Based Asset Servicing and Securitization, Ser 2005-CB3, Cl M2 | | | | | | | | |
1.369%, 05/25/2035 (A) | | | 3,810 | | | | 3,766 | |
Encore Credit Receivables Trust, Ser 2005-3, Cl M2 | | | | | | | | |
1.181%, 10/25/2035 (A) | | | 1,422 | | | | 1,396 | |
FBR Securitization Trust, Ser 2005-2, Cl M1 | | | | | | | | |
1.159%, 09/25/2035 (A) | | | 686 | | | | 680 | |
GE Equipment Small Ticket, Ser 2014-1A, Cl A4 | | | | | | | | |
1.440%, 10/25/2021 (B) | | | 1,665 | | | | 1,662 | |
John Deere Owner Trust, Ser 2014-B, Cl A3 | | | | | | | | |
1.070%, 11/15/2018 | | | 1,205 | | | | 1,203 | |
John Deere Owner Trust, Ser 2015-A, Cl A3 | | | | | | | | |
1.320%, 06/17/2019 | | | 2,755 | | | | 2,759 | |
Kubota Credit Owner Trust, Ser 2014-1A, Cl A3 | | | | | | | | |
1.160%, 05/15/2018 (B) | | | 1,690 | | | | 1,690 | |
MMAF Equipment Finance, Ser 2016-AA, Cl A2 | | | | | | | | |
1.390%, 12/17/2018 (B) | | | 3,500 | | | | 3,499 | |
Navient Student Loan Trust, Ser 2014-1, Cl A1 | | | | | | | | |
0.689%, 03/25/2021 (A) | | | 600 | | | | 599 | |
Navient Student Loan Trust, Ser 2016-2, Cl A1 | | | | | | | | |
1.189%, 06/25/2065 (A) (B) | | | 650 | | | | 650 | |
Nelnet Student Loan Trust, Ser 2012-5A, Cl A | | | | | | | | |
1.046%, 10/27/2036 (A) (B) | | | 743 | | | | 718 | |
Nelnet Student Loan Trust, Ser 2014-2A, Cl A1 | | | | | | | | |
0.719%, 06/25/2021 (A) (B) | | | 1,311 | | | | 1,306 | |
Park Place Securities Asset-Backed Pass- | | | | | | | | |
Through Certificates, Ser 2004-WHQ2, Cl M2 | | | | | | | | |
1.391%, 02/25/2035 (A) | | | 1,442 | | | | 1,437 | |
RAMP Trust, Ser 2004-RS12, Cl MII3 | | | | | | | | |
1.950%, 12/25/2034 (A) | | | 1,477 | | | | 1,466 | |
RAMP Trust, Ser 2006-RZ1, Cl M1 | | | | | | | | |
0.846%, 03/25/2036 (A) | | | 1,500 | | | | 1,449 | |
Saxon Asset Securities Trust, Ser 2006-1, Cl A2C | | | | | | | | |
0.766%, 03/25/2036 (A) | | | 4,532 | | | | 4,445 | |
Securitized Asset Backed Receivables Trust, Ser 2006-OP1, Cl M1 | | | | | | | | |
0.816%, 10/25/2035 (A) | | | 1,048 | | | | 1,017 | |
SLC Student Loan Trust, Ser 2006-1, Cl A5 | | | | | | | | |
0.744%, 03/15/2027 (A) | | | 740 | | | | 710 | |
SLM Student Loan Trust, Ser 2004-10, Cl A6B | | | | | | | | |
1.188%, 04/27/2026 (A) (B) | | | 1,500 | | | | 1,482 | |
SLM Student Loan Trust, Ser 2013-4, Cl A | | | | | | | | |
0.996%, 06/25/2027 (A) | | | 666 | | | | 638 | |
| | | | | | | | |
| Description | | Face Amount
($ Thousands) | | | Market Value
($ Thousands) | |
| | | | | | | | |
SLM Student Loan Trust, Ser 2013-5, Cl A2 | | | | | | | | |
0.839%, 10/26/2020 (A) | | $ | 281 | | | $ | 280 | |
SLM Student Loan Trust, Ser 2013-6, Cl A2 | | | | | | | | |
0.946%, 02/25/2021 (A) | | | 397 | | | | 396 | |
SLM Student Loan Trust, Ser 2014-1, Cl A2 | | | | | | | | |
0.826%, 07/26/2021 (A) | | | 697 | | | | 694 | |
Structured Asset Investment Loan Trust, Ser 2004-10, Cl A7 | | | | | | | | |
1.506%, 11/25/2034 (A) | | | 1,465 | | | | 1,454 | |
Structured Asset Investment Loan Trust, Ser 2004-11, Cl A4 | | | | | | | | |
1.346%, 01/25/2035 (A) | | | 1,448 | | | | 1,429 | |
Structured Asset Investment Loan Trust, Ser 2005-3, Cl M2 | | | | | | | | |
1.106%, 04/25/2035 (A) | | | 1,500 | | | | 1,474 | |
Structured Asset Securities, Ser 2005-WF1, Cl A3 | | | | | | | | |
1.106%, 02/25/2035 (A) | | | 2,015 | | | | 1,960 | |
| | | | | | | | |
| | | | | | | 45,873 | |
| | | | | | | | |
Total Asset-Backed Securities
(Cost $197,024) ($ Thousands) | | | | 196,806 | |
| | | | | | | | |
|
MORTGAGE-BACKED SECURITIES — 14.3% | |
|
Agency Mortgage-Backed Obligations — 6.1% | |
FFCB | | | | | | | | |
0.482%, 04/09/2018 (A) | | | 6,200 | | | | 6,194 | |
FHLB | | | | | | | | |
1.450%, 12/22/2017 | | | 4,100 | | | | 4,095 | |
FHLMC | | | | | | | | |
5.000%, 06/01/2019 | | | 79 | | | | 82 | |
4.000%, 06/01/2025 | | | 752 | | | | 794 | |
FHLMC ARM | | | | | | | | |
2.259%, 03/01/2037 (A) | | | 249 | | | | 262 | |
FHLMC CMO, Ser 2004-2761, Cl FT | | | | | | | | |
0.785%, 12/15/2033 (A) | | | 1,562 | | | | 1,568 | |
FHLMC CMO, Ser 2005-3066, Cl PF | | | | | | | | |
0.735%, 04/15/2035 (A) | | | 3,567 | | | | 3,562 | |
FHLMC CMO, Ser 2008-3419, Cl FA | | | | | | | | |
1.005%, 08/15/2037 (A) | | | 2,845 | | | | 2,855 | |
FHLMC CMO, Ser 2010-3747, Cl PA | | | | | | | | |
4.000%, 04/15/2038 | | | 413 | | | | 431 | |
FHLMC CMO, Ser 2011-3960, Cl JF | | | | | | | | |
0.885%, 04/15/2041 (A) | | | 1,767 | | | | 1,769 | |
FHLMC CMO, Ser 2990, Cl LK | | | | | | | | |
0.805%, 10/15/2034 (A) | | | 2,983 | | | | 2,983 | |
FHLMC CMO, Ser 3102, Cl FB | | | | | | | | |
0.735%, 01/15/2036 (A) | | | 2,491 | | | | 2,490 | |
FHLMC Multifamily Structured Pass-Through Certificates, Ser 2010-K008, Cl A1 | | | | | | | | |
2.746%, 12/25/2019 | | | 271 | | | | 275 | |
| | |
| 230 | | SEI Institutional Investments Trust / Annual Report / May 31, 2016 |
| | | | | | | | |
| Description | | Face Amount
($ Thousands) | | | Market Value
($ Thousands) | |
| | | | | | | | |
FHLMC Multifamily Structured Pass-Through Certificates, Ser K501, Cl A2 | | | | | | | | |
1.655%, 11/25/2016 | | $ | 552 | | | $ | 552 | |
FHLMC Multifamily Structured Pass-Through Certificates, Ser K502, Cl A2 | | | | | | | | |
1.426%, 08/25/2017 | | | 796 | | | | 797 | |
FHLMC Multifamily Structured Pass-Through Certificates, Ser KGRP, Cl A | | | | | | | | |
0.817%, 04/25/2020 (A) | | | 723 | | | | 723 | |
FHLMC Multifamily Structured Pass-Through Certificates, Ser KIR1 | | | | | | | | |
2.446%, 03/25/2026 | | | 2,085 | | | | 2,123 | |
FNMA | | | | | | | | |
4.506%, 06/01/2019 | | | 4,550 | | | | 4,710 | |
4.383%, 04/01/2021 | | | 975 | | | | 1,073 | |
4.330%, 04/01/2021 | | | 768 | | | | 844 | |
3.800%, 04/01/2018 | | | 2,026 | | | | 2,097 | |
3.427%, 01/01/2018 | | | 1,440 | | | | 1,485 | |
3.270%, 10/01/2020 | | | 1,044 | | | | 1,110 | |
1.220%, 08/01/2017 | | | 657 | | | | 658 | |
FNMA CMO, Ser 2004-94, Cl HF | | | | | | | | |
0.746%, 10/25/2034 (A) | | | 1,411 | | | | 1,415 | |
FNMA CMO, Ser 2005-45, Cl PF | | | | | | | | |
0.696%, 10/25/2034 (A) | | | 2,915 | | | | 2,905 | |
FNMA CMO, Ser 2005-83, Cl FP | | | | | | | | |
0.776%, 10/25/2035 (A) | | | 2,347 | | | | 2,336 | |
FNMA CMO, Ser 2007-98, Cl FD | | | | | | | | |
0.896%, 06/25/2037 (A) | | | 1,039 | | | | 1,036 | |
FNMA CMO, Ser 2008-18, Cl HD | | | | | | | | |
4.000%, 12/25/2018 | | | 115 | | | | 118 | |
FNMA CMO, Ser 2011-23, Cl AB | | | | | | | | |
2.750%, 06/25/2020 | | | 128 | | | | 129 | |
FNMA CMO, Ser 2012-29, Cl NA | | | | | | | | |
3.500%, 03/25/2042 | | | 593 | | | | 611 | |
FNMA CMO, Ser 2013-55, Cl MA | | | | | | | | |
3.000%, 12/25/2032 | | | — | | | | — | |
FNMA, Ser M14, Cl FA | | | | | | | | |
0.796%, 08/25/2018 (A) | | | 2,102 | | | | 2,103 | |
FNMA, Ser M2, Cl ASV2 | | | | | | | | |
2.777%, 06/25/2021 (A) | | | 2,000 | | | | 2,091 | |
FNMA, Ser M6, Cl FA | | | | | | | | |
0.722%, 12/25/2017 (A) | | | 1,496 | | | | 1,497 | |
FNMA, Ser M7, Cl A2 | | | | | | | | |
3.655%, 11/25/2020 | | | 1,075 | | | | 1,145 | |
GNMA ARM | | | | | | | | |
2.000%, 02/20/2041 to 10/20/2042 (A) | | | 1,443 | | | | 1,487 | |
1.875%, 08/20/2041 (A) | | | 913 | | | | 936 | |
1.750%, 04/20/2042 (A) | | | 249 | | | | 257 | |
GNMA CMO, Ser 2004-17, Cl MA | | | | | | | | |
5.000%, 02/16/2032 | | | 26 | | | | 26 | |
GNMA CMO, Ser 2010-162, Cl PQ | | | | | | | | |
4.500%, 06/16/2039 | | | 157 | | | | 163 | |
| | | | | | | | |
| Description | | Face Amount
($ Thousands) | | | Market Value
($ Thousands) | |
| | | | | | | | |
GNMA CMO, Ser 2011-106, Cl ME | | | | | | | | |
3.000%, 06/20/2038 | | $ | 62 | | | $ | 62 | |
GNMA CMO, Ser 2012-31, Cl QJ | | | | | | | | |
3.000%, 12/20/2039 | | | 410 | | | | 417 | |
GNMA CMO, Ser 2012-77, Cl FM | | | | | | | | |
1.105%, 11/16/2039 (A) | | | 2,593 | | | | 2,615 | |
GNMA, Ser 119, Cl A | | | | | | | | |
2.160%, 07/16/2033 | | | 652 | | | | 652 | |
GNMA, Ser 142, Cl A | | | | | | | | |
2.337%, 10/16/2040 | | | 2,337 | | | | 2,353 | |
GNMA, Ser 2012-109, Cl AB | | | | | | | | |
1.388%, 09/16/2044 | | | 927 | | | | 909 | |
GNMA, Ser 2013-12, Cl AB | | | | | | | | |
1.826%, 11/16/2052 | | | 1,444 | | | | 1,415 | |
GNMA, Ser 22, Cl AB | | | | | | | | |
1.661%, 03/16/2033 | | | 360 | | | | 360 | |
| | | | | | | | |
| | | | | | | 70,570 | |
| | | | | | | | |
|
Non-Agency Mortgage-Backed Obligations — 8.2% | |
Agate Bay Mortgage Trust, Ser 2015-2, Cl A7 | | | | | | | | |
3.500%, 03/25/2045 (A) (B) | | | 2,598 | | | | 2,665 | |
Agate Bay Mortgage Trust, Ser 2015-5, Cl A5 | | | | | | | | |
3.500%, 07/25/2045 (A) (B) | | | 3,449 | | | | 3,522 | |
BAMLL Commercial Mortgage Securities Trust, Ser 2013-DSNY, Cl A | | | | | | | | |
1.483%, 09/15/2026 (A) (B) | | | 1,790 | | | | 1,789 | |
BAMLL Commercial Mortgage Securities Trust, Ser 2014-ICTS, Cl A | | | | | | | | |
1.233%, 06/15/2028 (A) (B) | | | 600 | | | | 591 | |
BAMLL-DB Trust, Ser OSI, Cl B | | | | | | | | |
4.830%, 04/13/2029 (B) | | | 1,500 | | | | 1,530 | |
Banc of America Commercial Mortgage Trust, Ser 2006-5, Cl A4 | | | | | | | | |
5.414%, 09/10/2047 | | | 1,189 | | | | 1,194 | |
Banc of America Commercial Mortgage Trust, Ser 2006-6, Cl A4 | | | | | | | | |
5.356%, 10/10/2045 | | | 605 | | | | 608 | |
Banc of America Commercial Mortgage Trust, Ser 2007-2, Cl A4 | | | | | | | | |
5.625%, 04/10/2049 (A) | | | 1,659 | | | | 1,672 | |
BLCP Hotel Trust, Ser 2014-CLRN, Cl A | | | | | | | | |
1.384%, 08/15/2029 (A) (B) | | | 1,056 | | | | 1,043 | |
Citigroup Commercial Mortgage Trust, Ser 2012-GC8, Cl A2 | | | | | | | | |
1.813%, 09/10/2045 | | | 635 | | | | 636 | |
Citigroup Commercial Mortgage Trust, Ser 2013-GC11, Cl A2 | | | | | | | | |
1.987%, 04/10/2046 | | | 985 | | | | 989 | |
Citigroup Commercial Mortgage Trust, Ser 2013-SMP, Cl A | | | | | | | | |
2.110%, 01/12/2030 (B) | | | 4,347 | | | | 4,361 | |
| | | | |
| SEI Institutional Investments Trust / Annual Report / May 31, 2016 | | | 231 | |
SCHEDULE OF INVESTMENTS
Limited Duration Bond Fund (Continued)
May 31, 2016
| | | | | | | | |
| Description | | Face Amount
($ Thousands) | | | Market Value
($ Thousands) | |
| | | | | | | | |
Citigroup Commercial Mortgage Trust, Ser 2014-388G, Cl A | | | | | | | | |
1.185%, 06/15/2033 (A) (B) | | $ | 5,363 | | | $ | 5,363 | |
Citigroup Commercial Mortgage Trust, Ser 2016-C1, Cl A1 | | | | | | | | |
1.506%, 05/10/2049 | | | 3,650 | | | | 3,642 | |
COMM Mortgage Trust, Ser 2012-9W57, Cl A | | | | | | | | |
2.365%, 02/10/2029 (B) | | | 2,810 | | | | 2,823 | |
COMM Mortgage Trust, Ser 2013-CR9, Cl A1 | | | | | | | | |
1.344%, 07/10/2045 | | | 55 | | | | 55 | |
COMM Mortgage Trust, Ser 2014-BBG, Cl A | | | | | | | | |
1.235%, 03/15/2029 (A) (B) | | | 4,223 | | | | 4,144 | |
COMM Mortgage Trust, Ser 2014-PAT, Cl A | | | | | | | | |
1.236%, 08/13/2027 (A) (B) | | | 320 | | | | 316 | |
COMM Mortgage Trust, Ser 2014-UBS4, Cl A2 | | | | | | | | |
2.963%, 08/10/2019 | | | 1,575 | | | | 1,624 | |
COMM Mortgage Trust, Ser 2015-LC23, Cl A1 | | | | | | | | |
1.811%, 10/10/2053 | | | 276 | | | | 277 | |
Credit Suisse Commercial Mortgage Trust Series, Ser 2007-C1, Cl A1A | | | | | | | | |
5.361%, 02/15/2040 | | | 1,337 | | | | 1,356 | |
CSMC Trust, Ser 2014-WIN1, Cl 2A5 | | | | | | | | |
3.000%, 09/25/2044 (A) (B) | | | 1,816 | | | | 1,843 | |
CSMC Trust, Ser 2014-WIN1, Cl 1A1 | | | | | | | | |
3.000%, 08/25/2029 (A) (B) | | | 3,687 | | | | 3,770 | |
CSMLT Trust, Ser 2015-1, Cl A3 | | | | | | | | |
3.500%, 05/25/2045 (B) | | | 2,766 | | | | 2,797 | |
FHLMC Structured Agency Credit Risk Debt Notes, Ser 2015-DNA1, Cl M1 | | | | | | | | |
1.339%, 10/25/2027 (A) | | | 2,252 | | | | 2,250 | |
GS Mortgage Securities Trust, Ser 2010-C1, Cl A1 | | | | | | | | |
3.679%, 08/10/2043 (B) | | | 234 | | | | 243 | |
GS Mortgage Securities Trust, Ser 2010-C2, Cl A1 | | | | | | | | |
3.849%, 12/10/2043 (B) | | | 32 | | | | 34 | |
Homestar Mortgage Acceptance, Ser 2004-3, Cl AV1 | | | | | | | | |
0.896%, 07/25/2034 (A) | | | 821 | | | | 807 | |
JPMBB Commercial Mortgage Securities Trust, Ser 2013-C12, Cl A1 | | | | | | | | |
1.085%, 07/15/2045 | | | 598 | | | | 596 | |
JPMBB Commercial Mortgage Securities Trust, Ser 2013-C15, Cl A2 | | | | | | | | |
2.977%, 11/15/2045 | | | 1,600 | | | | 1,643 | |
JPMBB Commercial Mortgage Securities Trust, Ser 2014-C19, Cl A1 | | | | | | | | |
1.266%, 04/15/2047 | | | 304 | | | | 303 | |
JPMBB Commercial Mortgage Securities Trust, Ser 2014-C22, Cl A1 | | | | | | | | |
1.451%, 06/15/2019 | | | 925 | | | | 923 | |
| | | | | | | | |
| Description | | Face Amount
($ Thousands) | | | Market Value
($ Thousands) | |
| | | | | | | | |
JPMBB Commercial Mortgage Securities Trust, Ser 2015-C29, Cl A1 | | | | | | | | |
1.626%, 05/15/2048 | | $ | 1,146 | | | $ | 1,144 | |
JPMorgan Chase Commercial Mortgage Securities Trust, Ser 2007-CIBC19, Cl ASB | | | | | | | | |
5.682%, 02/12/2049 (A) | | | 756 | | | | 763 | |
JPMorgan Chase Commercial Mortgage Securities Trust, Ser 2010-C2, Cl A3 | | | | | | | | |
4.070%, 11/15/2043 (B) | | | 1,333 | | | | 1,419 | |
JPMorgan Chase Commercial Mortgage Securities Trust, Ser 2011-C3, Cl A3 | | | | | | | | |
4.388%, 02/15/2046 (B) | | | 675 | | | | 701 | |
JPMorgan Chase Commercial Mortgage Securities Trust, Ser 2013-C13, Cl A2 | | | | | | | | |
2.665%, 01/15/2046 | | | 750 | | | | 766 | |
JPMorgan Chase Commercial Mortgage Securities Trust, Ser 2014-CBM, Cl A | | | | | | | | |
1.334%, 10/15/2029 (A) (B) | | | 1,785 | | | | 1,748 | |
JPMorgan Chase Commercial Mortgage Securities Trust, Ser 2014-FL5, Cl A | | | | | | | | |
1.413%, 07/15/2031 (A) (B) | | | 373 | | | | 371 | |
JPMorgan Chase Commercial Mortgage Securities Trust, Ser 2014-PHH, Cl A | | | | | | | | |
1.633%, 08/15/2027 (A) (B) | | | 4,110 | | | | 4,103 | |
JPMorgan Chase Commercial Mortgage Securities Trust, Ser 2015-CSMO, Cl A | | | | | | | | |
1.685%, 01/15/2032 (A) (B) | | | 3,486 | | | | 3,477 | |
JPMorgan Mortgage Trust, Ser 2014-5, Cl A1 | | | | | | | | |
3.000%, 10/25/2029 (A) (B) | | | 2,703 | | | | 2,772 | |
JPMorgan Mortgage Trust, Ser 2015-3, Cl A5 | | | | | | | | |
3.500%, 05/25/2045 (A) (B) | | | 4,282 | | | | 4,376 | |
JPMorgan Resecuritization Trust Series, Ser 2009-7, Cl 18A1 | | | | | | | | |
2.713%, 11/27/2036 (A) (B) | | | 1,071 | | | | 1,070 | |
LB-UBS Commercial Mortgage Trust, Ser 2007- C2, Cl A3 | | | | | | | | |
5.430%, 02/15/2040 | | | 1,646 | | | | 1,672 | |
Merrill Lynch Mortgage Investors Trust, Ser 2004-A, Cl A1 | | | | | | | | |
0.906%, 04/25/2029 (A) | | | 1,302 | | | | 1,216 | |
Morgan Stanley Bank of America Merrill Lynch Trust, Ser 2012-C5, Cl A2 | | | | | | | | |
1.972%, 08/15/2045 | | | 2,295 | | | | 2,306 | |
Morgan Stanley Bank of America Merrill Lynch Trust, Ser 2013-C7, Cl A2 | | | | | | | | |
1.863%, 02/15/2046 | | | 1,500 | | | | 1,505 | |
Morgan Stanley Bank of America Merrill Lynch Trust, Ser 2015-C21, Cl A2 | | | | | | | | |
2.933%, 03/15/2048 | | | 300 | | | | 309 | |
Morgan Stanley Bank of America Merrill Lynch Trust, Ser 2015-C27, Cl A1 | | | | | | | | |
1.980%, 12/15/2047 | | | 334 | | | | 335 | |
| | |
| 232 | | SEI Institutional Investments Trust / Annual Report / May 31, 2016 |
| | | | | | | | |
| Description | | Face Amount
($ Thousands) | | | Market Value
($ Thousands) | |
| | | | | | | | |
Structured Agency Credit Risk Debt Notes, Ser 2014-DN1, Cl M2 | | | | | | | | |
2.639%, 02/25/2024 (A) | | $ | 4,703 | | | $ | 4,753 | |
WFRBS Commercial Mortgage Trust, Ser 2013-C12, Cl A2 | | | | | | | | |
2.072%, 03/15/2048 | | | 1,125 | | | | 1,131 | |
WFRBS Commercial Mortgage Trust, Ser 2014-C25, Cl A1 | | | | | | | | |
1.518%, 11/15/2047 | | | 1,222 | | | | 1,221 | |
WinWater Mortgage Loan Trust, Ser 2015-A, Cl A5 | | | | | | | | |
3.500%, 06/20/2045 (A) (B) | | | 2,446 | | | | 2,487 | |
| | | | | | | | |
| | | | | | | 95,054 | |
| | | | | | | | |
Total Mortgage-Backed Securities
(Cost $165,852) ($ Thousands) | | | | 165,624 | |
| | | | | | | | |
| | |
MUNICIPAL BONDS — 4.9% | | | | | | | | |
| | |
California — 1.2% | | | | | | | | |
Municipal Improvement Corp of Los Angeles, Ser A, RB | | | | | | | | |
2.344%, 11/01/2018 | | | 995 | | | | 1,022 | |
San Francisco City & County Airport Comm-San Francisco International Airport, RB | | | | | | | | |
3.396%, 05/01/2019 | | | 3,805 | | | | 4,010 | |
Southern California Public Power Authority, Sub-Ser, RB | | | | | | | | |
0.645%, 07/01/2016 | | | 4,195 | | | | 4,195 | |
State of California, GO | | | | | | | | |
6.200%, 03/01/2019 | | | 4,475 | | | | 5,051 | |
| | | | | | | | |
| | | | | | | 14,278 | |
| | | | | | | | |
| | |
Colorado — 0.2% | | | | | | | | |
City & County of Denver Colorado, Ser B, RB | | | | | | | | |
1.825%, 08/01/2019 | | | 2,000 | | | | 2,018 | |
| | | | | | | | |
| | |
Florida — 0.2% | | | | | | | | |
Greater Orlando Aviation Authority, Ser D, RB | | | | | | | | |
3.733%, 10/01/2020 | | | 1,545 | | | | 1,673 | |
Miami Beach Redevelopment Agency, TA | | | | | | | | |
2.407%, 02/01/2018 | | | 1,000 | | | | 1,006 | |
| | | | | | | | |
| | | | | | | 2,679 | |
| | | | | | | | |
| | |
Georgia — 0.1% | | | | | | | | |
Georgia State, Electric Authority, Ser D, RB | | | | | | | | |
3.552%, 01/01/2017 | | | 810 | | | | 823 | |
| | | | | | | | |
| | |
Illinois — 0.1% | | | | | | | | |
City of Waukegan Illinois, Ser B, GO | | | | | | | | |
2.566%, 12/30/2019 | | | 1,045 | | | | 1,060 | |
| | | | | | | | |
| | | | | | | | |
| Description | | Face Amount
($ Thousands) | | | Market Value
($ Thousands) | |
| | | | | | | | |
| | |
Kentucky — 0.2% | | | | | | | | |
Louisville Regional Airport Authority, Ser C, RB | | | | | | | | |
1.313%, 07/01/2017 | | $ | 1,640 | | | $ | 1,646 | |
Louisville, Regional Airport Authority, Ser C, RB | | | | | | | | |
0.769%, 07/01/2016 | | | 1,000 | | | | 1,000 | |
| | | | | | | | |
| | | | | | | 2,646 | |
| | | | | | | | |
| | |
Louisiana — 0.4% | | | | | | | | |
State of Louisiana, Ser C, GO | | | | | | | | |
1.087%, 08/01/2017 | | | 4,455 | | | | 4,455 | |
| | | | | | | | |
| | |
Michigan — 0.4% | | | | | | | | |
Hartland Consolidated Schools, Ser B, GO, Q-SBLF | | | | | | | | |
1.830%, 05/01/2019 | | | 2,050 | | | | 2,087 | |
Haslett Public Schools, Ser B, GO, Q-SBLF | | | | | | | | |
1.384%, 05/01/2018 | | | 2,050 | | | | 2,052 | |
Michigan State, Ser A, GO | | | | | | | | |
1.625%, 05/15/2017 | | | 1,000 | | | | 1,008 | |
| | | | | | | | |
| | | | | | | 5,147 | |
| | | | | | | | |
| | |
Minnesota — 0.4% | | | | | | | | |
Saint Paul, Housing & Redevelopment Authority, RB | | | | | | | | |
1.838%, 07/01/2018 | | | 4,235 | | | | 4,259 | |
| | | | | | | | |
| | |
New Jersey — 0.5% | | | | | | | | |
New Jersey State, Economic Development Authority, Ser Q, RB | | | | | | | | |
1.802%, 06/15/2017 | | | 4,915 | | | | 4,921 | |
New Jersey State, Transportation Trust Fund Authority, Ser B, RB | | | | | | | | |
1.758%, 12/15/2018 | | | 1,000 | | | | 983 | |
| | | | | | | | |
| | | | | | | 5,904 | |
| | | | | | | | |
| | |
New York — 0.1% | | | | | | | | |
New York City, Sub-Ser G, GO | | | | | | | | |
1.700%, 04/01/2017 | | | 1,610 | | | | 1,625 | |
| | | | | | | | |
| | |
North Carolina — 0.4% | | | | | | | | |
North Carolina State, Eastern Municipal Power Agency, RB | | | | | | | | |
2.003%, 07/01/2018 | | | 4,075 | | | | 4,104 | |
| | | | | | | | |
| | |
Ohio — 0.3% | | | | | | | | |
JobsOhio Beverage System, Ser B, RB | | | | | | | | |
1.820%, 01/01/2018 | | | 2,195 | | | | 2,220 | |
State of Ohio, RB | | | | | | | | |
4.168%, 06/15/2018 | | | 1,275 | | | | 1,350 | |
| | | | | | | | |
| | | | | | | 3,570 | |
| | | | | | | | |
| | | | |
| SEI Institutional Investments Trust / Annual Report / May 31, 2016 | | | 233 | |
SCHEDULE OF INVESTMENTS
Limited Duration Bond Fund (Concluded)
May 31, 2016
| | | | | | | | |
| Description | | Face Amount
($ Thousands) | | | Market Value
($ Thousands) | |
| | | | | | | | |
| | |
Oklahoma — 0.2% | | | | | | | | |
University of Oklahoma, Ser D, RB | | | | | | | | |
2.349%, 07/01/2020 | | $ | 1,815 | | | $ | 1,840 | |
| | | | | | | | |
| | |
Washington — 0.2% | | | | | | | | |
WBRP 3.2, Ser B, RB | | | | | | | | |
1.485%, 03/01/2018 | | | 2,405 | | | | 2,410 | |
| | | | | | | | |
Total Municipal Bonds
(Cost $56,596) ($ Thousands) | | | | 56,818 | |
| | | | | | | | |
| | |
SOVEREIGN DEBT — 3.2% | | | | | | | | |
European Investment Bank | | | | | | | | |
0.875%, 04/18/2017 | | | 6,600 | | | | 6,599 | |
Export-Import Bank of Korea | | | | | | | | |
1.380%, 01/14/2017 (A) | | | 3,915 | | | | 3,921 | |
Hydro-Quebec | | | | | | | | |
1.375%, 06/19/2017 | | | 1,290 | | | | 1,294 | |
Inter-American Development Bank MTN | | | | | | | | |
0.625%, 09/12/2016 | | | 2,000 | | | | 2,000 | |
0.622%, 12/12/2016 (A) | | | 6,000 | | | | 5,997 | |
International Bank for Reconstruction & Development MTN | | | | | | | | |
0.444%, 07/26/2016 (A) | | | 3,350 | | | | 3,350 | |
International Finance MTN | | | | | | | | |
0.477%, 08/01/2016 (A) | | | 2,270 | | | | 2,270 | |
Korea Development Bank | | | | | | | | |
1.260%, 01/22/2017 (A) | | | 7,056 | | | | 7,056 | |
Province of Ontario | | | | | | | | |
1.600%, 09/21/2016 | | | 1,000 | | | | 1,002 | |
Province of Quebec Canada MTN | | | | | | | | |
0.865%, 09/04/2018 (A) | | | 3,585 | | | | 3,576 | |
| | | | | | | | |
Total Sovereign Debt
(Cost $37,078) ($ Thousands) | | | | 37,065 | |
| | | | | | | | |
|
COMMERCIAL PAPER(B)(C)(D) — 0.8% | |
Chevron Phillips Chemical | | | | | | | | |
0.600%, 06/07/2016 | | | 5,500 | | | | 5,499 | |
Shiseido Americas | | | | | | | | |
0.750%, 06/01/2016 | | | 3,000 | | | | 3,000 | |
| | | | | | | | |
Total Commercial Paper
(Cost $8,499) ($ Thousands) | | | | 8,499 | |
| | | | | | | | |
| | | | | | | | |
| Description | | Shares | | | Market Value
($ Thousands) | |
| | | | | | | | |
|
CASH EQUIVALENT — 0.6% | |
SEI Daily Income Trust, Prime Obligation Fund, Cl A | | | | | | | | |
0.270% **† | | | 6,510,674 | | | $ | 6,511 | |
| | | | | | | | |
Total Cash Equivalent
(Cost $6,511) ($ Thousands) | | | | 6,511 | |
| | | | | | | | |
Total Investments — 96.8%
(Cost $1,117,754) ($ Thousands) | | | $ | 1,119,199 | |
| | | | | | | | |
Percentages are based on a Net Assets of $1,156,258 ($ Thousands).
| ** | | Rate shown is the 7-day effective yield as of May 31, 2016. |
| † | | Investment in Affiliated Security (see Note 6). |
| (A) | | Variable Rate Security — The rate reported on the Schedule of Investments is the rate in effect as of May 31, 2016. |
| (B) | | Security exempt from registration under Rule 144A of the Securities Act of 1933. These securities may be resold in transactions exempt from registration normally to qualified institutions. On May 31, 2016, the value of these securities amounted to $181,739 ($ Thousands), 15.7% representing of the net assets of the Fund. |
| (C) | | The rate reported is the effective yield at time of purchase. |
| (D) | | Securities are held in connection with a letter of credit issued by a major bank. |
ARM — Adjustable Rate Mortgage
Cl — Class
CMO — Collateralized Mortgage Obligation
FFCB — Federal Farm Credit Bank
FHLB — Federal Home Loan Bank
FHLMC — Federal Home Loan Mortgage Corporation
FNMA — Federal National Mortgage Association
GNMA — Government National Mortgage Association
GO — General Obligation
LP — Limited Partnership
MTN — Medium Term Note
RB — Revenue Bond
Ser — Series
TA — Tax Allocation
The following is a list of the level of inputs used as of May 31, 2016, in valuing the Fund’s i’nvestments carried at value ($ Thousands):
| | | | | | | | | | | | | | | | |
| Investments in Securities | | Level 1 | | | Level 2 | | | Level 3 | | | Total | |
Corporate Obligations | | $ | — | | | $ | 329,504 | | | $ | — | | | $ | 329,504 | |
U.S. Treasury Obligations | | | — | | | | 318,372 | | | | — | | | | 318,372 | |
Asset-Backed Securities | | | — | | | | 196,806 | | | | — | | | | 196,806 | |
Mortgage-Backed Securities | | | — | | | | 165,624 | | | | — | | | | 165,624 | |
Municipal Bonds | | | — | | | | 56,818 | | | | — | | | | 56,818 | |
Sovereign Debt | | | — | | | | 37,065 | | | | — | | | | 37,065 | |
Commercial Paper | | | — | | | | 8,499 | | | | — | | | | 8,499 | |
Cash Equivalent | | | 6,511 | | | | – | | | | — | | | | 6,511 | |
| | | | | | | | | | | | | | | | |
Total Investments in Securities | | $ | 6,511 | | | $ | 1,112,688 | | | $ | — | | | $ | 1,119,199 | |
| | | | | | | | | | | | | | | | |
| | |
| 234 | | SEI Institutional Investments Trust / Annual Report / May 31, 2016 |
For the year ended May 31, 2016, there were no transfers between Level 1 and Level 2 assets and liabilities.
For the year ended May 31, 2016, there were no transfers between Level 2 and Level 3 assets and liabilities.
For more information on valuation inputs, see Note 2 – Significant Accounting Policies in Notes to Financial Statements.
Amounts designated as “—” are $0 or have been rounded to $0.
The accompanying notes are an integral part of the financial statements.
| | | | |
| SEI Institutional Investments Trust / Annual Report / May 31, 2016 | | | 235 | |
SCHEDULE OF INVESTMENTS
Intermediate Duration Credit Fund
May 31, 2016
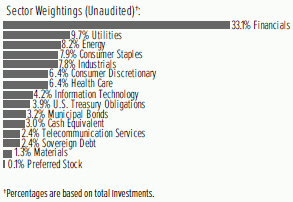
| | | | | | | | |
| Description | | Face Amount
($ Thousands) | | | Market Value
($ Thousands) | |
| | | | | | | | |
|
CORPORATE OBLIGATIONS — 87.4%‡‡ | |
|
Consumer Discretionary — 6.4% | |
21st Century Fox America | | | | | | | | |
8.150%, 10/17/2036 | | $ | 40 | | | $ | 54 | |
6.900%, 08/15/2039 | | | 2,170 | | | | 2,833 | |
Air Canada, Pass-Through Trust, Ser 2015-1, Cl A | | | | | | | | |
3.600%, 03/15/2027 (A) | | | 4,184 | | | | 4,236 | |
Amazon.com | | | | | | | | |
4.950%, 12/05/2044 | | | 2,550 | | | | 2,980 | |
American Honda Finance | | | | | | | | |
2.125%, 10/10/2018 | | | 2,690 | | | | 2,737 | |
BMW US Capital | | | | | | | | |
2.800%, 04/11/2026 (A) | | | 2,715 | | | | 2,709 | |
1.500%, 04/11/2019 (A) | | | 1,875 | | | | 1,872 | |
Charter Communications Operating | | | | | | | | |
4.464%, 07/23/2022 (A) | | | 1,185 | | | | 1,249 | |
Comcast | | | | | | | | |
6.950%, 08/15/2037 | | | 4,290 | | | | 6,021 | |
5.650%, 06/15/2035 | | | 190 | | | | 239 | |
4.200%, 08/15/2034 | | | 3,700 | | | | 3,932 | |
3.375%, 02/15/2025 | | | 6,425 | | | | 6,747 | |
3.150%, 03/01/2026 | | | 2,435 | | | | 2,522 | |
Comcast Cable Communications Holdings | | | | | | | | |
9.455%, 11/15/2022 | | | 1,750 | | | | 2,447 | |
Daimler Finance North America | | | | | | | | |
2.875%, 03/10/2021 (A) | | | 835 | | | | 857 | |
Daimler Finance North America LLC | | | | | | | | |
1.375%, 08/01/2017 (A) | | | 3,000 | | | | 2,998 | |
Ford Holdings | | | | | | | | |
9.300%, 03/01/2030 | | | 287 | | | | 397 | |
Ford Motor | | | | | | | | |
7.400%, 11/01/2046 | | | 290 | | | | 390 | |
Ford Motor Credit LLC | | | | | | | | |
2.551%, 10/05/2018 | | | 1,395 | | | | 1,414 | |
General Motors | | | | | | | | |
4.875%, 10/02/2023 | | | 1,150 | | | | 1,222 | |
General Motors Financial | | | | | | | | |
5.250%, 03/01/2026 | | | 2,180 | | | | 2,341 | |
| | | | | | | | |
| Description | | Face Amount
($ Thousands) | | | Market Value
($ Thousands) | |
| | | | | | | | |
Home Depot | | | | | | | | |
4.400%, 04/01/2021 | | $ | 1,050 | | | $ | 1,167 | |
4.400%, 03/15/2045 | | | 840 | | | | 927 | |
3.350%, 09/15/2025 | | | 785 | | | | 838 | |
2.250%, 09/10/2018 | | | 2,000 | | | | 2,046 | |
2.000%, 04/01/2021 | | | 1,280 | | | | 1,292 | |
Lowe’s | | | | | | | | |
4.375%, 09/15/2045 | | | 520 | | | | 562 | |
3.375%, 09/15/2025 | | | 1,590 | | | | 1,688 | |
Nissan Motor Acceptance MTN | | | | | | | | |
1.500%, 03/02/2018 (A) | | | 3,000 | | | | 2,995 | |
NVR | | | | | | | | |
3.950%, 09/15/2022 | | | 665 | | | | 685 | |
QVC | | | | | | | | |
5.450%, 08/15/2034 | | | 1,990 | | | | 1,775 | |
4.375%, 03/15/2023 | | | 1,395 | | | | 1,374 | |
Starbucks | | | | | | | | |
2.100%, 02/04/2021 | | | 900 | | | | 913 | |
Target | | | | | | | | |
6.500%, 10/15/2037 | | | 1,750 | | | | 2,407 | |
3.625%, 04/15/2046 | | | 1,575 | | | | 1,542 | |
2.900%, 01/15/2022 | | | 5,420 | | | | 5,696 | |
2.500%, 04/15/2026 | | | 1,350 | | | | 1,340 | |
Time Warner Entertainment | | | | | | | | |
8.375%, 07/15/2033 | | | 797 | | | | 1,038 | |
Toyota Motor Credit MTN | | | | | | | | |
2.800%, 07/13/2022 | | | 2,450 | | | | 2,543 | |
1.550%, 07/13/2018 | | | 2,980 | | | | 3,000 | |
1.450%, 01/12/2018 | | | 4,135 | | | | 4,150 | |
Viacom | | | | | | | | |
5.625%, 09/15/2019 | | | 2,200 | | | | 2,410 | |
Volkswagen Group of America Finance LLC | | | | | | | | |
1.250%, 05/23/2017 (A) | | | 2,175 | | | | 2,167 | |
| | | | | | | | |
| | | | | | | 92,752 | |
| | | | | | | | |
| | |
Consumer Staples — 7.9% | | | | | | | | |
Altria Group | | | | | | | | |
9.950%, 11/10/2038 | | | 1,663 | | | | 2,951 | |
4.750%, 05/05/2021 | | | 1,000 | | | | 1,124 | |
Anheuser-Busch | | | | | | | | |
5.000%, 03/01/2019 | | | 1,000 | | | | 1,086 | |
Anheuser-Busch InBev Finance | | | | | | | | |
4.900%, 02/01/2046 | | | 7,919 | | | | 8,840 | |
4.700%, 02/01/2036 | | | 8,741 | | | | 9,463 | |
3.650%, 02/01/2026 | | | 2,475 | | | | 2,574 | |
3.300%, 02/01/2023 | | | 2,730 | | | | 2,807 | |
2.650%, 02/01/2021 | | | 2,720 | | | | 2,768 | |
Anheuser-Busch InBev Worldwide | | | | | | | | |
2.500%, 07/15/2022 | | | 2,900 | | | | 2,887 | |
1.375%, 07/15/2017 | | | 2,765 | | | | 2,772 | |
BAT International Finance | | | | | | | | |
2.750%, 06/15/2020 (A) | | | 4,240 | | | | 4,363 | |
| | |
| 236 | | SEI Institutional Investments Trust / Annual Report / May 31, 2016 |
| | | | | | | | |
| Description | | Face Amount
($ Thousands) | | | Market Value
($ Thousands) | |
| | | | | | | | |
1.850%, 06/15/2018 (A) | | $ | 2,740 | | | $ | 2,759 | |
Bayer US Finance | | | | | | | | |
1.500%, 10/06/2017 (A) | | | 2,955 | | | | 2,950 | |
Blue Cross & Blue Shield of Minnesota | | | | | | | | |
3.790%, 05/01/2025 (A) | | | 2,086 | | | | 2,061 | |
Bowdoin College | | | | | | | | |
4.693%, 07/01/2112 | | | 2,056 | | | | 2,116 | |
CVS Health | | | | | | | | |
5.125%, 07/20/2045 | | | 870 | | | | 1,012 | |
3.875%, 07/20/2025 | | | 350 | | | | 376 | |
2.875%, 06/01/2026 | | | 2,830 | | | | 2,816 | |
CVS Pass-Through Trust | | | | | | | | |
8.353%, 07/10/2031 (A) | | | 2,420 | | | | 3,095 | |
7.507%, 01/10/2032 (A) | | | 1,707 | | | | 2,074 | |
Japan Tobacco | | | | | | | | |
2.100%, 07/23/2018 (A) | | | 1,628 | | | | 1,644 | |
Kraft Heinz Foods | | | | | | | | |
4.875%, 02/15/2025 (A) | | | 724 | | | | 791 | |
Massachusetts Institute of Technology | | | | | | | | |
5.600%, 07/01/2111 | | | 3,080 | | | | 4,065 | |
Novartis Capital | | | | | | | | |
3.000%, 11/20/2025 | | | 3,085 | | | | 3,190 | |
PepsiCo | | | | | | | | |
3.125%, 11/01/2020 | | | 3,915 | | | | 4,145 | |
1.500%, 02/22/2019 | | | 1,175 | | | | 1,178 | |
1.250%, 04/30/2018 | | | 2,700 | | | | 2,712 | |
Philip Morris International | | | | | | | | |
4.500%, 03/20/2042 | | | 1,375 | | | | 1,484 | |
3.875%, 08/21/2042 | | | 335 | | | | 330 | |
Reynolds American | | | | | | | | |
5.850%, 08/15/2045 | | | 905 | | | | 1,107 | |
Roche Holdings | | | | | | | | |
2.875%, 09/29/2021 (A) | | | 3,950 | | | | 4,116 | |
S&P Global | | | | | | | | |
3.300%, 08/14/2020 | | | 2,543 | | | | 2,639 | |
SABMiller Holdings | | | | | | | | |
3.750%, 01/15/2022 (A) | | | 1,620 | | | | 1,713 | |
Sanofi | | | | | | | | |
1.250%, 04/10/2018 | | | 3,410 | | | | 3,418 | |
Toledo Hospital | | | | | | | | |
4.982%, 11/15/2045 | | | 2,180 | | | | 2,635 | |
University of Southern California | | | | | | | | |
5.250%, 10/01/2111 | | | 3,250 | | | | 3,977 | |
Walgreens Boots Alliance | | | | | | | | |
3.450%, 06/01/2026 | | | 2,800 | | | | 2,799 | |
1.750%, 05/30/2018 | | | 3,160 | | | | 3,164 | |
Wal-Mart Stores | | | | | | | | |
4.300%, 04/22/2044 | | | 80 | | | | 88 | |
2.550%, 04/11/2023 | | | 5,680 | | | | 5,814 | |
Wesleyan University | | | | | | | | |
4.781%, 07/01/2116 | | | 2,040 | | | | 2,057 | |
| | | | | | | | |
| | | | | | | 113,960 | |
| | | | | | | | |
| | | | | | | | |
| Description | | Face Amount
($ Thousands) | | | Market Value
($ Thousands) | |
| | | | | | | | |
Energy — 8.2% | | | | | | | | |
Anadarko Petroleum | | | | | | | | |
6.450%, 09/15/2036 | | $ | 3,315 | | | $ | 3,559 | |
4.428%, 10/10/2036 (B) | | | 12,000 | | | | 4,485 | |
BP Capital Markets | | | | | | | | |
1.846%, 05/05/2017 | | | 2,779 | | | | 2,792 | |
1.375%, 11/06/2017 | | | 2,512 | | | | 2,510 | |
British Transco Finance | | | | | | | | |
6.625%, 06/01/2018 | | | 1,765 | | | | 1,938 | |
Chevron | | | | | | | | |
2.954%, 05/16/2026 | | | 3,015 | | | | 3,029 | |
2.100%, 05/16/2021 | | | 2,325 | | | | 2,325 | |
1.365%, 03/02/2018 | | | 3,500 | | | | 3,505 | |
1.344%, 11/09/2017 | | | 2,800 | | | | 2,808 | |
CNOOC Finance 2013 | | | | | | | | |
1.750%, 05/09/2018 | | | 190 | | | | 188 | |
Columbia Pipeline Group | | | | | | | | |
4.500%, 06/01/2025 | | | 1,510 | | | | 1,562 | |
2.450%, 06/01/2018 | | | 2,925 | | | | 2,920 | |
Conoco Funding | | | | | | | | |
6.950%, 04/15/2029 | | | 1,067 | | | | 1,282 | |
ConocoPhillips | | | | | | | | |
6.500%, 02/01/2039 | | | 1,715 | | | | 2,118 | |
4.200%, 03/15/2021 | | | 3,220 | | | | 3,413 | |
2.400%, 12/15/2022 | | | 3,000 | | | | 2,888 | |
1.526%, 05/15/2022 (C) | | | 3,955 | | | | 3,703 | |
Devon Energy | | | | | | | | |
5.850%, 12/15/2025 | | | 1,485 | | | | 1,548 | |
Devon Financing | | | | | | | | |
7.875%, 09/30/2031 | | | 1,761 | | | | 1,885 | |
Energy Transfer Partners | | | | | | | | |
4.650%, 06/01/2021 | | | 2,982 | | | | 2,958 | |
4.050%, 03/15/2025 | | | 1,635 | | | | 1,506 | |
Enterprise Products Operating | | | | | | | | |
3.900%, 02/15/2024 | | | 4,250 | | | | 4,395 | |
Exxon Mobil | | | | | | | | |
4.114%, 03/01/2046 | | | 1,505 | | | | 1,597 | |
3.043%, 03/01/2026 | | | 1,985 | | | | 2,046 | |
1.305%, 03/06/2018 | | | 4,700 | | | | 4,715 | |
Halliburton | | | | | | | | |
3.800%, 11/15/2025 | | | 2,325 | | | | 2,353 | |
Kinder Morgan | | | | | | | | |
5.550%, 06/01/2045 | | | 1,330 | | | | 1,225 | |
Kinder Morgan Energy Partners | | | | | | | | |
6.375%, 03/01/2041 | | | 3,448 | | | | 3,371 | |
Nexen | | | | | | | | |
7.400%, 05/01/2028 | | | 1,012 | | | | 1,304 | |
Noble Energy | | | | | | | | |
5.250%, 11/15/2043 | | | 20 | | | | 19 | |
Occidental Petroleum | | | | | | | | |
4.400%, 04/15/2046 | | | 1,910 | | | | 1,994 | |
| | | | |
| SEI Institutional Investments Trust / Annual Report / May 31, 2016 | | | 237 | |
SCHEDULE OF INVESTMENTS
Intermediate Duration Credit Fund (Continued)
May 31, 2016
| | | | | | | | |
| Description | | Face Amount
($ Thousands) | | | Market Value
($ Thousands) | |
| | | | | | | | |
Phillips 66 | | | | | | | | |
5.875%, 05/01/2042 | | $ | 1,300 | | | $ | 1,461 | |
Schlumberger Holdings | | | | | | | | |
4.000%, 12/21/2025 (A) | | | 1,500 | | | | 1,564 | |
3.000%, 12/21/2020 (A) | | | 2,562 | | | | 2,628 | |
Shell International Finance | | | | | | | | |
6.375%, 12/15/2038 | | | 1,170 | | | | 1,497 | |
4.125%, 05/11/2035 | | | 2,040 | | | | 2,083 | |
4.000%, 05/10/2046 | | | 3,115 | | | | 3,032 | |
3.625%, 08/21/2042 | | | 641 | | | | 592 | |
3.400%, 08/12/2023 | | | 5,525 | | | | 5,754 | |
2.875%, 05/10/2026 | | | 5,690 | | | | 5,627 | |
1.875%, 05/10/2021 | | | 1,200 | | | | 1,184 | |
1.375%, 05/10/2019 | | | 4,170 | | | | 4,144 | |
Statoil | | | | | | | | |
1.200%, 01/17/2018 | | | 3,750 | | | | 3,729 | |
Suncor Energy | | | | | | | | |
5.950%, 12/01/2034 | | | 1,375 | | | | 1,525 | |
Sunoco Logistics Partners Operations | | | | | | | | |
4.950%, 01/15/2043 | | | 2,124 | | | | 1,825 | |
TransCanada PipeLines | | | | | | | | |
6.100%, 06/01/2040 | | | 1,435 | | | | 1,682 | |
4.625%, 03/01/2034 | | | 935 | | | | 961 | |
Valero Energy | | | | | | | | |
10.500%, 03/15/2039 | | | 1,668 | | | | 2,348 | |
| | | | | | | | |
| | | | | | | 117,577 | |
| | | | | | | | |
| | |
Financials — 33.1% | | | | | | | | |
ABN AMRO Bank | | | | | | | | |
1.434%, 10/28/2016 (A) (C) | | | 1,930 | | | | 1,934 | |
AgriBank FCB | | | | | | | | |
9.125%, 07/15/2019 (A) | | | 3,907 | | | | 3,936 | |
AIA Group MTN | | | | | | | | |
3.200%, 03/11/2025 (A) | | | 3,600 | | | | 3,621 | |
American Express Credit MTN | | | | | | | | |
2.375%, 03/24/2017 | | | 2,370 | | | | 2,396 | |
1.125%, 06/05/2017 | | | 3,773 | | | | 3,769 | |
American International Group | | | | | | | | |
4.875%, 06/01/2022 | | | 1,300 | | | | 1,421 | |
American Tower Trust I | | | | | | | | |
3.070%, 03/15/2023 (A) | | | 3,850 | | | | 3,848 | |
Ameriprise Financial | | | | | | | | |
4.000%, 10/15/2023 | | | 2,450 | | | | 2,622 | |
ANZ New Zealand International | | | | | | | | |
1.750%, 03/29/2018 (A) | | | 4,000 | | | | 4,003 | |
Apollo Management Holdings | | | | | | | | |
4.400%, 05/27/2026 (A) | | | 1,210 | | | | 1,223 | |
4.000%, 05/30/2024 (A) | | | 3,835 | | | | 3,867 | |
Bank of America MTN | | | | | | | | |
6.400%, 08/28/2017 | | | 2,120 | | | | 2,244 | |
6.000%, 10/15/2036 | | | 345 | | | | 429 | |
5.000%, 01/21/2044 | | | 550 | | | | 614 | |
| | | | | | | | |
| Description | | Face Amount
($ Thousands) | | | Market Value
($ Thousands) | |
| | | | | | | | |
4.875%, 04/01/2044 | | $ | 335 | | | $ | 371 | |
4.450%, 03/03/2026 | | | 4,915 | | | | 5,069 | |
3.500%, 04/19/2026 | | | 3,060 | | | | 3,105 | |
2.625%, 04/19/2021 | | | 2,040 | | | | 2,049 | |
Bank of New York Mellon MTN | | | | | | | | |
2.600%, 08/17/2020 | | | 3,745 | | | | 3,842 | |
2.300%, 09/11/2019 | | | 1,650 | | | | 1,680 | |
2.150%, 02/24/2020 | | | 2,825 | | | | 2,865 | |
BB&T | | | | | | | | |
4.900%, 06/30/2017 | | | 880 | | | | 913 | |
Bear Stearns | | | | | | | | |
5.550%, 01/22/2017 | | | 1,940 | | | | 1,991 | |
Berkshire Hathaway | | | | | | | | |
3.125%, 03/15/2026 | | | 3,978 | | | | 4,115 | |
2.750%, 03/15/2023 | | | 3,585 | | | | 3,677 | |
2.200%, 03/15/2021 | | | 935 | | | | 953 | |
Berkshire Hathaway Finance | | | | | | | | |
4.300%, 05/15/2043 | | | 70 | | | | 75 | |
1.700%, 03/15/2019 | | | 3,475 | | | | 3,509 | |
Blackstone Holdings Finance | | | | | | | | |
5.000%, 06/15/2044 (A) | | | 3,115 | | | | 3,241 | |
4.450%, 07/15/2045 (A) | | | 3,845 | | | | 3,693 | |
Branch Banking & Trust | | | | | | | | |
3.800%, 10/30/2026 | | | 1,780 | | | | 1,900 | |
2.850%, 04/01/2021 | | | 4,065 | | | | 4,201 | |
Capital One Bank USA | | | | | | | | |
2.300%, 06/05/2019 | | | 2,475 | | | | 2,477 | |
Carlyle Holdings Finance | | | | | | | | |
3.875%, 02/01/2023 (A) | | | 1,182 | | | | 1,210 | |
Carlyle Holdings II Finance | | | | | | | | |
5.625%, 03/30/2043 (A) | | | 3,362 | | | | 3,632 | |
CDP Financial | | | | | | | | |
5.600%, 11/25/2039 (A) | | | 700 | | | | 904 | |
4.400%, 11/25/2019 (A) | | | 2,290 | | | | 2,501 | |
Charles Schwab | | | | | | | | |
4.450%, 07/22/2020 | | | 1,720 | | | | 1,890 | |
Chubb INA Holdings | | | | | | | | |
4.350%, 11/03/2045 | | | 1,138 | | | | 1,246 | |
2.875%, 11/03/2022 | | | 3,685 | | | | 3,788 | |
2.300%, 11/03/2020 | | | 5,585 | | | | 5,684 | |
Citigroup | | | | | | | | |
4.750%, 05/18/2046 | | | 1,010 | | | | 990 | |
4.650%, 07/30/2045 | | | 1,680 | | | | 1,789 | |
4.450%, 09/29/2027 | | | 3,465 | | | | 3,516 | |
Cooperatieve Rabobank UA | | | | | | | | |
5.250%, 08/04/2045 | | | 2,985 | | | | 3,272 | |
3.875%, 02/08/2022 | | | 2,675 | | | | 2,891 | |
Credit Agricole MTN | | | | | | | | |
2.375%, 07/01/2021 (A) | | | 1,750 | | | | 1,752 | |
Credit Suisse Group Funding Guernsey | | | | | | | | |
4.550%, 04/17/2026 (A) | | | 3,195 | | | | 3,288 | |
| | |
| 238 | | SEI Institutional Investments Trust / Annual Report / May 31, 2016 |
| | | | | | | | |
| Description | | Face Amount
($ Thousands) | | | Market Value
($ Thousands) | |
| | | | | | | | |
Credit Suisse NY | | | | | | | | |
3.000%, 10/29/2021 | | $ | 2,810 | | | $ | 2,853 | |
1.750%, 01/29/2018 | | | 4,260 | | | | 4,271 | |
1.375%, 05/26/2017 | | | 2,810 | | | | 2,810 | |
Crown Castle Towers | | | | | | | | |
6.113%, 01/15/2020 (A) | | | 4,235 | | | | 4,680 | |
3.222%, 05/15/2022 (A) | | | 2,230 | | | | 2,253 | |
Farmers Exchange Capital III | | | | | | | | |
5.454%, 10/15/2054 (A) (C) | | | 1,750 | | | | 1,693 | |
Fifth Third Bank | | | | | | | | |
2.875%, 10/01/2021 | | | 3,570 | | | | 3,655 | |
2.300%, 03/15/2019 | | | 3,950 | | | | 3,995 | |
2.150%, 08/20/2018 | | | 4,000 | | | | 4,044 | |
General Electric MTN | | | | | | | | |
6.875%, 01/10/2039 | | | 1,775 | | | | 2,598 | |
5.625%, 09/15/2017 | | | 2,740 | | | | 2,896 | |
2.300%, 04/27/2017 | | | 2,335 | | | | 2,364 | |
1.013%, 05/05/2026 (C) | | | 2,210 | | | | 2,056 | |
Goldman Sachs Group MTN | | | | | | | | |
7.500%, 02/15/2019 | | | 2,900 | | | | 3,304 | |
6.750%, 10/01/2037 | | | 1,650 | | | | 2,007 | |
6.345%, 02/15/2034 | | | 1,665 | | | | 1,929 | |
6.250%, 02/01/2041 | | | 3,150 | | | | 4,011 | |
6.150%, 04/01/2018 | | | 980 | | | | 1,057 | |
5.950%, 01/18/2018 | | | 1,465 | | | | 1,563 | |
5.375%, 03/15/2020 | | | 2,140 | | | | 2,366 | |
5.150%, 05/22/2045 | | | 1,115 | | | | 1,148 | |
4.800%, 07/08/2044 | | | 2,850 | | | | 3,055 | |
4.750%, 10/21/2045 | | | 1,905 | | | | 2,041 | |
3.750%, 02/25/2026 | | | 1,500 | | | | 1,539 | |
2.625%, 04/25/2021 | | | 3,635 | | | | 3,645 | |
2.600%, 04/23/2020 | | | 2,160 | | | | 2,182 | |
Harley-Davidson Financial Services MTN | | | | | | | | |
2.250%, 01/15/2019 (A) | | | 2,105 | | | | 2,130 | |
Hartford Financial Services Group | | | | | | | | |
6.100%, 10/01/2041 | | | 1,820 | | | | 2,176 | |
HSBC Bank | | | | | | | | |
7.650%, 05/01/2025 | | | 2,515 | | | | 3,105 | |
HSBC Bank USA | | | | | | | | |
5.875%, 11/01/2034 | | | 1,990 | | | | 2,376 | |
4.875%, 08/24/2020 | | | 2,745 | | | | 2,955 | |
HSBC Finance | | | | | | | | |
6.676%, 01/15/2021 | | | 410 | | | | 465 | |
HSBC Holdings | | | | | | | | |
6.875%, 12/31/2049 (C) | | | 1,280 | | | | 1,290 | |
3.900%, 05/25/2026 | | | 2,420 | | | | 2,451 | |
2.950%, 05/25/2021 | | | 1,735 | | | | 1,740 | |
Huntington National Bank | | | | | | | | |
2.200%, 11/06/2018 | | | 2,140 | | | | 2,158 | |
1.700%, 02/26/2018 | | | 2,750 | | | | 2,751 | |
Infinity Property & Casualty | | | | | | | | |
5.000%, 09/19/2022 | | | 2,075 | | | | 2,162 | |
| | | | | | | | |
| Description | | Face Amount
($ Thousands) | | | Market Value
($ Thousands) | |
| | | | | | | | |
Intercontinental Exchange | | | | | | | | |
2.750%, 12/01/2020 | | $ | 6,830 | | | $ | 7,022 | |
JPMorgan Chase | | | | | | | | |
6.400%, 05/15/2038 | | | 3,440 | | | | 4,599 | |
6.000%, 10/01/2017 | | | 6,610 | | | | 6,996 | |
6.000%, 01/15/2018 | | | 7,900 | | | | 8,454 | |
4.950%, 06/01/2045 | | | 2,845 | | | | 3,049 | |
4.625%, 05/10/2021 | | | 675 | | | | 742 | |
4.250%, 10/01/2027 | | | 1,470 | | | | 1,521 | |
3.875%, 09/10/2024 | | | 3,140 | | | | 3,216 | |
3.250%, 09/23/2022 | | | 2,855 | | | | 2,938 | |
3.200%, 06/15/2026 | | | 2,710 | | | | 2,709 | |
2.700%, 05/18/2023 | | | 2,860 | | | | 2,834 | |
0.962%, 06/13/2016 (C) | | | 2,540 | | | | 2,540 | |
JPMorgan Chase Capital XXIII | | | | | | | | |
1.626%, 05/15/2047 (C) | | | 1,285 | | | | 952 | |
KeyBank | | | | | | | | |
2.350%, 03/08/2019 | | | 2,970 | | | | 3,005 | |
1.700%, 06/01/2018 | | | 2,120 | | | | 2,122 | |
KFW MTN | | | | | | | | |
2.125%, 01/17/2023 | | | 2,810 | | | | 2,870 | |
1.500%, 04/20/2020 | | | 2,925 | | | | 2,936 | |
1.250%, 02/15/2017 | | | 4,850 | | | | 4,860 | |
KKR Group Finance III | | | | | | | | |
5.125%, 06/01/2044 (A) | | | 6,541 | | | | 6,370 | |
Lloyds Bank | | | | | | | | |
2.350%, 09/05/2019 | | | 1,880 | | | | 1,902 | |
Macquarie Group MTN | | | | | | | | |
4.875%, 08/10/2017 (A) | | | 2,890 | | | | 2,989 | |
MetLife | | | | | | | | |
10.750%, 08/01/2039 | | | 1,650 | | | | 2,558 | |
4.600%, 05/13/2046 | | | 1,260 | | | | 1,324 | |
3.000%, 03/01/2025 | | | 2,500 | | | | 2,503 | |
Metropolitan Life Global Funding I | | | | | | | | |
2.300%, 04/10/2019 (A) | | | 3,500 | | | | 3,558 | |
Mitsubishi UFJ Trust & Banking | | | | | | | | |
1.600%, 10/16/2017 (A) | | | 3,500 | | | | 3,498 | |
Morgan Stanley MTN | | | | | | | | |
7.300%, 05/13/2019 | | | 1,905 | | | | 2,180 | |
6.375%, 07/24/2042 | | | 2,030 | | | | 2,645 | |
5.625%, 09/23/2019 | | | 970 | | | | 1,074 | |
4.300%, 01/27/2045 | | | 1,430 | | | | 1,455 | |
4.000%, 07/23/2025 | | | 2,230 | | | | 2,344 | |
3.875%, 01/27/2026 | | | 3,882 | | | | 4,044 | |
2.800%, 06/16/2020 | | | 1,205 | | | | 1,224 | |
2.650%, 01/27/2020 | | | 2,900 | | | | 2,945 | |
2.500%, 04/21/2021 | | | 7,180 | | | | 7,155 | |
2.450%, 02/01/2019 | | | 2,990 | | | | 3,032 | |
MUFG Americas Holdings | | | | | | | | |
3.000%, 02/10/2025 | | | 3,590 | | | | 3,553 | |
National Rural Utilities Cooperative Finance | | | | | | | | |
4.750%, 04/30/2043 (C) | | | 2,056 | | | | 1,996 | |
| | | | |
| SEI Institutional Investments Trust / Annual Report / May 31, 2016 | | | 239 | |
SCHEDULE OF INVESTMENTS
Intermediate Duration Credit Fund (Continued)
May 31, 2016
| | | | | | | | |
| Description | | Face Amount
($ Thousands) | | | Market Value
($ Thousands) | |
| | | | | | | | |
4.023%, 11/01/2032 | | $ | 3,230 | | | $ | 3,369 | |
0.950%, 04/24/2017 | | | 2,855 | | | | 2,855 | |
New York Life Global Funding | | | | | | | | |
2.000%, 04/13/2021 (A) | | | 5,000 | | | | 4,988 | |
1.950%, 02/11/2020 (A) | | | 3,500 | | | | 3,516 | |
Nordea Bank MTN | | | | | | | | |
2.250%, 05/27/2021 (A) | | | 2,060 | | | | 2,059 | |
1.625%, 05/15/2018 (A) | | | 2,460 | | | | 2,462 | |
Pacific Life Insurance | | | | | | | | |
9.250%, 06/15/2039 (A) | | | 1,215 | | | | 1,737 | |
PNC Bank MTN | | | | | | | | |
3.300%, 10/30/2024 | | | 1,840 | | | | 1,920 | |
2.250%, 07/02/2019 | | | 945 | | | | 960 | |
2.150%, 04/29/2021 | | | 4,880 | | | | 4,884 | |
1.950%, 03/04/2019 | | | 2,030 | | | | 2,048 | |
1.600%, 06/01/2018 | | | 3,810 | | | | 3,823 | |
Pricoa Global Funding I | | | | | | | | |
2.200%, 06/03/2021 (A) | | | 2,925 | | | | 2,921 | |
Principal Life Global Funding II | | | | | | | | |
1.500%, 09/11/2017 (A) | | | 2,157 | | | | 2,161 | |
Prudential Financial MTN | | | | | | | | |
5.700%, 12/14/2036 | | | 1,660 | | | | 1,906 | |
Royal Bank of Canada MTN | | | | | | | | |
4.650%, 01/27/2026 | | | 1,780 | | | | 1,860 | |
2.500%, 01/19/2021 | | | 2,165 | | | | 2,209 | |
Simon Property Group | | | | | | | | |
4.375%, 03/01/2021 | | | 2,300 | | | | 2,529 | |
2.500%, 07/15/2021 | | | 2,215 | | | | 2,257 | |
2.200%, 02/01/2019 | | | 6,565 | | | | 6,673 | |
SunTrust Banks | | | | | | | | |
2.900%, 03/03/2021 | | | 1,715 | | | | 1,744 | |
Teachers Insurance & Annuity Association of America | | | | | | | | |
6.850%, 12/16/2039 (A) | | | 115 | | | | 149 | |
4.900%, 09/15/2044 (A) | | | 1,605 | | | | 1,744 | |
TIAA Asset Management Finance | | | | | | | | |
2.950%, 11/01/2019 (A) | | | 2,810 | | | | 2,856 | |
Toronto-Dominion Bank MTN | | | | | | | | |
2.625%, 09/10/2018 | | | 3,500 | | | | 3,587 | |
Travelers | | | | | | | | |
5.750%, 12/15/2017 | | | 160 | | | | 170 | |
3.750%, 05/15/2046 | | | 2,965 | | | | 2,957 | |
UBS MTN | | | | | | | | |
1.800%, 03/26/2018 | | | 3,500 | | | | 3,515 | |
1.375%, 08/14/2017 | | | 2,165 | | | | 2,164 | |
UBS Group Funding Jersey | | | | | | | | |
4.125%, 04/15/2026 (A) | | | 1,635 | | | | 1,677 | |
US Bancorp MTN | | | | | | | | |
2.200%, 11/15/2016 | | | 2,840 | | | | 2,855 | |
US Bank | | | | | | | | |
2.125%, 10/28/2019 | | | 2,305 | | | | 2,338 | |
| | | | | | | | |
| Description | | Face Amount
($ Thousands) | | | Market Value
($ Thousands) | |
| | | | | | | | |
USF&G Capital III | | | | | | | | |
8.312%, 07/01/2046 (A) | | $ | 585 | | | $ | 790 | |
Validus Holdings | | | | | | | | |
8.875%, 01/26/2040 | | | 1,410 | | | | 1,862 | |
Ventas Realty | | | | | | | | |
3.125%, 06/15/2023 | | | 1,320 | | | | 1,318 | |
Vesey Street Investment Trust I | | | | | | | | |
4.404%, 09/01/2016 (D) | | | 2,720 | | | | 2,729 | |
Visa | | | | | | | | |
2.800%, 12/14/2022 | | | 3,270 | | | | 3,385 | |
2.200%, 12/14/2020 | | | 2,110 | | | | 2,145 | |
Wachovia Capital Trust III | | | | | | | | |
5.570%, 12/31/2049 (C) | | | 1,260 | | | | 1,251 | |
WEA Finance LLC | | | | | | | | |
3.750%, 09/17/2024 (A) | | | 3,382 | | | | 3,447 | |
Wells Fargo | | | | | | | | |
4.900%, 11/17/2045 | | | 1,690 | | | | 1,821 | |
4.300%, 07/22/2027 | | | 4,985 | | | | 5,285 | |
3.900%, 05/01/2045 | | | 410 | | | | 414 | |
2.500%, 03/04/2021 | | | 2,745 | | | | 2,782 | |
2.150%, 01/15/2019 | | | 8,776 | | | | 8,896 | |
2.150%, 01/30/2020 | | | 5,665 | | | | 5,713 | |
Westpac Banking | | | | | | | | |
4.625%, 06/01/2018 | | | 3,466 | | | | 3,644 | |
WP Carey | | | | | | | | |
4.600%, 04/01/2024 | | | 4,135 | | | | 4,177 | |
ZFS Finance USA Trust I | | | | | | | | |
6.500%, 05/09/2037 (A) (C) | | | 1,945 | | | | 1,950 | |
ZFS Finance USA Trust II | | | | | | | | |
6.450%, 12/15/2065 (A) (C) | | | 725 | | | | 726 | |
| | | | | | | | |
| | | | | | | 476,722 | |
| | | | | | | | |
| | |
Health Care — 6.4% | | | | | | | | |
AbbVie | | | | | | | | |
4.500%, 05/14/2035 | | | 2,080 | | | | 2,115 | |
2.850%, 05/14/2023 | | | 1,470 | | | | 1,458 | |
2.500%, 05/14/2020 | | | 1,000 | | | | 1,010 | |
Aetna | | | | | | | | |
2.750%, 11/15/2022 | | | 2,945 | | | | 2,942 | |
AmerisourceBergen | | | | | | | | |
1.150%, 05/15/2017 | | | 445 | | | | 445 | |
AstraZeneca | | | | | | | | |
6.450%, 09/15/2037 | | | 750 | | | | 997 | |
2.375%, 11/16/2020 | | | 1,150 | | | | 1,166 | |
Coventry Health Care | | | | | | | | |
5.950%, 03/15/2017 | | | 6,155 | | | | 6,380 | |
5.450%, 06/15/2021 | | | 1,265 | | | | 1,419 | |
Dignity Health | | | | | | | | |
2.637%, 11/01/2019 | | | 4,364 | | | | 4,456 | |
Express Scripts Holding | | | | | | | | |
4.500%, 02/25/2026 | | | 975 | | | | 1,046 | |
| | |
| 240 | | SEI Institutional Investments Trust / Annual Report / May 31, 2016 |
| | | | | | | | |
| Description | | Face Amount
($ Thousands) | | | Market Value
($ Thousands) | |
| | | | | | | | |
Forest Laboratories | | | | | | | | |
5.000%, 12/15/2021 (A) | | $ | 1,860 | | | $ | 2,041 | |
Gilead Sciences | | | | | | | | |
4.750%, 03/01/2046 | | | 1,375 | | | | 1,471 | |
3.650%, 03/01/2026 | | | 880 | | | | 932 | |
3.250%, 09/01/2022 | | | 2,225 | | | | 2,325 | |
2.550%, 09/01/2020 | | | 4,440 | | | | 4,556 | |
2.050%, 04/01/2019 | | | 4,100 | | | | 4,171 | |
Johnson & Johnson | | | | | | | | |
5.550%, 08/15/2017 | | | 1,759 | | | | 1,856 | |
Medtronic | | | | | | | | |
4.375%, 03/15/2035 | | | 3,576 | | | | 3,889 | |
3.150%, 03/15/2022 | | | 2,285 | | | | 2,406 | |
2.500%, 03/15/2020 | | | 7,695 | | | | 7,905 | |
1.500%, 03/15/2018 | | | 3,445 | | | | 3,468 | |
Merck | | | | | | | | |
2.750%, 02/10/2025 | | | 730 | | | | 745 | |
2.350%, 02/10/2022 | | | 2,715 | | | | 2,756 | |
1.850%, 02/10/2020 | | | 2,865 | | | | 2,905 | |
1.300%, 05/18/2018 | | | 4,200 | | | | 4,223 | |
Mylan | | | | | | | | |
3.150%, 06/15/2021 (A) | | | 1,670 | | | | 1,668 | |
2.550%, 03/28/2019 | | | 1,700 | | | | 1,695 | |
Mylan NV | | | | | | | | |
3.950%, 06/15/2026 | | | 2,195 | | | | 2,178 | |
Perrigo Finance Unlimited | | | | | | | | |
4.375%, 03/15/2026 | | | 1,185 | | | | 1,205 | |
Pharmacia | | | | | | | | |
6.600%, 12/01/2028 | | | 2,800 | | | | 3,709 | |
Stryker | | | | | | | | |
2.000%, 03/08/2019 | | | 2,595 | | | | 2,620 | |
UnitedHealth Group | | | | | | | | |
4.700%, 02/15/2021 | | | 4,150 | | | | 4,635 | |
4.625%, 07/15/2035 | | | 695 | | | | 779 | |
1.400%, 12/15/2017 | | | 4,205 | | | | 4,221 | |
| | | | | | | | |
| | | | | | | 91,793 | |
| | | | | | | | |
| | |
Industrials — 7.8% | | | | | | | | |
American Airlines, Pass-Through Trust, Ser 2013-2, Cl A | | | | | | | | |
4.950%, 01/15/2023 | | | 4,369 | | | | 4,697 | |
American Airlines, Pass-Through Trust, Ser 2014-1, Cl A | | | | | | | | |
4.375%, 10/01/2022 | | | 1,599 | | | | 1,633 | |
American Airlines, Pass-Through Trust, Ser 2016-2, Cl A | | | | | | | | |
3.650%, 06/15/2028 | | | 1,700 | | | | 1,721 | |
American Airlines, Pass-Through Trust, Ser 2016-2, Cl AA | | | | | | | | |
3.200%, 06/15/2028 | | | 2,335 | | | | 2,358 | |
BAE Systems | | | | | | | | |
5.800%, 10/11/2041 (A) | | | 3,940 | | | | 4,620 | |
| | | | | | | | |
| Description | | Face Amount
($ Thousands) | | | Market Value
($ Thousands) | |
| | | | | | | | |
Boeing | | | | | | | | |
2.500%, 03/01/2025 | | $ | 1,440 | | | $ | 1,453 | |
1.875%, 06/15/2023 | | | 3,885 | | | | 3,798 | |
Burlington Northern Santa Fe | | | | | | | | |
5.650%, 05/01/2017 | | | 1,700 | | | | 1,772 | |
Burlington Northern Santa Fe LLC | | | | | | | | |
4.550%, 09/01/2044 | | | 2,955 | | | | 3,229 | |
Caterpillar | | | | | | | | |
4.750%, 05/15/2064 | | | 640 | | | | 686 | |
3.803%, 08/15/2042 | | | 1,060 | | | | 1,024 | |
3.400%, 05/15/2024 | | | 3,050 | | | | 3,224 | |
Continental Airlines, Pass-Through Trust, Ser 2012-2, Cl A | | | | | | | | |
4.000%, 10/29/2024 | | | 4,253 | | | | 4,434 | |
Delta Air Lines, Pass-Through Trust, Ser 2012- 1, Cl A | | | | | | | | |
4.750%, 05/07/2020 | | | 3,824 | | | | 4,082 | |
Delta Air Lines, Pass-Through Trust, Ser 2015- 1, Cl A | | | | | | | | |
3.875%, 07/30/2027 | | | 1,541 | | | | 1,587 | |
GE Capital International Funding Unlimited | | | | | | | | |
4.418%, 11/15/2035 (A) | | | 5,921 | | | | 6,441 | |
2.342%, 11/15/2020 (A) | | | 7,076 | | | | 7,216 | |
General Dynamics | | | | | | | | |
2.250%, 11/15/2022 | | | 2,210 | | | | 2,225 | |
General Electric | | | | | | | | |
5.250%, 12/06/2017 | | | 2,920 | | | | 3,101 | |
5.000%, 12/29/2049 (C) | | | 1,988 | | | | 2,067 | |
4.500%, 03/11/2044 | | | 3,245 | | | | 3,619 | |
4.125%, 10/09/2042 | | | 1,720 | | | | 1,822 | |
Harris | | | | | | | | |
1.999%, 04/27/2018 | | | 1,775 | | | | 1,774 | |
John Deere Capital MTN | | | | | | | | |
2.800%, 03/04/2021 | | | 5,915 | | | | 6,124 | |
Norfolk Southern | | | | | | | | |
6.000%, 05/23/2111 | | | 4,499 | | | | 5,207 | |
PACCAR Financial MTN | | | | | | | | |
2.200%, 09/15/2019 | | | 4,000 | | | | 4,073 | |
1.600%, 03/15/2017 | | | 164 | | | | 165 | |
1.100%, 06/06/2017 | | | 3,680 | | | | 3,682 | |
Raytheon | | | | | | | | |
7.200%, 08/15/2027 | | | 1,005 | | | | 1,392 | |
2.500%, 12/15/2022 | | | 4,305 | | | | 4,405 | |
Siemens Financieringsmaatschappij | | | | | | | | |
4.400%, 05/27/2045 (A) | | | 2,000 | | | | 2,189 | |
2.900%, 05/27/2022 (A) | | | 2,105 | | | | 2,186 | |
Southwest Airlines | | | | | | | | |
2.650%, 11/05/2020 | | | 1,325 | | | | 1,352 | |
Southwest Airlines, Pass-Through Trust, Ser
2007-1 | | | | | | | | |
6.150%, 08/01/2022 | | | 767 | | | | 865 | |
| | | | |
| SEI Institutional Investments Trust / Annual Report / May 31, 2016 | | | 241 | |
SCHEDULE OF INVESTMENTS
Intermediate Duration Credit Fund (Continued)
May 31, 2016
| | | | | | | | |
| Description | | Face Amount
($ Thousands) | | | Market Value
($ Thousands) | |
| | | | | | | | |
Tyco International Finance | | | | | | | | |
5.125%, 09/14/2045 | | $ | 650 | | | $ | 715 | |
Union Pacific | | | | | | | | |
4.050%, 03/01/2046 | | | 3,070 | | | | 3,195 | |
United Technologies | | | | | | | | |
4.500%, 06/01/2042 | | | 4,530 | | | | 4,955 | |
3.100%, 06/01/2022 | | | 2,650 | | | | 2,780 | |
| | | | | | | | |
| | | | | | | 111,868 | |
| | | | | | | | |
| | |
Information Technology — 4.2% | | | | | | | | |
Alibaba Group Holding | | | | | | | | |
1.625%, 11/28/2017 | | | 1,843 | | | | 1,839 | |
Apple | | | | | | | | |
4.650%, 02/23/2046 | | | 2,695 | | | | 2,958 | |
4.500%, 02/23/2036 | | | 2,750 | | | | 2,984 | |
3.250%, 02/23/2026 | | | 1,660 | | | | 1,722 | |
2.850%, 05/06/2021 | | | 4,052 | | | | 4,231 | |
2.250%, 02/23/2021 | | | 1,150 | | | | 1,168 | |
1.550%, 02/07/2020 | | | 4,000 | | | | 4,002 | |
Applied Materials | | | | | | | | |
2.625%, 10/01/2020 | | | 2,312 | | | | 2,374 | |
CDK Global | | | | | | | | |
4.500%, 10/15/2024 | | | 2,351 | | | | 2,345 | |
Cisco Systems | | | | | | | | |
2.200%, 02/28/2021 | | | 4,730 | | | | 4,794 | |
Diamond 1 Finance | | | | | | | | |
5.450%, 06/15/2023 (A) | | | 2,330 | | | | 2,369 | |
4.420%, 06/15/2021 (A) | | | 2,535 | | | | 2,586 | |
Hewlett Packard Enterprise | | | | | | | | |
6.200%, 10/15/2035 (A) | | | 2,085 | | | | 2,031 | |
Intel | | | | | | | | |
4.900%, 07/29/2045 | | | 4,785 | | | | 5,354 | |
3.700%, 07/29/2025 | | | 1,060 | | | | 1,159 | |
2.450%, 07/29/2020 | | | 2,885 | | | | 2,970 | |
Microsoft | | | | | | | | |
3.500%, 02/12/2035 | | | 1,980 | | | | 1,996 | |
3.125%, 11/03/2025 | | | 1,885 | | | | 1,982 | |
2.700%, 02/12/2025 | | | 2,550 | | | | 2,594 | |
Oracle | | | | | | | | |
6.125%, 07/08/2039 | | | 1,000 | | | | 1,309 | |
4.300%, 07/08/2034 | | | 2,495 | | | | 2,662 | |
2.250%, 10/08/2019 | | | 4,630 | | | | 4,757 | |
Seagate HDD Cayman | | | | | | | | |
4.750%, 06/01/2023 | | | 970 | | | | 811 | |
| | | | | | | | |
| | | | | | | 60,997 | |
| | | | | | | | |
| | |
Materials — 1.3% | | | | | | | | |
Albemarle | | | | | | | | |
4.150%, 12/01/2024 | | | 1,830 | | | | 1,864 | |
3.000%, 12/01/2019 | | | 250 | | | | 251 | |
Barrick | | | | | | | | |
5.250%, 04/01/2042 | | | 1,290 | | | | 1,182 | |
| | | | | | | | |
| Description | | Face Amount
($ Thousands) | | | Market Value
($ Thousands) | |
| | | | | | | | |
BHP Billiton Finance USA | | | | | | | | |
6.750%, 10/19/2075 (A) (C) | | $ | 1,380 | | | $ | 1,430 | |
5.000%, 09/30/2043 | | | 105 | | | | 111 | |
Georgia-Pacific | | | | | | | | |
8.875%, 05/15/2031 | | | 1,951 | | | | 3,026 | |
Glencore Finance Canada | | | | | | | | |
5.800%, 11/15/2016 (A) | | | 1,200 | | | | 1,221 | |
LyondellBasell Industries | | | | | | | | |
4.625%, 02/26/2055 | | | 2,490 | | | | 2,204 | |
Nacional del Cobre de Chile | | | | | | | | |
4.500%, 09/16/2025 (A) | | | 1,360 | | | | 1,384 | |
Praxair | | | | | | | | |
3.200%, 01/30/2026 | | | 1,525 | | | | 1,618 | |
Rio Tinto Finance USA | | | | | | | | |
6.500%, 07/15/2018 | | | 2,990 | | | | 3,267 | |
2.250%, 12/14/2018 | | | 950 | | | | 957 | |
| | | | | | | | |
| | | | | | | 18,515 | |
| | | | | | | | |
|
Telecommunication Services — 2.4% | |
America Movil | | | | | | | | |
6.125%, 03/30/2040 | | | 965 | | | | 1,132 | |
3.125%, 07/16/2022 | | | 6,135 | | | | 6,233 | |
AT&T | | | | | | | | |
3.436%, 11/27/2022 (A) (B) | | | 8,000 | | | | 6,386 | |
Bellsouth Capital Funding | | | | | | | | |
7.875%, 02/15/2030 | | | 1,610 | | | | 2,014 | |
SES | | | | | | | | |
3.600%, 04/04/2023 (A) | | | 5,399 | | | | 5,326 | |
SES Global Americas Holdings | | | | | | | | |
5.300%, 03/25/2044 (A) | | | 1,750 | | | | 1,584 | |
Telefonos de Mexico | | | | | | | | |
5.500%, 11/15/2019 | | | 2,715 | | | | 3,009 | |
Verizon Communications | | | | | | | | |
5.012%, 08/21/2054 | | | 1,342 | | | | 1,385 | |
4.862%, 08/21/2046 | | | 2,423 | | | | 2,587 | |
4.672%, 03/15/2055 | | | 2,325 | | | | 2,278 | |
4.522%, 09/15/2048 | | | 2,629 | | | | 2,655 | |
| | | | | | | | |
| | | | | | | 34,589 | |
| | | | | | | | |
| | |
Utilities — 9.7% | | | | | | | | |
Ameren Illinois | | | | | | | | |
6.125%, 11/15/2017 | | | 1,450 | | | | 1,549 | |
2.700%, 09/01/2022 | | | 2,000 | | | | 2,050 | |
Berkshire Hathaway Energy | | | | | | | | |
2.000%, 11/15/2018 | | | 4,470 | | | | 4,521 | |
CenterPoint Energy Houston Electric | | | | | | | | |
4.500%, 04/01/2044 | | | 2,215 | | | | 2,467 | |
Commonwealth Edison | | | | | | | | |
4.000%, 08/01/2020 | | | 35 | | | | 38 | |
Connecticut Light & Power | | | | | | | | |
5.650%, 05/01/2018 | | | 2,775 | | | | 2,998 | |
| | |
| 242 | | SEI Institutional Investments Trust / Annual Report / May 31, 2016 |
| | | | | | | | |
| Description | | Face Amount
($ Thousands) | | | Market Value
($ Thousands) | |
| | | | | | | | |
Consumers Energy | | | | | | | | |
6.700%, 09/15/2019 | | $ | 425 | | | $ | 492 | |
Dominion Resources | | | | | | | | |
5.250%, 08/01/2033 | | | 3,531 | | | | 3,825 | |
Duke Energy Carolinas | | | | | | | | |
5.300%, 02/15/2040 | | | 1,700 | | | | 2,099 | |
3.900%, 06/15/2021 | | | 190 | | | | 209 | |
Duke Energy Carolinas LLC | | | | | | | | |
4.250%, 12/15/2041 | | | 105 | | | | 113 | |
4.000%, 09/30/2042 | | | 340 | | | | 358 | |
Duke Energy Florida | | | | | | | | |
3.100%, 08/15/2021 | | | 4,530 | | | | 4,762 | |
Duke Energy Indiana | | | | | | | | |
6.350%, 08/15/2038 | | | 270 | | �� | | 370 | |
4.900%, 07/15/2043 | | | 210 | | | | 247 | |
Duke Energy Progress | | | | | | | | |
4.200%, 08/15/2045 | | | 2,995 | | | | 3,213 | |
4.100%, 05/15/2042 | | | 744 | | | | 782 | |
3.000%, 09/15/2021 | | | 3,745 | | | | 3,945 | |
2.800%, 05/15/2022 | | | 4,400 | | | | 4,552 | |
Edison International | | | | | | | | |
2.950%, 03/15/2023 | | | 1,655 | | | | 1,670 | |
Electricite de France | | | | | | | | |
4.950%, 10/13/2045 (A) | | | 1,615 | | | | 1,727 | |
4.750%, 10/13/2035 (A) | | | 720 | | | | 756 | |
2.150%, 01/22/2019 (A) | | | 4,000 | | | | 4,039 | |
Entergy Mississippi | | | | | | | | |
2.850%, 06/01/2028 | | | 2,745 | | | | 2,713 | |
Exelon | | | | | | | | |
3.950%, 06/15/2025 | | | 1,846 | | | | 1,938 | |
Florida Power & Light | | | | | | | | |
5.960%, 04/01/2039 | | | 120 | | | | 161 | |
5.125%, 06/01/2041 | | | 187 | | | | 226 | |
4.125%, 02/01/2042 | | | 2,540 | | | | 2,738 | |
Georgia Power | | | | | | | | |
4.300%, 03/15/2042 | | | 290 | | | | 310 | |
4.300%, 03/15/2043 | | | 3,455 | | | | 3,616 | |
1.950%, 12/01/2018 | | | 6,179 | | | | 6,247 | |
Great Plains Energy | | | | | | | | |
5.292%, 06/15/2022 (D) | | | 1,090 | | | | 1,210 | |
Indianapolis Power & Light | | | | | | | | |
4.700%, 09/01/2045 (A) | | | 4,920 | | | | 5,428 | |
Kansas City Power & Light | | | | | | | | |
7.150%, 04/01/2019 | | | 3,880 | | | | 4,407 | |
Kentucky Utilities | | | | | | | | |
5.125%, 11/01/2040 | | | 250 | | | | 300 | |
Louisville Gas & Electric | | | | | | | | |
4.650%, 11/15/2043 | | | 110 | | | | 127 | |
MidAmerican Energy | | | | | | | | |
2.400%, 03/15/2019 | | | 2,420 | | | | 2,482 | |
Monongahela Power | | | | | | | | |
5.400%, 12/15/2043 (A) | | | 845 | | | | 1,026 | |
| | | | | | | | |
| Description | | Face Amount
($ Thousands) | | | Market Value
($ Thousands) | |
| | | | | | | | |
4.100%, 04/15/2024 (A) | | $ | 2,190 | | | $ | 2,353 | |
NextEra Energy Capital Holdings | | | | | | | | |
1.586%, 06/01/2017 | | | 2,355 | | | | 2,358 | |
Northern States Power | | | | | | | | |
7.125%, 07/01/2025 | | | 3,220 | | | | 4,334 | |
Oglethorpe Power | | | | | | | | |
5.375%, 11/01/2040 | | | 1,420 | | | | 1,650 | |
4.250%, 04/01/2046 | | | 1,015 | | | | 1,020 | |
4.200%, 12/01/2042 | | | 150 | | | | 149 | |
Oncor Electric Delivery | | | | | | | | |
5.300%, 06/01/2042 | | | 2,505 | | | | 3,016 | |
Pacific Gas & Electric | | | | | | | | |
5.800%, 03/01/2037 | | | 2,226 | | | | 2,826 | |
PacifiCorp | | | | | | | | |
6.000%, 01/15/2039 | | | 3,815 | | | | 5,037 | |
4.100%, 02/01/2042 | | | 95 | | | | 101 | |
2.950%, 06/01/2023 | | | 3,930 | | | | 4,078 | |
PECO Energy | | | | | | | | |
4.800%, 10/15/2043 | | | 2,925 | | | | 3,488 | |
Public Service Electric & Gas MTN | | | | | | | | |
1.800%, 06/01/2019 | | | 4,198 | | | | 4,242 | |
Public Service of Colorado | | | | | | | | |
6.250%, 09/01/2037 | | | 190 | | | | 260 | |
3.950%, 03/15/2043 | | | 180 | | | | 190 | |
Public Service of Oklahoma | | | | | | | | |
6.625%, 11/15/2037 | | | 900 | | | | 1,120 | |
San Diego Gas & Electric | | | | | | | | |
3.950%, 11/15/2041 | | | 41 | | | | 42 | |
3.600%, 09/01/2023 | | | 1,224 | | | | 1,332 | |
3.000%, 08/15/2021 | | | 2,470 | | | | 2,603 | |
South Carolina Electric & Gas | | | | | | | | |
5.450%, 02/01/2041 | | | 2,980 | | | | 3,642 | |
Southaven Combined Cycle Generation | | | | | | | | |
3.846%, 08/15/2033 | | | 176 | | | | 189 | |
Southern California Edison | | | | | | | | |
3.875%, 06/01/2021 | | | 4,895 | | | | 5,340 | |
1.845%, 02/01/2022 | | | 4,684 | | | | 4,618 | |
1.125%, 05/01/2017 | | | 555 | | | | 556 | |
Southern California Gas | | | | | | | | |
3.750%, 09/15/2042 | | | 155 | | | | 156 | |
Union Electric | | | | | | | | |
6.700%, 02/01/2019 | | | 5,035 | | | | 5,679 | |
| | | | | | | | |
| | | | | | | 140,090 | |
| | | | | | | | |
Total Corporate Obligations
(Cost $1,250,822) ($ Thousands) | | | | 1,258,863 | |
| | | | | | | | |
U.S. TREASURY OBLIGATIONS — 3.9% | |
U.S. Treasury Bond | | | | | | | | |
2.500%, 02/15/2046 | | | 13,680 | | | | 13,299 | |
U.S. Treasury Notes | | | | | | | | |
1.625%, 04/30/2023 | | | 9,205 | | | | 9,191 | |
| | | | |
| SEI Institutional Investments Trust / Annual Report / May 31, 2016 | | | 243 | |
SCHEDULE OF INVESTMENTS
Intermediate Duration Credit Fund (Continued)
May 31, 2016
| | | | | | | | |
| Description | | Face Amount
($ Thousands) | | | Market Value
($ Thousands) | |
| | | | | | | | |
1.625%, 02/15/2026 | | $ | 5,848 | | | $ | 5,732 | |
1.625%, 05/15/2026 | | | 10,310 | | | | 10,114 | |
1.375%, 04/30/2021 (E) | | | 14,245 | | | | 14,250 | |
1.375%, 05/31/2021 | | | 1,795 | | | | 1,796 | |
0.875%, 05/15/2019 | | | 1,530 | | | | 1,523 | |
| | | | | | | | |
Total U.S. Treasury Obligations
(Cost $56,110) ($ Thousands) | | | | | | | 55,905 | |
| | | | | | | | |
| | |
MUNICIPAL BONDS — 3.2% | | | | | | | | |
| | |
California — 1.0% | | | | | | | | |
Bay Area, Toll Authority, Build America Project, RB | | | | | | | | |
6.263%, 04/01/2049 | | | 1,760 | | | | 2,594 | |
Bay Area, Toll Authority, Build America Project, Ser S1-SUB, RB | | | | | | | | |
6.793%, 04/01/2030 | | | 1,222 | | | | 1,569 | |
California State, Build America Project, GO | | | | | | | | |
7.550%, 04/01/2039 | | | 2,985 | | | | 4,610 | |
Los Angeles, Community College District, Build America Project, GO | | | | | | | | |
6.750%, 08/01/2049 | | | 500 | | | | 770 | |
Los Angeles, Unified School District, Build America Project, Ser RY, GO | | | | | | | | |
6.758%, 07/01/2034 | | | 2,070 | | | | 2,915 | |
Regents of the University of California Medical Center Pooled Revenue, Build America Project, Ser H, RB | | | | | | | | |
6.548%, 05/15/2048 | | | 120 | | | | 169 | |
University of California, Build America Project, RB | | | | | | | | |
5.770%, 05/15/2043 | | | 1,350 | | | | 1,771 | |
| | | | | | | | |
| | | | | | | 14,398 | |
| | | | | | | | |
| | |
Florida — 0.1% | | | | | | | | |
Florida State Board of Administration Finance, Ser A, RB | | | | | | | | |
2.638%, 07/01/2021 | | | 1,905 | | | | 1,954 | |
| | | | | | | | |
| | |
Georgia — 0.7% | | | | | | | | |
Municipal Electric Authority of Georgia, Build | | | | | | | | |
America Project, RB | | | | | | | | |
7.055%, 04/01/2057 | | | 3,512 | | | | 4,119 | |
6.637%, 04/01/2057 | | | 4,414 | | | | 5,794 | |
| | | | | | | | |
| | | | | | | 9,913 | |
| | | | | | | | |
| | |
Illinois — 0.1% | | | | | | | | |
Illinois State, GO | | | | | | | | |
5.100%, 06/01/2033 | | | 1,700 | | | | 1,627 | |
| | | | | | | | |
| | | | | | | | |
| Description | | Face Amount
($ Thousands) | | | Market Value
($ Thousands) | |
| | | | | | | | |
| | |
Kansas — 0.3% | | | | | | | | |
Kansas State, Development Finance Authority, Ser H, RB | | | | | | | | |
4.727%, 04/15/2037 | | $ | 3,860 | | | $ | 4,232 | |
| | | | | | | | |
| | |
Kentucky — 0.1% | | | | | | | | |
Kentucky State, Asset Liability Commission, RB | | | | | | | | |
3.165%, 04/01/2018 | | | 1,141 | | | | 1,166 | |
| | | | | | | | |
| | |
Massachusetts — 0.0% | | | | | | | | |
Commonwealth of Massachusetts, Build America Project, GO | | | | | | | | |
4.910%, 05/01/2029 | | | 100 | | | | 123 | |
Commonwealth of Massachusetts, Build America Project, RB | | | | | | | | |
5.731%, 06/01/2040 | | | 80 | | | | 107 | |
| | | | | | | | |
| | | | | | | 230 | |
| | | | | | | | |
| | |
New Jersey — 0.5% | | | | | | | | |
New Jersey State, Economic Development Authority, Ser B, RB, AGM | | | | | | | | |
2.997%, 02/15/2020 (B) | | | 4,500 | | | | 4,000 | |
New Jersey State, State Turnpike Authority, Build America Project, RB | | | | | | | | |
7.102%, 01/01/2041 | | | 2,500 | | | | 3,697 | |
| | | | | | | | |
| | | | | | | 7,697 | |
| | | | | | | | |
| | |
New York — 0.1% | | | | | | | | |
City of New York New York, Build America Project, GO | | | | | | | | |
6.271%, 12/01/2037 | | | 200 | | | | 276 | |
Port Authority of New York & New Jersey, RB | | | | | | | | |
4.458%, 10/01/2062 | | | 620 | | | | 690 | |
Port Authority of New York & New Jersey, Ser 181, RB | | | | | | | | |
4.960%, 08/01/2046 | | | 155 | | | | 185 | |
| | | | | | | | |
| | | | | | | 1,151 | |
| | | | | | | | |
| | |
North Carolina — 0.2% | | | | | | | | |
University of North Carolina at Chapel Hill, Ser C, RB | | | | | | | | |
3.327%, 12/01/2036 | | | 2,150 | | | | 2,215 | |
| | | | | | | | |
| | |
Texas — 0.1% | | | | | | | | |
City of Houston, Ser A, GO | | | | | | | | |
6.290%, 03/01/2032 | | | 405 | | | | 510 | |
Grand Parkway Transportation, Sub-Ser E, RB | | | | | | | | |
5.184%, 10/01/2042 | | | 530 | | | | 674 | |
North Texas, Tollway Authority, Build America Project, RB | | | | | | | | |
6.718%, 01/01/2049 | | | 60 | | | | 91 | |
| | |
| 244 | | SEI Institutional Investments Trust / Annual Report / May 31, 2016 |
| | | | | | | | |
| Description | | Face Amount
($ Thousands)/Shares | | | Market Value
($ Thousands) | |
| | | | | | | | |
Texas State, Build America Project, GO | | | | | | | | |
5.517%, 04/01/2039 | | $ | 540 | | | $ | 728 | |
| | | | | | | | |
| | | | | | | 2,003 | |
| | | | | | | | |
Total Municipal Bonds
(Cost $44,888) ($ Thousands) | | | | | | | 46,586 | |
| | | | | | | | |
| | |
SOVEREIGN DEBT — 2.4% | | | | | | | | |
Asian Development Bank MTN | | | | | | | | |
1.500%, 01/22/2020 | | | 2,330 | | | | 2,344 | |
European Investment Bank MTN | | | | | | | | |
1.875%, 03/15/2019 | | | 5,590 | | | | 5,696 | |
1.375%, 06/15/2020 | | | 2,960 | | | | 2,953 | |
1.250%, 05/15/2019 | | | 6,030 | | | | 6,030 | |
Inter-American Development Bank MTN | | | | | | | | |
1.750%, 10/15/2019 | | | 3,655 | | | | 3,697 | |
International Bank for Reconstruction & Development | | | | | | | | |
1.375%, 04/10/2018 | | | 5,210 | | | | 5,238 | |
International Finance MTN | | | | | | | | |
1.750%, 09/04/2018 | | | 3,860 | | | | 3,918 | |
Province of Quebec Canada MTN | | | | | | | | |
6.350%, 01/30/2026 | | | 270 | | | | 344 | |
Qatar Government International Bond | | | | | | | | |
4.625%, 06/02/2046 (A) | | | 3,045 | | | | 3,060 | |
3.250%, 06/02/2026 (A) | | | 650 | | | | 640 | |
2.375%, 06/02/2021 (A) | | | 550 | | | | 543 | |
| | | | | | | | |
Total Sovereign Debt
(Cost $34,339) ($ Thousands) | | | | | | | 34,463 | |
| | | | | | | | |
| | |
PREFERRED STOCK — 0.1% | | | | | | | | |
State Street, 5.350% (C) | | | 55,000 | | | | 1,443 | |
| | | | | | | | |
Total Preferred Stock
(Cost $1,375) ($ Thousands) | | | | 1,443 | |
| | | | | | | | |
| | |
CASH EQUIVALENT — 3.0% | | | | | | | | |
SEI Daily Income Trust, Prime Obligation Fund, Cl A 0.270%**† | | | 43,414,338 | | | | 43,414 | |
| | | | | | | | |
Total Cash Equivalent
(Cost $43,414) ($ Thousands) | | | | 43,414 | |
| | | | | | | | |
Total Investments — 100.0% (Cost $1,430,948) ($ Thousands) | | | | | | $ | 1,440,674 | |
| | | | | | | | |
A list of the open futures contracts held by the Fund at May 31, 2016, is as follows:
| | | | | | | | | | | | |
| Type of Contract | | Number of
Contracts
Short | | | Expiration
Date | | | Unrealized
Depreciation
($ Thousands) | |
U.S. 10-Year Treasury Note | | | (151 | ) | | | Sep-2016 | | | $ | (44 | ) |
U.S. 5-Year Treasury Note | | | (15 | ) | | | Sep-2016 | | | | (3 | ) |
U.S. Ultra Long Treasury Bond | | | (36 | ) | | | Sep-2016 | | | | (29 | ) |
| | | | | | | | | | | | |
| | | | | | | | | | $ | (76 | ) |
| | | | | | | | | | | | |
For the year ended May 31, 2016, the total amount of all open futures contracts, as presented in the table above, are representative of the volume of activity for the derivative type during the year.
Percentages are based on a Net Assets of $1,440,434 ($ Thousands).
| ** | | Rate shown is the 7-day effective yield as of May 31, 2016. |
| † | | Investment in Affiliated Security (see Note 6). |
| ‡‡ | | Narrow industries are utilized for compliance purposes, whereas broad sectors are utilized for reporting. |
| (A) | | Security exempt from registration under Rule 144A of the Securities Act of 1933. These securities may be resold in transactions exempt from registration normally to qualified institutions. On May 31, 2016, the value of these securities amounted to $222,098 ($ Thousands), representing 15.4% of the net assets of the Fund. |
| (B) | | Zero coupon security. The rate shown on the schedule of investments represents the security’s effective yield at the time of purchase. |
| (C) | | Variable Rate Security — The rate reported on the Schedule of Investments is the rate in effect as of May 31, 2016. |
| (D) | | Step Bonds – The rate reflected on the Schedule of Investments is the effective yield on May 31, 2016. The coupon on a step bond changes on a specified date. |
| (E) | | Security, or portion thereof, has been pledged as collateral on open futures contracts. |
AGM — Assured Guaranty Municipal
Cl — Class
GO — General Obligation
LLC — Limited Liability Company
MTN — Medium Term Note
RB — Revenue Bond
Ser — Series
| | | | |
| SEI Institutional Investments Trust / Annual Report / May 31, 2016 | | | 245 | |
SCHEDULE OF INVESTMENTS
Intermediate Duration Credit Fund (Concluded)
May 31, 2016
The following is a list of the level of inputs used as of May 31, 2016, in valuing the Fund’s investments and other financial instruments carried at value ($ Thousands):
| | | | | | | | | | | | | | | | |
| Investments in Securities | | Level 1 | | | Level 2 | | | Level 3 | | | Total | |
Corporate Obligations | | $ | — | | | $ | 1,258,863 | | | $ | — | | | $ | 1,258,863 | |
U.S. Treasury Obligations | | | — | | | | 55,905 | | | | — | | | | 55,905 | |
Municipal Bonds | | | — | | | | 46,586 | | | | — | | | | 46,586 | |
Sovereign Debt | | | — | | | | 34,463 | | | | — | | | | 34,463 | |
Preferred Stock | | | — | | | | 1,443 | | | | — | | | | 1,443 | |
Cash Equivalent | | | 43,414 | | | | — | | | | — | | | | 43,414 | |
| | | | | | | | | | | | | | | | |
Total Investments in Securities | | $ | 43,414 | | | $ | 1,397,260 | | | $ | — | | | $ | 1,440,674 | |
| | | | | | | | | | | | | | | | |
| | | | | | | | | | | | | | | | |
| Other Financial Instruments | | Level 1 | | | Level 2 | | | Level 3 | | | Total | |
Futures Contracts * | | | | | | | | | | | | | | | | |
Unrealized Depreciation | | $ | (76 | ) | | $ | — | | | $ | — | | | $ | (76 | ) |
| | | | | | | | | | | | | | | | |
Total Other Financial Instruments | | $ | (76 | ) | | $ | — | | | $ | — | | | $ | (76 | ) |
| | | | | | | | | | | | | | | | |
| * | | Futures contracts are valued at the unrealized depreciation on the instrument. |
For the year ended May 31, 2016, there were no transfers between Level 1 and Level 2 assets and liabilities.
For the year ended May 31, 2016, there were no transfers between Level 2 and Level 3 assets and liabilities.
For more information on valuation inputs, see Note 2 — Significant Accounting Policies in Notes to Financial Statements.
Amounts designated as “—” are $0 or have been rounded to $0.
The accompanying notes are an integral part of the financial statements.
| | |
| 246 | | SEI Institutional Investments Trust / Annual Report / May 31, 2016 |
CONSOLIDATED SUMMARY SCHEDULE OF INVESTMENTS
Dynamic Asset Allocation Fund
MAY 31, 2016
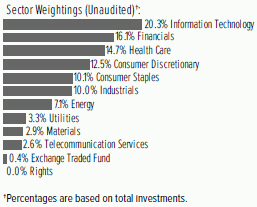
| | | | | | | | | | | | |
| Description | | Percentage of
Net Assets (%) | | | Shares | | | Market Value ($ Thousands) | |
| | | | | | | | | | | | |
|
COMMON STOCK — 96.1% | |
|
Consumer Discretionary — 12.1% | |
Amazon.com* | | | 1.5 | % | | | 42,200 | | | $ | 30,502 | |
Comcast, Cl A | | | 0.8 | | | | 267,200 | | | | 16,914 | |
Home Depot | | | 0.9 | | | | 139,232 | | | | 18,395 | |
McDonald’s | | | 0.6 | | | | 98,700 | | | | 12,047 | |
Starbucks | | | 0.4 | | | | 162,100 | | | | 8,898 | |
Walt Disney | | | 0.8 | | | | 163,862 | | | | 16,258 | |
Other Securities | | | 7.1 | | | | | | | | 147,705 | |
| | | | | | | | | | | | |
| | | | | | | | | | | 250,719 | |
| | | | | | | | | | | | |
| |
Consumer Staples — 9.7% | | | | | |
Altria Group | | | 0.7 | | | | 214,300 | | | | 13,638 | |
Coca-Cola | | | 0.9 | | | | 425,700 | | | | 18,986 | |
CVS Health | | | 0.6 | | | | 120,300 | | | | 11,603 | |
PepsiCo | | | 0.8 | | | | 158,162 | | | | 16,001 | |
Philip Morris International | | | 0.8 | | | | 169,500 | | | | 16,726 | |
Procter & Gamble | | | 1.1 | | | | 289,900 | | | | 23,494 | |
Wal-Mart Stores | | | 0.6 | | | | 171,855 | | | | 12,164 | |
Other Securities | | | 4.2 | | | | | | | | 89,137 | |
| | | | | | | | | | | | |
| | | | | | | | | | | 201,749 | |
| | | | | | | | | | | | |
| |
Energy — 6.9% | | | | | |
Chevron | | | 1.0 | | | | 205,800 | | | | 20,786 | |
Exxon Mobil | | | 1.9 | | | | 454,300 | | | | 40,442 | |
Schlumberger | | | 0.6 | | | | 152,237 | | | | 11,616 | |
Other Securities | | | 3.4 | | | | | | | | 69,818 | |
| | | | | | | | | | | | |
| | | | | | | | | | | 142,662 | |
| | | | | | | | | | | | |
| |
Financials — 15.6% | | | | | |
Bank of America | | | 0.8 | | | | 1,127,600 | | | | 16,677 | |
Berkshire Hathaway, Cl B* | | | 1.4 | | | | 204,900 | | | | 28,797 | |
Citigroup | | | 0.7 | | | | 322,600 | | | | 15,024 | |
JPMorgan Chase | | | 1.3 | | | | 401,200 | | | | 26,186 | |
Wells Fargo | | | 1.2 | | | | 505,000 | | | | 25,614 | |
Other Securities | | | 10.2 | | | | | | | | 211,323 | |
| | | | | | | | | | | | |
| | | | | | | | | | | 323,621 | |
| | | | | | | | | | | | |
| | | |
Health Care — 14.1% | | | | | | | | | | | | |
AbbVie | | | 0.5 | | | | 176,500 | | | | 11,107 | |
Allergan* | | | 0.5 | | | | 43,300 | | | | 10,208 | |
Amgen | | | 0.6 | | | | 82,300 | | | | 12,999 | |
| | | | | | | | | | | | |
| Description | | Percentage of
Net Assets (%) | | | Shares | | | Market Value ($ Thousands) | |
| | | | | | | | | | | | |
Bristol-Myers Squibb | | | 0.6 | % | | | 182,800 | | | $ | 13,107 | |
Celgene* | | | 0.4 | | | | 85,700 | | | | 9,043 | |
Gilead Sciences | | | 0.6 | | | | 149,556 | | | | 13,020 | |
Johnson & Johnson | | | 1.6 | | | | 301,800 | | | | 34,010 | |
Medtronic | | | 0.6 | | | | 153,955 | | | | 12,390 | |
Merck | | | 0.8 | | | | 303,600 | | | | 17,081 | |
Pfizer | | | 1.1 | | | | 660,996 | | | | 22,937 | |
UnitedHealth Group | | | 0.7 | | | | 104,100 | | | | 13,915 | |
Other Securities | | | 6.1 | | | | | | | | 124,242 | |
| | | | | | | | | | | | |
| | | | | | | | | | | 294,059 | |
| | | | | | | | | | | | |
| | | |
Industrials — 9.6% | | | | | | | | | | | | |
3M | | | 0.5 | | | | 66,300 | | | | 11,160 | |
Boeing | | | 0.4 | | | | 68,300 | | | | 8,616 | |
General Electric | | | 1.5 | | | | 1,020,292 | | | | 30,843 | |
Honeywell International | | | 0.5 | | | | 84,300 | | | | 9,596 | |
Other Securities | | | 6.7 | | | | | | | | 140,232 | |
| | | | | | | | | | | | |
| | | | | | | | | | | 200,447 | |
| | | | | | | | | | | | |
| |
Information Technology — 19.6% | | | | | |
Alphabet, Cl A* | | | 1.2 | | | | 31,945 | | | | 23,922 | |
Alphabet, Cl C* | | | 1.2 | | | | 32,622 | | | | 24,001 | |
Apple | | | 2.9 | | | | 606,800 | | | | 60,595 | |
Cisco Systems | | | 0.8 | | | | 550,600 | | | | 15,995 | |
Facebook, Cl A* | | | 1.4 | | | | 250,900 | | | | 29,809 | |
Intel | | | 0.8 | | | | 516,800 | | | | 16,326 | |
International Business | | | | | | | | | | | | |
Machines | | | 0.7 | | | | 96,758 | | | | 14,876 | |
MasterCard, Cl A | | | 0.5 | | | | 107,400 | | | | 10,300 | |
Microsoft | | | 2.2 | | | | 865,300 | | | | 45,861 | |
Oracle | | | 0.7 | | | | 344,900 | | | | 13,865 | |
Qualcomm | | | 0.4 | | | | 162,800 | | | | 8,941 | |
Visa, Cl A | | | 0.8 | | | | 209,600 | | | | 16,546 | |
Other Securities | | | 6.0 | | | | | | | | 125,899 | |
| | | | | | | | | | | | |
| | | | | | | | | | | 406,936 | |
| | | | | | | | | | | | |
| | | |
Materials — 2.8% | | | | | | | | | | | | |
Other Securities | | | 2.8 | | | | | | | | 57,171 | |
| | | | | | | | | | | | |
|
Telecommunication Services — 2.5% | |
AT&T | | | 1.2 | | | | 672,416 | | | | 26,325 | |
Verizon Communications | | | 1.1 | | | | 445,200 | | | | 22,661 | |
Other Securities | | | 0.2 | | | | | | | | 3,946 | |
| | | | | | | | | | | | |
| | | | | | | | | | | 52,932 | |
| | | | | | | | | | | | |
| | | |
Utilities — 3.2% | | | | | | | | | | | | |
Other Securities | | | 3.2 | | | | | | | | 67,003 | |
| | | | | | | | | | | | |
Total Common Stock
(Cost $1,510,839) ($ Thousands) | | | | 1,997,299 | |
| | | | | | | | | | | | |
| | | | |
| SEI Institutional Investments Trust / Annual Report / May 31, 2016 | | | 247 | |
CONSOLIDATED SUMMARY SCHEDULE OF INVESTMENTS
Dynamic Asset Allocation Fund (Concluded)
May 31, 2016
| | | | | | | | | | | | |
| Description | | Percentage of
Net Assets (%) | | | Shares | | | Market Value ($ Thousands) | |
| | | | | | | | | | | | |
|
EXCHANGE TRADED FUND — 0.3% | |
Other Securities | | | 0.3 | % | | | | | | $ | 7,018 | |
| | | | | | | | | | | | |
Total Exchange Traded Fund
(Cost $5,987) ($ Thousands) | | | | 7,018 | |
| | | | | | | | | | | | |
| | | |
RIGHTS — 0.0% | | | | | | | | | | | | |
| | | |
United States — 0.0% | | | | | | | | | | | | |
Other Securities | | | 0.0 | | | | | | | | 23 | |
| | | | | | | | | | | | |
Total Rights
(Cost $–) ($ Thousands) | | | | 23 | |
| | | | | | | | | | | | |
Total Investments — 96.4%
(Cost $1,516,826) ($ Thousands) | | | $ | 2,004,340 | |
| | | | | | | | | | | | |
| | | | | | | | | | | | |
| | | | | | Contracts | | | | |
|
PURCHASED OPTION(A) — 0.0% | |
June 16, S&P 500 Index Call, Expires 06/18/2016, Strike Price $2,200* | | | 0.0 | | | | 7,000 | | | $ | 161 | |
| | | | | | | | | | | | |
Total Purchased Option
(Premiums Received $1,450) ($ Thousands) | | | $ | 161 | |
| | | | | | | | | | | | |
A list of the open futures contracts held by the Fund at May 31, 2016, is as follows:
| | | | | | | | |
| Type of Contract | | Number of Contracts
Long (Short) | | Expiration
Date | | Unrealized
Appreciation
(Depreciation)
($ Thousands) | |
S&P 500 Index E-MINI | | 983 | | Jun-2016 | | $ | 3,076 | |
U.S. 10-Year Treasury Note | | (797) | | Sep-2006 | | | (160 | ) |
| | | | | | | | |
| | | | | | $ | 2,916 | |
| | | | | | | | |
For the year ended May 31, 2016, the total amount of all open futures contracts, as presented in the table above, are representative of the volume of activity for the derivative type during the year.
A list of the open forward foreign currency contracts held by the Fund at May 31, 2016, is as follows:
| | | | | | | | | | | | | | | | | | | | |
Settlement Date | | Currency
to Deliver
(Thousands) | | | Currency
To Receive
(Thousands) | | | Unrealized
Appreciation
(Depreciation)
($ Thousands) | |
07/21/2016 | | | EUR | | | | 185,469 | | | | USD | | | | 211,488 | | | $ | 4,670 | |
07/21/2016 | | | USD | | | | 205,349 | | | | INR | | | | 13,840,506 | | | | (919 | ) |
07/21/2016 | | | KRW | | | | 243,475,344 | | | | USD | | | | 211,618 | | | | 7,123 | |
01/09/2017 | | | USD | | | | 3,962 | | | | SAR | | | | 15,103 | | | | 34 | |
01/09/2017- 01/19/2017 | | | SAR | | | | 402,242 | | | | USD | | | | 104,382 | | | | (2,050 | ) |
| | | | | | | | | | | | | | | | | | | | |
| | | | | | | | | | | | | | | | | | $ | 8,858 | |
| | | | | | | | | | | | | | | | | | | | |
A list of the counterparties for the outstanding forward foreign currency contracts held by the Fund at May 31, 2016, is as follows:
| | | | | | | | | | | | |
| Counterparty | | Currency to
Deliver
($ Thousands) | | | Currency to
Receive
($ Thousands) | | | Unrealized
Appreciation
(Depreciation)
($ Thousands) | |
Bank of America | | $ | (315,744 | ) | | $ | 312,809 | | | $ | (2,935 | ) |
BNP Paribas | | | (7,017 | ) | | | 7,215 | | | | 198 | |
Societe Generale | | | (199,800 | ) | | | 204,272 | | | | 4,472 | |
Standard Chartered | | | (204,495 | ) | | | 211,618 | | | | 7,123 | |
| | | | | | | | | | | | |
| | | | | | | | | | $ | 8,858 | |
| | | | | | | | | | | | |
For the year ended May 31, 2016 the total amount of all open forward foreign currency contracts, as presented in the table above, are representative of the volume of activity for the derivative type during the year.
A list of the OTC swap agreements held by the Fund at May 31, 2016, is as follows:
| | | | | | | | | | | | | | | | |
Interest Rate Swaps | |
| Counterparty | | Fund Pays | | Fund Receives | | Termination Date | | | Notional Amount ($ Thousands) | | | Net Unrealized Appreciation (Depreciation) ($Thousands) | |
Bank of America | | 1.99% | | US CPI URBAN CONSUMERS NSA | | | 12/24/2045 | | | $ | 54,920 | | | $ | (533 | ) |
Bank of America | | UK RPI ALL ITEMS NSA | | 3.46% | | | 12/24/2045 | | | | 20,500 | | | | 4,648 | |
Bank of America | | 2.06% | | US CPI URBAN CONSUMERS NSA | | | 11/13/2045 | | | | 38,660 | | | | (1,324 | ) |
Bank of America | | UK RPI ALL ITEMS NSA | | 3.47% | | | 11/13/2045 | | | | 14,930 | | | | 3,593 | |
| | | | | | | | | | | | | | | | |
| | | | | | | | | | | | | | $ | 6,384 | |
| | | | | | | | | | | | | | | | |
For the year ended May 31, 2016, the total amount of all open swap contracts, as presented in the table above, are representative of the volume of activity for this derivative type during the year.
Percentages are based on a Net Assets of $2,079,154 ($ Thousands).
| * | | Non-income producing security. |
| (A) | | For the year ended May 31, 2016, the total amount of open purchased options, as presented in the Schedule of Investments, are representative of the volume of activity for these derivative types during the period. |
Cl — Class
CPI — Consumer Price Index
EUR — Euro
INR — Indian Rupee
KRW — Korean Won
NSA — Not seasonally adjusted
OTC — Over the Counter
RPI — Retail Price Index
S&P— Standard & Poor’s
| | |
| 248 | | SEI Institutional Investments Trust / Annual Report / May 31, 2016 |
SAR — Saudi Riyal
USD — United States Dollar
The Summary Schedule of Investments does not reflect the complete portfolio holdings. It includes the Fund’s 50 largest holdings and each investment of any issuer that exceeds 1% of the Fund’s net assets. “Other Securities” represent all issues not required to be disclosed under the rules adopted by the U.S. Securities and Exchange Commission (“SEC”). In certain instances, securities for which footnotes listed above may otherwise apply are included in the Other Securities caption. The complete schedule of portfolio holdings is available (i) without charge, upon request, by calling (800) 342-5734; and (ii) on the SEC’s website at http://www.sec.gov.
The following is a list of the level of inputs used as of May 31, 2016, in valuing the Fund’s investments and other financial instruments carried at value ($ Thousands):
| | | | | | | | | | | | | | | | |
| Investments in Securities | | Level 1 | | | Level 2 | | | Level 3 | | | Total | |
Common Stock | | $ | 1,997,299 | | | $ | — | | | $ | — | | | $ | 1,997,299 | |
Exchange Traded Fund | | | 7,018 | | | | — | | | | — | | | | 7,018 | |
Rights | | | — | | | | 23 | | | | — | | | | 23 | |
| | | | | | | | | | | | | | | | |
Total Investments in Securities | | $ | 2,004,317 | | | $ | 23 | | | $ | — | | | $ | 2,004,340 | |
| | | | | | | | | | | | | | | | |
| | | | | | | | | | | | | | | | |
| Other Financial Instruments | | Level 1 | | | Level 2 | | | Level 3 | | | Total | |
Purchased Options | | $ | 161 | | | $ | — | | | $ | — | | | $ | 161 | |
Futures Contracts* | | | | | | | | | | | | | | | | |
Unrealized Appreciation | | | 3,076 | | | | — | | | | — | | | | 3,076 | |
Unrealized Depreciation | | | (160 | ) | | | — | | | | — | | | | (160 | ) |
Forwards Contracts* | | | | | | | | | | | | | | | | |
Unrealized Appreciation | | | — | | | | 11,827 | | | | — | | | | 11,827 | |
Unrealized Depreciation | | | — | | | | (2,969 | ) | | | — | | | | (2,969 | ) |
OTC Swaps | | | | | | | | | | | | | | | | |
Interest Rate Swaps* | | | | | | | | | | | | | | | | |
Unrealized Appreciation | | | — | | | | 8,241 | | | | — | | | | 8,241 | |
Unrealized Depreciation | | | — | | | | (1,857 | ) | | | — | | | | (1,857 | ) |
| | | | | | | | | | | | | | | | |
Total Other Financial Instruments | | $ | 3,077 | | | $ | 15,242 | | | $ | — | | | $ | 18,319 | |
| | | | | | | | | | | | | | | | |
| * | | Futures contracts, forwards contracts and swaps are valued at the unrealized appreciation (depreciation) on the instrument. |
For the year ended May 31, 2016, there were no transfers between Level 1 and Level 2 assets and liabilities.
For the year ended May 31, 2016, there were no transfers between Level 2 and Level 3 assets and liabilities.
For more information on valuation inputs, see Note 2 – Significant Accounting Policies in Notes to Financial Statements.
Amounts designated as “—” are $0 or have been rounded to $0.
The accompanying notes are an integral part of the financial statements.
| | | | |
| SEI Institutional Investments Trust / Annual Report / May 31, 2016 | | | 249 | |
CONSOLIDATED SCHEDULE OF INVESTMENTS
Multi-Asset Real Return Fund
May 31, 2016
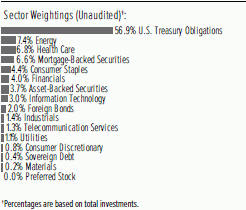
| | | | | | | | | | | | |
| Description | | | | | Face Amount
($ Thousands)/Shares | | | Market Value
($ Thousands) | |
| | | | | | | | | | | | |
| |
U.S. TREASURY OBLIGATIONS — 66.7% | | | | | |
U.S. Treasury Bill(A) | | | | | | | | | | | | |
0.430%, 06/02/2016 (B) | | | | | | $ | 69,300 | | | $ | 69,300 | |
0.350%, 10/20/2016 (B) | | | | | | | 14,000 | | | | 13,977 | |
0.350%, 11/10/2016 (B) | | | | | | | 34,700 | | | | 34,630 | |
U.S. Treasury Inflation-Protected Securities(C) | | | | | | | | | | | | |
2.125%, 01/15/2019 | | | | | | | 12,684 | | | | 13,566 | |
1.375%, 01/15/2020 | | | | | | | 42,618 | | | | 45,188 | |
1.250%, 07/15/2020 | | | | | | | 39,251 | | | | 41,816 | |
0.625%, 07/15/2021 | | | | | | | 56,508 | | | | 58,752 | |
0.125%, 04/15/2017 | | | | | | | 6,923 | | | | 6,974 | |
0.125%, 04/15/2018 | | | | | | | 70,310 | | | | 71,212 | |
0.125%, 04/15/2019 | | | | | | | 76,283 | | | | 77,430 | |
0.125%, 04/15/2020 | | | | | | | 55,139 | | | | 55,885 | |
| | | | | | | | | | | | |
Total U.S. Treasury Obligations
(Cost $486,506) ($ Thousands) | | | | | | | | | | | 488,730 | |
| | | | | | | | | | | | |
| | | |
COMMON STOCK — 28.3% | | | | | | | | | | | | |
| | | |
Consumer Staples — 4.6% | | | | | | | | | | | | |
Altria Group (C) | | | | | | | 74,100 | | | | 4,716 | |
Campbell Soup (C) | | | | | | | 67,100 | | | | 4,064 | |
Clorox | | | | | | | 3,900 | | | | 501 | |
Coca-Cola | | | | | | | 9,400 | | | | 419 | |
CVS Health (C) | | | | | | | 22,300 | | | | 2,151 | |
Dean Foods | | | | | | | 233,400 | | | | 4,267 | |
Dr. Pepper Snapple Group (C) | | | | | | | 18,200 | | | | 1,664 | |
Energizer Holdings | | | | | | | 1,400 | | | | 66 | |
Fresh Del Monte Produce | | | | | | | 5,600 | | | | 293 | |
Herbalife* | | | | | | | 8,900 | | | | 515 | |
Ingredion | | | | | | | 1,900 | | | | 223 | |
Kroger | | | | | | | 10,100 | | | | 361 | |
Medifast | | | | | | | 6,300 | | | | 201 | |
Mondelez International, Cl A | | | | | | | 36,700 | | | | 1,633 | |
Natural Health Trends | | | | | | | 7,900 | | | | 236 | |
Nu Skin Enterprises, Cl A | | | | | | | 14,000 | | | | 552 | |
Omega Protein* | | | | | | | 13,500 | | | | 267 | |
| | | | | | | | | | | | |
| Description | | | | | Shares | | | Market Value
($ Thousands) | |
| | | | | | | | | | | | |
PepsiCo | | | | | | | 14,500 | | | $ | 1,467 | |
Philip Morris International | | | | | | | 500 | | | | 49 | |
Post Holdings* | | | | | | | 7,800 | | | | 593 | |
Procter & Gamble | | | | | | | 27,800 | | | | 2,253 | |
Reynolds American | | | | | | | 22,500 | | | | 1,118 | |
Sanderson Farms | | | | | | | 4,500 | | | | 404 | |
Seaboard* | | | | | | | 23 | | | | 70 | |
SpartanNash | | | | | | | 2,400 | | | | 71 | |
Sysco | | | | | | | 25,700 | | | | 1,236 | |
Tyson Foods, Cl A | | | | | | | 27,100 | | | | 1,728 | |
Universal | | | | | | | 13,200 | | | | 722 | |
Walgreens Boots Alliance | | | | | | | 1,900 | | | | 147 | |
Wal-Mart Stores | | | | | | | 21,200 | | | | 1,501 | |
| | | | | | | | | | | | |
| | | | | | | | | | | 33,488 | |
| | | | | | | | | | | | |
| | | |
Energy — 7.9% | | | | | | | | | | | | |
Alon USA Energy | | | | | | | 18,100 | | | | 137 | |
Antero Resources* | | | | | | | 49,400 | | | | 1,434 | |
Atwood Oceanics | | | | | | | 363,200 | | | | 3,875 | |
Chevron (C) | | | | | | | 30,270 | | | | 3,057 | |
CVR Energy | | | | | | | 8,100 | | | | 159 | |
DHT Holdings | | | | | | | 582,300 | | | | 3,179 | |
Diamond Offshore Drilling (C) | | | | | | | 167,700 | | | | 4,330 | |
Exxon Mobil (C) | | | | | | | 123,800 | | | | 11,021 | |
Frontline | | | | | | | 55,420 | | | | 492 | |
Gener8 Maritime* | | | | | | | 13,400 | | | | 97 | |
Hallador Energy | | | | | | | 17,000 | | | | 73 | |
Marathon Petroleum | | | | | | | 18,600 | | | | 648 | |
McDermott International* | | | | | | | 354,000 | | | | 1,682 | |
Noble (C) | | | | | | | 281,800 | | | | 2,350 | |
PHI* | | | | | | | 7,200 | | | | 123 | |
REX American Resources* | | | | | | | 9,400 | | | | 549 | |
Rowan, Cl A | | | | | | | 238,300 | | | | 4,034 | |
Schlumberger (C) | | | | | | | 52,300 | | | | 3,990 | |
Ship Finance International | | | | | | | 60,800 | | | | 975 | |
Teekay | | | | | | | 33,700 | | | | 355 | |
Teekay Tankers, Cl A | | | | | | | 166,000 | | | | 588 | |
Tesoro (C) | | | | | | | 57,900 | | | | 4,521 | |
Transocean (C) | | | | | | | 416,300 | | | | 4,076 | |
Valero Energy (C) | | | | | | | 82,200 | | | | 4,496 | |
Western Refining | | | | | | | 71,100 | | | | 1,510 | |
| | | | | | | | | | | | |
| | | | | | | | | | | 57,751 | |
| | | | | | | | | | | | |
| | | |
Financials — 2.8% | | | | | | | | | | | | |
Altisource Portfolio Solutions* | | | | | | | 74,400 | | | | 2,078 | |
Ambac Financial Group* | | | | | | | 21,000 | | | | 346 | |
Annaly Capital Management (C) | | | | | | | 236,000 | | | | 2,497 | |
Assurant | | | | | | | 5,000 | | | | 437 | |
Assured Guaranty | | | | | | | 28,000 | | | | 753 | |
Banc of California | | | | | | | 27,100 | | | | 544 | |
Bancorp* | | | | | | | 19,000 | | | | 128 | |
Chimera Investment | | | | | | | 55,700 | | | | 835 | |
| | |
| 250 | | SEI Institutional Investments Trust / Annual Report / May 31, 2016 |
| | | | | | | | | | | | |
| Description | | | | | Shares | | | Market Value
($ Thousands) | |
| | | | | | | | | | | | |
Citigroup | | | | | | | 7,100 | | | $ | 331 | |
CoreSite Realty | | | | | | | 13,800 | | | | 1,047 | |
Dynex Capital | | | | | | | 20,900 | | | | 140 | |
Equity Residential | | | | | | | 42,100 | | | | 2,914 | |
Getty Realty | | | | | | | 2,430 | | | | 49 | |
Heartland Financial USA | | | | | | | 10,100 | | | | 354 | |
Kimco Realty | | | | | | | 62,000 | | | | 1,747 | |
MFA Financial | | | | | | | 138,000 | | | | 995 | |
MGIC Investment* | | | | | | | 238,500 | | | | 1,681 | |
Old Republic International | | | | | | | 36,000 | | | | 690 | |
Public Storage | | | | | | | 1,500 | | | | 381 | |
Ryman Hospitality Properties | | | | | | | 18,800 | | | | 922 | |
Simon Property Group | | | | | | | 1,200 | | | | 237 | |
SL Green Realty | | | | | | | 1,500 | | | | 152 | |
Two Harbors Investment | | | | | | | 124,700 | | | | 1,057 | |
| | | | | | | | | | | | |
| | | | | | | | | | | 20,315 | |
| | | | | | | | | | | | |
| | | |
Health Care — 7.1% | | | | | | | | | | | | |
Aetna | | | | | | | 21,000 | | | | 2,378 | |
AMAG Pharmaceuticals* | | | | | | | 23,800 | | | | 510 | |
Amedisys* | | | | | | | 33,300 | | | | 1,694 | |
Amgen (C) | | | | | | | 19,000 | | | | 3,001 | |
AMN Healthcare Services* | | | | | | | 18,600 | | | | 695 | |
Anthem | | | | | | | 1,900 | | | | 251 | |
Baxter International | | | | | | | 93,800 | | | | 4,048 | |
Bristol-Myers Squibb | | | | | | | 17,200 | | | | 1,233 | |
Bruker | | | | | | | 9,700 | | | | 256 | |
Cambrex* | | | | | | | 31,200 | | | | 1,526 | |
Centene* (C) | | | | | | | 69,320 | | | | 4,322 | |
Charles River Laboratories International* | | | | | | | 20,300 | | | | 1,744 | |
Cigna | | | | | | | 200 | | | | 26 | |
Computer Programs & Systems | | | | | | | 6,000 | | | | 248 | |
Exactech* | | | | | | | 2,000 | | | | 49 | |
Express Scripts Holding* | | | | | | | 5,900 | | | | 446 | |
Five Prime Therapeutics* | | | | | | | 9,400 | | | | 430 | |
Gilead Sciences (C) | | | | | | | 67,000 | | | | 5,833 | |
Hologic* | | | | | | | 17,700 | | | | 609 | |
INC Research Holdings, Cl A* | | | | | | | 4,800 | | | | 209 | |
Johnson & Johnson (C) | | | | | | | 48,600 | | | | 5,477 | |
Lannett* | | | | | | | 1,500 | | | | 37 | |
LeMaitre Vascular | | | | | | | 8,200 | | | | 115 | |
Magellan Health Services* | | | | | | | 13,800 | | | | 914 | |
Merck | | | | | | | 15,700 | | | | 883 | |
Mettler Toledo International* | | | | | | | 5,260 | | | | 1,974 | |
OraSure Technologies* | | | | | | | 38,000 | | | | 292 | |
PDL BioPharma | | | | | | | 308,300 | | | | 1,107 | |
Pfizer | | | | | | | 92,000 | | | | 3,192 | |
Quintiles Transnational Holdings* | | | | | | | 29,100 | | | | 1,976 | |
ResMed | | | | | | | 18,100 | | | | 1,069 | |
Triple-S Management, Cl B* | | | | | | | 9,100 | | | | 209 | |
United Therapeutics* | | | | | | | 9,600 | | | | 1,143 | |
UnitedHealth Group | | | | | | | 14,000 | | | | 1,871 | |
| | | | | | | | | | | | |
| Description | | | | | Shares | | | Market Value
($ Thousands) | |
| | | | | | | | | | | | |
Waters* | | | | | | | 19,200 | | | $ | 2,641 | |
| | | | | | | | | | | | |
| | | | | | | | | | | 52,408 | |
| | | | | | | | | | | | |
| | | |
Industrials — 1.4% | | | | | | | | | | | | |
American Airlines Group | | | | | | | 6,000 | | | | 191 | |
Argan | | | | | | | 17,600 | | | | 611 | |
Comfort Systems USA | | | | | | | 1,000 | | | | 32 | |
FreightCar America | | | | | | | 7,200 | | | | 104 | |
Greenbrier | | | | | | | 102,800 | | | | 2,950 | |
Hawaiian Holdings* (C) | | | | | | | 40,800 | | | | 1,651 | |
Manpowergroup | | | | | | | 3,700 | | | | 295 | |
United Continental Holdings* | | | | | | | 93,300 | | | | 4,207 | |
USA Truck* | | | | | | | 2,900 | | | | 58 | |
Wabash National* | | | | | | | 20,100 | | | | 285 | |
| | | | | | | | | | | | |
| | | | | | | | | | | 10,384 | |
| | | | | | | | | | | | |
| |
Information Technology — 3.0% | | | | | |
Accenture, Cl A | | | | | | | 14,700 | | | | 1,749 | |
Brightcove* | | | | | | | 24,300 | | | | 163 | |
EarthLink Holdings | | | | | | | 131,800 | | | | 865 | |
Electronic Arts* (C) | | | | | | | 25,900 | | | | 1,988 | |
ExlService Holdings* | | | | | | | 800 | | | | 41 | |
Hackett Group | | | | | | | 20,400 | | | | 298 | |
International Business Machines | | | | | | | 35,000 | | | | 5,381 | |
Leidos Holdings | | | | | | | 15,400 | | | | 761 | |
Manhattan Associates* | | | | | | | 15,100 | | | | 996 | |
Microsoft | | | | | | | 38,000 | | | | 2,014 | |
Monster Worldwide* | | | | | | | 169,900 | | | | 450 | |
NeuStar, Cl A* | | | | | | | 132,700 | | | | 3,125 | |
Nuance Communications* | | | | | | | 39,000 | | | | 652 | |
Symantec | | | | | | | 162,700 | | | | 2,824 | |
Unisys* | | | | | | | 11,300 | | | | 95 | |
Vasco Data Security International* | | | | | | | 8,700 | | | | 144 | |
Xerox | | | | | | | 7,300 | | | | 73 | |
Zix* | | | | | | | 31,400 | | | | 126 | |
| | | | | | | | | | | | |
| | | | | | | | | | | 21,745 | |
| | | | | | | | | | | | |
| |
Telecommunication Services — 0.7% | | | | | |
AT&T | | | | | | | 13,300 | | | | 521 | |
Cincinnati Bell* | | | | | | | 44,200 | | | | 176 | |
FairPoint Communications* | | | | | | | 10,800 | | | | 146 | |
IDT, Cl B | | | | | | | 16,400 | | | | 244 | |
Inteliquent | | | | | | | 18,500 | | | | 309 | |
Shenandoah Telecommunications | | | | | | | 2,900 | | | | 93 | |
Telephone & Data Systems | | | | | | | 83,900 | | | | 2,415 | |
US Cellular* | | | | | | | 1,500 | | | | 57 | |
Verizon Communications | | | | | | | 17,400 | | | | 886 | |
| | | | | | | | | | | | |
| | | | | | | | | | | 4,847 | |
| | | | | | | | | | | | |
| | | |
Utilities — 0.8% | | | | | | | | | | | | |
Entergy | | | | | | | 12,600 | | | | 957 | |
Exelon | | | | | | | 38,900 | | | | 1,333 | |
MDU Resources Group | | | | | | | 28,800 | | | | 659 | |
| | | | |
| SEI Institutional Investments Trust / Annual Report / May 31, 2016 | | | 251 | |
CONSOLIDATED SCHEDULE OF INVESTMENTS
Multi-Asset Real Return Fund (Continued)
May 31, 2016
| | | | | | | | | | | | |
| Description | | | | | Face Amount ($ Thousands)/Shares | | | Market Value
($ Thousands) | |
| | | | | | | | | | | | |
NiSource | | | | | | | 49,700 | | | $ | 1,186 | |
PPL | | | | | | | 55,800 | | | | 2,150 | |
| | | | | | | | | | | | |
| | | | | | | | | | | 6,285 | |
| | | | | | | | | | | | |
Total Common Stock
(Cost $191,128) ($ Thousands) | | | | | | | | | | | 207,223 | |
| | | | | | | | | | | | |
|
MORTGAGE-BACKED SECURITIES — 7.8% | |
|
Agency Mortgage-Backed Obligations — 0.5% | |
FHLMC CMO, Ser 2007-3311, Cl IE, IO | | | | | | | | | | | | |
5.976%, 05/15/2037 (D) | | | | | | | 2,028 | | | | 418 | |
FHLMC Multifamily Structured Pass-Through Certificates, Ser K025, Cl A1 | | | | | | | | | | | | |
1.875%, 04/25/2022 | | | | | | | 844 | | | | 847 | |
FNMA CMO, Ser 2013-130, Cl SN, IO | | | | | | | | | | | | |
6.204%, 10/25/2042 (D) | | | | | | | 2,807 | | | | 526 | |
FNMA CMO, Ser 2015-33, Cl AI, IO | | | | | | | | | | | | |
5.000%, 06/25/2045 | | | | | | | 3,007 | | | | 554 | |
FNMA CMO, Ser 2015-66, Cl AS, IO | | | | | | | | | | | | |
5.804%, 09/25/2045 (D) | | | | | | | 2,725 | | | | 541 | |
FNMA CMO, Ser 2016-19, Cl SA, IO | | | | | | | | | | | | |
5.654%, 04/25/2046 (D) | | | | | | | 2,485 | | | | 434 | |
FNMA CMO, Ser 2016-22, Cl ST, IO | | | | | | | | | | | | |
5.654%, 04/25/2046 (D) | | | | | | | 2,997 | | | | 559 | |
| | | | | | | | | | | | |
| | | | | | | | | | | 3,879 | |
| | | | | | | | | | | | |
|
Non-Agency Mortgage-Backed Obligations — 7.3% | |
Alternative Loan Trust, Ser 2005-20CB, Cl 3A6 | | | | | | | | | | | | |
5.500%, 07/25/2035 | | | | | | | 115 | | | | 107 | |
Alternative Loan Trust, Ser 2005-57CB, Cl 4A3 | | | | | | | | | | | | |
5.500%, 12/25/2035 | | | | | | | 295 | | | | 264 | |
Alternative Loan Trust, Ser 2006-23CB, Cl 1A7 | | | | | | | | | | | | |
6.000%, 08/25/2036 | | | | | | | 190 | | | | 182 | |
Alternative Loan Trust, Ser 2006-24CB, Cl A16 | | | | | | | | | | | | |
5.750%, 06/25/2036 | | | | | | | 487 | | | | 408 | |
Alternative Loan Trust, Ser 2006-28CB, Cl A14 | | | | | | | | | | | | |
6.250%, 10/25/2036 | | | | | | | 335 | | | | 279 | |
Alternative Loan Trust, Ser 2006-9T1, Cl A1 | | | | | | | | | | | | |
5.750%, 05/25/2036 | | | | | | | 199 | | | | 161 | |
Alternative Loan Trust, Ser 2006-J1, Cl 1A13 | | | | | | | | | | | | |
5.500%, 02/25/2036 | | | | | | | 281 | | | | 250 | |
Alternative Loan Trust, Ser 2007-2CB, Cl 2A4 | | | | | | | | | | | | |
5.750%, 03/25/2037 | | | | | | | 281 | | | | 241 | |
Banc of America Commercial Mortgage Trust, Ser 2007-4, Cl A1A | | | | | | | | | | | | |
5.774%, 02/10/2051 (D) | | | | | | | 1,356 | | | | 1,402 | |
Banc of America Commercial Mortgage Trust, Ser 2007-5, Cl AM | | | | | | | | | | | | |
5.772%, 02/10/2051 (D) | | | | | | | 78 | | | | 80 | |
| | | | | | | | | | | | |
| Description | | | | | Face Amount
($ Thousands) | | | Market Value
($ Thousands) | |
| | | | | | | | | | | | |
Bear Stearns Commercial Mortgage Securities Trust, Ser 2006-PW13, Cl AJ | | | | | | | | | | | | |
5.611%, 09/11/2041 (D) | | | | | | $ | 568 | | | $ | 567 | |
Bellemeade Re II, Ser 2016-1A, Cl M2B | | | | | | | | | | | | |
6.933%, 04/25/2026 (D)(E) | | | | | | | 311 | | | | 313 | |
Bellemeade Re, Ser 2015-1A, Cl M1 | | | | | | | | | | | | |
2.939%, 07/25/2025 (D)(E) | | | | | | | 277 | | | | 275 | |
BHMS Mortgage Trust, Ser 2014-ATLS, Cl AFX | | | | | | | | | | | | |
3.600%, 07/05/2033 (E) | | | | | | | 905 | | | | 936 | |
Carefree Portfolio Trust, Ser 2014-CARE, Cl A | | | | | | | | | | | | |
1.754%, 11/15/2019 (D)(E) | | | | | | | 516 | | | | 515 | |
CGRBS Commercial Mortgage Trust, Ser 2013- VN05, Cl A | | | | | | | | | | | | |
3.187%, 03/13/2035 (E) | | | | | | | 285 | | | | 298 | |
Chase Mortgage Finance Trust, Ser 2007-S5, Cl 1A17 | | | | | | | | | | | | |
6.000%, 07/25/2037 | | | | | | | 154 | | | | 126 | |
CHL Mortgage Pass-Through Trust, Ser 2006- 10, Cl 1A8 | | | | | | | | | | | | |
6.000%, 05/25/2036 | | | | | | | 255 | | | | 230 | |
CHL Mortgage Pass-Through Trust, Ser 2006- 13, Cl 1A19 | | | | | | | | | | | | |
6.250%, 09/25/2036 | | | | | | | 132 | | | | 117 | |
CHL Mortgage Pass-Through Trust, Ser 2006- 13, Cl 1A18 | | | | | | | | | | | | |
6.250%, 09/25/2036 | | | | | | | 366 | | | | 326 | |
Citigroup Commercial Mortgage Trust, Ser 2012-GC8, Cl D | | | | | | | | | | | | |
4.877%, 09/10/2045 (D)(E) | | | | | | | 541 | | | | 501 | |
Citigroup Commercial Mortgage Trust, Ser 2013-GC11, Cl D | | | | | | | | | | | | |
4.603%, 04/10/2046 (D)(E) | | | | | | | 560 | | | | 492 | |
Citigroup Commercial Mortgage Trust, Ser 2015-GC27, Cl A5 | | | | | | | | | | | | |
3.137%, 02/10/2048 | | | | | | | 779 | | | | 800 | |
Citigroup Commercial Mortgage Trust, Ser 2016-C1, Cl A4 | | | | | | | | | | | | |
3.209%, 05/10/2049 | | | | | | | 750 | | | | 768 | |
COMM Mortgage Trust, Ser 2006-C8, Cl A1A | | | | | | | | | | | | |
5.292%, 12/10/2046 | | | | | | | 1,155 | | | | 1,170 | |
COMM Mortgage Trust, Ser 2013-SFS, Cl A1 | | | | | | | | | | | | |
1.873%, 04/12/2035 (E) | | | | | | | 1,200 | | | | 1,184 | |
COMM Mortgage Trust, Ser 2014-KYO, Cl F | | | | | | | | | | | | |
3.939%, 06/11/2027 (D)(E) | | | | | | | 345 | | | | 341 | |
COMM Mortgage Trust, Ser 2014-KYO, Cl A | | | | | | | | | | | | |
1.336%, 06/11/2027 (D)(E) | | | | | | | 663 | | | | 660 | |
COMM Mortgage Trust, Ser 2014-SAVA, Cl A | | | | | | | | | | | | |
1.583%, 06/15/2034 (D)(E) | | | | | | | 320 | | | | 315 | |
Commercial Mortgage Loan Trust, Ser 2008- LS1, Cl A1A | | | | | | | | | | | | |
6.298%, 12/10/2049 (D) | | | | | | | 1,161 | | | | 1,217 | |
| | |
| 252 | | SEI Institutional Investments Trust / Annual Report / May 31, 2016 |
| | | | | | | | | | | | |
| Description | | | | | Face Amount
($ Thousands) | | | Market Value
($ Thousands) | |
| | | | | | | | | | | | |
Commercial Mortgage Trust, Ser 2007-GG9, Cl A4 | | | | | | | | | | | | |
5.444%, 03/10/2039 | | | | | | $ | 1,063 | | | $ | 1,077 | |
Commercial Mortgage Trust, Ser 2007-GG9, Cl AM | | | | | | | | | | | | |
5.475%, 03/10/2039 | | | | | | | 246 | | | | 251 | |
Countrywide Home Loan Mortgage Pass-Through Trust, Ser 2007-HYB2, Cl 3A1 | | | | | | | | | | | | |
2.879%, 02/25/2047 (D) | | | | | | | 157 | | | | 141 | |
Credit Suisse Commercial Mortgage Trust, Ser 2007-C3, Cl AM | | | | | | | | | | | | |
5.888%, 06/15/2039 (D) | | | | | | | 461 | | | | 466 | |
CSAIL Commercial Mortgage Trust, Ser 2015- C3, Cl A4 | | | | | | | | | | | | |
3.691%, 08/15/2048 | | | | | | | 641 | | | | 685 | |
CSMC Series, Ser 2010-6R, Cl 3A2 | | | | | | | | | | | | |
5.875%, 01/26/2038 (E) | | | | | | | 426 | | | | 353 | |
CW Capital Cobalt, Ser 2007-C3, Cl A4 | | | | | | | | | | | | |
5.956%, 05/15/2046 (D) | | | | | | | 151 | | | | 155 | |
Deutsche Alt-A Securities Mortgage Loan Trust, Ser 2006-AR4, Cl A2 | | | | | | | | | | | | |
0.629%, 12/25/2036 (D) | | | | | | | 295 | | | | 176 | |
FHLMC Structured Agency Credit Risk Debt Notes, Ser 2013-DN2, Cl M2 | | | | | | | | | | | | |
4.683%, 11/25/2023 (D) | | | | | | | 785 | | | | 793 | |
FHLMC Structured Agency Credit Risk Debt Notes, Ser 2014-DN2, Cl M1 | | | | | | | | | | | | |
1.296%, 04/25/2024 (D) | | | | | | | 116 | | | | 116 | |
FHLMC Structured Agency Credit Risk Debt Notes, Ser 2014-DN3, Cl M3 | | | | | | | | | | | | |
4.439%, 08/25/2024 (D) | | | | | | | 890 | | | | 888 | |
FHLMC Structured Agency Credit Risk Debt Notes, Ser 2014-DN4, Cl M3 | | | | | | | | | | | | |
4.989%, 10/25/2024 (D) | | | | | | | 250 | | | | 258 | |
FHLMC Structured Agency Credit Risk Debt Notes, Ser 2014-HQ3, Cl M3 | | | | | | | | | | | | |
5.189%, 10/25/2024 (D) | | | | | | | 650 | | | | 659 | |
FHLMC Structured Agency Credit Risk Debt Notes, Ser 2015-DNA1, Cl M3 | | | | | | | | | | | | |
3.739%, 10/25/2027 (D) | | | | | | | 265 | | | | 260 | |
FHLMC Structured Agency Credit Risk Debt Notes, Ser 2015-DNA2, Cl M2 | | | | | | | | | | | | |
3.039%, 12/25/2027 (D) | | | | | | | 1,107 | | | | 1,123 | |
FHLMC Structured Agency Credit Risk Debt Notes, Ser 2015-DNA3, Cl M3 | | | | | | | | | | | | |
5.139%, 04/25/2028 (D) | | | | | | | 292 | | | | 291 | |
FHLMC Structured Agency Credit Risk Debt Notes, Ser 2015-HQ1, Cl M2 | | | | | | | | | | | | |
2.639%, 03/25/2025 (D) | | | | | | | 425 | | | | 428 | |
FHLMC Structured Agency Credit Risk Debt Notes, Ser 2015-HQA1, Cl M2 | | | | | | | | | | | | |
3.089%, 03/25/2028 (D) | | | | | | | 840 | | | | 854 | |
| | | | | | | | | | | | |
| Description | | | | | Face Amount
($ Thousands) | | | Market Value
($ Thousands) | |
| | | | | | | | | | | | |
FHLMC Structured Agency Credit Risk Debt Notes, Ser 2015-HQA2, Cl M2 | | | | | | | | | | | | |
3.246%, 05/25/2028 (D) | | | | | | $ | 311 | | | $ | 317 | |
FHLMC Structured Agency Credit Risk Debt Notes, Ser 2015-HQA2, Cl M3 | | | | | | | | | | | | |
5.246%, 05/25/2028 (D) | | | | | | | 280 | | | | 277 | |
FHLMC Structured Agency Credit Risk Debt Notes, Ser 2016-DNA1, Cl M3 | | | | | | | | | | | | |
5.975%, 07/25/2028 (D) | | | | | | | 350 | | | | 365 | |
FHLMC Structured Agency Credit Risk Debt Notes, Ser 2016-DNA2, Cl M3 | | | | | | | | | | | | |
5.096%, 10/25/2028 (D) | | | | | | | 318 | | | | 313 | |
FHLMC Structured Agency Credit Risk Debt Notes, Ser 2016-HQA1, Cl M3 | | | | | | | | | | | | |
6.796%, 09/25/2028 (D) | | | | | | | 342 | | | | 368 | |
First Horizon Alternative Mortgage Securities Trust, Ser 2006-FA3, Cl A9 | | | | | | | | | | | | |
6.000%, 07/25/2036 | | | | | | | 118 | | | | 92 | |
FNMA Connecticut Avenue Securities, Ser 2014-C03, Cl 1M1 | | | | | | | | | | | | |
1.646%, 07/25/2024 (D) | | | | | | | 192 | | | | 192 | |
FNMA Connecticut Avenue Securities, Ser 2014-C04, Cl 1M2 | | | | | | | | | | | | |
5.339%, 11/25/2024 (D) | | | | | | | 533 | | | | 547 | |
FNMA Connecticut Avenue Securities, Ser 2014-C04, Cl 2M2 | | | | | | | | | | | | |
5.439%, 11/25/2024 (D) | | | | | | | 205 | | | | 209 | |
FNMA Connecticut Avenue Securities, Ser 2015-C01, Cl 2M2 | | | | | | | | | | | | |
4.996%, 02/25/2025 (D) | | | | | | | 696 | | | | 706 | |
FNMA Connecticut Avenue Securities, Ser 2015-C01, Cl 1M2 | | | | | | | | | | | | |
4.739%, 02/25/2025 (D) | | | | | | | 415 | | | | 420 | |
FNMA Connecticut Avenue Securities, Ser 2015-C02, Cl 1M2 | | | | | | | | | | | | |
4.446%, 05/25/2025 (D) | | | | | | | 674 | | | | 674 | |
FNMA Connecticut Avenue Securities, Ser 2015-C02, Cl 2M2 | | | | | | | | | | | | |
4.439%, 05/25/2025 (D) | | | | | | | 465 | | | | 464 | |
FNMA Connecticut Avenue Securities, Ser 2015-C03, Cl 2M2 | | | | | | | | | | | | |
5.439%, 07/25/2025 (D) | | | | | | | 718 | | | | 732 | |
FNMA Connecticut Avenue Securities, Ser 2015-C03, Cl 1M1 | | | | | | | | | | | | |
1.939%, 07/25/2025 (D) | | | | | | | 358 | | | | 359 | |
FNMA Connecticut Avenue Securities, Ser 2015-C03, Cl 1M2 | | | | | | | | | | | | |
5.439%, 07/25/2025 (D) | | | | | | | 737 | | | | 753 | |
FNMA Connecticut Avenue Securities, Ser 2015-C04, Cl 1M2 | | | | | | | | | | | | |
5.894%, 04/25/2028 (D) | | | | | | | 218 | | | | 227 | |
| | | | |
| SEI Institutional Investments Trust / Annual Report / May 31, 2016 | | | 253 | |
CONSOLIDATED SCHEDULE OF INVESTMENTS
Multi-Asset Real Return Fund (Continued)
May 31, 2016
| | | | | | | | | | | | |
| Description | | | | | Face Amount
($ Thousands) | | | Market Value
($ Thousands) | |
| | | | | | | | | | | | |
FNMA Connecticut Avenue Securities, Ser 2015-C04, Cl 2M2 | | | | | | | | | | | | |
5.989%, 04/25/2028 (D) | | | | | | $ | 750 | | | $ | 773 | |
FNMA Connecticut Avenue Securities, Ser 2016-C01, Cl 1M2 | | | | | | | | | | | | |
7.189%, 08/25/2028 (D) | | | | | | | 478 | | | | 521 | |
FNMA Connecticut Avenue Securities, Ser 2016-C01, Cl 2M2 | | | | | | | | | | | | |
7.389%, 08/25/2028 (D) | | | | | | | 495 | | | | 537 | |
FNMA Connecticut Avenue Securities, Ser 2016-C02, Cl 1M2 | | | | | | | | | | | | |
6.446%, 09/25/2028 (D) | | | | | | | 565 | | | | 600 | |
FNMA Connecticut Avenue Securities, Ser 2016-C03, Cl 2M2 | | | | | | | | | | | | |
6.346%, 10/25/2028 (D) | | | | | | | 459 | | | | 478 | |
FNMA Connecticut Avenue Securities, Ser 2016-C03, Cl 1M2 | | | | | | | | | | | | |
5.746%, 10/25/2028 (D) | | | | | | | 92 | | | | 94 | |
GS Mortgage Securites, Ser 2006-AR4, Cl A2 | | | | | | | | | | | | |
2.059%, 04/10/2031 (D) | | | | | | | 188 | | | | 185 | |
GS Mortgage Securities II, Ser 2007-GG10, Cl A4 | | | | | | | | | | | | |
5.987%, 08/10/2045 (D) | | | | | | | 564 | | | | 578 | |
GS Mortgage Securities Trust, Ser 2013-G1, Cl A2 | | | | | | | | | | | | |
3.557%, 04/10/2031 (D)(E) | | | | | | | 1,485 | | | | 1,521 | |
GS Mortgage Securities Trust, Ser 2014-GC18, Cl D | | | | | | | | | | | | |
4.948%, 01/10/2047 (D)(E) | | | | | | | 631 | | | | 510 | |
GS Mortgage Securities, Ser 2013-KING, Cl A | | | | | | | | | | | | |
2.706%, 12/10/2027 (E) | | | | | | | 257 | | | | 260 | |
H/2 Asset Funding, Ser 2015-1A | | | | | | | | | | | | |
2.093%, 06/24/2049 | | | | | | | 692 | | | | 687 | |
HomeBanc Mortgage Trust, Ser 2005-1, Cl A1 | | | | | | | | | | | | |
0.939%, 03/25/2035 (D) | | | | | | | 128 | | | | 107 | |
JPMBB Commercial Mortgage Securities Trust, Ser 2015-C31, Cl A3 | | | | | | | | | | | | |
3.801%, 08/15/2048 | | | | | | | 592 | | | | 637 | |
JPMBB Commercial Mortgage Securities Trust, Ser 2015-C32, Cl C | | | | | | | | | | | | |
4.819%, 11/15/2048 (D) | | | | | | | 585 | | | | 534 | |
JPMorgan Chase Commercial Mortgage Securities Trust 2006-LDP8, Ser 2006- LDP8, Cl AJ | | | | | | | | | | | | |
5.480%, 05/15/2045 (D) | | | | | | | 453 | | | | 452 | |
JPMorgan Chase Commercial Mortgage Securities Trust, Ser 2004-LN2, Cl A1A | | | | | | | | | | | | |
4.838%, 07/15/2041 (D)(E) | | | | | | | 163 | | | | 163 | |
JPMorgan Chase Commercial Mortgage Securities Trust, Ser 2006-LDP9, Cl AM | | | | | | | | | | | | |
5.372%, 05/15/2047 | | | | | | | 364 | | | | 362 | |
| | | | | | | | | | | | |
| Description | | | | | Face Amount
($ Thousands) | | | Market Value
($ Thousands) | |
| | | | | | | | | | | | |
JPMorgan Chase Commercial Mortgage Securities Trust, Ser 2007-CB19, Cl AM | | | | | | | | | | | | |
5.889%, 02/12/2049 (D) | | | | | | $ | 100 | | | $ | 102 | |
JPMorgan Chase Commercial Mortgage Securities Trust, Ser 2007-LD12, Cl AM | | | | | | | | | | | | |
6.207%, 02/15/2051 (D) | | | | | | | 75 | | | | 78 | |
JPMorgan Chase Commercial Mortgage Securities Trust, Ser 2007-LD12, Cl A4 | | | | | | | | | | | | |
5.882%, 02/15/2051 (D) | | | | | | | 1,275 | | | | 1,310 | |
JPMorgan Chase Commercial Mortgage Securities Trust, Ser 2007-LDPX, Cl A1A | | | | | | | | | | | | |
5.439%, 01/15/2049 | | | | | | | 1,040 | | | | 1,058 | |
JPMorgan Chase Commercial Mortgage Securities Trust, Ser 2010-C2, Cl A1 | | | | | | | | | | | | |
2.749%, 11/15/2043 (E) | | | | | | | 42 | | | | 42 | |
JPMorgan Chase Commercial Mortgage Securities Trust, Ser 2014-INN, Cl A | | | | | | | | | | | | |
1.354%, 06/15/2029 (D)(E) | | | | | | | 923 | | | | 912 | |
JPMorgan Chase Commercial Mortgage Securities Trust, Ser 2015-SGP, Cl A | | | | | | | | | | | | |
2.133%, 07/15/2036 (D)(E) | | | | | | | 913 | | | | 914 | |
JPMorgan Mortgage Trust, Ser 2007-S3, Cl 1A8 | | | | | | | | | | | | |
6.000%, 08/25/2037 | | | | | | | 224 | | | | 193 | |
LB-UBS Commercial Mortgage Trust, Ser 2006-C6, Cl AJ | | | | | | | | | | | | |
5.452%, 09/15/2039 (D) | | | | | | | 313 | | | | 311 | |
LB-UBS Commercial Mortgage Trust, Ser 2007-C1, Cl A4 | | | | | | | | | | | | |
5.424%, 02/15/2040 | | | | | | | 286 | | | | 290 | |
LB-UBS Commercial Mortgage Trust, Ser 2007-C1, Cl AM | | | | | | | | | | | | |
5.455%, 02/15/2040 | | | | | | | 305 | | | | 309 | |
LSTAR Commercial Mortgage Trust, Ser 2014-2, Cl A2 | | | | | | | | | | | | |
2.767%, 01/20/2041 (E) | | | | | | | 470 | | | | 471 | |
LSTAR Commercial Mortgage Trust, Ser 2015-3, Cl A2 | | | | | | | | | | | | |
2.729%, 04/20/2048 (D)(E) | | | | | | | 748 | | | | 759 | |
Merrill Lynch Mortgage Trust, Ser 2006-C2, Cl AJ | | | | | | | | | | | | |
5.802%, 08/12/2043 (D) | | | | | | | 372 | | | | 371 | |
Merrill Lynch Mortgage Trust, Ser 2006-C2, Cl A1A | | | | | | | | | | | | |
5.739%, 08/12/2043 (D) | | | | | | | 67 | | | | 67 | |
ML-CFC Commercial Mortgage Trust, Ser 2006- 4, Cl A1A | | | | | | | | | | | | |
5.166%, 12/12/2049 | | | | | | | 303 | | | | 305 | |
ML-CFC Commercial Mortgage Trust, Ser 2007- 9, Cl A4 | | | | | | | | | | | | |
5.700%, 09/12/2049 | | | | | | | 285 | | | | 296 | |
Morgan Stanley Capital I Trust, Ser 2015-XLF2, Cl SNMA | | | | | | | | | | | | |
2.383%, 11/15/2026 (D)(E) | | | | | | | 151 | | | | 152 | |
| | |
| 254 | | SEI Institutional Investments Trust / Annual Report / May 31, 2016 |
| | | | | | | | | | | | |
| Description | | | | | Face Amount
($ Thousands) | | | Market Value
($ Thousands) | |
| | | | | | | | | | | | |
Morgan Stanley Capital I Trust, Ser 2015-XLF2, Cl AFSA | | | | | | | | | | | | |
2.303%, 08/15/2026 (D)(E) | | | | | | $ | 151 | | | $ | 151 | |
RBSSP Resecuritization Trust, Ser 2009-7, Cl 10A3 | | | | | | | | | | | | |
6.000%, 08/26/2037 (E) | | | | | | | 598 | | | | 509 | |
RBSSP Resecuritization Trust, Ser 2010-9, Cl 7A6 | | | | | | | | | | | | |
6.639%, 05/26/2037 (D)(E) | | | | | | | 523 | | | | 438 | |
Resource Capital, Ser 2014-CRE2, Cl A | | | | | | | | | | | | |
1.483%, 04/15/2032 (D)(E) | | | | | | | 259 | | | | 254 | |
Starwood Retail Property Trust, Ser 2014, Cl A | | | | | | | | | | | | |
1.653%, 11/15/2027 (D)(E) | | | | | | | 1,220 | | | | 1,205 | |
UBS-Barclays Commercial Mortgage Trust, Ser 2012-C3, Cl A4 | | | | | | | | | | | | |
3.091%, 08/10/2049 | | | | | | | 98 | | | | 102 | |
UBS-Barclays Commercial Mortgage Trust, Ser 2012-C4, Cl A5 | | | | | | | | | | | | |
2.850%, 12/10/2045 | | | | | | | 194 | | | | 199 | |
UBS-Citigroup Commercial Mortgage Trust, Ser 2011-C1, Cl E | | | | | | | | | | | | |
6.084%, 01/10/2045 (D)(E) | | | | | | | 239 | | | | 257 | |
Wachovia Bank Commercial Mortgage Trust Series, Ser 2006-C26, Cl A1A | | | | | | | | | | | | |
6.009%, 06/15/2045 (D) | | | | | | | 184 | | | | 184 | |
Wells Fargo Commercial Mortgage Trust, Ser 2015-SG1, Cl C | | | | | | | | | | | | |
4.620%, 12/15/2047 (D) | | | | | | | 527 | | | | 517 | |
Wells Fargo Credit Risk Transfer Securities Trust, Ser 2015-WF1, Cl 2M2 | | | | | �� | | | | | | | |
5.939%, 11/25/2025 (D)(E) | | | | | | | 122 | | | | 120 | |
Wells Fargo Credit Risk Transfer Securities Trust, Ser 2015-WF1, Cl 1M2 | | | | | | | | | | | | |
5.689%, 11/25/2025 (D)(E) | | | | | | | 432 | | | | 427 | |
Wells Fargo Mortgage-Backed Securities Trust, Ser 2007-8, Cl 2A5 | | | | | | | | | | | | |
5.750%, 07/25/2037 | | | | | | | 170 | | | | 165 | |
WFRBS Commercial Mortgage Trust, Ser 2012- C9, Cl D | | | | | | | | | | | | |
4.961%, 11/15/2045 (D)(E) | | | | | | | 354 | | | | 340 | |
WFRBS Commercial Mortgage Trust, Ser 2013- C14, Cl A5 | | | | | | | | | | | | |
3.337%, 06/15/2046 | | | | | | | 280 | | | | 295 | |
WFRBS Commercial Mortgage Trust, Ser 2014- C20, Cl A2 | | | | | | | | | | | | |
3.036%, 05/15/2047 | | | | | | | 549 | | | | 568 | |
| | | | | | | | | | | | |
| | | | | | | | | | | 53,184 | |
| | | | | | | | | | | | |
Total Mortgage-Backed Securities
(Cost $57,308) ($ Thousands) | | | | | | | | | | | 57,063 | |
| | | | | | | | | | | | |
| | | | | | | | | | | | |
| Description | | | | | Face Amount
($ Thousands) | | | Market Value
($ Thousands) | |
| | | | | | | | | | | | |
CORPORATE OBLIGATIONS — 6.9% | | | | | |
| |
Consumer Discretionary — 0.9% | | | | | |
21st Century Fox America | | | | | | | | | | | | |
6.150%, 02/15/2041 | | | | | | $ | 75 | | | $ | 92 | |
4.500%, 02/15/2021 | | | | | | | 90 | | | | 99 | |
4.000%, 10/01/2023 | | | | | | | 117 | | | | 126 | |
3.000%, 09/15/2022 | | | | | | | 420 | | | | 431 | |
CBS | | | | | | | | | | | | |
5.750%, 04/15/2020 | | | | | | | 145 | | | | 164 | |
3.500%, 01/15/2025 | | | | | | | 625 | | | | 641 | |
Comcast | | | | | | | | | | | | |
6.450%, 03/15/2037 | | | | | | | 40 | | | | 53 | |
CSC Holdings | | | | | | | | | | | | |
8.625%, 02/15/2019 | | | | | | | 126 | | | | 140 | |
Dana Holdings | | | | | | | | | | | | |
6.000%, 09/15/2023 | | | | | | | 91 | | | | 92 | |
Discovery Communications | | | | | | | | | | | | |
3.450%, 03/15/2025 | | | | | | | 338 | | | | 327 | |
Ford Motor Credit | | | | | | | | | | | | |
5.875%, 08/02/2021 | | | | | | | 200 | | | | 227 | |
4.375%, 08/06/2023 | | | | | | | 260 | | | | 279 | |
Ford Motor Credit LLC | | | | | | | | | | | | |
2.597%, 11/04/2019 | | | | | | | 346 | | | | 351 | |
General Motors | | | | | | | | | | | | |
3.500%, 10/02/2018 | | | | | | | 365 | | | | 374 | |
Hanesbrands | | | | | | | | | | | | |
4.625%, 05/15/2024 (E) | | | | | | | 227 | | | | 227 | |
KB Home | | | | | | | | | | | | |
4.750%, 05/15/2019 | | | | | | | 294 | | | | 293 | |
Kohl’s | | | | | | | | | | | | |
5.550%, 07/17/2045 | | | | | | | 485 | | | | 411 | |
Newell Brands | | | | | | | | | | | | |
3.850%, 04/01/2023 | | | | | | | 269 | | | | 280 | |
3.150%, 04/01/2021 | | | | | | | 915 | | | | 939 | |
Time Warner | | | | | | | | | | | | |
4.700%, 01/15/2021 | | | | | | | 130 | | | | 143 | |
3.550%, 06/01/2024 | | | | | | | 559 | | | | 584 | |
Time Warner Cable | | | | | | | | | | | | |
4.500%, 09/15/2042 | | | | | | | 245 | | | | 218 | |
4.125%, 02/15/2021 | | | | | | | 65 | | | | 68 | |
| | | | | | | | | | | | |
| | | | | | | | | | | 6,559 | |
| | | | | | | | | | | | |
| | | |
Consumer Staples — 0.6% | | | | | | | | | | | | |
Altria Group | | | | | | | | | | | | |
4.750%, 05/05/2021 | | | | | | | 215 | | | | 242 | |
2.625%, 01/14/2020 | | | | | | | 895 | | | | 921 | |
Bayer US Finance LLC | | | | | | | | | | | | |
3.375%, 10/08/2024 (E) | | | | | | | 337 | | | | 345 | |
Kraft Heinz Foods | | | | | | | | | | | | |
3.500%, 07/15/2022 (E) | | | | | | | 472 | | | | 492 | |
2.800%, 07/02/2020 (E) | | | | | | | 370 | | | | 380 | |
Reynolds American | | | | | | | | | | | | |
4.000%, 06/12/2022 | | | | | | | 654 | | | | 703 | |
| | | | |
| SEI Institutional Investments Trust / Annual Report / May 31, 2016 | | | 255 | |
CONSOLIDATED SCHEDULE OF INVESTMENTS
Multi-Asset Real Return Fund (Continued)
May 31, 2016
| | | | | | | | | | | | |
| Description | | | | | Face Amount
($ Thousands) | | | Market Value
($ Thousands) | |
| | | | | | | | | | | | |
Valeant Pharmaceuticals International | | | | | | | | | | | | |
6.125%, 04/15/2025 (E) | | | | | | $ | 415 | | | $ | 347 | |
Walgreens Boots Alliance | | | | | | | | | | | | |
3.800%, 11/18/2024 | | | | | | | 885 | | | | 918 | |
| | | | | | | | | | | | |
| | | | | | | | | | | 4,348 | |
| | | | | | | | | | | | |
| | | |
Energy — 0.8% | | | | | | | | | | | | |
Cenovus Energy | | | | | | | | | | | | |
3.000%, 08/15/2022 | | | | | | | 36 | | | | 32 | |
Diamond Offshore Drilling | | | | | | | | | | | | |
4.875%, 11/01/2043 | | | | | | | 301 | | | | 215 | |
Energy Transfer Partners | | | | | | | | | | | | |
5.200%, 02/01/2022 | | | | | | | 465 | | | | 467 | |
4.650%, 06/01/2021 | | | | | | | 85 | | | | 84 | |
EnLink Midstream Partners | | | | | | | | | | | | |
5.050%, 04/01/2045 | | | | | | | 371 | | | | 274 | |
Enterprise Products Operating | | | | | | | | | | | | |
5.200%, 09/01/2020 | | | | | | | 110 | | | | 122 | |
3.700%, 02/15/2026 | | | | | | | 810 | | | | 820 | |
Husky Energy | | | | | | | | | | | | |
7.250%, 12/15/2019 | | | | | | | 103 | | | | 115 | |
Kinder Morgan Energy Partners | | | | | | | | | | | | |
4.150%, 03/01/2022 | | | | | | | 48 | | | | 47 | |
3.950%, 09/01/2022 | | | | | | | 536 | | | | 526 | |
Marathon Petroleum | | | | | | | | | | | | |
5.125%, 03/01/2021 | | | | | | | 47 | | | | 51 | |
Noble Energy | | | | | | | | | | | | |
8.250%, 03/01/2019 | | | | | | | 174 | | | | 196 | |
4.150%, 12/15/2021 | | | | | | | 340 | | | | 348 | |
3.900%, 11/15/2024 | | | | | | | 463 | | | | 457 | |
ONEOK | | | | | | | | | | | | |
4.250%, 02/01/2022 | | | | | | | 111 | | | | 100 | |
Plains All American Pipeline | | | | | | | | | | | | |
3.600%, 11/01/2024 | | | | | | | 660 | | | | 586 | |
Regency Energy Partners | | | | | | | | | | | | |
4.500%, 11/01/2023 | | | | | | | 72 | | | | 68 | |
Schlumberger Holdings | | | | | | | | | | | | |
3.000%, 12/21/2020 (E) | | | | | | | 880 | | | | 903 | |
SM Energy | | | | | | | | | | | | |
6.500%, 01/01/2023 | | | | | | | 35 | | | | 32 | |
Transocean | | | | | | | | | | | | |
6.500%, 11/15/2020 | | | | | | | 390 | | | | 301 | |
Valero Energy | | | | | | | | | | | | |
6.125%, 02/01/2020 | | | | | | | 149 | | | | 166 | |
Williams Partners | | | | | | | | | | | | |
3.900%, 01/15/2025 | | | | | | | 176 | | | | 152 | |
| | | | | | | | | | | | |
| | | | | | | | | | | 6,062 | |
| | | | | | | | | | | | |
| | | |
Financials — 1.5% | | | | | | | | | | | | |
American International Group | | | | | | | | | | | | |
4.875%, 06/01/2022 | | | | | | | 410 | | | | 448 | |
| | | | | | | | | | | | |
| Description | | | | | Face Amount
($ Thousands) | | | Market Value
($ Thousands) | |
| | | | | | | | | | | | |
American Tower | | | | | | | | | | | | |
5.050%, 09/01/2020 | | | | | | $ | 145 | | | $ | 158 | |
4.700%, 03/15/2022 | | | | | | | 230 | | | | 250 | |
3.500%, 01/31/2023 | | | | | | | 110 | | | | 112 | |
2.800%, 06/01/2020 | | | | | | | 450 | | | | 455 | |
Bank of America | | | | | | | | | | | | |
6.500%, 12/31/2049 (D) | | | | | | | 233 | | | | 246 | |
Citigroup | | | | | | | | | | | | |
3.875%, 03/26/2025 | | | | | | | 680 | | | | 680 | |
Cooperatieve Rabobank UA | | | | | | | | | | | | |
4.375%, 08/04/2025 | | | | | | | 425 | | | | 443 | |
Credit Suisse Group Funding Guernsey | | | | | | | | | | | | |
4.550%, 04/17/2026 (E) | | | | | | | 762 | | | | 784 | |
Goldman Sachs Group MTN | | | | | | | | | | | | |
2.274%, 11/29/2023 (D) | | | | | | | 1,315 | | | | 1,319 | |
Hartford Financial Services Group | | | | | | | | | | | | |
5.500%, 03/30/2020 | | | | | | | 80 | | | | 89 | |
5.125%, 04/15/2022 | | | | | | | 335 | | | | 377 | |
Healthcare Realty Trust | | | | | | | | | | | | |
5.750%, 01/15/2021 | | | | | | | 320 | | | | 355 | |
Host Hotels & Resorts | | | | | | | | | | | | |
5.250%, 03/15/2022 | | | | | | | 70 | | | | 75 | |
3.750%, 10/15/2023 | | | | | | | 13 | | | | 13 | |
HSBC Finance | | | | | | | | | | | | |
6.676%, 01/15/2021 | | | | | | | 60 | | | | 68 | |
JPMorgan Chase | | | | | | | | | | | | |
6.400%, 05/15/2038 | | | | | | | 40 | | | | 53 | |
Lincoln National | | | | | | | | | | | | |
4.200%, 03/15/2022 | | | | | | | 110 | | | | 117 | |
MetLife | | | | | | | | | | | | |
7.717%, 02/15/2019 | | | | | | | 50 | | | | 58 | |
5.700%, 06/15/2035 | | | | | | | 65 | | | | 77 | |
5.250%, 12/29/2049 (D) | | | | | | | 565 | | | | 565 | |
Mitsubishi UFJ Financial Group | | | | | | | | | | | | |
2.553%, 03/01/2021 (D) | | | | | | | 914 | | | | 944 | |
Morgan Stanley MTN | | | | | | | | | | | | |
5.500%, 07/28/2021 | | | | | | | 168 | | | | 190 | |
4.750%, 03/22/2017 | | | | | | | 40 | | | | 41 | |
Murray Street Investment Trust I | | | | | | | | | | | | |
4.647%, 03/09/2017 (F) | | | | | | | 18 | | | | 18 | |
Nationwide Financial Services | | | | | | | | | | | | |
5.375%, 03/25/2021 (E) | | | | | | | 320 | | | | 352 | |
Navient MTN | | | | | | | | | | | | |
7.250%, 01/25/2022 | | | | | | | 15 | | | | 14 | |
PNC Bank | | | | | | | | | | | | |
3.800%, 07/25/2023 | | | | | | | 460 | | | | 487 | |
Prudential Financial | | | | | | | | | | | | |
5.625%, 06/15/2043 (D) | | | | | | | 180 | | | | 190 | |
Santander Bank | | | | | | | | | | | | |
1.561%, 01/12/2018 (D) | | | | | | | 990 | | | | 985 | |
Santander Issuances | | | | | | | | | | | | |
5.179%, 11/19/2025 | | | | | | | 400 | | | | 398 | |
| | |
| 256 | | SEI Institutional Investments Trust / Annual Report / May 31, 2016 |
| | | | | | | | | | | | |
| Description | | | | | Face Amount
($ Thousands) | | | Market Value
($ Thousands) | |
| | | | | | | | | | | | |
Welltower | | | | | | | | | | | | |
5.250%, 01/15/2022 | | | | | | $ | 540 | | | $ | 595 | |
| | | | | | | | | | | | |
| | | | | | | | | | | 10,956 | |
| | | | | | | | | | | | |
| | | |
Health Care — 0.8% | | | | | | | | | | | | |
AbbVie | | | | | | | | | | | | |
3.600%, 05/14/2025 | | | | | | | 479 | | | | 493 | |
Actavis Funding SCS | | | | | | | | | | | | |
3.850%, 06/15/2024 | | | | | | | 241 | | | | 246 | |
3.800%, 03/15/2025 | | | | | | | 846 | | | | 858 | |
Baxalta | | | | | | | | | | | | |
3.600%, 06/23/2022 (E) | | | | | | | 745 | | | | 752 | |
Becton Dickinson | | | | | | | | | | | | |
3.734%, 12/15/2024 | | | | | | | 403 | | | | 427 | |
Biogen | | | | | | | | | | | | |
3.625%, 09/15/2022 | | | | | | | 464 | | | | 484 | |
Celgene | | | | | | | | | | | | |
3.875%, 08/15/2025 | | | | | | | 530 | | | | 555 | |
Gilead Sciences | | | | | | | | | | | | |
3.650%, 03/01/2026 | | | | | | | 359 | | | | 380 | |
Laboratory Corp of America Holdings | | | | | | | | | | | | |
3.600%, 02/01/2025 | | | | | | | 285 | | | | 291 | |
Medtronic | | | | | | | | | | | | |
3.500%, 03/15/2025 | | | | | | | 920 | | | | 981 | |
Perrigo Finance Unlimited | | | | | | | | | | | | |
3.900%, 12/15/2024 | | | | | | | 320 | | | | 315 | |
3.500%, 12/15/2021 | | | | | | | 217 | | | | 219 | |
| | | | | | | | | | | | |
| | | | | | | | | | | 6,001 | |
| | | | | | | | | | | | |
| | | |
Industrials — 0.2% | | | | | | | | | | | | |
AerCap Aviation Solutions | | | | | | | | | | | | |
6.375%, 05/30/2017 | | | | | | | 355 | | | | 367 | |
General Electric | | | | | | | | | | | | |
5.000%, 12/29/2049 (D) | | | | | | | 200 | | | | 208 | |
International Lease Finance | | | | | | | | | | | | |
5.875%, 04/01/2019 | | | | | | | 249 | | | | 266 | |
Novelis | | | | | | | | | | | | |
8.375%, 12/15/2017 | | | | | | | 76 | | | | 77 | |
Reynolds Group Issuer | | | | | | | | | | | | |
5.750%, 10/15/2020 | | | | | | | 345 | | | | 356 | |
| | | | | | | | | | | | |
| | | | | | | | | | | 1,274 | |
| | | | | | | | | | | | |
| | | |
Information Technology — 0.5% | | | | | | | | | | | | |
Advanced Micro Devices | | | | | | | | | | | | |
6.750%, 03/01/2019 | | | | | | | 301 | | | | 271 | |
Diamond 1 Finance | | | | | | | | | | | | |
4.420%, 06/15/2021 (E) | | | | | | | 935 | | | | 954 | |
eBay | | | | | | | | | | | | |
3.800%, 03/09/2022 | | | | | | | 240 | | | | 249 | |
Fidelity National Information Services | | | | | | | | | | | | |
5.000%, 10/15/2025 | | | | | | | 3 | | | | 3 | |
3.500%, 04/15/2023 | | | | | | | 126 | | | | 128 | |
| | | | | | | | | | | | |
| Description | | | | | Face Amount
($ Thousands) | | | Market Value
($ Thousands) | |
| | | | | | | | | | | | |
Intel | | | | | | | | | | | | |
4.800%, 10/01/2041 | | | | | | $ | 95 | | | $ | 105 | |
KLA-Tencor | | | | | | | | | | | | |
4.650%, 11/01/2024 | | | | | | | 691 | | | | 735 | |
Lam Research | | | | | | | | | | | | |
2.800%, 06/15/2021 | | | | | | | 437 | | | | 441 | |
Micron Technology | | | | | | | | | | | | |
7.500%, 09/15/2023 (E) | | | | | | | 234 | | | | 246 | |
NXP BV | | | | | | | | | | | | |
4.125%, 06/01/2021 (E) | | | | | | | 375 | | | | 378 | |
Seagate HDD Cayman | | | | | | | | | | | | |
4.750%, 01/01/2025 | | | | | | | 343 | | | | 264 | |
Total System Services | | | | | | | | | | | | |
2.375%, 06/01/2018 | | | | | | | 90 | | | | 90 | |
| | | | | | | | | | | | |
| | | | | | | | | | | 3,864 | |
| | | | | | | | | | | | |
| | | |
Materials — 0.3% | | | | | | | | | | | | |
Barrick Gold | | | | | | | | | | | | |
4.100%, 05/01/2023 | | | | | | | 49 | | | | 50 | |
Dow Chemical | | | | | | | | | | | | |
4.250%, 11/15/2020 | | | | | | | 41 | | | | 44 | |
Freeport-McMoran Oil & Gas LLC | | | | | | | | | | | | |
6.500%, 11/15/2020 | | | | | | | 129 | | | | 124 | |
International Paper | | | | | | | | | | | | |
4.750%, 02/15/2022 | | | | | | | 305 | | | | 334 | |
LyondellBasell Industries | | | | | | | | | | | | |
5.750%, 04/15/2024 | | | | | | | 1,125 | | | | 1,306 | |
| | | | | | | | | | | | |
| | | | | | | | | | | 1,858 | |
| | | | | | | | | | | | |
| |
Telecommunication Services — 0.8% | | | | | |
AT&T | | | | | | | | | | | | |
4.600%, 02/15/2021 | | | | | | | 60 | | | | 65 | |
4.450%, 04/01/2024 | | | | | | | 734 | | | | 786 | |
3.800%, 03/15/2022 | | | | | | | 110 | | | | 115 | |
3.400%, 05/15/2025 | | | | | | | 280 | | | | 281 | |
3.000%, 02/15/2022 | | | | | | | 485 | | | | 487 | |
Cox Communications | | | | | | | | | | | | |
2.950%, 06/30/2023 (E) | | | | | | | 173 | | | | 162 | |
RELX Capital | | | | | | | | | | | | |
8.625%, 01/15/2019 | | | | | | | 455 | | | | 524 | |
SBA Tower Trust | | | | | | | | | | | | |
3.156%, 10/15/2020 (E) | | | | | | | 753 | | | | 750 | |
Sprint Capital | | | | | | | | | | | | |
6.900%, 05/01/2019 | | | | | | | 1,070 | | | | 998 | |
Verizon Communications | | | | | | | | | | | | |
4.600%, 04/01/2021 | | | | | | | 850 | | | | 944 | |
3.850%, 11/01/2042 | | | | | | | 323 | | | | 296 | |
3.500%, 11/01/2024 | | | | | | | 611 | | | | 635 | |
| | | | | | | | | | | | |
| | | | | | | | | | | 6,043 | |
| | | | | | | | | | | | |
| | | |
Utilities — 0.5% | | | | | | | | | | | | |
AES | | | | | | | | | | | | |
7.375%, 07/01/2021 | | | | | | | 318 | | | | 362 | |
| | | | |
| SEI Institutional Investments Trust / Annual Report / May 31, 2016 | | | 257 | |
CONSOLIDATED SCHEDULE OF INVESTMENTS
Multi-Asset Real Return Fund (Continued)
May 31, 2016
| | | | | | | | | | | | |
| Description | | | | | Face Amount
($ Thousands) | | | Market Value
($ Thousands) | |
| | | | | | | | | | | | |
Berkshire Hathaway Energy | | | | | | | | | | | | |
6.125%, 04/01/2036 | | | | | | $ | 275 | | | $ | 353 | |
CMS Energy | | | | | | | | | | | | |
5.050%, 03/15/2022 | | | | | | | 52 | | | | 58 | |
Constellation Energy Group | | | | | | | | | | | | |
5.150%, 12/01/2020 | | | | | | | 26 | | | | 29 | |
Entergy | | | | | | | | | | | | |
4.000%, 07/15/2022 | | | | | | | 648 | | | | 686 | |
Exelon | | | | | | | | | | | | |
2.850%, 06/15/2020 | | | | | | | 1,225 | | | | 1,253 | |
Exelon Generation | | | | | | | | | | | | |
4.250%, 06/15/2022 | | | | | | | 360 | | | | 377 | |
NRG Energy | | | | | | | | | | | | |
6.250%, 05/01/2024 | | | | | | | 243 | | | | 236 | |
Pacific Gas & Electric | | | | | | | | | | | | |
4.500%, 12/15/2041 | | | | | | | 65 | | | | 73 | |
| | | | | | | | | | | | |
| | | | | | | | | | | 3,427 | |
| | | | | | | | | | | | |
Total Corporate Obligations
(Cost $49,778) ($ Thousands) | | | | | | | | | | | 50,392 | |
| | | | | | | | | | | | |
| |
ASSET-BACKED SECURITIES — 4.4% | | | | | |
| | | |
Automotive — 2.2% | | | | | | | | | | | | |
Ally Auto Receivables Trust, Ser 2015-2, Cl A3 | | | | | | | | | | | | |
1.490%, 11/15/2019 | | | | | | | 364 | | | | 366 | |
AmeriCredit Automobile Receivables Trust, Ser 2013-3, Cl A3 | | | | | | | | | | | | |
0.920%, 04/09/2018 | | | | | | | 20 | | | | 20 | |
AmeriCredit Automobile Receivables Trust, Ser 2013-4, Cl A3 | | | | | | | | | | | | |
0.960%, 04/09/2018 | | | | | | | 22 | | | | 22 | |
ARI Fleet Lease Trust, Ser 2014-A, Cl A2 | | | | | | | | | | | | |
0.810%, 11/15/2022 (E) | | | | | | | 99 | | | | 99 | |
Avis Budget Rental Car Funding AESOP LLC, Ser 2016-1A, Cl A | | | | | | | | | | | | |
2.990%, 06/20/2022 (E) | | | | | | | 438 | | | | 438 | |
Avis Budget Rental Car Funding AESOP, Ser 2013-2A, Cl A | | | | | | | | | | | | |
2.970%, 02/20/2020 (E) | | | | | | | 710 | | | | 724 | |
Bank of The West Auto Trust, Ser 2015-1, Cl A3 | | | | | | | | | | | | |
1.310%, 10/15/2019 (E) | | | | | | | 748 | | | | 749 | |
California Republic Auto Receivables Trust, Ser 2014-2, Cl A4 | | | | | | | | | | | | |
1.570%, 12/16/2019 | | | | | | | 734 | | | | 734 | |
California Republic Auto Receivables Trust, Ser 2015-2, Cl A3 | | | | | | | | | | | | |
1.310%, 08/15/2019 | | | | | | | 561 | | | | 561 | |
Capital Auto Receivables Asset Trust, Ser 2014-1, Cl B | | | | | | | | | | | | |
2.220%, 01/22/2019 | | | | | | | 160 | | | | 160 | |
| | | | | | | | | | | | |
| Description | | | | | Face Amount
($ Thousands) | | | Market Value
($ Thousands) | |
| | | | | | | | | | | | |
CPS Auto Receivables Trust, Ser 2013-B, Cl A | | | | | | | | | | | | |
1.820%, 09/15/2020 (E) | | | | | | $ | 236 | | | $ | 233 | |
CPS Auto Receivables Trust, Ser 2014-B, Cl A | | | | | | | | | | | | |
1.110%, 11/15/2018 (E) | | | | | | | 158 | | | | 157 | |
Drive Auto Receivables Trust, Ser 2015-CA, Cl A2A | | | | | | | | | | | | |
1.030%, 02/15/2018 (E) | | | | | | | 6 | | | | 6 | |
Drive Auto Receivables Trust, Ser 2015-DA, Cl A2A | | | | | | | | | | | | |
1.230%, 06/15/2018 (E) | | | | | | | 193 | | | | 192 | |
Drive Auto Receivables Trust, Ser 2016-AA, Cl A2A | | | | | | | | | | | | |
1.500%, 03/15/2018 (E) | | | | | | | 85 | | | | 84 | |
Drive Auto Receivables Trust, Ser 2016-BA, Cl A2 | | | | | | | | | | | | |
1.380%, 08/15/2018 (E) | | | | | | | 1,029 | | | | 1,029 | |
Enterprise Fleet Financing, Ser 2014-1, Cl A2 | | | | | | | | | | | | |
0.870%, 09/20/2019 (E) | | | | | | | 113 | | | | 113 | |
Enterprise Fleet Financing, Ser 2015-1, Cl A2 | | | | | | | | | | | | |
1.300%, 09/20/2020 (E) | | | | | | | 594 | | | | 592 | |
Exeter Automobile Receivables Trust, Ser 2014-2A, Cl A | | | | | | | | | | | | |
1.060%, 08/15/2018 (E) | | | | | | | 29 | | | | 29 | |
Exeter Automobile Receivables Trust, Ser 2016- 1A, Cl D | | | | | | | | | | | | |
8.200%, 02/15/2023 (E) | | | | | | | 280 | | | | 277 | |
Flagship Credit Auto Trust, Ser 2016-2, Cl D | | | | | | | | | | | | |
8.560%, 11/15/2023 (E) | | | | | | | 365 | | | | 365 | |
Ford Credit Auto Owner Trust, Ser 2012-D, Cl B | | | | | | | | | | | | |
1.010%, 05/15/2018 | | | | | | | 100 | | | | 100 | |
Ford Credit Auto Owner Trust, Ser 2014-2, Cl A | | | | | | | | | | | | |
2.310%, 04/15/2026 (E) | | | | | | | 640 | | | | 651 | |
Ford Credit Floorplan Master Owner Trust, Ser 2015-2, Cl A2 | | | | | | | | | | | | |
1.003%, 01/15/2022 (D) | | | | | | | 741 | | | | 736 | |
GM Financial Automobile Leasing Trust, Ser 2015-2, Cl A3 | | | | | | | | | | | | |
1.680%, 12/20/2018 | | | | | | | 855 | | | | 859 | |
Harley-Davidson Motorcycle Trust, Ser 2014-1, Cl A3 | | | | | | | | | | | | |
1.100%, 09/15/2019 | | | | | | | 340 | | | | 340 | |
Harley-Davidson Motorcycle Trust, Ser 2015-2, Cl A3 | | | | | | | | | | | | |
1.300%, 03/16/2020 | | | | | | | 748 | | | | 747 | |
Hertz Fleet Lease Funding, Ser 2013-3, Cl A | | | | | | | | | | | | |
0.988%, 12/10/2027 (D)(E) | | | | | | | 365 | | | | 365 | |
Hertz Vehicle Financing II, Ser 2015-2A, Cl A | | | | | | | | | | | | |
2.020%, 09/25/2019 (E) | | | | | | | 542 | | | | 541 | |
Hertz Vehicle Financing, Ser 2013-1A, Cl B2 | | | | | | | | | | | | |
2.480%, 08/25/2019 (E) | | | | | | | 395 | | | | 384 | |
Hertz Vehicle Financing, Ser 2016-1A, Cl A | | | | | | | | | | | | |
2.320%, 03/25/2020 (E) | | | | | | | 352 | | | | 352 | |
| | |
| 258 | | SEI Institutional Investments Trust / Annual Report / May 31, 2016 |
| | | | | | | | | | | | |
| Description | | | | | Face Amount
($ Thousands) | | | Market Value
($ Thousands) | |
| | | | | | | | | | | | |
Hyundai Auto Lease Securitization Trust, Ser 2015-A, Cl A2 | | | | | | | | | | | | |
1.000%, 10/16/2017 (E) | | | | | | $ | 286 | | | $ | 286 | |
Hyundai Auto Lease Securitization Trust, Ser 2015-B, Cl A3 | | | | | | | | | | | | |
1.400%, 11/15/2018 (E) | | | | | | | 596 | | | | 597 | |
Mercedes Benz Auto Lease Trust, Ser 2015-B, Cl A3 | | | | | | | | | | | | |
1.340%, 07/16/2018 | | | | | | | 343 | | | | 343 | |
Nissan Auto Lease Trust, Ser 2015-A, Cl A3 | | | | | | | | | | | | |
1.400%, 06/15/2018 | | | | | | | 626 | | | | 627 | |
Porsche Innovative Lease Owner Trust, Ser 2015-1, Cl A4 | | | | | | | | | | | | |
1.430%, 05/21/2021 (E) | | | | | | | 746 | | | | 746 | |
Santander Drive Auto Receivables Trust, Ser 2015-3, Cl A2A | | | | | | | | | | | | |
1.020%, 09/17/2018 | | | | | | | 264 | | | | 264 | |
Santander Drive Auto Receivables Trust, Ser 2015-4, Cl A2A | | | | | | | | | | | | |
1.200%, 12/17/2018 | | | | | | | 200 | | | | 199 | |
TCF Auto Receivables Owner Trust, Ser 2015- 1A, Cl A2 | | | | | | | | | | | | |
1.020%, 08/15/2018 (E) | | | | | | | 375 | | | | 375 | |
Westlake Automobile Receivables Trust, Ser 2015-3A, Cl A2A | | | | | | | | | | | | |
1.420%, 05/17/2021 (E) | | | | | | | 269 | | | | 269 | |
| | | | | | | | | | | | |
| | | | | | | | | | | 15,731 | |
| | | | | | | | | | | | |
| | | |
Credit Cards — 1.0% | | | | | | | | | | | | |
Barclays Dryrock Issuance Trust, Ser 2014-3, Cl A | | | | | | | | | | | | |
2.410%, 07/15/2022 | | | | | | | 416 | | | | 425 | |
Barclays Dryrock Issuance Trust, Ser 2015-1, Cl A | | | | | | | | | | | | |
2.240%, 12/15/2022 | | | | | | | 748 | | | | 751 | |
Barclays Dryrock Issuance Trust, Ser 2015-2, Cl A | | | | | | | | | | | | |
1.560%, 03/15/2021 | | | | | | | 784 | | | | 786 | |
Cabela’s Credit Card Master Note Trust, Ser 2014-1, Cl A | | | | | | | | | | | | |
0.785%, 03/16/2020 (D) | | | | | | | 500 | | | | 500 | |
Capital One Multi-Asset Execution Trust, Ser 2015-A5, Cl A5 | | | | | | | | | | | | |
1.600%, 05/17/2021 | | | | | | | 708 | | | | 713 | |
Chase Issuance Trust, Ser 2014, Cl A1 | | | | | | | | | | | | |
1.150%, 01/15/2019 | | | | | | | 630 | | | | 631 | |
Discover Card Execution Note Trust, Ser 2015- A1, Cl A1 | | | | | | | | | | | | |
0.783%, 08/17/2020 (D) | | | | | | | 540 | | | | 541 | |
Discover Card Execution Note Trust, Ser 2015- A2, Cl A | | | | | | | | | | | | |
1.900%, 10/17/2022 | | | | | | | 754 | | | | 761 | |
| | | | | | | | | | | | |
| Description | | | | | Face Amount
($ Thousands) | | | Market Value
($ Thousands) | |
| | | | | | | | | | | | |
First National Master Note Trust, Ser 2013-2, Cl A | | | | | | | | | | | | |
0.963%, 10/15/2019 (D) | | | | | | $ | 561 | | | $ | 561 | |
Synchrony Credit Card Master Note Trust, Ser 2012-2, Cl A | | | | | | | | | | | | |
2.220%, 01/15/2022 | | | | | | | 1,098 | | | | 1,113 | |
Synchrony Credit Card Master Note Trust, Ser 2016-1, Cl A | | | | | | | | | | | | |
2.040%, 03/15/2022 | | | | | | | 247 | | | | 249 | |
World Financial Network Credit Card Master Trust, Ser 2013-A, Cl A | | | | | | | | | | | | |
1.610%, 12/15/2021 | | | | | | | 161 | | | | 161 | |
World Financial Network Credit Card Master Trust, Ser 2015-A, Cl A | | | | | | | | | | | | |
0.915%, 02/15/2022 (D) | | | | | | | 424 | | | | 424 | |
| | | | | | | | | | | | |
| | | | | | | | | | | 7,616 | |
| | | | | | | | | | | | |
| |
Other Asset-Backed Securities — 1.2% | | | | | |
Ally Master Owner Trust, Ser 2014-1, Cl A2 | | | | | | | | | | | | |
1.290%, 01/15/2019 | | | | | | | 1,051 | | | | 1,051 | |
Ally Master Owner Trust, Ser 2015-3, Cl A | | | | | | | | | | | | |
1.630%, 05/15/2020 | | | | | | | 788 | | | | 787 | |
BMW Floorplan Master Owner Trust, Ser 2015- 1A, Cl A | | | | | | | | | | | | |
0.933%, 07/15/2020 (D)(E) | | | | | | | 1,062 | | | | 1,063 | |
CIT Equipment Collateral, Ser 2014-VT1, Cl A2 | | | | | | | | | | | | |
0.860%, 05/22/2017 (E) | | | | | | | 271 | | | | 271 | |
Citi Held For Asset Issuance, Ser 2016-PM1, Cl A | | | | | | | | | | | | |
4.650%, 04/15/2025 (E) | | | | | | | 435 | | | | 438 | |
CNH Equipment Trust, Ser 2015-A, Cl A4 | | | | | | | | | | | | |
1.850%, 04/15/2021 | | | | | | | 520 | | | | 523 | |
Dell Equipment Finance Trust, Ser 2015-1, Cl A3 | | | | | | | | | | | | |
1.300%, 03/23/2020 (E) | | | | | | | 258 | | | | 258 | |
Dell Equipment Finance Trust, Ser 2015-2, Cl A2A | | | | | | | | | | | | |
1.420%, 12/22/2017 (E) | | | | | | | 309 | | | | 309 | |
Ford Credit Floorplan Master Owner Trust, Ser 2014-1, Cl A1 | | | | | | | | | | | | |
1.200%, 02/15/2019 | | | | | | | 770 | | | | 770 | |
GE Dealer Floorplan Master Note Trust, Ser 2014-1, Cl A | | | | | | | | | | | | |
0.819%, 07/20/2019 (D) | | | | | | | 481 | | | | 480 | |
GE Dealer Floorplan Master Note Trust, Ser 2015-1, Cl A | | | | | | | | | | | | |
0.939%, 01/20/2020 (D) | | | | | | | 683 | | | | 682 | |
Navistar Financial Dealer Note Master Owner Trust II, Ser 2014-1, Cl A | | | | | | | | | | | | |
1.196%, 10/25/2019 (D)(E) | | | | | | | 596 | | | | 597 | |
Taco Bell Funding, Ser 2016-1A, Cl A2I | | | | | | | | | | | | |
3.832%, 05/25/2046 (E) | | | | | | | 558 | | | | 559 | |
| | | | |
| SEI Institutional Investments Trust / Annual Report / May 31, 2016 | | | 259 | |
CONSOLIDATED SCHEDULE OF INVESTMENTS
Multi-Asset Real Return Fund (Continued)
May 31, 2016
| | | | | | | | | | | | |
| Description | | | | | Face Amount
($ Thousands) | | | Market Value
($ Thousands) | |
| | | | | | | | | | | | |
Volkswagen Credit Auto Master Trust, Ser 2014-1A, Cl A1 | | | | | | | | | | | | |
0.789%, 07/22/2019 (D)(E) | | | | | | $ | 350 | | | $ | 347 | |
Volvo Financial Equipment, Ser 2015-1A, Cl A3 | | | | | | | | | | | | |
1.510%, 06/17/2019 (E) | | | | | | | 742 | | | | 744 | |
| | | | | | | | | | | | |
| | | | | | | | | | | 8,879 | |
| | | | | | | | | | | | |
Total Asset-Backed Securities
(Cost $32,163) ($ Thousands) | | | | 32,226 | |
| | | | | | | | | | | | |
| | | |
FOREIGN BONDS — 2.3% | | | | | | | | | | | | |
Bank of America MTN | | | | | | | | | | | | |
0.599%, 03/28/2018 (D) | | | | | | EUR | 850 | | | | 944 | |
Barclays Bank | | | | | | | | | | | | |
7.750%, 04/10/2023 (D) | | | | | | $ | 321 | | | | 340 | |
6.860%, 09/29/2049 (D)(E) | | | | | | | 106 | | | | 122 | |
6.625%, 03/30/2022 | | | | | | EUR | 75 | | | | 102 | |
3.650%, 03/16/2025 | | | | | | $ | 235 | | | | 228 | |
Basell Finance | | | | | | | | | | | | |
8.100%, 03/15/2027 (E) | | | | | | | 70 | | | | 90 | |
Cenovus Energy | | | | | | | | | | | | |
5.700%, 10/15/2019 | | | | | | | 178 | | | | 182 | |
Credit Agricole | | | | | | | | | | | | |
8.125%, 12/31/2049 (D)(E) | | | | | | | 210 | | | | 218 | |
Credit Suisse Group Funding Guernsey | | | | | | | | | | | | |
3.750%, 03/26/2025 | | | | | | | 375 | | | | 367 | |
Ecopetrol | | | | | | | | | | | | |
5.875%, 05/28/2045 | | | | | | | 252 | | | | 203 | |
Empresa de Transporte de Pasajeros Metro | | | | | | | | | | | | |
4.750%, 02/04/2024 (E) | | | | | | | 296 | | | | 312 | |
Glencore Funding | | | | | | | | | | | | |
3.125%, 04/29/2019 (E) | | | | | | | 1,455 | | | | 1,408 | |
Grupo Bimbo | | | | | | | | | | | | |
3.875%, 06/27/2024 (E) | | | | | | | 553 | | | | 562 | |
Hutchison Whampoa International | | | | | | | | | | | | |
1.625%, 10/31/2017 (E) | | | | | | | 355 | | | | 355 | |
International Game Technology | | | | | | | | | | | | |
6.250%, 02/15/2022 (E) | | | | | | | 380 | | | | 387 | |
Intesa Sanpaolo MTN | | | | | | | | | | | | |
5.017%, 06/26/2024 (E) | | | | | | | 583 | | | | 553 | |
Israel Electric | | | | | | | | | | | | |
5.000%, 11/12/2024 (E) | | | | | | | 581 | | | | 620 | |
Korea National Oil | | | | | | | | | | | | |
3.125%, 04/03/2017 (E) | | | | | | | 200 | | | | 203 | |
Lloyds Banking Group | | | | | | | | | | | | |
7.500%, 12/01/2099 (D) | | | | | | | 371 | | | | 372 | |
MCE Finance | | | | | | | | | | | | |
5.000%, 02/15/2021 (E) | | | | | | | 250 | | | | 245 | |
Minsur | | | | | | | | | | | | |
6.250%, 02/07/2024 (E) | | | | | | | 320 | | | | 307 | |
Mizuho Financial Group Cayman 3 | | | | | | | | | | | | |
4.600%, 03/27/2024 (E) | | | | | | | 631 | | | | 676 | |
| | | | | | | | | | | | |
| Description | | | | | Face Amount
($ Thousands) | | | Market Value
($ Thousands) | |
| | | | | | | | | | | | |
Nacional del Cobre de Chile | | | | | | | | | | | | |
4.500%, 09/16/2025 (E) | | | | | | $ | 625 | | | $ | 636 | |
Nomura Holdings MTN | | | | | | | | | | | | |
2.000%, 09/13/2016 | | | | | | | 248 | | | | 249 | |
NOVA Chemicals | | | | | | | | | | | | |
5.250%, 08/01/2023 (E) | | | | | | | 339 | | | | 340 | |
Numericable Group | | | | | | | | | | | | |
5.375%, 05/15/2022 (E) | | | | | | EUR | 223 | | | | 258 | |
Odebrecht Finance | | | | | | | | | | | | |
7.125%, 06/26/2042 (E) | | | | | | $ | 571 | | | | 198 | |
5.250%, 06/27/2029 (E) | | | | | | | 369 | | | | 113 | |
Petrobras International Finance | | | | | | | | | | | | |
5.750%, 01/20/2020 | | | | | | | 702 | | | | 659 | |
Petroleos Mexicanos | | | | | | | | | | | | |
3.500%, 07/18/2018 | | | | | | | 144 | | | | 144 | |
Rabobank Capital Funding Trust | | | | | | | | | | | | |
5.254%, 10/21/2016 (D)(E) | | | | | | | 240 | | | | 240 | |
Rogers Communications | | | | | | | | | | | | |
4.000%, 06/06/2022 | | | | | | CAD | 20 | | | | 17 | |
Royal Bank of Scotland MTN | | | | | | | | | | | | |
9.500%, 03/16/2022 (D) | | | | | | $ | 10 | | | | 10 | |
Royal Bank of Scotland Group | | | | | | | | | | | | |
7.640%, 09/29/2017 (D) | | | | | | | 300 | | | | 289 | |
7.500%, 12/29/2049 (D) | | | | | | | 350 | | | | 334 | |
Santander UK | | | | | | | | | | | | |
5.000%, 11/07/2023 (E) | | | | | | | 555 | | | | 578 | |
Sociedad Quimica y Minera de Chile | | | | | | | | | | | | |
3.625%, 04/03/2023 (E) | | | | | | | 280 | | | | 265 | |
Societe Generale | | | | | | | | | | | | |
5.922%, 04/05/2017 (D)(E) | | | | | | | 100 | | | | 101 | |
Standard Chartered | | | | | | | | | | | | |
6.409%, 01/30/2049 (D)(E) | | | | | | | 400 | | | | 364 | |
Talent Yield Investments | | | | | | | | | | | | |
4.500%, 04/25/2022 (E) | | | | | | | 1,012 | | | | 1,082 | |
Telefonica Emisiones SAU | | | | | | | | | | | | |
5.462%, 02/16/2021 | | | | | | | 70 | | | | 79 | |
Tencent Holdings MTN | | | | | | | | | | | | |
3.375%, 05/02/2019 (E) | | | | | | | 520 | | | | 537 | |
Trust F | | | | | | | | | | | | |
5.250%, 12/15/2024 (E) | | | | | | | 630 | | | | 650 | |
UBS Group Funding Jersey | | | | | | | | | | | | |
4.125%, 09/24/2025 (E) | | | | | | | 486 | | | | 499 | |
Virgolino de Oliveira Finance | | | | | | | | | | | | |
10.500%, 01/28/2018 (E)(G) | | | | | | | 500 | | | | 25 | |
Wind Acquisition Finance | | | | | | | | | | | | |
4.750%, 07/15/2020 (E) | | | | | | | 360 | | | | 353 | |
Yamana | | | | | | | | | | | | |
4.950%, 07/15/2024 | | | | | | | 359 | | | | 339 | |
| | | | | | | | | | | | |
Total Foreign Bonds
(Cost $17,890) ($ Thousands) | | | | | | | | | | | 17,155 | |
| | | | | | | | | | | | |
| | |
| 260 | | SEI Institutional Investments Trust / Annual Report / May 31, 2016 |
| | | | | | | | | | | | |
| Description | | | | | Face Amount
($ Thousands)/Shares | | | Market Value
($ Thousands) | |
| | | | | | | | | | | | |
SOVEREIGN DEBT — 0.5% | | | | | | | | | | | | |
Brazil Notas do Tesouro Nacional, Ser F | | | | | | | | | | | | |
10.000%, 01/01/2017 | | | | | | BRL | 4,890 | | | $ | 1,330 | |
10.000%, 01/01/2027 | | | | | | | 6,340 | | | | 1,486 | |
Qatar Government International Bond | | | | | | | | | | | | |
2.375%, 06/02/2021 (E) | | | | | | $ | 652 | | | | 644 | |
United Mexican States MTN | | | | | | | | | | | | |
5.950%, 03/19/2019 | | | | | | | 94 | | | | 104 | |
| | | | | | | | | | | | |
Total Sovereign Debt
(Cost $3,986) ($ Thousands) | | | | | | | | | | | 3,564 | |
| | | | | | | | | | | | |
FOREIGN COMMON STOCK — 0.4% | |
| |
Israel — 0.0% | | | | | |
magicJack VocalTec* | | | | | | | 97 | | | | 1 | |
| | | | | | | | | | | | |
| | | |
Puerto Rico — 0.4% | | | | | | | | | | | | |
Popular (C) | | | | | | | 102,200 | | | | 3,203 | |
| | | | | | | | | | | | |
Total Foreign Common Stock
(Cost $2,471) ($ Thousands) | | | | 3,204 | |
| | | | | | | | | | | | |
| | | |
PREFERRED STOCK — 0.0% | | | | | | | | | | | | |
| | | |
Financials — 0.0% | | | | | | | | | | | | |
Allstate, 5.100% (D) | | | | | | | 125 | | | | 3 | |
| | | | | | | | | | | | |
Total Preferred Stock
(Cost $3) ($ Thousands) | | | | 3 | |
| | | | | | | | | | | | |
Total Investments — 117.3%
(Cost $841,233) ($ Thousands) | | | $ | 859,560 | |
| | | | | | | | | | | | |
| |
COMMON STOCK SOLD SHORT— (14.2)% | | | | | |
| |
Consumer Discretionary — (7.7)% | | | | | |
1-800-Flowers.com, Cl A* | | | | | | | (32,400 | ) | | | (261 | ) |
America’s Car-Mart* | | | | | | | (11,400 | ) | | | (271 | ) |
Apollo Education Group, Cl A* | | | | | | | (47,300 | ) | | | (435 | ) |
Arctic Cat | | | | | | | (41,400 | ) | | | (653 | ) |
Ascena Retail Group* | | | | | | | (173,800 | ) | | | (1,255 | ) |
Ascent Capital Group, Cl A* | | | | | | | (11,400 | ) | | | (214 | ) |
Beazer Homes USA* | | | | | | | (183,900 | ) | | | (1,444 | ) |
Belmond, Cl A* | | | | | | | (9,300 | ) | | | (88 | ) |
Boot Barn Holdings* | | | | | | | (6,500 | ) | | | (49 | ) |
BorgWarner | | | | | | | (80,300 | ) | | | (2,733 | ) |
Bridgepoint Education* | | | | | | | (9,100 | ) | | | (71 | ) |
Cabela’s* | | | | | | | (18,300 | ) | | | (889 | ) |
Carmax* | | | | | | | (78,500 | ) | | | (4,212 | ) |
Cherokee* | | | | | | | (5,100 | ) | | | (72 | ) |
Chipotle Mexican Grill, Cl A* | | | | | | | (7,220 | ) | | | (3,191 | ) |
| | | | | | | | | | | | |
| Description | | | | | Shares | | | Market Value
($ Thousands) | |
| | | | | | | | | | | | |
Choice Hotels International | | | | | | | (10,000 | ) | | $ | (454 | ) |
Christopher & Banks* | | | | | | | (19,848 | ) | | | (39 | ) |
ClubCorp Holdings | | | | | | | (12,200 | ) | | | (147 | ) |
Crocs* | | | | | | | (28,400 | ) | | | (279 | ) |
Del Frisco’s Restaurant Group* | | | | | | | (24,700 | ) | | | (382 | ) |
Delphi Automotive | | | | | | | (3,200 | ) | | | (217 | ) |
Destination XL Group* | | | | | | | (13,200 | ) | | | (62 | ) |
Dollar Tree* | | | | | | | (500 | ) | | | (45 | ) |
EW Scripps, Cl A* | | | | | | | (54,500 | ) | | | (919 | ) |
Federal-Mogul Holdings, Cl A* | | | | | | | (6,600 | ) | | | (56 | ) |
Fiesta Restaurant Group* | | | | | | | (29,500 | ) | | | (741 | ) |
Fox Factory Holding* | | | | | | | (24,500 | ) | | | (408 | ) |
Fred’s, Cl A | | | | | | | (9,900 | ) | | | (145 | ) |
Gentherm* | | | | | | | (16,800 | ) | | | (615 | ) |
Global Eagle Entertainment* | | | | | | | (21,300 | ) | | | (154 | ) |
Groupon, Cl A* | | | | | | | (285,100 | ) | | | (1,009 | ) |
H&R Block | | | | | | | (14,700 | ) | | | (314 | ) |
Hanesbrands | | | | | | | (97,400 | ) | | | (2,637 | ) |
Harley-Davidson | | | | | | | (96,700 | ) | | | (4,486 | ) |
Houghton Mifflin Harcourt* | | | | | | | (59,400 | ) | | | (1,022 | ) |
HSN | | | | | | | (8,300 | ) | | | (435 | ) |
Johnson Controls | | | | | | | (1,200 | ) | | | (53 | ) |
Kate Spade* | | | | | | | (72,000 | ) | | | (1,574 | ) |
Kona Grill* | | | | | | | (21,100 | ) | | | (266 | ) |
La Quinta Holdings* | | | | | | | (12,400 | ) | | | (147 | ) |
Liberty Global, Cl A* | | | | | | | (15,400 | ) | | | (575 | ) |
Liberty Ventures, Ser A* | | | | | | | (114,900 | ) | | | (4,287 | ) |
Lions Gate Entertainment | | | | | | | (50,100 | ) | | | (1,117 | ) |
Malibu Boats, Cl A* | | | | | | | (15,600 | ) | | | (212 | ) |
MarineMax* | | | | | | | (1,700 | ) | | | (29 | ) |
Media General* | | | | | | | (76,700 | ) | | | (1,368 | ) |
MGM Resorts International* | | | | | | | (18,500 | ) | | | (423 | ) |
Monro Muffler | | | | | | | (7,000 | ) | | | (441 | ) |
Motorcar Parts & Accessories* | | | | | | | (29,700 | ) | | | (890 | ) |
NetFlix* | | | | | | | (47,900 | ) | | | (4,913 | ) |
New Home* | | | | | | | (11,100 | ) | | | (112 | ) |
Penn National Gaming* | | | | | | | (31,600 | ) | | | (495 | ) |
Ruby Tuesday* | | | | | | | (11,400 | ) | | | (44 | ) |
Service International | | | | | | | (2,500 | ) | | | (68 | ) |
Sotheby’s | | | | | | | (28,900 | ) | | | (864 | ) |
Spartan Motors | | | | | | | (14,000 | ) | | | (90 | ) |
Taylor Morrison Home, Cl A* | | | | | | | (32,400 | ) | | | (483 | ) |
Thor Industries | | | | | | | (1,700 | ) | | | (111 | ) |
Time | | | | | | | (87,900 | ) | | | (1,395 | ) |
TripAdvisor* | | | | | | | (37,600 | ) | | | (2,547 | ) |
Tuesday Morning* | | | | | | | (49,600 | ) | | | (337 | ) |
Under Armour, Cl A* | | | | | | | (56,500 | ) | | | (2,132 | ) |
Universal Technical Institute | | | | | | | (6,773 | ) | | | (22 | ) |
VF | | | | | | | (8,800 | ) | | | (548 | ) |
William Lyon Homes, Cl A* | | | | | | | (18,900 | ) | | | (307 | ) |
| | | | | | | | | | | | |
| | | | | | | | | | | (56,254 | ) |
| | | | | | | | | | | | |
| | | | |
| SEI Institutional Investments Trust / Annual Report / May 31, 2016 | | | 261 | |
CONSOLIDATED SCHEDULE OF INVESTMENTS
Multi-Asset Real Return Fund (Continued)
May 31, 2016
| | | | | | | | | | | | |
| Description | | | | | Shares | | | Market Value
($ Thousands) | |
| | | | | | | | | | | | |
| | | |
Financials — (1.1)% | | | | | | | | | | | | |
Ally Financial* | | | | | | | (87,800 | ) | | $ | (1,575 | ) |
Ezcorp, Cl A* | | | | | | | (21,400 | ) | | | (145 | ) |
Forestar Group* | | | | | | | (18,200 | ) | | | (223 | ) |
Genworth Financial, Cl A* | | | | | | | (409,000 | ) | | | (1,513 | ) |
Greenlight Capital Re, Cl A* | | | | | | | (10,500 | ) | | | (213 | ) |
Home BancShares | | | | | | | (9,500 | ) | | | (417 | ) |
Kennedy-Wilson Holdings | | | | | | | (2,800 | ) | | | (60 | ) |
Moody’s | | | | | | | (26,600 | ) | | | (2,624 | ) |
OneMain Holdings, Cl A* | | | | | | | (4,500 | ) | | | (141 | ) |
PHH * | | | | | | | (41,700 | ) | | | (595 | ) |
TFS Financial | | | | | | | (39,500 | ) | | | (729 | ) |
Yadkin Financial | | | | | | | (6,900 | ) | | | (183 | ) |
| | | | | | | | | | | | |
| | | | | | | | | | | (8,418 | ) |
| | | | | | | | | | | | |
| | | |
Industrials — (1.4)% | | | | | | | | | | | | |
Acacia Research | | | | | | | (31,800 | ) | | | (164 | ) |
Ameresco, Cl A* | | | | | | | (8,200 | ) | | | (38 | ) |
American Science & Engineering | | | | | | | (5,100 | ) | | | (160 | ) |
Builders FirstSource* | | | | | | | (105,800 | ) | | | (1,244 | ) |
CDI | | | | | | | (4,700 | ) | | | (30 | ) |
Chart Industries* | | | | | | | (33,000 | ) | | | (857 | ) |
DXP Enterprises* | | | | | | | (17,700 | ) | | | (246 | ) |
Engility Holdings* | | | | | | | (6,600 | ) | | | (155 | ) |
Kirby* | | | | | | | (11,800 | ) | | | (827 | ) |
KLX* | | | | | | | (9,600 | ) | | | (316 | ) |
Knight Transportation | | | | | | | (38,000 | ) | | | (993 | ) |
Kratos Defense & Security Solutions* | | | | | | | (19,900 | ) | | | (83 | ) |
LB Foster, Cl A | | | | | | | (8,900 | ) | | | (103 | ) |
LMI Aerospace* | | | | | | | (3,700 | ) | | | (31 | ) |
Macquarie Infrastructure | | | | | | | (12,400 | ) | | | (888 | ) |
MRC Global* | | | | | | | (111,000 | ) | | | (1,575 | ) |
Northwest Pipe* | | | | | | | (2,400 | ) | | | (22 | ) |
Primoris Services | | | | | | | (14,900 | ) | | | (321 | ) |
Quad, Cl A | | | | | | | (20,200 | ) | | | (388 | ) |
Raven Industries | | | | | | | (18,100 | ) | | | (365 | ) |
RBC Bearings* | | | | | | | (3,100 | ) | | | (232 | ) |
Rush Enterprises, Cl A* | | | | | | | (15,500 | ) | | | (341 | ) |
Sparton* | | | | | | | (3,400 | ) | | | (66 | ) |
SPX | | | | | | | (10,300 | ) | | | (171 | ) |
Team* | | | | | | | (1,400 | ) | | | (42 | ) |
Twin Disc | | | | | | | (2,400 | ) | | | (23 | ) |
Wesco Aircraft Holdings* | | | | | | | (32,400 | ) | | | (456 | ) |
YRC Worldwide* | | | | | | | (32,100 | ) | | | (296 | ) |
| | | | | | | | | | | | |
| | | | | | | | | | | (10,433 | ) |
| | | | | | | | | | | | |
| |
Information Technology — (1.9)% | | | | | |
Apple | | | | | | | (10,500 | ) | | | (1,049 | ) |
Applied Micro Circuits* | | | | | | | (84,100 | ) | | | (553 | ) |
Applied Optoelectronics* | | | | | | | (5,800 | ) | | | (61 | ) |
Bel Fuse, Cl B | | | | | | | (3,600 | ) | | | (65 | ) |
Black Box | | | | | | | (8,200 | ) | | | (103 | ) |
| | | | | | | | | | | | |
| Description | | | | | Shares | | | Market Value
($ Thousands) | |
| | | | | | | | | | | | |
Brocade Communications Systems | | | | | | | (41,550 | ) | | $ | (377 | ) |
Cabot Microelectronics | | | | | | | (1,000 | ) | | | (43 | ) |
Calix* | | | | | | | (32,200 | ) | | | (218 | ) |
Cavium* | | | | | | | (11,200 | ) | | | (557 | ) |
Cognex | | | | | | | (19,900 | ) | | | (857 | ) |
CommScope Holding* | | | | | | | (24,600 | ) | | | (766 | ) |
CUI Global* | | | | | | | (10,600 | ) | | | (61 | ) |
Cypress Semiconductor | | | | | | | (330,800 | ) | | | (3,517 | ) |
Daktronics | | | | | | | (11,300 | ) | | | (90 | ) |
Exar* | | | | | | | (12,600 | ) | | | (86 | ) |
FARO Technologies* | | | | | | | (8,400 | ) | | | (297 | ) |
Harmonic* | | | | | | | (40,700 | ) | | | (117 | ) |
Immersion* | | | | | | | (20,600 | ) | | | (132 | ) |
Lattice Semiconductor* | | | | | | | (313,200 | ) | | | (1,823 | ) |
M* | | | | | | | (8,900 | ) | | | (321 | ) |
PDF Solutions* | | | | | | | (2,800 | ) | | | (41 | ) |
Power Integrations | | | | | | | (7,800 | ) | | | (389 | ) |
Silicon Graphics International* | | | | | | | (74,900 | ) | | | (394 | ) |
Sonus Networks* | | | | | | | (29,400 | ) | | | (269 | ) |
Synaptics* | | | | | | | (1,200 | ) | | | (81 | ) |
Ultratech* | | | | | | | (1,500 | ) | | | (34 | ) |
Veeco Instruments* | | | | | | | (27,000 | ) | | | (480 | ) |
ViaSat* | | | | | | | (3,000 | ) | | | (207 | ) |
Zebra Technologies, Cl A* | | | | | | | (19,000 | ) | | | (1,009 | ) |
| | | | | | | | | | | | |
| | | | | | | | | | | (13,997 | ) |
| | | | | | | | | | | | |
| | | |
Materials — (2.1)% | | | | | | | | | | | | |
Allegheny Technologies | | | | | | | (60,100 | ) | | | (744 | ) |
Axiall | | | | | | | (110,600 | ) | | | (2,576 | ) |
Century Aluminum* | | | | | | | (213,600 | ) | | | (1,380 | ) |
CF Industries Holdings | | | | | | | (8,100 | ) | | | (224 | ) |
Chemours | | | | | | | (29,400 | ) | | | (256 | ) |
Coeur Mining* | | | | | | | (173,200 | ) | | | (1,304 | ) |
Compass Minerals International | | | | | | | (31,400 | ) | | | (2,448 | ) |
Deltic Timber | | | | | | | (1,700 | ) | | | (109 | ) |
Freeport-McMoRan, Cl B | | | | | | | (316,400 | ) | | | (3,506 | ) |
KapStone Paper and Packaging | | | | | | | (20,200 | ) | | | (308 | ) |
LSB Industries* | | | | | | | (52,100 | ) | | | (685 | ) |
Olin | | | | | | | (5,200 | ) | | | (120 | ) |
Real Industry* | | | | | | | (8,600 | ) | | | (58 | ) |
Rentech* | | | | | | | (9,900 | ) | | | (25 | ) |
TimkenSteel | | | | | | | (120,800 | ) | | | (1,082 | ) |
WestRock | | | | | | | (9,000 | ) | | | (357 | ) |
| | | | | | | | | | | | |
| | | | | | | | | | | (15,182 | ) |
| | | | | | | | | | | | |
Total Common Stock Sold Short
(Proceeds $105,558) ($ Thousands) | | | | (104,284 | ) |
| | | | | | | | | | | | |
Total Investments Sold Short — (14.2)%
(Proceeds $105,558) ($ Thousands) | | | $ | (104,284 | ) |
| | | | | | | | | | | | |
| | |
| 262 | | SEI Institutional Investments Trust / Annual Report / May 31, 2016 |
| | | | | | | | | | | | |
| Description | | | | | Contracts | | | Market Value
($ Thousands) | |
| | | | | | | | | | | | |
| | | |
PURCHASED OPTION(H) — 0.1% | | | | | | | | | | | | |
August 2016, Brent Crude Put, | | | | | | | | | | | | |
Expires 08/01/2016, | | | | | | | | | | | | |
Strike Price $48* | | | | | | | 76 | | | $ | 87 | |
| | | | | | | | | �� | | | |
Total Purchased Option
(Cost $156) ($ Thousands) | | | | | | | | | | $ | 87 | |
| | | | | | | | | | | | |
A list of the open futures contracts held by the Fund at May 31, 2016, is as follows:
| | | | | | | | | | | | |
| Type of Contract | | Number of
Contracts
Long
(Short) | | | Expiration
Date | | | Unrealized
Appreciation
(Depreciation)
($ Thousands) | |
Brent Crude | | | 266 | | | | Sep-2016 | | | $ | 831 | |
Brent Crude | | | 31 | | | | Nov-2016 | | | | 112 | |
Coffee | | | 32 | | | | Jul-2016 | | | | 19 | |
Coffee Robusta | | | 92 | | | | Jul-2016 | | | | 113 | |
Copper | | | 89 | | | | Jul-2016 | | | | (69 | ) |
Corn | | | 450 | | | | Sep-2016 | | | | 328 | |
Corn | | | 310 | | | | Jul-2016 | | | | 602 | |
Cotton No. 2 | | | (89 | ) | | | Jul-2016 | | | | (8 | ) |
Cotton No. 2 | | | 46 | | | | Dec-2016 | | | | – | |
Crude Oil | | | (62 | ) | | | Nov-2016 | | | | (230 | ) |
Crude Oil | | | (58 | ) | | | Dec-2016 | | | | 39 | |
Crude Oil | | | 81 | | | | Dec-2017 | | | | 229 | |
Crude Oil | | | 242 | | | | Jul-2016 | | | | 1,573 | |
Euro-Bob | | | (81 | ) | | | Jun-2016 | | | | 13 | |
Feeder Cattle | | | (43 | ) | | | Aug-2016 | | | | (114 | ) |
Gold | | | 154 | | | | Aug-2016 | | | | (886 | ) |
Heating Oil | | | 24 | | | | Nov-2016 | | | | 120 | |
Heating Oil | | | 106 | | | | Jul-2016 | | | | 987 | |
ICE Brent Crude | | | 11 | | | | Dec-2017 | | | | 169 | |
Lean Hogs | | | 265 | | | | Jul-2016 | | | | (79 | ) |
Live Cattle | | | 82 | | | | Aug-2016 | | | | (35 | ) |
LME Nickel | | | (56 | ) | | | Dec-2016 | | | | 23 | |
LME Nickel | | | 144 | | | | Jul-2016 | | | | (232 | ) |
LME Zinc | | | 184 | | | | Jul-2016 | | | | 491 | |
LME Zinc | | | (30 | ) | | | Dec-2016 | | | | (88 | ) |
MSCI EAFE Index E-MINI | | | (131 | ) | | | Jun-2016 | | | | (320 | ) |
Natural Gas Swap Future | | | 574 | | | | Jul-2016 | | | | 571 | |
Natural Gas Swap Future | | | (79 | ) | | | Nov-2016 | | | | (103 | ) |
Palladium | | | 31 | | | | Sep-2016 | | | | (102 | ) |
RBOB Gasoline | | | 67 | | | | Jul-2016 | | | | 336 | |
S&P 500 Index E-MINI | | | (111 | ) | | | Jun-2016 | | | | (485 | ) |
Silver | | | 77 | | | | Jul-2016 | | | | 58 | |
Soybean | | | 174 | | | | Jul-2016 | | | | 1,163 | |
Soybean | | | 35 | | | | Nov-2016 | | | | 6 | |
Soybean Meal | | | 191 | | | | Jul-2016 | | | | 1,250 | |
Soybean Oil | | | 151 | | | | Dec-2016 | | | | (45 | ) |
Soybean Oil | | | 147 | | | | Jul-2016 | | | | (171 | ) |
Sugar No. 11 | | | 130 | | | | Jul-2016 | | | | 319 | |
Sugar No. 11 | | | (232 | ) | | | May-2017 | | | | (220 | ) |
| | | | | | | | | | | | |
| Type of Contract | | Number of
Contracts
Long
(Short) | | | Expiration
Date | | | Unrealized
Appreciation
(Depreciation)
($ Thousands) | |
Sugar No. 11 | | | 225 | | | | Mar-2017 | | | $ | 237 | |
U.S. 10-Year Treasury Note | | | (102 | ) | | | Sep-2016 | | | | (4 | ) |
U.S. 5-Year Treasury Note | | | 115 | | | | Sep-2016 | | | | 22 | |
Wheat | | | 62 | | | | Jul-2016 | | | | (41 | ) |
Wheat | | | (184 | ) | | | Sep-2016 | | | | (29 | ) |
Wheat | | | 184 | | | | Jul-2016 | | | | 28 | |
| | | | | | | | | | | | |
| | | | | | | | | | $ | 6,378 | |
| | | | | | | | | | | | |
For the year ended May 31, 2016, the total amount of all open futures contracts, as presented in the table above, are representative of the volume of activity for the derivative type during the year.
A list of the open forward foreign currency contracts held by the Fund at May 31, 2016, is as follows:
| | | | | | | | | | | | | | | | | | | | |
Settlement Date | | Currency
to Deliver
(Thousands) | | | Currency
To Receive
(Thousands) | | | Unrealized
Appreciation
(Depreciation)
($ Thousands) | |
06/02/16 | | | USD | | | | 1,575 | | | | BRL | | | | 5,667 | | | $ | (2 | ) |
06/02/16-01/04/17 | | | BRL | | | | 16,468 | | | | USD | | | | 4,265 | | | | (207 | ) |
06/10/16 | | | USD | | | | 1,401 | | | | MYR | | | | 5,721 | | | | (14 | ) |
06/17/16 | | | USD | | | | 1,845 | | | | MXN | | | | 32,624 | | | | (75 | ) |
06/23/16 | | | CAD | | | | 2,237 | | | | USD | | | | 1,701 | | | | (9 | ) |
07/15/16 | | | USD | | | | 901 | | | | INR | | | | 60,644 | | | | (4 | ) |
07/15/16 | | | SGD | | | | 3,831 | | | | USD | | | | 2,831 | | | | 49 | |
07/15/16 | | | MYR | | | | 5,710 | | | | USD | | | | 1,464 | | | | 76 | |
07/20/16 | | | USD | | | | 372 | | | | EUR | | | | 333 | | | | (1 | ) |
07/20/16 | | | EUR | | | | 2,961 | | | | USD | | | | 3,354 | | | | 52 | |
07/21/16 | | | GBP | | | | 1,610 | | | | USD | | | | 2,327 | | | | (17 | ) |
08/05/16 | | | TWD | | | | 89,090 | | | | USD | | | | 2,731 | | | | (1 | ) |
| | | | | | | | | | | | | | | | | | | | |
| | | | | | | | | | | | | | | | | | $ | (153 | ) |
| | | | | | | | | | | | | | | | | | | | |
A list of the counterparties for the outstanding forward foreign currency contracts held by the Fund at May 31, 2016, is as follows:
| | | | | | | | | | | | |
| Counterparty | | Currency to
Deliver
($ Thousands) | | | Currency to
Receive
($ Thousands) | | | Unrealized
Appreciation
(Depreciation)
($ Thousands) | |
Bank of New York | | $ | (2,782 | ) | | $ | 2,831 | | | $ | 49 | |
Barclays PLC | | | (901 | ) | | | 897 | | | | (4 | ) |
Brown Brothers Harriman | | | (372 | ) | | | 371 | | | | (1 | ) |
Deutsche Bank | | | (1,388 | ) | | | 1,464 | | | | 76 | |
Goldman Sachs | | | (3,052 | ) | | | 2,818 | | | | (234 | ) |
HSBC | | | (5,076 | ) | | | 5,058 | | | | (18 | ) |
JPMorgan Chase Bank | | | (8,325 | ) | | | 8,315 | | | | (10 | ) |
Morgan Stanley | | | (1,527 | ) | | | 1,530 | | | | 3 | |
USAllianz | | | (1,402 | ) | | | 1,388 | | | | (14 | ) |
| | | | | | | | | | | | |
| | | | | | | | | | $ | (153 | ) |
| | | | | | | | | | | | |
For the year ended May 31, 2016 the total amount of all open forward foreign currency contracts, as presented in the table above, are representative of the volume of activity for the derivative type during the year.
| | | | |
| SEI Institutional Investments Trust / Annual Report / May 31, 2016 | | | 263 | |
CONSOLIDATED SCHEDULE OF INVESTMENTS
Multi-Asset Real Return Fund (Concluded)
May 31, 2016
A list of the open centrally cleared swap agreements held by the Fund at May 31, 2016, is as follows:
| | | | | | | | | | | | | | | | |
| Interest Rate Swaps | |
| Counterparty | | Fund Pays | | Fund Receives | | Termination Date | | | | Notional Amount
($ Thousands) | | | Net Unrealized
Appreciation
(Depreciation)
($ Thousands) | |
| Credit Suisse | | 3-Month USD - LIBOR | | 1.75% | | 10/31/2019 | | | | $ | 3,860 | | | $ | 76 | |
| Morgan Stanley | | 3-Month NZD - BKBM | | 4.07% | | 06/09/2025 | | | | | 3,800 | | | | 280 | |
| Morgan Stanley | | 2.25% | | 3-Month NZD - BKBM | | 04/28/2018 | | | | | 15,380 | | | | 11 | |
| Morgan Stanley | | 2.21% | | 3-Month AUD - BBR | | 04/27/2018 | | | | | 15,550 | | | | (68 | ) |
| Morgan Stanley | | 1.92% | | 3-Month AUD - BBR | | 10/30/2017 | | | | | 15,030 | | | | – | |
| Morgan Stanley | | 3.37% | | 3-Month NZD - BKBM | | 06/09/2017 | | | | | 32,580 | | | | (455 | ) |
| Morgan Stanley | | 2.40% | | 6-Month GBP - LIBOR | | 06/05/2045 | | | | | 560 | | | | (143 | ) |
| Morgan Stanley | | 2.63% | | 3-Month USD - LIBOR | | 11/10/2035 | | | | | 3,600 | | | | (346 | ) |
| Morgan Stanley | | 3-Month USD - LIBOR | | 3.31% | | 05/06/2034 | | | | | 1,650 | | | | 334 | |
| Morgan Stanley | | 6-Month NOK - NIBOR | | 1.56% | | 05/12/2026 | | | | | 27,340 | | | | (20 | ) |
| Morgan Stanley | | 2.29% | | 3-Month USD - LIBOR | | 08/04/2025 | | | | | 3,900 | | | | (241 | ) |
| Morgan Stanley | | 6-Month AUD - BBR | | 3.38% | | 06/09/2025 | | | | | 2,260 | | | | 142 | |
| Morgan Stanley | | 2.49% | | 3-Month USD - LIBOR | | 06/09/2025 | | | | | 1,240 | | | | (102 | ) |
| Morgan Stanley | | 2.31% | | 3-Month USD - LIBOR | | 05/18/2025 | | | | | 2,880 | | | | (165 | ) |
| Morgan Stanley | | 1.99% | | 3-Month USD - LIBOR | | 04/21/2025 | | | | | 2,040 | | | | (63 | ) |
| Morgan Stanley | | 6-Month AUD - BBR | | 2.97% | | 03/11/2025 | | | | | 3,610 | | | | 126 | |
| Morgan Stanley | | 3-Month USD - LIBOR | | 2.69% | | 09/24/2024 | | | | | 2,470 | | | | 222 | |
| Morgan Stanley | | 3-Month USD - LIBOR | | 2.67% | | 07/18/2024 | | | | | 1,710 | | | | 158 | |
| Morgan Stanley | | 2.67% | | 3-Month USD - LIBOR | | 07/10/2024 | | | | | 2,130 | | | | (199 | ) |
| Morgan Stanley | | 2.63% | | 3-Month USD - LIBOR | | 07/02/2024 | | | | | 3,360 | | | | (304 | ) |
| Morgan Stanley | | 3-Month USD - LIBOR | | 2.63% | | 05/29/2024 | | | | | 1,630 | | | | 131 | |
| Morgan Stanley | | 2.63% | | 3-Month USD - LIBOR | | 05/23/2024 | | | | | 4,050 | | | | (325 | ) |
| Morgan Stanley | | 2.82% | | 3-Month USD - LIBOR | | 04/28/2024 | | | | | 2,770 | | | | (266 | ) |
| Morgan Stanley | | 2.89% | | 3-Month USD - LIBOR | | 02/14/2024 | | | | | 1,780 | | | | (189 | ) |
| Morgan Stanley | | 2.98% | | 3-Month USD - LIBOR | | 01/14/2024 | | | | | 1,990 | | | | (228 | ) |
| Morgan Stanley | | 2.24% | | 3-Month USD - LIBOR | | 06/25/2021 | | | | | 1,680 | | | | (88 | ) |
| Morgan Stanley | | 1.69% | | 3-Month USD - LIBOR | | 08/06/2020 | | | | | 7,270 | | | | (161 | ) |
| Morgan Stanley | | 6-Month GBP - LIBOR | | 1.65% | | 06/05/2020 | | | | | 6,030 | | | | 256 | |
| Morgan Stanley | | 1.57% | | 3-Month USD - LIBOR | | 04/01/2020 | | | | | 5,370 | | | | (76 | ) |
| Morgan Stanley | | 1.01% | | 6M NOK - NIBOR | | 05/19/2018 | | | | | 73,190 | | | | 1 | |
| Morgan Stanley | | 0.95% | | 6M NOK - NIBOR | | 05/12/2018 | | | | | 220,160 | | | | 27 | |
| Morgan Stanley | | 2.22% | | 3-Month AUD - BBR | | 06/09/2017 | | | | | 20,800 | | | | (45 | ) |
| Morgan Stanley | | 0.81% | | 3-Month USD - LIBOR | | 05/18/2017 | | | | | 15,030 | | | | 5 | |
| Morgan Stanley | | 2.14% | | 3-Month AUD - BBR | | 03/11/2017 | | | | | 23,690 | | | | (22 | ) |
| | | | | | | | | | | | | | | | |
| | | | | | | | | | | | | | $ | (1,737 | ) |
| | | | | | | | | | | | | | | | |
A list of the open OTC swap agreements held by the Fund at May 31, 2016 is as follows: | |
| Interest Rate Swaps | |
| Counterparty | | Fund Pays | | Fund Receives | | Termination Date | | | | Notional Amount
($ Thousands) | | | Net Unrealized
Appreciation
(Depreciation)
($ Thousands) | |
| Barclays Bank PLC | | 1.10% | | 3 Month USD - LIBOR | | 02/21/2017 | | | | $ | 500 | | | $ | (2 | ) |
| Credit Suisse | | 3-Month USD -LIBOR | | 2.09% | | 03/12/2022 | | | | | 250 | | | | 10 | |
| Morgan Stanley | | 2.80% | | 3 Month USD - LIBOR | | 03/06/2042 | | | | | 330 | | | | (49 | ) |
| Morgan Stanley | | 2.81% | | 3 Month USD - LIBOR | | 02/21/2042 | | | | | 450 | | | | (69 | ) |
| | | | | | | | | | | | | | | | |
| | | | | | | | | | | | | | $ | (110 | ) |
| | | | | | | | | | | | | | | | |
| | | | | | | | | | | | | | | | |
| Credit Default Swaps | |
| Counterparty | | Reference Entity/Obligation | | Buy/Sell Protection | | (Pays)/Receives Rate | | Termination
Date | | Notional Amount
($ Thousands) | | | Net Unrealized Appreciation
(Depreciation)
($ Thousands) | |
| Bank of America | | Societe Generale | | SELL | | 3.00% | | 12/20/2017 | | $ | (223 | ) | | $ | 7 | |
| Citibank | | Advanced Micro Devices | | BUY | | 5.00 | | 03/20/2019 | | | 300 | | | | (3 | ) |
| Citibank | | Sprint Communications | | BUY | | 5.00 | | 06/20/2019 | | | 499 | | | | 61 | |
| Citibank | | Sprint Communications | | BUY | | 5.00 | | 06/20/2019 | | | 571 | | | | 70 | |
| Deutsche Bank | | Anadarko Petroleum Corporation | | SELL | | 1.00 | | 09/20/2017 | | | (170 | ) | | | 1 | |
| | | | | | | | | | | | | | | | |
| | | | | | | | | | | | | | $ | 136 | |
| | | | | | | | | | | | | | | | |
| | |
| 264 | | SEI Institutional Investments Trust / Annual Report / May 31, 2016 |
For the year ended May 31, 2016, the total amount of all open swap agreements, as presented in the table above, are representative of the volume of activity for this derivative type during the year.
Percentages are based on a Net Assets of $733,029 ($ Thousands).
| * | | Non-income producing security. |
| (A) | | The rate reported is the effective yield at time of purchase. |
| (B) | | Security, or portion thereof, has been pledged as collateral on open futures contracts. |
| (C) | | Security, or a portion thereof, has been pledged as collateral on reverse repurchase agreements and securities sold short. |
| (D) | | Variable Rate Security — The rate reported on the Schedule of Investments is the rate in effect as of May 31, 2016. |
| (E) | | Security exempt from registration under Rule 144A of the Securities Act of 1933. These securities may be resold in transactions exempt from registration normally to qualified institutions. On May 31, 2016, the value of these securities amounted to $49,840 ($ Thousands), 6.8% representing of the net assets of the Fund. |
| (F) | | Step Bonds — The rate reflected on the Schedule of Investments is the effective yield on May 31, 2016. The coupon on a step bond changes on a specified date. |
| (G) | | Security is in default on interest payment. |
| (H) | | For the year ended May 31, 2016, the total amount of open purchased options, as presented in the Schedule of Investments, are representative of the volume of activity for these derivative types during the period. |
AUD — Australian Dollar
BBR — Australian Bank Bill Benchmark
BKBM — New Zealand Bank Bill Benchmark
BRL — Brazilian Real
CAD — Canadian Dollar
Cl — Class
CMO — Collateralized Mortgage Obligation
EAFE — Europe, Australasia and Far East
EUR — Euro
FHLMC — Federal Home Loan Mortgage Corporation
FNMA — Federal National Mortgage Association
GBP — British Pound Sterling
INR — Indian Rupee
IO — Interest Only
LIBOR — London Interbank Offered Rate
LLC — Limited Liability Company
MSCI — Morgan Stanley Capital International
MTN — Medium Term Note
MXN — Mexican Peso
MYR — Malaysian Ringgit
NIBOR — Norwegian Interbank Offered Rate
NOK — Norwegian Krone
NZD — New Zealand Dollar
OTC — Over the Counter
PLC — Public Limited Company
S&P — Standard & Poor’s
Ser — Series
SGD — Singapore Dollar
TWD — Taiwanese Dollar
USD — United States Dollar
The following is a list of the level of inputs used as of May 31, 2016, in valuing the Fund’s investments and other financial instruments carried at value ($ Thousands):
| | | | | | | | | | | | | | | | |
| Investments in Securities | | Level 1 | | | Level 2 | | | Level 3 | | | Total | |
U.S. Treasury Obligations | | $ | — | | | $ | 488,730 | | | $ | — | | | $ | 488,730 | |
Common Stock | | | 207,223 | | | | — | | | | — | | | | 207,223 | |
Mortgage-Backed Securities | | | — | | | | 57,063 | | | | — | | | | 57,063 | |
Corporate Obligations | | | — | | | | 50,392 | | | | — | | | | 50,392 | |
Asset-Backed Securities | | | — | | | | 32,226 | | | | — | | | | 32,226 | |
Foreign Bonds | | | — | | | | 17,155 | | | | — | | | | 17,155 | |
Sovereign Debt | | | — | | | | 3,564 | | | | — | | | | 3,564 | |
Foreign Common Stock | | | 3,204 | | | | — | | | | — | | | | 3,204 | |
Preferred Stock | | | — | | | | 3 | | | | — | | | | 3 | |
| | | | | | | | | | | | | | | | |
Total Investments in Securities | | $ | 210,427 | | | $ | 649,133 | | | $ | — | | | $ | 859,560 | |
| | | | | | | | | | | | | | | | |
| | | | | | | | | | | | | | | | |
| Securities Sold Short | | Level 1 | | | Level 2 | | | Level 3 | | | Total | |
Common Stock | | $ | (104,284 | ) | | $ | — | | | $ | — | | | $ | (104,284 | ) |
| | | | | | | | | | | | | | | | |
Total Securities Sold Short | | $ | (104,284 | ) | | $ | — | | | $ | — | | | $ | (104,284 | ) |
| | | | | | | | | | | | | | | | |
| | | | | | | | | | | | | | | | |
| Other Financial Instruments | | Level 1 | | | Level 2 | | | Level 3 | | | Total | |
Purchased Options | | $ | 87 | | | $ | — | | | $ | — | | | $ | 87 | |
Futures Contracts* | | | | | | | | | | | | | | | | |
Unrealized Appreciation | | | 9,639 | | | | — | | | | — | | | | 9,639 | |
Unrealized Depreciation | | | (3,261 | ) | | | — | | | | — | | | | (3,261 | ) |
Forwards Contracts* | | | | | | | | | | | | | | | | |
Unrealized Appreciation | | | — | | | | 177 | | | | — | | | | 177 | |
Unrealized Depreciation | | | — | | | | (330 | ) | | | — | | | | (330 | ) |
Centrally Cleared Swaps | | | | | | | | | | | | | | | | |
Interest Rate Swaps* | | | | | | | | | | | | | | | | |
Unrealized Appreciation | | | — | | | | 1,769 | | | | — | | | | 1,769 | |
Unrealized Depreciation | | | — | | | | (3,506 | ) | | | — | | | | (3,506 | ) |
OTC Swaps | | | | | | | | | | | | | | | | |
Interest Rate Swaps* | | | | | | | | | | | | | | | | |
Unrealized Appreciation | | | — | | | | 10 | | | | — | | | | 10 | |
Unrealized Depreciation | | | — | | | | (120 | ) | | | — | | | | (120 | ) |
Credit Default Swaps* | | | | | | | | | | | | | | | | |
Unrealized Appreciation | | | — | | | | 139 | | | | — | | | | 139 | |
Unrealized Depreciation | | | — | | | | (3 | ) | | | — | | | | (3 | ) |
Reverse Repurchase Agreements | | | — | | | | (158,503 | ) | | | — | | | | (158,503 | ) |
| | | | | | | | | | | | | | | | |
Total Other Financial Instruments | | $ | 6,465 | | | $ | (160,367 | ) | | $ | — | | | $ | (153,902 | ) |
| | | | | | | | | | | | | | | | |
| * | | Futures contracts, forwards contracts and swaps are valued at the unrealized appreciation (depreciation) on the instrument. |
For the year ended May 31, 2016, there were no transfers between Level 1 and Level 2 assets and liabilities.
For the year ended May 31, 2016, there were no transfers between Level 2 and Level 3 assets and liabilities.
For more information on valuation inputs, see Note 2 — Significant Accounting Policies in Notes to Financial Statements.
Amounts designated as “—” are $0 or have been rounded to $0.
The accompanying notes are an integral part of the financial statements.
| | | | |
| SEI Institutional Investments Trust / Annual Report / May 31, 2016 | | | 265 | |
STATEMENTS OF ASSETS AND LIABILITIES ($ Thousands)
May 31, 2016
| | | | | | | | |
| | | Large Cap
Fund | | | Large Cap Diversified
Alpha Fund | |
Assets: | | | | | | | | |
Investments, at value† | | $ | 2,025,770 | * | | $ | 50,951 | |
Affiliated investments, at value†† | | | 102,659 | | | | 3,568 | |
Cash and cash equivalents | | | — | | | | 64 | |
Cash pledged as collateral for forward foreign currency contracts, futures contracts and swap contracts | | | — | | | | — | |
Receivable for fund shares sold | | | 1,454 | | | | — | |
Receivable for investment securities sold | | | 64,204 | | | | 690 | |
Dividends and Interest receivable | | | 4,037 | | | | 100 | |
Foreign tax reclaim receivable | | | 7 | | | | 3 | |
Receivable for variation margin | | | — | | | | — | |
Prepaid expenses | | | 9 | | | | — | |
Total Assets | | | 2,198,140 | | | | 55,376 | |
Liabilities: | | | | | | | | |
Payable for fund shares redeemed | | | 42,735 | | | | — | |
Payable upon return on securities loaned | | | 40,532 | | | | — | |
Payable for investment securities purchased | | | 27,956 | | | | 1,028 | |
Payable for variation margin | | | 1 | | | | 1 | |
Investment advisory fees payable | | | 319 | | | | 10 | |
Trustees fees payable | | | 5 | | | | — | |
CCO fees payable | | | 5 | | | | — | |
Accrued expense payable | | | 65 | | | | 2 | |
Total Liabilities | | | 111,618 | | | | 1,041 | |
Net Assets | | $ | 2,086,522 | | | $ | 54,335 | |
† Cost of investments | | $ | 1,644,626 | | | $ | 44,947 | |
†† Cost of affiliated investments | | | 102,659 | | | | 3,568 | |
* Includes market value of securities on loan | | | 39,531 | | | | — | |
Net Assets: | | | | | | | | |
Paid-in Capital — (unlimited authorization — no par value) | | $ | 1,702,844 | | | $ | 51,093 | |
Undistributed net investment income | | | 4,108 | | | | — | |
Accumulated net realized gain (loss) on investments, option contracts, swaptions, futures contracts, securities sold short, swap contracts and foreign currency | | | (1,574 | ) | | | (2,773 | ) |
Net unrealized appreciation on investments and securities sold short | | | 381,144 | | | | 6,004 | |
Net unrealized appreciation on futures contracts | | | — | | | | 11 | |
Net unrealized depreciation on forward foreign currency contracts, foreign currencies and translation of other assets and liabilities denominated in foreign currencies | | | — | | | | — | |
Net Assets | | $ | 2,086,522 | | | $ | 54,335 | |
Net Asset Value, Offering and Redemption Price Per Share — Class A | | | $18.90 | | | | $9.18 | |
| | |
| ($2,086,522,326 ÷
110,376,304 shares |
) | |
| ($54,334,972 ÷
5,917,558 shares |
) |
Amounts designated as “—” are $0 or have been rounded to $0.
The accompanying notes are an integral part of the financial statements.
| | |
| 266 | | SEI Institutional Investments Trust / Annual Report / May 31, 2016 |
| | | | | | | | | | | | | | | | | | | | | | | | | | |
Large Cap Disciplined
Equity Fund | | | Large Cap Index Fund | | | S&P 500 Index Fund | | | Extended Market Index Fund | | | Small Cap Fund | | | Small Cap II Fund | | | Small/Mid Cap Equity
Fund | |
| | | | | | | | | | | | | | | | | | | | | | | | | | | |
| | $3,449,018 | * | | | $2,009,940 | * | | | $3,315,774 | * | | | $695,837 | * | | | $469,552 | * | | | $429,839 | * | | | $1,568,013 | * |
| | 176,395 | | | | 61,067 | | | | 87,430 | | | | 58,423 | | | | 49,120 | | | | 54,906 | | | | 231,810 | |
| | 11 | | | | 332 | | | | — | | | | 129 | | | | 35 | | | | — | | | | 17 | |
| | 2,200 | | | | — | | | | — | | | | — | | | | — | | | | — | | | | — | |
| | 9,517 | | | | 37,164 | | | | 46,216 | | | | 1,863 | | | | 1,780 | | | | 2,639 | | | | 3,422 | |
| | 41,696 | | | | 8,102 | | | | 6,723 | | | | 3,579 | | | | 14,827 | | | | 4,982 | | | | 38,186 | |
| | 6,553 | | | | 4,157 | | | | 7,271 | | | | 616 | | | | 423 | | | | 337 | | | | 1,632 | |
| | 59 | | | | — | | | | 6 | | | | — | | | | 2 | | | | — | | | | 4 | |
| | — | | | | 4 | | | | — | | | | 26 | | | | 13 | | | | 16 | | | | 23 | |
| | 23 | | | | 11 | | | | 155 | | | | 4 | | | | 3 | | | | 2 | | | | 10 | |
| | 3,685,472 | | | | 2,120,777 | | | | 3,463,575 | | | | 760,477 | | | | 535,755 | | | | 492,721 | | | | 1,843,117 | |
| | | | | | | | | | | | | | | | | | | | | | | | | | |
| | 25,617 | | | | 9,519 | | | | 10,644 | | | | 2,720 | | | | 275 | | | | 414 | | | | 10,244 | |
| | 24,483 | | | | 20,890 | | | | 26,532 | | | | 42,598 | | | | 22,227 | | | | 33,837 | | | | 152,985 | |
| | 42,347 | | | | 28,461 | | | | 41,603 | | | | 818 | | | | 10,836 | | | | 2,550 | | | | 36,454 | |
| | 156 | | | | 55 | | | | 83 | | | | — | | | | — | | | | — | | | | — | |
| | 512 | | | | 17 | | | | 28 | | | | 24 | | | | 178 | | | | 153 | | | | 587 | |
| | 8 | | | | 5 | | | | 8 | | | | 2 | | | | 1 | | | | 1 | | | | 4 | |
| | 8 | | | | 4 | | | | 7 | | | | 1 | | | | 1 | | | | 1 | | | | 4 | |
| | 115 | | | | 156 | | | | 110 | | | | 56 | | | | 15 | | | | 23 | | | | 55 | |
| | 93,246 | | | | 59,107 | | | | 79,015 | | | | 46,219 | | | | 33,533 | | | | 36,979 | | | | 200,333 | |
| | $3,592,226 | | | | $2,061,670 | | | | $3,384,560 | | | | $714,258 | | | | $502,222 | | | | $455,742 | | | | $1,642,784 | |
| | $2,935,956 | | | | $1,205,321 | | | | $3,132,817 | | | | $677,020 | | | | $422,557 | | | | $390,120 | | | | $1,368,924 | |
| | 176,395 | | | | 60,686 | | | | 87,430 | | | | 58,025 | | | | 49,120 | | | | 54,906 | | | | 231,810 | |
| | 23,966 | | | | 20,437 | | | | 25,973 | | | | 41,654 | | | | 21,631 | | | | 33,133 | | | | 149,493 | |
|
$3,112,875 |
| | | $1,249,148 | | | | $3,229,249 | | | | $690,065 | | | | $476,497 | | | | $444,954 | | | | $1,462,202 | |
| | 5,236 | | | | 4,973 | | | | 8,453 | | | | 693 | | | | 137 | | | | 336 | | | | 4,644 | |
|
(42,785 |
) | | | 748 | | | | (39,115 | ) | | | 3,219 | | | | (21,568 | ) | | | (29,736 | ) | | | (23,526 | ) |
| | 513,062 | | | | 805,000 | | | | 182,957 | | | | 19,215 | | | | 46,995 | | | | 39,719 | | | | 199,089 | |
| | 3,840 | | | | 1,801 | | | | 3,016 | | | | 1,066 | | | | 161 | | | | 469 | | | | 376 | |
|
(2 |
) | | | — | | | | — | | | | — | | | | — | | | | — | | | | (1 | ) |
| | $3,592,226 | | | | $2,061,670 | | | | $3,384,560 | | | | $714,258 | | | | $502,222 | | | | $455,742 | | | | $1,642,784 | |
| | $12.57 | | | | $160.22 | | | | $11.60 | | | | $12.30 | | | | $15.99 | | | | $11.14 | | | | $11.98 | |
| ($3,592,225,877 ÷
285,888,559 shares |
) | |
| ($2,061,669,873 ÷
12,867,700 shares |
) | |
| ($3,384,560,012 ÷
291,667,388 shares |
) | |
| ($714,257,941 ÷
58,085,938 shares |
) | |
| ($502,222,414 ÷
31,406,430 shares |
) | |
| ($455,742,404 ÷
40,905,016 shares |
) | |
| ($1,642,783,852 ÷
137,153,919 shares |
) |
| | | | |
| SEI Institutional Investments Trust / Annual Report / May 31, 2016 | | | 267 | |
STATEMENTS OF ASSETS AND LIABILITIES ($ Thousands)
May 31, 2016
| | | | | | | | |
| | | U.S. Managed
Volatility Fund | | | Global Managed
Volatility Fund | |
Assets: | | | | | | | | |
Investments, at value† | | $ | 1,505,041 | | | $ | 996,406 | |
Affiliated investments, at value†† | | | 3,594 | | | | 54,498 | |
Cash and cash equivalents | | | — | | | | 4,274 | |
Cash pledged as collateral for forward foreign currency contracts, futures contracts and swap contracts | | | — | | | | — | |
Foreign currency, at value††† | | | 4,032 | | | | 4,172 | |
Receivable from custodian | | | — | | | | — | |
Receivable for fund shares sold | | | 3,312 | | | | 6,648 | |
Receivable for investment securities sold | | | 53,101 | | | | 8,774 | |
Dividends and Interest receivable | | | 3,449 | | | | 2,721 | |
Unrealized gain on forward foreign currency contracts | | | — | | | | 737 | |
Unrealized gain on foreign spot currency contracts | | | — | | | | 10 | |
Options purchased, at value††††† | | | — | | | | — | |
Foreign tax reclaim receivable | | | — | | | | 474 | |
Receivable for variation margin | | | — | | | | 82 | |
Prepaid expenses | | | 9 | | | | 1 | |
Total Assets | | | 1,572,538 | | | | 1,078,797 | |
Liabilities: | | | | | | | | |
Payable for fund shares redeemed | | | 33,802 | | | | 6,415 | |
Payable to custodian | | | 12,580 | | | | — | |
Payable for investment securities purchased | | | 1,149 | | | | 10,768 | |
Payable for variation margin | | | 79 | | | | 83 | |
Payable upon return on securities loaned | | | — | | | | — | |
Income distribution payable | | | — | | | | — | |
Swap contracts, at value†††† | | | — | | | | — | |
Options written, at value††††† | | | — | | | | — | |
Foreign currency payable to custodian, at value††† | | | — | | | | — | |
Unrealized loss on foreign currency spot contracts | | | — | | | | 1 | |
Unrealized loss on forward foreign currency contracts | | | — | | | | 214 | |
Investment advisory fees payable | | | 280 | | | | 198 | |
Trustees fees payable | | | 4 | | | | 3 | |
CCO fees payable | | | 3 | | | | 2 | |
Interest payable | | | — | | | | — | |
Accrued expense payable | | | 73 | | | | 99 | |
Accrued foreign capital gains tax on appreciated securities | | | — | | | | — | |
Total Liabilities | | | 47,970 | | | | 17,783 | |
Net Assets | | $ | 1,524,568 | | | $ | 1,061,014 | |
† Cost of investments | | $ | 1,279,955 | | | $ | 927,943 | |
†† Cost of affiliated investments | | | 3,594 | | | | 54,498 | |
††† Cost of foreign currency | | | 4,082 | | | | 4,218 | |
†††† Cost (Premiums received) | | | — | | | | — | |
††††† Cost (Premiums received) | | | — | | | | — | |
* Includes market value of securities on loan | | | — | | | | — | |
Net Assets: | | | | | | | | |
Paid-in Capital — (unlimited authorization — no par value) | | $ | 1,269,175 | | | $ | 985,366 | |
Undistributed (distributions in excess of) net investment income | | | 3,555 | | | | 451 | |
Accumulated net realized gain (loss) on investments, option contracts, swaptions, futures contracts, securities sold short, swap contracts and foreign currency | | | 26,552 | | | | 5,486 | |
Net unrealized appreciation (depreciation) on investments and securities sold short | | | 225,086 | | | | 68,463 | |
Net unrealized depreciation on option contracts | | | — | | | | — | |
Net unrealized appreciation (depreciation) on futures contracts | | | 249 | | | | 769 | |
Net unrealized appreciation (depreciation) on forward foreign currency contracts, foreign currencies and translation of other assets and liabilities denominated in foreign currencies | | | (49 | ) | | | 479 | |
Net unrealized depreciation on swap contracts | | | — | | | | — | |
Accumulated foreign capital gains tax on appreciated securities | | | — | | | | — | |
Net Assets | | $ | 1,524,568 | | | $ | 1,061,014 | |
Net Asset Value, Offering and Redemption Price Per Share — Class A | | | $13.92 | | | | $10.78 | |
| | |
| ($1,524,567,525 ÷
109,515,110 shares |
) | |
| ($1,061,013,974 ÷
98,406,651 shares |
) |
Amounts designated as “—” are $0 or have been rounded to $0.
The accompanying notes are an integral part of the financial statements.
| | |
| 268 | | SEI Institutional Investments Trust / Annual Report / May 31, 2016 |
| | | | | | | | | | | | | | | | | | | | | | | | | | |
World Equity
Ex-US Fund | | | Screened World
Equity
Ex-US Fund | | | Emerging Markets
Equity Fund | | | Opportunistic Income Fund | | | Core Fixed Income Fund | | | High Yield Bond Fund | | | Long Duration
Fund | |
| | | | | | | | | | | | | | | | | | | | | | | | | | | |
| | $6,523,491 | * | | | $77,654 | | | | $904,751 | | | | $2,065,532 | | | | $5,382,903 | | | | $2,512,720 | | | | $2,731,591 | |
| | 559,427 | | | | 2,084 | | | | 2,804 | | | | 67,573 | | | | 69,172 | | | | 120,669 | | | | 37,360 | |
| | 167,531 | | | | 2,814 | | | | 16,574 | | | | 962 | | | | 1,369 | | | | 257 | | | | 7,618 | |
| | — | | | | — | | | | — | | | | 53 | | | | 6,745 | | | | — | | | | 321 | |
| | 6,498 | | | | 43 | | | | — | | | | — | | | | 677 | | | | — | | | | — | |
| | — | | | | — | | | | 1,746 | | | | — | | | | — | | | | — | | | | — | |
| | 30,297 | | | | — | | | | 30,937 | | | | 16,622 | | | | 22,412 | | | | 12,674 | | | | 8 | |
| | 10,245 | | | | 20 | | | | 15,033 | | | | 3,444 | | | | 474,606 | | | | 15,132 | | | | 71,817 | |
| | 19,819 | | | | 207 | | | | 2,100 | | | | 7,091 | | | | 25,983 | | | | 40,691 | | | | 27,479 | |
| | — | | | | — | | | | — | | | | — | | | | 968 | | | | — | | | | — | |
| | 10 | | | | — | | | | 8 | | | | — | | | | — | | | | — | | | | — | |
| | — | | | | — | | | | — | | | | — | | | | 268 | | | | — | | | | — | |
| | 7,459 | | | | 100 | | | | 30 | | | | — | | | | 6 | | | | 2 | | | | 19 | |
| | 1,121 | | | | 11 | | | | — | | | | 1 | | | | 196 | | | | — | | | | 354 | |
| | 41 | | | | 1 | | | | 4 | | | | 13 | | | | 32 | | | | 14 | | | | 17 | |
| | 7,325,939 | | | | 82,934 | | | | 973,987 | | | | 2,161,291 | | | | 5,985,337 | | | | 2,702,159 | | | | 2,876,584 | |
| | | | | | | | | | | | | | | | | | | | | | | | | | | |
| | 21,638 | | | | 6 | | | | 6,595 | | | | 4,503 | | | | 26,222 | | | | 5,611 | | | | 65,505 | |
| | — | | | | — | | | | — | | | | — | | | | — | | | | — | | | | — | |
| | 15,159 | | | | 51 | | | | 31,324 | | | | 26,575 | | | | 690,715 | | | | 55,612 | | | | 33,939 | |
| | 706 | | | | 8 | | | | — | | | | — | | | | 899 | | | | — | | | | 179 | |
| | 362,212 | | | | — | | | | — | | | | — | | | | — | | | | — | | | | — | |
| | — | | | | — | | | | — | | | | — | | | | 180 | | | | 293 | | | | 604 | |
| | — | | | | — | | | | — | | | | — | | | | 1,163 | | | | — | | | | 700 | |
| | — | | | | — | | | | — | | | | — | | | | 29 | | | | — | | | | — | |
| | — | | | | — | | | | 31 | | | | — | | | | — | | | | — | | | | — | |
| | 14 | | | | — | | | | 10 | | | | — | | | | — | | | | — | | | | — | |
| | — | | | | — | | | | — | | | | — | | | | 577 | | | | — | | | | — | |
| | 1,740 | | | | 18 | | | | 428 | | | | 437 | | | | 494 | | | | 615 | | | | 314 | |
| | 17 | | | | — | | | | 2 | | | | 5 | | | | 13 | | | | 6 | | | | 7 | |
| | 15 | | | | — | | | | 2 | | | | 5 | | | | 12 | | | | 6 | | | | 6 | |
| | — | | | | — | | | | — | | | | 20 | | | | — | | | | — | | | | — | |
| | 334 | | | | 15 | | | | 196 | | | | 77 | | | | 174 | | | | 97 | | | | 93 | |
| | 167 | | | | — | | | | — | | | | — | | | | — | | | | — | | | | — | |
| | 402,002 | | | | 98 | | | | 38,588 | | | | 31,622 | | | | 720,478 | | | | 62,240 | | | | 101,347 | |
| | $6,923,937 | | | | $82,836 | | | | $935,399 | | | | $2,129,669 | | | | $5,264,859 | | | | $2,639,919 | | | | $2,775,237 | |
| | $6,414,628 | | | | $79,703 | | | | $932,010 | | | | $2,088,839 | | | | $5,278,329 | | | | $2,646,129 | | | | $2,550,423 | |
| | 559,427 | | | | 2,084 | | | | 2,804 | | | | 67,573 | | | | 69,172 | | | | 120,669 | | | | 37,360 | |
| | 6,491 | | | | 49 | | | | (30 | ) | | | — | | | | 708 | | | | — | | | | — | |
| | — | | | | — | | | | — | | | | — | | | | 173 | | | | — | | | | — | |
| | — | | | | — | | | | — | | | | — | | | | 354 | | | | — | | | | — | |
| | | | | | | | | | | | | | | | | | | | | | | | | | | |
| | 344,379 | | | | — | | | | — | | | | — | | | | — | | | | — | | | | — | |
| | $7,094,091 | | | | $95,794 | | | | $1,001,097 | | | | $2,201,420 | | | | $5,170,321 | | | | $2,874,064 | | | | $2,610,626 | |
| | 69,787 | | | | 843 | | | | 5,936 | | | | 17,489 | | | | 4,712 | | | | 13,848 | | | | (1,653 | ) |
|
(356,218 |
) | | | (11,782 | ) | | | (44,385 | ) | | | (65,921 | ) | | | (7,006 | ) | | | (114,584 | ) | | | (13,524 | ) |
| | 108,863 | | | | (2,049 | ) | | | (27,259 | ) | | | (23,307 | ) | | | 104,574 | | | | (133,409 | ) | | | 181,168 | |
| | — | | | | — | | | | — | | | | — | | | | (115 | ) | | | — | | | | — | |
| | 7,805 | | | | 41 | | | | — | | | | (12 | ) | | | (385 | ) | | | — | | | | 507 | |
|
(224 |
) | | | (11 | ) | | | 10 | | | | — | | | | 417 | | | | — | | | | — | |
| | — | | | | — | | | | — | | | | — | | | | (7,659 | ) | | | — | | | | (1,887 | ) |
| | (167 | ) | | | — | | | | — | | | | — | | | | — | | | | — | | | | — | |
| | $6,923,937 | | | | $82,836 | | | | $935,399 | | | | $2,129,669 | | | | $5,264,859 | | | | $2,639,919 | | | | $2,775,237 | |
| | $10.80 | | | | $8.50 | | | | $8.61 | | | | $8.11 | | | | $10.44 | | | | $8.53 | | | | $8.68 | |
| ($6,923,937,020 ÷
640,827,265 shares |
) | |
| ($82,836,123 ÷
9,749,180 shares |
) | |
| ($935,398,909 ÷
108,615,531 shares |
) | |
| ($2,129,669,270 ÷
262,465,691 shares |
) | |
| ($5,264,858,666 ÷
504,493,098 shares |
) | |
| ($2,639,918,595 ÷
309,416,058 shares |
) | |
| ($2,775,236,944 ÷
319,665,463 shares |
) |
| | | | |
| SEI Institutional Investments Trust / Annual Report / May 31, 2016 | | | 269 | |
STATEMENTS OF ASSETS AND LIABILITIES / CONSOLIDATED STATEMENTS OF ASSETS AND LIABILITIES ($ Thousands)
May 31, 2016
| | | | | | | | |
| | | Long Duration Credit Fund | | | Ultra Short Duration Bond Fund | |
Assets: | | | | | | | | |
Investments, at value† | | $ | 3,272,729 | | | $ | 547,829 | |
Affiliated investments, at value†† | | | 41,861 | | | | 1,968 | |
Cash and cash equivalents | | | 2,319 | | | | 15 | |
Cash pledged as collateral for forward foreign currency contracts, futures contracts and swap contracts | | | — | | | | 45 | |
Foreign currency, at value††† | | | — | | | | — | |
Receivable from custodian | | | — | | | | — | |
Receivable for fund shares sold | | | 46,364 | | | | 4,130 | |
Dividends and Interest receivable | | | 34,735 | | | | 1,366 | |
Receivable for investment securities sold | | | 29,189 | | | | 35 | |
Receivable for variation margin | | | 144 | | | | 1 | |
Foreign tax reclaim receivable | | | 30 | | | | — | |
Unrealized gain on forward foreign currency contracts | | | — | | | | — | |
Unrealized gain on foreign spot currency contracts | | | — | | | | — | |
Swap contracts, at value†††† | | | — | | | | — | |
Options purchased, at value††††† | | | — | | | | — | |
Prepaid expenses | | | 21 | | | | 4 | |
Total Assets | | | 3,427,392 | | | | 555,393 | |
Liabilities: | | | | | | | | |
Payable for investment securities purchased | | | 88,048 | | | | 15,193 | |
Payable for fund shares redeemed | | | 4,801 | | | | 4,490 | |
Payable for variation margin | | | 262 | | | | — | |
Payable for securities sold short@ | | | — | | | | — | |
Income distribution payable | | | — | | | | 11 | |
Swap contracts, at value†††† | | | — | | | | — | |
Reverse repurchase agreements | | | — | | | | — | |
Payable to custodian | | | — | | | | — | |
Unrealized loss on foreign currency spot contracts | | | — | | | | — | |
Unrealized loss on forward foreign currency contracts | | | — | | | | — | |
Investment advisory fees payable | | | 360 | | | | 47 | |
Trustees fees payable | | | 8 | | | | 1 | |
CCO fees payable | | | 7 | | | | 1 | |
Interest payable | | | — | | | | — | |
Accrued expense payable | | | 100 | | | | 21 | |
Total Liabilities | | | 93,586 | | | | 19,764 | |
Net Assets | | $ | 3,333,806 | | | $ | 535,629 | |
† Cost of investments | | $ | 3,172,971 | | | $ | 548,177 | |
†† Cost of affiliated investments | | | 41,861 | | | | 1,968 | |
††† Cost of foreign currency | | | — | | | | — | |
†††† Cost (Premiums received) | | | — | | | | — | |
††††† Cost (Premiums received) | | | — | | | | — | |
@ Proceedsfrom securities sold short | | | — | | | | — | |
Net Assets: | | | | | | | | |
Paid-in Capital — (unlimited authorization — no par value) | | $ | 3,263,996 | | | $ | 539,661 | |
Undistributed (distributions in excess of) net investment income | | | (14 | ) | | | (35 | ) |
Accumulated net realized loss on investments, option contracts, swaptions, futures contracts, securities sold short, swap contracts and foreign currency | | | (30,130 | ) | | | (3,644 | ) |
Net unrealized appreciation (depreciation) on investments and securities sold short | | | 99,758 | | | | (348 | ) |
Net unrealized depreciation on option contracts | | | — | | | | — | |
Net unrealized appreciation (depreciation) on futures contracts | | | 196 | | | | (5 | ) |
Net unrealized appreciation (depreciation) on forward foreign currency contracts, foreign currencies and translation of other assets and liabilities denominated in foreign currencies | | | — | | |
|
— |
|
Net unrealized appreciation (depreciation) on swap contracts | | | — | | | | — | |
Net Assets | | $ | 3,333,806 | | | $ | 535,629 | |
Net Asset Value, Offering and Redemption Price Per Share — Class A | | | $10.26 | | | | $9.98 | |
| | |
| ($3,333,805,612 ÷
325,017,438 shares |
) | |
| ($535,629,352 ÷
53,666,530 shares |
) |
Amounts designated as “—” are $0 or have been rounded to $0.
The accompanying notes are an integral part of the financial statements.
| | |
| 270 | | SEI Institutional Investments Trust / Annual Report / May 31, 2016 |
| | | | | | | | | | | | | | | | | | | | | | |
Emerging Markets
Debt Fund | | | Real Return
Fund | | | Limited Duration
Bond Fund | | | Intermediate Duration
Credit Fund | | | Dynamic Asset
Allocation Fund | | | Multi-Asset Real
Return Fund | |
| | | | | | | | | | | | | | | | | | | | | | |
| | $1,836,642 | | | | $149,342 | | | | $1,112,688 | | | | $1,397,260 | | | | $2,004,340 | | | | $859,560 | |
| | — | | | | — | | | | 6,511 | | | | 43,414 | | | | — | | | | — | |
| | 53,861 | | | | 1,411 | | | | — | | | | 50 | | | | 13,679 | | | | 140,320 | |
| 6,758 | | | | — | | | | — | | | | — | | | | 38,599 | | | | 3,751 | |
| | 11,860 | | | | — | | | | — | | | | — | | | | — | | | | — | |
| | 1,773 | | | | — | | | | — | | | | — | | | | — | | | | — | |
| | 12,420 | | | | 88 | | | | 54,120 | | | | 3,552 | | | | 19,061 | | | | 2,349 | |
| | 34,420 | | | | 443 | | | | 3,768 | | | | 11,276 | | | | 4,432 | | | | 1,978 | |
| | 8,797 | | | | 5,592 | | | | 7,227 | | | | 35,346 | | | | 1,049 | | | | 21,143 | |
| | 20 | | | | — | | | | — | | | | 2 | | | | 12 | | | | 1,308 | |
| | — | | | | — | | | | 2 | | | | — | | | | 19 | | | | 15 | |
| | 6,932 | | | | — | | | | — | | | | — | | | | 11,827 | | | | 177 | |
| | 179 | | | | — | | | | — | | | | — | | | | — | | | | — | |
| | 2,070 | | | | — | | | | — | | | | — | | | | 100,971 | | | | 149 | |
| | — | | | | — | | | | — | | | | — | | | | 161 | | | | 87 | |
| | 3 | | | | 1 | | | | 6 | | | | 10 | | | | 11 | | | | 4 | |
| | 1,975,735 | | | | 156,877 | | | | 1,184,322 | | | | 1,490,910 | | | | 2,194,161 | | | | 1,030,841 | |
| | | | | | | | | | | | | | | | | | | | | | |
| | 18,216 | | | | — | | | | 24,625 | | | | 50,256 | | | | 916 | | | | 24,232 | |
| | 5,531 | | | | 6,893 | | | | 3,257 | | | | — | | | | 16,247 | | | | 8,891 | |
| | 56 | | | | — | | | | — | | | | 12 | | | | 115 | | | | 1,149 | |
| | — | | | | — | | | | — | | | | — | | | | — | | | | 104,284 | |
| | — | | | | — | | | | 27 | | | | — | | | | — | | | | — | |
| | 2,916 | | | | — | | | | — | | | | — | | | | 94,587 | | | | 110 | |
| | — | | | | — | | | | — | | | | — | | | | — | | | | 158,503 | |
| | 67 | | | | — | | | | 1 | | | | — | | | | — | | | | — | |
| | 163 | | | | — | | | | — | | | | — | | | | — | | | | — | |
| | 12,235 | | | | — | | | | — | | | | — | | | | 2,969 | | | | 330 | |
| | 630 | | | | 8 | | | | 84 | | | | 156 | | | | 104 | | | | 150 | |
| | 5 | | | | — | | | | 3 | | | | 3 | | | | 5 | | | | 2 | |
| | 4 | | | | — | | | | 2 | | | | 3 | | | | 4 | | | | 2 | |
| | — | | | | — | | | | — | | | | — | | | | — | | | | 2 | |
| | 161 | | | | 4 | | | | 65 | | | | 46 | | | | 60 | | | | 157 | |
| | 39,984 | | | | 6,905 | | | | 28,064 | | | | 50,476 | | | | 115,007 | | | | 297,812 | |
| | $1,935,751 | | | | $149,972 | | | | $1,156,258 | | | | $1,440,434 | | | | $2,079,154 | | | | $733,029 | |
| | $1,985,712 | | | | $147,791 | | | | $1,111,243 | | | | $1,387,534 | | | | $1,516,826 | | | | $841,233 | |
| | — | | | | — | | | | 6,511 | | | | 43,414 | | | | — | | | | — | |
| | 11,909 | | | | — | | | | — | | | | — | | | | — | | | | — | |
| | 1,761 | | | | — | | | | — | | | | — | | | | — | | | | (23 | ) |
| | — | | | | — | | | | — | | | | — | | | | 1,450 | | | | 156 | |
| | — | | | | — | | | | — | | | | — | | | | — | | | | 105,558 | |
| | | | | | | | | | | | | | | | | | | | | | |
| | $2,157,663 | | | | $154,203 | | | | $1,155,031 | | | | $1,451,018 | | | | $1,613,962 | | | | $803,717 | |
| | (10,047 | ) | | | (256 | ) | | | 18 | | | | 140 | | | | (8,239 | ) | | | (12,327 | ) |
| (53,804 | ) | | | (5,526 | ) | | | (236 | ) | | | (20,374 | ) | | | (30,962 | ) | | | (82,409 | ) |
| | | | | |
| | (149,070 | ) | | | 1,551 | | | | 1,445 | | | | 9,726 | | | | 486,225 | | | | 19,601 | |
| | — | | | | — | | | | — | | | | — | | | | (1,289 | ) | | | (69 | ) |
| | (57 | ) | | | — | | | | — | | | | (76 | ) | | | 2,916 | | | | 6,378 | |
| | | | | |
| | (5,539 | ) | | | — | | | | — | | | | — | | | | 10,157 | | | | (151 | ) |
| | (3,395 | ) | | | — | | | | — | | | | — | | | | 6,384 | | | | (1,711 | ) |
| | $1,935,751 | | | | $149,972 | | | | $1,156,258 | | | | $1,440,434 | | | | $2,079,154 | | | | $733,029 | |
| | $9.39 | | | | $9.64 | | | | $10.00 | | | | $9.96 | | | | $15.83 | | | | $8.28 | |
| ($1,935,750,979 ÷
206,064,843 shares |
) | |
| ($149,971,579 ÷
15,554,785 shares |
) | |
| ($1,156,257,952 ÷
115,597,556 shares |
) | |
| ($1,440,434,266 ÷
144,625,741 shares |
) | |
| ($2,079,153,895 ÷
131,331,151 shares |
) | |
| ($733,028,835 ÷
88,576,325 shares |
) |
| | | | |
| SEI Institutional Investments Trust / Annual Report / May 31, 2016 | | | 271 | |
STATEMENTS OF OPERATIONS ($ Thousands)
For the year ended May 31, 2016
| | | | | | | | | | | | |
| | | Large Cap Fund | | | Large Cap Diversified Alpha Fund | | | Large Cap Disciplined Equity Fund | |
Investment Income: | | | | | | | | | | | | |
Dividends | | $ | 37,793 | | | $ | 1,172 | | | $ | 74,779 | |
Dividends from Affiliated Registered Investment Company | | | 120 | | | | 4 | | | | 208 | |
Interest Income | | | 5 | | | | — | | | | 16 | |
Security Lending Income — Net | | | 444 | | | | — | | | | 175 | |
Less: Foreign Taxes Withheld | | | (138 | ) | | | (12 | ) | | | (155 | ) |
Total Investment Income | | | 38,224 | | | | 1,164 | | | | 75,023 | |
Expenses: | | | | | | | | | | | | |
Investment Advisory Fees | | | 8,497 | | | | 232 | | | | 14,933 | |
Administration Fees | | | 1,062 | | | | 29 | | | | 1,867 | |
Trustees’ Fees | | | 28 | | | | 1 | | | | 50 | |
Chief Compliance Officer Fees | | | 12 | | | | — | | | | 20 | |
Custodian/Wire Agent Fees | | | 98 | | | | 2 | | | | 174 | |
Professional Fees | | | 86 | | | | 2 | | | | 153 | |
Proxy Fees | | | 28 | | | | 1 | | | | 49 | |
Registration Fees | | | 26 | | | | 1 | | | | 83 | |
Printing Fees | | | 24 | | | | 1 | | | | 42 | |
Interest Expense on Reverse Repurchase Agreements | | | — | | | | — | | | | — | |
Other Expenses | | | 100 | | | | 2 | | | | 176 | |
Total Expenses | | | 9,961 | | | | 271 | | | | 17,547 | |
Less: | | | | | | | | | | | | |
Waiver of Investment Advisory Fees | | | (4,673 | ) | | | (104 | ) | | | (8,587 | ) |
Waiver of Administration Fees | | | (1,062 | ) | | | (29 | ) | | | (1,867 | ) |
Fees Paid Indirectly(1) | | | (18 | ) | | | — | | | | (60 | ) |
Net Expenses | | | 4,208 | | | | 138 | | | | 7,033 | |
Net Investment Income | | | 34,016 | | | | 1,026 | | | | 67,990 | |
Net Realized Gain (Loss) on: | | | | | | | | | | | | |
Investments | | | 105,991 | | | | 276 | | | | 120,142 | |
Futures Contracts | | | 5,751 | | | | 148 | | | | (6,938 | ) |
Foreign Currency Transactions | | | — | | | | — | | | | 9 | |
Net Change in Unrealized Appreciation (Depreciation) on: | | | | | | | | | | | | |
Investments | | | (204,357 | ) | | | (4,359 | ) | | | (158,635 | ) |
Futures Contracts | | | — | | | | (26 | ) | | | 1,870 | |
Foreign Currency Translation of Other Assets and Liabilities Denominated in Foreign Currencies | | | — | | | | — | | | | 9 | |
Net Increase (Decrease) in Net Assets Resulting from Operations | | $ | (58,599 | ) | | $ | (2,935 | ) | | $ | 24,447 | |
| (1) | | See Note 6 in the Notes to Financial Statements. |
Amounts designated as “—” are $0 or have been rounded to $0.
The accompanying notes are an integral part of the financial statements.
| | |
| 272 | | SEI Institutional Investments Trust / Annual Report / May 31, 2016 |
| | | | | | | | | | | | | | | | | | | | | | |
Large Cap
Index Fund | | | S&P 500
Index Fund | | | Extended Market Index Fund | | | Small Cap
Fund | | | Small Cap
II Fund | | | Small/Mid Cap
Equity Fund | |
| | | | | | | | | | | | | | | | | | | | | | |
| $ | 38,409 | | | $ | 66,487 | | | $ | 9,688 | | | $ | 7,178 | | | $ | 4,092 | | | $ | 21,410 | |
| | 46 | | | | 93 | | | | 34 | | | | 37 | | | | 39 | | | | 101 | |
| | 3 | | | | 7 | | | | 2 | | | | 1 | | | | 2 | | | | 4 | |
| | 231 | | | | 136 | | | | 839 | | | | 822 | | | | 415 | | | | 1,414 | |
| | (7 | ) | | | (5 | ) | | | (12 | ) | | | (20 | ) | | | (14 | ) | | | (42 | ) |
| | 38,682 | | | | 66,718 | | | | 10,551 | | | | 8,018 | | | | 4,534 | | | | 22,887 | |
| | | | | | | | | | | | | | | | | | | | | | |
| | 3,152 | | | | 928 | | | | 813 | | | | 3,597 | | | | 2,561 | | | | 10,782 | |
| | 927 | | | | 1,547 | | | | 339 | | | | 277 | | | | 197 | | | | 829 | |
| | 25 | | | | 42 | | | | 9 | | | | 7 | | | | 5 | | | | 21 | |
| | 10 | | | | 17 | | | | 4 | | | | 3 | | | | 2 | | | | 9 | |
| | 88 | | | | 151 | | | | 33 | | | | 26 | | | | 20 | | | | 79 | |
| | 78 | | | | 127 | | | | 28 | | | | 23 | | | | 16 | | | | 68 | |
| | 25 | | | | 41 | | | | 9 | | | | 7 | | | | 6 | | | | 22 | |
| | 26 | | | | 94 | | | | 19 | | | | 7 | | | | 16 | | | | 10 | |
| | 21 | | | | 35 | | | | 8 | | | | 6 | | | | 4 | | | | 19 | |
| | — | | | | — | | | | — | | | | 1 | | | | — | | | | — | |
| | 186 | | | | 758 | | | | 76 | | | | 27 | | | | 19 | | | | 78 | |
| | 4,538 | | | | 3,740 | | | | 1,338 | | | | 3,981 | | | | 2,846 | | | | 11,917 | |
| | | | | | | | | | | | | | | | | | | | | | |
| | (2,966 | ) | | | (619 | ) | | | (542 | ) | | | (1,123 | ) | | | (861 | ) | | | (3,509 | ) |
| | (927 | ) | | | (1,547 | ) | | | (339 | ) | | | (277 | ) | | | (197 | ) | | | (829 | ) |
| | — | | | | — | | | | — | | | | (12 | ) | | | (19 | ) | | | (9 | ) |
| | 645 | | | | 1,574 | | | | 457 | | | | 2,569 | | | | 1,769 | | | | 7,570 | |
| | 38,037 | | | | 65,144 | | | | 10,094 | | | | 5,449 | | | | 2,765 | | | | 15,317 | |
| | | | | | | | | | | | | | | | | | | | | | |
| | 40,689 | | | | (26,802 | ) | | | 12,959 | | | | 14,981 | | | | (13,339 | ) | | | 43,784 | |
| | 1,330 | | | | (405 | ) | | | (1,262 | ) | | | 1,280 | | | | (868 | ) | | | 2,552 | |
| | — | | | | — | | | | — | | | | — | | | | — | | | | — | |
| (65,321 | ) | | | 12,175 | | | | (63,739 | ) | | | (55,653 | ) | | | (7,706 | ) | | | (160,661 | ) |
| | 803 | | | | 1,463 | | | | 819 | | | | (206 | ) | | | 252 | | | | (253 | ) |
| | | | | |
| | — | | | | — | | | | — | | | | — | | | | — | | | | — | |
$ | 15,538 | | | $ | 51,575 | | | $ | (41,129 | ) | | $ | (34,149 | ) | | $ | (18,896 | ) | | $ | (99,261 | ) |
| | | | |
| SEI Institutional Investments Trust / Annual Report / May 31, 2016 | | | 273 | |
STATEMENTS OF OPERATIONS ($ Thousands)
For the year or period ended May 31, 2016
| | | | | | | | | | | | |
| | | U.S. Managed
Volatility Fund | | | Global Managed
Volatility Fund(1) | | | World Equity
Ex-US Fund | |
Investment Income: | | | | | | | | | | | | |
Dividends | | $ | 42,360 | | | $ | 13,062 | | | $ | 181,801 | |
Dividends from Affiliated Registered Investment Company | | | 54 | | | | 44 | | | | 260 | |
Interest Income | | | 4 | | | | 4 | | | | 121 | |
Security Lending Income — Net | | | — | | | | — | | | | 3,613 | |
Less: Foreign Taxes Withheld | | | (283 | ) | | | (685 | ) | | | (19,656 | ) |
Total Investment Income | | | 42,135 | | | | 12,425 | | | | 166,139 | |
Expenses: | | | | | | | | | | | | |
Investment Advisory Fees | | | 10,121 | | | | 2,187 | | | | 37,389 | |
Administration Fees | | | 779 | | | | 168 | | | | 3,399 | |
Trustees’ Fees | | | 20 | | | | 3 | | | | 91 | |
Chief Compliance Officer Fees | | | 8 | | | | 2 | | | | 37 | |
Custodian/Wire Agent Fees | | | 76 | | | | 50 | | | | 791 | |
Professional Fees | | | 65 | | | | 19 | | | | 274 | |
Registration Fees | | | 33 | | | | 65 | | | | 135 | |
Proxy Fees | | | 22 | | | | 8 | | | | 89 | |
Printing Fees | | | 18 | | | | 2 | | | | 77 | |
Overdraft fees | | | — | | | | — | | | | 6 | |
Other Expenses | | | 75 | | | | 12 | | | | 323 | |
Total Expenses | | | 11,217 | | | | 2,516 | | | | 42,611 | |
Less: | | | | | | | | | | | | |
Waiver of Investment Advisory Fees | | | (6,764 | ) | | | (1,447 | ) | | | (16,430 | ) |
Waiver of Administration Fees | | | (779 | ) | | | (168 | ) | | | (3,399 | ) |
Fees Paid Indirectly(2) | | | — | | | | — | | | | (73 | ) |
Net Expenses | | | 3,674 | | | | 901 | | | | 22,709 | |
Net Investment Income | | | 38,461 | | | | 11,524 | | | | 143,430 | |
Net Realized Gain (Loss) on: | | | | | | | | | | | | |
Investments | | | 57,709 | | | | 4,487 | | | | (330,993 | ) |
Futures Contracts | | | (2,328 | ) | | | 1,285 | | | | (12,301 | ) |
Foreign Currency Transactions | | | (73 | ) | | | (11,359 | ) | | | (6,606 | ) |
Purchased and Written Options | | | — | | | | — | | | | — | |
Purchased and Written Swaptions | | | — | | | | — | | | | — | |
Swap Contracts | | | — | | | | — | | | | — | |
Net Change in Unrealized Appreciation (Depreciation) on: | | | | | | | | | | | | |
Investments | | | (19,620 | ) | | | 68,463 | | | | (756,526 | ) |
Futures Contracts | | | (888 | ) | | | 769 | | | | 5,878 | |
Purchased and Written Options | | | — | | | | — | | | | — | |
Purchased and Written Swaptions | | | — | | | | — | | | | — | |
Swap Contracts | | | — | | | | — | | | | — | |
Foreign Capital Gains Tax | | | — | | | | — | | | | 413 | |
Foreign Currency Translation of Other Assets and Liabilities Denominated in Foreign Currencies | | | (35 | ) | | | 479 | | | | 541 | |
Net Increase (Decrease) in Net Assets Resulting from Operations | | $ | 73,226 | | | $ | 75,648 | | | $ | (956,164 | ) |
| (1) | | Commenced operations on January 29, 2016. |
| (2) | | See Note 6 in the Notes to Financial Statements. |
Amounts designated as “—” are $0 or have been rounded to $0.
The accompanying notes are an integral part of the financial statements.
| | |
| 274 | | SEI Institutional Investments Trust / Annual Report / May 31, 2016 |
| | | | | | | | | | | | | | | | | | | | | | |
Screened World
Equity Ex-US Fund | | | Emerging Markets
Equity Fund | | | Opportunistic
Income Fund | | | Core Fixed
Income Fund | | | High Yield
Bond Fund | | | Long Duration
Fund | |
| | | | | | | | | | | | | | | | | | | | | | |
| $ | 2,072 | | | $ | 19,514 | | | $ | 172 | | | $ | – | | | $ | 1,583 | | | $ | – | |
| | 4 | | | | 10 | | | | 190 | | | | 315 | | | | 192 | | | | 50 | |
| | 1 | | | | 15 | | | | 63,095 | | | | 148,705 | | | | 167,872 | | | | 129,211 | |
| | – | | | | – | | | | – | | | | 118 | | | | – | | | | – | |
| | (232 | ) | | | (2,166 | ) | | | – | | | | (1 | ) | | | (38 | ) | | | (3 | ) |
| | 1,845 | | | | 17,373 | | | | 63,457 | | | | 149,137 | | | | 169,609 | | | | 129,258 | |
| | | | | | | | | | | | | | | | | | | | | | |
| | 510 | | | | 7,690 | | | | 9,750 | | | | 16,064 | | | | 11,653 | | | | 8,872 | |
| | 39 | | | | 366 | | | | 1,083 | | | | 2,677 | | | | 1,195 | | | | 1,479 | |
| | 1 | | | | 10 | | | | 29 | | | | 70 | | | | 32 | | | | 38 | |
| | 1 | | | | 4 | | | | 12 | | | | 29 | | | | 13 | | | | 16 | |
| | 52 | | | | 844 | | | | 105 | | | | 254 | | | | 115 | | | | 141 | |
| | 3 | | | | 31 | | | | 89 | | | | 222 | | | | 100 | | | | 123 | |
| | 1 | | | | 43 | | | | 35 | | | | 59 | | | | 45 | | | | 36 | |
| | 1 | | | | 11 | | | | 29 | | | | 71 | | | | 32 | | | | 38 | |
| | 1 | | | | 9 | | | | 25 | | | | 61 | | | | 27 | | | | 34 | |
| | – | | | | 13 | | | | – | | | | – | | | | – | | | | – | |
| | 8 | | | | 36 | | | | 121 | | | | 278 | | | | 127 | | | | 142 | |
| | 617 | | | | 9,057 | | | | 11,278 | | | | 19,785 | | | | 13,339 | | | | 10,919 | |
| | | | | | | | | | | | | | | | | | | | | | |
| | (306 | ) | | | (3,550 | ) | | | (4,550 | ) | | | (10,174 | ) | | | (4,960 | ) | | | (5,027 | ) |
| | (39 | ) | | | (366 | ) | | | (1,083 | ) | | | (2,677 | ) | | | (1,195 | ) | | | (1,479 | ) |
| | – | | | | – | | | | – | | | | – | | | | – | | | | – | |
| | 272 | | | | 5,141 | | | | 5,645 | | | | 6,934 | | | | 7,184 | | | | 4,413 | |
| | 1,573 | | | | 12,232 | | | | 57,812 | | | | 142,203 | | | | 162,425 | | | | 124,845 | |
| | | | | | | | | | | | | | | | | | | | | | | |
| | (2,239 | ) | | | (41,168 | ) | | | (9,502 | ) | | | 45,517 | | | | (70,567 | ) | | | 39,868 | |
| | (160 | ) | | | – | | | | (289 | ) | | | 2,389 | | | | – | | | | 9,170 | |
| | (46 | ) | | | (355 | ) | | | – | | | | 493 | | | | – | | | | – | |
| | – | | | | – | | | | – | | | | (513 | ) | | | – | | | | – | |
| | – | | | | – | | | | – | | | | 211 | | | | – | | | | – | |
| | – | | | | – | | | | – | | | | (1,888 | ) | | | 1,743 | | | | (1,138 | ) |
| | | | | | | | | | | | | | | | | | | | | | |
| | (6,464 | ) | | | (34,235 | ) | | | (28,223 | ) | | | (25,994 | ) | | | (132,802 | ) | | | (10,988 | ) |
| | 36 | | | | – | | | | 119 | | | | (1,573 | ) | | | – | | | | (1,088 | ) |
| | – | | | | – | | | | – | | | | (188 | ) | | | – | | | | – | |
| | – | | | | – | | | | – | | | | (201 | ) | | | – | | | | – | |
| | – | | | | – | | | | – | | | | (6,331 | ) | | | 90 | | | | (498 | ) |
| | – | | | | – | | | | – | | | | – | | | | – | | | | – | |
| 10 | | | | 30 | | | | – | | | | (1,345 | ) | | | – | | | | – | |
| $ | (7,290 | ) | | $ | (63,496 | ) | | $ | 19,917 | | | $ | 152,780 | | | $ | (39,111 | ) | | $ | 160,171 | |
| | | | |
| SEI Institutional Investments Trust / Annual Report / May 31, 2016 | | | 275 | |
STATEMENTS OF OPERATIONS / CONSOLIDATED STATEMENTS OF OPERATIONS ($ Thousands)
For the year ended May 31, 2016
| | | | | | | | | | | | |
| | | Long Duration Credit
Fund | | | Ultra Short Duration
Bond Fund | | | Emerging Markets
Debt Fund | |
Investment Income: | | | | | | | | | | | | |
Dividends | | $ | — | | | $ | — | | | $ | — | |
Dividends from Affiliated Registered Investment Company | | | 63 | | | | 8 | | | | — | |
Interest Income | | | 138,203 | | | | 7,781 | | | | 121,885 | |
Security Lending Income — Net | | | — | | | | — | | | | 5 | |
Less: Foreign Taxes Withheld | | | (7 | ) | | | — | | | | (1,370 | ) |
Total Investment Income | | | 138,259 | | | | 7,789 | | | | 120,520 | |
Expenses: | | | | | | | | | | | | |
Investment Advisory Fees | | | 9,669 | | | | 972 | | | | 15,516 | |
Administration Fees | | | 1,612 | | | | 324 | | | | 913 | |
Trustees’ Fees | | | 42 | | | | 9 | | | | 25 | |
Chief Compliance Officer Fees | | | 17 | | | | 3 | | | | 10 | |
Custodian/Wire Agent Fees | | | 156 | | | | 31 | | | | 558 | |
Professional Fees | | | 131 | | | | 27 | | | | 77 | |
Proxy Fees | | | 42 | | | | 8 | | | | 25 | |
Registration Fees | | | 39 | | | | 7 | | | | 32 | |
Printing Fees | | | 36 | | | | 8 | | | | 21 | |
Interest Expense on Reverse Repurchase Agreements | | | — | | | | — | | | | — | |
Dividend Expense on Securities Sold Short | | | — | | | | — | | | | — | |
Overdraft fees | | | — | | | | — | | | | 15 | |
Other Expenses | | | 165 | | | | 41 | | | | 58 | |
Total Expenses | | | 11,909 | | | | 1,430 | | | | 17,250 | |
Less: | | | | | | | | | | | | |
Waiver of Investment Advisory Fees | | | (5,479 | ) | | | (324 | ) | | | (8,580 | ) |
Waiver of Administration Fees | | | (1,612 | ) | | | (324 | ) | | | (913 | ) |
Net Expenses | | | 4,818 | | | | 782 | | | | 7,757 | |
Net Investment Income | | | 133,441 | | | | 7,007 | | | | 112,763 | |
Net Realized Gain (Loss) on: | | | | | | | | | | | | |
Investments | | | (21,184 | ) | | | 89 | | | | (9,194 | ) |
Securities Sold Short | | | — | | | | — | | | | — | |
Futures Contracts | | | (1,492 | ) | | | (211 | ) | | | (1,332 | ) |
Foreign Currency Transactions | | | — | | | | — | | | | (92,417 | ) |
Purchased and Written Options | | | — | | | | — | | | | — | |
Swap Contracts | | | — | | | | — | | | | (10,900 | ) |
Net Change in Unrealized Appreciation (Depreciation) on: | | | | | | | | | | | | |
Investments | | | 106,635 | | | | (663 | ) | | | (10,442 | ) |
Securities Sold Short | | | — | | | | — | | | | — | |
Futures Contracts | | | (29 | ) | | | 24 | | | | 190 | |
Purchased and Written Options | | | — | | | | — | | | | — | |
Swap Contracts | | | — | | | | — | | | | (1,470 | ) |
Foreign Currency Translation of Other Assets and Liabilities Denominated in Foreign Currencies | | | — | | | | — | | | | (12,341 | ) |
Net Increase (Decrease) in Net Assets Resulting from Operations | | $ | 217,371 | | | $ | 6,246 | | | $ | (25,143 | ) |
Amounts designated as “—” are $0 or have been rounded to $0.
The accompanying notes are an integral part of the financial statements.
| | |
| 276 | | SEI Institutional Investments Trust / Annual Report / May 31, 2016 |
| | | | | | | | | | | | | | | | | | |
| Real Return Fund | | | Limited Duration Bond
Fund | | | Intermediate Duration
Credit Fund | | | Dynamic Asset Allocation
Fund | | | Multi-Asset Real Return
Fund | |
| | | | | | | | | | | | | | | | | | | |
| $ | — | | | $ | — | | | $ | 13 | | | $ | 41,823 | | | $ | 4,526 | |
| | — | | | | 26 | | | | 40 | | | | — | | | | — | |
| | 1,738 | | | | 12,479 | | | | 42,971 | | | | 13 | | | | 7,606 | |
| | — | | | | — | | | | — | | | | — | | | | — | |
| | — | | | | — | | | | — | | | | (44 | ) | | | (10 | ) |
| | 1,738 | | | | 12,505 | | | | 43,024 | | | | 41,792 | | | | 12,122 | |
| | | | | | | | | | | | | | | | | | | |
| | 401 | | | | 2,288 | | | | 3,822 | | | | 11,628 | | | | 3,912 | |
| | 91 | | | | 458 | | | | 764 | | | | 969 | | | | 356 | |
| | 3 | | | | 12 | | | | 20 | | | | 26 | | | | 9 | |
| | 1 | | | | 6 | | | | 8 | | | | 11 | | | | 4 | |
| | 6 | | | | 42 | | | | 68 | | | | 40 | | | | 16 | |
| | 8 | | | | 38 | | | | 47 | | | | 80 | | | | 29 | |
| | 2 | | | | 13 | | | | 19 | | | | 26 | | | | 358 | |
| | 3 | | | | 49 | | | | 75 | | | | 34 | | | | 9 | |
| | 2 | | | | 11 | | | | 17 | | | | 22 | | | | 8 | |
| | — | | | | — | | | | — | | | | — | | | | 597 | |
| | — | | | | — | | | | — | | | | — | | | | 1,032 | |
| | 6 | | | | — | | | | — | | | | 3 | | | | 6 | |
| | 9 | | | | 47 | | | | 66 | | | | 91 | | | | 38 | |
| | 532 | | | | 2,964 | | | | 4,906 | | | | 12,930 | | | | 6,374 | |
| | | | | | | | | | | | | | | | | | | |
| | (292 | ) | | | (1,453 | ) | | | (1,780 | ) | | | (10,465 | ) | | | (2,205 | ) |
| | (91 | ) | | | (458 | ) | | | (764 | ) | | | (969 | ) | | | (356 | ) |
| | 149 | | | | 1,053 | | | | 2,362 | | | | 1,496 | | | | 3,813 | |
| | 1,589 | | | | 11,452 | | | | 40,662 | | | | 40,296 | | | | 8,309 | |
| | �� | | | | | | | | | | | | | | | | | |
| | (2,891 | ) | | | 776 | | | | (15,439 | ) | | | (3,325 | ) | | | (14,110 | ) |
| | — | | | | — | | | | — | | | | — | | | | 13,365 | |
| | — | | | | — | | | | (2,691 | ) | | | (22,088 | ) | | | (28,682 | ) |
| | — | | | | — | | | | — | | | | (32,506 | ) | | | 731 | |
| | — | | | | — | | | | — | | | | (1,255 | ) | | | (197 | ) |
| | — | | | | — | | | | — | | | | — | | | | (202 | ) |
| | | | | | | | | | | | | | | | | | | |
| | 1,467 | | | | 615 | | | | 32,726 | | | | (1,965 | ) | | | 1,564 | |
| | — | | | | — | | | | — | | | | — | | | | (8,558 | ) |
| | — | | | | — | | | | 179 | | | | (8,863 | ) | | | 7,623 | |
| | — | | | | — | | | | — | | | | (868 | ) | | | (8 | ) |
| | — | | | | — | | | | — | | | | 6,384 | | | | (1,164 | ) |
| — | | | | — | | | | — | | | | 17,963 | | | | (401 | ) |
| $ | 165 | | | $ | 12,843 | | | $ | 55,437 | | | $ | (6,227 | ) | | $ | (21,730 | ) |
| | | | |
| SEI Institutional Investments Trust / Annual Report / May 31, 2016 | | | 277 | |
STATEMENTS OF CHANGES IN NET ASSETS ($ Thousands)
For the years or period ended May 31,
| | | | | | | | | | | | | | | | | | | | | | | | |
| | | Large Cap Fund | | | Large Cap Diversified Alpha
Fund | | | Large Cap Disciplined Equity Fund | |
| | | 2016 | | | 2015 | | | 2016 | | | 2015 | | | 2016 | | | 2015 | |
Operations: | | | | | | | | | | | | | | | | | | | | | | | | |
Net Investment Income | | $ | 34,016 | | | $ | 31,171 | | | $ | 1,026 | | | $ | 1,724 | | | $ | 67,990 | | | $ | 73,927 | |
Net Realized Gain (Loss) from Investments, Securities Sold Short, Futures Contracts, Options, Swaptions and Swap Contracts | | | 111,742 | | | | 267,769 | | | | 424 | | | | 21,738 | | | | 113,204 | | | | 501,691 | |
Net Realized Gain on Foreign Currency Transactions | | | — | | | | — | | | | — | | | | — | | | | 9 | | | | — | |
Net Change in Unrealized Appreciation (Depreciation) on Investments, Securities Sold Short, Futures Contracts, Options and Swap Contracts | | | (204,357 | ) | | | (30,173 | ) | | | (4,385 | ) | | | (9,888 | ) | | | (156,765 | ) | | | (47,181 | ) |
Net Change in Unrealized Appreciation on Foreign Currency Transactions | | | — | | | | — | | | | — | | | | — | | | | 9 | | | | — | |
Net Increase (Decrease) in Net Assets Resulting from Operations | | | (58,599 | ) | | | 268,767 | | | | (2,935 | ) | | | 13,574 | | | | 24,447 | | | | 528,437 | |
Dividends and Distributions to Shareholders: | | | | | | | | | | | | | | | | | | | | | | | | |
Net Investment Income: | | | | | | | | | | | | | | | | | | | | | | | | |
Class A | | | (34,137 | ) | | | (32,637 | ) | | | (1,026 | ) | | | (1,987 | ) | | | (73,173 | ) | | | (73,454 | ) |
Net Realized Gains: | | | | | | | | | | | | | | | | | | | | | | | | |
Class A | | | (293,971 | ) | | | (213,341 | ) | | | (20,185 | ) | | | (2,247 | ) | | | (435,090 | ) | | | (558,785 | ) |
Return of Capital: | | | | | | | | | | | | | | | | | | | | | | | | |
Class A | | | — | | | | — | | | | (365 | ) | | | — | | | | — | | | | — | |
Total Dividends and Distributions | | | (328,108 | ) | | | (245,978 | ) | | | (21,576 | ) | | | (4,234 | ) | | | (508,263 | ) | | | (632,239 | ) |
Capital Share Transactions:(1) | | | | | | | | | | | | | | | | | | | | | | | | |
Class A: | | | | | | | | | | | | | | | | | | | | | | | | |
Proceeds from Shares Issued | | | 363,483 | | | | 526,105 | | | | 18,548 | | | | 7,304 | | | | 358,811 | | | | 393,813 | |
Reinvestment of Dividends & Distributions | | | 319,314 | | | | 238,120 | | | | 14,464 | | | | 3,514 | | | | 500,632 | | | | 620,914 | |
Cost of Shares Redeemed | | | (575,772 | ) | | | (726,024 | ) | | | (17,773 | ) | | | (95,276 | ) | | | (982,046 | ) | | | (1,334,496 | ) |
Net Increase (Decrease) from Class A Transactions | | | 107,025 | | | | 38,201 | | | | 15,239 | | | | (84,458 | ) | | | (122,603 | ) | | | (319,769 | ) |
Net Increase (Decrease) in Net Assets | | | (279,682 | ) | | | 60,990 | | | | (9,272 | ) | | | (75,118 | ) | | | (606,419 | ) | | | (423,571 | ) |
Net Assets | | | | | | | | | | | | | | | | | | | | | | | | |
Beginning of Year or Period | | | 2,366,204 | | | | 2,305,214 | | | | 63,607 | | | | 138,725 | | | | 4,198,645 | | | | 4,622,216 | |
End of Year or Period | | $ | 2,086,522 | | | $ | 2,366,204 | | | $ | 54,335 | | | $ | 63,607 | | | $ | 3,592,226 | | | $ | 4,198,645 | |
Undistributed Net Investment Income Included in Net Assets at Year or Period End | | $ | 4,108 | | | $ | 4,124 | | | $ | — | | | $ | — | | | $ | 5,236 | | | $ | 10,481 | |
(1) See Note 7 in the Notes to Financial Statements for additional information.
(2) Includes subscriptions as a result of an in-kind transfer of securities (see Note 11).
Amounts designated as “—” are $0 or have been rounded to $0.
The accompanying notes are an integral part of the financial statements.
| | |
| 278 | | SEI Institutional Investments Trust / Annual Report / May 31, 2016 |
| | | | | | | | | | | | | | | | | | | | | | | | | | | | | | |
Large Cap Index Fund | | | S&P 500 Index Fund | | | Extended Market Index Fund | | | Small Cap Fund | |
| 2016 | | | 2015 | | | 2016 | | | 2015 | | | 2016 | | | 2015 | | | 2016 | | | 2015 | |
| | | | | | | | | | | | | | | | | | | | | | | | | | | | | | | |
| $ | 38,037 | | | $ | 35,636 | | | $ | 65,144 | | | $ | 37,545 | | | $ | 10,094 | | | $ | 7,645 | | | $ | 5,449 | | | $ | 4,172 | |
| 42,019 | | | | 80,050 | | | | (27,207 | ) | | | (469 | ) | | | 11,697 | | | | 20,338 | | | | 16,261 | | | | 44,616 | |
| | — | | | | — | | | | — | | | | — | | | | — | | | | 1 | | | | — | | | | — | |
| (64,518 | ) | | | 97,399 | | | | 13,638 | | | | 134,819 | | | | (62,920 | ) | | | 36,273 | | | | (55,859 | ) | | | 15,049 | |
| | — | | | | — | | | | — | | | | — | | | | — | | | | — | | | | — | | | | — | |
| | 15,538 | | | | 213,085 | | | | 51,575 | | | | 171,895 | | | | (41,129 | ) | | | 64,257 | | | | (34,149 | ) | | | 63,837 | |
| | | | | | | | | | | | | | | | | | | | | | | | | | | | | | | |
| | | | | | | | | | | | | | | | | | | | | | | | | | | | | | | |
| | (38,254 | ) | | | (36,785 | ) | | | (66,365 | ) | | | (31,162 | ) | | | (9,861 | ) | | | (8,576 | ) | | | (5,988 | ) | | | (4,749 | ) |
| | | | | | | | | | | | | | | | | | | | | | | | | | | | | | |
| | (70,310 | ) | | | (112,771 | ) | | | (8,700 | ) | | | (2,404 | ) | | | (22,374 | ) | | | (12,821 | ) | | | (56,411 | ) | | | (17,304 | ) |
| | | | | | | | | | | | | | | | | | | | | | | | | | | | | | |
| | — | | | | — | | | | — | | | | — | | | | — | | | | — | | | | — | | | | — | |
| | (108,564 | ) | | | (149,556 | ) | | | (75,065 | ) | | | (33,566 | ) | | | (32,235 | ) | | | (21,397 | ) | | | (62,399 | ) | | | (22,053 | ) |
| | | | | | | | | | | | | | | | | | | | | | | | | | | | | | | |
| | | | | | | | | | | | | | | | | | | | | | | | | | | | | | | |
| | 561,572 | | | | 308,586 | | | | 751,497 | | | | 2,662,395 | (2) | | | 183,326 | | | | 264,461 | | | | 46,690 | | | | 69,000 | |
| | 108,163 | | | | 148,236 | | | | 74,445 | | | | 33,048 | | | | 32,115 | | | | 21,340 | | | | 54,340 | | | | 18,158 | |
| | (487,293 | ) | | | (453,706 | ) | | | (612,736 | ) | | | (475,519 | ) | | | (165,182 | ) | | | (104,581 | ) | | | (185,884 | ) | | | (137,872 | ) |
| | 182,442 | | | | 3,116 | | | | 213,206 | | | | 2,219,924 | | | | 50,259 | | | | 181,220 | | | | (84,854 | ) | | | (50,714 | ) |
| | 89,416 | | | | 66,645 | | | | 189,716 | | | | 2,358,253 | | | | (23,105 | ) | | | 224,080 | | | | (181,402 | ) | | | (8,930 | ) |
| | | | | | | | | | | | | | | | | | | | | | | | | | | | | | | |
| | 1,972,254 | | | | 1,905,609 | | | | 3,194,844 | | | | 836,591 | | | | 737,363 | | | | 513,283 | | | | 683,624 | | | | 692,554 | |
| $ | 2,061,670 | | | $ | 1,972,254 | | | $ | 3,384,560 | | | $ | 3,194,844 | | | $ | 714,258 | | | $ | 737,363 | | | $ | 502,222 | | | $ | 683,624 | |
$ | 4,973 | | | $ | 5,034 | | | $ | 8,453 | | | $ | 9,496 | | | $ | 693 | | | $ | 284 | | | $ | 137 | | | $ | 434 | |
| | | | |
| SEI Institutional Investments Trust / Annual Report / May 31, 2016 | | | 279 | |
STATEMENTS OF CHANGES IN NET ASSETS ($ Thousands)
For the years or period ended May 31,
| | | | | | | | | | | | | | | | |
| | | Small Cap II Fund | | | Small/Mid Cap Equity Fund | |
| | | 2016 | | | 2015 | | | 2016 | | | 2015 | |
Operations: | | | | | | | | | | | | | | | | |
Net Investment Income | | $ | 2,765 | | | $ | 1,486 | | | $ | 15,317 | | | $ | 12,378 | |
Net Realized Gain (Loss) from Investments, Securities Sold Short, Futures Contracts, Options, Swaptions and Swap Contracts | | | (14,207 | ) | | | 22,166 | | | | 46,336 | | | | 273,569 | |
Net Realized Gain (Loss) on Foreign Currency Transactions | | | — | | | | — | | | | — | | | | (2 | ) |
Net Change in Unrealized Appreciation (Depreciation) on Investments, Securities Sold Short, Futures Contracts, Options and Swap Contracts | | | (7,454 | ) | | | 11,465 | | | | (160,914 | ) | | | (86,593 | ) |
Net Change in Unrealized Appreciation (Depreciation) on Foreign Currency Transactions | | | — | | | | — | | | | — | | | | — | |
Net Change in Unrealized Appreciation on Foreign Cap Gains Tax | | | — | | | | — | | | | — | | | | — | |
Net Increase (Decrease) in Net Assets Resulting from Operations | | | (18,896 | ) | | | 35,117 | | | | (99,261 | ) | | | 199,352 | |
Dividends and Distributions to Shareholders: | | | | | | | | | | | | | | | | |
Net Investment Income: | | | | | | | | | | | | | | | | |
Class A | | | (2,674 | ) | | | (1,730 | ) | | | (16,765 | ) | | | (13,133 | ) |
Net Realized Gains: | | | | | | | | | | | | | | | | |
Class A | | | (29,158 | ) | | | (22,274 | ) | | | (226,544 | ) | | | (249,463 | ) |
Total Dividends and Distributions | | | (31,832 | ) | | | (24,004 | ) | | | (243,309 | ) | | | (262,596 | ) |
Capital Share Transactions:(3) | | | | | | | | | | | | | | | | |
Class A: | | | | | | | | | | | | | | | | |
Proceeds from Shares Issued | | | 229,943 | | | | 148,293 | | | | 174,795 | | | | 209,230 | |
Reinvestment of Dividends & Distributions | | | 30,961 | | | | 22,855 | | | | 240,258 | | | | 258,096 | |
Cost of Shares Redeemed | | | (128,292 | ) | | | (60,838 | ) | | | (289,308 | ) | | | (373,749 | ) |
Net Increase (Decrease) from Class A Transactions | | | 132,612 | | | | 110,310 | | | | 125,745 | | | | 93,577 | |
Net Increase (Decrease) in Net Assets | | | 81,884 | | | | 121,423 | | | | (216,825 | ) | | | 30,333 | |
Net Assets | | | | | | | | | | | | | | | | |
Beginning of Year or Period | | | 373,858 | | | | 252,435 | | | | 1,859,609 | | | | 1,829,276 | |
End of Year or Period | | $ | 455,742 | | | $ | 373,858 | | | $ | 1,642,784 | | | $ | 1,859,609 | |
Undistributed Net Investment Income Included in Net Assets at Year or Period End | | $ | 336 | | | $ | 196 | | | $ | 4,644 | | | $ | 4,932 | |
(1) Commenced operations on January 29, 2016.
(2) Commenced operations on October 31, 2014.
(3) See Note 7 in Notes to Financial Statements for additional information
Amounts designated as “—” are $0 or have been rounded to $0.
The accompanying notes are an integral part of the financial statements.
| | |
| 280 | | SEI Institutional Investments Trust / Annual Report / May 31, 2016 |
| | | | | | | | | | | | | | | | | | | | | | | | | | | | | | | | | | |
U.S. Managed Volatility Fund | | | Global Managed
Volatility Fund(1) | | | World Equity Ex-US Fund | | | Screened World
Equity Ex-US Fund | | | Emerging Markets Equity Fund(2) | |
| 2016 | | | 2015 | | | 2016 | | | 2016 | | | 2015 | | | 2016 | | | 2015 | | | 2016 | | | 2015 | |
| | | | | | | | | | | | | | | | | | | | | | | | | | | | | | | | | | | |
| $ | 38,461 | | | $ | 30,106 | | | $ | 11,524 | | | $ | 143,430 | | | $ | 140,241 | | | $ | 1,573 | | | $ | 1,595 | | | $ | 12,232 | | | $ | 3,366 | |
|
55,381 |
| | | 116,939 | | | | 5,772 | | | | (343,294 | ) | | | 170,588 | | | | (2,399 | ) | | | 3,723 | | | | (41,168 | ) | | | 1,333 | |
| | (73 | ) | | | 11 | | | | (11,359 | ) | | | (6,606 | ) | | | (4,709 | ) | | | (46 | ) | | | (95 | ) | | | (355 | ) | | | (263 | ) |
| (20,508 | ) | | | 17,591 | | | | 69,232 | | | | (750,648 | ) | | | (155,553 | ) | | | (6,428 | ) | | | (5,134 | ) | | | (34,235 | ) | | | 6,976 | |
| | (35 | ) | | | (20 | ) | | | 479 | | | | 541 | | | | (415 | ) | | | 10 | | | | (16 | ) | | | 30 | | | | (20 | ) |
| | — | | | | — | | | | — | | | | 413 | | | | — | | | | — | | | | — | | | | — | | | | — | |
| | 73,226 | | | | 164,627 | | | | 75,648 | | | | (956,164 | ) | | | 150,152 | | | | (7,290 | ) | | | 73 | | | | (63,496 | ) | | | 11,392 | |
| | | | | | | | | | | | | | | | | | | | | | | | | | | | | | | | | | | |
| | | | | | | | | | | | | | | | | | | | | | | | | | | | | | | | | | | |
| | (38,954 | ) | | | (30,488 | ) | | | — | | | | (138,717 | ) | | | (135,664 | ) | | | (1,667 | ) | | | (1,372 | ) | | | (11,121 | ) | | | (668 | ) |
| | | | | | | | | | | | | | | | | | | | | | | | | | | | | | | | | | | |
| | (96,312 | ) | | | (135,734 | ) | | | — | | | | (30,172 | ) | | | (82,563 | ) | | | — | | | | — | | | | (1,805 | ) | | | — | |
| | (135,266 | ) | | | (166,222 | ) | | | — | | | | (168,889 | ) | | | (218,227 | ) | | | (1,667 | ) | | | (1,372 | ) | | | (12,926 | ) | | | (668 | ) |
| | | | | | | | | | | | | | | | | | | | | | | | | | | | | | | | | | | |
| | | | | | | | | | | | | | | | | | | | | | | | | | | | | | | | | | | |
| | 601,031 | | | | 299,776 | | | | 1,229,214 | | | | 1,408,936 | | | | 1,723,101 | | | | 13,462 | | | | 17,626 | | | | 495,732 | | | | 607,465 | |
| | 132,818 | | | | 161,311 | | | | — | | | | 165,514 | | | | 213,272 | | | | 1,098 | | | | 924 | | | | 12,653 | | | | 658 | |
| | (561,879 | ) | | | (281,378 | ) | | | (243,848 | ) | | | (1,170,304 | ) | | | (946,582 | ) | | | (6,646 | ) | | | (10,489 | ) | | | (88,527 | ) | | | (26,884 | ) |
| | 171,970 | | | | 179,709 | | | | 985,366 | | | | 404,146 | | | | 989,791 | | | | 7,914 | | | | 8,061 | | | | 419,858 | | | | 581,239 | |
| | 109,930 | | | | 178,114 | | | | 1,061,014 | | | | (720,907 | ) | | | 921,716 | | | | (1,043 | ) | | | 6,762 | | | | 343,436 | | | | 591,963 | |
| | | | | | | | | | | | | | | | | | | | | | | | | | | | | | | | | | | |
| | 1,414,638 | | | | 1,236,524 | | | | — | | | | 7,644,844 | | | | 6,723,128 | | | | 83,879 | | | | 77,117 | | | | 591,963 | | | | — | |
| $ | 1,524,568 | | | $ | 1,414,638 | | | $ | 1,061,014 | | | $ | 6,923,937 | | | $ | 7,644,844 | | | $ | 82,836 | | | $ | 83,879 | | | $ | 935,399 | | | $ | 591,963 | |
| $ | 3,555 | | | $ | 3,742 | | | $ | 451 | | | $ | 69,787 | | | $ | 69,403 | | | $ | 843 | | | $ | 838 | | | $ | 5,936 | | | $ | 3,230 | |
| | | | |
| SEI Institutional Investments Trust / Annual Report / May 31, 2016 | | | 281 | |
STATEMENTS OF CHANGES IN NET ASSETS ($ Thousands)
For the years or period ended May 31,
| | | | | | | | | | | | | | | | | | | | | | | | |
| | | Opportunistic Income Fund | | | Core Fixed Income Fund | | | High Yield Bond Fund | |
| | | 2016 | | | 2015 | | | 2016 | | | 2015 | | | 2016 | | | 2015 | |
Operations: | | | | | | | | | | | | | | | | | | | | | | | | |
Net Investment Income | | $ | 57,812 | | | $ | 52,573 | | | $ | 142,203 | | | $ | 157,639 | | | $ | 162,425 | | | $ | 139,705 | |
Net Realized Gain (Loss) from Investments, Securities Sold Short, Futures Contracts, Options, Swaptions and Swap Contracts | | | (9,791 | ) | | | (1,837 | ) | | | 45,716 | | | | 120,412 | | | | (68,824 | ) | | | 5,137 | |
Net Realized Gain (Loss) on Foreign Currency Transactions | | | — | | | | (1 | ) | | | 493 | | | | 5,999 | | | | — | | | | — | |
Net Change in Unrealized Appreciation (Depreciation) on Investments, | | | | | | | | | | | | | | | | | | | | | | | | |
Securities Sold Short, Futures Contracts, Options and Swap Contracts | | | (28,104 | ) | | | (10,366 | ) | | | (34,287 | ) | | | (52,348 | ) | | | (132,712 | ) | | | (79,189 | ) |
Net Change in Unrealized Appreciation (Depreciation) on Foreign Currency Transactions | | | — | | | | — | | | | (1,345 | ) | | | 613 | | | | — | | | | — | |
Net Increase (Decrease) in Net Assets Resulting from Operations | | | 19,917 | | | | 40,369 | | | | 152,780 | | | | 232,315 | | | | (39,111 | ) | | | 65,653 | |
Dividends and Distributions to Shareholders: | | | | | | | | | | | | | | | | | | | | | | | | |
Net Investment Income: | | | | | | | | | | | | | | | | | | | | | | | | |
Class A | | | (56,898 | ) | | | (51,651 | ) | | | (146,140 | ) | | | (161,700 | ) | | | (161,193 | ) | | | (138,330 | ) |
Net Realized Gains: | | | | | | | | | | | | | | | | | | | | | | | | |
Class A | | | — | | | | — | | | | (100,701 | ) | | | (19,513 | ) | | | (20,343 | ) | | | (49,592 | ) |
Total Dividends and Distributions | | | (56,898 | ) | | | (51,651 | ) | | | (246,841 | ) | | | (181,213 | ) | | | (181,536 | ) | | | (187,922 | ) |
Capital Share Transactions:(1) | | | | | | | | | | | | | | | | | | | | | | | | |
Class A: | | | | | | | | | | | | | | | | | | | | | | | | |
Proceeds from Shares Issued | | | 337,500 | | | | 755,105 | | | | 1,048,275 | (2) | | | 1,588,584 | | | | 634,290 | | | | 678,945 | |
Reinvestment of Dividends & Distributions | | | 54,859 | | | | 50,192 | | | | 242,742 | | | | 177,099 | | | | 177,399 | | | | 181,899 | |
Cost of Shares Redeemed | | | (393,187 | ) | | | (502,388 | ) | | | (1,532,904 | ) | | | (2,126,284 | ) | | | (467,893 | ) | | | (396,907 | ) |
Net Increase (Decrease) from Class A Transactions | | | (828 | ) | | | 302,909 | | | | (241,887 | ) | | | (360,601 | ) | | | 343,796 | | | | 463,937 | |
Net Increase (Decrease) in Net Assets | | | (37,809 | ) | | | 291,627 | | | | (335,948 | ) | | | (309,499 | ) | | | 123,149 | | | | 341,668 | |
Net Assets | | | | | | | | | | | | | | | | | | | | | | | | |
Beginning of Year or Period | | | 2,167,478 | | | | 1,875,851 | | | | 5,600,807 | | | | 5,910,306 | | | | 2,516,770 | | | | 2,175,102 | |
End of Year or Period | | $ | 2,129,669 | | | $ | 2,167,478 | | | $ | 5,264,859 | | | $ | 5,600,807 | | | $ | 2,639,919 | | | $ | 2,516,770 | |
Undistributed (Distributions in Excess of) Net Investment Income Included in Net Assets at Year or Period End | | $ | 17,489 | | | $ | 18,074 | | | $ | 4,712 | | | $ | 4,872 | | | $ | 13,848 | | | $ | 11,788 | |
(1) See Note 7 in Notes to Financial Statements for additional information.
(2) Includes subscriptions as a result of an in-kind transfer of securities (see Note 11).
(3) Includes redemptions as a result of an in-kind transfer of securities (see Note 11).
Amounts designated as “—” are $0 or have been rounded to $0.
The accompanying notes are an integral part of the financial statements.
| | |
| 282 | | SEI Institutional Investments Trust / Annual Report / May 31, 2016 |
| | | | | | | | | | | | | | | | | | | | | | | | | | | | | | |
Long Duration Fund | | | Long Duration Credit Fund | | | Ultra Short Duration Bond Fund | | | Emerging Markets Debt Fund | |
| 2016 | | | 2015 | | | 2016 | | | 2015 | | | 2016 | | | 2015 | | | 2016 | | | 2015 | |
| | | | | | | | | | | | | | | | | | | | | | | | | | | | | | | |
| $ | 124,845 | | | $ | 155,999 | | | $ | 133,441 | | | $ | 131,239 | | | $ | 7,007 | | | $ | 7,299 | | | $ | 112,763 | | | $ | 97,783 | |
|
47,900 |
| | | 171,115 | | | | (22,676 | ) | | | 96,729 | | | | (122 | ) | | | 75 | | | | (21,426 | ) | | | (1,121 | ) |
| | — | | | | — | | | | — | | | | — | | | | — | | | | — | | | | (92,417 | ) | | | (40,767 | ) |
|
(12,574 |
) | | | (82,758 | ) | | | 106,606 | | | | (115,374 | ) | | | (639 | ) | | | (1,864 | ) | | | (11,722 | ) | | | (167,068 | ) |
| | — | | | | — | | | | — | | | | — | | | | — | | | | — | | | | (12,341 | ) | | | 4,102 | |
| | 160,171 | | | | 244,356 | | | | 217,371 | | | | 112,594 | | | | 6,246 | | | | 5,510 | | | | (25,143 | ) | | | (107,071 | ) |
| | | | | | | | | | | | | | | | | | | | | | | | | | | | | | | |
| | | | | | | | | | | | | | | | | | | | | | | | | | | | | | | |
| | (124,564 | ) | | | (155,525 | ) | | | (133,496 | ) | | | (131,283 | ) | | | (8,407 | ) | | | (8,484 | ) | | | (16,885 | ) | | | (62,267 | ) |
| | | | | | | | | | | | | | | | | | | | | | | | | | | | | | | |
| | (126,907 | ) | | | (43,415 | ) | | | (67,810 | ) | | | — | | | | — | | | | — | | | | — | | | | — | |
| | (251,471 | ) | | | (198,940 | ) | | | (201,306 | ) | | | (131,283 | ) | | | (8,407 | ) | | | (8,484 | ) | | | (16,885 | ) | | | (62,267 | ) |
| | | | | | | | | | | | | | | | | | | | | | | | | | | | | | | |
| | | | | | | | | | | | | | | | | | | | | | | | | | | | | | | |
| | 448,715 | | | | 506,434 | | | | 349,678 | (2) | | | 1,426,153 | (2) | | | 260,010 | | | | 396,249 | | | | 457,705 | | | | 593,399 | |
| | 241,069 | | | | 191,899 | | | | 200,665 | | | | 130,812 | | | | 8,283 | | | | 8,329 | | | | 16,472 | | | | 60,474 | |
| | (1,167,092 | )(3) | | | (1,421,341 | ) | | | (697,830 | ) | | | (893,305 | ) | | | (376,375 | ) | | | (473,931 | ) | | | (333,174 | ) | | | (243,859 | ) |
| | (477,308 | ) | | | (723,008 | ) | | | (147,487 | ) | | | 663,660 | | | | (108,082 | ) | | | (69,353 | ) | | | 141,003 | | | | 410,014 | |
| | (568,608 | ) | | | (677,592 | ) | | | (131,422 | ) | | | 644,971 | | | | (110,243 | ) | | | (72,327 | ) | | | 98,975 | | | | 240,676 | |
| | | | | | | | | | | | | | | | | | | | | | | | | | | | | | | |
| | 3,343,845 | | | | 4,021,437 | | | | 3,465,228 | | | | 2,820,257 | | | | 645,872 | | | | 718,199 | | | | 1,836,776 | | | | 1,596,100 | |
| $ | 2,775,237 | | | $ | 3,343,845 | | | $ | 3,333,806 | | | $ | 3,465,228 | | | $ | 535,629 | | | $ | 645,872 | | | $ | 1,935,751 | | | $ | 1,836,776 | |
$ |
(1,653 |
) | | $ | (1,296 | ) | | $ | (14 | ) | | $ | 30 | | | $ | (35 | ) | | $ | — | | | $ | (10,047 | ) | | $ | (12,145 | ) |
| | | | |
| SEI Institutional Investments Trust / Annual Report / May 31, 2016 | | | 283 | |
STATEMENTS OF CHANGES IN NET ASSETS/CONSOLIDATED STATEMENTS OF CHANGES IN NET ASSETS ($ Thousands)
For the years or period ended May 31,
| | | | | | | | | | | | | | | | |
| | | Real Return Fund | | | Limited Duration Bond Fund(1) | |
| | | 2016 | | | 2015 | | | 2016 | | | 2015 | |
Operations: | | | | | | | | | | | | | | | | |
Net Investment Income (Loss) | | $ | 1,589 | | | $ | (1,629 | ) | | $ | 11,452 | | | $ | 2,725 | |
Net Realized Gain (Loss) from Investments, Securities Sold Short, Futures Contracts, Options, Swaptions and Swap Contracts | | | (2,891 | ) | | | (77 | ) | | | 776 | | | | 246 | |
Net Realized Gain (Loss) on Foreign Currency Transactions | | | — | | | | — | | | | — | | | | — | |
Net Change in Unrealized Appreciation (Depreciation) on Investments, Securities Sold Short, Futures Contracts, Options and Swap Contracts | | | 1,467 | | | | (1,368 | ) | | | 615 | | | | 830 | |
Net Change in Unrealized Appreciation (Depreciation) on Foreign Currency Transactions | | | — | | | | — | | | | — | | | | — | |
Net Increase (Decrease) in Net Assets Resulting from Operations | | | 165 | | | | (3,074 | ) | | | 12,843 | | | | 3,801 | |
Dividends and Distributions to Shareholders: | | | | | | | | | | | | | | | | |
Net Investment Income: | | | | | | | | | | | | | | | | |
Class A | | | — | | | | (1,584 | ) | | | (11,927 | ) | | | (2,884 | ) |
Net Realized Gains: | | | | | | | | | | | | | | | | |
Class A | | | — | | | | — | | | | (553 | ) | | | (53 | ) |
Return of Capital: | | | | | | | | | | | | | | | | |
Class A | | | — | | | | — | | | | — | | | | — | |
Total Dividends and Distributions | | | — | | | | (1,584 | ) | | | (12,480 | ) | | | (2,937 | ) |
Capital Share Transactions:(3) | | | | | | | | | | | | | | | | |
Class A: | | | | | | | | | | | | | | | | |
Proceeds from Shares Issued | | | 86,798 | | | | 58,556 | | | | 681,315 | | | | 692,080 | |
Reinvestment of Dividends & Distributions | | | — | | | | 1,563 | | | | 12,220 | | | | 2,847 | |
Cost of Shares Redeemed | | | (164,326 | ) | | | (35,704 | ) | | | (208,219 | ) | | | (25,212 | ) |
Net Increase (Decrease) from Class A Transactions | | | (77,528 | ) | | | 24,415 | | | | 485,316 | | | | 669,715 | |
Net Increase (Decrease) in Net Assets | | | (77,363 | ) | | | 19,757 | | | | 485,679 | | | | 670,579 | |
Net Assets | | | | | | | | | | | | | | | | |
Beginning of Year or Period | | | 227,335 | | | | 207,578 | | | | 670,579 | | | | — | |
End of Year or Period | | $ | 149,972 | | | $ | 227,335 | | | $ | 1,156,258 | | | $ | 670,579 | |
Undistributed (Distributions in Excess of) Net Investment Income Included in Net Assets at Year or Period End | | $ | (256 | ) | | $ | (2,012 | ) | | $ | 18 | | | $ | 3 | |
(1) Commenced operations on July 31, 2014.
(2) Commenced operations on March 31, 2015.
(3) See Note 7 in Notes to Financial Statements for additional information.
(4) Includes subscriptions as a result of an in-kind transfer of securities (see Note 11).
Amounts designated as “—” are $0 or have been rounded to $0.
The accompanying notes are an integral part of the financial statements.
| | |
| 284 | | SEI Institutional Investments Trust / Annual Report / May 31, 2016 |
| | | | | | | | | | | | | | | | | | | | | | |
Intermediate Duration Credit Fund(2) | | | Dynamic Asset Allocation Fund | | | Multi-Asset Real Return Fund | |
| 2016 | | | 2015 | | | 2016 | | | 2015 | | | 2016 | | | 2015 | |
| | | | | | | | | | | | | | | | | | | | | | | |
| $ | 40,662 | | | $ | 4,939 | | | $ | 40,296 | | | $ | 34,532 | | | $ | 8,309 | | | $ | 2,099 | |
| | (18,130 | ) | | | (2,064 | ) | | | (26,668 | ) | | | 36,631 | | | | (29,826 | ) | | | (53,110 | ) |
| | — | | | | — | | | | (32,506 | ) | | | 148,542 | | | | 731 | | | | 2,037 | |
|
32,905 |
| | | (23,255 | ) | | | (5,312 | ) | | | 156,029 | | | | (543 | ) | | | 11,027 | |
| | — | | | | — | | | | 17,963 | | | | (16,157 | ) | | | (401 | ) | | | 245 | |
| | 55,437 | | | | (20,380 | ) | | | (6,227 | ) | | | 359,577 | | | | (21,730 | ) | | | (37,702 | ) |
| | | | | | | | | | | | | | | | | | | | | | | |
| | | | | | | | | | | | | | | | | | | | | | | |
| | (40,672 | ) | | | (4,969 | ) | | | (107,550 | ) | | | (84,817 | ) | | | (7,020 | ) | | | (12,380 | ) |
| | | | | | | | | | | | | | | | | | | | | | | |
| | — | | | | — | | | | (17,904 | ) | | | — | | | | — | | | | — | |
| | | | | | | | | | | | | | | | | | | | | | | |
| | — | | | | (129 | ) | | | — | | | | — | | | | — | | | | (2,378 | ) |
| | (40,672 | ) | | | (5,098 | ) | | | (125,454 | ) | | | (84,817 | ) | | | (7,020 | ) | | | (14,758 | ) |
| | | | | | | | | | | | | | | | | | | | | | | |
| | | | | | | | | | | | | | | | | | | | | | | |
| | 320,630 | | | | 1,646,813 | (4) | | | 443,753 | | | | 412,308 | | | | 192,897 | | | | 226,397 | |
| | 40,417 | | | | 5,009 | | | | 122,245 | | | | 83,152 | | | | 6,609 | | | | 13,785 | |
| | (535,495 | ) | | | (26,227 | ) | | | (348,739 | ) | | | (333,966 | ) | | | (168,539 | ) | | | (172,932 | ) |
| | (174,448 | ) | | | 1,625,595 | | | | 217,259 | | | | 161,494 | | | | 30,967 | | | | 67,250 | |
| | (159,683 | ) | | | 1,600,117 | | | | 85,578 | | | | 436,254 | | | | 2,217 | | | | 14,790 | |
| | | | | | | | | | | | | | | | | | | | | | | |
| | 1,600,117 | | | | — | | | | 1,993,576 | | | | 1,557,322 | | | | 730,812 | | | | 716,022 | |
| $ | 1,440,434 | | | $ | 1,600,117 | | | $ | 2,079,154 | | | $ | 1,993,576 | | | $ | 733,029 | | | $ | 730,812 | |
| $ | 140 | | | $ | — | | | $ | (8,239 | ) | | $ | 91,417 | | | $ | (12,327 | ) | | $ | (14,431 | ) |
| | | | |
| SEI Institutional Investments Trust / Annual Report / May 31, 2016 | | | 285 | |
CONSOLIDATED STATEMENT OF CASH FLOWS ($ Thousands)
For the year ended May 31, 2016
| | | | |
| | | Multi-Asset Real Return Fund | |
Cash Flows from Operating Activities: | | | | |
Net Decrease in Net Assets from Operations | | $ | (21,730 | ) |
Adjustments to Reconcile Net Decrease in Net Assets Resulting from Operations to Net Cash Used in Operating Activities: | | | | |
Purchase of investment securities | | | (975,448 | ) |
Proceeds from disposition of investment securities | | | 969,068 | |
Purchased options/purchases to cover written options & securities sold short | | | (234,583 | ) |
Proceeds from sale of options/expired options and securities sold short | | | 237,956 | |
Amortization (accretion of market discount) | | | (101 | ) |
Net Realized (Gain) Loss on: | | | | |
Investments | | | 14,110 | |
Options | | | 197 | |
Securities sold short | | | (13,365 | ) |
Net Change in Unrealized (Appreciation) Depreciation on: | | | | |
Investments | | | (1,564 | ) |
Options | | | 8 | |
Securities sold short | | | 8,558 | |
Changes in assets: | | | | |
Cash pledged as collateral for forward foreign currency contracts, futures contracts and swap contracts | | | (2,208 | ) |
Dividends and interest receivable | | | (191 | ) |
Receivable for investment securities sold | | | (15,856 | ) |
Unrealized gain on forward foreign currency contracts | | | 205 | |
Swap contracts, at value | | | (105 | ) |
Unrealized gain on foreign spot currency contracts | | | 7 | |
Receivable for variation margin | | | 1,913 | |
Foreign tax reclaim receivable | | | 12 | |
Changes in liabilities: | | | | |
Payable for investment securities purchased | | | 14,896 | |
Unrealized loss on forward foreign currency contracts | | | 229 | |
Swap contracts, at value | | | 52 | |
Unrealized loss on foreign spot currency contracts | | | (25 | ) |
Payable for variation margin | | | (427 | ) |
CCO fees payable | | | 1 | |
Foreign currency payable to custodian | | | (1 | ) |
Interest payable | | | 2 | |
Accrued expense payable | | | 87 | |
Net Cash Used in Operating Activities | | | (18,303 | ) |
Cash Flows from Financing Activities: | | | | |
Reverse repurchase agreements | | | 22,871 | |
Proceeds from shares issued | | | 192,363 | |
Distributions from net investment income | | | (411 | ) |
Cost of shares redeemed | | | (164,888 | ) |
Net Cash Provided by Financing Activities | | | 49,935 | |
Net Change in Cash | | | 31,632 | |
Cash at beginning of year | | $ | 108,688 | |
Cash at end of year | | $ | 140,320 | |
Supplemental Disclosure of Cash Flow Information | | | | |
Interest paid | | $ | 597 | |
The accompanying notes are an integral part of the financial statements.
| | |
| 286 | | SEI Institutional Investments Trust / Annual Report / May 31, 2016 |
FINANCIAL HIGHLIGHTS
For the years or period ended May 31,
For a share outstanding throughout each period
| | | | | | | | | | | | | | | | | | | | | | | | | | | | | | | | | | | | | | | | | | | | | | | | | | | | | | | | | | | | |
| | | Net Asset
Value,
Beginning
of Period | | | Net
Investment
Income
(Loss)(1) | | | Net Realized and Unrealized Gains (Losses) on
Investments(1) | | | Total from
Operations | | | Dividends
from Net Investment
Income | �� | | Distributions
from Net
Realized
Capital
Gains | | | Total
Dividends
and Distributions | | | Net Asset
Value, End of Period | | | Total Return† | | | Net Assets End of Period
($ Thousands) | | | Ratio of Net
Expenses
to Average
Net Assets | | | Ratio of Expenses to Average Net Assets (Excluding Fees Paid Indirectly
and Including
Waivers) | | | Ratio of Expenses to Average Net Assets (Excluding Fees Paid Indirectly and
Waivers) | | | Ratio of Net Investment Income (Loss) to Average
Net Assets | | | Portfolio Turnover
Rate† | |
Large Cap Fund | | | | | | | | | | | | | | | | | | | | | | | | | | | | | | | | | | | | | | | | | | | | | | | | | | | | | | | | | |
Class A | | | | | | | | | | | | | | | | | | | | | | | | | | | | | | | | | | | | | | | | | | | | | | | | | | | | | | | | | |
2016 | | $ | 22.89 | | | $ | 0.33 | | | $ | (0.96 | ) | | $ | (0.63 | ) | | $ | (0.32 | ) | | $ | (3.04 | ) | | $ | (3.36 | ) | | $ | 18.90 | | | | (2.41 | )% | | $ | 2,086,522 | | | | 0.20 | %(2) | | | 0.20 | %(2) | | | 0.47 | %(2) | | | 1.60 | % | | | 73 | % |
2015 | | | 22.72 | | | | 0.30 | | | | 2.27 | | | | 2.57 | | | | (0.31 | ) | | | (2.09 | ) | | | (2.40 | ) | | | 22.89 | | | | 11.95 | | | | 2,366,204 | | | | 0.19 | | | | 0.19 | | | | 0.47 | | | | 1.30 | | | | 60 | |
2014 | | | 20.94 | | | | 0.30 | | | | 3.96 | | | | 4.26 | | | | (0.30 | ) | | | (2.18 | ) | | | (2.48 | ) | | | 22.72 | | | | 21.32 | | | | 2,305,214 | | | | 0.18 | | | | 0.18 | | | | 0.46 | | | | 1.38 | | | | 59 | |
2013 | | | 17.07 | | | | 0.34 | | | | 4.38 | | | | 4.72 | | | | (0.33 | ) | | | (0.52 | ) | | | (0.85 | ) | | | 20.94 | | | | 28.44 | | | | 1,897,837 | | | | 0.19 | (3) | | | 0.19 | (3) | | | 0.46 | (3) | | | 1.79 | | | | 47 | |
2012 | | | 18.40 | | | | 0.25 | | | | (0.61 | ) | | | (0.36 | ) | | | (0.24 | ) | | | (0.73 | ) | | | (0.97 | ) | | | 17.07 | | | | (1.69 | ) | | | 1,774,178 | | | | 0.26 | (4) | | | 0.26 | (4) | | | 0.47 | (4) | | | 1.47 | | | | 83 | |
Large Cap Diversified Alpha Fund | | | | | | | | | | | | | | | | | | | | | | | | | | | | | | | | | | | | | | | | | | | | | | | | | |
Class A | | | | | | | | | | | | | | | | | | | | | | | | | | | | | | | | | | | | | | | | | | | | | | | | | | | | | | | | | |
2016 | | $ | 15.28 | | | $ | 0.20 | | | $ | (0.94 | ) | | $ | (0.74 | ) | | $ | (0.25 | )** | | $ | (5.11 | ) | | $ | (5.36 | ) | | $ | 9.18 | | | | (3.89 | )% | | $ | 54,335 | | | | 0.24 | %(2) | | | 0.24 | %(2) | | | 0.47 | %(2) | | | 1.77 | % | | | 142 | % |
2015 | | | 14.05 | | | | 0.22 | | | | 1.50 | | | | 1.72 | | | | (0.23 | ) | | | (0.26 | ) | | | (0.49 | ) | | | 15.28 | | | | 12.43 | | | | 63,607 | | | | 0.24 | | | | 0.24 | | | | 0.47 | | | | 1.49 | | | | 110 | |
2014 | | | 11.59 | | | | 0.16 | | | | 2.42 | | | | 2.58 | | | | (0.12 | ) | | | — | | | | (0.12 | ) | | | 14.05 | | | | 22.36 | | | | 138,725 | | | | 0.24 | | | | 0.24 | | | | 0.46 | | | | 1.24 | | | | 121 | |
2013 | | | 9.41 | | | | 0.16 | | | | 2.22 | | | | 2.38 | | | | (0.20 | ) | | | — | | | | (0.20 | ) | | | 11.59 | | | | 25.66 | | | | 309,577 | | | | 0.24 | | | | 0.24 | | | | 0.46 | | | | 1.55 | | | | 82 | |
2012 | | | 9.53 | | | | 0.13 | | | | (0.16 | ) | | | (0.03 | ) | | | (0.09 | ) | | | — | | | | (0.09 | ) | | | 9.41 | | | | (0.24 | ) | | | 320,907 | | | | 0.31 | | | | 0.31 | | | | 0.47 | | | | 1.40 | | | | 101 | |
Large Cap Disciplined Equity Fund | | | | | | | | | | | | | | | | | | | | | | | | | | | | | | | | | | | | | | | | | |
Class A | | | | | | | | | | | | | | | | | | | | | | | | | | | | | | | | | | | | | | | | | | | | | | | | | | | | | | | | | |
2016 | | $ | 14.38 | | | $ | 0.24 | | | $ | (0.14 | ) | | $ | 0.10 | | | $ | (0.25 | ) | | $ | (1.66 | ) | | $ | (1.91 | ) | | $ | 12.57 | | | | 1.34 | % | | $ | 3,592,226 | | | | 0.19 | %(2) | | | 0.19 | %(2) | | | 0.47 | %(2) | | | 1.82 | % | | | 102 | % |
2015 | | | 14.79 | | | | 0.24 | | | | 1.45 | | | | 1.69 | | | | (0.23 | ) | | | (1.87 | ) | | | (2.10 | ) | | | 14.38 | | | | 12.23 | | | | 4,198,645 | | | | 0.18 | (5) | | | 0.18 | (5) | | | 0.47 | (5) | | | 1.61 | | | | 113 | |
2014 | | | 13.24 | | | | 0.23 | | | | 2.39 | | | | 2.62 | | | | (0.20 | ) | | | (0.87 | ) | | | (1.07 | ) | | | 14.79 | | | | 20.49 | | | | 4,622,216 | | | | 0.18 | (6) | | | 0.18 | (6) | | | 0.46 | (6) | | | 1.65 | | | | 110 | |
2013 | | | 10.58 | | | | 0.21 | | | | 2.73 | | | | 2.94 | | | | (0.28 | ) | | | — | | | | (0.28 | ) | | | 13.24 | | | | 28.24 | | | | 5,500,315 | | | | 0.17 | (7) | | | 0.17 | (7) | | | 0.46 | (7) | | | 1.80 | | | | 109 | |
2012 | | | 10.87 | | | | 0.16 | | | | (0.29 | ) | | | (0.13 | ) | | | (0.16 | ) | | | — | | | | (0.16 | ) | | | 10.58 | | | | (1.14 | ) | | | 5,436,390 | | | | 0.18 | (5) | | | 0.18 | (5) | | | 0.47 | (5) | | | 1.54 | | | | 93 | |
Large Cap Index Fund | | | | | | | | | | | | | | | | | | | | | | | | | | | | | | | | | | | | | | | | | | | | | | | | | |
Class A | | | | | | | | | | | | | | | | | | | | | | | | | | | | | | | | | | | | | | | | | | | | | | | | | | | | | | | | | |
2016 | | $ | 169.36 | | | $ | 3.26 | | | $ | (2.45 | ) | | $ | 0.81 | | | $ | (3.32 | ) | | $ | (6.63 | ) | | $ | (9.95 | ) | | $ | 160.22 | | | | 0.76 | % | | $ | 2,061,670 | | | | 0.03 | %(2) | | | 0.03 | %(2) | | | 0.25 | %(2) | | | 2.06 | % | | | 18 | % |
2015 | | | 164.21 | | | | 3.14 | | | | 15.63 | | | | 18.77 | | | | (3.23 | ) | | | (10.39 | ) | | | (13.62 | ) | | | 169.36 | | | | 11.89 | | | | 1,972,254 | | | | 0.03 | | | | 0.03 | | | | 0.24 | | | | 1.87 | | | | 12 | |
2014 | | | 140.87 | | | | 2.91 | | | | 25.93 | | | | 28.84 | | | | (3.02 | ) | | | (2.48 | ) | | | (5.50 | ) | | | 164.21 | | | | 20.88 | | | | 1,905,609 | | | | 0.02 | | | | 0.02 | | | | 0.23 | | | | 1.92 | | | | 10 | |
2013 | | | 113.85 | | | | 2.77 | | | | 28.02 | | | | 30.79 | | | | (2.61 | ) | | | (1.16 | ) | | | (3.77 | ) | | | 140.87 | | | | 27.55 | | | | 2,214,088 | | | | 0.03 | | | | 0.03 | | | | 0.23 | | | | 2.18 | | | | 14 | |
2012 | | | 117.49 | | | | 2.26 | | | | (3.78 | ) | | | (1.52 | ) | | | (2.12 | ) | | | — | | | | (2.12 | ) | | | 113.85 | | | | (1.24 | ) | | | 1,255,669 | | | | 0.06 | | | | 0.06 | | | | 0.24 | | | | 2.01 | | | | 12 | |
S&P 500 Index Fund | | | | | | | | | | | | | | | | | | | | | | | | | | | | | | | | | | | | | | | | | | | | | | | | | | | | | |
Class A | | | | | | | | | | | | | | | | | | | | | | | | | | | | | | | | | | | | | | | | | | | | | | | | | | | | | |
2016 | | $ | 11.69 | | | $ | 0.24 | | | $ | (0.06 | ) | | $ | 0.18 | | | $ | (0.24 | ) | | $ | (0.03 | ) | | $ | (0.27 | ) | | $ | 11.60 | | | | 1.66 | % | | $ | 3,384,560 | | | | 0.05 | %(2) | | | 0.05 | %(2) | | | 0.12 | %(2) | | | 2.11 | % | | | 13 | % |
2015 | | | 10.68 | | | | 0.23 | | | | 1.01 | | | | 1.24 | | | | (0.21 | ) | | | (0.02 | ) | | | (0.23 | ) | | | 11.69 | | | | 11.71 | | | | 3,194,844 | | | | 0.04 | | | | 0.04 | | | | 0.11 | | | | 2.03 | | | | 15 | |
2014(8) | | | 10.00 | | | | 0.09 | | | | 0.63 | | | | 0.72 | | | | (0.04 | ) | | | — | | | | (0.04 | ) | | | 10.68 | | | | 7.27 | | | | 836,591 | | | | 0.04 | | | | 0.04 | | | | 0.11 | | | | 2.02 | | | | 3 | |
Extended Market Index Fund | | | | | | | | | | | | | | | | | | | | | | | | | | | | | | | | | | | | | | | | | | | | | | | | | |
Class A | | | | | | | | | | | | | | | | | | | | | | | | | | | | | | | | | | | | | | | | | | | | | | | | | | | | | |
2016 | | $ | 13.69 | | | $ | 0.18 | | | $ | (0.98 | ) | | $ | (0.80 | ) | | $ | (0.18 | ) | | $ | (0.41 | ) | | $ | (0.59 | ) | | $ | 12.30 | | | | (5.66 | )% | | $ | 714,258 | | | | 0.07 | %(2) | | | 0.07 | %(2) | | | 0.20 | %(2) | | | 1.49 | % | | | 27 | % |
2015 | | | 12.74 | | | | 0.17 | | | | 1.27 | | | | 1.44 | | | | (0.19 | ) | | | (0.30 | ) | | | (0.49 | ) | | | 13.69 | | | | 11.61 | | | | 737,363 | | | | 0.06 | | | | 0.06 | | | | 0.19 | | | | 1.30 | | | | 19 | |
2014 | | | 10.77 | | | | 0.17 | | | | 2.03 | | | | 2.20 | | | | (0.14 | ) | | | (0.09 | ) | | | (0.23 | ) | | | 12.74 | | | | 20.59 | | | | 513,283 | | | | 0.06 | | | | 0.06 | | | | 0.18 | | | | 1.36 | | | | 17 | |
2013(9) | | | 10.00 | | | | 0.03 | | | | 0.75 | | | | 0.78 | | | | (0.01 | ) | | | — | | | | (0.01 | ) | | | 10.77 | | | | 7.84 | | | | 174,107 | | | | 0.11 | | | | 0.11 | | | | 0.22 | | | | 1.30 | | | | 4 | |
| ** | | Includes a return of capital of less than $0.01 per share. |
| † | | Returns and portfolio turnover rates are for the period indicated and have not been annualized. Returns do not reflect the deduction of taxes the shareholder would pay on fund distributions or redemption of fund shares. |
| (1) | | Per share net investment income and net realized and unrealized gains (losses) calculated using average shares. |
| (2) | | The expense ratio includes proxy expenses outside the cap. |
| (3) | | The expense ratio includes interest expense. Had this expense been excluded, the ratios would have been 0.19%, 0.19% and 0.46%, respectively. |
| (4) | | The expense ratio includes interest expense. Had this expense been excluded, the ratios would have been 0.26%, 0.26% and 0.47%, respectively. |
| (5) | | The expense ratio includes interest expense. Had this expense been excluded, the ratios would have been 0.18%, 0.18% and 0.47%, respectively. |
| (6) | | The expense ratio includes interest expense. Had this expense been excluded, the ratios would have been 0.18%, 0.18% and 0.46%, respectively. |
| (7) | | The expense ratio includes interest expense. Had this expense been excluded, the ratios would have been 0.17%, 0.17% and 0.46%, respectively. |
| (8) | | Commenced operations on December 18, 2013. All ratios for the period have been annualized. |
| (9) | | Commenced operations on February 28, 2013. All ratios for the period have been annualized. |
| Amounts | | designated as “—” are $0 or have been rounded to $0. |
The accompanying notes are an integral part of the financial statements.
| | | | |
| SEI Institutional Investments Trust / Annual Report / May 31, 2016 | | | 287 | |
FINANCIAL HIGHLIGHTS
For the years or period ended May 31,
For a share outstanding throughout each period
| | | | | | | | | | | | | | | | | | | | | | | | | | | | | | | | | | | | | | | | | | | | | | | | | | | | | | | | | | | | |
| | | Net Asset
Value,
Beginning
of Period | | | Net
Investment
Income
(Loss)(1) | | | Net Realized and Unrealized Gains (Losses) on
Investments(1) | | | Total from
Operations | | | Dividends
from Net Investment
Income | | | Distributions
from Net
Realized
Capital
Gains | | | Total
Dividends
and Distributions | | | Net Asset
Value, End of Period | | | Total Return† | | | Net Assets End of Period
($ Thousands) | | | Ratio of Net
Expenses
to Average
Net Assets | | | Ratio of Expenses to Average Net Assets (Excluding Fees Paid Indirectly
and Including
Waivers) | | | Ratio of Expenses to Average Net Assets (Excluding Fees Paid Indirectly and
Waivers) | | | Ratio of Net Investment Income (Loss) to Average
Net Assets | | | Portfolio Turnover
Rate† | |
Small Cap Fund | | | | | | | | | | | | | | | | | | | | | | | | | | | | | | | | | | | | | | | | | |
Class A | | | | | | | | | | | | | | | | | | | | | | | | | | | | | | | | | | | | | | | | | | | | | | | | | | | | | | | | | |
2016 | | $ | 19.06 | | | $ | 0.17 | | | $ | (1.18 | ) | | $ | (1.01 | ) | | $ | (0.19 | ) | | $ | (1.87 | ) | | $ | (2.06 | ) | | $ | 15.99 | | | | (4.99 | )% | | $ | 502,222 | | | | 0.46 | %(2)(3) | | | 0.46 | %(2)(3) | | | 0.72 | %(2)(3) | | | 0.99 | % | | | 115 | % |
2015 | | | 17.95 | | | | 0.11 | | | | 1.62 | | | | 1.73 | | | | (0.13 | ) | | | (0.49 | ) | | | (0.62 | ) | | | 19.06 | | | | 9.86 | | | | 683,624 | | | | 0.48 | (4) | | | 0.48 | (4) | | | 0.72 | (4) | | | 0.61 | | | | 113 | |
2014 | | | 15.42 | | | | 0.12 | | | | 2.56 | | | | 2.68 | | | | (0.15 | ) | | | — | | | | (0.15 | ) | | | 17.95 | | | | 17.39 | | | | 692,554 | | | | 0.47 | | | | 0.47 | | | | 0.72 | | | | 0.67 | | | | 63 | |
2013 | | | 12.04 | | | | 0.13 | | | | 3.42 | | | | 3.55 | | | | (0.17 | ) | | | — | | | | (0.17 | ) | | | 15.42 | | | | 29.71 | | | | 778,976 | | | | 0.47 | | | | 0.47 | | | | 0.71 | | | | 1.01 | | | | 85 | |
2012 | | | 13.49 | | | | 0.11 | | | | (1.47 | ) | | | (1.36 | ) | | | (0.09 | ) | | | — | | | | (0.09 | ) | | | 12.04 | | | | (10.11 | ) | | | 753,232 | | | | 0.54 | | | | 0.54 | | | | 0.72 | | | | 0.88 | | | | 85 | |
Small Cap II Fund | | | | | | | | | | | | | | | | | | | | | | | | | | | | | | | | | | | | | | | | | | | | | | | | | |
Class A | | | | | | | | | | | | | | | | | | | | | | | | | | | | | | | | | | | | | | | | | | | | | | | | | | | | | | | | | |
2016 | | $ | 12.95 | | | $ | 0.08 | | | $ | (0.89 | ) | | $ | (0.81 | ) | | $ | (0.08 | ) | | $ | (0.92 | ) | | $ | (1.00 | ) | | $ | 11.14 | | | | (6.07 | )% | | $ | 455,742 | | | | 0.45 | %(3) | | | 0.45 | %(3) | | | 0.72 | %(3) | | | 0.70 | % | | | 134 | % |
2015 | | | 12.50 | | | | 0.06 | | | | 1.42 | | | | 1.48 | | | | (0.07 | ) | | | (0.96 | ) | | | (1.03 | ) | | | 12.95 | | | | 12.58 | | | | 373,858 | | | | 0.46 | | | | 0.46 | | | | 0.72 | | | | 0.49 | | | | 107 | |
2014 | | | 12.23 | | | | 0.06 | | | | 2.01 | | | | 2.07 | | | | (0.07 | ) | | | (1.73 | ) | | | (1.80 | ) | | | 12.50 | | | | 17.35 | | | | 252,435 | | | | 0.46 | (5) | | | 0.46 | (5) | | | 0.71 | (5) | | | 0.50 | | | | 108 | |
2013 | | | 9.62 | | | | 0.09 | | | | 2.64 | | | | 2.73 | | | | (0.09 | ) | | | (0.03 | ) | | | (0.12 | ) | | | 12.23 | | | | 28.54 | | | | 221,697 | | | | 0.48 | | | | 0.48 | | | | 0.72 | | | | 0.88 | | | | 113 | |
2012(6) | | | 10.00 | | | | 0.02 | | | | (0.40 | ) | | | (0.38 | ) | | | — | | | | — | | | | — | | | | 9.62 | | | | (3.80 | ) | | | 62,066 | | | | 0.59 | | | | 0.59 | | | | 0.78 | | | | 1.07 | | | | 9 | |
Small/Mid Cap Equity Fund | | | | | | | | | | | | | | | | | | | | | | | | | | | | | | | | | | | | | | | | | |
Class A | | | | | | | | | | | | | | | | | | | | | | | | | | | | | | | | | | | | | | | | | | | | | | | | | | �� | | | | | | | |
2016 | | $ | 14.89 | | | $ | 0.12 | | | $ | (0.99 | ) | | $ | (0.87 | ) | | $ | (0.13 | ) | | $ | (1.91 | ) | | $ | (2.04 | ) | | $ | 11.98 | | | | (5.33 | )% | | $ | 1,642,784 | | | | 0.46 | %(3) | | | 0.46 | %(3) | | | 0.72 | %(3) | | | 0.93 | % | | | 104 | % |
2015 | | | 15.58 | | | | 0.10 | | | | 1.47 | | | | 1.57 | | | | (0.10 | ) | | | (2.16 | ) | | | (2.26 | ) | | | 14.89 | | | | 11.16 | | | | 1,859,609 | | | | 0.47 | | | | 0.47 | | | | 0.72 | | | | 0.66 | | | | 95 | |
2014 | | | 15.69 | | | | 0.09 | | | | 2.87 | | | | 2.96 | | | | (0.11 | ) | | | (2.96 | ) | | | (3.07 | ) | | | 15.58 | | | | 20.09 | | | | 1,829,276 | | | | 0.46 | | | | 0.46 | | | | 0.71 | | | | 0.55 | | | | 54 | |
2013 | | | 12.34 | | | | 0.14 | | | | 3.45 | | | | 3.59 | | | | (0.15 | ) | | | (0.09 | ) | | | (0.24 | ) | | | 15.69 | | | | 29.49 | | | | 2,153,745 | | | | 0.46 | | | | 0.46 | | | | 0.71 | | | | 1.02 | | | | 92 | |
2012 | | | 13.62 | | | | 0.09 | | | | (1.28 | ) | | | (1.19 | ) | | | (0.09 | ) | | | — | | | | (0.09 | ) | | | 12.34 | | | | (8.71 | ) | | | 1,981,358 | | | | 0.49 | | | | 0.49 | | | | 0.72 | | | | 0.77 | | | | 84 | |
U.S. Managed Volatility Fund | | | | | | | | | | | | | | | | | | | | | | | | | | | | | | | | | | | | | | | | | | | | | | | | | |
Class A | | | | | | | | | | | | | | | | | | | | | | | | | | | | | | | | | | | | | | | | | | | | | | | | | | | | | | | | | |
2016 | | $ | 14.64 | | | $ | 0.34 | | | $ | 0.13 | | | $ | 0.47 | | | $ | (0.35 | ) | | $ | (0.84 | ) | | $ | (1.19 | ) | | $ | 13.92 | | | | 3.71 | % | | $ | 1,524,568 | | | | 0.24 | %(3) | | | 0.24 | %(3) | | | 0.72 | %(3) | | | 2.47 | % | | | 62 | % |
2015 | | | 14.74 | | | | 0.34 | | | | 1.52 | | | | 1.86 | | | | (0.34 | ) | | | (1.62 | ) | | | (1.96 | ) | | | 14.64 | | | | 13.33 | | | | 1,414,638 | | | | 0.24 | | | | 0.24 | | | | 0.72 | | | | 2.27 | | | | 58 | |
2014 | | | 13.54 | | | | 0.31 | | | | 2.42 | | | | 2.73 | | | | (0.31 | ) | | | (1.22 | ) | | | (1.53 | ) | | | 14.74 | | | | 21.39 | | | | 1,236,524 | | | | 0.23 | | | | 0.23 | | | | 0.71 | | | | 2.19 | | | | 72 | |
2013 | | | 11.39 | | | | 0.32 | | | | 2.37 | | | | 2.69 | | | | (0.31 | ) | | | (0.23 | ) | | | (0.54 | ) | | | 13.54 | | | | 24.19 | | | | 1,145,980 | | | | 0.24 | | | | 0.24 | | | | 0.71 | | | | 2.55 | | | | 41 | |
2012 | | | 12.15 | | | | 0.25 | | | | 0.01 | | | | 0.26 | | | | (0.21 | ) | | | (0.81 | ) | | | (1.02 | ) | | | 11.39 | | | | 2.62 | | | | 722,082 | | | | 0.35 | | | | 0.35 | | | | 0.73 | | | | 2.25 | | | | 44 | |
Global Managed Volatility Fund | | | | | | | | | | | | | | | | | | | | | | | | | | | | | | | | | | | | | | | | | | | | | |
Class A | | | | | | | | | | | | | | | | | | | | | | | | | | | | | | | | | | | | | | | | | | | | | | | | | | | | | |
2016(7) | | $ | 10.00 | | | $ | 0.12 | | | $ | 0.66 | | | $ | 0.78 | | | $ | — | | | $ | — | | | $ | — | | | $ | 10.78 | | | | 7.80 | % | | $ | 1,061,014 | | | | 0.26 | %(3) | | | 0.26 | %(3) | | | 0.73 | %(3) | | | 3.34 | % | | | 42 | % |
World Equity Ex-US Fund | | | | | | | | | | | | | | | | | | | | | | | | | | | | | | | | | | | | | | | | | | | | | |
Class A | | | | | | | | | | | | | | | | | | | | | | | | | | | | | | | | | | | | | | | | | | | | | | | | | | | | | | | | | |
2016 | | $ | 12.68 | | | $ | 0.23 | | | $ | (1.83 | ) | | $ | (1.60 | ) | | $ | (0.23 | ) | | $ | (0.05 | ) | | $ | (0.28 | ) | | $ | 10.80 | | | | (12.60 | )% | | $ | 6,923,937 | | | | 0.33 | %(3) | | | 0.33 | %(3) | | | 0.63 | %(3) | | | 2.11 | % | | | 50 | % |
2015 | | | 12.86 | | | | 0.25 | | | | (0.03 | )(8) | | | 0.22 | | | | (0.25 | ) | | | (0.15 | ) | | | (0.40 | ) | | | 12.68 | | | | 1.93 | | | | 7,644,844 | | | | 0.34 | | | | 0.34 | | | | 0.62 | | | | 2.00 | | | | 45 | |
2014 | | | 11.51 | | | | 0.24 | | | | 1.40 | | | | 1.64 | | | | (0.29 | ) | | | — | | | | (0.29 | ) | | | 12.86 | | | | 14.31 | | | | 6,723,128 | | | | 0.34 | | | | 0.34 | | | | 0.62 | | | | 2.01 | | | | 46 | |
2013 | | | 9.24 | | | | 0.25 | | | | 2.24 | | | | 2.49 | | | | (0.22 | ) | | | — | | | | (0.22 | ) | | | 11.51 | | | | 27.11 | | | | 6,192,852 | | | | 0.35 | | | | 0.35 | | | | 0.62 | | | | 2.30 | | | | 52 | |
2012 | | | 11.71 | | | | 0.23 | | | | (2.50 | ) | | | (2.27 | ) | | | (0.20 | ) | | | — | | | | (0.20 | ) | | | 9.24 | | | | (19.36 | ) | | | 4,623,934 | | | | 0.45 | | | | 0.45 | | | | 0.63 | | | | 2.28 | | | | 56 | |
Screened World Equity Ex-US Fund | | | | | | | | | | | | | | | | | | | | | | | | | | | | | | | | | | | | | | | | | |
Class A | | | | | | | | | | | | | | | | | | | | | | | | | | | | | | | | | | | | | | | | | | | | | | | | | | | | | | | | | |
2016 | | $ | 9.52 | | | $ | 0.17 | | | $ | (1.01 | ) | | $ | (0.84 | ) | | $ | (0.18 | ) | | $ | — | | | $ | (0.18 | ) | | $ | 8.50 | | | | (8.78 | )% | | $ | 82,836 | | | | 0.35 | %(3) | | | 0.35 | %(3) | | | 0.79 | %(3) | | | 2.01 | % | | | 41 | % |
2015 | | | 9.69 | | | | 0.18 | | | | (0.19 | ) | | | (0.01 | ) | | | (0.16 | ) | | | — | | | | (0.16 | ) | | | 9.52 | | | | (0.04 | ) | | | 83,879 | | | | 0.36 | | | | 0.36 | | | | 0.78 | | | | 1.96 | | | | 63 | |
2014 | | | 8.66 | | | | 0.16 | | | | 1.04 | | | | 1.20 | | | | (0.17 | ) | | | — | | | | (0.17 | ) | | | 9.69 | | | | 13.87 | | | | 77,117 | | | | 0.44 | | | | 0.44 | | | | 0.85 | | | | 1.75 | | | | 45 | |
2013 | | | 7.02 | | | | 0.15 | | | | 1.64 | | | | 1.79 | | | | (0.15 | ) | | | — | | | | (0.15 | ) | | | 8.66 | | | | 25.69 | | | | 62,521 | | | | 0.50 | | | | 0.50 | | | | 0.89 | | | | 1.81 | | | | 76 | |
2012 | | | 9.01 | | | | 0.13 | | | | (1.97 | ) | | | (1.84 | ) | | | (0.15 | ) | | | — | | | | (0.15 | ) | | | 7.02 | | | | (20.39 | ) | | | 48,756 | | | | 0.74 | | | | 0.74 | | | | 0.93 | | | | 1.63 | | | | 76 | |
| † | | Returns and portfolio turnover rates are for the period indicated and have not been annualized. Returns do not reflect the deduction of taxes the shareholder would pay on fund distributions or redemption of fund shares. |
| (1) | | Per share net investment income and net realized and unrealized gains (losses) calculated using average shares. |
| (2) | | The expense ratio includes interest expense. Had this expense been excluded, the ratios would have been 0.46%, 0.46% and 0.72%, respectively. |
| (3) | | The expense ratio includes proxy expenses outside the cap. |
| (4) | | The expense ratio includes interest expense. Had this expense been excluded, the ratios would have been 0.48%, 0.48% and 0.72%, respectively. |
| (5) | | The expense ratio includes interest expense. Had this expense been excluded, the ratios would have been 0.46%, 0.46% and 0.71%, respectively. |
| (6) | | Commenced operations on April 10, 2012. All ratios for the period have been annualized. |
| (7) | | Commenced operations on January 29, 2016. All ratios for the period have been annualized. |
| (8) | | The amount shown for the year ended May 31, 2013, for a share outstanding throughout the period does not accord with the aggregate net gains on investments for that period because of the sales and repurchase of Fund shares in relation to fluctuating market value of the investments of the Fund. |
Amounts designated as “—” are $0 or have been rounded to $0.
The accompanying notes are an integral part of the financial statements.
| | |
| 288 | | SEI Institutional Investments Trust / Annual Report / May 31, 2016 |
FINANCIAL HIGHLIGHTS
For the years or period ended May 31,
For a share outstanding throughout each period
| | | | | | | | | | | | | | | | | | | | | | | | | | | | | | | | | | | | | | | | | | | | | | | | | | | | | | | | | | | | |
| | | Net Asset
Value,
Beginning
of Period | | | Net
Investment
Income
(Loss)(1) | | | Net Realized and Unrealized Gains (Losses) on
Investments(1) | | | Total from
Operations | | | Dividends
from Net Investment
Income | | | Distributions
from Net
Realized
Capital
Gains | | | Total
Dividends
and Distributions | | | Net Asset
Value, End of Period | | | Total Return† | | | Net Assets End of Period
($ Thousands) | | | Ratio of Net
Expenses
to Average
Net Assets | | | Ratio of Expenses to Average Net Assets (Excluding Fees Paid Indirectly
and Including
Waivers) | | | Ratio of Expenses to Average Net Assets (Excluding Fees Paid Indirectly and
Waivers) | | | Ratio of Net Investment Income (Loss) to Average
Net Assets | | | Portfolio Turnover
Rate† | |
Emerging Markets Equity Fund | | | | | | | | | | | | | | | | | | | | | | | | | | | | | | | | | | | | | | | | | | | | | | | | | |
Class A | | | | | | | | | | | | | | | | | | | | | | | | | | | | | | | | | | | | | | | | | | | | | | | | | | | | | | | | | |
2016 | | $ | 10.01 | | | $ | 0.14 | | | $ | (1.40 | ) | | $ | (1.26 | ) | | $ | (0.12 | ) | | $ | (0.02 | ) | | $ | (0.14 | ) | | $ | 8.61 | | | | (12.53 | )% | | $ | 935,399 | | | | 0.70 | %(2) | | | 0.70 | %(2) | | | 1.24 | %(2) | | | 1.67 | % | | | 105 | % |
2015(3) | | | 10.00 | | | | 0.10 | | | | (0.07 | )(4) | | | 0.03 | | | | (0.02 | ) | | | — | | | | (0.02 | ) | | | 10.01 | | | | 0.33 | | | | 591,963 | | | | 0.65 | | | | 0.65 | | | | 1.16 | | | | 1.57 | | | | 103 | |
Opportunistic Income Fund | | | | | | | | | | | | | | | | | | | | | | | | | | | | | | | | | | | | | | | | | | | | | | | | | |
Class A | | | | | | | | | | | | | | | | | | | | | | | | | | | | | | | | | | | | | | | | | | | | | | | | | | | | | | | | | |
2016 | | $ | 8.25 | | | $ | 0.22 | | | $ | (0.15 | ) | | $ | 0.07 | | | $ | (0.21 | ) | | $ | — | | | $ | (0.21 | ) | | $ | 8.11 | | | | 0.93 | % | | $ | 2,129,669 | | | | 0.26 | %(2) | | | 0.26 | %(2) | | | 0.52 | %(2) | | | 2.67 | % | | | 35 | % |
2015 | | | 8.31 | | | | 0.22 | | | | (0.06 | ) | | | 0.16 | | | | (0.22 | ) | | | — | | | | (0.22 | ) | | | 8.25 | | | | 1.91 | | | | 2,167,478 | | | | 0.26 | | | | 0.26 | | | | 0.52 | | | | 2.64 | | | | 42 | |
2014 | | | 8.26 | | | | 0.19 | | | | 0.02 | | | | 0.21 | | | | (0.16 | ) | | | — | | | | (0.16 | ) | | | 8.31 | | | | 2.59 | | | | 1,875,851 | | | | 0.24 | (5) | | | 0.24 | (5) | | | 0.52 | (5) | | | 2.34 | | | | 121 | |
2013 | | | 7.97 | | | | 0.12 | | | | 0.34 | | | | 0.46 | | | | (0.17 | ) | | | — | | | | (0.17 | ) | | | 8.26 | | | | 5.78 | | | | 996,522 | | | | 0.21 | | | | 0.26 | | | | 0.52 | | | | 1.41 | | | | 26 | |
2012 | | | 7.95 | | | | 0.15 | | | | 0.04 | | | | 0.19 | | | | (0.17 | ) | | | — | | | | (0.17 | ) | | | 7.97 | | | | 2.49 | | | | 218,959 | | | | 0.41 | | | | 0.41 | | | | 0.53 | | | | 1.94 | | | | 58 | |
Core Fixed Income Fund | | | | | | | | | | | | | | | | | | | | | | | | | | | | | | | | | | | | | | | | | | | | | | | | | |
Class A | | | | | | | | | | | | | | | | | | | | | | | | | | | | | | | | | | | | | | | | | | | | | | | | | | | | | | | | | |
2016 | | $ | 10.62 | | | $ | 0.28 | | | $ | 0.02 | | | $ | 0.30 | | | $ | (0.28 | ) | | $ | (0.20 | ) | | $ | (0.48 | ) | | $ | 10.44 | | | | 2.97 | % | | $ | 5,264,859 | | | | 0.13 | %(2) | | | 0.13 | %(2) | | | 0.37 | %(2) | | | 2.66 | % | | | 364 | % |
2015 | | | 10.54 | | | | 0.27 | | | | 0.12 | | | | 0.39 | | | | (0.28 | ) | | | (0.03 | ) | | | (0.31 | ) | | | 10.62 | | | | 3.79 | | | | 5,600,807 | | | | 0.13 | | | | 0.13 | | | | 0.37 | | | | 2.59 | | | | 316 | |
2014 | | | 10.54 | | | | 0.29 | | | | 0.05 | | | | 0.34 | | | | (0.30 | ) | | | (0.04 | ) | | | (0.34 | ) | | | 10.54 | | | | 3.36 | | | | 5,910,306 | | | | 0.12 | | | | 0.12 | | | | 0.36 | | | | 2.78 | | | | 329 | |
2013 | | | 10.63 | | | | 0.27 | | | | 0.06 | | | | 0.33 | | | | (0.29 | ) | | | (0.13 | ) | | | (0.42 | ) | | | 10.54 | | | | 3.12 | | | | 6,484,218 | | | | 0.13 | | | | 0.13 | | | | 0.36 | | | | 2.53 | | | | 315 | |
2012 | | | 10.39 | | | | 0.34 | | | | 0.47 | | | | 0.81 | | | | (0.36 | ) | | | (0.21 | ) | | | (0.57 | ) | | | 10.63 | | | | 7.98 | | | | 7,081,317 | | | | 0.14 | | | | 0.14 | | | | 0.37 | | | | 3.21 | | | | 386 | |
High Yield Bond Fund | | | | | | | | | | | | | | | | | | | | | | | | | | | | | | | | | | | | | | | | | | | | | | | | | |
Class A | | | | | | | | | | | | | | | | | | | | | | | | | | | | | | | | | | | | | | | | | | | | | | | | | | | | | | | | | |
2016 | | $ | 9.41 | | | $ | 0.58 | | | $ | (0.81 | ) | | $ | (0.23 | ) | | $ | (0.58 | ) | | $ | (0.07 | ) | | $ | (0.65 | ) | | $ | 8.53 | | | | (2.17 | )% | | $ | 2,639,919 | | | | 0.30 | %(2) | | | 0.30 | %(2) | | | 0.56 | %(2) | | | 6.81 | % | | | 50 | % |
2015 | | | 9.96 | | | | 0.58 | | | | (0.34 | ) | | | 0.24 | | | | (0.58 | ) | | | (0.21 | ) | | | (0.79 | ) | | | 9.41 | | | | 2.63 | | | | 2,516,770 | | | | 0.30 | | | | 0.30 | | | | 0.56 | | | | 6.09 | | | | 55 | |
2014 | | | 10.01 | | | | 0.63 | | | | 0.10 | | | | 0.73 | | | | (0.62 | ) | | | (0.16 | ) | | | (0.78 | ) | | | 9.96 | | | | 7.75 | | | | 2,175,102 | | | | 0.30 | | | | 0.30 | | | | 0.56 | | | | 6.41 | | | | 65 | |
2013 | | | 9.30 | | | | 0.71 | | | | 0.69 | | | | 1.40 | | | | (0.69 | ) | | | — | | | | (0.69 | ) | | | 10.01 | | | | 15.46 | | | | 2,162,551 | | | | 0.30 | (6) | | | 0.30 | (6) | | | 0.56 | (6) | | | 7.23 | | | | 72 | |
2012 | | | 9.58 | | | | 0.74 | | | | (0.29 | ) | | | 0.45 | | | | (0.72 | ) | | | (0.01 | ) | | | (0.73 | ) | | | 9.30 | | | | 5.09 | | | | 1,914,780 | | | | 0.35 | (7) | | | 0.35 | (7) | | | 0.56 | (7) | | | 7.97 | | | | 50 | |
Long Duration Fund | | | | | | | | | | | | | | | | | | | | | | | | | | | | | | | | | | | | | | | | | | | | | | | | | |
Class A | | | | | | | | | | | | | | | | | | | | | | | | | | | | | | | | | | | | | | | | | | | | | | | | | | | | | | | | | |
2016 | | $ | 8.92 | | | $ | 0.36 | | | $ | 0.14 | | | $ | 0.50 | | | $ | (0.36 | ) | | $ | (0.38 | ) | | $ | (0.74 | ) | | $ | 8.68 | | | | 6.19 | % | | $ | 2,775,237 | | | | 0.15 | %(2) | | | 0.15 | %(2) | | | 0.37 | %(2) | | | 4.23 | % | | | 72 | % |
2015 | | | 8.88 | | | | 0.36 | | | | 0.14 | | | | 0.50 | | | | (0.36 | ) | | | (0.10 | ) | | | (0.46 | ) | | | 8.92 | | | | 5.68 | | | | 3,343,845 | | | | 0.15 | | | | 0.15 | | | | 0.37 | | | | 4.00 | | | | 73 | |
2014 | | | 8.75 | | | | 0.36 | | | | 0.17 | | | | 0.53 | | | | (0.36 | ) | | | (0.04 | ) | | | (0.40 | ) | | | 8.88 | | | | 6.41 | | | | 4,021,437 | | | | 0.15 | | | | 0.15 | | | | 0.37 | | | | 4.28 | | | | 105 | |
2013 | | | 9.65 | | | | 0.36 | | | | (0.25 | ) | | | 0.11 | | | | (0.36 | ) | | | (0.65 | ) | | | (1.01 | ) | | | 8.75 | | | | 0.78 | | | | 3,322,291 | | | | 0.16 | | | | 0.16 | | | | 0.37 | | | | 3.80 | | | | 96 | |
2012 | | | 8.83 | | | | 0.41 | | | | 1.42 | | | | 1.83 | | | | (0.42 | ) | | | (0.59 | ) | | | (1.01 | ) | | | 9.65 | | | | 21.70 | | | | 5,497,375 | | | | 0.20 | | | | 0.20 | | | | 0.37 | | | | 4.45 | | | | 121 | |
Long Duration Credit Fund | | | | | | | | | | | | | | | | | | | | | | | | | | | | | | | | | | | | | | | | | | | | | | | | | |
Class A | | | | | | | | | | | | | | | | | | | | | | | | | | | | | | | | | | | | | | | | | | | | | | | | | | | | | | | | | |
2016 | | $ | 10.18 | | | $ | 0.41 | | | $ | 0.30 | | | $ | 0.71 | | | $ | (0.41 | ) | | $ | (0.22 | ) | | $ | (0.63 | ) | | $ | 10.26 | | | | 7.37 | % | | $ | 3,333,806 | | | | 0.15 | %(2) | | | 0.15 | %(2) | | | 0.37 | %(2) | | | 4.15 | % | | | 74 | % |
2015 | | | 10.20 | | | | 0.43 | | | | (0.02 | ) | | | 0.41 | | | | (0.43 | ) | | | — | | | | (0.43 | ) | | | 10.18 | | | | 4.02 | | | | 3,465,228 | | | | 0.15 | | | | 0.15 | | | | 0.37 | | | | 4.16 | | | | 151 | |
2014 | | | 9.93 | | | | 0.44 | | | | 0.32 | | | | 0.76 | | | | (0.44 | ) | | | (0.05 | ) | | | (0.49 | ) | | | 10.20 | | | | 8.10 | | | | 2,820,257 | | | | 0.15 | | | | 0.15 | | | | 0.36 | | | | 4.56 | | | | 115 | |
2013(8) | | | 10.00 | | | | 0.39 | | | | — | | | | 0.39 | | | | (0.39 | ) | | | (0.07 | ) | | | (0.46 | ) | | | 9.93 | | | | 3.75 | | | | 2,082,952 | | | | 0.15 | | | | 0.15 | | | | 0.36 | | | | 4.08 | | | | 100 | |
Ultra Short Duration Bond Fund | | | | | | | | | | | | | | | | | | | | | | | | | | | | | | | | | | | | | | | | | | | | | | | | | |
Class A | | | | | | | | | | | | | | | | | | | | | | | | | | | | | | | | | | | | | | | | | | | | | | | | | | | | | | | | | |
2016 | | $ | 10.01 | | | $ | 0.11 | | | $ | (0.01 | ) | | $ | 0.10 | | | $ | (0.13 | ) | | $ | — | | | $ | (0.13 | ) | | $ | 9.98 | | | | 1.01 | % | | $ | 535,629 | | | | 0.12 | %(2) | | | 0.12 | %(2) | | | 0.22 | %(2) | | | 1.08 | % | | | 103 | % |
2015 | | | 10.05 | | | | 0.09 | | | | (0.02 | ) | | | 0.07 | | | | (0.11 | ) | | | — | | | | (0.11 | ) | | | 10.01 | | | | 0.72 | | | | 645,872 | | | | 0.12 | | | | 0.12 | | | | 0.22 | | | | 0.95 | | | | 112 | |
2014 | | | 10.04 | | | | 0.09 | | | | 0.02 | | | | 0.11 | | | | (0.10 | ) | | | — | | | | (0.10 | ) | | | 10.05 | | | | 1.13 | | | | 718,199 | | | | 0.11 | | | | 0.11 | | | | 0.21 | | | | 0.87 | | | | 118 | |
2013 | | | 9.95 | | | | 0.10 | | | | 0.11 | | | | 0.21 | | | | (0.12 | ) | | | — | | | | (0.12 | ) | | | 10.04 | | | | 2.14 | | | | 522,593 | | | | 0.12 | | | | 0.12 | | | | 0.21 | | | | 1.02 | | | | 178 | |
2012 | | | 9.99 | | | | 0.11 | | | | (0.02 | ) | | | 0.09 | | | | (0.13 | ) | | | — | | | | (0.13 | ) | | | 9.95 | | | | 0.86 | | | | 298,223 | | | | 0.16 | | | | 0.16 | | | | 0.21 | | | | 1.14 | | | | 222 | |
| † | | Returns and portfolio turnover rates are for the period indicated and have not been annualized. Returns do not reflect the deduction of taxes the shareholder would pay on fund distributions or redemption of fund shares. |
| (1) | | Per share net investment income and net realized and unrealized gains (losses) calculated using average shares. |
| (2) | | The expense ratio includes proxy expenses outside the cap. |
| (3) | | Commenced operations on October 31, 2014. All ratios for the period have been annualized. |
| (4) | | The amount shown for the year ended May 31, 2015, for a share outstanding throughout the period does not accord with the aggregate net gains on investments for that period because of the sales and repurchase of Fund shares in relation to fluctuating market value of the investments of the Fund. |
| (5) | | The expense ratio includes interest expense. Had this expense been excluded, the ratios would have been 0.24%, 0.24% and 0.52%, respectively. |
| (6) | | The expense ratio includes interest expense. Had this expense been excluded, the ratios would have been 0.30%, 0.30% and 0.56%, respectively. |
| (7) | | The expense ratio includes interest expense. Had this expense been excluded, the ratios would have been 0.35%, 0.35% and 0.56%, respectively. |
| (8) | | Commenced operations on June 29, 2012. All ratios for the period have been annualized. |
Amounts designated as “—” are $0 or have been rounded to $0.
The accompanying notes are an integral part of the financial statements.
| | | | |
| SEI Institutional Investments Trust / Annual Report / May 31, 2016 | | | 289 | |
FINANCIAL HIGHLIGHTS / CONSOLIDATED FINANCIAL HIGHLIGHTS
For the years or period ended May 31,
For a share outstanding throughout each period
| | | | | | | | | | | | | | | | | | | | | | | | | | | | | | | | | | | | | | | | | | | | | | | | | | | | | | | | | | | | |
| | | Net Asset
Value,
Beginning
of Period | | | Net
Investment
Income
(Loss)(1) | | | Net Realized and Unrealized Gains (Losses) on
Investments(1) | | | Total from
Operations | | | Dividends
from Net Investment
Income | | | Distributions
from Net
Realized
Capital
Gains | | | Total
Dividends
and Distributions | | | Net Asset
Value, End of Period | | | Total Return† | | | Net Assets End of Period
($ Thousands) | | | Ratio of Net
Expenses
to Average
Net Assets | | | Ratio of Expenses to Average Net Assets (Excluding Fees Paid Indirectly
and Including
Waivers) | | | Ratio of Expenses to Average Net Assets (Excluding Fees Paid Indirectly and
Waivers) | | | Ratio of Net Investment Income (Loss) to Average
Net Assets | | | Portfolio Turnover
Rate† | |
Emerging Markets Debt Fund | | | | | | | | | | | | | | | | | | | | | | | | | | | | | | | | | | | | | | | | | | | | | | | | | |
Class A | | | | | | | | | | | | | | | | | | | | | | | | | | | | | | | | | | | | | | | | | | | | | | | | | | | | | | | | | |
2016 | | $ | 9.65 | | | $ | 0.56 | | | $ | (0.73 | ) | | $ | (0.17 | ) | | $ | (0.09 | ) | | $ | — | | | $ | (0.09 | ) | | $ | 9.39 | | | | (1.77 | )% | | $ | 1,935,751 | | | | 0.43 | %(2) | | | 0.43 | %(2) | | | 0.95 | %(2) | | | 6.19 | % | | | 77 | % |
2015 | | | 10.68 | | | | 0.57 | | | | (1.22 | ) | | | (0.65 | ) | | | (0.38 | ) | | | — | | | | (0.38 | ) | | | 9.65 | | | | (6.17 | ) | | | 1,836,776 | | | | 0.40 | | | | 0.40 | | | | 0.93 | | | | 5.69 | | | | 78 | |
2014 | | | 11.11 | | | | 0.60 | | | | (0.58 | ) | | | 0.02 | | | | (0.33 | ) | | | (0.12 | ) | | | (0.45 | ) | | | 10.68 | | | | 0.44 | | | | 1,596,100 | | | | 0.45 | | | | 0.45 | | | | 0.95 | | | | 5.86 | | | | 100 | |
2013 | | | 11.22 | | | | 0.56 | | | | 0.65 | | | | 1.21 | | | | (0.84 | ) | | | (0.48 | ) | | | (1.32 | ) | | | 11.11 | | | | 10.64 | | | | 1,411,893 | | | | 0.48 | | | | 0.48 | | | | 0.94 | | | | 4.79 | | | | 119 | |
2012 | | | 11.60 | | | | 0.73 | | | | (0.22 | ) | | | 0.51 | | | | (0.77 | ) | | | (0.12 | ) | | | (0.89 | ) | | | 11.22 | | | | 4.67 | | | | 1,114,918 | | | | 0.55 | | | | 0.55 | | | | 0.93 | | | | 6.43 | | | | 55 | |
Real Return Fund | | | | | | | | | | | | | | | | | | | | | | | | | | | | | | | | | | | | | | | | | | | | | | | | | |
Class A | | | | | | | | | | | | | | | | | | | | | | | | | | | | | | | | | | | | | | | | | | | | | | | | | | | | | | | | | |
2016 | | $ | 9.59 | | | $ | 0.08 | | | $ | (0.03 | ) | | $ | 0.05 | | | $ | — | | | $ | — | | | $ | — | | | $ | 9.64 | | | | 0.52 | % | | $ | 149,972 | | | | 0.08 | %(2) | | | 0.08 | %(2) | | | 0.29 | %(2) | | | 0.87 | % | | | 80 | % |
2015 | | | 9.82 | | | | (0.07 | ) | | | (0.09 | ) | | | (0.16 | ) | | | (0.07 | ) | | | — | | | | (0.07 | ) | | | 9.59 | | | | (1.60 | ) | | | 227,335 | | | | 0.08 | | | | 0.08 | | | | 0.29 | | | | (0.77 | ) | | | 41 | |
2014 | | | 9.86 | | | | 0.05 | | | | 0.04 | | | | 0.09 | | | | (0.04 | ) | | | (0.09 | ) | | | (0.13 | ) | | | 9.82 | | | | 0.96 | | | | 207,578 | | | | 0.08 | | | | 0.08 | | | | 0.29 | | | | 0.52 | | | | 49 | |
2013 | | | 10.29 | | | | 0.09 | | | | (0.10 | ) | | | (0.01 | ) | | | (0.18 | ) | | | (0.24 | ) | | | (0.42 | ) | | | 9.86 | | | | (0.15 | ) | | | 251,852 | | | | 0.11 | | | | 0.11 | | | | 0.28 | | | | 0.87 | | | | 97 | |
2012 | | | 10.67 | | | | 0.29 | | | | (0.07 | ) | | | 0.22 | | | | (0.35 | ) | | | (0.25 | ) | | | (0.60 | ) | | | 10.29 | | | | 2.15 | | | | 281,861 | | | | 0.20 | | | | 0.20 | | | | 0.28 | | | | 2.75 | | | | 96 | |
Limited Duration Bond Fund | | | | | | | | | | | | | | | | | | | | | | | | | | | | | | | | | | | | | | | | | | | | | | | | | |
Class A | | | | | | | | | | | | | | | | | | | | | | | | | | | | | | | | | | | | | | | | | | | | | | | | | | | | | | | | | |
2016 | | $ | 10.01 | | | $ | 0.12 | | | $ | 0.01 | | | $ | 0.13 | | | $ | (0.13 | ) | | $ | (0.01 | ) | | $ | (0.14 | ) | | $ | 10.00 | | | | 1.26 | % | | $ | 1,156,258 | | | | 0.12 | % | | | 0.12 | % | | | 0.32 | % | | | 1.25 | % | | | 134 | % |
2015(3) | | | 10.00 | | | | 0.09 | | | | 0.01 | | | | 0.10 | | | | (0.09 | ) | | | — | | | | (0.09 | ) | | | 10.01 | | | | 0.98 | | | | 670,579 | | | | 0.15 | | | | 0.15 | | | | 0.34 | | | | 1.03 | | | | 62 | |
Intermediate Duration Credit Fund | | | | | | | | | | | | | | | | | | | | | | | | | | | | | | | | | | | | | | | | | | | | | | | | | |
Class A | | | | | | | | | | | | | | | | | | | | | | | | | | | | | | | | | | | | | | | | | | | | | | | | | | | | | | | | | |
2016 | | $ | 9.82 | | | $ | 0.26 | | | $ | 0.14 | | | $ | 0.40 | | | $ | (0.26 | ) | | $ | — | | | $ | (0.26 | ) | | $ | 9.96 | | | | 4.16 | % | | $ | 1,440,434 | | | | 0.15 | % | | | 0.15 | % | | | 0.32 | % | | | 2.66 | % | | | 181 | % |
2015(4) | | | 10.00 | | | | 0.03 | | | | (0.18 | ) | | | (0.15 | ) | | | (0.03 | )** | | | — | | | | (0.03 | ) | | | 9.82 | | | | (1.46 | ) | | | 1,600,117 | | | | 0.20 | | | | 0.20 | | | | 0.35 | | | | 2.03 | | | | 122 | |
Dynamic Asset Allocation Fund | | | | | | | | | | | | | | | | | | | | | | | | | | | | | | | | | | | | | | | | | | | | | | | | | |
Class A | | | | | | | | | | | | | | | | | | | | | | | | | | | | | | | | | | | | | | | | | | | | | | | | | | | | | | | | | |
2016 | | $ | 16.97 | | | $ | 0.33 | | | $ | (0.41 | ) | | $ | (0.08 | ) | | $ | (0.91 | ) | | $ | (0.15 | ) | | $ | (1.06 | ) | | $ | 15.83 | | | | (0.32 | )% | | $ | 2,079,154 | | | | 0.08 | % | | | 0.08 | % | | | 0.67 | % | | | 2.08 | % | | | 12 | % |
2015 | | | 14.53 | | | | 0.31 | | | | 2.88 | | | | 3.19 | | | | (0.75 | ) | | | — | | | | (0.75 | ) | | | 16.97 | | | | 22.32 | | | | 1,993,576 | | | | 0.07 | | | | 0.07 | | | | 0.66 | | | | 1.92 | | | | 9 | |
2014 | | | 12.81 | | | | 0.27 | | | | 1.69 | | | | 1.96 | | | | (0.02 | ) | | | (0.22 | ) | | | (0.24 | ) | | | 14.53 | | | | 15.49 | | | | 1,557,322 | | | | 0.07 | | | | 0.07 | | | | 0.66 | | | | 1.99 | | | | 11 | |
2013 | | | 11.14 | | | | 0.30 | | | | 2.20 | | | | 2.50 | | | | (0.35 | ) | | | (0.48 | ) | | | (0.83 | ) | | | 12.81 | | | | 23.75 | | | | 1,135,631 | | | | 0.10 | | | | 0.10 | | | | 0.66 | | | | 2.50 | | | | 35 | |
2012 | | | 11.26 | | | | (0.01 | ) | | | 0.39 | | | | 0.38 | | | | — | | | | (0.50 | ) | | | (0.50 | ) | | | 11.14 | | | | 3.73 | | | | 552,649 | | | | 0.50 | | | | 0.50 | | | | 0.67 | | | | (0.10 | ) | | | 140 | |
Multi-Asset Real Return Fund | | | | | | | | | | | | | | | | | | | | | | | | | | | | | | | | | | | | | | | | | | | | | | | | | |
Class A | | | | | | | | | | | | | | | | | | | | | | | | | | | | | | | | | | | | | | | | | | | | | | | | | | | | | | | | | |
2016 | | $ | 8.64 | | | $ | 0.10 | | | $ | (0.38 | ) | | $ | (0.28 | ) | | $ | (0.08 | ) | | $ | — | | | $ | (0.08 | ) | | $ | 8.28 | | | | (3.19 | )% | | $ | 733,029 | | | | 0.54 | %(5) | | | 0.54 | %(5) | | | 0.90 | %(5) | | | 1.17 | % | | | 91 | % |
2015 | | | 9.30 | | | | 0.03 | | | | (0.51 | ) | | | (0.48 | ) | | | (0.18 | )*** | | | — | | | | (0.18 | ) | | | 8.64 | | | | (5.16 | ) | | | 730,812 | | | | 0.43 | (6) | | | 0.43 | (6) | | | 0.80 | (6) | | | 0.29 | | | | 99 | |
2014 | | | 9.19 | | | | 0.12 | | | | (0.01 | ) | | | 0.11 | | | | — | | | | — | | | | — | | | | 9.30 | | | | 1.20 | | | | 716,022 | | | | 0.32 | (7) | | | 0.32 | (7) | | | 0.64 | (7) | | | 1.30 | | | | 122 | |
2013 | | | 9.25 | | | | 0.11 | | | | (0.10 | )(8) | | | 0.01 | | | | (0.07 | )** | | | — | | | | (0.07 | ) | | | 9.19 | | | | 0.07 | | | | 303,899 | | | | 0.32 | (9) | | | 0.32 | (9) | | | 0.66 | (9) | | | 1.11 | | | | 49 | |
2012(10) | | | 10.00 | | | | 0.10 | | | | (0.84 | ) | | | (0.74 | ) | | | (0.01 | ) | | | — | | | | (0.01 | ) | | | 9.25 | | | | (7.37 | ) | | | 140,063 | | | | 0.41 | (11) | | | 0.41 | (11) | | | 0.66 | (11) | | | 1.23 | | | | 58 | |
| ** | | Includes a return of capital of less than $0.01 per share. |
| *** | | Includes a return of capital of less than $0.02 per share. |
| † | | Returns and portfolio turnover rates are for the period indicated and have not been annualized. Returns do not reflect the deduction of taxes the shareholder would pay on fund distributions or redemption of fund shares. |
| (1) | | Per share net investment income and net realized and unrealized gains (losses) calculated using average shares. |
| (2) | | The expense ratio includes proxy expenses outside the cap. |
| (3) | | Commenced operations on July 31, 2014. All ratios for the period have been annualized. |
| (4) | | Commenced operations on March 31, 2015. All ratios for the period have been annualized. |
| (5) | | The expense ratio includes interest expense on reverse repurchase agreements and dividend expense on securities sold short. Had this expense been excluded, the ratios would have been 0.31%, 0.31% and 0.67%, respectively. |
| (6) | | The expense ratio includes interest expense on reverse repurchase agreements and dividend expense on securities sold short. Had this expense been excluded, the ratios would have been 0.30%, 0.30% and 0.67%, respectively. |
| (7) | | The expense ratio includes interest expense on reverse repurchase agreements and dividend expense on securities sold short. Had this expense been excluded, the ratios would have been 0.30%, 0.30% and 0.62%, respectively. |
| (8) | | The amount shown for the year ended May 31, 2013, for a share outstanding throughout the period does not accord with the aggregate net gains on investments for that period because of the sales and repurchase of Fund shares in relation to fluctuating market value of the investments of the Fund. |
| (9) | | The expense ratio includes interest expense on reverse repurchase agreements. Had this expense been excluded, the ratios would have been 0.29%, 0.29% and 0.63%, respectively. |
| (10) | | Commenced operations on July 29, 2011. All ratios for the period have been annualized. |
| (11) | | The expense ratio includes interest expense on reverse repurchase agreements. Had this expense been excluded, the ratios would have been 0.39%, 0.39% and 0.64%, respectively |
| Amounts | | designated as “—” are $0 or have been rounded to $0. |
The accompanying notes are an integral part of the financial statements.
| | |
| 290 | | SEI Institutional Investments Trust / Annual Report / May 31, 2016 |
NOTES TO FINANCIAL STATEMENTS/CONSOLIDATED NOTES TO FINANCIAL STATEMENTS
May 31, 2016
1. ORGANIZATION
SEI Institutional Investments Trust (the “Trust”) was organized as a Massachusetts business trust under a Declaration of Trust dated March 1, 1995. The Trust commenced operations on June 14, 1996.
The Trust is registered under the Investment Company Act of 1940, as amended, as an open-end investment company with 28 registered funds: Large Cap, Large Cap Diversified Alpha, Large Cap Disciplined Equity, Large Cap Index, S&P 500 Index, Extended Market Index, Small Cap, Small Cap II, Small/Mid Cap Equity, U.S. Managed Volatility, Global Managed Volatility, World Equity Ex-US, Screened World Equity Ex-US, Emerging Markets Equity, Opportunistic Income, Core Fixed Income, High Yield Bond, Long Duration, Long Duration Credit, Ultra Short Duration Bond, Emerging Markets Debt, Real Return, Limited Duration Bond, Intermediate Duration Credit, Dynamic Asset Allocation, Multi-Asset Real Return, Strategic U.S. Large Cap Equity and Global Equity Funds (each a “Fund,” collectively, the “Funds”) each of which are diversified Funds with the exception of the Emerging Markets Debt and Multi-Asset Real Return Funds. The Trust is registered to offer Class A shares of all Funds. The assets of each Fund are segregated, and a shareholder’s interest is limited to the Fund in which shares are held. The Trust’s prospectus provides a description of each Fund’s investment goals, principal strategies and risks.
The DAA Commodity Strategy Subsidiary, Ltd. and the MARR Commodity Strategy Subsidiary, Ltd. are wholly-owned subsidiaries of the Dynamic Asset Allocation and Multi-Asset Real Return Funds (the “Subsidiaries”) respectively. The Subsidiaries are organized under the laws of the Cayman Islands as an exempt limited company. Information regarding the Dynamic Asset Allocation and Multi-Asset Real Return Funds and their respective subsidiary has been consolidated on the Consolidated Summary Schedule of Investments, Consolidated Schedule of Investments, Consolidated Statements of Assets and Liabilities, Consolidated Statements of Operations, Consolidated Statements of Changes in Net Assets, Consolidated Statement of Cash Flows and Consolidated Financial Highlights.
As of May 31, 2016, the Strategic U.S. Large Cap Equity and Global Equity Funds have not yet commenced operations.
2. SIGNIFICANT ACCOUNTING POLICIES
The following is a summary of the significant accounting policies followed by the Funds.
Use of Estimates — The preparation of financial statements, in conformity with U.S. generally accepted
accounting principles (“U.S. GAAP”), requires management to make estimates and assumptions that affect the reported amount of assets and liabilities and disclosure of contingent assets and liabilities as of the date of the financial statements and the reported amounts of increases and decreases in net assets from operations during the reporting period. Actual results could differ from those estimates.
Security Valuation — Securities listed on a securities exchange, market or automated quotation system for which quotations are readily available (other than securities traded on National Association of Securities Dealers Automated Quotations (NASDAQ) or as otherwise noted below) at the last quoted sale price on an exchange or market (foreign or domestic) on which the securities are traded, or, if there is no such reported sale, at the most recent quoted bid price. The Funds value securities traded on NASDAQ at the NASDAQ Official Closing Price. If available, debt securities, swaps (which are not centrally cleared), bank loans or collateralized debt obligations (including collateralized loan obligations), such as those held by the Funds, are priced based upon valuations provided by independent, third-party pricing agents. Such values generally reflect the last reported sales price if the security is actively traded. The third-party pricing agents may also value debt securities at an evaluated bid price by employing methodologies that utilize actual market transactions, broker-supplied valuations or other methodologies designed to identify the market value for such securities. Redeemable securities issued by open-end investment companies are valued at the investment company’s applicable net asset value, with the exception of ETFs, which are priced as equity securities. The prices of foreign securities are reported in local currency and converted to U.S. dollars using currency exchange rates. If a security’s price cannot be obtained, as noted above, the Funds will value the securities using a bid price from at least one independent broker. If such prices are not readily available or cannot be valued using the methodologies described above, the Funds will value the security using the Funds’ Fair Value Pricing Policies and Procedures (“Fair Value Procedures”), as described below.
On the first day a new debt security purchase is recorded, if a price is not available from a third-party pricing agent or an independent broker, the security may be valued at its purchase price. Each day thereafter, the debt security will be valued according to the Funds’ Fair Value Procedures until a price from an independent source can be secured. Securities held by a Fund with remaining maturities of 60 days or less may be valued by the amortized cost method, which involves valuing a security at its cost on the date of purchase and
| | | | |
| SEI Institutional Investments Trust / Annual Report / May 31, 2016 | | | 291 | |
NOTES TO FINANCIAL STATEMENTS/CONSOLIDATED NOTES TO FINANCIAL STATEMENTS (Continued)
MAY 31, 2016
thereafter (absent unusual circumstances) assuming a constant amortization to maturity of any discount or premium, regardless of the impact of fluctuations in general market rates of interest on the value of the instrument. While this method provides certainty in valuation, it may result in periods during which value, as determined by this method, is higher or lower than the price a Fund would receive if it sold the instrument. Further, the value of securities in the Fund can be expected to vary inversely with changes in prevailing interest rates. Should existing credit, liquidity or interest rate conditions in the relevant markets and issuer-specific circumstances suggest that amortized cost does not approximate fair value, then the amortized cost method may not be used.
Options and warrants are valued at the last quoted sales price. If there is no such reported sale on the valuation date, long positions are valued at the most recent bid price, and short positions are valued at the most recent ask price.
Futures and swaps cleared through a central clearing house (“centrally cleared swaps”) are valued at the settlement price established each day by the board of exchange on which they are traded. The daily settlement prices for financial futures and centrally cleared swaps are provided by an independent source. On days when there is excessive volume, market volatility or the future or centrally cleared swap does not end trading by the time a Fund calculates its NAV, the settlement price may not be available at the time at which the Fund calculates its NAV. On such days, the best available price (which is typically the last sales price) may be used to value a Fund’s futures or centrally cleared swaps position.
Foreign currency forward contracts are valued at the current day’s interpolated foreign exchange rate, as calculated using the current day’s spot rate, and the thirty, sixty, ninety and one-hundred eighty day forward rates provided by an independent source.
Prices for most securities held by a Fund are provided daily by third-party independent pricing agents. SEI Investments Management Corporation (“SIMC”) or a Sub-Adviser (“Sub-Adviser”), as applicable, reasonably believes that prices provided by independent pricing agents are reliable. However, there can be no assurance that such pricing service’s prices will be reliable. SIMC or a Sub-Adviser, as applicable, will continuously monitor the reliability of prices obtained from any pricing service and shall promptly notify the Funds’ administrator if it believes that a particular pricing service is no longer a reliable source of prices. The Funds’ administrator, in turn, will notify the Fair Value Pricing Committee (the “Committee”) if it receives such notification from SIMC or a Sub-Adviser, as applicable, or if the Funds’
administrator reasonably believes that a particular pricing service is no longer a reliable source for prices.
The Funds’ Fair Value Procedures provide that any change in a primary pricing agent or a pricing methodology requires prior approval by the Board of Trustees (“Board”) or its designated sub-committee. However, when the change would not materially affect valuation of a Fund’s net assets or involve a material departure in pricing methodology from that of the Fund’s existing pricing agent or pricing methodology, approval may be obtained at the next regularly scheduled meeting of the Board.
Securities for which market prices are not readily available, for which market prices are determined to be unreliable, or which cannot be valued using the methodologies described above are valued in accordance with the Fair Value Procedures established by the Board. The Funds’ Fair Value Procedures are implemented through the Committee designated by the Board. The Committee is currently composed of two members of the Board, as well as representatives from SIMC and its affiliates. Some of the more common reasons that may necessitate that a security be valued using Fair Value Procedures include: (i) the security’s trading has been halted or suspended, (ii) the security has been delisted from a national exchange, (iii) the security’s primary trading market is temporarily closed at a time when under normal conditions it would be open, or (iv) the security’s primary pricing source is not able or willing to provide a price. When a security is valued in accordance with the Fair Value Procedures, the Committee will determine the value after taking into consideration relevant information reasonably available to the Committee. Examples of factors the Committee may consider include: (i) the facts giving rise to the need to fair value, (ii) the last trade price, (iii) the performance of the market or the issuer’s industry, (iv) the liquidity of the security, (v) the size of the holding in a Fund, or (vi) any other appropriate information.
The determination of a security’s fair value price often involves the consideration of a number of subjective factors, and is therefore subject to the unavoidable risk that the value assigned to a security may be higher or lower than the security’s value would be if a reliable market quotation for the security was readily available.
For securities that principally trade on a foreign market or exchange, a significant gap in time can exist between the time of a particular security’s last trade and the time at which a Fund calculates its Net Asset Value (“NAV”). The closing prices of such securities may no longer reflect their market value at the time a Fund calculates NAV if an event that could materially affect the value of those securities (a “Significant Event”), including
| | |
| 292 | | SEI Institutional Investments Trust / Annual Report / May 31, 2016 |
substantial fluctuations in domestic or foreign markets or occurrences not tied directly to the securities markets, such as natural disasters, armed conflicts or significant governmental actions, has occurred between the time of the security’s last close and the time that the Fund calculates NAV. A Fund may invest in securities that are primarily listed on foreign exchanges that trade on weekends or other days when the Fund does not price its shares. As a result, the NAV of the Fund’s shares may change on days when shareholders will not be able to purchase or redeem Fund shares.
A Significant Event may relate to a single issuer or to an entire market sector. If SIMC or a Sub-Adviser becomes aware of a Significant Event that has occurred with respect to a security or group of securities after the closing of the exchange or market on which the security or securities principally trade, but before the time at which the Funds calculate NAV, it may request that a Committee meeting be called. In addition, the Funds use several processes, with respect to certain securities to monitor the pricing data supplied by various sources, including price comparisons and price movements. Any identified discrepancies are researched and subject to the procedures described above.
The World Equity Ex-US, Screened World Equity Ex-US, Emerging Markets Equity and Multi-Asset Real Return Funds that hold international securities also use a third-party fair valuation vendor. The vendor provides a fair value for foreign securities held by the Funds based on certain factors and methodologies (involving, generally, tracking valuation correlations between the U.S. market and each non-U.S. security). Values from the fair value vendor are applied in the event that there is a movement in the U.S. market that exceeds a specific threshold that has been established by the Committee. The Committee has also established a “confidence interval” which is used to determine the level of historical correlation between the value of a specific foreign security and movements in the U.S. market before a particular security will be fair valued when the threshold is exceeded. In the event that the threshold established by the Committee is exceeded on a specific day, these Funds will value the non-U.S. securities in their portfolios that exceed the applicable “confidence interval” based upon the adjusted prices provided by the fair valuation vendor.
In accordance with U.S. GAAP, fair value is defined as the price that a Fund would receive upon selling an investment in an orderly transaction to an independent buyer in the principal or most advantageous market of the investment. A three tier hierarchy has been established to maximize the use of observable and minimize the use of unobservable inputs and to establish
classification of fair value measurements for disclosure purposes. Inputs refer broadly to the assumptions that market participants would use in pricing an asset. Inputs may be observable or unobservable. Observable inputs are inputs that reflect the assumptions market participants would use in pricing the asset or liability based on market data obtained from sources independent of the reporting entity. Unobservable inputs are inputs that reflect the reporting entity’s own assumptions about the assumptions market participants would use in pricing the asset or liability based on the best information available in the circumstances.
The three-tier hierarchy of inputs is summarized in the three broad Levels listed below:
| Level 1 — | quoted prices in active markets for identical investments |
| Level 2 — | other significant observable inputs (including quoted prices for similar investments, interest rates, prepayment speeds, credit risks, etc.) |
| Level 3 — | significant unobservable inputs (including the Fund’s own assumptions in determining the fair value of investments) |
Investments are classified within the level of the lowest significant input considered in determining fair value. Investments classified within Level 3 whose fair value measurement considers several inputs may include Level 1 or Level 2 inputs as components of the overall fair value measurement.
Debt securities are valued in accordance with the evaluated bid price supplied by the pricing service and generally categorized as Level 2 in the hierarchy. Other securities that are categorized as Level 2 in the hierarchy include, but are not limited to, preferred stocks, bank loans, warrants, swaps and forward contracts. The Fund may use a systematic fair valuation model provided by an independent pricing service to value foreign equity securities in order to adjust for stale pricing, which may occur between the close of certain foreign exchanges and the New York Stock Exchange. These are generally categorized as Level 2 in the hierarchy.
When independent prices are unavailable or unreliable, debt securities and swaps may be valued utilizing pricing matrices which consider similar factors that would be used by independent pricing services. These are generally categorized as Level 2 in the hierarchy but may be Level 3 depending on the circumstances. For certain collateralized debt obligations, corporate obligations, mortgage backed securities, auction rate preferred securities and loan participations where observable inputs are limited, assumptions about market activity and risk are used and are categorized as Level 3 in the hierarchy.
| | | | |
| SEI Institutional Investments Trust / Annual Report / May 31, 2016 | | | 293 | |
NOTES TO FINANCIAL STATEMENTS/CONSOLIDATED NOTES TO FINANCIAL STATEMENTS (Continued)
MAY 31, 2016
The valuation techniques used by the Funds to measure fair value during the year ended May 31, 2016 maximized the use of observable inputs and minimized the use of unobservable inputs.
For the year ended May 31, 2016, there have been no significant changes to the Trust’s fair valuation methodologies. For details of the investment classification, reference the Summary Schedules of Investments/Schedules of Investments.
Security Transactions and Investment Income — Security transactions are recorded on the trade date. Cost used in determining net realized capital gains and losses on the sale of securities is determined on the basis of specific identification. Dividend income and expense is recognized on the ex-dividend date, and interest income or expense is recognized using the accrual basis of accounting.
Distributions received on securities that represent a return of capital or capital gain are recorded as a reduction of cost of investments and/ or as a realized gain. The Trust estimates the components of distributions received that may be considered nontaxable distributions or capital gain distributions.
Amortization and accretion is calculated using the scientific interest method, which approximates the effective interest method over the holding period of the security. Amortization of premiums and discounts is included in interest income.
Cash and Cash Equivalents — Idle cash and currency balances may be swept into various overnight sweep accounts and are classified as cash equivalents on the Statement of Assets and Liabilities. These amounts, at times, may exceed United States federally insured limits. Amounts swept are available on the next business day.
Repurchase Agreements — Securities pledged as collateral for repurchase agreements are held by each Fund’s custodian bank until the repurchase date of the repurchase agreement. The Funds may also invest in tri-party repurchase agreements. Securities held as collateral for tri-party repurchase agreements are maintained by the broker’s custodian bank in a segregated account until the repurchase date of the repurchase agreement. Provisions of the repurchase agreements and the Trust’s policies require that the market value of the collateral, including accrued interest thereon, is sufficient in the event of default by the counterparty. If the counterparty defaults and the value of the collateral declines, or if the counterparty enters into an insolvency proceeding, realization of the collateral by the Funds may be delayed or limited.
Reverse Repurchase Agreements — To the extent consistent with its Investment Objective and Strategies, a Fund may enter into reverse repurchase agreements. A reverse repurchase agreement involves the sale of portfolio assets together with an agreement to repurchase the same assets later at a fixed price. Assets are then segregated to cover the requirements to repurchase the assets. The segregated assets may consist of cash, U.S. Government securities, or other liquid securities at least equal in value to the obligations under the reverse repurchase agreements. In the event the buyer of securities under a reverse repurchase agreement files for bankruptcy or becomes insolvent, a Fund’s use of the proceeds under the reverse repurchase agreement may be restricted pending a determination by the other party, or its trustee or receiver, whether to enforce the obligation to repurchase the securities.
Reverse repurchase agreements outstanding as of May 31, 2016 were as follows:
| | | | | | | | | | |
| Multi-Asset Real Return Fund | |
Principal Amount
($ Thousands) | | | Counterparty | | Rate % | | Value
($ Thousands) | |
| | $32,209 | | | Chase Securities | | 0.51% | | $ | 32,209 | |
| | 42,171 | | | Chase Securities | | 0.51 | | | 42,171 | |
| | 6,240 | | | Chase Securities | | 0.54 | | | 6,240 | |
| | 1,649 | | | HSBC | | 0.36 | | | 1,649 | |
| | 4,239 | | | HSBC | | 0.36 | | | 4,239 | |
| | 7,177 | | | HSBC | | 0.36 | | | 7,177 | |
| | 5,901 | | | HSBC | | 0.36 | | | 5,901 | |
| | 2,652 | | | HSBC | | 0.36 | | | 2,652 | |
| | 6,090 | | | HSBC | | 0.36 | | | 6,090 | |
| | 10,185 | | | HSBC | | 0.56 | | | 10,185 | |
| | 21,192 | | | HSBC | | 0.58 | | | 21,192 | |
| | 18,798 | | | Merrill Lynch | | 0.47 | | | 18,798 | |
| | | | | | | | | | |
| | | | | | | | $ | 158,503 | |
| | | | | | | | | | |
Expenses — Expenses that are directly related to a Fund are charged directly to that Fund. Other operating expenses of the Funds are prorated to the Funds on the basis of relative net assets.
Commodity-Linked Investments — To the extent consistent with its Investment Objective and Strategies, the Dynamic Asset Allocation and Multi-Asset Real Return Funds may invest in commodity investments to provide exposure to the investment returns of the commodities markets. Commodity investments include notes with interest payments that are tied to an underlying commodity or commodity index, ETFs or other exchange-traded products that are tied to the performance of a commodity or commodity index or other types of commodities or commodity indices. The Dynamic Asset Allocation and Multi-Asset Real Return Funds may also invest in equity securities of issuers in commodity-related industries.
| | |
| 294 | | SEI Institutional Investments Trust / Annual Report / May 31, 2016 |
The Dynamic Asset Allocation and Multi-Asset Real Return Funds may also seek to gain exposure to the commodity markets, in whole or in part, through investments in a wholly owned Subsidiary. The Subsidiary, unlike the Fund, may invest to a significant extent directly in commodities and in equity-linked securities and commodity-linked derivative instruments, including options, futures contracts, swaps, options on futures contracts and commodity-linked structured notes. The Subsidiary may also invest in other instruments in which the Fund is permitted to invest, either as investments or to serve as margin or collateral for its derivative positions. A Fund may invest up to 25% of its total assets in its Subsidiary.
In order for a Fund to qualify as a regulated investment company under Subchapter M of the Code, the Fund must derive at least 90% of its gross income each taxable year from qualifying income. The status of certain commodity-linked derivative instruments as qualifying income has been addressed in Revenue Ruling 2006-1 and Revenue Ruling 2006-31 which provide that income from certain commodity-linked derivative instruments in which the Fund invests will not be considered qualifying income. To the extent the Dynamic Asset Allocation and Multi-Asset Real Return Funds invest in such instruments directly, each Fund will seek to restrict its income from commodity-linked derivative instruments that do not generate qualifying income, such as commodity-linked swaps, to a maximum of 10% of its gross income (when combined with its other investments that produce non-qualifying income).
Foreign Currency Translation — The books and records of the Funds investing in international securities are maintained in U.S. dollars on the following basis:
(I) market value of investment securities, assets and liabilities at the current rate of exchange; and
(II) purchases and sales of investment securities, income and expenses at the relevant rates of exchange prevailing on the respective dates of such transactions.
The Funds do not isolate that portion of gains and losses on investments in equity securities that is due to changes in the foreign exchange rates from that which is due to changes in market prices of equity securities.
The Funds report certain foreign-currency-related transactions as components of realized gains for financial reporting purposes, whereas such components are treated as ordinary income for Federal income tax purposes.
Forward Foreign Currency Contracts — To the extent consistent with its Investment Objective and Strategies, a Fund may enter into forward foreign currency contracts as hedges against either specific transactions, fund positions or anticipated fund positions. A Fund may also engage in currency transactions to enhance that Fund’s returns. All commitments are marked-to-market daily at the applicable foreign exchange rate, and any resulting unrealized gains or losses are recorded currently. A Fund realizes gains and losses at the time forward contracts are extinguished. Unrealized gains or losses on outstanding positions in forward foreign currency contracts held at the close of the period are recognized as ordinary income or loss for Federal income tax purposes. A Fund could be exposed to risk if the counterparties to the contracts are unable to meet the terms of the contract and from unanticipated movements in the value of a foreign currency relative to the U.S. dollar.
Finally, the risk exists that losses could exceed amounts disclosed on the Statements of Assets and Liabilities or Consolidated Statements of Assets and Liabilities. Refer to each Fund’s Schedule of Investments, Summary Schedule of Investments, Consolidated Schedule of Investments or Consolidated Summary Schedule of Investments for details regarding open forward foreign currency contracts as of May 31, 2016, if applicable.
Futures Contracts — To the extent consistent with its Investment Objective and Strategies, a Fund may use futures contracts for tactical hedging purposes as well as to enhance the Fund’s returns. In addition, fixed income funds will utilize futures contracts to help manage duration and yield curve exposure. These Funds’ investments in futures contracts are designed to enable the Funds to more closely approximate the performance of their benchmark indices. Initial margin deposits of cash or securities are made upon entering into futures contracts. The contracts are marked-to-market daily and the resulting changes in value are accounted for as unrealized gains and losses. Variation margin payments are paid or received, depending upon whether unrealized gains or losses are incurred. When contracts are closed, the Funds record a realized gain or loss equal to the difference between the proceeds from (or cost of) the closing transaction and the amount invested in the contract.
Risks of entering into futures contracts include the possibility that there will be an imperfect price correlation between the futures and the underlying securities. Second, it is possible that a lack of liquidity for futures contracts could exist in the secondary market, resulting in an inability to close a position prior to its maturity date. Third, futures contracts involve the risk that a Fund could lose more than the original margin deposit required to initiate a futures transaction.
| | | | |
| SEI Institutional Investments Trust / Annual Report / May 31, 2016 | | | 295 | |
NOTES TO FINANCIAL STATEMENTS/CONSOLIDATED NOTES TO FINANCIAL STATEMENTS (Continued)
MAY 31, 2016
Finally, the risk exists that losses could exceed amounts disclosed on the Statements of Assets and Liabilities or Consolidated Statements of Assets and Liabilities. Refer to each Fund’s Schedule of Investments, Summary Schedule of Investments or Consolidated Schedule of Investments for details regarding open futures contracts as of May 31, 2016, if applicable.
Options/Swaptions Written/Purchased — To the extent consistent with its Investment Objective and Strategies, a Fund may invest in financial options/swaptions contracts for the purpose of hedging its existing portfolio securities, or securities that a Fund intends to purchase, against fluctuations in fair market value caused by changes in prevailing market interest rates. A Fund may also invest in financial option/swaption contracts to enhance its returns. When the Fund writes or purchases an option/swaption, an amount equal to the premium received or paid by the Fund is recorded as a liability or an asset and is subsequently adjusted to the current market value of the option/swaption written or purchased. Premiums received or paid from writing or purchasing options/ swaptions which expire unexercised are treated by the Fund on the expiration date as realized gains or losses. The difference between the premium and the amount paid or received on effecting a closing purchase or sale transaction, including brokerage commissions, is also treated as a realized gain or loss. If an option/swaption is exercised, the premium paid or received is added to the cost of the purchase or proceeds from the sale in determining whether the Fund has realized a gain or a loss. The Core Fixed Income, Dynamic Asset Allocation and Multi-Asset Real Return Funds had options/swaption contracts as of May 31, 2016, as disclosed in the Funds’ Schedule of Investments or Consolidated Summary Schedule of Investments.
The risk in writing a call option/swaption is a Fund may give up the opportunity for profit if the market price of the security increases. The risk in writing a put option/swaption is a Fund may incur a loss if the market price of the security decreases and the option/swaption is exercised. The risk in purchasing an option/swaption is a Fund may pay a premium whether or not the option/swaption is exercised. The Funds also have the additional risk of being unable to enter into a closing transaction at an acceptable price if a liquid secondary market does not exist. Option/swaption contracts also involve the risk that they may not work as intended due to unanticipated developments in market conditions or other causes.
Finally, the risk exists that losses on written options could exceed amounts disclosed on the Statements of Assets and Liabilities. Refer to each Fund’s Schedule of Investments or Consolidated Summary Schedule of Investments for details regarding open option/swaption contracts as of May 31, 2016, if applicable.
Securities Sold Short — To the extent consistent with its Investment Objective and Strategies, a Fund may engage in short sales. Short sales are transactions under which a Fund sells a security it does not own. To complete such a transaction, a Fund must borrow the security to make delivery to the buyer. A Fund then is obligated to replace the security borrowed by purchasing the security at the market price at the time of the replacement. The price at such time may be more or less than the price at which the security was sold by a Fund. Until the security is replaced, a Fund is required to pay the lender amounts equal to any dividends or interest that accrue during the period of the loan. Dividends and interest are shown as an expense for financial reporting purposes. To borrow the security, a Fund also may be required to pay a premium, which would decrease proceeds of the security sold. The proceeds of the short sale are retained by the broker, to the extent necessary to meet margin requirements, until the short position is closed out. A gain, limited to the price at which a Fund sold the security short, or a loss, unlimited in size, will be recognized upon the close of a short sale.
Until a Fund closes its short position or replaces the borrowed security, the Fund will: (i) earmark on the books of the Fund or place in a segregated account cash or liquid securities at such a level that the amount earmarked or deposited in the segregated account plus the amount deposited with the broker as collateral will equal the current value of the security sold short; or (ii) otherwise “cover” the Fund’s short position as required by the 1940 Act. Refer to each Fund’s Schedule of Investments, Summary Schedule of Investments, Consolidated Summary Schedule of Investments or Consolidated Schedule of Investments for details regarding securities sold short as of May 31, 2016, if applicable. As of May 31, 2016, the Multi-Asset Real Return Fund held short positions.
Swap Agreements — To the extent consistent with its Investment Objective and Strategies, a Fund may invest in swap contracts as an efficient means to synthetically obtain exposure to securities or baskets of securities and to manage a Fund’s interest rate duration and yield curve exposure. Swap contracts may also be used to mitigate a Fund’s overall level of risk and/or a Fund’s risk to particular types of securities, currencies or market segments. Interest rate swaps may further be used to
| | |
| 296 | | SEI Institutional Investments Trust / Annual Report / May 31, 2016 |
manage a Fund’s yield spread sensitivity. A Fund may buy credit default swaps in an attempt to manage credit risk where a Fund has credit exposure to an issuer, and a Fund may sell credit default swaps to more efficiently gain credit exposure to a security or basket of securities. A swap agreement is a two-party contract under which an agreement is made to exchange returns from predetermined investments or instruments, including a particular interest rate, foreign currency, or “basket” of securities representing a particular index. Swap agreements are privately negotiated in the over-the-counter market (“OTC swaps”) or may be executed in a multilateral or other trade facility platform, such as a registered commodities exchange (“Centrally Cleared swaps”). Interest rate swaps involve the exchange by a Fund with another party of their respective commitments to pay or receive interest (e.g., an exchange of floating rate payments for fixed rate payments) with respect to a notional amount of principal. Credit-default swaps involve periodic payments by a Fund or counterparty based on a specified rate multiplied by a notional amount assigned to an underlying debt instrument or group of debt instruments in exchange for the assumption of credit risk on the same instruments. In the event of a credit event, usually in the form of a credit rating downgrade, the party receiving periodic payments (i.e. floating rate payer) must pay the other party (i.e. fixed rate payer) an amount equal to the recovery rate used to settle the contracts. The recovery rate is a function of how many credit default swap investors wish to deliver the security or receive the security. The recovery rate is determined through an auction process. Total return swaps allow an investor to benefit from the cash flow without ever actually owning the underlying security. The receiver must pay any decline in value to the payer at the end of the total return swap. However, the investor does not need to make a payment if there is no decline in price. Payments can be made on various indices, bonds (i.e. mortgage backed securities, bank debt and corporate), loans or commodities. The value of a total return swap is equal to the change in value of the underlying asset versus the accrued income payment based on LIBOR or some other form of indices on the notional amount. Interest rate swaps involve the exchange by a Fund with another party of their respective commitments to pay or receive interest (e.g., an exchange of floating rate payments for fixed rate payments) with respect to a notional amount of principal to manage a Fund’s exposure to interest rates. Payments received or made are recorded as realized gains or loss. A Fund could be exposed to credit or market risk due to unfavorable changes in the fluctuation of interest rates or if the counterparty defaults on its obligation to perform. Risk of loss may exceed amounts recognized on the Statements of Assets and Liabilities
or Consolidated Statements of Assets and Liabilities. Interest rate swap contracts outstanding at period end, if any, are listed after a Fund’s portfolio. In connection with swap agreements securities may be set aside as collateral by a Fund’s custodian.
Swaps are marked-to-market daily based upon quotations from market makers and the resulting changes in market values, if any, are recorded as an unrealized gain or loss on the Statements of Operations or Consolidated Statements of Operations. Net payments of interest are recorded as realized gains or losses. Daily changes in valuation of Centrally Cleared swaps, if any, are recorded as a receivable or payable for the change in value as appropriate (“variation margin”) on the Statements of Assets and Liabilities or Consolidated Statements of Assets and Liabilities.
Entering into swap agreements involves, to varying degrees, elements of credit and market risk in excess of the amounts recognized on the Statements of Assets and Liabilities or Consolidated Statements of Assets and Liabilities. Such risks involve the possibility that there will be no liquid market for these agreements, that the counterparty to the agreement may default on its obligation to perform and that there may be unfavorable changes in the fluctuation of interest rates. Risks also arise from potential losses from adverse market movements.
This risk is mitigated by having a master netting arrangement between a Fund and the counterparty and by having the counterparty post collateral to cover a Fund’s exposure to the counterparty. See Note 3 for further details. Refer to each Fund’s Schedule of Investments, Summary Schedule of Investments or Consolidated Schedule of Investments for details regarding open swap agreements as of May 31, 2016, if applicable.
Forward Treasury Commitments — To the extent consistent with its Investment Objective and Strategies, a Fund may invest in commitments to purchase U.S. Treasury securities on an extended settlement basis. Such transactions involve the commitment to purchase a security with payment and delivery taking place in the future, sometimes a month or more after the transaction date. The Funds account for such transactions as purchases and sales and record an unrealized gain or loss each day equal to the difference between the cost of the purchase commitment and the current market value. Realized gains or losses are recorded upon closure or settlement of such commitments. No interest is earned prior to settlement of the transaction. These instruments are subject to market fluctuation due to changes in interest rates and the market value at the time of settlement could be higher or lower than the purchase price. A Fund may incur losses due to changes in the value of the underlying treasury securities from interest rate fluctuations or as a result of counterparty nonperformance.
| | | | |
| SEI Institutional Investments Trust / Annual Report / May 31, 2016 | | | 297 | |
NOTES TO FINANCIAL STATEMENTS/CONSOLIDATED NOTES TO FINANCIAL STATEMENTS (Continued)
MAY 31, 2016
Delayed Delivery Transactions — To the extent consistent with its Investment Objective and Strategies, a Fund may purchase or sell securities on a when-issued or delayed delivery basis. These transactions involve a commitment by the Fund to purchase or sell securities for a predetermined price or yield, with payment and delivery taking place beyond the customary settlement period. When purchasing a security on a delayed delivery basis, the Fund assumes the rights and risks of ownership of the security, including the risk of price and yield fluctuations, and takes such fluctuations into account when determining its net asset value. The Funds may dispose of or renegotiate a delayed delivery transaction after it is entered into, and may sell when-issued securities before they are delivered, which may result in a capital gain or loss. When the Fund has sold a security on a delayed delivery basis, the Fund does not participate in future gains and losses with respect to the security.
Participation Notes (P-Notes) — To the extent consistent with its Investment Objective and Strategies, a Fund may acquire P-Notes issued by participating banks or broker-dealers. P-Notes are participation interest notes that are designed to offer a return linked to a particular underlying equity, debt, currency or market. The P-Notes in which the Fund may invest will typically have a maturity of one year. When purchasing a P-Note, the posting of margin is not required because the full cost of the P-Note (plus commission) is paid at the time of purchase. When the P-Note matures, the issuer will pay to, or receive from, the purchaser the difference between the minimal value of the underlying instrument at the time of purchase and that instrument’s value at maturity. Investments in P-Notes involve the same risks associated with a direct investment in the underlying foreign companies of foreign securities markets that they seek to replicate.
In addition, there can be no assurance that the trading price of P-Notes will equal the underlying value of the foreign companies or foreign securities markets that they seek to replicate. The holder of a participation note that is linked to a particular underlying security is entitled to receive any dividends paid in connection with an underlying security or instrument. However, the holder of a participation note does not receive voting rights as it would if it directly owned the underlying security or instrument. P-Notes are generally traded over-the- counter. P-Notes constitute general unsecured contractual obligations of the banks or broker-dealers that issue them and the counterparty. There is also
counterparty risk associated with these investments because the Fund is relying on the creditworthiness of such counterparty and has no rights under a participation note against the issuer of the underlying security. In addition, the Fund will incur transaction costs as a result of investments in P-Notes.
Loan Participations and Brady Bonds — To the extent consistent with its Investment Objective and Strategies, a Fund may invest in U.S. dollar-denominated fixed- and floating-rate loans (“Loans”) arranged through private negotiations between a foreign sovereign entity and one or more financial institutions (“Lenders”). The Fund invests in such Loans in the form of participations in Loans (“Participations”) or assignments of all or a portion of Loans from third parties. Participations typically result in this Fund having a contractual relationship only with the Lenders, not with the sovereign borrowers. This Fund has the right to receive payments of principal, interest and any fees to which it is entitled from the Lender selling the Participation and only upon receipt by the Lender of the payments from the borrower. In connection with purchasing Participations, the Fund generally has no right to enforce compliance by the borrower with the terms of the loan agreement relating to the Loan, nor any rights of set-off against the borrower, and the Fund will not benefit directly from any collateral supporting the Loan in which it has purchased the Participation. As a result, the Fund assumes the credit risk of both the borrower and the Lender that is selling the Participation.
Certain debt obligations, customarily referred to as “Brady Bonds,” are created through the exchange of existing commercial bank loans to foreign entities for new obligations in connection with debt restructuring under a plan introduced by former U.S. Secretary of the Treasury Nicholas F. Brady. Brady Bonds have only been issued since 1989, and, accordingly, do not have a long payment history. They are issued by governments that may have previously defaulted on the loans being restructured by the Brady Bonds, so they are subject to the risk of default by the issuer. They may be fully or partially collateralized or uncollateralized and issued in various currencies.
Collateralized Debt Obligations — To the extent consistent with its Investment Objective and Strategies, a Fund may invest in collateralized debt obligations (“CDOs”), which include collateralized loan obligations (“CLOs”) if it holds only loans and other similarly structured securities. Multiple levels of securities are issued by the CDO, offering various maturity and credit risk characteristics that are characterized according to their degree of credit risk. Purchasers in CDOs are credited with their portion of the scheduled payments
| | |
| 298 | | SEI Institutional Investments Trust / Annual Report / May 31, 2016 |
of interest and principal on the underlying assets plus all unscheduled prepayments of principal based on a predetermined priority schedule. Accordingly, the CDOs in the longer maturity series are less likely than other asset pass-throughs to be prepaid prior to their stated maturity.
Dividends and Distributions to Shareholders — Dividends from net investment income are declared and paid to shareholders quarterly for the Large Cap, Large Cap Diversified Alpha, Large Cap Disciplined Equity, Large Cap Index, S&P 500 Index, Extended Market Index, Small Cap, Small Cap II, Small/Mid Cap Equity, U.S. Managed Volatility, Opportunistic Income, Emerging Markets Debt and Real Return Funds; declared daily and paid monthly for the Core Fixed Income, High Yield Bond, Long Duration, Long Duration Credit, Ultra Short Duration Bond and Intermediate Duration Credit Funds; declared and paid at least annually for the Global Managed Volatility, World Equity Ex-US, Screened World Equity Ex-US, Emerging Markets Equity, Limited Duration Bond, Dynamic Asset Allocation and Multi-Asset Real Return Funds. Dividends and distributions are recorded
on the ex-dividend date. Any net realized capital gains will be distributed at least annually by the Funds.
Illiquid Securities — A security is considered illiquid if it cannot be sold or disposed of in the ordinary course of business within seven days or less for its approximate carrying value on the books of a Fund. Valuations of illiquid securities may differ significantly from the values that would have been used had an active market value for these securities existed.
Restricted Securities — As of May 31, 2016, the following Fund owned private placement investments that were purchased through private offerings or acquired through initial public offerings and cannot be sold without prior registration under the Securities Act of 1933 or pursuant to an exemption therefrom. In addition, this Fund has generally agreed to further restrictions on the disposition of certain holdings as set forth in various agreements entered into in connection with the purchase of these private placement investments. The acquisition dates of these investments, the enforceable right to acquire these private placement investments, along with the cost and values at May 31, 2016, were as follows:
| | | | | | | | | | | | | | | | | | | | | | | | |
| | | Face Amount
($ Thousands)/
Shares | | | Acquisition
Date | | | Right to
Acquire Date | | | Cost
($ Thousands) | | | Market Value
($ Thousands) | | | % of Net
Assets | |
| | | | | | |
| High Yield Bond Fund | | | | | | | | | | | | | | | | | | | | | | | | |
Aventine (Escrow Security) | | $ | 2,600 | | | | 11/30/10 | | | | 11/30/10 | | | $ | — | | | $ | 1 | | | | 0.00 | % |
Aspect Software CR1 | | | 40,500 | | | | 05/25/16 | | | | 05/25/16 | | | | 376 | | | | 376 | | | | 0.00 | |
Aspect Software CR2 | | | 2,248 | | | | 05/25/16 | | | | 05/25/16 | | | | 21 | | | | 21 | | | | 0.00 | |
| | | | | | | | | | | | | | | | | | | | | | | | |
| | | | | | | | | | | | | | $ | 397 | | | $ | 398 | | | | 0.00 | % |
| | | | | | | | | | | | | | | | | | | | | | | | |
Investments in Real Estate Investment Trusts (“REITs”) — With respect to the Funds, with the exception of the World Equity Ex-US, Screened World Equity Ex-US and Real Return Funds, dividend income is recorded based on the income included in distributions received from the REIT investments using published REIT reclassifications including some management estimates when actual amounts are not available. Distributions received in excess of this estimated amount are recorded as a reduction of the cost of investments or reclassified to capital gains. The actual amounts of income, return of capital, and capital gains are only determined by each REIT after its fiscal year-end, and may differ from the estimated amounts.
Investment in Subsidiary — The Dynamic Asset Allocation and Multi-Asset Real Return Funds may invest in their own Subsidiary. By investing in its Subsidiary, each Fund is indirectly exposed to the risks associated with the Subsidiary’s investments. The commodity-related instruments held by a Subsidiary are generally similar to those that are permitted to be held by the applicable Fund and are subject to the same risks that apply to similar investments if held directly by the Fund.
A Subsidiary, however, is not registered under the 1940 Act and will not be subject to all of the investor protections of the 1940 Act. Thus, the Dynamic Asset Allocation and Multi-Asset Real Return Funds, as investors in their own Subsidiary, will not have all of the protections offered to investors in registered investment companies.
However, each Fund wholly owns and controls its respective Subsidiary, and the Funds and the Subsidiaries are all managed by SIMC, making it unlikely that the Subsidiary will take action contrary to the interests of the applicable Fund or its shareholders. While a Subsidiary has its own Board of Directors (“Board”) that is responsible for overseeing the operations of such Subsidiary, the respective Fund’s Board has oversight responsibility for the investment activities of the Fund, including its investment in the respective Subsidiary, and the Fund’s role as the sole shareholder of such Subsidiary. It is not currently expected that shares of the Subsidiary will be sold or offered to investors other than the respective Fund.
| | | | |
| SEI Institutional Investments Trust / Annual Report / May 31, 2016 | | | 299 | |
NOTES TO FINANCIAL STATEMENTS/CONSOLIDATED NOTES TO FINANCIAL STATEMENTS (Continued)
MAY 31, 2016
Changes in the laws of the United States and/or the Cayman Islands or governmental interpretation of such laws, under which the Fund and the Subsidiary, respectively, are organized, could result in the inability of the Fund and/or its respective Subsidiary to operate as intended and could negatively affect the Fund and its shareholders. For example, Cayman Islands law does not currently impose any income, corporate or capital gains tax, estate duty, inheritance tax, gift tax or withholding tax on the Subsidiaries. If Cayman Islands law changes such that the Subsidiaries must pay Cayman Islands governmental authority taxes, Fund shareholders would likely suffer decreased investment return.
3. CREDIT DERIVATIVES
A Fund may use credit default swaps to reduce risk where a Fund has exposure to the issuer, or to take an active long or short position with respect to the likelihood of an event of default. The reference obligation of the swap can be a single issuer, a “basket” of issuers, or an index. The underlying referenced assets are corporate debt, sovereign debt and asset backed securities.
The buyer of a credit default swap is generally obligated to pay the seller a periodic stream of payments over the term of the contract in return for a contingent payment upon the occurrence of a credit event with respect to an underlying reference obligation. Generally, a credit event for corporate or sovereign reference obligations means bankruptcy, failure to pay, obligation acceleration, repudiation/moratorium or restructuring. For credit default swaps on asset-backed securities, a credit event may be triggered by events such as failure to pay principal, maturity extension, rating downgrade or write-down.
If a Fund is a seller of protection, and a credit event occurs, as defined under the terms of that particular swap agreement, a Fund will generally either (i) pay to the buyer an amount equal to the notional amount of the swap and take delivery of the referenced obligation, other deliverable obligations, or underlying
securities comprising a referenced index or (ii) pay a net settlement amount in the form of cash or securities equal to the notional amount of the swap less the recovery value of the referenced obligation or underlying securities comprising a referenced index.
If a Fund is a buyer of protection and a credit event occurs, as defined under the terms of that particular swap agreement, a Fund will either (i) receive from the seller of protection an amount equal to the notional amount of the swap and deliver the referenced obligation, other deliverable obligations or underlying securities comprising the referenced index or (ii) receive a net settlement amount in the form of cash or securities equal to the notional amount of the swap less the recovery value of the referenced obligation or underlying securities comprising the referenced index. Recovery values are assumed by market makers considering either industry standard recovery rates or entity specific factors and considerations until a credit event occurs. If a credit event has occurred, the recovery value is determined by a facilitated auction whereby a minimum number of allowable broker bids, together with a specified valuation method, are used to calculate the settlement value.
As of May 31, 2016, the Emerging Markets Debt and Multi-Asset Real Return Fund are the buyers (“receiving protection”) on a total notional amount of $18.5 million and $1.4 million, respectively. Additionally, the Core Fixed Income and Multi-Asset Real Return Funds are the sellers (“providing protection”) on a total notional amount of $7.3 million and $0.4 million, respectively. The notional amounts of the swaps are not recorded in the financial statements; however the notional amounts approximate the maximum potential amount of future payments that the Fund could be required to make if the Fund was the seller of protection and a credit event were to occur. Those credit default swaps (“CDS”) for which the Fund is providing protection at balance sheet date are summarized as follows:
| | | | | | | | | | | | | | | | | | | | |
Core Fixed Income Fund
Written Credit Derivative Contracts | | Single Name CDS | | | CDS Index | | | | |
| Reference Asset | | Corp
US$ | | | Sovereign
US$ | | | ABS
US$ | | | Corp
US$ | | | Total | |
Fair value of written credit derivatives | | $ | (60,942 | ) | | $ | (8,498 | ) | | $ | — | | | $ | — | | | $ | (69,440 | ) |
Maximum potential amount of future payments | | | 6,220,000 | | | | 1,079,000 | | | | — | | | | — | | | | 7,299,000 | |
Recourse provisions with the third parties any amounts paid under the credit derivative (including any purchased credit protection)1 | | | — | | | | — | | | | — | | | | — | | | | — | |
Collateral held by the Partnership or other third parties which the Partnership can obtain upon occurrence of triggering event | | | — | | | | — | | | | — | | | | — | | | | — | |
| 1 | | Potential recoveries would include purchased credit derivatives to the extent they offset written credit derivatives which have an identical underlying, or a netting arrangement or credit support annex with the counterparty. There may be other potential recoveries from recourse provisions where agreements cover multiple derivative arrangements but those amounts have not been included. |
| | |
| 300 | | SEI Institutional Investments Trust / Annual Report / May 31, 2016 |
| | | | | | | | | | | | | | | | | | | | | | | | |
| Maximum Potential Amount of Future Payments by Contract Term | | | | | | | | | | | | | | | | | | |
| | | 0-6 Months | | | 6-12 Months | | | 1-5 Years | | | 5-10 Years | | | >10 Years | | | Total | |
Current credit spread* on underlying (in basis points) | | | | | | | | | | | | | | | | | | | | | | | | |
0-100 | | $ | — | | | $ | — | | | $ | 1,079,000 | | | $ | 6,220,000 | | | $ | — | | | $ | 7,299,000 | |
> than 400 | | | — | | | | — | | | | — | | | | — | | | | — | | | | — | |
Total | | $ | — | | | $ | — | | | $ | 1,079,000 | | | $ | 6,220,000 | | | $ | — | | | $ | 7,299,000 | |
| * | | The credit spread on the underlying asset is generally indicative of the current status of the underlying risk of the Fund having to perform. The spread also reflects the cost of buying/selling protection and may include upfront payments required to be made to enter into a contract. Higher credit spreads with a shorter contract term is indicative of a higher likelihood of performance by the Fund. |
| | | | | | | | | | | | | | | | | | | | |
Multi-Asset Real Return Fund
Written Credit Derivative Contracts | | Single Name CDS | | | CDS Index | | | | |
| Reference Asset | | Corp
US$ | | | Sovereign
US$ | | | ABS
US$ | | | Corp
US$ | | | Total | |
Fair value of written credit derivatives | | $ | 10,717 | | | $ | — | | | $ | — | | | $ | — | | | $ | 10,717 | |
Maximum potential amount of future payments | | | 392,650 | | | | — | | | | — | | | | — | | | | 392,650 | |
Recourse provisions with the third parties any amounts paid under the credit derivative (including any purchased credit protection)1 | | | — | | | | — | | | | — | | | | — | | | | — | |
Collateral held by the Partnership or other third parties which the Partnership can obtain upon occurrence of triggering event | | | — | | | | — | | | | — | | | | — | | | | — | |
| 1 | | Potential recoveries would include purchased credit derivatives to the extent they offset written credit derivatives which have an identical underlying, or a netting arrangement or credit support annex with the counterparty. There may be other potential recoveries from recourse provisions where agreements cover multiple derivative arrangements but those amounts have not been included. |
| | | | | | | | | | | | | | | | | | | | | | | | |
| Maximum Potential Amount of Future Payments by Contract Term | | | | | | | | | | | | | | | | | | |
| | | 0-6 Months | | | 6-12 Months | | | 1-5 Years | | | 5-10 Years | | | >10 Years | | | Total | |
Current credit spread* on underlying (in basis points) | | | | | | | | | | | | | | | | | | | | | | | | |
0-100 | | $ | — | | | $ | — | | | $ | 222,650 | | | $ | — | | | $ | — | | | $ | 222,650 | |
>100 | | | — | | | | — | | | | 170,000 | | | | — | | | | — | | | | 170,000 | |
Total | | $ | — | | | $ | — | | | $ | 392,650 | | | $ | — | | | $ | — | | | $ | 392,650 | |
| * | | The credit spread on the underlying asset is generally indicative of the current status of the underlying risk of the Fund having to perform. The spread also reflects the cost of buying/selling protection and may include upfront payments required to be made to enter into a contract. Higher credit spreads with a shorter contract term is indicative of a higher likelihood of performance by the Fund. |
The credit spread disclosed above for each reference obligation where the Fund is the seller of protection is a representation of the current payment/performance risk of the swap.
4. DERIVATIVE TRANSACTIONS
The following tables include only Funds that had exposure to more than one type of risk on derivatives held throughout the year. For Funds that held derivatives throughout the period with only one type of risk exposure, additional information can be found on the Schedule of Investments, Consolidated Summary Schedule of Investments or Consolidated Schedule of Investments and the Statements of Operations or Consolidated Statements of Operations.
The fair value of derivative instruments as of May 31, 2016 was as follows:
| | | | | | | | | | | | |
| | | Asset Derivatives | | | Liability Derivatives | |
| | | Statements of Assets and Liabilities Location | | Fair Value | | | Statements of Assets and Liabilities Location | | Fair Value | |
| | | | |
| Global Managed Volatility Fund | | | | | | | | | | | | |
Interest rate contracts | | Net Assets — Unrealized appreciation on futures contracts | | $ | 769 | * | | Net Assets — Unrealized depreciation on futures contracts | | $ | — | |
Foreign exchange contracts | | Unrealized gain on forward foreign currency contracts | | | 737 | | | Unrealized loss on forward foreign currency contracts | | | 214 | |
| | | | | | | | | | | | |
Total derivatives not accounted for as hedging instruments | | $ | 1,506 | | | | | $ | 214 | |
| | | | | | | | | | | | |
| | | | |
| SEI Institutional Investments Trust / Annual Report / May 31, 2016 | | | 301 | |
NOTES TO FINANCIAL STATEMENTS/CONSOLIDATED NOTES TO FINANCIAL STATEMENTS (Continued)
MAY 31, 2016
| | | | | | | | | | | | |
| | | Asset Derivatives | | | Liability Derivatives | |
| | | Statements of Assets and Liabilities Location | | Fair Value | | | Statements of Assets and Liabilities Location | | Fair Value | |
| | | | |
| Core Fixed Income Fund | | | | | | | | | | | | |
Interest rate contracts | | Net Assets — Unrealized appreciation on futures contracts | | $ | 875 | * | | Net Assets — Unrealized depreciation on futures contracts | | $ | 1,260 | * |
| | Net Assets — Unrealized appreciation on swaps contracts | | | — | | | Net Assets — Unrealized depreciation on swaps contracts | | | 7,763 | † |
| | Options purchased, at value | | | 268 | | | Options written, at value | | | 29 | |
Credit Contracts | | Net Assets — Unrealized appreciation on swaps contracts | | | 153 | † | | Net Assets — Unrealized depreciation on swap contracts | | | 49 | †�� |
Foreign exchange contracts | | Unrealized gain on forward foreign currency contracts | | | 968 | | | Unrealized loss on forward foreign currency contracts | | | 577 | |
| | | | | | | | | | | | |
Total derivatives not accounted for as hedging instruments | | $ | 2,264 | | | | | $ | 9,678 | |
| | | | | | | | | | | | |
| | | | |
| Long Duration Fund | | | | | | | | | | | | |
Interest rate contracts | | Net Assets — Unrealized appreciation on futures contracts | | $ | 720 | | | Net Assets — Unrealized depreciation on futures contracts | | $ | 213 | |
| | Net Assets — Unrealized appreciation on swaps contracts | | | — | | | Net Assets — Unrealized depreciation on swap contracts | | | 1,887 | |
| | | | | | | | | | | | |
Total derivatives not accounted for as hedging instruments | | $ | 720 | | | | | $ | 2,100 | |
| | | | | | | | | | | | |
| | | | |
| Emerging Markets Debt Fund | | | | | | | | | | | | |
Interest rate contracts | | Net Assets — Unrealized appreciation on futures contracts | | $ | 119 | * | | Net Assets — Unrealized depreciation on futures contracts | | $ | 136 | * |
| | Net Assets — Unrealized appreciation on swaps contracts | | | 381 | † | | Net Assets — Unrealized depreciation on swaps contracts | | | 3,704 | † |
Credit Contracts | | Net Assets — Unrealized appreciation on swaps contracts | | | — | | | Net Assets — Unrealized depreciation on swap contracts | | | 72 | † |
Foreign exchange contracts | | Unrealized gain on forward foreign currency contracts | | | 6,932 | | | Unrealized loss on forward foreign currency contracts | | | 12,235 | |
| | | | | | | | | | | | |
Total derivatives not accounted for as hedging instruments | | $ | 7,432 | | | | | $ | 16,147 | |
| | | | | | | | | | | | |
| | | | |
| Dynamic Asset Allocation Fund | | | | | | | | | | | | |
Interest rate contracts | | Net Assets — Unrealized appreciation on swaps contracts | | $ | 8,241 | † | | Net Assets — Unrealized depreciation on swaps contracts | | $ | 1,857 | † |
| | Net Assets — Unrealized appreciation on futures contracts | | | — | | | Net Assets — Unrealized depreciation on futures contracts | | | 160 | * |
Equity contracts | | Net Assets — Unrealized appreciation on futures contracts | | | 3,076 | * | | Net Assets — Unrealized depreciation on futures contracts | | | — | |
Foreign exchange contracts | | Unrealized gain on forward foreign currency contracts | | | 11,827 | | | Unrealized loss on forward foreign currency contracts | | | 2,969 | |
| | Options purchased, at value | | | 161 | | | Options written, at value | | | — | |
| | | | | | | | | | | | |
Total derivatives not accounted for as hedging instruments | | $ | 23,305 | | | | | $ | 4,986 | |
| | | | | | | | | | | | |
| | | | |
| Multi-Asset Real Return Fund | | | | | | | | | | | | |
Interest rate contracts | | Net Assets — Unrealized appreciation on swaps contracts | | $ | 1,779 | † | | Net Assets — Unrealized depreciation on swaps contracts | | $ | 3,626 | † |
| | Net Assets — Unrealized appreciation on futures contracts | | | 35 | * | | Net Assets — Unrealized depreciation on futures contracts | | | 4 | * |
Equity contracts | | Net Assets — Unrealized appreciation on futures contracts | | | — | * | | Net Assets — Unrealized depreciation on futures contracts | | | 805 | * |
Commodity contracts | | Net Assets — Unrealized appreciation on futures contracts | | | 9,604 | * | | Net Assets — Unrealized depreciation on futures contracts | | | 2,452 | * |
Credit contracts | | Net Assets — Unrealized appreciation on swaps contracts | | | 139 | † | | Net Assets — Unrealized depreciation on swaps contracts | | | 3 | † |
| | |
| 302 | | SEI Institutional Investments Trust / Annual Report / May 31, 2016 |
| | | | | | | | | | | | |
| | | Asset Derivatives | | | Liability Derivatives | |
| | | Statements of Assets and Liabilities Location | | Fair Value | | | Statements of Assets and Liabilities Location | | Fair Value | |
Foreign exchange contracts | | Unrealized gain on forward foreign currency contracts | | $ | 177 | | | Unrealized loss on forward foreign currency contracts | | $ | 330 | |
| | Options purchased, at value | | | 87 | | | Options written, at value | | | — | |
| | | | | | | | | | | | |
Total derivatives not accounted for as hedging instruments | | $ | 11,821 | | | | | $ | 7,220 | |
| | | | | | | | | | | | |
| * | | Includes cumulative appreciation/depreciation of futures contracts as reported in the Schedules of Investments, Consolidated Summary Schedule of Investments or Consolidated Schedule of Investments. Only current day’s variation margin is reported within the Statements of Assets and Liabilities or Consolidated Statements of Assets and Liabilities. |
| † | | Includes cumulative appreciation/depreciation of swap contracts as reported in the Schedules of Investments or Consolidated Schedule of Investments. Market Value is reported within the Statements of Assets and Liabilities or Consolidated Statements of Assets and Liabilities for swap contracts that have paid premiums. |
The effect of derivative instruments on the Statements of Operations or Consolidated Statements of Operations for the year ended May 31, 2016.
Amount of realized gain or (loss) on derivatives recognized in income ($ Thousands):
| | | | | | | | | | | | | | | | | | | | | | | | |
| Derivatives Not Accounted for as Hedging Instruments | | Swaptions | | | Options | | | Futures | | | Forward
Currency
Contracts | | | Swaps | | | Total | |
Global Managed Volatility Fund | | | | | | | | | | | | | | | | | | | | | | | | |
Interest rate contracts | | $ | — | | | $ | — | | | $ | 1,285 | | | $ | — | | | $ | — | | | $ | 1,285 | |
Foreign exchange contracts | | | — | | | | — | | | | — | | | | (8,288 | ) | | | — | | | | (8,288 | ) |
Total | | $ | — | | | $ | — | | | $ | 1,285 | | | $ | (8,288 | ) | | $ | — | | | $ | (7,003 | ) |
Core Fixed Income Fund | | | | | | | | | | | | | | | | | | | | | | | | |
Interest rate contracts | | $ | 211 | | | $ | (513 | ) | | $ | 2,428 | | | $ | — | | | $ | (1,146 | ) | | $ | 980 | |
Foreign exchange contracts | | | — | | | | — | | | | (39 | ) | | | 635 | | | | — | | | | 596 | |
Credit contracts | | | — | | | | — | | | | — | | | | — | | | | (742 | ) | | | (742 | ) |
Total | | $ | 211 | | | $ | (513 | ) | | $ | 2,389 | | | $ | 635 | | | $ | (1,888 | ) | | $ | 834 | |
Long Duration Fund | | | | | | | | | | | | | | | | | | | | | | | | |
Interest rate contracts | | $ | — | | | $ | — | | | $ | 9,170 | | | $ | — | | | $ | (1,138 | ) | | $ | 8,032 | |
Total | | $ | — | | | $ | — | | | $ | 9,170 | | | $ | — | | | $ | (1,138 | ) | | $ | 8,032 | |
Emerging Markets Debt Fund | | | | | | | | | | | | | | | | | | | | | | | | |
Interest rate contracts | | $ | — | | | $ | — | | | $ | (1,332 | ) | | $ | — | | | $ | (10,889 | ) | | $ | (12,221 | ) |
Foreign exchange contracts | | | — | | | | — | | | | — | | | | 3,076 | | | | — | | | | 3,076 | |
Credit contracts | | | — | | | | — | | | | — | | | | — | | | | (11 | ) | | | (11 | ) |
Total | | $ | — | | | $ | — | | | $ | (1,332 | ) | | $ | 3,076 | | | $ | (10,900 | ) | | $ | (9,156 | ) |
Dynamic Asset Allocation Fund | | | | | | | | | | | | | | | | | | | | | | | | |
Interest rate contracts | | $ | — | | | $ | (631 | ) | | $ | (172 | ) | | $ | — | | | $ | — | | | $ | (803 | ) |
Foreign exchange contracts | | | — | | | | — | | | | — | | | | (35,182 | ) | | | — | | | | (35,182 | ) |
Equity contracts | | | — | | | | (624 | ) | | | (21,916 | ) | | | — | | | | — | | | | (22,540 | ) |
Total | | $ | — | | | $ | (1,255 | ) | | $ | (22,088 | ) | | $ | (35,182 | ) | | $ | — | | | $ | (58,525 | ) |
Multi-Asset Real Return Fund | | | | | | | | | | | | | | | | | | | | | | | | |
Interest rate contracts | | $ | — | | | $ | — | | | $ | (1,130 | ) | | $ | — | | | $ | (184 | ) | | $ | (1,314 | ) |
Foreign exchange contracts | | | — | | | | 25 | | | | — | | | | (305 | ) | | | — | | | | (280 | ) |
Credit contracts | | | — | | | | — | | | | — | | | | — | | | | (18 | ) | | | (18 | ) |
Equity contracts | | | — | | | | — | | | | 648 | | | | — | | | | — | | | | 648 | |
Commodity contracts | | | — | | | | (222 | ) | | | (28,200 | ) | | | — | | | | — | | | | (28,422 | ) |
Total | | $ | — | | | $ | (197 | ) | | $ | (28,682 | ) | | $ | (305 | ) | | $ | (202 | ) | | $ | (29,386 | ) |
| | | | |
| SEI Institutional Investments Trust / Annual Report / May 31, 2016 | | | 303 | |
NOTES TO FINANCIAL STATEMENTS/CONSOLIDATED NOTES TO FINANCIAL STATEMENTS (Continued)
MAY 31, 2016
Change in unrealized appreciation or (depreciation) on derivatives recognized in income ($ Thousands):
| | | | | | | | | | | | | | | | | | | | | | | | |
| Derivatives Not Accounted for as Hedging Instruments | | Swaptions | | | Options | | | Futures | | | Forward
Currency
Contracts | | | Swaps | | | Total | |
Global Managed Volatility Fund | | | | | | | | | | | | | | | | | | | | | | | | |
Interest rate contracts | | $ | — | | | $ | — | | | $ | 769 | | | $ | — | | | $ | — | | | $ | 769 | |
Foreign exchange contracts | | | — | | | | — | | | | — | | | | 523 | | | | — | | | | 523 | |
Total | | $ | — | | | $ | — | | | $ | 769 | | | $ | 523 | | | $ | — | | | $ | 1,292 | |
Core Fixed Income Fund | | | | | | | | | | | | | | | | | | | | | | | | |
Interest rate contracts | | $ | (201 | ) | | $ | (188 | ) | | $ | (1,573 | ) | | $ | — | | | $ | (6,362 | ) | | $ | (8,324 | ) |
Foreign exchange contracts | | | — | | | | — | | | | — | | | | (1,361 | ) | | | — | | | | (1,361 | ) |
Credit contracts | | | — | | | | — | | | | — | | | | — | | | | 31 | | | | 31 | |
Total | | $ | (201 | ) | | $ | (188 | ) | | $ | (1,573 | ) | | $ | (1,361 | ) | | $ | (6,331 | ) | | $ | (9,654 | ) |
Long Duration Fund | | | | | | | | | | | | | | | | | | | | | | | | |
Interest rate contracts | | $ | — | | | $ | — | | | $ | (1,088 | ) | | $ | — | | | $ | (498 | ) | | $ | (1,586 | ) |
Total | | $ | — | | | $ | — | | | $ | (1,088 | ) | | $ | — | | | $ | (498 | ) | | $ | (1,586 | ) |
Emerging Markets Debt Fund | | | | | | | | | | | | | | | | | | | | | | | | |
Interest rate contracts | | $ | — | | | $ | — | | | $ | 190 | | | $ | — | | | $ | (1,917 | ) | | $ | (1,727 | ) |
Foreign exchange contracts | | | — | | | | — | | | | — | | | | (5,624 | ) | | | 519 | | | | (5,105 | ) |
Credit contracts | | | — | | | | — | | | | — | | | | — | | | | (72 | ) | | | (72 | ) |
Total | | $ | — | | | $ | — | | | $ | 190 | | | $ | (5,624 | ) | | $ | (1,470 | ) | | $ | (6,904 | ) |
Dynamic Asset Allocation Fund | | | | | | | | | | | | | | | | | | | | | | | | |
Interest rate contracts | | $ | — | | | $ | 421 | | | $ | (160 | ) | | $ | — | | | $ | 6,384 | | | $ | 6,645 | |
Foreign exchange contracts | | | — | | | | — | | | | — | | | | 21,322 | | | | — | | | | 21,322 | |
Equity contracts | | | — | | | | (1,289 | ) | | | (8,703 | ) | | | — | | | | — | | | | (9,992 | ) |
Total | | $ | — | | | $ | (868 | ) | | $ | (8,863 | ) | | $ | 21,322 | | | $ | 6,384 | | | $ | 17,975 | |
Multi-Asset Real Return Fund | | | | | | | | | | | | | | | | | | | | | | | | |
Interest rate contracts | | $ | — | | | $ | 61 | | | $ | 208 | | | $ | — | | | $ | (1,260 | ) | | $ | (991 | ) |
Foreign exchange contracts | | | — | | | | — | | | | — | | | | (415 | ) | | | — | | | | (415 | ) |
Credit contracts | | | — | | | | — | | | | — | | | | — | | | | 96 | | | | 96 | |
Equity contracts | | | — | | | | — | | | | 133 | | | | — | | | | — | | | | 133 | |
Commodity contracts | | | — | | | | (69 | ) | | | 7,282 | | | | — | | | | — | | | | 7,213 | |
Total | | $ | — | | | $ | (8 | ) | | $ | 7,623 | | | $ | (415 | ) | | $ | (1,164 | ) | | $ | 6,036 | |
A Fund is subject to various netting arrangements with select counterparties (“Master Agreements”). Master Agreements govern the terms of certain transactions, and reduce the counterparty risk associated with relevant transactions by specifying credit protection mechanisms and providing standardization that improves legal certainty. Since different types of transactions have different mechanics and are sometimes traded out of different legal entities of a particular counterparty organization, each type of transaction may be covered by a different Master Agreement, resulting in the need for multiple agreements with a single counterparty. As the Master Agreements are specific to unique operations of different asset types, they allow a Fund to close out and net its total exposure to a specific counterparty entity in the event of a default with respect to all the transactions governed under a single agreement with a specific counterparty entity.
Master Agreements can also help limit counterparty risk by specifying collateral posting arrangements at pre-arranged exposure levels. Under the Master
Agreements, collateral is routinely transferred if the total net exposure to certain transactions (net of existing collateral already in place) governed under the relevant Master Agreement with a counterparty in a given account exceeds a specified threshold, which typically ranges from zero to $250,000 depending on the counterparty and the type of Master Agreement. United States Treasury Securities and U.S. dollar cash are generally the preferred forms of collateral. Securities and cash pledged as collateral are reflected as assets on the Statements of Assets and Liabilities/Consolidated Statements of Assets and Liabilities as either a component of investments at value (securities) or deposits due from counterparties (cash). Cash collateral received is not typically held in a segregated account and as such is reflected as a liability on the Statements of Assets and Liabilities/Consolidated Statements of Assets and Liabilities as deposits due to counterparties. The market value of any securities received as collateral is not reflected as a component of net asset value. A Fund’s overall exposure to counterparty risk can change substantially within a short period, as it is affected by each transaction subject to the relevant Master Agreement.
| | |
| 304 | | SEI Institutional Investments Trust / Annual Report / May 31, 2016 |
Customer Account Agreements and related addendums govern exchange traded derivatives transactions such as futures, options on futures, and centrally cleared swaps. Exchange traded derivative transactions require posting of initial margin as determined by each relevant clearing agency which is segregated at a broker account
registered with the Commodities Futures Trading Commission (CFTC), or the applicable regulator. In the US, counterparty risk is significantly reduced as creditors of the futures broker do not have claim to Fund assets in the segregated account. Additionally, portability of exposure in the event of default further reduces risk to the Funds. Variation margin, or changes in market value, are exchanged daily, but may not be netted between futures and cleared OTC derivatives.
The following is a summary of the market value and variation margin of exchange-traded or centrally cleared financial derivative instruments of the Funds as of May 31, 2016 ($ Thousands):
| | | | | | | | | | | | | | | | | | | | | | | | | | | | | | | | | | | | |
| | | Financial Derivative Assets | | | | | | Financial Derivative Liabilities | |
| | | Market Value | | | Variation Margin Asset | | | | | | | | | Market Value | | | Variation Margin Liability | | | | |
| Fund | | Purchased
Options | | | Futures | | | Swap
Agreements | | | Total | | | | | | Written
Options | | | Futures | | | Swap
Agreements | | | Total | |
Large Cap Fund | | $ | — | | | $ | — | | | $ | — | | | $ | — | | | | | | | $ | — | | | $ | 1 | | | $ | — | | | $ | 1 | |
Large Cap Diversified Alpha Fund | | | — | | | | — | | | | — | | | | — | | | | | | | | — | | | | 1 | | | | — | | | | 1 | |
Large Cap Disciplined Equity Fund | | | — | | | | — | | | | — | | | | — | | | | | | | | — | | | | 156 | | | | — | | | | 156 | |
Large Cap Index Fund | | | — | | | | 4 | | | | — | | | | 4 | | | | | | | | — | | | | 55 | | | | — | | | | 55 | |
S&P 500 Index Fund | | | — | | | | — | | | | — | | | | — | | | | | | | | — | | | | 83 | | | | — | | | | 83 | |
Extended Market Index Fund | | | — | | | | 26 | | | | — | | | | 26 | | | | | | | | — | | | | — | | | | — | | | | — | |
Small Cap Fund | | | — | | | | 13 | | | | — | | | | 13 | | | | | | | | — | | | | — | | | | — | | | | — | |
Small Cap II Fund | | | — | | | | 16 | | | | — | | | | 16 | | | | | | | | — | | | | — | | | | — | | | | — | |
Small/Mid Cap Equity Fund | | | — | | | | 23 | | | | — | | | | 23 | | | | | | | | — | | | | — | | | | — | | | | — | |
U.S. Managed Volatility Fund | | | — | | | | — | | | | — | | | | — | | | | | | | | — | | | | 79 | | | | — | | | | 79 | |
Global Managed Volatility Fund | | | — | | | | 82 | | | | — | | | | 82 | | | | | | | | — | | | | 83 | | | | — | | | | 83 | |
World Equity Ex-US Fund | | | — | | | | 1,121 | | | | — | | | | 1,121 | | | | | | | | — | | | | 706 | | | | — | | | | 706 | |
Screened World Equity Ex-US Fund | | | — | | | | 11 | | | | — | | | | 11 | | | | | | | | — | | | | 8 | | | | — | | | | 8 | |
Opportunistic Income Fund | | | — | | | | 1 | | | | — | | | | 1 | | | | | | | | — | | | | — | | | | — | | | | — | |
Core Fixed Income Fund | | | 268 | | | | 196 | | | | — | | | | 464 | | | | | | | | 29 | | | | 793 | | | | 106 | | | | 928 | |
Long Duration Fund | | | — | | | | 354 | | | | — | | | | 354 | | | | | | | | — | | | | 164 | | | | 15 | | | | 179 | |
Long Duration Credit Fund | | | — | | | | 144 | | | | — | | | | 144 | | | | | | | | — | | | | 262 | | | | — | | | | 262 | |
Ultra Short Duration Bond Fund | | | — | | | | 1 | | | | — | | | | 1 | | | | | | | | — | | | | — | | | | — | | | | — | |
Emerging Markets Debt Fund | | | — | | | | 20 | | | | — | | | | 20 | | | | | | | | — | | | | 44 | | | | 12 | | | | 56 | |
Intermediate Duration Credit Fund | | | — | | | | 2 | | | | — | | | | 2 | | | | | | | | — | | | | 12 | | | | — | | | | 12 | |
Dynamic Asset Allocation Fund | | | 161 | | | | 12 | | | | — | | | | 173 | | | | | | | | — | | | | 115 | | | | — | | | | 115 | |
Multi-Asset Real Return Fund | | | 87 | | | | 1,256 | | | | 52 | | | | 1,395 | | | | | | | | — | | | | 1,080 | | | | 69 | | | | 1,149 | |
Securities with an aggregate fair market value of $78,769,869 have been pledged as collateral for exchange-traded and centrally cleared derivative instruments as of May 31, 2016.
International Swaps and Derivatives Association, Inc. Master Agreements and Credit Support Annexes (“ISDA Master Agreements”) govern OTC financial derivative transactions entered into by a Fund and select counterparties. ISDA Master Agreements maintain provisions for general obligations, representations, agreements, collateral and events of default or termination. Events of termination include conditions that may entitle counterparties to elect to terminate early and cause settlement of all outstanding transactions under the applicable ISDA Master Agreement. Any election to terminate early could be material to the financial statements. In limited circumstances, the ISDA Master Agreement may contain additional provisions that add
additional counterparty protection beyond coverage of existing daily exposure if the counterparty has a decline in credit quality below a predefined level. These amounts, if any, may be segregated with a third party custodian.
| | | | |
| SEI Institutional Investments Trust / Annual Report / May 31, 2016 | | | 305 | |
NOTES TO FINANCIAL STATEMENTS/CONSOLIDATED NOTES TO FINANCIAL STATEMENTS (Continued)
MAY 31, 2016
The following is a summary by derivative type of the market value of OTC financial derivative instruments and collateral (received) pledged as of May 31, 2016 ($ Thousands):
| | | | | | | | | | | | | | | | | | | | | | | | | | | | | | | | | | | | | | | | | | | | | | | | | | | | | | | | |
| | | Financial Derivative Assets | | | | | | Financial Derivative Liabilities | | | | | | | | | | | | | |
| Fund | | Forward
Foreign
Currency
Contracts | | | Purchased
Options
and
Swaptions | | | Swap
Agreements | | | Total
Over the
Counter | | | | | | Forward
Foreign
Currency
Contracts | | | Written
Options
and
Swaptions | | | Swap
Agreements | | | Reverse
Repurchase
Agreements | | | Total Over the
Counter | | | | | | Net Market
Value of OTC
Derivatives | | | Collateral
(Received)
Pledged | | | Net
Exposures(1) | |
Core Fixed Income Fund | | $ | 968 | | | $ | — | | | $ | 153 | | | $ | 1,121 | | | | | | | $ | 577 | | | $ | — | | | $ | 1,143 | | | $ | — | | | $ | 1,720 | | | | | | | $ | (599 | ) | | $ | — | | | $ | (599 | ) |
Emerging Markets Debt Fund | | | 6,932 | | | | — | | | | 381 | | | | 7,313 | | | | | | | | 12,235 | | | | — | | | | 2,988 | | | | — | | | | 15,223 | | | | | | | | (7,910 | ) | | | — | | | | (7,910 | ) |
Long Duration Fund | | | — | | | | — | | | | — | | | | — | | | | | | | | — | | | | — | | | | 700 | | | | — | | | | 700 | | | | | | | | (700 | ) | | | — | | | | (700 | ) |
Dynamic Asset Allocation Fund | | | 11,827 | | | | — | | | | 8,241 | | | | 20,068 | | | | | | | | 2,969 | | | | — | | | | 1,857 | | | | — | | | | 4,826 | | | | | | | | 15,242 | | | | — | | | | 15,242 | |
Multi-Asset Real Return Fund | | | 177 | | | | — | | | | 149 | | | | 326 | | | | | | | | 330 | | | | — | | | | 123 | | | | 158,503 | | | | 158,956 | | | | | | | | (158,630 | ) | | | 158,503 | (2) | | | (127 | ) |
| (1) | | Net Exposures represents the net receivable/(payable) that would be due from/to the counterparty in the event of default. Exposure from OTC financial derivative instruments can only be netted across transactions governed under the same master agreement with the same legal entity. |
| (2) | | Excess collateral pledged is not shown for financial reporting purposes. |
Securities with an aggregate fair market value of $0 have been pledged and $0 have been received as collateral for financial derivative instruments as governed by International Swaps and Derivatives Association, Inc. master agreements as of May 31, 2016.
Written Swaptions transactions entered into during the year ended May 31, 2016, are summarized as follows:
| | | | | | | | |
| Core Fixed Income Fund | |
| | | Number of
Contracts | | | Premium
($ Thousands) | |
| Balance at the beginning of period | | | 30,730,000 | | | $ | 795 | |
| Closing buys | | | (30,730,000 | ) | | | (795 | ) |
| Balance at the end of period | | | — | | | $ | — | |
Written options transactions entered into during the year ended May 31, 2016, are summarized as follows: | |
| Core Fixed Income Fund | |
| | | Number of
Contracts | | | Premium
($ Thousands) | |
| Balance at the beginning of period | | | 1,801 | | | $ | 586 | |
| Written | | | 15,400 | | | | 5,271 | |
| Expired | | | (9,940 | ) | | | (3,061 | ) |
| Closing buys | | | (6,940 | ) | | | (2,696 | ) |
| Balance at the end of period | | | 321 | | | $ | (100 | ) |
As of May 31, 2016, the Funds had cash and/or securities at least equal to the value of written options.
5. BASIS FOR CONSOLIDATION FOR THE DYNAMIC ASSET ALLOCATION AND MULTI-ASSET REAL RETURN FUNDS
The Consolidated Summary Schedule of Investments, Consolidated Schedule of Investments, Consolidated Statements of Assets and Liabilities, Consolidated
Statements of Operations, Consolidated Statements of Changes in Net Assets, Consolidated Statement of Cash Flows, and the Consolidated Financial Highlights of the Dynamic Asset Allocation and Multi-Asset Real Return Funds include the accounts of their respective Subsidiaries. All intercompany accounts and transactions have been eliminated in consolidation for the Funds. The Subsidiaries have a fiscal year end of May 31 for financial statement consolidation purposes and a nonconforming tax year end of April 30.
The Subsidiaries are classified as controlled foreign corporations under the Internal Revenue Code of 1986 (“IRC”). The Subsidiaries taxable income is included in the calculation of the Funds’ taxable income. Net losses of the Subsidiaries are not deductible by the Funds either in the current period or carried forward to future periods.
The Dynamic Asset Allocation and Multi-Asset Real Return Funds may invest up to 25% of their total assets in their respective Subsidiary.
A summary of the Funds’ investments in the Subsidiaries are as follows:
| | | | | | | | | | | | |
| | | Inception Date of Subsidiary | | | Subsidiary
Net Assets at
May 31, 2016
($ Thousands) | | | % of Total
Net Assets at
May 31, 2016 | |
Dynamic Asset Allocation Commodity Strategy Subsidiary, Ltd. | | | January 28, 2014 | | | $ | 7,028 | | | | 0.3 | % |
Multi-Asset Real Return Commodity Strategy Subsidiary, Ltd. | | | June 27, 2013 | | | $ | 148,115 | | | | 20.2 | % |
| | |
| 306 | | SEI Institutional Investments Trust / Annual Report / May 31, 2016 |
6. INVESTMENT ADVISORY, ADMINISTRATION AND DISTRIBUTION AGREEMENTS, INVESTMENT SUBADVISORY AGREEMENTS AND OTHER TRANSACTIONS WITH AFFILIATES
Investment Advisory, Administration and Distribution Agreements — SEI Investments Global Funds Services (the “Administrator”) serves as administrator to the Funds. The Administrator provides certain administrative and shareholder servicing for an annual fee of 0.05% of the average daily net assets of each Fund. For the year ended May 31, 2016, the Administrator has voluntarily agreed to waive all of its fee. The Funds’ Administrator may discontinue all or part of these voluntary waiver at any time.
SIMC serves as investment adviser (the “Adviser”) to each Fund. In connection with serving as Adviser, SIMC is entitled to a fee that is calculated daily and paid monthly, based on the average daily net assets of each Fund. SIMC plans to voluntarily waive a portion of its fees in order to keep investment advisory fees at a specified level. The Funds’ Adviser may discontinue all or part of these voluntary waivers at any time. Accordingly, the advisory fee and voluntary expense limitations for each Fund are as follows:
| | | | | | | | |
| | | Advisory
Fees | | | Investment
Advisory Fees
After Fee Waivers | |
Large Cap Fund | | | 0.40 | % | | | 0.18 | % |
Large Cap Diversified Alpha Fund | | | 0.40 | | | | 0.22 | |
Large Cap Disciplined Equity Fund | | | 0.40 | | | | 0.17 | |
Large Cap Index Fund | | | 0.17 | | | | 0.01 | |
S&P 500 Index Fund | | | 0.03 | | | | 0.01 | |
Extended Market Index Fund | | | 0.12 | | | | 0.04 | |
Small Cap Fund | | | 0.65 | | | | 0.45 | |
Small Cap II Fund | | | 0.65 | | | | 0.43 | |
Small/Mid Cap Equity Fund | | | 0.65 | | | | 0.44 | |
U.S. Managed Volatility Fund | | | 0.65 | | | | 0.22 | |
Global Managed Volatility Fund | | | 0.65 | | | | 0.22 | |
World Equity Ex-US Fund | | | 0.55 | | | | 0.31 | |
Screened World Equity Ex-US Fund | | | 0.65 | | | | 0.26 | |
Emerging Markets Equity Fund | | | 1.05 | | | | 0.56 | |
Opportunistic Income Fund | | | 0.45 | | | | 0.24 | |
Core Fixed Income Fund | | | 0.30 | | | | 0.11 | |
High Yield Bond Fund | | | 0.4875 | | | | 0.28 | |
Long Duration Fund | | | 0.30 | | | | 0.13 | |
Long Duration Credit Fund | | | 0.30 | | | | 0.13 | |
Ultra Short Duration Bond Fund | | | 0.15 | | | | 0.10 | |
Emerging Markets Debt Fund | | | 0.85 | | | | 0.38 | |
| | | | | | | | |
| | | Advisory
Fees | | | Investment
Advisory Fees
After Fee Waivers | |
Real Return Fund | | | 0.22 | | | | 0.06 | |
Limited Duration Bond Fund | | | 0.25 | | | | 0.09 | |
Intermediate Duration Credit Fund | | | 0.25 | | | | 0.13 | |
Dynamic Asset Allocation Fund | | | 0.60 | | | | 0.06 | |
Multi-Asset Real Return Fund | | | 0.55 | | | | 0.24 | |
As of May 31, 2016, SIMC has entered into investment sub-advisory agreements with the following parties and pays the sub-advisers out of the fee that it receives from the Funds:
|
| Investment Sub-Adviser |
Large Cap Fund |
AJO, LP |
AQR Capital Management, LLC |
Brown Advisory LLC |
Jackson Square Partners, LLC |
LSV Asset Management |
Waddell & Reed Investment Management Company |
Large Cap Diversified Alpha Fund |
AQR Capital Management, LLC |
| Brandywine Global Investment Management, LLC |
| Coho Partners, Ltd. |
| Jackson Square Partners, LLC |
| Parametric Portfolio Associates LLC |
| Large Cap Disciplined Equity Fund |
| Analytic Investors, LLC |
| INTECH Investment Management, LLC |
| Lazard Asset Management LLC |
| OppenheimerFunds, Inc. |
| Quantitative Management Associates, LLC |
Large Cap Index Fund |
| SSGA Funds Management, Inc. |
S&P 500 Index Fund |
| SSGA Funds Management, Inc. |
Extended Market Index Fund |
| SSGA Funds Management, Inc. |
Small Cap Fund |
| AQR Capital Management, LLC |
| EAM Investors, LLC |
| Falcon Point Capital, LLC |
| J.P. Morgan Investment Management Inc. |
| LSV Asset Management |
| Robecco Investment Management, Inc. |
| William Blair & Company, L.L.C. |
Small Cap II Fund |
| AllianceBernstein L.P. |
| AQR Capital Management, LLC |
| EAM Investors, LLC |
| Falcon Point Capital, LLC |
| LMCG Investments, LLC |
| Mesirow Financial Investment Management, Inc. |
| Snow Capital Management, L.P. |
| | | | |
| SEI Institutional Investments Trust / Annual Report / May 31, 2016 | | | 307 | |
NOTES TO FINANCIAL STATEMENTS/CONSOLIDATED NOTES TO FINANCIAL STATEMENTS (Continued)
MAY 31, 2016
|
Small/Mid Cap Equity Fund |
AllianceBernstein L.P. |
AQR Capital Management, LLC |
Arrowpoint Asset Management, LLC |
Axiom International Investors, LLC |
Castle Ark Management, LLC |
Integrity Asset Management |
LMCG Investments, LLC |
LSV Asset Management |
Robeco Investment Management, Inc. |
U.S. Managed Volatility Fund |
AJO, L.P. |
Analytic Investors, LLC |
LSV Asset Management |
Global Managed Volatility Fund |
Acadian Asset Management LLC |
Analytic Investors, LLC |
LSV Asset Management |
World Equity Ex-US Fund |
Acadian Asset Management LLC |
Bailie Gifford Overseas Ltd |
BlackRock International, Ltd. |
EARNEST Partners LLC |
J O Hambro Capital Management Limited |
McKinley Capital Management, LLC |
NFJ Investment Group LLC |
Screened World Equity Ex-US Fund |
Acadian Asset Management LLC |
Baillie Gifford Overseas, Ltd. |
EARNEST Partners LLC |
McKinley Capital Management, LLC |
Emerging Markets Equity Fund |
AllianceBernstein L.P. |
Causeway Capital Management LLC |
J O Hambro Capital Management Limited |
Kleinwort Benson Investors International Ltd |
RWC Asset Advisor (US) LLC |
WCM Investment Management |
Opportunistic Income Fund |
Ares Management, LLC |
Brookfield Investment Management Inc. |
Declaration Management & Research, LLC |
Wellington Management Company, LLP |
Core Fixed Income Fund |
Jennison Associates LLC |
Metropolitan West Asset Management, LLC |
Wells Capital Management, Incorporated |
Western Asset Management Company |
Western Asset Management Company Limited |
High Yield Bond Fund |
Ares Management, LLC |
Benefit Street Partners, LLC |
Brigade Capital Management, LP |
Delaware Investments Fund Advisers |
J.P. Morgan Investment Management, Inc. |
|
Long Duration Fund |
Income Research & Management |
Jennison Associates LLC |
Legal & General Investment Management America, Inc. |
Metropolitan West Asset Management LLC |
Long Duration Credit Fund |
Income Research & Management |
Jennison Associates LLC |
Legal & General Investment Management America, Inc. |
Logan Circle Partners, L.P. |
Metropolitan West Asset Management LLC |
Ultra Short Duration Bond Fund |
Logan Circle Partners, L.P. |
Wellington Management Company, LLP |
Emerging Markets Debt Fund |
Investec Asset Management Ltd. |
Neuberger Berman Fixed Income, LLC |
Stone Harbor Investment Partners, L.P. |
Limited Duration Bond Fund |
Logan Circle Partners, L.P. |
Metropolitan West Asset Management LLC |
Intermediate Duration Credit Fund |
Income Research & Management |
Legal & General Investment Management America Inc. |
Logan Circle Partners, L.P. |
Dynamic Asset Allocation Fund |
SSgA Funds Management, Inc. |
Multi-Asset Real Return Fund |
AllianceBernstein L.P. |
QS Investors, LLC |
SEI Investments Distribution Co. (the “Distributor”), a wholly owned subsidiary of SEI Investments Company (“SEI”), serves as each Fund’s Distributor pursuant to a Distribution Agreement with the Trust.
Other — The Distribution Agreement between the Distributor and the Trust provides that the Distributor may receive compensation on fund transactions effected for the Trust in accordance with Securities and Exchange Commission (“SEC”) rules. Accordingly, it is expected that fund transactions may result in brokerage commissions being paid to the Distributor. The SEC rules require that such commissions not exceed usual and customary commissions.
Such commissions for the year ended May 31, 2016, were as follows ($ Thousands):
| | | | |
| Large Cap Fund | | $ | 5 | |
| Large Cap Disciplined Equity Fund | | | 13 | |
| Small Cap Fund | | | 155 | |
| Small Cap II Fund | | | 20 | |
| Small/Mid Cap Equity Fund | | | 3 | |
| World Equity Ex-US Fund | | | 37 | |
| | |
| 308 | | SEI Institutional Investments Trust / Annual Report / May 31, 2016 |
Payments to Affiliates — Certain officers and/or trustees of the Trust are also officers and/or Directors of the Distributor, the Adviser and/or the Administrator. The Trust pays each unaffiliated Trustee an annual fee for attendance at quarterly and interim meetings. Compensation of officers and affiliated Trustees of the Trust is paid by the Distributor or Administrator.
A portion of the services provided by the Chief Compliance Officer (“CCO”) and his staff, whom are employees of the Administrator, are paid for by the Trust as incurred. The services include regulatory oversight of the Trust’s Adviser, sub-advisers and service providers as required by SEC regulations.
LSV Asset Management (partially-owned subsidiary of SIMC) serves as a sub-adviser to the Large Cap, Small Cap, Small/Mid Cap Equity, U.S. Managed Volatility, Global Managed Volatility and Intermediate Duration Credit Funds. For this service, LSV Asset Management is entitled to receive a fee from SIMC. Such fees for the year ended May 31, 2016, were as follows ($ Thousands):
| | | | |
| Large Cap Fund | | $ | 473 | |
| Small Cap Fund | | | 326 | |
| Small/Mid Cap Equity Fund | | | 875 | |
| U.S. Managed Volatility Fund | | | 1,662 | |
Fees Paid Indirectly — The Funds may direct certain fund trades to the Distributor who pays a portion of each Fund’s expenses. Accordingly, the expenses reduced, which were used to pay third party expenses, can be found on the Statements of Operations or Consolidated Statement of Operations and the effect on each Fund’s expense ratio, as a percentage of each Fund’s average daily net assets for the year ended May 31, 2016, can be found on the Financial Highlights or Consolidated Financial Highlights.
Investment in Affiliated Security —The Funds may invest in the SEI Daily Income Trust (“SDIT”) Prime Obligation Fund, an affiliated money market fund to manage excess cash or to serve as margin or collateral for derivative positions. Additionally, the Funds may invest the cash collateral from the securities lending program in the SEI Liquidity Fund, L.P.
The following is a summary of the transactions with affiliates for the year ended May 31, 2016 ($ Thousands):
| | | | | | | | | | | | | | | | |
| SEI Liquidity Fund, L.P. | | Purchases at Cost | | | Proceeds from Sales | | | Value 5/31/2016 | | | Dividend
Income | |
Large Cap Fund | | $ | 262,735 | | | $ | (258,758 | ) | | $ | 40,532 | | | $ | 444 | |
Large Cap Disciplined | | | | | | | | | | | | | | | | |
Equity Fund | | | 233,184 | | | | (238,384 | ) | | | 24,483 | | | | 175 | |
Large Cap Index Fund | | | 177,749 | | | | (182,434 | ) | | | 20,890 | | | | 231 | |
S&P 500 Index Fund | | | 196,962 | | | | (182,758 | ) | | | 26,532 | | | | 136 | |
Extended Market Index | | | | | | | | | | | | | | | | |
Fund | | | 140,668 | | | | (140,884 | ) | | | 42,598 | | | | 839 | |
Small Cap Fund | | | 147,722 | | | | (185,990 | ) | | | 22,227 | | | | 822 | |
Small Cap II Fund | | | 115,520 | | | | (111,597 | ) | | | 33,837 | | | | 415 | |
Small/Mid Cap Equity Fund | | | 440,173 | | | | (478,997 | ) | | | 152,985 | | | | 1,414 | |
| | | | | | | | | | | | | | | | |
| SEI Liquidity Fund, L.P. | | Purchases at Cost | | | Proceeds from Sales | | | Value 5/31/2016 | | | Dividend
Income | |
World Equity Ex-US Fund | | $ | 1,990,960 | | | $ | (1,976,613 | ) | | $ | 362,212 | | | $ | 3,613 | |
Core Fixed Income Fund | | | 159,179 | | | | (415,241 | ) | | | — | | | | 118 | |
Emerging Markets Debt | | | | | | | | | | | | | | | | |
Fund | | | 6,485 | | | | (14,380 | ) | | | — | | | | 5 | |
SEI Daily Income Trust, Prime Obligation Fund | | | | | | | | | | | | |
Large Cap Fund | | $ | 542,850 | | | $ | (599,584 | ) | | $ | 62,127 | | | $ | 120 | |
Large Cap Diversified | | | | | | | | | | | | | | | | |
Alpha Fund | | | 42,615 | | | | (42,732 | ) | | | 3,568 | | | | 4 | |
Large Cap Disciplined | | | | | | | | | | | | | | | | |
Equity Fund | | | 1,212,631 | | | | (1,233,054 | ) | | | 151,912 | | | | 208 | |
Large Cap Index Fund | | | 332,602 | | | | (329,031 | ) | | | 39,573 | | | | 46 | |
S&P 500 Index Fund | | | 875,526 | | | | (859,818 | ) | | | 60,898 | | | | 93 | |
Extended Market Index | | | | | | | | | | | | | | | | |
Fund | | | 202,891 | | | | (202,469 | ) | | | 14,579 | | | | 34 | |
Small Cap Fund | | | 269,022 | | | | (280,423 | ) | | | 26,893 | | | | 37 | |
Small Cap II Fund | | | 313,499 | | | | (311,856 | ) | | | 21,069 | | | | 39 | |
Small/Mid Cap Equity Fund | | | 670,167 | | | | (690,227 | ) | | | 78,825 | | | | 101 | |
U.S. Managed Volatility Fund | | | 883,939 | | | | (939,189 | ) | | | 3,594 | | | | 54 | |
Global Managed Volatility Fund | | | 229,988 | | | | (175,490 | ) | | | 54,498 | | | | 44 | |
World Equity Ex-US Fund | | | 908,658 | | | | (871,237 | ) | | | 197,215 | | | | 260 | |
Screened World Equity Ex- | | | | | | | | | | | | | | | | |
US Fund | | | 14,824 | | | | (13,036 | ) | | | 2,084 | | | | 4 | |
Emerging Markets Equity Fund | | | 260,909 | | | | (260,905 | ) | | | 2,804 | | | | 10 | |
Opportunistic Income Fund | | | 796,573 | | | | (807,062 | ) | | | 67,573 | | | | 190 | |
Core Fixed Income Fund | | | 3,580,423 | | | | (3,786,400 | ) | | | 69,172 | | | | 315 | |
High Yield Bond Fund | | | 1,056,371 | | | | (1,022,203 | ) | | | 120,669 | | | | 192 | |
Long Duration Fund | | | 889,798 | | | | (900,369 | ) | | | 37,360 | | | | 50 | |
Long Duration Credit Fund | | | 964,294 | | | | (972,745 | ) | | | 41,861 | | | | 63 | |
Ultra Short Duration Bond Fund | | | 321,309 | | | | (323,102 | ) | | | 1,968 | | | | 8 | |
Limited Duration Bond Fund | | | 1,010,955 | | | | (1,009,380 | ) | | | 6,511 | | | | 26 | |
Intermediate Duration Credit Fund | | | 878,638 | | | | (860,767 | ) | | | 43,414 | | | | 40 | |
| SEI Common Stock | | | | | | | | | | | | |
Large Cap Index Fund | | $ | — | | | $ | — | | | $ | 604 | | | $ | 6 | |
Extended Market Index Fund | | | 150 | | | | (82 | ) | | | 1,246 | | | | 11 | |
Interfund Lending — The SEC has granted an exemption that permits the Trust to participate in an interfund lending program (“The Program”) with existing or future investment companies registered under the 1940 Act that are advised by SIMC (the “SEI Funds”). The Program allows the SEI Funds to lend money to and borrow money from each other for temporary or emergency purposes. Participation in The Program is voluntary for both borrowing and lending funds. Interfund loans may be made only when the rate of interest to be charged is more favorable to the lending fund than an investment in overnight repurchase agreements (“Repo Rate”), and more favorable to the borrowing fund than the rate of interest that would be charged by a bank for short-term borrowings (“Bank Loan Rate”). The Bank Loan Rate will be determined using a formula annually reviewed by the SEI Funds’ Board of Trustees. The interest rate imposed on inter fund loans is the average of the Repo Rate and the Bank Loan Rate.
| | | | |
| SEI Institutional Investments Trust / Annual Report / May 31, 2016 | | | 309 | |
NOTES TO FINANCIAL STATEMENTS/CONSOLIDATED NOTES TO FINANCIAL STATEMENTS (Continued)
MAY 31, 2016
During the year ended May 31, 2016, the Trust borrowed funds from SEI Liquid Asset Trust Prime Obligation Fund. The amount borrowed, interest paid on the borrowing
and the corresponding interest rate were as follows ($ Thousands):
| | | | | | | | | | | | | | | | |
| Account Name | | Date | | | Amount
Borrowed | | | Interest
Paid | | | Rate | |
Small Cap Fund | | | 11/25/2015 | | | $ | 25,000 | | | $ | 1 | | | | 0.22 | % |
Small Cap Fund | | | 12/16/2015 | | | | 18,000 | | | | — | | | | 0.46 | |
Small Cap Fund | | | 12/17/2015 | | | | 17,000 | | | | — | | | | 0.38 | |
Ultra Short Duration Bond Fund | | | 05/10/2016 | | | | 12,208 | | | | — | | | | 0.46 | |
At May 31, 2016, the Trust had no outstanding borrowings.
7. CAPITAL SHARE TRANSACTIONS
Capital share transactions for the Funds were as follows (Thousands):
| | | | | | | | | | | | | | | | | | | | | | | | | | | | | | | | |
| | | Large Cap Fund | | | Large Cap
Diversified
Alpha Fund | | | Large Cap
Disciplined
Equity Fund | | | Large Cap
Index Fund | |
| | | 2016 | | | 2015 | | | 2016 | | | 2015 | | | 2016 | | | 2015 | | | 2016 | | | 2015 | |
Class A: | | | | | | | | | | | | | | | | | | | | | | | | | | | | | | | | |
Shares Issued | | | 18,834 | | | | 22,923 | | | | 1,634 | | | | 497 | | | | 27,859 | | | | 26,998 | | | | 3,582 | | | | 1,846 | |
Shares Issued in Lieu of Dividends and Distributions | | | 17,001 | | | | 10,902 | | | | 1,579 | | | | 241 | | | | 40,864 | | | | 45,065 | | | | 695 | | | | 908 | |
Shares Redeemed | | | (28,840 | ) | | | (31,917 | ) | | | (1,459 | ) | | | (6,447 | ) | | | (74,856 | ) | | | (92,482 | ) | | | (3,055 | ) | | | (2,714 | ) |
Total Increase (Decrease) in Net Assets Derived from Class A Transactions | | | 6,995 | | | | 1,908 | | | | 1,754 | | | | (5,709 | ) | | | (6,133 | ) | | | (20,419 | ) | | | 1,222 | | | | 40 | |
| | | | | | | | | | | | | | | | | | | | | | | | | | | | | | | | |
| | | S&P 500 Index Fund | | | Extended Market
Index Fund | | | Small Cap Fund | | | Small Cap II Fund | |
| | | 2016 | | | 2015 | | | 2016 | | | 2015 | | | 2016 | | | 2015 | | | 2016 | | | 2015 | |
Class A: | | | | | | | | | | | | | | | | | | | | | | | | | | | | | | | | |
Shares Issued | | | 66,483 | | | | 234,645 | (1) | | | 15,048 | | | | 19,886 | | | | 2,905 | | | | 3,754 | | | | 20,766 | | | | 11,622 | |
Shares Issued in Lieu of Dividends and Distributions | | | 6,627 | | | | 2,925 | | | | 2,678 | | | | 1,655 | | | | 3,466 | | | | 1,007 | | | | 2,823 | | | | 1,901 | |
Shares Redeemed | | | (54,692 | ) | | | (42,674 | ) | | | (13,492 | ) | | | (7,991 | ) | | | (10,827 | ) | | | (7,478 | ) | | | (11,555 | ) | | | (4,848 | ) |
Total Increase (Decrease) in Net Assets Derived from Class A Transactions | | | 18,418 | | | | 194,896 | | | | 4,234 | | | | 13,550 | | | | (4,456 | ) | | | (2,717 | ) | | | 12,034 | | | | 8,675 | |
| | | | | | | | | | | | | | | | | | | | | | | | | | | | |
| | | Small/Mid Cap
Equity Fund | | | U.S. Managed
Volatility Fund | | | Global
Managed
Volatility
Fund(3) | | | World Equity Ex-US Fund | |
| | | 2016 | | | 2015 | | | 2016 | | | 2015 | | | 2016 | | | 2016 | | | 2015 | |
Class A: | | | | | | | | | | | | | | | | | | | | | | | | | | | | |
Shares Issued | | | 13,939 | | | | 13,690 | | | | 43,538 | | | | 20,365 | | | | 121,441 | | | | 129,197 | | | | 137,907 | |
Shares Issued in Lieu of Dividends and Distributions | | | 20,663 | | | | 18,497 | | | | 9,956 | | | | 11,373 | | | | — | | | | 15,224 | | | | 17,907 | |
Shares Redeemed | | | (22,342 | ) | | | (24,682 | ) | | | (40,619 | ) | | | (18,977 | ) | | | (23,034 | ) | | | (106,454 | ) | | | (75,565 | ) |
Total Increase in Net Assets Derived from Class A Transactions | | | 12,260 | | | | 7,505 | | | | 12,875 | | | | 12,761 | | | | 98,407 | | | | 37,967 | | | | 80,249 | |
| | | | | | | | | | | | | | | | | | | | | | | | |
| | | Screened World
Equity Ex-US Fund | | | Emerging Markets
Equity Fund | | | Opportunistic
Income Fund | |
| | | 2016 | | | 2015 | | | 2016 | | | 2015 | | | 2016 | | | 2015 | |
Class A: | | | | | | | | | | | | | | | | | | | | | | | | |
Shares Issued | | | 1,581 | | | | 1,865 | | | | 58,292 | | | | 61,812 | | | | 41,392 | | | | 91,373 | |
Shares Issued in Lieu of Dividends and Distributions | | | 129 | | | | 102 | | | | 1,545 | | | | 70 | | | | 6,774 | | | | 6,100 | |
Shares Redeemed | | | (775 | ) | | | (1,109 | ) | | | (10,369 | ) | | | (2,735 | ) | | | (48,311 | ) | | | (60,713 | ) |
Total Increase (Decrease) in Net Assets Derived from Class A Transactions | | | 935 | | | | 858 | | | | 49,468 | | | | 59,147 | | | | (145 | ) | | | 36,760 | |
| | |
| 310 | | SEI Institutional Investments Trust / Annual Report / May 31, 2016 |
| | | | | | | | | | | | | | | | | | | | | | | | | | | | | | | | |
| | | Core Fixed
Income Fund | | | High Yield
Bond Fund | | | Long Duration
Fund | | | Long Duration
Credit Fund | |
| | | 2016 | | | 2015 | | | 2016 | | | 2015 | | | 2016 | | | 2015 | | | 2016 | | | 2015 | |
Class A: | | | | | | | | | | | | | | | | | | | | | | | | | | | | | | | | |
Shares Issued | | | 100,693 | (1) | | | 150,096 | | | | 75,177 | | | | 71,047 | | | | 53,155 | | | | 56,339 | | | | 34,900 | (1) | | | 136,641 | (1) |
Shares Issued in Lieu of Dividends and Distributions | | | 23,419 | | | | 16,690 | | | | 20,813 | | | | 19,237 | | | | 28,777 | | | | 21,114 | | | | 20,357 | | | | 12,551 | |
Shares Redeemed | | | (147,078 | ) | | | (199,854 | ) | | | (54,082 | ) | | | (41,258 | ) | | | (137,160 | )(2) | | | (155,587 | ) | | | (70,602 | ) | | | (85,266 | ) |
Total Increase (Decrease) in Net Assets Derived from Class A Transactions | | | (22,966 | ) | | | (33,068 | ) | | | 41,908 | | | | 49,026 | | | | (55,228 | ) | | | (78,134 | ) | | | (15,345 | ) | | | 63,926 | |
| | | | | | | | | | | | | | | | | | | | | | | | | | | | | | | | |
| | | Ultra Short Duration
Bond Fund | | | Emerging Markets
Debt Fund | | | Real Return
Fund | | | Limited Duration
Bond Fund(5) | |
| | | 2016 | | | 2015 | | | 2016 | | | 2015 | | | 2016 | | | 2015 | | | 2016 | | | 2015 | |
Class A: | | | | | | | | | | | | | | | | | | | | | | | | | | | | | | | | |
Shares Issued | | | 26,044 | | | | 39,520 | | | | 50,673 | | | | 59,071 | | | | 9,101 | | | | 6,116 | | | | 68,270 | | | | 69,230 | |
Shares Issued in Lieu of Dividends and Distributions | | | 830 | | | | 832 | | | | 1,782 | | | | 5,979 | | | | — | | | | 160 | | | | 1,225 | | | | 285 | |
Shares Redeemed | | | (37,724 | ) | | | (47,326 | ) | | | (36,683 | ) | | | (24,191 | ) | | | (17,250 | ) | | | (3,703 | ) | | | (20,891 | ) | | | (2,521 | ) |
Total Increase (Decrease) in Net Assets Derived from Class A Transactions | | | (10,850 | ) | | | (6,974 | ) | | | 15,772 | | | | 40,859 | | | | (8,149 | ) | | | 2,573 | | | | 48,604 | | | | 66,994 | |
| | | | | | | | | | | | | | | | | | | | | | | | |
| | | Intermediate Duration
Credit Fund(6) | | | Dynamic Asset
Allocation Fund | | | Multi-Asset Real
Return Fund | |
| | | 2016 | | | 2015 | | | 2016 | | | 2015 | | | 2016 | | | 2015 | |
Class A: | | | | | | | | | | | | | | | | | | | | | | | | |
Shares Issued | | | 32,843 | | | | 165,014 | (1) | | | 28,244 | | | | 25,892 | | | | 23,380 | | | | 25,248 | |
Shares Issued in Lieu of Dividends and Distributions | | | 4,152 | | | | 509 | | | | 7,787 | | | | 5,216 | | | | 818 | | | | 1,610 | |
Shares Redeemed | | | (55,237 | ) | | | (2,655 | ) | | | (22,164 | ) | | | (20,816 | ) | | | (20,202 | ) | | | (19,286 | ) |
Total Increase (Decrease) in Net Assets Derived from Class A Transactions | | | (18,242 | ) | | | 162,868 | | | | 13,867 | | | | 10,292 | | | | 3,996 | | | | 7,572 | |
| (1) | | Includes subscriptions as a result of an in-kind transfer of securities (see Note 11). |
| (2) | | Includes redemptions as a result of an in-kind transfer of securities (see Note 11). |
| (3) | | Fund commenced operations on January 29, 2016. |
| (4) | | Fund commenced operations on October 31, 2014. |
| (5) | | Fund commenced operations on July 31, 2014. |
| (6) | | Fund commenced operations on March 31, 2015. |
8. INVESTMENT TRANSACTIONS
The cost of security purchases and proceeds from the sale and maturities of securities other than temporary cash investments, during the year ended May 31, 2016, were as follows:
| | | | | | | | | | | | |
| | | U.S. Gov’t
($ Thousands) | | | Other ($ Thousands) | | | Total ($ Thousands) | |
Large Cap Fund | |
Purchases | | $ | — | | | $ | 1,488,045 | | | $ | 1,488,045 | |
Sales | | | — | | | | 1,643,731 | | | | 1,643,731 | |
Large Cap Diversified Alpha Fund | | | | | | | | | | | | |
Purchases | | | — | | | | 76,884 | | | | 76,884 | |
Sales | | | — | | | | 82,172 | | | | 82,172 | |
Large Cap Disciplined Equity Fund | | | | | | | | | | | | |
Purchases | | | — | | | | 3,653,294 | | | | 3,653,294 | |
Sales | | | — | | | | 4,202,410 | | | | 4,202,410 | |
Large Cap Index Fund | | | | | | | | | | | | |
Purchases | | | — | | | | 427,719 | | | | 427,719 | |
Sales | | | — | | | | 328,074 | | | | 328,074 | |
S&P 500 Index Fund | | | | | | | | | | | | |
Purchases | | | — | | | | 595,367 | | | | 595,367 | |
Sales | | | — | | | | 403,415 | | | | 403,415 | |
| | | | | | | | | | | | |
| | | U.S. Gov’t
($ Thousands) | | | Other ($ Thousands) | | | Total ($ Thousands) | |
Extended Market Index Fund | |
Purchases | | $ | — | | | $ | 206,916 | | | $ | 206,916 | |
Sales | | | — | | | | 181,690 | | | | 181,690 | |
Small Cap Fund | | | | | | | | | | | | |
Purchases | | | — | | | | 607,648 | | | | 607,648 | |
Sales | | | — | | | | 740,399 | | | | 740,399 | |
Small Cap II Fund | | | | | | | | | | | | |
Purchases | | | — | | | | 594,344 | | | | 594,344 | |
Sales | | | — | | | | 498,903 | | | | 498,903 | |
Small/Mid Cap Equity Fund | | | | | | | | | | | | |
Purchases | | | — | | | | 1,658,431 | | | | 1,658,431 | |
Sales | | | — | | | | 1,749,265 | | | | 1,749,265 | |
U.S. Managed Volatility Fund | | | | | | | | | | | | |
Purchases | | | — | | | | 1,028,011 | | | | 1,028,011 | |
Sales | | | — | | | | 927,392 | | | | 927,392 | |
Global Managed Volatility Fund | | | | | | | | | | | | |
Purchases | | | — | | | | 1,328,053 | (1) | | | 1,328,053 | |
Sales | | | — | | | | 408,914 | | | | 408,914 | |
World Equity Ex-US Fund | | | | | | | | | | | | |
Purchases | | | — | | | | 3,584,062 | | | | 3,584,062 | |
Sales | | | — | | | | 3,285,265 | | | | 3,285,265 | |
| | | | |
| SEI Institutional Investments Trust / Annual Report / May 31, 2016 | | | 311 | |
NOTES TO FINANCIAL STATEMENTS/CONSOLIDATED NOTES TO FINANCIAL STATEMENTS (Continued)
MAY 31, 2016
| | | | | | | | | | | | |
| | | U.S. Gov’t
($ Thousands) | | | Other
($ Thousands) | | | Total ($ Thousands) | |
Screened World Equity
Ex-US Fund | |
Purchases | | $ | — | | | $ | 36,560 | | | $ | 36,560 | |
Sales | | | — | | | | 30,659 | | | | 30,659 | |
Emerging Markets Equity Fund | | | | | | | | | | | | |
Purchases | | | — | | | | 1,144,155 | | | | 1,144,155 | |
Sales | | | — | | | | 748,261 | | | | 748,261 | |
Opportunistic Income Fund | | | | | | | | | | | | |
Purchases | | | 91,513 | | | | 324,075 | | | | 415,588 | |
Sales | | | 146,383 | | | | 390,387 | | | | 536,770 | |
Core Fixed Income Fund | | | | | | | | | | | | |
Purchases | | | 16,586,327 | | | | 1,953,221 | | | | 18,539,548 | |
Sales | | | 16,791,234 | | | | 2,082,347 | | | | 18,873,581 | |
High Yield Bond Fund | | | | | | | | | | | | |
Purchases | | | — | | | | 1,272,859 | | | | 1,272,859 | |
Sales | | | — | | | | 1,016,751 | | | | 1,016,751 | |
Long Duration Fund | | | | | | | | | | | | |
Purchases | | | 1,528,449 | | | | 536,471 | | | | 2,064,920 | |
Sales | | | 1,637,443 | | | | 1,042,230 | | | | 2,679,673 | |
Long Duration Credit Fund | | | | | | | | | | | | |
Purchases | | | 1,264,671 | | | | 1,041,914 | | | | 2,306,585 | |
Sales | | | 1,174,011 | | | | 1,328,498 | | | | 2,502,509 | |
Ultra Short Duration Bond Fund | | | | | | | | | | | | |
Purchases | | | 300,665 | | | | 137,784 | | | | 438,449 | |
Sales | | | 300,568 | | | | 303,091 | | | | 603,659 | |
Emerging Markets Debt Fund | | | | | | | | | | | | |
Purchases | | | 210,850 | | | | 1,282,987 | | | | 1,493,837 | |
Sales | | | 64,515 | | | | 1,192,938 | | | | 1,257,453 | |
Real Return Fund | | | | | | | | | | | | |
Purchases | | | 146,913 | | | | — | | | | 146,913 | |
Sales | | | 224,014 | | | | — | | | | 224,014 | |
Limited Duration Bond Fund | | | | | | | | | | | | |
Purchases | | | 703,230 | | | | 707,350 | | | | 1,410,580 | |
Sales | | | 447,779 | | | | 584,649 | | | | 1,032,428 | |
Intermediate Duration Credit Fund | | | | | | | | | | | | |
Purchases | | | 1,413,387 | | | | 1,207,781 | | | | 2,621,168 | |
Sales | | | 1,388,346 | | | | 1,365,881 | | | | 2,754,227 | |
Dynamic Asset Allocation Fund | | | | | | | | | | | | |
Purchases | | | — | | | | 275,998 | | | | 275,998 | |
Sales | | | — | | | | 236,044 | | | | 236,044 | |
Multi-Asset Real Return Fund | | | | | | | | | | | | |
Purchases | | | 191,550 | | | | 263,573 | | | | 455,123 | |
Sales | | | 197,930 | | | | 208,036 | | | | 405,966 | |
| (1) | | Includes 17a-7 related party transactions of $843,073 ($ Thousands). |
9. FEDERAL TAX INFORMATION
It is each Fund’s intention to qualify for or continue to qualify as a regulated investment company under Subchapter M of the Internal Revenue Code and distribute all of its taxable income (including net capital gains). Accordingly, no provision for Federal income taxes is required.
The Dynamic Asset Allocation and Multi-Asset Real Return Funds have each requested private letter rulings from the Internal Revenue Service (“IRS”) concluding that the income generated from their investment in their respective Subsidiaries, each of which invests in commodity-linked derivatives, will be “qualifying income”
for regulated investment company (“RIC”) qualification purposes, regardless of whether actual distributions are made to the Funds by the respective Subsidiary.
In July 2011, the IRS suspended the issuance of private letter rulings regarding the investment by RICs into controlled foreign corporations which principally invest in commodities, such as the Subsidiaries, indicating that it was reconsidering its policies surrounding the issuance of these rulings. The IRS subsequently stated that it intends to issue public guidance regarding the use of controlled foreign corporations by RICs to indirectly invest in commodities. It is unclear whether this guidance will continue to permit or somehow restrict the distributions from controlled foreign corporations to be treated as “qualifying income” for purposes of the RIC qualification rules. As a result, there can be no assurance that the IRS will grant the private letter ruling requested by the Funds. While the private letter ruling request is pending with the IRS, the Dynamic Asset Allocation and Multi-Asset Real Return Funds have secured an opinion of counsel based on customary representations that actual distributions made to the Funds should be treated as “qualifying income.” If the IRS does issue public guidance that results in an adverse determination relating to the treatment of income and gain to the Funds from controlled foreign corporations such as the Subsidiaries, the Funds would likely need to significantly change their investment strategies, which could adversely affect such Funds.
Dividends from net investment income and distributions from net realized capital gains are determined in accordance with U.S. Federal income tax regulations, which may differ from those amounts determined under U.S. GAAP. These book/tax differences are either temporary or permanent in nature. To the extent these differences are permanent, they are charged or credited to paid-in capital, undistributed net investment income or accumulated net realized gain, as appropriate, in the period that the differences arise.
Accordingly, the following permanent differences, primarily attributable to different treatment for gains and losses on paydowns of mortgage and asset-backed securities for tax purposes, defaulted bond basis adjustments, reclassification of long term capital gain distributions on Real Estate Investment Trust securities, reclassification of income and expense from swap transactions, Treasury Inflation-Protected Securities and net operating losses, basis adjustments for investments in partnerships, and gains and losses on passive foreign investment companies and certain foreign currency related transactions and non taxable in-kind redemption, have been reclassified to/from the following accounts as of May 31, 2016:
| | |
| 312 | | SEI Institutional Investments Trust / Annual Report / May 31, 2016 |
| | | | | | | | | | | | |
| | | Undistributed Net Investment Income (Loss) ($ Thousands) | | | Accumulated Realized Gain (Loss) ($ Thousands) | | | Paid-
in-Capital ($ Thousands) | |
Large Cap Fund | | $ | 105 | | | $ | (105 | ) | | $ | — | |
Large Cap Disciplined Equity Fund | | | (62 | ) | | | 62 | | | | — | |
Large Cap Index Fund | | | 156 | | | | (156 | ) | | | — | |
S&P 500 Index Fund | | | 178 | | | | (178 | ) | | | — | |
Extended Market Index Fund | | | 176 | | | | (176 | ) | | | — | |
Small Cap Fund | | | 242 | | | | (242 | ) | | | — | |
Small Cap II Fund | | | 49 | | | | (49 | ) | | | — | |
Small/Mid Cap Equity Fund | | | 1,160 | | | | (1,160 | ) | | | — | |
U.S. Managed Volatility Fund | | | 306 | | | | (306 | ) | | | — | |
Global Managed Volatility Fund | | | (11,073 | ) | | | 11,073 | | | | — | |
World Equity Ex-US Fund | | | (4,329 | ) | | | 4,329 | | | | — | |
Screened World Equity Ex-US Fund | | | 99 | | | | (96 | ) | | | (3 | ) |
Emerging Markets Equity Fund | | | 1,595 | | | | (1,595 | ) | | | — | |
Opportunistic Income Fund | | | (1,499 | ) | | | (848 | ) | | | 2,347 | |
Core Fixed Income Fund | | | 3,777 | | | | (3,777 | ) | | | — | |
High Yield Bond Fund | | | 828 | | | | (828 | ) | | | — | |
Long Duration Fund | | | (638 | ) | | | (2,145 | ) | | | 2,783 | |
Long Duration Credit Fund | | | 11 | | | | (11 | ) | | | — | |
Ultra Short Duration Bond Fund | | | 1,365 | | | | (1,365 | ) | | | — | |
Emerging Markets Debt Fund | | | (93,780 | ) | | | 93,780 | | | | — | |
Real Return Fund | | | 167 | | | | (18 | ) | | | (149 | ) |
Limited Duration Bond Fund | | | 490 | | | | (490 | ) | | | — | |
Intermediate Duration Credit Fund | | | 150 | | | | (150 | ) | | | — | |
Dynamic Asset Allocation Fund | | | (32,402 | ) | | | 32,402 | | | | — | |
Multi-Asset Real Return Fund | | | 815 | | | | 3,682 | | | | (4,497 | ) |
These reclassifications have no impact on net assets or net asset value per share.
The tax character of dividends and distributions paid during the last two years or periods ended May 31, 2016 were as follows:
| | | | | | | | | | | | | | | | | | | | |
| | | | | | Ordinary Income
($ Thousands) | | | Long-term Capital Gain
($ Thousands) | | | Return of Capital
($ Thousands) | | | Total
($ Thousands) | |
Large Cap Fund | | | 2016 | | | $ | 35,569 | | | $ | 292,539 | | | $ | — | | | $ | 328,108 | |
| | | 2015 | | | | 59,060 | | | | 186,918 | | | | — | | | | 245,978 | |
Large Cap Diversified Alpha Fund | | | 2016 | | | | 2,805 | | | | 18,406 | | | | 365 | | | | 21,576 | |
| | | 2015 | | | | 1,987 | | | | 2,247 | | | | — | | | | 4,234 | |
Large Cap Disciplined Equity Fund | | | 2016 | | | | 159,971 | �� | | | 348,292 | | | | — | | | | 508,263 | |
| | | 2015 | | | | 123,271 | | | | 508,968 | | | | — | | | | 632,239 | |
Large Cap Index Fund | | | 2016 | | | | 40,817 | | | | 67,747 | | | | — | | | | 108,564 | |
| | | 2015 | | | | 43,351 | | | | 106,205 | | | | — | | | | 149,556 | |
S&P 500 Index Fund | | | 2016 | | | | 70,828 | | | | 4,237 | | | | — | | | | 75,065 | |
| | | 2015 | | | | 32,451 | | | | 1,115 | | | | — | | | | 33,566 | |
Extended Market Index Fund | | | 2016 | | | | 13,527 | | | | 18,708 | | | | — | | | | 32,235 | |
| | | 2015 | | | | 17,020 | | | | 4,377 | | | | — | | | | 21,397 | |
Small Cap Fund | | | 2016 | | | | 8,250 | | | | 54,149 | | | | — | | | | 62,399 | |
| | | 2015 | | | | 4,749 | | | | 17,304 | | | | — | | | | 22,053 | |
| | | | |
| SEI Institutional Investments Trust / Annual Report / May 31, 2016 | | | 313 | |
NOTES TO FINANCIAL STATEMENTS/CONSOLIDATED NOTES TO FINANCIAL STATEMENTS (Continued)
MAY 31, 2016
| | | | | | | | | | | | | | | | | | | | |
| | | | | | Ordinary Income
($ Thousands) | | | Long-term Capital Gain
($ Thousands) | | | Return of Capital
($ Thousands) | | | Total
($ Thousands) | |
Small Cap II Fund | | | 2016 | | | $ | 5,957 | | | $ | 25,875 | | | $ | — | | | $ | 31,832 | |
| | | 2015 | | | | 5,493 | | | | 18,511 | | | | — | | | | 24,004 | |
Small/Mid Cap Equity Fund | | | 2016 | | | | 32,327 | | | | 210,982 | | | | — | | | | 243,309 | |
| | | 2015 | | | | 56,049 | | | | 206,547 | | | | — | | | | 262,596 | |
U.S. Managed Volatility Fund | | | 2016 | | | | 47,909 | | | | 87,357 | | | | — | | | | 135,266 | |
| | | 2015 | | | | 64,197 | | | | 102,025 | | | | — | | | | 166,222 | |
Global Managed Volatility Fund | | | 2016 | | | | — | | | | — | | | | — | | | | — | |
World Equity Ex-US Fund | | | 2016 | | | | 138,753 | | | | 30,136 | | | | — | | | | 168,889 | |
| | | 2015 | | | | 135,664 | | | | 82,563 | | | | — | | | | 218,227 | |
Screened World Equity Ex-US Fund | | | 2016 | | | | 1,667 | | | | — | | | | — | | | | 1,667 | |
| | | 2015 | | | | 1,372 | | | | — | | | | — | | | | 1,372 | |
Emerging Markets Equity Fund | | | 2016 | | | | 12,926 | | | | — | | | | — | | | | 12,926 | |
| | | 2015 | | | | 668 | | | | — | | | | — | | | | 668 | |
Opportunistic Income Fund | | | 2016 | | | | 56,898 | | | | — | | | | — | | | | 56,898 | |
| | | 2015 | | | | 51,651 | | | | — | | | | — | | | | 51,651 | |
Core Fixed Income Fund | | | 2016 | | | | 209,971 | | | | 36,870 | | | | — | | | | 246,841 | |
| | | 2015 | | | | 181,213 | | | | — | | | | — | | | | 181,213 | |
High Yield Bond Fund | | | 2016 | | | | 181,482 | | | | 54 | | | | — | | | | 181,536 | |
| | | 2015 | | | | 148,070 | | | | 39,852 | | | | — | | | | 187,922 | |
Long Duration Fund | | | 2016 | | | | 198,920 | | | | 52,551 | | | | — | | | | 251,471 | |
| | | 2015 | | | | 190,776 | | | | 8,164 | | | | — | | | | 198,940 | |
Long Duration Credit Fund | | | 2016 | | | | 172,839 | | | | 28,467 | | | | — | | | | 201,306 | |
| | | 2015 | | | | 131,283 | | | | — | | | | — | | | | 131,283 | |
Ultra Short Duration Bond Fund | | | 2016 | | | | 8,407 | | | | — | | | | — | | | | 8,407 | |
| | | 2015 | | | | 8,484 | | | | — | | | | — | | | | 8,484 | |
Emerging Markets Debt Fund | | | 2016 | | | | 16,885 | | | | — | | | | — | | | | 16,885 | |
| | | 2015 | | | | 62,267 | | | | — | | | | — | | | | 62,267 | |
Real Return Fund | | | 2016 | | | | — | | | | — | | | | — | | | | — | |
| | | 2015 | | | | 1,584 | | | | — | | | | — | | | | 1,584 | |
Limited Duration Bond Fund | | | 2016 | | | | 12,469 | | | | 11 | | | | — | | | | 12,480 | |
| | | 2015 | | | | 2,937 | | | | — | | | | — | | | | 2,937 | |
Intermediate Duration Credit Fund | | | 2016 | | | | 40,672 | | | | — | | | | — | | | | 40,672 | |
| | | 2015 | | | | 4,969 | | | | — | | | | 129 | | | | 5,098 | |
Dynamic Asset Allocation Fund | | | 2016 | | | | 124,343 | | | | 1,111 | | | | — | | | | 125,454 | |
| | | 2015 | | | | 84,817 | | | | — | | | | — | | | | 84,817 | |
Multi-Asset Real Return Fund | | | 2016 | | | | 7,020 | | | | — | | | | — | | | | 7,020 | |
| | | 2015 | | | | 12,380 | | | | — | | | | 2,378 | | | | 14,758 | |
| | |
| 314 | | SEI Institutional Investments Trust / Annual Report / May 31, 2016 |
As of May 31, 2016, the components of distributable earnings (accumulated losses) were as follows:
| | | | | | | | | | | | | | | | | | | | | | | | | | | | | | | | |
| | | Undistributed Ordinary
Income ($ Thousands) | | | Undistributed
Long-Term Capital Gain
($ Thousands) | | | Capital Loss
Carryforwards
($ Thousands) | | | Post-October
Losses
($ Thousands) | | | Late Year
Ordinary
Losses ($ Thousands) | | | Unrealized
Appreciation
(Depreciation) ($ Thousands) | | | Other
Temporary
Differences
($ Thousands) | | | Total Distributable
Earnings
(Accumulated Losses)
($ Thousands) | |
Large Cap Fund | | $ | 4,109 | | | $ | 44,075 | | | $ | — | | | $ | — | | | $ | — | | | $ | 335,494 | | | $ | — | | | $ | 383,678 | |
Large Cap Diversified Alpha Fund | | | — | | | | — | | | | — | | | | (1,033 | ) | | | — | | | | 4,285 | | | | (10 | ) | | | 3,242 | |
Large Cap Disciplined Equity Fund | | | 5,323 | | | | 26,555 | | | | — | | | | — | | | | — | | | | 451,316 | | | | (3,843 | ) | | | 479,351 | |
Large Cap Index Fund | | | 6,181 | | | | 22,236 | | | | — | | | | — | | | | — | | | | 785,906 | | | | (1,801 | ) | | | 812,522 | |
S&P 500 Index Fund | | | 8,455 | | | | — | | | | (6,150 | ) | | | — | | | | — | | | | 156,023 | | | | (3,017 | ) | | | 155,311 | |
Extended Market Index Fund | | | 2,154 | | | | 12,119 | | | | — | | | | — | | | | — | | | | 10,986 | | | | (1,066 | ) | | | 24,193 | |
Small Cap Fund | | | 422 | | | | — | | | | — | | | | (7,949 | ) | | | — | | | | 33,413 | | | | (161 | ) | | | 25,725 | |
Small Cap II Fund | | | 336 | | | | — | | | | — | | | | (14,693 | ) | | | — | | | | 25,613 | | | | (468 | ) | | | 10,788 | |
Small/Mid Cap Equity Fund | | | 5,857 | | | | 22,060 | | | | — | | | | — | | | | — | | | | 153,043 | | | | (378 | ) | | | 180,582 | |
U.S. Managed Volatility Fund | | | 3,558 | | | | 31,627 | | | | — | | | | — | | | | — | | | | 220,459 | | | | (251 | ) | | | 255,393 | |
Global Managed Volatility Fund | | | 9,693 | | | | 1,193 | | | | — | | | | — | | | | — | | | | 65,964 | | | | (1,202 | ) | | | 75,648 | |
World Equity Ex-US Fund | | | 71,194 | | | | — | | | | (150,020 | ) | | | (189,602 | ) | | | — | | | | 101,493 | | | | (3,219 | ) | | | (170,154 | ) |
Screened World Equity Ex-US Fund | | | 894 | | | | — | | | | (9,959 | ) | | | (1,588 | ) | | | — | | | | (2,287 | ) | | | (18 | ) | | | (12,958 | ) |
Emerging Markets Equity Fund | | | 8,218 | | | | — | | | | (10,824 | ) | | | (27,354 | ) | | | — | | | | (35,733 | ) | | | (5 | ) | | | (65,698 | ) |
Opportunistic Income Fund | | | 18,335 | | | | — | | | | (57,789 | ) | | | (8,121 | ) | | | — | | | | (23,445 | ) | | | (731 | ) | | | (71,751 | ) |
Core Fixed Income Fund | | | 37,524 | | | | — | | | | — | | | | — | | | | — | | | | 91,179 | | | | (34,165 | ) | | | 94,538 | |
High Yield Bond Fund | | | 31,342 | | | | — | | | | (71,296 | ) | | | — | | | | — | | | | (178,826 | ) | | | (15,365 | ) | | | (234,145 | ) |
Long Duration Fund | | | 39,247 | | | | 1,055 | | | | — | | | | — | | | | — | | | | 168,686 | | | | (44,377 | ) | | | 164,611 | |
Long Duration Credit Fund | | | 10,718 | | | | — | | | | (25,325 | ) | | | — | | | | — | | | | 95,798 | | | | (11,381 | ) | | | 69,810 | |
Ultra Short Duration Bond Fund | | | 674 | | | | — | | | | (3,390 | ) | | | — | | | | — | | | | (568 | ) | | | (748 | ) | | | (4,032 | ) |
Emerging Markets Debt Fund | | | 2,695 | | | | — | | | | (45,790 | ) | | | — | | | | — | | | | (165,224 | ) | | | (13,593 | ) | | | (221,912 | ) |
Real Return Fund | | | — | | | | — | | | | (4,248 | ) | | | — | | | | (12 | ) | | | 470 | | | | (441 | ) | | | (4,231 | ) |
Limited Duration Bond Fund | | | 45 | | | | — | | | | — | | | | (113 | ) | | | — | | | | 1,322 | | | | (27 | ) | | | 1,227 | |
Intermediate Duration Credit Fund | | | 140 | | | | — | | | | (18,802 | ) | | | — | | | | — | | | | 8,041 | | | | 37 | | | | (10,584 | ) |
Dynamic Asset Allocation Fund | | | 2,654 | | | | — | | | | (8,196 | ) | | | (3,640 | ) | | | — | | | | 486,888 | | | | (12,514 | ) | | | 465,192 | |
Multi-Asset Real Return Fund | | | 874 | | | | — | | | | (18,037 | ) | | | — | | | | — | | | | (52,650 | ) | | | (875 | ) | | | (70,688 | ) |
Post-October losses represent losses realized on investment transactions from November 1, 2015 through May 31, 2016 that, in accordance with Federal income tax regulations, the Funds may elect to defer and treat as having arisen in the following fiscal year.
For Federal income tax purposes, capital losses incurred in taxable years beginning before December 22, 2010 may be carried forward for a maximum period of eight years and applied against future net capital gains as follows:
| | | | | | | | | | | | | | | | |
| | | Expires 2017
($ Thousands) | | | Expires 2018
($ Thousands) | | | Expires 2019
($ Thousands) | | | Total Capital Loss
Carryforwards
May 31, 2016
($ Thousands) | |
Screened World Equity Ex-US Fund | | $ | — | | | $ | 9,159 | | | $ | — | | | $ | 9,159 | |
Opportunistic Fund | | | 7,753 | | | | 23,512 | | | | 19,071 | | | | 50,336 | |
Funds are permitted to carry forward capital losses incurred in taxable years beginning after December 22, 2010 for an unlimited period. However, any losses incurred during those future taxable years will be required to be utilized prior to the losses incurred in pre-enactment taxable years. As a result of this ordering rule, pre-enactment capital loss carryforwards may be more likely to expire unused. Additionally, post-enactment capital losses that are carried forward will retain their character as either short-term or long-term capital losses rather than being considered all short-term as under previous law. Losses carried forward under these new provisions are as follows:
| | | | |
| SEI Institutional Investments Trust / Annual Report / May 31, 2016 | | | 315 | |
NOTES TO FINANCIAL STATEMENTS/CONSOLIDATED NOTES TO FINANCIAL STATEMENTS (Continued)
MAY 31, 2016
| | | | | | | | | | | | |
| | | Short-Term Loss
($ Thousands) | | | Long-Term
Loss ($ Thousands) | | | Total * ($ Thousands) | |
S&P 500 Index Fund | | $ | 6,150 | | | $ | — | | | $ | 6,150 | |
World Equity Ex-US Fund | | | 125,183 | | | | 24,837 | | | | 150,020 | |
Screened World Equity Ex-US Fund | | | 800 | | | | — | | | | 800 | |
Emerging Markets Equity Fund | | | 10,824 | | | | — | | | | 10,824 | |
Opportunistic Income Fund | | | 2,582 | | | | 4,871 | | | | 7,453 | |
High Yield Bond Fund | | | 26,760 | | | | 44,536 | | | | 71,296 | |
Long Duration Credit Fund | | | 17,031 | | | | 8,294 | | | | 25,325 | |
Ultra Short Duration Bond Fund | | | 942 | | | | 2,448 | | | | 3,390 | |
Emerging Markets Debt Fund | | | 28,032 | | | | 17,758 | | | | 45,790 | |
Real Return | | | 724 | | | | 3,524 | | | | 4,248 | |
Intermediate Duration Credit Fund | | | 10,416 | | | | 8,386 | | | | 18,802 | |
Dynamic Asset Allocation Fund | | | 8,196 | | | | — | | | | 8,196 | |
Multi-Asset Real Return Fund | | | 16,470 | | | | 1,567 | | | | 18,037 | |
| * | | This table should be used in conjunction with the capital loss carryforwards table. |
For Federal income tax purposes, the cost of securities owned at May 31, 2016, and the net realized gains or losses on securities sold for the period were not materially different from amounts reported for financial reporting purposes. These differences are primarily due to investments in partnerships, passive foreign investment companies, defaulted bond and wash sales which cannot be used for Federal income tax purposes in the current year and have been deferred for use in future years. The aggregate gross unrealized appreciation and depreciation on total investments held by the Funds at May 31, 2016, was as follows:
| | | | | | | | | | | | | | | | |
| | | Federal Tax Cost ($ Thousands) | | | Appreciated
Securities
($ Thousands) | | | Depreciated
Securities
($ Thousands) | | | Net
Unrealized
Appreciation
(Depreciation)
($ Thousands) | |
Large Cap Fund | | $ | 1,792,935 | | | $ | 429,586 | | | $ | (94,092 | ) | | $ | 335,494 | |
Large Cap Diversified Alpha Fund | | | 50,245 | | | | 6,928 | | | | (2,654 | ) | | | 4,274 | |
Large Cap Disciplined Equity Fund | | | 3,177,937 | | | | 543,814 | | | | (96,338 | ) | | | 447,476 | |
Large Cap Index Fund | | | 1,286,902 | | | | 837,185 | | | | (53,080 | ) | | | 784,105 | |
S&P 500 Index Fund | | | 3,250,197 | | | | 337,676 | | | | (184,669 | ) | | | 153,007 | |
Extended Market Index Fund | | | 744,340 | | | | 102,409 | | | | (92,489 | ) | | | 9,920 | |
Small Cap Fund | | | 485,420 | | | | 67,378 | | | | (34,126 | ) | | | 33,252 | |
Small Cap II Fund | | | 459,601 | | | | 54,499 | | | | (29,355 | ) | | | 25,144 | |
Small/Mid Cap Equity Fund | | | 1,647,156 | | | | 254,454 | | | | (101,787 | ) | | | 152,667 | |
U.S. Managed Volatility Fund | | | 1,288,376 | | | | 264,445 | | | | (44,186 | ) | | | 220,259 | |
Global Managed Volatility Fund | | | 986,188 | | | | 77,837 | | | | (13,121 | ) | | | 64,716 | |
World Equity Ex-US Fund | | | 6,988,839 | | | | 715,316 | | | | (621,237 | ) | | | 94,079 | |
Screened World Equity Ex-US Fund | | | 82,055 | | | | 7,175 | | | | (9,492 | ) | | | (2,317 | ) |
Emerging Markets Equity Fund | | | 943,298 | | | | 56,043 | | | | (91,786 | ) | | | (35,743 | ) |
| | | | | | | | | | | | | | | | |
| | | Federal Tax Cost ($ Thousands) | | | Appreciated
Securities
($ Thousands) | | | Depreciated
Securities
($ Thousands) | | | Net Unrealized
Appreciation
(Depreciation)
($ Thousands) | |
Opportunistic Income Fund | | $ | 2,156,538 | | | $ | 17,540 | | | $ | (40,973 | ) | | $ | (23,433 | ) |
Core Fixed Income Fund | | | 5,353,211 | | | | 139,587 | | | | (40,723 | ) | | | 98,864 | |
High Yield Bond Fund | | | 2,812,216 | | | | 67,781 | | | | (246,608 | ) | | | (178,827 | ) |
Long Duration Fund | | | 2,598,886 | | | | 210,868 | | | | (40,803 | ) | | | 170,065 | |
Long Duration Credit Fund | | | 3,218,988 | | | | 131,422 | | | | (35,820 | ) | | | 95,602 | |
Ultra Short Duration Bond Fund | | | 550,360 | | | | 1,385 | | | | (1,948 | ) | | | (563 | ) |
Emerging Markets Debt Fund | | | 1,992,875 | | | | 29,940 | | | | (186,173 | ) | | | (156,233 | ) |
Real Return Fund | | | 148,872 | | | | 1,632 | | | | (1,162 | ) | | | 470 | |
Limited Duration Bond Fund | | | 1,117,877 | | | | 2,597 | | | | (1,275 | ) | | | 1,322 | |
Intermediate Duration Credit Fund | | | 1,432,558 | | | | 20,339 | | | | (12,223 | ) | | | 8,116 | |
Dynamic Asset Allocation Fund | | | 1,534,330 | | | | 535,555 | | | | (65,545 | ) | | | 470,010 | |
Multi-Asset Real Return Fund | | | 850,524 | | | | 25,669 | | | | (16,633 | ) | | | 9,036 | |
Management has analyzed the Funds’ tax positions taken on Federal income tax returns for all open tax years and has concluded that as of May 31, 2016, no provision for income tax would be required in the Funds’ financial statements. The Funds’ Federal and state income and Federal excise tax returns for tax years for which the applicable statutes of limitations have not expired are subject to examination by the Internal Revenue Service and state departments of revenue.
10. CONCENTRATION/RISKS
In the normal course of business, the Trust enters into contracts that provide general indemnifications by the Trust to the counterparty to the contract. The Trust’s maximum exposure under these arrangements is dependent on future claims that may be made against the Trust and, therefore, cannot be estimated; however, Management believes that, based on experience, the risk of loss from such claims is considered remote.
The market values of the Core Fixed Income, High Yield Bond, Long Duration, Long Duration Credit, Ultra Short Duration Bond, Limited Duration Bond, Intermediate Duration Credit and Multi-Asset Real Return Funds’ investments will change in response to interest rate changes and other factors. During periods of falling interest rates, the values of fixed income securities generally rise. Conversely, during periods of rising interest rates, the values of such securities generally decline. Changes by recognized rating agencies in the ratings of any fixed income security and in the ability of an issuer to make payments of interest and principal may also affect the value of these investments.
| | |
| 316 | | SEI Institutional Investments Trust / Annual Report / May 31, 2016 |
The World Equity Ex-US, Screened World Equity Ex-US, Emerging Markets Equity and Emerging Markets Debt Funds concentrate their investments in securities of foreign issuers in various countries. These investments may involve certain considerations and risks not typically associated with investments in the United States, as a result of, among other factors, the possibility of future political and economic developments and the level of governmental supervision and regulation of securities markets in the respective countries.
The following descriptions provide additional information about some of the risks of investing in the Funds:
Asset-Backed Securities Risk — Payment of principal and interest on asset-backed securities is dependent largely on the cash flows generated by the assets backing the securities, and asset-backed securities may not have the benefit of any security interest in the related assets.
Bank Loans Risk — With respect to bank loans, the Fund will assume the credit risk of both the borrower and the lender that is selling the participation. The Fund may also have difficulty disposing of bank loans because, in certain cases, the market for such instruments is not highly liquid.
Credit Risk — The risk that the issuer of a security or the counterparty to a contract will default or otherwise become unable to honor a financial obligation.
Currency Risk — To the extent a Fund takes positions in currencies, it will be subject to the risk that currency exchange rates may fluctuate in response to, among other things, changes in interest rates, intervention (or failure to intervene) by U.S. or foreign governments, central banks or supranational entities, or by the imposition of currency controls or other political developments in the United States or abroad.
Fixed Income Market Risk — The prices of a Fund’s fixed income securities respond to economic developments, particularly interest rate changes, as well as to perceptions about the creditworthiness of individual issuers, including governments and their agencies. Generally, the Fund’s fixed income securities will decrease in value if interest rates rise and vice versa. In the case of foreign securities, price fluctuations will reflect international economic and political events, as well as changes in currency valuations relative to the U.S. dollar.
Foreign Investment/Emerging Markets Risk — The risk that non-U.S. securities may be subject to additional risks due to, among other things, political, social and economic developments abroad, currency movements,
and different legal, regulatory and tax environments. These additional risks may be heightened with respect to emerging market countries since political turmoil and rapid changes in economic conditions are more likely to occur in these countries.
Interest Rate Risk — The risk that a rise in interest rates will cause a fall in the value of fixed income securities, including U.S. Government Securities, in which the Fund invests. Although U.S. Government securities are considered to be among the safest investments, they are not guaranteed against price movements due to changing interest rates. A low interest rate environment may present greater interest rate risk, because there may be a greater likelihood of rates increasing and rates may increase more rapidly.
Leverage Risk — Certain Fund transactions, such as derivatives or reverse repurchase agreements, may give rise to a form of leverage. The use of leverage can amplify the effects of market volatility on the Funds’ share price and make the Funds’ returns more volatile. This is because leverage tends to exaggerate the effect of any increase or decrease in the value of the Funds’ portfolio securities. The use of leverage may also cause the Funds to liquidate portfolio positions when it would not be advantageous to do so in order to satisfy its obligations.
Mortgage-Backed Securities Risk — Mortgage-backed securities are affected by, among other things, interest rate changes and the possibility of prepayment of the underlying mortgage loans. Mortgage-backed securities are also subject to the risk that underlying borrowers will be unable to meet their obligations.
Please refer to each Fund’s current prospectus for additional disclosure regarding the risks associated with investing in the Funds. The foregoing is not intended to be a complete discussion of the risks associated with the investment strategies of the Funds.
11. IN-KIND TRANSFERS OF SECURITIES
During the year ended May 31, 2016, the Core Fixed Income, Long Duration and Long Duration Credit Funds issued/(redeemed) shares of beneficial interest in exchange for securities. These securities were transferred at their current value on the date of such transactions.
| | | | | | | | | | | | |
| | | Shares Issued
(Redeemed)
(Thousands) | | | Value
($ Thousands) | | | Gain
($ Thousands) | |
Core Fixed Income Fund | | | | | | | | | | | | |
12/31/2015 | | | 6,509 | | | $ | 66,396 | | | $ | — | |
Long Duration Fund | | | | | | | | | | | | |
05/31/2016 | | | (3,777 | ) | | | (33,688 | ) | | | 2,784 | |
Long Duration Credit Fund | | | | | | | | | | | | |
05/31/2016 | | | 3,309 | | | | 33,688 | | | | — | |
| | | | |
| SEI Institutional Investments Trust / Annual Report / May 31, 2016 | | | 317 | |
NOTES TO FINANCIAL STATEMENTS/CONSOLIDATED NOTES TO FINANCIAL STATEMENTS (Concluded)
MAY 31, 2016
During the year ended May 31, 2015, the S&P 500 Index, Long Duration Credit, and Intermediate Duration Credit Funds issued shares of beneficial interest in exchange for securities. These securities were transferred at their current value on the date of such transactions.
| | | | | | | | | | | | |
| | | Shares Issued
(Thousands) | | | Value
($ Thousands) | | | Gain
($ Thousands) | |
S&P 500 Index Fund | | | | | | | | | | | | |
10/31/2014 | | | 73,459 | | | $ | 821,276 | | | $ | — | |
12/30/2014 | | | 70,090 | | | | 806,037 | | | | — | |
02/27/2015 | | | 7,008 | | | | 81,779 | | | | — | |
03/31/2015 | | | 418 | | | | 4,800 | | | | — | |
04/30/2015 | | | 3,574 | | | | 41,249 | | | | — | |
Long Duration Credit Fund | | | | | | | | | | | | |
04/30/2015 | | | 8,812 | | | | 91,729 | | | | — | |
Intermediate Duration Credit Fund | | | | | | | | | | | | |
04/30/2015 | | | 1,153 | | | | 11,402 | | | | — | |
12. SECURITIES LENDING
To the extent consistent with its Investment Objective and Strategies, a Fund may lend portfolio securities to brokers, dealers and other financial organizations that meet capital and other credit requirements or other criteria established by the Trust’s Board of Trustees. These loans may not exceed 33 1/3% of the total asset value of the Fund including the loan collateral). No Fund will lend portfolio securities to its Adviser, sub-adviser or their affiliates unless it has applied for and received specific authority to do so from the SEC. Loans of portfolio securities will be fully collateralized by cash. Collateral will be maintained in an amount equal to at least 100% of the current market value of the loaned securities by marking-to-market daily, although the borrower will be required to deliver collateral between 102% and 105% of the market value of borrowed securities for domestic and foreign securities, respectively. However, due to market fluctuations during the day, the value of securities loaned on a particular day may, during the course of the day, exceed the value of collateral. On each business day, the amount of collateral is adjusted based on the prior day’s market fluctuations and the current day’s lending activity.
Income from lending activity is determined by the amount of interest earned on collateral, less any amounts payable to the borrowers of the securities and the lending agent. Lending securities involves certain risks, including the risk that the Fund may be delayed or prevented from recovering the collateral if the borrower fails to return the securities.
Cash collateral received in connection with securities lending is invested in short-term investments by the lending agent. These investments may include the SEI Liquidity Fund, L.P., and the Fund bears all of the gains and losses on such investment. There is no guarantee that these investments will not lose value.
The following is a summary of securities lending agreements held by certain Funds which would be subject to offset as of May 31, 2016 ($ Thousands):
| | | | | | | | | | | | |
| Fund | | Securities Loaned at Value | | | Cash Collateral Received(1) | | | Net
Amount | |
Large Cap Fund | | $ | 39,531 | | | $ | 39,531 | | | $ | — | |
Large Cap Disciplined Equity Fund | | | 23,966 | | | | 23,966 | | | | — | |
Large Cap Index Fund | | | 20,437 | | | | 20,437 | | | | — | |
S&P 500 Index Fund | | | 25,973 | | | | 25,973 | | | | — | |
Extended Market Index Fund | | | 41,654 | | | | 41,654 | | | | — | |
Small Cap Fund | | | 21,631 | | | | 21,631 | | | | — | |
Small Cap II Fund | | | 33,133 | | | | 33,133 | | | | — | |
Small/Mid Cap Equity Fund | | | 149,493 | | | | 149,493 | | | | — | |
World Equity Ex-US Fund | | | 344,379 | | | | 344,379 | | | | — | |
| (1) | | Excess collateral received in connection with the above securities lending transactions is not shown for financial reporting purposes. See each Fund’s Summary Schedule of Investments or Schedule of Investments for the total collateral received. |
13. CONCENTRATION OF SHAREHOLDERS
SEI Private Trust Company (“SPTC”) and SIMC are subsidiaries of SEI Investments Company. As of May 31, 2016, SPTC held of record the following:
| | | | |
| Large Cap Fund | | | 54.71 | % |
| Large Cap Fund Diversified Alpha Fund | | | 99.48 | % |
| Large Cap Disciplined Equity Fund | | | 70.11 | % |
| Large Cap Index Fund | | | 55.03 | % |
| S&P 500 Index Fund | | | 52.39 | % |
| Extended Market Index Fund | | | 63.48 | % |
| Small Cap Fund | | | 41.97 | % |
| Small Cap II Fund | | | 51.37 | % |
| Small/Mid Cap Equity Fund | | | 60.56 | % |
| U.S. Managed Volatility Fund | | | 57.80 | % |
| Global Managed Volatility Fund | | | 47.06 | % |
| World Equity Ex-US Fund | | | 55.39 | % |
| Screened World Equity Ex-US Fund | | | 100.00 | % |
| Emerging Markets Equity Fund | | | 67.33 | % |
| Opportunistic Income Fund | | | 71.82 | % |
| Core Fixed Income Fund | | | 61.30 | % |
| High Yield Bond Fund | | | 56.57 | % |
| Long Duration Fund | | | 68.78 | % |
| Long Duration Credit Fund | | | 36.50 | % |
| Ultra Short Duration Bond Fund | | | 73.84 | % |
| Emerging Markets Debt Fund | | | 61.44 | % |
| Real Return Fund | | | 67.69 | % |
| Limited Duration Bond Fund | | | 66.72 | % |
| Intermediate Duration Credit Fund | | | 48.72 | % |
| Dynamic Asset Allocation Fund | | | 66.86 | % |
| Multi-Asset Real Return Fund | | | 69.64 | % |
SPTC is not a direct service provider to the Funds. However, SPTC performs a key role in the comprehensive investment solution that SEI provides to investors. SPTC holds the vast majority of shares in the Funds as custodian for shareholders that are clients of the advisors and financial planners. SPTC maintains accounts at SEI Institutional Transfer Agency (“SITA”), and operates in an omnibus fund account environment.
| | |
| 318 | | SEI Institutional Investments Trust / Annual Report / May 31, 2016 |
14. SUBSEQUENT EVENTS
Management has evaluated the need for disclosures and/or adjustments resulting from subsequent events through the date the financial statements were issued. Based on this evaluation, no disclosure and/or adjustments were required to the financial statements as of May 31, 2016.
| | | | |
| SEI Institutional Investments Trust / Annual Report / May 31, 2016 | | | 319 | |
REPORT OF INDEPENDENT REGISTERED PUBLIC ACCOUNTING FIRM
The Shareholders and Board of Trustees
We have audited the accompanying statements of assets and liabilities, including the summary schedules of investments, of the Large Cap Fund, Large Cap Diversified Alpha Fund, Large Cap Disciplined Equity Fund, Large Cap Index Fund, S&P 500 Index Fund, Extended Market Index Fund, Small Cap Fund, Small Cap II Fund, Small/Mid Cap Equity Fund, U.S. Managed Volatility Fund, Global Managed Volatility Fund, World Equity Ex-US Fund, Screened World Equity Ex-US Fund and Emerging Markets Equity Fund and the statements of assets and liabilities, including the schedules of investments, of the Opportunistic Income Fund, Core Fixed Income Fund, High Yield Bond Fund, Long Duration Fund, Long Duration Credit Fund, Ultra Short Duration Bond Fund, Emerging Markets Debt Fund, Real Return Fund, Limited Duration Bond Fund and Intermediate Duration Credit Fund (twenty-four of the twenty-six funds comprising the SEI Institutional Investments Trust (the Trust)), as of May 31, 2016, and the related statements of operations for the year or period then ended, the statements of changes in net assets for each of the years or periods in the two-year period then ended, and the financial highlights for each of the years or periods in the five-year period then ended. We have also audited the accompanying consolidated statements of assets and liabilities, including the consolidated summary schedules of investments of the Dynamic Asset Allocation Fund and the Multi-Asset Real Return Fund, as of May 31, 2016 (two of the twenty-six funds comprising the Trust), and the related consolidated statements of operations for the year then ended, the consolidated statements of changes in net assets for each of the years in the two-year period then ended, the consolidated statement of cash flows for the year then ended for the Multi-Asset Real Return Fund, and the consolidated financial highlights for each of the years or periods in the five-year period then ended. These financial statements and consolidated financial statements and financial highlights and consolidated financial highlights are the responsibility of the Trust’s management. Our responsibility is to express an opinion on these financial statements and consolidated financial statements and financial highlights and consolidated financial highlights based on our audits.
We conducted our audits in accordance with the standards of the Public Company Accounting Oversight Board (United States). Those standards require that we plan and perform the audit to obtain reasonable assurance about whether the financial statements and financial highlights are free of material misstatement. An audit includes examining, on a test basis, evidence supporting the amounts and disclosures in the financial statements. Our procedures included confirmation of securities owned as of May 31, 2016, by correspondence with custodians and brokers or other appropriate auditing procedures. An audit also includes assessing the accounting principles used and significant estimates made by management, as well as evaluating the overall financial statement presentation. We believe that our audits provide a reasonable basis for our opinion.
In our opinion, the financial statements and consolidated financial statements and financial highlights and consolidated financial highlights referred to above present fairly, in all material respects, the financial position of each of the funds comprising the SEI Institutional Investments Trust as of May 31, 2016, the results of their operations, the changes in their net assets, their cash flows, and the financial highlights for each of the years or periods described in the first paragraph, in conformity with U.S. generally accepted accounting principles.

Philadelphia, Pennsylvania
July 29, 2016
| | |
| 320 | | SEI Institutional Investments Trust / Annual Report / May 31, 2016 |
TRUSTEES AND OFFICERS OF THE TRUST (Unaudited)
The following chart lists Trustees and Officers as of May 31, 2016.
Set forth below are the names, addresses, ages, position with the Trust, Term of Office and Length of Time Served, the principal occupations for the last five years, number of portfolios in fund complex overseen by trustee, and other directorships outside the fund complex of each of the persons currently serving as Trustees and Officers of the Trust. The Trust’s Statement of Additional Information (“SAI”) includes additional information about the Trustees and Officers. The SAI may be obtained without charge by calling 1-800-342-5734.
| | | | | | | | | | |
| Name | | Position(s) Held with Trusts | | Term of Office and Length of
Time Served 1 | | Principal Occupation(s)
During Past Five Years | | Number of
Portfolios in
Fund Complex
Overseen by Trustee 2 | | Other Directorships
Held by Trustee |
| INTERESTED TRUSTEES | | | | | | | | |
Robert A. Nesher One Freedom Valley Drive Oaks, PA 19456 68 yrs. old | | Chairman of the Board of Trustees* | | since 1995 | | Currently performs various services on behalf of SEI for which Mr. Nesher is compensated. | | 104 | | Vice Chairman of The Advisors’ Inner Circle Fund III, O’Connor EQUUS, Winton Series Trust and Winton Diversified Opportunities Fund since 2014. Vice Chairman of Gallery Trust since 2015. President and Director of SEI Structured Credit Fund, LP. Director of SEI Global Master Fund plc, SEI Global Assets Fund plc, SEI Global Investments Fund plc, SEI Investments — Global Funds Services, Limited, SEI Investments Global, Limited, SEI Investments (Europe) Ltd., SEI Multi-Strategy Funds PLC, SEI Global Nominee Ltd and SEI Investments — Unit Trust Management (UK) Limited. Director and President of SEI Opportunity Fund, L.P. to 2010. Director of SEI Alpha Strategy Portfolios, LP from 2007 to 2013. Trustee of The Advisors’ Inner Circle Fund, The Advisors’ Inner Circle Fund II, Bishop Street Funds and The KP Funds. |
William M. Doran One Freedom Valley Drive Oaks, PA 19456 74 yrs. old | | Trustee* | | since 1995 | | Self-employed consultant since 2003. Partner, Morgan, Lewis & Bockius LLP (law firm) from 1976 to 2003, counsel to the Trust, SEI, SIMC, the Administrator and the Distributor. | | 104 | | Director of SEI since 1974;. Director of SEI Investments Distribution Co. since 2003.Director of SEI Investments — Global Funds Services, Limited, SEI Investments Global, Limited, SEI Investments (Europe), Limited, SEI Investments (Asia) Limited, SEI Global Nominee Ltd. and SEI Investments — Unit Trust Management (UK) Limited. Director of SEI Opportunity Fund, L.P. to 2010. Director of SEI Alpha Strategy Portfolios, LP from 2007 to 2013. Trustee/Director of The Advisors’ Inner Circle Fund, The Advisors’ Inner Circle Fund II, The Advisors’ Inner Circle Fund III, O’Connor EQUUS, Winton Series Trust, Winton Diversified Opportunities Fund, Gallery Trust, Bishop Street Funds, and The KP Funds. |
| | * | Messrs. Nesher and Doran are Trustees who may be deemed as “interested” persons of the Trust as that term is defined in the 1940 Act by virtue of their affiliation with SIMC and the Trust’s Distributor. |
| | 1 | There is no stated term of office for the Trustees of the Trust. However, a Trustee must retire from the Board by the end of the calendar year in which the Trustee turns 75 provided that, although there shall be a presumption that each Trustee attaining such age shall retire, the Board may, if it deems doing so to be consistent with the best interest of the Trust, and with the consent of any Trustee that is eligible for retirement, by unanimous vote, extend the term of such Trustee for successive periods of one year. |
| | 2 | The Fund Complex includes the following Trusts: SEI Asset Allocation Trust, SEI Daily Income Trust, SEI Institutional Investments Trust, Adviser Managed Trust, SEI Institutional International Trust, SEI Institutional Managed Trust, SEI Liquid Asset Trust, SEI Tax Exempt Trust, SEI |
| | | Insurance Products Trust, New Covenant Funds and SEI Catholic Values Trust. |
| | | | |
| SEI Institutional Investments Trust / Annual Report / May 31, 2016 | | | 321 | |
TRUSTEES AND OFFICERS OF THE TRUST (Unaudited) (Continued)
| | | | | | | | | | |
Name
Address,
and Age | | Position(s)
Held with
Trusts | | Term of
Office and
Length of
Time Served1 | | Principal Occupation(s)
During Past Five Years | | Number of
Portfolios in
Fund Complex
Overseen
by Trustee2 | | Other Directorships
Held by Trustee |
| TRUSTEES | | | | | | | | |
George J. Sullivan, Jr. One Freedom Valley Drive Oaks, PA 19456 72 yrs. old | | Trustee | | since 1996 | | Retired since January 2012. Self-Employed Consultant, Newfound Consultants Inc. April 1997-December 2011. | | 104 | | Director of SEI Opportunity Fund, L.P. to 2010. Director of SEI Alpha Strategy Portfolios, LP from 2007 to 2013. Trustee/Director of State Street Navigator Securities Lending Trust, The Advisors’ Inner Circle Fund, The Advisors’ Inner Circle Fund II, Bishop Street Funds, and The KP Funds. |
Nina Lesavoy One Freedom Valley Drive Oaks, PA 19456 57 yrs. old | | Trustee | | since 2003 | | Founder and Managing Director, Avec Capital since 2008. Managing Director, Cue Capital from March 2002-March 2008. | | 104 | | Director of SEI Opportunity Fund, L.P. to 2010. Director of SEI Alpha Strategy Portfolios, LP from 2007 to 2013. Director of SEI Structured Credit Fund, L.P. |
James M. Williams One Freedom Valley Drive Oaks, PA 19456 67 yrs. old | | Trustee | | since 2004 | | Vice President and Chief Investment Officer, J. Paul Getty Trust, Non-Profit Foundation for Visual Arts, since December 2002. President, Harbor Capital Advisors and Harbor Mutual Funds, 2000-2002. Manager, Pension Asset Management, Ford Motor Company, 1997-1999. | | 104 | | Director of SEI Opportunity Fund, L.P. to 2010. Director of SEI Alpha Strategy Portfolios, LP from 2007 to 2013. Trustee/Director of Ariel Mutual Funds, and SEI Structured Credit Fund, L.P. |
Mitchell A. Johnson One Freedom Valley Drive Oaks, PA 19456 73 yrs. old | | Trustee | | since 2007 | | Retired Private Investor since 1994. | | 104 | | Director, Federal Agricultural Mortgage Corporation (Farmer Mac) since 1997. Director of SEI Alpha Strategy Portfolios, LP from 2007 to 2013. Trustee of the Advisors’ Inner Circle Fund, The Advisors’ Inner Circle Fund II, and Bishop Street Funds and The KP Funds. |
Hubert L. Harris, Jr. One Freedom Valley Drive Oaks, PA 19456 71 yrs. old | | Trustee | | since 2008 | | Retired since December 2005. Owner of Harris Plantation, Inc. since 1995. Chief Executive Officer of Harris CAPM, a consulting asset and property management entity. Chief Executive Officer, INVESCO North America, August 2003-December 2005. Chief Executive Officer and Chair of the Board of Directors, AMVESCAP Retirement, Inc., January 1998- August 2003. | | 104 | | Director of AMVESCAP PLC from 1993-2004. Served as a director of a bank holding company, 2003-2009. Director, Aaron’s Inc., 2012-present. President and CEO, Oasis Ornamentals LLC, 2011-present. Serves as a member of the Board of Councilors of the Carter Center (nonprofit corporation) and served on the board of other non-profit organizations. Director of SEI Alpha Strategy Portfolios, LP from 2008 to 2013. |
Susan C. Cote One Freedom Valley Drive Oaks, PA 19456 61 yrs. old | | Trustee | | since 2015 | | Retired since July 2015. Americas Director of Asset Management, Ernst & Young LLP from 2006-2013. Global Asset Management Assurance Leader, Ernst & Young LLP from 2006-2015. Partner, Ernst & Young LLP from 1997-2015. Prudential, 1983-1997. Member of Ernst & Young LLP Retirement Investment Committee. Treasurer and Chair of Finance, Investment and Audit Committee of the New York Women’s Foundation. Independent Consultant to SEI Liquid Asset Allocation Trust. | | 104 | | N/A |
| | |
| 322 | | SEI Institutional Investments Trust / Annual Report / May 31, 2016 |
| | | | | | | | | | |
Name
Address,
and Age | | Position(s)
Held with
Trusts | | Term of
Office and
Length of
Time Served1 | | Principal Occupation(s)
During Past Five Years | | Number of
Portfolios in
Fund Complex
Overseen
by Trustee2 | | Other Directorships
Held by Trustee |
| OFFICERS | | | | | | | | |
Robert A. Nesher One Freedom Valley Drive Oaks, PA 19456 68 yrs. old | | President and CEO | | since 2005 | | Currently performs various services on behalf of SEI for which Mr. Nesher is compensated. | | N/A | | N/A |
Arthur Ramanjulu One Freedom Valley Drive Oaks, PA 19456 51 yrs. old | | Controller and Chief Financial Officer | | since 2015 | | Director, Funds Accounting, SEI Investments Global Funds Services (March 2015); Senior Manager, Funds Accounting, SEI Global Funds Services (March 2007 to February 2015). | | N/A | | N/A |
Russell Emery One Freedom Valley Drive Oaks, PA 19456 52 yrs. old | | Chief Compliance Officer | | since 2006 | | Chief Compliance Officer of SEI Institutional Investments Trust, SEI Asset Allocation Trust, SEI Institutional International Trust, SEI Liquid Asset Trust, SEI Daily Income Trust, SEI Institutional Managed Trust, SEI Tax Exempt Trust, The Advisors’ Inner Circle Fund, The Advisors’ Inner Circle Fund II and Bishop Street Funds since March 2006. Chief Compliance Officer of SEI Structured Credit Fund, LP since June 2007. Chief Compliance Officer of SEI Opportunity Fund, L.P. to 2010. Chief Compliance Officer of SEI Alpha Strategy Portfolios, LP from 2007 to 2013. Chief Compliance Officer of Adviser Managed Trust since December 2010. Chief Compliance Officer of New Covenant Funds since February 2012. Chief Compliance Officer of SEI Insurance Products Trust and The KP Funds since 2013. Chief Compliance Officer of The Advisors’ Inner Circle Fund III, O’Connor EQUUS, Winton Series Trust and Winton Diversified Opportunities Fund since 2014. Chief Compliance Officer of SEI Catholic Values Trust and Gallery Trust since 2015. | | N/A | | N/A |
Timothy D. Barto One Freedom Valley Drive Oaks, PA 19456 47 yrs. old | | Vice President and Secretary | | since 2002 | | Vice President and Secretary of SEI Institutional Transfer Agent, Inc. since 2009. General Counsel and Secretary of SIMC and the Administrator since 2004. Vice President of SIMC and the Administrator since 1999. Vice President and Assistant Secretary of SEI since 2001. | | N/A | | N/A |
Aaron Buser One Freedom Valley Drive Oaks, PA 19456 44 yrs. old | | Vice President and Assistant Secretary | | since 2008 | | Vice President and Assistant Secretary of SEI Institutional Transfer Agent, Inc. since 2009. Vice President and Assistant Secretary of SIMC since 2007. Attorney, Stark & Stark (law firm), March 2004-July 2007. | | N/A | | N/A |
David F. McCann One Freedom Valley Drive Oaks, PA 19456 39 yrs. old | | Vice President and Assistant Secretary | | since 2009 | | Vice President and Assistant Secretary of SEI Institutional Transfer Agent, Inc. since 2009. Vice President and Assistant Secretary of SIMC since 2008. Attorney, Drinker Biddle & Reath, LLP (law firm), May 2005-October 2008. | | N/A | | N/A |
| | | | |
| SEI Institutional Investments Trust / Annual Report / May 31, 2016 | | | 323 | |
TRUSTEES AND OFFICERS OF THE TRUST (Unaudited) (Concluded)
| | | | | | | | | | |
Name
Address,
and Age | | Position(s)
Held with
Trusts | | Term of
Office and
Length of
Time Served1 | | Principal Occupation(s)
During Past Five Years | | Number of
Portfolios in
Fund Complex
Overseen
by Trustee2 | | Other Directorships
Held by Trustee |
| OFFICERS (continued) | | | | | | | | |
Stephen G. MacRae One Freedom Valley Drive Oaks, PA 19456 47 yrs. old | | Vice President | | since 2012 | | Director of Global Investment Product Management, January 2004 to present. | | N/A | | N/A |
Bridget E. Sudall One Freedom Valley Drive Oaks, PA 19456 35 yrs. old | | Anti-Money Laundering Compliance Officer and Privacy Officer | | since 2015 | | Anti-Money Laundering Compliance Officer and Privacy Officer (since 2015), Senior Associate and AML Officer, Morgan Stanley Alternative Investment Partners, April 2011-March 2015, Investor Services Team Lead, Morgan Stanley Alternative Investment Partners, July 2007-April 2011. | | N/A | | N/A |
| | 1 | There is no stated term of office for the Trustees of the Trust. However, a Trustee must retire from the Board by the end of the calendar year in which the Trustee turns 75 provided that, although there shall be a presumption that each Trustee attaining such age shall retire, the Board may, if it deems doing so to be consistent with the best interest of the Trust, and with the consent of any Trustee that is eligible for retirement, by unanimous vote, extend the term of such Trustee for successive periods of one year. |
| | 2 | The Fund Complex includes the following Trusts: SEI Asset Allocation Trust, SEI Daily Income Trust, SEI Institutional Investments Trust, Adviser Managed Trust, SEI Institutional International Trust, SEI Institutional Managed Trust, SEI Liquid Asset Trust, SEI Tax Exempt Trust, SEI Insurance Products Trust, New Covenant Funds and SEI Catholic Values Trust. |
| | |
| 324 | | SEI Institutional Investments Trust / Annual Report / May 31, 2016 |
DISCLOSURE OF FUND EXPENSES (Unaudited)
May 31, 2016
All mutual funds have operating expenses. As a shareholder of a fund, your investment is affected by these ongoing costs, which include (among others) costs for portfolio management, administrative services, and shareholder reports like this one. It is important for you to understand the impact of these costs on your investment returns.
Operating expenses such as these are deducted from the fund’s gross income and directly reduce your final investment return. These expenses are expressed as a percentage of the fund’s average net assets; this percentage is known as the fund’s expense ratio.
The following examples use the expense ratio and are intended to help you understand the ongoing costs (in dollars) of investing in your fund and to compare these costs with those of other mutual funds. The examples are based on an investment of $1,000 made at the beginning of the period shown and held for the entire period (December 1, 2015 through May 31, 2016).
The table on this page illustrates your fund’s costs in two ways:
• Actual fund return. This section helps you to estimate the actual expenses after fee waivers that your Fund incurred over the period. The “Expenses Paid During Period” column shows the actual dollar expense cost incurred by a $1,000 investment in the Fund, and the “Ending Account Value” number is derived from deducting that expense cost from the Fund’s gross investment return.
You can use this information, together with the actual amount you invested in the Fund, to estimate the expenses you paid over that period. Simply divide your actual account value by $1,000 to arrive at a ratio (for example, an $8,600 account value divided by $1,000 = 8.6), then multiply that ratio by the number shown for your Fund under “Expenses Paid During Period.”
• Hypothetical 5% return. This section helps you compare your Fund’s costs with those of other mutual funds. It assumes that the fund had an annual 5% return before expenses during the year, but that the expense ratio (Column 3) for the period is unchanged. This example is useful in making comparisons because the Securities and Exchange Commission requires all mutual funds to make this 5% calculation. You can assess your Fund’s comparative cost by comparing the hypothetical result for your Fund in the “Expense Paid During Period” column with those that appear in the same charts in the shareholder reports for other funds.
NOTE: Because the return is set at 5% for comparison purposes — NOT your Fund’s actual return — the account values shown may not apply to your specific investment.
| | | | | | | | | | | | | | | | |
| | | Beginning
Account
Value
12/1/15 | | | Ending
Account
Value
5/31/16 | | | Annualized
Expense
Ratios | | | Expenses
Paid
During
Period* | |
Large Cap Fund | |
Actual Fund Return | | | | | | | | | |
Class A Shares | | $ | 1,000.00 | | | $ | 986.50 | | | | 0.20 | % | | $ | 0.99 | |
Hypothetical 5% Return | | | | | | | | | |
Class A Shares | | $ | 1,000.00 | | | $ | 1,024.00 | | | | 0.20 | % | | $ | 1.01 | |
Large Cap Diversified Alpha Fund | |
Actual Fund Return | | | | | | | | | |
Class A Shares | | $ | 1,000.00 | | | $ | 992.40 | | | | 0.24 | % | | $ | 1.20 | |
Hypothetical 5% Return | | | | | | | | | |
Class A Shares | | $ | 1,000.00 | | | $ | 1,023.80 | | | | 0.24 | % | | $ | 1.21 | |
Large Cap Disciplined Equity Fund | |
Actual Fund Return | | | | | | | | | |
Class A Shares | | $ | 1,000.00 | | | $ | 1,014.40 | | | | 0.19 | % | | $ | 0.96 | |
Hypothetical 5% Return | | | | | | | | | |
Class A Shares | | $ | 1,000.00 | | | $ | 1,024.05 | | | | 0.19 | % | | $ | 0.96 | |
| | | | | | | | | | | | | | | | |
| | | Beginning
Account
Value
12/1/15 | | | Ending
Account
Value
5/31/16 | | | Annualized
Expense
Ratios | | | Expenses
Paid
During
Period* | |
Large Cap Index Fund | |
Actual Fund Return | | | | | | | | | |
Class A | | $ | 1,000.00 | | | $ | 1,016.20 | | | | 0.04 | % | | $ | 0.20 | |
Hypothetical 5% Return | | | | | | | | | |
Class A | | $ | 1,000.00 | | | $ | 1,024.80 | | | | 0.04 | % | | $ | 0.20 | |
S&P 500 Index Fund | |
Actual Fund Return | | | | | | | | | |
Class A | | $ | 1,000.00 | | | $ | 1,018.80 | | | | 0.06 | % | | $ | 0.30 | |
Hypothetical 5% Return | | | | | | | | | |
Class A | | $ | 1,000.00 | | | $ | 1,024.70 | | | | 0.06 | % | | $ | 0.30 | |
Extended Market Index Fund | |
Actual Fund Return | | | | | | | | | |
Class A | | $ | 1,000.00 | | | $ | 988.50 | | | | 0.07 | % | | $ | 0.35 | |
Hypothetical 5% Return | | | | | | | | | |
Class A | | $ | 1,000.00 | | | $ | 1,024.65 | | | | 0.07 | % | | $ | 0.35 | |
| | | | |
| SEI Institutional Investments Trust / Annual Report / May 31, 2016 | | | 325 | |
DISCLOSURE OF FUND EXPENSES (Unaudited) (Concluded)
May 31, 2016
| | | | | | | | | | | | | | | | |
| | | Beginning
Account
Value
12/1/15 | | | Ending
Account
Value
5/31/16 | | | Annualized
Expense
Ratios | | | Expenses
Paid
During
Period* | |
Small Cap Fund | |
Actual Fund Return | | | | | | | | | |
Class A Shares | | $ | 1,000.00 | | | $ | 972.90 | | | | 0.46 | % | | $ | 2.27 | |
Hypothetical 5% Return | | | | | | | | | |
Class A Shares | | $ | 1,000.00 | | | $ | 1,022.70 | | | | 0.46 | % | | $ | 2.33 | |
Small Cap II Fund | |
Actual Fund Return | | | | | | | | | |
Class A Shares | | $ | 1,000.00 | | | $ | 965.60 | | | | 0.45 | % | | $ | 2.21 | |
Hypothetical 5% Return | | | | | | | | | |
Class A Shares | | $ | 1,000.00 | | | $ | 1,022.75 | | | | 0.45 | % | | $ | 2.28 | |
Small/Mid Cap Equity Fund | |
Actual Fund Return | | | | | | | | | |
Class A Shares | | $ | 1,000.00 | | | $ | 985.80 | | | | 0.46 | % | | $ | 2.28 | |
Hypothetical 5% Return | | | | | | | | | |
Class A Shares | | $ | 1,000.00 | | | $ | 1,022.70 | | | | 0.46 | % | | $ | 2.33 | |
U.S. Managed Volatility Fund | |
Actual Fund Return | | | | | | | | | |
Class A Shares | | $ | 1,000.00 | | | $ | 1,049.90 | | | | 0.24 | % | | $ | 1.23 | |
Hypothetical 5% Return | | | | | | | | | |
Class A Shares | | $ | 1,000.00 | | | $ | 1,023.80 | | | | 0.24 | % | | $ | 1.21 | |
Global Managed Volatility Fund (Commenced 1/29/2016) | |
Actual Fund Return | | | | | | | | | |
Class A Shares** | | $ | 1,000.00 | | | $ | 1,078.00 | | | | 0.26 | % | | $ | 0.91 | |
Hypothetical 5% Return | | | | | | | | | |
Class A Shares | | $ | 1,000.00 | | | $ | 1,023.70 | | | | 0.26 | % | | $ | 1.32 | |
World Equity Ex-US Fund | |
Actual Fund Return | | | | | | | | | |
Class A Shares | | $ | 1,000.00 | | | $ | 983.30 | | | | 0.34 | % | | $ | 1.69 | |
Hypothetical 5% Return | | | | | | | | | |
Class A Shares | | $ | 1,000.00 | | | $ | 1,023.30 | | | | 0.34 | % | | $ | 1.72 | |
Screened World Equity Ex-US Fund | |
Actual Fund Return | | | | | | | | | |
Class A Shares | | $ | 1,000.00 | | | $ | 991.30 | | | | 0.35 | % | | $ | 1.74 | |
Hypothetical 5% Return | | | | | | | | | |
Class A Shares | | $ | 1,000.00 | | | $ | 1,023.25 | | | | 0.35 | % | | $ | 1.77 | |
Emerging Markets Equity Fund | |
Actual Fund Return | | | | | | | | | |
Class A Shares | | $ | 1,000.00 | | | $ | 1,033.80 | | | | 0.75 | % | | $ | 3.81 | |
Hypothetical 5% Return | | | | | | | | | |
Class A Shares | | $ | 1,000.00 | | | $ | 1,021.25 | | | | 0.75 | % | | $ | 3.79 | |
Opportunistic Income Fund | |
Actual Fund Return | | | | | | | | | |
Class A Shares | | $ | 1,000.00 | | | $ | 1,011.30 | | | | 0.26 | % | | $ | 1.31 | |
Hypothetical 5% Return | | | | | | | | | |
Class A Shares | | $ | 1,000.00 | | | $ | 1,023.70 | | | | 0.26 | % | | $ | 1.32 | |
Core Fixed Income Fund | |
Actual Fund Return | | | | | | | | | |
Class A Shares | | $ | 1,000.00 | | | $ | 1,031.10 | | | | 0.13 | % | | $ | 1.53 | |
Hypothetical 5% Return | | | | | | | | | |
Class A Shares | | $ | 1,000.00 | | | $ | 1,024.35 | | | | 0.13 | % | | $ | 1.52 | |
| | | | | | | | | | | | | | | | |
| | | Beginning
Account
Value
12/1/15 | | | Ending
Account
Value
5/31/16 | | | Annualized
Expense
Ratios | | | Expenses
Paid
During
Period* | |
High Yield Bond Fund | |
Actual Fund Return | | | | | | | | | |
Class A Shares | | $ | 1,000.00 | | | $ | 1,042.10 | | | | 0.30 | % | | $ | 1.53 | |
Hypothetical 5% Return | | | | | | | | | |
Class A Shares | | $ | 1,000.00 | | | $ | 1,023.50 | | | | 0.30 | % | | $ | 1.52 | |
Long Duration Fund | |
Actual Fund Return | | | | | | | | | |
Class A Shares | | $ | 1,000.00 | | | $ | 1,082.10 | | | | 0.15 | % | | $ | 0.78 | |
Hypothetical 5% Return | | | | | | | | | |
Class A Shares | | $ | 1,000.00 | | | $ | 1,024.25 | | | | 0.15 | % | | $ | 0.76 | |
Long Duration Credit Fund | |
Actual Fund Return | | | | | | | | | |
Class A Shares | | $ | 1,000.00 | | | $ | 1,081.30 | | | | 0.15 | % | | $ | 0.78 | |
Hypothetical 5% Return | | | | | | | | | |
Class A Shares | | $ | 1,000.00 | | | $ | 1,024.25 | | | | 0.15 | % | | $ | 0.76 | |
Ultra Short Duration Bond Fund | |
Actual Fund Return | | | | | | | | | |
Class A Shares | | $ | 1,000.00 | | | $ | 1,007.90 | | | | 0.12 | % | | $ | 0.60 | |
Hypothetical 5% Return | | | | | | | | | |
Class A Shares | | $ | 1,000.00 | | | $ | 1,024.40 | | | | 0.12 | % | | $ | 0.61 | |
Emerging Markets Debt Fund | |
Actual Fund Return | | | | | | | | | |
Class A Shares | | $ | 1,000.00 | | | $ | 1,050.60 | | | | 0.43 | % | | $ | 2.20 | |
Hypothetical 5% Return | | | | | | | | | |
Class A Shares | | $ | 1,000.00 | | | $ | 1,022.85 | | | | 0.43 | % | | $ | 2.17 | |
Real Return Fund | |
Actual Fund Return | | | | | | | | | |
Class A Shares | | $ | 1,000.00 | | | $ | 1,015.80 | | | | 0.09 | % | | $ | 0.45 | |
Hypothetical 5% Return | | | | | | | | | |
Class A Shares | | $ | 1,000.00 | | | $ | 1,024.55 | | | | 0.09 | % | | $ | 0.46 | |
Limited Duration Bond Fund | |
Actual Fund Return | | | | | | | | | |
Class A Shares | | $ | 1,000.00 | | | $ | 1,012.30 | | | | 0.12 | % | | $ | 0.60 | |
Hypothetical 5% Return | | | | | | | | | |
Class A Shares | | $ | 1,000.00 | | | $ | 1,024.40 | | | | 0.12 | % | | $ | 0.61 | |
Intermediate Duration Credit Fund | |
Actual Fund Return | | | | | | | | | |
Class A Shares | | $ | 1,000.00 | | | $ | 1,043.20 | | | | 0.15 | % | | $ | 0.51 | |
Hypothetical 5% Return | | | | | | | | | |
Class A Shares | | $ | 1,000.00 | | | $ | 1,024.25 | | | | 0.15 | % | | $ | 0.76 | |
Dynamic Asset Allocation Fund | |
Actual Fund Return | | | | | | | | | |
Class A Shares | | $ | 1,000.00 | | | $ | 1,003.30 | | | | 0.08 | % | | $ | 0.40 | |
Hypothetical 5% Return | | | | | | | | | |
Class A Shares | | $ | 1,000.00 | | | $ | 1,024.60 | | | | 0.08 | % | | $ | 0.40 | |
Multi-Asset Real Return Fund | |
Actual Fund Return | | | | | | | | | |
Class A Shares | | $ | 1,000.00 | | | $ | 1,006.50 | | | | 0.62 | % | | $ | 0.66 | |
Hypothetical 5% Return | | | | | | | | | |
Class A Shares | | $ | 1,000.00 | | | $ | 1,021.90 | | | | 0.62 | % | | $ | 0.66 | |
| | * | | Expenses are equal to the Fund’s annualized expense ratio multiplied by the average account value over the period, multiplied by 183/366 (to reflect the one-half year period shown). |
| | ** | | Expenses are equal to the Fund’s annualized expense ratio multiplied by the average account value over the period, multiplied by 123/366 (to reflect the period since inception to period end). |
| | |
| 326 | | SEI Institutional Investments Trust / Annual Report / May 31, 2016 |
BOARD OF TRUSTEES CONSIDERATIONS IN APPROVING FUND’S INVESTMENT ADVISORY AND SUB-ADVISORY AGREEMENT (Unaudited)
SEI Institutional Investments Trust (the “Trust”) and SEI Investments Management Corporation (“SIMC”) have entered into an investment advisory agreement (the “Advisory Agreement”). Pursuant to the Advisory Agreement, SIMC is responsible for the investment advisory services provided to the series of the Trust (the “Funds”). Pursuant to separate sub-advisory agreements with SIMC (the “Sub-Advisory Agreements” and, together with the Advisory Agreement, the “Investment Advisory Agreements”), and under the supervision of SIMC and the Trust’s Board of Trustees (the “Board”), the sub-advisers (each, a “Sub-Adviser” and collectively, the “Sub-Advisers”) provide security selection and certain other advisory services with respect to all or a discrete portion of the assets of the Funds. The Sub-Advisers are also responsible for managing their employees who provide services to the Funds. The Sub-Advisers are selected based primarily upon the research and recommendations of SIMC, which evaluates quantitatively and qualitatively the Sub-Advisers’ skills and investment results in managing assets for specific asset classes, investment styles and strategies.
The Investment Company Act of 1940, as amended (the “1940 Act”), requires that the initial approval of, as well as the continuation of, the Funds’ Investment Advisory Agreements be specifically approved: (i) by the vote of the Board or by a vote of the shareholders of the Funds; and (ii) by the vote of a majority of the Trustees who are not parties to the Investment Advisory Agreements or “interested persons” of any party (the “Independent Trustees”), cast in person at a meeting called for the purpose of voting on such approval(s). In connection with their consideration of such approval(s), the Funds’ Trustees must request and evaluate, and SIMC and the Sub-Advisers are required to furnish, such information as may be reasonably necessary to evaluate the terms of the Investment Advisory Agreements. In addition, the Securities and Exchange Commission takes the position that, as part of their fiduciary duties with respect to a mutual fund’s fees, mutual fund boards are required to evaluate the material factors applicable to a decision to approve an Investment Advisory Agreement.
Consistent with these responsibilities, the Board calls and holds meetings each year to consider whether to approve new and/or renew existing Investment Advisory Agreements between the Trust and SIMC and SIMC and the Sub-Advisers with respect to the Funds of the Trust. In preparation for these meetings, the Board requests and reviews a wide variety of materials provided by SIMC and the Sub-Advisers, including information about SIMC’s and the Sub-Advisers’ affiliates, personnel and operations and the services provided pursuant to the Investment Advisory Agreements. The Board also receives data from third parties. This information is provided in addition to the detailed information about the Funds that the Board reviews during the course of each year, including information that relates to Fund operations and Fund performance. The Trustees also receive a memorandum from counsel regarding the responsibilities of Trustees in connection with their consideration of whether to approve the Trust’s Investment Advisory Agreements. Finally, the Independent Trustees receive advice from independent counsel to the Independent Trustees, meet in executive sessions outside the presence of Fund management and participate in question and answer sessions with representatives of SIMC and the Sub-Advisers.
Specifically, during the course of the Trust’s fiscal year, the Board requested and received written materials from SIMC and the Sub-Advisers regarding: (i) the quality of SIMC’s and the Sub-Advisers’ investment management and other services; (ii) SIMC’s and the Sub-Advisers’ investment management personnel; (iii) SIMC’s and the Sub-Advisers’ operations and financial condition; (iv) SIMC’s and the Sub-Advisers’ brokerage practices (including any soft dollar arrangements) and investment strategies; (v) the level of the advisory fees that SIMC charges the Funds and the level of the sub-advisory fees that SIMC pays the Sub-Advisers, compared with fees each charge to comparable accounts; (vi) the advisory fees charged by SIMC and the Funds’ overall fees and operating expenses compared with peer groups of mutual funds prepared by Broadridge, an independent provider of investment company data; (vii) the level of SIMC’s and the Sub-Advisers’ profitability from their Fund-related operations; (viii) SIMC’s and the Sub-Advisers’ compliance program, including a description of material compliance matters and material compliance violations; (ix) SIMC’s potential economies of scale; (x) SIMC’s and the Sub-Advisers’ policies on and compliance procedures for personal securities transactions; (xi) SIMC’s and the Sub-Advisers’ expertise and resources in domestic and/or international financial markets; and (xii) the Funds’ performance over various periods of time or compared with peer groups of mutual funds prepared by Broadridge and the Funds’ benchmark indices.
At the March 28-29 meetings of the Board, the Trustees, including a majority of the Independent Trustees, approved the renewal of the Advisory Agreement. Also, each Sub-Advisory Agreement (unless operating under an initial two-year term) was either initially approved or, if the Sub-Advisory Agreement was already in effect, renewed at a meeting of the Board during the course of the Trust’s fiscal year. In each case, the Board’s approvals were based on its consideration and evaluation of the factors described above, as discussed at the meetings and at prior meetings.
| | | | |
| SEI Institutional Investments Trust / Annual Report / May 31, 2016 | | | 327 | |
BOARD OF TRUSTEES CONSIDERATIONS IN APPROVING FUND’S INVESTMENT ADVISORY AND SUB-ADVISORY AGREEMENT (Unaudited) (Concluded)
The following discusses some, but not all, of the factors that were considered by the Board in connection with its assessment of the Investment Advisory Agreements.
Nature, Extent and Quality of Services. The Board considered the nature, extent and quality of the services provided by SIMC and the Sub-Advisers to the Funds and the resources of SIMC and the Sub-Advisers and their affiliates dedicated to the Funds. In this regard, the Trustees evaluated, among other things, SIMC’s and each Sub-Adviser’s personnel, experience, track record and compliance program. Following evaluation, the Board concluded that, within the context of its full deliberations, the nature, extent and quality of services provided by SIMC and the Sub-Advisers to the Funds and the resources of SIMC and the Sub-Advisers and their affiliates dedicated to the Funds were sufficient to support renewal of the Investment Advisory Agreements. In addition to advisory services, the Board considered the nature and quality of certain administrative, transfer agency and other non-investment advisory services provided to the Funds by SIMC and/or its affiliates.
Performance. In determining whether to renew SIMC’s Advisory Agreement, the Trustees considered the Funds’ performance relative to their peer groups and appropriate indices/benchmarks. The Trustees reviewed performance information for each Fund, noting that they receive performance reports that permit them to monitor each Fund’s performance at board meetings throughout the year. As part of this review, the Trustees considered the composition of each peer group and selection criteria. In assessing Fund performance, the Trustees considered a report compiled by Broadridge, an independent third-party, which was engaged to prepare an assessment of the Funds in connection with the renewal of the Advisory Agreement (the “Broadridge Report”). For each Fund with at least one year of performance history, with certain exceptions, the Broadridge Report included metrics on risk analysis, volatility versus total return, net total return, and performance consistency both for the Fund and a universe of comparable funds. For certain Funds, the Broadridge Report did not include metrics on risk analysis and for one Fund, the Broadridge Report did not include metrics on risk analysis, net total return or performance consistency. Based on the materials considered and discussed at the meetings, the Trustees found Fund performance satisfactory, or, where performance was materially below the benchmark and/or peer group, the Trustees were satisfied with the reasons provided to explain such performance. In connection with the approval or renewal of Sub-Advisory Agreements, the Board considered the performance of the Sub-Adviser relative to appropriate indices/benchmarks. Following evaluation, the Board concluded that, within the context of its full deliberations, the performance of the Funds was sufficient to support renewal of SIMC’s Advisory Agreement, and the performance of each Sub-Adviser was sufficient to support approval or renewal of the Sub-Advisory Agreement.
Fees. With respect to the Funds’ expenses under the Investment Advisory Agreements, the Trustees considered the rate of compensation called for by the Investment Advisory Agreements and the Funds’ net operating expense ratio in comparison to those of the Funds’ respective peer groups. In assessing Fund expenses, the Trustees considered the information in the Broadridge Report, which included various metrics related to fund expenses, including, but not limited to, contractual management fees at various fee levels, actual management fees, and actual total expenses (including underlying fund expenses) for the Funds and a universe of comparable funds. Based on the materials considered and discussion at the meetings, the Trustees further determined that fees were either shown to be below the peer average in the comparative fee analysis, or that there was a reasonable basis for the fee level. The Trustees also considered the effects of SIMC’s waiver of management and other fees to prevent total Fund operating expenses from exceeding a specified cap and concluded that SIMC, through waivers, has maintained the Funds’ net operating expenses at competitive levels for their distribution channels. In determining the appropriateness of fees, the Board also took into consideration the impact of fees incurred indirectly by the Funds as a result of investments into underlying funds, including funds from which SIMC or its affiliates earn fees. The Board also took into consideration compensation earned from the Funds by SIMC or its affiliates for non-advisory services, such as administration, transfer agency, shareholder services or brokerage, and considered whether SIMC and its affiliates may have realized other benefits from their relationship with the Funds, such as any research and brokerage services received under soft dollar arrangements. When considering fees paid to Sub-Advisers, the Board took into account the fact that the Sub-Advisers are compensated by SIMC and not by the Funds directly, and that such compensation with respect to any unaffiliated Sub-Adviser reflects an arms-length negotiation between the Sub-Adviser and SIMC. Following evaluation, the Board concluded that, within the context of its full deliberations, the expenses of the Funds are reasonable and supported renewal of the Investment Advisory Agreements. The Board also considered whether the Sub-Advisers and their affiliates may have realized other benefits from their relationship with the Funds, such as any research and brokerage services received under soft dollar arrangements.
| | |
| 328 | | SEI Institutional Investments Trust / Annual Report / May 31, 2016 |
Profitability. With regard to profitability, the Trustees considered compensation flowing to SIMC and the Sub-Advisers and their affiliates, directly or indirectly. The Trustees considered whether the levels of compensation and profitability were reasonable. As with the fee levels, when considering the profitability of the Sub-Advisers, the Board took into account the fact that compensation with respect to any unaffiliated Sub-Adviser reflects an arms-length negotiation between the Sub-Adviser and SIMC. In connection with the approval or renewal of each Sub-Advisory Agreement, the Board also took into consideration the impact that the fees paid to the Sub-Adviser have on SIMC’s advisory fee margin and profitability. Based on this evaluation, the Board concluded that, within the context of its full deliberations, the profitability of each of SIMC and the Sub-Advisers is reasonable and supported renewal of the Investment Advisory Agreements.
Economies of Scale. With respect to the Advisory Agreement, the Trustees considered whether any economies of scale were being realized by SIMC and their affiliates and, if so, whether the benefits of such economies of scale were passed along to the Funds’ shareholders through a graduated investment advisory fee schedule or other means, including any fee waivers by SIMC and its affiliates. The Trustees recognized that economies of scale are difficult to identify and quantify and are rarely identifiable on a fund-by-fund basis. Based on this evaluation, the Board determined that the fees were reasonable in light of the information that was provided by SIMC with respect to economies of scale.
Based on the Trustees’ deliberation and their evaluation of the information described above, the Board, including all of the Independent Trustees, with the assistance of Fund counsel and Independent Trustees’ counsel, unanimously approved the approval or renewal, as applicable, of the Investment Advisory Agreements and concluded that the compensation under the Investment Advisory Agreements is fair and reasonable in light of such services and expenses and such other matters as the Trustees considered to be relevant in the exercise of their reasonable judgment. In the course of its deliberations, the Board did not identify any particular factor (or conclusion with respect thereto) or single piece of information that was all-important, controlling or determinative of its decision, but considered all of the factors together, and each Trustee may have attributed different weights to the various factors (and conclusions with respect thereto) and information.
| | | | |
| SEI Institutional Investments Trust / Annual Report / May 31, 2016 | | | 329 | |
NOTICE TO SHAREHOLDERS (Unaudited)
For shareholders who do not have a May 31, 2016, taxable year end, this notice is for informational purposes only. For shareholders with a May 31, 2016, taxable year end, please consult your tax adviser as to the pertinence of this notice.
For the fiscal year ended May 31, 2016, the Funds are designating long term and qualifying dividend income with regard to distributions paid during the year as follows:
| | | | | | | | | | | | | | | | | | | | |
| | | (A)
Long Term
Capital Gains
Distributions
(Tax Basis) | | | (B)
Return of
Capital
(Tax Basis) | | | (C)
Ordinary
Income
Distributions
(Tax Basis) | | | Total
Distributions
(Tax Basis) | | | (D)
Dividends
Qualifying
for Corporate
Dividends Rec.
Deduction (1) | |
| Large Cap Fund | | | 89.16 | % | | | 0.00 | % | | | 10.84 | % | | | 100.00 | % | | | 92.35 | % |
| Large Cap Diversified Alpha Fund | | | 85.31 | % | | | 1.69 | % | | | 13.00 | % | | | 100.00 | % | | | 64.47 | % |
| Large Cap Disciplined Equity Fund | | | 68.53 | % | | | 0.00 | % | | | 31.47 | % | | | 100.00 | % | | | 59.14 | % |
| Large Cap Index Fund | | | 62.40 | % | | | 0.00 | % | | | 37.60 | % | | | 100.00 | % | | | 88.81 | % |
| S&P 500 Index Fund | | | 5.64 | % | | | 0.00 | % | | | 94.36 | % | | | 100.00 | % | | | 93.42 | % |
| Extended Market Index Fund | | | 58.04 | % | | | 0.00 | % | | | 41.96 | % | | | 100.00 | % | | | 46.86 | % |
| Small Cap Fund | | | 86.78 | % | | | 0.00 | % | | | 13.22 | % | | | 100.00 | % | | | 66.51 | % |
| Small Cap II Fund | | | 81.29 | % | | | 0.00 | % | | | 18.71 | % | | | 100.00 | % | | | 65.78 | % |
| Small/Mid Cap Equity Fund | | | 86.71 | % | | | 0.00 | % | | | 13.29 | % | | | 100.00 | % | | | 47.30 | % |
| U.S. Managed Volatility Fund | | | 64.58 | % | | | 0.00 | % | | | 35.42 | % | | | 100.00 | % | | | 78.93 | % |
| Global Managed Volatility Fund | | | 0.00 | % | | | 0.00 | % | | | 0.00 | % | | | 0.00 | % | | | 0.00 | % |
| World Equity Ex-US Fund(6) | | | 16.51 | % | | | 0.00 | % | | | 83.49 | % | | | 100.00 | % | | | 0.00 | % |
| Screened World Equity Ex-US Fund(7) | | | 0.00 | % | | | 0.00 | % | | | 100.00 | % | | | 100.00 | % | | | 0.30 | % |
| Emerging Markets Equity Fund(8) | | | 0.00 | % | | | 0.00 | % | | | 100.00 | % | | | 100.00 | % | | | 1.59 | % |
| Opportunistic Income Fund | | | 0.00 | % | | | 0.00 | % | | | 100.00 | % | | | 100.00 | % | | | 0.38 | % |
| Core Fixed Income Fund | | | 14.88 | % | | | 0.00 | % | | | 85.12 | % | | | 100.00 | % | | | 0.00 | % |
| High Yield Bond Fund | | | 0.03 | % | | | 0.00 | % | | | 99.97 | % | | | 100.00 | % | | | 0.00 | % |
| Long Duration Fund | | | 20.73 | % | | | 0.00 | % | | | 79.27 | % | | | 100.00 | % | | | 0.00 | % |
| Long Duration Credit Fund | | | 14.06 | % | | | 0.00 | % | | | 85.94 | % | | | 100.00 | % | | | 0.00 | % |
| Ultra Short Duration Bond Fund | | | 0.00 | % | | | 0.00 | % | | | 100.00 | % | | | 100.00 | % | | | 0.00 | % |
| Emerging Markets Debt Fund | | | 0.00 | % | | | 0.00 | % | | | 100.00 | % | | | 100.00 | % | | | 0.00 | % |
| Real Return Fund | | | 0.00 | % | | | 0.00 | % | | | 0.00 | % | | | 000.00 | % | | | 0.00 | % |
| Limited Duration Bond Fund | | | 0.09 | % | | | 0.00 | % | | | 99.91 | % | | | 100.00 | % | | | 0.00 | % |
| Intermediate Duration Credit Fund | | | 0.00 | % | | | 0.00 | % | | | 100.00 | % | | | 100.00 | % | | | 0.00 | % |
| Dynamic Asset Allocation Fund | | | 0.89 | % | | | 0.00 | % | | | 99.11 | % | | | 100.00 | % | | | 37.89 | % |
| Multi-Asset Real Return Fund | | | 0.00 | % | | | 0.00 | % | | | 100.00 | % | | | 100.00 | % | | | 19.41 | % |
| | | | | | | | | | | | | | | | |
| | | (E)
Qualifying
Dividend Income
(15% Tax Rate
for QDI) (2) | | | (F)
U.S. Government
Interest (3) | | | Interest
Related
Dividends (4) | | | Short-Term
Capital Gain
Dividends (5) | |
| Large Cap Fund | | | 97.36 | % | | | 0.01 | % | | | 0.01 | % | | | 100.00 | % |
| Large Cap Diversified Alpha Fund | | | 67.86 | % | | | 0.01 | % | | | 0.01 | % | | | 100.00 | % |
| Large Cap Disciplined Equity Fund | | | 59.65 | % | | | 0.01 | % | | | 0.02 | % | | | 100.00 | % |
| Large Cap Index Fund | | | 90.46 | % | | | 0.01 | % | | | 0.01 | % | | | 100.00 | % |
| S&P 500 Index Fund | | | 94.48 | % | | | 0.01 | % | | | 0.01 | % | | | 100.00 | % |
| Extended Market Index Fund | | | 50.67 | % | | | 0.01 | % | | | 0.01 | % | | | 100.00 | % |
| Small Cap Fund | | | 74.45 | % | | | 0.01 | % | | | 0.02 | % | | | 100.00 | % |
| Small Cap II Fund | | | 67.62 | % | | | 0.02 | % | | | 0.04 | % | | | 100.00 | % |
| Small/Mid Cap Equity Fund | | | 50.19 | % | | | 0.01 | % | | | 0.01 | % | | | 100.00 | % |
| U.S. Managed Volatility Fund | | | 88.11 | % | | | 0.01 | % | | | 0.01 | % | | | 100.00 | % |
| Global Managed Volatility Fund | | | 0.00 | % | | | 0.00 | % | | | 0.00 | % | | | 0.00 | % |
| World Equity Ex-US Fund(6) | | | 73.95 | % | | | 0.02 | % | | | 0.01 | % | | | 0.00 | % |
| Screened World Equity Ex-US Fund(7) | | | 98.93 | % | | | 0.03 | % | | | 0.07 | % | | | 0.00 | % |
| | |
| 330 | | SEI Institutional Investments Trust / Annual Report / May 31, 2016 |
NOTICE TO SHAREHOLDERS (Unaudited) (Concluded)
| | | | | | | | | | | | | | | | |
| | | (E)
Qualifying
Dividend Income
(15% Tax Rate
for QDI) (2) | | | (F)
U.S. Government
Interest (3) | | | Interest
Related
Dividends (4) | | | Short-Term
Capital Gain
Dividends (5) | |
| Emerging Markets Equity Fund(8) | | | 61.60 | % | | | 0.00 | % | | | 2.22 | % | | | 100.00 | % |
| Opportunistic Income Fund | | | 0.38 | % | | | 0.78 | % | | | 92.75 | % | | | 0.00 | % |
| Core Fixed Income Fund | | | 0.00 | % | | | 11.63 | % | | | 82.91 | % | | | 100.00 | % |
| High Yield Bond Fund | | | 0.00 | % | | | 0.00 | % | | | 86.78 | % | | | 0.00 | % |
| Long Duration Fund | | | 0.00 | % | | | 7.60 | % | | | 73.81 | % | | | 100.00 | % |
| Long Duration Credit Fund | | | 0.00 | % | | | 1.32 | % | | | 97.44 | % | | | 100.00 | % |
| Ultra Short Duration Bond Fund | | | 0.00 | % | | | 4.39 | % | | | 99.49 | % | | | 0.00 | % |
| Emerging Markets Debt Fund | | | 0.00 | % | | | 0.00 | % | | | 0.00 | % | | | 0.00 | % |
| Real Return Fund | | | 0.00 | % | | | 0.00 | % | | | 0.00 | % | | | 0.00 | % |
| Limited Duration Bond Fund | | | 0.00 | % | | | 20.72 | % | | | 98.48 | % | | | 100.00 | % |
| Intermediate Duration Credit Fund | | | 0.00 | % | | | 2.58 | % | | | 99.00 | % | | | 0.00 | % |
| Dynamic Asset Allocation Fund | | | 38.07 | % | | | 0.00 | % | | | 0.01 | % | | | 100.00 | % |
| Multi-Asset Real Return Fund | | | 27.34 | % | | | 0.00 | % | | | 46.38 | % | | | 0.00 | % |
| (1) | Qualifying dividends represent dividends which qualify for the corporate dividends received deduction. |
| (2) | The percentage in this column represents the amount of “Qualifying Dividend Income” is reflected as a percentage of “Ordinary Income Distributions.” It is the intention of each of the aforementioned funds to designate the maximum amount permitted by the law. The information reported herein may differ from the information and distributions taxable to the shareholders for the calendar year ending December 31, 2016. Complete information will be computed and reported in conjunction with your 2016 Form 1099-DIV. |
| (3) | “U.S. Government Interest” represents the amount of interest that was derived from direct U.S. Government obligations and distributed during the fiscal year. This amount is reflected as a percentage of total ordinary income distributions (the total of short term capital gain and net investment income distributions). Generally, interest from direct U.S. Government obligations is exempt from state income tax. However, for shareholders of the SEI Institutional Trust, who are residents of California, Connecticut and New York, the statutory threshold requirements were not satisfied to permit exemption of these amounts from state income. |
| (4) | The percentage in this column represents the amount of “Interest Related Dividend” is reflected as a percentage of ordinary income distribution. Interest related dividends are exempted from U.S. withholding tax when paid to foreign investors. |
| (5) | The percentage of this column represents the amount of “Short Term Capital Gain Dividend” is reflected as a percentage of short term capital gain distribution that is exempted from U.S. withholding tax when paid to foreign investors. |
| (6) | The Fund intends to pass through a foreign tax credit to shareholders. For fiscal year ended 2016, the total amount of foreign source income is $183,807,073. The total amount of foreign tax to be paid is $13,663,266. Your allocable share of the foreign tax credit will be reported on Form 1099 DIV. |
| (7) | The Fund intends to pass through a foreign tax credit to shareholders. For fiscal year ended 2016, the total amount of foreign source income is $2,099,336. The total amount of foreign tax paid is $203,905. Your allocable share of the foreign tax credit will be reported on Form 1099 DIV. |
| (8) | The Fund intends to pass through a foreign tax credit to shareholders. For fiscal year ended 2016, the total amount of foreign source income is $20,417,522. The total amount of foreign tax paid is $2,132,544. Your allocable share of the foreign tax credit will be reported on Form 1099 DIV |
Items (A), (B) and (C) are based on the percentage of each Fund’s total distribution.
Items (D) and (E) are based on the percentage of ordinary income distributions of each Fund. Item (F) is based on the percentage of gross income of each Fund.
Please consult your tax adviser for proper treatment of this information. This notification should be kept with your permanent tax records.
| | | | |
| SEI Institutional Investments Trust / Annual Report / May 31, 2016 | | | 331 | |
SHAREHOLDER VOTING RESULTS (Unaudited)
At a special meeting of Shareholders of the SEI Institutional Investments Trust ( the “Trust”) was held on January 15, 2016 for the purpose of considering the proposal to elect, as a slate of nominees, each of the current Trustees and one new Trust to the Board of Trustees of the Trust. The proposal was approved with the following voting results:
| | | | |
| Trustee | | Shares Voted | |
| Robert A. Nesher | | | | |
For | | | 1,502,297,605.46 | |
Withheld | | | 254.94 | |
| William M. Doran | | | | |
For | | | 1,502,297,605.46 | |
Withheld | | | 254.94 | |
| George J. Sullivan, JR. | | | | |
For | | | 1,502,297,605.46 | |
Withheld | | | 254.94 | |
| Nina Lesavoy | | | | |
For | | | 1,502,297,605.46 | |
Withheld | | | 254.94 | |
| James M. Williams | | | | |
For | | | 1,502,297,605.46 | |
Withheld | | | 254.94 | |
| Mitchell A. Johnson | | | | |
For | | | 1,502,297,605.46 | |
Withheld | | | 254.94 | |
| Hubert L. Harris, JR. | | | | |
For | | | 1,502,297,605.46 | |
Withheld | | | 254.94 | |
| Susan C. Cote | | | | |
For | | | 1,502,297,605.46 | |
Withheld | | | 254.94 | |
| | |
| 332 | | SEI Institutional Investments Trust / Annual Report / May 31, 2016 |
SEI Institutional Investments Trust Annual Report May 31, 2016
Robert A. Nesher, Chairman
Trustees
William M. Doran
George J. Sullivan, Jr.
Nina Lesavoy
James M. Williams
Mitchell A. Johnson
Hubert L. Harris, Jr.
Susan C. Cote
Officers
Robert A. Nesher
President and Chief Executive Officer
Arthur Ramanjulu
Controller and Chief Financial Officer
Russell Emery
Chief Compliance Officer
Timothy D. Barto
Vice President, Secretary
Aaron Buser
Vice President, Assistant Secretary
David F. McCann
Vice President, Assistant Secretary
Stephen G. MacRae
Vice President
Bridget E. Sudall
Anti-Money Laundering Compliance Officer
Privacy Officer
Investment Adviser
SEI Investments Management Corporation
Administrator
SEI Investments Global Funds Services
Distributor
SEI Investments Distribution Co.
Legal Counsel
Morgan, Lewis & Bockius LLP
Independent Registered Public Accounting Firm
KPMG LLP
This report and the financial statements contained herein are submitted for the general information of the shareholders of the Trust and must be preceded or accompanied by a current prospectus. Shares of the Funds are not deposits or obligations of, or guaranteed or endorsed by, any bank. The shares are not federally insured by the Federal Deposit Insurance Corporation (FDIC), the Federal Reserve Board, or any other government agency. Investment in the shares involves risk, including the possible loss of principal.
For more information call
1 800 DIAL SEI
(1 800 342 5734)

1 Freedom Valley Drive
Oaks, PA 19456
SEI-F-140 (5/16)
The Registrant has adopted a code of ethics that applies to the Registrant’s principal executive officer, principal financial officer, comptroller or principal accounting officer, and any person who performs a similar function.
| Item 3. | Audit Committee Financial Expert. |
(a)(1) The Registrant’s Board of Trustees has determined that the Registrant has at least two audit committee financial experts serving on the audit committee.
(a) (2) The audit committee financial experts are George J. Sullivan, Jr. and Hubert L. Harris, Jr. Messrs. Sullivan and Harris are independent as defined in Form N-CSR Item 3 (a) (2).
| Item 4. | Principal Accountant Fees and Services. |
Fees billed by KPMG LLP (“KPMG”) related to the Registrant.
KPMG billed the Registrant aggregate fees for services rendered to the Registrant for the fiscal years 2016 and 2015 as follows:
| | | | | | | | | | | | | | | | | | | | | | | | | | |
| | | Fiscal Year 2016 | | | Fiscal Year 2015 | |
| | | | | All fees and
services to
the Registrant
that were pre-
approved | | | All fees and
services to
service
affiliates that
were pre-
approved | | | All other fees
and services
to service
affiliates that
did not
require pre-
approval | | | All fees and
services to
the Registrant
that were pre-
approved | | | All fees and
services to
service
affiliates that
were pre-
approved | | | All other fees
and services
to service
affiliates that
did not
require pre-
approval | |
(a) | | Audit Fees(1) | | $ | 849,500 | | | $ | 0 | | | | N/A | | | $ | 814,500 | | | $ | 0 | | | | N/A | |
(b) | | Audit-Related Fees | | $ | 0 | | | $ | 0 | | | $ | 0 | | | $ | 0 | | | $ | 0 | | | $ | 0 | |
(c) | | Tax Fees (3) | | $ | 0 | | | $ | 0 | | | $ | 0 | | | $ | 0 | | | $ | 0 | | | $ | 0 | |
(d) | | All Other Fees(2) | | $ | 0 | | | $ | 240,350 | | | $ | 0 | | | $ | 0 | | | $ | 240,350 | | | $ | 0 | |
Notes:
| (1) | Audit fees include amounts related to the audit of the Registrant’s annual financial statements and services normally provided by the accountant in connection with statutory and regulatory filings. |
| (2) | See Item 4 (g) for a description of the services comprising the fees disclosed under this category. |
| (3) | Tax fees include amounts related to tax compliance and consulting services for various service affiliates of the Registrant. |
(e)(1) The Registrant’s Audit Committee has adopted an Audit and Non-Audit Services Pre-Approval Policy (the “Policy”), which sets forth the procedures and the conditions pursuant to which services proposed to be performed by the independent auditor of the Registrant may be pre-approved.
The Policy provides that all requests or applications for proposed services to be provided by the independent auditor must be submitted to the Registrant’s Chief Financial Officer (“CFO”) and must include a detailed description of the services proposed to be rendered. The CFO will determine whether such services: (1) require specific pre-approval; (2) are included within the list of services that have received the general pre-approval of the Audit Committee pursuant to the Policy; or (3) have been previously pre-approved in connection with the independent auditor’s annual engagement letter for the applicable year or otherwise. In any instance where services require pre-approval, the Audit Committee will consider whether such services are consistent with SEC’s rules and whether the provision of such services would impair the auditor’s independence.
Requests or applications to provide services that require specific pre-approval by the Audit Committee will be submitted to the Audit Committee by the CFO. The Audit Committee will be informed by the CFO on a quarterly basis of all services rendered by the independent auditor. The Audit Committee has delegated specific pre-approval authority to either the Audit Committee Chair or financial experts, provided that the estimated fee for any such proposed pre-approved service does not exceed $100,000 and any pre-approval decisions are reported to the Audit Committee at its next regularly scheduled meeting.
Services that have received the general pre-approval of the Audit Committee are identified and described in the Policy. In addition, the Policy sets forth a maximum fee per engagement with respect to each identified service that has received general pre-approval.
All services to be provided by the independent auditor shall be provided pursuant to a signed written engagement letter with the Registrant, the investment advisor or applicable control affiliate (except that matters as to which an engagement letter would be impractical because of timing issues or because the matter is small may not be the subject of an engagement letter) that sets forth both the services to be provided by the independent auditor and the total fees to be paid to the independent auditor for those services.
In addition, the Audit Committee has determined to take additional measures on an annual basis to meet its responsibility to oversee the work of the independent auditor and to assure the auditor’s independence from the Registrant, such as reviewing a formal written statement from the independent auditor delineating all relationships between the independent auditor and the Registrant, and discussing with the independent auditor its methods and procedures for ensuring independence.
(e)(2) Percentage of fees billed applicable to non-audit services pursuant to waiver of pre-approval requirement were as follows:
| | | | | | | | |
| | | Fiscal Year 2016 | | | Fiscal Year 2015 | |
Audit-Related Fees | | | 0 | % | | | 0 | % |
Tax Fees | | | 0 | % | | | 0 | % |
All Other Fees | | | 0 | % | | | 0 | % |
(f) Not Applicable.
(g) The aggregate non-audit fees and services billed by KPMG for the fiscal years 2016 and 2015 were $240,350 and $240,350, respectively. Non-audit fees consist of SSAE No.16 review of fund accounting and administration operations, attestation report in accordance with Rule 17Ad-13, agreed upon procedures report over certain internal controls related to compliance with federal securities laws and regulations and tax compliance and consulting services for various service affiliates of the registrant.
(h) During the past fiscal year, Registrant’s principal accountant provided certain non-audit services to Registrant’s investment adviser or to entities controlling, controlled by, or under common control with Registrant’s investment adviser that provide ongoing services to Registrant that were not subject to pre-approval pursuant to paragraph (c)(7)(ii) of Rule 2-01 of Regulation S-X. The Audit Committee of Registrant’s Board of Trustees reviewed and considered these non-audit services provided by Registrant’s principal accountant to Registrant’s affiliates, including whether the provision of these non-audit services is compatible with maintaining the principal accountant’s independence.
| Item 5. | Audit Committee of Listed Registrants. |
Not applicable.
| Item 6. | Schedule of Investments |
(a) The Schedules of Investments in securities of unaffiliated issuers as of the close of the reporting period for the Large Cap Fund, Large Cap Diversified Alpha Fund, Large Cap Disciplined Equity Fund, Large Cap Index Fund, S&P 500 Index Fund, Extended Market Index Fund, Small Cap Fund, Small Cap II Fund, Small/Mid Cap Equity Fund, U.S. Managed Volatility Fund, Global Managed Volatility Fund, World Equity Ex-US Fund, Screened World Equity Ex-US Fund and Emerging Markets Equity Fund and the Consolidated Schedule of Investments in securities of unaffiliated issuers as of the close of the reporting period for the Dynamic Asset Allocation Fund are listed below. The Schedule of Investments in securities of unaffiliated issuers as of the close of the reporting period for the Opportunistic Income Fund, Core Fixed Income Fund, High Yield Bond Fund, Long Duration Fund, Long Duration Credit Fund, Ultra Short Duration Bond Fund, Emerging Markets Debt Fund, Real Return Fund, Limited Duration Bond Fund and Intermediate Duration Credit Fund and the Consolidated Schedule of Investments in securities of unaffiliated issuers as of the close of the reporting period for the Multi-Asset Real Return Fund are included as part of the report to shareholders filed under Item 1 of this form.
SCHEDULE OF INVESTMENTS
Large Cap Fund
May 31, 2016
| | | | | | | | |
| Description | | Shares | | | Market Value
($ Thousands) | |
COMMON STOCK†† — 96.9% | | | | | | | | |
| | |
Consumer Discretionary — 10.8% | | | | | | | | |
Abercrombie & Fitch, Cl A | | | 64,032 | | | $ | 1,274 | |
Amazon.com * | | | 35,182 | | | | 25,429 | |
American Eagle Outfitters | | | 99,000 | | | | 1,548 | |
Autoliv | | | 12,300 | | | | 1,508 | |
Bed Bath & Beyond | | | 47,605 | | | | 2,130 | |
Best Buy | | | 94,536 | | | | 3,041 | |
Big Lots | | | 39,521 | | | | 2,067 | |
Carnival, Cl A | | | 22,674 | | | | 1,083 | |
Carter’s | | | 1,853 | | | | 186 | |
Charter Communications, Cl A * | | | 1,765 | | | | 387 | |
Chipotle Mexican Grill, Cl A * | | | 10,450 | | | | 4,619 | |
Comcast, Cl A | | | 115,161 | | | | 7,290 | |
Cooper Tire & Rubber | | | 57,641 | | | | 1,852 | |
Dana Holdings | | | 7,451 | | | | 90 | |
Darden Restaurants | | | 10,650 | | | | 722 | |
Dick’s Sporting Goods | | | 1,917 | | | | 82 | |
Dillard’s, Cl A | | | 18,164 | | | | 1,074 | |
Discovery Communications, Cl A * | | | 100,960 | | | | 2,812 | |
Discovery Communications, Cl C * | | | 182,155 | | | | 4,876 | |
DR Horton | | | 39,034 | | | | 1,193 | |
Foot Locker | | | 22,600 | | | | 1,264 | |
Ford Motor | | | 283,200 | | | | 3,820 | |
GameStop, Cl A | | | 28,800 | | | | 838 | |
Gannett | | | 39,588 | | | | 618 | |
General Motors | | | 290,588 | | | | 9,090 | |
Goodyear Tire & Rubber | | | 230,512 | | | | 6,448 | |
GoPro, Cl A * | | | 8,221 | | | | 85 | |
Graham Holdings, Cl B | | | 227 | | | | 113 | |
Groupon, Cl A *(A) | | | 145,408 | | | | 515 | |
Harley-Davidson (A) | | | 46,800 | | | | 2,171 | |
Home Depot | | | 45,786 | | | | 6,049 | |
Hyatt Hotels, Cl A * | | | 3,579 | | | | 164 | |
International Game Technology (A) | | | 9,880 | | | | 187 | |
Interpublic Group | | | 28,031 | | | | 670 | |
John Wiley & Sons, Cl A | | | 3,663 | | | | 197 | |
KB Home | | | 47,000 | | | | 655 | |
Kohl’s | | | 54,900 | | | | 1,979 | |
L Brands | | | 106,408 | | | | 7,294 | |
Las Vegas Sands | | | 21,013 | | | | 972 | |
Lear | | | 61,957 | | | | 7,358 | |
Liberty Global * | | | 267,341 | | | | 9,659 | |
Liberty Global, Cl A * | | | 86,272 | | | | 3,222 | |
Liberty Interactive QVC Group, Cl A * | | | 643,986 | | | | 17,375 | |
Lowe’s | | | 17,869 | | | | 1,432 | |
Macy’s | | | 42,201 | | | | 1,402 | |
Magna International, Cl A | | | 96,440 | | | | 3,909 | |
Michael Kors Holdings * | | | 111,222 | | | | 4,751 | |
MSG Networks * | | | 4,538 | | | | 79 | |
Murphy USA * | | | 6,800 | | | | 462 | |
Newell Brands | | | 52,850 | | | | 2,520 | |
NIKE, Cl B | | | 81,657 | | | | 4,509 | |
| | | | | | | | |
| Description | | Shares | | | Market Value
($ Thousands) | |
NVR * | | | 437 | | | $ | 757 | |
Priceline Group * | | | 861 | | | | 1,089 | |
Starbucks | | | 213,485 | | | | 11,718 | |
Starwood Hotels & Resorts Worldwide | | | 2,483 | | | | 182 | |
Target | | | 43,426 | | | | 2,987 | |
TEGNA | | | 55,900 | | | | 1,284 | |
Time Warner | | | 3,779 | | | | 286 | |
TopBuild * | | | 29,476 | | | | 1,065 | |
TripAdvisor * | | | 311,097 | | | | 21,074 | |
Tupperware Brands | | | 1,490 | | | | 84 | |
Twenty-First Century Fox, Cl A | | | 224,630 | | | | 6,487 | |
Under Armour, Cl A *(A) | | | 79,414 | | | | 2,996 | |
Under Armour, Cl C * | | | 96,944 | | | | 3,390 | |
Urban Outfitters * | | | 18,846 | | | | 538 | |
Viacom, Cl B | | | 87,179 | | | | 3,868 | |
Whirlpool | | | 18,562 | | | | 3,241 | |
Wyndham Worldwide | | | 9,900 | | | | 667 | |
Yum! Brands | | | 14,609 | | | | 1,199 | |
| | | | | | | | |
| | | | | | | 225,982 | |
| | | | | | | | |
| | |
Consumer Staples — 7.6% | | | | | | | | |
Altria Group | | | 23,425 | | | | 1,491 | |
Anheuser-Busch InBev ADR | | | 30,244 | | | | 3,817 | |
Archer-Daniels-Midland | | | 119,287 | | | | 5,102 | |
Bunge | | | 64,520 | | | | 4,327 | |
Cal-Maine Foods (A) | | | 26,300 | | | | 1,170 | |
Coca-Cola | | | 48,929 | | | | 2,182 | |
ConAgra Foods | | | 10,803 | | | | 494 | |
Constellation Brands, Cl A | | | 7,120 | | | | 1,090 | |
Costco Wholesale | | | 98,429 | | | | 14,643 | |
Dean Foods (A) | | | 229,555 | | | | 4,196 | |
Dr. Pepper Snapple Group | | | 47,893 | | | | 4,377 | |
Estee Lauder, Cl A | | | 116,873 | | | | 10,727 | |
General Mills | | | 10,038 | | | | 630 | |
Herbalife *(A) | | | 45,694 | | | | 2,645 | |
Ingredion | | | 41,962 | | | | 4,927 | |
Kimberly-Clark | | | 13,737 | | | | 1,745 | |
Kraft Heinz | | | 90,686 | | | | 7,544 | |
Kroger | | | 32,300 | | | | 1,155 | |
Mead Johnson Nutrition, Cl A | | | 104,858 | | | | 8,628 | |
Molson Coors Brewing, Cl B | | | 53,942 | | | | 5,350 | |
Mondelez International, Cl A | | | 23,675 | | | | 1,053 | |
Nu Skin Enterprises, Cl A (A) | | | 39,670 | | | | 1,565 | |
PepsiCo | | | 80,050 | | | | 8,099 | |
Philip Morris International | | | 169,441 | | | | 16,721 | |
Pilgrim’s Pride * | | | 83,045 | | | | 2,065 | |
Procter & Gamble | | | 67,124 | | | | 5,440 | |
Reynolds American | | | 12,138 | | | | 603 | |
Rite Aid * | | | 15,556 | | | | 120 | |
Sanderson Farms (A) | | | 30,494 | | | | 2,736 | |
SUPERVALU * | | | 120,100 | | | | 556 | |
Sysco | | | 9,241 | | | | 445 | |
| | |
| 1 | | SEI Institutional Investments Trust / Annual Report / May 31, 2016 |
SCHEDULE OF INVESTMENTS
Large Cap Fund
May 31, 2016
| | | | | | | | |
| Description | | Shares | | | Market Value ($ Thousands) | |
Tyson Foods, Cl A | | | 156,313 | | | $ | 9,970 | |
Walgreens Boots Alliance | | | 215,916 | | | | 16,712 | |
Wal-Mart Stores | | | 84,774 | | | | 6,000 | |
| | | | | | | | |
| | | | | | | 158,325 | |
| | | | | | | | |
| | |
Energy — 6.0% | | | | | | | | |
Antero Resources * | | | 21,896 | | | | 636 | |
Cabot Oil & Gas | | | 158,970 | | | | 3,811 | |
California Resources * | | | 445,982 | | | | 678 | |
Chevron | | | 63,523 | | | | 6,416 | |
Cimarex Energy | | | 55,523 | | | | 6,456 | |
ConocoPhillips | | | 20,353 | | | | 891 | |
Denbury Resources * | | | 132,787 | | | | 533 | |
Dril-Quip * | | | 23,799 | | | | 1,452 | |
Ensco, Cl A | | | 449,216 | | | | 4,443 | |
EOG Resources | | | 67,061 | | | | 5,456 | |
EP Energy, Cl A *(A) | | | 63,161 | | | | 357 | |
Exxon Mobil | | | 197,390 | | | | 17,572 | |
FMC Technologies * | | | 88,276 | | | | 2,404 | |
Halliburton | | | 232,320 | | | | 9,799 | |
Helmerich & Payne (A) | | | 38,879 | | | | 2,377 | |
HollyFrontier | | | 87,081 | | | | 2,330 | |
Kinder Morgan | | | 10,674 | | | | 193 | |
Marathon Oil | | | 6,181 | | | | 81 | |
Marathon Petroleum | | | 203,951 | | | | 7,104 | |
Murphy Oil (A) | | | 44,290 | | | | 1,369 | |
Nabors Industries | | | 154,814 | | | | 1,455 | |
National Oilwell Varco | | | 67,159 | | | | 2,213 | |
Noble (A) | | | 339,859 | | | | 2,834 | |
Oceaneering International | | | 182,120 | | | | 6,021 | |
Oil States International * | | | 90,509 | | | | 2,974 | |
Phillips 66 | | | 45,600 | | | | 3,664 | |
Pioneer Natural Resources | | | 2,322 | | | | 372 | |
QEP Resources * | | | 5,583 | | | | 104 | |
Rowan, Cl A *(A) | | | 251,903 | | | | 4,265 | |
Teekay (A) | | | 90,664 | | | | 954 | |
Tesoro | | | 130,777 | | | | 10,211 | |
Transocean *(A) | | | 87,028 | | | | 852 | |
Tsakos Energy Navigation | | | 126,600 | | | | 819 | |
Valero Energy | | | 226,053 | | | | 12,365 | |
Western Refining | | | 74,747 | | | | 1,588 | |
Williams | | | 11,008 | | | | 244 | |
World Fuel Services | | | 2,532 | | | | 116 | |
| | | | | | | | |
| | | | | | | 125,409 | |
| | | | | | | | |
| | |
Financials — 17.1% | | | | | | | | |
Aflac | | | 37,600 | | | | 2,612 | |
Allied World Assurance Holdings | | | 4,392 | | | | 163 | |
Allstate | | | 151,475 | | | | 10,226 | |
Ally Financial * | | | 188,618 | | | | 3,384 | |
American Financial Group | | | 29,172 | | | | 2,138 | |
American International Group | | | 327,998 | | | | 18,985 | |
| | | | | | | | |
| Description | | Shares | | | Market Value
($ Thousands) | |
American National Insurance | | | 2,729 | | | $ | 326 | |
American Tower, Cl A ‡ | | | 71,680 | | | | 7,582 | |
Ameriprise Financial | | | 26,300 | | | | 2,674 | |
Annaly Capital Management ‡ | | | 280,700 | | | | 2,970 | |
Aspen Insurance Holdings | | | 17,355 | | | | 830 | |
Assurant | | | 38,240 | | | | 3,342 | |
Assured Guaranty | | | 109,843 | | | | 2,954 | |
Axis Capital Holdings | | | 55,367 | | | | 3,053 | |
Bank of America | | | 1,135,514 | | | | 16,794 | |
BB&T | | | 53,900 | | | | 1,960 | |
Berkshire Hathaway, Cl B * | | | 24,783 | | | | 3,483 | |
Brandywine Realty Trust ‡ | | | 56,000 | | | | 884 | |
Brixmor Property Group ‡ | | | 18,188 | | | | 459 | |
Capital One Financial | | | 83,586 | | | | 6,122 | |
Care Capital Properties ‡ | | | 6,392 | | | | 166 | |
CBL & Associates Properties ‡ | | | 189,111 | | | | 1,819 | |
CBRE Group, Cl A * | | | 125,958 | | | | 3,760 | |
Charles Schwab | | | 300,560 | | | | 9,191 | |
Chubb | | | — | | | | — | |
CIT Group | | | 26,600 | | | | 911 | |
Citigroup | | | 552,253 | | | | 25,718 | |
Citizens Financial Group | | | 9,624 | | | | 227 | |
CNA Financial | | | 37,100 | | | | 1,219 | |
Columbia Property Trust ‡ | | | 42,814 | | | | 883 | |
Corporate Office Properties Trust ‡ | | | 3,203 | | | | 87 | |
Corrections Corp of America ‡ | | | 32,958 | | | | 1,107 | |
Crown Castle International ‡ | | | 195,477 | | | | 17,751 | |
Discover Financial Services | | | 91,500 | | | | 5,198 | |
Endurance Specialty Holdings | | | 37,205 | | | | 2,527 | |
Equinix ‡ | | | 35,485 | | | | 12,846 | |
Equity Commonwealth *‡ | | | 4,816 | | | | 139 | |
Everest Re Group | | | 36,332 | | | | 6,507 | |
Fifth Third Bancorp | | | 181,100 | | | | 3,417 | |
Gaming and Leisure Properties ‡ | | | 24,324 | | | | 801 | |
Genworth Financial, Cl A * | | | 312,226 | | | | 1,155 | |
Goldman Sachs Group | | | 9,300 | | | | 1,483 | |
Hanover Insurance Group | | | 1,535 | | | | 133 | |
Hartford Financial Services Group | | | 78,256 | | | | 3,535 | |
Hospitality Properties Trust ‡ | | | 90,389 | | | | 2,314 | |
Host Hotels & Resorts ‡ | | | 180,035 | | | | 2,773 | |
Huntington Bancshares | | | 173,300 | | | | 1,811 | |
Intercontinental Exchange | | | 50,408 | | | | 13,667 | |
JPMorgan Chase | | | 536,557 | | | | 35,021 | |
KeyCorp | | | 334,140 | | | | 4,284 | |
Legg Mason | | | 27,700 | | | | 956 | |
Lexington Realty Trust ‡ | | | 223,000 | | | | 2,107 | |
Lincoln National | | | 106,014 | | | | 4,861 | |
Mack-Cali Realty ‡ | | | 75,859 | | | | 1,991 | |
MetLife | | | 69,689 | | | | 3,174 | |
MGIC Investment * | | | 206,400 | | | | 1,455 | |
Morgan Stanley | | | 55,700 | | | | 1,525 | |
MSCI, Cl A | | | 1,211 | | | | 97 | |
| | |
| 2 | | SEI Institutional Investments Trust / Annual Report / May 31, 2016 |
SCHEDULE OF INVESTMENTS
Large Cap Fund
May 31, 2016
| | | | | | | | |
| Description | | Shares | | | Market Value
($ Thousands) | |
Navient | | | 69,800 | | | $ | 957 | |
Old Republic International | | | 39,534 | | | | 757 | |
Outfront Media ‡ | | | 33,580 | | | | 747 | |
Piedmont Office Realty Trust, Cl A ‡ | | | 5,612 | | | | 113 | |
PNC Financial Services Group | | | 73,424 | | | | 6,589 | |
Popular | | | 12,961 | | | | 406 | |
Post Properties ‡ | | | 16,271 | | | | 986 | |
Progressive | | | 12,766 | | | | 425 | |
Prudential Financial | | | 87,659 | | | | 6,947 | |
Public Storage ‡ | | | 4,641 | | | | 1,177 | |
Radian Group | | | 62,800 | | | | 779 | |
Regions Financial | | | 792,849 | | | | 7,794 | |
Reinsurance Group of America, Cl A | | | 10,385 | | | | 1,030 | |
Retail Properties of America, Cl A ‡ | | | 22,239 | | | | 352 | |
RLJ Lodging Trust ‡ | | | 47,793 | | | | 979 | |
RMR Group | | | 893 | | | | 26 | |
S&P Global | | | 4,023 | | | | 450 | |
Simon Property Group ‡ | | | 5,984 | | | | 1,183 | |
Starwood Property Trust ‡ | | | 64,800 | | | | 1,336 | |
State Street | | | 20,300 | | | | 1,280 | |
SunTrust Banks | | | 270,139 | | | | 11,837 | |
Synchrony Financial * | | | 5,630 | | | | 176 | |
T. Rowe Price Group | | | 28,091 | | | | 2,165 | |
Taubman Centers ‡ | | | 13,730 | | | | 941 | |
Travelers | | | 119,409 | | | | 13,629 | |
Unum Group | | | 150,241 | | | | 5,547 | |
US Bancorp | | | 5,185 | | | | 222 | |
Validus Holdings | | | 53,211 | | | | 2,591 | |
VEREIT ‡ | | | 271,900 | | | | 2,608 | |
Voya Financial | | | 241,034 | | | | 7,920 | |
Waddell & Reed Financial, Cl A | | | 27,861 | | | | 595 | |
Wells Fargo | | | 104,219 | | | | 5,286 | |
| | | | | | | | |
| | | | | | | 355,387 | |
| | | | | | | | |
| | |
Health Care — 14.2% | | | | | | | | |
Abbott Laboratories | | | 17,321 | | | | 686 | |
AbbVie | | | 35,200 | | | | 2,215 | |
Aetna | | | 24,934 | | | | 2,823 | |
Alexion Pharmaceuticals * | | | 82,541 | | | | 12,455 | |
Allergan * | | | 99,530 | | | | 23,464 | |
AmerisourceBergen | | | 1,856 | | | | 139 | |
Amgen | | | 62,441 | | | | 9,863 | |
Anthem | | | 39,423 | | | | 5,210 | |
Baxalta | | | 36,319 | | | | 1,643 | |
Baxter International (A) | | | 28,472 | | | | 1,229 | |
Biogen * | | | 53,370 | | | | 15,463 | |
Bristol-Myers Squibb | | | 229,906 | | | | 16,484 | |
Bruker | | | 48,839 | | | | 1,289 | |
C.R. Bard | | | 3,419 | | | | 749 | |
Cardinal Health | | | 54,086 | | | | 4,270 | |
Celgene * | | | 226,201 | | | | 23,869 | |
Cigna | | | 20,885 | | | | 2,676 | |
| | | | | | | | |
| Description | | Shares | | | Market Value
($ Thousands) | |
Community Health Systems *(A) | | | 93,360 | | | $ | 1,255 | |
DaVita HealthCare Partners * | | | 89,036 | | | | 6,884 | |
Dentsply Sirona | | | 143,913 | | | | 8,946 | |
Edwards Lifesciences * | | | 1,580 | | | | 156 | |
Express Scripts Holding * | | | 138,262 | | | | 10,446 | |
Gilead Sciences | | | 106,577 | | | | 9,279 | |
HCA Holdings * | | | 111,394 | | | | 8,691 | |
Hologic * | | | 26,937 | | | | 927 | |
Humana | | | 2,643 | | | | 456 | |
Intrexon * | | | 20,228 | | | | 622 | |
Intuitive Surgical * | | | 16,076 | | | | 10,204 | |
Johnson & Johnson | | | 321,674 | | | | 36,249 | |
Ligand Pharmaceuticals, Cl B * | | | 11,855 | | | | 1,418 | |
McKesson | | | 6,671 | | | | 1,222 | |
Medivation * | | | 2,147 | | | | 130 | |
Merck | | | 137,629 | | | | 7,743 | |
Novo Nordisk ADR | | | 197,866 | | | | 11,088 | |
Pfizer | | | 760,835 | | | | 26,401 | |
Quest Diagnostics | | | 48,608 | | | | 3,751 | |
Shire ADR (A) | | | 37,808 | | | | 7,038 | |
St. Jude Medical | | | 5,596 | | | | 438 | |
Teva Pharmaceutical Industries ADR | | | 145,550 | | | | 7,550 | |
United Therapeutics * | | | 69,346 | | | | 8,257 | |
UnitedHealth Group | | | 10,933 | | | | 1,461 | |
| | | | | | | | |
| | | | | | | 295,139 | |
| | | | | | | | |
| | |
Industrials — 7.8% | | | | | | | | |
3M | | | 9,098 | | | | 1,531 | |
AGCO | | | 44,200 | | | | 2,295 | |
Alaska Air Group | | | 64,565 | | | | 4,287 | |
American Airlines Group | | | 102,763 | | | | 3,279 | |
Babcock & Wilcox Enterprises * | | | 6,864 | | | | 149 | |
Boeing | | | 51,230 | | | | 6,463 | |
BWX Technologies | | | 54,406 | | | | 1,913 | |
Canadian Pacific Railway | | | 29,164 | | | | 3,779 | |
Carlisle | | | 2,561 | | | | 266 | |
Chicago Bridge & Iron | | | 40,300 | | | | 1,541 | |
Cintas | | | 4,084 | | | | 387 | |
CSX | | | 21,722 | | | | 574 | |
Cummins | | | 24,867 | | | | 2,847 | |
Danaher | | | 120,406 | | | | 11,843 | |
Deere | | | 23,200 | | | | 1,909 | |
Delta Air Lines | | | 205,970 | | | | 8,951 | |
Equifax | | | 3,621 | | | | 455 | |
Fastenal (A) | | | 138,933 | | | | 6,395 | |
FedEx | | | 34,997 | | | | 5,773 | |
Fluor | | | 43,200 | | | | 2,280 | |
General Dynamics | | | 23,906 | | | | 3,392 | |
General Electric | | | 56,068 | | | | 1,695 | |
Hawaiian Holdings * | | | 72,690 | | | | 2,941 | |
HD Supply Holdings * | | | 2,579 | | | | 91 | |
Huntington Ingalls Industries | | | 56,827 | | | | 8,718 | |
| | |
| 3 | | SEI Institutional Investments Trust / Annual Report / May 31, 2016 |
SCHEDULE OF INVESTMENTS
Large Cap Fund
May 31, 2016
| | | | | | | | |
| Description | | Shares | | | Market Value
($ Thousands) | |
JB Hunt Transport Services | | | 36,850 | | | $ | 3,048 | |
JetBlue Airways * | | | 51,077 | | | | 916 | |
Kansas City Southern | | | 51,210 | | | | 4,768 | |
Kennametal | | | 15,812 | | | | 387 | |
L-3 Communications Holdings, Cl 3 | | | 1,606 | | | | 220 | |
Manitowoc | | | 144,251 | | | | 822 | |
Manpowergroup | | | 4,775 | | | | 381 | |
Masco | | | 7,158 | | | | 234 | |
Moog, Cl A * | | | 18,200 | | | | 982 | |
MSC Industrial Direct, Cl A | | | 10,977 | | | | 823 | |
Nielsen Holdings | | | 183,355 | | | | 9,789 | |
Norfolk Southern | | | 17,439 | | | | 1,466 | |
Northrop Grumman | | | 38,076 | | | | 8,098 | |
Owens Corning | | | 59,151 | | | | 3,021 | |
Pitney Bowes | | | 89,702 | | | | 1,671 | |
Quanta Services * | | | 22,478 | | | | 540 | |
Raytheon | | | 11,880 | | | | 1,540 | |
Republic Services, Cl A | | | 30,047 | | | | 1,451 | |
Rockwell Collins | | | 43,710 | | | | 3,864 | |
RR Donnelley & Sons | | | 89,392 | | | | 1,456 | |
Southwest Airlines | | | 170,662 | | | | 7,250 | |
Spirit AeroSystems Holdings, Cl A * | | | 126,696 | | | | 5,927 | |
SPX * | | | 35,625 | | | | 590 | |
SPX FLOW * | | | 35,738 | | | | 1,071 | |
Timken | | | 36,800 | | | | 1,224 | |
Trinity Industries | | | 55,800 | | | | 1,008 | |
Union Pacific | | | 29,920 | | | | 2,519 | |
United Continental Holdings * | | | 150,467 | | | | 6,785 | |
Vectrus * | | | 900 | | | | 23 | |
Wabtec | | | 83,467 | | | | 6,459 | |
Waste Management | | | 18,568 | | | | 1,132 | |
| | | | | | | | |
| | | | | | | 163,219 | |
| | | | | | | | |
| | |
Information Technology — 25.1% | | | | | | | | |
Adobe Systems * | | | 143,171 | | | | 14,241 | |
Akamai Technologies * | | | 128,465 | | | | 7,012 | |
Alphabet, Cl A * | | | 39,407 | | | | 29,510 | |
Alphabet, Cl C * | | | 31,039 | | | | 22,836 | |
Amdocs | | | 33,021 | | | | 1,915 | |
Amphenol, Cl A | | | 165,160 | | | | 9,698 | |
Ansys * | | | 61,341 | | | | 5,465 | |
Apple | | | 58,518 | | | | 5,844 | |
Applied Materials | | | 344,690 | | | | 8,417 | |
Arrow Electronics * | | | 26,836 | | | | 1,734 | |
Aspen Technology * | | | 32,920 | | | | 1,255 | |
Avnet | | | 69,716 | | | | 2,860 | |
Brocade Communications Systems | | | 440,966 | | | | 3,995 | |
CA | | | 86,753 | | | | 2,804 | |
Cadence Design Systems * | | | 70,146 | | | | 1,734 | |
Cisco Systems | | | 375,570 | | | | 10,910 | |
Citrix Systems * | | | 56,559 | | | | 4,803 | |
Cognizant Technology Solutions, Cl A * | | | 201,027 | | | | 12,351 | |
| | | | | | | | |
| Description | | Shares | | | Market Value
($ Thousands) | |
Computer Sciences | | | 17,649 | | | $ | 868 | |
Convergys | | | 60,800 | | | | 1,714 | |
CoreLogic * | | | 21,253 | | | | 792 | |
Corning | | | 202,000 | | | | 4,220 | |
DST Systems | | | 5,335 | | | | 645 | |
eBay * | | | 739,737 | | | | 18,094 | |
Electronic Arts * | | | 229,820 | | | | 17,639 | |
EMC | | | 176,245 | | | | 4,926 | |
Facebook, Cl A * | | | 309,789 | | | | 36,806 | |
First Solar * | | | 28,871 | | | | 1,433 | |
FleetCor Technologies * | | | 46,740 | | | | 6,959 | |
Flextronics International * | | | 150,000 | | | | 1,867 | |
Genpact * | | | 321,443 | | | | 9,061 | |
Hewlett Packard Enterprise | | | 107,300 | | | | 1,982 | |
HP | | | 221,768 | | | | 2,967 | |
IAC * | | | 6,011 | | | | 336 | |
Ingram Micro, Cl A * | | | 46,804 | | | | 1,621 | |
Intel | | | 577,015 | | | | 18,228 | |
International Business Machines | | | 32,854 | | | | 5,051 | |
Intuit | | | 77,756 | | | | 8,293 | |
Jabil Circuit | | | 39,292 | | | | 750 | |
Juniper Networks | | | 86,400 | | | | 2,023 | |
Lam Research | | | 24,900 | | | | 2,062 | |
Leidos Holdings (A) | | | 850 | | | | 42 | |
LinkedIn, Cl A * | | | 1,887 | | | | 258 | |
Marvell Technology Group | | | 128,178 | | | | 1,311 | |
MasterCard, Cl A | | | 246,920 | | | | 23,680 | |
Micron Technology * | | | 85,083 | | | | 1,082 | |
Microsoft | | | 763,214 | | | | 40,450 | |
National Instruments | | | 100,466 | | | | 2,870 | |
NCR * | | | 56,200 | | | | 1,735 | |
NetSuite *(A) | | | 81,827 | | | | 6,490 | |
Nuance Communications * | | | 74,847 | | | | 1,251 | |
NXP Semiconductor * | | | 179,284 | | | | 16,941 | |
ON Semiconductor * | | | 50,230 | | | | 491 | |
Oracle | | | 32,652 | | | | 1,313 | |
PayPal Holdings * | | | 458,979 | | | | 17,345 | |
Qualcomm | | | 417,107 | | | | 22,908 | |
Rackspace Hosting * | | | 69,471 | | | | 1,737 | |
salesforce.com * | | | 135,519 | | | | 11,344 | |
Seagate Technology (A) | | | 55,700 | | | | 1,257 | |
Symantec | | | 439,708 | | | | 7,633 | |
Tableau Software, Cl A * | | | 20,387 | | | | 1,049 | |
Take-Two Interactive Software * | | | 96,049 | | | | 3,737 | |
Tech Data * | | | 18,100 | | | | 1,368 | |
Teradata * | | | 13,365 | | | | 379 | |
Teradyne | | | 34,701 | | | | 687 | |
Total System Services | | | 5,548 | | | | 298 | |
VeriSign * | | | 56,966 | | | | 4,868 | |
Viavi Solutions * | | | 39,498 | | | | 270 | |
Visa, Cl A | | | 521,392 | | | | 41,159 | |
Vishay Intertechnology | | | 112,000 | | | | 1,452 | |
| | |
| 4 | | SEI Institutional Investments Trust / Annual Report / May 31, 2016 |
SCHEDULE OF INVESTMENTS
Large Cap Fund
May 31, 2016
| | | | | | | | |
| Description | | Shares | | | Market Value
($ Thousands) | |
VMware, Cl A *(A) | | | 3,477 | | | $ | 211 | |
Western Digital | | | 31,600 | | | | 1,471 | |
Western Union | | | 81,100 | | | | 1,577 | |
Xerox | | | 737,295 | | | | 7,351 | |
Yelp, Cl A * | | | 7,733 | | | | 203 | |
Zynga, Cl A * | | | 388,449 | | | | 998 | |
| | | | | | | | |
| | | | | | | 522,937 | |
| | | | | | | | |
| | |
Materials — 2.8% | | | | | | | | |
Air Products & Chemicals | | | 28,040 | | | | 4,000 | |
Cabot | | | 39,099 | | | | 1,787 | |
Celanese, Cl A | | | 33,651 | | | | 2,372 | |
CF Industries Holdings | | | 41,500 | | | | 1,148 | |
Domtar | | | 66,736 | | | | 2,579 | |
Dow Chemical | | | 8,629 | | | | 443 | |
E.I. du Pont de Nemours | | | 13,418 | | | | 878 | |
Eastman Chemical | | | 34,300 | | | | 2,516 | |
Ecolab | | | 86,872 | | | | 10,185 | |
Freeport-McMoRan, Cl B *(A) | | | 43,500 | | | | 482 | |
Graphic Packaging Holding | | | 25,546 | | | | 342 | |
Huntsman | | | 136,327 | | | | 2,035 | |
International Paper | | | 50,144 | | | | 2,114 | |
LyondellBasell Industries, Cl A | | | 117,277 | | | | 9,542 | |
Monsanto | | | 5,873 | | | | 661 | |
Mosaic | | | 52,000 | | | | 1,312 | |
Owens-Illinois * | | | 56,900 | | | | 1,075 | |
Packaging Corp of America | | | 53,300 | | | | 3,637 | |
Reliance Steel & Aluminum | | | 69,282 | | | | 5,151 | |
Sherwin-Williams | | | 13,690 | | | | 3,985 | |
Steel Dynamics | | | 52,098 | | | | 1,286 | |
Westlake Chemical | | | 18,200 | | | | 803 | |
| | | | | | | | |
| | | | | | | 58,333 | |
| | | | | | | | |
| | |
Telecommunication Services — 2.0% | | | | | | | | |
AT&T | | | 369,093 | | | | 14,450 | |
Level 3 Communications * | | | 126,949 | | | | 6,849 | |
SBA Communications, Cl A * | | | 67,146 | | | | 6,674 | |
Verizon Communications | | | 277,524 | | | | 14,126 | |
| | | | | | | | |
| | | | | | | 42,099 | |
| | | | | | | | |
| | |
Utilities — 3.5% | | | | | | | | |
AES | | | 578,148 | | | | 6,412 | |
Ameren | | | 37,387 | | | | 1,853 | |
American Electric Power | | | 189,458 | | | | 12,264 | |
Centerpoint Energy | | | 16,532 | | | | 373 | |
Consolidated Edison | | | 27,942 | | | | 2,047 | |
Edison International | | | 146,786 | | | | 10,514 | |
Entergy | | | 142,431 | | | | 10,813 | |
Exelon | | | 118,615 | | | | 4,065 | |
FirstEnergy | | | 194,659 | | | | 6,387 | |
Great Plains Energy | | | 29,002 | | | | 846 | |
NiSource | | | 32,057 | | | | 765 | |
NRG Energy | | | 84,384 | | | | 1,382 | |
| | | | | | | | |
| Description | | Shares | | | Market Value
($ Thousands) | |
PG&E | | | 22,554 | | | $ | 1,355 | |
Pinnacle West Capital | | | 16,800 | | | | 1,236 | |
Public Service Enterprise Group | | | 275,427 | | | | 12,325 | |
SCANA | | | 14,218 | | | | 994 | |
| | | | | | | | |
| | | | | | | 73,631 | |
| | | | | | | | |
Total Common Stock
(Cost $1,639,317) ($ Thousands) | | | | | | | 2,020,461 | |
| | | | | | | | |
| |
AFFILIATED PARTNERSHIP — 1.9% | | | | | |
SEI Liquidity Fund, L.P. | | | | | | | | |
0.410% **†(B) | | | 40,531,934 | | | | 40,532 | |
| | | | | | | | |
Total Affiliated Partnership (Cost $40,532) ($ Thousands) | | | | | | | 40,532 | |
| | | | | | | | |
| | |
| | | Face Amount
(Thousands) | | | | |
| |
U.S. TREASURY OBLIGATION — 0.0% | | | | | |
U.S. Treasury Bills | | | | | | | | |
0.433%, 08/18/2016 (C)(D) | | $ | 660 | | | | 660 | |
| | | | | | | | |
Total U.S. Treasury Obligation
(Cost $660) ($ Thousands) | | | | | | | 660 | |
| | | | | | | | |
| | |
| | | Shares | | | | |
| |
CASH EQUIVALENTS — 3.2% | | | | | |
Investors Cash Trust - Treasury Portfolio - Deutsche U.S. Treasury Money Fund, Cl S | | | | | | | | |
0.010% ** | | | 4,649,322 | | | | 4,649 | |
SEI Daily Income Trust, Prime Obligation Fund, Cl A | | | | | | | | |
0.270% **† | | | 62,127,165 | | | | 62,127 | |
| | | | | | | | |
Total Cash Equivalents
(Cost $66,776) ($ Thousands) | | | | | | | 66,776 | |
| | | | | | | | |
Total Investments — 102.0%
(Cost $1,747,285) ($ Thousands) | | | | | | $ | 2,128,429 | |
| | | | | | | | |
| | |
| 5 | | SEI Institutional Investments Trust / Annual Report / May 31, 2016 |
SCHEDULE OF INVESTMENTS
Large Cap Fund
May 31, 2016
Percentages are based on a Net Assets of $2,086,522 ($ Thousands).
| * | | Non-income producing security. |
| ** | | Rate shown is the 7-day effective yield as of May 31, 2016. |
| † | | Investment in Affiliated Security. |
| †† | | Narrow Industries are utilized for compliance purposes, whereas broad sectors are utilized for reporting. |
| ‡ | | Real Estate Investment Trust. |
| (A) | | This security or a partial position of this security is on loan at May 31, 2016. The total market value of securities on loan at May 31, 2016 was $39,531 ($ Thousands). |
| (B) | | This security was purchased with cash collateral held from securities on loan. The total market value of such securities as of May 31, 2016 was $40,532($Thousands). |
| (C) | | Security, or portion thereof, has been pledged as collateral on open futures contracts. |
| (D) | | The rate reported is the effective yield at time of purchase. |
ADR — American Depositary Receipt
Cl — Class
L.P. — Limited Partnership
MSCI — Morgan Stanley Capital International
The following is a list of the level of inputs used as of May 31, 2016, in valuing the Fund’s investments carried at value ($ Thousands):
| | | | | | | | | | | | | | | | |
| Investments in Securities | | Level 1 | | | Level 2 | | | Level 3 | | | Total | |
Common Stock | | $ | 2,020,461 | | | $ | — | | | $ | — | | | $ | 2,020,461 | |
Affiliated Partnership | | | — | | | | 40,532 | | | | — | | | | 40,532 | |
U.S. Treasury Obligation | | | — | | | | 660 | | | | — | | | | 660 | |
Cash Equivalents | | | 66,776 | | | | — | | | | — | | | | 66,776 | |
| | | | | | | | | | | | | | | | |
Total Investments in Securities | | $ | 2,087,237 | | | $ | 41,192 | | | $ | — | | | $ | 2,128,429 | |
| | | | | | | | | | | | | | | | |
For the year ended May 31, 2016, there were no transfers between Level 1 and Level 2 assets and liabilities.
For the year ended May 31, 2016, there were no transfers between Level 2 and Level 3 assets and liabilities.
For more information on valuation inputs, see Note 2 – Significant Accounting Policies in Notes to Financial Statements.
Amounts designated as “—” are $0 or have been rounded to $0.
The accompanying notes are an integral part of the financial statements.
| | |
| 6 | | SEI Institutional Investments Trust / Annual Report / May 31, 2016 |
SCHEDULE OF INVESTMENTS
Large Cap Diversified Alpha Fund
May 31, 2016
| | | | | | | | |
| Description | | Shares | | | Market Value
($ Thousands) | |
COMMON STOCK — 93.7% | | | | | | | | |
| | |
Consumer Discretionary — 11.8% | | | | | | | | |
Amazon.com * | | | 166 | | | $ | 120 | |
Bed Bath & Beyond | | | 793 | | | | 35 | |
Best Buy | | | 4,477 | | | | 144 | |
Carnival, Cl A | | | 1,369 | | | | 65 | |
Carter’s | | | 455 | | | | 46 | |
Comcast, Cl A | | | 418 | | | | 26 | |
Darden Restaurants | | | 990 | | | | 67 | |
Delphi Automotive | | | 832 | | | | 57 | |
Dillard’s, Cl A | | | 2,004 | | | | 118 | |
Discovery Communications, Cl C * | | | 8,390 | | | | 225 | |
Dollar General | | | 3,711 | | | �� | 334 | |
General Motors | | | 16,347 | | | | 511 | |
Goodyear Tire & Rubber | | | 9,574 | | | | 268 | |
Home Depot | | | 644 | | | | 85 | |
Interpublic Group | | | 2,922 | | | | 70 | |
Interval Leisure Group | | | — | | | | — | |
John Wiley & Sons, Cl A | | | 1,884 | | | | 101 | |
Kohl’s | | | 5,066 | | | | 183 | |
L Brands | | | 4,637 | | | | 318 | |
Liberty Global * | | | 10,270 | | | | 371 | |
Liberty Global, Cl A * | | | 4,310 | | | | 161 | |
Liberty Interactive QVC Group, Cl A * | | | 20,344 | | | | 549 | |
Lowe’s | | | 2,506 | | | | 201 | |
Macy’s | | | 7,076 | | | | 235 | |
Magna International, Cl A | | | 4,731 | | | | 192 | |
Marriott International, Cl A | | | 381 | | | | 25 | |
Michael Kors Holdings * | | | 6,685 | | | | 286 | |
MSG Networks * | | | 4,905 | | | | 85 | |
Murphy USA * | | | 737 | | | | 50 | |
NIKE, Cl B | | | 1,107 | | | | 61 | |
Omnicom Group | | | 4,922 | | | | 410 | |
Starwood Hotels & Resorts Worldwide | | | 609 | | | | 45 | |
Target | | | 682 | | | | 47 | |
TJX | | | 372 | | | | 28 | |
TopBuild * | | | 2,109 | | | | 76 | |
Toyota Motor ADR | | | 2,509 | | | | 259 | |
TripAdvisor * | | | 5,987 | | | | 406 | |
Tupperware Brands | | | 449 | | | | 25 | |
Whirlpool | | | 175 | | | | 31 | |
Yum! Brands | | | 1,301 | | | | 107 | |
| | | | | | | | |
| | | | | | | 6,423 | |
| | | | | | | | |
| | |
Consumer Staples — 8.3% | | | | | | | | |
Altria Group | | | 1,344 | | | | 86 | |
Bunge | | | 457 | | | | 31 | |
Campbell Soup | | | 4,081 | | | | 247 | |
Clorox | | | 2,076 | | | | 267 | |
Coca-Cola European Partners | | | 4,410 | | | | 171 | |
Constellation Brands, Cl A | | | 160 | | | | 25 | |
CVS Health | | | 3,857 | | | | 372 | |
Dr. Pepper Snapple Group | | | 1,664 | | | | 152 | |
| | | | | | | | |
| Description | | Shares | | | Market Value
($ Thousands) | |
General Mills | | | 2,978 | | | $ | 187 | |
Hershey | | | 874 | | | | 81 | |
JM Smucker | | | 1,372 | | | | 177 | |
Kimberly-Clark | | | 2,538 | | | | 322 | |
Kroger | | | 6,354 | | | | 227 | |
Molson Coors Brewing, Cl B | | | 679 | | | | 67 | |
Mondelez International, Cl A | | | 608 | | | | 27 | |
PepsiCo | | | 3,470 | | | | 351 | |
Philip Morris International | | | 2,918 | | | | 288 | |
Procter & Gamble | | | 4,800 | | | | 389 | |
Quorum Health * | | | 587 | | | | 8 | |
Reynolds American | | | 4,099 | | | | 204 | |
Sysco | | | 1,060 | | | | 51 | |
Tyson Foods, Cl A | | | 2,508 | | | | 160 | |
Walgreens Boots Alliance | | | 5,368 | | | | 415 | |
Wal-Mart Stores | | | 2,855 | | | | 202 | |
| | | | | | | | |
| | | | | | | 4,507 | |
| | | | | | | | |
| | |
Energy — 6.1% | | | | | | | | |
Antero Resources * | | | 1,170 | | | | 34 | |
Apache | | | 2,867 | | | | 164 | |
BP PLC ADR | | | 17,933 | | | | 563 | |
California Resources * | | | 32,899 | | | | 50 | |
Canadian Natural Resources | | | 10,181 | | | | 303 | |
Chevron | | | 789 | | | | 80 | |
Cimarex Energy | | | 1,552 | | | | 180 | |
ConocoPhillips | | | 1,114 | | | | 49 | |
Denbury Resources * | | | 6,453 | | | | 26 | |
Devon Energy | | | 10,603 | | | | 383 | |
Exxon Mobil | | | 1,091 | | | | 97 | |
Helmerich & Payne | | | 872 | | | | 53 | |
HollyFrontier | | | 1,128 | | | | 30 | |
Marathon Petroleum | | | 2,867 | | | | 100 | |
Occidental Petroleum | | | 8,276 | | | | 624 | |
Rowan, Cl A * | | | 1,404 | | | | 24 | |
Royal Dutch Shell ADR, Cl A | | | 5,767 | | | | 279 | |
Teekay | | | 4,822 | | | | 51 | |
Tesoro | | | 1,350 | | | | 105 | |
Valero Energy | | | 1,793 | | | | 98 | |
| | | | | | | | |
| | | | | | | 3,293 | |
| | | | | | | | |
| | |
Financials — 16.6% | | | | | | | | |
Aflac | | | 4,197 | | | | 291 | |
Allied World Assurance Holdings | | | 4,168 | | | | 155 | |
Allstate | | | 2,808 | | | | 190 | |
American Financial Group | | | 379 | | | | 28 | |
Aspen Insurance Holdings | | | 2,046 | | | | 98 | |
Assured Guaranty | | | 2,102 | | | | 56 | |
Bank of America | | | 50,013 | | | | 740 | |
Berkshire Hathaway, Cl B * | | | 1,899 | | | | 267 | |
Blackstone Group | | | 6,817 | | | | 178 | |
Care Capital Properties ‡ | | | 1,642 | | | | 43 | |
| | |
| 7 | | SEI Institutional Investments Trust / Annual Report / May 31, 2016 |
SCHEDULE OF INVESTMENTS
Large Cap Diversified Alpha Fund
May 31, 2016
| | | | | | | | |
| Description | | Shares | | | Market Value
($ Thousands) | |
CBRE Group, Cl A * | | | 3,961 | | | $ | 118 | |
Citigroup | | | 16,207 | | | | 755 | |
Columbia Property Trust ‡ | | | 2,955 | | | | 61 | |
Corporate Office Properties Trust ‡ | | | 5,089 | | | | 138 | |
Crown Castle International ‡ | | | 8,703 | | | | 790 | |
Cullen/Frost Bankers | | | 1,456 | | | | 97 | |
Discover Financial Services | | | 448 | | | | 25 | |
Equinix ‡ | | | 1,170 | | | | 423 | |
Goldman Sachs Group | | | 827 | | | | 132 | |
Hartford Financial Services Group | | | 572 | | | | 26 | |
Hatteras Financial ‡ | | | 1,909 | | | | 31 | |
Host Hotels & Resorts ‡ | | | 2,378 | | | | 37 | |
Intercontinental Exchange | | | 1,677 | | | | 455 | |
JPMorgan Chase | | | 8,896 | | | | 581 | |
KeyCorp | | | 2,888 | | | | 37 | |
KKR (A) | | | 24,574 | | | | 332 | |
Liberty Property Trust ‡ | | | 2,512 | | | | 94 | |
Marsh & McLennan | | | 4,575 | | | | 302 | |
MetLife | | | 3,605 | | | | 164 | |
MSCI, Cl A | | | 1,373 | | | | 110 | |
Nomura Holdings ADR | | | 35,666 | | | | 152 | |
PNC Financial Services Group | | | 1,891 | | | | 170 | |
Popular | | | 3,464 | | | | 109 | |
Post Properties ‡ | | | 2,772 | | | | 168 | |
Principal Financial Group | | | 1,580 | | | | 70 | |
Prudential Financial | | | 1,155 | | | | 91 | |
Retail Properties of America, Cl A ‡ | | | 1,609 | | | | 25 | |
S&P Global | | | 1,257 | | | | 140 | |
Santander Consumer USA Holdings * | | | 15,326 | | | | 197 | |
State Street | | | 7,592 | | | | 479 | |
Synchrony Financial * | | | 3,240 | | | | 101 | |
T. Rowe Price Group | | | 1,118 | | | | 86 | |
Two Harbors Investment ‡ | | | 3,902 | | | | 33 | |
Validus Holdings | | | 3,592 | | | | 175 | |
Wells Fargo | | | 4,821 | | | | 244 | |
| | | | | | | | |
| | | | | | | 8,994 | |
| | | | | | | | |
| | |
Health Care — 14.5% | | | | | | | | |
Abbott Laboratories | | | 4,260 | | | | 169 | |
AbbVie | | | 3,577 | | | | 225 | |
Allergan * | | | 3,150 | | | | 743 | |
AmerisourceBergen | | | 3,484 | | | | 261 | |
Amgen | | | 1,620 | | | | 256 | |
Baxalta | | | 1,181 | | | | 53 | |
Baxter International | | | 10,800 | | | | 466 | |
Becton Dickinson | | | 2,293 | | | | 382 | |
Biogen * | | | 2,812 | | | | 815 | |
C.R. Bard | | | 122 | | | | 27 | |
Celgene * | | | 6,820 | | | | 720 | |
Cigna | | | 1,076 | | | | 138 | |
Community Health Systems * | | | 2,901 | | | | 39 | |
Dentsply Sirona | | | 5,272 | | | | 328 | |
| | | | | | | | |
| Description | | Shares | | | Market Value
($ Thousands) | |
Edwards Lifesciences * | | | 364 | | | $ | 36 | |
Gilead Sciences | | | 5,286 | | | | 460 | |
HCA Holdings * | | | 953 | | | | 74 | |
Horizon Pharma * | | | 8,306 | | | | 143 | |
Humana | | | 310 | | | | 53 | |
Jazz Pharmaceuticals * | | | 193 | | | | 29 | |
Johnson & Johnson | | | 5,167 | | | | 582 | |
Mallinckrodt * | | | 2,016 | | | | 128 | |
McKesson | | | 309 | | | | 57 | |
Medivation * | | | 545 | | | | 33 | |
Merck | | | 3,217 | | | | 181 | |
Mylan * | | | 2,979 | | | | 129 | |
Novo Nordisk ADR | | | 9,751 | | | | 546 | |
Pfizer | | | 3,487 | | | | 121 | |
Regeneron Pharmaceuticals * | | | 173 | | | | 69 | |
United Therapeutics * | | | 496 | | | | 59 | |
UnitedHealth Group | | | 3,219 | | | | 430 | |
Valeant Pharmaceuticals International * | | | 5,020 | | | | 143 | |
| | | | | | | | |
| | | | | | | 7,895 | |
| | | | | | | | |
| | |
Industrials — 10.0% | | | | | | | | |
3M | | | 3,467 | | | | 584 | |
AECOM Technology * | | | 3,587 | | | | 115 | |
AerCap Holdings * | | | 5,819 | | | | 227 | |
AGCO | | | 480 | | | | 25 | |
American Airlines Group | | | 7,161 | | | | 229 | |
B/E Aerospace | | | 576 | | | | 27 | |
Babcock & Wilcox Enterprises * | | | 2,474 | | | | 54 | |
Caterpillar | | | 1,941 | | | | 141 | |
Chicago Bridge & Iron | | | 3,415 | | | | 131 | |
Cummins | | | 861 | | | | 99 | |
Delta Air Lines | | | 11,717 | | | | 509 | |
Eaton | | | 4,599 | | | | 283 | |
Huntington Ingalls Industries | | | 983 | | | | 151 | |
Illinois Tool Works | | | 3,506 | | | | 372 | |
Manitowoc | | | 9,210 | | | | 52 | |
Manpowergroup | | | 3,288 | | | | 262 | |
Nielsen Holdings | | | 5,620 | | | | 300 | |
Norfolk Southern | | | 602 | | | | 51 | |
Northrop Grumman | | | 1,347 | | | | 286 | |
Orbital ATK | | | 650 | | | | 57 | |
Owens Corning | | | 3,928 | | | | 201 | |
Raytheon | | | 798 | | | | 103 | |
Southwest Airlines | | | 2,545 | | | | 108 | |
Spirit AeroSystems Holdings, Cl A * | | | 2,831 | | | | 132 | |
SPX * | | | 1,627 | | | | 27 | |
SPX FLOW * | | | 1,311 | | | | 39 | |
Terex | | | 4,817 | | | | 102 | |
United Continental Holdings * | | | 1,892 | | | | 85 | |
Waste Management | | | 935 | | | | 57 | |
WW Grainger | | | 2,678 | | | | 612 | |
| | | | | | | | |
| | | | | | | 5,421 | |
| | | | | | | | |
| | |
| 8 | | SEI Institutional Investments Trust / Annual Report / May 31, 2016 |
SCHEDULE OF INVESTMENTS
Large Cap Diversified Alpha Fund
May 31, 2016
| | | | | | | | |
| Description | | Shares | | | Market Value
($ Thousands) | |
Information Technology — 21.7% | | | | | | | | |
Adobe Systems * | | | 1,837 | | | $ | 183 | |
Akamai Technologies * | | | 678 | | | | 37 | |
Alphabet, Cl A * | | | 1,083 | | | | 811 | |
Alphabet, Cl C * | | | 614 | | | | 452 | |
Amdocs | | | 1,779 | | | | 103 | |
Apple | | | 2,975 | | | | 297 | |
Applied Materials | | | 9,026 | | | | 220 | |
Arrow Electronics * | | | 396 | | | | 26 | |
Automatic Data Processing | | | 1,254 | | | | 110 | |
Broadridge Financial Solutions | | | 492 | | | | 32 | |
Brocade Communications Systems | | | 4,289 | | | | 39 | |
CA | | | 4,127 | | | | 133 | |
Cisco Systems | | | 14,347 | | | | 417 | |
Citrix Systems * | | | 405 | | | | 34 | |
Cognizant Technology Solutions, Cl A * | | | 2,004 | | | | 123 | |
Computer Sciences | | | 3,260 | | | | 160 | |
eBay * | | | 23,772 | | | | 582 | |
Electronic Arts * | | | 8,623 | | | | 662 | |
EMC | | | 9,593 | | | | 268 | |
Facebook, Cl A * | | | 5,466 | | | | 649 | |
First Solar * | | | 509 | | | | 25 | |
Genpact * | | | 1,142 | | | | 32 | |
Hewlett Packard Enterprise | | | 2,034 | | | | 38 | |
HP | | | 3,077 | | | | 41 | |
Ingram Micro, Cl A * | | | 1,128 | | | | 39 | |
Intel | | | 10,410 | | | | 329 | |
International Business Machines | | | 1,551 | | | | 238 | |
Intuit | | | 3,141 | | | | 335 | |
Jabil Circuit | | | 2,881 | | | | 55 | |
Juniper Networks | | | 2,832 | | | | 66 | |
Lam Research | | | 1,992 | | | | 165 | |
Marvell Technology Group | | | 5,583 | | | | 57 | |
MasterCard, Cl A | | | 4,999 | | | | 479 | |
Microchip Technology | | | 4,461 | | | | 231 | |
Micron Technology * | | | 28,878 | | | | 367 | |
Microsoft | | | 18,720 | | | | 992 | |
Motorola Solutions | | | 1,949 | | | | 135 | |
Nuance Communications * | | | 1,435 | | | | 24 | |
ON Semiconductor * | | | 6,121 | | | | 60 | |
Oracle | | | 2,650 | | | | 107 | |
PayPal Holdings * | | | 16,564 | | | | 626 | |
Qualcomm | | | 15,404 | | | | 846 | |
Rackspace Hosting * | | | 2,302 | | | | 58 | |
Skyworks Solutions | | | 433 | | | | 29 | |
Texas Instruments | | | 2,071 | | | | 126 | |
Visa, Cl A | | | 9,965 | | | | 787 | |
Western Digital | | | 536 | | | | 25 | |
Xerox | | | 12,865 | | | | 128 | |
| | | | | | | | |
| | | | | | | 11,778 | |
| | | | | | | | |
| | | | | | | | |
| Description | | Shares | | | Market Value
($ Thousands) | |
Materials — 1.6% | | | | | | | | |
Cabot | | | 3,555 | | | $ | 163 | |
Dow Chemical | | | 3,244 | | | | 167 | |
Eastman Chemical | | | 2,385 | | | | 175 | |
Huntsman | | | 2,840 | | | | 43 | |
Louisiana-Pacific * | | | 6,963 | | | | 127 | |
LyondellBasell Industries, Cl A | | | 631 | | | | 51 | |
Reliance Steel & Aluminum | | | 1,927 | | | | 143 | |
Sealed Air | | | 545 | | | | 25 | |
| | | | | | | | |
| | | | | | | 894 | |
| | | | | | | | |
| |
Telecommunication Services — 0.8% | | | | | |
China Mobile ADR | | | 3,840 | | | | 217 | |
Verizon Communications | | | 4,363 | | | | 222 | |
| | | | | | | | |
| | | | | | | 439 | |
| | | | | | | | |
| | |
Utilities — 2.3% | | | | | | | | |
American Electric Power | | | 657 | | | | 42 | |
Calpine * | | | 3,099 | | | | 46 | |
CMS Energy | | | 6,079 | | | | 254 | |
Consolidated Edison | | | 2,818 | | | | 206 | |
Entergy | | | 727 | | | | 55 | |
Exelon | | | 3,199 | | | | 110 | |
NiSource | | | 2,402 | | | | 57 | |
PG&E | | | 1,892 | | | | 114 | |
Pinnacle West Capital | | | 3,842 | | | | 283 | |
Public Service Enterprise Group | | | 2,226 | | | | 100 | |
| | | | | | | | |
| | | | | | | 1,267 | |
| | | | | | | | |
Total Common Stock
(Cost $44,907) ($ Thousands) | | | | | | | 50,911 | |
| | | | | | | | |
| | |
| | | Face Amount
(Thousands) | | | | |
| |
U.S. TREASURY OBLIGATION — 0.0% | | | | | |
U.S. Treasury Bills | | | | | | | | |
0.363%, 08/18/2016 (B)(C) | | $ | 40 | | | | 40 | |
| | | | | | | | |
Total U.S. Treasury Obligation
(Cost $40) ($ Thousands) | | | | | | | 40 | |
| | | | | | | | |
| | |
| 9 | | SEI Institutional Investments Trust / Annual Report / May 31, 2016 |
SCHEDULE OF INVESTMENTS
Large Cap Diversified Alpha Fund
May 31, 2016
| | | | | | | | |
| Description | | Shares | | | Market Value
($ Thousands) | |
CASH EQUIVALENT — 6.6% | | | | | |
SEI Daily Income Trust, Prime Obligation Fund, Cl A | | | | | | | | |
0.270% **† | | | 3,567,514 | | | $ | 3,568 | |
| | | | | | | | |
Total Cash Equivalent (Cost $3,568) ($ Thousands) | | | | | | | 3,568 | |
| | | | | | | | |
Total Investments — 100.3%
(Cost $48,515) ($ Thousands) | | | | | | $ | 54,519 | |
| | | | | | | | |
A list of the open futures contracts held by the Fund at May 31, 2016, is as follows:
| | | | | | | | | | | | |
| Type of Contract | | Number of
Contracts
Long | | | Expiration
Date | | | Unrealized
Appreciation)
($ Thousands) | |
S&P 500 Index E-MINI | | | 6 | | | | Jun-2016 | | | $ | 11 | |
| | | | | | | | | | | | |
For the year ended May 31, 2016, the total amount of all open futures contracts, as presented in the table above, are representative of the volume of activity for the derivative type during the year.
Percentages are based on a Net Assets of $54,335 ($ Thousands).
| * | | Non-income producing security. |
| ** | | Rate shown is the 7-day effective yield as of May 31, 2016. |
| † | | Investment in Affiliated Security. |
| ‡ | | Real Estate Investment Trust. |
| (A) | | Security is a Master Limited Partnership. At May 31, 2016, such securities amounted to $332 ($ Thousands), or 0.61% of Net Assets. |
| (B) | | Security, or portion thereof, has been pledged as collateral on open futures contracts. |
| (C) | | The rate reported is the effective yield at time of purchase. |
ADR — American Depositary Receipt
Cl — Class
PLC — Public Limited Company
S&P— Standard & Poor’s
The following is a list of the level of inputs used as of May 31, 2016, in valuing the Fund’s investments carried at value ($ Thousands):
| | | | | | | | | | | | | | | | |
| Investments in Securities | | Level 1 | | | Level 2 | | | Level 3 | | | Total | |
Common Stock | | $ | 50,911 | | | $ | — | | | $ | — | | | $ | 50,911 | |
U.S. Treasury Obligation | | | — | | | | 40 | | | | — | | | | 40 | |
Cash Equivalent | | | 3,568 | | | | — | | | | — | | | | 3,568 | |
| | | | | | | | | | | | | | | | |
Total Investments in Securities | | $ | 54,479 | | | $ | 40 | | | $ | — | | | $ | 54,519 | |
| | | | | | | | | | | | | | | | |
| | | | | | | | | | | | | | | | |
| Other Financial Instruments | | Level 1 | | | Level 2 | | | Level 3 | | | Total | |
Futures Contracts * | | | | | | | | | | | | | | | | |
Unrealized Appreciation | | $ | 11 | | | $ | — | | | $ | — | | | $ | 11 | |
| | | | | | | | | | | | | | | | |
| * | | Futures contracts are valued at the unrealized appreciation on the instrument. |
For the year ended May 31, 2016, there were no transfers between Level 1 and Level 2 assets and liabilities.
For the year ended May 31, 2016, there were no transfers between Level 2 and Level 3 assets and liabilities.
For more information on valuation inputs, see Note 2 – Significant Accounting Policies in Notes to Financial Statements.
Amounts designated as “—” are $0 or have been rounded to $0.
The accompanying notes are an integral part of the financial statements.
| | |
| 10 | | SEI Institutional Investments Trust / Annual Report / May 31, 2016 |
SCHEDULE OF INVESTMENTS
Large Cap Disciplined Equity Fund
May 31, 2016
| | | | | | | | |
| Description | | Shares | | | Market Value
($ Thousands) | |
COMMON STOCK — 95.9% | |
| |
Consumer Discretionary — 11.0% | | | | | |
Advance Auto Parts | | | 56,004 | | | $ | 8,616 | |
Amazon.com * | | | 39,781 | | | | 28,753 | |
AMC Networks, Cl A * | | | 22,065 | | | | 1,411 | |
AutoNation * | | | 4,200 | | | | 212 | |
AutoZone * | | | 23,107 | | | | 17,612 | |
Barnes & Noble | | | 75,900 | | | | 883 | |
Bed Bath & Beyond | | | 29,700 | | | | 1,329 | |
Best Buy | | | 13,300 | | | | 428 | |
Bloomin’ Brands | | | 77,890 | | | | 1,484 | |
BorgWarner | | | 5,600 | | | | 191 | |
Brunswick | | | 50,214 | | | | 2,404 | |
Cable One | | | 2,325 | | | | 1,139 | |
Cablevision Systems, Cl A * | | | 49,500 | | | | 1,717 | |
Carmax *(A) | | | 50,140 | | | | 2,690 | |
Carnival, Cl A | | | 15,900 | | | | 759 | |
CBS, Cl B | | | 1,600 | | | | 88 | |
Charter Communications, Cl A * | | | 6,686 | | | | 1,464 | |
Chico’s FAS | | | 115,165 | | | | 1,249 | |
Chipotle Mexican Grill, Cl A * | | | 100 | | | | 44 | |
Coach | | | 9,600 | | | | 378 | |
Comcast, Cl A | | | 751,050 | | | | 47,541 | |
Cooper-Standard Holding * | | | 5,600 | | | | 481 | |
Darden Restaurants | | | 14,400 | | | | 977 | |
Deckers Outdoor * | | | 46,015 | | | | 2,420 | |
Delphi Automotive | | | 215,820 | | | | 14,667 | |
Discovery Communications, Cl A * | | | 600 | | | | 17 | |
Discovery Communications, Cl C * | | | 179,007 | | | | 4,792 | |
Dollar General | | | 5,200 | | | | 467 | |
Dollar Tree * | | | 13,000 | | | | 1,177 | |
DR Horton | | | 274,600 | | | | 8,392 | |
DSW, Cl A | | | 73,600 | | | | 1,557 | |
Expedia | | | 2,200 | | | | 245 | |
Express * | | | 111,300 | | | | 1,618 | |
Extended Stay America | | | 42,000 | | | | 599 | |
Foot Locker | | | 28,980 | | | | 1,621 | |
Ford Motor | | | 18,700 | | | | 252 | |
Fox Factory Holding * | | | 100,640 | | | | 1,675 | |
Gannett | | | 242,476 | | | | 3,787 | |
Gap | | | 163,000 | | | | 2,932 | |
Garmin | | | 400 | | | | 17 | |
General Motors | | | 234,900 | | | | 7,348 | |
Gentherm * | | | 27,565 | | | | 1,008 | |
Genuine Parts | | | 16,417 | | | | 1,591 | |
Goodyear Tire & Rubber | | | 59,900 | | | | 1,675 | |
H&R Block | | | 1,200 | | | | 26 | |
Hanesbrands | | | 8,200 | | | | 222 | |
Harley-Davidson | | | 800 | | | | 37 | |
Harman International Industries | | | 300 | | | | 23 | |
Hasbro | | | 21,000 | | | | 1,833 | |
Home Depot | | | 282,237 | | | | 37,289 | |
Interpublic Group | | | 285,100 | | | | 6,814 | |
| | | | | | | | |
| Description | | Shares | | | Market Value
($ Thousands) | |
Interval Leisure Group | | | 1,212 | | | $ | 17 | |
J.C. Penney *(A) | | | 329,990 | | | | 2,571 | |
Johnson Controls | | | 13,664 | | | | 603 | |
Kohl’s | | | 800 | | | | 29 | |
L Brands | | | 50,800 | | | | 3,482 | |
Las Vegas Sands | | | 8,586 | | | | 397 | |
Lear | | | 14,930 | | | | 1,773 | |
Leggett & Platt | | | 24,500 | | | | 1,231 | |
Lennar, Cl A | | | 7,700 | | | | 351 | |
Lowe’s | | | 44,300 | | | | 3,550 | |
Macy’s | | | 220,800 | | | | 7,333 | |
Madison Square Garden, Cl A * | | | 68,118 | | | | 11,412 | |
Marriott International, Cl A (A) | | | 12,700 | | | | 839 | |
Mattel | | | 65,895 | | | | 2,101 | |
McDonald’s | | | 234,596 | | | | 28,635 | |
Meritage Homes * | | | 27,600 | | | | 1,007 | |
Michael Kors Holdings * | | | 163,100 | | | | 6,968 | |
Modine Manufacturing * | | | 93,683 | | | | 937 | |
Mohawk Industries * | | | 6,400 | | | | 1,259 | |
NetFlix * | | | 26,000 | | | | 2,667 | |
Newell Brands | | | 42,700 | | | | 2,036 | |
News, Cl A | | | 16,810 | | | | 201 | |
NIKE, Cl B | | | 66,061 | | | | 3,648 | |
Nordstrom (A) | | | 500 | | | | 19 | |
Norwegian Cruise Line Holdings * | | | 145,635 | | | | 6,759 | |
Omnicom Group | | | 41,645 | | | | 3,470 | |
O’Reilly Automotive * | | | 13,900 | | | | 3,676 | |
Priceline Group * | | | 1,100 | | | | 1,391 | |
PulteGroup | | | 1,200 | | | | 22 | |
PVH | | | 300 | | | | 28 | |
Ralph Lauren, Cl A | | | 200 | | | | 19 | |
Ross Stores | | | 127,510 | | | | 6,809 | |
Royal Caribbean Cruises (A) | | | 21,900 | | | | 1,695 | |
Sally Beauty Holdings * | | | 33,045 | | | | 949 | |
Scholastic | | | 43,240 | | | | 1,688 | |
Scripps Networks Interactive, Cl A | | | 400 | | | | 26 | |
Signet Jewelers | | | 300 | | | | 30 | |
Staples | | | 269,227 | | | | 2,369 | |
Starbucks | | | 260,987 | | | | 14,326 | |
Starwood Hotels & Resorts Worldwide | | | 3,511 | | | | 258 | |
Steven Madden * | | | 32,235 | | | | 1,106 | |
Sturm Ruger | | | 13,900 | | | | 921 | |
Target | | | 120,300 | | | | 8,274 | |
TEGNA | | | 38,600 | | | | 886 | |
Tenneco * | | | 15,140 | | | | 813 | |
Tiffany | | | 500 | | | | 31 | |
Time Warner | | | 34,147 | | | | 2,584 | |
TJX | | | 3,000 | | | | 228 | |
Tractor Supply | | | 4,600 | | | | 442 | |
TripAdvisor * | | | 500 | | | | 34 | |
Twenty-First Century Fox, Cl A | | | 7,300 | | | | 211 | |
Twenty-First Century Fox, Cl B | | | 43,221 | | | | 1,264 | |
| | |
| 11 | | SEI Institutional Investments Trust / Annual Report / May 31, 2016 |
SCHEDULE OF INVESTMENTS
Large Cap Disciplined Equity Fund
May 31, 2016
| | | | | | | | |
| Description | | Shares | | | Market Value
($ Thousands) | |
Under Armour, Cl A *(A) | | | 12,000 | | | $ | 453 | |
Under Armour, Cl C * | | | 11,300 | | | | 395 | |
Urban Outfitters * | | | 300 | | | | 9 | |
VF | | | 17,600 | | | | 1,097 | |
Viacom, Cl B | | | 1,500 | | | | 67 | |
Walt Disney | | | 119,750 | | | | 11,882 | |
Whirlpool | | | 2,500 | | | | 436 | |
Williams-Sonoma | | | 51,349 | | | | 2,724 | |
Wolverine World Wide | | | 41,200 | | | | 750 | |
Wyndham Worldwide | | | 85,700 | | | | 5,775 | |
Wynn Resorts | | | 100 | | | | 10 | |
Yum! Brands | | | 34,900 | | | | 2,864 | |
| | | | | | | | |
| | | | | | | 395,788 | |
| | | | | | | | |
| |
Consumer Staples — 11.2% | | | | | |
Altria Group | | | 557,076 | | | | 35,452 | |
Archer-Daniels-Midland | | | 121,700 | | | | 5,205 | |
Brown-Forman, Cl B | | | 11,100 | | | | 1,089 | |
Bunge | | | 14,800 | | | | 993 | |
Campbell Soup | | | 31,400 | | | | 1,902 | |
Clorox | | | 10,200 | | | | 1,311 | |
Coca-Cola | | | 108,452 | | | | 4,837 | |
Coca-Cola European Partners | | | 900 | | | | 35 | |
Colgate-Palmolive | | | 115,700 | | | | 8,146 | |
ConAgra Foods | | | 57,400 | | | | 2,623 | |
Constellation Brands, Cl A | | | 28,700 | | | | 4,395 | |
Costco Wholesale | | | 6,100 | | | | 908 | |
CVS Health | | | 173,847 | | | | 16,768 | |
Dr. Pepper Snapple Group | | | 41,400 | | | | 3,784 | |
Estee Lauder, Cl A | | | 7,900 | | | | 725 | |
General Mills | | | 2,300 | | | | 144 | |
Hershey | | | 500 | | | | 46 | |
Hormel Foods | | | 69,200 | | | | 2,381 | |
Ingredion | | | 15,374 | | | | 1,805 | |
JM Smucker | | | 31,100 | | | | 4,017 | |
Kellogg | | | 154,050 | | | | 11,457 | |
Kimberly-Clark | | | 52,072 | | | | 6,615 | |
Kraft Heinz | | | 273,452 | | | | 22,748 | |
Kroger | | | 313,300 | | | | 11,204 | |
McCormick | | | 9,000 | | | | 874 | |
Mead Johnson Nutrition, Cl A | | | 900 | | | | 74 | |
Molson Coors Brewing, Cl B | | | 172,970 | | | | 17,155 | |
Mondelez International, Cl A | | | 532,860 | | | | 23,707 | |
Monster Beverage * | | | 2,000 | | | | 300 | |
PepsiCo | | | 533,023 | | | | 53,926 | |
Philip Morris International | | | 404,802 | | | | 39,946 | |
Pilgrim’s Pride * | | | 14,500 | | | | 361 | |
Procter & Gamble | | | 569,823 | | | | 46,178 | |
Reynolds American | | | 348,906 | | | | 17,341 | |
Sysco | | | 144,087 | | | | 6,932 | |
Tyson Foods, Cl A | | | 158,200 | | | | 10,090 | |
Walgreens Boots Alliance | | | 219,570 | | | | 16,995 | |
| | | | | | | | |
| Description | | Shares | | | Market Value
($ Thousands) | |
Wal-Mart Stores | | | 292,632 | | | $ | 20,712 | |
Whole Foods Market | | | 1,300 | | | | 42 | |
| | | | | | | | |
| | | | | | | 403,223 | |
| | | | | | | | |
| |
Energy — 4.7% | | | | | |
Anadarko Petroleum | | | 2,900 | | | | 150 | |
Antero Resources * | | | 102,361 | | | | 2,972 | |
Apache | | | 12,200 | | | | 697 | |
Baker Hughes | | | 2,400 | | | | 111 | |
Bristow Group | | | 32,900 | | | | 441 | |
Cabot Oil & Gas | | | 1,500 | | | | 36 | |
Chevron | | | 262,365 | | | | 26,499 | |
Cimarex Energy | | | 12,500 | | | | 1,453 | |
Columbia Pipeline Group | | | 4,200 | | | | 107 | |
Concho Resources * | | | 4,500 | | | | 546 | |
ConocoPhillips | | | 178,939 | | | | 7,836 | |
Devon Energy | | | 2,900 | | | | 105 | |
EOG Resources | | | 57,530 | | | | 4,681 | |
EQT | | | 600 | | | | 44 | |
Exxon Mobil | | | 197,774 | | | | 17,606 | |
FMC Technologies * | | | 900 | | | | 25 | |
Halliburton | | | 8,200 | | | | 346 | |
Helmerich & Payne (A) | | | 11,200 | | | | 685 | |
Hess | | | 800 | | | | 48 | |
HollyFrontier | | | 117,541 | | | | 3,145 | |
Kinder Morgan | | | 160,800 | | | | 2,907 | |
Magellan Midstream Partners (B) | | | 113,394 | | | | 7,943 | |
Marathon Oil | | | 183,828 | | | | 2,403 | |
Marathon Petroleum | | | 317,335 | | | | 11,053 | |
Matador Resources *(A) | | | 52,685 | | | | 1,197 | |
Memorial Resource Development * | | | 73,880 | | | | 1,167 | |
Murphy Oil | | | 700 | | | | 22 | |
Nabors Industries | | | 211,656 | | | | 1,990 | |
National Oilwell Varco | | | 1,600 | | | | 53 | |
Newfield Exploration * | | | 71,285 | | | | 2,906 | |
Noble Energy | | | 194,111 | | | | 6,939 | |
Occidental Petroleum | | | 12,400 | | | | 935 | |
Oceaneering International | | | 19,880 | | | | 657 | |
ONEOK | | | 29,294 | | | | 1,267 | |
Phillips 66 | | | 123,400 | | | | 9,916 | |
Pioneer Natural Resources | | | 24,310 | | | | 3,897 | |
QEP Resources * | | | 30,580 | | | | 570 | |
Range Resources | | | 3,000 | | | | 128 | |
Schlumberger | | | 152,653 | | | | 11,647 | |
Southwestern Energy * | | | 1,500 | | | | 20 | |
Spectra Energy | | | 1,700 | | | | 54 | |
Suncor Energy | | | 376,473 | | | | 10,409 | |
Tesoro | | | 125,572 | | | | 9,805 | |
Transocean *(A) | | | 137,860 | | | | 1,350 | |
Valero Energy | | | 185,300 | | | | 10,136 | |
Western Refining | | | 28,100 | | | | 597 | |
Williams | | | 19,078 | | | | 423 | |
| | |
| 12 | | SEI Institutional Investments Trust / Annual Report / May 31, 2016 |
SCHEDULE OF INVESTMENTS
Large Cap Disciplined Equity Fund
May 31, 2016
| | | | | | | | |
| Description | | Shares | | | Market Value
($ Thousands) | |
World Fuel Services | | | 27,986 | | | $ | 1,287 | |
| | | | | | | | |
| | | | | | | 169,211 | |
| | | | | | | | |
| |
Financials — 15.0% | | | | | |
Affiliated Managers Group * | | | 2,000 | | | | 347 | |
Aflac | | | 65,500 | | | | 4,550 | |
Allstate | | | 58,100 | | | | 3,922 | |
Altisource Portfolio Solutions * | | | 26,000 | | | | 726 | |
American Express | | | 3,881 | | | | 255 | |
American International Group | | | 54,700 | | | | 3,166 | |
American Tower, Cl A ‡ | | | 11,200 | | | | 1,185 | |
Ameriprise Financial | | | 18,990 | | | | 1,931 | |
Aon | | | 85,915 | | | | 9,388 | |
Apartment Investment & Management, Cl A ‡ | | | 32,400 | | | | 1,382 | |
Arch Capital Group * | | | 26,820 | | | | 1,949 | |
Argo Group International Holdings | | | 36,960 | | | | 1,946 | |
Assurant | | | 15,900 | | | | 1,389 | |
Assured Guaranty | | | 104,576 | | | | 2,812 | |
AvalonBay Communities ‡ | | | 13,700 | | | | 2,464 | |
Bank of America | | | 2,987,594 | | | | 44,187 | |
Bank of New York Mellon | | | 520,389 | | | | 21,888 | |
BB&T | | | 7,800 | | | | 284 | |
Berkshire Hathaway, Cl B * | | | 275,539 | | | | 38,724 | |
BlackRock, Cl A | | | 1,200 | | | | 437 | |
Boston Properties ‡ | | | 600 | | | | 75 | |
Brown & Brown | | | 29,355 | | | | 1,059 | |
Capital One Financial | | | 8,000 | | | | 586 | |
Care Capital Properties ‡ | | | 62,992 | | | | 1,637 | |
CBL & Associates Properties ‡ | | | 178,000 | | | | 1,712 | |
CBOE Holdings | | | 22,860 | | | | 1,455 | |
CBRE Group, Cl A * | | | 23,200 | | | | 693 | |
Charles Schwab | | | 251,930 | | | | 7,704 | |
Chimera Investment ‡ | | | 157,070 | | | | 2,354 | |
Chubb | | | 1,741 | | | | 220 | |
Cincinnati Financial | | | 18,300 | | | | 1,265 | |
Citigroup | | | 752,432 | | | | 35,041 | |
CME Group, Cl A | | | 267,699 | | | | 26,205 | |
CNA Financial | | | 3,898 | | | | 128 | |
Comerica | | | 6,600 | | | | 311 | |
Corrections Corp of America ‡ | | | 50,740 | | | | 1,705 | |
Crown Castle International ‡ | | | 1,200 | | | | 109 | |
DCT Industrial Trust ‡ | | | 41,365 | | | | 1,784 | |
Digital Realty Trust ‡ | | | 6,800 | | | | 649 | |
Discover Financial Services | | | 185,888 | | | | 10,560 | |
E*TRADE Financial * | | | 13,200 | | | | 368 | |
East West Bancorp | | | 180,676 | | | | 6,974 | |
Equinix ‡ | | | 7,710 | | | | 2,791 | |
Equity Residential ‡ | | | 42,800 | | | | 2,962 | |
Erie Indemnity, Cl A | | | 4,801 | | | | 470 | |
Essex Property Trust ‡ | | | 13,100 | | | | 2,977 | |
EverBank Financial | | | 27,000 | | | | 414 | |
Extra Space Storage ‡ | | | 38,935 | | | | 3,620 | |
| | | | | | | | |
| Description | | Shares | | | Market Value
($ Thousands) | |
Federal Realty Investment Trust ‡ | | | 6,100 | | | $ | 934 | |
Fifth Third Bancorp | | | 17,600 | | | | 332 | |
Franklin Resources | | | 100 | | | | 4 | |
Franklin Street Properties ‡ | | | 42,800 | | | | 488 | |
General Growth Properties ‡ | | | 143,230 | | | | 3,849 | |
GEO Group ‡ | | | 42,300 | | | | 1,407 | |
Goldman Sachs Group | | | 69,000 | | | | 11,004 | |
Hartford Financial Services Group | | | 201,675 | | | | 9,110 | |
HCP ‡ | | | 80,700 | | | | 2,653 | |
Home BancShares | | | 39,115 | | | | 1,719 | |
Host Hotels & Resorts ‡ | | | 3,200 | | | | 49 | |
Huntington Bancshares | | | 52,023 | | | | 544 | |
Intercontinental Exchange | | | 41,163 | | | | 11,160 | |
Invesco | | | 285,486 | | | | 8,964 | |
Iron Mountain ‡ | | | 900 | | | | 33 | |
Jones Lang LaSalle | | | 46,525 | | | | 5,483 | |
JPMorgan Chase | | | 566,453 | | | | 36,972 | |
KeyCorp | | | 44,978 | | | | 577 | |
Kilroy Realty ‡ | | | 18,410 | | | | 1,163 | |
Kimco Realty ‡ | | | 24,300 | | | | 685 | |
Lamar Advertising, Cl A | | | 73,934 | | | | 4,809 | |
Legg Mason | | | 9,400 | | | | 324 | |
Leucadia National | | | 700 | | | | 13 | |
Lincoln National | | | 73,600 | | | | 3,375 | |
Loews | | | 1,100 | | | | 45 | |
M&T Bank | | | 58,544 | | | | 6,996 | |
Macerich ‡ | | | 8,300 | | | | 633 | |
Marsh & McLennan | | | 123,871 | | | | 8,184 | |
MetLife | | | 7,300 | | | | 333 | |
Moody’s | | | 4,300 | | | | 424 | |
Morgan Stanley | | | 13,100 | | | | 359 | |
Morningstar | | | 20,320 | | | | 1,716 | |
Nasdaq | | | 31,500 | | | | 2,079 | |
Navient | | | 390,904 | | | | 5,359 | |
Northern Trust | | | 1,800 | | | | 133 | |
Old Republic International | | | 151,095 | | | | 2,895 | |
PacWest Bancorp | | | 40,925 | | | | 1,706 | |
People’s United Financial | | | 78,900 | | | | 1,253 | |
PNC Financial Services Group | | | 102,200 | | | | 9,171 | |
Principal Financial Group | | | 26,162 | | | | 1,166 | |
Progressive | | | 361,920 | | | | 12,052 | |
Prologis ‡ | | | 13,700 | | | | 651 | |
Prudential Financial | | | 1,900 | | | | 151 | |
Public Storage ‡ | | | 16,051 | | | | 4,072 | |
Realogy Holdings * | | | 79,776 | | | | 2,617 | |
Realty Income ‡(A) | | | 25,500 | | | | 1,532 | |
Regions Financial | | | 25,000 | | | | 246 | |
Reinsurance Group of America, Cl A | | | 20,185 | | | | 2,001 | |
Ryman Hospitality Properties ‡ | | | 14,900 | | | | 731 | |
S&P Global | | | 97,229 | | | | 10,871 | |
Signature Bank NY * | | | 8,840 | | | | 1,193 | |
Simon Property Group ‡ | | | 72,492 | | | | 14,327 | |
| | |
| 13 | | SEI Institutional Investments Trust / Annual Report / May 31, 2016 |
SCHEDULE OF INVESTMENTS
Large Cap Disciplined Equity Fund
May 31, 2016
| | | | | | | | |
| Description | | Shares | | | Market Value
($ Thousands) | |
SL Green Realty ‡ | | | 300 | | | $ | 30 | |
SLM * | | | 205,253 | | | | 1,410 | |
Starwood Property Trust ‡ | | | 286,900 | | | | 5,916 | |
State Street | | | 4,700 | | | | 296 | |
SunTrust Banks | | | 166,220 | | | | 7,284 | |
SVB Financial Group * | | | 11,710 | | | | 1,290 | |
Synchrony Financial * | | | 70,828 | | | | 2,210 | |
T. Rowe Price Group | | | 1,100 | | | | 85 | |
Tanger Factory Outlet Centers ‡ | | | 45,665 | | | | 1,608 | |
Torchmark | | | 4,100 | | | | 253 | |
Travelers | | | 7,600 | | | | 867 | |
UDR ‡ | | | 20,200 | | | | 728 | |
Unum Group | | | 7,700 | | | | 284 | |
US Bancorp | | | 364,262 | | | | 15,598 | |
Validus Holdings | | | 30,300 | | | | 1,475 | |
Ventas ‡ | | | 1,400 | | | | 93 | |
Vornado Realty Trust ‡ | | | 1,300 | | | | 124 | |
Waddell & Reed Financial, Cl A | | | 27,121 | | | | 580 | |
Webster Financial | | | 42,780 | | | | 1,675 | |
Wells Fargo | | | 701,725 | | | | 35,591 | |
Welltower ‡ | | | 11,400 | | | | 786 | |
Weyerhaeuser | | | 2,900 | | | | 91 | |
Willis Towers Watson | | | 5,600 | | | | 717 | |
Xenia Hotels & Resorts ‡ | | | 59,900 | | | | 966 | |
XL Group, Cl A | | | 1,200 | | | | 41 | |
Zions Bancorporation | | | 13,600 | | | | 381 | |
| | | | | | | | |
| | | | | | | 537,686 | |
| | | | | | | | |
| |
Health Care — 15.9% | | | | | |
Abbott Laboratories | | | 288,795 | | | | 11,445 | |
AbbVie | | | 175,787 | | | | 11,062 | |
Aetna | | | 72,915 | | | | 8,256 | |
Agilent Technologies | | | 90,860 | | | | 4,170 | |
Alexion Pharmaceuticals * | | | 500 | | | | 75 | |
Allergan * | | | 48,972 | | | | 11,545 | |
AmerisourceBergen | | | 41,500 | | | | 3,112 | |
Amgen | | | 168,808 | | | | 26,663 | |
Anthem | | | 100,700 | | | | 13,309 | |
Baxalta | | | 95,054 | | | | 4,299 | |
Baxter International | | | 25,627 | | | | 1,106 | |
Becton Dickinson | | | 49,500 | | | | 8,239 | |
Biogen * | | | 24,100 | | | | 6,983 | |
Boston Scientific * | | | 487,795 | | | | 11,078 | |
Bristol-Myers Squibb | | | 621,725 | | | | 44,578 | |
Bruker | | | 179,324 | | | | 4,734 | |
C.R. Bard | | | 21,600 | | | | 4,731 | |
Cardinal Health | | | 93,258 | | | | 7,363 | |
Celgene * | | | 182,325 | | | | 19,239 | |
Cellectis ADR *(A) | | | 35,700 | | | | 1,170 | |
Cerner * | | | 92,120 | | | | 5,123 | |
Cigna | | | 24,045 | | | | 3,080 | |
DaVita HealthCare Partners * | | | 700 | | | | 54 | |
| | | | | | | | |
| Description | | Shares | | | Market Value
($ Thousands) | |
Dentsply Sirona | | | 45,063 | | | $ | 2,801 | |
Edwards Lifesciences * | | | 31,300 | | | | 3,083 | |
Eli Lilly | | | 160,915 | | | | 12,073 | |
Endo International * | | | 10,100 | | | | 160 | |
Express Scripts Holding * | | | 326,158 | | | | 24,641 | |
Gilead Sciences | | | 172,433 | | | | 15,012 | |
HCA Holdings * | | | 65,200 | | | | 5,087 | |
Henry Schein * | | | 3,600 | | | | 625 | |
Hologic * | | | 178,000 | | | | 6,125 | |
Humana | | | 7,959 | | | | 1,373 | |
Illumina * | | | 700 | | | | 101 | |
Intuitive Surgical * | | | 100 | | | | 63 | |
Jazz Pharmaceuticals * | | | 15,100 | | | | 2,289 | |
Johnson & Johnson | | | 689,661 | | | | 77,718 | |
Laboratory Corp of America Holdings * | | | 300 | | | | 38 | |
Mallinckrodt * | | | 121,895 | | | | 7,723 | |
McKesson | | | 119,197 | | | | 21,830 | |
Medtronic | | | 93,076 | | | | 7,491 | |
Merck | | | 422,234 | | | | 23,755 | |
Mylan * | | | 123,737 | | | | 5,363 | |
Patterson | | | 1,500 | | | | 73 | |
PerkinElmer | | | 18,500 | | | | 1,013 | |
Perrigo | | | 500 | | | | 48 | |
Pfizer | | | 1,406,638 | | | | 48,810 | |
Quest Diagnostics | | | 1,700 | | | | 131 | |
Quintiles Transnational Holdings * | | | 116,655 | | | | 7,920 | |
Regeneron Pharmaceuticals * | | | 3,100 | | | | 1,237 | |
St. Jude Medical | | | 5,566 | | | | 436 | |
STERIS | | | 21,100 | | | | 1,465 | |
Stryker | | | 1,200 | | | | 133 | |
Team Health Holdings * | | | 27,720 | | | | 1,330 | |
Thermo Fisher Scientific | | | 68,385 | | | | 10,379 | |
United Therapeutics * | | | 12,250 | | | | 1,459 | |
UnitedHealth Group | | | 270,673 | | | | 36,181 | |
Universal Health Services, Cl B | | | 8,700 | | | | 1,173 | |
Varian Medical Systems * | | | 200 | | | | 17 | |
Vertex Pharmaceuticals * | | | 65,235 | | | | 6,077 | |
VWR * | | | 58,950 | | | | 1,701 | |
Waters * | | | 8,174 | | | | 1,124 | |
Zimmer Biomet Holdings | | | 700 | | | | 86 | |
Zoetis, Cl A | | | 462,695 | | | | 21,941 | |
| | | | | | | | |
| | | | | | | 571,499 | |
| | | | | | | | |
| |
Industrials — 10.3% | | | | | |
3M | | | 80,966 | | | | 13,628 | |
Acuity Brands | | | 3,800 | | | | 984 | |
Alaska Air Group | | | 30,535 | | | | 2,028 | |
Allegion | | | 15,633 | | | | 1,057 | |
Allison Transmission Holdings, Cl A | | | 25,700 | | | | 722 | |
Altra Industrial Motion | | | 44,155 | | | | 1,194 | |
American Airlines Group | | | 22,900 | | | | 731 | |
Ametek | | | 13,400 | | | | 641 | |
| | |
| 14 | | SEI Institutional Investments Trust / Annual Report / May 31, 2016 |
SCHEDULE OF INVESTMENTS
Large Cap Disciplined Equity Fund
May 31, 2016
| | | | | | | | |
| Description | | Shares | | | Market Value
($ Thousands) | |
Armstrong Flooring * | | | 32,793 | | | $ | 544 | |
B/E Aerospace | | | 26,010 | | | | 1,239 | |
Babcock & Wilcox Enterprises * | | | 14,000 | | | | 305 | |
Beacon Roofing Supply * | | | 28,915 | | | | 1,248 | |
Boeing | | | 31,400 | | | | 3,961 | |
BWX Technologies | | | 48,400 | | | | 1,702 | |
C.H. Robinson Worldwide | | | 29,267 | | | | 2,194 | |
Canadian National Railway | | | 104,140 | | | | 6,175 | |
Canadian Pacific Railway | | | 56,110 | | | | 7,271 | |
Caterpillar | | | 2,300 | | | | 167 | |
Cintas | | | 17,500 | | | | 1,659 | |
Continental Building Products * | | | 74,280 | | | | 1,702 | |
Copart * | | | 156,410 | | | | 7,744 | |
CSX | | | 19,700 | | | | 521 | |
Cummins | | | 100 | | | | 11 | |
Danaher | | | 2,400 | | | | 236 | |
Deere (A) | | | 82,065 | | | | 6,753 | |
Delta Air Lines | | | 54,550 | | | | 2,371 | |
Dover | | | 600 | | | | 40 | |
Dun & Bradstreet | | | 1,300 | | | | 165 | |
Eaton | | | 150,237 | | | | 9,259 | |
Echo Global Logistics * | | | 50,879 | | | | 1,153 | |
EMCOR Group | | | 15,775 | | | | 750 | |
Emerson Electric | | | 102,700 | | | | 5,343 | |
Equifax | | | 12,500 | | | | 1,572 | |
Expeditors International of Washington | | | 300 | | | | 15 | |
Fastenal | | | 1,000 | | | | 46 | |
FedEx | | | 55,500 | | | | 9,156 | |
Flowserve | | | 400 | | | | 19 | |
Fluor | | | 600 | | | | 32 | |
Generac Holdings * | | | 27,430 | | | | 1,040 | |
General Dynamics | | | 50,500 | | | | 7,164 | |
General Electric | | | 1,425,310 | | | | 43,087 | |
HD Supply Holdings * | | | 143,376 | | | | 5,061 | |
Honeywell International | | | 179,703 | | | | 20,456 | |
Huntington Ingalls Industries | | | 29,900 | | | | 4,587 | |
Illinois Tool Works | | | 1,400 | | | | 148 | |
Ingersoll-Rand | | | 900 | | | | 60 | |
Jacobs Engineering Group * | | | 500 | | | | 25 | |
JB Hunt Transport Services | | | 400 | | | | 33 | |
Kansas City Southern | | | 800 | | | | 75 | |
KBR | | | 101,599 | | | | 1,478 | |
L-3 Communications Holdings, Cl 3 | | | 300 | | | | 41 | |
Lockheed Martin | | | 65,546 | | | | 15,484 | |
Manitowoc (A) | | | 322,479 | | | | 1,838 | |
Manpowergroup | | | 60,654 | | | | 4,837 | |
Masco | | | 234,500 | | | | 7,654 | |
Nielsen Holdings | | | 208,839 | | | | 11,150 | |
Norfolk Southern | | | 1,200 | | | | 101 | |
Northrop Grumman | | | 22,200 | | | | 4,721 | |
Owens Corning | | | 20,800 | | | | 1,062 | |
Paccar | | | 2,800 | | | | 156 | |
| | | | | | | | |
| Description | | Shares | | | Market Value
($ Thousands) | |
Parker Hannifin | | | 500 | | | $ | 57 | |
Pentair | | | 700 | | | | 42 | |
PGT * | | | 99,440 | | | | 1,066 | |
Pitney Bowes | | | 268,405 | | | | 5,000 | |
Quanta Services * | | | 30,700 | | | | 738 | |
Raytheon | | | 135,751 | | | | 17,603 | |
Regal-Beloit | | | 45,090 | | | | 2,576 | |
Republic Services, Cl A | | | 118,444 | | | | 5,719 | |
Robert Half International | | | 158,049 | | | | 6,573 | |
Rockwell Automation | | | 57,940 | | | | 6,724 | |
Rockwell Collins | | | 3,400 | | | | 301 | |
Roper Technologies | | | 4,100 | | | | 701 | |
RR Donnelley & Sons | | | 247,960 | | | | 4,039 | |
Ryder System | | | 200 | | | | 14 | |
Snap-on | | | 8,600 | | | | 1,392 | |
Southwest Airlines | | | 295,800 | | | | 12,566 | |
Spirit AeroSystems Holdings, Cl A * | | | 7,100 | | | | 332 | |
SPX FLOW * | | | 59,271 | | | | 1,776 | |
Stanley Black & Decker | | | 6,100 | | | | 690 | |
Steelcase, Cl A | | | 21,400 | | | | 342 | |
Stericycle * | | | 300 | | | | 29 | |
Terex | | | 40,400 | | | | 856 | |
Textron | | | 2,200 | | | | 84 | |
TriMas * | | | 86,135 | | | | 1,472 | |
Tyco International | | | 420,419 | | | | 17,918 | |
Union Pacific | | | 207,580 | | | | 17,476 | |
United Continental Holdings * | | | 24,400 | | | | 1,100 | |
United Parcel Service, Cl B | | | 126,318 | | | | 13,022 | |
United Rentals * | | | 15,580 | | | | 1,086 | |
United Technologies | | | 176,571 | | | | 17,760 | |
Verisk Analytics, Cl A * | | | 1,200 | | | | 95 | |
Waste Connections | | | 101,879 | | | | 6,670 | |
Waste Management | | | 3,600 | | | | 219 | |
Woodward Governor | | | 16,900 | | | | 962 | |
WW Grainger | | | 200 | | | | 46 | |
Xylem | | | 1,000 | | | | 45 | |
| | | | | | | | |
| | | | | | | 371,687 | |
| | | | | | | | |
| |
Information Technology — 20.3% | | | | | |
Accenture, Cl A | | | 121,845 | | | | 14,496 | |
Activision Blizzard | | | 92,000 | | | | 3,612 | |
Adobe Systems * | | | 109,952 | | | | 10,937 | |
Akamai Technologies * | | | 2,800 | | | | 153 | |
Alliance Data Systems * | | | 200 | | | | 44 | |
Alphabet, Cl A * | | | 59,919 | | | | 44,870 | |
Alphabet, Cl C * | | | 72,675 | | | | 53,468 | |
Amdocs | | | 303,796 | | | | 17,617 | |
Amphenol, Cl A | | | 8,700 | | | | 511 | |
Analog Devices | | | 7,100 | | | | 415 | |
Apple | | | 1,121,496 | | | | 111,993 | |
Applied Materials | | | 698,139 | | | | 17,049 | |
Autodesk * | | | 900 | | | | 52 | |
| | |
| 15 | | SEI Institutional Investments Trust / Annual Report / May 31, 2016 |
SCHEDULE OF INVESTMENTS
Large Cap Disciplined Equity Fund
May 31, 2016
| | | | | | | | |
| Description | | Shares | | | Market Value
($ Thousands) | |
Automatic Data Processing | | | 14,400 | | | $ | 1,265 | |
Broadcom | | | 26,043 | | | | 4,020 | |
Broadridge Financial Solutions | | | 48,984 | | | | 3,144 | |
BroadSoft * | | | 26,950 | | | | 1,175 | |
Brocade Communications Systems | | | 92,400 | | | | 837 | |
CA | | | 141,800 | | | | 4,583 | |
Check Point Software Technologies *(A) | | | 68,600 | | | | 5,829 | |
Ciena * | | | 69,515 | | | | 1,214 | |
Cisco Systems | | | 1,380,380 | | | | 40,100 | |
Citrix Systems * | | | 70,900 | | | | 6,021 | |
Cognizant Technology Solutions, Cl A * | | | 156,695 | | | | 9,627 | |
Corning | | | 9,900 | | | | 207 | |
CSRA | | | 23,200 | | | | 575 | |
Cypress Semiconductor | | | 143,970 | | | | 1,530 | |
DST Systems | | | 65,679 | | | | 7,942 | |
eBay * | | | 835,765 | | | | 20,443 | |
Electronic Arts * | | | 41,400 | | | | 3,177 | |
EMC | | | 61,459 | | | | 1,718 | |
F5 Networks * | | | 2,800 | | | | 309 | |
Facebook, Cl A * | | | 406,527 | | | | 48,299 | |
Fidelity National Information Services | | | 84,540 | | | | 6,279 | |
First Data, Cl A * | | | 142,300 | | | | 1,783 | |
First Solar * | | | 44,300 | | | | 2,199 | |
Fiserv * | | | 27,800 | | | | 2,928 | |
FLIR Systems | | | 49,255 | | | | 1,534 | |
GoDaddy, Cl A * | | | 24,311 | | | | 791 | |
Hewlett Packard Enterprise | | | 171,300 | | | | 3,164 | |
HP | | | 352,000 | | | | 4,710 | |
Intel | | | 938,200 | | | | 29,638 | |
International Business Machines | | | 12,695 | | | | 1,952 | |
Intuit | | | 7,900 | | | | 843 | |
j2 Global | | | 24,280 | | | | 1,626 | |
Jabil Circuit | | | 67,179 | | | | 1,282 | |
Juniper Networks | | | 180,800 | | | | 4,233 | |
Kla-Tencor | | | 4,030 | | | | 294 | |
Lam Research | | | 7,300 | | | | 605 | |
Leidos Holdings (A) | | | 66,600 | | | | 3,290 | |
Linear Technology | | | 1,000 | | | | 47 | |
Littelfuse | | | 13,240 | | | | 1,516 | |
M * | | | 30,300 | | | | 1,091 | |
MasterCard, Cl A | | | 44,500 | | | | 4,268 | |
Microchip Technology | | | 900 | | | | 47 | |
Micron Technology * | | | 3,600 | | | | 46 | |
Microsemi * | | | 40,885 | | | | 1,383 | |
Microsoft | | | 1,307,886 | | | | 69,318 | |
Motorola Solutions | | | 11,400 | | | | 790 | |
NCR * | | | 39,150 | | | | 1,209 | |
NetApp | | | 1,100 | | | | 28 | |
NETGEAR * | | | 8,900 | | | | 400 | |
Nvidia | | | 66,900 | | | | 3,126 | |
NXP Semiconductor * | | | 90,885 | | | | 8,588 | |
Oracle | | | 515,683 | | | | 20,730 | |
| | | | | | | | |
| Description | | Shares | | | Market Value
($ Thousands) | |
Paychex | | | 81,919 | | | $ | 4,442 | |
PayPal Holdings * | | | 319,536 | | | | 12,075 | |
Pegasystems | | | 39,085 | | | | 1,031 | |
Qorvo * | | | 1,200 | | | | 61 | |
Qualcomm | | | 204,556 | | | | 11,234 | |
RealPage * | | | 73,120 | | | | 1,590 | |
Red Hat * | | | 29,890 | | | | 2,315 | |
salesforce.com inc * | | | 28,145 | | | | 2,356 | |
Seagate Technology (A) | | | 332,300 | | | | 7,497 | |
Skyworks Solutions | | | 84,300 | | | | 5,628 | |
Symantec | | | 9,700 | | | | 168 | |
TE Connectivity | | | 1,700 | | | | 102 | |
Teradata * | | | 5,800 | | | | 164 | |
Tessera Technologies | | | 28,600 | | | | 923 | |
Texas Instruments | | | 337,595 | | | | 20,458 | |
Total System Services | | | 117,416 | | | | 6,305 | |
Vantiv, Cl A * | | | 92,450 | | | | 4,971 | |
VeriSign *(A) | | | 25,500 | | | | 2,179 | |
Visa, Cl A | | | 182,696 | | | | 14,422 | |
Western Digital | | | 89,697 | | | | 4,174 | |
Western Union | | | 3,300 | | | | 64 | |
Xerox | | | 819,882 | | | | 8,174 | |
Xilinx | | | 12,800 | | | | 607 | |
Yahoo! * | | | 3,000 | | | | 114 | |
| | | | | | | | |
| | | | | | | 728,024 | |
| | | | | | | | |
| |
Materials — 1.9% | | | | | |
Air Products & Chemicals | | | 23,300 | | | | 3,323 | |
Alcoa | | | 26,600 | | | | 247 | |
Avery Dennison | | | 15,000 | | | | 1,116 | |
Ball | | | 18,000 | | | | 1,301 | |
Calgon Carbon | | | 104,120 | | | | 1,549 | |
CF Industries Holdings | | | 5,200 | | | | 144 | |
Crown Holdings * | | | 76,900 | | | | 4,012 | |
Dow Chemical | | | 45,012 | | | | 2,312 | |
E.I. du Pont de Nemours | | | 31,292 | | | | 2,047 | |
Eastman Chemical | | | 16,015 | | | | 1,175 | |
Ecolab | | | 1,100 | | | | 129 | |
FMC | | | 500 | | | | 24 | |
Freeport-McMoRan, Cl B * | | | 4,600 | | | | 51 | |
Greif, Cl A | | | 19,200 | | | | 689 | |
Ingevity * | | | 50,300 | | | | 1,466 | |
International Flavors & Fragrances | | | 600 | | | | 77 | |
International Paper | | | 1,600 | | | | 67 | |
LyondellBasell Industries, Cl A | | | 175,443 | | | | 14,274 | |
Martin Marietta Materials | | | 6,500 | | | | 1,229 | |
Monsanto | | | 34,615 | | | | 3,893 | |
Mosaic | | | 400 | | | | 10 | |
Newmont Mining | | | 57,700 | | | | 1,870 | |
Nucor | | | 63,901 | | | | 3,100 | |
Owens-Illinois * | | | 700 | | | | 13 | |
PPG Industries | | | 58,704 | | | | 6,321 | |
| | |
| 16 | | SEI Institutional Investments Trust / Annual Report / May 31, 2016 |
SCHEDULE OF INVESTMENTS
Large Cap Disciplined Equity Fund
May 31, 2016
| | | | | | | | |
| Description | | Shares | | | Market Value
($ Thousands) | |
Praxair | | | 1,300 | | | $ | 143 | |
Reliance Steel & Aluminum | | | 34,086 | | | | 2,534 | |
Sealed Air | | | 14,400 | | | | 669 | |
Sherwin-Williams | | | 600 | | | | 175 | |
Steel Dynamics | | | 19,900 | | | | 491 | |
Vulcan Materials | | | 88,979 | | | | 10,388 | |
Westlake Chemical | | | 69,100 | | | | 3,049 | |
WestRock | | | 2,800 | | | | 111 | |
| | | | | | | | |
| | | | | | | 67,999 | |
| | | | | | | | |
| |
Telecommunication Services — 2.6% | | | | | |
AT&T | | | 983,054 | | | | 38,487 | |
CenturyLink | | | 1,900 | | | | 52 | |
Frontier Communications (A) | | | 4,100 | | | | 21 | |
Level 3 Communications * | | | 2,300 | | | | 124 | |
Verizon Communications | | | 1,038,257 | | | | 52,847 | |
| | | | | | | | |
| | | | | | | 91,531 | |
| | | | | | | | |
| |
Utilities — 3.0% | | | | | |
AES | | | 176,200 | | | | 1,954 | |
AGL Resources | | | 500 | | | | 33 | |
Ameren | | | 21,500 | | | | 1,065 | |
American Electric Power | | | 169,561 | | | | 10,976 | |
American Water Works | | | 17,800 | | | | 1,319 | |
AmeriGas Partners | | | 108,391 | | | | 4,973 | |
Centerpoint Energy | | | 1,800 | | | | 41 | |
CMS Energy | | | 80,535 | | | | 3,368 | |
Consolidated Edison | | | 14,400 | | | | 1,055 | |
Dominion Resources | | | 2,400 | | | | 173 | |
DTE Energy | | | 18,800 | | | | 1,705 | |
Duke Energy | | | 4,800 | | | | 376 | |
Edison International | | | 26,000 | | | | 1,862 | |
Entergy | | | 31,600 | | | | 2,399 | |
Eversource Energy | | | 18,000 | | | | 994 | |
Exelon | | | 263,200 | | | | 9,020 | |
FirstEnergy | | | 229,400 | | | | 7,527 | |
MDU Resources Group | | | 34,200 | | | | 782 | |
New Jersey Resources | | | 41,375 | | | | 1,454 | |
NextEra Energy | | | 7,000 | | | | 841 | |
NiSource | | | 50,900 | | | | 1,214 | |
NRG Energy | | | 324,300 | | | | 5,312 | |
OGE Energy | | | 91,640 | | | | 2,767 | |
PG&E | | | 242,961 | | | | 14,597 | |
Pinnacle West Capital | | | 11,400 | | | | 839 | |
PNM Resources | | | 37,300 | | | | 1,225 | |
PPL | | | 290,200 | | | | 11,184 | |
Public Service Enterprise Group | | | 57,800 | | | | 2,587 | |
SCANA | | | 23,700 | | | | 1,657 | |
Sempra Energy | | | 13,800 | | | | 1,478 | |
Southern | | | 26,000 | | | | 1,285 | |
TECO Energy | | | 12,300 | | | | 339 | |
UGI | | | 71,200 | | | | 3,056 | |
| | | | | | | | |
| Description | | Shares | | | Market Value
($ Thousands) | |
WEC Energy Group | | | 21,553 | | | $ | 1,296 | |
Xcel Energy | | | 153,457 | | | | 6,349 | |
| | | | | | | | |
| | | | | | | 107,102 | |
| | | | | | | | |
Total Common Stock
(Cost $2,930,780) ($ Thousands) | | | | 3,443,750 | |
| | | | | | | | |
| | |
| | | Number of Rights | | | | |
RIGHTS — 0.0% | | | | | | | | |
| | |
United States — 0.0% | | | | | | | | |
Safeway—PDC * ‡‡ | | | 86 | | | | 4 | |
Safeway CVR—Casa Ley * ‡‡ | | | 86 | | | | 87 | |
| | | | | | | | |
Total Rights (Cost $—) ($ Thousands) | | | | | | | 91 | |
| | |
| | | Shares | | | | |
AFFILIATED PARTNERSHIP — 0.7% | | | | | |
SEI Liquidity Fund, L.P. | | | | | | | | |
0.410% **†(C) | | | 24,483,147 | | | | 24,483 | |
| | | | | | | | |
Total Affiliated Partnership
(Cost $24,483) ($ Thousands) | | | | | | | 24,483 | |
| | | | | | | | |
| | |
| | | Face Amount
(Thousands) | | | | |
U.S. TREASURY OBLIGATIONS — 0.1% | | | | | |
U.S. Treasury Bills | | | | | | | | |
0.363%, 08/18/2016 (D)(E) | | $ | 4,980 | | | | 4,977 | |
0.000%, 06/16/2016 (D)(E) | | | 200 | | | | 200 | |
| | | | | | | | |
Total U.S. Treasury Obligations (Cost $5,175) ($ Thousands) | | | | | | | 5,177 | |
| | | | | | | | |
| | |
| | | Shares | | | | | |
| | | | | | | | |
CASH EQUIVALENT — 4.2% | | | | | | | | |
SEI Daily Income Trust, Prime Obligation Fund, Cl A | | | | | | | | |
0.270% **† | | | 151,912,001 | | | | 151,912 | |
| | | | | | | | |
Total Cash Equivalent
(Cost $151,912) ($ Thousands) | | | | | | | 151,912 | |
| | | | | | | | |
Total Investments — 100.9%
(Cost $3,112,350) ($ Thousands) | | | | | | $ | 3,625,413 | |
| | | | | | | | |
| | |
| 17 | | SEI Institutional Investments Trust / Annual Report / May 31, 2016 |
SCHEDULE OF INVESTMENTS
Large Cap Disciplined Equity Fund
May 31, 2016
A list of the open futures contracts held by the Fund at May 31, 2016, is as follows:
| | | | | | | | | | | | |
| Type of Contract | | Number of
Contracts
Long | | | Expiration Date | | | Unrealized
Appreciation
($ Thousands) | |
S&P 500 Index E-MINI | | | 941 | | | | Jun-2016 | | | $ | 3,840 | |
| | | | | | | | | | | | |
For the year ended May 31, 2016, the total amount of all open futures contracts, as presented in the table above, are representative of the volume of activity for the derivative type during the year.
Percentages are based on a Net Assets of $3,592,226 ($ Thousands).
| * | | Non-income producing security. |
| ** | | Rate shown is the 7-day effective yield as of May 31, 2016. |
| † | | Investment in Affiliated Security. |
| ‡ | | Real Estate Investment Trust. |
| ‡‡ | | Expiration date unavailable. |
| (A) | | This security or a partial position of this security is on loan at May 31, 2016. The total market value of securities on loan at May 31, 2016 was $23,966 ($ Thousands). |
| (B) | | Security is a Master Limited Partnership. At May 31, 2016, such securities amounted to $7,943 ($ Thousands), or 0.22% of Net Assets. |
| (C) | | This security was purchased with cash collateral held from securities on loan. The total market value of such securities as of May 31, 2016 was $24,483($Thousands). |
| (D) | | Security, or portion thereof, has been pledged as collateral on open futures contracts. |
| (E) | | The rate reported is the effective yield at time of purchase. |
ADR — American Depositary Receipt
Cl — Class
L.P. — Limited Partnership
S&P— Standard & Poor’s
The following is a list of the level of inputs used as of May 31, 2016, in valuing the Fund’s investments carried at value ($ Thousands):
| | | | | | | | | | | | | | | | |
| Investments in Securities | | Level 1 | | | Level 2 | | | Level 3 | | | Total | |
Common Stock | | $ | 3,443,750 | | | $ | — | | | $ | — | | | $ | 3,443,750 | |
Rights | | | — | | | | 91 | | | | — | | | | 91 | |
Affiliated Partnership | | | — | | | | 24,483 | | | | — | | | | 24,483 | |
U.S. Treasury Obligations | | | — | | | | 5,177 | | | | — | | | | 5,177 | |
Cash Equivalent | | | 151,912 | | | | — | | | | — | | | | 151,912 | |
| | | | | | | | | | | | | | | | |
Total Investments in Securities | | $ | 3,595,662 | | | $ | 29,751 | | | $ | — | | | $ | 3,625,413 | |
| | | | | | | | | | | | | | | | |
| | | | | | | | | | | | | | | | |
| Other Financial Instruments | | Level 1 | | | Level 2 | | | Level 3 | | | Total | |
Futures Contracts * | | | | | | | | | | | | | | | | |
Unrealized Appreciation | | $ | 3,840 | | | $ | — | | | $ | — | | | $ | 3,840 | |
| | | | | | | | | | | | | | | | |
| * | | Futures contracts are valued at the unrealized appreciation on the instrument. |
For the year ended May 31, 2016, there were no transfers between Level 1 and Level 2 assets and liabilities.
For the year ended May 31, 2016, there were no transfers between Level 2 and Level 3 assets and liabilities.
For more information on valuation inputs, see Note 2 – Significant Accounting Policies in Notes to Financial Statements.
Amounts designated as “—” are $0 or have been rounded to $0.
The accompanying notes are an integral part of the financial statements.
| | |
| 18 | | SEI Institutional Investments Trust / Annual Report / May 31, 2016 |
SCHEDULE OF INVESTMENTS
Large Cap Index Fund
May 31, 2016
| | | | | | | | |
| Description | | Shares | | | Market Value
($ Thousands) | |
COMMON STOCK — 97.4% | | | | | | | | |
| | |
Consumer Discretionary — 12.8% | | | | | | | | |
Aaron’s | | | 5,400 | | | $ | 136 | |
Advance Auto Parts | | | 7,508 | | | | 1,155 | |
Amazon.com * | | | 37,289 | | | | 26,952 | |
AMC Networks, Cl A * | | | 5,485 | | | | 351 | |
Aramark | | | 17,300 | | | | 576 | |
AutoNation * | | | 5,632 | | | | 284 | |
AutoZone * | | | 3,207 | | | | 2,444 | |
Bed Bath & Beyond | | | 14,915 | | | | 667 | |
Best Buy | | | 27,647 | | | | 889 | |
BorgWarner | | | 20,464 | | | | 696 | |
Brinker International | | | 5,283 | | | | 238 | |
Brunswick | | | 8,300 | | | | 397 | |
Cabela’s * | | | 4,800 | | | | 233 | |
Cable One | | | 257 | | | | 126 | |
Cablevision Systems, Cl A * | | | 17,542 | | | | 608 | |
Carmax *(A) | | | 20,460 | | | | 1,098 | |
Carnival, Cl A | | | 40,000 | | | | 1,910 | |
Carter’s | | | 4,300 | | | | 432 | |
CBS, Cl B | | | 45,899 | | | | 2,534 | |
Charter Communications, Cl A * | | | 20,493 | | | | 4,487 | |
Chipotle Mexican Grill, Cl A * | | | 3,019 | | | | 1,334 | |
Choice Hotels International | | | 2,584 | | | | 117 | |
Cinemark Holdings | | | 11,000 | | | | 398 | |
Clear Channel Outdoor Holdings, Cl A * | | | 700 | | | | 5 | |
Coach | | | 28,667 | | | | 1,130 | |
Comcast, Cl A | | | 245,325 | | | | 15,529 | |
CST Brands | | | 7,148 | | | | 271 | |
Darden Restaurants | | | 11,222 | | | | 761 | |
Delphi Automotive | | | 27,100 | | | | 1,842 | |
Dick’s Sporting Goods | | | 8,758 | | | | 376 | |
Dillard’s, Cl A | | | 1,900 | | | | 112 | |
Discovery Communications, Cl A * | | | 17,600 | | | | 490 | |
Discovery Communications, Cl C * | | | 24,600 | | | | 659 | |
DISH Network, Cl A * | | | 21,462 | | | | 1,071 | |
Dollar General | | | 29,000 | | | | 2,607 | |
Dollar Tree * | | | 23,034 | | | | 2,085 | |
Domino’s Pizza | | | 5,000 | | | | 604 | |
DR Horton | | | 35,268 | | | | 1,078 | |
DSW, Cl A | | | 7,200 | | | | 152 | |
Dunkin’ Brands Group (A) | | | 9,800 | | | | 424 | |
Expedia | | | 11,622 | | | | 1,293 | |
Extended Stay America | | | 5,900 | | | | 84 | |
Foot Locker | | | 12,369 | | | | 692 | |
Ford Motor | | | 378,184 | | | | 5,102 | |
Fossil Group * | | | 4,000 | | | | 111 | |
GameStop, Cl A | | | 10,100 | | | | 294 | |
Gannett | | | 10,029 | | | | 157 | |
Gap | | | 21,721 | | | | 391 | |
Garmin (A) | | | 11,200 | | | | 476 | |
General Motors | | | 155,800 | | | | 4,873 | |
Gentex | | | 26,264 | | | | 435 | |
| | | | | | | | |
| Description | | Shares | | | Market Value
($ Thousands) | |
Genuine Parts | | | 15,571 | | | $ | 1,509 | |
GNC Holdings, Cl A | | | 8,000 | | | | 208 | |
Goodyear Tire & Rubber | | | 23,252 | | | | 650 | |
GoPro, Cl A *(A) | | | 8,000 | | | | 82 | |
Graham Holdings, Cl B | | | 257 | | | | 128 | |
Groupon, Cl A * | | | 44,900 | | | | 159 | |
H&R Block | | | 23,325 | | | | 498 | |
Hanesbrands | | | 41,972 | | | | 1,136 | |
Harley-Davidson | | | 20,603 | | | | 956 | |
Harman International Industries | | | 5,768 | | | | 451 | |
Hasbro | | | 11,767 | | | | 1,027 | |
Hilton Worldwide Holdings | | | 51,700 | | | | 1,074 | |
Home Depot | | | 127,215 | | | | 16,808 | |
Hyatt Hotels, Cl A * | | | 3,800 | | | | 174 | |
International Game Technology | | | 8,400 | | | | 159 | |
Interpublic Group | | | 37,575 | | | | 898 | |
J.C. Penney *(A) | | | 29,251 | | | | 228 | |
John Wiley & Sons, Cl A | | | 4,042 | | | | 218 | |
Johnson Controls | | | 62,045 | | | | 2,739 | |
Kate Spade * | | | 11,900 | | | | 260 | |
Kohl’s | | | 18,119 | | | | 653 | |
L Brands | | | 23,257 | | | | 1,594 | |
Las Vegas Sands | | | 36,593 | | | | 1,692 | |
Lear | | | 6,900 | | | | 819 | |
Leggett & Platt | | | 15,219 | | | | 765 | |
Lennar, Cl A | | | 15,430 | | | | 703 | |
Liberty Broadband, Cl A * | | | 2,080 | | | | 120 | |
Liberty Broadband, Cl C * | | | 5,408 | | | | 313 | |
Liberty Interactive QVC Group, Cl A * | | | 50,647 | | | | 1,366 | |
Liberty Media Group, Cl A * | | | 2,080 | | | | 41 | |
Liberty Media Group, Cl C * | | | 4,160 | | | | 79 | |
Liberty Ventures, Ser A * | | | 12,082 | | | | 451 | |
Lions Gate Entertainment | | | 7,400 | | | | 165 | |
Live Nation * | | | 13,600 | | | | 328 | |
LKQ * | | | 27,200 | | | | 900 | |
Lowe’s | | | 88,610 | | | | 7,100 | |
lululemon athletica *(A) | | | 10,000 | | | | 650 | |
Macy’s | | | 30,330 | | | | 1,007 | |
Madison Square Garden, Cl A * | | | 1,786 | | | | 299 | |
Marriott International, Cl A (A) | | | 19,987 | | | | 1,320 | |
Mattel | | | 35,442 | | | | 1,130 | |
McDonald’s | | | 85,480 | | | | 10,434 | |
MGM Resorts International * | | | 39,939 | | | | 913 | |
Michael Kors Holdings * | | | 17,500 | | | | 748 | |
Michaels * | | | 9,500 | | | | 278 | |
Mohawk Industries * | | | 6,366 | | | | 1,252 | |
MSG Networks * | | | 5,360 | | | | 93 | |
Murphy USA * | | | 4,188 | | | | 285 | |
NetFlix * | | | 41,300 | | | | 4,236 | |
Newell Brands | | | 45,394 | | | | 2,165 | |
News | | | 10,800 | | | | 133 | |
News, Cl A | | | 42,346 | | | | 506 | |
| | |
| 19 | | SEI Institutional Investments Trust / Annual Report / May 31, 2016 |
SCHEDULE OF INVESTMENTS
Large Cap Index Fund
May 31, 2016
| | | | | | | | |
| Description | | Shares | | | Market Value
($ Thousands) | |
NIKE, Cl B | | | 130,368 | | | $ | 7,199 | |
Nordstrom (A) | | | 11,812 | | | | 449 | |
Norwegian Cruise Line Holdings * | | | 11,800 | | | | 548 | |
NVR * | | | 424 | | | | 735 | |
Office Depot * | | | 49,100 | | | | 176 | |
Omnicom Group | | | 24,644 | | | | 2,054 | |
O’Reilly Automotive * | | | 10,240 | | | | 2,708 | |
Panera Bread, Cl A * | | | 2,262 | | | | 496 | |
Penske Auto Group | | | 4,000 | | | | 158 | |
Polaris Industries | | | 5,900 | | | | 502 | |
Priceline Group * | | | 5,000 | | | | 6,322 | |
PulteGroup | | | 31,745 | | | | 596 | |
PVH | | | 8,800 | | | | 825 | |
Ralph Lauren, Cl A | | | 5,080 | | | | 479 | |
Regal Entertainment Group, Cl A (A) | | | 7,388 | | | | 155 | |
Ross Stores | | | 41,006 | | | | 2,190 | |
Royal Caribbean Cruises | | | 15,700 | | | | 1,215 | |
Sally Beauty Holdings * | | | 14,200 | | | | 408 | |
Scripps Networks Interactive, Cl A | | | 10,172 | | | | 654 | |
Sears Holdings *(A) | | | 2,128 | | | | 28 | |
Service International | | | 17,694 | | | | 485 | |
ServiceMaster Global Holdings * | | | 9,200 | | | | 352 | |
Signet Jewelers | | | 7,000 | | | | 693 | |
Sirius XM Holdings * | | | 194,600 | | | | 782 | |
Six Flags Entertainment | | | 6,500 | | | | 375 | |
Skechers U.S.A., Cl A * | | | 11,100 | | | | 346 | |
Staples | | | 56,364 | | | | 496 | |
Starbucks | | | 147,912 | | | | 8,119 | |
Starwood Hotels & Resorts Worldwide | | | 17,384 | | | | 1,277 | |
Starz * | | | 8,820 | | | | 238 | |
Target | | | 58,785 | | | | 4,043 | |
TEGNA | | | 20,059 | | | | 461 | |
Tempur Sealy International * | | | 5,600 | | | | 326 | |
Tesla Motors *(A) | | | 11,300 | | | | 2,522 | |
Thomson Reuters | | | 30,000 | | | | 1,261 | |
Thor Industries | | | 4,100 | | | | 267 | |
Tiffany | | | 9,825 | | | | 609 | |
Time Warner | | | 79,679 | | | | 6,029 | |
TJX | | | 65,908 | | | | 5,017 | |
Toll Brothers * | | | 15,751 | | | | 459 | |
TopBuild * | | | 3,378 | | | | 122 | |
Tractor Supply | | | 13,400 | | | | 1,288 | |
Tribune Media, Cl A | | | 7,200 | | | | 290 | |
TripAdvisor * | | | 12,367 | | | | 838 | |
Tupperware Brands | | | 4,800 | | | | 272 | |
Twenty-First Century Fox, Cl A | | | 109,785 | | | | 3,171 | |
Twenty-First Century Fox, Cl B | | | 47,000 | | | | 1,374 | |
Ulta Salon Cosmetics & Fragrance * | | | 6,652 | | | | 1,550 | |
Under Armour, Cl A *(A) | | | 16,300 | | | | 615 | |
Under Armour, Cl C * | | | 17,100 | | | | 598 | |
Urban Outfitters * | | | 10,120 | | | | 289 | |
VF | | | 31,968 | | | | 1,992 | |
| | | | | | | | |
| Description | | Shares | | | Market Value
($ Thousands) | |
Viacom, Cl B | | | 33,569 | | | $ | 1,489 | |
Vista Outdoor * | | | 5,672 | | | | 285 | |
Visteon * | | | 3,900 | | | | 292 | |
Walt Disney | | | 166,172 | | | | 16,488 | |
Wendy’s | | | 24,175 | | | | 249 | |
Whirlpool | | | 7,987 | | | | 1,395 | |
Williams-Sonoma | | | 7,962 | | | | 422 | |
Wyndham Worldwide | | | 10,868 | | | | 732 | |
Wynn Resorts (A) | | | 8,996 | | | | 865 | |
Yum! Brands | | | 40,048 | | | | 3,288 | |
| | | | | | | | |
| | | | | | | 263,024 | |
| | | | | | | | |
| | |
Consumer Staples — 9.2% | | | | | | | | |
Altria Group | | | 190,240 | | | | 12,107 | |
Archer-Daniels-Midland | | | 58,479 | | | | 2,501 | |
Avon Products * | | | 40,706 | | | | 159 | |
Blue Buffalo Pet Products *(A) | | | 7,400 | | | | 191 | |
Brown-Forman, Cl A | | | 2,500 | | | | 263 | |
Brown-Forman, Cl B | | | 10,527 | | | | 1,032 | |
Bunge | | | 13,700 | | | | 919 | |
Campbell Soup | | | 18,078 | | | | 1,095 | |
Church & Dwight | | | 12,907 | | | | 1,271 | |
Clorox | | | 12,603 | | | | 1,620 | |
Coca-Cola | | | 383,940 | | | | 17,124 | |
Coca-Cola European Partners | | | 22,915 | | | | 889 | |
Colgate-Palmolive | | | 87,250 | | | | 6,143 | |
ConAgra Foods | | | 40,686 | | | | 1,859 | |
Constellation Brands, Cl A | | | 15,431 | | | | 2,363 | |
Costco Wholesale | | | 42,381 | | | | 6,305 | |
Coty, Cl A (A) | | | 6,400 | | | | 169 | |
CVS Health | | | 109,252 | | | | 10,537 | |
Dr. Pepper Snapple Group | | | 19,300 | | | | 1,764 | |
Edgewell Personal Care * | | | 5,241 | | | | 416 | |
Energizer Holdings | | | 5,241 | | | | 248 | |
Estee Lauder, Cl A | | | 20,008 | | | | 1,836 | |
Flowers Foods | | | 16,525 | | | | 310 | |
General Mills | | | 58,692 | | | | 3,685 | |
Hain Celestial Group * | | | 8,400 | | | | 415 | |
Herbalife *(A) | | | 6,500 | | | | 376 | |
Hershey | | | 14,198 | | | | 1,318 | |
Hormel Foods | | | 26,556 | | | | 914 | |
Ingredion | | | 6,600 | | | | 775 | |
JM Smucker | | | 11,511 | | | | 1,487 | |
Kellogg | | | 23,803 | | | | 1,770 | |
Kimberly-Clark | | | 35,318 | | | | 4,487 | |
Kraft Heinz | | | 57,502 | | | | 4,784 | |
Kroger | | | 96,646 | | | | 3,456 | |
McCormick | | | 13,193 | | | | 1,281 | |
Mead Johnson Nutrition, Cl A | | | 19,386 | | | | 1,595 | |
Molson Coors Brewing, Cl B | | | 16,062 | | | | 1,593 | |
Mondelez International, Cl A | | | 156,906 | | | | 6,981 | |
Monster Beverage * | | | 14,900 | | | | 2,235 | |
| | |
| 20 | | SEI Institutional Investments Trust / Annual Report / May 31, 2016 |
SCHEDULE OF INVESTMENTS
Large Cap Index Fund
May 31, 2016
| | | | | | | | |
| Description | | Shares | | | Market Value
($ Thousands) | |
Nu Skin Enterprises, Cl A | | | 5,500 | | | $ | 217 | |
PepsiCo | | | 144,652 | | | | 14,634 | |
Philip Morris International | | | 151,768 | | | | 14,976 | |
Pilgrim’s Pride * | | | 5,700 | | | | 142 | |
Pinnacle Foods | | | 10,400 | | | | 438 | |
Procter & Gamble | | | 265,274 | | | | 21,498 | |
Quorum Health * | | | 2,547 | | | | 34 | |
Reynolds American | | | 81,150 | | | | 4,033 | |
Rite Aid * | | | 84,200 | | | | 648 | |
Spectrum Brands Holdings | | | 1,900 | | | | 222 | |
Sprouts Farmers Market * | | | 17,300 | | | | 428 | |
Sysco | | | 55,848 | | | | 2,687 | |
Tyson Foods, Cl A | | | 29,465 | | | | 1,879 | |
Walgreens Boots Alliance | | | 82,825 | | | | 6,411 | |
Wal-Mart Stores | | | 155,179 | | | | 10,984 | |
WhiteWave Foods, Cl A * | | | 15,722 | | | | 702 | |
Whole Foods Market | | | 31,704 | | | | 1,026 | |
| | | | | | | | |
| | | | | | | 189,232 | |
| | | | | | | | |
| | |
Energy — 6.6% | | | | | | | | |
Anadarko Petroleum | | | 47,740 | | | | 2,476 | |
Antero Resources * | | | 5,000 | | | | 145 | |
Apache | | | 37,859 | | | | 2,163 | |
Baker Hughes | | | 43,940 | | | | 2,038 | |
Cabot Oil & Gas | | | 48,400 | | | | 1,160 | |
Cheniere Energy * | | | 20,500 | | | | 659 | |
Chesapeake Energy * | | | 47,266 | | | | 203 | |
Chevron | | | 184,002 | | | | 18,584 | |
Cimarex Energy | | | 9,000 | | | | 1,046 | |
Cobalt International Energy * | | | 33,000 | | | | 74 | |
Columbia Pipeline Group | | | 41,821 | | | | 1,068 | |
Concho Resources * | | | 13,200 | | | | 1,602 | |
ConocoPhillips | | | 119,576 | | | | 5,236 | |
CONSOL Energy * | | | 19,644 | | | | 302 | |
Continental Resources *(A) | | | 8,000 | | | | 336 | |
CVR Energy (A) | | | 1,800 | | | | 35 | |
Denbury Resources * | | | 32,324 | | | | 130 | |
Devon Energy | | | 45,913 | | | | 1,657 | |
Diamond Offshore Drilling *(A) | | | 6,209 | | | | 160 | |
Diamondback Energy * | | | 6,800 | | | | 618 | |
Dril-Quip * | | | 3,700 | | | | 226 | |
Energen * | | | 11,337 | | | | 540 | |
Ensco, Cl A | | | 21,000 | | | | 208 | |
EOG Resources | | | 52,590 | | | | 4,279 | |
EP Energy, Cl A * | | | 4,000 | | | | 23 | |
EQT | | | 16,066 | | | | 1,177 | |
Exxon Mobil | | | 408,038 | | | | 36,323 | |
FMC Technologies * | | | 20,920 | | | | 570 | |
Frank’s International (A) | | | 4,000 | | | | 64 | |
Golar LNG (A) | | | 8,100 | | | | 141 | |
Gulfport Energy * | | | 15,300 | | | | 470 | |
Halliburton | | | 81,536 | | | | 3,439 | |
| | | | | | | | |
| Description | | Shares | | | Market Value
($ Thousands) | |
Helmerich & Payne (A) | | | 8,650 | | | $ | 529 | |
Hess | | �� | 28,212 | | | | 1,691 | |
HollyFrontier | | | 16,726 | | | | 447 | |
Kinder Morgan | | | 179,422 | | | | 3,244 | |
Kosmos Energy * | | | 9,200 | | | | 53 | |
Laredo Petroleum *(A) | | | 7,000 | | | | 85 | |
Marathon Oil | | | 80,576 | | | | 1,053 | |
Marathon Petroleum | | | 51,276 | | | | 1,786 | |
Memorial Resource Development * | | | 4,600 | | | | 73 | |
Murphy Oil | | | 15,454 | | | | 478 | |
Nabors Industries | | | 26,800 | | | | 252 | |
National Oilwell Varco | | | 38,480 | | | | 1,268 | |
Newfield Exploration * | | | 18,899 | | | | 770 | |
Noble (A) | | | 21,700 | | | | 181 | |
Noble Energy | | | 44,524 | | | | 1,592 | |
Occidental Petroleum | | | 74,354 | | | | 5,609 | |
Oceaneering International | | | 9,700 | | | | 321 | |
ONEOK | | | 22,658 | | | | 980 | |
Patterson-UTI Energy | | | 13,232 | | | | 246 | |
PBF Energy, Cl A | | | 7,000 | | | | 185 | |
Phillips 66 | | | 52,588 | | | | 4,226 | |
Pioneer Natural Resources | | | 16,144 | | | | 2,588 | |
QEP Resources * | | | 16,646 | | | | 310 | |
Range Resources (A) | | | 14,239 | | | | 606 | |
Rice Energy * | | | 4,600 | | | | 93 | |
Rowan, Cl A * | | | 10,886 | | | | 184 | |
RPC *(A) | | | 5,550 | | | | 82 | |
Schlumberger | | | 138,255 | | | | 10,549 | |
Seadrill *(A) | | | 30,700 | | | | 95 | |
SM Energy | | | 5,500 | | | | 173 | |
Southwestern Energy *(A) | | | 38,376 | | | | 525 | |
Spectra Energy | | | 66,909 | | | | 2,132 | |
Superior Energy Services * | | | 14,700 | | | | 253 | |
Targa Resources | | | 15,300 | | | | 655 | |
Teekay | | | 3,800 | | | | 40 | |
Tesoro | | | 13,546 | | | | 1,058 | |
Valero Energy | | | 48,736 | | | | 2,666 | |
Weatherford International * | | | 97,600 | | | | 547 | |
Whiting Petroleum * | | | 21,348 | | | | 264 | |
Williams | | | 73,946 | | | | 1,639 | |
World Fuel Services | | | 5,500 | | | | 253 | |
WPX Energy * | | | 18,748 | | | | 193 | |
| | | | | | | | |
| | | | | | | 137,126 | |
| | | | | | | | |
| | |
Financials — 16.6% | | | | | | | | |
Affiliated Managers Group * | | | 4,820 | | | | 836 | |
Aflac | | | 43,656 | | | | 3,032 | |
Alexandria Real Estate Equities ‡ | | | 6,600 | | | | 640 | |
Alleghany * | | | 1,704 | | | | 928 | |
Allied World Assurance Holdings | | | 8,900 | | | | 330 | |
Allstate | | | 38,225 | | | | 2,581 | |
Ally Financial * | | | 43,200 | | | | 775 | |
| | |
| 21 | | SEI Institutional Investments Trust / Annual Report / May 31, 2016 |
SCHEDULE OF INVESTMENTS
Large Cap Index Fund
May 31, 2016
| | | | | | | | |
| Description | | Shares | | | Market Value
($ Thousands) | |
American Campus Communities ‡ | | | 14,000 | | | $ | 658 | |
American Capital Agency ‡ | | | 31,659 | | | | 598 | |
American Express | | | 79,334 | | | | 5,217 | |
American Financial Group | | | 6,414 | | | | 470 | |
American Homes 4 Rent, Cl A ‡ | | | 19,200 | | | | 352 | |
American International Group | | | 113,623 | | | | 6,576 | |
American National Insurance | | | 222 | | | | 27 | |
American Tower, Cl A ‡ | | | 41,522 | | | | 4,392 | |
Ameriprise Financial | | | 17,200 | | | | 1,749 | |
AmTrust Financial Services | | | 6,800 | | | | 180 | |
Annaly Capital Management ‡ | | | 100,011 | | | | 1,058 | |
Aon | | | 26,444 | | | | 2,890 | |
Apartment Investment & Management, Cl A ‡ | | | 17,299 | | | | 738 | |
Apple Hospitality ‡ | | | 16,700 | | | | 304 | |
Arch Capital Group * | | | 12,700 | | | | 923 | |
Arthur J Gallagher | | | 18,104 | | | | 875 | |
Artisan Partners Asset Management, Cl A | | | 2,500 | | | | 82 | |
Aspen Insurance Holdings | | | 5,700 | | | | 273 | |
Associated Banc | | | 14,684 | | | | 274 | |
Assurant | | | 6,293 | | | | 550 | |
Assured Guaranty | | | 15,100 | | | | 406 | |
AvalonBay Communities ‡ | | | 12,441 | | | | 2,238 | |
Axis Capital Holdings | | | 8,800 | | | | 485 | |
Bank of America | | | 1,028,963 | | | | 15,218 | |
Bank of Hawaii | | | 4,082 | | | | 293 | |
Bank of New York Mellon | | | 109,109 | | | | 4,589 | |
BankUnited | | | 9,600 | | | | 318 | |
BB&T | | | 80,406 | | | | 2,924 | |
Berkshire Hathaway, Cl B * | | | 181,700 | | | | 25,536 | |
BlackRock, Cl A | | | 12,185 | | | | 4,433 | |
BOK Financial (A) | | | 2,475 | | | | 158 | |
Boston Properties ‡ | | | 14,584 | | | | 1,832 | |
Brandywine Realty Trust ‡ | | | 15,500 | | | | 245 | |
Brixmor Property Group ‡ | | | 15,500 | | | | 391 | |
Brown & Brown | | | 11,124 | | | | 401 | |
Camden Property Trust ‡ | | | 7,547 | | | | 643 | |
Capital One Financial | | | 50,525 | | | | 3,700 | |
Care Capital Properties ‡ | | | 7,223 | | | | 188 | |
CBL & Associates Properties ‡ | | | 15,700 | | | | 151 | |
CBOE Holdings | | | 7,900 | | | | 503 | |
CBRE Group, Cl A * | | | 24,917 | | | | 744 | |
Charles Schwab | | | 109,685 | | | | 3,354 | |
Chimera Investment ‡ | | | 18,880 | | | | 283 | |
Chubb | | | 44,991 | | | | 5,696 | |
Cincinnati Financial | | | 17,486 | | | | 1,208 | |
CIT Group | | | 18,200 | | | | 624 | |
Citigroup | | | 297,504 | | | | 13,855 | |
Citizens Financial Group | | | 28,000 | | | | 659 | |
CME Group, Cl A | | | 32,270 | | | | 3,159 | |
CNA Financial | | | 1,700 | | | | 56 | |
Columbia Property Trust ‡ | | | 11,800 | | | | 243 | |
Comerica | | | 15,553 | | | | 733 | |
| | | | | | | | |
| Description | | Shares | | | Market Value
($ Thousands) | |
Commerce Bancshares | | | 7,814 | | | $ | 382 | |
Communications Sales & Leasing ‡ | | | 10,829 | | | | 270 | |
Corporate Office Properties Trust ‡ | | | 7,900 | | | | 214 | |
Corrections Corp of America ‡ | | | 10,240 | | | | 344 | |
Credit Acceptance *(A) | | | 800 | | | | 150 | |
Crown Castle International ‡ | | | 31,496 | | | | 2,860 | |
Cullen/Frost Bankers (A) | | | 4,568 | | | | 306 | |
DDR ‡ | | | 24,700 | | | | 425 | |
Digital Realty Trust ‡ | | | 15,000 | | | | 1,432 | |
Discover Financial Services | | | 41,589 | | | | 2,363 | |
Douglas Emmett ‡ | | | 12,600 | | | | 427 | |
Duke Realty ‡ | | | 37,809 | | | | 895 | |
E*TRADE Financial * | | | 26,500 | | | | 739 | |
East West Bancorp | | | 12,300 | | | | 475 | |
Eaton Vance | | | 11,010 | | | | 400 | |
Empire State Realty Trust, Cl A ‡ | | | 10,000 | | | | 189 | |
Endurance Specialty Holdings | | | 5,600 | | | | 380 | |
Equinix ‡ | | | 6,842 | | | | 2,477 | |
Equity Commonwealth *‡ | | | 11,525 | | | | 333 | |
Equity LifeStyle Properties ‡ | | | 7,700 | | | | 564 | |
Equity Residential ‡ | | | 36,887 | | | | 2,553 | |
Erie Indemnity, Cl A | | | 2,419 | | | | 237 | |
Essex Property Trust ‡ | | | 6,254 | | | | 1,421 | |
Everest Re Group | | | 4,700 | | | | 842 | |
Extra Space Storage ‡ | | | 12,700 | | | | 1,181 | |
FactSet Research Systems | | | 3,900 | | | | 620 | |
Federal Realty Investment Trust ‡ | | | 6,096 | | | | 934 | |
Federated Investors, Cl B | | | 8,158 | | | | 264 | |
Fifth Third Bancorp | | | 77,682 | | | | 1,466 | |
First Horizon National | | | 21,756 | | | | 317 | |
First Niagara Financial Group | | | 34,200 | | | | 373 | |
First Republic Bank | | | 14,400 | | | | 1,043 | |
FNF Group | | | 24,852 | | | | 869 | |
Forest City Realty Trust, Cl A ‡ | | | 24,542 | | | | 560 | |
Four Corners Property Trust ‡ | | | 5,111 | | | | 99 | |
Franklin Resources | | | 39,309 | | | | 1,468 | |
Gaming and Leisure Properties ‡ | | | 18,491 | | | | 609 | |
General Growth Properties ‡ | | | 59,853 | | | | 1,608 | |
Genworth Financial, Cl A * | | | 44,092 | | | | 163 | |
Goldman Sachs Group | | | 41,675 | | | | 6,646 | |
Hanover Insurance Group | | | 3,793 | | | | 329 | |
Hartford Financial Services Group | | | 40,010 | | | | 1,807 | |
HCP ‡ | | | 44,074 | | | | 1,449 | |
Healthcare Trust of America, Cl A ‡ | | | 11,200 | | | | 338 | |
Hospitality Properties Trust ‡ | | | 13,466 | | | | 345 | |
Host Hotels & Resorts ‡ | | | 77,840 | | | | 1,199 | |
Howard Hughes * | | | 3,673 | | | | 401 | |
Huntington Bancshares | | | 70,434 | | | | 736 | |
Interactive Brokers Group, Cl A | | | 5,600 | | | | 225 | |
Intercontinental Exchange | | | 11,080 | | | | 3,004 | |
Invesco | | | 44,000 | | | | 1,382 | |
Iron Mountain ‡ | | | 28,003 | | | | 1,029 | |
| | |
| 22 | | SEI Institutional Investments Trust / Annual Report / May 31, 2016 |
SCHEDULE OF INVESTMENTS
Large Cap Index Fund
May 31, 2016
| | | | | | | | |
| Description | | Shares | | | Market Value
($ Thousands) | |
Jones Lang LaSalle | | | 4,000 | | | $ | 471 | |
JPMorgan Chase | | | 362,734 | | | | 23,676 | |
KeyCorp | | | 84,295 | | | | 1,081 | |
Kilroy Realty ‡ | | | 7,300 | | | | 461 | |
Kimco Realty ‡ | | | 43,044 | | | | 1,213 | |
Lamar Advertising, Cl A ‡ | | | 7,040 | | | | 458 | |
Lazard, Cl A | | | 11,000 | | | | 387 | |
Legg Mason | | | 9,181 | | | | 317 | |
LendingClub *(A) | | | 10,900 | | | | 52 | |
Leucadia National | | | 31,306 | | | | 567 | |
Liberty Property Trust ‡ | | | 12,806 | | | | 478 | |
Lincoln National | | | 22,788 | | | | 1,045 | |
Loews | | | 27,836 | | | | 1,127 | |
LPL Financial Holdings (A) | | | 7,900 | | | | 220 | |
M&T Bank | | | 15,157 | | | | 1,811 | |
Macerich ‡ | | | 15,411 | | | | 1,176 | |
Markel * | | | 1,350 | | | | 1,287 | |
Marsh & McLennan | | | 51,465 | | | | 3,400 | |
Mercury General | | | 2,396 | | | | 126 | |
MetLife | | | 91,109 | | | | 4,150 | |
MFA Financial ‡ | | | 33,700 | | | | 243 | |
Mid-America Apartment Communities ‡ | | | 6,600 | | | | 680 | |
Moody’s | | | 16,927 | | | | 1,670 | |
Morgan Stanley | | | 149,478 | | | | 4,091 | |
Morningstar | | | 1,800 | | | | 152 | |
MSCI, Cl A | | | 10,300 | | | | 822 | |
Nasdaq | | | 10,500 | | | | 693 | |
National Retail Properties ‡ | | | 15,600 | | | | 707 | |
Navient | | | 35,614 | | | | 488 | |
New York Community Bancorp | | | 53,572 | | | | 843 | |
Northern Trust | | | 22,305 | | | | 1,653 | |
NorthStar Asset Management Group | | | 17,300 | | | | 216 | |
NorthStar Realty Europe ‡ | | | 4,516 | | | | 51 | |
NorthStar Realty Finance ‡ | | | 13,550 | | | | 183 | |
Old Republic International | | | 23,390 | | | | 448 | |
Omega Healthcare Investors ‡ | | | 16,600 | | | | 530 | |
OneMain Holdings, Cl A * | | | 4,700 | | | | 147 | |
Outfront Media ‡ | | | 12,680 | | | | 282 | |
PacWest Bancorp | | | 9,600 | | | | 400 | |
Paramount Group ‡ | | | 13,200 | | | | 216 | |
People’s United Financial | | | 28,134 | | | | 447 | |
Piedmont Office Realty Trust, Cl A ‡ | | | 14,600 | | | | 293 | |
PNC Financial Services Group | | | 50,322 | | | | 4,516 | |
Popular | | | 9,053 | | | | 284 | |
Post Properties ‡ | | | 5,000 | | | | 303 | |
Principal Financial Group | | | 28,908 | | | | 1,288 | |
ProAssurance | | | 5,500 | | | | 289 | |
Progressive | | | 58,480 | | | | 1,947 | |
Prologis ‡ | | | 49,418 | | | | 2,349 | |
Prudential Financial | | | 43,363 | | | | 3,436 | |
Public Storage ‡ | | | 14,268 | | | | 3,620 | |
Raymond James Financial | | | 11,321 | | | | 635 | |
| | | | | | | | |
| Description | | Shares | | | Market Value
($ Thousands) | |
Rayonier ‡ | | | 11,704 | | | $ | 303 | |
Realogy Holdings * | | | 12,400 | | | | 407 | |
Realty Income ‡(A) | | | 25,300 | | | | 1,520 | |
Regency Centers ‡ | | | 8,308 | | | | 636 | |
Regions Financial | | | 134,187 | | | | 1,319 | |
Reinsurance Group of America, Cl A | | | 6,099 | | | | 605 | |
RenaissanceRe Holdings | | | 5,000 | | | | 578 | |
Retail Properties of America, Cl A ‡ | | | 21,400 | | | | 339 | |
S&P Global | | | 27,539 | | | | 3,079 | |
Santander Consumer USA Holdings * | | | 8,000 | | | | 103 | |
SEI † | | | 11,742 | | | | 604 | |
Senior Housing Properties Trust ‡ | | | 18,400 | | | | 344 | |
Signature Bank NY * | | | 4,300 | | | | 580 | |
Simon Property Group ‡ | | | 30,081 | | | | 5,945 | |
SL Green Realty ‡ | | | 9,868 | | | | 1,000 | |
SLM * | | | 37,014 | | | | 254 | |
Spirit Realty Capital ‡ | | | 50,800 | | | | 582 | |
Starwood Property Trust ‡ | | | 19,500 | | | | 402 | |
State Street | | | 41,694 | | | | 2,629 | |
SunTrust Banks | | | 49,246 | | | | 2,158 | |
SVB Financial Group * | | | 4,200 | | | | 463 | |
Synchrony Financial * | | | 78,318 | | | | 2,443 | |
Synovus Financial | | | 12,096 | | | | 389 | |
T. Rowe Price Group | | | 26,080 | | | | 2,010 | |
Tanger Factory Outlet Centers ‡ | | | 8,200 | | | | 289 | |
Taubman Centers ‡ | | | 5,800 | | | | 398 | |
TCF Financial | | | 15,001 | | | | 216 | |
TD Ameritrade Holding | | | 23,945 | | | | 782 | |
TFS Financial | | | 6,200 | | | | 114 | |
Torchmark | | | 13,087 | | | | 807 | |
Travelers | | | 28,875 | | | | 3,296 | |
Two Harbors Investment ‡ | | | 31,800 | | | | 270 | |
UDR ‡ | | | 23,593 | | | | 850 | |
Unum Group | | | 21,905 | | | | 809 | |
US Bancorp | | | 161,497 | | | | 6,915 | |
Validus Holdings | | | 7,926 | | | | 386 | |
Ventas ‡ | | | 32,992 | | | | 2,188 | |
VEREIT ‡ | | | 81,400 | | | | 781 | |
Vornado Realty Trust ‡ | | | 18,936 | | | | 1,809 | |
Voya Financial | | | 20,500 | | | | 674 | |
Waddell & Reed Financial, Cl A | | | 6,900 | | | | 147 | |
Weingarten Realty Investors ‡ | | | 11,267 | | | | 424 | |
Wells Fargo | | | 455,466 | | | | 23,101 | |
Welltower ‡ | | | 32,983 | | | | 2,273 | |
Weyerhaeuser ‡ | | | 78,946 | | | | 2,487 | |
White Mountains Insurance Group | | | 547 | | | | 441 | |
WP Carey ‡ | | | 8,800 | | | | 564 | |
WP Glimcher ‡ | | | 15,090 | | | | 154 | |
WR Berkley | | | 8,814 | | | | 503 | |
XL Group, Cl A | | | 30,300 | | | | 1,041 | |
Zions Bancorporation | | | 17,002 | | | | 476 | |
| | | | | | | | |
| | | | | | | 342,028 | |
| | | | | | | | |
| | |
| 23 | | SEI Institutional Investments Trust / Annual Report / May 31, 2016 |
SCHEDULE OF INVESTMENTS
Large Cap Index Fund
May 31, 2016
| | | | | | | | |
| Description | | Shares | | | Market Value
($ Thousands) | |
Health Care — 13.8% | | | | | | | | |
Abbott Laboratories | | | 143,776 | | | $ | 5,698 | |
AbbVie | | | 162,761 | | | | 10,243 | |
Acadia Healthcare * | | | 4,600 | | | | 271 | |
Aetna | | | 34,435 | | | | 3,899 | |
Agilent Technologies | | | 34,064 | | | | 1,563 | |
Agios Pharmaceuticals *(A) | | | 2,300 | | | | 129 | |
Akorn * | | | 7,000 | | | | 209 | |
Alere * | | | 7,400 | | | | 318 | |
Alexion Pharmaceuticals * | | | 21,400 | | | | 3,229 | |
Align Technology * | | | 7,700 | | | | 607 | |
Alkermes * | | | 12,800 | | | | 594 | |
Allergan * | | | 38,654 | | | | 9,113 | |
Allscripts Healthcare Solutions * | | | 16,500 | | | | 223 | |
Alnylam Pharmaceuticals * | | | 6,800 | | | | 488 | |
AmerisourceBergen | | | 20,624 | | | | 1,546 | |
Amgen | | | 74,658 | | | | 11,792 | |
Anthem | | | 25,931 | | | | 3,427 | |
athenahealth *(A) | | | 3,200 | | | | 406 | |
Baxalta | | | 56,524 | | | | 2,557 | |
Baxter International (A) | | | 51,015 | | | | 2,202 | |
Becton Dickinson | | | 20,978 | | | | 3,492 | |
Biogen * | | | 21,600 | | | | 6,258 | |
BioMarin Pharmaceutical * | | | 15,500 | | | | 1,390 | |
Bio-Rad Laboratories, Cl A * | | | 1,900 | | | | 283 | |
Bio-Techne | | | 3,441 | | | | 378 | |
Bluebird Bio * | | | 2,900 | | | | 131 | |
Boston Scientific * | | | 134,939 | | | | 3,064 | |
Bristol-Myers Squibb | | | 163,659 | | | | 11,734 | |
Brookdale Senior Living, Cl A * | | | 15,100 | | | | 271 | |
Bruker | | | 9,400 | | | | 248 | |
C.R. Bard | | | 7,585 | | | | 1,661 | |
Cardinal Health | | | 33,529 | | | | 2,647 | |
Celgene * | | | 76,360 | | | | 8,058 | |
Centene * | | | 15,628 | | | | 974 | |
Cerner * | | | 29,096 | | | | 1,618 | |
Charles River Laboratories International * | | | 4,443 | | | | 382 | |
Cigna | | | 25,455 | | | | 3,261 | |
Community Health Systems * | | | 10,191 | | | | 137 | |
Cooper | | | 5,204 | | | | 847 | |
DaVita HealthCare Partners * | | | 18,116 | | | | 1,401 | |
Dentsply Sirona | | | 24,731 | | | | 1,537 | |
DexCom * | | | 7,100 | | | | 458 | |
Edwards Lifesciences * | | | 21,528 | | | | 2,121 | |
Eli Lilly | | | 94,261 | | | | 7,072 | |
Endo International * | | | 22,597 | | | | 357 | |
Envision Healthcare Holdings * | | | 16,600 | | | | 412 | |
Express Scripts Holding * | | | 62,036 | | | | 4,687 | |
Gilead Sciences | | | 132,134 | | | | 11,504 | |
HCA Holdings * | | | 30,300 | | | | 2,364 | |
Henry Schein * | | | 8,084 | | | | 1,404 | |
Hill-Rom Holdings | | | 5,224 | | | | 257 | |
| | | | | | | | |
| Description | | Shares | | | Market Value
($ Thousands) | |
Hologic * | | | 26,900 | | | $ | 926 | |
Humana | | | 14,075 | | | | 2,428 | |
Idexx Laboratories * | | | 8,504 | | | | 745 | |
Illumina * | | | 13,505 | | | | 1,956 | |
IMS Health Holdings * | | | 12,000 | | | | 313 | |
Incyte * | | | 15,100 | | | | 1,275 | |
Intercept Pharmaceuticals * | | | 1,200 | | | | 178 | |
Intrexon *(A) | | | 4,100 | | | | 126 | |
Intuitive Surgical * | | | 3,500 | | | | 2,221 | |
Ionis Pharmaceuticals * | | | 10,700 | | | | 243 | |
Jazz Pharmaceuticals * | | | 6,600 | | | | 1,000 | |
Johnson & Johnson | | | 270,809 | | | | 30,517 | |
Laboratory Corp of America Holdings * | | | 10,390 | | | | 1,329 | |
LifePoint Hospitals * | | | 3,976 | | | | 264 | |
Mallinckrodt * | | | 10,712 | | | | 679 | |
McKesson | | | 22,166 | | | | 4,059 | |
Medivation * | | | 13,800 | | | | 834 | |
MEDNAX * | | | 8,500 | | | | 582 | |
Medtronic | | | 139,926 | | | | 11,261 | |
Merck | | | 276,743 | | | | 15,570 | |
Mettler Toledo International * | | | 2,836 | | | | 1,064 | |
Mylan * | | | 40,019 | | | | 1,734 | |
OPKO Health *(A) | | | 21,000 | | | | 223 | |
Patterson | | | 7,683 | | | | 375 | |
PerkinElmer | | | 10,134 | | | | 555 | |
Perrigo | | | 13,800 | | | | 1,323 | |
Pfizer | | | 602,222 | | | | 20,897 | |
Premier, Cl A * | | | 3,500 | | | | 111 | |
Puma Biotechnology *(A) | | | 2,200 | | | | 83 | |
QIAGEN * | | | 21,400 | | | | 462 | |
Quest Diagnostics | | | 15,244 | | | | 1,176 | |
Quintiles Transnational Holdings * | | | 7,100 | | | | 482 | |
Regeneron Pharmaceuticals * | | | 7,800 | | | | 3,112 | |
ResMed | | | 15,435 | | | | 912 | |
Seattle Genetics * | | | 9,100 | | | | 368 | |
St. Jude Medical | | | 26,846 | | | | 2,104 | |
Stryker | | | 33,004 | | | | 3,669 | |
Teleflex | | | 3,740 | | | | 603 | |
Tenet Healthcare * | | | 8,698 | | | | 252 | |
Thermo Fisher Scientific | | | 38,525 | | | | 5,847 | |
United Therapeutics * | | | 4,300 | | | | 512 | |
UnitedHealth Group | | | 93,420 | | | | 12,487 | |
Universal Health Services, Cl B | | | 9,176 | | | | 1,237 | |
Varian Medical Systems * | | | 8,930 | | | | 739 | |
VCA Antech * | | | 8,139 | | | | 528 | |
Veeva Systems, Cl A * | | | 10,000 | | | | 329 | |
Vertex Pharmaceuticals * | | | 22,700 | | | | 2,115 | |
Waters * | | | 8,772 | | | | 1,207 | |
Zimmer Biomet Holdings | | | 16,325 | | | | 1,993 | |
Zoetis, Cl A | | | 47,044 | | | | 2,231 | |
| | | | | | | | |
| | | | | | | 284,158 | |
| | | | | | | | |
| | |
| 24 | | SEI Institutional Investments Trust / Annual Report / May 31, 2016 |
SCHEDULE OF INVESTMENTS
Large Cap Index Fund
May 31, 2016
| | | | | | | | |
| Description | | Shares | | | Market Value
($ Thousands) | |
Industrials — 10.2% | | | | | | | | |
3M | | | 62,333 | | | $ | 10,492 | |
Acuity Brands | | | 4,100 | | | | 1,062 | |
AECOM Technology * | | | 13,116 | | | | 421 | |
AGCO | | | 8,800 | | | | 457 | |
Air Lease, Cl A | | | 7,900 | | | | 237 | |
Alaska Air Group | | | 13,000 | | | | 863 | |
Allegion | | | 8,866 | | | | 600 | |
Allison Transmission Holdings, Cl A | | | 16,700 | | | | 469 | |
AMERCO * | | | 700 | | | | 264 | |
American Airlines Group | | | 59,000 | | | | 1,883 | |
Ametek | | | 25,580 | | | | 1,223 | |
AO Smith | | | 6,800 | | | | 560 | |
Armstrong Flooring * | | | 2,050 | | | | 34 | |
Armstrong World Industries * | | | 4,100 | | | | 170 | |
Avis Budget Group * | | | 9,700 | | | | 291 | |
B/E Aerospace | | | 8,866 | | | | 422 | |
Babcock & Wilcox Enterprises * | | | 4,925 | | | | 107 | |
Boeing | | | 63,191 | | | | 7,972 | |
BWX Technologies | | | 9,850 | | | | 346 | |
C.H. Robinson Worldwide | | | 15,386 | | | | 1,154 | |
Carlisle | | | 5,766 | | | | 599 | |
Caterpillar | | | 58,588 | | | | 4,248 | |
Chicago Bridge & Iron | | | 9,095 | | | | 348 | |
Cintas | | | 9,257 | | | | 878 | |
Clean Harbors * | | | 5,800 | | | | 299 | |
Colfax * | | | 7,900 | | | | 214 | |
Copa Holdings, Cl A (A) | | | 3,000 | | | | 155 | |
Copart * | | | 10,318 | | | | 511 | |
Covanta Holding | | | 9,700 | | | | 162 | |
Crane | | | 4,700 | | | | 270 | |
CSX | | | 92,696 | | | | 2,450 | |
Cummins | | | 15,812 | | | | 1,810 | |
Danaher | | | 57,702 | | | | 5,676 | |
Deere | | | 31,219 | | | | 2,569 | |
Delta Air Lines | | | 73,900 | | | | 3,212 | |
Donaldson | | | 13,144 | | | | 440 | |
Dover | | | 14,457 | | | | 965 | |
Dun & Bradstreet | | | 3,256 | | | | 413 | |
Eaton | | | 47,118 | | | | 2,904 | |
Emerson Electric | | | 65,920 | | | | 3,429 | |
Equifax | | | 11,556 | | | | 1,453 | |
Expeditors International of Washington | | | 16,848 | | | | 818 | |
Fastenal (A) | | | 26,824 | | | | 1,235 | |
FedEx | | | 26,244 | | | | 4,329 | |
Flowserve | | | 11,600 | | | | 558 | |
Fluor | | | 12,608 | | | | 665 | |
Fortune Brands Home & Security | | | 14,020 | | | | 823 | |
GATX (A) | | | 4,200 | | | | 193 | |
General Dynamics | | | 26,972 | | | | 3,826 | |
General Electric | | | 918,706 | | | | 27,772 | |
Genesee & Wyoming, Cl A * | | | 4,600 | | | | 276 | |
| | | | | | | | |
| Description | | Shares | | | Market Value
($ Thousands) | |
Graco | | | 5,424 | | | $ | 435 | |
HD Supply Holdings * | | | 15,300 | | | | 540 | |
Hertz Global Holdings * | | | 29,700 | | | | 288 | |
Hexcel | | | 8,800 | | | | 384 | |
Honeywell International | | | 76,990 | | | | 8,764 | |
Hubbell, Cl B | | | 5,392 | | | | 573 | |
Huntington Ingalls Industries | | | 5,396 | | | | 828 | |
IDEX | | | 7,093 | | | | 591 | |
IHS, Cl A * | | | 6,200 | | | | 762 | |
Illinois Tool Works | | | 29,380 | | | | 3,115 | |
Ingersoll-Rand | | | 26,700 | | | | 1,784 | |
ITT | | | 7,951 | | | | 282 | |
Jacobs Engineering Group * | | | 14,102 | | | | 715 | |
JB Hunt Transport Services | | | 10,172 | | | | 841 | |
JetBlue Airways * | | | 28,100 | | | | 504 | |
Joy Global (A) | | | 8,933 | | | | 152 | |
Kansas City Southern | | | 11,700 | | | | 1,089 | |
KAR Auction Services | | | 11,600 | | | | 476 | |
KBR | | | 13,180 | | | | 192 | |
Kennametal | | | 7,000 | | | | 171 | |
Kirby * | | | 5,200 | | | | 364 | |
L-3 Communications Holdings, Cl 3 | | | 7,377 | | | | 1,012 | |
Landstar System | | | 4,165 | | | | 283 | |
Lennox International | | | 3,900 | | | | 536 | |
Lincoln Electric Holdings | | | 7,400 | | | | 445 | |
Lockheed Martin | | | 26,229 | | | | 6,196 | |
Macquarie Infrastructure | | | 6,200 | | | | 444 | |
Manitowoc | | | 10,500 | | | | 60 | |
Manitowoc Foodservice * | | | 10,500 | | | | 173 | |
Manpowergroup | | | 7,184 | | | | 573 | |
Masco | | | 36,709 | | | | 1,198 | |
Middleby * | | | 5,200 | | | | 646 | |
MSC Industrial Direct, Cl A | | | 4,220 | | | | 316 | |
Nielsen Holdings | | | 35,200 | | | | 1,879 | |
Nordson | | | 5,800 | | | | 504 | |
Norfolk Southern | | | 28,933 | | | | 2,432 | |
Northrop Grumman | | | 17,978 | | | | 3,823 | |
NOW * | | | 9,870 | | | | 171 | |
Old Dominion Freight Line * | | | 5,800 | | | | 373 | |
Orbital ATK | | | 5,136 | | | | 447 | |
Oshkosh Truck | | | 6,659 | | | | 306 | |
Owens Corning | | | 10,800 | | | | 552 | |
Paccar | | | 35,470 | | | | 1,977 | |
Parker Hannifin | | | 13,504 | | | | 1,551 | |
Pentair | | | 17,173 | | | | 1,034 | |
Pitney Bowes | | | 18,085 | | | | 337 | |
Quanta Services * | | | 18,200 | | | | 437 | |
Raytheon | | | 30,068 | | | | 3,899 | |
Regal-Beloit | | | 4,000 | | | | 229 | |
Republic Services, Cl A | | | 22,042 | | | | 1,064 | |
Robert Half International | | | 11,676 | | | | 486 | |
Rockwell Automation | | | 12,304 | | | | 1,428 | |
| | |
| 25 | | SEI Institutional Investments Trust / Annual Report / May 31, 2016 |
SCHEDULE OF INVESTMENTS
Large Cap Index Fund
May 31, 2016
| | | | | | | | |
| Description | | Shares | | | Market Value
($ Thousands) | |
Rockwell Collins | | | 12,979 | | | $ | 1,147 | |
Rollins | | | 8,850 | | | | 251 | |
Roper Technologies | | | 10,100 | | | | 1,728 | |
RR Donnelley & Sons | | | 19,177 | | | | 312 | |
Ryder System | | | 4,806 | | | | 335 | |
Snap-on | | | 6,191 | | | | 1,002 | |
SolarCity *(A) | | | 4,000 | | | | 90 | |
Southwest Airlines | | | 67,420 | | | | 2,864 | |
Spirit AeroSystems Holdings, Cl A * | | | 11,000 | | | | 515 | |
Spirit Airlines * | | | 6,400 | | | | 278 | |
SPX * | | | 3,511 | | | | 58 | |
SPX FLOW * | | | 3,511 | | | | 105 | |
Stanley Black & Decker | | | 14,693 | | | | 1,663 | |
Stericycle * | | | 7,426 | | | | 728 | |
Terex | | | 10,048 | | | | 213 | |
Textron | | | 29,322 | | | | 1,116 | |
Timken | | | 7,869 | | | | 262 | |
Toro | | | 5,020 | | | | 448 | |
TransDigm Group * | | | 5,500 | | | | 1,449 | |
TransUnion * | | | 6,300 | | | | 209 | |
Trinity Industries | | | 14,400 | | | | 260 | |
Triumph Group | | | 4,800 | | | | 181 | |
Tyco International | | | 42,600 | | | | 1,816 | |
Union Pacific | | | 84,332 | | | | 7,100 | |
United Continental Holdings * | | | 32,800 | | | | 1,479 | |
United Parcel Service, Cl B | | | 67,541 | | | | 6,963 | |
United Rentals * | | | 8,700 | | | | 606 | |
United Technologies | | | 82,390 | | | | 8,287 | |
USG * | | | 8,800 | | | | 254 | |
Valmont Industries | | | 2,400 | | | | 332 | |
Verisk Analytics, Cl A * | | | 15,400 | | | | 1,223 | |
WABCO Holdings * | | | 4,624 | | | | 499 | |
Wabtec | | | 8,600 | | | | 665 | |
Waste Management | | | 45,094 | | | | 2,748 | |
Watsco | | | 2,300 | | | | 309 | |
WESCO International * | | | 4,100 | | | | 239 | |
WW Grainger (A) | | | 6,081 | | | | 1,389 | |
Xylem | | | 19,902 | | | | 889 | |
| | | | | | | | |
| | | | | | | 210,200 | |
| | | | | | | | |
| | |
Information Technology — 19.3% | | | | | | | | |
3D Systems *(A) | | | 10,400 | | | | 139 | |
Accenture, Cl A | | | 60,500 | | | | 7,198 | |
Activision Blizzard | | | 47,856 | | | | 1,879 | |
Adobe Systems * | | | 48,602 | | | | 4,834 | |
Akamai Technologies * | | | 15,818 | | | | 863 | |
Alliance Data Systems * | | | 6,112 | | | | 1,358 | |
Alphabet, Cl A * | | | 28,229 | | | | 21,139 | |
Alphabet, Cl C * | | | 28,799 | | | | 21,188 | |
Amdocs | | | 13,500 | | | | 783 | |
Amphenol, Cl A | | | 30,984 | | | | 1,819 | |
Analog Devices | | | 29,912 | | | | 1,750 | |
| | | | | | | | |
| Description | | Shares | | | Market Value
($ Thousands) | |
Ansys * | | | 7,800 | | | $ | 695 | |
Apple | | | 561,715 | | | | 56,093 | |
Applied Materials | | | 113,755 | | | | 2,778 | |
Arista Networks *(A) | | | 3,000 | | | | 220 | |
ARRIS International * | | | 20,200 | | | | 487 | |
Arrow Electronics * | | | 8,789 | | | | 568 | |
Autodesk * | | | 22,037 | | | | 1,284 | |
Automatic Data Processing | | | 46,092 | | | | 4,049 | |
Avnet | | | 12,410 | | | | 509 | |
Booz Allen Hamilton Holding, Cl A | | | 13,300 | | | | 389 | |
Broadcom | | | 36,432 | | | | 5,624 | |
Broadridge Financial Solutions | | | 13,173 | | | | 846 | |
Brocade Communications Systems | | | 39,300 | | | | 356 | |
CA | | | 28,538 | | | | 922 | |
Cadence Design Systems * | | | 25,563 | | | | 632 | |
CDK Global | | | 14,397 | | | | 796 | |
CDW | | | 11,200 | | | | 477 | |
Cisco Systems | | | 498,527 | | | | 14,482 | |
Citrix Systems * | | | 16,587 | | | | 1,409 | |
Cognex | | | 7,800 | | | | 336 | |
Cognizant Technology Solutions, Cl A * | | | 60,176 | | | | 3,697 | |
CommScope Holding * | | | 10,000 | | | | 311 | |
Computer Sciences | | | 12,364 | | | | 608 | |
CoreLogic * | | | 7,984 | | | | 298 | |
Corning | | | 110,358 | | | | 2,305 | |
CoStar Group * | | | 3,600 | | | | 744 | |
Cree * | | | 10,722 | | | | 258 | |
CSRA | | | 12,364 | | | | 306 | |
Cypress Semiconductor (A) | | | 29,700 | | | | 316 | |
Dolby Laboratories, Cl A | | | 4,343 | | | | 206 | |
DST Systems | | | 2,695 | | | | 326 | |
eBay * | | | 112,911 | | | | 2,762 | |
EchoStar, Cl A * | | | 3,732 | | | | 149 | |
Electronic Arts * | | | 29,765 | | | | 2,284 | |
EMC | | | 188,097 | | | | 5,257 | |
F5 Networks * | | | 7,738 | | | | 853 | |
Facebook, Cl A * | | | 211,500 | | | | 25,128 | |
Fidelity National Information Services | | | 28,490 | | | | 2,116 | |
FireEye * | | | 12,400 | | | | 197 | |
First Data, Cl A * | | | 15,000 | | | | 188 | |
First Solar * | | | 6,600 | | | | 328 | |
Fiserv * | | | 22,338 | | | | 2,353 | |
Fitbit, Cl A * | | | 5,900 | | | | 84 | |
FleetCor Technologies * | | | 9,000 | | | | 1,340 | |
FLIR Systems | | | 11,700 | | | | 364 | |
Fortinet * | | | 12,600 | | | | 431 | |
Gartner * | | | 7,600 | | | | 772 | |
Genpact * | | | 15,700 | | | | 443 | |
Global Payments | | | 16,468 | | | | 1,279 | |
Harris | | | 13,254 | | | | 1,044 | |
Hewlett Packard Enterprise | | | 170,070 | | | | 3,141 | |
HP | | | 173,770 | | | | 2,325 | |
| | |
| 26 | | SEI Institutional Investments Trust / Annual Report / May 31, 2016 |
SCHEDULE OF INVESTMENTS
Large Cap Index Fund
May 31, 2016
| | | | | | | | |
| Description | | Shares | | | Market Value
($ Thousands) | |
IAC * | | | 6,632 | | | $ | 371 | |
Ingram Micro, Cl A * | | | 14,723 | | | | 510 | |
Intel | | | 464,958 | | | | 14,688 | |
International Business Machines | | | 88,998 | | | | 13,683 | |
Intuit | | | 25,586 | | | | 2,729 | |
IPG Photonics * | | | 3,000 | | | | 259 | |
Jabil Circuit | | | 17,874 | | | | 341 | |
Jack Henry & Associates | | | 8,600 | | | | 726 | |
Juniper Networks | | | 39,325 | | | | 921 | |
Keysight Technologies * | | | 14,932 | | | | 457 | |
Kla-Tencor | | | 15,809 | | | | 1,153 | |
Lam Research | | | 15,452 | | | | 1,280 | |
Leidos Holdings (A) | | | 5,900 | | | | 291 | |
Lexmark International, Cl A | | | 5,386 | | | | 204 | |
Linear Technology | | | 25,457 | | | | 1,205 | |
LinkedIn, Cl A * | | | 10,400 | | | | 1,420 | |
Lumentum Holdings * | | | 4,248 | | | | 108 | |
Marvell Technology Group | | | 36,400 | | | | 372 | |
MasterCard, Cl A | | | 98,300 | | | | 9,427 | |
Maxim Integrated Products | | | 30,300 | | | | 1,150 | |
Microchip Technology (A) | | | 19,915 | | | | 1,029 | |
Micron Technology * | | | 104,916 | | | | 1,335 | |
Microsoft | | | 789,300 | | | | 41,833 | |
Motorola Solutions | | | 18,214 | | | | 1,262 | |
National Instruments | | | 8,704 | | | | 249 | |
NCR * | | | 15,189 | | | | 469 | |
NetApp | | | 30,355 | | | | 775 | |
NetSuite * | | | 3,600 | | | | 286 | |
Nuance Communications * | | | 24,100 | | | | 403 | |
Nvidia | | | 51,356 | | | | 2,399 | |
ON Semiconductor * | | | 39,300 | | | | 384 | |
Oracle | | | 306,520 | | | | 12,322 | |
Palo Alto Networks * | | | 7,100 | | | | 926 | |
Pandora Media *(A) | | | 19,400 | | | | 229 | |
Paychex | | | 32,607 | | | | 1,768 | |
PayPal Holdings * | | | 117,911 | | | | 4,456 | |
PTC * | | | 11,200 | | | | 400 | |
Qorvo * | | | 13,400 | | | | 683 | |
Qualcomm | | | 144,659 | | | | 7,945 | |
Rackspace Hosting * | | | 9,800 | | | | 245 | |
Red Hat * | | | 17,627 | | | | 1,365 | |
Sabre | | | 14,200 | | | | 400 | |
salesforce.com * | | | 63,652 | | | | 5,328 | |
ServiceNow * | | | 14,900 | | | | 1,067 | |
Skyworks Solutions | | | 18,400 | | | | 1,228 | |
Splunk * | | | 14,700 | | | | 844 | |
SS&C Technologies Holdings | | | 6,400 | | | | 394 | |
SunPower, Cl A *(A) | | | 4,100 | | | | 72 | |
Symantec | | | 70,648 | | | | 1,226 | |
Synopsys * | | | 13,982 | | | | 722 | |
Tableau Software, Cl A * | | | 4,600 | | | | 237 | |
Teradata * | | | 13,289 | | | | 377 | |
| | | | | | | | |
| Description | | Shares | | | Market Value
($ Thousands) | |
Teradyne | | | 17,863 | | | $ | 354 | |
Texas Instruments | | | 100,508 | | | | 6,091 | |
Total System Services | | | 14,991 | | | | 805 | |
Trimble Navigation * | | | 23,928 | | | | 612 | |
Twitter *(A) | | | 55,500 | | | | 845 | |
Ultimate Software Group * | | | 2,600 | | | | 532 | |
Vantiv, Cl A * | | | 15,400 | | | | 828 | |
VeriFone Holdings * | | | 10,200 | | | | 269 | |
VeriSign * | | | 8,885 | | | | 759 | |
Viavi Solutions * | | | 21,240 | | | | 145 | |
Visa, Cl A | | | 191,800 | | | | 15,141 | |
VMware, Cl A *(A) | | | 7,400 | | | | 448 | |
Western Digital | | | 28,897 | | | | 1,345 | |
Western Union | | | 46,728 | | | | 909 | |
WEX * | | | 3,500 | | | | 323 | |
Workday, Cl A * | | | 10,800 | | | | 819 | |
Xerox | | | 101,196 | | | | 1,009 | |
Xilinx | | | 27,257 | | | | 1,292 | |
Yahoo! * | | | 91,781 | | | | 3,482 | |
Yelp, Cl A * | | | 4,800 | | | | 126 | |
Zebra Technologies, Cl A * | | | 4,825 | | | | 256 | |
Zillow Group, Cl A * | | | 4,143 | | | | 121 | |
Zillow Group, Cl C *(A) | | | 8,286 | | | | 238 | |
Zynga, Cl A * | | | 61,800 | | | | 159 | |
| | | | | | | | |
| | | | | | | 398,976 | |
| | | | | | | | |
| | |
Materials — 3.1% | | | | | | | | |
Air Products & Chemicals | | | 21,594 | | | | 3,080 | |
Albemarle | | | 12,173 | | | | 956 | |
Alcoa | | | 127,502 | | | | 1,182 | |
Allegheny Technologies (A) | | | 10,297 | | | | 127 | |
AptarGroup | | | 6,000 | | | | 464 | |
Ashland | | | 5,976 | | | | 677 | |
Avery Dennison | | | 8,310 | | | | 618 | |
Axalta Coating Systems * | | | 9,000 | | | | 253 | |
Ball | | | 14,550 | | | | 1,052 | |
Bemis | | | 9,174 | | | | 462 | |
Cabot | | | 6,173 | | | | 282 | |
Celanese, Cl A | | | 13,683 | | | | 964 | |
CF Industries Holdings | | | 25,930 | | | | 717 | |
Chemours | | | 16,218 | | | | 141 | |
Compass Minerals International | | | 3,100 | | | | 242 | |
Crown Holdings * | | | 15,151 | | | | 790 | |
Domtar | | | 6,100 | | | | 236 | |
Dow Chemical | | | 108,170 | | | | 5,556 | |
E.I. du Pont de Nemours | | | 87,492 | | | | 5,723 | |
Eagle Materials | | | 4,500 | | | | 352 | |
Eastman Chemical | | | 13,428 | | | | 985 | |
Ecolab | | | 26,508 | | | | 3,108 | |
FMC | | | 11,820 | | | | 561 | |
Freeport-McMoRan, Cl B * | | | 128,324 | | | | 1,422 | |
GCP Applied Technologies * | | | 6,500 | | | | 154 | |
| | |
| 27 | | SEI Institutional Investments Trust / Annual Report / May 31, 2016 |
SCHEDULE OF INVESTMENTS
Large Cap Index Fund
May 31, 2016
| | | | | | | | |
| Description | | Shares | | | Market Value
($ Thousands) | |
Graphic Packaging Holding | | | 29,500 | | | $ | 395 | |
Huntsman | | | 18,929 | | | | 283 | |
Ingevity * | | | 4,307 | | | | 126 | |
International Flavors & Fragrances | | | 8,591 | | | | 1,108 | |
International Paper | | | 40,455 | | | | 1,706 | |
LyondellBasell Industries, Cl A | | | 34,400 | | | | 2,799 | |
Martin Marietta Materials | | | 6,063 | | | | 1,146 | |
Monsanto | | | 42,150 | | | | 4,741 | |
Mosaic | | | 34,978 | | | | 882 | |
NewMarket | | | 800 | | | | 324 | |
Newmont Mining | | | 53,833 | | | | 1,745 | |
Nucor | | | 32,290 | | | | 1,566 | |
Owens-Illinois * | | | 13,491 | | | | 255 | |
Packaging Corp of America | | | 8,299 | | | | 566 | |
Platform Specialty Products *(A) | | | 8,000 | | | | 76 | |
PPG Industries | | | 26,646 | | | | 2,869 | |
Praxair | | | 28,925 | | | | 3,178 | |
Reliance Steel & Aluminum | | | 7,100 | | | | 528 | |
Royal Gold | | | 6,100 | | | | 342 | |
RPM International | | | 12,269 | | | | 616 | |
Scotts Miracle-Gro, Cl A | | | 4,006 | | | | 278 | |
Sealed Air | | | 18,468 | | | | 858 | |
Sherwin-Williams | | | 7,637 | | | | 2,223 | |
Silgan Holdings | | | 3,004 | | | | 154 | |
Sonoco Products | | | 9,046 | | | | 431 | |
Southern Copper (A) | | | 14,768 | | | | 385 | |
Steel Dynamics | | | 20,200 | | | | 499 | |
Tahoe Resources | | | 21,300 | | | | 254 | |
United States Steel (A) | | | 12,783 | | | | 185 | |
Valspar | | | 7,464 | | | | 808 | |
Vulcan Materials | | | 12,657 | | | | 1,478 | |
Westlake Chemical | | | 3,800 | | | | 168 | |
WestRock | | | 25,845 | | | | 1,024 | |
WR Grace | | | 6,500 | | | | 505 | |
| | | | | | | | |
| | | | | | | 64,605 | |
| | | | | | | | |
| | |
Telecommunication Services — 2.5% | | | | | | | | |
AT&T | | | 595,051 | | | | 23,296 | |
CenturyLink | | | 56,554 | | | | 1,534 | |
Frontier Communications | | | 128,195 | | | | 663 | |
Level 3 Communications * | | | 29,286 | | | | 1,580 | |
Liberty Braves Group, Cl A * | | | 832 | | | | 13 | |
Liberty Braves Group, Cl C * | | | 1,664 | | | | 25 | |
Liberty SiriusXM Group, Cl A * | | | 8,320 | | | | 265 | |
Liberty SiriusXM Group, Cl C * | | | 16,640 | | | | 523 | |
SBA Communications, Cl A * | | | 12,700 | | | | 1,262 | |
Sprint *(A) | | | 59,715 | | | | 227 | |
Telephone & Data Systems | | | 7,880 | | | | 227 | |
T-Mobile US * | | | 28,800 | | | | 1,232 | |
US Cellular * | | | 831 | | | | 32 | |
Verizon Communications | | | 398,976 | | | | 20,308 | |
| | | | | | | | |
| Description | | Shares | | | Market Value
($ Thousands) | |
Zayo Group Holdings * | | | 12,900 | | | $ | 358 | |
| | | | | | | | |
| | |
| | | | | | | 51,545 | |
| | | | | | | | |
| | |
Utilities — 3.3% | | | | | | | | |
AES | | | 62,924 | | | | 698 | |
AGL Resources | | | 10,947 | | | | 720 | |
Alliant Energy | | | 19,952 | | | | 739 | |
Ameren | | | 25,690 | | | | 1,273 | |
American Electric Power | | | 49,250 | | | | 3,188 | |
American Water Works | | | 18,600 | | | | 1,378 | |
Aqua America | | | 16,246 | | | | 525 | |
Atmos Energy | | | 9,191 | | | | 670 | |
Avangrid | | | 8,000 | | | | 336 | |
Calpine * | | | 33,700 | | | | 499 | |
Centerpoint Energy | | | 38,515 | | | | 868 | |
CMS Energy | | | 28,842 | | | | 1,206 | |
Consolidated Edison | | | 29,116 | | | | 2,133 | |
Dominion Resources | | | 58,312 | | | | 4,213 | |
DTE Energy | | | 18,064 | | | | 1,638 | |
Duke Energy | | | 66,916 | | | | 5,235 | |
Edison International | | | 32,279 | | | | 2,312 | |
Entergy | | | 16,398 | | | | 1,245 | |
Eversource Energy | | | 31,808 | | | | 1,757 | |
Exelon | | | 92,476 | | | | 3,169 | |
FirstEnergy | | | 41,227 | | | | 1,353 | |
Great Plains Energy | | | 12,071 | | | | 352 | |
Hawaiian Electric Industries * | | | 9,146 | | | | 300 | |
ITC Holdings | | | 14,100 | | | | 628 | |
MDU Resources Group | | | 17,521 | | | | 401 | |
National Fuel Gas | | | 7,089 | | | | 390 | |
NextEra Energy | | | 42,973 | | | | 5,162 | |
NiSource | | | 27,421 | | | | 654 | |
NRG Energy | | | 30,200 | | | | 495 | |
OGE Energy | | | 16,736 | | | | 505 | |
PG&E | | | 48,418 | | | | 2,909 | |
Pinnacle West Capital | | | 12,192 | | | | 897 | |
PPL | | | 63,026 | | | | 2,429 | |
Public Service Enterprise Group | | | 48,052 | | | | 2,150 | |
Questar | | | 15,646 | | | | 395 | |
SCANA | | | 14,920 | | | | 1,043 | |
Sempra Energy | | | 23,323 | | | | 2,498 | |
Southern | | | 88,203 | | | | 4,361 | |
TECO Energy | | | 26,100 | | | | 719 | |
TerraForm Power, Cl A (A) | | | 4,600 | | | | 39 | |
UGI | | | 15,525 | | | | 666 | |
Vectren | | | 7,391 | | | | 367 | |
WEC Energy Group | | | 31,657 | | | | 1,904 | |
Westar Energy, Cl A | | | 15,400 | | | | 868 | |
| | |
| 28 | | SEI Institutional Investments Trust / Annual Report / May 31, 2016 |
SCHEDULE OF INVESTMENTS
Large Cap Index Fund
May 31, 2016
| | | | | | | | |
| Description | | Shares | | | Market Value
($ Thousands) | |
Xcel Energy | | | 48,281 | | | $ | 1,997 | |
| | | | | | | | |
| | | | | | | 67,284 | |
| | | | | | | | |
Total Common Stock
(Cost $1,203,182) ($ Thousands) | | | | 2,008,178 | |
| | | | | | | | |
| | |
| | | Number of Rights | | | | |
| | |
RIGHTS — 0.0% | | | | | | | | |
| | |
United States — 0.0% | | | | | | | | |
Liberty Braves Group, Expires 06/21/2016 * | | | 1 | | | | 3 | |
| | | | | | | | |
Total Rights
(Cost $—) ($ Thousands) | | | | | | | 3 | |
| | | | | | | | |
| | |
| | | Shares | | | | |
| |
AFFILIATED PARTNERSHIP — 1.0% | | | | | |
SEI Liquidity Fund, L.P. | | | | | | | | |
0.410% **†(B) | | | 20,889,946 | | | | 20,890 | |
| | | | | | | | |
Total Affiliated Partnership
(Cost $20,890) ($ Thousands) | | | | 20,890 | |
| | | | | | | | |
| | |
| | | Face Amount
(Thousands) | | | | |
| |
U.S. TREASURY OBLIGATION — 0.2% | | | | | |
U.S. Treasury Bills | | | | | | | | |
0.000%, 09/08/2016 (C)(D) | | $ | 2,365 | | | | 2,363 | |
| | | | | | | | |
Total U.S. Treasury Obligation
(Cost $2,362) ($ Thousands) | | | | | | | 2,363 | |
| | | | | | | | |
| | |
| | | Shares | | | | |
| |
CASH EQUIVALENT — 1.9% | | | | | |
SEI Daily Income Trust, Prime Obligation Fund, Cl A | | | | | | | | |
0.270% **† | | | 39,573,220 | | | | 39,573 | |
| | | | | | | | |
Total Cash Equivalent
(Cost $39,573) ($ Thousands) | | | | | | | 39,573 | |
| | | | | | | | |
Total Investments — 100.5%
(Cost $1,266,007) ($ Thousands) | | | | | | $ | 2,071,007 | |
| | | | | | | | |
A list of the open futures contracts held by the Fund at May 31, 2016, is as follows:
| | | | | | | | | | | | |
| Type of Contract | | Number of
Contracts
Long | | | Expiration
Date | | | Unrealized
Appreciation
($ Thousands) | |
S&P 500 Index E-MINI | | | 457 | | | | Jun-2016 | | | $ | 1,523 | |
S&P Mid Cap 400 Index E-MINI | | | 37 | | | | Jun-2016 | | | | 278 | |
| | | | | | | | | | | | |
| | | | | | | | | | $ | 1,801 | |
| | | | | | | | | | | | |
For the year ended May 31, 2016, the total amount of all open futures contracts, as presented in the table above, are representative of the volume of activity for the derivative type during the year.
Percentages are based on a Net Assets of $2,061,670 ($ Thousands).
| * | | Non-income producing security. |
| ** | | Rate shown is the 7-day effective yield as of May 31, 2016. |
| † | | Investment in Affiliated Security. |
| ‡ | | Real Estate Investment Trust. |
| (A) | | This security or a partial position of this security is on loan at May 31, 2016. The total market value of securities on loan at May 31, 2016 was $20,437 ($ Thousands). |
| (B) | | This security was purchased with cash collateral held from securities on loan. The total market value of such securities as of May 31, 2016 was $20,890($Thousands). |
| (C) | | Security, or portion thereof, has been pledged as collateral on open futures contracts. |
| (D) | | The rate reported is the effective yield at time of purchase. |
Cl — Class
L.P. — Limited Partnership S&P— Standard & Poor’s
The following is a list of the level of inputs used as of May 31, 2016, in valuing the Fund’s investments carried at value ($ Thousands):
| | | | | | | | | | | | | | | | |
| Investments in Securities | | Level 1 | | | Level 2 | | | Level 3 | | | Total | |
Common Stock | | $ | 2,008,178 | | | $ | — | | | $ | — | | | $ | 2,008,178 | |
Right | | | 3 | | | | — | | | | — | | | | 3 | |
Affiliated Partnership | | | — | | | | 20,890 | | | | — | | | | 20,890 | |
U.S. Treasury Obligation | | | — | | | | 2,363 | | | | — | | | | 2,363 | |
Cash Equivalent | | | 39,573 | | | | — | | | | — | | | | 39,573 | |
| | | | | | | | | | | | | | | | |
Total Investments in Securities | | $ | 2,047,754 | | | $ | 23,253 | | | $ | — | | | $ | 2,071,007 | |
| | | | | | | | | | | | | | | | |
| | | | | | | | | | | | | |
| Other Financial Instruments | | Level 1 | | | Level 2 | | | Level 3 | | | Total | |
Futures Contracts * | | | | | | | | | | | | | | | | |
Unrealized Appreciation | | $ | 1,801 | | | $ | — | | | $ | — | | | $ | 1,801 | |
| | | | | | | | | | | | | | | | |
* Futures contracts are valued at the unrealized appreciation on the instrument.
For the year ended May 31, 2016, there were no transfers between Level 1 and Level 2 assets and liabilities.
For the year ended May 31, 2016, there were no transfers between Level 2 and Level 3 assets and liabilities.
For more information on valuation inputs, see Note 2 – Significant Accounting Policies in Notes to Financial Statements.
Amounts designated as “—” are $0 or have been rounded to $0.
The accompanying notes are an integral part of the financial statements.
| | |
| 29 | | SEI Institutional Investments Trust / Annual Report / May 31, 2016 |
SCHEDULE OF INVESTMENTS
S&P 500 Index Fund
May 31, 2016
| | | | | | | | |
| Description | | Shares | | | Market Value ($ Thousands) | |
COMMON STOCK — 97.9% | | | | | | | | |
| | |
Consumer Discretionary — 12.3% | | | | | | | | |
Advance Auto Parts | | | 13,400 | | | $ | 2,061 | |
Amazon.com * | | | 70,060 | | | | 50,639 | |
AutoNation * | | | 12,600 | | | | 636 | |
AutoZone * | | | 5,445 | | | | 4,150 | |
Bed Bath & Beyond | | | 30,000 | | | | 1,343 | |
Best Buy | | | 51,487 | | | | 1,656 | |
BorgWarner | | | 40,000 | | | | 1,361 | |
Cablevision Systems, Cl A * | | | 40,700 | | | | 1,411 | |
Carmax *(A) | | | 35,700 | | | | 1,916 | |
Carnival, Cl A | | | 80,900 | | | | 3,862 | |
CBS, Cl B | | | 78,182 | | | | 4,316 | |
Charter Communications, Cl A * | | | 1 | | | | — | |
Chipotle Mexican Grill, Cl A * | | | 5,520 | | | | 2,440 | |
Coach | | | 50,691 | | | | 1,998 | |
Comcast, Cl A | | | 441,474 | | | | 27,945 | |
Darden Restaurants | | | 21,095 | | | | 1,431 | |
Delphi Automotive | | | 50,000 | | | | 3,398 | |
Discovery Communications, Cl A *(A) | | | 25,900 | | | | 721 | |
Discovery Communications, Cl C * | | | 41,000 | | | | 1,098 | |
Dollar General | | | 52,200 | | | | 4,693 | |
Dollar Tree * | | | 42,169 | | | | 3,818 | |
DR Horton | | | 60,091 | | | | 1,836 | |
Expedia | | | 21,595 | | | | 2,402 | |
Foot Locker | | | 25,100 | | | | 1,404 | |
Ford Motor | | | 707,143 | | | | 9,539 | |
Gap | | | 38,300 | | | | 689 | |
Garmin (A) | | | 20,295 | | | | 863 | |
General Motors | | | 255,787 | | | | 8,001 | |
Genuine Parts | | | 27,300 | | | | 2,646 | |
Goodyear Tire & Rubber | | | 48,900 | | | | 1,368 | |
H&R Block | | | 40,691 | | | | 869 | |
Hanesbrands | | | 71,500 | | | | 1,936 | |
Harley-Davidson | | | 33,700 | | | | 1,563 | |
Harman International Industries | | | 12,295 | | | | 962 | |
Hasbro | | | 20,495 | | | | 1,789 | |
Home Depot | | | 230,087 | | | | 30,399 | |
Interpublic Group | | | 73,500 | | | | 1,757 | |
Johnson Controls | | | 116,196 | | | | 5,130 | |
Kohl’s | | | 32,691 | | | | 1,178 | |
L Brands | | | 45,800 | | | | 3,140 | |
Leggett & Platt | | | 23,395 | | | | 1,176 | |
Lennar, Cl A | | | 32,991 | | | | 1,503 | |
LKQ * | | | 54,800 | | | | 1,812 | |
Lowe’s | | | 165,387 | | | | 13,252 | |
Macy’s | | | 56,700 | | | | 1,883 | |
Marriott International, Cl A (A) | | | 34,696 | | | | 2,291 | |
Mattel | | | 62,087 | | | | 1,979 | |
McDonald’s | | | 163,587 | | | | 19,967 | |
Michael Kors Holdings * | | | 32,900 | | | | 1,405 | |
Mohawk Industries * | | | 11,600 | | | | 2,282 | |
NetFlix * | | | 77,779 | | | | 7,978 | |
| | | | | | | | |
| Description | | Shares | | | Market Value ($ Thousands) | |
Newell Brands | | | 81,991 | | | $ | 3,910 | |
News | | | 18,600 | | | | 230 | |
News, Cl A | | | 64,683 | | | | 774 | |
NIKE, Cl B | | | 245,082 | | | | 13,533 | |
Nordstrom (A) | | | 22,095 | | | | 839 | |
Omnicom Group | | | 43,200 | | | | 3,600 | |
O’Reilly Automotive * | | | 17,400 | | | | 4,601 | |
Priceline Group * | | | 8,984 | | | | 11,359 | |
PulteGroup | | | 54,783 | | | | 1,028 | |
PVH | | | 15,000 | | | | 1,407 | |
Ralph Lauren, Cl A | | | 10,695 | | | | 1,009 | |
Ross Stores | | | 75,100 | | | | 4,010 | |
Royal Caribbean Cruises (A) | | | 30,900 | | | | 2,391 | |
Scripps Networks Interactive, Cl A | | | 16,300 | | | | 1,049 | |
Signet Jewelers | | | 14,600 | | | | 1,445 | |
Staples | | | 110,978 | | | | 977 | |
Starbucks | | | 268,282 | | | | 14,726 | |
Starwood Hotels & Resorts Worldwide | | | 30,800 | | | | 2,262 | |
Target | | | 109,491 | | | | 7,531 | |
TEGNA | | | 37,100 | | | | 852 | |
Tiffany | | | 19,195 | | | | 1,189 | |
Time Warner | | | 143,087 | | | | 10,826 | |
TJX | | | 121,591 | | | | 9,256 | |
Tractor Supply | | | 24,400 | | | | 2,345 | |
TripAdvisor * | | | 20,895 | | | | 1,415 | |
Twenty-First Century Fox, Cl A | | | 204,974 | | | | 5,920 | |
Twenty-First Century Fox, Cl B | | | 78,700 | | | | 2,301 | |
Ulta Salon Cosmetics & Fragrance * | | | 11,600 | | | | 2,703 | |
Under Armour, Cl A *(A) | | | 33,295 | | | | 1,256 | |
Under Armour, Cl C * | | | 31,095 | | | | 1,087 | |
Urban Outfitters * | | | 14,900 | | | | 425 | |
VF | | | 60,891 | | | | 3,795 | |
Viacom, Cl B | | | 63,100 | | | | 2,800 | |
Walt Disney | | | 272,383 | | | | 27,026 | |
Whirlpool | | | 14,100 | | | | 2,462 | |
Wyndham Worldwide | | | 20,600 | | | | 1,388 | |
Wynn Resorts (A) | | | 14,900 | | | | 1,433 | |
Yum! Brands | | | 74,900 | | | | 6,149 | |
| | | | | | | | |
| | | | | | | 415,201 | |
| | | | | | | | |
| | |
Consumer Staples — 9.9% | | | | | | | | |
Altria Group | | | 355,283 | | | | 22,610 | |
Archer-Daniels-Midland | | | 106,691 | | | | 4,563 | |
Brown-Forman, Cl B | | | 18,396 | | | | 1,804 | |
Campbell Soup | | | 32,791 | | | | 1,986 | |
Church & Dwight | | | 23,300 | | | | 2,295 | |
Clorox | | | 23,300 | | | | 2,995 | |
Coca-Cola | | | 706,957 | | | | 31,530 | |
Colgate-Palmolive | | | 161,591 | | | | 11,378 | |
ConAgra Foods | | | 78,287 | | | | 3,578 | |
Constellation Brands, Cl A | | | 32,400 | | | | 4,962 | |
Costco Wholesale | | | 79,500 | | | | 11,827 | |
| | |
| 30 | | SEI Institutional Investments Trust / Annual Report / May 31, 2016 |
SCHEDULE OF INVESTMENTS
S&P 500 Index Fund
May 31, 2016
| | | | | | | | |
| Description | | Shares | | | Market Value ($ Thousands) | |
CVS Health | | | 199,383 | | | $ | 19,230 | |
Dr. Pepper Snapple Group | | | 33,700 | | | | 3,080 | |
Estee Lauder, Cl A | | | 39,800 | | | | 3,653 | |
General Mills | | | 108,496 | | | | 6,811 | |
Hershey | | | 26,200 | | | | 2,433 | |
Hormel Foods | | | 49,392 | | | | 1,700 | |
JM Smucker | | | 21,795 | | | | 2,815 | |
Kellogg | | | 45,500 | | | | 3,384 | |
Kimberly-Clark | | | 65,696 | | | | 8,346 | |
Kraft Heinz | | | 108,191 | | | | 9,000 | |
Kroger | | | 178,382 | | | | 6,379 | |
McCormick | | | 21,095 | | | | 2,048 | |
Mead Johnson Nutrition, Cl A | | | 33,500 | | | | 2,756 | |
Molson Coors Brewing, Cl B | | | 32,995 | | | | 3,272 | |
Mondelez International, Cl A | | | 283,678 | | | | 12,621 | |
Monster Beverage * | | | 26,900 | | | | 4,035 | |
PepsiCo | | | 262,278 | | | | 26,535 | |
Philip Morris International | | | 281,178 | | | | 27,747 | |
Procter & Gamble | | | 481,270 | | | | 39,002 | |
Reynolds American | | | 151,012 | | | | 7,505 | |
Sysco | | | 94,200 | | | | 4,532 | |
Tyson Foods, Cl A | | | 52,787 | | | | 3,367 | |
Walgreens Boots Alliance | | | 155,987 | | | | 12,073 | |
Wal-Mart Stores | | | 284,783 | | | | 20,157 | |
Whole Foods Market | | | 59,291 | | | | 1,918 | |
| | | | | | | | |
| | | | | | | 333,927 | |
| | | | | | | | |
| | |
Energy — 7.0% | | | | | | | | |
Anadarko Petroleum | | | 93,795 | | | | 4,864 | |
Apache | | | 68,200 | | | | 3,897 | |
Baker Hughes | | | 78,900 | | | | 3,659 | |
Cabot Oil & Gas | | | 83,687 | | | | 2,006 | |
Chesapeake Energy *(A) | | | 88,378 | | | | 379 | |
Chevron | | | 341,678 | | | | 34,509 | |
Cimarex Energy | | | 17,296 | | | | 2,011 | |
Columbia Pipeline Group | | | 73,087 | | | | 1,867 | |
Concho Resources * | | | 23,200 | | | | 2,815 | |
ConocoPhillips | | | 223,983 | | | | 9,808 | |
Devon Energy | | | 91,700 | | | | 3,309 | |
Diamond Offshore Drilling *(A) | | | 10,500 | | | | 271 | |
EOG Resources | | | 100,091 | | | | 8,143 | |
EQT | | | 30,795 | | | | 2,256 | |
Exxon Mobil | | | 753,300 | | | | 67,059 | |
FMC Technologies * | | | 39,100 | | | | 1,065 | |
Halliburton | | | 157,091 | | | | 6,626 | |
Helmerich & Payne (A) | | | 18,595 | | | | 1,137 | |
Hess | | | 48,200 | | | | 2,889 | |
Kinder Morgan | | | 335,683 | | | | 6,069 | |
Marathon Oil | | | 154,000 | | | | 2,013 | |
Marathon Petroleum | | | 94,992 | | | | 3,309 | |
Murphy Oil | | | 27,891 | | | | 862 | |
National Oilwell Varco | | | 68,600 | | | | 2,260 | |
| | | | | | | | |
| Description | | Shares | | | Market Value ($ Thousands) | |
Newfield Exploration * | | | 36,300 | | | $ | 1,480 | |
Noble Energy | | | 78,100 | | | | 2,792 | |
Occidental Petroleum | | | 138,395 | | | | 10,441 | |
ONEOK | | | 38,391 | | | | 1,660 | |
Phillips 66 | | | 85,596 | | | | 6,879 | |
Pioneer Natural Resources | | | 30,096 | | | | 4,825 | |
Range Resources (A) | | | 29,200 | | | | 1,244 | |
Schlumberger | | | 252,366 | | | | 19,256 | |
Southwestern Energy *(A) | | | 71,700 | | | | 980 | |
Spectra Energy | | | 120,500 | | | | 3,839 | |
Tesoro | | | 21,800 | | | | 1,702 | |
Transocean *(A) | | | 58,300 | | | | 571 | |
Valero Energy | | | 86,600 | | | | 4,737 | |
Williams | | | 124,396 | | | | 2,757 | |
| | | | | | | | |
| | | | | | | 236,246 | |
| | | | | | | | |
| | |
Financials — 15.9% | | | | | | | | |
Affiliated Managers Group * | | | 9,900 | | | | 1,718 | |
Aflac | | | 75,291 | | | | 5,230 | |
Allstate | | | 67,800 | | | | 4,577 | |
American Express | | | 148,687 | | | | 9,778 | |
American International Group | | | 207,978 | | | | 12,038 | |
American Tower, Cl A ‡ | | | 77,200 | | | | 8,166 | |
Ameriprise Financial | | | 30,500 | | | | 3,101 | |
Aon | | | 48,400 | | | | 5,289 | |
Apartment Investment & Management, Cl A ‡ | | | 27,000 | | | | 1,152 | |
Arthur J Gallagher | | | 31,800 | | | | 1,537 | |
Assurant | | | 10,995 | | | | 961 | |
AvalonBay Communities ‡ | | | 25,300 | | | | 4,551 | |
Bank of America | | | 1,873,583 | | | | 27,710 | |
Bank of New York Mellon | | | 195,887 | | | | 8,239 | |
BB&T | | | 145,491 | | | | 5,292 | |
Berkshire Hathaway, Cl B * | | | 339,928 | | | | 47,773 | |
BlackRock, Cl A | | | 22,996 | | | | 8,367 | |
Boston Properties ‡ | | | 27,700 | | | | 3,480 | |
Capital One Financial | | | 96,296 | | | | 7,053 | |
CBRE Group, Cl A * | | | 53,191 | | | | 1,588 | |
Charles Schwab | | | 218,391 | | | | 6,678 | |
Chubb | | | 83,647 | | | | 10,591 | |
Cincinnati Financial | | | 26,996 | | | | 1,865 | |
Citigroup | | | 534,957 | | | | 24,913 | |
Citizens Financial Group | | | 96,300 | | | | 2,268 | |
CME Group, Cl A | | | 61,495 | | | | 6,020 | |
Comerica | | | 31,991 | | | | 1,507 | |
Crown Castle International ‡ | | | 60,696 | | | | 5,512 | |
Digital Realty Trust ‡ | | | 26,200 | | | | 2,501 | |
Discover Financial Services | | | 74,300 | | | | 4,221 | |
E*TRADE Financial * | | | 51,791 | | | | 1,444 | |
Equinix ‡ | | | 12,357 | | | | 4,473 | |
Equity Residential ‡ | | | 65,496 | | | | 4,533 | |
Essex Property Trust ‡ | | | 11,900 | | | | 2,704 | |
Extra Space Storage ‡ | | | 22,800 | | | | 2,120 | |
| | |
| 31 | | SEI Institutional Investments Trust / Annual Report / May 31, 2016 |
SCHEDULE OF INVESTMENTS
S&P 500 Index Fund
May 31, 2016
| | | | | | | | |
| Description | | Shares | | | Market Value ($ Thousands) | |
Federal Realty Investment Trust ‡ | | | 12,700 | | | $ | 1,946 | |
Fifth Third Bancorp | | | 140,700 | | | | 2,655 | |
Franklin Resources | | | 67,095 | | | | 2,506 | |
General Growth Properties ‡ | | | 106,100 | | | | 2,851 | |
Goldman Sachs Group | | | 71,091 | | | | 11,338 | |
Hartford Financial Services Group | | | 71,300 | | | | 3,221 | |
HCP ‡ | | | 84,800 | | | | 2,787 | |
Host Hotels & Resorts ‡ | | | 137,274 | | | | 2,114 | |
Huntington Bancshares | | | 145,461 | | | | 1,520 | |
Intercontinental Exchange | | | 21,600 | | | | 5,856 | |
Invesco | | | 75,900 | | | | 2,383 | |
Iron Mountain ‡ | | | 43,501 | | | | 1,598 | |
JPMorgan Chase | | | 665,857 | | | | 43,460 | |
KeyCorp | | | 152,600 | | | | 1,956 | |
Kimco Realty ‡ | | | 75,487 | | | | 2,127 | |
Legg Mason | | | 17,895 | | | | 617 | |
Leucadia National | | | 57,487 | | | | 1,041 | |
Lincoln National | | | 44,000 | | | | 2,017 | |
Loews | | | 48,887 | | | | 1,979 | |
M&T Bank | | | 28,723 | | | | 3,432 | |
Macerich ‡ | | | 23,196 | | | | 1,770 | |
Marsh & McLennan | | | 94,691 | | | | 6,256 | |
MetLife | | | 199,187 | | | | 9,073 | |
Moody’s | | | 30,600 | | | | 3,018 | |
Morgan Stanley | | | 278,500 | | | | 7,623 | |
Nasdaq | | | 21,000 | | | | 1,386 | |
Navient | | | 57,600 | | | | 790 | |
Northern Trust | | | 39,196 | | | | 2,904 | |
People’s United Financial (A) | | | 53,600 | | | | 851 | |
PNC Financial Services Group | | | 91,291 | | | | 8,192 | |
Principal Financial Group | | | 49,491 | | | | 2,205 | |
Progressive | | | 105,383 | | | | 3,509 | |
Prologis ‡ | | | 94,000 | | | | 4,468 | |
Prudential Financial | | | 81,100 | | | | 6,427 | |
Public Storage ‡ | | | 26,895 | | | | 6,824 | |
Realty Income ‡(A) | | | 45,600 | | | | 2,740 | |
Regions Financial | | | 234,900 | | | | 2,309 | |
S&P Global | | | 48,800 | | | | 5,456 | |
Simon Property Group ‡ | | | 55,996 | | | | 11,067 | |
SL Green Realty ‡ | | | 18,300 | | | | 1,855 | |
State Street | | | 71,700 | | | | 4,521 | |
SunTrust Banks | | | 90,600 | | | | 3,970 | |
Synchrony Financial * | | | 149,421 | | | | 4,662 | |
T. Rowe Price Group | | | 44,700 | | | | 3,445 | |
Torchmark | | | 20,646 | | | | 1,272 | |
Travelers | | | 54,096 | | | | 6,175 | |
UDR ‡ | | | 48,800 | | | | 1,758 | |
Unum Group | | | 43,691 | | | | 1,613 | |
US Bancorp | | | 295,183 | | | | 12,640 | |
Ventas ‡ | | | 60,300 | | | | 4,000 | |
Vornado Realty Trust ‡ | | | 31,796 | | | | 3,037 | |
Wells Fargo | | | 838,148 | | | | 42,511 | |
| | | | | | | | |
| Description | | Shares | | | Market Value ($ Thousands) | |
Welltower ‡ | | | 63,700 | | | $ | 4,390 | |
Weyerhaeuser ‡ | | | 133,845 | | | | 4,216 | |
Willis Towers Watson | | | 24,845 | | | | 3,181 | |
XL Group, Cl A | | | 53,300 | | | | 1,831 | |
Zions Bancorporation | | | 35,300 | | | | 989 | |
| | | | | | | | |
| | | | | | | 539,288 | |
| | | | | | | | |
| | |
Health Care — 14.4% | | | | | | | | |
Abbott Laboratories | | | 266,883 | | | | 10,577 | |
AbbVie | | | 292,478 | | | | 18,406 | |
Aetna | | | 63,795 | | | | 7,223 | |
Agilent Technologies | | | 59,691 | | | | 2,739 | |
Alexion Pharmaceuticals * | | | 41,300 | | | | 6,232 | |
Allergan * | | | 71,599 | | | | 16,879 | |
AmerisourceBergen | | | 34,396 | | | | 2,579 | |
Amgen | | | 136,491 | | | | 21,559 | |
Anthem | | | 47,796 | | | | 6,317 | |
Baxalta | | | 122,596 | | | | 5,545 | |
Baxter International (A) | | | 100,696 | | | | 4,346 | |
Becton Dickinson | | | 38,538 | | | | 6,415 | |
Biogen * | | | 39,600 | | | | 11,473 | |
Boston Scientific * | | | 241,600 | | | | 5,487 | |
Bristol-Myers Squibb | | | 302,983 | | | | 21,724 | |
C.R. Bard | | | 13,200 | | | | 2,891 | |
Cardinal Health | | | 60,796 | | | | 4,800 | |
Celgene * | | | 141,887 | | | | 14,972 | |
Centene * | | | 31,000 | | | | 1,933 | |
Cerner * | | | 54,400 | | | | 3,025 | |
Cigna | | | 46,800 | | | | 5,996 | |
DaVita HealthCare Partners * | | | 29,795 | | | | 2,304 | |
Dentsply Sirona | | | 43,991 | | | | 2,734 | |
Edwards Lifesciences * | | | 39,800 | | | | 3,920 | |
Eli Lilly | | | 175,791 | | | | 13,190 | |
Endo International * | | | 35,000 | | | | 553 | |
Express Scripts Holding * | | | 115,091 | | | | 8,695 | |
Gilead Sciences | | | 248,078 | | | | 21,598 | |
HCA Holdings * | | | 54,795 | | | | 4,275 | |
Henry Schein * | | | 14,900 | | | | 2,589 | |
Hologic * | | | 45,200 | | | | 1,555 | |
Humana | | | 26,596 | | | | 4,588 | |
Illumina * | | | 26,400 | | | | 3,823 | |
Intuitive Surgical * | | | 6,700 | | | | 4,253 | |
Johnson & Johnson | | | 500,570 | | | | 56,409 | |
Laboratory Corp of America Holdings * | | | 18,500 | | | | 2,367 | |
Mallinckrodt * | | | 20,496 | | | | 1,299 | |
McKesson | | | 41,700 | | | | 7,637 | |
Medtronic | | | 255,161 | | | | 20,535 | |
Merck | | | 503,570 | | | | 28,331 | |
Mylan * | | | 74,096 | | | | 3,211 | |
Patterson | | | 14,500 | | | | 708 | |
PerkinElmer | | | 20,200 | | | | 1,106 | |
Perrigo | | | 26,696 | | | | 2,559 | |
| | |
| 32 | | SEI Institutional Investments Trust / Annual Report / May 31, 2016 |
SCHEDULE OF INVESTMENTS
S&P 500 Index Fund
May 31, 2016
| | | | | | | | |
| Description | | Shares | | | Market Value ($ Thousands) | |
Pfizer | | | 1,097,335 | | | $ | 38,078 | |
Quest Diagnostics | | | 26,100 | | | | 2,014 | |
Regeneron Pharmaceuticals * | | | 14,300 | | | | 5,705 | |
St. Jude Medical | | | 50,900 | | | | 3,988 | |
Stryker | | | 57,396 | | | | 6,380 | |
Thermo Fisher Scientific | | | 71,791 | | | | 10,896 | |
UnitedHealth Group | | | 172,487 | | | | 23,056 | |
Universal Health Services, Cl B | | | 16,500 | | | | 2,225 | |
Varian Medical Systems * | | | 17,495 | | | | 1,448 | |
Vertex Pharmaceuticals * | | | 44,400 | | | | 4,136 | |
Waters * | | | 14,800 | | | | 2,036 | |
Zimmer Biomet Holdings | | | 32,095 | | | | 3,919 | |
Zoetis, Cl A | | | 82,100 | | | | 3,893 | |
| | | | | | | | |
| | | | | | | 487,131 | |
| | | | | | | | |
| | |
Industrials — 9.8% | | | | | | | | |
3M | | | 109,791 | | | | 18,480 | |
Acuity Brands | | | 8,000 | | | | 2,072 | |
Alaska Air Group | | | 22,300 | | | | 1,481 | |
Allegion | | | 16,596 | | | | 1,123 | |
American Airlines Group | | | 108,691 | | | | 3,468 | |
Ametek | | | 43,000 | | | | 2,056 | |
Boeing | | | 113,091 | | | | 14,266 | |
C.H. Robinson Worldwide | | | 26,195 | | | | 1,964 | |
Caterpillar | | | 105,991 | | | | 7,685 | |
Cintas | | | 15,995 | | | | 1,516 | |
CSX | | | 177,778 | | | | 4,699 | |
Cummins | | | 29,096 | | | | 3,331 | |
Danaher | | | 108,300 | | | | 10,652 | |
Deere (A) | | | 53,696 | | | | 4,419 | |
Delta Air Lines | | | 142,687 | | | | 6,201 | |
Dover | | | 28,300 | | | | 1,889 | |
Dun & Bradstreet | | | 6,295 | | | | 799 | |
Eaton | | | 84,395 | | | | 5,201 | |
Emerson Electric | | | 117,691 | | | | 6,122 | |
Equifax | | | 21,295 | | | | 2,677 | |
Expeditors International of Washington | | | 33,291 | | | | 1,616 | |
Fastenal | | | 52,591 | | | | 2,421 | |
FedEx | | | 46,700 | | | | 7,704 | |
Flowserve | | | 22,400 | | | | 1,078 | |
Fluor | | | 25,400 | | | | 1,341 | |
General Dynamics | | | 53,296 | | | | 7,561 | |
General Electric | | | 1,692,688 | | | | 51,170 | |
Honeywell International | | | 139,687 | | | | 15,901 | |
Illinois Tool Works | | | 59,995 | | | | 6,361 | |
Ingersoll-Rand | | | 46,296 | | | | 3,093 | |
Jacobs Engineering Group * | | | 21,096 | | | | 1,069 | |
JB Hunt Transport Services | | | 16,300 | | | | 1,348 | |
Kansas City Southern | | | 19,800 | | | | 1,843 | |
L-3 Communications Holdings, Cl 3 | | | 14,200 | | | | 1,948 | |
Lockheed Martin | | | 47,596 | | | | 11,244 | |
Masco | | | 61,000 | | | | 1,991 | |
| | | | | | | | |
| Description | | Shares | | | Market Value ($ Thousands) | |
Nielsen Holdings | | | 65,200 | | | $ | 3,481 | |
Norfolk Southern | | | 54,996 | | | | 4,623 | |
Northrop Grumman | | | 32,896 | | | | 6,996 | |
Paccar | | | 63,300 | | | | 3,529 | |
Parker Hannifin | | | 24,300 | | | | 2,791 | |
Pentair | | | 33,300 | | | | 2,006 | |
Pitney Bowes | | | 32,600 | | | | 607 | |
Quanta Services * | | | 26,900 | | | | 646 | |
Raytheon | | | 54,595 | | | | 7,079 | |
Republic Services, Cl A | | | 43,400 | | | | 2,095 | |
Robert Half International | | | 22,595 | | | | 940 | |
Rockwell Automation | | | 23,996 | | | | 2,785 | |
Rockwell Collins | | | 23,900 | | | | 2,113 | |
Roper Technologies | | | 18,200 | | | | 3,114 | |
Ryder System | | | 9,095 | | | | 633 | |
Snap-on | | | 10,600 | | | | 1,715 | |
Southwest Airlines | | | 117,487 | | | | 4,991 | |
Stanley Black & Decker | | | 27,395 | | | | 3,101 | |
Stericycle * | | | 15,596 | | | | 1,528 | |
Textron | | | 49,491 | | | | 1,884 | |
Tyco International | | | 76,300 | | | | 3,252 | |
Union Pacific | | | 152,887 | | | | 12,872 | |
United Continental Holdings * | | | 61,600 | | | | 2,778 | |
United Parcel Service, Cl B | | | 124,687 | | | | 12,854 | |
United Rentals * | | | 16,700 | | | | 1,164 | |
United Technologies | | | 141,191 | | | | 14,201 | |
Verisk Analytics, Cl A * | | | 28,200 | | | | 2,239 | |
Waste Management | | | 74,300 | | | | 4,529 | |
WW Grainger (A) | | | 10,400 | | | | 2,375 | |
Xylem | | | 32,700 | | | | 1,460 | |
| | | | | | | | |
| | | | | | | 332,171 | |
| | | | | | | | |
| | |
Information Technology — 19.9% | | | | | | | | |
Accenture, Cl A | | | 113,496 | | | | 13,503 | |
Activision Blizzard | | | 91,400 | | | | 3,588 | |
Adobe Systems * | | | 90,595 | | | | 9,012 | |
Akamai Technologies * | | | 32,296 | | | | 1,763 | |
Alliance Data Systems * | | | 10,800 | | | | 2,400 | |
Alphabet, Cl A * | | | 53,041 | | | | 39,720 | |
Alphabet, Cl C * | | | 53,963 | | | | 39,702 | |
Amphenol, Cl A | | | 55,291 | | | | 3,247 | |
Analog Devices | | | 55,700 | | | | 3,258 | |
Apple | | | 1,005,746 | | | | 100,434 | |
Applied Materials | | | 202,900 | | | | 4,955 | |
Autodesk * | | | 41,100 | | | | 2,395 | |
Automatic Data Processing | | | 83,391 | | | | 7,325 | |
Broadcom | | | 67,259 | | | | 10,382 | |
CA | | | 54,087 | | | | 1,748 | |
Cisco Systems | | | 913,143 | | | | 26,527 | |
Citrix Systems * | | | 28,100 | | | | 2,386 | |
Cognizant Technology Solutions, Cl A * | | | 111,395 | | | | 6,844 | |
Corning | | | 199,670 | | | | 4,171 | |
| | |
| 33 | | SEI Institutional Investments Trust / Annual Report / May 31, 2016 |
SCHEDULE OF INVESTMENTS
S&P 500 Index Fund
May 31, 2016
| | | | | | | | |
| Description | | Shares | | | Market Value ($ Thousands) | |
CSRA | | | 22,895 | | | $ | 567 | |
eBay * | | | 200,083 | | | | 4,894 | |
Electronic Arts * | | | 55,700 | | | | 4,275 | |
EMC | | | 353,574 | | | | 9,882 | |
F5 Networks * | | | 12,600 | | | | 1,389 | |
Facebook, Cl A * | | | 416,378 | | | | 49,470 | |
Fidelity National Information Services | | | 49,800 | | | | 3,699 | |
First Solar * | | | 13,200 | | | | 655 | |
Fiserv * | | | 40,000 | | | | 4,213 | |
FLIR Systems | | | 23,000 | | | | 716 | |
Global Payments | | | 28,082 | | | | 2,182 | |
Harris | | | 22,800 | | | | 1,796 | |
Hewlett Packard Enterprise | | | 312,074 | | | | 5,764 | |
HP | | | 309,874 | | | | 4,146 | |
Intel | | | 857,152 | | | | 27,077 | |
International Business Machines | | | 160,451 | | | | 24,668 | |
Intuit | | | 46,000 | | | | 4,906 | |
Juniper Networks | | | 64,400 | | | | 1,508 | |
Kla-Tencor | | | 28,400 | | | | 2,071 | |
Lam Research | | | 28,995 | | | | 2,401 | |
Linear Technology | | | 43,696 | | | | 2,068 | |
MasterCard, Cl A | | | 177,947 | | | | 17,065 | |
Microchip Technology (A) | | | 38,996 | | | | 2,015 | |
Micron Technology * | | | 189,200 | | | | 2,407 | |
Microsoft | | | 1,434,704 | | | | 76,039 | |
Motorola Solutions | | | 28,988 | | | | 2,008 | |
NetApp | | | 52,991 | | | | 1,353 | |
Nvidia | | | 92,083 | | | | 4,302 | |
Oracle | | | 571,765 | | | | 22,985 | |
Paychex | | | 57,687 | | | | 3,128 | |
PayPal Holdings * | | | 202,583 | | | | 7,656 | |
Qorvo * | | | 22,200 | | | | 1,132 | |
Qualcomm | | | 271,378 | | | | 14,904 | |
Red Hat * | | | 33,300 | | | | 2,579 | |
salesforce.com * | | | 114,491 | | | | 9,584 | |
Seagate Technology (A) | | | 54,400 | | | | 1,227 | |
Skyworks Solutions | | | 34,996 | | | | 2,336 | |
Symantec | | | 111,400 | | | | 1,934 | |
TE Connectivity | | | 66,291 | | | | 3,978 | |
Teradata * | | | 22,100 | | | | 626 | |
Texas Instruments | | | 182,083 | | | | 11,034 | |
Total System Services | | | 30,791 | | | | 1,654 | |
VeriSign * | | | 17,600 | | | | 1,504 | |
Visa, Cl A | | | 348,270 | | | | 27,492 | |
Western Digital | | | 51,231 | | | | 2,384 | |
Western Union | | | 91,678 | | | | 1,783 | |
Xerox | | | 174,000 | | | | 1,735 | |
Xilinx | | | 46,600 | | | | 2,208 | |
Yahoo! * | | | 159,891 | | | | 6,066 | |
| | | | | | | | |
| | | | | | | 674,825 | |
| | | | | | | | |
| | | | | | | | |
| Description | | Shares | | | Market Value ($ Thousands) | |
Materials — 2.8% | | | | | | | | |
Air Products & Chemicals | | | 35,700 | | | $ | 5,092 | |
Alcoa | | | 239,900 | | | | 2,224 | |
Avery Dennison | | | 16,400 | | | | 1,220 | |
Ball | | | 25,896 | | | | 1,872 | |
CF Industries Holdings | | | 40,000 | | | | 1,106 | |
Dow Chemical | | | 202,383 | | | | 10,394 | |
Eastman Chemical | | | 26,996 | | | | 1,981 | |
Ecolab | | | 48,896 | | | | 5,733 | |
EI du Pont de Nemours | | | 157,987 | | | | 10,334 | |
FMC | | | 23,100 | | | | 1,097 | |
Freeport-McMoRan, Cl B *(A) | | | 228,200 | | | | 2,529 | |
International Flavors & Fragrances | | | 14,600 | | | | 1,883 | |
International Paper | | | 73,896 | | | | 3,116 | |
LyondellBasell Industries, Cl A | | | 63,596 | | | | 5,174 | |
Martin Marietta Materials | | | 11,700 | | | | 2,212 | |
Monsanto | | | 79,991 | | | | 8,997 | |
Mosaic | | | 64,491 | | | | 1,627 | |
Newmont Mining | | | 95,383 | | | | 3,091 | |
Nucor | | | 57,987 | | | | 2,813 | |
Owens-Illinois * | | | 27,900 | | | | 527 | |
PPG Industries | | | 49,000 | | | | 5,276 | |
Praxair | | | 52,200 | | | | 5,735 | |
Sealed Air | | | 35,800 | | | | 1,663 | |
Sherwin-Williams | | | 14,100 | | | | 4,104 | |
Vulcan Materials | | | 24,300 | | | | 2,837 | |
WestRock | | | 46,382 | | | | 1,837 | |
| | | | | | | | |
| | | | | | | 94,474 | |
| | | | | | | | |
| | |
Telecommunication Services — 2.6% | | | | | | | | |
AT&T | | | 1,115,943 | | | | 43,689 | |
CenturyLink | | | 99,087 | | | | 2,687 | |
Frontier Communications (A) | | | 201,265 | | | | 1,041 | |
Level 3 Communications * | | | 52,700 | | | | 2,843 | |
Verizon Communications | | | 739,152 | | | | 37,623 | |
| | | | | | | | |
| | | | | | | 87,883 | |
| | | | | | | | |
| | |
Utilities — 3.3% | | | | | | | | |
AES | | | 120,800 | | | | 1,340 | |
AGL Resources | | | 22,000 | | | | 1,447 | |
Ameren | | | 44,291 | | | | 2,195 | |
American Electric Power | | | 90,200 | | | | 5,839 | |
American Water Works | | | 32,500 | | | | 2,408 | |
Centerpoint Energy | | | 78,583 | | | | 1,770 | |
CMS Energy | | | 50,591 | | | | 2,116 | |
Consolidated Edison | | | 52,700 | | | | 3,861 | |
Dominion Resources | | | 108,700 | | | | 7,853 | |
DTE Energy | | | 32,700 | | | | 2,965 | |
Duke Energy | | | 124,891 | | | | 9,770 | |
Edison International | | | 58,496 | | | | 4,190 | |
Entergy | | | 32,500 | | | | 2,467 | |
Eversource Energy | | | 57,200 | | | | 3,160 | |
| | |
| 34 | | SEI Institutional Investments Trust / Annual Report / May 31, 2016 |
SCHEDULE OF INVESTMENTS
S&P 500 Index Fund
May 31, 2016
| | | | | | | | |
| Description | | Shares | | | Market Value ($ Thousands) | |
Exelon | | | 168,691 | | | $ | 5,781 | |
FirstEnergy | | | 77,287 | | | | 2,536 | |
NextEra Energy | | | 83,600 | | | | 10,042 | |
NiSource | | | 58,587 | | | | 1,398 | |
NRG Energy | | | 54,387 | | | | 891 | |
PG&E | | | 90,700 | | | | 5,449 | |
Pinnacle West Capital | | | 20,300 | | | | 1,494 | |
PPL | | | 120,800 | | | | 4,656 | |
Public Service Enterprise Group | | | 90,900 | | | | 4,068 | |
SCANA | | | 26,096 | | | | 1,824 | |
Sempra Energy | | | 43,595 | | | | 4,670 | |
Southern | | | 166,100 | | | | 8,212 | |
TECO Energy | | | 40,600 | | | | 1,118 | |
WEC Energy Group | | | 56,931 | | | | 3,424 | |
Xcel Energy | | | 91,483 | | | | 3,785 | |
| | | | | | | | |
| | | | | | | 110,729 | |
| | | | | | | | |
Total Common Stock (Cost $3,128,919) ($ Thousands) | | | | | | | 3,311,875 | |
| | | | | | | | |
| |
AFFILIATED PARTNERSHIP — 0.8% | | | | | |
SEI Liquidity Fund, L.P. | | | | | | | | |
0.410% **†(B) | | | 26,532,492 | | | | 26,532 | |
| | | | | | | | |
Total Affiliated Partnership | | | | | | | | |
(Cost $26,532) ($ Thousands) | | | | | �� | | 26,532 | |
| | | | | | | | |
| | |
| | | Face Amount
(Thousands) | | | | |
| |
U.S. TREASURY OBLIGATIONS — 0.1% | | | | | |
U.S. Treasury Bills | | | | | | | | |
0.461%, 06/16/2016 (C)(D) | | $ | 2,800 | | | | 2,800 | |
0.000%, 09/08/2016 (C)(D) | | | 1,100 | | | | 1,099 | |
| | | | | | | | |
Total U.S. Treasury Obligations | | | | | | | | |
(Cost $3,898) ($ Thousands) | | | | | | | 3,899 | |
| | | | | | | | |
| | |
| | | Shares | | | | |
| | |
CASH EQUIVALENT — 1.8% | | | | | | | | |
SEI Daily Income Trust, Prime Obligation Fund, Cl A | | | | | | | | |
0.270% **† | | | 60,897,951 | | | | 60,898 | |
| | | | | | | | |
Total Cash Equivalent | | | | | | | | |
(Cost $60,898) ($ Thousands) | | | | | | | 60,898 | |
| | | | | | | | |
Total Investments — 100.6% | | | | | | | | |
(Cost $3,220,247) ($ Thousands) | | | | | | $ | 3,403,204 | |
| | | | | | | | |
A list of the open futures contracts held by the Fund at May 31, 2016, is as follows:
| | | | | | | | | | | | |
| Type of Contract | | Number of
Contracts
Long | | | Expiration Date | | | Unrealized
Appreciation
($ Thousands) | |
S&P 500 Index E-MINI | | | 691 | | | | Jun-2016 | | | $ | 3,016 | |
| | | | | | | | | | | | |
For the year ended May 31, 2016, the total amount of all open futures contracts, as presented in the table above, are representative of the volume of activity for the derivative type during the year.
Percentages are based on a Net Assets of $3,384,560 ($ Thousands).
| * | | Non-income producing security. |
| ** | | Rate shown is the 7-day effective yield as of May 31, 2016. |
| † | | Investment in Affiliated Security. |
| ‡ | | Real Estate Investment Trust. |
| (A) | | This security or a partial position of this security is on loan at May 31, 2016. The total market value of securities on loan at May 31, 2016 was $25,973 ($ Thousands). |
| (B) | | This security was purchased with cash collateral held from securities on loan. The total market value of such securities as of May 31, 2016 was $26,532 ($Thousands). |
| (C) | | Security, or portion thereof, has been pledged as collateral on open futures contracts. |
| (D) | | The rate reported is the effective yield at time of purchase. |
L.P. — Limited Partnership
S&P— Standard & Poor’s
The following is a list of the level of inputs used as of May 31, 2016, in valuing the Fund’s investments carried at value ($ Thousands):
| | | | | | | | | | | | | | | | |
| Investments in Securities | | Level 1 | | | Level 2 | | | Level 3 | | | Total | |
Common Stock | | $ | 3,311,875 | | | $ | — | | | $ | — | | | $ | 3,311,875 | |
Affiliated Partnership | | | — | | | | 26,532 | | | | — | | | | 26,532 | |
U.S. Treasury Obligations | | | — | | | | 3,899 | | | | — | | | | 3,899 | |
Cash Equivalent | | | 60,898 | | | | — | | | | — | | | | 60,898 | |
| | | | | | | | | | | | | | | | |
Total Investments in Securities | | $ | 3,372,773 | | | $ | 30,431 | | | $ | — | | | $ | 3,403,204 | |
| | | | | | | | | | | | | | | | |
| | | | | | | | | | | | | | | | |
| Other Financial Instruments | | Level 1 | | | Level 2 | | | Level 3 | | | Total | |
Futures Contracts * | | | | | | | | | | | | | | | | |
Unrealized Appreciation | | $ | 3,016 | | | $ | — | | | $ | — | | | $ | 3,016 | |
| | | | | | | | | | | | | | | | |
| * | | Futures contracts are valued at the unrealized appreciation on the instrument. |
For the year ended May 31, 2016, there were no transfers between Level 1 and Level 2 assets and liabilities.
For the year ended May 31, 2016, there were no transfers between Level 2 and Level 3 assets and liabilities.
For more information on valuation inputs, see Note 2 — Significant Accounting Policies in Notes to Financial Statements.
Amounts designated as “—” are $0 or have been rounded to $0.
The accompanying notes are an integral part of the financial statements.
| | |
| 35 | | SEI Institutional Investments Trust / Annual Report / May 31, 2016 |
SCHEDULE OF INVESTMENTS
Extended Market Index Fund
May 31, 2016
| | | | | | | | |
| Description | | Shares | | | Market Value ($ Thousands) | |
COMMON STOCK — 97.5% | | | | | | | | |
Consumer Discretionary — 14.6% | | | | | | | | |
1-800-Flowers.com, Cl A * | | | 1,700 | | | $ | 14 | |
2U *(A) | | | 3,700 | | | | 103 | |
Aaron’s | | | 12,216 | | | | 307 | |
Abercrombie & Fitch, Cl A | | | 12,300 | | | | 245 | |
AMC Entertainment Holdings, Cl A | | | 4,100 | | | | 118 | |
AMC Networks, Cl A * | | | 10,660 | | | | 682 | |
American Axle & Manufacturing Holdings * | | | 13,498 | | | | 225 | |
American Eagle Outfitters | | | 32,922 | | | | 515 | |
American Public Education * | | | 2,727 | | | | 77 | |
America’s Car-Mart *(A) | | | 850 | | | | 20 | |
Apollo Education Group, Cl A * | | | 16,100 | | | | 148 | |
Aramark | | | 33,500 | | | | 1,115 | |
Arctic Cat | | | 1,535 | | | | 24 | |
Asbury Automotive Group * | | | 4,098 | | | | 230 | |
Ascena Retail Group * | | | 33,727 | | | | 243 | |
Ascent Capital Group, Cl A * | | | 1,754 | | | | 33 | |
Barnes & Noble | | | 9,327 | | | | 108 | |
Barnes & Noble Education * | | | 5,894 | | | | 56 | |
Bassett Furniture Industries | | | 2,700 | | | | 75 | |
Beazer Homes USA * | | | 7,161 | | | | 56 | |
bebe stores | | | 1,520 | | | | 1 | |
Belmond, Cl A * | | | 17,030 | | | | 162 | |
Big 5 Sporting Goods | | | 923 | | | | 8 | |
Big Lots | | | 9,446 | | | | 494 | |
Biglari Holdings * | | | 342 | | | | 137 | |
BJ’s Restaurants * | | | 3,542 | | | | 159 | |
Black Diamond * | | | 4,204 | | | | 18 | |
Bloomin’ Brands | | | 22,950 | | | | 437 | |
Blue Nile | | | 1,431 | | | | 38 | |
Bob Evans Farms | | | 3,287 | | | | 147 | |
Boot Barn Holdings *(A) | | | 3,000 | | | | 23 | |
Boyd Gaming * | | | 12,945 | | | | 245 | |
Bravo Brio Restaurant Group * | | | 3,676 | | | | 27 | |
Bridgepoint Education * | | | 2,679 | | | | 21 | |
Bright Horizons Family Solutions * | | | 6,735 | | | | 436 | |
Brinker International | | | 10,182 | | | | 458 | |
Brunswick | | | 16,383 | | | | 784 | |
Buckle (A) | | | 4,851 | | | | 120 | |
Buffalo Wild Wings * | | | 3,227 | | | | 469 | |
Build-A-Bear Workshop, Cl A * | | | 2,700 | | | | 37 | |
Burlington Stores * | | | 12,100 | | | | 730 | |
Cabela’s * | | | 8,539 | | | | 415 | |
Cable One | | | 600 | | | | 294 | |
Caesars Acquisition, Cl A * | | | 5,300 | | | | 53 | |
Caesars Entertainment *(A) | | | 7,783 | | | | 57 | |
CalAtlantic Group | | | 12,775 | | | | 473 | |
Caleres | | | 8,576 | | | | 210 | |
Callaway Golf | | | 13,906 | | | | 140 | |
Capella Education | | | 2,138 | | | | 112 | |
Career Education * | | | 10,054 | | | | 59 | |
Carmike Cinemas * | | | 5,042 | | | | 151 | |
| | | | | | | | |
| Description | | Shares | | | Market Value ($ Thousands) | |
Carriage Services, Cl A | | | 2,006 | | | $ | 47 | |
Carrols Restaurant Group * | | | 7,900 | | | | 96 | |
Carter’s | | | 9,770 | | | | 982 | |
Cato, Cl A | | | 4,096 | | | | 155 | |
Cavco Industries * | | | 1,331 | | | | 132 | |
Central European Media Enterprises, Cl A * | | | 7,006 | | | | 19 | |
Century Communities * | | | 4,200 | | | | 76 | |
Charter Communications, Cl A * | | | 36,614 | | | | 8,016 | |
Cheesecake Factory | | | 8,723 | | | | 435 | |
Chegg *(A) | | | 8,600 | | | | 42 | |
Cherokee * | | | 2,600 | | | | 37 | |
Chico’s FAS | | | 22,151 | | | | 240 | |
Children’s Place Retail Stores | | | 3,633 | | | | 256 | |
Choice Hotels International | | | 6,377 | | | | 289 | |
Christopher & Banks * | | | 3,400 | | | | 7 | |
Churchill Downs | | | 2,234 | | | | 280 | |
Chuy’s Holdings * | | | 2,335 | | | | 77 | |
Cinemark Holdings | | | 21,340 | | | | 772 | |
Citi Trends | | | 3,097 | | | | 48 | |
Clear Channel Outdoor Holdings, Cl A | | | 6,796 | | | | 44 | |
ClubCorp Holdings | | | 6,800 | | | | 82 | |
Collectors Universe | | | 1,500 | | | | 29 | |
Columbia Sportswear | | | 5,144 | | | | 273 | |
Conn’s *(A) | | | 3,909 | | | | 43 | |
Container Store Group * | | | 1,600 | | | | 9 | |
Cooper Tire & Rubber | | | 10,632 | | | | 342 | |
Cooper-Standard Holding * | | | 2,600 | | | | 223 | |
Core-Mark Holdings | | | 3,918 | | | | 335 | |
Cracker Barrel Old Country Store (A) | | | 3,144 | | | | 476 | |
Crocs * | | | 11,003 | | | | 108 | |
CSS Industries | | | 2,292 | | | | 61 | |
CST Brands | | | 13,100 | | | | 497 | |
Culp | | | 2,861 | | | | 79 | |
Cumulus Media, Cl A * | | | 18,139 | | | | 6 | |
Daily Journal * | | | 100 | | | | 20 | |
Dana Holdings | | | 26,698 | | | | 321 | |
Dave & Buster’s Entertainment * | | | 4,500 | | | | 176 | |
Deckers Outdoor * | | | 5,604 | | | | 295 | |
Del Frisco’s Restaurant Group * | | | 2,800 | | | | 43 | |
Denny’s * | | | 14,463 | | | | 155 | |
Destination XL Group * | | | 4,342 | | | | 20 | |
DeVry Education Group | | | 10,381 | | | | 188 | |
Diamond Resorts International *(A) | | | 8,900 | | | | 204 | |
Dick’s Sporting Goods | | | 17,335 | | | | 744 | |
Dillard’s, Cl A | | | 3,862 | | | | 228 | |
DineEquity | | | 2,772 | | | | 233 | |
DISH Network, Cl A * | | | 39,019 | | | | 1,947 | |
Domino’s Pizza | | | 8,958 | | | | 1,083 | |
Dorman Products * | | | 4,440 | | | | 245 | |
DreamWorks Animation SKG, Cl A * | | | 13,391 | | | | 539 | |
Drew Industries | | | 4,049 | | | | 313 | |
DSW, Cl A | | | 11,992 | | | | 254 | |
| | |
| 36 | | SEI Institutional Investments Trust / Annual Report / May 31, 2016 |
SCHEDULE OF INVESTMENTS
Extended Market Index Fund
May 31, 2016
| | | | | | | | |
| Description | | Shares | | | Market Value ($ Thousands) | |
Duluth Holdings, Cl B * | | | 2,900 | | | $ | 77 | |
Dunkin’ Brands Group (A) | | | 17,630 | | | | 763 | |
Eastman Kodak * | | | 2,100 | | | | 28 | |
El Pollo Loco Holdings * | | | 1,400 | | | | 16 | |
Eldorado Resorts * | | | 7,500 | | | | 112 | |
Entercom Communications, Cl A | | | 4,782 | | | | 61 | |
Entravision Communications, Cl A | | | 14,200 | | | | 102 | |
Eros International *(A) | | | 5,900 | | | | 87 | |
Ethan Allen Interiors | | | 5,276 | | | | 178 | |
Etsy * | | | 5,300 | | | | 49 | |
EVINE Live * | | | 4,000 | | | | 6 | |
EW Scripps, Cl A * | | | 10,496 | | | | 177 | |
Express * | | | 14,962 | | | | 218 | |
Extended Stay America | | | 9,200 | | | | 131 | |
Federal-Mogul Holdings, Cl A * | | | 3,316 | | | | 28 | |
Fiesta Restaurant Group * | | | 4,005 | | | | 101 | |
Finish Line, Cl A | | | 9,311 | | | | 169 | |
Five Below * | | | 10,605 | | | | 444 | |
Flexsteel Industries | | | 600 | | | | 25 | |
Fossil Group * | | | 8,500 | | | | 237 | |
Fox Factory Holding * | | | 1,400 | | | | 23 | |
Francesca’s Holdings * | | | 8,224 | | | | 86 | |
Fred’s, Cl A | | | 6,579 | | | | 97 | |
FTD * | | | 2,392 | | | | 65 | |
GameStop, Cl A | | | 19,000 | | | | 553 | |
Gannett | | | 20,200 | | | | 315 | |
Genesco * | | | 4,069 | | | | 263 | |
Gentex | | | 51,790 | | | | 859 | |
Gentherm * | | | 6,548 | | | | 240 | |
G-III Apparel Group * | | | 6,806 | | | | 266 | |
Global Eagle Entertainment * | | | 4,900 | | | | 36 | |
GNC Holdings, Cl A | | | 13,278 | | | | 346 | |
GoPro, Cl A *(A) | | | 13,800 | | | | 142 | |
Graham Holdings, Cl B | | | 600 | | | | 299 | |
Grand Canyon Education * | | | 9,315 | | | | 389 | |
Gray Television * | | | 12,300 | | | | 145 | |
Green Brick Partners *(A) | | | 6,200 | | | | 44 | |
Group 1 Automotive | | | 4,735 | | | | 294 | |
Groupon, Cl A *(A) | | | 82,141 | | | | 291 | |
Guess? | | | 11,317 | | | | 178 | |
Habit Restaurants, Cl A * | | | 1,600 | | | | 29 | |
Harte-Hanks | | | 7,846 | | | | 8 | |
Haverty Furniture | | | 2,163 | | | | 40 | |
Helen of Troy * | | | 4,848 | | | | 498 | |
Hibbett Sports *(A) | | | 4,012 | | | | 139 | |
Hilton Worldwide Holdings | | | 92,900 | | | | 1,930 | |
Hooker Furniture | | | 2,700 | | | | 65 | |
Horizon Global * | | | 2,470 | | | | 29 | |
Houghton Mifflin Harcourt * | | | 24,200 | | | | 416 | |
Hovnanian Enterprises, Cl A *(A) | | | 10,715 | | | | 20 | |
HSN | | | 6,411 | | | | 336 | |
Hyatt Hotels, Cl A *(A) | | | 5,927 | | | | 272 | |
| | | | | | | | |
| Description | | Shares | | | Market Value ($ Thousands) | |
Iconix Brand Group *(A) | | | 8,051 | | | $ | 62 | |
Imax * | | | 11,800 | | | | 393 | |
Installed Building Products * | | | 3,100 | | | | 104 | |
International Game Technology (A) | | | 18,500 | | | | 351 | |
International Speedway, Cl A | | | 5,498 | | | | 182 | |
Interval Leisure Group | | | 20,298 | | | | 291 | |
iRobot * | | | 5,702 | | | | 220 | |
Isle of Capri Casinos * | | | 4,779 | | | | 76 | |
J Alexander’s Holdings * | | | 2,756 | | | | 29 | |
J.C. Penney *(A) | | | 56,995 | | | | 444 | |
Jack in the Box | | | 6,221 | | | | 530 | |
JAKKS Pacific * | | | 427 | | | | 3 | |
Jamba * | | | 1,407 | | | | 16 | |
John Wiley & Sons, Cl A | | | 7,872 | | | | 424 | |
Johnson Outdoors, Cl A | | | 700 | | | | 18 | |
K12 * | | | 3,988 | | | | 47 | |
Kate Spade * | | | 22,098 | | | | 483 | |
KB Home (A) | | | 13,785 | | | | 192 | |
Kimball International, Cl B | | | 4,125 | | | | 48 | |
Kirkland’s | | | 2,028 | | | | 27 | |
Krispy Kreme Doughnuts * | | | 12,571 | | | | 269 | |
La Quinta Holdings * | | | 14,500 | | | | 172 | |
Lands’ End *(A) | | | 4,362 | | | | 73 | |
Las Vegas Sands | | | 64,504 | | | | 2,983 | |
La-Z-Boy, Cl Z | | | 8,926 | | | | 236 | |
Lear | | | 12,771 | | | | 1,517 | |
LGI Homes *(A) | | | 1,700 | | | | 46 | |
Libbey | | | 2,785 | | | | 48 | |
Liberty Broadband, Cl A * | | | 4,583 | | | | 265 | |
Liberty Broadband, Cl C * | | | 12,268 | | | | 709 | |
Liberty Interactive, Cl A * | | | 82,744 | | | | 2,232 | |
Liberty Media Group, Cl A * | | | 4,509 | | | | 88 | |
Liberty Media Group, Cl C * | | | 9,043 | | | | 171 | |
Liberty Tripadvisor Holdings, Cl A * | | | 13,392 | | | | 308 | |
Liberty Ventures, Ser A * | | | 24,379 | | | | 910 | |
LifeLock * | | | 19,363 | | | | 253 | |
Lifetime Brands | | | 300 | | | | 4 | |
Lions Gate Entertainment | | | 18,309 | | | | 408 | |
Lithia Motors, Cl A | | | 4,189 | | | | 345 | |
Live Nation * | | | 25,803 | | | | 623 | |
Loral Space & Communications * | | | 1,900 | | | | 73 | |
lululemon athletica *(A) | | | 20,400 | | | | 1,327 | |
Lumber Liquidators Holdings *(A) | | | 4,126 | | | | 54 | |
M/I Homes * | | | 6,094 | | | | 115 | |
Madison Square Garden, Cl A * | | | 3,579 | | | | 600 | |
Malibu Boats, Cl A * | | | 4,600 | | | | 63 | |
Marcus | | | 2,761 | | | | 54 | |
MarineMax * | | | 3,996 | | | | 68 | |
Marriott Vacations Worldwide | | | 4,374 | | | | 265 | |
Mattress Firm Holding *(A) | | | 3,811 | | | | 129 | |
MDC Holdings | | | 7,689 | | | | 179 | |
MDC Partners, Cl A | | | 8,576 | | | | 154 | |
| | |
| 37 | | SEI Institutional Investments Trust / Annual Report / May 31, 2016 |
SCHEDULE OF INVESTMENTS
Extended Market Index Fund
May 31, 2016
| | | | | | | | |
| Description | | Shares | | | Market Value ($ Thousands) | |
Media General * | | | 17,300 | | | $ | 309 | |
Meredith | | | 7,344 | | | | 364 | |
Meritage Homes * | | | 7,211 | | | | 263 | |
Metaldyne Performance Group | | | 3,400 | | | | 55 | |
MGM Resorts International * | | | 79,874 | | | | 1,825 | |
Michaels * | | | 12,200 | | | | 358 | |
Modine Manufacturing * | | | 7,374 | | | | 74 | |
Monarch Casino & Resort * | | | 1,100 | | | | 23 | |
Monro Muffler | | | 5,728 | | | | 361 | |
Morgans Hotel Group * | | | 2,200 | | | | 5 | |
Motorcar Parts & Accessories * | | | 3,700 | | | | 111 | |
Movado Group | | | 2,720 | | | | 56 | |
MSG Networks * | | | 9,540 | | | | 165 | |
Murphy USA * | | | 6,900 | | | | 469 | |
National CineMedia | | | 10,007 | | | | 146 | |
Nautilus * | | | 6,200 | | | | 128 | |
New Media Investment | | | 8,900 | | | | 155 | |
New York Times, Cl A | | | 22,982 | | | | 278 | |
Nexstar Broadcasting Group, Cl A (A) | | | 5,722 | | | | 305 | |
Noodles, Cl A * | | | 700 | | | | 7 | |
Norwegian Cruise Line Holdings * | | | 23,769 | | | | 1,103 | |
Nutrisystem | | | 4,559 | | | | 124 | |
NVR * | | | 725 | | | | 1,256 | |
Office Depot * | | | 100,647 | | | | 360 | |
Ollie’s Bargain Outlet Holdings * | | | 3,000 | | | | 75 | |
Outerwall (A) | | | 3,343 | | | | 138 | |
Overstock.com * | | | 700 | | | | 12 | |
Oxford Industries | | | 2,854 | | | | 181 | |
Panera Bread, Cl A * | | | 3,920 | | | | 859 | |
Papa John’s International | | | 5,042 | | | | 319 | |
Party City Holdco * | | | 3,900 | | | | 54 | |
Penn National Gaming * | | | 16,554 | | | | 259 | |
Penske Auto Group | | | 7,388 | | | | 292 | |
Performance Sports Group * | | | 7,000 | | | | 23 | |
Perry Ellis International * | | | 2,439 | | | | 47 | |
PetMed Express (A) | | | 3,796 | | | | 71 | |
Pier 1 Imports | | | 18,189 | | | | 102 | |
Pinnacle Entertainment * | | | 10,760 | | | | 121 | |
Planet Fitness, Cl A * | | | 4,600 | | | | 82 | |
Polaris Industries | | | 12,207 | | | | 1,038 | |
Pool | | | 8,070 | | | | 739 | |
Popeyes Louisiana Kitchen * | | | 4,739 | | | | 275 | |
Potbelly * | | | 5,900 | | | | 78 | |
Reading International, Cl A * | | | 3,800 | | | | 48 | |
Red Robin Gourmet Burgers * | | | 2,967 | | | | 150 | |
Regal Entertainment Group, Cl A (A) | | | 13,705 | | | | 288 | |
Regis * | | | 6,527 | | | | 85 | |
Rent-A-Center, Cl A | | | 9,840 | | | | 130 | |
Restoration Hardware Holdings * | | | 5,511 | | | | 183 | |
Ruby Tuesday * | | | 9,879 | | | | 38 | |
Ruth’s Hospitality Group | | | 7,672 | | | | 127 | |
Saga Communications, Cl A | | | 593 | | | | 25 | |
| | | | | | | | |
| Description | | Shares | | | Market Value ($ Thousands) | |
Sally Beauty Holdings * | | | 27,491 | | | $ | 790 | |
Scholastic | | | 4,467 | | | | 174 | |
Scientific Games, Cl A *(A) | | | 8,962 | | | | 88 | |
Sears Holdings *(A) | | | 2,026 | | | | 27 | |
SeaWorld Entertainment | | | 10,900 | | | | 190 | |
Select Comfort * | | | 9,009 | | | | 202 | |
Sequential Brands Group *(A) | | | 10,040 | | | | 81 | |
Service International | | | 35,489 | | | | 972 | |
ServiceMaster Global Holdings * | | | 19,200 | | | | 734 | |
Shake Shack, Cl A *(A) | | | 900 | | | | 34 | |
Shoe Carnival | | | 2,076 | | | | 48 | |
Shutterfly * | | | 6,425 | | | | 310 | |
Sinclair Broadcast Group, Cl A | | | 12,711 | | | | 402 | |
Sirius XM Holdings * | | | 385,179 | | | | 1,548 | |
Six Flags Entertainment | | | 12,758 | | | | 736 | |
Sizmek * | | | 2,348 | | | | 6 | |
Skechers U.S.A., Cl A * | | | 22,846 | | | | 712 | |
Skullcandy * | | | 2,500 | | | | 10 | |
Smith & Wesson Holding * | | | 9,683 | | | | 236 | |
Sonic | | | 9,133 | | | | 272 | |
Sonic Automotive, Cl A | | | 5,064 | | | | 90 | |
Sotheby’s (A) | | | 10,761 | | | | 322 | |
Speedway Motorsports | | | 1,635 | | | | 28 | |
Sportsman’s Warehouse Holdings * | | | 5,400 | | | | 47 | |
Stage Stores (A) | | | 3,854 | | | | 21 | |
Standard Motor Products | | | 3,066 | | | | 118 | |
Starz * | | | 16,539 | | | | 447 | |
Stein Mart | | | 4,791 | | | | 33 | |
Steven Madden * | | | 10,401 | | | | 357 | |
Stoneridge * | | | 3,730 | | | | 61 | |
Strattec Security | | | 400 | | | | 18 | |
Strayer Education * | | | 1,817 | | | | 88 | |
Sturm Ruger | | | 3,542 | | | | 235 | |
Superior Industries International | | | 2,623 | | | | 71 | |
Systemax * | | | 1,400 | | | | 13 | |
Tailored Brands | | | 7,268 | | | | 100 | |
Taylor Morrison Home, Cl A * | | | 3,800 | | | | 57 | |
Tempur Sealy International * | | | 11,323 | | | | 659 | |
Tenneco * | | | 10,063 | | | | 541 | |
Tesla Motors *(A) | | | 19,879 | | | | 4,438 | |
Texas Roadhouse, Cl A | | | 13,066 | | | | 585 | |
Thomson Reuters | | | 57,985 | | | | 2,438 | |
Thor Industries | | | 8,590 | | | | 558 | |
Tile Shop Holdings * | | | 3,300 | | | | 60 | |
Tilly’s, Cl A * | | | 843 | | | | 5 | |
Time | | | 19,600 | | | | 311 | |
Toll Brothers * | | | 32,039 | | | | 934 | |
TopBuild * | | | 5,900 | | | | 213 | |
Tower International | | | 4,800 | | | | 104 | |
TRI Pointe Homes * | | | 27,473 | | | | 320 | |
Tribune Media, Cl A | | | 14,100 | | | | 568 | |
Tribune Publishing | | | 4,100 | | | | 48 | |
| | |
| 38 | | SEI Institutional Investments Trust / Annual Report / May 31, 2016 |
SCHEDULE OF INVESTMENTS
Extended Market Index Fund
May 31, 2016
| | | | | | | | |
| Description | | Shares | | | Market Value ($ Thousands) | |
Tuesday Morning * | | | 6,886 | | | $ | 47 | |
Tumi Holdings * | | | 10,498 | | | | 282 | |
Tupperware Brands | | | 8,824 | | | | 499 | |
Unifi * | | | 2,480 | | | | 62 | |
Universal Electronics * | | | 2,487 | | | | 161 | |
Universal Technical Institute | | | 3,013 | | | | 10 | |
Vail Resorts | | | 6,412 | | | | 842 | |
Vera Bradley * | | | 2,470 | | | | 38 | |
Vince Holding * | | | 1,977 | | | | 11 | |
Vista Outdoor * | | | 10,688 | | | | 536 | |
Visteon | | | 5,765 | | | | 432 | |
Vitamin Shoppe * | | | 5,384 | | | | 163 | |
VOXX International, Cl A * | | | 2,864 | | | | 9 | |
Wayfair, Cl A *(A) | | | 2,900 | | | | 119 | |
WCI Communities * | | | 1,400 | | | | 24 | |
Weight Watchers International *(A) | | | 5,774 | | | | 88 | |
Wendy’s | | | 36,875 | | | | 379 | |
West Marine * | | | 537 | | | | 5 | |
Weyco Group | | | 263 | | | | 7 | |
William Lyon Homes, Cl A *(A) | | | 3,000 | | | | 49 | |
Williams-Sonoma | | | 16,037 | | | | 851 | |
Wingstop * | | | 2,500 | | | | 70 | |
Winmark | | | 395 | | | | 39 | |
Winnebago Industries | | | 4,035 | | | | 91 | |
Wolverine World Wide | | | 20,096 | | | | 366 | |
World Wrestling Entertainment, Cl A | | | 4,234 | | | | 74 | |
Zagg * | | | 7,200 | | | | 35 | |
Zoe’s Kitchen * | | | 3,000 | | | | 111 | |
Zumiez * | | | 3,903 | | | | 58 | |
| | | | | | | | |
| | | | | | | 104,390 | |
| | | | | | | | |
| | |
Consumer Staples — 3.4% | | | | | | | | |
Alico | | | 143 | | | | 4 | |
Alliance One International * | | | 466 | | | | 9 | |
Amplify Snack Brands * | | | 4,900 | | | | 64 | |
Andersons | | | 5,399 | | | | 193 | |
Avon Products | | | 83,800 | | | | 327 | |
B&G Foods, Cl A | | | 11,511 | | | | 495 | |
Blue Buffalo Pet Products *(A) | | | 7,700 | | | | 199 | |
Boston Beer, Cl A * | | | 1,783 | | | | 277 | |
Bunge | | | 25,843 | | | | 1,733 | |
Calavo Growers | | | 2,126 | | | | 120 | |
Cal-Maine Foods (A) | | | 5,228 | | | | 233 | |
Casey’s General Stores | | | 7,159 | | | | 861 | |
Central Garden and Pet, Cl A * | | | 7,929 | | | | 145 | |
Chefs’ Warehouse * | | | 3,921 | | | | 60 | |
Coca-Cola Bottling | | | 889 | | | | 110 | |
Coty, Cl A (A) | | | 14,000 | | | | 369 | |
Craft Brew Alliance * | | | 1,600 | | | | 15 | |
Darling International * | | | 29,257 | | | | 449 | |
Dean Foods | | | 16,450 | | | | 301 | |
Edgewell Personal Care | | | 11,345 | | | | 901 | |
| | | | | | | | |
| Description | | Shares | | | Market Value ($ Thousands) | |
Elizabeth Arden *(A) | | | 3,000 | | | $ | 28 | |
Energizer Holdings | | | 11,345 | | | | 537 | |
Farmer Brothers * | | | 900 | | | | 25 | |
Flowers Foods | | | 33,208 | | | | 623 | |
Fresh Del Monte Produce | | | 5,681 | | | | 298 | |
Freshpet *(A) | | | 3,400 | | | | 31 | |
Hain Celestial Group * | | | 18,160 | | | | 898 | |
Herbalife *(A) | | | 13,472 | | | | 780 | |
HRG Group * | | | 14,978 | | | | 197 | |
Ingles Markets, Cl A | | | 2,245 | | | | 84 | |
Ingredion | | | 12,865 | | | | 1,510 | |
Inter Parfums | | | 3,806 | | | | 111 | |
Inventure Foods * | | | 900 | | | | 7 | |
J&J Snack Foods | | | 2,364 | | | | 249 | |
John B Sanfilippo & Son | | | 1,519 | | | | 72 | |
Lancaster Colony | | | 3,229 | | | | 391 | |
Landec * | | | 4,693 | | | | 54 | |
Limoneira (A) | | | 1,295 | | | | 21 | |
Medifast | | | 1,564 | | | | 50 | |
MGP Ingredients | | | 2,300 | | | | 75 | |
National Beverage * | | | 2,352 | | | | 123 | |
Natural Grocers by Vitamin Cottage * | | | 1,085 | | | | 14 | |
Natural Health Trends (A) | | | 2,100 | | | | 63 | |
Nature’s Sunshine Products | | | 437 | | | | 4 | |
Nu Skin Enterprises, Cl A (A) | | | 10,405 | | | | 410 | |
Nutraceutical International * | | | 362 | | | | 9 | |
Oil-Dri Corp of America | | | 210 | | | | 7 | |
Omega Protein * | | | 3,866 | | | | 76 | |
Orchids Paper Products | | | 800 | | | | 25 | |
Performance Food Group * | | | 3,600 | | | | 89 | |
Pilgrim’s Pride | | | 11,607 | | | | 289 | |
Pinnacle Foods | | | 20,400 | | | | 859 | |
Post Holdings * | | | 11,469 | | | | 872 | |
PriceSmart | | | 3,923 | | | | 348 | |
Revlon, Cl A * | | | 2,920 | | | | 91 | |
Rite Aid * | | | 178,027 | | | | 1,371 | |
Sanderson Farms (A) | | | 4,341 | | | | 389 | |
Seaboard * | | | 57 | | | | 172 | |
Seneca Foods, Cl A * | | | 462 | | | | 14 | |
Smart & Final Stores * | | | 3,500 | | | | 56 | |
Snyder’s-Lance | | | 12,053 | | | | 373 | |
SpartanNash | | | 7,336 | | | | 218 | |
Spectrum Brands Holdings | | | 4,739 | | | | 552 | |
Sprouts Farmers Market * | | | 28,900 | | | | 716 | |
SUPERVALU * | | | 52,216 | | | | 242 | |
Tootsie Roll Industries (A) | | | 3,118 | | | | 112 | |
TreeHouse Foods * | | | 10,309 | | | | 976 | |
United Natural Foods * | | | 9,698 | | | | 361 | |
Universal | | | 4,145 | | | | 227 | |
USANA Health Sciences *(A) | | | 816 | | | | 98 | |
Vector Group | | | 15,019 | | | | 322 | |
Village Super Market, Cl A | | | 462 | | | | 13 | |
| | |
| 39 | | SEI Institutional Investments Trust / Annual Report / May 31, 2016 |
SCHEDULE OF INVESTMENTS
Extended Market Index Fund
May 31, 2016
| | | | | | | | |
| Description | | Shares | | | Market Value ($ Thousands) | |
WD-40 | | | 2,686 | | | $ | 299 | |
Weis Markets | | | 1,704 | | | | 86 | |
WhiteWave Foods, Cl A * | | | 31,652 | | | | 1,413 | |
| | | | | | | | |
| | | | | | | 24,195 | |
| | | | | | | | |
| | |
Energy — 3.6% | | | | | | | | |
Abraxas Petroleum * | | | 16,494 | | | | 19 | |
Adams Resources & Energy | | | 300 | | | | 12 | |
Alon USA Energy | | | 3,296 | | | | 25 | |
Antero Resources * | | | 13,600 | | | | 395 | |
Approach Resources * | | | 4,198 | | | | 11 | |
Archrock | | | 9,683 | | | | 74 | |
Ardmore Shipping | | | 2,100 | | | | 20 | |
Atwood Oceanics (A) | | | 9,540 | | | | 102 | |
Basic Energy Services * | | | 3,973 | | | | 8 | |
Bill Barrett *(A) | | | 6,264 | | | | 44 | |
Bonanza Creek Energy *(A) | | | 6,388 | | | | 17 | |
Bristow Group | | | 5,303 | | | | 71 | |
C&J Energy Services * | | | 5,495 | | | | 3 | |
California Resources | | | 56,000 | | | | 85 | |
Callon Petroleum * | | | 24,585 | | | | 280 | |
CARBO Ceramics (A) | | | 2,350 | | | | 29 | |
Carrizo Oil & Gas * | | | 11,309 | | | | 435 | |
Cheniere Energy * | | | 42,565 | | | | 1,368 | |
Clayton Williams Energy *(A) | | | 916 | | | | 23 | |
Clean Energy Fuels * | | | 7,588 | | | | 25 | |
Cloud Peak Energy * | | | 8,089 | | | | 16 | |
Cobalt International Energy * | | | 61,015 | | | | 137 | |
CONSOL Energy (A) | | | 43,300 | | | | 665 | |
Contango Oil & Gas * | | | 2,535 | | | | 27 | |
Continental Resources *(A) | | | 16,196 | | | | 681 | |
CVR Energy (A) | | | 1,897 | | | | 37 | |
Delek US Holdings | | | 9,609 | | | | 132 | |
Denbury Resources | | | 73,000 | | | | 293 | |
DHT Holdings | | | 14,000 | | | | 76 | |
Diamondback Energy * | | | 12,975 | | | | 1,180 | |
Dorian LPG * | | | 6,000 | | | | 54 | |
Dril-Quip * | | | 7,387 | | | | 451 | |
Eclipse Resources *(A) | | | 3,800 | | | | 10 | |
Energen | | | 17,589 | | | | 838 | |
Ensco, Cl A | | | 57,300 | | | | 567 | |
EP Energy, Cl A * | | | 3,800 | | | | 21 | |
Era Group * | | | 2,093 | | | | 20 | |
Evolution Petroleum | | | 627 | | | | 3 | |
EXCO Resources * | | | 19,913 | | | | 18 | |
Exterran * | | | 4,841 | | | | 61 | |
Fairmount Santrol Holdings *(A) | | | 7,500 | | | | 40 | |
Forum Energy Technologies * | | | 8,605 | | | | 144 | |
Frank’s International (A) | | | 5,300 | | | | 85 | |
Frontline (A) | | | 9,120 | | | | 81 | |
GasLog | | | 8,650 | | | | 108 | |
Gastar Exploration * | | | 6,900 | | | | 6 | |
| | | | | | | | |
| Description | | Shares | | | Market Value ($ Thousands) | |
Geospace Technologies * | | | 1,598 | | | $ | 28 | |
Golar LNG (A) | | | 17,702 | | | | 308 | |
Green Plains Renewable Energy | | | 5,590 | | | | 104 | |
Gulfmark Offshore, Cl A * | | | 3,380 | | | | 11 | |
Gulfport Energy * | | | 22,281 | | | | 685 | |
Halcon Resources *(A) | | | 6,562 | | | | 2 | |
Helix Energy Solutions Group * | | | 19,569 | | | | 157 | |
HollyFrontier | | | 33,954 | | | | 909 | |
Hornbeck Offshore Services * | | | 4,612 | | | | 38 | |
ION Geophysical * | | | 1,391 | | | | 10 | |
Jones Energy, Cl A * | | | 2,600 | | | | 10 | |
Key Energy Services * | | | 20,159 | | | | 6 | |
Kosmos Energy * | | | 24,375 | | | | 140 | |
Laredo Petroleum *(A) | | | 18,989 | | | | 230 | |
Matador Resources * | | | 13,100 | | | | 298 | |
Matrix Service * | | | 4,781 | | | | 79 | |
McDermott International *(A) | | | 48,370 | | | | 230 | |
Memorial Resource Development * | | | 13,600 | | | | 215 | |
Nabors Industries | | | 46,000 | | | | 432 | |
Natural Gas Services Group * | | | 3,844 | | | | 78 | |
Navios Maritime Acquisition | | | 9,600 | | | | 18 | |
Newpark Resources * | | | 18,020 | | | | 83 | |
Noble (A) | | | 44,100 | | | | 368 | |
Nordic American Offshore | | | 2,300 | | | | 11 | |
Nordic American Tankers (A) | | | 16,977 | | | | 261 | |
North Atlantic Drilling * | | | 760 | | | | 3 | |
Northern Oil And Gas *(A) | | | 7,039 | | | | 31 | |
Oasis Petroleum * | | | 34,497 | | | | 346 | |
Oceaneering International | | | 16,646 | | | | 550 | |
Oil States International * | | | 9,399 | | | | 309 | |
Pacific Ethanol * | | | 2,400 | | | | 15 | |
Panhandle Oil and Gas, Cl A | | | 1,682 | | | | 27 | |
Par Petroleum * | | | 3,900 | | | | 60 | |
Parker Drilling * | | | 16,551 | | | | 36 | |
Parsley Energy, Cl A * | | | 18,700 | | | | 487 | |
Patterson-UTI Energy | | | 25,022 | | | | 466 | |
PBF Energy, Cl A | | | 18,177 | | | | 479 | |
PDC Energy * | | | 8,393 | | | | 487 | |
PHI * | | | 1,443 | | | | 25 | |
Pioneer Energy Services * | | | 9,836 | | | | 35 | |
QEP Resources | | | 38,700 | | | | 721 | |
Renewable Energy Group * | | | 10,800 | | | | 99 | |
REX American Resources * | | | 800 | | | | 47 | |
Rex Energy *(A) | | | 4,990 | | | | 4 | |
Rice Energy * | | | 15,100 | | | | 306 | |
RigNet * | | | 1,441 | | | | 18 | |
Ring Energy * | | | 2,200 | | | | 18 | |
Rowan, Cl A | | | 21,700 | | | | 367 | |
RPC (A) | | | 8,499 | | | | 125 | |
RSP Permian * | | | 11,600 | | | | 382 | |
Sanchez Energy *(A) | | | 6,830 | | | | 53 | |
Scorpio Tankers | | | 31,743 | | | | 187 | |
| | |
| 40 | | SEI Institutional Investments Trust / Annual Report / May 31, 2016 |
SCHEDULE OF INVESTMENTS
Extended Market Index Fund
May 31, 2016
| | | | | | | | |
| Description | | Shares | | | Market Value ($ Thousands) | |
SEACOR Holdings * | | | 2,574 | | | $ | 148 | |
Seadrill *(A) | | | 66,300 | | | | 205 | |
SemGroup, Cl A | | | 7,444 | | | | 237 | |
Ship Finance International (A) | | | 11,476 | | | | 184 | |
SM Energy | | | 11,713 | | | | 369 | |
Stone Energy * | | | 6,684 | | | | 4 | |
Superior Energy Services | | | 29,060 | | | | 501 | |
Synergy Resources * | | | 30,062 | | | | 182 | |
Targa Resources | | | 29,359 | | | | 1,257 | |
Teekay | | | 7,454 | | | | 78 | |
Teekay Tankers, Cl A | | | 18,023 | | | | 64 | |
TerraVia Holdings *(A) | | | 7,830 | | | | 19 | |
Tesco | | | 5,269 | | | | 38 | |
TETRA Technologies * | | | 16,405 | | | | 90 | |
Tidewater (A) | | | 6,246 | | | | 27 | |
TransAtlantic Petroleum * | | | 2,700 | | | | 2 | |
Triangle Petroleum * | | | 11,537 | | | | 2 | |
Unit * | | | 8,395 | | | | 117 | |
US Silica Holdings (A) | | | 12,126 | | | | 346 | |
W&T Offshore *(A) | | | 3,238 | | | | 7 | |
Weatherford International * | | | 165,700 | | | | 930 | |
Western Refining | | | 13,699 | | | | 291 | |
Westmoreland Coal * | | | 2,400 | | | | 19 | |
Whiting Petroleum * | | | 39,660 | | | | 490 | |
World Fuel Services | | | 12,541 | | | | 576 | |
WPX Energy * | | | 41,100 | | | | 423 | |
| | | | | | | | |
| | | | | | | 25,797 | |
| | | | | | | | |
| | |
Financials — 24.9% | | | | | | | | |
1st Source | | | 3,958 | | | | 134 | |
Acadia Realty Trust ‡ | | | 13,039 | | | | 442 | |
Agree Realty ‡ | | | 3,647 | | | | 155 | |
Alexander & Baldwin | | | 8,877 | | | | 334 | |
Alexander’s, Cl REIT ‡ | | | 288 | | | | 106 | |
Alexandria Real Estate Equities ‡ | | | 13,061 | | | | 1,266 | |
Alleghany * | | | 2,867 | | | | 1,562 | |
Allied World Assurance Holdings | | | 16,112 | | | | 597 | |
Ally Financial * | | | 86,600 | | | | 1,554 | |
Altisource Asset Management * | | | 200 | | | | 4 | |
Altisource Portfolio Solutions * | | | 1,700 | | | | 47 | |
Altisource Residential, Cl B ‡ | | | 11,300 | | | | 113 | |
Ambac Financial Group * | | | 6,300 | | | | 104 | |
American Assets Trust ‡ | | | 6,791 | | | | 272 | |
American Campus Communities ‡ | | | 22,562 | | | | 1,061 | |
American Capital Agency ‡ | | | 60,921 | | | | 1,151 | |
American Capital Mortgage Investment ‡ | | | 7,965 | | | | 126 | |
American Equity Investment Life Holding | | | 14,478 | | | | 235 | |
American Financial Group | | | 12,153 | | | | 891 | |
American Homes 4 Rent, Cl A ‡ | | | 37,700 | | | | 691 | |
American National Bankshares | | | 1,206 | | | | 33 | |
American National Insurance | | | 1,031 | | | | 123 | |
Ameris Bancorp | | | 5,752 | | | | 183 | |
| | | | | | | | |
| Description | | Shares | | | Market Value ($ Thousands) | |
AMERISAFE | | | 3,033 | | | $ | 184 | |
Ames National | | | 697 | | | | 18 | |
AmTrust Financial Services | | | 15,918 | | | | 422 | |
Annaly Capital Management ‡ | | | 169,914 | | | | 1,798 | |
Anworth Mortgage Asset ‡ | | | 20,368 | | | | 94 | |
Apollo Commercial Real Estate Finance ‡ | | | 10,637 | | | | 172 | |
Apollo Residential Mortgage ‡ | | | 4,987 | | | | 67 | |
Apple Hospitality ‡ | | | 32,600 | | | | 594 | |
Arch Capital Group * | | | 22,336 | | | | 1,623 | |
Ares Commercial Real Estate ‡ | | | 4,800 | | | | 57 | |
Argo Group International Holdings | | | 5,427 | | | | 286 | |
Arlington Asset Investment, Cl A | | | 3,412 | | | | 45 | |
Armada Hoffler Properties ‡ | | | 7,500 | | | | 91 | |
ARMOUR Residential, Cl REIT ‡(A) | | | 7,624 | | | | 148 | |
Arrow Financial | | | 1,062 | | | | 31 | |
Artisan Partners Asset Management, Cl A | | | 6,300 | | | | 206 | |
Ashford * | | | 108 | | | | 6 | |
Ashford Hospitality Prime ‡ | | | 4,381 | | | | 47 | |
Ashford Hospitality Trust ‡ | | | 14,971 | | | | 75 | |
Aspen Insurance Holdings | | | 10,595 | | | | 507 | |
Associated Banc | | | 27,586 | | | | 516 | |
Associated Capital Group * | | | 822 | | | | 25 | |
Assured Guaranty | | | 26,287 | | | | 707 | |
Astoria Financial | | | 16,365 | | | | 262 | |
Atlas Financial Holdings * | | | 2,600 | | | | 47 | |
AV Homes * | | | 407 | | | | 5 | |
Axis Capital Holdings | | | 16,268 | | | | 897 | |
Baldwin & Lyons, Cl B | | | 1,481 | | | | 35 | |
Banc of California | | | 8,100 | | | | 162 | |
BancFirst | | | 1,025 | | | | 64 | |
Banco Latinoamericano de Comercio Exterior, Cl E | | | 5,312 | | | | 142 | |
Bancorp * | | | 3,104 | | | | 21 | |
Bancorpsouth | | | 16,982 | | | | 406 | |
Bank Mutual | | | 9,599 | | | | 78 | |
Bank of Hawaii | | | 8,224 | | | | 591 | |
Bank of Marin Bancorp | | | 907 | | | | 46 | |
Bank of the Ozarks | | | 13,570 | | | | 528 | |
BankFinancial | | | 6,097 | | | | 77 | |
BankUnited | | | 19,196 | | | | 635 | |
Banner | | | 3,851 | | | | 171 | |
Bar Harbor Bankshares | | | 1,900 | | | | 64 | |
BBCN Bancorp | | | 14,495 | | | | 236 | |
BBX Capital, Cl A * | | | 521 | | | | 8 | |
Beneficial Bancorp * | | | 12,788 | | | | 176 | |
Berkshire Hills Bancorp | | | 6,050 | | | | 166 | |
BGC Partners, Cl A | | | 31,636 | | | | 294 | |
Blue Hills Bancorp | | | 4,700 | | | | 67 | |
Bluerock Residential Growth, Cl A ‡(A) | | | 5,800 | | | | 69 | |
BNC Bancorp | | | 5,900 | | | | 141 | |
BofI Holding *(A) | | | 11,936 | | | | 224 | |
BOK Financial (A) | | | 4,993 | | | | 318 | |
| | |
| 41 | | SEI Institutional Investments Trust / Annual Report / May 31, 2016 |
SCHEDULE OF INVESTMENTS
Extended Market Index Fund
May 31, 2016
| | | | | | | | |
| Description | | Shares | | | Market Value
($ Thousands) | |
Boston Private Financial Holdings | | | 13,415 | | | $ | 169 | |
Brandywine Realty Trust ‡ | | | 31,239 | | | | 493 | |
Bridge Bancorp | | | 3,412 | | | | 102 | |
Brixmor Property Group ‡ | | | 31,800 | | | | 803 | |
Brookline Bancorp | | | 14,374 | | | | 167 | |
Brown & Brown | | | 19,676 | | | | 710 | |
Bryn Mawr Bank | | | 4,322 | | | | 126 | |
BSB Bancorp * | | | 1,200 | | | | 28 | |
Calamos Asset Management, Cl A | | | 4,282 | | | | 33 | |
Camden National | | | 2,039 | | | | 88 | |
Camden Property Trust ‡ | | | 15,638 | | | | 1,333 | |
Capital Bank Financial, Cl A | | | 2,860 | | | | 88 | |
Capital City Bank Group | | | 800 | | | | 12 | |
Capitol Federal Financial | | | 26,187 | | | | 356 | |
Capstead Mortgage ‡ | | | 18,718 | | | | 181 | |
Cardinal Financial | | | 4,941 | | | | 112 | |
Care Capital Properties ‡ | | | 15,800 | | | | 411 | |
CareTrust ‡ | | | 10,653 | | | | 143 | |
Cascade Bancorp * | | | 915 | | | | 5 | |
Cash America International | | | 4,479 | | | | 162 | |
CatchMark Timber Trust, Cl A ‡ | | | 7,800 | | | | 84 | |
Cathay General Bancorp | | | 14,115 | | | | 435 | |
CBL & Associates Properties ‡ | | | 29,282 | | | | 282 | |
CBOE Holdings | | | 15,238 | | | | 970 | |
Cedar Realty Trust ‡ | | | 18,338 | | | | 125 | |
Centerstate Banks | | | 9,585 | | | | 152 | |
Central Pacific Financial | | | 2,910 | | | | 70 | |
Charter Financial | | | 2,200 | | | | 29 | |
Chatham Lodging Trust ‡ | | | 7,735 | | | | 168 | |
Chemical Financial (A) | | | 6,299 | | | | 248 | |
Chesapeake Lodging Trust ‡ | | | 9,967 | | | | 238 | |
Chimera Investment ‡ | | | 32,865 | | | | 493 | |
CIT Group | | | 30,037 | | | | 1,029 | |
Citizens, Cl A *(A) | | | 7,833 | | | | 63 | |
Citizens & Northern | | | 1,840 | | | | 37 | |
City Holding | | | 3,385 | | | | 166 | |
Clifton Bancorp | | | 3,100 | | | | 47 | |
CNA Financial | | | 5,975 | | | | 196 | |
CNB Financial | | | 2,048 | | | | 37 | |
CNO Financial Group | | | 34,625 | | | | 703 | |
CoBiz Financial | | | 5,671 | | | | 72 | |
Cohen & Steers | | | 2,936 | | | | 113 | |
Colony Financial ‡ | | | 21,700 | | | | 398 | |
Colony Starwood Homes ‡ | | | 7,076 | | | | 193 | |
Columbia Banking System | | | 10,209 | | | | 311 | |
Columbia Property Trust ‡ | | | 24,100 | | | | 497 | |
Commerce Bancshares | | | 14,737 | | | | 721 | |
Communications Sales & Leasing ‡ | | | 20,960 | | | | 524 | |
Community Bank System | | | 7,202 | | | | 297 | |
Community Trust Bancorp | | | 3,393 | | | | 122 | |
ConnectOne Bancorp | | | 6,383 | | | | 101 | |
Consolidated-Tomoka Land | | | 500 | | | | 24 | |
| | | | | | | | |
| Description | | Shares | | | Market Value
($ Thousands) | |
CorEnergy Infrastructure Trust ‡(A) | | | 2,140 | | | $ | 51 | |
CoreSite Realty ‡ | | | 4,373 | | | | 332 | |
Corporate Office Properties Trust ‡ | | | 16,530 | | | | 447 | |
Corrections Corp of America ‡ | | | 21,702 | | | | 729 | |
Cousins Properties ‡ | | | 39,746 | | | | 427 | |
Cowen Group, Cl A *(A) | | | 14,521 | | | | 49 | |
Crawford, Cl B | | | 3,520 | | | | 30 | |
Credit Acceptance *(A) | | | 1,712 | | | | 321 | |
CU Bancorp * | | | 3,900 | | | | 90 | |
CubeSmart ‡ | | | 30,322 | | | | 965 | |
Cullen/Frost Bankers | | | 10,205 | | | | 683 | |
Customers Bancorp * | | | 4,070 | | | | 109 | |
CVB Financial | | | 18,579 | | | | 326 | |
CyrusOne ‡ | | | 13,129 | | | | 647 | |
CYS Investments ‡ | | | 29,962 | | | | 245 | |
DCT Industrial Trust ‡ | | | 16,471 | | | | 710 | |
DDR ‡ | | | 52,014 | | | | 895 | |
Diamond Hill Investment Group | | | 554 | | | | 100 | |
DiamondRock Hospitality ‡ | | | 38,907 | | | | 348 | |
Dime Community Bancshares | | | 5,583 | | | | 102 | |
Douglas Emmett ‡ | | | 25,685 | | | | 870 | |
Duke Realty ‡ | | | 62,195 | | | | 1,472 | |
DuPont Fabros Technology ‡ | | | 11,621 | | | | 492 | |
Dynex Capital ‡ | | | 6,593 | | | | 44 | |
Eagle Bancorp * | | | 5,706 | | | | 294 | |
East West Bancorp | | | 26,366 | | | | 1,018 | |
Easterly Government Properties ‡ | | | 4,100 | | | | 77 | |
EastGroup Properties ‡ | | | 5,785 | | | | 370 | |
Eaton Vance | | | 21,925 | | | | 797 | |
Education Realty Trust ‡ | | | 11,257 | | | | 482 | |
eHealth * | | | 1,874 | | | | 26 | |
EMC Insurance Group | | | 1,050 | | | | 28 | |
Empire State Realty Trust, Cl A ‡ | | | 19,600 | | | | 371 | |
Employers Holdings | | | 5,274 | | | | 157 | |
Encore Capital Group *(A) | | | 5,075 | | | | 136 | |
Endurance Specialty Holdings | | | 10,551 | | | | 717 | |
Enova International * | | | 3,366 | | | | 24 | |
Enstar Group * | | | 1,651 | | | | 257 | |
Enterprise Bancorp | | | 1,148 | | | | 27 | |
Enterprise Financial Services | | | 4,849 | | | | 139 | |
EPR Properties ‡ | | | 9,951 | | | | 709 | |
Equity Commonwealth *‡ | | | 24,244 | | | | 700 | |
Equity LifeStyle Properties ‡ | | | 14,532 | | | | 1,065 | |
Equity One ‡ | | | 13,885 | | | | 409 | |
Erie Indemnity, Cl A | | | 4,187 | | | | 410 | |
Essent Group * | | | 9,900 | | | | 216 | |
EverBank Financial | | | 16,824 | | | | 258 | |
Evercore Partners, Cl A | | | 6,076 | | | | 316 | |
Everest Re Group | | | 7,944 | | | | 1,423 | |
Ezcorp, Cl A * | | | 7,457 | | | | 51 | |
FactSet Research Systems | | | 7,586 | | | | 1,207 | |
Farmers Capital Bank | | | 1,300 | | | | 35 | |
| | |
| 42 | | SEI Institutional Investments Trust / Annual Report / May 31, 2016 |
SCHEDULE OF INVESTMENTS
Extended Market Index Fund
May 31, 2016
| | | | | | | | |
| Description | | Shares | | | Market Value
($ Thousands) | |
FBL Financial Group, Cl A | | | 1,682 | | | $ | 106 | |
FCB Financial Holdings, Cl A * | | | 4,300 | | | | 159 | |
Federal Agricultural Mortgage, Cl C | | | 1,988 | | | | 72 | |
Federated Investors, Cl B | | | 17,970 | | | | 581 | |
Federated National Holding | | | 1,300 | | | | 28 | |
FelCor Lodging Trust ‡ | | | 25,463 | | | | 168 | |
Fidelity & Guaranty Life | | | 2,700 | | | | 64 | |
Fidelity Southern | | | 3,513 | | | | 57 | |
Financial Engines (A) | | | 8,464 | | | | 234 | |
Financial Institutions | | | 1,767 | | | | 49 | |
First American Financial | | | 19,172 | | | | 733 | |
First Bancorp | | | 7,697 | | | | 153 | |
First BanCorp * | | | 18,716 | | | | 79 | |
First Busey | | | 7,436 | | | | 165 | |
First Business Financial Services | | | 1,000 | | | | 25 | |
First Cash Financial Services | | | 4,958 | | | | 217 | |
First Citizens BancShares, Cl A | | | 1,491 | | | | 386 | |
First Commonwealth Financial | | | 15,201 | | | | 143 | |
First Community Bancshares | | | 4,442 | | | | 97 | |
First Connecticut Bancorp | | | 4,848 | | | | 79 | |
First Defiance Financial | | | 2,292 | | | | 93 | |
First Financial | | | 1,612 | | | | 60 | |
First Financial Bancorp | | | 11,549 | | | | 228 | |
First Financial Bankshares (A) | | | 11,056 | | | | 370 | |
First Horizon National | | | 43,700 | | | | 636 | |
First Industrial Realty Trust ‡ | | | 20,953 | | | | 519 | |
First Interstate Bancsystem, Cl A | | | 4,412 | | | | 128 | |
First Merchants | | | 8,633 | | | | 224 | |
First Midwest Bancorp | | | 13,142 | | | | 246 | |
First NBC Bank Holding * | | | 2,500 | | | | 47 | |
First Niagara Financial Group | | | 60,247 | | | | 658 | |
First of Long Island | | | 3,330 | | | | 100 | |
First Potomac Realty Trust ‡ | | | 14,422 | | | | 129 | |
First Republic Bank | | | 25,543 | | | | 1,850 | |
FirstMerit | | | 29,297 | | | | 664 | |
Flagstar Bancorp * | | | 4,600 | | | | 111 | |
Flushing Financial | | | 4,470 | | | | 93 | |
FNB (Pennsylvania) | | | 35,801 | | | | 479 | |
FNF Group | | | 50,358 | | | | 1,760 | |
FNFV Group * | | | 15,962 | | | | 192 | |
Forest City Realty Trust, Cl A ‡ | | | 40,045 | | | | 913 | |
Forestar Group * | | | 4,832 | | | | 59 | |
Four Corners Property Trust ‡ | | | 12,719 | | | | 247 | |
Fox Chase Bancorp | | | 1,553 | | | | 31 | |
Franklin Street Properties ‡ | | | 17,896 | | | | 204 | |
FRP Holdings * | | | 838 | | | | 26 | |
Fulton Financial | | | 33,712 | | | | 480 | |
Gain Capital Holdings | | | 5,300 | | | | 37 | |
GAMCO Investors, Cl A | | | 822 | | | | 30 | |
Gaming and Leisure Properties ‡ | | | 27,915 | | | | 919 | |
Genworth Financial, Cl A * | | | 98,400 | | | | 364 | |
GEO Group ‡ | | | 12,790 | | | | 425 | |
| | | | | | | | |
| Description | | Shares | | | Market Value
($ Thousands) | |
German American Bancorp | | | 3,444 | | | $ | 111 | |
Getty Realty ‡ | | | 6,289 | | | | 127 | |
Glacier Bancorp | | | 13,280 | | | | 363 | |
Gladstone Commercial ‡ | | | 3,119 | | | | 52 | |
Global Indemnity, Cl A * | | | 1,002 | | | | 30 | |
Government Properties Income Trust ‡(A) | | | 12,966 | | | | 254 | |
Gramercy Property Trust ‡ | | | 78,673 | | | | 703 | |
Great Southern Bancorp | | | 1,299 | | | | 51 | |
Great Western Bancorp | | | 8,600 | | | | 293 | |
Green Dot, Cl A * | | | 8,955 | | | | 198 | |
Greenhill | | | 3,971 | | | | 82 | |
Greenlight Capital Re, Cl A * | | | 6,409 | | | | 130 | |
Guaranty Bancorp | | | 4,005 | | | | 64 | |
Hancock Holding | | | 15,214 | | | | 418 | |
Hanmi Financial | | | 5,678 | | | | 138 | |
Hannon Armstrong Sustainable Infrastructure Capital ‡ | | | 7,100 | | | | 144 | |
Hanover Insurance Group | | | 8,117 | | | | 704 | |
Hatteras Financial ‡ | | | 17,783 | | | | 286 | |
HCI Group | | | 915 | | | | 29 | |
Healthcare Realty Trust ‡ | | | 17,555 | | | | 558 | |
Healthcare Trust of America, Cl A ‡ | | | 23,150 | | | | 699 | |
Heartland Financial USA | | | 2,575 | | | | 90 | |
Heritage Commerce | | | 3,100 | | | | 33 | |
Heritage Financial | | | 4,271 | | | | 78 | |
Heritage Insurance Holdings | | | 3,800 | | | | 50 | |
Heritage Oaks Bancorp | | | 1,400 | | | | 11 | |
Hersha Hospitality Trust, Cl A ‡ | | | 9,019 | | | | 160 | |
HFF, Cl A | | | 7,995 | | | | 257 | |
Highwoods Properties ‡ | | | 17,268 | | | | 840 | |
Hilltop Holdings * | | | 12,338 | | | | 252 | |
Home BancShares | | | 9,896 | | | | 435 | |
HomeStreet * | | | 4,372 | | | | 90 | |
HomeTrust Bancshares * | | | 4,102 | | | | 78 | |
Horace Mann Educators | | | 7,614 | | | | 259 | |
Horizon Bancorp | | | 900 | | | | 22 | |
Hospitality Properties Trust ‡ | | | 27,941 | | | | 715 | |
Houlihan Lokey, Cl A | | | 3,400 | | | | 82 | |
Howard Hughes * | | | 7,017 | | | | 767 | |
Hudson Pacific Properties ‡ | | | 14,270 | | | | 401 | |
Iberiabank | | | 6,884 | | | | 427 | |
Independence Realty Trust ‡ | | | 9,700 | | | | 76 | |
Independent Bank | | | 7,602 | | | | 282 | |
Independent Bank Group | | | 1,100 | | | | 42 | |
Infinity Property & Casualty | | | 2,414 | | | | 188 | |
InfraREIT ‡ | | | 4,600 | | | | 79 | |
Interactive Brokers Group, Cl A | | | 10,527 | | | | 423 | |
International Bancshares | | | 9,350 | | | | 262 | |
International FCStone * | | | 3,268 | | | | 91 | |
Invesco Mortgage Capital ‡ | | | 19,071 | | | | 274 | |
Investment Technology Group | | | 6,017 | | | | 111 | |
Investors Bancorp | | | 55,643 | | | | 666 | |
| | |
| 43 | | SEI Institutional Investments Trust / Annual Report / May 31, 2016 |
SCHEDULE OF INVESTMENTS
Extended Market Index Fund
May 31, 2016
| | | | | | | | |
| Description | | Shares | | | Market Value
($ Thousands) | |
Investors Real Estate Trust ‡ | | | 24,031 | | | $ | 149 | |
iStar Financial *‡ | | | 16,418 | | | | 168 | |
James River Group Holdings | | | 2,700 | | | | 95 | |
Janus Capital Group | | | 25,412 | | | | 386 | |
JG Wentworth Company, Cl A * | | | 2,500 | | | | 1 | |
Jones Lang LaSalle | | | 8,159 | | | | 962 | |
KCG Holdings, Cl A * | | | 6,853 | | | | 96 | |
Kearny Financial | | | 19,637 | | | | 257 | |
Kemper | | | 8,836 | | | | 285 | |
Kennedy-Wilson Holdings | | | 17,929 | | | | 382 | |
Kilroy Realty ‡ | | | 15,143 | | | | 956 | |
Kite Realty Group Trust ‡ | | | 15,255 | | | | 410 | |
Ladder Capital, Cl A ‡ | | | 9,219 | | | | 113 | |
Ladenburg Thalmann Financial Services *(A) | | | 12,600 | | | | 34 | |
Lakeland Bancorp | | | 4,693 | | | | 54 | |
Lakeland Financial | | | 3,305 | | | | 162 | |
Lamar Advertising, Cl A ‡ | | | 14,797 | | | | 963 | |
LaSalle Hotel Properties ‡ | | | 19,242 | | | | 445 | |
Lazard, Cl A | | | 23,131 | | | | 814 | |
LegacyTexas Financial Group | | | 8,610 | | | | 232 | |
LendingClub *(A) | | | 11,600 | | | | 55 | |
LendingTree *(A) | | | 1,500 | | | | 125 | |
Lexington Realty Trust ‡ | | | 37,290 | | | | 352 | |
Liberty Property Trust ‡ | | | 26,275 | | | | 981 | |
LPL Financial Holdings | | | 12,762 | | | | 356 | |
LTC Properties ‡ | | | 7,317 | | | | 341 | |
Mack-Cali Realty ‡ | | | 15,467 | | | | 406 | |
Maiden Holdings | | | 7,723 | | | | 101 | |
MainSource Financial Group | | | 2,690 | | | | 61 | |
Marcus & Millichap * | | | 1,700 | | | | 43 | |
Markel * | | | 2,513 | | | | 2,395 | |
MarketAxess Holdings | | | 6,452 | | | | 903 | |
Marlin Business Services | | | 322 | | | | 5 | |
MB Financial | | | 12,726 | | | | 460 | |
MBIA * | | | 22,582 | | | | 163 | |
Medical Properties Trust ‡ | | | 42,062 | | | | 618 | |
Mercantile Bank | | | 2,257 | | | | 55 | |
Merchants Bancshares | | | 207 | | | | 6 | |
Mercury General | | | 4,578 | | | | 241 | |
Meridian Bancorp | | | 11,227 | | | | 168 | |
Meta Financial Group | | | 2,100 | | | | 105 | |
MFA Financial ‡ | | | 64,397 | | | | 464 | |
MGIC Investment * | | | 66,018 | | | | 465 | |
Mid-America Apartment Communities ‡ | | | 13,753 | | | | 1,416 | |
MidWestOne Financial Group | | | 769 | | | | 22 | |
Moelis, Cl A | | | 4,000 | | | | 107 | |
Monmouth Real Estate Investment, Cl A ‡ | | | 13,346 | | | | 159 | |
Monogram Residential Trust ‡ | | | 32,700 | | | | 332 | |
Morningstar | | | 3,120 | | | | 263 | |
Mortgage Investment Trust ‡ | | | 7,588 | | | | 106 | |
MSCI, Cl A | | | 17,169 | | | | 1,370 | |
National Bank Holdings, Cl A | | | 4,600 | | | | 98 | |
| | | | | | | | |
| Description | | Shares | | | Market Value
($ Thousands) | |
National Bankshares (A) | | | 1,036 | | | $ | 35 | |
National General Holdings | | | 8,000 | | | | 166 | |
National Health Investors ‡ | | | 6,564 | | | | 458 | |
National Interstate | | | 924 | | | | 29 | |
National Retail Properties ‡ | | | 25,543 | | | | 1,158 | |
National Storage Affiliates Trust ‡ | | | 5,400 | | | | 113 | |
National Western Life Group, Cl A | | | 341 | | | | 73 | |
Nationstar Mortgage Holdings *(A) | | | 6,046 | | | | 77 | |
Navigators Group | | | 2,083 | | | | 190 | |
NBT Bancorp | | | 9,108 | | | | 266 | |
Nelnet, Cl A | | | 4,531 | | | | 166 | |
New Residential Investments ‡ | | | 43,350 | | | | 589 | |
New Senior Investment Group ‡ | | | 16,600 | | | | 172 | |
New York ‡ | | | 27,200 | | | | 248 | |
New York Community Bancorp | | | 87,539 | | | | 1,378 | |
New York Mortgage Trust ‡(A) | | | 16,838 | | | | 100 | |
NewStar Financial * | | | 3,393 | | | | 29 | |
NexPoint Residential Trust ‡ | | | 5,600 | | | | 79 | |
Nicolet Bankshares * | | | 2,000 | | | | 76 | |
NMI Holdings, Cl A * | | | 5,900 | | | | 37 | |
Northfield Bancorp | | | 6,705 | | | | 104 | |
NorthStar Asset Management Group | | | 32,958 | | | | 412 | |
NorthStar Realty Europe ‡ | | | 10,009 | | | | 113 | |
NorthStar Realty Finance ‡(A) | | | 35,029 | | | | 473 | |
Northwest Bancshares | | | 18,499 | | | | 274 | |
OceanFirst Financial | | | 5,588 | | | | 104 | |
Ocwen Financial * | | | 20,161 | | | | 40 | |
OFG Bancorp | | | 5,625 | | | | 51 | |
Old National Bancorp | | | 21,095 | | | | 278 | |
Old Republic International | | | 45,944 | | | | 880 | |
Old Second Bancorp | | | 9,000 | | | | 65 | |
OM Asset Management | | | 3,100 | | | | 47 | |
Omega Healthcare Investors ‡ | | | 31,547 | | | | 1,007 | |
On Deck Capital * | | | 3,300 | | | | 17 | |
One Liberty Properties ‡ | | | 1,124 | | | | 25 | |
OneBeacon Insurance Group, Cl A | | | 4,135 | | | | 54 | |
OneMain Holdings, Cl A * | | | 10,500 | | | | 328 | |
Oppenheimer Holdings, Cl A | | | 2,164 | | | | 34 | |
Opus Bank | | | 1,100 | | | | 41 | |
Orchid Island Capital, Cl A ‡(A) | | | 6,800 | | | | 71 | |
Oritani Financial | | | 7,124 | | | | 119 | |
Outfront Media ‡ | | | 23,009 | | | | 512 | |
Pacific Continental | | | 2,665 | | | | 44 | |
Pacific Premier Bancorp * | | | 5,100 | | | | 127 | |
PacWest Bancorp | | | 20,642 | | | | 860 | |
Paramount Group ‡ | | | 29,800 | | | | 488 | |
Park National (A) | | | 2,405 | | | | 226 | |
Park Sterling | | | 13,570 | | | | 101 | |
Parkway Properties ‡ | | | 15,170 | | | | 265 | |
Peapack Gladstone Financial | | | 2,654 | | | | 50 | |
Pebblebrook Hotel Trust ‡ | | | 13,903 | | | | 351 | |
Penns Woods Bancorp | | | 652 | | | | 28 | |
| | |
| 44 | | SEI Institutional Investments Trust / Annual Report / May 31, 2016 |
SCHEDULE OF INVESTMENTS
Extended Market Index Fund
May 31, 2016
| | | | | | | | |
| Description | | Shares | | | Market Value
($ Thousands) | |
Pennsylvania Real Estate Investment Trust ‡ | | | 11,599 | | | $ | 245 | |
PennyMac Financial Services, Cl A * | | | 1,100 | | | | 15 | |
PennyMac Mortgage Investment Trust ‡ | | | 14,063 | | | | 216 | |
Peoples Bancorp | | | 4,910 | | | | 106 | |
Peoples Financial Services | | | 900 | | | | 33 | |
PHH * | | | 7,132 | | | | 102 | |
Physicians Realty Trust ‡ | | | 22,200 | | | | 422 | |
PICO Holdings * | | | 2,621 | | | | 24 | |
Piedmont Office Realty Trust, Cl A ‡ | | | 24,966 | | | | 501 | |
Pinnacle Financial Partners | | | 6,325 | | | | 311 | |
Piper Jaffray * | | | 2,277 | | | | 96 | |
Popular | | | 17,856 | | | | 560 | |
Post Properties ‡ | | | 9,211 | | | | 558 | |
Potlatch ‡ | | | 6,820 | | | | 233 | |
PRA Group * | | | 8,058 | | | | 222 | |
Preferred Apartment Communities, Cl A ‡ | | | 6,000 | | | | 83 | |
Preferred Bank | | | 1,937 | | | | 64 | |
Primerica | | | 9,329 | | | | 523 | |
PrivateBancorp, Cl A | | | 14,719 | | | | 653 | |
ProAssurance | | | 10,325 | | | | 542 | |
Prosperity Bancshares | | | 12,269 | | | | 661 | |
Provident Financial Services | | | 11,979 | | | | 245 | |
PS Business Parks ‡ | | | 3,428 | | | | 338 | |
QCR Holdings | | | 3,400 | | | | 93 | |
QTS Realty Trust, Cl A ‡ | | | 5,200 | | | | 269 | |
Radian Group | | | 32,648 | | | | 405 | |
RAIT Financial Trust ‡ | | | 13,021 | | | | 43 | |
Ramco-Gershenson Properties ‡ | | | 13,237 | | | | 238 | |
Raymond James Financial | | | 23,181 | | | | 1,300 | |
Rayonier ‡ | | | 21,353 | | | | 554 | |
RE, Cl A | | | 1,600 | | | | 65 | |
Realogy Holdings * | | | 26,702 | | | | 876 | |
Redwood Trust ‡ | | | 16,405 | | | | 234 | |
Regency Centers ‡ | | | 16,367 | | | | 1,254 | |
Regional Management * | | | 700 | | | | 12 | |
Reinsurance Group of America, Cl A | | | 12,016 | | | | 1,191 | |
RenaissanceRe Holdings | | | 8,006 | | | | 925 | |
Renasant | | | 7,360 | | | | 253 | |
Republic Bancorp, Cl A | | | 1,298 | | | | 36 | |
Resource Capital ‡ | | | 3,376 | | | | 43 | |
Retail Opportunity Investments ‡ | | | 16,959 | | | | 343 | |
Retail Properties of America, Cl A ‡ | | | 41,203 | | | | 653 | |
Rexford Industrial Realty ‡ | | | 13,700 | | | | 273 | |
RLI | | | 7,382 | | | | 488 | |
RLJ Lodging Trust ‡ | | | 23,137 | | | | 474 | |
RMR Group | | | 1,170 | | | | 35 | |
Rouse Properties ‡ | | | 6,017 | | | | 110 | |
Ryman Hospitality Properties ‡ | | | 8,360 | | | | 410 | |
S&T Bancorp | | | 7,532 | | | | 195 | |
Sabra Health Care ‡ | | | 11,662 | | | | 244 | |
Safeguard Scientifics * | | | 3,396 | | | | 45 | |
Safety Insurance Group | | | 2,931 | | | | 174 | |
| | | | | | | | |
| Description | | Shares | | | Market Value
($ Thousands) | |
Sandy Spring Bancorp | | | 4,647 | | | $ | 137 | |
Santander Consumer USA Holdings * | | | 18,600 | | | | 239 | |
Saul Centers ‡ | | | 1,444 | | | | 81 | |
Seacoast Banking Corporation of Florida * | | | 3,898 | | | | 66 | |
SEI †(D) | | | 24,219 | | | | 1,246 | |
Select Income ‡ | | | 11,421 | | | | 281 | |
Selective Insurance Group | | | 10,084 | | | | 375 | |
Senior Housing Properties Trust ‡ | | | 40,107 | | | | 749 | |
ServisFirst Bancshares | | | 4,700 | | | | 245 | |
Sierra Bancorp | | | 478 | | | | 8 | |
Signature Bank NY * | | | 9,170 | | | | 1,238 | |
Silver Bay Realty Trust ‡ | | | 8,946 | | | | 140 | |
Simmons First National, Cl A | | | 5,418 | | | | 257 | |
SLM * | | | 81,900 | | | | 563 | |
South State | | | 4,786 | | | | 347 | |
Southside Bancshares | | | 3,911 | | | | 115 | |
Southwest Bancorp | | | 1,679 | | | | 28 | |
Sovran Self Storage ‡ | | | 8,093 | | | | 876 | |
Spirit Realty Capital ‡ | | | 82,666 | | | | 947 | |
St. Joe * | | | 8,800 | | | | 153 | |
STAG Industrial ‡ | | | 12,156 | | | | 260 | |
Starwood Property Trust ‡ | | | 41,980 | | | | 866 | |
State Auto Financial | | | 1,890 | | | | 39 | |
State Bank Financial | | | 6,384 | | | | 139 | |
State National | | | 5,800 | | | | 62 | |
Sterling Bancorp | | | 21,134 | | | | 348 | |
Stewart Information Services | | | 3,341 | | | | 124 | |
Stifel Financial * | | | 11,382 | | | | 430 | |
Stock Yards Bancorp | | | 4,703 | | | | 137 | |
Stonegate Bank | | | 1,200 | | | | 38 | |
Stonegate Mortgage * | | | 3,100 | | | | 12 | |
STORE Capital ‡ | | | 7,500 | | | | 191 | |
Suffolk Bancorp | | | 2,000 | | | | 51 | |
Summit Hotel Properties ‡ | | | 17,029 | | | | 199 | |
Sun Bancorp * | | | 332 | | | | 7 | |
Sun Communities ‡ | | | 9,521 | | | | 665 | |
Sunstone Hotel Investors ‡ | | | 36,838 | | | | 444 | |
SVB Financial Group * | | | 9,382 | | | �� | 1,034 | |
Synovus Financial | | | 21,892 | | | | 704 | |
Talmer Bancorp, Cl A | | | 8,400 | | | | 167 | |
Tanger Factory Outlet Centers ‡ | | | 17,749 | | | | 625 | |
Taubman Centers ‡ | | | 11,387 | | | | 781 | |
TCF Financial | | | 28,739 | | | | 413 | |
TD Ameritrade Holding | | | 48,073 | | | | 1,571 | |
Tejon Ranch * | | | 1,647 | | | | 38 | |
Terreno Realty ‡ | | | 6,663 | | | | 160 | |
Territorial Bancorp | | | 773 | | | | 20 | |
Texas Capital Bancshares * | | | 7,423 | | | | 380 | |
TFS Financial | | | 12,343 | | | | 228 | |
Third Point Reinsurance * | | | 17,900 | | | | 209 | |
Tiptree Financial | | | 9,700 | | | | 55 | |
Tompkins Financial | | | 2,405 | | | | 160 | |
| | |
| 45 | | SEI Institutional Investments Trust / Annual Report / May 31, 2016 |
SCHEDULE OF INVESTMENTS
Extended Market Index Fund
May 31, 2016
| | | | | | | | |
| Description | | Shares | | | Market Value
($ Thousands) | |
Towne Bank (A) | | | 7,180 | | | $ | 157 | |
TriCo Bancshares | | | 4,809 | | | | 135 | |
TriState Capital Holdings * | | | 2,600 | | | | 34 | |
Triumph Bancorp * | | | 4,500 | | | | 72 | |
TrustCo Bank | | | 22,326 | | | | 147 | |
Trustmark | | | 11,339 | | | | 281 | |
Two Harbors Investment ‡ | | | 61,540 | | | | 522 | |
UMB Financial | | | 7,645 | | | | 440 | |
UMH Properties ‡ | | | 5,400 | | | | 54 | |
Umpqua Holdings | | | 41,931 | | | | 670 | |
Union Bankshares | | | 8,742 | | | | 237 | |
United Bankshares | | | 13,183 | | | | 525 | |
United Community Banks | | | 10,174 | | | | 205 | |
United Community Financial | | | 4,200 | | | | 26 | |
United Development Funding IV ‡(A) | | | 4,700 | | | | 15 | |
United Financial Bancorp | | | 11,373 | | | | 151 | |
United Fire Group | | | 3,071 | | | | 126 | |
United Insurance Holdings | | | 1,900 | | | | 33 | |
Universal Health Realty Income Trust ‡ | | | 2,016 | | | | 108 | |
Universal Insurance Holdings (A) | | | 5,200 | | | | 101 | |
Univest Corp of Pennsylvania | | | 2,123 | | | | 43 | |
Urban Edge Properties ‡ | | | 16,300 | | | | 438 | |
Urstadt Biddle Properties, Cl A ‡ | | | 6,156 | | | | 130 | |
Validus Holdings | | | 15,726 | | | | 766 | |
Valley National Bancorp | | | 39,670 | | | | 378 | |
VEREIT ‡ | | | 163,000 | | | | 1,563 | |
Virtu Financial, Cl A | | | 2,900 | | | | 52 | |
Virtus Investment Partners | | | 1,308 | | | | 106 | |
Voya Financial | | | 35,200 | | | | 1,157 | |
Waddell & Reed Financial, Cl A | | | 16,402 | | | | 351 | |
Walker & Dunlop * | | | 4,123 | | | | 99 | |
Walter Investment Management *(A) | | | 4,636 | | | | 23 | |
Washington Federal | | | 18,236 | | | | 456 | |
Washington Real Estate Investment Trust ‡ | | | 13,513 | | | | 400 | |
Washington Trust Bancorp | | | 2,270 | | | | 87 | |
Waterstone Financial | | | 4,000 | | | | 58 | |
Webster Financial | | | 16,051 | | | | 629 | |
Weingarten Realty Investors ‡ | | | 21,768 | | | | 819 | |
WesBanco | | | 7,424 | | | | 242 | |
West Bancorporation | | | 1,985 | | | | 37 | |
Westamerica Bancorporation (A) | | | 4,755 | | | | 231 | |
Western Alliance Bancorp * | | | 16,461 | | | | 621 | |
Western Asset Mortgage Capital ‡(A) | | | 6,644 | | | | 62 | |
Westwood Holdings Group | | | 928 | | | | 53 | |
White Mountains Insurance Group | | | 855 | | | | 689 | |
Whitestone, Cl B ‡ | | | 7,077 | | | | 97 | |
Wilshire Bancorp | | | 10,663 | | | | 122 | |
Wintrust Financial | | | 8,449 | | | | 450 | |
WisdomTree Investments (A) | | | 19,675 | | | | 244 | |
World Acceptance * | | | 976 | | | | 43 | |
WP Carey ‡ | | | 18,100 | | | | 1,160 | |
WP Glimcher ‡ | | | 32,702 | | | | 334 | |
| | | | | | | | |
| Description | | Shares | | | Market Value
($ Thousands) | |
WR Berkley | | | 16,724 | | | $ | 954 | |
WSFS Financial | | | 5,829 | | | | 207 | |
Xenia Hotels & Resorts ‡ | | | 21,900 | | | | 353 | |
Yadkin Financial | | | 7,600 | | | | 201 | |
| | | | | | | | |
| | | | | | | 177,459 | |
| | | | | | | | |
|
Health Care — 11.3% | |
AAC Holdings *(A) | | | 1,600 | | | | 34 | |
Abaxis | | | 4,493 | | | | 207 | |
ABIOMED * | | | 7,112 | | | | 706 | |
Acadia Healthcare * | | | 11,387 | | | | 670 | |
ACADIA Pharmaceuticals *(A) | | | 15,500 | | | | 549 | |
Accelerate Diagnostics *(A) | | | 2,800 | | | | 36 | |
Acceleron Pharma * | | | 4,900 | | | | 168 | |
Accuray * | | | 14,863 | | | | 81 | |
Aceto | | | 4,717 | | | | 105 | |
Achillion Pharmaceuticals * | | | 17,898 | | | | 167 | |
Acorda Therapeutics * | | | 7,142 | | | | 203 | |
Adamas Pharmaceuticals * | | | 3,000 | | | | 50 | |
Adeptus Health, Cl A *(A) | | | 800 | | | | 57 | |
Aduro Biotech * | | | 2,500 | | | | 31 | |
Advaxis *(A) | | | 4,700 | | | | 44 | |
Adverum Biotechnologies * | | | 1,300 | | | | 6 | |
Aegerion Pharmaceuticals * | | | 3,706 | | | | 7 | |
Aerie Pharmaceuticals * | | | 4,500 | | | | 80 | |
Affimed *(A) | | | 4,400 | | | | 16 | |
Agenus * | | | 16,000 | | | | 68 | |
Agios Pharmaceuticals *(A) | | | 5,400 | | | | 302 | |
Aimmune Therapeutics * | | | 500 | | | | 8 | |
Air Methods * | | | 7,077 | | | | 240 | |
Akebia Therapeutics * | | | 4,100 | | | | 37 | |
Akorn * | | | 12,927 | | | | 386 | |
Albany Molecular Research *(A) | | | 3,800 | | | | 55 | |
Alder Biopharmaceuticals * | | | 3,900 | | | | 117 | |
Alere * | | | 15,621 | | | | 671 | |
Align Technology * | | | 14,013 | | | | 1,105 | |
Alimera Sciences *(A) | | | 3,300 | | | | 5 | |
Alkermes * | | | 26,153 | | | | 1,214 | |
Alliance HealthCare Services * | | | 800 | | | | 6 | |
Allscripts Healthcare Solutions * | | | 32,253 | | | | 435 | |
Almost Family * | | | 1,009 | | | | 42 | |
Alnylam Pharmaceuticals * | | | 13,489 | | | | 967 | |
AMAG Pharmaceuticals * | | | 6,003 | | | | 129 | |
Amedisys * | | | 5,671 | | | | 288 | |
Amicus Therapeutics * | | | 20,500 | | | | 145 | |
AMN Healthcare Services * | | | 8,709 | | | | 325 | |
Amphastar Pharmaceuticals * | | | 4,900 | | | | 77 | |
Amsurg, Cl A * | | | 9,966 | | | | 745 | |
Anacor Pharmaceuticals * | | | 7,700 | | | | 765 | |
Analogic | | | 2,420 | | | | 198 | |
AngioDynamics * | | | 7,370 | | | | 89 | |
ANI Pharmaceuticals *(A) | | | 800 | | | | 43 | |
| | |
| 46 | | SEI Institutional Investments Trust / Annual Report / May 31, 2016 |
SCHEDULE OF INVESTMENTS
Extended Market Index Fund
May 31, 2016
| | | | | | | | |
| Description | | Shares | | | Market Value
($ Thousands) | |
Anika Therapeutics * | | | 3,070 | | | $ | 145 | |
Antares Pharma * | | | 13,708 | | | | 13 | |
Anthera Pharmaceuticals *(A) | | | 9,700 | | | | 36 | |
Aralez Pharmaceuticals *(A) | | | 5,328 | | | | 21 | |
Aratana Therapeutics *(A) | | | 6,400 | | | | 46 | |
Ardelyx * | | | 4,600 | | | | 42 | |
Arena Pharmaceuticals * | | | 39,753 | | | | 72 | |
ARIAD Pharmaceuticals * | | | 25,724 | | | | 228 | |
Array BioPharma * | | | 20,560 | | | | 78 | |
Arrowhead Pharmaceuticals *(A) | | | 6,000 | | | | 37 | |
Atara Biotherapeutics * | | | 3,400 | | | | 62 | |
athenahealth *(A) | | | 6,992 | | | | 887 | |
AtriCure * | | | 6,020 | | | | 87 | |
Atrion | | | 230 | | | | 90 | |
Axovant Sciences * | | | 600 | | | | 8 | |
BioCryst Pharmaceuticals * | | | 13,600 | | | | 46 | |
BioDelivery Sciences International *(A) | | | 7,400 | | | | 17 | |
BioMarin Pharmaceutical * | | | 28,246 | | | | 2,532 | |
Bio-Rad Laboratories, Cl A * | | | 3,953 | | | | 588 | |
BioScrip *(A) | | | 9,311 | | | | 25 | |
BioSpecifics Technologies * | | | 1,400 | | | | 53 | |
Bio-Techne | | | 6,525 | | | | 717 | |
BioTelemetry * | | | 5,500 | | | | 96 | |
BioTime * | | | 5,100 | | | | 15 | |
Bluebird Bio * | | | 5,900 | | | | 267 | |
Blueprint Medicines * | | | 2,700 | | | | 51 | |
Brookdale Senior Living, Cl A * | | | 33,209 | | | | 596 | |
Bruker | | | 20,632 | | | | 545 | |
Cambrex * | | | 5,360 | | | | 262 | |
Cantel Medical | | | 6,077 | | | | 404 | |
Capital Senior Living * | | | 5,312 | | | | 97 | |
Cara Therapeutics * | | | 4,500 | | | | 29 | |
Cardiovascular Systems * | | | 6,125 | | | | 103 | |
Castlight Health, Cl B * | | | 2,800 | | | | 12 | |
Catalent * | | | 15,300 | | | | 430 | |
Catalyst Pharmaceuticals *(A) | | | 19,700 | | | | 12 | |
Celldex Therapeutics *(A) | | | 15,756 | | | | 72 | |
Cellular Biomedicine Group *(A) | | | 2,500 | | | | 36 | |
Cempra *(A) | | | 5,000 | | | | 94 | |
Cepheid * | | | 13,969 | | | | 391 | |
Cerus *(A) | | | 15,197 | | | | 85 | |
Charles River Laboratories International * | | | 8,006 | | | | 688 | |
Chemed | | | 3,345 | | | | 436 | |
ChemoCentryx * | | | 2,000 | | | | 11 | |
Chimerix * | | | 7,900 | | | | 39 | |
Civitas Solutions * | | | 3,000 | | | | 65 | |
Clovis Oncology *(A) | | | 4,066 | | | | 68 | |
Coherus Biosciences * | | | 4,900 | | | | 91 | |
Community Health Systems * | | | 21,729 | | | | 292 | |
Computer Programs & Systems (A) | | | 1,702 | | | | 70 | |
Concert Pharmaceuticals * | | | 3,900 | | | | 52 | |
ConforMIS *(A) | | | 3,300 | | | | 25 | |
| | | | | | | | |
| Description | | Shares | | | Market Value
($ Thousands) | |
CONMED | | | 5,108 | | | $ | 203 | |
Cooper | | | 8,834 | | | | 1,438 | |
Corcept Therapeutics * | | | 13,100 | | | | 78 | |
CorVel * | | | 1,434 | | | | 69 | |
Cross Country Healthcare * | | | 5,079 | | | | 69 | |
CryoLife | | | 5,045 | | | | 58 | |
CTI BioPharma * | | | 17,100 | | | | 8 | |
Curis * | | | 28,500 | | | | 50 | |
Cutera * | | | 4,700 | | | | 49 | |
Cynosure, Cl A * | | | 4,339 | | | | 207 | |
Cytokinetics * | | | 8,500 | | | | 69 | |
CytRx *(A) | | | 6,500 | | | | 19 | |
Depomed * | | | 9,255 | | | | 189 | |
Dermira * | | | 3,500 | | | | 111 | |
DexCom * | | | 13,924 | | | | 898 | |
Dicerna Pharmaceuticals * | | | 2,500 | | | | 9 | |
Diplomat Pharmacy *(A) | | | 5,600 | | | | 182 | |
Durect * | | | 31,600 | | | | 37 | |
Dynavax Technologies * | | | 5,889 | | | | 98 | |
Eagle Pharmaceuticals *(A) | | | 1,300 | | | | 62 | |
Editas Medicine *(A) | | | 2,000 | | | | 74 | |
Emergent Biosolutions * | | | 4,984 | | | | 219 | |
Enanta Pharmaceuticals * | | | 3,300 | | | | 81 | |
Endocyte * | | | 4,870 | | | | 19 | |
Endologix *(A) | | | 10,295 | | | | 130 | |
Ensign Group | | | 10,436 | | | | 207 | |
Envision Healthcare Holdings * | | | 34,300 | | | | 851 | |
Epizyme * | | | 9,700 | | | | 107 | |
Esperion Therapeutics *(A) | | | 2,500 | | | | 43 | |
Evolent Health, Cl A * | | | 2,200 | | | | 34 | |
Exact Sciences *(A) | | | 14,554 | | | | 97 | |
Exactech * | | | 1,239 | | | | 31 | |
ExamWorks Group * | | | 8,045 | | | | 281 | |
Exelixis * | | | 41,500 | | | | 269 | |
FibroGen * | | | 7,400 | | | | 138 | |
Five Prime Therapeutics * | | | 4,400 | | | | 201 | |
Five Star Quality Care * | | | 8,527 | | | | 17 | |
Flexion Therapeutics * | | | 3,700 | | | | 65 | |
Fluidigm * | | | 4,553 | | | | 45 | |
Foamix Pharmaceuticals *(A) | | | 6,800 | | | | 50 | |
Foundation Medicine *(A) | | | 2,952 | | | | 56 | |
Galena Biopharma *(A) | | | 54,200 | | | | 98 | |
Genesis Healthcare, Cl A * | | | 2,900 | | | | 5 | |
GenMark Diagnostics * | | | 5,900 | | | | 44 | |
Genocea Biosciences *(A) | | | 5,400 | | | | 25 | |
Genomic Health * | | | 2,897 | | | | 78 | |
Geron *(A) | | | 23,970 | | | | 71 | |
Global Blood Therapeutics * | | | 701 | | | | 17 | |
Globus Medical, Cl A * | | | 12,200 | | | | 296 | |
Greatbatch * | | | 4,630 | | | | 146 | |
Haemonetics * | | | 8,447 | | | | 237 | |
Halozyme Therapeutics *(A) | | | 21,658 | | | | 218 | |
| | |
| 47 | | SEI Institutional Investments Trust / Annual Report / May 31, 2016 |
SCHEDULE OF INVESTMENTS
Extended Market Index Fund
May 31, 2016
| | | | | | | | |
| Description | | Shares | | | Market Value
($ Thousands) | |
Halyard Health * | | | 8,300 | | | $ | 258 | |
HealthEquity * | | | 5,600 | | | | 145 | |
HealthSouth | | | 17,041 | | | | 687 | |
HealthStream * | | | 3,264 | | | | 77 | |
Healthways * | | | 3,221 | | | | 39 | |
HeartWare International * | | | 2,579 | | | | 76 | |
Heron Therapeutics *(A) | | | 5,000 | | | | 107 | |
Heska * | | | 1,900 | | | | 69 | |
Hill-Rom Holdings | | | 10,101 | | | | 496 | |
HMS Holdings * | | | 17,331 | | | | 286 | |
ICU Medical * | | | 2,627 | | | | 273 | |
Idera Pharmaceuticals * | | | 7,600 | | | | 12 | |
Idexx Laboratories * | | | 17,102 | | | | 1,498 | |
Ignyta * | | | 5,200 | | | | 35 | |
Immune Design * | | | 3,200 | | | | 40 | |
ImmunoGen * | | | 15,452 | | | | 87 | |
Immunomedics *(A) | | | 26,657 | | | | 129 | |
Impax Laboratories * | | | 12,288 | | | | 420 | |
IMS Health Holdings * | | | 23,600 | | | | 616 | |
INC Research Holdings, Cl A * | | | 2,200 | | | | 96 | |
Incyte * | | | 27,971 | | | | 2,361 | |
Infinity Pharmaceuticals * | | | 6,394 | | | | 34 | |
Innoviva (A) | | | 17,709 | | | | 200 | |
Inogen * | | | 2,400 | | | | 115 | |
Inovalon Holdings, Cl A *(A) | | | 4,900 | | | | 91 | |
Inovio Pharmaceuticals *(A) | | | 16,000 | | | | 181 | |
Insmed * | | | 11,100 | | | | 131 | |
Insulet * | | | 10,121 | | | | 304 | |
Insys Therapeutics *(A) | | | 3,800 | | | | 59 | |
Integra LifeSciences Holdings * | | | 4,552 | | | | 340 | |
Intercept Pharmaceuticals *(A) | | | 2,976 | | | | 442 | |
Intersect ENT * | | | 2,200 | | | | 29 | |
Intra-Cellular Therapies, Cl A * | | | 4,800 | | | | 186 | |
Intrexon *(A) | | | 8,000 | | | | 246 | |
Invacare | | | 6,889 | | | | 74 | |
InVivo Therapeutics Holdings *(A) | | | 4,100 | | | | 28 | |
Ionis Pharmaceuticals * | | | 21,894 | | | | 497 | |
Ironwood Pharmaceuticals, Cl A * | | | 22,154 | | | | 277 | |
Jazz Pharmaceuticals * | | | 10,934 | | | | 1,657 | |
Juno Therapeutics *(A) | | | 2,100 | | | | 91 | |
K2M Group Holdings * | | | 2,800 | | | | 35 | |
Karyopharm Therapeutics * | | | 5,000 | | | | 48 | |
Keryx Biopharmaceuticals * | | | 17,594 | | | | 106 | |
Kindred Healthcare | | | 14,973 | | | | 178 | |
Kite Pharma * | | | 5,800 | | | | 297 | |
La Jolla Pharmaceutical * | | | 3,000 | | | | 48 | |
Landauer | | | 1,073 | | | | 43 | |
Lannett *(A) | | | 3,900 | | | | 95 | |
LDR Holding * | | | 3,600 | | | | 76 | |
LeMaitre Vascular | | | 4,100 | | | | 57 | |
Lexicon Pharmaceuticals *(A) | | | 9,305 | | | | 132 | |
LHC Group * | | | 2,284 | | | | 96 | |
| | | | | | | | |
| Description | | Shares | | | Market Value
($ Thousands) | |
LifePoint Hospitals * | | | 7,596 | | | $ | 504 | |
Ligand Pharmaceuticals, Cl B * | | | 2,928 | | | | 350 | |
Lion Biotechnologies * | | | 7,000 | | | | 41 | |
LivaNova * | | | 8,446 | | | | 412 | |
Loxo Oncology * | | | 2,300 | | | | 62 | |
Luminex * | | | 8,555 | | | | 176 | |
MacroGenics * | | | 5,400 | | | | 138 | |
Magellan Health Services * | | | 4,540 | | | | 301 | |
MannKind *(A) | | | 34,843 | | | | 33 | |
Masimo * | | | 7,693 | | | | 383 | |
Medicines * | | | 11,257 | | | | 423 | |
Medidata Solutions * | | | 9,594 | | | | 441 | |
Medivation * | | | 28,408 | | | | 1,718 | |
MEDNAX * | | | 16,156 | | | | 1,106 | |
Meridian Bioscience | | | 6,141 | | | | 120 | |
Merit Medical Systems * | | | 7,375 | | | | 138 | |
Merrimack Pharmaceuticals *(A) | | | 23,500 | | | | 157 | |
Mettler Toledo International * | | | 4,982 | | | | 1,870 | |
MiMedx Group *(A) | | | 16,900 | | | | 133 | |
Mirati Therapeutics * | | | 2,400 | | | | 44 | |
Molina Healthcare * | | | 6,636 | | | | 321 | |
Momenta Pharmaceuticals * | | | 11,154 | | | | 131 | |
Myriad Genetics * | | | 12,426 | | | | 421 | |
NanoString Technologies * | | | 3,500 | | | | 48 | |
National Healthcare | | | 1,494 | | | | 93 | |
National Research, Cl A | | | 312 | | | | 4 | |
Natus Medical * | | | 5,958 | | | | 193 | |
Navidea Biopharmaceuticals *(A) | | | 38,805 | | | | 32 | |
Nektar Therapeutics * | | | 23,495 | | | | 363 | |
Neogen * | | | 6,380 | | | | 315 | |
NeoGenomics * | | | 13,300 | | | | 119 | |
Neurocrine Biosciences * | | | 15,900 | | | | 789 | |
Nevro * | | | 3,500 | | | | 244 | |
NewLink Genetics * | | | 3,916 | | | | 46 | |
Northwest Biotherapeutics * | | | 4,100 | | | | 3 | |
Novavax *(A) | | | 43,853 | | | | 267 | |
NuVasive * | | | 8,378 | | | | 456 | |
Nuvectra * | | | 1,543 | | | | 14 | |
NxStage Medical * | | | 13,347 | | | | 252 | |
Ocular Therapeutix * | | | 1,700 | | | | 20 | |
Omeros *(A) | | | 5,200 | | | | 61 | |
Omnicell * | | | 6,412 | | | | 207 | |
Oncocyte * | | | 255 | | | | 1 | |
OncoMed Pharmaceuticals * | | | 1,500 | | | | 22 | |
Oncothyreon * | | | 8,400 | | | | 10 | |
Ophthotech * | | | 3,700 | | | | 199 | |
OPKO Health *(A) | | | 52,684 | | | | 560 | |
OraSure Technologies * | | | 14,539 | | | | 112 | |
Orexigen Therapeutics *(A) | | | 15,061 | | | | 6 | |
Organovo Holdings *(A) | | | 7,300 | | | | 21 | |
Orthofix International * | | | 3,940 | | | | 174 | |
Osiris Therapeutics | | | 4,100 | | | | 21 | |
| | |
| 48 | | SEI Institutional Investments Trust / Annual Report / May 31, 2016 |
SCHEDULE OF INVESTMENTS
Extended Market Index Fund
May 31, 2016
| | | | | | | | |
| Description | | Shares | | | Market Value
($ Thousands) | |
Otonomy * | | | 1,500 | | | $ | 22 | |
OvaScience *(A) | | | 2,500 | | | | 18 | |
Owens & Minor | | | 11,039 | | | | 412 | |
Oxford Immunotec Global * | | | 1,500 | | | | 13 | |
Pacific Biosciences of California *(A) | | | 15,900 | | | | 153 | |
Pacira Pharmaceuticals * | | | 6,345 | | | | 295 | |
Paratek Pharmaceuticals * | | | 3,300 | | | | 53 | |
PAREXEL International * | | | 10,246 | | | | 644 | |
PDL BioPharma | | | 31,600 | | | | 113 | |
Penumbra * | | | 1,300 | | | | 69 | |
Peregrine Pharmaceuticals * | | | 15,000 | | | | 6 | |
Pernix Therapeutics Holdings *(A) | | | 3,900 | | | | 2 | |
Pfenex * | | | 4,300 | | | | 30 | |
PharMerica * | | | 6,850 | | | | 182 | |
Phibro Animal Health, Cl A | | | 3,700 | | | | 70 | |
Portola Pharmaceuticals, Cl A * | | | 8,000 | | | | 220 | |
PRA Health Sciences * | | | 3,200 | | | | 151 | |
Premier, Cl A * | | | 6,900 | | | | 219 | |
Press Ganey Holdings * | | | 2,700 | | | | 92 | |
Prestige Brands Holdings * | | | 8,679 | | | | 469 | |
Progenics Pharmaceuticals * | | | 11,596 | | | | 58 | |
Prothena *(A) | | | 6,200 | | | | 301 | |
Providence Service * | | | 1,758 | | | | 84 | |
PTC Therapeutics *(A) | | | 5,200 | | | | 42 | |
Puma Biotechnology *(A) | | | 4,200 | | | | 159 | |
QIAGEN * | | | 42,248 | | | | 912 | |
Quality Systems | | | 7,215 | | | | 92 | |
Quidel * | | | 3,412 | | | | 57 | |
Quintiles Transnational Holdings * | | | 14,400 | | | | 978 | |
Quorum Health * | | | 2,432 | | | | 32 | |
Radius Health *(A) | | | 5,800 | | | | 210 | |
RadNet * | | | 3,900 | | | | 20 | |
Raptor Pharmaceutical * | | | 13,007 | | | | 72 | |
Regulus Therapeutics *(A) | | | 3,400 | | | | 21 | |
Relypsa *(A) | | | 6,200 | | | | 118 | |
Repligen * | | | 5,222 | | | | 125 | |
ResMed | | | 25,399 | | | | 1,500 | |
Retrophin * | | | 5,400 | | | | 96 | |
Revance Therapeutics *(A) | | | 2,600 | | | | 53 | |
Rigel Pharmaceuticals * | | | 17,759 | | | | 46 | |
Rockwell Medical * | | | 10,000 | | | | 96 | |
RTI Surgical * | | | 6,918 | | | | 26 | |
Sage Therapeutics * | | | 2,100 | | | | 69 | |
Sagent Pharmaceuticals * | | | 3,875 | | | | 50 | |
Sangamo BioSciences * | | | 11,070 | | | | 76 | |
Sarepta Therapeutics *(A) | | | 7,600 | | | | 159 | |
Sciclone Pharmaceuticals * | | | 11,601 | | | | 164 | |
SeaSpine Holdings * | | | 1,550 | | | | 15 | |
Seattle Genetics * | | | 19,500 | | | | 788 | |
Select Medical Holdings * | | | 18,465 | | | | 234 | |
Sequenom *(A) | | | 22,017 | | | | 22 | |
Seres Therapeutics * | | | 2,400 | | | | 73 | |
| | | | | | | | |
| Description | | Shares | | | Market Value
($ Thousands) | |
Sorrento Therapeutics *(A) | | | 4,400 | | | $ | 31 | |
Spark Therapeutics *(A) | | | 1,600 | | | | 90 | |
Spectranetics * | | | 6,524 | | | | 120 | |
Spectrum Pharmaceuticals * | | | 16,579 | | | | 124 | |
STAAR Surgical * | | | 5,378 | | | | 29 | |
Stemline Therapeutics * | | | 900 | | | | 8 | |
STERIS | | | 14,698 | | | | 1,020 | |
Sucampo Pharmaceuticals, Cl A * | | | 5,500 | | | | 65 | |
Supernus Pharmaceuticals * | | | 5,000 | | | | 98 | |
Surgery Partners * | | | 3,500 | | | | 48 | |
Surgical Care Affiliates * | | | 3,300 | | | | 148 | |
SurModics * | | | 2,444 | | | | 54 | |
Synergy Pharmaceuticals *(A) | | | 19,215 | | | | 71 | |
Synta Pharmaceuticals * | | | 9,354 | | | | 3 | |
Tandem Diabetes Care * | | | 1,500 | | | | 10 | |
Team Health Holdings * | | | 12,708 | | | | 610 | |
Teladoc * | | | 1,600 | | | | 18 | |
Teleflex | | | 7,502 | | | | 1,209 | |
Teligent *(A) | | | 6,200 | | | | 37 | |
Tenet Healthcare * | | | 17,500 | | | | 506 | |
TESARO * | | | 3,700 | | | | 171 | |
Tetraphase Pharmaceuticals * | | | 5,400 | | | | 24 | |
TG Therapeutics *(A) | | | 7,600 | | | | 57 | |
TherapeuticsMD *(A) | | | 30,100 | | | | 269 | |
Theravance Biopharma (A) | | | 6,345 | | | | 146 | |
Threshold Pharmaceuticals * | | | 9,295 | | | | 4 | |
TransEnterix * | | | 13,500 | | | | 25 | |
Trevena * | | | 3,600 | | | | 26 | |
Triple-S Management, Cl B * | | | 5,566 | | | | 128 | |
Trovagene *(A) | | | 9,900 | | | | 52 | |
Trupanion *(A) | | | 800 | | | | 12 | |
Ultragenyx Pharmaceutical * | | | 6,700 | | | | 490 | |
Unilife * | | | 1,817 | | | | 6 | |
United Therapeutics * | | | 8,464 | | | | 1,008 | |
Universal American | | | 7,316 | | | | 60 | |
US Physical Therapy | | | 1,926 | | | | 111 | |
Utah Medical Products | | | 1,200 | | | | 79 | |
Vanda Pharmaceuticals * | | | 9,100 | | | | 95 | |
Vascular Solutions * | | | 2,718 | | | | 104 | |
VCA Antech * | | | 14,983 | | | | 973 | |
Veeva Systems, Cl A * | | | 13,800 | | | | 455 | |
Verastem * | | | 6,700 | | | | 10 | |
Versartis *(A) | | | 5,400 | | | | 50 | |
Vital Therapies *(A) | | | 4,300 | | | | 35 | |
VIVUS * | | | 8,977 | | | | 11 | |
Vocera Communications * | | | 6,142 | | | | 71 | |
VWR * | | | 6,100 | | | | 176 | |
WellCare Health Plans * | | | 8,166 | | | | 828 | |
West Pharmaceutical Services | | | 13,130 | | | | 986 | |
Wright Medical Group * | | | 15,378 | | | | 297 | |
Xencor * | | | 7,400 | | | | 105 | |
XenoPort * | | | 9,916 | | | | 70 | |
| | |
| 49 | | SEI Institutional Investments Trust / Annual Report / May 31, 2016 |
SCHEDULE OF INVESTMENTS
Extended Market Index Fund
May 31, 2016
| | | | | | | | |
| Description | | Shares | | | Market Value
($ Thousands) | |
XOMA * | | | 9,730 | | | $ | 7 | |
Zafgen * | | | 3,500 | | | | 25 | |
Zeltiq Aesthetics *(A) | | | 6,800 | | | | 194 | |
ZIOPHARM Oncology *(A) | | | 18,646 | | | | 145 | |
Zogenix * | | | 5,700 | | | | 57 | |
| | | | | | | | |
| | | | | | | 80,813 | |
| | | | | | | | |
|
Industrials — 12.9% | |
AAON | | | 6,950 | | | | 191 | |
AAR | | | 5,729 | | | | 140 | |
ABM Industries | | | 9,355 | | | | 320 | |
Acacia Research | | | 8,749 | | | | 45 | |
ACCO Brands * | | | 23,129 | | | | 230 | |
Accuride * | | | 10,900 | | | | 17 | |
Actuant, Cl A | | | 11,042 | | | | 301 | |
Advanced Drainage Systems | | | 5,200 | | | | 126 | |
Advisory Board * | | | 8,484 | | | | 279 | |
AECOM Technology * | | | 26,448 | | | | 849 | |
Aegion, Cl A * | | | 7,603 | | | | 152 | |
Aerojet Rocketdyne Holdings * | | | 12,579 | | | | 217 | |
Aerovironment * | | | 3,825 | | | | 110 | |
AGCO | | | 12,923 | | | | 671 | |
Air Lease, Cl A (A) | | | 19,331 | | | | 581 | |
Air Transport Services Group * | | | 10,936 | | | | 138 | |
Aircastle | | | 11,657 | | | | 246 | |
Alamo Group | | | 2,135 | | | | 132 | |
Albany International, Cl A | | | 5,898 | | | | 232 | |
Allegiant Travel, Cl A | | | 2,450 | | | | 341 | |
Allison Transmission Holdings, Cl A | | | 31,576 | | | | 887 | |
Altra Industrial Motion | | | 5,589 | | | | 151 | |
AMERCO | | | 1,300 | | | | 490 | |
Ameresco, Cl A * | | | 779 | | | | 4 | |
American Railcar Industries (A) | | | 1,277 | | | | 51 | |
American Science & Engineering | | | 955 | | | | 30 | |
American Woodmark * | | | 2,484 | | | | 201 | |
AO Smith | | | 13,458 | | | | 1,108 | |
Apogee Enterprises | | | 5,411 | | | | 245 | |
Applied Industrial Technologies | | | 7,261 | | | | 328 | |
ARC Document Solutions * | | | 4,300 | | | | 18 | |
ArcBest | | | 3,290 | | | | 57 | |
Argan | | | 1,879 | | | | 65 | |
Armstrong Flooring * | | | 3,038 | | | | 50 | |
Armstrong World Industries * | | | 7,677 | | | | 317 | |
Astec Industries | | | 3,163 | | | | 169 | |
Astronics * | | | 3,274 | | | | 126 | |
Astronics, Cl B * | | | 1,013 | | | | 39 | |
Atlas Air Worldwide Holdings * | | | 4,769 | | | | 209 | |
Avis Budget Group * | | | 15,760 | | | | 473 | |
AZZ | | | 4,696 | | | | 277 | |
B/E Aerospace | | | 18,630 | | | | 888 | |
Babcock & Wilcox Enterprises * | | | 11,162 | | | | 243 | |
Barnes Group | | | 9,852 | | | | 329 | |
| | | | | | | | |
| Description | | Shares | | | Market Value
($ Thousands) | |
Barrett Business Services | | | 834 | | | $ | 31 | |
Beacon Roofing Supply * | | | 8,370 | | | | 361 | |
BMC Stock Holdings * | | | 7,400 | | | | 145 | |
Brady, Cl A | | | 7,827 | | | | 249 | |
Briggs & Stratton | | | 6,749 | | | | 151 | |
Brink’s | | | 9,606 | | | | 280 | |
Builders FirstSource * | | | 7,970 | | | | 94 | |
BWX Technologies | | | 20,024 | | | | 704 | |
CAI International * | | | 1,272 | | | | 10 | |
Carlisle | | | 11,277 | | | | 1,171 | |
Casella Waste Systems, Cl A * | | | 11,391 | | | | 82 | |
CBIZ * | | | 11,445 | | | | 121 | |
CDI | | | 2,269 | | | | 14 | |
CEB | | | 6,461 | | | | 412 | |
Ceco Environmental | | | 2,047 | | | | 17 | |
Celadon Group | | | 3,375 | | | | 33 | |
Chart Industries * | | | 6,872 | | | | 178 | |
Chicago Bridge & Iron | | | 18,492 | | | | 707 | |
CIRCOR International | | | 3,715 | | | | 208 | |
Civeo * | | | 11,798 | | | | 24 | |
CLARCOR | | | 9,423 | | | | 559 | |
Clean Harbors * | | | 10,376 | | | | 534 | |
Colfax * | | | 18,889 | | | | 512 | |
Columbus McKinnon | | | 2,465 | | | | 37 | |
Comfort Systems USA | | | 6,991 | | | | 224 | |
Commercial Vehicle Group * | | | 5,592 | | | | 21 | |
Continental Building Products * | | | 6,600 | | | | 151 | |
Copa Holdings, Cl A (A) | | | 5,828 | | | | 301 | |
Copart * | | | 19,250 | | | | 953 | |
Covanta Holding | | | 21,258 | | | | 354 | |
Covenant Transportation Group, Cl A * | | | 3,300 | | | | 70 | |
CRA International * | | | 2,105 | | | | 50 | |
Crane | | | 8,229 | | | | 472 | |
Cubic | | | 4,689 | | | | 191 | |
Curtiss-Wright | | | 8,278 | | | | 689 | |
Deluxe | | | 9,454 | | | | 616 | |
DigitalGlobe * | | | 11,232 | | | | 235 | |
Donaldson | | | 24,146 | | | | 809 | |
Douglas Dynamics | | | 4,222 | | | | 92 | |
Ducommun * | | | 1,000 | | | | 17 | |
DXP Enterprises * | | | 1,662 | | | | 23 | |
Dycom Industries * | | | 5,907 | | | | 501 | |
Echo Global Logistics * | | | 4,586 | | | | 104 | |
EMCOR Group | | | 11,087 | | | | 527 | |
Encore Wire | | | 3,103 | | | | 121 | |
EnerNOC * | | | 4,160 | | | | 27 | |
EnerSys | | | 7,883 | | | | 474 | |
Engility Holdings * | | | 2,010 | | | | 47 | |
Ennis | | | 3,488 | | | | 64 | |
Enphase Energy *(A) | | | 2,300 | | | | 5 | |
EnPro Industries | | | 4,668 | | | | 236 | |
ESCO Technologies | | | 5,477 | | | | 221 | |
| | |
| 50 | | SEI Institutional Investments Trust / Annual Report / May 31, 2016 |
SCHEDULE OF INVESTMENTS
Extended Market Index Fund
May 31, 2016
| | | | | | | | |
| Description | | Shares | | | Market Value
($ Thousands) | |
Essendant | | | 7,137 | | | $ | 220 | |
Esterline Technologies * | | | 5,090 | | | | 343 | |
ExOne * | | | 1,900 | | | | 20 | |
Exponent | | | 4,786 | | | | 258 | |
Federal Signal | | | 9,547 | | | | 124 | |
Fortune Brands Home & Security | | | 27,873 | | | | 1,635 | |
Forward Air | | | 6,318 | | | | 287 | |
Franklin Covey * | | | 404 | | | | 6 | |
Franklin Electric | | | 8,781 | | | | 293 | |
FreightCar America | | | 1,733 | | | | 25 | |
FTI Consulting * | | | 6,968 | | | | 292 | |
FuelCell Energy * | | | 2,863 | | | | 22 | |
G&K Services, Cl A | | | 3,439 | | | | 258 | |
GATX (A) | | | 6,752 | | | | 310 | |
Generac Holdings * | | | 12,145 | | | | 460 | |
General Cable | | | 8,737 | | | | 119 | |
Genesee & Wyoming, Cl A * | | | 9,774 | | | | 587 | |
Gibraltar Industries * | | | 6,160 | | | | 184 | |
Global Brass & Copper Holdings | | | 5,100 | | | | 139 | |
Golden Ocean Group * | | | 5,743 | | | | 5 | |
Gorman-Rupp | | | 4,077 | | | | 126 | |
GP Strategies * | | | 2,500 | | | | 60 | |
Graco | | | 10,235 | | | | 822 | |
Graham | | | 796 | | | | 14 | |
Granite Construction | | | 6,811 | | | | 292 | |
Great Lakes Dredge & Dock * | | | 9,180 | | | | 42 | |
Greenbrier (A) | | | 5,123 | | | | 147 | |
Griffon | | | 4,237 | | | | 71 | |
H&E Equipment Services | | | 5,625 | | | | 108 | |
Harsco | | | 11,028 | | | | 73 | |
Hawaiian Holdings * | | | 8,480 | | | | 343 | |
HD Supply Holdings * | | | 31,000 | | | | 1,094 | |
Healthcare Services Group | | | 13,439 | | | | 524 | |
Heartland Express | | | 9,772 | | | | 181 | |
Heico | | | 2,881 | | | | 192 | |
HEICO, Cl A | | | 7,700 | | | | 425 | |
Heidrick & Struggles International | | | 2,952 | | | | 54 | |
Heritage-Crystal Clean * | | | 1,200 | | | | 14 | |
Herman Miller | | | 9,943 | | | | 315 | |
Hertz Global Holdings * | | | 65,514 | | | | 635 | |
Hexcel | | | 17,698 | | | | 773 | |
Hillenbrand | | | 10,385 | | | | 324 | |
HNI | | | 8,849 | | | | 408 | |
Hub Group, Cl A * | | | 5,762 | | | | 231 | |
Hubbell, Cl B | | | 10,489 | | | | 1,115 | |
Huntington Ingalls Industries | | | 8,759 | | | | 1,344 | |
Hurco | | | 1,235 | | | | 40 | |
Huron Consulting Group * | | | 4,011 | | | | 235 | |
Hyster-Yale Materials Handling | | | 2,002 | | | | 123 | |
ICF International * | | | 4,368 | | | | 178 | |
IDEX | | | 14,141 | | | | 1,179 | |
IHS, Cl A * | | | 12,399 | | | | 1,524 | |
| | | | | | | | |
| Description | | Shares | | | Market Value
($ Thousands) | |
InnerWorkings * | | | 3,487 | | | $ | 30 | |
Insperity | | | 3,012 | | | | 217 | |
Insteel Industries | | | 2,941 | | | | 82 | |
Interface, Cl A | | | 10,545 | | | | 179 | |
ITT | | | 16,963 | | | | 602 | |
JetBlue Airways * | | | 55,381 | | | | 993 | |
John Bean Technologies | | | 5,731 | | | | 348 | |
Joy Global (A) | | | 19,200 | | | | 327 | |
Kadant | | | 1,725 | | | | 86 | |
Kaman | | | 5,573 | | | | 238 | |
KAR Auction Services | | | 24,429 | | | | 1,003 | |
KBR | | | 26,445 | | | | 385 | |
Kelly Services, Cl A | | | 6,795 | | | | 135 | |
Kennametal | | | 13,814 | | | | 338 | |
KEYW Holding *(A) | | | 4,068 | | | | 36 | |
Kforce | | | 4,537 | | | | 85 | |
Kirby * | | | 9,926 | | | | 696 | |
KLX * | | | 8,665 | | | | 285 | |
Knight Transportation | | | 10,937 | | | | 286 | |
Knoll | | | 8,163 | | | | 203 | |
Korn/Ferry International | | | 9,058 | | | | 261 | |
Kratos Defense & Security Solutions * | | | 5,216 | | | | 22 | |
Landstar System | | | 7,844 | | | | 532 | |
LB Foster, Cl A | | | 1,171 | | | | 14 | |
Lennox International | | | 7,329 | | | | 1,007 | |
Lincoln Electric Holdings | | | 12,733 | | | | 766 | |
Lindsay Manufacturing | | | 1,627 | | | | 116 | |
LSI Industries | | | 2,000 | | | | 22 | |
Lydall * | | | 3,632 | | | | 138 | |
Macquarie Infrastructure | | | 12,200 | | | | 874 | |
Manitowoc | | | 23,950 | | | | 137 | |
Manitowoc Foodservice * | | | 23,950 | | | | 394 | |
Manpowergroup | | | 13,356 | | | | 1,065 | |
Marten Transport | | | 3,095 | | | | 61 | |
Masonite International * | | | 5,300 | | | | 370 | |
MasTec * | | | 12,762 | | | | 294 | |
Matson | | | 7,152 | | | | 238 | |
Matthews International, Cl A | | | 6,513 | | | | 357 | |
McGrath RentCorp | | | 3,748 | | | | 107 | |
Meritor * | | | 18,495 | | | | 163 | |
Middleby * | | | 9,925 | | | | 1,233 | |
Milacron Holdings * | | | 4,400 | | | | 72 | |
Miller Industries | | | 2,311 | | | | 49 | |
Mistras Group * | | | 2,697 | | | | 67 | |
Mobile Mini | | | 8,283 | | | | 285 | |
Moog, Cl A * | | | 5,924 | | | | 319 | |
MRC Global * | | | 17,212 | | | | 244 | |
MSA Safety | | | 4,744 | | | | 239 | |
MSC Industrial Direct, Cl A | | | 9,003 | | | | 675 | |
Mueller Industries | | | 11,208 | | | | 348 | |
Mueller Water Products, Cl A | | | 27,012 | | | | 297 | |
Multi-Color | | | 1,957 | | | | 122 | |
| | |
| 51 | | SEI Institutional Investments Trust / Annual Report / May 31, 2016 |
SCHEDULE OF INVESTMENTS
Extended Market Index Fund
May 31, 2016
| | | | | | | | |
| Description | | Shares | | | Market Value
($ Thousands) | |
MYR Group * | | | 4,179 | | | $ | 101 | |
NACCO Industries, Cl A | | | 305 | | | | 16 | |
National Presto Industries | | | 591 | | | | 53 | |
Navigant Consulting * | | | 7,641 | | | | 122 | |
Navios Maritime Holdings (A) | | | 9,200 | | | | 10 | |
Navistar International *(A) | | | 10,291 | | | | 116 | |
NCI Building Systems * | | | 3,548 | | | | 57 | |
NN | | | 5,587 | | | | 93 | |
Nordson | | | 9,712 | | | | 845 | |
Nortek * | | | 1,242 | | | | 61 | |
Northwest Pipe * | | | 1,186 | | | | 11 | |
NOW * | | | 19,100 | | | | 331 | |
Old Dominion Freight Line * | | | 12,790 | | | | 823 | |
On Assignment * | | | 10,069 | | | | 379 | |
Orbital ATK | | | 10,992 | | | | 957 | |
Orion Marine Group * | | | 1,874 | | | | 9 | |
Oshkosh Truck | | | 12,917 | | | | 593 | |
Owens Corning | | | 20,360 | | | | 1,040 | |
PAM Transportation Services * | | | 900 | | | | 19 | |
Park-Ohio Holdings | | | 1,118 | | | | 34 | |
Patrick Industries * | | | 1,950 | | | | 104 | |
Paylocity Holding * | | | 3,700 | | | | 136 | |
Pendrell * | | | 8,751 | | | | 5 | |
PGT * | | | 10,000 | | | | 107 | |
Plug Power *(A) | | | 19,400 | | | | 37 | |
Ply Gem Holdings * | | | 5,900 | | | | 89 | |
Powell Industries | | | 1,364 | | | | 49 | |
Power Solutions International * | | | 800 | | | | 13 | |
Preformed Line Products | | | 90 | | | | 4 | |
Primoris Services | | | 7,847 | | | | 169 | |
Proto Labs *(A) | | | 4,199 | | | | 276 | |
Quad, Cl A | | | 3,562 | | | | 68 | |
Quanex Building Products | | | 5,765 | | | | 115 | |
Raven Industries | | | 6,155 | | | | 124 | |
RBC Bearings * | | | 4,295 | | | | 322 | |
Regal-Beloit | | | 8,625 | | | | 493 | |
Resources Connection | | | 7,181 | | | | 112 | |
Rexnord * | | | 18,826 | | | | 390 | |
Roadrunner Transportation Systems * | | | 3,272 | | | | 26 | |
Rollins | | | 16,062 | | | | 456 | |
RPX * | | | 12,610 | | | | 127 | |
RR Donnelley & Sons | | | 39,660 | | | | 646 | |
Rush Enterprises, Cl A * | | | 5,399 | | | | 119 | |
Safe Bulkers | | | 4,500 | | | | 5 | |
Saia * | | | 5,692 | | | | 148 | |
Scorpio Bulkers *(A) | | | 5,716 | | | | 23 | |
Simpson Manufacturing | | | 8,343 | | | | 330 | |
SkyWest | | | 9,922 | | | | 234 | |
SolarCity *(A) | | | 11,631 | | | | 260 | |
SP Plus * | | | 2,498 | | | | 56 | |
Sparton * | | | 1,100 | | | | 21 | |
Spirit AeroSystems Holdings, Cl A * | | | 22,975 | | | | 1,075 | |
| | | | | | | | |
| Description | | Shares | | | Market Value
($ Thousands) | |
Spirit Airlines * | | | 13,647 | | | $ | 593 | |
SPX | | | 7,194 | | | | 119 | |
SPX FLOW * | | | 7,194 | | | | 216 | |
Standex International | | | 2,429 | | | | 211 | |
Steelcase, Cl A | | | 14,057 | | | | 224 | |
Sun Hydraulics | | | 4,677 | | | | 137 | |
Swift Transporation, Cl A *(A) | | | 17,609 | | | | 274 | |
TAL International Group | | | 5,884 | | | | 84 | |
Taser International * | | | 9,069 | | | | 203 | |
Team * | | | 4,257 | | | | 129 | |
Teledyne Technologies * | | | 6,637 | | | | 651 | |
Tennant | | | 3,938 | | | | 211 | |
Terex | | | 18,670 | | | | 395 | |
Tetra Tech | | | 10,742 | | | | 329 | |
Textainer Group Holdings (A) | | | 2,253 | | | | 30 | |
Thermon Group Holdings * | | | 6,882 | | | | 138 | |
Timken | | | 13,209 | | | | 439 | |
Titan International | | | 5,472 | | | | 35 | |
Titan Machinery * | | | 3,312 | | | | 35 | |
Toro | | | 10,200 | | | | 911 | |
TransDigm Group * | | | 9,405 | | | | 2,479 | |
TransUnion * | | | 6,400 | | | | 212 | |
Trex * | | | 4,940 | | | | 223 | |
TriMas * | | | 9,876 | | | | 169 | |
TriNet Group * | | | 6,400 | | | | 129 | |
Trinity Industries | | | 26,542 | | | | 479 | |
Triumph Group | | | 9,696 | | | | 366 | |
TrueBlue * | | | 8,328 | | | | 165 | |
Tutor Perini * | | | 6,751 | | | | 153 | |
Twin Disc | | | 1,870 | | | | 18 | |
UniFirst | | | 2,440 | | | | 282 | |
Univar * | | | 8,300 | | | | 155 | |
Universal Forest Products | | | 3,655 | | | | 307 | |
Universal Logistics Holdings | | | 700 | | | | 10 | |
US Ecology | | | 4,640 | | | | 210 | |
USA Truck * | | | 1,700 | | | | 34 | |
USG * | | | 17,582 | | | | 507 | |
Valmont Industries | | | 3,914 | | | | 541 | |
Vectrus * | | | 1,379 | | | | 35 | |
Veritiv * | | | 1,000 | | | | 39 | |
Viad | | | 4,271 | | | | 136 | |
Vicor * | | | 2,500 | | | | 25 | |
Virgin America * | | | 3,300 | | | | 185 | |
VSE | | | 500 | | | | 34 | |
Wabash National * | | | 11,741 | | | | 166 | |
WABCO Holdings * | | | 9,910 | | | | 1,069 | |
Wabtec | | | 15,606 | | | | 1,208 | |
WageWorks * | | | 6,371 | | | | 357 | |
Watsco | | | 4,559 | | | | 612 | |
Watts Water Technologies, Cl A | | | 5,056 | | | | 291 | |
Werner Enterprises | | | 8,390 | | | | 209 | |
Wesco Aircraft Holdings * | | | 12,046 | | | | 170 | |
| | |
| 52 | | SEI Institutional Investments Trust / Annual Report / May 31, 2016 |
SCHEDULE OF INVESTMENTS
Extended Market Index Fund
May 31, 2016
| | | | | | | | |
| Description | | Shares | | | Market Value
($ Thousands) | |
WESCO International * | | | 7,766 | | | $ | 453 | |
West | | | 8,100 | | | | 171 | |
Woodward Governor | | | 10,842 | | | | 617 | |
Xerium Technologies * | | | 2,400 | | | | 15 | |
XPO Logistics *(A) | | | 13,090 | | | | 383 | |
YRC Worldwide * | | | 4,500 | | | | 41 | |
| | | | | | | | |
| | | | | | | 92,165 | |
| | | | | | | | |
| | |
Information Technology — 16.3% | | | | | | | | |
3D Systems *(A) | | | 19,547 | | | | 262 | |
A10 Networks * | | | 9,800 | | | | 63 | |
ACI Worldwide * | | | 20,512 | | | | 424 | |
Actua * | | | 5,188 | | | | 50 | |
Acxiom * | | | 13,974 | | | | 296 | |
ADTRAN | | | 9,897 | | | | 192 | |
Advanced Energy Industries * | | | 7,719 | | | | 295 | |
Advanced Micro Devices *(A) | | | 105,200 | | | | 481 | |
Agilysys * | | | 900 | | | | 11 | |
Alarm.com Holdings *(A) | | | 2,700 | | | | 57 | |
Alliance Fiber Optic Products | | | 2,400 | | | | 44 | |
Alpha & Omega Semiconductor * | | | 6,000 | | | | 82 | |
Ambarella *(A) | | | 5,200 | | | | 215 | |
Amber Road * | | | 1,900 | | | | 11 | |
Amdocs | | | 27,768 | | | | 1,610 | |
American Software, Cl A | | | 2,872 | | | | 28 | |
Amkor Technology * | | | 20,913 | | | | 132 | |
Angie’s List * | | | 10,248 | | | | 90 | |
Anixter International * | | | 5,041 | | | | 303 | |
Ansys * | | | 16,217 | | | | 1,445 | |
Applied Micro Circuits * | | | 18,598 | | | | 122 | |
Applied Optoelectronics *(A) | | | 1,700 | | | | 18 | |
Arista Networks *(A) | | | 6,200 | | | | 454 | |
ARRIS International * | | | 33,570 | | | | 809 | |
Arrow Electronics * | | | 17,525 | | | | 1,132 | |
Aspen Technology * | | | 14,967 | | | | 571 | |
Atlassian, Cl A * | | | 5,600 | | | | 126 | |
AVG Technologies * | | | 7,600 | | | | 146 | |
Avid Technology * | | | 5,000 | | | | 30 | |
Avnet | | | 22,899 | | | | 940 | |
AVX | | | 7,078 | | | | 98 | |
Axcelis Technologies * | | | 30,200 | | | | 82 | |
Badger Meter | | | 2,862 | | | | 215 | |
Bankrate * | | | 13,049 | | | | 119 | |
Barracuda Networks * | | | 900 | | | | 15 | |
Bazaarvoice * | | | 8,300 | | | | 31 | |
Bel Fuse, Cl B | | | 888 | | | | 16 | |
Belden | | | 8,023 | | | | 519 | |
Benchmark Electronics * | | | 9,930 | | | | 206 | |
Benefitfocus *(A) | | | 700 | | | | 26 | |
Black Box | | | 2,509 | | | | 31 | |
Black Knight Financial Services, Cl A * | | | 3,200 | | | | 112 | |
Blackbaud | | | 8,055 | | | | 505 | |
| | | | | | | | |
| Description | | Shares | | | Market Value
($ Thousands) | |
Blackhawk Network Holdings, Cl A * | | | 10,600 | | | $ | 365 | |
Blucora * | | | 6,429 | | | | 58 | |
Booz Allen Hamilton Holding, Cl A | | | 16,965 | | | | 497 | |
Bottomline Technologies de * | | | 7,571 | | | | 190 | |
Box, Cl A *(A) | | | 3,600 | | | | 45 | |
Brightcove * | | | 2,600 | | | | 17 | |
Broadridge Financial Solutions | | | 20,897 | | | | 1,341 | |
BroadSoft * | | | 5,594 | | | | 244 | |
Brocade Communications Systems | | | 88,260 | | | | 800 | |
Brooks Automation | | | 14,503 | | | | 159 | |
Cabot Microelectronics | | | 4,424 | | | | 191 | |
CACI International, Cl A * | | | 4,232 | | | | 426 | |
Cadence Design Systems * | | | 50,847 | | | | 1,257 | |
CalAmp * | | | 4,756 | | | | 71 | |
Calix * | | | 4,945 | | | | 33 | |
Callidus Software * | | | 11,856 | | | | 220 | |
Carbonite * | | | 1,400 | | | | 13 | |
Cardtronics * | | | 7,485 | | | | 294 | |
Cascade Microtech * | | | 3,600 | | | | 74 | |
Cass Information Systems | | | 1,490 | | | | 72 | |
Cavium * | | | 10,231 | | | | 509 | |
CDK Global | | | 28,900 | | | | 1,598 | |
CDW | | | 24,000 | | | | 1,021 | |
CEVA * | | | 3,838 | | | | 104 | |
ChannelAdvisor * | | | 2,400 | | | | 30 | |
Ciber * | | | 13,787 | | | | 17 | |
Ciena * | | | 20,986 | | | | 366 | |
Cimpress *(A) | | | 5,799 | | | | 581 | |
Cirrus Logic * | | | 12,095 | | | | 435 | |
Clearfield *(A) | | | 1,400 | | | | 25 | |
Cognex | | | 16,358 | | | | 705 | |
Coherent * | | | 4,153 | | | | 393 | |
Cohu | | | 2,077 | | | | 25 | |
CommScope Holding * | | | 18,600 | | | | 579 | |
CommVault Systems * | | | 8,784 | | | | 398 | |
Computer Sciences | | | 23,800 | | | | 1,171 | |
comScore * | | | 9,833 | | | | 318 | |
Comtech Telecommunications | | | 1,932 | | | | 45 | |
Control4 * | | | 1,400 | | | | 11 | |
Convergys | | | 17,587 | | | | 496 | |
CoreLogic * | | | 15,783 | | | | 588 | |
Cornerstone OnDemand * | | | 9,599 | | | | 384 | |
CoStar Group * | | | 5,663 | | | | 1,170 | |
Cray * | | | 7,570 | | | | 252 | |
Cree *(A) | | | 17,523 | | | | 422 | |
CSG Systems International | | | 5,617 | | | | 239 | |
CTS | | | 7,945 | | | | 142 | |
Cvent * | | | 4,700 | | | | 168 | |
Cypress Semiconductor | | | 60,035 | | | | 638 | |
Daktronics | | | 4,580 | | | | 37 | |
Datalink * | | | 3,697 | | | | 30 | |
Demandware * | | | 5,745 | | | | 276 | |
| | |
| 53 | | SEI Institutional Investments Trust / Annual Report / May 31, 2016 |
SCHEDULE OF INVESTMENTS
Extended Market Index Fund
May 31, 2016
| | | | | | | | |
| Description | | Shares | | | Market Value
($ Thousands) | |
DHI Group * | | | 6,690 | | | $ | 47 | |
Diebold | | | 13,033 | | | | 337 | |
Digi International * | | | 3,601 | | | | 40 | |
Digimarc *(A) | | | 2,076 | | | | 57 | |
Diodes * | | | 5,742 | | | | 111 | |
Dolby Laboratories, Cl A | | | 8,704 | | | | 413 | |
DSP Group * | | | 862 | | | | 9 | |
DST Systems | | | 6,450 | | | | 780 | |
DTS * | | | 3,044 | | | | 79 | |
EarthLink Holdings | | | 20,333 | | | | 133 | |
Ebix (A) | | | 3,725 | | | | 168 | |
EchoStar, Cl A * | | | 8,603 | | | | 344 | |
Electro Rent | | | 1,059 | | | | 14 | |
Electronics For Imaging * | | | 7,728 | | | | 339 | |
Ellie Mae * | | | 5,163 | | | | 437 | |
Endurance International Group Holdings *(A) | | | 9,100 | | | | 86 | |
Entegris * | | | 25,308 | | | | 361 | |
Envestnet * | | | 6,152 | | | | 208 | |
EPAM Systems * | | | 8,500 | | | | 650 | |
Epiq Systems | | | 7,990 | | | | 122 | |
ePlus * | | | 644 | | | | 56 | |
Euronet Worldwide * | | | 8,988 | | | | 717 | |
Everi Holdings * | | | 7,316 | | | | 10 | |
EVERTEC | | | 10,200 | | | | 156 | |
Everyday Health * | | | 6,300 | | | | 42 | |
Exar * | | | 4,992 | | | | 34 | |
ExlService Holdings * | | | 6,623 | | | | 343 | |
Extreme Networks * | | | 10,187 | | | | 38 | |
Fabrinet * | | | 7,315 | | | | 260 | |
Fair Isaac | | | 5,391 | | | | 601 | |
Fairchild Semiconductor International, Cl A * | | | 20,609 | | | | 410 | |
FARO Technologies * | | | 2,208 | | | | 78 | |
FEI | | | 7,852 | | | | 844 | |
Finisar * | | | 18,954 | | | | 319 | |
FireEye *(A) | | | 25,100 | | | | 400 | |
First Data, Cl A * | | | 30,500 | | | | 382 | |
Fitbit, Cl A *(A) | | | 7,500 | | | | 106 | |
Five9 * | | | 7,300 | | | | 74 | |
FleetCor Technologies * | | | 16,173 | | | | 2,408 | |
FleetMatics Group * | | | 7,578 | | | | 310 | |
FormFactor * | | | 6,967 | | | | 50 | |
Forrester Research | | | 1,564 | | | | 58 | |
Fortinet * | | | 26,199 | | | | 896 | |
Gartner * | | | 14,937 | | | | 1,518 | |
Genpact * | | | 29,250 | | | | 825 | |
Gigamon * | | | 5,400 | | | | 168 | |
Globant *(A) | | | 2,400 | | | | 96 | |
Glu Mobile *(A) | | | 16,800 | | | | 40 | |
GoDaddy, Cl A * | | | 3,600 | | | | 117 | |
Gogo *(A) | | | 9,200 | | | | 103 | |
GrubHub *(A) | | | 14,600 | | | | 374 | |
GTT Communications * | | | 5,300 | | | | 99 | |
| | | | | | | | |
| Description | | Shares | | | Market Value
($ Thousands) | |
Guidance Software * | | | 594 | | | $ | 3 | |
Guidewire Software * | | | 12,969 | | | | 761 | |
Hackett Group | | | 3,300 | | | | 48 | |
Harmonic * | | | 14,394 | | | | 41 | |
HubSpot * | | | 2,900 | | | | 139 | |
IAC | | | 13,621 | | | | 761 | |
II-VI * | | | 8,943 | | | | 182 | |
Immersion * | | | 3,567 | | | | 23 | |
Imperva * | | | 4,583 | | | | 175 | |
Infinera * | | | 22,884 | | | | 300 | |
Infoblox * | | | 10,603 | | | | 199 | |
Ingram Micro, Cl A | | | 27,346 | | | | 947 | |
Inphi * | | | 7,262 | | | | 227 | |
Insight Enterprises * | | | 7,198 | | | | 195 | |
Integrated Device Technology * | | | 23,345 | | | | 545 | |
Interactive Intelligence Group * | | | 3,968 | | | | 164 | |
InterDigital | | | 6,130 | | | | 357 | |
Internap Network Services * | | | 8,784 | | | | 19 | |
Intersil, Cl A | | | 24,172 | | | | 327 | |
Intralinks Holdings * | | | 6,626 | | | | 52 | |
InvenSense, Cl A *(A) | | | 12,577 | | | | 78 | |
IPG Photonics * | | | 6,520 | | | | 563 | |
Itron * | | | 7,111 | | | | 313 | |
Ixia * | | | 12,258 | | | | 125 | |
IXYS | | | 1,980 | | | | 22 | |
j2 Global | | | 8,057 | | | | 540 | |
Jabil Circuit | | | 35,900 | | | | 685 | |
Jack Henry & Associates | | | 14,219 | | | | 1,201 | |
Jive Software * | | | 7,834 | | | | 30 | |
Keysight Technologies * | | | 29,700 | | | | 910 | |
Kimball Electronics * | | | 3,093 | | | | 35 | |
Knowles *(A) | | | 15,800 | | | | 231 | |
Kopin * | | | 8,823 | | | | 19 | |
KVH Industries * | | | 1,997 | | | | 17 | |
Lattice Semiconductor * | | | 16,962 | | | | 99 | |
Leidos Holdings (A) | | | 11,650 | | | | 576 | |
Lexmark International, Cl A | | | 11,880 | | | | 450 | |
Limelight Networks * | | | 15,000 | | | | 22 | |
LinkedIn, Cl A * | | | 19,306 | | | | 2,635 | |
Lionbridge Technologies * | | | 7,618 | | | | 33 | |
Liquidity Services * | | | 2,222 | | | | 15 | |
Littelfuse | | | 4,203 | | | | 481 | |
LivePerson * | | | 8,091 | | | | 56 | |
LogMeIn * | | | 4,313 | | | | 264 | |
Lumentum Holdings * | | | 8,140 | | | | 206 | |
Luxoft Holding, Cl A * | | | 2,800 | | | | 182 | |
MA-COM Tech * | | | 3,600 | | | | 130 | |
Manhattan Associates * | | | 13,580 | | | | 895 | |
ManTech International, Cl A | | | 4,922 | | | | 177 | |
Marchex, Cl B * | | | 2,900 | | | | 10 | |
Marin Software * | | | 1,400 | | | | 3 | |
Marketo * | | | 7,900 | | | | 278 | |
| | |
| 54 | | SEI Institutional Investments Trust / Annual Report / May 31, 2016 |
SCHEDULE OF INVESTMENTS
Extended Market Index Fund
May 31, 2016
| | | | | | | | |
| Description | | Shares | | | Market Value
($ Thousands) | |
Marvell Technology Group | | | 82,802 | | | $ | 847 | |
Match Group *(A) | | | 7,200 | | | | 101 | |
Maxim Integrated Products | | | 50,904 | | | | 1,932 | |
MAXIMUS | | | 11,416 | | | | 658 | |
MaxLinear, Cl A * | | | 10,244 | | | | 212 | |
Mentor Graphics | | | 15,740 | | | | 337 | |
Mercury Systems * | | | 6,123 | | | | 130 | |
Mesa Laboratories (A) | | | 300 | | | | 30 | |
Methode Electronics | | | 6,984 | | | | 206 | |
Microchip Technology | | | — | | | | — | |
Microsemi * | | | 19,962 | | | | 675 | |
MicroStrategy, Cl A * | | | 1,653 | | | | 308 | |
MKS Instruments | | | 10,323 | | | | 423 | |
MobileIron * | | | 11,500 | | | | 38 | |
Model N * | | | 7,000 | | | | 86 | |
ModusLink Global Solutions * | | | 6,400 | | | | 9 | |
MoneyGram International * | | | 2,905 | | | | 19 | |
Monolithic Power Systems | | | 6,851 | | | | 468 | |
Monotype Imaging Holdings | | | 6,860 | | | | 164 | |
Monster Worldwide * | | | 12,508 | | | | 33 | |
MTS Systems | | | 3,089 | | | | 148 | |
Multi-Fineline Electronix * | | | 1,200 | | | | 27 | |
Nanometrics * | | | 3,644 | | | | 68 | |
National Instruments | | | 19,567 | | | | 559 | |
NCR * | | | 23,083 | | | | 713 | |
NeoPhotonics * | | | 7,500 | | | | 68 | |
NETGEAR * | | | 5,692 | | | | 256 | |
NetScout Systems * | | | 15,358 | | | | 373 | |
NetSuite * | | | 7,203 | | | | 571 | |
NeuStar, Cl A * | | | 10,232 | | | | 241 | |
New Relic * | | | 100 | | | | 3 | |
NIC | | | 10,822 | | | | 215 | |
Nimble Storage * | | | 7,800 | | | | 70 | |
Novanta * | | | 5,462 | | | | 84 | |
Nuance Communications * | | | 40,181 | | | | 672 | |
NVE | | | 694 | | | | 39 | |
Oclaro *(A) | | | 23,500 | | | | 118 | |
ON Semiconductor * | | | 75,900 | | | | 742 | |
OPOWER * | | | 7,200 | | | | 74 | |
OSI Systems * | | | 3,768 | | | | 201 | |
Palo Alto Networks * | | | 13,733 | | | | 1,792 | |
Pandora Media *(A) | | | 34,571 | | | | 408 | |
Park Electrochemical | | | 1,982 | | | | 32 | |
Paycom Software * | | | 6,600 | | | | 267 | |
PC Connection | | | 831 | | | | 19 | |
PDF Solutions * | | | 4,653 | | | | 68 | |
Pegasystems | | | 7,736 | | | | 204 | |
Perficient * | | | 6,700 | | | | 140 | |
PFSweb * | | | 4,500 | | | | 56 | |
Photronics * | | | 13,129 | | | | 126 | |
Plantronics | | | 6,269 | | | | 279 | |
Plexus * | | | 5,828 | | | | 256 | |
| | | | | | | | |
| Description | | Shares | | | Market Value
($ Thousands) | |
Polycom * | | | 23,847 | | | $ | 286 | |
Power Integrations | | | 5,289 | | | | 264 | |
Progress Software * | | | 9,058 | | | | 239 | |
Proofpoint * | | | 6,700 | | | | 393 | |
PROS Holdings * | | | 3,399 | | | | 48 | |
PTC * | | | 20,390 | | | | 729 | |
Pure Storage, Cl A *(A) | | | 5,800 | | | | 68 | |
Q2 Holdings * | | | 2,400 | | | | 60 | |
QAD, Cl A | | | 2,900 | | | | 54 | |
Qlik Technologies * | | | 15,225 | | | | 437 | |
QLogic * | | | 13,122 | | | | 182 | |
Qualys * | | | 3,800 | | | | 119 | |
Quantum * | | | 41,478 | | | | 16 | |
QuinStreet * | | | 1,186 | | | | 4 | |
Quotient Technology *(A) | | | 9,400 | | | | 105 | |
Rackspace Hosting * | | | 20,277 | | | | 507 | |
Rambus * | | | 21,110 | | | | 255 | |
RealNetworks * | | | 844 | | | | 4 | |
RealPage * | | | 8,546 | | | | 186 | |
Reis | | | 500 | | | | 12 | |
RetailMeNot * | | | 8,100 | | | | 58 | |
RingCentral, Cl A * | | | 8,300 | | | | 164 | |
Rocket Fuel * | | | 2,100 | | | | 5 | |
Rofin-Sinar Technologies * | | | 5,715 | | | | 183 | |
Rogers * | | | 3,593 | | | | 239 | |
Rovi * | | | 13,934 | | | | 234 | |
Rubicon Project * | | | 4,000 | | | | 59 | |
Rudolph Technologies * | | | 5,507 | | | | 80 | |
Sabre | | | 19,800 | | | | 558 | |
Sanmina * | | | 12,666 | | | | 339 | |
Sapiens International | | | 5,300 | | | | 64 | |
ScanSource * | | | 5,696 | | | | 219 | |
Science Applications International | | | 7,842 | | | | 428 | |
SciQuest * | | | 7,138 | | | | 126 | |
Seachange International * | | | 3,843 | | | | 13 | |
Semtech * | | | 12,175 | | | | 287 | |
ServiceNow * | | | 29,069 | | | | 2,082 | |
ServiceSource International * | | | 9,746 | | | | 36 | |
ShoreTel * | | | 13,670 | | | | 90 | |
Shutterstock *(A) | | | 4,397 | | | | 185 | |
Sigma Designs * | | | 5,500 | | | | 40 | |
Silicon Graphics International * | | | 3,190 | | | | 17 | |
Silicon Laboratories * | | | 7,082 | | | | 352 | |
Silver Spring Networks * | | | 8,400 | | | | 110 | |
Sonus Networks * | | | 5,720 | | | | 52 | |
Splunk * | | | 22,984 | | | | 1,320 | |
SPS Commerce * | | | 3,029 | | | | 165 | |
Square, Cl A * | | | 6,600 | | | | 63 | |
SS&C Technologies Holdings | | | 14,809 | | | | 912 | |
Stamps.com * | | | 2,355 | | | | 214 | |
Stratasys *(A) | | | 9,769 | | | | 223 | |
SunPower, Cl A *(A) | | | 10,636 | | | | 186 | |
| | |
| 55 | | SEI Institutional Investments Trust / Annual Report / May 31, 2016 |
SCHEDULE OF INVESTMENTS
Extended Market Index Fund
May 31, 2016
| | | | | | | | |
| Description | | Shares | | | Market Value
($ Thousands) | |
Super Micro Computer * | | | 6,951 | | | $ | 182 | |
Sykes Enterprises * | | | 6,211 | | | | 185 | |
Synaptics * | | | 6,887 | | | | 467 | |
Synchronoss Technologies * | | | 6,297 | | | | 222 | |
SYNNEX | | | 4,870 | | | | 444 | |
Synopsys * | | | 27,952 | | | | 1,444 | |
Syntel * | | | 6,254 | | | | 288 | |
Tableau Software, Cl A * | | | 9,500 | | | | 489 | |
Take-Two Interactive Software * | | | 14,139 | | | | 550 | |
Tangoe *(A) | | | 4,655 | | | | 37 | |
Tech Data * | | | 6,265 | | | | 473 | |
TechTarget * | | | 4,700 | | | | 38 | |
Telenav * | | | 3,400 | | | | 16 | |
TeleTech Holdings | | | 3,427 | | | | 94 | |
Teradyne | | | 39,400 | | | | 781 | |
Tessera Technologies | | | 8,730 | | | | 282 | |
Textura * | | | 4,900 | | | | 127 | |
TiVo * | | | 21,086 | | | | 210 | |
Travelport Worldwide | | | 21,000 | | | | 278 | |
Travelzoo * | | | 287 | | | | 2 | |
Trimble Navigation * | | | 47,020 | | | | 1,203 | |
TrueCar *(A) | | | 7,600 | | | | 58 | |
TTM Technologies * | | | 7,087 | | | | 55 | |
TubeMogul * | | | 5,200 | | | | 65 | |
Twitter * | | | 101,400 | | | | 1,543 | |
Tyler Technologies * | | | 6,187 | | | | 948 | |
Ubiquiti Networks (A) | | | 5,700 | | | | 227 | |
Ultimate Software Group * | | | 5,035 | | | | 1,030 | |
Ultra Clean Holdings * | | | 4,452 | | | | 25 | |
Ultratech * | | | 5,268 | | | | 120 | |
Unisys *(A) | | | 7,183 | | | | 61 | |
United Online * | | | 3,600 | | | | 39 | |
Universal Display * | | | 7,708 | | | | 518 | |
Vantiv, Cl A * | | | 25,808 | | | | 1,388 | |
Varonis Systems * | | | 1,500 | | | | 36 | |
Vasco Data Security International * | | | 4,254 | | | | 70 | |
Veeco Instruments * | | | 7,001 | | | | 125 | |
VeriFone Holdings * | | | 19,629 | | | | 518 | |
Verint Systems * | | | 10,350 | | | | 341 | |
ViaSat * | | | 7,356 | | | | 508 | |
Viavi Solutions * | | | 40,700 | | | | 278 | |
Violin Memory *(A) | | | 9,300 | | | | 5 | |
VirnetX Holding *(A) | | | 4,742 | | | | 23 | |
Virtusa * | | | 4,649 | | | | 164 | |
Vishay Intertechnology | | | 22,517 | | | | 292 | |
Vishay Precision Group * | | | 464 | | | | 6 | |
VMware, Cl A *(A) | | | 15,017 | | | | 909 | |
Web.com Group * | | | 7,239 | | | | 123 | |
WebMD Health, Cl A * | | | 6,627 | | | | 436 | |
WEX * | | | 6,776 | | | | 625 | |
Wix.com * | | | 4,200 | | | | 116 | |
Workday, Cl A * | | | 19,089 | | | | 1,448 | |
| | | | | | | | |
| Description | | Shares | | | Market Value
($ Thousands) | |
Xcerra * | | | 7,941 | | | $ | 52 | |
XO Group * | | | 4,415 | | | | 75 | |
Xura * | | | 4,800 | | | | 119 | |
Yelp, Cl A * | | | 10,198 | | | | 267 | |
Zebra Technologies, Cl A * | | | 9,564 | | | | 508 | |
Zendesk * | | | 11,500 | | | | 282 | |
Zillow Group, Cl A * | | | 7,391 | | | | 216 | |
Zillow Group, Cl C *(A) | | | 14,482 | | | | 415 | |
Zix * | | | 6,113 | | | | 25 | |
Zynga, Cl A * | | | 119,074 | | | | 306 | |
| | | | | | | | |
| | | | | | | 116,180 | |
| | | | | | | | |
| | |
Materials — 5.2% | | | | | | | | |
A. Schulman | | | 4,729 | | | | 120 | |
AEP Industries | | | 980 | | | | 59 | |
AK Steel Holding *(A) | | | 31,700 | | | | 136 | |
Albemarle | | | 20,264 | | | | 1,591 | |
Allegheny Technologies (A) | | | 21,500 | | | | 266 | |
American Vanguard | | | 3,999 | | | | 52 | |
AptarGroup | | | 11,466 | | | | 886 | |
Ashland | | | 11,008 | | | | 1,248 | |
Axalta Coating Systems * | | | 17,800 | | | | 501 | |
Axiall | | | 12,425 | | | | 289 | |
Balchem | | | 6,188 | | | | 371 | |
Bemis | | | 17,100 | | | | 861 | |
Berry Plastics Group * | | | 22,138 | | | | 867 | |
Boise Cascade * | | | 5,970 | | | | 137 | |
Cabot | | | 10,832 | | | | 495 | |
Calgon Carbon | | | 8,218 | | | | 122 | |
Carpenter Technology | | | 8,701 | | | | 279 | |
Celanese, Cl A | | | 27,492 | | | | 1,938 | |
Century Aluminum *(A) | | | 6,659 | | | | 43 | |
Chase | | | 800 | | | | 47 | |
Chemours | | | 32,100 | | | | 280 | |
Chemtura * | | | 11,929 | | | | 318 | |
Clearwater Paper * | | | 2,951 | | | | 185 | |
Cliffs Natural Resources *(A) | | | 41,500 | | | | 178 | |
Coeur Mining * | | | 26,161 | | | | 197 | |
Commercial Metals | | | 19,541 | | | | 336 | |
Compass Minerals International | | | 5,740 | | | | 447 | |
Crown Holdings * | | | 25,135 | | | | 1,311 | |
Deltic Timber | | | 1,596 | | | | 103 | |
Domtar | | | 10,850 | | | | 419 | |
Eagle Materials | | | 9,283 | | | | 727 | |
Ferro * | | | 14,205 | | | | 196 | |
Ferroglobe | | | 11,102 | | | | 101 | |
Flotek Industries *(A) | | | 10,196 | | | | 120 | |
FutureFuel | | | 3,876 | | | | 43 | |
GCP Applied Technologies * | | | 11,524 | | | | 274 | |
Glatfelter | | | 7,871 | | | | 161 | |
Graphic Packaging Holding | | | 58,117 | | | | 779 | |
Greif, Cl A | | | 6,519 | | | | 234 | |
| | |
| 56 | | SEI Institutional Investments Trust / Annual Report / May 31, 2016 |
SCHEDULE OF INVESTMENTS
Extended Market Index Fund
May 31, 2016
| | | | | | | | |
| Description | | Shares | | | Market Value
($ Thousands) | |
H.B. Fuller | | | 9,733 | | | $ | 444 | |
Handy & Harman * | | | 800 | | | | 20 | |
Hawkins | | | 1,773 | | | | 69 | |
Haynes International | | | 2,823 | | | | 81 | |
Headwaters * | | | 14,120 | | | | 268 | |
Hecla Mining (A) | | | 65,556 | | | | 266 | |
Huntsman | | | 39,124 | | | | 584 | |
Ingevity * | | | 7,900 | | | | 230 | |
Innophos Holdings | | | 2,889 | | | | 111 | |
Innospec | | | 4,513 | | | | 219 | |
Intrepid Potash * | | | 7,060 | | | | 9 | |
Kaiser Aluminum | | | 3,154 | | | | 270 | |
KapStone Paper and Packaging | | | 17,642 | | | | 269 | |
KMG Chemicals | | | 2,509 | | | | 54 | |
Koppers Holdings * | | | 4,773 | | | | 121 | |
Kraton Performance Polymers * | | | 4,880 | | | | 133 | |
Kronos Worldwide (A) | | | 3,484 | | | | 20 | |
Louisiana-Pacific * | | | 26,942 | | | | 493 | |
LSB Industries * | | | 2,939 | | | | 39 | |
Materion | | | 3,474 | | | | 84 | |
Minerals Technologies | | | 6,124 | | | | 353 | |
Multi Packaging Solutions International * | | | 4,800 | | | | 76 | |
Myers Industries | | | 3,418 | | | | 49 | |
Neenah Paper | | | 2,593 | | | | 180 | |
NewMarket | | | 1,597 | | | | 647 | |
Olin | | | 29,116 | | | | 670 | |
Olympic Steel | | | 1,927 | | | | 46 | |
OMNOVA Solutions * | | | 7,567 | | | | 52 | |
Packaging Corp of America | | | 16,949 | | | | 1,156 | |
Platform Specialty Products *(A) | | | 27,200 | | | | 258 | |
PolyOne | | | 15,032 | | | | 563 | |
Quaker Chemical | | | 2,734 | | | | 236 | |
Rayonier Advanced Materials | | | 9,817 | | | | 127 | |
Real Industry * | | | 7,000 | | | | 47 | |
Reliance Steel & Aluminum | | | 13,038 | | | | 969 | |
Rentech * | | | 3,726 | | | | 9 | |
Royal Gold | | | 12,002 | | | | 674 | |
RPM International | | | 24,088 | | | | 1,209 | |
Ryerson Holding * | | | 1,400 | | | | 20 | |
Schnitzer Steel Industries, Cl A | | | 3,456 | | | | 56 | |
Schweitzer-Mauduit International | | | 4,938 | | | | 170 | |
Scotts Miracle-Gro, Cl A | | | 8,059 | | | | 560 | |
Senomyx *(A) | | | 4,900 | | | | 14 | |
Sensient Technologies | | | 8,835 | | | | 603 | |
Silgan Holdings | | | 7,030 | | | | 360 | |
Sonoco Products | | | 18,421 | | | | 878 | |
Southern Copper (A) | | | 20,029 | | | | 522 | |
Steel Dynamics | | | 44,037 | | | | 1,087 | |
Stepan | | | 3,825 | | | | 221 | |
Stillwater Mining * | | | 24,580 | | | | 249 | |
Summit Materials, Cl A * | | | 7,358 | | | | 160 | |
SunCoke Energy | | | 8,646 | | | | 52 | |
| | | | | | | | |
| Description | | Shares | | | Market Value
($ Thousands) | |
Tahoe Resources | | | 43,288 | | | $ | 516 | |
TimkenSteel | | | 7,904 | | | | 71 | |
Trecora Resources * | | | 2,517 | | | | 28 | |
Tredegar | | | 5,341 | | | | 87 | |
Trinseo | | | 2,300 | | | | 108 | |
Tronox, Cl A | | | 10,100 | | | | 47 | |
United States Steel (A) | | | 25,200 | | | | 365 | |
US Concrete * | | | 3,000 | | | | 192 | |
Valspar | | | 14,226 | | | | 1,541 | |
Westlake Chemical | | | 7,810 | | | | 345 | |
Worthington Industries | | | 9,402 | | | | 351 | |
WR Grace | | | 12,524 | | | | 972 | |
| | | | | | | | |
| | | | | | | 37,397 | |
| | | | | | | | |
| | |
Telecommunication Services — 1.5% | | | | | | | | |
8x8 * | | | 16,714 | | | | 213 | |
Atlantic Telegraph-Network | | | 2,267 | | | | 169 | |
Boingo Wireless * | | | 2,700 | | | | 20 | |
Cincinnati Bell * | | | 46,686 | | | | 186 | |
Cogent Communications Holdings | | | 8,304 | | | | 331 | |
Consolidated Communications Holdings | | | 10,276 | | | | 253 | |
FairPoint Communications * | | | 4,570 | | | | 62 | |
General Communication, Cl A * | | | 8,003 | | | | 125 | |
Globalstar *(A) | | | 73,600 | | | | 160 | |
Hawaiian Telcom Holdco * | | | 905 | | | | 18 | |
IDT, Cl B | | | 3,103 | | | | 46 | |
inContact * | | | 8,528 | | | | 118 | |
Inteliquent | | | 7,353 | | | | 123 | |
Intelsat * | | | 5,200 | | | | 17 | |
Iridium Communications *(A) | | | 11,746 | | | | 103 | |
Liberty Braves Group, Cl A * | | | 1,803 | | | | 28 | |
Liberty Braves Group, Cl C * | | | 3,617 | | | | 54 | |
Liberty SiriusXM Group, Cl A * | | | 18,035 | | | | 575 | |
Liberty SiriusXM Group, Cl C * | | | 36,170 | | | | 1,138 | |
Lumos Networks * | | | 2,271 | | | | 29 | |
ORBCOMM * | | | 7,786 | | | | 73 | |
pdvWireless *(A) | | | 2,000 | | | | 48 | |
SBA Communications, Cl A * | | | 22,719 | | | | 2,258 | |
Shenandoah Telecommunications | | | 9,304 | | | | 298 | |
Spok Holdings | | | 4,132 | | | | 72 | |
Sprint *(A) | | | 143,690 | | | | 546 | |
Straight Path Communications * | | | 2,700 | | | | 86 | |
Telephone & Data Systems | | | 16,355 | | | | 471 | |
T-Mobile US * | | | 49,105 | | | | 2,100 | |
US Cellular * | | | 2,952 | | | | 111 | |
Vonage Holdings * | | | 30,720 | | | | 142 | |
Windstream Holdings (A) | | | 14,883 | | | | 125 | |
Zayo Group Holdings * | | | 25,400 | | | | 706 | |
| | | | | | | | |
| | | | | | | 10,804 | |
| | | | | | | | |
| | |
Utilities — 3.8% | | | | | | | | |
Abengoa Yield (A) | | | 7,600 | | | | 137 | |
| | |
| 57 | | SEI Institutional Investments Trust / Annual Report / May 31, 2016 |
SCHEDULE OF INVESTMENTS
Extended Market Index Fund
May 31, 2016
| | | | | | | | |
| Description | | Shares | | | Market Value
($ Thousands) | |
ALLETE | | | 9,170 | | | $ | 530 | |
Alliant Energy | | | 40,636 | | | | 1,506 | |
American States Water | | | 6,574 | | | | 257 | |
Aqua America | | | 30,537 | | | | 987 | |
Artesian Resources, Cl A | | | 2,184 | | | | 62 | |
Atlantic Power | | | 12,421 | | | | 29 | |
Atmos Energy | | | 18,182 | | | | 1,325 | |
Avangrid | | | 10,950 | | | | 460 | |
Avista | | | 10,852 | | | | 436 | |
Black Hills | | | 8,802 | | | | 533 | |
California Water Service Group | | | 9,641 | | | | 281 | |
Calpine * | | | 64,172 | | | | 950 | |
Chesapeake Utilities | | | 2,915 | | | | 168 | |
Connecticut Water Service | | | 1,906 | | | | 92 | |
Consolidated Water | | | 3,000 | | | | 40 | |
Dynegy, Cl A * | | | 21,400 | | | | 403 | |
El Paso Electric | | | 6,836 | | | | 305 | |
Empire District Electric | | | 8,156 | | | | 273 | |
Great Plains Energy | | | 28,223 | | | | 824 | |
Hawaiian Electric Industries * | | | 20,158 | | | | 662 | |
IDACORP | | | 9,324 | | | | 683 | |
ITC Holdings | | | 28,075 | | | | 1,250 | |
MDU Resources Group | | | 33,232 | | | | 760 | |
MGE Energy | | | 5,914 | | | | 300 | |
Middlesex Water | | | 2,701 | | | | 100 | |
National Fuel Gas | | | 15,688 | | | | 863 | |
New Jersey Resources | | | 15,394 | | | | 541 | |
Northwest Natural Gas | | | 4,976 | | | | 273 | |
NorthWestern | | | 7,746 | | | | 449 | |
NRG Yield, Cl A | | | 7,000 | | | | 102 | |
NRG Yield, Cl C | | | 12,100 | | | | 187 | |
OGE Energy | | | 34,476 | | | | 1,041 | |
ONE Gas | | | 8,800 | | | | 516 | |
Ormat Technologies | | | 6,934 | | | | 302 | |
Otter Tail | | | 6,146 | | | | 182 | |
Pattern Energy Group, Cl A | | | 10,300 | | | | 224 | |
Piedmont Natural Gas | | | 14,392 | | | | 864 | |
PNM Resources | | | 15,017 | | | | 493 | |
Portland General Electric | | | 15,400 | | | | 634 | |
Questar | | | 32,608 | | | | 822 | |
SJW | | | 2,464 | | | | 85 | |
South Jersey Industries | | | 12,196 | | | | 352 | |
Southwest Gas | | | 8,941 | | | | 621 | |
Spire | | | 8,103 | | | | 515 | |
Talen Energy * | | | 13,600 | | | | 156 | |
TerraForm Global, Cl A | | | 2,200 | | | | 6 | |
TerraForm Power, Cl A (A) | | | 7,900 | | | | 67 | |
UGI | | | 29,996 | | | | 1,287 | |
Unitil | | | 3,058 | | | | 121 | |
Vectren | | | 15,343 | | | | 762 | |
Vivint Solar *(A) | | | 4,900 | | | | 18 | |
Westar Energy, Cl A | | | 24,570 | | | | 1,384 | |
| | | | | | | | |
| Description | | Shares | | | Market Value
($ Thousands) | |
WGL Holdings | | | 9,261 | | | $ | 604 | |
York Water | | | 1,552 | | | | 42 | |
| | | | | | | | |
| | | | | | | 26,866 | |
| | | | | | | | |
Total Common Stock
(Cost $676,859) ($ Thousands) | | | | | | | 696,066 | |
| | | | | | | | |
| | | Number of Rights | | | | |
| | |
RIGHTS — 0.0% | | | | | | | | |
| | |
Bermuda — 0.0% | | | | | | | | |
Central European Media Enterprises ‡‡ | | | — | | | | — | |
| | | | | | | | |
| | |
United States — 0.0% | | | | | | | | |
Chelsea Therapeutics International ‡‡ | | | 4 | | | | — | |
Durata Therapeutics ‡‡ | | | 1 | | | | — | |
Dyax, Expires 12/31/2019 | | | 23 | | | | — | |
Enterprise Bancorp, Expires 06/01/2016 | | | 1 | | | | 2 | |
Leap Wireless ‡‡ | | | 8 | | | | — | |
Liberty Braves Group, Expires 06/21/2016 | | | 3 | | | | 6 | |
Trius Contingent Value ‡‡ | | | 3 | | | | — | |
| | | | | | | | |
Total Rights
(Cost $—) ($ Thousands) | | | | | | | 8 | |
| | | | | | | | |
| | | Number of
Warrants | | | | |
| | |
WARRANT — 0.0% | | | | | | | | |
Tejon Ranch, Expires 08/31/16 | | | 96 | | | | — | |
| | | | | | | | |
Total Warrant
(Cost $0) ($ Thousands) | | | | | | | — | |
| | | | | | | | |
| | | Shares | | | | |
| |
AFFILIATED PARTNERSHIP — 6.0% | | | | | |
SEI Liquidity Fund, L.P. | | | | | | | | |
0.410% **†(B) | | | 42,597,677 | | | | 42,598 | |
| | | | | | | | |
Total Affiliated Partnership
(Cost $42,598) ($ Thousands) | | | | | | | 42,598 | |
| | | | | | | | |
| | | Face Amount
(Thousands) | | | | |
| |
U.S. TREASURY OBLIGATIONS — 0.1% | | | | | |
U.S. Treasury Bills | | | | | | | | |
0.451%, 09/08/2016 (C)(E) | | $ | 510 | | | | 509 | |
0.433%, 06/16/2016 (C)(E) | | | 500 | | | | 500 | |
| | | | | | | | |
Total U.S. Treasury Obligations
(Cost $1,009) ($ Thousands) | | | | | | | 1,009 | |
| | | | | | | | |
| | |
| 58 | | SEI Institutional Investments Trust / Annual Report / May 31, 2016 |
SCHEDULE OF INVESTMENTS
Extended Market Index Fund
May 31, 2016
| | | | | | | | |
| Description | | Shares | | | Market Value
($ Thousands) | |
CASH EQUIVALENT — 2.0% | | | | | | | | |
SEI Daily Income Trust, Prime Obligation Fund, Cl A | | | | | | | | |
0.270% **† | | | 14,579,354 | | | $ | 14,579 | |
| | | | | | | | |
Total Cash Equivalent
(Cost $14,579) ($ Thousands) | | | | | | | 14,579 | |
| | | | | | | | |
Total Investments — 105.6%
(Cost $735,045) ($ Thousands) | | | | | | $ | 754,260 | |
| | | | | | | | |
A list of the open futures contracts held by the Fund at May 31, 2016, is as follows:
| | | | | | | | | | | | |
| Type of Contract | | Number of
Contracts
Long (Short) | | | Expiration Date | | | Unrealized
Appreciation
($ Thousands) | |
Russell 2000 Index E-MINI | | | 59 | | | | Jun-2016 | | | $ | 421 | |
S&P Mid Cap 400 Index E-MINI | | | 67 | | | | Jun-2016 | | | | 645 | |
| | | | | | | | | | | | |
| | | | | | | | | | $ | 1,066 | |
| | | | | | | | | | | | |
For the year ended May 31, 2016, the total amount of all open futures contracts, as presented in the table above, are representative of the volume of activity for the derivative type during the year.
Percentages are based on a Net Assets of $714,258 ($ Thousands).
| * | | Non-income producing security. |
| ** | | Rate shown is the 7-day effective yield as of May 31, 2016. |
| † | | Investment in Affiliated Security (see Note 6). |
| ‡ | | Real Estate Investment Trust. |
| ‡‡ | | Expiration date unavailable. |
| (A) | | This security or a partial position of this security is on loan at May 31, 2016. The total market value of securities on loan at May 31, 2016 was $41,654 ($ Thousands). |
| (B) | | This security was purchased with cash collateral held from securities on loan. The total market value of such securities as of May 31, 2016 was $42,598 ($Thousands). |
| (C) | | The rate reported is the effective yield at time of purchase. |
| (D) | | The Fund may purchase securities of certain companies with which it is affiliated to the extent those companies are represented in its benchmark index. |
| (E) | | Security, or portion thereof, has been pledged as collateral on open futures contracts. |
AID — Agency for International Development
Cl — Class
L.P. — Limited Partnership
MSCI — Morgan Stanley Capital International
PIPE — Private Investment in Public Entity
REIT — Real Estate Investment Trust
Ser — Series
S&P — Standard & Poor’s
SPX — Standard & Poor’s 500 Index
The following is a list of the level of inputs used as of May 31, 2016, in valuing the Fund’s investments and other financial instruments carried a value ($ Thousands):
| | | | | | | | | | | | | | | | |
| Investments in Securities | | Level 1 | | | Level 2 | | | Level 3 | | | Total | |
Common Stock | | $ | 696,066 | | | $ | — | | | $ | — | | | $ | 696,066 | |
Rights | | | 8 | | | | — | | | | — | | | | 8 | |
Warrant | | | — | | | | — | | | | — | | | | — | |
Affiliated Partnership | | | — | | | | 42,598 | | | | — | | | | 42,598 | |
U.S. Treasury Obligations | | | — | | | | 1,009 | | | | — | | | | 1,009 | |
Cash Equivalent | | | 14,579 | | | | — | | | | — | | | | 14,579 | |
| | | | | | | | | | | | | | | | |
Total Investments in Securities | | $ | 710,653 | | | $ | 43,607 | | | $ | — | | | $ | 754,260 | |
| | | | | | | | | | | | | | | | |
| | | | | | | | | | | | | |
| Other Financial Instruments | | Level 1 | | | Level 2 | | | Level 3 | | | Total | |
Futures Contracts * | | | | | | | | | | | | | | | | |
Unrealized Appreciation | | $ | 1,066 | | | $ | — | | | $ | — | | | $ | 1,066 | |
| | | | | | | | | | | | | | | | |
Total Other Financial Instruments | | $ | 1,066 | | | $ | — | | | $ | — | | | $ | 1,066 | |
| | | | | | | | | | | | | | | | |
| * | | Futures contracts are value at the unrealized appreciation on the instrument. |
For the year ended May 31, 2016, there were no transfers between Level 1 and Level 2 assets and liabilities.
For the year ended May 31, 2016, there were no transfers between Level 2 and Level 3 assets and liabilities.
For more information on valuation inputs, see Note 2 – Significant Accounting Policies in Notes to Financial Statements.
Amounts designated as “—” are $0 or have been rounded to $0.
The accompanying notes are an integral part of the financial statements.
| | |
| 59 | | SEI Institutional Investments Trust / Annual Report / May 31, 2016 |
SCHEDULE OF INVESTMENTS
Small Cap Fund
May 31, 2016
| | | | | | | | |
| Description | | Shares | | | Market Value
($ Thousands) | |
COMMON STOCK — 93.2% | | | | | | | | |
| | |
Consumer Discretionary — 11.0% | | | | | | | | |
1-800-Flowers.com, Cl A * | | | 7,805 | | | $ | 63 | |
2U *(A) | | | 15,341 | | | | 427 | |
Abercrombie & Fitch, Cl A | | | 6,678 | | | | 133 | |
AMC Entertainment Holdings, Cl A | | | 3,229 | | | | 93 | |
American Axle & Manufacturing Holdings * | | | 23,227 | | | | 387 | |
American Eagle Outfitters | | | 1,917 | | | | 30 | |
American Public Education * | | | 11,519 | | | | 325 | |
Apollo Education Group, Cl A * | | | 6,616 | | | | 61 | |
Bassett Furniture Industries | | | 3,538 | | | | 99 | |
Beazer Homes USA * | | | 29,047 | | | | 228 | |
Big 5 Sporting Goods | | | 19,393 | | | | 162 | |
Big Lots | | | 16,515 | | | | 864 | |
BJ’s Restaurants * | | | 4,563 | | | | 204 | |
Bloomin’ Brands | | | 26,049 | | | | 496 | |
Bob Evans Farms | | | 416 | | | | 19 | |
Boot Barn Holdings * | | | 2,059 | | | | 16 | |
Boyd Gaming * | | | 26,361 | | | | 498 | |
Brinker International | | | 13,900 | | | | 625 | |
Brunswick | | | 4,145 | | | | 198 | |
Build-A-Bear Workshop, Cl A * | | | 1,539 | | | | 21 | |
Burlington Stores * | | | 13,218 | | | | 798 | |
Cablevision Systems, Cl A | | | 5,107 | | | | 177 | |
Caesars Entertainment *(A) | | | 17,094 | | | | 125 | |
CalAtlantic Group | | | 7,400 | | | | 274 | |
Callaway Golf | | | 89,318 | | | | 899 | |
Capella Education | | | 1,019 | | | | 53 | |
Carmike Cinemas * | | | 36,927 | | | | 1,103 | |
Carrols Restaurant Group * | | | 6,731 | | | | 82 | |
Cavco Industries * | | | 7,382 | | | | 733 | |
Century Communities * | | | 46,800 | | | | 848 | |
Children’s Place Retail Stores | | | 8,500 | | | | 599 | |
Christopher & Banks * | | | 1,315 | | | | 3 | |
Churchill Downs | | | 2,335 | | | | 293 | |
Citi Trends | | | 9,074 | | | | 141 | |
Cooper Tire & Rubber | | | 13,861 | | | | 445 | |
Cooper-Standard Holding * | | | 12,171 | | | | 1,046 | |
Core-Mark Holding | | | 20,218 | | | | 1,731 | |
Cracker Barrel Old Country Store | | | 2,084 | | | | 316 | |
Crocs * | | | 35,900 | | | | 353 | |
CSS Industries | | | 10,800 | | | | 289 | |
Dana Holdings | | | 54,570 | | | | 656 | |
Dave & Buster’s Entertainment * | | | 10,698 | | | | 418 | |
Deckers Outdoor * | | | 5,000 | | | | 263 | |
Destination XL Group * | | | 40,100 | | | | 188 | |
DineEquity | | | 394 | | | | 33 | |
DR Horton | | | 5,493 | | | | 168 | |
DreamWorks Animation SKG, Cl A * | | | 3,617 | | | | 146 | |
Drew Industries | | | 3,771 | | | | 292 | |
Duluth Holdings, Cl B * | | | 12,485 | | | | 331 | |
Eldorado Resorts * | | | 1,328 | | | | 20 | |
Entravision Communications, Cl A | | | 19,384 | | | | 140 | |
| | | | | | | | |
| Description | | Shares | | | Market Value
($ Thousands) | |
Ethan Allen Interiors | | | 25,549 | | | $ | 863 | |
Express * | | | 50,584 | | | | 735 | |
Fiesta Restaurant Group * | | | 101,374 | | | | 2,547 | |
Finish Line, Cl A | | | 20,700 | | | | 375 | |
Five Below * | | | 6,483 | | | | 271 | |
Foot Locker | | | 589 | | | | 33 | |
GameStop, Cl A | | | 4,227 | | | | 123 | |
Genesco * | | | 4,685 | | | | 303 | |
G-III Apparel Group * | | | 5,789 | | | | 226 | |
Graham Holdings, Cl B | | | 128 | | | | 64 | |
Group 1 Automotive | | | 5,300 | | | | 330 | |
Harte-Hanks | | | 47,808 | | | | 47 | |
Haverty Furniture | | | 13,427 | | | | 250 | |
Helen of Troy * | | | 1,732 | | | | 178 | |
Hooker Furniture | | | 3,293 | | | | 80 | |
Installed Building Products * | | | 8,636 | | | | 289 | |
Interval Leisure Group | | | 25,700 | | | | 369 | |
Isle of Capri Casinos * | | | 5,846 | | | | 93 | |
J Alexander’s Holdings * | | | 7,415 | | | | 77 | |
Jack in the Box | | | 34,257 | | | | 2,919 | |
JAKKS Pacific * | | | 849 | | | | 6 | |
John Wiley & Sons, Cl A | | | 6,087 | | | | 328 | |
K12 * | | | 3,766 | | | | 45 | |
Kate Spade * | | | 20,664 | | | | 452 | |
Kirkland’s | | | 1,898 | | | | 25 | |
Krispy Kreme Doughnuts * | | | 27,616 | | | | 590 | |
La Quinta Holdings * | | | 11,006 | | | | 131 | |
La-Z-Boy, Cl Z | | | 9,348 | | | | 248 | |
LGI Homes * | | | 1,700 | | | | 46 | |
Libbey | | | 117,484 | | | | 2,008 | |
Lithia Motors, Cl A | | | 5,412 | | | | 446 | |
Loral Space & Communications * | | | 784 | | | | 30 | |
Lumber Liquidators Holdings *(A) | | | 38,700 | | | | 507 | |
Marriott Vacations Worldwide | | | 3,879 | | | | 235 | |
MDC Partners, Cl A (A) | | | 255,104 | | | | 4,577 | |
Media General * | | | 1,141 | | | | 20 | |
Meredith | | | 7,745 | | | | 383 | |
Meritage Homes * | | | 8,100 | | | | 296 | |
Modine Manufacturing * | | | 318 | | | | 3 | |
Monro Muffler Brake | | | 21,255 | | | | 1,338 | |
Murphy USA * | | | 9,281 | | | | 631 | |
NACCO Industries, Cl A | | | 1,971 | | | | 104 | |
National CineMedia | | | 2,420 | | | | 35 | |
New Media Investment | | | 7,098 | | | | 124 | |
New York Times, Cl A | | | 9,159 | | | | 111 | |
Nutrisystem | | | 11,373 | | | | 309 | |
Office Depot * | | | 14,831 | | | | 53 | |
Ollie’s Bargain Outlet Holdings *(A) | | | 12,678 | | | | 318 | |
Outerwall (A) | | | 6,900 | | | | 285 | |
Overstock.com * | | | 3,773 | | | | 64 | |
Papa John’s International | | | 131 | | | | 8 | |
Penske Auto Group | | | 6,233 | | | | 246 | |
| | |
| 60 | | SEI Institutional Investments Trust / Annual Report / May 31, 2016 |
SCHEDULE OF INVESTMENTS
Small Cap Fund
May 31, 2016
| | | | | | | | |
| Description | | Shares | | | Market Value
($ Thousands) | |
Performance Sports Group *(A) | | | 77,087 | | | $ | 251 | |
Perry Ellis International * | | | 3,439 | | | | 67 | |
Pier 1 Imports | | | 569 | | | | 3 | |
Pinnacle Entertainment * | | | 727 | | | | 8 | |
Planet Fitness, Cl A * | | | 15,771 | | | | 282 | |
Pool | | | 6,492 | | | | 594 | |
Rent-A-Center, Cl A | | | 15,700 | | | | 207 | |
Ruth’s Hospitality Group | | | 21,152 | | | | 351 | |
Sally Beauty Holdings * | | | 9,239 | | | | 265 | |
Sequential Brands Group *(A) | | | 102,500 | | | | 826 | |
Shoe Carnival | | | 14,270 | | | | 332 | |
Sinclair Broadcast Group, Cl A | | | 938 | | | | 30 | |
SiteOne Landscape Supply * | | | 14,100 | | | | 397 | |
Six Flags Entertainment | | | 4,820 | | | | 278 | |
Skullcandy * | | | 11,005 | | | | 43 | |
Smith & Wesson Holding *(A) | | | 13,965 | | | | 340 | |
Sonic Automotive, Cl A | | | 16,000 | | | | 286 | |
Stage Stores (A) | | | 15,900 | | | | 88 | |
Steven Madden * | | | 35,223 | | | | 1,208 | |
Stoneridge * | | | 14,036 | | | | 230 | |
Strayer Education * | | | 863 | | | | 42 | |
Superior Industries International | | | 11,758 | | | | 319 | |
Tailored Brands | | | 8,600 | | | | 119 | |
Tenneco * | | | 5,018 | | | | 270 | |
Texas Roadhouse, Cl A | | | 5,834 | | | | 261 | |
Thor Industries | | | 4,408 | | | | 286 | |
Tile Shop Holdings * | | | 15,186 | | | | 277 | |
Tilly’s, Cl A * | | | 19,481 | | | | 115 | |
TopBuild * | | | 7,764 | | | | 281 | |
Tower International | | | 12,411 | | | | 269 | |
TRI Pointe Homes * | | | 16,364 | | | | 191 | |
Tribune Publishing | | | 2,600 | | | | 30 | |
Universal Electronics * | | | 4,228 | | | | 274 | |
Vail Resorts | | | 7,791 | | | | 1,023 | |
Vince Holding *(A) | | | 16,242 | | | | 91 | |
Vitamin Shoppe * | | | 5,095 | | | | 154 | |
Wayfair, Cl A *(A) | | | 8,437 | | | | 347 | |
William Lyon Homes, Cl A * | | | 79,608 | | | | 1,291 | |
Wingstop * | | | 10,396 | | | | 290 | |
Wolverine World Wide | | | 27,037 | | | | 492 | |
ZAGG * | | | 77,525 | | | | 375 | |
| | | | | | | | |
| | | | | | | 54,969 | |
| | | | | | | | |
|
Consumer Staples — 2.9% | |
B&G Foods, Cl A | | | 6,587 | | | | 283 | |
Boston Beer, Cl A * | | | 200 | | | | 31 | |
Cal-Maine Foods (A) | | | 3,338 | | | | 149 | |
Casey’s General Stores | | | 3,520 | | | | 423 | |
Central Garden and Pet, Cl A * | | | 504 | | | | 9 | |
Darling Ingredients * | | | 48,327 | | | | 742 | |
Dean Foods (A) | | | 24,615 | | | | 450 | |
Energizer Holdings | | | 1,896 | | | | 90 | |
| | | | | | | | |
| Description | | Shares | | | Market Value
($ Thousands) | |
Farmer Brothers * | | | 100 | | | $ | 3 | |
Fresh Del Monte Produce | | | 23,725 | | | | 1,242 | |
Freshpet *(A) | | | 84,277 | | | | 780 | |
Ingles Markets, Cl A | | | 7,500 | | | | 280 | |
Ingredion | | | 5,827 | | | | 684 | |
J&J Snack Foods | | | 4,943 | | | | 522 | |
John B Sanfilippo & Son | | | 7,919 | | | | 375 | |
Lancaster Colony | | | 2,570 | | | | 312 | |
Landec * | | | 83,300 | | | | 965 | |
Medifast | | | 1,337 | | | | 43 | |
MGP Ingredients | | | 8,899 | | | | 291 | |
National Beverage * | | | 7,894 | | | | 411 | |
Natural Health Trends | | | 105 | | | | 3 | |
Nu Skin Enterprises, Cl A | | | 2,319 | | | | 91 | |
Omega Protein * | | | 27,449 | | | | 542 | |
Performance Food Group * | | | 11,641 | | | | 289 | |
Pilgrim’s Pride | | | 4,196 | | | | 104 | |
Pinnacle Foods | | | 1,472 | | | | 62 | |
Post Holdings * | | | 5,082 | | | | 386 | |
Quorum Health * | | | 1,302 | | | | 17 | |
Rite Aid * | | | 11,802 | | | | 91 | |
Sanderson Farms (A) | | | 14,684 | | | | 1,317 | |
Seaboard * | | | 34 | | | | 103 | |
Seneca Foods, Cl A * | | | 2,800 | | | | 87 | |
Snyder’s-Lance | | | 3,990 | | | | 123 | |
SpartanNash | | | 52,702 | | | | 1,566 | |
Sprouts Farmers Market * | | | 12,945 | | | | 321 | |
SUPERVALU * | | | 76,767 | | | | 355 | |
TreeHouse Foods * | | | 360 | | | | 34 | |
United Natural Foods * | | | 1,484 | | | | 55 | |
Universal | | | 11,767 | | | | 644 | |
USANA Health Sciences * | | | 273 | | | | 33 | |
Vector Group | | | 979 | | | | 21 | |
WD-40 | | | 181 | | | | 20 | |
Weis Markets | | | 7,611 | | | | 382 | |
| | | | | | | | |
| | | | | | | 14,731 | |
| | | | | | | | |
|
Energy — 3.9% | |
Alberta Oilsands * | | | 536,100 | | | | 47 | |
Alon USA Energy | | | 12,905 | | | | 97 | |
Approach Resources *(A) | | | 109,000 | | | | 291 | |
Archrock | | | 27,870 | | | | 213 | |
Ardmore Shipping | | | 89,900 | | | | 852 | |
Atwood Oceanics | | | 28,795 | | | | 307 | |
Bill Barrett *(A) | | | 65,700 | | | | 467 | |
C&J Energy Services * | | | 14,912 | | | | 8 | |
California Resources | | | 60,231 | | | | 92 | |
Callon Petroleum * | | | 23,839 | | | | 271 | |
Carrizo Oil & Gas * | | | 25,929 | | | | 998 | |
Clayton Williams Energy * | | | 10,070 | | | | 254 | |
CVR Energy | | | 1,223 | | | | 24 | |
Dawson Geophysical * | | | 10,919 | | | | 79 | |
| | |
| 61 | | SEI Institutional Investments Trust / Annual Report / May 31, 2016 |
SCHEDULE OF INVESTMENTS
Small Cap Fund
May 31, 2016
| | | | | | | | |
| Description | | Shares | | | Market Value
($ Thousands) | |
Delek US Holdings | | | 7,029 | | | $ | 97 | |
Denbury Resources | | | 3,664 | | | | 15 | |
DHT Holdings | | | 72,683 | | | | 397 | |
Diamond Offshore Drilling | | | 1,868 | | | | 48 | |
Diamondback Energy * | | | 4,361 | | | | 397 | |
Dril-Quip * | | | 835 | | | | 51 | |
Energen | | | 3,432 | | | | 163 | |
Ensco, Cl A | | | 5,425 | | | | 54 | |
EP Energy, Cl A * | | | 4,795 | | | | 27 | |
Exterran * | | | 12,683 | | | | 159 | |
Frank’s International | | | 1,761 | | | | 28 | |
Frontline | | | 1,576 | | | | 14 | |
Gener8 Maritime * | | | 882 | | | | 6 | |
Gulfport Energy * | | | 31,380 | | | | 965 | |
Helix Energy Solutions Group * | | | 67,998 | | | | 545 | |
Matrix Service * | | | 49,672 | | | | 823 | |
Memorial Resource Development * | | | 34,640 | | | | 547 | |
Navigator Holdings *(A) | | | 26,600 | | | | 371 | |
Newfield Exploration * | | | 1,285 | | | | 52 | |
Newpark Resources * | | | 23,300 | | | | 107 | |
Noble | | | 8,626 | | | | 72 | |
Nordic American Tankers | | | 4,006 | | | | 62 | |
Northern Oil And Gas *(A) | | | 9,700 | | | | 42 | |
Oasis Petroleum * | | | 3,052 | | | | 31 | |
Oceaneering International | | | 1,015 | | | | 34 | |
Pacific Ethanol *(A) | | | 236,876 | | | | 1,499 | |
Par Petroleum * | | | 1,687 | | | | 26 | |
Parsley Energy, Cl A * | | | 28,539 | | | | 744 | |
PBF Energy, Cl A | | | 16,044 | | | | 423 | |
PDC Energy * | | | 6,170 | | | | 358 | |
PHI * | | | 10,900 | | | | 186 | |
QEP Resources | | | 18,398 | | | | 343 | |
Renewable Energy Group * | | | 3,181 | | | | 29 | |
REX American Resources * | | | 4,899 | | | | 286 | |
Rowan, Cl A | | | 4,084 | | | | 69 | |
RSP Permian * | | | 13,795 | | | | 454 | |
Sanchez Energy * | | | 36,704 | | | | 288 | |
Scorpio Tankers | | | 241,011 | | | | 1,417 | |
Ship Finance International | | | 1,890 | | | | 30 | |
StealthGas *(A) | | | 124,000 | | | | 582 | |
Superior Energy Services | | | 11,800 | | | | 203 | |
Synergy Resources * | | | 150,600 | | | | 910 | |
Teekay | | | 17,270 | | | | 182 | |
Teekay Tankers, Cl A | | | 17,010 | | | | 60 | |
TETRA Technologies * | | | 221,127 | | | | 1,210 | |
US Silica Holdings | | | 10,424 | | | | 297 | |
VAALCO Energy * | | | 30,600 | | | | 33 | |
Western Refining | | | 2,903 | | | | 62 | |
Westmoreland Coal *(A) | | | 95,400 | | | | 772 | |
World Fuel Services | | | 3,411 | | | | 157 | |
| | | | | | | | |
| | | | | | | 19,727 | |
| | | | | | | | |
| | | | | | | | |
| Description | | Shares | | | Market Value
($ Thousands) | |
Financials — 24.6% | | | | | |
1st Source | | | 6,820 | | | $ | 231 | |
Acadia Realty Trust ‡ | | | 13,355 | | | | 453 | |
Agree Realty ‡ | | | 12,082 | | | | 514 | |
Alexander & Baldwin | | | 565 | | | | 21 | |
Alexander’s ‡ | | | 43 | | | | 16 | |
Alexandria Real Estate Equities ‡ | | | 4,072 | | | | 395 | |
Alleghany * | | | 112 | | | | 61 | |
Allied World Assurance Holdings | | | 7,579 | | | | 281 | |
Ambac Financial Group * | | | 7,699 | | | | 127 | |
American Assets Trust ‡ | | | 12,833 | | | | 513 | |
American Campus Communities ‡ | | | 17,730 | | | | 834 | |
American Equity Investment Life Holding | | | 1,090 | | | | 18 | |
American Financial Group | | | 3,528 | | | | 259 | |
American National Insurance | | | 636 | | | | 76 | |
AMERISAFE | | | 6,337 | | | | 385 | |
AmTrust Financial Services | | | 8,800 | | | | 233 | |
Anworth Mortgage Asset ‡ | | | 57,000 | | | | 264 | |
Apartment Investment & Management, Cl A ‡ | | | 6,771 | | | | 289 | |
Apollo Commercial Real Estate Finance ‡ | | | 28,900 | | | | 468 | |
Apple Hospitality ‡ | | | 5,213 | | | | 95 | |
Arch Capital Group * | | | 3,804 | | | | 276 | |
Ares Capital | | | 1,950 | | | | 29 | |
Argo Group International Holdings | | | 13,145 | | | | 692 | |
Armada Hoffler Properties ‡ | | | 9,101 | | | | 110 | |
Ashford * | | | 387 | | | | 20 | |
Ashford Hospitality Prime ‡ | | | 4,219 | | | | 46 | |
Ashford Hospitality Trust ‡ | | | 51,500 | | | | 259 | |
Aspen Insurance Holdings | | | 26,140 | | | | 1,251 | |
Associated Banc | | | 14,000 | | | | 262 | |
Assurant | | | 810 | | | | 71 | |
Assured Guaranty | | | 6,897 | | | | 185 | |
Axis Capital Holdings | | | 14,076 | | | | 776 | |
Banc of California | | | 26,800 | | | | 538 | |
Banco Latinoamericano de Comercio Exterior, Cl E | | | 18,800 | | | | 502 | |
Bancorpsouth | | | 12,404 | | | | 296 | |
Bank of Hawaii | | | 605 | | | | 43 | |
Bank of the Ozarks | | | 10,710 | | | | 417 | |
Banner | | | 4,885 | | | | 217 | |
BBCN Bancorp | | | 25,300 | | | | 411 | |
Beneficial Bancorp * | | | 18,256 | | | | 251 | |
Berkshire Hills Bancorp | | | 27,405 | | | | 753 | |
BlackRock Capital Investment (A) | | | 33,900 | | | | 262 | |
Blackstone Mortgage Trust, Cl A ‡ | | | 9,500 | | | | 268 | |
BofI Holding *(A) | | | 7,945 | | | | 149 | |
Boston Private Financial Holdings | | | 21,485 | | | | 270 | |
Brandywine Realty Trust ‡ | | | 15,696 | | | | 248 | |
Brixmor Property Group ‡ | | | 13,403 | | | | 338 | |
Camden National | | | 4,600 | | | | 198 | |
Camden Property Trust ‡ | | | 5,633 | | | | 480 | |
Capital Bank Financial, Cl A | | | 1,241 | | | | 38 | |
| | |
| 62 | | SEI Institutional Investments Trust / Annual Report / May 31, 2016 |
SCHEDULE OF INVESTMENTS
Small Cap Fund
May 31, 2016
| | | | | | | | |
| Description | | Shares | | | Market Value
($ Thousands) | |
Capstead Mortgage ‡ | | | 21,600 | | | $ | 209 | |
Care Capital Properties ‡ | | | 11,150 | | | | 290 | |
CareTrust ‡ | | | 6,713 | | | | 90 | |
Cascade Bancorp * | | | 46,765 | | | | 264 | |
CatchMark Timber Trust, Cl A ‡ | | | 123,100 | | | | 1,331 | |
Cathay General Bancorp | | | 609 | | | | 19 | |
CBL & Associates Properties ‡ | | | 26,467 | | | | 255 | |
Cedar Realty Trust ‡ | | | 187,573 | | | | 1,274 | |
Centerstate Banks | | | 3,527 | | | | 56 | |
Central Pacific Financial | | | 80,118 | | | | 1,920 | |
Chatham Lodging Trust ‡ | | | 9,526 | | | | 207 | |
Chemical Financial (A) | | | 10,562 | | | | 416 | |
Chesapeake Lodging Trust ‡ | | | 539 | | | | 13 | |
Chimera Investment ‡ | | | 5,781 | | | | 87 | |
Clifton Bancorp | | | 1,654 | | | | 25 | |
CNO Financial Group | | | 129,220 | | | | 2,622 | |
CoBiz Financial | | | 36,608 | | | | 463 | |
Colony Financial ‡ | | | 4,749 | | | | 87 | |
Colony Starwood Homes ‡ | | | 55,500 | | | | 1,511 | |
Columbia Property Trust ‡ | | | 6,449 | | | | 133 | |
Commerce Bancshares | | | 5,288 | | | | 259 | |
Communications Sales & Leasing ‡ | | | 3,945 | | | | 99 | |
Community Bank System | | | 324 | | | | 13 | |
Community Trust Bancorp | | | 9,240 | | | | 333 | |
CoreSite Realty ‡ | | | 2,974 | | | | 226 | |
Corporate Office Properties Trust ‡ | | | 1,376 | | | | 37 | |
Corrections Corp of America ‡ | | | 10,171 | | | | 342 | |
Cousins Properties ‡ | | | 63,809 | | | | 685 | |
CubeSmart ‡ | | | 16,603 | | | | 529 | |
Customers Bancorp * | | | 59,652 | | | | 1,604 | |
CVB Financial | | | 14,155 | | | | 248 | |
CyrusOne ‡ | | | 6,741 | | | | 332 | |
CYS Investments ‡ | | | 38,000 | | | | 310 | |
DCT Industrial Trust ‡ | | | 2,252 | | | | 97 | |
DDR ‡ | | | 1,635 | | | | 28 | |
Dime Community Bancshares | | | 22,130 | | | | 406 | |
Douglas Emmett ‡ | | | 20,328 | | | | 689 | |
Duke Realty ‡ | | | 12,419 | | | | 294 | |
DuPont Fabros Technology ‡ | | | 6,594 | | | | 279 | |
Dynex Capital ‡ | | | 28,900 | | | | 193 | |
East West Bancorp | | | 3,792 | | | | 146 | |
EastGroup Properties ‡ | | | 6,208 | | | | 397 | |
Education Realty Trust ‡ | | | 14,852 | | | | 636 | |
Employers Holdings | | | 30,763 | | | | 918 | |
Endurance Specialty Holdings | | | 15,080 | | | | 1,024 | |
Enterprise Financial Services | | | 7,057 | | | | 202 | |
EPR Properties ‡ | | | 9,744 | | | | 695 | |
Equity Commonwealth *‡ | | | 77,372 | | | | 2,235 | |
Equity One ‡ | | | 13,976 | | | | 412 | |
Evercore Partners, Cl A | | | 5,836 | | | | 303 | |
Everest Re Group | | | 4,536 | | | | 812 | |
FBL Financial Group, Cl A | | | 2,088 | | | | 131 | |
| | | | | | | | |
| Description | | Shares | | | Market Value
($ Thousands) | |
FBR | | | 47,675 | | | $ | 916 | |
Federal Agricultural Mortgage, Cl C | | | 16,603 | | | | 599 | |
Federated National Holding | | | 2,195 | | | | 47 | |
FelCor Lodging Trust ‡ | | | 90,400 | | | | 598 | |
Fidelity Southern | | | 9,913 | | | | 162 | |
Financial Engines (A) | | | 10,896 | | | | 301 | |
First American Financial | | | 13,724 | | | | 525 | |
First BanCorp * | | | 7,186 | | | | 30 | |
First Busey | | | 11,400 | | | | 253 | |
First Business Financial Services | | | 2,000 | | | | 49 | |
First Citizens BancShares, Cl A | | | 185 | | | | 48 | |
First Commonwealth Financial | | | 23,400 | | | | 220 | |
First Defiance Financial | | | 7,279 | | | | 294 | |
First Financial Bancorp | | | 2,850 | | | | 56 | |
First Foundation * | | | 28,100 | | | | 645 | |
First Industrial Realty Trust ‡ | | | 17,596 | | | | 436 | |
First Interstate Bancsystem, Cl A | | | 29,247 | | | | 847 | |
First Merchants | | | 9,000 | | | | 233 | |
First NBC Bank Holding * | | | 5,185 | | | | 97 | |
First Niagara Financial Group | | | 10,637 | | | | 116 | |
First Potomac Realty Trust ‡ | | | 7,675 | | | | 69 | |
First Republic Bank | | | 4,169 | | | | 302 | |
FirstMerit | | | 7,173 | | | | 163 | |
Flagstar Bancorp * | | | 16,441 | | | | 399 | |
Flushing Financial | | | 31,022 | | | | 647 | |
FNB (Pennsylvania) | | | 18,900 | | | | 253 | |
FNFV Group * | | | 68,100 | | | | 819 | |
Forest City Realty Trust, Cl A ‡ | | | 5,651 | | | | 129 | |
Four Corners Property Trust ‡ | | | 14,588 | | | | 284 | |
Franklin Street Properties ‡ | | | 77,964 | | | | 890 | |
Fulton Financial | | | 129,122 | | | | 1,840 | |
GAMCO Investors, Cl A | | | 2,093 | | | | 77 | |
Gaming and Leisure Properties ‡ | | | 2,961 | | | | 97 | |
GEO Group ‡ | | | 77,781 | | | | 2,587 | |
Getty Realty ‡ | | | 11,400 | | | | 231 | |
Glacier Bancorp | | | 20,140 | | | | 551 | |
Government Properties Income Trust ‡(A) | | | 10,600 | | | | 208 | |
Gramercy Property Trust ‡ | | | 194,702 | | | | 1,739 | |
Great Southern Bancorp | | | 536 | | | | 21 | |
Great Western Bancorp | | | 9,185 | | | | 312 | |
Hancock Holding | | | 30,000 | | | | 825 | |
Hanmi Financial | | | 32,207 | | | | 784 | |
Hanover Insurance Group | | | 20,526 | | | | 1,779 | |
Healthcare Realty Trust ‡ | | | 3,728 | | | | 119 | |
Healthcare Trust of America, Cl A ‡ | | | 8,858 | | | | 267 | |
Heartland Financial USA | | | 2,351 | | | | 83 | |
Hercules Capital | | | 20,100 | | | | 247 | |
Heritage Financial | | | 2,379 | | | | 43 | |
Heritage Insurance Holdings | | | 7,242 | | | | 95 | |
Hersha Hospitality Trust, Cl A ‡ | | | 12,700 | | | | 225 | |
Highwoods Properties ‡ | | | 15,479 | | | | 753 | |
Home BancShares | | | 10,680 | | | | 469 | |
| | |
| 63 | | SEI Institutional Investments Trust / Annual Report / May 31, 2016 |
SCHEDULE OF INVESTMENTS
Small Cap Fund
May 31, 2016
| | | | | | | | |
| Description | | Shares | | | Market Value
($ Thousands) | |
HomeTrust Bancshares * | | | 4,828 | | | $ | 92 | |
Horace Mann Educators | | | 621 | | | | 21 | |
Hospitality Properties Trust ‡ | | | 29,600 | | | | 758 | |
Hudson Pacific Properties ‡ | | | 868 | | | | 24 | |
Huntington Bancshares | | | 21,259 | | | | 222 | |
Iberiabank | | | 10,198 | | | | 632 | |
Independence Realty Trust ‡ | | | 3,634 | | | | 28 | |
Independent Bank | | | 19,697 | | | | 389 | |
Infinity Property & Casualty | | | 2,013 | | | | 157 | |
International Bancshares | | | 17,500 | | | | 491 | |
International FCStone * | | | 6,910 | | | | 193 | |
Investment Technology Group | | | 1,512 | | | | 28 | |
Investors Bancorp | | | 137,738 | | | | 1,649 | |
Jones Lang LaSalle | | | 353 | | | | 42 | |
KCG Holdings, Cl A * | | | 19,861 | | | | 279 | |
Kearny Financial | | | 51,100 | | | | 669 | |
Kemper | | | 52,600 | | | | 1,700 | |
Kennedy-Wilson Holdings | | | 70,200 | | | | 1,497 | |
Kilroy Realty ‡ | | | 679 | | | | 43 | |
Lakeland Bancorp | | | 21,685 | | | | 250 | |
LaSalle Hotel Properties ‡ | | | 93,114 | | | | 2,152 | |
Lexington Realty Trust ‡ | | | 16,992 | | | | 161 | |
Liberty Property Trust ‡ | | | 7,143 | | | | 267 | |
LTC Properties ‡ | | | 374 | | | | 17 | |
Mack-Cali Realty ‡ | | | 19,800 | | | | 520 | |
Maiden Holdings | | | 122,700 | | | | 1,610 | |
MainSource Financial Group | | | 23,500 | | | | 531 | |
MarketAxess Holdings | | | 767 | | | | 107 | |
MBIA * | | | 12,941 | | | | 93 | |
Mercantile Bank | | | 11,200 | | | | 274 | |
Meridian Bancorp | | | 102,400 | | | | 1,536 | |
MFA Financial ‡ | | | 11,125 | | | | 80 | |
MGIC Investment * | | | 44,947 | | | | 317 | |
Mid-America Apartment Communities ‡ | | | 4,185 | | | | 431 | |
Mortgage Investment Trust ‡ | | | 14,400 | | | | 202 | |
Nasdaq | | | 3,427 | | | | 226 | |
National Bank Holdings, Cl A | | | 81,905 | | | | 1,740 | |
National Health Investors ‡ | | | 4,443 | | | | 310 | |
National Retail Properties ‡ | | | 8,052 | | | | 365 | |
National Storage Affiliates Trust ‡ | | | 13,294 | | | | 277 | |
Navigators Group | | | 3,036 | | | | 277 | |
NBT Bancorp | | | 11,654 | | | | 340 | |
Nelnet, Cl A | | | 15,700 | | | | 576 | |
New Residential Investments ‡ | | | 10,218 | | | | 139 | |
NexPoint Residential Trust ‡ | | | 1,280 | | | | 18 | |
Northfield Bancorp | | | 98,300 | | | | 1,529 | |
OceanFirst Financial | | | 10,300 | | | | 192 | |
OFG Bancorp | | | 28,261 | | | | 258 | |
Old National Bancorp | | | 46,400 | | | | 611 | |
Old Republic International | | | 10,297 | | | | 197 | |
Omega Healthcare Investors ‡ | | | 1,300 | | | | 41 | |
OneBeacon Insurance Group, Cl A | | | 10,067 | | | | 131 | |
| | | | | | | | |
| Description | | Shares | | | Market Value
($ Thousands) | |
Oppenheimer Holdings, Cl A | | | 7,500 | | | $ | 118 | |
Opus Bank | | | 7,867 | | | | 296 | |
Outfront Media ‡ | | | 10,025 | | | | 223 | |
Pacific Premier Bancorp * | | | 872 | | | | 22 | |
PacWest Bancorp | | | 12,629 | | | | 526 | |
Pebblebrook Hotel Trust ‡ | | | 14,259 | | | | 360 | |
PennantPark Investment | | | 29,394 | | | | 191 | |
PennyMac Mortgage Investment Trust ‡ | | | 14,000 | | | | 215 | |
People’s United Financial | | | 13,876 | | | | 220 | |
Piedmont Office Realty Trust, Cl A ‡ | | | 25,816 | | | | 518 | |
Piper Jaffray * | | | 9,073 | | | | 383 | |
Popular | | | 61,751 | | | | 1,935 | |
Post Properties ‡ | | | 8,070 | | | | 489 | |
Potlatch ‡ | | | 233 | | | | 8 | |
PRA Group * | | | 562 | | | | 15 | |
Preferred Bank | | | 5,502 | | | | 181 | |
PrivateBancorp, Cl A | | | 9,746 | | | | 432 | |
ProAssurance | | | 358 | | | | 19 | |
Prosperity Bancshares | | | 9,540 | | | | 514 | |
PS Business Parks ‡ | | | 4,524 | | | | 447 | |
QTS Realty Trust, Cl A ‡ | | | 8,119 | | | | 420 | |
Radian Group | | | 46,863 | | | | 582 | |
RAIT Financial Trust ‡ | | | 6,566 | | | | 22 | |
Rayonier ‡ | | | 3,737 | | | | 97 | |
RE, Cl A | | | 9,409 | | | | 380 | |
Regency Centers �� | | | 5,473 | | | | 419 | |
Regional Management * | | | 788 | | | | 13 | |
Reinsurance Group of America, Cl A | | | 890 | | | | 88 | |
RenaissanceRe Holdings | | | 4,966 | | | | 574 | |
Renasant | | | 14,720 | | | | 507 | |
Republic Bancorp, Cl A | | | 10,200 | | | | 283 | |
Retail Opportunity Investments ‡ | | | 3,665 | | | | 74 | |
Retail Properties of America, Cl A ‡ | | | 10,791 | | | | 171 | |
Rexford Industrial Realty ‡ | | | 1,115 | | | | 22 | |
RLJ Lodging Trust ‡ | | | 6,229 | | | | 128 | |
Ryman Hospitality Properties ‡ | | | 835 | | | | 41 | |
Sabra Health Care ‡ | | | 14,800 | | | | 310 | |
Safeguard Scientifics * | | | 19,236 | | | | 254 | |
Saul Centers ‡ | | | 5,836 | | | | 328 | |
Select Income ‡ | | | 47,108 | | | | 1,160 | |
Selective Insurance Group | | | 25,843 | | | | 960 | |
Senior Housing Properties Trust ‡ | | | 8,748 | | | | 163 | |
Seritage Growth Properties ‡(A) | | | 13,100 | | | | 605 | |
ServisFirst Bancshares | | | 2,381 | | | | 124 | |
Signature Bank NY * | | | 2,404 | | | | 325 | |
Silver Bay Realty Trust ‡ | | | 1,661 | | | | 26 | |
Sovran Self Storage ‡ | | | 3,902 | | | | 422 | |
Spirit Realty Capital ‡ | | | 5,009 | | | | 57 | |
Starwood Property Trust ‡ | | | 7,115 | | | | 147 | |
State Bank Financial | | | 82,000 | | | | 1,783 | |
Stewart Information Services | | | 80 | | | | 3 | |
Stock Yards Bancorp | | | 362 | | | | 10 | |
| | |
| 64 | | SEI Institutional Investments Trust / Annual Report / May 31, 2016 |
SCHEDULE OF INVESTMENTS
Small Cap Fund
May 31, 2016
| | | | | | | | |
| Description | | Shares | | | Market Value
($ Thousands) | |
Stonegate Bank | | | 77 | | | $ | 2 | |
STORE Capital ‡ | | | 3,541 | | | | 90 | |
Summit Hotel Properties ‡ | | | 62,073 | | | | 726 | |
Sun Communities ‡ | | | 4,064 | | | | 284 | |
Sunstone Hotel Investors ‡ | | | 42,559 | | | | 512 | |
Synovus Financial | | | 2,189 | | | | 70 | |
Talmer Bancorp, Cl A | | | 1,519 | | | | 30 | |
Taubman Centers ‡ | | | 2,473 | | | | 170 | |
TCF Financial | | | 63,726 | | | | 916 | |
Texas Capital Bancshares * | | | 6,416 | | | | 329 | |
THL Credit | | | 33,300 | | | | 366 | |
Tompkins Financial | | | 2,100 | | | | 140 | |
Towne Bank (A) | | | 8,348 | | | | 182 | |
TriCo Bancshares | | | 12,200 | | | | 344 | |
Trustmark | | | 958 | | | | 24 | |
Two Harbors Investment ‡ | | | 61,652 | | | | 523 | |
Umpqua Holdings | | | 31,365 | | | | 502 | |
Union Bankshares | | | 9,866 | | | | 268 | |
United Community Banks | | | 57,438 | | | | 1,156 | |
United Financial Bancorp | | | 28,000 | | | | 372 | |
United Fire Group | | | 8,459 | | | | 348 | |
Universal Insurance Holdings (A) | | | 13,900 | | | | 270 | |
Urban Edge Properties ‡ | | | 654 | | | | 18 | |
Urstadt Biddle Properties, Cl A ‡ | | | 11,313 | | | | 239 | |
Validus Holdings | | | 25,587 | | | | 1,246 | |
Washington Federal | | | 24,763 | | | | 619 | |
Washington Real Estate Investment Trust ‡ | | | 413 | | | | 12 | |
Waterstone Financial | | | 9,305 | | | | 135 | |
Webster Financial | | | 1,727 | | | | 68 | |
Weingarten Realty Investors ‡ | | | 5,971 | | | | 225 | |
WesBanco | | | 7,700 | | | | 251 | |
Westamerica Bancorporation | | | 429 | | | | 21 | |
Western Alliance Bancorp * | | | 23,945 | | | | 903 | |
White Mountains Insurance Group | | | 168 | | | | 135 | |
Wintrust Financial | | | 39,109 | | | | 2,083 | |
WisdomTree Investments (A) | | | 9,379 | | | | 116 | |
World Acceptance * | | | 3,200 | | | | 140 | |
WSFS Financial | | | 15,205 | | | | 539 | |
Xenia Hotels & Resorts ‡ | | | 1,334 | | | | 21 | |
Yadkin Financial | | | 61,365 | | | | 1,624 | |
| | | | | | | | |
| | | | | | | 123,472 | |
| | | | | | | | |
|
Health Care — 11.5% | |
Abaxis | | | 2,575 | | | | 118 | |
ABIOMED * | | | 20,284 | | | | 2,014 | |
Acadia Healthcare * | | | 7,662 | | | | 451 | |
ACADIA Pharmaceuticals *(A) | | | 9,034 | | | | 320 | |
Acceleron Pharma * | | | 6,024 | | | | 206 | |
Accuray *(A) | | | 393,600 | | | | 2,145 | |
Acorda Therapeutics * | | | 540 | | | | 15 | |
Adverum Biotechnologies * | | | 9,506 | | | | 43 | |
Air Methods * | | | 7,900 | | | | 268 | |
| | | | | | | | |
| Description | | Shares | | | Market Value
($ Thousands) | |
AMAG Pharmaceuticals * | | | 110,670 | | | $ | 2,373 | |
Amedisys * | | | 6,674 | | | | 340 | |
AMN Healthcare Services * | | | 63,714 | | | | 2,379 | |
Amphastar Pharmaceuticals * | | | 19,026 | | | | 299 | |
Anacor Pharmaceuticals * | | | 1,861 | | | | 185 | |
Analogic | | | 157 | | | | 13 | |
AngioDynamics * | | | 2,117 | | | | 25 | |
Anika Therapeutics * | | | 1,679 | | | | 79 | |
Applied Genetic Technologies * | | | 2,921 | | | | 50 | |
Arrowhead Pharmaceuticals *(A) | | | 17,610 | | | | 108 | |
Avexis * | | | 7,051 | | | | 303 | |
Axovant Sciences * | | | 7,828 | | | | 103 | |
Bellicum Pharmaceuticals *(A) | | | 13,728 | | | | 160 | |
BioCryst Pharmaceuticals * | | | 16,548 | | | | 56 | |
BioDelivery Sciences International * | | | 387,392 | | | | 872 | |
Bio-Rad Laboratories, Cl A * | | | 1,083 | | | | 161 | |
BioSpecifics Technologies * | | | 1,351 | | | | 51 | |
BioTelemetry * | | | 18,129 | | | | 316 | |
Calithera Biosciences * | | | 4,439 | | | | 23 | |
Cambrex * | | | 7,007 | | | | 343 | |
Capital Senior Living * | | | 114,657 | | | | 2,097 | |
Cara Therapeutics * | | | 8,413 | | | | 54 | |
Cardiovascular Systems * | | | 4,487 | | | | 76 | |
Centene * | | | 1,182 | | | | 74 | |
Cepheid * | | | 489 | | | | 14 | |
Coherus Biosciences *(A) | | | 9,752 | | | | 182 | |
Community Health Systems * | | | 13,494 | | | | 181 | |
Concert Pharmaceuticals * | | | 598 | | | | 8 | |
CONMED | | | 11,670 | | | | 465 | |
Corcept Therapeutics * | | | 1,675 | | | | 10 | |
Cross Country Healthcare * | | | 8,062 | | | | 110 | |
Cynosure, Cl A * | | | 68,886 | | | | 3,291 | |
DENTSPLY SIRONA | | | 1,977 | | | | 123 | |
Dermira * | | | 9,087 | | | | 288 | |
Emergent Biosolutions * | | | 6,953 | | | | 305 | |
Endologix * | | | 21,733 | | | | 275 | |
Evolent Health, Cl A * | | | 20,477 | | | | 314 | |
Exact Sciences *(A) | | | 13,384 | | | | 89 | |
Exactech * | | | 15,600 | | | | 385 | |
Exelixis * | | | 48,768 | | | | 316 | |
FibroGen * | | | 6,794 | | | | 127 | |
Five Prime Therapeutics * | | | 2,406 | | | | 110 | |
Flamel Technologies ADR * | | | 183,241 | | | | 1,950 | |
GenMark Diagnostics * | | | 32,756 | | | | 247 | |
Glaukos * | | | 10,783 | | | | 263 | |
Globus Medical, Cl A * | | | 99,709 | | | | 2,417 | |
Greatbatch * | | | 13,735 | | | | 433 | |
Haemonetics * | | | 2,647 | | | | 74 | |
Halozyme Therapeutics *(A) | | | 26,810 | | | | 270 | |
Halyard Health * | | | 4,952 | | | | 154 | |
HealthSouth | | | 14,097 | | | | 568 | |
Healthways * | | | 5,112 | | | | 61 | |
| | |
| 65 | | SEI Institutional Investments Trust / Annual Report / May 31, 2016 |
SCHEDULE OF INVESTMENTS
Small Cap Fund
May 31, 2016
| | | | | | | | |
| Description | | Shares | | | Market Value
($ Thousands) | |
Heska * | | | 7,107 | | | $ | 258 | |
HMS Holdings * | | | 4,327 | | | | 71 | |
Horizon Pharma *(A) | | | 11,847 | | | | 204 | |
ICU Medical * | | | 3,283 | | | | 341 | |
Ignyta * | | | 14,912 | | | | 101 | |
INC Research Holdings, Cl A * | | | 3,289 | | | | 143 | |
Insmed * | | | 12,427 | | | | 147 | |
Insulet * | | | 6,775 | | | | 203 | |
Integra LifeSciences Holdings * | | | 31,106 | | | | 2,324 | |
Invacare | | | 42,600 | | | | 456 | |
K2M Group Holdings * | | | 15,012 | | | | 188 | |
Kindred Healthcare | | | 40,252 | | | | 478 | |
Kite Pharma *(A) | | | 5,012 | | | | 257 | |
Lannett *(A) | | | 8,100 | | | | 198 | |
LeMaitre Vascular | | | 5,658 | | | | 79 | |
Lexicon Pharmaceuticals * | | | 47,141 | | | | 670 | |
LHC Group * | | | 7,811 | | | | 328 | |
LifePoint Hospitals * | | | 920 | | | | 61 | |
Ligand Pharmaceuticals, Cl B * | | | 11,585 | | | | 1,385 | |
LivaNova * | | | 3,446 | | | | 168 | |
Loxo Oncology * | | | 12,037 | | | | 325 | |
Luminex * | | | 8,324 | | | | 171 | |
MacroGenics * | | | 162 | | | | 4 | |
Magellan Health Services * | | | 9,375 | | | | 621 | |
Masimo * | | | 7,798 | | | | 388 | |
Merit Medical Systems * | | | 4,411 | | | | 83 | |
Molina Healthcare * | | | 41,502 | | | | 2,010 | |
Myriad Genetics * | | | 1,889 | | | | 64 | |
Natus Medical * | | | 2,916 | | | | 94 | |
Nektar Therapeutics * | | | 14,050 | | | | 217 | |
NeoGenomics * | | | 52,540 | | | | 471 | |
Neurocrine Biosciences * | | | 11,152 | | | | 554 | |
Nevro *(A) | | | 8,757 | | | | 611 | |
Nobilis Health * | | | 1,435 | | | | 4 | |
Novadaq Technologies *(A) | | | 32,160 | | | | 311 | |
Novavax *(A) | | | 3,325 | | | | 20 | |
NuVasive * | | | 5,104 | | | | 277 | |
OncoMed Pharmaceuticals * | | | 294 | | | | 4 | |
OraSure Technologies * | | | 23,686 | | | | 182 | |
Orthofix International * | | | 6,082 | | | | 269 | |
Owens & Minor | | | 10,421 | | | | 389 | |
Pacific Biosciences of California * | | | 29,215 | | | | 282 | |
PAREXEL International * | | | 427 | | | | 27 | |
PDL BioPharma | | | 82,536 | | | | 296 | |
Penumbra * | | | 5,905 | | | | 312 | |
PerkinElmer | | | 243 | | | | 13 | |
Pernix Therapeutics Holdings *(A) | | | 65,685 | | | | 29 | |
Pfenex * | | | 1,112 | | | | 8 | |
PharMerica * | | | 3,789 | | | | 101 | |
Phibro Animal Health, Cl A | | | 3,013 | | | | 57 | |
PhotoMedex * | | | 7,200 | | | | 2 | |
Portola Pharmaceuticals, Cl A * | | | 9,375 | | | | 258 | |
| | | | | | | | |
| Description | | Shares | | | Market Value
($ Thousands) | |
Press Ganey Holdings * | | | 8,169 | | | $ | 278 | |
Prestige Brands Holdings * | | | 34,391 | | | | 1,858 | |
Prothena * | | | 346 | | | | 17 | |
Quality Systems | | | 1,241 | | | | 16 | |
Quintiles Transnational Holdings * | | | 1,546 | | | | 105 | |
RadNet * | | | 2,023 | | | | 11 | |
REGENXBIO *(A) | | | 5,183 | | | | 64 | |
Repligen * | | | 165 | | | | 4 | |
Retrophin * | | | 318 | | | | 6 | |
Revance Therapeutics *(A) | | | 8,144 | | | | 167 | |
RTI Surgical * | | | 13,670 | | | | 52 | |
Sage Therapeutics * | | | 4,584 | | | | 151 | |
Sagent Pharmaceuticals * | | | 11,293 | | | | 146 | |
Sciclone Pharmaceuticals * | | | 8,956 | | | | 127 | |
SeaSpine Holdings * | | | 2,595 | | | | 26 | |
Second Sight Medical Products *(A) | | | 3,655 | | | | 14 | |
Select Medical Holdings * | | | 16,100 | | | | 204 | |
Spark Therapeutics *(A) | | | 3,245 | | | | 182 | |
STERIS | | | 1,338 | | | | 93 | |
Supernus Pharmaceuticals * | | | 67,774 | | | | 1,322 | |
Surgical Care Affiliates * | | | 8,762 | | | | 392 | |
SurModics * | | | 8,666 | | | | 191 | |
Syneron Medical * | | | 28,330 | | | | 209 | |
Teleflex | | | 813 | | | | 131 | |
TherapeuticsMD *(A) | | | 83,567 | | | | 747 | |
TransEnterix *(A) | | | 46,412 | | | | 85 | |
Trinity Biotech ADR | | | 141,600 | | | | 1,637 | |
Triple-S Management, Cl B * | | | 20,254 | | | | 465 | |
Ultragenyx Pharmaceutical * | | | 1,994 | | | | 146 | |
Unilife *(A) | | | 12,726 | | | | 45 | |
Vascular Solutions * | | | 6,993 | | | | 266 | |
VCA Antech * | | | 652 | | | | 42 | |
Veeva Systems, Cl A * | | | 21,793 | | | | 718 | |
Versartis *(A) | | | 8,897 | | | | 82 | |
Vocera Communications * | | | 50,200 | | | | 580 | |
VWR * | | | 3,842 | | | | 111 | |
WellCare Health Plans * | | | 9,555 | | | | 969 | |
West Pharmaceutical Services | | | 3,693 | | | | 277 | |
Xencor * | | | 630 | | | | 9 | |
| | | | | | | | |
| | | | | | | 57,609 | |
| | | | | | | | |
|
Industrials — 14.6% | |
AAR | | | 30,175 | | | | 737 | |
ABM Industries | | | 365 | | | | 12 | |
ACCO Brands * | | | 81,396 | | | | 809 | |
Acuity Brands | | | 1,649 | | | | 427 | |
Advanced Drainage Systems (A) | | | 11,365 | | | | 276 | |
Aegion, Cl A * | | | 13,625 | | | | 272 | |
Air Transport Services Group * | | | 67,874 | | | | 859 | |
Aircastle | | | 26,200 | | | | 554 | |
Alamo Group | | | 3,500 | | | | 216 | |
Alaska Air Group | | | 3,400 | | | | 226 | |
| | |
| 66 | | SEI Institutional Investments Trust / Annual Report / May 31, 2016 |
SCHEDULE OF INVESTMENTS
Small Cap Fund
May 31, 2016
| | | | | | | | |
| Description | | Shares | | | Market Value
($ Thousands) | |
Allegiant Travel, Cl A | | | 160 | | | $ | 22 | |
American Railcar Industries | | | 5,600 | | | | 222 | |
American Science & Engineering | | | 1,611 | | | | 51 | |
American Woodmark * | | | 1,044 | | | | 84 | |
Apogee Enterprises | | | 73,309 | | | | 3,315 | |
Applied Industrial Technologies | | | 4,156 | | | | 188 | |
ARC Document Solutions * | | | 175,200 | | | | 743 | |
ArcBest | | | 11,300 | | | | 195 | |
Astec Industries | | | 5,999 | | | | 320 | |
Atlas Air Worldwide Holdings * | | | 7,700 | | | | 338 | |
Barrett Business Services | | | 300 | | | | 11 | |
Beacon Roofing Supply * | | | 5,591 | | | | 241 | |
Brady, Cl A | | | 10,966 | | | | 349 | |
Briggs & Stratton | | | 24,006 | | | | 536 | |
BWX Technologies | | | 8,741 | | | | 307 | |
Caesarstone Sdot-Yam * | | | 7,093 | | | | 280 | |
CAI International * | | | 3,458 | | | | 27 | |
Carlisle | | | 5,602 | | | | 582 | |
Celadon Group | | | 35,400 | | | | 350 | |
CIRCOR International | | | 12,814 | | | | 718 | |
Comfort Systems USA | | | 22,830 | | | | 731 | |
Copa Holdings, Cl A | | | 827 | | | | 43 | |
Covanta Holding | | | 37,600 | | | | 627 | |
CRA International * | | | 4,455 | | | | 105 | |
Crane | | | 455 | | | | 26 | |
Cubic | | | 599 | | | | 24 | |
Curtiss-Wright | | | 10,742 | | | | 894 | |
Deluxe | | | 9,400 | | | | 612 | |
DigitalGlobe * | | | 2,776 | | | | 58 | |
Ducommun * | | | 11,574 | | | | 196 | |
Dycom Industries * | | | 3,828 | | | | 325 | |
EMCOR Group | | | 15,680 | | | | 746 | |
Engility Holdings * | | | 17,900 | | | | 421 | |
Ennis | | | 52,022 | | | | 950 | |
Essendant | | | 6,900 | | | | 212 | |
Esterline Technologies * | | | 684 | | | | 46 | |
Fortune Brands Home & Security | | | 6,483 | | | | 380 | |
FreightCar America | | | 99,300 | | | | 1,431 | |
FTI Consulting * | | | 9,575 | | | | 401 | |
G&K Services, Cl A | | | 8,517 | | | | 638 | |
Generac Holdings * | | | 18,800 | | | | 713 | |
General Cable | | | 11,378 | | | | 155 | |
Gibraltar Industries * | | | 13,361 | | | | 399 | |
Global Brass & Copper Holdings | | | 6,117 | | | | 167 | |
Graco | | | 4,205 | | | | 338 | |
Granite Construction | | | 5,763 | | | | 247 | |
Great Lakes Dredge & Dock * | | | 474,000 | | | | 2,161 | |
Hawaiian Holdings * | | | 16,065 | | | | 650 | |
HEICO | | | 11,105 | | | | 739 | |
HEICO, Cl A | | | 456 | | | | 25 | |
Heidrick & Struggles International | | | 5,696 | | | | 105 | |
Herman Miller | | | 15,770 | | | | 499 | |
| | | | | | | | |
| Description | | Shares | | | Market Value
($ Thousands) | |
Hexcel | | | 7,003 | | | $ | 306 | |
Hillenbrand | | | 6,500 | | | | 203 | |
Huron Consulting Group * | | | 41,779 | | | | 2,446 | |
Hyster-Yale Materials Handling | | | 5,400 | | | | 331 | |
ICF International * | | | 54,800 | | | | 2,235 | |
InnerWorkings * | | | 49,800 | | | | 429 | |
Insperity | | | 5,977 | | | | 430 | |
Insteel Industries | | | 6,504 | | | | 180 | |
Interface, Cl A | | | 31,659 | | | | 537 | |
JetBlue Airways * | | | 17,166 | | | | 308 | |
John Bean Technologies | | | 11,087 | | | | 673 | |
Joy Global | | | 14,094 | | | | 240 | |
Kadant | | | 15,006 | | | | 747 | |
KBR | | | 70,161 | | | | 1,021 | |
Kelly Services, Cl A | | | 15,900 | | | | 315 | |
KEYW Holding *(A) | | | 104,200 | | | | 929 | |
Kforce | | | 4,321 | | | | 81 | |
Kirby * | | | 1,714 | | | | 120 | |
Knoll | | | 3,011 | | | | 75 | |
Korn/Ferry International | | | 19,200 | | | | 554 | |
LB Foster, Cl A | | | 8,747 | | | | 101 | |
Lennox International | | | 2,919 | | | | 401 | |
Lydall * | | | 8,680 | | | | 329 | |
Macquarie Infrastructure | | | 1,955 | | | | 140 | |
Manpowergroup | | | 3,008 | | | | 240 | |
Masonite International * | | | 6,298 | | | | 440 | |
MasTec * | | | 112,860 | | | | 2,596 | |
Matson | | | 11,798 | | | | 393 | |
Matthews International, Cl A | | | 20,000 | | | | 1,097 | |
Meritor * | | | 34,598 | | | | 306 | |
Middleby * | | | 3,390 | | | | 421 | |
Mistras Group * | | | 4,767 | | | | 118 | |
Moog, Cl A * | | | 2,111 | | | | 114 | |
MRC Global * | | | 20,955 | | | | 297 | |
MSC Industrial Direct, Cl A | | | 2,353 | | | | 176 | |
Mueller Water Products, Cl A | | | 25,284 | | | | 278 | |
MYR Group * | | | 110 | | | | 3 | |
National Presto Industries | | | 3,041 | | | | 272 | |
Navigant Consulting * | | | 1,280 | | | | 20 | |
NCI Building Systems * | | | 13,477 | | | | 217 | |
Nordson | | | 3,137 | | | | 273 | |
Northwest Pipe * | | | 35,916 | | | | 334 | |
Old Dominion Freight Line * | | | 5,337 | | | | 343 | |
On Assignment * | | | 72,004 | | | | 2,712 | |
Orbital ATK | | | 218 | | | | 19 | |
Orion Marine Group * | | | 133,300 | | | | 623 | |
Oshkosh Truck | | | 5,850 | | | | 269 | |
Owens Corning | | | 7,222 | | | | 369 | |
Park-Ohio Holdings | | | 7,900 | | | | 241 | |
Patrick Industries * | | | 7,970 | | | | 426 | |
Ply Gem Holdings * | | | 5,696 | | | | 86 | |
Primoris Services | | | 29,700 | | | | 639 | |
| | |
| 67 | | SEI Institutional Investments Trust / Annual Report / May 31, 2016 |
SCHEDULE OF INVESTMENTS
Small Cap Fund
May 31, 2016
| | | | | | | | |
| Description | | Shares | | | Market Value
($ Thousands) | |
Quad, Cl A | | | 7,525 | | | $ | 145 | |
Quanta Services * | | | 2,611 | | | | 63 | |
Rand Logistics * | | | 73,172 | | | | 64 | |
Resources Connection | | | 22,622 | | | | 352 | |
Roadrunner Transportation Systems * | | | 12,610 | | | | 102 | |
RPX * | | | 18,116 | | | | 182 | |
Rush Enterprises, Cl A * | | | 11,186 | | | | 246 | |
SkyWest | | | 23,564 | | | | 556 | |
Spirit AeroSystems Holdings, Cl A * | | | 4,985 | | | | 233 | |
SPX FLOW * | | | 4,495 | | | | 135 | |
Standex International | | | 5,008 | | | | 434 | |
Steelcase, Cl A | | | 143,612 | | | | 2,292 | |
Sterling Construction * | | | 70,800 | | | | 358 | |
Swift Transportation, Cl A * | | | 105,026 | | | | 1,636 | |
TAL International Group | | | 8,200 | | | | 118 | |
Terex | | | 3,266 | | | | 69 | |
Tetra Tech | | | 21,122 | | | | 646 | |
Textainer Group Holdings | | | 2,500 | | | | 33 | |
Titan Machinery *(A) | | | 60,300 | | | | 643 | |
Toro | | | 6,190 | | | | 553 | |
TransUnion * | | | 9,893 | | | | 327 | |
Trex * | | | 9,016 | | | | 407 | |
Triumph Group | | | 9,000 | | | | 340 | |
TrueBlue * | | | 2,874 | | | | 57 | |
Tutor Perini * | | | 90,700 | | | | 2,052 | |
UniFirst | | | 3,251 | | | | 376 | |
Universal Forest Products | | | 6,534 | | | | 548 | |
USA Truck * | | | 1,873 | | | | 37 | |
USG * | | | 10,060 | | | | 290 | |
Valmont Industries | | | 4,147 | | | | 574 | |
Wabash National * | | | 38,538 | | | | 546 | |
WageWorks * | | | 61,629 | | | | 3,454 | |
Waste Connections | | | 607 | | | | 40 | |
Watsco | | | 2,880 | | | | 387 | |
West | | | 2,301 | | | | 49 | |
XPO Logistics *(A) | | | 5,882 | | | | 172 | |
Xylem | | | 3,121 | | | | 139 | |
| | | | | | | | |
| | | | | | | 73,439 | |
| | | | | | | | |
|
Information Technology — 16.7% | |
A10 Networks * | | | 749 | | | | 5 | |
Acxiom * | | | 154,702 | | | | 3,277 | |
ADTRAN | | | 15,250 | | | | 297 | |
Advanced Energy Industries * | | | 6,286 | | | | 240 | |
Advanced Micro Devices * | | | 77,786 | | | | 355 | |
Ambarella *(A) | | | 804 | | | | 33 | |
Amkor Technology * | | | 83,664 | | | | 528 | |
Ansys * | | | 556 | | | | 50 | |
Applied Micro Circuits * | | | 96,500 | | | | 635 | |
Arrow Electronics * | | | 4,313 | | | | 279 | |
Aspen Technology * | | | 593 | | | | 23 | |
Atlassian, Cl A *(A) | | | 9,302 | | | | 210 | |
| | | | | | | | |
| Description | | Shares | | | Market Value
($ Thousands) | |
AVG Technologies * | | | 6,556 | | | $ | 126 | |
Avnet | | | 5,007 | | | | 205 | |
Axcelis Technologies * | | | 4,436 | | | | 12 | |
Bankrate * | | | 22,631 | | | | 206 | |
Barracuda Networks *(A) | | | 1,298 | | | | 22 | |
Bel Fuse, Cl B | | | 10,088 | | | | 182 | |
Belden | | | 8,215 | | | | 531 | |
Benchmark Electronics * | | | 39,178 | | | | 812 | |
Benefitfocus *(A) | | | 6,615 | | | | 243 | |
Black Box | | | 27,432 | | | | 344 | |
Blucora * | | | 27,705 | | | | 249 | |
Booz Allen Hamilton Holding, Cl A | | | 16,293 | | | | 477 | |
Brightcove * | | | 6,500 | | | | 44 | |
BroadSoft * | | | 6,864 | | | | 299 | |
Brocade Communications Systems | | | 25,661 | | | | 232 | |
CACI International, Cl A * | | | 737 | | | | 74 | |
Cadence Design Systems * | | | 17,815 | | | | 440 | |
CalAmp * | | | 202,348 | | | | 3,041 | |
Callidus Software * | | | 146,305 | | | | 2,715 | |
Cardtronics * | | | 52,366 | | | | 2,057 | |
Cavium * | | | 53,160 | | | | 2,645 | |
CEVA * | | | 10,822 | | | | 293 | |
CIBER * | | | 424,300 | | | | 526 | |
Ciena * | | | 8,644 | | | | 151 | |
Cimpress *(A) | | | 297 | | | | 30 | |
Coherent * | | | 4,168 | | | | 394 | |
Cohu | | | 16,013 | | | | 189 | |
CommScope Holding * | | | 10,530 | | | | 328 | |
comScore * | | | 766 | | | | 25 | |
Comtech Telecommunications | | | 4,577 | | | | 105 | |
Convergys | | | 6,962 | | | | 196 | |
Cornerstone OnDemand * | | | 91,407 | | | | 3,657 | |
CoStar Group * | | | 1,866 | | | | 386 | |
Cray * | | | 1,862 | | | | 62 | |
CSG Systems International | | | 16,276 | | | | 692 | |
Demandware * | | | 7,523 | | | | 361 | |
DHI Group * | | | 32,356 | | | | 228 | |
Digi International * | | | 88,198 | | | | 974 | |
Dolby Laboratories, Cl A | | | 5,971 | | | | 283 | |
DST Systems | | | 2,310 | | | | 279 | |
EarthLink Holdings | | | 3,385 | | | | 22 | |
Ebix | | | 6,146 | | | | 278 | |
EMCORE * | | | 28,512 | | | | 161 | |
Envestnet * | | | 12,865 | | | | 435 | |
ePlus * | | | 2,400 | | | | 210 | |
Euronet Worldwide * | | | 2,943 | | | | 235 | |
Everi Holdings * | | | 31,918 | | | | 46 | |
EVERTEC | | | 7,370 | | | | 113 | |
Everyday Health * | | | 5,353 | | | | 36 | |
Exar * | | | 268,967 | | | | 1,837 | |
ExlService Holdings * | | | 5,910 | | | | 306 | |
Extreme Networks * | | | 22,014 | | | | 81 | |
| | |
| 68 | | SEI Institutional Investments Trust / Annual Report / May 31, 2016 |
SCHEDULE OF INVESTMENTS
Small Cap Fund
May 31, 2016
| | | | | | | | |
| Description | | Shares | | | Market Value
($ Thousands) | |
Fabrinet * | | | 5,100 | | | $ | 181 | |
Fair Isaac | | | 88 | | | | 10 | |
Fairchild Semiconductor International, Cl A * | | | 5,815 | | | | 116 | |
Finisar * | | | 10,338 | | | | 174 | |
First Solar * | | | 6,758 | | | | 336 | |
Five9 * | | | 32,155 | | | | 328 | |
FleetMatics Group * | | | 6,797 | | | | 278 | |
Gigamon * | | | 1,652 | | | | 51 | |
Global Payments | | | 1 | | | | — | |
GoDaddy, Cl A * | | | 19,322 | | | | 629 | |
GrubHub *(A) | | | 11,256 | | | | 288 | |
Guidewire Software * | | | 12,623 | | | | 741 | |
Hackett Group | | | 3,654 | | | | 53 | |
HubSpot * | | | 4,524 | | | | 216 | |
II-VI * | | | 31,093 | | | | 634 | |
Immersion * | | | 5,995 | | | | 38 | |
Imperva * | | | 6,445 | | | | 246 | |
Infoblox * | | | 85,289 | | | | 1,604 | |
Ingram Micro, Cl A | | | 3,817 | | | | 132 | |
Inphi * | | | 35,809 | | | | 1,117 | |
Insight Enterprises * | | | 22,359 | | | | 607 | |
Instructure * | | | 7,592 | | | | 132 | |
Integrated Device Technology * | | | 4,293 | | | | 100 | |
Internap Network Services * | | | 3,464 | | | | 8 | |
Intersil, Cl A | | | 17,070 | | | | 231 | |
Intralinks Holdings * | | | 35,821 | | | | 281 | |
Ixia * | | | 10,228 | | | | 104 | |
IXYS | | | 10,270 | | | | 112 | |
j2 Global | | | 7,515 | | | | 503 | |
Kulicke & Soffa Industries * | | | 33,200 | | | | 415 | |
Leidos Holdings | | | 1,896 | | | | 94 | |
Liquidity Services * | | | 18,374 | | | | 123 | |
Littelfuse | | | 4,964 | | | | 569 | |
M *(A) | | | 9,284 | | | | 334 | |
Manhattan Associates * | | | 763 | | | | 50 | |
ManTech International, Cl A | | | 5,935 | | | | 213 | |
Marketo * | | | 133,960 | | | | 4,719 | |
Marvell Technology Group | | | 18,556 | | | | 190 | |
MAXIMUS | | | 58,310 | | | | 3,362 | |
MaxLinear, Cl A * | | | 12,870 | | | | 267 | |
Medallion Financial (A) | | | 23,200 | | | | 179 | |
Mentor Graphics | | | 50,450 | | | | 1,082 | |
Mercury Systems * | | | 16,400 | | | | 349 | |
MicroStrategy, Cl A * | | | 506 | | | | 94 | |
Mitek Systems * | | | 35,166 | | | | 320 | |
MKS Instruments | | | 8,732 | | | | 358 | |
MoneyGram International * | | | 53,409 | | | | 347 | |
Monolithic Power Systems | | | 12,018 | | | | 821 | |
Monotype Imaging Holdings | | | 70,056 | | | | 1,673 | |
Monster Worldwide * | | | 30,411 | | | | 81 | |
Multi-Fineline Electronix * | | | 20,616 | | | | 456 | |
NETGEAR * | | | 28,009 | | | | 1,260 | |
| | | | | | | | |
| Description | | Shares | | | Market Value
($ Thousands) | |
NeuStar, Cl A * | | | 17,794 | | | $ | 419 | |
NIC | | | 3,212 | | | | 64 | |
Nimble Storage *(A) | | | 17,264 | | | | 154 | |
Nuance Communications * | | | 10,902 | | | | 182 | |
Paycom Software * | | | 7,864 | | | | 318 | |
PDF Solutions * | | | 125,988 | | | | 1,853 | |
Pegasystems | | | 1,064 | | | | 28 | |
Perficient * | | | 99,696 | | | | 2,089 | |
PFSweb * | | | 21,548 | | | | 269 | |
Photronics * | | | 27,386 | | | | 263 | |
Plantronics | | | 18,500 | | | | 824 | |
Plexus * | | | 7,532 | | | | 331 | |
Polycom * | | | 2,908 | | | | 35 | |
Progress Software * | | | 10,155 | | | | 267 | |
Proofpoint * | | | 40,394 | | | | 2,368 | |
PTC * | | | 5,828 | | | | 208 | |
Q2 Holdings * | | | 8,736 | | | | 218 | |
QAD, Cl A | | | 36,225 | | | | 681 | |
Qlik Technologies * | | | 1,804 | | | | 52 | |
QLogic * | | | 46,749 | | | | 648 | |
Quantum * | | | 21,972 | | | | 8 | |
QuinStreet * | | | 21,592 | | | | 80 | |
RealPage * | | | 1,403 | | | | 31 | |
RetailMeNot * | | | 35,711 | | | | 258 | |
RingCentral, Cl A * | | | 15,179 | | | | 300 | |
Rogers * | | | 4,391 | | | | 292 | |
Rovi * | | | 14,462 | | | | 243 | |
Rudolph Technologies * | | | 19,195 | | | | 280 | |
Sanmina * | | | 29,982 | | | | 803 | |
ScanSource * | | | 983 | | | | 38 | |
Shopify, Cl A * | | | 11,192 | | | | 328 | |
Shutterstock * | | | 98 | | | | 4 | |
Sigma Designs * | | | 4,502 | | | | 33 | |
Silicon Laboratories * | | | 5,594 | | | | 278 | |
Silver Spring Networks * | | | 7,833 | | | | 102 | |
SuperCom *(A) | | | 82,500 | | | | 314 | |
Sykes Enterprises * | | | 40,798 | | | | 1,217 | |
Synaptics * | | | 367 | | | | 25 | |
Synchronoss Technologies * | | | 151 | | | | 5 | |
SYNNEX | | | 4,477 | | | | 408 | |
Synopsys * | | | 6,425 | | | | 332 | |
Tableau Software, Cl A * | | | 2,449 | | | | 126 | |
Take-Two Interactive Software * | | | 5,712 | | | | 222 | |
Tech Data * | | | 12,357 | | | | 934 | |
Telenav * | | | 7,079 | | | | 33 | |
TeleTech Holdings | | | 12,466 | | | | 340 | |
Teradyne | | | 4,701 | | | | 93 | |
Tessera Technologies | | | 725 | | | | 23 | |
Tyler Technologies * | | | 1,189 | | | | 182 | |
Ultratech * | | | 55,200 | | | | 1,259 | |
United Online * | | | 9,864 | | | | 108 | |
Universal Display * | | | 5,833 | | | | 392 | |
| | |
| 69 | | SEI Institutional Investments Trust / Annual Report / May 31, 2016 |
SCHEDULE OF INVESTMENTS
Small Cap Fund
May 31, 2016
| | | | | | | | |
| Description | | Shares | | | Market Value
($ Thousands) | |
Vasco Data Security International * | | | 1,831 | | | $ | 30 | |
Verint Systems * | | | 3,196 | | | | 105 | |
Viavi Solutions * | | | 67,700 | | | | 462 | |
Virtusa * | | | 1,284 | | | | 45 | |
Vishay Intertechnology | | | 39,000 | | | | 505 | |
Vishay Precision Group * | | | 19,700 | | | | 266 | |
WebMD Health, Cl A * | | | 5,954 | | | | 391 | |
Xcerra * | | | 102,400 | | | | 669 | |
XO Group * | | | 2,549 | | | | 43 | |
Zendesk * | | | 24,234 | | | | 594 | |
Zix * | | | 20,458 | | | | 82 | |
Zynga, Cl A * | | | 6,227 | | | | 16 | |
| | | | | | | | |
| | | | | | | 83,983 | |
| | | | | | | | |
|
Materials — 3.4% | |
A. Schulman | | | 7,300 | | | | 185 | |
AEP Industries | | | 1,044 | | | | 63 | |
AK Steel Holding * | | | 2,763 | | | | 12 | |
Allegheny Technologies (A) | | | 41,900 | | | | 519 | |
Avery Dennison | | | 687 | | | | 51 | |
Axiall | | | 1,831 | | | | 43 | |
Bemis | | | 2,429 | | | | 122 | |
Berry Plastics Group * | | | 66,997 | | | | 2,624 | |
Cabot | | | 9,948 | | | | 455 | |
Carpenter Technology | | | 18,700 | | | | 599 | |
Chemtura * | | | 20,000 | | | | 534 | |
Clearwater Paper * | | | 7,700 | | | | 482 | |
Cliffs Natural Resources * | | | 52,241 | | | | 224 | |
Coeur Mining * | | | 32,695 | | | | 246 | |
Crown Holdings * | | | 1,688 | | | | 88 | |
Domtar | | | 13,200 | | | | 510 | |
Eagle Materials | | | 5,936 | | | | 465 | |
Ferro * | | | 19,331 | | | | 267 | |
Flotek Industries *(A) | | | 33,000 | | | | 388 | |
FutureFuel | | | 16,160 | | | | 180 | |
Glatfelter | | | 15,000 | | | | 308 | |
Graphic Packaging Holding | | | 10,395 | | | | 139 | |
Huntsman | | | 1,518 | | | | 23 | |
Innophos Holdings | | | 2,374 | | | | 91 | |
Innospec | | | 10,054 | | | | 488 | |
Intrepid Potash * | | | 58,683 | | | | 75 | |
Kaiser Aluminum | | | 6,200 | | | | 531 | |
Koppers Holdings * | | | 1,944 | | | | 49 | |
Kraton Performance Polymers * | | | 10,594 | | | | 288 | |
Martin Marietta Materials | | | 1,455 | | | | 275 | |
Minerals Technologies | | | 7,347 | | | | 423 | |
Neenah Paper | | | 5,551 | | | | 385 | |
Olin | | | 13,451 | | | | 310 | |
PolyOne | | | 13,935 | | | | 522 | |
Rayonier Advanced Materials | | | 21,986 | | | | 285 | |
Real Industry * | | | 28,700 | | | | 194 | |
Reliance Steel & Aluminum | | | 1,967 | | | | 146 | |
| | | | | | | | |
| Description | | Shares | | | Market Value
($ Thousands) | |
Schweitzer-Mauduit International | | | 45,500 | | | $ | 1,565 | |
Sensient Technologies | | | 6,905 | | | | 471 | |
Silgan Holdings | | | 7,579 | | | | 388 | |
Sonoco Products | | | 1,287 | | | | 61 | |
Steel Dynamics | | | 12,784 | | | | 316 | |
Stepan | | | 12,133 | | | | 700 | |
Summit Materials, Cl A * | | | 20,410 | | | | 444 | |
SunCoke Energy | | | 11,129 | | | | 67 | |
Tahoe Resources | | | 5,005 | | | | 60 | |
TimkenSteel | | | 4,140 | | | | 37 | |
Tredegar | | | 1,740 | | | | 28 | |
Trinseo * | | | 1,443 | | | | 68 | |
US Concrete * | | | 4,349 | | | | 279 | |
| | | | | | | | |
| | | | | | | 17,073 | |
| | | | | | | | |
| | |
Telecommunication Services — 0.7% | | | | | | | | |
8x8 * | | | 23,845 | | | | 305 | |
Atlantic Telegraph-Network | | | 3,926 | | | | 292 | |
Cincinnati Bell * | | | 67,431 | | | | 268 | |
IDT, Cl B | | | 12,855 | | | | 191 | |
Inteliquent | | | 37,572 | | | | 628 | |
Intelsat * | | | 37,611 | | | | 122 | |
Iridium Communications *(A) | | | 74,300 | | | | 649 | |
magicJack VocalTec *(A) | | | 22,200 | | | | 133 | |
Ooma * | | | 6,400 | | | | 44 | |
Shenandoah Telecommunications | | | 2,261 | | | | 72 | |
Spok Holdings | | | 5,100 | | | | 89 | |
Telephone & Data Systems | | | 12,145 | | | | 350 | |
US Cellular * | | | 1,475 | | | | 56 | |
Vonage Holdings * | | | 62,208 | | | | 287 | |
| | | | | | | | |
| | | | | | | 3,486 | |
| | | | | | | | |
| | |
Utilities — 3.9% | | | | | | | | |
AGL Resources | | | 3,469 | | | | 228 | |
ALLETE | | | 16,685 | | | | 963 | |
Alliant Energy | | | 4,612 | | | | 171 | |
American States Water | | | 4,550 | | | | 178 | |
American Water Works | | | 12,061 | | | | 894 | |
Aqua America | | | 1,797 | | | | 58 | |
Atmos Energy | | | 6,177 | | | | 450 | |
Avista | | | 24,989 | | | | 1,005 | |
Black Hills | | | 3,886 | | | | 235 | |
Cadiz *(A) | | | 48,200 | | | | 294 | |
California Water Service Group | | | 23,207 | | | | 677 | |
Chesapeake Utilities | | | 14,115 | | | | 814 | |
CMS Energy | | | 11,323 | | | | 474 | |
El Paso Electric | | | 373 | | | | 17 | |
Great Plains Energy | | | 5,631 | | | | 164 | |
Hawaiian Electric Industries * | | | 3,201 | | | | 105 | |
IDACORP | | | 10,767 | | | | 788 | |
ITC Holdings | | | 2,534 | | | | 113 | |
MDU Resources Group | | | 1,894 | | | | 43 | |
| | |
| 70 | | SEI Institutional Investments Trust / Annual Report / May 31, 2016 |
SCHEDULE OF INVESTMENTS
Small Cap Fund
May 31, 2016
| | | | | | | | |
| Description | | Shares | | | Market Value
($ Thousands) | |
New Jersey Resources | | | 193 | | | $ | 7 | |
Northwest Natural Gas | | | 1,415 | | | | 78 | |
NorthWestern | | | 1,099 | | | | 64 | |
OGE Energy | | | 3,119 | | | | 94 | |
ONE Gas | | | 8,627 | | | | 506 | |
Ormat Technologies | | | 275 | | | | 12 | |
Otter Tail | | | 22,314 | | | | 660 | |
Piedmont Natural Gas | | | 3,887 | | | | 233 | |
Pinnacle West Capital | | | 13,319 | | | | 980 | |
PNM Resources | | | 41,963 | | | | 1,378 | |
Portland General Electric | | | 50,914 | | | | 2,097 | |
Questar | | | 5,327 | | | | 134 | |
SCANA | | | 11,880 | | | | 831 | |
SJW | | | 2,396 | | | | 83 | |
South Jersey Industries | | | 24,600 | | | | 711 | |
Southwest Gas | | | 21,711 | | | | 1,507 | |
Spark Energy, Cl A | | | 4,190 | | | | 126 | |
Spire | | | 6,742 | | | | 429 | |
Talen Energy * | | | 1,691 | | | | 19 | |
TECO Energy | | | 6,806 | | | | 187 | |
UGI | | | 17,469 | | | | 750 | |
Unitil | | | 1,714 | | | | 68 | |
Vectren | | | 11,281 | | | | 560 | |
Westar Energy, Cl A | | | 10,143 | | | | 571 | |
| | | | | | | | |
| | | | | | | 19,756 | |
| | | | | | | | |
Total Common Stock
(Cost $420,875) ($ Thousands) | | | | 468,245 | |
| | | | | | | | |
| |
EXCHANGE TRADED FUND — 0.2% | | | | | |
| | |
Exchange Traded Fund — 0.2% | | | | | | | | |
iShares Russell 2000 Value Fund (A) | | | 9,700 | | | | 940 | |
| | | | | | | | |
Total Exchange Traded Fund
(Cost $874) ($ Thousands) | | | | | | | 940 | |
| | | | | | | | |
| | |
| | | Face Amount
($ Thousands) | | | | |
CONVERTIBLE BOND — 0.0% | | | | | | | | |
Eddie Bauer Holdings | | | | | | | | |
5.250%, 04/01/14 (B) | | $ | 2,856 | | | | 4 | |
| | | | | | | | |
Total Convertible Bond
(Cost $445) ($ Thousands) | | | | | | | 4 | |
| | | | | | | | |
| | |
| | | Number of
Rights | | | | |
RIGHTS — 0.0% | | | | | | | | |
| | |
United States — 0.0% | | | | | | | | |
Allos Therapeutics ‡‡ | | | 81 | | | | — | |
Dyax, Expires 12/31/2019 | | | 2 | | | | — | |
Kinder Morgan Escrow ‡‡ | | | 70 | | | | — | |
| | | | | | | | |
| Description | | Number of Rights | | | Market Value
($ Thousands) | |
Total Rights
(Cost $—) ($ Thousands) | | | | | | $ | — | |
| | | | | | | | |
| | |
| | | Shares | | | | | |
| | | | | | | | |
AFFILIATED PARTNERSHIP — 4.4% | | | | | |
SEI Liquidity Fund, L.P. | | | | | | | | |
0.410% **†(C) | | | 22,227,345 | | | | 22,227 | |
| | | | | | | | |
Total Affiliated Partnership
(Cost $22,227) ($ Thousands) | | | | | | | 22,227 | |
| | | | | | | | |
| | |
| |
| Face Amount
($ Thousands) |
| | | | |
| | | | | | | | |
U.S. TREASURY OBLIGATION — 0.1% | | | | | |
U.S. Treasury Bills | | | | | | | | |
0.433%, 08/18/2016 (D)(E) | | | 363 | | | | 363 | |
| | | | | | | | |
Total U.S. Treasury Obligation
(Cost $363) ($ Thousands) | | | | | | | 363 | |
| | | | | | | | |
| | |
| | | Shares | | | | | |
| | | | | | | | |
CASH EQUIVALENT — 5.4% | | | | | | | | |
SEI Daily Income Trust, Prime Obligation Fund, Cl A | | | | | | | | |
0.270% ** | | | 26,893,306 | | | | 26,893 | |
| | | | | | | | |
Total Cash Equivalent
(Cost $26,893) ($ Thousands) | | | | | | | 26,893 | |
| | | | | | | | |
Total Investments — 103.3%
(Cost $471,677) ($ Thousands) | | | | | | $ | 518,672 | |
| | | | | | | | |
A list of the open futures contracts held by the Fund at May 31, 2016, is as follows:
| | | | | | | | | | | | |
| Type of Contract | | Number of
Contracts
Long | | | Expiration
Date | | | Unrealized
Appreciation
($ Thousands) | |
Russell 2000 Index E-MINI | | | 52 | | | | Jun-2016 | | | $ | 161 | |
| | | | | | | | | | | | |
For the year ended May 31, 2016, the total amount of all open futures contracts, as presented in the table above, are representative of the volume of activity for the derivative type during the year.
Percentages are based on a Net Assets of $502,222 ($ Thousands).
| * | | Non-income producing security. |
| ** | | Rate shown is the 7-day effective yield as of May 31, 2016. |
| † | | Investment in Affiliated Security (see Note 6). |
| ‡ | | Real Estate Investment Trust. |
| ‡‡ | | Expiration date unavailable. |
| (A) | | This security or a partial position of this security is on loan at May 31, 2016. The total market value of securities on loan at May 31, 2016, was $21,631 ($ Thousands). |
| (B) | | Security is in default on interest payment. |
| | |
| 71 | | SEI Institutional Investments Trust / Annual Report / May 31, 2016 |
SCHEDULE OF INVESTMENTS
Small Cap Fund
May 31, 2016
| (C) | | This security was purchased with cash collateral held from securities on loan. The total market value of such securities as of May 31, 2016, was $22,227 ($Thousands). |
| (D) | | The rate reported is the effective yield at time of purchase. |
| (E) | | All or a portion of this security has been pledged as collateral for open future contracts. |
ADR — American Depositary Receipt
Cl — Class
L.P. — Limited Partnership
The following is a list of the level of inputs used as of May 31, 2016, in valuing the Fund’s investments and other financial instruments carried at value ($ Thousands):
| | | | | | | | | | | | | | | | |
| Investments in Securities | | Level 1 | | | Level 2 | | | Level 3(1) | | | Total | |
Common Stock | | $ | 468,245 | | | $ | — | | | $ | — | | | $ | 468,245 | |
Exchange Traded Fund | | | 940 | | | | — | | | | — | | | | 940 | |
Convertible Bond | | | — | | | | — | | | | 4 | | | | 4 | |
Rights | | | — | | | | — | | | | — | | | | — | |
Affiliated Partnership | | | — | | | | 22,227 | | | | — | | | | 22,227 | |
U.S. Treasury Obligation | | | — | | | | 363 | | | | — | | | | 363 | |
Cash Equivalent | | | 26,893 | | | | — | | | | — | | | | 26,893 | |
| | | | | | | | | | | | | | | | |
Total Investments in Securities | | $ | 496,078 | | | $ | 22,590 | | | $ | 4 | | | $ | 518,672 | |
| | | | | | | | | | | | | | | | |
| | | | | | | | | | | | | | | | |
| Other Financial Instruments | | Level 1 | | | Level 2 | | | Level 3 | | | Total | |
Futures Contracts * | | | | | | | | | | | | | | | | |
Unrealized Appreciation | | $ | 161 | | | $ | — | | | $ | — | | | $ | 161 | |
| | | | | | | | | | | | | | | | |
| (1) | | A reconciliation of Level 3 investments is presented when the Fund has a significant amount of Level 3 investments at the beginning and/or end of the period in relation to the net assets. |
| * | | Futures contracts are valued at the unrealized appreciation on the instrument. |
For the year ended May 31, 2016, there were no transfers between Level 1 and Level 2 assets and liabilities.
For the year ended May 31, 2016, there were no transfers between Level 2 and Level 3 assets and liabilities.
For more information on valuation inputs, see Note 2 — Significant Accounting Policies in Notes to Financial Statements.
Amounts designated as “—” are $0 or have been rounded to $0.
The accompanying notes are an integral part of the financial statements.
| | |
| 72 | | SEI Institutional Investments Trust / Annual Report / May 31, 2016 |
SCHEDULE OF INVESTMENTS
Small Cap II Fund
May 31, 2016
| | | | | | | | |
| Description | | Shares | | | Market Value
($ Thousands) | |
COMMON STOCK — 94.2% | | | | | | | | |
| | |
Consumer Discretionary — 12.0% | | | | | | | | |
1-800-Flowers.com, Cl A * | | | 10,265 | | | $ | 83 | |
2U *(A) | | | 17,852 | | | | 497 | |
Abercrombie & Fitch, Cl A | | | 72,388 | | | | 1,440 | |
AMC Entertainment Holdings, Cl A | | | 5,644 | | | | 162 | |
American Axle & Manufacturing Holdings * | | | 6,858 | | | | 114 | |
American Eagle Outfitters | | | 34,195 | | | | 535 | |
American Public Education * | | | 3,085 | | | | 87 | |
Apollo Education Group, Cl A * | | | 1,511 | | | | 14 | |
Arctic Cat | | | 6,697 | | | | 106 | |
Bassett Furniture Industries | | | 5,592 | | | | 156 | |
Beazer Homes USA * | | | 28,574 | | | | 224 | |
Big 5 Sporting Goods | | | 8,359 | | | | 70 | |
Big Lots (A) | | | 36,175 | | | | 1,892 | |
BJ’s Restaurants * | | | 5,835 | | | | 261 | |
Bloomin’ Brands | | | 48,040 | | | | 915 | |
Bob Evans Farms | | | 416 | | | | 19 | |
Boyd Gaming * | | | 3,720 | | | | 70 | |
Bright Horizons Family Solutions * | | | 26,164 | | | | 1,695 | |
Buffalo Wild Wings * | | | 5,032 | | | | 732 | |
Build-A-Bear Workshop, Cl A * | | | 3,731 | | | | 52 | |
Burlington Stores * | | | 4,394 | | | | 265 | |
Cabela’s * | | | 2,468 | | | | 120 | |
Cablevision Systems, Cl A | | | 2,764 | | | | 96 | |
Caesars Entertainment *(A) | | | 14,079 | | | | 103 | |
Callaway Golf | | | 58,026 | | | | 584 | |
Capella Education | | | 2,515 | | | | 132 | |
Carmike Cinemas * | | | 27,736 | | | | 829 | |
Carrols Restaurant Group * | | | 4,598 | | | | 56 | |
Cavco Industries * | | | 3,716 | | | | 369 | |
Century Communities * | | | 808 | | | | 15 | |
Cheesecake Factory | | | 1,844 | | | | 92 | |
Children’s Place Retail Stores | | | 1,311 | | | | 92 | |
Citi Trends | | | 11,743 | | | | 183 | |
Cooper Tire & Rubber | | | 5,255 | | | | 169 | |
Cooper-Standard Holding * | | | 4,571 | | | | 393 | |
Core-Mark Holdings | | | 16,741 | | | | 1,433 | |
Cracker Barrel Old Country Store (A) | | | 1,559 | | | | 236 | |
Culp | | | 3,208 | | | | 88 | |
Dave & Buster’s Entertainment * | | | 17,253 | | | | 673 | |
Denny’s * | | | 1,054 | | | | 11 | |
Diamond Resorts International *(A) | | | 28,074 | | | | 644 | |
DineEquity | | | 257 | | | | 22 | |
Dorman Products * | | | 3,831 | | | | 211 | |
DR Horton | | | 3,736 | | | | 114 | |
DreamWorks Animation SKG, Cl A * | | | 3,417 | | | | 137 | |
Drew Industries | | | 3,513 | | | | 272 | |
DSW, Cl A | | | 9,428 | | | | 199 | |
Duluth Holdings, Cl B * | | | 11,628 | | | | 308 | |
Eldorado Resorts * | | | 559 | | | | 8 | |
Entravision Communications, Cl A | | | 28,442 | | | | 205 | |
Ethan Allen Interiors | | | 12,982 | | | | 438 | |
| | | | | | | | |
| Description | | Shares | | | Market Value
($ Thousands) | |
Express * | | | 26,476 | | | $ | 385 | |
Fiesta Restaurant Group * | | | 81,916 | | | | 2,059 | |
Five Below * | | | 22,268 | | | | 932 | |
GameStop, Cl A | | | 2,829 | | | | 82 | |
Genesco * | | | 13,450 | | | | 869 | |
Graham Holdings, Cl B | | | 62 | | | | 31 | |
Harte-Hanks | | | 36,974 | | | | 37 | |
Haverty Furniture | | | 1,855 | | | | 34 | |
Helen of Troy * | | | 13,728 | | | | 1,412 | |
Hooker Furniture | | | 2,214 | | | | 54 | |
Horizon Global * | | | 19,021 | | | | 222 | |
Imax * | | | 12,389 | | | | 413 | |
Installed Building Products * | | | 8,045 | | | | 269 | |
Isle of Capri Casinos * | | | 4,990 | | | | 79 | |
J Alexander’s Holdings * | | | 4,618 | | | | 48 | |
Jack in the Box | | | 29,556 | | | | 2,518 | |
JAKKS Pacific *(A) | | | 1,869 | | | | 14 | |
John Wiley & Sons, Cl A | | | 2,732 | | | | 147 | |
K12 * | | | 6,535 | | | | 78 | |
Kate Spade * | | | 11,172 | | | | 244 | |
Kirkland’s | | | 4,120 | | | | 55 | |
Krispy Kreme Doughnuts * | | | 5,229 | | | | 112 | |
La-Z-Boy, Cl Z | | | 10,337 | | | | 274 | |
Libbey | | | 7,932 | | | | 136 | |
Lithia Motors, Cl A | | | 5,830 | | | | 480 | |
Loral Space & Communications * | | | 1,666 | | | | 64 | |
Marriott Vacations Worldwide | | | 13,680 | | | | 829 | |
MDC Partners, Cl A (A) | | | 173,744 | | | | 3,117 | |
Media General * | | | 3,270 | | | | 58 | |
Monro Muffler | | | 14,216 | | | | 895 | |
Murphy USA * | | | 8,505 | | | | 578 | |
NACCO Industries, Cl A | | | 1,401 | | | | 74 | |
National CineMedia | | | 32,610 | | | | 476 | |
New Media Investment | | | 7,464 | | | | 130 | |
New York Times, Cl A | | | 12,949 | | | | 157 | |
Nexstar Broadcasting Group, Cl A (A) | | | 21,440 | | | | 1,141 | |
Nutrisystem | | | 11,215 | | | | 304 | |
Office Depot * | | | 11,385 | | | | 41 | |
Ollie’s Bargain Outlet Holdings *(A) | | | 14,570 | | | | 365 | |
Overstock.com * | | | 8,947 | | | | 153 | |
Oxford Industries | | | 4,852 | | | | 307 | |
Papa John’s International | | | 278 | | | | 18 | |
Performance Sports Group * | | | 18,635 | | | | 61 | |
Perry Ellis International * | | | 4,322 | | | | 84 | |
Pier 1 Imports | | | 4,434 | | | | 25 | |
Pinnacle Entertainment * | | | 1,611 | | | | 18 | |
Planet Fitness, Cl A *(A) | | | 41,980 | | | | 750 | |
Pool | | | 21,167 | | | | 1,938 | |
Ruth’s Hospitality Group | | | 17,502 | | | | 291 | |
Select Comfort * | | | 35,360 | | | | 793 | |
Shoe Carnival | | | 6,749 | | | | 157 | |
Sinclair Broadcast Group, Cl A | | | 390 | | | | 12 | |
| | |
| 73 | | SEI Institutional Investments Trust / Annual Report / May 31, 2016 |
SCHEDULE OF INVESTMENTS
Small Cap II Fund
May 31, 2016
| | | | | | | | |
| Description | | Shares | | | Market Value
($ Thousands) | |
SiteOne Landscape Supply * | | | 6,052 | | | $ | 170 | |
Six Flags Entertainment | | | 4,487 | | | | 259 | |
Skullcandy * | | | 24,880 | | | | 97 | |
Smith & Wesson Holding *(A) | | | 3,233 | | | | 79 | |
SodaStream International *(A) | | | 78,200 | | | | 1,621 | |
Standard Motor Products | | | 549 | | | | 21 | |
Steven Madden * | | | 61,152 | | | | 2,098 | |
Stoneridge * | | | 543 | | | | 9 | |
Strayer Education * | | | 533 | | | | 26 | |
Superior Industries International | | | 10,953 | | | | 297 | |
Tailored Brands | | | 12,865 | | | | 177 | |
Tempur Sealy International * | | | 5,993 | | | | 349 | |
Tenneco * | | | 4,675 | | | | 251 | |
Texas Roadhouse, Cl A | | | 34,605 | | | | 1,551 | |
Thor Industries | | | 4,104 | | | | 267 | |
Tile Shop Holdings * | | | 38,045 | | | | 694 | |
Tilly’s, Cl A * | | | 19,814 | | | | 117 | |
TopBuild * | | | 7,232 | | | | 261 | |
Tower International | | | 711 | | | | 15 | |
Universal Electronics * | | | 3,936 | | | | 256 | |
Vail Resorts | | | 3,247 | | | | 426 | |
Vince Holding * | | | 29,189 | | | | 164 | |
Vista Outdoor * | | | 22,590 | | | | 1,134 | |
Visteon | | | 13,170 | | | | 987 | |
VOXX International, Cl A * | | | 85,070 | | | | 282 | |
William Lyon Homes, Cl A *(A) | | | 61,560 | | | | 998 | |
Wingstop * | | | 9,678 | | | | 270 | |
Zagg * | | | 46,718 | | | | 226 | |
Zoe’s Kitchen *(A) | | | 9,487 | | | | 350 | |
| | | | | | | | |
| | | | | | | 54,893 | |
| | | | | | | | |
| | |
Consumer Staples — 3.0% | | | | | | | | |
Andersons | | | 48,110 | | | | 1,721 | |
B&G Foods, Cl A | | | 28,958 | | | | 1,245 | |
Cal-Maine Foods (A) | | | 4,776 | | | | 213 | |
Casey’s General Stores | | | 407 | | | | 49 | |
Central Garden and Pet, Cl A * | | | 2,760 | | | | 50 | |
Chefs’ Warehouse * | | | 21,019 | | | | 319 | |
Darling International * | | | 70,110 | | | | 1,076 | |
Dean Foods (A) | | | 24,045 | | | | 440 | |
Energizer Holdings | | | 1,455 | | | | 69 | |
Farmer Brothers * | | | 529 | | | | 15 | |
Fresh Del Monte Produce | | | 22,768 | | | | 1,192 | |
Freshpet *(A) | | | 26,997 | | | | 250 | |
Hain Celestial Group * | | | 10,221 | | | | 505 | |
Ingredion | | | 4,381 | | | | 514 | |
John B Sanfilippo & Son | | | 7,519 | | | | 356 | |
Lancaster Colony | | | 2,243 | | | | 272 | |
Medifast | | | 5,270 | | | | 168 | |
MGP Ingredients | | | 8,291 | | | | 271 | |
National Beverage * | | | 7,498 | | | | 391 | |
Natural Health Trends (A) | | | 1,720 | | | | 51 | |
| | | | | | | | |
| Description | | Shares | | | Market Value
($ Thousands) | |
Nu Skin Enterprises, Cl A | | | 1,564 | | | $ | 62 | |
Omega Protein * | | | 93,442 | | | | 1,845 | |
Pilgrim’s Pride | | | 4,196 | | | | 104 | |
Pinnacle Foods | | | 520 | | | | 22 | |
Post Holdings * | | | 3,973 | | | | 302 | |
Quorum Health * | | | 796 | | | | 11 | |
Rite Aid * | | | 9,060 | | | | 70 | |
Sanderson Farms (A) | | | 3,094 | | | | 278 | |
Seaboard * | | | 24 | | | | 72 | |
Snyder’s-Lance | | | 6,441 | | | | 199 | |
SpartanNash | | | 17,266 | | | | 513 | |
SUPERVALU * | | | 37,096 | | | | 172 | |
TreeHouse Foods * | | | 7,833 | | | | 742 | |
United Natural Foods * | | | 1,043 | | | | 39 | |
Vector Group | | | 2,249 | | | | 48 | |
WD-40 | | | 447 | | | | 50 | |
Weis Markets | | | 2,201 | | | | 110 | |
| | | | | | | | |
| | | | | | | 13,806 | |
| | | | | | | | |
| | |
Energy — 3.5% | | | | | | | | |
Alon USA Energy | | | 7,721 | | | | 58 | |
Atwood Oceanics (A) | | | 16,652 | | | | 178 | |
California Resources | | | 28,267 | | | | 43 | |
Callon Petroleum * | | | 36,991 | | | | 421 | |
CARBO Ceramics (A) | | | 128,200 | | | | 1,581 | |
Carrizo Oil & Gas * | | | 54,487 | | | | 2,098 | |
Clayton Williams Energy *(A) | | | 9,382 | | | | 236 | |
CVR Energy | | | 613 | | | | 12 | |
DHT Holdings | | | 67,977 | | | | 371 | |
Diamond Offshore Drilling | | | 1,044 | | | | 27 | |
Diamondback Energy * | | | 1,499 | | | | 136 | |
Dril-Quip * | | | 5,167 | | | | 315 | |
Energen | | | 2,245 | | | | 107 | |
Ensco, Cl A | | | 3,363 | | | | 33 | |
EP Energy, Cl A * | | | 3,063 | | | | 17 | |
Frank’s International | | | 1,761 | | | | 28 | |
Frontline (A) | | | 2,872 | | | | 26 | |
Gener8 Maritime * | | | 1,265 | | | | 9 | |
Gulfport Energy * | | | 2,441 | | | | 75 | |
Helix Energy Solutions Group * | | | 32,262 | | | | 258 | |
Matador Resources *(A) | | | 13,590 | | | | 309 | |
Matrix Service * | | | 2,265 | | | | 38 | |
Memorial Resource Development * | | | 22,948 | | | | 363 | |
Newfield Exploration * | | | 748 | | | | 31 | |
Noble | | | 5,429 | | | | 45 | |
Nordic American Tankers | | | 1,353 | | | | 21 | |
Oasis Petroleum * | | | 7,954 | | | | 80 | |
Oceaneering International | | | 535 | | | | 18 | |
Oil States International * | | | 29,275 | | | | 962 | |
Pacific Ethanol * | | | 47,213 | | | | 299 | |
Par Petroleum * | | | 1,291 | | | | 20 | |
Parsley Energy, Cl A * | | | 10,846 | | | | 283 | |
| | |
| 74 | | SEI Institutional Investments Trust / Annual Report / May 31, 2016 |
SCHEDULE OF INVESTMENTS
Small Cap II Fund
May 31, 2016
| | | | | | | | |
| Description | | Shares | | | Market Value
($ Thousands) | |
Patterson-UTI Energy | | | 45,845 | | | $ | 853 | |
PBF Energy, Cl A | | | 83,063 | | | | 2,190 | |
QEP Resources | | | 16,024 | | | | 299 | |
Renewable Energy Group * | | | 3,101 | | | | 29 | |
REX American Resources * | | | 221 | | | | 13 | |
Rowan, Cl A | | | 2,502 | | | | 42 | |
RSP Permian * | | | 7,356 | | | | 242 | |
Sanchez Energy *(A) | | | 34,190 | | | | 268 | |
Scorpio Tankers | | | 24,870 | | | | 146 | |
SemGroup, Cl A | | | 432 | | | | 14 | |
Ship Finance International | | | 2,493 | | | | 40 | |
Southwestern Energy *(A) | | | 70,700 | | | | 966 | |
Superior Energy Services | | | 41,885 | | | | 722 | |
Teekay | | | 10,340 | | | | 109 | |
Teekay Tankers, Cl A | | | 1,970 | | | | 7 | |
TETRA Technologies * | | | 3,667 | | | | 20 | |
Tidewater (A) | | | 203,035 | | | | 879 | |
US Silica Holdings (A) | | | 9,710 | | | | 277 | |
Western Refining | | | 9,556 | | | | 203 | |
World Fuel Services | | | 7,816 | | | | 359 | |
| | | | | | | | |
| | | | | | | 16,176 | |
| | | | | | | | |
| | |
Financials — 18.7% | | | | | | | | |
Agree Realty ‡ | | | 28,377 | | | | 1,208 | |
Alexander & Baldwin | | | 1,305 | | | | 49 | |
Alexander’s ‡ | | | 18 | | | | 7 | |
Alexandria Real Estate Equities ‡ | | | 2,694 | | | | 261 | |
Alleghany * | | | 96 | | | | 52 | |
Allied World Assurance Holdings | | | 4,876 | | | | 181 | |
Ambac Financial Group * | | | 7,938 | | | | 131 | |
American Assets Trust ‡ | | | 473 | | | | 19 | |
American Campus Communities ‡ | | | 3,855 | | | | 181 | |
American Equity Investment Life Holding | | | 101,975 | | | | 1,653 | |
American Financial Group | | | 2,888 | | | | 212 | |
American Homes 4 Rent, Cl A ‡ | | | 61,585 | | | | 1,129 | |
American National Insurance | | | 423 | | | | 51 | |
AMERISAFE | | | 5,635 | | | | 342 | |
Apartment Investment & Management, Cl A ‡ | | | 4,537 | | | | 193 | |
Apple Hospitality ‡ | | | 4,002 | | | | 73 | |
Arch Capital Group * | | | 2,334 | | | | 170 | |
Argo Group International Holdings | | | 36,390 | | | | 1,916 | |
Armada Hoffler Properties ‡ | | | 12,021 | | | | 145 | |
Ashford Hospitality Prime ‡ | | | 1,370 | | | | 15 | |
Aspen Insurance Holdings | | | 5,994 | | | | 287 | |
Assurant | | | 387 | | | | 34 | |
Assured Guaranty | | | 5,745 | | | | 154 | |
Axis Capital Holdings | | | 8,761 | | | | 483 | |
Banc of California | | | 40,165 | | | | 806 | |
Banco Latinoamericano de Comercio Exterior, Cl E | | | 394 | | | | 10 | |
Bancorp * | | | 194,633 | | | | 1,314 | |
Bancorpsouth | | | 11,963 | | | | 286 | |
| | | | | | | | |
| Description | | Shares | | | Market Value
($ Thousands) | |
Bank of Hawaii | | | 605 | | | $ | 43 | |
BankUnited | | | 5,917 | | | | 196 | |
Beneficial Bancorp * | | | 13,791 | | | | 190 | |
Blackstone Mortgage Trust, Cl A ‡ | | | 25,445 | | | | 717 | |
Boston Private Financial Holdings | | | 17,391 | | | | 219 | |
Brandywine Realty Trust ‡ | | | 62,639 | | | | 989 | |
Brixmor Property Group ‡ | | | 9,463 | | | | 239 | |
Camden National | | | 160 | | | | 7 | |
Camden Property Trust ‡ | | | 4,272 | | | | 364 | |
Capital Bank Financial, Cl A | | | 7,811 | | | | 241 | |
Capitol Federal Financial | | | 97,240 | | | | 1,320 | |
Cardinal Financial | | | 434 | | | | 10 | |
CareTrust ‡ | | | 2,929 | | | | 39 | |
Cathay General Bancorp | | | 545 | | | | 17 | |
Cedar Realty Trust ‡ | | | 2,275 | | | | 15 | |
Centerstate Banks | | | 1,533 | | | | 24 | |
Central Pacific Financial | | | 4,400 | | | | 105 | |
Chatham Lodging Trust ‡ | | | 1,826 | | | | 40 | |
Chemical Financial | | | 1,487 | | | | 59 | |
Chesapeake Lodging Trust ‡ | | | 324 | | | | 8 | |
Chimera Investment ‡ | | | 4,437 | | | | 66 | |
CNO Financial Group | | | 57,618 | | | | 1,169 | |
Colony Financial ‡ | | | 5,587 | | | | 102 | |
Columbia Property Trust ‡ | | | 3,917 | | | | 81 | |
Commerce Bancshares | | | 4,216 | | | | 206 | |
Communications Sales & Leasing ‡ | | | 3,028 | | | | 76 | |
Community Bank System | | | 324 | | | | 13 | |
CoreSite Realty ‡ | | | 3,615 | | | | 274 | |
Corporate Office Properties Trust ‡ | | | 20,223 | | | | 547 | |
Corrections Corp of America ‡ | | | 6,751 | | | | 227 | |
Cousins Properties ‡ | | | 2,421 | | | | 26 | |
CubeSmart ‡ | | | 7,214 | | | | 230 | |
CyrusOne ‡ | | | 29,205 | | | | 1,440 | |
DCT Industrial Trust ‡ | | | 538 | | | | 23 | |
DDR ‡ | | | 857 | | | | 15 | |
Dime Community Bancshares | | | 1,409 | | | | 26 | |
Douglas Emmett ‡ | | | 3,031 | | | | 103 | |
Duke Realty ‡ | | | 8,061 | | | | 191 | |
DuPont Fabros Technology ‡ | | | 7,351 | | | | 311 | |
Eagle Bancorp * | | | 6,937 | | | | 357 | |
East West Bancorp | | | 2,937 | | | | 113 | |
EastGroup Properties ‡ | | | 488 | | | | 31 | |
Education Realty Trust ‡ | | | 11,362 | | | | 486 | |
Employers Holdings | | | 12,736 | | | | 380 | |
Endurance Specialty Holdings | | | 5,654 | | | | 384 | |
Enova International * | | | 724 | | | | 5 | |
Enstar Group * | | | 61 | | | | 9 | |
Enterprise Financial Services | | | 5,656 | | | | 162 | |
EPR Properties ‡ | | | 19,398 | | | | 1,383 | |
Equity Commonwealth *‡ | | | 7,138 | | | | 206 | |
Equity One ‡ | | | 15,148 | | | | 446 | |
Evercore Partners, Cl A | | | 16,050 | | | | 835 | |
| | |
| 75 | | SEI Institutional Investments Trust / Annual Report / May 31, 2016 |
SCHEDULE OF INVESTMENTS
Small Cap II Fund
May 31, 2016
| | | | | | | | |
| Description | | Shares | | | Market Value
($ Thousands) | |
Everest Re Group | | | 2,896 | | | $ | 519 | |
FBL Financial Group, Cl A | | | 819 | | | | 51 | |
FBR | | | 23,655 | | | | 455 | |
Federal Agricultural Mortgage, Cl C | | | 1,872 | | | | 67 | |
Federated Investors, Cl B | | | 5,958 | | | | 193 | |
Federated National Holding | | | 4,777 | | | | 103 | |
Fidelity Southern | | | 3,799 | | | | 62 | |
First American Financial | | | 1,870 | | | | 71 | |
First BanCorp * | | | 16,185 | | | | 68 | |
First Citizens BancShares, Cl A | | | 318 | | | | 82 | |
First Commonwealth Financial | | | 159,065 | | | | 1,494 | |
First Defiance Financial | | | 5,170 | | | | 209 | |
First Financial Bancorp | | | 457 | | | | 9 | |
First Horizon National | | | 29,626 | | | | 431 | |
First Industrial Realty Trust ‡ | | | 18,317 | | | | 454 | |
First Interstate Bancsystem, Cl A | | | 23,676 | | | | 686 | |
First Midwest Bancorp | | | 1,878 | | | | 35 | |
First NBC Bank Holding * | | | 13,960 | | | | 261 | |
First Niagara Financial Group | | | 8,165 | | | | 89 | |
First Potomac Realty Trust ‡ | | | 2,161 | | | | 19 | |
First Republic Bank | | | 2,767 | | | | 200 | |
FirstMerit | | | 8,944 | | | | 203 | |
Flagstar Bancorp * | | | 4,289 | | | | 104 | |
Flushing Financial | | | 2,950 | | | | 62 | |
FNB (Pennsylvania) | | | 133,800 | | | | 1,792 | |
Forest City Realty Trust, Cl A ‡ | | | 4,103 | | | | 94 | |
Four Corners Property Trust ‡ | | | 13,580 | | | | 264 | |
Franklin Street Properties ‡ | | | 14,509 | | | | 166 | |
Fulton Financial | | | 11,696 | | | | 167 | |
GAMCO Investors, Cl A | | | 262 | | | | 10 | |
Gaming and Leisure Properties ‡ | | | 3,168 | | | | 104 | |
GEO Group ‡ | | | 11,439 | | | | 380 | |
Gramercy Property Trust ‡ | | | 24,212 | | | | 216 | |
Great Southern Bancorp | | | 263 | | | | 10 | |
Great Western Bancorp | | | 51,558 | | | | 1,754 | |
Green Dot, Cl A * | | | 148,903 | | | | 3,285 | |
Hancock Holding | | | 16,653 | | | | 458 | |
Hanmi Financial | | | 421 | | | | 10 | |
Hanover Insurance Group | | | 19,210 | | | | 1,665 | |
Healthcare Realty Trust ‡ | | | 5,473 | | | | 174 | |
Healthcare Trust of America, Cl A ‡ | | | 47,458 | | | | 1,432 | |
Heartland Financial USA | | | 1,057 | | | | 37 | |
Hercules Capital | | | 36,539 | | | | 448 | |
Heritage Financial | | | 1,609 | | | | 29 | |
Heritage Insurance Holdings | | | 12,683 | | | | 167 | |
Highwoods Properties ‡ | | | 39,921 | | | | 1,943 | |
HomeTrust Bancshares * | | | 3,350 | | | | 64 | |
Horace Mann Educators | | | 21,625 | | | | 737 | |
Houlihan Lokey, Cl A | | | 11,481 | | | | 277 | |
Hudson Pacific Properties ‡ | | | 1,128 | | | | 32 | |
Huntington Bancshares | | | 13,844 | | | | 145 | |
Iberiabank | | | 23,228 | | | | 1,440 | |
| | | | | | | | |
| Description | | Shares | | | Market Value
($ Thousands) | |
Independence Realty Trust ‡ | | | 1,479 | | | $ | 12 | |
Independent Bank | | | 11,637 | | | | 216 | |
Infinity Property & Casualty | | | 6,589 | | | | 513 | |
InfraREIT ‡ | | | 529 | | | | 9 | |
International FCStone * | | | 7,033 | | | | 196 | |
Investment Technology Group | | | 1,545 | | | | 28 | |
Investors Bancorp | | | 11,046 | | | | 132 | |
Investors Real Estate Trust ‡ | | | 1,292 | | | | 8 | |
Jones Lang LaSalle | | | 192 | | | | 23 | |
KCG Holdings, Cl A * | | | 18,500 | | | | 260 | |
Kilroy Realty ‡ | | | 417 | | | | 26 | |
LaSalle Hotel Properties ‡ | | | 75,278 | | | | 1,740 | |
Lexington Realty Trust ‡ | | | 37,020 | | | | 350 | |
Liberty Property Trust ‡ | | | 4,572 | | | | 171 | |
LTC Properties ‡ | | | 374 | | | | 17 | |
MarketAxess Holdings | | | 994 | | | | 139 | |
MB Financial | | | 11,637 | | | | 421 | |
MBIA * | | | 16,993 | | | | 122 | |
MFA Financial ‡ | | | 8,540 | | | | 62 | |
MGIC Investment * | | | 53,983 | | | | 381 | |
Mid-America Apartment Communities ‡ | | | 2,891 | | | | 298 | |
Nasdaq | | | 1,858 | | | | 123 | |
National Health Investors ‡ | | | 15,246 | | | | 1,065 | |
National Retail Properties ‡ | | | 5,919 | | | | 268 | |
National Storage Affiliates Trust ‡ | | | 12,376 | | | | 258 | |
National Western Life Group, Cl A | | | 98 | | | | 21 | |
Navigators Group | | | 4,631 | | | | 422 | |
NBT Bancorp | | | 11,514 | | | | 336 | |
Nelnet, Cl A | | | 1,486 | | | | 54 | |
New Residential Investments ‡ | | | 11,815 | | | | 160 | |
NexPoint Residential Trust ‡ | | | 624 | | | | 9 | |
OFG Bancorp (A) | | | 426,760 | | | | 3,901 | |
Old Republic International | | | 8,957 | | | | 172 | |
Omega Healthcare Investors ‡ | | | 702 | | | | 22 | |
OneBeacon Insurance Group, Cl A | | | 10,260 | | | | 134 | |
Opus Bank | | | 3,319 | | | | 125 | |
Outfront Media ‡ | | | 7,260 | | | | 161 | |
Pacific Premier Bancorp * | | | 955 | | | | 24 | |
PacWest Bancorp | | | 9,902 | | | | 413 | |
People’s United Financial | | | 10,595 | | | | 168 | |
Piedmont Office Realty Trust, Cl A ‡ | | | 6,342 | | | | 127 | |
Piper Jaffray * | | | 1,721 | | | | 73 | |
Popular | | | 1,151 | | | | 36 | |
Post Properties ‡ | | | 5,580 | | | | 338 | |
PRA Group * | | | 1,284 | | | | 35 | |
Preferred Bank | | | 3,963 | | | | 130 | |
PrivateBancorp, Cl A | | | 37,015 | | | | 1,642 | |
ProAssurance | | | 22,285 | | | | 1,170 | |
PS Business Parks ‡ | | | 3,871 | | | | 382 | |
QTS Realty Trust, Cl A ‡ | | | 31,037 | | | | 1,604 | |
Radian Group | | | 13,739 | | | | 170 | |
Rayonier ‡ | | | 1,374 | | | | 36 | |
| | |
| 76 | | SEI Institutional Investments Trust / Annual Report / May 31, 2016 |
SCHEDULE OF INVESTMENTS
Small Cap II Fund
May 31, 2016
| | | | | | | | |
| Description | | Shares | | | Market Value
($ Thousands) | |
Regency Centers ‡ | | | 3,966 | | | $ | 304 | |
Regional Management * | | | 412 | | | | 7 | |
Reinsurance Group of America, Cl A | | | 147 | | | | 15 | |
RenaissanceRe Holdings | | | 830 | | | | 96 | |
Retail Opportunity Investments ‡ | | | 1,213 | | | | 24 | |
Retail Properties of America, Cl A ‡ | | | 6,603 | | | | 105 | |
Rexford Industrial Realty ‡ | | | 993 | | | | 20 | |
RLJ Lodging Trust ‡ | | | 7,662 | | | | 157 | |
Saul Centers ‡ | | | 6,210 | | | | 349 | |
Select Income ‡ | | | 5,998 | | | | 148 | |
Selective Insurance Group | | | 570 | | | | 21 | |
Senior Housing Properties Trust ‡ | | | 5,304 | | | | 99 | |
ServisFirst Bancshares (A) | | | 9,889 | | | | 515 | |
Signature Bank NY * | | | 3,650 | | | | 493 | |
Silver Bay Realty Trust ‡ | | | 274 | | | | 4 | |
SLM * | | | 52,419 | | | | 360 | |
Sovran Self Storage ‡ | | | 3,835 | | | | 415 | |
Spirit Realty Capital ‡ | | | 2,837 | | | | 32 | |
Starwood Property Trust ‡ | | | 3,784 | | | | 78 | |
Sterling Bancorp | | | 39,750 | | | | 654 | |
Stifel Financial * | | | 8,166 | | | | 308 | |
Stock Yards Bancorp | | | 203 | | | | 6 | |
STORE Capital ‡ | | | 3,162 | | | | 81 | |
Summit Hotel Properties ‡ | | | 4,673 | | | | 55 | |
Sun Communities ‡ | | | 2,209 | | | | 154 | |
Sunstone Hotel Investors ‡ | | | 6,736 | | | | 81 | |
SVB Financial Group * | | | 4,526 | | | | 499 | |
Synovus Financial | | | 1,601 | | | | 51 | |
Talmer Bancorp, Cl A | | | 3,690 | | | | 74 | |
Taubman Centers ‡ | | | 1,569 | | | | 108 | |
TCF Financial | | | 103,677 | | | | 1,490 | |
Texas Capital Bancshares * | | | 2,098 | | | | 107 | |
Towne Bank | | | 3,201 | | | | 70 | |
Trustmark | | | 625 | | | | 15 | |
Two Harbors Investment ‡ | | | 8,484 | | | | 72 | |
Union Bankshares | | | 320 | | | | 9 | |
United Community Banks | | | 7,955 | | | | 160 | |
United Fire Group | | | 9,367 | | | | 386 | |
Univest Corp of Pennsylvania | | | 13,379 | | | | 270 | |
Urban Edge Properties ‡ | | | 2,346 | | | | 63 | |
Urstadt Biddle Properties, Cl A ‡ | | | 7,711 | | | | 163 | |
Validus Holdings | | | 15,847 | | | | 772 | |
Voya Financial | | | 42,200 | | | | 1,387 | |
Walker & Dunlop * | | | 185 | | | | 4 | |
Washington Federal | | | 505 | | | | 13 | |
Washington Real Estate Investment Trust ‡ | | | 276 | | | | 8 | |
Waterstone Financial | | | 6,091 | | | | 88 | |
Webster Financial | | | 32,410 | | | | 1,269 | |
Weingarten Realty Investors ‡ | | | 5,466 | | | | 206 | |
WesBanco | | | 269 | | | | 9 | |
Westamerica Bancorporation | | | 429 | | | | 21 | |
Western Alliance Bancorp * | | | 53,427 | | | | 2,014 | |
| | | | | | | | |
| Description | | Shares | | | Market Value
($ Thousands) | |
White Mountains Insurance Group | | | 115 | | | $ | 93 | |
Wintrust Financial | | | 55,158 | | | | 2,938 | |
Xenia Hotels & Resorts ‡ | | | 2,981 | | | | 48 | |
| | | | | | | | |
| | | | | | | 85,045 | |
| | | | | | | | |
| | |
Health Care — 14.6% | | | | | | | | |
Abaxis | | | 2,098 | | | | 97 | |
ABIOMED * | | | 16,913 | | | | 1,680 | |
Acadia Healthcare * | | | 7,973 | | | | 469 | |
ACADIA Pharmaceuticals *(A) | | | 2,172 | | | | 77 | |
Acorda Therapeutics * | | | 394 | | | | 11 | |
Adamas Pharmaceuticals * | | | 9,004 | | | | 151 | |
Addus HomeCare * | | | 432 | | | | 9 | |
Adverum Biotechnologies * | | | 8,149 | | | | 37 | |
Aerie Pharmaceuticals *(A) | | | 8,390 | | | | 150 | |
Aimmune Therapeutics *(A) | | | 9,378 | | | | 144 | |
Akorn * | | | 16,296 | | | | 487 | |
Alder Biopharmaceuticals *(A) | | | 6,523 | | | | 196 | |
Align Technology * | | | 7,580 | | | | 598 | |
AMAG Pharmaceuticals * | | | 89,428 | | | | 1,917 | |
Amedisys * | | | 4,989 | | | | 254 | |
American Renal Associates Holdings * | | | 4,918 | | | | 138 | |
Amicus Therapeutics * | | | 24,357 | | | | 172 | |
AMN Healthcare Services * | | | 52,525 | | | | 1,961 | |
Amphastar Pharmaceuticals * | | | 17,726 | | | | 279 | |
Amsurg, Cl A * | | | 32,188 | | | | 2,407 | |
Anacor Pharmaceuticals * | | | 2,998 | | | | 298 | |
Analogic | | | 29,287 | | | | 2,402 | |
AngioDynamics * | | | 1,016 | | | | 12 | |
Anika Therapeutics * | | | 1,986 | | | | 94 | |
Applied Genetic Technologies * | | | 4,521 | | | | 78 | |
Avexis * | | | 6,569 | | | | 282 | |
BioCryst Pharmaceuticals * | | | 13,235 | | | | 45 | |
BioDelivery Sciences International *(A) | | | 290,956 | | | | 655 | |
Bio-Rad Laboratories, Cl A * | | | 278 | | | | 41 | |
BioSpecifics Technologies * | | | 2,026 | | | | 76 | |
BioTelemetry * | | | 19,396 | | | | 338 | |
Calithera Biosciences * | | | 2,468 | | | | 13 | |
Cambrex * | | | 7,304 | | | | 357 | |
Capital Senior Living * | | | 92,543 | | | | 1,693 | |
Cara Therapeutics * | | | 4,580 | | | | 30 | |
Cardiovascular Systems * | | | 6,259 | | | | 106 | |
Centene * | | | 628 | | | | 39 | |
Cepheid * | | | 588 | | | | 16 | |
Charles River Laboratories International * | | | 6,201 | | | | 533 | |
Community Health Systems *(A) | | | 137,928 | | | | 1,854 | |
Concert Pharmaceuticals * | | | 1,771 | | | | 24 | |
CONMED | | | 507 | | | | 20 | |
Corcept Therapeutics *(A) | | | 12,760 | | | | 76 | |
CorMedix *(A) | | | 5,009 | | | | 14 | |
Cross Country Healthcare * | | | 5,566 | | | | 76 | |
Cynosure, Cl A * | | | 72,955 | | | | 3,485 | |
| | |
| 77 | | SEI Institutional Investments Trust / Annual Report / May 31, 2016 |
SCHEDULE OF INVESTMENTS
Small Cap II Fund
May 31, 2016
| | | | | | | | |
| Description | | Shares | | | Market Value
($ Thousands) | |
DBV Technologies ADR * | | | 3,778 | | | $ | 127 | |
Dentsply Sirona | | | 6,561 | | | | 408 | |
Dermira * | | | 8,465 | | | | 269 | |
DexCom * | | | 7,098 | | | | 458 | |
Diplomat Pharmacy *(A) | | | 11,290 | | | | 368 | |
Emergent Biosolutions * | | | 32,083 | | | | 1,408 | |
Endologix * | | | 20,248 | | | | 257 | |
Ensign Group | | | 864 | | | | 17 | |
Envision Healthcare Holdings * | | | 41,155 | | | | 1,021 | |
Exelixis * | | | 45,429 | | | | 295 | |
Five Prime Therapeutics * | | | 3,458 | | | | 158 | |
Flamel Technologies ADR * | | | 148,142 | | | | 1,576 | |
Glaukos * | | | 16,660 | | | | 406 | |
Globus Medical, Cl A * | | | 123,141 | | | | 2,985 | |
Greatbatch * | | | 251 | | | | 8 | |
GW Pharmaceuticals ADR *(A) | | | 1,948 | | | | 174 | |
Haemonetics * | | | 2,688 | | | | 75 | |
Halozyme Therapeutics *(A) | | | 2,568 | | | | 26 | |
Halyard Health * | | | 5,020 | | | | 156 | |
HealthSouth | | | 17,859 | | | | 720 | |
Healthways * | | | 7,099 | | | | 85 | |
Heska * | | | 6,621 | | | | 240 | |
HMS Holdings * | | | 5,224 | | | | 86 | |
ICON * | | | 5,823 | | | | 410 | |
ICU Medical * | | | 2,706 | | | | 281 | |
Impax Laboratories * | | | 25,880 | | | | 884 | |
INC Research Holdings, Cl A * | | | 3,817 | | | | 166 | |
Integra LifeSciences Holdings * | | | 73,151 | | | | 5,465 | |
Kindred Healthcare | | | 151,974 | | | | 1,804 | |
Lannett *(A) | | | 97,900 | | | | 2,388 | |
LeMaitre Vascular | | | 3,746 | | | | 52 | |
Lexicon Pharmaceuticals *(A) | | | 38,127 | | | | 542 | |
LHC Group * | | | 5,283 | | | | 222 | |
LifePoint Hospitals * | | | 134 | | | | 9 | |
Ligand Pharmaceuticals, Cl B *(A) | | | 15,901 | | | | 1,902 | |
LivaNova * | | | 7,034 | | | | 343 | |
Loxo Oncology *(A) | | | 11,205 | | | | 303 | |
Luminex * | | | 4,890 | | | | 101 | |
Magellan Health Services * | | | 3,448 | | | | 228 | |
Masimo * | | | 8,174 | | | | 407 | |
Medicines * | | | 5,010 | | | | 188 | |
Merit Medical Systems * | | | 4,553 | | | | 85 | |
Molina Healthcare * | | | 34,868 | | | | 1,689 | |
Myriad Genetics * | | | 3,139 | | | | 106 | |
Natus Medical * | | | 1,988 | | | | 64 | |
NeoGenomics * | | | 48,909 | | | | 439 | |
Neurocrine Biosciences * | | | 12,701 | | | | 631 | |
Nevro *(A) | | | 11,764 | | | | 820 | |
Nobilis Health * | | | 1,722 | | | | 5 | |
Novavax *(A) | | | 7,309 | | | | 44 | |
NuVasive * | | | 5,863 | | | | 319 | |
OraSure Technologies * | | | 39,961 | | | | 307 | |
| | | | | | | | |
| Description | | Shares | | | Market Value
($ Thousands) | |
Orthofix International * | | | 2,357 | | | $ | 104 | |
Otonomy * | | | 8,856 | | | | 130 | |
Owens & Minor | | | 1,721 | | | | 64 | |
Pacific Biosciences of California *(A) | | | 27,560 | | | | 266 | |
PDL BioPharma | | | 90,963 | | | | 327 | |
Penumbra * | | | 8,753 | | | | 462 | |
PerkinElmer | | | 7,785 | | | | 426 | |
Pernix Therapeutics Holdings *(A) | | | 83,469 | | | | 37 | |
Pfenex * | | | 3,421 | | | | 24 | |
Phibro Animal Health, Cl A | | | 3,194 | | | | 61 | |
Portola Pharmaceuticals, Cl A * | | | 1,245 | | | | 34 | |
Premier, Cl A * | | | 14,393 | | | | 458 | |
Press Ganey Holdings * | | | 7,610 | | | | 259 | |
Prestige Brands Holdings * | | | 44,528 | | | | 2,406 | |
Prothena *(A) | | | 5,210 | | | | 253 | |
Quality Systems | | | 1,291 | | | | 16 | |
Quintiles Transnational Holdings * | | | 1,068 | | | | 72 | |
Radius Health *(A) | | | 4,810 | | | | 174 | |
RadNet * | | | 4,296 | | | | 22 | |
Retrophin * | | | 798 | | | | 14 | |
RTI Surgical * | | | 7,704 | | | | 29 | |
Sage Therapeutics * | | | 5,114 | | | | 168 | |
Sciclone Pharmaceuticals * | | | 23,417 | | | | 331 | |
SeaSpine Holdings * | | | 2,478 | | | | 25 | |
Second Sight Medical Products *(A) | | | 1,286 | | | | 5 | |
Sequenom * | | | 14,553 | | | | 15 | |
Seres Therapeutics *(A) | | | 5,430 | | | | 165 | |
STERIS | | | 4,808 | | | | 334 | |
Sucampo Pharmaceuticals, Cl A * | | | 3,424 | | | | 40 | |
Supernus Pharmaceuticals * | | | 56,689 | | | | 1,106 | |
SurModics * | | | 7,762 | | | | 171 | |
Teleflex | | | 953 | | | | 153 | |
TESARO * | | | 3,647 | | | | 169 | |
TherapeuticsMD *(A) | | | 42,216 | | | | 377 | |
TransEnterix *(A) | | | 70,043 | | | | 128 | |
Triple-S Management, Cl B * | | | 17,660 | | | | 406 | |
Ultragenyx Pharmaceutical * | | | 3,748 | | | | 274 | |
Vascular Solutions * | | | 6,514 | | | | 248 | |
VCA Antech * | | | 436 | | | | 28 | |
Veeva Systems, Cl A * | | | 7,845 | | | | 258 | |
VWR * | | | 1,337 | | | | 39 | |
WellCare Health Plans * | | | 5,039 | | | | 511 | |
West Pharmaceutical Services | | | 3,440 | | | | 258 | |
Zeltiq Aesthetics *(A) | | | 13,670 | | | | 389 | |
| | | | | | | | |
| | | | | | | 66,654 | |
| | | | | | | | |
| | |
Industrials — 15.9% | | | | | | | | |
AAR | | | 13,716 | | | | 335 | |
ABM Industries | | | 245 | | | | 8 | |
Acacia Research | | | 351,385 | | | | 1,813 | |
ACCO Brands * | | | 232,322 | | | | 2,309 | |
Actuant, Cl A | | | 45,588 | | | | 1,244 | |
| | |
| 78 | | SEI Institutional Investments Trust / Annual Report / May 31, 2016 |
SCHEDULE OF INVESTMENTS
Small Cap II Fund
May 31, 2016
| | | | | | | | |
| Description | | Shares | | | Market Value
($ Thousands) | |
Aegion, Cl A * | | | 4,550 | | | $ | 91 | |
Air Transport Services Group * | | | 16,453 | | | | 208 | |
Allegiant Travel, Cl A | | | 362 | | | | 50 | |
Allied Motion Technologies | | | 797 | | | | 18 | |
Altra Industrial Motion | | | 7,538 | | | | 204 | |
American Science & Engineering | | | 1,360 | | | | 43 | |
American Woodmark * | | | 1,359 | | | | 110 | |
Apogee Enterprises | | | 58,718 | | | | 2,655 | |
Applied Industrial Technologies | | | 3,318 | | | | 150 | |
Astec Industries | | | 6,855 | | | | 366 | |
Atlas Air Worldwide Holdings * | | | 70,600 | | | | 3,095 | |
Barnes Group | | | 33,575 | | | | 1,121 | |
Barrett Business Services | | | 1,319 | | | | 49 | |
Beacon Roofing Supply * | | | 27,895 | | | | 1,204 | |
Brady, Cl A | | | 13,345 | | | | 424 | |
Briggs & Stratton | | | 4,821 | | | | 108 | |
BWX Technologies | | | 6,688 | | | | 235 | |
CAI International * | | | 5,356 | | | | 41 | |
Carlisle | | | 6,165 | | | | 640 | |
CIRCOR International | | | 11,484 | | | | 644 | |
Clean Harbors * | | | 7,745 | | | | 399 | |
Comfort Systems USA | | | 24,158 | | | | 773 | |
Continental Building Products * | | | 1,963 | | | | 45 | |
Copa Holdings, Cl A | | | 517 | | | | 27 | |
CRA International * | | | 4,174 | | | | 98 | |
Crane | | | 41,200 | | | | 2,365 | |
Curtiss-Wright | | | 13,263 | | | | 1,104 | |
DigitalGlobe * | | | 2,930 | | | | 61 | |
Ducommun * | | | 2,666 | | | | 45 | |
DXP Enterprises * | | | 33,100 | | | | 459 | |
Dycom Industries * | | | 11,248 | | | | 955 | |
EMCOR Group | | | 41,082 | | | | 1,953 | |
Engility Holdings * | | | 1,474 | | | | 35 | |
Ennis | | | 27,733 | | | | 506 | |
Enphase Energy * | | | 10,461 | | | | 22 | |
EnPro Industries | | | 7,535 | | | | 381 | |
Esterline Technologies * | | | 1,074 | | | | 72 | |
Federal Signal | | | 629 | | | | 8 | |
Forward Air | | | 26,045 | | | | 1,185 | |
G&K Services, Cl A | | | 2,234 | | | | 168 | |
Generac Holdings * | | | 9,256 | | | | 351 | |
General Cable | | | 9,447 | | | | 129 | |
Genesee & Wyoming, Cl A * | | | 6,641 | | | | 399 | |
Gibraltar Industries * | | | 14,501 | | | | 433 | |
Global Brass & Copper Holdings | | | 7,792 | | | | 213 | |
Granite Construction | | | 5,365 | | | | 230 | |
H&E Equipment Services | | | 22,627 | | | | 435 | |
Hawaiian Holdings * | | | 1,317 | | | | 53 | |
Heico | | | 23,170 | | | | 1,542 | |
HEICO, Cl A | | | 1,063 | | | | 59 | |
Heidrick & Struggles International | | | 7,208 | | | | 133 | |
Herman Miller | | | 2,097 | | | | 66 | |
| | | | | | | | |
| Description | | Shares | | | Market Value
($ Thousands) | |
Hexcel | | | 19,972 | | | $ | 872 | |
Huron Consulting Group * | | | 42,534 | | | | 2,490 | |
Hyster-Yale Materials Handling | | | 133 | | | | 8 | |
ICF International * | | | 393 | | | | 16 | |
IDEX | | | 6,382 | | | | 532 | |
Insperity | | | 5,692 | | | | 410 | |
Insteel Industries | | | 8,635 | | | | 239 | |
Interface, Cl A | | | 12,792 | | | | 217 | |
ITT | | | 44,889 | | | | 1,594 | |
JetBlue Airways * | | | 3,106 | | | | 56 | |
John Bean Technologies | | | 20,350 | | | | 1,235 | |
Joy Global (A) | | | 13,128 | | | | 224 | |
KBR | | | 4,061 | | | | 59 | |
Kforce | | | 6,245 | | | | 117 | |
Kirby * | | | 8,305 | | | | 582 | |
Knoll | | | 1,752 | | | | 44 | |
Korn/Ferry International | | | 6,913 | | | | 199 | |
LB Foster, Cl A | | | 87,073 | | | | 1,004 | |
Lincoln Electric Holdings | | | 7,109 | | | | 428 | |
Macquarie Infrastructure | | | 1,501 | | | | 108 | |
Manpowergroup | | | 1,983 | | | | 158 | |
MasTec * | | | 92,610 | | | | 2,130 | |
Matson | | | 1,157 | | | | 39 | |
Matthews International, Cl A | | | 5,557 | | | | 305 | |
Middleby * | | | 2,995 | | | | 372 | |
Mistras Group * | | | 4,275 | | | | 106 | |
Moog, Cl A * | | | 1,559 | | | | 84 | |
MRC Global * | | | 20,714 | | | | 294 | |
MSC Industrial Direct, Cl A | | | 2,023 | | | | 152 | |
Mueller Water Products, Cl A | | | 23,552 | | | | 259 | |
Multi-Color | | | 4,140 | | | | 258 | |
MYR Group * | | | 413 | | | | 10 | |
National Presto Industries | | | 1,314 | | | | 118 | |
Navigant Consulting * | | | 2,279 | | | | 36 | |
Navistar International * | | | 681 | | | | 8 | |
NCI Building Systems * | | | 20,665 | | | | 333 | |
Nordson | | | 5,623 | | | | 489 | |
Northwest Pipe * | | | 8,699 | | | | 81 | |
On Assignment * | | | 58,049 | | | | 2,187 | |
Orbital ATK | | | 162 | | | | 14 | |
Oshkosh Truck | | | 5,449 | | | | 250 | |
Owens Corning | | | 4,835 | | | | 247 | |
Patrick Industries * | | | 7,420 | | | | 396 | |
Paylocity Holding * | | | 10,241 | | | | 376 | |
Ply Gem Holdings * | | | 5,208 | | | | 78 | |
Proto Labs *(A) | | | 15,890 | | | | 1,046 | |
Quad, Cl A | | | 6,849 | | | | 132 | |
Quanta Services * | | | 3,030 | | | | 73 | |
RBC Bearings * | | | 5,552 | | | | 416 | |
Regal-Beloit | | | 6,528 | | | | 373 | |
Resources Connection | | | 19,886 | | | | 310 | |
Roadrunner Transportation Systems * | | | 5,961 | | | | 48 | |
| | |
| 79 | | SEI Institutional Investments Trust / Annual Report / May 31, 2016 |
SCHEDULE OF INVESTMENTS
Small Cap II Fund
May 31, 2016
| | | | | | | | |
| Description | | Shares | | | Market Value
($ Thousands) | |
RPX * | | | 25,740 | | | $ | 259 | |
SkyWest | | | 12,806 | | | | 302 | |
Spirit AeroSystems Holdings, Cl A * | | | 3,062 | | | | 143 | |
SPX FLOW * | | | 3,142 | | | | 94 | |
Standex International | | | 4,561 | | | | 395 | |
Steelcase, Cl A | | | 91,034 | | | | 1,453 | |
Swift Transporation, Cl A *(A) | | | 84,932 | | | | 1,323 | |
Team * | | | 12,304 | | | | 373 | |
Teledyne Technologies * | | | 2,195 | | | | 215 | |
Terex | | | 2,494 | | | | 53 | |
Tetra Tech | | | 18,702 | | | | 572 | |
Titan Machinery *(A) | | | 48,430 | | | | 517 | |
TransUnion * | | | 9,210 | | | | 305 | |
TriMas * | | | 19,073 | | | | 326 | |
TriNet Group * | | | 22,894 | | | | 461 | |
Triumph Group | | | 104,554 | | | | 3,945 | |
TrueBlue * | | | 2,124 | | | | 42 | |
UniFirst | | | 3,650 | | | | 422 | |
Universal Forest Products | | | 7,058 | | | | 592 | |
USA Truck * | | | 3,074 | | | | 61 | |
USG * | | | 9,371 | | | | 270 | |
Valmont Industries | | | 2,061 | | | | 285 | |
Wabash National * | | | 4,420 | | | | 63 | |
WageWorks * | | | 50,360 | | | | 2,823 | |
Watts Water Technologies, Cl A | | | 6,030 | | | | 347 | |
Wesco Aircraft Holdings * | | | 218,840 | | | | 3,083 | |
Xylem | | | 1,138 | | | | 51 | |
| | | | | | | | |
| | | | | | | 72,256 | |
| | | | | | | | |
| | |
Information Technology — 19.3% | | | | | | | | |
A10 Networks * | | | 1,511 | | | | 10 | |
Acxiom * | | | 100,047 | | | | 2,119 | |
Advanced Energy Industries * | | | 6,421 | | | | 245 | |
Advanced Micro Devices *(A) | | | 72,459 | | | | 331 | |
Ambarella *(A) | | | 6,357 | | | | 263 | |
Amkor Technology * | | | 37,084 | | | | 234 | |
Anixter International * | | | 12,790 | | | | 770 | |
Ansys * | | | 141 | | | | 13 | |
Arista Networks * | | | 2,020 | | | | 148 | |
Arrow Electronics * | | | 2,984 | | | | 193 | |
Aspen Technology * | | | 12,751 | | | | 486 | |
Atlassian, Cl A *(A) | | | 13,036 | | | | 294 | |
AVG Technologies * | | | 9,744 | | | | 187 | |
Avnet | | | 2,852 | | | | 117 | |
Axcelis Technologies * | | | 13,058 | | | | 35 | |
Bankrate * | | | 22,570 | | | | 205 | |
Barracuda Networks * | | | 4,253 | | | | 73 | |
Benchmark Electronics * | | | 12,712 | | | | 264 | |
Black Box | | | 105,629 | | | | 1,326 | |
Blackbaud | | | 24,030 | | | | 1,506 | |
Brightcove * | | | 8,529 | | | | 57 | |
BroadSoft * | | | 16,160 | | | | 705 | |
| | | | | | | | |
| Description | | Shares | | | Market Value
($ Thousands) | |
Brocade Communications Systems | | | 18,287 | | | $ | 166 | |
CACI International, Cl A * | | | 14,793 | | | | 1,491 | |
CalAmp * | | | 163,390 | | | | 2,456 | |
Callidus Software * | | | 117,694 | | | | 2,184 | |
Cardtronics * | | | 43,129 | | | | 1,695 | |
Cavium * | | | 39,996 | | | | 1,990 | |
CEVA * | | | 10,081 | | | | 273 | |
Ciena * | | | 5,630 | | | | 98 | |
Cimpress *(A) | | | 7,556 | | | | 757 | |
Coherent * | | | 6,674 | | | | 631 | |
Cohu | | | 10,866 | | | | 128 | |
CommVault Systems * | | | 25,180 | | | | 1,140 | |
comScore * | | | 592 | | | | 19 | |
Comtech Telecommunications | | | 5,243 | | | | 121 | |
Convergys | | | 34,522 | | | | 973 | |
Cornerstone OnDemand * | | | 66,637 | | | | 2,666 | |
CoStar Group * | | | 2,111 | | | | 436 | |
Cray * | | | 1,978 | | | | 66 | |
CSG Systems International | | | 2,097 | | | | 89 | |
Cypress Semiconductor (A) | | | 98,000 | | | | 1,042 | |
DHI Group * | | | 8,608 | | | | 61 | |
Diebold | | | 16,123 | | | | 417 | |
Digi International * | | | 8,013 | | | | 88 | |
Dolby Laboratories, Cl A | | | 5,562 | | | | 264 | |
DST Systems | | | 2,152 | | | | 260 | |
EarthLink Holdings | | | 2,854 | | | | 19 | |
Ebix (A) | | | 5,807 | | | | 263 | |
Electronics For Imaging * | | | 22,135 | | | | 970 | |
EMCORE * | | | 24,892 | | | | 141 | |
EPAM Systems * | | | 6,440 | | | | 493 | |
Euronet Worldwide * | | | 2,740 | | | | 219 | |
Everi Holdings * | | | 39,399 | | | | 56 | |
EVERTEC | | | 10,129 | | | | 155 | |
Everyday Health * | | | 17,582 | | | | 118 | |
Exar * | | | 5,353 | | | | 37 | |
ExlService Holdings * | | | 35,925 | | | | 1,861 | |
Extreme Networks * | | | 14,569 | | | | 54 | |
Fair Isaac | | | 3,618 | | | | 403 | |
Fairchild Semiconductor International, Cl A * | | | 5,395 | | | | 107 | |
Finisar * | | | 1,416 | | | | 24 | |
First Solar * | | | 4,542 | | | | 225 | |
Five9 * | | | 29,933 | | | | 305 | |
FleetMatics Group * | | | 4,039 | | | | 165 | |
Fortinet * | | | 7,770 | | | | 266 | |
Gigamon * | | | 5,045 | | | | 157 | |
Global Payments | | | 2,561 | | | | 199 | |
GoDaddy, Cl A * | | | 6,534 | | | | 213 | |
Guidewire Software * | | | 13,439 | | | | 789 | |
Hackett Group | | | 4,631 | | | | 68 | |
HubSpot * | | | 9,800 | | | | 468 | |
II-VI * | | | 10,727 | | | | 219 | |
Immersion * | | | 3,787 | | | | 24 | |
| | |
| 80 | | SEI Institutional Investments Trust / Annual Report / May 31, 2016 |
SCHEDULE OF INVESTMENTS
Small Cap II Fund
May 31, 2016
| | | | | | | | |
| Description | | Shares | | | Market Value
($ Thousands) | |
Infoblox * | | | 69,222 | | | $ | 1,302 | |
Ingram Micro, Cl A | | | 2,772 | | | | 96 | |
Inphi * | | | 38,241 | | | | 1,193 | |
Insight Enterprises * | | | 5,954 | | | | 162 | |
Integrated Device Technology * | | | 5,527 | | | | 129 | |
Internap Network Services * | | | 1,974 | | | | 4 | |
Ixia * | | | 83,155 | | | | 845 | |
IXYS | | | 8,981 | | | | 98 | |
j2 Global | | | 15,111 | | | | 1,012 | |
Keysight Technologies * | | | 51,200 | | | | 1,568 | |
Leidos Holdings | | | 1,448 | | | | 72 | |
Liquidity Services * | | | 8,249 | | | | 55 | |
Littelfuse | | | 11,035 | | | | 1,264 | |
M *(A) | | | 10,341 | | | | 372 | |
Manhattan Associates * | | | 2,058 | | | | 136 | |
ManTech International, Cl A | | | 9,926 | | | | 357 | |
Marketo * | | | 105,427 | | | | 3,714 | |
Marvell Technology Group | | | 12,926 | | | | 132 | |
MAXIMUS | | | 47,113 | | | | 2,716 | |
MaxLinear, Cl A * | | | 69,726 | | | | 1,445 | |
Mellanox Technologies * | | | 8,660 | | | | 410 | |
Mentor Graphics | | | 20,001 | | | | 429 | |
Microsemi * | | | 21,510 | | | | 728 | |
MicroStrategy, Cl A * | | | 693 | | | | 129 | |
Mitek Systems *(A) | | | 32,758 | | | | 298 | |
MKS Instruments | | | 17,337 | | | | 710 | |
MoneyGram International * | | | 6,336 | | | | 41 | |
Monolithic Power Systems | | | 25,599 | | | | 1,749 | |
Monotype Imaging Holdings | | | 59,484 | | | | 1,420 | |
Monster Worldwide * | | | 30,483 | | | | 81 | |
Multi-Fineline Electronix * | | | 7,798 | | | | 172 | |
NETGEAR * | | | 14,632 | | | | 658 | |
NeuStar, Cl A * | | | 3,898 | | | | 92 | |
NIC | | | 4,141 | | | | 82 | |
Nuance Communications * | | | 7,540 | | | | 126 | |
Oclaro *(A) | | | 64,790 | | | | 325 | |
Open Text (A) | | | 54,500 | | | | 3,198 | |
Orbotech * | | | 37,100 | | | | 1,035 | |
OSI Systems * | | | 47,521 | | | | 2,532 | |
Pandora Media *(A) | | | 19,806 | | | | 234 | |
Paycom Software * | | | 7,321 | | | | 296 | |
PDF Solutions * | | | 101,793 | | | | 1,497 | |
Perficient * | | | 80,551 | | | | 1,688 | |
PFSweb * | | | 20,059 | | | | 250 | |
Photronics * | | | 1,167 | | | | 11 | |
Plexus * | | | 6,813 | | | | 299 | |
Polycom * | | | 4,273 | | | | 51 | |
Progress Software * | | | 11,142 | | | | 293 | |
Proofpoint * | | | 35,980 | | | | 2,109 | |
PTC * | | | 19,688 | | | | 704 | |
Q2 Holdings * | | | 8,133 | | | | 203 | |
QAD, Cl A | | | 2,151 | | | | 40 | |
| | | | | | | | |
| Description | | Shares | | | Market Value
($ Thousands) | |
Qlik Technologies * | | | 16,388 | | | $ | 470 | |
QLogic * | | | 33,263 | | | | 461 | |
Quantum * | | | 97,947 | | | | 37 | |
QuinStreet * | | | 8,317 | | | | 31 | |
RealPage * | | | 1,185 | | | | 26 | |
RetailMeNot * | | | 44,396 | | | | 321 | |
RingCentral, Cl A * | | | 22,187 | | | | 438 | |
Rogers * | | | 4,088 | | | | 272 | |
Rovi * | | | 16,906 | | | | 284 | |
Rubicon Project * | | | 522 | | | | 8 | |
Rudolph Technologies * | | | 17,869 | | | | 261 | |
Sanmina * | | | 12,043 | | | | 323 | |
ScanSource * | | | 451 | | | | 17 | |
Semtech * | | | 16,821 | | | | 396 | |
Shutterstock *(A) | | | 282 | | | | 12 | |
Sigma Designs * | | | 8,214 | | | | 59 | |
Silicon Graphics International * | | | 262,954 | | | | 1,383 | |
Silicon Laboratories * | | | 13,198 | | | | 657 | |
Silver Spring Networks * | | | 3,890 | | | | 51 | |
Sonus Networks * | | | 1,162 | | | | 11 | |
Sykes Enterprises * | | | 27,758 | | | | 828 | |
Synaptics * | | | 5,812 | | | | 394 | |
SYNNEX | | | 2,899 | | | | 264 | |
Synopsys * | | | 4,519 | | | | 233 | |
Take-Two Interactive Software * | | | 45,543 | | | | 1,772 | |
Tech Data * | | | 3,274 | | | | 247 | |
Telenav * | | | 4,614 | | | | 21 | |
TeleTech Holdings | | | 9,937 | | | | 271 | |
Teradyne | | | 2,756 | | | | 55 | |
Ultimate Software Group * | | | 2,655 | | | | 543 | |
United Online * | | | 9,431 | | | | 103 | |
Universal Display * | | | 5,431 | | | | 365 | |
Vasco Data Security International * | | | 814 | | | | 13 | |
VeriFone Holdings * | | | 14,148 | | | | 373 | |
Verint Systems * | | | 3,111 | | | | 103 | |
Virtusa * | | | 1,568 | | | | 55 | |
WebMD Health, Cl A * | | | 5,543 | | | | 364 | |
XO Group * | | | 5,211 | | | | 88 | |
Zebra Technologies, Cl A * | | | 4,500 | | | | 239 | |
Zendesk * | | | 8,157 | | | | 200 | |
Zix * | | | 26,772 | | | | 108 | |
| | | | | | | | |
| | | | | | | 87,829 | |
| | | | | | | | |
| | |
Materials — 3.9% | | | | | | | | |
AEP Industries | | | 1,613 | | | | 97 | |
AK Steel Holding * | | | 6,220 | | | | 27 | |
Allegheny Technologies (A) | | | 19,945 | | | | 247 | |
Axiall | | | 3,183 | | | | 74 | |
Bemis | | | 1,521 | | | | 77 | |
Berry Plastics Group * | | | 63,566 | | | | 2,490 | |
Cabot | | | 29,045 | | | | 1,328 | |
Century Aluminum *(A) | | | 49,825 | | | | 322 | |
| | |
| 81 | | SEI Institutional Investments Trust / Annual Report / May 31, 2016 |
SCHEDULE OF INVESTMENTS
Small Cap II Fund
May 31, 2016
| | | | | | | | |
| Description | | Shares | | | Market Value
($ Thousands) | |
Cliffs Natural Resources *(A) | | | 48,663 | | | $ | 208 | |
Coeur Mining * | | | 30,457 | | | | 229 | |
Commercial Metals | | | 65,950 | | | | 1,132 | |
Crown Holdings * | | | 1,415 | | | | 74 | |
Ferro * | | | 18,008 | | | | 249 | |
Ferroglobe | | | 2,400 | | | | 22 | |
FMC | | | 24,000 | | | | 1,140 | |
FutureFuel | | | 11,862 | | | | 132 | |
Graphic Packaging Holding | | | 6,119 | | | | 82 | |
Headwaters * | | | 54,960 | | | | 1,044 | |
Huntsman | | | 886 | | | | 13 | |
Innophos Holdings | | | 8,744 | | | | 335 | |
Innospec | | | 10,805 | | | | 525 | |
Intrepid Potash * | | | 49,963 | | | | 63 | |
KMG Chemicals | | | 874 | | | | 19 | |
Koppers Holdings * | | | 4,309 | | | | 109 | |
Kraton Performance Polymers * | | | 9,868 | | | | 268 | |
LSB Industries *(A) | | | 109,124 | | | | 1,435 | |
Martin Marietta Materials | | | 1,090 | | | | 206 | |
Neenah Paper | | | 5,168 | | | | 359 | |
Olin | | | 28,732 | | | | 661 | |
Owens-Illinois * | | | 11,203 | | | | 212 | |
PolyOne | | | 18,516 | | | | 694 | |
Rayonier Advanced Materials | | | 29,569 | | | | 383 | |
Reliance Steel & Aluminum | | | 1,355 | | | | 101 | |
Sensient Technologies | | | 14,705 | | | | 1,003 | |
Silgan Holdings | | | 4,839 | | | | 247 | |
Sonoco Products | | | 1,218 | | | | 58 | |
Steel Dynamics | | | 12,060 | | | | 298 | |
Stepan | | | 909 | | | | 52 | |
Summit Materials, Cl A * | | | 32,564 | | | | 708 | |
SunCoke Energy | | | 16,133 | | | | 98 | |
Tahoe Resources | | | 3,130 | | | | 37 | |
TimkenSteel | | | 5,129 | | | | 46 | |
Tredegar | | | 1,286 | | | | 21 | |
Trinseo * | | | 2,696 | | | | 127 | |
United States Steel (A) | | | 24,485 | | | | 354 | |
US Concrete * | | | 4,048 | | | | 260 | |
| | | | | | | | |
| | | | | | | 17,666 | |
| | | | | | | | |
| |
Telecommunication Services — 0.4% | | | | | |
8x8 * | | | 21,219 | | | | 271 | |
Atlantic Telegraph-Network | | | 3,039 | | | | 226 | |
Cincinnati Bell * | | | 41,028 | | | | 163 | |
Cogent Communications Holdings | | | 6,669 | | | | 266 | |
IDT, Cl B | | | 9,976 | | | | 148 | |
Inteliquent | | | 6,022 | | | | 101 | |
Intelsat *(A) | | | 63,567 | | | | 205 | |
Telephone & Data Systems | | | 6,178 | | | | 178 | |
US Cellular * | | | 1,132 | | | | 43 | |
Vonage Holdings * | | | 56,605 | | | | 261 | |
| | | | | | | | |
| | | | | | | 1,862 | |
| | | | | | | | |
| | | | | | | | |
| Description | | Shares | | | Market Value
($ Thousands) | |
Utilities — 2.9% | | | | | | | | |
AGL Resources | | | 1,921 | | | $ | 126 | |
ALLETE | | | 640 | | | | 37 | |
Alliant Energy | | | 1,730 | | | | 64 | |
American States Water | | | 3,080 | | | | 120 | |
American Water Works | | | 7,107 | | | | 527 | |
Aqua America | | | 1,797 | | | | 58 | |
Atlantic Power | | | 2,548 | | | | 6 | |
Atmos Energy | | | 4,330 | | | | 316 | |
Avista | | | 11,826 | | | | 476 | |
Black Hills | | | 466 | | | | 28 | |
California Water Service Group | | | 2,225 | | | | 65 | |
Chesapeake Utilities | | | 170 | | | | 10 | |
CMS Energy | | | 9,382 | | | | 392 | |
El Paso Electric | | | 373 | | | | 17 | |
Great Plains Energy | | | 25,064 | | | | 731 | |
Hawaiian Electric Industries * | | | 2,457 | | | | 81 | |
IDACORP | | | 5,708 | | | | 418 | |
ITC Holdings | | | 1,840 | | | | 82 | |
MDU Resources Group | | | 1,894 | | | | 43 | |
MGE Energy | | | 221 | | | | 11 | |
Northwest Natural Gas | | | 991 | | | | 54 | |
NorthWestern | | | 3,588 | | | | 208 | |
NRG Yield, Cl C | | | 1,922 | | | | 30 | |
OGE Energy | | | 424 | | | | 13 | |
ONE Gas | | | 6,867 | | | | 403 | |
Otter Tail | | | 949 | | | | 28 | |
Piedmont Natural Gas | | | 3,858 | | | | 232 | |
Pinnacle West Capital | | | 9,531 | | | | 701 | |
PNM Resources | | | 52,929 | | | | 1,738 | |
Portland General Electric | | | 47,140 | | | | 1,941 | |
Questar | | | 2,804 | | | | 71 | |
SCANA | | | 9,452 | | | | 661 | |
SJW | | | 1,163 | | | | 40 | |
Southwest Gas | | | 7,163 | | | | 497 | |
Spark Energy, Cl A | | | 3,579 | | | | 108 | |
Spire | | | 24,052 | | | | 1,529 | |
Talen Energy * | | | 668 | | | | 8 | |
TECO Energy | | | 3,750 | | | | 103 | |
UGI | | | 13,957 | | | | 599 | |
Unitil | | | 1,093 | | | | 43 | |
Vectren | | | 5,238 | | | | 260 | |
Westar Energy, Cl A | | | 5,622 | | | | 317 | |
| | | | | | | | |
| | | | | | | 13,192 | |
| | | | | | | | |
Total Common Stock (Cost $389,660) ($ Thousands) | | | | | | | 429,379 | |
| | | | | | | | |
| | |
| | | Number of Rights | | | | |
RIGHTS — 0.0% | | | | | | | | |
| |
United States — 0.0% | | | | | |
Dyax ‡‡ | | | 4 | | | | — | |
| | | | | | | | |
| | |
| 82 | | SEI Institutional Investments Trust / Annual Report / May 31, 2016 |
SCHEDULE OF INVESTMENTS
Small Cap II Fund
May 31, 2016
| | | | | | | | |
| Description | | Number of Rights | | | Market Value ($ Thousands) | |
Total Rights
(Cost $—) ($ Thousands) | | | | | | $ | — | |
| | | | | | | | |
| | | Shares | | | | |
|
AFFILIATED PARTNERSHIP — 7.5% | |
SEI Liquidity Fund, L.P. | | | | | | | | |
0.410% **†(B) | | | 33,837,493 | | | | 33,837 | |
| | | | | | | | |
Total Affiliated Partnership (Cost $33,837) ($ Thousands) | | | | | | | 33,837 | |
| | | | | | | | |
| | | Face Amount
($Thousands) | | | | |
| |
U.S. TREASURY OBLIGATION — 0.1% | | | | | |
U.S. Treasury Bills | | | | | | | | |
0.363%, 08/18/2016 (C) | | $ | 460 | | | | 460 | |
| | | | | | | | |
Total U.S. Treasury Obligation
(Cost $460) ($ Thousands) | | | | 460 | |
| | | | | | | | |
| | | Shares | | | | |
|
CASH EQUIVALENT — 4.6% | |
SEI Daily Income Trust, Prime Obligation Fund, Cl A | | | | | | | | |
0.270% **† | | | 21,068,541 | | | | 21,069 | |
| | | | | | | | |
Total Cash Equivalent (Cost $21,069) ($ Thousands) | | | | | | | 21,069 | |
| | | | | | | | |
Total Investments — 106.4%
(Cost $445,026) ($ Thousands) | | | $ | 484,745 | |
| | | | | | | | |
A list of the open futures contracts held by the Fund at May 31, 2016, is as follows:
| | | | | | | | | | | | |
| Type of Contract | | Number of
Contracts
Long | | | Expiration
Date | | | Unrealized
Appreciation
($ Thousands) | |
Russell 2000 Index E-MINI | | | 67 | | | | Jun-2016 | | | $ | 469 | |
| | | | | | | | | | | | |
For the year ended May 31, 2016, the total amount of all open futures contracts, as presented in the table above, are representative of the volume of activity for the derivative type during the year.
Percentages are based on a Net Assets of $455,742 ($ Thousands).
| * | | Non-income producing security. |
| ** | | Rate shown is the 7-day effective yield as of May 31, 2016. |
| † | | Investment in Affiliated Security (see Note 6). |
| ‡ | | Real Estate Investment Trust. |
| ‡‡ | | Expiration date unavailable. |
| (A) | | This security or a partial position of this security is on loan at May 31, 2016. The total market value of securities on loan at May 31, 2016 was $33,133 ($ Thousands). |
| (B) | | This security was purchased with cash collateral held from securities on loan. The total market value of such securities as of May 31, 2016 was $33,837($Thousands). |
| (C) | | All or a portion of this security has been pledged as collateral for open futures contracts. |
ADR — American Depositary Receipt
Cl — Class
L.P. — Limited Partnership
| | | | | | | | | | | | | | | | |
| Investments in Securities | | Level 1 | | | Level 2 | | | Level 3 | | | Total | |
Common Stock | | $ | 429,379 | | | $ | — | | | $ | — | | | $ | 429,379 | |
Rights | | | — | | | | — | | | | — | | | | — | |
Affiliated Partnership | | | — | | | | 33,837 | | | | — | | | | 33,837 | |
U.S. Treasury Obligation | | | — | | | | 460 | | | | — | | | | 460 | |
Cash Equivalent | | | 21,069 | | | | — | | | | — | | | | 21,069 | |
| | | | | | | | | | | | | | | | |
Total Investments in Securities | | $ | 450,448 | | | $ | 34,297 | | | $ | — | | | $ | 484,745 | |
| | | | | | | | | | | | | | | | |
| | | | | | | | | | | | | | | | |
| Other Financial Instruments | | Level 1 | | | Level 2 | | | Level 3 | | | Total | |
Futures Contracts * | | | | | | | | | | | | | | | | |
Unrealized Appreciation | | $ | 469 | | | $ | — | | | $ | — | | | $ | 469 | |
| | | | | | | | | | | | | | | | |
| * | | Futures contracts are valued at the unrealized appreciation on the instrument. |
For the year ended May 31, 2016, there were no transfers between Level 1 and Level 2 assets and liabilities.
For the year ended May 31, 2016, there were no transfers between Level 2 and Level 3 assets and liabilities.
For more information on valuation inputs, see Note 2 — Significant Accounting Policies in Notes to Financial Statements.
Amounts designated as “—” are $0 or have been rounded to $0.
The accompanying notes are an integral part of the financial statements.
| | |
| 83 | | SEI Institutional Investments Trust / Annual Report / May 31, 2016 |
SCHEDULE OF INVESTMENTS
Small/Mid Cap Equity Fund
May 31, 2016
| | | | | | | | |
| Description | | Shares | | | Market Value
($ Thousands) | |
COMMON STOCK — 95.3% | | | | | | | | |
| | |
Consumer Discretionary — 12.4% | | | | | | | | |
2U *(A) | | | 244,903 | | | $ | 6,818 | |
Abercrombie & Fitch, Cl A | | | 24,099 | | | | 479 | |
AMC Entertainment Holdings, Cl A | | | 2,249 | | | | 65 | |
American Eagle Outfitters (A) | | | 167,776 | | | | 2,624 | |
Aramark | | | 65,059 | | | | 2,166 | |
Arctic Cat (A) | | | 11,896 | | | | 188 | |
Ascena Retail Group * | | | 81,963 | | | | 592 | |
Bassett Furniture Industries | | | 3,689 | | | | 103 | |
Beazer Homes USA * | | | 22,513 | | | | 177 | |
Big 5 Sporting Goods | | | 8,097 | | | | 68 | |
Big Lots (A) | | | 37,900 | | | | 1,982 | |
Bob Evans Farms | | | 1,665 | | | | 74 | |
BorgWarner | | | 23,382 | | | | 796 | |
Bright Horizons Family Solutions * | | | 75,093 | | | | 4,865 | |
Brinker International | | | 15,900 | | | | 715 | |
Brunswick | | | 33,376 | | | | 1,598 | |
Buffalo Wild Wings * | | | 11,976 | | | | 1,741 | |
Burlington Stores * | | | 24,425 | | | | 1,474 | |
Cabela’s * | | | 4,380 | | | | 213 | |
Cablevision Systems, Cl A | | | 9,285 | | | | 322 | |
Caesars Entertainment * | | | 25,842 | | | | 189 | |
CalAtlantic Group | | | 37,405 | | | | 1,384 | |
Caleres | | | 52,246 | | | | 1,278 | |
Callaway Golf | | | 196,129 | | | | 1,973 | |
Carriage Services, Cl A | | | 72,705 | | | | 1,711 | |
Carrols Restaurant Group * | | | 10,223 | | | | 124 | |
Carter’s | | | 54,338 | | | | 5,463 | |
Century Communities * | | | 111,661 | | | | 2,022 | |
Children’s Place | | | 18,899 | | | | 1,332 | |
Citi Trends | | | 10,136 | | | | 158 | |
Coach | | | 25,255 | | | | 996 | |
Cooper Tire & Rubber | | | 35,901 | | | | 1,153 | |
Cooper-Standard Holding * | | | 571 | | | | 49 | |
Core-Mark Holding | | | 30,080 | | | | 2,575 | |
Cracker Barrel Old Country Store | | | 1,733 | | | | 262 | |
Crocs * | | | 85,649 | | | | 843 | |
Dave & Buster’s Entertainment * | | | 34,666 | | | | 1,353 | |
Denny’s * | | | 4,217 | | | | 45 | |
Destination XL Group * | | | 95,886 | | | | 449 | |
Diamond Resorts International *(A) | | | 79,920 | | | | 1,833 | |
Dick’s Sporting Goods | | | 44,113 | | | | 1,892 | |
Dillard’s, Cl A (A) | | | 20,600 | | | | 1,218 | |
DineEquity | | | 2,209 | | | | 186 | |
Dollar General | | | 9,451 | | | | 850 | |
Dorman Products * | | | 6,803 | | | | 376 | |
DR Horton | | | 64,040 | | | | 1,957 | |
DreamWorks Animation SKG, Cl A * | | | 5,811 | | | | 234 | |
DSW, Cl A | | | 156,310 | | | | 3,307 | |
Dunkin’ Brands Group (A) | | | 88,680 | | | | 3,839 | |
Eldorado Resorts * | | | 2,233 | | | | 33 | |
Entravision Communications, Cl A | | | 18,841 | | | | 136 | |
| | | | | | | | |
| Description | | Shares | | | Market Value
($ Thousands) | |
Ethan Allen Interiors | | | 37,645 | | | $ | 1,271 | |
Express * | | | 110,613 | | | | 1,608 | |
Finish Line, Cl A | | | 51,465 | | | | 933 | |
Five Below * | | | 118,415 | | | | 4,957 | |
FTD * | | | 1,107 | | | | 30 | |
GameStop, Cl A | | | 50,066 | | | | 1,457 | |
Gannett | | | 18,350 | | | | 287 | |
G-III Apparel Group * | | | 10,088 | | | | 395 | |
Goodyear Tire & Rubber | | | 123,038 | | | | 3,441 | |
Graham Holdings, Cl B | | | 160 | | | | 80 | |
Grand Canyon Education * | | | 103,924 | | | | 4,340 | |
Gray Television * | | | 119,710 | | | | 1,415 | |
Group 1 Automotive | | | 14,300 | | | | 889 | |
Harley-Davidson | | | 55,285 | | | | 2,565 | |
Harte-Hanks | | | 38,220 | | | | 38 | |
Haverty Furniture | | | 56,822 | | | | 1,056 | |
Helen of Troy * | | | 39,502 | | | | 4,062 | |
Hibbett Sports *(A) | | | 142,238 | | | | 4,913 | |
Hooker Furniture | | | 4,726 | | | | 114 | |
Horizon Global * | | | 33,786 | | | | 394 | |
Imax * | | | 70,380 | | | | 2,346 | |
Isle of Capri Casinos * | | | 8,639 | | | | 137 | |
J Alexander’s Holdings * | | | 17,214 | | | | 179 | |
J.C. Penney *(A) | | | 71,750 | | | | 559 | |
John Wiley & Sons, Cl A | | | 12,706 | | | | 685 | |
Kate Spade * | | | 48,170 | | | | 1,053 | |
KB Home | | | 71,300 | | | | 994 | |
La-Z-Boy, Cl Z | | | 11,181 | | | | 296 | |
Lear | | | 34,838 | | | | 4,137 | |
LGI Homes * | | | 4,100 | | | | 111 | |
Libbey | | | 267,768 | | | | 4,576 | |
Lithia Motors, Cl A | | | 16,580 | | | | 1,365 | |
Live Nation * | | | 58,824 | | | | 1,421 | |
LKQ * | | | 78,631 | | | | 2,600 | |
Lumber Liquidators Holdings *(A) | | | 92,400 | | | | 1,210 | |
MarineMax * | | | 61,040 | | | | 1,036 | |
Mattel | | | 19,520 | | | | 622 | |
MDC Partners, Cl A (A) | | | 95,300 | | | | 1,710 | |
Monro Muffler | | | 27,197 | | | | 1,712 | |
Motorcar Parts & Accessories * | | | 24,410 | | | | 731 | |
Murphy USA * | | | 33,050 | | | | 2,247 | |
National CineMedia | | | 604,830 | | | | 8,830 | |
Nautilus * | | | 86,880 | | | | 1,792 | |
New Media Investment | | | 11,804 | | | | 206 | |
New York Times, Cl A | | | 12,410 | | | | 150 | |
Office Depot * | | | 37,527 | | | | 134 | |
Ollie’s Bargain Outlet Holdings *(A) | | | 41,505 | | | | 1,041 | |
Oxford Industries | | | 8,611 | | | | 546 | |
Panera Bread, Cl A * | | | 6,690 | | | | 1,466 | |
Penn National Gaming * | | | 56,545 | | | | 886 | |
Performance Sports Group *(A) | | | 145,700 | | | | 473 | |
Perry Ellis International * | | | 1,454 | | | | 28 | |
| | |
| 84 | | SEI Institutional Investments Trust / Annual Report / May 31, 2016 |
SCHEDULE OF INVESTMENTS
Small/Mid Cap Equity Fund
May 31, 2016
| | | | | | | | |
| Description | | Shares | | | Market Value
($ Thousands) | |
Planet Fitness, Cl A *(A) | | | 77,771 | | | $ | 1,389 | |
Polaris Industries (A) | | | 34,769 | | | | 2,956 | |
Pool | | | 19,434 | | | | 1,780 | |
Ralph Lauren, Cl A | | | 5,800 | | | | 547 | |
Rent-A-Center, Cl A | | | 56,700 | | | | 747 | |
Restaurant Brands International (A) | | | 36,675 | | | | 1,532 | |
Ruth’s Hospitality Group | | | 48,679 | | | | 809 | |
Sally Beauty Holdings * | | | 259,115 | | | | 7,442 | |
Sequential Brands Group *(A) | | | 244,400 | | | | 1,970 | |
ServiceMaster Global Holdings * | | | 206,421 | | | | 7,894 | |
Shoe Carnival | | | 28,738 | | | | 670 | |
SiteOne Landscape Supply * | | | 56,244 | | | | 1,582 | |
Sonic Automotive, Cl A | | | 71,600 | | | | 1,279 | |
Stage Stores (A) | | | 77,000 | | | | 426 | |
Starz * | | | 51,800 | | | | 1,399 | |
Steven Madden * | | | 12,517 | | | | 429 | |
Strayer Education * | | | 961 | | | | 46 | |
Tailored Brands | | | 22,852 | | | | 315 | |
TEGNA | | | 101,714 | | | | 2,335 | |
Tempur Sealy International * | | | 17,040 | | | | 992 | |
Tenneco * | | | 30,862 | | | | 1,658 | |
Texas Roadhouse, Cl A | | | 35,190 | | | | 1,577 | |
Tile Shop Holdings * | | | 68,040 | | | | 1,242 | |
Tilly’s, Cl A * | | | 30,381 | | | | 179 | |
Tower International | | | 2,845 | | | | 62 | |
Tumi Holdings * | | | 57,952 | | | | 1,555 | |
Universal Electronics * | | | 37,678 | | | | 2,446 | |
Vail Resorts | | | 11,740 | | | | 1,541 | |
Visteon | | | 18,460 | | | | 1,384 | |
Whirlpool | | | 6,200 | | | | 1,083 | |
Wolverine World Wide | | | 245,492 | | | | 4,470 | |
Wyndham Worldwide | | | 41,399 | | | | 2,790 | |
Zagg * | | | 58,899 | | | | 285 | |
Zoe’s Kitchen *(A) | | | 27,028 | | | | 998 | |
| | | | | | | | |
| | | | | | | 203,613 | |
| | | | | | | | |
| |
Consumer Staples — 3.8% | | | | | |
Amplify Snack Brands *(A) | | | 116,970 | | | | 1,527 | |
B&G Foods, Cl A | | | 49,943 | | | | 2,147 | |
Boston Beer, Cl A *(A) | | | 8,968 | | | | 1,394 | |
Casey’s General Stores | | | 13,152 | | | | 1,581 | |
Central Garden & Pet * | | | 90,795 | | | | 1,696 | |
Chefs’ Warehouse * | | | 59,772 | | | | 907 | |
Darling Ingredients * | | | 159,122 | | | | 2,443 | |
Dean Foods | | | 45,981 | | | | 841 | |
Edgewell Personal Care | | | 382 | | | | 30 | |
Energizer Holdings | | | 37,037 | | | | 1,753 | |
Fresh Del Monte Produce | | | 24,389 | | | | 1,277 | |
Freshpet *(A) | | | 224,071 | | | | 2,075 | |
Hain Celestial Group * | | | 70,635 | | | | 3,492 | |
Hershey | | | 10,304 | | | | 957 | |
Ingles Markets, Cl A | | | 27,718 | | | | 1,033 | |
| | | | | | | | |
| Description | | Shares | | | Market Value
($ Thousands) | |
Ingredion | | | 29,582 | | | $ | 3,473 | |
John B Sanfilippo & Son | | | 12,461 | | | | 590 | |
Lancaster Colony | | | 5,035 | | | | 610 | |
Landec * | | | 198,746 | | | | 2,302 | |
Nu Skin Enterprises, Cl A | | | 6,923 | | | | 273 | |
Omega Protein * | | | 120,084 | | | | 2,370 | |
Pilgrim’s Pride | | | 17,625 | | | | 438 | |
Pinnacle Foods | | | 5,440 | | | | 229 | |
Post Holdings * | | | 28,262 | | | | 2,148 | |
Primo Water * | | | 156,015 | | | | 1,771 | |
Rite Aid * | | | 195,885 | | | | 1,508 | |
Sanderson Farms | | | 10,160 | | | | 911 | |
Seaboard * | | | 64 | | | | 193 | |
Snyder’s-Lance | | | 11,440 | | | | 354 | |
SpartanNash | | | 26,679 | | | | 793 | |
Spectrum Brands Holdings (A) | | | 73,386 | | | | 8,555 | |
SUPERVALU * | | | 174,141 | | | | 806 | |
TreeHouse Foods * | | | 60,882 | | | | 5,766 | |
WD-40 | | | 31,005 | | | | 3,453 | |
Weis Markets | | | 28,731 | | | | 1,441 | |
WhiteWave Foods, Cl A * | | | 27,917 | | | | 1,247 | |
| | | | | | | | |
| | | | | | | 62,384 | |
| | | | | | | | |
| |
Energy — 4.1% | | | | | |
Alberta Oilsands * | | | 1,600,500 | | | | 141 | |
Alon USA Energy | | | 19,017 | | | | 144 | |
Anadarko Petroleum | | | 16,537 | | | | 858 | |
Approach Resources *(A) | | | 260,124 | | | | 695 | |
Ardmore Shipping | | | 133,498 | | | | 1,266 | |
Atwood Oceanics (A) | | | 60,499 | | | | 645 | |
Bill Barrett *(A) | | | 156,200 | | | | 1,111 | |
California Resources | | | 121,785 | | | | 185 | |
Callon Petroleum * | | | 26,239 | | | | 299 | |
Carrizo Oil & Gas *(A) | | | 84,423 | | | | 3,250 | |
Continental Resources *(A) | | | 37,188 | | | | 1,564 | |
CVR Energy | | | 3,142 | | | | 62 | |
Denbury Resources | | | 9,275 | | | | 37 | |
DHT Holdings | | | 98,167 | | | | 536 | |
Diamond Offshore Drilling | | | 5,135 | | | | 133 | |
Diamondback Energy * | | | 4,940 | | | | 449 | |
Dril-Quip * | | | 49,735 | | | | 3,035 | |
Energen | | | 8,758 | | | | 417 | |
Ensco, Cl A | | | 14,722 | | | | 146 | |
EP Energy, Cl A * | | | 12,416 | | | | 70 | |
EQT | | | 11,888 | | | | 871 | |
Frank’s International | | | 7,043 | | | | 113 | |
Frontline | | | 3,989 | | | | 35 | |
Gulfport Energy * | | | 75,345 | | | | 2,316 | |
HollyFrontier | | | 53,200 | | | | 1,424 | |
Matador Resources *(A) | | | 38,646 | | | | 878 | |
Matrix Service * | | | 140,932 | | | | 2,335 | |
McDermott International * | | | 7,268 | | | | 34 | |
| | |
| 85 | | SEI Institutional Investments Trust / Annual Report / May 31, 2016 |
SCHEDULE OF INVESTMENTS
Small/Mid Cap Equity Fund
May 31, 2016
| | | | | | | | |
| Description | | Shares | | | Market Value
($ Thousands) | |
Memorial Resource Development * | | | 40,727 | | | $ | 643 | |
Nabors Industries | | | 206,467 | | | | 1,941 | |
Navigator Holdings *(A) | | | 63,500 | | | | 885 | |
Newfield Exploration * | | | 45,974 | | | | 1,874 | |
Newpark Resources * | | | 85,200 | | | | 391 | |
Noble (A) | | | 73,486 | | | | 613 | |
Nordic American Tankers | | | 9,310 | | | | 143 | |
Oasis Petroleum * | | | 66,700 | | | | 670 | |
Oceaneering International | | | 3,105 | | | | 103 | |
Oil States International * | | | 26,107 | | | | 858 | |
Pacific Ethanol *(A) | | | 444,200 | | | | 2,812 | |
Parsley Energy, Cl A * | | | 59,052 | | | | 1,539 | |
PBF Energy, Cl A | | | 28,879 | | | | 762 | |
PDC Energy * | | | 14,243 | | | | 827 | |
Pioneer Natural Resources | | | 6,994 | | | | 1,121 | |
QEP Resources | | | 5,559 | | | | 104 | |
Renewable Energy Group * | | | 10,205 | | | | 94 | |
REX American Resources * | | | 884 | | | | 52 | |
Rice Energy * | | | 62,737 | | | | 1,270 | |
RigNet * | | | 250,157 | | | | 3,109 | |
Rowan, Cl A | | | 43,146 | | | | 730 | |
RSP Permian * | | | 16,639 | | | | 548 | |
Scorpio Tankers | | | 565,651 | | | | 3,326 | |
Ship Finance International | | | 8,342 | | | | 134 | |
Spectra Energy | | | 14,046 | | | | 447 | |
StealthGas * | | | 296,200 | | | | 1,389 | |
Superior Energy Services | | | 116,502 | | | | 2,008 | |
Synergy Resources * | | | 594,219 | | | | 3,589 | |
Teekay | | | 40,328 | | | | 424 | |
Tesoro | | | 29,400 | | | | 2,296 | |
TETRA Technologies * | | | 438,659 | | | | 2,399 | |
Tsakos Energy Navigation | | | 93,500 | | | | 605 | |
US Silica Holdings (A) | | | 110,893 | | | | 3,164 | |
Westmoreland Coal *(A) | | | 227,700 | | | | 1,842 | |
Whiting Petroleum * | | | 76,105 | | | | 940 | |
World Fuel Services | | | 19,141 | | | | 880 | |
| | | | | | | | |
| | | | | | | 67,581 | |
| | | | | | | | |
| |
Financials — 23.6% | | | | | |
Agree Realty ‡ | | | 12,367 | | | | 526 | |
Alexandria Real Estate Equities ‡ | | | 24,521 | | | | 2,376 | |
Alleghany * | | | 450 | | | | 245 | |
Allied World Assurance Holdings | | | 20,567 | | | | 763 | |
Allstate | | | 16,047 | | | | 1,083 | |
Ally Financial * | | | 57,626 | | | | 1,034 | |
Ambac Financial Group * | | | 2,620 | | | | 43 | |
American Assets Trust ‡ | | | 1,893 | | | | 76 | |
American Campus Communities ‡ | | | 71,205 | | | | 3,348 | |
American Financial Group | | | 97,803 | | | | 7,167 | |
American National Insurance | | | 1,468 | | | | 175 | |
Ameriprise Financial | | | 7,867 | | | | 800 | |
AMERISAFE | | | 2,716 | | | | 165 | |
| | | | | | | | |
| Description | | Shares | | | Market Value
($ Thousands) | |
Apartment Investment & Management, Cl A ‡ | | | 70,838 | | | $ | 3,021 | |
Apple Hospitality ‡ | | | 13,191 | | | | 240 | |
Arch Capital Group * | | | 55,076 | | | | 4,002 | |
Ares Capital (A) | | | 53,000 | | | | 787 | |
Argo Group International Holdings | | | 10,626 | | | | 559 | |
Armada Hoffler Properties ‡ | | | 7,346 | | | | 89 | |
Arthur J Gallagher | | | 30,771 | | | | 1,487 | |
Ashford * | | | 670 | | | | 35 | |
Ashford Hospitality Prime ‡ | | | 3,000 | | | | 32 | |
Ashford Hospitality Trust ‡ | | | 83,700 | | | | 421 | |
Aspen Insurance Holdings | | | 67,080 | | | | 3,210 | |
Associated Banc | | | 72,700 | | | | 1,359 | |
Assurant | | | 44,073 | | | | 3,852 | |
Assured Guaranty | | | 20,298 | | | | 546 | |
Axis Capital Holdings | | | 29,798 | | | | 1,643 | |
Banco Latinoamericano de Comercio Exterior, Cl E | | | 65,100 | | | | 1,737 | |
Bancorpsouth | | | 13,311 | | | | 318 | |
Bank of Hawaii | | | 2,420 | | | | 174 | |
Bank of the Ozarks (A) | | | 44,551 | | | | 1,733 | |
BankUnited | | | 67,049 | | | | 2,219 | |
Bats Global Markets * | | | 59,340 | | | | 1,650 | |
Beneficial Bancorp * | | | 45,980 | | | | 633 | |
Blackstone Mortgage Trust, Cl A ‡ | | | 78,301 | | | | 2,207 | |
Boston Private Financial Holdings | | | 30,891 | | | | 389 | |
Brandywine Realty Trust ‡ | | | 124,667 | | | | 1,969 | |
Brixmor Property Group ‡ | | | 70,954 | | | | 1,792 | |
Brookline Bancorp | | | 5,890 | | | | 69 | |
Camden Property Trust ‡ | | | 15,669 | | | | 1,335 | |
Capital Bank Financial, Cl A | | | 1,899 | | | | 59 | |
Cardinal Financial | | | 1,735 | | | | 39 | |
CareTrust ‡ | | | 6,018 | | | | 81 | |
CatchMark Timber Trust, Cl A ‡ | | | 293,900 | | | | 3,177 | |
CBL & Associates Properties ‡ | | | 70,700 | | | | 680 | |
Cedar Realty Trust ‡ | | | 443,000 | | | | 3,008 | |
Centerstate Banks | | | 6,842 | | | | 108 | |
Central Pacific Financial | | | 202,572 | | | | 4,856 | |
Chatham Lodging Trust ‡ | | | 37,400 | | | | 811 | |
Chemical Financial | | | 5,468 | | | | 215 | |
Chesapeake Lodging Trust ‡ | | | 2,833 | | | | 68 | |
Chimera Investment ‡ | | | 93,626 | | | | 1,403 | |
Clifton Bancorp | | | 3,443 | | | | 52 | |
CNA Financial | | | 28,100 | | | | 923 | |
CNO Financial Group | | | 403,504 | | | | 8,187 | |
Colony Financial ‡ | | | 8,691 | | | | 159 | |
Colony Starwood Homes ‡ | | | 132,400 | | | | 3,604 | |
Columbia Property Trust ‡ | | | 15,031 | | | | 310 | |
Comerica | | | 40,830 | | | | 1,923 | |
Commerce Bancshares | | | 10,757 | | | | 526 | |
Communications Sales & Leasing ‡ | | | 9,981 | | | | 249 | |
Community Bank System | | | 1,294 | | | | 53 | |
Community Trust Bancorp | | | 17,255 | | | | 623 | |
| | |
| 86 | | SEI Institutional Investments Trust / Annual Report / May 31, 2016 |
SCHEDULE OF INVESTMENTS
Small/Mid Cap Equity Fund
May 31, 2016
| | | | | | | | |
| Description | | Shares | | | Market Value
($ Thousands) | |
Corporate Office Properties Trust ‡ | | | 38,980 | | | $ | 1,054 | |
Corrections Corp of America ‡ | | | 22,899 | | | | 769 | |
Cousins Properties ‡ | | | 154,668 | | | | 1,661 | |
CubeSmart ‡ | | | 43,025 | | | | 1,370 | |
Customers Bancorp * | | | 142,623 | | | | 3,835 | |
CyrusOne ‡ | | | 20,755 | | | | 1,023 | |
CYS Investments ‡ | | | 125,100 | | | | 1,022 | |
DCT Industrial Trust ‡ | | | 6,198 | | | | 267 | |
DDR ‡ | | | 134,139 | | | | 2,309 | |
DiamondRock Hospitality ‡ | | | 98,509 | | | | 881 | |
Digital Realty Trust ‡ | | | 11,019 | | | | 1,052 | |
Dime Community Bancshares | | | 48,213 | | | | 885 | |
Douglas Emmett ‡ | | | 11,420 | | | | 387 | |
Duke Realty ‡ | | | 134,957 | | | | 3,194 | |
DuPont Fabros Technology ‡ | | | 39,214 | | | | 1,659 | |
E*TRADE Financial * | | | 30,880 | | | | 861 | |
Eagle Bancorp * | | | 66,582 | | | | 3,428 | |
East West Bancorp | | | 9,552 | | | | 369 | |
EastGroup Properties ‡ | | | 1,953 | | | | 125 | |
Education Realty Trust ‡ | | | 23,926 | | | | 1,024 | |
Employers Holdings | | | 79,217 | | | | 2,365 | |
Endurance Specialty Holdings | | | 50,652 | | | | 3,440 | |
Enstar Group * | | | 244 | | | | 38 | |
Enterprise Financial Services | | | 17,315 | | | | 495 | |
EPR Properties ‡ | | | 5,425 | | | | 387 | |
Equinix ‡ | | | 2,197 | | | | 795 | |
Equity Commonwealth *‡ | | | 164,126 | | | | 4,742 | |
Equity One ‡ | | | 37,207 | | | | 1,096 | |
Everest Re Group | | | 25,677 | | | | 4,599 | |
FBL Financial Group, Cl A | | | 3,567 | | | | 224 | |
FBR | | | 119,508 | | | | 2,297 | |
Federal Agricultural Mortgage, Cl C | | | 2,031 | | | | 73 | |
Federated Investors, Cl B | | | 10,583 | | | | 342 | |
FelCor Lodging Trust ‡ | | | 215,700 | | | | 1,426 | |
Fidelity Southern | | | 11,478 | | | | 188 | |
Financial Engines (A) | | | 128,654 | | | | 3,556 | |
First Citizens BancShares, Cl A | | | 449 | | | | 116 | |
First Defiance Financial | | | 15,695 | | | | 634 | |
First Financial Bancorp | | | 1,828 | | | | 36 | |
First Foundation * | | | 67,000 | | | | 1,538 | |
First Horizon National | | | 52,622 | | | | 766 | |
First Industrial Realty Trust ‡ | | | 22,551 | | | | 558 | |
First Interstate Bancsystem, Cl A | | | 25,400 | | | | 736 | |
First NBC Bank Holding * | | | 16,639 | | | | 311 | |
First Niagara Financial Group | | | 26,914 | | | | 294 | |
First Potomac Realty Trust ‡ | | | 2,402 | | | | 22 | |
First Republic Bank | | | 33,604 | | | | 2,433 | |
FirstMerit | | | 12,816 | | | | 291 | |
Flagstar Bancorp * | | | 12,191 | | | | 296 | |
Flushing Financial | | | 70,545 | | | | 1,472 | |
FNF Group | | | 36,634 | | | | 1,280 | |
FNFV Group * | | | 162,400 | | | | 1,952 | |
| | | | | | | | |
| Description | | Shares | | | Market Value
($ Thousands) | |
Forest City Realty Trust, Cl A ‡ | | | 100,196 | | | $ | 2,285 | |
Franklin Financial Network * | | | 33,900 | | | | 1,051 | |
Franklin Street Properties ‡ | | | 152,810 | | | | 1,744 | |
Fulton Financial | | | 299,613 | | | | 4,270 | |
Gaming and Leisure Properties ‡ | | | 5,930 | | | | 195 | |
Geo Group ‡ | | | 172,766 | | | | 5,746 | |
Getty Realty ‡ | | | 28,300 | | | | 572 | |
Gramercy Property Trust ‡ | | | 445,783 | | | | 3,981 | |
Great Southern Bancorp | | | 731 | | | | 29 | |
Great Western Bancorp | | | 3,343 | | | | 114 | |
Hancock Holding | | | 141,597 | | | | 3,893 | |
Hanmi Financial | | | 44,684 | | | | 1,088 | |
Hanover Insurance Group | | | 64,216 | | | | 5,566 | |
Hartford Financial Services Group | | | 15,908 | | | | 719 | |
HCI Group | | | 1,092 | | | | 35 | |
Healthcare Realty Trust ‡ | | | 4,564 | | | | 145 | |
Healthcare Trust of America, Cl A ‡ | | | 20,828 | | | | 629 | |
Heartland Financial USA | | | 5,535 | | | | 194 | |
Hercules Capital | | | 64,901 | | | | 796 | |
Heritage Financial | | | 4,983 | | | | 91 | |
Heritage Insurance Holdings | | | 2,971 | | | | 39 | |
Highwoods Properties ‡ | | | 6,285 | | | | 306 | |
HomeTrust Bancshares * | | | 12,224 | | | | 233 | |
Horace Mann Educators | | | 31,331 | | | | 1,067 | |
Hospitality Properties Trust ‡ | | | 99,100 | | | | 2,537 | |
Host Hotels & Resorts ‡ | | | 49,839 | | | | 768 | |
Houlihan Lokey, Cl A | | | 32,638 | | | | 788 | |
Huntington Bancshares | | | 565,429 | | | | 5,909 | |
Iberiabank | | | 16,528 | | | | 1,025 | |
Independent Bank | | | 29,628 | | | | 587 | |
Infinity Property & Casualty | | | 8,465 | | | | 660 | |
InfraREIT ‡ | | | 2,116 | | | | 36 | |
International Bancshares | | | 55,700 | | | | 1,562 | |
International FCStone * | | | 12,061 | | | | 336 | |
Investment Technology Group | | | 55,345 | | | | 1,021 | |
Investors Bancorp | | | 333,909 | | | | 3,997 | |
Investors Real Estate Trust ‡ | | | 6,562 | | | | 41 | |
Iron Mountain ‡ | | | 35,455 | | | | 1,303 | |
Janus Capital Group | | | 82,524 | | | | 1,253 | |
Jones Lang LaSalle | | | 1,396 | | | | 165 | |
Kearny Financial | | | 121,837 | | | | 1,595 | |
Kemper | | | 125,300 | | | | 4,048 | |
Kennedy-Wilson Holdings | | | 167,300 | | | | 3,567 | |
KeyCorp | | | 373,896 | | | | 4,793 | |
Kilroy Realty ‡ | | | 3,489 | | | | 220 | |
Lakeland Financial | | | 651 | | | | 32 | |
LendingTree *(A) | | | 12,420 | | | | 1,034 | |
Lexington Realty Trust ‡ | | | 403,358 | | | | 3,812 | |
Liberty Property Trust ‡ | | | 15,878 | | | | 593 | |
Lincoln National | | | 37,500 | | | | 1,719 | |
LPL Financial Holdings (A) | | | 194,097 | | | | 5,413 | |
LTC Properties ‡ | | | 1,494 | | | | 70 | |
| | |
| 87 | | SEI Institutional Investments Trust / Annual Report / May 31, 2016 |
SCHEDULE OF INVESTMENTS
Small/Mid Cap Equity Fund
May 31, 2016
| | | | | | | | |
| Description | | Shares | | | Market Value
($ Thousands) | |
M&T Bank | | | 8,028 | | | $ | 959 | |
Mack-Cali Realty ‡ | | | 148,887 | | | | 3,907 | |
Maiden Holdings | | | 299,532 | | | | 3,930 | |
MB Financial | | | 20,671 | | | | 747 | |
MBIA * | | | 4,561 | | | | 33 | |
Medical Properties Trust ‡ | | | 94,214 | | | | 1,385 | |
Meridian Bancorp | | | 243,900 | | | | 3,659 | |
MFA Financial ‡ | | | 219,549 | | | | 1,583 | |
MGIC Investment * | | | 151,378 | | | | 1,067 | |
Mid-America Apartment Communities ‡ | | | 11,902 | | | | 1,226 | |
Mortgage Investment Trust ‡ | | | 82,400 | | | | 1,154 | |
Nasdaq | | | 29,016 | | | | 1,915 | |
National Bank Holdings, Cl A | | | 163,549 | | | | 3,475 | |
National General Holdings | | | 100,380 | | | | 2,081 | |
National Health Investors ‡ | | | 18,611 | | | | 1,300 | |
National Retail Properties ‡ | | | 20,240 | | | | 917 | |
National Storage Affiliates Trust ‡ | | | 112,767 | | | | 2,351 | |
National Western Life Group, Cl A | | | 159 | | | | 34 | |
Navient | | | 53,300 | | | | 731 | |
Navigators Group | | | 3,021 | | | | 275 | |
NBT Bancorp | | | 14,646 | | | | 427 | |
Nelnet, Cl A | | | 39,700 | | | | 1,456 | |
New Residential Investments ‡ | | | 18,944 | | | | 257 | |
Northfield Bancorp | | | 234,300 | | | | 3,643 | |
NorthStar Realty Finance ‡ | | | 108,567 | | | | 1,466 | |
OFG Bancorp | | | 77,700 | | | | 710 | |
Old Republic International | | | 32,710 | | | | 627 | |
Omega Healthcare Investors ‡(A) | | | 50,954 | | | | 1,626 | |
Opus Bank | | | 56,303 | | | | 2,120 | |
Outfront Media ‡ | | | 23,947 | | | | 533 | |
PacWest Bancorp | | | 52,059 | | | | 2,170 | |
People’s United Financial | | | 45,978 | | | | 730 | |
Piedmont Office Realty Trust, Cl A ‡ | | | 110,394 | | | | 2,213 | |
Piper Jaffray * | | | 2,243 | | | | 95 | |
Popular | | | 117,684 | | | | 3,688 | |
Post Properties ‡ | | | 18,673 | | | | 1,131 | |
Preferred Bank | | | 13,492 | | | | 444 | |
Primerica | | | 27,267 | | | | 1,530 | |
PrivateBancorp, Cl A | | | 27,890 | | | | 1,237 | |
ProAssurance | | | 1,430 | | | | 75 | |
Prospect Capital (A) | | | 212,000 | | | | 1,592 | |
PS Business Parks ‡ | | | 7,494 | | | | 740 | |
QTS Realty Trust, Cl A ‡ | | | 6,269 | | | | 324 | |
Radian Group | | | 6,701 | | | | 83 | |
RAIT Financial Trust ‡ | | | 22,999 | | | | 76 | |
Raymond James Financial | | | 25,006 | | | | 1,402 | |
Rayonier ‡ | | | 3,859 | | | | 100 | |
Regency Centers ‡ | | | 43,153 | | | | 3,306 | |
Regions Financial | | | 322,100 | | | | 3,166 | |
Reinsurance Group of America, Cl A | | | 23,579 | | | | 2,338 | |
RenaissanceRe Holdings | | | 5,182 | | | | 599 | |
Republic Bancorp, Cl A | | | 31,200 | | | | 865 | |
| | | | | | | | |
| Description | | Shares | | | Market Value
($ Thousands) | |
Retail Opportunity Investments ‡ | | | 4,854 | | | $ | 98 | |
Retail Properties of America, Cl A ‡ | | | 21,137 | | | | 335 | |
Rexford Industrial Realty ‡ | | | 4,460 | | | | 89 | |
RMR Group | | | — | | | | — | |
Ryman Hospitality Properties ‡ | | | 23,103 | | | | 1,133 | |
Sabra Health Care ‡ | | | 44,600 | | | | 934 | |
Saul Centers ‡ | | | 6,870 | | | | 386 | |
Select Income ‡ | | | 103,030 | | | | 2,538 | |
Selective Insurance Group | | | 2,862 | | | | 106 | |
Senior Housing Properties Trust ‡ | | | 152,262 | | | | 2,844 | |
Seritage Growth Properties ‡(A) | | | 31,200 | | | | 1,442 | |
ServisFirst Bancshares (A) | | | 19,957 | | | | 1,039 | |
Signature Bank NY * | | | 10,372 | | | | 1,400 | |
SLM * | | | 93,107 | | | | 640 | |
Sovran Self Storage ‡ | | | 8,659 | | | | 938 | |
Spirit Realty Capital ‡ | | | 22,825 | | | | 261 | |
Starwood Property Trust ‡ | | | 46,804 | | | | 965 | |
State Bank Financial | | | 195,200 | | | | 4,244 | |
Sterling Bancorp | | | 70,606 | | | | 1,162 | |
Stewart Information Services | | | 1,116 | | | | 42 | |
Stifel Financial * | | | 23,215 | | | | 877 | |
Stock Yards Bancorp | | | 885 | | | | 26 | |
STORE Capital ‡ | | | 12,646 | | | | 323 | |
Summit Hotel Properties ‡ | | | 4,292 | | | | 50 | |
Sun Communities ‡ | | | 8,494 | | | | 593 | |
Sunstone Hotel Investors ‡ | | | 109,537 | | | | 1,319 | |
SunTrust Banks | | | 21,930 | | | | 961 | |
SVB Financial Group * | | | 12,862 | | | | 1,417 | |
Synovus Financial | | | 155,757 | | | | 5,011 | |
Talmer Bancorp, Cl A | | | 3,814 | | | | 76 | |
Taubman Centers ‡ | | | 5,455 | | | | 374 | |
TCF Financial | | | 277,024 | | | | 3,981 | |
Terreno Realty ‡ | | | 1,512 | | | | 36 | |
THL Credit | | | 79,347 | | | | 872 | |
Towne Bank | | | 15,667 | | | | 342 | |
Trustmark | | | 3,154 | | | | 78 | |
Two Harbors Investment ‡ | | | 148,605 | | | | 1,260 | |
Union Bankshares | | | 1,278 | | | | 35 | |
United Community Banks | | | 294,870 | | | | 5,936 | |
United Fire Group | | | 11,212 | | | | 462 | |
Universal Insurance Holdings (A) | | | 36,800 | | | | 715 | |
Univest Corp of Pennsylvania | | | 23,745 | | | | 479 | |
Unum Group | | | 120,347 | | | | 4,443 | |
Urstadt Biddle Properties, Cl A ‡ | | | 23,415 | | | | 495 | |
Validus Holdings | | | 78,878 | | | | 3,841 | |
VEREIT ‡ | | | 174,900 | | | | 1,677 | |
Washington Federal | | | 74,583 | | | | 1,864 | |
Washington Real Estate Investment Trust ‡ | | | 4,559 | | | | 135 | |
Waterstone Financial | | | 21,999 | | | | 319 | |
Weingarten Realty Investors ‡ | | | 16,037 | | | | 603 | |
WesBanco | | | 30,800 | | | | 1,006 | |
Westamerica Bancorporation (A) | | | 33,081 | | | | 1,609 | |
| | |
| 88 | | SEI Institutional Investments Trust / Annual Report / May 31, 2016 |
SCHEDULE OF INVESTMENTS
Small/Mid Cap Equity Fund
May 31, 2016
| | | | | | | | |
| Description | | Shares | | | Market Value
($ Thousands) | |
Western Alliance Bancorp * | | | 122,899 | | | $ | 4,633 | |
White Mountains Insurance Group | | | 466 | | | | 375 | |
WisdomTree Investments (A) | | | 291,105 | | | | 3,610 | |
World Acceptance *(A) | | | 13,400 | | | | 585 | |
WP Carey ‡ | | | 1,000 | | | | 64 | |
WR Berkley | | | 1,744 | | | | 99 | |
Yadkin Financial | | | 103,762 | | | | 2,747 | |
Zions Bancorporation | | | 132,807 | | | | 3,721 | |
| | | | | | | | |
| | | | | | | 387,211 | |
| | | | | | | | |
| |
Health Care — 10.2% | | | | | |
ABIOMED * | | | 30,419 | | | | 3,021 | |
Acadia Healthcare * | | | 74,425 | | | | 4,381 | |
Accuray *(A) | | | 939,200 | | | | 5,119 | |
Adamas Pharmaceuticals * | | | 25,579 | | | | 430 | |
Aerie Pharmaceuticals *(A) | | | 23,870 | | | | 427 | |
Aimmune Therapeutics *(A) | | | 26,665 | | | | 409 | |
Akorn * | | | 46,418 | | | | 1,387 | |
Alder Biopharmaceuticals * | | | 18,549 | | | | 558 | |
Align Technology * | | | 66,403 | | | | 5,235 | |
Alnylam Pharmaceuticals * | | | 25,753 | | | | 1,847 | |
AMAG Pharmaceuticals * | | | 15,400 | | | | 330 | |
Amedisys * | | | 1,226 | | | | 62 | |
American Renal Associates Holdings * | | | 18,705 | | | | 524 | |
AmerisourceBergen | | | 4,864 | | | | 365 | |
Amicus Therapeutics *(A) | | | 69,422 | | | | 491 | |
AMN Healthcare Services * | | | 90,365 | | | | 3,374 | |
Amsurg, Cl A * | | | 53,455 | | | | 3,998 | |
Anacor Pharmaceuticals * | | | 5,470 | | | | 543 | |
Analogic | | | 629 | | | | 52 | |
AngioDynamics * | | | 3,278 | | | | 39 | |
Anika Therapeutics * | | | 1,739 | | | | 82 | |
Atara Biotherapeutics *(A) | | | 86,077 | | | | 1,559 | |
athenahealth *(A) | | | 12,232 | | | | 1,552 | |
Bio-Rad Laboratories, Cl A * | | | 2,217 | | | | 330 | |
Bluebird Bio * | | | 36,753 | | | | 1,663 | |
Bruker | | | 46,395 | | | | 1,225 | |
C.R. Bard | | | 6,027 | | | | 1,320 | |
Calithera Biosciences * | | | 11,024 | | | | 58 | |
Cambrex * | | | 87,450 | | | | 4,277 | |
Centene * | | | 21,151 | | | | 1,319 | |
Charles River Laboratories International * | | | 34,713 | | | | 2,983 | |
Community Health Systems * | | | 70,171 | | | | 943 | |
Cooper | | | 35,644 | | | | 5,803 | |
Cynosure, Cl A * | | | 1,316 | | | | 63 | |
DBV Technologies ADR *(A) | | | 55,191 | | | | 1,851 | |
Dentsply Sirona | | | 52,096 | | | | 3,238 | |
Depomed * | | | 29,700 | | | | 607 | |
DexCom * | | | 52,490 | | | | 3,385 | |
Diplomat Pharmacy *(A) | | | 99,744 | | | | 3,250 | |
Emergent Biosolutions * | | | 35,281 | | | | 1,548 | |
Endologix *(A) | | | 269,879 | | | | 3,419 | |
| | | | | | | | |
| Description | | Shares | | | Market Value
($ Thousands) | |
Glaukos * | | | 18,809 | | | $ | 458 | |
GW Pharmaceuticals ADR *(A) | | | 5,514 | | | | 491 | |
Haemonetics * | | | 5,378 | | | | 151 | |
Halyard Health * | | | 1,447 | | | | 45 | |
HealthSouth | | | 91,136 | | | | 3,675 | |
Healthways * | | | 2,817 | | | | 34 | |
Hill-Rom Holdings | | | 37,402 | | | | 1,838 | |
Humana | | | 2,900 | | | | 500 | |
ICON * | | | 16,598 | | | | 1,169 | |
ICU Medical * | | | 1,086 | | | | 113 | |
Idexx Laboratories * | | | 14,120 | | | | 1,236 | |
Impax Laboratories * | | | 39,683 | | | | 1,355 | |
INC Research Holdings, Cl A * | | | 92,269 | | | | 4,015 | |
Insulet * | | | 49,233 | | | | 1,478 | |
Invacare | | | 101,530 | | | | 1,086 | |
Juno Therapeutics *(A) | | | 39,960 | | | | 1,735 | |
Kindred Healthcare | | | 75,400 | | | | 895 | |
Lannett *(A) | | | 19,092 | | | | 466 | |
LDR Holding * | | | 155,748 | | | | 3,275 | |
LeMaitre Vascular | | | 8,957 | | | | 125 | |
LHC Group * | | | 15,835 | | | | 665 | |
LifePoint Hospitals * | | | 795 | | | | 53 | |
Ligand Pharmaceuticals, Cl B *(A) | | | 47,635 | | | | 5,697 | |
LivaNova * | | | 1,297 | | | | 63 | |
Luminex * | | | 18,747 | | | | 386 | |
Magellan Health Services * | | | 9,736 | | | | 645 | |
Mallinckrodt * | | | 26,700 | | | | 1,692 | |
Medicines * | | | 14,270 | | | | 537 | |
Medidata Solutions * | | | 63,513 | | | | 2,918 | |
Merit Medical Systems * | | | 4,886 | | | | 92 | |
Molina Healthcare * | | | 24,788 | | | | 1,200 | |
NeoGenomics * | | | 225,720 | | | | 2,025 | |
Neurocrine Biosciences * | | | 66,816 | | | | 3,317 | |
Nevro *(A) | | | 45,186 | | | | 3,150 | |
Novadaq Technologies *(A) | | | 148,899 | | | | 1,438 | |
Omnicell * | | | 68,070 | | | | 2,202 | |
OraSure Technologies * | | | 12,590 | | | | 97 | |
Orthofix International * | | | 12,067 | | | | 534 | |
Otonomy * | | | 25,188 | | | | 370 | |
OvaScience *(A) | | | 176,451 | | | | 1,304 | |
Owens & Minor | | | 35,785 | | | | 1,334 | |
Patterson | | | 17,491 | | | | 854 | |
PDL BioPharma | | | 66,608 | | | | 239 | |
Penumbra * | | | 9,265 | | | | 489 | |
PerkinElmer | | | 13,816 | | | | 756 | |
PharMerica * | | | 4,270 | | | | 113 | |
Premier, Cl A * | | | 40,935 | | | | 1,302 | |
Press Ganey Holdings * | | | 51,700 | | | | 1,759 | |
Prothena *(A) | | | 12,370 | | | | 600 | |
Quest Diagnostics | | | 12,055 | | | | 930 | |
Quidel * | | | 88,931 | | | | 1,477 | |
Quintiles Transnational Holdings * | | | 5,043 | | | | 342 | |
| | |
| 89 | | SEI Institutional Investments Trust / Annual Report / May 31, 2016 |
SCHEDULE OF INVESTMENTS
Small/Mid Cap Equity Fund
May 31, 2016
| | | | | | | | |
| Description | | Shares | | | Market Value
($ Thousands) | |
Quorum Health * | | | 12,521 | | | $ | 166 | |
Radius Health *(A) | | | 13,700 | | | | 497 | |
Revance Therapeutics *(A) | | | 82,772 | | | | 1,697 | |
Sage Therapeutics * | | | 14,553 | | | | 479 | |
SciClone Pharmaceuticals * | | | 55,000 | | | | 778 | |
SeaSpine Holdings * | | | 6,455 | | | | 64 | |
Select Medical Holdings * | | | 55,400 | | | | 702 | |
Seres Therapeutics *(A) | | | 15,410 | | | | 469 | |
Spectranetics *(A) | | | 133,272 | | | | 2,442 | |
St. Jude Medical | | | 16,330 | | | | 1,280 | |
STERIS | | | 71,739 | | | | 4,981 | |
SurModics * | | | 12,576 | | | | 277 | |
Teleflex | | | 3,253 | | | | 524 | |
TESARO * | | | 10,389 | | | | 481 | |
TransEnterix * | | | 47,296 | | | | 87 | |
Trinity Biotech ADR | | | 337,900 | | | | 3,906 | |
Triple-S Management, Cl B * | | | 32,608 | | | | 749 | |
Ultragenyx Pharmaceutical * | | | 10,652 | | | | 779 | |
United Therapeutics * | | | 9,100 | | | | 1,084 | |
VCA Antech * | | | 62,622 | | | | 4,066 | |
Vocera Communications * | | | 220,010 | | | | 2,541 | |
VWR * | | | 9,135 | | | | 264 | |
WellCare Health Plans * | | | 9,621 | | | | 976 | |
West Pharmaceutical Services | | | 17,820 | | | | 1,338 | |
Zeltiq Aesthetics *(A) | | | 50,631 | | | | 1,441 | |
| | | | | | | | |
| | | | | | | 167,855 | |
| | | | | | | | |
| |
Industrials — 16.4% | | | | | |
AAR | | | 55,569 | | | | 1,356 | |
ABM Industries | | | 102,825 | | | | 3,514 | |
ACCO Brands * | | | 10,537 | | | | 105 | |
Actuant, Cl A | | | 21,472 | | | | 586 | |
Advisory Board * | | | 40,388 | | | | 1,326 | |
Aegion, Cl A * | | | 6,160 | | | | 123 | |
AerCap Holdings * | | | 28,419 | | | | 1,111 | |
Aerojet Rocketdyne Holdings * | | | 80,836 | | | | 1,394 | |
AGCO | | | 19,500 | | | | 1,013 | |
Air Transport Services Group * | | | 79,900 | | | | 1,011 | |
Aircastle | | | 67,002 | | | | 1,416 | |
Albany International, Cl A | | | 30,365 | | | | 1,194 | |
Allegion | | | 15,484 | | | | 1,047 | |
Altra Industrial Motion | | | 14,174 | | | | 383 | |
American Woodmark * | | | 27,790 | | | | 2,244 | |
AO Smith | | | 9,228 | | | | 759 | |
Apogee Enterprises | | | 13,990 | | | | 633 | |
Applied Industrial Technologies | | | 11,173 | | | | 505 | |
ARC Document Solutions * | | | 417,900 | | | | 1,772 | |
Astec Industries | | | 35,980 | | | | 1,919 | |
Beacon Roofing Supply * | | | 27,845 | | | | 1,201 | |
Brady, Cl A | | | 12,256 | | | | 390 | |
Briggs & Stratton | | | 68,699 | | | | 1,533 | |
BWX Technologies | | | 122,539 | | | | 4,310 | |
| | | | | | | | |
| Description | | Shares | | | Market Value
($ Thousands) | |
Carlisle | | | 18,096 | | | $ | 1,879 | |
CEB | | | 98,529 | | | | 6,282 | |
Celadon Group | | | 84,600 | | | | 836 | |
Clean Harbors * | | | 186,401 | | | | 9,598 | |
Colfax * | | | 41,980 | | | | 1,137 | |
Comfort Systems USA | | | 18,846 | | | | 603 | |
Copa Holdings, Cl A | | | 1,719 | | | | 89 | |
Copart * | | | 12,950 | | | | 641 | |
Costamare (A) | | | 86,039 | | | | 847 | |
Covanta Holding | | | 89,600 | | | | 1,494 | |
CRA International * | | | 2,830 | | | | 67 | |
Crane | | | 26,462 | | | | 1,519 | |
Deluxe | | | 110,280 | | | | 7,183 | |
Donaldson | | | 66,356 | | | | 2,224 | |
Dover | | | 10,458 | | | | 698 | |
Dycom Industries * | | | 50,887 | | | | 4,320 | |
EMCOR Group | | | 63,055 | | | | 2,998 | |
Engility Holdings * | | | 57,671 | | | | 1,357 | |
Ennis | | | 34,265 | | | | 626 | |
EnPro Industries | | | 13,372 | | | | 676 | |
Equifax | | | 11,904 | | | | 1,497 | |
Exponent | | | 54,750 | | | | 2,952 | |
Federal Signal | | | 2,517 | | | | 33 | |
Fluor | | | 35,509 | | | | 1,874 | |
Forward Air | | | 116,429 | | | | 5,296 | |
FreightCar America | | | 236,800 | | | | 3,412 | |
G&K Services, Cl A | | | 2,789 | | | | 209 | |
Generac Holdings * | | | 61,227 | | | | 2,321 | |
General Cable | | | 44,925 | | | | 614 | |
Genesee & Wyoming, Cl A * | | | 46,171 | | | | 2,773 | |
Gibraltar Industries * | | | 1,823 | | | | 54 | |
Global Brass & Copper Holdings | | | 12,157 | | | | 332 | |
Great Lakes Dredge & Dock * | | | 1,129,500 | | | | 5,150 | |
H&E Equipment Services | | | 64,473 | | | | 1,239 | |
Harsco | | | 77,763 | | | | 512 | |
Heartland Express (A) | | | 303,256 | | | | 5,604 | |
Heico | | | 23,443 | | | | 1,560 | |
HEICO, Cl A | | | 88,886 | | | | 4,904 | |
Heidrick & Struggles International | | | 6,968 | | | | 129 | |
Hexcel | | | 48,379 | | | | 2,113 | |
Hillenbrand | | | 47,350 | | | | 1,478 | |
Huntington Ingalls Industries | | | 34,864 | | | | 5,348 | |
Huron Consulting Group * | | | 15,660 | | | | 917 | |
Hyster-Yale Materials Handling | | | 677 | | | | 41 | |
ICF International * | | | 131,724 | | | | 5,372 | |
IDEX | | | 29,221 | | | | 2,435 | |
InnerWorkings * | | | 119,187 | | | | 1,027 | |
Insteel Industries | | | 6,051 | | | | 168 | |
ITT | | | 15,806 | | | | 561 | |
Jacobs Engineering Group * | | | 16,719 | | | | 847 | |
JetBlue Airways * | | | 130,124 | | | | 2,333 | |
John Bean Technologies | | | 28,120 | | | | 1,706 | |
| | |
| 90 | | SEI Institutional Investments Trust / Annual Report / May 31, 2016 |
SCHEDULE OF INVESTMENTS
Small/Mid Cap Equity Fund
May 31, 2016
| | | | | | | | |
| Description | | Shares | | | Market Value
($ Thousands) | |
Kadant | | | 23,600 | | | $ | 1,174 | |
Kansas City Southern | | | 14,175 | | | | 1,320 | |
KAR Auction Services | | | 27,253 | | | | 1,118 | |
KBR | | | 174,044 | | | | 2,532 | |
Kennametal | | | 72,921 | | | | 1,785 | |
KEYW Holding *(A) | | | 248,500 | | | | 2,217 | |
Kirby * | | | 92,631 | | | | 6,492 | |
Korn/Ferry International | | | 57,980 | | | | 1,673 | |
Lincoln Electric Holdings | | | 36,993 | | | | 2,226 | |
Macquarie Infrastructure | | | 4,946 | | | | 354 | |
Manitowoc Foodservice * | | | 88,937 | | | | 1,465 | |
Manpowergroup | | | 49,491 | | | | 3,947 | |
Masco | | | 46,211 | | | | 1,508 | |
Matthews International, Cl A | | | 57,510 | | | | 3,156 | |
Meritor * | | | 261,761 | | | | 2,314 | |
Middleby * | | | 8,530 | | | | 1,059 | |
Mistras Group * | | | 3,276 | | | | 81 | |
Moog, Cl A * | | | 18,795 | | | | 1,014 | |
MRC Global * | | | 31,525 | | | | 447 | |
MSC Industrial Direct, Cl A | | | 74,378 | | | | 5,575 | |
Multi-Color | | | 7,138 | | | | 445 | |
MYR Group * | | | 1,654 | | | | 40 | |
NACCO Industries, Cl A | | | 2,259 | | | | 119 | |
National Presto Industries | | | 4,328 | | | | 387 | |
Navigant Consulting * | | | 2,198 | | | | 35 | |
Nordson | | | 10,050 | | | | 874 | |
Northwest Pipe * | | | 26,508 | | | | 247 | |
NV5 Global * | | | 28,560 | | | | 778 | |
Old Dominion Freight Line * | | | 34,280 | | | | 2,206 | |
Orbital ATK | | | 1,641 | | | | 143 | |
Orion Marine Group * | | | 318,400 | | | | 1,487 | |
Oshkosh Truck | | | 47,100 | | | | 2,162 | |
Owens Corning | | | 80,569 | | | | 4,115 | |
Parker Hannifin | | | 5,450 | | | | 626 | |
Paylocity Holding * | | | 29,101 | | | | 1,068 | |
PGT * | | | 71,815 | | | | 770 | |
Pitney Bowes | | | 103,400 | | | | 1,926 | |
Primoris Services | | | 70,900 | | | | 1,526 | |
Proto Labs *(A) | | | 32,369 | | | | 2,130 | |
Quad, Cl A | | | 6,434 | | | | 124 | |
Quanta Services * | | | 9,926 | | | | 238 | |
Rand Logistics * | | | 150,387 | | | | 132 | |
RBC Bearings * | | | 15,780 | | | | 1,182 | |
Regal-Beloit | | | 26,235 | | | | 1,499 | |
Resources Connection | | | 42,968 | | | | 669 | |
Ritchie Bros Auctioneers | | | 66,042 | | | | 2,161 | |
Roadrunner Transportation Systems * | | | 179,052 | | | | 1,441 | |
RPX * | | | 13,722 | | | | 138 | |
RR Donnelley & Sons | | | 43,256 | | | | 705 | |
Ryder System | | | 17,600 | | | | 1,225 | |
Saia * | | | 50,591 | | | | 1,319 | |
Sensata Technologies Holding * | | | 159,134 | | | | 5,885 | |
| | | | | | | | |
| Description | | Shares | | | Market Value
($ Thousands) | |
SkyWest | | | 3,268 | | | $ | 77 | |
Spirit AeroSystems Holdings, Cl A * | | | 57,626 | | | | 2,696 | |
SPX FLOW * | | | 10,326 | | | | 309 | |
Standex International | �� | | 7,986 | | | | 692 | |
Stericycle * | | | 9,435 | | | | 925 | |
Sterling Construction * | | | 168,850 | | | | 853 | |
TAL International Group | | | 24,400 | | | | 350 | |
Team * | | | 21,837 | | | | 662 | |
Teledyne Technologies * | | | 3,899 | | | | 383 | |
Tennant | | | 82,039 | | | | 4,405 | |
Terex | | | 8,201 | | | | 174 | |
Tetra Tech | | | 85,586 | | | | 2,619 | |
Textainer Group Holdings (A) | | | 9,800 | | | | 131 | |
Timken | | | 22,400 | | | | 745 | |
Titan Machinery *(A) | | | 144,000 | | | | 1,536 | |
TransDigm Group * | | | 5,915 | | | | 1,559 | |
TriMas * | | | 33,877 | | | | 579 | |
TriNet Group * | | | 312,360 | | | | 6,294 | |
Trinity Industries | | | 72,400 | | | | 1,308 | |
Triumph Group | | | 55,562 | | | | 2,096 | |
Tutor Perini * | | | 210,900 | | | | 4,771 | |
UniFirst | | | 5,724 | | | | 662 | |
Universal Forest Products | | | 10,314 | | | | 866 | |
Valmont Industries | | | 10,905 | | | | 1,508 | |
Wabash National * | | | 57,200 | | | | 811 | |
WABCO Holdings * | | | 5,510 | | | | 595 | |
Wabtec | | | 28,316 | | | | 2,191 | |
Waste Connections (A) | | | 24,640 | | | | 1,613 | |
Watts Water Technologies, Cl A | | | 10,711 | | | | 616 | |
Werner Enterprises | | | 49,471 | | | | 1,231 | |
Woodward Governor | | | 49,364 | | | | 2,811 | |
XPO Logistics *(A) | | | 27,350 | | | | 800 | |
Xylem | | | 58,095 | | | | 2,595 | |
| | | | | | | | |
| | | | | | | 269,452 | |
| | | | | | | | |
| |
Information Technology — 16.6% | | | | | |
Advanced Energy Industries * | | | 5,575 | | | | 213 | |
Alarm.com Holdings *(A) | | | 83,800 | | | | 1,777 | |
Amdocs | | | 8,000 | | | | 464 | |
Amkor Technology * | | | 30,987 | | | | 196 | |
Ansys * | | | 283 | | | | 25 | |
Applied Micro Circuits * | | | 229,836 | | | | 1,512 | |
Arista Networks *(A) | | | 5,760 | | | | 422 | |
Arrow Electronics * | | | 38,479 | | | | 2,487 | |
Aspen Technology * | | | 28,804 | | | | 1,098 | |
Atlassian, Cl A *(A) | | | 37,117 | | | | 838 | |
Avnet | | | 47,251 | | | | 1,939 | |
Bankrate * | | | 22,886 | | | | 208 | |
Barracuda Networks *(A) | | | 164,350 | | | | 2,828 | |
Benchmark Electronics * | | | 78,767 | | | | 1,633 | |
Black Box | | | 39,167 | | | | 492 | |
Blackbaud | | | 51,845 | | | | 3,249 | |
| | |
| 91 | | SEI Institutional Investments Trust / Annual Report / May 31, 2016 |
SCHEDULE OF INVESTMENTS
Small/Mid Cap Equity Fund
May 31, 2016
| | | | | | | | |
| Description | | Shares | | | Market Value
($ Thousands) | |
Blackhawk Network Holdings, Cl A * | | | 25,980 | | | $ | 894 | |
Booz Allen Hamilton Holding, Cl A | | | 60,040 | | | | 1,757 | |
Broadridge Financial Solutions | | | 22,775 | | | | 1,462 | |
BroadSoft * | | | 39,510 | | | | 1,723 | |
Brocade Communications Systems | | | 260,661 | | | | 2,362 | |
CACI International, Cl A * | | | 17,885 | | | | 1,802 | |
Cadence Design Systems * | | | 413,093 | | | | 10,212 | |
CalAmp * | | | 74,650 | | | | 1,122 | |
Cavium * | | | 8,438 | | | | 420 | |
CDW | | | 31,494 | | | | 1,340 | |
ChannelAdvisor * | | | 347,848 | | | | 4,313 | |
Ciber * | | | 1,012,200 | | | | 1,255 | |
Ciena * | | | 92,246 | | | | 1,611 | |
Cimpress *(A) | | | 55,871 | | | | 5,597 | |
Citrix Systems * | | | 13,034 | | | | 1,107 | |
Coherent * | | | 22,812 | | | | 2,159 | |
Cohu | | | 26,143 | | | | 309 | |
CommScope Holding * | | | 57,735 | | | | 1,798 | |
CommVault Systems * | | | 33,870 | | | | 1,534 | |
Computer Sciences | | | 30,100 | | | | 1,481 | |
Comtech Telecommunications | | | 8,359 | | | | 193 | |
Convergys | | | 91,108 | | | | 2,568 | |
CoStar Group * | | | 20,745 | | | | 4,286 | |
Criteo ADR *(A) | | | 38,830 | | | | 1,742 | |
CSG Systems International | | | 55,980 | | | | 2,380 | |
CSRA | | | 30,100 | | | | 746 | |
Cypress Semiconductor | | | 182,444 | | | | 1,939 | |
Demandware *(A) | | | 85,416 | | | | 4,099 | |
Descartes Systems Group * | | | 126,470 | | | | 2,648 | |
Diebold | | | 59,081 | | | | 1,527 | |
Digi International * | | | 200,398 | | | | 2,212 | |
DST Systems | | | 45,269 | | | | 5,474 | |
EMCORE * | | | 23,618 | | | | 134 | |
EPAM Systems * | | | 32,130 | | | | 2,458 | |
ePlus * | | | 7,300 | | | | 639 | |
Euronet Worldwide * | | | 101,230 | | | | 8,079 | |
Everi Holdings * | | | 19,036 | | | | 27 | |
Exar * | | | 640,000 | | | | 4,371 | |
ExlService Holdings * | | | 12,776 | | | | 662 | |
Fair Isaac | | | 19,441 | | | | 2,166 | |
Fairchild Semiconductor International, Cl A * | | | 8,659 | | | | 172 | |
Fidelity National Information Services | | | 15,457 | | | | 1,148 | |
Finisar * | | | 22,200 | | | | 373 | |
First Solar * | | | 17,530 | | | | 870 | |
FleetMatics Group * | | | 99,618 | | | | 4,074 | |
Flextronics International * | | | 329,217 | | | | 4,099 | |
Fortinet * | | | 22,140 | | | | 757 | |
Gartner * | | | 49,313 | | | | 5,011 | |
Global Payments | | | 31,225 | | | | 2,426 | |
Globant *(A) | | | 42,030 | | | | 1,687 | |
Guidewire Software * | | | 67,026 | | | | 3,934 | |
Hackett Group | | | 147,945 | | | | 2,163 | |
| | | | | | | | |
| Description | | Shares | | | Market Value
($ Thousands) | |
Harris | | | 9,700 | | | $ | 764 | |
Himax Technologies ADR (A) | | | 82,605 | | | | 809 | |
HubSpot * | | | 27,910 | | | | 1,333 | |
IAC | | | 9,638 | | | | 539 | |
II-VI * | | | 11,176 | | | | 228 | |
Ingram Micro, Cl A | | | 9,664 | | | | 335 | |
Insight Enterprises * | | | 53,509 | | | | 1,452 | |
Integrated Device Technology * | | | 46,840 | | | | 1,094 | |
Intersil, Cl A | | | 116,881 | | | | 1,580 | |
InterXion Holding * | | | 44,835 | | | | 1,680 | |
Ixia * | | | 93,843 | | | | 953 | |
IXYS | | | 11,980 | | | | 131 | |
Juniper Networks | | | 31,053 | | | | 727 | |
Kulicke & Soffa Industries * | | | 29,529 | | | | 369 | |
Leidos Holdings | | | 4,761 | | | | 235 | |
Lexmark International, Cl A | | | 49,300 | | | | 1,867 | |
Liquidity Services * | | | 22,290 | | | | 149 | |
Littelfuse | | | 57,938 | | | | 6,636 | |
LogMeIn * | | | 19,347 | | | | 1,185 | |
Lumentum Holdings * | | | 37,285 | | | | 945 | |
M *(A) | | | 44,013 | | | | 1,585 | |
Manhattan Associates * | | | 26,030 | | | | 1,716 | |
ManTech International, Cl A | | | 4,341 | | | | 156 | |
Marvell Technology Group | | | 297,906 | | | | 3,048 | |
Maxim Integrated Products | | | 29,407 | | | | 1,116 | |
MAXIMUS | | | 37,758 | | | | 2,177 | |
Mellanox Technologies * | | | 24,670 | | | | 1,169 | |
Mentor Graphics | | | 75,610 | | | | 1,621 | |
Mercury Systems * | | | 40,665 | | | | 864 | |
Microchip Technology (A) | | | 20,072 | | | | 1,037 | |
Microsemi * | | | 88,535 | | | | 2,995 | |
MKS Instruments | | | 12,623 | | | | 517 | |
Monolithic Power Systems | | | 48,388 | | | | 3,306 | |
Multi-Fineline Electronix * | | | 28,562 | | | | 632 | |
NCR * | | | 69,300 | | | | 2,140 | |
NETGEAR * | | | 74,182 | | | | 3,338 | |
NeuStar, Cl A * | | | 4,780 | | | | 113 | |
New Relic *(A) | | | 60,213 | | | | 1,816 | |
Nuance Communications * | | | 85,627 | | | | 1,432 | |
Oclaro *(A) | | | 184,240 | | | | 923 | |
Pandora Media *(A) | | | 56,328 | | | | 664 | |
Photronics * | | | 4,669 | | | | 45 | |
Plantronics | | | 27,300 | | | | 1,215 | |
Plexus * | | | 33,217 | | | | 1,459 | |
Progress Software * | | | 13,117 | | | | 345 | |
Proofpoint * | | | 30,737 | | | | 1,802 | |
PTC * | | | 71,965 | | | | 2,572 | |
Q2 Holdings * | | | 59,320 | | | | 1,482 | |
QAD, Cl A | | | 86,535 | | | | 1,626 | |
Qlik Technologies * | | | 44,580 | | | | 1,279 | |
QLogic * | | | 21,651 | | | | 300 | |
Qorvo * | | | 21,530 | | | | 1,097 | |
| | |
| 92 | | SEI Institutional Investments Trust / Annual Report / May 31, 2016 |
SCHEDULE OF INVESTMENTS
Small/Mid Cap Equity Fund
May 31, 2016
| | | | | | | | |
| Description | | Shares | | | Market Value
($ Thousands) | |
Quantum * | | | 302 | | | $ | — | |
QuinStreet * | | | 30,252 | | | | 112 | |
RealPage * | | | 133,371 | | | | 2,901 | |
RetailMeNot * | | | 34,235 | | | | 247 | |
RingCentral, Cl A * | | | 63,106 | | | | 1,246 | |
Rovi * | | | 14,116 | | | | 237 | |
Rudolph Technologies * | | | 57,300 | | | | 837 | |
Sanmina * | | | 73,977 | | | | 1,982 | |
Seagate Technology (A) | | | 44,900 | | | | 1,013 | |
Semtech * | | | 29,877 | | | | 703 | |
Shutterstock *(A) | | | 67,800 | | | | 2,845 | |
Silicon Laboratories * | | | 22,718 | | | | 1,130 | |
Silver Spring Networks * | | | 11,503 | | | | 150 | |
Sonus Networks * | | | 4,649 | | | | 43 | |
SPS Commerce * | | | 33,902 | | | | 1,848 | |
SS&C Technologies Holdings | | | 68,951 | | | | 4,247 | |
Stamps.com *(A) | | | 10,094 | | | | 918 | |
Stratasys *(A) | | | 72,410 | | | | 1,652 | |
SuperCom *(A) | | | 196,400 | | | | 748 | |
Sykes Enterprises * | | | 42,131 | | | | 1,256 | |
Synaptics * | | | 15,480 | | | | 1,050 | |
SYNNEX | | | 5,019 | | | | 457 | |
Synopsys * | | | 29,433 | | | | 1,521 | |
Take-Two Interactive Software * | | | 39,535 | | | | 1,538 | |
Tech Data * | | | 52,540 | | | | 3,970 | |
Telenav * | | | 17,335 | | | | 81 | |
TeleTech Holdings | | | 19,741 | | | | 539 | |
Teradata *(A) | | | 52,200 | | | | 1,479 | |
Teradyne | | | 170,671 | | | | 3,381 | |
Total System Services | | | 16,456 | | | | 884 | |
Trimble Navigation * | | | 278,619 | | | | 7,127 | |
Tyler Technologies * | | | 28,490 | | | | 4,367 | |
Ultimate Software Group * | | | 16,184 | | | | 3,309 | |
Ultratech * | | | 131,600 | | | | 3,002 | |
United Online * | | | 11,862 | | | | 130 | |
Vantiv, Cl A * | | | 22,962 | | | | 1,235 | |
VeriFone Holdings * | | | 98,645 | | | | 2,604 | |
Viavi Solutions * | | | 161,500 | | | | 1,103 | |
Western Digital | | | 20,300 | | | | 945 | |
Xcerra * | | | 243,941 | | | | 1,593 | |
| | | | | | | | |
| | | | | | | 271,731 | |
| | | | | | | | |
| |
Materials — 3.5% | | | | | |
AK Steel Holding * | | | 11,432 | | | | 49 | |
Albemarle | | | 13,543 | | | | 1,063 | |
Allegheny Technologies (A) | | | 274,726 | | | | 3,401 | |
Ashland | | | 13,262 | | | | 1,503 | |
Avery Dennison | | | 20,478 | | | | 1,523 | |
Axiall | | | 5,028 | | | | 117 | |
Ball | | | 17,830 | | | | 1,289 | |
Bemis | | | 20,934 | | | | 1,054 | |
Berry Plastics Group * | | | 133,127 | | | | 5,215 | |
| | | | | | | | |
| Description | | Shares | | | Market Value
($ Thousands) | |
Cabot | | | 79,359 | | | $ | 3,627 | |
Carpenter Technology | | | 44,600 | | | | 1,429 | |
Century Aluminum *(A) | | | 79,855 | | | | 516 | |
Chemours | | | 58,589 | | | | 510 | |
Clearwater Paper * | | | 11,700 | | | | 733 | |
Crown Holdings * | | | 34,084 | | | | 1,778 | |
Domtar | | | 36,200 | | | | 1,399 | |
Eastman Chemical | | | 9,900 | | | | 726 | |
Flotek Industries *(A) | | | 78,668 | | | | 925 | |
FMC | | | 30,646 | | | | 1,455 | |
FutureFuel | | | 22,466 | | | | 250 | |
Glatfelter | | | 39,200 | | | | 804 | |
Graphic Packaging Holding | | | 21,777 | | | | 292 | |
Headwaters * | | | 75,615 | | | | 1,436 | |
Huntsman | | | 149,137 | | | | 2,227 | |
Ingevity * | | | 643 | | | | 19 | |
Innophos Holdings | | | 15,694 | | | | 602 | |
Innospec | | | 10,276 | | | | 499 | |
Kaiser Aluminum | | | 15,930 | | | | 1,365 | |
Martin Marietta Materials | | | 7,906 | | | | 1,495 | |
Olin | | | 83,629 | | | | 1,924 | |
Owens-Illinois * | | | 19,882 | | | | 376 | |
PolyOne | | | 85,917 | | | | 3,219 | |
Rayonier Advanced Materials | | | 29,725 | | | | 385 | |
Real Industry * | | | 67,548 | | | | 458 | |
Reliance Steel & Aluminum | | | 6,407 | | | | 476 | |
Schweitzer-Mauduit International | | | 98,400 | | | | 3,385 | |
Scotts Miracle-Gro, Cl A | | | 8,510 | | | | 591 | |
Sealed Air | | | 29,413 | | | | 1,366 | |
Silgan Holdings | | | 8,588 | | | | 439 | |
Sonoco Products | | | 5,148 | | | | 245 | |
Steel Dynamics | | | 50,601 | | | | 1,249 | |
Stepan | | | 2,076 | | | | 120 | |
Summit Materials, Cl A * | | | 131,243 | | | | 2,855 | |
SunCoke Energy | | | 6,362 | | | | 38 | |
Tahoe Resources | | | 10,406 | | | | 124 | |
TimkenSteel | | | 8,544 | | | | 77 | |
Tredegar | | | 1,390 | | | | 23 | |
Tronox, Cl A (A) | | | 124,711 | | | | 577 | |
UFP Technologies * | | | 32,800 | | | | 707 | |
United States Steel (A) | | | 45,933 | | | | 665 | |
WestRock | | | 3,861 | | | | 153 | |
Worthington Industries | | | 560 | | | | 21 | |
WR Grace | | | 16,279 | | | | 1,264 | |
| | | | | | | | |
| | | | | | | 58,038 | |
| | | | | | | | |
| |
Telecommunication Services — 0.7% | | | | | |
8x8 * | | | 246,300 | | | | 3,145 | |
Atlantic Telegraph-Network | | | 8,210 | | | | 612 | |
Cincinnati Bell * | | | 96,859 | | | | 385 | |
Cogent Communications Holdings | | | 51,362 | | | | 2,045 | |
IDT, Cl B | | | 13,561 | | | | 202 | |
| | |
| 93 | | SEI Institutional Investments Trust / Annual Report / May 31, 2016 |
SCHEDULE OF INVESTMENTS
Small/Mid Cap Equity Fund
May 31, 2016
| | | | | | | | |
| Description | | Shares | | | Market Value
($ Thousands) | |
Inteliquent | | | 84,732 | | | $ | 1,417 | |
Intelsat * | | | 21,935 | | | | 71 | |
Iridium Communications *(A) | | | 204,300 | | | | 1,783 | |
Ooma * | | | 14,529 | | | | 100 | |
Telephone & Data Systems | | | 23,495 | | | | 676 | |
US Cellular * | | | 4,443 | | | | 168 | |
Vonage Holdings * | | | 92,103 | | | | 425 | |
| | | | | | | | |
| | | | | | | 11,029 | |
| | | | | | | | |
| |
Utilities — 4.0% | | | | | |
AGL Resources | | | 9,193 | | | | 605 | |
ALLETE | | | 69,778 | | | | 4,029 | |
Alliant Energy | | | 64,254 | | | | 2,381 | |
Ameren | | | 28,700 | | | | 1,422 | |
American States Water | | | 9,561 | | | | 374 | |
American Water Works | | | 31,261 | | | | 2,316 | |
Aqua America | | | 7,188 | | | | 232 | |
Atmos Energy | | | 41,013 | | | | 2,990 | |
Avista | | | 46,958 | | | | 1,889 | |
Black Hills (A) | | | 25,000 | | | | 1,514 | |
Cadiz *(A) | | | 114,973 | | | | 700 | |
California Water Service Group | | | 53,500 | | | | 1,560 | |
Chesapeake Utilities | | | 22,280 | | | | 1,285 | |
CMS Energy | | | 33,415 | | | | 1,397 | |
DTE Energy | | | 13,696 | | | | 1,242 | |
Edison International | | | 15,361 | | | | 1,100 | |
El Paso Electric | | | 1,493 | | | | 67 | |
Great Plains Energy | | | 88,139 | | | | 2,572 | |
Hawaiian Electric Industries * | | | 8,100 | | | | 266 | |
IDACORP | | | 13,252 | | | | 970 | |
ITC Holdings | | | 6,416 | | | | 286 | |
MDU Resources Group | | | 7,577 | | | | 173 | |
MGE Energy | | | 883 | | | | 45 | |
Northwest Natural Gas | | | 1,716 | | | | 94 | |
NorthWestern | | | 9,115 | | | | 528 | |
OGE Energy | | | 110,652 | | | | 3,341 | |
ONE Gas | | | 17,470 | | | | 1,025 | |
Ormat Technologies | | | 1,047 | | | | 46 | |
Piedmont Natural Gas | | | 5,735 | | | | 344 | |
Pinnacle West Capital | | | 77,487 | | | | 5,702 | |
PNM Resources | | | 107,250 | | | | 3,522 | |
Portland General Electric | | | 129,569 | | | | 5,336 | |
PPL | | | 24,174 | | | | 932 | |
Questar | | | 43,372 | | | | 1,093 | |
SCANA | | | 52,967 | | | | 3,703 | |
SJW | | | 3,607 | | | | 124 | |
South Jersey Industries | | | 58,650 | | | | 1,694 | |
Southwest Gas | | | 9,367 | | | | 650 | |
Spark Energy, Cl A | | | 3,165 | | | | 95 | |
Spire | | | 1,807 | | | | 115 | |
Talen Energy * | | | 4,553 | | | | 52 | |
TECO Energy | | | 12,594 | | | | 347 | |
| | | | | | | | |
| Description | | Shares | | | Market Value
($ Thousands) | |
UGI | | | 74,030 | | | $ | 3,177 | |
Unitil | | | 1,986 | | | | 79 | |
Vectren | | | 23,928 | | | | 1,189 | |
Westar Energy, Cl A | | | 57,751 | | | | 3,253 | |
| | | | | | | | |
| | | | | | | 65,856 | |
| | | | | | | | |
Total Common Stock
(Cost $1,365,825) ($ Thousands) | | | | 1,564,750 | |
| | | | | | | | |
| |
EXCHANGE TRADED FUND — 0.1% | | | | | |
| | |
Exchange Traded Fund — 0.1% | | | | | | | | |
iShares Russell 2000 Value Fund | | | 23,200 | | | | 2,249 | |
| | | | | | | | |
Total Exchange Traded Fund
(Cost $2,085) ($ Thousands) | | | | | | | 2,249 | |
| | | | | | | | |
| | |
| |
| Number of
Rights |
| | | | |
| | | | | | | | |
RIGHTS — 0.0% | | | | | | | | |
| | |
United States — 0.0% | | | | | | | | |
Dyax, Expires 12/31/2019 | | | 60 | | | | — | |
| | | | | | | | |
Total Rights
(Cost $—) ($ Thousands) | | | | | | | — | |
| | | | | | | | |
| | |
| | | Shares | | | | | |
| | | | | | | | |
AFFILIATED PARTNERSHIP — 9.3% | | | | | |
SEI Liquidity Fund, L.P. | | | | | | | | |
0.410% **†(B) | | | 152,985,404 | | | | 152,985 | |
| | | | | | | | |
Total Affiliated Partnership
(Cost $152,985) ($ Thousands) | | | | | | | 152,985 | |
| | | | | | | | |
| | |
| |
| Face Amount
(Thousands |
) | | | | |
| | | | | | | | |
U.S. TREASURY OBLIGATION — 0.1% | | | | | |
U.S. Treasury Bills | | | | | | | | |
0.322%, 08/18/2016 (C)(D) | | $ | 1,015 | | | | 1,014 | |
| | | | | | | | |
Total U.S. Treasury Obligation
(Cost $1,014) ($ Thousands) | | | | | | | 1,014 | |
| | | | | | | | |
| | |
| 94 | | SEI Institutional Investments Trust / Annual Report / May 31, 2016 |
SCHEDULE OF INVESTMENTS
Small/Mid Cap Equity Fund
May 31, 2016
| | | | | | | | |
| Description | | Shares | | | Market Value
($ Thousands) | |
CASH EQUIVALENT — 4.8% | | | | | | | | |
SEI Daily Income Trust, Prime Obligation Fund, Cl A | | | | | | | | |
0.270% **† | | | 78,824,896 | | | $ | 78,825 | |
| | | | | | | | |
Total Cash Equivalent
(Cost $78,825) ($ Thousands) | | | | | | | 78,825 | |
| | | | | | | | |
Total Investments — 109.6%
(Cost $1,600,734) ($ Thousands) | | | | | | $ | 1,799,823 | |
| | | | | | | | |
A list of the open futures contracts held by the Fund at May 31, 2016, is as follows:
| | | | | | | | | | | | |
| Type of Contract | | Number of
Contracts
Long (Short) | | | Expiration
Date | | | Unrealized
Appreciation
($ Thousands) | |
Russell 2000 Index E-MINI | | | 31 | | | | Jun-2016 | | | $ | 189 | |
S&P Mid Cap 400 Index E-MINI | | | 28 | | | | Jun-2016 | | | | 187 | |
| | | | | | | | | | | | |
| | | | | | | | | | $ | 376 | |
| | | | | | | | | | | | |
For the year ended May 31, 2016, the total amount of all open futures contracts, as presented in the table above, are representative of the volume of activity for the derivative type during the year.
Percentages are based on a Net Assets of $1,642,784 ($ Thousands).
| * | | Non-income producing security. |
| ** | | Rate shown is the 7-day effective yield as of May 31, 2016. |
| † | | Investment in Affiliated Security (see Note 6). |
| ‡ | | Real Estate Investment Trust. |
| (A) | | This security or a partial position of this security is on loan at May 31, 2016. The total market value of securities on loan at May 31, 2016 was $149,493 ($ Thousands). |
| (B) | | This security was purchased with cash collateral held from securities on loan. The total market value of such securities as of May 31, 2016 was $152,985 ($Thousands). |
| (C) | | The rate reported is the effective yield at time of purchase. |
| (D) | | Security, or portion thereof, has been pledged as collateral on open futures contracts. |
ADR — American Depositary Receipt
AID — Agency for International Development
Cl — Class
L.P. — Limited Partnership
MYR — Malaysian Ringgit
PIPE — Private Investment in Public Entity
REIT — Real Estate Investment Trust
S&P — Standard & Poor’s
SPX — Standard & Poor’s 500 Index
The following is a list of the level of inputs used as of May 31, 2016, in valuing the Fund’s investments and other financial instruments carried a value ($ Thousands):
| | | | | | | | | | | | | | | | |
| Investments in Securities | | Level 1 | | | Level 2 | | | Level 3 | | | Total | |
Common Stock | | $ | 1,564,750 | | | $ | — | | | $ | — | | | $ | 1,564,750 | |
Exchange Traded Fund | | | 2,249 | | | | — | | | | — | | | | 2,249 | |
Right | | | — | | | | — | | | | — | | | | — | |
Affiliated Partnership | | | — | | | | 152,985 | | | | — | | | | 152,985 | |
U.S. Treasury Obligation | | | — | | | | 1,014 | | �� | | — | | | | 1,014 | |
Cash Equivalent | | | 78,825 | | | | — | | | | — | | | | 78,825 | |
| | | | | | | | | | | | | | | | |
Total Investments in Securities | | $ | 1,645,824 | | | $ | 153,999 | | | $ | — | | | $ | 1,799,823 | |
| | | | | | | | | | | | | | | | |
| | | | | | | | | | | | | | | | |
| Other Financial Instruments | | Level 1 | | | Level 2 | | | Level 3 | | | Total | |
Futures Contracts * | | | | | | | | | | | | | | | | |
Unrealized Appreciation | | $ | 376 | | | $ | — | | | $ | — | | | $ | 376 | |
| | | | | | | | | | | | | | | | |
Total Other Financial Instruments | | $ | 376 | | | $ | — | | | $ | — | | | $ | 376 | |
| | | | | | | | | | | | | | | | |
| * | | Futures contracts are valued at the unrealized appreciation on the instrument. |
For the year ended May 31, 2016, there were no transfers between Level 1 and Level 2 assets and liabilities.
For the year ended May 31, 2016, there were no transfers between Level 2 and Level 3 assets and liabilities.
For more information on valuation inputs, see Note 2 – Significant Accounting Policies in Notes to Financial Statements.
Amounts designated as “—” are $0 or have been rounded to $0.
The accompanying notes are an integral part of the financial statements.
| | |
| 95 | | SEI Institutional Investments Trust / Annual Report / May 31, 2016 |
SCHEDULE OF INVESTMENTS
U.S. Managed Volatility Fund
May 31, 2016
| | | | | | | | |
| Description | | Shares | | | Market Value
($ Thousands) | |
COMMON STOCK — 98.5% | | | | | | | | |
Consumer Discretionary — 9.9% | | | | | | | | |
Aaron’s | | | 93,911 | | | $ | 2,357 | |
Abercrombie & Fitch, Cl A | | | 60,555 | | | | 1,205 | |
American Eagle Outfitters | | | 266,306 | | | | 4,165 | |
Aramark | | | 149,337 | | | | 4,972 | |
AutoZone * | | | 4,200 | | | | 3,201 | |
Bed Bath & Beyond | | | 177,047 | | | | 7,923 | |
Best Buy | | | 26,454 | | | | 851 | |
Big Lots | | | 89,544 | | | | 4,683 | |
BJ’s Restaurants * | | | 7,547 | | | | 338 | |
Brinker International | | | 183,311 | | | | 8,244 | |
Canadian Tire, Cl A | | | 77,700 | | | | 8,506 | |
Cheesecake Factory | | | 88,530 | | | | 4,415 | |
Chico’s FAS | | | 198,028 | | | | 2,149 | |
Cogeco Communications | | | 13,400 | | | | 703 | |
Comcast, Cl A | | | 104,000 | | | | 6,583 | |
Cooper Tire & Rubber | | | 21,062 | | | | 677 | |
Cooper-Standard Holding * | | | 4,652 | | | | 400 | |
Cracker Barrel Old Country Store | | | 2,634 | | | | 399 | |
CST Brands | | | 12,481 | | | | 473 | |
Del Frisco’s Restaurant Group * | | | 3,767 | | | | 58 | |
Dillard’s, Cl A | | | 43,914 | | | | 2,596 | |
Dollar General | | | 54,064 | | | | 4,860 | |
Eldorado Resorts * | | | 23,701 | | | | 353 | |
Escalade | | | 6,097 | | | | 69 | |
Foot Locker | | | 122,823 | | | | 6,868 | |
GameStop, Cl A | | | 28,187 | | | | 820 | |
Gannett | | | 146,558 | | | | 2,289 | |
Genuine Parts | | | 19,518 | | | | 1,892 | |
Hemisphere Media Group, Cl A * | | | 11,030 | | | | 120 | |
Hooker Furniture | | | 1,279 | | | | 31 | |
HSN | | | 41,600 | | | | 2,179 | |
Jack in the Box | | | 11,443 | | | | 975 | |
John Wiley & Sons, Cl A | | | 5,143 | | | | 277 | |
Kohl’s | | | 107,400 | | | | 3,871 | |
LKQ * | | | 22,004 | | | | 728 | |
Macy’s | | | 42,600 | | | | 1,415 | |
Mattel | | | 17,010 | | | | 542 | |
McDonald’s | | | 19,786 | | | | 2,415 | |
Michael Kors Holdings * | | | 132,421 | | | | 5,657 | |
MSG Networks * | | | 134,955 | | | | 2,336 | |
Murphy USA * | | | 88,400 | | | | 6,010 | |
National CineMedia | | | 16,509 | | | | 241 | |
News, Cl A | | | 60,414 | | | | 723 | |
NVR * | | | 2,423 | | | | 4,199 | |
Panera Bread, Cl A * | | | 9,582 | | | | 2,100 | |
PetMed Express | | | 21,310 | | | | 401 | |
Regal Entertainment Group, Cl A | | | 19,324 | | | | 406 | |
Sally Beauty Holdings * | | | 137,600 | | | | 3,952 | |
Scripps Networks Interactive, Cl A | | | 70,000 | | | | 4,504 | |
Sportsman’s Warehouse Holdings * | | | 4,039 | | | | 35 | |
Staples | | | 265,352 | | | | 2,335 | |
| | | | | | | | |
| Description | | Shares | | | Market Value
($ Thousands) | |
Starbucks | | | 20,074 | | | $ | 1,102 | |
Target | | | 232,529 | | | | 15,993 | |
Texas Roadhouse, Cl A | | | 2,218 | | | | 99 | |
Thomson Reuters | | | 17,972 | | | | 756 | |
Viacom, Cl B | | | 109,400 | | | | 4,854 | |
| | | | | | | | |
| | | | | | | 150,305 | |
| | | | | | | | |
| |
Consumer Staples — 17.5% | | | | | |
Altria Group | | | 378,949 | | | | 24,116 | |
Amplify Snack Brands * | | | 3,138 | | | | 41 | |
Archer-Daniels-Midland | | | 74,600 | | | | 3,191 | |
B&G Foods, Cl A | | | 3,307 | | | | 142 | |
Blue Buffalo Pet Products * | | | 6,905 | | | | 178 | |
Brown-Forman, Cl B | | | 24,314 | | | | 2,384 | |
Bunge | | | 132,400 | | | | 8,880 | |
Calavo Growers | | | 2,483 | | | | 141 | |
Cal-Maine Foods | | | 86,738 | | | | 3,860 | |
Campbell Soup | | | 82,931 | | | | 5,023 | |
Casey’s General Stores | | | 4,367 | | | | 525 | |
Church & Dwight | | | 10,602 | | | | 1,044 | |
Clorox | | | 82,191 | | | | 10,565 | |
Coca-Cola European Partners | | | 82,567 | | | | 3,204 | |
ConAgra Foods | | | 128,800 | | | | 5,886 | |
Costco Wholesale | | | 20,086 | | | | 2,988 | |
CVS Health | | | 59,500 | | | | 5,739 | |
Dean Foods | | | 226,481 | | | | 4,140 | |
Dr. Pepper Snapple Group | | | 166,980 | | | | 15,262 | |
Flowers Foods | | | 184,658 | | | | 3,462 | |
General Mills | | | 156,000 | | | | 9,794 | |
Hershey | | | 54,362 | | | | 5,048 | |
Hormel Foods | | | 105,457 | | | | 3,629 | |
Ingredion | | | 78,059 | | | | 9,165 | |
J&J Snack Foods | | | 4,374 | | | | 461 | |
John B Sanfilippo & Son | | | 2,489 | | | | 118 | |
Kellogg | | | 72,578 | | | | 5,398 | |
Kimberly-Clark | | | 75,617 | | | | 9,606 | |
Kroger | | | 496,469 | | | | 17,754 | |
Lancaster Colony | | | 4,520 | | | | 548 | |
McCormick | | | 55,206 | | | | 5,359 | |
Metro, Cl A | | | 88,500 | | | | 3,006 | |
National Beverage * | | | 2,408 | | | | 125 | |
Nu Skin Enterprises, Cl A | | | 72,524 | | | | 2,861 | |
Orchids Paper Products | | | 5,799 | | | | 184 | |
PepsiCo | | | 106,325 | | | | 10,757 | |
Philip Morris International | | | 111,215 | | | | 10,975 | |
Pinnacle Foods | | | 83,881 | | | | 3,534 | |
Sanderson Farms | | | 91,704 | | | | 8,227 | |
Snyder’s-Lance | | | 7,995 | | | | 247 | |
Sysco | | | 217,124 | | | | 10,446 | |
Tyson Foods, Cl A | | | 233,907 | | | | 14,919 | |
Universal | | | 47,006 | | | | 2,571 | |
Vector Group | | | 27,799 | | | | 597 | |
| | |
| 96 | | SEI Institutional Investments Trust / Annual Report / May 31, 2016 |
SCHEDULE OF INVESTMENTS
U.S. Managed Volatility Fund
May 31, 2016
| | | | | | | | |
| Description | | Shares | | | Market Value
($ Thousands) | |
Wal-Mart Stores | | | 330,760 | | | $ | 23,411 | |
Weis Markets | | | 81,847 | | | | 4,106 | |
Whole Foods Market | | | 101,639 | | | | 3,288 | |
| | | | | | | | |
| | | | | | | 266,905 | |
| | | | | | | | |
| |
Energy — 0.8% | | | | | |
Adams Resources & Energy | | | 1,049 | | | | 41 | |
Exxon Mobil | | | 115,600 | | | | 10,291 | |
Frank’s International | | | 95,543 | | | | 1,529 | |
Memorial Resource Development * | | | 47,338 | | | | 748 | |
| | | | | | | | |
| | | | | | | 12,609 | |
| | | | | | | | |
| |
Financials — 18.1% | | | | | |
Allied World Assurance Holdings | | | 53,495 | | | | 1,984 | |
Allstate | | | 186,711 | | | | 12,605 | |
American Capital Agency ‡ | | | 79,200 | | | | 1,496 | |
American Capital Mortgage Investment ‡ | | | 11,717 | | | | 185 | |
American Financial Group | | | 137,852 | | | | 10,102 | |
American National Insurance | | | 8,758 | | | | 1,047 | |
AMERISAFE | | | 2,204 | | | | 134 | |
Annaly Capital Management ‡ | | | 667,000 | | | | 7,057 | |
Anworth Mortgage Asset ‡ | | | 50,060 | | | | 232 | |
Apollo Commercial Real Estate Finance ‡ | | | 305,527 | | | | 4,953 | |
Arch Capital Group * | | | 52,286 | | | | 3,799 | |
Ares Commercial Real Estate ‡ | | | 10,956 | | | | 131 | |
Argo Group International Holdings | | | 4,488 | | | | 236 | |
Aspen Insurance Holdings | | | 110,525 | | | | 5,289 | |
Assured Guaranty | | | 52,025 | | | | 1,399 | |
Atlas Financial Holdings * | | | 16,638 | | | | 299 | |
Axis Capital Holdings | | | 238,048 | | | | 13,128 | |
Bank of Marin Bancorp | | | 763 | | | | 39 | |
Beneficial Bancorp * | | | 11,281 | | | | 155 | |
BNC Bancorp | | | 10,354 | | | | 247 | |
BOK Financial | | | 102,929 | | | | 6,561 | |
Canadian Imperial Bank of Commerce | | | 65,200 | | | | 5,072 | |
Capitol Federal Financial | | | 52,256 | | | | 710 | |
Capstead Mortgage ‡ | | | 39,925 | | | | 386 | |
CBL & Associates Properties ‡ | | | 142,551 | | | | 1,371 | |
CBOE Holdings | | | 156,030 | | | | 9,931 | |
Charter Financial | | | 8,051 | | | | 107 | |
Chimera Investment ‡ | | | 151,739 | | | | 2,275 | |
Community Trust Bancorp | | | 2,375 | | | | 86 | |
Corrections Corp of America ‡ | | | 166 | | | | 6 | |
CU Bancorp * | | | 3,267 | | | | 75 | |
Cullen/Frost Bankers | | | 12,504 | | | | 837 | |
Donegal Group, Cl A | | | 3,072 | | | | 50 | |
Easterly Government Properties ‡ | | | 20,000 | | | | 374 | |
Employers Holdings | | | 5,887 | | | | 176 | |
Endurance Specialty Holdings | | | 143,363 | | | | 9,737 | |
Equity LifeStyle Properties ‡ | | | 58,451 | | | | 4,284 | |
Erie Indemnity, Cl A | | | 10,152 | | | | 994 | |
Essent Group * | | | 14,914 | | | | 326 | |
| | | | | | | | |
| Description | | Shares | | | Market Value
($ Thousands) | |
Everest Re Group | | | 99,649 | | | $ | 17,848 | |
Farmers Capital Bank | | | 530 | | | | 14 | |
Fidelity Southern | | | 16,739 | | | | 274 | |
First Business Financial Services | | | 5,209 | | | | 129 | |
First Interstate Bancsystem, Cl A | | | 3,743 | | | | 108 | |
Four Corners Property Trust ‡ | | | 14,087 | | | | 274 | |
Genworth MI Canada | | | 22,800 | | | | 587 | |
Guaranty Bancorp | | | 4,827 | | | | 77 | |
Hanover Insurance Group | | | 41,400 | | | | 3,589 | |
Heritage Insurance Holdings | | | 14,637 | | | | 193 | |
James River Group Holdings | | | 792 | | | | 28 | |
Ladder Capital, Cl A ‡ | | | 8,527 | | | | 105 | |
Lamar Advertising, Cl A ‡ | | | 13,108 | | | | 853 | |
Mercury General | | | 4,798 | | | | 252 | |
MFA Financial ‡ | | | 1,182,993 | | | | 8,529 | |
Mid-America Apartment Communities ‡ | | | 45,700 | | | | 4,707 | |
MidWestOne Financial Group | | | 4,003 | | | | 117 | |
Monogram Residential Trust ‡ | | | 13,042 | | | | 132 | |
National Bank of Canada | | | 119,200 | | | | 3,966 | |
National Health Investors ‡ | | | 68,200 | | | | 4,762 | |
New York Mortgage Trust ‡ | | | 10,674 | | | | 63 | |
Northwest Bancshares | | | 14,483 | | | | 214 | |
Old Second Bancorp | | | 17,266 | | | | 125 | |
Opus Bank | | | 550 | | | | 21 | |
Outfront Media ‡ | | | 53,562 | | | | 1,191 | |
Pacific Premier Bancorp * | | | 20,127 | | | | 503 | |
PennyMac Mortgage Investment Trust ‡ | | | 251,400 | | | | 3,869 | |
Peoples Financial Services | | | 3,680 | | | | 136 | |
Piedmont Office Realty Trust, Cl A ‡ | | | 226,600 | | | | 4,543 | |
PNC Financial Services Group | | | 125,700 | | | | 11,280 | |
Preferred Bank | | | 5,536 | | | | 182 | |
ProAssurance | | | 5,469 | | | | 287 | |
Progressive | | | 149,300 | | | | 4,972 | |
PS Business Parks ‡ | | | 3,573 | | | | 353 | |
Reinsurance Group of America, Cl A | | | 43,274 | | | | 4,290 | |
RenaissanceRe Holdings | | | 96,961 | | | | 11,200 | |
Retail Properties of America, Cl A ‡ | | | 18,518 | | | | 293 | |
Ryman Hospitality Properties ‡ | | | 70,290 | | | | 3,448 | |
Select Income ‡ | | | 197,068 | | | | 4,854 | |
Silver Bay Realty Trust ‡ | | | 32,625 | | | | 510 | |
Starwood Property Trust ‡ | | | 320,852 | | | | 6,616 | |
Stonegate Bank | | | 17,321 | | | | 554 | |
Talmer Bancorp, Cl A | | | 6,139 | | | | 122 | |
Toronto-Dominion Bank | | | 140,900 | | | | 6,152 | |
Travelers | | | 184,538 | | | | 21,063 | |
Triumph Bancorp * | | | 1,315 | | | | 21 | |
Two Harbors Investment ‡ | | | 834,544 | | | | 7,077 | |
Validus Holdings | | | 313,104 | | | | 15,245 | |
Virtu Financial, Cl A | | | 20,798 | | | | 370 | |
Waterstone Financial | | | 8,424 | | | | 122 | |
Wells Fargo | | | 140,300 | | | | 7,116 | |
| | |
| 97 | | SEI Institutional Investments Trust / Annual Report / May 31, 2016 |
SCHEDULE OF INVESTMENTS
U.S. Managed Volatility Fund
May 31, 2016
| | | | | | | | |
| Description | | Shares | | | Market Value
($ Thousands) | |
Welltower ‡ | | | 71,800 | | | $ | 4,948 | |
| | | | | | | | |
| | | | | | | 276,159 | |
| | | | | | | | |
| |
Health Care — 14.8% | | | | | |
AbbVie | | | 92,600 | | | | 5,827 | |
Addus HomeCare * | | | 5,718 | | | | 114 | |
Aetna | | | 71,200 | | | | 8,062 | |
Amgen | | | 20,800 | | | | 3,285 | |
Anthem | | | 56,700 | | | | 7,493 | |
Baxalta | | | 94,900 | | | | 4,292 | |
Bristol-Myers Squibb | | | 71,882 | | | | 5,154 | |
C.R. Bard | | | 20,835 | | | | 4,564 | |
Cardinal Health | | | 187,600 | | | | 14,811 | |
Chemed | | | 3,333 | | | | 435 | |
Computer Programs & Systems | | | 6,275 | | | | 259 | |
DaVita HealthCare Partners * | | | 40,357 | | | | 3,120 | |
Eli Lilly | | | 21,291 | | | | 1,597 | |
Express Scripts Holding * | | | 77,500 | | | | 5,855 | |
Gilead Sciences | | | 49,256 | | | | 4,288 | |
HCA Holdings * | | | 20,662 | | | | 1,612 | |
Henry Schein * | | | 7,844 | | | | 1,363 | |
Heska * | | | 6,493 | | | | 236 | |
Hill-Rom Holdings | | | 49,340 | | | | 2,424 | |
Humana | | | 12,600 | | | | 2,174 | |
ICON * | | | 59,538 | | | | 4,194 | |
ICU Medical * | | | 3,520 | | | | 366 | |
Johnson & Johnson | | | 323,143 | | | | 36,415 | |
LeMaitre Vascular | | | 14,166 | | | | 198 | |
Luminex * | | | 14,411 | | | | 297 | |
McKesson | | | 51,221 | | | | 9,381 | |
Merck | | | 444,586 | | | | 25,012 | |
Meridian Bioscience | | | 23,234 | | | | 453 | |
MiMedx Group * | | | 25,495 | | | | 201 | |
Myriad Genetics * | | | 50,164 | | | | 1,700 | |
NeoGenomics * | | | 30,133 | | | | 270 | |
Owens & Minor | | | 115,757 | | | | 4,317 | |
Patterson | | | 88,805 | | | | 4,335 | |
Pfizer | | | 679,575 | | | | 23,581 | |
PharMerica * | | | 2,713 | | | | 72 | |
Quality Systems | | | 6,425 | | | | 82 | |
Quest Diagnostics | | | 127,199 | | | | 9,816 | |
Quintiles Transnational Holdings * | | | 13,742 | | | | 933 | |
Teleflex | | | 40,363 | | | | 6,502 | |
United Therapeutics * | | | 36,796 | | | | 4,381 | |
UnitedHealth Group | | | 47,100 | | | | 6,296 | |
Utah Medical Products | | | 2,986 | | | | 195 | |
Varian Medical Systems * | | | 47,272 | | | | 3,914 | |
Vocera Communications * | | | 17,563 | | | | 203 | |
Waters * | | | 26,455 | | | | 3,639 | |
West Pharmaceutical Services | | | 5,594 | | | | 420 | |
Zoetis, Cl A | | | 20,521 | | | | 973 | |
| | | | | | | | |
| | | | | | | 225,111 | |
| | | | | | | | |
| | | | | | | | |
| Description | | Shares | | | Market Value
($ Thousands) | |
Industrials — 5.4% | | | | | | | | |
Alaska Air Group | | | 10,294 | | | $ | 684 | |
American Airlines Group | | | 16,188 | | | | 517 | |
Blue Bird * | | | 4,608 | | | | 51 | |
Boeing | | | 36,100 | | | | 4,554 | |
CBIZ * | | | 334,000 | | | | 3,527 | |
Deere | | | 116,700 | | | | 9,603 | |
Delta Air Lines | | | 87,267 | | | | 3,793 | |
FedEx | | | 25,700 | | | | 4,240 | |
Global Brass & Copper Holdings | | | 14,155 | | | | 386 | |
Hub Group, Cl A * | | | 6,628 | | | | 265 | |
Huntington Ingalls Industries | | | 31,321 | | | | 4,805 | |
Insperity | | | 5,992 | | | | 431 | |
Kaman | | | 86,000 | | | | 3,673 | |
KAR Auction Services | | | 37,702 | | | | 1,547 | |
Landstar System | | | 53,587 | | | | 3,636 | |
Lockheed Martin | | | 24,211 | | | | 5,719 | |
Masonite International * | | | 4,138 | | | | 289 | |
Northrop Grumman | | | 47,700 | | | | 10,144 | |
Raytheon | | | 56,100 | | | | 7,275 | |
Republic Services, Cl A | | | 84,200 | | | | 4,065 | |
RR Donnelley & Sons | | | 26,078 | | | | 425 | |
Spirit AeroSystems Holdings, Cl A * | | | 21,462 | | | | 1,004 | |
United Technologies | | | 92,000 | | | | 9,253 | |
Vectrus * | | | 3,515 | | | | 89 | |
Waste Management | | | 40,000 | | | | 2,438 | |
| | | | | | | | |
| | | | | | | 82,413 | |
| | | | | | | | |
| |
Information Technology — 11.0% | | | | | |
Accenture, Cl A | | | 34,939 | | | | 4,157 | |
Activision Blizzard | | | 94,071 | | | | 3,693 | |
Amdocs | | | 397,432 | | | | 23,047 | |
Apple | | | 84,600 | | | | 8,448 | |
Aspen Technology * | | | 115,489 | | | | 4,402 | |
AVX | | | 471,700 | | | | 6,514 | |
Blackhawk Network Holdings, Cl A * | | | 10,410 | | | | 358 | |
Booz Allen Hamilton Holding, Cl A | | | 139,987 | | | | 4,097 | |
Broadridge Financial Solutions | | | 49,352 | | | | 3,168 | |
Brocade Communications Systems | | | 70,770 | | | | 641 | |
CA | | | 143,195 | | | | 4,628 | |
CDW | | | 35,338 | | | | 1,504 | |
Cisco Systems | | | 495,700 | | | | 14,400 | |
Comtech Telecommunications | | | 1,637 | | | | 38 | |
Convergys | | | 184,400 | | | | 5,198 | |
CSG Systems International | | | 114,696 | | | | 4,876 | |
DST Systems | | | 17,268 | | | | 2,088 | |
eBay * | | | 164,341 | | | | 4,020 | |
Forrester Research | | | 11,180 | | | | 412 | |
Harris | | | 37,300 | | | | 2,938 | |
IAC | | | 71,363 | | | | 3,988 | |
Ingram Micro, Cl A | | | 49,435 | | | | 1,712 | |
Intel | | | 327,900 | | | | 10,358 | |
| | |
| 98 | | SEI Institutional Investments Trust / Annual Report / May 31, 2016 |
SCHEDULE OF INVESTMENTS
U.S. Managed Volatility Fund
May 31, 2016
| | | | | | | | |
| Description | | Shares | | | Market Value
($ Thousands) | |
International Business Machines | | | 77,400 | | | $ | 11,900 | |
MAXIMUS | | | 2,769 | | | | 160 | |
Motorola Solutions | | | 76,615 | | | | 5,307 | |
NetApp | | | 82,105 | | | | 2,096 | |
NIC | | | 14,159 | | | | 281 | |
Oracle | | | 116,000 | | | | 4,663 | |
Pure Storage, Cl A * | | | 2,706 | | | | 32 | |
Qualcomm | | | 120,100 | | | | 6,596 | |
RealPage * | | | 8,729 | | | | 190 | |
Reis | | | 5,899 | | | | 138 | |
Sapiens International | | | 11,982 | | | | 146 | |
Symantec | | | 238,088 | | | | 4,133 | |
Take-Two Interactive Software * | | | 110,401 | | | | 4,296 | |
Tech Data * | | | 26,306 | | | | 1,988 | |
VeriSign * | | | 48,687 | | | | 4,161 | |
Western Union | | | 374,000 | | | | 7,274 | |
| | | | | | | | |
| | | | | | | 168,046 | |
| | | | | | | | |
| |
Materials — 2.4% | | | | | |
Avery Dennison | | | 58,200 | | | | 4,329 | |
Bemis | | | 99,000 | | | | 4,984 | |
Compass Minerals International | | | 36,251 | | | | 2,826 | |
International Paper | | | 92,200 | | | | 3,887 | |
Kaiser Aluminum | | | 45,000 | | | | 3,857 | |
Mosaic | | | 95,700 | | | | 2,414 | |
Newmont Mining | | | 80,551 | | | | 2,611 | |
Pan American Silver | | | 75,995 | | | | 1,074 | |
Scotts Miracle-Gro, Cl A | | | 48,100 | | | | 3,343 | |
Sonoco Products | | | 158,200 | | | | 7,541 | |
| | | | | | | | |
| | | | | | | 36,866 | |
| | | | | | | | |
| |
Telecommunication Services — 6.0% | | | | | |
AT&T | | | 720,736 | | | | 28,217 | |
BCE | | | 125,300 | | | | 5,790 | |
CenturyLink | | | 226,600 | | | | 6,145 | |
Hawaiian Telcom Holdco * | | | 11,011 | | | | 225 | |
NTT DOCOMO ADR | | | 135,700 | | | | 3,398 | |
Rogers Communications, Cl B | | | 115,800 | | | | 4,426 | |
SK Telecom ADR | | | 207,600 | | | | 4,324 | |
TELUS Toronto Stock Exchange | | | 176,800 | | | | 5,619 | |
Verizon Communications | | | 661,291 | | | | 33,660 | |
| | | | | | | | |
| | | | | | | 91,804 | |
| | | | | | | | |
| |
Utilities — 12.6% | | | | | |
AES | | | 60,364 | | | | 669 | |
ALLETE | | | 6,129 | | | | 354 | |
Ameren | | | 156,900 | | | | 7,774 | |
American Electric Power | | | 266,804 | | | | 17,270 | |
Artesian Resources, Cl A | | | 5,850 | | | | 165 | |
Atmos Energy | | | 6,038 | | | | 440 | |
Avista | | | 57,389 | | | | 2,308 | |
CMS Energy | | | 100,155 | | | | 4,189 | |
Consolidated Edison | | | 211,386 | | | | 15,486 | |
| | | | | | | | |
| Description | | Shares | | | Market Value
($ Thousands) | |
DTE Energy | | | 41,177 | | | $ | 3,734 | |
Edison International | | | 265,593 | | | | 19,024 | |
El Paso Electric | | | 7,153 | | | | 319 | |
Entergy | | | 201,443 | | | | 15,294 | |
Exelon | | | 343,184 | | | | 11,761 | |
FirstEnergy | | | 371,556 | | | | 12,191 | |
Great Plains Energy | | | 133,806 | | | | 3,905 | |
IDACORP | | | 23,049 | | | | 1,687 | |
MGE Energy | | | 4,857 | | | | 246 | |
NiSource | | | 173,762 | | | | 4,146 | |
Northwest Natural Gas | | | 9,450 | | | | 519 | |
NorthWestern | | | 6,293 | | | | 365 | |
PG&E | | | 160,651 | | | | 9,652 | |
Pinnacle West Capital | | | 156,705 | | | | 11,532 | |
PNM Resources | | | 27,318 | | | | 897 | |
Portland General Electric | | | 128,662 | | | | 5,298 | |
PPL | | | 141,200 | | | | 5,442 | |
Public Service Enterprise Group | | | 387,616 | | | | 17,346 | |
SCANA | | | 82,800 | | | | 5,789 | |
Southern | | | 123,206 | | | | 6,091 | |
Southwest Gas | | | 45,659 | | | | 3,170 | |
Spire | | | 26,718 | | | | 1,699 | |
UGI | | | 13,340 | | | | 573 | |
Unitil | | | 14,975 | | | | 593 | |
Vectren | | | 7,318 | | | | 364 | |
Xcel Energy | | | 24,013 | | | | 993 | |
| | | | | | | | |
| | | | | | | 191,285 | |
| | | | | | | | |
Total Common Stock
(Cost $1,276,417) ($ Thousands) | | | | 1,501,503 | |
| | | | | | | | |
| | |
| | | Face Amount
(Thousands) | | | | |
U.S. TREASURY OBLIGATION — 0.2% | | | | | |
U.S. Treasury Bills | | | | | | | | |
0.233%, 08/18/2016 (A)(B) | | $ | 3,540 | | | | 3,538 | |
| | | | | | | | |
Total U.S. Treasury Obligation
(Cost $3,538) ($ Thousands) | | | | | | | 3,538 | |
| | | | | | | | |
| | |
| | | Shares | | | | | |
| | | | | | | | |
CASH EQUIVALENT — 0.2% | | | | | |
SEI Daily Income Trust, Prime Obligation Fund, Cl A | | | | | | | | |
0.270% **† | | | 3,593,737 | | | | 3,594 | |
| | | | | | | | |
Total Cash Equivalent
(Cost $3,594) ($ Thousands) | | | | | | | 3,594 | |
| | | | | | | | |
Total Investments — 98.9%
(Cost $1,283,549) ($ Thousands) | | | | | | $ | 1,508,635 | |
| | | | | | | | |
| | |
| 99 | | SEI Institutional Investments Trust / Annual Report / May 31, 2016 |
SCHEDULE OF INVESTMENTS
U.S. Managed Volatility Fund
May 31, 2016
A list of the open futures contracts held by the Fund at May 31, 2016, is as follows:
| | | | | | | | | | | | |
| Type of Contract | | Number of
Contracts
Long | | | Expiration
Date | | | Unrealized
Appreciation
($ Thousands) | |
S&P 500 Index E-MINI | | | 80 | | | | Jun-2016 | | | $ | 249 | |
| | | | | | | | | | | | |
For the year ended May 31, 2016, the total amount of all open futures contracts, as presented in the table above, are representative of the volume of activity for the derivative type during the year.
Percentages are based on a Net Assets of $1,524,568 ($ Thousands).
| * | | Non-income producing security. |
| ** | | Rate shown is the 7-day effective yield as of May 31, 2016. |
| † | | Investment in Affiliated Security (see Note 6). |
| ‡ | | Real Estate Investment Trust. |
| (A) | | Security, or portion thereof, has been pledged as collateral on open futures contracts. |
| (B) | | The rate reported is the effective yield at time of purchase. |
ADR — American Depositary Receipt
Cl — Class
S&P— Standard & Poor’s
The following is a list of the level of inputs used as of May 31, 2016, in valuing the Fund’s investments and other financial instruments carried at value ($ Thousands):
| | | | | | | | | | | | | | | | |
| Investments in Securities | | Level 1 | | | Level 2 | | | Level 3 | | | Total | |
Common Stock | | $ | 1,501,503 | | | $ | — | | | $ | — | | | $ | 1,501,503 | |
U.S. Treasury Obligation | | | — | | | | 3,538 | | | | — | | | | 3,538 | |
Cash Equivalent | | | 3,594 | | | | — | | | | — | | | | 3,594 | |
| | | | | | | | | | | | | | | | |
Total Investments in Securities | | $ | 1,505,097 | | | $ | 3,538 | | | $ | — | | | $ | 1,508,635 | |
| | | | | | | | | | | | | | | | |
| | | | | | | | | | | | | | | | |
| Other Financial Instruments | | Level 1 | | | Level 2 | | | Level 3 | | | Total | |
Futures Contracts * | | | | | | | | | | | | | | | | |
Unrealized Appreciation | | $ | 249 | | | $ | — | | | $ | — | | | $ | 249 | |
| | | | | | | | | | | | | | | | |
| * | | Futures contracts are valued at the unrealized appreciation on the instrument. |
For the year ended May 31, 2016, there were no transfers between Level 1 and Level 2 assets and liabilities.
For the year ended May 31, 2016, there were no transfers between Level 2 and Level 3 assets and liabilities.
For more information on valuation inputs, see Note 2 – Significant Accounting Policies in Notes to Financial Statements.
Amounts designated as “—” are $0 or have been rounded to $0.
The accompanying notes are an integral part of the financial statements.
| | |
| 100 | | SEI Institutional Investments Trust / Annual Report / May 31, 2016 |
SCHEDULE OF INVESTMENTS
Global Managed Volatility Fund
May 31, 2016
| | | | | | | | |
| Description | | Shares | | | Market Value
($ Thousands) | |
COMMON STOCK — 93.5% | | | | | | | | |
Australia — 3.7% | | | | | | | | |
AGL Energy | | | 279,803 | | | $ | 3,768 | |
Amcor | | | 294,848 | | | | 3,477 | |
Aristocrat Leisure | | | 81,976 | | | | 764 | |
ASX | | | 40,415 | | | | 1,303 | |
Aurizon Holdings | | | 526,701 | | | | 1,721 | |
AusNet Services | | | 819,508 | | | | 935 | |
Bank of Queensland | | | 16,815 | | | | 142 | |
Boral | | | 97,446 | | | | 480 | |
CIMIC Group | | | 17,234 | | | | 467 | |
Coca-Cola Amatil | | | 413,243 | | | | 2,658 | |
Cochlear | | | 12,881 | | | | 1,126 | |
CSL | | | 36,574 | | | | 3,067 | |
Flight Centre Travel Group | | | 34,069 | | | | 780 | |
Goodman Group ‡ | | | 203,513 | | | | 1,048 | |
GPT Group ‡ | | | 96,869 | | | | 378 | |
Harvey Norman Holdings | | | 127,502 | | | | 421 | |
Healthscope | | | 224,274 | | | | 487 | |
Iluka Resources | | | 11,335 | | | | 53 | |
LendLease Group | | | 136,132 | | | | 1,325 | |
Medibank Pvt | | | 161,009 | | | | 373 | |
Mirvac Group ‡ | | | 181,624 | | | | 256 | |
Newcrest Mining * | | | 95,566 | | | | 1,320 | |
Orica | | | 60,542 | | | | 597 | |
Qantas Airways | | | 304,482 | | | | 679 | |
REA Group | | | 2,924 | | | | 119 | |
Rio Tinto | | | 1,908 | | | | 62 | |
Sonic Healthcare | | | 109,475 | | | | 1,697 | |
Stockland ‡ | | | 443,203 | | | | 1,455 | |
Tabcorp Holdings | | | 347,333 | | | | 1,112 | |
Tatts Group | | | 512,794 | | | | 1,464 | |
Telstra | | | 335,940 | | | | 1,360 | |
TPG Telecom | | | 6,786 | | | | 61 | |
Treasury Wine Estates | | | 74,699 | | | | 560 | |
Vicinity Centres ‡ | | | 84,077 | | | | 199 | |
Wesfarmers | | | 105,788 | | | | 3,114 | |
Westfield ‡ | | | 41,512 | | | | 322 | |
Woolworths | | | 9,993 | | | | 160 | |
| | | | | | | | |
| | | | | | | 39,310 | |
| | | | | | | | |
| |
Austria — 0.3% | | | | | |
Atrium European Real Estate | | | 26,177 | | | | 111 | |
BUWOG | | | 18,259 | | | | 393 | |
Flughafen Wien | | | 3,738 | | | | 413 | |
Oesterreichische Post | | | 52,044 | | | | 1,865 | |
Telekom Austria | | | 74,555 | | | | 462 | |
Voestalpine | | | 13,828 | | | | 474 | |
| | | | | | | | |
| | | | | | | 3,718 | |
| | | | | | | | |
| |
Belgium — 0.5% | | | | | |
bpost | | | 109,000 | | | | 2,875 | |
Colruyt | | | 17,428 | | | | 1,036 | |
Elia System Operator | | | 4,533 | | | | 229 | |
| | | | | | | | |
| Description | | Shares | | | Market Value
($ Thousands) | |
Proximus | | | 27,037 | | | $ | 879 | |
| | | | | | | | |
| | | | | | | 5,019 | |
| | | | | | | | |
| |
Canada — 8.9% | | | | | |
Agnico Eagle Mines | | | 2,300 | | | | 104 | |
Alimentation Couche-Tard, Cl B | | | 29,378 | | | | 1,296 | |
Atco, Cl I | | | 16,300 | | | | 538 | |
Bank of Montreal | | | 102,193 | | | | 6,430 | |
BCE | | | 227,436 | | | | 10,486 | |
Canadian Imperial Bank of Commerce | | | 62,918 | | | | 4,894 | |
Canadian National Railway | | | 2,608 | | | | 155 | |
Canadian Tire, Cl A | | | 79,932 | | | | 8,750 | |
CCL Industries, Cl B | | | 9,781 | | | | 1,745 | |
CGI Group, Cl A * | | | 2,713 | | | | 127 | |
CI Financial | | | 30,122 | | | | 661 | |
Cineplex | | | 9,880 | | | | 390 | |
Constellation Software | | | 4,475 | | | | 1,823 | |
Dollarama | | | 44,531 | | | | 3,074 | |
Emera | | | 64,754 | | | | 2,288 | |
Empire, Cl A | | | 156,277 | | | | 2,684 | |
Fairfax Financial Holdings | | | 2,434 | | | | 1,254 | |
First Capital Realty | | | 68,160 | | | | 1,095 | |
Fortis | | | 44,681 | | | | 1,401 | |
Franco-Nevada | | | 17,768 | | | | 1,127 | |
George Weston | | | 30,490 | | | | 2,643 | |
Great-West Lifeco | | | 7,495 | | | | 203 | |
H&R ‡ | | | 45,709 | | | | 742 | |
IGM Financial | | | 8,225 | | | | 241 | |
Industrial Alliance Insurance & Financial Services | | | 6,016 | | | | 196 | |
Intact Financial | | | 59,761 | | | | 4,189 | |
Jean Coutu Group, Cl A | | | 22,107 | | | | 350 | |
Killam Apartment ‡ | | | 87,280 | | | | 794 | |
Kinross Gold * | | | 16,700 | | | | 72 | |
Manitoba Telecom Services | | | 23,984 | | | | 693 | |
Maple Leaf Foods | | | 10,100 | | | | 227 | |
Metro, Cl A | | | 65,965 | | | | 2,241 | |
Morguard ‡ | | | 5,427 | | | | 62 | |
National Bank of Canada | | | 112,610 | | | | 3,747 | |
Open Text | | | 25,137 | | | | 1,476 | |
Power Financial | | | 19,394 | | | | 471 | |
RioCan ‡ | | | 56,415 | | | | 1,183 | |
Rogers Communications, Cl B | | | 134,063 | | | | 5,124 | |
Rogers Sugar | | | 23,300 | | | | 102 | |
Royal Bank of Canada | | | 78,114 | | | | 4,707 | |
Saputo | | | 45,435 | | | | 1,388 | |
Shaw Communications, Cl B | | | 264,044 | | | | 5,062 | |
Smart Real Estate Investment Trust ‡ | | | 13,946 | | | | 368 | |
TELUS | | | 92,800 | | | | 2,949 | |
Toronto-Dominion Bank | | | 95,494 | | | | 4,169 | |
Valener | | | 27,217 | | | | 470 | |
| | | | | | | | |
| | | | | | | 94,191 | |
| | | | | | | | |
| | |
| 101 | | SEI Institutional Investments Trust / Annual Report / May 31, 2016 |
SCHEDULE OF INVESTMENTS
Global Managed Volatility Fund
May 31, 2016
| | | | | | | | |
| Description | | Shares | | | Market Value
($ Thousands) | |
Denmark — 0.2% | | | | | | | | |
Carlsberg, Cl B | | | 3,653 | | | $ | 353 | |
Chr Hansen Holding | | | 1,500 | | | | 95 | |
Coloplast, Cl B | | | 3,688 | | | | 279 | |
Novo Nordisk, Cl B | | | 3,450 | | | | 192 | |
Schouw | | | 2,547 | | | | 155 | |
William Demant Holding * | | | 30,910 | | | | 652 | |
| | | | | | | | |
| | | | | | | 1,726 | |
| | | | | | | | |
| |
Finland — 0.0% | | | | | |
Orion, Cl B | | | 3,564 | | | | 128 | |
| | | | | | | | |
| |
France — 1.3% | | | | | |
Atos | | | 33,300 | | | | 3,079 | |
Boiron | | | 744 | | | | 63 | |
Dassault Systemes | | | 4,229 | | | | 337 | |
Sanofi-Aventis | | | 62,000 | | | | 5,086 | |
SES Global, Cl A | | | 9,645 | | | | 216 | |
Tessi | | | 54 | | | | 9 | |
TOTAL | | | 100,300 | | | | 4,877 | |
Vilmorin & Cie | | | 541 | | | | 37 | |
| | | | | | | | |
| | | | | | | 13,704 | |
| | | | | | | | |
| |
Germany — 0.9% | | | | | |
Celesio | | | 19,259 | | | | 544 | |
Commerzbank | | | 77,320 | | | | 663 | |
Fielmann | | | 7 | | | | — | |
Merck KGaA | | | 4,199 | | | | 420 | |
Muenchener Rueckversicherungs | | | 17,500 | | | | 3,290 | |
Rhoen Klinikum | | | 36,938 | | | | 1,134 | |
Stada Arzneimittel | | | 17,752 | | | | 946 | |
Talanx | | | 60,400 | | | | 2,034 | |
Wuestenrot & Wuerttembergische | | | 4,601 | | | | 96 | |
| | | | | | | | |
| | | | | | | 9,127 | |
| | | | | | | | |
| |
Hong Kong — 2.8% | | | | | |
Bank of East Asia | | | 24,288 | | | | 90 | |
Cathay Pacific Airways | | | 286,283 | | | | 448 | |
Cheung Kong Infrastructure Holdings | | | 156,710 | | | | 1,467 | |
CLP Holdings | | | 1,154,301 | | | | 10,892 | |
First Pacific | | | 325,619 | | | | 214 | |
Hang Lung Properties | | | 10,097 | | | | 19 | |
Hang Seng Bank | | | 73,611 | | | | 1,307 | |
HK Electric Investments & HK Electric Investments (A) | | | 494,324 | | | | 436 | |
HKT Trust & HKT | | | 563,203 | | | | 816 | |
Hopewell Holdings | | | 23,000 | | | | 74 | |
Hysan Development | | | 62,684 | | | | 270 | |
Kerry Properties | | | 95,311 | | | | 238 | |
Link ‡ | | | 466,669 | | | | 2,869 | |
MTR | | | 123,369 | | | | 585 | |
NWS Holdings | | | 92,553 | | | | 146 | |
PCCW | | | 4,739,480 | | | | 3,093 | |
Power Assets Holdings | | | 57,520 | | | | 558 | |
Shangri-La Asia | | | 57,215 | | | | 65 | |
| | | | | | | | |
| Description | | Shares | | | Market Value
($ Thousands) | |
Sino Land | | | 29,028 | | | $ | 44 | |
SmarTone Telecommunications Holdings | | | 815,500 | | | | 1,337 | |
Sunlight ‡ | | | 113,943 | | | | 62 | |
Swire Pacific, Cl A | | | 132,940 | | | | 1,434 | |
WH Group (A) | | | 366,086 | | | | 282 | |
Wheelock | | | 59,621 | | | | 269 | |
Yue Yuen Industrial Holdings | | | 609,744 | | | | 2,300 | |
| | | | | | | | |
| | | | | | | 29,315 | |
| | | | | | | | |
| |
Ireland — 0.1% | | | | | |
Hibernia ‡ | | | 127,195 | | | | 184 | |
Irish Residential Properties ‡ | | | 50,199 | | | | 65 | |
James Hardie Industries, CDI | | | 10,562 | | | | 161 | |
Total Produce | | | 101,736 | | | | 182 | |
| | | | | | | | |
| | | | | | | 592 | |
| | | | | | | | |
| |
Israel — 1.9% | | | | | |
Amot Investments | | | 162,544 | | | | 629 | |
Bank Hapoalim | | | 1,171,644 | | | | 6,055 | |
Bank Leumi Le-Israel * | | | 1,223,266 | | | | 4,492 | |
Israel Discount Bank, Cl A * | | | 308,718 | | | | 513 | |
Mizrahi Tefahot Bank | | | 280,700 | | | | 3,306 | |
Orbotech * | | | 54,364 | | | | 1,516 | |
Teva Pharmaceutical Industries | | | 62,490 | | | | 3,247 | |
| | | | | | | | |
| | | | | | | 19,758 | |
| | | | | | | | |
| |
Italy — 0.5% | | | | | |
ACEA | | | 6,435 | | | | 94 | |
Amplifon | | | 18,777 | | | | 184 | |
Ascopiave | | | 22,643 | | | | 62 | |
CSP International Fashion Group | | | 233 | | | | — | |
DiaSorin | | | 6,082 | | | | 368 | |
Hera | | | 543,633 | | | | 1,574 | |
Parmalat | | | 20,771 | | | | 53 | |
Terna Rete Elettrica Nazionale | | | 537,877 | | | | 2,985 | |
| | | | | | | | |
| | | | | | | 5,320 | |
| | | | | | | | |
| |
Japan — 7.2% | | | | | |
Alpen | | | 3,360 | | | | 52 | |
Aozora Bank | | | 939,309 | | | | 3,193 | |
Ashikaga Holdings | | | 570,100 | | | | 1,815 | |
Atsugi | | | 173,000 | | | | 173 | |
Bookoff | | | 7,200 | | | | 55 | |
Can Do | | | 4,416 | | | | 64 | |
Canon | | | 184,400 | | | | 5,341 | |
Coca-Cola West | | | 49,978 | | | | 1,390 | |
COMSYS Holdings | | | 88,100 | | | | 1,454 | |
Daiichi Sankyo | | | 38,895 | | | | 904 | |
Dydo Drinco | | | 13,596 | | | | 696 | |
Earth Chemical | | | 5,644 | | | | 252 | |
Ehime Bank | | | 31,000 | | | | 67 | |
Fuji Oil Holdings | | | 107,100 | | | | 1,862 | |
Geo Holdings | | | 78,800 | | | | 1,084 | |
Hogy Medical | | | 55,800 | | | | 3,462 | |
Hoya | | | 610 | | | | 21 | |
| | |
| 102 | | SEI Institutional Investments Trust / Annual Report / May 31, 2016 |
SCHEDULE OF INVESTMENTS
Global Managed Volatility Fund
May 31, 2016
| | | | | | | | |
| Description | | Shares | | | Market Value
($ Thousands) | |
Itochu-Shokuhin | | | 753 | | | $ | 27 | |
Japan Airlines | | | 60,500 | | | | 2,073 | |
KDDI | | | 129,135 | | | | 3,769 | |
KFC Holdings Japan | | | 9,173 | | | | 154 | |
Kisoji | | | 2,800 | | | | 57 | |
Kohnan Shoji | | | 118,754 | | | | 2,059 | |
Kourakuen Holdings | | | 4,200 | | | | 58 | |
Kurimoto | | | 43,000 | | | | 66 | |
Kyowa Exeo | | | 191,900 | | | | 2,319 | |
Lawson | | | 11,969 | | | | 946 | |
Lion | | | 156,693 | | | | 2,292 | |
Marudai Food | | | 15,836 | | | | 71 | |
Maruha Nichiro | | | 26,980 | | | | 628 | |
Matsuya Foods | | | 5,330 | | | | 134 | |
Maxvalu Tokai | | | 483 | | | | 8 | |
Ministop | | | 17,767 | | | | 290 | |
MOS Food Services | | | 7,546 | | | | 204 | |
Mr Max | | | 28,312 | | | | 77 | |
Nagatanien Holdings | | | 11,000 | | | | 119 | |
Nagoya Railroad | | | 79,581 | | | | 400 | |
Natori | | | 9,100 | | | | 134 | |
Nihon Shokuhin Kako | | | 386 | | | | 1 | |
Nippon Express | | | 5,890 | | | | 25 | |
Nippon Flour Mills | | | 234,285 | | | | 1,798 | |
Nippon Telegraph & Telephone | | | 235,200 | | | | 10,296 | |
Nisshin Oillio Group | | | 57,249 | | | | 257 | |
NTT DoCoMo | | | 243,550 | | | | 6,103 | |
Oracle Japan | | | 18,574 | | | | 986 | |
Osaka Gas | | | 785,222 | | | | 2,945 | |
Plenus | | | 93,900 | | | | 1,630 | |
Rock Field | | | 10,698 | | | | 166 | |
Sankyo | | | 30,177 | | | | 1,125 | |
Sekisui Chemical | | | 127,537 | | | | 1,663 | |
Senko | | | 233,000 | | | | 1,387 | |
Senshu Ikeda Holdings | | | 460,000 | | | | 1,746 | |
Shimachu | | | 73,600 | | | | 1,634 | |
Studio Alice | | | 6,508 | | | | 156 | |
Sumitomo Bakelite | | | 294,000 | | | | 1,424 | |
Sumitomo Osaka Cement | | | 547,000 | | | | 2,224 | |
Suzuken | | | 6,701 | | | | 216 | |
Takeda Pharmaceutical | | | 25,100 | | | | 1,086 | |
Toho | | | 3,000 | | | | 68 | |
Toho Gas | | | 9,466 | | | | 70 | |
Tokai | | | 1,777 | | | | 53 | |
Trend Micro | | | 23,117 | | | | 838 | |
Vital KSK Holdings | | | 26,700 | | | | 246 | |
Yahoo! Japan | | | 14,556 | | | | 65 | |
| | | | | | | | |
| | | | | | | 75,978 | |
| | | | | | | | |
| |
Luxembourg — 0.0% | | | | | |
RTL Group | | | 3,428 | | | | 308 | |
| | | | | | | | |
| |
Netherlands — 0.4% | | | | | |
Heineken Holding | | | 6,817 | | | | 560 | |
| | | | | | | | |
| Description | | Shares | | | Market Value
($ Thousands) | |
NN Group | | | 122,265 | | | $ | 4,085 | |
Sligro Food Group | | | 1,912 | | | | 72 | |
Unilever | | | 1,224 | | | | 55 | |
| | | | | | | | |
| | | | | | | 4,772 | |
| | | | | | | | |
| |
New Zealand — 2.2% | | | | | |
Air New Zealand | | | 334,251 | | | | 509 | |
Argosy Property | | | 265,836 | | | | 216 | |
Auckland International Airport | | | 459,332 | | | | 1,939 | |
Chorus | | | 97,783 | | | | 265 | |
Contact Energy | | | 693,620 | | | | 2,529 | |
Fisher & Paykel Healthcare | | | 198,769 | | | | 1,405 | |
Fletcher Building | | | 711,734 | | | | 4,310 | |
Freightways | | | 52,116 | | | | 233 | |
Genesis Energy | | | 298,184 | | | | 428 | |
Infratil | | | 19,844 | | | | 45 | |
Kiwi Property Group ‡ | | | 786,480 | | | | 790 | |
Mainfreight | | | 7,129 | | | | 83 | |
Meridian Energy | | | 105,706 | | | | 192 | |
Metlifecare | | | 69,101 | | | | 281 | |
Mighty River Power | | | 93,545 | | | | 188 | |
Nuplex Industries | | | 40,195 | | | | 145 | |
Port of Tauranga | | | 7,166 | | | | 94 | |
Restaurant Brands New Zealand | | | 33,676 | | | | 125 | |
Ryman Healthcare | | | 100,573 | | | | 653 | |
Sky City Entertainment Group | | | 1,087,399 | | | | 3,553 | |
SKY Network Television | | | 161,852 | | | | 493 | |
Spark New Zealand | | | 1,980,773 | | | | 4,958 | |
Stride Property | | | 70,899 | | | | 106 | |
Summerset Group Holdings | | | 61,203 | | | | 199 | |
Z Energy | | | 30,367 | | | | 172 | |
| | | | | | | | |
| | | | | | | 23,911 | |
| | | | | | | | |
| |
Norway — 0.9% | | | | | |
AF Gruppen | | | 3,785 | | | | 60 | |
Atea | | | 21,284 | | | | 191 | |
DnB | | | 48,575 | | | | 623 | |
Norsk Hydro | | | 503,620 | | | | 2,008 | |
Orkla | | | 403,212 | | | | 3,650 | |
SpareBank 1 SR-Bank | | | 12,111 | | | | 60 | |
Stolt-Nielsen | | | 14,894 | | | | 205 | |
Telenor | | | 191,134 | | | | 3,186 | |
| | | | | | | | |
| | | | | | | 9,983 | |
| | | | | | | | |
| |
Portugal — 0.2% | | | | | |
Energias de Portugal | | | 313,761 | | | | 1,046 | |
REN—Redes Energeticas Nacionais | | | 346,913 | | | | 1,024 | |
Sonaecom SGPS | | | 10,320 | | | | 27 | |
| | | | | | | | |
| | | | | | | 2,097 | |
| | | | | | | | |
| |
Singapore — 2.1% | | | | | |
Ascendas ‡ | | | 932,886 | | | | 1,552 | |
CapitaLand Commercial Trust ‡ | | | 849,427 | | | | 858 | |
CapitaLand Mall Trust ‡ | | | 2,059,075 | | | | 3,036 | |
ComfortDelGro | | | 458,391 | | | | 912 | |
| | |
| 103 | | SEI Institutional Investments Trust / Annual Report / May 31, 2016 |
SCHEDULE OF INVESTMENTS
Global Managed Volatility Fund
May 31, 2016
| | | | | | | | |
| Description | | Shares | | | Market Value
($ Thousands) | |
DBS Group Holdings | | | 274,800 | | | $ | 3,094 | |
Hutchison Port Holdings Trust, Cl U | | | 500,403 | | | | 215 | |
Metro Holdings | | | 14,202 | | | | 11 | |
Sabana Shari’ah Compliant Industrial ‡ | | | 167,438 | | | | 74 | |
Singapore Airlines | | | 167,751 | | | | 1,301 | |
Singapore Exchange | | | 66,720 | | | | 376 | |
Singapore Press Holdings | | | 301,092 | | | | 844 | |
Singapore Technologies Engineering | | | 20,488 | | | | 48 | |
Singapore Telecommunications | | | 973,596 | | | | 2,737 | |
SPH ‡ | | | 329,900 | | | | 225 | |
StarHub | | | 336,136 | | | | 862 | |
Suntec ‡ | | | 86,222 | | | | 104 | |
United Overseas Bank | | | 126,643 | | | | 1,676 | |
UOL Group | | | 290,631 | | | | 1,199 | |
Venture | | | 253,106 | | | | 1,529 | |
Wilmar International | | | 410,866 | | | | 991 | |
Yangzijiang Shipbuilding Holdings | | | 418,992 | | | | 278 | |
| | | | | | | | |
| | | | | | | 21,922 | |
| | | | | | | | |
| |
Spain — 0.9% | | | | | |
Ebro Foods | | | 84,222 | | | | 1,975 | |
Endesa | | | 75,701 | | | | 1,557 | |
Iberdrola | | | 445,707 | | | | 3,025 | |
Red Electrica | | | 34,298 | | | | 3,056 | |
| | | | | | | | |
| | | | | | | 9,613 | |
| | | | | | | | |
| |
Sweden — 0.7% | | | | | |
Axfood | | | 49,994 | | | | 919 | |
ICA Gruppen | | | 21,394 | | | | 752 | |
Millicom International Cellular | | | 3,718 | | | | 216 | |
Svenska Cellulosa, Cl B | | | 12,949 | | | | 414 | |
Swedish Match | | | 80,882 | | | | 2,756 | |
Tele2, Cl B | | | 73,817 | | | | 647 | |
Telefonaktiebolaget LM Ericsson, Cl B | | | 287,300 | | | | 2,212 | |
| | | | | | | | |
| | | | | | | 7,916 | |
| | | | | | | | |
| |
Switzerland — 2.4% | | | | | |
Actelion | | | 2,070 | | | | 340 | |
Allreal Holding | | | 7,328 | | | | 1,004 | |
Alpiq Holding | | | 811 | | | | 53 | |
Banque Cantonale Vaudoise | | | 447 | | | | 309 | |
Barry Callebaut | | | 239 | | | | 282 | |
Basler Kantonalbank | | | 428 | | | | 30 | |
Bell | | | 90 | | | | 35 | |
BKW | | | 2,587 | | | | 110 | |
Cembra Money Bank | | | 31,500 | | | | 2,123 | |
Chocoladefabriken Lindt & Spruengli | | | 4 | | | | 296 | |
Coca-Cola HBC | | | 32,072 | | | | 627 | |
Flughafen Zuerich | | | 2,735 | | | | 479 | |
Galenica | | | 2,048 | | | | 2,705 | |
Intershop Holding | | | 594 | | | | 268 | |
Kuehne + Nagel International | | | 1,482 | | | | 208 | |
Mobilezone Holding | | | 76 | | | | 1 | |
Mobimo Holding | | | 1,009 | | | | 229 | |
| | | | | | | | |
| Description | | Shares | | | Market Value
($ Thousands) | |
Nestle | | | 40,953 | | | $ | 3,023 | |
Orior | | | 127 | | | | 8 | |
Schindler Holding | | | 2,552 | | | | 473 | |
SGS | | | 376 | | | | 802 | |
Sonova Holding | | | 5,463 | | | | 729 | |
St. Galler Kantonalbank | | | 414 | | | | 169 | |
Swiss Life Holding | | | 9,900 | | | | 2,566 | |
Swiss Prime Site | | | 14,747 | | | | 1,264 | |
Swiss Re | | | 39,200 | | | | 3,521 | |
Swisscom | | | 3,835 | | | | 1,827 | |
Tecan Group | | | 805 | | | | 119 | |
Valora Holding | | | 1,880 | | | | 493 | |
Ypsomed Holding | | | 5,747 | | | | 1,023 | |
| | | | | | | | |
| | | | | | | 25,116 | |
| | | | | | | | |
| |
United Kingdom — 6.7% | | | | | |
Admiral Group | | | 31,628 | | | | 906 | |
AstraZeneca | | | 20,500 | | | | 1,202 | |
Auto Trader Group (A) | | | 29,658 | | | | 170 | |
BAE Systems | | | 579,700 | | | | 4,080 | |
BCA Marketplace | | | 22,773 | | | | 56 | |
Berendsen PLC | | | 9,417 | | | | 166 | |
Berkeley Group Holdings | | | 18,070 | | | | 861 | |
British American Tobacco | | | 51,949 | | | | 3,174 | |
Britvic | | | 24,487 | | | | 241 | |
Centrica | | | 56,781 | | | | 168 | |
Character Group | | | 7,583 | | | | 60 | |
Compass Group | | | 1 | | | | — | |
Conviviality | | | 11,240 | | | | 34 | |
Cranswick | | | 13,817 | | | | 466 | |
Dechra Pharmaceuticals | | | 22,867 | | | | 392 | |
Diageo | | | 82,009 | | | | 2,233 | |
Direct Line Insurance Group | | | 477,063 | | | | 2,606 | |
easyJet | | | 95,600 | | | | 2,133 | |
EMIS Group | | | 15,419 | | | | 238 | |
GCP Student Living ‡ | | | 14,000 | | | | 28 | |
GlaxoSmithKline | | | 141,868 | | | | 2,984 | |
Greggs | | | 92,288 | | | | 1,514 | |
Halfords Group | | | 24,365 | | | | 155 | |
Hammerson ‡ | | | 9,992 | | | | 84 | |
Hansteen Holdings ‡ | | | 30,383 | | | | 46 | |
Headlam Group | | | 2,089 | | | | 15 | |
Hill & Smith Holdings | | | 24,348 | | | | 334 | |
Imperial Brands | | | 175,722 | | | | 9,619 | |
Inchcape | | | 87,174 | | | | 864 | |
Indivior | | | 23,098 | | | | 58 | |
ITV | | | 125,791 | | | | 393 | |
J D Wetherspoon | | | 131,200 | | | | 1,432 | |
JD Sports Fashion | | | 3,493 | | | | 67 | |
John Menzies | | | 8,852 | | | | 66 | |
KCOM Group | | | 113,713 | | | | 180 | |
Kennedy Wilson Europe Real Estate | | | 17,886 | | | | 282 | |
LondonMetric Property ‡ | | | 43,696 | | | | 105 | |
| | |
| 104 | | SEI Institutional Investments Trust / Annual Report / May 31, 2016 |
SCHEDULE OF INVESTMENTS
Global Managed Volatility Fund
May 31, 2016
| | | | | | | | |
| Description | | Shares | | | Market Value
($ Thousands) | |
Lookers | | | 451,200 | | | $ | 983 | |
McBride | | | 21,767 | | | | 49 | |
Melrose Industries | | | 49,717 | | | | 278 | |
Merlin Entertainments (A) | | | 25,365 | | | | 156 | |
Mitie Group | | | 22,401 | | | | 92 | |
National Grid | | | 420,772 | | | | 6,167 | |
Next | | | 29,606 | | | | 2,344 | |
Persimmon | | | 1,498 | | | | 46 | |
QinetiQ | | | 146,951 | | | | 526 | |
Reckitt Benckiser Group | | | 31,548 | | | | 3,157 | |
Rentokil Initial | | | 321,807 | | | | 844 | |
Royal Mail | | | 585,784 | | | | 4,613 | |
Sage Group | | | 156,055 | | | | 1,392 | |
Shaftesbury ‡ | | | 4,720 | | | | 63 | |
SSE | | | 306,196 | | | | 6,828 | |
Tate & Lyle | | | 25,644 | | | | 235 | |
Taylor Wimpey | | | 50,431 | | | | 151 | |
Tritax Big Box ‡ | | | 322,869 | | | | 646 | |
UDG Healthcare | | | 42,475 | | | | 366 | |
Unilever | | | 94,063 | | | | 4,307 | |
William Hill | | | 80,010 | | | | 362 | |
| | | | | | | | |
| | | | | | | 71,017 | |
| | | | | | | | |
| |
United States — 48.7% | | | | | |
Consumer Discretionary — 4.0% | | | | | | | | |
AutoZone * | | | 4,927 | | | | 3,755 | |
Bob Evans Farms | | | 36,400 | | | | 1,624 | |
Brinker International | | | 37,600 | | | | 1,691 | |
Comcast, Cl A | | | 52,900 | | | | 3,349 | |
Darden Restaurants | | | 25,052 | | | | 1,699 | |
Dick’s Sporting Goods | | | 6,628 | | | | 284 | |
Dollar General | | | 32,466 | | | | 2,919 | |
Foot Locker | | | 34,572 | | | | 1,933 | |
GameStop, Cl A | | | 83,753 | | | | 2,437 | |
Kohl’s | | | 47,300 | | | | 1,705 | |
Liberty Media Group, Cl A * | | | 21,439 | | | | 418 | |
McDonald’s | | | 36,750 | | | | 4,486 | |
Omnicom Group | | | 7,050 | | | | 587 | |
O’Reilly Automotive * | | | 960 | | | | 254 | |
Target | | | 137,233 | | | | 9,439 | |
Thomson Reuters (CAD) | | | 42,753 | | | | 1,800 | |
Viacom, Cl B | | | 37,600 | | | | 1,668 | |
| | | | | | | | |
| | | | | | | 40,048 | |
| | | | | | | | |
| |
Consumer Staples — 10.4% | | | | | |
Altria Group | | | 116,722 | | | | 7,428 | |
Bunge | | | 81,760 | | | | 5,484 | |
Campbell Soup | | | 23,188 | | | | 1,405 | |
Church & Dwight | | | 34,291 | | | | 3,377 | |
Clorox | | | 42,603 | | | | 5,476 | |
Coca-Cola | | | 74,979 | | | | 3,344 | |
Colgate-Palmolive | | | 36,069 | | | | 2,540 | |
Costco Wholesale | | | 11,389 | | | | 1,694 | |
| | | | | | | | |
| Description | | Shares | | | Market Value
($ Thousands) | |
CVS Health | | | 21,700 | | | $ | 2,093 | |
Dr. Pepper Snapple Group | | | 15,333 | | | | 1,401 | |
Fresh Del Monte Produce | | | 62,867 | | | | 3,292 | |
General Mills | | | 102,863 | | | | 6,458 | |
Hershey | | | 18,299 | | | | 1,699 | |
Hormel Foods | | | 17,994 | | | | 619 | |
Ingredion | | | 28,164 | | | | 3,307 | |
J&J Snack Foods | | | 461 | | | | 49 | |
Kellogg | | | 35,589 | | | | 2,647 | |
Kimberly-Clark | | | 9,621 | | | | 1,222 | |
Kroger | | | 80,000 | | | | 2,861 | |
McCormick | | | 30,022 | | | | 2,914 | |
Nutraceutical International * | | | 5,384 | | | | 128 | |
Oil-Dri Corp of America | | | 662 | | | | 22 | |
PepsiCo | | | 31,048 | | | | 3,141 | |
Philip Morris International | | | 67,734 | | | | 6,684 | |
Procter & Gamble | | | 61,888 | | | | 5,015 | |
Spectrum Brands Holdings | | | 17,332 | | | | 2,020 | |
Sysco | | | 204,226 | | | | 9,825 | |
Tyson Foods, Cl A | | | 63,000 | | | | 4,018 | |
Universal | | | 48,403 | | | | 2,648 | |
Wal-Mart Stores | | | 203,442 | | | | 14,400 | |
Weis Markets | | | 39,534 | | | | 1,983 | |
| | | | | | | | |
| | | | | | | 109,194 | |
| | | | | | | | |
| |
Energy — 0.4% | | | | | |
Exxon Mobil | | | 47,100 | | | | 4,193 | |
| | | | | | | | |
| |
Financials — 7.4% | | | | | |
Allstate | | | 52,300 | | | | 3,531 | |
American Capital Agency ‡ | | | 67,755 | | | | 1,280 | |
American Financial Group | | | 31,700 | | | | 2,323 | |
Annaly Capital Management ‡ | | | 492,054 | | | | 5,206 | |
Apollo Commercial Real Estate Finance ‡ | | | 122,800 | | | | 1,991 | |
Apollo Residential Mortgage ‡ | | | 29,239 | | | | 394 | |
Ares Commercial Real Estate ‡ | | | 54,489 | | | | 653 | |
Assurant | | | 26,000 | | | | 2,272 | |
BankFinancial | | | 4,723 | | | | 60 | |
BB&T | | | 60,200 | | | | 2,189 | |
Beneficial Bancorp * | | | 44,157 | | | | 608 | |
Berkshire Hathaway, Cl B * | | | 14,184 | | | | 1,993 | |
Blackstone Mortgage Trust, Cl A ‡ | | | 108,500 | | | | 3,059 | |
BOK Financial | | | 71,800 | | | | 4,577 | |
Capitol Federal Financial | | | 143,538 | | | | 1,949 | |
Charter Financial | | | 26,998 | | | | 359 | |
Chimera Investment ‡ | | | 67,426 | | | | 1,011 | |
Cincinnati Financial | | | 496 | | | | 34 | |
Clifton Bancorp | | | 33,189 | | | | 501 | |
CYS Investments ‡ | | | 9,809 | | | | 80 | |
Dime Community Bancshares | | | 4,537 | | | | 83 | |
Endurance Specialty Holdings | | | 48,000 | | | | 3,260 | |
Everest Re Group | | | 34,100 | | | | 6,108 | |
First Financial Northwest | | | 6,862 | | | | 91 | |
| | |
| 105 | | SEI Institutional Investments Trust / Annual Report / May 31, 2016 |
SCHEDULE OF INVESTMENTS
Global Managed Volatility Fund
May 31, 2016
| | | | | | | | |
| Description | | Shares | | | Market Value
($ Thousands) | |
Genworth Financial, Cl A * | | | 94,377 | | | $ | 349 | |
Kearny Financial | | | 30,045 | | | | 393 | |
Lamar Advertising, Cl A ‡ | | | 36,064 | | | | 2,346 | |
National Health Investors ‡ | | | 50,100 | | | | 3,498 | |
Northfield Bancorp | | | 24,655 | | | | 383 | |
Northwest Bancshares | | | 224,075 | | | | 3,319 | |
OceanFirst Financial | | | 6,561 | | | | 122 | |
PNC Financial Services Group | | | 24,500 | | | | 2,199 | |
Progressive | | | 75,800 | | | | 2,524 | |
Provident Financial Holdings | | | 3,182 | | | | 58 | |
Reinsurance Group of America, Cl A | | | 35,400 | | | | 3,510 | |
Select Income ‡ | | | 66,800 | | | | 1,645 | |
Senior Housing Properties Trust ‡ | | | 268,100 | | | | 5,008 | |
Starwood Property Trust ‡ | | | 113,100 | | | | 2,332 | |
Territorial Bancorp | | | 1,397 | | | | 37 | |
Travelers | | | 77,500 | | | | 8,846 | |
TrustCo Bank | | | 10,137 | | | | 67 | |
Voya Financial | | | 51,592 | | | | 1,695 | |
Waterstone Financial | | | 34,437 | | | | 499 | |
| | | | | | | | |
| | | | | | | 82,442 | |
| | | | | | | | |
| |
Health Care — 9.2% | | | | | |
AbbVie | | | 62,900 | | | | 3,958 | |
AmerisourceBergen | | | 59,971 | | | | 4,497 | |
Amgen | | | 10,234 | | | | 1,616 | |
Anthem | | | 17,900 | | | | 2,366 | |
Bio-Rad Laboratories, Cl A * | | | 4,159 | | | | 619 | |
C.R. Bard | | | 2,851 | | | | 624 | |
Cardinal Health | | | 83,340 | | | | 6,580 | |
Chemed | | | 14,931 | | | | 1,947 | |
Cigna | | | 17,400 | | | | 2,229 | |
DaVita HealthCare Partners * | | | 41,680 | | | | 3,223 | |
Gilead Sciences | | | 28,078 | | | | 2,444 | |
HCA Holdings * | | | 29,700 | | | | 2,317 | |
Henry Schein * | | | 19,125 | | | | 3,323 | |
Hill-Rom Holdings | | | 9,917 | | | | 487 | |
Johnson & Johnson | | | 171,087 | | | | 19,280 | |
LifePoint Hospitals * | | | 54,787 | | | | 3,632 | |
Magellan Health Services * | | | 6,010 | | | | 398 | |
Merck | | | 203,800 | | | | 11,466 | |
Meridian Bioscience | | | 20,503 | | | | 399 | |
Mettler Toledo International * | | | 522 | | | | 196 | |
National Healthcare | | | 10,093 | | | | 625 | |
Owens & Minor | | | 135,169 | | | | 5,040 | |
Pfizer | | | 209,700 | | | | 7,277 | |
Quality Systems | | | 44,947 | | | | 571 | |
Quest Diagnostics | | | 66,222 | | | | 5,110 | |
Taro Pharmaceuticals Industries * | | | 2,104 | | | | 307 | |
Teleflex | | | 19,160 | | | | 3,087 | |
United Therapeutics * | | | 23,827 | | | | 2,837 | |
| | | | | | | | |
| Description | | Shares | | | Market Value
($ Thousands) | |
Varian Medical Systems * | | | 8,095 | | | $ | 670 | |
| | | | | | | | |
| | | | | | | 97,125 | |
| | | | | | | | |
| |
Industrials — 3.2% | | | | | |
Boeing | | | 20,900 | | | | 2,637 | |
CBIZ * | | | 166,900 | | | | 1,762 | |
Deere | | | 46,200 | | | | 3,802 | |
Emerson Electric | | | 64,900 | | | | 3,376 | |
Kaman | | | 52,700 | | | | 2,251 | |
Lockheed Martin | | | 4,051 | | | | 957 | |
Republic Services, Cl A | | | 103,827 | | | | 5,013 | |
Toro | | | 31,000 | | | | 2,769 | |
United Parcel Service, Cl B | | | 24,917 | | | | 2,569 | |
United Technologies | | | 38,600 | | | | 3,882 | |
Waste Management | | | 54,290 | | | | 3,309 | |
| | | | | | | | |
| | | | | | | 32,327 | |
| | | | | | | | |
| |
Information Technology — 4.4% | | | | | |
Activision Blizzard | | | 28,721 | | | | 1,128 | |
Alphabet, Cl A * | | | 338 | | | | 253 | |
Amdocs | | | 177,243 | | | | 10,278 | |
Apple | | | 21,800 | | | | 2,177 | |
Benchmark Electronics * | | | 60,800 | | | | 1,260 | |
CACI International, Cl A * | | | 26,403 | | | | 2,661 | |
Cisco Systems | | | 191,600 | | | | 5,566 | |
CSG Systems International | | | 30,100 | | | | 1,280 | |
EMC | | | 68,800 | | | | 1,923 | |
Intel | | | 150,500 | | | | 4,754 | |
International Business Machines | | | 36,200 | | | | 5,565 | |
ManTech International, Cl A | | | 11,268 | | | | 405 | |
Motorola Solutions | | | 54,900 | | | | 3,803 | |
Qualcomm | | | 60,400 | | | | 3,317 | |
Sykes Enterprises * | | | 61,981 | | | | 1,848 | |
Synopsys * | | | 6,078 | | | | 314 | |
VeriSign * | | | 1,620 | | | | 138 | |
| | | | | | | | |
| | | | | | | 46,670 | |
| | | | | | | | |
| |
Materials — 1.2% | | | | | |
Bemis | | | 44,700 | | | | 2,250 | |
Kaiser Aluminum | | | 59,374 | | | | 5,089 | |
Reliance Steel & Aluminum | | | 17,215 | | | | 1,280 | |
Sonoco Products | | | 81,800 | | | | 3,899 | |
| | | | | | | | |
| | | | | | | 12,518 | |
| | | | | | | | |
| |
Telecommunication Services — 2.8% | | | | | |
AT&T | | | 386,494 | | | | 15,131 | |
CenturyLink | | | 117,100 | | | | 3,176 | |
Hawaiian Telcom Holdco * | | | 2,876 | | | | 59 | |
NII Holdings * | | | 55,543 | | | | 206 | |
Telephone & Data Systems | | | 9,026 | | | | 260 | |
US Cellular * | | | 1,518 | | | | 57 | |
| | |
| 106 | | SEI Institutional Investments Trust / Annual Report / May 31, 2016 |
SCHEDULE OF INVESTMENTS
Global Managed Volatility Fund
May 31, 2016
| | | | | | | | |
| Description | | Shares | | | Market Value
($ Thousands) | |
Verizon Communications | | | 230,900 | | | $ | 11,753 | |
| | | | | | | | |
| | | | | | | 30,642 | |
| | | | | | | | |
| |
Utilities — 5.7% | | | | | |
Ameren | | | 46,200 | | | | 2,289 | |
American Electric Power | | | 92,907 | | | | 6,014 | |
Consolidated Edison | | | 120,347 | | | | 8,817 | |
Duke Energy | | | 23,586 | | | | 1,845 | |
Edison International | | | 95,600 | | | | 6,848 | |
Entergy | | | 86,052 | | | | 6,533 | |
FirstEnergy | | | 199,500 | | | | 6,546 | |
PG&E | | | 44,325 | | | | 2,663 | |
Pinnacle West Capital | | | 47,596 | | | | 3,503 | |
Public Service Enterprise Group | | | 152,900 | | | | 6,842 | |
Southern | | | 94,012 | | | | 4,648 | |
Unitil | | | 81,084 | | | | 3,213 | |
Xcel Energy | | | 52,384 | | | | 2,167 | |
| | | | | | | | |
| | | | | | | 61,928 | |
| | | | | | | | |
| | | | | | | 517,087 | |
| | | | | | | | |
Total Common Stock
(Cost $923,221) ($ Thousands) | | | | 991,628 | |
| | | | | | | | |
| |
PREFERRED STOCK — 0.0% | | | | | |
| | |
Sweden — 0.0% | | | | | | | | |
Akelius Residential Property | | | 9,764 | | | | 351 | |
| | | | | | | | |
Total Preferred Stock
(Cost $326) ($ Thousands) | | | | | | | 351 | |
| | | | | | | | |
| | |
| | | Number of
Rights | | | | |
RIGHTS — 0.0% | | | | | | | | |
| | |
New Zealand — 0.0% | | | | | | | | |
SkyCity Entertainment Group6823193RT * | | | 102 | | | | 30 | |
| | | | | | | | |
Total Rights
(Cost $—) ($ Thousands) | | | | | | | 30 | |
| | | | | | | | |
| | |
| | | Face Amount
(Thousands) | | | | |
U.S. TREASURY OBLIGATION — 0.4% | | | | | |
U.S. Treasury Bills | | | | | | | | |
0.432%, 08/18/2016 (B)(C) | | $ | 4,400 | | | | 4,397 | |
| | | | | | | | |
Total U.S. Treasury Obligation
(Cost $4,396) ($ Thousands) | | | | | | | 4,397 | |
| | | | | | | | |
| | | | | | | | |
| Description | | Shares | | | Market Value
($ Thousands) | |
CASH EQUIVALENT — 5.1% | | | | | |
SEI Daily Income Trust, Prime Obligation Fund, Cl A | | | | | | | | |
0.270% **† | | | 54,498 | | | $ | 54,498 | |
| | | | | | | | |
Total Cash Equivalent
(Cost $54,498) ($ Thousands) | | | | | | | 54,498 | |
| | | | | | | | |
Total Investments — 99.0%
(Cost $982,441) ($ Thousands) | | | | | | $ | 1,050,904 | |
| | | | | | | | |
A list of the open futures contracts held by the Fund at May 31, 2016, is as follows:
| | | | | | | | | | | | |
| Type of Contract | | Number of
Contracts
Long | | | Expiration
Date | | | Unrealized
Appreciation
($ Thousands) | |
DJ Euro Stoxx 50 Index | | | 146 | | | | Jun-2016 | | | $ | 224 | |
FTSE 100 Index | | | 38 | | | | Jun-2016 | | | | 40 | |
Hang Seng Index | | | 6 | | | | Jun-2016 | | | | 19 | |
S&P 500 Index E-MINI | | | 216 | | | | Jun-2016 | | | | 377 | |
SPI 200 Index | | | 17 | | | | Jun-2016 | | | | 24 | |
Topix Index | | | 27 | | | | Jun-2016 | | | | 85 | |
| | | | | | | | | | | | |
| | | | | | | | | | $ | 769 | |
| | | | | | | | | | | | |
For the period ended May 31, 2016, the total amount of all open futures contracts, as presented in the table above, are representative of the volume of activity for the derivative type during the period.
A list of the open forward foreign currency contracts held by the Fund at May 31, 2016, is as follows:
| | | | | | | | | | | | | | | | | | | | |
| Settlement Date | | Currency to Deliver (Thousands) | | | Currency To Receive (Thousands) | | | Unrealized
Appreciation
(Depreciation)
($ Thousands) | |
06/30/16 | | | USD | | | | 2 | | | | DKK | | | | 12 | | | $ | — | |
06/30/16 | | | USD | | | | 15 | | | | SGD | | | | 20 | | | | — | |
06/30/16 | | | USD | | | | 28 | | | | NOK | | | | 232 | | | | — | |
06/30/16 | | | USD | | | | 59 | | | | AUD | | | | 81 | | | | — | |
06/30/16 | | | USD | | | | 82 | | | | EUR | | | | 74 | | | | — | |
06/30/16 | | | USD | | | | 174 | | | | JPY | | | | 19,103 | | | | (2 | ) |
06/30/16 | | | USD | | | | 347 | | | | CAD | | | | 451 | | | | (3 | ) |
06/30/16 | | | DKK | | | | 5,726 | | | | USD | | | | 859 | | | | 1 | |
06/30/16 | | | CHF | | | | 13,956 | | | | USD | | | | 14,091 | | | | 26 | |
06/30/16 | | | NZD | | | | 17,814 | | | | USD | | | | 12,016 | | | | (11 | ) |
06/30/16 | | | SGD | | | | 18,074 | | | | USD | | | | 13,097 | | | | (29 | ) |
06/30/16 | | | GBP | | | | 25,814 | | | | USD | | | | 37,992 | | | | 416 | |
06/30/16 | | | AUD | | | | 28,696 | | | | USD | | | | 20,605 | | | | (155 | ) |
06/30/16 | | | EUR | | | | 35,564 | | | | USD | | | | 39,669 | | | | 38 | |
06/30/16 | | | NOK | | | | 43,909 | | | | USD | | | | 5,272 | | | | 20 | |
06/30/16 | | | SEK | | | | 53,456 | | | | USD | | | | 6,444 | | | | 33 | |
06/30/16 | | | CAD | | | | 62,128 | | | | USD | | | | 47,488 | | | | (14 | ) |
06/30/16 | | | HKD | | | | 119,719 | | | | USD | | | | 15,420 | | | | 1 | |
06/30/16 | | | JPY | | | | 4,568,205 | | | | USD | | | | 41,447 | | | | 202 | |
| | | | | | | | | | | | | | | | | | | | |
| | | | | | | | | | | | | | | | | | $ | 523 | |
| | | | | | | | | | | | | | | | | | | | |
A list of the counterparties for the outstanding forward foreign currency contracts held by the Fund at May 31, 2016, is as follows:
| | |
| 107 | | SEI Institutional Investments Trust / Annual Report / May 31, 2016 |
SCHEDULE OF INVESTMENTS
Global Managed Volatility Fund
May 31, 2016
| | | | | | | | | | | | |
| Counterparty | | Currency to
Deliver
($ Thousands) | | | Currency to
Receive
($ Thousands) | | | Unrealized
Appreciation
($ Thousands) | |
Brown Brothers Harriman | | $ | (254,579 | ) | | $ | 255,102 | | | $ | 523 | |
| | | | | | | | | | | | |
For the period ended May 31, 2016, the total amount of all open forward foreign currency contracts, as presented in the table above, are representative of the volume of activity for the derivative type during the period.
Percentages are based on a Net Assets of $1,061,014 ($ Thousands).
| * | | Non-income producing security. |
| ** | | Rate shown is the 7-day effective yield as of May 31, 2016. |
| † | | Investment in Affiliated Security (see Note 6). |
| ‡ | | Real Estate Investment Trust. |
| (A) | | Securities sold within terms of a private placement memorandum, exempt from registration under Section 144A of the Securities Act of 1933, as amended, and may be sold only to dealers in that program or other “accredited investors.” These securities have been determined to be liquid under guidelines established by the Board of Trustees. |
| (B) | | Security, or portion thereof, has been pledged as collateral on open futures contracts. |
| (C) | | The rate reported is the effective yield at time of purchase. |
AUD — Australian Dollar
CAD — Canadian Dollar
CHF — Swiss Franc
Cl — Class
DJ — Dow Jones
DKK — Danish Krone
EUR — Euro
FTSE— Financial Times and Stock Exchange
GBP — British Pound Sterling
HKD — Hong Kong Dollar
JPY — Japanese Yen
NOK — Norwegian Krone
NZD — New Zealand Dollar
PLC — Public Limited Company
S&P— Standard & Poor’s
SGD — Singapore Dollar
SEK — Swedish Krona
SPI — Share Price Index
USD — United States Dollar
The following is a list of the level of inputs used as of May 31, 2016, in valuing the Fund’s investments and other financial instruments carried at value ($ Thousands):
| | | | | | | | | | | | | | | | |
| Investments in Securities | | Level 1 | | | Level 2 | | | Level 3 | | | Total | |
Common Stock | | $ | 991,628 | | | $ | — | | | $ | — | | | $ | 991,628 | |
Preferred Stock | | | 351 | | | | — | | | | — | | | | 351 | |
Right | | | 30 | | | | — | | | | — | | | | 30 | |
U.S. Treasury Obligation | | | — | | | | 4,397 | | | | — | | | | 4,397 | |
Cash Equivalent | | | 54,498 | | | | — | | | | — | | | | 54,498 | |
| | | | | | | | | | | | | | | | |
Total Investments in Securities | | $ | 1,046,507 | | | $ | 4,397 | | | $ | — | | | $ | 1,050,904 | |
| | | | | | | | | | | | | | | | |
| | | | | | | | | | | | | | | | |
| Other Financial Instruments | | Level 1 | | | Level 2 | | | Level 3 | | | Total | |
Futures Contracts * | | | | | | | | | | | | | | | | |
Unrealized Appreciation | | $ | 769 | | | $ | — | | | $ | — | | | $ | 769 | |
Forwards Contracts * | | | | | | | | | | | | | | | | |
Unrealized Appreciation | | | — | | | | 737 | | | | — | | | | 737 | |
Unrealized Depreciation | | | — | | | | (214 | ) | | | — | | | | (214 | ) |
| | | | | | | | | | | | | | | | |
Total Other Financial Instruments | | $ | 769 | | | $ | 523 | | | $ | — | | | $ | 1,292 | |
| | | | | | | | | | | | | | | | |
| * | | Futures contracts and forwards contracts are valued at the unrealized appreciation (depreciation) on the instrument. |
For the period ended May 31, 2016, there were no transfers between Level 1 and Level 2 assets and liabilities.
For the period ended May 31, 2016, there were no transfers between Level 2 and Level 3 assets and liabilities.
For more information on valuation inputs, see Note 2 – Significant Accounting Policies in Notes to Financial Statements.
Amounts designated as “—” are $0 or have been rounded to $0.
The accompanying notes are an integral part of the financial statements.
| | |
| 108 | | SEI Institutional Investments Trust / Annual Report / May 31, 2016 |
SCHEDULE OF INVESTMENTS
World Equity Ex-US Fund
May 31, 2016
| | | | | | | | |
| Description | | Shares | | | Market Value
($ Thousands) | |
COMMON STOCK — 93.5% | | | | | | | | |
| | |
Argentina — 0.6% | | | | | | | | |
MercadoLibre | | | 157,000 | | | $ | 21,431 | |
Ternium ADR | | | 108,115 | | | | 1,972 | |
YPF ADR | | | 988,284 | | | | 20,665 | |
| | | | | | | | |
| | | | | | | 44,068 | |
| | | | | | | | |
| | |
Australia — 3.5% | | | | | | | | |
Alumina | | | 21,075,848 | | | | 21,605 | |
Amcor | | | 485,761 | | | | 5,729 | |
Australia & New Zealand Banking Group ADR (A) | | | 1,029,500 | | | | 18,814 | |
Bellamy’s Australia (A) | | | 276,824 | | | | 2,204 | |
BGP Holdings * | | | 239,898 | | | | — | |
BHP Billiton | | | 1,429,697 | | | | 19,762 | |
BHP Billiton ADR (A) | | | 354,185 | | | | 9,552 | |
BlueScope Steel | | | 832,927 | | | | 3,777 | |
Boral | | | 1,920,342 | | | | 9,460 | |
Brambles | | | 1,636,229 | | | | 15,232 | |
Caltex Australia | | | 666,579 | | | | 15,801 | |
Coca-Cola Amatil | | | 1,881,800 | | | | 12,106 | |
Cochlear | | | 157,239 | | | | 13,746 | |
CSR | | | 963,037 | | | | 2,505 | |
Downer | | | 506,364 | | | | 1,434 | |
Goodman Group ‡ | | | 856,810 | | | | 4,413 | |
Newcrest Mining * | | | 1,527,666 | | | | 21,105 | |
Orora | | | 1,421,011 | | | | 2,841 | |
Qantas Airways | | | 7,077,917 | | | | 15,793 | |
Regis Resources | | | 388,158 | | | | 821 | |
SEEK | | | 418,621 | | | | 4,943 | |
Sonic Healthcare | | | 936,500 | | | | 14,519 | |
South32 | | | 20,140,709 | | | | 22,363 | |
Star Entertainment Grp | | | 337,598 | | | | 1,382 | |
| | | | | | | | |
| | | | | | | 239,907 | |
| | | | | | | | |
| | |
Austria — 1.0% | | | | | | | | |
Conwert Immobilien Invest | | | 1,004,134 | | | | 16,321 | |
Erste Group Bank (A) | | | 677,590 | | | | 18,141 | |
OMV (A) | | | 31,102 | | | | 867 | |
Schoeller-Bleckmann Oilfield Equipment (A) | | | 240,481 | | | | 14,668 | |
Voestalpine | | | 539,275 | | | | 18,482 | |
| | | | | | | | |
| | | | | | | 68,479 | |
| | | | | | | | |
| | |
Belgium — 0.6% | | | | | | | | |
Bekaert | | | 15,656 | | | | 697 | |
Colruyt | | | 70,650 | | | | 4,200 | |
Delhaize Group | | | 218,671 | | | | 22,939 | |
KBC Groep | | | 233,200 | | | | 13,814 | |
| | | | | | | | |
| | | | | | | 41,650 | |
| | | | | | | | |
| | |
Brazil — 1.6% | | | | | | | | |
Banco Bradesco ADR | | | 1,774,927 | | | | 11,111 | |
Banco do Brasil | | | 1,228,625 | | | | 5,574 | |
BM&F Bovespa | | | 360,700 | | | | 1,583 | |
BR Malls Participacoes * | | | 147,700 | | | | 476 | |
BRF - Brasil Foods | | | 361,000 | | | | 4,564 | |
| | | | | | | | |
| Description | | Shares | | | Market Value
($ Thousands) | |
CETIP - Mercados Organizados | | | 1,701,813 | | | $ | 19,938 | |
Cia Energetica de Minas Gerais ADR (A) | | | 440,454 | | | | 656 | |
Cyrela Brazil Realty Empreendimentos e Participacoes | | | 265,200 | | | | 709 | |
EDP - Energias do Brasil | | | 267,100 | | | | 908 | |
Fibria Celulose | | | 90,600 | | | | 840 | |
Gerdau ADR | | | 9,218,280 | | | | 14,196 | |
Hypermarcas | | | 2,554,908 | | | | 20,073 | |
JBS | | | 2,734,800 | | | | 7,646 | |
Light | | | 305,700 | | | | 773 | |
MRV Engenharia e Participacoes | | | 223,800 | | | | 610 | |
Qualicorp | | | 2,548,700 | | | | 10,847 | |
TIM Participacoes | | | 297,100 | | | | 593 | |
Ultrapar Participacoes | | | 376,300 | | | | 7,186 | |
| | | | | | | | |
| | | | | | | 108,283 | |
| | | | | | | | |
| | |
Canada — 5.5% | | | | | | | | |
Aecon Group | | | 47,000 | | | | 634 | |
Agnico Eagle Mines | | | 442,726 | | | | 19,921 | |
Alacer Gold * | | | 323,600 | | | | 735 | |
ARC Resources | | | 1,416,582 | | | | 23,359 | |
Argonaut Gold * | | | 171,400 | | | | 337 | |
B2Gold * | | | 255,900 | | | | 473 | |
Bank of Montreal | | | 506,700 | | | | 31,879 | |
Bank of Nova Scotia | | | 40,000 | | | | 1,961 | |
Bankers Petroleum * | | | 561,600 | | | | 880 | |
BCE | | | 177,560 | | | | 8,175 | |
Birchcliff Energy * | | | 157,100 | | | | 689 | |
Cameco | | | 995,400 | | | | 11,577 | |
Canadian Imperial Bank of Commerce | | | 299,000 | | | | 23,258 | |
Canadian National Railway | | | 101,840 | | | | 6,053 | |
Cascades | | | 79,900 | | | | 607 | |
Celestica * | | | 174,000 | | | | 1,854 | |
CGI Group, Cl A * | | | 158,100 | | | | 7,413 | |
Cogeco Communications | | | 9,000 | | | | 472 | |
Constellation Software | | | 37,578 | | | | 15,312 | |
Detour Gold * | | | 28,200 | | | | 559 | |
Eldorado Gold | | | 158,800 | | | | 677 | |
Fairfax Financial Holdings | | | 44,606 | | | | 22,979 | |
Franco-Nevada | | | 306,431 | | | | 19,429 | |
Genworth MI Canada | | | 118,335 | | | | 3,047 | |
George Weston | | | 16,500 | | | | 1,430 | |
Kinross Gold * | | | 441,800 | | | | 1,898 | |
Linamar | | | 175,400 | | | | 7,353 | |
Lundin Mining * | | | 134,500 | | | | 447 | |
Magna International, Cl A | | | 1,463,741 | | | | 59,490 | |
Manulife Financial | | | 1,277,200 | | | | 19,014 | |
Maple Leaf Foods | | | 69,473 | | | | 1,564 | |
New Gold * | | | 190,871 | | | | 731 | |
Open Text | | | 16,100 | | | | 946 | |
Power Corp of Canada | | | 30,800 | | | | 696 | |
Premium Brands Holdings | | | 10,000 | | | | 403 | |
Quebecor, Cl B | | | 295,100 | | | | 8,437 | |
| | |
| 109 | | SEI Institutional Investments Trust / Annual Report / May 31, 2016 |
SCHEDULE OF INVESTMENTS
World Equity Ex-US Fund
May 31, 2016
| | | | | | | | |
| Description | | Shares | | | Market Value
($ Thousands) | |
Restaurant Brands International | | | 246,700 | | | $ | 10,326 | |
Ritchie Bros Auctioneers (A) | | | 286,821 | | | | 9,385 | |
Rogers Communications, Cl B | | | 314,020 | | | | 11,986 | |
Royal Bank of Canada | | | 103,400 | | | | 6,231 | |
Russel Metals | | | 60,000 | | | | 1,063 | |
SEMAFO * | | | 284,200 | | | | 1,091 | |
Toronto-Dominion Bank | | | 667,400 | | | | 29,101 | |
Yamana Gold | | | 1,481,525 | | | | 6,263 | |
| | | | | | | | |
| | | | | | | 380,135 | |
| | | | | | | | |
| | |
Chile — 0.0% | | | | | | | | |
Enersis Americas ADR | | | 230,029 | | | | 1,757 | |
Enersis Chile ADR | | | 230,029 | | | | 1,307 | |
| | | | | | | | |
| | | | | | | 3,064 | |
| | | | | | | | |
| | |
China — 1.6% | | | | | | | | |
Alibaba Group Holding ADR * | | | 205,335 | | | | 16,838 | |
Baidu ADR * | | | 146,798 | | | | 26,209 | |
BYD * | | | 518,000 | | | | 2,997 | |
China Petroleum & Chemical | | | 994,000 | | | | 678 | |
China Telecom | | | 11,410,000 | | | | 5,317 | |
Dongfeng Motor Group | | | 1,256,000 | | | | 1,400 | |
NetEase ADR | | | 92,239 | | | | 16,404 | |
New Oriental Education & Technology Group ADR | | | 244,449 | | | | 10,328 | |
Ping An Insurance Group of China | | | 1,123,000 | | | | 5,017 | |
Trina Solar ADR *(A) | | | 2,316,294 | | | | 18,600 | |
Weichai Power | | | 6,081,200 | | | | 7,108 | |
| | | | | | | | |
| | | | | | | 110,896 | |
| | | | | | | | |
| | |
Colombia — 0.2% | | | | | | | | |
Bancolombia ADR, Cl R (A) | | | 445,543 | | | | 14,507 | |
| | | | | | | | |
| | |
Czech Republic — 0.2% | | | | | | | | |
Komercni Banka | | | 328,625 | | | | 12,929 | |
| | | | | | | | |
| | |
Denmark — 1.4% | | | | | | | | |
DSV | | | 362,272 | | | | 16,531 | |
Genmab * | | | 31,425 | | | | 5,681 | |
H Lundbeck | | | 43,331 | | | | 1,705 | |
Novo Nordisk, Cl B | | | 322,560 | | | | 17,949 | |
Novozymes, Cl B | | | 293,176 | | | | 13,953 | |
Pandora | | | 96,408 | | | | 14,335 | |
Vestas Wind Systems | | | 372,785 | | | | 26,724 | |
| | | | | | | | |
| | | | | | | 96,878 | |
| | | | | | | | |
| | |
Finland — 1.0% | | | | | | | | |
Elisa, Cl A | | | 82,680 | | | | 3,152 | |
Kone, Cl B (A) | | | 336,038 | | | | 15,892 | |
Neste Oil | | | 448,982 | | | | 15,140 | |
Nokian Renkaat | | | 89,470 | | | | 3,160 | |
Orion, Cl B | | | 176,467 | | | | 6,336 | |
Sampo, Cl A | | | 266,435 | | | | 11,885 | |
Stora Enso, Cl R | | | 729,736 | | | | 6,259 | |
Tieto | | | 35,692 | | | | 979 | |
| | | | | | | | |
| Description | | Shares | | | Market Value
($ Thousands) | |
UPM-Kymmene | | | 234,316 | | | $ | 4,510 | |
| | | | | | | | |
| | | | | | | 67,313 | |
| | | | | | | | |
| | |
France — 5.2% | | | | | | | | |
Air France-KLM * | | | 90,550 | | | | 730 | |
Atos | | | 321,258 | | | | 29,706 | |
AXA | | | 1,507,844 | | | | 37,903 | |
Bureau Veritas (A) | | | 251,926 | | | | 5,418 | |
Compagnie de St.-Gobain | | | 154,782 | | | | 6,913 | |
Compagnie Generale des Etablissements Michelin, Cl B | | | 129,000 | | | | 13,117 | |
Danone | | | 310,717 | | | | 21,820 | |
Edenred (A) | | | 351,753 | | | | 6,520 | |
Essilor International (A) | | | 104,274 | | | | 13,622 | |
Eutelsat Communications | | | 401,200 | | | | 8,004 | |
France Telecom | | | 1,164,408 | | | | 20,241 | |
Legrand (A) | | | 204,046 | | | | 11,229 | |
L’Oreal | | | 117,242 | | | | 22,045 | |
Peugeot * | | | 496,897 | | | | 7,825 | |
Safran | | | 262,024 | | | | 18,377 | |
Sanofi-Aventis | | | 287,428 | | | | 23,579 | |
Societe Generale (A) | | | 401,508 | | | | 16,534 | |
Sodexo | | | 192,429 | | | | 20,250 | |
Technicolor | | | 246,123 | | | | 1,636 | |
Teleperformance | | | 96,044 | | | | 8,381 | |
Thales | | | 144,215 | | | | 12,500 | |
TOTAL | | | 696,454 | | | | 33,862 | |
Valeo | | | 51,467 | | | | 7,772 | |
Veolia Environnement | | | 322,130 | | | | 7,237 | |
Vinci | | | 65,730 | | | | 4,946 | |
| | | | | | | | |
| | | | | | | 360,167 | |
| | | | | | | | |
| | |
Germany — 5.8% | | | | | | | | |
adidas | | | 223,317 | | | | 28,627 | |
Allianz | | | 52,492 | | | | 8,573 | |
BASF | | | 148,389 | | | | 11,469 | |
Bayer | | | 99,600 | | | | 9,495 | |
Brenntag | | | 205,613 | | | | 11,012 | |
Continental | | | 146,865 | | | | 31,522 | |
Deutsche Boerse | | | 624,803 | | | | 54,776 | |
Deutsche Euroshop | | | 102,548 | | | | 4,701 | |
Deutsche Lufthansa (A) | | | 3,008,938 | | | | 42,189 | |
Deutz | | | 84,126 | | | | 408 | |
Duerr | | | 44,311 | | �� | | 3,443 | |
Evonik Industries | | | 100,729 | | | | 2,972 | |
Fresenius | | | 67,800 | | | | 5,120 | |
Gerresheimer | | | 105,259 | | | | 8,383 | |
Hannover Rueck | | | 58,086 | | | | 6,554 | |
Henkel | | | 199,252 | | | | 20,906 | |
Hochtief | | | 106,320 | | | | 13,458 | |
Krones | | | 3,721 | | | | 444 | |
KUKA (A) | | | 20,840 | | | | 2,459 | |
Merck KGaA | | | 214,438 | | | | 21,473 | |
MTU Aero Engines | | | 81,925 | | | | 7,742 | |
| | |
| 110 | | SEI Institutional Investments Trust / Annual Report / May 31, 2016 |
SCHEDULE OF INVESTMENTS
World Equity Ex-US Fund
May 31, 2016
| | | | | | | | |
| Description | | Shares | | | Market Value
($ Thousands) | |
Nordex * | | | 780,678 | | | $ | 22,205 | |
ProSiebenSat.1 Media | | | 22,207 | | | | 1,117 | |
Rhoen Klinikum | | | 87,988 | | | | 2,701 | |
SAP | | | 508,869 | | | | 41,332 | |
Siemens | | | 182,640 | | | | 19,680 | |
Software | | | 92,342 | | | | 3,588 | |
Stada Arzneimittel | | | 153,460 | | | | 8,176 | |
TUI | | | 367,915 | | | | 5,587 | |
| | | | | | | | |
| | | | | | | 400,112 | |
| | | | | | | | |
| | |
Hong Kong — 4.4% | | | | | | | | |
AIA Group | | | 1,587,000 | | | | 9,285 | |
Anhui Conch Cement | | | 5,824,000 | | | | 14,095 | |
Bank of China | | | 28,346,000 | | | | 11,531 | |
Beijing Enterprises Holdings | | | 2,181,400 | | | | 11,345 | |
BOC Hong Kong Holdings | | | 8,913,500 | | | | 27,424 | |
Chaoda Modern Agriculture * | | | 52,790 | | | | 1 | |
China Construction Bank | | | 38,721,900 | | | | 24,973 | |
China Mobile | | | 3,672,100 | | | | 41,882 | |
China Unicom | | | 1,890,000 | | | | 2,041 | |
Citic Pacific | | | 355,000 | | | | 516 | |
CK Hutchison Holdings | | | 1,611,000 | | | | 18,706 | |
ENN Energy Holdings | | | 2,696,000 | | | | 13,379 | |
Hang Seng Bank | | | 770,900 | | | | 13,685 | |
Hong Kong Exchanges and Clearing | | | 1,615,631 | | | | 38,685 | |
Industrial & Commercial Bank of China | | | 16,815,000 | | | | 8,918 | |
Orient Overseas International | | | 4,225,000 | | | | 16,398 | |
PAX Global Technology (A) | | | 19,504,515 | | | | 16,446 | |
Tencent Holdings | | | 1,418,009 | | | | 31,635 | |
Want Want China Holdings (A) | | | 9,706,000 | | | | 6,872 | |
| | | | | | | | |
| | | | | | | 307,817 | |
| | | | | | | | |
| | |
Hungary — 0.1% | | | | | | | | |
MOL Hungarian Oil and Gas | | | 70,130 | | | | 3,859 | |
OTP Bank | | | 177,970 | | | | 4,303 | |
| | | | | | | | |
| | | | | | | 8,162 | |
| | | | | | | | |
| | |
India — 1.3% | | | | | | | | |
Bharat Petroleum | | | 694,176 | | | | 10,116 | |
HDFC Bank ADR | | | 472,003 | | | | 30,378 | |
Hindustan Petroleum | | | 113,841 | | | | 1,534 | |
ICICI Bank ADR | | | 6,151,634 | | | | 44,230 | |
Indian Oil | | | 365,230 | | | | 2,259 | |
Tata Motors | | | 390,135 | | | | 2,665 | |
| | | | | | | | |
| | | | | | | 91,182 | |
| | | | | | | | |
| | |
Indonesia — 0.7% | | | | | | | | |
Bank Mandiri Persero | | | 9,490,100 | | | | 6,270 | |
Bank Rakyat Indonesia Persero | | | 25,027,500 | | | | 18,963 | |
Gudang Garam | | | 207,300 | | | | 1,050 | |
Indofood Sukses Makmur * | | | 21,561,500 | | | | 10,931 | |
Telekomunikasi Indonesia Persero | | | 7,324,900 | | | | 1,984 | |
Telekomunikasi Indonesia Persero ADR (A) | | | 107,365 | | | | 5,900 | |
| | | | | | | | |
| | | | | | | 45,098 | |
| | | | | | | | |
| | | | | | | | |
| Description | | Shares | | | Market Value
($ Thousands) | |
Ireland — 1.3% | | | | | | | | |
James Hardie Industries, CDI | | | 1,138,626 | | | $ | 17,388 | |
Ryanair Holdings ADR | | | 354,564 | | | | 30,989 | |
Shire ADR (A) | | | 100,262 | | | | 18,665 | |
Smurfit Kappa Group | | | 970,092 | | | | 26,481 | |
| | | | | | | | |
| | | | | | | 93,523 | |
| | | | | | | | |
| | |
Israel — 1.3% | | | | | | | | |
Bank Hapoalim | | | 1,806,927 | | | | 9,338 | |
Check Point Software Technologies *(A) | | | 261,979 | | | | 22,260 | |
Teva Pharmaceutical Industries ADR | | | 1,167,701 | | | | 60,569 | |
| | | | | | | | |
| | | | | | | 92,167 | |
| | | | | | | | |
| | |
Italy — 1.1% | | | | | | | | |
Banca Intesa | | | 3,951,104 | | | | 10,152 | |
Brembo | | | 29,981 | | | | 1,730 | |
Enel | | | 5,775,643 | | | | 26,195 | |
Exor | | | 257,432 | | | | 9,770 | |
Prysmian | | | 778,611 | | | | 19,061 | |
Recordati | | | 116,109 | | | | 3,430 | |
Saras (A) | | | 2,187,265 | | | | 3,833 | |
| | | | | | | | |
| | | | | | | 74,171 | |
| | | | | | | | |
| | |
Japan — 12.2% | | | | | | | | |
Alfresa Holdings | | | 278,700 | | | | 5,873 | |
Calsonic Kansei | | | 823,000 | | | | 6,412 | |
Canon Marketing Japan | | | 28,800 | | | | 546 | |
Coca-Cola West | | | 272,100 | | | | 7,569 | |
Concordia Financial Group * | | | 2,635,100 | | | | 12,267 | |
Dai-ichi Life Insurance | | | 373,300 | | | | 4,916 | |
Daiichi Sankyo | | | 849,638 | | | | 19,738 | |
Daiichikosho | | | 9,200 | | | | 351 | |
Daikyo | | | 1,447,000 | | | | 2,218 | |
Daito Trust Construction | | | 162,900 | | | | 23,641 | |
Daiwa House Industry | | | 659,100 | | | | 19,118 | |
DCM Holdings | | | 92,200 | | | | 673 | |
Denso | | | 1,235,300 | | | | 48,664 | |
FANUC | | | 68,900 | | | | 10,549 | |
Fast Retailing | | | 28,400 | | | | 7,653 | |
Fujitsu | | | 809,000 | | | | 3,268 | |
Fujitsu General | | | 147,000 | | | | 2,736 | |
Furukawa Electric | | | 893,000 | | | | 2,150 | |
Haseko | | | 550,300 | | | | 6,054 | |
Hazama Ando | | | 610,800 | | | | 3,437 | |
Hitachi | | | 3,208,000 | | | | 14,810 | |
Iida Group Holdings | | | 246,100 | | | | 5,153 | |
Isuzu Motors | | | 2,332,800 | | | | 28,102 | |
IT Holdings | | | 256,600 | | | | 6,215 | |
Itochu | | | 346,000 | | | | 4,341 | |
Japan Airlines | | | 765,900 | | | | 26,249 | |
Japan Exchange Group | | | 3,085,408 | | | | 42,009 | |
Kao | | | 469,666 | | | | 25,837 | |
KDDI | | | 1,667,585 | | | | 48,672 | |
Konami | | | 129,900 | | | | 4,919 | |
| | |
| 111 | | SEI Institutional Investments Trust / Annual Report / May 31, 2016 |
SCHEDULE OF INVESTMENTS
World Equity Ex-US Fund
May 31, 2016
| | | | | | | | |
| Description | | Shares | | | Market Value
($ Thousands) | |
Kura | | | 19,300 | | | $ | 908 | |
Kyowa Hakko Kirin | | | 74,700 | | | | 1,361 | |
Maeda Road Construction | | | 141,000 | | | | 2,535 | |
Marubeni | | | 1,262,100 | | | | 6,064 | |
Mazda Motor | | | 608,100 | | | | 10,478 | |
Medipal Holdings | | | 584,900 | | | | 10,152 | |
Misawa Homes | | | 54,200 | | | | 394 | |
Mitsubishi Chemical Holdings | | | 124,800 | | | | 635 | |
Mitsubishi Electric | | | 1,327,000 | | | | 16,027 | |
Mitsubishi Gas Chemical | | | 440,000 | | | | 2,495 | |
Mitsui Sumitomo Insurance Group Holdings | | | 622,900 | | | | 17,759 | |
Mitsui Trust Holdings | | | 4,922,000 | | | | 17,117 | |
Mixi | | | 130,100 | | | | 5,021 | |
Nichi-iko Pharmaceutical | | | 26,100 | | | | 576 | |
Nidec | | | 162,200 | | | | 12,515 | |
Nippo | | | 183,000 | | | | 3,303 | |
Nippon Flour Mills | | | 33,000 | | | | 253 | |
Nippon Steel & Sumitomo Metal | | | 719,500 | | | | 14,856 | |
Nippon Suisan Kaisha | | | 353,200 | | | | 2,013 | |
Nissan Motor | | | 590,000 | | | | 5,985 | |
Nissan Tokyo Sales Holdings | | | 115,600 | | | | 246 | |
NSK | | | 2,311,500 | | | | 20,530 | |
NTT Data | | | 55,400 | | | | 2,857 | |
NTT DoCoMo | | | 898,562 | | | | 22,516 | |
Omron | | | 449,600 | | | | 14,472 | |
ORIX | | | 397,500 | | | | 5,520 | |
Otsuka Holdings | | | 14,400 | | | | 588 | |
Pioneer * | | | 392,600 | | | | 857 | |
Rakuten | | | 1,525,700 | | | | 16,433 | |
Recruit Holdings | | | 633,800 | | | | 21,573 | |
Secom | | | 500,200 | | | | 39,171 | |
Shimano | | | 107,700 | | | | 16,790 | |
SMC | | | 65,900 | | | | 16,786 | |
Sumitomo Chemical | | | 3,875,780 | | | | 17,753 | |
Sumitomo Osaka Cement | | | 97,000 | | | | 394 | |
Suzuken | | | 133,290 | | | | 4,303 | |
T&D Holdings | | | 2,407,700 | | | | 24,022 | |
Teijin | | | 390,000 | | | | 1,371 | |
THK | | | 664,900 | | | | 12,572 | |
Toho Gas | | | 37,000 | | | | 274 | |
Toho Holdings | | | 134,200 | | | | 3,295 | |
Tokyo Electric Power * | | | 1,755,300 | | | | 8,246 | |
Tosoh | | | 171,000 | | | | 842 | |
Toyota Tsusho | | | 628,800 | | | | 14,855 | |
Trend Micro | | | 304,700 | | | | 11,045 | |
Ube Industries | | | 2,233,000 | | | | 4,188 | |
Ulvac | | | 9,400 | | | | 314 | |
West Japan Railway | | | 435,300 | | | | 27,216 | |
Yamazaki Baking | | | 195,000 | | | | 4,784 | |
Zenkoku Hosho | | | 103,000 | | | | 3,390 | |
| | | | | | | | |
| | | | | | | 841,790 | |
| | | | | | | | |
| | | | | | | | |
| Description | | Shares | | | Market Value
($ Thousands) | |
Malaysia — 0.4% | | | | | | | | |
Axiata Group | | | 234,400 | | | $ | 296 | |
MISC | | | 1,516,600 | | | | 2,836 | |
Public Bank | | | 2,542,800 | | | | 11,775 | |
Tenaga Nasional | | | 3,188,100 | | | | 10,794 | |
| | | | | | | | |
| | | | | | | 25,701 | |
| | | | | | | | |
| | |
Mexico — 0.3% | | | | | | | | |
Alfa, Cl A | | | 350,501 | | | | 620 | |
America Movil ADR, Ser L (A) | | | 1,296,993 | | | | 15,888 | |
Cemex ADR * | | | 258,821 | | | | 1,646 | |
Gruma, Ser B | | | 59,583 | | | | 855 | |
Grupo Financiero Banorte, Ser O | | | 835,013 | | | | 4,387 | |
Mexichem | | | 133,997 | | | | 283 | |
Wal-Mart de Mexico | | | 178,858 | | | | 417 | |
| | | | | | | | |
| | | | | | | 24,096 | |
| | | | | | | | |
| | |
Netherlands — 2.6% | | | | | | | | |
Aegon | | | 2,269,517 | | | | 11,673 | |
AerCap Holdings * | | | 94,310 | | | | 3,687 | |
ASML Holding | | | 108,800 | | | | 10,828 | |
BE Semiconductor Industries | | | 12,598 | | | | 355 | |
Boskalis Westminster | | | 102,282 | | | | 3,706 | |
Euronext (B) | | | 468,421 | | | | 19,688 | |
Heineken Holding | | | 327,752 | | | | 26,906 | |
ING Groep | | | 1,120,687 | | | | 13,967 | |
Koninklijke Ahold | | | 1,027,854 | | | | 22,782 | |
Koninklijke DSM | | | 341,772 | | | | 20,352 | |
NN Group | | | 132,980 | | | | 4,443 | |
RELX | | | 133,229 | | | | 2,311 | |
Unilever | | | 710,086 | | | | 31,909 | |
Wolters Kluwer | | | 152,564 | | | | 6,085 | |
| | | | | | | | |
| | | | | | | 178,692 | |
| | | | | | | | |
| | |
Norway — 1.3% | | | | | | | | |
DnB | | | 3,214,656 | | | | 41,244 | |
Norsk Hydro | | | 3,807,449 | | | | 15,183 | |
Statoil | | | 163,890 | | | | 2,614 | |
Statoil ADR (A) | | | 1,185,676 | | | | 18,686 | |
Telenor (A) | | | 798,300 | | | | 13,307 | |
| | | | | | | | |
| | | | | | | 91,034 | |
| | | | | | | | |
| | |
Panama — 0.1% | | | | | | | | |
Copa Holdings, Cl A (A) | | | 146,197 | | | | 7,539 | |
| | | | | | | | |
| | |
Peru — 0.4% | | | | | | | | |
Credicorp | | | 178,760 | | | | 25,062 | |
| | | | | | | | |
| | |
Poland — 0.1% | | | | | | | | |
Polski Koncern Naftowy ORLEN | | | 399,509 | | | | 7,007 | |
| | | | | | | | |
| | |
Portugal — 0.4% | | | | | | | | |
Galp Energia, Cl B | | | 1,509,032 | | | | 19,790 | |
Jeronimo Martins | | | 357,344 | | | | 5,792 | |
| | | | | | | | |
| | | | | | | 25,582 | |
| | | | | | | | |
| | |
| 112 | | SEI Institutional Investments Trust / Annual Report / May 31, 2016 |
SCHEDULE OF INVESTMENTS
World Equity Ex-US Fund
May 31, 2016
| | | | | | | | |
| Description | | Shares | | | Market Value
($ Thousands) | |
Qatar — 0.0% | | | | | | | | |
Barwa Real Estate | | | 381,136 | | | $ | 3,172 | |
| | | | | | | | |
| | |
Russia — 0.8% | | | | | | | | |
Gazprom ADR | | | 601,219 | | | | 2,628 | |
Lukoil ADR (A) | | | 524,996 | | | | 20,192 | |
Magnit GDR | | | 260,046 | | | | 9,206 | |
Novolipetsk Steel GDR | | | 24,052 | | | | 311 | |
Rosneft OAO GDR | | | 483,016 | | | | 2,337 | |
Rosneft Oil GDR | | | 1,143,320 | | | | 5,531 | |
Sberbank of Russia ADR | | | 743,332 | | | | 6,241 | |
Severstal PAO GDR | | | 36,956 | | | | 386 | |
Yandex, Cl A * | | | 546,304 | | | | 11,254 | |
| | | | | | | | |
| | | | | | | 58,086 | |
| | | | | | | | |
| | |
Singapore — 1.1% | | | | | | | | |
DBS Group Holdings | | | 2,835,000 | | | | 31,918 | |
Jardine Cycle & Carriage | | | 121,800 | | | | 2,990 | |
Singapore Airlines | | | 152,200 | | | | 1,181 | |
Singapore Exchange | | | 228,300 | | | | 1,285 | |
United Overseas Bank | | | 1,266,210 | | | | 16,757 | |
United Overseas Bank ADR | | | 829,900 | | | | 22,017 | |
| | | | | | | | |
| | | | | | | 76,148 | |
| | | | | | | | |
| | |
South Africa — 1.6% | | | | | | | | |
Anglo American Platinum * | | | 25,286 | | | | 565 | |
Bid * | | | 19,962 | | | | 384 | |
Bidvest Group | | | 19,962 | | | | 159 | |
Brait * | | | 187,755 | | | | 1,904 | |
Clicks Group | | | 102,539 | | | | 702 | |
FirstRand | | | 1,281,440 | | | | 3,463 | |
Gold Fields ADR (A) | | | 557,758 | | | | 1,963 | |
Harmony Gold Mining ADR (A) | | | 287,764 | | | | 881 | |
Investec | | | 431,543 | | | | 2,941 | |
Kumba Iron Ore (A) | | | 216,231 | | | | 1,114 | |
Liberty Holdings | | | 86,627 | | | | 656 | |
Naspers, Cl N | | | 256,094 | | | | 37,639 | |
Sappi * | | | 113,773 | | | | 533 | |
Sasol | | | 485,152 | | | | 14,714 | |
Sasol ADR | | | 872,900 | | | | 26,370 | |
Shoprite Holdings | | | 42,399 | | | | 445 | |
Sibanye Gold | | | 1,763,388 | | | | 5,045 | |
SPAR Group | | | 80,154 | | | | 1,031 | |
Standard Bank Group | | | 512,503 | | | | 4,041 | |
Steinhoff International Holdings | | | 352,028 | | | | 2,064 | |
Telkom | | | 1,239,923 | | | | 4,570 | |
| | | | | | | | |
| | | | | | | 111,184 | |
| | | | | | | | |
| | |
South Korea — 3.5% | | | | | | | | |
Hyundai Mobis | | | 92,088 | | | | 19,703 | |
Kia Motors | | | 63,159 | | | | 2,472 | |
Korea Electric Power | | | 130,143 | | | | 6,869 | |
Korea Electric Power ADR | | | 1,469,911 | | | | 38,820 | |
Korea Petrochemical Industries | | | 10,220 | | | | 1,938 | |
LG Chemical | | | 9,502 | | | | 2,161 | |
| | | | | | | | |
| Description | | Shares | | | Market Value
($ Thousands) | |
LG Electronics | | | 99,655 | | | $ | 4,691 | |
LG Household & Health Care | | | 23,262 | | | | 20,611 | |
LG.Philips LCD | | | 598,418 | | | | 12,955 | |
Lotte Chemical | | | 8,198 | | | | 1,954 | |
NAVER | | | 21,646 | | | | 13,077 | |
POSCO | | | 8,719 | | | | 1,522 | |
Samsung Electronics | | | 73,422 | | | | 79,595 | |
SK Hynix | | | 252,664 | | | | 6,084 | |
SK Innovation | | | 26,906 | | | | 3,691 | |
SK Telecom | | | 56,508 | | | | 10,526 | |
SK Telecom ADR | | | 542,339 | | | | 11,297 | |
S-Oil | | | 25,045 | | | | 1,805 | |
| | | | | | | | |
| | | | | | | 239,771 | |
| | | | | | | | |
| | |
Spain — 1.7% | | | | | | | | |
ACS Actividades Construcciones y Servicios | | | 375,457 | | | | 12,393 | |
Amadeus IT Holding, Cl A | | | 1,039,986 | | | | 48,204 | |
Bankinter | | | 1,745,318 | | | | 13,282 | |
Gamesa Tecnologica | | | 33,774 | | | | 673 | |
Iberdrola | | | 2,947,439 | | | | 20,002 | |
Industria de Diseno Textil | | | 658,495 | | | | 22,256 | |
Mediaset Espana Comunicacion | | | 301,370 | | | | 4,023 | |
| | | | | | | | |
| | | | | | | 120,833 | |
| | | | | | | | |
| | |
Sweden — 2.5% | | | | | | | | |
Atlas Copco, Cl B | | | 974,558 | | | | 23,205 | |
Axfood | | | 19,610 | | | | 361 | |
BillerudKorsnas | | | 343,646 | | | | 5,253 | |
Electrolux, Cl B | | | 236,120 | | | | 6,326 | |
Getinge, Cl B | | | 1,093,232 | | | | 23,296 | |
Mycronic | | | 52,291 | | | | 413 | |
NCC, Cl B | | | 15,734 | | | | 578 | |
Nordea Bank | | | 2,391,500 | | | | 23,176 | |
Securitas, Cl B | | | 126,585 | | | | 1,993 | |
Skanska, Cl B | | | 244,750 | | | | 5,368 | |
SKF, Cl B | | | 409,460 | | | | 7,196 | |
Svenska Cellulosa, Cl B | | | 243,015 | | | | 7,768 | |
Svenska Cellulosa ADR | | | 518,100 | | | | 16,553 | |
Svenska Handelsbanken, Cl A | | | 1,951,344 | | | | 24,949 | |
Swedish Orphan Biovitrum *(A) | | | 42,968 | | | | 574 | |
Telefonaktiebolaget LM Ericsson, Cl B | | | 2,728,708 | | | | 21,005 | |
Volvo, Cl B | | | 729,112 | | | | 8,104 | |
| | | | | | | | |
| | | | | | | 176,118 | |
| | | | | | | | |
| | |
Switzerland — 4.3% | | | | | | | | |
Actelion | | | 201,996 | | | | 33,138 | |
Cie Financiere Richemont | | | 169,452 | | | | 9,979 | |
Credit Suisse Group ADR (A) | | | 1,233,487 | | | | 16,874 | |
Forbo Holding | | | 2,111 | | | | 2,610 | |
Galenica (A) | | | 9,507 | | | | 12,555 | |
Georg Fischer | | | 6,575 | | | | 5,248 | |
Givaudan | | | 10,047 | | | | 19,251 | |
Holcim | | | 214,379 | | | | 9,639 | |
Lonza Group | | | 150,085 | | | | 25,905 | |
| | |
| 113 | | SEI Institutional Investments Trust / Annual Report / May 31, 2016 |
SCHEDULE OF INVESTMENTS
World Equity Ex-US Fund
May 31, 2016
| | | | | | | | |
| Description | | Shares | | | Market Value
($ Thousands) | |
Nestle | | | 462,378 | | | $ | 34,136 | |
Novartis ADR | | | 381,352 | | | | 30,321 | |
Roche Holding | | | 132,984 | | | | 34,898 | |
SGS | | | 3,383 | | | | 7,217 | |
Swiss Life Holding | | | 78,150 | | | | 20,257 | |
Swiss Re | | | 146,043 | | | | 13,118 | |
Transocean (A) | | | 86,155 | | | | 864 | |
Wolseley | | | 312,838 | | | | 18,446 | |
| | | | | | | | |
| | | | | | | 294,456 | |
| | | | | | | | |
| | |
Taiwan — 3.0% | | | | | | | | |
Advanced Semiconductor Engineering | | | 23,012,000 | | | | 26,037 | |
AU Optronics | | | 12,408,000 | | | | 3,447 | |
Chunghwa Telecom | | | 5,914,126 | | | | 19,948 | |
Fubon Financial Holding | | | 8,532,949 | | | | 10,073 | |
Hermes Microvision | | | 220,000 | | | | 7,791 | |
Hon Hai Precision Industry | | | 8,749,708 | | | | 21,490 | |
Hon Hai Precision Industry GDR | | | 1,748,259 | | | | 8,689 | |
Innolux, Cl A | | | 15,521,544 | | | | 4,602 | |
Lite-On Technology | | | 496,000 | | | | 639 | |
Pegatron | | | 4,156,000 | | | | 8,653 | |
Taiwan PCB Techvest | | | 451,000 | | | | 416 | |
Taiwan Semiconductor Manufacturing | | | 4,807,000 | | | | 23,068 | |
Taiwan Semiconductor Manufacturing ADR | | | 2,930,744 | | | | 72,448 | |
United Microelectronics | | | 3,643,000 | | | | 1,363 | |
United Microelectronics ADR (A) | | | 1,211,600 | | | | 2,278 | |
| | | | | | | | |
| | | | | | | 210,942 | |
| | | | | | | | |
| | |
Thailand — 0.4% | | | | | | | | |
Bangkok Bank NVDR | | | 1,154,700 | | | | 5,285 | |
Fabrinet * | | | 236,840 | | | | 8,408 | |
IRPC | | | 10,193,800 | | | | 1,421 | |
Siam Cement NVDR, NVDR | | | 460,900 | | | | 6,244 | |
Thai Oil | | | 1,090,000 | | | | 1,937 | |
Thanachart Capital | | | 1,205,600 | | | | 1,147 | |
| | | | | | | | |
| | | | | | | 24,442 | |
| | | | | | | | |
| | |
Turkey — 0.8% | | | | | | | | |
Akbank | | | 6,669,761 | | | | 18,010 | |
Arcelik | | | 89,601 | | | | 595 | |
Eregli Demir ve Celik Fabrikalari | | | 992,626 | | | | 1,385 | |
KOC Holding ADR | | | 568,950 | | | | 12,591 | |
Petkim Petrokimya Holding | | | 1,972,827 | | | | 2,841 | |
Tupras Turkiye Petrol Rafinerileri | | | 41,259 | | | | 931 | |
Turkiye Is Bankasi, Cl C | | | 3,387,155 | | | | 5,175 | |
Turkiye Vakifiar Bankasi Tao, Cl D | | | 9,368,340 | | | | 14,156 | |
Yapi ve Kredi Bankasi | | | 972,252 | | | | 1,360 | |
| | | | | | | | |
| | | | | | | 57,044 | |
| | | | | | | | |
| | |
United Arab Emirates — 0.3% | | | | | | | | |
Aldar Properties | | | 807,235 | | | | 578 | |
Dubai Islamic Bank | | | 13,945,717 | | | | 19,364 | |
| | | | | | | | |
| | | | | | | 19,942 | |
| | | | | | | | |
| | | | | | | | |
| Description | | Shares | | | Market Value
($ Thousands) | |
United Kingdom — 13.9% | | | | | | | | |
Abcam | | | 49,922 | | | $ | 465 | |
ARM Holdings | | | 1,778,722 | | | | 25,553 | |
ARM Holdings ADR | | | 1,178,458 | | | | 50,792 | |
ASOS * | | | 139,251 | | | | 7,086 | |
Associated British Foods | | | 364,512 | | | | 15,619 | |
AstraZeneca | | | 599,399 | | | | 35,141 | |
BAE Systems ADR (A) | | | 984,500 | | | | 27,551 | |
Berkeley Group Holdings | | | 166,158 | | | | 7,920 | |
BP PLC ADR (A) | | | 357,978 | | | | 11,240 | |
British American Tobacco | | | 275,075 | | | | 16,808 | |
BT Group, Cl A | | | 782,060 | | | | 5,040 | |
Burberry Group | | | 450,796 | | | | 7,047 | |
Capita | | | 984,107 | | | | 15,240 | |
Carnival | | | 430,834 | | | | 21,377 | |
Centrica | | | 3,565,784 | | | | 10,577 | |
Compass Group | | | 526,915 | | | | 9,870 | |
CRH | | | 582,365 | | | | 17,588 | |
Dart Group | | | 41,579 | | | | 392 | |
Debenhams | | | 1,592,681 | | | | 1,714 | |
Diageo | | | 1,113,676 | | | | 30,320 | |
Dialog Semiconductor * | | | 130,056 | | | | 4,131 | |
Direct Line Insurance Group | | | 4,961,390 | | | | 27,102 | |
Experian | | | 923,108 | | | | 17,547 | |
Greggs | | | 26,619 | | | | 437 | |
Halma | | | 365,551 | | | | 5,044 | |
Hargreaves Lansdown | | | 689,508 | | | | 13,538 | |
Home Retail Group | | | 353,577 | | | | 851 | |
Howden Joinery Group | | | 1,059,677 | | | | 7,820 | |
HSBC Holdings | | | 1,567,413 | | | | 10,153 | |
Imperial Brands | | | 643,422 | | | | 35,222 | |
Inchcape | | | 132,067 | | | | 1,309 | |
Indivior | | | 822,116 | | | | 2,057 | |
Investec | | | 447,508 | | | | 3,054 | |
ITV | | | 12,986,799 | | | | 40,602 | |
John Wood Group | | | 384,032 | | | | 3,443 | |
Kingfisher | | | 3,191,530 | | | | 17,057 | |
Lloyds Banking Group | | | 19,632,950 | | | | 20,580 | |
London Stock Exchange Group | | | 537,817 | | | | 21,409 | |
Man Group | | | 6,105,584 | | | | 11,722 | |
Marks & Spencer Group ADR (A) | | | 1,984,600 | | | | 22,099 | |
Mondi | | | 508,405 | | | | 9,960 | |
Persimmon | | | 1,225,782 | | | | 37,502 | |
Polymetal International | | | 41,589 | | | | 491 | |
Prudential | | | 928,199 | | | | 18,644 | |
QinetiQ | | | 613,518 | | | | 2,196 | |
Reckitt Benckiser Group | | | 200,564 | | | | 20,070 | |
Rentokil Initial | | | 498,152 | | | | 1,306 | |
Rightmove | | | 11,157 | | | | 686 | |
Rio Tinto | | | 1,233,280 | | | | 34,869 | |
Rio Tinto ADR (A) | | | 511,196 | | | | 14,334 | |
Rolls-Royce Holdings | | | 620,263 | | | | 5,588 | |
| | |
| 114 | | SEI Institutional Investments Trust / Annual Report / May 31, 2016 |
SCHEDULE OF INVESTMENTS
World Equity Ex-US Fund
May 31, 2016
| | | | | | | | |
| Description | | Shares | | | Market Value
($ Thousands) | |
Royal Dutch Shell, Cl A (GBP) | | | 120,089 | | | $ | 2,897 | |
Royal Dutch Shell, Cl A | | | 2,040,893 | | | | 49,894 | |
Royal Dutch Shell ADR, Cl A (A) | | | 627,200 | | | | 30,413 | |
Schroders | | | 62,782 | | | | 2,476 | |
Shire | | | 1,058,538 | | | | 65,634 | |
St. James’s Place | | | 925,337 | | | | 12,492 | |
Tullow Oil | | | 1,588,442 | | | | 5,329 | |
Vodafone Group | | | 10,196,290 | | | | 34,260 | |
WPP | | | 1,200,141 | | | | 27,809 | |
| | | | | | | | |
| | | | | | | 959,367 | |
| | | | | | | | |
| | |
United States — 3.4% | | | | | | | | |
Alexion Pharmaceuticals * | | | 49,150 | | | | 7,417 | |
Carnival, Cl A | | | 730,900 | | | | 34,893 | |
Core Laboratories (A) | | | 306,587 | | | | 37,174 | |
Estee Lauder, Cl A | | | 52,976 | | | | 4,862 | |
Everest Re Group | | | 226,031 | | | | 40,484 | |
ICON * | | | 826,090 | | | | 58,190 | |
Liberty Global, Cl A * | | | 293,730 | | | | 10,971 | |
Open Text (A) | | | 279,600 | | | | 16,407 | |
PriceSmart | | | 115,660 | | | | 10,246 | |
Richmont Mines * | | | 60,387 | | | | 471 | |
Taro Pharmaceuticals Industries * | | | 14,180 | | | | 2,072 | |
TripAdvisor * | | | 131,220 | | | | 8,889 | |
| | | | | | | | |
| | | | | | | 232,076 | |
| | | | | | | | |
Total Common Stock
(Cost $6,347,727) ($ Thousands) | | | | 6,470,592 | |
| | | | | | | | |
| |
PREFERRED STOCK — 0.4% | | | | | |
| | |
Brazil — 0.4% | | | | | | | | |
Banco Bradesco | | | 618,508 | | | | 3,922 | |
Cia Energetica de Minas Gerais | | | 645,654 | | | | 1,004 | |
Gerdau | | | 436,400 | | | | 682 | |
Itau Unibanco Holding | | | 295,050 | | | | 2,382 | |
Itau Unibanco Holding ADR (A) | | | 854,294 | | | | 6,843 | |
Metalurgica Gerdau | | | 878,200 | | | | 468 | |
Telefonica Brasil | | | 696,864 | | | | 8,085 | |
| | | | | | | | |
| | | | | | | 23,386 | |
| | | | | | | | |
Total Preferred Stock
(Cost $39,158) ($ Thousands) | | | | 23,386 | |
| | | | | | | | |
| | |
| | | Number of
Rights | | | | |
RIGHTS — 0.0% | | | | | |
| |
United Arab Emirates — 0.0% | | | | | |
Dubai Islamic Bank, Expires 06/23/2016 * | | | 3,486 | | | | 1,766 | |
| | | | | | | | |
Total Rights
(Cost $—) ($ Thousands) | | | | 1,766 | |
| | | | | | | | |
| | | | | | | | |
| Description | | Shares | | | Market Value
($ Thousands) | |
AFFILIATED PARTNERSHIP — 5.2% | | | | | |
SEI Liquidity Fund, L.P. | | | | | | | | |
0.410% **†(C) | | | 362,212,338 | | | $ | 362,212 | |
| | | | | | | | |
Total Affiliated Partnership
(Cost $362,212) ($ Thousands) | | | | | | | 362,212 | |
| | | | | | | | |
| | |
| | | Face Amount
(Thousands) | | | | |
U.S. TREASURY OBLIGATION — 0.4% | | | | | |
U.S. Treasury Bills | | | | | | | | |
0.363%, 08/18/2016 (D)(E) | | $ | 27,765 | | | | 27,747 | |
| | | | | | | | |
Total U.S. Treasury Obligation
(Cost $27,743) ($ Thousands) | | | | 27,747 | |
| | | | | | | | |
| | |
| | | Shares | | | | | |
| | | | | | | | |
CASH EQUIVALENT — 2.8% | | | | | |
SEI Daily Income Trust, Prime Obligation Fund, Cl A | | | | | | | | |
0.270% **† | | | 197,214,725 | | | | 197,215 | |
| | | | | | | | |
Total Cash Equivalent
(Cost $197,215) ($ Thousands) | | | | 197,215 | |
| | | | | | | | |
Total Investments — 102.3%
(Cost $6,974,055) ($ Thousands) | | | $ | 7,082,918 | |
| | | | | | | | |
A list of the open futures contracts held by the Fund at May 31, 2016, is as follows:
| | | | | | | | | | | | |
| Type of Contract | | Number of
Contracts
Long | | | Expiration
Date | | | Unrealized
Appreciation
($ Thousands) | |
DJ Euro Stoxx 50 Index | | | 1,940 | | | | Jun-2016 | | | $ | 2,955 | |
FTSE 100 Index | | | 466 | | | | Jun-2016 | | | | 254 | |
Hang Seng Index | | | 269 | | | | Jun-2016 | | | | 809 | |
S&P TSX 60 Index | | | 198 | | | | Jun-2016 | | | | 698 | |
SPI 200 Index | | | 219 | | | | Jun-2016 | | | | 950 | |
Topix Index | | | 346 | | | | Jun-2016 | | | | 2,139 | |
| | | | | | | | | | | | |
| | | | | | | | | | $ | 7,805 | |
| | | | | | | | | | | | |
For the year ended May 31, 2016, the total amount of all open futures contracts, as presented in the table above, are representative of the volume of activity for the derivative type during the year.
Percentages are based on a Net Assets of $6,923,937 ($ Thousands).
| * | | Non-income producing security. |
| ** | | Rate shown is the 7-day effective yield as of May 31, 2016. |
| † | | Investment in Affiliated Security (see Note 6). |
| ‡ | | Real Estate Investment Trust. |
| (A) | | This security or a partial position of this security is on loan at May 31, 2016. The total market value of securities on loan at May 31, 2016 was $344,379 ($ Thousands). |
| (B) | | Security exempt from registration under Rule 144A of the Securities Act of 1933. These securities may be resold in transactions exempt from registration normally to qualified institutions. On May 31, 2016, the value of these securities amounted to $19,688 ($ Thousands), representing 0.3% of the net assets of the Fund. |
| | |
| 115 | | SEI Institutional Investments Trust / Annual Report / May 31, 2016 |
SCHEDULE OF INVESTMENTS
World Equity Ex-US Fund
May 31, 2016
| (C) | | This security was purchased with cash collateral held from securities on loan. The total market value of such securities as of May 31, 2016 was $362,212 ($Thousands). |
| (D) | | Security, or portion thereof, has been pledged as collateral on open futures contracts. |
| (E) | | The rate reported is the effective yield at time of purchase. |
ADR — American Depositary Receipt
Cl — Class
DJ — Dow Jones
EUR — Euro
FTSE— Financial Times and Stock Exchange
GBP — British Pound Sterling
GDR — Global Depositary Receipt
L.P. — Limited Partnership
NVDR — Non-Voting Depositary Receipt
PLC — Public Limited Company
Ser — Series
SPI — Share Price Index
The following is a list of the level of inputs used as of May 31, 2016, in valuing the Fund’s investments and other financial instruments carried at value ($ Thousands):
| | | | | | | | | | | | | | | | |
| Investments in Securities | | Level 1 | | | Level 2 | | | Level 3 | | | Total | |
Common Stock | | $ | 6,470,592 | | | $ | — | | | $ | — | | | $ | 6,470,592 | |
Preferred Stock | | | 23,386 | | | | — | | | | — | | | | 23,386 | |
Right | | | 1,766 | | | | — | | | | — | | | | 1,766 | |
Affiliated Partnership | | | — | | | | 362,212 | | | | — | | | | 362,212 | |
U.S. Treasury Obligation | | | — | | | | 27,747 | | | | — | | | | 27,747 | |
Cash Equivalent | | | 197,215 | | | | — | | | | — | | | | 197,215 | |
| | | | | | | | | | | | | | | | |
Total Investments in Securities | | $ | 6,692,959 | | | $ | 389,959 | | | $ | — | | | $ | 7,082,918 | |
| | | | | | | | | | | | | | | | |
| | | | | | | | | | | | | | | | |
| Other Financial Instruments | | Level 1 | | | Level 2 | | | Level 3 | | | Total | |
Futures Contracts * | | | | | | | | | | | | | | | | |
Unrealized Appreciation | | $ | 7,805 | | | $ | — | | | $ | — | | | $ | 7,805 | |
| | | | | | | | | | | | | | | | |
| * | | Futures contracts are valued at the unrealized appreciation on the instrument. |
For the year ended May 31, 2016, there were no transfers between Level 1 and Level 2 assets and liabilities.
For the year ended May 31, 2016, there were no transfers between Level 2 and Level 3 assets and liabilities.
For more information on valuation inputs, see Note 2 – Significant Accounting Policies in Notes to Financial Statements.
Amounts designated as “—” are $0 or have been rounded to $0.
The accompanying notes are an integral part of the financial statements.
| | |
| 116 | | SEI Institutional Investments Trust / Annual Report / May 31, 2016 |
SCHEDULE OF INVESTMENTS
Screened World Equity Ex-US Fund
May 31, 2016
| | | | | | | | |
| Description | | Shares | | | Market Value
($ Thousands) | |
COMMON STOCK — 92.3% | | | | | | | | |
| | |
Argentina — 0.5% | | | | | | | | |
MercadoLibre | | | 2,936 | | | $ | 401 | |
Ternium ADR | | | 1,099 | | | | 20 | |
| | | | | | | | |
| | | | | | | 421 | |
| | | | | | | | |
| |
Australia — 2.8% | | | | | |
Bellamy’s Australia | | | 7,690 | | | | 61 | |
BGP Holdings * | | | 4,500 | | | | — | |
BHP Billiton ADR | | | 6,689 | | | | 180 | |
BlueScope Steel | | | 19,080 | | | | 86 | |
Brambles | | | 30,059 | | | | 280 | |
Cochlear | | | 6,093 | | | | 533 | |
Collins Foods | | | 16,130 | | | | 58 | |
Commonwealth Bank of Australia | | | 7,214 | | | | 405 | |
Goodman Group ‡ | | | 23,830 | | | | 123 | |
Northern Star Resources | | | 22,747 | | | | 71 | |
Objective Corporation | | | 5,533 | | | | 8 | |
Qantas Airways | | | 135,423 | | | | 302 | |
SEEK | | | 7,478 | | | | 88 | |
Telstra | | | 18,674 | | | | 76 | |
Watpac * | | | 10,863 | | | | 6 | |
Westpac Banking | | | 548 | | | | 12 | |
| | | | | | | | |
| | | | | | | 2,289 | |
| | | | | | | | |
| |
Austria — 2.1% | | | | | |
Conwert Immobilien Invest | | | 18,963 | | | | 308 | |
Erste Group Bank | | | 12,796 | | | | 343 | |
Kapsch TrafficCom | | | 3,230 | | | | 103 | |
OMV | | | 8,837 | | | | 246 | |
Porr Ag | | | 2,082 | | | | 61 | |
Schoeller-Bleckmann Oilfield Equipment | | | 4,542 | | | | 277 | |
Strabag | | | 1,092 | | | | 35 | |
Voestalpine | | | 10,184 | | | | 349 | |
Wienerberger | | | 1,053 | | | | 19 | |
| | | | | | | | |
| | | | | | | 1,741 | |
| | | | | | | | |
| |
Belgium — 0.2% | | | | | |
AGFA-Gevaert * | | | 11,327 | | | | 42 | |
Colruyt | | | 1,970 | | | | 117 | |
Sioen Industries | | | 210 | | | | 4 | |
| | | | | | | | |
| | | | | | | 163 | |
| | | | | | | | |
| |
Brazil — 0.8% | | | | | |
Banco Bradesco ADR | | | 32,107 | | | | 201 | |
Banco do Brasil | | | 23,530 | | | | 107 | |
JBS | | | 53,900 | | | | 151 | |
Qualicorp | | | 46,100 | | | | 196 | |
| | | | | | | | |
| | | | | | | 655 | |
| | | | | | | | |
| |
Canada — 6.1% | | | | | |
Bank of Montreal | | | 5,900 | | | | 371 | |
Bank of Nova Scotia | | | 300 | | | | 15 | |
Bird Construction | | | 13,100 | | | | 134 | |
Canadian National Railway | | | 2,790 | | | | 166 | |
Centerra Gold | | | 18,800 | | | | 99 | |
| | | | | | | | |
| Description | | Shares | | | Market Value
($ Thousands) | |
Chorus Aviation | | | 2,740 | | | $ | 13 | |
Cogeco | | | 1,682 | | | | 72 | |
Constellation Software | | | 550 | | | | 224 | |
Crescent Point Energy | | | 600 | | | | 10 | |
Delphi Energy * | | | 3,956 | | | | 3 | |
Fairfax Financial Holdings | | | 840 | | | | 433 | |
Genworth MI Canada | | | 3,320 | | | | 85 | |
Granite Oil | | | 535 | | | | 3 | |
High Arctic Energy Services | | | 10,800 | | | | 34 | |
High Liner Foods | | | 2,683 | | | | 39 | |
Indigo Books & Music * | | | 162 | | | | 2 | |
Lucara Diamond | | | 114,900 | | | | 358 | |
Magna International, Cl A | | | 9,360 | | | | 381 | |
Mainstreet Equity * | | | 300 | | | | 8 | |
Manulife Financial | | | 11,700 | | | | 175 | |
Newmarket Gold * | | | 55,711 | | | | 150 | |
North American Energy Partners | | | 908 | | | | 3 | |
Restaurant Brands International | | | 4,862 | | | | 204 | |
Ritchie Bros Auctioneers | | | 5,645 | | | | 185 | |
Rocky Mountain Dealerships | | | 3,500 | | | | 19 | |
Rogers Communications, Cl B | | | 5,930 | | | | 226 | |
Royal Bank of Canada | | | 7,800 | | | | 470 | |
Savanna Energy Services * | | | 5,700 | | | | 7 | |
Strad Energy Services | | | 14,708 | | | | 18 | |
Stuart Olson | | | 14,600 | | | | 75 | |
Supremex | | | 20,200 | | | | 85 | |
Toronto-Dominion Bank | | | 10,400 | | | | 454 | |
Transat AT * | | | 31,800 | | | | 196 | |
Transcontinental, Cl A | | | 10,500 | | | | 157 | |
Vecima Networks | | | 500 | | | | 4 | |
WestJet Airlines | | | 235 | | | | 4 | |
Yellow Pages * | | | 13,133 | | | | 198 | |
ZCL Composites | | | 700 | | | | 5 | |
| | | | | | | | |
| | | | | | | 5,085 | |
| | | | | | | | |
| |
Chile — 0.1% | | | | | |
Embotelladora Andina ADR, Cl B | | | 2,983 | | | | 56 | |
Enersis Americas ADR | | | 2,614 | | | | 20 | |
Enersis Chile ADR | | | 2,614 | | | | 15 | |
| | | | | | | | |
| | | | | | | 91 | |
| | | | | | | | |
| |
China — 1.4% | | | | | |
Alibaba Group Holding ADR * | | | 4,611 | | | | 378 | |
Baidu ADR * | | | 1,959 | | | | 350 | |
BYD * | | | 9,800 | | | | 56 | |
China Telecom | | | 8,000 | | | | 4 | |
NetEase ADR | | | 690 | | | | 123 | |
Ping An Insurance Group of China | | | 31,000 | | | | 138 | |
Weichai Power | | | 115,400 | | | | 135 | |
| | | | | | | | |
| | | | | | | 1,184 | |
| | | | | | | | |
| |
Colombia — 0.3% | | | | | |
Bancolombia ADR, Cl R | | | 8,414 | | | | 274 | |
| | | | | | | | |
| | |
| 117 | | SEI Institutional Investments Trust / Annual Report / May 31, 2016 |
SCHEDULE OF INVESTMENTS
Screened World Equity Ex-US Fund
May 31, 2016
| | | | | | | | |
| Description | | Shares | | | Market Value
($ Thousands) | |
Czech Republic — 0.3% | | | | | | | | |
Komercni Banka | | | 5,935 | | | $ | 234 | |
Unipetrol * | | | 895 | | | | 6 | |
| | | | | | | | |
| | | | | | | 240 | |
| | | | | | | | |
| |
Denmark — 1.8% | | | | | |
Columbus | | | 42,579 | | | | 55 | |
DSV | | | 6,302 | | | | 287 | |
Genmab * | | | 872 | | | | 158 | |
Novo Nordisk, Cl B | | | 6,613 | | | | 368 | |
Novozymes, Cl B | | | 5,541 | | | | 264 | |
Pandora | | | 2,220 | | | | 330 | |
| | | | | | | | |
| | | | | | | 1,462 | |
| | | | | | | | |
| |
Finland — 1.8% | | | | | |
Atria, Cl A | | | 10,693 | | | | 105 | |
Elisa, Cl A | | | 2,300 | | | | 88 | |
Kone, Cl B | | | 8,131 | | | | 385 | |
Lemminkainen | | | 365 | | | | 5 | |
Neste Oil | | | 11,654 | | | | 393 | |
Nokian Renkaat | | | 2,490 | | | | 88 | |
Orion, Cl B | | | 138 | | | | 5 | |
Sampo, Cl A | | | 5,004 | | | | 223 | |
UPM-Kymmene | | | 9,844 | | | | 189 | |
| | | | | | | | |
| | | | | | | 1,481 | |
| | | | | | | | |
| |
France — 4.9% | | | | | |
Boiron | | | 670 | | | | 57 | |
Burelle | | | 112 | | | | 101 | |
Caisse Regionale de Credit Agricole Mutuel Brie Picardie | | | 144 | | | | 4 | |
Cegedim * | | | 1,522 | | | | 44 | |
Credit Agricole Loire Haute-Loire | | | 140 | | | | 12 | |
Credit Agricole Toulouse | | | 315 | | | | 32 | |
Derichebourg | | | 31,217 | | | | 90 | |
Edenred | | | 6,646 | | | | 123 | |
Essilor International | | | 1,919 | | | | 251 | |
Esso Francaise * | | | 528 | | | | 24 | |
Fleury Michon | | | 329 | | | | 22 | |
Groupe Fnac * | | | 822 | | | | 48 | |
Groupe Guillin | | | 563 | | | | 15 | |
Groupe Open | | | 757 | | | | 16 | |
Groupe Partouche * | | | 778 | | | | 28 | |
Ipsen | | | 2,948 | | | | 186 | |
LafargeHolcim | | | 267 | | | | 12 | |
Lectra | | | 3,453 | | | | 55 | |
Legrand | | | 3,928 | | | | 216 | |
PCAS | | | 8,453 | | | | 103 | |
Peugeot * | | | 14,422 | | | | 227 | |
Plastivaloire | | | 564 | | | | 50 | |
PSB Industries | | | 59 | | | | 3 | |
Safran | | | 4,948 | | | | 347 | |
Savencia | | | 79 | | | | 5 | |
Societe Generale | | | 7,583 | | | | 312 | |
| | | | | | | | |
| Description | | Shares | | | Market Value
($ Thousands) | |
Sodexo | | | 3,634 | | | $ | 382 | |
Synergie | | | 2,610 | | | | 78 | |
Thales | | | 2,160 | | | | 187 | |
TOTAL | | | 6,810 | | | | 331 | |
UBISOFT Entertainment * | | | 9,201 | | | | 340 | |
Veolia Environnement | | | 8,970 | | | | 202 | |
Vetoquinol | | | 324 | | | | 13 | |
Vinci | | | 1,830 | | | | 138 | |
| | | | | | | | |
| | | | | | | 4,054 | |
| | | | | | | | |
| |
Germany — 4.6% | | | | | |
Adesso | | | 169 | | | | 5 | |
Allianz | | | 3,539 | | | | 578 | |
AUDI | | | 37 | | | | 26 | |
BASF | | | 2,679 | | | | 207 | |
Brenntag | | | 3,779 | | | | 202 | |
CENTROTEC Sustainable | | | 477 | | | | 7 | |
Constantin Medien * | | | 17,806 | | | | 45 | |
Continental | | | 2,802 | | | | 601 | |
C-QUADRAT Investment | | | 340 | | | | 23 | |
CropEnergies | | | 4,408 | | | | 22 | |
Deutsche Boerse | | | 4,877 | | | | 428 | |
Deutsche Lufthansa | | | 16,667 | | | | 234 | |
Eckert & Ziegler | | | 1,449 | | | | 34 | |
Fresenius | | | 1,890 | | | | 143 | |
FRoSTA | | | 447 | | | | 30 | |
Highlight Communications | | | 5,433 | | | | 37 | |
Hochtief | | | 1,002 | | | | 127 | |
Hypoport * | | | 447 | | | | 43 | |
KUKA | | | 580 | | | | 68 | |
Leifheit | | | 72 | | | | 5 | |
Mensch und Maschine Software | | | 3,238 | | | | 52 | |
Merck KGaA | | | 1,286 | | | | 129 | |
MPC Muenchmeyer Petersen Capital * | | | 1,356 | | | | 12 | |
MTU Aero Engines | | | 1,590 | | | | 150 | |
Paul Hartmann | | | 49 | | | | 25 | |
SAP | | | 4,181 | | | | 340 | |
Schloss Wachenheim | | | 625 | | | | 10 | |
Ultrasonic * | | | 1,032 | | | | — | |
VERBIO Vereinigte BioEnergie | | | 29,159 | | | | 190 | |
| | | | | | | | |
| | | | | | | 3,773 | |
| | | | | | | | |
| |
Hong Kong — 3.4% | | | | | |
1010 Printing Group | | | 158,180 | | | | 25 | |
Anhui Conch Cement | | | 110,000 | | | | 266 | |
Bank of China | | | 54,000 | | | | 22 | |
China Construction Bank | | | 528,000 | | | | 341 | |
China Mobile | | | 33,500 | | | | 382 | |
EcoGreen International Group | | | 407,000 | | | | 88 | |
Hang Seng Bank | | | 14,700 | | | | 261 | |
Hong Kong Exchanges and Clearing | | | 15,300 | | | | 366 | |
Hong Kong Ferry Holdings | | | 27,000 | | | | 30 | |
Industrial & Commercial Bank of China | | | 451,000 | | | | 239 | |
Luen Thai Holdings | | | 39,000 | | | | 6 | |
| | |
| 118 | | SEI Institutional Investments Trust / Annual Report / May 31, 2016 |
SCHEDULE OF INVESTMENTS
Screened World Equity Ex-US Fund
May 31, 2016
| | | | | | | | |
| Description | | Shares | | | Market Value
($ Thousands) | |
Niraku GC Holdings | | | 208,000 | | | $ | 22 | |
Orient Overseas International | | | 76,500 | | | | 297 | |
Tencent Holdings | | | 12,400 | | | | 277 | |
Want Want China Holdings | | | 200,000 | | | | 142 | |
Wing On International | | | 8,111 | | | | 24 | |
| | | | | | | | |
| | | | | | | 2,788 | |
| | | | | | | | |
| |
Hungary — 0.1% | | | | | |
OTP Bank | | | 4,940 | | | | 119 | |
| | | | | | | | |
| |
India — 1.2% | | | | | |
HDFC Bank ADR | | | 8,522 | | | | 548 | |
ICICI Bank ADR | | | 58,826 | | | | 423 | |
| | | | | | | | |
| | | | | | | 971 | |
| | | | | | | | |
| |
Indonesia — 0.6% | | | | | |
Bank Rakyat Indonesia Persero | | | 205,200 | | | | 156 | |
Indofood Sukses Makmur * | | | 398,900 | | | | 202 | |
Japfa Comfeed Indonesia | | | 954,900 | | | | 62 | |
Samudera Indonesia | | | 4,200 | | | | 1 | |
Telekomunikasi Indonesia Persero | | | 104,000 | | | | 28 | |
Unilever Indonesia | | | 27,100 | | | | 86 | |
| | | | | | | | |
| | | | | | | 535 | |
| | | | | | | | |
| |
Ireland — 1.1% | | | | | |
James Hardie Industries, CDI | | | 21,563 | | | | 329 | |
Ryanair Holdings ADR | | | 6,690 | | | | 585 | |
| | | | | | | | |
| | | | | | | 914 | |
| | | | | | | | |
| |
Israel — 1.1% | | | | | |
Bank Hapoalim | | | 28,620 | | | | 148 | |
Electra Consumer Products 1970 * | | | 4,661 | | | | 42 | |
Knafaim Holdings | | | 3,989 | | | | 29 | |
Tadiran Holdings | | | 4,929 | | | | 93 | |
Teva Pharmaceutical Industries ADR | | | 11,446 | | | | 594 | |
| | | | | | | | |
| | | | | | | 906 | |
| | | | | | | | |
| |
Italy — 0.8% | | | | | |
Danieli & C Officine Meccaniche | | | 145 | | | | 3 | |
Exor | | | 4,191 | | | | 159 | |
Fiat Chrysler Automobiles | | | 15,600 | | | | 112 | |
La Doria | | | 629 | | | | 8 | |
Prysmian | | | 14,722 | | | | 360 | |
Rizzoli Corriere Della Sera Mediagroup * | | | 1,056 | | | | 1 | |
Servizi Italia | | | 332 | | | | 1 | |
| | | | | | | | |
| | | | | | | 644 | |
| | | | | | | | |
| |
Japan — 11.5% | | | | | |
Aichi Bank | | | 200 | | | | 9 | |
Aoki Super | | | 1,000 | | | | 12 | |
Arata | | | 1,800 | | | | 39 | |
Astellas Pharma | | | 14,400 | | | | 197 | |
AT-Group | | | 4,000 | | | | 77 | |
Axyz | | | 200 | | | | 4 | |
BML | | | 1,500 | | | | 70 | |
Chubu Shiryo | | | 600 | | | | 4 | |
| | | | | | | | |
| Description | | Shares | | | Market Value
($ Thousands) | |
Computer Engineering & Consulting | | | 8,400 | | | $ | 117 | |
Dai-ichi Life Insurance | | | 10,400 | | | | 137 | |
Daiichi Sankyo | | | 9,400 | | | | 218 | |
Daito Trust Construction | | | 300 | | | | 44 | |
Denso | | | 23,600 | | | | 930 | |
FANUC | | | 1,400 | | | | 214 | |
Fast Retailing | | | 600 | | | | 162 | |
Fujitsu | | | 40,000 | | | | 162 | |
G-7 Holdings | | | 1,900 | | | | 21 | |
Haseko | | | 15,300 | | | | 168 | |
Hitachi | | | 61,000 | | | | 282 | |
Hokuriku Gas | | | 7,000 | | | | 17 | |
Itochu | | | 9,600 | | | | 120 | |
Japan Airlines | | | 6,100 | | | | 209 | |
Japan Exchange Group | | | 29,900 | | | | 407 | |
Kamei | | | 10,200 | | | | 87 | |
Kao | | | 1,500 | | | | 83 | |
Kawasumi Laboratories | | | 900 | | | | 6 | |
KDDI | | | 8,000 | | | | 234 | |
Keiyo Gas | | | 1,000 | | | | 4 | |
Kita-Nippon Bank | | | 1,200 | | | | 29 | |
Kitano Construction | | | 13,000 | | | | 31 | |
Marubeni | | | 35,500 | | | | 171 | |
Marukyo | | | 2,000 | | | | 12 | |
Maruzen | | | 5,000 | | | | 43 | |
Mitsubishi Gas Chemical | | | 12,000 | | | | 68 | |
Mitsubishi Research Institute | | | 700 | | | | 21 | |
Mitsui Sumitomo Insurance Group Holdings | | | 13,300 | | | | 379 | |
Mitsui Trust Holdings | | | 89,000 | | | | 310 | |
Mixi | | | 2,400 | | | | 93 | |
Mizuho Financial Group | | | 149,300 | | | | 235 | |
NDS | | | 2,000 | | | | 5 | |
Nidec | | | 3,100 | | | | 239 | |
Nihon Eslead | | | 1,400 | | | | 14 | |
Nippon Steel & Sumitomo Metal | | | 13,400 | | | | 277 | |
Nippon Telegraph & Telephone | | | 8,370 | | | | 366 | |
Nissan Motor | | | 16,400 | | | | 166 | |
NTT DoCoMo | | | 10,900 | | | | 273 | |
ORIX | | | 11,100 | | | | 154 | |
Otsuka Holdings | | | 5,200 | | | | 212 | |
Rakuten | | | 29,100 | | | | 313 | |
San-Ai Oil | | | 2,191 | | | | 15 | |
Secom | | | 9,400 | | | | 736 | |
Shimano | | | 2,000 | | | | 312 | |
SMC | �� | | 1,300 | | | | 331 | |
T&D Holdings | | | 13,700 | | | | 137 | |
T-Gaia | | | 3,000 | | | | 43 | |
Toho Gas | | | 1,000 | | | | 7 | |
Toyota Motor | | | 8,100 | | | | 422 | |
Yamae Hisano | | | 600 | | | | 5 | |
Yamato | | | 6,000 | | | | 30 | |
Zenkoku Hosho | | | 1,400 | | | | 46 | |
| | | | | | | | |
| | | | | | | 9,529 | |
| | | | | | | | |
| | |
| 119 | | SEI Institutional Investments Trust / Annual Report / May 31, 2016 |
SCHEDULE OF INVESTMENTS
Screened World Equity Ex-US Fund
May 31, 2016
| | | | | | | | |
| Description | | Shares | | | Market Value
($ Thousands) | |
Malaysia — 0.5% | | | | | |
Dutch Lady Milk Industries | | | 800 | | | $ | 11 | |
Malayan Banking | | | 30,600 | | | | 60 | |
Malaysian Pacific Industries | | | 10,700 | | | | 19 | |
MISC | | | 42,200 | | | | 79 | |
Padini Holdings | | | 108,200 | | | | 62 | |
Petron Malaysia Refining & Marketing * | | | 42,200 | | | | 44 | |
Public Bank | | | 19,600 | | | | 91 | |
Tenaga Nasional | | | 25,000 | | | | 85 | |
| | | | | | | | |
| | | | | | | 451 | |
| | | | | | | | |
| |
Mexico — 0.3% | | | | | |
Bio Pappel * | | | 18,819 | | | | 24 | |
Cemex ADR * | | | 17,675 | | | | 113 | |
Grupo Financiero Banorte, Ser O | | | 14,100 | | | | 74 | |
Wal-Mart de Mexico | | | 8,626 | | | | 20 | |
| | | | | | | | |
| | | | | | | 231 | |
| | | | | | | | |
| |
Netherlands — 2.4% | | | | | |
AerCap Holdings * | | | 2,620 | | | | 103 | |
AMG Advanced Metallurgical Group | | | 5,451 | | | | 76 | |
BE Semiconductor Industries | | | 1,150 | | | | 33 | |
DOCdata | | | 492 | | | | — | |
Heineken Holding | | | 4,800 | | | | 394 | |
Nederland Apparatenfabriek | | | 1,341 | | | | 44 | |
NN Group | | | 3,700 | | | | 124 | |
SNS Reaal * | | | 1,762 | | | | — | |
Unilever | | | 26,375 | | | | 1,185 | |
| | | | | | | | |
| | | | | | | 1,959 | |
| | | | | | | | |
| |
New Zealand — 0.2% | | | | | |
Air New Zealand | | | 39,770 | | | | 61 | |
Scales | | | 10,857 | | | | 24 | |
Tourism Holdings | | | 3,995 | | | | 8 | |
Z Energy | | | 17,342 | | | | 98 | |
| | | | | | | | |
| | | | | | | 191 | |
| | | | | | | | |
| |
Norway — 1.4% | | | | | |
DnB | | | 41,581 | | | | 534 | |
Norsk Hydro | | | 72,018 | | | | 287 | |
Statoil ADR | | | 22,427 | | | | 353 | |
| | | | | | | | |
| | | | | | | 1,174 | |
| | | | | | | | |
| |
Panama — 0.2% | | | | | |
Copa Holdings, Cl A | | | 2,818 | | | | 145 | |
| | | | | | | | |
| |
Peru — 0.2% | | | | | |
Credicorp | | | 1,253 | | | | 176 | |
| | | | | | | | |
| | |
Philippines — 0.1% | | | | | | | | |
Cebu Air | | | 2,290 | | | | 5 | |
Top Frontier Investment Holdings * | | | 8,700 | | | | 33 | |
| | | | | | | | |
| | | | | | | 38 | |
| | | | | | | | |
| | | | | | | | |
| Description | | Shares | | | Market Value
($ Thousands) | |
Poland — 0.2% | | | | | | | | |
Ciech * | | | 731 | | | $ | 12 | |
Emperia Holding | | | 1,287 | | | | 18 | |
Polski Koncern Naftowy ORLEN | | | 7,954 | | | | 140 | |
| | | | | | | | |
| | | | | | | 170 | |
| | | | | | | | |
| |
Portugal — 0.5% | | | | | |
Galp Energia, Cl B | | | 14,466 | | | | 190 | |
Jeronimo Martins | | | 9,000 | | | | 146 | |
Sonae Capital SGPS | | | 53,697 | | | | 36 | |
| | | | | | | | |
| | | | | | | 372 | |
| | | | | | | | |
| |
Qatar — 0.3% | | | | | |
Barwa Real Estate | | | 10,982 | | | | 91 | |
Ooredoo QSC | | | 7,839 | | | | 177 | |
| | | | | | | | |
| | | | | | | 268 | |
| | | | | | | | |
| |
Russia — 1.2% | | | | | |
Magnit GDR | | | 1,002 | | | | 35 | |
Magnit PJSC GDR | | | 4,122 | | | | 146 | |
Rosneft Oil GDR | | | 66,978 | | | | 324 | |
Sberbank of Russia ADR | | | 34,329 | | | | 288 | |
Yandex, Cl A * | | | 10,557 | | | | 218 | |
| | | | | | | | |
| | | | | | | 1,011 | |
| | | | | | | | |
| |
Singapore — 1.7% | | | | | |
Boustead Singapore | | | 86,100 | | | | 50 | |
DBS Group Holdings | | | 37,400 | | | | 421 | |
Frencken Group | | | 11,600 | | | | 2 | |
Golden Agri-Resources | | | 8,000 | | | | 2 | |
Hong Leong Finance | | | 7,000 | | | | 12 | |
Jardine Cycle & Carriage | | | 3,100 | | | | 76 | |
Lantrovision Singapore | | | 4,220 | | | | 10 | |
NatSteel * | | | 8,500 | | | | 9 | |
New Toyo International Holdings | | | 23,200 | | | | 4 | |
Oversea-Chinese Banking | | | 33,500 | | | | 210 | |
QAF | | | 6,792 | | | | 5 | |
Singapore Exchange | | | 16,100 | | | | 91 | |
United Industrial | | | 110,000 | | | | 220 | |
United Overseas Bank | | | 24,800 | | | | 328 | |
| | | | | | | | |
| | | | | | | 1,440 | |
| | | | | | | | |
| |
South Africa — 2.3% | | | | | |
Brait * | | | 9,462 | | | | 96 | |
FirstRand | | | 10,320 | | | | 28 | |
Harmony Gold Mining ADR | | | 13,267 | | | | 41 | |
Impala Platinum Holdings * | | | 30,257 | | | | 86 | |
Kumba Iron Ore | | | 6,005 | | | | 31 | |
Liberty Holdings | | | 24,073 | | | | 182 | |
Naspers, Cl N | | | 4,831 | | | | 710 | |
RCL Foods | | | 16,799 | | | | 15 | |
Sanlam | | | 2,546 | | | | 10 | |
Sasol | | | 6,290 | | | | 191 | |
Sibanye Gold | | | 40,260 | | | | 115 | |
Standard Bank Group | | | 7,111 | | | | 56 | |
| | |
| 120 | | SEI Institutional Investments Trust / Annual Report / May 31, 2016 |
SCHEDULE OF INVESTMENTS
Screened World Equity Ex-US Fund
May 31, 2016
| | | | | | | | |
| Description | | Shares | | | Market Value
($ Thousands) | |
Steinhoff International Holdings | | | 32,179 | | | $ | 189 | |
Telkom | | | 29,987 | | | | 110 | |
| | | | | | | | |
| | | | | | | 1,860 | |
| | | | | | | | |
| |
South Korea — 3.3% | | | | | |
Hyundai Mobis | | | 1,739 | | | | 372 | |
Korea Electric Power | | | 4,514 | | | | 238 | |
Korea Petrochemical Industries | | | 280 | | | | 53 | |
LG.Philips LCD | | | 510 | | | | 11 | |
NAVER | | | 387 | | | | 234 | |
Samsung Electronics | | | 1,354 | | | | 1,468 | |
SK Hynix | | | 6,309 | | | | 152 | |
SK Telecom | | | 1,088 | | | | 203 | |
| | | | | | | | |
| | | | | | | 2,731 | |
| | | | | | | | |
| |
Spain — 2.0% | | | | | |
ACS Actividades Construcciones y Servicios | | | 6,092 | | | | 201 | |
Amadeus IT Holding, Cl A | | | 16,084 | | | | 746 | |
Bankinter | | | 33,057 | | | | 252 | |
Iberpapel Gestion | | | 431 | | | | 8 | |
Industria de Diseno Textil | | | 12,785 | | | | 432 | |
| | | | | | | | |
| | | | | | | 1,639 | |
| | | | | | | | |
| |
Sweden — 2.5% | | | | | |
Atlas Copco, Cl B | | | 18,313 | | | | 436 | |
Biotage | | | 68,876 | | | | 245 | |
Catella | | | 18,486 | | | | 45 | |
Getinge, Cl B | | | 19,739 | | | | 421 | |
Proact IT Group | | | 1,997 | | | | 28 | |
Probi | | | 442 | | | | 10 | |
Skanska, Cl B | | | 6,810 | | | | 149 | |
Svenska Cellulosa, Cl B | | | 4,200 | | | �� | 134 | |
Svenska Handelsbanken, Cl A | | | 37,335 | | | | 477 | |
Volvo, Cl B | | | 14,666 | | | | 163 | |
| | | | | | | | |
| | | | | | | 2,108 | |
| | | | | | | | |
| |
Switzerland — 4.4% | | | | | |
ABB | | | 2,715 | | | | 56 | |
Bachem Holding, Cl B | | | 280 | | | | 21 | |
Cie Financiere Richemont | | | 3,033 | | | | 179 | |
Credit Suisse Group ADR | | | 23,314 | | | | 319 | |
Goldbach Group | | | 1,151 | | | | 28 | |
Holcim | | | 3,758 | | | | 169 | |
Lonza Group | | | 339 | | | | 58 | |
Looser Holding * | | | 259 | | | | 14 | |
Metall Zug | | | 12 | | | | 35 | |
Nestle | | | 10,287 | | | | 759 | |
Novartis ADR | | | 7,202 | | | | 573 | |
Roche Holding | | | 2,511 | | | | 659 | |
SGS | | | 118 | | | | 252 | |
Swiss Life Holding | | | 31 | | | | 8 | |
Swiss Re | | | 1,470 | | | | 132 | |
Tamedia | | | 27 | | | | 4 | |
| | | | | | | | |
| Description | | Shares | | | Market Value
($ Thousands) | |
Wolseley | | | 5,867 | | | $ | 346 | |
| | | | | | | | |
| | | | | | | 3,612 | |
| | | | | | | | |
| |
Taiwan — 3.5% | | | | | |
Advanced Semiconductor Engineering | | | 435,000 | | | | 492 | |
Hon Hai Precision Industry | | | 105,101 | | | | 258 | |
Hon Hai Precision Industry GDR | | | 59,928 | | | | 298 | |
Pegatron | | | 3,633 | | | | 8 | |
Taiwan Semiconductor Manufacturing | | | 117,000 | | | | 561 | |
Taiwan Semiconductor Manufacturing ADR | | | 52,810 | | | | 1,306 | |
| | | | | | | | |
| | | | | | | 2,923 | |
| | | | | | | | |
| |
Thailand — 0.9% | | | | | |
Bangkok Bank NVDR | | | 32,100 | | | | 147 | |
Esso Thailand | | | 72,100 | | | | 12 | |
PTT | | | 29,700 | | | | 250 | |
Siam Cement | | | 14,300 | | | | 194 | |
Siam Cement NVDR, NVDR | | | 12,850 | | | | 174 | |
| | | | | | | | |
| | | | | | | 777 | |
| | | | | | | | |
| |
Turkey — 0.6% | | | | | |
Akbank | | | 126,192 | | | | 341 | |
Turkiye Is Bankasi, Cl C | | | 3,001 | | | | 5 | |
Turkiye Vakifiar Bankasi Tao, Cl D | | | 99,500 | | | | 150 | |
| | | | | | | | |
| | | | | | | 496 | |
| | | | | | | | |
| |
United Kingdom — 12.3% | | | | | |
3i Group | | | 874 | | | | 7 | |
ARM Holdings | | | 33,617 | | | | 483 | |
ARM Holdings ADR | | | 22,290 | | | | 961 | |
ASOS * | | | 2,764 | | | | 141 | |
Associated British Foods | | | 8,751 | | | | 375 | |
AstraZeneca | | | 6,447 | | | | 378 | |
Berkeley Group Holdings | | | 4,390 | | | | 209 | |
BHP Billiton | | | 194 | | | | 2 | |
BP | | | 21,255 | | | | 110 | |
BP PLC ADR | | | 5,984 | | | | 188 | |
British American Tobacco | | | 5,309 | | | | 324 | |
BT Group, Cl A | | | 38,807 | | | | 250 | |
Burberry Group | | | 8,863 | | | | 139 | |
Capita | | | 19,045 | | | | 295 | |
Carnival | | | 4,740 | | | | 235 | |
Cenkos Securities | | | 5,511 | | | | 12 | |
Character Group | | | 4,317 | | | | 34 | |
CML Microsystems | | | 475 | | | | 2 | |
Coats Group * | | | 23,012 | | | | 10 | |
Compass Group | | | 10,230 | | | | 192 | |
CRH | | | 11,098 | | | | 335 | |
Dart Group | | | 7,297 | | | | 69 | |
Dechra Pharmaceuticals | | | 610 | | | | 10 | |
Diageo | | | 21,032 | | | | 573 | |
Eco Animal Health Group | | | 1,679 | | | | 10 | |
entu UK | | | 42 | | | | — | |
Evraz * | | | 14,693 | | | | 24 | |
Experian | | | 17,602 | | | | 335 | |
| | |
| 121 | | SEI Institutional Investments Trust / Annual Report / May 31, 2016 |
SCHEDULE OF INVESTMENTS
Screened World Equity Ex-US Fund
May 31, 2016
| | | | | | | | |
| Description | | Shares | | | Market Value
($ Thousands) | |
Games Workshop Group | | | 1,198 | | | $ | 9 | |
Gem Diamonds | | | 5,298 | | | | 10 | |
Greggs | | | 1,752 | | | | 29 | |
Halma | | | 10,200 | | | | 141 | |
Hargreaves Lansdown | | | 13,025 | | | | 256 | |
Hargreaves Services | | | 1,346 | | | | 3 | |
Howden Joinery Group | | | 20,974 | | | | 155 | |
HSBC Holdings | | | 64,087 | | | | 415 | |
Imperial Brands | | | 4,430 | | | | 242 | |
Indivior | | | 17,994 | | | | 45 | |
ITV | | | 94,839 | | | | 296 | |
Lloyds Banking Group | | | 213,520 | | | | 224 | |
Moneysupermarket.com Group | | | 7,731 | | | | 37 | |
NWF Group * | | | 20,576 | | | | 45 | |
Persimmon | | | 7,240 | | | | 221 | |
Prudential | | | 17,710 | | | | 356 | |
Rio Tinto | | | 10,792 | | | | 305 | |
Rio Tinto ADR | | | 9,654 | | | | 271 | |
Rolls-Royce Holdings | | | 12,794 | | | | 115 | |
Shire | | | 15,482 | | | | 960 | |
Sky | | | 271 | | | | 4 | |
Skyepharma * | | | 109 | | | | 1 | |
St. James’s Place | | | 16,271 | | | | 220 | |
Tullow Oil | | | 33,157 | | | | 111 | |
Vodafone Group ADR | | | 289 | | | | 10 | |
WPP | | | 1,599 | | | | 37 | |
| | | | | | | | |
| | | | | | | 10,221 | |
| | | | | | | | |
| |
United States — 3.8% | | | | | |
Carnival, Cl A | | | 13,803 | | | | 659 | |
Core Laboratories | | | 5,721 | | | | 694 | |
Everest Re Group | | | 4,275 | | | | 766 | |
ICON * | | | 11,712 | | | | 825 | |
PriceSmart | | | 2,183 | | | | 193 | |
TransGlobe Energy | | | 19,916 | | | | 33 | |
| | | | | | | | |
| | | | | | | 3,170 | |
| | | | | | | | |
Total Common Stock
(Cost $78,103) ($ Thousands) | | | | 76,482 | |
| | | | | | | | |
| |
PREFERRED STOCK — 1.0% | | | | | |
| | |
Brazil — 1.0% | | | | | | | | |
Alpargatas | | | 20,600 | | | | 56 | |
Banco Bradesco | | | 41,448 | | | | 263 | |
Centrais Eletricas Santa Catarina | | | 8,800 | | | | 30 | |
Itau Unibanco Holding | | | 31,131 | | | | 251 | |
Itau Unibanco Holding ADR | | | 17,252 | | | | 138 | |
Metalurgica Gerdau | | | 30,400 | | | | 16 | |
Vale, Cl A | | | 11,000 | | | | 35 | |
| | | | | | | | |
| | | | | | | 789 | |
| | | | | | | | |
| | |
Germany — 0.0% | | | | | | | | |
Einhell Germany | | | 165 | | | | 6 | |
| | | | | | | | |
| Description | | Shares | | | Market Value
($ Thousands) | |
Westag & Getalit | | | 305 | | | $ | 7 | |
| | | | | | | | |
| | | | | | | 13 | |
| | | | | | | | |
Total Preferred Stock
(Cost $1,230) ($ Thousands) | | | | 802 | |
| | | | | | | | |
| | |
| | | Number of
Rights | | | | |
RIGHTS — 0.0% | | | | | | | | |
| | |
Italy — 0.0% | | | | | | | | |
UnipolSai, Cl A ‡‡ | | | 64 | | | | — | |
| | | | | | | | |
Total Rights
(Cost $—) ($ Thousands) | | | | — | |
| | | | | | | | |
| | |
| | | Face Amount
(Thousands) | | | | |
U.S. TREASURY OBLIGATION — 0.5% | | | | | |
U.S. Treasury Bills | | | | | | | | |
0.363%, 08/18/2016 (A)(B) | | $ | 370 | | | | 370 | |
| | | | | | | | |
Total U.S. Treasury Obligation
(Cost $370) ($ Thousands) | | | | 370 | |
| | | | | | | | |
| | |
| | | Shares | | | | | |
| | | | | | | | |
CASH EQUIVALENT — 2.5% | | | | | |
SEI Daily Income Trust, Prime Obligation Fund, Cl A | | | | | | | | |
0.270% **† | | | 2,083,935 | | | | 2,084 | |
| | | | | | | | |
Total Cash Equivalent
(Cost $2,084) ($ Thousands) | | | | 2,084 | |
| | | | | | | | |
Total Investments — 96.3%
(Cost $81,787) ($ Thousands) | | | $ | 79,738 | |
| | | | | | | | |
A list of the open futures contracts held by the Fund at May 31, 2016, is as follows:
| | | | | | | | | | | | |
| Type of Contract | | Number of
Contracts
Long | | | Expiration
Date | | | Unrealized
Appreciation
(Depreciation)
($ Thousands) | |
DJ Euro Stoxx 50 Index | | | 19 | | | | Jun-2016 | | | $ | 20 | |
FTSE 100 Index | | | 4 | | | | Jun-2016 | | | | – | |
Hang Seng Index | | | 3 | | | | Jun-2016 | | | | 8 | |
S&P TSX 60 Index | | | 3 | | | | Jun-2016 | | | | 1 | |
SPI 200 Index | | | 2 | | | | Jun-2016 | | | | (1 | ) |
Topix Index | | | 3 | | | | Jun-2016 | | | | 13 | |
| | | | | | | | | | | | |
| | | | | | | | | | $ | 41 | |
| | | | | | | | | | | | |
For the year ended May 31, 2016, the total amount of all open futures contracts, as presented in the table above, are representative of the volume of activity for the derivative type during the year.
| | |
| 122 | | SEI Institutional Investments Trust / Annual Report / May 31, 2016 |
SCHEDULE OF INVESTMENTS
Screened World Equity Ex-US Fund
May 31, 2016
Percentages are based on a Net Assets of $82,836 ($ Thousands).
| * | | Non-income producing security. |
| ** | | Rate shown is the 7-day effective yield as of May 31, 2016. |
| † | | Investment in Affiliated Security (see Note 6). |
| ‡ | | Real Estate Investment Trust. |
| ‡‡ | | Expiration date unavailable. |
| (A) | | Security, or portion thereof, has been pledged as collateral on open futures contracts. |
| (B) | | The rate reported is the effective yield at time of purchase. |
ADR — American Depositary Receipt
Cl — Class
DJ — Dow Jones
FTSE — Financial Times and Stock Exchange
GDR — Global Depositary Receipt
NVDR — Non-Voting Depositary Receipt
PLC — Public Limited Company
Ser — Series
S&P — Standard & Poor’s
SPI — Share Price Index
The following is a list of the level of inputs used as of May 31, 2016, in valuing the Fund’s investments and other financial instruments carried at value ($ Thousands):
| | | | | | | | | | | | | | | | |
| Investments in Securities | | Level 1 | | | Level 2 | | | Level 3 | | | Total | |
Common Stock | | $ | 76,482 | | | $ | — | | | $ | — | | | $ | 76,482 | |
Preferred Stock | | | 802 | | | | — | | | | — | | | | 802 | |
Rights | | | — | | | | — | | | | — | | | | — | |
U.S. Treasury Obligation | | | — | | | | 370 | | | | — | | | | 370 | |
Cash Equivalent | | | 2,084 | | | | — | | | | — | | | | 2,084 | |
| | | | | | | | | | | | | | | | |
Total Investments in Securities | | $ | 79,368 | | | $ | 370 | | | $ | — | | | $ | 79,738 | |
| | | | | | | | | | | | | | | | |
| | | | | | | | | | | | | | | | |
| Other Financial Instruments | | Level 1 | | | Level 2 | | | Level 3 | | | Total | |
Futures Contracts * | | | | | | | | | | | | | | | | |
Unrealized Appreciation | | $ | 42 | | | $ | — | | | $ | — | | | $ | 42 | |
Unrealized Depreciation | | | (1 | ) | | | — | | | | — | | | | (1 | ) |
| | | | | | | | | | | | | | | | |
Total Other Financial Instruments | | $ | 41 | | | $ | — | | | $ | — | | | $ | 41 | |
| | | | | | | | | | | | | | | | |
| * | | Futures contracts are valued at the unrealized appreciation (depreciation) on the instrument. |
For the year ended May 31, 2016, there were no transfers between Level 1 and Level 2 assets and liabilities.
For the year ended May 31, 2016, there were no transfers between Level 2 and Level 3 assets and liabilities.
For more information on valuation inputs, see Note 2 – Significant Accounting Policies in Notes to Financial Statements.
Amounts designated as “—” are $0 or have been rounded to $0.
The accompanying notes are an integral part of the financial statements.
| | |
| 123 | | SEI Institutional Investments Trust / Annual Report / May 31, 2016 |
SCHEDULE OF INVESTMENTS
Emerging Markets Equity Fund
May 31, 2016
| | | | | | | | |
| Description | | Shares | | | Market Value
($ Thousands) | |
COMMON STOCK — 84.7% | | | | | | | | |
| | |
Argentina — 2.6% | | | | | | | | |
Arcos Dorados Holdings, Cl A * | | | 330,068 | | | $ | 1,439 | |
Banco Macro ADR | | | 25,470 | | | | 1,592 | |
Grupo Clarin GDR, Cl B | | | 60,800 | | | | 1,176 | |
Grupo Financiero Galicia ADR | | | 205,192 | | | | 5,830 | |
MercadoLibre | | | 50,580 | | | | 6,904 | |
Pampa Energia ADR * | | | 59,295 | | | | 1,392 | |
Telecom Argentina ADR | | | 49,166 | | | | 864 | |
YPF ADR | | | 226,037 | | | | 4,726 | |
| | | | | | | | |
| | | | | | | 23,923 | |
| | | | | | | | |
|
Bangladesh — 0.4% | |
BRAC Bank | | | 2,006,670 | | | | 1,188 | |
Envoy Textiles | | | 771,287 | | | | 338 | |
GrameenPhone | | | 413,070 | | | | 1,344 | |
Square Pharmaceuticals | | | 318,180 | | | | 1,057 | |
| | | | | | | | |
| | | | | | | 3,927 | |
| | | | | | | | |
|
Botswana — 0.0% | |
Sechaba Breweries Holdings | | | 116,590 | | | | 296 | |
| | | | | | | | |
|
Brazil — 3.2% | |
AES Tiete Energia | | | 208,400 | | | | 839 | |
Ambev | | | 1,560,540 | | | | 8,223 | |
Banco do Brasil | | | 510,700 | | | | 2,317 | |
BB Seguridade Participacoes | | | 59,500 | | | | 454 | |
BM&F Bovespa | | | 134,900 | | | | 592 | |
BRF — Brasil Foods | | | 23,000 | | | | 291 | |
BTG Pactual Group | | | 290,000 | | | | 1,455 | |
Cia de Saneamento de Minas Gerais-COPASA (Brazil) | | | 50,300 | | | | 345 | |
Cosan, Cl A | | | 292,343 | | | | 1,582 | |
Cosan Industria e Comercio (Brazil) | | | 61,000 | | | | 562 | |
EcoRodovias Infraestrutura e Logistica * | | | 299,800 | | | | 653 | |
Estacio Participacoes | | | 150,500 | | | | 468 | |
Even Construtora e Incorporadora | | | 529,100 | | | | 593 | |
JBS | | | 684,300 | | | | 1,913 | |
Lojas Renner | | | 251,329 | | | | 1,451 | |
Petroleo Brasileiro ADR, Cl A * | | | 214,500 | | | | 946 | |
Porto Seguro | | | 75,100 | | | | 552 | |
Raia Drogasil | | | 339,665 | | | | 5,398 | |
Ultrapar Participacoes | | | 38,500 | | | | 735 | |
WEG | | | 55,100 | | | | 224 | |
| | | | | | | | |
| | | | | | | 29,593 | |
| | | | | | | | |
|
Canada — 0.9% | |
Africa Oil * | | | 714,629 | | | | 1,120 | |
First Quantum Minerals | | | 265,880 | | | | 1,748 | |
Gran Tierra Energy * | | | 1,202,854 | | | | 3,564 | |
Guyana Goldfields * | | | 229,118 | | | | 1,303 | |
Parex Resources * | | | 99,100 | | | | 1,022 | |
| | | | | | | | |
| | | | | | | 8,757 | |
| | | | | | | | |
|
Chile — 0.7% | |
Banco de Chile | | | 6,669,719 | | | | 674 | |
| | | | | | | | |
| Description | | Shares | | | Market Value
($ Thousands) | |
Banco Santander Chile | | | 14,976,929 | | | $ | 678 | |
Empresas COPEC | | | 37,933 | | | | 324 | |
Forus | | | 398,190 | | | | 1,155 | |
Parque Arauco | | | 949,702 | | | | 1,826 | |
SONDA | | | 454,146 | | | | 808 | |
Vina Concha y Toro | | | 518,110 | | | | 853 | |
| | | | | | | | |
| | | | | | | 6,318 | |
| | | | | | | | |
|
China — 6.9% | |
Agricultural Bank of China | | | 4,047,000 | | | | 1,479 | |
Alibaba Group Holding ADR * | | | 36,500 | | | | 2,993 | |
Baidu ADR * | | | 6,700 | | | | 1,196 | |
Bank of Chongqing | | | 846,252 | | | | 639 | |
Belle International Holdings | | | 1,000 | | | | 1 | |
China Biologic Products * | | | 42,380 | | | | 4,999 | |
China Communications Construction | | | 2,401,000 | | | | 2,720 | |
China Communications Services | | | 1,830,000 | | | | 860 | |
China Everbright Bank | | | 7,516,000 | | | | 3,232 | |
China Petroleum & Chemical | | | 4,770,000 | | | | 3,254 | |
China Petroleum & Chemical ADR | | | 15,500 | | | | 1,058 | |
China Railway Construction | | | 1,418,500 | | | | 1,773 | |
China Railway Group | | | 1,982,000 | | | | 1,523 | |
China Shenhua Energy | | | 551,500 | | | | 876 | |
Cogobuy Group *(A) | | | 1,253,000 | | | | 2,065 | |
Ctrip.com International ADR * | | | 152,145 | | | | 6,962 | |
Datang International Power Generation | | | 1,884,000 | | | | 504 | |
Dongfeng Motor Group | | | 1,566,000 | | | | 1,746 | |
Evergrande Real Estate Group | | | 1,349,000 | | | | 903 | |
Great Wall Motor | | | 456,000 | | | | 351 | |
Guangzhou R&F Properties | | | 2,306,800 | | | | 3,065 | |
Huaneng Power International | | | 1,366,000 | | | | 934 | |
JA Solar Holdings ADR * | | | 68,500 | | | | 546 | |
Jiangnan Group | | | 4,922,000 | | | | 817 | |
Jiangsu Expressway | | | 808,000 | | | | 1,107 | |
JinkoSolar Holding ADR * | | | 64,300 | | | | 1,398 | |
NetEase ADR | | | 27,243 | | | | 4,845 | |
New Oriental Education & Technology Group ADR | | | 67,300 | | | | 2,843 | |
PICC Property & Casualty | | | 1,118,000 | | | | 2,041 | |
Ping An Insurance Group of China | | | 113,000 | | | | 505 | |
Sinopec Engineering Group | | | 848,500 | | | | 745 | |
Sinopharm Group | | | 385,200 | | | | 1,785 | |
TAL Education Group ADR * | | | 27,613 | | | | 1,475 | |
Weichai Power | | | 1,034,000 | | | | 1,209 | |
Zhejiang Expressway | | | 2,208,000 | | | | 2,069 | |
| | | | | | | | |
| | | | | | | 64,518 | |
| | | | | | | | |
|
Colombia — 1.3% | |
Bancolombia | | | 49,180 | | | | 377 | |
Bancolombia ADR, Cl R | | | 119,033 | | | | 3,876 | |
Canacol Energy * | | | 377,810 | | | | 1,093 | |
Cementos Argos | | | 127,912 | | | | 482 | |
Cemex Latam Holdings * | | | 539,695 | | | | 2,354 | |
Constructora Conconcreto | | | 445,980 | | | | 164 | |
| | |
| 124 | | SEI Institutional Investments Trust / Annual Report / May 31, 2016 |
SCHEDULE OF INVESTMENTS
Emerging Markets Equity Fund
May 31, 2016
| | | | | | | | |
| Description | | Shares | | | Market Value
($ Thousands) | |
Empresa de Telecomunicaciones de Bogota | | | 4,844,650 | | | $ | 930 | |
Financiera Colombiana | | | 50,694 | | | | 638 | |
Financiera Colombiana ADR | | | 12,420 | | | | 257 | |
Grupo Aval Acciones y Valores ADR | | | 174,094 | | | | 1,264 | |
Interconexion Electrica ESP | | | 134,623 | | | | 383 | |
| | | | | | | | |
| | | | | | | 11,818 | |
| | | | | | | | |
|
Czech Republic — 0.2% | |
CEZ | | | 37,030 | | | | 673 | |
Komercni Banka | | | 9,875 | | | | 388 | |
Moneta Money Bank *(A) | | | 157,454 | | | | 495 | |
| | | | | | | | |
| | | | | | | 1,556 | |
| | | | | | | | |
|
Egypt — 0.4% | |
Commercial International Bank Egypt GDR | | | 330,457 | | | | 1,221 | |
Global Telecom Holding GDR * | | | 344,140 | | | | 583 | |
Integrated Diagnostics Holdings (A) | | | 442,170 | | | | 1,990 | |
| | | | | | | | |
| | | | | | | 3,794 | |
| | | | | | | | |
|
Georgia — 0.4% | |
BGEO Group | | | 53,670 | | | | 1,964 | |
TBC Bank GDR | | | 143,620 | | | | 1,831 | |
| | | | | | | | |
| | | | | | | 3,795 | |
| | | | | | | | |
|
Greece — 0.7% | |
Alpha Bank * | | | 315,368 | | | | 857 | |
Eurobank Ergasias * | | | 1,243,000 | | | | 1,370 | |
JUMBO | | | 105,281 | | | | 1,441 | |
National Bank of Greece * | | | 9,479,734 | | | | 3,029 | |
| | | | | | | | |
| | | | | | | 6,697 | |
| | | | | | | | |
|
Hong Kong — 9.2% | |
Anhui Conch Cement | | | 464,000 | | | | 1,123 | |
Bank of China | | | 22,792,000 | | | | 9,272 | |
China Conch Venture Holdings | | | 481,500 | | | | 971 | |
China Construction Bank | | | 11,270,000 | | | | 7,268 | |
China Everbright | | | 748,000 | | | | 1,437 | |
China High Speed Transmission Equipment Group | | | 1,645,000 | | | | 1,262 | |
China Maple Leaf Educational Systems | | | 2,854,000 | | | | 2,561 | |
China Medical System Holdings | | | 559,000 | | | | 800 | |
China Mobile | | | 247,000 | | | | 2,817 | |
China Mobile ADR | | | 34,900 | | | | 1,970 | |
China Resources Power Holdings | | | 438,000 | | | | 688 | |
China Southern Airlines | | | 1,688,000 | | | | 991 | |
Geely Automobile Holdings | | | 2,180,000 | | | | 1,153 | |
GOME Electrical Appliances Holdings | | | 3,906,000 | | | | 468 | |
Goodbaby International Holdings | | | 1,806,000 | | | | 1,093 | |
Guangzhou Automobile Group | | | 1,034,000 | | | | 1,183 | |
Guotai Junan International Holdings | | | 6,740,000 | | | | 2,152 | |
Hengan International Group | | | 51,000 | | | | 460 | |
Huabao International Holdings | | | 126,000 | | | | 49 | |
Huaneng Renewables | | | 4,468,000 | | | | 1,357 | |
Industrial & Commercial Bank of China | | | 9,587,000 | | | | 5,085 | |
KWG Property Holding | | | 1,178,000 | | | | 740 | |
| | | | | | | | |
| Description | | Shares | | | Market Value
($ Thousands) | |
Man Wah Holdings | | | 1,255,200 | | | $ | 1,758 | |
Minth Group | | | 368,000 | | | | 1,082 | |
Pou Sheng International Holdings * | | | 5,272,000 | | | | 1,479 | |
Regina Miracle International Holdings *(A) | | | 1,770,480 | | | | 2,434 | |
Shanghai Industrial Holdings | | | 361,000 | | | | 814 | |
Shanghai Pharmaceuticals Holding | | | 248,900 | | | | 538 | |
Shenzhen International Holdings | | | 930,000 | | | | 1,413 | |
Shenzhen Investment | | | 4,370,000 | | | | 1,766 | |
Shimao Property Holdings | | | 1,027,000 | | | | 1,301 | |
Sinosoft Technology Group | | | 3,002,000 | | | | 1,720 | |
Sinotruk Hong Kong | | | 2,522,426 | | | | 1,136 | |
SJM Holdings | | | 2,253,000 | | | | 1,444 | |
Skyworth Digital Holdings | | | 3,074,000 | | | | 1,856 | |
Sunac China Holdings | | | 1,711,000 | | | | 1,064 | |
Sunny Optical Technology Group | | | 672,000 | | | | 2,323 | |
Tencent Holdings | | | 658,400 | | | | 14,688 | |
TravelSky Technology | | | 470,000 | | | | 891 | |
Truly International Holdings | | | 1,228,000 | | | | 520 | |
Want Want China Holdings | | | 1,008,000 | | | | 714 | |
Xinyi Solar Holdings | | | 5,340,000 | | | | 2,165 | |
| | | | | | | | |
| | | | | | | 86,006 | |
| | | | | | | | |
|
Hungary — 0.4% | |
OTP Bank | | | 21,345 | | | | 516 | |
Richter Gedeon Nyrt | | | 165,700 | | | | 3,324 | |
| | | | | | | | |
| | | | | | | 3,840 | |
| | | | | | | | |
|
India — 1.9% | |
Dr Reddy’s Laboratories ADR | | | 83,100 | | | | 3,919 | |
HDFC Bank ADR | | | 96,390 | | | | 6,204 | |
ICICI Bank ADR | | | 419,300 | | | | 3,015 | |
Infosys ADR | | | 106,600 | | | | 2,072 | |
Tata Motors ADR | | | 77,900 | | | | 2,609 | |
| | | | | | | | |
| | | | | | | 17,819 | |
| | | | | | | | |
|
Indonesia — 4.1% | |
Ace Hardware Indonesia | | | 6,723,900 | | | | 409 | |
Adaro Energy | | | 6,883,900 | | | | 358 | |
Adhi Karya Persero | | | 4,308,200 | | | | 811 | |
Agung Podomoro Land * | | | 20,012,500 | | | | 354 | |
Astra Agro Lestari * | | | 336,500 | | | | 349 | |
Astra International | | | 3,117,700 | | | | 1,506 | |
Bank Central Asia | | | 1,929,627 | | | | 1,836 | |
Bank Negara Indonesia Persero | | | 3,722,900 | | | | 1,308 | |
Bank Tabungan Negara Persero | | | 15,363,100 | | | | 1,918 | |
Bumi Serpong Damai | | | 4,818,900 | | | | 646 | |
Global Mediacom | | | 11,447,898 | | | | 834 | |
Indofood Sukses Makmur * | | | 2,831,200 | | | | 1,435 | |
Kalbe Farma * | | | 50,223,995 | | | | 5,258 | |
Kino Indonesia * | | | 1,971,500 | | | | 805 | |
Malindo Feedmill * | | | 3,961,500 | | | | 429 | |
Matahari Putra Prima | | | 5,412,000 | | | | 505 | |
Media Nusantara Citra | | | 18,119,300 | | | | 2,785 | |
Pakuwon Jati | | | 101,768,603 | | | | 4,098 | |
| | |
| 125 | | SEI Institutional Investments Trust / Annual Report / May 31, 2016 |
SCHEDULE OF INVESTMENTS
Emerging Markets Equity Fund
May 31, 2016
| | | | | | | | |
| Description | | Shares | | | Market Value
($ Thousands) | |
Pan Brothers | | | 11,885,100 | | | $ | 433 | |
Surya Citra Media | | | 11,645,155 | | | | 2,856 | |
Telekomunikasi Indonesia Persero | | | 12,337,700 | | | | 3,342 | |
Tower Bersama Infrastructure | | | 6,226,865 | | | | 3,031 | |
United Tractors | | | 1,016,300 | | | | 1,056 | |
Waskita Karya Persero | | | 9,054,800 | | | | 1,664 | |
| | | | | | | | |
| | | | | | | 38,026 | |
| | | | | | | | |
|
Ivory Coast — 0.2% | |
Societe Generale de Banques en Cote d’Ivoire | | | 1,120 | | | | 284 | |
Sonatel | | | 31,288 | | | | 1,231 | |
| | | | | | | | |
| | | | | | | 1,515 | |
| | | | | | | | |
|
Kashmiri — 0.0% | |
Advanced Process Systems * | | | 23,301 | | | | 389 | |
| | | | | | | | |
|
Kazakhstan — 0.4% | |
Halyk Savings Bank of Kazakhstan JSC GDR * | | | 452,220 | | | | 2,238 | |
KazMunaiGas Exploration Production GDR * | | | 120,920 | | | | 909 | |
KCell GDR | | | 270,676 | | | | 1,002 | |
| | | | | | | | |
| | | | | | | 4,149 | |
| | | | | | | | |
|
Kenya — 0.5% | |
ARM Cement | | | 10 | | | | — | |
Barclays Bank of Kenya | | | 3,622,490 | | | | 359 | |
East African Breweries | | | 63 | | | | — | |
Equity Group Holdings | | | 6,991,321 | | | | 2,739 | |
Safaricom | | | 7,499,590 | | | | 1,264 | |
| | | | | | | | |
| | | | | | | 4,362 | |
| | | | | | | | |
|
Malaysia — 0.7% | |
AirAsia | | | 3,859,600 | | | | 2,150 | |
AMMB Holdings | | | 585,200 | | | | 611 | |
IHH Healthcare | | | 1,797,995 | | | | 2,813 | |
Karex | | | 1,658,625 | | | | 908 | |
Petronas Gas | | | 51,900 | | | | 272 | |
| | | | | | | | |
| | | | | | | 6,754 | |
| | | | | | | | |
|
Mauritius — 0.2% | |
MCB Group | | | 244,290 | | | | 1,431 | |
| | | | | | | | |
|
Mexico — 4.0% | |
Alfa, Cl A | | | 768,000 | | | | 1,358 | |
Alsea | | | 201,072 | | | | 764 | |
America Movil, Ser L | | | 814,200 | | | | 501 | |
Arca Continental | | | 245,000 | | | | 1,627 | |
Banregio Grupo Financiero | | | 888,280 | | | | 4,878 | |
Controladora Vuela Cia de Aviacion ADR * | | | 74,203 | | | | 1,433 | |
Credito Real SOFOM ER | | | 388,300 | | | | 814 | |
Fomento Economico Mexicano | | | 111,500 | | | | 1,016 | |
Genomma Lab Internacional, Cl B * | | | 416,400 | | | | 426 | |
Gentera | | | 244,200 | | | | 445 | |
Gruma, Ser B | | | 140,745 | | | | 2,020 | |
Grupo Aeroportuario del Centro Norte, Cl B | | | 150,169 | | | | 865 | |
Grupo Aeroportuario del Pacifico, Ser B, Cl B | | | 150,800 | | | | 1,533 | |
Grupo Mexico, Ser B | | | 156,500 | | | | 349 | |
| | | | | | | | |
| Description | | Shares | | | Market Value
($ Thousands) | |
Grupo Simec, Ser B, Cl B * | | | 338,189 | | | $ | 990 | |
Grupo Televisa ADR | | | 169,795 | | | | 4,540 | |
Kimberly-Clark de Mexico, Cl A | | | 2,203,145 | | | | 5,246 | |
Megacable Holdings | | | 363,148 | | | | 1,533 | |
Wal-Mart de Mexico | | | 3,070,730 | | | | 7,167 | |
| | | | | | | | |
| | | | | | | 37,505 | |
| | | | | | | | |
|
Morocco — 0.4% | |
Attijariwafa Bank | | | 47,130 | | | | 1,689 | |
Ciments du Maroc | | | 7,180 | | | | 889 | |
Cosumar | | | 40,420 | | | | 772 | |
| | | | | | | | |
| | | | | | | 3,350 | |
| | | | | | | | |
|
Nigeria — 0.4% | |
Guaranty Trust Bank | | | 8,078,095 | | | | 793 | |
Presco | | | 1,618,660 | | | | 297 | |
SEPLAT Petroleum Development | | | 734,571 | | | | 1,328 | |
Zenith Bank | | | 11,963,979 | | | | 900 | |
| | | | | | | | |
| | | | | | | 3,318 | |
| | | | | | | | |
|
Oman — 0.1% | |
Bank Muscat | | | 841,513 | | | | 852 | |
| | | | | | | | |
|
Pakistan — 0.9% | |
Bank Alfalah | | | 4,104,940 | | | | 948 | |
DG Khan Cement | | | 535,960 | | | | 912 | |
Fauji Cement | | | 1,205,020 | | | | 441 | |
Habib Bank | | | 1,572,759 | | | | 2,637 | |
Oil & Gas Development | | | 2,070,500 | | | | 2,754 | |
United Bank | | | 566,070 | | | | 914 | |
| | | | | | | | |
| | | | | | | 8,606 | |
| | | | | | | | |
|
Panama — 0.4% | |
Avianca Holdings ADR | | | 432,599 | | | | 2,236 | |
Copa Holdings, Cl A | | | 34,781 | | | | 1,794 | |
| | | | | | | | |
| | | | | | | 4,030 | |
| | | | | | | | |
|
Peru — 1.3% | |
Alicorp | | | 532,500 | | | | 1,025 | |
Cementos Pacasmayo | | | 990,650 | | | | 1,761 | |
Cia de Minas Buenaventura ADR * | | | 262,151 | | | | 2,506 | |
Credicorp | | | 22,828 | | | | 3,201 | |
Ferreycorp | | | 1,191,539 | | | | 600 | |
InRetail Peru *(A) | | | 27,646 | | | | 470 | |
Intercorp Financial Services | | | 17,100 | | | | 512 | |
Southern Copper | | | 84,753 | | | | 2,208 | |
| | | | | | | | |
| | | | | | | 12,283 | |
| | | | | | | | |
|
Philippines — 3.5% | |
Aboitiz Power | | | 398,800 | | | | 392 | |
Ayala Land | | | 1,898,000 | | | | 1,449 | |
BDO Unibank | | | 1,731,081 | | | | 3,739 | |
East West Banking | | | 2,247,000 | | | | 823 | |
Emperador | | | 2,462,500 | | | | 374 | |
GT Capital Holdings | | | 24,250 | | | | 723 | |
Jollibee Foods | | | 502,170 | | | | 2,528 | |
| | |
| 126 | | SEI Institutional Investments Trust / Annual Report / May 31, 2016 |
SCHEDULE OF INVESTMENTS
Emerging Markets Equity Fund
May 31, 2016
| | | | | | | | |
| Description | | Shares | | | Market Value
($ Thousands) | |
Megaworld | | | 43,552,007 | | | $ | 4,191 | |
PNOC Energy Development (Philippines) | | | 5,939,200 | | | | 718 | |
Puregold Price Club | | | 1,017,803 | | | | 914 | |
Robinsons Land | | | 6,743,600 | | | | 4,182 | |
Robinsons Retail Holdings | | | 1,558,270 | | | | 2,682 | |
Security Bank | | | 334,350 | | | | 1,451 | |
SM Prime Holdings | | | 2,243,500 | | | | 1,151 | |
Universal Robina | | | 1,512,105 | | | | 6,305 | |
Xurpas | | | 4,020,000 | | | | 1,539 | |
| | | | | | | | |
| | | | | | | 33,161 | |
| | | | | | | | |
|
Poland — 1.8% | |
Agora | | | 219,711 | | | | 691 | |
Asseco Poland | | | 42,200 | | | | 591 | |
Eurocash | | | 643,949 | | | | 7,999 | |
Kernel Holding | | | 77,650 | | | | 1,068 | |
PGE | | | 671,931 | | | | 2,148 | |
Polski Koncern Naftowy ORLEN | | | 150,481 | | | | 2,639 | |
Powszechny Zaklad Ubezpieczen | | | 201,413 | | | | 1,594 | |
Tauron Polska Energia | | | 791,912 | | | | 518 | |
| | | | | | | | |
| | | | | | | 17,248 | |
| | | | | | | | |
|
Qatar — 0.6% | |
Al Khalij Commercial Bank | | | 118,280 | | | | 535 | |
Barwa Real Estate | | | 133,536 | | | | 1,111 | |
Commercial Bank QSC | | | 42,221 | | | | 427 | |
Doha Bank QSC | | | 23,667 | | | | 226 | |
Industries Qatar | | | 18,574 | | | | 490 | |
Ooredoo QSC | | | 10,096 | | | | 227 | |
Qatar Electricity & Water | | | 14,800 | | | | 811 | |
United Development | | | 321,820 | | | | 1,593 | |
| | | | | | | | |
| | | | | | | 5,420 | |
| | | | | | | | |
|
Romania — 1.0% | |
Banca Transilvania | | | 12,758,303 | | | | 6,696 | |
OMV Petrom | | | 7,374,250 | �� | | | 402 | |
Societatea Nationala de Gaze Naturale ROMGAZ | | | 28,914 | | | | 171 | |
Societatea Nationala de Gaze Naturale ROMGAZ GDR | | | 366,051 | | | | 2,105 | |
| | | | | | | | |
| | | | | | | 9,374 | |
| | | | | | | | |
|
Russia — 2.3% | |
Gazprom ADR | | | 573,273 | | | | 2,499 | |
Lukoil ADR | | | 49,658 | | | | 1,899 | |
Mail.ru Group GDR * | | | 48,434 | | | | 959 | |
Rosneft Oil GDR | | | 172,402 | | | | 834 | |
Sberbank of Russia ADR | | | 252,045 | | | | 2,152 | |
Sistema GDR | | | 89,605 | | | | 668 | |
Surgutneftegas GDR | | | 350,525 | | | | 1,788 | |
Surgutneftegaz ADR | | | 178,918 | | | | 907 | |
Tatneft ADR | | | 44,040 | | | | 1,191 | |
Yandex, Cl A * | | | 432,375 | | | | 8,907 | |
| | | | | | | | |
| | | | | | | 21,804 | |
| | | | | | | | |
| | | | | | | | |
| Description | | Shares | | | Market Value
($ Thousands) | |
Singapore — 0.2% | | | | | | | | |
Yoma Strategic Holdings * | | | 5,030,000 | | | $ | 1,900 | |
| | | | | | | | |
|
South Africa — 3.1% | |
Barclays Africa Group | | | 123,017 | | | | 1,141 | |
Exxaro Resources | | | 135,477 | | | | 539 | |
FirstRand | | | 532,218 | | | | 1,438 | |
Foschini Group | | | 35,225 | | | | 313 | |
Liberty Holdings | | | 140,636 | | | | 1,064 | |
Life Healthcare Group Holdings | | | 225,108 | | | | 550 | |
Mediclinic International | | | 123,000 | | | | 1,565 | |
MMI Holdings | | | 1,673,828 | | | | 2,394 | |
Mondi | | | 49,941 | | | | 967 | |
Mr Price Group | | | 342,430 | | | | 4,017 | |
MTN Group | | | 85,543 | | | | 666 | |
Naspers, Cl N | | | 3,809 | | | | 560 | |
Netcare | | | 528,398 | | | | 1,098 | |
Pioneer Foods Group | | | 48,493 | | | | 504 | |
Royal Bafokeng Platinum * | | | 265,372 | | | | 688 | |
Sasol | | | 38,228 | | | | 1,159 | |
Shoprite Holdings | | | 226,278 | | | | 2,373 | |
Sibanye Gold | | | 942,631 | | | | 2,697 | |
SPAR Group | | | 53,400 | | | | 687 | |
Standard Bank Group | | | 104,008 | | | | 820 | |
Steinhoff International Holdings | | | 97,339 | | | | 571 | |
Truworths International | | | 100,469 | | | | 601 | |
Tsogo Sun Holdings | | | 273,513 | | | | 469 | |
Vodacom Group | | | 163,063 | | | | 1,704 | |
| | | | | | | | |
| | | | | | | 28,585 | |
| | | | | | | | |
|
South Korea — 8.8% | |
Able C&C | | | 23,364 | | | | 701 | |
Amorepacific | | | 17,544 | | | | 6,146 | |
BNK Financial Group | | | 85,113 | | | | 625 | |
CJ | | | 5,790 | | | | 1,054 | |
Coway | | | 10,539 | | | | 911 | |
Dongbu Insurance | | | 31,378 | | | | 1,919 | |
Ecopro * | | | 66,770 | | | | 804 | |
Hana Financial Group | | | 76,662 | | | | 1,663 | |
Hanon Systems | | | 84,097 | | | | 871 | |
Hansol SeenTec * | | | 273,208 | | | | 594 | |
Hanwha | | | 33,941 | | | | 1,096 | |
Hanwha Life Insurance | | | 227,636 | | | | 1,221 | |
Hanwha Techwin | | | 60,519 | | | | 2,260 | |
Heung-A Shipping, Cl A | | | 313,605 | | | | 386 | |
Hyosung | | | 7,980 | | | | 787 | |
Hyundai Marine & Fire Insurance | | | 83,233 | | | | 2,207 | |
Hyundai Mobis | | | 4,963 | | | | 1,062 | |
Jusung Engineering * | | | 194,874 | | | | 1,354 | |
Kangwon Land | | | 33,576 | | | | 1,199 | |
Kia Motors | | | 116,300 | | | | 4,552 | |
Korea Electric Power ADR | | | 170,400 | | | | 4,500 | |
KT&G | | | 53,839 | | | | 5,760 | |
LG | | | 15,134 | | | | 837 | |
| | |
| 127 | | SEI Institutional Investments Trust / Annual Report / May 31, 2016 |
SCHEDULE OF INVESTMENTS
Emerging Markets Equity Fund
May 31, 2016
| | | | | | | | |
| Description | | Shares | | | Market Value
($ Thousands) | |
LG Display ADR | | | 162,200 | | | $ | 1,768 | |
LG Electronics | | | 33,967 | | | | 1,599 | |
LG Household & Health Care | | | 1,846 | | | | 1,636 | |
Mando | | | 7,726 | | | | 1,439 | |
Medy-Tox | | | 12,735 | | | | 4,691 | |
Meritz Fire & Marine Insurance | | | 111,096 | | | | 1,477 | |
NCSoft | | | 5,724 | | | | 1,155 | |
Nong Shim | | | 2,519 | | | | 805 | |
Posco Daewoo | | | 40,925 | | | | 810 | |
S-1, Cl 1 | | | 9,192 | | | | 771 | |
Samsung Electronics | | | 10,736 | | | | 11,639 | |
Sekonix | | | 50,141 | | | | 698 | |
SK Innovation | | | 13,574 | | | | 1,862 | |
SK Materials | | | 19,991 | | | | 1,983 | |
SK Telecom | | | 6,612 | | | | 1,232 | |
SK Telecom ADR | | | 10,900 | | | | 227 | |
Soulbrain | | | 12,085 | | | | 497 | |
Value Added Technologies | | | 32,701 | | | | 1,023 | |
Viatron Technologies | | | 16,829 | | | | 396 | |
Vieworks | | | 38,943 | | | | 1,742 | |
WiSoL | | | 111,026 | | | | 1,397 | |
Woory Industrial | | | 44,879 | | | | 1,344 | |
| | | | | | | | |
| | | | | | | 82,700 | |
| | | | | | | | |
|
Switzerland — 0.1% | |
Wizz Air Holdings *(A) | | | 36,722 | | | | 1,034 | |
| | | | | | | | |
|
Taiwan — 9.7% | |
Advanced Semiconductor Engineering | | | 1,110,000 | | | | 1,256 | |
ASPEED Technology | | | 118,132 | | | | 1,195 | |
Asustek Computer | | | 177,000 | | | | 1,520 | |
AU Optronics ADR | | | 630,700 | | | | 1,728 | |
Basso Industry | | | 163,000 | | | | 350 | |
Bioteque | | | 402,000 | | | | 2,034 | |
Bizlink Holding | | | 392,000 | | | | 2,266 | |
Catcher Technology | | | 129,000 | | | | 981 | |
Cheng Shin Rubber Industry | | | 320,000 | | | | 657 | |
Chicony Electronics | | | 494,630 | | | | 1,192 | |
Chin-Poon Industrial * | | | 694,000 | | | | 1,528 | |
Chroma ATE | | | 425,000 | | | | 1,019 | |
Chunghwa Telecom | | | 165,000 | | | | 557 | |
Compal Electronics | | | 3,766,000 | | | | 2,217 | |
Coretronic | | | 1,162,000 | | | | 1,046 | |
CTBC Financial Holding | | | 830,929 | | | | 436 | |
Eclat Textile | | | 224,643 | | | | 2,411 | |
Formosa Laboratories * | | | 267,000 | | | | 752 | |
Foxconn Technology | | | 249,000 | | | | 569 | |
Fubon Financial Holding | | | 989,000 | | | | 1,168 | |
Gourmet Master | | | 276,000 | | | | 2,471 | |
Highwealth Construction | | | 1,199,600 | | | | 1,808 | |
Himax Technologies ADR | | | 91,134 | | | | 892 | |
Hon Hai Precision Industry | | | 3,026,250 | | | | 7,433 | |
Hotai Motor | | | 20,000 | | | | 191 | |
Innolux, Cl A | | | 4,182,000 | | | | 1,240 | |
| | | | | | | | |
| Description | | Shares | | | Market Value
($ Thousands) | |
Inventec | | | 2,110,000 | | | $ | 1,404 | |
Lite-On Technology | | | 1,447,475 | | | | 1,864 | |
Macauto Industrial | | | 398,000 | | | | 2,185 | |
Merida Industry | | | 269,000 | | | | 1,134 | |
Nan Ya Plastics | | | 568,000 | | | | 1,083 | |
Pegatron | | | 2,373,000 | | | | 4,941 | |
Powertech Technology | | | 1,569,000 | | | | 3,382 | |
Radiant Opto-Electronics | | | 574,000 | | | | 885 | |
Ruentex Development | | | 953,000 | | | | 1,103 | |
Silergy | | | 202,947 | | | | 2,402 | |
Silicon Motion Technology ADR | | | 56,596 | | | | 2,516 | |
Simplo Technology | | | 317,000 | | | | 1,064 | |
Sinbon Electronics * | | | 344,000 | | | | 776 | |
TaiDoc Technology * | | | 263,000 | | | | 1,290 | |
Taishin Financial Holding | | | 1,581,000 | | | | 596 | |
Taiwan PCB Techvest | | | 79,000 | | | | 73 | |
Taiwan Semiconductor Manufacturing | | | 743,000 | | | | 3,565 | |
Taiwan Semiconductor Manufacturing ADR | | | 583,325 | | | | 14,420 | |
TTY Biopharm | | | 256,000 | | | | 879 | |
Tung Thih Electronic | | | 183,000 | | | | 2,559 | |
Vanguard International Semiconductor | | | 480,000 | | | | 787 | |
WPG Holdings | | | 2,735,000 | | | | 3,007 | |
| | | | | | | | |
| | | | | | | 90,832 | |
| | | | | | | | |
|
Thailand — 3.3% | |
Bangchak Petroleum | | | 1,833,900 | | | | 1,553 | |
Bangkok Dusit Medical Services | | | 2,360,800 | | | | 1,593 | |
Bangkok Expressway & Metro | | | 20 | | | | — | |
Banpu | | | 327,400 | | | | 112 | |
Beauty Community | | | 9,857,623 | | | | 1,876 | |
Big Camera | | | 15,983,500 | | | | 1,611 | |
Carabao Group NVDR | | | 1,530,968 | | | | 1,853 | |
Charoen Pokphand Foods | | | 1,152,400 | | | | 944 | |
Delta Electronics Thailand | | | 573,600 | | | | 1,152 | |
Kiatnakin Bank | | | 866,600 | | | | 1,007 | |
Minor International | | | 991,300 | | | | 1,089 | |
Minor International NVDR | | | 2,337,636 | | | | 2,568 | |
Plan B Media | | | 3,954,700 | | | | 681 | |
PTT | | | 336,700 | | | | 2,837 | |
PTT Global Chemical | | | 1,169,400 | | | | 1,948 | |
Sansiri | | | 11,920,200 | | | | 527 | |
Sino-Thai Engineering & Construction | | | 3,397,279 | | | | 2,187 | |
Srisawad Power 1979 | | | 1,458,935 | | | | 1,736 | |
Taokaenoi Food & Marketing | | | 1,549,200 | | | | 620 | |
Thai Oil | | | 939,700 | | | | 1,670 | |
Thai Union Group | | | 2,995,700 | | | | 1,853 | |
Thanachart Capital | | | 1,492,500 | | | | 1,420 | |
| | | | | | | | |
| | | | | | | 30,837 | |
| | | | | | | | |
|
Turkey — 2.1% | |
Arcelik | | | 68,532 | | | | 455 | |
Coca-Cola Icecek | | | 302,725 | | | | 3,692 | |
Emlak Konut Gayrimenkul Yatirim Ortakligi | | | 788,075 | | | | 721 | |
Eregli Demir ve Celik Fabrikalari | | | 830,686 | | | | 1,159 | |
| | |
| 128 | | SEI Institutional Investments Trust / Annual Report / May 31, 2016 |
SCHEDULE OF INVESTMENTS
Emerging Markets Equity Fund
May 31, 2016
| | | | | | | | |
| Description | | Shares | | | Market Value
($ Thousands) | |
Ford Otomotiv Sanayi | | | 116,014 | | | $ | 1,375 | |
Lokman Hekim Engurusag Saglik Turizm Egitim Hizmetleri ve Insaat Taahhut | | | 365,932 | | | | 426 | |
Park Elektrik Uretim Madencilik Sanayi ve Ticaret | | | 1,313,435 | | | | 1,153 | |
Selcuk Ecza Deposu Ticaret ve Sanayi A.S. | | | 879,449 | | | | 819 | |
TAV Havalimanlari Holding | | | 218,515 | | | | 1,121 | |
Tekfen Holding | | | 239,792 | | | | 582 | |
Tupras Turkiye Petrol Rafinerileri | | | 131,704 | | | | 2,972 | |
Turk Hava Yollari * | | | 1,403,547 | | | | 2,958 | |
Turk Traktor ve Ziraat Makineleri | | | 45,448 | | | | 1,254 | |
Turkiye Is Bankasi, Cl C | | | 393,110 | | | | 601 | |
| | | | | | | | |
| | | | | | | 19,288 | |
| | | | | | | | |
|
Ukraine — 0.1% | |
MHP GDR | | | 62,001 | | | | 559 | |
| | | | | | | | |
|
United Arab Emirates — 2.1% | |
Aldar Properties | | | 3,770,725 | | | | 2,700 | |
DAMAC Properties Dubai | | | 4,534,689 | | | | 2,889 | |
Dubai Islamic Bank | | | 2,000,275 | | | | 2,778 | |
Emaar Properties | | | 4,492,619 | | | | 7,645 | |
Emirates NBD | | | 300,000 | | | | 690 | |
First Gulf Bank | | | 254,826 | | | | 822 | |
NMC Health | | | 78,616 | | | | 1,316 | |
Ras Al Khaimah Ceramics | | | 1,309,459 | | | | 1,194 | |
| | | | | | | | |
| | | | | | | 20,034 | |
| | | | | | | | |
|
United Kingdom — 0.8% | |
Centamin | | | 531,765 | | | | 746 | |
Commercial International Bank Egypt GDR | | | 93,700 | | | | 346 | |
Georgia Healthcare Group *(A) | | | 359,020 | | | | 1,385 | |
Global Telecom Holding GDR * | | | 1,905,563 | | | | 3,297 | |
MHP GDR | | | 93,939 | | | | 846 | |
PhosAgro GDR | | | 78,630 | | | | 1,179 | |
| | | | | | | | |
| | | | | | | 7,799 | |
| | | | | | | | |
|
United States — 2.4% | |
EPAM Systems * | | | 37,375 | | | | 2,860 | |
Globant * | | | 41,865 | | | | 1,680 | |
Kansas City Southern | | | 57,010 | | | | 5,307 | |
Luxoft Holding, Cl A * | | | 51,544 | | | | 3,347 | |
PriceSmart | | | 93,755 | | | | 8,306 | |
Tahoe Resources | | | 70,091 | | | | 836 | |
| | | | | | | | |
| | | | | | | 22,336 | |
| | | | | | | | |
Total Common Stock
(Cost $815,802) ($ Thousands) | | | | 792,138 | |
| | | | | | | | |
| | |
| | | Number of
Warrants | | | | |
PARTICIPATION NOTES — 7.5% | | | | | |
| | |
Africa — 0.3% | | | | | | | | |
East African Breweries, Expires 10/31/17 | | | 787,144 | | | | 2,276 | |
| | | | | | | | |
| | | | | | | | |
| Description | | Number of
Warrants | | | Market Value
($ Thousands) | |
Chile — 0.2% | | | | | | | | |
SACI Falabella, Expires 11/07/18 | | | 298,427 | | | $ | 2,094 | |
| | | | | | | | |
|
China — 0.2% | |
Huangshan Tourism Development, Expires 11/06/20 | | | 561,392 | | | | 2,160 | |
| | |
Colombia — 0.1% | | | | | | | | |
Baco Davivienda, Expires 12/05/18 | | | 22,810 | | | | 193 | |
Constructora Conconcreto, Expires 12/05/18 | | | 497,710 | | | | 183 | |
Empresa de Telecomunicaciones de Bogota, Expires 12/05/18 | | | 1,784,970 | | | | 342 | |
| | | | | | | | |
| | | | | | | 718 | |
| | | | | | | | |
|
Egypt — 0.3% | |
Emaar Misr for Development, Expires 05/02/18 | | | 1,685,143 | | | | 446 | |
Palm Hills Developments, Expires 05/02/18 | | | 8,969,988 | | | | 2,484 | |
| | | | | | | | |
| | | | | | | 2,930 | |
| | | | | | | | |
|
India — 1.2% | |
Biocon, Expires 04/22/21 | | | 177,362 | | | | 1,881 | |
Fortis Healthcare, Expires 08/07/20 | | | 685,940 | | | | 1,647 | |
LIC Housing Finance, Expires 03/08/19 | | | 214,630 | | | | 1,505 | |
Shriram Transport Finance, Expires 01/30/19 | | | 96,281 | | | | 1,693 | |
SKS Microfinance, Expires 11/05/18 | | | 377,989 | | | | 3,661 | |
Voltas, Expires 05/28/20 | | | 202,975 | | | | 1,008 | |
| | | | | | | | |
| | | | | | | 11,395 | |
| | | | | | | | |
|
Japan — 0.0% | |
Tokyo Cement Lanka, Expires 12/05/16 | | | 456,690 | | | | 123 | |
| | | | | | | | |
|
Kuwait — 0.9% | |
Kuwait Food Americana SAK, Expires 02/14/19 | | | 120,850 | | | | 930 | |
Mabanee, Expires 08/05/19 | | | 354,597 | | | | 926 | |
Mabanee SAK, Expires 08/05/19 | | | 39,130 | | | | 102 | |
Mezzan Holding, Expires 05/02/18 | | | 698,349 | | | | 2,388 | |
National Bank of Kuwait, Expires 03/24/16 | | | 1,498,481 | | | | 3,122 | |
National Bank of Kuwait, Expires 04/30/18 | | | 287,700 | | | | 592 | |
National Bank of Kuwait, Expires 11/20/18 | | | 317,915 | | | | 658 | |
| | | | | | | | |
| | | | | | | 8,718 | |
| | | | | | | | |
|
Pakistan — 0.6% | |
DG Khan Cement, Expires 01/17/17 | | | 581,000 | | | | 988 | |
Fauji Cement, Expires 12/02/16 | | | 1,025,450 | | | | 374 | |
United Bank, Expires 01/17/17 | | | 136,660 | | | | 220 | |
United Bank, Expires 10/31/16 | | | 2,526,373 | | | | 4,077 | |
| | | | | | | | |
| | | | | | | 5,659 | |
| | | | | | | | |
|
Saudi Arabia — 1.7% | |
Bupa Arabia for Cooperative Insurance, Expires 04/05/17 | | | 5,569 | | | | 206 | |
Bupa Arabia for Cooperative Insurance, Expires 04/05/17 | | | 76,440 | | | | 2,847 | |
| | |
| 129 | | SEI Institutional Investments Trust / Annual Report / May 31, 2016 |
SCHEDULE OF INVESTMENTS
Emerging Markets Equity Fund
May 31, 2016
| | | | | | | | |
| Description | | Number of
Warrants | | | Market Value
($ Thousands) | |
CO For Cooperative Insurance, Expires 07/31/17 | | | 113,112 | | | $ | 2,544 | |
Fawaz Abdulaziz Al Hokair, Expires 03/02/17 | | | 53,966 | | | | 669 | |
Mouwasat Medical Services, Expires 09/20/17 | | | 59,887 | | | | 2,083 | |
National Industrialization, Expires 07/12/17 | | | 236,000 | | | | 794 | |
National Industrialization, Expires 07/12/17 | | | 841,331 | | | | 2,833 | |
Samba Financial Group, Expires 03/02/17 | | | 243,843 | | | | 1,378 | |
United International Transportation, Expires 07/31/17 | | | 154,290 | | | | 1,486 | |
United International Transportation, Expires 02/26/18 | | | 76,127 | | | | 738 | |
| | | | | | | | |
| | | | | | | 15,578 | |
| | | | | | | | |
|
Singapore — 0.1% | |
Eclerx Services, Expires 11/13/20 | | | 45,421 | | | | 957 | |
| | | | | | | | |
|
Spain — 0.1% | |
Cemex Latam Holdings, Expires 10/31/18 | | | 199,176 | | | | 844 | |
| | | | | | | | |
|
Sri Lanka — 0.3% | |
Danang Rubber, Expires 06/03/19 | | | 26,270 | | | | 61 | |
Hatton National Bank, Expires 09/05/16 | | | 753,561 | | | | 1,081 | |
Hemas Holdings, Expires 12/05/17 | | | 688,148 | | | | 415 | |
John Keells Holdings, Expires 07/05/19 | | | 915,684 | | | | 962 | |
LAUGFS Gas, Expires 12/05/16 | | | 704,271 | | | | 195 | |
Military Commercial Joint Stock Bank, Expires 02/12/18 | | | 389,460 | | | | 268 | |
Vingroup, Expires 07/31/19 | | | 59,600 | | | | 138 | |
| | | | | | | | |
| | | | | | | 3,120 | |
| | | | | | | | |
|
Turkey — 0.1% | |
Turkiye Garanti Bankasi, Expires 11/30/17 | | | 486,183 | | | | 1,232 | |
| | | | | | | | |
|
Vietnam — 1.4% | |
Danang Rubber, Expires 06/03/19 | | | 455,957 | | | | 1,058 | |
FPT, Expires 06/01/15 | | | 536,600 | | | | 968 | |
Hoa Phat Group, Expires 07/24/18 | | | 1,110,989 | | | | 1,660 | |
Military Commercial Joint Stock Bank, Expires 02/12/18 | | | 1,657,624 | | | | 1,143 | |
Military Commercial Joint Stock Bank, Expires 04/20/17 | | | 1,179,000 | | | | 813 | |
Mobile World Investment, Expires 08/15/16 | | | 93,570 | | | | 356 | |
Pha Lai Thermal Power, Expires 01/17/17 | | | 177,040 | | | | 124 | |
Vietnam Dairy Products, Expires 12/05/16 | | | 240,898 | | | | 1,528 | |
Vingroup, Expires 01/20/16 | | | 1,306,064 | | | | 3,032 | |
Vingroup, Expires 07/31/19 | | | 973,620 | | | | 2,260 | |
| | | | | | | | |
| | | | | | | 12,942 | |
| | | | | | | | |
Total Participation Notes
(Cost $72,947) ($ Thousands) | | | | 70,746 | |
| | | | | | | | |
| | | | | | | | |
| Description | | Shares | | | Market Value
($ Thousands) | |
EXCHANGE TRADED FUNDS — 3.1% | | | | | |
| | |
United States — 3.1% | | | | | | | | |
iPath MSCI India Index ETN | | | 77,247 | | | $ | 4,963 | |
iShares MSCI Emerging Markets Index Fund | | | 284,531 | | | | 9,426 | |
iShares MSCI Frontier 100 ETF | | | 40,780 | | | | 1,042 | |
iShares MSCI India ETF | | | 179,600 | | | | 4,962 | |
WisdomTree India Earnings Fund | | | 422,100 | | | | 8,345 | |
| | | | | | | | |
Total Exchange Traded Funds
(Cost $30,516) ($ Thousands) | | | | 28,738 | |
| | | | | | | | |
| | |
PREFERRED STOCK — 1.4% | | | | | | | | |
| | |
Brazil — 1.0% | | | | | | | | |
Banco Bradesco | | | 201,380 | | | | 1,277 | |
Bradespar | | | 755,100 | | | | 1,444 | |
Braskem | | | 278,100 | | | | 1,615 | |
Cia Brasileira de Distribuicao | | | 33,500 | | | | 375 | |
Cia Brasileira de Distribuicao Grupo Pao de Acucar | | | 4,500 | | | | 50 | |
Cia Paranaense de Energia | | | 186,100 | | | | 1,213 | |
Itausa — Investimentos Itau | | | 987,290 | | | | 1,960 | |
Suzano Papel e Celulose, Cl A | | | 129,400 | | | | 525 | |
Telefonica Brasil | | | 21,100 | | | | 245 | |
| | | | | | | | |
| | | | | | | 8,704 | |
| | | | | | | | |
|
Colombia — 0.3% | |
Banco Davivienda | | | 315,631 | | | | 2,676 | |
Bancolombia | | | 42,105 | | | | 344 | |
| | | | | | | | |
| | | | | | | 3,020 | |
| | | | | | | | |
|
South Korea — 0.1% | |
LG Chemical | | | 6,973 | | | | 1,147 | |
| | | | | | | | |
Total Preferred Stock
(Cost $12,745) ($ Thousands) | | | | 12,871 | |
| | | | | | | | |
| | |
| |
| Number of
Rights |
| | | | |
| | | | | | | | |
RIGHTS — 0.0% | | | | | | | | |
| | |
Brazil — 0.0% | | | | | | | | |
Cia de Saneamento de Minas Gerais-COPASA, Expires 06/23/2016 * | | | 3 | | | | 5 | |
| | | | | | | | |
| | |
United Arab Emirates — 0.0% | | | | | | | | |
Dubai Islamic Bank, Expires 06/23/2016 * | | | 500 | | | | 253 | |
| | | | | | | | |
Total Rights
(Cost $—) ($ Thousands) | | | | 258 | |
| | | | | | | | |
| | |
| 130 | | SEI Institutional Investments Trust / Annual Report / May 31, 2016 |
SCHEDULE OF INVESTMENTS
Emerging Markets Equity Fund
May 31, 2016
| | | | | | | | |
| Description | | Shares | | | Market Value
($ Thousands) | |
CASH EQUIVALENT — 0.3% | | | | | | | | |
SEI Daily Income Trust, Prime Obligation Fund, Cl A | | | | | | | | |
0.270% **† | | | 2,804,047 | | | $ | 2,804 | |
| | | | | | | | |
Total Cash Equivalent
(Cost $2,804) ($ Thousands) | | | | | | | 2,804 | |
| | | | | | | | |
Total Investments — 97.0%
(Cost $934,814) ($ Thousands) | | | | | | $ | 907,555 | |
| | | | | | | | |
Percentages are based on a Net Assets of $935,399 ($ Thousands).
| * | | Non-income producing security. |
| ** | | Rate shown is the 7-day effective yield as of May 31, 2016. |
| † | | Investment in Affiliated Security (see Note 6). |
| ‡ | | Real Estate Investment Trust. |
| (A) | | Security exempt from registration under Rule 144A of the Securities Act of 1933. These securities may be resold in transactions exempt from registration normally to qualified institutions. On May 31, 2016, the value of these securities amounted to $9,873 ($ Thousands), representing 1.0% of the net assets of the Fund. |
ADR — American Depositary Receipt
Cl — Class
ETF — Exchange Traded Fund
ETN — Exchange Traded Note
GDR — Global Depositary Receipt
MSCI — Morgan Stanley Capital International
Ser — Series
The following is a list of the level of inputs used as of May 31, 2016, in valuing the Fund’s investments carried at value ($ Thousands).
| | | | | | | | | | | | | | | | |
| Investments in Securities | | Level 1 | | | Level 2 | | | Level 3 | | | Total | |
Common Stock | | $ | 792,138 | | | $ | — | | | $ | — | | | $ | 792,138 | |
Participation Notes | | | — | | | | 70,746 | | | | — | | | | 70,746 | |
Exchange Traded Funds | | | 28,738 | | | | — | | | | — | | | | 28,738 | |
Preferred Stock | | | 12,871 | | | | — | | | | — | | | | 12,871 | |
Rights | | | 258 | | | | — | | | | — | | | | 258 | |
Cash Equivalent | | | 2,804 | | | | — | | | | — | | | | 2,804 | |
| | | | | | | | | | | | | | | | |
Total Investments in Securities | | $ | 836,809 | | | $ | 70,746 | | | $ | — | | | $ | 907,555 | |
| | | | | | | | | | | | | | | | |
For the year ended May 31, 2016, there were transfers between Level 1 and Level 2 assets and liabilities. The primary reason for changes in the classifications between Levels 1 and 2 occurs when foreign equity securities are fair valued using other observable market-based inputs in place of the closing exchange price due to events occurring after the close of the exchange or market on which the investment is principally traded.
For the year ended May 31, 2016, there were no transfers between Level 2 and Level 3 assets and liabilities.
For more information on valuation inputs, see Note 2 — Significant Accounting Policies in Notes to Financial Statements.
Amounts designated as “—” are $0 or have been rounded to $0.
The accompanying notes are an integral part of the financial statements.
| | |
| 131 | | SEI Institutional Investments Trust / Annual Report / May 31, 2016 |
CONSOLIDATED SCHEDULE OF INVESTMENTS
Dynamic Asset Allocation Fund
May 31, 2016
| | | | | | | | |
| Description | | Shares | | | Market Value
($ Thousands) | |
COMMON STOCK — 96.1% | | | | | | | | |
| | |
Consumer Discretionary — 12.1% | | | | | | | | |
Advance Auto Parts | | | 7,700 | | | $ | 1,185 | |
Amazon.com * | | | 42,200 | | | | 30,502 | |
AutoNation * | | | 8,900 | | | | 449 | |
AutoZone * | | | 3,300 | | | | 2,515 | |
Bed Bath & Beyond | | | 17,100 | | | | 765 | |
Best Buy | | | 32,400 | | | | 1,042 | |
BorgWarner | | | 23,500 | | | | 800 | |
Cablevision Systems, Cl A | | | 24,500 | | | | 850 | |
Carmax * | | | 21,800 | | | | 1,170 | |
Carnival, Cl A | | | 49,700 | | | | 2,373 | |
CBS, Cl B | | | 46,043 | | | | 2,542 | |
Chipotle Mexican Grill, Cl A * | | | 3,400 | | | | 1,503 | |
Coach | | | 29,500 | | | | 1,163 | |
Comcast, Cl A | | | 267,200 | | | | 16,914 | |
Darden Restaurants | | | 12,300 | | | | 834 | |
Delphi Automotive | | | 30,000 | | | | 2,039 | |
Discovery Communications, Cl A * | | | 15,500 | | | | 432 | |
Discovery Communications, Cl C * | | | 27,800 | | | | 744 | |
Dollar General | | | 32,400 | | | | 2,913 | |
Dollar Tree * | | | 26,284 | | | | 2,380 | |
DR Horton | | | 35,800 | | | | 1,094 | |
Expedia | | | 13,500 | | | | 1,502 | |
Foot Locker | | | 14,800 | | | | 828 | |
Ford Motor | | | 430,300 | | | | 5,805 | |
Gap | | | 27,600 | | | | 497 | |
Garmin | | | 14,000 | | | | 595 | |
General Motors | | | 152,600 | | | | 4,773 | |
Genuine Parts | | | 16,351 | | | | 1,585 | |
Goodyear Tire & Rubber | | | 27,000 | | | | 755 | |
H&R Block | | | 27,400 | | | | 585 | |
Hanesbrands | | | 41,400 | | | | 1,121 | |
Harley-Davidson | | | 21,100 | | | | 979 | |
Harman International Industries | | | 7,200 | | | | 563 | |
Hasbro | | | 12,400 | | | | 1,082 | |
Home Depot | | | 139,232 | | | | 18,395 | |
Interpublic Group | | | 42,900 | | | | 1,025 | |
Johnson Controls | | | 71,900 | | | | 3,174 | |
Kohl’s | | | 21,000 | | | | 757 | |
L Brands | | | 27,600 | | | | 1,892 | |
Leggett & Platt | | | 14,400 | | | | 724 | |
Lennar, Cl A | | | 19,800 | | | | 902 | |
LKQ * | | | 33,600 | | | | 1,111 | |
Lowe’s | | | 100,500 | | | | 8,053 | |
Macy’s | | | 33,900 | | | | 1,126 | |
Marriott International, Cl A | | | 20,900 | | | | 1,380 | |
Mattel | | | 36,400 | | | | 1,160 | |
McDonald’s | | | 98,700 | | | | 12,047 | |
Michael Kors Holdings * | | | 20,100 | | | | 859 | |
Mohawk Industries * | | | 6,828 | | | | 1,343 | |
NetFlix * | | | 46,900 | | | | 4,811 | |
Newell Brands | | | 49,999 | | | | 2,384 | |
| | | | | | | | |
| Description | | Shares | | | Market Value
($ Thousands) | |
News | | | 14,100 | | | $ | 174 | |
News, Cl A | | | 37,200 | | | | 445 | |
NIKE, Cl B | | | 148,100 | | | | 8,178 | |
Nordstrom | | | 15,000 | | | | 570 | |
Omnicom Group | | | 25,600 | | | | 2,133 | |
O’Reilly Automotive * | | | 10,700 | | | | 2,829 | |
Priceline Group * | | | 5,400 | | | | 6,827 | |
PulteGroup | | | 31,700 | | | | 595 | |
PVH | | | 8,600 | | | | 807 | |
Ralph Lauren, Cl A | | | 6,500 | | | | 613 | |
Ross Stores | | | 45,200 | | | | 2,414 | |
Royal Caribbean Cruises | | | 18,200 | | | | 1,409 | |
Scripps Networks Interactive, Cl A | | | 10,000 | | | | 643 | |
Signet Jewelers | | | 8,400 | | | | 831 | |
Staples | | | 69,900 | | | | 615 | |
Starbucks | | | 162,100 | | | | 8,898 | |
Starwood Hotels & Resorts Worldwide | | | 18,400 | | | | 1,351 | |
Target | | | 65,900 | | | | 4,533 | |
TEGNA | | | 23,600 | | | | 542 | |
Tiffany | | | 12,900 | | | | 799 | |
Time Warner | | | 86,100 | | | | 6,514 | |
TJX | | | 73,200 | | | | 5,572 | |
Tractor Supply | | | 14,700 | | | | 1,413 | |
TripAdvisor * | | | 11,600 | | | | 786 | |
Twenty-First Century Fox, Cl A | | | 123,700 | | | | 3,572 | |
Twenty-First Century Fox, Cl B | | | 45,600 | | | | 1,333 | |
Ulta Salon Cosmetics & Fragrance * | | | 7,000 | | | | 1,631 | |
Under Armour, Cl A * | | | 19,200 | | | | 724 | |
Under Armour, Cl C * | | | 19,200 | | | | 671 | |
Urban Outfitters * | | | 10,300 | | | | 294 | |
VF | | | 36,200 | | | | 2,256 | |
Viacom, Cl B | | | 37,500 | | | | 1,664 | |
Walt Disney | | | 163,862 | | | | 16,258 | |
Whirlpool | | | 8,200 | | | | 1,432 | |
Wyndham Worldwide | | | 12,900 | | | | 869 | |
Wynn Resorts | | | 8,400 | | | | 808 | |
Yum! Brands | | | 45,000 | | | | 3,694 | |
| | | | | | | | |
| | | | | | | 250,719 | |
| | | | | | | | |
|
Consumer Staples — 9.7% | |
Altria Group | | | 214,300 | | | | 13,638 | |
Archer-Daniels-Midland | | | 66,200 | | | | 2,831 | |
Brown-Forman, Cl B | | | 10,900 | | | | 1,069 | |
Campbell Soup | | | 20,500 | | | | 1,242 | |
Church & Dwight | | | 13,800 | | | | 1,359 | |
Clorox | | | 14,000 | | | | 1,800 | |
Coca-Cola | | | 425,700 | | | | 18,986 | |
Colgate-Palmolive | | | 98,600 | | | | 6,942 | |
ConAgra Foods | | | 48,600 | | | | 2,221 | |
Constellation Brands, Cl A | | | 19,300 | | | | 2,956 | |
Costco Wholesale | | | 48,000 | | | | 7,141 | |
CVS Health | | | 120,300 | | | | 11,603 | |
| | |
| 132 | | SEI Institutional Investments Trust / Annual Report / May 31, 2016 |
CONSOLIDATED SCHEDULE OF INVESTMENTS
Dynamic Asset Allocation Fund
May 31, 2016
| | | | | | | | |
| Description | | Shares | | | Market Value
($ Thousands) | |
Dr. Pepper Snapple Group | | | 20,450 | | | $ | 1,869 | |
Estee Lauder, Cl A | | | 24,900 | | | | 2,285 | |
General Mills | | | 64,300 | | | | 4,037 | |
Hershey | | | 15,400 | | | | 1,430 | |
Hormel Foods | | | 31,200 | | | | 1,074 | |
JM Smucker | | | 12,982 | | | | 1,677 | |
Kellogg | | | 27,200 | | | | 2,023 | |
Kimberly-Clark | | | 39,100 | | | | 4,967 | |
Kraft Heinz | | | 65,466 | | | | 5,446 | |
Kroger | | | 108,400 | | | | 3,876 | |
McCormick | | | 13,100 | | | | 1,272 | |
Mead Johnson Nutrition, Cl A | | | 20,800 | | | | 1,711 | |
Molson Coors Brewing, Cl B | | | 20,600 | | | | 2,043 | |
Mondelez International, Cl A | | | 172,200 | | | | 7,661 | |
Monster Beverage * | | | 16,100 | | | | 2,415 | |
PepsiCo | | | 158,162 | | | | 16,001 | |
Philip Morris International | | | 169,500 | | | | 16,726 | |
Procter & Gamble | | | 289,900 | | | | 23,494 | |
Reynolds American | | | 90,942 | | | | 4,520 | |
Sysco | | | 58,100 | | | | 2,795 | |
Tyson Foods, Cl A | | | 32,800 | | | | 2,092 | |
Walgreens Boots Alliance | | | 94,100 | | | | 7,283 | |
Wal-Mart Stores | | | 171,855 | | | | 12,164 | |
Whole Foods Market | | | 34,000 | | | | 1,100 | |
| | | | | | | | |
| | | | | | | 201,749 | |
| | | | | | | | |
|
Energy — 6.9% | |
Anadarko Petroleum | | | 54,700 | | | | 2,837 | |
Apache | | | 42,300 | | | | 2,417 | |
Baker Hughes | | | 46,800 | | | | 2,170 | |
Cabot Oil & Gas | | | 47,800 | | | | 1,146 | |
Chesapeake Energy | | | 53,800 | | | | 231 | |
Chevron | | | 205,800 | | | | 20,786 | |
Cimarex Energy | | | 10,800 | | | | 1,256 | |
Columbia Pipeline Group | | | 45,800 | | | | 1,170 | |
Concho Resources * | | | 14,300 | | | | 1,735 | |
ConocoPhillips | | | 135,900 | | | | 5,951 | |
Devon Energy | | | 57,500 | | | | 2,075 | |
Diamond Offshore Drilling | | | 6,400 | | | | 165 | |
EOG Resources | | | 60,300 | | | | 4,906 | |
EQT | | | 18,200 | | | | 1,333 | |
Exxon Mobil | | | 454,300 | | | | 40,442 | |
FMC Technologies * | | | 24,100 | | | | 656 | |
Halliburton | | | 94,800 | | | | 3,999 | |
Helmerich & Payne | | | 11,200 | | | | 685 | |
Hess | | | 29,900 | | | | 1,792 | |
Kinder Morgan | | | 201,377 | | | | 3,641 | |
Marathon Oil | | | 96,700 | | | | 1,264 | |
Marathon Petroleum | | | 57,410 | | | | 2,000 | |
Murphy Oil | | | 17,300 | | | | 535 | |
National Oilwell Varco | | | 42,800 | | | | 1,410 | |
Newfield Exploration * | | | 22,400 | | | | 913 | |
| | | | | | | | |
| Description | | Shares | | | Market Value
($ Thousands) | |
Noble Energy | | | 46,000 | | | $ | 1,644 | |
Occidental Petroleum | | | 84,000 | | | | 6,337 | |
ONEOK | | | 22,400 | | | | 969 | |
Phillips 66 | | | 51,500 | | | | 4,138 | |
Pioneer Natural Resources | | | 18,100 | | | | 2,902 | |
Range Resources | | | 18,100 | | | | 771 | |
Schlumberger | | | 152,237 | | | | 11,616 | |
Southwestern Energy * | | | 40,500 | | | | 554 | |
Spectra Energy | | | 75,000 | | | | 2,389 | |
Tesoro | | | 13,000 | | | | 1,015 | |
Transocean | | | 38,700 | | | | 379 | |
Valero Energy | | | 51,400 | | | | 2,811 | |
Williams | | | 73,200 | | | | 1,622 | |
| | | | | | | | |
| | | | | | | 142,662 | |
| | | | | | | | |
|
Financials — 15.6% | |
Affiliated Managers Group * | | | 5,900 | | | | 1,024 | |
Afiac | | | 46,100 | | | | 3,202 | |
Allstate | | | 41,500 | | | | 2,802 | |
American Express | | | 89,600 | | | | 5,892 | |
American International Group | | | 126,700 | | | | 7,333 | |
American Tower, Cl A ‡ | | | 46,747 | | | | 4,945 | |
Ameriprise Financial | | | 19,000 | | | | 1,932 | |
Aon | | | 29,700 | | | | 3,245 | |
Apartment Investment & Management, Cl A ‡ | | | 17,600 | | | | 751 | |
Arthur J Gallagher | | | 19,400 | | | | 938 | |
Assurant | | | 7,100 | | | | 620 | |
AvalonBay Communities ‡ | | | 15,100 | | | | 2,716 | |
Bank of America | | | 1,127,600 | | | | 16,677 | |
Bank of New York Mellon | | | 117,700 | | | | 4,950 | |
BB&T | | | 89,100 | | | | 3,241 | |
Berkshire Hathaway, Cl B * | | | 204,900 | | | | 28,797 | |
BlackRock, Cl A | | | 13,941 | | | | 5,072 | |
Boston Properties ‡ | | | 17,200 | | | | 2,161 | |
Capital One Financial | | | 57,200 | | | | 4,189 | |
CBRE Group, Cl A * | | | 31,500 | | | | 940 | |
Charles Schwab | | | 132,000 | | | | 4,037 | |
Chubb | | | 50,326 | | | | 6,372 | |
Cincinnati Financial | | | 15,400 | | | | 1,064 | |
Citigroup | | | 322,600 | | | | 15,024 | |
Citizens Financial Group | | | 57,900 | | | | 1,364 | |
CME Group, Cl A | | | 37,200 | | | | 3,642 | |
Comerica | | | 18,500 | | | | 871 | |
Crown Castle International ‡ | | | 37,200 | | | | 3,378 | |
Digital Realty Trust ‡ | | | 16,000 | | | | 1,527 | |
Discover Financial Services | | | 46,000 | | | | 2,613 | |
E*TRADE Financial * | | | 30,000 | | | | 837 | |
Equinix ‡ | | | 7,657 | | | | 2,772 | |
Equity Residential ‡ | | | 40,700 | | | | 2,817 | |
Essex Property Trust ‡ | | | 7,400 | | | | 1,682 | |
Extra Space Storage ‡ | | | 13,600 | | | | 1,264 | |
Federal Realty Investment Trust ‡ | | | 7,600 | | | | 1,164 | |
| | |
| 133 | | SEI Institutional Investments Trust / Annual Report / May 31, 2016 |
CONSOLIDATED SCHEDULE OF INVESTMENTS
Dynamic Asset Allocation Fund
May 31, 2016
| | | | | | | | |
| Description | | Shares | | | Market Value
($ Thousands) | |
Fifth Third Bancorp | | | 84,700 | | | $ | 1,598 | |
Four Corners Property Trust ‡ | | | 1 | | | | — | |
Franklin Resources | | | 40,700 | | | | 1,520 | |
General Growth Properties ‡ | | | 65,700 | | | | 1,765 | |
Goldman Sachs Group | | | 42,800 | | | | 6,826 | |
Hartford Financial Services Group | | | 43,800 | | | | 1,978 | |
HCP ‡ | | | 52,400 | | | | 1,722 | |
Host Hotels & Resorts ‡ | | | 80,785 | | | | 1,244 | |
Huntington Bancshares | | | 84,200 | | | | 880 | |
Intercontinental Exchange | | | 13,169 | | | | 3,570 | |
Invesco | | | 44,800 | | | | 1,407 | |
Iron Mountain ‡ | | | 27,671 | | | | 1,017 | |
JPMorgan Chase | | | 401,200 | | | | 26,186 | |
KeyCorp | | | 88,900 | | | | 1,140 | |
Kimco Realty ‡ | | | 43,900 | | | | 1,237 | |
Legg Mason | | | 12,500 | | | | 431 | |
Leucadia National | | | 33,700 | | | | 610 | |
Lincoln National | | | 27,600 | | | | 1,265 | |
Loews | | | 30,500 | | | | 1,235 | |
M&T Bank | | | 17,321 | | | | 2,070 | |
Macerich ‡ | | | 14,600 | | | | 1,114 | |
Marsh & McLennan | | | 56,300 | | | | 3,720 | |
MetLife | | | 119,900 | | | | 5,461 | |
Moody’s | | | 18,447 | | | | 1,820 | |
Morgan Stanley | | | 167,600 | | | | 4,587 | |
Nasdaq | | | 12,300 | | | | 812 | |
Navient | | | 39,300 | | | | 539 | |
Northern Trust | | | 23,100 | | | | 1,712 | |
People’s United Financial | | | 34,100 | | | | 542 | |
PNC Financial Services Group | | | 54,700 | | | | 4,909 | |
Principal Financial Group | | | 28,800 | | | | 1,283 | |
Progressive | | | 65,600 | | | | 2,184 | |
Prologis ‡ | | | 56,300 | | | | 2,676 | |
Prudential Financial | | | 49,000 | | | | 3,883 | |
Public Storage ‡ | | | 16,300 | | | | 4,135 | |
Realty Income ‡ | | | 27,200 | | | | 1,634 | |
Regions Financial | | | 139,600 | | | | 1,372 | |
S&P Global | | | 29,200 | | | | 3,265 | |
Simon Property Group ‡ | | | 34,000 | | | | 6,720 | |
SL Green Realty ‡ | | | 11,000 | | | | 1,115 | |
SunTrust Banks | | | 56,200 | | | | 2,463 | |
Synchrony Financial * | | | 92,911 | | | | 2,899 | |
T. Rowe Price Group | | | 27,800 | | | | 2,142 | |
Torchmark | | | 12,300 | | | | 758 | |
Travelers | | | 32,400 | | | | 3,698 | |
UDR ‡ | | | 28,300 | | | | 1,020 | |
Unum Group | | | 26,100 | | | | 964 | |
US Bancorp | | | 177,800 | | | | 7,613 | |
Ventas ‡ | | | 37,500 | | | | 2,487 | |
Vornado Realty Trust ‡ | | | 19,900 | | | | 1,901 | |
Wells Fargo | | | 505,000 | | | | 25,614 | |
Welltower ‡ | | | 39,500 | | | | 2,722 | |
| | | | | | | | |
| Description | | Shares | | | Market Value
($ Thousands) | |
Weyerhaeuser | | | 82,027 | | | $ | 2,584 | |
Willis Towers Watson | | | 15,595 | | | | 1,996 | |
XL Group, Cl A | | | 31,400 | | | | 1,079 | |
Zions Bancorporation | | | 22,900 | | | | 642 | |
| | | | | | | | |
| | | | | | | 323,621 | |
| | | | | | | | |
|
Health Care — 14.1% | |
Abbott Laboratories | | | 160,900 | | | | 6,376 | |
AbbVie | | | 176,500 | | | | 11,107 | |
Aetna | | | 38,518 | | | | 4,361 | |
Agilent Technologies | | | 35,200 | | | | 1,615 | |
Alexion Pharmaceuticals * | | | 24,900 | | | | 3,757 | |
Allergan * | | | 43,300 | | | | 10,208 | |
AmerisourceBergen | | | 20,361 | | | | 1,527 | |
Amgen | | | 82,300 | | | | 12,999 | |
Anthem | | | 29,000 | | | | 3,833 | |
Baxalta | | | 75,167 | | | | 3,400 | |
Baxter International | | | 60,338 | | | | 2,604 | |
Becton Dickinson | | | 23,177 | | | | 3,858 | |
Biogen * | | | 23,900 | | | | 6,925 | |
Boston Scientific * | | | 149,300 | | | | 3,391 | |
Bristol-Myers Squibb | | | 182,800 | | | | 13,107 | |
C.R. Bard | | | 7,800 | | | | 1,708 | |
Cardinal Health | | | 36,500 | | | | 2,882 | |
Celgene * | | | 85,700 | | | | 9,043 | |
Centene * | | | 18,300 | | | | 1,141 | |
Cerner * | | | 34,000 | | | | 1,891 | |
Cigna | | | 27,700 | | | | 3,549 | |
DaVita HealthCare Partners * | | | 18,500 | | | | 1,430 | |
Dentsply Sirona | | | 26,900 | | | | 1,672 | |
Edwards Lifesciences * | | | 23,700 | | | | 2,334 | |
Eli Lilly | | | 107,400 | | | | 8,058 | |
Endo International * | | | 22,700 | | | | 359 | |
Express Scripts Holding * | | | 69,700 | | | | 5,266 | |
Gilead Sciences | | | 149,556 | | | | 13,020 | |
HCA Holdings * | | | 34,100 | | | | 2,660 | |
Henry Schein * | | | 9,300 | | | | 1,616 | |
Hologic * | | | 26,600 | | | | 915 | |
Humana | | | 15,900 | | | | 2,743 | |
Illumina * | | | 16,400 | | | | 2,375 | |
Intuitive Surgical * | | | 4,100 | | | | 2,602 | |
Johnson & Johnson | | | 301,800 | | | | 34,010 | |
Laboratory Corp of America Holdings * | | | 10,854 | | | | 1,389 | |
Mallinckrodt * | | | 12,200 | | | | 773 | |
McKesson | | | 25,100 | | | | 4,597 | |
Medtronic | | | 153,955 | | | | 12,390 | |
Merck | | | 303,600 | | | | 17,081 | |
Mylan * | | | 46,100 | | | | 1,998 | |
Patterson | | | 8,900 | | | | 434 | |
PerkinElmer | | | 12,000 | | | | 657 | |
Perrigo | | | 15,500 | | | | 1,486 | |
Pfizer | | | 660,996 | | | | 22,937 | |
| | |
| 134 | | SEI Institutional Investments Trust / Annual Report / May 31, 2016 |
CONSOLIDATED SCHEDULE OF INVESTMENTS
Dynamic Asset Allocation Fund
May 31, 2016
| | | | | | | | |
| Description | | Shares | | | Market Value
($ Thousands) | |
Quest Diagnostics | | | 15,300 | | | $ | 1,181 | |
Regeneron Pharmaceuticals * | | | 8,700 | | | | 3,471 | |
St. Jude Medical | | | 30,400 | | | | 2,382 | |
Stryker | | | 33,900 | | | | 3,768 | |
Thermo Fisher Scientific | | | 43,100 | | | | 6,541 | |
UnitedHealth Group | | | 104,100 | | | | 13,915 | |
Universal Health Services, Cl B | | | 9,700 | | | | 1,308 | |
Varian Medical Systems * | | | 10,400 | | | | 861 | |
Vertex Pharmaceuticals * | | | 27,500 | | | | 2,562 | |
Waters * | | | 8,600 | | | | 1,183 | |
Zimmer Biomet Holdings | | | 19,500 | | | | 2,381 | |
Zoetis, Cl A | | | 51,067 | | | | 2,422 | |
| | | | | | | | |
| | | | | | | 294,059 | |
| | | | | | | | |
|
Industrials — 9.6% | |
3M | | | 66,300 | | | | 11,160 | |
Acuity Brands | | | 4,700 | | | | 1,218 | |
Alaska Air Group | | | 13,700 | | | | 910 | |
Allegion | | | 11,333 | | | | 767 | |
American Airlines Group | | | 67,500 | | | | 2,154 | |
Ametek | | | 25,100 | | | | 1,200 | |
Boeing | | | 68,300 | | | | 8,616 | |
C.H. Robinson Worldwide | | | 15,200 | | | | 1,140 | |
Caterpillar | | | 64,100 | | | | 4,648 | |
Cintas | | | 9,600 | | | | 910 | |
CSX | | | 105,300 | | | | 2,783 | |
Cummins | | | 17,400 | | | | 1,992 | |
Danaher | | | 65,300 | | | | 6,423 | |
Deere | | | 33,300 | | | | 2,740 | |
Delta Air Lines | | | 84,700 | | | | 3,681 | |
Dover | | | 17,000 | | | | 1,135 | |
Dun & Bradstreet | | | 3,500 | | | | 444 | |
Eaton | | | 50,101 | | | | 3,088 | |
Emerson Electric | | | 70,300 | | | | 3,657 | |
Equifax | | | 13,400 | | | | 1,685 | |
Expeditors International of Washington | | | 19,900 | | | | 966 | |
Fastenal | | | 30,400 | | | | 1,399 | |
FedEx | | | 28,049 | | | | 4,627 | |
Flowserve | | | 14,000 | | | | 674 | |
Fluor | | | 15,200 | | | | 802 | |
General Dynamics | | | 32,000 | | | | 4,540 | |
General Electric | | | 1,020,292 | | | | 30,843 | |
Honeywell International | | | 84,300 | | | | 9,596 | |
Illinois Tool Works | | | 36,356 | | | | 3,855 | |
Ingersoll-Rand | | | 28,900 | | | | 1,931 | |
Jacobs Engineering Group * | | | 12,300 | | | | 623 | |
JB Hunt Transport Services | | | 9,700 | | | | 802 | |
Kansas City Southern | | | 11,600 | | | | 1,080 | |
L-3 Communications Holdings, Cl 3 | | | 8,600 | | | | 1,180 | |
Lockheed Martin | | | 28,600 | | | | 6,756 | |
Masco | | | 36,300 | | | | 1,185 | |
Nielsen Holdings | | | 39,600 | | | | 2,114 | |
| | | | | | | | |
| Description | | Shares | | | Market Value
($ Thousands) | |
Norfolk Southern | | | 33,300 | | | $ | 2,799 | |
Northrop Grumman | | | 19,600 | | | | 4,168 | |
Paccar | | | 37,600 | | | | 2,096 | |
Parker Hannifin | | | 15,200 | | | | 1,746 | |
Pentair | | | 20,046 | | | | 1,208 | |
Pitney Bowes | | | 18,800 | | | | 350 | |
Quanta Services * | | | 16,600 | | | | 399 | |
Raytheon | | | 32,800 | | | | 4,253 | |
Republic Services, Cl A | | | 27,100 | | | | 1,308 | |
Robert Half International | | | 14,100 | | | | 586 | |
Rockwell Automation | | | 14,200 | | | | 1,648 | |
Rockwell Collins | | | 14,400 | | | | 1,273 | |
Roper Technologies | | | 11,300 | | | | 1,933 | |
Ryder System | | | 6,200 | | | | 432 | |
Snap-on | | | 6,400 | | | | 1,036 | |
Southwest Airlines | | | 70,500 | | | | 2,995 | |
Stanley Black & Decker | | | 16,400 | | | | 1,856 | |
Stericycle * | | | 9,000 | | | | 882 | |
Textron | | | 29,800 | | | | 1,134 | |
Tyco International | | | 45,300 | | | | 1,931 | |
Union Pacific | | | 92,900 | | | | 7,821 | |
United Continental Holdings * | | | 37,000 | | | | 1,668 | |
United Parcel Service, Cl B | | | 75,700 | | | | 7,804 | |
United Rentals * | | | 10,800 | | | | 752 | |
United Technologies | | | 85,300 | | | | 8,579 | |
Verisk Analytics, Cl A * | | | 17,600 | | | | 1,397 | |
Waste Management | | | 46,000 | | | | 2,804 | |
WW Grainger | | | 6,200 | | | | 1,416 | |
Xylem | | | 19,000 | | | | 849 | |
| | | | | | | | |
| | | | | | | 200,447 | |
| | | | | | | | |
|
Information Technology — 19.6% | |
Accenture, Cl A | | | 68,900 | | | | 8,197 | |
Activision Blizzard | | | 56,900 | | | | 2,234 | |
Adobe Systems * | | | 54,900 | | | | 5,461 | |
Akamai Technologies * | | | 18,600 | | | | 1,015 | |
Alliance Data Systems * | | | 6,600 | | | | 1,466 | |
Alphabet, Cl A * | | | 31,945 | | | | 23,922 | |
Alphabet, Cl C * | | | 32,622 | | | | 24,001 | |
Amphenol, Cl A | | | 32,900 | | | | 1,932 | |
Analog Devices | | | 34,800 | | | | 2,036 | |
Apple | | | 606,800 | | | | 60,595 | |
Applied Materials | | | 122,000 | | | | 2,979 | |
Autodesk * | | | 24,000 | | | | 1,398 | |
Automatic Data Processing | | | 49,700 | | | | 4,366 | |
Broadcom | | | 40,493 | | | | 6,250 | |
CA | | | 30,900 | | | | 999 | |
Cisco Systems | | | 550,600 | | | | 15,995 | |
Citrix Systems * | | | 16,600 | | | | 1,410 | |
Cognizant Technology Solutions, Cl A * | | | 67,500 | | | | 4,147 | |
Corning | | | 124,500 | | | | 2,601 | |
CSRA | | | 15,200 | | | | 376 | |
| | |
| 135 | | SEI Institutional Investments Trust / Annual Report / May 31, 2016 |
CONSOLIDATED SCHEDULE OF INVESTMENTS
Dynamic Asset Allocation Fund
May 31, 2016
| | | | | | | | |
| Description | | Shares | | | Market Value
($ Thousands) | |
eBay * | | | 118,300 | | | $ | 2,894 | |
Electronic Arts * | | | 34,600 | | | | 2,656 | |
EMC | | | 212,900 | | | | 5,951 | |
F5 Networks * | | | 7,500 | | | | 826 | |
Facebook, Cl A * | | | 250,900 | | | | 29,809 | |
Fidelity National Information Services | | | 29,900 | | | | 2,221 | |
First Solar * | | | 7,800 | | | | 387 | |
Fiserv * | | | 24,400 | | | | 2,570 | |
FLIR Systems | | | 13,200 | | | | 411 | |
Global Payments | | | 16,612 | | | | 1,291 | |
Harris | | | 13,600 | | | | 1,071 | |
Hewlett Packard Enterprise | | | 188,800 | | | | 3,487 | |
HP | | | 192,600 | | | | 2,577 | |
Intel | | | 516,800 | | | | 16,326 | |
International Business Machines | | | 96,758 | | | | 14,876 | |
Intuit | | | 28,300 | | | | 3,018 | |
Juniper Networks | | | 40,800 | | | | 955 | |
Kla-Tencor | | | 16,900 | | | | 1,232 | |
Lam Research | | | 16,587 | | | | 1,374 | |
Linear Technology | | | 24,900 | | | | 1,178 | |
MasterCard, Cl A | | | 107,400 | | | | 10,300 | |
Microchip Technology | | | 22,300 | | | | 1,152 | |
Micron Technology * | | | 118,400 | | | | 1,506 | |
Microsoft | | | 865,300 | | | | 45,861 | |
Motorola Solutions | | | 17,267 | | | | 1,196 | |
NetApp | | | 32,400 | | | | 827 | |
Nvidia | | | 54,900 | | | | 2,565 | |
Oracle | | | 344,900 | | | | 13,865 | |
Paychex | | | 34,200 | | | | 1,854 | |
PayPal Holdings * | | | 123,000 | | | | 4,648 | |
Qorvo * | | | 12,800 | | | | 652 | |
Qualcomm | | | 162,800 | | | | 8,941 | |
Red Hat * | | | 19,900 | | | | 1,541 | |
Salesforce.com * | | | 69,300 | | | | 5,801 | |
Seagate Technology | | | 30,300 | | | | 684 | |
Skyworks Solutions | | | 21,800 | | | | 1,455 | |
Symantec | | | 69,800 | | | | 1,212 | |
TE Connectivity | | | 41,300 | | | | 2,478 | |
Teradata * | | | 14,700 | | | | 417 | |
Texas Instruments | | | 109,400 | | | | 6,630 | |
Total System Services | | | 17,600 | | | | 945 | |
VeriSign * | | | 11,100 | | | | 949 | |
Visa, Cl A | | | 209,600 | | | | 16,546 | |
Western Digital | | | 30,203 | | | | 1,406 | |
Western Union | | | 55,100 | | | | 1,072 | |
Xerox | | | 100,300 | | | | 1,000 | |
Xilinx | | | 27,200 | | | | 1,289 | |
Yahoo! * | | | 96,300 | | | | 3,654 | |
| | | | | | | | |
| | | | | | | 406,936 | |
| | | | | | | | |
|
Materials — 2.8% | |
Air Products & Chemicals | | | 21,600 | | | | 3,081 | |
| | | | | | | | |
| Description | | Shares | | | Market Value
($ Thousands) | |
Alcoa | | | 140,900 | | | $ | 1,306 | |
Avery Dennison | | | 10,400 | | | | 774 | |
Ball | | | 15,000 | | | | 1,085 | |
CF Industries Holdings | | | 25,000 | | | | 692 | |
Dow Chemical | | | 123,500 | | | | 6,343 | |
E.I. du Pont de Nemours | | | 95,700 | | | | 6,260 | |
Eastman Chemical | | | 16,100 | | | | 1,181 | |
Ecolab | | | 29,600 | | | | 3,470 | |
FMC | | | 13,900 | | | | 660 | |
Freeport-McMoRan, Cl B | | | 140,700 | | | | 1,559 | |
International Flavors & Fragrances | | | 8,800 | | | | 1,135 | |
International Paper | | | 44,800 | | | | 1,889 | |
LyondellBasell Industries, Cl A | | | 38,100 | | | | 3,100 | |
Martin Marietta Materials | | | 7,200 | | | | 1,361 | |
Monsanto | | | 48,700 | | | | 5,477 | |
Mosaic | | | 36,800 | | | | 928 | |
Newmont Mining | | | 59,400 | | | | 1,925 | |
Nucor | | | 35,900 | | | | 1,742 | |
Owens-Illinois * | | | 17,100 | | | | 323 | |
PPG Industries | | | 28,800 | | | | 3,101 | |
Praxair | | | 31,664 | | | | 3,479 | |
Sealed Air | | | 21,900 | | | | 1,017 | |
Sherwin-Williams | | | 8,775 | | | | 2,554 | |
Vulcan Materials | | | 14,100 | | | | 1,646 | |
WestRock | | | 27,341 | | | | 1,083 | |
| | | | | | | | |
| | | | | | | 57,171 | |
| | | | | | | | |
|
Telecommunication Services — 2.5% | |
AT&T | | | 672,416 | | | | 26,325 | |
CenturyLink | | | 59,100 | | | | 1,603 | |
Frontier Communications | | | 130,800 | | | | 676 | |
Level 3 Communications * | | | 30,900 | | | | 1,667 | |
Verizon Communications | | | 445,200 | | | | 22,661 | |
| | | | | | | | |
| | | | | | | 52,932 | |
| | | | | | | | |
|
Utilities — 3.2% | |
AES | | | 77,600 | | | | 861 | |
AGL Resources | | | 12,400 | | | | 816 | |
Ameren | | | 26,400 | | | | 1,308 | |
American Electric Power | | | 54,000 | | | | 3,495 | |
American Water Works | | | 19,400 | | | | 1,438 | |
Centerpoint Energy | | | 44,900 | | | | 1,012 | |
CMS Energy | | | 30,100 | | | | 1,259 | |
Consolidated Edison | | | 32,200 | | | | 2,359 | |
Dominion Resources | | | 65,300 | | | | 4,718 | |
DTE Energy | | | 20,200 | | | | 1,832 | |
Duke Energy | | | 75,730 | | | | 5,924 | |
Edison International | | | 36,300 | | | | 2,600 | |
Entergy | | | 18,800 | | | | 1,427 | |
Eversource Energy | | | 35,600 | | | | 1,967 | |
Exelon | | | 101,200 | | | | 3,468 | |
FirstEnergy | | | 47,800 | | | | 1,568 | |
| | |
| 136 | | SEI Institutional Investments Trust / Annual Report / May 31, 2016 |
CONSOLIDATED SCHEDULE OF INVESTMENTS
Dynamic Asset Allocation Fund
May 31, 2016
| | | | | | | | |
| Description | | Shares | | | Market Value
($ Thousands) | |
NextEra Energy | | | 50,700 | | | $ | 6,090 | |
NiSource | | | 33,000 | | | | 787 | |
NRG Energy | | | 35,100 | | | | 575 | |
PG&E | | | 54,600 | | | | 3,280 | |
Pinnacle West Capital | | | 11,500 | | | | 846 | |
PPL | | | 75,000 | | | | 2,891 | |
Public Service Enterprise Group | | | 56,600 | | | | 2,533 | |
SCANA | | | 16,500 | | | | 1,154 | |
Sempra Energy | | | 26,300 | | | | 2,817 | |
Southern | | | 99,900 | | | | 4,939 | |
TECO Energy | | | 27,100 | | | | 746 | |
WEC Energy Group | | | 34,162 | | | | 2,055 | |
Xcel Energy | | | 54,100 | | | | 2,238 | |
| | | | | | | | |
| | | | | | | 67,003 | |
| | | | | | | | |
Total Common Stock
(Cost $1,510,839) ($ Thousands) | | | | 1,997,299 | |
| | | | | | | | |
| |
EXCHANGE TRADED FUND — 0.3% | | | | | |
| | |
Exchange Traded Fund — 0.3% | | | | | | | | |
SPDR S&P 500 ETF Trust | | | 33,406 | | | | 7,018 | |
| | | | | | | | |
Total Exchange Traded Fund
(Cost $5,987) ($ Thousands) | | | | 7,018 | |
| | | | | | | | |
| | |
| |
| Number of
Rights |
| | | | |
| | | | | | | | |
RIGHTS — 0.0% | | | | | | | | |
| | |
United States — 0.0% | | | | | | | | |
Safeway - PDC *‡‡ | | | 22 | | | | 1 | |
Safeway CVR - Casa Ley *‡‡ | | | 22 | | | | 22 | |
| | | | | | | | |
Total Rights
(Cost $—) ($ Thousands) | | | | 23 | |
| | | | | | | | |
Total Investments — 96.4%
(Cost $1,516,826) ($ Thousands) | | | $ | 2,004,340 | |
| | | | | | | | |
| | |
| | | Contracts | | | | |
PURCHASED OPTION(A) — 0.0% | | | | | |
June 16, S&P 500 Index Call, Expires 06/18/2016, | | | | | | | | |
Strike Price $2,200* | | | 7,000 | | | $ | 161 | |
| | | | | | | | |
Total Purchased Option
(Cost $1,450) ($ Thousands) | | | | | | $ | 161 | |
| | | | | | | | |
A list of the open futures contracts held by the Fund at May 31, 2016, is as follows:
| | | | | | | | | | | | |
| Type of Contract | | Number of
Contracts
Long (Short) | | | Expiration
Date | | | Unrealized
Appreciation
(Depreciation)
($ Thousands) | |
S&P 500 Index E-MINI | | | 983 | | | | Jun-2016 | | | $ | 3,076 | |
U.S. 10-Year Treasury Note | | | (797 | ) | | | Sep-2006 | | | | (160 | ) |
| | | | | | | | | | | | |
| | | | | | | | | | $ | 2,916 | |
| | | | | | | | | | | | |
For the year ended May 31, 2016, the total amount of all open futures contracts, as presented in the table above, are representative of the volume of activity for the derivative type during the year.
A list of the open forward foreign currency contracts held by the Fund at May 31, 2016, is as follows:
| | | | | | | | | | | | | | | | | | | | |
| Settlement Date | | Currency to Deliver (Thousands) | | | Currency To Receive (Thousands) | | | Unrealized
Appreciation
(Depreciation)
($ Thousands) | |
07/21/2016 | | | EUR | | | | 185,469 | | | | USD | | | | 211,488 | | | $ | 4,670 | |
07/21/2016 | | | USD | | | | 205,349 | | | | INR | | | | 13,840,506 | | | | (919 | ) |
07/21/2016 | | | KRW | | | | 243,475,344 | | | | USD | | | | 211,618 | | | | 7,123 | |
01/09/2017 | | | USD | | | | 3,962 | | | | SAR | | | | 15,103 | | | | 34 | |
01/09/2017- 01/19/2017 | | | SAR | | | | 402,242 | | | | USD | | | | 104,382 | | | | (2,050 | ) |
| | | | | | | | | | | | | | | | | | | | |
| | | | | | | | | | | | | | | | | | $ | 8,858 | |
| | | | | | | | | | | | | | | | | | | | |
A list of the counterparties for the outstanding forward foreign currency contracts held by the Fund at May 31, 2016, is as follows:
| | | | | | | | | | | | |
| Counterparty | | Currency to
Deliver
($ Thousands) | | | Currency to
Receive
($ Thousands) | | | Unrealized
Appreciation
(Depreciation)
($ Thousands) | |
Bank of America | | $ | (315,744 | ) | | $ | 312,809 | | | $ | (2,935 | ) |
BNP Paribas | | | (7,017 | ) | | | 7,215 | | | | 198 | |
Societe Generale | | | (199,800 | ) | | | 204,272 | | | | 4,472 | |
Standard Chartered | | | (204,495 | ) | | | 211,618 | | | | 7,123 | |
| | | | | | | | | | | | |
| | | | | | | | | | $ | 8,858 | |
| | | | | | | | | | | | |
For the year ended May 31, 2016 the total amount of all open forward foreign currency contracts, as presented in the table above, are representative of the volume of activity for the derivative type during the year.
| | |
| 137 | | SEI Institutional Investments Trust / Annual Report / May 31, 2016 |
CONSOLIDATED SCHEDULE OF INVESTMENTS
Dynamic Asset Allocation Fund
May 31, 2016
A list of the OTC swap agreements held by the Fund at May 31, 2016, is as follows:
| | | | | | | | | | | | | | |
| Interest Rate Swaps | |
| Counterparty | | Fund Pays | | Fund Receives | | Termination Date | | Notional Amount
($ Thousands) | | | Net Unrealized Appreciation (Depreciation) ($Thousands) | |
| Bank of America | | 1.99% | | US CPI URBAN CONSUMERS NSA | | 12/24/2045 | | $ | 54,920 | | | $ | (533 | ) |
| Bank of America | | UK RPI ALL ITEMS NSA | | 3.46% | | 12/24/2045 | | | 20,500 | | | | 4,648 | |
| Bank of America | | 2.06% | | US CPI URBAN CONSUMERS NSA | | 11/13/2045 | | | 38,660 | | | | (1,324 | ) |
| Bank of America | | UK RPI ALL ITEMS NSA | | 3.47% | | 11/13/2045 | | | 14,930 | | | | 3,593 | |
| | | | | | | | | | | | | | |
| | | | | | | | | | | | $ | 6,384 | |
| | | | | | | | | | | | | | |
For the year ended May 31, 2016, the total amount of all open swap contracts, as presented in the table above, are representative of the volume of activity for this derivative type during the year.
Percentages are based on a Net Assets of $2,079,154 ($ Thousands).
| * | | Non-income producing security. |
| ‡ | | Real Estate Investment Trust. |
| ‡‡ | | Expiration date unavailable. |
| (A) | | For the year ended May 31, 2016, the total amount of open purchased options, as presented in the Schedule of Investments, are representative of the volume of activity for these derivative types during the period. |
Cl — Class
CPI — Consumer Price Index
EUR — Euro
INR — Indian Rupee
KRW — Korean Won
NSA — Not seasonally adjusted
OTC — Over the Counter
RPI — Retail Price Index
S&P— Standard & Poor’s
SAR— Saudi Riyal
SPDR — Standard & Poor’s Depository Receipt
USD — United States Dollar
The following is a list of the level of inputs used as of May 31, 2016, in valuing the Fund’s investments and other financial instruments carried at value ($ Thousands):
| | | | | | | | | | | | | | | | |
| Investments in Securities | | Level 1 | | | Level 2 | | | Level 3 | | | Total | |
Common Stock | | $ | 1,997,299 | | | $ | — | | | $ | — | | | $ | 1,997,299 | |
Exchange Traded Fund | | | 7,018 | | | | — | | | | — | | | | 7,018 | |
Rights | | | — | | | | 23 | | | | — | | | | 23 | |
| | | | | | | | | | | | | | | | |
Total Investments in Securities | | $ | 2,004,317 | | | $ | 23 | | | $ | — | | | $ | 2,004,340 | |
| | | | | | | | | | | | | | | | |
| | | | | | | | | | | | | | | | |
| Other Financial Instruments | | Level 1 | | | Level 2 | | | Level 3 | | | Total | |
Purchased Options | | $ | 161 | | | $ | — | | | $ | — | | | $ | 161 | |
Futures Contracts * | | | | | | | | | | | | | | | | |
Unrealized Appreciation | | | 3,076 | | | | — | | | | — | | | | 3,076 | |
Unrealized Depreciation | | | (160 | ) | | | — | | | | — | | | | (160 | ) |
Forwards Contracts * | | | | | | | | | | | | | | | | |
Unrealized Appreciation | | | — | | | | 11,827 | | | | — | | | | 11,827 | |
Unrealized Depreciation | | | — | | | | (2,969 | ) | | | — | | | | (2,969 | ) |
OTC Swaps | | | | | | | | | | | | | | | | |
Interest Rate Swaps * | | | | | | | | | | | | | | | | |
Unrealized Appreciation | | | — | | | | 8,241 | | | | — | | | | 8,241 | |
Unrealized Depreciation | | | — | | | | (1,857 | ) | | | — | | | | (1,857 | ) |
| | | | | | | | | | | | | | | | |
Total Other Financial Instruments | | $ | 3,077 | | | $ | 15,242 | | | $ | — | | | $ | 18,319 | |
| | | | | | | | | | | | | | | | |
| * | | Futures contracts, forwards contracts and swaps are valued at the unrealized appreciation (depreciation) on the instrument. |
For the year ended May 31, 2016, there were no transfers between Level 1 and Level 2 assets and liabilities.
For the year ended May 31, 2016, there were no transfers between Level 2 and Level 3 assets and liabilities.
For more information on valuation inputs, see Note 2 — Significant Accounting Policies in Notes to Financial Statements.
Amounts designated as “—” are $0 or have been rounded to $0.
| | |
| 138 | | SEI Institutional Investments Trust / Annual Report / May 31, 2016 |
Report of Independent Registered Public Accounting Firm
The Board of Trustees and Shareholders
SEI Institutional Investments Trust:
We have audited the accompanying statements of assets and liabilities, including the summary schedules of investments, of the Large Cap Fund, Large Cap Diversified Alpha Fund, Large Cap Disciplined Equity Fund, Large Cap Index Fund, S&P 500 Index Fund, Extended Market Index Fund, Small Cap Fund, Small Cap II Fund, Small/Mid Cap Equity Fund, U.S. Managed Volatility Fund, Global Managed Volatility Fund, World Equity Ex-US Fund, Screened World Equity Ex-US Fund and Emerging Markets Equity Fund, and the accompanying statements of assets and liabilities, including the schedules of investments, of the Opportunistic Income Fund, Core Fixed Income Fund, High Yield Bond Fund, Long Duration Fund, Long Duration Credit Fund, Ultra Short Duration Bond Fund, Emerging Markets Debt Fund, Real Return Fund, Limited Duration Bond Fund and Intermediate Duration Credit Fund (twenty-four of the twenty-six funds comprising the SEI Institutional Investments Trust (the Trust)), as of May 31, 2016, and the related statements of operations for the year or period then ended, the statements of changes in net assets for each of the years or periods in the two-year period then ended, and the financial highlights for each of the years or periods in the five-year period then ended. We have also audited the accompanying consolidated statement of assets and liabilities, including the consolidated summary schedule of investments of the Dynamic Asset Allocation Fund and the consolidated statement of assets and liabilities, including the consolidated schedule of investments, of the Multi-Asset Real Return Fund (two of the twenty-six funds comprising the Trust), as of May 31, 2016, and the related consolidated statements of operations for the year then ended, the consolidated statements of changes in net assets for each of the years in the two-year period then ended, the consolidated statement of cash flows for the year then ended for the Multi-Asset Real Return Fund, and the consolidated financial highlights for each of the years or periods in the five-year period then ended. The financial statements and consolidated financial statements and financial highlights and consolidated financial highlights, are included in Item 1 of this Form N-CSR and the schedules of investments in securities of the Large Cap Fund, Large Cap Diversified Alpha Fund, Large Cap Disciplined Equity Fund, Large Cap Index Fund, S&P 500 Index Fund, Extended Market Index Fund, Small Cap Fund, Small Cap II Fund, Small/Mid Cap Equity Fund, U.S. Managed Volatility Fund, Global Managed Volatility Fund, World Equity Ex-US Fund, Screened World Equity Ex-US Fund and Emerging Markets Equity Fund and the consolidated schedule of investments in securities of the Dynamic Asset Allocation Fund, as of May 31, 2016 are included in Item 6 of this Form N-CSR. These financial statements and consolidated financial statements and financial highlights and consolidated financial highlights and the schedules of investments in securities and consolidated schedules of investments in securities are the responsibility of the Trust’s management. Our responsibility is to express an opinion on these financial statements, consolidated financial statements, financial highlights, consolidated financial highlights and schedules of investments in securities and consolidated schedules of investments in securities based on our audits.
We conducted our audits in accordance with the standards of the Public Company Accounting Oversight Board (United States). Those standards require that we plan and perform the audit to obtain reasonable assurance about whether the financial statements and financial highlights are free of material misstatement. An audit includes examining, on a test basis, evidence supporting the amounts and disclosures in the financial statements. Our procedures included confirmation of securities owned as of May 31, 2016, by correspondence with custodians and brokers or other appropriate auditing procedures. An audit also includes assessing the accounting principles used and significant estimates made by management, as well as evaluating the overall financial statement presentation. We believe that our audits provide a reasonable basis for our opinion.
In our opinion, the financial statements and consolidated financial statements and financial highlights and consolidated financial highlights referred to above present fairly, in all material respects, the financial position of each of the funds comprising the SEI Institutional Investments Trust as of May 31, 2016, the results of their operations, the changes in their net assets, the cash flows for the Multi-Asset Real Return Fund, and the financial highlights for each of the years or periods described in the first paragraph, in conformity with U.S. generally accepted accounting principles.
/s/ KPMG LLP
Philadelphia, Pennsylvania
July 29, 2016
(b) In accordance with Section 13(c) of the Investment Company Act of 1940 the Screened World Equity Ex-US Fund did not hold any divested securities during the fiscal year ended May 31, 2015.
| Item 7. | Disclosure of Proxy Voting Policies and Procedures for Closed-End Management Investment Companies. |
Not applicable.
| Item 8. | Portfolio Managers of Closed-End Management Investment Companies |
Not applicable.
| Item 9. | Purchases of Equity Securities by Closed-End Management Company and Affiliated Purchasers. |
Not applicable.
| Item 10. | Submission of Matters to a Vote of Security Holders. |
The Registrant has a standing Governance Committee (the “Committee”) currently consisting of the Independent Trustees. The Committee is responsible for evaluating and recommending nominees for election to the Registrant’s Board of Trustees (the “Board”). Pursuant to the Committee’s Charter, adopted on June 18, 2004, as amended, the Committee will review all shareholder recommendations for nominations to fill vacancies on the Board if such recommendations are submitted in writing and addressed to the Committee at the Registrant’s office.
| Item 11. | Controls and Procedures. |
(a) The Registrant’s principal executive and principal financial officers, or persons performing similar functions, have concluded that the Registrant’s disclosure controls and procedures (as defined in Rule 30a-3(c) under the Investment Company Act of 1940 (the “1940 Act”)) are effective, based on the evaluation of these controls and procedures required by Rule 30a-3(b) under the 1940 Act and Rules 13a-15(b) or 15d-15(b) under the Securities Exchange Act of 1934 as of a date within 90 days of the filing date of this report.
(b) There were no changes in the Registrant’s internal control over financial reporting (as defined in Rule 30a-3(d) under the 1940 Act) that occurred during the second fiscal quarter of the period covered by this report that have materially affected, or are reasonably likely to materially affect, the Registrant’s internal control over financial reporting.
(a)(1) Code of Ethics attached hereto.
(a)(2) A separate certification for the principal executive officer and the principal financial officer of the Registrant as required by Rule 30a-2(a) under the Investment Company Act of 1940, as amended (17 CFR 270.30a-2(a)), are filed herewith.
(b) Officer certifications as required by Rule 30a-2(b) under the Investment Company Act of 1940, as amended (17 CFR 270.30a-2(b)) also accompany this filing as an exhibit.
SIGNATURES
Pursuant to the requirements of the Securities Exchange Act of 1934 and the Investment Company Act of 1940, the Registrant has duly caused this report to be signed on its behalf by the undersigned, thereunto duly authorized.
| | | | | | |
| | | | | | SEI Institutional Investments Trust |
| | | |
| By | | | | | | /s/ Robert A. Nesher |
| | | | | | Robert A. Nesher |
| | | | | | President & CEO |
Date: August 8, 2016
Pursuant to the requirements of the Securities Exchange Act of 1934 and the Investment Company Act of 1940, this report has been signed below by the following persons on behalf of the Registrant and in the capacities and on the dates indicated.
| | | | | | |
| By | | | | | | /s/ Robert A. Nesher |
| | | | | | Robert A. Nesher |
| | | | | | President & CEO |
Date: August 8, 2016
| | | | | | |
| By | | | | | | /s/ Arthur Ramanjulu |
| | | | | | Arthur Ramanjulu |
| | | | | | Controller & CFO |
Date: August 8, 2016