UNITED STATES
SECURITIES AND EXCHANGE COMMISSION
Washington, D.C. 20549
FORM N-CSR
CERTIFIED SHAREHOLDER REPORT OF REGISTERED
MANAGEMENT INVESTMENT COMPANIES
Investment Company Act file number | 811-07261 |
|
CREDIT SUISSE TRUST |
(Exact name of registrant as specified in charter) |
|
Eleven Madison Avenue, New York, New York | | 10010 |
(Address of principal executive offices) | | (Zip code) |
|
J. Kevin Gao, Esq. Credit Suisse Trust Eleven Madison Avenue New York, New York 10010 |
(Name and address of agent for service) |
|
Registrant’s telephone number, including area code: | (212) 325-2000 | |
|
Date of fiscal year end: | December 31st | |
|
Date of reporting period: | January 1, 2007 to December 31, 2007 | |
| | | | | | | |
Item 1. Reports to Stockholders.

CREDIT SUISSE FUNDS
Annual Report
December 31, 2007
CREDIT SUISSE TRUST
n INTERNATIONAL FOCUS PORTFOLIO
Credit Suisse Trust (the "Trust") shares are not available directly to individual investors, but may be offered only through certain insurance products and pension and retirement plans.
The Trust's investment objectives, risks, charges and expenses (which should be considered carefully before investing), and more complete information about the Trust, are provided in the Prospectus, which should be read carefully before investing. You may obtain additional copies by calling 800-222-8977 or by writing to Credit Suisse Trust, P.O. Box 55030, Boston, MA 02205-5030.
Credit Suisse Asset Management Securities, Inc., Distributor, is located at Eleven Madison Avenue, New York, NY 10010. The Trust is advised by Credit Suisse Asset Management, LLC.
The views of the Portfolio's management are as of the date of the letter and the Portfolio holdings described in this document are as of December 31, 2007; these views and Portfolio holdings may have changed subsequent to these dates. Nothing in this document is a recommendation to purchase or sell securities.
Portfolio shares are not deposits or other obligations of Credit Suisse Asset Management, LLC ("Credit Suisse") or any affiliate, are not FDIC-insured and are not guaranteed by Credit Suisse or any affiliate. Portfolio investments are subject to investment risks, including loss of your investment.
Credit Suisse Trust — International Focus Portfolio
Annual Investment Adviser's Report
December 31, 2007 (unaudited)
January 28, 2008
Dear Shareholder:
For the annual period ended December 31, 2007, Credit Suisse Trust — International Focus Portfolio (the "Portfolio")1 had a gain of 16.60%, versus an increase of 11.17% for the Morgan Stanley Capital International EAFE Index Net Dividends2 ("MSCI EAFE").
Market Review: Weakened U.S. dollar drives international returns
The year ended December 31, 2007, was a strong one for international equity markets in U.S. Dollar terms. The markets began the year very strongly with the small- and mid-cap areas performing particularly well, driven by private equity and industrial buyers.
However, in the second quarter, evidence of the sub-prime crisis began to emerge. Concerns over sub-prime exposure turned into a full-scale credit crunch, with banks becoming extremely cautious about lending to each other and to private equity funds. This lack of credit extension in private equity removed a major support from the market and caused equity markets to fall in the second half of 2007. Small- and mid-caps came under significant pressure, particularly as liquidity in these parts of the market dried up. Through all of this turmoil, however, emerging market equities remained strong.
Another important factor that drove returns for EAFE investors in 2007 was the depreciation of the U.S. dollar versus the Euro and the British Pound. A weakening U.S. dollar has a positive impact on returns for U.S. dollar based investors investing in non-U.S. dollar denominated assets. Consider that the price of oil came close to doubling in U.S. dollar terms during the year. This drove the performance of the European oil service sector in particular; the large integrated oil companies struggled to perform as, although they enjoy higher revenues from a higher oil price, they have also seen substantial cost increases and project delays.
Strategic review and market outlook: Value emerging in many global regions
Positive contributors to performance included stock selection in the capital goods and telecommunications services sectors. Leading detractors to performance came from stock selection in the technology hardware & equipment and diversified financials sectors.
Over the past year, we have had a number of themes at work in the portfolio. We were overweight the energy sector due to our strong positive view on the price of oil. Within this sector, we have been holders of oil service companies as they are benefiting from substantial price increases and volume growth.
1
Credit Suisse Trust — International Focus Portfolio
Annual Investment Adviser's Report (continued)
December 31, 2007 (unaudited)
Additionally, we have been overweight the telecommunications services sector. Toward the end of 2006, these names traded on very cheap valuations. Within the sector, we have had a greater exposure toward emerging market telecommunications companies.
We have maintained our overweight position in emerging equity markets during the year. In many instances, emerging market companies have better prospects to grow and generate high returns. And they often trade at cheaper valuations than developed market companies. However, this discrepancy did narrow substantially during 2007, as emerging equity markets outperformed developed equity markets.
In the short term, we see some risks facing equity markets: (1) whether the U.S. economy deteriorates further and descends into a full-blown recession, and the knock-on effect that this could potentially have on global economic growth; and (2) whether the credit crisis continues for longer than many market participants anticipate.
However, we have not reached the extreme of equity market overvaluation that we reached in 2001 and 2002. We therefore believe that the current sell-off in markets will be contained. We currently see value emerging in many sectors and regions of the world. And, in our opinion, the current market sell-off provides some very interesting investment opportunities.
The Credit Suisse International Equity Team
Neil Gregson
Tom Mann
International investing entails special risk considerations, including currency fluctuations, lower liquidity, economic and political risks, and differences in accounting methods. The Portfolio's fifteen largest holdings may account for 40% or more of the Portfolio's assets. As a result of this strategy, the Portfolio may be subject to greater volatility than a portfolio that invests in a larger number of issuers.
In addition to historical information, this report contains forward-looking statements, which may concern, among other things, domestic and foreign market, industry and economic trends and developments and government regulation and their potential impact on the Portfolio's investments. These statements are subject to risks and uncertainties and actual trends, developments and regulations in the future, and their impact on the Portfolio could be materially different from those projected, anticipated or implied. The Portfolio has no obligation to update or revise forward-looking statements.
2
Credit Suisse Trust — International Focus Portfolio
Annual Investment Adviser's Report (continued)
December 31, 2007 (unaudited)
Comparison of Change in Value of $10,000 Investment in the
Credit Suisse Trust — International Focus Portfolio1
and the Morgan Stanley Capital International EAFE Index2
for Ten Years.

3
Credit Suisse Trust — International Focus Portfolio
Annual Investment Adviser's Report (continued)
December 31, 2007 (unaudited)
Average Annual Returns as of December 31, 20071
| 1 Year | | 5 Years | | 10 Years | | Since
Inception3 | |
| | 16.60 | % | | | 19.93 | % | | | 6.35 | % | | | 6.25 | % | |
Returns represent past performance and include change in share price and reinvestment of dividends and capital gains. Past performance cannot guarantee future results. The current performance of the Portfolio may be lower or higher than the figures shown. Returns and share price will fluctuate, and redemption value may be more or less than original cost. The performance results do not reflect the deduction of taxes that a shareholder would pay on portfolio distributions or the redemption of portfolio shares. Performance includes the effect of deducting expenses, but does not include charges and expenses attributable to any particular variable contract or plan. Accordingly, the Prospectus of the sponsoring Participating Insurance Company separate account or plan documents or other informational materials supplied by plan sponsors should be carefully reviewed for information on relevant charges and expenses. Excluding these charges and expenses from quotations of performance has the effect of increasing the performance quoted, and the effect of these charges should be considered when comparing performance to that of other mutual funds. Performance information current to the most recent month-end is available at www.credit-suisse.com/us.
1 Fee waivers and/or expense reimbursements may reduce expenses for the Portfolio, without which performance would be lower. Waivers and/or reimbursements may be discontinued at any time.
2 The Morgan Stanley Capital International EAFE (Europe, Australasia, Far East) Index Net Dividends is a free float-adjusted market capitalization index that is designed to measure developed-market equity performance, excluding the U.S. and Canada. It is the exclusive property of Morgan Stanley Capital International Inc. Investors cannot invest directly in an index.
3 Inception date: 6/30/95.
4
Credit Suisse Trust — International Focus Portfolio
Annual Investment Adviser's Report (continued)
December 31, 2007 (unaudited)
Information About Your Portfolio's Expenses
As an investor of the Portfolio, you incur two types of costs: ongoing expenses and transaction costs. Ongoing expenses include management fees, distribution and service (12b-1) fees and other Portfolio expenses. Examples of transaction costs include sales charges (loads), redemption fees and account maintenance fees, which are not shown in this section and which would result in higher total expenses. The following table is intended to help you understand your ongoing expenses of investing in the Portfolio and to help you compare these expenses with the ongoing expenses of investing in other mutual funds. The table is based on an investment of $1,000 made at the beginning of the six month period ended December 31, 2007.
The table illustrates your Portfolio's expenses in two ways:
• Actual Portfolio Return. This helps you estimate the actual dollar amount of ongoing expenses paid on a $1,000 investment in the Portfolio using the Portfolio's actual return during the period. To estimate the expenses you paid over the period, simply divide your account value by $1,000 (for example, an $8,600 account value divided by $1,000 = 8.6), then multiply the result by the number in the "Expenses Paid per $1,000" line under the share class you hold.
• Hypothetical 5% Portfolio Return. This helps you to compare your Portfolio's ongoing expenses with those of other mutual funds using the Portfolio's actual expense ratio and a hypothetical rate of return of 5% per year before expenses. Examples using a 5% hypothetical fund return may be found in the shareholder reports of other mutual funds. The hypothetical account values and expenses may not be used to estimate the actual ending account balance or expenses you paid for the period.
Please note that the expenses shown in these tables are meant to highlight your ongoing expenses only and do not reflect any transaction costs, such as sales charges (loads) or redemption fees. If these transaction costs had been included, your costs would have been higher. The "Expenses Paid per $1,000" line of the tables is useful in comparing ongoing expenses only and will not help you determine the relative total expenses of owning different funds.
5
Credit Suisse Trust — International Focus Portfolio
Annual Investment Adviser's Report (continued)
December 31, 2007 (unaudited)
Expenses and Value of a $1,000 Investment
for the six month period ended December 31, 2007
| Actual Portfolio Return | |
| Beginning Account Value 7/1/07 | | $ | 1,000.00 | | |
| Ending Account Value 12/31/07 | | $ | 1,034.20 | | |
| Expenses Paid per $1,000* | | $ | 6.87 | | |
| Hypothetical 5% Portfolio Return | |
| Beginning Account Value 7/1/07 | | $ | 1,000.00 | | |
| Ending Account Value 12/31/07 | | $ | 1,018.45 | | |
| Expenses Paid per $1,000* | | $ | 6.82 | | |
| Annualized Expense Ratios* | | | 1.34 | % | |
* Expenses are equal to the Portfolio's annualized expense ratio multiplied by the average account value over the period, multiplied by the number of days in the most recent fiscal half year period, then divided by 365.
The "Expenses Paid per $1,000" and the "Annualized Expense Ratios" in the tables are based on actual expenses paid by the Portfolio during the period, net of fee waivers and/or expense reimbursements. If those fee waivers and/or expense reimbursements had not been in effect, the Portfolio's actual expenses would have been higher. Expenses do not reflect additional charges and expenses that are, or may be, imposed under the variable contracts or plans. Such charges and expenses are described in the prospectus of the insurance company separate account or in the plan documents or other informational materials supplied by plan sponsors. The Portfolio's expenses should be considered with these charges and expenses in evaluating the overall cost of investing in the separate account.
For more information, please refer to the Portfolio's prospectus.
6
Credit Suisse Trust — International Focus Portfolio
Annual Investment Adviser's Report (continued)
December 31, 2007 (unaudited)
SECTOR BREAKDOWN*
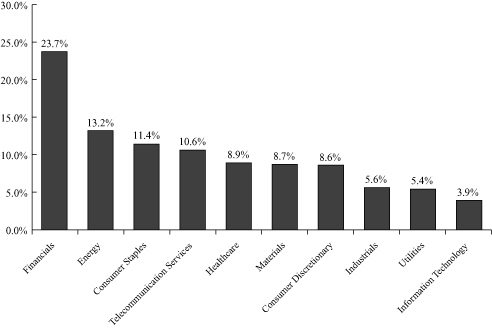
* Expressed as a percentage of total investments (excluding security lending collateral) and may vary over time.
7
Credit Suisse Trust — International Focus Portfolio
Schedule of Investments
December 31, 2007
| | | Number of
Shares | | Value | |
| COMMON STOCKS (100.0%) | |
| Austria (0.9%) | |
| Energy Equipment & Services (0.9%) | |
| C.A.T. oil AG*§ | | | 42,509 | | | $ | 934,699 | | |
| TOTAL AUSTRIA | | | 934,699 | | |
| Belgium (1.4%) | |
| Metals & Mining (1.4%) | |
| Umicore | | | 5,401 | | | | 1,338,386 | | |
| TOTAL BELGIUM | | | 1,338,386 | | |
| Brazil (2.0%) | |
| Oil & Gas (2.0%) | |
| Petroleo Brasileiro SA - Petrobras ADR | | | 20,822 | | | | 2,003,493 | | |
| TOTAL BRAZIL | | | 2,003,493 | | |
| Denmark (1.7%) | |
| Pharmaceuticals (1.7%) | |
| Novo Nordisk AS Series B | | | 25,604 | | | | 1,671,463 | | |
| TOTAL DENMARK | | | 1,671,463 | | |
| France (12.2%) | |
| Banks (3.2%) | |
| BNP Paribas§ | | | 14,081 | | | | 1,527,787 | | |
| Societe Generale | | | 11,415 | | | | 1,650,939 | | |
| | | | 3,178,726 | | |
| Beverages (1.4%) | |
| Pernod Ricard SA§ | | | 6,126 | | | | 1,413,767 | | |
| Insurance (2.3%) | |
| Axa§ | | | 57,597 | | | | 2,296,330 | | |
| Metals & Mining (1.5%) | |
| Vallourec SA | | | 5,532 | | | | 1,496,196 | | |
| Oil & Gas (1.4%) | |
| Total SA§ | | | 16,397 | | | | 1,357,677 | | |
| Pharmaceuticals (1.1%) | |
| Sanofi-Aventis | | | 11,459 | | | | 1,048,960 | | |
| Textiles & Apparel (1.3%) | |
| LVMH Moet Hennessy Louis Vuitton SA§ | | | 10,512 | | | | 1,270,366 | | |
| TOTAL FRANCE | | | 12,062,022 | | |
| Germany (9.9%) | |
| Auto Components (1.9%) | |
| Continental AG | | | 14,578 | | | | 1,907,543 | | |
| Banks (1.5%) | |
| Deutsche Bank AG | | | 10,993 | | | | 1,435,410 | | |
See Accompanying Notes to Financial Statements.
8
Credit Suisse Trust — International Focus Portfolio
Schedule of Investments (continued)
December 31, 2007
| | | Number of
Shares | | Value | |
| COMMON STOCKS | |
| Germany | |
| Electric Utilities (2.9%) | |
| E.ON AG | | | 13,527 | | | $ | 2,875,742 | | |
| Electrical Equipment (1.1%) | |
| Norddeutsche Affinerie AG§ | | | 29,053 | | | | 1,128,383 | | |
| Multi-Utilities (2.5%) | |
| RWE AG§ | | | 17,683 | | | | 2,479,336 | | |
| TOTAL GERMANY | | | 9,826,414 | | |
| Greece (1.9%) | |
| Diversified Telecommunication Services (0.9%) | |
| Hellenic Telecommunications Organization SA | | | 24,955 | | | | 912,870 | | |
| Wireless Telecommunication Services (1.0%) | |
| Cosmote Mobile Telecommunications SA | | | 24,730 | | | | 939,734 | | |
| TOTAL GREECE | | | 1,852,604 | | |
| India (2.2%) | |
| Diversified Telecommunication Services (2.2%) | |
| Bharti Airtel, Ltd.* | | | 89,087 | | | | 2,213,981 | | |
| TOTAL INDIA | | | 2,213,981 | | |
| Israel (1.8%) | |
| Pharmaceuticals (1.8%) | |
| Teva Pharmaceutical Industries, Ltd. ADR§ | | | 38,655 | | | | 1,796,684 | | |
| TOTAL ISRAEL | | | 1,796,684 | | |
| Italy (2.8%) | |
| Banks (2.8%) | |
| Intesa Sanpaolo | | | 285,652 | | | | 2,247,955 | | |
| UniCredito Italiano SpA | | | 64,599 | | | | 531,352 | | |
| TOTAL ITALY | | | 2,779,307 | | |
| Japan (15.1%) | |
| Automobiles (1.2%) | |
| Toyota Motor Corp. | | | 21,781 | | | | 1,160,027 | | |
| Banks (2.3%) | |
| Mitsubishi UFJ Financial Group, Inc. | | | 97,092 | | | | 915,571 | | |
| Mizuho Financial Group, Inc. | | | 287 | | | | 1,367,108 | | |
| | | | 2,282,679 | | |
| Chemicals (3.1%) | |
| Kuraray Company, Ltd. | | | 109,435 | | | | 1,320,259 | | |
| Shin-Etsu Chemical Company, Ltd. | | | 28,739 | | | | 1,787,312 | | |
| | | | 3,107,571 | | |
| Diversified Financials (1.4%) | |
| Daiwa Securities Group, Inc. | | | 155,701 | | | | 1,397,829 | | |
See Accompanying Notes to Financial Statements.
9
Credit Suisse Trust — International Focus Portfolio
Schedule of Investments (continued)
December 31, 2007
| | | Number of
Shares | | Value | |
| COMMON STOCKS | |
| Japan | |
| Electronic Equipment & Instruments (1.4%) | |
| Omron Corp. | | | 58,437 | | | $ | 1,375,806 | | |
| Household Products (1.7%) | |
| Uni-Charm Corp. | | | 27,041 | | | | 1,706,514 | | |
| Machinery (1.5%) | |
| Komatsu, Ltd.§ | | | 53,777 | | | | 1,442,254 | | |
| Specialty Retail (2.5%) | |
| Yamada Denki Company, Ltd.§ | | | 22,055 | | | | 2,487,917 | | |
| TOTAL JAPAN | | | 14,960,597 | | |
| Luxembourg (0.9%) | |
| Energy Equipment & Services (0.9%) | |
| Acergy SA§ | | | 39,004 | | | | 858,120 | | |
| TOTAL LUXEMBOURG | | | 858,120 | | |
| Mexico (2.0%) | |
| Wireless Telecommunication Services (2.0%) | |
| America Movil SAB de CV ADR Series L | | | 32,097 | | | | 1,970,435 | | |
| TOTAL MEXICO | | | 1,970,435 | | |
| Netherlands (6.6%) | |
| Energy Equipment & Services (1.2%) | |
| Fugro NV | | | 15,431 | | | | 1,191,779 | | |
| Household Durables (1.7%) | |
| Koninklijke (Royal) Philips Electronics NV | | | 38,407 | | | | 1,645,747 | | |
| IT Consulting & Services (2.5%) | |
| Exact Holding NV | | | 35,842 | | | | 1,297,191 | | |
| Ordina NV | | | 67,168 | | | | 1,195,219 | | |
| | | | 2,492,410 | | |
| Transportation Infrastructure (1.2%) | |
| Smit International NV | | | 11,824 | | | | 1,216,830 | | |
| TOTAL NETHERLANDS | | | 6,546,766 | | |
| Norway (5.7%) | |
| Banks (1.7%) | |
| DNB NOR ASA | | | 113,235 | | | | 1,722,529 | | |
| Energy Equipment & Services (1.3%) | |
| Sevan Marine ASA*§ | | | 88,094 | | | | 1,317,605 | | |
| Oil & Gas (2.7%) | |
| DNO ASA*§ | | | 489,775 | | | | 899,250 | | |
| Prosafe SE§ | | | 100,513 | | | | 1,738,929 | | |
| | | | 2,638,179 | | |
| TOTAL NORWAY | | | 5,678,313 | | |
See Accompanying Notes to Financial Statements.
10
Credit Suisse Trust — International Focus Portfolio
Schedule of Investments (continued)
December 31, 2007
| | | Number of
Shares | | Value | |
| COMMON STOCKS | |
| Singapore (2.0%) | |
| Banks (2.0%) | |
| United Overseas Bank, Ltd. | | | 142,775 | | | $ | 1,955,350 | | |
| TOTAL SINGAPORE | | | 1,955,350 | | |
| Spain (4.5%) | |
| Banks (1.8%) | |
| Banco Santander SA | | | 80,547 | | | | 1,739,650 | | |
| Diversified Telecommunication Services (1.5%) | |
| Telefonica SA | | | 45,208 | | | | 1,465,474 | | |
| Tobacco (1.2%) | |
| Altadis SA | | | 16,703 | | | | 1,211,956 | | |
| TOTAL SPAIN | | | 4,417,080 | | |
| Switzerland (4.5%) | |
| Banks (1.5%) | |
| UBS AG | | | 31,376 | | | | 1,446,675 | | |
| Food Products (1.3%) | |
| Nestle SA | | | 2,925 | | | | 1,343,131 | | |
| Pharmaceuticals (1.7%) | |
| Novartis AG | | | 30,933 | | | | 1,691,643 | | |
| TOTAL SWITZERLAND | | | 4,481,449 | | |
| Taiwan (1.2%) | |
| Diversified Telecommunication Services (1.2%) | |
| Chunghwa Telecom Company, Ltd. ADR | | | 58,550 | | | | 1,235,991 | | |
| TOTAL TAIWAN | | | 1,235,991 | | |
| United Kingdom (20.7%) | |
| Aerospace & Defense (1.4%) | |
| BAE Systems PLC | | | 138,156 | | | | 1,371,044 | | |
| Banks (3.2%) | |
| Barclays PLC | | | 49,779 | | | | 502,733 | | |
| HSBC Holdings PLC§ | | | 114,085 | | | | 1,918,243 | | |
| Royal Bank of Scotland Group PLC | | | 88,953 | | | | 785,406 | | |
| | | | 3,206,382 | | |
| Beverages (2.0%) | |
| SABMiller PLC | | | 70,360 | | | | 1,974,698 | | |
| Commercial Services & Supplies (0.4%) | |
| Hays PLC | | | 179,531 | | | | 415,273 | | |
| Food & Drug Retailing (1.6%) | |
| Tesco PLC | | | 172,690 | | | | 1,642,717 | | |
| Metals & Mining (2.7%) | |
| BHP Billiton PLC | | | 87,503 | | | | 2,668,256 | | |
See Accompanying Notes to Financial Statements.
11
Credit Suisse Trust — International Focus Portfolio
Schedule of Investments (continued)
December 31, 2007
| | | Number of
Shares | | Value | |
| COMMON STOCKS | |
| United Kingdom | |
| Oil & Gas (2.8%) | |
| BP PLC | | | 108,429 | | | $ | 1,325,026 | | |
| Royal Dutch Shell PLC Class A§ | | | 34,441 | | | | 1,453,729 | | |
| | | | 2,778,755 | | |
| Pharmaceuticals (2.7%) | |
| AstraZeneca PLC | | | 19,065 | | | | 820,611 | | |
| GlaxoSmithKline PLC | | | 71,529 | | | | 1,816,587 | | |
| | | | 2,637,198 | | |
| Tobacco (2.1%) | |
| Imperial Tobacco Group PLC | | | 37,753 | | | | 2,041,939 | | |
| Wireless Telecommunication Services (1.8%) | |
| Vodafone Group PLC | | | 479,340 | | | | 1,799,399 | | |
| TOTAL UNITED KINGDOM | | | 20,535,661 | | |
| TOTAL COMMON STOCKS (Cost $74,487,318) | | | 99,118,815 | | |
| SHORT-TERM INVESTMENT (18.9%) | |
| State Street Navigator Prime Portfolio§§ (Cost $18,781,744) | | | 18,781,744 | | | | 18,781,744 | | |
| TOTAL INVESTMENTS AT VALUE (118.9%) (Cost $93,269,062) | | | 117,900,559 | | |
| LIABILITIES IN EXCESS OF OTHER ASSETS (-18.9%) | | | (18,754,539 | ) | |
| NET ASSETS (100.0%) | | $ | 99,146,020 | | |
INVESTMENT ABBREVIATION
ADR = American Depositary Receipt
* Non-income producing security.
§ Security or portion thereof is out on loan.
§§ Represents security purchased with cash collateral received for securities on loan.
See Accompanying Notes to Financial Statements.
12
Credit Suisse Trust — International Focus Portfolio
Statement of Assets and Liabilities
December 31, 2007
| Assets | |
Investments at value, including collateral for securities on loan of $18,781,744
(Cost $93,269,062) (Note 2) | | $ | 117,900,5591 | | |
| Foreign currency at value (cost $552,584) | | | 551,203 | | |
| Dividend and interest receivable | | | 94,395 | | |
| Receivable for portfolio shares sold | | | 5,883 | | |
| Prepaid expenses and other assets | | | 11,540 | | |
| Total Assets | | | 118,563,580 | | |
| Liabilities | |
| Advisory fee payable (Note 3) | | | 84,854 | | |
| Administrative services fee payable (Note 3) | | | 10,098 | | |
| Payable upon return of securities loaned (Note 2) | | | 18,781,744 | | |
| Due to custodian | | | 345,180 | | |
| Payable for portfolio shares redeemed | | | 92,369 | | |
| Trustees' fee payable | | | 804 | | |
| Other accrued expenses payable | | | 102,511 | | |
| Total Liabilities | | | 19,417,560 | | |
| Net Assets | |
| Capital stock, $0.001 par value (Note 6) | | | 6,257 | | |
| Paid-in capital (Note 6) | | | 160,073,394 | | |
| Undistributed net investment income | | | 1,277,977 | | |
| Accumulated net realized loss on investments and foreign currency transactions | | | (86,840,040 | ) | |
| Net unrealized appreciation from investments and foreign currency translations | | | 24,628,432 | | |
| Net Assets | | $ | 99,146,020 | | |
| Shares outstanding | | | 6,256,685 | | |
| Net asset value, offering price, and redemption price per share | | $ | 15.85 | | |
1 Including $17,924,778 of securities on loan.
See Accompanying Notes to Financial Statements.
13
Credit Suisse Trust — International Focus Portfolio
Statement of Operations
For the Year Ended December 31, 2007
| Investment Income (Note 2) | |
| Dividends | | $ | 2,599,667 | | |
| Interest | | | 52,797 | | |
| Securities lending | | | 113,359 | | |
| Foreign taxes withheld | | | (240,597 | ) | |
| Total investment income | | | 2,525,226 | | |
| Expenses | |
| Investment advisory fees (Note 3) | | | 953,530 | | |
| Administrative services fees (Note 3) | | | 114,418 | | |
| Printing fees (Note 3) | | | 58,802 | | |
| Custodian fees | | | 51,116 | | |
| Audit and tax fees | | | 28,261 | | |
| Trustees' fees | | | 19,857 | | |
| Legal fees | | | 18,387 | | |
| Interest expense (Note 4) | | | 5,095 | | |
| Transfer agent fees | | | 3,775 | | |
| Insurance expense | | | 3,710 | | |
| Commitment fees (Note 4) | | | 2,373 | | |
| Miscellaneous expense | | | 8,646 | | |
| Total expenses | | | 1,267,970 | | |
| Less: fees waived (Note 3) | | | (7,632 | ) | |
| Net expenses | | | 1,260,338 | | |
| Net investment income | | | 1,264,888 | | |
| Net Realized and Unrealized Gain (Loss) from Investments and Foreign Currency Related Items | |
| Net realized gain from investments | | | 17,664,262 | | |
| Net realized gain from foreign currency transactions | | | 16,611 | | |
| Net change in unrealized appreciation (depreciation) from investments | | | (4,533,948 | ) | |
| Net change in unrealized appreciation (depreciation) from foreign currency translations | | | 63,080 | | |
| Net realized and unrealized gain from investments and foreign currency related items | | | 13,210,005 | | |
| Net increase in net assets resulting from operations | | $ | 14,474,893 | | |
See Accompanying Notes to Financial Statements.
14
Credit Suisse Trust — International Focus Portfolio
Statements of Changes in Net Assets
| | | For the Year
Ended
December 31, 2007 | | For the Year
Ended
December 31, 2006 | |
| From Operations | |
| Net investment income | | $ | 1,264,888 | | | $ | 1,021,698 | | |
| Net realized gain from investments and foreign currency transactions | | | 17,680,873 | | | | 8,456,656 | | |
Net change in unrealized appreciation (depreciation)
from investments and foreign currency translations | | | (4,470,868 | ) | | | 6,338,235 | | |
| Net increase in net assets resulting from operations | | | 14,474,893 | | | | 15,816,589 | | |
| From Dividends | |
| Dividends from net investment income | | | (981,812 | ) | | | (967,042 | ) | |
| Net decrease in net assets resulting from dividends | | | (981,812 | ) | | | (967,042 | ) | |
| From Capital Share Transactions (Note 6) | |
| Proceeds from sale of shares | | | 15,532,378 | | | | 13,572,464 | | |
| Reinvestment of dividends | | | 981,812 | | | | 967,042 | | |
| Net asset value of shares redeemed | | | (25,667,303 | ) | | | (26,794,834 | ) | |
| Net decrease in net assets from capital share transactions | | | (9,153,113 | ) | | | (12,255,328 | ) | |
| Net increase in net assets | | | 4,339,968 | | | | 2,594,219 | | |
| Net Assets | |
| Beginning of year | | | 94,806,052 | | | | 92,211,833 | | |
| End of year | | $ | 99,146,020 | | | $ | 94,806,052 | | |
| Undistributed net investment income | | $ | 1,277,977 | | | $ | 969,893 | | |
See Accompanying Notes to Financial Statements.
15
Credit Suisse Trust — International Focus Portfolio
Financial Highlights
(For a Share of the Portfolio Outstanding Throughout Each Year)
| | | For the Year Ended December 31, | |
| | | 2007 | | 2006 | | 2005 | | 2004 | | 2003 | |
| Per share data | |
| Net asset value, beginning of year | | $ | 13.74 | | | $ | 11.70 | | | $ | 10.04 | | | $ | 8.85 | | | $ | 6.68 | | |
| INVESTMENT OPERATIONS | |
| Net investment income | | | 0.22 | | | | 0.15 | | | | 0.14 | | | | 0.11 | | | | 0.09 | | |
Net gain on investments and foreign currency
related items (both realized and unrealized) | | | 2.05 | | | | 2.02 | | | | 1.62 | | | | 1.17 | | | | 2.12 | | |
| Total from investment operations | | | 2.27 | | | | 2.17 | | | | 1.76 | | | | 1.28 | | | | 2.21 | | |
| LESS DIVIDENDS | |
| Dividends from net investment income | | | (0.16 | ) | | | (0.13 | ) | | | (0.10 | ) | | | (0.09 | ) | | | (0.04 | ) | |
| Net asset value, end of year | | $ | 15.85 | | | $ | 13.74 | | | $ | 11.70 | | | $ | 10.04 | | | $ | 8.85 | | |
| Total return1 | | | 16.60 | % | | | 18.65 | % | | | 17.56 | % | | | 14.63 | % | | | 33.09 | % | |
| RATIOS AND SUPPLEMENTAL DATA | |
| Net assets, end of year (000s omitted) | | $ | 99,146 | | | $ | 94,806 | | | $ | 92,212 | | | $ | 87,301 | | | $ | 90,970 | | |
| Ratio of expenses to average net assets | | | 1.32 | % | | | 1.32 | % | | | 1.42 | % | | | 1.37 | % | | | 1.41 | % | |
| Ratio of net investment income to average net assets | | | 1.33 | % | | | 1.08 | % | | | 1.17 | % | | | 0.98 | % | | | 1.01 | % | |
Decrease reflected in above operating expense
ratios due to waivers/reimbursements | | | 0.01 | % | | | 0.04 | % | | | — | | | | — | | | | — | | |
| Portfolio turnover rate | | | 41 | % | | | 37 | % | | | 47 | % | | | 90 | % | | | 131 | % | |
1 Total returns are historical and assume changes in share price and reinvestment of all dividends and distributions. Had certain expenses not been reduced during the years shown, total returns would have been lower. Total returns do not reflect charges and expenses attributable to any particular variable contract or plan.
See Accompanying Notes to Financial Statements.
16
Credit Suisse Trust — International Focus Portfolio
Notes to Financial Statements
December 31, 2007
Note 1. Organization
Credit Suisse Trust (the "Trust") is an open-end management investment company registered under the Investment Company Act of 1940, as amended (the "1940 Act"), and currently offers eight managed investment portfolios of which one, the International Focus Portfolio (the "Portfolio"), is included in this report. The Portfolio is a diversified investment fund that seeks long-term capital appreciation. Shares of the Portfolio are not available directly to individual investors but may be offered only through (a) variable annuity contracts and variable life insurance contracts offered by separate accounts of certain insurance companies and (b) tax-qualified pension and retirement plans. The Portfolio may not be available in connection with a particular contract or plan. The Trust was organized under the laws of The Commonwealth of Massachusetts as a business trust on March 15, 1995.
Note 2. Significant Accounting Policies
A) SECURITY VALUATION — The net asset value of the Portfolio is determined daily as of the close of regular trading on the New York Stock Exchange, Inc. (the "Exchange") on each day the Exchange is open for business. Equity investments are valued at market value, which is generally determined using the closing price on the exchange or market on which the security is primarily traded at the time of valuation (the "Valuation Time"). If no sales are reported, equity investments are generally valued at the most recent bid quotation as of the Valuation Time or at the lowest asked quotation in the case of a short sale of securities. Debt securities with a remaining maturity greater than 60 days are valued in accordance with the price supplied by a pricing service, which may use a matrix, formula or other objective method that takes into consideration market indices, yield curves and other specific adjustments. Debt obligations that will matur e in 60 days or less are valued on the basis of amortized cost, which approximates market value, unless it is determined that using this method would not represent fair value. Investments in mutual funds are valued at the mutual fund's closing net asset value per share on the day of valuation. Securities and other assets for which market quotations are not readily available, or whose values have been materially affected by events occurring before the Portfolio's Valuation Time but after the close of the securities' primary markets, are valued at fair value as determined in good faith by, or under the direction of, the Board of Trustees under procedures established by the Board of Trustees. The Portfolio may utilize a service provided by an independent third party which has been approved by the Board of Trustees to fair value certain securities. When fair-value pricing is employed, the prices of securities used by a portfolio to calculate its net asset value may differ from quoted or published prices for the same securities.
17
Credit Suisse Trust — International Focus Portfolio
Notes to Financial Statements (continued)
December 31, 2007
Note 2. Significant Accounting Policies
B) FOREIGN CURRENCY TRANSACTIONS — The books and records of the Portfolio are maintained in U.S. dollars. Transactions denominated in foreign currencies are recorded at the current prevailing exchange rates. All assets and liabilities denominated in foreign currencies are translated into U.S. dollar amounts at the current exchange rate at the end of the period. Translation gains or losses resulting from changes in the exchange rate during the reporting period and realized gains and losses on the settlement of foreign currency transactions are reported in the results of operations for the current period. The Portfolio does not isolate that portion of realized gains and losses on investments in equity securities which is due to changes in the foreign exchange rate from that which is due to changes in market prices of equity securities. The Portfolio isolates that portion of realized gains and losses on investments in debt securities which is due to changes in the foreign exchange rate from that which is due to changes in market prices of debt securities.
C) SECURITY TRANSACTIONS AND INVESTMENT INCOME — Security transactions are accounted for on a trade date basis. Interest income is recorded on the accrual basis. Dividends are recorded on the ex-dividend date. The cost of investments sold is determined by use of the specific identification method for both financial reporting and income tax purposes.
D) DIVIDENDS AND DISTRIBUTIONS TO SHAREHOLDERS — Dividends from net investment income and distributions of net realized capital gains, if any, are declared and paid at least annually. However, to the extent that a net realized capital gain can be reduced by a capital loss carryforward, such gain will not be distributed. Income and capital gain distributions are determined in accordance with federal income tax regulations, which may differ from accounting principles generally accepted in the United States of America ("GAAP").
E) FEDERAL INCOME TAXES — No provision is made for federal taxes as it is the Portfolio's intention to continue to qualify for and elect the tax treatment applicable to regulated investment companies under the Internal Revenue Code of 1986, as amended, and to make the requisite distributions to its shareholders, which will be sufficient to relieve it from federal income and excise taxes.
F) USE OF ESTIMATES — The preparation of financial statements in conformity with GAAP requires management to make estimates and assumptions that affect the reported amounts of assets and liabilities and disclosure of contingent assets and liabilities at the date of the financial statements and the reported amounts of income and expenses during the reporting period. Actual results could differ from these estimates.
18
Credit Suisse Trust — International Focus Portfolio
Notes to Financial Statements (continued)
December 31, 2007
Note 2. Significant Accounting Policies
G) SHORT-TERM INVESTMENTS — The Portfolio, together with other funds/portfolios advised by Credit Suisse Asset Management, LLC ("Credit Suisse"), an indirect, wholly-owned subsidiary of Credit Suisse Group, pools available cash into either a short-term variable rate time deposit issued by State Street Bank and Trust Company ("SSB"), the Portfolio's custodian, or a money market fund advised by Credit Suisse. The short-term time deposit issued by SSB is a variable rate account classified as a short-term investment.
H) FORWARD FOREIGN CURRENCY CONTRACTS — The Portfolio may enter into forward foreign currency contracts for the purchase or sale of a specific foreign currency at a fixed price on a future date. Risks may arise upon entering into these contracts from the potential inability of counterparties to meet the terms of their contracts and from unanticipated movements in the value of a foreign currency. The Portfolio will enter into forward foreign currency contracts primarily for hedging purposes. Forward foreign currency contracts are adjusted by the daily forward exchange rate of the underlying currency and any gains or losses are recorded for financial statement purposes as unrealized until the contract settlement date or an offsetting position is entered into. At December 31, 2007, the Portfolio had no open forward foreign currency contracts.
I) SECURITIES LENDING — Loans of securities are required at all times to be secured by collateral at least equal to 102% of the market value of domestic securities on loan (including any accrued interest thereon) and 105% of the market value of foreign securities on loan (including any accrued interest thereon). Cash collateral received by the Portfolio in connection with securities lending activity may be pooled together with cash collateral for other funds/portfolios advised by Credit Suisse and may be invested in a variety of investments, including certain Credit Suisse-advised funds, funds advised by SSB, the Portfolio's securities lending agent, or money market instruments. However, in the event of default or bankruptcy by the other party to the agreement, realization and/or retention of the collateral may be subject to legal proceedings.
SSB has been engaged by the Portfolio to act as the Portfolio's securities lending agent. The Portfolio's securities lending arrangement provides that the Portfolio and SSB will share the net income earned from securities lending activities. During the year ended December 31, 2007, total earnings from the Portfolio's investment in cash collateral received in connection with securities lending arrangements was $1,107,565 of which $968,167 was rebated to borrowers (brokers). The Portfolio retained $113,359 in income from the cash collateral investment, and SSB, as lending agent, was paid $26,039.
19
Credit Suisse Trust — International Focus Portfolio
Notes to Financial Statements (continued)
December 31, 2007
Note 2. Significant Accounting Policies
The Portfolio may also be entitled to certain minimum amounts of income from its securities lending activities. Securities lending income is accrued as earned.
J) OTHER — The Portfolio may invest in securities of foreign countries and governments which involve certain risks in addition to those inherent in domestic investments. Such risks generally include, among others, currency risk (fluctuations in currency exchange rates), information risk (key information may be inaccurate or unavailable) and political risk (expropriation, nationalization or the imposition of capital or currency controls or punitive taxes). Other risks of investing in foreign securities include liquidity and valuation risks.
The Portfolio may be subject to taxes imposed by countries in which it invests with respect to its investments in issuers existing or operating in such countries. Such taxes are generally based on income earned or repatriated and capital gains realized on the sale of such investments. The Portfolio accrues such taxes when the related income is earned or gains are realized.
The Portfolio may invest up to 15% of its net assets in non-publicly traded securities. Non-publicly traded securities may be less liquid than publicly traded securities. Although these securities may be resold in privately negotiated transactions, the prices realized from such sales could differ from the price originally paid by the Portfolio or the current carrying values, and the difference could be material.
Note 3. Transactions with Affiliates and Related Parties
Credit Suisse serves as investment adviser for the Portfolio. For its investment advisory services, Credit Suisse is entitled to receive a fee from the Portfolio at an annual rate of 1.00% of the Portfolio's average daily net assets. Effective March 1, 2006 to February 28, 2007, Credit Suisse agreed to voluntarily waive part of its investment advisory fee from 1.00% to 0.95%. For the year ended December 31, 2007, investment advisory fees earned and voluntarily waived were $953,530 and $7,632, respectively. Credit Suisse will not recapture from the Portfolio any fees it waived during the fiscal year ended December 31, 2007. Fee waivers and reimbursements are voluntary and may be discontinued by Credit Suisse at anytime.
20
Credit Suisse Trust — International Focus Portfolio
Notes to Financial Statements (continued)
December 31, 2007
Note 3. Transactions with Affiliates and Related Parties
Credit Suisse Asset Management Limited ("Credit Suisse U.K.") and Credit Suisse Asset Management Limited ("Credit Suisse Australia"), each an affiliate of Credit Suisse, are sub-investment advisers to the Portfolio (the "Sub-Advisors"). Credit Suisse U.K.'s and Credit Suisse Australia's sub-investment advisory fees are paid by Credit Suisse out of Credit Suisse's net investment advisory fee and are not paid by the Portfolio.
Credit Suisse Asset Management Securities, Inc. ("CSAMSI"), an affiliate of Credit Suisse, and SSB serve as co-administrators to the Portfolio. For its co-administrative services, CSAMSI currently receives a fee calculated at an annual rate of 0.09% of the Portfolio's average daily net assets. For the year ended December 31, 2007, co-administrative services fees earned by CSAMSI were $85,818.
For its co-administrative services, SSB receives a fee, exclusive of out-of-pocket expenses, calculated in total for all the Credit Suisse funds/portfolios co-administered by SSB and allocated based upon relative average net assets of each fund/portfolio, subject to an annual minimum fee. For the year ended December 31, 2007, co-administrative services fees earned by SSB (including out-of-pocket expenses) were $28,600.
In addition to serving as the Portfolio's co-administrator, CSAMSI currently serves as distributor of the Portfolio's shares without compensation.
Merrill Corporation ("Merrill"), an affiliate of Credit Suisse, has been engaged by the Portfolio to provide certain financial printing and fulfillment services. For the year ended December 31, 2007, Merrill was paid $13,902 for its services to the Portfolio.
Note 4. Line of Credit
The Portfolio, together with other funds/portfolios advised by Credit Suisse (collectively, the "Participating Funds"), participates in a $50 million committed, unsecured line of credit facility ("Credit Facility") for temporary or emergency purposes with Deutsche Bank, A.G. as administrative agent and syndication agent and SSB as operations agent. Under the terms of the Credit Facility, the Participating Funds pay an aggregate commitment fee at a rate of 0.10% per annum on the average unused amount of the Credit Facility, which is allocated among the Participating Funds in such manner as is determined by the governing Boards of the Participating Funds. In addition, the Participating Funds pay interest on borrowings at the Federal Funds rate plus 0.50%. At December 31, 2007, the Portfolio had no loans outstanding. During the year ended
21
Credit Suisse Trust — International Focus Portfolio
Notes to Financial Statements (continued)
December 31, 2007
Note 4. Line of Credit
December 31, 2007, the Portfolio had borrowings under the Credit Facility as follows:
Average Daily
Loan Balance | | Weighted Average
Interest Rate% | | Maximum Daily
Loan Outstanding | |
| $ | 1,576,727 | | | | 5.288 | % | | $ | 2,010,000 | | |
Note 5. Purchases and Sales of Securities
For the year ended December 31, 2007, purchases and sales of investment securities (excluding short-term investments) were $38,930,916 and $43,551,095, respectively.
Note 6. Capital Share Transactions
The Trust is authorized to issue an unlimited number of full and fractional shares of beneficial interest, $.001 par value per share. Transactions in capital shares of the Portfolio were as follows:
| | | For the Year Ended
December 31, 2007 | | For the Year Ended
December 31, 2006 | |
| Shares sold | | | 1,004,291 | | | | 1,061,928 | | |
| Shares issued in reinvestment of dividends | | | 64,424 | | | | 76,205 | | |
| Shares redeemed | | | (1,709,884 | ) | | | (2,120,998 | ) | |
| Net decrease | | | (641,169 | ) | | | (982,865 | ) | |
On December 31, 2007, the number of shareholders that held 5% or more of the outstanding shares of the Portfolio was as follows:
Number of
Shareholders | | Approximate Percentage
of Outstanding Shares | |
| | 5 | | | | 85 | % | |
Some of the shareholders are omnibus accounts, which hold shares on behalf of individual shareholders.
Note 7. Federal Income Taxes
Income and capital gain distributions are determined in accordance with federal income tax regulations, which may differ from GAAP.
22
Credit Suisse Trust — International Focus Portfolio
Notes to Financial Statements (continued)
December 31, 2007
Note 7. Federal Income Taxes
The tax character of dividends paid during the years ended December 31, 2007 and 2006, respectively, for the Portfolio were as follows:
| | | Ordinary Income | |
| | 2007 | | 2006 | |
| | $ | 981,812 | | | $ | 967,042 | | |
The tax basis of components of distributable earnings differ from the amounts reflected in the Statement of Assets and Liabilities by temporary book/tax differences. These differences are primarily due to losses deferred on wash sales and unused capital loss carryforwards. At December 31, 2007, the components of distributable earnings on a tax basis for the Portfolio were as follows:
| Undistributed net investment income | | $ | 1,277,977 | | |
| Accumulated net realized loss | | | (86,724,681 | ) | |
| Unrealized appreciation | | | 24,513,073 | | |
| | | $ | (60,933,631 | ) | |
At December 31, 2007, the Portfolio had capital loss carryforwards available to offset possible future capital gains as follows:
| | | Expires December 31, | |
| | 2009 | | 2010 | | 2011 | |
| | $ | 46,227,886 | | | $ | 37,413,453 | | | $ | 3,083,342 | | |
During the tax year ended December 31, 2007, the Portfolio utilized $17,674,651 of the capital loss carryforwards.
It is uncertain that the Portfolio will realize the full benefit of these losses prior to expiration.
At December 31, 2007, the identified cost for federal income tax purposes, as well as the gross unrealized appreciation from investments for those securities having an excess of value over cost, gross unrealized depreciation from investments for those securities having an excess of cost over value and the net unrealized appreciation from investments were: $93,384,420, $27,616,882, $(3,100,743) and $24,516,139, respectively.
At December 31, 2007, the Portfolio reclassified $25,008 from accumulated net realized loss from investments to undistributed net investment income, to adjust for current period permanent book/tax differences which arose principally from differing book/tax treatments of foreign currency transactions and adjustments to income and gain/(loss) on Partnerships. Net assets were not affected by these reclassifications.
23
Credit Suisse Trust — International Focus Portfolio
Notes to Financial Statements (continued)
December 31, 2007
Note 8. Contingencies
In the normal course of business, the Portfolio may provide general indemnifications pursuant to certain contracts and organizational documents. The Portfolio's maximum exposure under these arrangements is dependent on future claims that may be made against the Portfolio and, therefore, cannot be estimated; however, based on experience, the risk of loss from such claims is considered remote.
Note 9. Recent Accounting Pronouncements
During June 2006, the Financial Accounting Standards Board ("FASB") issued FASB Interpretation 48 ("FIN 48" or the "Interpretation"), Accounting for Uncertainty in Income Taxes — an interpretation of FASB statement 109. FIN 48 supplements FASB Statement 109, Accounting for Income Taxes, by defining the confidence level that a tax position must meet in order to be recognized in the financial statements. FIN 48 prescribes a comprehensive model for how a fund should recognize, measure, present, and disclose in its financial statements uncertain tax positions that the fund has taken or expects to take on a tax return. FIN 48 requires that the t ax effects of a position be recognized only if it is "more likely than not" to be sustained based solely on its technical merits. Management must be able to conclude that the tax law, regulations, case law, and other objective information regarding the technical merits sufficiently support the position's sustainability with a likelihood of more than 50 percent. During the period ended December 31, 2007, Management has adopted FIN 48. There was no material impact to the financial statements or disclosures thereto as a result of the adoption of this pronouncement.
On September 20, 2006, the FASB released Statement of Financial Accounting Standards No. 157 "Fair Value Measurements" ("FAS 157"). FAS 157 establishes an authoritative definition of fair value, sets out a framework for measuring fair value, and requires additional disclosures about fair-value measurements. The application of FAS 157 is required for fiscal years, beginning after November 15, 2007 and interim periods within those fiscal years. As of December 31, 2007, management does not believe the adoption of FAS 157 will impact the amounts reported in the financial statements, however, additional disclosures will be required in subsequent reports.
24
Credit Suisse Trust — International Focus Portfolio
Report of Independent Registered Public Accounting Firm
To the Board of Trustees of Credit Suisse Trust and Shareholders of
Credit Suisse Trust — International Focus Portfolio:
In our opinion, the accompanying statement of assets and liabilities, including the schedule of investments, and the related statements of operations and of changes in net assets and the financial highlights present fairly, in all material respects, the financial position of International Focus Portfolio (the "Portfolio"), a portfolio of the Credit Suisse Trust, at December 31, 2007, the results of its operations for the year then ended, the changes in its net assets for each of the two years in the period then ended and the financial highlights for each of the five years in the period then ended, in conformity with accounting principles generally accepted in the United States of America. These financial statements and financial highlights (hereafter referred to as "financial statements") are the responsibility of the Portfolio's management; our responsibility is to express an opinion on these financial statements based on our audits. We con ducted our audits of these financial statements in accordance with the standards of the Public Company Accounting Oversight Board (United States). Those standards require that we plan and perform the audit to obtain reasonable assurance about whether the financial statements are free of material misstatement. An audit includes examining, on a test basis, evidence supporting the amounts and disclosures in the financial statements, assessing the accounting principles used and significant estimates made by management, and evaluating the overall financial statement presentation. We believe that our audits, which included confirmation of securities at December 31, 2007 by correspondence with the custodian, provide a reasonable basis for our opinion.
PricewaterhouseCoopers LLP
Baltimore, Maryland
February 25, 2008
25
Credit Suisse Trust — International Focus Portfolio
Board Approval of Advisory Agreement (unaudited)
In approving the renewal of the current Advisory and Sub-Advisory Agreements, the Board of Trustees, including the Independent Trustees, at a meeting held on November 13 and 14, 2007, considered the following factors with respect to the International Focus Portfolio (the "Portfolio"):
Investment Advisory Fee Rates
The Board reviewed and considered the contractual advisory fee rate of 1.00% for the Portfolio ("Contractual Advisory Fee") in light of the extent and quality of the advisory services provided by Credit Suisse Asset Management, LLC ("Credit Suisse") or Credit Suisse Asset Management Limited ("Credit Suisse U.K.") and Credit Suisse Asset Management Limited ("Credit Suisse Australia"). The Board noted that Credit Suisse had voluntarily waived fees through February 28, 2007 to reduce the fee to 0.97% ("Net Advisory Fee"). The Board noted that the compensation paid to Credit Suisse U.K. and Credit Suisse Australia (collectively, the "Sub-Advisers") does not increase the fees or expenses otherwise incurred by the Portfolio's shareholders.
Additionally, the Board received and considered information comparing the Portfolio's Contractual Advisory Fee, Net Advisory Fee, the Portfolio's overall expenses with those of funds in both the relevant expense group ("Expense Group") and universe of funds ("Expense Universe") provided by Lipper Inc., an independent provider of investment company data.
Nature, Extent and Quality of the Services under the Advisory and
Sub-Advisory Agreements
The Board received and considered information regarding the nature, extent and quality of services provided to the Portfolio by Credit Suisse under the Advisory Agreement and by the Sub-Advisers under the Sub-Advisory Agreements. The Board also noted information received at regular meetings throughout the year related to the services rendered by Credit Suisse and the Sub-Advisers. The Board reviewed background information about Credit Suisse and the Sub-Advisers, including their respective Forms ADV. The Board considered the background and experience of both Credit Suisse's and the Sub-Advisers' senior management and the expertise of, and the amount of attention given to the Portfolio by, senior personnel of Credit Suisse and the Sub-Advisers. With respect to the Sub-Advisers, the Board also considered their expertise in managing the types of global investments that the Portfolio
26
Credit Suisse Trust — International Focus Portfolio
Board Approval of Advisory Agreement (unaudited) (continued)
utilizes in its investment strategy. In addition, the Board reviewed the qualifications, backgrounds and responsibilities of the portfolio management team primarily responsible for the day-to-day portfolio management of the Portfolio and the extent of the resources devoted to research and analysis of actual and potential investments. The Board also received and considered information about the nature, extent and quality of services and fee rates offered to other Credit Suisse clients for comparable services.
In approving the Sub-Advisory Agreements, the Board also considered the benefits of retaining Credit Suisse's United Kingdom and Australian affiliates given the increased complexity of the domestic and international securities markets, specifically that retention of Credit Suisse U.K. and Credit Suisse Australia expands the universe of companies and countries from which investment opportunities could be sought and enhances the ability of the Portfolio to obtain the best price and execution on trades in international markets.
Portfolio Performance
The Board received and considered the performance results of the Portfolio over time, along with comparisons both to the relevant performance group ("Performance Group") and universe of funds ("Performance Universe") for the Portfolio. The Board was provided with a description of the methodology used to arrive at the funds included in the Performance Group and the Performance Universe.
Credit Suisse Profitability
The Board received and considered a profitability analysis of Credit Suisse based on the fees payable under the Advisory Agreement for the Portfolio, including any fee waivers or fee caps, as well as other relationships between the Portfolio on the one hand and Credit Suisse affiliates on the other. The Board received profitability information for the other funds in the Credit Suisse family of funds.
Economies of Scale
The Board considered whether economies of scale in the provision of services to the Portfolio were being passed along to the shareholders. Accordingly, the Board considered whether alternative fee structures (such as breakpoint fee structures) would be more appropriate or reasonable taking into consideration economies of scale or other efficiencies that might accrue from increases in the Portfolio's asset levels.
27
Credit Suisse Trust — International Focus Portfolio
Board Approval of Advisory Agreement (unaudited) (continued)
Other Benefits to Credit Suisse
The Board considered other benefits received by Credit Suisse, the Sub-Advisers and their affiliates as a result of their relationships with the Portfolio. Such benefits include, among others, research arrangements with brokers who execute transactions on behalf of the Portfolio, administrative and brokerage relationships with affiliates of Credit Suisse and the Sub-Advisers and benefits potentially derived from an increase in Credit Suisse's and the Sub-Advisers' businesses as a result of their relationship with the Portfolio (such as the ability to market to shareholders other financial products offered by Credit Suisse, the Sub-Advisers and their affiliates).
The Board considered the standards applied in seeking best execution, whether and to what extent soft dollar credits are sought and how any such credits are utilized, any benefits that may be achieved by using an affiliated broker and the existence of quality controls applicable to brokerage allocation procedures. The Board also reviewed Credit Suisse's and the Sub-Advisers' method for allocating portfolio investment opportunities among their advisory clients.
Conclusions
In selecting Credit Suisse and the Sub-Advisers, and approving the Advisory Agreement and the investment advisory fee under such agreement and the Sub-Advisory Agreements, the Board concluded that:
• Although the Contractual Advisory Fee of 1.00% was higher than the median of the Portfolio's Expense Group, the Board considered the fee to be reasonable taking the relatively small size of the Portfolio into account.
• The Portfolio's performance was above most of its peers in the Performance Universe for the one- and three-year period but was below most of its peers in its Performance Universe for the other periods reviewed. The Portfolio's performance was above most of its peers in its Performance Group for the one-, two-, and three-year term periods. The Board noted that performance was improving and acknowledged the steps undertaken by Credit Suisse to improve performance. The Board stated it would continue to monitor performance.
• Aside from performance (as described above), the Board was satisfied with the nature and extent of the investment advisory services provided to the Portfolio by Credit Suisse and the Sub-Advisers and that, based on dialogue with management and counsel, the services provided by Credit Suisse under the Advisory Agreement and by the Sub-Advisers under the Sub-Advisory Agreements are typical of, and consistent with, those provided to similar mutual funds by other investment advisers.
28
Credit Suisse Trust — International Focus Portfolio
Board Approval of Advisory Agreement (unaudited) (continued)
• In light of the costs of providing investment management and other services to the Portfolio and Credit Suisse's ongoing commitment to the Portfolio, the profits and other ancillary benefits that Credit Suisse and its affiliates received were considered reasonable.
• Credit Suisse's profitability based on fees payable under the Advisory Agreement was reasonable in light of the nature, extent and quality of the services provided to the Portfolio thereunder.
• In light of the relatively small size of the Portfolio and the Portfolio's recent performance in its Performance Group, the Portfolio's current fee structure (without breakpoints) was considered reasonable.
No single factor reviewed by the Board was identified by the Board as the principal factor in determining whether to approve the Advisory Agreement and the Sub-Advisory Agreements. The Independent Trustees were advised by separate independent legal counsel throughout the process.
29
Credit Suisse Trust — International Focus Portfolio
Information Concerning Trustees and Officers (unaudited)
Name, Address
(Year of Birth) | | Position(s)
Held with
Trust | | Term
of Office1
and
Length
of Time
Served | | Principal
Occupation(s) During
Past Five Years | | Number of
Portfolios in
Fund
Complex
Overseen by
Trustee | | Other
Directorships
Held by Trustee | |
| Independent Trustees | | | | | | | | | | | |
|
Enrique Arzac
c/o Credit Suisse Asset
Management, LLC
Attn: General Counsel
Eleven Madison Avenue
New York, New York
10010
(1941) | | Trustee,
Nominating Committee
Member and
Audit
Committee
Chairman | | Since
2005 | | Professor of Finance and Economics, Graduate School of Business, Columbia University since 1971. | | | 35 | | | Director of Epoch
Holding Corporation
(an investment
management and investment advisory
services company);
Director of The Adams Express Company
(a closed-end investment
company); Director of
Petroleum and
Resources Corporation
(a closed-end investment company). | |
|
Jeffrey E. Garten2
Box 208200
New Haven, Connecticut
06520-8200
(1946) | | Trustee, Nominating
and Audit
Committee
Member | | Since
1998 | | The Juan Trippe Professor in the Practice of International Trade, Finance and Business from July 2005 to present; Partner and Chairman of Garten Rothkopf (consulting firm) from October 2005 to present; Dean of Yale School of Management from November 1995 to June 2005. | | | 28 | | | Director of
Aetna, Inc.
(insurance company);
Director of
CarMax Group
(used car dealers);
Director of Alcan, Inc. (smelting and refining of nonferrous metals company). | |
|
1 Each Trustee and Officer serves until his or her respective successor has been duly elected and qualified.
2 Mr. Garten was initially appointed as a Trustee of the Trust on February 6, 1998. He resigned as Trustee on February 3, 2000 and was subsequently reappointed on December 21, 2000.
30
Credit Suisse Trust — International Focus Portfolio
Information Concerning Trustees and Officers (unaudited) (continued)
Name, Address
(Year of Birth) | | Position(s)
Held with
Trust | | Term
of Office1
and
Length
of Time
Served | | Principal
Occupation(s) During
Past Five Years | | Number of
Portfolios in
Fund
Complex
Overseen by
Trustee | | Other
Directorships
Held by Trustee | |
| Independent Trustees | | | | | | | | | | | | | |
|
Peter F. Krogh
SFS/ICC 702
Georgetown University
Washington, DC 20057
(1937) | | Trustee, Nominating
and Audit Committee Member | | Since
2001 | | Dean Emeritus and
Distinguished Professor
of International Affairs
at the Edmund A.
Walsh School of
Foreign Service,
Georgetown University from June 1995 to present. | | | 28 | | | Director of
Carlisle Companies Incorporated
(diversified manufacturing company). | |
|
Steven N. Rappaport
Lehigh Court, LLC
555 Madison Avenue
29th Floor
New York, New York
10022
(1948) | | Chairman
of the Board
of Trustees, Nominating Committee Chairman
and Audit
Committee Member | | Trustee
since
1999 and
Chairman since 2005 | | Partner of Lehigh Court, LLC and RZ Capital (private investment firms) from July 2002 to present. | | | 35 | | | Director of iCAD, Inc. (surgical and medical instruments and apparatus company);
Director of Presstek, Inc.
(digital imaging technologies company); Director of Wood Resources, LLC. (plywood manufacturing company). | |
|
| Interested Trustee | | | | | | | | | | | | | |
|
Michael E. Kenneally3
c/o Credit Suisse Asset Management, LLC
Attn: General Counsel
Eleven Madison Avenue
New York, New York
10010
(1954) | | Trustee | | Since
2004 | | Chairman and Global Chief Executive Officer of Credit Suisse from March 2003 to July 2005; Chairman and Chief Investment Officer of Banc of America Capital Management from 1998 to March 2003. | | | 28 | | | None | |
|
3 Mr. Kenneally is a Trustee who is an "interested person" of the Trust as defined in the Investment Company Act of 1940, as amended, because he was an officer of Credit Suisse within the last two fiscal years.
31
Credit Suisse Trust — International Focus Portfolio
Information Concerning Trustees and Officers (unaudited) (continued)
Name, Address
(Year of Birth) | | Position(s)
Held with
Trust | | Term
of Office1
and
Length
of Time
Served | | Principal Occupation(s) During Past Five Years | |
| Officers | | | | | | | |
|
Lawrence D. Haber c/o Credit Suisse Asset Management, LLC. Attn: General Counsel Eleven Madison Avenue New York, New York 10010
(1951) | | Chief Executive Officer and President | | Since 2007 | | Managing Director and Chief Operating Officer of Credit Suisse; Member of Credit Suisse's Management Committee; Chief Financial Officer of Merrill Lynch Investment Managers from 1997 to 2003. | |
|
Michael A. Pignataro
Credit Suisse Asset
Management, LLC
Eleven Madison Avenue
New York, New York
10010
(1959) | | Chief Financial Officer | | Since
1999 | | Director and Director of Fund Administration of Credit Suisse; Associated with Credit Suisse or its predecessor since 1984; Officer of other Credit Suisse Funds. | |
|
Emidio Morizio
Credit Suisse Asset
Management, LLC
Eleven Madison Avenue
New York, New York
10010
(1966) | | Chief Compliance Officer | | Since
2004 | | Director and Global Head of Compliance of Credit Suisse; Associated with Credit Suisse since July 2000; Officer of other Credit Suisse Funds. | |
|
J. Kevin Gao
Credit Suisse Asset
Management, LLC
Eleven Madison Avenue
New York, New York
10010
(1967) | | Chief Legal Officer since 2006, Vice President and Secretary since 2004 | | Since
2004 | | Director and Legal Counsel of Credit Suisse; Associated with Credit Suisse since July 2003; Associated with the law firm of Willkie Farr & Gallagher LLP from 1998 to 2003; Officer of other Credit Suisse Funds. | |
|
Robert Rizza
Credit Suisse Asset
Management, LLC
Eleven Madison Avenue
New York, New York
10010
(1965) | | Treasurer | | Since
2006 | | Vice President of Credit Suisse; Associated with Credit Suisse since 1998; Officer of other Credit Suisse Funds. | |
|
The Statement of Additional Information includes additional information about the Trustees and is available, without charge, upon request, by calling 800-222-8977.
32
Credit Suisse Trust — International Focus Portfolio
December 31, 2007 (unaudited)
Important Tax Information for Corporate Shareholders
Corporate Shareholders should note for the year ended December 31, 2007, the percentage of the Portfolio's investment income (i.e., net investment income plus short-term capital gains) that qualified for the intercorporate dividends received deduction is 0%.
33
Credit Suisse Trust — International Focus Portfolio
Proxy Voting and Portfolio Holdings Information (unaudited)
Information regarding how the Portfolio voted proxies related to its portfolio securities during the 12 month period ended June 30 of each year, as well as the policies and procedures that the Portfolio uses to determine how to vote proxies relating to its portfolio securities are available:
• By calling 1-800-222-8977
• On the Portfolio's website, www.credit-suisse.com/us
• On the website of the Securities and Exchange Commission, www.sec.gov.
The Portfolio files a complete schedule of its portfolio holdings for the first and third quarters of its fiscal year with the SEC on Form N-Q. The Portfolio's Forms N-Q are available on the SEC's website at www.sec.gov and may be reviewed and copied at the SEC's Public Reference Room in Washington, DC. Information on the operation of the SEC's Public Reference Room may be obtained by calling 1-202-551-8090.
34
This page intentionally left blank
This page intentionally left blank

P.O. BOX 55030, BOSTON, MA 02205-5030
800-222-8977 n www.credit-suisse.com/us
CREDIT SUISSE ASSET MANAGEMENT SECURITIES, INC., DISTRIBUTOR. TRINT-AR-1207

CREDIT SUISSE FUNDS
Annual Report
December 31, 2007
CREDIT SUISSE TRUST
n BLUE CHIP PORTFOLIO
Credit Suisse Trust (the "Trust") shares are not available directly to individual investors, but may be offered only through certain insurance products and pension and retirement plans.
The Trust's investment objectives, risks, charges and expenses (which should be considered carefully before investing), and more complete information about the Trust, are provided in the Prospectus, which should be read carefully before investing. You may obtain additional copies by calling 800-222-8977 or by writing to Credit Suisse Trust, P.O. Box 55030, Boston, MA 02205-5030.
Credit Suisse Asset Management Securities, Inc., Distributor, is located at Eleven Madison Avenue, New York, NY 10010. The Trust is advised by Credit Suisse Asset Management, LLC.
The views of the Portfolio's management are as of the date of the letter and the Portfolio holdings described in this document are as of December 31, 2007; these views and Portfolio holdings may have changed subsequent to these dates. Nothing in this document is a recommendation to purchase or sell securities.
Portfolio shares are not deposits or other obligations of Credit Suisse Asset Management, LLC ("Credit Suisse") or any affiliate, are not FDIC-insured and are not guaranteed by Credit Suisse or any affiliate. Portfolio investments are subject to investment risks, including loss of your investment.
Credit Suisse Trust — Blue Chip Portfolio
Annual Investment Adviser's Report
December 31, 2007 (unaudited)
January 25, 2008
Dear Shareholder:
For the twelve months ended December 31, 2007, Credit Suisse Trust — Blue Chip Portfolio1 (the "Portfolio") had a gain of 7.56%, versus an increase of 5.49% for the Standard & Poor's 500 Index2 (the "S&P 500").
Market Review: A challenging market on many fronts
For the year ended December 31, 2007, U.S. large-cap stocks gained in 2007 with the benchmark S&P 500 posting a 5.49% total return including dividends. Eight out of the ten economic sectors in the large-cap S&P 500 advanced in 2007. Rising global demand and elevated commodity prices boosted the energy and materials sectors to post the highest returns of 32.4% and 20%, respectively. The biggest laggard in the large-cap space was financials (-20.8%), which were negatively impacted by the credit market turmoil and housing market slowdown.
The U.S. Federal Reserve held its benchmark rate at 5.25% until September 2007 when the target federal funds rate was cut by 50 basis points to 4.75%, marking the first cut in four years. The Federal Reserve cut the target rate by another 25 basis points in October and again in December to 4.25%. The cuts were made in an effort to prevent some of the adverse effects on the overall economy from the depressed housing market and tighter lending conditions for both consumers and corporations.
The aggressive lending environment over the past few years led to a rise in mortgage defaults. U.S. home foreclosures rose 68% in November from a year earlier, according to data compiled by RealtyTrac Inc. As a result, the U.S. housing sector weakened significantly in 2007 as mortgage providers tightened their lending standards and some lenders went bankrupt. Home prices in 20 U.S. metropolitan areas dropped in October by the most in at least six years. Property values fell 6.1% from October 2006, according to the S&P/Case-Shiller home-price index.
The Chicago Board Options Exchange Volatility Index (VIX), a measure of expected stock market volatility, reached a five-year low in January 2007. However, market conditions changed rapidly in mid-2007 and the VIX reached a four-year high in November 2007 amid deteriorating conditions in the U.S. housing and credit markets.
Despite the housing market slowdown, the economy grew at a solid 4.9% annual rate in the third quarter of 2007. The personal consumption expenditures (PCE) price index, excluding food and energy, rose 2.2% year-over-year in November. The increase was the biggest since March 2007. The Fed watches the PCE price index for signs of inflation and its preferred range for this gauge is 1.0% to 2.0%.
The labor market also showed signs of weakening in 2007. Non-farm payrolls rose 1.3 million in 2007, compared with gains of 2.3 million in 2006.
1
Credit Suisse Trust — Blue Chip Portfolio
Annual Investment Adviser's Report (continued)
December 31, 2007 (unaudited)
The unemployment rate rose from 4.7% in November to 5.0% in December 2007, the highest level since November 2005. And, the Reuters/University of Michigan final index of consumer confidence dropped to 75.5 in December, the lowest since October 2005. The gauge has averaged 88 since monthly data were first compiled in 1978.
Strategic Review and Market Outlook: Potential for further rate cuts
The leading positive relative contributors to performance came from stock selection in financials, industrials, and consumer discretionary. The largest detractors to performance came primarily from stock selection within the healthcare sector, followed closely by information technology.
The U.S. Federal Reserve anticipates economic growth will be "somewhat more sluggish" than the 1.8% – 2.5% they had projected for 2008. And, Fed policy makers also expect core inflation to "trend down a bit over the next few years."
The Federal Reserve on January 22, 2008 took significant action between scheduled meetings by cutting rates 75 basis points to 3.50%. The Fed cited the weakening economic outlook and increasing downside risks to growth.
The Fed is scheduled to meet next on January 30 to discuss interest rates. Based on interest-rate futures on January 25, traders expect policy makers to further lower the target rate for overnight lending by 50 to 75 basis points.
In our opinion, U.S. housing markets may remain weak through the first half of 2008. Additionally, expectations for U.S. stock market volatility, as measured by the VIX Index, are for levels above historical averages. The pace of mergers and acquisitions by private equity firms isn't expected to reach the level seen in the first half of 2007, as the availability of debt financing has lessened significantly.
The Credit Suisse Quantitative Equities Group
Jordan Low
Eric Leng
Todd Jablonski
The value of investments generally will fluctuate in response to market movements.
In addition to historical information, this report contains forward-looking statements, which may concern, among other things, domestic and foreign market, industry and economic trends and developments and government regulation and their potential impact on the Portfolio's investments. These statements are subject to risks and uncertainties and actual trends, developments and regulations in the future, and their impact on the Portfolio could be materially different from those projected, anticipated or implied. The Portfolio has no obligation to update or revise forward-looking statements.
2
Credit Suisse Trust — Blue Chip Portfolio
Annual Investment Adviser's Report (continued)
December 31, 2007 (unaudited)
Comparison of Change in Value of $10,000 Investment in the
Credit Suisse Trust — Blue Chip Portfolio1 and the
S&P 500 Index2, 3 from Inception (11/30/01).
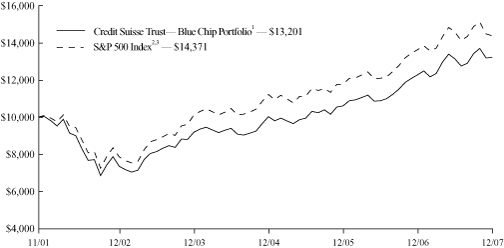
3
Credit Suisse Trust — Blue Chip Portfolio
Annual Investment Adviser's Report (continued)
December 31, 2007 (unaudited)
Average Annual Returns as of December 31, 20071
| 1 Year | | 5 Years | | Since
Inception | |
| | 7.56 | % | | | 12.42 | % | | | 4.67 | % | |
Returns represent past performance and include change in share price and reinvestment of dividends and capital gains. Past performance cannot guarantee future results. The current performance of the Portfolio may be lower or higher than the figures shown. Returns and share price will fluctuate, and redemption value may be more or less than original cost. The performance results do not reflect the deduction of taxes that a shareholder would pay on portfolio distributions or the redemption of portfolio shares. Performance includes the effect of deducting expenses, but does not include charges and expenses attributable to any particular variable contract or plan. Accordingly, the Prospectus of the sponsoring Participating Insurance Company separate account or plan documents or ot her informational materials supplied by plan sponsors should be carefully reviewed for information on relevant charges and expenses. Excluding these charges and expenses from quotations of performance has the effect of increasing the performance quoted, and the effect of these charges should be considered when comparing performance to that of other mutual funds. Performance information current to the most recent month-end is available at www.credit-suisse.com/us.
1 Fee waivers and/or expense reimbursements may reduce expenses for the Portfolio, without which performance would be lower. Waivers and/or reimbursements may be discontinued at any time.
2 The Standard & Poor's 500 Index is an unmanaged index (with no defined investment objective) of common stocks, includes reinvestment of dividends, and is a registered trademark of The McGraw-Hill Companies, Inc. Investors cannot invest directly in an index.
3 Performance for the benchmark is not available for the period beginning November 30, 2001 (commencement of operations). For that reason, performance is shown for the period beginning December 1, 2001.
4
Credit Suisse Trust — Blue Chip Portfolio
Annual Investment Adviser's Report (continued)
December 31, 2007 (unaudited)
Information About Your Portfolio's Expenses
As an investor of the Portfolio, you incur two types of costs: ongoing expenses and transaction costs. Ongoing expenses include management fees, distribution and service (12b-1) fees and other Portfolio expenses. Examples of transaction costs include sales charges (loads), redemption fees and account maintenance fees, which are not shown in this section and which would result in higher total expenses. The following table is intended to help you understand your ongoing expenses of investing in the Portfolio and to help you compare these expenses with the ongoing expenses of investing in other mutual funds. The table is based on an investment of $1,000 made at the beginning of the six month period ended December 31, 2007.
The table illustrates your Portfolio's expenses in two ways:
• Actual Portfolio Return. This helps you estimate the actual dollar amount of ongoing expenses paid on a $1,000 investment in the Portfolio using the Portfolio's actual return during the period. To estimate the expenses you paid over the period, simply divide your account value by $1,000 (for example, an $8,600 account value divided by $1,000 = 8.6), then multiply the result by the number in the "Expenses Paid per $1,000" line under the share class you hold.
• Hypothetical 5% Portfolio Return. This helps you to compare your Portfolio's ongoing expenses with those of other mutual funds using the Portfolio's actual expense ratio and a hypothetical rate of return of 5% per year before expenses. Examples using a 5% hypothetical fund return may be found in the shareholder reports of other mutual funds. The hypothetical account values and expenses may not be used to estimate the actual ending account balance or expenses you paid for the period.
Please note that the expenses shown in these tables are meant to highlight your ongoing expenses only and do not reflect any transaction costs, such as sales charges (loads) or redemption fees. If these transaction costs had been included, your costs would have been higher. The "Expenses Paid per $1,000" line of the tables is useful in comparing ongoing expenses only and will not help you determine the relative total expenses of owning different funds.
5
Credit Suisse Trust — Blue Chip Portfolio
Annual Investment Adviser's Report (continued)
December 31, 2007 (unaudited)
Expenses and Value of a $1,000 Investment
for the six month period ended December 31, 2007
| Actual Portfolio Return | |
| Beginning Account Value 7/1/07 | | $ | 1,000.00 | | |
| Ending Account Value 12/31/07 | | $ | 1,005.70 | | |
| Expenses Paid per $1,000* | | $ | 4.80 | | |
| Hypothetical 5% Portfolio Return | |
| Beginning Account Value 7/1/07 | | $ | 1,000.00 | | |
| Ending Account Value 12/31/07 | | $ | 1,020.42 | | |
| Expenses Paid per $1,000* | | $ | 4.84 | | |
| Annualized Expense Ratios* | | | 0.95 | % | |
* Expenses are equal to the Portfolio's annualized expense ratio multiplied by the average account value over the period, multiplied by the number of days in the most recent fiscal half year period, then divided by 365.
The "Expenses Paid per $1,000" and the "Annualized Expense Ratios" in the tables are based on actual expenses paid by the Portfolio during the period, net of fee waivers and/or expense reimbursements. If those fee waivers and/or expense reimbursements had not been in effect, the Portfolio's actual expenses would have been higher. Expenses do not reflect additional charges and expenses that are, or may be, imposed under the variable contracts or plans. Such charges and expenses are described in the prospectus of the insurance company separate account or in the plan documents or other informational materials supplied by plan sponsors. The Portfolio's expenses should be considered with these charges and expenses in evaluating the overall cost of investing in the separate account.
For more information, please refer to the Portfolio's prospectus.
6
Credit Suisse Trust — Blue Chip Portfolio
Annual Investment Adviser's Report (continued)
December 31, 2007 (unaudited)
SECTOR BREAKDOWN*
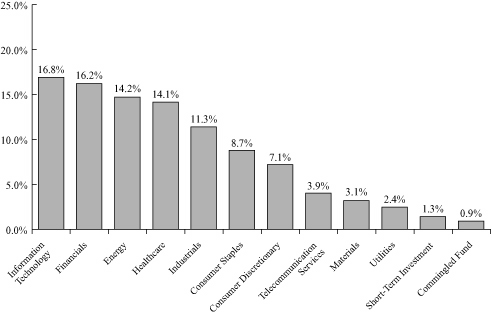
* Expressed as a percentage of total investments and may vary over time.
7
Credit Suisse Trust — Blue Chip Portfolio
Schedule of Investments
December 31, 2007
| | | Number of
Shares | | Value | |
| COMMON STOCKS (98.7%) | |
| Aerospace & Defense (3.0%) | |
| Boeing Co. | | | 1,200 | | | $ | 104,952 | | |
| Lockheed Martin Corp. | | | 700 | | | | 73,682 | | |
| Raytheon Co. | | | 1,200 | | | | 72,840 | | |
| Rockwell Collins, Inc. | | | 900 | | | | 64,773 | | |
| United Technologies Corp. | | | 100 | | | | 7,654 | | |
| | | | 323,901 | | |
| Air Freight & Couriers (0.6%) | |
| FedEx Corp. | | | 600 | | | | 53,502 | | |
| United Parcel Service, Inc. Class B | | | 100 | | | | 7,072 | | |
| | | | 60,574 | | |
| Auto Components (1.1%) | |
| Autoliv, Inc. | | | 900 | | | | 47,439 | | |
| Johnson Controls, Inc. | | | 1,900 | | | | 68,476 | | |
| | | | 115,915 | | |
| Automobiles (0.3%) | |
| Hertz Global Holdings, Inc.* | | | 300 | | | | 4,767 | | |
| Thor Industries, Inc. | | | 600 | | | | 22,806 | | |
| | | | 27,573 | | |
| Banks (2.7%) | |
| Bank of America Corp. | | | 2,500 | | | | 103,150 | | |
| Bank of New York Mellon Corp. | | | 1,300 | | | | 63,388 | | |
| Northern Trust Corp. | | | 800 | | | | 61,264 | | |
| Wachovia Corp. | | | 300 | | | | 11,409 | | |
| Wells Fargo & Co. | | | 1,600 | | | | 48,304 | | |
| | | | 287,515 | | |
| Beverages (2.2%) | |
| Coca-Cola Co. | | | 1,200 | | | | 73,644 | | |
| Molson Coors Brewing Co. Class B | | | 200 | | | | 10,324 | | |
| Pepsi Bottling Group, Inc. | | | 1,400 | | | | 55,244 | | |
| PepsiCo, Inc. | | | 1,300 | | | | 98,670 | | |
| | | | 237,882 | | |
| Biotechnology (0.8%) | |
| Amgen, Inc.* | | | 1,400 | | | | 65,016 | | |
| Celgene Corp. | | | 100 | | | | 4,621 | | |
| Genzyme Corp. | | | 200 | | | | 14,888 | | |
| | | | 84,525 | | |
| Chemicals (1.6%) | |
| Dow Chemical Co. | | | 2,100 | | | | 82,782 | | |
| Monsanto Co. | | | 800 | | | | 89,352 | | |
| | | | 172,134 | | |
See Accompanying Notes to Financial Statements.
8
Credit Suisse Trust — Blue Chip Portfolio
Schedule of Investments (continued)
December 31, 2007
| | | Number of
Shares | | Value | |
| COMMON STOCKS | |
| Commercial Services & Supplies (0.7%) | |
| DST Systems, Inc. | | | 100 | | | $ | 8,255 | | |
| Robert Half International, Inc. | | | 1,100 | | | | 29,744 | | |
| Steelcase, Inc. Class A | | | 2,600 | | | | 41,262 | | |
| | | | 79,261 | | |
| Commingled Fund (0.9%) | |
| SPDR Trust Series 1 | | | 700 | | | | 102,347 | | |
| Communications Equipment (1.9%) | |
| Cisco Systems, Inc.* | | | 6,900 | | | | 186,783 | | |
| QUALCOMM, Inc. | | | 600 | | | | 23,610 | | |
| | | | 210,393 | | |
| Computers & Peripherals (5.2%) | |
| Apple Computer, Inc.* | | | 700 | | | | 138,656 | | |
| Dell, Inc.* | | | 1,800 | | | | 44,118 | | |
| Hewlett-Packard Co. | | | 2,700 | | | | 136,296 | | |
| International Business Machines Corp. | | | 700 | | | | 75,670 | | |
| Network Appliance, Inc.* | | | 1,800 | | | | 44,928 | | |
| NVIDIA Corp.* | | | 1,800 | | | | 61,236 | | |
| Seagate Technology | | | 1,100 | | | | 28,050 | | |
| Western Digital Corp.* | | | 1,100 | | | | 33,231 | | |
| | | | 562,185 | | |
| Diversified Financials (8.1%) | |
| American Express Co. | | | 100 | | | | 5,202 | | |
| Charles Schwab Corp. | | | 3,000 | | | | 76,650 | | |
| Citigroup, Inc. | | | 3,600 | | | | 105,984 | | |
| Federated Investors, Inc. Class B | | | 1,400 | | | | 57,624 | | |
| First Marblehead Corp. | | | 1,400 | | | | 21,420 | | |
| Franklin Resources, Inc. | | | 600 | | | | 68,658 | | |
| Goldman Sachs Group, Inc. | | | 400 | | | | 86,020 | | |
| JPMorgan Chase & Co. | | | 4,000 | | | | 174,600 | | |
| Morgan Stanley | | | 1,900 | | | | 100,909 | | |
| Nymex Holdings, Inc. | | | 400 | | | | 53,444 | | |
| State Street Corp. | | | 1,000 | | | | 81,200 | | |
| Western Union Co. | | | 1,900 | | | | 46,132 | | |
| | | | 877,843 | | |
| Diversified Telecommunication Services (3.9%) | |
| AT&T, Inc. | | | 6,397 | | | | 265,859 | | |
| Verizon Communications, Inc. | | | 3,600 | | | | 157,284 | | |
| | | | 423,143 | | |
| Electric Utilities (2.4%) | |
| Constellation Energy Group | | | 400 | | | | 41,012 | | |
| DTE Energy Co. | | | 1,200 | | | | 52,752 | | |
| Edison International | | | 600 | | | | 32,022 | | |
| FirstEnergy Corp. | | | 1,000 | | | | 72,340 | | |
| Public Service Enterprise Group, Inc. | | | 600 | | | | 58,944 | | |
| | | | 257,070 | | |
See Accompanying Notes to Financial Statements.
9
Credit Suisse Trust — Blue Chip Portfolio
Schedule of Investments (continued)
December 31, 2007
| | | Number of
Shares | | Value | |
| COMMON STOCKS | |
| Electrical Equipment (0.5%) | |
| Rockwell Automation, Inc. | | | 800 | | | $ | 55,168 | | |
| Energy Equipment & Services (2.1%) | |
| ENSCO International, Inc. | | | 1,100 | | | | 65,582 | | |
| Halliburton Co. | | | 700 | | | | 26,537 | | |
| National-Oilwell Varco, Inc.* | | | 600 | | | | 44,076 | | |
| Noble Corp. | | | 900 | | | | 50,859 | | |
| Schlumberger, Ltd. | | | 400 | | | | 39,348 | | |
| | | | 226,402 | | |
| Food & Drug Retailing (1.3%) | |
| Kroger Co. | | | 2,500 | | | | 66,775 | | |
| Safeway, Inc. | | | 1,400 | | | | 47,894 | | |
| Sysco Corp. | | | 1,000 | | | | 31,210 | | |
| | | | 145,879 | | |
| Food Products (0.3%) | |
| Kellogg Co. | | | 700 | | | | 36,701 | | |
| Healthcare Equipment & Supplies (2.0%) | |
| Baxter International, Inc. | | | 1,200 | | | | 69,660 | | |
| Hlth Corp.* | | | 1,300 | | | | 17,420 | | |
| Kinetic Concepts, Inc.* | | | 1,000 | | | | 53,560 | | |
| Medtronic, Inc. | | | 1,500 | | | | 75,405 | | |
| | | | 216,045 | | |
| Healthcare Providers & Services (3.7%) | |
| Aetna, Inc. | | | 1,300 | | | | 75,049 | | |
| Coventry Health Care, Inc.* | | | 1,100 | | | | 65,175 | | |
| Humana, Inc.* | | | 900 | | | | 67,779 | | |
| McKesson Corp. | | | 900 | | | | 58,959 | | |
| UnitedHealth Group, Inc. | | | 2,040 | | | | 118,728 | | |
| WellPoint, Inc.* | | | 200 | | | | 17,546 | | |
| | | | 403,236 | | |
| Hotels, Restaurants & Leisure (0.1%) | |
| McDonald's Corp. | | | 100 | | | | 5,891 | | |
| Household Durables (0.5%) | |
| Whirlpool Corp. | | | 700 | | | | 57,141 | | |
| Household Products (2.5%) | |
| Clorox Co. | | | 900 | | | | 58,653 | | |
| Procter & Gamble Co. | | | 2,900 | | | | 212,918 | | |
| | | | 271,571 | | |
| Industrial Conglomerates (4.2%) | |
| 3M Co. | | | 600 | | | | 50,592 | | |
| General Electric Co. | | | 6,900 | | | | 255,783 | | |
| Honeywell International, Inc. | | | 1,400 | | | | 86,198 | | |
| Tyco International, Ltd. | | | 1,700 | | | | 67,405 | | |
| | | | 459,978 | | |
See Accompanying Notes to Financial Statements.
10
Credit Suisse Trust — Blue Chip Portfolio
Schedule of Investments (continued)
December 31, 2007
| | | Number of
Shares | | Value | |
| COMMON STOCKS | |
| Insurance (5.5%) | |
| ACE, Ltd. | | | 600 | | | $ | 37,068 | | |
| Aflac, Inc. | | | 1,100 | | | | 68,893 | | |
| American International Group, Inc. | | | 1,800 | | | | 104,940 | | |
| Aon Corp. | | | 1,000 | | | | 47,690 | | |
| Assurant, Inc. | | | 900 | | | | 60,210 | | |
| Endurance Specialty Holdings, Ltd. | | | 100 | | | | 4,173 | | |
| Loews Corp. | | | 1,400 | | | | 70,476 | | |
| Prudential Financial, Inc. | | | 900 | | | | 83,736 | | |
| Travelers Companies, Inc. | | | 600 | | | | 32,280 | | |
| Unum Group | | | 200 | | | | 4,758 | | |
| W.R. Berkley Corp. | | | 1,000 | | | | 29,810 | | |
| XL Capital, Ltd. Class A | | | 1,000 | | | | 50,310 | | |
| | | | 594,344 | | |
| Internet & Catalog Retail (0.1%) | |
| Amazon.com, Inc.* | | | 100 | | | | 9,264 | | |
| Internet Software & Services (1.6%) | |
| Google, Inc. Class A* | | | 200 | | | | 138,296 | | |
| IAC/InterActiveCorp* | | | 1,100 | | | | 29,612 | | |
| | | | 167,908 | | |
| IT Consulting & Services (0.5%) | |
| Accenture, Ltd. Class A | | | 1,600 | | | | 57,648 | | |
| Leisure Equipment & Products (0.4%) | |
| Callaway Golf Co. | | | 300 | | | | 5,229 | | |
| Mattel, Inc. | | | 2,200 | | | | 41,888 | | |
| | | | 47,117 | | |
| Machinery (1.6%) | |
| Caterpillar, Inc. | | | 1,200 | | | | 87,072 | | |
| Cummins, Inc. | | | 500 | | | | 63,685 | | |
| Eaton Corp. | | | 100 | | | | 9,695 | | |
| Parker Hannifin Corp. | | | 150 | | | | 11,297 | | |
| | | | 171,749 | | |
| Media (2.6%) | |
| Comcast Corp. Class A | | | 300 | | | | 5,478 | | |
| DIRECTV Group, Inc.* | | | 2,800 | | | | 64,736 | | |
| News Corp. Class A | | | 3,600 | | | | 73,764 | | |
| Regal Entertainment Group Class A | | | 2,200 | | | | 39,754 | | |
| Walt Disney Co. | | | 3,200 | | | | 103,296 | | |
| | | | 287,028 | | |
| Metals & Mining (1.2%) | |
| Freeport-McMoRan Copper & Gold, Inc. | | | 802 | | | | 82,157 | | |
| Nucor Corp. | | | 800 | | | | 47,376 | | |
| | | | 129,533 | | |
See Accompanying Notes to Financial Statements.
11
Credit Suisse Trust — Blue Chip Portfolio
Schedule of Investments (continued)
December 31, 2007
| | | Number of
Shares | | Value | |
| COMMON STOCKS | |
| Multiline Retail (1.1%) | |
| Big Lots, Inc.* | | | 700 | | | $ | 11,193 | | |
| Family Dollar Stores, Inc. | | | 1,800 | | | | 34,614 | | |
| Wal-Mart Stores, Inc. | | | 1,600 | | | | 76,048 | | |
| | | | 121,855 | | |
| Oil & Gas (12.1%) | |
| Chevron Corp. | | | 2,300 | | | | 214,659 | | |
| ConocoPhillips | | | 1,788 | | | | 157,880 | | |
| Devon Energy Corp. | | | 300 | | | | 26,673 | | |
| Exxon Mobil Corp. | | | 5,200 | | | | 487,188 | | |
| Hess Corp. | | | 300 | | | | 30,258 | | |
| Marathon Oil Corp. | | | 1,200 | | | | 73,032 | | |
| Murphy Oil Corp. | | | 900 | | | | 76,356 | | |
| Occidental Petroleum Corp. | | | 1,200 | | | | 92,388 | | |
| Transocean, Inc.* | | | 639 | | | | 91,473 | | |
| Valero Energy Corp. | | | 900 | | | | 63,027 | | |
| | | | 1,312,934 | | |
| Paper & Forest Products (0.4%) | |
| International Paper Co. | | | 1,200 | | | | 38,856 | | |
| Pharmaceuticals (7.6%) | |
| Abbott Laboratories | | | 300 | | | | 16,845 | | |
| Bristol-Myers Squibb Co. | | | 3,500 | | | | 92,820 | | |
| Eli Lilly and Co. | | | 300 | | | | 16,017 | | |
| Endo Pharmaceuticals Holdings, Inc.* | | | 500 | | | | 13,335 | | |
| Forest Laboratories, Inc.* | | | 1,000 | | | | 36,450 | | |
| Johnson & Johnson | | | 2,900 | | | | 193,430 | | |
| Merck & Company, Inc. | | | 1,700 | | | | 98,787 | | |
| Pfizer, Inc. | | | 7,900 | | | | 179,567 | | |
| Schering-Plough Corp. | | | 3,000 | | | | 79,920 | | |
| Sepracor, Inc.* | | | 2,000 | | | | 52,500 | | |
| Watson Pharmaceuticals, Inc.* | | | 1,800 | | | | 48,852 | | |
| | | | 828,523 | | |
| Road & Rail (0.7%) | |
| Union Pacific Corp. | | | 600 | | | | 75,372 | | |
| Semiconductor Equipment & Products (3.2%) | |
| Analog Devices, Inc. | | | 1,000 | | | | 31,700 | | |
| Intel Corp. | | | 6,700 | | | | 178,622 | | |
| MEMC Electronic Materials, Inc.* | | | 500 | | | | 44,245 | | |
| Texas Instruments, Inc. | | | 2,900 | | | | 96,860 | | |
| | | | 351,427 | | |
| Software (4.3%) | |
| Autodesk, Inc. | | | 800 | | | | 39,808 | | |
| BMC Software, Inc.* | | | 800 | | | | 28,512 | | |
| Microsoft Corp. | | | 8,200 | | | | 291,920 | | |
| Oracle Corp.* | | | 4,900 | | | | 110,642 | | |
| | | | 470,882 | | |
See Accompanying Notes to Financial Statements.
12
Credit Suisse Trust — Blue Chip Portfolio
Schedule of Investments (continued)
December 31, 2007
| | | Number of
Shares | | Value | |
| COMMON STOCKS | |
| Specialty Retail (0.6%) | |
| Bare Escentuals, Inc.* | | | 200 | | | $ | 4,850 | | |
| Best Buy Company, Inc. | | | 100 | | | | 5,265 | | |
| RadioShack Corp. | | | 3,000 | | | | 50,580 | | |
| | | | 60,695 | | |
| Textiles & Apparel (0.3%) | |
| Nike, Inc. Class B | | | 500 | | | | 32,120 | | |
| Tobacco (2.3%) | |
| Altria Group, Inc. | | | 1,500 | | | | 113,370 | | |
| Loews Corp. Carolina Group | | | 800 | | | | 68,240 | | |
| UST, Inc. | | | 1,200 | | | | 65,760 | | |
| | | | 247,370 | | |
| TOTAL COMMON STOCKS (Cost $9,153,788) | | | 10,704,898 | | |
| | | Par
(000) | | | |
| SHORT-TERM INVESTMENT (1.2%) | |
| State Street Bank and Trust Co. Euro Time Deposit, 3.100%, 1/02/08 (Cost $135,000) | | $ | 135 | | | | 135,000 | | |
| TOTAL INVESTMENTS AT VALUE (99.9%) (Cost $9,288,788) | | | 10,839,898 | | |
| OTHER ASSETS IN EXCESS OF LIABILITIES (0.1%) | | | 7,644 | | |
| NET ASSETS (100.0%) | | $ | 10,847,542 | | |
* Non-income producing security.
See Accompanying Notes to Financial Statements.
13
Credit Suisse Trust — Blue Chip Portfolio
Statement of Assets and Liabilities
December 31, 2007
| Assets | |
| Investments at value (Cost $9,288,788) (Note 2) | | $ | 10,839,898 | | |
| Cash | | | 985 | | |
| Dividend and interest receivable | | | 17,286 | | |
| Receivable for portfolio shares sold | | | 11,453 | | |
| Receivable from investment adviser (Note 3) | | | 6,339 | | |
| Prepaid expenses | | | 75 | | |
| Total Assets | | | 10,876,036 | | |
| Liabilities | |
| Administrative services fee payable (Note 3) | | | 1,997 | | |
| Trustees' fee payable | | | 804 | | |
| Other accrued expenses payable | | | 25,693 | | |
| Total Liabilities | | | 28,494 | | |
| Net Assets | |
| Capital stock, $0.001 par value (Note 6) | | | 852 | | |
| Paid-in capital (Note 6) | | | 10,273,261 | | |
| Undistributed net investment income | | | 97,441 | | |
| Accumulated net realized loss on investments | | | (1,075,122 | ) | |
| Net unrealized appreciation from investments | | | 1,551,110 | | |
| Net Assets | | $ | 10,847,542 | | |
| Shares outstanding | | | 851,627 | | |
| Net asset value, offering price, and redemption price per share | | $ | 12.74 | | |
See Accompanying Notes to Financial Statements.
14
Credit Suisse Trust — Blue Chip Portfolio
Statement of Operations
For the Year Ended December 31, 2007
| Investment Income (Note 2) | |
| Dividends | | $ | 202,910 | | |
| Interest | | | 3,339 | | |
| Total investment income | | | 206,249 | | |
| Expenses | |
| Investment advisory fees (Note 3) | | | 57,067 | | |
| Administrative services fees (Note 3) | | | 24,042 | | |
| Trustees' fees | | | 19,855 | | |
| Audit and tax fees | | | 17,001 | | |
| Printing fees (Note 3) | | | 16,400 | | |
| Legal fees | | | 14,093 | | |
| Custodian fees | | | 9,841 | | |
| Transfer agent fees | | | 1,876 | | |
| Interest expense (Note 4) | | | 598 | | |
| Insurance expense | | | 443 | | |
| Commitment fees (Note 4) | | | 291 | | |
| Total expenses | | | 161,507 | | |
| Less: fees waived (Note 3) | | | (53,080 | ) | |
| Net expenses | | | 108,427 | | |
| Net investment income | | | 97,822 | | |
| Net Realized and Unrealized Gain (Loss) from Investments | |
| Net realized gain from investments | | | 787,062 | | |
| Net change in unrealized appreciation (depreciation) from investments | | | (68,810 | ) | |
| Net realized and unrealized gain from investments | | | 718,252 | | |
| Net increase in net assets resulting from operations | | $ | 816,074 | | |
See Accompanying Notes to Financial Statements.
15
Credit Suisse Trust — Blue Chip Portfolio
Statements of Changes in Net Assets
| | | For the Year
Ended
December 31, 2007 | | For the Year
Ended
December 31, 2006 | |
| From Operations | |
| Net investment income | | $ | 97,822 | | | $ | 97,495 | | |
| Net realized gain from investments | | | 787,062 | | | | 783,587 | | |
| Net change in unrealized appreciation (depreciation) from investments | | | (68,810 | ) | | | 718,724 | | |
| Net increase in net assets resulting from operations | | | 816,074 | | | | 1,599,806 | | |
| From Dividends | |
| Dividends from net investment income | | | (97,194 | ) | | | (96,044 | ) | |
| Net decrease in net assets resulting from dividends | | | (97,194 | ) | | | (96,044 | ) | |
| From Capital Share Transactions (Note 6) | |
| Proceeds from sale of shares | | | 1,935,326 | | | | 1,684,418 | | |
| Reinvestment of dividends | | | 97,194 | | | | 96,044 | | |
| Net asset value of shares redeemed | | | (2,771,300 | ) | | | (3,524,491 | ) | |
| Net decrease in net assets from capital share transactions | | | (738,780 | ) | | | (1,744,029 | ) | |
| Net decrease in net assets | | | (19,900 | ) | | | (240,267 | ) | |
| Net Assets | |
| Beginning of year | | | 10,867,442 | | | | 11,107,709 | | |
| End of year | | $ | 10,847,542 | | | $ | 10,867,442 | | |
| Undistributed net investment income | | $ | 97,441 | | | $ | 97,372 | | |
See Accompanying Notes to Financial Statements.
16
Credit Suisse Trust — Blue Chip Portfolio
Financial Highlights
(For a Share of the Portfolio Outstanding Throughout Each Year)
| | | For the Year Ended December 31, | |
| | | 2007 | | 2006 | | 2005 | | 2004 | | 2003 | |
| Per share data | |
| Net asset value, beginning of year | | $ | 11.95 | | | $ | 10.41 | | | $ | 9.91 | | | $ | 9.15 | | | $ | 7.35 | | |
| INVESTMENT OPERATIONS | |
| Net investment income | | | 0.12 | | | | 0.10 | | | | 0.09 | | | | 0.08 | | | | 0.07 | | |
Net gain on investments
(both realized and unrealized) | | | 0.78 | | | | 1.53 | | | | 0.48 | | | | 0.75 | | | | 1.76 | | |
| Total from investment operations | | | 0.90 | | | | 1.63 | | | | 0.57 | | | | 0.83 | | | | 1.83 | | |
| LESS DIVIDENDS | |
| Dividends from net investment income | | | (0.11 | ) | | | (0.09 | ) | | | (0.07 | ) | | | (0.07 | ) | | | (0.03 | ) | |
| Net asset value, end of year | | $ | 12.74 | | | $ | 11.95 | | | $ | 10.41 | | | $ | 9.91 | | | $ | 9.15 | | |
| Total return1 | | | 7.56 | % | | | 15.79 | % | | | 5.78 | % | | | 9.13 | % | | | 24.92 | % | |
| RATIOS AND SUPPLEMENTAL DATA | |
| Net assets, end of year (000s omitted) | | $ | 10,848 | | | $ | 10,867 | | | $ | 11,108 | | | $ | 13,437 | | | $ | 15,776 | | |
| Ratio of expenses to average net assets | | | 0.95 | % | | | 0.95 | % | | | 1.04 | % | | | 1.16 | % | | | 1.16 | % | |
| Ratio of net investment income to average net assets | | | 0.86 | % | | | 0.88 | % | | | 0.74 | % | | | 0.69 | % | | | 0.58 | % | |
Decrease reflected in above operating expense
ratios due to waivers/reimbursements | | | 0.47 | % | | | 0.58 | % | | | 0.47 | % | | | 0.50 | % | | | 0.33 | % | |
| Portfolio turnover rate | | | 124 | % | | | 131 | % | | | 114 | % | | | 47 | % | | | 40 | % | |
1 Total returns are historical and assume changes in share price and reinvestment of all dividends and distributions. Had certain expenses not been reduced during the years shown, total returns would have been lower. Total returns do not reflect charges and expenses attributable to any particular variable contract or plan.
See Accompanying Notes to Financial Statements.
17
Credit Suisse Trust — Blue Chip Portfolio
Notes to Financial Statements
December 31, 2007
Note 1. Organization
Credit Suisse Trust (the "Trust") is an open-end management investment company registered under the Investment Company Act of 1940, as amended (the "1940 Act"), and currently offers eight managed investment portfolios of which one, the Blue Chip Portfolio (the "Portfolio"), is included in this report. The Portfolio is a diversified investment fund that seeks long-term capital appreciation. Shares of the Portfolio are not available directly to individual investors but may be offered only through (a) variable annuity contracts and variable life insurance contracts offered by separate accounts of certain insurance companies and (b) tax-qualified pension and retirement plans. The Portfolio may not be available in connection with a particular contract or plan. The Trust was organized under the laws of The Commonwealth of Massachusetts as a business trust on March 15, 1995.
Note 2. Significant Accounting Policies
A) SECURITY VALUATION — The net asset value of the Portfolio is determined daily as of the close of regular trading on the New York Stock Exchange, Inc. (the "Exchange") on each day the Exchange is open for business. Equity investments are valued at market value, which is generally determined using the closing price on the exchange or market on which the security is primarily traded at the time of valuation (the "Valuation Time"). If no sales are reported, equity investments are generally valued at the most recent bid quotation as of the Valuation Time or at the lowest asked quotation in the case of a short sale of securities. Debt securities with a remaining maturity greater than 60 days are valued in accordance with the price supplied by a pricing service, which may use a matrix, formula or other objective method that takes into consideration market indices, yield curves and other specific adjustments. Debt obligations that will matur e in 60 days or less are valued on the basis of amortized cost, which approximates market value, unless it is determined that using this method would not represent fair value. Investments in mutual funds are valued at the mutual fund's closing net asset value per share on the day of valuation. Securities and other assets for which market quotations are not readily available, or whose values have been materially affected by events occurring before the Portfolio's Valuation Time but after the close of the securities' primary markets, are valued at fair value as determined in good faith by, or under the direction of, the Board of Trustees under procedures established by the Board of Trustees. The Portfolio may utilize a service provided by an independent third party which has been approved by the Board of Trustees to fair value certain securities. When fair-value pricing is employed,
18
Credit Suisse Trust — Blue Chip Portfolio
Notes to Financial Statements (continued)
December 31, 2007
Note 2. Significant Accounting Policies
the prices of securities used by a portfolio to calculate its net asset value may differ from quoted or published prices for the same securities.
B) SECURITY TRANSACTIONS AND INVESTMENT INCOME — Security transactions are accounted for on a trade date basis. Interest income is recorded on the accrual basis. Dividends are recorded on the ex-dividend date. The cost of investments sold is determined by use of the specific identification method for both financial reporting and income tax purposes.
C) DIVIDENDS AND DISTRIBUTIONS TO SHAREHOLDERS — Dividends from net investment income and distributions of net realized capital gains, if any, are declared and paid at least annually. However, to the extent that a net realized capital gain can be reduced by a capital loss carryforward, such gain will not be distributed. Income and capital gain distributions are determined in accordance with federal income tax regulations, which may differ from accounting principles generally accepted in the United States of America ("GAAP").
D) FEDERAL INCOME TAXES — No provision is made for federal taxes as it is the Portfolio's intention to continue to qualify for and elect the tax treatment applicable to regulated investment companies under the Internal Revenue Code of 1986, as amended, and to make the requisite distributions to its shareholders, which will be sufficient to relieve it from federal income and excise taxes.
E) USE OF ESTIMATES — The preparation of financial statements in conformity with GAAP requires management to make estimates and assumptions that affect the reported amounts of assets and liabilities and disclosure of contingent assets and liabilities at the date of the financial statements and the reported amounts of income and expenses during the reporting period. Actual results could differ from these estimates.
F) SHORT-TERM INVESTMENTS — The Portfolio, together with other funds/portfolios advised by Credit Suisse Asset Management, LLC ("Credit Suisse"), an indirect, wholly-owned subsidiary of Credit Suisse Group, pools available cash into either a short-term variable rate time deposit issued by State Street Bank and Trust Company ("SSB"), the Portfolio's custodian, or a money market fund advised by Credit Suisse. The short-term time deposit issued by SSB is a variable rate account classified as a short-term investment.
G) SECURITIES LENDING — Loans of securities are required at all times to be secured by collateral at least equal to 102% of the market value of domestic securities on loan (including any accrued interest thereon) and 105% of the market value of foreign securities on loan (including any accrued interest
19
Credit Suisse Trust — Blue Chip Portfolio
Notes to Financial Statements (continued)
December 31, 2007
Note 2. Significant Accounting Policies
thereon). Cash collateral received by the Portfolio in connection with securities lending activity may be pooled together with cash collateral for other funds/portfolios advised by Credit Suisse and may be invested in a variety of investments, including certain Credit Suisse-advised funds, funds advised by SSB, the Portfolio's securities lending agent, or money market instruments. However, in the event of default or bankruptcy by the other party to the agreement, realization and/or retention of the collateral may be subject to legal proceedings. The Portfolio had no securities out on loan during the year ended December 31, 2007.
SSB has been engaged by the Portfolio to act as the Portfolio's securities lending agent. The Portfolio's securities lending arrangement provides that the Portfolio and SSB will share the net income earned from securities lending activities. The Portfolio may also be entitled to certain minimum amounts of income from its securities lending activities. Securities lending income is accrued as earned.
Note 3. Transactions with Affiliates and Related Parties
Credit Suisse serves as investment adviser for the Portfolio. For its investment advisory services, Credit Suisse is entitled to receive a fee from the Portfolio at an annual rate of 0.50% of the Portfolio's average daily net assets. For the year ended December 31, 2007, investment advisory fees earned and voluntarily waived were $57,067 and $53,080, respectively. Credit Suisse will not recapture from the Portfolio any fees it waived during the fiscal year ended December 31, 2007. Fee waivers and reimbursements are voluntary and may be discontinued by Credit Suisse at any time.
Credit Suisse Asset Management Securities, Inc. ("CSAMSI"), an affiliate of Credit Suisse, and SSB serve as co-administrators to the Portfolio. For its co-administrative services, CSAMSI currently receives a fee calculated at an annual rate of 0.09% of the Portfolio's average daily net assets. For the year ended December 31, 2007, co-administrative services fees earned by CSAMSI were $10,272.
For its co-administrative services, SSB receives a fee, exclusive of out-of-pocket expenses, calculated in total for all the Credit Suisse funds/portfolios co-administered by SSB and allocated based upon relative average net assets of each fund/portfolio, subject to an annual minimum fee. For the year ended December 31, 2007, co-administrative services fees earned by SSB (including out-of-pocket expenses) were $13,770.
20
Credit Suisse Trust — Blue Chip Portfolio
Notes to Financial Statements (continued)
December 31, 2007
Note 3. Transactions with Affiliates and Related Parties
In addition to serving as the Portfolio's co-administrator, CSAMSI currently serves as distributor of the Portfolio's shares without compensation.
Merrill Corporation ("Merrill"), an affiliate of Credit Suisse, has been engaged by the Portfolio to provide certain financial printing and fulfillment services. For the year ended December 31, 2007, Merrill was paid $13,895 for its services to the Portfolio.
Note 4. Line of Credit
The Portfolio, together with other funds/portfolios advised by Credit Suisse (collectively, the "Participating Funds"), participates in a $50 million committed, unsecured line of credit facility ("Credit Facility") for temporary or emergency purposes with Deutsche Bank, A.G. as administrative agent and syndication agent and SSB as operations agent. Under the terms of the Credit Facility, the Participating Funds pay an aggregate commitment fee at a rate of 0.10% per annum on the average unused amount of the Credit Facility, which is allocated among the Participating Funds in such manner as is determined by the governing Boards of the Participating Funds. In addition, the Participating Funds pay interest on borrowings at the Federal Funds rate plus 0.50%. During the year ended December 31, 2007, the Portfolio had borrowings under the Credit Facility as follows:
Average Daily
Loan Balance | | Weighted Average
Interest Rate % | | Maximum Daily
Loan Outstanding | |
| $ | 213,056 | | | | 5.613 | % | | $ | 401,000 | | |
Note 5. Purchases and Sales of Securities
For the year ended December 31, 2007, purchases and sales of investment securities (excluding short-term investments) were $13,959,047 and $14,533,178, respectively.
21
Credit Suisse Trust — Blue Chip Portfolio
Notes to Financial Statements (continued)
December 31, 2007
Note 6. Capital Share Transactions
The Trust is authorized to issue an unlimited number of full and fractional shares of beneficial interest, $0.001 par value per share. Transactions in capital shares of the Portfolio were as follows:
| | | For the Year Ended
December 31, 2007 | | For the Year Ended
December 31, 2006 | |
| Shares sold | | | 156,069 | | | | 153,746 | | |
| Shares issued in reinvestment of dividends | | | 7,832 | | | | 8,828 | | |
| Shares redeemed | | | (221,807 | ) | | | (319,850 | ) | |
| Net increase (decrease) | | | (57,906 | ) | | | (157,276 | ) | |
On December 31, 2007, the number of shareholders that held 5% or more of the outstanding shares of the Portfolio was as follows:
Number of
Shareholders | | Approximate Percentage
of Outstanding Shares | |
| | 1 | | | | 97 | % | |
Some of the shareholders are omnibus accounts, which hold shares on behalf of individual shareholders.
Note 7. Federal Income Taxes
Income and capital gain distributions are determined in accordance with federal income tax regulations, which may differ from GAAP.
The tax characteristics of dividends paid during the years ended December 31, 2007 and 2006, respectively, for the Portfolio were as follows:
| | | Ordinary Income | |
| | | 2007 | | 2006 | |
| | $ | 97,194 | | | $ | 96,044 | | |
The tax basis of components of distributable earnings differ from the amounts reflected in the Statement of Assets and Liabilities by temporary book/tax differences. These differences are primarily due to losses deferred on wash sales and deferral of post-October losses.
At December 31, 2007, the components of distributable earnings on a tax basis for the Portfolio were as follows:
| Undistributed net investment income | | $ | 97,440 | | |
| Accumulated net realized loss | | | (1,004,942 | ) | |
| Unrealized appreciation | | | 1,480,931 | | |
| | | $ | 573,429 | | |
22
Credit Suisse Trust — Blue Chip Portfolio
Notes to Financial Statements (continued)
December 31, 2007
Note 7. Federal Income Taxes
At December 31, 2007, the Portfolio had capital loss carryforwards available to offset possible future capital gains as follows:
| Expires December 31, | |
| 2011 | |
| $ | 1,004,942 | | |
During the tax year ended December 31, 2007, the Portfolio utilized $764,926 of the capital loss carryforwards.
It is uncertain that the Portfolio will realize the full benefit of these losses prior to expiration.
At December 31, 2007, the identified cost for federal income tax purposes, as well as the gross unrealized appreciation from investments for those securities having an excess of value over cost, gross unrealized depreciation from investments for those securities having an excess of cost over value and the net unrealized appreciation from investments were $9,358,967, $1,810,669, $(329,738) and $1,480,931, respectively.
At December 31, 2007, the Portfolio reclassified $559 from undistributed net investment income to accumulated net realized loss from investments, to adjust for current period permanent book/tax differences which arose principally from differing book/tax treatments of distributions received from real estate investment trusts. Net assets were not affected by these reclassifications.
Note 8. Contingencies
In the normal course of business, the Portfolio may provide general indemnifications pursuant to certain contracts and organizational documents. The Portfolio's maximum exposure under these arrangements is dependent on future claims that may be made against the Portfolio and, therefore, cannot be estimated; however, based on experience, the risk of loss from such claims is considered remote.
Note 9. Recent Accounting Pronouncements
During June 2006, the Financial Accounting Standards Board ("FASB") issued FASB Interpretation 48 ("FIN 48" or the "Interpretation"), Accounting for Uncertainty in Income Taxes — an interpretation of FASB statement 109. FIN 48 supplements FASB Statement 109, Accounting for Income Taxes, by defining the confidence level that a tax position must meet in order to be recognized in the financial statements. FIN 48 prescribes a comprehensive model for how
23
Credit Suisse Trust — Blue Chip Portfolio
Notes to Financial Statements (continued)
December 31, 2007
Note 9. Recent Accounting Pronouncements
a fund should recognize, measure, present, and disclose in its financial statements uncertain tax positions that the fund has taken or expects to take on a tax return. FIN 48 requires that the tax effects of a position be recognized only if it is "more likely than not" to be sustained based solely on its technical merits. Management must be able to conclude that the tax law, regulations, case law, and other objective information regarding the technical merits sufficiently support the position's sustainability with a likelihood of more than 50 percent. During the period ended December 31, 2007, Management has adopted FIN 48. There was no material impact to the financial statements or disclosures thereto as a result of the adoption of this pronouncement.
On September 20, 2006, the FASB released Statement of Financial Accounting Standards No. 157 "Fair Value Measurements" ("FAS 157"). FAS 157 establishes an authoritative definition of fair value, sets out a framework for measuring fair value, and requires additional disclosures about fair-value measurements. The application of FAS 157 is required for fiscal years, beginning after November 15, 2007 and interim periods within those fiscal years. As of December 31, 2007, management does not believe the adoption of FAS 157 will impact the amounts reported in the financial statements, however, additional disclosures will be required in subsequent reports.
24
Credit Suisse Trust — Blue Chip Portfolio
Report of Independent Registered Public Accounting Firm
To the Board of Trustees of Credit Suisse Trust and Shareholders of
Credit Suisse Trust — Blue Chip Portfolio:
In our opinion, the accompanying statement of assets and liabilities, including the schedule of investments, and the related statements of operations and of changes in net assets and the financial highlights present fairly, in all material respects, the financial position of Blue Chip Portfolio (the "Portfolio"), a portfolio of the Credit Suisse Trust, at December 31, 2007, the results of its operations for the year then ended, the changes in its net assets for each of the two years in the period then ended and the financial highlights for each of the five years in the period then ended, in conformity with accounting principles generally accepted in the United States of America. These financial statements and financial highlights (hereafter referred to as "financial statements") are the responsibility of the Portfolio's management; our responsibility is to express an opinion on these financial statements based on our audits. We conducted our audits of these financial statements in accordance with the standards of the Public Company Accounting Oversight Board (United States). Those standards require that we plan and perform the audit to obtain reasonable assurance about whether the financial statements are free of material misstatement. An audit includes examining, on a test basis, evidence supporting the amounts and disclosures in the financial statements, assessing the accounting principles used and significant estimates made by management, and evaluating the overall financial statement presentation. We believe that our audits, which included confirmation of securities at December 31, 2007 by correspondence with the custodian, provide a reasonable basis for our opinion.
PricewaterhouseCoopers LLP
Baltimore, Maryland
February 25, 2008
25
Credit Suisse Trust — Blue Chip Portfolio
Board Approval of Advisory Agreement (unaudited)
In approving the renewal of the current Advisory Agreement, the Board of Trustees, including the Independent Trustees, at a meeting held on November 13 and 14, 2007, considered the following factors with respect to the Blue Chip Portfolio (the "Portfolio"):
Investment Advisory Fee Rates
The Board reviewed and considered the contractual advisory fee of 0.50% ("Contractual Advisory Fee") in light of the extent and quality of the advisory services provided by Credit Suisse Asset Management, LLC ("Credit Suisse"). The Board noted that Credit Suisse had waived the advisory fee (the "Net Advisory Fee") and reimbursed expenses during the year. The Board acknowledged that voluntary fee waivers and expense reimbursements could be discontinued at any time.
Additionally, the Board received and considered information comparing the Portfolio's Contractual Advisory Fee, Net Advisory Fee and the Portfolio's overall expenses with those of funds in both the relevant expense group ("Expense Group") and universe of funds (the "Expense Universe") provided by Lipper Inc., an independent provider of investment company data.
Nature, Extent and Quality of the Services under the Advisory Agreement
The Board received and considered information regarding the nature, extent and quality of services provided to the Portfolio by Credit Suisse under the Advisory Agreement. The Board also noted information received at regular meetings throughout the year related to the services rendered by Credit Suisse. The Board reviewed background information about Credit Suisse, including its Form ADV. The Board considered the background and experience of Credit Suisse's senior management and the expertise of, and the amount of attention given to the Portfolio by, senior personnel of Credit Suisse. In addition, the Board reviewed the qualifications, backgrounds and responsibilities of the portfolio management team primarily responsible for the day-to-day portfolio management of the Portfolio and the extent of the resources devoted to research and analysis of actual and potential investments. The Board also received and considered information about the nat ure, extent and quality of services and fee rates offered to other Credit Suisse clients for comparable services.
Portfolio Performance
The Board received and considered the performance results of the Portfolio over time, along with comparisons both to the relevant performance group
26
Credit Suisse Trust — Blue Chip Portfolio
Board Approval of Advisory Agreement (unaudited) (continued)
("Performance Group") and universe of funds ("Performance Universe") for the Portfolio. The Board was provided with a description of the methodology used to arrive at the funds included in the Performance Group and the Performance Universe.
Credit Suisse Profitability
The Board received and considered a profitability analysis of Credit Suisse based on the fees payable under the Advisory Agreement for the Portfolio, including any fee waivers or fee caps, as well as other relationships between the Portfolio on the one hand and Credit Suisse affiliates on the other. The Board received profitability information for the other funds in the Credit Suisse family of funds.
Economies of Scale
The Board considered whether economies of scale in the provision of services to the Portfolio were being passed along to the shareholders. Accordingly, the Board considered whether alternative fee structures (such as breakpoint fee structures) would be more appropriate or reasonable taking into consideration economies of scale or other efficiencies that might accrue from increases in the Portfolio's asset levels.
Other Benefits to Credit Suisse
The Board considered other benefits received by Credit Suisse and its affiliates as a result of their relationship with the Portfolio. Such benefits include, among others, research arrangements with brokers who execute transactions on behalf of the Portfolio, administrative and brokerage relationships with affiliates of Credit Suisse and benefits potentially derived from an increase in Credit Suisse's businesses as a result of its relationship with the Portfolio (such as the ability to market to shareholders other financial products offered by Credit Suisse and its affiliates).
The Board considered the standards applied in seeking best execution, whether and to what extent soft dollar credits are sought and how any such credits are utilized, any benefits that may be achieved by using an affiliated broker and the existence of quality controls applicable to brokerage allocation procedures. The Board also reviewed Credit Suisse's method for allocating portfolio investment opportunities among its advisory clients.
27
Credit Suisse Trust — Blue Chip Portfolio
Board Approval of Advisory Agreement (unaudited) (continued)
Conclusions
In selecting Credit Suisse, and approving the Advisory Agreement and the investment advisory fee under such agreement, the Board concluded that:
• As the Contractual Advisory Fee was at the low end in the Portfolio's Expense Group and Credit Suisse had waived the advisory fee and reimbursed expenses, the Board considered the fee to be reasonable.
• The Portfolio's performance for the past one, two and three-year periods was above the median for its Performance Group and Performance Universe.
• The Board was satisfied with the nature and extent of the investment advisory services provided to the Portfolio by Credit Suisse and that, based on dialogue with management and counsel, the services provided by Credit Suisse under the Advisory Agreement are typical of, and consistent with, those provided to similar mutual funds by other investment advisers.
• In light of the costs of providing investment management and other services to the Portfolio and Credit Suisse's ongoing commitment to the Portfolio and willingness to waive fees and expenses, the profits and other ancillary benefits that Credit Suisse and its affiliates received were considered reasonable.
• Credit Suisse's profitability based on fees payable under the Advisory Agreement was reasonable in light of the nature, extent and quality of the services provided to the Portfolio thereunder.
• In light of the fee waiver and the relatively small size of the Portfolio and the amount of the Contractual Advisory Fee, the Portfolio's current fee structure (without breakpoints) was considered reasonable.
No single factor reviewed by the Board was identified by the Board as the principal factor in determining whether to approve the Advisory Agreement. The Independent Trustees were advised by separate independent legal counsel throughout the process.
28
Credit Suisse Trust — Blue Chip Portfolio
Information Concerning Trustees and Officers (unaudited)
Name, Address
(Year of Birth) | | Position(s)
Held with
Trust | | Term
of Office1
and
Length
of Time
Served | | Principal
Occupation(s) During
Past Five Years | | Number of
Portfolios in
Fund
Complex
Overseen by
Trustee | | Other
Directorships
Held by
Trustee | |
| Independent Trustees | | | | | | | | | | | |
|
Enrique Arzac
c/o Credit Suisse Asset
Management, LLC
Attn: General Counsel
Eleven Madison Avenue
New York, New York
10010
(1941) | | Trustee,
Nominating
Committee
Member and
Audit
Committee
Chairman | | Since
2005 | | Professor of Finance and
Economics, Graduate
School of Business,
Columbia University
since 1971. | | | 35 | | | Director of
Epoch Holding
Corporation (an
investment
management
and investment
advisory
services
company);
Director of The
Adams Express
Company (a
closed-end
investment
company);
Director of
Petroleum and
Resources
Corporation (a
closed-end
investment
company). | |
|
Jeffrey E. Garten
Box 208200
New Haven, Connecticut
06520-8200
(1946) | | Trustee,
Nominating
and Audit
Committee
Member | | Since
Portfolio Inception | | The Juan Trippe
Professor in the Practice
of International Trade,
Finance and Business
from July 2005 to
present; Partner and
Chairman of Garten
Rothkopf (consulting
firm) from October 2005
to present; Dean of Yale
School of Management
from November 1995 to
June 2005. | | | 28 | | | Director of
Aetna, Inc.
(insurance
company);
Director of
CarMax Group
(used car
dealers);
Director of
Alcan, Inc.
(smelting and
refining of
nonferrous
metals
company). | |
|
1 Each Trustee and Officer serves until his or her respective successor has been duly elected and qualified.
29
Credit Suisse Trust — Blue Chip Portfolio
Information Concerning Trustees and Officers (unaudited) (continued)
Name, Address
(Year of Birth) | | Position(s)
Held with
Trust | | Term
of Office1
and
Length
of Time
Served | | Principal
Occupation(s) During
Past Five Years | | Number of
Portfolios in
Fund
Complex
Overseen by
Trustee | | Other
Directorships
Held by
Director | |
| Independent Trustees | | | | | | | | | | | | | |
|
Peter F. Krogh
SFS/ICC 702
Georgetown University
Washington, DC 20057
(1937) | | Trustee,
Nominating
and Audit
Committee
Member | | Since
Portfolio Inception | | Dean Emeritus and
Distinguished Professor
of International Affairs at
the Edmund A. Walsh
School of Foreign
Service, Georgetown
University from
June 1995 to present. | | | 28 | | | Director of
Carlisle
Companies
Incorporated
(diversified
manufacturing
company). | |
|
Steven N. Rappaport
Lehigh Court, LLC
555 Madison Avenue
29th Floor
New York, New York
10022
(1948) | | Chairman of
the Board of
Trustees,
Nominating
Committee
Chairman and
Audit
Committee
Member | | Trustee
since
Portfolio Inception and
Chairman
since
2005 | | Partner of Lehigh Court,
LLC and RZ Capital
(private investment
firms) from July 2002
to present. | | | 35 | | | Director of
iCAD, Inc.
(surgical and
medical
instruments and
apparatus
company);
Director of
Presstek, Inc.
(digital imaging
technologies
company);
Director of
Wood
Resources, LLC.
(plywood
manufacturing
company). | |
|
| Interested Trustee | | | | | | | | | | | | | |
|
Michael E. Kenneally2
c/o Credit Suisse Asset
Management, LLC
Attn: General Counsel
Eleven Madison Avenue
New York, New York
10010
(1954) | | Trustee | | Since
2004 | | Chairman and Global
Chief Executive Officer
of Credit Suisse from
March 2003 to
July 2005; Chairman and
Chief Investment Officer
of Banc of America
Capital Management
from 1998 to
March 2003. | | | 28 | | | None | |
|
2 Mr. Kenneally is a Trustee who is an "interested person" of the Trust as defined in the Investment Company Act of 1940, as amended, because he was an officer of Credit Suisse within the last two fiscal years.
30
Credit Suisse Trust — Blue Chip Portfolio
Information Concerning Trustees and Officers (unaudited) (continued)
Name, Address
(Year of Birth) | | Position(s)
Held with
Trust | | Term
of Office1
and
Length
of Time
Served | | Principal Occupation(s) During Past Five Years | |
| Officers | | | | | | | |
|
Lawrence D. Haber
c/o Credit Suisse Asset Management, LLC
Attn: General Counsel
Eleven Madison Avenue
New York, New York 10010
(1951) | | Chief Executive Officer and President | | Since 2007 | | Managing Director and Chief Operating Officer of Credit Suisse; Member of Credit Suisse's Management Committee; Chief Financial Officer of Merrill Lynch Investment Managers from 1997 to 2003. | |
|
Michael A. Pignataro
Credit Suisse Asset
Management, LLC
Eleven Madison Avenue
New York, New York
10010
(1959) | | Chief
Financial
Officer | | Since
Portfolio Inception | | Director and Director of Fund Administration of Credit
Suisse; Associated with Credit Suisse or its predecessor
since 1984; Officer of other Credit Suisse Funds. | |
|
Emidio Morizio
Credit Suisse Asset
Management, LLC
Eleven Madison Avenue
New York, New York
10010
(1966) | | Chief
Compliance
Officer | | Since
2004 | | Director and Global Head of Compliance of Credit Suisse;
Associated with Credit Suisse since July 2000; Officer of
other Credit Suisse Funds. | |
|
J. Kevin Gao
Credit Suisse Asset
Management, LLC
Eleven Madison Avenue
New York, New York
10010
(1967) | | Chief Legal
Officer since
2006, Vice
President and
Secretary
since 2004 | | Since
2004 | | Director and Legal Counsel of Credit Suisse; Associated
with Credit Suisse since July 2003; Associated with the law
firm of Willkie Farr & Gallagher LLP from 1998 to 2003;
Officer of other Credit Suisse Funds. | |
|
Robert Rizza
Credit Suisse Asset
Management, LLC
Eleven Madison Avenue
New York, New York
10010
(1965) | | Treasurer | | Since
2006 | | Vice President of Credit Suisse; Associated with Credit
Suisse since 1998; Officer of other Credit Suisse Funds. | |
|
The Statement of Additional Information includes additional information about the Trustees and is available, without charge, upon request, by calling 800-222-8977.
31
Credit Suisse Trust — Blue Chip Portfolio
December 31, 2007 (unaudited)
Important Tax Information for Corporate Shareholders
Corporate Shareholders should note for the year ended December 31, 2007, the percentage of the Fund's investment income (i.e., net investment income plus short-term capital gains) that qualified for the intercorporate dividends received deduction is 100%.
32
Credit Suisse Trust — Blue Chip Portfolio
Proxy Voting and Portfolio Holdings Information (unaudited)
Information regarding how the Portfolio voted proxies related to its portfolio securities during the 12 month period ended June 30 of each year, as well as the policies and procedures that the Portfolio uses to determine how to vote proxies relating to its portfolio securities are available:
• By calling 1-800-222-8977
• On the Portfolio's website, www.credit-suisse.com/us
• On the website of the Securities and Exchange Commission, www.sec.gov.
The Portfolio files a complete schedule of its portfolio holdings for the first and third quarters of its fiscal year with the SEC on Form N-Q. The Portfolio's Forms N-Q are available on the SEC's website at www.sec.gov and may be reviewed and copied at the SEC's Public Reference Room in Washington, DC. Information on the operation of the SEC's Public Reference Room may be obtained by calling 1-202-551-8090.
33

P.O. BOX 55030, BOSTON, MA 02205-5030
800-222-8977 n www.credit-suisse.com/US
CREDIT SUISSE ASSET MANAGEMENT SECURITIES, INC., DISTRIBUTOR. TRBLC-AR-1207

CREDIT SUISSE FUNDS
Annual Report
December 31, 2007
CREDIT SUISSE TRUST
n COMMODITY RETURN STRATEGY PORTFOLIO
Credit Suisse Trust (the "Trust") shares are not available directly to individual investors, but may be offered only through certain insurance products and pension and retirement plans.
The Trust's investment objectives, risks, charges and expenses (which should be considered carefully before investing), and more complete information about the Trust, are provided in the Prospectus, which should be read carefully before investing. You may obtain additional copies by calling 800-222-8977 or by writing to Credit Suisse Trust, P.O. Box 55030, Boston, MA 02205-5030.
Credit Suisse Asset Management Securities, Inc., Distributor, is located at Eleven Madison Avenue, New York, NY 10010. The Trust is advised by Credit Suisse Asset Management, LLC.
The views of the Portfolio's management are as of the date of the letter and the Portfolio holdings described in this document are as of December 31, 2007; these views and Portfolio holdings may have changed subsequent to these dates. Nothing in this document is a recommendation to purchase or sell securities.
Portfolio shares are not deposits or other obligations of Credit Suisse Asset Management, LLC ("Credit Suisse") or any affiliate, are not FDIC-insured and are not guaranteed by Credit Suisse or any affiliate. Portfolio investments are subject to investment risks, including loss of your investment.
Credit Suisse Trust — Commodity Return Strategy Portfolio
Annual Investment Adviser's Report
December 31, 2007 (unaudited)
January 29, 2008
Dear Shareholder:
For the 12-month period ended December 31, 2007, Credit Suisse Trust — Commodity Return Strategy Portfolio1 (the "Portfolio") had a gain of 17.33%. The Dow Jones-AIG Commodity Index Total Return2 ("DJ-AIG Index") had a same period increase of 16.23%.
Market Review: A strong year for commodities
For the annual period ending December 31, 2007, commodities posted strong positive gains — marking the sixth consecutive year of gains. The Dow Jones AIG Total Return Index returned 16.23% for the year, outperforming the 5.49% total return of the S&P 500 Index and the 7.0% total return of the Lehman Brothers U.S. Aggregate Bond Index.
During the year, commodities within the agriculture, energy and precious metals sectors contributed positively to performance, whereas industrial metals and livestock related commodities were negative. While the index had positive returns for the vast majority of the year, it wasn't until September 2007 that it reached year-to-date performance of more than 10%. Much of this surge was due to expectations that the Federal Reserve would lower the target for the federal funds rate as a result of the credit crisis, creating the potential for unexpected inflation.
Agriculture was the top performing commodity group for the fiscal year, rising 29.89% on a total return basis on wheat (+59.18%), soybeans (+61.49%), and soybean oil (+58.70%). Due to adverse weather conditions throughout much of the world, including Australia and Canada, wheat production estimates dropped, leading to higher prices. Soybeans and soybean oil rose on expectations of an acreage shift from soybeans to wheat to take advantage of high wheat prices, potentially creating a smaller than expected soybean crop. Precious metals were also up strongly (+25.95%), on the lower U.S. dollar and higher inflation expectations. The energy sector rose 20.69%, but performance of individual commodities was mixed. Heating oil was the strongest performer, up 53.40% on limited available inventories.
While most of the commodities that the Portfolio gained exposure to rose during the strong commodity market in the fiscal year, some also fell. Zinc fell 40.58% as the potential for a U.S. recession lowered projected demand for economically-sensitive industrial metals. Lean hogs were down 26.41% on lower than expected exports to China — despite the Porcine Reproductive and Respiratory Syndrome Virus (PRRSV) that lowered the hog supply in China. Natural gas performed poorly for the second year in a row, falling 19.30% on a cool summer and lack of severe hurricane activity.
1
Credit Suisse Trust — Commodity Return Strategy Portfolio
Annual Investment Adviser's Report (continued)
December 31, 2007 (unaudited)
Strategic Review and Market Outlook: Diversification and Potential Upside
Fears of rising inflation and the falling U.S. dollar during the turmoil in the credit markets contributed to performance. In the fixed income portion of the Portfolio, holdings maintained a bias toward high quality short-term assets, especially floating rate notes. These assets were able to take advantage of a Fed that kept the overnight funds rate steady at 5.25% until September. However, the final five months of the year displayed unprecedented turmoil in the markets, resulting in an almost complete lack of liquidity and widening spreads. This negatively affected some of the Portfolio's holdings in fixed income securities. To lower the Portfolio's exposure to sectors affected by the turmoil in credit markets, in recent months most new purchases have been of U.S. agency securities.
Historically, commodity index returns have tended to exhibit long-term positive returns with low correlations to other asset classes, creating potential risk/return benefits within a diversified portfolio. With the credit crisis this fiscal year, we once again witnessed the diversification benefits of commodities. Despite equity and credit markets performing poorly, commodities still performed well. This is because many of the factors that drive commodity prices, such as inflation expectations, currencies, and physical supply-demand factors, have historically either not affected, or had the opposite effect, on the equity and fixed income markets.
In addition to our strong belief in the diversification benefits of commodities, we remain tactically bullish on the commodity market in the coming year. Many of the same factors that have driven prices up recently remain in place. There are still very low supplies of crude oil and wheat, leaving both vulnerable to upward price spikes in the case of further supply disruptions. Fundamentally, with the continued growth from China, we believe that the low supply situation in crude oil may continue in the foreseeable future without a meaningful increase in production by the Organization of Petroleum Exporting Countries (OPEC). Additionally, with the turmoil in the credit markets likely to continue in 2008, any further rate cuts from the Federal Reserve could potentially result in higher inflation and a weaker U.S. dollar — two factors that have historically coincided with higher commodity prices.
The DJ-AIG Index is a broadly diversified futures index composed of futures contracts on 19 physical commodities. The Index is weighted among commodity sectors using dollar-adjusted liquidity and production data. Currently, four energy products, six metals and nine agricultural products are represented in the Index. The DJ-AIG Index is rebalanced as of the beginning of each calendar year so that as of that time no single commodity constitutes less than 2% or more
2
Credit Suisse Trust — Commodity Return Strategy Portfolio
Annual Investment Adviser's Report (continued)
December 31, 2007 (unaudited)
than 15% of the index, and each sector represented in the index is limited to 33%. However, following this rebalancing and for the remainder of the calendar year these percentages may change so that a single commodity may constitute a lesser or greater percentage of the index and different sectors may represent different proportions of the index.
The Portfolio seeks total return and is designed to replicate the performance of the DJ-AIG Index. The Portfolio gains exposure to commodities markets by investing in structured notes whose principal and/or coupon payments are linked to the DJ-AIG Index and through investment in the Credit Suisse Cayman Commodity Fund II, Ltd. (the "Subsidiary"), a wholly owned subsidiary of the Portfolio formed in the Cayman Islands, swap agreements on the DJ-AIG Index and futures contracts on individual commodities or a subset of commodities and options on them.
The Portfolio has obtained a private letter ruling from the Internal Revenue Service (IRS) confirming that the income produced by certain types of structured notes constitutes "qualifying income" under the Internal Revenue Code of 1986, as amended. In addition, the IRS has also issued another private letter ruling to the Portfolio in which the IRS concluded that income derived from the Portfolio's investment in its Subsidiary will constitute qualifying income to the Portfolio, even if the Subsidiary itself owns commodity futures, commodity swaps or other similar positions.
The Credit Suisse Commodities Management Team
Christopher Burton
Andrew Karsh
Andrew S. Lenskold
Kam T. Poon
This Portfolio is non-diversified, which means it may invest a greater proportion of its assets in the securities of a smaller number of issuers than a diversified mutual fund and may therefore be subject to greater volatility. Exposure to commodity markets should only form a small part of a diversified portfolio. Investment in commodity markets may not be suitable for all investors. The Portfolio's investment in commodity-linked derivative instruments may subject the Portfolio to greater volatility than investment in traditional securities, particularly in investments involving leverage.
The use of derivatives such as commodity-linked structured notes, swaps and futures entails substantial risks, including risk of loss of a significant portion of their principal
3
Credit Suisse Trust — Commodity Return Strategy Portfolio
Annual Investment Adviser's Report (continued)
December 31, 2007 (unaudited)
value, lack of a secondary market, increased volatility, correlation risk, liquidity risk, interest-rate risk, market risk, credit risk, valuation risk and tax risk. Gains and losses from speculative positions in derivatives may be much greater than the derivative's cost. At any time, the risk of loss of any individual security held by the Portfolio could be significantly higher than 50% of the security's value. For a detailed discussion of these and other risks, please refer to the Portfolio's Prospectus, which should be read carefully before you invest.
In addition to historical information, this report contains forward-looking statements, which may concern, among other things, domestic and foreign market, industry and economic trends and developments and government regulation and their potential impact on the Portfolio's investments. These statements are subject to risks and uncertainties and actual trends, developments and regulations in the future and their impact on the Portfolio could be materially different from that projected, anticipated or implied. The Portfolio has no obligation to update or revise forward-looking statements.
4
Credit Suisse Trust — Commodity Return Strategy Portfolio
Annual Investment Adviser's Report (continued)
December 31, 2007 (unaudited)
Comparison of Change in Value of $10,000 Investment in the
Credit Suisse Trust — Commodity Return Strategy Portfolio1 and the
Dow Jones-AIG Commodity Index2,3 from Inception (2/28/06).

Average Annual Returns as of December 31, 20071
| 1 Year | | Since
Inception | |
| | 17.33 | % | | | 12.78 | % | |
Returns represent past performance and include change in share price and reinvestment of dividends and capital gains. Past performance cannot guarantee future results. The current performance of the Portfolio may be lower or higher than the figures shown. Returns and share price will fluctuate, and redemption value may be more or less than original cost. The performance results do not reflect the deduction of taxes that a shareholder would pay on portfolio distributions or the redemption of portfolio shares. Performance includes the effect of deducting expenses, but does not include charges and expenses attributable to any particular variable contract or plan. Accordingly, the Prospectus of the sponsoring Participating Insurance Company separate account or plan documents or ot her informational materials supplied by plan sponsors should be carefully reviewed for information on relevant charges and expenses. Excluding these charges and expenses from quotations of performance has the effect of increasing the performance quoted, and the effect of these charges should be considered when comparing performance to that of other mutual funds. Performance information current to the most recent month-end is available at www.credit-suisse.com/us.
1 Fee waivers and/or expense reimbursements may reduce expenses for the Portfolio, without which performance would be lower. Waivers and/or reimbursements may be discontinued at any time.
2 The Dow Jones-AIG Commodity Index Total Return is composed of futures contracts on 19 physical commodities. Investors cannot invest directly in an index.
3 Performance for the benchmark is not available for the period beginning February 28, 2006, (commencement of operations). For that reason, performance is shown for the period beginning March 1, 2006.
5
Credit Suisse Trust — Commodity Return Strategy Portfolio
Annual Investment Adviser's Report (continued)
December 31, 2007 (unaudited)
Information About Your Portfolio's Expenses
As an investor of the Portfolio, you incur two types of costs: ongoing expenses and transaction costs. Ongoing expenses include management fees, distribution and service (12b-1) fees and other Portfolio expenses. Examples of transaction costs include sales charges (loads), redemption fees and account maintenance fees, which are not shown in this section and which would result in higher total expenses. The following table is intended to help you understand your ongoing expenses of investing in the Portfolio and to help you compare these expenses with the ongoing expenses of investing in other mutual funds. The table is based on an investment of $1,000 made at the beginning of the six month period ended December 31, 2007.
The table illustrates your Portfolio's expenses in two ways:
• Actual Portfolio Return. This helps you estimate the actual dollar amount of ongoing expenses paid on a $1,000 investment in the Portfolio using the Portfolio's actual return during the period. To estimate the expenses you paid over the period, simply divide your account value by $1,000 (for example, an $8,600 account value divided by $1,000 = 8.6), then multiply the result by the number in the "Expenses Paid per $1,000" line under the share class you hold.
• Hypothetical 5% Portfolio Return. This helps you to compare your Portfolio's ongoing expenses with those of other mutual funds using the Portfolio's actual expense ratio and a hypothetical rate of return of 5% per year before expenses. Examples using a 5% hypothetical fund return may be found in the shareholder reports of other mutual funds. The hypothetical account values and expenses may not be used to estimate the actual ending account balance or expenses you paid for the period.
Please note that the expenses shown in these tables are meant to highlight your ongoing expenses only and do not reflect any transaction costs, such as sales charges (loads) or redemption fees. If these transaction costs had been included, your costs would have been higher. The "Expenses Paid per $1,000" line of the tables is useful in comparing ongoing expenses only and will not help you determine the relative total expenses of owning different funds.
6
Credit Suisse Trust — Commodity Return Strategy Portfolio
Annual Investment Adviser's Report (continued)
December 31, 2007 (unaudited)
Expenses and Value of a $1,000 Investment
for the six month period ended December 31, 2007
| Actual Portfolio Return | |
| Beginning Account Value 7/1/07 | | $ | 1,000.00 | | |
| Ending Account Value 12/31/07 | | $ | 1,127.00 | | |
| Expenses Paid per $1,000* | | $ | 5.09 | | |
| Hypothetical 5% Portfolio Return | |
| Beginning Account Value 7/1/07 | | $ | 1,000.00 | | |
| Ending Account Value 12/31/07 | | $ | 1,020.42 | | |
| Expenses Paid per $1,000* | | $ | 4.84 | | |
| Annualized Expense Ratios* | | | 0.95 | % | |
* Expenses are equal to the Portfolio's annualized expense ratio multiplied by the average account value over the period, multiplied by the number of days in the most recent fiscal half year period, then divided by 365.
The "Expenses Paid per $1,000" and the "Annualized Expense Ratios" in the tables are based on actual expenses paid by the Portfolio during the period, net of fee waivers and/or expense reimbursements. If those fee waivers and/or expense reimbursements had not been in effect, the Portfolio's actual expenses would have been higher. Expenses do not reflect additional charges and expenses that are, or may be, imposed under the variable contracts or plans. Such charges and expenses are described in the prospectus of the insurance company separate account or in the plan documents or other informational materials supplied by plan sponsors. The Portfolio's expenses should be considered with these charges and expenses in evaluating the overall cost of investing in the separate account.
For more information, please refer to the Portfolio's prospectus.
7
Credit Suisse Trust — Commodity Return Strategy Portfolio
Annual Investment Adviser's Report (continued)
December 31, 2007 (unaudited)
| Sector Breakdown* | |
| United States Agency Obligations | | | 38.4 | % | |
| Commodity-Index Structured Notes | | | 36.0 | % | |
| Mortgage Backed Securities | | | 17.6 | % | |
| Asset Backed Securities | | | 5.2 | % | |
| Wholly-Owned Subsidiary | | | 1.9 | % | |
| Short-Term Investment | | | 0.9 | % | |
| Total | | | 100.0 | % | |
* Expressed as a percentage of total investments and may vary over time.
8
Credit Suisse Trust — Commodity Return Strategy Portfolio
Schedule of Investments
December 31, 2007
Par
(000) | |
| | Ratings†
(S&P/Moody's) | | Maturity | | Rate% | | Value | |
| COMMERCIAL PAPER (5.2%) | | | |
| ASSET BACKED (5.2%) | | | |
| $ | 3,000 | | | Whitehawk CDO Funding, Ltd., Series 2004-1A,
Class A1J# (Cost $3,000,000) | | (AAA, Aaa) | | 12/15/08 | | | 5.041 | | | $ | 2,941,980 | | |
| MORTGAGE BACKED SECURITIES (17.6%) | | | |
| | 5,000 | | | Brunel Residential Mortgage Securities,
Series 2007-1A, Class A3# | | (AAA, Aaa) | | 01/13/08 | | | 5.194 | | | | 4,998,968 | | |
| | 5,000 | | | Pendeford Master Issuer PLC, Series 2007-1A,
Class 1A# | | (A-1, P-1) | | 02/12/08 | | | 5.222 | | | | 5,000,000 | | |
| TOTAL MORTGAGE BACKED SECURITIES (Cost $10,000,000) | | | 9,998,968 | | |
| STRUCTURED NOTES (36.2%) | | | |
| | 2,100 | | | AIG: Commodity Index Linked Notes | | (A-1+, P-1) | | 12/08/08 | | | 4.996 | | | | 2,173,395 | | |
| | 300 | | | AIG: Commodity Index Linked Notes | | (A-1+, P-1) | | 12/08/08 | | | 4.996 | | | | 303,558 | | |
| | 1,500 | | | Barclays Bank PLC:Commodity Index
Linked Notes# | | (A-1+, P-1) | | 01/20/09 | | | 4.916 | | | | 1,635,303 | | |
| | 1,500 | | | Bear Stearns Company, Inc.: Commodity Index
Linked Notes# | | (A-1+, P-1) | | 12/09/08 | | | 4.685 | | | | 1,552,425 | | |
| | 7,000 | | | Commonwealth Bank of Australia: Commodity
Index Linked Notes# | | (AAA, Aaa) | | 02/07/08 | | | 4.318 | | | | 10,249,820 | | |
| | 2,300 | | | Merrill Lynch & Co, Inc.: Commodity Index
Linked Notes# | | (AAA, Aaa) | | 02/17/09 | | | 4.750 | | | | 2,420,681 | | |
| | 500 | | | Morgan Stanley: Commodity Index
Linked Notes | | (A-1, P-1) | | 11/17/08 | | | 4.998 | | | | 584,285 | | |
| | 1,500 | | | Natixis Financial Products, Inc.: Commodity
Index Linked Notes# | | (A-1+, P-1) | | 12/08/08 | | | 4.976 | | | | 1,558,905 | | |
| TOTAL STRUCTURED NOTES (Cost $16,700,000) | | | 20,478,372 | | |
| UNITED STATES AGENCY OBLIGATIONS (38.5%) | | | |
| | 3,000 | | | Fannie Mae Discount Notes ‡‡ | | (AAA, Aaa) | | 01/16/08 | | | 4.150 | | | | 2,995,100 | | |
| | 800 | | | Fannie Mae Discount Notes | | (AAA, Aaa) | | 01/24/08 | | | 4.169 | | | | 797,848 | | |
| | 15 | | | Fannie Mae Discount Notes | | (AAA, Aaa) | | 01/30/08 | | | 4.339 | | | | 14,948 | | |
| | 350 | | | Fannie Mae Discount Notes | | (AAA, Aaa) | | 02/01/08 | | | 4.410 | | | | 348,689 | | |
| | 500 | | | Fannie Mae Discount Notes | | (AAA, Aaa) | | 02/06/08 | | | 4.329 | | | | 497,865 | | |
| | 20 | | | Fannie Mae Discount Notes | | (AAA, Aaa) | | 02/13/08 | | | 4.163 | | | | 19,899 | | |
| | 1,300 | | | Fannie Mae Discount Notes ‡‡ | | (AAA, Aaa) | | 02/15/08 | | | 4.144 | | | | 1,293,133 | | |
| | 4,000 | | | Fannie Mae Discount Notes ‡‡ | | (AAA, Aaa) | | 03/12/08 | | | 4.129 | | | | 3,968,228 | | |
| | 750 | | | Federal Home Loan Bank Discount Notes | | (AAA, Aaa) | | 01/07/08 | | | 4.238 | | | | 749,478 | | |
| | 700 | | | Federal Home Loan Bank Discount Notes | | (AAA, Aaa) | | 01/11/08 | | | 4.390 | | | | 699,158 | | |
| | 300 | | | Federal Home Loan Bank Discount Notes | | (AAA, Aaa) | | 01/25/08 | | | 4.321 | | | | 299,148 | | |
| | 4,200 | | | Federal Home Loan Bank Discount Notes ‡‡ | | (AAA, Aaa) | | 01/30/08 | | | 4.350 | | | | 4,185,485 | | |
| | 3,000 | | | Federal Home Loan Bank Discount Notes ‡‡ | | (AAA, Aaa) | | 02/29/08 | | | 4.339 | | | | 2,978,957 | | |
| | 2,000 | | | Freddie Mac Discount Notes | | (AAA, Aaa) | | 01/30/08 | | | 4.150 | | | | 1,992,992 | | |
| | 950 | | | Freddie Mac Discount Notes | | (AAA, Aaa) | | 01/31/08 | | | 4.138 | | | | 946,635 | | |
| TOTAL UNITED STATES AGENCY OBLIGATIONS (Cost $21,785,965) | | | 21,787,563 | | |
See Accompanying Notes to Financial Statements.
9
Credit Suisse Trust — Commodity Return Strategy Portfolio
Schedule of Investments (continued)
December 31, 2007
Par
(000) | |
| |
| | Maturity | | Rate% | | Value | |
| SHORT-TERM INVESTMENT (0.9%) | |
| $ | 495 | | | State Street Bank and Trust Co.
Euro Time Deposit ‡‡ (Cost $495,000) | | | | 01/02/08 | | | 3.100 | | | $ | 495,000 | | |
Number of
Shares | |
| |
| |
| |
| |
| |
| WHOLLY-OWNED SUBSIDIARY (1.9%) | |
| DIVERSIFIED FINANCIALS (1.9%) | |
| | 100 | | | Credit Suisse Cayman Commodity Fund II, Ltd.
(Cost $1,000,000) | | | | | | | | | 1,085,580 | | |
| TOTAL INVESTMENTS AT VALUE (100.3%) (Cost $52,980,965) | | | 56,787,463 | | |
| LIABILITIES IN EXCESS OF OTHER ASSETS (-0.3%) | | | (163,002 | ) | |
| NET ASSETS (100.0%) | | $ | 56,624,461 | | |
† Credit ratings given by the Standard & Poor's Division of The McGraw-Hill Companies, Inc. ("S&P") and Moody's Investors Service, Inc. ("Moody's") are unaudited.
# Variable rate obligations — The interest rate shown is the rate as of December 31, 2007.
‡‡ Collateral segregated for futures contracts.
See Accompanying Notes to Financial Statements.
10
Credit Suisse Trust — Commodity Return Strategy Portfolio
Statement of Assets and Liabilities
December 31, 2007
| Assets | |
| Investments at value (Cost $52,980,965) (Note 2) | | $ | 56,787,463 | | |
| Cash | | | 854 | | |
| Interest receivable | | | 128,695 | | |
| Variation margin receivable (Note 2) | | | 1,859 | | |
| Receivable for portfolio shares sold | | | 199 | | |
| Prepaid expenses | | | 1,284 | | |
| Total Assets | | | 56,920,354 | | |
| Liabilities | |
| Advisory fee payable (Note 3) | | | 4,240 | | |
| Administrative services fee payable (Note 3) | | | 5,425 | | |
| Distribution fee payable (Note 3) | | | 11,397 | | |
| Payable for portfolio shares redeemed | | | 140,446 | | |
| Organizational fee payable (Note 3) | | | 58,636 | | |
| Trustees' fee payable | | | 804 | | |
| Other accrued expenses payable | | | 74,945 | | |
| Total Liabilities | | | 295,893 | | |
| Net Assets | |
| Capital stock, $0.001 par value (Note 6) | | | 4,891 | | |
| Paid-in capital (Note 6) | | | 46,203,259 | | |
| Accumulated net investment loss | | | (10,406 | ) | |
| Accumulated net realized gain from investments and futures contracts | | | 6,627,955 | | |
| Net unrealized appreciation from investments and futures contracts | | | 3,798,762 | | |
| Net Assets | | $ | 56,624,461 | | |
| Shares outstanding | | | 4,890,613 | | |
| Net asset value, offering price, and redemption price per share | | $ | 11.58 | | |
See Accompanying Notes to Financial Statements.
11
Credit Suisse Trust — Commodity Return Strategy Portfolio
Statement of Operations
For the Year Ended December 31, 2007
| Investment Income (Note 2) | |
| Interest | | $ | 6,420,890 | | |
| Expenses | |
| Investment advisory fees (Note 3) | | | 640,829 | | |
| Administrative services fees (Note 3) | | | 149,264 | | |
| Distribution fees (Note 3) | | | 320,415 | | |
| Legal fees | | | 83,027 | | |
| Audit and tax fees | | | 60,478 | | |
| Trustees' fees | | | 20,632 | | |
| Custodian fees | | | 14,393 | | |
| Printing fees (Note 3) | | | 13,284 | | |
| Offering costs (Note 3) | | | 9,477 | | |
| Commitment fees (Note 4) | | | 4,074 | | |
| Transfer agent fees | | | 2,990 | | |
| Insurance expense | | | 1,802 | | |
| Total expenses | | | 1,320,665 | | |
| Less: fees waived (Note 3) | | | (103,090 | ) | |
| Net expenses | | | 1,217,575 | | |
| Net investment income | | | 5,203,315 | | |
| Net Realized and Unrealized Gain (Loss) from Investments and Futures Contracts | |
| Net realized gain from investments | | | 12,892,231 | | |
| Net realized gain from futures contracts | | | 14,983 | | |
| Net change in unrealized appreciation (depreciation) from investments | | | (104,594 | ) | |
| Net change in unrealized appreciation (depreciation) from futures contracts | | | (33,096 | ) | |
| Net realized and unrealized gain from investments and futures contracts | | | 12,769,524 | | |
| Net increase in net assets resulting from operations | | $ | 17,972,839 | | |
See Accompanying Notes to Financial Statements.
12
Credit Suisse Trust — Commodity Return Strategy Portfolio
Statements of Changes in Net Assets
| For the Year For the Period | | Ended
December 31, 2007 | | Ended
December 31, 20061 | |
| From Operations | |
| Net investment income | | $ | 5,203,315 | | | $ | 2,251,135 | | |
Net realized gain (loss) from investments, futures contracts
and swap contracts | | | 12,907,214 | | | | (6,279,259 | ) | |
Net change in unrealized appreciation (depreciation)
from investments and futures contracts | | | (137,690 | ) | | | 3,936,452 | | |
| Net increase (decrease) in net assets resulting from operations | | | 17,972,839 | | | | (91,672 | ) | |
| From Dividends | |
| Dividends from net investment income | | | (5,262,535 | ) | | | (2,251,480 | ) | |
| From Capital Share Transactions (Note 6) | |
| Proceeds from sale of shares | | | 81,389,351 | | | | 151,418,130 | | |
| Reinvestment of dividends | | | 5,262,535 | | | | 2,213,080 | | |
| Net asset value of shares redeemed | | | (188,644,559 | ) | | | (5,381,228 | ) | |
| Net increase (decrease) in net assets from capital share transactions | | | (101,992,673 | ) | | | 148,249,982 | | |
| Net increase (decrease) in net assets | | | (89,282,369 | ) | | | 145,906,830 | | |
| Net Assets | |
| Beginning of year | | | 145,906,830 | | | | — | | |
| End of year | | $ | 56,624,461 | | | $ | 145,906,830 | | |
| Undistributed net investment income (loss) | | $ | (10,406 | ) | | $ | 48,814 | | |
1 For the period February 28, 2006 (commencement of operations) through December 31, 2006.
See Accompanying Notes to Financial Statements.
13
Credit Suisse Trust — Commodity Return Strategy Portfolio
Financial Highlights
(For a Share of the Portfolio Outstanding Throughout Each Period)
| | | For the Year
Ended
December 31, 2007 | | For the Period
Ended
December 31, 20061 | |
| Per share data | |
| Net asset value, beginning of period | | $ | 10.37 | | | $ | 10.00 | | |
| INVESTMENT OPERATIONS | |
| Net investment income2 | | | 0.54 | | | | 0.38 | | |
Net gain on investments, futures contracts and swap contracts
(both realized and unrealized) | | | 1.22 | | | | 0.25 | | |
| Total from investment operations | | | 1.76 | | | | 0.63 | | |
| LESS DIVIDENDS | |
| Dividends from net investment income | | | (0.55 | ) | | | (0.26 | ) | |
| Net asset value, end of period | | $ | 11.58 | | | $ | 10.37 | | |
| Total return3 | | | 17.33 | % | | | 6.36 | % | |
| RATIOS AND SUPPLEMENTAL DATA | |
| Net assets, end of period (000s omitted) | | $ | 56,624 | | | $ | 145,907 | | |
| Ratio of expenses to average net assets | | | 0.95 | % | | | 0.95 | %4 | |
| Ratio of net investment income to average net assets | | | 4.06 | % | | | 4.28 | %4 | |
Decrease reflected in above operating expense
ratios due to waivers/reimbursements | | | 0.08 | % | | | 0.31 | %4 | |
| Portfolio turnover rate | | | 93 | % | | | 27 | % | |
1 For the period February 28, 2006 (commencement of operations) through December 31, 2006.
2 Per share information is calculated using the average shares outstanding method.
3 Total returns are historical and assume changes in share price and reinvestment of all dividends and distributions. Had certain expenses not been reduced during the periods shown, total returns would have been lower. Total returns do not reflect charges and expenses attributable to any particular variable contract or plan. Total returns for periods less than one year are not annualized.
4 Annualized.
See Accompanying Notes to Financial Statements.
14
Credit Suisse Trust — Commodity Return Strategy Portfolio
Notes to Financial Statements
December 31, 2007
Note 1. Organization
Credit Suisse Trust (the "Trust") is an open-end management investment company registered under the Investment Company Act of 1940, as amended (the "1940 Act"), and currently offers eight managed investment portfolios of which one, the Commodity Return Strategy Portfolio (the "Portfolio"), is included in this report. The Portfolio is a non-diversified open-end management investment company that seeks total return. Shares of the Portfolio are not available directly to individual investors but may be offered only through (a) variable annuity contracts and variable life insurance contracts offered by separate accounts of certain insurance companies and (b) tax-qualified pension and retirement plans. The Portfolio may not be available in connection with a particular contract or plan. The Trust was organized under the laws of The Commonwealth of Massachusetts as a business trust on March 15, 1995.
Note 2. Significant Accounting Policies
A) SECURITY VALUATION — The net asset value of the Portfolio is determined daily as of the close of regular trading on the New York Stock Exchange, Inc. (the "Exchange") on each day the Exchange is open for business. Debt securities with a remaining maturity greater than 60 days are valued in accordance with the price supplied by a pricing service, which may use a matrix, formula or other objective method that takes into consideration market indices, yield curves and other specific adjustments. Debt obligations that will mature in 60 days or less are valued on the basis of amortized cost, which approximates market value, unless it is determined that using this method would not represent fair value. Equity investments are valued at market value, which is generally determined using the closing price on the exchange or market on which the security is primarily traded at the time of valuation (the "Valuation Time"). If no sales are reported , equity investments are generally valued at the most recent bid quotation as of the Valuation Time or at the lowest asked quotation in the case of a short sale of securities. Investments in mutual funds are valued at the mutual fund's closing net asset value per share on the day of valuation. Swap contracts are generally valued at a price at which the counterparty to such contract would repurchase the instrument or terminate the contract. Securities, options, futures contracts and other assets (including swaps and structured note agreements), for which market quotations are not readily available, or whose values have been materially affected by events occurring before the Portfolio's Valuation Time but after the close of the securities' primary markets, are valued at fair value as determined in good faith by, or under the direction of, the Board of Trustees under procedures established by the Board of Trustees. Structured note agreements are valued in
15
Credit Suisse Trust — Commodity Return Strategy Portfolio
Notes to Financial Statements (continued)
December 31, 2007
Note 2. Significant Accounting Policies
accordance with a dealer-supplied valuation based on changes in the value of the underlying index. The Portfolio may utilize a service provided by an independent third party which has been approved by the Board of Trustees to fair value certain securities. When fair-value pricing is employed, the prices of securities used by a portfolio to calculate its net asset value may differ from quoted or published prices for the same securities.
B) SECURITY TRANSACTIONS AND INVESTMENT INCOME — Security transactions are accounted for on a trade date basis. Interest income is recorded on the accrual basis. Dividends are recorded on the ex-dividend date. The cost of investments sold is determined by use of the specific identification method for both financial reporting and income tax purposes.
C) DIVIDENDS AND DISTRIBUTIONS TO SHAREHOLDERS — Dividends from net investment income are declared and paid quarterly. Distributions of net realized capital gains, if any, are declared and paid at least annually. However, to the extent that a net realized capital gain can be reduced by a capital loss carryforward, such gain will not be distributed. Income and capital gain distributions are determined in accordance with federal income tax regulations, which may differ from accounting principles generally accepted in the United States of America ("GAAP").
D) FEDERAL INCOME TAXES — No provision is made for federal taxes as it is the Portfolio's intention to continue to qualify for and elect the tax treatment applicable to regulated investment companies ("RIC") under the Internal Revenue Code of 1986, as amended (the "Code"), and to make the requisite distributions to its shareholders, which will be sufficient to relieve it from federal income and excise taxes.
In order to qualify as a RIC under the Code, the Portfolio must meet certain requirements regarding the source of its income, the diversification of its assets and the distribution of its income. One of these requirements is that the Portfolio derive at least 90% of its gross income for each taxable year from dividends, interest, payments with respect to certain securities loans, gains from the sale or other disposition of stock, securities or foreign currencies, other income derived with respect to its business of investing in such stock, securities or currencies or net income derived from interests in certain publicly traded partnerships ("Qualifying Income"). The Portfolio may seek to track the performance of the Dow Jones-AIG Commodity Index ("DJ-AIG Index") through investing in structured notes designed to track the performance of the DJ-AIG Index. The Portfolio has received a private letter ruling from the IRS which confirms that the P ortfolio's use of certain types of structured notes designed to track the performance of the DJ-AIG Index produce Qualifying
16
Credit Suisse Trust — Commodity Return Strategy Portfolio
Notes to Financial Statements (continued)
December 31, 2007
Note 2. Significant Accounting Policies
Income. In addition, the Portfolio may, through its investment in the Credit Suisse Cayman Commodity Fund II, Ltd., a wholly owned and controlled Cayman Islands subsidiary, ("the Subsidiary"), seek to track the performance of the DJ-AIG Index by the Subsidiary's investments in commodity-linked swaps and/or futures contracts. The Portfolio has obtained a private letter ruling from the IRS that its investment in the Subsidiary will produce Qualifying Income. If the Portfolio is unable to ensure continued qualification as a RIC, the Portfolio may be required to change its investment objective, policies or techniques, or may be liquidated. If the Portfolio fails to qualify as a RIC, the Portfolio will be subject to federal income tax on its net income and capital gains at regular corporate rates (without reduction for distributions to shareholders). If the Portfolio were to fail to qualify as a RIC and become subject to federal income tax, share holders of the Portfolio would be subject to the risk of diminished returns. If the Portfolio should fail to qualify as a RIC, it would be considered as a single investment, which may result in variable contracts invested in the Portfolio not being treated as annuity, endowment or life insurance contracts under the Code. All income and gain inside the variable contracts would be taxed currently to the holders, and the contracts would remain subject to taxation as ordinary income thereafter, even if they become adequately diversified.
E) USE OF ESTIMATES — The preparation of financial statements in conformity with GAAP requires management to make estimates and assumptions that affect the reported amounts of assets and liabilities and disclosure of contingent assets and liabilities at the date of the financial statements and the reported amounts of income and expenses during the reporting period. Actual results could differ from these estimates.
F) SHORT-TERM INVESTMENTS — The Portfolio, together with other funds/portfolios advised by Credit Suisse Asset Management, LLC ("Credit Suisse"), an indirect, wholly-owned subsidiary of Credit Suisse Group, pools available cash into either a short-term variable rate time deposit issued by State Street Bank and Trust Company ("SSB"), the Portfolio's custodian, or a money market fund advised by Credit Suisse. The short-term time deposit issued by SSB is a variable rate account classified as a short-term investment.
G) FUTURES — The Portfolio may enter into futures contracts to the extent permitted by its investment policies and objectives. Upon entering into a futures contract, the Portfolio is required to deposit cash and/or pledge U.S. Government securities as initial margin. Subsequent payments, which are dependent on the daily fluctuations in the value of the underlying instrument, are made or received by the Portfolio each day (daily variation margin) and are
17
Credit Suisse Trust — Commodity Return Strategy Portfolio
Notes to Financial Statements (continued)
December 31, 2007
Note 2. Significant Accounting Policies
recorded as unrealized gains or losses until the contracts are closed. When the contracts are closed, the Portfolio records a realized gain or loss equal to the difference between the proceeds from (or cost of) the closing transactions and the Portfolio's basis in the contract. Risks of entering into futures contracts for hedging purposes include the possibility that a change in the value of the contract may not correlate with the changes in the value of the underlying instruments. In addition, the purchase of a futures contract involves the risk that the Portfolio could lose more than the original margin deposit and subsequent payments required for a futures transaction. At December 31, 2007, the Portfolio had the following open futures contracts:
| Futures Contract | | Number of
Contracts | | Expiration
Date | | Contract
Amount | | Contract
Value | | Unrealized
Appreciation
(Depreciation) | |
U.S. Treasury
2 Year Notes Futures | | | 85 | | | 03/31/08 | | $ | 17,833,033 | | | $ | 17,871,250 | | | $ | 38,217 | | |
U.S. Treasury
10 Year Notes Futures | | | (51 | ) | | 03/19/08 | | | (5,736,969 | ) | | | (5,782,922 | ) | | | (45,953 | ) | |
| | | | | $ | 12,096,064 | | | $ | 12,088,328 | | | $ | (7,736 | ) | |
H) SWAPS — The Portfolio may enter into commodity index swaps for hedging purposes or to seek to increase total return. A swap is an agreement that obligates two parties to exchange a series of cash flows at specified intervals based upon or calculated by reference to changes in specified prices or rates for a specified amount of an underlying asset or notional principal amount. The Portfolio will enter into index swaps only on a net basis, which means that the two payment streams are netted out, with the Portfolio receiving or paying, as the case may be, only the net amount of the two payments. Risks may arise as a result of the failure of the counterparty to the swap contract to comply with the terms of the swap contract. The loss incurred by the failure of a counterparty is generally limited to the net interest payment to be received by the Portfolio, and/or the termination value at the end of the contract. Therefore, the Portfolio c onsiders the creditworthiness of each counterparty to a swap contract in evaluating potential credit risk. Additionally, risks may arise from unanticipated movements in interest rates or in the value of the underlying reference asset or index.
The Portfolio may enter into total return swap contracts, involving commitments to pay interest in exchange for a market-linked return, both based on notional amounts. To the extent the total return of the security or index underlying the transactions exceeds or falls short of the offsetting interest rate obligation, the Portfolio will receive a payment from or make a payment to the counterparty.
18
Credit Suisse Trust — Commodity Return Strategy Portfolio
Notes to Financial Statements (continued)
December 31, 2007
Note 2. Significant Accounting Policies
The Portfolio records unrealized gains or losses on a daily basis representing the value and the current net receivable or payable relating to open swap contracts. Net amounts received or paid on the swap contract are recorded as realized gains or losses. Fluctuations in the value of swap contracts are recorded for financial statement purposes as unrealized appreciation or depreciation of swap contracts. Realized gains and losses from terminated swaps are included in net realized gains/losses on swap contracts transactions.
I) COMMODITY INDEX-LINKED NOTES — The Portfolio may invest in structured notes whose value is based on the price movements of a commodity index. The structured notes are often leveraged, increasing the volatility of each note's value relative to the change in the underlying linked financial element. The value of these notes will rise and fall in response to changes in the underlying commodity index. Structured notes may entail a greater degree of market risk than other types of debt securities because the investor bears the risk of the underlying commodity index. Structured notes may also be more volatile, less liquid, and more difficult to accurately price than less complex securities or more traditional debt securities. Fluctuations in the value of the structured notes are recorded as unrealized gains and losses in the accompanying financial statements. Net payments are recorded as net realized gains/ (losses). These notes are subject to prepayment, credit and interest risks. The Portfolio has the option to request prepayment from the issuer. At maturity, or when a note is sold, the Portfolio records a realized gain or loss. At December 31, 2007, the value of these securities comprised 36.2% of the Portfolio's net assets and resulted in unrealized appreciation of $3,778,372.
J) SECURITIES LENDING — Loans of securities are required at all times to be secured by collateral at least equal to 102% of the market value of domestic securities on loan (including any accrued interest thereon) and 105% of the market value of foreign securities on loan (including any accrued interest thereon). Cash collateral received by the Portfolio in connection with securities lending activity may be pooled together with cash collateral for other funds/portfolios advised by Credit Suisse and may be invested in a variety of investments, including certain Credit Suisse-advised funds, funds advised by SSB, the Portfolio's securities lending agent, or money market instruments. However, in the event of default or bankruptcy by the other party to the agreement, realization and/or retention of the collateral may be subject to legal proceedings. The Portfolio had no securities out on loan during the year ended December 31, 2007.
SSB has been engaged by the Portfolio to act as the Portfolio's securities lending agent. The Portfolio's securities lending arrangement provides that the Portfolio and SSB will share the net income earned from the securities
19
Credit Suisse Trust — Commodity Return Strategy Portfolio
Notes to Financial Statements (continued)
December 31, 2007
Note 2. Significant Accounting Policies
lending activities. The Portfolio may also be entitled to certain minimum amounts of income from its securities lending activities. Securities lending income is accrued as earned.
K) OTHER — The Portfolio may invest in securities of foreign countries and governments which involve certain risks in addition to those inherent in domestic investments. Such risks generally include, among others, currency risks (fluctuations in currency exchange rates), information risk (key information may be inaccurate or unavailable) and political risk (expropriation, nationalization or the imposition of capital or currency controls or punitive taxes). Other risks of investing in foreign securities include liquidity and valuation risks.
The Portfolio may be subject to taxes imposed by countries in which it invests with respect to its investments in issuers existing or operating in such countries. Such taxes are generally based on income earned or repatriated and capital gains realized on the sale of such investments. The Portfolio accrues such taxes when the related income is earned or gains are realized.
Note 3. Transactions with Affiliates and Related Parties
Credit Suisse serves as investment adviser for the Portfolio. For its investment advisory services, Credit Suisse is entitled to receive a fee from the Portfolio at an annual rate of 0.50% of the Portfolio's average daily net assets. For the year ended December 31, 2007, investment advisory fees earned and voluntarily waived were $640,829 and $103,090, respectively. Credit Suisse will not recapture from the Portfolio any fees it waived during the fiscal year ended December 31, 2007. Fee waivers and reimbursements are voluntary and may be discontinued by Credit Suisse at any time.
Credit Suisse Asset Management Securities, Inc. ("CSAMSI"), an affiliate of Credit Suisse, and SSB serve as co-administrators to the Portfolio. For its co-administrative services, CSAMSI currently receives a fee calculated at an annual rate of 0.09% of the Portfolio's average daily net assets. For the year ended December 31, 2007, co-administrative services fees earned by CSAMSI were $115,349.
For its co-administrative services, SSB receives a fee, exclusive of out-of-pocket expenses, calculated in total for all the Credit Suisse funds/portfolios co-administered by SSB and allocated based upon relative average net assets of each fund/portfolio, subject to an annual minimum fee. For the year ended December 31, 2007, co-administrative services fees earned by SSB (including out-of-pocket expenses) were $33,915.
20
Credit Suisse Trust — Commodity Return Strategy Portfolio
Notes to Financial Statements (continued)
December 31, 2007
Note 3. Transactions with Affiliates and Related Parties
In addition to serving as the Portfolio's co-administrator, CSAMSI currently serves as distributor of the Portfolio's shares. Pursuant to distribution plans adopted by the Portfolio pursuant to Rule 12b-1 under the 1940 Act, CSAMSI receives fees for its distribution services. These fees are calculated at an annual rate of 0.25% of the average daily net assets.
Merrill Corporation ("Merrill"), an affiliate of Credit Suisse, has been engaged by the Portfolio to provide certain financial printing and fulfillment services. For the year ended December 31, 2007, Merrill was paid $14,591 for its services to the Portfolio.
The Portfolio will reimburse Credit Suisse for offering costs in the amount of $58,636 that have been paid by Credit Suisse. Offering costs, including initial registration costs, were deferred and charged to expenses during the Portfolio's first year of operation. For the period January 1, 2007 through February 28, 2007, $9,477 was expensed to the Portfolio.
Investment in Cayman Commodity Fund II, Ltd. The Portfolio may invest up to 25% of its total assets in the Subsidiary, which invests primarily in commodity and financial futures and option contracts, as well as fixed income securities and other investments intended to serve as margin or collateral for the Subsidiary's derivatives positions. The Portfolio wholly owns and controls the Subsidiary, and the Portfolio and Subsidiary are both managed by Credit Suisse.
The Portfolio does not consolidate the assets, liabilities, capital or operations of the Subsidiary into its financial statements. Rather, the Subsidiary is separately presented as an investment in the Portfolio's Schedule of Investments. Unrealized appreciation or depreciation on the Portfolio's investment in the Subsidiary is recorded in the Portfolio's Statement of Assets and Liabilities and Portfolio's Statement of Operations.
For tax purposes, the Subsidiary is an exempted Cayman investment company. The Subsidiary has received an undertaking from the Government of the Cayman Islands exempting it from all local income, profits and capital gains taxes through June of 2027. No such taxes are levied in the Cayman Islands at the present time. For U.S. income tax purposes, the Subsidiary is a Controlled Foreign Corporation and as such is not subject to U.S. income tax. However, as a wholly-owned Controlled Foreign Corporation, the Subsidiary's net income and capital gain, to the extent of its earnings and profits, will be included each year in the Portfolio's investment company taxable income.
21
Credit Suisse Trust — Commodity Return Strategy Portfolio
Notes to Financial Statements (continued)
December 31, 2007
Note 4. Line of Credit
The Portfolio, together with other funds/portfolios advised by Credit Suisse (collectively, the "Participating Funds"), participates in a $50 million committed, unsecured line of credit facility ("Credit Facility") for temporary or emergency purposes with Deutsche Bank, A.G. as administrative agent and syndication agent and SSB as operations agent. Under the terms of the Credit Facility, the Participating Funds pay an aggregate commitment fee at a rate of 0.10% per annum on the average unused amount of the Credit Facility, which is allocated among the Participating Funds in such manner as is determined by the governing Boards of the Participating Funds. In addition, the Participating Funds pay interest on borrowings at the Federal Funds rate plus 0.50%. At December 31, 2007, and during the year ended December 31, 2007, the Portfolio had no borrowings under the Credit Facility.
Note 5. Purchases and Sales of Securities
For the year ended December 31, 2007, purchases and sales of investment securities (excluding short-term investments) were $55,200,000 and $90,409,503, respectively.
Note 6. Capital Share Transactions
The Trust is authorized to issue an unlimited number of full and fractional shares of beneficial interest, $0.001 par value per share. Transactions in capital shares of the Portfolio were as follows:
| | | For the Year Ended
December 31, 2007 | | For the Period Ended
December 31, 20061 | |
| Shares sold | | | 7,693,479 | | | | 14,354,276 | | |
| Shares issued in reinvestment of dividends | | | 486,914 | | | | 217,832 | | |
| Shares redeemed | | | (17,357,645 | ) | | | (504,243 | ) | |
| Net increase (decrease) | | | (9,177,252 | ) | | | 14,067,865 | | |
1 For the period February 28, 2006 (commencement date) through December 31, 2006.
On December 31, 2007, the number of shareholders that held 5% or more of the outstanding shares of the Portfolio was as follows:
Number of
Shareholders | | Approximate Percentage
of Outstanding Shares | |
| | 1 | | | | 94 | % | |
Some of the shareholders are omnibus accounts, which hold shares on behalf of individual shareholders.
22
Credit Suisse Trust — Commodity Return Strategy Portfolio
Notes to Financial Statements (continued)
December 31, 2007
Note 7. Federal Income Taxes
Income and capital gain distributions are determined in accordance with federal income tax regulations, which may differ from GAAP.
The tax characteristics of dividends paid during the years ended December 31, 2007 and 2006, respectively by the Portfolio were as follows:
| | Ordinary Income | |
| | 2007 | | 2006 | |
| | $ | 5,262,535 | | | $ | 2,251,480 | | |
The tax basis of components of distributable earnings differ from the amount reflected in the Statement of Assets and Liabilities by temporary book/tax differences. These differences are primarily due to a mark to market of futures contracts and income from the Subsidiary. At December 31, 2007, the components of distributable earnings on a tax basis for the Portfolio were as follows:
| Undistributed net investment income | | $ | 4,356,595 | | |
| Accumulated realized gain | | | 2,338,795 | | |
| Unrealized appreciation | | | 3,720,921 | | |
| | | $ | 10,416,311 | | |
During the tax year ended December 31, 2007, the Portfolio utilized $6,063,568 of capital loss carryforwards.
At December 31, 2007, the identified cost for federal income tax purposes, as well as the gross unrealized appreciation from investments for those securities having an excess of value over cost, gross unrealized depreciation from investments for those securities having an excess of cost over value and the net unrealized appreciation from investments were $53,066,542, $3,779,973, $(59,052) and $3,720,921, respectively.
Note 8. Contingencies
In the normal course of business, the Portfolio may provide general indemnifications pursuant to certain contracts and organizational documents. The Portfolio's maximum exposure under these arrangements is dependent on future claims that may be made against the Portfolio and, therefore, cannot be estimated; however, based on experience, the risk of loss from such claims is considered remote.
Note 9. Recent Accounting Pronouncements
During June 2006, the Financial Accounting Standards Board ("FASB") issued FASB Interpretation 48 ("FIN 48" or the "Interpretation"), Accounting for
23
Credit Suisse Trust — Commodity Return Strategy Portfolio
Notes to Financial Statements (continued)
December 31, 2007
Note 9. Recent Accounting Pronouncements
Uncertainty in Income Taxes — an interpretation of FASB statement 109. FIN 48 supplements FASB Statement 109, Accounting for Income Taxes, by defining the confidence level that a tax position must meet in order to be recognized in the financial statements. FIN 48 prescribes a comprehensive model for how a fund should recognize, measure, present, and disclose in its financial statements uncertain tax positions that the fund has taken or expects to take on a tax return. FIN 48 requires that the tax effects of a position be recognized only if it is "more likely than not" to be sustained based solely on its technical merits. Management must be able to conclude that the tax law, regulations, case law, and other obje ctive information regarding the technical merits sufficiently support the position's sustainability with a likelihood of more than 50 percent. During the period ended December 31, 2007, management has adopted FIN 48. There was no material impact to the financial statements or disclosures thereto as a result of the adoption of this pronouncement.
On September 20, 2006, the FASB released Statement of Financial Accounting Standards No. 157 "Fair Value Measurements" ("FAS 157"). FAS 157 establishes an authoritative definition of fair value, sets out a framework for measuring fair value, and requires additional disclosures about fair-value measurements. The application of FAS 157 is required for fiscal years beginning after November 15, 2007 and interim periods within those fiscal years. As of December 31, 2007, management does not believe the adoption of FAS 157 will impact the amounts reported in the financial statements, however, additional disclosures will be required in subsequent reports.
24
Credit Suisse Trust — Commodity Return Strategy Portfolio
Report of Independent Registered Public Accounting Firm
To the Board of Trustees of Credit Suisse Trust and Shareholders of
Credit Suisse Trust — Commodity Return Strategy Portfolio:
In our opinion, the accompanying statement of assets and liabilities, including the schedule of investments, and the related statements of operations and of changes in net assets and the financial highlights present fairly, in all material respects, the financial position of Commodity Return Strategy Portfolio (the "Portfolio"), a portfolio of the Credit Suisse Trust, at December 31, 2007, the results of its operations for the year then ended and the changes in its net assets and the financial highlights for the years (or periods) presented, in conformity with accounting principles generally accepted in the United States of America. These financial statements and financial highlights (hereafter referred to as "financial statements") are the responsibility of the Portfolio's management; our responsibility is to express an opinion on these financial statements based on our audits. We conducted our audits of these financial statements in accord ance with the standards of the Public Company Accounting Oversight Board (United States). Those standards require that we plan and perform the audit to obtain reasonable assurance about whether the financial statements are free of material misstatement. An audit includes examining, on a test basis, evidence supporting the amounts and disclosures in the financial statements, assessing the accounting principles used and significant estimates made by management, and evaluating the overall financial statement presentation. We believe that our audits, which included confirmation of securities at December 31, 2007 by correspondence with the custodian and brokers, provide a reasonable basis for our opinion.
PricewaterhouseCoopers LLP
Baltimore, Maryland
February 25, 2008
25
Credit Suisse Trust — Commodity Return Strategy Portfolio
Board Approval of Advisory Agreement (unaudited)
In approving the renewal of the current Advisory Agreement, the Board of Trustees, including the Independent Trustees, at a meeting held on November 13 and 14, 2007, considered the following factors with respect to the Commodity Return Strategy Portfolio (the "Portfolio"):
Investment Advisory Fee Rates
The Board reviewed and considered the contractual advisory fee rate of 0.50% for the Portfolio ("Contractual Advisory Fee") in light of the extent and quality of the advisory services provided by Credit Suisse Asset Management, LLC ("Credit Suisse"). The Board also reviewed and considered the fee waivers and/or expense reimbursement arrangements currently in place for the Portfolio and considered the actual fee rate of 0.19% paid by the Portfolio after taking waivers and reimbursements into account ("Net Advisory Fee"). The Board acknowledged that voluntary fee waivers and expense reimbursements could be discontinued at any time.
Additionally, the Board received and considered information comparing the Portfolio's Contractual Advisory Fee, Net Advisory Fee and the Portfolio's overall expenses with those of funds in both the relevant expense group ("Expense Group") and universe of funds (the "Expense Universe") provided by Lipper Inc., an independent provider of investment company data.
Nature, Extent and Quality of the Services under the Advisory Agreement
The Board received and considered information regarding the nature, extent and quality of services provided to the Portfolio by Credit Suisse under the Advisory Agreement. The Board also noted information received at regular meetings throughout the year related to the services rendered by Credit Suisse. The Board reviewed background information about Credit Suisse, including its Form ADV. The Board considered the background and experience of Credit Suisse's senior management and the expertise of, and the amount of attention given to the Portfolio by, senior personnel of Credit Suisse. In addition, the Board reviewed the qualifications, backgrounds and responsibilities of the portfolio management team primarily responsible for the day-to-day portfolio management of the Portfolio and the extent of the resources devoted to research and analysis of actual and potential investments. The Board also received and considered information about the nat ure, extent and quality of services and fee rates offered to other Credit Suisse clients for comparable services.
26
Credit Suisse Trust — Commodity Return Strategy Portfolio
Board Approval of Advisory Agreement (unaudited) (continued)
Portfolio Performance
The Board received and considered the performance results of the Portfolio, along with comparisons both to the relevant performance group ("Performance Group") and universe of funds ("Performance Universe") for the Portfolio. The Board was provided with a description of the methodology used to arrive at the funds included in the Performance Group and the Performance Universe.
Credit Suisse Profitability
The Board received and considered a profitability analysis of Credit Suisse based on the fees payable under the Advisory Agreement for the Portfolio, including any fee waivers or fee caps, as well as other relationships between the Portfolio on the one hand and Credit Suisse affiliates on the other. The Board received profitability information for the other funds in the Credit Suisse family of funds.
Economies of Scale
The Board considered whether economies of scale in the provision of services to the Portfolio were being passed along to the shareholders. Accordingly, the Board considered whether alternative fee structures (such as breakpoint fee structures) would be more appropriate or reasonable taking into consideration economies of scale or other efficiencies that might accrue from increases in the Portfolio's asset levels.
Other Benefits to Credit Suisse
The Board considered other benefits received by Credit Suisse and its affiliates as a result of their relationship with the Portfolio. Such benefits include, among others, benefits potentially derived from an increase in Credit Suisse's business as a result of its relationship with the Portfolio (such as the ability to market to shareholders other financial products offered by Credit Suisse and its affiliates).
The Board considered the standards applied in seeking best execution and reviewed Credit Suisse's method for allocating portfolio investment opportunities among its advisory clients.
27
Credit Suisse Trust — Commodity Return Strategy Portfolio
Board Approval of Advisory Agreement (unaudited) (continued)
Conclusions
In selecting Credit Suisse, and approving the Advisory Agreement and the investment advisory fee under such agreement, the Board concluded that:
• The contractual management fee was the lowest in the Portfolio's Expense Group and the Board considered the fee to be reasonable.
• The Portfolio's return for the year was the second highest in the Performance Group, but was below most of the funds in the Performance Universe. The Board noted that the Performance Group was limited to funds that, like the Portfolio, invested primarily in commodity-related investments, while the Performance Universe was composed of all specialty diversified equity funds, not just commodity funds.
• The Board was satisfied with the nature and extent of the investment advisory services provided to the Portfolio by Credit Suisse and that, based on dialogue with management and counsel, the services provided by Credit Suisse under the Advisory Agreement are typical of, and consistent with, those provided to similar mutual funds by other investment advisers.
• In light of the costs of providing investment management and other services to the Portfolio and Credit Suisse's ongoing commitment to the Portfolio and willingness to waive fees and expenses, the profits and other ancillary benefits that Credit Suisse and its affiliates received were considered reasonable.
• Credit Suisse's profitability based on fees payable under the Advisory Agreement was reasonable in light of the nature, extent and quality of the services provided to the Portfolio thereunder.
• In light of the fee waiver and the amount of the Contractual Advisory Fee, the Portfolio's current fee structure (without breakpoints) was considered reasonable.
No single factor reviewed by the Board was identified by the Board as the principal factor in determining whether to approve the Advisory Agreement. The Independent Trustees were advised by separate independent legal counsel throughout the process.
28
Credit Suisse Trust — Commodity Return Strategy Portfolio
Information Concerning Directors/Trustees and Officers (unaudited)
Name, Address
(Year of Birth) | | Position(s)
Held with
Trust | | Term
of Office1
and
Length
of Time
Served | | Principal
Occupation(s) During
Past Five Years | | Number of
Portfolios in
Fund
Complex
Overseen by
Trustee | | Other
Directorships
Held by
Trustee | |
| Independent Trustees | |
|
Enrique Arzac
c/o Credit Suisse Asset
Management, LLC
Attn: General Counsel
Eleven Madison Avenue
New York, New York
10010
(1941) | | Trustee,
Nominating Committee
Member and
Audit
Committee
Chairman | | Since
Portfolio
Inception | | Professor of Finance and Economics, Graduate School of Business, Columbia University since 1971. | | | 35 | | | Director of Epoch Holding Corporation (an investment management and investment advisory services company); Director of The Adams Express Company (a closed-end investment company); Director of Petroleum and Resources Corporation (a closed-end investment company). | |
|
Jeffrey E. Garten
Box 208200
New Haven, Connecticut
06520-8200
(1946) | | Trustee, Nominating
and Audit
Committee
Member | | Since
Portfolio
Inception | | The Juan Trippe Professor in the Practice of International Trade, Finance and Business from July 2005 to present; Partner and Chairman of Garten Rothkopf (consulting firm) from October 2005 to present; Dean of Yale School of Management from November 1995 to June 2005. | | | 28 | | | Director of Aetna, Inc. (insurance company); Director of CarMax Group (used car dealers); Director of Alcan, Inc. (smelting and refining of nonferrous metals company). | |
|
1 Each Trustee and Officer serves until his or her respective successor has been duly elected and qualified.
29
Credit Suisse Trust — Commodity Return Strategy Portfolio
Information Concerning Directors/Trustees and Officers (unaudited) (continued)
Name, Address
(Year of Birth) | | Position(s)
Held with
Trust | | Term
of Office1
and
Length
of Time
Served | | Principal
Occupation(s) During
Past Five Years | | Number of
Portfolios in
Fund
Complex
Overseen by
Trustee | | Other
Directorships
Held by
Director | |
| Independent Trustees | |
|
Peter F. Krogh
SFS/ICC 702
Georgetown University
Washington, DC 20057
(1937) | | Trustee, Nominating and Audit Committee Member | | Since
Portfolio
Inception | | Dean Emeritus and Distinguished Professor of International Affairs at the Edmund A. Walsh School of Foreign Service, Georgetown University from June 1995 to present. | | | 28 | | | Director of Carlisle Companies Incorporated (diversified manufacturing company). | |
|
Steven N. Rappaport
Lehigh Court, LLC
555 Madison Avenue
29th Floor
New York, New York
10022
(1948) | | Chairman of the Board of Trustees, Nominating Committee Chairman and Audit Committee Member | | Since
Portfolio
Inception | | Partner of Lehigh Court, LLC and RZ Capital (private investment firms) from July 2002 to present. | | | 35 | | | Director of iCAD, Inc. (surgical and medical instruments and apparatus company); Director of Presstek, Inc. (digital imaging technologies company); Director of Wood Resources, LLC. (plywood manufacturing company). | |
|
| Interested Trustee | |
|
Michael E. Kenneally2
c/o Credit Suisse Asset
Management, LLC
Attn: General Counsel
Eleven Madison Avenue
New York, New York
10010
(1954) | | Trustee | | Since
Portfolio
Inception | | Chairman and Global Chief Executive Officer of Credit Suisse from March 2003 to July 2005; Chairman and Chief Investment Officer of Banc of America Capital Management from 1998 to March 2003. | | | 28 | | | None | |
|
2 Mr. Kenneally is a Trustee who is an "interested person" of the Trust as defined in the Investment Company Act of 1940, as amended, because he was an officer of Credit Suisse within the last two fiscal years.
30
Credit Suisse Trust — Commodity Return Strategy Portfolio
Information Concerning Directors/Trustees and Officers (unaudited) (continued)
Name, Address
(Year of Birth) | | Position(s)
Held with
Trust | | Term
of Office1
and
Length
of Time
Served | | Principal Occupation(s) During Past Five Years | |
| Officers | |
|
Lawrence D. Haber
c/o Credit Suisse Asset Management, LLC.
Attn: General Counsel Eleven Madison Avenue New York, New York
10010
(1951) | | Chief Executive Officer and President | | Since
2007 | | Managing Director and Chief Operating Officer of Credit Suisse; Member of Credit Suisse's Management Committee; Chief Financial Officer of Merrill Lynch Investment Managers from 1997 to 2003. | |
|
Michael A. Pignataro
Credit Suisse Asset
Management, LLC
Eleven Madison Avenue
New York, New York
10010
(1959) | | Chief Financial Officer | | Since
Portfolio
Inception | | Director and Director of Fund Administration of Credit Suisse; Associated with Credit Suisse or its predecessor since 1984; Officer of other Credit Suisse Funds. | |
|
Emidio Morizio
Credit Suisse Asset
Management, LLC
Eleven Madison Avenue
New York, New York
10010
(1966) | | Chief Compliance Officer | | Since
Portfolio
Inception | | Director and Global Head of Compliance of Credit Suisse; Associated with Credit Suisse since July 2000; Officer of other Credit Suisse Funds. | |
|
J. Kevin Gao
Credit Suisse Asset
Management, LLC
Eleven Madison Avenue
New York, New York
10010
(1967) | | Chief Legal Officer since 2006, Vice President and Secretary Portfolio Inception | | Since
Portfolio
Inception | | Director and Legal Counsel of Credit Suisse; Associated with Credit Suisse since July 2003; Associated with the law firm of Willkie Farr & Gallagher LLP from 1998 to 2003; Officer of other Credit Suisse Funds. | |
|
Robert Rizza
Credit Suisse Asset
Management, LLC
Eleven Madison Avenue
New York, New York
10010
(1965) | | Treasurer | | Since
Portfolio
Inception | | Vice President of Credit Suisse; Associated with Credit Suisse since 1998; Officer of other Credit Suisse Funds. | |
|
The Statement of Additional Information includes additional information about the Trustees and is available, without charge, upon request, by calling 800-222-8977.
31
Credit Suisse Trust — Commodity Return Strategy Portfolio
Proxy Voting and Portfolio Holdings Information (unaudited)
Information regarding how the Portfolio voted proxies related to its portfolio securities during the 12 month period ended June 30 of each year, as well as the policies and procedures that the Portfolio uses to determine how to vote proxies relating to its portfolio securities are available:
• By calling 1-800-222-8977
• On the Portfolio's website, www.credit-suisse.com/us
• On the website of the Securities and Exchange Commission, www.sec.gov.
The Portfolio files a complete schedule of its portfolio holdings for the first and third quarters of its fiscal year with the SEC on Form N-Q. The Portfolio's Forms N-Q are available on the SEC's website at www.sec.gov and may be reviewed and copied at the SEC's Public Reference Room in Washington, DC. Information on the operation of the SEC's Public Reference Room may be obtained by calling 1-202-551-8090.
32

n CREDIT SUISSE
CAYMAN COMMODITY FUND II, LTD.
(THE "SUBSIDIARY")
For the period ended December 31, 2007
33
Credit Suisse Cayman Commodity Fund II, Ltd. (the "Subsidiary")
Schedule of Investments
December 31, 2007
Par
(000) | |
| | Ratings†
(S&P/Moody's) | | Maturity | | Rate% | | Value | |
| GOVERNMENT AGENCY (75.4%) | | | |
| | 500 | | | Fannie Mae Discount Notes | | (AAA,Aaa) | | 01/16/08 | | | 3.281 | | | $ | 499,183 | | |
| | 70 | | | Fannie Mae Discount Notes‡‡ | | (AAA,Aaa) | | 02/13/08 | | | 4.239 | | | | 69,642 | | |
| | 250 | | | Federal Home Loan Bank Discount Notes | | (AAA,Aaa) | | 01/02/08 | | | 4.343 | | | | 249,826 | | |
| TOTAL GOVERNMENT AGENCY (Cost $818,651) | | | 818,651 | | |
| SHORT-TERM INVESTMENT (24.3%) | | | |
| | 264 | | | State Street Bank and Trust Co. Euro Time Deposit,
3.600%, 01/02/08 (Cost $264,000) | | | | | | | | | | | 264,000 | | |
| TOTAL INVESTMENTS AT VALUE (99.7%) (Cost $1,082,651) | | | 1,082,651 | | |
| OTHER ASSETS IN EXCESS OF LIABILITIES (0.3%) | | | 2,929 | | |
| NET ASSETS (100.00%) | | $ | 1,085,580 | | |
† Credit ratings given by the Standard & Poor's Division of The McGraw-Hill Companies, Inc. ("S&P") and Moody's Investors Services, Inc. ("Moody's") are unaudited.
‡‡ Collateral segregated for futures contracts.
See Accompanying Notes to Financial Statements.
34
Credit Suisse Cayman Commodity Fund II, Ltd. (the "Subsidiary")
Statement of Assets and Liabilities
December 31, 2007
| Assets | |
| Investments at value (Cost $1,082,651) (Note 2) | | $ | 1,082,651 | | |
| Cash | | | 237 | | |
| Interest receivable | | | 23 | | |
| Variation margin receivable (Note 2) | | | 2,666 | | |
| Other assets | | | 24,269 | | |
| Total Assets | | | 1,109,846 | | |
| Liabilities | |
| Accrued expenses payable | | | 24,266 | | |
| Total Liabilities | | | 24,266 | | |
| Net Assets | |
| Par value of participating shares (Note 4) | | | 100 | | |
| Paid-in capital (Note 4) | | | 999,900 | | |
| Accumulated net investment income | | | 20,144 | | |
| Accumulated net realized gain on futures contracts | | | 76,227 | | |
| Net unrealized depreciation on futures contracts | | | (10,791 | ) | |
| Net Assets | | $ | 1,085,580 | | |
| Shares Outstanding | | | 100,000 | | |
| Net asset value, redemption price per share and offering price per share | | $ | 10.86 | | |
See Accompanying Notes to Financial Statements.
35
Credit Suisse Cayman Commodity Fund II, Ltd. (the "Subsidiary")
Statement of Operations
For the Period July 27, 20071 through December 31, 2007
| Investment Income (Note 2) | |
| Interest | | $ | 20,144 | | |
| Total investment income | | | 20,144 | | |
| Expenses | |
| Administration fees (Note 3) | | | 266 | | |
| Audit fees | | | 24,000 | | |
| Total expenses | | | 24,266 | | |
| Less: fees reimbursed (Note 3) | | | (24,266 | ) | |
| Net expenses | | | — | | |
| Net investment income | | | 20,144 | | |
| Net Realized and Unrealized Gain (Loss) from Futures Contracts | |
| Net realized gain on futures contracts | | | 76,227 | | |
| Net change in unrealized appreciation (depreciation) from futures contracts | | | (10,791 | ) | |
| Net realized and unrealized gain from futures contracts | | | 65,436 | | |
| Net increase in net assets resulting from operations | | $ | 85,580 | | |
1 Commencement of operations
See Accompanying Notes to Financial Statements.
36
Credit Suisse Cayman Commodity Fund II, Ltd. (the "Subsidiary")
Statement of Changes in Net Assets
| | | For the Period
Ended
December 31, 20071 | |
| From Operations | |
| Net investment income | | $ | 20,144 | | |
| Net realized gain from futures contracts | | | 76,227 | | |
| Net change in unrealized appreciation (depreciation) from futures contracts | | | (10,791 | ) | |
| Net increase in net assets resulting from operations | | | 85,580 | | |
| From Capital Transactions (Note 4) | |
| Proceeds from sale of shares | | | 1,000,000 | | |
| Net increase in net assets from capital share transactions | | | 1,000,000 | | |
| Net increase in net assets | | | 1,085,580 | | |
| Net Assets | |
| Beginning of period | | | — | | |
| End of period (including accumulated net investment income of $20,144) | | $ | 1,085,580 | | |
1 For the period July 27, 2007 (commencement of operations) through December 31, 2007.
See Accompanying Notes to Financial Statements.
37
Credit Suisse Cayman Commodity Fund II, Ltd. (the "Subsidiary")
Notes to Financial Statements
December 31, 2007
Note 1. Organization
Credit Suisse Cayman Commodity Fund II, Ltd. (the "Fund") is organized as a Cayman Islands Company. The Fund intends to carry on the business of an investment company. The Fund's investment manager is Credit Suisse Asset Management, LLC ("Credit Suisse"). As of December 31, 2007, 100% of the Fund's participating shares were owned by Credit Suisse Trust — Commodity Return Strategy Portfolio.
Note 2. Significant Accounting Policies
A) SECURITY VALUATION — The net asset value of the Fund is determined daily as of the close of regular trading on the New York Stock Exchange, Inc. (the "Exchange") on each day the Exchange is open for business. Debt securities with a remaining maturity greater than 60 days are valued in accordance with the price supplied by a pricing service, which may use a matrix, formula or other objective method that takes into consideration market indices, yield curves and other specific adjustments. Debt obligations that will mature in 60 days or less are valued on the basis of amortized cost, which approximates market value, unless it is determined that using this method would not represent fair value. Equity investments are valued at market value, which is generally determined using the closing price on the exchange or market on which the security is primarily traded at the time of valuation (the "Valuation Time"). If no sales are reported, equ ity investments are generally valued at the most recent bid quotation as of the Valuation Time or at the lowest asked quotation in the case of a short sale of securities. Investments in mutual funds are valued at the mutual fund's closing net asset value per share on the day of valuation. Swap contracts are generally valued at a price at which the counterparty to such contract would repurchase the instrument or terminate the contract. Securities, options, futures contracts and other assets (including swaps), for which market quotations are not readily available, or whose values have been materially affected by events occurring before the Fund's Valuation Time but after the close of the securities' primary markets, are valued at fair value as determined in good faith by, or under the direction of, the Board of Directors under procedures established by the Board of Directors. Structured note agreements are valued in accordance with a dealer-supplied valuation based on changes in the value of the underlying ind ex. The Fund may utilize a service provided by an independent third party which has been approved by the Board of Directors to fair value certain securities. When fair-value pricing is employed, the prices of securities used by a fund to calculate its net asset value may differ from quoted or published prices for the same securities.
38
Credit Suisse Cayman Commodity Fund II, Ltd. (the "Subsidiary")
Notes to Financial Statements (continued)
December 31, 2007
Note 2. Significant Accounting Policies
B) INCOME TAXES — The Fund has received an undertaking from the Government of the Cayman Islands exempting it from all local income, profits and capital gains taxes through June of 2027. No such taxes are levied in the Cayman Islands at the present time. The Fund is a Controlled Foreign Corporation under U.S. tax laws and as such is not subject to U.S. income tax. Therefore, the Fund is not required to record a tax provision.
C) SECURITY TRANSACTIONS AND INVESTMENT INCOME — Security transactions are accounted for on a trade date basis. Interest income is recorded on the accrual basis. Dividends are recorded on the ex-dividend date. The cost of investments sold is determined by use of the specific identification method for both financial reporting and income tax purposes.
D) FUTURES — The Fund may enter into futures contracts to the extent permitted by its investment policies and objectives. Upon entering into a futures contract, the Fund is required to deposit cash and/or pledge U.S. Government securities as initial margin. Subsequent payments, which are dependent on the daily fluctuations in the value of the underlying instrument, are made or received by the Fund each day (daily variation margin) and are recorded as unrealized gains or losses until the contracts are closed. When the contracts are closed, the Fund records a realized gain or loss equal to the difference between the proceeds from (or cost of) the closing transactions and the Fund's basis in the contract. Risks of entering into futures contracts for hedging purposes include the possibility that a change in the value of the contract may not correlate with the changes in the value of the underlying instruments. In addition, the purchase of a futures contract involves the risk that the Fund could lose more than the original margin deposit and subsequent payments required for a futures transaction. At December 31, 2007, the Fund had the following open futures contracts:
| Contract Description | | Unrealized
Appreciation (Depreciation) | |
| Contracts to Purchase | | | | | |
| Energy | | $ | 67,058 | | |
| Agriculture | | $ | 147 | | |
| | | $ | 67,205 | | |
| Contracts to Sell | | | | | |
| Energy | | $ | (95,108 | ) | |
| Agriculture | | $ | 17,112 | | |
| | | $ | (77,996 | ) | |
| Net unrealized (depreciation) | | $ | (10,791 | ) | |
39
Credit Suisse Cayman Commodity Fund II, Ltd. (the "Subsidiary")
Notes to Financial Statements (continued)
December 31, 2007
Note 2. Significant Accounting Policies
E) USE OF ESTIMATES — The preparation of financial statements in conformity with GAAP requires management to make estimates and assumptions that affect the reported amounts of assets and liabilities and disclosure of contingent assets and liabilities at the date of the financial statements and the reported amounts of income and expenses during the reporting period. Actual results could differ from those estimates.
Note 3. Transactions with Affiliates and Related Parties
Credit Suisse recognizes that it receives compensation for performing investment advisory services for the Credit Suisse Trust Commodity Return Strategy Portfolio pursuant to a separate investment advisory agreement and agrees to receive no additional compensation for rendering its services to the Fund. During the period ended December 31, 2007, Credit Suisse voluntarily reimbursed the Fund $24,266 in Fund expenses. Reimbursements are voluntary and may be discontinued by Credit Suisse at any time.
State Street Bank and Trust Company ("SSB") serves as administrator to the Fund. For its administrative services, SSB currently receives a fee based on the Fund's average daily net assets. For the period ended December 31, 2007, administrative services fees earned by SSB were $266.
Note 4. Capital Transactions
The Fund has authorized 5,000,000 participating shares of $.01 par value per share. The Fund issued 100,000 participating shares for $1,000,000 on July 27, 2007 in conjunction with the initial capitalization of the Fund. Capital transactions were as follows:
| | | For the Period Ended
December 31, 20071 | |
| Shares sold | | | 100,000 | | |
| Net increase | | | 100,000 | | |
1 For the period from July 27, 2007 (commencement of operations) to December 31, 2007.
40
Credit Suisse Cayman Commodity Fund II, Ltd. (the "Subsidiary")
Notes to Financial Statements (continued)
December 31, 2007
Note 5. Financial Highlights
The following represents the total return of the Fund for the period from July 27, 2007 through December 31, 2007. Total return was calculated based upon the daily returns of the Fund during this period. The calculation has not been annualized for reporting purposes:
The following represents certain financial ratios of the Fund for the period noted. The computation of the net investment income and total expense ratios was based upon the daily net assets of the Fund during these periods. The calculations have been annualized for reporting purposes:
| Ratio to Average Net Assets: | | For the Period Ended
December 31, 20071 | |
| Net investment income | | | 4.46 | % | |
| Total expenses (before expense reimbursement) | | | 5.37 | % | |
| Total expenses (after expense reimbursement) | | | 0.00 | % | |
1 For the period from July 27, 2007 (commencement of operations) to December 31, 2007.
Note 6. Contingencies
In the normal course of business, the Fund may provide general indemnifications pursuant to certain contracts and organizational documents. The Fund's maximum exposure under these arrangements is dependent on future claims that may be made against the Fund and, therefore, cannot be estimated; however, based on experience, the risk of loss from such claims is considered remote.
Note 7. Recent Accounting Pronouncements
During June 2006, the Financial Accounting Standards Board ("FASB") issued FASB Interpretation 48 ("FIN 48" or the "Interpretation"), Accounting for Uncertainty in Income Taxes—an interpretation of FASB statement 109. FIN 48 supplements FASB Statement 109, Accounting for Income Taxes, by defining the confidence level that a tax position must meet in order to be recognized in the financial statements. FIN 48 prescribes a comprehensive model for how a fund should recognize, measure, present, and disclose in its financial statements uncertain tax positions that the fund has taken or expects to take on a tax return. FIN 48 requires that the tax effects of a position be recognized only if it is "more likely than not" to be sustained based solely on its technical merits. Management must be able to conclude that the tax law, regulations, case law, and other objective information regarding the technical merits sufficiently support the position's sustainability with a likelihood of more than 50 percent.
41
Credit Suisse Cayman Commodity Fund II, Ltd. (the "Subsidiary")
Notes to Financial Statements (continued)
December 31, 2007
Note 7. Recent Accounting Pronouncements
During the period ended December 31, 2007, Management has adopted FIN 48. There was no material impact to the financial statements or disclosures thereto as a result of the adoption of this pronouncement.
On September 20, 2006, the FASB released Statement of Financial Accounting Standards No. 157 "Fair Value Measurements" ("FAS 157"). FAS 157 establishes an authoritative definition of fair value, sets out a framework for measuring fair value, and requires additional disclosures about fair-value measurements. The application of FAS 157 is required for fiscal years, beginning after November 15, 2007 and interim periods within those fiscal years. As of December 31, 2007, management does not believe the adoption of FAS 157 will impact the amounts reported in the financial statements, however, additional disclosures will be required in subsequent reports.
42
Credit Suisse Cayman Commodity Fund II, Ltd. (the "Subsidiary")
Report of Independent Registered Public Accounting Firm
To the Board of Directors and Shareholders of
Credit Suisse Cayman Commodity Fund II, Ltd.:
In our opinion, the accompanying statement of assets and liabilities, including the schedule of investments, and the related statements of operations and of changes in net assets present fairly, in all material respects, the financial position of Credit Suisse Cayman Commodity Fund II, Ltd. (the "Fund"), at December 31, 2007, and the results of its operations and the changes in its net assets for the period from July 27, 2007 to December 31, 2007, in conformity with accounting principles generally accepted in the United States of America. These financial statements are the responsibility of the Fund's management; our responsibility is to express an opinion on these financial statements based on our audit. We conducted our audit of these financial statements in accordance with auditing standards generally accepted in the United States of America. Those standards require that we plan and perform the audit to obtain reasonable assurance about w hether the financial statements are free of material misstatement. An audit includes examining, on a test basis, evidence supporting the amounts and disclosures in the financial statements, assessing the accounting principles used and significant estimates made by management, and evaluating the overall financial statement presentation. We believe that our audits, which included confirmation of securities at December 31, 2007 by correspondence with the custodian and brokers, provide a reasonable basis for our opinion.
PricewaterhouseCoopers LLP
Baltimore, Maryland
February 25, 2008
43
This page intentionally left blank

P.O. BOX 55030, BOSTON, MA 02205-5030
800-222-8977 n www.credit-suisse.com/us
CREDIT SUISSE ASSET MANAGEMENT SECURITIES, INC., DISTRIBUTOR. TRCOM-AR-1207

CREDIT SUISSE FUNDS
Annual Report
December 31, 2007
CREDIT SUISSE TRUST
n EMERGING MARKETS PORTFOLIO
Credit Suisse Trust (the "Trust") shares are not available directly to individual investors, but may be offered only through certain insurance products and pension and retirement plans.
The Trust's investment objectives, risks, charges and expenses (which should be considered carefully before investing), and more complete information about the Trust, are provided in the Prospectus, which should be read carefully before investing. You may obtain additional copies by calling 800-222-8977 or by writing to Credit Suisse Trust, P.O. Box 55030, Boston, MA 02205-5030.
Credit Suisse Asset Management Securities, Inc., Distributor, is located at Eleven Madison Avenue, New York, NY 10010. The Trust is advised by Credit Suisse Asset Management, LLC.
The views of the Portfolio's management are as of the date of the letter and the Portfolio holdings described in this document are as of December 31, 2007; these views and Portfolio holdings may have changed subsequent to these dates. Nothing in this document is a recommendation to purchase or sell securities.
Portfolio shares are not deposits or other obligations of Credit Suisse Asset Management, LLC ("Credit Suisse") or any affiliate, are not FDIC-insured and are not guaranteed by Credit Suisse or any affiliate. Portfolio investments are subject to investment risks, including loss of your investment.
Credit Suisse Trust — Emerging Markets Portfolio
Annual Investment Adviser's Report
December 31, 2007 (unaudited)
January 28, 2008
Dear Shareholder:
For the twelve-month period ended December 31, 2007, Credit Suisse Trust — Emerging Markets Portfolio1 (the "Portfolio") had a gain of 29.44%, versus an increase of 39.78% for the Morgan Stanley Capital International Emerging Markets Free Index.2
Market Review: A volatile, yet strong market
For the year ended December 31, 2007, emerging markets showed very strong performance led by BRIC (Brazil, Russia, India and China) and some smaller markets. By sector, strongest performance was seen in materials, energy and industrials (particularly sub-segments related to infrastructure spending). In fact, information technology was the only sector to post negative returns for the year. Markets proved more volatile in Q3 and Q4 as the sub-prime fallout and broader credit market tightness translated into lower risk appetite and concerns over global growth, but overall, emerging market equities continued to outperform developed market peers.
Strategic Review
For the annual period ended December 31, 2007, the Portfolio returned 29.44%, as compared to 39.78% for the MSCI Emerging Markets Free Index. On a country basis, leading contributors to performance included an overweight to Turkey, where index-heavy banks strongly outperformed. Our country overweight and stock selection in Russia (focused on selected energy and wireless telecoms) was also positive, as were our overweights in Brazil and smaller markets such as Egypt.
The fund underperformed primarily due to our underweight in China, a market which showed very strong performance over the year and significant IPO activity, which resulted in a large increase in its benchmark weight within the index. Lack of exposure to some of the smaller cap names which were leading performers also detracted from performance. Stock selection in India and South Korea was also negative overall for the period.
Market Outlook
Going into 2008, emerging market equities face a more uncertain growth environment than in previous years. The stress in credit markets emanating from the fallout from the sub-prime crisis has placed greater uncertainty on the U.S. growth outlook for 2008 and hence global growth as a whole and has resulted in a sharp rise in risk aversion which has hit emerging market stocks
1
Credit Suisse Trust — Emerging Markets Portfolio
Annual Investment Adviser's Report (continued)
December 31, 2007 (unaudited)
disproportionately. While we do not expect the U.S. economy to slide into outright recession, growth risks are increasingly on the downside, which is already feeding into commodity prices and export growth within certain emerging markets.
Having said that, slowdown in the U.S. economy does not necessarily translate into significant slowdown globally as it did in the past. Europe and Japan are on a stronger macroeconomic footing while domestically-driven growth within the emerging markets remains strong and more durable than in previous cycles. Over the past decade, the adoption of market-based policies, trade and capital account liberalization, and strong capital expenditure have created longer-term sources of growth for much of the emerging world and, by extension, the global economy as a whole. As a result, emerging markets themselves are becoming growth leaders and now account for about 30% of the global economy compared to 23% a decade ago. In 2007, they are estimated to have contributed 47% of the world's growth. Moreover, most of this has been led by domestic growth, as investment spending has accelerated across many markets (China, Russia, India, Brazil, Indonesia, Cen tral Europe, Middle East) while consumption growth has entered a take-off phase as per capita GDPs have risen.
Meanwhile, macro and micro fundamentals within emerging markets remain supportive. Emerging markets were chained to the global events over the course of the 1990s due to weak external fundamentals and fixed exchange rates, which meant that any deterioration in global growth and liquidity had direct negative transmission effects on the real economy. The sharp improvement in external surpluses, fiscal, monetary and exchange rate management and greater policy continuity have put emerging markets on a stronger footing than in previous cycles. As a result, while developed market economies enter 2008 on shaky ground, emerging market countries — almost across the board — come into the current turbulence with multi-year positive growth momentum, record levels of investment and portfolio flows and lower debt levels. On the micro level, emerging market corporates are underleveraged compared to the past, while banks in general have limited ex posure to the type of financial engineering structures that have resulted in the liquidity crunch and capital losses amongst developed market financial institutions.
One area of concern has been the rising levels of inflation in much of the emerging world. Much of this is related to the global rise in food and energy prices which command a larger share of CPI baskets in the developing world (27% on average versus 15% in developed world CPI baskets). In addition, the complications of managing external liquidity and a build-up in reserves have resulted in higher monetary growth in much of the emerging world which could
2
Credit Suisse Trust — Emerging Markets Portfolio
Annual Investment Adviser's Report (continued)
December 31, 2007 (unaudited)
potentially threaten domestic price levels. In 2007, we saw several cases where monetary authorities unexpectedly hiked rates to deal with incipient inflation problems — South Africa, Chile, Taiwan, Mexico and of course China. While we do not see inflation as a serious issue for emerging markets generally as yet, there could continue to be monetary policy surprises that could affect individual market sentiment.
Given the more uncertain outlook for U.S. growth, growth visibility and uncorrelated growth are likely to be strong investment themes for 2008, which could take a variety of forms. The first of these is a focus on domestic demand, i.e. consumption and investment. On the consumption side, the reduction in real interest rates, growing disposable incomes and deepening financial intermediation have significantly increased the potential for domestic spending in a number of markets. Longer-term demographics favour consumption in the developing world, given the projected structure of working age population and growth in labour force. As countries progress up the development ladder, we expect developing market consumers to close the gap with peers in other markets, be it in the form of rising car ownership, greater overseas travel or enhanced demand for financial services products.
Infrastructure is also likely to remain an important theme. The improvement in fiscal balances over the past decade and greater macro stability have allowed governments in emerging markets to embark on longer-term infrastructure spending after severe neglect over the 1990s — a theme that did not go unnoticed by investors in 2007, as infrastructure-related sub-segments (construction and engineering, transport) posted very strong returns. We believe that the search for earnings visibility will continue to support the investment case for infrastructure-related stocks. Expansion in ports, airports, highways, rail systems and power generation capacity is a multi-year phenomenon that will continue to support overall growth, regardless of the global cycle — and could even be stepped up as a countercyclical policy tool should global growth falter more than expected.
Smaller markets and smaller caps have also shown themselves to be less correlated to the global cycle. Positive demographic and growth trends and economic liberalization make for a compelling investment case across many "frontier" markets in Africa, the former Soviet Union, Asia and the Gulf region. In the past, regulatory and liquidity constraints have limited foreign participation in these markets but over the past few years, we have seen greater liberalization in market access. Similarly, smaller cap stocks which tend to be more domestic in focus have also attracted greater investor attention.
While global flows to emerging markets could continue to prove volatile in the short term, we still believe that global asset allocation will continue to favor a
3
Credit Suisse Trust — Emerging Markets Portfolio
Annual Investment Adviser's Report (continued)
December 31, 2007 (unaudited)
shift toward emerging markets. With emerging markets now accounting for close to 50% of the world economy and continuing to increase as a proportion of global market cap (now 11%), they are simply becoming too important to ignore by global asset allocators and the current sell-off is creating attractive entry points into what we believe to be a longer-term structural growth story.
The Credit Suisse Emerging Markets Team
Neil Gregson
Annabel Betz
Elizabeth H. Eaton
Matthew J.K. Hickman
Stephen Parr
International investing entails special risk considerations, including currency fluctuations, lower liquidity, economic and political risks, and differences in accounting methods; these risks are generally heightened for emerging-market investments. The Portfolio may involve a greater degree of risk than other funds that seek capital growth by investing in larger, more developed markets.
In addition to historical information, this report contains forward-looking statements, which may concern, among other things, domestic and foreign market, industry and economic trends and developments and government regulation and their potential impact on the Portfolio's investments. These statements are subject to risks and uncertainties and actual trends, developments and regulations in the future and their impact on the Portfolio could be materially different from those projected, anticipated or implied. The Portfolio has no obligation to update or revise forward-looking statements.
4
Credit Suisse Trust — Emerging Markets Portfolio
Annual Investment Adviser's Report (continued)
December 31, 2007 (unaudited)
Comparison of Change in Value of $10,000 Investment in the
Credit Suisse Trust — Emerging Markets Portfolio1 and the
MSCI Emerging Markets Free Index2,3 for Ten Years.
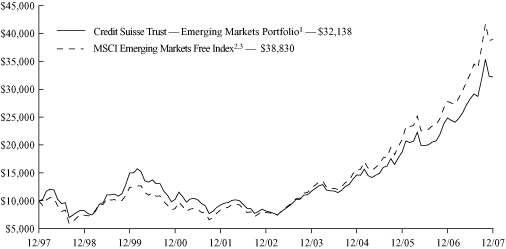
Average Annual Returns as of December 31, 20071
| 1 Year | | 5 Years | | 10 Years | | Since
Inception | |
| | 29.44 | % | | | 31.40 | % | | | 12.38 | % | | | 12.38 | % | |
Returns represent past performance and include change in share price and reinvestment of dividends and capital gains. Past performance cannot guarantee future results. The current performance of the Portfolio may be lower or higher than the figures shown. Returns and share price will fluctuate, and redemption value may be more or less than original cost. The performance results do not reflect the deduction of taxes that a shareholder would pay on portfolio distributions or the redemption of portfolio shares. Performance includes the effect of deducting expenses, but does not include charges and expenses attributable to any particular variable contract or plan. Accordingly, the Prospectus of the sponsoring Participating Insurance Company separate account or plan documents or ot her informational materials supplied by plan sponsors should be carefully reviewed for information on relevant charges and expenses. Excluding these charges and expenses from quotations of performance has the effect of increasing the performance quoted, and the effect of these charges should be considered when comparing performance to that of other mutual funds. Performance information current to the most recent month-end is available at www.credit-suisse.com/us.
1 Fee waivers and/or expense reimbursements may reduce expenses for the Portfolio, without which performance would be lower. Waivers and/or reimbursements may be discontinued at any time.
2 The Morgan Stanley Capital International Emerging Markets Free Index is a free float-adjusted market capitalization index that is designed to measure equity market performance in the global emerging markets. It is the exclusive property of Morgan Stanley Capital International Inc. Investors cannot invest directly in an index.
3 Performance for the benchmark is not available for the period beginning December 31, 1997 (commencement of operations). For that reason performance is shown for the period beginning January 1, 1998.
5
Credit Suisse Trust — Emerging Markets Portfolio
Annual Investment Adviser's Report (continued)
December 31, 2007 (unaudited)
Information About Your Portfolio's Expenses
As an investor of the Portfolio, you incur two types of costs: ongoing expenses and transaction costs. Ongoing expenses include management fees, distribution and service (12b-1) fees and other Portfolio expenses. Examples of transaction costs include sales charges (loads), redemption fees and account maintenance fees, which are not shown in this section and which would result in higher total expenses. The following table is intended to help you understand your ongoing expenses of investing in the Portfolio and to help you compare these expenses with the ongoing expenses of investing in other mutual funds. The table is based on an investment of $1,000 made at the beginning of the six month period ended December 31, 2007.
The table illustrates your Portfolio's expenses in two ways:
• Actual Portfolio Return. This helps you estimate the actual dollar amount of ongoing expenses paid on a $1,000 investment in the Portfolio using the Portfolio's actual return during the period. To estimate the expenses you paid over the period, simply divide your account value by $1,000 (for example, an $8,600 account value divided by $1,000 = 8.6), then multiply the result by the number in the "Expenses Paid per $1,000" line under the share class you hold.
• Hypothetical 5% Portfolio Return. This helps you to compare your Portfolio's ongoing expenses with those of other mutual funds using the Portfolio's actual expense ratio and a hypothetical rate of return of 5% per year before expenses. Examples using a 5% hypothetical fund return may be found in the shareholder reports of other mutual funds. The hypothetical account values and expenses may not be used to estimate the actual ending account balance or expenses you paid for the period.
Please note that the expenses shown in these tables are meant to highlight your ongoing expenses only and do not reflect any transaction costs, such as sales charges (loads) or redemption fees. If these transaction costs had been included, your costs would have been higher. The "Expenses Paid per $1,000" line of the tables is useful in comparing ongoing expenses only and will not help you determine the relative total expenses of owning different funds.
6
Credit Suisse Trust — Emerging Markets Portfolio
Annual Investment Adviser's Report (continued)
December 31, 2007 (unaudited)
Expenses and Value of a $1,000 Investment
for the six month period ended December 31, 2007
| Actual Portfolio Return | |
| Beginning Account Value 7/1/07 | | $ | 1,000.00 | | |
| Ending Account Value 12/31/07 | | $ | 1,137.20 | | |
| Expenses Paid per $1,000* | | $ | 7.27 | | |
| Hypothetical 5% Portfolio Return | |
| Beginning Account Value 7/1/07 | | $ | 1,000.00 | | |
| Ending Account Value 12/31/07 | | $ | 1,018.40 | | |
| Expenses Paid per $1,000* | | $ | 6.87 | | |
| Annualized Expense Ratios* | | | 1.35 | % | |
* Expenses are equal to the Portfolio's annualized expense ratio multiplied by the average account value over the period, multiplied by the number of days in the most recent fiscal half year period, then divided by 365.
The "Expenses Paid per $1,000" and the "Annualized Expense Ratios" in the tables are based on actual expenses paid by the Portfolio during the period, net of fee waivers and/or expense reimbursements. If those fee waivers and/or expense reimbursements had not been in effect, the Portfolio's actual expenses would have been higher. Expenses do not reflect additional charges and expenses that are, or may be, imposed under the variable contracts or plans. Such charges and expenses are described in the prospectus of the insurance company separate account or in the plan documents or other informational materials supplied by plan sponsors. The Portfolio's expenses should be considered with these charges and expenses in evaluating the overall cost of investing in the separate account.
For more information, please refer to the Portfolio's prospectus.
7
Credit Suisse Trust — Emerging Markets Portfolio
Annual Investment Adviser's Report (continued)
December 31, 2007 (unaudited)
SECTOR BREAKDOWN*
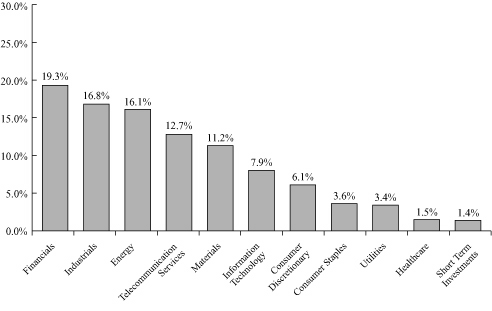
* Expressed as a percentage of total investments (excluding security lending collateral) and may vary over time.
8
Credit Suisse Trust — Emerging Markets Portfolio
Schedule of Investments
December 31, 2007
| | | Number of
Shares | | Value | |
| COMMON STOCKS (90.6%) | |
| Argentina (0.5%) | |
| Energy Equipment & Services (0.5%) | |
| Tenaris SA ADR | | | 19,200 | | | $ | 858,816 | | |
| TOTAL ARGENTINA | | | 858,816 | | |
| Austria (0.3%) | |
| Energy Equipment & Services (0.3%) | |
| C.A.T. oil AG* | | | 26,412 | | | | 581,174 | | |
| TOTAL AUSTRIA | | | 581,174 | | |
| Brazil (7.3%) | |
| Airlines (0.2%) | |
| Gol-Linhas Aereas Inteligentes SA ADR§ | | | 14,500 | | | | 359,890 | | |
| Banks (0.5%) | |
| Unibanco - Uniao de Bancos Brasileiros SA GDR | | | 6,800 | | | | 949,552 | | |
| Beverages (0.2%) | |
| Companhia de Bebidas das Americas ADR§ | | | 4,140 | | | | 281,520 | | |
| Diversified Telecommunication Services (0.5%) | |
| Brasil Telecom Participacoes SA | | | 32,359 | | | | 845,333 | | |
| Electric Utilities (0.8%) | |
| Obrascon Huarte Lain Brasil SA | | | 52,800 | | | | 667,119 | | |
| Terna Participacoes SA | | | 49,700 | | | | 865,562 | | |
| | | | 1,532,681 | | |
| Food Products (0.2%) | |
| Cosan SA Industria e Comercio | | | 27,200 | | | | 317,843 | | |
| Oil & Gas (2.6%) | |
| Petroleo Brasileiro SA - Petrobras ADR | | | 48,400 | | | | 4,657,048 | | |
| Real Estate (0.8%) | |
| Cyrela Brazil Realty SA | | | 36,000 | | | | 489,438 | | |
| PDG Realty SA Empreendimentos e Participacoes | | | 68,300 | | | | 959,270 | | |
| | | | 1,448,708 | | |
| Specialty Retail (1.2%) | |
| B2W Compania Global do Varejo | | | 31,500 | | | | 1,256,461 | | |
| Lojas Renner SA | | | 34,000 | | | | 687,640 | | |
| Redecard SA | | | 16,227 | | | | 262,549 | | |
| | | | 2,206,650 | | |
| Transportation Infrastructure (0.3%) | |
| Wilson Sons, Ltd. BDR* | | | 41,349 | | | | 602,813 | | |
| TOTAL BRAZIL | | | 13,202,038 | | |
| Chile (0.3%) | |
| Electric Utilities (0.3%) | |
| Enersis SA ADR§ | | | 34,500 | | | | 553,035 | | |
| TOTAL CHILE | | | 553,035 | | |
See Accompanying Notes to Financial Statements.
9
Credit Suisse Trust — Emerging Markets Portfolio
Schedule of Investments (continued)
December 31, 2007
| | | Number of
Shares | | Value | |
| COMMON STOCKS | |
| China | |
| Airlines (1.1%) | |
| Air China, Ltd. Series H§ | | | 792,000 | | | $ | 1,162,928 | | |
| China Eastern Airlines Corporation, Ltd. Series H*§ | | | 881,597 | | | | 857,254 | | |
| | | | 2,020,182 | | |
| Banks (1.8%) | |
| China Construction Bank Series H§ | | | 1,786,400 | | | | 1,498,255 | | |
| Industrial & Commercial Bank of China Series H§ | | | 2,478,500 | | | | 1,756,342 | | |
| | | | 3,254,597 | | |
| Electrical Equipment (1.0%) | |
| Dongfang Electrical Machinery Company, Ltd. Series H | | | 226,000 | | | | 1,877,145 | | |
| Insurance (2.1%) | |
| China Life Insurance Company, Ltd. Series H§ | | | 418,100 | | | | 2,137,102 | | |
| Ping An Insurance Group Company, Ltd. Series H§ | | | 147,000 | | | | 1,554,379 | | |
| | | | 3,691,481 | | |
| Metals & Mining (0.7%) | |
| Maanshan Iron & Steel Company, Ltd. Series H§ | | | 850,019 | | | | 555,867 | | |
| Yanzhou Coal Mining Company, Ltd. Series H§ | | | 375,082 | | | | 724,664 | | |
| | | | 1,280,531 | | |
| Oil & Gas (1.6%) | |
| China Petroleum & Chemical Corp. Series H | | | 584,400 | | | | 864,872 | | |
| PetroChina Company, Ltd. Series H | | | 1,116,100 | | | | 1,965,833 | | |
| | | | 2,830,705 | | |
| Real Estate (1.1%) | |
| Beijing Capital Land, Ltd. Series H | | | 1,839,001 | | | | 1,105,327 | | |
| Shimao Property Holdings, Ltd.§ | | | 364,000 | | | | 911,955 | | |
| | | | 2,017,282 | | |
| Textiles & Apparel (0.8%) | |
| China Hongxing Sports, Ltd.§ | | | 1,123,981 | | | | 737,607 | | |
| Sino Techfibre, Ltd. | | | 967,300 | | | | 662,010 | | |
| | | | 1,399,617 | | |
| TOTAL CHINA | | | 18,371,540 | | |
| Colombia (0.3%) | |
| Diversified Financials (0.3%) | |
| Suramericana de Inversiones SA | | | 57,200 | | | | 565,975 | | |
| TOTAL COLOMBIA | | | 565,975 | | |
| Egypt (1.4%) | |
| Construction & Engineering (0.9%) | |
| Orascom Construction Industries | | | 15,900 | | | | 1,642,291 | | |
| Diversified Telecommunication Services (0.5%) | |
| Telecom Egypt | | | 246,000 | | | | 931,430 | | |
| TOTAL EGYPT | | | 2,573,721 | | |
See Accompanying Notes to Financial Statements.
10
Credit Suisse Trust — Emerging Markets Portfolio
Schedule of Investments (continued)
December 31, 2007
| | | Number of
Shares | | Value | |
| COMMON STOCKS | |
| Hong Kong (4.9%) | |
| Oil & Gas (1.1%) | |
| CNOOC, Ltd. | | | 1,229,500 | | | $ | 2,064,787 | | |
| Real Estate (0.3%) | |
| China Resources Land, Ltd. | | | 237,542 | | | | 517,173 | | |
| Wireless Telecommunication Services (3.5%) | |
| China Mobile, Ltd. | | | 356,344 | | | | 6,205,551 | | |
| TOTAL HONG KONG | | | 8,787,511 | | |
| India (6.8%) | |
| Automobiles (0.5%) | |
| Mahindra & Mahindra, Ltd. | | | 45,700 | | | | 982,080 | | |
| Chemicals (1.3%) | |
| Reliance Industries, Ltd. | | | 33,010 | | | | 2,405,680 | | |
| Diversified Financials (0.8%) | |
| ICICI Bank, Ltd. ADR | | | 24,900 | | | | 1,531,350 | | |
| Diversified Telecommunication Services (1.0%) | |
| Bharti Airtel, Ltd.* | | | 68,574 | | | | 1,715,211 | | |
| Electrical Equipment (1.0%) | |
| Bharat Heavy Electricals, Ltd. | | | 26,400 | | | | 1,718,122 | | |
| Gas Utilities (0.8%) | |
| Gail India, Ltd. | | | 108,200 | | | | 1,469,172 | | |
| Industrial Conglomerates (0.8%) | |
| Grasim Industries, Ltd. | | | 15,100 | | | | 1,374,763 | | |
| IT Consulting & Services (0.6%) | |
| Infosys Technologies, Ltd. ADR§ | | | 23,800 | | | | 1,079,568 | | |
| TOTAL INDIA | | | 12,275,946 | | |
| Indonesia (2.1%) | |
| Banks (1.0%) | |
| PT Bank Central Asia | | | 1,380,000 | | | | 1,057,480 | | |
| PT Bank Mandiri | | | 2,339,631 | | | | 857,491 | | |
| | | | 1,914,971 | | |
| Construction & Engineering (0.3%) | |
| PT Truba Alam Manunggal Engineering TBK* | | | 3,700,000 | | | | 553,382 | | |
| Industrial Conglomerates (0.3%) | |
| PT Bakrie & Brothers TBK* | | | 16,500,000 | | | | 498,331 | | |
| Wireless Telecommunication Services (0.5%) | |
| PT Telekomunikasi Indonesia | | | 803,900 | | | | 851,041 | | |
| TOTAL INDONESIA | | | 3,817,725 | | |
See Accompanying Notes to Financial Statements.
11
Credit Suisse Trust — Emerging Markets Portfolio
Schedule of Investments (continued)
December 31, 2007
| | | Number of
Shares | | Value | |
| COMMON STOCKS | |
| Israel (1.0%) | |
| Electronic Equipment & Instruments (0.3%) | |
| Orbotech, Ltd.*§ | | | 25,100 | | | $ | 440,505 | | |
| Pharmaceuticals (0.7%) | |
| Teva Pharmaceutical Industries, Ltd. ADR | | | 27,600 | | | | 1,282,848 | | |
| TOTAL ISRAEL | | | 1,723,353 | | |
| Kazakhstan (1.2%) | |
| Oil & Gas (1.2%) | |
| KazMunaiGas Exploration Production GDR Rule 144A‡ | | | 68,300 | | | | 2,117,300 | | |
| TOTAL KAZAKHSTAN | | | 2,117,300 | | |
| Malaysia (1.4%) | |
| Construction & Engineering (0.2%) | |
| Muhibbah Engineering Berhad | | | 254,900 | | | | 287,272 | | |
| Diversified Financials (0.3%) | |
| AMMB Holdings Berhad | | | 509,400 | | | | 580,971 | | |
| Hotels, Restaurants & Leisure (0.3%) | |
| Resorts World Berhad | | | 498,300 | | | | 580,736 | | |
| Industrial Conglomerates (0.6%) | |
| IOI Corporation Berhad | | | 439,075 | | | | 1,021,626 | | |
| TOTAL MALAYSIA | | | 2,470,605 | | |
| Mexico (4.8%) | |
| Beverages (0.4%) | |
| Fomento Economico Mexicano SAB de CV ADR | | | 18,731 | | | | 714,962 | | |
| Construction Materials (0.6%) | |
| Cemex SA de CV ADR*§ | | | 40,249 | | | | 1,040,437 | | |
| Household Durables (0.3%) | |
| Consorcio ARA SA de CV§ | | | 460,200 | | | | 514,411 | | |
| Metals & Mining (0.4%) | |
| Grupo Mexico SA de CV Series B | | | 114,450 | | | | 719,356 | | |
| Multiline Retail (0.4%) | |
| Wal-Mart de Mexico SAB de CV ADR§ | | | 18,000 | | | | 621,000 | | |
| Real Estate (0.6%) | |
| Urbi Desarrollos Urbanos SA de CV*§ | | | 307,772 | | | | 1,063,101 | | |
| Transportation Infrastructure (0.4%) | |
| Grupo Aeroportuario del Pacifico SA de CV ADR | | | 17,300 | | | | 772,099 | | |
| Wireless Telecommunication Services (1.7%) | |
| America Movil SAB de CV ADR Series L | | | 37,074 | | | | 2,275,973 | | |
| America Movil SAB de CV Series L | | | 266,342 | | | | 817,502 | | |
| | | | 3,093,475 | | |
| TOTAL MEXICO | | | 8,538,841 | | |
See Accompanying Notes to Financial Statements.
12
Credit Suisse Trust — Emerging Markets Portfolio
Schedule of Investments (continued)
December 31, 2007
| | | Number of
Shares | | Value | |
| COMMON STOCKS | |
| Poland (0.5%) | |
| Banks (0.5%) | |
| Powszechna Kasa Oszczednosci Bank Polski SA | | | 40,000 | | | $ | 852,717 | | |
| TOTAL POLAND | | | 852,717 | | |
| Russia (12.8%) | |
| Banks (1.9%) | |
| Sberbank RF | | | 797,000 | | | | 3,357,464 | | |
| Electric Utilities (0.7%) | |
| OGK-5 | | | 383,394 | | | | 66,833 | | |
| RAO Unified Energy System of Russia* | | | 930,900 | | | | 1,214,668 | | |
| TGK-5 JSC | | | 12,655,572 | | | | 11,390 | | |
| | | | 1,292,891 | | |
| Industrial Conglomerates (0.9%) | |
| Mining and Metallurgical Company Norilsk Nickel ADR | | | 5,700 | | | | 1,543,275 | | |
| Metals & Mining (0.3%) | |
| Evraz Group SA GDR | | | 6,500 | | | | 503,750 | | |
| Oil & Gas (5.9%) | |
| Gazprom | | | 514,914 | | | | 7,203,206 | | |
| Gazprom ADR | | | 15,700 | | | | 887,157 | | |
| Lukoil ADR | | | 30,100 | | | | 2,603,650 | | |
| | | | 10,694,013 | | |
| Pharmaceuticals (0.8%) | |
| Pharmstandard* | | | 5,242 | | | | 376,113 | | |
| Pharmstandard GDR* | | | 38,000 | | | | 1,045,000 | | |
| | | | 1,421,113 | | |
| Wireless Telecommunication Services (2.3%) | |
| Mobile Telesystems | | | 115,000 | | | | 1,752,893 | | |
| OAO Vimpel Communications ADR | | | 57,845 | | | | 2,406,352 | | |
| | | | 4,159,245 | | |
| TOTAL RUSSIA | | | 22,971,751 | | |
| Singapore (1.3%) | |
| Energy Equipment & Services (0.4%) | |
| First Resources, Ltd.* | | | 836,120 | | | | 720,268 | | |
| Food Products (0.7%) | |
| Golden Agri-Resources, Ltd. | | | 500,000 | | | | 728,188 | | |
| Indofood Agri Resources, Ltd.* | | | 300,000 | | | | 498,595 | | |
| | | | 1,226,783 | | |
| Marine (0.2%) | |
| Cosco Corp. (Singapore), Ltd. | | | 116,699 | | | | 460,719 | | |
| TOTAL SINGAPORE | | | 2,407,770 | | |
See Accompanying Notes to Financial Statements.
13
Credit Suisse Trust — Emerging Markets Portfolio
Schedule of Investments (continued)
December 31, 2007
| | | Number of
Shares | | Value | |
| COMMON STOCKS | |
| South Africa (5.4%) | |
| Banks (0.7%) | |
| FirstRand, Ltd. | | | 416,552 | | | $ | 1,201,520 | | |
| Construction & Engineering (0.6%) | |
| Group Five, Ltd. | | | 63,300 | | | | 507,632 | | |
| Murray & Roberts Holdings, Ltd. | | | 39,000 | | | | 578,746 | | |
| | | | 1,086,378 | | |
| Construction Materials (0.6%) | |
| Pretoria Portland Cement Company, Ltd. | | | 164,819 | | | | 1,053,264 | | |
| Food Products (0.4%) | |
| Tiger Brands, Ltd. | | | 28,800 | | | | 706,742 | | |
| Insurance (0.5%) | |
| Discovery Holdings, Ltd. | | | 1 | | | | 4 | | |
| Liberty Group, Ltd. | | | 66,300 | | | | 871,027 | | |
| | | | 871,031 | | |
| Metals & Mining (0.9%) | |
| Anglo Platinum, Ltd. | | | 11,500 | | | | 1,696,416 | | |
| Oil & Gas (0.5%) | |
| Sasol | | | 16,500 | | | | 817,632 | | |
| Wireless Telecommunication Services (1.2%) | |
| MTN Group, Ltd. | | | 119,600 | | | | 2,240,067 | | |
| TOTAL SOUTH AFRICA | | | 9,673,050 | | |
| South Korea (14.1%) | |
| Banks (1.6%) | |
| Kookmin Bank* | | | 23,010 | | | | 1,696,159 | | |
| Shinhan Financial Group Company, Ltd.* | | | 21,396 | | | | 1,213,684 | | |
| | | | 2,909,843 | | |
| Beverages (0.4%) | |
| Hite Brewery Company, Ltd. | | | 4,700 | | | | 710,589 | | |
| Construction & Engineering (2.3%) | |
| GS Engineering & Construction Corp. | | | 11,610 | | | | 1,909,145 | | |
| Hyundai Development Co. | | | 13,760 | | | | 1,330,196 | | |
| Hyundai Engineering & Construction Company, Ltd.*§ | | | 10,000 | | | | 929,660 | | |
| | | | 4,169,001 | | |
| Diversified Financials (0.8%) | |
| Woori Investment & Securities Company, Ltd. | | | 48,900 | | | | 1,358,377 | | |
| Machinery (2.8%) | |
| Daewoo Shipbuilding & Marine Engineering Company, Ltd.* | | | 31,000 | | | | 1,690,975 | | |
| Hyundai Heavy Industries Company, Ltd.* | | | 5,600 | | | | 2,610,161 | | |
| Pyeong San Company, Ltd.*§ | | | 15,000 | | | | 803,115 | | |
| | | | 5,104,251 | | |
See Accompanying Notes to Financial Statements.
14
Credit Suisse Trust — Emerging Markets Portfolio
Schedule of Investments (continued)
December 31, 2007
| | | Number of
Shares | | Value | |
| COMMON STOCKS | |
| South Korea | |
| Metals & Mining (1.7%) | |
| POSCO ADR§ | | | 19,900 | | | $ | 2,993,159 | | |
| Multiline Retail (2.1%) | |
| Hyundai Department Store Company, Ltd. | | | 16,329 | | | | 2,057,888 | | |
| Shinsegae Company, Ltd.* | | | 2,350 | | | | 1,810,905 | | |
| | | | 3,868,793 | | |
| Semiconductor Equipment & Products (2.4%) | |
| Samsung Electronics Company, Ltd. | | | 7,261 | | | | 4,273,081 | | |
| TOTAL SOUTH KOREA | | | 25,387,094 | | |
| Taiwan (9.8%) | |
| Chemicals (0.7%) | |
| Formosa Plastics Corp. | | | 436,000 | | | | 1,213,670 | | |
| Computers & Peripherals (0.7%) | |
| Acer, Inc. | | | 236,400 | | | | 458,232 | | |
| Wistron Corp. | | | 476,424 | | | | 875,039 | | |
| | | | 1,333,271 | | |
| Construction Materials (1.1%) | |
| Asia Cement Corp. | | | 1,360,908 | | | | 1,971,909 | | |
| Diversified Financials (0.8%) | |
| Yuanta Financial Holdings Company, Ltd.* | | | 2,260,900 | | | | 1,458,677 | | |
| Electronic Equipment & Instruments (2.4%) | |
| Delta Electronics, Inc. | | | 145,270 | | | | 491,904 | | |
| Hon Hai Precision Industry Company, Ltd. | | | 456,395 | | | | 2,812,980 | | |
| InnoLux Display Corp. | | | 298,227 | | | | 994,216 | | |
| | | | 4,299,100 | | |
| Food Products (0.9%) | |
| Uni-President Enterprises Corp. | | | 1,276,770 | | | | 1,703,697 | | |
| Industrial Conglomerates (0.5%) | |
| Far Eastern Textile, Ltd. | | | 752,000 | | | | 874,098 | | |
| Insurance (0.5%) | |
| Cathay Financial Holding Company, Ltd. | | | 408,043 | | | | 843,115 | | |
| Metals & Mining (0.6%) | |
| China Steel Corp. | | | 790,559 | | | | 1,051,656 | | |
| Semiconductor Equipment & Products (1.6%) | |
| MediaTek, Inc. | | | 86,000 | | | | 1,102,335 | | |
| Taiwan Semiconductor Manufacturing Company, Ltd. | | | 928,596 | | | | 1,760,606 | | |
| | | | 2,862,941 | | |
| TOTAL TAIWAN | | | 17,612,134 | | |
See Accompanying Notes to Financial Statements.
15
Credit Suisse Trust — Emerging Markets Portfolio
Schedule of Investments (continued)
December 31, 2007
| | | Number of
Shares | | Value | |
| COMMON STOCKS | |
| Thailand (1.3%) | |
| Banks (0.7%) | |
| Kasikornbank Public Company, Ltd. | | | 295,000 | | | $ | 758,930 | | |
| Siam City Bank Public Company, Ltd. | | | 987,100 | | | | 436,115 | | |
| | | | 1,195,045 | | |
| Construction & Engineering (0.6%) | |
| Italian - Thai Development Public Company, Ltd.* | | | 4,500,000 | | | | 1,084,485 | | |
| TOTAL THAILAND | | | 2,279,530 | | |
| Turkey (2.4%) | |
| Banks (1.4%) | |
| Turkiye Garanti Bankasi AS | | | 170,233 | | | | 1,519,062 | | |
| Turkiye Is Bankasi Series C | | | 147,000 | | | | 918,240 | | |
| | | | 2,437,302 | | |
| Commercial Services & Supplies (0.4%) | |
| TAV Havalimanlari Holding AS* | | | 83,250 | | | | 758,220 | | |
| Wireless Telecommunication Services (0.6%) | |
| Turkcell Iletisim Hizmetleri AS§ | | | 102,800 | | | | 1,129,124 | | |
| TOTAL TURKEY | | | 4,324,646 | | |
| Zambia (0.5%) | |
| Metals & Mining (0.5%) | |
| First Quantum Minerals, Ltd. | | | 11,000 | | | | 948,143 | | |
| TOTAL ZAMBIA | | | 948,143 | | |
| TOTAL COMMON STOCKS (Cost $101,508,034) | | | 162,894,415 | | |
| PREFERRED STOCKS (8.0%) | |
| Brazil (8.0%) | |
| Banks (1.4%) | |
| Banco Bradesco SA | | | 34,300 | | | | 1,097,407 | | |
| Banco Itau Holding Financeira SA | | | 59,600 | | | | 1,523,483 | | |
| | | | 2,620,890 | | |
| Beverages (0.4%) | |
| Companhia de Bebidas das Americas ADR§ | | | 10,200 | | | | 724,506 | | |
| Diversified Telecommunication Services (1.0%) | |
| Telemar Norte Leste SA Class A | | | 24,600 | | | | 946,685 | | |
| Telesp - Telecomunicacoes de Sao Paulo SA | | | 32,400 | | | | 822,742 | | |
| | | | 1,769,427 | | |
| Industrial Conglomerates (0.6%) | |
| Bradespar SA | | | 39,600 | | | | 1,058,966 | | |
| Itausa - Investimentos Itau SA | | | 2,027 | | | | 13,381 | | |
| | | | 1,072,347 | | |
See Accompanying Notes to Financial Statements.
16
Credit Suisse Trust — Emerging Markets Portfolio
Schedule of Investments (continued)
December 31, 2007
| | | Number of
Shares | | Value | |
| PREFERRED STOCKS | |
| Brazil | |
| Metals & Mining (1.9%) | |
| Companhia Vale do Rio Doce ADR | | | 119,800 | | | $ | 3,352,004 | | |
| Oil & Gas (2.0%) | |
| Petroleo Brasileiro SA - Petrobras ADR | | | 30,800 | | | | 3,549,392 | | |
| Road & Rail (0.7%) | |
| ALL America Latina Logistica | | | 96,000 | | | | 1,242,607 | | |
| TOTAL PREFERRED STOCKS (Cost $4,288,844) | | | 14,331,173 | | |
| RIGHTS (0.0%) | |
| Brazil (0.0%) | |
| Food Products (0.0%) | |
| Cosan SA Industria e Comercio, strike price BRL 21.00, expires 01/07/08 | | | 11,851 | | | | — | | |
| TOTAL BRAZIL | | | — | | |
| Thailand (0.0%) | |
| Diversified Telecommunication Services (0.0%) | |
| True Corporation Public Company, Ltd. strike price THB 20.60, expires 04/03/08^ | | | 50,021 | | | | — | | |
| TOTAL THAILAND | | | — | | |
| TOTAL RIGHTS (Cost $0) | | | — | | |
| SHORT-TERM INVESTMENTS (9.7%) | |
| State Street Navigator Prime Portfolio§§ | | | 14,984,938 | | | | 14,984,938 | | |
| | | Par
(000) | | | |
| State Street Bank and Trust Co. Euro Time Deposit, 3.100%, 1/02/08 | | $ | 2,534 | | | | 2,534,000 | | |
| TOTAL SHORT-TERM INVESTMENTS (Cost $17,518,938) | | | 17,518,938 | | |
| TOTAL INVESTMENTS AT VALUE (108.3%) (Cost $123,315,816) | | | 194,744,526 | | |
| LIABILITIES IN EXCESS OF OTHER ASSETS (-8.3%) | | | (14,927,872 | ) | |
| NET ASSETS (100.0%) | | $ | 179,816,654 | | |
INVESTMENT ABBREVIATIONS
ADR = American Depositary Receipt
BDR = Brazilian Depositary Receipt
GDR = Global Depositary Receipt
* Non-income producing security.
‡ Security exempt from registration under Rule 144A of the Securities Act of 1933. These securities may be resold in transactions exempt from registration, normally to qualified institutional buyers. At December 31, 2007, these securities amounted to a value of $2,117,300 or 1.2% of net assets.
^ Not readily marketable security; security is valued at fair value as determined in good faith by, or under the direction of, the Board of Trustees.
§ Security or portion thereof is out on loan.
§§ Represents security purchased with cash collateral received for securities on loan.
See Accompanying Notes to Financial Statements.
17
Credit Suisse Trust — Emerging Markets Portfolio
Statement of Assets and Liabilities
December 31, 2007
| Assets | |
Investments at value, including collateral for securities on loan of $14,984,938
(Cost $123,315,816) (Note 2) | | $ | 194,744,5261 | | |
| Cash | | | 897 | | |
| Foreign currency at value (cost $180,084) | | | 180,627 | | |
| Dividend and interest receivable | | | 276,432 | | |
| Receivable for portfolio shares sold | | | 232,847 | | |
| Prepaid expenses and other assets | | | 17,785 | | |
| Total Assets | | | 195,453,114 | | |
| Liabilities | |
| Advisory fee payable (Note 3) | | | 190,041 | | |
| Administrative services fee payable (Note 3) | | | 18,169 | | |
| Payable upon return of securities loaned (Note 2) | | | 14,984,938 | | |
| Payable for portfolio shares redeemed | | | 244,860 | | |
| Deferred foreign tax liability (Note 2) | | | 106,971 | | |
| Trustees' fee payable | | | 804 | | |
| Other accrued expenses payable | | | 90,677 | | |
| Total Liabilities | | | 15,636,460 | | |
| Net Assets | |
| Capital stock, $0.001 par value (Note 6) | | | 7,627 | | |
| Paid-in capital (Note 6) | | | 50,465,009 | | |
| Undistributed net investment income | | | 1,201,133 | | |
| Accumulated net realized gain from investments and foreign currency transactions | | | 56,816,943 | | |
| Net unrealized appreciation from investments and foreign currency translations | | | 71,325,942 | | |
| Net Assets | | $ | 179,816,654 | | |
| Shares outstanding | | | 7,626,907 | | |
| Net asset value, offering price, and redemption price per share | | $ | 23.58 | | |
1 Including $14,273,298 of securities on loan.
See Accompanying Notes to Financial Statements.
18
Credit Suisse Trust — Emerging Markets Portfolio
Statement of Operations
For the Year Ended December 31, 2007
| Investment Income (Note 2) | |
| Dividends | | $ | 4,450,440 | | |
| Interest | | | 167,200 | | |
| Securities lending | | | 112,501 | | |
| Foreign taxes withheld | | | (471,330 | ) | |
| Total investment income | | | 4,258,811 | | |
| Expenses | |
| Investment advisory fees (Note 3) | | | 2,183,988 | | |
| Administrative services fees (Note 3) | | | 228,182 | | |
| Custodian fees | | | 184,046 | | |
| Interest expense (Note 4) | | | 36,232 | | |
| Audit and tax fees | | | 34,652 | | |
| Trustees' fees | | | 19,852 | | |
| Legal fees | | | 15,931 | | |
| Printing fees (Note 3) | | | 14,657 | | |
| Insurance expense | | | 8,111 | | |
| Transfer agent fees | | | 4,931 | | |
| Commitment fees (Note 4) | | | 4,363 | | |
| Miscellaneous expense | | | 28,095 | | |
| Total expenses | | | 2,763,040 | | |
| Less: fees waived (Note 3) | | | (293,555 | ) | |
| Net expenses | | | 2,469,485 | | |
| Net investment income | | | 1,789,326 | | |
| Net Realized and Unrealized Gain (Loss) from Investments and Foreign Currency Related Items | |
| Net realized gain from investments (net of Foreign Capital Gain Tax $64,182) | | | 57,931,762 | | |
| Net realized loss from foreign currency transactions | | | (394,205 | ) | |
| Net change in unrealized appreciation (depreciation) from investments | | | (14,167,971 | ) | |
| Net change in unrealized appreciation (depreciation) from foreign currency translations | | | 137,608 | | |
| Net realized and unrealized gain from investments and foreign currency related items | | | 43,507,194 | | |
| Net increase in net assets resulting from operations | | $ | 45,296,520 | | |
See Accompanying Notes to Financial Statements.
19
Credit Suisse Trust — Emerging Markets Portfolio
Statements of Changes in Net Assets
| | | For the Year
Ended
December 31, 2007 | | For the Year
Ended
December 31, 2006 | |
| From Operations | |
| Net investment income | | $ | 1,789,326 | | | $ | 2,384,682 | | |
| Net realized gain from investments and foreign currency transactions | | | 57,537,557 | | | | 24,141,498 | | |
Net change in unrealized appreciation (depreciation)
from investments and foreign currency translations | | | (14,030,363 | ) | | | 32,665,333 | | |
| Net increase in net assets resulting from operations | | | 45,296,520 | | | | 59,191,513 | | |
| From Dividends and Distributions | |
| Dividends from net investment income | | | (2,363,281 | ) | | | (1,180,743 | ) | |
| Distributions from net realized gains | | | (24,399,983 | ) | | | (2,900,006 | ) | |
| Net decrease in net assets resulting from dividends and distributions | | | (26,763,264 | ) | | | (4,080,749 | ) | |
| From Capital Share Transactions (Note 6) | |
| Proceeds from sale of shares | | | 40,554,090 | | | | 53,674,806 | | |
| Reinvestment of dividends and distributions | | | 26,763,264 | | | | 4,080,749 | | |
| Net asset value of shares redeemed | | | (148,352,555 | ) | | | (56,737,879 | ) | |
| Net increase (decrease) in net assets from capital share transactions | | | (81,035,201 | ) | | | 1,017,676 | | |
| Net increase (decrease) in net assets | | | (62,501,945 | ) | | | 56,128,440 | | |
| Net Assets | |
| Beginning of year | | | 242,318,599 | | | | 186,190,159 | | |
| End of year | | $ | 179,816,654 | | | $ | 242,318,599 | | |
| Undistributed net investment income | | $ | 1,201,133 | | | $ | 1,830,087 | | |
See Accompanying Notes to Financial Statements.
20
Credit Suisse Trust — Emerging Markets Portfolio
Financial Highlights
(For a Share of the Portfolio Outstanding Throughout Each Year)
| | | For The Year Ended December 31, | |
| | | 2007 | | 2006 | | 2005 | | 2004 | | 2003 | |
| Per share data | |
| Net asset value, beginning of year | | $ | 21.85 | | | $ | 16.82 | | | $ | 13.25 | | | $ | 10.63 | | | $ | 7.44 | | |
| INVESTMENT OPERATIONS | |
| Net investment income | | | 0.37 | | | | 0.21 | | | | 0.14 | | | | 0.12 | | | | 0.07 | | |
Net gain on investments
and foreign currency related items
(both realized and unrealized) | | | 5.58 | | | | 5.19 | | | | 3.53 | | | | 2.53 | | | | 3.12 | | |
| Total from investment operations | | | 5.95 | | | | 5.40 | | | | 3.67 | | | | 2.65 | | | | 3.19 | | |
| LESS DIVIDENDS AND DISTRIBUTIONS | |
| Dividends from net investment income | | | (0.37 | ) | | | (0.11 | ) | | | (0.10 | ) | | | (0.03 | ) | | | — | | |
| Distributions from net realized gains | | | (3.85 | ) | | | (0.26 | ) | | | — | | | | — | | | | — | | |
| Total dividends and distributions | | | (4.22 | ) | | | (0.37 | ) | | | (0.10 | ) | | | (0.03 | ) | | | — | | |
| Net asset value, end of year | | $ | 23.58 | | | $ | 21.85 | | | $ | 16.82 | | | $ | 13.25 | | | $ | 10.63 | | |
| Total return1 | | | 29.44 | % | | | 32.51 | % | | | 27.84 | % | | | 25.02 | % | | | 42.88 | % | |
| RATIOS AND SUPPLEMENTAL DATA | |
| Net assets, end of year (000s omitted) | | $ | 179,817 | | | $ | 242,319 | | | $ | 186,190 | | | $ | 115,224 | | | $ | 73,782 | | |
| Ratio of expenses to average net assets | | | 1.30 | % | | | 1.36 | % | | | 1.40 | % | | | 1.40 | % | | | 1.40 | % | |
| Ratio of net investment income to average net assets | | | 0.94 | % | | | 1.11 | % | | | 1.11 | % | | | 1.21 | % | | | 0.94 | % | |
Decrease reflected in above operating expense
ratios due to waivers/reimbursements | | | 0.15 | % | | | 0.23 | % | | | 0.25 | % | | | 0.29 | % | | | 0.41 | % | |
| Portfolio turnover rate | | | 62 | % | | | 80 | % | | | 77 | % | | | 121 | % | | | 167 | % | |
1 Total returns are historical and assume changes in share price and reinvestment of all dividends and distributions. Had certain expenses not been reduced during the years shown, total returns would have been lower. Total returns do not reflect charges and expenses attributable to any particular variable contract or plan.
See Accompanying Notes to Financial Statements.
21
Credit Suisse Trust — Emerging Markets Portfolio
Notes to Financial Statements
December 31, 2007
Note 1. Organization
Credit Suisse Trust (the "Trust") is an open-end management investment company registered under the Investment Company Act of 1940, as amended (the "1940 Act"), and currently offers eight managed investment portfolios of which one, the Emerging Markets Portfolio (the "Portfolio"), is included in this report. The Portfolio is a diversified investment fund that seeks long-term growth of capital. Shares of the Portfolio are not available directly to individual investors but may be offered only through (a) variable annuity contracts and variable life insurance contracts offered by separate accounts of certain insurance companies and (b) tax-qualified pension and retirement plans. The Portfolio may not be available in connection with a particular contract or plan. The Trust was organized under the laws of The Commonwealth of Massachusetts as a business trust on March 15, 1995.
Note 2. Significant Accounting Policies
A) SECURITY VALUATION — The net asset value of the Portfolio is determined daily as of the close of regular trading on the New York Stock Exchange, Inc. (the "Exchange") on each day the Exchange is open for business. Equity investments are valued at market value, which is generally determined using the closing price on the exchange or market on which the security is primarily traded at the time of valuation (the "Valuation Time"). If no sales are reported, equity investments are generally valued at the most recent bid quotation as of the Valuation Time or at the lowest asked quotation in the case of a short sale of securities. Debt securities with a remaining maturity greater than 60 days are valued in accordance with the price supplied by a pricing service, which may use a matrix, formula or other objective method that takes into consideration market indices, yield curves and other specific adjustments. Debt obligations that will matur e in 60 days or less are valued on the basis of amortized cost, which approximates market value, unless it is determined that using this method would not represent fair value. Investments in mutual funds are valued at the mutual fund's closing net asset value per share on the day of valuation. Securities and other assets for which market quotations are not readily available, or whose values have been materially affected by events occurring before the Portfolio's Valuation Time but after the close of the securities' primary markets, are valued at fair value as determined in good faith by, or under the direction of, the Board of Trustees under procedures established by the Board of Trustees. The Portfolio may utilize a service provided by an independent third party which has been approved by the Board of Trustees to fair value certain securities. When fair-value pricing is employed,
22
Credit Suisse Trust — Emerging Markets Portfolio
Notes to Financial Statements (continued)
December 31, 2007
Note 2. Significant Accounting Policies
the prices of securities used by a portfolio to calculate its net asset value may differ from quoted or published prices for the same securities.
B) FOREIGN CURRENCY TRANSACTIONS — The books and records of the Portfolio are maintained in U.S. dollars. Transactions denominated in foreign currencies are recorded at the current prevailing exchange rates. All assets and liabilities denominated in foreign currencies are translated into U.S. dollar amounts at the current exchange rate at the end of the period. Translation gains or losses resulting from changes in the exchange rate during the reporting period and realized gains and losses on the settlement of foreign currency transactions are reported in the results of operations for the current period. The Portfolio does not isolate that portion of realized gains and losses on investments in equity securities which is due to changes in the foreign exchange rate from that which is due to changes in market prices of equity securities. The Portfolio isolates that portion of realized gains and losses on investments in debt securities which is due to changes in the foreign exchange rate from that which is due to changes in market prices of debt securities.
C) SECURITY TRANSACTIONS AND INVESTMENT INCOME — Security transactions are accounted for on a trade date basis. Interest income is recorded on the accrual basis. Dividends are recorded on the ex-dividend date. The cost of investments sold is determined by use of the specific identification method for both financial reporting and income tax purposes.
D) DIVIDENDS AND DISTRIBUTIONS TO SHAREHOLDERS — Dividends from net investment income and distributions of net realized capital gains, if any, are declared and paid at least annually. However, to the extent that a net realized capital gain can be reduced by a capital loss carryforward, such gain will not be distributed. Income and capital gain distributions are determined in accordance with federal income tax regulations, which may differ from accounting principles generally accepted in the United States of America ("GAAP").
E) FEDERAL INCOME TAXES — No provision is made for federal taxes as it is the Portfolio's intention to continue to qualify for and elect the tax treatment applicable to regulated investment companies under the Internal Revenue Code of 1986, as amended, and to make the requisite distributions to its shareholders, which will be sufficient to relieve it from federal income and excise taxes.
F) USE OF ESTIMATES — The preparation of financial statements in conformity with GAAP requires management to make estimates and assumptions that affect the reported amounts of assets and liabilities and
23
Credit Suisse Trust — Emerging Markets Portfolio
Notes to Financial Statements (continued)
December 31, 2007
Note 2. Significant Accounting Policies
disclosure of contingent assets and liabilities at the date of the financial statements and the reported amounts of income and expenses during the reporting period. Actual results could differ from these estimates.
G) SHORT-TERM INVESTMENTS — The Portfolio, together with other funds/portfolios advised by Credit Suisse Asset Management, LLC ("Credit Suisse"), an indirect, wholly-owned subsidiary of Credit Suisse Group, pools available cash into either a short-term variable rate time deposit issued by State Street Bank and Trust Company ("SSB"), the Portfolio's custodian, or a money market fund advised by Credit Suisse. The short-term time deposit issued by SSB is a variable rate account classified as a short-term investment.
H) FORWARD FOREIGN CURRENCY CONTRACTS — The Portfolio may enter into forward foreign currency contracts for the purchase or sale of a specific foreign currency at a fixed price on a future date. Risks may arise upon entering into these contracts from the potential inability of counterparties to meet the terms of their contracts and from unanticipated movements in the value of a foreign currency. The Portfolio will enter into forward foreign currency contracts primarily for hedging purposes. Forward foreign currency contracts are adjusted by the daily forward exchange rate of the underlying currency and any gains or losses are recorded for financial statement purposes as unrealized until the contract settlement date or an offsetting position is entered into. At December 31, 2007, the Portfolio had no open forward foreign currency contracts.
I) SECURITIES LENDING — Loans of securities are required at all times to be secured by collateral at least equal to 102% of the market value of domestic securities on loan (including any accrued interest thereon) and 105% of the market value of foreign securities on loan (including any accrued interest thereon). Cash collateral received by the Portfolio in connection with securities lending activity may be pooled together with cash collateral for other funds/portfolios advised by Credit Suisse and may be invested in a variety of investments, including certain Credit Suisse-advised funds, funds advised by SSB, the Portfolio's securities lending agent, or money market instruments. However, in the event of default or bankruptcy by the other party to the agreement, realization and/or retention of the collateral may be subject to legal proceedings.
SSB has been engaged by the Portfolio to act as the Portfolio's securities lending agent. The Portfolio's securities lending arrangement provides that the Portfolio and SSB will share the net income earned from securities lending activities. During the year ended December 31, 2007, total earnings from the
24
Credit Suisse Trust — Emerging Markets Portfolio
Notes to Financial Statements (continued)
December 31, 2007
Note 2. Significant Accounting Policies
Portfolio's investment in cash collateral received in connection with securities lending arrangements was $1,087,311, of which $949,060 was rebated to borrowers (brokers). The Portfolio retained $112,501 in income from the cash collateral investment, and SSB, as lending agent, was paid $25,750. The Portfolio may also be entitled to certain minimum amounts of income from its securities lending activities. Securities lending income is accrued as earned.
J) OTHER — The Portfolio may invest in securities of foreign countries and governments which involve certain risks in addition to those inherent in domestic investments. Such risks generally include, among others, currency risk (fluctuations in currency exchange rates), information risk (key information may be inaccurate or unavailable) and political risk (expropriation, nationalization or the imposition of capital or currency controls or punitive taxes). Other risks of investing in foreign securities include liquidity and valuation risks.
The Portfolio's investments in securities of issuers located in less developed countries considered to be "emerging markets" involve risks in addition to those generally applicable to foreign securities. Focusing on emerging (less developed) markets involves higher levels of risk, including increased currency, information, liquidity, market, political and valuation risks. Deficiencies in regulatory oversight, market infrastructure, shareholder protections and company laws could expose the Portfolio to operational and other risks as well. Some countries may have restrictions that could limit the Portfolio's access to attractive investment opportunities. Additionally, emerging markets often face serious economic problems (such as high external debt, inflation and unemployment) that could subject the Portfolio to increased volatility or substantial declines in value.
The Portfolio may be subject to taxes imposed by countries in which it invests with respect to its investments in issuers existing or operating in such countries. Such taxes are generally based on income earned or repatriated and capital gains realized on the sale of such investments. The Portfolio accrues such taxes when the related income is earned or gains are realized.
Note 3. Transactions with Affiliates and Related Parties
Credit Suisse serves as investment adviser for the Portfolio. Effective October 1, 2006, the Portfolio pays Credit Suisse for its advisory services a fee that consists of two components: (1) a monthly base management fee calculated by applying a fixed rate of 1.20% ("Base Fee"), plus or minus (2) a performance-fee adjustment ("Performance Adjustment") calculated by applying a variable
25
Credit Suisse Trust — Emerging Markets Portfolio
Notes to Financial Statements (continued)
December 31, 2007
Note 3. Transactions with Affiliates and Related Parties
rate of up to 0.20% (positive or negative) to the Portfolio's average daily net assets during the applicable performance measurement period. The performance measurement period will generally be 36 months. During the period from October 1, 2006 through September 30, 2007, only the Base Fee applied to the Portfolio. The fee adjustment went into effect on October 1, 2007. After 12 months have passed, the measurement period will be equal to the number of months that have elapsed since October 1, 2006 until 36 months has passed, after which the measurement period will become 36 months. The Base Fee is calculated and accrued daily. The Performance Adjustment is accrued and calculated daily. The investment advisory fee is paid monthly in arrears. No Performance Adjustment will be applied unless the difference between the Portfolio's investment performance and the investment record of the MSCI Emerging Markets Free Index, the Portfolio's benchmark i ndex (the "Index"), is 1.00% or greater (plus or minus) during the applicable performance measurement period. For purposes of computing the Base Fee and the Performance Adjustment, net assets will be averaged over different periods (average daily net assets during the relevant month for the Base Fee, versus average daily net assets during the performance measurement period for the Performance Adjustment). The investment performance of the Portfolio for the performance measurement period is used to calculate the Portfolio's Performance Adjustment. After Credit Suisse determines whether the Portfolio's performance was above or below the Index by comparing the investment performance of the Portfolio against the investment record of the Index, Credit Suisse will apply the Performance Adjustment (positive or negative) across the Portfolio.
The following table shows the structure of the Performance Adjustment. No Performance Adjustment will be applied unless the difference between the Portfolio's investment performance and the investment record of the Index is 1.00% or greater (plus or minus) during the applicable performance measurement period.
| | | Annualized Return
(Net of Expenses)
Relative to Index | |
Performance
Adjustment | |
| | | Over 2.00% | | | +0.20 | % | |
| | | 1.00% to 2.00% | | | +0.10 | % | |
| Base Fee plus/minus | | 0.00% to 1.00% | | | None | | |
| | | 0.00% to -1.00% | | | None | | |
| | | -1.00% to -2.00% | | | -0.10 | % | |
| | | Over -2.00% | | | -0.20 | % | |
For the year ended December 31, 2007, investment advisory fees earned and voluntarily waived were $2,283,972 and $293,555, respectively, less a
26
Credit Suisse Trust — Emerging Markets Portfolio
Notes to Financial Statements (continued)
December 31, 2007
Note 3. Transactions with Affiliates and Related Parties
performance fee adjustment of $99,984. Credit Suisse will not recapture from the Portfolio any fees it waived during the fiscal year ended December 31, 2007. Fee waivers and reimbursements are voluntary and may be discontinued by Credit Suisse at anytime.
Credit Suisse Asset Management Limited ("Credit Suisse U.K.") and Credit Suisse Asset Management Limited ("Credit Suisse Australia"), affiliates of Credit Suisse, are sub-investment advisers to the Portfolio (the "Sub-Advisers"). Credit Suisse U.K's and Credit Suisse Australia's sub-investment advisory fees are paid by Credit Suisse out of Credit Suisse's net investment advisory fee and are not paid by the Portfolio.
Credit Suisse Asset Management Securities, Inc. ("CSAMSI"), an affiliate of Credit Suisse, and SSB serve as co-administrators to the Portfolio. For its co-administrative services, CSAMSI currently receives a fee calculated at an annual rate of 0.09% of the Portfolio's average daily net assets. For the year ended December 31, 2007, co-administrative services fees earned by CSAMSI were $171,298.
For its co-administrative services, SSB receives a fee, exclusive of out-of-pocket expenses, calculated in total for all the Credit Suisse funds/portfolios co-administered by SSB and allocated based upon relative average net assets of each fund/portfolio, subject to an annual minimum fee. For the year ended December 31, 2007, co-administrative services fees earned by SSB (including out-of-pocket expenses) were $56,884.
In addition to serving as the Portfolio's co-administrator, CSAMSI currently serves as distributor of the Portfolio's shares without compensation.
Merrill Corporation ("Merrill"), an affiliate of Credit Suisse, has been engaged by the Portfolio to provide certain financial printing and fulfillment services. For the year ended December 31, 2007, Merrill was paid $15,406 for its services to the Portfolio.
Note 4. Line of Credit
The Portfolio, together with other funds/portfolios advised by Credit Suisse (collectively, the "Participating Funds"), participates in a $50 million committed, unsecured line of credit facility ("Credit Facility") for temporary or emergency purposes with Deutsche Bank, A.G. as administrative agent and syndication agent and SSB as operations agent. Under the terms of the Credit Facility, the Participating Funds pay an aggregate commitment fee at a rate of 0.10% per annum on the average unused amount of the Credit Facility, which
27
Credit Suisse Trust — Emerging Markets Portfolio
Notes to Financial Statements (continued)
December 31, 2007
Note 4. Line of Credit
is allocated among the Participating Funds in such manner as is determined by the governing Boards of the Participating Funds. In addition, the Participating Funds pay interest on borrowings at the Federal Funds rate plus 0.50%. At December 31, 2007, the Portfolio had no loans outstanding under the Credit Facility. During the year ended December 31, 2007, the Portfolio had borrowings under the Credit Facility as follows:
Average Daily
Loan Balance | | Weighted Average
Interest Rate% | | Maximum Daily
Loan Outstanding | |
| $ | 4,708,458 | | | | 5.771 | % | | $ | 17,247,000 | | |
Note 5. Purchases and Sales of Securities
For the year ended December 31, 2007, purchases and sales of investment securities (excluding short-term investments) were $115,350,106 and $212,287,476, respectively.
Note 6. Capital Share Transactions
The Trust is authorized to issue an unlimited number of full and fractional shares of beneficial interest, $.001 par value per share. Transactions in capital shares of the Portfolio were as follows:
| | | For the Year Ended
December 31, 2007 | | For the Year Ended
December 31, 2006 | |
| Shares sold | | | 1,735,883 | | | | 2,834,504 | | |
Shares issued in reinvestment of
dividends and distributions | | | 1,264,207 | | | | 225,705 | | |
| Shares redeemed | | | (6,461,658 | ) | | | (3,040,925 | ) | |
| Net increase (decrease) | | | (3,461,568 | ) | | | 19,284 | | |
On December 31, 2007, the number of shareholders that held 5% or more of the outstanding shares of the Portfolio was as follows:
Number of
Shareholders | | Approximate Percentage
of Outstanding Shares | |
| | 4 | | | | 94 | % | |
Some of the shareholders are omnibus accounts, which hold shares on behalf of individual shareholders.
28
Credit Suisse Trust — Emerging Markets Portfolio
Notes to Financial Statements (continued)
December 31, 2007
Note 7. Federal Income Taxes
The tax characteristics of dividends and distributions paid during the years ended December 31, 2007, and 2006, respectively, by the Portfolio were as follows:
| Ordinary Income | | Long-Term Capital Gain | |
| 2007 | | 2006 | | 2007 | | 2006 | |
| $ | 10,113,031 | | | $ | 1,930,716 | | | $ | 16,650,233 | | | $ | 2,150,033 | | |
The tax basis components of distributable earnings differ from the amounts reflected in the Statement of Assets and Liabilities by temporary book/ tax differences. These differences are primarily due to losses deferred on wash sales, post-October loss deferrals and the mark-to-market income from Passive Foreign Investment Companies.
At December 31, 2007, the components of distributable earnings on a tax basis for the Portfolio were as follows:
| Undistributed net investment income | | $ | 18,662,054 | | |
| Accumulated net realized gains | | | 40,633,293 | | |
| Unrealized appreciation | | | 70,058,486 | | |
| Deferral of Post – October currency losses | | | (9,815 | ) | |
| | | $ | 129,344,018 | | |
Under current tax law, certain currency losses realized after October 31 within a taxable year may be deferred and treated as occurring on the first day of the following tax year. For the tax period ended December 31, 2007, the Portfolio elected to defer net losses arising between November 1, 2007 and December 31, 2007 as follows:
At December 31, 2007, the identified cost for federal income tax purposes, as well as the gross unrealized appreciation from investments for those securities having an excess of value over cost, gross unrealized depreciation from investments for those securities having and excess of cost over value and the net unrealized appreciation from investments were $124,583,273, $72,876,174, $(2,714,921) and $70,161,253, respectively.
At December 31, 2007, the Portfolio reclassified $54,999 from undistributed net investment income to accumulated net realized gain from investments, to adjust for current year permanent book/tax differences which arose principally from differing book/tax treatments of foreign currency transactions, realized capital gains tax and the sale of Passive Foreign Investment Companies. Net assets were not affected by these reclassifications.
29
Credit Suisse Trust — Emerging Markets Portfolio
Notes to Financial Statements (continued)
December 31, 2007
Note 8. Contingencies
In the normal course of business, the Portfolio may provide general indemnifications pursuant to certain contracts and organizational documents. The Portfolio's maximum exposure under these arrangements is dependent on future claims that may be made against the Portfolio and, therefore, cannot be estimated; however, based on experience, the risk of loss from such claims is considered remote.
Note 9. Recent Accounting Pronouncements
During June 2006, the Financial Accounting Standards Board ("FASB") issued FASB Interpretation 48 ("FIN 48" or the "Interpretation"), Accounting for Uncertainty in Income Taxes—an interpretation of FASB statement 109. FIN 48 supplements FASB Statement 109, Accounting for Income Taxes, by defining the confidence level that a tax position must meet in order to be recognized in the financial statements. FIN 48 prescribes a comprehensive model for how a fund should recognize, measure, present, and disclose in its financial statements uncertain tax positions that the fund has taken or expects to take on a tax return. FIN 48 requires that the tax effects of a position be recognized only if it is "more likely than not" to be sustained based solely on its technical merits. Management must be able to conclude that the tax law, regulations, case law, and other objective information regarding the technical merits sufficiently support the position's sustainability with a likelihood of more than 50 percent. During the period ended December 31, 2007, Management has adopted FIN 48. There was no material impact to the financial statements or disclosures thereto as a result of the adoption of this pronouncement.
On September 20, 2006, the FASB released Statement of Financial Accounting Standards No. 157 "Fair Value Measurements" ("FAS 157"). FAS 157 establishes an authoritative definition of fair value, sets out a framework for measuring fair value, and requires additional disclosures about fair-value measurements. The application of FAS 157 is required for fiscal years, beginning after November 15, 2007 and interim periods within those fiscal years. As of December 31, 2007, management does not believe the adoption of FAS 157 will impact the amounts reported in the financial statements, however, additional disclosures will be required in subsequent reports.
30
Credit Suisse Trust — Emerging Markets Portfolio
Report of Independent Registered Public Accounting Firm
To the Board of Trustees of Credit Suisse Trust and Shareholders of
Credit Suisse Trust — Emerging Markets Portfolio:
In our opinion, the accompanying statement of assets and liabilities, including the schedule of investments, and the related statements of operations and of changes in net assets and the financial highlights present fairly, in all material respects, the financial position of Emerging Markets Portfolio (the "Portfolio"), a portfolio of the Credit Suisse Trust, at December 31, 2007, the results of its operations for the year then ended, the changes in its net assets for each of the two years in the period then ended and the financial highlights for each of the five years in the period then ended, in conformity with accounting principles generally accepted in the United States of America. These financial statements and financial highlights (hereafter referred to as "financial statements") are the responsibility of the Portfolio's management; our responsibility is to express an opinion on these financial statements based on our audits. We conduc ted our audits of these financial statements in accordance with the standards of the Public Company Accounting Oversight Board (United States). Those standards require that we plan and perform the audit to obtain reasonable assurance about whether the financial statements are free of material misstatement. An audit includes examining, on a test basis, evidence supporting the amounts and disclosures in the financial statements, assessing the accounting principles used and significant estimates made by management, and evaluating the overall financial statement presentation. We believe that our audits, which included confirmation of securities at December 31, 2007 by correspondence with the custodian, provide a reasonable basis for our opinion.
PricewaterhouseCoopers LLP
Baltimore, Maryland
February 25, 2008
31
Credit Suisse Trust — Emerging Markets Portfolio
Board Approval of Advisory Agreement (unaudited)
In approving the renewal of the current Advisory and Sub-Advisory Agreements, the Board of Trustees, including the Independent Trustees, at a meeting held on November 13 and 14, 2007, considered the following factors with respect to the Emerging Markets Portfolio (the "Portfolio"):
Investment Advisory Fee Rates
The Board reviewed and considered the current contractual advisory fee with a base rate of 1.20% for the Portfolio plus a variable performance adjustment fee based upon the Portfolio's performance relative to its benchmark during a performance adjustment period ("Contractual Advisory Fee"), in light of the extent and quality of the advisory services provided by Credit Suisse Asset Management, LLC ("Credit Suisse") or Credit Suisse Asset Management Limited ("Credit Suisse U.K.") and Credit Suisse Asset Management Limited ("Credit Suisse Australia"). The Board also reviewed and considered the fee waivers and/or expense reimbursement arrangements currently in place for the Portfolio and considered the actual fee rate of 1.00% paid by the Portfolio after taking waivers and reimbursements into account ("Net Advisory Fee"). The Board acknowledged that voluntary fee waivers and expense reimbursements could be discontinued at any time. The Board not ed that the compensation paid to Credit Suisse U.K. and Credit Suisse Australia (collectively, the "Sub-Advisers") does not increase the fees or expenses otherwise incurred by the Portfolio's shareholders.
Additionally, the Board received and considered information comparing the Portfolio's Contractual Advisory Fee, Net Advisory Fee and the Portfolio's overall expenses with those of funds in both the relevant expense group ("Expense Group") and universe of funds (the "Expense Universe") provided by Lipper Inc., an independent provider of investment company data.
Nature, Extent and Quality of the Services under the Advisory and
Sub-Advisory Agreements
The Board received and considered information regarding the nature, extent and quality of services provided to the Portfolio by Credit Suisse under the Advisory Agreement and by the Sub-Advisers under the Sub-Advisory Agreements. The Board also noted information received at regular meetings throughout the year related to the services rendered by Credit Suisse and the Sub-Advisers. The Board reviewed background information about Credit Suisse and the Sub-Advisers, including their respective Forms ADV. The Board considered the background and experience of both Credit Suisse's and the
32
Credit Suisse Trust — Emerging Markets Portfolio
Board Approval of Advisory Agreement (unaudited) (continued)
Sub-Advisers' senior management and the expertise of, and the amount of attention given to the Portfolio by, senior personnel of Credit Suisse and the Sub-Advisers. With respect to the Sub-Advisers, the Board also considered their expertise in managing the types of global investments that the Portfolio utilizes in its investment strategy. In addition, the Board reviewed the qualifications, backgrounds and responsibilities of the portfolio management team primarily responsible for the day-to-day portfolio management of the Portfolio and the extent of the resources devoted to research and analysis of actual and potential investments. The Board also received and considered information about the nature, extent and quality of services and fee rates offered to other Credit Suisse clients for comparable services.
In approving the Sub-Advisory Agreements, the Board also considered the benefits of retaining Credit Suisse's United Kingdom and Australian affiliates given the increased complexity of the domestic and international securities markets, specifically that retention of Credit Suisse U.K. and Credit Suisse Australia expands the universe of companies and countries from which investment opportunities could be sought and enhances the ability of the Portfolio to obtain the best price and execution on trades in international markets.
Portfolio Performance
The Board received and considered the performance results of the Portfolio, along with comparisons both to the relevant performance group ("Performance Group") and universe of funds ("Performance Universe") for the Portfolio. The Board was provided with a description of the methodology used to arrive at the funds included in the Performance Group and the Performance Universe.
Credit Suisse Profitability
The Board received and considered a profitability analysis of Credit Suisse based on the fees payable under the Advisory Agreement for the Portfolio, including any fee waivers or fee caps, as well as other relationships between the Portfolio on the one hand and Credit Suisse affiliates on the other. The Board received profitability information for the other funds in the Credit Suisse family of funds.
Economies of Scale
The Board considered whether economies of scale in the provision of services to the Portfolio were being passed along to the shareholders. Accordingly, the
33
Credit Suisse Trust — Emerging Markets Portfolio
Board Approval of Advisory Agreement (unaudited) (continued)
Board considered whether alternative fee structures (such as breakpoint fee structures) would be more appropriate or reasonable taking into consideration economies of scale or other efficiencies that might accrue from increases in the Portfolio's asset levels.
Other Benefits to Credit Suisse
The Board considered other benefits received by Credit Suisse, the Sub-Advisers and their affiliates as a result of their relationship with the Portfolio. Such benefits include, among others, research arrangements with brokers who execute transactions on behalf of the Portfolio, administrative and brokerage relationships with affiliates of Credit Suisse and the Sub-Advisers and benefits potentially derived from an increase in Credit Suisse's and the Sub-Advisers' businesses as a result of their relationship with the Portfolio (such as the ability to market to shareholders other financial products offered by Credit Suisse, the Sub-Advisers and their affiliates).
The Board considered the standards applied in seeking best execution, whether and to what extent soft dollar credits are sought and how any such credits are utilized, any benefits that may be achieved by using an affiliated broker and the existence of quality controls applicable to brokerage allocation procedures. The Board also reviewed Credit Suisse's and the Sub-Advisers' method for allocating portfolio investment opportunities among their advisory clients.
Conclusions
In selecting Credit Suisse and the Sub-Advisers, and approving the Advisory Agreement and the investment advisory fee under such agreement and the Sub-Advisory Agreements, the Board concluded that:
• The Board noted that while the Contractual Advisory Fee was above the median for the Expense Group, the net total expenses were below the median.
• The Board was aware that the Portfolio's performance was below most funds in the Performance Group and the Performance Universe for all periods reviewed. The Board noted that the performance-based fee adjustment, which went into effect in October 2007, had been adopted to more closely align Credit Suisse's interests with the interests of the Portfolio's shareholders, which could results in improved investment performance over time for the benefit of all shareholders. The Board would continue to monitor steps taken by Credit Suisse to improve performance.
34
Credit Suisse Trust — Emerging Markets Portfolio
Board Approval of Advisory Agreement (unaudited) (continued)
• Aside from performance (as described above), the Board was satisfied with the nature and extent of the investment advisory services provided to the Portfolio by Credit Suisse and the Sub-Advisers and that, based on dialogue with management and counsel, the services provided by Credit Suisse under the Advisory Agreement and by the Sub-Advisers under the Sub-Advisory Agreements are typical of, and consistent with, those provided to similar mutual funds by other investment advisers.
• In light of the costs of providing investment management and other services to the Portfolio and Credit Suisse's ongoing commitment to the Portfolio and willingness to waive fees and expenses, the profits and other ancillary benefits that Credit Suisse and its affiliates received were considered reasonable.
• Credit Suisse's profitability based on fees payable under the Advisory Agreement was reasonable in light of the nature, extent and quality of the services provided to the Portfolio thereunder.
• In light of the amount of the net total expenses, the Portfolio's current fee structure was considered reasonable.
No single factor reviewed by the Board was identified by the Board as the principal factor in determining whether to approve the Advisory Agreement and the Sub-Advisory Agreements. The Independent Trustees were advised by separate independent legal counsel throughout the process.
35
Credit Suisse Trust — Emerging Markets Portfolio
Information Concerning Trustees and Officers (unaudited)
Name, Address
(Year of Birth) | | Position(s)
Held with
Trust | | Term
of Office1
and
Length
of Time
Served | | Principal
Occupation(s) During
Past Five Years | | Number of
Portfolios in
Fund
Complex
Overseen by
Trustee | | Other
Directorships
Held by
Trustee | |
| Independent Trustees | | | | | | | | | |
|
Enrique Arzac
c/o Credit Suisse Asset
Management, LLC
Attn: General Counsel
Eleven Madison Avenue New York, New York 10010
(1941) | | Trustee,
Nominating
Committee
Member and
Audit
Committee
Chairman | | Since
2005 | | Professor of Finance and
Economics, Graduate
School of Business,
Columbia University
since 1971. | | | 35 | | | Director of
Epoch Holding
Corporation (an
investment
management
and investment
advisory
services
company);
Director of The
Adams Express
Company
(a closed-end investment
company);
Director of
Petroleum and
Resources
Corporation
(a closed-end
investment
company). | |
|
Jeffrey E. Garten2
Box 208200
New Haven, Connecticut
06520-8200
(1946) | | Trustee,
Nominating
and Audit
Committee
Member | | Since
1998 | | The Juan Trippe
Professor in the Practice
of International Trade,
Finance and Business
from July 2005 to
present; Partner and
Chairman of Garten
Rothkopf (consulting
firm) from October 2005
to present; Dean of Yale
School of Management
from November 1995 to
June 2005. | | | 28 | | | Director of
Aetna, Inc.
(insurance
company);
Director of
CarMax Group
(used car
dealers);
Director of
Alcan, Inc.
(smelting and
refining of
nonferrous
metals
company). | |
|
1 Each Trustee and Officer serves until his or her respective successor has been duly elected and qualified.
2 Mr. Garten was initially appointed as a Trustee of the Trust on February 6, 1998. He resigned as Trustee on February 3, 2000 and was subsequently reappointed on December 21, 2000.
36
Credit Suisse Trust — Emerging Markets Portfolio
Information Concerning Trustees and Officers (unaudited) (continued)
Name, Address
(Year of Birth) | | Position(s)
Held with
Trust | | Term
of Office1
and
Length
of Time
Served | | Principal
Occupation(s) During
Past Five Years | | Number of
Portfolios in
Fund
Complex
Overseen by
Trustee | | Other
Directorships
Held by
Trustee | |
| Independent Trustees | | | | | | | | | |
|
Peter F. Krogh
SFS/ICC 702
Georgetown University
Washington, DC 20057
(1937) | | Trustee,
Nominating
and Audit
Committee
Member | | Since
2001 | | Dean Emeritus and
Distinguished Professor
of International Affairs at
the Edmund A. Walsh
School of Foreign
Service, Georgetown
University from
June 1995 to present. | | | 28 | | | Director of
Carlisle
Companies
Incorporated
(diversified
manufacturing
company). | |
|
Steven N. Rappaport
Lehigh Court, LLC
555 Madison Avenue
29th Floor
New York, New York
10022
(1948) | | Chairman of
the Board of
Trustees,
Nominating
Committee
Chairman and
Audit
Committee
Member | | Trustee
since
1999 and
Chairman
since
2005 | | Partner of Lehigh Court,
LLC and RZ Capital
(private investment
firms) from July 2002 to
present. | | | 35 | | | Director of
iCAD, Inc.
(surgical and
medical
instruments and
apparatus
company);
Director of
Presstek, Inc.
(digital imaging
technologies
company);
Director of
Wood
Resources, LLC.
(plywood
manufacturing
company). | |
|
| Interested Trustee | | | | | | | |
|
Michael E. Kenneally3
c/o Credit Suisse Asset
Management, LLC
Attn: General Counsel
Eleven Madison Avenue
New York, New York 10010
(1954) | | Trustee | | Since
2004 | | Chairman and Global Chief Executive Officer of Credit Suisse from March 2003 to July 2005; Chairman and Chief Investment Officer of Banc of America Capital Management from 1998 to March 2003. | | | 28 | | | None | |
|
3 Mr. Kenneally is a Trustee who is an "interested person" of the Trust as defined in the Investment Company Act of 1940, as amended, because he was an officer of Credit Suisse within the last two fiscal years.
37
Credit Suisse Trust — Emerging Markets Portfolio
Information Concerning Trustees and Officers (unaudited) (continued)
Name, Address
(Year of Birth) | | Position(s)
Held with
Trust | | Term
of Office1
and
Length
of Time
Served | | Principal Occupation(s) During Past Five Years | |
| Officers | | | | | | | |
|
Lawrence D. Haber
c/o Credit Suisse Asset
Management, LLC.
Attn: General Counsel
Eleven Madison Avenue
New York, New York
10010
(1951) | | Chief
Executive
Officer and
President | | Since
2007 | | Managing Director and Chief Operating Officer of Credit Suisse; Member of Credit Suisse's Management Committee; Chief Financial Officer of Merrill Lynch Investment Managers from 1997 to 2003. | |
|
Michael A. Pignataro
Credit Suisse Asset
Management, LLC
Eleven Madison Avenue
New York, New York
10010
(1959) | | Chief Financial Officer | | Since
1999 | | Director and Director of Fund Administration of Credit Suisse; Associated with Credit Suisse or its predecessor since 1984; Officer of other Credit Suisse Funds. | |
|
Emidio Morizio
Credit Suisse Asset
Management, LLC
Eleven Madison Avenue
New York, New York
10010
(1966) | | Chief Compliance Officer | | Since
2004 | | Director and Global Head of Compliance of Credit Suisse; Associated with Credit Suisse since July 2000; Officer of other Credit Suisse Funds. | |
|
J. Kevin Gao
Credit Suisse Asset
Management, LLC
Eleven Madison Avenue
New York, New York
10010
(1967) | | Chief Legal Officer since 2006, Vice President and Secretary since 2004 | | Since
2004 | | Director and Legal Counsel of Credit Suisse; Associated with Credit Suisse since July 2003; Associated with the law firm of Willkie Farr & Gallagher LLP from 1998 to 2003; Officer of other Credit Suisse Funds. | |
|
Robert Rizza
Credit Suisse Asset
Management, LLC
Eleven Madison Avenue
New York, New York
10010
(1965) | | Treasurer | | Since
2006 | | Vice President of Credit Suisse; Associated with Credit Suisse since 1998; Officer of other Credit Suisse Funds. | |
|
The Statement of Additional Information includes additional information about the Trustees and is available, without charge, upon request, by calling 800-222-8977.
38
Credit Suisse Trust — Emerging Markets Portfolio
December 31, 2007 (unaudited)
Important Tax Information for Corporate Shareholders
Corporate Shareholders should note for the year ended December 31, 2007, the percentage of the Portfolio's investment income (i.e., net investment income plus short-term capital gains) that qualified for the intercorporate dividends received deduction is 0%.
Important Tax Information for Shareholders
During the year ended December 31, 2007, the Portfolio declared $16,650,233 in dividends that were designated as long-term capital gains dividends.
39
Credit Suisse Trust — Emerging Markets Portfolio
Proxy Voting and Portfolio Holdings Information (unaudited)
Information regarding how the Portfolio voted proxies related to its portfolio securities during the 12 month period ended June 30 of each year, as well as the policies and procedures that the Portfolio uses to determine how to vote proxies relating to its portfolio securities are available:
• By calling 1-800-222-8977
• On the Portfolio's website, www.credit-suisse.com/us
• On the website of the Securities and Exchange Commission, www.sec.gov.
The Portfolio files a complete schedule of its portfolio holdings for the first and third quarters of its fiscal year with the SEC on Form N-Q. The Portfolio's Forms N-Q are available on the SEC's website at www.sec.gov and may be reviewed and copied at the SEC's Public Reference Room in Washington, DC. Information on the operation of the SEC's Public Reference Room may be obtained by calling 1-202-551-8090.
40

P.O. BOX 55030, BOSTON, MA 02205-5030
800-222-8977 n www.credit-suisse.com/us
CREDIT SUISSE ASSET MANAGEMENT SECURITIES, INC., DISTRIBUTOR. TREMK-AR-1207

CREDIT SUISSE FUNDS
Annual Report
December 31, 2007
CREDIT SUISSE TRUST
n GLOBAL SMALL CAP PORTFOLIO
Credit Suisse Trust (the "Trust") shares are not available directly to individual investors, but may be offered only through certain insurance products and pension and retirement plans.
The Trust's investment objectives, risks, charges and expenses (which should be considered carefully before investing), and more complete information about the Trust, are provided in the Prospectus, which should be read carefully before investing. You may obtain additional copies by calling 800-222-8977 or by writing to Credit Suisse Trust, P.O. Box 55030, Boston, MA 02205-5030.
Credit Suisse Asset Management Securities, Inc., Distributor, is located at Eleven Madison Avenue, New York, NY 10010. The Trust is advised by Credit Suisse Asset Management, LLC.
The views of the Portfolio's management are as of the date of the letter and the Portfolio holdings described in this document are as of December 31, 2007; these views and Portfolio holdings may have changed subsequent to these dates. Nothing in this document is a recommendation to purchase or sell securities.
Portfolio shares are not deposits or other obligations of Credit Suisse Asset Management, LLC ("Credit Suisse") or any affiliate, are not FDIC-insured and are not guaranteed by Credit Suisse or any affiliate. Portfolio investments are subject to investment risks, including loss of your investment.
Credit Suisse Trust — Global Small Cap Portfolio
Annual Investment Adviser's Report
December 31, 2007 (unaudited)
January 28, 2008
Dear Shareholder:
For the twelve months ended December 31, 2007, Credit Suisse Trust — Global Small Cap Portfolio (the "Portfolio") had a loss of -4.02%, versus an increase of 1.13% for the Morgan Stanley Capital International World Small Cap Index.1
Market Review: China remains the global growth engine
For the year ended December 31, 2007, global growth has remained robust as China continues to act as the growth engine within the Asian markets. In the United States, rising global demand and elevated commodity prices boosted the energy and materials sectors to post the highest returns within the large cap sector of 32.4% and 20%, respectively. Additionally, U.S. real Gross Domestic Product — driven by consumer demand and solid growth in the manufacturing and service sectors — is forecast to grow at around 2% for 2007 in spite of the exceptionally weak start to the year.
Growth within the Euro region appears to have decelerated with export growth showing signs of slowing, probably due to the strength of the Euro. China has tightened monetary policy while the Federal Reserve (Fed) has cut interest rates by 1.0% to 4.25%. The European Central Bank has raised rates by 0.25% on four occasions taking official rates to 4%, but they have remained on hold since June. In February, the Bank of Japan (BoJ) tightened for the second time in this current cycle to 0.5%.
The U.S. dollar declined against a broad index of world currencies and oil rose to record levels, surpassing the $100 intraday on January 2, 2008.
Strategic Review and Market Outlook: Economic growth in emerging markets remains robust
Internationally, the leading contributors to performance came from healthcare, industrials, and information technology. Domestically, the leading positive relative contributors to performance came from stock selection in materials, healthcare, and consumer discretionary. Conversely, on a global basis, the largest detractors to performance came from consumer discretionary, financials and materials. Domestically, the largest detractors to performance came primarily from stock selection within the industrials, followed closely by information technology and energy.
Globally, we have adopted a reasonably defensive stance for the UK and continental Europe in light of the uncertain economic outlook. This includes significant healthcare exposure through holdings such as Getinge (2.05% of the portfolio's net assets as of December 31). In Japan, we are focused on companies
1
Credit Suisse Trust — Global Small Cap Portfolio
Annual Investment Adviser's Report (continued)
December 31, 2007 (unaudited)
such as infrastructure-related firms that are set to grow in the expanding emerging markets, as well as companies that supply internationally competitive products. We also focus on companies such as those involved in the environment, energy conservation, medicine and healthcare, or ubiquitous services as we believe these sectors are less susceptible to economic fallout.
In the United States, we believe growth stocks could continue to outperform their value counterparts in 2008. We expect companies with solid growth prospects and strong operating results momentum to lead the market, and believe that companies fitting attractive valuation profiles will make a moderate comeback in the coming quarters. From a sector perspective, we are favorable toward the healthcare, energy, commercial services, and consumer staples groups. Conversely, the unsettled credit market and risks of further impact from mortgage losses leads us to underweight financial and consumer discretionary industries.
Overall, the economic outlook appears to be more uncertain than at any time in the past 5 years amid fears that the slowdown in the U.S. and the impact of the credit crisis will have major implications for the UK and Europe. Amid the general uncertainty, investors have become far more risk averse. This could potentially have major implications for less liquid asset classes — such as small cap equities. However, economic growth in emerging markets remains robust and the strength in these markets is compensating for the weakness in more established economies such as the United States. Against this backdrop we remain reasonably optimistic on the outlook for small cap equities.
In this context, we believe there are good opportunities for growth in niche markets — especially in Europe — as there are companies that have excellent positions in their respective fields of activity with a bias to exports in either Eastern Europe or the Asian markets. Furthermore, the convergence into a single European market has maintained its positive effect as the intra-European trade increases. This makes the region more robust against slower economic growth in the United States.
The outlook for the UK economy appears mixed. While most small cap companies continue to report healthy levels of profitability, there are fears that the impact of rising interest rates is now having a delayed effect on UK consumer spending. Further, although the UK Government has prudently scaled back its GDP growth expectations for 2008, it remains too early to say what, if any, impact the U.S. sub-prime crisis will have on UK financial institutions and the general availability of credit. In view of the uncertain outlook, the UK proportion of the fund is relatively defensive. It is also worth noting that the present volatility in the UK equity markets has the advantage of offering some attractive buying opportunities in the small cap arena.
2
Credit Suisse Trust — Global Small Cap Portfolio
Annual Investment Adviser's Report (continued)
December 31, 2007 (unaudited)
While the financial markets are likely to remain nervous globally, decoupling in the global economy continues and economic growth in BRICs (Brazil, Russia, India and China) has become more organic. This affects the Fund through Japan as small cap market valuations there have reached about the same level as those associated with major markets in the United States and Europe — historically very low levels by Japanese standards. Therefore, solid movement will be expected over the medium and long terms.
In the United States, we expect housing markets may remain weak through the first half of 2008. Additionally, expectations for U.S. stock market volatility, as measured by the VIX Index, are for levels above historical averages. We also expect the pace of mergers and acquisitions by private equity firms will not reach the level seen in the first half of 2007, as the availability of debt financing has lessened significantly.
Sincerely,
James Chapman
Jordan Low
Eric Leng
Todd Jablonski
International investing entails special risk considerations, including currency fluctuations, lower liquidity, economic and political risks, and differences in accounting methods. Because of the nature of the Portfolio's investments in start-up and other small companies and certain aggressive strategies it may use, an investment in the Portfolio may be more volatile and less liquid than investments in larger companies and may not be appropriate for all investors.
In addition to historical information, this report contains forward-looking statements, which may concern, among other things, domestic and foreign market, industry and economic trends and developments and government regulation and their potential impact on the Portfolio's investments. These statements are subject to risks and uncertainties and actual trends, developments and regulations in the future, and their impact on the Portfolio could be materially different from those projected, anticipated or implied. The Portfolio has no obligation to update or revise forward-looking statements.
3
Credit Suisse Trust — Global Small Cap Portfolio
Annual Investment Adviser's Report (continued)
December 31, 2007 (unaudited)
Comparison of Change in Value of $10,000 Investment in the
Credit Suisse Trust — Global Small Cap Portfolio1 and the
MSCI World Small Cap Index2 for Ten Years.

4
Credit Suisse Trust — Global Small Cap Portfolio
Annual Investment Adviser's Report (continued)
December 31, 2007 (unaudited)
Average Annual Returns as of December 31, 20071
| 1 Year | | 5 Years | | 10 Years | | Since
Inception3 | |
| | (4.02 | )% | | | 17.08 | % | | | 3.85 | % | | | 4.35 | % | |
Returns represent past performance and include change in share price and reinvestment of dividends and capital gains. Past performance cannot guarantee future results. The current performance of the Portfolio may be lower or higher than the figures shown. Returns and share price will fluctuate, and redemption value may be more or less than original cost. The performance results do not reflect the deduction of taxes that a shareholder would pay on portfolio distributions or the redemption of portfolio shares. Performance includes the effect of deducting expenses, but does not include charges and expenses attributable to any particular variable contract or plan. Accordingly, the Prospectus of the sponsoring Participating Insurance Company separate account or plan documents or ot her informational materials supplied by plan sponsors should be carefully reviewed for information on relevant charges and expenses. Excluding these charges and expenses from quotations of performance has the effect of increasing the performance quoted, and the effect of these charges should be considered when comparing performance to that of other mutual funds. Performance information current to the most recent month-end is available at www.credit-suisse.com/us.
1 Fee waivers and/or expense reimbursements may reduce expenses for the Portfolio, without which performance would be lower. Waivers and/or reimbursements may be discontinued at any time.
2 The Morgan Stanley Capital International World Small Cap Index is an unmanaged broad-based index comprised of small cap companies from 23 developed markets. Index returns are price only and do not reflect the reinvestment of dividends. It is the exclusive property of Morgan Stanley Capital International Inc. Investors cannot invest directly in an index.
3 Inception date 9/30/96.
5
Credit Suisse Trust — Global Small Cap Portfolio
Annual Investment Adviser's Report (continued)
December 31, 2007 (unaudited)
Information About Your Portfolio's Expenses
As an investor of the Portfolio, you incur two types of costs: ongoing expenses and transaction costs. Ongoing expenses include management fees, distribution and service (12b-1) fees and other Portfolio expenses. Examples of transaction costs include sales charges (loads), redemption fees and account maintenance fees, which are not shown in this section and which would result in higher total expenses. The following table is intended to help you understand your ongoing expenses of investing in the Portfolio and to help you compare these expenses with the ongoing expenses of investing in other mutual funds. The table is based on an investment of $1,000 made at the beginning of the six month period ended December 31, 2007.
The table illustrates your Portfolio's expenses in two ways:
• Actual Portfolio Return. This helps you estimate the actual dollar amount of ongoing expenses paid on a $1,000 investment in the Portfolio using the Portfolio's actual return during the period. To estimate the expenses you paid over the period, simply divide your account value by $1,000 (for example, an $8,600 account value divided by $1,000 = 8.6), then multiply the result by the number in the "Expenses Paid per $1,000" line under the share class you hold.
• Hypothetical 5% Portfolio Return. This helps you to compare your Portfolio's ongoing expenses with those of other mutual funds using the Portfolio's actual expense ratio and a hypothetical rate of return of 5% per year before expenses. Examples using a 5% hypothetical fund return may be found in the shareholder reports of other mutual funds. The hypothetical account values and expenses may not be used to estimate the actual ending account balance or expenses you paid for the period.
Please note that the expenses shown in these tables are meant to highlight your ongoing expenses only and do not reflect any transaction costs, such as sales charges (loads) or redemption fees. If these transaction costs had been included, your costs would have been higher. The "Expenses Paid per $1,000" line of the tables is useful in comparing ongoing expenses only and will not help you determine the relative total expenses of owning different funds.
6
Credit Suisse Trust — Global Small Cap Portfolio
Annual Investment Adviser's Report (continued)
December 31, 2007 (unaudited)
Expenses and Value of a $1,000 Investment
for the six month period ended December 31, 2007
| Actual Portfolio Return | |
| Beginning Account Value 7/1/07 | | $ | 1,000.00 | | |
| Ending Account Value 12/31/07 | | $ | 901.40 | | |
| Expenses Paid per $1,000* | | $ | 6.42 | | |
| Hypothetical 5% Portfolio Return | |
| Beginning Account Value 7/1/07 | | $ | 1,000.00 | | |
| Ending Account Value 12/31/07 | | $ | 1,018.45 | | |
| Expenses Paid per $1,000* | | $ | 6.82 | | |
| Annualized Expense Ratios* | | | 1.34 | % | |
* Expenses are equal to the Portfolio's annualized expense ratio multiplied by the average account value over the period, multiplied by the number of days in the most recent fiscal half year period, then divided by 365.
The "Expenses Paid per $1,000" and the "Annualized Expense Ratios" in the tables are based on actual expenses paid by the Portfolio during the period, net of fee waivers and/or expense reimbursements. If those fee waivers and/or expense reimbursements had not been in effect, the Portfolio's actual expenses would have been higher. Expenses do not reflect additional charges and expenses that are, or may be, imposed under the variable contracts or plans. Such charges and expenses are described in the prospectus of the insurance company separate account or in the plan documents or other informational materials supplied by plan sponsors. The Portfolio's expenses should be considered with these charges and expenses in evaluating the overall cost of investing in the separate account.
For more information, please refer to the Portfolio's prospectus.
7
Credit Suisse Trust — Global Small Cap Portfolio
Annual Investment Adviser's Report (continued)
December 31, 2007 (unaudited)
SECTOR BREAKDOWN*

* Expressed as a percentage of total investments (excluding security lending collateral) and may vary over time.
8
Credit Suisse Trust — Global Small Cap Portfolio
Schedule of Investments
December 31, 2007
| | | Number of
Shares | | Value | |
| COMMON STOCKS (98.1%) | |
| Australia (6.9%) | |
| Banks (1.0%) | |
| Bendigo Bank, Ltd.§ | | | 67,000 | | | $ | 864,319 | | |
| Commercial Services & Supplies (0.4%) | |
| Iress Market Technology, Ltd.§ | | | 55,000 | | | | 382,833 | | |
| Diversified Financials (3.1%) | |
| Austbrokers Holdings, Ltd. | | | 312,000 | | | | 1,250,330 | | |
| Australian Infrastructure Fund§ | | | 256,000 | | | | 693,237 | | |
| Mortgage Choice, Ltd.§ | | | 395,000 | | | | 746,309 | | |
| | | | 2,689,876 | | |
| Machinery (0.4%) | |
| Emeco Holdings, Ltd.§ | | | 329,000 | | | | 306,490 | | |
| Media (1.3%) | |
| Seven Network, Ltd.§ | | | 67,000 | | | | 747,877 | | |
| STW Communications Group, Ltd.§ | | | 205,000 | | | | 420,387 | | |
| | | | 1,168,264 | | |
| Transportation Infrastructure (0.7%) | |
| Babcock & Brown Infrastructure Group | | | 419,192 | | | | 585,526 | | |
| TOTAL AUSTRALIA | | | 5,997,308 | | |
| Bermuda (0.7%) | |
| Insurance (0.4%) | |
| Argo Group International Holdings, Ltd.* | | | 2,200 | | | | 92,686 | | |
| IPC Holdings, Ltd.§ | | | 2,000 | | | | 57,740 | | |
| Max Capital Group, Ltd. | | | 5,300 | | | | 148,347 | | |
| Platinum Underwriters Holdings, Ltd. | | | 1,600 | | | | 56,896 | | |
| | | | 355,669 | | |
| Internet & Catalog Retail (0.1%) | |
| Global Sources, Ltd.§ | | | 3,960 | | | | 111,751 | | |
| Marine (0.2%) | |
| Golar LNG, Ltd.§ | | | 3,200 | | | | 70,784 | | |
| TBS International, Ltd. Class A*§ | | | 1,700 | | | | 56,202 | | |
| | | | 126,986 | | |
| TOTAL BERMUDA | | | 594,406 | | |
| Cayman Islands (0.1%) | |
| Food Products (0.1%) | |
| Fresh Del Monte Produce, Inc.* | | | 1,600 | | | | 53,728 | | |
| TOTAL CAYMAN ISLANDS | | | 53,728 | | |
| China (1.4%) | |
| Communications Equipment (1.4%) | |
| ZTE Corp. Series H§ | | | 237,550 | | | | 1,263,065 | | |
| TOTAL CHINA | | | 1,263,065 | | |
See Accompanying Notes to Financial Statements.
9
Credit Suisse Trust — Global Small Cap Portfolio
Schedule of Investments (continued)
December 31, 2007
| | | Number of
Shares | | Value | |
| COMMON STOCKS | |
| Denmark (1.2%) | |
| Household Durables (1.2%) | |
| Bang & Olufsen AS B Shares§ | | | 11,600 | | | $ | 1,084,123 | | |
| TOTAL DENMARK | | | 1,084,123 | | |
| Finland (0.4%) | |
| Communications Equipment (0.4%) | |
| Elcoteq SE§ | | | 54,150 | | | | 321,404 | | |
| TOTAL FINLAND | | | 321,404 | | |
| France (1.0%) | |
| Real Estate (1.0%) | |
| Nexity | | | 19,491 | | | | 891,307 | | |
| TOTAL FRANCE | | | 891,307 | | |
| Germany (9.8%) | |
| Building Products (1.4%) | |
| Pfleiderer AG§ | | | 57,300 | | | | 1,186,470 | | |
| Commercial Services & Supplies (1.3%) | |
| CeWe Color Holding AG | | | 28,500 | | | | 1,121,525 | | |
| Healthcare Providers & Services (1.6%) | |
| Rhoen-Klinikum AG | | | 43,050 | | | | 1,355,987 | | |
| Machinery (2.5%) | |
| KUKA AG*§ | | | 58,000 | | | | 2,206,985 | | |
| Real Estate (0.7%) | |
| Vivacon AG§ | | | 35,000 | | | | 657,501 | | |
| Specialty Retail (2.3%) | |
| Fielmann AG | | | 30,600 | | | | 1,996,944 | | |
| TOTAL GERMANY | | | 8,525,412 | | |
| Japan (16.3%) | |
| Auto Components (2.3%) | |
| NHK Spring Company, Ltd. | | | 96,000 | | | | 876,257 | | |
| Nippon Seiki Company, Ltd. | | | 50,000 | | | | 1,091,704 | | |
| | | | 1,967,961 | | |
| Chemicals (3.4%) | |
| Kuraray Company, Ltd. | | | 100,500 | | | | 1,212,464 | | |
| Nippon Shokubai Company, Ltd. | | | 71,000 | | | | 680,320 | | |
| Teijin, Ltd. | | | 251,850 | | | | 1,073,364 | | |
| | | | 2,966,148 | | |
| Commercial Services & Supplies (0.1%) | |
| Take and Give Needs Company, Ltd.§ | | | 895 | | | | 125,778 | | |
| Communications Equipment (0.7%) | |
| Epson Toyocom Corp. | | | 153,000 | | | | 645,549 | | |
See Accompanying Notes to Financial Statements.
10
Credit Suisse Trust — Global Small Cap Portfolio
Schedule of Investments (continued)
December 31, 2007
| | | Number of
Shares | | Value | |
| COMMON STOCKS | |
| Japan | |
| Computers & Peripherals (0.9%) | |
| Melco Holdings, Inc.§ | | | 51,300 | | | $ | 801,141 | | |
| Distributor (0.4%) | |
| Happinet Corp. | | | 21,100 | | | | 307,309 | | |
| Diversified Financials (0.9%) | |
| Asset Managers Company, Ltd. | | | 440 | | | | 511,974 | | |
| OMC Card, Inc.§ | | | 87,100 | | | | 297,189 | | |
| | | | 809,163 | | |
| Electrical Equipment (1.3%) | |
| Hitachi Cable, Ltd. | | | 187,000 | | | | 1,103,503 | | |
| Food Products (0.8%) | |
| Mitsui Sugar Company, Ltd. | | | 199,000 | | | | 705,588 | | |
| Hotels, Restaurants & Leisure (0.7%) | |
| Round One Corp. | | | 309 | | | | 612,408 | | |
| Internet & Catalog Retail (0.4%) | |
| Belluna Company, Ltd.§ | | | 50,200 | | | | 349,372 | | |
| Internet Software & Services (1.4%) | |
| ACCA Networks Company, Ltd.§ | | | 206 | | | | 308,877 | | |
| SBI Holdings, Inc. | | | 3,375 | | | | 907,504 | | |
| | | | 1,216,381 | | |
| Machinery (1.0%) | |
| Sodick Company, Ltd. | | | 159,800 | | | | 841,929 | | |
| Media (1.3%) | |
| Kadokawa Group Holdings, Inc.§ | | | 38,000 | | | | 1,091,709 | | |
| Specialty Retail (0.7%) | |
| Village Vanguard Company, Ltd. | | | 109 | | | | 583,341 | | |
| TOTAL JAPAN | | | 14,127,280 | | |
| Netherlands (3.0%) | |
| Electronic Equipment & Instruments (1.2%) | |
| Gemalto NV*§ | | | 34,200 | | | | 1,075,242 | | |
| Semiconductor Equipment & Products (1.5%) | |
| ASM International NV | | | 53,120 | | | | 1,302,278 | | |
| Software (0.3%) | |
| Tele Atlas NV*§ | | | 6,744 | | | | 278,481 | | |
| TOTAL NETHERLANDS | | | 2,656,001 | | |
| Norway (3.0%) | |
| Electronic Equipment & Instruments (1.6%) | |
| Tandberg ASA | | | 66,172 | | | | 1,366,290 | | |
| Machinery (1.4%) | |
| Tomra Systems ASA§ | | | 172,000 | | | | 1,210,773 | | |
| TOTAL NORWAY | | | 2,577,063 | | |
See Accompanying Notes to Financial Statements.
11
Credit Suisse Trust — Global Small Cap Portfolio
Schedule of Investments (continued)
December 31, 2007
| | | Number of
Shares | | Value | |
| COMMON STOCKS | |
| Panama (0.1%) | |
| Banks (0.1%) | |
| Banco Latinoamericano de Exportaciones SA | | | 2,900 | | | $ | 47,299 | | |
| TOTAL PANAMA | | | 47,299 | | |
| Puerto Rico (0.1%) | |
| Banks (0.1%) | |
| First Bancorp. | | | 10,400 | | | | 75,816 | | |
| Santander Bancorp | | | 2,800 | | | | 24,248 | | |
| TOTAL PUERTO RICO | | | 100,064 | | |
| Sweden (4.1%) | |
| Commercial Services & Supplies (0.7%) | |
| Cision AB*§ | | | 216,000 | | | | 569,220 | | |
| Healthcare Equipment & Supplies (2.0%) | |
| Getinge AB Class B | | | 66,664 | | | | 1,782,244 | | |
| Machinery (1.4%) | |
| Alfa Laval AB | | | 21,652 | | | | 1,215,748 | | |
| TOTAL SWEDEN | | | 3,567,212 | | |
| Switzerland (1.3%) | |
| Machinery (1.3%) | |
| Georg Fischer AG* | | | 1,865 | | | | 1,147,440 | | |
| TOTAL SWITZERLAND | | | 1,147,440 | | |
| United Kingdom (10.7%) | |
| Commercial Services & Supplies (3.4%) | |
| Michael Page International PLC | | | 135,000 | | | | 768,580 | | |
| Serco Group PLC | | | 240,000 | | | | 2,209,068 | | |
| | | | 2,977,648 | | |
| Diversified Financials (0.7%) | |
| Melrose PLC | | | 189,680 | | | | 594,982 | | |
| Industrial Conglomerates (3.7%) | |
| Intertek Group PLC | | | 100,000 | | | | 1,974,168 | | |
| Synergy Healthcare PLC | | | 81,215 | | | | 1,272,051 | | |
| | | | 3,246,219 | | |
| Insurance (0.9%) | |
| Amlin PLC | | | 115,555 | | | | 682,448 | | |
| Amlin PLC, Class B | | | 130,000 | | | | 57,966 | | |
| | | | 740,414 | | |
| Road & Rail (2.0%) | |
| Arriva PLC | | | 110,000 | | | | 1,712,644 | | |
| TOTAL UNITED KINGDOM | | | 9,271,907 | | |
See Accompanying Notes to Financial Statements.
12
Credit Suisse Trust — Global Small Cap Portfolio
Schedule of Investments (continued)
December 31, 2007
| | | Number of
Shares | | Value | |
| COMMON STOCKS | |
| United States (38.0%) | |
| Aerospace & Defense (0.7%) | |
| Cubic Corp. | | | 4,400 | | | $ | 172,480 | | |
| Curtiss-Wright Corp.§ | | | 8,000 | | | | 401,600 | | |
| | | | 574,080 | | |
| Airlines (0.0%) | |
| Alaska Air Group, Inc.*§ | | | 800 | | | | 20,008 | | |
| Auto Components (0.5%) | |
| American Axle & Manufacturing Holdings, Inc.§ | | | 7,500 | | | | 139,650 | | |
| Cooper Tire & Rubber Co. | | | 11,100 | | | | 184,038 | | |
| Lear Corp.* | | | 3,900 | | | | 107,874 | | |
| | | | 431,562 | | |
| Banks (1.5%) | |
| 1st Source Corp.§ | | | 1,000 | | | | 17,310 | | |
| AMCORE Financial, Inc.§ | | | 1,800 | | | | 40,860 | | |
| Anchor Bancorp Wisconsin, Inc.§ | | | 1,300 | | | | 30,576 | | |
| BancFirst Corp.§ | | | 800 | | | | 34,280 | | |
| Bank of the Ozarks, Inc. | | | 900 | | | | 23,580 | | |
| BankUnited Financial Corp. Class A§ | | | 2,500 | | | | 17,250 | | |
| Cathay General Bancorp§ | | | 2,400 | | | | 63,576 | | |
| Central Pacific Financial Corp.§ | | | 3,900 | | | | 71,994 | | |
| Chemical Financial Corp.§ | | | 800 | | | | 19,032 | | |
| Citizens Republic Bancorp, Inc.§ | | | 6,700 | | | | 97,217 | | |
| Community Trust Bancorp, Inc. | | | 600 | | | | 16,518 | | |
| Corus Bankshares, Inc.§ | | | 2,600 | | | | 27,742 | | |
| Downey Financial Corp.§ | | | 800 | | | | 24,888 | | |
| East West Bancorp, Inc.§ | | | 3,600 | | | | 87,228 | | |
| First Community Bancorp§ | | | 2,200 | | | | 90,728 | | |
| FirstFed Financial Corp.*§ | | | 2,200 | | | | 78,804 | | |
| Hanmi Financial Corp.§ | | | 6,800 | | | | 58,616 | | |
| Pacific Capital Bancorp§ | | | 1,800 | | | | 36,234 | | |
| Prosperity Bancshares, Inc.§ | | | 2,700 | | | | 79,353 | | |
| Sterling Financial Corp.§ | | | 5,500 | | | | 92,345 | | |
| Sterling Financial Corp. | | | 1,000 | | | | 16,420 | | |
| SVB Financial Group*§ | | | 2,700 | | | | 136,080 | | |
| Umpqua Holdings Corp.§ | | | 5,300 | | | | 81,302 | | |
| United Community Banks, Inc.§ | | | 3,500 | | | | 55,300 | | |
| | | | 1,297,233 | | |
| Beverages (0.1%) | |
| Boston Beer Company, Inc. Class A*§ | | | 2,100 | | | | 79,065 | | |
See Accompanying Notes to Financial Statements.
13
Credit Suisse Trust — Global Small Cap Portfolio
Schedule of Investments (continued)
December 31, 2007
| | | Number of
Shares | | Value | |
| COMMON STOCKS | |
| United States | |
| Biotechnology (3.0%) | |
| Acorda Therapeutics, Inc.*§ | | | 3,800 | | | $ | 83,448 | | |
| Alexion Pharmaceuticals, Inc.*§ | | | 1,000 | | | | 75,030 | | |
| BioMarin Pharmaceutical, Inc.*§ | | | 8,600 | | | | 304,440 | | |
| Cubist Pharmaceuticals, Inc.*§ | | | 7,600 | | | | 155,876 | | |
| IDEXX Laboratories, Inc.* | | | 3,200 | | | | 187,616 | | |
| Isis Pharmaceuticals, Inc.*§ | | | 9,400 | | | | 148,050 | | |
| LifeCell Corp.*§ | | | 3,500 | | | | 150,885 | | |
| Myriad Genetics, Inc.*§ | | | 3,200 | | | | 148,544 | | |
| Onyx Pharmaceuticals, Inc.*§ | | | 4,900 | | | | 272,538 | | |
| OSI Pharmaceuticals, Inc.*§ | | | 1,500 | | | | 72,765 | | |
| Pharmanet Development Group, Inc.*§ | | | 4,900 | | | | 192,129 | | |
| Regeneron Pharmaceuticals, Inc.*§ | | | 4,100 | | | | 99,015 | | |
| Savient Pharmaceuticals, Inc.*§ | | | 9,200 | | | | 211,324 | | |
| Seattle Genetics, Inc.*§ | | | 6,800 | | | | 77,520 | | |
| United Therapeutics Corp.* | | | 2,000 | | | | 195,300 | | |
| ViroPharma, Inc.*§ | | | 24,900 | | | | 197,706 | | |
| | | | 2,572,186 | | |
| Building Products (0.1%) | |
| Lennox International, Inc.§ | | | 2,000 | | | | 82,840 | | |
| Chemicals (1.7%) | |
| Calgon Carbon Corp.*§ | | | 5,100 | | | | 81,039 | | |
| CF Industries Holdings, Inc. | | | 6,200 | | | | 682,372 | | |
| Minerals Technologies, Inc.§ | | | 1,400 | | | | 93,730 | | |
| Olin Corp.§ | | | 7,800 | | | | 150,774 | | |
| OM Group, Inc.*§ | | | 5,200 | | | | 299,208 | | |
| W.R. Grace & Co.* | | | 5,500 | | | | 143,990 | | |
| | | | 1,451,113 | | |
| Commercial Services & Supplies (2.6%) | |
| Arbitron, Inc.§ | | | 1,400 | | | | 58,198 | | |
| Atlas Air Worldwide Holdings, Inc.*§ | | | 3,200 | | | | 173,504 | | |
| Bally Technologies, Inc.*§ | | | 3,800 | | | | 188,936 | | |
| Bowne & Company, Inc.§ | | | 2,200 | | | | 38,720 | | |
| Capella Education Co.*§ | | | 2,400 | | | | 157,104 | | |
| Clean Harbors, Inc.*§ | | | 1,900 | | | | 98,230 | | |
| Convergys Corp.* | | | 8,000 | | | | 131,680 | | |
| CSG Systems International, Inc.*§ | | | 3,300 | | | | 48,576 | | |
| Darling International, Inc.* | | | 6,800 | | | | 78,608 | | |
| DeVry, Inc.§ | | | 3,100 | | | | 161,076 | | |
| DynCorp International, Inc. Class A* | | | 7,600 | | | | 204,288 | | |
| FTI Consulting, Inc.*§ | | | 4,100 | | | | 252,724 | | |
| Heidrick & Struggles International, Inc.§ | | | 1,500 | | | | 55,665 | | |
| Herman Miller, Inc.§ | | | 1,200 | | | | 38,868 | | |
| Koppers Holdings, Inc. | | | 1,700 | | | | 73,508 | | |
| Korn/Ferry International*§ | | | 3,200 | | | | 60,224 | | |
| Pre-Paid Legal Services, Inc.*§ | | | 2,700 | | | | 149,445 | | |
| Strayer Education, Inc.§ | | | 500 | | | | 85,290 | | |
| Tetra Tech, Inc.*§ | | | 5,900 | | | | 126,850 | | |
| TrueBlue, Inc.*§ | | | 3,500 | | | | 50,680 | | |
| | | | 2,232,174 | | |
See Accompanying Notes to Financial Statements.
14
Credit Suisse Trust — Global Small Cap Portfolio
Schedule of Investments (continued)
December 31, 2007
| | | Number of
Shares | | Value | |
| COMMON STOCKS | |
| United States | |
| Commingled Fund (0.4%) | |
| iShares Russell 2000 Index Fund§ | | | 4,400 | | | $ | 334,048 | | |
| Communications Equipment (0.8%) | |
| Arris Group, Inc.*§ | | | 2,874 | | | | 28,680 | | |
| Atheros Communications* | | | 4,100 | | | | 125,214 | | |
| Comtech Telecommunications Corp.*§ | | | 3,100 | | | | 167,431 | | |
| Emulex Corp.*§ | | | 6,500 | | | | 106,080 | | |
| Foundry Networks, Inc.*§ | | | 4,300 | | | | 75,336 | | |
| Ixia* | | | 3,200 | | | | 30,336 | | |
| Plantronics, Inc.§ | | | 2,400 | | | | 62,400 | | |
| ViaSat, Inc.* | | | 2,000 | | | | 68,860 | | |
| | | | 664,337 | | |
| Computers & Peripherals (0.6%) | |
| Hutchinson Technology, Inc.* | | | 4,500 | | | | 118,440 | | |
| NCR Corp.* | | | 14,700 | | | | 368,970 | | |
| Novatel Wireless, Inc.*§ | | | 2,400 | | | | 38,880 | | |
| Sigma Designs, Inc.*§ | | | 800 | | | | 44,160 | | |
| | | | 570,450 | | |
| Construction & Engineering (0.3%) | |
| Perini Corp.*§ | | | 2,200 | | | | 91,124 | | |
| Shaw Group, Inc.*§ | | | 2,100 | | | | 126,924 | | |
| URS Corp.* | | | 103 | | | | 5,596 | | |
| | | | 223,644 | | |
| Containers & Packaging (0.3%) | |
| AptarGroup, Inc. | | | 1,700 | | | | 69,547 | | |
| Myers Industries, Inc. | | | 3,600 | | | | 52,092 | | |
| Rock-Tenn Co. Class A | | | 2,600 | | | | 66,066 | | |
| Silgan Holdings, Inc.§ | | | 1,300 | | | | 67,522 | | |
| | | | 255,227 | | |
| Diversified Financials (0.9%) | |
| Advanta Corp. Class B§ | | | 2,200 | | | | 17,754 | | |
| ASTA Funding, Inc.§ | | | 800 | | | | 21,152 | | |
| CBIZ, Inc.*§ | | | 3,700 | | | | 36,297 | | |
| Cohen & Steers, Inc.§ | | | 1,100 | | | | 32,967 | | |
| GAMCO Investors, Inc. Class A | | | 1,300 | | | | 89,960 | | |
| GFI Group, Inc.*§ | | | 400 | | | | 38,288 | | |
| Greenhill & Company, Inc.§ | | | 1,400 | | | | 93,072 | | |
| MCG Capital Corp.§ | | | 7,600 | | | | 88,084 | | |
| Morningstar, Inc.*§ | | | 500 | | | | 38,875 | | |
| optionsXpress Holdings, Inc.§ | | | 3,500 | | | | 118,370 | | |
| Texas Capital Bancshares, Inc.*§ | | | 1,900 | | | | 34,675 | | |
| Walter Industries, Inc.§ | | | 5,800 | | | | 208,394 | | |
| | | | 817,888 | | |
See Accompanying Notes to Financial Statements.
15
Credit Suisse Trust — Global Small Cap Portfolio
Schedule of Investments (continued)
December 31, 2007
| | | Number of
Shares | | Value | |
| COMMON STOCKS | |
| United States | |
| Diversified Telecommunication Services (0.3%) | |
| Cincinnati Bell, Inc.*§ | | | 19,200 | | | $ | 91,200 | | |
| PAETEC Holding Corp.*§ | | | 2,800 | | | | 27,300 | | |
| Premiere Global Services, Inc.* | | | 7,400 | | | | 109,890 | | |
| | | | 228,390 | | |
| Electric Utilities (0.7%) | |
| Black Hills Corp.§ | | | 2,800 | | | | 123,480 | | |
| El Paso Electric Co.* | | | 10,100 | | | | 258,257 | | |
| ITC Holdings Corp.§ | | | 2,000 | | | | 112,840 | | |
| Ormat Technologies, Inc.§ | | | 2,900 | | | | 159,529 | | |
| | | | 654,106 | | |
| Electrical Equipment (0.2%) | |
| Encore Wire Corp.§ | | | 3,100 | | | | 49,352 | | |
| II-VI, Inc.* | | | 2,800 | | | | 85,540 | | |
| Superior Essex, Inc.*§ | | | 1,000 | | | | 24,000 | | |
| | | | 158,892 | | |
| Electronic Equipment & Instruments (0.9%) | |
| FLIR Systems, Inc.*§ | | | 2,800 | | | | 87,640 | | |
| Itron, Inc.*§ | | | 1,100 | | | | 105,567 | | |
| Littelfuse, Inc.*§ | | | 1,700 | | | | 56,032 | | |
| Methode Electronics, Inc. | | | 8,100 | | | | 133,164 | | |
| MTS Systems Corp.§ | | | 800 | | | | 34,136 | | |
| Plexus Corp.* | | | 3,600 | | | | 94,536 | | |
| Rofin-Sinar Technologies, Inc.* | | | 2,000 | | | | 96,220 | | |
| Varian, Inc.* | | | 2,400 | | | | 156,720 | | |
| | | | 764,015 | | |
| Energy Equipment & Services (1.2%) | |
| Atwood Oceanics, Inc.*§ | | | 3,900 | | | | 390,936 | | |
| Basic Energy Services, Inc.*§ | | | 2,800 | | | | 61,460 | | |
| Dril-Quip, Inc.*§ | | | 2,600 | | | | 144,716 | | |
| Global Industries, Ltd.* | | | 3,100 | | | | 66,402 | | |
| ION Geophysical Corp*§ | | | 5,300 | | | | 83,634 | | |
| Lufkin Industries, Inc.§ | | | 2,800 | | | | 160,412 | | |
| Oil States International, Inc.*§ | | | 2,500 | | | | 85,300 | | |
| Trico Marine Services, Inc.*§ | | | 1,800 | | | | 66,636 | | |
| | | | 1,059,496 | | |
| Food & Drug Retailing (1.7%) | |
| Casey's General Stores, Inc. | | | 3,500 | | | | 103,635 | | |
| Central European Distribution Corp.*§ | | | 5,200 | | | | 302,016 | | |
| Longs Drug Stores Corp.§ | | | 2,700 | | | | 126,900 | | |
| Nash Finch Co.§ | | | 1,900 | | | | 67,032 | | |
| Performance Food Group Co.*§ | | | 2,600 | | | | 69,862 | | |
| Spartan Stores, Inc.§ | | | 1,500 | | | | 34,275 | | |
| Terra Industries, Inc.*§ | | | 15,900 | | | | 759,384 | | |
| Winn-Dixie Stores, Inc.* | | | 3,200 | | | | 53,984 | | |
| | | | 1,517,088 | | |
See Accompanying Notes to Financial Statements.
16
Credit Suisse Trust — Global Small Cap Portfolio
Schedule of Investments (continued)
December 31, 2007
| | | Number of
Shares | | Value | |
| COMMON STOCKS | |
| United States | |
| Food Products (0.3%) | |
| Cal-Maine Foods, Inc.§ | | | 2,800 | | | $ | 74,284 | | |
| Chiquita Brands International, Inc.*§ | | | 3,300 | | | | 60,687 | | |
| Sanderson Farms, Inc.§ | | | 3,700 | | | | 124,986 | | |
| USANA Health Sciences, Inc.*§ | | | 700 | | | | 25,956 | | |
| | | | 285,913 | | |
| Gas Utilities (0.6%) | |
| Energen Corp. | | | 4,000 | | | | 256,920 | | |
| New Jersey Resources Corp.§ | | | 700 | | | | 35,014 | | |
| Northwest Natural Gas Co.§ | | | 2,000 | | | | 97,320 | | |
| Southwest Gas Corp. | | | 3,300 | | | | 98,241 | | |
| | | | 487,495 | | |
| Healthcare Equipment & Supplies (1.8%) | |
| ArthroCare Corp.*§ | | | 2,000 | | | | 96,100 | | |
| Haemonetics Corp.*§ | | | 1,500 | | | | 94,530 | | |
| Hologic, Inc.*§ | | | 3,500 | | | | 240,240 | | |
| Immucor, Inc.* | | | 5,500 | | | | 186,945 | | |
| Meridian Bioscience, Inc.§ | | | 3,850 | | | | 115,808 | | |
| ResMed, Inc.*§ | | | 2,700 | | | | 141,831 | | |
| SurModics, Inc.*§ | | | 4,200 | | | | 227,934 | | |
| Ventana Medical Systems, Inc.* | | | 4,000 | | | | 348,920 | | |
| Wright Medical Group, Inc.*§ | | | 5,500 | | | | 160,435 | | |
| | | | 1,612,743 | | |
| Healthcare Providers & Services (1.5%) | |
| Air Methods Corp.*§ | | | 3,800 | | | | 188,746 | | |
| Amedisys, Inc.*§ | | | 4,300 | | | | 208,636 | | |
| Amerigroup Corp.* | | | 1,100 | | | | 40,095 | | |
| AmSurg Corp.*§ | | | 4,200 | | | | 113,652 | | |
| Kindred Healthcare, Inc.*§ | | | 4,900 | | | | 122,402 | | |
| Magellan Health Services, Inc.*§ | | | 800 | | | | 37,304 | | |
| Molina Healthcare, Inc.*§ | | | 1,000 | | | | 38,700 | | |
| PARAXEL International Corp.* | | | 6,000 | | | | 289,800 | | |
| Sunrise Senior Living, Inc.*§ | | | 3,600 | | | | 110,448 | | |
| Tenet Healthcare Corp.*§ | | | 38,700 | | | | 196,596 | | |
| | | | 1,346,379 | | |
| Hotels, Restaurants & Leisure (0.4%) | |
| Buffalo Wild Wings, Inc.*§ | | | 1,300 | | | | 30,186 | | |
| Chipotle Mexican Grill, Inc. Class B*§ | | | 300 | | | | 36,915 | | |
| Jack in the Box, Inc.* | | | 1,200 | | | | 30,924 | | |
| Landry's Restaurants, Inc.§ | | | 1,400 | | | | 27,580 | | |
| Monarch Casino & Resort, Inc.*§ | | | 4,100 | | | | 98,728 | | |
| Papa John's International, Inc.*§ | | | 1,900 | | | | 43,130 | | |
| Ruby Tuesday, Inc. | | | 2,600 | | | | 25,350 | | |
| WMS Industries, Inc.*§ | | | 1,600 | | | | 58,624 | | |
| | | | 351,437 | | |
See Accompanying Notes to Financial Statements.
17
Credit Suisse Trust — Global Small Cap Portfolio
Schedule of Investments (continued)
December 31, 2007
| | | Number of
Shares | | Value | |
| COMMON STOCKS | |
| United States | |
| Household Durables (0.4%) | |
| American Greetings Corp. Class A§ | | | 5,200 | | �� | $ | 105,560 | | |
| Tempur-Pedic International, Inc.§ | | | 4,800 | | | | 124,656 | | |
| Tupperware Brands Corp. | | | 4,600 | | | | 151,938 | | |
| | | | 382,154 | | |
| Industrial Conglomerates (0.1%) | |
| Chemed Corp.§ | | | 1,300 | | | | 72,644 | | |
| Insurance (0.8%) | |
| American Equity Investment Life Holding Co.§ | | | 3,900 | | | | 32,331 | | |
| American Physicians Capital, Inc.§ | | | 700 | | | | 29,022 | | |
| CNA Surety Corp.* | | | 1,700 | | | | 33,643 | | |
| Commerce Group, Inc.§ | | | 900 | | | | 32,382 | | |
| Employers Holdings, Inc.§ | | | 2,000 | | | | 33,420 | | |
| National Interstate Corp.§ | | | 1,000 | | | | 33,100 | | |
| Navigators Group, Inc.* | | | 700 | | | | 45,500 | | |
| Philadelphia Consolidated Holding Corp.* | | | 900 | | | | 35,415 | | |
| Safety Insurance Group, Inc. | | | 1,000 | | | | 36,620 | | |
| Selective Insurance Group, Inc. | | | 4,300 | | | | 98,857 | | |
| State Auto Financial Corp.§ | | | 2,400 | | | | 63,120 | | |
| Tower Group, Inc.§ | | | 1,500 | | | | 50,100 | | |
| United Fire & Casualty Co. | | | 1,600 | | | | 46,544 | | |
| Zenith National Insurance Corp.§ | | | 2,800 | | | | 125,244 | | |
| | | | 695,298 | | |
| Internet & Catalog Retail (0.5%) | |
| Blue Nile, Inc.*§ | | | 700 | | | | 47,642 | | |
| Insight Enterprises, Inc.*§ | | | 1,900 | | | | 34,656 | | |
| Priceline.com, Inc.*§ | | | 2,700 | | | | 310,122 | | |
| School Specialty, Inc.*§ | | | 1,500 | | | | 51,825 | | |
| | | | 444,245 | | |
| Internet Software & Services (0.8%) | |
| Blue Coat Systems, Inc.* | | | 2,300 | | | | 75,601 | | |
| NETGEAR, Inc.*§ | | | 3,500 | | | | 124,845 | | |
| Sohu.com, Inc.*§ | | | 3,300 | | | | 179,916 | | |
| United Online, Inc.§ | | | 15,800 | | | | 186,756 | | |
| ValueClick, Inc.* | | | 3,100 | | | | 67,890 | | |
| Vignette Corp.* | | | 2,200 | | | | 32,142 | | |
| | | | 667,150 | | |
| IT Consulting & Services (0.4%) | |
| IHS, Inc. Class A*§ | | | 1,600 | | | | 96,896 | | |
| Phase Forward, Inc.*§ | | | 6,300 | | | | 137,025 | | |
| SAIC, Inc.* | | | 1,700 | | | | 34,204 | | |
| Sapient Corp.* | | | 6,600 | | | | 58,146 | | |
| | | | 326,271 | | |
See Accompanying Notes to Financial Statements.
18
Credit Suisse Trust — Global Small Cap Portfolio
Schedule of Investments (continued)
December 31, 2007
| | | Number of
Shares | | Value | |
| COMMON STOCKS | |
| United States | |
| Leisure Equipment & Products (0.3%) | |
| Callaway Golf Co.§ | | | 5,100 | | | $ | 88,893 | | |
| JAKKS Pacific, Inc.*§ | | | 3,400 | | | | 80,274 | | |
| Marvel Entertainment, Inc.*§ | | | 1,200 | | | | 32,052 | | |
| Polaris Industries, Inc.§ | | | 2,200 | | | | 105,094 | | |
| | | | 306,313 | | |
| Machinery (1.7%) | |
| Actuant Corp. Class A§ | | | 4,400 | | | | 149,644 | | |
| Applied Industrial Technologies, Inc. | | | 2,200 | | | | 63,844 | | |
| Badger Meter, Inc.§ | | | 1,000 | | | | 44,950 | | |
| Barnes Group, Inc.§ | | | 2,000 | | | | 66,780 | �� | |
| Bucyrus International, Inc.§ | | | 2,700 | | | | 268,353 | | |
| Cascade Corp.§ | | | 1,200 | | | | 55,752 | | |
| Ceradyne, Inc.*§ | | | 1,800 | | | | 84,474 | | |
| Columbus McKinnon Corp.* | | | 2,500 | | | | 81,550 | | |
| Dionex Corp.* | | | 1,900 | | | | 157,434 | | |
| Gorman-Rupp Co.§ | | | 1,250 | | | | 39,000 | | |
| Hurco Companies, Inc.* | | | 1,200 | | | | 52,380 | | |
| Manitowoc Company, Inc. | | | 2,300 | | | | 112,309 | | |
| Mueller Industries, Inc. | | | 2,600 | | | | 75,374 | | |
| RBC Bearings, Inc.* | | | 1,000 | | | | 43,460 | | |
| Robbins & Myers, Inc. | | | 1,100 | | | | 83,193 | | |
| Valmont Industries, Inc.§ | | | 800 | | | | 71,296 | | |
| | | | 1,449,793 | | |
| Marine (0.2%) | |
| Cal Dive International, Inc.*§ | | | 6,750 | | | | 89,370 | | |
| Genco Shipping & Trading, Ltd.§ | | | 1,100 | | | | 60,236 | | |
| | | | 149,606 | | |
| Media (0.5%) | |
| Entercom Communications Corp.§ | | | 2,300 | | | | 31,487 | | |
| Interactive Data Corp. | | | 1,100 | | | | 36,311 | | |
| Journal Communications, Inc. Class A§ | | | 3,800 | | | | 33,972 | | |
| Macrovision Corp.* | | | 3,900 | | | | 71,487 | | |
| Netflix, Inc.*§ | | | 4,000 | | | | 106,480 | | |
| Scholastic Corp.*§ | | | 4,100 | | | | 143,049 | | |
| | | | 422,786 | | |
| Metals & Mining (1.0%) | |
| Century Aluminum Co.*§ | | | 2,300 | | | | 124,062 | | |
| Cleveland-Cliffs, Inc.§ | | | 2,800 | | | | 282,240 | | |
| GrafTech International, Ltd.*§ | | | 11,600 | | | | 205,900 | | |
| Hecla Mining Co.*§ | | | 19,200 | | | | 179,520 | | |
| Massey Energy Co. | | | 2,400 | | | | 85,800 | | |
| | | | 877,522 | | |
See Accompanying Notes to Financial Statements.
19
Credit Suisse Trust — Global Small Cap Portfolio
Schedule of Investments (continued)
December 31, 2007
| | | Number of
Shares | | Value | |
| COMMON STOCKS | |
| United States | |
| Oil & Gas (1.7%) | |
| Alon USA Energy, Inc.§ | | | 2,100 | | | $ | 57,078 | | |
| Bois d'Arc Energy, Inc.* | | | 3,500 | | | | 69,475 | | |
| Comstock Resources, Inc.*§ | | | 3,300 | | | | 112,200 | | |
| Delek US Holdings, Inc.§ | | | 4,200 | | | | 84,966 | | |
| General Maritime Corp.§ | | | 5,200 | | | | 127,140 | | |
| Mariner Energy, Inc.*§ | | | 6,000 | | | | 137,280 | | |
| Petroleum Development Corp.* | | | 4,200 | | | | 248,346 | | |
| PetroQuest Energy, Inc.*§ | | | 4,500 | | | | 64,350 | | |
| Rosetta Resources, Inc.*§ | | | 3,600 | | | | 71,388 | | |
| Stone Energy Corp.* | | | 5,800 | | | | 272,078 | | |
| Swift Energy Co.* | | | 5,800 | | | | 255,374 | | |
| | | | 1,499,675 | | |
| Paper & Forest Products (0.2%) | |
| Buckeye Technologies, Inc.* | | | 4,200 | | | | 52,500 | | |
| Potlatch Corp. | | | 3,800 | | | | 168,872 | | |
| | | | 221,372 | | |
| Personal Products (0.2%) | |
| Chattem, Inc.* | | | 1,200 | | | | 90,648 | | |
| Elizabeth Arden, Inc.*§ | | | 3,300 | | | | 67,155 | | |
| | | | 157,803 | | |
| Pharmaceuticals (0.3%) | |
| Alnylam Pharmaceuticals, Inc.*§ | | | 2,200 | | | | 63,976 | | |
| Omrix Biopharmaceuticals, Inc.*§ | | | 1,800 | | | | 62,532 | | |
| Salix Pharmaceuticals, Ltd.*§ | | | 3,600 | | | | 28,368 | | |
| Sciele Pharma, Inc.* | | | 5,200 | | | | 106,340 | | |
| | | | 261,216 | | |
| Real Estate (1.0%) | |
| Anthracite Capital, Inc.§ | | | 4,600 | | | | 33,304 | | |
| Arbor Realty Trust, Inc.§ | | | 1,600 | | | | 25,776 | | |
| Avatar Holdings, Inc.*§ | | | 800 | | | | 33,456 | | |
| Deerfield Capital Corp.§ | | | 4,100 | | | | 32,800 | | |
| Digital Realty Trust, Inc.§ | | | 2,000 | | | | 76,740 | | |
| Entertainment Properties Trust§ | | | 2,200 | | | | 103,400 | | |
| FelCor Lodging Trust, Inc. | | | 4,700 | | | | 73,273 | | |
| First Industrial Realty Trust, Inc.§ | | | 900 | | | | 31,140 | | |
| Gramercy Capital Corp.§ | | | 1,400 | | | | 34,034 | | |
| Mid-America Apartment Communities, Inc. | | | 1,900 | | | | 81,225 | | |
| National Health Investors, Inc.§ | | | 1,900 | | | | 53,010 | | |
| National Retail Properties, Inc. | | | 1,500 | | | | 35,070 | | |
| Parkway Properties, Inc.§ | | | 2,100 | | | | 77,658 | | |
| Pennsylvania Real Estate Investment Trust | | | 1,000 | | | | 29,680 | | |
| PS Business Parks, Inc. | | | 700 | | | | 36,785 | | |
| RAIT Financail Trust§ | | | 3,000 | | | | 25,860 | | |
| Realty Income Corp.§ | | | 1,400 | | | | 37,828 | | |
| Redwood Trust, Inc.§ | | | 1,900 | | | | 65,056 | | |
| | | | 886,095 | | |
See Accompanying Notes to Financial Statements.
20
Credit Suisse Trust — Global Small Cap Portfolio
Schedule of Investments (continued)
December 31, 2007
| | | Number of
Shares | | Value | |
| COMMON STOCKS | |
| United States | |
| Road & Rail (0.1%) | |
| Kansas City Southern*§ | | | 2,000 | | | $ | 68,660 | | |
| Semiconductor Equipment & Products (1.6%) | |
| Advanced Energy Industries, Inc.* | | | 7,200 | | | | 94,176 | | |
| AMIS Holdings, Inc.*§ | | | 4,400 | | | | 44,088 | | |
| Amkor Technology, Inc.*§ | | | 8,300 | | | | 70,799 | | |
| Cymer, Inc.*§ | | | 2,800 | | | | 109,004 | | |
| Entegris, Inc.*§ | | | 4,000 | | | | 34,520 | | |
| Kulicke and Soffa Industries, Inc.* | | | 8,700 | | | | 59,682 | | |
| Microsemi Corp.*§ | | | 5,400 | | | | 119,556 | | |
| MKS Instruments, Inc.* | | | 3,200 | | | | 61,248 | | |
| Monolithic Power Systems, Inc.* | | | 3,200 | | | | 68,704 | | |
| ON Semiconductor Corp.*§ | | | 7,400 | | | | 65,712 | | |
| Photronics, Inc.*§ | | | 6,300 | | | | 78,561 | | |
| Semtech Corp.*§ | | | 9,600 | | | | 148,992 | | |
| Skyworks Solutions, Inc.* | | | 11,600 | | | | 98,600 | | |
| Varian Semiconductor Equipment Associates, Inc.*§ | | | 2,550 | | | | 94,350 | | |
| Zoran Corp.*§ | | | 11,200 | | | | 252,112 | | |
| | | | 1,400,104 | | |
| Software (1.2%) | |
| Aspen Technology, Inc.*§ | | | 13,000 | | | | 210,860 | | |
| Blackbaud, Inc.§ | | | 1,200 | | | | 33,648 | | |
| Informatica Corp.*§ | | | 8,700 | | | | 156,774 | | |
| MicroStrategy, Inc. Class A*§ | | | 1,400 | | | | 133,140 | | |
| Progress Software Corp.* | | | 3,400 | | | | 114,512 | | |
| SPSS, Inc.*§ | | | 1,900 | | | | 68,229 | | |
| Sybase, Inc.*§ | | | 2,600 | | | | 67,834 | | |
| Taleo Corp. Class A*§ | | | 3,700 | | | | 110,186 | | |
| THQ, Inc.*§ | | | 4,800 | | | | 135,312 | | |
| | | | 1,030,495 | | |
| Specialty Retail (0.7%) | |
| Aeropostale, Inc.*§ | | | 10,900 | | | | 288,850 | | |
| Buckle, Inc.§ | | | 1,100 | | | | 36,300 | | |
| Collective Brands, Inc.*§ | | | 2,200 | | | | 38,258 | | |
| Conn's, Inc.*§ | | | 1,500 | | | | 25,665 | | |
| Jo-Ann Stores, Inc.*§ | | | 1,800 | | | | 23,544 | | |
| Jos. A. Bank Clothiers, Inc.*§ | | | 5,300 | | | | 150,785 | | |
| Men's Wearhouse, Inc. | | | 1,900 | | | | 51,262 | | |
| | | | 614,664 | | |
| Textiles & Apparel (0.5%) | |
| Crocs, Inc.*§ | | | 800 | | | | 29,448 | | |
| Deckers Outdoor Corp.*§ | | | 1,000 | | | | 155,060 | | |
| Fossil, Inc.*§ | | | 1,600 | | | | 67,168 | | |
| Kellwood Co.§ | | | 4,200 | | | | 69,888 | | |
| Warnaco Group, Inc.*§ | | | 4,300 | | | | 149,640 | | |
| | | | 471,204 | | |
See Accompanying Notes to Financial Statements.
21
Credit Suisse Trust — Global Small Cap Portfolio
Schedule of Investments (continued)
December 31, 2007
| | | Number of
Shares | | Value | |
| COMMON STOCKS | |
| United States | |
| Tobacco (0.3%) | |
| Universal Corp.§ | | | 2,800 | | | $ | 143,416 | | |
| Vector Group, Ltd.§ | | | 4,385 | | | | 87,963 | | |
| | | | 231,379 | | |
| Water Utilities (0.1%) | |
| American States Water Co.§ | | | 800 | | | | 30,144 | | |
| California Water Service Group§ | | | 900 | | | | 33,318 | | |
| | | | 63,462 | | |
| Wireless Telecommunication Services (0.3%) | |
| Centennial Communications Corp.*§ | | | 3,800 | | | | 35,302 | | |
| NTELOS Holdings Corp.§ | | | 4,800 | | | | 142,512 | | |
| Syniverse Holdings, Inc.* | | | 2,200 | | | | 34,276 | | |
| USA Mobility, Inc.*§ | | | 2,600 | | | | 37,180 | | |
| | | | 249,270 | | |
| TOTAL UNITED STATES | | | 33,020,990 | | |
| TOTAL COMMON STOCKS (Cost $80,128,100) | | | 85,246,009 | | |
| PREFERRED STOCK (2.2%) | |
| Germany (2.2%) | |
| Healthcare Equipment & Supplies (2.2%) | |
| Draegerwerk AG (Cost $1,540,403) | | | 26,000 | | | | 1,912,785 | | |
| SHORT-TERM INVESTMENT (28.6%) | |
| State Street Navigator Prime Portfolio§§ (Cost $24,814,299) | | | 24,814,299 | | | | 24,814,299 | | |
| TOTAL INVESTMENTS AT VALUE (128.9%) (Cost $106,482,802) | | | 111,973,093 | | |
| LIABILITIES IN EXCESS OF OTHER ASSETS (-28.9%) | | | (25,088,738 | ) | |
| NET ASSETS (100.0%) | | $ | 86,884,355 | | |
* Non-income producing security.
§ Security or portion thereof is out on loan.
§§ Represents security purchased with cash collateral received for securities on loan.
See Accompanying Notes to Financial Statements.
22
Credit Suisse Trust — Global Small Cap Portfolio
Statement of Assets and Liabilities
December 31, 2007
| Assets | |
Investments at value, including collateral for securities on loan of $24,814,299
(Cost $106,482,802) (Note 2) | | $ | 111,973,0931 | | |
| Foreign currency at value (cost $10,472) | | | 10,548 | | |
| Dividend receivable | | | 68,845 | | |
| Receivable for portfolio shares sold | | | 38,791 | | |
| Prepaid expenses and other assets | | | 22,218 | | |
| Total Assets | | | 112,113,495 | | |
| Liabilities | |
| Advisory fee payable (Note 3) | | | 35,235 | | |
| Administrative services fee payable (Note 3) | | | 8,904 | | |
| Payable upon return of securities loaned (Note 2) | | | 24,814,299 | | |
| Due to custodian | | | 248,615 | | |
| Payable for portfolio shares redeemed | | | 26,500 | | |
| Trustees' fee payable | | | 804 | | |
| Other accrued expenses payable | | | 94,783 | | |
| Total Liabilities | | | 25,229,140 | | |
| Net Assets | |
| Capital stock, $0.001 par value (Note 6) | | | 6,171 | | |
| Paid-in capital (Note 6) | | | 100,227,813 | | |
| Undistributed net investment income | | | 1,053,844 | | |
| Accumulated net realized loss on investments, futures contracts and foreign currency transactions | | | (19,894,287 | ) | |
| Net unrealized appreciation from investments and foreign currency translations | | | 5,490,814 | | |
| Net Assets | | $ | 86,884,355 | | |
| Shares outstanding | | | 6,171,400 | | |
| Net asset value, offering price, and redemption price per share | | $ | 14.08 | | |
1 Including $23,965,878 of securities on loan.
See Accompanying Notes to Financial Statements.
23
Credit Suisse Trust — Global Small Cap Portfolio
Statement of Operations
For the Year Ended December 31, 2007
| Investment Income (Note 2) | |
| Dividends | | $ | 2,337,188 | | |
| Interest | | | 67,345 | | |
| Securities lending | | | 230,386 | | |
| Foreign taxes withheld | | | (83,122 | ) | |
| Total investment income | | | 2,551,797 | | |
| Expenses | |
| Investment advisory fees (Note 3) | | | 1,339,060 | | |
| Administrative services fees (Note 3) | | | 148,588 | | |
| Custodian fees | | | 67,802 | | |
| Printing fees (Note 3) | | | 54,181 | | |
| Audit and tax fees | | | 27,888 | | |
| Trustees' fees | | | 19,857 | | |
| Legal fees | | | 12,077 | | |
| Transfer agent fees | | | 6,718 | | |
| Insurance expense | | | 5,103 | | |
| Commitment fees (Note 4) | | | 2,721 | | |
| Interest expense (Note 4) | | | 1,474 | | |
| Miscellaneous expense | | | 9,579 | | |
| Total expenses | | | 1,695,048 | | |
| Less: fees waived (Note 3) | | | (225,230 | ) | |
| Net expenses | | | 1,469,818 | | |
| Net investment income | | | 1,081,979 | | |
Net Realized and Unrealized Gain (Loss) from Investments, Futures Contracts and
Foreign Currency Related Items | |
| Net realized gain from investments | | | 5,960,734 | | |
| Net realized loss from futures contracts | | | (3,264 | ) | |
| Net realized loss from foreign currency transactions | | | (9,509 | ) | |
| Net change in unrealized appreciation (depreciation) from investments | | | (9,600,599 | ) | |
| Net change in unrealized appreciation (depreciation) from futures contracts | | | 2,592 | | |
| Net change in unrealized appreciation (depreciation) from foreign currency translations | | | (151 | ) | |
| Net realized and unrealized loss from investments, futures contracts and foreign currency related items | | | (3,650,197 | ) | |
| Net decrease in net assets resulting from operations | | $ | (2,568,218 | ) | |
See Accompanying Notes to Financial Statements.
24
Credit Suisse Trust — Global Small Cap Portfolio
Statements of Changes in Net Assets
| | | For the Year
Ended
December 31, 2007 | | For the Year
Ended
December 31, 2006 | |
| From Operations | |
| Net investment income (loss) | | $ | 1,081,979 | | | $ | (27,488 | ) | |
Net realized gain from investments, futures contracts and
foreign currency transactions | | | 5,947,961 | | | | 22,310,658 | | |
Net change in unrealized appreciation (depreciation)
from investments, futures contracts and foreign currency translations | | | (9,598,158 | ) | | | (7,853,700 | ) | |
| Net increase (decrease) in net assets resulting from operations | | | (2,568,218 | ) | | | 14,429,470 | | |
| From Capital Share Transactions (Note 6) | |
| Proceeds from sale of shares | | | 8,774,027 | | | | 21,903,845 | | |
| Net asset value of shares redeemed | | | (38,426,851 | ) | | | (46,535,898 | ) | |
| Net decrease in net assets from capital share transactions | | | (29,652,824 | ) | | | (24,632,053 | ) | |
| Net decrease in net assets | | | (32,221,042 | ) | | | (10,202,583 | ) | |
| Net Assets | |
| Beginning of year | | | 119,105,397 | | | | 129,307,980 | | |
| End of year | | $ | 86,884,355 | | | $ | 119,105,397 | | |
| Undistributed net investment income | | $ | 1,053,844 | | | $ | 1,351 | | |
See Accompanying Notes to Financial Statements.
25
Credit Suisse Trust — Global Small Cap Portfolio
Financial Highlights
(For a Share of the Portfolio Outstanding Throughout Each Year)
| | | For the Year Ended December 31, | |
| | | 2007 | | 2006 | | 2005 | | 2004 | | 2003 | |
| Per share data | |
| Net asset value, beginning of year | | $ | 14.67 | | | $ | 12.95 | | | $ | 11.15 | | | $ | 9.45 | | | $ | 6.40 | | |
| INVESTMENT OPERATIONS | |
| Net investment income (loss) | | | 0.18 | | | | (0.00 | )1 | | | (0.04 | ) | | | (0.09 | ) | | | (0.06 | ) | |
Net gain (loss) on investments,
futures contracts and foreign currency
related items (both realized and unrealized) | | | (0.77 | ) | | | 1.72 | | | | 1.84 | | | | 1.79 | | | | 3.11 | | |
| Total from investment operations | | | (0.59 | ) | | | 1.72 | | | | 1.80 | | | | 1.70 | | | | 3.05 | | |
| Net asset value, end of year | | $ | 14.08 | | | $ | 14.67 | | | $ | 12.95 | | | $ | 11.15 | | | $ | 9.45 | | |
| Total return2 | | | (4.02 | )% | | | 13.28 | % | | | 16.14 | % | | | 17.99 | % | | | 47.66 | % | |
| RATIOS AND SUPPLEMENTAL DATA | |
| Net assets, end of year (000s omitted) | | $ | 86,884 | | | $ | 119,105 | | | $ | 129,308 | | | $ | 110,110 | | | $ | 102,577 | | |
| Ratio of expenses to average net assets | | | 1.37 | % | | | 1.40 | % | | | 1.40 | % | | | 1.40 | % | | | 1.40 | % | |
Ratio of net investment income (loss) to
average net assets | | | 1.01 | % | | | (0.02 | )% | | | (0.39 | )% | | | (0.85 | )% | | | (0.94 | )% | |
Decrease reflected in above operating expense
ratios due to waivers/reimbursements | | | 0.21 | % | | | 0.16 | % | | | 0.19 | % | | | 0.17 | % | | | 0.23 | % | |
| Portfolio turnover rate | | | 76 | % | | | 117 | % | | | 75 | % | | | 79 | % | | | 86 | % | |
1 This amount represents less than $(0.01) per share.
2 Total returns are historical and assume changes in share price and reinvestment of all dividends and distributions. Had certain expenses not been reduced during the years shown, total returns would have been lower. Total returns do not reflect charges and expenses attributable to any particular variable contract or plan.
See Accompanying Notes to Financial Statements.
26
Credit Suisse Trust — Global Small Cap Portfolio
Notes to Financial Statements
December 31, 2007
Note 1. Organization
Credit Suisse Trust, (the "Trust") is an open-end management investment company registered under the Investment Company Act of 1940, as amended (the "1940 Act"), and currently offers eight managed investment portfolios of which one, the Global Small Cap Portfolio (the "Portfolio"), is included in this report. The Portfolio is a diversified investment fund that seeks long-term growth of capital. Shares of the Portfolio are not available directly to individual investors but may be offered only through (a) variable annuity contracts and variable life insurance contracts offered by separate accounts of certain insurance companies and (b) tax-qualified pension and retirement plans. The Portfolio may not be available in connection with a particular contract or plan. The Trust was organized under the laws of The Commonwealth of Massachusetts as a business trust on March 15, 1995.
Note 2. Significant Accounting Policies
A) SECURITY VALUATION — The net asset value of the Portfolio is determined daily as of the close of regular trading on the New York Stock Exchange, Inc. (the "Exchange") on each day the Exchange is open for business. Equity investments are valued at market value, which is generally determined using the closing price on the exchange or market on which the security is primarily traded at the time of valuation (the "Valuation Time"). If no sales are reported, equity investments are generally valued at the most recent bid quotation as of the Valuation Time or at the lowest asked quotation in the case of a short sale of securities. Debt securities with a remaining maturity greater than 60 days are valued in accordance with the price supplied by a pricing service, which may use a matrix, formula or other objective method that takes into consideration market indices, yield curves and other specific adjustments. Debt obligations that will matur e in 60 days or less are valued on the basis of amortized cost, which approximates market value, unless it is determined that using this method would not represent fair value. Investments in mutual funds are valued at the mutual fund's closing net asset value per share on the day of valuation. Securities and other assets for which market quotations are not readily available, or whose values have been materially affected by events occurring before the Portfolio's Valuation Time but after the close of the securities' primary markets, are valued at fair value as determined in good faith by, or under the direction of, the Board of Trustees under procedures established by the Board of Trustees. The Portfolio may utilize a service provided by an independent third party which has been approved by the Board of Trustees to fair value certain securities. When fair-value pricing is employed,
27
Credit Suisse Trust — Global Small Cap Portfolio
Notes to Financial Statements (continued)
December 31, 2007
Note 2. Significant Accounting Policies
the prices of securities used by a portfolio to calculate its net asset value may differ from quoted or published prices for the same securities.
B) FOREIGN CURRENCY TRANSACTIONS — The books and records of the Portfolio are maintained in U.S. dollars. Transactions denominated in foreign currencies are recorded at the current prevailing exchange rates. All assets and liabilities denominated in foreign currencies are translated into U.S. dollar amounts at the current exchange rate at the end of the period. Translation gains or losses resulting from changes in the exchange rate during the reporting period and realized gains and losses on the settlement of foreign currency transactions are reported in the results of operations for the current period. The Portfolio does not isolate that portion of realized gains and losses on investments in equity securities which is due to changes in the foreign exchange rate from that which is due to changes in market prices of equity securities. The Portfolio isolates that portion of realized gains and losses on investments in debt securities which is due to changes in the foreign exchange rate from that which is due to changes in market prices of debt securities.
C) SECURITY TRANSACTIONS AND INVESTMENT INCOME — Security transactions are accounted for on a trade date basis. Interest income is recorded on the accrual basis. Dividends are recorded on the ex-dividend date. The cost of investments sold is determined by use of the specific identification method for both financial reporting and income tax purposes.
D) DIVIDENDS AND DISTRIBUTIONS TO SHAREHOLDERS — Dividends from net investment income and distributions of net realized capital gains, if any, are declared and paid at least annually. However, to the extent that a net realized capital gain can be reduced by a capital loss carryforward, such gain will not be distributed. Income and capital gain distributions are determined in accordance with federal income tax regulations, which may differ from accounting principles generally accepted in the United States of America ("GAAP").
E) FEDERAL INCOME TAXES — No provision is made for federal taxes as it is the Portfolio's intention to continue to qualify for and elect the tax treatment applicable to regulated investment companies under the Internal Revenue Code of 1986, as amended, and to make the requisite distributions to its shareholders, which will be sufficient to relieve it from federal income and excise taxes.
F) USE OF ESTIMATES — The preparation of financial statements in conformity with GAAP requires management to make estimates and
28
Credit Suisse Trust — Global Small Cap Portfolio
Notes to Financial Statements (continued)
December 31, 2007
Note 2. Significant Accounting Policies
assumptions that affect the reported amounts of assets and liabilities and disclosure of contingent assets and liabilities at the date of the financial statements and the reported amounts of income and expenses during the reporting period. Actual results could differ from these estimates.
G) SHORT TERM INVESTMENTS — The Portfolio, together with other funds/portfolios advised by Credit Suisse Asset Management, LLC ("Credit Suisse"), an indirect, wholly-owned subsidiary of Credit Suisse Group, pools available cash into either a short-term variable rate time deposit issued by State Street Bank and Trust Company ("SSB"), the Portfolio's custodian, or a money market fund advised by Credit Suisse. The short-term time deposit issued by SSB is a variable rate account classified as a short-term investment.
H) FORWARD FOREIGN CURRENCY CONTRACTS — The Portfolio may enter into forward foreign currency contracts for the purchase or sale of a specific foreign currency at a fixed price on a future date. Risks may arise upon entering into these contracts from the potential inability of counterparties to meet the terms of their contracts and from unanticipated movements in the value of a foreign currency. The Portfolio will enter into forward foreign currency contracts primarily for hedging purposes. Forward foreign currency contracts are adjusted by the daily forward exchange rate of the underlying currency and any gains or losses are recorded for financial statement purposes as unrealized until the contract settlement date or an offsetting position is entered into. At December 31, 2007, the Portfolio had no open forward foreign currency contracts.
I) FUTURES — The Portfolio may enter into futures contracts to the extent permitted by its investment policies and objectives. Upon entering into a futures contract, the Portfolio is required to deposit cash or pledge U.S. Government securities as initial margin. Subsequent payments, which are dependent on the daily fluctuations in the value of the underlying instrument, are made or received by the Portfolio each day (daily variation margin) and are recorded as unrealized gains or losses until the contracts are closed.
When the contracts are closed, the Portfolio records a realized gain or loss equal to the difference between the proceeds from (or cost of) the closing transactions and the Portfolio's basis in the contracts. Risks of entering into futures contracts for hedging purposes include the possibility that a change in the value of the contract may not correlate with the changes in the value of the underlying instruments. In addition, the purchase of a futures contract involves the risk that the Portfolio could lose more than the original margin deposit and
29
Credit Suisse Trust — Global Small Cap Portfolio
Notes to Financial Statements (continued)
December 31, 2007
Note 2. Significant Accounting Policies
subsequent payments required for a futures transaction. At December 31, 2007, the Portfolio had no open futures contracts.
J) SECURITIES LENDING — Loans of securities are required at all times to be secured by collateral at least equal to 102% of the market value of domestic securities on loan (including any accrued interest thereon) and 105% of the market value of foreign securities on loan (including any accrued interest thereon). Cash collateral received by the Portfolio in connection with securities lending activity may be pooled together with cash collateral for other funds/portfolios advised by Credit Suisse and may be invested in a variety of investments, including certain Credit Suisse-advised funds, funds advised by SSB, the Portfolio's securities lending agent, or money market instruments. However, in the event of default or bankruptcy by the other party to the agreement, realization and/or retention of the collateral may be subject to legal proceedings.
SSB has been engaged by the Portfolio to act as the Portfolio's securities lending agent. The Portfolio's securities lending arrangement provides that the Portfolio and SSB will share the net income earned from securities lending activities. During the year ended December 31, 2007, total earnings from the Portfolio's investment in cash collateral received in connection with securities lending arrangements was $1,601,813, of which $1,317,827 was rebated to borrowers (brokers). The Portfolio retained $230,386 in income from the cash collateral investment, and SSB, as lending agent, was paid $53,600. The Portfolio may also be entitled to certain minimum amounts of income from its securities lending activities. Securities lending income is accrued as earned.
K) OTHER — The Portfolio may invest in securities of foreign countries and governments which involve certain risks in addition to those inherent in domestic investments. Such risks generally include, among others, currency risk (fluctuations in currency exchange rates), information risk (key information may be inaccurate or unavailable) and political risk (expropriation, nationalization or the imposition of capital or currency controls or punitive taxes). Other risks of investing in foreign securities include liquidity and valuation risks.
The Portfolio may be subject to taxes imposed by countries in which it invests with respect to its investments in issuers existing or operating in such countries. Such taxes are generally based on income earned or repatriated and capital gains realized on the sale of such investments. The Portfolio accrues such taxes when the related income is earned or gains are realized.
30
Credit Suisse Trust — Global Small Cap Portfolio
Notes to Financial Statements (continued)
December 31, 2007
Note 2. Significant Accounting Policies
The Portfolio may invest up to 15% of its net assets in non-publicly traded securities. Non-publicly traded securities may be less liquid than publicly traded securities. Although these securities may be resold in privately negotiated transactions, the prices realized from such sales could differ from the price originally paid by the Portfolio or the current carrying values, and the difference could be material.
Note 3. Transactions with Affiliates and Related Parties
Credit Suisse serves as investment adviser for the Portfolio. For its investment advisory services, Credit Suisse is entitled to receive a fee from the Portfolio at an annual rate of 1.25% of the Portfolio's average daily net assets. For the year ended December 31, 2007, investment advisory fees earned and voluntarily waived for the Portfolio were $1,339,060 and $225,230, respectively. Credit Suisse will not recapture from the Portfolio any fees it waived during the fiscal year ended December 31, 2007. Fee waivers and reimbursements are voluntary and may be discontinued by Credit Suisse at any time.
Credit Suisse Asset Management Limited ("Credit Suisse U.K."), Credit Suisse Asset Management Limited ("Credit Suisse Japan") and Credit Suisse Asset Management Limited ("Credit Suisse Australia"), each an affiliate of Credit Suisse, are sub-investment advisers to the Portfolio (the "Sub-Advisers"). Credit Suisse U.K.'s, Credit Suisse Japan's and Credit Suisse Australia's sub-investment advisory fees are paid by Credit Suisse out of Credit Suisse's net investment advisory fee and are not paid by the Portfolio.
Credit Suisse Asset Management Securities, Inc. ("CSAMSI"), an affiliate of Credit Suisse, and SSB serve as co-administrators to the Portfolio. For its co-administrative services, CSAMSI currently receives a fee calculated at an annual rate of 0.09% of the Portfolio's average daily net assets. For the year ended December 31, 2007, co-administrative services fees earned by CSAMSI were $96,412.
For its co-administrative services, SSB receives a fee, exclusive of out-of-pocket expenses, calculated in total for all the Credit Suisse funds/portfolios co-administered by SSB and allocated based upon relative average net assets of each fund/portfolio, subject to an annual minimum fee. For the year ended December 31, 2007, co-administrative services fees earned by SSB (including out-of-pocket expenses) were $52,176.
In addition to serving as the Portfolio's co-administrator, CSAMSI currently serves as distributor of the Portfolio's shares without compensation.
31
Credit Suisse Trust — Global Small Cap Portfolio
Notes to Financial Statements (continued)
December 31, 2007
Note 3. Transactions with Affiliates and Related Parties
Merrill Corporation ("Merrill"), an affiliate of Credit Suisse, has been engaged by the Portfolio to provide certain financial printing and fulfillment services. For the year ended December 31, 2007, Merrill was paid $23,103 for its services to the Portfolio.
Note 4. Line of Credit
The Portfolio, together with other funds/portfolios advised by Credit Suisse (collectively, the "Participating Funds"), participates in a $50 million committed, unsecured line of credit facility ("Credit Facility") for temporary or emergency purposes with Deutsche Bank, A.G. as administrative agent and syndication agent and SSB as operations agent. Under the terms of the Credit Facility, the Participating Funds pay an aggregate commitment fee at a rate of 0.10% per annum on the average unused amount of the Credit Facility, which is allocated among the Participating Funds in such manner as is determined by the governing Boards of the Participating Funds. In addition, the Participating Funds pay interest on borrowings at the Federal Funds rate plus 0.50%. At December 31, 2007, the Portfolio had no loans outstanding under the Credit Facility. During the year ended December 31, 2007, the Portfolio had borrowings under the Credit Facility as foll ows:
Average Daily
Loan Balance | | Weighted Average
Interest Rate% | | Maximum Daily
Loan Outstanding | |
| $ | 1,841,600 | | | | 5.765 | % | | $ | 2,148,000 | | |
Note 5. Purchases and Sales of Securities
For the year ended December 31, 2007, purchases and sales of investment securities (excluding short-term investments) were $80,443,165 and $107,481,494, respectively.
Note 6. Capital Share Transactions
The Trust is authorized to issue an unlimited number of full and fractional shares of beneficial interest, $.001 par value per share. Transactions in capital shares of the Portfolio were as follows:
| | | For the Year Ended
December 31, 2007 | | For the Year Ended
December 31, 2006 | |
| Shares sold | | | 576,327 | | | | 1,576,665 | | |
| Shares redeemed | | | (2,523,446 | ) | | | (3,440,797 | ) | |
| Net decrease | | | (1,947,119 | ) | | | (1,864,132 | ) | |
32
Credit Suisse Trust — Global Small Cap Portfolio
Notes to Financial Statements (continued)
December 31, 2007
Note 6. Capital Share Transactions
On December 31, 2007, the number of shareholders that held 5% or more of the outstanding shares of the Portfolio was as follows:
Number of
Shareholders | | Approximate Percentage
of Outstanding Shares | |
| | 5 | | | | 79 | % | |
Some of the shareholders are omnibus accounts, which hold shares on behalf of individual shareholders.
Note 7. Federal Income Taxes
Income and capital gain distributions are determined in accordance with federal income tax regulations, which may differ from GAAP.
The tax basis components of distributable earnings differ from the amounts reflected in the Statement of Assets and Liabilities by temporary book/tax differences. These differences are primarily due to losses deferred on wash sales, mark to market of forwards contracts, unused capital loss carryforwards, dividends received from Real Estate Investment Trusts and current year post October loss deferred. At December 31, 2007, the components of distributable earnings on a tax basis by the Portfolio were as follows:
| Undistributed ordinary income | | $ | 1,052,166 | | |
| Accumulated net realized loss | | | (19,528,575 | ) | |
| Unrealized appreciation | | | 5,305,362 | | |
| Deferral of post-October capital losses | | | (178,582 | ) | |
| | | $ | (13,349,629 | ) | |
At December 31, 2007, the Portfolio had capital loss carryforwards available to offset possible future capital gains as follows:
| | | Expires December 31, | |
| | | 2010 | | 2011 | |
| | $ | 14,650,377 | | | $ | 4,878,198 | | |
During the tax year ended December 31, 2007, the Portfolio utilized $6,283,166 of the capital loss carryforwards.
It is uncertain that the Portfolio will realize the full benefit of these losses prior to expiration.
At December 31, 2007, the identified cost for federal income tax purposes, as well as the gross unrealized appreciation from investments for those securities having an excess of value over cost, gross unrealized depreciation from
33
Credit Suisse Trust — Global Small Cap Portfolio
Notes to Financial Statements (continued)
December 31, 2007
Note 7. Federal Income Taxes
investments for those securities having and excess of cost over value and the net unrealized appreciation from investments were $106,668,361, $17,749,369, $(12,444,637) and $5,304,732, respectively.
At December 31, 2007, the Portfolio reclassified $7,044 to accumulated net realized loss from investments and $22,442 to paid in capital from undistributed net investment income, adjusting for current period permanent book/tax differences which arose principally from differing book/tax treatments of foreign currency reclasses, income/(loss) from investment in partnerships and dividends received from Real Estate Investment Trusts. Net assets were not affected by these reclassifications.
Note 8. Contingencies
In the normal course of business, the Portfolio may provide general indemnifications pursuant to certain contracts and organizational documents. The Portfolio's maximum exposure under these arrangements is dependent on future claims that may be made against the Portfolio and, therefore, cannot be estimated; however, based on experience, the risk of loss from such claims is considered remote.
Note 9. Recent Accounting Pronouncements
During June 2006, the Financial Accounting Standards Board ("FASB") issued FASB Interpretation 48 ("FIN 48" or the "Interpretation"), Accounting for Uncertainty in Income Taxes — an interpretation of FASB statement 109. FIN 48 supplements FASB Statement 109, Accounting for Income Taxes, by defining the confidence level that a tax position must meet in order to be recognized in the financial statements. FIN 48 prescribes a comprehensive model for how a fund should recognize, measure, present, and disclose in its financial statements uncertain tax positions that the fund has taken or expects to take on a tax return. FIN 48 requires that th e tax effects of a position be recognized only if it is "more likely than not" to be sustained based solely on its technical merits. Management must be able to conclude that the tax law, regulations, case law, and other objective information regarding the technical merits sufficiently support the position's sustainability with a likelihood of more than 50 percent. During the period ended December 31, 2007, Management has adopted FIN 48. There was no material impact to the financial statements or disclosures thereto as a result of the adoption of this pronouncement.
34
Credit Suisse Trust — Global Small Cap Portfolio
Notes to Financial Statements (continued)
December 31, 2007
Note 9. Recent Accounting Pronouncements
On September 20, 2006, the FASB released Statement of Financial Accounting Standards No. 157 "Fair Value Measurements" ("FAS 157"). FAS 157 establishes an authoritative definition of fair value, sets out a framework for measuring fair value, and requires additional disclosures about fair-value measurements. The application of FAS 157 is required for fiscal years, beginning after November 15, 2007 and interim periods within those fiscal years. As of December 31, 2007, management does not believe the adoption of FAS 157 will impact the amounts reported in the financial statements, however, additional disclosures will be required in subsequent reports.
35
Credit Suisse Trust — Global Small Cap Portfolio
Report of Independent Registered Public Accounting Firm
To the Board of Trustees of Credit Suisse Trust and Shareholders of
Credit Suisse Trust — Global Small Cap Portfolio:
In our opinion, the accompanying statement of assets and liabilities, including the schedule of investments, and the related statements of operations and of changes in net assets and the financial highlights present fairly, in all material respects, the financial position of Global Small Cap Portfolio (the "Portfolio"), a portfolio of the Credit Suisse Trust, at December 31, 2007, the results of its operations for the year then ended, the changes in its net assets for each of the two years in the period then ended and the financial highlights for each of the five years in the period then ended, in conformity with accounting principles generally accepted in the United States of America. These financial statements and financial highlights (hereafter referred to as "financial statements") are the responsibility of the Portfolio's management; our responsibility is to express an opinion on these financial statements based on our audits. We cond ucted our audits of these financial statements in accordance with the standards of the Public Company Accounting Oversight Board (United States). Those standards require that we plan and perform the audit to obtain reasonable assurance about whether the financial statements are free of material misstatement. An audit includes examining, on a test basis, evidence supporting the amounts and disclosures in the financial statements, assessing the accounting principles used and significant estimates made by management, and evaluating the overall financial statement presentation. We believe that our audits, which included confirmation of securities at December 31, 2007 by correspondence with the custodian, provide a reasonable basis for our opinion.
PricewaterhouseCoopers LLP
Baltimore, Maryland
February 25, 2008
36
Credit Suisse Trust — Global Small Cap Portfolio
Board Approval of Advisory Agreement (unaudited)
In approving the renewal of the current Advisory and Sub-Advisory Agreements, the Board of Trustees, including the Independent Trustees, at a meeting held on November 13 and 14, 2007, considered the following factors with respect to the Global Small Cap Portfolio (the "Portfolio"):
Investment Advisory Fee Rates
The Board reviewed and considered the contractual advisory fee rate of 1.25% for the Portfolio ("Contractual Advisory Fee") in light of the extent and quality of the advisory services provided by Credit Suisse Asset Management, LLC ("Credit Suisse") or Credit Suisse Asset Management Limited ("Credit Suisse U.K."), Credit Suisse Asset Management Limited ("Credit Suisse Australia") and Credit Suisse Asset Management Limited ("Credit Suisse Japan"). The Board also reviewed and considered the fee waivers and/or expense reimbursement arrangements currently in place for the Portfolio and considered the actual fee rate of 1.09% paid by the Portfolio after taking waivers and reimbursements into account ("Net Advisory Fee"). The Board acknowledged that voluntary fee waivers and reimbursements could be discontinued at any time. In addition, the Board noted that the compensation paid to Credit Suisse U.K., Credit Suisse Australia and Credit Suisse Japa n (collectively, the "Sub-Advisers") does not increase the fees or expenses otherwise incurred by the Portfolio's shareholders.
Additionally, the Board received and considered information comparing the Portfolio's Contractual Advisory Fee, Net Advisory Fee and the Portfolio's overall expenses with those of funds in both the relevant expense group ("Expense Group") and universe of funds (the "Expense Universe") provided by Lipper Inc., an independent provider of investment company data.
Nature, Extent and Quality of the Services under the Advisory and
Sub-Advisory Agreements
The Board received and considered information regarding the nature, extent and quality of services provided to the Portfolio by Credit Suisse under the Advisory Agreement and by the Sub-Advisers under the Sub-Advisory Agreements. The Board also noted information received at regular meetings throughout the year related to the services rendered by Credit Suisse and the Sub-Advisers. The Board reviewed background information about Credit Suisse and the Sub-Advisers, including their respective Forms ADV. The Board considered the background and experience of both Credit Suisse's
37
Credit Suisse Trust — Global Small Cap Portfolio
Board Approval of Advisory Agreement (unaudited) (continued)
and the Sub-Advisers' senior management and the expertise of, and the amount of attention given to the Portfolio by, senior personnel of Credit Suisse and the Sub-Advisers. With respect to the Sub-Advisers, the Board also considered their expertise in managing the types of global investments that the Portfolio utilizes in its investment strategy. In addition, the Board reviewed the qualifications, backgrounds and responsibilities of the portfolio management team primarily responsible for the day-to-day portfolio management of the Portfolio and the extent of the resources devoted to research and analysis of actual and potential investments. The Board also received and considered information about the nature, extent and quality of services and fee rates offered to other Credit Suisse clients for comparable services.
In approving the Sub-Advisory Agreements, the Board also considered the benefits of retaining Credit Suisse's United Kingdom, Australian and Japanese affiliates given the increased complexity of the domestic and international securities markets, specifically that retention of Credit Suisse U.K., Credit Suisse Australia and Credit Suisse Japan expands the universe of companies and countries from which investment opportunities could be sought and enhances the ability of the Portfolio to obtain the best price and execution on trades in international markets.
Portfolio Performance
The Board received and considered the performance results of the Portfolio over time, along with comparisons, both to the relevant performance group ("Performance Group") and universe of funds ("Performance Universe") for the Portfolio. The Board was provided with a description of the methodology used to arrive at the funds included in the Performance Group and the Performance Universe.
Credit Suisse Profitability
The Board received and considered a profitability analysis of Credit Suisse based on the fees payable under the Advisory Agreement for the Portfolio, including any fee waivers or fee caps, as well as other relationships between the Portfolio on the one hand and Credit Suisse affiliates on the other. The Board received profitability information for the other funds in the Credit Suisse family of funds.
38
Credit Suisse Trust — Global Small Cap Portfolio
Board Approval of Advisory Agreement (unaudited) (continued)
Economies of Scale
The Board considered whether economies of scale in the provision of services to the Portfolio were being passed along to the shareholders. Accordingly, the Board considered whether alternative fee structures (such as breakpoint fee structures) would be more appropriate or reasonable taking into consideration economies of scale or other efficiencies that might accrue from increases in the Portfolio's asset levels.
Other Benefits to Credit Suisse
The Board considered other benefits received by Credit Suisse, the Sub-Advisers and their affiliates as a result of their relationships with the Portfolio. Such benefits include, among others, research arrangements with brokers who execute transactions on behalf of the Portfolio, administrative and brokerage relationships with affiliates of Credit Suisse and the Sub-Advisers and benefits potentially derived from an increase in Credit Suisse's and the Sub-Advisers' businesses as a result of their relationship with the Portfolio (such as the ability to market to shareholders other financial products offered by Credit Suisse, the Sub-Advisers and their affiliates).
The Board considered the standards applied in seeking best execution, whether and to what extent soft dollar credits are sought and how any such credits are utilized, any benefits that may be achieved by using an affiliated broker and the existence of quality controls applicable to brokerage allocation procedures. The Board also reviewed Credit Suisse's and the Sub-Advisers' method for allocating portfolio investment opportunities among their advisory clients.
Conclusions
In selecting Credit Suisse and the Sub-Advisers, and approving the Advisory Agreement and the investment advisory fee under such agreement and the Sub-Advisory Agreements, the Board concluded that:
• Both the Contractual and Net Advisory Fees were at the high end in the Portfolio's Expense Group. The Board considered the fee to be reasonable taking into account that Credit Suisse agreed to an increased fee waiver and the relatively small size of the Portfolio.
• The Portfolio's performance was below most of the funds in its Performance Group and Performance Universe for most of the periods reviewed. The Board noted that performance for periods prior to December 2006 was not particularly relevant since the strategy for the
39
Credit Suisse Trust — Global Small Cap Portfolio
Board Approval of Advisory Agreement (unaudited) (continued)
U.S. portion of the Portfolio had changed to a quantitative strategy. The Board further noted that a new portfolio manager for the non-U.S. portion of the Portfolio had been appointed in October 2007. The Board determined it would continue to monitor steps undertaken by Credit Suisse to improve performance.
• Aside from performance (as described above), the Board was satisfied with the nature and extent of the investment advisory services provided to the Portfolio by Credit Suisse and the Sub-Advisers and that, based on dialogue with management and counsel, the services provided by Credit Suisse under the Advisory Agreement and by the Sub-Advisers under the Sub-Advisory Agreements are typical of, and consistent with, those provided to similar mutual funds by other investment advisers.
• In light of the costs of providing investment management and other services to the Portfolio and Credit Suisse's ongoing commitment to the Portfolio and willingness to waive fees and expenses, the profits and other ancillary benefits that Credit Suisse and its affiliates received were considered reasonable.
• Credit Suisse's profitability based on fees payable under the Advisory Agreement was reasonable in light of the nature, extent and quality of the services provided to the Portfolio thereunder.
• In light of the fee waiver and the relatively small size of the Portfolio, the Portfolio's current fee structure (without breakpoints) was considered reasonable.
No single factor reviewed by the Board was identified by the Board as the principal factor in determining whether to approve the Advisory Agreement and the Sub-Advisory Agreements. The Independent Trustees were advised by separate independent legal counsel throughout the process.
40
Credit Suisse Trust — Global Small Cap Portfolio
Information Concerning Trustees and Officers (unaudited)
Name, Address
(Year of Birth) | | Position(s)
Held with
Trust | | Term
of Office1
and
Length
of Time
Served | | Principal
Occupation(s) During
Past Five Years | | Number of
Portfolios in
Fund
Complex
Overseen by
Trustee | | Other
Directorships
Held by
Trustee | |
| Independent Trustees | | | | | | | | | | | |
|
Enrique Arzac
c/o Credit Suisse Asset
Management, LLC
Attn: General Counsel Eleven Madison Avenue New York, New York
10010
(1941) | | Trustee,
Nominating
Committee
Member
and Audit
Committee
Chairman | | Since 2005 | | Professor of Finance and Economics, Graduate School of Business, Columbia University since 1971. | | | 35 | | | Director of Epoch Holding Corporation (an investment management and investment advisory services company); Director of The Adams Express Company (a closed-end investment company); Director of Petroleum and Resources Corporation (a closed-end investment company). | |
|
Jeffrey E. Garten2
Box 208200
New Haven, Connecticut
06520-8200
(1946) | | Trustee,
Nominating
and Audit
Committee
Member | | Since
1998 | | The Juan Trippe Professor in the Practice of International Trade, Finance and Business from July 2005 to present; Partner and Chairman of Garten Rothkopf (consulting firm) from October 2005 to present; Dean of Yale School of Management from November 1995 to June 2005. | | | 28 | | | Director of Aetna, Inc. (insurance company); Director of CarMax Group (used car dealers); Director of Alcan, Inc. (smelting and refining of nonferrous metals company). | |
|
1 Each Trustee and Officer serves until his or her respective successor has been duly elected and qualified.
2 Mr. Garten was initially appointed as a Trustee of the Trust on February 6, 1998. He resigned as Trustee on February 3, 2000 and was subsequently reappointed on December 21, 2000.
41
Credit Suisse Trust — Global Small Cap Portfolio
Information Concerning Trustees and Officers (unaudited) (continued)
Name, Address
(Year of Birth) | | Position(s)
Held with
Trust | | Term
of Office1
and
Length
of Time
Served | | Principal
Occupation(s) During
Past Five Years | | Number of
Portfolios in
Fund
Complex
Overseen by
Trustee | | Other
Directorships
Held by
Trustee | |
| Independent Trustees | | | | | | | | | | | | | |
|
Peter F. Krogh
SFS/ICC 702
Georgetown University
Washington, DC 20057
(1937) | | Trustee, Nominating and Audit Committee Member | | Since 2001 | | Dean Emeritus and Distinguished Professor of International Affairs at the Edmund A. Walsh School of Foreign Service, Georgetown University from June 1995 to present. | | | 28 | | | Director of Carlisle Companies Incorporated (diversified manufacturing company). | |
|
Steven N. Rappaport
Lehigh Court, LLC
555 Madison Avenue
29th Floor
New York, New York
10022
(1948) | | Chairman of the Board of Trustees, Nominating Committee Chairman and Audit Committee Member | | Trustee since 1999 and Chairman since 2005 | | Partner of Lehigh Court, LLC and RZ Capital (private investment firms) from July 2002 to present. | | | 35 | | | Director of iCAD, Inc. (surgical and medical instruments and apparatus company); Director of Presstek, Inc. (digital imaging technologies company); Director of Wood Resources, LLC. (plywood manufacturing company). | |
|
| Interested Trustee | | | | | | | | | | | | | |
|
Michael E. Kenneally3
c/o Credit Suisse Asset
Management, LLC
Attn: General Counsel
Eleven Madison Avenue
New York, New York
10010
(1954) | | Trustee | | Since 2004 | | Chairman and Global Chief Executive Officer of Credit Suisse from March 2003 to July 2005; Chairman and Chief Investment Officer of Banc of America Capital Management from 1998 to March 2003. | | | 28 | | | None | |
|
3 Mr. Kenneally is a Trustee who is an "interested person" of the Trust as defined in the Investment Company Act of 1940, as amended, because he was an officer of Credit Suisse within the last two fiscal years.
42
Credit Suisse Trust — Global Small Cap Portfolio
Information Concerning Trustees and Officers (unaudited) (continued)
Name, Address
(Year of Birth) | | Position(s)
Held with
Trust | | Term
of Office1
and
Length
of Time
Served | | Principal Occupation(s) During Past Five Years | |
| Officers | | | | | | | |
|
Lawrence D. Haber
c/o Credit Suisse Asset Management, LLC.
Attn: General Counsel
Eleven Madison Avenue
New York, New York
10010
(1951) | | Chief Executive Officer and President | | Since 2007 | | Managing Director and Chief Operating Officer of Credit Suisse; Member of Credit Suisse's Management Committee; Chief Financial Officer of Merrill Lynch Investment Managers from 1997 to 2003. | |
|
Michael A. Pignataro
Credit Suisse Asset
Management, LLC
Eleven Madison Avenue
New York, New York
10010
(1959) | | Chief Financial Officer | | Since 1999 | | Director and Director of Fund Administration of Credit Suisse; Associated with Credit Suisse or its predecessor since 1984; Officer of other Credit Suisse Funds. | |
|
Emidio Morizio
Credit Suisse Asset
Management, LLC
Eleven Madison Avenue
New York, New York
10010
(1966) | | Chief Compliance Officer | | Since 2004 | | Director and Global Head of Compliance of Credit Suisse; Associated with Credit Suisse since July 2000; Officer of other Credit Suisse Funds. | |
|
J. Kevin Gao
Credit Suisse Asset
Management, LLC
Eleven Madison Avenue
New York, New York
10010
(1967) | | Chief Legal Officer since 2006, Vice President and Secretary since 2004 | | Since 2004 | | Director and Legal Counsel of Credit Suisse; Associated with Credit Suisse since July 2003; Associated with the law firm of Willkie Farr & Gallagher LLP from 1998 to 2003; Officer of other Credit Suisse Funds. | |
|
Robert Rizza
Credit Suisse Asset
Management, LLC
Eleven Madison Avenue New York, New York
10010
(1965) | | Treasurer | | Since 2006 | | Vice President of Credit Suisse; Associated with Credit Suisse since 1998; Officer of other Credit Suisse Funds. | |
|
The Statement of Additional Information includes additional information about the Trustees and is available, without charge, upon request, by calling 800-222-8977.
43
Credit Suisse Trust — Global Small Cap Portfolio
Proxy Voting and Portfolio Holdings Information (unaudited)
Information regarding how the Portfolio voted proxies related to its portfolio securities during the 12 month period ended June 30 of each year, as well as the policies and procedures that the Portfolio uses to determine how to vote proxies relating to its portfolio securities are available:
• By calling 1-800-222-8977
• On the Portfolio's website, www.credit-suisse.com/us
• On the website of the Securities and Exchange Commission, www.sec.gov.
The Portfolio files a complete schedule of its portfolio holdings for the first and third quarters of its fiscal year with the SEC on Form N-Q. The Portfolio's Forms N-Q are available on the SEC's website at www.sec.gov and may be reviewed and copied at the SEC's Public Reference Room in Washington, DC. Information on the operation of the SEC's Public Reference Room may be obtained by calling 1-202-551-8090.
44

P.O. BOX 55030, BOSTON, MA 02205-5030
800-222-8977 n www.credit-suisse.com/us
CREDIT SUISSE ASSET MANAGEMENT SECURITIES, INC., DISTRIBUTOR. TRGSC-AR-1207

CREDIT SUISSE FUNDS
Annual Report
December 31, 2007
CREDIT SUISSE TRUST
n LARGE CAP VALUE PORTFOLIO
Credit Suisse Trust (the "Trust") shares are not available directly to individual investors, but may be offered only through certain insurance products and pension and retirement plans.
The Trust's investment objectives, risks, charges and expenses (which should be considered carefully before investing), and more complete information about the Trust, are provided in the Prospectus, which should be read carefully before investing. You may obtain additional copies by calling 800-222-8977 or by writing to Credit Suisse Trust, P.O. Box 55030, Boston, MA 02205-5030.
Credit Suisse Asset Management Securities, Inc., Distributor, is located at Eleven Madison Avenue, New York, NY 10010. The Trust is advised by Credit Suisse Asset Management, LLC.
The views of the Portfolio's management are as of the date of the letter and the Portfolio holdings described in this document are as of December 31, 2007; these views and Portfolio holdings may have changed subsequent to these dates. Nothing in this document is a recommendation to purchase or sell securities.
Portfolio shares are not deposits or other obligations of Credit Suisse Asset Management, LLC ("Credit Suisse") or any affiliate, are not FDIC-insured and are not guaranteed by Credit Suisse or any affiliate. Portfolio investments are subject to investment risks, including loss of your investment.
Credit Suisse Trust — Large Cap Value Portfolio
Annual Investment Adviser's Report
December 31, 2007 (unaudited)
January 25, 2008
Dear Shareholder:
For the twelve months ended December 31, 2007, Credit Suisse Trust — Large Cap Value Portfolio1 (the "Portfolio") had a gain of 1.79%, versus a return of -0.17% for the Russell 1000® Value Index2 (the "Russell 1000").
Market Review: A challenging market on many fronts
For the year ended December 31, 2007, U.S. large-cap stocks were mixed with the benchmark Russell 1000 Value Index returning -0.17%, and the bellwether S&P 500 Index posting a 5.49% total return including dividends. Eight out of the ten economic sectors in the large-cap S&P 500 Index advanced in 2007. Rising global demand and elevated commodity prices boosted the energy and materials sectors to post the highest returns of 32.4% and 20%, respectively. The biggest laggard in the large-cap space was financials (-20.8%), which were negatively impacted by the credit market turmoil and housing market slowdown.
The U.S. Federal Reserve held its benchmark rate at 5.25% until September 2007 when the target federal funds rate was cut by 50 basis points to 4.75%, marking the first cut in four years. The Federal Reserve cut the target rate by another 25 basis points in October and again in December to 4.25%. The cuts were made in an effort to prevent some of the adverse effects on the overall economy from the depressed housing market and tighter lending conditions for both consumers and corporations.
The aggressive lending environment over the past few years led to a rise in mortgage defaults. U.S. home foreclosures rose 68% in November from a year earlier, according to data compiled by RealtyTrac Inc. As a result, the U.S. housing sector weakened significantly in 2007 as mortgage providers tightened their lending standards and some lenders went bankrupt. Home prices in 20 U.S. metropolitan areas dropped in October by the most in at least six years. Property values fell 6.1% from October 2006, according to the S&P/Case-Shiller home-price index.
The Chicago Board Options Exchange Volatility Index (VIX), a measure of expected stock market volatility, reached a five-year low in January 2007. However, market conditions changed rapidly in mid-2007 and the VIX reached a four-year high in November 2007 amid deteriorating conditions in the U.S. housing and credit markets.
Despite the housing market slowdown, the economy grew at a solid 4.9% annual rate in the third quarter of 2007. The personal consumption expenditures (PCE) price index, excluding food and energy, rose 2.2% year-over-year in November. The increase was the biggest since March 2007. The Fed watches the PCE price index for signs of inflation and its preferred range for this gauge is 1.0% to 2.0%.
The labor market also showed signs of weakening in 2007. Non-farm payrolls rose 1.3 million in 2007, compared with gains of 2.3 million in 2006. The
1
Credit Suisse Trust — Large Cap Value Portfolio
Annual Investment Adviser's Report (continued)
December 31, 2007 (unaudited)
unemployment rate rose from 4.7% in November to 5.0% in December 2007, the highest level since November 2005. And, the Reuters/University of Michigan final index of consumer confidence dropped to 75.5 in December, the lowest since October 2005. The gauge has averaged 88 since monthly data were first compiled in 1978.
Strategic Review and Market Outlook: Potential for further rate cuts
The leading positive relative contributors to performance came from stock selection in consumer discretionary, utilities, and financials. The largest detractors to performance came primarily from stock selection within the materials sector, followed closely by energy and information technology groups.
The U.S. Federal Reserve anticipates economic growth will be "somewhat more sluggish" than the 1.8% – 2.5% they had projected for 2008. And, Fed policy makers also expect core inflation to "trend down a bit over the next few years."
The Federal Reserve on January 22, 2008 took significant action between scheduled meetings by cutting rates 75 basis points to 3.50%. The Fed cited the weakening economic outlook and increasing downside risks to growth.
The Fed is scheduled to meet next on January 30 to discuss interest rates. Based on interest-rate futures on January 25, traders expect policy makers to further lower the target rate for overnight lending by 50 to 75 basis points.
In our opinion, U.S. housing markets may remain weak through the first half of 2008. Additionally, expectations for U.S. stock market volatility, as measured by the VIX Index, are for levels above historical averages. The pace of mergers and acquisitions by private equity firms isn't expected to reach the level seen in the first half of 2007, as the availability of debt financing has lessened significantly.
The Credit Suisse Quantitative Equities Group
Jordan Low
Eric Leng
Todd Jablonski
The value of investments generally will fluctuate in response to market movements and the Portfolio's performance will largely depend on the performance of value stocks, which may be more volatile than the overall market.
In addition to historical information, this report contains forward-looking statements, which may concern, among other things, domestic and foreign market, industry and economic trends and developments and government regulation and their potential impact on the Portfolio's investments. These statements are subject to risks and uncertainties and actual trends, developments and regulations in the future, and their impact on the Portfolio could be materially different from those projected, anticipated or implied. The Portfolio has no obligation to update or revise forward-looking statements.
2
Credit Suisse Trust — Large Cap Value Portfolio
Annual Investment Adviser's Report (continued)
December 31, 2007 (unaudited)
Comparison of Change in Value of $10,000 Investment in the
Credit Suisse Trust — Large Cap Value Portfolio1 and the
Russell 1000® Value Index2 for Ten Years.
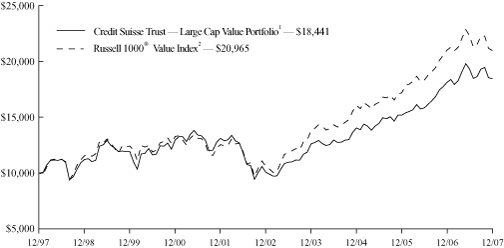
3
Credit Suisse Trust — Large Cap Value Portfolio
Annual Investment Adviser's Report (continued)
December 31, 2007 (unaudited)
Average Annual Returns as of December 31, 20071
| 1 Year | | 5 Years | | 10 Years | | Since
Inception3 | |
| | 1.79 | % | | | 12.86 | % | | | 6.31 | % | | | 6.60 | % | |
Returns represent past performance and include change in share price and reinvestment of dividends and capital gains. Past performance cannot guarantee future results. The current performance of the Portfolio may be lower or higher than the figures shown. Returns and share price will fluctuate, and redemption value may be more or less than original cost. The performance results do not reflect the deduction of taxes that a shareholder would pay on portfolio distributions or the redemption of portfolio shares. Performance includes the effect of deducting expenses, but does not include charges and expenses attributable to any particular variable contract or plan. Accordingly, the Prospectus of the sponsoring Participating Insurance Company separate account or plan documents or ot her informational materials supplied by plan sponsors should be carefully reviewed for information on relevant charges and expenses. Excluding these charges and expenses from quotations of performance has the effect of increasing the performance quoted, and the effect of these charges should be considered when comparing performance to that of other mutual funds. Performance information current to the most recent month-end is available at www.credit-suisse.com/us.
1 Fee waivers and/or expense reimbursements may reduce expenses for the Portfolio, without which performance would be lower. Waivers and/or reimbursements may be discontinued at any time.
2 The Russell 1000® Value Index measures the performance of those companies in the Russell 1000® Index with lower price-to-book ratios and lower forecasted growth values. It is an unmanaged index of common stocks that includes reinvestment of dividends and is compiled by Frank Russell Company. Investors cannot invest directly in an index.
3 Inception date 10/31/97.
4
Credit Suisse Trust — Large Cap Value Portfolio
Annual Investment Adviser's Report (continued)
December 31, 2007 (unaudited)
Information About Your Portfolio's Expenses
As an investor of the Portfolio, you incur two types of costs: ongoing expenses and transaction costs. Ongoing expenses include management fees, distribution and service (12b-1) fees and other Portfolio expenses. Examples of transaction costs include sales charges (loads), redemption fees and account maintenance fees, which are not shown in this section and which would result in higher total expenses. The following table is intended to help you understand your ongoing expenses of investing in the Portfolio and to help you compare these expenses with the ongoing expenses of investing in other mutual funds. The table is based on an investment of $1,000 made at the beginning of the six month period ended December 31, 2007.
The table illustrates your Portfolio's expenses in two ways:
• Actual Portfolio Return. This helps you estimate the actual dollar amount of ongoing expenses paid on a $1,000 investment in the Portfolio using the Portfolio's actual return during the period. To estimate the expenses you paid over the period, simply divide your account value by $1,000 (for example, an $8,600 account value divided by $1,000 = 8.6), then multiply the result by the number in the "Expenses Paid per $1,000" line under the share class you hold.
• Hypothetical 5% Portfolio Return. This helps you to compare your Portfolio's ongoing expenses with those of other mutual funds using the Portfolio's actual expense ratio and a hypothetical rate of return of 5% per year before expenses. Examples using a 5% hypothetical fund return may be found in the shareholder reports of other mutual funds. The hypothetical account values and expenses may not be used to estimate the actual ending account balance or expenses you paid for the period.
Please note that the expenses shown in these tables are meant to highlight your ongoing expenses only and do not reflect any transaction costs, such as sales charges (loads) or redemption fees. If these transaction costs had been included, your costs would have been higher. The "Expenses Paid per $1,000" line of the tables is useful in comparing ongoing expenses only and will not help you determine the relative total expenses of owning different funds.
5
Credit Suisse Trust — Large Cap Value Portfolio
Annual Investment Adviser's Report (continued)
December 31, 2007 (unaudited)
Expenses and Value of a $1,000 Investment
for the six month period ended December 31, 2007
| Actual Portfolio Return | |
| Beginning Account Value 7/1/07 | | $ | 1,000.00 | | |
| Ending Account Value 12/31/07 | | $ | 954.40 | | |
| Expenses Paid per $1,000* | | $ | 3.99 | | |
| Hypothetical 5% Portfolio Return | |
| Beginning Account Value 7/1/07 | | $ | 1,000.00 | | |
| Ending Account Value 12/31/07 | | $ | 1,021.12 | | |
| Expenses Paid per $1,000* | | $ | 4.13 | | |
| Annualized Expense Ratios* | | | 0.81 | % | |
* Expenses are equal to the Portfolio's annualized expense ratio multiplied by the average account value over the period, multiplied by the number of days in the most recent fiscal half year period, then divided by 365.
The "Expenses Paid per $1,000" and the "Annualized Expense Ratios" in the tables are based on actual expenses paid by the Portfolio during the period, net of fee waivers and/or expense reimbursements. If those fee waivers and/or expense reimbursements had not been in effect, the Portfolio's actual expenses would have been higher. Expenses do not reflect additional charges and expenses that are, or may be, imposed under the variable contracts or plans. Such charges and expenses are described in the prospectus of the insurance company separate account or in the plan documents or other informational materials supplied by plan sponsors. The Portfolio's expenses should be considered with these charges and expenses in evaluating the overall cost of investing in the separate account.
For more information, please refer to the Portfolio's prospectus.
6
Credit Suisse Trust — Large Cap Value Portfolio
Annual Investment Adviser's Report (continued)
December 31, 2007 (unaudited)
SECTOR BREAKDOWN*
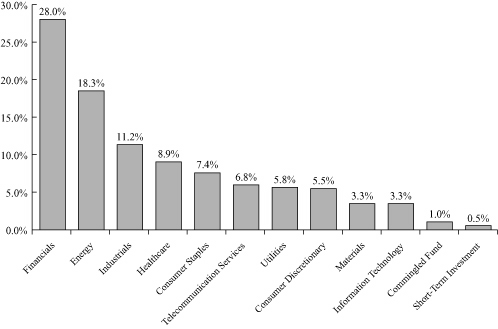
* Expressed as a percentage of total investments (excluding security lending collateral) and may vary over time.
7
Credit Suisse Trust — Large Cap Value Portfolio
Schedule of Investments
December 31, 2007
| | | Number of
Shares | | Value | |
| COMMON STOCKS (99.4%) | |
| Aerospace & Defense (2.7%) | |
| Boeing Co. | | | 3,300 | | | $ | 288,618 | | |
| L-3 Communications Holdings, Inc. | | | 3,100 | | | | 328,414 | | |
| Northrop Grumman Corp. | | | 5,400 | | | | 424,656 | | |
| Raytheon Co. | | | 6,000 | | | | 364,200 | | |
| | | | 1,405,888 | | |
| Auto Components (0.9%) | |
| Autoliv, Inc.§ | | | 5,400 | | | | 284,634 | | |
| BorgWarner, Inc.§ | | | 3,800 | | | | 183,958 | | |
| | | | 468,592 | | |
| Automobiles (0.7%) | |
| Hertz Global Holdings, Inc.*§ | | | 5,500 | | | | 87,395 | | |
| Thor Industries, Inc.§ | | | 6,700 | | | | 254,667 | | |
| | | | 342,062 | | |
| Banks (6.9%) | |
| Bank of America Corp. | | | 30,670 | | | | 1,265,444 | | |
| Bank of New York Mellon Corp. | | | 6,000 | | | | 292,560 | | |
| Colonial BancGroup, Inc.§ | | | 3,900 | | | | 52,806 | | |
| National City Corp.§ | | | 2,600 | | | | 42,796 | | |
| Northern Trust Corp.§ | | | 2,400 | | | | 183,792 | | |
| PNC Financial Services Group, Inc. | | | 4,700 | | | | 308,555 | | |
| U.S. Bancorp§ | | | 4,000 | | | | 126,960 | | |
| Wachovia Corp.§ | | | 7,700 | | | | 292,831 | | |
| Washington Mutual, Inc.§ | | | 2,900 | | | | 39,469 | | |
| Wells Fargo & Co. | | | 31,200 | | | | 941,928 | | |
| | | | 3,547,141 | | |
| Beverages (1.4%) | |
| Coca-Cola Co. | | | 1,300 | | | | 79,781 | | |
| Pepsi Bottling Group, Inc. | | | 8,500 | | | | 335,410 | | |
| PepsiAmericas, Inc.§ | | | 9,600 | | | | 319,872 | | |
| | | | 735,063 | | |
| Chemicals (1.5%) | |
| Dow Chemical Co.§ | | | 13,600 | | | | 536,112 | | |
| E.I. du Pont de Nemours & Co.§ | | | 1,100 | | | | 48,499 | | |
| Lubrizol Corp. | | | 3,300 | | | | 178,728 | | |
| | | | 763,339 | | |
| Commercial Services & Supplies (0.7%) | |
| Allied Waste Industries, Inc.*§ | | | 4,500 | | | | 49,590 | | |
| Steelcase, Inc. Class A§ | | | 19,000 | | | | 301,530 | | |
| | | | 351,120 | | |
| Commingled Fund (1.0%) | |
| iShares Russell 1000 Value Index Fund | | | 6,200 | | | | 497,550 | | |
See Accompanying Notes to Financial Statements.
8
Credit Suisse Trust — Large Cap Value Portfolio
Schedule of Investments (continued)
December 31, 2007
| | | Number of
Shares | | Value | |
| COMMON STOCKS | |
| Communications Equipment (0.1%) | |
| Harris Corp. | | | 1,100 | | | $ | 68,948 | | |
| Computers & Peripherals (0.9%) | |
| Dell, Inc.* | | | 3,700 | | | | 90,687 | | |
| Hewlett-Packard Co. | | | 3,300 | | | | 166,584 | | |
| Western Digital Corp.* | | | 7,700 | | | | 232,617 | | |
| | | | 489,888 | | |
| Diversified Financials (10.2%) | |
| Ameriprise Financial, Inc. | | | 1,600 | | | | 88,176 | | |
| Capital One Financial Corp.§ | | | 2,000 | | | | 94,520 | | |
| Citigroup, Inc. | | | 34,700 | | | | 1,021,568 | | |
| Eaton Vance Corp.§ | | | 1,200 | | | | 54,492 | | |
| Federal National Mortgage Association | | | 2,700 | | | | 107,946 | | |
| Federated Investors, Inc. Class B§ | | | 3,200 | | | | 131,712 | | |
| First Marblehead Corp.§ | | | 2,400 | | | | 36,720 | | |
| Franklin Resources, Inc.§ | | | 900 | | | | 102,987 | | |
| Goldman Sachs Group, Inc. | | | 1,500 | | | | 322,575 | | |
| JPMorgan Chase & Co. | | | 31,100 | | | | 1,357,515 | | |
| Legg Mason, Inc. | | | 700 | | | | 51,205 | | |
| Lehman Brothers Holdings, Inc.§ | | | 1,900 | | | | 124,336 | | |
| Merrill Lynch & Company, Inc.§ | | | 8,500 | | | | 456,280 | | |
| Morgan Stanley§ | | | 12,500 | | | | 663,875 | | |
| Nymex Holdings, Inc.§ | | | 1,900 | | | | 253,859 | | |
| State Street Corp.§ | | | 4,100 | | | | 332,920 | | |
| Western Union Co. | | | 3,100 | | | | 75,268 | | |
| | | | 5,275,954 | | |
| Diversified Telecommunication Services (6.6%) | |
| AT&T, Inc. | | | 52,212 | | | | 2,169,931 | | |
| Sprint Nextel Corp. | | | 3,900 | | | | 51,207 | | |
| Verizon Communications, Inc. | | | 27,600 | | | | 1,205,844 | | |
| | | | 3,426,982 | | |
| Electric Utilities (5.3%) | |
| Alliant Energy Corp.§ | | | 7,600 | | | | 309,244 | | |
| Constellation Energy Group | | | 3,100 | | | | 317,843 | | |
| Dominion Resources, Inc.§ | | | 4,400 | | | | 208,780 | | |
| DTE Energy Co.§ | | | 7,000 | | | | 307,720 | | |
| Edison International§ | | | 3,100 | | | | 165,447 | | |
| FirstEnergy Corp.§ | | | 6,400 | | | | 462,976 | | |
| FPL Group, Inc. | | | 3,000 | | | | 203,340 | | |
| Pepco Holdings, Inc.§ | | | 9,200 | | | | 269,836 | | |
| Public Service Enterprise Group, Inc. | | | 4,800 | | | | 471,552 | | |
| | | | 2,716,738 | | |
| Electrical Equipment (0.7%) | |
| Energizer Holdings, Inc.*§ | | | 2,800 | | | | 313,964 | | |
| Tyco Electronics, Ltd. | | | 1,400 | | | | 51,982 | | |
| | | | 365,946 | | |
See Accompanying Notes to Financial Statements.
9
Credit Suisse Trust — Large Cap Value Portfolio
Schedule of Investments (continued)
December 31, 2007
| | | Number of
Shares | | Value | |
| COMMON STOCKS | |
| Electronic Equipment & Instruments (0.4%) | |
| Avnet, Inc.* | | | 5,900 | | | $ | 206,323 | | |
| Energy Equipment & Services (0.7%) | |
| ENSCO International, Inc.§ | | | 5,900 | | | | 351,758 | | |
| Food & Drug Retailing (0.9%) | |
| Kroger Co. | | | 7,700 | | | | 205,667 | | |
| Safeway, Inc.§ | | | 8,000 | | | | 273,680 | | |
| | | | 479,347 | | |
| Food Products (0.8%) | |
| Corn Products International, Inc.§ | | | 7,400 | | | | 271,950 | | |
| Kellogg Co. | | | 1,000 | | | | 52,430 | | |
| Kraft Foods, Inc. Class A | | | 3,400 | | | | 110,942 | | |
| | | | 435,322 | | |
| Gas Utilities (0.6%) | |
| UGI Corp.§ | | | 10,700 | | | | 291,575 | | |
| Healthcare Equipment & Supplies (0.3%) | |
| Kinetic Concepts, Inc.§ | | | 2,700 | | | | 144,612 | | |
| Healthcare Providers & Services (2.2%) | |
| Aetna, Inc. | | | 5,600 | | | | 323,288 | | |
| Coventry Health Care, Inc.*§ | | | 1,900 | | | | 112,575 | | |
| Humana, Inc.*§ | | | 4,000 | | | | 301,240 | | |
| McKesson Corp. | | | 1,600 | | | | 104,816 | | |
| WellPoint, Inc.* | | | 3,400 | | | | 298,282 | | |
| | | | 1,140,201 | | |
| Hotels, Restaurants & Leisure (0.2%) | |
| McDonald's Corp. | | | 2,100 | | | | 123,711 | | |
| Household Durables (0.9%) | |
| American Greetings Corp. Class A§ | | | 6,900 | | | | 140,070 | | |
| Whirlpool Corp.§ | | | 3,700 | | | | 302,031 | | |
| | | | 442,101 | | |
| Household Products (2.1%) | |
| Clorox Co.§ | | | 4,800 | | | | 312,816 | | |
| Procter & Gamble Co. | | | 10,400 | | | | 763,568 | | |
| | | | 1,076,384 | | |
| Industrial Conglomerates (5.8%) | |
| 3M Co. | | | 3,600 | | | | 303,552 | | |
| General Electric Co. | | | 59,100 | | | | 2,190,837 | | |
| Honeywell International, Inc. | | | 900 | | | | 55,413 | | |
| Tyco International, Ltd. | | | 10,600 | | | | 420,290 | | |
| | | | 2,970,092 | | |
See Accompanying Notes to Financial Statements.
10
Credit Suisse Trust — Large Cap Value Portfolio
Schedule of Investments (continued)
December 31, 2007
| | | Number of
Shares | | Value | |
| COMMON STOCKS | |
| Insurance (10.7%) | |
| ACE, Ltd.§ | | | 900 | | | $ | 55,602 | | |
| Aflac, Inc. | | | 2,600 | | | | 162,838 | | |
| Allstate Corp. | | | 4,400 | | | | 229,812 | | |
| American Financial Group, Inc.§ | | | 7,600 | | | | 219,488 | | |
| American International Group, Inc. | | | 10,300 | | | | 600,490 | | |
| Aon Corp. | | | 6,200 | | | | 295,678 | | |
| Assurant, Inc.§ | | | 3,400 | | | | 227,460 | | |
| Axis Capital Holdings, Ltd.§ | | | 8,400 | | | | 327,348 | | |
| CNA Financial Corp.§ | | | 6,400 | | | | 215,808 | | |
| Endurance Specialty Holdings, Ltd.§ | | | 7,500 | | | | 312,975 | | |
| Lincoln National Corp. | | | 900 | | | | 52,398 | | |
| Loews Corp. | | | 9,100 | | | | 458,094 | | |
| MetLife, Inc. | | | 3,700 | | | | 227,994 | | |
| PartnerRe, Ltd. | | | 700 | | | | 57,771 | | |
| Prudential Financial, Inc. | | | 5,500 | | | | 511,720 | | |
| Reinsurance Group of America, Inc.§ | | | 5,800 | | | | 304,384 | | |
| RenaissanceRe Holdings, Ltd.§ | | | 1,300 | | | | 78,312 | | |
| StanCorp Financial Group, Inc. | | | 1,100 | | | | 55,418 | | |
| Torchmark Corp.§ | | | 5,200 | | | | 314,756 | | |
| Transatlantic Holdings, Inc.§ | | | 900 | | | | 65,403 | | |
| Travelers Companies, Inc. | | | 2,200 | | | | 118,360 | | |
| W.R. Berkley Corp. | | | 10,200 | | | | 304,062 | | |
| XL Capital, Ltd. Class A§ | | | 6,200 | | | | 311,922 | | |
| | | | 5,508,093 | | |
| IT Consulting & Services (0.6%) | |
| Accenture, Ltd. Class A§ | | | 8,400 | | | | 302,652 | | |
| Leisure Equipment & Products (0.1%) | |
| Eastman Kodak Co.§ | | | 2,000 | | | | 43,740 | | |
| Machinery (1.1%) | |
| Cummins, Inc. | | | 500 | | | | 63,685 | | |
| Kennametal, Inc. | | | 7,400 | | | | 280,164 | | |
| Parker Hannifin Corp. | | | 2,800 | | | | 210,868 | | |
| | | | 554,717 | | |
| Media (2.3%) | |
| News Corp. Class A | | | 13,100 | | | | 268,419 | | |
| Regal Entertainment Group Class A§ | | | 14,600 | | | | 263,822 | | |
| Time Warner, Inc. | | | 7,400 | | | | 122,174 | | |
| Walt Disney Co.§ | | | 16,600 | | | | 535,848 | | |
| | | | 1,190,263 | | |
| Metals & Mining (1.1%) | |
| Alcoa, Inc. | | | 1,900 | | | | 69,445 | | |
| Freeport-McMoRan Copper & Gold, Inc. | | | 3,400 | | | | 348,296 | | |
| Nucor Corp.§ | | | 2,700 | | | | 159,894 | | |
| | | | 577,635 | | |
See Accompanying Notes to Financial Statements.
11
Credit Suisse Trust — Large Cap Value Portfolio
Schedule of Investments (continued)
December 31, 2007
| | | Number of
Shares | | Value | |
| COMMON STOCKS | |
| Oil & Gas (17.5%) | |
| Chevron Corp. | | | 18,800 | | | $ | 1,754,604 | | |
| ConocoPhillips | | | 12,804 | | | | 1,130,593 | | |
| Continental Resources, Inc.*§ | | | 13,500 | | | | 352,755 | | |
| Devon Energy Corp. | | | 5,700 | | | | 506,787 | | |
| Exxon Mobil Corp. | | | 35,700 | | | | 3,344,733 | | |
| Marathon Oil Corp. | | | 9,900 | | | | 602,514 | | |
| Murphy Oil Corp.§ | | | 3,500 | | | | 296,940 | | |
| Occidental Petroleum Corp. | | | 10,000 | | | | 769,900 | | |
| Valero Energy Corp. | | | 4,100 | | | | 287,123 | | |
| | | | 9,045,949 | | |
| Paper & Forest Products (0.7%) | |
| International Paper Co. | | | 11,300 | | | | 365,894 | | |
| Pharmaceuticals (6.4%) | |
| Eli Lilly and Co. | | | 1,800 | | | | 96,102 | | |
| Endo Pharmaceuticals Holdings, Inc.* | | | 2,000 | | | | 53,340 | | |
| Johnson & Johnson | | | 14,100 | | | | 940,470 | | |
| Merck & Company, Inc. | | | 5,500 | | | | 319,605 | | |
| Pfizer, Inc. | | | 62,800 | | | | 1,427,444 | | |
| Sepracor, Inc.§ | | | 10,900 | | | | 286,125 | | |
| Watson Pharmaceuticals, Inc.§ | | | 7,400 | | | | 200,836 | | |
| | | | 3,323,922 | | |
| Real Estate (0.2%) | |
| Jones Lang LaSalle, Inc.§ | | | 1,300 | | | | 92,508 | | |
| Road & Rail (0.3%) | |
| Kansas City Southern*§ | | | 1,500 | | | | 51,495 | | |
| Union Pacific Corp. | | | 700 | | | | 87,934 | | |
| | | | 139,429 | | |
| Semiconductor Equipment & Products (1.0%) | |
| Intel Corp. | | | 11,800 | | | | 314,588 | | |
| Teradyne, Inc.* | | | 4,400 | | | | 45,496 | | |
| Texas Instruments, Inc. | | | 4,400 | | | | 146,960 | | |
| | | | 507,044 | | |
| Software (0.2%) | |
| Microsoft Corp. | | | 3,700 | | | | 131,720 | | |
| Specialty Retail (0.5%) | |
| RadioShack Corp.§ | | | 9,300 | | | | 156,798 | | |
| Sherwin-Williams Co.§ | | | 1,500 | | | | 87,060 | | |
| | | | 243,858 | | |
| Tobacco (2.1%) | |
| Altria Group, Inc. | | | 6,000 | | | | 453,480 | | |
| Loews Corp. Carolina Group§ | | | 3,600 | | | | 307,080 | | |
| UST, Inc.§ | | | 5,500 | | | | 301,400 | | |
| | | | 1,061,960 | | |
See Accompanying Notes to Financial Statements.
12
Credit Suisse Trust — Large Cap Value Portfolio
Schedule of Investments (continued)
December 31, 2007
| | | Number of
Shares | | Value | |
| COMMON STOCKS | |
| Wireless Telecommunication Services (0.1%) | |
| Telephone and Data Systems, Inc. | | | 800 | | | $ | 50,080 | | |
| TOTAL COMMON STOCKS (Cost $47,014,740) | | | 51,256,101 | | |
| SHORT-TERM INVESTMENTS (23.8%) | |
| State Street Navigator Prime Portfolio§§ | | | 12,049,324 | | | | 12,049,324 | | |
| | | Par
(000) | | | |
| State Street Bank and Trust Co. Euro Time Deposit, 3.100%, 1/02/08 | | $ | 250 | | | | 250,000 | | |
| TOTAL SHORT-TERM INVESTMENTS (Cost $12,299,324) | | | 12,299,324 | | |
| TOTAL INVESTMENTS AT VALUE (123.2%) (Cost $59,314,064) | | | 63,555,425 | | |
| LIABILITIES IN EXCESS OF OTHER ASSETS (-23.2%) | | | (11,980,688 | ) | |
| NET ASSETS (100.0%) | | $ | 51,574,737 | | |
* Non-income producing security.
§ Security or portion thereof is out on loan.
§§ Represents security purchased with cash collateral received for securities on loan.
See Accompanying Notes to Financial Statements.
13
Credit Suisse Trust — Large Cap Value Portfolio
Statement of Assets and Liabilities
December 31, 2007
| Assets | |
Investments at value, including collateral for securities on loan of $12,049,324
(Cost $59,314,064) (Note 2) | | $ | 63,555,4251 | | |
| Cash | | | 2,632 | | |
| Dividend and interest receivable | | | 100,324 | | |
| Receivable for portfolio shares sold | | | 26,036 | | |
| Prepaid expenses and other assets | | | 5,535 | | |
| Total Assets | | | 63,689,952 | | |
| Liabilities | |
| Advisory fee payable (Note 3) | | | 22,085 | | |
| Administrative services fee payable (Note 3) | | | 5,256 | | |
| Payable upon return of securities loaned (Note 2) | | | 12,049,324 | | |
| Payable for portfolio shares redeemed | | | 3,653 | | |
| Trustees' fee payable | | | 804 | | |
| Other accrued expenses payable | | | 34,093 | | |
| Total Liabilities | | | 12,115,215 | | |
| Net Assets | |
| Capital stock, $0.001 par value (Note 6) | | | 3,826 | | |
| Paid-in capital (Note 6) | | | 44,675,128 | | |
| Undistributed net investment income | | | 845,280 | | |
| Accumulated net realized gain from investments and foreign currency transactions | | | 1,809,142 | | |
| Net unrealized appreciation from investments | | | 4,241,361 | | |
| Net Assets | | $ | 51,574,737 | | |
| Shares outstanding | | | 3,825,803 | | |
| Net asset value, offering price, and redemption price per share | | $ | 13.48 | | |
1 Including $11,776,238 of securities on loan.
See Accompanying Notes to Financial Statements.
14
Credit Suisse Trust — Large Cap Value Portfolio
Statement of Operations
For the Year Ended December 31, 2007
| Investment Income (Note 2) | |
| Dividends | | $ | 1,259,649 | | |
| Interest | | | 14,642 | | |
| Securities lending | | | 18,065 | | |
| Total investment income | | | 1,292,356 | | |
| Expenses | |
| Investment advisory fees (Note 3) | | | 274,057 | | |
| Administrative services fees (Note 3) | | | 72,125 | | |
| Audit and tax fees | | | 20,590 | | |
| Printing fees (Note 3) | | | 20,061 | | |
| Trustees' fees | | | 19,852 | | |
| Legal fees | | | 17,021 | | |
| Custodian fees | | | 12,676 | | |
| Insurance expense | | | 2,275 | | |
| Transfer agent fees | | | 2,000 | | |
| Commitment fees (Note 4) | | | 1,829 | | |
| Miscellaneous expense | | | 189 | | |
| Total expenses | | | 442,675 | | |
| Net investment income | | | 849,681 | | |
| Net Realized and Unrealized Gain (Loss) from Investments | |
| Net realized gain from investments | | | 1,854,302 | | |
| Net change in unrealized appreciation (depreciation) from investments | | | (1,593,996 | ) | |
| Net realized and unrealized gain from investments | | | 260,306 | | |
| Net increase in net assets resulting from operations | | $ | 1,109,987 | | |
See Accompanying Notes to Financial Statements.
15
Credit Suisse Trust — Large Cap Value Portfolio
Statements of Changes in Net Assets
| | | For the Year
Ended
December 31, 2007 | | For the Year
Ended
December 31, 2006 | |
| From Operations | |
| Net investment income | | $ | 849,681 | | | $ | 743,994 | | |
| Net realized gain from investments and foreign currency transactions | | | 1,854,302 | | | | 11,087,287 | | |
| Net change in unrealized appreciation (depreciation) from investments | | | (1,593,996 | ) | | | (1,655,802 | ) | |
| Net increase in net assets resulting from operations | | | 1,109,987 | | | | 10,175,479 | | |
| From Dividends and Distributions | |
| Dividends from net investment income | | | (734,026 | ) | | | (560,490 | ) | |
| Distributions from net realized gains | | | (10,891,849 | ) | | | — | | |
| Net decrease in net assets resulting from dividends and distributions | | | (11,625,875 | ) | | | (560,490 | ) | |
| From Capital Share Transactions (Note 6) | |
| Proceeds from sale of shares | | | 1,159,214 | | | | 1,652,792 | | |
| Reinvestment of dividends and distributions | | | 11,625,875 | | | | 560,490 | | |
| Net asset value of shares redeemed | | | (6,490,755 | ) | | | (13,837,296 | ) | |
| Net increase (decrease) in net assets from capital share transactions | | | 6,294,334 | | | | (11,624,014 | ) | |
| Net decrease in net assets | | | (4,221,554 | ) | | | (2,009,025 | ) | |
| Net Assets | |
| Beginning of year | | | 55,796,291 | | | | 57,805,316 | | |
| End of year | | $ | 51,574,737 | | | $ | 55,796,291 | | |
| Undistributed net investment income | | $ | 845,280 | | | $ | 736,770 | | |
See Accompanying Notes to Financial Statements.
16
Credit Suisse Trust — Large Cap Value Portfolio
Financial Highlights
(For a Share of the Portfolio Outstanding Throughout Each Year)
| | | For the Year Ended December 31, | |
| | | 2007 | | 2006 | | 2005 | | 2004 | | 2003 | |
| Per share data | |
| Net asset value, beginning of year | | $ | 17.00 | | | $ | 14.38 | | | $ | 13.40 | | | $ | 12.10 | | | $ | 9.74 | | |
| INVESTMENT OPERATIONS | |
| Net investment income | | | 0.24 | | | | 0.23 | | | | 0.11 | | | | 0.12 | | | | 0.09 | | |
Net gain on investments and
foreign currency related items
(both realized and unrealized) | | | 0.08 | | | | 2.54 | | | | 0.98 | | | | 1.25 | | | | 2.35 | | |
| Total from investment operations | | | 0.32 | | | | 2.77 | | | | 1.09 | | | | 1.37 | | | | 2.44 | | |
| LESS DIVIDENDS AND DISTRIBUTIONS | |
| Dividends from net investment income | | | (0.24 | ) | | | (0.15 | ) | | | (0.11 | ) | | | (0.07 | ) | | | (0.08 | ) | |
| Distributions from net realized gains | | | (3.60 | ) | | | — | | | | — | | | | — | | | | — | | |
| Total dividends and distributions | | | (3.84 | ) | | | — | | | | — | | | | — | | | | — | | |
| Net asset value, end of year | | $ | 13.48 | | | $ | 17.00 | | | $ | 14.38 | | | $ | 13.40 | | | $ | 12.10 | | |
| Total return1 | | | 1.79 | % | | | 19.35 | % | | | 8.14 | % | | | 11.34 | % | | | 25.16 | % | |
| RATIOS AND SUPPLEMENTAL DATA | |
| Net assets, end of year (000s omitted) | | $ | 51,575 | | | $ | 55,796 | | | $ | 57,805 | | | $ | 44,853 | | | $ | 29,536 | | |
| Ratio of expenses to average net assets | | | 0.81 | % | | | 1.00 | % | | | 1.00 | % | | | 1.00 | % | | | 1.00 | % | |
| Ratio of net investment income to average net assets | | | 1.55 | % | | | 1.29 | % | | | 1.03 | % | | | 1.15 | % | | | 0.97 | % | |
Decrease reflected in above operating expense
ratios due to waivers/reimbursements | | | — | | | | 0.06 | % | | | 0.09 | % | | | 0.14 | % | | | 0.25 | % | |
| Portfolio turnover rate | | | 95 | % | | | 143 | % | | | 81 | % | | | 53 | % | | | 86 | % | |
1 Total returns are historical and assume changes in share price and reinvestment of all dividends and distributions. Had certain expenses not been reduced during the years shown, total returns would have been lower. Total returns do not reflect charges and expenses attributable to any particular variable contract or plan.
See Accompanying Notes to Financial Statements.
17
Credit Suisse Trust — Large Cap Value Portfolio
Notes to Financial Statements
December 31, 2007
Note 1. Organization
Credit Suisse Trust (the "Trust") is an open-end management investment company registered under the Investment Company Act of 1940, as amended (the "1940 Act"), and currently offers eight managed investment portfolios of which one, the Large Cap Value Portfolio (the "Portfolio"), is included in this report. The Portfolio is a diversified investment fund that seeks long-term growth of capital and income. Shares of the Portfolio are not available directly to individual investors but may be offered only through (a) variable annuity contracts and variable life insurance contracts offered by separate accounts of certain insurance companies and (b) tax-qualified pension and retirement plans. The Portfolio may not be available in connection with a particular contract or plan. The Trust was organized under the laws of The Commonwealth of Massachusetts as a business trust on March 15, 1995.
Note 2. Significant Accounting Policies
A) SECURITY VALUATION — The net asset value of the Portfolio is determined daily as of the close of regular trading on the New York Stock Exchange, Inc. (the "Exchange") on each day the Exchange is open for business. Equity investments are valued at market value, which is generally determined using the closing price on the exchange or market on which the security is primarily traded at the time of valuation (the "Valuation Time"). If no sales are reported, equity investments are generally valued at the most recent bid quotation as of the Valuation Time or at the lowest asked quotation in the case of a short sale of securities. Debt securities with a remaining maturity greater than 60 days are valued in accordance with the price supplied by a pricing service, which may use a matrix, formula or other objective method that takes into consideration market indices, yield curves and other specific adjustments. Debt obligations that will matur e in 60 days or less are valued on the basis of amortized cost, which approximates market value, unless it is determined that using this method would not represent fair value. Investments in mutual funds are valued at the mutual fund's closing net asset value per share on the day of valuation. Securities and other assets for which market quotations are not readily available, or whose values have been materially affected by events occurring before the Portfolio's Valuation Time but after the close of the securities' primary markets, are valued at fair value as determined in good faith by, or under the direction of, the Board of Trustees under procedures established by the Board of Trustees. The Portfolio may utilize a service provided by an independent third party which has been approved by the Board of Trustees to fair value certain securities. When fair-value pricing is employed,
18
Credit Suisse Trust — Large Cap Value Portfolio
Notes to Financial Statements (continued)
December 31, 2007
Note 2. Significant Accounting Policies
the prices of securities used by a portfolio to calculate its net asset value may differ from quoted or published prices for the same securities.
B) FOREIGN CURRENCY TRANSACTIONS — The books and records of the Portfolio are maintained in U.S. dollars. Transactions denominated in foreign currencies are recorded at the current prevailing exchange rates. All assets and liabilities denominated in foreign currencies are translated into U.S. dollar amounts at the current exchange rate at the end of the period. Translation gains or losses resulting from changes in the exchange rate during the reporting period and realized gains and losses on the settlement of foreign currency transactions are reported in the results of operations for the current period. The Portfolio does not isolate that portion of realized gains and losses on investments in equity securities which is due to changes in the foreign exchange rate from that which is due to changes in market prices of equity securities. The Portfolio isolates that portion of realized gains and losses on investments in debt securities which is due to changes in the foreign exchange rate from that which is due to changes in market prices of debt securities.
C) SECURITY TRANSACTIONS AND INVESTMENT INCOME — Security transactions are accounted for on a trade date basis. Interest income is recorded on the accrual basis. Dividends are recorded on the ex-dividend date. The cost of investments sold is determined by use of the specific identification method for both financial reporting and income tax purposes.
D) DIVIDENDS AND DISTRIBUTIONS TO SHAREHOLDERS — Dividends from net investment income and distributions of net realized capital gains, if any, are declared and paid at least annually. However, to the extent that a net realized capital gain can be reduced by a capital loss carryforward, such gain will not be distributed. Income and capital gain distributions are determined in accordance with federal income tax regulations, which may differ from accounting principles generally accepted in the United States of America ("GAAP").
E) FEDERAL INCOME TAXES — No provision is made for federal taxes as it is the Portfolio's intention to continue to qualify for and elect the tax treatment applicable to regulated investment companies under the Internal Revenue Code of 1986, as amended, and to make the requisite distributions to its shareholders, which will be sufficient to relieve it from federal income and excise taxes.
F) USE OF ESTIMATES — The preparation of financial statements in conformity with GAAP requires management to make estimates and assumptions that affect the reported amounts of assets and liabilities and disclosure of contingent assets and liabilities at the date of the financial
19
Credit Suisse Trust — Large Cap Value Portfolio
Notes to Financial Statements (continued)
December 31, 2007
Note 2. Significant Accounting Policies
statements and the reported amounts of income and expenses during the reporting period. Actual results could differ from these estimates.
G) SHORT-TERM INVESTMENTS — The Portfolio, together with other funds/portfolios advised by Credit Suisse Asset Management, LLC ("Credit Suisse"), an indirect, wholly-owned subsidiary of Credit Suisse Group, pools available cash into either a short-term variable rate time deposit issued by State Street Bank and Trust Company ("SSB"), the Portfolio's custodian, or a money market fund advised by Credit Suisse. The short-term time deposit issued by SSB is a variable rate account classified as a short-term investment.
H) SECURITIES LENDING — Loans of securities are required at all times to be secured by collateral at least equal to 102% of the market value of domestic securities on loan (including any accrued interest thereon) and 105% of the market value of foreign securities on loan (including any accrued interest thereon). Cash collateral received by the Portfolio in connection with securities lending activity may be pooled together with cash collateral for other funds/portfolios advised by Credit Suisse and may be invested in a variety of investments, including certain Credit Suisse-advised funds, funds advised by SSB, the Portfolio's securities lending agent, or money market instruments. However, in the event of default or bankruptcy by the other party to the agreement, realization and/or retention of the collateral may be subject to legal proceedings.
SSB has been engaged by the Portfolio to act as the Portfolio's securities lending agent. The Portfolio's securities lending arrangement provides that the Portfolio and SSB will share the net income earned from securities lending activities. During the year ended December 31, 2007, total earnings from the Portfolio's investment in cash collateral received in connection with securities lending arrangements was $423,249, of which $401,009 was rebated to borrowers (brokers). The Portfolio retained $18,065 in income from the cash collateral investment, and SSB, as lending agent, was paid 4,175. The Portfolio may also be entitled to certain minimum amounts of income from its securities lending activities. Securities lending income is accrued as earned.
Note 3. Transactions with Affiliates and Related Parties
Credit Suisse serves as investment adviser for the Portfolio. For its investment advisory services, Credit Suisse is entitled to receive a fee from the Portfolio at an annual rate of 0.50% of the Portfolio's average daily net assets. For the year ended December 31, 2007, investment advisory fees earned were $274,057.
20
Credit Suisse Trust — Large Cap Value Portfolio
Notes to Financial Statements (continued)
December 31, 2007
Note 3. Transactions with Affiliates and Related Parties
Credit Suisse Asset Management Securities, Inc. ("CSAMSI"), an affiliate of Credit Suisse, and SSB serve as co-administrators to the Portfolio. For its co-administrative services, CSAMSI currently receives a fee calculated at an annual rate of 0.09% of the Portfolio's average daily net assets. For the year ended December 31, 2007, co-administrative services fees earned by CSAMSI were $49,330.
For its co-administrative services, SSB receives a fee, exclusive of out-of-pocket expenses, calculated in total for all the Credit Suisse funds/portfolios co-administered by SSB and allocated based upon relative average net assets of each fund/portfolio, subject to an annual minimum fee. For the year ended December 31, 2007, co-administrative services fees earned by SSB (including out-of-pocket expenses) were $22,795.
In addition to serving as the Portfolio's co-administrator, CSAMSI currently serves as distributor of the Portfolio's shares without compensation.
Merrill Corporation ("Merrill"), an affiliate of Credit Suisse, has been engaged by the Portfolio to provide certain financial printing and fulfillment services. For the year ended December 31, 2007, Merrill was paid $15,249 for its services to the Portfolio.
Note 4. Line of Credit
The Portfolio, together with other funds/portfolios advised by Credit Suisse (collectively, the "Participating Funds"), participates in a $50 million committed, unsecured line of credit facility ("Credit Facility") for temporary or emergency purposes with Deutsche Bank, A.G. as administrative agent and syndication agent and SSB as operations agent. Under the terms of the Credit Facility, the Participating Funds pay an aggregate commitment fee at a rate of 0.10% per annum on the average unused amount of the Credit Facility, which is allocated among the Participating Funds in such manner as is determined by the governing Boards of the Participating Funds. In addition, the Participating Funds pay interest on borrowings at the Federal Funds rate plus 0.50%. At December 31, 2007, and during the year ended December 31, 2007, the Portfolio had no borrowings under the Credit Facility.
Note 5. Purchases and Sales of Securities
For the year ended December 31, 2007, purchases and sales of investment securities (excluding short-term investments) were $51,692,599 and $55,682,477, respectively.
21
Credit Suisse Trust — Large Cap Value Portfolio
Notes to Financial Statements (continued)
December 31, 2007
Note 6. Capital Share Transactions
The Trust is authorized to issue an unlimited number of full and fractional shares of beneficial interest, $0.001 par value per share. Transactions in capital shares of the Portfolio were as follows:
| | | For the Year Ended
December 31, 2007 | | For the Year Ended
December 31, 2006 | |
| Shares sold | | | 70,390 | | | | 105,440 | | |
| Shares issued in reinvestment of dividends | | | 857,998 | | | | 36,419 | | |
| Shares redeemed | | | (384,581 | ) | | | (878,987 | ) | |
| Net increase (decrease) | | | 543,807 | | | | (737,128 | ) | |
On December 31, 2007, the number of shareholders that held 5% or more of the outstanding shares of the Portfolio was as follows:
Number of
Shareholders | | Approximate Percentage
of Outstanding Shares | |
| | 2 | | | | 96 | % | |
Some of the shareholders are omnibus accounts, which hold shares on behalf of individual shareholders.
Note 7. Federal Income Taxes
Income and capital gain distributions are determined in accordance with federal income tax regulations, which may differ from GAAP.
The tax characteristics of dividends and distributions paid during the years ended December 31, 2007 and 2006, respectively, for the Portfolio were as follows:
| Ordinary Income | | Long-Term Capital Gain | |
| 2007 | | 2006 | | 2007 | |
| $ | 5,729,741 | | | $ | 560,490 | | | $ | 5,896,134 | | |
The tax basis of components of distributable earnings differ from the amounts reflected in the Statement of Assets and Liabilities by temporary book/tax differences. These differences are primarily due to losses deferred on wash sales and deferral of post-October losses.
At December 31, 2007, the components of distributable earnings on a tax basis for the Portfolio were as follows:
| Undistributed net investment income | | $ | 2,481,790 | | |
| Accumulated net realized gain | | | 1,050,238 | | |
| Unrealized appreciation | | | 4,179,005 | | |
| Deferral of post-October currency losses | | | (815,250 | ) | |
| | | $ | 6,895,783 | | |
22
Credit Suisse Trust — Large Cap Value Portfolio
Notes to Financial Statements (continued)
December 31, 2007
Note 7. Federal Income Taxes
At December 31, 2007, the identified cost for federal income tax purposes, as well as the gross unrealized appreciation from investments for those securities having an excess of value over cost, gross unrealized depreciation from investments for those securities having an excess of cost over value and the net unrealized appreciation from investments were: $59,376,420, $6,828,484, $(2,649,479) and $4,179,005, respectively.
At December 31, 2007, the Portfolio reclassified $7,145 from undistributed net investment income to accumulated net realized loss from investments, to adjust for current period permanent book/tax differences which arose principally from differing book/tax treatments of foreign currency transactions, prior return of capital adjustments on Real Estate Investment Trusts sold and dividends from Real Estate Investment Trusts reclassed from income to capital gains. Net assets were not affected by these reclassifications.
Note 8. Contingencies
In the normal course of business, the Portfolio may provide general indemnifications pursuant to certain contracts and organizational documents. The Portfolio's maximum exposure under these arrangements is dependent on future claims that may be made against the Portfolio and, therefore, cannot be estimated; however, based on experience, the risk of loss from such claims is considered remote.
Note 9. Recent Accounting Pronouncements
During June 2006, the Financial Accounting Standards Board ("FASB") issued FASB Interpretation 48 ("FIN 48" or the "Interpretation"), Accounting for Uncertainty in Income Taxes — an interpretation of FASB statement 109. FIN 48 supplements FASB Statement 109, Accounting for Income Taxes, by defining the confidence level that a tax position must meet in order to be recognized in the financial statements. FIN 48 prescribes a comprehensive model for how a fund should recognize, measure, present, and disclose in its financial statements uncertain tax positions that the fund has taken or expects to take on a tax return. FIN 48 requires that the t ax effects of a position be recognized only if it is "more likely than not" to be sustained based solely on its technical merits. Management must be able to conclude that the tax law, regulations, case law, and other objective information regarding the technical merits sufficiently support the position's sustainability with a likelihood of more than 50 percent. During the period ended December 31, 2007, Management has adopted FIN 48.
23
Credit Suisse Trust — Large Cap Value Portfolio
Notes to Financial Statements (continued)
December 31, 2007
Note 9. Recent Accounting Pronouncements
There was no material impact to the financial statements or disclosures thereto as a result of the adoption of this pronouncement.
On September 20, 2006, the FASB released Statement of Financial Accounting Standards No. 157 "Fair Value Measurements" ("FAS 157"). FAS 157 establishes an authoritative definition of fair value, sets out a framework for measuring fair value, and requires additional disclosures about fair-value measurements. The application of FAS 157 is required for fiscal years, beginning after November 15, 2007 and interim periods within those fiscal years. As of December 31, 2007, management does not believe the adoption of FAS 157 will impact the amounts reported in the financial statements, however, additional disclosures will be required in subsequent reports.
24
Credit Suisse Trust — Large Cap Value Portfolio
Report of Independent Registered Public Accounting Firm
To the Board of Trustees of Credit Suisse Trust and Shareholders of
Credit Suisse Trust — Large Cap Value Portfolio:
In our opinion, the accompanying statement of assets and liabilities, including the schedule of investments, and the related statements of operations and of changes in net assets and the financial highlights present fairly, in all material respects, the financial position of Large Cap Value Portfolio (the "Portfolio"), a portfolio of the Credit Suisse Trust, at December 31, 2007, the results of its operations for the year then ended, the changes in its net assets for each of the two years in the period then ended and the financial highlights for each of the five years in the period then ended, in conformity with accounting principles generally accepted in the United States of America. These financial statements and financial highlights (hereafter referred to as "financial statements") are the responsibility of the Portfolio's management; our responsibility is to express an opinion on these financial statements based on our audits. We conduct ed our audits of these financial statements in accordance with the standards of the Public Company Accounting Oversight Board (United States). Those standards require that we plan and perform the audit to obtain reasonable assurance about whether the financial statements are free of material misstatement. An audit includes examining, on a test basis, evidence supporting the amounts and disclosures in the financial statements, assessing the accounting principles used and significant estimates made by management, and evaluating the overall financial statement presentation. We believe that our audits, which included confirmation of securities at December 31, 2007 by correspondence with the custodian, provide a reasonable basis for our opinion.
PricewaterhouseCoopers LLP
Baltimore, Maryland
February 25, 2008
25
Credit Suisse Trust — Large Cap Value Portfolio
Board Approval of Advisory Agreement (unaudited)
In approving the renewal of the current Advisory Agreement, the Board of Trustees, including the Independent Trustees, at a meeting held on November 13 and 14, 2007, considered the following factors with respect to the Large Cap Value Portfolio (the "Portfolio"):
Investment Advisory Fee Rates
The Board reviewed and considered the contractual advisory fee rate of 0.50% ("Contractual Advisory Fee") in light of the extent and quality of the advisory services provided by Credit Suisse Asset Management, LLC ("Credit Suisse").
Additionally, the Board received and considered information comparing the Portfolio's Contractual Advisory Fee and the Portfolio's overall expenses with those of funds in both the relevant expense group ("Expense Group") and universe of funds ("Expense Universe") provided by Lipper Inc., an independent provider of investment company data.
Nature, Extent and Quality of the Services under the Advisory Agreement
The Board received and considered information regarding the nature, extent and quality of services provided to the Portfolio by Credit Suisse under the Advisory Agreement. The Board also noted information received at regular meetings throughout the year related to the services rendered by Credit Suisse. The Board reviewed background information about Credit Suisse, including its Form ADV. The Board considered the background and experience of Credit Suisse's senior management and the expertise of, and the amount of attention given to the Portfolio by, senior personnel of Credit Suisse. In addition, the Board reviewed the qualifications, backgrounds and responsibilities of the portfolio management team primarily responsible for the day-to-day portfolio management of the Portfolio and the extent of the resources devoted to research and analysis of actual and potential investments. The Board also received and considered information about the nat ure, extent and quality of services and fee rates offered to other Credit Suisse clients for comparable services.
Portfolio Performance
The Board received and considered the performance results of the Portfolio over time, along with comparisons both to the relevant performance group ("Performance Group") and universe of funds ("Performance Universe") for the Portfolio. The Board was provided with a description of the methodology
26
Credit Suisse Trust — Large Cap Value Portfolio
Board Approval of Advisory Agreement (unaudited) (continued)
used to arrive at the funds included in the Performance Group and the Performance Universe.
Credit Suisse Profitability
The Board received and considered a profitability analysis of Credit Suisse based on the fees payable under the Advisory Agreement for the Portfolio, including any fee waivers or fee caps, as well as other relationships between the Portfolio on the one hand and Credit Suisse affiliates on the other. The Board received profitability information for the other funds in the Credit Suisse family of funds.
Economies of Scale
The Board considered whether economies of scale in the provision of services to the Portfolio were being passed along to the shareholders. Accordingly, the Board considered whether alternative fee structures (such as breakpoint fee structures) would be more appropriate or reasonable taking into consideration economies of scale or other efficiencies that might accrue from increases in the Portfolio's asset levels.
Other Benefits to Credit Suisse
The Board considered other benefits received by Credit Suisse and its affiliates as a result of their relationship with the Portfolio. Such benefits include, among others, research arrangements with brokers who execute transactions on behalf of the Portfolio, administrative and brokerage relationships with affiliates of Credit Suisse and benefits potentially derived from an increase in Credit Suisse's businesses as a result of its relationship with the Portfolio (such as the ability to market to shareholders other financial products offered by Credit Suisse and its affiliates).
The Board considered the standards applied in seeking best execution, whether and to what extent soft dollar credits are sought and how any such credits are utilized, any benefits that may be achieved by using an affiliated broker and the existence of quality controls applicable to brokerage allocation procedures. The Board also reviewed Credit Suisse's method for allocating portfolio investment opportunities among its advisory clients.
27
Credit Suisse Trust — Large Cap Value Portfolio
Board Approval of Advisory Agreement (unaudited) (continued)
Conclusions
In selecting Credit Suisse, and approving the Advisory Agreement and the investment advisory fee under such agreement, the Board concluded that:
• The Contractual Advisory Fee was the second lowest in the Portfolio's Expense Group and the Board considered the fee to be reasonable.
• The Portfolio's performance was above most of its peers in both the Performance Group and Performance Universe for most periods reviewed, but was below the median for the one-year period. The Board noted that changes in the Portfolio's investment strategies and portfolio management had gone into effect on December 1, 2006.
• The Board was satisfied with the nature and extent of the investment advisory services provided to the Portfolio by Credit Suisse, and that, based on dialogue with management and counsel, the services provided by Credit Suisse under the Advisory Agreement are typical of, and consistent with, those provided to similar mutual funds by other investment advisers.
• In light of the costs of providing investment management and other services to the Portfolio and Credit Suisse's ongoing commitment to the Portfolio, the profits and other ancillary benefits that Credit Suisse and its affiliates received were considered reasonable.
• Credit Suisse's profitability based on fees payable under the Advisory Agreement was reasonable in light of the nature, extent and quality of the services provided to the Portfolio thereunder.
• In light of the relatively small size of the Portfolio and the amount of the Contractual Advisory Fee, the Portfolio's current fee structure (without breakpoints) was considered reasonable.
No single factor reviewed by the Board was identified by the Board as the principal factor in determining whether to approve the Advisory Agreement. The Independent Trustees were advised by separate independent legal counsel throughout the process.
28
Credit Suisse Trust — Large Cap Value Portfolio
Information Concerning Trustees and Officers (unaudited)
Name, Address
(Year of Birth) | | Position(s)
Held with
Trust | | Term
of Office1
and
Length
of Time
Served | | Principal
Occupation(s) During
Past Five Years | | Number of
Portfolios in
Fund
Complex
Overseen by
Trustee | | Other
Directorships
Held by
Trustee | |
| Independent Trustees | | | | | | | | | | | |
|
Enrique Arzac
c/o Credit Suisse Asset
Management, LLC
Attn: General Counsel
Eleven Madison Avenue
New York, New York
10010
(1941) | | Trustee,
Nominating
Committee
Member and
Audit
Committee
Chairman | | Since
2005 | | Professor of Finance and
Economics, Graduate
School of Business,
Columbia University
since 1971. | | | 35 | | | Director of
Epoch Holding
Corporation (an
investment
management
and investment
advisory
services
company);
Director of The
Adams Express
Company (a
closed-end
investment
company);
Director of
Petroleum and
Resources
Corporation (a
closed-end
investment
company). | |
|
Jeffrey E. Garten2
Box 208200
New Haven, Connecticut
06520-8200
(1946) | | Trustee,
Nominating
and Audit
Committee
Member | | Since
1998 | | The Juan Trippe
Professor in the Practice
of International Trade,
Finance and Business
from July 2005 to
present; Partner and
Chairman of Garten
Rothkopf (consulting
firm) from October 2005
to present; Dean of Yale
School of Management
from November 1995 to
June 2005. | | | 28 | | | Director of
Aetna, Inc.
(insurance
company);
Director of
CarMax Group
(used car
dealers);
Director of
Alcan, Inc.
(smelting and
refining of
nonferrous metals
company). | |
|
1 Each Trustee and Officer serves until his or her respective successor has been duly elected and qualified.
2 Mr. Garten was initially appointed as a Trustee of the Trust on February 6, 1998. He resigned as Trustee on February 3, 2000 and was subsequently reappointed on December 21, 2000.
29
Credit Suisse Trust — Large Cap Value Portfolio
Information Concerning Trustees and Officers (unaudited) (continued)
Name, Address
(Year of Birth) | | Position(s)
Held with
Trust | | Term
of Office1
and
Length
of Time
Served | | Principal
Occupation(s) During
Past Five Years | | Number of
Portfolios in
Fund
Complex
Overseen by
Trustee | | Other
Directorships
Held by
Trustee | |
| Independent Trustees | | | | | | | | | | | | | |
|
Peter F. Krogh
SFS/ICC 702
Georgetown University
Washington, DC 20057
(1937) | | Trustee,
Nominating
and Audit
Committee
Member | | Since
2001 | | Dean Emeritus and
Distinguished Professor
of International Affairs at
the Edmund A. Walsh
School of Foreign
Service, Georgetown
University from
June 1995 to present. | | | 28 | | | Director of
Carlisle
Companies
Incorporated
(diversified
manufacturing
company). | |
|
Steven N. Rappaport
Lehigh Court, LLC
555 Madison Avenue
29th Floor
New York, New York
10022
(1948) | | Chairman of
the Board of
Trustees,
Nominating
Committee
Chairman and
Audit
Committee
Member | | Trustee
since
1999 and
Chairman
since
2005 | | Partner of Lehigh Court,
LLC and RZ Capital
(private investment
firms) from July 2002
to present. | | | 35 | | | Director of
iCAD, Inc.
(surgical and
medical
instruments and
apparatus
company);
Director of
Presstek, Inc.
(digital imaging
technologies
company);
Director of
Wood
Resources, LLC.
(plywood
manufacturing
company). | |
|
| Interested Trustee | | | | | | | | | | | | | |
|
Michael E. Kenneally3
c/o Credit Suisse Asset
Management, LLC
Attn: General Counsel
Eleven Madison Avenue
New York, New York
10010
(1954) | | Trustee | | Since
2004 | | Chairman and Global
Chief Executive Officer
of Credit Suisse from
March 2003 to
July 2005; Chairman and
Chief Investment Officer
of Banc of America
Capital Management
from 1998 to
March 2003. | | | 28 | | | None | |
|
3 Mr. Kenneally is a Trustee who is an "interested person" of the Trust as defined in the Investment Company Act of 1940, as amended, because he was an officer of Credit Suisse within the last two fiscal years.
30
Credit Suisse Trust — Large Cap Value Portfolio
Information Concerning Trustees and Officers (unaudited) (continued)
Name, Address
(Year of Birth) | | Position(s)
Held with
Trust | | Term
of Office1
and
Length
of Time
Served | | Principal Occupation(s) During Past Five Years | |
| Officers | | | | | | | |
|
Lawrence D. Haber
c/o Credit Suisse Asset
Management, LLC
Attn: General Counsel
Eleven Madison Avenue
New York, New York
10010
(1951) | | Chief
Executive
Officer and
President | | Since
2007 | | Managing Director and Chief Operating Officer of Credit Suisse; Member of Credit Suisse's Management Committee; Chief Financial Officer of Merrill Lynch Investment Managers from 1997 to 2003. | |
|
Michael A. Pignataro
Credit Suisse Asset
Management, LLC
Eleven Madison Avenue
New York, New York
10010
(1959) | | Chief
Financial
Officer | | Since
1999 | | Director and Director of Fund Administration of Credit Suisse; Associated with Credit Suisse or its predecessor since 1984; Officer of other Credit Suisse Funds. | |
|
Emidio Morizio
Credit Suisse Asset
Management, LLC
Eleven Madison Avenue
New York, New York
10010
(1966) | | Chief Compliance Officer | | Since
2004 | | Director and Global Head of Compliance of Credit Suisse; Associated with Credit Suisse since July 2000; Officer of other Credit Suisse Funds. | |
|
J. Kevin Gao
Credit Suisse Asset
Management, LLC
Eleven Madison Avenue
New York, New York
10010
(1967) | | Chief Legal
Officer since
2006, Vice
President and
Secretary
since 2004 | | Since
2004 | | Director and Legal Counsel of Credit Suisse; Associated with Credit Suisse since July 2003; Associated with the law firm of Willkie Farr & Gallagher LLP from 1998 to 2003; Officer of other Credit Suisse Funds. | |
|
Robert Rizza
Credit Suisse Asset
Management, LLC
Eleven Madison Avenue
New York, New York
10010
(1965) | | Treasurer | | Since
2006 | | Vice President of Credit Suisse; Associated with Credit Suisse since 1998; Officer of other Credit Suisse Funds. | |
|
The Statement of Additional Information includes additional information about the Trustees and is available, without charge, upon request, by calling 800-222-8977.
31
Credit Suisse Trust — Large Cap Value Portfolio
December 31, 2007 (unaudited)
Important Tax Information for Corporate Shareholders
Corporate Shareholders should note for the year ended December 31, 2007, the percentage of the Portfolio's investment income (i.e., net investment income plus short-term capital gains) that qualified for the intercorporate dividends received deduction is 20.57%.
Important Tax Information for Shareholders
During the year ended December 31, 2007, the Portfolio declared $5,896,134 in dividends that were designated as long-term capital gains dividends.
32
Credit Suisse Trust — Large Cap Value Portfolio
Proxy Voting and Portfolio Holdings Information (unaudited)
Information regarding how the Portfolio voted proxies related to its portfolio securities during the 12 month period ended June 30 of each year, as well as the policies and procedures that the Portfolio uses to determine how to vote proxies relating to its portfolio securities are available:
• By calling 1-800-222-8977
• On the Portfolio's website, www.credit-suisse.com/us
• On the website of the Securities and Exchange Commission, www.sec.gov.
The Portfolio files a complete schedule of its portfolio holdings for the first and third quarters of its fiscal year with the SEC on Form N-Q. The Portfolio's Forms N-Q are available on the SEC's website at www.sec.gov and may be reviewed and copied at the SEC's Public Reference Room in Washington, DC. Information on the operation of the SEC's Public Reference Room may be obtained by calling 1-202-551-8090.
33

P.O. BOX 55030, BOSTON, MA 02205-5030
800-222-8977 n www.credit-suisse.com/us
CREDIT SUISSE ASSET MANAGEMENT SECURITIES, INC., DISTRIBUTOR. TRLCV-AR-1207

CREDIT SUISSE FUNDS
Annual Report
December 31, 2007
CREDIT SUISSE TRUST
n MID-CAP CORE PORTFOLIO
Credit Suisse Trust (the "Trust") shares are not available directly to individual investors, but may be offered only through certain insurance products and pension and retirement plans.
The Trust's investment objectives, risks, charges and expenses (which should be considered carefully before investing), and more complete information about the Trust, are provided in the Prospectus, which should be read carefully before investing. You may obtain additional copies by calling 800-222-8977 or by writing to Credit Suisse Trust, P.O. Box 55030, Boston, MA 02205-5030.
Credit Suisse Asset Management Securities, Inc., Distributor, is located at Eleven Madison Avenue, New York, NY 10010. The Trust is advised by Credit Suisse Asset Management, LLC.
The views of the Portfolio's management are as of the date of the letter and the Portfolio holdings described in this document are as of December 31, 2007; these views and Portfolio holdings may have changed subsequent to these dates. Nothing in this document is a recommendation to purchase or sell securities.
Portfolio shares are not deposits or other obligations of Credit Suisse Asset Management, LLC ("Credit Suisse") or any affiliate, are not FDIC-insured and are not guaranteed by Credit Suisse or any affiliate. Portfolio investments are subject to investment risks, including loss of your investment.
Credit Suisse Trust — Mid-Cap Core Portfolio
Annual Investment Adviser's Report
December 31, 2007 (unaudited)
January 25, 2008
Dear Shareholder:
For the twelve months ended December 31, 2007, Credit Suisse Trust — Mid Cap Core Portfolio1 (the "Portfolio") had a gain of 11.68%, versus an increase of 7.98% for the Standard & Poor's MidCap 400 Index (S&P 400).2
Market Review: A challenging market on many fronts
For the year ended December 31, 2007, the benchmark S&P 400 Midcap Index returned 7.98% — outperforming the large-cap S&P 500 Index, which posted a 5.49% total return including dividends.
The U.S. Federal Reserve held its benchmark rate at 5.25% until September 2007 when the target federal funds rate was cut by 50 basis points to 4.75%, marking the first cut in four years. The Federal Reserve cut the target rate by another 25 basis points in October and again in December to 4.25%. The cuts were made in an effort to prevent some of the adverse effects on the overall economy from the depressed housing market and tighter lending conditions for both consumers and corporations.
The aggressive lending environment over the past few years led to a rise in mortgage defaults. U.S. home foreclosures rose 68% in November from a year earlier, according to data compiled by RealtyTrac Inc. As a result, the U.S. housing sector weakened significantly in 2007 as mortgage providers tightened their lending standards and some lenders went bankrupt. Home prices in 20 U.S. metropolitan areas dropped in October by the most in at least six years. Property values fell 6.1% from October 2006, according to the S&P/Case-Shiller home-price index.
The Chicago Board Options Exchange Volatility Index (VIX), a measure of expected stock market volatility, reached a five-year low in January 2007. However, market conditions changed rapidly in mid-2007 and the VIX reached a four-year high in November 2007 amid deteriorating conditions in the U.S. housing and credit markets.
Despite the housing market slowdown, the economy grew at a solid 4.9% annual rate in the third quarter of 2007. The personal consumption expenditures (PCE) price index, excluding food and energy, rose 2.2% year-over-year in November. The increase was the biggest since March 2007. The Fed watches the PCE price index for signs of inflation and its preferred range for this gauge is 1.0% to 2.0%.
1
Credit Suisse Trust — Mid-Cap Core Portfolio
Annual Investment Adviser's Report (continued)
December 31, 2007 (unaudited)
The labor market also showed signs of weakening in 2007. Non-farm payrolls rose 1.3 million in 2007, compared with gains of 2.3 million in 2006. The unemployment rate rose from 4.7% in November to 5.0% in December 2007, the highest level since November 2005. And, the Reuters/University of Michigan final index of consumer confidence dropped to 75.5 in December, the lowest since October 2005. The gauge has averaged 88 since monthly data were first compiled in 1978.
Strategic Review and Market Outlook: Potential for further rate cuts
The leading positive relative contributors to performance came from stock selection in materials, healthcare, and consumer discretionary. The largest detractors to performance came primarily from stock selection within the information technology sector, followed closely by consumer staples and financials.
The U.S. Federal Reserve anticipates economic growth will be "somewhat more sluggish" than the 1.8% – 2.5% they had projected for 2008. And, Fed policy makers also expect core inflation to "trend down a bit over the next few years."
The Federal Reserve on January 22, 2008 took significant action between scheduled meetings by cutting rates 75 basis points to 3.50%. The Fed cited the weakening economic outlook and increasing downside risks to growth.
The Fed is scheduled to meet next on January 30 to discuss interest rates. Based on interest-rate futures on January 25, traders expect policy makers to further lower the target rate for overnight lending by 50 to 75 basis points.
In our opinion, U.S. housing markets may remain weak through the first half of 2008. Additionally, expectations for U.S. stock market volatility, as measured by the VIX Index, are for levels above historical averages. The pace of mergers and acquisitions by private equity firms isn't expected to reach the level seen in the first half of 2007, as the availability of debt financing has lessened significantly.
The Credit Suisse Quantitative Equities Group
Jordan Low
Eric Leng
Todd Jablonski
2
Credit Suisse Trust — Mid-Cap Core Portfolio
Annual Investment Adviser's Report (continued)
December 31, 2007 (unaudited)
Investing in small to medium-sized companies may be more volatile and less liquid than investments in larger companies.
In addition to historical information, this report contains forward-looking statements, which may concern, among other things, domestic and foreign market, industry and economic trends and developments and government regulation and their potential impact on the Portfolio's investments. These statements are subject to risks and uncertainties and actual trends, developments and regulations in the future, and their impact on the Portfolio could be materially different from those projected, anticipated or implied. The Portfolio has no obligation to update or revise forward-looking statements.
3
Credit Suisse Trust — Mid-Cap Core Portfolio
Annual Investment Adviser's Report (continued)
December 31, 2007 (unaudited)
Comparison of Change in Value of $10,000 Investment in the
Credit Suisse Trust — Mid Cap Core Portfolio1, the Russell 2500TM
Growth Index3,5, the Russell MidCap® Growth Index4,5 and
the S&P MidCap 400 Index2,5 from Inception (09/13/99).

4
Credit Suisse Trust — Mid-Cap Core Portfolio
Annual Investment Adviser's Report (continued)
December 31, 2007 (unaudited)
Average Annual Returns as of December 31, 20071
| 1 Year | | 5 Years | | Since
Inception | |
| | 11.68 | % | | | 14.58 | % | | | 5.14 | % | |
Returns represent past performance and include change in share price and reinvestment of dividends and capital gains. Past performance cannot guarantee future results. The current performance of the Portfolio may be lower or higher than the figures shown. Returns and share price will fluctuate, and redemption value may be more or less than original cost. The performance results do not reflect the deduction of taxes that a shareholder would pay on portfolio distributions or the redemption of portfolio shares. Performance includes the effect of deducting expenses, but does not include charges and expenses attributable to any particular variable contract or plan. Accordingly, the Prospectus of the sponsoring Participating Insurance Company separate account or plan documents or ot her informational materials supplied by plan sponsors should be carefully reviewed for information on relevant charges and expenses. Excluding these charges and expenses from quotations of performance has the effect of increasing the performance quoted, and the effect of these charges should be considered when comparing performance to that of other mutual funds. Performance information current to the most recent month-end is available at www.credit-suisse.com/us.
1 Fee waivers and/or expense reimbursements may reduce expenses for the Portfolio, without which performance would be lower. Waivers and/or reimbursements may be discontinued at any time.
2 The S&P MidCap 400 Index is an unmanaged market-weighted index composed of 400 U.S. stocks selected on the basis of market capitalization, liquidity and industry group representation and is a registered trademark of The McGraw-Hill Co., Inc. The S&P MidCap 400 Index became the Portfolio's benchmark index on December 1, 2006 in connection with its change in investment strategy. Investors cannot invest directly in an index.
3 The Russell 2500TM Growth Index measures the performance of those companies in the Russell 2500TM Index with higher price-to-book ratios and higher forecasted growth values. It is an unmanaged index of common stocks that includes reinvestment of dividends and is compiled by Frank Russell Company. Investors cannot invest directly in an index.
4 The Russell MidCap® Growth Index measures the performance of those companies in the Russell MidCap® Index with higher price-to-book ratios and higher forecasted growth values. The stocks are also members of the Russell 1000® Growth Index. It is an unmanaged index of common stocks that includes reinvestment of dividends and is compiled by Frank Russell Company. Investors cannot invest directly in an index.
5 Performance for the benchmark is not available for the period beginning September 13, 1999 (commencement of operations). For that reason, performance is shown for the period beginning September 1, 1999.
5
Credit Suisse Trust — Mid-Cap Core Portfolio
Annual Investment Adviser's Report (continued)
December 31, 2007 (unaudited)
Information About Your Portfolio's Expenses
As an investor of the Portfolio, you incur two types of costs: ongoing expenses and transaction costs. Ongoing expenses include management fees, distribution and service (12b-1) fees and other Portfolio expenses. Examples of transaction costs include sales charges (loads), redemption fees and account maintenance fees, which are not shown in this section and which would result in higher total expenses. The following table is intended to help you understand your ongoing expenses of investing in the Portfolio and to help you compare these expenses with the ongoing expenses of investing in other mutual funds. The table is based on an investment of $1,000 made at the beginning of the six month period ended December 31, 2007.
The table illustrates your Portfolio's expenses in two ways:
• Actual Portfolio Return. This helps you estimate the actual dollar amount of ongoing expenses paid on a $1,000 investment in the Portfolio using the Portfolio's actual return during the period. To estimate the expenses you paid over the period, simply divide your account value by $1,000 (for example, an $8,600 account value divided by $1,000 = 8.6), then multiply the result by the number in the "Expenses Paid per $1,000" line under the share class you hold.
• Hypothetical 5% Portfolio Return. This helps you to compare your Portfolio's ongoing expenses with those of other mutual funds using the Portfolio's actual expense ratio and a hypothetical rate of return of 5% per year before expenses. Examples using a 5% hypothetical fund return may be found in the shareholder reports of other mutual funds. The hypothetical account values and expenses may not be used to estimate the actual ending account balance or expenses you paid for the period.
Please note that the expenses shown in these tables are meant to highlight your ongoing expenses only and do not reflect any transaction costs, such as sales charges (loads) or redemption fees. If these transaction costs had been included, your costs would have been higher. The "Expenses Paid per $1,000" line of the tables is useful in comparing ongoing expenses only and will not help you determine the relative total expenses of owning different funds.
6
Credit Suisse Trust — Mid-Cap Core Portfolio
Annual Investment Adviser's Report (continued)
December 31, 2007 (unaudited)
Expenses and Value of a $1,000 Investment
for the six month period ended December 31, 2007
| Actual Portfolio Return | |
| Beginning Account Value 7/1/07 | | $ | 1,000.00 | | |
| Ending Account Value 12/31/07 | | $ | 1,003.30 | | |
| Expenses Paid per $1,000* | | $ | 6.67 | | |
| Hypothetical 5% Portfolio Return | |
| Beginning Account Value 7/1/07 | | $ | 1,000.00 | | |
| Ending Account Value 12/31/07 | | $ | 1,018.55 | | |
| Expenses Paid per $1,000* | | $ | 6.72 | | |
| Annualized Expense Ratios* | | | 1.32 | % | |
* Expenses are equal to the Portfolio's annualized expense ratio multiplied by the average account value over the period, multiplied by the number of days in the most recent fiscal half year period, then divided by 365.
The "Expenses Paid per $1,000" and the "Annualized Expense Ratios" in the tables are based on actual expenses paid by the Portfolio during the period, net of fee waivers and/or expense reimbursements. If those fee waivers and/or expense reimbursements had not been in effect, the Portfolio's actual expenses would have been higher. Expenses do not reflect additional charges and expenses that are, or may be, imposed under the variable contracts or plans. Such charges and expenses are described in the prospectus of the insurance company separate account or in the plan documents or other informational materials supplied by plan sponsors. The Portfolio's expenses should be considered with these charges and expenses in evaluating the overall cost of investing in the separate account.
For more information, please refer to the Portfolio's prospectus.
7
Credit Suisse Trust — Mid-Cap Core Portfolio
Annual Investment Adviser's Report (continued)
December 31, 2007 (unaudited)
SECTOR BREAKDOWN*

* Expressed as a percentage of total investments (excluding security lending collateral) and may vary over time.
8
Credit Suisse Trust — Mid-Cap Core Portfolio
Schedule of Investments
December 31, 2007
| | | Number of
Shares | | Value | |
| COMMON STOCKS (100.2%) | |
| Aerospace & Defense (2.3%) | |
| Alliant Techsystems, Inc.*§ | | | 2,000 | | | $ | 227,520 | | |
| Goodrich Corp.§ | | | 1,800 | | | | 127,098 | | |
| L-3 Communications Holdings, Inc. | | | 700 | | | | 74,158 | | |
| Precision Castparts Corp.§ | | | 900 | | | | 124,830 | | |
| Rockwell Collins, Inc. | | | 1,100 | | | | 79,167 | | |
| | | | 632,773 | | |
| Airlines (0.2%) | |
| AMR Corp.*§ | | | 900 | | | | 12,627 | | |
| Continental Airlines, Inc. Class B*§ | | | 900 | | | | 20,025 | | |
| US Airways Group, Inc.*§ | | | 900 | | | | 13,239 | | |
| | | | 45,891 | | |
| Auto Components (1.0%) | |
| Autoliv, Inc.§ | | | 400 | | | | 21,084 | | |
| BorgWarner, Inc.§ | | | 2,200 | | | | 106,502 | | |
| Lear Corp.* | | | 4,700 | | | | 130,002 | | |
| | | | 257,588 | | |
| Banks (2.3%) | |
| Bank of Hawaii Corp. | | | 1,300 | | | | 66,482 | | |
| Cathay General Bancorp§ | | | 2,100 | | | | 55,629 | | |
| City National Corp.§ | | | 1,000 | | | | 59,550 | | |
| Colonial BancGroup, Inc.§ | | | 5,600 | | | | 75,824 | | |
| East West Bancorp, Inc.§ | | | 1,900 | | | | 46,037 | | |
| Huntington Bancshares, Inc.§ | | | 1,700 | | | | 25,092 | | |
| KeyCorp§ | | | 1,200 | | | | 28,140 | | |
| South Financial Group, Inc.§ | | | 1,700 | | | | 26,571 | | |
| Sovereign Bancorp, Inc. | | | 2,200 | | | | 25,080 | | |
| SVB Financial Group*§ | | | 1,900 | | | | 95,760 | | |
| Synovus Financial Corp. | | | 2,300 | | | | 55,384 | | |
| Webster Financial Corp.§ | | | 1,400 | | | | 44,758 | | |
| Zions Bancorporation§ | | | 600 | | | | 28,014 | | |
| | | | 632,321 | | |
| Beverages (0.5%) | |
| Pepsi Bottling Group, Inc. | | | 1,400 | | | | 55,244 | | |
| PepsiAmericas, Inc.§ | | | 2,200 | | | | 73,304 | | |
| | | | 128,548 | | |
| Biotechnology (3.3%) | |
| Alexion Pharmaceuticals, Inc.*§ | | | 1,600 | | | | 120,048 | | |
| BioMarin Pharmaceutical, Inc.*§ | | | 3,700 | | | | 130,980 | | |
| Charles River Laboratories International, Inc.*§ | | | 1,600 | | | | 105,280 | | |
| Gen-Probe, Inc.* | | | 1,200 | | | | 75,516 | | |
| Invitrogen Corp.*§ | | | 2,800 | | | | 261,548 | | |
| Millennium Pharmaceuticals, Inc.*§ | | | 7,900 | | | | 118,342 | | |
| OSI Pharmaceuticals, Inc.*§ | | | 1,600 | | | | 77,616 | | |
| | | | 889,330 | | |
See Accompanying Notes to Financial Statements.
9
Credit Suisse Trust — Mid-Cap Core Portfolio
Schedule of Investments (continued)
December 31, 2007
| | | Number of
Shares | | Value | |
| COMMON STOCKS | |
| Building Products (0.2%) | |
| Crane Co. | | | 1,200 | | | $ | 51,480 | | |
| Chemicals (4.0%) | |
| Celanese Corp. Class A | | | 3,400 | | | | 143,888 | | |
| CF Industries Holdings, Inc.§ | | | 2,600 | | | | 286,156 | | |
| Cytec Industries, Inc. | | | 1,000 | | | | 61,580 | | |
| Ecolab Inc. | | | 500 | | | | 25,605 | | |
| Ferro Corp. | | | 1,000 | | | | 20,730 | | |
| FMC Corp.§ | | | 1,800 | | | | 98,190 | | |
| Lubrizol Corp. | | | 2,100 | | | | 113,736 | | |
| Minerals Technologies, Inc.§ | | | 500 | | | | 33,475 | | |
| Mosaic Co.* | | | 2,800 | | | | 264,152 | | |
| Olin Corp.§ | | | 1,700 | | | | 32,861 | | |
| | | | 1,080,373 | | |
| Commercial Services & Supplies (4.7%) | |
| Alliance Data Systems Corp.*§ | | | 1,800 | | | | 134,982 | | |
| Apollo Group, Inc. Class A*§ | | | 1,800 | | | | 126,270 | | |
| Bally Technologies, Inc.*§ | | | 1,800 | | | | 89,496 | | |
| CSG Systems International, Inc.*§ | | | 2,500 | | | | 36,800 | | |
| DeVry, Inc. | | | 1,400 | | | | 72,744 | | |
| DST Systems, Inc.*§ | | | 1,300 | | | | 107,315 | | |
| Dun & Bradstreet Corp.§ | | | 1,400 | | | | 124,082 | | |
| Herman Miller, Inc. | | | 1,500 | | | | 48,585 | | |
| ITT Educational Services, Inc.*§ | | | 2,300 | | | | 196,121 | | |
| Manpower, Inc.§ | | | 1,100 | | | | 62,590 | | |
| Republic Services, Inc. | | | 4,000 | | | | 125,400 | | |
| Sotheby's§ | | | 1,600 | | | | 60,960 | | |
| Strayer Education, Inc.§ | | | 300 | | | | 51,174 | | |
| Total System Services, Inc.§ | | | 1,100 | | | | 30,800 | | |
| | | | 1,267,319 | | |
| Communications Equipment (1.9%) | |
| CommScope, Inc.*§ | | | 2,600 | | | | 127,946 | | |
| Harris Corp. | | | 3,700 | | | | 231,916 | | |
| Juniper Networks, Inc.* | | | 4,000 | | | | 132,800 | | |
| Plantronics, Inc.§ | | | 1,200 | | | | 31,200 | | |
| | | | 523,862 | | |
| Computers & Peripherals (1.7%) | |
| NCR Corp.*§ | | | 4,400 | | | | 110,440 | | |
| NVIDIA Corp.* | | | 3,549 | | | | 120,737 | | |
| Seagate Technology | | | 1,000 | | | | 25,500 | | |
| Teradata Corp.* | | | 600 | | | | 16,446 | | |
| Western Digital Corp.*§ | | | 6,100 | | | | 184,281 | | |
| | | | 457,404 | | |
See Accompanying Notes to Financial Statements.
10
Credit Suisse Trust — Mid-Cap Core Portfolio
Schedule of Investments (continued)
December 31, 2007
| | | Number of
Shares | | Value | |
| COMMON STOCKS | |
| Construction & Engineering (2.0%) | |
| Fluor Corp. | | | 900 | | | $ | 131,148 | | |
| Foster Wheeler, Ltd.* | | | 800 | | | | 124,016 | | |
| Jacobs Engineering Group, Inc.* | | | 1,400 | | | | 133,854 | | |
| McDermott International, Inc.* | | | 1,000 | | | | 59,030 | | |
| Shaw Group, Inc.*§ | | | 1,700 | | | | 102,748 | | |
| | | | 550,796 | | |
| Containers & Packaging (0.3%) | |
| Owens-Illinois, Inc.* | | | 600 | | | | 29,700 | | |
| Packaging Corp. of America | | | 2,200 | | | | 62,040 | | |
| | | | 91,740 | | |
| Distributor (0.1%) | |
| WESCO International, Inc.*§ | | | 600 | | | | 23,784 | | |
| Diversified Financials (3.6%) | |
| AmeriCredit Corp.*§ | | | 2,700 | | | | 34,533 | | |
| Ameriprise Financial, Inc. | | | 400 | | | | 22,044 | | |
| BlackRock, Inc.§ | | | 500 | | | | 108,400 | | |
| Broadridge Financial Solutions, Inc. | | | 3,300 | | | | 74,019 | | |
| Eaton Vance Corp.§ | | | 3,500 | | | | 158,935 | | |
| Federated Investors, Inc. Class B§ | | | 600 | | | | 24,696 | | |
| Greenhill & Company, Inc.§ | | | 400 | | | | 26,592 | | |
| IntercontinentalExchange Inc.* | | | 100 | | | | 19,250 | | |
| MF Global, Ltd.*§ | | | 1,900 | | | | 59,793 | | |
| Morningstar, Inc.*§ | | | 700 | | | | 54,425 | | |
| Nasdaq Stock Market, Inc.*§ | | | 4,400 | | | | 217,756 | | |
| SEI Investments Co.§ | | | 2,100 | | | | 67,557 | | |
| T. Rowe Price Group, Inc.§ | | | 400 | | | | 24,352 | | |
| Waddell & Reed Financial, Inc. Class A | | | 2,000 | | | | 72,180 | | |
| | | | 964,532 | | |
| Diversified Telecommunication Services (0.4%) | |
| Cincinnati Bell, Inc.*§ | | | 5,800 | | | | 27,550 | | |
| Embarq Corp. | | | 500 | | | | 24,765 | | |
| NeuStar, Inc. Class A*§ | | | 1,700 | | | | 48,756 | | |
| | | | 101,071 | | |
| Electric Utilities (5.4%) | |
| Alliant Energy Corp.§ | | | 2,700 | | | | 109,863 | | |
| CenterPoint Energy, Inc.§ | | | 7,500 | | | | 128,475 | | |
| Constellation Energy Group | | | 1,300 | | | | 133,289 | | |
| DPL, Inc.§ | | | 2,700 | | | | 80,055 | | |
| Edison International§ | | | 2,400 | | | | 128,088 | | |
| Energy East Corp. | | | 3,600 | | | | 97,956 | | |
| Entergy Corp. | | | 1,200 | | | | 143,424 | | |
| Mirant Corp.*§ | | | 3,400 | | | | 132,532 | | |
| Northeast Utilities | | | 3,600 | | | | 112,716 | | |
| NRG Energy, Inc.*§ | | | 3,200 | | | | 138,688 | | |
| PPL Corp.§ | | | 2,500 | | | | 130,225 | | |
| Reliant Energy, Inc.* | | | 5,100 | | | | 133,824 | | |
| | | | 1,469,135 | | |
See Accompanying Notes to Financial Statements.
11
Credit Suisse Trust — Mid-Cap Core Portfolio
Schedule of Investments (continued)
December 31, 2007
| | | Number of
Shares | | Value | |
| COMMON STOCKS | |
| Electrical Equipment (1.7%) | |
| Energizer Holdings, Inc.*§ | | | 1,900 | | | $ | 213,047 | | |
| General Cable Corp.*§ | | | 400 | | | | 29,312 | | |
| Hubbell, Inc. Class B | | | 1,400 | | | | 72,240 | | |
| Rockwell Automation, Inc.§ | | | 400 | | | | 27,584 | | |
| SunPower Corp. Class A*§ | | | 400 | | | | 52,156 | | |
| Thomas & Betts Corp.* | | | 1,200 | | | | 58,848 | | |
| | | | 453,187 | | |
| Electronic Equipment & Instruments (3.6%) | |
| Amphenol Corp. Class A§ | | | 4,300 | | | | 199,391 | | |
| Arrow Electronics, Inc.*§ | | | 3,700 | | | | 145,336 | | |
| Avnet, Inc.*§ | | | 5,100 | | | | 178,347 | | |
| Intersil Corp. Class A | | | 3,300 | | | | 80,784 | | |
| Mettler-Toledo International, Inc.* | | | 700 | | | | 79,660 | | |
| Molex, Inc.§ | | | 1,100 | | | | 30,030 | | |
| Varian, Inc.* | | | 2,300 | | | | 150,190 | | |
| Waters Corp.* | | | 1,400 | | | | 110,698 | | |
| | | | 974,436 | | |
| Energy Equipment & Services (4.2%) | |
| Cameron International Corp.* | | | 5,200 | | | | 250,276 | | |
| Diamond Offshore Drilling, Inc.§ | | | 1,000 | | | | 142,000 | | |
| FMC Technologies, Inc.*§ | | | 3,000 | | | | 170,100 | | |
| Global Industries, Ltd.* | | | 1,800 | | | | 38,556 | | |
| Grant Prideco, Inc.*§ | | | 3,500 | | | | 194,285 | | |
| Helmerich & Payne, Inc. | | | 3,200 | | | | 128,224 | | |
| Smith International, Inc. | | | 400 | | | | 29,540 | | |
| Superior Energy Services, Inc.* | | | 2,000 | | | | 68,840 | | |
| Tidewater, Inc. | | | 1,800 | | | | 98,748 | | |
| | | | 1,120,569 | | |
| Food & Drug Retailing (1.2%) | |
| SUPERVALU, Inc. | | | 1,100 | | | | 41,272 | | |
| Terra Industries, Inc.*§ | | | 5,700 | | | | 272,232 | | |
| | | | 313,504 | | |
| Food Products (1.4%) | |
| Bunge, Ltd. | | | 700 | | | | 81,487 | | |
| Herbalife, Ltd.§ | | | 1,100 | | | | 44,308 | | |
| Hormel Foods Corp.§ | | | 3,100 | | | | 125,488 | | |
| Pilgrim's Pride Corp.§ | | | 1,500 | | | | 43,425 | | |
| Sara Lee Corp. | | | 3,300 | | | | 52,998 | | |
| Sensient Technologies Corp.§ | | | 1,100 | | | | 31,108 | | |
| | | | 378,814 | | |
| Gas Utilities (2.5%) | |
| Energen Corp. | | | 3,800 | | | | 244,074 | | |
| MDU Resources Group, Inc. | | | 4,300 | | | | 118,723 | | |
| National Fuel Gas Co.§ | | | 2,000 | | | | 93,360 | | |
| Southwestern Energy Co.* | | | 4,100 | | | | 228,452 | | |
| | | | 684,609 | | |
See Accompanying Notes to Financial Statements.
12
Credit Suisse Trust — Mid-Cap Core Portfolio
Schedule of Investments (continued)
December 31, 2007
| | | Number of
Shares | | Value | |
| COMMON STOCKS | |
| Healthcare Equipment & Supplies (6.5%) | |
| Beckman Coulter, Inc.§ | | | 1,500 | | | $ | 109,200 | | |
| DENTSPLY International, Inc.§ | | | 3,600 | | | | 162,072 | | |
| Hologic, Inc.*§ | | | 4,800 | | | | 329,472 | | |
| Intuitive Surgical, Inc.*§ | | | 1,500 | | | | 486,750 | | |
| Kinetic Concepts, Inc.*§ | | | 3,000 | | | | 160,680 | | |
| Mine Safety Appliances Co.§ | | | 700 | | | | 36,309 | | |
| ResMed, Inc.* | | | 4,700 | | | | 246,891 | | |
| Varian Medical Systems, Inc.* | | | 1,000 | | | | 52,160 | | |
| Ventana Medical Systems, Inc.* | | | 1,900 | | | | 165,737 | | |
| | | | 1,749,271 | | |
| Healthcare Providers & Services (3.6%) | |
| AmerisourceBergen Corp.§ | | | 300 | | | | 13,461 | | |
| Apria Healthcare Group, Inc.* | | | 1,000 | | | | 21,570 | | |
| Covance, Inc.* | | | 1,500 | | | | 129,930 | | |
| Henry Schein, Inc.* | | | 2,100 | | | | 128,940 | | |
| Humana, Inc.* | | | 2,700 | | | | 203,337 | | |
| Kindred Healthcare, Inc.*§ | | | 2,800 | | | | 69,944 | | |
| LifePoint Hospitals, Inc.*§ | | | 1,400 | | | | 41,636 | | |
| Pharmaceutical Product Development, Inc. | | | 2,400 | | | | 96,888 | | |
| Tenet Healthcare Corp.*§ | | | 7,400 | | | | 37,592 | | |
| VCA Antech, Inc.* | | | 2,100 | | | | 92,883 | | |
| WellCare Health Plans, Inc.*§ | | | 3,300 | | | | 139,953 | | |
| | | | 976,134 | | |
| Hotels, Restaurants & Leisure (1.0%) | |
| Chipotle Mexican Grill, Inc. Class A*§ | | | 1,000 | | | | 147,070 | | |
| Darden Restaurants, Inc. | | | 700 | | | | 19,397 | | |
| Ruby Tuesday, Inc.§ | | | 1,300 | | | | 12,675 | | |
| Yum! Brands, Inc.§ | | | 2,200 | | | | 84,194 | | |
| | | | 263,336 | | |
| Household Durables (1.1%) | |
| American Greetings Corp. Class A§ | | | 1,400 | | | | 28,420 | | |
| Blyth, Inc.§ | | | 1,100 | | | | 24,134 | | |
| Centex Corp.§ | | | 1,300 | | | | 32,838 | | |
| Garmin, Ltd. | | | 200 | | | | 19,400 | | |
| KB Home§ | | | 1,300 | | | | 28,080 | | |
| Lennar Corp. Class A§ | | | 1,700 | | | | 30,413 | | |
| NVR, Inc.*§ | | | 100 | | | | 52,400 | | |
| Pulte Homes, Inc.§ | | | 2,700 | | | | 28,458 | | |
| Tupperware Brands Corp.§ | | | 1,600 | | | | 52,848 | | |
| | | | 296,991 | | |
| Household Products (0.3%) | |
| Church & Dwight Company, Inc.§ | | | 1,500 | | | | 81,105 | | |
See Accompanying Notes to Financial Statements.
13
Credit Suisse Trust — Mid-Cap Core Portfolio
Schedule of Investments (continued)
December 31, 2007
| | | Number of
Shares | | Value | |
| COMMON STOCKS | |
| Industrial Conglomerates (0.9%) | |
| KBR, Inc.*§ | | | 4,100 | | | $ | 159,080 | | |
| Textron Inc. | | | 1,200 | | | | 85,560 | | |
| | | | 244,640 | | |
| Insurance (4.9%) | |
| Allied World Assurance Holdings, Ltd. | | | 600 | | | | 30,102 | | |
| Ambac Financial Group, Inc.§ | | | 3,300 | | | | 85,041 | | |
| American Financial Group, Inc.§ | | | 1,800 | | | | 51,984 | | |
| Aon Corp.§ | | | 1,100 | | | | 52,459 | | |
| Arch Capital Group, Ltd.* | | | 400 | | | | 28,140 | | |
| Assurant, Inc.§ | | | 800 | | | | 53,520 | | |
| Axis Capital Holdings, Ltd.§ | | | 1,500 | | | | 58,455 | | |
| CNA Financial Corp.§ | | | 1,500 | | | | 50,580 | | |
| Endurance Specialty Holdings, Ltd.§ | | | 700 | | | | 29,211 | | |
| Everest Re Group, Ltd. | | | 1,700 | | | | 170,680 | | |
| Fidelity National Financial, Inc. Class A§ | | | 5,200 | | | | 75,972 | | |
| HCC Insurance Holdings, Inc. | | | 2,700 | | | | 77,436 | | |
| Mercury General Corp. | | | 800 | | | | 39,848 | | |
| MGIC Investment Corp.§ | | | 1,300 | | | | 29,159 | | |
| Nationwide Financial Services, Inc. Class A | | | 600 | | | | 27,006 | | |
| PartnerRe, Ltd. | | | 300 | | | | 24,759 | | |
| PMI Group, Inc.§ | | | 3,900 | | | | 51,792 | | |
| Protective Life Corp. | | | 1,700 | | | | 69,734 | | |
| Radian Group, Inc.§ | | | 4,700 | | | | 54,896 | | |
| RenaissanceRe Holdings, Ltd.§ | | | 500 | | | | 30,120 | | |
| SAFECO Corp.§ | | | 1,000 | | | | 55,680 | | |
| Transatlantic Holdings, Inc.§ | | | 400 | | | | 29,068 | | |
| Unum Group | | | 1,100 | | | | 26,169 | | |
| W.R. Berkley Corp. | | | 3,900 | | | | 116,259 | | |
| | | | 1,318,070 | | |
| Internet & Catalog Retail (0.2%) | |
| Global Sources, Ltd.*§ | | | 2,310 | | | | 65,188 | | |
| Internet Software & Services (0.7%) | |
| McAfee, Inc.* | | | 3,800 | | | | 142,500 | | |
| ValueClick, Inc.*§ | | | 2,400 | | | | 52,560 | | |
| | | | 195,060 | | |
| IT Consulting & Services (0.2%) | |
| Computer Sciences Corp.*§ | | | 1,000 | | | | 49,470 | | |
| Leisure Equipment & Products (0.6%) | |
| Callaway Golf Co.§ | | | 1,800 | | | | 31,374 | | |
| Hasbro, Inc.§ | | | 1,000 | | | | 25,580 | | |
| Marvel Entertainment, Inc.*§ | | | 900 | | | | 24,039 | | |
| Polaris Industries, Inc.§ | | | 1,800 | | | | 85,986 | | |
| | | | 166,979 | | |
See Accompanying Notes to Financial Statements.
14
Credit Suisse Trust — Mid-Cap Core Portfolio
Schedule of Investments (continued)
December 31, 2007
| | | Number of
Shares | | Value | |
| COMMON STOCKS | |
| Machinery (5.2%) | |
| AGCO Corp.*§ | | | 5,200 | | | $ | 353,496 | | |
| Cummins, Inc.§ | | | 1,100 | | | | 140,107 | | |
| Eaton Corp. | | | 300 | | | | 29,085 | | |
| Flowserve Corp. | | | 1,600 | | | | 153,920 | | |
| Gardner Denver, Inc.* | | | 800 | | | | 26,400 | | |
| Harsco Corp.§ | | | 2,000 | | | | 128,140 | | |
| Joy Global, Inc.§ | | | 2,500 | | | | 164,550 | | |
| Kennametal, Inc. | | | 1,800 | | | | 68,148 | | |
| Manitowoc Company, Inc. | | | 2,800 | | | | 136,724 | | |
| Parker Hannifin Corp. | | | 350 | | | | 26,358 | | |
| SPX Corp.§ | | | 1,800 | | | | 185,130 | | |
| | | | 1,412,058 | | |
| Marine (0.2%) | |
| Overseas Shipholding Group, Inc. | | | 700 | | | | 52,101 | | |
| Media (0.8%) | |
| E.W. Scripps Co. Class A§ | | | 600 | | | | 27,006 | | |
| Harte-Hanks, Inc.§ | | | 1,100 | | | | 19,030 | | |
| Interactive Data Corp.§ | | | 1,700 | | | | 56,117 | | |
| Netflix, Inc.*§ | | | 1,300 | | | | 34,606 | | |
| Scholastic Corp.* | | | 2,100 | | | | 73,269 | | |
| | | | 210,028 | | |
| Metals & Mining (3.6%) | |
| Cleveland-Cliffs, Inc.§ | | | 2,700 | | | | 272,160 | | |
| Consol Energy Inc. | | | 400 | | | | 28,608 | | |
| Freeport-McMoRan Copper & Gold, Inc. | | | 2,100 | | | | 215,124 | | |
| Massey Energy Co.§ | | | 1,500 | | | | 53,625 | | |
| Steel Dynamics, Inc.§ | | | 3,600 | | | | 214,452 | | |
| United States Steel Corp. | | | 1,500 | | | | 181,365 | | |
| | | | 965,334 | | |
| Multi-Utilities (0.4%) | |
| Questar Corp. | | | 2,000 | | | | 108,200 | | |
| Multiline Retail (1.2%) | |
| Big Lots, Inc.*§ | | | 3,300 | | | | 52,767 | | |
| BJ's Wholesale Club, Inc.*§ | | | 3,100 | | | | 104,873 | | |
| Dollar Tree Stores, Inc.*§ | | | 2,300 | | | | 59,616 | | |
| Nordstrom, Inc.§ | | | 800 | | | | 29,384 | | |
| Saks, Inc.*§ | | | 3,500 | | | | 72,660 | | |
| | | | 319,300 | | |
See Accompanying Notes to Financial Statements.
15
Credit Suisse Trust — Mid-Cap Core Portfolio
Schedule of Investments (continued)
December 31, 2007
| | | Number of
Shares | | Value | |
| COMMON STOCKS | |
| Oil & Gas (7.2%) | |
| Bill Barrett Corp.*§ | | | 1,500 | | | $ | 62,805 | | |
| Cabot Oil & Gas Corp. | | | 700 | | | | 28,259 | | |
| Cimarex Energy Co.§ | | | 4,000 | | | | 170,120 | | |
| Continental Resources, Inc.*§ | | | 2,200 | | | | 57,486 | | |
| Denbury Resources, Inc.*§ | | | 5,600 | | | | 166,600 | | |
| Equitable Resources, Inc.§ | | | 2,900 | | | | 154,512 | | |
| Frontier Oil Corp.§ | | | 3,200 | | | | 129,856 | | |
| Frontline, Ltd.§ | | | 600 | | | | 28,800 | | |
| Hess Corp.§ | | | 2,100 | | | | 211,806 | | |
| Holly Corp. | | | 600 | | | | 30,534 | | |
| Murphy Oil Corp.§ | | | 1,100 | | | | 93,324 | | |
| Newfield Exploration Co.* | | | 3,100 | | | | 163,370 | | |
| Noble Energy, Inc.§ | | | 2,400 | | | | 190,848 | | |
| Plains Exploration & Production Co.* | | | 2,700 | | | | 145,800 | | |
| Sunoco, Inc. | | | 400 | | | | 28,976 | | |
| Tesoro Corp.§ | | | 600 | | | | 28,620 | | |
| Transocean, Inc.* | | | 1,018 | | | | 145,727 | | |
| W&T Offshore, Inc.§ | | | 2,800 | | | | 83,888 | | |
| Western Refining, Inc.§ | | | 1,000 | | | | 24,210 | | |
| | | | 1,945,541 | | |
| Paper & Forest Products (0.5%) | |
| Potlatch Corp.§ | | | 900 | | | | 39,996 | | |
| Rayonier, Inc.§ | | | 1,800 | | | | 85,032 | | |
| | | | 125,028 | | |
| Pharmaceuticals (0.7%) | |
| King Pharmaceuticals, Inc.*§ | | | 3,900 | | | | 39,936 | | |
| Par Pharmaceutical Cos, Inc.* | | | 3,400 | | | | 81,600 | | |
| Perrigo Co.§ | | | 1,800 | | | | 63,018 | | |
| | | | 184,554 | | |
| Real Estate (2.5%) | |
| Apartment Investment & Management Co. Class A§ | | | 1,000 | | | | 34,730 | | |
| Brandywine Realty Trust | | | 1,100 | | | | 19,723 | | |
| Duke Realty Corp. | | | 2,500 | | | | 65,200 | | |
| First Industrial Realty Trust, Inc.§ | | | 700 | | | | 24,220 | | |
| General Growth Properties, Inc. | | | 600 | | | | 24,708 | | |
| Hospitality Properties Trust | | | 2,200 | | | | 70,884 | | |
| HRPT Properties Trust | | | 2,900 | | | | 22,417 | | |
| Jones Lang LaSalle, Inc.§ | | | 1,300 | | | | 92,508 | | |
| Liberty Property Trust§ | | | 1,400 | | | | 40,334 | | |
| Macerich Co. | | | 1,700 | | | | 120,802 | | |
| Mack-Cali Realty Corp. | | | 1,600 | | | | 54,400 | | |
| ProLogis | | | 900 | | | | 57,042 | | |
| Weingarten Realty Investors§ | | | 1,800 | | | | 56,592 | | |
| | | | 683,560 | | |
See Accompanying Notes to Financial Statements.
16
Credit Suisse Trust — Mid-Cap Core Portfolio
Schedule of Investments (continued)
December 31, 2007
| | | Number of
Shares | | Value | |
| COMMON STOCKS | |
| Road & Rail (0.1%) | |
| CSX Corp. | | | 600 | | | $ | 26,388 | | |
| Semiconductor Equipment & Products (2.6%) | |
| Analog Devices, Inc.§ | | | 800 | | | | 25,360 | | |
| Cypress Semiconductor Corp.* | | | 4,500 | | | | 162,135 | | |
| First Solar, Inc.*§ | | | 300 | | | | 80,142 | | |
| Lam Research Corp.*§ | | | 3,200 | | | | 138,336 | | |
| MEMC Electronic Materials, Inc.* | | | 2,400 | | | | 212,376 | | |
| National Semiconductor Corp. | | | 2,200 | | | | 49,808 | | |
| Semtech Corp.*§ | | | 1,300 | | | | 20,176 | | |
| | | | 688,333 | | |
| Software (1.3%) | |
| Autodesk, Inc.* | | | 1,200 | | | | 59,712 | | |
| BMC Software, Inc.*§ | | | 1,500 | | | | 53,460 | | |
| CA, Inc.§ | | | 1,000 | | | | 24,950 | | |
| Cadence Design Systems, Inc.* | | | 4,800 | | | | 81,648 | | |
| Salesforce.com, Inc.*§ | | | 500 | | | | 31,345 | | |
| Sybase, Inc.*§ | | | 2,000 | | | | 52,180 | | |
| Synopsys, Inc.* | | | 2,300 | | | | 59,639 | | |
| | | | 362,934 | | |
| Specialty Retail (3.6%) | |
| Abercrombie & Fitch Co. Class A§ | | | 800 | | | | 63,976 | | |
| Advance Auto Parts, Inc.§ | | | 4,600 | | | | 174,754 | | |
| Aeropostale, Inc.*§ | | | 3,200 | | | | 84,800 | | |
| AnnTaylor Stores Corp.*§ | | | 1,500 | | | | 38,340 | | |
| AutoZone, Inc.*§ | | | 900 | | | | 107,919 | | |
| Copart, Inc.* | | | 1,700 | | | | 72,335 | | |
| GameStop Corp. Class A* | | | 3,700 | | | | 229,807 | | |
| Gap, Inc. | | | 1,200 | | | | 25,536 | | |
| Men's Wearhouse, Inc.§ | | | 1,300 | | | | 35,074 | | |
| Tiffany & Co.§ | | | 2,000 | | | | 92,060 | | |
| United Rentals, Inc.* | | | 1,800 | | | | 33,048 | | |
| | | | 957,649 | | |
| Textiles & Apparel (0.5%) | |
| Fossil, Inc.*§ | | | 1,300 | | | | 54,574 | | |
| Jones Apparel Group, Inc.§ | | | 1,400 | | | | 22,386 | | |
| Warnaco Group, Inc.*§ | | | 1,800 | | | | 62,640 | | |
| | | | 139,600 | | |
| Tobacco (0.5%) | |
| Loews Corp. Carolina Group | | | 600 | | | | 51,180 | | |
| Universal Corp.§ | | | 1,700 | | | | 87,074 | | |
| | | | 138,254 | | |
| Trading Companies & Distributors (0.2%) | |
| Fastenal Co.§ | | | 1,600 | | | | 64,672 | | |
See Accompanying Notes to Financial Statements.
17
Credit Suisse Trust — Mid-Cap Core Portfolio
Schedule of Investments (continued)
December 31, 2007
| | | Number of
Shares | | Value | |
| COMMON STOCKS | |
| Wireless Telecommunication Services (0.6%) | |
| Telephone and Data Systems, Inc. | | | 2,600 | | | $ | 162,760 | | |
| TOTAL COMMON STOCKS (Cost $24,692,113) | | | 27,045,604 | | |
| SHORT-TERM INVESTMENT (29.3%) | |
| State Street Navigator Prime Portfolio§§ (Cost $7,887,466) | | | 7,887,466 | | | | 7,887,466 | | |
| TOTAL INVESTMENTS AT VALUE (129.5%) (Cost $32,579,579) | | | 34,933,070 | | |
| LIABILITIES IN EXCESS OF OTHER ASSETS (-29.5%) | | | (7,948,152 | ) | |
| NET ASSETS (100.0%) | | $ | 26,984,918 | | |
* Non-income producing security.
§ Security or portion thereof is out on loan.
§§ Represents security purchased with cash collateral received for securities on loan.
See Accompanying Notes to Financial Statements.
18
Credit Suisse Trust — Mid-Cap Core Portfolio
Statement of Assets and Liabilities
December 31, 2007
| Assets | |
Investments at value, including collateral for securities on loan of $7,887,466
(Cost $32,579,579) (Note 2) | | $ | 34,933,0701 | | |
| Cash | | | 13,955 | | |
| Dividend and interest receivable | | | 22,662 | | |
| Prepaid expenses and other assets | | | 4,518 | | |
| Total Assets | | | 34,974,205 | | |
| Liabilities | |
| Advisory fee payable (Note 3) | | | 6,683 | | |
| Administrative services fee payable (Note 3) | | | 2,753 | | |
| Payable upon return of securities loaned (Note 2) | | | 7,887,466 | | |
| Payable for portfolio shares redeemed | | | 24,034 | | |
| Trustees' fee payable | | | 804 | | |
| Other accrued expenses payable | | | 67,547 | | |
| Total Liabilities | | | 7,989,287 | | |
| Net Assets | |
| Capital stock, $0.001 par value (Note 6) | | | 5,258 | | |
| Paid-in capital (Note 6) | | | 29,757,631 | | |
| Undistributed net investment income | | | 1,360 | | |
| Accumulated net realized loss on investments and futures contracts | | | (5,132,822 | ) | |
| Net unrealized appreciation from investments | | | 2,353,491 | | |
| Net Assets | | $ | 26,984,918 | | |
| Shares outstanding | | | 1,798,350 | | |
| Net asset value, offering price, and redemption price per share | | $ | 15.01 | | |
1 Including $7,709,466 of securities on loan.
See Accompanying Notes to Financial Statements.
19
Credit Suisse Trust — Mid-Cap Core Portfolio
Statement of Operations
For the Year Ended December 31, 2007
| Investment Income (Note 2) | |
| Dividends | | $ | 268,104 | | |
| Interest | | | 8,371 | | |
| Securities lending | | | 19,414 | | |
| Total investment income | | | 295,889 | | |
| Expenses | |
| Investment advisory fees (Note 3) | | | 203,735 | | |
| Administrative services fees (Note 3) | | | 49,464 | | |
| Printing fees (Note 3) | | | 33,649 | | |
| Custodian fees | | | 25,574 | | |
| Trustees' fees | | | 19,855 | | |
| Audit and tax fees | | | 19,041 | | |
| Legal fees | | | 16,728 | | |
| Transfer agent fees | | | 2,853 | | |
| Insurance expense | | | 1,402 | | |
| Commitment fees (Note 4) | | | 732 | | |
| Total expenses | | | 373,033 | | |
| Less: fees waived (Note 3) | | | (9,513 | ) | |
| Net expenses | | | 363,520 | | |
| Net investment loss | | | (67,631 | ) | |
| Net Realized and Unrealized Gain (Loss) from Investments and Futures Contracts | |
| Net realized gain from investments | | | 1,194,134 | | |
| Net realized loss from futures contracts | | | (15,055 | ) | |
| Net change in unrealized appreciation (depreciation) from investments | | | 2,173,297 | | |
| Net change in unrealized appreciation (depreciation) from futures contracts | | | 18,780 | | |
| Net realized and unrealized gain from investments and futures contracts | | | 3,371,156 | | |
| Net increase in net assets resulting from operations | | $ | 3,303,525 | | |
See Accompanying Notes to Financial Statements.
20
Credit Suisse Trust — Mid-Cap Core Portfolio
Statements of Changes in Net Assets
| | | For the Year
Ended
December 31, 2007 | | For the Year
Ended
December 31, 2006 | |
| From Operations | |
| Net investment loss | | $ | (67,631 | ) | | $ | (89,558 | ) | |
| Net realized gain from investments and futures contracts | | | 1,179,079 | | | | 6,586,886 | | |
Net change in unrealized appreciation (depreciation)
from investments and futures contracts | | | 2,192,077 | | | | (5,910,101 | ) | |
| Net increase in net assets resulting from operations | | | 3,303,525 | | | | 587,227 | | |
| From Capital Share Transactions (Note 6) | |
| Proceeds from sale of shares | | | 658,389 | | | | 611,444 | | |
| Net asset value of shares redeemed | | | (7,473,324 | ) | | | (8,361,205 | ) | |
| Net decrease in net assets from capital share transactions | | | (6,814,935 | ) | | | (7,749,761 | ) | |
| Net decrease in net assets | | | (3,511,410 | ) | | | (7,162,534 | ) | |
| Net Assets | |
| Beginning of year | | | 30,496,328 | | | | 37,658,862 | | |
| End of year | | $ | 26,984,918 | | | $ | 30,496,328 | | |
| Undistributed net investment income | | $ | 1,360 | | | $ | 4,159 | | |
See Accompanying Notes to Financial Statements.
21
Credit Suisse Trust — Mid-Cap Core Portfolio
Financial Highlights
(For a Share of the Portfolio Outstanding Throughout Each Year)
| | | For the Year Ended December 31, | |
| | | 2007 | | 2006 | | 2005 | | 2004 | | 2003 | |
| Per share data | |
| Net asset value, beginning of year | | $ | 13.44 | | | $ | 13.19 | | | $ | 12.33 | | | $ | 10.90 | | | $ | 7.60 | | |
| INVESTMENT OPERATIONS | |
| Net investment loss | | | (0.04 | ) | | | (0.04 | ) | | | (0.10 | ) | | | (0.11 | ) | | | (0.08 | ) | |
Net gain on investments and futures contracts
(both realized and unrealized) | | | 1.61 | | | | 0.29 | | | | 0.96 | | | | 1.54 | | | | 3.38 | | |
| Total from investment operations | | | 1.57 | | | | 0.25 | | | | 0.86 | | | | 1.43 | | | | 3.30 | | |
| Net asset value, end of year | | $ | 15.01 | | | $ | 13.44 | | | $ | 13.19 | | | $ | 12.33 | | | $ | 10.90 | | |
| Total return1 | | | 11.68 | % | | | 1.90 | % | | | 6.97 | % | | | 13.12 | % | | | 43.42 | % | |
| RATIOS AND SUPPLEMENTAL DATA | |
| Net assets, end of year (000s omitted) | | $ | 26,985 | | | $ | 30,496 | | | $ | 37,659 | | | $ | 42,452 | | | $ | 41,569 | | |
| Ratio of expenses to average net assets | | | 1.25 | % | | | 1.21 | % | | | 1.25 | % | | | 1.25 | % | | | 1.25 | % | |
| Ratio of net investment loss to average net assets | | | (0.23 | )% | | | (0.26 | )% | | | (0.70 | )% | | | (0.87 | )% | | | (0.90 | )% | |
Decrease reflected in above operating expense
ratios due to waivers/reimbursements | | | 0.03 | % | | | 0.13 | % | | | 0.12 | % | | | 0.08 | % | | | 0.14 | % | |
| Portfolio turnover rate | | | 232 | % | | | 140 | % | | | 95 | % | | | 124 | % | | | 73 | % | |
1 Total returns are historical and assume changes in share price and reinvestment of all dividends and distributions. Had certain expenses not been reduced during the years shown, total returns would have been lower. Total returns do not reflect charges and expenses attributable to any particular variable contract or plan.
See Accompanying Notes to Financial Statements.
22
Credit Suisse Trust — Mid-Cap Core Portfolio
Notes to Financial Statements
December 31, 2007
Note 1. Organization
Credit Suisse Trust (the "Trust") is an open-end management investment company registered under the Investment Company Act of 1940, as amended (the "1940 Act"), and currently offers eight managed investment portfolios of which one, the Mid-Cap Core Portfolio (the "Portfolio"), is included in this report. The Portfolio is a diversified investment fund that seeks maximum capital appreciation. Shares of the Portfolio are not available directly to individual investors but may be offered only through (a) variable annuity contracts and variable life insurance contracts offered by separate accounts of certain insurance companies and (b) tax-qualified pension and retirement plans. The Portfolio may not be available in connection with a particular contract or plan. The Trust was organized under the laws of The Commonwealth of Massachusetts as a business trust on March 15, 1995.
Note 2. Significant Accounting Policies
A) SECURITY VALUATION — The net asset value of the Portfolio is determined daily as of the close of regular trading on the New York Stock Exchange, Inc. (the "Exchange") on each day the Exchange is open for business. Equity investments are valued at market value, which is generally determined using the closing price on the exchange or market on which the security is primarily traded at the time of valuation (the "Valuation Time"). If no sales are reported, equity investments are generally valued at the most recent bid quotation as of the Valuation Time or at the lowest asked quotation in the case of a short sale of securities. Debt securities with a remaining maturity greater than 60 days are valued in accordance with the price supplied by a pricing service, which may use a matrix, formula or other objective method that takes into consideration market indices, yield curves and other specific adjustments. Debt obligations that will matur e in 60 days or less are valued on the basis of amortized cost, which approximates market value, unless it is determined that using this method would not represent fair value. Investments in mutual funds are valued at the mutual fund's closing net asset value per share on the day of valuation. Securities and other assets for which market quotations are not readily available, or whose values have been materially affected by events occurring before the Portfolio's Valuation Time but after the close of the securities' primary markets, are valued at fair value as determined in good faith by, or under the direction of, the Board of Trustees under procedures established by the Board of Trustees. The Portfolio may utilize a service provided by an independent third party which has been approved by the Board of Trustees to fair value certain securities. When fair-value pricing is employed, the prices of securities used by a portfolio to calculate its net asset value may differ from quoted or published prices for the same securities.
23
Credit Suisse Trust — Mid-Cap Core Portfolio
Notes to Financial Statements (continued)
December 31, 2007
Note 2. Significant Accounting Policies
B) SECURITY TRANSACTIONS AND INVESTMENT INCOME — Security transactions are accounted for on a trade date basis. Interest income is recorded on the accrual basis. Dividends are recorded on the ex-dividend date. The cost of investments sold is determined by use of the specific identification method for both financial reporting and income tax purposes.
C) DIVIDENDS AND DISTRIBUTIONS TO SHAREHOLDERS — Dividends from net investment income and distributions of net realized capital gains, if any, are declared and paid at least annually. However, to the extent that a net realized capital gain can be reduced by a capital loss carryforward, such gain will not be distributed. Income and capital gain distributions are determined in accordance with federal income tax regulations, which may differ from accounting principles generally accepted in the United States of America ("GAAP").
D) FEDERAL INCOME TAXES — No provision is made for federal taxes as it is the Portfolio's intention to continue to qualify for and elect the tax treatment applicable to regulated investment companies under the Internal Revenue Code of 1986, as amended, and to make the requisite distributions to its shareholders, which will be sufficient to relieve it from federal income and excise taxes.
E) USE OF ESTIMATES — The preparation of financial statements in conformity with GAAP requires management to make estimates and assumptions that affect the reported amounts of assets and liabilities and disclosure of contingent assets and liabilities at the date of the financial statements and the reported amounts of income and expenses during the reporting period. Actual results could differ from these estimates.
F) SHORT-TERM INVESTMENTS — The Portfolio, together with other funds/portfolios advised by Credit Suisse Asset Management, LLC ("Credit Suisse"), an indirect, wholly-owned subsidiary of Credit Suisse Group, pools available cash into either a short-term variable rate time deposit issued by State Street Bank and Trust Company ("SSB"), the Portfolio's custodian, or a money market fund advised by Credit Suisse. The short-term time deposit issued by SSB is a variable rate account classified as a short-term investment.
G) FUTURES — The Portfolio may enter into futures contracts to the extent permitted by its investment policies and objectives. Upon entering into a futures contract, the Portfolio is required to deposit cash or pledge U.S. Government securities as initial margin. Subsequent payments, which are dependent on the daily fluctuations in the value of the underlying instrument, are made or received by the Portfolio each day (daily variation margin) and are recorded as unrealized gains or losses until the contracts are closed.
24
Credit Suisse Trust — Mid-Cap Core Portfolio
Notes to Financial Statements (continued)
December 31, 2007
Note 2. Significant Accounting Policies
When the contracts are closed, the Portfolio records a realized gain or loss equal to the difference between the proceeds from (or cost of) the closing transactions and the Portfolio's basis in the contracts. Risks of entering into futures contracts for hedging purposes include the possibility that a change in the value of the contract may not correlate with the changes in the value of the underlying instruments. In addition, the purchase of a futures contract involves the risk that the Portfolio could lose more than the original margin deposit and subsequent payments required for a futures transaction. At December 31, 2007, the Portfolio had no open futures contracts.
H) SECURITIES LENDING — Loans of securities are required at all times to be secured by collateral at least equal to 102% of the market value of domestic securities on loan (including any accrued interest thereon) and 105% of the market value of foreign securities on loan (including any accrued interest thereon). Cash collateral received by the Portfolio in connection with securities lending activity may be pooled together with cash collateral for other funds/portfolios advised by Credit Suisse and may be invested in a variety of investments, including certain Credit Suisse-advised funds, funds advised by SSB, the Portfolio's securities lending agent, or money market instruments. However, in the event of default or bankruptcy by the other party to the agreement, realization and/or retention of the collateral may be subject to legal proceedings.
SSB has been engaged by the Portfolio to act as the Portfolio's securities lending agent. The Portfolio's securities lending arrangement provides that the Portfolio and SSB will share the net income earned from securities lending activities. During the year ended December 31, 2007, total earnings from the Portfolio's investment in cash collateral received in connection with securities lending arrangements was $420,544, of which $396,660 was rebated to borrowers (brokers). The Portfolio retained $19,414 in income from the cash collateral investment, and SSB, as lending agent, was paid $4,470. The Portfolio may also be entitled to certain minimum amounts of income from its securities lending activities. Securities lending income is accrued as earned.
Note 3. Transactions with Affiliates and Related Parties
Credit Suisse serves as investment adviser for the Portfolio. For its investment advisory services, Credit Suisse is entitled to receive a fee from the Portfolio at an annual rate of 0.70% of the Portfolio's average daily net assets. For the year ended December 31, 2007, investment advisory fees earned and voluntarily waived were $203,735 and $9,513, respectively. Credit Suisse will not recapture from the Portfolio any fees it waived during the fiscal year ended
25
Credit Suisse Trust — Mid-Cap Core Portfolio
Notes to Financial Statements (continued)
December 31, 2007
Note 3. Transactions with Affiliates and Related Parties
December 31, 2007. Fee waivers and reimbursements are voluntary and may be discontinued by Credit Suisse at any time.
Credit Suisse Asset Management Securities, Inc. ("CSAMSI"), an affiliate of Credit Suisse, and SSB serve as co-administrators to the Portfolio. For its co-administrative services, CSAMSI currently receives a fee calculated at an annual rate of 0.09% of the Portfolio's average daily net assets. For the year ended December 31, 2007, co-administrative services fees earned by CSAMSI were $26,194.
For its co-administrative services, SSB receives a fee, exclusive of out-of-pocket expenses, calculated in total for all the Credit Suisse funds/portfolios co-administered by SSB and allocated based upon relative average net assets of each fund/portfolio, subject to an annual minimum fee. For the year ended December 31, 2007, co-administrative services fees earned by SSB (including out-of-pocket expenses) were $23,270.
In addition to serving as the Portfolio's co-administrator, CSAMSI currently serves as distributor of the Portfolio's shares without compensation.
Merrill Corporation ("Merrill"), an affiliate of Credit Suisse, has been engaged by the Portfolio to provide certain financial printing and fulfillment services. For the year ended December 31, 2007, Merrill was paid $13,084 for its services to the Portfolio.
Note 4. Line of Credit
The Portfolio, together with other funds/portfolios advised by Credit Suisse (collectively, the "Participating Funds"), participates in a $50 million committed, unsecured line of credit facility ("Credit Facility") for temporary or emergency purposes with Deutsche Bank, A.G. as administrative agent and syndication agent and SSB as operations agent. Under the terms of the Credit Facility, the Participating Funds pay an aggregate commitment fee at a rate of 0.10% per annum on the average unused amount of the Credit Facility, which is allocated among the Participating Funds in such manner as is determined by the governing Boards of the Participating Funds. In addition, the Participating Funds pay interest on borrowings at the Federal Funds rate plus 0.50%. At December 31, 2007, and during the year ended December 31, 2007, the Portfolio had no borrowings under the Credit Facility.
26
Credit Suisse Trust — Mid-Cap Core Portfolio
Notes to Financial Statements (continued)
December 31, 2007
Note 5. Purchases and Sales of Securities
For the year ended December 31, 2007, purchases and sales of investment securities (excluding short-term investments) were $66,862,605 and $72,658,149, respectively.
Note 6. Capital Share Transactions
The Trust is authorized to issue an unlimited number of full and fractional shares of beneficial interest, $0.001 par value per share. Transactions in capital shares of the Portfolio were as follows:
| | | For the Year Ended
December 31, 2007 | | For the Year Ended
December 31, 2006 | |
| Shares sold | | | 44,882 | | | | 45,845 | | |
| Shares redeemed | | | (516,029 | ) | | | (631,109 | ) | |
| Net decrease | | | (471,147 | ) | | | (585,264 | ) | |
On December 31, 2007, the number of shareholders that held 5% or more of the outstanding shares of the Portfolio was as follows:
Number of
Shareholders | | Approximate Percentage
of Outstanding Shares | |
| | 1 | | | | 95 | % | |
Some of the shareholders are omnibus accounts, which hold shares on behalf of individual shareholders.
Note 7. Federal Income Taxes
Income and capital gain distributions are determined in accordance with federal income tax regulations, which may differ from GAAP.
The tax basis of components of distributable earnings differs from the amounts reflected in the Statement of Assets and Liabilities by temporary book/tax differences. These differences are primarily due to outstanding wash sale deferrals, unused capital loss carryforwards and return of capital on Real Estate Investment Trusts.
At December 31, 2007, the components of distributable earnings on a tax basis for the Portfolio were as follows:
| Accumulated net realized loss | | $ | (4,962,268 | ) | |
| Unrealized appreciation | | | 2,184,297 | | |
| | | $ | (2,777,971 | ) | |
27
Credit Suisse Trust — Mid-Cap Core Portfolio
Notes to Financial Statements (continued)
December 31, 2007
Note 7. Federal Income Taxes
At December 31, 2007, the Portfolio had capital loss carryforwards available to offset possible future capital gains as follows:
| Expires December 31, | |
| 2009 | | 2010 | |
| $ | 896,376 | | | $ | 4,065,892 | | |
During the tax year ended December 31, 2007, the Portfolio utilized $1,384,329 of the capital loss carryforwards.
It is uncertain whether the Portfolio will be able to realize the full benefit of these losses prior to expiration.
At December 31, 2007, the identified cost for federal income tax purposes, as well as the gross unrealized appreciation from investments for those securities having an excess of value over cost, gross unrealized depreciation from investments for those securities having an excess of cost over value and the net unrealized appreciation from investments were: $32,748,776, $3,328,869, $(1,144,575) and $2,184,294, respectively.
At December 31, 2007, the Portfolio reclassified $64,832 to undistributed net investment income and $15,914 to accumulated net realized loss from paid in capital, to adjust for current period permanent book/tax differences which arose principally from differing book/tax treatments of net operating losses and dividends received from Real Estate Investment Trusts. Net assets were not affected by these reclassifications.
Note 8. Contingencies
In the normal course of business, the Portfolio may provide general indemnifications pursuant to certain contracts and organizational documents. The Portfolio's maximum exposure under these arrangements is dependent on future claims that may be made against the Portfolio and, therefore, cannot be estimated; however, based on experience, the risk of loss from such claims is considered remote.
Note 9. Recent Accounting Pronouncements
During June 2006, the Financial Accounting Standards Board ("FASB") issued FASB Interpretation 48 ("FIN 48" or the "Interpretation"), Accounting for Uncertainty in Income Taxes — an interpretation of FASB statement 109. FIN 48 supplements FASB Statement 109, Accounting for Income Taxes, by defining the confidence level that a tax position must meet in order to be recognized in the
28
Credit Suisse Trust — Mid-Cap Core Portfolio
Notes to Financial Statements (continued)
December 31, 2007
Note 9. Recent Accounting Pronouncements
financial statements. FIN 48 prescribes a comprehensive model for how a fund should recognize, measure, present, and disclose in its financial statements uncertain tax positions that the fund has taken or expects to take on a tax return. FIN 48 requires that the tax effects of a position be recognized only if it is "more likely than not" to be sustained based solely on its technical merits. Management must be able to conclude that the tax law, regulations, case law, and other objective information regarding the technical merits sufficiently support the position's sustainability with a likelihood of more than 50 percent. During the period ended December 31, 2007, Management has adopted FIN 48. There was no material impact to the financial statements or disclosures thereto as a result of the adoption of this pronouncement.
On September 20, 2006, the FASB released Statement of Financial Accounting Standards No. 157 "Fair Value Measurements" ("FAS 157"). FAS 157 establishes an authoritative definition of fair value, sets out a framework for measuring fair value, and requires additional disclosures about fair-value measurements. The application of FAS 157 is required for fiscal years, beginning after November 15, 2007 and interim periods within those fiscal years. As of December 31, 2007, management does not believe the adoption of FAS 157 will impact the amounts reported in the financial statements, however, additional disclosures will be required in subsequent reports.
29
Credit Suisse Trust — Mid-Cap Core Portfolio
Report of Independent Registered Public Accounting Firm
To the Board of Trustees of Credit Suisse Trust and Shareholders of
Credit Suisse Trust — Mid-Cap Core Portfolio:
In our opinion, the accompanying statement of assets and liabilities, including the schedule of investments, and the related statements of operations and of changes in net assets and the financial highlights present fairly, in all material respects, the financial position of Mid-Cap Core Portfolio (the "Portfolio"), a portfolio of the Credit Suisse Trust, at December 31, 2007, the results of its operations for the year then ended, the changes in its net assets for each of the two years in the period then ended and the financial highlights for each of the five years in the period then ended, in conformity with accounting principles generally accepted in the United States of America. These financial statements and financial highlights (hereafter referred to as "financial statements") are the responsibility of the Portfolio's management; our responsibility is to express an opinion on these financial statements based on our audits. We conducted our audits of these financial statements in accordance with the standards of the Public Company Accounting Oversight Board (United States). Those standards require that we plan and perform the audit to obtain reasonable assurance about whether the financial statements are free of material misstatement. An audit includes examining, on a test basis, evidence supporting the amounts and disclosures in the financial statements, assessing the accounting principles used and significant estimates made by management, and evaluating the overall financial statement presentation. We believe that our audits, which included confirmation of securities at December 31, 2007 by correspondence with the custodian, provide a reasonable basis for our opinion.
PricewaterhouseCoopers LLP
Baltimore, Maryland
February 25, 2008
30
Credit Suisse Trust — Mid-Cap Core Portfolio
Board Approval of Advisory Agreement (unaudited)
In approving the renewal of the current Advisory Agreement, the Board of Trustees, including the Independent Trustees, at a meeting held on November 13 and 14, 2007, considered the following factors with respect to the Mid-Cap Core Portfolio (the "Portfolio"):
Investment Advisory Fee Rates
The Board reviewed and considered the contractual advisory fee of 0.70% ("Contractual Advisory Fee") in light of the extent and quality of the advisory services provided by Credit Suisse Asset Management, LLC ("Credit Suisse").
Additionally, the Board received and considered information comparing the Portfolio's Contractual Advisory Fee and the Portfolio's overall expenses with those of funds in both the relevant expense group ("Expense Group") and universe of funds ("Expense Universe") provided by Lipper Inc., an independent provider of investment company data.
Nature, Extent and Quality of the Services under the Advisory Agreement
The Board received and considered information regarding the nature, extent and quality of services provided to the Portfolio by Credit Suisse under the Advisory Agreement. The Board also noted information received at regular meetings throughout the year related to the services rendered by Credit Suisse. The Board reviewed background information about Credit Suisse, including its Form ADV. The Board considered the background and experience of Credit Suisse's senior management and the expertise of, and the amount of attention given to the Portfolio by, senior personnel of Credit Suisse. In addition, the Board reviewed the qualifications, backgrounds and responsibilities of the portfolio management team primarily responsible for the day-to-day portfolio management of the Portfolio and the extent of the resources devoted to research and analysis of actual and potential investments. The Board also received and considered information about the nat ure, extent and quality of services and fee rates offered to other Credit Suisse clients for comparable services.
Portfolio Performance
The Board received and considered the performance results of the Portfolio over time, along with comparisons both to the relevant performance group ("Performance Group") and universe of funds ("Performance Universe") for the Portfolio. The Board was provided with a description of the methodology
31
Credit Suisse Trust — Mid-Cap Core Portfolio
Board Approval of Advisory Agreement (unaudited) (continued)
used to arrive at the funds included in the Performance Group and the Performance Universe.
Credit Suisse Profitability
The Board received and considered a profitability analysis of Credit Suisse based on the fees payable under the Advisory Agreement for the Portfolio, including other relationships between the Portfolio on the one hand and Credit Suisse affiliates on the other. The Board received profitability information for the other funds in the Credit Suisse family of funds.
Economies of Scale
The Board considered whether economies of scale in the provision of services to the Portfolio were being passed along to the shareholders. Accordingly, the Board considered whether alternative fee structures (such as breakpoint fee structures) would be more appropriate or reasonable taking into consideration economies of scale or other efficiencies that might accrue from increases in the Portfolio's asset levels.
Other Benefits to Credit Suisse
The Board considered other benefits received by Credit Suisse and its affiliates as a result of their relationship with the Portfolio. Such benefits include, among others, research arrangements with brokers who execute transactions on behalf of the Portfolio, administrative and brokerage relationships with affiliates of Credit Suisse and benefits potentially derived from an increase in Credit Suisse's businesses as a result of its relationship with the Portfolio (such as the ability to market to shareholders other financial products offered by Credit Suisse and its affiliates).
The Board considered the standards applied in seeking best execution, whether and to what extent soft dollar credits are sought and how any such credits are utilized, any benefits that may be achieved by using an affiliated broker and the existence of quality controls applicable to brokerage allocation procedures. The Board also reviewed Credit Suisse's method for allocating portfolio investment opportunities among its advisory clients.
32
Credit Suisse Trust — Mid-Cap Core Portfolio
Board Approval of Advisory Agreement (unaudited) (continued)
Conclusions
In selecting Credit Suisse, and approving the Advisory Agreement and the investment advisory fee under such agreement, the Board concluded that:
• Although the actual combined management and co-administration fees were above the median of the Portfolio's Expense Group, the Contractual Advisory Fee was below the median and the Board considered the fee to be reasonable.
• The Portfolio's performance was below most of its peers in its Performance Group and Performance Universe for all of the periods reviewed. The Board noted that changes in the Portfolio's investment strategies and portfolio management had gone into effect on December 1, 2006 and that it would continue to monitor steps undertaken by Credit Suisse to improve performance.
• Aside from performance (as described above), the Board was satisfied with the nature and extent of the investment advisory services provided to the Portfolio by Credit Suisse and that, based on dialogue with management and counsel, the services provided by Credit Suisse under the Advisory Agreement are typical of, and consistent with, those provided to similar mutual funds by other investment advisers.
• In light of the costs of providing investment management and other services to the Portfolio and Credit Suisse's ongoing commitment to the Portfolio, the profits and other ancillary benefits that Credit Suisse and its affiliates received were considered reasonable.
• Credit Suisse's profitability based on fees payable under the Advisory Agreement was reasonable in light of the nature, extent and quality of the services provided to the Portfolio thereunder.
• In light of the relatively small size of the Portfolio and the amount of the Contractual Advisory Fee, the Portfolio's current fee structure (without breakpoints) was considered reasonable.
No single factor reviewed by the Board was identified by the Board as the principal factor in determining whether to approve the Advisory Agreement. The Independent Trustees were advised by separate independent legal counsel throughout the process.
33
Credit Suisse Trust — Mid-Cap Core Portfolio
Information Concerning Trustees and Officers (unaudited)
Name, Address
(Year of Birth) | | Position(s)
Held with
Trust | | Term
of Office1
and
Length
of Time
Served | | Principal
Occupation(s) During
Past Five Years | | Number of
Portfolios in
Fund
Complex
Overseen by
Trustee | | Other
Directorships
Held by Director/
Trustee | |
| Independent Trustees | | | | | | | | | | | |
|
Enrique Arzac
c/o Credit Suisse Asset Management, LLC
Attn: General Counsel
Eleven Madison Avenue
New York, New York
10010
(1941) | | Trustee, Nominating Committee Member and Audit Committee Chairman | | Since 2005 | | Professor of Finance
and Economics, Graduate School of Business, Columbia University since 1971. | | | 35 | | | Director of Epoch Holding Corporation (an investment management and investment advisory services company); Director of The Adams Express Company (a closed-end investment company); Director of Petroleum and Resources Corporation (a closed-end investment company). | |
|
Jeffrey E. Garten2
Box 208200
New Haven, Connecticut
06520-8200
(1946) | | Trustee, Nominating and Audit Committee Member | | Since
Portfolio Inception | | The Juan Trippe Professor in the Practice of International Trade, Finance and Business from July 2005 to present; Partner and Chairman of Garten Rothkopf (consulting firm) from October 2005 to present; Dean of Yale School of Management from November 1995 to June 2005. | | | 28 | | | Director of Aetna, Inc. (insurance company); Director of CarMax Group (used car dealers); Director of Alcan, Inc. (smelting and refining of nonferrous metals company). | |
|
1 Each Trustee and Officer serves until his or her respective successor has been duly elected and qualified.
2 Mr. Garten was initially appointed as a Trustee of the Trust at inception. He resigned as Trustee on February 3, 2000 and was subsequently reappointed on December 21, 2000.
34
Credit Suisse Trust — Mid-Cap Core Portfolio
Information Concerning Trustees and Officers (unaudited) (continued)
Name, Address
(Year of Birth) | | Position(s)
Held with
Trust | | Term
of Office1
and
Length
of Time
Served | | Principal
Occupation(s) During
Past Five Years | | Number of
Portfolios in
Fund
Complex
Overseen by
Trustee | | Other
Directorships
Held by Director/
Trustee | |
| Independent Trustees | | | | | | | | | | | | | |
|
Peter F. Krogh
SFS/ICC 702
Georgetown University Washington, DC 20057
(1937) | | Trustee Nominating and Audit Committee Member | | Since 2001 | | Dean Emeritus and Distinguished Professor of International Affairs at the Edmund A. Walsh School of Foreign Service, Georgetown University from June 1995 to present. | | | 28 | | | Director of Carlisle Companies Incorporated (diversified manufacturing company). | |
|
Steven N. Rappaport
Lehigh Court, LLC
555 Madison Avenue
29th Floor
New York, New York
10022
(1948) | | Chairman of the Board of Trustees, Nominating Committee Chairman and
Audit Committee Member | | Trustee since Portfolio Inception and Chairman
since 2005 | | Partner of Lehigh Court, LLC and RZ Capital (private investment firms) from July 2002 to present. | | | 35 | | | Director of iCAD, Inc. (surgical and medical instruments and
apparatus company); Director of Presstek, Inc. (digital imaging technologies company); Director of Wood Resources, LLC. (plywood manufacturing company). | |
|
| Interested Trustee | | | | | | | | | | | | | |
|
Michael E. Kenneally 3
c/o Credit Suisse Asset
Management, LLC
Attn: General Counsel
Eleven Madison Avenue
New York, New York
10010
(1954) | | Trustee | | Since 2004 | | Chairman and Global Chief Executive Officer of Credit Suisse from March 2003 to July 2005; Chairman and Chief Investment Officer of Banc of America Capital Management from 1998 to March 2003. | | | 28 | | | None | |
|
3 Mr. Kenneally is a Trustee who is an "interested person" of the Trust as defined in the Investment Company Act of 1940, as amended, because he was an officer of Credit Suisse within the last two fiscal years.
35
Credit Suisse Trust — Mid-Cap Core Portfolio
Information Concerning Trustees and Officers (unaudited) (continued)
Name, Address
(Year of Birth) | | Position(s)
Held with
Fund | | Term
of Office1
and
Length
of Time
Served | | Principal Occupation(s) During Past Five Years | |
| Officers | | | | | | | |
|
Lawrence D. Haber
c/o Credit Suisse Asset
Management, LLC
Attn: General Counsel
Eleven Madison Avenue
New York, New York
10010
(1951) | | Chief Executive Officer and President | | Since 2007 | | Managing Director and Chief Operating Officer of Credit Suisse; Member of Credit Suisse's Management Committee; Chief Financial Officer of Merrill Lynch Investment Managers from 1997 to 2003. | |
|
Michael A. Pignataro
Credit Suisse Asset Management, LLC
Eleven Madison Avenue New York, New York
10010
(1959) | | Chief Financial Officer | | Since Portfolio Inception | | Director and Director of Fund Administration of Credit Suisse; Associated with Credit Suisse or its predecessor since 1984; Officer of other Credit Suisse Funds. | |
|
Emidio Morizio
Credit Suisse Asset Management, LLC
Eleven Madison Avenue New York, New York
10010
(1966) | | Chief Compliance Officer | | Since 2004 | | Director and Global Head of Compliance of Credit Suisse; Associated with Credit Suisse since July 2000; Officer of other Credit Suisse Funds. | |
|
J. Kevin Gao
Credit Suisse Asset
Management, LLC
Eleven Madison Avenue
New York, New York
10010
(1967) | | Chief Legal Officer since 2006, Vice President and Secretary since 2004 | | Since 2004 | | Director and Legal Counsel of Credit Suisse; Associated with Credit Suisse since July 2003; Associated with the law firm of Willkie Farr & Gallagher LLP from 1998 to 2003; Officer of other Credit Suisse Funds. | |
|
Robert Rizza
Credit Suisse Asset
Management, LLC
Eleven Madison Avenue
New York, New York
10010
(1965) | | Treasurer | | Since 2006 | | Vice President of Credit Suisse; Associated with Credit Suisse since 1998; Officer of other Credit Suisse Funds. | |
|
The Statement of Additional Information includes additional information about the Trustees and is available, without charge, upon request, by calling 800-222-8977.
36
Credit Suisse Trust — Mid-Cap Core Portfolio
Proxy Voting and Portfolio Holdings Information (unaudited)
Information regarding how the Portfolio voted proxies related to its portfolio securities during the 12 month period ended June 30 of each year, as well as the policies and procedures that the Portfolio uses to determine how to vote proxies relating to its portfolio securities are available:
• By calling 1-800-222-8977
• On the Portfolio's website, www.credit-suisse.com/us
• On the website of the Securities and Exchange Commission, www.sec.gov.
The Portfolio files a complete schedule of its portfolio holdings for the first and third quarters of its fiscal year with the SEC on Form N-Q. The Portfolio's Forms N-Q are available on the SEC's website at www.sec.gov and may be reviewed and copied at the SEC's Public Reference Room in Washington, DC. Information on the operation of the SEC's Public Reference Room may be obtained by calling 1-202-551-8090.
37

P.O. BOX 55030, BOSTON, MA 02205-5030
800-222-8977 n www.credit-suisse.com/us
CREDIT SUISSE ASSET MANAGEMENT SECURITIES, INC., DISTRIBUTOR. TRMCC-AR-1207

CREDIT SUISSE FUNDS
Annual Report
December 31, 2007
CREDIT SUISSE TRUST
n SMALL CAP CORE I PORTFOLIO
Credit Suisse Trust (the "Trust") shares are not available directly to individual investors, but may be offered only through certain insurance products and pension and retirement plans.
The Trust's investment objectives, risks, charges and expenses (which should be considered carefully before investing), and more complete information about the Trust, are provided in the Prospectus, which should be read carefully before investing. You may obtain additional copies by calling 800-222-8977 or by writing to Credit Suisse Trust, P.O. Box 55030, Boston, MA 02205-5030.
Credit Suisse Asset Management Securities, Inc., Distributor, is located at Eleven Madison Avenue, New York, NY 10010. The Trust is advised by Credit Suisse Asset Management, LLC.
The views of the Portfolio's management are as of the date of the letter and the Portfolio holdings described in this document are as of December 31, 2007; these views and Portfolio holdings may have changed subsequent to these dates. Nothing in this document is a recommendation to purchase or sell securities.
Portfolio shares are not deposits or other obligations of Credit Suisse Asset Management, LLC ("Credit Suisse") or any affiliate, are not FDIC-insured and are not guaranteed by Credit Suisse or any affiliate. Portfolio investments are subject to investment risks, including loss of your investment.
Credit Suisse Trust — Small Cap Core I Portfolio
Annual Investment Adviser's Report
December 31, 2007 (unaudited)
January 25, 2008
Dear Shareholder:
For the twelve months ended December 31, 2007, Credit Suisse Trust — Small Cap Core I Portfolio (the "Portfolio") had a loss of -0.83%, versus a negative total return of 0.30% for the S&P SmallCap 600 Index.1
Market Review: A challenging market on many fronts
For the year ended December 31, 2007, the benchmark S&P SmallCap 600 Index had a negative total return of 0.30% in 2007. That compares with the large-cap S&P 500 Index posting a 5.49% total return including dividends.
The U.S. Federal Reserve held its benchmark rate at 5.25% until September 2007 when the target federal funds rate was cut by 50 basis points to 4.75%, marking the first cut in four years. The Federal Reserve cut the target rate by another 25 basis points in October and again in December to 4.25%. The cuts were made in an effort to prevent some of the adverse effects on the overall economy from the depressed housing market and tighter lending conditions for both consumers and corporations.
The aggressive lending environment over the past few years led to a rise in mortgage defaults. U.S. home foreclosures rose 68% in November from a year earlier, according to data compiled by RealtyTrac Inc. As a result, the U.S. housing sector weakened significantly in 2007 as mortgage providers tightened their lending standards and some lenders went bankrupt. Home prices in 20 U.S. metropolitan areas dropped in October by the most in at least six years. Property values fell 6.1% from October 2006, according to the S&P/Case-Shiller home-price index.
The Chicago Board Options Exchange Volatility Index (VIX), a measure of expected stock market volatility, reached a five-year low in January 2007. However, market conditions changed rapidly in mid-2007 and the VIX reached a four-year high in November 2007 amid deteriorating conditions in the U.S. housing and credit markets.
Despite the housing market slowdown, the economy grew at a solid 4.9% annual rate in the third quarter of 2007. The personal consumption expenditures (PCE) price index, excluding food and energy, rose 2.2% year-over-year in November. The increase was the biggest since March 2007. The Fed watches the PCE price index for signs of inflation and its preferred range for this gauge is 1.0% to 2.0%.
1
Credit Suisse Trust — Small Cap Core I Portfolio
Annual Investment Adviser's Report (continued)
December 31, 2007 (unaudited)
The labor market also showed signs of weakening in 2007. Non-farm payrolls rose 1.3 million in 2007, compared with gains of 2.3 million in 2006. The unemployment rate rose from 4.7% in November to 5.0% in December 2007, the highest level since November 2005. And, the Reuters/University of Michigan final index of consumer confidence dropped to 75.5 in December, the lowest since October 2005. The gauge has averaged 88 since monthly data were first compiled in 1978.
Strategic Review and Market Outlook: Potential for further rate cuts
The leading positive relative contributors to performance came from stock selection in materials, consumer discretionary, and telecommunication services. The largest detractors to performance came primarily from stock selection within the information technology sector, followed closely by financials and energy.
The U.S. Federal Reserve anticipates economic growth will be "somewhat more sluggish" than the 1.8% – 2.5% they had projected for 2008. And, Fed policy makers also expect core inflation to "trend down a bit over the next few years."
The Federal Reserve on January 22, 2008 took significant action between scheduled meetings by cutting rates 75 basis points to 3.50%. The Fed cited the weakening economic outlook and increasing downside risks to growth.
The Fed is scheduled to meet next on January 30 to discuss interest rates. Based on interest-rate futures on January 25, traders expect policy makers to further lower the target rate for overnight lending by 50 to 75 basis points.
In our opinion, U.S. housing markets may remain weak through the first half of 2008. Additionally, expectations for U.S. stock market volatility, as measured by the VIX Index, are for levels above historical averages. The pace of mergers and acquisitions by private equity firms isn't expected to reach the level seen in the first half of 2007, as the availability of debt financing has lessened significantly.
The Credit Suisse Quantitative Equities Group
Jordan Low
Eric Leng
Todd Jablonski
2
Credit Suisse Trust — Small Cap Core I Portfolio
Annual Investment Adviser's Report (continued)
December 31, 2007 (unaudited)
Because of the nature of the Portfolio's investments in special-situation, start-up and other small companies, an investment in the Portfolio may be more volatile and less liquid than investments in larger companies.
In addition to historical information, this report contains forward-looking statements, which may concern, among other things, domestic and foreign market, industry and economic trends and developments and government regulation and their potential impact on the Portfolio's investments. These statements are subject to risks and uncertainties and actual trends, developments and regulations in the future, and their impact on the Portfolio could be materially different from those projected, anticipated or implied. The Portfolio has no obligation to update or revise forward-looking statements.
3
Credit Suisse Trust — Small Cap Core I Portfolio
Annual Investment Adviser's Report (continued)
December 31, 2007 (unaudited)
Comparison of Change in Value of $10,000 Investment in the
Credit Suisse Trust — Small Cap Core I Portfolio and the Russell 2000®
Growth Index1 and the S&P SmallCap 600 Index2 for Ten Years.

4
Credit Suisse Trust — Small Cap Core I Portfolio
Annual Investment Adviser's Report (continued)
December 31, 2007 (unaudited)
Average Annual Returns as of December 31, 2007
| | |
1 Year | |
5 Years | |
10 Years | | Since
Inception3 | |
| | | (0.83 | )% | | | 10.74 | % | | | 2.24 | % | | | 5.93 | % | |
Returns represent past performance and include change in share price and reinvestment of dividends and capital gains. Past performance cannot guarantee future results. The current performance of the Portfolio may be lower or higher than the figures shown. Returns and share price will fluctuate, and redemption value may be more or less than original cost. The performance results do not reflect the deduction of taxes that a shareholder would pay on portfolio distributions or the redemption of portfolio shares. Performance includes the effect of deducting expenses, but does not include charges and expenses attributable to any particular variable contract or plan. Accordingly, the Prospectus of the sponsoring Participating Insurance Company separate account or plan documents or ot her informational materials supplied by plan sponsors should be carefully reviewed for information on relevant charges and expenses. Excluding these charges and expenses from quotations of performance has the effect of increasing the performance quoted, and the effect of these charges should be considered when comparing performance to that of other mutual funds. Performance information current to the most recent month-end is available at www.credit-suisse.com/us.
1 The Russell 2000® Growth Index measures the performance of those companies in the Russell 2000® Index with higher price-to-book ratios and higher forecasted growth values. It is an unmanaged index of common stocks that includes reinvestment of dividends and is compiled by Frank Russell Company. Investors cannot invest directly in an index.
2 The S&P SmallCap 600 Index is a market capitalization-weighted index composed of 600 stocks, including reinvestment of dividends that is generally considered representative of small-sized U.S. companies. Investors cannot invest directly in an index.
3 Inception Date: 6/30/95
5
Credit Suisse Trust — Small Cap Core I Portfolio
Annual Investment Adviser's Report (continued)
December 31, 2007 (unaudited)
Information About Your Portfolio's Expenses
As an investor of the Portfolio, you incur two types of costs: ongoing expenses and transaction costs. Ongoing expenses include management fees, distribution and service (12b-1) fees and other Portfolio expenses. Examples of transaction costs include sales charges (loads), redemption fees and account maintenance fees, which are not shown in this section and which would result in higher total expenses. The following table is intended to help you understand your ongoing expenses of investing in the Portfolio and to help you compare these expenses with the ongoing expenses of investing in other mutual funds. The table is based on an investment of $1,000 made at the beginning of the six month period ended December 31, 2007.
The table illustrates your Portfolio's expenses in two ways:
• Actual Portfolio Return. This helps you estimate the actual dollar amount of ongoing expenses paid on a $1,000 investment in the Portfolio using the Portfolio's actual return during the period. To estimate the expenses you paid over the period, simply divide your account value by $1,000 (for example, an $8,600 account value divided by $1,000 = 8.6), then multiply the result by the number in the "Expenses Paid per $1,000" line under the share class you hold.
• Hypothetical 5% Portfolio Return. This helps you to compare your Portfolio's ongoing expenses with those of other mutual funds using the Portfolio's actual expense ratio and a hypothetical rate of return of 5% per year before expenses. Examples using a 5% hypothetical fund return may be found in the shareholder reports of other mutual funds. The hypothetical account values and expenses may not be used to estimate the actual ending account balance or expenses you paid for the period.
Please note that the expenses shown in these tables are meant to highlight your ongoing expenses only and do not reflect any transaction costs, such as sales charges (loads) or redemption fees. If these transaction costs had been included, your costs would have been higher. The "Expenses Paid per $1,000" line of the tables is useful in comparing ongoing expenses only and will not help you determine the relative total expenses of owning different funds.
6
Credit Suisse Trust — Small Cap Core I Portfolio
Annual Investment Adviser's Report (continued)
December 31, 2007 (unaudited)
Expenses and Value of a $1,000 Investment
for the six month period ended December 31, 2007
| Actual Portfolio Return | | | | | |
| Beginning Account Value 7/1/07 | | $ | 1,000.00 | | |
| Ending Account Value 12/31/07 | | $ | 919.20 | | |
| Expenses Paid per $1,000* | | $ | 4.50 | | |
| Hypothetical 5% Portfolio Return | |
| Beginning Account Value 7/1/07 | | $ | 1,000.00 | | |
| Ending Account Value 12/31/07 | | $ | 1,020.52 | | |
| Expenses Paid per $1,000* | | $ | 4.74 | | |
| Annualized Expense Ratios* | | | 0.93 | % | |
* Expenses are equal to the Portfolio's annualized expense ratio multiplied by the average account value over the period, multiplied by the number of days in the most recent fiscal half year period, then divided by 365.
The "Expenses Paid per $1,000" and the "Annualized Expense Ratios" in the tables are based on actual expenses paid by the Portfolio during the period, net of fee waivers and/or expense reimbursements. If those fee waivers and/or expense reimbursements had not been in effect, the Portfolio's actual expenses would have been higher. Expenses do not reflect additional charges and expenses that are, or may be, imposed under the variable contracts or plans. Such charges and expenses are described in the prospectus of the insurance company separate account or in the plan documents or other informational materials supplied by plan sponsors. The Portfolio's expenses should be considered with these charges and expenses in evaluating the overall cost of investing in the separate account.
For more information, please refer to the Portfolio's prospectus.
7
Credit Suisse Trust — Small Cap Core I Portfolio
Annual Investment Adviser's Report (continued)
December 31, 2007 (unaudited)
SECTOR BREAKDOWN*
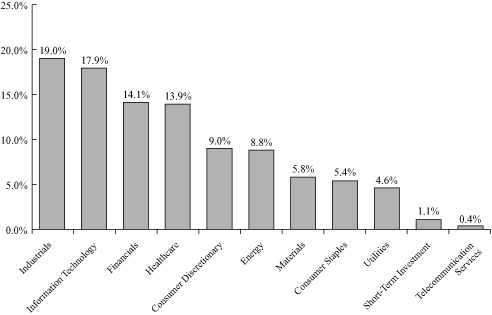
* Expressed as a percentage of total investments (excluding security lending collateral) and may vary over time.
8
Credit Suisse Trust — Small Cap Core I Portfolio
Schedule of Investments
December 31, 2007
| | | Number of
Shares | | Value | |
| COMMON STOCKS (99.2%) | |
| Aerospace & Defense (2.4%) | |
| Alliant Techsystems, Inc.* | | | 10,000 | | | $ | 1,137,600 | | |
| BE Aerospace, Inc.* | | | 11,100 | | | | 587,190 | | |
| Cubic Corp.§ | | | 46,600 | | | | 1,826,720 | | |
| Curtiss-Wright Corp. | | | 53,000 | | | | 2,660,600 | | |
| TransDigm Group, Inc.* | | | 12,700 | | | | 573,659 | | |
| | | | 6,785,769 | | |
| Airlines (0.4%) | |
| SkyWest, Inc. | | | 36,700 | | | | 985,395 | | |
| Auto Components (1.4%) | |
| American Axle & Manufacturing Holdings, Inc.§ | | | 24,800 | | | | 461,776 | | |
| Cooper Tire & Rubber Co. | | | 39,100 | | | | 648,278 | | |
| Lear Corp.* | | | 19,300 | | | | 533,838 | | |
| LKQ Corp.* | | | 112,100 | | | | 2,356,342 | | |
| | | | 4,000,234 | | |
| Banks (5.0%) | |
| 1st Source Corp. | | | 7,900 | | | | 136,749 | | |
| AMCORE Financial, Inc.§ | | | 14,500 | | | | 329,150 | | |
| BancFirst Corp.§ | | | 2,800 | | | | 119,980 | | |
| Boston Private Financial Holdings, Inc. | | | 21,700 | | | | 587,636 | | |
| Cathay General Bancorp§ | | | 21,300 | | | | 564,237 | | |
| Central Pacific Financial Corp.§ | | | 35,400 | | | | 653,484 | | |
| Citizens Republic Bancorp, Inc.§ | | | 18,100 | | | | 262,631 | | |
| Community Bank System, Inc.§ | | | 15,900 | | | | 315,933 | | |
| East West Bancorp, Inc.§ | | | 56,100 | | | | 1,359,303 | | |
| First Bancorp. | | | 98,100 | | | | 715,149 | | |
| First Community Bancorp§ | | | 6,400 | | | | 263,936 | | |
| First Financial Bancorp. | | | 18,300 | | | | 208,620 | | |
| Frontier Financial Corp.§ | | | 21,200 | | | | 393,684 | | |
| Hanmi Financial Corp.§ | | | 50,300 | | | | 433,586 | | |
| Pacific Capital Bancorp§ | | | 13,200 | | | | 265,716 | | |
| Popular, Inc.§ | | | 28,800 | | | | 305,280 | | |
| Prosperity Bancshares, Inc.§ | | | 23,800 | | | | 699,482 | | |
| Provident Bankshares Corp.§ | | | 18,800 | | | | 402,132 | | |
| Santander Bancorp | | | 6,900 | | | | 59,754 | | |
| South Financial Group, Inc.§ | | | 56,800 | | | | 887,784 | | |
| Sterling Bancshares, Inc.§ | | | 42,250 | | | | 471,510 | | |
| Sterling Financial Corp.§ | | | 43,600 | | | | 732,044 | | |
| SVB Financial Group*§ | | | 28,000 | | | | 1,411,200 | | |
| Umpqua Holdings Corp.§ | | | 55,900 | | | | 857,506 | | |
| United Community Banks, Inc.§ | | | 38,100 | | | | 601,980 | | |
| Webster Financial Corp. | | | 8,700 | | | | 278,139 | | |
| Whitney Holding Corp.§ | | | 40,900 | | | | 1,069,535 | | |
| | | | 14,386,140 | | |
See Accompanying Notes to Financial Statements.
9
Credit Suisse Trust — Small Cap Core I Portfolio
Schedule of Investments (continued)
December 31, 2007
| | | Number of
Shares | | Value | |
| COMMON STOCKS | |
| Beverages (0.4%) | |
| Boston Beer Company, Inc. Class A*§ | | | 23,100 | | | $ | 869,715 | | |
| PepsiAmericas, Inc. | | | 8,400 | | | | 279,888 | | |
| | | | 1,149,603 | | |
| Biotechnology (3.4%) | |
| Acorda Therapeutics, Inc.*§ | | | 23,100 | | | | 507,276 | | |
| Alexion Pharmaceuticals, Inc.* | | | 7,700 | | | | 577,731 | | |
| BioMarin Pharmaceutical, Inc.* | | | 40,200 | | | | 1,423,080 | | |
| LifeCell Corp.*§ | | | 20,400 | | | | 879,444 | | |
| Martek Biosciences Corp.*§ | | | 39,400 | | | | 1,165,452 | | |
| Onyx Pharmaceuticals, Inc.* | | | 10,300 | | | | 572,886 | | |
| OSI Pharmaceuticals, Inc.*§ | | | 11,600 | | | | 562,716 | | |
| Pharmanet Development Group, Inc.* | | | 42,200 | | | | 1,654,662 | | |
| Regeneron Pharmaceuticals, Inc.* | | | 36,300 | | | | 876,645 | | |
| Seattle Genetics, Inc.*§ | | | 38,400 | | | | 437,760 | | |
| United Therapeutics Corp.* | | | 4,100 | | | | 400,365 | | |
| ViroPharma, Inc.*§ | | | 71,400 | | | | 566,916 | | |
| | | | 9,624,933 | | |
| Building Products (0.8%) | |
| Drew Industries, Inc.* | | | 10,100 | | | | 276,740 | | |
| Lennox International, Inc. | | | 50,400 | | | | 2,087,568 | | |
| | | | 2,364,308 | | |
| Chemicals (2.3%) | |
| Calgon Carbon Corp.*§ | | | 45,200 | | | | 718,228 | | |
| CF Industries Holdings, Inc. | | | 28,600 | | | | 3,147,716 | | |
| OM Group, Inc.* | | | 39,200 | | | | 2,255,568 | | |
| W.R. Grace & Co.*§ | | | 21,900 | | | | 573,342 | | |
| | | | 6,694,854 | | |
| Commercial Services & Supplies (5.1%) | |
| Atlas Air Worldwide Holdings, Inc.*§ | | | 28,600 | | | | 1,550,692 | | |
| Bally Technologies, Inc.*§ | | | 14,700 | | | | 730,884 | | |
| Bowne & Company, Inc.§ | | | 16,200 | | | | 285,120 | | |
| Bristow Group, Inc.*§ | | | 13,900 | | | | 787,435 | | |
| Capella Education Co.* | | | 14,300 | | | | 936,078 | | |
| Convergys Corp.* | | | 17,400 | | | | 286,404 | | |
| Covanta Holding Corp.* | | | 10,100 | | | | 279,366 | | |
| CSG Systems International, Inc.* | | | 16,800 | | | | 247,296 | | |
| Darling International, Inc.* | | | 63,800 | | | | 737,528 | | |
| DeVry, Inc. | | | 18,400 | | | | 956,064 | | |
| DynCorp International, Inc. Class A* | | | 56,200 | | | | 1,510,656 | | |
| G&K Services, Inc. Class A§ | | | 11,800 | | | | 442,736 | | |
| ITT Educational Services, Inc.* | | | 7,800 | | | | 665,106 | | |
| Koppers Holdings, Inc. | | | 14,900 | | | | 644,276 | | |
| Pre-Paid Legal Services, Inc.*§ | | | 18,400 | | | | 1,018,440 | | |
| Spherion Corp.* | | | 37,100 | | | | 270,088 | | |
| Stericycle, Inc.* | | | 4,800 | | | | 285,120 | | |
See Accompanying Notes to Financial Statements.
10
Credit Suisse Trust — Small Cap Core I Portfolio
Schedule of Investments (continued)
December 31, 2007
| | | Number of
Shares | | Value | |
| COMMON STOCKS | |
| Commercial Services & Supplies | |
| Strayer Education, Inc. | | | 5,700 | | | $ | 972,306 | | |
| Team, Inc.* | | | 7,900 | | | | 288,982 | | |
| Tetra Tech, Inc.* | | | 22,600 | | | | 485,900 | | |
| Viad Corp. | | | 10,900 | | | | 344,222 | | |
| Watson Wyatt Worldwide, Inc. Class A | | | 16,600 | | | | 770,406 | | |
| | | | 14,495,105 | | |
| Commingled Fund (4.1%) | |
| iShares S&P SmallCap 600 Index Fund§ | | | 182,600 | | | | 11,872,652 | | |
| Communications Equipment (1.4%) | |
| Arris Group, Inc.* | | | 86,929 | | | | 867,550 | | |
| CommScope, Inc.* | | | 11,800 | | | | 580,678 | | |
| Comtech Telecommunications Corp.* | | | 24,800 | | | | 1,339,448 | | |
| Plantronics, Inc. | | | 23,300 | | | | 605,800 | | |
| ViaSat, Inc.* | | | 13,900 | | | | 478,577 | | |
| | | | 3,872,053 | | |
| Computers & Peripherals (1.0%) | |
| Hutchinson Technology, Inc.*§ | | | 37,100 | | | | 976,472 | | |
| NCR Corp.* | | | 24,000 | | | | 602,400 | | |
| Novatel Wireless, Inc.*§ | | | 52,400 | | | | 848,880 | | |
| Sigma Designs, Inc.*§ | | | 3,500 | | | | 193,200 | | |
| Smart Modular Technologies, Inc.*§ | | | 22,900 | | | | 233,122 | | |
| | | | 2,854,074 | | |
| Construction & Engineering (1.8%) | |
| Perini Corp.* | | | 18,400 | | | | 762,128 | | |
| Shaw Group, Inc.* | | | 59,100 | | | | 3,572,004 | | |
| URS Corp.* | | | 16,450 | | | | 893,729 | | |
| | | | 5,227,861 | | |
| Containers & Packaging (0.5%) | |
| AptarGroup, Inc. | | | 16,400 | | | | 670,924 | | |
| Myers Industries, Inc. | | | 15,800 | | | | 228,626 | | |
| Rock-Tenn Co. Class A | | | 20,900 | | | | 531,069 | | |
| | | | 1,430,619 | | |
| Diversified Financials (2.7%) | |
| Bankrate, Inc.*§ | | | 7,200 | | | | 346,248 | | |
| Broadridge Financial Solutions, Inc. | | | 12,600 | | | | 282,618 | | |
| CBIZ, Inc.*§ | | | 20,000 | | | | 196,200 | | |
| Eaton Vance Corp. | | | 9,300 | | | | 422,313 | | |
| FCStone Group, Inc.* | | | 6,100 | | | | 280,783 | | |
| Federated Investors, Inc. Class B | | | 10,500 | | | | 432,180 | | |
| GAMCO Investors, Inc. Class A | | | 10,300 | | | | 712,760 | | |
| Greenhill & Company, Inc.§ | | | 4,200 | | | | 279,216 | | |
| Interactive Brokers Group, Inc. Class A*§ | | | 18,100 | | | | 584,992 | | |
| MF Global, Ltd.* | | | 9,600 | | | | 302,112 | | |
| Morningstar, Inc.*§ | | | 3,800 | | | | 295,450 | | |
See Accompanying Notes to Financial Statements.
11
Credit Suisse Trust — Small Cap Core I Portfolio
Schedule of Investments (continued)
December 31, 2007
| | | Number of
Shares | | Value | |
| COMMON STOCKS | |
| Diversified Financials | |
| Nasdaq Stock Market, Inc.* | | | 24,100 | | | $ | 1,192,709 | | |
| optionsXpress Holdings, Inc.§ | | | 35,400 | | | | 1,197,228 | | |
| Waddell & Reed Financial, Inc. Class A | | | 18,100 | | | | 653,229 | | |
| Walter Industries, Inc. | | | 18,500 | | | | 664,705 | | |
| | | | 7,842,743 | | |
| Electric Utilities (1.4%) | |
| Black Hills Corp.§ | | | 16,700 | | | | 736,470 | | |
| CMS Energy Corp. | | | 32,700 | | | | 568,326 | | |
| El Paso Electric Co.* | | | 47,500 | | | | 1,214,575 | | |
| ITC Holdings Corp. | | | 10,900 | | | | 614,978 | | |
| Northeast Utilities | | | 9,000 | | | | 281,790 | | |
| Ormat Technologies, Inc. | | | 12,100 | | | | 665,621 | | |
| | | | 4,081,760 | | |
| Electrical Equipment (1.9%) | |
| Acuity Brands, Inc. | | | 26,700 | | | | 1,201,500 | | |
| Belden, Inc.§ | | | 25,000 | | | | 1,112,500 | | |
| Energy Conversion Devices, Inc.*§ | | | 2,900 | | | | 97,585 | | |
| EnerSys* | | | 15,600 | | | | 389,376 | | |
| Evergreen Solar, Inc.*§ | | | 18,200 | | | | 314,314 | | |
| FuelCell Energy, Inc.* | | | 23,200 | | | | 230,144 | | |
| Regal-Beloit Corp.§ | | | 18,900 | | | | 849,555 | | |
| Woodward Governor Co. | | | 17,800 | | | | 1,209,510 | | |
| | | | 5,404,484 | | |
| Electronic Equipment & Instruments (5.5%) | |
| Analogic Corp. | | | 11,300 | | | | 765,236 | | |
| Anixter International, Inc.*§ | | | 17,000 | | | | 1,058,590 | | |
| FLIR Systems, Inc.*§ | | | 72,400 | | | | 2,266,120 | | |
| Itron, Inc.*§ | | | 17,500 | | | | 1,679,475 | | |
| Littelfuse, Inc.* | | | 12,400 | | | | 408,704 | | |
| Methode Electronics, Inc. | | | 69,100 | | | | 1,136,004 | | |
| Mettler-Toledo International, Inc.* | | | 2,500 | | | | 284,500 | | |
| MTS Systems Corp. | | | 16,400 | | | | 699,788 | | |
| Park Electrochemical Corp. | | | 12,100 | | | | 341,704 | | |
| Plexus Corp.* | | | 35,200 | | | | 924,352 | | |
| Rofin-Sinar Technologies, Inc.* | | | 30,000 | | | | 1,443,300 | | |
| Rogers Corp.* | | | 9,500 | | | | 412,015 | | |
| Technitrol, Inc. | | | 26,500 | | | | 757,370 | | |
| Trimble Navigation, Ltd.* | | | 68,000 | | | | 2,056,320 | | |
| Universal Display Corp.* | | | 15,300 | | | | 316,251 | | |
| Varian, Inc.* | | | 18,500 | | | | 1,208,050 | | |
| | | | 15,757,779 | | |
See Accompanying Notes to Financial Statements.
12
Credit Suisse Trust — Small Cap Core I Portfolio
Schedule of Investments (continued)
December 31, 2007
| | | Number of
Shares | | Value | |
| COMMON STOCKS | |
| Energy Equipment & Services (4.3%) | |
| Atwood Oceanics, Inc.* | | | 26,300 | | | $ | 2,636,312 | | |
| Core Laboratories NV* | | | 4,700 | | | | 586,184 | | |
| Dawson Geophysical Co.* | | | 4,100 | | | | 292,986 | | |
| Dresser-Rand Group, Inc.* | | | 7,700 | | | | 300,685 | | |
| Dril-Quip, Inc.* | | | 19,900 | | | | 1,107,634 | | |
| GulfMark Offshore, Inc.*§ | | | 7,300 | | | | 341,567 | | |
| Helmerich & Payne, Inc. | | | 15,000 | | | | 601,050 | | |
| Lufkin Industries, Inc.§ | | | 27,100 | | | | 1,552,559 | | |
| NATCO Group, Inc. Class A* | | | 10,700 | | | | 579,405 | | |
| Oceaneering International, Inc.* | | | 21,200 | | | | 1,427,820 | | |
| Oil States International, Inc.*§ | | | 26,400 | | | | 900,768 | | |
| Tidewater, Inc. | | | 5,300 | | | | 290,758 | | |
| Trico Marine Services, Inc.*§ | | | 12,300 | | | | 455,346 | | |
| W-H Energy Services, Inc.* | | | 21,900 | | | | 1,230,999 | | |
| | | | 12,304,073 | | |
| Food & Drug Retailing (3.5%) | |
| Casey's General Stores, Inc. | | | 48,000 | | | | 1,421,280 | | |
| Central European Distribution Corp.*§ | | | 25,200 | | | | 1,463,616 | | |
| Flowers Foods, Inc. | | | 55,650 | | | | 1,302,766 | | |
| Longs Drug Stores Corp. | | | 45,000 | | | | 2,115,000 | | |
| Nash Finch Co.§ | | | 15,000 | | | | 529,200 | | |
| Terra Industries, Inc.* | | | 66,500 | | | | 3,176,040 | | |
| | | | 10,007,902 | | |
| Food Products (0.9%) | |
| Fresh Del Monte Produce, Inc.* | | | 22,700 | | | | 762,266 | | |
| Hormel Foods Corp. | | | 10,500 | | | | 425,040 | | |
| Pilgrim's Pride Corp.§ | | | 15,200 | | | | 440,040 | | |
| Sanderson Farms, Inc.§ | | | 21,300 | | | | 719,514 | | |
| USANA Health Sciences, Inc.*§ | | | 4,600 | | | | 170,568 | | |
| | | | 2,517,428 | | |
| Gas Utilities (2.9%) | |
| Atmos Energy Corp. | | | 48,600 | | | | 1,362,744 | | |
| Energen Corp. | | | 34,100 | | | | 2,190,243 | | |
| New Jersey Resources Corp.§ | | | 15,000 | | | | 750,300 | | |
| Northwest Natural Gas Co.§ | | | 14,700 | | | | 715,302 | | |
| South Jersey Industries, Inc.§ | | | 16,200 | | | | 584,658 | | |
| Southern Union Co. | | | 65,700 | | | | 1,928,952 | | |
| Southwest Gas Corp. | | | 23,600 | | | | 702,572 | | |
| | | | 8,234,771 | | |
See Accompanying Notes to Financial Statements.
13
Credit Suisse Trust — Small Cap Core I Portfolio
Schedule of Investments (continued)
December 31, 2007
| | | Number of
Shares | | Value | |
| COMMON STOCKS | |
| Healthcare Equipment & Supplies (4.8%) | |
| ABIOMED, Inc.*§ | | | 18,700 | | | $ | 290,598 | | |
| ArthroCare Corp.*§ | | | 15,200 | | | | 730,360 | | |
| Haemonetics Corp.* | | | 28,400 | | | | 1,789,768 | | |
| Hologic, Inc.* | | | 31,500 | | | | 2,162,160 | | |
| Immucor, Inc.* | | | 37,600 | | | | 1,278,024 | | |
| Kinetic Concepts, Inc.* | | | 5,300 | | | | 283,868 | | |
| Meridian Bioscience, Inc.§ | | | 22,049 | | | | 663,234 | | |
| ResMed, Inc.* | | | 45,900 | | | | 2,411,127 | | |
| STERIS Corp. | | | 9,800 | | | | 282,632 | | |
| SurModics, Inc.*§ | | | 21,000 | | | | 1,139,670 | | |
| Ventana Medical Systems, Inc.* | | | 14,700 | | | | 1,282,281 | | |
| Wright Medical Group, Inc.* | | | 52,200 | | | | 1,522,674 | | |
| | | | 13,836,396 | | |
| Healthcare Providers & Services (4.8%) | |
| Air Methods Corp.*§ | | | 12,400 | | | | 615,908 | | |
| Amedisys, Inc.*§ | | | 21,332 | | | | 1,035,029 | | |
| Amerigroup Corp.* | | | 44,500 | | | | 1,622,025 | | |
| AmSurg Corp.* | | | 17,700 | | | | 478,962 | | |
| Kindred Healthcare, Inc.* | | | 18,300 | | | | 457,134 | | |
| Magellan Health Services, Inc.* | | | 3,200 | | | | 149,216 | | |
| MedCath Corp.* | | | 8,700 | | | | 213,672 | | |
| Molina Healthcare, Inc.*§ | | | 22,000 | | | | 851,400 | | |
| Owens & Minor, Inc. | | | 21,100 | | | | 895,273 | | |
| PARAXEL International Corp.* | | | 43,500 | | | | 2,101,050 | | |
| Pediatrix Medical Group, Inc.* | | | 29,200 | | | | 1,989,980 | | |
| Res-Care, Inc.* | | | 25,000 | | | | 629,000 | | |
| Sierra Health Services, Inc.* | | | 30,900 | | | | 1,296,564 | | |
| Sunrise Senior Living, Inc.*§ | | | 26,500 | | | | 813,020 | | |
| WellCare Health Plans, Inc.* | | | 13,300 | | | | 564,053 | | |
| | | | 13,712,286 | | |
| Hotels, Restaurants & Leisure (1.1%) | |
| Bob Evans Farms, Inc. | | | 8,800 | | | | 236,984 | | |
| CBRL Group, Inc. | | | 8,900 | | | | 288,271 | | |
| Chipotle Mexican Grill, Inc. Class B*§ | | | 4,800 | | | | 590,640 | | |
| Jack in the Box, Inc.* | | | 44,000 | | | | 1,133,880 | | |
| Landry's Restaurants, Inc.§ | | | 20,400 | | | | 401,880 | | |
| WMS Industries, Inc.* | | | 13,400 | | | | 490,976 | | |
| | | | 3,142,631 | | |
| Household Durables (0.5%) | |
| American Greetings Corp. Class A | | | 18,500 | | | | 375,550 | | |
| Blyth, Inc. | | | 12,300 | | | | 269,862 | | |
| KB Home§ | | | 13,000 | | | | 280,800 | | |
| NVR, Inc.* | | | 600 | | | | 314,400 | | |
| Ryland Group, Inc. | | | 10,800 | | | | 297,540 | | |
| | | | 1,538,152 | | |
See Accompanying Notes to Financial Statements.
14
Credit Suisse Trust — Small Cap Core I Portfolio
Schedule of Investments (continued)
December 31, 2007
| | | Number of
Shares | | Value | |
| COMMON STOCKS | |
| Industrial Conglomerates (0.5%) | |
| Chemed Corp. | | | 24,700 | | | $ | 1,380,236 | | |
| Insurance (3.5%) | |
| Arch Capital Group, Ltd.* | | | 4,200 | | | | 295,470 | | |
| Argo Group International Holdings, Ltd.* | | | 8,000 | | | | 337,040 | | |
| Assured Guaranty, Ltd. | | | 14,500 | | | | 384,830 | | |
| CNA Surety Corp.* | | | 15,600 | | | | 308,724 | | |
| Endurance Specialty Holdings, Ltd. | | | 6,800 | | | | 283,764 | | |
| Infinity Property & Casualty Corp.§ | | | 11,800 | | | | 426,334 | | |
| Max Capital Group, Ltd. | | | 18,700 | | | | 523,413 | | |
| MGIC Investment Corp.§ | | | 12,600 | | | | 282,618 | | |
| Navigators Group, Inc.* | | | 6,100 | | | | 396,500 | | |
| Philadelphia Consolidated Holding Corp.* | | | 31,400 | | | | 1,235,590 | | |
| Phoenix Companies, Inc. | | | 24,900 | | | | 295,563 | | |
| Platinum Underwriters Holdings, Ltd. | | | 15,200 | | | | 540,512 | | |
| PMI Group, Inc.§ | | | 22,500 | | | | 298,800 | | |
| Presidential Life Corp.§ | | | 29,800 | | | | 521,798 | | |
| ProAssurance Corp.* | | | 19,700 | | | | 1,081,924 | | |
| Radian Group, Inc.§ | | | 27,400 | | | | 320,032 | | |
| Selective Insurance Group, Inc. | | | 30,200 | | | | 694,298 | | |
| State Auto Financial Corp. | | | 9,800 | | | | 257,740 | | |
| Triad Guaranty, Inc.*§ | | | 7,200 | | | | 70,560 | | |
| United Fire & Casualty Co. | | | 11,900 | | | | 346,171 | | |
| Zenith National Insurance Corp. | | | 28,000 | | | | 1,252,440 | | |
| | | | 10,154,121 | | |
| Internet & Catalog Retail (1.1%) | |
| Blue Nile, Inc.*§ | | | 17,000 | | | | 1,157,020 | | |
| Global Sources, Ltd.*§ | | | 53,570 | | | | 1,511,745 | | |
| Priceline.com, Inc.*§ | | | 3,900 | | | | 447,954 | | |
| | | | 3,116,719 | | |
| Internet Software & Services (1.0%) | |
| Blue Coat Systems, Inc.* | | | 18,100 | | | | 594,947 | | |
| Cogent Communications Group, Inc.* | | | 12,500 | | | | 296,375 | | |
| CyberSource Corp.*§ | | | 37,606 | | | | 668,259 | | |
| Sohu.com, Inc.*§ | | | 17,700 | | | | 965,004 | | |
| United Online, Inc.§ | | | 35,900 | | | | 424,338 | | |
| | | | 2,948,923 | | |
| IT Consulting & Services (0.7%) | |
| Phase Forward, Inc.* | | | 22,600 | | | | 491,550 | | |
| SAIC, Inc.* | | | 25,400 | | | | 511,048 | | |
| Sapient Corp.* | | | 39,100 | | | | 344,471 | | |
| Sykes Enterprises, Inc.* | | | 40,900 | | | | 736,200 | | |
| | | | 2,083,269 | | |
See Accompanying Notes to Financial Statements.
15
Credit Suisse Trust — Small Cap Core I Portfolio
Schedule of Investments (continued)
December 31, 2007
| | | Number of
Shares | | Value | |
| COMMON STOCKS | |
| Leisure Equipment & Products (0.9%) | |
| Callaway Golf Co. | | | 17,800 | | | $ | 310,254 | | |
| JAKKS Pacific, Inc.*§ | | | 15,800 | | | | 373,038 | | |
| Marvel Entertainment, Inc.*§ | | | 10,600 | | | | 283,126 | | |
| Polaris Industries, Inc.§ | | | 33,500 | | | | 1,600,295 | | |
| | | | 2,566,713 | | |
| Machinery (4.6%) | |
| Actuant Corp. Class A§ | | | 8,700 | | | | 295,887 | | |
| AGCO Corp.* | | | 21,500 | | | | 1,461,570 | | |
| Applied Industrial Technologies, Inc. | | | 20,500 | | | | 594,910 | | |
| Badger Meter, Inc. | | | 7,200 | | | | 323,640 | | |
| Barnes Group, Inc.§ | | | 43,100 | | | | 1,439,109 | | |
| Chart Industries, Inc.* | | | 9,700 | | | | 299,730 | | |
| Columbus McKinnon Corp.* | | | 8,800 | | | | 287,056 | | |
| Dionex Corp.*§ | | | 23,900 | | | | 1,980,354 | | |
| Flowserve Corp. | | | 3,000 | | | | 288,600 | | |
| H&E Equipment Services, Inc.* | | | 15,000 | | | | 283,200 | | |
| Kaydon Corp.§ | | | 18,900 | | | | 1,030,806 | | |
| Kennametal, Inc. | | | 7,700 | | | | 291,522 | | |
| Manitowoc Company, Inc. | | | 30,200 | | | | 1,474,666 | | |
| Mueller Industries, Inc. | | | 20,400 | | | | 591,396 | | |
| Robbins & Myers, Inc. | | | 19,000 | | | | 1,436,970 | | |
| Valmont Industries, Inc.§ | | | 13,300 | | | | 1,185,296 | | |
| | | | 13,264,712 | | |
| Marine (0.6%) | |
| Cal Dive International, Inc.*§ | | | 44,525 | | | | 589,511 | | |
| Genco Shipping & Trading, Ltd.§ | | | 10,400 | | | | 569,504 | | |
| Golar LNG, Ltd.§ | | | 28,000 | | | | 619,360 | | |
| | | | 1,778,375 | | |
| Media (0.2%) | |
| Interactive Data Corp. | | | 8,900 | | | | 293,789 | | |
| Scholastic Corp.* | | | 8,200 | | | | 286,098 | | |
| | | | 579,887 | | |
| Metals & Mining (2.1%) | |
| Century Aluminum Co.* | | | 15,800 | | | | 852,252 | | |
| Cleveland-Cliffs, Inc.§ | | | 25,300 | | | | 2,550,240 | | |
| GrafTech International, Ltd.* | | | 32,600 | | | | 578,650 | | |
| Massey Energy Co. | | | 60,600 | | | | 2,166,450 | | |
| | | | 6,147,592 | | |
See Accompanying Notes to Financial Statements.
16
Credit Suisse Trust — Small Cap Core I Portfolio
Schedule of Investments (continued)
December 31, 2007
| | | Number of
Shares | | Value | |
| COMMON STOCKS | |
| Oil & Gas (4.2%) | |
| Alon USA Energy, Inc.§ | | | 9,600 | | | $ | 260,928 | | |
| Berry Petroleum Co. Class A | | | 6,500 | | | | 288,925 | | |
| Bill Barrett Corp.* | | | 6,700 | | | | 280,529 | | |
| Cabot Oil & Gas Corp. | | | 55,500 | | | | 2,240,535 | | |
| Comstock Resources, Inc.* | | | 8,300 | | | | 282,200 | | |
| Continental Resources, Inc.* | | | 11,400 | | | | 297,882 | | |
| Delek US Holdings, Inc.§ | | | 14,300 | | | | 289,289 | | |
| Frontier Oil Corp. | | | 6,900 | | | | 280,002 | | |
| Helix Energy Solutions Group, Inc.*§ | | | 50,400 | | | | 2,091,600 | | |
| Holly Corp. | | | 5,500 | | | | 279,895 | | |
| Mariner Energy, Inc.*§ | | | 52,200 | | | | 1,194,336 | | |
| Petroleum Development Corp.*§ | | | 17,300 | | | | 1,022,949 | | |
| PetroQuest Energy, Inc.*§ | | | 30,700 | | | | 439,010 | | |
| Stone Energy Corp.* | | | 44,300 | | | | 2,078,113 | | |
| W&T Offshore, Inc. | | | 19,300 | | | | 578,228 | | |
| | | | 11,904,421 | | |
| Paper & Forest Products (0.6%) | |
| Buckeye Technologies, Inc.* | | | 61,800 | | | | 772,500 | | |
| Potlatch Corp.§ | | | 14,600 | | | | 648,824 | | |
| Rayonier, Inc. | | | 6,100 | | | | 288,164 | | |
| | | | 1,709,488 | | |
| Personal Products (0.1%) | |
| Elizabeth Arden, Inc.* | | | 19,200 | | | | 390,720 | | |
| Mannatech, Inc.§ | | | 1,800 | | | | 11,376 | | |
| | | | 402,096 | | |
| Pharmaceuticals (0.4%) | |
| Obagi Medical Products, Inc.*§ | | | 14,700 | | | | 268,863 | | |
| Perrigo Co. | | | 8,400 | | | | 294,084 | | |
| Sciele Pharma, Inc.*§ | | | 32,300 | | | | 660,535 | | |
| | | | 1,223,482 | | |
| Real Estate (2.3%) | |
| Anthracite Capital, Inc.§ | | | 18,800 | | | | 136,112 | | |
| EastGroup Properties, Inc.§ | | | 13,700 | | | | 573,345 | | |
| Entertainment Properties Trust§ | | | 21,500 | | | | 1,010,500 | | |
| Gramercy Capital Corp.§ | | | 6,900 | | | | 167,739 | | |
| Lexington Realty Trust | | | 40,100 | | | | 583,054 | | |
| Mid-America Apartment Communities, Inc. | | | 14,500 | | | | 619,875 | | |
| National Health Investors, Inc.§ | | | 20,200 | | | | 563,580 | | |
| National Retail Properties, Inc. | | | 51,200 | | | | 1,197,056 | | |
| Parkway Properties, Inc. | | | 15,700 | | | | 580,586 | | |
| Pennsylvania Real Estate Investment Trust | | | 9,600 | | | | 284,928 | | |
| PS Business Parks, Inc. | | | 9,500 | | | | 499,225 | | |
| Realty Income Corp.§ | | | 10,300 | | | | 278,306 | | |
| | | | 6,494,306 | | |
See Accompanying Notes to Financial Statements.
17
Credit Suisse Trust — Small Cap Core I Portfolio
Schedule of Investments (continued)
December 31, 2007
| | | Number of
Shares | | Value | |
| COMMON STOCKS | |
| Road & Rail (0.3%) | |
| Kansas City Southern*§ | | | 25,100 | | | $ | 861,683 | | |
| Semiconductor Equipment & Products (3.5%) | |
| Advanced Energy Industries, Inc.* | | | 41,900 | | | | 548,052 | | |
| Amkor Technology, Inc.*§ | | | 65,700 | | | | 560,421 | | |
| Cabot Microelectronics Corp.*§ | | | 14,300 | | | | 513,513 | | |
| Cymer, Inc.*§ | | | 25,700 | | | | 1,000,501 | | |
| Entegris, Inc.*§ | | | 34,100 | | | | 294,283 | | |
| Kulicke and Soffa Industries, Inc.*§ | | | 76,400 | | | | 524,104 | | |
| MKS Instruments, Inc.* | | | 44,000 | | | | 842,160 | | |
| Monolithic Power Systems, Inc.* | | | 15,100 | | | | 324,197 | | |
| ON Semiconductor Corp.*§ | | | 65,500 | | | | 581,640 | | |
| Photronics, Inc.* | | | 54,400 | | | | 678,368 | | |
| RF Micro Devices, Inc.*§ | | | 50,400 | | | | 287,784 | | |
| Semtech Corp.* | | | 17,200 | | | | 266,944 | | |
| Skyworks Solutions, Inc.* | | | 97,600 | | | | 829,600 | | |
| Teradyne, Inc.* | | | 27,700 | | | | 286,418 | | |
| Varian Semiconductor Equipment Associates, Inc.*§ | | | 42,300 | | | | 1,565,100 | | |
| Zoran Corp.* | | | 39,300 | | | | 884,643 | | |
| | | | 9,987,728 | | |
| Software (4.1%) | |
| ANSYS, Inc.* | | | 42,400 | | | | 1,757,904 | | |
| Aspen Technology, Inc.* | | | 54,200 | | | | 879,124 | | |
| Blackbaud, Inc. | | | 34,800 | | | | 975,792 | | |
| Concur Technologies, Inc.* | | | 23,400 | | | | 847,314 | | |
| Informatica Corp.* | | | 54,000 | | | | 973,080 | | |
| JDA Software Group, Inc.* | | | 28,500 | | | | 583,110 | | |
| MICROS Systems, Inc.* | | | 14,200 | | | | 996,272 | | |
| MicroStrategy, Inc. Class A* | | | 5,700 | | | | 542,070 | | |
| Parametric Technology Corp.* | | | 16,200 | | | | 289,170 | | |
| SPSS, Inc.*§ | | | 26,100 | | | | 937,251 | | |
| Sybase, Inc.* | | | 23,700 | | | | 618,333 | | |
| Take-Two Interactive Software, Inc.* | | | 41,000 | | | | 756,450 | | |
| Taleo Corp. Class A* | | | 23,000 | | | | 684,940 | | |
| THQ, Inc.*§ | | | 36,300 | | | | 1,023,297 | | |
| | | | 11,864,107 | | |
| Specialty Retail (1.7%) | |
| Aeropostale, Inc.* | | | 43,900 | | | | 1,163,350 | | |
| Buckle, Inc. | | | 7,800 | | | | 257,400 | | |
| Cato Corp. Class A§ | | | 25,800 | | | | 404,028 | | |
| Jo-Ann Stores, Inc.*§ | | | 28,800 | | | | 376,704 | | |
| Jos. A. Bank Clothiers, Inc.*§ | | | 27,300 | | | | 776,685 | | |
| Men's Wearhouse, Inc. | | | 40,300 | | | | 1,087,294 | | |
| Tractor Supply Co.*§ | | | 19,900 | | | | 715,206 | | |
| | | | 4,780,667 | | |
See Accompanying Notes to Financial Statements.
18
Credit Suisse Trust — Small Cap Core I Portfolio
Schedule of Investments (continued)
December 31, 2007
| | | Number of
Shares | | Value | |
| COMMON STOCKS | |
| Textiles & Apparel (1.8%) | |
| Crocs, Inc.*§ | | | 46,800 | | | $ | 1,722,708 | | |
| Deckers Outdoor Corp.*§ | | | 6,800 | | | | 1,054,408 | | |
| Fossil, Inc.* | | | 38,500 | | | | 1,616,230 | | |
| Movado Group, Inc. | | | 15,900 | | | | 402,111 | | |
| Warnaco Group, Inc.* | | | 7,700 | | | | 267,960 | | |
| | | | 5,063,417 | | |
| Tobacco (0.2%) | |
| Universal Corp.§ | | | 8,500 | | | | 435,370 | | |
| Vector Group, Ltd.§ | | | 12,855 | | | | 257,871 | | |
| | | | 693,241 | | |
| Water Utilities (0.1%) | |
| American States Water Co.§ | | | 9,700 | | | | 365,496 | | |
| Wireless Telecommunication Services (0.4%) | |
| Centennial Communications Corp.*§ | | | 32,100 | | | | 298,209 | | |
| NTELOS Holdings Corp. | | | 15,800 | | | | 469,102 | | |
| USA Mobility, Inc.* | | | 20,800 | | | | 297,440 | | |
| | | | 1,064,751 | | |
| TOTAL COMMON STOCKS (Cost $272,871,064) | | | 284,559,435 | | |
| SHORT-TERM INVESTMENTS (30.6%) | |
| State Street Navigator Prime Portfolio§§ | | | 84,702,428 | | | | 84,702,428 | | |
| | | Par
(000) | | | |
| State Street Bank and Trust Co. Euro Time Deposit, 3.100%, 01/02/08 | | $ | 2,964 | | | | 2,964,000 | | |
| TOTAL SHORT-TERM INVESTMENTS (Cost $87,666,428) | | | 87,666,428 | | |
| TOTAL INVESTMENTS AT VALUE (129.8%) (Cost $360,537,492) | | | 372,225,863 | | |
| LIABILITIES IN EXCESS OF OTHER ASSETS (-29.8%) | | | (85,370,935 | ) | |
| NET ASSETS (100.0%) | | $ | 286,854,928 | | |
* Non-income producing security.
§ Security or a portion thereof is on loan.
§§ Represents security purchased with cash collateral received for securities on loan.
See Accompanying Notes to Financial Statements.
19
Credit Suisse Trust — Small Cap Core I Portfolio
Statement of Assets and Liabilities
December 31, 2007
| Assets | |
Investments at value, including collateral for securities on loan of $84,702,428
(Cost $360,537,492) (Note 2) | | $ | 372,225,8631 | | |
| Cash | | | 351 | | |
| Dividend and interest receivable | | | 308,357 | | |
| Receivable for portfolio shares sold | | | 26,038 | | |
| Prepaid expenses and other assets | | | 46,887 | | |
| Total Assets | | | 372,607,496 | | |
| Liabilities | |
| Advisory fee payable (Note 3) | | | 172,282 | | |
| Administrative services fee payable (Note 3) | | | 29,288 | | |
| Payable upon return of securities loaned (Note 2) | | | 84,702,428 | | |
| Payable for portfolio shares redeemed | | | 599,708 | | |
| Trustees' fee payable | | | 804 | | |
| Other accrued expenses payable | | | 248,058 | | |
| Total Liabilities | | | 85,752,568 | | |
| Net Assets | |
| Capital stock, $0.001 par value (Note 6) | | | 18,542 | | |
| Paid-in capital (Note 6) | | | 356,901,657 | | |
| Undistributed net investment income | | | 175,341 | | |
| Accumulated net realized loss on investments and futures contracts | | | (81,928,983 | ) | |
| Net unrealized appreciation from investments | | | 11,688,371 | | |
| Net Assets | | $ | 286,854,928 | | |
| Shares outstanding | | | 18,541,577 | | |
| Net asset value, offering price, and redemption price per share | | $ | 15.47 | | |
1 Including $82,701,992 of securities on loan.
See Accompanying Notes to Financial Statements.
20
Credit Suisse Trust — Small Cap Core I Portfolio
Statement of Operations
For the Year Ended December 31, 2007
| Investment Income (Note 2) | |
| Dividends | | $ | 3,212,202 | | |
| Interest | | | 79,014 | | |
| Securities lending | | | 383,877 | | |
| Foreign taxes withheld | | | (1,584 | ) | |
| Total investment income | | | 3,673,509 | | |
| Expenses | |
| Investment advisory fees (Note 3) | | | 2,557,759 | | |
| Administrative services fees (Note 3) | | | 443,162 | | |
| Printing fees (Note 3) | | | 151,017 | | |
| Audit and tax fees | | | 60,117 | | |
| Custodian fees | | | 37,406 | | |
| Interest expense (Note 4) | | | 26,031 | | |
| Insurance expense | | | 20,540 | | |
| Trustees' fees | | | 19,855 | | |
| Legal fees | | | 18,888 | | |
| Commitment fees (Note 4) | | | 9,522 | | |
| Transfer agent fees | | | 6,797 | | |
| Miscellaneous expense | | | 12,726 | | |
| Total expenses | | | 3,363,820 | | |
| Net investment income | | | 309,689 | | |
| Net Realized and Unrealized Gain (Loss) from Investments and Futures Contracts | |
| Net realized loss from investments | | | (3,657,462 | ) | |
| Net realized loss from futures contracts | | | (27,200 | ) | |
| Net change in unrealized appreciation (depreciation) from investments | | | 4,753,668 | | |
| Net change in unrealized appreciation (depreciation) from futures contracts | | | 21,600 | | |
| Net realized and unrealized gain from investments and futures contracts | | | 1,090,606 | | |
| Net increase in net assets resulting from operations | | $ | 1,400,295 | | |
See Accompanying Notes to Financial Statements.
21
Credit Suisse Trust — Small Cap Core I Portfolio
Statements of Changes in Net Assets
| | | For the Year
Ended
December 31, 2007 | | For the Year
Ended
December 31, 2006 | |
| From Operations | |
| Net investment income (loss) | | $ | 309,689 | | | $ | (3,755,630 | ) | |
| Net realized gain (loss) from investments and futures contracts | | | (3,684,662 | ) | | | 50,702,095 | | |
Net change in unrealized appreciation (depreciation)
from investments and futures contracts | | | 4,775,268 | | | | (23,483,308 | ) | |
| Net increase in net assets resulting from operations | | | 1,400,295 | | | | 23,463,157 | | |
| From Capital Share Transactions (Note 6) | |
| Proceeds from sale of shares | | | 4,376,948 | | | | 13,448,844 | | |
| Exchange value of shares due to merger | | | 27,490,187 | | | | — | | |
| Net asset value of shares redeemed | | | (159,747,764 | ) | | | (180,953,431 | ) | |
| Net decrease in net assets from capital share transactions | | | (127,880,629 | ) | | | (167,504,587 | ) | |
| Net decrease in net assets | | | (126,480,334 | ) | | | (144,041,430 | ) | |
| Net Assets | |
| Beginning of year | | | 413,335,262 | | | | 557,376,692 | | |
| End of year | | $ | 286,854,928 | | | $ | 413,335,262 | | |
| Undistributed net investment income | | $ | 175,341 | | | $ | 755 | | |
See Accompanying Notes to Financial Statements.
22
Credit Suisse Trust — Small Cap Core I Portfolio
Financial Highlights
(For a Share of the Portfolio Outstanding Throughout Each Year)
| | | For the Year Ended December 31, | |
| | | 2007 | | 2006 | | 2005 | | 2004 | | 2003 | |
| Per share data | |
| Net asset value, beginning of year | | $ | 15.60 | | | $ | 14.89 | | | $ | 15.30 | | | $ | 13.80 | | | $ | 9.29 | | |
| INVESTMENT OPERATIONS | |
| Net investment income (loss) | | | 0.02 | | | | (0.14 | ) | | | (0.14 | ) | | | (0.14 | ) | | | (0.10 | ) | |
Net gain (loss) on investments and futures
contracts (both realized and unrealized) | | | (0.15 | ) | | | 0.85 | | | | (0.27 | ) | | | 1.64 | | | | 4.61 | | |
| Total from investment operations | | | (0.13 | ) | | | 0.71 | | | | (0.41 | ) | | | 1.50 | | | | 4.51 | | |
| Net asset value, end of year | | $ | 15.47 | | | $ | 15.60 | | | $ | 14.89 | | | $ | 15.30 | | | $ | 13.80 | | |
| Total return1 | | | (0.83 | )% | | | 4.77 | % | | | (2.68 | )% | | | 10.87 | % | | | 48.55 | % | |
| RATIOS AND SUPPLEMENTAL DATA | |
| Net assets, end of year (000s omitted) | | $ | 286,855 | | | $ | 413,335 | | | $ | 557,377 | | | $ | 767,104 | | | $ | 775,347 | | |
| Ratio of expenses to average net assets | | | 0.92 | % | | | 1.11 | % | | | 1.14 | % | | | 1.10 | % | | | 1.12 | % | |
| Ratio of net investment income to average net assets | | | 0.08 | % | | | (0.75 | )% | | | (0.84 | )% | | | (0.92 | )% | | | (0.97 | )% | |
| Portfolio turnover rate | | | 203 | % | | | 208 | % | | | 82 | % | | | 99 | % | | | 76 | % | |
1 Total returns are historical and assume changes in share price and reinvestment of all dividends and distributions. Total returns do not reflect charges and expenses attributable to any particular variable contract or plan.
See Accompanying Notes to Financial Statements.
23
Credit Suisse Trust — Small Cap Core I Portfolio
Notes to Financial Statements
December 31, 2007
Note 1. Organization
Credit Suisse Trust (the "Trust") is an open-end management investment company registered under the Investment Company Act of 1940, as amended (the "1940 Act"), and currently offers eight managed investment portfolios of which one, the Small Cap Core I Portfolio (the "Portfolio"), is included in this report. The Portfolio is a diversified investment fund that seeks capital growth. Shares of the Portfolio are not available directly to individual investors but may be offered only through (a) variable annuity contracts and variable life insurance contracts offered by separate accounts of certain insurance companies and (b) tax-qualified pension and retirement plans. The Portfolio may not be available in connection with a particular contract or plan. The Trust was organized under the laws of the Commonwealth of Massachusetts as a business trust on March 15, 1995.
Effective as of the close of business on April 27, 2007, the Portfolio acquired all of the net assets of Credit Suisse Trust Small Cap Core II Portfolio ("Small Cap Core II") in a tax-free exchange of shares. The Portfolio was also the accounting survivor in the tax-free exchange. The shares exchanged were 1,666,592 shares (valued at $27,490,187) of the Portfolio for 2,324,973 shares of Small Cap Core II. The Small Cap Core II Portfolio's net assets of $27,490,187 at that date, which included $1,820,166 of unrealized appreciation, were combined with those of the Portfolio. The aggregate net assets of Small Cap Core II and the Portfolio immediately before the acquisition were $27,490,187 and $383,162,531, respectively, and the combined net assets of the Portfolio after the acquisition were $410,652,718.
Note 2. Significant Accounting Policies
A) SECURITY VALUATION — The net asset value of the Portfolio is determined daily as of the close of regular trading on the New York Stock Exchange, Inc. (the "Exchange") on each day the Exchange is open for business. Equity investments are valued at market value, which is generally determined using the closing price on the exchange or market on which the security is primarily traded at the time of valuation (the "Valuation Time"). If no sales are reported, equity investments are generally valued at the most recent bid quotation as of the Valuation Time or at the lowest asked quotation in the case of a short sale of securities. Debt securities with a remaining maturity greater than 60 days are valued in accordance with the price supplied by a pricing service, which may use a matrix, formula or other objective method that takes into consideration market indices, yield curves and other specific adjustments. Debt obligations that will matur e in 60 days or less are valued on the basis of amortized cost, which approximates market value, unless it is determined that
24
Credit Suisse Trust — Small Cap Core I Portfolio
Notes to Financial Statements (continued)
December 31, 2007
Note 2. Significant Accounting Policies
using this method would not represent fair value. Investments in mutual funds are valued at the mutual fund's closing net asset value per share on the day of valuation. Securities and other assets for which market quotations are not readily available, or whose values have been materially affected by events occurring before the Portfolio's Valuation Time but after the close of the securities' primary markets, are valued at fair value as determined in good faith by, or under the direction of, the Board of Trustees under procedures established by the Board of Trustees. The Portfolio may utilize a service provided by an independent third party which has been approved by the Board of Trustees to fair value certain securities. When fair-value pricing is employed, the prices of securities used by a portfolio to calculate its net asset value may differ from quoted or published prices for the same securities.
B) SECURITY TRANSACTIONS AND INVESTMENT INCOME — Security transactions are accounted for on a trade date basis. Interest income is recorded on the accrual basis. Dividends are recorded on the ex-dividend date. The cost of investments sold is determined by use of the specific identification method for both financial reporting and income tax purposes.
C) DIVIDENDS AND DISTRIBUTIONS TO SHAREHOLDERS — Dividends from net investment income and distributions of net realized capital gains, if any, are declared and paid at least annually. However, to the extent that a net realized capital gain can be reduced by a capital loss carryforward, such gain will not be distributed. Income and capital gain distributions are determined in accordance with federal income tax regulations, which may differ from accounting principles generally accepted in the United States of America ("GAAP").
D) FEDERAL INCOME TAXES — No provision is made for federal taxes as it is the Portfolio's intention to continue to qualify for and elect the tax treatment applicable to regulated investment companies under the Internal Revenue Code of 1986, as amended, and to make the requisite distributions to its shareholders, which will be sufficient to relieve it from federal income and excise taxes.
E) USE OF ESTIMATES — The preparation of financial statements in conformity with GAAP requires management to make estimates and assumptions that affect the reported amounts of assets and liabilities and disclosure of contingent assets and liabilities at the date of the financial statements and the reported amounts of income and expenses during the reporting period. Actual results could differ from these estimates.
F) SHORT-TERM INVESTMENTS — The Portfolio, together with other funds/portfolios advised by Credit Suisse Asset Management, LLC
25
Credit Suisse Trust — Small Cap Core I Portfolio
Notes to Financial Statements (continued)
December 31, 2007
Note 2. Significant Accounting Policies
("Credit Suisse"), an indirect, wholly-owned subsidiary of Credit Suisse Group, pools available cash into either a short-term variable rate time deposit issued by State Street Bank and Trust Company ("SSB"), the Portfolio's custodian, or a money market fund advised by Credit Suisse. The short-term time deposit issued by SSB is a variable rate account classified as a short-term investment.
G) FUTURES — The Portfolio may enter into futures contracts to the extent permitted by its investment policies and objectives. Upon entering into a futures contract, the Portfolio is required to deposit cash or pledge U.S. Government securities as initial margin. Subsequent payments, which are dependent on the daily fluctuations in the value of the underlying instrument, are made or received by the Portfolio each day (daily variation margin) and are recorded as unrealized gains or losses until the contracts are closed.
When the contracts are closed, the Portfolio records a realized gain or loss equal to the difference between the proceeds from (or cost of) the closing transactions and the Portfolio's basis in the contracts. Risks of entering into futures contracts for hedging purposes include the possibility that a change in the value of the contract may not correlate with the changes in the value of the underlying instruments. In addition, the purchase of a futures contract involves the risk that the Portfolio could lose more than the original margin deposit and subsequent payments required for a futures transaction. At December 31, 2007, the Portfolio had no open futures contracts.
H) SECURITIES LENDING — Loans of securities are required at all times to be secured by collateral at least equal to 102% of the market value of domestic securities on loan (including any accrued interest thereon) and 105% of the market value of foreign securities on loan (including any accrued interest thereon). Cash collateral received by the Portfolio in connection with securities lending activity may be pooled together with cash collateral for other funds/portfolios advised by Credit Suisse and may be invested in a variety of investments, including certain Credit Suisse-advised funds, funds advised by SSB, the Portfolio's securities lending agent, or money market instruments. However, in the event of default or bankruptcy by the other party to the agreement, realization and/or retention of the collateral may be subject to legal proceedings.
SSB has been engaged by the Portfolio to act as the Portfolio's securities lending agent. The Portfolio's securities lending arrangement provides that the Portfolio and SSB will share the net income earned from securities lending activities. During the year ended December 31, 2007, total earnings from the Portfolio's investment in cash collateral received in connection with securities lending arrangements was $5,260,923, of which $4,781,999 was rebated to
26
Credit Suisse Trust — Small Cap Core I Portfolio
Notes to Financial Statements (continued)
December 31, 2007
Note 2. Significant Accounting Policies
borrowers (brokers). The Portfolio retained $383,877 in income from the cash collateral investment, and SSB, as lending agent, was paid $95,047. The Portfolio may also be entitled to certain minimum amounts of income from its securities lending activities. Securities lending income is accrued as earned.
I) OTHER — The Portfolio may invest up to 15% of its net assets in non-publicly traded securities. Non-publicly traded securities may be less liquid than publicly traded securities. Although these securities may be resold in privately negotiated transactions, the prices realized from such sales could differ from the price originally paid by the Portfolio or the current carrying values, and the difference could be material.
Note 3. Transactions with Affiliates and Related Parties
Credit Suisse serves as investment adviser for the Portfolio. For its investment advisory services, Credit Suisse is entitled to receive a fee from the Portfolio at an annual rate of 0.70% of the Portfolio's average daily net assets. For the year ended December 31, 2007, investment advisory fees earned were $2,557,759.
Credit Suisse Asset Management Securities, Inc. ("CSAMSI"), an affiliate of Credit Suisse, and SSB serve as co-administrators to the Portfolio. For its co-administrative services, CSAMSI currently receives a fee calculated at an annual rate of 0.09% of the Portfolio's average daily net assets. For the year ended December 31, 2007, co-administrative services fees earned by CSAMSI were $328,855.
For its co-administrative services, SSB receives a fee, exclusive of out-of-pocket expenses, calculated in total for all the Credit Suisse funds/portfolios co-administered by SSB and allocated based upon relative average net assets of each fund/portfolio, subject to an annual minimum fee. For the year ended December 31, 2007, co-administrative services fees earned by SSB (including out-of-pocket expenses) were $114,307.
In addition to serving as the Portfolio's co-administrator, CSAMSI currently serves as distributor of the Portfolio's shares without compensation.
Merrill Corporation ("Merrill"), an affiliate of Credit Suisse, has been engaged by the Portfolio to provide certain financial printing and fulfillment services. For the year ended December 31, 2007, Merrill was paid $21,245 for its services to the Portfolio.
27
Credit Suisse Trust — Small Cap Core I Portfolio
Notes to Financial Statements (continued)
December 31, 2007
Note 4. Line of Credit
The Portfolio, together with other funds/portfolios advised by Credit Suisse (collectively, the "Participating Funds"), participates in a $50 million committed, unsecured line of credit facility ("Credit Facility") for temporary or emergency purposes with Deutsche Bank, A.G. as administrative agent and syndication agent and SSB as operations agent. Under the terms of the Credit Facility, the Participating Funds pay an aggregate commitment fee at a rate of 0.10% per annum on the average unused amount of the Credit Facility, which is allocated among the Participating Funds in such manner as is determined by the governing Boards of the Participating Funds. In addition, the Participating Funds pay interest on borrowings at the Federal Funds rate plus 0.50%. At December 31, 2007, the Portfolio had no loans outstanding under the Credit Facility. During the year ended December 31, 2007, the Portfolio had borrowings under the Credit Facility as foll ows:
Average Daily
Loan Balance | | Weighted Average
Interest Rate% | | Maximum Daily
Loan Outstanding | |
| $ | 6,237,345 | | | | 5.181 | % | | $ | 17,245,000 | | |
Note 5. Purchases and Sales of Securities
For the year ended December 31, 2007, purchases and sales of investment securities (excluding short-term investments) were $734,211,844 and $866,814,635, respectively.
Note 6. Capital Share Transactions
The Trust is authorized to issue an unlimited number of full and fractional shares of beneficial interest, $.001 par value per share. Transactions in capital shares of the Portfolio were as follows:
| | | For the Year Ended
December 31, 2007 | | For the Year Ended
December 31, 2006 | |
| Shares sold | | | 281,131 | | | | 819,680 | | |
| Shares exchanged due to merger | | | 1,666,592 | | | | — | | |
| Shares redeemed | | | (9,907,124 | ) | | | (11,749,498 | ) | |
| Net decrease | | | (7,959,401 | ) | | | (10,929,818 | ) | |
On December 31, 2007, the number of shareholders that held 5% or more of the outstanding shares of the Portfolio was as follows:
Number of
Shareholders | | Approximate Percentage
of Outstanding Shares | |
| | 4 | | | | 86 | % | |
Some of the shareholders are omnibus accounts, which hold shares on behalf of individual shareholders.
28
Credit Suisse Trust — Small Cap Core I Portfolio
Notes to Financial Statements (continued)
December 31, 2007
Note 7. Federal Income Taxes
Income and capital gain distributions are determined in accordance with federal income tax regulations, which may differ from GAAP.
The tax basis components of distributable earnings differ from the amounts reflected in the Statement of Assets and Liabilities by temporary book/ tax differences. These differences are primarily due to losses deferred on wash sales, unused capital loss carryforwards, current year post October loss deferral and return of capital on Real Estate Investment Trusts. At December 31, 2007, the components of distributable earnings on a tax basis by the Portfolio were as follows:
| Undistributed net investment income | | $ | 171,100 | | |
| Accumulated net realized loss | | | (75,727,314 | ) | |
| Unrealized appreciation | | | 9,193,405 | | |
| Deferral of post-October capital losses | | | (3,702,462 | ) | |
| | | $ | (70,065,271 | ) | |
At December 31, 2007, the Portfolio had capital loss carryforwards available to offset possible future capital gains as follows:
| | | Expires December 31, | |
| | 2010 | | 2011 | |
| | | $ | 70,469,127 | | | $ | 5,258,187 | | |
During the tax year ended December 31, 2007, the Portfolio utilized $2,505,533 of the capital loss carryforwards.
It is uncertain that the Portfolio will realize the full benefit of these losses prior to expiration.
At December 31, 2007, the identified cost for federal income tax purposes, as well as the gross unrealized appreciation from investments for those securities having an excess of value over cost, gross unrealized depreciation from investments for those securities having and excess of cost over value and the net unrealized appreciation from investments were $363,032,457, $24,983,143, $(15,789,737) and $9,193,406, respectively.
At December 31, 2007, the Portfolio reclassified $127,547 to accumulated gain (loss) and $7,556 to paid in capital from undistributed net investment income, to account for current period permanent book/ tax differences which arose principally from differing book/tax treatments of dividends received from Real Estate Investment Trusts. Net assets were not affected by these reclassifications.
29
Credit Suisse Trust — Small Cap Core I Portfolio
Notes to Financial Statements (continued)
December 31, 2007
Note 8. Contingencies
In the normal course of business, the Portfolio may provide general indemnifications pursuant to certain contracts and organizational documents. The Portfolio's maximum exposure under these arrangements is dependent on future claims that may be made against the Portfolio and, therefore, cannot be estimated; however, based on experience, the risk of loss from such claims is considered remote.
Note 9. Recent Accounting Pronouncements
During June 2006, the Financial Accounting Standards Board ("FASB") issued FASB Interpretation 48 ("FIN 48" or the "Interpretation"), Accounting for Uncertainty in Income Taxes — an interpretation of FASB statement 109. FIN 48 supplements FASB Statement 109, Accounting for Income Taxes, by defining the confidence level that a tax position must meet in order to be recognized in the financial statements. FIN 48 prescribes a comprehensive model for how a fund should recognize, measure, present, and disclose in its financial statements uncertain tax positions that the fund has taken or expects to take on a tax return. FIN 48 requires that the tax effects of a position be recognized only if it is "more likely than not" to be sustained based solely on its technical merits. Management must be ab le to conclude that the tax law, regulations, case law, and other objective information regarding the technical merits sufficiently support the position's sustainability with a likelihood of more than 50 percent. During the period ended December 31, 2007, Management has adopted FIN 48. There was no material impact to the financial statements or disclosures thereto as a result of the adoption of this pronouncement.
On September 20, 2006, the FASB released Statement of Financial Accounting Standards No. 157 "Fair Value Measurements" ("FAS 157"). FAS 157 establishes an authoritative definition of fair value, sets out a framework for measuring fair value, and requires additional disclosures about fair-value measurements. The application of FAS 157 is required for fiscal years, beginning after November 15, 2007 and interim periods within those fiscal years. As of December 31, 2007, management does not believe the adoption of FAS 157 will impact the amounts reported in the financial statements, however, additional disclosures will be required in subsequent reports.
30
Credit Suisse Trust — Small Cap Core I Portfolio
Report of Independent Registered Public Accounting Firm
To the Board of Trustees of Credit Suisse Trust and Shareholders of
Credit Suisse Trust — Small Cap Core I Portfolio:
In our opinion, the accompanying statement of assets and liabilities, including the schedule of investments, and the related statements of operations and of changes in net assets and the financial highlights present fairly, in all material respects, the financial position of Small Cap Core I Portfolio (the "Portfolio"), a portfolio of the Credit Suisse Trust, at December 31, 2007, the results of its operations for the year then ended, the changes in its net assets for each of the two years in the period then ended and the financial highlights for each of the five years in the period then ended, in conformity with accounting principles generally accepted in the United States of America. These financial statements and financial highlights (hereafter referred to as "financial statements") are the responsibility of the Portfolio's management; our responsibility is to express an opinion on these financial statements based on our audits. We conduc ted our audits of these financial statements in accordance with the standards of the Public Company Accounting Oversight Board (United States). Those standards require that we plan and perform the audit to obtain reasonable assurance about whether the financial statements are free of material misstatement. An audit includes examining, on a test basis, evidence supporting the amounts and disclosures in the financial statements, assessing the accounting principles used and significant estimates made by management, and evaluating the overall financial statement presentation. We believe that our audits, which included confirmation of securities at December 31, 2007 by correspondence with the custodian, provide a reasonable basis for our opinion.
PricewaterhouseCoopers LLP
Baltimore, Maryland
February 25, 2008
31
Credit Suisse Trust — Small Cap Core I Portfolio
Board Approval of Advisory Agreement (unaudited)
In approving the renewal of the current Advisory Agreement, the Board of Trustees, including the Independent Trustees, at a meeting held on November 13 and 14, 2007, considered the following factors with respect to the Small Cap Core I Portfolio (the "Portfolio"):
Investment Advisory Fee Rates
The Board reviewed and considered the contractual advisory fee of 0.70% ("Contractual Advisory Fee") in light of the extent and quality of the advisory services provided by Credit Suisse Asset Management, LLC ("Credit Suisse").
Additionally, the Board received and considered information comparing the Portfolio's Contractual Advisory Fee and the Portfolio's overall expenses with those of funds in both the relevant expense group ("Expense Group") and universe of funds (the "Expense Universe") provided by Lipper Inc., an independent provider of investment company data.
Nature, Extent and Quality of the Services under the Advisory Agreement
The Board received and considered information regarding the nature, extent and quality of services provided to the Portfolio by Credit Suisse under the Advisory Agreement. The Board also noted information received at regular meetings throughout the year related to the services rendered by Credit Suisse. The Board reviewed background information about Credit Suisse, including its Form ADV. The Board considered the background and experience of Credit Suisse's senior management and the expertise of, and the amount of attention given to the Portfolio by, senior personnel of Credit Suisse. In addition, the Board reviewed the qualifications, backgrounds and responsibilities of the portfolio management team primarily responsible for the day-to-day portfolio management of the Portfolio and the extent of the resources devoted to research and analysis of actual and potential investments. The Board also received and considered information about the nat ure, extent and quality of services and fee rates offered to other Credit Suisse clients for comparable services.
Portfolio Performance
The Board received and considered the performance results of the Portfolio over time, along with comparisons both to the relevant performance group ("Performance Group") and universe of funds ("Performance Universe") for
32
Credit Suisse Trust — Small Cap Core I Portfolio
Board Approval of Advisory Agreement (unaudited) (continued)
the Portfolio. The Board was provided with a description of the methodology used to arrive at the funds included in the Performance Group and the Performance Universe.
Credit Suisse Profitability
The Board received and considered a profitability analysis of Credit Suisse based on the fees payable under the Advisory Agreement for the Portfolio, including other relationships between the Portfolio on the one hand and Credit Suisse affiliates on the other. The Board received profitability information for the other funds in the Credit Suisse family of funds.
Economies of Scale
The Board considered whether economies of scale in the provision of services to the Portfolio were being passed along to the shareholders. Accordingly, the Board considered whether alternative fee structures (such as breakpoint fee structures) would be more appropriate or reasonable taking into consideration economies of scale or other efficiencies that might accrue from increases in the Portfolio's asset levels.
Other Benefits to Credit Suisse
The Board considered other benefits received by Credit Suisse and its affiliates as a result of their relationship with the Portfolio. Such benefits include, among others, research arrangements with brokers who execute transactions on behalf of the Portfolio, administrative and brokerage relationships with affiliates of Credit Suisse and benefits potentially derived from an increase in Credit Suisse's businesses as a result of its relationship with the Portfolio (such as the ability to market to shareholders other financial products offered by Credit Suisse and its affiliates).
The Board considered the standards applied in seeking best execution, whether and to what extent soft dollar credits are sought and how any such credits are utilized, any benefits that may be achieved by using a affiliated broker and the existence of quality controls applicable to brokerage allocation procedures. The Board also reviewed Credit Suisse's method for allocating portfolio investment opportunities among its advisory clients.
33
Credit Suisse Trust — Small Cap Core I Portfolio
Board Approval of Advisory Agreement (unaudited) (continued)
Conclusions
In selecting Credit Suisse, and approving the Advisory Agreement and the investment advisory fee under such agreement, the Board concluded that:
• The Contractual Advisory Fee is at the low end in the Portfolio's Expense Group and the Board considered the fee to be reasonable.
• The Portfolio's performance was below most of its peers in its Performance Group and Performance Universe for all of the periods reviewed. The Board noted that changes in the Portfolio's investment strategies and portfolio management had gone into effect on December 1, 2006 and that the Board would continue to monitor steps undertaken by Credit Suisse to improve performance.
• Aside from performance (as described above), the Board was satisfied with the nature and extent of the investment advisory services provided to the Portfolio by Credit Suisse and that, based on dialogue with management and counsel, the services provided by Credit Suisse under the Advisory Agreement are typical of, and consistent with, those provided to similar mutual funds by other investment advisers.
• In light of the costs of providing investment management and other services to the Portfolio and Credit Suisse's ongoing commitment to the Portfolio, the profits and other ancillary benefits that Credit Suisse and its affiliates received were considered reasonable.
• Credit Suisse's profitability based on fees payable under the Advisory Agreement was reasonable in light of the nature, extent and quality of the services provided to the Portfolio thereunder.
• In light of the amount of the Contractual Advisory Fee, the Portfolio's current fee structure (without breakpoints) was considered reasonable.
No single factor reviewed by the Board was identified by the Board as the principal factor in determining whether to approve the Advisory Agreement. The Independent Trustees were advised by separate independent legal counsel throughout the process.
34
Credit Suisse Trust — Small Cap Core I Portfolio
Information Concerning Trustees and Officers (unaudited)
Name, Address
(Year of Birth) | |
Position(s)
Held with
Trust | | Term
of Office1
and
Length
of Time
Served | |
Principal
Occupation(s) During
Past Five Years | | Number of
Portfolios in
Fund
Complex
Overseen by
Trustee | |
Other
Directorships
Held by
Trustee | |
| Independent Trustees | | | | | | | | | | | |
|
Enrique Arzac
c/o Credit Suisse Asset Management, LLC
Attn: General Counsel Eleven Madison Avenue New York, New York
10010
(1941) | | Trustee, Nominating Committee Member and Audit Committee Chairman | | Since 2005 | | Professor of Finance and Economics, Graduate School of Business, Columbia University since 1971. | | | 35 | | | Director of Epoch Holding Corporation (an investment management and investment advisory
services company); Director of The Adams Express Company (a closed-end investment company); Director of Petroleum and Resources Corporation (a closed-end investment company). | |
|
Jeffrey E. Garten2
Box 208200
New Haven, Connecticut 06520-8200
(1946) | | Trustee, Nominating and Audit Committee Member | | Since 1998 | | The Juan Trippe Professor in the Practice of International Trade, Finance and Business from July 2005 to present; Partner and Chairman of Garten Rothkopf (consulting firm) from October 2005 to present; Dean of Yale School of Management from November 1995 to June 2005. | | | 28 | | | Director of Aetna, Inc. (insurance company); Director of CarMax Group (used car dealers); Director of Alcan, Inc. (smelting and refining of nonferrous metals company). | |
|
1 Each Trustee and Officer serves until his or her respective successor has been duly elected and qualified.
2 Mr. Garten was initially appointed as a Trustee of the Trust on February 6, 1998. He resigned as Trustee on February 3, 2000 and subsequently reappointed on December 21, 2000.
35
Credit Suisse Trust — Small Cap Core I Portfolio
Information Concerning Trustees and Officers (unaudited) (continued)
Name, Address
(Year of Birth) | |
Position(s)
Held with
Trust | | Term
of Office1
and
Length
of Time
Served | |
Principal
Occupation(s) During
Past Five Years | | Number of
Portfolios in
Fund
Complex
Overseen by
Trustee | |
Other
Directorships
Held by
Trustee | |
| Independent Trustees | | | | | | | | | | | | | |
|
Peter F. Krogh
SFS/ICC 702
Georgetown University
Washington, DC 20057
(1937) | | Trustee, Nominating and Audit Committee Member | | Since 2001 | | Dean Emeritus and Distinguished Professor of International Affairs at the Edmund A. Walsh School of Foreign Service, Georgetown University from June 1995 to present. | | | 28 | | | Director of Carlisle Companies Incorporated (diversified manufacturing company). | |
|
Steven N. Rappaport
Lehigh Court, LLC
555 Madison Avenue
29th Floor
New York, New York 10022
(1948) | | Chairman of the Board of Trustees, Nominating Committee Chairman and Audit Committee Member | | Trustee since 1999 and Chairman since 2005 | | Partner of Lehigh Court, LLC and RZ Capital (private investment firms) from July 2002 to present. | | | 35 | | | Director of iCAD, Inc. (surgical and medical instruments and apparatus company); Director of Presstek, Inc. (digital imaging technologies company); Director of Wood Resources, LLC. (plywood manufacturing company). | |
|
| Interested Trustee | |
|
Michael E. Kenneally3
c/o Credit Suisse Asset Management, LLC Attn: General Counsel Eleven Madison Avenue New York, New York 10010
(1954) | | Trustee | | Since 2004 | | Chairman and Global Chief Executive Officer of Credit Suisse from March 2003 to July 2005; Chairman and Chief Investment Officer of Banc of America Capital Management from 1998 to March 2003. | | | 28 | | | None | |
|
3 Mr. Kenneally is a Trustee who is an "interested person" of the Trust as defined in the Investment Company Act of 1940, as amended, because he was an officer of Credit Suisse within the last two fiscal years.
36
Credit Suisse Trust — Small Cap Core I Portfolio
Information Concerning Trustees and Officers (unaudited) (continued)
Name, Address
(Year of Birth) | | Held with
Trust | | Term
of Office1
and
Position(s)
of Time
Served | | Length
Principal Occupation(s) During Past Five Years | |
| Officers | | | | | | | |
|
Lawrence D. Haber
c/o Credit Suisse Asset Management, LLC.
Attn: General Counsel
Eleven Madison Avenue
New York, New York 10010
(1951) | | Chief Executive Officer and President | | Since 2007 | | Managing Director and Chief Operating Officer of Credit Suisse; Member of Credit Suisse's Management Committee; Chief Financial Officer of Merrill Lynch Investment Managers from 1997 to 2003. | |
|
Michael A. Pignataro
Credit Suisse Asset Management, LLC
Eleven Madison Avenue New York, New York 10010
(1959) | | Chief Financial Officer | | Since 1999 | | Director and Director of Fund Administration of Credit Suisse; Associated with Credit Suisse or its predecessor since 1984; Officer of other Credit Suisse Funds. | |
|
Emidio Morizio
Credit Suisse Asset Management, LLC
Eleven Madison Avenue New York, New York 10010
(1966) | | Chief Compliance Officer | | Since 2004 | | Director and Global Head of Compliance of Credit Suisse; Associated with Credit Suisse since July 2000; Officer of other Credit Suisse Funds. | |
|
J. Kevin Gao
Credit Suisse Asset Management, LLC
Eleven Madison Avenue New York, New York 10010
(1967) | | Chief Legal Officer since 2006, Vice President and Secretary since 2004 | | Since 2004 | | Director and Legal Counsel of Credit Suisse; Associated with Credit Suisse since July 2003; Associated with the law firm of Willkie Farr & Gallagher LLP from 1998 to 2003; Officer of other Credit Suisse Funds. | |
|
Robert Rizza
Credit Suisse Asset Management, LLC
Eleven Madison Avenue New York, New York 10010
(1965) | | Treasurer | | Since 2006 | | Vice President of Credit Suisse; Associated with Credit Suisse since 1998; Officer of other Credit Suisse Funds. | |
|
The Statement of Additional Information includes additional information about the Trustees and is available, without charge, upon request, by calling 800-222-8977.
37
Credit Suisse Trust — Small Cap Core I Portfolio
Proxy Voting and Portfolio Holdings Information (unaudited)
Information regarding how the Portfolio voted proxies related to its portfolio securities during the 12 month period ended June 30 of each year, as well as the policies and procedures that the Portfolio uses to determine how to vote proxies relating to its portfolio securities are available:
• By calling 1-800-222-8977
• On the Portfolio's website, www.credit-suisse.com/us
• On the website of the Securities and Exchange Commission, www.sec.gov.
The Portfolio files a complete schedule of its portfolio holdings for the first and third quarters of its fiscal year with the SEC on Form N-Q. The Portfolio's Forms N-Q are available on the SEC's website at www.sec.gov and may be reviewed and copied at the SEC's Public Reference Room in Washington, DC. Information on the operation of the SEC's Public Reference Room may be obtained by calling 1-202-551-8090.
38
This page intentionally left blank
This page intentionally left blank

P.O. BOX 55030, BOSTON, MA 02205-5030
800-222-8977 n WWW.credit-suisse.com/us
CREDIT SUISSE ASSET MANAGEMENT SECURITIES, INC., DISTRIBUTOR. TRSCC I-AR-1207
Item 2. Code of Ethics.
The registrant has adopted a code of ethics applicable to its Chief Executive Officer, President, Chief Financial Officer and Chief Accounting Officer, or persons performing similar functions. A copy of the code is filed as Exhibit 12(a)(1) to this Form. There were no amendments to the code during the fiscal year ended December 31, 2007. There were no waivers or implicit waivers from the code granted by the registrant during the fiscal year ended December 31, 2007.
Item 3. Audit Committee Financial Expert.
The registrant’s governing board has determined that it has two audit committee financial experts serving on its audit committee: Enrique R. Arzac and Steven N. Rappaport. Each audit committee financial expert is “independent” for purposes of this item.
Item 4. Principal Accountant Fees and Services.
(a) through (d). The information in the table below is provided for services rendered to the registrant by its independent registered public accounting firm, PricewaterhouseCoopers LLP (“PwC”), for its fiscal years ended December 31, 2006 and December 31, 2007.
| | 2006 | | 2007 | |
| | | | | |
Audit Fees | | $ | 193,987 | | $ | 210,529 | |
| | | | | |
Audit-Related Fees(1) | | $ | 29,205 | | $ | 26,720 | |
| | | | | |
Tax Fees(2) | | $ | 22,635 | | $ | 20,720 | |
| | | | | |
All Other Fees | | — | | — | |
| | | | | |
Total | | $ | 245,827 | | $ | 257,969 | |
(1) Services include agreed-upon procedures in connection with the registrant’s semi-annual financial statements ($29,205 for 2006 and $26,720 for 2007).
(2) Tax services in connection with the registrant’s excise tax calculations and review of the registrant’s applicable tax returns.
The information in the table below is provided with respect to non-audit services that directly relate to the registrant’s operations and financial reporting and that were rendered by PwC to the registrant’s investment adviser, Credit Suisse Asset Management, LLC (“Credit Suisse”), and any service provider to the registrant controlling, controlled by or under common control with Credit Suisse that provided ongoing services to the registrant (“Covered Services Provider”), for the registrant’s fiscal years ended December 31, 2006 and December 31, 2007.
| | 2006 | | 2007 | |
| | | | | |
Audit-Related Fees | | N/A | | N/A | |
| | | | | |
Tax Fees | | N/A | | N/A | |
| | | | | |
All Other Fees | | N/A | | N/A | |
| | | | | |
Total | | N/A | | N/A | |
2
(e)(1) Pre-Approval Policies and Procedures. The Audit Committee (“Committee”) of the registrant is responsible for pre-approving (i) all audit and permissible non-audit services to be provided by the independent registered public accounting firm to the registrant and (ii) all permissible non-audit services to be provided by the independent registered public accounting firm to Credit Suisse and any Covered Services Provider if the engagement relates directly to the operations and financial reporting of the registrant. The Committee may delegate its responsibility to pre-approve any such audit and permissible non-audit services to the Chairperson of the Committee, and the Chairperson shall report to the Committee, at its next regularly scheduled meeting after the Chairperson’s pre-approval of such services, his or her decision(s). The Committee may also establish detailed pre-approval policies and procedures for pre-approval of such services in accordance with applicable laws, including the delegation of some or all of the Committee’s pre-approval responsibilities to other persons (other than Credit Suisse or the registrant’s officers). Pre-approval by the Committee of any permissible non-audit services shall not be required so long as: (i) the aggregate amount of all such permissible non-audit services provided to the registrant, Credit Suisse and any Covered Services Provider constitutes not more than 5% of the total amount of revenues paid by the registrant to its independent registered public accounting firm during the fiscal year in which the permissible non-audit services are provided; (ii) the permissible non-audit services were not recognized by the registrant at the time of the engagement to be non-audit services; and (iii) such services are promptly brought to the attention of the Committee and approved by the Committee (or its delegate(s)) prior to the completion of the audit.
(e)(2) The information in the table below sets forth the percentages of fees for services (other than audit, review or attest services) rendered by PwC to the registrant for which the pre-approval requirement was waived pursuant to Rule 2-01(c)(7)(i)(C) of Regulation S-X:
| | 2006 | | 2007 | |
| | | | | |
Audit-Related Fees | | N/A | | N/A | |
| | | | | |
Tax Fees | | N/A | | N/A | |
| | | | | |
All Other Fees | | N/A | | N/A | |
| | | | | |
Total | | N/A | | N/A | |
3
The information in the table below sets forth the percentages of fees for services (other than audit, review or attest services) rendered by PwC to Credit Suisse and any Covered Services Provider required to be approved pursuant to Rule 2-01(c)(7)(ii) of Regulation
S-X, for the registrant’s fiscal years ended December 31, 2006 and December 31, 2007:
| | 2006 | | 2007 | |
| | | | | |
Audit-Related Fees | | N/A | | N/A | |
| | | | | |
Tax Fees | | N/A | | N/A | |
| | | | | |
All Other Fees | | N/A | | N/A | |
| | | | | |
Total | | N/A | | N/A | |
(f) Not Applicable.
(g) The aggregate fees billed by PwC for non-audit services rendered to the registrant, Credit Suisse and Covered Service Providers for the fiscal years ended December 31, 2006 and December 31, 2007 were $51,840 and $47,440, respectively.
(h) Not Applicable.
Item 5. Audit Committee of Listed Registrants.
Form N-CSR disclosure requirement is not applicable to the registrant.
Item 6. Schedule of Investments.
Included as part of the report to shareholders filed under Item 1 of this Form.
4
Item 7. Disclosure of Proxy Voting Policies and Procedures for Closed-End Management Investment Companies.
Form N-CSR disclosure requirement is not applicable to the registrant.
Item 8. Portfolio Managers of Closed-End Management Investment Companies.
Form N-CSR disclosure requirement is not applicable to the registrant.
Item 9. Purchases of Equity Securities by Closed-End Management Investment Company and Affiliated Purchasers.
Form N-CSR disclosure requirement is not applicable to the registrant.
Item 10. Submission of Matters to a Vote of Security Holders.
None
Item 11. Controls and Procedures.
(a) As of a date within 90 days from the filing date of this report, the principal executive officer and principal financial officer concluded that the registrant’s disclosure controls and procedures (as defined in Rule 30a-3(c) under the Investment Company Act of 1940 (the “Act”)) were effective based on their evaluation of the disclosure controls and procedures required by Rule 30a-3(b) under the Act and Rules 13a-15(b) or 15d-15(b) under the Securities Exchange Act of 1934.
(b) There were no changes in registrant’s internal control over financial reporting (as defined in Rule 30a-3(d) under the Act) that occurred during the second fiscal quarter of the period covered by this report that have materially affected, or are reasonably likely to materially affect, the registrant’s internal control over financial reporting.
Item 12. Exhibits.
(a)(1) Registrant’s Code of Ethics is an exhibit to this report.
(a)(2) The certifications of the registrant as required by Rule 30a-2(a) under the Act are exhibits to this report.
(a)(3) Not applicable.
(b) The certifications of the registrant as required by Rule 30a-2(b) under the Act are an exhibit to this report.
5
SIGNATURES
Pursuant to the requirements of the Securities Exchange Act of 1934 and the Investment Company Act of 1940, the registrant has duly caused this report to be signed on its behalf by the undersigned, thereunto duly authorized.
| CREDIT SUISSE TRUST |
| |
| /s/ Lawrence D. Haber | |
| Name: | Lawrence D. Haber |
| Title: | Chief Executive Officer |
| Date: | March 6, 2008 |
| | | |
Pursuant to the requirements of the Securities Exchange Act of 1934 and the Investment Company Act of 1940, this report has been signed below by the following persons on behalf of the registrant and in the capacities and on the dates indicated.
| /s/ Lawrence D. Haber | |
| Name: | Lawrence D. Haber |
| Title: | Chief Executive Officer |
| Date: | March 6, 2008 |
| | |
| /s/ Michael A. Pignataro | |
| Name: | Michael A. Pignataro |
| Title: | Chief Financial Officer |
| Date: | March 6, 2008 |
| | | |
6