UNITED STATES
SECURITIES AND EXCHANGE COMMISSION
Washington, D.C. 20549
FORM N-CSR
CERTIFIED SHAREHOLDER REPORT OF REGISTERED
MANAGEMENT INVESTMENT COMPANIES
Investment Company Act file number | 811-07261 |
|
CREDIT SUISSE TRUST |
(Exact name of registrant as specified in charter) |
|
Eleven Madison Avenue, New York, New York | | 10010 |
(Address of principal executive offices) | | (Zip code) |
|
J. Kevin Gao, Esq.
Credit Suisse Trust
Eleven Madison Avenue
New York, New York 10010 |
(Name and address of agent for service) |
|
Registrant’s telephone number, including area code: | (212) 325-2000 | |
|
Date of fiscal year end: | December 31st | |
|
Date of reporting period: | January 1, 2008 to December 31, 2008 | |
| | | | | | | | | |
Item 1. Reports to Stockholders.

CREDIT SUISSE FUNDS
Annual Report
December 31, 2008
CREDIT SUISSE TRUST
n BLUE CHIP PORTFOLIO
Credit Suisse Trust (the "Trust") shares are not available directly to individual investors, but may be offered only through certain insurance products and pension and retirement plans.
The Trust's investment objectives, risks, charges and expenses (which should be considered carefully before investing), and more complete information about the Trust, are provided in the Prospectus, which should be read carefully before investing. You may obtain additional copies by calling 800-222-8977 or by writing to Credit Suisse Trust, P.O. Box 55030, Boston, MA 02205-5030.
Credit Suisse Asset Management Securities, Inc., Distributor, is located at Eleven Madison Avenue, New York, NY 10010. The Trust is advised by Credit Suisse Asset Management, LLC.
The views of the Portfolio's management are as of the date of the letter and the Portfolio holdings described in this document are as of December 31, 2008; these views and Portfolio holdings may have changed subsequent to these dates. Nothing in this document is a recommendation to purchase or sell securities.
Portfolio shares are not deposits or other obligations of Credit Suisse Asset Management, LLC ("Credit Suisse") or any affiliate, are not FDIC-insured and are not guaranteed by Credit Suisse or any affiliate. Portfolio investments are subject to investment risks, including loss of your investment.
Credit Suisse Trust — Blue Chip Portfolio
Annual Investment Adviser's Report
December 31, 2008 (unaudited)
January 29, 2009
Dear Shareholder:
For the twelve months ended December 31, 2008, Credit Suisse Trust — Blue Chip Portfolio1 (the "Portfolio") had a loss of -35.69% versus a decrease of -37.00% for the Standard & Poor's 500 Index2 (the "S&P500").
Market Review: A volatile year
The fiscal year ending December 31, 2008 was a tumultuous one marked by dramatic losses in the equity markets. The benchmark S&P 500 Index fell by 37.00%, while the Dow Jones Industrial Average fell by 31.93%. The Chicago Board of Exchange Volatility Index (the "VIX"), a measure of market volatility, hit highs of 80 in October and November. The current global economic crisis was caused by a multitude of factors, including a lack of liquidity, a bleak outlook for future growth, and recessionary attitudes and signals.
In December, The National Bureau of Economic Research said that the U.S. has been in a recession since December 2007. The year was marked by turmoil across industries and asset classes as evidenced by the collapse of companies such as Bear Stearns and Lehman Brothers within the financials, the sharp price fluctuations and ultimate decline of all commodities, and government efforts toward the bailout of the banking and automotive industries.
All 10 sectors within the large cap S&P 500 produced negative returns. Consumer staples and health care declined the least — by 17.66% and 24.48%, respectively. The financials and materials sector suffered the greatest losses of 56.95% and 47.05%, respectively. These losses were primarily due to market illiquidity (financials) and weakened demand (materials). Consumer staples and health care are usually considered good defensive bets, and while they finished the year with losses, their performance was substantially better than materials and financials.
The U.S. Federal Reserve cut the Federal Funds rate several times, dropping it from 4.50% to a range of 0.00% – 0.25% by October 29, 2008. Throughout the year, the discount rate was also cut in conjunction with the Federal Funds rate, and is now at 0.50%.
The U.S. housing sector continued to weaken in 2008, as evidenced by the S&P/Case Shiller U.S. Home Price Index, which measures home prices in 20 U.S. metropolitan areas. In October, the index was down 18% from a year earlier. The drop was more than originally forecast and the index has been falling every month since January 2007.
1
Credit Suisse Trust — Blue Chip Portfolio
Annual Investment Adviser's Report (continued)
December 31, 2008 (unaudited)
Additionally, as reported on December 30, 2008, the Conference Board Consumer Confidence Index fell to an all time low. The Index is now at 38.0, down from 44.7 in November. The Consumer Confidence Survey is based on a representative sample of 5,000 U.S. households.
Unemployment continued to rise in 2008, with increased job losses in all major industry sectors. Non-farm payrolls fell by 533,000 jobs in November, following losses of 403,000 in September and 320,000 in October. The household unemployment rate was 6.7%.
Strategic Review and Portfolio Outlook: Confidence and liquidity need to be restored
For the annual period ending December 31, 2008, the portfolio outperformed its benchmark. Stock selection in financials and stock and sector selection in industrials and consumer discretionary contributed positively to performance. Conversely, stock and sector selection in health care, stock selection in energy and sector selection in telecomm services detracted from performance. The Fund's outperformance over its benchmark was much stronger in the fourth quarter than in the other quarters. This was mainly because of a solid performance in December, resulting from the fact that hedge funds eased liquidation of positions. In addition, volatility, as demonstrated through the VIX, also decreased significantly in December compared to October and November.
On December 16, 2008, the Federal Open Market Committee (the "FOMC") issued a press release stating that "labor market conditions have deteriorated, and the available data indicate that consumer spending, business investment, and industrial production have declined. Financial markets remain quite strained and credit conditions tight. Overall, the outlook for economic activity has weakened further."
Chairman of the Federal Reserve Board Ben Bernanke stated in a speech at the Economic Club of New York on October 15, 2008 that the root of the current economic crisis is a loss of confidence by investors and the public in the strength of key financial institutions and the markets. He predicted that, as political and financial leaders slowly restore the public's faith in the markets, investors will gradually begin to re-establish their trust, and the markets will start to recover.
Despite the easing of volatility in December, compared to that of prior months, we believe there will continue to be months of uncertainty. At the end of the year, the market showed signs of easing liquidity with interest rates such as the LIBOR decreasing, interbank lending increasing, and the U.S. dollar strengthening. However, it is not clear that this additional liquidity in the markets and between banks will truly benefit consumers. For example, banks have begun
2
Credit Suisse Trust — Blue Chip Portfolio
Annual Investment Adviser's Report (continued)
December 31, 2008 (unaudited)
to tighten their credit standards to such an extent that the average consumer may have a harder time borrowing money. Therefore, in this economic crisis where faith in the markets is key, we believe, like Bernanke, that in order for the market to recover, confidence and liquidity need to be restored.
Additionally, we have observed an increase in technical movements — caused by large hedge funds reducing leverage — not related to the fundamentals that most quantitative models are based upon. We believe that these volatile intraday swings will need to be monitored closely, but as our investment model is designed with long-term goals in mind, a drastic change in our investment model will not be made. That being said, we are continuously conducting economic, statistical, and financial research on various levels in order to enhance our model. We have gone back to the basics of finance, where we seek to buy businesses that make comfortable returns without the need for excessive leverage.
Jordan Low
Portfolio Manager
The value of investments generally will fluctuate in response to market movements.
In addition to historical information, this report contains forward-looking statements, which may concern, among other things, domestic and foreign market, industry and economic trends and developments and government regulation and their potential impact on the Portfolio's investments. These statements are subject to risks and uncertainties and actual trends, developments and regulations in the future, and their impact on the Portfolio could be materially different from those projected, anticipated or implied. The Portfolio has no obligation to update or revise forward-looking statements.
3
Credit Suisse Trust — Blue Chip Portfolio
Annual Investment Adviser's Report (continued)
December 31, 2008 (unaudited)
Comparison of Change in Value of $10,000 Investment in the
Credit Suisse Trust — Blue Chip Portfolio1 and the
S&P 500 Index2, 3 from Inception (11/30/01).

4
Credit Suisse Trust — Blue Chip Portfolio
Annual Investment Adviser's Report (continued)
December 31, 2008 (unaudited)
Average Annual Returns as of December 31, 20081
| 1 Year | | 5 Years | | Since
Inception | |
| | (35.69 | )% | | | (1.56 | )% | | | (2.28 | )% | |
Returns represent past performance and include change in share price and reinvestment of dividends and capital gains. Past performance cannot guarantee future results. The current performance of the Portfolio may be lower or higher than the figures shown. Returns and share price will fluctuate, and redemption value may be more or less than original cost. The performance results do not reflect the deduction of taxes that a shareholder would pay on portfolio distributions or the redemption of portfolio shares. Performance includes the effect of deducting expenses, but does not include charges and expenses attributable to any particular variable contract or plan. Accordingly, the Prospectus of the sponsoring Participating Insurance Company separate account or plan documents or ot her informational materials supplied by plan sponsors should be carefully reviewed for information on relevant charges and expenses. Excluding these charges and expenses from quotations of performance has the effect of increasing the performance quoted, and the effect of these charges should be considered when comparing performance to that of other mutual funds. Performance information current to the most recent month-end is available at www.credit-suisse.com/us.
The annualized gross expense ratio is 2.03%. The annualized net expense ratio after fee waivers and/or expense reimbursements is 0.95%.
1 Fee waivers and/or expense reimbursements may reduce expenses for the Portfolio, without which performance would be lower. Waivers and/or reimbursements may be discontinued at any time.
2 The Standard & Poor's 500 Index is an unmanaged index (with no defined investment objective) of common stocks, includes reinvestment of dividends, and is a registered trademark of The McGraw-Hill Companies, Inc. Investors cannot invest directly in an index.
3 Performance for the benchmark is not available for the period beginning November 30, 2001 (commencement of operations). For that reason, performance is shown for the period beginning December 1, 2001.
5
Credit Suisse Trust — Blue Chip Portfolio
Annual Investment Adviser's Report (continued)
December 31, 2008 (unaudited)
Information About Your Portfolio's Expenses
As an investor of the Portfolio, you incur two types of costs: ongoing expenses and transaction costs. Ongoing expenses include management fees, distribution and service (12b-1) fees and other Portfolio expenses. Examples of transaction costs include sales charges (loads), redemption fees and account maintenance fees, which are not shown in this section and which would result in higher total expenses. The following table is intended to help you understand your ongoing expenses of investing in the Portfolio and to help you compare these expenses with the ongoing expenses of investing in other mutual funds. The table is based on an investment of $1,000 made at the beginning of the six month period ended December 31, 2008.
The table illustrates your Portfolio's expenses in two ways:
• Actual Portfolio Return. This helps you estimate the actual dollar amount of ongoing expenses paid on a $1,000 investment in the Portfolio using the Portfolio's actual return during the period. To estimate the expenses you paid over the period, simply divide your account value by $1,000 (for example, an $8,600 account value divided by $1,000 = 8.6), then multiply the result by the number in the "Expenses Paid per $1,000" line under the share class you hold.
• Hypothetical 5% Portfolio Return. This helps you to compare your Portfolio's ongoing expenses with those of other mutual funds using the Portfolio's actual expense ratio and a hypothetical rate of return of 5% per year before expenses. Examples using a 5% hypothetical portfolio return may be found in the shareholder reports of other mutual funds. The hypothetical account values and expenses may not be used to estimate the actual ending account balance or expenses you paid for the period.
Please note that the expenses shown in these tables are meant to highlight your ongoing expenses only and do not reflect any transaction costs, such as sales charges (loads) or redemption fees. If these transaction costs had been included, your costs would have been higher. The "Expenses Paid per $1,000" line of the tables is useful in comparing ongoing expenses only and will not help you determine the relative total expenses of owning different funds.
6
Credit Suisse Trust — Blue Chip Portfolio
Annual Investment Adviser's Report (continued)
December 31, 2008 (unaudited)
Expenses and Value for a $1,000 Investment
for the six month period ended December 31, 2008
| Actual Portfolio Return | |
| Beginning Account Value 7/1/08 | | $ | 1,000.00 | | |
| Ending Account Value 12/31/08 | | $ | 732.20 | | |
| Expenses Paid per $1,000* | | $ | 4.14 | | |
| Hypothetical 5% Portfolio Return | |
| Beginning Account Value 7/1/08 | | $ | 1,000.00 | | |
| Ending Account Value 12/31/08 | | $ | 1,020.36 | | |
| Expenses Paid per $1,000* | | $ | 4.82 | | |
| Annualized Expense Ratios* | | | 0.95 | % | |
* Expenses are equal to the Portfolio's annualized expense ratio multiplied by the average account value over the period, multiplied by the number of days in the most recent fiscal half year period, then divided by 366.
The "Expenses Paid per $1,000" and the "Annualized Expense Ratios" in the tables are based on actual expenses paid by the Portfolio during the period, net of fee waivers and/or expense reimbursements. If those fee waivers and/or expense reimbursements had not been in effect, the Portfolio's actual expenses would have been higher. Expenses do not reflect additional charges and expenses that are, or may be, imposed under the variable contracts or plans. Such charges and expenses are described in the prospectus of the insurance company separate account or in the plan documents or other informational materials supplied by plan sponsors. The Portfolio's expenses should be considered with these charges and expenses in evaluating the overall cost of investing in the separate account.
For more information, please refer to the Portfolio's prospectus.
7
Credit Suisse Trust — Blue Chip Portfolio
Annual Investment Adviser's Report (continued)
December 31, 2008 (unaudited)
SECTOR BREAKDOWN*
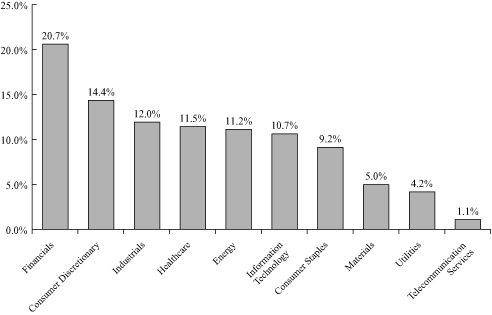
* Expressed as a percentage of total investments (excluding securities lending collateral if applicable) and may vary over time.
8
Credit Suisse Trust — Blue Chip Portfolio
Schedule of Investments
December 31, 2008
| | | Number of
Shares | | Value | |
| COMMON STOCKS (99.4%) | |
| Aerospace & Defense (2.1%) | |
| General Dynamics Corp. | | | 400 | | | $ | 23,036 | | |
| Goodrich Corp. | | | 500 | | | | 18,510 | | |
| Hexcel Corp.* | | | 100 | | | | 739 | | |
| L-3 Communications Holdings, Inc. | | | 200 | | | | 14,756 | | |
| Northrop Grumman Corp. | | | 700 | | | | 31,528 | | |
| Raytheon Co. | | | 300 | | | | 15,312 | | |
| Rockwell Collins, Inc. | | | 400 | | | | 15,636 | | |
| The Boeing Co. | | | 300 | | | | 12,801 | | |
| United Technologies Corp. | | | 300 | | | | 16,080 | | |
| | | | 148,398 | | |
| Air Freight & Couriers (0.4%) | |
| FedEx Corp. | | | 200 | | | | 12,830 | | |
| United Parcel Service, Inc. Class B | | | 300 | | | | 16,548 | | |
| | | | 29,378 | | |
| Airlines (0.1%) | |
| Southwest Airlines Co. | | | 800 | | | | 6,896 | | |
| Auto Components (0.9%) | |
| Autoliv, Inc. | | | 800 | | | | 17,168 | | |
| BorgWarner, Inc. | | | 800 | | | | 17,416 | | |
| Federal Signal Corp. | | | 200 | | | | 1,642 | | |
| Johnson Controls, Inc. | | | 1,400 | | | | 25,424 | | |
| The Goodyear Tire & Rubber Co.* | | | 700 | | | | 4,179 | | |
| | | | 65,829 | | |
| Automobiles (0.1%) | |
| Ford Motor Co.* | | | 1,700 | | | | 3,893 | | |
| General Motors Corp. | | | 400 | | | | 1,280 | | |
| | | | 5,173 | | |
| Banks (4.0%) | |
| Astoria Financial Corp. | | | 1,300 | | | | 21,424 | | |
| BancorpSouth, Inc. | | | 200 | | | | 4,672 | | |
| Bank of America Corp. | | | 254 | | | | 3,576 | | |
| Bank of Hawaii Corp. | | | 300 | | | | 13,551 | | |
| Bank of New York Mellon Corp. | | | 400 | | | | 11,332 | | |
| BB&T Corp. | | | 300 | | | | 8,238 | | |
| Cullen/Frost Bankers, Inc. | | | 400 | | | | 20,272 | | |
| Fifth Third Bancorp | | | 200 | | | | 1,652 | | |
| Hudson City Bancorp, Inc. | | | 3,800 | | | | 60,648 | | |
| Huntington Bancshares, Inc. | | | 100 | | | | 766 | | |
| National City Corp. | | | 600 | | | | 1,086 | | |
| New York Community Bancorp, Inc. | | | 300 | | | | 3,588 | | |
| Northern Trust Corp. | | | 900 | | | | 46,926 | | |
| PNC Financial Services Group, Inc. | | | 300 | | | | 14,700 | | |
| Provident Financial Services, Inc. | | | 1,200 | | | | 18,360 | | |
| SunTrust Banks, Inc. | | | 300 | | | | 8,862 | | |
| U.S. Bancorp | | | 300 | | | | 7,503 | | |
See Accompanying Notes to Financial Statements.
9
Credit Suisse Trust — Blue Chip Portfolio
Schedule of Investments (continued)
December 31, 2008
| | | Number of
Shares | | Value | |
| COMMON STOCKS | |
| Banks | |
| Valley National Bancorp | | | 1,100 | | | $ | 22,275 | | |
| Washington Mutual, Inc. | | | 1,200 | | | | 26 | | |
| Wells Fargo & Co. | | | 200 | | | | 5,896 | | |
| Zions Bancorporation | | | 100 | | | | 2,451 | | |
| | | | 277,804 | | |
| Beverages (2.0%) | |
| Coca-Cola Enterprises, Inc. | | | 300 | | | | 3,609 | | |
| Dr. Pepper Snapple Group, Inc.* | | | 1,200 | | | | 19,500 | | |
| Molson Coors Brewing Co. Class B | | | 200 | | | | 9,784 | | |
| PepsiAmericas, Inc. | | | 1,700 | | | | 34,612 | | |
| PepsiCo, Inc. | | | 300 | | | | 16,431 | | |
| The Coca-Cola Co. | | | 300 | | | | 13,581 | | |
| The Pepsi Bottling Group, Inc. | | | 1,800 | | | | 40,518 | | |
| | | | 138,035 | | |
| Biotechnology (2.2%) | |
| BioMarin Pharmaceutical, Inc.* | | | 200 | | | | 3,560 | | |
| Celgene Corp.* | | | 100 | | | | 5,528 | | |
| Charles River Laboratories International, Inc.* | | | 100 | | | | 2,620 | | |
| Facet Biotech Corp.* | | | 20 | | | | 192 | | |
| Genentech, Inc.* | | | 100 | | | | 8,291 | | |
| Genzyme Corp.* | | | 200 | | | | 13,274 | | |
| Gilead Sciences, Inc.* | | | 300 | | | | 15,342 | | |
| Life Technologies Corp.* | | | 4,121 | | | | 96,060 | | |
| Myriad Genetics, Inc.* | | | 100 | | | | 6,626 | | |
| PDL BioPharma, Inc. | | | 100 | | | | 618 | | |
| | | | 152,111 | | |
| Building Products (1.0%) | |
| Crane Co. | | | 4,100 | | | | 70,684 | | |
| Chemicals (2.5%) | |
| Air Products & Chemicals, Inc. | | | 100 | | | | 5,027 | | |
| Airgas, Inc. | | | 500 | | | | 19,495 | | |
| Ashland, Inc. | | | 251 | | | | 2,638 | | |
| CF Industries Holdings, Inc. | | | 900 | | | | 44,244 | | |
| Eastman Chemical Co. | | | 200 | | | | 6,342 | | |
| FMC Corp. | | | 400 | | | | 17,892 | | |
| Monsanto Co. | | | 300 | | | | 21,105 | | |
| Olin Corp. | | | 300 | | | | 5,424 | | |
| Rohm & Haas Co. | | | 100 | | | | 6,179 | | |
| The Dow Chemical Co. | | | 900 | | | | 13,581 | | |
| The Mosaic Co. | | | 1,000 | | | | 34,600 | | |
| | | | 176,527 | | |
See Accompanying Notes to Financial Statements.
10
Credit Suisse Trust — Blue Chip Portfolio
Schedule of Investments (continued)
December 31, 2008
| | | Number of
Shares | | Value | |
| COMMON STOCKS | |
| Commercial Services & Supplies (2.2%) | |
| Cogent, Inc.* | | | 100 | | | $ | 1,357 | | |
| DST Systems, Inc.* | | | 100 | | | | 3,798 | | |
| FTI Consulting, Inc.* | | | 200 | | | | 8,936 | | |
| Global Payments, Inc. | | | 200 | | | | 6,558 | | |
| H&R Block, Inc. | | | 1,200 | | | | 27,264 | | |
| Hewitt Associates, Inc. Class A* | | | 100 | | | | 2,838 | | |
| Monster Worldwide, Inc.* | | | 100 | | | | 1,209 | | |
| Pitney Bowes, Inc. | | | 300 | | | | 7,644 | | |
| Republic Services, Inc. | | | 700 | | | | 17,353 | | |
| Robert Half International, Inc. | | | 300 | | | | 6,246 | | |
| Rollins, Inc. | | | 500 | | | | 9,040 | | |
| Steelcase, Inc. Class A | | | 300 | | | | 1,686 | | |
| The Brink's Co. | | | 500 | | | | 13,440 | | |
| Total System Services, Inc. | | | 500 | | | | 7,000 | | |
| Waste Management, Inc. | | | 1,000 | | | | 33,140 | | |
| Weight Watchers International, Inc. | | | 300 | | | | 8,826 | | |
| | | | 156,335 | | |
| Communications Equipment (0.4%) | |
| Ciena Corp.* | | | 200 | | | | 1,340 | | |
| Cisco Systems, Inc.* | | | 300 | | | | 4,890 | | |
| Corning, Inc. | | | 500 | | | | 4,765 | | |
| Motorola, Inc. | | | 1,000 | | | | 4,430 | | |
| QUALCOMM, Inc. | | | 300 | | | | 10,749 | | |
| Tellabs, Inc.* | | | 200 | | | | 824 | | |
| | | | 26,998 | | |
| Computers & Peripherals (2.7%) | |
| Apple Computer, Inc.* | | | 200 | | | | 17,070 | | |
| Dell, Inc.* | | | 400 | | | | 4,096 | | |
| Hewlett-Packard Co. | | | 300 | | | | 10,887 | | |
| International Business Machines Corp. | | | 300 | | | | 25,248 | | |
| Lexmark International, Inc. Class A* | | | 800 | | | | 21,520 | | |
| NCR Corp.* | | | 3,500 | | | | 49,490 | | |
| NetApp, Inc.* | | | 400 | | | | 5,588 | | |
| NVIDIA Corp.* | | | 1,900 | | | | 15,333 | | |
| Teradata Corp.* | | | 100 | | | | 1,483 | | |
| Western Digital Corp.* | | | 3,400 | | | | 38,930 | | |
| | | | 189,645 | | |
| Construction & Engineering (0.7%) | |
| Fluor Corp. | | | 900 | | | | 40,383 | | |
| Foster Wheeler, Ltd.* | | | 200 | | | | 4,676 | | |
| McDermott International, Inc.* | | | 100 | | | | 988 | | |
| | | | 46,047 | | |
See Accompanying Notes to Financial Statements.
11
Credit Suisse Trust — Blue Chip Portfolio
Schedule of Investments (continued)
December 31, 2008
| | | Number of
Shares | | Value | |
| COMMON STOCKS | |
| Containers & Packaging (0.9%) | |
| AptarGroup, Inc. | | | 400 | | | $ | 14,096 | | |
| Crown Holdings, Inc.* | | | 300 | | | | 5,760 | | |
| Owens-Illinois, Inc.* | | | 500 | | | | 13,665 | | |
| Packaging Corp. of America | | | 1,400 | | | | 18,844 | | |
| Sonoco Products Co. | | | 500 | | | | 11,580 | | |
| | | | 63,945 | | |
| Diversified Financials (4.7%) | |
| American Capital, Ltd. | | | 100 | | | | 324 | | |
| American Express Co. | | | 300 | | | | 5,565 | | |
| Ameriprise Financial, Inc. | | | 200 | | | | 4,672 | | |
| Broadridge Financial Solutions, Inc. | | | 300 | | | | 3,762 | | |
| CIT Group, Inc. | | | 100 | | | | 454 | | |
| Citigroup, Inc. | | | 1,000 | | | | 6,710 | | |
| Discover Financial Services | | | 600 | | | | 5,718 | | |
| E*TRADE Financial Corp.* | | | 400 | | | | 460 | | |
| Fannie Mae | | | 600 | | | | 456 | | |
| Federated Investors, Inc. Class B | | | 1,800 | | | | 30,528 | | |
| First Horizon National Corp. | | | 105 | | | | 1,109 | | |
| Franklin Resources, Inc. | | | 400 | | | | 25,512 | | |
| Freddie Mac | | | 300 | | | | 219 | | |
| Invesco, Ltd. | | | 300 | | | | 4,332 | | |
| Investment Technology Group, Inc.* | | | 600 | | | | 13,632 | | |
| Janus Capital Group, Inc. | | | 800 | | | | 6,424 | | |
| JPMorgan Chase & Co. | | | 200 | | | | 6,306 | | |
| Manulife Financial Corp. | | | 900 | | | | 15,327 | | |
| Marshall & Ilsley Corp. | | | 200 | | | | 2,728 | | |
| Merrill Lynch & Co., Inc. | | | 300 | | | | 3,492 | | |
| Morgan Stanley | | | 300 | | | | 4,812 | | |
| Nasdaq OMX Group, Inc.* | | | 300 | | | | 7,413 | | |
| NewAlliance Bancshares, Inc. | | | 100 | | | | 1,317 | | |
| NYSE Euronext | | | 100 | | | | 2,738 | | |
| Principal Financial Group, Inc. | | | 200 | | | | 4,514 | | |
| Raymond James Financial, Inc. | | | 700 | | | | 11,991 | | |
| State Street Corp. | | | 700 | | | | 27,531 | | |
| T. Rowe Price Group, Inc. | | | 1,400 | | | | 49,616 | | |
| The Charles Schwab Corp. | | | 3,000 | | | | 48,510 | | |
| Waddell & Reed Financial, Inc. Class A | | | 1,600 | | | | 24,736 | | |
| Western Union Co. | | | 300 | | | | 4,302 | | |
| | | | 325,210 | | |
| Diversified Telecommunication Services (1.0%) | |
| AT&T, Inc. | | | 897 | | | | 25,564 | | |
| Embarq Corp. | | | 400 | | | | 14,384 | | |
| FairPoint Communications, Inc. | | | 67 | | | | 220 | | |
| JDS Uniphase Corp.* | | | 100 | | | | 365 | | |
| NeuStar, Inc. Class A* | | | 700 | | | | 13,391 | | |
| Qwest Communications International, Inc. | | | 900 | | | | 3,276 | | |
See Accompanying Notes to Financial Statements.
12
Credit Suisse Trust — Blue Chip Portfolio
Schedule of Investments (continued)
December 31, 2008
| | | Number of
Shares | | Value | |
| COMMON STOCKS | |
| Diversified Telecommunication Services | |
| Sprint Nextel Corp.* | | | 800 | | | $ | 1,464 | | |
| Verizon Communications, Inc. | | | 300 | | | | 10,170 | | |
| Windstream Corp. | | | 400 | | | | 3,680 | | |
| | | | 72,514 | | |
| Electric Utilities (1.1%) | |
| Alliant Energy Corp. | | | 300 | | | | 8,754 | | |
| Constellation Energy Group, Inc. | | | 200 | | | | 5,018 | | |
| Dominion Resources, Inc. | | | 300 | | | | 10,752 | | |
| DPL, Inc. | | | 200 | | | | 4,568 | | |
| Edison International | | | 300 | | | | 9,636 | | |
| FirstEnergy Corp. | | | 100 | | | | 4,858 | | |
| NRG Energy, Inc.* | | | 200 | | | | 4,666 | | |
| Ormat Technologies, Inc. | | | 300 | | | | 9,561 | | |
| Public Service Enterprise Group, Inc. | | | 300 | | | | 8,751 | | |
| TECO Energy, Inc. | | | 300 | | | | 3,705 | | |
| Unisource Energy Corp. | | | 300 | | | | 8,808 | | |
| | | | 79,077 | | |
| Electronic Equipment & Instruments (1.6%) | |
| Benchmark Electronics, Inc.* | | | 1,600 | | | | 20,432 | | |
| Brady Corp. Class A | | | 700 | | | | 16,765 | | |
| Energizer Holdings, Inc.* | | | 300 | | | | 16,242 | | |
| FLIR Systems, Inc.* | | | 200 | | | | 6,136 | | |
| Ingram Micro, Inc. Class A* | | | 1,000 | | | | 13,390 | | |
| Jabil Circuit, Inc. | | | 400 | | | | 2,700 | | |
| Rockwell Automation, Inc. | | | 400 | | | | 12,896 | | |
| Tyco Electronics, Ltd. | | | 700 | | | | 11,347 | | |
| Waters Corp.* | | | 300 | | | | 10,995 | | |
| | | | 110,903 | | |
| Energy Equipment & Services (2.0%) | |
| Baker Hughes, Inc. | | | 300 | | | | 9,621 | | |
| BJ Services Co. | | | 300 | | | | 3,501 | | |
| Cameron International Corp.* | | | 300 | | | | 6,150 | | |
| Dresser-Rand Group, Inc.* | | | 800 | | | | 13,800 | | |
| ENSCO International, Inc. | | | 200 | | | | 5,678 | | |
| FMC Technologies, Inc.* | | | 300 | | | | 7,149 | | |
| Halliburton Co. | | | 300 | | | | 5,454 | | |
| Helmerich & Payne, Inc. | | | 300 | | | | 6,825 | | |
| Noble Corp. | | | 1,200 | | | | 26,508 | | |
| Oceaneering International, Inc.* | | | 200 | | | | 5,828 | | |
| Patterson-UTI Energy, Inc. | | | 900 | | | | 10,359 | | |
| Schlumberger, Ltd. | | | 300 | | | | 12,699 | | |
| Smith International, Inc. | | | 100 | | | | 2,289 | | |
| Tidewater, Inc. | | | 500 | | | | 20,135 | | |
| | | | 135,996 | | |
See Accompanying Notes to Financial Statements.
13
Credit Suisse Trust — Blue Chip Portfolio
Schedule of Investments (continued)
December 31, 2008
| | | Number of
Shares | | Value | |
| COMMON STOCKS | |
| Food & Drug Retailing (0.7%) | |
| CVS Caremark Corp. | | | 100 | | | $ | 2,874 | | |
| Flowers Foods, Inc. | | | 400 | | | | 9,744 | | |
| Ruddick Corp. | | | 100 | | | | 2,765 | | |
| Sysco Corp. | | | 400 | | | | 9,176 | | |
| Terra Industries, Inc. | | | 200 | | | | 3,334 | | |
| The Kroger Co. | | | 200 | | | | 5,282 | | |
| Walgreen Co. | | | 600 | | | | 14,802 | | |
| Whole Foods Market, Inc. | | | 100 | | | | 944 | | |
| | | | 48,921 | | |
| Food Products (2.0%) | |
| Campbell Soup Co. | | | 300 | | | | 9,003 | | |
| Dean Foods Co.* | | | 300 | | | | 5,391 | | |
| Del Monte Foods Co. | | | 700 | | | | 4,998 | | |
| H.J. Heinz Co. | | | 100 | | | | 3,760 | | |
| Herbalife, Ltd. | | | 800 | | | | 17,344 | | |
| Hormel Foods Corp. | | | 300 | | | | 9,324 | | |
| Kraft Foods, Inc. Class A | | | 300 | | | | 8,055 | | |
| McCormick & Co., Inc. | | | 300 | | | | 9,558 | | |
| Sara Lee Corp. | | | 100 | | | | 979 | | |
| The Hershey Co. | | | 300 | | | | 10,422 | | |
| Tyson Foods, Inc. Class A | | | 2,700 | | | | 23,652 | | |
| Unilever NV NY Shares | | | 1,600 | | | | 39,280 | | |
| | | | 141,766 | | |
| Forestry & Paper (0.3%) | |
| MeadWestvaco Corp. | | | 2,000 | | | | 22,380 | | |
| Gas Utilities (2.8%) | |
| Atmos Energy Corp. | | | 300 | | | | 7,110 | | |
| Kinder Morgan Management LLC* | | | 710 | | | | 28,386 | | |
| MDU Resources Group, Inc. | | | 300 | | | | 6,474 | | |
| National Fuel Gas Co. | | | 1,200 | | | | 37,596 | | |
| New Jersey Resources Corp. | | | 900 | | | | 35,415 | | |
| Nicor, Inc. | | | 300 | | | | 10,422 | | |
| Northwest Natural Gas Co. | | | 400 | | | | 17,692 | | |
| Piedmont Natural Gas Co., Inc. | | | 900 | | | | 28,503 | | |
| Sempra Energy | | | 100 | | | | 4,263 | | |
| South Jersey Industries, Inc. | | | 100 | | | | 3,985 | | |
| Southwestern Energy Co.* | | | 100 | | | | 2,897 | | |
| WGL Holdings, Inc. | | | 300 | | | | 9,807 | | |
| | | | 192,550 | | |
| Healthcare Equipment & Supplies (1.1%) | |
| Boston Scientific Corp.* | | | 300 | | | | 2,322 | | |
| Covidien, Ltd. | | | 300 | | | | 10,872 | | |
| Edwards Lifesciences Corp.* | | | 300 | | | | 16,485 | | |
| IMS Health, Inc. | | | 200 | | | | 3,032 | | |
| Kinetic Concepts, Inc.* | | | 300 | | | | 5,754 | | |
| Medtronic, Inc. | | | 300 | | | | 9,426 | | |
| Stryker Corp. | | | 300 | | | | 11,985 | | |
See Accompanying Notes to Financial Statements.
14
Credit Suisse Trust — Blue Chip Portfolio
Schedule of Investments (continued)
December 31, 2008
| | | Number of
Shares | | Value | |
| COMMON STOCKS | |
| Healthcare Equipment & Supplies | |
| Varian Medical Systems, Inc.* | | | 300 | | | $ | 10,512 | | |
| Zimmer Holdings, Inc.* | | | 100 | | | | 4,042 | | |
| | | | 74,430 | | |
| Healthcare Providers & Services (2.7%) | |
| Aetna, Inc. | | | 2,000 | | | | 57,000 | | |
| CIGNA Corp. | | | 2,100 | | | | 35,385 | | |
| Covance, Inc.* | | | 600 | | | | 27,618 | | |
| Humana, Inc.* | | | 300 | | | | 11,184 | | |
| Lincare Holdings, Inc.* | | | 200 | | | | 5,386 | | |
| Magellan Health Services, Inc.* | | | 200 | | | | 7,832 | | |
| McKesson Corp. | | | 300 | | | | 11,619 | | |
| Owens & Minor, Inc. | | | 100 | | | | 3,765 | | |
| Pharmaceutical Product Development, Inc. | | | 100 | | | | 2,901 | | |
| Quest Diagnostics, Inc. | | | 300 | | | | 15,573 | | |
| Tenet Healthcare Corp.* | | | 300 | | | | 345 | | |
| WellPoint, Inc.* | | | 200 | | | | 8,426 | | |
| | | | 187,034 | | |
| Hotels, Restaurants & Leisure (1.6%) | |
| Burger King Holdings, Inc. | | | 100 | | | | 2,388 | | |
| Carnival Corp. | | | 1,300 | | | | 31,616 | | |
| Darden Restaurants, Inc. | | | 200 | | | | 5,636 | | |
| McDonald's Corp. | | | 200 | | | | 12,438 | | |
| Starwood Hotels & Resorts Worldwide, Inc. | | | 300 | | | | 5,370 | | |
| Tim Hortons, Inc. | | | 300 | | | | 8,652 | | |
| WMS Industries, Inc.* | | | 1,300 | | | | 34,970 | | |
| Wyndham Worldwide Corp. | | | 100 | | | | 655 | | |
| Yum! Brands, Inc. | | | 300 | | | | 9,450 | | |
| | | | 111,175 | | |
| Household Durables (2.7%) | |
| D.R. Horton, Inc. | | | 100 | | | | 707 | | |
| Harman International Industries, Inc. | | | 200 | | | | 3,346 | | |
| Koninklijke (Royal) Philips Electronics NV NY Shares | | | 5,800 | | | | 115,246 | | |
| Leggett & Platt, Inc. | | | 400 | | | | 6,076 | | |
| M.D.C. Holdings, Inc. | | | 200 | | | | 6,060 | | |
| Snap-on, Inc. | | | 400 | | | | 15,752 | | |
| The Stanley Works | | | 200 | | | | 6,820 | | |
| Tupperware Brands Corp. | | | 600 | | | | 13,620 | | |
| Whirlpool Corp. | | | 400 | | | | 16,540 | | |
| | | | 184,167 | | |
| Household Products (0.9%) | |
| Church & Dwight Co., Inc. | | | 300 | | | | 16,836 | | |
| Clorox Co. | | | 300 | | | | 16,668 | | |
| Kimberly-Clark Corp. | | | 200 | | | | 10,548 | | |
| The Procter & Gamble Co. | | | 300 | | | | 18,546 | | |
| | | | 62,598 | | |
See Accompanying Notes to Financial Statements.
15
Credit Suisse Trust — Blue Chip Portfolio
Schedule of Investments (continued)
December 31, 2008
| | | Number of
Shares | | Value | |
| COMMON STOCKS | |
| Industrial Conglomerates (1.2%) | |
| 3M Co. | | | 300 | | | $ | 17,262 | | |
| General Electric Co. | | | 300 | | | | 4,860 | | |
| Honeywell International, Inc. | | | 1,100 | | | | 36,113 | | |
| KBR, Inc. | | | 100 | | | | 1,520 | | |
| Reynolds American, Inc. | | | 300 | | | | 12,093 | | |
| Textron, Inc. | | | 100 | | | | 1,387 | | |
| Tyco International, Ltd. | | | 400 | | | | 8,640 | | |
| | | | 81,875 | | |
| Insurance (11.1%) | |
| ACE, Ltd. | | | 1,000 | | | | 52,920 | | |
| Aflac, Inc. | | | 1,500 | | | | 68,760 | | |
| American Financial Group, Inc. | | | 1,400 | | | | 32,032 | | |
| Aon Corp. | | | 500 | | | | 22,840 | | |
| Arthur J. Gallagher & Co. | | | 300 | | | | 7,773 | | |
| Assurant, Inc. | | | 800 | | | | 24,000 | | |
| Axis Capital Holdings, Ltd. | | | 1,200 | | | | 34,944 | | |
| Brown & Brown, Inc. | | | 100 | | | | 2,090 | | |
| CNA Financial Corp. | | | 100 | | | | 1,644 | | |
| Endurance Specialty Holdings, Ltd. | | | 400 | | | | 12,212 | | |
| First American Corp. | | | 300 | | | | 8,667 | | |
| Genworth Financial, Inc. Class A | | | 100 | | | | 283 | | |
| Hanover Insurance Group, Inc. | | | 100 | | | | 4,297 | | |
| HCC Insurance Holdings, Inc. | | | 100 | | | | 2,675 | | |
| Lincoln National Corp. | | | 200 | | | | 3,768 | | |
| Loews Corp. | | | 2,800 | | | | 79,100 | | |
| Marsh & McLennan Cos., Inc. | | | 200 | | | | 4,854 | | |
| MBIA, Inc.* | | | 100 | | | | 407 | | |
| MetLife, Inc. | | | 400 | | | | 13,944 | | |
| PartnerRe, Ltd. | | | 100 | | | | 7,127 | | |
| Prudential Financial, Inc. | | | 100 | | | | 3,026 | | |
| Reinsurance Group of America, Inc. | | | 400 | | | | 17,128 | | |
| RenaissanceRe Holdings, Ltd. | | | 200 | | | | 10,312 | | |
| StanCorp Financial Group, Inc. | | | 100 | | | | 4,177 | | |
| The Allstate Corp. | | | 4,400 | | | | 144,144 | | |
| The Chubb Corp. | | | 400 | | | | 20,400 | | |
| The Hartford Financial Services Group, Inc. | | | 300 | | | | 4,926 | | |
| The Progressive Corp. | | | 100 | | | | 1,481 | | |
| The Travelers Cos., Inc. | | | 1,500 | | | | 67,800 | | |
| Torchmark Corp. | | | 1,400 | | | | 62,580 | | |
| Unum Group | | | 2,500 | | | | 46,500 | | |
| XL Capital, Ltd. Class A | | | 200 | | | | 740 | | |
| | | | 767,551 | | |
| Internet Software & Services (1.0%) | |
| eBay, Inc.* | | | 300 | | | | 4,188 | | |
| Google, Inc. Class A* | | | 100 | | | | 30,765 | | |
| Sohu.com, Inc.* | | | 700 | | | | 33,138 | | |
| Yahoo!, Inc.* | | | 300 | | | | 3,660 | | |
| | | | 71,751 | | |
See Accompanying Notes to Financial Statements.
16
Credit Suisse Trust — Blue Chip Portfolio
Schedule of Investments (continued)
December 31, 2008
| | | Number of
Shares | | Value | |
| COMMON STOCKS | |
| IT Consulting & Services (0.9%) | |
| Automatic Data Processing, Inc. | | | 700 | | | $ | 27,538 | | |
| Cognizant Technology Solutions Corp. Class A* | | | 100 | | | | 1,806 | | |
| Computer Sciences Corp.* | | | 700 | | | | 24,598 | | |
| Sun Microsystems, Inc.* | | | 400 | | | | 1,528 | | |
| Tyler Technologies, Inc.* | | | 700 | | | | 8,386 | | |
| | | | 63,856 | | |
| Leisure Equipment & Products (0.2%) | |
| Eastman Kodak Co. | | | 1,000 | | | | 6,580 | | |
| Marvel Entertainment, Inc.* | | | 300 | | | | 9,225 | | |
| | | | 15,805 | | |
| Machinery (2.1%) | |
| AGCO Corp.* | | | 300 | | | | 7,077 | | |
| Cummins, Inc. | | | 1,300 | | | | 34,749 | | |
| Danaher Corp. | | | 300 | | | | 16,983 | | |
| Deere & Co. | | | 200 | | | | 7,664 | | |
| Dover Corp. | | | 100 | | | | 3,292 | | |
| Gardner Denver, Inc.* | | | 300 | | | | 7,002 | | |
| Harsco Corp. | | | 600 | | | | 16,608 | | |
| Illinois Tool Works, Inc. | | | 300 | | | | 10,515 | | |
| John Bean Technologies Corp. | | | 21 | | | | 172 | | |
| Joy Global, Inc. | | | 300 | | | | 6,867 | | |
| PACCAR, Inc. | | | 600 | | | | 17,160 | | |
| Parker Hannifin Corp. | | | 350 | | | | 14,889 | | |
| The Manitowoc Co., Inc. | | | 200 | | | | 1,732 | | |
| The Timken Co. | | | 200 | | | | 3,926 | | |
| | | | 148,636 | | |
| Marine (0.2%) | |
| Kirby Corp.* | | | 300 | | | | 8,208 | | |
| Overseas Shipholding Group, Inc. | | | 100 | | | | 4,211 | | |
| | | | 12,419 | | |
| Media (1.7%) | |
| Cablevision Systems Corp. Group A | | | 200 | | | | 3,368 | | |
| CBS Corp. Class B | | | 300 | | | | 2,457 | | |
| Comcast Corp. Class A | | | 300 | | | | 5,064 | | |
| DISH Network Corp. Class A* | | | 1,800 | | | | 19,962 | | |
| John Wiley & Sons, Inc. Class A | | | 300 | | | | 10,674 | | |
| News Corp. Class A | | | 1,500 | | | | 13,635 | | |
| Omnicom Group, Inc. | | | 600 | | | | 16,152 | | |
| Regal Entertainment Group Class A | | | 2,300 | | | | 23,483 | | |
| Scripps Networks Interactive Class A | | | 100 | | | | 2,200 | | |
| The Interpublic Group of Cos., Inc.* | | | 200 | | | | 792 | | |
| The New York Times Co. Class A | | | 100 | | | | 733 | | |
| The Walt Disney Co. | | | 300 | | | | 6,807 | | |
| Time Warner, Inc. | | | 1,600 | | | | 16,096 | | |
| | | | 121,423 | | |
See Accompanying Notes to Financial Statements.
17
Credit Suisse Trust — Blue Chip Portfolio
Schedule of Investments (continued)
December 31, 2008
| | | Number of
Shares | | Value | |
| COMMON STOCKS | |
| Metals & Mining (1.1%) | |
| AK Steel Holding Corp. | | | 300 | | | $ | 2,796 | | |
| Alcoa, Inc. | | | 300 | | | | 3,378 | | |
| Alpha Natural Resources, Inc.* | | | 300 | | | | 4,857 | | |
| Arch Coal, Inc. | | | 300 | | | | 4,887 | | |
| Compass Minerals International, Inc. | | | 300 | | | | 17,598 | | |
| CONSOL Energy, Inc. | | | 100 | | | | 2,858 | | |
| Freeport-McMoRan Copper & Gold, Inc. | | | 102 | | | | 2,493 | | |
| Massey Energy Co. | | | 100 | | | | 1,379 | | |
| Newmont Mining Corp. | | | 200 | | | | 8,140 | | |
| Nucor Corp. | | | 300 | | | | 13,860 | | |
| Peabody Energy Corp. | | | 300 | | | | 6,825 | | |
| Southern Copper Corp. | | | 100 | | | | 1,606 | | |
| United States Steel Corp. | | | 200 | | | | 7,440 | | |
| Worthington Industries, Inc. | | | 100 | | | | 1,102 | | |
| | | | 79,219 | | |
| Multi-Utilities (0.3%) | |
| Avista Corp. | | | 100 | | | | 1,938 | | |
| Duke Energy Corp. | | | 300 | | | | 4,503 | | |
| NiSource, Inc. | | | 1,100 | | | | 12,067 | | |
| Westar Energy, Inc. | | | 100 | | | | 2,051 | | |
| | | | 20,559 | | |
| Multiline Retail (2.0%) | |
| 99 Cents Only Stores* | | | 800 | | | | 8,744 | | |
| Big Lots, Inc.* | | | 1,000 | | | | 14,490 | | |
| BJ's Wholesale Club, Inc.* | | | 400 | | | | 13,704 | | |
| Costco Wholesale Corp. | | | 300 | | | | 15,750 | | |
| Dollar Tree, Inc.* | | | 400 | | | | 16,720 | | |
| Family Dollar Stores, Inc. | | | 1,100 | | | | 28,677 | | |
| Fred's, Inc. Class A | | | 100 | | | | 1,076 | | |
| Macy's, Inc. | | | 1,300 | | | | 13,455 | | |
| Target Corp. | | | 300 | | | | 10,359 | | |
| Wal-Mart Stores, Inc. | | | 300 | | | | 16,818 | | |
| | | | 139,793 | | |
| Office Electronics (0.2%) | |
| Xerox Corp. | | | 1,400 | | | | 11,158 | | |
| Oil & Gas (9.2%) | |
| Apache Corp. | | | 100 | | | | 7,453 | | |
| Chevron Corp. | | | 1,200 | | | | 88,764 | | |
| Cimarex Energy Co. | | | 300 | | | | 8,034 | | |
| ConocoPhillips | | | 1,288 | | | | 66,718 | | |
| Devon Energy Corp. | | | 200 | | | | 13,142 | | |
| Enbridge Energy Partners LP | | | 100 | | | | 2,550 | | |
| Enbridge, Inc. | | | 300 | | | | 9,741 | | |
| EnCana Corp. | | | 100 | | | | 4,648 | | |
| Enterprise Products Partners LP | | | 200 | | | | 4,146 | | |
See Accompanying Notes to Financial Statements.
18
Credit Suisse Trust — Blue Chip Portfolio
Schedule of Investments (continued)
December 31, 2008
| | | Number of
Shares | | Value | |
| COMMON STOCKS | |
| Oil & Gas | |
| Exxon Mobil Corp. | | | 1,400 | | | $ | 111,762 | | |
| Magellan Midstream Partners LP | | | 300 | | | | 9,063 | | |
| Murphy Oil Corp. | | | 800 | | | | 35,480 | | |
| Occidental Petroleum Corp. | | | 300 | | | | 17,997 | | |
| Petro-Canada | | | 200 | | | | 4,378 | | |
| Plains All American Pipeline LP | | | 100 | | | | 3,469 | | |
| Range Resources Corp. | | | 200 | | | | 6,878 | | |
| Royal Dutch Shell PLC ADR | | | 3,900 | | | | 206,466 | | |
| Stone Energy Corp.* | | | 200 | | | | 2,204 | | |
| Tesoro Corp. | | | 100 | | | | 1,317 | | |
| The Williams Cos., Inc. | | | 300 | | | | 4,344 | | |
| TransCanada Corp. | | | 200 | | | | 5,428 | | |
| Transocean, Ltd.* | | | 200 | | | | 9,450 | | |
| Valero Energy Corp. | | | 200 | | | | 4,328 | | |
| W&T Offshore, Inc. | | | 600 | | | | 8,592 | | |
| | | | 636,352 | | |
| Personal Products (0.7%) | |
| Alberto-Culver Co. | | | 900 | | | | 22,059 | | |
| Avon Products, Inc. | | | 100 | | | | 2,403 | | |
| The Estee Lauder Cos., Inc. Class A | | | 700 | | | | 21,672 | | |
| | | | 46,134 | | |
| Pharmaceuticals (5.5%) | |
| Abbott Laboratories | | | 300 | | | | 16,011 | | |
| Bristol-Myers Squibb Co. | | | 1,800 | | | | 41,850 | | |
| Eli Lilly & Co. | | | 2,300 | | | | 92,621 | | |
| Endo Pharmaceuticals Holdings, Inc.* | | | 400 | | | | 10,352 | | |
| Forest Laboratories, Inc.* | | | 2,300 | | | | 58,581 | | |
| Johnson & Johnson | | | 300 | | | | 17,949 | | |
| King Pharmaceuticals, Inc.* | | | 400 | | | | 4,248 | | |
| Medco Health Solutions, Inc.* | | | 100 | | | | 4,191 | | |
| Merck & Co., Inc. | | | 300 | | | | 9,120 | | |
| Mylan, Inc.* | | | 100 | | | | 989 | | |
| Pfizer, Inc. | | | 800 | | | | 14,168 | | |
| Valeant Pharmaceuticals International* | | | 300 | | | | 6,870 | | |
| Watson Pharmaceuticals, Inc.* | | | 3,900 | | | | 103,623 | | |
| | | | 380,573 | | |
| Real Estate (0.9%) | |
| Boston Properties, Inc. | | | 100 | | | | 5,500 | | |
| CB Richard Ellis Group, Inc. Class A* | | | 100 | | | | 432 | | |
| Developers Diversified Realty Corp. | | | 100 | | | | 488 | | |
| Equity Residential | | | 200 | | | | 5,964 | | |
| HCP, Inc. | | | 100 | | | | 2,777 | | |
| Host Hotels & Resorts, Inc. | | | 200 | | | | 1,514 | | |
| Kimco Realty Corp. | | | 1,000 | | | | 18,280 | | |
| Plum Creek Timber Co., Inc. | | | 100 | | | | 3,474 | | |
See Accompanying Notes to Financial Statements.
19
Credit Suisse Trust — Blue Chip Portfolio
Schedule of Investments (continued)
December 31, 2008
| | | Number of
Shares | | Value | |
| COMMON STOCKS | |
| Real Estate | |
| ProLogis | | | 200 | | | $ | 2,778 | | |
| Public Storage | | | 100 | | | | 7,950 | | |
| Simon Property Group, Inc. | | | 100 | | | | 5,313 | | |
| Vornado Realty Trust | | | 100 | | | | 6,035 | | |
| | | | 60,505 | | |
| Road & Rail (0.7%) | |
| CSX Corp. | | | 100 | | | | 3,247 | | |
| GATX Corp. | | | 400 | | | | 12,388 | | |
| Heartland Express, Inc. | | | 400 | | | | 6,304 | | |
| Knight Transportation, Inc. | | | 200 | | | | 3,224 | | |
| Werner Enterprises, Inc. | | | 1,200 | | | | 20,808 | | |
| | | | 45,971 | | |
| Semiconductor Equipment & Products (2.0%) | |
| Advanced Micro Devices, Inc.* | | | 300 | | | | 648 | | |
| Analog Devices, Inc. | | | 800 | | | | 15,216 | | |
| Applied Materials, Inc. | | | 300 | | | | 3,039 | | |
| Intel Corp. | | | 2,800 | | | | 41,048 | | |
| Linear Technology Corp. | | | 100 | | | | 2,212 | | |
| LSI Corp.* | | | 300 | | | | 987 | | |
| MEMC Electronic Materials, Inc.* | | | 500 | | | | 7,140 | | |
| Microchip Technology, Inc. | | | 300 | | | | 5,859 | | |
| Micron Technology, Inc.* | | | 300 | | | | 792 | | |
| QLogic Corp.* | | | 4,100 | | | | 55,104 | | |
| STMicroelectronics NV NY Shares | | | 300 | | | | 1,995 | | |
| Texas Instruments, Inc. | | | 300 | | | | 4,656 | | |
| | | | 138,696 | | |
| Software (3.1%) | |
| BMC Software, Inc.* | | | 1,600 | | | | 43,056 | | |
| CA, Inc. | | | 300 | | | | 5,559 | | |
| Cerner Corp.* | | | 400 | | | | 15,380 | | |
| Compuware Corp.* | | | 1,100 | | | | 7,425 | | |
| Electronic Arts, Inc.* | | | 200 | | | | 3,208 | | |
| Gartner, Inc.* | | | 400 | | | | 7,132 | | |
| Microsoft Corp. | | | 6,500 | | | | 126,360 | | |
| Novell, Inc.* | | | 200 | | | | 778 | | |
| Oracle Corp.* | | | 300 | | | | 5,319 | | |
| | | | 214,217 | | |
| Specialty Retail (4.2%) | |
| Aaron Rents, Inc. | | | 300 | | | | 7,986 | | |
| Abercrombie & Fitch Co. Class A | | | 400 | | | | 9,228 | | |
| Advance Auto Parts, Inc. | | | 300 | | | | 10,095 | | |
| Aeropostale, Inc.* | | | 1,000 | | | | 16,100 | | |
| AutoNation, Inc.* | | | 100 | | | | 988 | | |
| AutoZone, Inc.* | | | 200 | | | | 27,894 | | |
| Best Buy Co., Inc. | | | 300 | | | | 8,433 | | |
See Accompanying Notes to Financial Statements.
20
Credit Suisse Trust — Blue Chip Portfolio
Schedule of Investments (continued)
December 31, 2008
| | | Number of
Shares | | Value | |
| COMMON STOCKS | |
| Specialty Retail | |
| Foot Locker, Inc. | | | 1,500 | | | $ | 11,010 | | |
| GameStop Corp. Class A* | | | 700 | | | | 15,162 | | |
| Limited Brands, Inc. | | | 800 | | | | 8,032 | | |
| Lowe's Cos., Inc. | | | 300 | | | | 6,456 | | |
| Office Depot, Inc.* | | | 100 | | | | 298 | | |
| RadioShack Corp. | | | 3,700 | | | | 44,178 | | |
| Ross Stores, Inc. | | | 3,000 | | | | 89,190 | | |
| The Cato Corp. Class A | | | 200 | | | | 3,020 | | |
| The Gap, Inc. | | | 800 | | | | 10,712 | | |
| The Home Depot, Inc. | | | 300 | | | | 6,906 | | |
| The TJX Cos., Inc. | | | 300 | | | | 6,171 | | |
| Urban Outfitters, Inc.* | | | 100 | | | | 1,498 | | |
| Williams-Sonoma, Inc. | | | 837 | | | | 6,579 | | |
| | | | 289,936 | | |
| Textiles & Apparel (0.8%) | |
| Guess?, Inc. | | | 200 | | | | 3,070 | | |
| Jones Apparel Group, Inc. | | | 100 | | | | 586 | | |
| NIKE, Inc. Class B | | | 300 | | | | 15,300 | | |
| Phillips-Van Heusen Corp. | | | 1,700 | | | | 34,221 | | |
| | | | 53,177 | | |
| Tobacco (2.9%) | |
| Altria Group, Inc. | | | 7,300 | | | | 109,938 | | |
| Lorillard, Inc. | | | 300 | | | | 16,905 | | |
| Philip Morris International, Inc. | | | 900 | | | | 39,159 | | |
| UST, Inc. | | | 200 | | | | 13,876 | | |
| Vector Group, Ltd. | | | 1,500 | | | | 20,430 | | |
| | | | 200,308 | | |
| Water Utilities (0.0%) | |
| Nalco Holding Co. | | | 100 | | | | 1,154 | | |
| TOTAL COMMON STOCKS (Cost $8,376,741) | | | 6,903,594 | | |
| TOTAL INVESTMENTS AT VALUE (99.4%) (Cost $8,376,741) | | | 6,903,594 | | |
| OTHER ASSETS IN EXCESS OF LIABILITIES (0.6%) | | | 41,150 | | |
| NET ASSETS (100.0%) | | $ | 6,944,744 | | |
INVESTMENT ABBREVIATION
ADR = American Depositary Receipt
* Non-income producing security.
See Accompanying Notes to Financial Statements.
21
Credit Suisse Trust — Blue Chip Portfolio
Statement of Assets and Liabilities
December 31, 2008
| Assets | |
| Investments at value (Cost $8,376,741) (Note 2) | | $ | 6,903,594 | | |
| Cash | | | 22,224 | | |
| Receivable for investments sold | | | 47,084 | | |
| Receivable from investment adviser (Note 3) | | | 31,455 | | |
| Dividend receivable | | | 16,437 | | |
| Receivable for portfolio shares sold | | | 9,505 | | |
| Prepaid expenses | | | 148 | | |
| Total Assets | | | 7,030,447 | | |
| Liabilities | |
| Administrative services fee payable (Note 3) | | | 6,294 | | |
| Payable for investments purchased | | | 45,847 | | |
| Trustees' fee payable | | | 2,574 | | |
| Other accrued expenses payable | | | 30,988 | | |
| Total Liabilities | | | 85,703 | | |
| Net Assets | |
| Capital stock, $.001 par value (Note 6) | | | 857 | | |
| Paid-in capital (Note 6) | | | 10,331,346 | | |
| Undistributed net investment income | | | 118,201 | | |
| Accumulated net realized loss on investments and foreign currency transactions | | | (2,032,513 | ) | |
| Net unrealized depreciation on investments | | | (1,473,147 | ) | |
| Net Assets | | $ | 6,944,744 | | |
| Shares outstanding | | | 856,763 | | |
| Net asset value, offering price, and redemption price per share | | $ | 8.11 | | |
See Accompanying Notes to Financial Statements.
22
Credit Suisse Trust — Blue Chip Portfolio
Statement of Operations
For the Year Ended December 31, 2008
| Investment Income (Note 2) | |
| Dividends | | $ | 204,663 | | |
| Interest | | | 1,688 | | |
| Foreign taxes withheld | | | (247 | ) | |
| Total investment income | | | 206,104 | | |
| Expenses | |
| Investment advisory fees (Note 3) | | | 45,885 | | |
| Administrative services fees (Note 3) | | | 30,271 | | |
| Printing fees (Note 3) | | | 25,673 | | |
| Custodian fees | | | 22,433 | | |
| Audit and tax fees | | | 18,720 | | |
| Trustees' fees | | | 17,285 | | |
| Legal fees | | | 15,627 | | |
| Transfer agent fees | | | 1,453 | | |
| Insurance expense | | | 304 | | |
| Commitment fees (Note 4) | | | 115 | | |
| Interest expense (Note 4) | | | 7 | | |
| Miscellaneous expense | | | 8,585 | | |
| Total expenses | | | 186,358 | | |
| Less: fees waived and expenses reimbursed (Note 3) | | | (99,176 | ) | |
| Net expenses | | | 87,182 | | |
| Net investment income | | | 118,922 | | |
| Net Realized and Unrealized Loss from Investments and Foreign Currency Related Items | |
| Net realized loss from investments | | | (959,156 | ) | |
| Net realized loss from foreign currency transactions | | | (2 | ) | |
| Net change in unrealized appreciation (depreciation) from investments | | | (3,024,257 | ) | |
| Net realized and unrealized loss from investments and foreign currency related items | | | (3,983,415 | ) | |
| Net decrease in net assets resulting from operations | | $ | (3,864,493 | ) | |
See Accompanying Notes to Financial Statements.
23
Credit Suisse Trust — Blue Chip Portfolio
Statements of Changes in Net Assets
| | | For the Year
Ended
December 31, 2008 | | For the Year
Ended
December 31, 2007 | |
| From Operations | |
| Net investment income | | $ | 118,922 | | | $ | 97,822 | | |
| Net realized gain (loss) from investments and foreign currency transactions | | | (959,158 | ) | | | 787,062 | | |
| Net change in unrealized appreciation (depreciation) from investments | | | (3,024,257 | ) | | | (68,810 | ) | |
| Net increase (decrease) in net assets resulting from operations | | | (3,864,493 | ) | | | 816,074 | | |
| From Dividends | |
| Dividends from net investment income | | | (96,395 | ) | | | (97,194 | ) | |
| Net decrease in net assets resulting from dividends | | | (96,395 | ) | | | (97,194 | ) | |
| From Capital Share Transactions (Note 6) | |
| Proceeds from sale of shares | | | 1,771,620 | | | | 1,935,326 | | |
| Reinvestment of dividends | | | 96,395 | | | | 97,194 | | |
| Net asset value of shares redeemed | | | (1,809,925 | ) | | | (2,771,300 | ) | |
| Net increase (decrease) in net assets from capital share transactions | | | 58,090 | | | | (738,780 | ) | |
| Net decrease in net assets | | | (3,902,798 | ) | | | (19,900 | ) | |
| Net Assets | |
| Beginning of year | | | 10,847,542 | | | | 10,867,442 | | |
| End of year | | $ | 6,944,744 | | | $ | 10,847,542 | | |
| Undistributed net investment income | | $ | 118,201 | | | $ | 97,441 | | |
See Accompanying Notes to Financial Statements.
24
Credit Suisse Trust — Blue Chip Portfolio
Financial Highlights
(For a Share of the Portfolio Outstanding Throughout Each Year)
| | | For the Year Ended December 31, | |
| | | 2008 | | 2007 | | 2006 | | 2005 | | 2004 | |
| Per share data | |
| Net asset value, beginning of year | | $ | 12.74 | | | $ | 11.95 | | | $ | 10.41 | | | $ | 9.91 | | | $ | 9.15 | | |
| INVESTMENT OPERATIONS | |
| Net investment income | | | 0.13 | | | | 0.12 | | | | 0.10 | | | | 0.09 | | | | 0.08 | | |
Net gain (loss) on investments and foreign currency
related items (both realized and unrealized) | | | (4.65 | ) | | | 0.78 | | | | 1.53 | | | | 0.48 | | | | 0.75 | | |
| Total from investment operations | | | (4.52 | ) | | | 0.90 | | | | 1.63 | | | | 0.57 | | | | 0.83 | | |
| LESS DIVIDENDS | |
| Dividends from net investment income | | | (0.11 | ) | | | (0.11 | ) | | | (0.09 | ) | | | (0.07 | ) | | | (0.07 | ) | |
| Net asset value, end of year | | $ | 8.11 | | | $ | 12.74 | | | $ | 11.95 | | | $ | 10.41 | | | $ | 9.91 | | |
| Total return1 | | | (35.69 | )% | | | 7.56 | % | | | 15.79 | % | | | 5.78 | % | | | 9.13 | % | |
| RATIOS AND SUPPLEMENTAL DATA | |
| Net assets, end of year (000s omitted) | | $ | 6,945 | | | $ | 10,848 | | | $ | 10,867 | | | $ | 11,108 | | | $ | 13,437 | | |
| Ratio of expenses to average net assets | | | 0.95 | % | | | 0.95 | % | | | 0.95 | % | | | 1.04 | % | | | 1.16 | % | |
Ratio of net investment income to
average net assets | | | 1.30 | % | | | 0.86 | % | | | 0.88 | % | | | 0.74 | % | | | 0.69 | % | |
Decrease reflected in above operating expense
ratios due to waivers/reimbursements | | | 1.08 | % | | | 0.47 | % | | | 0.58 | % | | | 0.47 | % | | | 0.50 | % | |
| Portfolio turnover rate | | | 170 | % | | | 124 | % | | | 131 | % | | | 114 | % | | | 47 | % | |
1 Total returns are historical and assume changes in share price and reinvestment of all dividends and distributions. Had certain expenses not been reduced during the years shown, total returns would have been lower. Total returns do not reflect charges and expenses attributable to any particular variable contract or plan.
See Accompanying Notes to Financial Statements.
25
Credit Suisse Trust — Blue Chip Portfolio
Notes to Financial Statements
December 31, 2008
Note 1. Organization
Credit Suisse Trust (the "Trust") is an open-end management investment company registered under the Investment Company Act of 1940, as amended (the "1940 Act"), and currently offers eight managed investment portfolios of which one, the Blue Chip Portfolio (the "Portfolio"), is included in this report. The Portfolio is a diversified investment fund that seeks long-term capital appreciation. Shares of the Portfolio are not available directly to individual investors but may be offered only through (a) variable annuity contracts and variable life insurance contracts offered by separate accounts of certain insurance companies and (b) tax-qualified pension and retirement plans. The Portfolio may not be available in connection with a particular contract or plan. The Trust was organized under the laws of the Commonwealth of Massachusetts as a business trust on March 15, 1995.
Note 2. Significant Accounting Policies
A) SECURITY VALUATION — The net asset value of the Portfolio is determined daily as of the close of regular trading on the New York Stock Exchange, Inc. (the "Exchange") on each day the Exchange is open for business. Equity investments are valued at market value, which is generally determined using the closing price on the exchange or market on which the security is primarily traded at the time of valuation (the "Valuation Time"). If no sales are reported, equity investments are generally valued at the most recent bid quotation as of the Valuation Time or at the lowest asked quotation in the case of a short sale of securities. Debt securities with a remaining maturity greater than 60 days are valued in accordance with the price supplied by a pricing service, which may use a matrix, formula or other objective method that takes into consideration market indices, yield curves and other specific adjustments. Debt obligations that will matur e in 60 days or less are valued on the basis of amortized cost, which approximates market value, unless it is determined that using this method would not represent fair value. Investments in mutual funds are valued at the mutual fund's closing net asset value per share on the day of valuation. Securities and other assets for which market quotations are not readily available, or whose values have been materially affected by events occurring before the Portfolio's Valuation Time but after the close of the securities' primary markets, are valued at fair value as determined in good faith by, or under the direction of, the Board of Trustees under procedures established by the Board of Trustees. The Portfolio may utilize a service provided by an independent third party which has been approved by the Board of Trustees to fair value certain securities. When fair-value pricing is employed, the prices of securities used by a portfolio to calculate its net asset value may differ from quoted or published prices for the same securities.
26
Credit Suisse Trust — Blue Chip Portfolio
Notes to Financial Statements (continued)
December 31, 2008
Note 2. Significant Accounting Policies
The Portfolio adopted Financial Accounting Standards Board Statement of Financial Accounting Standards No. 157, Fair Value Measurements ("FAS 157"), effective January 1, 2008. In accordance with FAS 157, fair value is defined as the price that the Portfolio would receive upon selling an investment in a timely transaction to an independent buyer in the principal or most advantageous market of the investment. FAS 157 established a three-tier hierarchy to maximize the use of observable market data and minimize the use of unobservable inputs and to establish classification of fair value measurements for disclosure purposes. Inputs refer broadly to the assumptions that market participants would use in pricing the asset or liability, including assumptions about risk, for example, the risk inherent in a particular valuation technique used to measure fair value including such a pricing model and/or the risk inherent in the inputs to the valuation te chnique. Inputs may be observable or unobservable. Observable inputs are inputs that reflect the assumptions market participants would use in pricing the asset or liability developed based on market data obtained from sources independent of the reporting entity. Unobservable inputs are inputs that reflect the reporting entity's own assumptions about the assumptions market participants would use in pricing the asset or liability developed based on the best information available in the circumstances. The three-tier hierarchy of inputs is summarized in the three broad Levels listed below.
• Level 1 – quoted prices in active markets for identical investments
• Level 2 – other significant observable inputs (including quoted prices for similar investments, interest rates, prepayment speeds, credit risk, etc.)
• Level 3 – significant unobservable inputs (including the Portfolio's own assumptions in determining the fair value of investments)
The inputs or methodology used for valuing securities are not necessarily an indication of the risk associated with investing in those securities.
The following is a summary of the inputs used as of December 31, 2008 in valuing the Portfolio's investments carried at value:
| Valuation Inputs | | Investments in
Securities | | Other Financial
Instruments* | |
| Level 1 – Quoted Prices | | $ | 6,903,594 | | | $ | — | | |
| Level 2 – Other Significant Observable Inputs | | | — | | | | — | | |
| Level 3 – Significant Unobservable Inputs | | | — | | | | — | | |
| Total | | $ | 6,903,594 | | | $ | — | | |
*Other financial instruments include futures, forwards and swap contracts.
27
Credit Suisse Trust — Blue Chip Portfolio
Notes to Financial Statements (continued)
December 31, 2008
Note 2. Significant Accounting Policies
B) SECURITY TRANSACTIONS AND INVESTMENT INCOME — Security transactions are accounted for on a trade date basis. Interest income is recorded on the accrual basis. Dividends are recorded on the ex-dividend date. The cost of investments sold is determined by use of the specific identification method for both financial reporting and income tax purposes.
C) DIVIDENDS AND DISTRIBUTIONS TO SHAREHOLDERS — Dividends from net investment income and distributions of net realized capital gains, if any, are declared and paid at least annually. However, to the extent that a net realized capital gain can be reduced by a capital loss carryforward, such gain will not be distributed. Income and capital gain distributions are determined in accordance with federal income tax regulations, which may differ from accounting principles generally accepted in the United States of America ("GAAP").
D) FEDERAL INCOME TAXES — No provision is made for federal taxes as it is the Portfolio's intention to continue to qualify for and elect the tax treatment applicable to regulated investment companies under the Internal Revenue Code of 1986, as amended, and to make the requisite distributions to its shareholders, which will be sufficient to relieve it from federal income and excise taxes.
During June 2006, the Financial Accounting Standards Board ("FASB") issued FASB Interpretation 48 ("FIN 48" or the "Interpretation"), Accounting for Uncertainty in Income Taxes – an interpretation of FASB statement 109. The Portfolio has reviewed its current tax positions and has determined that no provision for income tax is required in the Portfolio's financial statements. The Portfolio's federal tax returns for the prior three fiscal years remain subject to examination by the Internal Revenue Service.
E) USE OF ESTIMATES — The preparation of financial statements in conformity with GAAP requires management to make estimates and assumptions that affect the reported amounts of assets and liabilities and disclosure of contingent assets and liabilities at the date of the financial statements and the reported amounts of income and expenses during the reporting period. Actual results could differ from these estimates.
F) SHORT-TERM INVESTMENTS — The Portfolio, together with other funds/portfolios advised by Credit Suisse Asset Management, LLC ("Credit Suisse"), an indirect, wholly-owned subsidiary of Credit Suisse Group AG, pools available cash into either a short-term variable rate time deposit issued by State Street Bank and Trust Company ("SSB"), the Portfolio's custodian, or
28
Credit Suisse Trust — Blue Chip Portfolio
Notes to Financial Statements (continued)
December 31, 2008
Note 2. Significant Accounting Policies
a money market fund advised by Credit Suisse. The short-term time deposit issued by SSB is a variable rate account classified as a short-term investment.
G) SECURITIES LENDING — Loans of securities are required at all times to be secured by collateral at least equal to 102% of the market value of domestic securities on loan (including any accrued interest thereon) and 105% of the market value of foreign securities on loan (including any accrued interest thereon). Cash collateral received by the Portfolio in connection with securities lending activity may be pooled together with cash collateral for other funds/portfolios advised by Credit Suisse and may be invested in a variety of investments, including certain Credit Suisse-advised funds, funds advised by SSB, the Portfolio's securities lending agent, or money market instruments. However, in the event of default or bankruptcy by the other party to the agreement, realization and/or retention of the collateral may be subject to legal proceedings. The Portfolio had no securities out on loan during the year ended December 31, 2008.
SSB has been engaged by the Portfolio to act as the Portfolio's securities lending agent. The Portfolio's securities lending arrangement provides that the Portfolio and SSB will share the net income earned from securities lending activities. The Portfolio may also be entitled to certain minimum amounts of income from its securities lending activities. Securities lending income is accrued as earned.
Note 3. Transactions with Affiliates and Related Parties
Credit Suisse serves as investment adviser for the Portfolio. For its investment advisory services, Credit Suisse is entitled to receive a fee from the Portfolio at an annual rate of 0.50% of the Portfolio's average daily net assets. For the year ended December 31, 2008, investment advisory fees earned, voluntarily waived and expenses reimbursed were $45,885, $45,885 and $53,291, respectively. Credit Suisse will not recapture from the Portfolio any fees it waived or expenses it reimbursed during the year ended December 31, 2008. Fee waivers and reimbursements are voluntary and may be discontinued by Credit Suisse at any time.
Credit Suisse Asset Management Securities, Inc. ("CSAMSI"), an affiliate of Credit Suisse, and SSB serve as co-administrators to the Portfolio. For its co-administrative services, CSAMSI currently receives a fee calculated at an annual rate of 0.09% of the Portfolio's average daily net assets. For the year ended December 31, 2008, co-administrative services fees earned by CSAMSI were $8,260.
29
Credit Suisse Trust — Blue Chip Portfolio
Notes to Financial Statements (continued)
December 31, 2008
Note 3. Transactions with Affiliates and Related Parties
For its co-administrative services, SSB receives a fee, exclusive of out-of-pocket expenses, calculated in total for all the Credit Suisse funds/portfolios co-administered by SSB and allocated based upon the relative average net assets of each fund/portfolio, subject to an annual minimum fee. For the year ended December 31, 2008, co-administrative services fees earned by SSB (including out-of-pocket expenses) were $22,011.
In addition to serving as the Portfolio's co-administrator, CSAMSI currently serves as distributor of the Portfolio's shares without compensation.
Merrill Corporation ("Merrill"), an affiliate of Credit Suisse, has been engaged by the Portfolio to provide certain financial printing and fulfillment services. For the year ended December 31, 2008, Merrill was paid $25,047 for its services to the Portfolio.
Note 4. Line of Credit
The Portfolio, together with other funds/portfolios advised by Credit Suisse (collectively, the "Participating Funds"), participates in a $50 million committed, unsecured line of credit facility ("Credit Facility") for temporary or emergency purposes with SSB. Under the terms of the Credit Facility, the Participating Funds pay an aggregate commitment fee at a rate of 0.10% per annum on the average unused amount of the Credit Facility, which is allocated among the Participating Funds in such manner as is determined by the governing Boards of the Participating Funds. In addition, the Participating Funds pay interest on borrowings at the Federal Funds rate plus 0.50%. At December 31, 2008, the Portfolio had no loans outstanding under the Credit Facility. During the year ended December 31, 2008, the Portfolio had borrowings under the Credit Facility as follows:
Average Daily
Loan Balance | | Weighted Average
Interest Rate % | | Maximum Daily
Loan Outstanding | |
| $ | 103,000 | | | | 0.638 | % | | $ | 115,000 | | |
Note 5. Purchases and Sales of Securities
For the year ended December 31, 2008, purchases and sales of investment securities (excluding short-term investments) were $15,885,442 and $15,490,302, respectively.
30
Credit Suisse Trust — Blue Chip Portfolio
Notes to Financial Statements (continued)
December 31, 2008
Note 6. Capital Share Transactions
The Trust is authorized to issue an unlimited number of full and fractional shares of beneficial interest, $.001 par value per share. Transactions in capital shares of the Portfolio were as follows:
| | | For the Year Ended
December 31, 2008 | | For the Year Ended
December 31, 2007 | |
| Shares sold | | | 164,329 | | | | 156,069 | | |
| Shares issued in reinvestment of dividends | | | 8,811 | | | | 7,832 | | |
| Shares redeemed | | | (168,004 | ) | | | (221,807 | ) | |
| Net increase (decrease) | | | 5,136 | | | | (57,906 | ) | |
On December 31, 2008, the number of shareholders that held 5% or more of the outstanding shares of the Portfolio was as follows:
Number of
Shareholders | | Approximate Percentage
of Outstanding Shares | |
| | 1 | | | | 97 | % | |
Some of the shareholders are omnibus accounts, which hold shares on behalf of individual shareholders.
Note 7. Federal Income Taxes
Income and capital gain distributions are determined in accordance with federal income tax regulations, which may differ from GAAP.
The tax characteristics of dividends paid during the years ended December 31, 2008 and 2007, respectively, by the Portfolio were as follows:
| Ordinary Income | |
| 2008 | | 2007 | |
| $ | 96,395 | | | $ | 97,194 | | |
The tax basis components of distributable earnings differ from the amounts reflected in the Statement of Assets and Liabilities by temporary book/tax differences. These differences are primarily due to losses deferred on wash sales, basis adjustments on Partnerships and Real Estate Investment Trusts and deferral of post-October losses.
31
Credit Suisse Trust — Blue Chip Portfolio
Notes to Financial Statements (continued)
December 31, 2008
Note 7. Federal Income Taxes
At December 31, 2008, the components of distributable earnings on a tax basis were as follows:
| Undistributed net investment income | | $ | 118,055 | | |
| Accumulated realized loss | | | (1,346,147 | ) | |
| Unrealized depreciation | | | (1,637,206 | ) | |
| Deferral of post-October capital losses | | | (522,161 | ) | |
| | | $ | (3,387,459 | ) | |
At December 31, 2008, the Portfolio had capital loss carryforwards available to offset possible future capital gains as follows:
Expires December 31,
2011 | | Expires December 31,
2016 | |
| $ | 1,003,892 | | | $ | 342,255 | | |
During the tax year ended December 31, 2008, the Portfolio did not utilize any of the capital loss carryforward.
It is uncertain whether the Portfolio will be able to realize the benefits of the capital loss carryforward before they expire.
At December 31, 2008, the identified cost for federal income tax purposes, as well as the gross unrealized appreciation from investments for those securities having an excess of value over cost, gross unrealized depreciation from investments for those securities having an excess of cost over value and the net unrealized depreciation from investments were $8,540,800, $348,659, $(1,985,865) and $(1,637,206), respectively.
At December 31, 2008, the Portfolio reclassified $1,767 from undistributed net investment income to accumulated net realized loss to adjust for current period permanent book/tax differences which arose principally from differing book/tax treatments of foreign currency transactions, adjustments to gain/(loss) on Partnerships, return of capital and distributions received from Real Estate Investment Trusts. Net assets were not affected by these reclassifications.
Note 8. Contingencies
In the normal course of business, the Portfolio may provide general indemnifications pursuant to certain contracts and organizational documents. The Portfolio's maximum exposure under these arrangements is dependent on future claims that may be made against the Portfolio and, therefore, cannot be estimated; however, based on experience, the risk of loss from such claims is considered remote.
32
Credit Suisse Trust — Blue Chip Portfolio
Notes to Financial Statements (continued)
December 31, 2008
Note 9. Recent Accounting Pronouncements
In March 2008, FASB issued Statement of Financial Accounting Standards No. 161, Disclosures about Derivative Instruments and Hedging Activities ("FAS 161"), an amendment of FASB Statement No. 133. FAS 161 requires enhanced disclosures about (a) how and why an entity uses derivative instruments, (b) how derivative instruments and hedging activities are accounted for, and (c) how derivative instruments and related hedging activities affect a fund's financial position, financial performance, and cash flows. Management of the Portfolio does not believe the adoption of FAS 161 will materially impact the financial statement amounts, but will require additional disclosures. This will include qualitative and quantitative disclosures on derivative positions existing at period end and the effect of usin g derivatives during the reporting period. FAS 161 is effective for financial statements issued for fiscal years and interim periods beginning after November 15, 2008.
33
Credit Suisse Trust — Blue Chip Portfolio
Report of Independent Registered Public Accounting Firm
To the Board of Trustees of Credit Suisse Trust and Shareholders of
Credit Suisse Trust — Blue Chip Portfolio:
In our opinion, the accompanying statement of assets and liabilities, including the schedule of investments, and the related statements of operations and of changes in net assets and the financial highlights present fairly, in all material respects, the financial position of Blue Chip Portfolio (the "Portfolio"), a portfolio of the Credit Suisse Trust, at December 31, 2008, the results of its operations for the year then ended and the changes in its net assets and financial highlights for the periods presented, in conformity with accounting principles generally accepted in the United States of America. These financial statements and financial highlights (hereafter referred to as "financial statements") are the responsibility of the Portfolio's management. Our responsibility is to express an opinion on these financial statements based on our audits. We conducted our audits of these financial statements in accordance with the standards of the Public Company Accounting Oversight Board (United States). Those standards require that we plan and perform the audit to obtain reasonable assurance about whether the financial statements are free of material misstatement. An audit includes examining, on a test basis, evidence supporting the amounts and disclosures in the financial statements, assessing the accounting principles used and significant estimates made by management, and evaluating the overall financial statement presentation. We believe that our audit, which included confirmation of securities at December 31, 2008 by correspondence with the custodian and brokers, provides a reasonable basis for our opinion.
PricewaterhouseCoopers LLP
Baltimore, Maryland
February 24, 2009
34
Credit Suisse Trust — Blue Chip Portfolio
Board Approval of Advisory Agreement (unaudited)
In approving the renewal of the current Advisory Agreement, the Board of Trustees, including the Independent Trustees, at a meeting held on November 18 and 19, 2008, considered the following factors with respect to the Blue Chip Portfolio (the "Portfolio"):
Investment Advisory Fee Rates
The Board reviewed and considered the contractual advisory fee rate of 0.50% ("Contractual Advisory Fee") in light of the extent and quality of the advisory services provided by Credit Suisse Asset Management, LLC ("Credit Suisse"). The Board also reviewed and considered the fee waivers and/or expense reimbursement arrangements currently in place for the Portfolio and considered the actual fee rate of 0.06% paid by the Portfolio after taking waivers and reimbursements into account ("Net Advisory Fee"). The Board acknowledged that voluntary fee waivers and expense reimbursements could be discontinued at any time.
Additionally, the Board received and considered information comparing the Portfolio's Contractual Advisory Fee, Net Advisory Fee and the Portfolio's overall expenses with those of funds in both the relevant expense group ("Expense Group") and universe of funds ("Expense Universe") provided by Lipper Inc., an independent provider of investment company data.
Nature, Extent and Quality of the Services under the Advisory Agreement
The Board received and considered information regarding the nature, extent and quality of services provided to the Portfolio by Credit Suisse under the Advisory Agreement. The Board also noted information received at regular meetings throughout the year related to the services rendered by Credit Suisse. The Board reviewed background information about Credit Suisse, including its Form ADV. The Board considered the background and experience of Credit Suisse's senior management and the expertise of, and the amount of attention given to the Portfolio by, senior personnel of Credit Suisse. In addition, the Board reviewed the qualifications, backgrounds and responsibilities of the portfolio management team primarily responsible for the day-to-day portfolio management of the Portfolio and the extent of the resources devoted to research and analysis of actual and potential investments. The Board also received and considered information about the nat ure, extent and quality of services and fee rates offered to other Credit Suisse clients for comparable services.
35
Credit Suisse Trust — Blue Chip Portfolio
Board Approval of Advisory Agreement (unaudited) (continued)
Portfolio Performance
The Board received and considered the performance results of the Portfolio over time, along with comparisons both to the relevant performance group ("Performance Group") and universe of funds ("Performance Universe") for the Portfolio. The Board was provided with a description of the methodology used to arrive at the funds included in the Performance Group and the Performance Universe.
Credit Suisse Profitability
The Board received and considered a profitability analysis of Credit Suisse based on the fees payable under the Advisory Agreement for the Portfolio, including any fee waivers or fee caps, as well as other relationships between the Portfolio on the one hand and Credit Suisse affiliates on the other. The Board received profitability information for the other funds in the Credit Suisse family of funds.
Economies of Scale
The Board considered whether economies of scale in the provision of services to the Portfolio were being passed along to the shareholders. Accordingly, the Board considered whether alternative fee structures (such as breakpoint fee structures) would be more appropriate or reasonable taking into consideration economies of scale or other efficiencies that might accrue from increases in the Portfolio's asset levels.
Other Benefits to Credit Suisse
The Board considered other benefits received by Credit Suisse and its affiliates as a result of their relationship with the Portfolio. Such benefits include, among others, research arrangements with brokers who execute transactions on behalf of the Portfolio, administrative and brokerage relationships with affiliates of Credit Suisse and benefits potentially derived from an increase in Credit Suisse's businesses as a result of its relationship with the Portfolio (such as the ability to market to shareholders other financial products offered by Credit Suisse and its affiliates).
The Board considered the standards applied in seeking best execution, whether and to what extent soft dollar credits are sought and how any such credits are utilized, any benefits that may be achieved by using an affiliated broker and the existence of quality controls applicable to brokerage allocation
36
Credit Suisse Trust — Blue Chip Portfolio
Board Approval of Advisory Agreement (unaudited) (continued)
procedures. The Board also reviewed Credit Suisse's method for allocating portfolio investment opportunities among its advisory clients.
Conclusions
In selecting Credit Suisse, and approving the Advisory Agreement and the investment advisory fee under such agreement, the Board concluded that:
• The Contractual Advisory Fee was at the low end in the Portfolio's Expense Group and the Net Advisory Fee was the lowest in the Expense Group. The Board considered the fee to be reasonable.
• The Portfolio's performance was above the median for its Performance Group and Performance Universe in all periods except the five year period for the Performance Group.
• The Board was satisfied with the nature and extent of the investment advisory services provided to the Portfolio by Credit Suisse and that, based on dialogue with management and counsel, the services provided by Credit Suisse under the Advisory Agreement are typical of, and consistent with, those provided to similar mutual funds by other investment advisers.
• In light of the costs of providing investment management and other services to the Portfolio and Credit Suisse's ongoing commitment to the Portfolio and willingness to waive fees and expenses, the profits and other ancillary benefits that Credit Suisse and its affiliates received were considered reasonable.
• Credit Suisse's profitability based on fees payable under the Advisory Agreement was reasonable in light of the nature, extent and quality of the services provided to the Portfolio thereunder.
• In light of the fee waiver and the relatively small size of the Portfolio and the amount of the Contractual Advisory Fee and the Net Advisory Fee, the Portfolio's current fee structure (without breakpoints) was considered reasonable.
No single factor reviewed by the Board was identified by the Board as the principal factor in determining whether to approve the Advisory Agreement. The Independent Trustees were advised by separate independent legal counsel throughout the process.
37
Credit Suisse Trust — Blue Chip Portfolio
Information Concerning Trustees and Officers (unaudited)
Name, Address
(Year of Birth) | | Position(s)
Held with
Trust | | Term
of Office1
and
Length
of Time
Served | | Principal
Occupation(s) During
Past Five Years | | Number of
Portfolios in
Fund
Complex
Overseen by
Trustee | | Other
Directorships
Held by
Trustee | |
| Independent Trustees | | | | | | | | | | | |
|
Enrique Arzac
c/o Credit Suisse Asset
Management, LLC
Attn: General Counsel
Eleven Madison Avenue
New York, New York
10010
(1941) | | Trustee,
Audit
Committee
Chairman
and
Nominating
Committee
Member | | Since
2005 | | Professor of Finance
and Economics,
Graduate School of Business, Columbia
University since 1971. | | | 33 | | | Director of
Epoch Holding
Corporation (an
investment
management
and investment
advisory
services
company);
Director of The
Adams Express
Company (a
closed-end
investment
company);
Director of
Petroleum and
Resources
Corporation (a
closed-end
investment
company). | |
|
Jeffrey E. Garten
Box 208200
New Haven, Connecticut
06520-8200
(1946) | | Trustee,
Audit and
Nominating
Committee
Member | | Since
Portfolio
Inception | | The Juan Trippe
Professor in the Practice
of International Trade,
Finance and Business
from July 2005 to
present; Partner and
Chairman of Garten
Rothkopf (consulting
firm) from October 2005
to present; Dean of Yale
School of Management
from November 1995 to
June 2005. | | | 26 | | | Director of
Aetna, Inc.
(insurance
company);
Director of
CarMax Group
(used car
dealers). | |
|
1 Each Trustee and Officer serves until his or her respective successor has been duly elected and qualified.
38
Credit Suisse Trust — Blue Chip Portfolio
Information Concerning Trustees and Officers (unaudited) (continued)
Name, Address
(Year of Birth) | | Position(s)
Held with
Trust | | Term
of Office1
and
Length
of Time
Served | | Principal
Occupation(s) During
Past Five Years | | Number of
Portfolios in
Fund
Complex
Overseen by
Trustee | | Other
Directorships
Held by
Trustee | |
| Independent Trustees | | | | | | | | | | | |
|
Peter F. Krogh
SFS/ICC 702
Georgetown University
Washington, DC 20057
(1937) | | Trustee,
Audit and
Nominating
Committee
Member | | Since
Portfolio
Inception | | Dean Emeritus and
Distinguished Professor
of International Affairs at
the Edmund A. Walsh
School of Foreign
Service, Georgetown
University from
June 1995 to present. | | | 26 | | | Director of
Carlisle
Companies
Incorporated
(diversified
manufacturing
company). | |
|
Steven N. Rappaport
Lehigh Court, LLC
555 Madison Avenue
29th Floor
New York, New York
10022
(1948) | | Chairman of
the Board of
Trustees,
Audit
Committee
Member and
Nominating
Committee
Chairman | | Trustee
since
Portfolio
Inception
and
Chairman
since
2005 | | Partner of Lehigh
Court, LLC and RZ Capital (private
investment firms) from
July 2002 to present. | | | 33 | | | Director of
iCAD, Inc.
(surgical and
medical
instruments and
apparatus
company);
Director of
Presstek, Inc.
(digital imaging
technologies
company);
Director of
Wood
Resources, LLC.
(plywood
manufacturing
company). | |
|
39
Credit Suisse Trust — Blue Chip Portfolio
Information Concerning Trustees and Officers (unaudited) (continued)
Name, Address
(Year of Birth) | | Position(s)
Held with
Trust | | Term
of Office1
and
Length
of Time
Served | | Principal Occupation(s) During Past Five Years | |
| Officers | | | | | | | |
|
George R. Hornig
Credit Suisse Asset Management, LLC
Eleven Madison Avenue
New York, New York
10010
(1954) | | Chief
Executive
Officer and
President | | Since
2008 | | Managing Director of Credit Suisse; Co-Chief Operating
Officer of Asset Management and Head of Asset
Management Americas; Associated with Credit Suisse since
1999; Officer of other Credit Suisse Funds. | |
|
Michael A. Pignataro
Credit Suisse Asset
Management, LLC
Eleven Madison Avenue
New York, New York
10010
(1959) | | Chief
Financial
Officer | | Since
Portfolio
Inception | | Director and Director of Fund Administration of Credit
Suisse; Associated with Credit Suisse or its predecessor
since 1984; Officer of other Credit Suisse Funds. | |
|
Emidio Morizio
Credit Suisse Asset
Management, LLC
Eleven Madison Avenue
New York, New York
10010
(1966) | | Chief
Compliance
Officer | | Since
2004 | | Director and Global Head of Compliance of Credit Suisse;
Associated with Credit Suisse since July 2000; Officer of
other Credit Suisse Funds. | |
|
J. Kevin Gao
Credit Suisse Asset
Management, LLC
Eleven Madison Avenue
New York, New York
10010
(1967) | | Chief Legal
Officer since
2006, Vice
President and
Secretary
since 2004 | | Since
2004 | | Director and Legal Counsel of Credit Suisse; Associated
with Credit Suisse since July 2003; Associated with the law
firm of Willkie Farr & Gallagher LLP from 1998 to 2003;
Officer of other Credit Suisse Funds. | |
|
Cecilia Chau
Credit Suisse Asset
Management, LLC
Eleven Madison Avenue
New York, New York
10010
(1973) | | Treasurer | | Since
2008 | | Assistant Vice President of Credit Suisse since June 2007;
Associated with Alliance Bernstein L.P. from January 2007
to May 2007; Associated with Credit Suisse from
August 2000 to December 2006; Officer of other Credit
Suisse Funds. | |
|
The Statement of Additional Information includes additional information about the Trustees and is available, without charge, upon request, by calling 800-222-8977.
40
Credit Suisse Trust — Blue Chip Portfolio
Tax Information Letter
December 31, 2008 (unaudited)
Important Tax Information for Corporate Shareholders
Corporate shareholders should note for the year ended December 31, 2008, the percentage of the Fund's investment income (i.e., net investment income plus short-term capital gains) that qualified for the intercorporate dividends received deduction is 100%.
41
Credit Suisse Trust — Blue Chip Portfolio
Proxy Voting and Portfolio Holdings Information (unaudited)
Information regarding how the Portfolio voted proxies related to its portfolio securities during the 12 month period ended June 30 of each year, as well as the policies and procedures that the Portfolio uses to determine how to vote proxies relating to its portfolio securities are available:
• By calling 1-800-222-8977
• On the Portfolio's website, www.credit-suisse.com/us
• On the website of the Securities and Exchange Commission, www.sec.gov.
The Portfolio files a complete schedule of its portfolio holdings for the first and third quarters of its fiscal year with the SEC on Form N-Q. The Portfolio's Forms N-Q are available on the SEC's website at www.sec.gov and may be reviewed and copied at the SEC's Public Reference Room in Washington, DC. Information on the operation of the SEC's Public Reference Room may be obtained by calling 1-202-551-8090.
42
This page intentionally left blank
This page intentionally left blank

P.O. BOX 55030, BOSTON, MA 02205-5030
800-222-8977 n www.credit-suisse.com/US
CREDIT SUISSE ASSET MANAGEMENT SECURITIES, INC., DISTRIBUTOR. TRBLC-AR-1208

CREDIT SUISSE FUNDS
Annual Report
December 31, 2008
CREDIT SUISSE TRUST
n COMMODITY RETURN STRATEGY PORTFOLIO
Credit Suisse Trust (the "Trust") shares are not available directly to individual investors, but may be offered only through certain insurance products and pension and retirement plans.
The Trust's investment objectives, risks, charges and expenses (which should be considered carefully before investing), and more complete information about the Trust, are provided in the Prospectus, which should be read carefully before investing. You may obtain additional copies by calling 800-222-8977 or by writing to Credit Suisse Trust, P.O. Box 55030, Boston, MA 02205-5030.
Credit Suisse Asset Management Securities, Inc., Distributor, is located at Eleven Madison Avenue, New York, NY 10010. The Trust is advised by Credit Suisse Asset Management, LLC.
The views of the Portfolio's management are as of the date of the letter and the Portfolio holdings described in this document are as of December 31, 2008; these views and Portfolio holdings may have changed subsequent to these dates. Nothing in this document is a recommendation to purchase or sell securities.
Portfolio shares are not deposits or other obligations of Credit Suisse Asset Management, LLC ("Credit Suisse") or any affiliate, are not FDIC-insured and are not guaranteed by Credit Suisse or any affiliate. Portfolio investments are subject to investment risks, including loss of your investment.
Credit Suisse Trust — Commodity Return Strategy Portfolio
Annual Investment Adviser's Report
December 31, 2008 (unaudited)
January 27, 2009
Dear Shareholder:
For the twelve-month period ending December 31, 2008, Credit Suisse Trust — Commodity Return Strategy Portfolio (the "Portfolio") had a loss of -33.72%1. Its benchmark, the Dow Jones-AIG Commodity Index Total Return2 ("DJ-AIG Index") had a twelve-month loss of -35.65%.
Market Review: First year of losses in seven years
The year ended December 31, 2008, was a challenging one for commodities. After six consecutive years of annual gains, commodities posted losses for the one-year period. The DJ-AIG Index fell 35.65% for the year, although there were greater losses in many equity indexes. The S&P 500 Index total return fell 37.00% while bonds performed better; for example, the Barclays U.S. Aggregate Bond Index total return rose 5.24%.
The commodities market experienced healthy growth throughout the year until July 2008, when the market began to see a reversion. At that point, the asset class experienced extreme volatility and downward pressure due to the dollar's strength, reduced inflation concerns, and liquidity issues becoming more pronounced. As the year came to a close, the rate of decline in commodities prices slowed, but a decrease in investor confidence due to uncertain market growth prospects remained prevalent. The resulting demand concerns were ultimately another reason behind the poor performance of commodities. The Federal Reserve's rate cuts in recent months did little to combat the downward trend of commodities.
In the DJ-AIG Index, precious metals were the top performing commodity group for the fiscal year, declining 4.06% on a total return basis. The fall was due to a stronger dollar, but was offset by the demand for gold as a risk reduction method (gold gained 3.91% for the year). Agriculture was down 27.47% on weakness from cotton (-42.77%), wheat (-38.53%), and soybean oil (-36.46%). However, due to an increase in demand for alternative energy sources, ethanol inputs (including corn and sugar) produced returns that were among the least negative within the DJ-AIG Index.
Industrial metals and energy were the worst performing commodity groups of the fiscal year. Industrial metals fell 48.27% due to the poor returns of nickel (-56.18%), zinc (-50.98%), and copper (-53.06%). As the outlook for growth in developed countries and emerging markets was reduced, the demand for materials followed suit. In fact, U.S. industrial production fell to its lowest level since 1974 and U.S. gross domestic product (GDP) reported a sharp decline.
1
Credit Suisse Trust — Commodity Return Strategy Portfolio
Annual Investment Adviser's Report (continued)
December 31, 2008 (unaudited)
Energy was down 47.33% for the year, marked by volatility. Natural gas suffered losses of 37.09% because of unexpected surpluses and lower-than-expected weather-related demand for cooling. Crude oil's decline of 53.23% was due to overall concerns about reduced demand as a result of the potentially slowing growth in global demand. Gasoline was down 61.44% and heating oil was down 47.23% for the year.
Strategic Review and Outlook: Diversification and Potential Upside
During the fiscal year ending December 31, 2008, the Portfolio suffered losses, however, on a relative basis, the Portfolio outperformed the benchmark by approximately 1.93%.
In the fixed income portion of the Portfolio, holdings maintained a bias toward high quality, short-term assets, especially bonds issued by U.S. Government-Sponsored Enterprises (GSEs) and high quality corporate commercial paper from non-financial sectors. In the current credit environment, we remain confident in our high quality fixed income positions, which have been only minimally affected by the credit market downturn of the past year.
Historically, commodity indexes have tended to exhibit long-term positive returns with low correlations to other asset classes, creating potential risk/return benefits within a diversified portfolio. This fiscal year, we saw strong gains in the first half of the year even while equity markets were falling. As the credit crisis deepened and global growth projections were reduced, the second half of the fiscal year was marked by falling commodity and equity markets. December showed signs of a possible recovery with price declines slowing and sectors demonstrating positive returns that were supported by easing liquidity constraints and global economic stimulus.
We believe that the recent volatility exhibited by commodities will persist in the coming months. In our opinion, if the global credit crisis and decline in equity markets continue, and if U.S. government responses to the financial crisis inflate the budget deficit and heighten consumer concerns, there may be significant price movements until more confidence returns to the financial markets. Although there may be near-term uncertainty in commodity price movements, we believe that the asset class could provide an effective portfolio hedge if the recent liquidity injections by global governments result in increased inflation.
The DJ-AIG Index is a broadly diversified futures index composed of futures contracts on 19 physical commodities. The index is weighted among commodity sectors using dollar-adjusted liquidity and production data. Currently, four energy products, six metals and nine agricultural products are represented in the index. The DJ-AIG Index is rebalanced as of the beginning of each calendar year
2
Credit Suisse Trust — Commodity Return Strategy Portfolio
Annual Investment Adviser's Report (continued)
December 31, 2008 (unaudited)
so that as of that time no single commodity constitutes less than 2% or more than 15% of the index, and each sector represented in the index is limited to 33%. However, following this rebalancing and for the remainder of the calendar year, these percentages may change so that a single commodity may constitute a lesser or greater percentage of the index and different sectors may represent different proportions of the index.
The Portfolio seeks total return and is designed to achieve positive return relative to the performance of the DJ-AIG Index. To do so, the Portfolio invests in commodity-linked derivative instruments and fixed-income securities. The Portfolio gains exposure to commodities markets by investing in structured notes whose principal and/or coupon payments are linked to the DJ-AIG Index and swap agreements on the DJ-AIG Index. The Portfolio may invest up to 25% of its' total assets in the Credit Suisse Cayman Commodity Fund II, Ltd. (the "Subsidiary"), a wholly owned subsidiary of the Portfolio formed in the Cayman Islands, which has the same investment objective as the portfolio and has a strategy of investing in commodity-linked swap agreements and other commodity-linked derivative instruments, futures contacts on individual commodities, or a subset of commodities and options on them.
The Credit Suisse Commodities Management Team
Andrew Karsh
Christopher Burton
Andrew S. Lenskold
Kam T. Poon
This Portfolio is non-diversified, which means it may invest a greater proportion of its assets in the securities of a smaller number of issuers than a diversified mutual fund and may therefore be subject to greater volatility. Exposure to commodity markets should only form a small part of a diversified portfolio. Investment in commodity markets may not be suitable for all investors. The Portfolio's investment in commodity-linked derivative instruments may subject the Portfolio to greater volatility than investment in traditional securities, particularly in investments involving leverage.
The use of derivatives such as commodity-linked structured notes, swaps and futures entails substantial risks, including risk of loss of a significant portion of their principal value, lack of a secondary market, increased volatility, correlation risk, liquidity risk, interest-rate risk, market risk, credit risk, valuation risk and tax risk. Gains and losses from speculative positions in derivatives may be much greater than the derivative's cost. At any time, the risk of loss of any individual security held by the Portfolio could be
3
Credit Suisse Trust — Commodity Return Strategy Portfolio
Annual Investment Adviser's Report (continued)
December 31, 2008 (unaudited)
significantly higher than 50% of the security's value. For a detailed discussion of these and other risks, please refer to the Portfolio's Prospectus, which should be read carefully before investing.
In addition to historical information, this report contains forward-looking statements, which may concern, among other things, domestic and foreign market, industry and economic trends and developments and government regulation and their potential impact on the Portfolio's investments. These statements are subject to risks and uncertainties and actual trends, developments and regulations in the future, and their impact on the Portfolio could be materially different from those projected, anticipated or implied. The Portfolio has no obligation to update or revise forward-looking statements.
4
Credit Suisse Trust — Commodity Return Strategy Portfolio
Annual Investment Adviser's Report (continued)
December 31, 2008 (unaudited)
Comparison of Change in Value of $10,000 Investment in the
Credit Suisse Trust — Commodity Return Strategy Portfolio1 and the
Dow Jones-AIG Commodity Index Total Return2,3 from Inception (2/28/06).
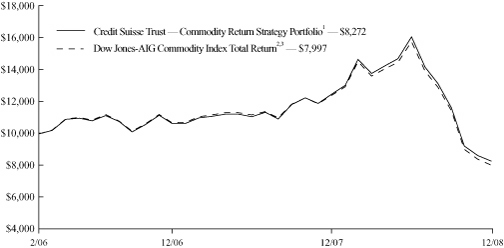
Average Annual Returns as of December 31, 20081
| 1 Year | | Since
Inception | |
| | (33.72 | )% | | | (6.46 | )% | |
Returns represent past performance and include change in share price and reinvestment of dividends and capital gains. Past performance cannot guarantee future results. The current performance of the Portfolio may be lower or higher than the figures shown. Returns and share price will fluctuate, and redemption value may be more or less than original cost. The performance results do not reflect the deduction of taxes that a shareholder would pay on portfolio distributions or the redemption of portfolio shares. Performance includes the effect of deducting expenses, but does not include charges and expenses attributable to any particular variable contract or plan. Accordingly, the Prospectus of the sponsoring Participating Insurance Company separate account or plan documents or ot her informational materials supplied by plan sponsors should be carefully reviewed for information on relevant charges and expenses. Excluding these charges and expenses from quotations of performance has the effect of increasing the performance quoted, and the effect of these charges should be considered when comparing performance to that of other mutual funds. Performance information current to the most recent month-end is available at www.credit-suisse.com/us.
The annualized gross expense ratio is 1.06%. The annualized net expense ratio after fee waivers and/or expense reimbursements is 0.95%.
1 Fee waivers and/or expense reimbursements may reduce expenses for the Portfolio, without which performance would be lower. Waivers and/or reimbursements may be discontinued at any time.
2 The Dow Jones-AIG Commodity Index Total Return is composed of futures contracts on 19 physical commodities. Investors cannot invest directly in an index.
3 Performance for the benchmark is not available for the period beginning February 28, 2006, (commencement of operations). For that reason, performance is shown for the period beginning March 1, 2006.
5
Credit Suisse Trust — Commodity Return Strategy Portfolio
Annual Investment Adviser's Report (continued)
December 31, 2008 (unaudited)
Information About Your Portfolio's Expenses
As an investor of the Portfolio, you incur two types of costs: ongoing expenses and transaction costs. Ongoing expenses include management fees, distribution and service (12b-1) fees and other Portfolio expenses. Examples of transaction costs include sales charges (loads), redemption fees and account maintenance fees, which are not shown in this section and which would result in higher total expenses. The following table is intended to help you understand your ongoing expenses of investing in the Portfolio and to help you compare these expenses with the ongoing expenses of investing in other mutual funds. The table is based on an investment of $1,000 made at the beginning of the six month period ended December 31, 2008.
The table illustrates your Portfolio's expenses in two ways:
• Actual Portfolio Return. This helps you estimate the actual dollar amount of ongoing expenses paid on a $1,000 investment in the Portfolio using the Portfolio's actual return during the period. To estimate the expenses you paid over the period, simply divide your account value by $1,000 (for example, an $8,600 account value divided by $1,000 = 8.6), then multiply the result by the number in the "Expenses Paid per $1,000" line under the share class you hold.
• Hypothetical 5% Portfolio Return. This helps you to compare your Portfolio's ongoing expenses with those of other mutual funds using the Portfolio's actual expense ratio and a hypothetical rate of return of 5% per year before expenses. Examples using a 5% hypothetical portfolio return may be found in the shareholder reports of other mutual funds. The hypothetical account values and expenses may not be used to estimate the actual ending account balance or expenses you paid for the period.
Please note that the expenses shown in these tables are meant to highlight your ongoing expenses only and do not reflect any transaction costs, such as sales charges (loads) or redemption fees. If these transaction costs had been included, your costs would have been higher. The "Expenses Paid per $1,000" line of the tables is useful in comparing ongoing expenses only and will not help you determine the relative total expenses of owning different funds.
6
Credit Suisse Trust — Commodity Return Strategy Portfolio
Annual Investment Adviser's Report (continued)
December 31, 2008 (unaudited)
Expenses and Value for a $1,000 Investment
for the six month period ended December 31, 2008
| Actual Portfolio Return | |
| Beginning Account Value 7/1/08 | | $ | 1,000.00 | | |
| Ending Account Value 12/31/08 | | $ | 513.70 | | |
| Expenses Paid per $1,000* | | $ | 3.61 | | |
| Hypothetical 5% Portfolio Return | |
| Beginning Account Value 7/1/08 | | $ | 1,000.00 | | |
| Ending Account Value 12/31/08 | | $ | 1,020.36 | | |
| Expenses Paid per $1,000* | | $ | 4.82 | | |
| Annualized Expense Ratios* | | | 0.95 | % | |
* Expenses are equal to the Portfolio's annualized expense ratio multiplied by the average account value over the period, multiplied by the number of days in the most recent fiscal half year period, then divided by 366.
The "Expenses Paid per $1,000" and the "Annualized Expense Ratios" in the tables are based on actual expenses paid by the Portfolio during the period, net of fee waivers and/or expense reimbursements. If those fee waivers and/or expense reimbursements had not been in effect, the Portfolio's actual expenses would have been higher. Expenses do not reflect additional charges and expenses that are, or may be, imposed under the variable contracts or plans. Such charges and expenses are described in the prospectus of the insurance company separate account or in the plan documents or other informational materials supplied by plan sponsors. The Portfolio's expenses should be considered with these charges and expenses in evaluating the overall cost of investing in the separate account.
For more information, please refer to the Portfolio's prospectus.
7
Credit Suisse Trust — Commodity Return Strategy Portfolio
Annual Investment Adviser's Report (continued)
December 31, 2008 (unaudited)
| Sector Breakdown* | |
| United States Agency Obligations | | | 39.8 | % | |
| Wholly-Owned Subsidiary | | | 23.8 | % | |
| Commercial Paper | | | 16.7 | % | |
| Commodity Indexed Structured Notes | | | 13.8 | % | |
| Variable Rate Corporate Obligation | | | 5.7 | % | |
| Short-Term Investment | | | 0.2 | % | |
| Total | | | 100.0 | % | |
* Expressed as a percentage of total investments (excluding securities lending collateral if applicable) and may vary over time.
8
Credit Suisse Trust — Commodity Return Strategy Portfolio
Schedule of Investments
December 31, 2008
Par
(000) | |
| | Ratings†
(S&P/Moody's) | | Maturity | | Rate% | | Value | |
| COMMERCIAL PAPER (16.7%) | | | |
| CORPORATES (16.7%) | | | |
| $ | 1,000 | | | ConocoPhillips | | (A-1, P-1) | | 01/14/09 | | | 0.250 | | | $ | 999,910 | | |
| | 1,500 | | | ConocoPhillips | | (A-1, P-1) | | 01/30/09 | | | 1.250 | | | | 1,498,490 | | |
| | 1,000 | | | Hewlett-Packard Co. | | (A-1, P-1) | | 03/04/09 | | | 0.400 | | | | 999,311 | | |
| | 1,500 | | | Hewlett-Packard Co. | | (A-1, P-1) | | 03/06/09 | | | 0.100 | | | | 1,499,733 | | |
| | 2,200 | | | Pfizer, Inc. | | (A-1+, P-1) | | 03/06/09 | | | 2.530 | | | | 2,190,104 | | |
| | 1,100 | | | The Coca-Cola Co. | | (A-1, P-1) | | 01/12/09 | | | 1.450 | | | | 1,099,513 | | |
| | 1,400 | | | The Coca-Cola Co. | | (A-1, P-1) | | 01/20/09 | | | 1.696 | | | | 1,399,076 | | |
| | 2,000 | | | The Walt Disney Co. | | (A-1, P-1) | | 03/10/09 | | | 0.400 | | | | 1,998,488 | | |
| TOTAL COMMERCIAL PAPER (Cost $11,684,627) | | | 11,684,625 | | |
| STRUCTURED NOTES (13.8%) | | | |
| | 3,000 | | | Deutsche Bank AG London, Series DJAI,
Senior Unsecured Notes# | | (AA-, Aa1) | | 12/17/09 | | | 0.801 | | | | 2,537,400 | | |
| | 1,200 | | | Deutsche Bank AG London, Series DJAI,
Senior Unsecured Notes# | | (AA-, Aa1) | | 01/13/10 | | | 1.475 | | | | 1,445,400 | | |
| | 4,700 | | | Svensk Exportkredit AB, Series DJA2,
Senior Unsecured Notes# | | (AA+, Aa1) | | 01/13/10 | | | 1.601 | | | | 5,660,459 | | |
| TOTAL STRUCTURED NOTES (Cost $8,900,000) | | | 9,643,259 | | |
| UNITED STATES AGENCY OBLIGATIONS (39.8%) | | | |
| | 5,000 | | | Fannie Mae# | | (AAA, Aaa) | | 02/12/10 | | | 2.180 | | | | 5,010,605 | | |
| | 2,500 | | | Fannie Mae Discount Notes | | (AAA, Aaa) | | 01/12/09 | | | 2.650 | | | | 2,497,976 | | |
| | 3,700 | | | Fannie Mae Discount Notes | | (AAA, Aaa) | | 02/02/09 | | | 2.800 | | | | 3,690,791 | | |
| | 150 | | | Federal Home Loan Bank Discount Notes | | (AAA, Aaa) | | 01/14/09 | | | 0.040 | | | | 149,998 | | |
| | 4,200 | | | Federal Home Loan Bank Discount Notes | | (AAA, Aaa) | | 01/16/09 | | | 0.031 | | | | 4,199,912 | | |
| | 5,000 | | | Federal Home Loan Banks# | | (AAA, Aaa) | | 02/10/10 | | | 2.318 | | | | 5,009,815 | | |
| | 2,300 | | | Federal Home Loan Banks Series 1# | | (AAA, Aaa) | | 07/10/09 | | | 4.349 | | | | 2,301,674 | | |
| | 1,700 | | | Freddie Mac Discount Notes | | (AAA, Aaa) | | 06/08/09 | | | 0.330 | | | | 1,697,962 | | |
| | 1,800 | | | Freddie Mac Discount Notes | | (AAA, Aaa) | | 06/22/09 | | | 2.940 | | | | 1,797,649 | | |
| | 1,500 | | | Freddie Mac Discount Notes | | (AAA, Aaa) | | 06/25/09 | | | 0.400 | | | | 1,498,007 | | |
| TOTAL UNITED STATES AGENCY OBLIGATIONS (Cost $27,806,587) | | | 27,854,389 | | |
| VARIABLE RATE CORPORATE OBLIGATION (5.7%) | | | |
| DIVERSIFIED FINANCIALS (5.7%) | | | |
| | 4,000 | | | Procter & Gamble Co., Series MTN,
Senior Unsecured Notes# (Cost $4,000,000) | | (AA-, Aa3) | | 09/09/09 | | | 2.216 | | | | 4,000,220 | | |
| SHORT-TERM INVESTMENT (0.2%) | | | |
| | 119 | | | State Street Bank and Trust Co. Euro Time Deposit
(Cost $119,000) | | | | 01/02/09 | | | 0.010 | | | | 119,000 | | |
See Accompanying Notes to Financial Statements.
9
Credit Suisse Trust — Commodity Return Strategy Portfolio
Schedule of Investments (continued)
December 31, 2008
Number of
Shares | |
| |
| |
| |
| |
Value | |
| WHOLLY-OWNED SUBSIDIARY (23.9%) | |
| | 38,027,058 | | | Credit Suisse Cayman Commodity Fund II, Ltd.^
(Cost $49,400,000) | | | | | | | | $ | 16,680,035 | | |
| TOTAL INVESTMENTS AT VALUE (100.1%) (Cost $101,910,214) | | | 69,981,528 | | |
| LIABILITIES IN EXCESS OF OTHER ASSETS (-0.1%) | | | (62,039 | ) | |
| NET ASSETS (100.0%) | | $ | 69,919,489 | | |
INVESTMENT ABBREVIATION
MTN = Medium Term Note
† Credit ratings given by the Standard & Poor's Division of The McGraw-Hill Companies, Inc. ("S&P") and Moody's Investors Service, Inc. ("Moody's") are unaudited.
# Variable rate obligations — The interest rate is the rate as of December 31, 2008.
^ Affiliated Issuer. See Note 3.
See Accompanying Notes to Financial Statements.
10
Credit Suisse Trust — Commodity Return Strategy Portfolio
Statement of Assets and Liabilities
December 31, 2008
| Assets | |
| Investments at value (Cost $52,510,214) (Note 2) | | $ | 53,301,493 | | |
| Investment in wholly-owned subsidiary at value (Cost $49,400,000) (Note 2) | | | 16,680,035 | | |
| Cash | | | 316 | | |
| Interest receivable | | | 66,138 | | |
| Cash segregated at brokers for futures contracts | | | 35,000 | | |
| Receivable for portfolio shares sold | | | 97 | | |
| Prepaid expenses | | | 1,684 | | |
| Total Assets | | | 70,084,763 | | |
| Liabilities | |
| Advisory fee payable (Note 3) | | | 58,222 | | |
| Administrative services fee payable (Note 3) | | | 11,762 | | |
| Shareholder servicing/Distribution fee payable (Note 3) | | | 14,091 | | |
| Payable for portfolio shares redeemed | | | 26,648 | | |
| Trustees' fee payable | | | 2,574 | | |
| Other accrued expenses payable | | | 51,977 | | |
| Total Liabilities | | | 165,274 | | |
| Net Assets | |
| Capital stock, $.001 par value (Note 6) | | | 9,838 | | |
| Paid-in capital (Note 6) | | | 112,330,652 | | |
| Accumulated net investment loss | | | (560 | ) | |
| Accumulated net realized loss on investments and futures contracts | | | (10,491,755 | ) | |
| Net unrealized depreciation on investments | | | (31,928,686 | ) | |
| Net Assets | | $ | 69,919,489 | | |
| Shares outstanding | | | 9,838,339 | | |
| Net asset value, offering price and redemption price per share | | $ | 7.11 | | |
See Accompanying Notes to Financial Statements.
11
Credit Suisse Trust — Commodity Return Strategy Portfolio
Statement of Operations
For the Year Ended December 31, 2008
| Investment Income (Note 2) | |
| Interest | | $ | 2,264,756 | | |
| Expenses | |
| Investment advisory fees (Note 3) | | | 491,577 | | |
| Administrative services fees (Note 3) | | | 121,301 | | |
| Shareholder servicing/Distribution fees (Note 3) | | | 245,789 | | |
| Legal fees | | | 72,252 | | |
| Audit and tax fees | | | 35,706 | | |
| Printing fees (Note 3) | | | 23,717 | | |
| Trustees' fees | | | 17,285 | | |
| Custodian fees | | | 9,800 | | |
| Transfer agent fees | | | 4,375 | | |
| Insurance expense | | | 3,630 | | |
| Commitment fees (Note 4) | | | 849 | | |
| Miscellaneous expense | | | 12,319 | | |
| Total expenses | | | 1,038,600 | | |
| Less: fees waived (Note 3) | | | (104,603 | ) | |
| Net expenses | | | 933,997 | | |
| Net investment income | | | 1,330,759 | | |
| Net Realized and Unrealized Gain (Loss) from Investments and Futures Contracts | |
| Net realized loss from investments | | | (10,609,434 | ) | |
| Net realized gain from futures contracts | | | 109,943 | | |
| Net change in unrealized appreciation (depreciation) from investments | | | (2,929,639 | ) | |
| Net change in unrealized appreciation (depreciation) from investment in wholly-owned subsidiary1 | | | (32,805,545 | ) | |
| Net change in unrealized appreciation (depreciation) from futures contracts | | | 7,736 | | |
| Net realized and unrealized loss from investments and futures contracts | | | (46,226,939 | ) | |
| Net decrease in net assets resulting from operations | | $ | (44,896,180 | ) | |
1 There was no income or realized gain/loss recognized from the investment in wholly-owned subsidiary.
See Accompanying Notes to Financial Statements.
12
Credit Suisse Trust — Commodity Return Strategy Portfolio
Statements of Changes in Net Assets
| | | For the Year
Ended
December 31, 2008 | | For the Year
Ended
December 31, 2007 | |
| From Operations | |
| Net investment income | | $ | 1,330,759 | | | $ | 5,203,315 | | |
| Net realized gain (loss) from investments and futures contracts | | | (10,499,491 | ) | | | 12,907,214 | | |
Net change in unrealized appreciation (depreciation)
from investments and futures contracts | | | (35,727,448 | ) | | | (137,690 | ) | |
| Net increase (decrease) in net assets resulting from operations | | | (44,896,180 | ) | | | 17,972,839 | | |
| From Dividends and Distributions | |
| Dividends from net investment income | | | (1,320,641 | ) | | | (5,262,535 | ) | |
| Distributions from net realized gains | | | (6,620,491 | ) | | | — | | |
| Net decrease in net assets resulting from dividends and distributions | | | (7,941,132 | ) | | | (5,262,535 | ) | |
| From Capital Share Transactions (Note 6) | |
| Proceeds from sale of shares | | | 72,262,206 | | | | 81,389,351 | | |
| Reinvestment of dividends and distributions | | | 7,941,132 | | | | 5,262,535 | | |
| Net asset value of shares redeemed | | | (14,070,998 | ) | | | (188,644,559 | ) | |
| Net increase (decrease) in net assets from capital share transactions | | | 66,132,340 | | | | (101,992,673 | ) | |
| Net increase (decrease) in net assets | | | 13,295,028 | | | | (89,282,369 | ) | |
| Net Assets | |
| Beginning of year | | | 56,624,461 | | | | 145,906,830 | | |
| End of year | | $ | 69,919,489 | | | $ | 56,624,461 | | |
| Accumulated net investment loss | | $ | (560 | ) | | $ | (10,406 | ) | |
See Accompanying Notes to Financial Statements.
13
Credit Suisse Trust — Commodity Return Strategy Portfolio
Financial Highlights
(For a Share of the Portfolio Outstanding Throughout Each Period)
| | | For the Year
Ended
December 31, | |
For the Period
Ended | |
| | | 2008 | | 2007 | | December 31, 20061 | |
| Per share data | |
| Net asset value, beginning of period | | $ | 11.58 | | | $ | 10.37 | | | $ | 10.00 | | |
| INVESTMENT OPERATIONS | |
| Net investment income2 | | | 0.15 | | | | 0.54 | | | | 0.38 | | |
Net gain (loss) on investments, futures contracts and swap contracts
(both realized and unrealized) | | | (3.80 | ) | | | 1.22 | | | | 0.25 | | |
| Total from investment operations | | | (3.65 | ) | | | 1.76 | | | | 0.63 | | |
| LESS DIVIDENDS AND DISTRIBUTIONS | |
| Dividends from net investment income | | | (0.15 | ) | | | (0.55 | ) | | | (0.26 | ) | |
| Distributions from net realized gains | | | (0.67 | ) | | | — | | | | — | | |
| Total dividends and distributions | | | (0.82 | ) | | | (0.55 | ) | | | (0.26 | ) | |
| Net asset value, end of period | | $ | 7.11 | | | $ | 11.58 | | | $ | 10.37 | | |
| Total return3 | | | (33.72 | )% | | | 17.33 | % | | | 6.36 | % | |
| RATIOS AND SUPPLEMENTAL DATA | |
| Net assets, end of period (000s omitted) | | $ | 69,919 | | | $ | 56,624 | | | $ | 145,907 | | |
| Ratio of expenses to average net assets | | | 0.95 | % | | | 0.95 | % | | | 0.95 | %4 | |
| Ratio of net investment income to average net assets | | | 1.35 | % | | | 4.06 | % | | | 4.28 | %4 | |
Decrease reflected in above operating expense
ratios due to waivers/reimbursements | | | 0.11 | % | | | 0.08 | % | | | 0.31 | %4 | |
| Portfolio turnover rate | | | 140 | % | | | 93 | % | | | 27 | % | |
1 For the period February 28, 2006 (commencement of operations) through December 31, 2006.
2 Per share information is calculated using the average shares outstanding method.
3 Total returns are historical and assume changes in share price and reinvestment of all dividends and distributions. Had certain expenses not been reduced during the periods shown, total returns would have been lower. Total returns do not reflect charges and expenses attributable to any particular variable contract or plan. Total returns for periods less than one year are not annualized.
4 Annualized.
See Accompanying Notes to Financial Statements.
14
Credit Suisse Trust — Commodity Return Strategy Portfolio
Notes to Financial Statements
December 31, 2008
Note 1. Organization
Credit Suisse Trust (the "Trust") is an open-end management investment company registered under the Investment Company Act of 1940, as amended (the "1940 Act"), and currently offers eight managed investment portfolios of which one, the Commodity Return Strategy Portfolio (the "Portfolio"), is included in this report. The Portfolio is a non-diversified open-end management investment company that seeks total return. Shares of the Portfolio are not available directly to individual investors but may be offered only through (a) variable annuity contracts and variable life insurance contracts offered by separate accounts of certain insurance companies and (b) tax-qualified pension and retirement plans. The Portfolio may not be available in connection with a particular contract or plan. The Trust was organized under the laws of the Commonwealth of Massachusetts as a business trust on March 15, 1995.
Note 2. Significant Accounting Policies
A) SECURITY VALUATION — The net asset value of the Portfolio is determined daily as of the close of regular trading on the New York Stock Exchange, Inc. (the "Exchange") on each day the Exchange is open for business. Debt securities with a remaining maturity greater than 60 days are valued in accordance with the price supplied by a pricing service, which may use a matrix, formula or other objective method that takes into consideration market indices, yield curves and other specific adjustments. Debt obligations that will mature in 60 days or less are valued on the basis of amortized cost, which approximates market value, unless it is determined that using this method would not represent fair value. Equity investments are valued at market value, which is generally determined using the closing price on the exchange or market on which the security is primarily traded at the time of valuation (the "Valuation Time"). If no sales are reported , equity investments are generally valued at the most recent bid quotation as of the Valuation Time or at the lowest asked quotation in the case of a short sale of securities. Investments in mutual funds are valued at the mutual fund's closing net asset value per share on the day of valuation. Swap contracts are generally valued at a price at which the counterparty to such contract would repurchase the instrument or terminate the contract. Structured note agreements are valued in accordance with a dealer-supplied valuation based on changes in the value of the underlying index. Securities, options, futures contracts and other assets (including swaps and structured note agreements), for which market quotations are not readily available, or whose values have been materially affected by events occurring before the Portfolio's Valuation Time but after the close of the
15
Credit Suisse Trust — Commodity Return Strategy Portfolio
Notes to Financial Statements (continued)
December 31, 2008
Note 2. Significant Accounting Policies
securities' primary markets, are valued at fair value as determined in good faith by, or under the direction of, the Board of Trustees under procedures established by the Board of Trustees. The Portfolio may utilize a service provided by an independent third party which has been approved by the Board of Trustees to fair value certain securities. When fair-value pricing is employed, the prices of securities used by a portfolio to calculate its net asset value may differ from quoted or published prices for the same securities.
The Portfolio adopted Financial Accounting Standards Board Statement of Financial Accounting Standards No. 157, Fair Value Measurements ("FAS 157"), effective January 1, 2008. In accordance with FAS 157, fair value is defined as the price that the Portfolio would receive upon selling an investment in a timely transaction to an independent buyer in the principal or most advantageous market of the investment. FAS 157 established a three-tier hierarchy to maximize the use of observable market data and minimize the use of unobservable inputs and to establish classification of fair value measurements for disclosure purposes. Inputs refer broadly to the assumptions that market participants would use in pricing the asset or liability, including assumptions about risk, for example, the risk inherent in a particular valuation technique used to measure fair value including such a pricing model and/or the risk inherent in the inputs to the valuation te chnique. Inputs may be observable or unobservable. Observable inputs are inputs that reflect the assumptions market participants would use in pricing the asset or liability developed based on market data obtained from sources independent of the reporting entity. Unobservable inputs are inputs that reflect the reporting entity's own assumptions about the assumptions market participants would use in pricing the asset or liability developed based on the best information available in the circumstances. The three-tier hierarchy of inputs is summarized in the three broad Levels listed below.
• Level 1 – quoted prices in active markets for identical investments
• Level 2 – other significant observable inputs (including quoted prices for similar investments, interest rates, prepayment speeds, credit risk, etc.)
• Level 3 – significant unobservable inputs (including the Portfolio's own assumptions in determining the fair value of investments)
The inputs or methodology used for valuing securities are not necessarily an indication of the risk associated with investing in those securities.
16
Credit Suisse Trust — Commodity Return Strategy Portfolio
Notes to Financial Statements (continued)
December 31, 2008
Note 2. Significant Accounting Policies
The following is a summary of the inputs used as of December 31, 2008 in valuing the Portfolio's investments carried at value:
| Valuation Inputs | | Investments in
Securities | | Other Financial
Instruments* | |
| Level 1 – Quoted Prices | | $ | — | | | $ | — | | |
| Level 2 – Other Significant Observable Inputs | | | 69,981,528 | | | | — | | |
| Level 3 – Significant Unobservable Inputs | | | — | | | | — | | |
| Total | | $ | 69,981,528 | | | $ | — | | |
*Other financial instruments include futures, forwards and swap contracts.
B) SECURITY TRANSACTIONS AND INVESTMENT INCOME — Security transactions are accounted for on a trade date basis. Interest income is recorded on the accrual basis. The Portfolio amortizes premiums and accretes discounts using the effective interest method. Dividends are recorded on the ex-dividend date. The cost of investments sold is determined by use of the specific identification method for both financial reporting and income tax purposes.
C) DIVIDENDS AND DISTRIBUTIONS TO SHAREHOLDERS — Dividends from net investment income are declared and paid quarterly. Distributions of net realized capital gains, if any, are declared and paid at least annually. However, to the extent that a net realized capital gain can be reduced by a capital loss carryforward, such gain will not be distributed. Income and capital gain distributions are determined in accordance with federal income tax regulations, which may differ from accounting principles generally accepted in the United States of America ("GAAP").
D) FEDERAL INCOME TAXES — No provision is made for federal taxes as it is the Portfolio's intention to continue to qualify for and elect the tax treatment applicable to regulated investment companies ("RIC") under the Internal Revenue Code of 1986, as amended (the "Code"), and to make the requisite distributions to its shareholders, which will be sufficient to relieve it from federal income and excise taxes.
In order to qualify as a RIC under the Code, the Portfolio must meet certain requirements regarding the source of its income, the diversification of its assets and the distribution of its income. One of these requirements is that the Portfolio derive at least 90% of its gross income for each taxable year from dividends, interest, payments with respect to certain securities loans, gains from the sale or other disposition of stock, securities or foreign currencies, other income derived with respect to its business of investing in such stock, securities or currencies or net income derived from interests in certain publicly traded partnerships ("Qualifying Income"). The Portfolio may seek to track
17
Credit Suisse Trust — Commodity Return Strategy Portfolio
Notes to Financial Statements (continued)
December 31, 2008
Note 2. Significant Accounting Policies
the performance of the Dow Jones-AIG Commodity Index ("DJ-AIG Index") through investing in structured notes designed to track the performance of the DJ-AIG Index. The Portfolio has received a private letter ruling from the IRS which confirms that the Portfolio's use of certain types of structured notes designed to track the performance of the DJ-AIG Index produce Qualifying Income. In addition, the Portfolio may, through its investment in the Credit Suisse Cayman Commodity Fund II, Ltd., a wholly owned and controlled Cayman Islands subsidiary, ("the Subsidiary"), seek to track the performance of the DJ-AIG Index by the Subsidiary's investments in commodity-linked swaps and/or futures contracts. The Portfolio has obtained a private letter ruling from the IRS that its investment in the Subsidiary will produce Qualifying Income. If the Portfolio is unable to ensure continued qualification as a RIC, the Portfolio may be required to change its in vestment objective, policies or techniques, or may be liquidated. If the Portfolio fails to qualify as a RIC, the Portfolio will be subject to federal income tax on its net income and capital gains at regular corporate rates (without reduction for distributions to shareholders). If the Portfolio were to fail to qualify as a RIC and become subject to federal income tax, shareholders of the Portfolio would be subject to the risk of diminished returns. If the Portfolio should fail to qualify as a RIC, it would be considered as a single investment, which may result in variable contracts invested in the Portfolio not being treated as annuity, endowment or life insurance contracts under the Code. All income and gain inside the variable contracts would be taxed currently to the holders, and the contracts would remain subject to taxation as ordinary income thereafter, even if they become adequately diversified.
During June 2006, the Financial Accounting Standards Board ("FASB") issued FASB Interpretation 48 ("FIN 48" or the "Interpretation"), Accounting for Uncertainty in Income Taxes — an interpretation of FASB statement 109. The Portfolio has reviewed its current tax positions and has determined that no provision for income tax is required in the Portfolio's financial statements. The Portfolio's federal tax returns for the prior three fiscal years remain subject to examination by the Internal Revenue Service.
E) USE OF ESTIMATES — The preparation of financial statements in conformity with GAAP requires management to make estimates and assumptions that affect the reported amounts of assets and liabilities and disclosure of contingent assets and liabilities at the date of the financial statements and the reported amounts of income and expenses during the reporting period. Actual results could differ from these estimates.
18
Credit Suisse Trust — Commodity Return Strategy Portfolio
Notes to Financial Statements (continued)
December 31, 2008
Note 2. Significant Accounting Policies
F) SHORT-TERM INVESTMENTS — The Portfolio, together with other funds/portfolios advised by Credit Suisse Asset Management, LLC ("Credit Suisse"), an indirect, wholly-owned subsidiary of Credit Suisse Group AG, pools available cash into either a short-term variable rate time deposit issued by State Street Bank and Trust Company ("SSB"), the Portfolio's custodian, or a money market fund advised by Credit Suisse. The short-term time deposit issued by SSB is a variable rate account classified as a short-term investment.
G) FUTURES — The Portfolio may enter into futures contracts to the extent permitted by its investment policies and objectives. Upon entering into a futures contract, the Portfolio is required to deposit cash and/or pledge U.S. Government securities as initial margin. Subsequent payments, which are dependent on the daily fluctuations in the value of the underlying instrument, are made or received by the Portfolio each day (daily variation margin) and are recorded as unrealized gains or losses until the contracts are closed. When the contracts are closed, the Portfolio records a realized gain or loss equal to the difference between the proceeds from (or cost of) the closing transactions and the Portfolio's basis in the contract. Risks of entering into futures contracts for hedging purposes include the possibility that a change in the value of the contract may not correlate with the changes in the value of the underlying instruments. In ad dition, the purchase of a futures contract involves the risk that the Portfolio could lose more than the original margin deposit and subsequent payments may be required for a futures transaction. At December 31, 2008, the Portfolio had no open futures contracts.
H) SWAPS — The Portfolio may enter into commodity index swaps for hedging purposes or to seek to increase total return. A swap is an agreement that obligates two parties to exchange a series of cash flows at specified intervals based upon or calculated by reference to changes in specified prices or rates for a specified amount of an underlying asset or notional principal amount. The Portfolio will enter into commodity index swaps only on a net basis, which means that the two payment streams are netted out, with the Portfolio receiving or paying, as the case may be, only the net amount of the two payments. Risks may arise as a result of the failure of the counterparty to the swap contract to comply with the terms of the swap contract. The loss incurred by the failure of a counterparty is generally limited to the net interest payment to be received by the Portfolio, and/or the termination value at the end of the contract. Therefore, the P ortfolio considers the creditworthiness of each counterparty to a swap contract in evaluating potential credit risk. Additionally, risks may arise from unanticipated movements in interest rates or in the value of the underlying reference asset or index.
19
Credit Suisse Trust — Commodity Return Strategy Portfolio
Notes to Financial Statements (continued)
December 31, 2008
Note 2. Significant Accounting Policies
The Portfolio may enter into total return swap contracts, involving commitments to pay interest in exchange for a market-linked return, both based on notional amounts. To the extent the total return of the security or index underlying the transactions exceeds or falls short of the offsetting interest rate obligation, the Portfolio will receive a payment from or make a payment to the counterparty.
The Portfolio records unrealized gains or losses on a daily basis representing the value and the current net receivable or payable relating to open swap contracts. Net amounts received or paid on the swap contract are recorded as realized gains or losses. Fluctuations in the value of swap contracts are recorded for financial statement purposes as unrealized appreciation or depreciation of swap contracts. Realized gains and losses from terminated swaps are included in net realized gains/losses on swap contracts transactions. At December 31, 2008, the Portfolio had no outstanding swap contracts.
I) COMMODITY INDEX-LINKED NOTES — The Portfolio may invest in structured notes whose value is based on the price movements of a commodity index. The structured notes are often leveraged, increasing the volatility of each note's value relative to the change in the underlying linked financial element. The value of these notes will rise and fall in response to changes in the underlying commodity index. Structured notes may entail a greater degree of market risk than other types of debt securities because the investor bears the risk of the underlying commodity index. Structured notes may also be more volatile, less liquid, and more difficult to accurately price than less complex securities or more traditional debt securities. Fluctuations in the value of the structured notes are recorded as unrealized gains and losses in the accompanying financial statements. Net payments are recorded as interest income. These notes are subject to prepaymen t, credit and interest risks. The Portfolio has the option to request prepayment from the issuer. At maturity, or when a note is sold, the Portfolio records a realized gain or loss. At December 31, 2008, the value of these securities comprised 13.8% of the Portfolio's net assets and resulted in unrealized appreciation of $743,259.
J) SECURITIES LENDING — Loans of securities are required at all times to be secured by collateral at least equal to 102% of the market value of domestic securities on loan (including any accrued interest thereon) and 105% of the market value of foreign securities on loan (including any accrued interest thereon). Cash collateral received by the Portfolio in connection with securities lending activity may be pooled together with cash collateral for other funds/portfolios advised by Credit Suisse and may be invested in a variety of
20
Credit Suisse Trust — Commodity Return Strategy Portfolio
Notes to Financial Statements (continued)
December 31, 2008
Note 2. Significant Accounting Policies
investments, including certain Credit Suisse-advised funds, funds advised by SSB, the Portfolio's securities lending agent, or money market instruments. However, in the event of default or bankruptcy by the other party to the agreement, realization and/or retention of the collateral may be subject to legal proceedings. The Portfolio had no securities out on loan during the year ended December 31, 2008.
SSB has been engaged by the Portfolio to act as the Portfolio's securities lending agent. The Portfolio's securities lending arrangement provides that the Portfolio and SSB will share the net income earned from securities lending activities. The Portfolio may also be entitled to certain minimum amounts of income from its securities lending activities. Securities lending income is accrued as earned.
K) OTHER — The Portfolio may invest in securities of foreign countries and governments which involve certain risks in addition to those inherent in domestic investments. Such risks generally include, among others, currency risk (fluctuations in currency exchange rates), information risk (key information may be inaccurate or unavailable) and political risk (expropriation, nationalization or the imposition of capital or currency controls or punitive taxes). Other risks of investing in foreign securities include liquidity and valuation risks.
In the normal course of business the Portfolio trades financial instruments and enters into financial transactions where risk of potential loss exists due to changes in the market (market risk) or failure of the other party to a transaction to perform (credit risk). Similar to credit risk, the Portfolio may be exposed to counterparty risk, or the risk that an institution or other entity with which the Portfolio has unsettled or open transactions will default. The potential loss could exceed the value of the financial assets recorded in the financial statements. Financial assets, which potentially expose the Portfolio to credit risk, consist principally of cash due from counterparties and investments. The extent of the Portfolio's exposure to credit and counterparty risks in respect to these financial assets approximates their carrying value as recorded in the Portfolio's Statement of Assets and Liabilities.
The Portfolio may be subject to taxes imposed by countries in which it invests with respect to its investments in issuers existing or operating in such countries. Such taxes are generally based on income earned or repatriated and capital gains realized on the sale of such investments. The Portfolio accrues such taxes when the related income is earned or gains are realized.
21
Credit Suisse Trust — Commodity Return Strategy Portfolio
Notes to Financial Statements (continued)
December 31, 2008
Note 3. Transactions with Affiliates and Related Parties
Credit Suisse serves as investment adviser for the Portfolio. For its investment advisory services, Credit Suisse is entitled to receive a fee from the Portfolio at an annual rate of 0.50% of the Portfolio's average daily net assets. For the year ended December 31, 2008, investment advisory fees earned and voluntarily waived were $491,577 and $104,603, respectively. Credit Suisse will not recapture from the Portfolio any fees it waived during the year ended December 31, 2008. Fee waivers and reimbursements are voluntary and may be discontinued by Credit Suisse at any time.
Credit Suisse Asset Management Securities, Inc. ("CSAMSI"), an affiliate of Credit Suisse, and SSB serve as co-administrators to the Portfolio. For its co-administrative services, CSAMSI currently receives a fee calculated at an annual rate of 0.09% of the Portfolio's average daily net assets. For the year ended December 31, 2008, co-administrative services fees earned by CSAMSI were $88,484.
For its co-administrative services, SSB receives a fee, exclusive of out-of-pocket expenses, calculated in total for all the Credit Suisse funds/portfolios co-administered by SSB and allocated based upon the relative average net assets of each fund/portfolio, subject to an annual minimum fee. For the year ended December 31, 2008, co-administrative services fees earned by SSB (including out-of-pocket expenses) were $32,817.
In addition to serving as the Portfolio's co-administrator, CSAMSI currently serves as distributor of the Portfolio's shares. Pursuant to distribution plans adopted by the Portfolio pursuant to Rule 12b-1 under the 1940 Act, CSAMSI receives fees for its distribution services. These fees are calculated at an annual rate of 0.25% of the average daily net assets.
Merrill Corporation ("Merrill"), an affiliate of Credit Suisse, has been engaged by the Portfolio to provide certain financial printing and fulfillment services. For the year ended December 31, 2008, Merrill was paid $20,811 for its services to the Portfolio.
Investment in Cayman Commodity Fund II, Ltd. The Portfolio may invest up to 25% of its total assets in the Subsidiary, which invests primarily in commodity and financial futures and options contracts, as well as fixed income securities and other investments intended to serve as margin or collateral for the Subsidiary's derivatives positions. The Portfolio wholly owns and controls the Subsidiary, and the Portfolio and Subsidiary are both managed by Credit Suisse.
22
Credit Suisse Trust — Commodity Return Strategy Portfolio
Notes to Financial Statements (continued)
December 31, 2008
Note 3. Transactions with Affiliates and Related Parties
The Portfolio does not consolidate the assets, liabilities, capital or operations of the Subsidiary into its financial statements. Rather, the Subsidiary is separately presented as an investment in the Portfolio's Schedule of Investments. Unrealized appreciation or depreciation on the Portfolio's investment in the Subsidiary is recorded in the Portfolio's Statement of Assets and Liabilities and Portfolio's Statement of Operations.
For tax purposes, the Subsidiary is an exempted Cayman investment company. The Subsidiary has received an undertaking from the Government of the Cayman Islands exempting it from all local income, profits and capital gains taxes through June of 2027. No such taxes are levied in the Cayman Islands at the present time. For U.S. income tax purposes, the Subsidiary is a Controlled Foreign Corporation and as such is not subject to U.S. income tax. However, as a wholly-owned Controlled Foreign Corporation, the Subsidiary's net income and capital gain, to the extent of its earnings and profits, will be included each year in the Portfolio's investment company taxable income.
| | | Beginning
Shares | | Additions | | Reductions | | Ending
Shares | | Dividend
Income | | Value
of affiliates
at 12/31/08 | |
Credit Suisse Cayman
Commodity Fund II, Ltd. | | | 100,000 | | | | 37,927,058 | | | | — | | | | 38,027,058 | | | $ | — | | | $ | 16,680,035 | | |
Note 4. Line of Credit
The Portfolio, together with other funds/portfolios advised by Credit Suisse (collectively, the "Participating Funds"), participates in a $50 million committed, unsecured line of credit facility ("Credit Facility") for temporary or emergency purposes with SSB. Under the terms of the Credit Facility, the Participating Funds pay an aggregate commitment fee at a rate of 0.10% per annum on the average unused amount of the Credit Facility, which is allocated among the Participating Funds in such manner as is determined by the governing Boards of the Participating Funds. In addition, the Participating Funds pay interest on borrowings at the Federal Funds rate plus 0.50%. At December 31, 2008, and during the year ended December 31, 2008, the Portfolio had no borrowings under the Credit Facility.
23
Credit Suisse Trust — Commodity Return Strategy Portfolio
Notes to Financial Statements (continued)
December 31, 2008
Note 5. Purchases and Sales of Securities
For the year ended December 31, 2008, purchases and sales of investment securities (excluding short-term investments) and U.S. Government and Agency Obligations were as follows:
| Investments Securities | | U.S. Government/
Agency Obligations | |
| Purchases | | Sales | | Purchases | | Sales | |
| $ | 116,950,014 | | | $ | 54,132,140 | | | $ | 12,298,069 | | | $ | 0 | | |
Note 6. Capital Share Transactions
The Trust is authorized to issue an unlimited number of full and fractional shares of beneficial interest, $.001 par value per share. Transactions in capital shares of the Portfolio were as follows:
| | | For the Year Ended
December 31, 2008 | | For the Year Ended
December 31, 2007 | |
| Shares sold | | | 5,618,528 | | | | 7,693,479 | | |
| Shares issued in reinvestment of dividends and distributions | | | 759,506 | | | | 486,914 | | |
| Shares redeemed | | | (1,430,308 | ) | | | (17,357,645 | ) | |
| Net increase (decrease) | | | 4,947,726 | | | | (9,177,252 | ) | |
On December 31, 2008, the number of shareholders that held 5% or more of the outstanding shares of the Portfolio was as follows:
Number of
Shareholders | | Approximate Percentage
of Outstanding Shares | |
| | 1 | | | | 93 | % | |
Some of the shareholders are omnibus accounts, which hold shares on behalf of individual shareholders.
Note 7. Federal Income Taxes
Income and capital gain distributions are determined in accordance with federal income tax regulations, which may differ from GAAP.
The tax characteristics of dividends paid during the years ended December 31, 2008 and 2007, respectively, by the Portfolio were as follows:
| Ordinary Income | | Long-Term Capital Gain | |
| 2008 | | 2007 | | 2008 | | 2007 | |
| $ | 5,602,337 | | | $ | 5,262,535 | | | $ | 2,338,795 | | | $ | 0 | | |
24
Credit Suisse Trust — Commodity Return Strategy Portfolio
Notes to Financial Statements (continued)
December 31, 2008
Note 7. Federal Income Taxes
The tax basis components of distributable earnings differ from the amount reflected in the Statement of Assets and Liabilities by temporary book/tax differences. These differences are primarily due to income from the subsidiary and deferral of post-October losses.
At December 31, 2008, the components of distributable earnings on a tax basis for the Portfolio were as follows:
| Undistributed net investment income | | $ | 85,020 | | |
| Accumulated realized loss | | | (6,043,468 | ) | |
| Unrealized depreciation | | | (32,014,266 | ) | |
| Deferral of post-October capital losses | | | (4,448,287 | ) | |
| | | $ | (42,421,001 | ) | |
At December 31,2008, the Portfolio had capital loss carryforward available to offset possible future capital gains as follows:
| | Expires December 31, | |
| | 2016 | |
| | | $ | 6,043,468 | | |
It is uncertain whether the Portfolio will be able to realize the benefits of the capital loss carryforward before it expires.
At December 31, 2008, the identified cost for federal income tax purposes, as well as the gross unrealized appreciation from investments for those securities having an excess of value over cost, gross unrealized depreciation from investments for those securities having an excess of cost over value and the net unrealized depreciation from investments were $101,995,794, $1,253,881, $(33,268,147) and $(32,014,266), respectively.
At December 31, 2008, the Portfolio reclassified $272 from undistributed net investment income to accumulated net realized gain, to adjust for current period permanent book/tax differences. These permanent differences are due to differing book/tax treatments of dividend redesignations. Net assets were not affected by these reclassifications.
Note 8. Contingencies
In the normal course of business, the Portfolio may provide general indemnifications pursuant to certain contracts and organizational documents. The Portfolio's maximum exposure under these arrangements is dependent on future claims that may be made against the Portfolio and, therefore, cannot be estimated; however, based on experience, the risk of loss from such claims is considered remote.
25
Credit Suisse Trust — Commodity Return Strategy Portfolio
Notes to Financial Statements (continued)
December 31, 2008
Note 9. Recent Accounting Pronouncements
In March 2008, FASB issued Statement of Financial Accounting Standards No. 161, Disclosures about Derivative Instruments and Hedging Activities ("FAS 161"), an amendment of FASB Statement No. 133. FAS 161 requires enhanced disclosures about (a) how and why an entity uses derivative instruments, (b) how derivative instruments and hedging activities are accounted for, and (c) how derivative instruments and related hedging activities affect a fund's financial position, financial performance, and cash flows. Management of the Portfolio does not believe the adoption of FAS 161 will materially impact the financial statement amounts, but will require additional disclosures. This will include qualitative and quantitative disclosures on derivative positions existing at period end and the effect of usin g derivatives during the reporting period. FAS 161 is effective for financial statements issued for fiscal years and interim periods beginning after November 15, 2008.
26
Credit Suisse Trust — Commodity Return Strategy Portfolio
Report of Independent Registered Public Accounting Firm
To the Board of Trustees of Credit Suisse Trust and Shareholders of
Credit Suisse Trust — Commodity Return Strategy Portfolio:
In our opinion, the accompanying statement of assets and liabilities, including the schedule of investments, and the related statements of operations and of changes in net assets and the financial highlights present fairly, in all material respects, the financial position of Commodity Return Strategy Portfolio (the "Portfolio"), a portfolio of the Credit Suisse Trust, at December 31, 2008, the results of its operations for the year then ended and the changes in its net assets and financial highlights for the periods presented, in conformity with accounting principles generally accepted in the United States of America. These financial statements and financial highlights (hereafter referred to as "financial statements") are the responsibility of the Portfolio's management. Our responsibility is to express an opinion on these financial statements based on our audits. We conducted our audits of these financial statements in accordance with the s tandards of the Public Company Accounting Oversight Board (United States). Those standards require that we plan and perform the audit to obtain reasonable assurance about whether the financial statements are free of material misstatement. An audit includes examining, on a test basis, evidence supporting the amounts and disclosures in the financial statements, assessing the accounting principles used and significant estimates made by management, and evaluating the overall financial statement presentation. We believe that our audit, which included confirmation of securities at December 31, 2008 by correspondence with the custodian, provides a reasonable basis for our opinion.
PricewaterhouseCoopers LLP
Baltimore, Maryland
February 24, 2009
27
Credit Suisse Trust — Commodity Return Strategy Portfolio
Board Approval of Advisory Agreement (unaudited)
In approving the renewal of the current Advisory Agreement, the Board of Trustees, including the Independent Trustees, at a meeting held on November 18 and 19, 2008, considered the following factors with respect to the Commodity Return Strategy Portfolio (the "Portfolio"):
Investment Advisory Fee Rates
The Board reviewed and considered the contractual advisory fee rate of 0.50% for the Portfolio ("Contractual Advisory Fee") in light of the extent and quality of the advisory services provided by Credit Suisse Asset Management, LLC ("Credit Suisse"). The Board also reviewed and considered the fee waivers and/or expense reimbursement arrangements currently in place for the Portfolio and considered the actual fee rate of 0.35% paid by the Portfolio after taking waivers and reimbursements into account ("Net Advisory Fee"). The Board acknowledged that voluntary fee waivers and expense reimbursements could be discontinued at any time.
Additionally, the Board received and considered information comparing the Portfolio's Contractual Advisory Fee, Net Advisory Fee and the Portfolio's overall expenses with those of funds in both the relevant expense group ("Expense Group") and universe of funds ("Expense Universe") provided by Lipper Inc., an independent provider of investment company data.
Nature, Extent and Quality of the Services under the Advisory Agreement
The Board received and considered information regarding the nature, extent and quality of services provided to the Portfolio by Credit Suisse under the Advisory Agreement. The Board also noted information received at regular meetings throughout the year related to the services rendered by Credit Suisse. The Board reviewed background information about Credit Suisse, including its Form ADV. The Board considered the background and experience of Credit Suisse's senior management and the expertise of, and the amount of attention given to the Portfolio by, senior personnel of Credit Suisse. In addition, the Board reviewed the qualifications, backgrounds and responsibilities of the portfolio management team primarily responsible for the day-to-day portfolio management of the Portfolio and the extent of the resources devoted to research and analysis of actual and potential investments. The Board also received and considered information about the nat ure, extent and quality of services and fee rates offered to other Credit Suisse clients for comparable services.
28
Credit Suisse Trust — Commodity Return Strategy Portfolio
Board Approval of Advisory Agreement (unaudited) (continued)
Portfolio Performance
The Board received and considered the performance results of the Portfolio, along with comparisons both to the relevant performance group ("Performance Group") and universe of funds ("Performance Universe") for the Portfolio. The Board was provided with a description of the methodology used to arrive at the funds included in the Performance Group and the Performance Universe.
Credit Suisse Profitability
The Board received and considered a profitability analysis of Credit Suisse based on the fees payable under the Advisory Agreement for the Portfolio, including any fee waivers or fee caps, as well as other relationships between the Portfolio on the one hand and Credit Suisse affiliates on the other. The Board received profitability information for the other funds in the Credit Suisse family of funds.
Economies of Scale
The Board considered whether economies of scale in the provision of services to the Portfolio were being passed along to the shareholders. Accordingly, the Board considered whether alternative fee structures (such as breakpoint fee structures) would be more appropriate or reasonable taking into consideration economies of scale or other efficiencies that might accrue from increases in the Portfolio's asset levels.
Other Benefits to Credit Suisse
The Board considered other benefits received by Credit Suisse and its affiliates as a result of their relationship with the Portfolio. Such benefits include, among others, benefits potentially derived from an increase in Credit Suisse's business as a result of its relationship with the Portfolio (such as the ability to market to shareholders other financial products offered by Credit Suisse and its affiliates).
The Board considered the standards applied in seeking best execution and reviewed Credit Suisse's method for allocating portfolio investment opportunities among its advisory clients.
29
Credit Suisse Trust — Commodity Return Strategy Portfolio
Board Approval of Advisory Agreement (unaudited) (continued)
Conclusions
In selecting Credit Suisse, and approving the Advisory Agreement and the investment advisory fee under such agreement, the Board concluded that:
• The Contractual Advisory Fee was at the low end in the Portfolio's Expense Group and the Net Advisory Fee was the lowest in the Expense Group. The Board considered the fee to be reasonable.
• The Portfolio commenced operations on February 28, 2006 and therefore performance information was shown only for the one and two year periods. The Portfolio's performance was above the median of both its Performance Group and Performance Universe for those periods. The Board noted that the Performance Group was limited to funds that, like the Portfolio, invested primarily in commodity-related investments, while the Performance Universe was composed of all specialty diversified equity funds, not just commodity funds.
• The Board was satisfied with the nature and extent of the investment advisory services provided to the Portfolio by Credit Suisse and that, based on dialogue with management and counsel, the services provided by Credit Suisse under the Advisory Agreement are typical of, and consistent with, those provided to similar mutual funds by other investment advisers.
• In light of the costs of providing investment management and other services to the Portfolio and Credit Suisse's ongoing commitment to the Portfolio and willingness to waive fees and expenses, the profits and other ancillary benefits that Credit Suisse and its affiliates received were considered reasonable.
• Credit Suisse's profitability based on fees payable under the Advisory Agreement was reasonable in light of the nature, extent and quality of the services provided to the Portfolio thereunder.
• In light of the fee waiver and the amount of the Contractual Advisory Fee and the Net Advisory Fee, the Portfolio's current fee structure (without breakpoints) was considered reasonable.
No single factor reviewed by the Board was identified by the Board as the principal factor in determining whether to approve the Advisory Agreement. The Independent Trustees were advised by separate independent legal counsel throughout the process.
30
Credit Suisse Trust — Commodity Return Strategy Portfolio
Information Concerning Trustees and Officers (unaudited)
Name, Address
(Year of Birth) | | Position(s)
Held with
Trust | | Term
of Office1
and
Length
of Time
Served | | Principal
Occupation(s) During
Past Five Years | | Number of
Portfolios in
Fund
Complex
Overseen by
Trustee | | Other
Directorships
Held by Trustee | |
| Independent Trustees | | | | | | | | | | | |
|
Enrique Arzac
c/o Credit Suisse Asset Management, LLC
Attn: General Counsel Eleven Madison Avenue New York, New York
10010
(1941) | | Trustee,
Audit
Committee
Chairman and Nominating
Committee Member | | Since Portfolio Inception | | Professor of Finance and Economics, Graduate
School of Business,
Columbia University
since 1971. | | | 33 | | | Director of
Epoch Holding
Corporation
(an investment management
and investment
advisory
services
company);
Director of The
Adams Express
Company (a
closed-end
investment
company);
Director of
Petroleum and
Resources Corporation
(a closed-end
investment company). | |
|
Jeffrey E. Garten
Box 208200
New Haven, Connecticut
06520-8200
(1946) | | Trustee,
Audit and
Nominating
Committee
Member | | Since Portfolio Inception | | The Juan Trippe
Professor in the Practice
of International Trade,
Finance and Business
from July 2005 to
present; Partner and
Chairman of Garten
Rothkopf (consulting
firm) from October 2005
to present; Dean of Yale
School of Management
from November 1995 to
June 2005. | | | 26 | | | Director of
Aetna, Inc.
(insurance
company);
Director of
CarMax Group
(used car
dealers). | |
|
1 Each Trustee and Officer serves until his or her respective successor has been duly elected and qualified.
31
Credit Suisse Trust — Commodity Return Strategy Portfolio
Information Concerning Trustees and Officers (unaudited) (continued)
Name, Address
(Year of Birth) | | Position(s)
Held with
Trust | | Term
of Office1
and
Length
of Time
Served | | Principal
Occupation(s) During
Past Five Years | | Number of
Portfolios in
Fund
Complex
Overseen by
Trustee | | Other
Directorships
Held by Trustee | |
| Independent Trustees | | | | | | | | | | | |
|
Peter F. Krogh
SFS/ICC 702
Georgetown University
Washington, DC 20057
(1937) | | Trustee,
Audit and
Nominating
Committee
Member | | Since Portfolio Inception | | Dean Emeritus and
Distinguished Professor
of International Affairs at
the Edmund A. Walsh
School of Foreign
Service, Georgetown
University from
June 1995 to present. | | | 26 | | | Director of
Carlisle
Companies
Incorporated
(diversified
manufacturing
company). | |
|
Steven N. Rappaport
Lehigh Court, LLC
555 Madison Avenue
29th Floor
New York, New York
10022
(1948) | | Chairman of
the Board of
Trustees,
Audit
Committee
Member and
Nominating
Committee
Chairman | | Since Portfolio Inception | | Partner of Lehigh Court,
LLC and RZ Capital
(private investment
firms) from July 2002
to present. | | | 33 | | | Director of
iCAD, Inc.
(surgical and
medical
instruments and
apparatus
company);
Director of
Presstek, Inc.
(digital imaging
technologies
company);
Director of
Wood
Resources, LLC. (plywood
manufacturing
company). | |
|
32
Credit Suisse Trust — Commodity Return Strategy Portfolio
Information Concerning Trustees and Officers (unaudited) (continued)
Name, Address
(Year of Birth) | | Position(s)
Held with
Trust | | Term
of Office1
and
Length
of Time
Served | | Principal Occupation(s) During Past Five Years | |
| Officers | | | | | | | |
|
George R. Hornig
Credit Suisse Asset
Management, LLC
Eleven Madison Avenue
New York, New York
10010
(1954) | | Chief Executive Officer and President | | Since
2008 | | Managing Director of Credit Suisse; Co-Chief Operating Officer of Asset Management and Head of Asset Management Americas; Associated with Credit Suisse since 1999; Officer of other Credit Suisse Funds. | |
|
Michael A. Pignataro
Credit Suisse Asset
Management, LLC
Eleven Madison Avenue
New York, New York
10010
(1959) | | Chief Financial Officer | | Since Portfolio Inception | | Director and Director of Fund Administration of Credit Suisse; Associated with Credit Suisse or its predecessor since 1984; Officer of other Credit Suisse Funds. | |
|
Emidio Morizio
Credit Suisse Asset
Management, LLC
Eleven Madison Avenue
New York, New York
10010
(1966) | | Chief Compliance Officer | | Since Portfolio Inception | | Director and Global Head of Compliance of Credit Suisse; Associated with Credit Suisse since July 2000; Officer of other Credit Suisse Funds. | |
|
J. Kevin Gao
Credit Suisse Asset
Management, LLC
Eleven Madison Avenue
New York, New York
10010
(1967) | | Chief Legal Officer since 2006, Vice President and Secretary since Portfolio Inception | | Since Portfolio Inception | | Director and Legal Counsel of Credit Suisse; Associated with Credit Suisse since July 2003; Associated with the law firm of Willkie Farr & Gallagher LLP from 1998 to 2003; Officer of other Credit Suisse Funds. | |
|
Cecilia Chau
Credit Suisse Asset
Management, LLC
Eleven Madison Avenue
New York, New York
10010
(1973) | | Treasurer | | Since
2008 | | Assistant Vice President of Credit Suisse since June 2007; Associated with Alliance Bernstein L.P. from January 2007 to May 2007; Associated with Credit Suisse from August 2000 to December 2006; Officer of other Credit Suisse Funds. | |
|
The Statement of Additional Information includes additional information about the Trustees and is available, without charge, upon request, by calling 800-222-8977.
33
Credit Suisse Trust — Commodity Return Strategy Portfolio
Tax Information Letter
December 31, 2008 (unaudited)
Important Tax Information for Shareholders
During the year ended December 31, 2008, the Portfolio declared $2,338,795 in dividends that were designated as long-term capital gains dividends.
34
Credit Suisse Trust — Commodity Return Strategy Portfolio
Proxy Voting and Portfolio Holdings Information (unaudited)
Information regarding how the Portfolio voted proxies related to its portfolio securities during the 12 month period ended June 30 of each year, as well as the policies and procedures that the Portfolio uses to determine how to vote proxies relating to its portfolio securities are available:
• By calling 1-800-222-8977
• On the Portfolio's website, www.credit-suisse.com/us
• On the website of the Securities and Exchange Commission, www.sec.gov.
The Portfolio files a complete schedule of its portfolio holdings for the first and third quarters of its fiscal year with the SEC on Form N-Q. The Portfolio's Forms N-Q are available on the SEC's website at www.sec.gov and may be reviewed and copied at the SEC's Public Reference Room in Washington, DC. Information on the operation of the SEC's Public Reference Room may be obtained by calling 1-202-551-8090.
35

n CREDIT SUISSE
CAYMAN COMMODITY FUND II, LTD.
for the Year Ended December 31, 2008
36
Credit Suisse Cayman Commodity Fund II, Ltd.
Schedule of Investments
December 31, 2008
Par
(000) | |
| | Ratings†
(S&P/Moody's) | | Maturity | | Rate% | | Value | |
| UNITED STATES AGENCY OBLIGATIONS (42.1%) | | | |
| $ | 220 | | | Federal Home Loan Bank Discount Notes‡‡ | | (AAA, Aaa) | | 02/02/09 | | | 0.131 | | | $ | 219,975 | | |
| | 800 | | | Federal Home Loan Bank Discount Notes | | (AAA, Aaa) | | 03/06/09 | | | 2.433 | | | | 799,937 | | |
| | 2,000 | | | Federal Home Loan Bank Discount Notes | | (AAA, Aaa) | | 03/31/09 | | | 2.819 | | | | 1,999,780 | | |
| | 1,000 | | | Federal Home Loan Mortgage Discount Notes | | (AAA, Aaa) | | 02/17/09 | | | 0.101 | | | | 999,869 | | |
| | 1,000 | | | Federal Home Loan Mortgage Discount Notes | | (AAA, Aaa) | | 02/18/09 | | | 0.101 | | | | 999,866 | | |
| | 300 | | | Federal Home Loan Mortgage Discount Notes | | (AAA, Aaa) | | 03/02/09 | | | 2.890 | | | | 299,978 | | |
| | 700 | | | Federal National Mortgage Association
Discount Notes | | (AAA, Aaa) | | 02/23/09 | | | 0.101 | | | | 699,897 | | |
| | 1,000 | | | Federal National Mortgage Association
Discount Notes | | (AAA, Aaa) | | 03/11/09 | | | 0.152 | | | | 999,915 | | |
| TOTAL UNITED STATES AGENCY OBLIGATIONS (Cost $7,000,736) | | | 7,019,217 | | |
| SHORT-TERM INVESTMENT (1.4%) | | | |
| | 239 | | | State Street Bank and Trust Co. Euro Time Deposit
(Cost $239,000) | | | | 01/02/09 | | | 0.010 | | | | 239,000 | | |
| TOTAL INVESTMENTS AT VALUE (43.5%) (Cost $7,239,736) | | | 7,258,217 | | |
| OTHER ASSETS IN EXCESS OF LIABILITIES (56.5%) | | | 9,421,818 | | |
| NET ASSETS (100.0%) | | $ | 16,680,035 | | |
† Credit ratings given by the Standard & Poor's Division of The McGraw-Hill Companies, Inc. ("S&P") and Moody's Investors Service, Inc. ("Moody's") are unaudited.
‡‡ Collateral segregated for futures contracts.
See Accompanying Notes to Financial Statements.
37
Credit Suisse Cayman Commodity Fund II, Ltd.
Statement of Assets and Liabilities
December 31, 2008
| Assets | |
| Investments at value (Cost $7,239,736) (Note 2) | | $ | 7,258,217 | | |
| Cash | | | 395 | | |
| Cash segregated at brokers for swap contracts | | | 7,380,627 | | |
| Unrealized appreciation on open swap contracts | | | 2,045,614 | | |
| Other assets | | | 30,624 | | |
| Total Assets | | | 16,715,477 | | |
| Liabilities | |
| Administrative services fee payable (Note 3) | | | 6,623 | | |
| Variation margin payable (Note 2) | | | 5,160 | | |
| Other accrued expenses payable | | | 23,659 | | |
| Total Liabilities | | | 35,442 | | |
| Net Assets | |
| Par value of participating shares (Note 4) | | | 38,027 | | |
| Paid-in capital (Note 4) | | | 49,361,973 | | |
| Undistributed net investment income | | | 240,796 | | |
| Accumulated net realized loss on investments, futures contracts and swap contracts | | | (34,901,993 | ) | |
| Net unrealized appreciation on investments, futures contracts and swap contracts | | | 1,941,232 | | |
| Net Assets | | $ | 16,680,035 | | |
| Shares outstanding | | | 38,027,058 | | |
| Net asset value, offering price and redemption price per share | | $ | 0.44 | | |
See Accompanying Notes to Financial Statements.
38
Credit Suisse Cayman Commodity Fund II, Ltd.
Statement of Operations
For the Year Ended December 31, 2008
| Investment Income (Note 2) | |
| Interest | | $ | 220,652 | | |
| Expenses | |
| Administrative services fees (Note 3) | | | 6,606 | | |
| Audit fees | | | 24,000 | | |
| Total expenses | | | 30,606 | | |
| Less: fees reimbursed (Note 3) | | | (30,606 | ) | |
| Net expenses | | | — | | |
| Net investment income | | | 220,652 | | |
| Net Realized and Unrealized Gain (Loss) from Investments, Futures Contracts and Swap Contracts | |
| Net realized gain from investments | | | 37,077 | | |
| Net realized gain from futures contracts | | | 305,879 | | |
| Net realized loss from swap contracts | | | (35,321,176 | ) | |
Net change in unrealized appreciation (depreciation) from investments, futures contracts
and swap contracts | | | 1,952,023 | | |
| Net realized and unrealized loss from investments, futures contracts and swap contracts | | | (33,026,197 | ) | |
| Net decrease in net assets resulting from operations | | $ | (32,805,545 | ) | |
See Accompanying Notes to Financial Statements.
39
Credit Suisse Cayman Commodity Fund II, Ltd.
Statements of Changes in Net Assets
| | | For the Year
Ended
December 31, 2008 | | For the Period
Ended
December 31, 20071 | |
| From Operations | |
| Net investment income | | $ | 220,652 | | | $ | 20,144 | | |
Net realized gain (loss) from investments, futures contracts
and swap contracts | | | (34,978,220 | ) | | | 76,227 | | |
Net change in unrealized appreciation (depreciation)
from investments, futures contracts and swap contracts | | | 1,952,023 | | | | (10,791 | ) | |
| Net increase (decrease) in net assets resulting from operations | | | (32,805,545 | ) | | | 85,580 | | |
| From Capital Share Transactions (Note 4) | |
| Proceeds from sale of shares | | | 48,400,000 | | | | 1,000,000 | | |
| Net increase in net assets from capital share transactions | | | 48,400,000 | | | | 1,000,000 | | |
| Net increase in net assets | | | 15,594,455 | | | | 1,085,580 | | |
| Net Assets | |
| Beginning of period | | | 1,085,580 | | | | — | | |
End of period (including undistributed net investment income of
$240,796, and $20,144, respectively) | | $ | 16,680,035 | | | $ | 1,085,580 | | |
1 For the period July 27, 2007 (commencement of operations ) through December 31, 2007.
See Accompanying Notes to Financial Statements.
40
Credit Suisse Cayman Commodity Fund II, Ltd.
Notes to Financial Statements
December 31, 2008
Note 1. Organization
Credit Suisse Cayman Commodity Fund II, Ltd. (the "Fund") is organized as a Cayman Islands Company. The Fund intends to carry on the business of an investment company. The Fund's investment manager is Credit Suisse Asset Management, LLC ("Credit Suisse"). As of December 31, 2008, 100% of the Fund's participating shares were owned by Credit Suisse Trust — Commodity Return Strategy Portfolio.
Note 2. Significant Accounting Policies
A) SECURITY VALUATION — The net asset value of the Fund is determined daily as of the close of regular trading on the New York Stock Exchange, Inc. (the "Exchange") on each day the Exchange is open for business. Debt securities with a remaining maturity greater than 60 days are valued in accordance with the price supplied by a pricing service, which may use a matrix, formula or other objective method that takes into consideration market indices, yield curves and other specific adjustments. Debt obligations that will mature in 60 days or less are valued on the basis of amortized cost, which approximates market value, unless it is determined that using this method would not represent fair value. Equity investments are valued at market value, which is generally determined using the closing price on the exchange or market on which the security is primarily traded at the time of valuation (the "Valuation Time"). If no sales are reported, equ ity investments are generally valued at the most recent bid quotation as of the Valuation Time or at the lowest asked quotation in the case of a short sale of securities. Investments in mutual funds are valued at the mutual fund's closing net asset value per share on the day of valuation. Swap contracts are generally valued at a price at which the counterparty to such contract would repurchase the instrument or terminate the contract. Structured note agreements are valued in accordance with a dealer-supplied valuation based on changes in the value of the underlying index. Securities, options, futures contracts and other assets (including swaps and structured note agreements), for which market quotations are not readily available, or whose values have been materially affected by events occurring before the Fund's Valuation Time but after the close of the securities' primary markets, are valued at fair value as determined in good faith by, or under the direction of, the Board of Directors under procedures esta blished by the Board of Directors. The Fund may utilize a service provided by an independent third party which has been approved by the Board of Directors to fair value certain securities. When fair-value pricing is employed, the prices of securities used by a fund to calculate its net asset value may differ from quoted or published prices for the same securities.
41
Credit Suisse Cayman Commodity Fund II, Ltd.
Notes to Financial Statements (continued)
December 31, 2008
Note 2. Significant Accounting Policies
The Fund adopted Financial Accounting Standards Board Statement of Financial Accounting Standards No. 157, Fair Value Measurements ("FAS 157"), effective January 1, 2008. In accordance with FAS 157, fair value is defined as the price that the Fund would receive upon selling an investment in a timely transaction to an independent buyer in the principal or most advantageous market of the investment. FAS 157 established a three-tier hierarchy to maximize the use of observable market data and minimize the use of unobservable inputs and to establish classification of fair value measurements for disclosure purposes. Inputs refer broadly to the assumptions that market participants would use in pricing the asset or liability, including assumptions about risk, for example, the risk inherent in a particular valuation technique used to measure fair value including such a pricing model and/or the risk inherent in the inputs to the valuation technique. I nputs may be observable or unobservable. Observable inputs are inputs that reflect the assumptions market participants would use in pricing the asset or liability developed based on market data obtained from sources independent of the reporting entity. Unobservable inputs are inputs that reflect the reporting entity's own assumptions about the assumptions market participants would use in pricing the asset or liability developed based on the best information available in the circumstances. The three-tier hierarchy of inputs is summarized in the three broad Levels listed below.
• Level 1 – quoted prices in active markets for identical investments
• Level 2 – other significant observable inputs (including quoted prices for similar investments, interest rates, prepayment speeds, credit risk, etc.)
• Level 3 – significant unobservable inputs (including the Fund's own assumptions in determining the fair value of investments)
The inputs or methodology used for valuing securities are not necessarily an indication of the risk associated with investing in those securities.
The following is a summary of the inputs used as of December 31, 2008 in valuing the Fund's investments carried at value:
| Valuation Inputs | | Investments in
Securities | | Other Financial
Instruments* | |
| Level 1 – Quoted Prices | | $ | — | | | $ | (122,863 | ) | |
| Level 2 – Other Significant Observable Inputs | | | 7,258,217 | | | | 2,045,614 | | |
| Level 3 – Significant Unobservable Inputs | | | — | | | | — | | |
| Total | | $ | 7,258,217 | | | $ | 1,922,751 | | |
*Other financial instruments include futures, forwards and swap contracts.
42
Credit Suisse Cayman Commodity Fund II, Ltd.
Notes to Financial Statements (continued)
December 31, 2008
Note 2. Significant Accounting Policies
B) INCOME TAXES — The Fund has received an undertaking from the Government of the Cayman Islands exempting it from all local income, profits and capital gains taxes through June of 2027. No such taxes are levied in the Cayman Islands at the present time. The Fund is a Controlled Foreign Corporation under U.S. tax laws and as such is not subject to U.S. income tax. Therefore, the Fund is not required to record a tax provision.
During June 2006, the Financial Accounting Standards Board ("FASB") issued FASB Interpretation 48 ("FIN 48" or the "Interpretation"), Accounting for Uncertainty in Income Taxes — an interpretation of FASB statement 109. The Fund has reviewed its current tax positions and has determined that no provision for income tax is required in the Fund's financial statements.
C) SECURITY TRANSACTIONS AND INVESTMENT INCOME — Security transactions are accounted for on a trade date basis. Interest income is recorded on the accrual basis. The Fund amortizes premiums and accretes discounts using the effective interest method. Dividends are recorded on the ex-dividend date. The cost of investments sold is determined by use of the specific identification method for both financial reporting and income tax purposes.
D) FUTURES — The Fund may enter into futures contracts to the extent permitted by its investment policies and objectives. Upon entering into a futures contract, the Fund is required to deposit cash and/or pledge U.S. Government securities as initial margin. Subsequent payments, which are dependent on the daily fluctuations in the value of the underlying instrument, are made or received by the Fund each day (daily variation margin) and are recorded as unrealized gains or losses until the contracts are closed. When the contracts are closed, the Fund records a realized gain or loss equal to the difference between the proceeds from (or cost of) the closing transactions and the Fund's basis in the contract. Risks of entering into futures contracts for hedging purposes include the possibility that a change in the value of the contract may not correlate with the changes in the value of the underlying instruments. In addition, the purchase of a futures contract involves the risk that the Fund could lose more than the original margin deposit and subsequent
43
Credit Suisse Cayman Commodity Fund II, Ltd.
Notes to Financial Statements (continued)
December 31, 2008
Note 2. Significant Accounting Policies
payments may be required for a futures transaction. At December 31, 2008, the Fund had the following open futures contracts:
| Contract Description | | Unrealized
Appreciation (Depreciation) | |
| Contracts to Purchase | | | | | |
| Energy | | $ | 243,240 | | |
| | | $ | 243,240 | | |
| Contracts to Sell | | | | | |
| Energy | | $ | (366,103 | ) | |
| | | $ | (366,103 | ) | |
| Net unrealized depreciation | | $ | (122,863 | ) | |
E) USE OF ESTIMATES — The preparation of financial statements in conformity with accounting principals generally accepted in the United States of America ("GAAP") requires management to make estimates and assumptions that affect the reported amounts of assets and liabilities and disclosure of contingent assets and liabilities at the date of the financial statements and the reported amounts of income and expenses during the reporting period. Actual results could differ from these estimates.
F) SWAPS — The Fund may enter into commodity index swaps for hedging purposes or to seek to increase total return. A swap is an agreement that obligates two parties to exchange a series of cash flows at specified intervals based upon or calculated by reference to changes in specified prices or rates for a specified amount of an underlying asset or notional principal amount. The Fund will enter into commodity index swaps only on a net basis, which means that the two payment streams are netted out, with the Fund receiving or paying, as the case may be, only the net amount of the two payments. Risks may arise as a result of the failure of the counterparty to the swap contract to comply with the terms of the swap contract. The loss incurred by the failure of a counterparty is generally limited to the net interest payment to be received by the Fund, and/or the termination value at the end of the contract. Therefore, the Fund considers the cr editworthiness of each counterparty to a swap contract in evaluating potential credit risk. Additionally, risks may arise from unanticipated movements in interest rates or in the value of the underlying reference asset or index.
The Fund may enter into total return swap contracts, involving commitments to pay interest in exchange for a market-linked return, both based on notional amounts. To the extent the total return of the security or index underlying the
44
Credit Suisse Cayman Commodity Fund II, Ltd.
Notes to Financial Statements (continued)
December 31, 2008
Note 2. Significant Accounting Policies
transactions exceeds or falls short of the offsetting interest rate obligation, the Fund will receive a payment from or make a payment to the counterparty.
The Fund records unrealized gains or losses on a daily basis representing the value and the current net receivable or payable relating to open swap contracts. Net amounts received or paid on the swap contract are recorded as realized gains or losses. Fluctuations in the value of swap contracts are recorded for financial statement purposes as unrealized appreciation or depreciation on swap contracts. Realized gains and losses from terminated swaps are included in net realized gains/losses on swap contracts transactions. At December 31, 2008, the Fund had the following outstanding swap contracts:
| Currency | | Notional
Amount | | Expiration
Date | | Counterparty | | Receive | | Pay | | Unrealized
Appreciation/
(Depreciation) | |
| USD | $ | | | | 4,182,645 | | | 1/26/09 | | Barclays | | Return on the
Dow Jones-
AIG Commodity
Total Return Index | |
Fee plus
Treasury Bill Rate | | $ | 223,947 | | |
| USD | $ | | | | 5,542,691 | | | 1/26/09 | | Barclays | | Return on the
Dow Jones-
AIG Commodity
Total Return Index | | Fee plus
Treasury Bill Rate | | | 281,351 | | |
| USD | $ | | | | 30,021,279 | | | 1/26/09 | | Merrill Lynch | | Return on the
Dow Jones-
AIG Commodity
Total Return Index | | Fee plus
Treasury Bill Rate | | | 1,523,905 | | |
| USD | $ | | | | 306,422 | | | 1/26/09 | | Merrill Lynch | | Return on the
Dow Jones-
AIG Commodity
Total Return Index | | Fee plus
Treasury Bill Rate | | | 16,411 | | |
| | | $ | 2,045,614 | | |
Note 3. Transactions with Affiliates and Related Parties
Credit Suisse recognizes that it receives compensation for performing investment advisory services for the Credit Suisse Trust — Commodity Return Strategy Portfolio pursuant to a separate investment advisory agreement and agrees to receive no additional compensation for rendering its services to the Fund. During the period ended December 31, 2008, Credit Suisse voluntarily reimbursed the Fund $30,606 in Fund expenses. Reimbursements are voluntary and may be discontinued by Credit Suisse at any time.
State Street Bank and Trust Company ("SSB") serves as administrator to the Fund. For its administrative services, SSB currently receives a fee based on the
45
Credit Suisse Cayman Commodity Fund II, Ltd.
Notes to Financial Statements (continued)
December 31, 2008
Note 3. Transactions with Affiliates and Related Parties
Fund's average daily net assets. For the year ended December 31, 2008, administrative services fees earned by SSB were $6,606.
Note 4. Capital Transactions
The Fund issued 100,000 participating shares for $1,000,000 on July 27, 2007 in conjunction with the initial capitalization of the Fund. Capital transactions were as follows:
| | | For the Year Ended
December 31, 2008 | | For the Period Ended
December 31, 20071 | |
| | | Shares | | Value | | Shares | | Value | |
| Shares sold | | | 37,927,058 | | | $ | 48,400,000 | | | | 100,000 | | | $ | 1,000,000 | | |
| Net increase | | | 37,927,058 | | | $ | 48,400,000 | | | | 100,000 | | | $ | 1,000,000 | | |
1 For the period from July 27, 2007 (commencement of operations) through December 31, 2007.
Note 5. Financial Highlights
The following represents the total return of the Fund for the year ended December 31, 2008 and the period ended December 31, 2007, respectively. Total returns were calculated based upon the daily returns of the Fund during the periods represented. The calculation has not been annualized for reporting purposes:
| | | For the Year Ended
December 31, 2008 | | For the Period Ended
December 31, 20071 | |
| Total Return | | | (95.95 | )% | | | 8.60 | % | |
1 For the period from July 27, 2007 (commencement of operations) through December 31, 2007.
The following represents certain financial ratios of the Fund for the periods noted. The computation of the net investment income and total expense ratios was based upon the daily net assets of the Fund during these periods. The calculations have been annualized for reporting purposes:
| Ratio to Average Net Assets: | | For the Year Ended
December 31, 2008 | | For the Period Ended
December 31, 20071 | |
| Net investment income | | | 2.08 | % | | | 4.46 | % | |
| Total expenses (before expense reimbursement) | | | 0.29 | % | | | 5.37 | % | |
| Total expenses (after expense reimbursement) | | | 0.00 | % | | | 0.00 | % | |
1 For the period from July 27, 2007 (commencement of operations) through December 31, 2007.
46
Credit Suisse Cayman Commodity Fund II, Ltd.
Notes to Financial Statements (continued)
December 31, 2008
Note 6. Contingencies
In the normal course of business, the Fund may provide general indemnifications pursuant to certain contracts and organizational documents. The Fund's maximum exposure under these arrangements is dependent on future claims that may be made against the Fund and, therefore, cannot be estimated; however, based on experience, the risk of loss from such claims is considered remote.
Note 7. Recent Accounting Pronouncements
In March 2008, FASB issued Statement of Financial Accounting Standards No. 161, Disclosures about Derivative Instruments and Hedging Activities ("FAS 161"), an amendment of FASB Statement No. 133. FAS 161 requires enhanced disclosures about (a) how and why an entity uses derivative instruments, (b) how derivative instruments and hedging activities are accounted for, and (c) how derivative instruments and related hedging activities affect a fund's financial position, financial performance, and cash flows. Management of the Fund does not believe the adoption of FAS 161 will materially impact the financial statement amounts, but will require additional disclosures. This will include qualitative and quantitative disclosures on derivative positions existing at period end and the effect of using der ivatives during the reporting period. FAS 161 is effective for financial statements issued for fiscal years and interim periods beginning after November 15, 2008.
47
Credit Suisse Cayman Commodity Fund II, Ltd.
Report of Independent Registered Public Accounting Firm
To the Board of Directors and Shareholders of
Credit Suisse Cayman Commodity Fund II, Ltd.:
In our opinion, the accompanying statement of assets and liabilities, including the schedule of investments, and the related statements of operations and of changes in net assets present fairly, in all material respects, the financial position of Cayman Commodity Fund II, Ltd. (the "Fund"), at December 31, 2008, the results of its operations for the year then ended and the changes in its net assets for the periods presented, in conformity with accounting principles generally accepted in the United States of America. These financial statements are the responsibility of the Fund's management. Our responsibility is to express an opinion on these financial statements based on our audit. We conducted our audit of these financial statements in accordance with auditing standards generally accepted in the United States of America. Those standards require that we plan and perform the audit to obtain reasonable assurance about whether the financial st atements are free of material misstatement. An audit includes examining, on a test basis, evidence supporting the amounts and disclosures in the financial statements, assessing the accounting principles used and significant estimates made by management, and evaluating the overall financial statement presentation. We believe that our audit, which included confirmation of securities at December 31, 2008 by correspondence with the custodian and brokers, provides a reasonable basis for our opinion.
PricewaterhouseCoopers LLP
Baltimore, Maryland
February 24, 2009
48

P.O. BOX 55030, BOSTON, MA 02205-5030
800-222-8977 n www.credit-suisse.com/us
CREDIT SUISSE ASSET MANAGEMENT SECURITIES, INC., DISTRIBUTOR. TRCOM-AR-1208

CREDIT SUISSE FUNDS
Annual Report
December 31, 2008
CREDIT SUISSE TRUST
n EMERGING MARKETS PORTFOLIO
Credit Suisse Trust (the "Trust") shares are not available directly to individual investors, but may be offered only through certain insurance products and pension and retirement plans.
The Trust's investment objectives, risks, charges and expenses (which should be considered carefully before investing), and more complete information about the Trust, are provided in the Prospectus, which should be read carefully before investing. You may obtain additional copies by calling 800-222-8977 or by writing to Credit Suisse Trust, P.O. Box 55030, Boston, MA 02205-5030.
Credit Suisse Asset Management Securities, Inc., Distributor, is located at Eleven Madison Avenue, New York, NY 10010. The Trust is advised by Credit Suisse Asset Management, LLC.
The views of the Portfolio's management are as of the date of the letter and the Portfolio holdings described in this document are as of December 31, 2008; these views and Portfolio holdings may have changed subsequent to these dates. Nothing in this document is a recommendation to purchase or sell securities.
Portfolio shares are not deposits or other obligations of Credit Suisse Asset Management, LLC ("Credit Suisse") or any affiliate, are not FDIC-insured and are not guaranteed by Credit Suisse or any affiliate. Portfolio investments are subject to investment risks, including loss of your investment.
Credit Suisse Trust — Emerging Markets Portfolio
Annual Investment Adviser's Report
December 31, 2008 (unaudited)
February 2, 2009
Dear Shareholder:
For the twelve-month period ended December 31, 2008, Credit Suisse Trust — Emerging Markets Portfolio (the "Portfolio")1 declined 54.80%, versus a decrease of 53.18% for its benchmark, the Morgan Stanley Capital International Emerging Markets Free Index (MSCI EM).2
Market Review: Emerging markets hard hit by global deleveraging
The year ended December 31, 2008 was a difficult one for almost all asset classes and emerging markets were no exception. Emerging market equities suffered their largest ever calendar year decline. A collapse of risk appetite and the ongoing credit freeze drove substantial redemptions in the asset class and resulted in declines across all markets, sectors and stocks.
Performance over the year was marked by several stages. In the first half of the year, rising energy and food prices lifted inflation above target rates and resulted in monetary tightening across many markets, which proved to be a strong de-rating force for emerging markets, particularly China. During this period, commodity suppliers (such as Brazil and Russia) and materials stocks were virtually the only outperformers. Markets entered a new phase of downturn in June and July as key commodity prices peaked, leading to large redemptions in BRIC and emerging market funds. The crisis deepened with the Lehman Brothers bankruptcy in September and Iceland's banking crisis in October, which prompted a collapse in risk appetite globally and exacerbated credit scarcity. Markets with poor external fundamentals and weak banking systems (such as those in Hungary and smaller central European countries) came under intense pressure, while a flight to the d ollar produced severe weakening in many emerging market currencies. The downturn in markets finally stabilized in late October, following the announcement of aggressive policy measures in developed markets and the announcement of fiscal stimulus by China. Markets staged a year-end rally led by China and material stocks in particular.
Strategic Review and Outlook: More challenges ahead
For the year ended December 31, 2008, the Portfolio slightly underperformed the benchmark. In general, it was a very hard year for performance given the extreme levels of market volatility and the indiscriminate sell-off that hit large cap stocks across all sectors and resulted in massive redemptions from emerging markets. Specifically, the Portfolio's country position and stock selection in Brazil, India and China contributed positively to performance, while stock selection in Russia, South Africa and Mexico detracted from performance.
1
Credit Suisse Trust — Emerging Markets Portfolio
Annual Investment Adviser's Report (continued)
December 31, 2008 (unaudited)
After a long bull market in emerging markets in which liquidity lifted all boats, we expect the market environment to remain challenging for emerging markets. On the negative side, to the extent that emerging markets remain a cyclical asset class, the global backdrop remains uncertain. The full impact of the downturn in growth in developed markets has yet to be seen, while economic momentum has been decreasing rapidly across emerging markets. On the positive side, fourth quarter gains and the abatement of some of the panic selling that took place in September and October provides a more stable basis for markets going forward. While we expect investor sentiment to remain cautious, the worst of the develeraging may be behind us. Valuations on the whole remain attractive, although we do not see this as significant enough catalyst for a serious return of capital to the asset class. In our opinion, any significant rally in emerging markets is lik ely to require global catalysts — narrower credit spreads, some stabilization in economic growth momentum and signs that the Chinese policy stimulus is working. We believe that macro and micro fundamentals will become more important in the coming year as differentiating factors for performance.
We remain focused on markets and companies less exposed to reductions in credit availability. For example, on a country level, we will focus on companies with stronger external balance sheets (lower external debt and financing needs/current account surpluses). On a company level, we will look for those with lower cash requirements and good corporate governance. While we expect there to be rallies in cyclical sectors, our portfolios are more broadly focused on domestic interest-rate sensitive sectors, defensive sectors (such as telecom and utilities), and areas that should benefit from countercyclical macroeconomic policies.
The Credit Suisse Emerging Markets Team
Neil Gregson
Annabel Betz
Matthew J.K. Hickman
Stephen Parr
International investing entails special risk considerations, including currency fluctuations, lower liquidity, economic and political risks, and differences in accounting methods; these risks are generally heightened for emerging-market investments. The Portfolio may involve a greater degree of risk than other funds that seek capital growth by investing in larger, more developed markets.
In addition to historical information, this report contains forward-looking statements, which may concern, among other things, domestic and foreign market, industry and
2
Credit Suisse Trust — Emerging Markets Portfolio
Annual Investment Adviser's Report (continued)
December 31, 2008 (unaudited)
economic trends and developments and government regulation and their potential impact on the Portfolio's investments. These statements are subject to risks and uncertainties and actual trends, developments and regulations in the future, and their impact on the Portfolio could be materially different from those projected, anticipated or implied. The Portfolio has no obligation to update or revise forward-looking statements.
3
Credit Suisse Trust — Emerging Markets Portfolio
Annual Investment Adviser's Report (continued)
December 31, 2008 (unaudited)
Comparison of Change in Value of $10,000 Investment in the
Credit Suisse Trust — Emerging Markets Portfolio1
and the MSCI Emerging Markets Free Index2
for Ten Years.
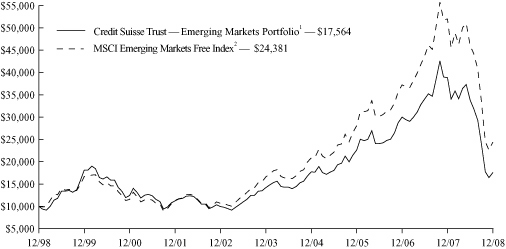
4
Credit Suisse Trust — Emerging Markets Portfolio
Annual Investment Adviser's Report (continued)
December 31, 2008 (unaudited)
Average Annual Returns as of December 31, 20081
| 1 Year | | 5 Years | | 10 Years | | Since
Inception3 | |
| | (54.80 | )% | | | 4.38 | % | | | 5.79 | % | | | 3.45 | % | |
Returns represent past performance and include change in share price and reinvestment of dividends and capital gains. Past performance cannot guarantee future results. The current performance of the Portfolio may be lower or higher than the figures shown. Returns and share price will fluctuate, and redemption value may be more or less than original cost. The performance results do not reflect the deduction of taxes that a shareholder would pay on portfolio distributions or the redemption of portfolio shares. Performance includes the effect of deducting expenses, but does not include charges and expenses attributable to any particular variable contract or plan. Accordingly, the Prospectus of the sponsoring Participating Insurance Company separate account or plan documents or ot her informational materials supplied by plan sponsors should be carefully reviewed for information on relevant charges and expenses. Excluding these charges and expenses from quotations of performance has the effect of increasing the performance quoted, and the effect of these charges should be considered when comparing performance to that of other mutual funds. Performance information current to the most recent month-end is available at www.credit-suisse.com/us.
The annualized gross expense ratio is 1.29%. The annualized net expense ratio after fee waivers and/or expense reimbursements is 1.04%.
1 Fee waivers and/or expense reimbursements may reduce expenses for the Portfolio, without which performance would be lower. Waivers and/or reimbursements may be discontinued at any time.
2 The Morgan Stanley Capital International Emerging Markets Free Index is a free float-adjusted market capitalization index that is designed to measure equity market performance in the global emerging markets. It is the exclusive property of Morgan Stanley Capital International Inc. Investors cannot invest directly in an index.
3 Inception date 12/31/97.
5
Credit Suisse Trust — Emerging Markets Portfolio
Annual Investment Adviser's Report (continued)
December 31, 2008 (unaudited)
Information About Your Portfolio's Expenses
As an investor of the Portfolio, you incur two types of costs: ongoing expenses and transaction costs. Ongoing expenses include management fees, distribution and service (12b-1) fees and other Portfolio expenses. Examples of transaction costs include sales charges (loads), redemption fees and account maintenance fees, which are not shown in this section and which would result in higher total expenses. The following table is intended to help you understand your ongoing expenses of investing in the Portfolio and to help you compare these expenses with the ongoing expenses of investing in other mutual funds. The table is based on an investment of $1,000 made at the beginning of the six month period ended December 31, 2008.
The table illustrates your Portfolio's expenses in two ways:
• Actual Portfolio Return. This helps you estimate the actual dollar amount of ongoing expenses paid on a $1,000 investment in the Portfolio using the Portfolio's actual return during the period. To estimate the expenses you paid over the period, simply divide your account value by $1,000 (for example, an $8,600 account value divided by $1,000 = 8.6), then multiply the result by the number in the "Expenses Paid per $1,000" line under the share class you hold.
• Hypothetical 5% Portfolio Return. This helps you to compare your Portfolio's ongoing expenses with those of other mutual funds using the Portfolio's actual expense ratio and a hypothetical rate of return of 5% per year before expenses. Examples using a 5% hypothetical portfolio return may be found in the shareholder reports of other mutual funds. The hypothetical account values and expenses may not be used to estimate the actual ending account balance or expenses you paid for the period.
Please note that the expenses shown in these tables are meant to highlight your ongoing expenses only and do not reflect any transaction costs, such as sales charges (loads) or redemption fees. If these transaction costs had been included, your costs would have been higher. The "Expenses Paid per $1,000" line of the tables is useful in comparing ongoing expenses only and will not help you determine the relative total expenses of owning different funds.
6
Credit Suisse Trust — Emerging Markets Portfolio
Annual Investment Adviser's Report (continued)
December 31, 2008 (unaudited)
Expenses and Value for a $1,000 Investment
for the six month period ended December 31, 2008
| Actual Portfolio Return | |
| Beginning Account Value 7/1/08 | | $ | 1,000.00 | | |
| Ending Account Value 12/31/08 | | $ | 519.60 | | |
| Expenses Paid per $1,000* | | $ | 3.59 | | |
| Hypothetical 5% Portfolio Return | |
| Beginning Account Value 7/1/08 | | $ | 1,000.00 | | |
| Ending Account Value 12/31/08 | | $ | 1,020.41 | | |
| Expenses Paid per $1,000* | | $ | 4.77 | | |
| Annualized Expense Ratios* | | | 0.94 | % | |
* Expenses are equal to the Portfolio's annualized expense ratio multiplied by the average account value over the period, multiplied by the number of days in the most recent fiscal half year period, then divided by 366.
The "Expenses Paid per $1,000" and the "Annualized Expense Ratios" in the tables are based on actual expenses paid by the Portfolio during the period, net of fee waivers and/or expense reimbursements. If those fee waivers and/or expense reimbursements had not been in effect, the Portfolio's actual expenses would have been higher. Expenses do not reflect additional charges and expenses that are, or may be, imposed under the variable contracts or plans. Such charges and expenses are described in the prospectus of the insurance company separate account or in the plan documents or other informational materials supplied by plan sponsors. The Portfolio's expenses should be considered with these charges and expenses in evaluating the overall cost of investing in the separate account.
For more information, please refer to the Portfolio's prospectus.
7
Credit Suisse Trust — Emerging Markets Portfolio
Annual Investment Adviser's Report (continued)
December 31, 2008 (unaudited)
SECTOR BREAKDOWN*
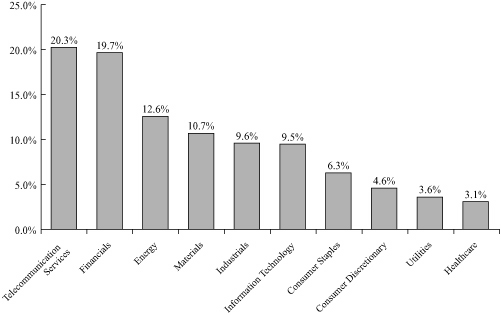
* Expressed as a percentage of total investments (excluding securities lending collateral if applicable) and may vary over time.
8
Credit Suisse Trust — Emerging Markets Portfolio
Schedule of Investments
December 31, 2008
| | | Number of
Shares | | Value | |
| COMMON STOCKS (91.7%) | |
| Brazil (7.9%) | |
| Banks (1.0%) | |
| Unibanco - Uniao de Bancos Brasileiros SA GDR | | | 7,900 | | | $ | 510,498 | | |
| Air Freight & Couriers (0.3%) | |
| Log-in Logistica Intermodal SA | | | 71,000 | | | | 153,752 | | |
| Diversified Financials (0.4%) | |
| Banco do Brasil SA | | | 36,000 | | | | 226,621 | | |
| Diversified Telecommunication Services (0.8%) | |
| Brasil Telecom Participacoes SA | | | 16,259 | | | | 410,658 | | |
| Electric Utilities (1.7%) | |
| Companhia Energetica de Minas Gerais | | | 18,364 | | | | 252,321 | | |
| EDP - Energias do Brasil SA | | | 30,200 | | | | 292,676 | | |
| Tractebel Energia SA | | | 45,000 | | | | 357,955 | | |
| | | | 902,952 | | |
| Food Products (0.3%) | |
| Cosan SA Industria e Comercio* | | | 28,200 | | | | 135,921 | | |
| Oil & Gas (2.3%) | |
| Petroleo Brasileiro SA - Petrobras ADR | | | 60,500 | | | | 1,234,805 | | |
| Real Estate (0.3%) | |
| PDG Realty SA Empreendimentos e Participacoes | | | 32,300 | | | | 154,436 | | |
| Specialty Retail (0.5%) | |
| Lojas Renner SA | | | 24,400 | | | | 163,957 | | |
| Redecard SA | | | 11,227 | | | | 123,728 | | |
| | | | 287,685 | | |
| Wireless Telecommunication Services (0.3%) | |
| Global Village Telecom SA* | | | 15,700 | | | | 170,802 | | |
| TOTAL BRAZIL | | | 4,188,130 | | |
| Chile (1.3%) | |
| Electric Utilities (0.7%) | |
| Empresa Nacional de Electricidad SA ADR | | | 5,000 | | | | 167,450 | | |
| Empresa Nacional de Telecumunicaciones SA | | | 19,000 | | | | 205,728 | | |
| | | | 373,178 | | |
| Metals & Mining (0.6%) | |
| Antofagasta PLC | | | 50,000 | | | | 313,205 | | |
| TOTAL CHILE | | | 686,383 | | |
| China (12.5%) | |
| Banks (4.4%) | |
| China Construction Bank Series H | | | 1,491,400 | | | | 829,772 | | |
| China Merchants Bank Co., Ltd. Series H | | | 163,000 | | | | 304,985 | | |
| Industrial & Commercial Bank of China Series H | | | 2,323,500 | | | | 1,233,584 | | |
| | | | 2,368,341 | | |
See Accompanying Notes to Financial Statements.
9
Credit Suisse Trust — Emerging Markets Portfolio
Schedule of Investments (continued)
December 31, 2008
| | | Number of
Shares | | Value | |
| COMMON STOCKS | |
| China | |
| Construction & Engineering (0.7%) | |
| China Railway Construction Corp. Series H* | | | 166,000 | | | $ | 248,520 | | |
| China Railway Group Ltd. Series H* | | | 208,000 | | | | 145,368 | | |
| | | | 393,888 | | |
| Construction Materials (0.2%) | |
| Anhui Conch Cement Co., Ltd. Series H* | | | 20,000 | | | | 93,016 | | |
| Electric - Integrated (0.2%) | |
| Datang International Power Generation Co., Ltd. Series H | | | 168,722 | | | | 90,050 | | |
| Food Products (0.6%) | |
| Chaoda Modern Agriculture (Holdings), Ltd. | | | 462,657 | | | | 297,308 | | |
| Hotels, Restaurants & Leisure (0.3%) | |
| Ctrip.com International, Ltd. ADR | | | 7,500 | | | | 178,500 | | |
| Insurance (2.0%) | |
| China Life Insurance Co., Ltd. Series H | | | 267,100 | | | | 820,660 | | |
| Ping An Insurance Group Co., Ltd. Series H | | | 45,000 | | | | 221,144 | | |
| | | | 1,041,804 | | |
| Metals & Mining (0.4%) | |
| Yanzhou Coal Mining Co., Ltd. Series H | | | 270,082 | | | | 201,287 | | |
| Oil & Gas (1.7%) | |
| China Petroleum & Chemical Corp. (Sinopec) Series H | | | 390,000 | | | | 239,719 | | |
| PetroChina Co., Ltd. Series H | | | 776,880 | | | | 690,379 | | |
| | | | 930,098 | | |
| Personal Products (0.9%) | |
| Hengan International Group Co., Ltd. | | | 150,000 | | | | 484,026 | | |
| Transportation Infrastructure (1.1%) | |
| Jiangsu Expressway Co., Ltd. Series H | | | 780,000 | | | | 578,755 | | |
| TOTAL CHINA | | | 6,657,073 | | |
| Colombia (0.7%) | |
| Diversified Financials (0.7%) | |
| Suramericana de Inversiones SA | | | 57,200 | | | | 393,276 | | |
| TOTAL COLOMBIA | | | 393,276 | | |
| Czech Republic (0.7%) | |
| Electric Utilities (0.7%) | |
| CEZ | | | 8,300 | | | | 354,990 | | |
| TOTAL CZECH REPUBLIC | | | 354,990 | | |
| Egypt (0.5%) | |
| Wireless Telecommunication Services (0.5%) | |
| Orascom Telecom Holding S.A.E | | | 52,000 | | | | 280,640 | | |
| TOTAL EGYPT | | | 280,640 | | |
See Accompanying Notes to Financial Statements.
10
Credit Suisse Trust — Emerging Markets Portfolio
Schedule of Investments (continued)
December 31, 2008
| | | Number of
Shares | | Value | |
| COMMON STOCKS | |
| Hong Kong (8.0%) | |
| Electric - Integrated (0.4%) | |
| China Resources Power Holdings Co., Ltd. | | | 120,000 | | | $ | 233,320 | | |
| Oil & Gas (0.8%) | |
| CNOOC, Ltd. | | | 464,500 | | | | 441,821 | | |
| Real Estate (1.3%) | |
| China Overseas Land & Investment, Ltd. | | | 148,677 | | | | 208,763 | | |
| China Resources Land, Ltd. | | | 367,542 | | | | 454,942 | | |
| | | | 663,705 | | |
| Wireless Telecommunication Services (5.5%) | |
| China Mobile, Ltd. | | | 262,344 | | | | 2,661,771 | | |
| China Unicom, Ltd. | | | 209,000 | | | | 254,148 | | |
| | | | 2,915,919 | | |
| TOTAL HONG KONG | | | 4,254,765 | | |
| India (4.7%) | |
| Automobiles (0.3%) | |
| Mahindra & Mahindra, Ltd. | | | 24,400 | | | | 140,261 | | |
| Chemicals (1.1%) | |
| Reliance Industries, Ltd. | | | 23,010 | | | | 585,864 | | |
| Construction & Engineering (0.3%) | |
| Larsen & Toubro, Ltd. GDR | | | 10,000 | | | | 162,000 | | |
| Diversified Financials (0.6%) | |
| ICICI Bank, Ltd. ADR | | | 17,800 | | | | 342,650 | | |
| Diversified Telecommunication Services (0.8%) | |
| Bharti Airtel, Ltd.* | | | 30,574 | | | | 449,331 | | |
| Electrical Equipment (0.5%) | |
| Bharat Heavy Electricals, Ltd. | | | 8,700 | | | | 243,767 | | |
| Industrial Conglomerates (0.3%) | |
| Grasim Industries, Ltd. | | | 5,929 | | | | 149,612 | | |
| IT Consulting & Services (0.8%) | |
| Infosys Technologies, Ltd. ADR | | | 17,400 | | | | 427,518 | | |
| TOTAL INDIA | | | 2,501,003 | | |
| Indonesia (1.8%) | |
| Banks (0.3%) | |
| PT Bank Rakyat Indonesia | | | 407,000 | | | | 173,077 | | |
| Construction Materials (0.4%) | |
| PT Indocement Tunggal Prakarsa Tbk | | | 440,000 | | | | 190,023 | | |
| Diversified Financials (0.3%) | |
| PT Bank Central Asia Tbk | | | 460,000 | | | | 139,101 | | |
| Industrial Conglomerates (0.1%) | |
| PT Bakrie & Brothers Tbk* | | | 10,953,800 | | | | 50,247 | | |
See Accompanying Notes to Financial Statements.
11
Credit Suisse Trust — Emerging Markets Portfolio
Schedule of Investments (continued)
December 31, 2008
| | | Number of
Shares | | Value | |
| COMMON STOCKS | |
| Indonesia | |
| Metals & Mining (0.1%) | |
| Straits Resources, Ltd. | | | 116,000 | | | $ | 74,184 | | |
| Wireless Telecommunication Services (0.6%) | |
| PT Telekomunikasi Indonesia | | | 538,984 | | | | 344,476 | | |
| TOTAL INDONESIA | | | 971,108 | | |
| Israel (4.2%) | |
| Chemicals (0.3%) | |
| Israel Chemicals, Ltd. | | | 23,500 | | | | 164,395 | | |
| Diversified Telecommunication Services (0.6%) | |
| Bezeq Israeli Telecommunication Corporation, Ltd. | | | 195,000 | | | | 320,580 | | |
| Internet Software & Services (0.7%) | |
| Check Point Software Technologies, Ltd.* | | | 19,000 | | | | 360,810 | | |
| Pharmaceuticals (2.6%) | |
| Teva Pharmaceutical Industries, Ltd. ADR | | | 33,180 | | | | 1,412,473 | | |
| TOTAL ISRAEL | | | 2,258,258 | | |
| Kazakhstan (0.4%) | |
| Oil & Gas (0.4%) | |
| KazMunaiGas Exploration Production GDR | | | 18,300 | | | | 230,580 | | |
| TOTAL KAZAKHSTAN | | | 230,580 | | |
| Kuwait (0.1%) | |
| Financial Services (0.1%) | |
| Global Investment House KSCC GDR, Rule 144A*‡ | | | 23,740 | | | | 57,688 | | |
| TOTAL KUWAIT | | | 57,688 | | |
| Malaysia (2.2%) | |
| Diversified Telecommunication Services (0.6%) | |
| Telekom Malaysia Berhad | | | 331,973 | | | | 296,449 | | |
| Hotels, Restaurants & Leisure (0.4%) | |
| Resorts World Berhad | | | 309,971 | | | | 203,338 | | |
| Industrial Conglomerates (1.2%) | |
| IOI Corporation Berhad | | | 329,075 | | | | 341,256 | | |
| Kumpulan Sime Darby Bhd | | | 209,000 | | | | 315,565 | | |
| | | | 656,821 | | |
| TOTAL MALAYSIA | | | 1,156,608 | | |
| Mexico (5.1%) | |
| Beverages (0.7%) | |
| Fomento Economico Mexicano SAB de CV ADR | | | 12,731 | | | | 383,585 | | |
| Metals & Mining (0.3%) | |
| Grupo Mexico SA de CV Series B | | | 264,080 | | | | 169,716 | | |
See Accompanying Notes to Financial Statements.
12
Credit Suisse Trust — Emerging Markets Portfolio
Schedule of Investments (continued)
December 31, 2008
| | | Number of
Shares | | Value | |
| COMMON STOCKS | |
| Mexico | |
| Multiline Retail (0.5%) | |
| Wal-Mart de Mexico SAB de CV ADR | | | 9,529 | | | $ | 254,593 | | |
| Real Estate (0.6%) | |
| Urbi Desarrollos Urbanos SA de CV* | | | 237,772 | | | | 324,504 | | |
| Wireless Telecommunication Services (3.0%) | |
| America Movil SAB de CV ADR Series L | | | 37,774 | | | | 1,170,616 | | |
| America Movil SAB de CV Series L | | | 266,342 | | | | 408,692 | | |
| | | | | | | 1,579,308 | | |
| TOTAL MEXICO | | | 2,711,706 | | |
| Peru (0.4%) | |
| Metals & Mining (0.4%) | |
| Compania de Minas Buenaventura SA ADR | | | 9,800 | | | | 195,216 | | |
| TOTAL PERU | | | 195,216 | | |
| Poland (1.1%) | |
| Banks (0.7%) | |
| Powszechna Kasa Oszczednosci Bank Polski SA | | | 31,500 | | | | 380,389 | | |
| Diversified Telecommunication Services (0.4%) | |
| Telekomunikacja Polska GDR | | | 35,000 | | | | 222,250 | | |
| TOTAL POLAND | | | 602,639 | | |
| Russia (5.8%) | |
| Banks (0.4%) | |
| Sberbank RF | | | 317,000 | | | | 237,181 | | |
| Electric Utilities (0.3%) | |
| Federal Grid Unified Energy System JSC* | | | 6,375,625 | | | | 25,503 | | |
| Holding MRSK OAO* | | | 630,900 | | | | 18,927 | | |
| Inter Rao Ues OAO* | | | 26,412,217 | | | | 5,282 | | |
| Kuzbassenergo* | | | 441,065 | | | | 882 | | |
| Mosenergo* | | | 211,972 | | | | 6,359 | | |
| OGK - 1* | | | 606,938 | | | | 6,676 | | |
| OGK - 3 | | | 259,558 | | | | 3,504 | | |
| OGK - 4 OJSC* | | | 648,173 | | | | 7,778 | | |
| RAO Energy Sysytem of OAO* | | | 630,900 | | | | 1,262 | | |
| RusHydro* | | | 2,178,604 | | | | 45,871 | | |
| Territorial Generating Co. 14* | | | 6,128,325 | | | | 613 | | |
| Territorial Generating Co. 6* | | | 9,669,110 | | | | 967 | | |
| TGK - 1 OAO* | | | 24,121,317 | | | | 2,412 | | |
| TGK - 10 OAO* | | | 60 | | | | 57 | | |
| TGK - 11 Holding OAO* | | | 630,900 | | | | 126 | | |
| TGK - 13 OAO* | | | 1,087,214 | | | | 815 | | |
| TGK - 2* | | | 8,190,898 | | | | 819 | | |
| TGK - 4* | | | 10,009,531 | | | | 2,502 | | |
| TGK - 5 JSC* | | | 5 | | | | 0 | | |
| TGK - 8* | | | 214,366 | | | | 26 | | |
See Accompanying Notes to Financial Statements.
13
Credit Suisse Trust — Emerging Markets Portfolio
Schedule of Investments (continued)
December 31, 2008
| | | Number of
Shares | | Value | |
| COMMON STOCKS | |
| Russia | |
| TGK - 9 | | | 42,481,476 | | | $ | 1,274 | | |
| The Second Wholesale Power Market Generating Co.* | | | 315,955 | | | | 2,528 | | |
| The Sixth Wholesale Power Market Generating Co. | | | 368,224 | | | | 2,983 | | |
| Volga Territorial Generation Co.* | | | 210,977 | | | | 1,477 | | |
| | | | 138,643 | | |
| Food Products (0.1%) | |
| Uralkali GDR | | | 6,700 | | | | 60,165 | | |
| Industrial Conglomerates (0.4%) | |
| Mining and Metallurgical Company Norilsk Nickel ADR | | | 36,855 | | | | 234,398 | | |
| Metals & Mining (0.1%) | |
| Evraz Group SA GDR | | | 6,400 | | | | 55,040 | | |
| Oil & Gas (3.8%) | |
| Eurasia Drilling Co., Ltd. GDR* | | | 17,000 | | | | 59,500 | | |
| Gazprom | | | 239,914 | | | | 883,927 | | |
| Gazprom ADR | | | 31,700 | | | | 456,711 | | |
| Lukoil ADR | | | 10,600 | | | | 339,730 | | |
| Rosneft Oil Co. | | | 68,000 | | | | 255,000 | | |
| | | | 1,994,868 | | |
| Pharmaceuticals (0.4%) | |
| Pharmstandard Reg S GDR* | | | 18,990 | | | | 201,294 | | |
| Wireless Telecommunication Services (0.3%) | |
| Mobile Telesystems | | | 26,000 | | | | 100,214 | | |
| OAO Vimpel Communications ADR | | | 10,745 | | | | 76,934 | | |
| | | | | | | | 177,148 | | |
| TOTAL RUSSIA | | | 3,098,737 | | |
| South Africa (7.5%) | |
| Banks (1.2%) | |
| FirstRand, Ltd. | | | 136,452 | | | | 240,022 | | |
| Standard Bank Group, Ltd. | | | 45,000 | | | | 406,017 | | |
| | | | 646,039 | | |
| Construction & Engineering (0.8%) | |
| Group Five, Ltd. | | | 36,600 | | | | 141,142 | | |
| Murray & Roberts Holdings, Ltd. | | | 51,500 | | | | 269,280 | | |
| | | | 410,422 | | |
| Construction Materials (0.2%) | |
| Pretoria Portland Cement Co., Ltd. | | | 33,097 | | | | 112,395 | | |
| Air Freight & Couriers (0.0%) | |
| Reinet Investments SCA* | | | 9,006 | | | | 9,449 | | |
| Diversified Telecommunication Services (0.3%) | |
| Telkom South Africa, Ltd. | | | 10,500 | | | | 130,382 | | |
See Accompanying Notes to Financial Statements.
14
Credit Suisse Trust — Emerging Markets Portfolio
Schedule of Investments (continued)
December 31, 2008
| | | Number of
Shares | | Value | |
| COMMON STOCKS | |
| South Africa | |
| Food Products (0.2%) | |
| Tiger Brands, Ltd. | | | 7,297 | | | $ | 112,957 | | |
| Industrial Conglomerates (0.3%) | |
| Remgro Ltd. | | | 22,038 | | | | 182,284 | | |
| Metals & Mining (1.6%) | |
| AngloGold Ashanti, Ltd. | | | 11,300 | | | | 313,408 | | |
| ArcelorMittal South Africa, Ltd. | | | 18,600 | | | | 179,359 | | |
| Impala Platinum Holdings, Ltd. | | | 25,000 | | | | 368,431 | | |
| | | | 861,198 | | |
| Oil & Gas (0.9%) | |
| Sasol | | | 15,700 | | | | 477,463 | | |
| Tobacco (0.3%) | |
| British American Tobacco PLC* | | | 5,740 | | | | 152,276 | | |
| Wireless Telecommunication Services (1.7%) | |
| MTN Group, Ltd. | | | 75,300 | | | | 887,798 | | |
| TOTAL SOUTH AFRICA | | | 3,982,663 | | |
| South Korea (11.9%) | |
| Auto Components (0.5%) | |
| Hyundai Mobis | | | 5,200 | | | | 265,212 | | |
| Banks (0.5%) | |
| Shinhan Financial Group Co., Ltd. | | | 11,832 | | | | 281,534 | | |
| Beverages (0.7%) | |
| Hite Brewery Co., Ltd.* | | | 2,749 | | | | 364,986 | | |
| Construction & Engineering (1.0%) | |
| Daelim Industrial Co., Ltd. | | | 3,900 | | | | 142,612 | | |
| Hyundai Development Co. | | | 13,760 | | | | 364,310 | | |
| | | | 506,922 | | |
| Diversified Financials (0.5%) | |
| KB Financial Group, Inc.* | | | 9,010 | | | | 241,068 | | |
| Electrical Equipment (0.5%) | |
| Pyeong San Co., Ltd. | | | 13,500 | | | | 274,432 | | |
| Household Durables (0.6%) | |
| Woongjin Coway Co., Ltd. | | | 14,800 | | | | 317,384 | | |
| Metals & Mining (1.1%) | |
| POSCO ADR | | | 8,000 | | | | 602,000 | | |
| Multiline Retail (1.2%) | |
| Hyundai Department Store Co., Ltd. | | | 5,829 | | | | 298,294 | | |
| Shinsegae Co., Ltd. | | | 880 | | | | 341,890 | | |
| | | | 640,184 | | |
See Accompanying Notes to Financial Statements.
15
Credit Suisse Trust — Emerging Markets Portfolio
Schedule of Investments (continued)
December 31, 2008
| | | Number of
Shares | | Value | |
| COMMON STOCKS | |
| South Korea | |
| Semiconductor Equipment & Products (3.3%) | |
| Samsung Electronics Co., Ltd. | | | 4,811 | | | $ | 1,754,043 | | |
| Tobacco (1.1%) | |
| KT&G Corp. | | | 9,600 | | | | 607,234 | | |
| Wireless Telecommunication Services (0.9%) | |
| SK Telecom Co., Ltd. | | | 3,000 | | | | 498,651 | | |
| TOTAL SOUTH KOREA | | | 6,353,650 | | |
| Taiwan (11.7%) | |
| Banks (0.6%) | |
| Chinatrust Financial Holding Co., Ltd. | | | 788,715 | | | | 337,564 | | |
| Chemicals (0.9%) | |
| Formosa Plastics Corp. | | | 140,000 | | | | 186,762 | | |
| Taiwan Fertilizer Co., Ltd. | | | 169,000 | | | | 270,736 | | |
| | | | 457,498 | | |
| Communications Equipment (0.3%) | |
| Zyxel Communications Corp. | | | 284,225 | | | | 149,238 | | |
| Computers & Peripherals (0.4%) | |
| Asustek Computer, Inc. | | | 186,948 | | | | 210,969 | | |
| Construction Materials (0.6%) | |
| Asia Cement Corp. | | | 377,562 | | | | 329,701 | | |
| Diversified Financials (1.0%) | |
| First Financial Holding Co., Ltd. | | | 394,680 | | | | 210,829 | | |
| Yuanta Financial Holdings Co., Ltd. | | | 675,900 | | | | 307,742 | | |
| | | | 518,571 | | |
| Diversified Telecommunication Services (1.2%) | |
| Chunghwa Telecom Co., Ltd. | | | 387,200 | | | | 623,703 | | |
| Electronic Equipment & Instruments (1.5%) | |
| AU Optronics Corp. | | | 340,000 | | | | 257,749 | | |
| Catcher Technology Co., Ltd. | | | 110,000 | | | | 183,749 | | |
| Hon Hai Precision Industry Co., Ltd. | | | 169,854 | | | | 334,911 | | |
| | | | 776,409 | | |
| Food Products (0.5%) | |
| Uni-President Enterprises Corp. | | | 305,608 | | | | 270,562 | | |
| Industrial Conglomerates (0.5%) | |
| Far Eastern Textile, Ltd. | | | 440,640 | | | | 283,632 | | |
| Insurance (0.6%) | |
| Cathay Financial Holding Co., Ltd. | | | 298,245 | | | | 336,021 | | |
| Multiline Retail (0.2%) | |
| Far Eastern Department Stores Co., Ltd. | | | 215,250 | | | | 122,823 | | |
See Accompanying Notes to Financial Statements.
16
Credit Suisse Trust — Emerging Markets Portfolio
Schedule of Investments (continued)
December 31, 2008
| | | Number of
Shares | | Value | |
| COMMON STOCKS | |
| Taiwan | |
| Real Estate (0.3%) | |
| Cathay Real Estate Development Co., Ltd. | | | 610,000 | | | $ | 135,991 | | |
| Semiconductor Equipment & Products (2.4%) | |
| MediaTek, Inc. | | | 39,040 | | | | 264,047 | | |
| Taiwan Semiconductor Manufacturing Co., Ltd. | | | 754,210 | | | | 1,029,104 | | |
| | | | 1,293,151 | | |
| Wireless Telecommunication Services (0.7%) | |
| Taiwan Mobile Co., Ltd. | | | 248,000 | | | | 369,031 | | |
| TOTAL TAIWAN | | | 6,214,864 | | |
| Thailand (2.5%) | |
| Banks (0.4%) | |
| Kasikornbank Public Co., Ltd. | | | 175,000 | | | | 229,518 | | |
| Construction & Engineering (0.4%) | |
| Italian - Thai Development Public Co., Ltd. | | | 2,117,000 | | | | 136,345 | | |
| Land and Houses Public Co., Ltd. | | | 710,000 | | | | 78,961 | | |
| | | | 215,306 | | |
| Metals & Mining (0.4%) | |
| Banpu Public Co., Ltd. | | | 29,000 | | | | 194,206 | | |
| Oil & Gas (0.5%) | |
| PTT Exploration & Production PCL | | | 86,000 | | | | 269,935 | | |
| Wireless Telecommunication Services (0.8%) | |
| Advanced Info Service Public Co., Ltd. | | | 191,000 | | | | 431,096 | | |
| TOTAL THAILAND | | | 1,340,061 | | |
| Turkey (0.7%) | |
| Banks (0.4%) | |
| Turkiye Is Bankasi Series C | | | 66,000 | | | | 179,726 | | |
| Wireless Telecommunication Services (0.3%) | |
| Turkcell Iletisim Hizmetleri AS | | | 29,000 | | | | 167,663 | | |
| TOTAL TURKEY | | | 347,389 | | |
| TOTAL COMMON STOCKS (Cost $61,631,223) | | | 48,837,427 | | |
| PREFERRED STOCKS (6.7%) | |
| Brazil (6.7%) | |
| Banks (1.1%) | |
| Banco Itau Holding Financeira SA | | | 53,625 | | | | 600,177 | | |
| Beverages (0.9%) | |
| Companhia de Bebidas das Americas ADR | | | 10,200 | | | | 451,962 | | |
| Air Freight & Couriers (0.2%) | |
| Bradespar SA | | | 12,100 | | | | 99,519 | | |
See Accompanying Notes to Financial Statements.
17
Credit Suisse Trust — Emerging Markets Portfolio
Schedule of Investments (continued)
December 31, 2008
| | | Number of
Shares | | Value | |
| PREFERRED STOCKS | |
| Brazil | |
| Diversified Telecommunication Services (0.3%) | |
| Telemar Norte Leste SA Class A | | | 6,400 | | | $ | 152,316 | | |
| Metals & Mining (1.9%) | |
| Companhia Vale do Rio Doce ADR | | | 92,300 | | | | 982,995 | | |
| Oil & Gas (1.9%) | |
| Petroleo Brasileiro SA - Petrobras ADR | | | 42,200 | | | | 1,033,478 | | |
| Road & Rail (0.4%) | |
| All America Latina Logistica | | | 50,500 | | | | 216,552 | | |
| TOTAL PREFERRED STOCKS (Cost $1,795,086) | | | 3,536,999 | | |
| RIGHTS (0.0%) | |
| Hong Kong (0.0%) | |
| Real Estate (0.0%) | |
| China Overseas Land & Investment, Ltd. strike price HKD 8.00 expires 01/21/09* (Cost $0) | | | 5,947 | | | | 2,133 | | |
| TOTAL RIGHTS (Cost $0) | | | 2,133 | | |
| TOTAL INVESTMENTS AT VALUE (98.4%) (Cost $63,426,309) | | | 52,376,559 | | |
| OTHER ASSETS IN EXCESS OF LIABILITIES (1.6%) | | | 868,078 | | |
| NET ASSETS (100.0%) | | $ | 53,244,637 | | |
INVESTMENT ABBREVIATIONS
ADR = American Depositary Receipt
GDR = Global Depositary Receipt
* Non-income producing security.
‡ Security exempt from registration under Rule 144A of the Securities Act of 1933. These securities may be resold in transactions exempt from registration, normally to qualified institutional buyers. At December 31, 2008, these securities amounted to a value of $57,688 or 0.1% of net assets.
See Accompanying Notes to Financial Statements.
18
Credit Suisse Trust — Emerging Markets Portfolio
Statement of Assets and Liabilities
December 31, 2008
| Assets | |
| Investments at value (Cost $63,426,309) (Note 2) | | $ | 52,376,559 | | |
| Foreign currency at value (cost $204,950) | | | 196,205 | | |
| Receivable for investments sold | | | 570,864 | | |
| Dividend and interest receivable | | | 121,514 | | |
| Receivable from investment adviser (Note 3) | | | 116,350 | | |
| Receivable for portfolio shares sold | | | 72,142 | | |
| Prepaid expenses and other assets | | | 2,116 | | |
| Total Assets | | | 53,455,750 | | |
| Liabilities | |
| Advisory fee payable (Note 3) | | | 46,910 | | |
| Administrative services fee payable (Note 3) | | | 11,854 | | |
| Due to custodian | | | 78,778 | | |
| Trustees' fee payable | | | 2,574 | | |
| Payable for portfolio shares redeemed | | | 1,662 | | |
| Other accrued expenses payable | | | 69,335 | | |
| Total Liabilities | | | 211,113 | | |
| Net Assets | |
| Capital stock, $.001 par value (Note 6) | | | 13,061 | | |
| Paid-in capital (Note 6) | | | 67,574,955 | | |
| Undistributed net investment income | | | 864,263 | | |
| Accumulated net realized loss on investments and foreign currency transactions | | | (4,141,934 | ) | |
| Net unrealized depreciation on investments and foreign currency translations | | | (11,065,708 | ) | |
| Net Assets | | $ | 53,244,637 | | |
| Shares outstanding | | | 13,060,985 | | |
| Net asset value, offering price, and redemption price per share | | $ | 4.08 | | |
See Accompanying Notes to Financial Statements.
19
Credit Suisse Trust — Emerging Markets Portfolio
Statement of Operations
For the Year Ended December 31, 2008
| Investment Income (Note 2) | |
| Dividends | | $ | 3,000,365 | | |
| Interest | | | 27,191 | | |
| Securities lending | | | 140,492 | | |
| Foreign taxes withheld | | | (334,048 | ) | |
| Total investment income | | | 2,834,000 | | |
| Expenses | |
| Investment advisory fees (Note 3) | | | 1,033,367 | | |
| Administrative services fees (Note 3) | | | 159,424 | | |
| Custodian fees | | | 142,649 | | |
| Audit and tax fees | | | 33,395 | | |
| Printing fees (Note 3) | | | 32,016 | | |
| Interest expense (Note 4) | | | 18,192 | | |
| Trustees' fees | | | 17,285 | | |
| Legal fees | | | 15,148 | | |
| Insurance expense | | | 4,670 | | |
| Transfer agent fees | | | 3,761 | | |
| Commitment fees (Note 4) | | | 1,568 | | |
| Miscellaneous expense | | | 35,963 | | |
| Total expenses | | | 1,497,438 | | |
| Less: fees waived (Note 3) | | | (289,647 | ) | |
| Net expenses | | | 1,207,791 | | |
| Net investment income | | | 1,626,209 | | |
| Net Realized and Unrealized Gain (Loss) from Investments and Foreign Currency Related Items | |
| Net realized loss from investments (net of Thailand and India Capital Gain Tax $94,793) | | | (3,515,087 | ) | |
| Net realized loss from foreign currency transactions | | | (227,677 | ) | |
Net increase from payments by affiliates on the disposal of investments in violation of
restrictions (Note 3) | | | 116,350 | | |
| Net change in unrealized appreciation (depreciation) from investments | | | (82,478,460 | ) | |
| Net change in unrealized appreciation (depreciation) from foreign currency translations | | | 86,810 | | |
| Net realized and unrealized loss from investments and foreign currency related items | | | (86,018,064 | ) | |
| Net decrease in net assets resulting from operations | | $ | (84,391,855 | ) | |
See Accompanying Notes to Financial Statements.
20
Credit Suisse Trust — Emerging Markets Portfolio
Statements of Changes in Net Assets
| | | For the Year
Ended
December 31, 2008 | | For the Year
Ended
December 31, 2007 | |
| From Operations | |
| Net investment income | | $ | 1,626,209 | | | $ | 1,789,326 | | |
| Net realized gain (loss) from investments and foreign currency transactions | | | (3,742,764 | ) | | | 57,537,557 | | |
Net increase from payments by affiliates on the disposal of investments in
violation of restrictions (Note 3) | | | 116,350 | | | | — | | |
Net change in unrealized appreciation (depreciation)
from investments and foreign currency translations | | | (82,391,650 | ) | | | (14,030,363 | ) | |
| Net increase (decrease) in net assets resulting from operations | | | (84,391,855 | ) | | | 45,296,520 | | |
| From Dividends and Distributions | |
| Dividends from net investment income | | | (2,085,510 | ) | | | (2,363,281 | ) | |
| Distributions from net realized gains | | | (57,210,032 | ) | | | (24,399,983 | ) | |
| Net decrease in net assets resulting from dividends and distributions | | | (59,295,542 | ) | | | (26,763,264 | ) | |
| From Capital Share Transactions (Note 6) | |
| Proceeds from sale of shares | | | 17,676,067 | | | | 40,554,090 | | |
| Reinvestment of dividends and distributions | | | 59,295,542 | | | | 26,763,264 | | |
| Net asset value of shares redeemed | | | (59,856,229 | ) | | | (148,352,555 | ) | |
| Net increase (decrease) in net assets from capital share transactions | | | 17,115,380 | | | | (81,035,201 | ) | |
| Net decrease in net assets | | | (126,572,017 | ) | | | (62,501,945 | ) | |
| Net Assets | |
| Beginning of year | | | 179,816,654 | | | | 242,318,599 | | |
| End of year | | $ | 53,244,637 | | | $ | 179,816,654 | | |
| Undistributed net investment income | | $ | 864,263 | | | $ | 1,201,133 | | |
See Accompanying Notes to Financial Statements.
21
Credit Suisse Trust — Emerging Markets Portfolio
Financial Highlights
(For a Share of the Portfolio Outstanding Throughout Each Year)
| | | For the Year Ended December 31, | |
| | | 2008 | | 2007 | | 2006 | | 2005 | | 2004 | |
| Per share data | |
| Net asset value, beginning of year | | $ | 23.58 | | | $ | 21.85 | | | $ | 16.82 | | | $ | 13.25 | | | $ | 10.63 | | |
| INVESTMENT OPERATIONS | |
| Net investment income | | | 0.25 | | | | 0.37 | | | | 0.21 | | | | 0.14 | | | | 0.12 | | |
Net gain (loss) on investments
and foreign currency related items
(both realized and unrealized) | | | (10.11 | )1 | | | 5.58 | | | | 5.19 | | | | 3.53 | | | | 2.53 | | |
| Total from investment operations | | | (9.86 | ) | | | 5.95 | | | | 5.40 | | | | 3.67 | | | | 2.65 | | |
| LESS DIVIDENDS AND DISTRIBUTIONS | |
| Dividends from net investment income | | | (0.34 | ) | | | (0.37 | ) | | | (0.11 | ) | | | (0.10 | ) | | | (0.03 | ) | |
| Distributions from net realized gains | | | (9.30 | ) | | | (3.85 | ) | | | (0.26 | ) | | | — | | | | — | | |
| Total dividends and distributions | | | (9.64 | ) | | | (4.22 | ) | | | (0.37 | ) | | | (0.10 | ) | | | (0.03 | ) | |
| Net asset value, end of year | | $ | 4.08 | | | $ | 23.58 | | | $ | 21.85 | | | $ | 16.82 | | | $ | 13.25 | | |
| Total return2 | | | (54.80 | )% | | | 29.44 | % | | | 32.51 | % | | | 27.84 | % | | | 25.02 | % | |
| RATIOS AND SUPPLEMENTAL DATA | |
| Net assets, end of year (000s omitted) | | $ | 53,245 | | | $ | 179,817 | | | $ | 242,319 | | | $ | 186,190 | | | $ | 115,224 | | |
| Ratio of expenses to average net assets | | | 1.04 | % | | | 1.30 | % | | | 1.36 | % | | | 1.40 | % | | | 1.40 | % | |
| Ratio of net investment income to average net assets | | | 1.40 | % | | | 0.94 | % | | | 1.11 | % | | | 1.11 | % | | | 1.21 | % | |
Decrease reflected in above operating expense
ratios due to waivers/reimbursements | | | 0.25 | % | | | 0.15 | % | | | 0.23 | % | | | 0.25 | % | | | 0.29 | % | |
| Portfolio turnover rate | | | 61 | % | | | 62 | % | | | 80 | % | | | 77 | % | | | 121 | % | |
1 The investment adviser fully reimbursed the Portfolio for a loss on a transaction not meeting the Portfolio's investment guidelines, which otherwise would have reduced the amount by $0.01 (Note 3).
2 Total returns are historical and assume changes in share price and reinvestment of all dividends and distributions. Had certain expenses not been reduced during the years shown, total returns would have been lower. Total returns do not reflect charges and expenses attributable to any particular variable contract or plan.
See Accompanying Notes to Financial Statements.
22
Credit Suisse Trust — Emerging Markets Portfolio
Notes to Financial Statements
December 31, 2008
Note 1. Organization
Credit Suisse Trust (the "Trust") is an open-end management investment company registered under the Investment Company Act of 1940, as amended (the "1940 Act"), and currently offers eight managed investment portfolios of which one, the Emerging Markets Portfolio (the "Portfolio"), is included in this report. The Portfolio is a diversified investment fund that seeks long-term growth of capital. Shares of the Portfolio are not available directly to individual investors but may be offered only through (a) variable annuity contracts and variable life insurance contracts offered by separate accounts of certain insurance companies and (b) tax-qualified pension and retirement plans. The Portfolio may not be available in connection with a particular contract or plan. The Trust was organized under the laws of the Commonwealth of Massachusetts as a business trust on March 15, 1995.
Note 2. Significant Accounting Policies
A) SECURITY VALUATION — The net asset value of the Portfolio is determined daily as of the close of regular trading on the New York Stock Exchange, Inc. (the "Exchange") on each day the Exchange is open for business. Equity investments are valued at market value, which is generally determined using the closing price on the exchange or market on which the security is primarily traded at the time of valuation (the "Valuation Time"). If no sales are reported, equity investments are generally valued at the most recent bid quotation as of the Valuation Time or at the lowest asked quotation in the case of a short sale of securities. Debt securities with a remaining maturity greater than 60 days are valued in accordance with the price supplied by a pricing service, which may use a matrix, formula or other objective method that takes into consideration market indices, yield curves and other specific adjustments. Debt obligations that will matur e in 60 days or less are valued on the basis of amortized cost, which approximates market value, unless it is determined that using this method would not represent fair value. Investments in mutual funds are valued at the mutual fund's closing net asset value per share on the day of valuation. Securities and other assets for which market quotations are not readily available, or whose values have been materially affected by events occurring before the Portfolio's Valuation Time but after the close of the securities' primary markets, are valued at fair value as determined in good faith by, or under the direction of, the Board of Trustees under procedures established by the Board of Trustees. The Portfolio may utilize a service provided by an independent third party which has been approved by the Board of Trustees to fair value certain securities. When fair-value pricing is employed, the prices of securities used by a portfolio to calculate its net asset value may differ from quoted or published prices for the same securities.
23
Credit Suisse Trust — Emerging Markets Portfolio
Notes to Financial Statements (continued)
December 31, 2008
Note 2. Significant Accounting Policies
The Portfolio adopted Financial Accounting Standards Board Statement of Financial Accounting Standards No. 157, Fair Value Measurements ("FAS 157"), effective January 1, 2008. In accordance with FAS 157, fair value is defined as the price that the Portfolio would receive upon selling an investment in a timely transaction to an independent buyer in the principal or most advantageous market of the investment. FAS 157 established a three-tier hierarchy to maximize the use of observable market data and minimize the use of unobservable inputs and to establish classification of fair value measurements for disclosure purposes. Inputs refer broadly to the assumptions that market participants would use in pricing the asset or liability, including assumptions about risk, for example, the risk inherent in a particular valuation technique used to measure fair value including such a pricing model and/or the risk inherent in the inputs to the valuation te chnique. Inputs may be observable or unobservable. Observable inputs are inputs that reflect the assumptions market participants would use in pricing the asset or liability developed based on market data obtained from sources independent of the reporting entity. Unobservable inputs are inputs that reflect the reporting entity's own assumptions about the assumptions market participants would use in pricing the asset or liability developed based on the best information available in the circumstances. The three-tier hierarchy of inputs is summarized in the three broad Levels listed below.
• Level 1 – quoted prices in active markets for identical investments
• Level 2 – other significant observable inputs (including quoted prices for similar investments, interest rates, prepayment speeds, credit risk, etc.)
• Level 3 – significant unobservable inputs (including the Portfolio's own assumptions in determining the fair value of investments)
The inputs or methodology used for valuing securities are not necessarily an indication of the risk associated with investing in those securities.
The following is a summary of the inputs used as of December 31, 2008 in valuing the Portfolio's investments carried at value:
| Valuation Inputs | | Investments in
Securities | | Other Financial
Instruments* | |
| Level 1 – Quoted Prices | | $ | 17,732,255 | | | $ | — | | |
| Level 2 – Other Significant Observable Inputs | | | 34,644,304 | | | | — | | |
| Level 3 – Significant Unobservable Inputs | | | — | | | | — | | |
| Total | | $ | 52,376,559 | | | $ | — | | |
*Other financial instruments include futures, forwards and swap contracts.
24
Credit Suisse Trust — Emerging Markets Portfolio
Notes to Financial Statements (continued)
December 31, 2008
Note 2. Significant Accounting Policies
B) FOREIGN CURRENCY TRANSACTIONS — The books and records of the Portfolio are maintained in U.S. dollars. Transactions denominated in foreign currencies are recorded at the current prevailing exchange rates. All assets and liabilities denominated in foreign currencies are translated into U.S. dollar amounts at the current exchange rate at the end of the period. Translation gains or losses resulting from changes in the exchange rate during the reporting period and realized gains and losses on the settlement of foreign currency transactions are reported in the results of operations for the current period. The Portfolio does not isolate that portion of realized gains and losses on investments in equity securities which is due to changes in the foreign exchange rate from that which is due to changes in market prices of equity securities. The Portfolio isolates that portion of realized gains and losses on investments in debt securities which is due to changes in the foreign exchange rate from that which is due to changes in market prices of debt securities.
C) SECURITY TRANSACTIONS AND INVESTMENT INCOME — Security transactions are accounted for on a trade date basis. Interest income is recorded on the accrual basis. Dividends are recorded on the ex-dividend date. The cost of investments sold is determined by use of the specific identification method for both financial reporting and income tax purposes.
D) DIVIDENDS AND DISTRIBUTIONS TO SHAREHOLDERS — Dividends from net investment income and distributions of net realized capital gains, if any, are declared and paid at least annually. However, to the extent that a net realized capital gain can be reduced by a capital loss carryforward, such gain will not be distributed. Income and capital gain distributions are determined in accordance with federal income tax regulations, which may differ from accounting principles generally accepted in the United States of America ("GAAP").
E) FEDERAL INCOME TAXES — No provision is made for federal taxes as it is the Portfolio's intention to continue to qualify for and elect the tax treatment applicable to regulated investment companies under the Internal Revenue Code of 1986, as amended, and to make the requisite distributions to its shareholders, which will be sufficient to relieve it from federal income and excise taxes.
During June 2006, the Financial Accounting Standards Board ("FASB") issued FASB Interpretation 48 ("FIN 48" or the "Interpretation"), Accounting for Uncertainty in Income Taxes – an interpretation of FASB statement 109. The Portfolio has reviewed its current tax positions and has determined that no provision for income tax is required in the Portfolio's financial statements. The Portfolio's
25
Credit Suisse Trust — Emerging Markets Portfolio
Notes to Financial Statements (continued)
December 31, 2008
Note 2. Significant Accounting Policies
federal tax returns for the prior three fiscal years remain subject to examination by the Internal Revenue Service.
F) USE OF ESTIMATES — The preparation of financial statements in conformity with GAAP requires management to make estimates and assumptions that affect the reported amounts of assets and liabilities and disclosure of contingent assets and liabilities at the date of the financial statements and the reported amounts of income and expenses during the reporting period. Actual results could differ from these estimates.
G) SHORT-TERM INVESTMENTS — The Portfolio, together with other funds/portfolios advised by Credit Suisse Asset Management, LLC ("Credit Suisse"), an indirect, wholly-owned subsidiary of Credit Suisse Group AG, pools available cash into either a short-term variable rate time deposit issued by State Street Bank and Trust Company ("SSB"), the Portfolio's custodian, or a money market fund advised by Credit Suisse. The short-term time deposit issued by SSB is a variable rate account classified as a short-term investment.
H) FORWARD FOREIGN CURRENCY CONTRACTS — The Portfolio may enter into forward foreign currency contracts for the purchase or sale of a specific foreign currency at a fixed price on a future date. Risks may arise upon entering into these contracts from the potential inability of counterparties to meet the terms of their contracts and from unanticipated movements in the value of a foreign currency. The Portfolio will enter into forward foreign currency contracts primarily for hedging purposes. Forward foreign currency contracts are adjusted by the daily forward exchange rate of the underlying currency and any gains or losses are recorded for financial statement purposes as unrealized until the contract settlement date or an offsetting position is entered into. At December 31, 2008, the Portfolio had no open forward foreign currency contracts.
I) SECURITIES LENDING — Loans of securities are required at all times to be secured by collateral at least equal to 102% of the market value of domestic securities on loan (including any accrued interest thereon) and 105% of the market value of foreign securities on loan (including any accrued interest thereon). Cash collateral received by the Portfolio in connection with securities lending activity may be pooled together with cash collateral for other funds/portfolios advised by Credit Suisse and may be invested in a variety of investments, including certain Credit Suisse-advised funds, funds advised by SSB, the Portfolio's securities lending agent, or money market instruments. However, in the event of default or bankruptcy by the other party to the
26
Credit Suisse Trust — Emerging Markets Portfolio
Notes to Financial Statements (continued)
December 31, 2008
Note 2. Significant Accounting Policies
agreement, realization and/or retention of the collateral may be subject to legal proceedings.
SSB has been engaged by the Portfolio to act as the Portfolio's securities lending agent. The Portfolio's securities lending arrangement provides that the Portfolio and SSB will share the net income earned from securities lending activities. During the year ended December 31, 2008, total earnings from the Portfolio's investment in cash collateral received in connection with securities lending arrangements was $415,019, of which $239,963 was rebated to borrowers (brokers). The Portfolio retained $140,492 in income from the cash collateral investment, and SSB, as lending agent, was paid $34,564. The Portfolio may also be entitled to certain minimum amounts of income from its securities lending activities. Securities lending income is accrued as earned.
J) OTHER — The Portfolio may invest in securities of foreign countries and governments which involve certain risks in addition to those inherent in domestic investments. Such risks generally include, among others, currency risk (fluctuations in currency exchange rates), information risk (key information may be inaccurate or unavailable) and political risk (expropriation, nationalization or the imposition of capital or currency controls or punitive taxes). Other risks of investing in foreign securities include liquidity and valuation risks.
The Portfolio's investments in securities of issuers located in less developed countries considered to be "emerging markets" involve risks in addition to those generally applicable to foreign securities. Focusing on emerging (less developed) markets involves higher levels of risk, including increased currency, information, liquidity, market, political and valuation risks. Deficiencies in regulatory oversight, market infrastructure, shareholder protections and company laws could expose the Portfolio to operational and other risks as well. Some countries may have restrictions that could limit the Portfolio's access to attractive investment opportunities. Additionally, emerging markets often face serious economic problems (such as high external debt, inflation and unemployment) that could subject the Portfolio to increased volatility or substantial declines in value.
The Portfolio may be subject to taxes imposed by countries in which it invests with respect to its investments in issuers existing or operating in such countries. Such taxes are generally based on income earned or repatriated and capital gains realized on the sale of such investments. The Portfolio accrues such taxes when the related income is earned or gains are realized.
27
Credit Suisse Trust — Emerging Markets Portfolio
Notes to Financial Statements (continued)
December 31, 2008
Note 3. Transactions with Affiliates and Related Parties
Credit Suisse serves as investment adviser for the Portfolio. Effective October 1, 2006, the Portfolio pays Credit Suisse for its advisory services a fee that consists of two components: (1) a monthly base management fee calculated by applying a fixed rate of 1.20% ("Base Fee"), plus or minus (2) a performance-fee adjustment ("Performance Adjustment") calculated by applying a variable rate of up to 0.20% (positive or negative) to the Portfolio's average daily net assets during the applicable performance measurement period. The performance measurement period will generally be 36 months. During the period from October 1, 2006 through September 30, 2007, only the Base Fee applied to the Portfolio. The fee adjustment went into effect on October 1, 2007. After 12 months have passed, the measurement period will be equal to the number of months that have elapsed since October 1, 2006 until 36 months has passed, after which the measurement period wi ll become 36 months. The Base Fee and Performance Adjustment are calculated and accrued daily. The investment advisory fee is paid monthly in arrears. No Performance Adjustment will be applied unless the difference between the Portfolio's investment performance and the investment record of the MSCI Emerging Markets Free Index, the Portfolio's benchmark index (the "Index"), is 1.00% or greater (plus or minus) during the applicable performance measurement period. For purposes of computing the Base Fee and the Performance Adjustment, net assets will be averaged over different periods (average daily net assets during the relevant month for the Base Fee, versus average daily net assets during the performance measurement period for the Performance Adjustment). The investment performance of the Portfolio for the performance measurement period is used to calculate the Portfolio's Performance Adjustment. After Credit Suisse determines whether the Portfolio's performance was above or below the Index by comparing the i nvestment performance of the Portfolio against the investment record of the Index, Credit Suisse will apply the Performance Adjustment (positive or negative) across the Portfolio.
The following table shows the structure of the Performance Adjustment. No Performance Adjustment will be applied unless the difference between the Portfolio's investment performance and the investment record of the Index is 1.00% or greater (plus or minus) during the applicable performance measurement period.
28
Credit Suisse Trust — Emerging Markets Portfolio
Notes to Financial Statements (continued)
December 31, 2008
Note 3. Transactions with Affiliates and Related Parties
| | | Annualized Return
(Net of Expenses)
Relative to Index | | Performance
Adjustment | |
| | | Over 2.00% | | | +0.20 | % | |
| | | 1.00% to 2.00% | | | +0.10 | % | |
| Base Fee plus/minus | | 0.00% to 1.00% | | | None | | |
| | | 0.00% to -1.00% | | | None | | |
| | | -1.00% to -2.00% | | | -0.10 | % | |
| | | Over -2.00% | | | -0.20 | % | |
For the year ended December 31, 2008, investment advisory fees earned and voluntarily waived were $1,395,384 and $289,647, respectively, less a performance fee adjustment of $362,017. Credit Suisse will not recapture from the Portfolio any fees it waived during the year ended December 31, 2008. Fee waivers and reimbursements are voluntary and may be discontinued by Credit Suisse at any time.
Credit Suisse Asset Management Limited ("Credit Suisse U.K.") and Credit Suisse Asset Management Limited ("Credit Suisse Australia"), each an affiliate of Credit Suisse, are sub-investment advisers to the Portfolio (the "Sub-Advisers"). Credit Suisse U.K.'s and Credit Suisse Australia's sub-investment advisory fees are paid by Credit Suisse out of Credit Suisse's net investment advisory fee and are not paid by the Portfolio. As of October 1, 2008, Credit Suisse Australia no longer serves as sub-investment advisor to the Portfolio.
Credit Suisse reimbursed the Portfolio for a $116,350 loss incurred on a transaction in September 2008 not meeting the Portfolio's investment guidelines. The reimbursement was recorded as a receivable as of December 31, 2008 and Credit Suisse subsequently made the payment in January 2009.
Credit Suisse Asset Management Securities, Inc. ("CSAMSI"), an affiliate of Credit Suisse, and SSB serve as co-administrators to the Portfolio. For its co-administrative services, CSAMSI currently receives a fee calculated at an annual rate of 0.09% of the Portfolio's average daily net assets. For the year ended December 31, 2008, co-administrative services fees earned by CSAMSI were $104,654.
For its co-administrative services, SSB receives a fee, exclusive of out-of-pocket expenses, calculated in total for all the Credit Suisse funds/portfolios co-administered by SSB and allocated based upon the relative average net assets of each fund/portfolio, subject to an annual minimum fee. For the year ended December 31, 2008, co-administrative services fees earned by SSB (including out-of-pocket expenses) were $54,770.
In addition to serving as the Portfolio's co-administrator, CSAMSI currently serves as distributor of the Portfolio's shares without compensation.
29
Credit Suisse Trust — Emerging Markets Portfolio
Notes to Financial Statements (continued)
December 31, 2008
Note 3. Transactions with Affiliates and Related Parties
Merrill Corporation ("Merrill"), an affiliate of Credit Suisse, has been engaged by the Portfolio to provide certain financial printing and fulfillment services. For the year ended December 31, 2008, Merrill was paid $22,884 for its services to the Portfolio.
Note 4. Line of Credit
The Portfolio, together with other funds/portfolios advised by Credit Suisse (collectively, the "Participating Funds"), participates in a $50 million committed, unsecured line of credit facility ("Credit Facility") for temporary or emergency purposes with SSB. Under the terms of the Credit Facility, the Participating Funds pay an aggregate commitment fee at a rate of 0.10% per annum on the average unused amount of the Credit Facility, which is allocated among the Participating Funds in such manner as is determined by the governing Boards of the Participating Funds. In addition, the Participating Funds pay interest on borrowings at the Federal Funds rate plus 0.50%. At December 31, 2008, the Portfolio had no loans outstanding under the Credit Facility. During the year ended December 31, 2008, the Portfolio had borrowings under the Credit Facility as follows:
Average Daily
Loan Balance | | Weighted Average
Interest Rate% | | Maximum Daily
Loan Outstanding | |
| $ | 4,499,486 | | | | 4.160 | % | | $ | 14,314,000 | | |
Note 5. Purchases and Sales of Securities
For the year ended December 31, 2008, purchases and sales of investment securities (excluding short-term investments) were $69,224,575 and $108,177,580, respectively.
Note 6. Capital Share Transactions
The Trust is authorized to issue an unlimited number of full and fractional shares of beneficial interest, $.001 par value per share. Transactions in capital shares of the Portfolio were as follows:
| | | For the Year Ended
December 31, 2008 | | For the Year Ended
December 31, 2007 | |
| Shares sold | | | 1,008,819 | | | | 1,735,883 | | |
Shares issued in reinvestment of
dividends and distributions | | | 9,915,642 | | | | 1,264,207 | | |
| Shares redeemed | | | (5,490,383 | ) | | | (6,461,658 | ) | |
| Net increase (decrease) | | | 5,434,078 | | | | (3,461,568 | ) | |
30
Credit Suisse Trust — Emerging Markets Portfolio
Notes to Financial Statements (continued)
December 31, 2008
Note 6. Capital Share Transactions
On December 31, 2008, the number of shareholders that held 5% or more of the outstanding shares of the Portfolio was as follows:
Number of
Shareholders | | Approximate Percentage
of Outstanding Shares | |
| | 3 | | | | 92 | % | |
Some of the shareholders are omnibus accounts, which hold shares on behalf of individual shareholders.
Note 7. Federal Income Taxes
Income and capital gain distributions are determined in accordance with federal income tax regulations, which may differ from GAAP.
The tax characteristics of dividends and distributions paid during the years ended December 31, 2008 and 2007, respectively, by the Portfolio were as follows:
| Ordinary Income | | Long-Term Capital Gain | |
| 2008 | | 2007 | | 2008 | | 2007 | |
| $ | 18,662,110 | | | $ | 10,113,031 | | | $ | 40,633,432 | | | $ | 16,650,233 | | |
The tax basis components of distributable earnings differ from the amounts reflected in the Statement of Assets and Liabilities by temporary book/tax differences. These differences are primarily due to losses deferred on wash sales, mark-to-market of forward contracts, mark-to-market income from Passive Foreign Investment Companies and deferral of post-October losses.
At December 31, 2008, the components of distributable earnings on a tax basis were as follows:
| Undistributed net investment income | | $ | 943,224 | | |
| Accumulated realized gain | | | 2,147,792 | | |
| Unrealized depreciation | | | (11,890,458 | ) | |
| Deferral of post – October capital losses | | | (5,508,381 | ) | |
| Deferral of post – October ordinary and currency losses | | | (35,556 | ) | |
| | | $ | (14,343,379 | ) | |
At December 31, 2008, the identified cost for federal income tax purposes, as well as the gross unrealized appreciation from investments for those securities having an excess of value over cost, gross unrealized depreciation from investments for those securities having an excess of cost over value and the net unrealized depreciation from investments were $64,251,355, $10,305,035, $(22,179,831) and $(11,874,796), respectively.
At December 31, 2008, the Portfolio reclassified $122,431 from accumulated net realized loss from investments to undistributed net investment income, to
31
Credit Suisse Trust — Emerging Markets Portfolio
Notes to Financial Statements (continued)
December 31, 2008
Note 7. Federal Income Taxes
adjust for current period permanent book/tax differences of foreign currency transactions, realized capital gains tax and the sale of Passive Foreign Investment Companies. Net assets were not affected by these reclassifications.
Note 8. Contingencies
In the normal course of business, the Portfolio may provide general indemnifications pursuant to certain contracts and organizational documents. The Portfolio's maximum exposure under these arrangements is dependent on future claims that may be made against the Portfolio and, therefore, cannot be estimated; however, based on experience, the risk of loss from such claims is considered remote.
Note 9. Recent Accounting Pronouncements
In March 2008, FASB issued Statement of Financial Accounting Standards No. 161, Disclosures about Derivative Instruments and Hedging Activities ("FAS 161"), an amendment of FASB Statement No. 133. FAS 161 requires enhanced disclosures about (a) how and why an entity uses derivative instruments, (b) how derivative instruments and hedging activities are accounted for, and (c) how derivative instruments and related hedging activities affect a fund's financial position, financial performance, and cash flows. Management of the Portfolio does not believe the adoption of FAS 161 will materially impact the financial statement amounts, but will require additional disclosures. This will include qualitative and quantitative disclosures on derivative positions existing at period end and the effect of usin g derivatives during the reporting period. FAS 161 is effective for financial statements issued for fiscal years and interim periods beginning after November 15, 2008.
32
Credit Suisse Trust — Emerging Markets Portfolio
Report of Independent Registered Public Accounting Firm
To the Board of Trustees of Credit Suisse Trust and Shareholders of
Credit Suisse Trust — Emerging Markets Portfolio:
In our opinion, the accompanying statement of assets and liabilities, including the schedule of investments, and the related statements of operations and of changes in net assets and the financial highlights present fairly, in all material respects, the financial position of Emerging Markets Portfolio (the "Portfolio"), a portfolio of the Credit Suisse Trust, at December 31, 2008, the results of its operations for the year then ended and the changes in its net assets and financial highlights for the periods presented, in conformity with accounting principles generally accepted in the United States of America. These financial statements and financial highlights (hereafter referred to as "financial statements") are the responsibility of the Portfolio's management. Our responsibility is to express an opinion on these financial statements based on our audits. We conducted our audits of these financial statements in accordance with the standards of the Public Company Accounting Oversight Board (United States). Those standards require that we plan and perform the audit to obtain reasonable assurance about whether the financial statements are free of material misstatement. An audit includes examining, on a test basis, evidence supporting the amounts and disclosures in the financial statements, assessing the accounting principles used and significant estimates made by management, and evaluating the overall financial statement presentation. We believe that our audit, which included confirmation of securities at December 31, 2008 by correspondence with the custodian and brokers, provides a reasonable basis for our opinion.
PricewaterhouseCoopers LLP
Baltimore, Maryland
February 24, 2009
33
Credit Suisse Trust — Emerging Markets Portfolio
Board Approval of Advisory Agreement (unaudited)
In approving the renewal of the current Advisory and Sub-Advisory Agreements, the Board of Trustees, including the Independent Trustees, at a meeting held on November 18 and 19, 2008, considered the following factors with respect to the Emerging Markets Portfolio (the "Portfolio"):
Investment Advisory Fee Rates
The Board reviewed and considered the current contractual advisory fee with a base rate of 1.20% for the Portfolio plus a variable performance adjustment fee based upon the Portfolio's performance relative to its benchmark during a performance adjustment period ("Contractual Advisory Fee"), in light of the extent and quality of the advisory services provided by Credit Suisse Asset Management, LLC ("Credit Suisse") or Credit Suisse Asset Management Limited ("Credit Suisse U.K."). The Board also reviewed and considered the fee waivers and/or expense reimbursement arrangements currently in place for the Portfolio and considered the actual fee rate of 0.78% paid by the Portfolio after taking waivers and reimbursements into account ("Net Advisory Fee"). The Board acknowledged that voluntary fee waivers and expense reimbursements could be discontinued at any time. The Board noted that the compensation paid to Credit Suisse U.K. (the "Sub-Adviser") does not increase the fees or expenses otherwise incurred by the Portfolio's shareholders.
Additionally, the Board received and considered information comparing the Portfolio's Contractual Advisory Fee, Net Advisory Fee and the Portfolio's overall expenses with those of funds in both the relevant expense group ("Expense Group") and universe of funds ("Expense Universe") provided by Lipper Inc., an independent provider of investment company data.
Nature, Extent and Quality of the Services under the Advisory and
Sub-Advisory Agreements
The Board received and considered information regarding the nature, extent and quality of services provided to the Portfolio by Credit Suisse under the Advisory Agreement and by the Sub-Adviser under the Sub-Advisory Agreement. The Board also noted information received at regular meetings throughout the year related to the services rendered by Credit Suisse and the Sub-Adviser. The Board reviewed background information about Credit Suisse and the Sub-Adviser, including their respective Forms ADV. The Board considered the background and experience of both Credit Suisse's and the Sub-Adviser's senior management and the expertise of, and the amount of
34
Credit Suisse Trust — Emerging Markets Portfolio
Board Approval of Advisory Agreement (unaudited) (continued)
attention given to the Portfolio by, senior personnel of Credit Suisse and the Sub-Adviser. With respect to the Sub-Adviser, the Board also considered their expertise in managing the types of global investments that the Portfolio utilizes in its investment strategy. In addition, the Board reviewed the qualifications, backgrounds and responsibilities of the portfolio management team primarily responsible for the day-to-day portfolio management of the Portfolio and the extent of the resources devoted to research and analysis of actual and potential investments. The Board also received and considered information about the nature, extent and quality of services and fee rates offered to other Credit Suisse clients for comparable services.
In approving the Sub-Advisory Agreement, the Board also considered the benefits of retaining Credit Suisse's United Kingdom affiliate given the increased complexity of the domestic and international securities markets, specifically that retention of Credit Suisse U.K. expands the universe of companies and countries from which investment opportunities could be sought.
Portfolio Performance
The Board received and considered the performance results of the Portfolio over time, along with comparisons both to the relevant performance group ("Performance Group") and universe of funds ("Performance Universe") for the Portfolio. The Board was provided with a description of the methodology used to arrive at the funds included in the Performance Group and the Performance Universe.
Credit Suisse Profitability
The Board received and considered a profitability analysis of Credit Suisse based on the fees payable under the Advisory Agreement for the Portfolio, including any fee waivers or fee caps, as well as other relationships between the Portfolio on the one hand and Credit Suisse affiliates on the other. The Board received profitability information for the other funds in the Credit Suisse family of funds.
Economies of Scale
The Board considered whether economies of scale in the provision of services to the Portfolio were being passed along to the shareholders. Accordingly, the Board considered whether alternative fee structures (such as breakpoint fee
35
Credit Suisse Trust — Emerging Markets Portfolio
Board Approval of Advisory Agreement (unaudited) (continued)
structures) would be more appropriate or reasonable taking into consideration economies of scale or other efficiencies that might accrue from increases in the Portfolio's asset levels.
Other Benefits to Credit Suisse
The Board considered other benefits received by Credit Suisse, the Sub-Adviser and their affiliates as a result of their relationship with the Portfolio. Such benefits include, among others, research arrangements with brokers who execute transactions on behalf of the Portfolio, administrative and brokerage relationships with affiliates of Credit Suisse and the Sub-Adviser and benefits potentially derived from an increase in Credit Suisse's and the Sub-Adviser's businesses as a result of their relationship with the Portfolio (such as the ability to market to shareholders other financial products offered by Credit Suisse, the Sub-Adviser and their affiliates).
The Board considered the standards applied in seeking best execution, whether and to what extent soft dollar credits are sought and how any such credits are utilized, any benefits that may be achieved by using an affiliated broker and the existence of quality controls applicable to brokerage allocation procedures. The Board also reviewed Credit Suisse's and the Sub-Adviser's method for allocating portfolio investment opportunities among their advisory clients.
Conclusions
In selecting Credit Suisse and the Sub-Adviser, and approving the Advisory Agreement and the investment advisory fee under such agreement and the Sub-Advisory Agreement, the Board concluded that:
• Although the combined Contractual Advisory Fee and co-administration fees were the highest in the Expense Group, the Net Advisory Fee and actual total expenses were the lowest in the Expense Group. The Board considered the fee to be reasonable.
• The Board was aware that the Portfolio's performance was below most funds in the Performance Group and the Performance Universe for all periods reviewed. The Board noted that the performance-based fee adjustment, which went into effect in October 2007, had been adopted to more closely align Credit Suisse's interests with the interests of the Portfolio's shareholders, which could result in improved investment performance over time for the benefit of all shareholders. The Board would continue to monitor steps taken by Credit Suisse to improve performance.
36
Credit Suisse Trust — Emerging Markets Portfolio
Board Approval of Advisory Agreement (unaudited) (continued)
• Aside from performance (as described above), the Board was satisfied with the nature and extent of the investment advisory services provided to the Portfolio by Credit Suisse and the Sub-Adviser and that, based on dialogue with management and counsel, the services provided by Credit Suisse under the Advisory Agreement and by the Sub-Adviser under the Sub-Advisory Agreement are typical of, and consistent with, those provided to similar mutual funds by other investment advisers.
• In light of the costs of providing investment management and other services to the Portfolio and Credit Suisse's ongoing commitment to the Portfolio and willingness to waive fees and expenses, the profits and other ancillary benefits that Credit Suisse and its affiliates received were considered reasonable.
• Credit Suisse's profitability based on fees payable under the Advisory Agreement was reasonable in light of the nature, extent and quality of the services provided to the Portfolio thereunder.
• In light of the amount of the Net Advisory Fee and actual total expenses, the Portfolio's current fee structure was considered reasonable.
No single factor reviewed by the Board was identified by the Board as the principal factor in determining whether to approve the Advisory Agreement and the Sub-Advisory Agreement. The Independent Trustees were advised by separate independent legal counsel throughout the process.
37
Credit Suisse Trust — Emerging Markets Portfolio
Information Concerning Trustees and Officers (unaudited)
Name, Address
(Year of Birth) | | Position(s)
Held with
Trust | | Term
of Office1
and
Length
of Time
Served | | Principal
Occupation(s) During
Past Five Years | | Number of
Portfolios in
Fund
Complex
Overseen by
Trustee | | Other
Directorships
Held by Trustee | |
| Independent Trustees | | | | | | | | | | | |
|
Enrique Arzac
c/o Credit Suisse Asset Management, LLC
Attn: General Counsel
Eleven Madison Avenue
New York, New York
10010
(1941) | | Trustee,
Audit
Committee
Chairman and
Nominating
Committee
Member | | Since
2005 | | Professor of Finance and
Economics, Graduate
School of Business,
Columbia University
since 1971. | | | 33 | | | Director of
Epoch Holding
Corporation
(an investment
management
and investment
advisory
services
company);
Director of The
Adams Express
Company (a
closed-end
investment
company);
Director of
Petroleum and
Resources
Corporation
(a closed-end
investment
company). | |
|
Jeffrey E. Garten2
Box 208200
New Haven, Connecticut
06520-8200
(1946) | | Trustee,
Audit and
Nominating
Committee
Member | | Since
1998 | | The Juan Trippe
Professor in the Practice
of International Trade,
Finance and Business
from July 2005 to
present; Partner and
Chairman of Garten
Rothkopf (consulting
firm) from October 2005
to present; Dean of Yale
School of Management
from November 1995 to
June 2005. | | | 26 | | | Director of
Aetna, Inc.
(insurance
company);
Director of
CarMax Group
(used car
dealers). | |
|
1 Each Trustee and Officer serves until his or her respective successor has been duly elected and qualified.
2 Mr. Garten was initially appointed as a Trustee of the Portfolio on February 6, 1998. He resigned as Trustee on February 3, 2000 and was subsequently reappointed on December 21, 2000.
38
Credit Suisse Trust — Emerging Markets Portfolio
Information Concerning Trustees and Officers (unaudited) (continued)
Name, Address
(Year of Birth) | | Position(s)
Held with
Trust | | Term
of Office1
and
Length
of Time
Served | | Principal
Occupation(s) During
Past Five Years | | Number of
Portfolios in
Fund
Complex
Overseen by
Trustee | | Other
Directorships
Held by Trustee | |
| Independent Trustees | | | | | | | | | | | |
|
Peter F. Krogh
SFS/ICC 702
Georgetown University
Washington, DC
20057
(1937) | | Trustee,
Audit and
Nominating
Committee
Member | | Since
2001 | | Dean Emeritus and
Distinguished Professor
of International Affairs at
the Edmund A. Walsh
School of Foreign
Service, Georgetown
University from
June 1995 to present. | | | 26 | | | Director of
Carlisle
Companies
Incorporated
(diversified
manufacturing
company). | |
|
Steven N. Rappaport
Lehigh Court, LLC
555 Madison Avenue
29th Floor
New York, New York
10022
(1948) | | Chairman of
the Board of
Trustees,
Audit
Committee
Member and
Nominating
Committee
Chairman | | Trustee
since
1999 and
Chairman
since
2005 | | Partner of Lehigh Court,
LLC and RZ Capital
(private investment
firms) from July 2002
to present. | | | 33 | | | Director of
iCAD, Inc.
(surgical and
medical
instruments and
apparatus
company);
Director of
Presstek, Inc.
(digital imaging
technologies company);
Director of
Wood
Resources, LLC.
(plywood
manufacturing
company). | |
|
39
Credit Suisse Trust — Emerging Markets Portfolio
Information Concerning Trustees and Officers (unaudited) (continued)
Name, Address
(Year of Birth) | | Position(s)
Held with
Trust | | Term
of Office1
and
Length
of Time
Served | | Principal Occupation(s) During Past Five Years | |
| Officers | | | | | | | |
|
George R. Hornig
Credit Suisse Asset
Management, LLC
Eleven Madison Avenue
New York, New York
10010
(1954) | | Chief Executive Officer and President | | Since
2008 | | Managing Director of Credit Suisse; Co-Chief Operating Officer of Asset Management and Head of Asset Management Americas; Associated with Credit Suisse since 1999; Officer of other Credit Suisse Funds. | |
|
Michael A. Pignataro
Credit Suisse Asset
Management, LLC
Eleven Madison Avenue
New York, New York
10010
(1959) | | Chief Financial Officer | | Since
1999 | | Director and Director of Fund Administration of Credit Suisse; Associated with Credit Suisse or its predecessor since 1984; Officer of other Credit Suisse Funds. | |
|
Emidio Morizio
Credit Suisse Asset
Management, LLC
Eleven Madison Avenue
New York, New York
10010
(1966) | | Chief Compliance Officer | | Since
2004 | | Director and Global Head of Compliance of Credit Suisse; Associated with Credit Suisse since July 2000; Officer of other Credit Suisse Funds. | |
|
J. Kevin Gao
Credit Suisse Asset
Management, LLC
Eleven Madison Avenue
New York, New York
10010
(1967) | | Chief Legal Officer since 2006, Vice President and Secretary since 2004 | | Since
2004 | | Director and Legal Counsel of Credit Suisse; Associated with Credit Suisse since July 2003; Associated with the law firm of Willkie Farr & Gallagher LLP from 1998 to 2003; Officer of other Credit Suisse Funds. | |
|
Cecilia Chau
Credit Suisse Asset
Management, LLC
Eleven Madison Avenue
New York, New York
10010
(1973) | | Treasurer | | Since
2008 | | Assistant Vice President of Credit Suisse since June 2007; Associated with Alliance Bernstein L.P. from January 2007 to May 2007; Associated with Credit Suisse from August 2000 to December 2006; Officer of other Credit Suisse Funds. | |
|
The Statement of Additional Information includes additional information about the Trustees and is available, without charge, upon request, by calling 800-222-8977.
40
Credit Suisse Trust — Emerging Markets Portfolio
Tax Information Letter
December 31, 2008 (unaudited)
Important Tax Information for Shareholders
During the year ended December 31, 2008, the Portfolio declared $40,633,432 in dividends that were designated as long-term capital gains dividends.
41
Credit Suisse Trust — Emerging Markets Portfolio
Proxy Voting and Portfolio Holdings Information (unaudited)
Information regarding how the Portfolio voted proxies related to its portfolio securities during the 12 month period ended June 30 of each year, as well as the policies and procedures that the Portfolio uses to determine how to vote proxies relating to its portfolio securities are available:
• By calling 1-800-222-8977
• On the Portfolio's website, www.credit-suisse.com/us
• On the website of the Securities and Exchange Commission, www.sec.gov.
The Portfolio files a complete schedule of its portfolio holdings for the first and third quarters of its fiscal year with the SEC on Form N-Q. The Portfolio's Forms N-Q are available on the SEC's website at www.sec.gov and may be reviewed and copied at the SEC's Public Reference Room in Washington, DC. Information on the operation of the SEC's Public Reference Room may be obtained by calling 1-202-551-8090.
42
This page intentionally left blank
This page intentionally left blank

P.O. BOX 55030, BOSTON, MA 02205-5030
800-222-8977 n www.credit-suisse.com/us
CREDIT SUISSE ASSET MANAGEMENT SECURITIES, INC., DISTRIBUTOR. TREMK-AR-1208

CREDIT SUISSE FUNDS
Annual Report
December 31, 2008
CREDIT SUISSE TRUST
n GLOBAL SMALL CAP PORTFOLIO
Credit Suisse Trust (the "Trust") shares are not available directly to individual investors, but may be offered only through certain insurance products and pension and retirement plans.
The Trust's investment objectives, risks, charges and expenses (which should be considered carefully before investing), and more complete information about the Trust, are provided in the Prospectus, which should be read carefully before investing. You may obtain additional copies by calling 800-222-8977 or by writing to Credit Suisse Trust, P.O. Box 55030, Boston, MA 02205-5030.
Credit Suisse Asset Management Securities, Inc., Distributor, is located at Eleven Madison Avenue, New York, NY 10010. The Trust is advised by Credit Suisse Asset Management, LLC.
The views of the Portfolio's management are as of the date of the letter and the Portfolio holdings described in this document are as of December 31, 2008; these views and Portfolio holdings may have changed subsequent to these dates. Nothing in this document is a recommendation to purchase or sell securities.
Portfolio shares are not deposits or other obligations of Credit Suisse Asset Management, LLC ("Credit Suisse") or any affiliate, are not FDIC-insured and are not guaranteed by Credit Suisse or any affiliate. Portfolio investments are subject to investment risks, including loss of your investment.
Credit Suisse Trust — Global Small Cap Portfolio
Annual Investment Adviser's Report
December 31, 2008 (unaudited)
January 29, 2009
Dear Shareholder:
For the twelve months ended December 31, 2008, Credit Suisse Trust — Global Small Cap Portfolio (the "Portfolio")1 had a loss of -46.75%, versus a loss of -42.91% for its benchmark, the Morgan Stanley Capital International World Small Cap Index.2
Market Review: A volatile year
The fiscal year ending December 31, 2008 was a tumultuous one marked by dramatic losses in the equity markets. Though 2008 will undoubtedly be remembered, most of us would rather forget it. The MSCI World Small Cap Index, the Portfolio's benchmark, declined 42.91%. Though this was the Index's worst performance on record, it was only 1% worse than the MSCI World Index, which includes securities of companies in all capitalization ranges.
In the United States, central bank target interest rates declined to their lowest level ever at 0% – 0.25%. Additionally, several household names like investment bank Lehman Brothers, global insurer AIG, mortgage and savings providers HBOS and Washington Mutual, and international financial services provider Fortis either went bankrupt or came very close to it. A series of hedge funds imploded — culminating in the $50 billion Madoff scandal, where Bernard Madoff (Chairman of Bernard L. Madoff Investment Securities LLC and former NASDAQ chairman) was accused of what may turn out to be the largest investor fraud ever committed.
Within equities, defensive securities and low beta regions and sectors performed best. For the year, Japanese and American securities, healthcare, consumer staples and telecommunications performed relatively better than the market. Conversely, emerging markets, financials and materials performed relatively worse. Banks in particular performed very poorly as losses eroded shareholder equity, forcing capital raises and, in many cases, leaving current shareholders with almost no equity. Investors moved to low-leverage, high-quality assets as deleveraging forced sellers into the market. This effect was especially felt in Russia (whose market ended the year down 72%) and commodities, both relatively thinly traded markets.
Domestically, the U.S. housing sector continued to weaken in 2008, as evidenced by the S&P/Case Shiller U.S. Home Price Index, which measures home prices in 20 U.S. metropolitan areas. In October, the index was down 18% from a year earlier. The drop was more than originally forecast and has been falling every month since January 2007.
1
Credit Suisse Trust — Global Small Cap Portfolio
Annual Investment Adviser's Report (continued)
December 31, 2008 (unaudited)
Additionally, unemployment continued to rise in 2008, with increased job losses in all major industry sectors. Non-farm payrolls fell by 533,000 jobs in November, following losses of 403,000 in September and 320,000 in October. The household unemployment rate was 6.7%.
Strategic Review and Portfolio Outlook: Confidence and liquidity need to be restored
For the annual period ending December 31, 2008, the Fund underperformed its benchmark. Asset allocation and stock selection in financials added to performance — though these same factors detracted domestically. Several additional factors detracted from performance: A large underweight in Japanese securities had a material effect on performance due to the strength in the Japanese yen, positions in Russia fell meaningfully over the year and, though exposure to Russian securities was reduced, performance was affected; also, stock selection in the United States, particularly in the energy and health care sectors, was poor.
The small cap market posed additional difficulties. By nature, small cap stocks are less liquid and more risky, and with the credit crisis and liquidation of numerous funds and hedge funds in the second half of the year, volatility increased in the small cap market. In part, this is because hedge funds tend to have more investments in small caps than do retail funds, and as the hedge funds unwound, the sell off of small caps caused a depression in prices.
Within the Fund, we continue to believe that the markets will ultimately differentiate between stronger businesses with better prospects, though this has not been the case in the sell-off so far. Additionally, we are adopting a barbell strategy that will focus equally on high quality companies with better-than-average long-term return profiles and organic growth potential and on cyclical companies with some balance sheet leverage, very low expectations and long-lived assets or brands.
Internationally, the Fund's largest overweight position is in healthcare where there are very strong global secular themes such as obesity, immunology, vaccines and advances in technology. The companies we are invested in have strong competitive positions, are often leaders in their fields and have strong balance sheets and attractive valuations. We expect consolidation to occur in this space and have already seen very large premiums paid for takeovers in 2009.
We believe that 2009 may be another year of bankruptcies. Though credit markets may be beginning to return to normal, banks are still unwilling to lend and have limited capacity to do so. In this environment, highly indebted companies with high fixed costs and rapidly declining volumes will not have the financial flexibility to weather the storm. We will focus on avoiding these companies for 2009.
2
Credit Suisse Trust — Global Small Cap Portfolio
Annual Investment Adviser's Report (continued)
December 31, 2008 (unaudited)
Globally, the economic outlook remains poor. Gross domestic product (GDP) growth will be the lowest for decades as both emerging and developed economies experience synchronized recessions. Central banks and governments will battle with deflation and trying to increase liquidity. By the end of 2009, we expect investors to become concerned with inflationary pressures and the long-term effects of the current policy response. However, this is not an average downturn and we expect global earnings to continue to drop sharply from here — reflecting the collapse in global demand experienced in the fourth quarter of 2008. However, with earnings declining, it is not impossible for stocks to react positively, even though traditionally this has only occurred for short periods of time. The market is a discounting mechanism. It may be possible that investors have already fully priced in the potential for earnings declines.
Globally, valuations look cheap on an absolute basis and very attractive relative to defensive assets such as government bonds and cash. The MSCI World trailing price earnings estimate is 11x (a level not seen since the 1980's). On a price-to-book basis, the MSCI World is now below 1.5x and its historical long-term average is 2.1x. Relative to U.S. bonds, equities now have a dividend yield higher than 10-year government bonds — a fact, however, that may be pointing to unsustainably low bond yields rather than attractive equities.
In our opinion, 2009 will be volatile, with sharp rallies and steep declines. However, overall we expect that the markets will end the year up from the lows of 2008.
Robert Graham-Brown
Portfolio Manager
International investing entails special risk considerations, including currency fluctuations, lower liquidity, economic and political risks, and differences in accounting methods. Because of the nature of the Portfolio's investments in start-up and other small companies and certain aggressive strategies it may use, an investment in the Portfolio may be more volatile and less liquid than investments in larger companies and may not be appropriate for all investors.
In addition to historical information, this report contains forward-looking statements, which may concern, among other things, domestic and foreign market, industry and economic trends and developments and government regulation and their potential impact on the Portfolio's investments. These statements are subject to risks and uncertainties and actual trends, developments and regulations in the future, and their impact on the Portfolio could be materially different from those projected, anticipated or implied. The Portfolio has no obligation to update or revise forward-looking statements.
3
Credit Suisse Trust — Global Small Cap Portfolio
Annual Investment Adviser's Report (continued)
December 31, 2008 (unaudited)
Comparison of Change in Value of $10,000 Investment in the
Credit Suisse Trust — Global Small Cap Portfolio1 and the
MSCI World Small Cap Index2 for Ten Years.
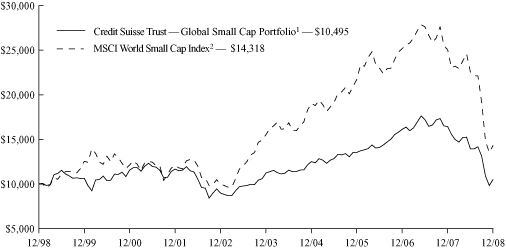
4
Credit Suisse Trust — Global Small Cap Portfolio
Annual Investment Adviser's Report (continued)
December 31, 2008 (unaudited)
Average Annual Returns as of December 31, 20081
| 1 Year | | 5 Years | | 10 Years | | Since
Inception3 | |
| | (46.75 | )% | | | (4.52 | )% | | | (3.14 | )% | | | (1.23 | )% | |
Returns represent past performance and include change in share price and reinvestment of dividends and capital gains. Past performance cannot guarantee future results. The current performance of the Portfolio may be lower or higher than the figures shown. Returns and share price will fluctuate, and redemption value may be more or less than original cost. The performance results do not reflect the deduction of taxes that a shareholder would pay on portfolio distributions or the redemption of portfolio shares. Performance includes the effect of deducting expenses, but does not include charges and expenses attributable to any particular variable contract or plan. Accordingly, the Prospectus of the sponsoring Participating Insurance Company separate account or plan documents or ot her informational materials supplied by plan sponsors should be carefully reviewed for information on relevant charges and expenses. Excluding these charges and expenses from quotations of performance has the effect of increasing the performance quoted, and the effect of these charges should be considered when comparing performance to that of other mutual funds. Performance information current to the most recent month-end is available at www.credit-suisse.com/us.
The annualized gross expense ratio is 1.88%. The annualized net expense ratio after fee waivers and/or expense reimbursements is 1.00%.
1 Fee waivers and/or expense reimbursements may reduce expenses for the Portfolio, without which performance would be lower. Waivers and/or reimbursements may be discontinued at any time.
2 The Morgan Stanley Capital International World Small Cap Index is an unmanaged broad-based index comprised of small cap companies from 23 developed markets. Index returns are price only and do not reflect the reinvestment of dividends. It is the exclusive property of Morgan Stanley Capital International Inc. Investors cannot invest directly in an index.
3 Inception date 9/30/96.
5
Credit Suisse Trust — Global Small Cap Portfolio
Annual Investment Adviser's Report (continued)
December 31, 2008 (unaudited)
Information About Your Portfolio's Expenses
As an investor of the Portfolio, you incur two types of costs: ongoing expenses and transaction costs. Ongoing expenses include management fees, distribution and service (12b-1) fees and other Portfolio expenses. Examples of transaction costs include sales charges (loads), redemption fees and account maintenance fees, which are not shown in this section and which would result in higher total expenses. The following table is intended to help you understand your ongoing expenses of investing in the Portfolio and to help you compare these expenses with the ongoing expenses of investing in other mutual funds. The table is based on an investment of $1,000 made at the beginning of the six month period ended December 31, 2008.
The table illustrates your Portfolio's expenses in two ways:
• Actual Portfolio Return. This helps you estimate the actual dollar amount of ongoing expenses paid on a $1,000 investment in the Portfolio using the Portfolio's actual return during the period. To estimate the expenses you paid over the period, simply divide your account value by $1,000 (for example, an $8,600 account value divided by $1,000 = 8.6), then multiply the result by the number in the "Expenses Paid per $1,000" line under the share class you hold.
• Hypothetical 5% Portfolio Return. This helps you to compare your Portfolio's ongoing expenses with those of other mutual funds using the Portfolio's actual expense ratio and a hypothetical rate of return of 5% per year before expenses. Examples using a 5% hypothetical portfolio return may be found in the shareholder reports of other mutual funds. The hypothetical account values and expenses may not be used to estimate the actual ending account balance or expenses you paid for the period.
Please note that the expenses shown in these tables are meant to highlight your ongoing expenses only and do not reflect any transaction costs, such as sales charges (loads) or redemption fees. If these transaction costs had been included, your costs would have been higher. The "Expenses Paid per $1,000" line of the tables is useful in comparing ongoing expenses only and will not help you determine the relative total expenses of owning different funds.
6
Credit Suisse Trust — Global Small Cap Portfolio
Annual Investment Adviser's Report (continued)
December 31, 2008 (unaudited)
Expenses and Value for a $1,000 Investment
for the six month period ended December 31, 2008
| Actual Portfolio Return | |
| Beginning Account Value 7/1/08 | | $ | 1,000.00 | | |
| Ending Account Value 12/31/08 | | $ | 572.80 | | |
| Expenses Paid per $1,000* | | $ | 3.95 | | |
| Hypothetical 5% Portfolio Return | |
| Beginning Account Value 7/1/08 | | $ | 1,000.00 | | |
| Ending Account Value 12/31/08 | | $ | 1,020.11 | | |
| Expenses Paid per $1,000* | | $ | 5.08 | | |
| Annualized Expense Ratios* | | | 1.00 | % | |
* Expenses are equal to the Portfolio's annualized expense ratio multiplied by the average account value over the period, multiplied by the number of days in the most recent fiscal half year period, then divided by 366.
The "Expenses Paid per $1,000" and the "Annualized Expense Ratios" in the tables are based on actual expenses paid by the Portfolio during the period, net of fee waivers and/or expense reimbursements. If those fee waivers and/or expense reimbursements had not been in effect, the Portfolio's actual expenses would have been higher. Expenses do not reflect additional charges and expenses that are, or may be, imposed under the variable contracts or plans. Such charges and expenses are described in the prospectus of the insurance company separate account or in the plan documents or other informational materials supplied by plan sponsors. The Portfolio's expenses should be considered with these charges and expenses in evaluating the overall cost of investing in the separate account.
For more information, please refer to the Portfolio's prospectus.
7
Credit Suisse Trust — Global Small Cap Portfolio
Annual Investment Adviser's Report (continued)
December 31, 2008 (unaudited)
SECTOR BREAKDOWN*
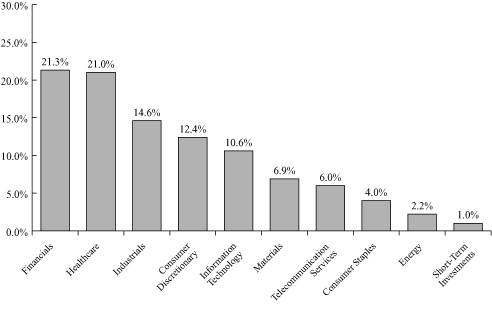
* Expressed as a percentage of total investments (excluding securities lending collateral if applicable) and may vary over time.
8
Credit Suisse Trust — Global Small Cap Portfolio
Schedule of Investments
December 31, 2008
| | | Number of
Shares | | Value | |
| COMMON STOCKS (97.9%) | |
| Austria (2.1%) | |
| Pharmaceuticals (2.1%) | |
| Intercell AG* | | | 22,920 | | | $ | 720,892 | | |
| TOTAL AUSTRIA | | | 720,892 | | |
| Belgium (3.7%) | |
| Diversified Telecommunication Services (3.1%) | |
| Mobistar SA | | | 14,600 | | | | 1,053,166 | | |
| Metals & Mining (0.6%) | |
| Umicore | | | 11,060 | | | | 218,551 | | |
| TOTAL BELGIUM | | | 1,271,717 | | |
| Cyprus (0.6%) | |
| Banks (0.6%) | |
| Bank of Cyprus Public Co., Ltd. | | | 52,430 | | | | 196,894 | | |
| TOTAL CYPRUS | | | 196,894 | | |
| Denmark (2.1%) | |
| Biotechnology (0.5%) | |
| Genmab AS* | | | 4,690 | | | | 182,057 | | |
| Insurance (1.6%) | |
| Trygvesta AS | | | 8,530 | | | | 537,558 | | |
| TOTAL DENMARK | | | 719,615 | | |
| Finland (3.9%) | |
| Auto Components (1.0%) | |
| Nokian Renkaat Oyj | | | 31,020 | | | | 352,442 | | |
| Diversified Telecommunication Services (2.9%) | |
| Elisa Oyj | | | 57,477 | | | | 1,000,610 | | |
| TOTAL FINLAND | | | 1,353,052 | | |
| France (5.4%) | |
| Media (4.2%) | |
| Eutelsat Communications | | | 47,510 | | | | 1,122,130 | | |
| M6 Metropole Television | | | 17,890 | | | | 346,837 | | |
| | | | 1,468,967 | | |
| Software (1.2%) | |
| UbiSoft Entertainment SA* | | | 21,260 | | | | 417,113 | | |
| TOTAL FRANCE | | | 1,886,080 | | |
| Germany (1.9%) | |
| Containers & Packaging (1.3%) | |
| Gerresheimer AG | | | 17,340 | | | | 471,832 | | |
| Internet Software & Services (0.6%) | |
| Wirecard AG* | | | 33,580 | | | | 196,247 | | |
| TOTAL GERMANY | | | 668,079 | | |
See Accompanying Notes to Financial Statements.
9
Credit Suisse Trust — Global Small Cap Portfolio
Schedule of Investments (continued)
December 31, 2008
| | | Number of
Shares | | Value | |
| COMMON STOCKS | |
| Gibraltar (0.7%) | |
| Hotels, Restaurants & Leisure (0.7%) | |
| 888 Holdings PLC | | | 160,980 | | | $ | 230,213 | | |
| TOTAL GIBRALTAR | | | 230,213 | | |
| Italy (1.2%) | |
| Textiles & Apparel (1.2%) | |
| Tod's SpA | | | 9,390 | | | | 408,692 | | |
| TOTAL ITALY | | | 408,692 | | |
| Japan (2.5%) | |
| Diversified Financials (2.5%) | |
| iShares MSCI Japan Small Cap Index Fund | | | 22,170 | | | | 885,692 | | |
| TOTAL JAPAN | | | 885,692 | | |
| Netherlands (2.0%) | |
| Electronic Equipment & Instruments (2.0%) | |
| Gemalto NV* | | | 27,410 | | | | 689,584 | | |
| TOTAL NETHERLANDS | | | 689,584 | | |
| Russia (0.7%) | |
| Pharmaceuticals (0.7%) | |
| Pharmstandard Reg S GDR* | | | 22,116 | | | | 234,430 | | |
| TOTAL RUSSIA | | | 234,430 | | |
| Spain (2.2%) | |
| Biotechnology (2.2%) | |
| Grifols SA | | | 43,220 | | | | 757,286 | | |
| TOTAL SPAIN | | | 757,286 | | |
| Sweden (0.9%) | |
| Healthcare Equipment & Supplies (0.9%) | |
| Elekta AB B Shares | | | 32,080 | | | | 322,810 | | |
| TOTAL SWEDEN | | | 322,810 | | |
| Switzerland (1.3%) | |
| Biotechnology (0.6%) | |
| Basilea Pharmaceutica AG* | | | 1,460 | | | | 207,233 | | |
| Healthcare Equipment & Supplies (0.7%) | |
| Nobel Biocare Holding AG | | | 11,770 | | | | 243,048 | | |
| TOTAL SWITZERLAND | | | 450,281 | | |
| United Kingdom (12.4%) | |
| Aerospace & Defense (2.0%) | |
| Smiths Group PLC | | | 22,120 | | | | 284,241 | | |
| VT Group PLC | | | 49,330 | | | | 398,565 | | |
| | | | 682,806 | | |
See Accompanying Notes to Financial Statements.
10
Credit Suisse Trust — Global Small Cap Portfolio
Schedule of Investments (continued)
December 31, 2008
| | | Number of
Shares | | Value | |
| COMMON STOCKS | |
| United Kingdom | |
| Commercial Services & Supplies (3.8%) | |
| Aggreko PLC | | | 66,670 | | | $ | 435,246 | | |
| Serco Group PLC | | | 133,820 | | | | 875,991 | | |
| | | | 1,311,237 | | |
| Industrial Conglomerates (1.4%) | |
| Intertek Group PLC | | | 41,630 | | | | 475,391 | | |
| Insurance (2.4%) | |
| Amlin PLC | | | 158,850 | | | | 825,686 | | |
| Oil & Gas (2.1%) | |
| Petrofac, Ltd. | | | 145,280 | | | | 727,230 | | |
| Road & Rail (0.7%) | |
| Arriva PLC | | | 30,405 | | | | 264,754 | | |
| TOTAL UNITED KINGDOM | | | 4,287,104 | | |
| United States (54.3%) | |
| Chemicals (2.5%) | |
| CF Industries Holdings, Inc. | | | 9,680 | | | | 475,869 | | |
| Intrepid Potash, Inc.* | | | 18,450 | | | | 383,206 | | |
| | | | 859,075 | | |
| Commercial Services & Supplies (4.9%) | |
| Brink's Home Security Holdings, Inc.* | | | 1,700 | | | | 37,264 | | |
| Stericycle, Inc.* | | | 9,960 | | | | 518,717 | | |
| VistaPrint, Ltd.* | | | 23,800 | | | | 442,918 | | |
| Waste Connections, Inc.* | | | 21,750 | | | | 686,647 | | |
| | | | 1,685,546 | | |
| Containers & Packaging (2.4%) | |
| Pactiv Corp.* | | | 32,940 | | | | 819,547 | | |
| Distributor (0.8%) | |
| Pool Corp. | | | 16,440 | | | | 295,427 | | |
| Diversified Financials (10.3%) | |
| IntercontinentalExchange, Inc.* | | | 2,230 | | | | 183,841 | | |
| MSCI, Inc. Class A* | | | 22,820 | | | | 405,283 | | |
| NewAlliance Bancshares, Inc. | | | 71,570 | | | | 942,577 | | |
| Portfolio Recovery Associates, Inc.* | | | 16,820 | | | | 569,189 | | |
| SPDR KBW Regional Banking ETF | | | 49,600 | | | | 1,446,336 | | |
| | | | 3,547,226 | | |
| Electric Utilities (0.0%) | |
| VeraSun Energy Corp.* | | | 500 | | | | 28 | | |
| Electronic Equipment & Instruments (3.3%) | |
| American Superconductor Corp.* | | | 23,410 | | | | 381,817 | | |
| Itron, Inc.* | | | 11,720 | | | | 747,033 | | |
| | | | 1,128,850 | | |
See Accompanying Notes to Financial Statements.
11
Credit Suisse Trust — Global Small Cap Portfolio
Schedule of Investments (continued)
December 31, 2008
| | | Number of
Shares | | Value | |
| COMMON STOCKS | |
| United States | |
| Energy Equipment & Services (0.1%) | |
| Basic Energy Services, Inc.* | | | 2,700 | | | $ | 35,208 | | |
| Healthcare Equipment & Supplies (9.6%) | |
| American Medical Systems Holdings, Inc.* | | | 18,450 | | | | 165,866 | | |
| Cyberonics, Inc.* | | | 15,630 | | | | 258,989 | | |
| Dexcom, Inc.* | | | 45,420 | | | | 125,359 | | |
| ev3, Inc.* | | | 59,860 | | | | 365,146 | | |
| Illumina, Inc.* | | | 14,920 | | | | 388,666 | | |
| Intuitive Surgical, Inc.* | | | 3,420 | | | | 434,306 | | |
| Masimo Corp.* | | | 19,080 | | | | 569,156 | | |
| NuVasive, Inc.* | | | 16,920 | | | | 586,278 | | |
| Vnus Medical Technologies* | | | 26,020 | | | | 422,044 | | |
| | | | 3,315,810 | | |
| Healthcare Providers & Services (5.3%) | |
| Amedisys, Inc.* | | | 13,770 | | | | 569,252 | | |
| PSS World Medical, Inc.* | | | 32,710 | | | | 615,602 | | |
| Psychiatric Solutions, Inc.* | | | 23,340 | | | | 650,019 | | |
| | | | 1,834,873 | | |
| Household Durables (0.8%) | |
| Toll Brothers, Inc.* | | | 12,820 | | | | 274,733 | | |
| Insurance (1.8%) | |
| Arthur J. Gallagher & Co. | | | 24,290 | | | | 629,354 | | |
| Internet Software & Services (1.0%) | |
| Equinix, Inc.* | | | 6,210 | | | | 330,310 | | |
| IT Consulting & Services (1.4%) | |
| SAIC, Inc.* | | | 25,600 | | | | 498,688 | | |
| Leisure Equipment & Products (1.1%) | |
| Marvel Entertainment, Inc.* | | | 12,300 | | | | 378,225 | | |
| Machinery (0.5%) | |
| Charter International PLC | | | 40,400 | | | | 191,681 | | |
| Multiline Retail (1.3%) | |
| Family Dollar Stores, Inc. | | | 17,220 | | | | 448,925 | | |
| Oil & Gas (0.0%) | |
| Brigham Exploration Co.* | | | 300 | | | | 960 | | |
| Personal Products (3.9%) | |
| Alberto-Culver Co. | | | 28,260 | | | | 692,652 | | |
| Chattem, Inc.* | | | 9,320 | | | | 666,660 | | |
| | | | 1,359,312 | | |
See Accompanying Notes to Financial Statements.
12
Credit Suisse Trust — Global Small Cap Portfolio
Schedule of Investments (continued)
December 31, 2008
| | | Number of
Shares | | Value | |
| COMMON STOCKS | |
| United States | |
| Real Estate (0.0%) | |
| Anthracite Capital, Inc. | | | 3,600 | | | $ | 8,028 | | |
| Software (2.2%) | |
| Concur Technologies, Inc.* | | | 23,060 | | | | 756,829 | | |
| Specialty Retail (1.1%) | |
| The Buckle, Inc. | | | 1,300 | | | | 28,366 | | |
| Tractor Supply Co.* | | | 9,810 | | | | 354,533 | | |
| | | | 382,899 | | |
| TOTAL UNITED STATES | | | 18,781,534 | | |
| TOTAL COMMON STOCKS (Cost $41,697,604) | | | 33,863,955 | | |
| SHORT-TERM INVESTMENT (0.9%) | |
| | | Par
(000) | | | |
| State Street Bank and Trust Co. Euro Time Deposit, 0.010%, 1/02/09 (Cost $330,000) | | $ | 330 | | | | 330,000 | | |
| TOTAL INVESTMENTS AT VALUE (98.8%) (Cost $42,027,604) | | | 34,193,955 | | |
| OTHER ASSETS IN EXCESS OF LIABILITIES (1.2%) | | | 405,677 | | |
| NET ASSETS (100.0%) | | $ | 34,599,632 | | |
INVESTMENT ABBREVIATION
GDR = Global Depositary Receipt
* Non-income producing security.
See Accompanying Notes to Financial Statements.
13
Credit Suisse Trust — Global Small Cap Portfolio
Statement of Assets and Liabilities
December 31, 2008
| Assets | |
| Investments at value (Cost $42,027,604) (Note 2) | | $ | 34,193,955 | | |
| Foreign currency at value (cost $375,118) | | | 404,666 | | |
| Receivable for investments sold | | | 411,103 | | |
| Receivable from investment adviser (Note 3) | | | 55,393 | | |
| Dividend receivable | | | 44,479 | | |
| Receivable for portfolio shares sold | | | 23,284 | | |
| Prepaid expenses | | | 1,053 | | |
| Total Assets | | | 35,133,933 | �� | |
| Liabilities | |
| Administrative services fee payable (Note 3) | | | 21,805 | | |
| Due to custodian | | | 411,020 | | |
| Payable for portfolio shares redeemed | | | 3,020 | | |
| Trustees' fee payable | | | 2,741 | | |
| Other accrued expenses payable | | | 95,715 | | |
| Total Liabilities | | | 534,301 | | |
| Net Assets | |
| Capital stock, $.001 par value (Note 6) | | | 4,700 | | |
| Paid-in capital (Note 6) | | | 83,533,671 | | |
| Undistributed net investment income | | | 277,383 | | |
| Accumulated net realized loss on investments and foreign currency transactions | | | (41,411,628 | ) | |
| Net unrealized depreciation on investments and foreign currency translations | | | (7,804,494 | ) | |
| Net Assets | | $ | 34,599,632 | | |
| Shares outstanding | | | 4,699,960 | | |
| Net asset value, offering price, and redemption price per share | | $ | 7.36 | | |
See Accompanying Notes to Financial Statements.
14
Credit Suisse Trust — Global Small Cap Portfolio
Statement of Operations
For the Year Ended December 31, 2008
| Investment Income (Note 2) | |
| Dividends | | $ | 1,032,797 | | |
| Interest | | | 21,422 | | |
| Securities lending | | | 179,855 | | |
| Foreign taxes withheld | | | (41,070 | ) | |
| Total investment income | | | 1,193,004 | | |
| Expenses | |
| Investment advisory fees (Note 3) | | | 765,229 | | |
| Administrative services fees (Note 3) | | | 140,050 | | |
| Custodian fees | | | 85,544 | | |
| Printing fees (Note 3) | | | 49,542 | | |
| Audit and tax fees | | | 30,908 | | |
| Trustees' fees | | | 18,452 | | |
| Legal fees | | | 18,202 | | |
| Transfer agent fees | | | 7,484 | | |
| Interest expense (Note 4) | | | 3,941 | | |
| Insurance expense | | | 2,318 | | |
| Commitment fees (Note 4) | | | 696 | | |
| Miscellaneous expense | | | 25,624 | | |
| Total expenses | | | 1,147,990 | | |
| Less: fees waived (Note 3) | | | (535,807 | ) | |
| Net expenses | | | 612,183 | | |
| Net investment income | | | 580,821 | | |
| Net Realized and Unrealized Gain (Loss) from Investments and Foreign Currency Related Items | |
| Net realized loss from investments | | | (21,558,899 | ) | |
| Net realized loss from foreign currency transactions | | | (295,088 | ) | |
| Net change in unrealized appreciation (depreciation) from investments | | | (13,323,940 | ) | |
| Net change in unrealized appreciation (depreciation) from foreign currency translations | | | 28,632 | | |
| Net realized and unrealized loss from investments and foreign currency related items | | | (35,149,295 | ) | |
| Net decrease in net assets resulting from operations | | $ | (34,568,474 | ) | |
See Accompanying Notes to Financial Statements.
15
Credit Suisse Trust — Global Small Cap Portfolio
Statements of Changes in Net Assets
| | | For the Year
Ended
December 31, 2008 | | For the Year
Ended
December 31, 2007 | |
| From Operations | |
| Net investment income | | $ | 580,821 | | | $ | 1,081,979 | | |
| Net realized gain (loss) from investments and foreign currency transactions | | | (21,853,987 | ) | | | 5,947,961 | | |
Net change in unrealized appreciation (depreciation)
from investments and foreign currency translations | | | (13,295,308 | ) | | | (9,598,158 | ) | |
| Net decrease in net assets resulting from operations | | | (34,568,474 | ) | | | (2,568,218 | ) | |
| From Dividends | |
| Dividends from net investment income | | | (1,052,206 | ) | | | — | | |
| From Capital Share Transactions (Note 6) | |
| Proceeds from sale of shares | | | 4,683,315 | | | | 8,774,027 | | |
| Reinvestment of dividends | | | 1,052,206 | | | | — | | |
| Net asset value of shares redeemed | | | (22,399,564 | ) | | | (38,426,851 | ) | |
| Net decrease in net assets from capital share transactions | | | (16,664,043 | ) | | | (29,652,824 | ) | |
| Net decrease in net assets | | | (52,284,723 | ) | | | (32,221,042 | ) | |
| Net Assets | |
| Beginning of year | | | 86,884,355 | | | | 119,105,397 | | |
| End of year | | $ | 34,599,632 | | | $ | 86,884,355 | | |
| Undistributed net investment income | | $ | 277,383 | | | $ | 1,053,844 | | |
See Accompanying Notes to Financial Statements.
16
Credit Suisse Trust — Global Small Cap Portfolio
Financial Highlights
(For a Share of the Portfolio Outstanding Throughout Each Year)
| | | For the Year Ended December 31, | |
| | | 2008 | | 2007 | | 2006 | | 2005 | | 2004 | |
| Per share data | |
| Net asset value, beginning of year | | $ | 14.08 | | | $ | 14.67 | | | $ | 12.95 | | | $ | 11.15 | | | $ | 9.45 | | |
| INVESTMENT OPERATIONS | |
| Net investment income (loss) | | | 0.10 | | | | 0.18 | | | | (0.00 | )1 | | | (0.04 | ) | | | (0.09 | ) | |
Net gain (loss) on investments and foreign currency
related items (both realized and unrealized) | | | (6.61 | ) | | | (0.77 | ) | | | 1.72 | | | | 1.84 | | | | 1.79 | | |
| Total from investment operations | | | (6.51 | ) | | | (0.59 | ) | | | 1.72 | | | | 1.80 | | | | 1.70 | | |
| LESS DIVIDENDS | |
| Dividends from net investment income | | | (0.21 | ) | | | — | | | | — | | | | — | | | | — | | |
| Net asset value, end of year | | $ | 7.36 | | | $ | 14.08 | | | $ | 14.67 | | | $ | 12.95 | | | $ | 11.15 | | |
| Total return2 | | | (46.75 | )% | | | (4.02 | )% | | | 13.28 | % | | | 16.14 | % | | | 17.99 | % | |
| RATIOS AND SUPPLEMENTAL DATA | |
| Net assets, end of year (000s omitted) | | $ | 34,600 | | | $ | 86,884 | | | $ | 119,105 | | | $ | 129,308 | | | $ | 110,110 | | |
| Ratio of expenses to average net assets | | | 1.00 | % | | | 1.37 | % | | | 1.40 | % | | | 1.40 | % | | | 1.40 | % | |
Ratio of net investment income (loss) to
average net assets | | | 0.95 | % | | | 1.01 | % | | | (0.02 | )% | | | (0.39 | )% | | | (0.85 | )% | |
Decrease reflected in above operating expense
ratios due to waivers/reimbursements | | | 0.88 | % | | | 0.21 | % | | | 0.16 | % | | | 0.19 | % | | | 0.17 | % | |
| Portfolio turnover rate | | | 171 | % | | | 76 | % | | | 117 | % | | | 75 | % | | | 79 | % | |
1 This amount represents less than $(0.01) per share.
2 Total returns are historical and assume changes in share price and reinvestment of all dividends and distributions. Had certain expenses not been reduced during the years shown, total returns would have been lower. Total returns do not reflect charges and expenses attributable to any particular variable contract or plan.
See Accompanying Notes to Financial Statements.
17
Credit Suisse Trust — Global Small Cap Portfolio
Notes to Financial Statements
December 31, 2008
Note 1. Organization
Credit Suisse Trust (the "Trust") is an open-end management investment company registered under the Investment Company Act of 1940, as amended (the "1940 Act"), and currently offers eight managed investment portfolios of which one, the Global Small Cap Portfolio (the "Portfolio"), is included in this report. The Portfolio is a diversified investment fund that seeks long-term growth of capital. Shares of the Portfolio are not available directly to individual investors but may be offered only through (a) variable annuity contracts and variable life insurance contracts offered by separate accounts of certain insurance companies and (b) tax-qualified pension and retirement plans. The Portfolio may not be available in connection with a particular contract or plan. The Trust was organized under the laws of the Commonwealth of Massachusetts as a business trust on March 15, 1995.
Note 2. Significant Accounting Policies
A) SECURITY VALUATION — The net asset value of the Portfolio is determined daily as of the close of regular trading on the New York Stock Exchange, Inc. (the "Exchange") on each day the Exchange is open for business. Equity investments are valued at market value, which is generally determined using the closing price on the exchange or market on which the security is primarily traded at the time of valuation (the "Valuation Time"). If no sales are reported, equity investments are generally valued at the most recent bid quotation as of the Valuation Time or at the lowest asked quotation in the case of a short sale of securities. Debt securities with a remaining maturity greater than 60 days are valued in accordance with the price supplied by a pricing service, which may use a matrix, formula or other objective method that takes into consideration market indices, yield curves and other specific adjustments. Debt obligations that will matur e in 60 days or less are valued on the basis of amortized cost, which approximates market value, unless it is determined that using this method would not represent fair value. Investments in mutual funds are valued at the mutual fund's closing net asset value per share on the day of valuation. Securities and other assets for which market quotations are not readily available, or whose values have been materially affected by events occurring before the Portfolio's Valuation Time but after the close of the securities' primary markets, are valued at fair value as determined in good faith by, or under the direction of, the Board of Trustees under procedures established by the Board of Trustees. The Portfolio may utilize a service provided by an independent third party which has been approved by the Board of Trustees to fair value certain securities. When fair-value pricing is employed, the prices of securities used by a portfolio to calculate its net asset value may differ from quoted or published prices for the same securities.
18
Credit Suisse Trust — Global Small Cap Portfolio
Notes to Financial Statements (continued)
December 31, 2008
Note 2. Significant Accounting Policies
The Portfolio adopted Financial Accounting Standards Board Statement of Financial Accounting Standards No. 157, Fair Value Measurements ("FAS 157"), effective January 1, 2008. In accordance with FAS 157, fair value is defined as the price that the Portfolio would receive upon selling an investment in a timely transaction to an independent buyer in the principal or most advantageous market of the investment. FAS 157 established a three-tier hierarchy to maximize the use of observable market data and minimize the use of unobservable inputs and to establish classification of fair value measurements for disclosure purposes. Inputs refer broadly to the assumptions that market participants would use in pricing the asset or liability, including assumptions about risk, for example, the risk inherent in a particular valuation technique used to measure fair value including such a pricing model and/or the risk inherent in the inputs to the valuation te chnique. Inputs may be observable or unobservable. Observable inputs are inputs that reflect the assumptions market participants would use in pricing the asset or liability developed based on market data obtained from sources independent of the reporting entity. Unobservable inputs are inputs that reflect the reporting entity's own assumptions about the assumptions market participants would use in pricing the asset or liability developed based on the best information available in the circumstances. The three-tier hierarchy of inputs is summarized in the three broad Levels listed below.
• Level 1 – quoted prices in active markets for identical investments
• Level 2 – other significant observable inputs (including quoted prices for similar investments, interest rates, prepayment speeds, credit risk, etc.)
• Level 3 – significant unobservable inputs (including the Portfolio's own assumptions in determining the fair value of investments)
The inputs or methodology used for valuing securities are not necessarily an indication of the risk associated with investing in those securities.
The following is a summary of the inputs used as of December 31, 2008 in valuing the Portfolio's investments carried at value:
| Valuation Inputs | | Investments in
Securities | | Other Financial
Instruments* | |
| Level 1 – Quoted Prices | | $ | 19,901,656 | | | $ | — | | |
| Level 2 – Other Significant Observable Inputs | | | 14,292,299 | | | | — | | |
| Level 3 – Significant Unobservable Inputs | | | — | | | | — | | |
| Total | | $ | 34,193,955 | | | $ | — | | |
*Other financial instruments include futures, forwards and swap contracts.
19
Credit Suisse Trust — Global Small Cap Portfolio
Notes to Financial Statements (continued)
December 31, 2008
Note 2. Significant Accounting Policies
B) FOREIGN CURRENCY TRANSACTIONS — The books and records of the Portfolio are maintained in U.S. dollars. Transactions denominated in foreign currencies are recorded at the current prevailing exchange rates. All assets and liabilities denominated in foreign currencies are translated into U.S. dollar amounts at the current exchange rate at the end of the period. Translation gains or losses resulting from changes in the exchange rate during the reporting period and realized gains and losses on the settlement of foreign currency transactions are reported in the results of operations for the current period. The Portfolio does not isolate that portion of realized gains and losses on investments in equity securities which is due to changes in the foreign exchange rate from that which is due to changes in market prices of equity securities. The Portfolio isolates that portion of realized gains and losses on investments in debt securities which is due to changes in the foreign exchange rate from that which is due to changes in market prices of debt securities.
C) SECURITY TRANSACTIONS AND INVESTMENT INCOME — Security transactions are accounted for on a trade date basis. Interest income is recorded on the accrual basis. Dividends are recorded on the ex-dividend date. The cost of investments sold is determined by use of the specific identification method for both financial reporting and income tax purposes.
D) DIVIDENDS AND DISTRIBUTIONS TO SHAREHOLDERS — Dividends from net investment income and distributions of net realized capital gains, if any, are declared and paid at least annually. However, to the extent that a net realized capital gain can be reduced by a capital loss carryforward, such gain will not be distributed. Income and capital gain distributions are determined in accordance with federal income tax regulations, which may differ from accounting principles generally accepted in the United States of America ("GAAP").
E) FEDERAL INCOME TAXES — No provision is made for federal taxes as it is the Portfolio's intention to continue to qualify for and elect the tax treatment applicable to regulated investment companies under the Internal Revenue Code of 1986, as amended, and to make the requisite distributions to its shareholders, which will be sufficient to relieve it from federal income and excise taxes.
During June 2006, the Financial Accounting Standards Board ("FASB") issued FASB Interpretation 48 ("FIN 48" or the "Interpretation"), Accounting for Uncertainty in Income Taxes – an interpretation of FASB statement 109. The Portfolio has reviewed its current tax positions and has determined that no provision for income tax is required in the Portfolio's financial statements. The Portfolio's
20
Credit Suisse Trust — Global Small Cap Portfolio
Notes to Financial Statements (continued)
December 31, 2008
Note 2. Significant Accounting Policies
federal tax returns for the prior three fiscal years remain subject to examination by the Internal Revenue Service.
F) USE OF ESTIMATES — The preparation of financial statements in conformity with GAAP requires management to make estimates and assumptions that affect the reported amounts of assets and liabilities and disclosure of contingent assets and liabilities at the date of the financial statements and the reported amounts of income and expenses during the reporting period. Actual results could differ from these estimates.
G) SHORT-TERM INVESTMENTS — The Portfolio, together with other funds/portfolios advised by Credit Suisse Asset Management, LLC ("Credit Suisse"), an indirect, wholly-owned subsidiary of Credit Suisse Group AG, pools available cash into either a short-term variable rate time deposit issued by State Street Bank and Trust Company ("SSB"), the Portfolio's custodian, or a money market fund advised by Credit Suisse. The short-term time deposit issued by SSB is a variable rate account classified as a short-term investment.
H) FORWARD FOREIGN CURRENCY CONTRACTS — The Portfolio may enter into forward foreign currency contracts for the purchase or sale of a specific foreign currency at a fixed price on a future date. Risks may arise upon entering into these contracts from the potential inability of counterparties to meet the terms of their contracts and from unanticipated movements in the value of a foreign currency. The Portfolio will enter into forward foreign currency contracts primarily for hedging purposes. Forward foreign currency contracts are adjusted by the daily forward exchange rate of the underlying currency and any gains or losses are recorded for financial statement purposes as unrealized until the contract settlement date or an offsetting position is entered into. At December 31, 2008, the Portfolio had no open forward foreign currency contracts.
I) FUTURES — The Portfolio may enter into futures contracts to the extent permitted by its investment policies and objectives. Upon entering into a futures contract, the Portfolio is required to deposit cash and/or pledge U.S. Government securities as initial margin. Subsequent payments, which are dependent on the daily fluctuations in the value of the underlying instrument, are made or received by the Portfolio each day (daily variation margin) and are recorded as unrealized gains or losses until the contracts are closed. When the contracts are closed, the Portfolio records a realized gain or loss equal to the difference between the proceeds from (or cost of) the closing transactions and the Portfolio's basis in the contract. Risks of entering into futures contracts for hedging purposes include the possibility that a change in the value of the
21
Credit Suisse Trust — Global Small Cap Portfolio
Notes to Financial Statements (continued)
December 31, 2008
Note 2. Significant Accounting Policies
contract may not correlate with the changes in the value of the underlying instruments. In addition, the purchase of a futures contract involves the risk that the Portfolio could lose more than the original margin deposit and subsequent payments may be required for a futures transaction. At December 31, 2008, the Portfolio had no open futures contracts.
J) SECURITIES LENDING — Loans of securities are required at all times to be secured by collateral at least equal to 102% of the market value of domestic securities on loan (including any accrued interest thereon) and 105% of the market value of foreign securities on loan (including any accrued interest thereon). Cash collateral received by the Portfolio in connection with securities lending activity may be pooled together with cash collateral for other funds/portfolios advised by Credit Suisse and may be invested in a variety of investments, including certain Credit Suisse-advised funds, funds advised by SSB, the Portfolio's securities lending agent, or money market instruments. However, in the event of default or bankruptcy by the other party to the agreement, realization and/or retention of the collateral may be subject to legal proceedings.
SSB has been engaged by the Portfolio to act as the Portfolio's securities lending agent. The Portfolio's securities lending arrangement provides that the Portfolio and SSB will share the net income earned from securities lending activities. During the year ended December 31, 2008, total earnings from the Portfolio's investment in cash collateral received in connection with securities lending arrangements was $550,737, of which $326,509 was rebated to borrowers (brokers). The Portfolio retained $179,855 in income from the cash collateral investment, and SSB, as lending agent, was paid $44,373. The Portfolio may also be entitled to certain minimum amounts of income from its securities lending activities. Securities lending income is accrued as earned.
K) OTHER — The Portfolio may invest in securities of foreign countries and governments which involve certain risks in addition to those inherent in domestic investments. Such risks generally include, among others, currency risk (fluctuations in currency exchange rates), information risk (key information may be inaccurate or unavailable) and political risk (expropriation, nationalization or the imposition of capital or currency controls or punitive taxes). Other risks of investing in foreign securities include liquidity and valuation risks.
The Portfolio may be subject to taxes imposed by countries in which it invests with respect to its investments in issuers existing or operating in such countries. Such taxes are generally based on income earned or repatriated and capital
22
Credit Suisse Trust — Global Small Cap Portfolio
Notes to Financial Statements (continued)
December 31, 2008
Note 2. Significant Accounting Policies
gains realized on the sale of such investments. The Portfolio accrues such taxes when the related income is earned or gains are realized.
Note 3. Transactions with Affiliates and Related Parties
Credit Suisse serves as investment adviser for the Portfolio. For its investment advisory services, Credit Suisse is entitled to receive a fee from the Portfolio at an annual rate of 1.25% of the Portfolio's average daily net assets. For the year ended December 31, 2008, investment advisory fees earned and voluntarily waived were $765,229 and $535,807, respectively. Credit Suisse will not recapture from the Portfolio any fees it waived during the year ended December 31, 2008. Fee waivers and reimbursements are voluntary and may be discontinued by Credit Suisse at any time.
Credit Suisse Asset Management Limited ("Credit Suisse U.K.") and Credit Suisse Asset Management Limited ("Credit Suisse Australia"), each an affiliate of Credit Suisse, are sub-investment advisers to the Portfolio (the "Sub-Advisers"). Credit Suisse U.K.'s and Credit Suisse Australia's sub-investment advisory fees are paid by Credit Suisse out of Credit Suisse's net investment advisory fee and are not paid by the Portfolio. As of October 1, 2008, Credit Suisse Australia no longer serves as sub-investment advisor to the Portfolio.
Credit Suisse Asset Management Securities, Inc. ("CSAMSI"), an affiliate of Credit Suisse, and SSB serve as co-administrators to the Portfolio. For its co-administrative services, CSAMSI currently receives a fee calculated at an annual rate of 0.09% of the Portfolio's average daily net assets. For the year ended December 31, 2008, co-administrative services fees earned by CSAMSI were $55,096.
For its co-administrative services, SSB receives a fee, exclusive of out-of-pocket expenses, calculated in total for all the Credit Suisse funds/portfolios co-administered by SSB and allocated based upon the relative average net assets of each fund/portfolio, subject to an annual minimum fee. For the year ended December 31, 2008, co-administrative services fees earned by SSB (including out-of-pocket expenses) were $84,954.
In addition to serving as the Portfolio's co-administrator, CSAMSI currently serves as distributor of the Portfolio's shares without compensation.
Merrill Corporation ("Merrill"), an affiliate of Credit Suisse, has been engaged by the Portfolio to provide certain financial printing and fulfillment services. For the year ended December 31, 2008, Merrill was paid $30,174 for its services to the Portfolio.
23
Credit Suisse Trust — Global Small Cap Portfolio
Notes to Financial Statements (continued)
December 31, 2008
Note 4. Line of Credit
The Portfolio, together with other funds/portfolios advised by Credit Suisse (collectively, the "Participating Funds"), participates in a $50 million committed, unsecured line of credit facility ("Credit Facility") for temporary or emergency purposes with SSB. Under the terms of the Credit Facility, the Participating Funds pay an aggregate commitment fee at a rate of 0.10% per annum on the average unused amount of the Credit Facility, which is allocated among the Participating Funds in such manner as is determined by the governing Boards of the Participating Funds. In addition, the Participating Funds pay interest on borrowings at the Federal Funds rate plus 0.50%. At December 31, 2008, the Portfolio had no loans outstanding under the Credit Facility. During the year ended December 31, 2008, the Portfolio had borrowings under the Credit Facility as follows:
Average Daily
Loan Balance | | Weighted Average
Interest Rate % | | Maximum Daily
Loan Outstanding | |
| $ | 1,156,484 | | | | 3.958 | % | | $ | 1,693,000 | | |
Note 5. Purchases and Sales of Securities
For the year ended December 31, 2008, purchases and sales of investment securities (excluding short-term investments) were $102,730,165 and $120,608,798, respectively.
Note 6. Capital Share Transactions
The Trust is authorized to issue an unlimited number of full and fractional shares of beneficial interest, $.001 par value per share. Transactions in capital shares of the Portfolio were as follows:
| | | For the Year Ended
December 31, 2008 | | For the Year Ended
December 31, 2007 | |
| Shares sold | | | 419,195 | | | | 576,327 | | |
| Shares issued in reinvestment of dividends | | | 94,708 | | | | — | | |
| Shares redeemed | | | (1,985,343 | ) | | | (2,523,446 | ) | |
| Net decrease | | | (1,471,440 | ) | | | (1,947,119 | ) | |
On December 31, 2008, the number of shareholders that held 5% or more of the outstanding shares of the Portfolio was as follows:
Number of
Shareholders | | Approximate Percentage
of Outstanding Shares | |
| | 5 | | | | 73 | % | |
24
Credit Suisse Trust — Global Small Cap Portfolio
Notes to Financial Statements (continued)
December 31, 2008
Note 6. Capital Share Transactions
Some of the shareholders are omnibus accounts, which hold shares on behalf of individual shareholders.
Note 7. Federal Income Taxes
Income and capital gain distributions are determined in accordance with federal income tax regulations, which may differ from GAAP.
The tax characteristics of dividends paid during the years ended December 31, 2008 and 2007, respectively, by the Portfolio were as follows:
| | Ordinary Income | |
| | 2008 | | 2007 | |
| | $ | 1,052,206 | | | $ | — | | |
The tax basis components of distributable earnings differ from the amounts reflected in the Statement of Assets and Liabilities by temporary book/tax differences. These differences are primarily due to losses deferred on wash sales and deferral of post-October losses. At December 31, 2008, the components of distributable earnings on a tax basis for the Portfolio were as follows:
| Undistributed net investment income | | $ | 419,403 | | |
| Accumulated net realized loss | | | (23,923,701 | ) | |
| Unrealized depreciation | | | (8,382,854 | ) | |
| Deferral of post-October capital losses | | | (16,909,566 | ) | |
| Deferral of post-October currency losses | | | (142,021 | ) | |
| | | $ | (48,938,739 | ) | |
At December 31, 2008, the Portfolio had capital loss carryforwards available to offset possible future capital gains as follows:
| | Expires December 31, | |
| | 2010 | | 2011 | | 2016 | |
| | $ | 14,618,807 | | | $ | 4,878,198 | | | $ | 4,426,696 | | |
During the tax year ended December 31, 2008, the Portfolio did not utilize any of the capital loss carryforward.
It is uncertain whether the Portfolio will be able to realize the benefits of the capital loss carryforward before they expire.
At December 31, 2008, the identified cost for federal income tax purposes, as well as the gross unrealized appreciation from investments for those securities
25
Credit Suisse Trust — Global Small Cap Portfolio
Notes to Financial Statements (continued)
December 31, 2008
Note 7. Federal Income Taxes
having an excess of value over cost, gross unrealized depreciation from investments for those securities having an excess of cost over value and the net unrealized depreciation from investments were $42,605,964, $1,092,058, $(9,504,067) and $(8,412,009), respectively.
At December 31, 2008, the Portfolio reclassified $305,076 from undistributed net investment income and $31,570 from paid-in capital to accumulated realized loss, to adjust for the current period permanent book/tax differences which arose principally from differing book/tax treatments of capital gain distributions received from Real Estate Investment Trusts, foreign currency gain (loss), reversal of prior year return of capital adjustments on Real Estate Investment Trusts sold and prior year adjustments on Partnerships. Net assets were not affected by these reclassifications.
Note 8. Contingencies
In the normal course of business, the Portfolio may provide general indemnifications pursuant to certain contracts and organizational documents. The Portfolio's maximum exposure under these arrangements is dependent on future claims that may be made against the Portfolio and, therefore, cannot be estimated; however, based on experience, the risk of loss from such claims is considered remote.
Note 9. Recent Accounting Pronouncements
In March 2008, FASB issued Statement of Financial Accounting Standards No. 161, Disclosures about Derivative Instruments and Hedging Activities ("FAS 161"), an amendment of FASB Statement No. 133. FAS 161 requires enhanced disclosures about (a) how and why an entity uses derivative instruments, (b) how derivative instruments and hedging activities are accounted for, and (c) how derivative instruments and related hedging activities affect a fund's financial position, financial performance, and cash flows. Management of the Portfolio does not believe the adoption of FAS 161 will materially impact the financial statement amounts, but will require additional disclosures. This will include qualitative and quantitative disclosures on derivative positions existing at period end and the effect of usin g derivatives during the reporting period. FAS 161 is effective for financial statements issued for fiscal years and interim periods beginning after November 15, 2008.
26
Credit Suisse Trust — Global Small Cap Portfolio
Report of Independent Registered Public Accounting Firm
To the Board of Trustees of Credit Suisse Trust and Shareholders of
Credit Suisse Trust — Global Small Cap Portfolio:
In our opinion, the accompanying statement of assets and liabilities, including the schedule of investments, and the related statements of operations and of changes in net assets and the financial highlights present fairly, in all material respects, the financial position of Global Small Cap Portfolio (the "Portfolio"), a portfolio of the Credit Suisse Trust, at December 31, 2008, the results of its operations for the year then ended and the changes in its net assets and financial highlights the periods presented, in conformity with accounting principles generally accepted in the United States of America. These financial statements and financial highlights (hereafter referred to as "financial statements") are the responsibility of the Portfolio's management. Our responsibility is to express an opinion on these financial statements based on our audits. We conducted our audits of these financial statements in accordance with the standards of t he Public Company Accounting Oversight Board (United States). Those standards require that we plan and perform the audit to obtain reasonable assurance about whether the financial statements are free of material misstatement. An audit includes examining, on a test basis, evidence supporting the amounts and disclosures in the financial statements, assessing the accounting principles used and significant estimates made by management, and evaluating the overall financial statement presentation. We believe that our audit, which included confirmation of securities at December 31, 2008 by correspondence with the custodian and brokers, provides a reasonable basis for our opinion.
PricewaterhouseCoopers LLP
Baltimore, Maryland
February 24, 2009
27
Credit Suisse Trust — Global Small Cap Portfolio
Board Approval of Advisory Agreement (unaudited)
In approving the renewal of the current Advisory and Sub-Advisory Agreements, the Board of Trustees, including the Independent Trustees, at a meeting held on November 18 and 19, 2008, considered the following factors with respect to the Global Small Cap Portfolio (the "Portfolio"):
Investment Advisory Fee Rates
The Board reviewed and considered the contractual advisory fee rate of 1.25% for the Portfolio ("Contractual Advisory Fee") in light of the extent and quality of the advisory services provided by Credit Suisse Asset Management, LLC ("Credit Suisse") or Credit Suisse Asset Management Limited ("Credit Suisse U.K.") The Board also reviewed and considered the fee waivers and/or expense reimbursement arrangements currently in place for the Portfolio and considered the actual fee rate of 0.60% paid by the Portfolio after taking waivers and expense reimbursements into account ("Net Advisory Fee"). The Board acknowledged that voluntary fee waivers and reimbursements could be discontinued at any time. In addition, the Board noted that the compensation paid to Credit Suisse U.K. (the "Sub-Adviser") does not increase the fees or expenses otherwise incurred by the Portfolio's shareholders.
Additionally, the Board received and considered information comparing the Portfolio's Contractual Advisory Fee, Net Advisory Fee and the Portfolio's overall expenses with those of funds in both the relevant expense group ("Expense Group") and universe of funds ("Expense Universe") provided by Lipper Inc., an independent provider of investment company data.
Nature, Extent and Quality of the Services under the Advisory and
Sub-Advisory Agreements
The Board received and considered information regarding the nature, extent and quality of services provided to the Portfolio by Credit Suisse under the Advisory Agreement and by the Sub-Adviser under the Sub-Advisory Agreement. The Board also noted information received at regular meetings throughout the year related to the services rendered by Credit Suisse and the Sub-Adviser. The Board reviewed background information about Credit Suisse and the Sub-Adviser, including their respective Forms ADV. The Board considered the background and experience of both Credit Suisse's and the Sub-Adviser's senior management and the expertise of, and the amount of attention given to the Portfolio by, senior personnel of Credit Suisse and the Sub-Adviser. With respect to the Sub-Adviser, the Board also considered their expertise in managing the types of global investments that the Portfolio utilizes in its
28
Credit Suisse Trust — Global Small Cap Portfolio
Board Approval of Advisory Agreement (unaudited) (continued)
investment strategy. In addition, the Board reviewed the qualifications, backgrounds and responsibilities of the portfolio management team primarily responsible for the day-to-day portfolio management of the Portfolio and the extent of the resources devoted to research and analysis of actual and potential investments. The Board also received and considered information about the nature, extent and quality of services and fee rates offered to other Credit Suisse clients for comparable services.
In approving the Sub-Advisory Agreement, the Board also considered the benefits of retaining Credit Suisse's United Kingdom affiliate given the increased complexity of the domestic and international securities markets, specifically that retention of Credit Suisse U.K. expands the universe of companies and countries from which investment opportunities could be sought.
Portfolio Performance
The Board received and considered the performance results of the Portfolio over time, along with comparisons, both to the relevant performance group ("Performance Group") and universe of funds ("Performance Universe") for the Portfolio. The Board was provided with a description of the methodology used to arrive at the funds included in the Performance Group and the Performance Universe.
Credit Suisse Profitability
The Board received and considered a profitability analysis of Credit Suisse based on the fees payable under the Advisory Agreement for the Portfolio, including any fee waivers or fee caps, as well as other relationships between the Portfolio on the one hand and Credit Suisse affiliates on the other. The Board received profitability information for the other funds in the Credit Suisse family of funds.
Economies of Scale
The Board considered whether economies of scale in the provision of services to the Portfolio were being passed along to the shareholders. Accordingly, the Board considered whether alternative fee structures (such as breakpoint fee structures) would be more appropriate or reasonable taking into consideration economies of scale or other efficiencies that might accrue from increases in the Portfolio's asset levels.
29
Credit Suisse Trust — Global Small Cap Portfolio
Board Approval of Advisory Agreement (unaudited) (continued)
Other Benefits to Credit Suisse
The Board considered other benefits received by Credit Suisse, the Sub-Adviser and their affiliates as a result of their relationships with the Portfolio. Such benefits include, among others, research arrangements with brokers who execute transactions on behalf of the Portfolio, administrative and brokerage relationships with affiliates of Credit Suisse and the Sub-Adviser and benefits potentially derived from an increase in Credit Suisse's and the Sub-Adviser's businesses as a result of their relationship with the Portfolio (such as the ability to market to shareholders other financial products offered by Credit Suisse, the Sub-Adviser and their affiliates).
The Board considered the standards applied in seeking best execution, whether and to what extent soft dollar credits are sought and how any such credits are utilized, any benefits that may be achieved by using an affiliated broker and the existence of quality controls applicable to brokerage allocation procedures. The Board also reviewed Credit Suisse's and the Sub-Adviser's method for allocating portfolio investment opportunities among their advisory clients.
Conclusions
In selecting Credit Suisse and the Sub-Adviser, and approving the Advisory Agreement and the investment advisory fee under such agreement and the Sub-Advisory Agreement, the Board concluded that:
• The Contractual Advisory Fee was the highest in the Expense Group, but the Net Advisory Fee was lower than the median in the Expense Group. The Board noted the recent increase in the fee waiver and considered the fee to be reasonable.
• The Portfolio's performance was the lowest in the Performance Group, and was among the lowest in its Performance Universe, for all periods reviewed. The Board noted that changes to investment strategy and portfolio management of the Fund had gone into effect on October 31, 2008, including a change from a quantitative/fundamental mix to a pure fundamental approach. The Board determined it would continue to monitor steps undertaken by Credit Suisse to improve performance.
• Aside from performance (as described above), the Board was satisfied with the nature and extent of the investment advisory services provided to the Portfolio by Credit Suisse and the Sub-Adviser and that, based on dialogue with management and counsel, the services provided by Credit Suisse
30
Credit Suisse Trust — Global Small Cap Portfolio
Board Approval of Advisory Agreement (unaudited) (continued)
under the Advisory Agreement and by the Sub-Adviser under the Sub-Advisory Agreement are typical of, and consistent with, those provided to similar mutual funds by other investment advisers.
• In light of the costs of providing investment management and other services to the Portfolio and Credit Suisse's ongoing commitment to the Portfolio and willingness to waive fees and expenses, the profits and other ancillary benefits that Credit Suisse and its affiliates received were considered reasonable.
• Credit Suisse's profitability based on fees payable under the Advisory Agreement was reasonable in light of the nature, extent and quality of the services provided to the Portfolio thereunder.
• In light of the fee waiver and the relatively small size of the Portfolio, the Portfolio's current fee structure (without breakpoints) was considered reasonable.
No single factor reviewed by the Board was identified by the Board as the principal factor in determining whether to approve the Advisory Agreement and the Sub-Advisory Agreement. The Independent Trustees were advised by separate independent legal counsel throughout the process.
31
Credit Suisse Trust — Global Small Cap Portfolio
Information Concerning Trustees and Officers (unaudited)
Name, Address
(Year of Birth) | | Position(s)
Held with
Trust | | Term
of Office1
and
Length
of Time
Served | | Principal
Occupation(s) During
Past Five Years | | Number of
Portfolios in
Fund
Complex
Overseen by
Trustee | | Other
Directorships
Held by
Trustee | |
| Independent Trustees | | | | | | | | | | | |
|
Enrique Arzac
c/o Credit Suisse Asset
Management, LLC
Attn: General Counsel
Eleven Madison Avenue
New York, New York
10010
(1941) | | Trustee,
Audit
Committee
Chairman
and
Nominating
Committee
Member | | Since
2005 | | Professor of Finance
and
Economics,
Graduate
School of Business,
Columbia
University
since 1971. | | | 33 | | | Director of
Epoch Holding
Corporation (an
investment
management
and investment
advisory
services
company);
Director of The
Adams Express
Company (a
closed-end
investment
company);
Director of
Petroleum and
Resources
Corporation (a
closed-end
investment
company). | |
|
Jeffrey E. Garten2
Box 208200
New Haven, Connecticut
06520-8200
(1946) | | Trustee,
Audit and
Nominating
Committee
Member | | Since
1998 | | The Juan Trippe
Professor in the Practice
of International Trade,
Finance and Business
from July 2005 to
present; Partner and
Chairman of Garten
Rothkopf (consulting
firm) from October 2005
to present; Dean of Yale
School of Management
from November 1995 to
June 2005. | | | 26 | | | Director of
Aetna, Inc.
(insurance
company);
Director of
CarMax Group
(used car
dealers). | |
|
1 Each Trustee and Officer serves until his or her respective successor has been duly elected and qualified.
2 Mr. Garten was initially appointed as a Trustee of the Portfolio on February 6, 1998. He resigned as Trustee on February 3, 2000 and was subsequently reappointed on December 21, 2000.
32
Credit Suisse Trust — Global Small Cap Portfolio
Information Concerning Trustees and Officers (unaudited) (continued)
Name, Address
(Year of Birth) | | Position(s)
Held with
Trust | | Term
of Office1
and
Length
of Time
Served | | Principal
Occupation(s) During
Past Five Years | | Number of
Portfolios in
Fund
Complex
Overseen by
Trustee | | Other
Directorships
Held by
Trustee | |
| Independent Trustees | | | | | | | | | | | |
|
Peter F. Krogh
SFS/ICC 702
Georgetown University
Washington, DC 20057
(1937) | | Trustee,
Audit and
Nominating
Committee
Member | | Since
2001 | | Dean Emeritus and
Distinguished Professor
of International Affairs at
the Edmund A. Walsh
School of Foreign
Service, Georgetown
University from
June 1995 to present. | | | 26 | | | Director of
Carlisle
Companies
Incorporated
(diversified
manufacturing
company). | |
|
Steven N. Rappaport
Lehigh Court, LLC
555 Madison Avenue
29th Floor
New York, New York 10022
(1948) | | Chairman of
the Board of
Trustees,
Audit
Committee
Member and
Nominating
Committee
Chairman | | Trustee
since
1999 and
Chairman
since
2005 | | Partner of Lehigh
Court, LLC and RZ Capital (private
investment firms) from
July 2002 to present. | | | 33 | | | Director of
iCAD, Inc.
(surgical and
medical
instruments and
apparatus
company);
Director of
Presstek, Inc.
(digital imaging
technologies
company);
Director of
Wood
Resources, LLC.
(plywood
manufacturing
company). | |
|
33
Credit Suisse Trust — Global Small Cap Portfolio
Information Concerning Trustees and Officers (unaudited) (continued)
Name, Address
(Year of Birth) | | Position(s)
Held with
Trust | | Term
of Office1
and
Length
of Time
Served | | Principal Occupation(s) During Past Five Years | |
| Officers | | | | | | | |
|
George R. Hornig
Credit Suisse Asset Management, LLC
Eleven Madison Avenue
New York, New York
10010
(1954) | | Chief
Executive
Officer and
President | | Since
2008 | | Managing Director of Credit Suisse; Co-Chief Operating
Officer of Asset Management and Head of Asset
Management Americas; Associated with Credit Suisse since
1999; Officer of other Credit Suisse Funds. | |
|
Michael A. Pignataro
Credit Suisse Asset Management, LLC
Eleven Madison Avenue
New York, New York
10010
(1959) | | Chief
Financial
Officer | | Since
1999 | | Director and Director of Fund Administration of Credit
Suisse; Associated with Credit Suisse or its predecessor
since 1984; Officer of other Credit Suisse Funds. | |
|
Emidio Morizio
Credit Suisse Asset Management, LLC
Eleven Madison Avenue
New York, New York
10010
(1966) | | Chief
Compliance
Officer | | Since
2004 | | Director and Global Head of Compliance of Credit Suisse;
Associated with Credit Suisse since July 2000; Officer of
other Credit Suisse Funds. | |
|
J. Kevin Gao
Credit Suisse Asset Management, LLC
Eleven Madison Avenue
New York, New York
10010
(1967) | | Chief Legal
Officer since
2006, Vice
President and
Secretary
since 2004 | | Since
2004 | | Director and Legal Counsel of Credit Suisse; Associated
with Credit Suisse since July 2003; Associated with the law
firm of Willkie Farr & Gallagher LLP from 1998 to 2003;
Officer of other Credit Suisse Funds. | |
|
Cecilia Chau
Credit Suisse Asset Management, LLC
Eleven Madison Avenue
New York, New York
10010
(1973) | | Treasurer | | Since
2008 | | Assistant Vice President of Credit Suisse since June 2007;
Associated with Alliance Bernstein L.P. from January 2007
to May 2007; Associated with Credit Suisse from
August 2000 to December 2006; Officer of other Credit
Suisse Funds. | |
|
The Statement of Additional Information includes additional information about the Trustees and is available, without charge, upon request, by calling 800-222-8977.
34
Credit Suisse Trust — Global Small Cap Portfolio
Proxy Voting and Portfolio Holdings Information (unaudited)
Information regarding how the Portfolio voted proxies related to its portfolio securities during the 12 month period ended June 30 of each year, as well as the policies and procedures that the Portfolio uses to determine how to vote proxies relating to its portfolio securities are available:
• By calling 1-800-222-8977
• On the Portfolio's website, www.credit-suisse.com/us
• On the website of the Securities and Exchange Commission, www.sec.gov.
The Portfolio files a complete schedule of its portfolio holdings for the first and third quarters of its fiscal year with the SEC on Form N-Q. The Portfolio's Forms N-Q are available on the SEC's website at www.sec.gov and may be reviewed and copied at the SEC's Public Reference Room in Washington, DC. Information on the operation of the SEC's Public Reference Room may be obtained by calling 1-202-551-8090.
35
This page intentionally left blank

P.O. BOX 55030, BOSTON, MA 02205-5030
800-222-8977 n www.credit-suisse.com/us
CREDIT SUISSE ASSET MANAGEMENT SECURITIES, INC., DISTRIBUTOR. TRGSC-AR-1208

CREDIT SUISSE FUNDS
Annual Report
December 31, 2008
CREDIT SUISSE TRUST
n INTERNATIONAL FOCUS PORTFOLIO
Credit Suisse Trust (the "Trust") shares are not available directly to individual investors, but may be offered only through certain insurance products and pension and retirement plans.
The Trust's investment objectives, risks, charges and expenses (which should be considered carefully before investing), and more complete information about the Trust, are provided in the Prospectus, which should be read carefully before investing. You may obtain additional copies by calling 800-222-8977 or by writing to Credit Suisse Trust, P.O. Box 55030, Boston, MA 02205-5030.
Credit Suisse Asset Management Securities, Inc., Distributor, is located at Eleven Madison Avenue, New York, NY 10010. The Trust is advised by Credit Suisse Asset Management, LLC.
The views of the Portfolio's management are as of the date of the letter and the Portfolio holdings described in this document are as of December 31, 2008; these views and Portfolio holdings may have changed subsequent to these dates. Nothing in this document is a recommendation to purchase or sell securities.
Portfolio shares are not deposits or other obligations of Credit Suisse Asset Management, LLC ("Credit Suisse") or any affiliate, are not FDIC-insured and are not guaranteed by Credit Suisse or any affiliate. Portfolio investments are subject to investment risks, including loss of your investment.
Credit Suisse Trust — International Focus Portfolio
Annual Investment Adviser's Report
December 31, 2008 (unaudited)
January 28, 2009
Dear Shareholder:
For the twelve-month period ended December 31, 2008, Credit Suisse Trust — International Focus Portfolio (the "Portfolio")1 had a loss of -41.03% versus a decrease of -43.38% for its benchmark, the Morgan Stanley Capital International EAFE Index2 (net dividends).
Market Review: A year characterized by selling pressure and extreme risk aversion
The year ended December 31, 2008, was a volatile one. International equity markets fell substantially and selling pressure was indiscriminate across all markets.
Although emerging markets initially avoided a sell-off, as markets became concerned about the imbalances existing in these economies, emerging market currencies came under significant selling pressure.
Commodity prices, including oil, started the year in very strong fashion, but weakened substantially toward the end of the year. For example, the price of oil began the year trading at around $100 per barrel, and by the middle of the year the price had topped $140 per barrel. By the end of the year, however, the price had fallen to around $40 per barrel.
Given the credit crisis, it is no surprise that financials were particularly poor performers. The year saw a number of large bankruptcies that negatively impacted the market quite significantly. Lehman Brothers went into bankruptcy, Merrill Lynch was acquired by Bank of America, Bear Stearns was acquired by JP Morgan, and Freddie Mac and Fannie Mae were, in effect, nationalized by the U.S. government. And, in the United Kingdom, mortgage lender Northern Rock was nationalized by the U.K. government.
For the year, low-risk assets rallied while yields on U.S. Treasuries fell to record lows. In short, markets around the world saw extremes of risk aversion.
Strategic Review and Outlook: Signs of recovery in the financial markets
For the year ended December 31, 2008, the Portfolio outperformed its benchmark. The outperformance was due to both positive sector selection and positive stock selection and other factors. Our policy of holding extra cash as a defensive measure paid off as markets fell and our overweight positions in pharmaceuticals and telecoms also added value, on a relative basis, as these sectors outperformed the market. In addition, we achieved strong results from
1
Credit Suisse Trust — International Focus Portfolio
Annual Investment Adviser's Report (continued)
December 31, 2008 (unaudited)
superior stock selection in materials, pharmaceuticals, and banks (although our overweight in materials detracted from relative performance).
Currently, the portfolio is tilted toward defensive stocks and sectors. We are avoiding stocks of companies that we believe have too much debt on their balance sheets. The sell-off in markets last year has provided us with many opportunities to buy solid, well-managed businesses at attractive valuations — and we are focused on searching for similar opportunities in 2009.
We believe that the global economic situation could worsen as a number of forward-looking economic indicators show. In our opinion, the effects of the financial crisis have started to find their way into the economy as we see companies are beginning to hoard cash, reduce inventories, and close plants. We are, however, beginning to see some signs of recovery in financial markets. LIBOR rates have begun to drop to more normal levels and equity prices are now quite low. We believe that, although a full-blown recession is factored into share prices, the subsequent recovery has not fully been factored in. In our opinion, the current markets represent a good buying opportunity for those investors with a suitably long time horizon.
The Credit Suisse International Equity Team
Neil Gregson
Tom Mann
International investing entails special risk considerations, including currency fluctuations, lower liquidity, economic and political risks, and differences in accounting methods. The Portfolio's fifteen largest holdings may account for 40% or more of the Portfolio's assets. As a result of this strategy, the Portfolio may be subject to greater volatility than a portfolio that invests in a larger number of issuers.
In addition to historical information, this report contains forward-looking statements, which may concern, among other things, domestic and foreign market, industry and economic trends and developments and government regulation and their potential impact on the Portfolio's investments. These statements are subject to risks and uncertainties and actual trends, developments and regulations in the future, and their impact on the Portfolio could be materially different from those projected, anticipated or implied. The Portfolio has no obligation to update or revise forward-looking statements.
2
Credit Suisse Trust — International Focus Portfolio
Annual Investment Adviser's Report (continued)
December 31, 2008 (unaudited)
Comparison of Change in Value of $10,000 Investment in the
Credit Suisse Trust — International Focus Portfolio1
and the Morgan Stanley Capital International EAFE Index2
for Ten Years.
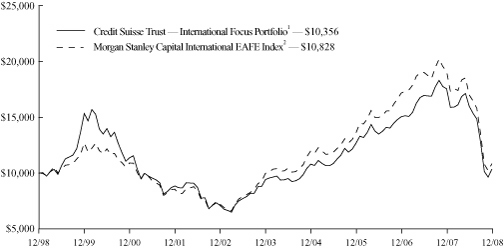
3
Credit Suisse Trust — International Focus Portfolio
Annual Investment Adviser's Report (continued)
December 31, 2008 (unaudited)
Average Annual Returns as of December 31, 20081
| 1 Year | | 5 Years | | 10 Years | | Since
Inception3 | |
| | (41.03 | )% | | | 1.91 | % | | | 0.35 | % | | | 1.72 | % | |
Returns represent past performance and include change in share price and reinvestment of dividends and capital gains. Past performance cannot guarantee future results. The current performance of the Portfolio may be lower or higher than the figures shown. Returns and share price will fluctuate, and redemption value may be more or less than original cost. The performance results do not reflect the deduction of taxes that a shareholder would pay on portfolio distributions or the redemption of portfolio shares. Performance includes the effect of deducting expenses, but does not include charges and expenses attributable to any particular variable contract or plan. Accordingly, the Prospectus of the sponsoring Participating Insurance Company separate account or plan documents or ot her informational materials supplied by plan sponsors should be carefully reviewed for information on relevant charges and expenses. Excluding these charges and expenses from quotations of performance has the effect of increasing the performance quoted, and the effect of these charges should be considered when comparing performance to that of other mutual funds. Performance information current to the most recent month-end is available at www.credit-suisse.com/us.
The annualized gross and net expense ratios are 1.34%.
1 Fee waivers and/or expense reimbursements may reduce expenses for the Portfolio, without which performance would be lower. Waivers and/or reimbursements may be discontinued at any time.
2 The Morgan Stanley Capital International EAFE (Europe, Australasia, Far East) Index Net Dividends is a free float-adjusted market capitalization index that is designed to measure developed-market equity performance, excluding the U.S. and Canada. It is the exclusive property of Morgan Stanley Capital International Inc. Investors cannot invest directly in an index.
3 Inception date 6/30/95.
4
Credit Suisse Trust — International Focus Portfolio
Annual Investment Adviser's Report (continued)
December 31, 2008 (unaudited)
Information About Your Portfolio's Expenses
As an investor of the Portfolio, you incur two types of costs: ongoing expenses and transaction costs. Ongoing expenses include management fees, distribution and service (12b-1) fees and other Portfolio expenses. Examples of transaction costs include sales charges (loads), redemption fees and account maintenance fees, which are not shown in this section and which would result in higher total expenses. The following table is intended to help you understand your ongoing expenses of investing in the Portfolio and to help you compare these expenses with the ongoing expenses of investing in other mutual funds. The table is based on an investment of $1,000 made at the beginning of the six month period ended December 31, 2008.
The table illustrates your Portfolio's expenses in two ways:
• Actual Portfolio Return. This helps you estimate the actual dollar amount of ongoing expenses paid on a $1,000 investment in the Portfolio using the Portfolio's actual return during the period. To estimate the expenses you paid over the period, simply divide your account value by $1,000 (for example, an $8,600 account value divided by $1,000 = 8.6), then multiply the result by the number in the "Expenses Paid per $1,000" line under the share class you hold.
• Hypothetical 5% Portfolio Return. This helps you to compare your Portfolio's ongoing expenses with those of other mutual funds using the Portfolio's actual expense ratio and a hypothetical rate of return of 5% per year before expenses. Examples using a 5% hypothetical portfolio return may be found in the shareholder reports of other mutual funds. The hypothetical account values and expenses may not be used to estimate the actual ending account balance or expenses you paid for the period.
Please note that the expenses shown in these tables are meant to highlight your ongoing expenses only and do not reflect any transaction costs, such as sales charges (loads) or redemption fees. If these transaction costs had been included, your costs would have been higher. The "Expenses Paid per $1,000" line of the tables is useful in comparing ongoing expenses only and will not help you determine the relative total expenses of owning different funds.
5
Credit Suisse Trust — International Focus Portfolio
Annual Investment Adviser's Report (continued)
December 31, 2008 (unaudited)
Expenses and Value for a $1,000 Investment
for the six month period ended December 31, 2008
| Actual Portfolio Return | |
| Beginning Account Value 7/1/08 | | $ | 1,000.00 | | |
| Ending Account Value 12/31/08 | | $ | 647.70 | | |
| Expenses Paid per $1,000* | | $ | 5.55 | | |
| Hypothetical 5% Portfolio Return | |
| Beginning Account Value 7/1/08 | | $ | 1,000.00 | | |
| Ending Account Value 12/31/08 | | $ | 1,018.40 | | |
| Expenses Paid per $1,000* | | $ | 6.80 | | |
| Annualized Expense Ratios* | | | 1.34 | % | |
* Expenses are equal to the Portfolio's annualized expense ratio multiplied by the average account value over the period, multiplied by the number of days in the most recent fiscal half year period, then divided by 366.
The "Expenses Paid per $1,000" and the "Annualized Expense Ratios" in the tables are based on actual expenses paid by the Portfolio during the period, net of fee waivers and/or expense reimbursements. If those fee waivers and/or expense reimbursements had not been in effect, the Portfolio's actual expenses would have been higher. Expenses do not reflect additional charges and expenses that are, or may be, imposed under the variable contracts or plans. Such charges and expenses are described in the prospectus of the insurance company separate account or in the plan documents or other informational materials supplied by plan sponsors. The Portfolio's expenses should be considered with these charges and expenses in evaluating the overall cost of investing in the separate account.
For more information, please refer to the Portfolio's prospectus.
6
Credit Suisse Trust — International Focus Portfolio
Annual Investment Adviser's Report (continued)
December 31, 2008 (unaudited)
SECTOR BREAKDOWN*
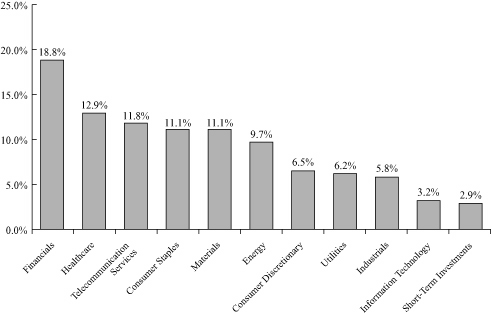
* Expressed as a percentage of total investments (excluding securities lending collateral if applicable) and may vary over time.
7
Credit Suisse Trust — International Focus Portfolio
Schedule of Investments
December 31, 2008
| | | Number of
Shares | | Value | |
| COMMON STOCKS (95.0%) | |
| Australia (0.9%) | |
| Banks (0.9%) | |
| Westpac Banking Corp. | | | 36,335 | | | $ | 435,792 | | |
| TOTAL AUSTRALIA | | | 435,792 | | |
| Belgium (1.0%) | |
| Metals & Mining (1.0%) | |
| Umicore | | | 26,019 | | | | 514,148 | | |
| TOTAL BELGIUM | | | 514,148 | | |
| Bermuda (1.0%) | |
| Marine (0.1%) | |
| Dockwise, Ltd.* | | | 46,400 | | | | 26,544 | | |
| Real Estate (0.9%) | |
| Hiscox, Ltd. | | | 92,385 | | | | 459,760 | | |
| TOTAL BERMUDA | | | 486,304 | | |
| Denmark (1.2%) | |
| Electronic Equipment & Instruments (1.2%) | |
| Vestas Wind Systems A/S* | | | 9,774 | | | | 575,168 | | |
| TOTAL DENMARK | | | 575,168 | | |
| Finland (2.0%) | |
| Diversified Telecommunication Services (2.0%) | |
| Nokia Oyj | | | 60,826 | | | | 954,505 | | |
| TOTAL FINLAND | | | 954,505 | | |
| France (9.7%) | |
| Banks (1.6%) | |
| BNP Paribas | | | 8,220 | | | | 354,812 | | |
| Societe Generale | | | 8,350 | | | | 423,620 | | |
| | | | 778,432 | | |
| Diversified Telecommunication Services (1.7%) | |
| France Telecom SA | | | 29,047 | | | | 809,619 | | |
| Insurance (1.2%) | |
| Axa | | | 25,011 | | | | 561,387 | | |
| Media (1.4%) | |
| Vivendi SA | | | 20,274 | | | | 660,812 | | |
| Metals & Mining (0.6%) | |
| Vallourec SA | | | 2,474 | | | | 281,294 | | |
| Oil & Gas (1.8%) | |
| Total SA | | | 16,305 | | | | 896,436 | | |
| Pharmaceuticals (1.4%) | |
| Sanofi-Aventis | | | 11,041 | | | | 706,217 | | |
| TOTAL FRANCE | | | 4,694,197 | | |
See Accompanying Notes to Financial Statements.
8
Credit Suisse Trust — International Focus Portfolio
Schedule of Investments (continued)
December 31, 2008
| | | Number of
Shares | | Value | |
| COMMON STOCKS | |
| Germany (17.0%) | |
| Automobiles (0.5%) | |
| Daimler AG | | | 6,060 | | | $ | 230,897 | | |
| Biotechnology (2.6%) | |
| MorphoSys AG* | | | 46,284 | | | | 1,239,621 | | |
| Chemicals (3.6%) | |
| BASF SE | | | 24,405 | | | | 948,224 | | |
| Bayer AG | | | 13,785 | | | | 803,230 | | |
| | | | 1,751,454 | | |
| Electric Utilities (2.5%) | |
| E.ON AG | | | 30,592 | | | | 1,201,262 | | |
| Electronic Equipment & Instruments (2.9%) | |
| Norddeutsche Affinerie AG | | | 17,340 | | | | 682,634 | | |
| Siemens AG | | | 9,660 | | | | 727,238 | | |
| | | | 1,409,872 | | |
| Insurance (1.3%) | |
| Muenchener Rueckversicherungs-Gesellshaft AG | | | 4,021 | | | | 624,251 | | |
| Multi-Utilities (2.4%) | |
| RWE AG | | | 13,266 | | | | 1,178,246 | | |
| Textiles & Apparel (1.2%) | |
| Adidas AG | | | 15,566 | | | | 593,370 | | |
| TOTAL GERMANY | | | 8,228,973 | | |
| Hong Kong (3.0%) | |
| Banks (1.5%) | |
| BOC Hong Kong (Holdings), Ltd. | | | 657,619 | | | | 752,703 | | |
| Wireless Telecommunication Services (1.5%) | |
| China Mobile, Ltd. | | | 69,926 | | | | 709,477 | | |
| TOTAL HONG KONG | | | 1,462,180 | | |
| India (1.8%) | |
| Diversified Telecommunication Services (1.8%) | |
| Bharti Airtel, Ltd.* | | | 58,409 | | | | 858,409 | | |
| TOTAL INDIA | | | 858,409 | | |
| Israel (1.9%) | |
| Pharmaceuticals (1.9%) | |
| Teva Pharmaceutical Industries, Ltd. ADR | | | 21,391 | | | | 910,615 | | |
| TOTAL ISRAEL | | | 910,615 | | |
| Italy (2.7%) | |
| Banks (1.5%) | |
| Intesa Sanpaolo | | | 149,796 | | | | 544,162 | | |
| UniCredito Italiano SpA | | | 62,257 | | | | 158,290 | | |
| | | | 702,452 | | |
See Accompanying Notes to Financial Statements.
9
Credit Suisse Trust — International Focus Portfolio
Schedule of Investments (continued)
December 31, 2008
| | | Number of
Shares | | Value | |
| COMMON STOCKS | |
| Italy | |
| Oil & Gas (1.2%) | |
| Eni SpA | | | 24,870 | | | $ | 598,463 | | |
| TOTAL ITALY | | | 1,300,915 | | |
| Japan (18.3%) | |
| Automobiles (1.9%) | |
| Honda Motor Co., Ltd. | | | 10,736 | | | | 228,662 | | |
| Toyota Motor Corp. | | | 20,893 | | | | 690,688 | | |
| | | | 919,350 | | |
| Banks (4.7%) | |
| Mitsubishi UFJ Financial Group, Inc. | | | 93,507 | | | | 587,705 | | |
| Mizuho Financial Group, Inc. | | | 274 | | | | 778,928 | | |
| The Bank of Kyoto, Ltd. | | | 80,107 | | | | 897,796 | | |
| | | | 2,264,429 | | |
| Chemicals (1.7%) | |
| Shin-Etsu Chemical Co., Ltd. | | | 18,313 | | | | 845,174 | | |
| Diversified Financials (1.0%) | |
| Daiwa Securities Group, Inc. | | | 81,171 | | | | 487,295 | | |
| Electronic Equipment & Instruments (1.6%) | |
| Omron Corp. | | | 56,290 | | | | 756,304 | | |
| Food & Drug Retailing (2.5%) | |
| Seven & I Holdings Co., Ltd. | | | 35,134 | | | | 1,207,611 | | |
| Pharmaceuticals (1.3%) | |
| Takeda Pharmaceutical Co., Ltd. | | | 11,739 | | | | 611,863 | | |
| Road & Rail (1.6%) | |
| Central Japan Railway Co. | | | 89 | | | | 771,866 | | |
| Wireless Telecommunication Services (2.0%) | |
| KDDI Corp. | | | 137 | | | | 978,220 | | |
| TOTAL JAPAN | | | 8,842,112 | | |
| Netherlands (5.1%) | |
| Chemicals (1.1%) | |
| Koninklijke DSM NV | | | 20,449 | | | | 524,747 | | |
| Food Products (1.2%) | |
| Nutreco Holding NV | | | 17,385 | | | | 571,271 | | |
| Household Durables (1.5%) | |
| Koninklijke (Royal) Philips Electronics NV | | | 37,013 | | | | 733,846 | | |
| IT Consulting & Services (1.3%) | |
| Exact Holding NV | | | 34,541 | | | | 634,868 | | |
| TOTAL NETHERLANDS | | | 2,464,732 | | |
See Accompanying Notes to Financial Statements.
10
Credit Suisse Trust — International Focus Portfolio
Schedule of Investments (continued)
December 31, 2008
| | | Number of
Shares | | Value | |
| COMMON STOCKS | |
| Norway (1.8%) | |
| Banks (0.9%) | |
| DnB NOR ASA | | | 109,131 | | | $ | 432,992 | | |
| Oil & Gas (0.9%) | |
| DNO International ASA* | | | 324,931 | | | | 214,712 | | |
| StatoilHydro ASA | | | 14,299 | | | | 239,148 | | |
| | | | 453,860 | | |
| TOTAL NORWAY | | | 886,852 | | |
| Singapore (1.1%) | |
| Banks (1.1%) | |
| United Overseas Bank, Ltd. | | | 60,098 | | | | 543,107 | | |
| TOTAL SINGAPORE | | | 543,107 | | |
| Spain (1.3%) | |
| Electric Utilities (1.3%) | |
| Iberdrola SA | | | 65,896 | | | | 614,262 | | |
| TOTAL SPAIN | | | 614,262 | | |
| Sweden (0.3%) | |
| Diversified Telecommunication Services (0.3%) | |
| Telefonaktiebolaget LM Ericsson Share B | | | 21,352 | | | | 166,457 | | |
| TOTAL SWEDEN | | | 166,457 | | |
| Switzerland (5.7%) | |
| Food Products (3.1%) | |
| Nestle SA | | | 37,332 | | | | 1,478,277 | | |
| Pharmaceuticals (2.6%) | |
| Novartis AG | | | 25,432 | | | | 1,273,670 | | |
| TOTAL SWITZERLAND | | | 2,751,947 | | |
| Taiwan (1.0%) | |
| Diversified Telecommunication Services (1.0%) | |
| Chunghwa Telecom Co., Ltd. ADR | | | 31,641 | | | | 493,600 | | |
| TOTAL TAIWAN | | | 493,600 | | |
| United Kingdom (18.2%) | |
| Banks (1.7%) | |
| HSBC Holdings PLC | | | 81,471 | | | | 808,534 | | |
| Insurance (0.4%) | |
| Chaucer Holdings PLC | | | 266,948 | | | | 193,266 | | |
| Metals & Mining (2.9%) | |
| Antofagasta PLC | | | 75,251 | | | | 471,379 | | |
| BHP Billiton PLC | | | 49,492 | | | | 959,926 | | |
| | | | 1,431,305 | | |
See Accompanying Notes to Financial Statements.
11
Credit Suisse Trust — International Focus Portfolio
Schedule of Investments (continued)
December 31, 2008
| | | Number of
Shares | | Value | |
| COMMON STOCKS | |
| United Kingdom | |
| Oil & Gas (5.7%) | |
| BG Group PLC | | | 33,455 | | | $ | 463,069 | | |
| BP PLC | | | 139,199 | | | | 1,074,536 | | |
| Royal Dutch Shell PLC Class A | | | 45,725 | | | | 1,201,336 | | |
| | | | 2,738,941 | | |
| Personal Products (0.9%) | |
| Unilever PLC | | | 19,436 | | | | 446,440 | | |
| Pharmaceuticals (3.0%) | |
| AstraZeneca PLC | | | 18,372 | | | | 751,605 | | |
| GlaxoSmithKline PLC | | | 37,107 | | | | 690,106 | | |
| | | | 1,441,711 | | |
| Tobacco (1.8%) | |
| Imperial Tobacco Group PLC | | | 32,886 | | | | 878,416 | | |
| Wireless Telecommunication Services (1.8%) | |
| Vodafone Group PLC | | | 417,124 | | | | 854,123 | | |
| TOTAL UNITED KINGDOM | | | 8,792,736 | | |
| TOTAL COMMON STOCKS (Cost $56,515,557) | | | 45,977,011 | | |
| PREFERRED STOCK (1.5%) | |
| Germany (1.5%) | |
| Household Products (1.5%) | |
| Henkel AG & Co. KGaA (Cost $962,179) | | | 24,180 | | | | 757,529 | | |
| | | Par
(000) | | | |
| SHORT-TERM INVESTMENT (2.9%) | |
| State Street Bank and Trust Co. Euro Time Deposit, 0.010%, 1/02/09 (Cost $1,404,000) | | $ | 1,404 | | | | 1,404,000 | | |
| TOTAL INVESTMENTS AT VALUE (99.4%) (Cost $58,881,736) | | | 48,138,540 | | |
| OTHER ASSETS IN EXCESS OF LIABILITIES (0.6%) | | | 267,379 | | |
| NET ASSETS (100.0%) | | $ | 48,405,919 | | |
INVESTMENT ABBREVIATION
ADR = American Depositary Receipt
* Non-income producing security.
See Accompanying Notes to Financial Statements.
12
Credit Suisse Trust — International Focus Portfolio
Statement of Assets and Liabilities
December 31, 2008
| Assets | |
| Investments at value (Cost $58,881,736) (Note 2) | | $ | 48,138,540 | | |
| Cash | | | 296 | | |
| Foreign currency at value (cost $230,221) | | | 236,338 | | |
| Receivable for investments sold | | | 57,791 | | |
| Receivable for portfolio shares sold | | | 48,683 | | |
| Dividend receivable | | | 40,843 | | |
| Prepaid expenses | | | 1,227 | | |
| Total Assets | | | 48,523,718 | | |
| Liabilities | |
| Advisory fee payable (Note 3) | | | 38,667 | | |
| Administrative services fee payable (Note 3) | | | 8,862 | | |
| Payable for portfolio shares redeemed | | | 3,272 | | |
| Trustees' fee payable | | | 2,574 | | |
| Deferred foreign tax liability (Note 2) | | | 176 | | |
| Other accrued expenses payable | | | 64,248 | | |
| Total Liabilities | | | 117,799 | | |
| Net Assets | |
| Capital stock, $.001 par value (Note 6) | | | 5,276 | | |
| Paid-in capital (Note 6) | | | 148,055,901 | | |
| Undistributed net investment income | | | 1,314,093 | | |
| Accumulated net realized loss on investments and foreign currency transactions | | | (90,230,252 | ) | |
| Net unrealized depreciation on investments and foreign currency translations | | | (10,739,099 | ) | |
| Net Assets | | $ | 48,405,919 | | |
| Shares outstanding | | | 5,276,456 | | |
| Net asset value, offering price, and redemption price per share | | $ | 9.17 | | |
See Accompanying Notes to Financial Statements.
13
Credit Suisse Trust — International Focus Portfolio
Statement of Operations
For the Year Ended December 31, 2008
| Investment Income (Note 2) | |
| Dividends | | $ | 2,555,863 | | |
| Interest | | | 9,334 | | |
| Securities lending | | | 151,089 | | |
| Foreign taxes withheld | | | (248,268 | ) | |
| Total investment income | | | 2,468,018 | | |
| Expenses | |
| Investment advisory fees (Note 3) | | | 739,849 | | |
| Administrative services fees (Note 3) | | | 98,513 | | |
| Custodian fees | | | 51,766 | | |
| Audit and tax fees | | | 30,896 | | |
| Trustees' fees | | | 17,285 | | |
| Legal fees | | | 15,039 | | |
| Transfer agent fees | | | 3,745 | | |
| Interest expense (Note 4) | | | 3,615 | | |
| Insurance expense | | | 2,542 | | |
| Commitment fees (Note 4) | | | 970 | | |
| Miscellaneous expense | | | 25,285 | | |
| Total expenses | | | 989,505 | | |
| Net investment income | | | 1,478,513 | | |
| Net Realized and Unrealized Gain (Loss) from Investments and Foreign Currency Related Items | |
| Net realized loss from investments | | | (3,329,358 | ) | |
| Net realized loss from foreign currency transactions | | | (223,726 | ) | |
| Net change in unrealized appreciation (depreciation) from investments | | | (35,374,693 | ) | |
| Net change in unrealized appreciation (depreciation) from foreign currency translations | | | 7,162 | | |
| Net realized and unrealized loss from investments and foreign currency related items | | | (38,920,615 | ) | |
| Net decrease in net assets resulting from operations | | $ | (37,442,102 | ) | |
See Accompanying Notes to Financial Statements.
14
Credit Suisse Trust — International Focus Portfolio
Statements of Changes in Net Assets
| | | For the Year
Ended
December 31, 2008 | | For the Year
Ended
December 31, 2007 | |
| From Operations | |
| Net investment income | | $ | 1,478,513 | | | $ | 1,264,888 | | |
Net realized gain (loss) from investments and foreign
currency transactions | | | (3,553,084 | ) | | | 17,680,873 | | |
Net change in unrealized appreciation (depreciation)
from investments and foreign currency translations | | | (35,367,531 | ) | | | (4,470,868 | ) | |
| Net increase (decrease) in net assets resulting from operations | | | (37,442,102 | ) | | | 14,474,893 | | |
| From Dividends | |
| Dividends from net investment income | | | (1,279,963 | ) | | | (981,812 | ) | |
| Net decrease in net assets resulting from dividends | | | (1,279,963 | ) | | | (981,812 | ) | |
| From Capital Share Transactions (Note 6) | |
| Proceeds from sale of shares | | | 14,167,422 | | | | 15,532,378 | | |
| Reinvestment of dividends | | | 1,279,963 | | | | 981,812 | | |
| Net asset value of shares redeemed | | | (27,465,421 | ) | | | (25,667,303 | ) | |
| Net decrease in net assets from capital share transactions | | | (12,018,036 | ) | | | (9,153,113 | ) | |
| Net increase (decrease) in net assets | | | (50,740,101 | ) | | | 4,339,968 | | |
| Net Assets | |
| Beginning of year | | | 99,146,020 | | | | 94,806,052 | | |
| End of year | | $ | 48,405,919 | | | $ | 99,146,020 | | |
| Undistributed net investment income | | $ | 1,314,093 | | | $ | 1,277,977 | | |
See Accompanying Notes to Financial Statements.
15
Credit Suisse Trust — International Focus Portfolio
Financial Highlights
(For a Share of the Portfolio Outstanding Throughout Each Year)
| | | For the Year Ended December 31, | |
| | | 2008 | | 2007 | | 2006 | | 2005 | | 2004 | |
| Per share data | |
| Net asset value, beginning of year | | $ | 15.85 | | | $ | 13.74 | | | $ | 11.70 | | | $ | 10.04 | | | $ | 8.85 | | |
| INVESTMENT OPERATIONS | |
| Net investment income | | | 0.27 | | | | 0.22 | | | | 0.15 | | | | 0.14 | | | | 0.11 | | |
Net gain (loss) on investments and foreign currency
related items (both realized and unrealized) | | | (6.72 | ) | | | 2.05 | | | | 2.02 | | | | 1.62 | | | | 1.17 | | |
| Total from investment operations | | | (6.45 | ) | | | 2.27 | | | | 2.17 | | | | 1.76 | | | | 1.28 | | |
| LESS DIVIDENDS | |
| Dividends from net investment income | | | (0.23 | ) | | | (0.16 | ) | | | (0.13 | ) | | | (0.10 | ) | | | (0.09 | ) | |
| Net asset value, end of year | | $ | 9.17 | | | $ | 15.85 | | | $ | 13.74 | | | $ | 11.70 | | | $ | 10.04 | | |
| Total return1 | | | (41.03 | )% | | | 16.60 | % | | | 18.65 | % | | | 17.56 | % | | | 14.63 | % | |
| RATIOS AND SUPPLEMENTAL DATA | |
| Net assets, end of year (000s omitted) | | $ | 48,406 | | | $ | 99,146 | | | $ | 94,806 | | | $ | 92,212 | | | $ | 87,301 | | |
| Ratio of expenses to average net assets | | | 1.34 | % | | | 1.32 | % | | | 1.32 | % | | | 1.42 | % | | | 1.37 | % | |
| Ratio of net investment income to average net assets | | | 2.00 | % | | | 1.33 | % | | | 1.08 | % | | | 1.17 | % | | | 0.98 | % | |
Decrease reflected in above operating expense ratios
due to waivers/reimbursements | | | — | | | | 0.01 | % | | | 0.04 | % | | | — | | | | — | | |
| Portfolio turnover rate | | | 80 | % | | | 41 | % | | | 37 | % | | | 47 | % | | | 90 | % | |
1 Total returns are historical and assume changes in share price and reinvestment of all dividends and distributions. Had certain expenses not been reduced during the years shown, total returns would have been lower. Total returns do not reflect charges and expenses attributable to any particular variable contract or plan.
See Accompanying Notes to Financial Statements.
16
Credit Suisse Trust — International Focus Portfolio
Notes to Financial Statements
December 31, 2008
Note 1. Organization
Credit Suisse Trust (the "Trust") is an open-end management investment company registered under the Investment Company Act of 1940, as amended (the "1940 Act"), and currently offers eight managed investment portfolios of which one, the International Focus Portfolio (the "Portfolio"), is included in this report. The Portfolio is a diversified investment fund that seeks long-term capital appreciation. Shares of the Portfolio are not available directly to individual investors but may be offered only through (a) variable annuity contracts and variable life insurance contracts offered by separate accounts of certain insurance companies and (b) tax-qualified pension and retirement plans. The Portfolio may not be available in connection with a particular contract or plan. The Trust was organized under the laws of the Commonwealth of Massachusetts as a business trust on March 15, 1995.
Note 2. Significant Accounting Policies
A) SECURITY VALUATION — The net asset value of the Portfolio is determined daily as of the close of regular trading on the New York Stock Exchange, Inc. (the "Exchange") on each day the Exchange is open for business. Equity investments are valued at market value, which is generally determined using the closing price on the exchange or market on which the security is primarily traded at the time of valuation (the "Valuation Time"). If no sales are reported, equity investments are generally valued at the most recent bid quotation as of the Valuation Time or at the lowest asked quotation in the case of a short sale of securities. Debt securities with a remaining maturity greater than 60 days are valued in accordance with the price supplied by a pricing service, which may use a matrix, formula or other objective method that takes into consideration market indices, yield curves and other specific adjustments. Debt obligations that will matur e in 60 days or less are valued on the basis of amortized cost, which approximates market value, unless it is determined that using this method would not represent fair value. Investments in mutual funds are valued at the mutual fund's closing net asset value per share on the day of valuation. Securities and other assets for which market quotations are not readily available, or whose values have been materially affected by events occurring before the Portfolio's Valuation Time but after the close of the securities' primary markets, are valued at fair value as determined in good faith by, or under the direction of, the Board of Trustees under procedures established by the Board of Trustees. The Portfolio may utilize a service provided by an independent third party which has been approved by the Board of Trustees to fair value certain securities. When fair-value pricing is employed, the prices of securities used by a portfolio to calculate its net asset value may differ from quoted or published prices for the same securities.
17
Credit Suisse Trust — International Focus Portfolio
Notes to Financial Statements (continued)
December 31, 2008
Note 2. Significant Accounting Policies
The Portfolio adopted Financial Accounting Standards Board Statement of Financial Accounting Standards No. 157, Fair Value Measurements ("FAS 157"), effective January 1, 2008. In accordance with FAS 157, fair value is defined as the price that the Portfolio would receive upon selling an investment in a timely transaction to an independent buyer in the principal or most advantageous market of the investment. FAS 157 established a three-tier hierarchy to maximize the use of observable market data and minimize the use of unobservable inputs and to establish classification of fair value measurements for disclosure purposes. Inputs refer broadly to the assumptions that market participants would use in pricing the asset or liability, including assumptions about risk, for example, the risk inherent in a particular valuation technique used to measure fair value including such a pricing model and/or the risk inherent in the inputs to the valuation te chnique. Inputs may be observable or unobservable. Observable inputs are inputs that reflect the assumptions market participants would use in pricing the asset or liability developed based on market data obtained from sources independent of the reporting entity. Unobservable inputs are inputs that reflect the reporting entity's own assumptions about the assumptions market participants would use in pricing the asset or liability developed based on the best information available in the circumstances. The three-tier hierarchy of inputs is summarized in the three broad Levels listed below.
• Level 1 – quoted prices in active markets for identical investments
• Level 2 – other significant observable inputs (including quoted prices for similar investments, interest rates, prepayment speeds, credit risk, etc.)
• Level 3 – significant unobservable inputs (including the Portfolio's own assumptions in determining the fair value of investments)
The inputs or methodology used for valuing securities are not necessarily an indication of the risk associated with investing in those securities.
The following is a summary of the inputs used as of December 31, 2008 in valuing the Portfolio's investments carried at value:
| Valuation Inputs | | Investments in
Securities | | Other Financial
Instruments* | |
| Level 1 – Quoted Prices | | $ | 2,183,142 | | | $ | — | | |
| Level 2 – Other Significant Observable Inputs | | | 45,955,398 | | | | — | | |
| Level 3 – Significant Unobservable Inputs | | | — | | | | — | | |
| Total | | $ | 48,138,540 | | | $ | — | | |
*Other financial instruments include futures, forwards and swap contracts.
18
Credit Suisse Trust — International Focus Portfolio
Notes to Financial Statements (continued)
December 31, 2008
Note 2. Significant Accounting Policies
B) FOREIGN CURRENCY TRANSACTIONS — The books and records of the Portfolio are maintained in U.S. dollars. Transactions denominated in foreign currencies are recorded at the current prevailing exchange rates. All assets and liabilities denominated in foreign currencies are translated into U.S. dollar amounts at the current exchange rate at the end of the period. Translation gains or losses resulting from changes in the exchange rate during the reporting period and realized gains and losses on the settlement of foreign currency transactions are reported in the results of operations for the current period. The Portfolio does not isolate that portion of realized gains and losses on investments in equity securities which is due to changes in the foreign exchange rate from that which is due to changes in market prices of equity securities. The Portfolio isolates that portion of realized gains and losses on investments in debt securities which is due to changes in the foreign exchange rate from that which is due to changes in market prices of debt securities.
C) SECURITY TRANSACTIONS AND INVESTMENT INCOME — Security transactions are accounted for on a trade date basis. Interest income is recorded on the accrual basis. Dividends are recorded on the ex-dividend date. The cost of investments sold is determined by use of the specific identification method for both financial reporting and income tax purposes.
D) DIVIDENDS AND DISTRIBUTIONS TO SHAREHOLDERS — Dividends from net investment income and distributions of net realized capital gains, if any, are declared and paid at least annually. However, to the extent that a net realized capital gain can be reduced by a capital loss carryforward, such gain will not be distributed. Income and capital gain distributions are determined in accordance with federal income tax regulations, which may differ from accounting principles generally accepted in the United States of America ("GAAP").
E) FEDERAL INCOME TAXES — No provision is made for federal taxes as it is the Portfolio's intention to continue to qualify for and elect the tax treatment applicable to regulated investment companies under the Internal Revenue Code of 1986, as amended, and to make the requisite distributions to its shareholders, which will be sufficient to relieve it from federal income and excise taxes.
During June 2006, the Financial Accounting Standards Board ("FASB") issued FASB Interpretation 48 ("FIN 48" or the "Interpretation"), Accounting for Uncertainty in Income Taxes – an interpretation of FASB statement 109. The Portfolio has reviewed its current tax positions and has determined that no provision for income tax is required in the Portfolio's financial statements. The Portfolio's
19
Credit Suisse Trust — International Focus Portfolio
Notes to Financial Statements (continued)
December 31, 2008
Note 2. Significant Accounting Policies
federal tax returns for the prior three fiscal years remain subject to examination by the Internal Revenue Service.
F) USE OF ESTIMATES — The preparation of financial statements in conformity with GAAP requires management to make estimates and assumptions that affect the reported amounts of assets and liabilities and disclosure of contingent assets and liabilities at the date of the financial statements and the reported amounts of income and expenses during the reporting period. Actual results could differ from these estimates.
G) SHORT-TERM INVESTMENTS — The Portfolio, together with other funds/portfolios advised by Credit Suisse Asset Management, LLC ("Credit Suisse"), an indirect, wholly-owned subsidiary of Credit Suisse Group AG, pools available cash into either a short-term variable rate time deposit issued by State Street Bank and Trust Company ("SSB"), the Portfolio's custodian, or a money market fund advised by Credit Suisse. The short-term time deposit issued by SSB is a variable rate account classified as a short-term investment.
H) FORWARD FOREIGN CURRENCY CONTRACTS — The Portfolio may enter into forward foreign currency contracts for the purchase or sale of a specific foreign currency at a fixed price on a future date. Risks may arise upon entering into these contracts from the potential inability of counterparties to meet the terms of their contracts and from unanticipated movements in the value of a foreign currency. The Portfolio will enter into forward foreign currency contracts primarily for hedging purposes. Forward foreign currency contracts are adjusted by the daily forward exchange rate of the underlying currency and any gains or losses are recorded for financial statement purposes as unrealized until the contract settlement date or an offsetting position is entered into. At December 31, 2008, the Portfolio had no open forward foreign currency contracts.
I) SECURITIES LENDING — Loans of securities are required at all times to be secured by collateral at least equal to 102% of the market value of domestic securities on loan (including any accrued interest thereon) and 105% of the market value of foreign securities on loan (including any accrued interest thereon). Cash collateral received by the Portfolio in connection with securities lending activity may be pooled together with cash collateral for other funds/portfolios advised by Credit Suisse and may be invested in a variety of investments, including certain Credit Suisse-advised funds, funds advised by SSB, the Portfolio's securities lending agent, or money market instruments. However, in the event of default or bankruptcy by the other party to the agreement, realization and/or retention of the collateral may be subject to legal proceedings.
20
Credit Suisse Trust — International Focus Portfolio
Notes to Financial Statements (continued)
December 31, 2008
Note 2. Significant Accounting Policies
SSB has been engaged by the Portfolio to act as the Portfolio's securities lending agent. The Portfolio's securities lending arrangement provides that the Portfolio and SSB will share the net income earned from securities lending activities. During the year ended December 31, 2008, total earnings from the Portfolio's investment in cash collateral received in connection with securities lending arrangements was $432,073, of which $244,834 was rebated to borrowers (brokers). The Portfolio retained $151,089 in income from the cash collateral investment, and SSB, as lending agent, was paid $36,150. The Portfolio may also be entitled to certain minimum amounts of income from its securities lending activities. Securities lending income is accrued as earned.
J) OTHER — The Portfolio may invest in securities of foreign countries and governments which involve certain risks in addition to those inherent in domestic investments. Such risks generally include, among others, currency risk (fluctuations in currency exchange rates), information risk (key information may be inaccurate or unavailable) and political risk (expropriation, nationalization or the imposition of capital or currency controls or punitive taxes). Other risks of investing in foreign securities include liquidity and valuation risks.
The Portfolio's investments in securities of issuers located in less developed countries considered to be "emerging markets" involve risks in addition to those generally applicable to foreign securities. Focusing on emerging (less developed) markets involves higher levels of risk, including increased currency, information, liquidity, market, political and valuation risks. Deficiencies in regulatory oversight, market infrastructure, shareholder protections and company laws could expose the Portfolio to operational and other risks as well. Some countries may have restrictions that could limit the Portfolio's access to attractive investment opportunities. Additionally, emerging markets often face serious economic problems (such as high external debt, inflation and unemployment) that could subject the Portfolio to increased volatility or substantial declines in value.
The Portfolio may be subject to taxes imposed by countries in which it invests with respect to its investments in issuers existing or operating in such countries. Such taxes are generally based on income earned or repatriated and capital gains realized on the sale of such investments. The Portfolio accrues such taxes when the related income is earned or gains are realized.
Note 3. Transactions with Affiliates and Related Parties
Credit Suisse serves as investment adviser for the Portfolio. For its investment advisory services, Credit Suisse is entitled to receive a fee from the
21
Credit Suisse Trust — International Focus Portfolio
Notes to Financial Statements (continued)
December 31, 2008
Note 3. Transactions with Affiliates and Related Parties
Portfolio at an annual rate of 1.00% of the Portfolio's average daily net assets. For the year ended December 31, 2008, investment advisory fees earned were $739,849.
Credit Suisse Asset Management Limited ("Credit Suisse U.K.") and Credit Suisse Asset Management Limited ("Credit Suisse Australia"), each an affiliate of Credit Suisse, are sub-investment advisers to the Portfolio (the "Sub-Advisers"). Credit Suisse U.K.'s and Credit Suisse Australia's sub-investment advisory fees are paid by Credit Suisse out of Credit Suisse's net investment advisory fee and are not paid by the Portfolio. As of October 1, 2008, Credit Suisse Australia no longer serves as sub-investment advisor to the Portfolio.
Credit Suisse Asset Management Securities, Inc. ("CSAMSI"), an affiliate of Credit Suisse, and SSB serve as co-administrators to the Portfolio. For its co-administrative services, CSAMSI currently receives a fee calculated at an annual rate of 0.09% of the Portfolio's average daily net assets. For the year ended December 31, 2008, co-administrative services fees earned by CSAMSI were $66,586.
For its co-administrative services, SSB receives a fee, exclusive of out-of-pocket expenses, calculated in total for all the Credit Suisse funds/portfolios co-administered by SSB and allocated based upon the relative average net assets of each fund/portfolio, subject to an annual minimum fee. For the year ended December 31, 2008, co-administrative services fees earned by SSB (including out-of-pocket expenses) were $31,927.
In addition to serving as the Portfolio's co-administrator, CSAMSI currently serves as distributor of the Portfolio's shares without compensation.
Merrill Corporation ("Merrill"), an affiliate of Credit Suisse, has been engaged by the Portfolio to provide certain financial printing and fulfillment services. For the year ended December 31, 2008, Merrill was paid $17,596 for its services to the Portfolio.
Note 4. Line of Credit
The Portfolio, together with other funds/portfolios advised by Credit Suisse (collectively, the "Participating Funds"), participates in a $50 million committed, unsecured line of credit facility ("Credit Facility") for temporary or emergency purposes with SSB. Under the terms of the Credit Facility, the Participating Funds pay an aggregate commitment fee at a rate of 0.10% per annum on the average unused amount of the Credit Facility, which is allocated among the Participating Funds in such manner as is determined by the
22
Credit Suisse Trust — International Focus Portfolio
Notes to Financial Statements (continued)
December 31, 2008
Note 4. Line of Credit
governing Boards of the Participating Funds. In addition, the Participating Funds pay interest on borrowings at the Federal Funds rate plus 0.50%. At December 31, 2008, the Portfolio had no loans outstanding under the Credit Facility. During the year ended December 31, 2008, the Portfolio had borrowings under the Credit Facility as follows:
Average Daily
Loan Balance | | Weighted Average
Interest Rate % | | Maximum Daily
Loan Outstanding | |
| $ | 969,568 | | | | 3.051 | % | | $ | 2,336,000 | | |
Note 5. Purchases and Sales of Securities
For the year ended December 31, 2008, purchases and sales of investment securities (excluding short-term investments) were $58,270,790 and $71,954,189, respectively.
Note 6. Capital Share Transactions
The Trust is authorized to issue an unlimited number of full and fractional shares of beneficial interest, $.001 par value per share. Transactions in capital shares of the Portfolio were as follows:
| | | For the Year Ended
December 31, 2008 | | For the Year Ended
December 31, 2007 | |
| Shares sold | | | 1,040,702 | | | | 1,004,291 | | |
| Shares issued in reinvestment of dividends | | | 106,930 | | | | 64,424 | | |
| Shares redeemed | | | (2,127,861 | ) | | | (1,709,884 | ) | |
| Net decrease | | | (980,229 | ) | | | (641,169 | ) | |
| | | | | | | | | | |
On December 31, 2008, the number of shareholders that held 5% or more of the outstanding shares of the Portfolio was as follows:
Number of
Shareholders | | Approximate Percentage
of Outstanding Shares | |
| | 4 | | | | 85 | % | |
Some of the shareholders are omnibus accounts, which hold shares on behalf of individual shareholders.
Note 7. Federal Income Taxes
Income and capital gain distributions are determined in accordance with federal income tax regulations, which may differ from GAAP.
23
Credit Suisse Trust — International Focus Portfolio
Notes to Financial Statements (continued)
December 31, 2008
Note 7. Federal Income Taxes
The tax characteristics of dividends paid during the years ended December 31, 2008 and 2007, respectively, by the Portfolio were as follows:
| | | Ordinary Income | |
| | | 2008 | | 2007 | |
| | $ | 1,279,963 | | | $ | 981,812 | | |
The tax basis components of distributable earnings differ from the amounts reflected in the Statement of Assets and Liabilities by temporary book/tax differences. These differences are primarily due to losses deferred on wash sales, mark-to-market of forward contracts, unused capital loss caryforwards and deferral of post-October losses.
At December 31, 2008, the components of distributable earnings on a tax basis were as follows:
| Undistributed net investment income | | $ | 1,325,615 | | |
| Accumulated realized loss | | | (88,423,067 | ) | |
| Unrealized depreciation | | | (11,036,141 | ) | |
| Deferral of post-October capital losses | | | (1,510,143 | ) | |
| Deferral of post-October currency losses | | | (11,522 | ) | |
| | | $ | (99,655,258 | ) | |
At December 31, 2008, the Portfolio had capital loss carryforwards available to offset possible future capital gains as follows:
| | | Expires December 31, | |
| | | 2009 | | 2010 | | 2011 | | 2016 | |
| | $ | 46,229,362 | | | $ | 37,413,453 | | | $ | 3,083,342 | | | $ | 1,696,910 | | |
During the tax year ended December 31, 2008, the Portfolio did not utilize any of the capital loss carryforward.
It is uncertain whether the Portfolio will be able to realize the benefits of the capital loss carryforward before they expire.
At December 31, 2008, the identified cost for federal income tax purposes, as well as the gross unrealized appreciation from investments for those securities having an excess of value over cost, gross unrealized depreciation from investments for those securities having an excess of cost over value and the net unrealized depreciation from investments were $59,179,074, $4,049,239, $(15,089,773) and $(11,040,534), respectively.
At December 31, 2008, the Portfolio reclassified $162,434 from undistributed net investment income and $438 from paid in capital to accumulated net realized loss from investments, to adjust for the current period permanent
24
Credit Suisse Trust — International Focus Portfolio
Notes to Financial Statements (continued)
December 31, 2008
Note 7. Federal Income Taxes
book/tax differences which arose principally from differing book/tax treatments of foreign currency transactions and realized gain (loss) from the sale of Partnerships. Net assets were not affected by these reclassifications.
Note 8. Contingencies
In the normal course of business, the Portfolio may provide general indemnifications pursuant to certain contracts and organizational documents. The Portfolio's maximum exposure under these arrangements is dependent on future claims that may be made against the Portfolio and, therefore, cannot be estimated; however, based on experience, the risk of loss from such claims is considered remote.
Note 9. Recent Accounting Pronouncements
In March 2008, FASB issued Statement of Financial Accounting Standards No. 161, Disclosures about Derivative Instruments and Hedging Activities ("FAS 161"), an amendment of FASB Statement No. 133. FAS 161 requires enhanced disclosures about (a) how and why an entity uses derivative instruments, (b) how derivative instruments and hedging activities are accounted for, and (c) how derivative instruments and related hedging activities affect a fund's financial position, financial performance, and cash flows. Management of the Portfolio does not believe the adoption of FAS 161 will materially impact the financial statement amounts, but will require additional disclosures. This will include qualitative and quantitative disclosures on derivative positions existing at period end and the effect of usin g derivatives during the reporting period. FAS 161 is effective for financial statements issued for fiscal years and interim periods beginning after November 15, 2008.
25
Credit Suisse Trust — International Focus Portfolio
Report of Independent Registered Public Accounting Firm
To the Board of Trustees of Credit Suisse Trust and Shareholders of
Credit Suisse Trust — International Focus Portfolio:
In our opinion, the accompanying statement of assets and liabilities, including the schedule of investments, and the related statements of operations and of changes in net assets and the financial highlights present fairly, in all material respects, the financial position of International Focus Portfolio (the "Portfolio"), a portfolio of the Credit Suisse Trust, at December 31, 2008, the results of its operations for the year then ended and the changes in its net assets and financial highlights the periods presented, in conformity with accounting principles generally accepted in the United States of America. These financial statements and financial highlights (hereafter referred to as "financial statements") are the responsibility of the Portfolio's management. Our responsibility is to express an opinion on these financial statements based on our audits. We conducted our audits of these financial statements in accordance with the standards o f the Public Company Accounting Oversight Board (United States). Those standards require that we plan and perform the audit to obtain reasonable assurance about whether the financial statements are free of material misstatement. An audit includes examining, on a test basis, evidence supporting the amounts and disclosures in the financial statements, assessing the accounting principles used and significant estimates made by management, and evaluating the overall financial statement presentation. We believe that our audit, which included confirmation of securities at December 31, 2008 by correspondence with the custodian, provides a reasonable basis for our opinion.
PricewaterhouseCoopers LLP
Baltimore, Maryland
February 24, 2009
26
Credit Suisse Trust — International Focus Portfolio
Board Approval of Advisory Agreement (unaudited)
In approving the renewal of the current Advisory and Sub-Advisory Agreements, the Board of Trustees, including the Independent Trustees, at a meeting held on November 18 and 19, 2008, considered the following factors with respect to the International Focus Portfolio (the "Portfolio"):
Investment Advisory Fee Rates
The Board reviewed and considered the contractual advisory fee rate of 1.00% for the Portfolio ("Contractual Advisory Fee") in light of the extent and quality of the advisory services provided by Credit Suisse Asset Management, LLC ("Credit Suisse") or Credit Suisse Asset Management Limited ("Credit Suisse U.K."). The Board noted that the compensation paid to Credit Suisse U.K. (the "Sub-Adviser") does not increase the fees or expenses otherwise incurred by the Portfolio's shareholders.
Additionally, the Board received and considered information comparing the Portfolio's Contractual Advisory Fee and the Portfolio's overall expenses with those of funds in both the relevant expense group ("Expense Group") and universe of funds ("Expense Universe") provided by Lipper Inc., an independent provider of investment company data.
Nature, Extent and Quality of the Services under the Advisory and
Sub-Advisory Agreements
The Board received and considered information regarding the nature, extent and quality of services provided to the Portfolio by Credit Suisse under the Advisory Agreement and by the Sub-Adviser under the Sub-Advisory Agreement. The Board also noted information received at regular meetings throughout the year related to the services rendered by Credit Suisse and the Sub-Adviser. The Board reviewed background information about Credit Suisse and the Sub-Adviser, including their respective Forms ADV. The Board considered the background and experience of both Credit Suisse's and the Sub-Adviser's senior management and the expertise of, and the amount of attention given to the Portfolio by, senior personnel of Credit Suisse and the Sub-Adviser. With respect to the Sub-Adviser, the Board also considered their expertise in managing the types of global investments that the Portfolio utilizes in its investment strategy. In addition, the Board reviewed the qualifications, backgrounds and responsibilities of the portfolio management team primarily responsible for the day-to-day portfolio management of the Portfolio and the extent of the resources devoted to research and analysis of actual and potential investments. The Board also received and considered information about the
27
Credit Suisse Trust — International Focus Portfolio
Board Approval of Advisory Agreement (unaudited) (continued)
nature, extent and quality of services and fee rates offered to other Credit Suisse clients for comparable services.
In approving the Sub-Advisory Agreement, the Board also considered the benefits of retaining Credit Suisse's United Kingdom affiliate given the increased complexity of the domestic and international securities markets, specifically that retention of Credit Suisse U.K. expands the universe of companies and countries from which investment opportunities could be sought.
Portfolio Performance
The Board received and considered the performance results of the Portfolio over time, along with comparisons both to the relevant performance group ("Performance Group") and universe of funds ("Performance Universe") for the Portfolio. The Board was provided with a description of the methodology used to arrive at the funds included in the Performance Group and the Performance Universe.
Credit Suisse Profitability
The Board received and considered a profitability analysis of Credit Suisse based on the fees payable under the Advisory Agreement for the Portfolio, including other relationships between the Portfolio on the one hand and Credit Suisse affiliates on the other. The Board received profitability information for the other funds in the Credit Suisse family of funds.
Economies of Scale
The Board considered whether economies of scale in the provision of services to the Portfolio were being passed along to the shareholders. Accordingly, the Board considered whether alternative fee structures (such as breakpoint fee structures) would be more appropriate or reasonable taking into consideration economies of scale or other efficiencies that might accrue from increases in the Portfolio's asset levels.
Other Benefits to Credit Suisse
The Board considered other benefits received by Credit Suisse, the Sub-Adviser and their affiliates as a result of their relationships with the Portfolio. Such benefits include, among others, research arrangements with brokers who
28
Credit Suisse Trust — International Focus Portfolio
Board Approval of Advisory Agreement (unaudited) (continued)
execute transactions on behalf of the Portfolio, administrative and brokerage relationships with affiliates of Credit Suisse and the Sub-Adviser and benefits potentially derived from an increase in Credit Suisse's and the Sub-Adviser's businesses as a result of their relationship with the Portfolio (such as the ability to market to shareholders other financial products offered by Credit Suisse, the Sub-Adviser and their affiliates).
The Board considered the standards applied in seeking best execution, whether and to what extent soft dollar credits are sought and how any such credits are utilized, any benefits that may be achieved by using an affiliated broker and the existence of quality controls applicable to brokerage allocation procedures. The Board also reviewed Credit Suisse's and the Sub-Adviser's method for allocating portfolio investment opportunities among their advisory clients.
Conclusions
In selecting Credit Suisse and the Sub-Adviser, and approving the Advisory Agreement and the investment advisory fee under such agreement and the Sub-Advisory Agreement, the Board concluded that:
• Although the Contractual Advisory Fee was near the highest in the Expense Group, the Board considered the fee to be reasonable taking the relatively small size of the Portfolio into account.
• The Portfolio's performance was equal to or above most of its peers in the Performance Group and Performance Universe for the one, two, three and four year periods, but was below the median in the Performance Group and Performance Universe for the five and ten year periods.
• The Board was satisfied with the nature and extent of the investment advisory services provided to the Portfolio by Credit Suisse and the Sub-Adviser and that, based on dialogue with management and counsel, the services provided by Credit Suisse under the Advisory Agreement and by the Sub-Adviser under the Sub-Advisory Agreement are typical of, and consistent with, those provided to similar mutual funds by other investment advisers.
• In light of the costs of providing investment management and other services to the Portfolio and Credit Suisse's ongoing commitment to the Portfolio, the profits and other ancillary benefits that Credit Suisse and its affiliates received were considered reasonable.
29
Credit Suisse Trust — International Focus Portfolio
Board Approval of Advisory Agreement (unaudited) (continued)
• Credit Suisse's profitability based on fees payable under the Advisory Agreement was reasonable in light of the nature, extent and quality of the services provided to the Portfolio thereunder.
• In light of the relatively small size of the Portfolio and the Portfolio's performance in its Performance Group, the Portfolio's current fee structure (without breakpoints) was considered reasonable.
No single factor reviewed by the Board was identified by the Board as the principal factor in determining whether to approve the Advisory Agreement and the Sub-Advisory Agreement. The Independent Trustees were advised by separate independent legal counsel throughout the process.
30
Credit Suisse Trust — International Focus Portfolio
Information Concerning Trustees and Officers (unaudited)
Name, Address
(Year of Birth) | | Position(s)
Held with
Trust | | Term
of Office1
and
Length
of Time
Served | | Principal
Occupation(s) During
Past Five Years | | Number of
Portfolios in
Fund
Complex
Overseen by
Trustee | | Other
Directorships
Held by Trustee | |
| Independent Trustees | | | | | | | | | | | |
|
Enrique Arzac
c/o Credit Suisse Asset Management, LLC
Attn: General Counsel
Eleven Madison Avenue
New York, New York
10010
(1941) | | Trustee,
Audit
Committee
Chairman and
Nominating
Committee
Member | | Since
2005 | | Professor of Finance and
Economics, Graduate
School of Business,
Columbia University
since 1971. | | | 33 | | | Director of
Epoch Holding
Corporation
(an investment
management
and investment
advisory
services
company);
Director of The
Adams Express
Company (a
closed-end
investment
company);
Director of
Petroleum and
Resources
Corporation
(a closed-end
investment
company). | |
|
Jeffrey E. Garten2
Box 208200
New Haven, Connecticut
06520-8200
(1946) | | Trustee,
Audit and
Nominating
Committee
Member | | Since
1998 | | The Juan Trippe
Professor in the Practice
of International Trade,
Finance and Business
from July 2005 to
present; Partner and
Chairman of Garten
Rothkopf (consulting
firm) from October 2005
to present; Dean of Yale
School of Management
from November 1995 to
June 2005. | | | 26 | | | Director of
Aetna, Inc.
(insurance
company);
Director of
CarMax Group
(used car
dealers). | |
|
1 Each Trustee and Officer serves until his or her respective successor has been duly elected and qualified.
2 Mr. Garten was initially appointed as a Trustee of the Portfolio on February 6, 1998. He resigned as Trustee on February 3, 2000 and was subsequently reappointed on December 21, 2000.
31
Credit Suisse Trust — International Focus Portfolio
Information Concerning Trustees and Officers (unaudited) (continued)
Name, Address
(Year of Birth) | | Position(s)
Held with
Trust | | Term
of Office1
and
Length
of Time
Served | | Principal
Occupation(s) During
Past Five Years | | Number of
Portfolios in
Fund
Complex
Overseen by
Trustee | | Other
Directorships
Held by Trustee | |
| Independent Trustees | | | | | | | | | | | |
|
Peter F. Krogh
SFS/ICC 702
Georgetown University
Washington, DC
20057
(1937) | | Trustee,
Audit and
Nominating
Committee
Member | | Since
2001 | | Dean Emeritus and
Distinguished Professor
of International Affairs at
the Edmund A. Walsh
School of Foreign
Service, Georgetown
University from
June 1995 to present. | | | 26 | | | Director of
Carlisle
Companies
Incorporated
(diversified
manufacturing
company). | |
|
Steven N. Rappaport
Lehigh Court, LLC
555 Madison Avenue
29th Floor
New York, New York
10022
(1948) | | Chairman of
the Board of
Trustees,
Audit
Committee
Member and
Nominating
Committee
Chairman | | Trustee
since
1999 and
Chairman
since
2005 | | Partner of Lehigh Court,
LLC and RZ Capital
(private investment
firms) from July 2002
to present. | | | 33 | | | Director of
iCAD, Inc.
(surgical and
medical
instruments and
apparatus
company);
Director of
Presstek, Inc.
(digital imaging
technologies company);
Director of
Wood
Resources, LLC.
(plywood
manufacturing
company). | |
|
32
Credit Suisse Trust — International Focus Portfolio
Information Concerning Trustees and Officers (unaudited) (continued)
Name, Address
(Year of Birth) | | Position(s)
Held with
Trust | | Term
of Office1
and
Length
of Time
Served | | Principal Occupation(s) During Past Five Years | |
| Officers | | | | | | | |
|
George R. Hornig
Credit Suisse Asset
Management, LLC
Eleven Madison Avenue
New York, New York
10010
(1954) | | Chief Executive Officer and President | | Since
2008 | | Managing Director of Credit Suisse; Co-Chief Operating Officer of Asset Management and Head of Asset Management Americas; Associated with Credit Suisse since 1999; Officer of other Credit Suisse Funds. | |
|
Michael A. Pignataro
Credit Suisse Asset
Management, LLC
Eleven Madison Avenue
New York, New York
10010
(1959) | | Chief Financial Officer | | Since
1999 | | Director and Director of Fund Administration of Credit Suisse; Associated with Credit Suisse or its predecessor since 1984; Officer of other Credit Suisse Funds. | |
|
Emidio Morizio
Credit Suisse Asset
Management, LLC
Eleven Madison Avenue
New York, New York
10010
(1966) | | Chief Compliance Officer | | Since
2004 | | Director and Global Head of Compliance of Credit Suisse; Associated with Credit Suisse since July 2000; Officer of other Credit Suisse Funds. | |
|
J. Kevin Gao
Credit Suisse Asset
Management, LLC
Eleven Madison Avenue
New York, New York
10010
(1967) | | Chief Legal Officer since 2006, Vice President and Secretary since 2004 | | Since
2004 | | Director and Legal Counsel of Credit Suisse; Associated with Credit Suisse since July 2003; Associated with the law firm of Willkie Farr & Gallagher LLP from 1998 to 2003; Officer of other Credit Suisse Funds. | |
|
Cecilia Chau
Credit Suisse Asset
Management, LLC
Eleven Madison Avenue
New York, New York
10010
(1973) | | Treasurer | | Since
2008 | | Assistant Vice President of Credit Suisse since June 2007; Associated with Alliance Bernstein L.P. from January 2007 to May 2007; Associated with Credit Suisse from August 2000 to December 2006; Officer of other Credit Suisse Funds. | |
|
The Statement of Additional Information includes additional information about the Trustees and is available, without charge, upon request, by calling 800-222-8977.
33
Credit Suisse Trust — International Focus Portfolio
Proxy Voting and Portfolio Holdings Information (unaudited)
Information regarding how the Portfolio voted proxies related to its portfolio securities during the 12 month period ended June 30 of each year, as well as the policies and procedures that the Portfolio uses to determine how to vote proxies relating to its portfolio securities are available:
• By calling 1-800-222-8977
• On the Portfolio's website, www.credit-suisse.com/us
• On the website of the Securities and Exchange Commission, www.sec.gov.
The Portfolio files a complete schedule of its portfolio holdings for the first and third quarters of its fiscal year with the SEC on Form N-Q. The Portfolio's Forms N-Q are available on the SEC's website at www.sec.gov and may be reviewed and copied at the SEC's Public Reference Room in Washington, DC. Information on the operation of the SEC's Public Reference Room may be obtained by calling 1-202-551-8090.
34
This page intentionally left blank
This page intentionally left blank

P.O. BOX 55030, BOSTON, MA 02205-5030
800-222-8977 n www.credit-suisse.com/us
CREDIT SUISSE ASSET MANAGEMENT SECURITIES, INC., DISTRIBUTOR. TRINT-AR-1208

CREDIT SUISSE FUNDS
Annual Report
December 31, 2008
CREDIT SUISSE TRUST
n LARGE CAP VALUE PORTFOLIO
Credit Suisse Trust (the "Trust") shares are not available directly to individual investors, but may be offered only through certain insurance products and pension and retirement plans.
The Trust's investment objectives, risks, charges and expenses (which should be considered carefully before investing), and more complete information about the Trust, are provided in the Prospectus, which should be read carefully before investing. You may obtain additional copies by calling 800-222-8977 or by writing to Credit Suisse Trust, P.O. Box 55030, Boston, MA 02205-5030.
Credit Suisse Asset Management Securities, Inc., Distributor, is located at Eleven Madison Avenue, New York, NY 10010. The Trust is advised by Credit Suisse Asset Management, LLC.
The views of the Portfolio's management are as of the date of the letter and the Portfolio holdings described in this document are as of December 31, 2008; these views and Portfolio holdings may have changed subsequent to these dates. Nothing in this document is a recommendation to purchase or sell securities.
Portfolio shares are not deposits or other obligations of Credit Suisse Asset Management, LLC ("Credit Suisse") or any affiliate, are not FDIC-insured and are not guaranteed by Credit Suisse or any affiliate. Portfolio investments are subject to investment risks, including loss of your investment.
Credit Suisse Trust — Large Cap Value Portfolio
Annual Investment Adviser's Report
December 31, 2008 (unaudited)
January 29, 2009
Dear Shareholder:
For the twelve months ended December 31, 2008, Credit Suisse Trust — Large Cap Value Portfolio1 (the "Portfolio") had a loss of -36.19%, versus a return of -36.85% for its benchmark, the Russell 1000® Value Index2 (the "Russell 1000").
Market Review: A volatile year
The fiscal year ending December 31, 2008 was a tumultuous one marked by dramatic losses in the equity markets. The benchmark S&P 500 Index fell by 37.00%, while the Dow Jones Industrial Average fell by 31.93%. The Chicago Board of Exchange Volatility Index (the "VIX"), a measure of market volatility, hit highs of 80 in October and November. The current global economic crisis was caused by a multitude of factors, including a lack of liquidity, a bleak outlook for future growth, and recessionary attitudes and signals.
In December, The National Bureau of Economic Research said that the U.S. has been in a recession since December 2007. The year was marked by turmoil across industries and asset classes as evidenced by the collapse of companies such as Bear Stearns and Lehman Brothers within the financials, the sharp price fluctuations and ultimate decline of all commodities, and government efforts toward the bailout of the banking and automotive industries.
The U.S. Federal Reserve cut the Federal Funds rate several times, dropping it from 4.50% to a range of 0.00% – 0.25% by October 29, 2008. Throughout the year, the discount rate was also cut in conjunction with the Federal Funds rate, and is now at 0.50%.
The U.S. housing sector continued to weaken in 2008, as evidenced by the S&P/Case Shiller U.S. Home Price Index, which measures home prices in 20 U.S. metropolitan areas. In October, the index was down 18% from a year earlier. The drop was more than originally forecast and the Index has been falling every month since January 2007.
Additionally, as reported on December 30, 2008, the Conference Board Consumer Confidence Index fell to an all time low. The Index is now at 38.0, down from 44.7 in November. The Consumer Confidence Survey is based on a representative sample of 5,000 U.S. households.
Unemployment continued to rise in 2008, with increased job losses in all major industry sectors. Non-farm payrolls fell by 533,000 jobs in November, following losses of 403,000 in September and 320,000 in October. The household unemployment rate was 6.7%.
1
Credit Suisse Trust — Large Cap Value Portfolio
Annual Investment Adviser's Report (continued)
December 31, 2008 (unaudited)
Strategic Review and Portfolio Outlook: Confidence and liquidity need to be restored
For the annual period ending December 31, 2008, the portfolio outperformed its benchmark. Stock and sector selections in financials and industrials, and sector selection in consumer staples contributed positively to performance. Conversely, stock and sector selection in energy, health care, and utilities detracted from performance. The Fund's outperformance over its benchmark was much stronger in the fourth quarter than in the other quarters. This was mainly because of a solid performance in December resulting from the fact that hedge funds eased liquidation of positions. In addition, volatility, as demonstrated through the VIX, also decreased significantly in December compared to October and November.
On December 16, 2008, the Federal Open Market Committee (the "FOMC") issued a press release stating that "labor market conditions have deteriorated, and the available data indicate that consumer spending, business investment, and industrial production have declined. Financial markets remain quite strained and credit conditions tight. Overall, the outlook for economic activity has weakened further."
Chairman of the Federal Reserve Board Ben Bernanke stated in a speech at the Economic Club of New York on October 15, 2008 that the root of the current economic crisis is a loss of confidence by investors and the public in the strength of key financial institutions and the markets. He predicted that, as political and financial leaders slowly restore the public's faith in the markets, investors will gradually begin to re-establish their trust, and the markets will start to recover.
Despite the easing of volatility in December, compared to that of prior months, we believe there will continue to be months of uncertainty. At the end of the year, the market showed signs of easing liquidity with interest rates such as the LIBOR decreasing, interbank lending increasing, and the U.S. dollar strengthening. However, it is not clear that this additional liquidity in the markets and between banks will truly benefit consumers. For example, banks have begun to tighten their credit standards to such an extent that the average consumer may have a harder time borrowing money. Therefore, in this economic crisis where faith in the markets is key, we believe, like Bernanke, that in order for the market to recover, confidence and liquidity need to be restored.
Additionally, we have observed an increase in technical movements — caused by large hedge funds reducing leverage — not related to the fundamentals that most quantitative models are based upon. We believe that these volatile intraday swings will need to be monitored closely, but as our investment model is designed with long-term goals in mind, a drastic change in our investment model
2
Credit Suisse Trust — Large Cap Value Portfolio
Annual Investment Adviser's Report (continued)
December 31, 2008 (unaudited)
will not be made. That being said, we are continuously conducting economic, statistical, and financial research on various levels in order to enhance our model. We have gone back to the basics of finance, where we seek to buy businesses that make comfortable returns without the need for excessive leverage.
Jordan Low
Portfolio Manager
The value of investments generally will fluctuate in response to market movements and the Portfolio's performance will largely depend on the performance of value stocks, which may be more volatile than the overall market.
In addition to historical information, this report contains forward-looking statements, which may concern, among other things, domestic and foreign market, industry and economic trends and developments and government regulation and their potential impact on the Portfolio's investments. These statements are subject to risks and uncertainties and actual trends, developments and regulations in the future, and their impact on the Portfolio could be materially different from those projected, anticipated or implied. The Portfolio has no obligation to update or revise forward-looking statements.
3
Credit Suisse Trust — Large Cap Value Portfolio
Annual Investment Adviser's Report (continued)
December 31, 2008 (unaudited)
Comparison of Change in Value of $10,000 Investment in the
Credit Suisse Trust — Large Cap Value Portfolio1 and the
Russell 1000® Value Index2 for Ten Years.
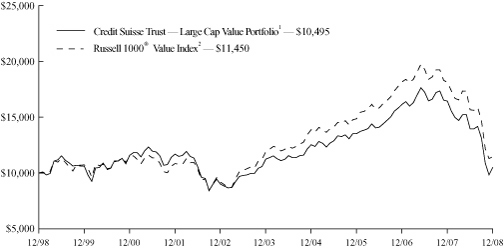
4
Credit Suisse Trust — Large Cap Value Portfolio
Annual Investment Adviser's Report (continued)
December 31, 2008 (unaudited)
Average Annual Returns as of December 31, 20081
| 1 Year | | 5 Years | | 10 Years | | Since
Inception3 | |
| | (36.19 | )% | | | (1.37 | )% | | | 0.48 | % | | | 1.82 | % | |
Returns represent past performance and include change in share price and reinvestment of dividends and capital gains. Past performance cannot guarantee future results. The current performance of the Portfolio may be lower or higher than the figures shown. Returns and share price will fluctuate, and redemption value may be more or less than original cost. The performance results do not reflect the deduction of taxes that a shareholder would pay on portfolio distributions or the redemption of portfolio shares. Performance includes the effect of deducting expenses, but does not include charges and expenses attributable to any particular variable contract or plan. Accordingly, the Prospectus of the sponsoring Participating Insurance Company separate account or plan documents or ot her informational materials supplied by plan sponsors should be carefully reviewed for information on relevant charges and expenses. Excluding these charges and expenses from quotations of performance has the effect of increasing the performance quoted, and the effect of these charges should be considered when comparing performance to that of other mutual funds. Performance information current to the most recent month-end is available at www.credit-suisse.com/us.
The annualized gross and net expense ratios are 1.16%.
1 Fee waivers and/or expense reimbursements may reduce expenses for the Portfolio, without which performance would be lower. Waivers and/or reimbursements may be discontinued at any time.
2 The Russell 1000® Value Index measures the performance of those companies in the Russell 1000® Index with lower price-to-book ratios and lower forecasted growth values. It is an unmanaged index of common stocks that includes reinvestment of dividends and is compiled by Frank Russell Company. Investors cannot invest directly in an index.
3 Inception date 10/31/97.
5
Credit Suisse Trust — Large Cap Value Portfolio
Annual Investment Adviser's Report (continued)
December 31, 2008 (unaudited)
Information About Your Portfolio's Expenses
As an investor of the Portfolio, you incur two types of costs: ongoing expenses and transaction costs. Ongoing expenses include management fees, distribution and service (12b-1) fees and other Portfolio expenses. Examples of transaction costs include sales charges (loads), redemption fees and account maintenance fees, which are not shown in this section and which would result in higher total expenses. The following table is intended to help you understand your ongoing expenses of investing in the Portfolio and to help you compare these expenses with the ongoing expenses of investing in other mutual funds. The table is based on an investment of $1,000 made at the beginning of the six month period ended December 31, 2008.
The table illustrates your Portfolio's expenses in two ways:
• Actual Portfolio Return. This helps you estimate the actual dollar amount of ongoing expenses paid on a $1,000 investment in the Portfolio using the Portfolio's actual return during the period. To estimate the expenses you paid over the period, simply divide your account value by $1,000 (for example, an $8,600 account value divided by $1,000 = 8.6), then multiply the result by the number in the "Expenses Paid per $1,000" line under the share class you hold.
• Hypothetical 5% Portfolio Return. This helps you to compare your Portfolio's ongoing expenses with those of other mutual funds using the Portfolio's actual expense ratio and a hypothetical rate of return of 5% per year before expenses. Examples using a 5% hypothetical portfolio return may be found in the shareholder reports of other mutual funds. The hypothetical account values and expenses may not be used to estimate the actual ending account balance or expenses you paid for the period.
Please note that the expenses shown in these tables are meant to highlight your ongoing expenses only and do not reflect any transaction costs, such as sales charges (loads) or redemption fees. If these transaction costs had been included, your costs would have been higher. The "Expenses Paid per $1,000" line of the tables is useful in comparing ongoing expenses only and will not help you determine the relative total expenses of owning different funds.
6
Credit Suisse Trust — Large Cap Value Portfolio
Annual Investment Adviser's Report (continued)
December 31, 2008 (unaudited)
Expenses and Value for a $1,000 Investment
for the six month period ended December 31, 2008
| Actual Portfolio Return | |
| Beginning Account Value 7/1/08 | | $ | 1,000.00 | | |
| Ending Account Value 12/31/08 | | $ | 751.90 | | |
| Expenses Paid per $1,000* | | $ | 6.25 | | |
| Hypothetical 5% Portfolio Return | |
| Beginning Account Value 7/1/08 | | $ | 1,000.00 | | |
| Ending Account Value 12/31/08 | | $ | 1,018.00 | | |
| Expenses Paid per $1,000* | | $ | 7.20 | | |
| Annualized Expense Ratios* | | | 1.42 | % | |
* Expenses are equal to the Portfolio's annualized expense ratio multiplied by the average account value over the period, multiplied by the number of days in the most recent fiscal half year period, then divided by 366.
The "Expenses Paid per $1,000" and the "Annualized Expense Ratios" in the tables are based on actual expenses paid by the Portfolio during the period, net of fee waivers and/or expense reimbursements. If those fee waivers and/or expense reimbursements had not been in effect, the Portfolio's actual expenses would have been higher. Expenses do not reflect additional charges and expenses that are, or may be, imposed under the variable contracts or plans. Such charges and expenses are described in the prospectus of the insurance company separate account or in the plan documents or other informational materials supplied by plan sponsors. The Portfolio's expenses should be considered with these charges and expenses in evaluating the overall cost of investing in the separate account.
For more information, please refer to the Portfolio's prospectus.
7
Credit Suisse Trust — Large Cap Value Portfolio
Annual Investment Adviser's Report (continued)
December 31, 2008 (unaudited)
SECTOR BREAKDOWN*

* Expressed as a percentage of total investments (excluding securities lending collateral if applicable) and may vary over time.
8
Credit Suisse Trust — Large Cap Value Portfolio
Schedule of Investments
December 31, 2008
| | | Number of
Shares | | Value | |
| COMMON STOCKS (217.4%) | |
| Aerospace & Defense (1.1%) | |
| General Dynamics Corp. | | | 300 | | | $ | 17,277 | | |
| Goodrich Corp. | | | 300 | | | | 11,106 | | |
| L-3 Communications Holdings, Inc. | | | 100 | | | | 7,378 | | |
| Northrop Grumman Corp. | | | 700 | | | | 31,528 | | |
| Raytheon Co. | | | 200 | | | | 10,208 | | |
| The Boeing Co. | | | 300 | | | | 12,801 | | |
| TransDigm Group, Inc.* | | | 100 | | | | 3,357 | | |
| United Technologies Corp. | | | 200 | | | | 10,720 | | |
| | | | 104,375 | | |
| Air Freight & Couriers (0.2%) | |
| FedEx Corp. | | | 200 | | | | 12,830 | | |
| United Parcel Service, Inc. Class B | | | 200 | | | | 11,032 | | |
| | | | 23,862 | | |
| Airlines (0.3%) | |
| AMR Corp.* | | | 300 | | | | 3,201 | | |
| Continental Airlines, Inc. Class B* | | | 500 | | | | 9,030 | | |
| Delta Air Lines, Inc.* | | | 800 | | | | 9,168 | | |
| Southwest Airlines Co. | | | 1,400 | | | | 12,068 | | |
| | | | 33,467 | | |
| Auto Components (1.5%) | |
| Autoliv, Inc. | | | 1,500 | | | | 32,190 | | |
| BorgWarner, Inc. | | | 3,500 | | | | 76,195 | | |
| Johnson Controls, Inc. | | | 1,200 | | | | 21,792 | | |
| The Goodyear Tire & Rubber Co.* | | | 1,500 | | | | 8,955 | | |
| TRW Automotive Holdings Corp.* | | | 100 | | | | 360 | | |
| WABCO Holdings, Inc. | | | 800 | | | | 12,632 | | |
| | | | 152,124 | | |
| Automobiles (0.4%) | |
| Avis Budget Group, Inc.* | | | 3,400 | | | | 2,380 | | |
| Ford Motor Co.* | | | 9,900 | | | | 22,671 | | |
| General Motors Corp. | | | 2,400 | | | | 7,680 | | |
| Hertz Global Holdings, Inc.* | | | 575 | | | | 2,915 | | |
| | | | 35,646 | | |
| Banks (15.0%) | |
| Astoria Financial Corp. | | | 10,700 | | | | 176,336 | | |
| BancorpSouth, Inc. | | | 8,600 | | | | 200,896 | | |
| Bank of America Corp. | | | 543 | | | | 7,645 | | |
| Bank of Hawaii Corp. | | | 2,300 | | | | 103,891 | | |
| Bank of New York Mellon Corp. | | | 400 | | | | 11,332 | | |
| BB&T Corp. | | | 300 | | | | 8,238 | | |
| Cullen/Frost Bankers, Inc. | | | 600 | | | | 30,408 | | |
| Fifth Third Bancorp | | | 900 | | | | 7,434 | | |
| First BanCorp. | | | 300 | | | | 3,342 | | |
| Hudson City Bancorp, Inc. | | | 18,300 | | | | 292,068 | | |
See Accompanying Notes to Financial Statements.
9
Credit Suisse Trust — Large Cap Value Portfolio
Schedule of Investments (continued)
December 31, 2008
| | | Number of
Shares | | Value | |
| COMMON STOCKS | |
| Banks | |
| Huntington Bancshares, Inc. | | | 500 | | | $ | 3,830 | | |
| KeyCorp | | | 100 | | | | 852 | | |
| National City Corp. | | | 3,674 | | | | 6,650 | | |
| New York Community Bancorp, Inc. | | | 1,200 | | | | 14,352 | | |
| Northern Trust Corp. | | | 2,600 | | | | 135,564 | | |
| Old National Bancorp | | | 500 | | | | 9,080 | | |
| Park National Corp. | | | 500 | | | | 35,875 | | |
| Popular, Inc. | | | 1,300 | | | | 6,708 | | |
| Provident Financial Services, Inc. | | | 14,200 | | | | 217,260 | | |
| Regions Financial Corp. | | | 800 | | | | 6,368 | | |
| SunTrust Banks, Inc. | | | 400 | | | | 11,816 | | |
| Synovus Financial Corp. | | | 1,100 | | | | 9,130 | | |
| TCF Financial Corp. | | | 500 | | | | 6,830 | | |
| U.S. Bancorp | | | 300 | | | | 7,503 | | |
| Valley National Bancorp | | | 6,200 | | | | 125,550 | | |
| Washington Mutual, Inc. | | | 6,300 | | | | 136 | | |
| Wells Fargo & Co. | | | 400 | | | | 11,792 | | |
| Wilmington Trust Corp. | | | 1,000 | | | | 22,240 | | |
| Zions Bancorporation | | | 200 | | | | 4,902 | | |
| | | | 1,478,028 | | |
| Beverages (1.5%) | |
| Brown-Forman Corp. Class B | | | 275 | | | | 14,160 | | |
| Dr. Pepper Snapple Group, Inc.* | | | 3,200 | | | | 52,000 | | |
| PepsiAmericas, Inc. | | | 2,400 | | | | 48,864 | | |
| PepsiCo, Inc. | | | 200 | | | | 10,954 | | |
| The Coca-Cola Co. | | | 300 | | | | 13,581 | | |
| The Pepsi Bottling Group, Inc. | | | 400 | | | | 9,004 | | |
| | | | 148,563 | | |
| Biotechnology (2.7%) | |
| Biogen Idec, Inc.* | | | 300 | | | | 14,289 | | |
| BioMarin Pharmaceutical, Inc.* | | | 600 | | | | 10,680 | | |
| Charles River Laboratories International, Inc.* | | | 500 | | | | 13,100 | | |
| Facet Biotech Corp.* | | | 340 | | | | 3,261 | | |
| Life Technologies Corp.* | | | 7,000 | | | | 163,170 | | |
| Myriad Genetics, Inc.* | | | 800 | | | | 53,008 | | |
| PDL BioPharma, Inc. | | | 1,700 | | | | 10,506 | | |
| | | | 268,014 | | |
| Building Products (3.5%) | |
| Crane Co. | | | 16,900 | | | | 291,356 | | |
| Griffon Corp.* | | | 5,200 | | | | 48,516 | | |
| USG Corp.* | | | 200 | | | | 1,608 | | |
| | | | 341,480 | | |
| Chemicals (3.3%) | |
| Air Products & Chemicals, Inc. | | | 300 | | | | 15,081 | | |
| Airgas, Inc. | | | 100 | | | | 3,899 | | |
See Accompanying Notes to Financial Statements.
10
Credit Suisse Trust — Large Cap Value Portfolio
Schedule of Investments (continued)
December 31, 2008
| | | Number of
Shares | | Value | |
| COMMON STOCKS | |
| Chemicals | |
| CF Industries Holdings, Inc. | | | 600 | | | $ | 29,496 | | |
| E.I. du Pont de Nemours & Co. | | | 400 | | | | 10,120 | | |
| FMC Corp. | | | 300 | | | | 13,419 | | |
| Huntsman Corp. | | | 300 | | | | 1,032 | | |
| Intrepid Potash, Inc.* | | | 2,000 | | | | 41,540 | | |
| Lubrizol Corp. | | | 500 | | | | 18,195 | | |
| Monsanto Co. | | | 100 | | | | 7,035 | | |
| Olin Corp. | | | 1,500 | | | | 27,120 | | |
| Praxair, Inc. | | | 200 | | | | 11,872 | | |
| The Dow Chemical Co. | | | 3,800 | | | | 57,342 | | |
| The Mosaic Co. | | | 2,500 | | | | 86,500 | | |
| | | | 322,651 | | |
| Commercial Services & Supplies (5.1%) | |
| ABM Industries, Inc. | | | 400 | | | | 7,620 | | |
| Career Education Corp.* | | | 4,900 | | | | 87,906 | | |
| Cogent, Inc.* | | | 1,200 | | | | 16,284 | | |
| Convergys Corp.* | | | 300 | | | | 1,923 | | |
| Corinthian Colleges, Inc.* | | | 1,100 | | | | 18,007 | | |
| FTI Consulting, Inc.* | | | 300 | | | | 13,404 | | |
| Global Payments, Inc. | | | 300 | | | | 9,837 | | |
| H&R Block, Inc. | | | 1,800 | | | | 40,896 | | |
| Pitney Bowes, Inc. | | | 200 | | | | 5,096 | | |
| Republic Services, Inc. | | | 2,200 | | | | 54,538 | | |
| Robert Half International, Inc. | | | 800 | | | | 16,656 | | |
| Rollins, Inc. | | | 2,000 | | | | 36,160 | | |
| Steelcase, Inc. Class A | | | 100 | | | | 562 | | |
| The Brink's Co. | | | 1,600 | | | | 43,008 | | |
| Universal Technical Institute, Inc.* | | | 100 | | | | 1,717 | | |
| Waste Management, Inc. | | | 4,100 | | | | 135,874 | | |
| Weight Watchers International, Inc. | | | 400 | | | | 11,768 | | |
| | | | 501,256 | | |
| Communications Equipment (0.9%) | |
| ADC Telecommunications, Inc.* | | | 200 | | | | 1,094 | | |
| Arris Group, Inc.* | | | 1,300 | | | | 10,335 | | |
| Cisco Systems, Inc.* | | | 500 | | | | 8,150 | | |
| Corning, Inc. | | | 700 | | | | 6,671 | | |
| InterDigital, Inc.* | | | 1,200 | | | | 33,000 | | |
| Motorola, Inc. | | | 4,100 | | | | 18,163 | | |
| QUALCOMM, Inc. | | | 300 | | | | 10,749 | | |
| Tellabs, Inc.* | | | 800 | | | | 3,296 | | |
| | | | 91,458 | | |
| Computers & Peripherals (5.3%) | |
| Dell, Inc.* | | | 200 | | | | 2,048 | | |
| Hewlett-Packard Co. | | | 300 | | | | 10,887 | | |
| International Business Machines Corp. | | | 100 | | | | 8,416 | | |
| Lexmark International, Inc. Class A* | | | 4,600 | | | | 123,740 | | |
See Accompanying Notes to Financial Statements.
11
Credit Suisse Trust — Large Cap Value Portfolio
Schedule of Investments (continued)
December 31, 2008
| | | Number of
Shares | | Value | |
| COMMON STOCKS | |
| Computers & Peripherals | |
| NCR Corp.* | | | 14,200 | | | $ | 200,788 | | |
| NetApp, Inc.* | | | 200 | | | | 2,794 | | |
| Seagate Technology | | | 500 | | | | 2,215 | | |
| Western Digital Corp.* | | | 14,800 | | | | 169,460 | | |
| | | | 520,348 | | |
| Construction & Engineering (0.0%) | |
| Foster Wheeler, Ltd.* | | | 100 | | | | 2,338 | | |
| Construction Materials (0.2%) | |
| Texas Industries, Inc. | | | 300 | | | | 10,350 | | |
| Vulcan Materials Co. | | | 200 | | | | 13,916 | | |
| | | | 24,266 | | |
| Containers & Packaging (1.2%) | |
| Ball Corp. | | | 300 | | | | 12,477 | | |
| Owens-Illinois, Inc.* | | | 300 | | | | 8,199 | | |
| Packaging Corp. of America | | | 3,900 | | | | 52,494 | | |
| Sonoco Products Co. | | | 2,000 | | | | 46,320 | | |
| Temple-Inland, Inc. | | | 500 | | | | 2,400 | | |
| | | | 121,890 | | |
| Diversified Financials (7.3%) | |
| Allied Capital Corp. | | | 600 | | | | 1,614 | | |
| American Capital, Ltd. | | | 900 | | | | 2,916 | | |
| American Express Co. | | | 500 | | | | 9,275 | | |
| AmeriCredit Corp.* | | | 300 | | | | 2,292 | | |
| BlackRock, Inc. | | | 100 | | | | 13,415 | | |
| Broadridge Financial Solutions, Inc. | | | 900 | | | | 11,286 | | |
| Capital One Financial Corp. | | | 225 | | | | 7,175 | | |
| CapitalSource, Inc. | | | 800 | | | | 3,696 | | |
| CIT Group, Inc. | | | 600 | | | | 2,724 | | |
| Citigroup, Inc. | | | 15,100 | | | | 101,321 | | |
| Discover Financial Services | | | 1,600 | | | | 15,248 | | |
| E*TRADE Financial Corp.* | | | 1,500 | | | | 1,725 | | |
| Fannie Mae | | | 3,300 | | | | 2,508 | | |
| Federated Investors, Inc. Class B | | | 6,600 | | | | 111,936 | | |
| First Horizon National Corp. | | | 629 | | | | 6,653 | | |
| Franklin Resources, Inc. | | | 300 | | | | 19,134 | | |
| Freddie Mac | | | 700 | | | | 511 | | |
| Invesco, Ltd. | | | 1,400 | | | | 20,216 | | |
| Investment Technology Group, Inc.* | | | 200 | | | | 4,544 | | |
| Janus Capital Group, Inc. | | | 400 | | | | 3,212 | | |
| Jefferies Group, Inc. | | | 400 | | | | 5,624 | | |
| JPMorgan Chase & Co. | | | 300 | | | | 9,459 | | |
| Manulife Financial Corp. | | | 600 | | | | 10,218 | | |
| Marshall & Ilsley Corp. | | | 2,500 | | | | 34,100 | | |
| Merrill Lynch & Co., Inc. | | | 600 | | | | 6,984 | | |
| MF Global, Ltd.* | | | 100 | | | | 204 | | |
See Accompanying Notes to Financial Statements.
12
Credit Suisse Trust — Large Cap Value Portfolio
Schedule of Investments (continued)
December 31, 2008
| | | Number of
Shares | | Value | |
| COMMON STOCKS | |
| Diversified Financials | |
| Morgan Stanley | | | 825 | | | $ | 13,233 | | |
| Nasdaq OMX Group, Inc.* | | | 500 | | | | 12,355 | | |
| Nelnet, Inc. Class A | | | 100 | | | | 1,433 | | |
| NewAlliance Bancshares, Inc. | | | 900 | | | | 11,853 | | |
| Principal Financial Group, Inc. | | | 1,000 | | | | 22,570 | | |
| Raymond James Financial, Inc. | | | 1,700 | | | | 29,121 | | |
| SLM Corp.* | | | 100 | | | | 890 | | |
| State Street Corp. | | | 200 | | | | 7,866 | | |
| T. Rowe Price Group, Inc. | | | 1,400 | | | | 49,616 | | |
| The Charles Schwab Corp. | | | 2,200 | | | | 35,574 | | |
| The Goldman Sachs Group, Inc. | | | 100 | | | | 8,439 | | |
| Waddell & Reed Financial, Inc. Class A | | | 7,400 | | | | 114,404 | | |
| Western Union Co. | | | 200 | | | | 2,868 | | |
| | | | 718,212 | | |
| Diversified Telecommunication Services (1.2%) | |
| AT&T, Inc. | | | 412 | | | | 11,742 | | |
| EchoStar Corp. Class A* | | | 100 | | | | 1,487 | | |
| Embarq Corp. | | | 600 | | | | 21,576 | | |
| FairPoint Communications, Inc. | | | 56 | | | | 184 | | |
| JDS Uniphase Corp.* | | | 200 | | | | 730 | | |
| NeuStar, Inc. Class A* | | | 1,400 | | | | 26,782 | | |
| Qwest Communications International, Inc. | | | 1,400 | | | | 5,096 | | |
| Sprint Nextel Corp.* | | | 5,100 | | | | 9,333 | | |
| Time Warner Cable, Inc. Class A* | | | 500 | | | | 10,725 | | |
| Verizon Communications, Inc. | | | 400 | | | | 13,560 | | |
| Windstream Corp. | | | 1,600 | | | | 14,720 | | |
| | | | 115,935 | | |
| Electric Utilities (1.9%) | |
| Alliant Energy Corp. | | | 500 | | | | 14,590 | | |
| Cleco Corp. | | | 400 | | | | 9,132 | | |
| Dominion Resources, Inc. | | | 300 | | | | 10,752 | | |
| DPL, Inc. | | | 600 | | | | 13,704 | | |
| Edison International | | | 300 | | | | 9,636 | | |
| Entergy Corp. | | | 100 | | | | 8,313 | | |
| FirstEnergy Corp. | | | 200 | | | | 9,716 | | |
| FPL Group, Inc. | | | 200 | | | | 10,066 | | |
| Mirant Corp.* | | | 500 | | | | 9,435 | | |
| NSTAR | | | 300 | | | | 10,947 | | |
| Ormat Technologies, Inc. | | | 900 | | | | 28,683 | | |
| Pepco Holdings, Inc. | | | 400 | | | | 7,104 | | |
| PG&E Corp. | | | 300 | | | | 11,613 | | |
| PNM Resources, Inc. | | | 400 | | | | 4,032 | | |
| Public Service Enterprise Group, Inc. | | | 300 | | | | 8,751 | | |
| Puget Energy, Inc. | | | 500 | | | | 13,635 | | |
| Reliant Energy, Inc.* | | | 800 | | | | 4,624 | | |
| | | | 184,733 | | |
See Accompanying Notes to Financial Statements.
13
Credit Suisse Trust — Large Cap Value Portfolio
Schedule of Investments (continued)
December 31, 2008
| | | Number of
Shares | | Value | |
| COMMON STOCKS | |
| Electronic Equipment & Instruments (8.8%) | |
| Benchmark Electronics, Inc.* | | | 14,700 | | | $ | 187,719 | | |
| Brady Corp. Class A | | | 1,700 | | | | 40,715 | | |
| Energizer Holdings, Inc.* | | | 200 | | | | 10,828 | | |
| FLIR Systems, Inc.* | | | 500 | | | | 15,340 | | |
| Ingram Micro, Inc. Class A* | | | 6,300 | | | | 84,357 | | |
| Jabil Circuit, Inc. | | | 500 | | | | 3,375 | | |
| Koninklijke (Royal) Philips Electronics NV NY Shares | | | 24,100 | | | | 478,867 | | |
| Thermo Fisher Scientific, Inc.* | | | 300 | | | | 10,221 | | |
| Tyco Electronics, Ltd. | | | 1,800 | | | | 29,178 | | |
| Waters Corp.* | | | 200 | | | | 7,330 | | |
| | | | 867,930 | | |
| Energy Equipment & Services (4.9%) | |
| Atwood Oceanics, Inc.* | | | 900 | | | | 13,752 | | |
| Baker Hughes, Inc. | | | 400 | | | | 12,828 | | |
| Cameron International Corp.* | | | 500 | | | | 10,250 | | |
| CARBO Ceramics, Inc. | | | 300 | | | | 10,659 | | |
| Dresser-Rand Group, Inc.* | | | 2,500 | | | | 43,125 | | |
| ENSCO International, Inc. | | | 1,151 | | | | 32,677 | | |
| FMC Technologies, Inc.* | | | 100 | | | | 2,383 | | |
| Halliburton Co. | | | 600 | | | | 10,908 | | |
| Helmerich & Payne, Inc. | | | 1,200 | | | | 27,300 | | |
| Hercules Offshore, Inc.* | | | 200 | | | | 950 | | |
| Key Energy Services, Inc.* | | | 200 | | | | 882 | | |
| Noble Corp. | | | 2,500 | | | | 55,225 | | |
| Oceaneering International, Inc.* | | | 400 | | | | 11,656 | | |
| Patterson-UTI Energy, Inc. | | | 2,100 | | | | 24,171 | | |
| Pride International, Inc.* | | | 1,500 | | | | 23,970 | | |
| RPC, Inc. | | | 200 | | | | 1,952 | | |
| Schlumberger, Ltd. | | | 300 | | | | 12,699 | | |
| Smith International, Inc. | | | 62 | | | | 1,419 | | |
| Superior Energy Services, Inc.* | | | 500 | | | | 7,965 | | |
| Tidewater, Inc. | | | 3,800 | | | | 153,026 | | |
| Unit Corp.* | | | 800 | | | | 21,376 | | |
| | | | 479,173 | | |
| Food & Drug Retailing (2.3%) | |
| CVS Caremark Corp. | | | 200 | | | | 5,748 | | |
| Flowers Foods, Inc. | | | 4,900 | | | | 119,364 | | |
| Rite Aid Corp.* | | | 2,900 | | | | 899 | | |
| Ruddick Corp. | | | 1,200 | | | | 33,180 | | |
| Safeway, Inc. | | | 500 | | | | 11,885 | | |
| SUPERVALU, Inc. | | | 200 | | | | 2,920 | | |
| Sysco Corp. | | | 400 | | | | 9,176 | | |
| Terra Industries, Inc. | | | 800 | | | | 13,336 | | |
| The Kroger Co. | | | 400 | | | | 10,564 | | |
| The Pantry, Inc.* | | | 200 | | | | 4,290 | | |
| Walgreen Co. | | | 500 | | | | 12,335 | | |
| | | | 223,697 | | |
See Accompanying Notes to Financial Statements.
14
Credit Suisse Trust — Large Cap Value Portfolio
Schedule of Investments (continued)
December 31, 2008
| | | Number of
Shares | | Value | |
| COMMON STOCKS | |
| Food Products (4.1%) | |
| Archer-Daniels-Midland Co. | | | 200 | | | $ | 5,766 | | |
| Bunge, Ltd. | | | 600 | | | | 31,062 | | |
| Campbell Soup Co. | | | 300 | | | | 9,003 | | |
| Corn Products International, Inc. | | | 1,700 | | | | 49,045 | | |
| Dean Foods Co.* | | | 1,500 | | | | 26,955 | | |
| Del Monte Foods Co. | | | 5,700 | | | | 40,698 | | |
| General Mills, Inc. | | | 200 | | | | 12,150 | | |
| H.J. Heinz Co. | | | 100 | | | | 3,760 | | |
| Herbalife, Ltd. | | | 5,700 | | | | 123,576 | | |
| Hormel Foods Corp. | | | 400 | | | | 12,432 | | |
| Kellogg Co. | | | 300 | | | | 13,155 | | |
| Kraft Foods, Inc. Class A | | | 300 | | | | 8,055 | | |
| McCormick & Co., Inc. | | | 500 | | | | 15,930 | | |
| Sara Lee Corp. | | | 500 | | | | 4,895 | | |
| Sensient Technologies Corp. | | | 200 | | | | 4,776 | | |
| The Hershey Co. | | | 200 | | | | 6,948 | | |
| Tyson Foods, Inc. Class A | | | 3,100 | | | | 27,156 | | |
| Unilever NV NY Shares | | | 500 | | | | 12,275 | | |
| | | | 407,637 | | |
| Forestry & Paper (0.5%) | |
| MeadWestvaco Corp. | | | 4,100 | | | | 45,879 | | |
| Gas Utilities (7.0%) | |
| Atmos Energy Corp. | | | 900 | | | | 21,330 | | |
| Energen Corp. | | | 300 | | | | 8,799 | | |
| Kinder Morgan Management LLC* | | | 306 | | | | 12,234 | | |
| MDU Resources Group, Inc. | | | 2,700 | | | | 58,266 | | |
| National Fuel Gas Co. | | | 1,700 | | | | 53,261 | | |
| New Jersey Resources Corp. | | | 8,200 | | | | 322,670 | | |
| Nicor, Inc. | | | 200 | | | | 6,948 | | |
| Northwest Natural Gas Co. | | | 1,300 | | | | 57,499 | | |
| Piedmont Natural Gas Co., Inc. | | | 1,400 | | | | 44,338 | | |
| South Jersey Industries, Inc. | | | 900 | | | | 35,865 | | |
| Southwestern Energy Co.* | | | 400 | | | | 11,588 | | |
| WGL Holdings, Inc. | | | 1,800 | | | | 58,842 | | |
| | | | 691,640 | | |
| Healthcare Equipment & Supplies (2.3%) | |
| Advanced Medical Optics, Inc.* | | | 6,200 | | | | 40,982 | | |
| Boston Scientific Corp.* | | | 2,800 | | | | 21,672 | | |
| Covidien, Ltd. | | | 300 | | | | 10,872 | | |
| Edwards Lifesciences Corp.* | | | 300 | | | | 16,485 | | |
| Haemonetics Corp.* | | | 500 | | | | 28,250 | | |
| Hill-Rom Holdings, Inc. | | | 200 | | | | 3,292 | | |
| IMS Health, Inc. | | | 900 | | | | 13,644 | | |
| Inverness Medical Innovations, Inc.* | | | 2,400 | | | | 45,384 | | |
| Kinetic Concepts, Inc.* | | | 400 | | | | 7,672 | | |
| STERIS Corp. | | | 400 | | | | 9,556 | | |
See Accompanying Notes to Financial Statements.
15
Credit Suisse Trust — Large Cap Value Portfolio
Schedule of Investments (continued)
December 31, 2008
| | | Number of
Shares | | Value | |
| COMMON STOCKS | |
| Healthcare Equipment & Supplies | |
| Stryker Corp. | | | 300 | | | $ | 11,985 | | |
| Varian Medical Systems, Inc.* | | | 400 | | | | 14,016 | | |
| Zimmer Holdings, Inc.* | | | 100 | | | | 4,042 | | |
| | | | 227,852 | | |
| Healthcare Providers & Services (6.8%) | |
| Aetna, Inc. | | | 9,400 | | | | 267,900 | | |
| AMERIGROUP Corp.* | | | 1,100 | | | | 32,472 | | |
| AmerisourceBergen Corp. | | | 500 | | | | 17,830 | | |
| Cardinal Health, Inc. | | | 100 | | | | 3,447 | | |
| Centene Corp.* | | | 100 | | | | 1,971 | | |
| CIGNA Corp. | | | 7,600 | | | | 128,060 | | |
| Community Health Systems, Inc.* | | | 300 | | | | 4,374 | | |
| Covance, Inc.* | | | 300 | | | | 13,809 | | |
| Humana, Inc.* | | | 300 | | | | 11,184 | | |
| Kindred Healthcare, Inc.* | | | 500 | | | | 6,510 | | |
| LifePoint Hospitals, Inc.* | | | 300 | | | | 6,852 | | |
| Lincare Holdings, Inc.* | | | 400 | | | | 10,772 | | |
| Magellan Health Services, Inc.* | | | 2,500 | | | | 97,900 | | |
| McKesson Corp. | | | 200 | | | | 7,746 | | |
| Omnicare, Inc. | | | 100 | | | | 2,776 | | |
| Owens & Minor, Inc. | | | 1,000 | | | | 37,650 | | |
| Quest Diagnostics, Inc. | | | 200 | | | | 10,382 | | |
| Service Corporation International | | | 500 | | | | 2,485 | | |
| UnitedHealth Group, Inc. | | | 100 | | | | 2,660 | | |
| WellCare Health Plans, Inc.* | | | 200 | | | | 2,572 | | |
| WellPoint, Inc.* | | | 171 | | | | 7,204 | | |
| | | | 676,556 | | |
| Hotels, Restaurants & Leisure (2.3%) | |
| Boyd Gaming Corp. | | | 100 | | | | 473 | | |
| Carnival Corp. | | | 600 | | | | 14,592 | | |
| CEC Entertainment, Inc.* | | | 200 | | | | 4,850 | | |
| Darden Restaurants, Inc. | | | 200 | | | | 5,636 | | |
| McDonald's Corp. | | | 200 | | | | 12,438 | | |
| Royal Caribbean Cruises, Ltd. | | | 600 | | | | 8,250 | | |
| Tim Hortons, Inc. | | | 300 | | | | 8,652 | | |
| Wendy's/Arby's Group, Inc. Class A | | | 328 | | | | 1,620 | | |
| WMS Industries, Inc.* | | | 6,000 | | | | 161,400 | | |
| Wyndham Worldwide Corp. | | | 400 | | | | 2,620 | | |
| Yum! Brands, Inc. | | | 300 | | | | 9,450 | | |
| | | | 229,981 | | |
| Household Durables (2.1%) | |
| D.R. Horton, Inc. | | | 700 | | | | 4,949 | | |
| Dolby Laboratories, Inc. Class A* | | | 700 | | | | 22,932 | | |
| Harman International Industries, Inc. | | | 500 | | | | 8,365 | | |
| Leggett & Platt, Inc. | | | 600 | | | | 9,114 | | |
| Lennar Corp. Class A | | | 600 | | | | 5,202 | | |
See Accompanying Notes to Financial Statements.
16
Credit Suisse Trust — Large Cap Value Portfolio
Schedule of Investments (continued)
December 31, 2008
| | | Number of
Shares | | Value | |
| COMMON STOCKS | |
| Household Durables | |
| M.D.C. Holdings, Inc. | | | 300 | | | $ | 9,090 | | |
| Mohawk Industries, Inc.* | | | 100 | | | | 4,297 | | |
| NVR, Inc.* | | | 100 | | | | 45,625 | | |
| Snap-on, Inc. | | | 1,200 | | | | 47,256 | | |
| The Stanley Works | | | 300 | | | | 10,230 | | |
| Tupperware Brands Corp. | | | 1,900 | | | | 43,130 | | |
| | | | 210,190 | | |
| Household Products (0.6%) | |
| Church & Dwight Co., Inc. | | | 200 | | | | 11,224 | | |
| Clorox Co. | | | 200 | | | | 11,112 | | |
| Colgate-Palmolive Co. | | | 200 | | | | 13,708 | | |
| The Procter & Gamble Co. | | | 300 | | | | 18,546 | | |
| | | | 54,590 | | |
| Industrial Conglomerates (0.6%) | |
| 3M Co. | | | 200 | | | | 11,508 | | |
| General Electric Co. | | | 600 | | | | 9,720 | | |
| KBR, Inc. | | | 500 | | | | 7,600 | | |
| Reynolds American, Inc. | | | 300 | | | | 12,093 | | |
| Textron, Inc. | | | 500 | | | | 6,935 | | |
| Tyco International, Ltd. | | | 600 | | | | 12,960 | | |
| | | | 60,816 | | |
| Insurance (38.3%) | |
| ACE, Ltd. | | | 3,700 | | | | 195,804 | | |
| Aflac, Inc. | | | 1,500 | | | | 68,760 | | |
| Ambac Financial Group, Inc. | | | 1,200 | | | | 1,560 | | |
| American Financial Group, Inc. | | | 9,100 | | | | 208,208 | | |
| American International Group, Inc. | | | 3,400 | | | | 5,338 | | |
| Aon Corp. | | | 300 | | | | 13,704 | | |
| Arch Capital Group, Ltd.* | | | 500 | | | | 35,050 | | |
| Arthur J. Gallagher & Co. | | | 500 | | | | 12,955 | | |
| Assurant, Inc. | | | 12,100 | | | | 363,000 | | |
| Axis Capital Holdings, Ltd. | | | 2,900 | | | | 84,448 | | |
| Brown & Brown, Inc. | | | 100 | | | | 2,090 | | |
| CNA Financial Corp. | | | 2,900 | | | | 47,676 | | |
| Conseco, Inc.* | | | 300 | | | | 1,554 | | |
| Endurance Specialty Holdings, Ltd. | | | 3,000 | | | | 91,590 | | |
| Everest Re Group, Ltd. | | | 300 | | | | 22,842 | | |
| Fidelity National Financial, Inc. Class A | | | 200 | | | | 3,550 | | |
| First American Corp. | | | 3,000 | | | | 86,670 | | |
| Genworth Financial, Inc. Class A | | | 1,400 | | | | 3,962 | | |
| Hanover Insurance Group, Inc. | | | 1,100 | | | | 47,267 | | |
| HCC Insurance Holdings, Inc. | | | 2,200 | | | | 58,850 | | |
| Horace Mann Educators Corp. | | | 2,500 | | | | 22,975 | | |
| Leucadia National Corp.* | | | 100 | | | | 1,980 | | |
| Lincoln National Corp. | | | 2,100 | | | | 39,564 | | |
| Loews Corp. | | | 11,500 | | | | 324,875 | | |
See Accompanying Notes to Financial Statements.
17
Credit Suisse Trust — Large Cap Value Portfolio
Schedule of Investments (continued)
December 31, 2008
| | | Number of
Shares | | Value | |
| COMMON STOCKS | |
| Insurance | |
| Marsh & McLennan Cos., Inc. | | | 400 | | | $ | 9,708 | | |
| MBIA, Inc.* | | | 1,100 | | | | 4,477 | | |
| MetLife, Inc. | | | 1,200 | | | | 41,832 | | |
| MGIC Investment Corp. | | | 300 | | | | 1,044 | | |
| Odyssey Re Holdings Corp. | | | 300 | | | | 15,543 | | |
| PartnerRe, Ltd. | | | 100 | | | | 7,127 | | |
| Protective Life Corp. | | | 300 | | | | 4,305 | | |
| Prudential Financial, Inc. | | | 1,000 | | | | 30,260 | | |
| Radian Group, Inc. | | | 200 | | | | 736 | | |
| Reinsurance Group of America, Inc. | | | 2,000 | | | | 85,640 | | |
| RenaissanceRe Holdings, Ltd. | | | 2,000 | | | | 103,120 | | |
| StanCorp Financial Group, Inc. | | | 1,500 | | | | 62,655 | | |
| The Allstate Corp. | | | 19,100 | | | | 625,716 | | |
| The Chubb Corp. | | | 1,500 | | | | 76,500 | | |
| The Hartford Financial Services Group, Inc. | | | 700 | | | | 11,494 | | |
| The Progressive Corp. | | | 500 | | | | 7,405 | | |
| The Travelers Cos., Inc. | | | 3,500 | | | | 158,200 | | |
| Torchmark Corp. | | | 8,000 | | | | 357,600 | | |
| Transatlantic Holdings, Inc. | | | 600 | | | | 24,036 | | |
| Unum Group | | | 15,400 | | | | 286,440 | | |
| W.R. Berkley Corp. | | | 3,100 | | | | 96,100 | | |
| Wesco Financial Corp. | | | 100 | | | | 28,790 | | |
| XL Capital, Ltd. Class A | | | 904 | | | | 3,345 | | |
| | | | 3,786,345 | | |
| Internet Software & Services (2.1%) | |
| McAfee, Inc.* | | | 400 | | | | 13,828 | | |
| Sohu.com, Inc.* | | | 4,000 | | | | 189,360 | | |
| | | | 203,188 | | |
| IT Consulting & Services (2.6%) | |
| Automatic Data Processing, Inc. | | | 300 | | | | 11,802 | | |
| Computer Sciences Corp.* | | | 3,300 | | | | 115,962 | | |
| Lender Processing Services, Inc. | | | 1,800 | | | | 53,010 | | |
| SAIC, Inc.* | | | 300 | | | | 5,844 | | |
| Sun Microsystems, Inc.* | | | 1,500 | | | | 5,730 | | |
| Tyler Technologies, Inc.* | | | 5,800 | | | | 69,484 | | |
| | | | 261,832 | | |
| Leisure Equipment & Products (0.6%) | |
| Eastman Kodak Co. | | | 2,900 | | | | 19,082 | | |
| Marvel Entertainment, Inc.* | | | 900 | | | | 27,675 | | |
| Mattel, Inc. | | | 700 | | | | 11,200 | | |
| | | | 57,957 | | |
| Machinery (3.8%) | |
| AGCO Corp.* | | | 2,700 | | | | 63,693 | | |
| Briggs & Stratton Corp. | | | 2,000 | | | | 35,180 | | |
| Cummins, Inc. | | | 1,400 | | | | 37,422 | | |
See Accompanying Notes to Financial Statements.
18
Credit Suisse Trust — Large Cap Value Portfolio
Schedule of Investments (continued)
December 31, 2008
| | | Number of
Shares | | Value | |
| COMMON STOCKS | |
| Machinery | |
| Deere & Co. | | | 100 | | | $ | 3,832 | | |
| Dover Corp. | | | 2,000 | | | | 65,840 | | |
| Eaton Corp. | | | 300 | | | | 14,913 | | |
| Gardner Denver, Inc.* | | | 500 | | | | 11,670 | | |
| Harsco Corp. | | | 700 | | | | 19,376 | | |
| Illinois Tool Works, Inc. | | | 200 | | | | 7,010 | | |
| Kennametal, Inc. | | | 1,200 | | | | 26,628 | | |
| Parker Hannifin Corp. | | | 300 | | | | 12,762 | | |
| Reliance Steel & Aluminum Co. | | | 500 | | | | 9,970 | | |
| The Manitowoc Co., Inc. | | | 300 | | | | 2,598 | | |
| The Timken Co. | | | 3,100 | | | | 60,853 | | |
| | | | 371,747 | | |
| Marine (1.0%) | |
| Kirby Corp.* | | | 2,200 | | | | 60,192 | | |
| Overseas Shipholding Group, Inc. | | | 900 | | | | 37,899 | | |
| | | | 98,091 | | |
| Media (2.9%) | |
| Cablevision Systems Corp. Group A | | | 500 | | | | 8,420 | | |
| Comcast Corp. Class A | | | 500 | | | | 8,440 | | |
| DISH Network Corp. Class A* | | | 1,800 | | | | 19,962 | | |
| Gannett Co., Inc. | | | 100 | | | | 800 | | |
| Idearc, Inc. | | | 300 | | | | 25 | | |
| John Wiley & Sons, Inc. Class A | | | 900 | | | | 32,022 | | |
| Liberty Media Corp. - Capital Series A* | | | 200 | | | | 942 | | |
| Liberty Media Corp. - Interactive Class A* | | | 1,100 | | | | 3,432 | | |
| News Corp. Class A | | | 5,500 | | | | 49,995 | | |
| News Corp. Class B | | | 6,100 | | | | 58,438 | | |
| Omnicom Group, Inc. | | | 400 | | | | 10,768 | | |
| Regal Entertainment Group Class A | | | 4,400 | | | | 44,924 | | |
| Scripps Networks Interactive Class A | | | 200 | | | | 4,400 | | |
| The Interpublic Group of Cos., Inc.* | | | 200 | | | | 792 | | |
| The New York Times Co. Class A | | | 500 | | | | 3,665 | | |
| The Walt Disney Co. | | | 600 | | | | 13,614 | | |
| Time Warner, Inc. | | | 1,500 | | | | 15,090 | | |
| Viacom, Inc. Class A* | | | 100 | | | | 2,012 | | |
| Virgin Media, Inc. | | | 1,300 | | | | 6,487 | | |
| | | | 284,228 | | |
| Metals & Mining (2.0%) | |
| AK Steel Holding Corp. | | | 500 | | | | 4,660 | | |
| Alcoa, Inc. | | | 500 | | | | 5,630 | | |
| Alpha Natural Resources, Inc.* | | | 1,300 | | | | 21,047 | | |
| Arch Coal, Inc. | | | 2,000 | | | | 32,580 | | |
| Compass Minerals International, Inc. | | | 1,100 | | | | 64,526 | | |
| Freeport-McMoRan Copper & Gold, Inc. | | | 100 | | | | 2,444 | | |
| Massey Energy Co. | | | 700 | | | | 9,653 | | |
| Nucor Corp. | | | 300 | | | | 13,860 | | |
See Accompanying Notes to Financial Statements.
19
Credit Suisse Trust — Large Cap Value Portfolio
Schedule of Investments (continued)
December 31, 2008
| | | Number of
Shares | | Value | |
| COMMON STOCKS | |
| Metals & Mining | |
| Peabody Energy Corp. | | | 500 | | | $ | 11,375 | | |
| Southern Copper Corp. | | | 1,400 | | | | 22,484 | | |
| United States Steel Corp. | | | 200 | | | | 7,440 | | |
| Worthington Industries, Inc. | | | 500 | | | | 5,510 | | |
| | | | 201,209 | | |
| Multi-Utilities (2.3%) | |
| Avista Corp. | | | 1,300 | | | | 25,194 | | |
| Duke Energy Corp. | | | 600 | | | | 9,006 | | |
| NiSource, Inc. | | | 17,600 | | | | 193,072 | | |
| Vectren Corp. | | | 100 | | | | 2,501 | | |
| | | | 229,773 | | |
| Multiline Retail (3.4%) | |
| 99 Cents Only Stores* | | | 4,700 | | | | 51,371 | | |
| Big Lots, Inc.* | | | 2,100 | | | | 30,429 | | |
| BJ's Wholesale Club, Inc.* | | | 1,800 | | | | 61,668 | | |
| Costco Wholesale Corp. | | | 200 | | | | 10,500 | | |
| Dollar Tree, Inc.* | | | 600 | | | | 25,080 | | |
| Family Dollar Stores, Inc. | | | 1,200 | | | | 31,284 | | |
| Macy's, Inc. | | | 9,500 | | | | 98,325 | | |
| Saks, Inc.* | | | 300 | | | | 1,314 | | |
| Sears Holdings Corp.* | | | 200 | | | | 7,774 | | |
| Wal-Mart Stores, Inc. | | | 300 | | | | 16,818 | | |
| | | | 334,563 | | |
| Office Electronics (0.0%) | |
| Xerox Corp. | | | 400 | | | | 3,188 | | |
| Oil & Gas (21.1%) | |
| Anadarko Petroleum Corp. | | | 300 | | | | 11,565 | | |
| Bill Barrett Corp.* | | | 2,100 | | | | 44,373 | | |
| Chesapeake Energy Corp. | | | 400 | | | | 6,468 | | |
| Chevron Corp. | | | 600 | | | | 44,382 | | |
| Cimarex Energy Co. | | | 300 | | | | 8,034 | | |
| Comstock Resources, Inc.* | | | 200 | | | | 9,450 | | |
| ConocoPhillips | | | 7,004 | | | | 362,807 | | |
| Devon Energy Corp. | | | 200 | | | | 13,142 | | |
| El Paso Corp. | | | 800 | | | | 6,264 | | |
| Enbridge Energy Partners LP | | | 3,100 | | | | 79,050 | | |
| Enbridge, Inc. | | | 400 | | | | 12,988 | | |
| EnCana Corp. | | | 500 | | | | 23,240 | | |
| Encore Acquisition Co.* | | | 1,300 | | | | 33,176 | | |
| Enterprise Products Partners LP | | | 500 | | | | 10,365 | | |
| EOG Resources, Inc. | | | 200 | | | | 13,316 | | |
| Exxon Mobil Corp. | | | 200 | | | | 15,966 | | |
| Frontier Oil Corp. | | | 800 | | | | 10,104 | | |
| Goodrich Petroleum Corp.* | | | 900 | | | | 26,955 | | |
| Imperial Oil, Ltd. | | | 1,200 | | | | 40,464 | | |
| Magellan Midstream Partners LP | | | 800 | | | | 24,168 | | |
See Accompanying Notes to Financial Statements.
20
Credit Suisse Trust — Large Cap Value Portfolio
Schedule of Investments (continued)
December 31, 2008
| | | Number of
Shares | | Value | |
| COMMON STOCKS | |
| Oil & Gas | |
| Marathon Oil Corp. | | | 400 | | | $ | 10,944 | | |
| Mariner Energy, Inc.* | | | 300 | | | | 3,060 | | |
| MarkWest Energy Partners, LP | | | 100 | | | | 798 | | |
| Murphy Oil Corp. | | | 2,800 | | | | 124,180 | | |
| Nexen, Inc. | | | 100 | | | | 1,758 | | |
| Occidental Petroleum Corp. | | | 200 | | | | 11,998 | | |
| Petro-Canada | | | 800 | | | | 17,512 | | |
| Pioneer Natural Resources Co. | | | 100 | | | | 1,618 | | |
| Royal Dutch Shell PLC ADR | | | 16,400 | | | | 868,216 | | |
| Stone Energy Corp.* | | | 1,100 | | | | 12,122 | | |
| Sunoco, Inc. | | | 200 | | | | 8,692 | | |
| Teekay Corp. | | | 100 | | | | 1,965 | | |
| Tesoro Corp. | | | 200 | | | | 2,634 | | |
| TransCanada Corp. | | | 300 | | | | 8,142 | | |
| Valero Energy Corp. | | | 4,978 | | | | 107,724 | | |
| W&T Offshore, Inc. | | | 6,900 | | | | 98,808 | | |
| Whiting Petroleum Corp.* | | | 200 | | | | 6,692 | | |
| | | | 2,083,140 | | |
| Paper & Forest Products (0.5%) | |
| International Paper Co. | | | 700 | | | | 8,260 | | |
| Rayonier, Inc. | | | 1,400 | | | | 43,890 | | |
| | | | 52,150 | | |
| Personal Products (2.1%) | |
| Alberto-Culver Co. | | | 6,400 | | | | 156,864 | | |
| Avon Products, Inc. | | | 300 | | | | 7,209 | | |
| The Estee Lauder Cos., Inc. Class A | | | 1,400 | | | | 43,344 | | |
| | | | 207,417 | | |
| Pharmaceuticals (9.8%) | |
| Abbott Laboratories | | | 200 | | | | 10,674 | | |
| Allergan, Inc. | | | 300 | | | | 12,096 | | |
| Eli Lilly & Co. | | | 200 | | | | 8,054 | | |
| Emergent Biosolutions, Inc.* | | | 1,400 | | | | 36,554 | | |
| Endo Pharmaceuticals Holdings, Inc.* | | | 5,200 | | | | 134,576 | | |
| Forest Laboratories, Inc.* | | | 3,800 | | | | 96,786 | | |
| Johnson & Johnson | | | 200 | | | | 11,966 | | |
| King Pharmaceuticals, Inc.* | | | 8,400 | | | | 89,208 | | |
| Medco Health Solutions, Inc.* | | | 100 | | | | 4,191 | | |
| Medicis Pharmaceutical Corp. Class A | | | 2,300 | | | | 31,970 | | |
| Merck & Co., Inc. | | | 300 | | | | 9,120 | | |
| Mylan, Inc.* | | | 800 | | | | 7,912 | | |
| Pfizer, Inc. | | | 600 | | | | 10,626 | | |
| Sepracor, Inc.* | | | 1,900 | | | | 20,862 | | |
| Teva Pharmaceutical Industries, Ltd. ADR | | | 251 | | | | 10,680 | | |
| Valeant Pharmaceuticals International* | | | 1,600 | | | | 36,640 | | |
| Watson Pharmaceuticals, Inc.* | | | 16,300 | | | | 433,091 | | |
| | | | 965,006 | | |
See Accompanying Notes to Financial Statements.
21
Credit Suisse Trust — Large Cap Value Portfolio
Schedule of Investments (continued)
December 31, 2008
| | | Number of
Shares | | Value | |
| COMMON STOCKS | |
| Real Estate (4.3%) | |
| Alexandria Real Estate Equities, Inc. | | | 100 | | | $ | 6,034 | | |
| AMB Property Corp. | | | 200 | | | | 4,684 | | |
| Annaly Capital Management, Inc. | | | 1,000 | | | | 15,870 | | |
| Apartment Investment & Management Co. Class A | | | 28 | | | | 323 | | |
| AvalonBay Communities, Inc. | | | 200 | | | | 12,116 | | |
| Boston Properties, Inc. | | | 200 | | | | 11,000 | | |
| Brandywine Realty Trust | | | 200 | | | | 1,542 | | |
| BRE Properties, Inc. | | | 100 | | | | 2,798 | | |
| CB Richard Ellis Group, Inc. Class A* | | | 200 | | | | 864 | | |
| CBL & Associates Properties, Inc. | | | 100 | | | | 650 | | |
| Developers Diversified Realty Corp. | | | 400 | | | | 1,952 | | |
| Douglas Emmett, Inc. | | | 400 | | | | 5,224 | | |
| Duke Realty Corp. | | | 300 | | | | 3,288 | | |
| Equity Residential | | | 600 | | | | 17,892 | | |
| Federal Realty Investment Trust | | | 100 | | | | 6,208 | | |
| HCP, Inc. | | | 500 | | | | 13,885 | | |
| Health Care REIT, Inc. | | | 200 | | | | 8,440 | | |
| Hospitality Properties Trust | | | 3,400 | | | | 50,558 | | |
| Host Hotels & Resorts, Inc. | | | 1,000 | | | | 7,570 | | |
| HRPT Properties Trust | | | 500 | | | | 1,685 | | |
| Jones Lang LaSalle, Inc. | | | 400 | | | | 11,080 | | |
| Kimco Realty Corp. | | | 2,700 | | | | 49,356 | | |
| Liberty Property Trust | | | 2,200 | | | | 50,226 | | |
| Mack-Cali Realty Corp. | | | 1,900 | | | | 46,550 | | |
| Nationwide Health Properties, Inc. | | | 200 | | | | 5,744 | | |
| Plum Creek Timber Co., Inc. | | | 300 | | | | 10,422 | | |
| ProLogis | | | 500 | | | | 6,945 | | |
| Public Storage | | | 300 | | | | 23,850 | | |
| Regency Centers Corp. | | | 200 | | | | 9,340 | | |
| SL Green Realty Corp. | | | 200 | | | | 5,180 | | |
| UDR, Inc. | | | 300 | | | | 4,137 | | |
| Ventas, Inc. | | | 200 | | | | 6,714 | | |
| Vornado Realty Trust | | | 300 | | | | 18,105 | | |
| Weingarten Realty Investors | | | 300 | | | | 6,207 | | |
| | | | 426,439 | | |
| Road & Rail (1.5%) | |
| CSX Corp. | | | 300 | | | | 9,741 | | |
| GATX Corp. | | | 800 | | | | 24,776 | | |
| Norfolk Southern Corp. | | | 300 | | | | 14,115 | | |
| Pacer International, Inc. | | | 1,800 | | | | 18,774 | | |
| Werner Enterprises, Inc. | | | 4,900 | | | | 84,966 | | |
| | | | 152,372 | | |
| Semiconductor Equipment & Products (5.7%) | |
| Advanced Micro Devices, Inc.* | | | 1,100 | | | | 2,376 | | |
| Analog Devices, Inc. | | | 500 | | | | 9,510 | | |
| Atmel Corp.* | | | 300 | | | | 939 | | |
| Cree, Inc.* | | | 200 | | | | 3,174 | | |
See Accompanying Notes to Financial Statements.
22
Credit Suisse Trust — Large Cap Value Portfolio
Schedule of Investments (continued)
December 31, 2008
| | | Number of
Shares | | Value | |
| COMMON STOCKS | |
| Semiconductor Equipment & Products | |
| Fairchild Semiconductor International, Inc.* | | | 300 | | | $ | 1,467 | | |
| Integrated Device Technology, Inc.* | | | 200 | | | | 1,122 | | |
| Intel Corp. | | | 600 | | | | 8,796 | | |
| International Rectifier Corp.* | | | 100 | | | | 1,350 | | |
| LSI Corp.* | | | 300 | | | | 987 | | |
| Microchip Technology, Inc. | | | 500 | | | | 9,765 | | |
| Micron Technology, Inc.* | | | 1,200 | | | | 3,168 | | |
| QLogic Corp.* | | | 37,700 | | | | 506,688 | | |
| STMicroelectronics NV NY Shares | | | 400 | | | | 2,660 | | |
| Texas Instruments, Inc. | | | 600 | | | | 9,312 | | |
| | | | 561,314 | | |
| Software (0.9%) | |
| Amdocs, Ltd.* | | | 500 | | | | 9,145 | | |
| Autodesk, Inc.* | | | 300 | | | | 5,895 | | |
| BMC Software, Inc.* | | | 800 | | | | 21,528 | | |
| CA, Inc. | | | 600 | | | | 11,118 | | |
| Cadence Design Systems, Inc.* | | | 500 | | | | 1,830 | | |
| Cerner Corp.* | | | 200 | | | | 7,690 | | |
| Compuware Corp.* | | | 2,200 | | | | 14,850 | | |
| Novell, Inc.* | | | 400 | | | | 1,556 | | |
| Oracle Corp.* | | | 500 | | | | 8,865 | | |
| Red Hat, Inc.* | | | 200 | | | | 2,644 | | |
| Symantec Corp.* | | | 500 | | | | 6,760 | | |
| | | | 91,881 | | |
| Specialty Retail (9.8%) | |
| Aaron Rents, Inc. | | | 2,900 | | | | 77,198 | | |
| Abercrombie & Fitch Co. Class A | | | 100 | | | | 2,307 | | |
| Advance Auto Parts, Inc. | | | 400 | | | | 13,460 | | |
| Aeropostale, Inc.* | | | 5,700 | | | | 91,770 | | |
| American Eagle Outfitters, Inc. | | | 800 | | | | 7,488 | | |
| AnnTaylor Stores Corp.* | | | 1,000 | | | | 5,770 | | |
| AutoNation, Inc.* | | | 100 | | | | 988 | | |
| Circuit City Stores, Inc. | | | 200 | | | | 26 | | |
| Foot Locker, Inc. | | | 9,200 | | | | 67,528 | | |
| GameStop Corp. Class A* | | | 1,700 | | | | 36,822 | | |
| Limited Brands, Inc. | | | 2,300 | | | | 23,092 | | |
| Lowe's Cos., Inc. | | | 500 | | | | 10,760 | | |
| Office Depot, Inc.* | | | 500 | | | | 1,490 | | |
| OfficeMax, Inc. | | | 200 | | | | 1,528 | | |
| RadioShack Corp. | | | 18,800 | | | | 224,472 | | |
| Regis Corp. | | | 3,300 | | | | 47,949 | | |
| Rent-A-Center, Inc.* | | | 400 | | | | 7,060 | | |
| Ross Stores, Inc. | | | 8,564 | | | | 254,608 | | |
| The Cato Corp. Class A | | | 2,500 | | | | 37,750 | | |
| The Gap, Inc. | | | 600 | | | | 8,034 | | |
| The Home Depot, Inc. | | | 500 | | | | 11,510 | | |
| The TJX Cos., Inc. | | | 500 | | | | 10,285 | | |
See Accompanying Notes to Financial Statements.
23
Credit Suisse Trust — Large Cap Value Portfolio
Schedule of Investments (continued)
December 31, 2008
| | | Number of
Shares | | Value | |
| COMMON STOCKS | |
| Specialty Retail | |
| Tractor Supply Co.* | | | 74 | | | $ | 2,674 | | |
| United Rentals, Inc.* | | | 200 | | | | 1,824 | | |
| Williams-Sonoma, Inc. | | | 2,148 | | | | 16,883 | | |
| | | | 963,276 | | |
| Textiles & Apparel (3.6%) | |
| Coach, Inc.* | | | 200 | | | | 4,154 | | |
| Jones Apparel Group, Inc. | | | 200 | | | | 1,172 | | |
| Liz Claiborne, Inc. | | | 251 | | | | 653 | | |
| NIKE, Inc. Class B | | | 200 | | | | 10,200 | | |
| Phillips-Van Heusen Corp. | | | 17,100 | | | | 344,223 | | |
| | | | 360,402 | | |
| Tobacco (3.9%) | |
| Altria Group, Inc. | | | 22,700 | | | | 341,862 | | |
| Lorillard, Inc. | | | 300 | | | | 16,905 | | |
| Vector Group, Ltd. | | | 2,000 | | | | 27,240 | | |
| | | | 386,007 | | |
| Water Utilities (0.2%) | |
| American Water Works Co., Inc. | | | 100 | | | | 2,088 | | |
| Aqua America, Inc. | | | 200 | | | | 4,118 | | |
| Nalco Holding Co. | | | 900 | | | | 10,386 | | |
| | | | 16,592 | | |
| Wireless Telecommunication Services (0.1%) | |
| United States Cellular Corp.* | | | 200 | | | | 8,648 | | |
| TOTAL COMMON STOCKS (Cost $25,101,280) | | | 21,471,352 | | |
| TOTAL INVESTMENTS AT VALUE (217.4%) (Cost $25,101,280) | | | 21,471,352 | | |
| LIABILITIES IN EXCESS OF OTHER ASSETS (-117.4%) | | | (11,594,529 | ) | |
| NET ASSETS (100.0%) | | $ | 9,876,823 | | |
INVESTMENT ABBREVIATION
ADR = American Depositary Receipt
* Non-income producing security.
See Accompanying Notes to Financial Statements.
24
Credit Suisse Trust — Large Cap Value Portfolio
Statement of Assets and Liabilities
December 31, 2008
| Assets | |
| Investments at value (Cost $25,101,280) (Note 2) | | $ | 21,471,352 | | |
| Cash | | | 45,774 | | |
| Receivable for investments sold | | | 694,311 | | |
| Dividend receivable | | | 48,647 | | |
| Receivable for portfolio shares sold | | | 19,001 | | |
| Prepaid expenses | | | 474 | | |
| Total Assets | | | 22,279,559 | | |
| Liabilities | |
| Advisory fee payable (Note 3) | | | 8,487 | | |
| Administrative services fee payable (Note 3) | | | 9,542 | | |
| Payable for portfolio shares redeemed | | | 11,664,544 | | |
| Payable for investments purchased | | | 682,479 | | |
| Trustees' fee payable | | | 2,574 | | |
| Other accrued expenses payable | | | 35,110 | | |
| Total Liabilities | | | 12,402,736 | | |
| Net Assets | |
| Capital stock, $.001 par value (Note 6) | | | 1,306 | | |
| Paid-in capital (Note 6) | | | 20,437,477 | | |
| Undistributed net investment income | | | 500,148 | | |
| Accumulated net realized loss on investments and foreign currency transactions | | | (7,432,181 | ) | |
| Net unrealized depreciation on investments and foreign currency translations | | | (3,629,927 | ) | |
| Net Assets | | $ | 9,876,823 | | |
| Shares outstanding | | | 1,306,013 | | |
| Net asset value, offering price, and redemption price per share | | $ | 7.56 | | |
See Accompanying Notes to Financial Statements.
25
Credit Suisse Trust — Large Cap Value Portfolio
Statement of Operations
For the Year Ended December 31, 2008
| Investment Income (Note 2) | |
| Dividends | | $ | 793,153 | | |
| Interest | | | 5,645 | | |
| Securities lending | | | 49,326 | | |
| Foreign taxes withheld | | | (688 | ) | |
| Total investment income | | | 847,436 | | |
| Expenses | |
| Investment advisory fees (Note 3) | | | 146,776 | | |
| Administrative services fees (Note 3) | | | 60,914 | | |
| Custodian fees | | | 51,324 | | |
| Audit and tax fees | | | 18,718 | | |
| Trustees' fees | | | 17,285 | | |
| Printing fees (Note 3) | | | 13,174 | | |
| Legal fees | | | 11,647 | | |
| Interest expense (Note 4) | | | 9,395 | | |
| Transfer agent fees | | | 2,154 | | |
| Insurance expense | | | 1,057 | | |
| Miscellaneous expense | | | 9,172 | | |
| Total expenses | | | 341,616 | | |
| Net investment income | | | 505,820 | | |
| Net Realized and Unrealized Gain (Loss) from Investments and Foreign Currency Related Items | |
| Net realized loss from investments | | | (6,563,183 | ) | |
| Net realized loss from foreign currency transactions | | | (7 | ) | |
| Net change in unrealized appreciation (depreciation) from investments | | | (7,871,289 | ) | |
| Net change in unrealized appreciation (depreciation) from foreign currency translations | | | 1 | | |
| Net realized and unrealized loss from investments and foreign currency related items | | | (14,434,478 | ) | |
| Net decrease in net assets resulting from operations | | $ | (13,928,658 | ) | |
See Accompanying Notes to Financial Statements.
26
Credit Suisse Trust — Large Cap Value Portfolio
Statements of Changes in Net Assets
| | | For the Year
Ended
December 31, 2008 | | For the Year
Ended
December 31, 2007 | |
| From Operations | |
| Net investment income | | $ | 505,820 | | | $ | 849,681 | | |
| Net realized gain (loss) from investments and foreign currency transactions | | | (6,563,190 | ) | | | 1,854,302 | | |
Net change in unrealized appreciation (depreciation)
from investments and foreign currency translations | | | (7,871,288 | ) | | | (1,593,996 | ) | |
| Net increase (decrease) in net assets resulting from operations | | | (13,928,658 | ) | | | 1,109,987 | | |
| From Dividends and Distributions | |
| Dividends from net investment income | | | (842,237 | ) | | | (734,026 | ) | |
| Distributions from net realized gains | | | (2,686,848 | ) | | | (10,891,849 | ) | |
| Net decrease in net assets resulting from dividends and distributions | | | (3,529,085 | ) | | | (11,625,875 | ) | |
| From Capital Share Transactions (Note 6) | |
| Proceeds from sale of shares | | | 702,720 | | | | 1,159,214 | | |
| Reinvestment of dividends and distributions | | | 3,529,085 | | | | 11,625,875 | | |
| Net asset value of shares redeemed | | | (28,471,976 | ) | | | (6,490,755 | ) | |
| Net increase (decrease) in net assets from capital share transactions | | | (24,240,171 | ) | | | 6,294,334 | | |
| Net decrease in net assets | | | (41,697,914 | ) | | | (4,221,554 | ) | |
| Net Assets | |
| Beginning of year | | | 51,574,737 | | | | 55,796,291 | | |
| End of year | | $ | 9,876,823 | | | $ | 51,574,737 | | |
| Undistributed net investment income | | $ | 500,148 | | | $ | 845,280 | | |
See Accompanying Notes to Financial Statements.
27
Credit Suisse Trust — Large Cap Value Portfolio
Financial Highlights
(For a Share of the Portfolio Outstanding Throughout Each Year)
| | | For the Year Ended December 31, | |
| | | 2008 | | 2007 | | 2006 | | 2005 | | 2004 | |
| Per share data | |
| Net asset value, beginning of year | | $ | 13.48 | | | $ | 17.00 | | | $ | 14.38 | | | $ | 13.40 | | | $ | 12.10 | | |
| INVESTMENT OPERATIONS | |
| Net investment income | | | 0.49 | | | | 0.24 | | | | 0.23 | | | | 0.11 | | | | 0.12 | | |
Net gain (loss) on investments and
foreign currency related items
(both realized and unrealized) | | | (5.02 | ) | | | 0.08 | | | | 2.54 | | | | 0.98 | | | | 1.25 | | |
| Total from investment operations | | | (4.53 | ) | | | 0.32 | | | | 2.77 | | | | 1.09 | | | | 1.37 | | |
| LESS DIVIDENDS AND DISTRIBUTIONS | |
| Dividends from net investment income | | | (0.33 | ) | | | (0.24 | ) | | | (0.15 | ) | | | (0.11 | ) | | | (0.07 | ) | |
| Distributions from net realized gains | | | (1.06 | ) | | | (3.60 | ) | | | — | | | | — | | | | — | | |
| Total dividends and distributions | | | (1.39 | ) | | | (3.84 | ) | | | (0.15 | ) | | | (0.11 | ) | | | (0.07 | ) | |
| Net asset value, end of year | | $ | 7.56 | | | $ | 13.48 | | | $ | 17.00 | | | $ | 14.38 | | | $ | 13.40 | | |
| Total return1 | | | (36.19 | )% | | | 1.79 | % | | | 19.35 | % | | | 8.14 | % | | | 11.34 | % | |
| RATIOS AND SUPPLEMENTAL DATA | |
| Net assets, end of year (000s omitted) | | $ | 9,877 | | | $ | 51,575 | | | $ | 55,796 | | | $ | 57,805 | | | $ | 44,853 | | |
| Ratio of expenses to average net assets | | | 1.16 | % | | | 0.81 | % | | | 1.00 | % | | | 1.00 | % | | | 1.00 | % | |
Ratio of net investment income to
average net assets | | | 1.72 | % | | | 1.55 | % | | | 1.29 | % | | | 1.03 | % | | | 1.15 | % | |
Decrease reflected in above operating expense
ratios due to waivers/reimbursements | | | — | | | | — | | | | 0.06 | % | | | 0.09 | % | | | 0.14 | % | |
| Portfolio turnover rate | | | 198 | % | | | 95 | % | | | 143 | % | | | 81 | % | | | 53 | % | |
1 Total returns are historical and assume changes in share price and reinvestment of all dividends and distributions. Had certain expenses not been reduced during the years shown, total returns would have been lower. Total returns do not reflect charges and expenses attributable to any particular variable contract or plan.
See Accompanying Notes to Financial Statements.
28
Credit Suisse Trust — Large Cap Value Portfolio
Notes to Financial Statements
December 31, 2008
Note 1. Organization
Credit Suisse Trust (the "Trust") is an open-end management investment company registered under the Investment Company Act of 1940, as amended (the "1940 Act"), and currently offers eight managed investment portfolios of which one, the Large Cap Value Portfolio (the "Portfolio"), is included in this report. The Portfolio is a diversified investment fund that seeks long-term growth of capital and income. Shares of the Portfolio are not available directly to individual investors but may be offered only through (a) variable annuity contracts and variable life insurance contracts offered by separate accounts of certain insurance companies and (b) tax-qualified pension and retirement plans. The Portfolio may not be available in connection with a particular contract or plan. The Trust was organized under the laws of the Commonwealth of Massachusetts as a business trust on March 15, 1995.
Note 2. Significant Accounting Policies
A) SECURITY VALUATION — The net asset value of the Portfolio is determined daily as of the close of regular trading on the New York Stock Exchange, Inc. (the "Exchange") on each day the Exchange is open for business. Equity investments are valued at market value, which is generally determined using the closing price on the exchange or market on which the security is primarily traded at the time of valuation (the "Valuation Time"). If no sales are reported, equity investments are generally valued at the most recent bid quotation as of the Valuation Time or at the lowest asked quotation in the case of a short sale of securities. Debt securities with a remaining maturity greater than 60 days are valued in accordance with the price supplied by a pricing service, which may use a matrix, formula or other objective method that takes into consideration market indices, yield curves and other specific adjustments. Debt obligations that will matur e in 60 days or less are valued on the basis of amortized cost, which approximates market value, unless it is determined that using this method would not represent fair value. Investments in mutual funds are valued at the mutual fund's closing net asset value per share on the day of valuation. Securities and other assets for which market quotations are not readily available, or whose values have been materially affected by events occurring before the Portfolio's Valuation Time but after the close of the securities' primary markets, are valued at fair value as determined in good faith by, or under the direction of, the Board of Trustees under procedures established by the Board of Trustees. The Portfolio may utilize a service provided by an independent third party which has been approved by the Board of Trustees to fair value certain securities. When fair-value pricing is employed, the prices of securities used by a portfolio to calculate its net asset value may differ from quoted or published prices for the same securities.
29
Credit Suisse Trust — Large Cap Value Portfolio
Notes to Financial Statements (continued)
December 31, 2008
Note 2. Significant Accounting Policies
The Portfolio adopted Financial Accounting Standards Board Statement of Financial Accounting Standards No. 157, Fair Value Measurements ("FAS 157"), effective January 1, 2008. In accordance with FAS 157, fair value is defined as the price that the Portfolio would receive upon selling an investment in a timely transaction to an independent buyer in the principal or most advantageous market of the investment. FAS 157 established a three-tier hierarchy to maximize the use of observable market data and minimize the use of unobservable inputs and to establish classification of fair value measurements for disclosure purposes. Inputs refer broadly to the assumptions that market participants would use in pricing the asset or liability, including assumptions about risk, for example, the risk inherent in a particular valuation technique used to measure fair value including such a pricing model and/or the risk inherent in the inputs to the valuation te chnique. Inputs may be observable or unobservable. Observable inputs are inputs that reflect the assumptions market participants would use in pricing the asset or liability developed based on market data obtained from sources independent of the reporting entity. Unobservable inputs are inputs that reflect the reporting entity's own assumptions about the assumptions market participants would use in pricing the asset or liability developed based on the best information available in the circumstances. The three-tier hierarchy of inputs is summarized in the three broad Levels listed below.
• Level 1 – quoted prices in active markets for identical investments
• Level 2 – other significant observable inputs (including quoted prices for similar investments, interest rates, prepayment speeds, credit risk, etc.)
• Level 3 – significant unobservable inputs (including the Portfolio's own assumptions in determining the fair value of investments)
The inputs or methodology used for valuing securities are not necessarily an indication of the risk associated with investing in those securities.
The following is a summary of the inputs used as of December 31, 2008 in valuing the Portfolio's investments carried at value:
| Valuation Inputs | | Investments in
Securities | | Other Financial
Instruments* | |
| Level 1 – Quoted Prices | | $ | 21,471,352 | | | $ | — | | |
| Level 2 – Other Significant Observable Inputs | | | — | | | | — | | |
| Level 3 – Significant Unobservable Inputs | | | — | | | | — | | |
| Total | | $ | 21,471,352 | | | $ | — | | |
*Other financial instruments include futures, forwards and swap contracts.
30
Credit Suisse Trust — Large Cap Value Portfolio
Notes to Financial Statements (continued)
December 31, 2008
Note 2. Significant Accounting Policies
B) FOREIGN CURRENCY TRANSACTIONS — The books and records of the Portfolio are maintained in U.S. dollars. Transactions denominated in foreign currencies are recorded at the current prevailing exchange rates. All assets and liabilities denominated in foreign currencies are translated into U.S. dollar amounts at the current exchange rate at the end of the period. Translation gains or losses resulting from changes in the exchange rate during the reporting period and realized gains and losses on the settlement of foreign currency transactions are reported in the results of operations for the current period. The Portfolio does not isolate that portion of realized gains and losses on investments in equity securities which is due to changes in the foreign exchange rate from that which is due to changes in market prices of equity securities. The Portfolio isolates that portion of realized gains and losses on investments in debt securities which is due to changes in the foreign exchange rate from that which is due to changes in market prices of debt securities.
C) SECURITY TRANSACTIONS AND INVESTMENT INCOME — Security transactions are accounted for on a trade date basis. Interest income is recorded on the accrual basis. Dividends are recorded on the ex-dividend date. The cost of investments sold is determined by use of the specific identification method for both financial reporting and income tax purposes.
D) DIVIDENDS AND DISTRIBUTIONS TO SHAREHOLDERS — Dividends from net investment income and distributions of net realized capital gains, if any, are declared and paid at least annually. However, to the extent that a net realized capital gain can be reduced by a capital loss carryforward, such gain will not be distributed. Income and capital gain distributions are determined in accordance with federal income tax regulations, which may differ from accounting principles generally accepted in the United States of America ("GAAP").
E) FEDERAL INCOME TAXES — No provision is made for federal taxes as it is the Portfolio's intention to continue to qualify for and elect the tax treatment applicable to regulated investment companies under the Internal Revenue Code of 1986, as amended, and to make the requisite distributions to its shareholders, which will be sufficient to relieve it from federal income and excise taxes.
During June 2006, the Financial Accounting Standards Board ("FASB") issued FASB Interpretation 48 ("FIN 48" or the "Interpretation"), Accounting for Uncertainty in Income Taxes — an interpretation of FASB statement 109. The Portfolio has reviewed its current tax positions and has determined that no provision for income tax is required in the Portfolio's financial statements. The
31
Credit Suisse Trust — Large Cap Value Portfolio
Notes to Financial Statements (continued)
December 31, 2008
Note 2. Significant Accounting Policies
Portfolio's federal tax returns for the prior three fiscal years remain subject to examination by the Internal Revenue Service.
F) USE OF ESTIMATES — The preparation of financial statements in conformity with GAAP requires management to make estimates and assumptions that affect the reported amounts of assets and liabilities and disclosure of contingent assets and liabilities at the date of the financial statements and the reported amounts of income and expenses during the reporting period. Actual results could differ from these estimates.
G) SHORT-TERM INVESTMENTS — The Portfolio, together with other funds/portfolios advised by Credit Suisse Asset Management, LLC ("Credit Suisse"), an indirect, wholly-owned subsidiary of Credit Suisse Group AG, pools available cash into either a short-term variable rate time deposit issued by State Street Bank and Trust Company ("SSB"), the Portfolio's custodian, or a money market fund advised by Credit Suisse. The short-term time deposit issued by SSB is a variable rate account classified as a short-term investment.
H) SECURITIES LENDING — Loans of securities are required at all times to be secured by collateral at least equal to 102% of the market value of domestic securities on loan (including any accrued interest thereon) and 105% of the market value of foreign securities on loan (including any accrued interest thereon). Cash collateral received by the Portfolio in connection with securities lending activity may be pooled together with cash collateral for other funds/portfolios advised by Credit Suisse and may be invested in a variety of investments, including certain Credit Suisse-advised funds, funds advised by SSB, the Portfolio's securities lending agent, or money market instruments. However, in the event of default or bankruptcy by the other party to the agreement, realization and/or retention of the collateral may be subject to legal proceedings.
SSB has been engaged by the Portfolio to act as the Portfolio's securities lending agent. The Portfolio's securities lending arrangement provides that the Portfolio and SSB will share the net income earned from securities lending activities. During the year ended December 31, 2008, total earnings from the Portfolio's investment in cash collateral received in connection with securities lending arrangements was $230,183, of which $168,753 was rebated to borrowers (brokers). The Portfolio retained $49,326 in income from the cash collateral investment, and SSB, as lending agent, was paid $12,104. The Portfolio may also be entitled to certain minimum amounts of income from its securities lending activities. Securities lending income is accrued as earned.
32
Credit Suisse Trust — Large Cap Value Portfolio
Notes to Financial Statements (continued)
December 31, 2008
Note 3. Transactions with Affiliates and Related Parties
Credit Suisse serves as investment adviser for the Portfolio. For its investment advisory services, Credit Suisse is entitled to receive a fee from the Portfolio at an annual rate of 0.50% of the Portfolio's average daily net assets. For the year ended December 31, 2008, investment advisory fees earned were $146,776.
Credit Suisse Asset Management Securities, Inc. ("CSAMSI"), an affiliate of Credit Suisse, and SSB serve as co-administrators to the Portfolio. For its co-administrative services, CSAMSI currently receives a fee calculated at an annual rate of 0.09% of the Portfolio's average daily net assets. For the year ended December 31, 2008, co-administrative services fees earned by CSAMSI were $26,419.
For its co-administrative services, SSB receives a fee, exclusive of out-of-pocket expenses, calculated in total for all the Credit Suisse funds/portfolios co-administered by SSB and allocated based upon the relative average net assets of each fund/portfolio, subject to an annual minimum fee. For the year ended December 31, 2008, co-administrative services fees earned by SSB (including out-of-pocket expenses) were $34,495.
In addition to serving as the Portfolio's co-administrator, CSAMSI currently serves as distributor of the Portfolio's shares without compensation.
Merrill Corporation ("Merrill"), an affiliate of Credit Suisse, has been engaged by the Portfolio to provide certain financial printing and fulfillment services. For the year ended December 31, 2008, Merrill was paid $17,065 for its services to the Portfolio.
Note 4. Line of Credit
The Portfolio, together with other funds/portfolios advised by Credit Suisse (collectively, the "Participating Funds"), participates in a $50 million committed, unsecured line of credit facility ("Credit Facility") for temporary or emergency purposes with SSB. Under the terms of the Credit Facility, the Participating Funds pay an aggregate commitment fee at a rate of 0.10% per annum on the average unused amount of the Credit Facility, which is allocated among the Participating Funds in such manner as is determined by the governing Boards of the Participating Funds. In addition, the Participating Funds pay interest on borrowings at the Federal Funds rate plus 0.50%. At December 31, 2008, the Portfolio had no loans outstanding under the Credit
33
Credit Suisse Trust — Large Cap Value Portfolio
Notes to Financial Statements (continued)
December 31, 2008
Note 4. Line of Credit
Facility. During the year ended December 31, 2008, the Portfolio had borrowings under the Credit Facility as follows:
Average Daily
Loan Balance | | Weighted Average
Interest Rate % | | Maximum Daily
Loan Outstanding | |
| $ | 12,498,667 | | | | 4.510 | % | | $ | 13,432,000 | | |
Note 5. Purchases and Sales of Securities
For the year ended December 31, 2008, purchases and sales of investment securities (excluding short-term investments) were $58,934,037 and $73,791,642, respectively.
Note 6. Capital Share Transactions
The Trust is authorized to issue an unlimited number of full and fractional shares of beneficial interest, $.001 par value per share. Transactions in capital shares of the Portfolio were as follows:
| | | For the Year Ended
December 31, 2008 | | For the Year Ended
December 31, 2007 | |
| Shares sold | | | 72,961 | | | | 70,390 | | |
| Shares issued in reinvestment of dividends and distributions | | | 351,153 | | | | 857,998 | | |
| Shares redeemed | | | (2,943,904 | ) | | | (38,458 | ) | |
| Net increase (decrease) | | | (2,519,790 | ) | | | 543,807 | | |
On December 31, 2008, the number of shareholders that held 5% or more of the outstanding shares of the Portfolio was as follows:
Number of
Shareholders | | Approximate Percentage
of Outstanding Shares | |
| | 2 | | | | 94 | % | |
Some of the shareholders are omnibus accounts, which hold shares on behalf of individual shareholders.
Note 7. Federal Income Taxes
Income and capital gain distributions are determined in accordance with federal income tax regulations, which may differ from GAAP.
34
Credit Suisse Trust — Large Cap Value Portfolio
Notes to Financial Statements (continued)
December 31, 2008
Note 7. Federal Income Taxes
The tax characteristics of dividends and distributions paid during the years ended December 31, 2008 and 2007, respectively, by the Portfolio were as follows:
| Ordinary Income | | Long-Term Capital Gain | |
| 2008 | | 2007 | | 2008 | | 2007 | |
| $ | 2,478,846 | | | $ | 5,729,741 | | | $ | 1,050,239 | | | $ | 5,896,134 | | |
The tax basis components of distributable earnings differ from the amounts reflected in the Statement of Assets and Liabilities by temporary book/tax differences. These differences are primarily due to losses deferred on wash sales, security lending transactions, cumulative return of capital on Real Estate Investment Trusts, cumulative basis adjustments on Partnerships and deferral of post-October losses.
At December 31, 2008, the components of distributable earnings on a tax basis were as follows:
| Undistributed net investment income | | $ | 499,785 | | |
| Accumulated realized loss | | | (4,191,425 | ) | |
| Unrealized depreciation | | | (4,476,387 | ) | |
| Defferal of post-October capital losses | | | (2,393,933 | ) | |
| | | $ | (10,561,960 | ) | |
At December 31, 2008, the Fund had capital loss carryforwards available to offset possible future capital gains as follows:
| Expires December 31, | |
| 2016 | |
| $ | 4,191,425 | | |
It is uncertain whether the Portfolio will be able to realize the benefits of the capital loss carryforward before they expire.
At December 31, 2008, the identified cost for federal income tax purposes, as well as the gross unrealized appreciation from investments for those securities having an excess of value over cost, gross unrealized depreciation from investments for those securities having an excess of cost over value and the net unrealized depreciation from investments were $25,947,738, $1,190,865, $(5,667,251) and $(4,476,386), respectively.
At December 31, 2008, the Portfolio reclassified $8,715 from undistributed net investment income to accumulated net realized loss from investments, to adjust for current period permanent book/tax differences. These permanent differences are due to differing book/tax treatments of foreign currency transactions, cumulative basis adjustments on Partnerships and prior return of
35
Credit Suisse Trust — Large Cap Value Portfolio
Notes to Financial Statements (continued)
December 31, 2008
Note 7. Federal Income Taxes
capital adjustments on Real Estate Investment Trusts reclassed from income to capital gains. Net assets were not affected by these reclassifications.
Note 8. Contingencies
In the normal course of business, the Portfolio may provide general indemnifications pursuant to certain contracts and organizational documents. The Portfolio's maximum exposure under these arrangements is dependent on future claims that may be made against the Portfolio and, therefore, cannot be estimated; however, based on experience, the risk of loss from such claims is considered remote.
Note 9. Recent Accounting Pronouncements
In March 2008, FASB issued Statement of Financial Accounting Standards No. 161, Disclosures about Derivative Instruments and Hedging Activities ("FAS 161"), an amendment of FASB Statement No. 133. FAS 161 requires enhanced disclosures about (a) how and why an entity uses derivative instruments, (b) how derivative instruments and hedging activities are accounted for, and (c) how derivative instruments and related hedging activities affect a fund's financial position, financial performance, and cash flows. Management of the Portfolio does not believe the adoption of FAS 161 will materially impact the financial statement amounts, but will require additional disclosures. This will include qualitative and quantitative disclosures on derivative positions existing at period end and the effect of usin g derivatives during the reporting period. FAS 161 is effective for financial statements issued for fiscal years and interim periods beginning after November 15, 2008.
36
Credit Suisse Trust — Large Cap Value Portfolio
Report of Independent Registered Public Accounting Firm
To the Board of Trustees of Credit Suisse Trust and Shareholders of
Credit Suisse Trust — Large Cap Value Portfolio:
In our opinion, the accompanying statement of assets and liabilities, including the schedule of investments, and the related statements of operations and of changes in net assets and the financial highlights present fairly, in all material respects, the financial position of Large Cap Value Portfolio (the "Portfolio"), a portfolio of the Credit Suisse Trust, at December 31, 2008, the results of its operations for the year then ended and the changes in its net assets and financial highlights for the periods presented, in conformity with accounting principles generally accepted in the United States of America. These financial statements and financial highlights (hereafter referred to as "financial statements") are the responsibility of the Portfolio's management. Our responsibility is to express an opinion on these financial statements based on our audits. We conducted our audits of these financial statements in accordance with the standards o f the Public Company Accounting Oversight Board (United States). Those standards require that we plan and perform the audit to obtain reasonable assurance about whether the financial statements are free of material misstatement. An audit includes examining, on a test basis, evidence supporting the amounts and disclosures in the financial statements, assessing the accounting principles used and significant estimates made by management, and evaluating the overall financial statement presentation. We believe that our audit, which included confirmation of securities at December 31, 2008 by correspondence with the custodian and brokers, provides a reasonable basis for our opinion.
PricewaterhouseCoopers LLP
Baltimore, Maryland
February 24, 2009
37
Credit Suisse Trust — Large Cap Value Portfolio
Board Approval of Advisory Agreement (unaudited)
In approving the renewal of the current Advisory Agreement, the Board of Trustees, including the Independent Trustees, at a meeting held on November 18 and 19, 2008, considered the following factors with respect to the Large Cap Value Portfolio (the "Portfolio"):
Investment Advisory Fee Rates
The Board reviewed and considered the contractual advisory fee rate of 0.50% ("Contractual Advisory Fee") in light of the extent and quality of the advisory services provided by Credit Suisse Asset Management, LLC ("Credit Suisse").
Additionally, the Board received and considered information comparing the Portfolio's Contractual Advisory Fee and the Portfolio's overall expenses with those of funds in both the relevant expense group ("Expense Group") and universe of funds ("Expense Universe") provided by Lipper Inc., an independent provider of investment company data.
Nature, Extent and Quality of the Services under the Advisory Agreement
The Board received and considered information regarding the nature, extent and quality of services provided to the Portfolio by Credit Suisse under the Advisory Agreement. The Board also noted information received at regular meetings throughout the year related to the services rendered by Credit Suisse. The Board reviewed background information about Credit Suisse, including its Form ADV. The Board considered the background and experience of Credit Suisse's senior management and the expertise of, and the amount of attention given to the Portfolio by, senior personnel of Credit Suisse. In addition, the Board reviewed the qualifications, backgrounds and responsibilities of the portfolio management team primarily responsible for the day-to-day portfolio management of the Portfolio and the extent of the resources devoted to research and analysis of actual and potential investments. The Board also received and considered information about the nat ure, extent and quality of services and fee rates offered to other Credit Suisse clients for comparable services.
Portfolio Performance
The Board received and considered the performance results of the Portfolio over time, along with comparisons both to the relevant performance group ("Performance Group") and universe of funds ("Performance Universe") for the Portfolio. The Board was provided with a description of the methodology
38
Credit Suisse Trust — Large Cap Value Portfolio
Board Approval of Advisory Agreement (unaudited) (continued)
used to arrive at the funds included in the Performance Group and the Performance Universe.
Credit Suisse Profitability
The Board received and considered a profitability analysis of Credit Suisse based on the fees payable under the Advisory Agreement for the Portfolio, including any fee waivers or fee caps, as well as other relationships between the Portfolio on the one hand and Credit Suisse affiliates on the other. The Board received profitability information for the other funds in the Credit Suisse family of funds.
Economies of Scale
The Board considered whether economies of scale in the provision of services to the Portfolio were being passed along to the shareholders. Accordingly, the Board considered whether alternative fee structures (such as breakpoint fee structures) would be more appropriate or reasonable taking into consideration economies of scale or other efficiencies that might accrue from increases in the Portfolio's asset levels.
Other Benefits to Credit Suisse
The Board considered other benefits received by Credit Suisse and its affiliates as a result of their relationship with the Portfolio. Such benefits include, among others, research arrangements with brokers who execute transactions on behalf of the Portfolio, administrative and brokerage relationships with affiliates of Credit Suisse and benefits potentially derived from an increase in Credit Suisse's businesses as a result of its relationship with the Portfolio (such as the ability to market to shareholders other financial products offered by Credit Suisse and its affiliates).
The Board considered the standards applied in seeking best execution, whether and to what extent soft dollar credits are sought and how any such credits are utilized, any benefits that may be achieved by using an affiliated broker and the existence of quality controls applicable to brokerage allocation procedures. The Board also reviewed Credit Suisse's method for allocating portfolio investment opportunities among its advisory clients.
39
Credit Suisse Trust — Large Cap Value Portfolio
Board Approval of Advisory Agreement (unaudited) (continued)
Conclusions
In selecting Credit Suisse, and approving the Advisory Agreement and the investment advisory fee under such agreement, the Board concluded that:
• The Contractual Advisory Fee was the third lowest in the Portfolio's Expense Group and the actual total expenses were near the median. The Board considered the fee to be reasonable.
• The Portfolio's performance was below the median performance of its peers in both the Performance Group and Performance Universe for all periods reviewed except the five and ten year periods. The Board noted that changes in investment strategies and portfolio management of the Portfolio had gone into effect on December 1, 2006 and that it would continue to monitor steps undertaken by Credit Suisse to improve performance.
• Aside from performance (as described above), the Board was satisfied with the nature and extent of the investment advisory services provided to the Portfolio by Credit Suisse, and that, based on dialogue with management and counsel, the services provided by Credit Suisse under the Advisory Agreement are typical of, and consistent with, those provided to similar mutual funds by other investment advisers.
• In light of the costs of providing investment management and other services to the Portfolio and Credit Suisse's ongoing commitment to the Portfolio, the profits and other ancillary benefits that Credit Suisse and its affiliates received were considered reasonable.
• Credit Suisse's profitability based on fees payable under the Advisory Agreement was reasonable in light of the nature, extent and quality of the services provided to the Portfolio thereunder.
• In light of the relatively small size of the Portfolio and the amount of the Contractual Advisory Fee, the Portfolio's current fee structure (without breakpoints) was considered reasonable.
No single factor reviewed by the Board was identified by the Board as the principal factor in determining whether to approve the Advisory Agreement. The Independent Trustees were advised by separate independent legal counsel throughout the process.
40
Credit Suisse Trust — Large Cap Value Portfolio
Information Concerning Trustees and Officers (unaudited)
Name, Address
(Year of Birth) | | Position(s)
Held with
Trust | | Term
of Office1
and
Length
of Time
Served | | Principal
Occupation(s) During
Past Five Years | | Number of
Portfolios in
Fund
Complex
Overseen by
Trustee | | Other
Directorships
Held by Trustee | |
| Independent Trustees | | | | | | | | | | | |
|
Enrique Arzac
c/o Credit Suisse Asset
Management, LLC
Attn: General Counsel
Eleven Madison Avenue
New York, New York
10010
(1941) | | Trustee, Audit Committee Chairman and Nominating Committee Member | | Since
2005 | | Professor of Finance and Economics, Graduate School of Business, Columbia University since 1971. | | | 33 | | | Director of Epoch Holding Corporation (an investment management and investment advisory services company); Director of The Adams Express Company (a closed-end investment company); Director of Petroleum and Resources Corporation (a closed-end investment company). | |
|
Jeffrey E. Garten2
Box 208200
New Haven, Connecticut
06520-8200
(1946) | | Trustee, Audit and Nominating Committee Member | | Since
1998 | | The Juan Trippe Professor in the Practice of International Trade, Finance and Business from July 2005 to present; Partner and Chairman of Garten Rothkopf (consulting firm) from October 2005 to present; Dean of Yale School of Management from November 1995 to June 2005. | | | 26 | | | Director of Aetna, Inc. (insurance company); Director of CarMax Group (used car dealers). | |
|
1 Each Trustee and Officer serves until his or her respective successor has been duly elected and qualified.
2 Mr. Garten was initially appointed as a Trustee of the Portfolio on February 6, 1998. He resigned as Trustee on February 3, 2000 and was subsequently reappointed on December 21, 2000.
41
Credit Suisse Trust — Large Cap Value Portfolio
Information Concerning Trustees and Officers (unaudited) (continued)
Name, Address
(Year of Birth) | | Position(s)
Held with
Trust | | Term
of Office1
and
Length
of Time
Served | | Principal
Occupation(s) During
Past Five Years | | Number of
Portfolios in
Fund
Complex
Overseen by
Trustee | | Other
Directorships
Held by Trustee | |
| Independent Trustees | | | | | | | | | | | |
|
Peter F. Krogh
SFS/ICC 702
Georgetown University
Washington, DC 20057
(1937) | | Trustee, Audit and Nominating Committee Member | | Since
2001 | | Dean Emeritus and Distinguished Professor of International Affairs at the Edmund A. Walsh School of Foreign Service, Georgetown University from June 1995 to present. | | | 26 | | | Director of Carlisle Companies Incorporated (diversified manufacturing company). | |
|
Steven N. Rappaport
Lehigh Court, LLC
555 Madison Avenue
29th Floor
New York, New York
10022
(1948) | | Chairman of the Board of Trustees, Audit Committee Member and Nominating Committee Chairman | | Trustee
since
1999 and
Chairman
since
2005 | | Partner of Lehigh Court, LLC and RZ Capital (private investment firms) from July 2002 to present. | | | 33 | | | Director of iCAD, Inc. (surgical and medical instruments and apparatus company); Director of Presstek, Inc. (digital imaging technologies company); Director of Wood Resources, LLC. (plywood manufacturing company). | |
|
42
Credit Suisse Trust — Large Cap Value Portfolio
Information Concerning Trustees and Officers (unaudited) (continued)
Name, Address
(Year of Birth) | | Position(s)
Held with
Trust | | Term
of Office1
and
Length
of Time
Served | | Principal Occupation(s) During Past Five Years | |
| Officers | | | | | | | |
|
George R. Hornig
Credit Suisse Asset
Management, LLC
Eleven Madison Avenue
New York, New York
10010
(1954) | | Chief Executive Officer and President | | Since
2008 | | Managing Director of Credit Suisse; Co-Chief Operating Officer of Asset Management and Head of Asset Management Americas; Associated with Credit Suisse since 1999; Officer of other Credit Suisse Funds. | |
|
Michael A. Pignataro
Credit Suisse Asset
Management, LLC
Eleven Madison Avenue
New York, New York
10010
(1959) | | Chief Financial Officer | | Since
1999 | | Director and Director of Fund Administration of Credit Suisse; Associated with Credit Suisse or its predecessor since 1984; Officer of other Credit Suisse Funds. | |
|
Emidio Morizio
Credit Suisse Asset
Management, LLC
Eleven Madison Avenue
New York, New York
10010
(1966) | | Chief Compliance Officer | | Since
2004 | | Director and Global Head of Compliance of Credit Suisse; Associated with Credit Suisse since July 2000; Officer of other Credit Suisse Funds. | |
|
J. Kevin Gao
Credit Suisse Asset
Management, LLC
Eleven Madison Avenue
New York, New York
10010
(1967) | | Chief Legal Officer since 2006, Vice President and Secretary since 2004 | | Since
2004 | | Director and Legal Counsel of Credit Suisse; Associated with Credit Suisse since July 2003; Associated with the law firm of Willkie Farr & Gallagher LLP from 1998 to 2003; Officer of other Credit Suisse Funds. | |
|
Cecilia Chau
Credit Suisse Asset
Management, LLC
Eleven Madison Avenue
New York, New York
10010
(1973) | | Treasurer | | Since
2008 | | Assistant Vice President of Credit Suisse since June 2007; Associated with Alliance Bernstein L.P. from January 2007 to May 2007; Associated with Credit Suisse from August 2000 to December 2006; Officer of other Credit Suisse Funds. | |
|
The Statement of Additional Information includes additional information about the Trustees and is available, without charge, upon request, by calling 800-222-8977.
43
Credit Suisse Trust — Large Cap Value Portfolio
Tax Information Letter
December 31, 2008 (unaudited)
Important Tax Information for Corporate Shareholders
Corporate shareholders should note for the year ended December 31, 2008, the percentage of the Portfolio's investment income (i.e., net investment income plus short-term capital gains) that qualified for the intercorporate dividends received deduction is 49%.
Important Tax Information for Shareholders
During the year ended December 31, 2008, the Portfolio declared $1,050,239 in dividends that were designated as long-term capital gains dividends.
44
Credit Suisse Trust — Large Cap Value Portfolio
Proxy Voting and Portfolio Holdings Information (unaudited)
Information regarding how the Portfolio voted proxies related to its portfolio securities during the 12 month period ended June 30 of each year, as well as the policies and procedures that the Portfolio uses to determine how to vote proxies relating to its portfolio securities are available:
• By calling 1-800-222-8977
• On the Portfolio's website, www.credit-suisse.com/us
• On the website of the Securities and Exchange Commission, www.sec.gov.
The Portfolio files a complete schedule of its portfolio holdings for the first and third quarters of its fiscal year with the SEC on Form N-Q. The Portfolio's Forms N-Q are available on the SEC's website at www.sec.gov and may be reviewed and copied at the SEC's Public Reference Room in Washington, DC. Information on the operation of the SEC's Public Reference Room may be obtained by calling 1-202-551-8090.
45

P.O. BOX 55030, BOSTON, MA 02205-5030
800-222-8977 n www.credit-suisse.com/us
CREDIT SUISSE ASSET MANAGEMENT SECURITIES, INC., DISTRIBUTOR. TRLCV-AR-1208

CREDIT SUISSE FUNDS
Annual Report
December 31, 2008
CREDIT SUISSE TRUST
n MID-CAP CORE PORTFOLIO
Credit Suisse Trust (the "Trust") shares are not available directly to individual investors, but may be offered only through certain insurance products and pension and retirement plans.
The Trust's investment objectives, risks, charges and expenses (which should be considered carefully before investing), and more complete information about the Trust, are provided in the Prospectus, which should be read carefully before investing. You may obtain additional copies by calling 800-222-8977 or by writing to Credit Suisse Trust, P.O. Box 55030, Boston, MA 02205-5030.
Credit Suisse Asset Management Securities, Inc., Distributor, is located at Eleven Madison Avenue, New York, NY 10010. The Trust is advised by Credit Suisse Asset Management, LLC.
The views of the Portfolio's management are as of the date of the letter and the Portfolio holdings described in this document are as of December 31, 2008; these views and Portfolio holdings may have changed subsequent to these dates. Nothing in this document is a recommendation to purchase or sell securities.
Portfolio shares are not deposits or other obligations of Credit Suisse Asset Management, LLC ("Credit Suisse") or any affiliate, are not FDIC-insured and are not guaranteed by Credit Suisse or any affiliate. Portfolio investments are subject to investment risks, including loss of your investment.
Credit Suisse Trust — Mid-Cap Core Portfolio
Annual Investment Adviser's Report
December 31, 2008 (unaudited)
January 29, 2009
Dear Shareholder:
For the twelve months ended December 31, 2008, Credit Suisse Trust — Mid Cap Core Portfolio1 (the "Portfolio") had a loss of -38.44%, versus an decrease of -36.23% for its benchmark, the Standard & Poor's MidCap 400 Index (S&P400).2
Market Review: A volatile year
The fiscal year ending December 31, 2008 was a tumultuous one marked by dramatic losses in the equity markets. The benchmark S&P Midcap 400 Index plummeted 36.23% while the S&P 500 Index and Dow Jones Industrial Average also fell by 37.00% and 31.93%, respectively. The Chicago Board of Exchange Volatility Index (the "VIX"), a measure of market volatility, hit highs of 80 in October and November. The current global economic crisis was caused by a multitude of factors, including a lack of liquidity, a bleak outlook for future growth, and recessionary attitudes and signals.
In December, The National Bureau of Economic Research said that the U.S. has been in a recession since December 2007. The year was marked by turmoil across industries and asset classes as evidenced by the collapse of companies such as Bear Stearns and Lehman Brothers within the financials, the sharp price fluctuations and ultimate decline of all commodities, and government efforts toward the bailout of the banking and automotive industries.
The U.S. Federal Reserve cut the Federal Funds rate several times, dropping it from 4.50% to a range of 0.00% – 0.25% by October 29, 2008. Throughout the year, the discount rate was also cut in conjunction with the Federal Funds rate, and is now at 0.50%.
The U.S. housing sector continued to weaken in 2008, as evidenced by the S&P/Case Shiller U.S. Home Price Index, which measures home prices in 20 U.S. metropolitan areas. In October, the index was down 18% from a year earlier. The drop was more than originally forecast and the Index has been falling every month since January 2007.
Additionally, as reported on December 30, 2008, the Conference Board Consumer Confidence Index fell to an all time low. The Index is now at 38.0, down from 44.7 in November. The Consumer Confidence Survey is based on a representative sample of 5,000 U.S. households.
Unemployment continued to rise in 2008, with increased job losses in all major industry sectors. Non-farm payrolls fell by 533,000 jobs in November, following
1
Credit Suisse Trust — Mid-Cap Core Portfolio
Annual Investment Adviser's Report (continued)
December 31, 2008 (unaudited)
losses of 403,000 in September and 320,000 in October. The household unemployment rate was 6.7%.
Strategic Review and Portfolio Outlook: Confidence and liquidity need to be restored
For the annual period ending December 31, 2008, the portfolio underperformed the benchmark. Although stock and sector selections in consumer staples, energy and industrials contributed positively to performance, stock and sector selection in utilities, financials and health care detracted from performance. Throughout 2008, the performance of the portfolio was comparable to that of its benchmark with minor deviations each month. There are a few exceptions: In November, the portfolio dramatically underperformed, though it recovered most of the losses in December; Additionally, October and November were extremely volatile, with the VIX hitting 80. As hedge funds continued to unwind in the last quarter, the price depression continued. Though mid-November marked the height of the hedge distress, volatility and the rate of pricing declines eased in December.
On December 16, 2008, the Federal Open Market Committee (the "FOMC") issued a press release stating that "labor market conditions have deteriorated, and the available data indicate that consumer spending, business investment, and industrial production have declined. Financial markets remain quite strained and credit conditions tight. Overall, the outlook for economic activity has weakened further."
Chairman of the Federal Reserve Board Ben Bernanke stated in a speech at the Economic Club of New York on October 15, 2008 that the root of the current economic crisis is a loss of confidence by investors and the public in the strength of key financial institutions and the markets. He predicted that, as political and financial leaders slowly restore the public's faith in the markets, investors will gradually begin to re-establish their trust, and the markets will start to recover.
Despite the easing of volatility in December, compared to that of prior months, we believe there will continue to be months of uncertainty. At the end of the year, the market showed signs of easing liquidity with interest rates such as the LIBOR decreasing, interbank lending increasing, and the U.S. dollar strengthening. However, it is not clear that this additional liquidity in the markets and between banks will truly benefit consumers. For example, banks have begun to tighten their credit standards to such an extent that the average consumer may have a harder time borrowing money. Therefore, in this economic crisis where faith in the markets is key, we believe, like Bernanke, that in order for the market to recover, confidence and liquidity need to be restored.
2
Credit Suisse Trust — Mid-Cap Core Portfolio
Annual Investment Adviser's Report (continued)
December 31, 2008 (unaudited)
Additionally, we have observed an increase in technical movements — caused by large hedge funds reducing leverage — not related to the fundamentals that most quantitative models are based upon. We believe that these volatile intraday swings will need to be monitored closely, but as our investment model is designed with long-term goals in mind, a drastic change in our investment model will not be made. That being said, we are continuously conducting economic, statistical, and financial research on various levels in order to enhance our model. We have gone back to the basics of finance, where we seek to buy businesses that make comfortable returns without the need for excessive leverage.
Jordan Low
Portfolio Manager
Investing in small to medium-sized companies may be more volatile and less liquid than investments in larger companies.
In addition to historical information, this report contains forward-looking statements, which may concern, among other things, domestic and foreign market, industry and economic trends and developments and government regulation and their potential impact on the Portfolio's investments. These statements are subject to risks and uncertainties and actual trends, developments and regulations in the future, and their impact on the Portfolio could be materially different from those projected, anticipated or implied. The Portfolio has no obligation to update or revise forward-looking statements.
3
Credit Suisse Trust — Mid-Cap Core Portfolio
Annual Investment Adviser's Report (continued)
December 31, 2008 (unaudited)
Comparison of Change in Value of $10,000 Investment in the
Credit Suisse Trust — Mid Cap Core Portfolio1 and
the S&P MidCap 400 Index2,3 from Inception (9/13/99).
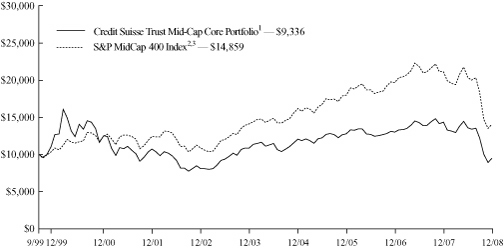
4
Credit Suisse Trust — Mid-Cap Core Portfolio
Annual Investment Adviser's Report (continued)
December 31, 2008 (unaudited)
Average Annual Returns as of December 31, 20081
| 1 Year | | 5 Years | | Since
Inception | |
| | (38.44 | )% | | | (3.25 | )% | | | (0.74 | )% | |
Returns represent past performance and include change in share price and reinvestment of dividends and capital gains. Past performance cannot guarantee future results. The current performance of the Portfolio may be lower or higher than the figures shown. Returns and share price will fluctuate, and redemption value may be more or less than original cost. The performance results do not reflect the deduction of taxes that a shareholder would pay on portfolio distributions or the redemption of portfolio shares. Performance includes the effect of deducting expenses, but does not include charges and expenses attributable to any particular variable contract or plan. Accordingly, the Prospectus of the sponsoring Participating Insurance Company separate account or plan documents or ot her informational materials supplied by plan sponsors should be carefully reviewed for information on relevant charges and expenses. Excluding these charges and expenses from quotations of performance has the effect of increasing the performance quoted, and the effect of these charges should be considered when comparing performance to that of other mutual funds. Performance information current to the most recent month-end is available at www.credit-suisse.com/us.
The annualized gross expense ratio is 1.45%. The annualized net expense ratio after fee waivers and/or expense reimbursements is 1.34%.
1 Fee waivers and/or expense reimbursements may reduce expenses for the Portfolio, without which performance would be lower. Waivers and/or reimbursements may be discontinued at any time.
2 The S&P MidCap 400 Index is an unmanaged market-weighted index composed of 400 U.S. stocks selected on the basis of market capitalization, liquidity and industry group representation and is a registered trademark of The McGraw-Hill Co., Inc. Investors cannot invest directly in an index.
3 Performance for the benchmark is not available for the period beginning September 13, 1999 (commencement of operations). For that reason, performance is shown for the period beginning September 1, 1999.
5
Credit Suisse Trust — Mid-Cap Core Portfolio
Annual Investment Adviser's Report (continued)
December 31, 2008 (unaudited)
Information About Your Portfolio's Expenses
As an investor of the Portfolio, you incur two types of costs: ongoing expenses and transaction costs. Ongoing expenses include management fees, distribution and service (12b-1) fees and other Portfolio expenses. Examples of transaction costs include sales charges (loads), redemption fees and account maintenance fees, which are not shown in this section and which would result in higher total expenses. The following table is intended to help you understand your ongoing expenses of investing in the Portfolio and to help you compare these expenses with the ongoing expenses of investing in other mutual funds. The table is based on an investment of $1,000 made at the beginning of the six month period ended December 31, 2008.
The table illustrates your Portfolio's expenses in two ways:
• Actual Portfolio Return. This helps you estimate the actual dollar amount of ongoing expenses paid on a $1,000 investment in the Portfolio using the Portfolio's actual return during the period. To estimate the expenses you paid over the period, simply divide your account value by $1,000 (for example, an $8,600 account value divided by $1,000 = 8.6), then multiply the result by the number in the "Expenses Paid per $1,000" line under the share class you hold.
• Hypothetical 5% Portfolio Return. This helps you to compare your Portfolio's ongoing expenses with those of other mutual funds using the Portfolio's actual expense ratio and a hypothetical rate of return of 5% per year before expenses. Examples using a 5% hypothetical portfolio return may be found in the shareholder reports of other mutual funds. The hypothetical account values and expenses may not be used to estimate the actual ending account balance or expenses you paid for the period.
Please note that the expenses shown in these tables are meant to highlight your ongoing expenses only and do not reflect any transaction costs, such as sales charges (loads) or redemption fees. If these transaction costs had been included, your costs would have been higher. The "Expenses Paid per $1,000" line of the tables is useful in comparing ongoing expenses only and will not help you determine the relative total expenses of owning different funds.
6
Credit Suisse Trust — Mid-Cap Core Portfolio
Annual Investment Adviser's Report (continued)
December 31, 2008 (unaudited)
Expenses and Value for a $1,000 Investment
for the six month period ended December 31, 2008
| Actual Portfolio Return | |
| Beginning Account Value 7/1/08 | | $ | 1,000.00 | | |
| Ending Account Value 12/31/08 | | $ | 654.40 | | |
| Expenses Paid per $1,000* | | $ | 6.11 | | |
| Hypothetical 5% Portfolio Return | |
| Beginning Account Value 7/1/08 | | $ | 1,000.00 | | |
| Ending Account Value 12/31/08 | | $ | 1,017.75 | | |
| Expenses Paid per $1,000* | | $ | 7.46 | | |
| Annualized Expense Ratios* | | | 1.47 | % | |
* Expenses are equal to the Portfolio's annualized expense ratio multiplied by the average account value over the period, multiplied by the number of days in the most recent fiscal half year period, then divided by 366.
The "Expenses Paid per $1,000" and the "Annualized Expense Ratios" in the tables are based on actual expenses paid by the Portfolio during the period, net of fee waivers and/or expense reimbursements. If those fee waivers and/or expense reimbursements had not been in effect, the Portfolio's actual expenses would have been higher. Expenses do not reflect additional charges and expenses that are, or may be, imposed under the variable contracts or plans. Such charges and expenses are described in the prospectus of the insurance company separate account or in the plan documents or other informational materials supplied by plan sponsors. The Portfolio's expenses should be considered with these charges and expenses in evaluating the overall cost of investing in the separate account.
For more information, please refer to the Portfolio's prospectus.
7
Credit Suisse Trust — Mid-Cap Core Portfolio
Annual Investment Adviser's Report (continued)
December 31, 2008 (unaudited)
SECTOR BREAKDOWN*
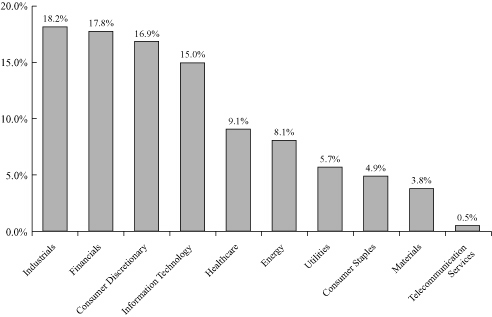
* Expressed as a percentage of total investments (excluding securities lending collateral if applicable) and may vary over time.
8
Credit Suisse Trust — Mid-Cap Core Portfolio
Schedule of Investments
December 31, 2008
| | | Number of
Shares | | Value | |
| COMMON STOCKS (100.3%) | |
| Aerospace & Defense (0.4%) | |
| BE Aerospace, Inc.* | | | 100 | | | $ | 769 | | |
| Cubic Corp. | | | 500 | | | | 13,600 | | |
| Hexcel Corp.* | | | 4,300 | | | | 31,777 | | |
| Spirit AeroSystems Holdings, Inc. Class A* | | | 700 | | | | 7,119 | | |
| | | | 53,265 | | |
| Airlines (0.2%) | |
| AirTran Holdings, Inc.* | | | 1,000 | | | | 4,440 | | |
| Copa Holdings SA Class A | | | 100 | | | | 3,032 | | |
| Delta Air Lines, Inc.* | | | 1,300 | | | | 14,898 | | |
| | | | 22,370 | | |
| Auto Components (1.5%) | |
| ArvinMeritor, Inc. | | | 649 | | | | 1,850 | | |
| BorgWarner, Inc. | | | 1,800 | | | | 39,186 | | |
| Federal Signal Corp. | | | 5,100 | | | | 41,871 | | |
| Gentex Corp. | | | 7,900 | | | | 69,757 | | |
| Lear Corp.* | | | 500 | | | | 705 | | |
| Modine Manufacturing Co. | | | 300 | | | | 1,461 | | |
| Superior Industries International, Inc. | | | 500 | | | | 5,260 | | |
| WABCO Holdings, Inc. | | | 1,400 | | | | 22,106 | | |
| Wabtec Corp. | | | 200 | | | | 7,950 | | |
| | | | 190,146 | | |
| Automobiles (0.0%) | |
| Avis Budget Group, Inc.* | | | 2,200 | | | | 1,540 | | |
| Thor Industries, Inc. | | | 300 | | | | 3,954 | | |
| | | | 5,494 | | |
| Banks (3.8%) | |
| Associated Banc-Corp. | | | 539 | | | | 11,281 | | |
| Astoria Financial Corp. | | | 4,153 | | | | 68,441 | | |
| BancorpSouth, Inc. | | | 100 | | | | 2,336 | | |
| Bank of Hawaii Corp. | | | 900 | | | | 40,653 | | |
| Cathay General Bancorp | | | 1,200 | | | | 28,500 | | |
| First Niagara Financial Group, Inc. | | | 173 | | | | 2,797 | | |
| FirstMerit Corp. | | | 405 | | | | 8,339 | | |
| New York Community Bancorp, Inc. | | | 100 | | | | 1,196 | | |
| PacWest Bancorp | | | 385 | | | | 10,357 | | |
| Park National Corp. | | | 400 | | | | 28,700 | | |
| Provident Financial Services, Inc. | | | 12,300 | | | | 188,190 | | |
| SVB Financial Group* | | | 643 | | | | 16,866 | | |
| Synovus Financial Corp. | | | 358 | | | | 2,971 | | |
| The Colonial BancGroup, Inc. | | | 1,100 | | | | 2,277 | | |
| Washington Federal, Inc. | | | 131 | | | | 1,960 | | |
| Westamerica BanCorporation | | | 400 | | | | 20,460 | | |
| Wilmington Trust Corp. | | | 1,823 | | | | 40,544 | | |
| | | | 475,868 | | |
See Accompanying Notes to Financial Statements.
9
Credit Suisse Trust — Mid-Cap Core Portfolio
Schedule of Investments (continued)
December 31, 2008
| | | Number of
Shares | | Value | |
| COMMON STOCKS | |
| Beverages (0.1%) | |
| Hansen Natural Corp.* | | | 127 | | | $ | 4,258 | | |
| The Boston Beer Co., Inc. Class A* | | | 100 | | | | 2,840 | | |
| | | | 7,098 | | |
| Biotechnology (1.0%) | |
| Affymetrix, Inc.* | | | 600 | | | | 1,794 | | |
| Cubist Pharmaceuticals, Inc.* | | | 1,000 | | | | 24,160 | | |
| CV Therapeutics, Inc.* | | | 1,400 | | | | 12,894 | | |
| Facet Biotech Corp.* | | | 2,060 | | | | 19,755 | | |
| PDL BioPharma, Inc. | | | 10,300 | | | | 63,654 | | |
| Sequenom, Inc.* | | | 200 | | | | 3,968 | | |
| | | | 126,225 | | |
| Building Products (4.1%) | |
| Crane Co. | | | 25,000 | | | | 431,000 | | |
| Griffon Corp.* | | | 7,000 | | | | 65,310 | | |
| Trex Co., Inc.* | | | 1,400 | | | | 23,044 | | |
| | | | 519,354 | | |
| Chemicals (0.9%) | |
| Airgas, Inc. | | | 1,500 | | | | 58,485 | | |
| Ashland, Inc. | | | 100 | | | | 1,051 | | |
| Chemtura Corp. | | | 3,300 | | | | 4,620 | | |
| Cytec Industries, Inc. | | | 246 | | | | 5,220 | | |
| Ferro Corp. | | | 900 | | | | 6,345 | | |
| FMC Corp. | | | 100 | | | | 4,473 | | |
| Innophos Holdings, Inc. | | | 300 | | | | 5,943 | | |
| Methanex Corp | | | 500 | | | | 5,620 | | |
| NL Industries, Inc. | | | 1,700 | | | | 22,780 | | |
| Olin Corp. | | | 100 | | | | 1,808 | | |
| | | | 116,345 | | |
| Commercial Services & Supplies (5.4%) | |
| Brink's Home Security Holdings, Inc.* | | | 900 | | | | 19,728 | | |
| Career Education Corp.* | | | 5,400 | | | | 96,876 | | |
| Cogent, Inc.* | | | 1,900 | | | | 25,783 | | |
| Coinstar, Inc.* | | | 500 | | | | 9,755 | | |
| Corinthian Colleges, Inc.* | | | 7,700 | | | | 126,049 | | |
| Darling International, Inc.* | | | 200 | | | | 1,098 | | |
| FactSet Research Systems, Inc. | | | 2,000 | | | | 88,480 | | |
| Herman Miller, Inc. | | | 1,700 | | | | 22,151 | | |
| Intermec, Inc.* | | | 400 | | | | 5,312 | | |
| Korn/Ferry International* | | | 1,600 | | | | 18,272 | | |
| PHI, Inc.* | | | 700 | | | | 9,807 | | |
| Republic Services, Inc. | | | 100 | | | | 2,479 | | |
| Rollins, Inc. | | | 3,400 | | | | 61,472 | | |
| The Brink's Co. | | | 5,300 | | | | 142,464 | | |
| The Corporate Executive Board Co. | | | 791 | | | | 17,449 | | |
| Universal Technical Institute, Inc.* | | | 300 | | | | 5,151 | | |
| Waste Management, Inc. | | | 800 | | | | 26,512 | | |
| | | | 678,838 | | |
See Accompanying Notes to Financial Statements.
10
Credit Suisse Trust — Mid-Cap Core Portfolio
Schedule of Investments (continued)
December 31, 2008
| | | Number of
Shares | | Value | |
| COMMON STOCKS | |
| Communications Equipment (1.4%) | |
| 3Com Corp.* | | | 2,500 | | | $ | 5,700 | | |
| ADC Telecommunications, Inc.* | | | 900 | | | | 4,923 | | |
| ADTRAN, Inc. | | | 100 | | | | 1,488 | | |
| Arris Group, Inc.* | | | 1,600 | | | | 12,720 | | |
| Bel Fuse, Inc. Class B | | | 400 | | | | 8,480 | | |
| Ciena Corp.* | | | 1,800 | | | | 12,060 | | |
| Emulex Corp.* | | | 2,000 | | | | 13,960 | | |
| F5 Networks, Inc.* | | | 1,400 | | | | 32,004 | | |
| InterDigital, Inc.* | | | 2,400 | | | | 66,000 | | |
| Plantronics, Inc. | | | 1,400 | | | | 18,480 | | |
| | | | 175,815 | | |
| Computers & Peripherals (3.1%) | |
| NCR Corp.* | | | 14,971 | | | | 211,690 | | |
| Palm, Inc.* | | | 2,000 | | | | 6,140 | | |
| Synaptics, Inc.* | | | 1,700 | | | | 28,152 | | |
| Western Digital Corp.* | | | 12,400 | | | | 141,980 | | |
| | | | 387,962 | | |
| Construction & Engineering (0.8%) | |
| Dycom Industries, Inc.* | | | 400 | | | | 3,288 | | |
| MasTec, Inc.* | | | 800 | | | | 9,264 | | |
| The Shaw Group, Inc.* | | | 4,400 | | | | 90,068 | | |
| | | | 102,620 | | |
| Construction Materials (0.2%) | |
| Texas Industries, Inc. | | | 700 | | | | 24,150 | | |
| Containers & Packaging (0.5%) | |
| Greif, Inc. Class A | | | 600 | | | | 20,058 | | |
| Packaging Corp. of America | | | 2,400 | | | | 32,304 | | |
| Sonoco Products Co. | | | 100 | | | | 2,316 | | |
| Temple-Inland, Inc. | | | 900 | | | | 4,320 | | |
| | | | 58,998 | | |
| Diversified Financials (2.5%) | |
| AmeriCredit Corp.* | | | 2,100 | | | | 16,044 | | |
| Apollo Investment Corp. | | | 2,700 | | | | 25,137 | | |
| Investment Technology Group, Inc.* | | | 3,800 | | | | 86,336 | | |
| Jefferies Group, Inc. | | | 500 | | | | 7,030 | | |
| Nelnet, Inc. Class A | | | 100 | | | | 1,433 | | |
| Raymond James Financial, Inc. | | | 1,170 | | | | 20,042 | | |
| Waddell & Reed Financial, Inc. Class A | | | 10,562 | | | | 163,289 | | |
| | | | 319,311 | | |
| Diversified Telecommunication Services (0.5%) | |
| Cincinnati Bell, Inc.* | | | 3,400 | | | | 6,562 | | |
| NeuStar, Inc. Class A* | | | 3,300 | | | | 63,129 | | |
| | | | 69,691 | | |
See Accompanying Notes to Financial Statements.
11
Credit Suisse Trust — Mid-Cap Core Portfolio
Schedule of Investments (continued)
December 31, 2008
| | | Number of
Shares | | Value | |
| COMMON STOCKS | |
| Electric Utilities (0.4%) | |
| ALLETE, Inc. | | | 600 | | | $ | 19,362 | | |
| PNM Resources, Inc. | | | 3,500 | | | | 35,280 | | |
| Puget Energy, Inc. | | | 100 | | | | 2,727 | | |
| | | | 57,369 | | |
| Electronic Equipment & Instruments (2.4%) | |
| Avnet, Inc.* | | | 400 | | | | 7,284 | | |
| Benchmark Electronics, Inc.* | | | 7,400 | | | | 94,498 | | |
| Brady Corp. Class A | | | 100 | | | | 2,395 | | |
| Ingram Micro, Inc. Class A* | | | 12,200 | | | | 163,358 | | |
| Intersil Corp. Class A | | | 200 | | | | 1,838 | | |
| Jabil Circuit, Inc. | | | 100 | | | | 675 | | |
| KEMET Corp.* | | | 1,700 | | | | 459 | | |
| Tecumseh Products Co. Class B* | | | 100 | | | | 955 | | |
| Varian, Inc.* | | | 900 | | | | 30,159 | | |
| | | | 301,621 | | |
| Energy Equipment & Services (4.8%) | |
| CARBO Ceramics, Inc. | | | 400 | | | | 14,212 | | |
| Dresser-Rand Group, Inc.* | | | 2,200 | | | | 37,950 | | |
| FMC Technologies, Inc.* | | | 1,300 | | | | 30,979 | | |
| Helmerich & Payne, Inc. | | | 100 | | | | 2,275 | | |
| Oceaneering International, Inc.* | | | 200 | | | | 5,828 | | |
| Oil States International, Inc.* | | | 3,100 | | | | 57,939 | | |
| Patterson-UTI Energy, Inc. | | | 1,600 | | | | 18,416 | | |
| Pride International, Inc.* | | | 9,900 | | | | 158,202 | | |
| Smith International, Inc. | | | 62 | | | | 1,419 | | |
| Superior Energy Services, Inc.* | | | 500 | | | | 7,965 | | |
| Tidewater, Inc. | | | 4,900 | | | | 197,323 | | |
| Unit Corp.* | | | 2,700 | | | | 72,144 | | |
| | | | 604,652 | | |
| Food & Drug Retailing (2.1%) | |
| Flowers Foods, Inc. | | | 1,200 | | | | 29,232 | | |
| PetMed Express, Inc.* | | | 300 | | | | 5,289 | | |
| Ruddick Corp. | | | 6,300 | | | | 174,195 | | |
| Terra Industries, Inc. | | | 2,200 | | | | 36,674 | | |
| The Pantry, Inc.* | | | 900 | | | | 19,305 | | |
| | | | 264,695 | | |
| Food Products (0.8%) | |
| Del Monte Foods Co. | | | 300 | | | | 2,142 | | |
| Diamond Foods, Inc. | | | 1,700 | | | | 34,255 | | |
| Herbalife, Ltd. | | | 3,100 | | | | 67,208 | | |
| Sensient Technologies Corp. | | | 100 | | | | 2,388 | | |
| | | | 105,993 | | |
See Accompanying Notes to Financial Statements.
12
Credit Suisse Trust — Mid-Cap Core Portfolio
Schedule of Investments (continued)
December 31, 2008
| | | Number of
Shares | | Value | |
| COMMON STOCKS | |
| Gas Utilities (4.2%) | |
| Energen Corp. | | | 1,100 | | | $ | 32,263 | | |
| MDU Resources Group, Inc. | | | 100 | | | | 2,158 | | |
| National Fuel Gas Co. | | | 2,000 | | | | 62,660 | | |
| Northwest Natural Gas Co. | | | 5,800 | | | | 256,534 | | |
| South Jersey Industries, Inc. | | | 3,100 | | | | 123,535 | | |
| UGI Corp. | | | 100 | | | | 2,442 | | |
| WGL Holdings, Inc. | | | 1,500 | | | | 49,035 | | |
| | | | 528,627 | | |
| Healthcare Equipment & Supplies (0.4%) | |
| Advanced Medical Optics, Inc.* | | | 200 | | | | 1,322 | | |
| Bio-Rad Laboratories, Inc. Class A* | | | 200 | | | | 15,062 | | |
| Boston Scientific Corp.* | | | 500 | | | | 3,870 | | |
| CryoLife, Inc.* | | | 400 | | | | 3,884 | | |
| Cyberonics, Inc.* | | | 200 | | | | 3,314 | | |
| Hill-Rom Holdings, Inc. | | | 1,200 | | | | 19,752 | | |
| STERIS Corp. | | | 134 | | | | 3,201 | | |
| Thoratec Corp.* | | | 100 | | | | 3,249 | | |
| | | | 53,654 | | |
| Healthcare Providers & Services (3.1%) | |
| AMERIGROUP Corp.* | | | 800 | | | | 23,616 | | |
| Centene Corp.* | | | 100 | | | | 1,971 | | |
| Community Health Systems, Inc.* | | | 200 | | | | 2,916 | | |
| Health Management Associates, Inc. Class A* | | | 4,800 | | | | 8,592 | | |
| Health Net, Inc.* | | | 288 | | | | 3,136 | | |
| Henry Schein, Inc.* | | | 79 | | | | 2,899 | | |
| Kindred Healthcare, Inc.* | | | 4,300 | | | | 55,986 | | |
| Lincare Holdings, Inc.* | | | 2,700 | | | | 72,711 | | |
| Magellan Health Services, Inc.* | | | 3,200 | | | | 125,312 | | |
| Pharmaceutical Product Development, Inc. | | | 1,700 | | | | 49,317 | | |
| Service Corporation International | | | 2,000 | | | | 9,940 | | |
| Universal Health Services, Inc. Class B | | | 300 | | | | 11,271 | | |
| VCA Antech, Inc.* | | | 900 | | | | 17,892 | | |
| WellCare Health Plans, Inc.* | | | 100 | | | | 1,286 | | |
| | | | 386,845 | | |
| Hotels, Restaurants & Leisure (1.6%) | |
| Boyd Gaming Corp. | | | 400 | | | | 1,892 | | |
| Brinker International, Inc.* | | | 300 | | | | 3,162 | | |
| Chipotle Mexican Grill, Inc. Class A* | | | 300 | | | | 18,594 | | |
| LIFE TIME FITNESS, Inc.* | | | 100 | | | | 1,295 | | |
| Panera Bread Co. Class A* | | | 700 | | | | 36,568 | | |
| Scientific Games Corp. Class A* | | | 100 | | | | 1,754 | | |
| WMS Industries, Inc.* | | | 5,200 | | | | 139,880 | | |
| | | | 203,145 | | |
See Accompanying Notes to Financial Statements.
13
Credit Suisse Trust — Mid-Cap Core Portfolio
Schedule of Investments (continued)
December 31, 2008
| | | Number of
Shares | | Value | |
| COMMON STOCKS | |
| Household Durables (1.3%) | |
| American Greetings Corp. Class A | | | 200 | | | $ | 1,514 | | |
| Blyth, Inc. | | | 1,000 | | | | 7,840 | | |
| Furniture Brands International, Inc. | | | 260 | | | | 575 | | |
| Harman International Industries, Inc. | | | 4,100 | | | | 68,593 | | |
| Hovnanian Enterprises, Inc. Class A* | | | 400 | | | | 688 | | |
| NVR, Inc.* | | | 100 | | | | 45,625 | | |
| Tupperware Brands Corp. | | | 1,700 | | | | 38,590 | | |
| | | | 163,425 | | |
| Industrial Conglomerates (0.5%) | |
| KBR, Inc. | | | 3,800 | | | | 57,760 | | |
| Insurance (7.6%) | |
| Allied World Assurance Co. Holdings, Ltd. | | | 1,000 | | | | 40,600 | | |
| American Equity Investment Life Holding Co. | | | 1,500 | | | | 10,500 | | |
| American Financial Group, Inc. | | | 18,400 | | | | 420,992 | | |
| Arthur J. Gallagher & Co. | | | 114 | | | | 2,954 | | |
| Everest Re Group, Ltd. | | | 100 | | | | 7,614 | | |
| First American Corp. | | | 600 | | | | 17,334 | | |
| Hanover Insurance Group, Inc. | | | 1,161 | | | | 49,888 | | |
| HCC Insurance Holdings, Inc. | | | 3,400 | | | | 90,950 | | |
| Horace Mann Educators Corp. | | | 7,300 | | | | 67,087 | | |
| Protective Life Corp. | | | 200 | | | | 2,870 | | |
| Reinsurance Group of America, Inc. | | | 600 | | | | 25,692 | | |
| StanCorp Financial Group, Inc. | | | 4,593 | | | | 191,849 | | |
| The PMI Group, Inc. | | | 619 | | | | 1,207 | | |
| Unitrin, Inc. | | | 737 | | | | 11,748 | | |
| W.R. Berkley Corp. | | | 800 | | | | 24,800 | | |
| | | | 966,085 | | |
| Internet & Catalog Retail (0.0%) | |
| Coldwater Creek, Inc.* | | | 400 | | | | 1,140 | | |
| Internet Software & Services (0.4%) | |
| Digital River, Inc.* | | | 1,900 | | | | 47,120 | | |
| IT Consulting & Services (2.5%) | |
| Acxiom Corp. | | | 9,300 | | | | 75,423 | | |
| Lender Processing Services, Inc. | | | 1,800 | | | | 53,010 | | |
| Tyler Technologies, Inc.* | | | 15,400 | | | | 184,492 | | |
| | | | 312,925 | | |
| Leisure Equipment & Products (0.9%) | |
| Callaway Golf Co. | | | 100 | | | | 929 | | |
| Marvel Entertainment, Inc.* | | | 3,500 | | | | 107,625 | | |
| | | | 108,554 | | |
See Accompanying Notes to Financial Statements.
14
Credit Suisse Trust — Mid-Cap Core Portfolio
Schedule of Investments (continued)
December 31, 2008
| | | Number of
Shares | | Value | |
| COMMON STOCKS | |
| Machinery (5.4%) | |
| AGCO Corp.* | | | 6,900 | | | $ | 162,771 | | |
| Briggs & Stratton Corp. | | | 3,300 | | | | 58,047 | | |
| Bucyrus International, Inc. | | | 800 | | | | 14,816 | | |
| Graham Corp. | | | 100 | | | | 1,082 | | |
| Harsco Corp. | | | 9,200 | | | | 254,656 | | |
| Joy Global, Inc. | | | 2,200 | | | | 50,358 | | |
| Kennametal, Inc. | | | 700 | | | | 15,533 | | |
| Oshkosh Corp. | | | 100 | | | | 889 | | |
| The Gorman-Rupp Co. | | | 2,100 | | | | 65,352 | | |
| The Timken Co. | | | 2,400 | | | | 47,112 | | |
| Trinity Industries, Inc. | | | 400 | | | | 6,304 | | |
| | | | 676,920 | | |
| Marine (0.3%) | |
| Overseas Shipholding Group, Inc. | | | 800 | | | | 33,688 | | |
| Media (1.5%) | |
| Belo Corp. Class A | | | 1,100 | | | | 1,716 | | |
| Entercom Communications Corp. Class A | | | 200 | | | | 246 | | |
| Harte-Hanks, Inc. | | | 500 | | | | 3,120 | | |
| Interactive Data Corp. | | | 1,600 | | | | 39,456 | | |
| Lamar Advertising Co. Class A* | | | 100 | | | | 1,256 | | |
| Lee Enterprises, Inc. | | | 600 | | | | 246 | | |
| Media General, Inc. | | | 200 | | | | 350 | | |
| Netflix, Inc.* | | | 4,200 | | | | 125,538 | | |
| Regal Entertainment Group Class A | | | 1,300 | | | | 13,273 | | |
| World Wrestling Entertainment, Inc. Class A | | | 900 | | | | 9,972 | | |
| | | | 195,173 | | |
| Metals & Mining (1.5%) | |
| Alpha Natural Resources, Inc.* | | | 1,600 | | | | 25,904 | | |
| Arch Coal, Inc. | | | 5,200 | | | | 84,708 | | |
| Carpenter Technology Corp. | | | 21 | | | | 431 | | |
| Cliffs Natural Resources, Inc. | | | 394 | | | | 10,090 | | |
| Foundation Coal Holdings, Inc. | | | 200 | | | | 2,804 | | |
| Patriot Coal Corp.* | | | 2,500 | | | | 15,625 | | |
| Worthington Industries, Inc. | | | 4,339 | | | | 47,816 | | |
| | | | 187,378 | | |
| Multi-Utilities (1.0%) | |
| Avista Corp. | | | 4,400 | | | | 85,272 | | |
| Vectren Corp. | | | 1,700 | | | | 42,517 | | |
| | | | 127,789 | | |
See Accompanying Notes to Financial Statements.
15
Credit Suisse Trust — Mid-Cap Core Portfolio
Schedule of Investments (continued)
December 31, 2008
| | | Number of
Shares | | Value | |
| COMMON STOCKS | |
| Multiline Retail (0.9%) | |
| 99 Cents Only Stores* | | | 3,700 | | | $ | 40,441 | | |
| Big Lots, Inc.* | | | 3,400 | | | | 49,266 | | |
| BJ's Wholesale Club, Inc.* | | | 200 | | | | 6,852 | | |
| Dollar Tree, Inc.* | | | 100 | | | | 4,180 | | |
| Fred's, Inc. Class A | | | 1,200 | | | | 12,912 | | |
| Saks, Inc.* | | | 1,300 | | | | 5,694 | | |
| | | | 119,345 | | |
| Oil & Gas (3.4%) | |
| Bill Barrett Corp.* | | | 3,600 | | | | 76,068 | | |
| Comstock Resources, Inc.* | | | 1,100 | | | | 51,975 | | |
| Denbury Resources, Inc.* | | | 100 | | | | 1,092 | | |
| Encore Acquisition Co.* | | | 2,600 | | | | 66,352 | | |
| Frontier Oil Corp. | | | 100 | | | | 1,263 | | |
| Goodrich Petroleum Corp.* | | | 400 | | | | 11,980 | | |
| Knightsbridge Tankers, Ltd. | | | 400 | | | | 5,860 | | |
| McMoRan Exploration Co.* | | | 1,500 | | | | 14,700 | | |
| Newfield Exploration Co.* | | | 300 | | | | 5,925 | | |
| Permian Basin Royalty Trust | | | 11,500 | | | | 157,550 | | |
| Pioneer Drilling Co.* | | | 100 | | | | 557 | | |
| San Juan Basin Royalty Trust | | | 1,100 | | | | 34,067 | | |
| W&T Offshore, Inc. | | | 100 | | | | 1,432 | | |
| | | | 428,821 | | |
| Paper & Forest Products (0.7%) | |
| Clearwater Paper Corp* | | | 371 | | | | 3,113 | | |
| Louisiana-Pacific Corp. | | | 1,200 | | | | 1,872 | | |
| Potlatch Corp. | | | 1,300 | | | | 33,813 | | |
| Rayonier, Inc. | | | 1,600 | | | | 50,160 | | |
| | | | 88,958 | | |
| Personal Products (0.7%) | |
| Alberto-Culver Co. | | | 2,700 | | | | 66,177 | | |
| Elizabeth Arden, Inc.* | | | 1,900 | | | | 23,959 | | |
| | | | 90,136 | | |
| Pharmaceuticals (4.6%) | |
| Alnylam Pharmaceuticals, Inc.* | | | 100 | | | | 2,473 | | |
| Emergent Biosolutions, Inc.* | | | 1,000 | | | | 26,110 | | |
| Endo Pharmaceuticals Holdings, Inc.* | | | 9,100 | | | | 235,508 | | |
| InterMune, Inc.* | | | 700 | | | | 7,406 | | |
| Medicis Pharmaceutical Corp. Class A | | | 8,000 | | | | 111,200 | | |
| Sepracor, Inc.* | | | 10,000 | | | | 109,800 | | |
| Valeant Pharmaceuticals International* | | | 3,900 | | | | 89,310 | | |
| | | | 581,807 | | |
See Accompanying Notes to Financial Statements.
16
Credit Suisse Trust — Mid-Cap Core Portfolio
Schedule of Investments (continued)
December 31, 2008
| | | Number of
Shares | | Value | |
| COMMON STOCKS | |
| Real Estate (3.9%) | |
| Alexandria Real Estate Equities, Inc. | | | 300 | | | $ | 18,102 | | |
| AMB Property Corp. | | | 900 | | | | 21,078 | | |
| Apartment Investment & Management Co. Class A | | | 52 | | | | 601 | | |
| BRE Properties, Inc. | | | 400 | | | | 11,192 | | |
| Camden Property Trust | | | 500 | | | | 15,670 | | |
| Cousins Properties, Inc. | | | 700 | | | | 9,695 | | |
| Duke Realty Corp. | | | 1,300 | | | | 14,248 | | |
| Equity One, Inc. | | | 400 | | | | 7,080 | | |
| Essex Property Trust, Inc. | | | 200 | | | | 15,350 | | |
| Federal Realty Investment Trust | | | 500 | | | | 31,040 | | |
| Health Care REIT, Inc. | | | 800 | | | | 33,760 | | |
| Highwoods Properties, Inc. | | | 500 | | | | 13,680 | | |
| Hospitality Properties Trust | | | 2,700 | | | | 40,149 | | |
| Jones Lang LaSalle, Inc. | | | 700 | | | | 19,390 | | |
| Liberty Property Trust | | | 2,000 | | | | 45,660 | | |
| Mack-Cali Realty Corp. | | | 1,700 | | | | 41,650 | | |
| Nationwide Health Properties, Inc. | | | 800 | | | | 22,976 | | |
| Realty Income Corp. | | | 1,900 | | | | 43,985 | | |
| Regency Centers Corp. | | | 600 | | | | 28,020 | | |
| SL Green Realty Corp. | | | 400 | | | | 10,360 | | |
| The Macerich Co. | | | 1,000 | | | | 18,160 | | |
| UDR, Inc. | | | 1,100 | | | | 15,169 | | |
| Weingarten Realty Investors | | | 1,000 | | | | 20,690 | | |
| | | | 497,705 | | |
| Road & Rail (1.2%) | |
| GATX Corp. | | | 100 | | | | 3,097 | | |
| Knight Transportation, Inc. | | | 300 | | | | 4,836 | | |
| Werner Enterprises, Inc. | | | 8,500 | | | | 147,390 | | |
| YRC Worldwide, Inc.* | | | 100 | | | | 287 | | |
| | | | 155,610 | | |
| Semiconductor Equipment & Products (3.1%) | |
| Atmel Corp.* | | | 3,800 | | | | 11,894 | | |
| Cree, Inc.* | | | 1,400 | | | | 22,218 | | |
| Cypress Semiconductor Corp.* | | | 800 | | | | 3,576 | | |
| Fairchild Semiconductor International, Inc.* | | | 1,000 | | | | 4,890 | | |
| Integrated Device Technology, Inc.* | | | 2,200 | | | | 12,342 | | |
| ON Semiconductor Corp.* | | | 2,500 | | | | 8,500 | | |
| QLogic Corp.* | | | 13,800 | | | | 185,472 | | |
| RF Micro Devices, Inc.* | | | 3,700 | | | | 2,886 | | |
| Semtech Corp.* | | | 321 | | | | 3,618 | | |
| Silicon Laboratories, Inc.* | | | 4,200 | | | | 104,076 | | |
| SunPower Corp. Class B* | | | 219 | | | | 6,666 | | |
| Tessera Technologies, Inc.* | | | 100 | | | | 1,188 | | |
| Ultratech, Inc.* | | | 1,300 | | | | 15,548 | | |
| Volterra Semiconductor Corp.* | | | 800 | | | | 5,720 | | |
| | | | 388,594 | | |
See Accompanying Notes to Financial Statements.
17
Credit Suisse Trust — Mid-Cap Core Portfolio
Schedule of Investments (continued)
December 31, 2008
| | | Number of
Shares | | Value | |
| COMMON STOCKS | |
| Software (2.3%) | |
| Activision Blizzard, Inc.* | | | 676 | | | $ | 5,841 | | |
| Advent Software, Inc.* | | | 100 | | | | 1,997 | | |
| Cadence Design Systems, Inc.* | | | 2,200 | | | | 8,052 | | |
| Cerner Corp.* | | | 2,100 | | | | 80,745 | | |
| Gartner, Inc.* | | | 2,300 | | | | 41,009 | | |
| Macrovision Solutions Corp.* | | | 100 | | | | 1,265 | | |
| Mentor Graphics Corp.* | | | 700 | | | | 3,619 | | |
| MICROS Systems, Inc.* | | | 2,000 | | | | 32,640 | | |
| Opnet Technologies, Inc.* | | | 100 | | | | 986 | | |
| Parametric Technology Corp.* | | | 1,000 | | | | 12,650 | | |
| Quality Systems, Inc. | | | 400 | | | | 17,448 | | |
| Sybase, Inc.* | | | 600 | | | | 14,862 | | |
| Synopsys, Inc.* | | | 3,000 | | | | 55,560 | | |
| Wind River Systems, Inc.* | | | 1,500 | | | | 13,545 | | |
| | | | 290,219 | | |
| Specialty Retail (7.4%) | |
| Aaron Rents, Inc. | | | 100 | | | | 2,662 | | |
| Aeropostale, Inc.* | | | 4,200 | | | | 67,620 | | |
| American Eagle Outfitters, Inc. | | | 5,200 | | | | 48,672 | | |
| AnnTaylor Stores Corp.* | | | 600 | | | | 3,462 | | |
| Barnes & Noble, Inc. | | | 12,900 | | | | 193,500 | | |
| Borders Group, Inc.* | | | 400 | | | | 160 | | |
| Chico's FAS, Inc.* | | | 1,500 | | | | 6,270 | | |
| Dick's Sporting Goods, Inc.* | | | 1,700 | | | | 23,987 | | |
| DSW, Inc. Class A* | | | 800 | | | | 9,968 | | |
| Foot Locker, Inc. | | | 2,400 | | | | 17,616 | | |
| Hanesbrands, Inc.* | | | 100 | | | | 1,275 | | |
| Hot Topic, Inc.* | | | 700 | | | | 6,489 | | |
| Jo-Ann Stores, Inc.* | | | 600 | | | | 9,294 | | |
| Men's Wearhouse, Inc. | | | 100 | | | | 1,354 | | |
| Pacific Sunwear of California, Inc.* | | | 800 | | | | 1,272 | | |
| RadioShack Corp. | | | 1,700 | | | | 20,298 | | |
| Regis Corp. | | | 6,500 | | | | 94,445 | | |
| Rent-A-Center, Inc.* | | | 4,700 | | | | 82,955 | | |
| Ross Stores, Inc. | | | 4,792 | | | | 142,466 | | |
| The Buckle, Inc. | | | 950 | | | | 20,729 | | |
| The Cato Corp. Class A | | | 2,800 | | | | 42,280 | | |
| Tractor Supply Co.* | | | 921 | | | | 33,285 | | |
| United Rentals, Inc.* | | | 2,500 | | | | 22,800 | | |
| Urban Outfitters, Inc.* | | | 100 | | | | 1,498 | | |
| Williams-Sonoma, Inc. | | | 9,718 | | | | 76,384 | | |
| | | | 930,741 | | |
| Textiles & Apparel (1.8%) | |
| Guess?, Inc. | | | 5,200 | | | | 79,820 | | |
| Phillips-Van Heusen Corp. | | | 6,500 | | | | 130,845 | | |
| The Warnaco Group, Inc.* | | | 1,200 | | | | 23,556 | | |
| | | | 234,221 | | |
See Accompanying Notes to Financial Statements.
18
Credit Suisse Trust — Mid-Cap Core Portfolio
Schedule of Investments (continued)
December 31, 2008
| | | Number of
Shares | | Value | |
| COMMON STOCKS | |
| Tobacco (1.2%) | |
| Vector Group, Ltd. | | | 10,900 | | | $ | 148,458 | | |
| Water Utilities (0.0%) | |
| California Water Service Group | | | 100 | | | | 4,643 | | |
| TOTAL COMMON STOCKS (Cost $13,618,026) | | | 12,677,366 | | |
| TOTAL INVESTMENTS AT VALUE (100.3%) (Cost $13,618,026) | | | 12,677,366 | | |
| LIABILITIES IN EXCESS OF OTHER ASSETS (-0.3%) | | | (39,438 | ) | |
| NET ASSETS (100.0%) | | $ | 12,637,928 | | |
* Non-income producing security.
See Accompanying Notes to Financial Statements.
19
Credit Suisse Trust — Mid-Cap Core Portfolio
Statement of Assets and Liabilities
December 31, 2008
| Assets | |
| Investments at value (Cost $13,618,026) (Note 2) | | $ | 12,677,366 | | |
| Receivable for investments sold | | | 247,950 | | |
| Dividend receivable | | | 48,905 | | |
| Receivable from investment adviser (Note 3) | | | 10,238 | | |
| Prepaid expenses | | | 360 | | |
| Total Assets | | | 12,984,819 | | |
| Liabilities | |
| Administrative services fee payable (Note 3) | | | 7,434 | | |
| Payable for investments purchased | | | 248,875 | | |
| Payable for portfolio shares redeemed | | | 22,149 | | |
| Due to custodian | | | 18,995 | | |
| Trustees' fee payable | | | 2,574 | | |
| Other accrued expenses payable | | | 46,864 | | |
| Total Liabilities | | | 346,891 | | |
| Net Assets | |
| Capital stock, $.001 par value (Note 6) | | | 1,367 | | |
| Paid-in capital (Note 6) | | | 24,143,741 | | |
| Undistributed net investment income | | | 145,345 | | |
| Accumulated net realized loss on investments | | | (10,711,865 | ) | |
| Net unrealized depreciation on investments | | | (940,660 | ) | |
| Net Assets | | $ | 12,637,928 | | |
| Shares outstanding | | | 1,367,096 | | |
| Net asset value, offering price, and redemption price per share | | $ | 9.24 | | |
See Accompanying Notes to Financial Statements.
20
Credit Suisse Trust — Mid-Cap Core Portfolio
Statement of Operations
For the Year Ended December 31, 2008
| Investment Income (Note 2) | |
| Dividends | | $ | 382,691 | | |
| Interest | | | 1,689 | | |
| Securities lending | | | 49,720 | | |
| Foreign taxes withheld | | | (12 | ) | |
| Total investment income | | | 434,088 | | |
| Expenses | |
| Investment advisory fees (Note 3) | | | 141,916 | | |
| Administrative services fees (Note 3) | | | 55,153 | | |
| Custodian fees | | | 34,786 | | |
| Audit and tax fees | | | 20,096 | | |
| Trustees' fees | | | 17,285 | | |
| Legal fees | | | 12,421 | | |
| Transfer agent fees | | | 1,632 | | |
| Insurance expense | | | 711 | | |
| Printing fees (Note 3) | | | 444 | | |
| Interest expense (Note 4) | | | 285 | | |
| Commitment fees (Note 4) | | | 252 | | |
| Miscellaneous expense | | | 9,555 | | |
| Total expenses | | | 294,536 | | |
| Less: fees waived (Note 3) | | | (22,966 | ) | |
| Net expenses | | | 271,570 | | |
| Net investment income | | | 162,518 | | |
| Net Realized and Unrealized Gain (Loss) from Investments | |
| Net realized loss from investments | | | (5,597,576 | ) | |
| Net change in unrealized appreciation (depreciation) from investments | | | (3,294,151 | ) | |
| Net realized and unrealized loss from investments | | | (8,891,727 | ) | |
| Net decrease in net assets resulting from operations | | $ | (8,729,209 | ) | |
See Accompanying Notes to Financial Statements.
21
Credit Suisse Trust — Mid-Cap Core Portfolio
Statements of Changes in Net Assets
| | | For the Year
Ended
December 31, 2008 | | For the Year
Ended
December 31, 2007 | |
| From Operations | |
| Net investment income (loss) | | $ | 162,518 | | | $ | (67,631 | ) | |
| Net realized gain (loss) from investments and futures contracts | | | (5,597,576 | ) | | | 1,179,079 | | |
| Net change in unrealized appreciation (depreciation) from investments | | | (3,294,151 | ) | | | 2,192,077 | | |
| Net increase (decrease) in net assets resulting from operations | | | (8,729,209 | ) | | | 3,303,525 | | |
| From Capital Share Transactions (Note 6) | |
| Proceeds from sale of shares | | | 380,242 | | | | 658,389 | | |
| Net asset value of shares redeemed | | | (5,998,023 | ) | | | (7,473,324 | ) | |
| Net decrease in net assets from capital share transactions | | | (5,617,781 | ) | | | (6,814,935 | ) | |
| Net decrease in net assets | | | (14,346,990 | ) | | | (3,511,410 | ) | |
| Net Assets | |
| Beginning of year | | | 26,984,918 | | | | 30,496,328 | | |
| End of year | | $ | 12,637,928 | | | $ | 26,984,918 | | |
| Undistributed net investment income | | $ | 145,345 | | | $ | 1,360 | | |
See Accompanying Notes to Financial Statements.
22
Credit Suisse Trust — Mid-Cap Core Portfolio
Financial Highlights
(For a Share of the Portfolio Outstanding Throughout Each Year)
| | | For the Year Ended December 31, | |
| | | 2008 | | 2007 | | 2006 | | 2005 | | 2004 | |
| Per share data | |
| Net asset value, beginning of year | | $ | 15.01 | | | $ | 13.44 | | | $ | 13.19 | | | $ | 12.33 | | | $ | 10.90 | | |
| INVESTMENT OPERATIONS | |
| Net investment income (loss) | | | 0.11 | | | | (0.04 | ) | | | (0.04 | ) | | | (0.10 | ) | | | (0.11 | ) | |
Net gain (loss) on investments and futures
contracts (both realized and unrealized) | | | (5.88 | ) | | | 1.61 | | | | 0.29 | | | | 0.96 | | | | 1.54 | | |
| Total from investment operations | | | (5.77 | ) | | | 1.57 | | | | 0.25 | | | | 0.86 | | | | 1.43 | | |
| Net asset value, end of year | | $ | 9.24 | | | $ | 15.01 | | | $ | 13.44 | | | $ | 13.19 | | | $ | 12.33 | | |
| Total return1 | | | (38.44 | )% | | | 11.68 | % | | | 1.90 | % | | | 6.97 | % | | | 13.12 | % | |
| RATIOS AND SUPPLEMENTAL DATA | |
| Net assets, end of year (000s omitted) | | $ | 12,638 | | | $ | 26,985 | | | $ | 30,496 | | | $ | 37,659 | | | $ | 42,452 | | |
| Ratio of expenses to average net assets | | | 1.34 | % | | | 1.25 | % | | | 1.21 | % | | | 1.25 | % | | | 1.25 | % | |
Ratio of net investment income (loss) to
average net assets | | | 0.80 | % | | | (0.23 | )% | | | (0.26 | )% | | | (0.70 | )% | | | (0.87 | )% | |
Decrease reflected in above operating expense
ratios due to waivers/reimbursements | | | 0.11 | % | | | 0.03 | % | | | 0.13 | % | | | 0.12 | % | | | 0.08 | % | |
| Portfolio turnover rate | | | 217 | % | | | 232 | % | | | 140 | % | | | 95 | % | | | 124 | % | |
1 Total returns are historical and assume changes in share price and reinvestment of all dividends and distributions. Had certain expenses not been reduced during the years shown, total returns would have been lower. Total returns do not reflect charges and expenses attributable to any particular variable contract or plan.
See Accompanying Notes to Financial Statements.
23
Credit Suisse Trust — Mid-Cap Core Portfolio
Notes to Financial Statements
December 31, 2008
Note 1. Organization
Credit Suisse Trust (the "Trust") is an open-end management investment company registered under the Investment Company Act of 1940, as amended (the "1940 Act"), and currently offers eight managed investment portfolios of which one, the Mid-Cap Core Portfolio (the "Portfolio"), is included in this report. The Portfolio is a diversified investment fund that seeks maximum capital appreciation. Shares of the Portfolio are not available directly to individual investors but may be offered only through (a) variable annuity contracts and variable life insurance contracts offered by separate accounts of certain insurance companies and (b) tax-qualified pension and retirement plans. The Portfolio may not be available in connection with a particular contract or plan. The Trust was organized under the laws of the Commonwealth of Massachusetts as a business trust on March 15, 1995.
Note 2. Significant Accounting Policies
A) SECURITY VALUATION — The net asset value of the Portfolio is determined daily as of the close of regular trading on the New York Stock Exchange, Inc. (the "Exchange") on each day the Exchange is open for business. Equity investments are valued at market value, which is generally determined using the closing price on the exchange or market on which the security is primarily traded at the time of valuation (the "Valuation Time"). If no sales are reported, equity investments are generally valued at the most recent bid quotation as of the Valuation Time or at the lowest asked quotation in the case of a short sale of securities. Debt securities with a remaining maturity greater than 60 days are valued in accordance with the price supplied by a pricing service, which may use a matrix, formula or other objective method that takes into consideration market indices, yield curves and other specific adjustments. Debt obligations that will matur e in 60 days or less are valued on the basis of amortized cost, which approximates market value, unless it is determined that using this method would not represent fair value. Investments in mutual funds are valued at the mutual fund's closing net asset value per share on the day of valuation. Securities and other assets for which market quotations are not readily available, or whose values have been materially affected by events occurring before the Portfolio's Valuation Time but after the close of the securities' primary markets, are valued at fair value as determined in good faith by, or under the direction of, the Board of Trustees under procedures established by the Board of Trustees. The Portfolio may utilize a service provided by an independent third party which has been approved by the Board of Trustees to fair value certain securities. When fair-value pricing is employed, the prices of securities used by a portfolio to calculate its net asset value may differ from quoted or published prices for the same securities.
24
Credit Suisse Trust — Mid-Cap Core Portfolio
Notes to Financial Statements (continued)
December 31, 2008
Note 2. Significant Accounting Policies
The Portfolio adopted Financial Accounting Standards Board Statement of Financial Accounting Standards No. 157, Fair Value Measurements ("FAS 157"), effective January 1, 2008. In accordance with FAS 157, fair value is defined as the price that the Portfolio would receive upon selling an investment in a timely transaction to an independent buyer in the principal or most advantageous market of the investment. FAS 157 established a three-tier hierarchy to maximize the use of observable market data and minimize the use of unobservable inputs and to establish classification of fair value measurements for disclosure purposes. Inputs refer broadly to the assumptions that market participants would use in pricing the asset or liability, including assumptions about risk, for example, the risk inherent in a particular valuation technique used to measure fair value including such a pricing model and/or the risk inherent in the inputs to the valuation te chnique. Inputs may be observable or unobservable. Observable inputs are inputs that reflect the assumptions market participants would use in pricing the asset or liability developed based on market data obtained from sources independent of the reporting entity. Unobservable inputs are inputs that reflect the reporting entity's own assumptions about the assumptions market participants would use in pricing the asset or liability developed based on the best information available in the circumstances. The three-tier hierarchy of inputs is summarized in the three broad Levels listed below.
• Level 1 – quoted prices in active markets for identical investments
• Level 2 – other significant observable inputs (including quoted prices for similar investments, interest rates, prepayment speeds, credit risk, etc.)
• Level 3 – significant unobservable inputs (including the Portfolio's own assumptions in determining the fair value of investments)
The inputs or methodology used for valuing securities are not necessarily an indication of the risk associated with investing in those securities.
The following is a summary of the inputs used as of December 31, 2008 in valuing the Portfolio's investments carried at value:
| Valuation Inputs | | Investments in
Securities | | Other Financial
Instruments* | |
| Level 1 – Quoted Prices | | $ | 12,677,366 | | | $ | — | | |
| Level 2 – Other Significant Observable Inputs | | | — | | | | — | | |
| Level 3 – Significant Unobservable Inputs | | | — | | | | — | | |
| Total | | $ | 12,677,366 | | | $ | — | | |
*Other financial instruments include futures, forwards and swap contracts.
25
Credit Suisse Trust — Mid-Cap Core Portfolio
Notes to Financial Statements (continued)
December 31, 2008
Note 2. Significant Accounting Policies
B) SECURITY TRANSACTIONS AND INVESTMENT INCOME — Security transactions are accounted for on a trade date basis. Interest income is recorded on the accrual basis. Dividends are recorded on the ex-dividend date. The cost of investments sold is determined by use of the specific identification method for both financial reporting and income tax purposes.
C) DIVIDENDS AND DISTRIBUTIONS TO SHAREHOLDERS — Dividends from net investment income and distributions of net realized capital gains, if any, are declared and paid at least annually. However, to the extent that a net realized capital gain can be reduced by a capital loss carryforward, such gain will not be distributed. Income and capital gain distributions are determined in accordance with federal income tax regulations, which may differ from accounting principles generally accepted in the United States of America ("GAAP").
D) FEDERAL INCOME TAXES — No provision is made for federal taxes as it is the Portfolio's intention to continue to qualify for and elect the tax treatment applicable to regulated investment companies under the Internal Revenue Code of 1986, as amended, and to make the requisite distributions to its shareholders, which will be sufficient to relieve it from federal income and excise taxes.
During June 2006, the Financial Accounting Standards Board ("FASB") issued FASB Interpretation 48 ("FIN 48" or the "Interpretation"), Accounting for Uncertainty in Income Taxes — an interpretation of FASB statement 109. The Portfolio has reviewed its current tax positions and has determined that no provision for income tax is required in the Portfolio's financial statements. The Portfolio's federal tax returns for the prior three fiscal years remain subject to examination by the Internal Revenue Service.
E) USE OF ESTIMATES — The preparation of financial statements in conformity with GAAP requires management to make estimates and assumptions that affect the reported amounts of assets and liabilities and disclosure of contingent assets and liabilities at the date of the financial statements and the reported amounts of income and expenses during the reporting period. Actual results could differ from these estimates.
F) SHORT-TERM INVESTMENTS — The Portfolio, together with other funds/portfolios advised by Credit Suisse Asset Management, LLC ("Credit Suisse"), an indirect, wholly-owned subsidiary of Credit Suisse Group AG, pools available cash into either a short-term variable rate time deposit issued by State Street Bank and Trust Company ("SSB"), the Portfolio's custodian, or a money market fund advised by Credit Suisse. The short-term time deposit issued by SSB is a variable rate account classified as a short-term investment.
26
Credit Suisse Trust — Mid-Cap Core Portfolio
Notes to Financial Statements (continued)
December 31, 2008
Note 2. Significant Accounting Policies
G) FUTURES — The Portfolio may enter into futures contracts to the extent permitted by its investment policies and objectives. Upon entering into a futures contract, the Portfolio is required to deposit cash and/or pledge U.S. Government securities as initial margin. Subsequent payments, which are dependent on the daily fluctuations in the value of the underlying instrument, are made or received by the Portfolio each day (daily variation margin) and are recorded as unrealized gains or losses until the contracts are closed. When the contracts are closed, the Portfolio records a realized gain or loss equal to the difference between the proceeds from (or cost of) the closing transactions and the Portfolio's basis in the contract. Risks of entering into futures contracts for hedging purposes include the possibility that a change in the value of the contract may not correlate with the changes in the value of the underlying instruments. In ad dition, the purchase of a futures contract involves the risk that the Portfolio could lose more than the original margin deposit and subsequent payments may be required for a futures transaction. At December 31, 2008, the Portfolio had no open futures contracts.
H) SECURITIES LENDING — Loans of securities are required at all times to be secured by collateral at least equal to 102% of the market value of domestic securities on loan (including any accrued interest thereon) and 105% of the market value of foreign securities on loan (including any accrued interest thereon). Cash collateral received by the Portfolio in connection with securities lending activity may be pooled together with cash collateral for other funds/portfolios advised by Credit Suisse and may be invested in a variety of investments, including certain Credit Suisse-advised funds, funds advised by SSB, the Portfolio's securities lending agent, or money market instruments. However, in the event of default or bankruptcy by the other party to the agreement, realization and/or retention of the collateral may be subject to legal proceedings.
SSB has been engaged by the Portfolio to act as the Portfolio's securities lending agent. The Portfolio's securities lending arrangement provides that the Portfolio and SSB will share the net income earned from securities lending activities. During the year ended December 31, 2008, total earnings from the Portfolio's investment in cash collateral received in connection with securities lending arrangements was $179,000, of which $117,008 was rebated to borrowers (brokers). The Portfolio retained $49,720 in income from the cash collateral investment, and SSB, as lending agent, was paid $12,272. The Portfolio may also be entitled to certain minimum amounts of income from its securities lending activities. Securities lending income is accrued as earned.
27
Credit Suisse Trust — Mid-Cap Core Portfolio
Notes to Financial Statements (continued)
December 31, 2008
Note 3. Transactions with Affiliates and Related Parties
Credit Suisse serves as investment adviser for the Portfolio. For its investment advisory services, Credit Suisse is entitled to receive a fee from the Portfolio at an annual rate of 0.70% of the Portfolio's average daily net assets. For the year ended December 31, 2008, investment advisory fees earned and voluntarily waived were $141,916 and $22,966, respectively. Credit Suisse will not recapture from the Portfolio any fees it waived during the year ended December 31, 2008. Fee waivers and reimbursements are voluntary and may be discontinued by Credit Suisse at any time.
Credit Suisse Asset Management Securities, Inc. ("CSAMSI"), an affiliate of Credit Suisse, and SSB serve as co-administrators to the Portfolio. For its co-administrative services, CSAMSI currently receives a fee calculated at an annual rate of 0.09% of the Portfolio's average daily net assets. For the year ended December 31, 2008, co-administrative services fees earned by CSAMSI were $18,247.
For its co-administrative services, SSB receives a fee, exclusive of out-of-pocket expenses, calculated in total for all the Credit Suisse funds/portfolios co-administered by SSB and allocated based upon the relative average net assets of each fund/portfolio, subject to an annual minimum fee. For the year ended December 31, 2008, co-administrative services fees earned by SSB (including out-of-pocket expenses) were $36,906.
In addition to serving as the Portfolio's co-administrator, CSAMSI currently serves as distributor of the Portfolio's shares without compensation.
Merrill Corporation ("Merrill"), an affiliate of Credit Suisse, has been engaged by the Portfolio to provide certain financial printing and fulfillment services. For the year ended December 31, 2008, Merrill was paid $16,767 for its services to the Portfolio.
Note 4. Line of Credit
The Portfolio, together with other funds/portfolios advised by Credit Suisse (collectively, the "Participating Funds"), participates in a $50 million committed, unsecured line of credit facility ("Credit Facility") for temporary or emergency purposes with SSB. Under the terms of the Credit Facility, the Participating Funds pay an aggregate commitment fee at a rate of 0.10% per annum on the average unused amount of the Credit Facility, which is allocated among the Participating Funds in such manner as is determined by the governing Boards of the Participating Funds. In addition, the Participating Funds pay interest on borrowings at the Federal Funds rate plus 0.50%. At
28
Credit Suisse Trust — Mid-Cap Core Portfolio
Notes to Financial Statements (continued)
December 31, 2008
Note 4. Line of Credit
December 31, 2008, the Portfolio had no loans outstanding under the Credit Facility. During the year ended December 31, 2008, the Portfolio had borrowings under the Credit Facility as follows:
Average Daily
Loan Balance | | Weighted Average
Interest Rate % | | Maximum Daily
Loan Outstanding | |
| $ | 159,500 | | | | 3.218 | % | | $ | 326,000 | | |
Note 5. Purchases and Sales of Securities
For the year ended December 31, 2008, purchases and sales of investment securities (excluding short-term investments) were $44,262,722 and $49,294,110, respectively.
Note 6. Capital Share Transactions
The Trust is authorized to issue an unlimited number of full and fractional shares of beneficial interest, $.001 par value per share. Transactions in capital shares of the Portfolio were as follows:
| | | For the Year Ended
December 31, 2008 | | For the Year Ended
December 31, 2007 | |
| Shares sold | | | 29,623 | | | | 44,882 | | |
| Shares redeemed | | | (460,877 | ) | | | (516,029 | ) | |
| Net decrease | | | (431,254 | ) | | | (471,147 | ) | |
On December 31, 2008, the number of shareholders that held 5% or more of the outstanding shares of the Portfolio was as follows:
Number of
Shareholders | | Approximate Percentage
of Outstanding Shares | |
| | 1 | | | | 93 | % | |
Some of the shareholders are omnibus accounts, which hold shares on behalf of individual shareholders.
Note 7. Federal Income Taxes
Income and capital gain distributions are determined in accordance with federal income tax regulations, which may differ from GAAP.
The tax basis components of distributable earnings differ from the amounts reflected in the Statement of Assets and Liabilities by temporary book/tax differences. These differences are primarily due to losses deferred on wash
29
Credit Suisse Trust — Mid-Cap Core Portfolio
Notes to Financial Statements (continued)
December 31, 2008
Note 7. Federal Income Taxes
sales, unused capital loss caryforwards, current year post-October loss deferrals, return of capital on Real Estate Investment Trusts, security lending transactions and investments in Partnerships.
At December 31, 2008, the components of distributable earnings on a tax basis were as follows:
| Undistributed net investment income | | $ | 143,626 | | |
| Accumulated realized loss | | | (6,192,951 | ) | |
| Unrealized depreciation | | | (1,974,105 | ) | |
| Deferral of post-October capital losses | | | (3,483,750 | ) | |
| | | $ | (11,507,180 | ) | |
At December 31, 2008, the Portfolio had capital loss carryforwards available to offset possible future capital gains as follows:
| Expires December 31, | |
| 2009 | | 2010 | | 2016 | |
| $ | 896,374 | | | $ | 4,065,894 | | | $ | 1,230,683 | | |
During the tax year ended December 31, 2008, the Portfolio did not utilize any of the capital loss carryforward.
It is uncertain whether the Portfolio will be able to realize the benefits of the capital loss carryforward before they expire.
At December 31, 2008, the identified cost for federal income tax purposes, as well as the gross unrealized appreciation from investments for those securities having an excess of value over cost, gross unrealized depreciation from investments for those securities having an excess of cost over value and the net unrealized depreciation from investments were $14,651,475, $907,749, $(2,881,858) and $(1,974,109), respectively.
At December 31, 2008, the Portfolio reclassified $18,533 from undistributed net investment income to accumulated net realized loss, to adjust for current period permanent book/tax differences which arose principally from differing book/tax treatments of dividends received from Real Estate Investment Trusts, reversal of prior return of capital adjustments on Real Estate Investment Trusts sold and investments in Partnerships. Net assets were not affected by these reclassifications.
Note 8. Contingencies
In the normal course of business, the Portfolio may provide general indemnifications pursuant to certain contracts and organizational documents.
30
Credit Suisse Trust — Mid-Cap Core Portfolio
Notes to Financial Statements (continued)
December 31, 2008
Note 8. Contingencies
The Portfolio's maximum exposure under these arrangements is dependent on future claims that may be made against the Portfolio and, therefore, cannot be estimated; however, based on experience, the risk of loss from such claims is considered remote.
Note 9. Recent Accounting Pronouncements
In March 2008, FASB issued Statement of Financial Accounting Standards No. 161, Disclosures about Derivative Instruments and Hedging Activities ("FAS 161"), an amendment of FASB Statement No. 133. FAS 161 requires enhanced disclosures about (a) how and why an entity uses derivative instruments, (b) how derivative instruments and hedging activities are accounted for, and (c) how derivative instruments and related hedging activities affect a fund's financial position, financial performance, and cash flows. Management of the Portfolio does not believe the adoption of FAS 161 will materially impact the financial statement amounts, but will require additional disclosures. This will include qualitative and quantitative disclosures on derivative positions existing at period end and the effect of usin g derivatives during the reporting period. FAS 161 is effective for financial statements issued for fiscal years and interim periods beginning after November 15, 2008.
31
Credit Suisse Trust — Mid-Cap Core Portfolio
Report of Independent Registered Public Accounting Firm
To the Board of Trustees of Credit Suisse Trust and Shareholders of
Credit Suisse Trust — Mid-Cap Core Portfolio:
In our opinion, the accompanying statement of assets and liabilities, including the schedule of investments, and the related statements of operations and of changes in net assets and the financial highlights present fairly, in all material respects, the financial position of Mid-Cap Core Portfolio (the "Portfolio"), a portfolio of the Credit Suisse Trust, at December 31, 2008, the results of its operations for the year then ended and the changes in its net assets and financial highlights for the periods presented, in conformity with accounting principles generally accepted in the United States of America. These financial statements and financial highlights (hereafter referred to as "financial statements") are the responsibility of the Portfolio's management. Our responsibility is to express an opinion on these financial statements based on our audits. We conducted our audits of these financial statements in accordance with the standards of t he Public Company Accounting Oversight Board (United States). Those standards require that we plan and perform the audit to obtain reasonable assurance about whether the financial statements are free of material misstatement. An audit includes examining, on a test basis, evidence supporting the amounts and disclosures in the financial statements, assessing the accounting principles used and significant estimates made by management, and evaluating the overall financial statement presentation. We believe that our audit, which included confirmation of securities at December 31, 2008 by correspondence with the custodian and brokers, provides a reasonable basis for our opinion.
PricewaterhouseCoopers LLP
Baltimore, Maryland
February 24, 2009
32
Credit Suisse Trust — Mid-Cap Core Portfolio
Board Approval of Advisory Agreement (unaudited)
In approving the renewal of the current Advisory Agreement, the Board of Trustees, including the Independent Trustees, at a meeting held on November 18 and 19, 2008, considered the following factors with respect to the Mid-Cap Core Portfolio (the "Portfolio"):
Investment Advisory Fee Rates
The Board reviewed and considered the contractual advisory fee rate of 0.70% ("Contractual Advisory Fee") in light of the extent and quality of the advisory services provided by Credit Suisse Asset Management, LLC ("Credit Suisse"). The Board also reviewed and considered the fee waivers and/or expense reimbursement arrangements currently in place for the Fund and considered the actual fee rate of 0.66% paid by the Fund after taking waivers and reimbursements into account ("Net Advisory Fee"). The Board acknowledged that voluntary fee waivers and expense reimbursements could be discontinued at any time.
Additionally, the Board received and considered information comparing the Portfolio's Contractual Advisory Fee, Net Advisory Fee and the Portfolio's overall expenses with those of funds in both the relevant expense group ("Expense Group") and universe of funds ("Expense Universe") provided by Lipper Inc., an independent provider of investment company data.
Nature, Extent and Quality of the Services under the Advisory Agreement
The Board received and considered information regarding the nature, extent and quality of services provided to the Portfolio by Credit Suisse under the Advisory Agreement. The Board also noted information received at regular meetings throughout the year related to the services rendered by Credit Suisse. The Board reviewed background information about Credit Suisse, including its Form ADV. The Board considered the background and experience of Credit Suisse's senior management and the expertise of, and the amount of attention given to the Portfolio by, senior personnel of Credit Suisse. In addition, the Board reviewed the qualifications, backgrounds and responsibilities of the portfolio management team primarily responsible for the day-to-day portfolio management of the Portfolio and the extent of the resources devoted to research and analysis of actual and potential investments. The Board also received and considered information about the nat ure, extent and quality of services and fee rates offered to other Credit Suisse clients for comparable services.
33
Credit Suisse Trust — Mid-Cap Core Portfolio
Board Approval of Advisory Agreement (unaudited) (continued)
Portfolio Performance
The Board received and considered the performance results of the Portfolio over time, along with comparisons both to the relevant performance group ("Performance Group") and universe of funds ("Performance Universe") for the Portfolio. The Board was provided with a description of the methodology used to arrive at the funds included in the Performance Group and the Performance Universe.
Credit Suisse Profitability
The Board received and considered a profitability analysis of Credit Suisse based on the fees payable under the Advisory Agreement for the Portfolio, including any fee waivers or fee caps, as well as other relationships between the Portfolio on the one hand and Credit Suisse affiliates on the other. The Board received profitability information for the other funds in the Credit Suisse family of funds.
Economies of Scale
The Board considered whether economies of scale in the provision of services to the Portfolio were being passed along to the shareholders. Accordingly, the Board considered whether alternative fee structures (such as breakpoint fee structures) would be more appropriate or reasonable taking into consideration economies of scale or other efficiencies that might accrue from increases in the Portfolio's asset levels.
Other Benefits to Credit Suisse
The Board considered other benefits received by Credit Suisse and its affiliates as a result of their relationship with the Portfolio. Such benefits include, among others, research arrangements with brokers who execute transactions on behalf of the Portfolio, administrative and brokerage relationships with affiliates of Credit Suisse and benefits potentially derived from an increase in Credit Suisse's businesses as a result of its relationship with the Portfolio (such as the ability to market to shareholders other financial products offered by Credit Suisse and its affiliates).
The Board considered the standards applied in seeking best execution, whether and to what extent soft dollar credits are sought and how any such credits are utilized, any benefits that may be achieved by using an affiliated broker and the existence of quality controls applicable to brokerage allocation
34
Credit Suisse Trust — Mid-Cap Core Portfolio
Board Approval of Advisory Agreement (unaudited) (continued)
procedures. The Board also reviewed Credit Suisse's method for allocating portfolio investment opportunities among its advisory clients.
Conclusions
In selecting Credit Suisse, and approving the Advisory Agreement and the investment advisory fee under such agreement, the Board concluded that:
• Although the actual combined Net Advisory Fee and co-administration fees were above the median of the Portfolio's Expense Group, the Contractual Advisory Fee was slightly below the median of the Portfolio's Expense Group. The Board considered the fee to be reasonable.
• The Portfolio's performance was among the highest compared to its Performance Group and Performance Universe for the one year period, but was among the lowest compared to its Performance Group and Performance Universe for the two, three, four and five year periods. The Board noted the improved performance of the Portfolio and the changes in the Portfolio's investment strategies and portfolio management that had gone into effect on December 1, 2006. The Board stated that it would continue to monitor steps undertaken by Credit Suisse to improve performance.
• The Board was satisfied with the nature and extent of the investment advisory services provided to the Portfolio by Credit Suisse and that, based on dialogue with management and counsel, the services provided by Credit Suisse under the Advisory Agreement are typical of, and consistent with, those provided to similar mutual funds by other investment advisers.
• In light of the costs of providing investment management and other services to the Portfolio and Credit Suisse's ongoing commitment to the Portfolio and willingness to waive fees and expenses, the profits and other ancillary benefits that Credit Suisse and its affiliates received were considered reasonable.
• Credit Suisse's profitability based on fees payable under the Advisory Agreement was reasonable in light of the nature, extent and quality of the services provided to the Portfolio thereunder.
• In light of the fee waiver, the relatively small size of the Portfolio and the amount of the Contractual Advisory Fee, the Portfolio's current fee structure (without breakpoints) was considered reasonable.
No single factor reviewed by the Board was identified by the Board as the principal factor in determining whether to approve the Advisory Agreement. The Independent Trustees were advised by separate independent legal counsel throughout the process.
35
Credit Suisse Trust — Mid-Cap Core Portfolio
Information Concerning Trustees and Officers (unaudited)
Name, Address
(Year of Birth) | | Position(s)
Held with
Trust | | Term
of Office1
and
Length
of Time
Served | | Principal
Occupation(s) During
Past Five Years | | Number of
Portfolios in
Fund
Complex
Overseen by
Trustee | | Other
Directorships
Held by
Trustee | |
| Independent Trustees | |
|
Enrique Arzac
c/o Credit Suisse Asset Management, LLC Attn: General Counsel Eleven Madison Avenue New York, New York
10010
(1941) | | Trustee, Audit
Committee
Chairman and Nominating Committee Member | | Since 2005 | | Professor of Finance
and Economics, Graduate School of Business, Columbia University since 1971. | | | 33 | | | Director of Epoch Holding Corporation (an investment management and investment advisory services company); Director of The Adams Express Company (a closed-end investment company); Director of Petroleum and Resources Corporation (a closed-end investment company). | |
|
Jeffrey E. Garten2
Box 208200
New Haven, Connecticut
06520-8200
(1946) | | Trustee, Audit and Nominating Committee Member | | Since Portfolio Inception | | The Juan Trippe Professor in the Practice of International Trade, Finance and Business from July 2005 to present; Partner and Chairman of Garten Rothkopf (consulting firm) from October 2005 to present; Dean of Yale School of Management from November 1995 to June 2005. | | | 26 | | | Director of Aetna, Inc. (insurance company); Director of CarMax Group (used car dealers). | |
|
1 Each Trustee and Officer serves until his or her respective successor has been duly elected and qualified.
2 Mr. Garten was initially appointed as a Trustee of the Portfolio at inception. He resigned as Trustee on February 3, 2000 and was subsequently reappointed on December 21, 2000.
36
Credit Suisse Trust — Mid-Cap Core Portfolio
Information Concerning Trustees and Officers (unaudited) (continued)
Name, Address
(Year of Birth) | | Position(s)
Held with
Trust | | Term
of Office1
and
Length
of Time
Served | | Principal
Occupation(s) During
Past Five Years | | Number of
Portfolios in
Fund
Complex
Overseen by
Trustee | | Other
Directorships
Held by
Trustee | |
| Independent Trustees | |
|
Peter F. Krogh
SFS/ICC 702
Georgetown University Washington, DC 20057
(1937) | | Trustee, Audit and Nominating Committee Member | | Since 2001 | | Dean Emeritus and Distinguished Professor of International Affairs at the Edmund A. Walsh School of Foreign Service, Georgetown University from June 1995 to present. | | | 26 | | | Director of Carlisle Companies Incorporated (diversified manufacturing company). | |
|
Steven N. Rappaport
Lehigh Court, LLC
555 Madison Avenue
29th Floor
New York, New York
10022
(1948) | | Chairman of the Board of Trustees, Audit Committee Member and Nominating Committee Chairman | | Trustee since Portfolio Inception and Chairman since 2005 | | Partner of Lehigh Court, LLC and RZ Capital (private investment firms) from July 2002 to present. | | | 33 | | | Director of iCAD, Inc. (surgical and medical instruments and apparatus company); Director of Presstek, Inc. (digital imaging technologies company); Director of Wood Resources, LLC. (plywood manufacturing company). | |
|
37
Credit Suisse Trust — Mid-Cap Core Portfolio
Information Concerning Trustees and Officers (unaudited) (continued)
Name, Address
(Year of Birth) | | Position(s)
Held with
Trust | | Term
of Office1
and
Length
of Time
Served | | Principal Occupation(s) During Past Five Years | |
| Officers | | | | | | | |
|
George R. Hornig
Credit Suisse Asset Management, LLC
Eleven Madison Avenue
New York, New York 10010
(1954) | | Chief Executive Officer and President | | Since 2008 | | Managing Director of Credit Suisse; Co-Chief Operating Officer of Asset Management and Head of Asset Management Americas; Associated with Credit Suisse since 1999; Officer of other Credit Suisse Funds. | |
|
Michael A. Pignataro
Credit Suisse Asset Management, LLC
Eleven Madison Avenue
New York, New York 10010
(1959) | | Chief Financial Officer | | Since Portfolio Inception | | Director and Director of Fund Administration of Credit Suisse; Associated with Credit Suisse or its predecessor since 1984; Officer of other Credit Suisse Funds. | |
|
Emidio Morizio
Credit Suisse Asset Management, LLC
Eleven Madison Avenue
New York, New York 10010
(1966) | | Chief Compliance Officer | | Since 2004 | | Director and Global Head of Compliance of Credit Suisse; Associated with Credit Suisse since July 2000; Officer of other Credit Suisse Funds. | |
|
J. Kevin Gao
Credit Suisse Asset Management, LLC
Eleven Madison Avenue
New York, New York 10010
(1967) | | Chief Legal Officer since 2006, Vice President and Secretary since 2004 | | Since 2004 | | Director and Legal Counsel of Credit Suisse; Associated with Credit Suisse since July 2003; Associated with the law firm of Willkie Farr & Gallagher LLP from 1998 to 2003; Officer of other Credit Suisse Funds. | |
|
Cecilia Chau
Credit Suisse Asset Management, LLC
Eleven Madison Avenue
New York, New York 10010
(1973) | | Treasurer | | Since 2008 | | Assistant Vice President of Credit Suisse since June 2007; Associated with Alliance Bernstein L.P. from January 2007 to May 2007; Associated with Credit Suisse from August 2000 to December 2006; Officer of other Credit Suisse Funds. | |
|
The Statement of Additional Information includes additional information about the Trustees and is available, without charge, upon request, by calling 800-222-8977.
38
Credit Suisse Trust — Mid-Cap Core Portfolio
Proxy Voting and Portfolio Holdings Information (unaudited)
Information regarding how the Portfolio voted proxies related to its portfolio securities during the 12 month period ended June 30 of each year, as well as the policies and procedures that the Portfolio uses to determine how to vote proxies relating to its portfolio securities are available:
• By calling 1-800-222-8977
• On the Portfolio's website, www.credit-suisse.com/us
• On the website of the Securities and Exchange Commission, www.sec.gov.
The Portfolio files a complete schedule of its portfolio holdings for the first and third quarters of its fiscal year with the SEC on Form N-Q. The Portfolio's Forms N-Q are available on the SEC's website at www.sec.gov and may be reviewed and copied at the SEC's Public Reference Room in Washington, DC. Information on the operation of the SEC's Public Reference Room may be obtained by calling 1-202-551-8090.
39
This page intentionally left blank

P.O. BOX 55030, BOSTON, MA 02205-5030
800-222-8977 n www.credit-suisse.com/us
CREDIT SUISSE ASSET MANAGEMENT SECURITIES, INC., DISTRIBUTOR. TRMCC-AR-1208

CREDIT SUISSE FUNDS
Annual Report
December 31, 2008
CREDIT SUISSE TRUST
n SMALL CAP CORE I PORTFOLIO
Credit Suisse Trust (the "Trust") shares are not available directly to individual investors, but may be offered only through certain insurance products and pension and retirement plans.
The Trust's investment objectives, risks, charges and expenses (which should be considered carefully before investing), and more complete information about the Trust, are provided in the Prospectus, which should be read carefully before investing. You may obtain additional copies by calling 800-222-8977 or by writing to Credit Suisse Trust, P.O. Box 55030, Boston, MA 02205-5030.
Credit Suisse Asset Management Securities, Inc., Distributor, is located at Eleven Madison Avenue, New York, NY 10010. The Trust is advised by Credit Suisse Asset Management, LLC.
The views of the Portfolio's management are as of the date of the letter and the Portfolio holdings described in this document are as of December 31, 2008; these views and Portfolio holdings may have changed subsequent to these dates. Nothing in this document is a recommendation to purchase or sell securities.
Portfolio shares are not deposits or other obligations of Credit Suisse Asset Management, LLC ("Credit Suisse") or any affiliate, are not FDIC-insured and are not guaranteed by Credit Suisse or any affiliate. Portfolio investments are subject to investment risks, including loss of your investment.
Credit Suisse Trust — Small Cap Core I Portfolio
Annual Investment Adviser's Report
December 31, 2008 (unaudited)
January 29, 2009
Dear Shareholder:
For the twelve months ended December 31, 2008, Credit Suisse Trust — Small Cap Core I Portfolio (the "Portfolio") had a loss of -34.66% versus a loss of -31.07% for its benchmark, the S&P SmallCap 600 Index.1
Market Review: A volatile year
The fiscal year ending December 31, 2008 was a tumultuous one marked by dramatic losses in the equity markets. The benchmark S&P SmallCap 600 Index plummeted 31.07% while the S&P 500 Index and Dow Jones Industrial Average also fell by 37.00% and 31.93%, respectively. The Chicago Board of Exchange Volatility Index (the "VIX"), a measure of market volatility, hit highs of 80 in October and November. The current global economic crisis was caused by a multitude of factors, including a lack of liquidity, a bleak outlook for future growth, and recessionary attitudes and signals.
In December, The National Bureau of Economic Research said that the U.S. has been in a recession since December 2007. The year was marked by turmoil across industries and asset classes as evidenced by the collapse of companies such as Bear Stearns and Lehman Brothers within the financials, the sharp price fluctuations and ultimate decline of all commodities, and government efforts toward the bailout of the banking and automotive industries.
The U.S. Federal Reserve cut the Federal Funds rate several times, dropping it from 4.50% to a range of 0.00% – 0.25% by October 29, 2008. Throughout the year, the discount rate was also cut in conjunction with the Federal Funds rate, and is now at 0.50%.
The U.S. housing sector continued to weaken in 2008, as evidenced by the S&P/Case Shiller U.S. Home Price Index, which measures home prices in 20 U.S. metropolitan areas. In October, the index was down 18% from a year earlier. The drop was more than originally forecast and the index has been falling every month since January 2007.
Additionally, as reported on December 30, 2008, the Conference Board Consumer Confidence Index fell to an all time low. The Index is now at 38.0, down from 44.7 in November. The Consumer Confidence Survey is based on a representative sample of 5,000 U.S. households.
Unemployment continued to rise in 2008, with increased job losses in all major industry sectors. Non-farm payrolls fell by 533,000 jobs in November, following losses of 403,000 in September and 320,000 in October. The household unemployment rate was 6.7%.
1
Credit Suisse Trust — Small Cap Core I Portfolio
Annual Investment Adviser's Report (continued)
December 31, 2008 (unaudited)
Strategic Review and Portfolio Outlook: Confidence and liquidity need to be restored
For the annual period ending December 31, 2008, the portfolio underperformed its benchmark. Although stock selection in consumer staples and materials, and sector selection in energy contributed positively to performance, stock and sector selection in information technology, consumer discretionary, and financials detracted from performance. The small cap market posed additional difficulties. By nature, small cap stocks are less liquid and more risky, and with the credit crisis and liquidation of numerous funds and hedge funds in the second half of the year, volatility increased in the small cap market. In part, this is because hedge funds tend to have more investments in small caps than do retail funds, and as the hedge funds unwound, the sell off of small caps contributed to a depression in prices.
On December 16, 2008, the Federal Open Market Committee (the "FOMC") issued a press release stating that "labor market conditions have deteriorated, and the available data indicate that consumer spending, business investment, and industrial production have declined. Financial markets remain quite strained and credit conditions tight. Overall, the outlook for economic activity has weakened further."
Chairman of the Federal Reserve Board Ben Bernanke stated in a speech at the Economic Club of New York on October 15, 2008 that the root of the current economic crisis is a loss of confidence by investors and the public in the strength of key financial institutions and the markets. He predicted that, as political and financial leaders slowly restore the public's faith in the markets, investors will gradually begin to re-establish their trust, and the markets will start to recover.
Despite the easing of volatility in December, compared to that of prior months, we believe there will continue to be months of uncertainty. At the end of the year, the market showed signs of easing liquidity with interest rates such as the LIBOR decreasing, interbank lending increasing, and the U.S. dollar strengthening. However, it is not clear that this additional liquidity in the markets and between banks will truly benefit consumers. For example, banks have begun to tighten their credit standards to such an extent that the average consumer may have a harder time borrowing money. Therefore, in this economic crisis where faith in the markets is key, we believe, like Bernanke, that in order for the market to recover, confidence and liquidity need to be restored.
Additionally, we have observed an increase in technical movements — caused by large hedge funds reducing leverage — not related to the fundamentals that most quantitative models are based upon. We believe that these volatile intraday
2
Credit Suisse Trust — Small Cap Core I Portfolio
Annual Investment Adviser's Report (continued)
December 31, 2008 (unaudited)
swings will need to be monitored closely, but as our investment model is designed with long-term goals in mind, a drastic change in our investment model will not be made. That being said, we are continuously conducting economic, statistical, and financial research on various levels in order to enhance our model. We have gone back to the basics of finance, where we seek to buy businesses that make comfortable returns without the need for excessive leverage.
Jordan Low
Portfolio Manager
Because of the nature of the Portfolio's investments in special-situation, start-up and other small companies, an investment in the Portfolio may be more volatile and less liquid than investments in larger companies.
In addition to historical information, this report contains forward-looking statements, which may concern, among other things, domestic and foreign market, industry and economic trends and developments and government regulation and their potential impact on the Portfolio's investments. These statements are subject to risks and uncertainties and actual trends, developments and regulations in the future, and their impact on the Portfolio could be materially different from those projected, anticipated or implied. The Portfolio has no obligation to update or revise forward-looking statements.
3
Credit Suisse Trust — Small Cap Core I Portfolio
Annual Investment Adviser's Report (continued)
December 31, 2008 (unaudited)
Comparison of Change in Value of $10,000 Investment in the
Credit Suisse Trust — Small Cap Core I Portfolio and the
S&P SmallCap 600 Index1 for Ten Years.
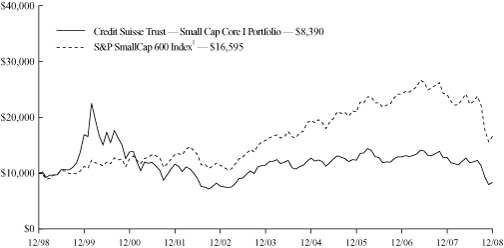
4
Credit Suisse Trust — Small Cap Core I Portfolio
Annual Investment Adviser's Report (continued)
December 31, 2008 (unaudited)
Average Annual Returns as of December 31, 2008
1 Year | |
5 Years | |
10 Years | | Since
Inception2 | |
| | (34.66 | )% | | | (6.04 | )% | | | (1.74 | )% | | | 2.21 | % | |
Returns represent past performance and include change in share price and reinvestment of dividends and capital gains. Past performance cannot guarantee future results. The current performance of the Portfolio may be lower or higher than the figures shown. Returns and share price will fluctuate, and redemption value may be more or less than original cost. The performance results do not reflect the deduction of taxes that a shareholder would pay on portfolio distributions or the redemption of portfolio shares. Performance includes the effect of deducting expenses, but does not include charges and expenses attributable to any particular variable contract or plan. Accordingly, the Prospectus of the sponsoring Participating Insurance Company separate account or plan documents or ot her informational materials supplied by plan sponsors should be carefully reviewed for information on relevant charges and expenses. Excluding these charges and expenses from quotations of performance has the effect of increasing the performance quoted, and the effect of these charges should be considered when comparing performance to that of other mutual funds. Performance information current to the most recent month-end is available at www.credit-suisse.com/us.
The annualized gross and net expense ratios are 0.93%.
1 The Standard & Poor's SmallCap 600 Index is an unmanaged market-weighted index of 600 U.S. stocks selected on the basis of market capitalization, liquidity and industry group representation and is a registered trademark of The McGraw-Hill Co., Inc. Investors cannot invest directly in an index.
2 Inception date 6/30/95.
5
Credit Suisse Trust — Small Cap Core I Portfolio
Annual Investment Adviser's Report (continued)
December 31, 2008 (unaudited)
Information About Your Portfolio's Expenses
As an investor of the Portfolio, you incur two types of costs: ongoing expenses and transaction costs. Ongoing expenses include management fees, distribution and service (12b-1) fees and other Portfolio expenses. Examples of transaction costs include sales charges (loads), redemption fees and account maintenance fees, which are not shown in this section and which would result in higher total expenses. The following table is intended to help you understand your ongoing expenses of investing in the Portfolio and to help you compare these expenses with the ongoing expenses of investing in other mutual funds. The table is based on an investment of $1,000 made at the beginning of the six month period ended December 31, 2008.
The table illustrates your Portfolio's expenses in two ways:
• Actual Portfolio Return. This helps you estimate the actual dollar amount of ongoing expenses paid on a $1,000 investment in the Portfolio using the Portfolio's actual return during the period. To estimate the expenses you paid over the period, simply divide your account value by $1,000 (for example, an $8,600 account value divided by $1,000 = 8.6), then multiply the result by the number in the "Expenses Paid per $1,000" line under the share class you hold.
• Hypothetical 5% Portfolio Return. This helps you to compare your Portfolio's ongoing expenses with those of other mutual funds using the Portfolio's actual expense ratio and a hypothetical rate of return of 5% per year before expenses. Examples using a 5% hypothetical portfolio return may be found in the shareholder reports of other mutual funds. The hypothetical account values and expenses may not be used to estimate the actual ending account balance or expenses you paid for the period.
Please note that the expenses shown in these tables are meant to highlight your ongoing expenses only and do not reflect any transaction costs, such as sales charges (loads) or redemption fees. If these transaction costs had been included, your costs would have been higher. The "Expenses Paid per $1,000" line of the tables is useful in comparing ongoing expenses only and will not help you determine the relative total expenses of owning different funds.
6
Credit Suisse Trust — Small Cap Core I Portfolio
Annual Investment Adviser's Report (continued)
December 31, 2008 (unaudited)
Expenses and Value for a $1,000 Investment
for the six month period ended December 31, 2008
| Actual Portfolio Return | | | | | |
| Beginning Account Value 7/1/08 | | $ | 1,000.00 | | |
| Ending Account Value 12/31/08 | | $ | 705.80 | | |
| Expenses Paid per $1,000* | | $ | 3.90 | | |
| Hypothetical 5% Portfolio Return | |
| Beginning Account Value 7/1/08 | | $ | 1,000.00 | | |
| Ending Account Value 12/31/08 | | $ | 1,020.56 | | |
| Expenses Paid per $1,000* | | $ | 4.62 | | |
| Annualized Expense Ratios* | | | 0.91 | % | |
* Expenses are equal to the Portfolio's annualized expense ratio multiplied by the average account value over the period, multiplied by the number of days in the most recent fiscal half year period, then divided by 366.
The "Expenses Paid per $1,000" and the "Annualized Expense Ratios" in the tables are based on actual expenses paid by the Portfolio during the period, net of fee waivers and/or expense reimbursements. If those fee waivers and/or expense reimbursements had not been in effect, the Portfolio's actual expenses would have been higher. Expenses do not reflect additional charges and expenses that are, or may be, imposed under the variable contracts or plans. Such charges and expenses are described in the prospectus of the insurance company separate account or in the plan documents or other informational materials supplied by plan sponsors. The Portfolio's expenses should be considered with these charges and expenses in evaluating the overall cost of investing in the separate account.
For more information, please refer to the Portfolio's prospectus.
7
Credit Suisse Trust — Small Cap Core I Portfolio
Annual Investment Adviser's Report (continued)
December 31, 2008 (unaudited)
SECTOR BREAKDOWN*

* Expressed as a percentage of total investments (excluding securities lending collateral if applicable) and may vary over time.
8
Credit Suisse Trust — Small Cap Core I Portfolio
Schedule of Investments
December 31, 2008
| | | Number of
Shares | | Value | |
| COMMON STOCKS (106.7%) | |
| Aerospace & Defense (2.0%) | |
| Applied Signal Technology, Inc. | | | 5,800 | | | $ | 104,052 | | |
| Cubic Corp. | | | 7,800 | | | | 212,160 | | |
| Curtiss-Wright Corp. | | | 29,600 | | | | 988,344 | | |
| GenCorp, Inc.* | | | 12,100 | | | | 44,528 | | |
| Kaman Corp. | | | 11,800 | | | | 213,934 | | |
| Moog, Inc. Class A* | | | 300 | | | | 10,971 | | |
| Orbital Sciences Corp.* | | | 55,100 | | | | 1,076,103 | | |
| | | | 2,650,092 | | |
| Air Freight & Couriers (0.4%) | |
| Hub Group, Inc. Class A* | | | 22,900 | | | | 607,537 | | |
| Airlines (0.0%) | |
| Copa Holdings SA Class A | | | 100 | | | | 3,032 | | |
| Auto Components (0.9%) | |
| ATC Technology Corp.* | | | 12,800 | | | | 187,264 | | |
| Federal Signal Corp. | | | 44,200 | | | | 362,882 | | |
| Fuel Systems Solutions, Inc.* | | | 16,200 | | | | 530,712 | | |
| Midas, Inc.* | | | 5,400 | | | | 56,646 | | |
| Spartan Motors, Inc. | | | 8,300 | | | | 39,259 | | |
| Standard Motor Products, Inc. | | | 3,100 | | | | 10,726 | | |
| Superior Industries International, Inc. | | | 2,200 | | | | 23,144 | | |
| | | | 1,210,633 | | |
| Automobiles (0.0%) | |
| Monaco Coach Corp. | | | 14,300 | | | | 7,293 | | |
| Banks (8.9%) | |
| Anchor BanCorp Wisconsin, Inc. | | | 4,300 | | | | 11,868 | | |
| Bank Mutual Corp. | | | 23,000 | | | | 265,420 | | |
| BankAtlantic Bancorp, Inc. Class A | | | 2,880 | | | | 16,704 | | |
| BankUnited Financial Corp. Class A | | | 4,100 | | | | 697 | | |
| Boston Private Financial Holdings, Inc. | | | 3,000 | | | | 20,520 | | |
| Brookline Bancorp, Inc. | | | 21,100 | | | | 224,715 | | |
| Cascade Bancorp | | | 11,200 | | | | 75,600 | | |
| Central Pacific Financial Corp. | | | 28,500 | | | | 286,140 | | |
| Columbia Banking System, Inc. | | | 8,400 | | | | 100,212 | | |
| Community Bank System, Inc. | | | 15,400 | | | | 375,606 | | |
| Corus Bankshares, Inc. | | | 8,900 | | | | 9,879 | | |
| Dime Community Bancshares | | | 11,700 | | | | 155,610 | | |
| Downey Financial Corp. | | | 13,200 | | | | 488 | | |
| East West Bancorp, Inc. | | | 33,600 | | | | 536,592 | | |
| First BanCorp. | | | 62,900 | | | | 700,706 | | |
| First Commonwealth Financial Corp. | | | 35,000 | | | | 433,300 | | |
| First Financial Bancorp. | | | 14,900 | | | | 184,611 | | |
| First Financial Bankshares, Inc. | | | 8,600 | | | | 474,806 | | |
| First Midwest Bancorp, Inc. | | | 13,800 | | | | 275,586 | | |
| FirstFed Financial Corp.* | | | 1,400 | | | | 2,450 | | |
| Flagstar Bancorp, Inc.* | | | 13,363 | | | | 9,488 | | |
See Accompanying Notes to Financial Statements.
9
Credit Suisse Trust — Small Cap Core I Portfolio
Schedule of Investments (continued)
December 31, 2008
| | | Number of
Shares | | Value | |
| COMMON STOCKS | |
| Banks | |
| Frontier Financial Corp. | | | 8,000 | | | $ | 34,880 | | |
| Glacier Bancorp, Inc. | | | 15,400 | | | | 292,908 | | |
| Hancock Holding Co. | | | 16,400 | | | | 745,544 | | |
| Hanmi Financial Corp. | | | 11,400 | | | | 23,484 | | |
| Independent Bank Corp./MICH | | | 9,500 | | | | 20,520 | | |
| Irwin Financial Corp.* | | | 4,300 | | | | 5,547 | | |
| Nara Bancorp, Inc. | | | 10,200 | | | | 100,266 | | |
| National Penn Bancshares, Inc. | | | 14,600 | | | | 211,846 | | |
| Old National Bancorp | | | 20,100 | | | | 365,016 | | |
| PrivateBancorp, Inc. | | | 13,300 | | | | 431,718 | | |
| Prosperity Bancshares, Inc. | | | 31,000 | | | | 917,290 | | |
| Provident Bankshares Corp. | | | 15,300 | | | | 147,798 | | |
| S&T Bancorp, Inc. | | | 11,600 | | | | 411,800 | | |
| Signature Bank* | | | 7,700 | | | | 220,913 | | |
| Sterling Bancorp NY | | | 8,500 | | | | 119,255 | | |
| Sterling Bancshares, Inc. | | | 33,500 | | | | 203,680 | | |
| Sterling Financial Corp. | | | 3,600 | | | | 31,680 | | |
| Susquehanna Bancshares, Inc. | | | 13,000 | | | | 206,830 | | |
| The South Financial Group, Inc. | | | 17,966 | | | | 77,613 | | |
| Tompkins Financial Corp. | | | 3,100 | | | | 179,645 | | |
| TrustCo Bank Corp. NY | | | 35,000 | | | | 332,850 | | |
| UCBH Holdings, Inc. | | | 19,200 | | | | 132,096 | | |
| UMB Financial Corp. | | | 16,400 | | | | 805,896 | | |
| Umpqua Holdings Corp. | | | 27,800 | | | | 402,266 | | |
| United Bankshares, Inc. | | | 8,900 | | | | 295,658 | | |
| United Community Banks, Inc. | | | 19,902 | | | | 270,268 | | |
| Whitney Holding Corp. | | | 32,900 | | | | 526,071 | | |
| Wilshire Bancorp, Inc. | | | 8,600 | | | | 78,088 | | |
| Wintrust Financial Corp. | | | 13,900 | | | | 285,923 | | |
| | | | 12,038,347 | | |
| Beverages (0.2%) | |
| The Boston Beer Co., Inc. Class A* | | | 10,100 | | | | 286,840 | | |
| Biotechnology (4.5%) | |
| Acorda Therapeutics, Inc.* | | | 8,100 | | | | 166,131 | | |
| ArQule, Inc.* | | | 7,100 | | | | 29,962 | | |
| Cubist Pharmaceuticals, Inc.* | | | 126,350 | | | | 3,052,616 | | |
| CV Therapeutics, Inc.* | | | 84,400 | | | | 777,324 | | |
| Dendreon Corp.* | | | 82,100 | | | | 376,018 | | |
| Enzo Biochem, Inc.* | | | 8,200 | | | | 40,098 | | |
| Genomic Health, Inc.* | | | 2,600 | | | | 50,648 | | |
| Kendle International, Inc.* | | | 6,200 | | | | 159,464 | | |
| Martek Biosciences Corp. | | | 21,800 | | | | 660,758 | | |
| Momenta Pharmaceuticals, Inc.* | | | 12,700 | | | | 147,320 | | |
| Pharmanet Development Group, Inc.* | | | 5,600 | | | | 5,096 | | |
| Regeneron Pharmaceuticals, Inc.* | | | 37,600 | | | | 690,336 | | |
| | | | 6,155,771 | | |
See Accompanying Notes to Financial Statements.
10
Credit Suisse Trust — Small Cap Core I Portfolio
Schedule of Investments (continued)
December 31, 2008
| | | Number of
Shares | | Value | |
| COMMON STOCKS | |
| Building Products (1.4%) | |
| AAON, Inc. | | | 2,300 | | | $ | 48,024 | | |
| Apogee Enterprises, Inc. | | | 12,000 | | | | 124,320 | | |
| Griffon Corp.* | | | 50,200 | | | | 468,366 | | |
| Insituform Technologies, Inc. Class A* | | | 13,000 | | | | 255,970 | | |
| Quanex Building Products Corp. | | | 9,800 | | | | 91,826 | | |
| Simpson Manufacturing Co., Inc. | | | 17,600 | | | | 488,576 | | |
| Trex Co., Inc.* | | | 21,300 | | | | 350,598 | | |
| Universal Forest Products, Inc. | | | 600 | | | | 16,146 | | |
| Watsco, Inc. | | | 800 | | | | 30,720 | | |
| | | | 1,874,546 | | |
| Chemicals (0.9%) | |
| A. Schulman, Inc. | | | 12,600 | | | | 214,200 | | |
| American Vanguard Corp. | | | 5,800 | | | | 67,860 | | |
| Arch Chemicals, Inc. | | | 2,900 | | | | 75,603 | | |
| Ashland, Inc. | | | 900 | | | | 9,459 | | |
| Balchem Corp. | | | 8,500 | | | | 211,735 | | |
| Calgon Carbon Corp.* | | | 18,200 | | | | 279,552 | | |
| Cambrex Corp.* | | | 6,600 | | | | 30,492 | | |
| Georgia Gulf Corp. | | | 9,200 | | | | 9,844 | | |
| Material Sciences Corp.* | | | 5,400 | | | | 8,370 | | |
| Omnova Solutions, Inc.* | | | 17,500 | | | | 11,375 | | |
| Penford Corp. | | | 5,200 | | | | 52,624 | | |
| PolyOne Corp.* | | | 24,000 | | | | 75,600 | | |
| Quaker Chemical Corp. | | | 4,700 | | | | 77,315 | | |
| Stepan Co. | | | 100 | | | | 4,699 | | |
| Tronox, Inc. Class B | | | 17,800 | | | | 676 | | |
| Zep, Inc. | | | 7,300 | | | | 140,963 | | |
| | | | 1,270,367 | | |
| Commercial Services & Supplies (3.8%) | |
| ABM Industries, Inc. | | | 64,589 | | | | 1,230,421 | | |
| Bowne & Co., Inc. | | | 1,900 | | | | 11,172 | | |
| Capella Education Co.* | | | 2,100 | | | | 123,396 | | |
| CDI Corp. | | | 6,400 | | | | 82,816 | | |
| Coinstar, Inc.* | | | 42,500 | | | | 829,175 | | |
| CPI Corp. | | | 1,400 | | | | 4,900 | | |
| CSG Systems International, Inc.* | | | 16,600 | | | | 290,002 | | |
| Darling International, Inc.* | | | 26,300 | | | | 144,387 | | |
| G&K Services, Inc. Class A | | | 9,800 | | | | 198,156 | | |
| Gevity HR, Inc. | | | 7,200 | | | | 10,872 | | |
| Healthcare Services Group, Inc. | | | 14,700 | | | | 234,171 | | |
| Heartland Payment Systems, Inc. | | | 100 | | | | 1,750 | | |
| Heidrick & Struggles International, Inc. | | | 5,200 | | | | 112,008 | | |
| HMS Holdings Corp.* | | | 10,600 | | | | 334,112 | | |
| Korn/Ferry International* | | | 16,300 | | | | 186,146 | | |
| Landauer, Inc. | | | 100 | | | | 7,330 | | |
| Mobile Mini, Inc.* | | | 1,800 | | | | 25,956 | | |
| On Assignment, Inc.* | | | 9,000 | | | | 51,030 | | |
See Accompanying Notes to Financial Statements.
11
Credit Suisse Trust — Small Cap Core I Portfolio
Schedule of Investments (continued)
December 31, 2008
| | | Number of
Shares | | Value | |
| COMMON STOCKS | |
| Commercial Services & Supplies | |
| PHI, Inc.* | | | 1,100 | | | $ | 15,411 | | |
| Pre-Paid Legal Services, Inc.* | | | 3,100 | | | | 115,599 | | |
| Spherion Corp.* | | | 16,200 | | | | 35,802 | | |
| StarTek, Inc.* | | | 3,000 | | | | 13,350 | | |
| Steelcase, Inc. Class A | | | 34,000 | | | | 191,080 | | |
| Tetra Technologies, Inc.* | | | 11,800 | | | | 284,970 | | |
| The Standard Register Co. | | | 4,800 | | | | 42,864 | | |
| Universal Technical Institute, Inc.* | | | 7,100 | | | | 121,907 | | |
| Viad Corp. | | | 10,400 | | | | 257,296 | | |
| Waste Management, Inc. | | | 400 | | | | 13,256 | | |
| Watson Wyatt Worldwide, Inc. Class A | | | 200 | | | | 9,564 | | |
| Wright Express Corp.* | | | 15,500 | | | | 195,300 | | |
| | | | 5,174,199 | | |
| Communications Equipment (2.2%) | |
| Arris Group, Inc.* | | | 161,828 | | | | 1,286,533 | | |
| Audiovox Corp. Class A* | | | 5,900 | | | | 29,559 | | |
| Bel Fuse, Inc. Class B | | | 5,200 | | | | 110,240 | | |
| Black Box Corp. | | | 7,800 | | | | 203,736 | | |
| Catapult Communications Corp.* | | | 4,400 | | | | 28,908 | | |
| Digi International, Inc.* | | | 9,300 | | | | 75,423 | | |
| DSP Group, Inc.* | | | 10,200 | | | | 81,804 | | |
| Emulex Corp.* | | | 64,700 | | | | 451,606 | | |
| Harmonic, Inc.* | | | 24,400 | | | | 136,884 | | |
| Network Equipment Technologies, Inc.* | | | 8,000 | | | | 23,040 | | |
| PC-Tel, Inc. | | | 7,300 | | | | 47,961 | | |
| Plantronics, Inc. | | | 6,800 | | | | 89,760 | | |
| Symmetricom, Inc.* | | | 11,500 | | | | 45,425 | | |
| Tekelec* | | | 15,800 | | | | 210,772 | | |
| Tollgrade Communications, Inc.* | | | 3,300 | | | | 15,774 | | |
| ViaSat, Inc.* | | | 3,800 | | | | 91,504 | | |
| | | | 2,928,929 | | |
| Computers & Peripherals (1.7%) | |
| Avid Technology, Inc.* | | | 16,300 | | | | 177,833 | | |
| Hutchinson Technology, Inc.* | | | 7,000 | | | | 24,360 | | |
| Mercury Computer Systems, Inc.* | | | 5,300 | | | | 33,443 | | |
| Novatel Wireless, Inc.* | | | 7,300 | | | | 33,872 | | |
| Stratasys, Inc.* | | | 8,900 | | | | 95,675 | | |
| Synaptics, Inc.* | | | 118,563 | | | | 1,963,403 | | |
| | | | 2,328,586 | | |
| Construction & Engineering (0.7%) | |
| Dycom Industries, Inc.* | | | 31,200 | | | | 256,464 | | |
| EMCOR Group, Inc.* | | | 7,000 | | | | 157,010 | | |
| MasTec, Inc.* | | | 35,300 | | | | 408,774 | | |
| Michael Baker Corp.* | | | 1,300 | | | | 47,983 | | |
| Sterling Construction Co., Inc.* | | | 3,800 | | | | 70,452 | | |
| | | | 940,683 | | |
See Accompanying Notes to Financial Statements.
12
Credit Suisse Trust — Small Cap Core I Portfolio
Schedule of Investments (continued)
December 31, 2008
| | | Number of
Shares | | Value | |
| COMMON STOCKS | |
| Construction Materials (0.5%) | |
| Texas Industries, Inc. | | | 21,300 | | | $ | 734,850 | | |
| Containers & Packaging (0.1%) | |
| Myers Industries, Inc. | | | 16,100 | | | | 128,800 | | |
| Rock-Tenn Co. Class A | | | 1,800 | | | | 61,524 | | |
| | | | 190,324 | | |
| Distributors (0.2%) | |
| Brightpoint, Inc.* | | | 12,800 | | | | 55,680 | | |
| Pool Corp. | | | 13,100 | | | | 235,407 | | |
| Spectrum Brands, Inc.* | | | 27,700 | | | | 2,493 | | |
| | | | 293,580 | | |
| Diversified Financials (2.3%) | |
| First Cash Financial Services, Inc.* | | | 13,000 | | | | 247,780 | | |
| Guaranty Financial Group, Inc.* | | | 4,800 | | | | 12,528 | | |
| Home Bancshares, Inc. | | | 800 | | | | 21,560 | | |
| Investment Technology Group, Inc.* | | | 85,100 | | | | 1,933,472 | | |
| LaBranche & Co., Inc.* | | | 13,900 | | | | 66,581 | | |
| National Financial Partners Corp. | | | 2,500 | | | | 7,600 | | |
| optionsXpress Holdings, Inc. | | | 8,700 | | | | 116,232 | | |
| Piper Jaffray Cos., Inc.* | | | 100 | | | | 3,976 | | |
| Portfolio Recovery Associates, Inc.* | | | 6,500 | | | | 219,960 | | |
| Rewards Network, Inc.* | | | 10,600 | | | | 27,454 | | |
| Stifel Financial Corp.* | | | 1,100 | | | | 50,435 | | |
| SWS Group, Inc. | | | 14,600 | | | | 276,670 | | |
| World Acceptance Corp.* | | | 7,800 | | | | 154,128 | | |
| | | | 3,138,376 | | |
| Diversified Telecommunication Services (0.4%) | |
| Ditech Networks, Inc.* | | | 12,800 | | | | 10,483 | | |
| FairPoint Communications, Inc. | | | 22,200 | | | | 72,816 | | |
| General Communication, Inc. Class A* | | | 8,800 | | | | 71,192 | | |
| Iowa Telecommunications Services, Inc. | | | 200 | | | | 2,856 | | |
| Starent Networks Corp.* | | | 26,600 | | | | 317,338 | | |
| | | | 474,685 | | |
| Electric Utilities (1.0%) | |
| ALLETE, Inc. | | | 14,300 | | | | 461,461 | | |
| Central Vermont Public Service Corp. | | | 4,000 | | | | 95,440 | | |
| CH Energy Group, Inc. | | | 8,700 | | | | 447,093 | | |
| NorthWestern Corp. | | | 200 | | | | 4,694 | | |
| Pike Electric Corp.* | | | 2,200 | | | | 27,060 | | |
| The Empire District Electric Co. | | | 200 | | | | 3,520 | | |
| UIL Holdings Corp. | | | 10,400 | | | | 312,312 | | |
| Unisource Energy Corp. | | | 200 | | | | 5,872 | | |
| | | | 1,357,452 | | |
See Accompanying Notes to Financial Statements.
13
Credit Suisse Trust — Small Cap Core I Portfolio
Schedule of Investments (continued)
December 31, 2008
| | | Number of
Shares | | Value | |
| COMMON STOCKS | |
| Electronic Equipment & Instruments (3.5%) | |
| Analogic Corp. | | | 7,100 | | | $ | 193,688 | | |
| Belden, Inc. | | | 32,200 | | | | 672,336 | | |
| Benchmark Electronics, Inc.* | | | 118,600 | | | | 1,514,522 | | |
| Brady Corp. Class A | | | 23,600 | | | | 565,220 | | |
| C&D Technologies, Inc.* | | | 12,400 | | | | 38,812 | | |
| Checkpoint Systems, Inc.* | | | 200 | | | | 1,968 | | |
| CTS Corp. | | | 9,900 | | | | 54,549 | | |
| Electro Scientific Industries, Inc.* | | | 11,100 | | | | 75,369 | | |
| EnerSys* | | | 4,200 | | | | 46,200 | | |
| Exar Corp.* | | | 21,100 | | | | 140,737 | | |
| II-VI, Inc.* | | | 3,600 | | | | 68,724 | | |
| Keithley Instruments, Inc. | | | 3,500 | | | | 12,775 | | |
| Kopin Corp.* | | | 16,600 | | | | 33,864 | | |
| Littelfuse, Inc.* | | | 7,100 | | | | 117,860 | | |
| LoJack Corp.* | | | 7,100 | | | | 29,252 | | |
| Magnetek, Inc.* | | | 7,600 | | | | 18,240 | | |
| Methode Electronics, Inc. | | | 20,100 | | | | 135,474 | | |
| MTS Systems Corp. | | | 12,400 | | | | 330,336 | | |
| Newport Corp.* | | | 16,800 | | | | 113,904 | | |
| Park Electrochemical Corp. | | | 10,000 | | | | 189,600 | | |
| Planar Systems, Inc.* | | | 8,500 | | | | 5,185 | | |
| Rogers Corp.* | | | 1,500 | | | | 41,655 | | |
| ScanSource, Inc.* | | | 3,700 | | | | 71,299 | | |
| Technitrol, Inc. | | | 10,400 | | | | 36,192 | | |
| Tecumseh Products Co. Class B* | | | 3,500 | | | | 33,425 | | |
| TTM Technologies, Inc.* | | | 10,800 | | | | 56,268 | | |
| Universal Display Corp.* | | | 6,600 | | | | 62,370 | | |
| Veeco Instruments, Inc.* | | | 9,600 | | | | 60,864 | | |
| Vicor Corp. | | | 5,500 | | | | 36,355 | | |
| | | | 4,757,043 | | |
| Energy Equipment & Services (4.6%) | |
| Atwood Oceanics, Inc.* | | | 131,300 | | | | 2,006,264 | | |
| CARBO Ceramics, Inc. | | | 35,500 | | | | 1,261,315 | | |
| Gulf Island Fabrication, Inc. | | | 5,500 | | | | 79,255 | | |
| ION Geophysical Corp.* | | | 21,600 | | | | 74,088 | | |
| Lufkin Industries, Inc. | | | 10,800 | | | | 372,600 | | |
| Matrix Service Co.* | | | 3,500 | | | | 26,845 | | |
| Oil States International, Inc.* | | | 115,300 | | | | 2,154,957 | | |
| SEACOR Holdings, Inc.* | | | 600 | | | | 39,990 | | |
| Superior Well Services, Inc.* | | | 7,500 | | | | 75,000 | | |
| TETRA Technologies, Inc.* | | | 18,700 | | | | 90,882 | | |
| | | | 6,181,196 | | |
| Food & Drug Retailing (1.1%) | |
| Casey's General Stores, Inc. | | | 26,000 | | | | 592,020 | | |
| Ingles Markets, Inc. Class A | | | 1,500 | | | | 26,385 | | |
| Nash Finch Co. | | | 5,100 | | | | 228,939 | | |
| PetMed Express, Inc.* | | | 11,100 | | | | 195,693 | | |
See Accompanying Notes to Financial Statements.
14
Credit Suisse Trust — Small Cap Core I Portfolio
Schedule of Investments (continued)
December 31, 2008
| | | Number of
Shares | | Value | |
| COMMON STOCKS | |
| Food & Drug Retailing | |
| Spartan Stores, Inc. | | | 11,000 | | | $ | 255,750 | | |
| The Pantry, Inc.* | | | 7,800 | | | | 167,310 | | |
| | | | 1,466,097 | | |
| Food Products (1.0%) | |
| Corn Products International, Inc. | | | 4,600 | | | | 132,710 | | |
| Diamond Foods, Inc. | | | 14,100 | | | | 284,115 | | |
| J & J Snack Foods Corp. | | | 8,000 | | | | 287,040 | | |
| Lance, Inc. | | | 17,100 | | | | 392,274 | | |
| Peet's Coffee & Tea, Inc.* | | | 7,700 | | | | 179,025 | | |
| The Hain Celestial Group, Inc.* | | | 900 | | | | 17,181 | | |
| USANA Health Sciences, Inc.* | | | 100 | | | | 3,424 | | |
| | | | 1,295,769 | | |
| Forestry & Paper (0.1%) | |
| Chesapeake Corp.* | | | 9,700 | | | | 320 | | |
| Deltic Timber Corp. | | | 500 | | | | 22,875 | | |
| Neenah Paper, Inc. | | | 5,100 | | | | 45,084 | | |
| Wausau Paper Corp. | | | 5,100 | | | | 58,344 | | |
| | | | 126,623 | | |
| Gas Utilities (5.1%) | |
| New Jersey Resources Corp. | | | 71,900 | | | | 2,829,265 | | |
| Northwest Natural Gas Co. | | | 20,400 | | | | 902,292 | | |
| Piedmont Natural Gas Co., Inc. | | | 39,900 | | | | 1,263,633 | | |
| South Jersey Industries, Inc. | | | 17,500 | | | | 697,375 | | |
| Southwest Gas Corp. | | | 1,600 | | | | 40,352 | | |
| The Laclede Group, Inc. | | | 25,200 | | | | 1,180,368 | | |
| | | | 6,913,285 | | |
| Healthcare Equipment & Supplies (4.3%) | |
| Abaxis, Inc.* | | | 9,700 | | | | 155,491 | | |
| American Medical Systems Holdings, Inc.* | | | 1,300 | | | | 11,687 | | |
| ArthroCare Corp.* | | | 12,000 | | | | 57,240 | | |
| BioLase Technology, Inc.* | | | 11,900 | | | | 17,731 | | |
| CONMED Corp.* | | | 13,100 | | | | 313,614 | | |
| CryoLife, Inc.* | | | 34,500 | | | | 334,995 | | |
| Cyberonics, Inc.* | | | 41,600 | | | | 689,312 | | |
| Datascope Corp. | | | 5,500 | | | | 287,320 | | |
| Hillenbrand, Inc. | | | 39,832 | | | | 664,398 | | |
| ICU Medical, Inc.* | | | 5,700 | | | | 188,898 | | |
| Immucor, Inc.* | | | 1,100 | | | | 29,238 | | |
| Invacare Corp. | | | 17,500 | | | | 271,600 | | |
| Kensey Nash Corp.* | | | 5,000 | | | | 97,050 | | |
| LCA-Vision, Inc. | | | 8,800 | | | | 36,168 | | |
| Mentor Corp. | | | 27,200 | | | | 841,296 | | |
| Meridian Bioscience, Inc. | | | 6,849 | | | | 174,444 | | |
| Merit Medical Systems, Inc.* | | | 13,600 | | | | 243,848 | | |
| Noven Pharmaceuticals, Inc.* | | | 11,600 | | | | 127,600 | | |
See Accompanying Notes to Financial Statements.
15
Credit Suisse Trust — Small Cap Core I Portfolio
Schedule of Investments (continued)
December 31, 2008
| | | Number of
Shares | | Value | |
| COMMON STOCKS | |
| Healthcare Equipment & Supplies | |
| Osteotech, Inc.* | | | 6,900 | | | $ | 11,661 | | |
| Palomar Medical Technologies, Inc.* | | | 8,500 | | | | 98,005 | | |
| SurModics, Inc.* | | | 11,600 | | | | 293,132 | | |
| Symmetry Medical, Inc.* | | | 4,700 | | | | 37,459 | | |
| Theragenics Corp.* | | | 10,300 | | | | 12,051 | | |
| West Pharmaceutical Services, Inc. | | | 17,000 | | | | 642,090 | | |
| Zoll Medical Corp.* | | | 10,000 | | | | 188,900 | | |
| | | | 5,825,228 | | |
| Healthcare Providers & Services (5.9%) | |
| AMERIGROUP Corp.* | | | 43,700 | | | | 1,290,024 | | |
| AMN Healthcare Services, Inc.* | | | 2,800 | | | | 23,688 | | |
| AmSurg Corp.* | | | 16,300 | | | | 380,442 | | |
| Catalyst Health Solutions, Inc.* | | | 43,600 | | | | 1,061,660 | | |
| Centene Corp.* | | | 49,800 | | | | 981,558 | | |
| Cross Country Healthcare, Inc.* | | | 14,300 | | | | 125,697 | | |
| Gentiva Health Services, Inc.* | | | 12,100 | | | | 354,046 | | |
| Healthways, Inc.* | | | 2,400 | | | | 27,552 | | |
| Kindred Healthcare, Inc.* | | | 19,200 | | | | 249,984 | | |
| Magellan Health Services, Inc.* | | | 45,500 | | | | 1,781,780 | | |
| MedCath Corp.* | | | 5,800 | | | | 60,552 | | |
| Molina Healthcare, Inc.* | | | 13,300 | | | | 234,213 | | |
| Odyssey HealthCare, Inc.* | | | 14,300 | | | | 132,275 | | |
| Omnicell, Inc.* | | | 14,400 | | | | 175,824 | | |
| Owens & Minor, Inc. | | | 18,300 | | | | 688,995 | | |
| PSS World Medical, Inc.* | | | 6,900 | | | | 129,858 | | |
| RehabCare Group, Inc.* | | | 7,200 | | | | 109,152 | | |
| Res-Care, Inc.* | | | 12,200 | | | | 183,244 | | |
| Sunrise Senior Living, Inc.* | | | 34,700 | | | | 58,296 | | |
| | | | 8,048,840 | | |
| Hotels, Restaurants & Leisure (6.5%) | |
| Buffalo Wild Wings, Inc.* | | | 15,600 | | | | 400,140 | | |
| California Pizza Kitchen, Inc.* | | | 16,300 | | | | 174,736 | | |
| Cracker Barrel Old Country Store, Inc. | | | 5,300 | | | | 109,127 | | |
| Landry's Restaurants, Inc. | | | 200 | | | | 2,320 | | |
| Live Nation, Inc.* | | | 21,200 | | | | 121,688 | | |
| Multimedia Games, Inc.* | | | 5,800 | | | | 13,804 | | |
| National CineMedia, Inc. | | | 7,000 | | | | 70,980 | | |
| O'Charley's, Inc. | | | 5,100 | | | | 10,200 | | |
| P.F. Chang's China Bistro, Inc.* | | | 19,100 | | | | 399,954 | | |
| Panera Bread Co. Class A* | | | 61,700 | | | | 3,223,208 | | |
| Papa John's International, Inc.* | | | 15,200 | | | | 280,136 | | |
| Red Robin Gourmet Burgers, Inc.* | | | 10,000 | | | | 168,300 | | |
| Ruby Tuesday, Inc.* | | | 11,700 | | | | 18,252 | | |
| Ruth's Hospitality Group, Inc.* | | | 5,900 | | | | 8,142 | | |
| Shuffle Master, Inc.* | | | 14,800 | | | | 73,408 | | |
| The Marcus Corp. | | | 1,200 | | | | 19,476 | | |
| The Steak N Shake Co.* | | | 8,700 | | | | 51,765 | | |
See Accompanying Notes to Financial Statements.
16
Credit Suisse Trust — Small Cap Core I Portfolio
Schedule of Investments (continued)
December 31, 2008
| | | Number of
Shares | | Value | |
| COMMON STOCKS | |
| Hotels, Restaurants & Leisure | |
| Wendy's/Arby's Group, Inc. Class A | | | 2,394 | | | $ | 11,826 | | |
| WMS Industries, Inc.* | | | 134,500 | | | | 3,618,050 | | |
| | | | 8,775,512 | | |
| Household Durables (0.7%) | |
| American Greetings Corp. Class A | | | 11,100 | | | | 84,027 | | |
| Bassett Furniture Industries, Inc. | | | 3,000 | | | | 10,050 | | |
| Blyth, Inc. | | | 15,400 | | | | 120,736 | | |
| Champion Enterprises, Inc.* | | | 7,000 | | | | 3,920 | | |
| Ethan Allen Interiors, Inc. | | | 13,800 | | | | 198,306 | | |
| Fleetwood Enterprises, Inc.* | | | 30,200 | | | | 3,020 | | |
| Interface, Inc. Class A | | | 15,000 | | | | 69,600 | | |
| Knoll, Inc. | | | 14,400 | | | | 129,888 | | |
| La-Z-Boy, Inc. | | | 12,700 | | | | 27,559 | | |
| Libbey, Inc. | | | 4,100 | | | | 5,125 | | |
| M/I Homes, Inc. | | | 5,000 | | | | 52,700 | | |
| National Presto Industries, Inc. | | | 1,800 | | | | 138,600 | | |
| Russ Berrie & Co., Inc.* | | | 4,500 | | | | 13,365 | | |
| Skyline Corp. | | | 3,200 | | | | 63,968 | | |
| Standard Pacific Corp.* | | | 29,400 | | | | 52,332 | | |
| Universal Electronics, Inc.* | | | 1,300 | | | | 21,086 | | |
| | | | 994,282 | | |
| Household Products (0.3%) | |
| Central Garden & Pet Co. Class A* | | | 18,700 | | | | 110,330 | | |
| WD-40 Co. | | | 8,000 | | | | 226,320 | | |
| | | | 336,650 | | |
| Industrial Conglomerates (0.5%) | |
| Lydall, Inc.* | | | 4,200 | | | | 24,150 | | |
| Standex International Corp. | | | 23,000 | | | | 456,320 | | |
| Tredegar Corp. | | | 9,500 | | | | 172,710 | | |
| | | | 653,180 | | |
| Insurance (2.3%) | |
| American Equity Investment Life Holding Co. | | | 10,600 | | | | 74,200 | | |
| Baldwin & Lyons, Inc. Class B | | | 300 | | | | 5,457 | | |
| Citizens Inc.* | | | 2,600 | | | | 25,220 | | |
| CNA Surety Corp.* | | | 3,200 | | | | 61,440 | | |
| Horace Mann Educators Corp. | | | 37,000 | | | | 340,030 | | |
| Infinity Property & Casualty Corp. | | | 6,900 | | | | 322,437 | | |
| LandAmerica Financial Group, Inc. | | | 5,200 | | | | 468 | | |
| Navigators Group, Inc.* | | | 6,200 | | | | 340,442 | | |
| Presidential Life Corp. | | | 7,700 | | | | 76,153 | | |
| ProAssurance Corp.* | | | 100 | | | | 5,278 | | |
| RLI Corp. | | | 900 | | | | 55,044 | | |
| Safety Insurance Group, Inc. | | | 7,700 | | | | 293,062 | | |
| Selective Insurance Group, Inc. | | | 19,600 | | | | 449,428 | | |
| Stewart Information Services Corp. | | | 8,300 | | | | 194,967 | | |
See Accompanying Notes to Financial Statements.
17
Credit Suisse Trust — Small Cap Core I Portfolio
Schedule of Investments (continued)
December 31, 2008
| | | Number of
Shares | | Value | |
| COMMON STOCKS | |
| Insurance | |
| Tower Group, Inc. | | | 9,100 | | | $ | 256,711 | | |
| United Fire & Casualty Co. | | | 11,800 | | | | 366,626 | | |
| Universal American Financial Corp.* | | | 4,600 | | | | 40,572 | | |
| Willis Group Holdings, Ltd. | | | 5,658 | | | | 140,771 | | |
| | | | 3,048,306 | | |
| Internet & Catalog Retail (0.2%) | |
| Blue Nile, Inc.* | | | 7,300 | | | | 178,777 | | |
| Insight Enterprises, Inc.* | | | 10,000 | | | | 69,000 | | |
| Stamps.com, Inc.* | | | 5,600 | | | | 55,048 | | |
| | | | 302,825 | | |
| Internet Software & Services (0.8%) | |
| AsiaInfo Holdings, Inc.* | | | 30,400 | | | | 359,936 | | |
| InfoSpace, Inc. | | | 20,200 | | | | 152,510 | | |
| j2 Global Communications, Inc.* | | | 25,300 | | | | 507,012 | | |
| TeleCommunication Systems, Inc.* | | | 1,500 | | | | 12,885 | | |
| | | | 1,032,343 | | |
| IT Consulting & Services (1.4%) | |
| Acxiom Corp. | | | 91,000 | | | | 738,010 | | |
| Agilysys, Inc. | | | 5,800 | | | | 24,882 | | |
| CACI International, Inc. Class A* | | | 200 | | | | 9,018 | | |
| CIBER, Inc.* | | | 13,600 | | | | 65,416 | | |
| Integral Systems, Inc.* | | | 100 | | | | 1,205 | | |
| Phase Forward, Inc.* | | | 7,300 | | | | 91,396 | | |
| Sykes Enterprises, Inc.* | | | 14,100 | | | | 269,592 | | |
| Tyler Technologies, Inc.* | | | 56,700 | | | | 679,266 | | |
| | | | 1,878,785 | | |
| Leisure Equipment & Products (0.6%) | |
| Arctic Cat, Inc. | | | 2,200 | | | | 10,538 | | |
| Brunswick Corp. | | | 22,400 | | | | 94,304 | | |
| JAKKS Pacific, Inc.* | | | 21,400 | | | | 441,482 | | |
| MarineMax, Inc.* | | | 3,700 | | | | 12,543 | | |
| Nautilus, Inc.* | | | 3,700 | | | | 8,177 | | |
| RC2 Corp.* | | | 18,200 | | | | 194,194 | | |
| Sturm, Ruger & Co., Inc.* | | | 8,800 | | | | 52,536 | | |
| | | | 813,774 | | |
| Machinery (3.0%) | |
| Albany International Corp. Class A | | | 10,400 | | | | 133,536 | | |
| American Science & Engineering, Inc. | | | 100 | | | | 7,396 | | |
| Applied Industrial Technologies, Inc. | | | 9,800 | | | | 185,416 | | |
| Astec Industries, Inc.* | | | 3,800 | | | | 119,054 | | |
| Briggs & Stratton Corp. | | | 63,200 | | | | 1,111,688 | | |
| Dionex Corp.* | | | 10,000 | | | | 448,500 | | |
| Gardner Denver, Inc.* | | | 37,500 | | | | 875,250 | | |
| Graham Corp. | | | 28,407 | | | | 307,364 | | |
See Accompanying Notes to Financial Statements.
18
Credit Suisse Trust — Small Cap Core I Portfolio
Schedule of Investments (continued)
December 31, 2008
| | | Number of
Shares | | Value | |
| COMMON STOCKS | |
| Machinery | |
| John Bean Technologies Corp. | | | 7,300 | | | $ | 59,641 | | |
| Robbins & Myers, Inc. | | | 23,800 | | | | 384,846 | | |
| The Gorman-Rupp Co. | | | 10,800 | | | | 336,096 | | |
| Wabash National Corp. | | | 7,800 | | | | 35,100 | | |
| | | | 4,003,887 | | |
| Marine (0.9%) | |
| Kirby Corp.* | | | 43,600 | | | | 1,192,896 | | |
| Media (0.4%) | |
| 4Kids Entertainment, Inc.* | | | 1,900 | | | | 3,724 | | |
| Hearst-Argyle Television, Inc. | | | 15,800 | | | | 95,748 | | |
| Interactive Data Corp. | | | 8,900 | | | | 219,474 | | |
| InVentiv Health, Inc.* | | | 1,500 | | | | 17,310 | | |
| Meredith Corp. | | | 5,100 | | | | 87,312 | | |
| Radio One, Inc. Class D* | | | 39,400 | | | | 9,062 | | |
| Sonic Solutions* | | | 8,200 | | | | 14,432 | | |
| The E.W. Scripps Co. Class A | | | 7,466 | | | | 16,500 | | |
| World Wrestling Entertainment, Inc. Class A | | | 3,500 | | | | 38,780 | | |
| | | | 502,342 | | |
| Metals & Mining (0.1%) | |
| Cliffs Natural Resources, Inc. | | | 200 | | | | 5,122 | | |
| Gibraltar Industries, Inc. | | | 14,300 | | | | 170,742 | | |
| Westmoreland Coal Co.* | | | 400 | | | | 4,440 | | |
| | | | 180,304 | | |
| Multi-Utilities (0.1%) | |
| Avista Corp. | | | 10,000 | | | | 193,800 | | |
| Multiline Retail (0.4%) | |
| Fred's, Inc. Class A | | | 48,000 | | | | 516,480 | | |
| Stein Mart, Inc.* | | | 7,800 | | | | 8,814 | | |
| Tuesday Morning Corp.* | | | 9,500 | | | | 15,485 | | |
| | | | 540,779 | | |
| Oil & Gas (0.4%) | |
| Continental Resources, Inc.* | | | 7,300 | | | | 151,183 | | |
| Knightsbridge Tankers, Ltd. | | | 4,100 | | | | 60,065 | | |
| Pioneer Drilling Co.* | | | 26,400 | | | | 147,048 | | |
| VAALCO Energy, Inc.* | | | 21,600 | | | | 160,704 | | |
| | | | 519,000 | | |
| Paper & Forest Products (0.0%) | |
| Buckeye Technologies, Inc.* | | | 9,900 | | | | 36,036 | | |
| Personal Products (0.3%) | |
| Elizabeth Arden, Inc.* | | | 31,002 | | | | 390,935 | | |
| Mannatech, Inc. | | | 7,600 | | | | 18,620 | | |
| | | | 409,555 | | |
See Accompanying Notes to Financial Statements.
19
Credit Suisse Trust — Small Cap Core I Portfolio
Schedule of Investments (continued)
December 31, 2008
| | | Number of
Shares | | Value | |
| COMMON STOCKS | |
| Pharmaceuticals (2.8%) | |
| Cypress Bioscience, Inc.* | | | 1,300 | | | $ | 8,892 | | |
| Emergent Biosolutions, Inc.* | | | 69,200 | | | | 1,806,812 | | |
| InterMune, Inc.* | | | 26,000 | | | | 275,080 | | |
| Medicis Pharmaceutical Corp. Class A | | | 85,300 | | | | 1,185,670 | | |
| MWI Veterinary Supply, Inc.* | | | 2,500 | | | | 67,400 | | |
| Par Pharmaceutical Cos., Inc.* | | | 19,500 | | | | 261,495 | | |
| PharMerica Corp.* | | | 500 | | | | 7,835 | | |
| Salix Pharmaceuticals, Ltd.* | | | 16,000 | | | | 141,280 | | |
| VIVUS, Inc.* | | | 5,800 | | | | 30,856 | | |
| | | | 3,785,320 | | |
| Real Estate (5.7%) | |
| Acadia Realty Trust | | | 8,400 | | | | 119,868 | | |
| BioMed Realty Trust, Inc. | | | 19,900 | | | | 233,228 | | |
| Cedar Shopping Centers, Inc. | | | 11,200 | | | | 79,296 | | |
| Colonial Properties Trust | | | 12,100 | | | | 100,793 | | |
| DiamondRock Hospitality Co. | | | 23,200 | | | | 117,624 | | |
| EastGroup Properties, Inc. | | | 19,000 | | | | 676,020 | | |
| Entertainment Properties Trust | | | 21,500 | | | | 640,700 | | |
| Extra Space Storage, Inc. | | | 19,500 | | | | 201,240 | | |
| Forestar Real Estate Group, Inc.* | | | 9,000 | | | | 85,680 | | |
| Hilltop Holdings, Inc.* | | | 200 | | | | 1,948 | | |
| Home Properties, Inc. | | | 8,300 | | | | 336,980 | | |
| Inland Real Estate Corp. | | | 44,900 | | | | 582,802 | | |
| Kilroy Realty Corp. | | | 8,200 | | | | 274,372 | | |
| Kite Realty Group Trust | | | 8,200 | | | | 45,592 | | |
| LaSalle Hotel Properties | | | 10,500 | | | | 116,025 | | |
| Lexington Realty Trust | | | 16,600 | | | | 83,000 | | |
| LTC Properties, Inc. | | | 6,000 | | | | 121,680 | | |
| Medical Properties Trust, Inc. | | | 16,900 | | | | 106,639 | | |
| Mid-America Apartment Communities, Inc. | | | 6,900 | | | | 256,404 | | |
| National Retail Properties, Inc. | | | 48,400 | | | | 831,996 | | |
| Parkway Properties, Inc. | | | 3,600 | | | | 64,800 | | |
| Pennsylvania Real Estate Investment Trust | | | 46,000 | | | | 342,700 | | |
| Post Properties, Inc. | | | 11,300 | | | | 186,450 | | |
| PS Business Parks, Inc. | | | 12,900 | | | | 576,114 | | |
| Senior Housing Properties Trust | | | 52,700 | | | | 944,384 | | |
| Sovran Self Storage, Inc. | | | 5,400 | | | | 194,400 | | |
| Tanger Factory Outlet Centers, Inc. | | | 8,200 | | | | 308,484 | | |
| Urstadt Biddle Properties, Class A | | | 5,600 | | | | 89,208 | | |
| | | | 7,718,427 | | |
| Road & Rail (1.8%) | |
| Arkansas Best Corp. | | | 20,500 | | | | 617,255 | | |
| Heartland Express, Inc. | | | 91,300 | | | | 1,438,888 | | |
| Knight Transportation, Inc. | | | 7,600 | | | | 122,512 | | |
| Old Dominion Freight Line, Inc.* | | | 9,400 | | | | 267,524 | | |
| | | | 2,446,179 | | |
See Accompanying Notes to Financial Statements.
20
Credit Suisse Trust — Small Cap Core I Portfolio
Schedule of Investments (continued)
December 31, 2008
| | | Number of
Shares | | Value | |
| COMMON STOCKS | |
| Semiconductor Equipment & Products (2.6%) | |
| Actel Corp.* | | | 11,800 | | | $ | 138,296 | | |
| Adaptec, Inc.* | | | 31,000 | | | | 102,300 | | |
| Advanced Energy Industries, Inc.* | | | 15,500 | | | | 154,225 | | |
| Axcelis Technologies, Inc.* | | | 46,500 | | | | 23,715 | | |
| Brooks Automation, Inc.* | | | 16,800 | | | | 97,608 | | |
| Cabot Microelectronics Corp.* | | | 15,900 | | | | 414,513 | | |
| Cohu, Inc. | | | 10,800 | | | | 131,220 | | |
| Cymer, Inc.* | | | 1,600 | | | | 35,056 | | |
| FEI Co.* | | | 1,400 | | | | 26,404 | | |
| Kulicke & Soffa Industries, Inc.* | | | 15,800 | | | | 26,860 | | |
| Micrel, Inc. | | | 23,300 | | | | 170,323 | | |
| Microsemi Corp.* | | | 2,100 | | | | 26,544 | | |
| MKS Instruments, Inc.* | | | 33,500 | | | | 495,465 | | |
| Pericom Semiconductor Corp.* | | | 11,800 | | | | 64,664 | | |
| Photronics, Inc.* | | | 13,100 | | | | 25,545 | | |
| Rudolph Technologies, Inc.* | | | 7,500 | | | | 26,475 | | |
| Skyworks Solutions, Inc.* | | | 122,700 | | | | 679,758 | | |
| Standard Microsystems Corp.* | | | 10,400 | | | | 169,936 | | |
| Supertex, Inc.* | | | 5,800 | | | | 139,258 | | |
| Teradyne, Inc.* | | | 27,300 | | | | 115,206 | | |
| TriQuint Semiconductor, Inc.* | | | 35,500 | | | | 122,120 | | |
| Ultratech, Inc.* | | | 12,300 | | | | 147,108 | | |
| Varian Semiconductor Equipment Associates, Inc.* | | | 900 | | | | 16,308 | | |
| Volterra Semiconductor Corp.* | | | 16,700 | | | | 119,405 | | |
| | | | 3,468,312 | | |
| Software (4.7%) | |
| Activision Blizzard, Inc.* | | | 800 | | | | 6,912 | | |
| ANSYS, Inc.* | | | 766 | | | | 21,364 | | |
| Blackbaud, Inc. | | | 14,400 | | | | 194,400 | | |
| Cognex Corp. | | | 16,900 | | | | 250,120 | | |
| Concur Technologies, Inc.* | | | 8,200 | | | | 269,124 | | |
| Epicor Software Corp.* | | | 14,900 | | | | 71,520 | | |
| EPIQ Systems, Inc.* | | | 11,100 | | | | 185,481 | | |
| FARO Technologies, Inc.* | | | 8,000 | | | | 134,880 | | |
| Gerber Scientific, Inc.* | | | 6,000 | | | | 30,660 | | |
| Informatica Corp.* | | | 59,200 | | | | 812,816 | | |
| JDA Software Group, Inc.* | | | 14,700 | | | | 193,011 | | |
| Manhattan Associates, Inc.* | | | 11,500 | | | | 181,815 | | |
| MICROS Systems, Inc.* | | | 149,500 | | | | 2,439,840 | | |
| Phoenix Technologies, Ltd.* | | | 14,100 | | | | 49,350 | | |
| Progress Software Corp.* | | | 13,400 | | | | 258,084 | | |
| Quality Systems, Inc. | | | 8,000 | | | | 348,960 | | |
| Radiant Systems, Inc.* | | | 7,000 | | | | 23,590 | | |
| RadiSys Corp.* | | | 3,100 | | | | 17,143 | | |
| SPSS, Inc.* | | | 8,900 | | | | 239,944 | | |
| Take-Two Interactive Software, Inc. | | | 40,400 | | | | 305,424 | | |
| Taleo Corp. Class A* | | | 4,600 | | | | 36,018 | | |
See Accompanying Notes to Financial Statements.
21
Credit Suisse Trust — Small Cap Core I Portfolio
Schedule of Investments (continued)
December 31, 2008
| | | Number of
Shares | | Value | |
| COMMON STOCKS | |
| Software | |
| THQ, Inc.* | | | 17,700 | | | $ | 74,163 | | |
| TradeStation Group, Inc.* | | | 13,700 | | | | 88,365 | | |
| Wind River Systems, Inc.* | | | 15,900 | | | | 143,577 | | |
| | | | 6,376,561 | | |
| Specialty Retail (11.1%) | |
| Aaron Rents, Inc. | | | 25,700 | | | | 684,134 | | |
| AnnTaylor Stores Corp.* | | | 6,400 | | | | 36,928 | | |
| Big 5 Sporting Goods Corp. | | | 5,500 | | | | 28,655 | | |
| Building Materials Holding Corp.* | | | 13,800 | | | | 5,106 | | |
| Charlotte Russe Holding, Inc.* | | | 8,100 | | | | 52,569 | | |
| Christopher & Banks Corp. | | | 9,000 | | | | 50,400 | | |
| DSW, Inc. Class A* | | | 32,700 | | | | 407,442 | | |
| Haverty Furniture Cos., Inc. | | | 11,500 | | | | 107,295 | | |
| Hibbett Sports, Inc.* | | | 20,300 | | | | 318,913 | | |
| Hot Topic, Inc.* | | | 73,000 | | | | 676,710 | | |
| Jo-Ann Stores, Inc.* | | | 48,900 | | | | 757,461 | | |
| Jos. A. Bank Clothiers, Inc.* | | | 28,200 | | | | 737,430 | | |
| Lawson Products, Inc. | | | 1,600 | | | | 36,560 | | |
| Lithia Motors, Inc. Class A | | | 7,500 | | | | 24,450 | | |
| Regis Corp. | | | 66,100 | | | | 960,433 | | |
| Select Comfort Corp.* | | | 31,500 | | | | 7,875 | | |
| Sonic Automotive, Inc. Class A | | | 2,400 | | | | 9,552 | | |
| Stage Stores, Inc. | | | 1,100 | | | | 9,075 | | |
| The Buckle, Inc. | | | 55,300 | | | | 1,206,646 | | |
| The Cato Corp. Class A | | | 31,500 | | | | 475,650 | | |
| The Children's Place Retail Stores, Inc.* | | | 24,460 | | | | 530,293 | | |
| The Dress Barn, Inc.* | | | 58,500 | | | | 628,290 | | |
| The Finish Line, Inc. Class A | | | 83,609 | | | | 468,211 | | |
| The Gymboree Corp.* | | | 56,400 | | | | 1,471,476 | | |
| The Pep Boys-Manny, Moe & Jack | | | 10,200 | | | | 42,126 | | |
| Tractor Supply Co.* | | | 104,328 | | | | 3,770,414 | | |
| Tween Brands, Inc.* | | | 1,200 | | | | 5,184 | | |
| United Rentals, Inc.* | | | 2,000 | | | | 18,240 | | |
| Williams-Sonoma, Inc. | | | 167,026 | | | | 1,312,824 | | |
| Zale Corp.* | | | 29,700 | | | | 98,901 | | |
| Zumiez, Inc.* | | | 7,800 | | | | 58,110 | | |
| | | | 14,997,353 | | |
| Textiles & Apparel (1.1%) | |
| Brown Shoe Co., Inc. | | | 11,000 | | | | 93,170 | | |
| Crocs, Inc.* | | | 39,800 | | | | 49,352 | | |
| Fossil, Inc.* | | | 29,600 | | | | 494,320 | | |
| K-Swiss, Inc. Class A | | | 400 | | | | 4,560 | | |
| Liz Claiborne, Inc. | | | 23,600 | | | | 61,360 | | |
| Maidenform Brands, Inc.* | | | 4,000 | | | | 40,600 | | |
| Movado Group, Inc. | | | 600 | | | | 5,634 | | |
| Perry Ellis International, Inc.* | | | 3,400 | | | | 21,556 | | |
| Quiksilver, Inc.* | | | 50,400 | | | | 92,736 | | |
See Accompanying Notes to Financial Statements.
22
Credit Suisse Trust — Small Cap Core I Portfolio
Schedule of Investments (continued)
December 31, 2008
| | | Number of
Shares | | Value | |
| COMMON STOCKS | |
| Textiles & Apparel | |
| The Timberland Co. Class A* | | | 40,000 | | | $ | 462,000 | | |
| UniFirst Corp. | | | 6,300 | | | | 187,047 | | |
| | | | 1,512,335 | | |
| Tobacco (0.1%) | |
| Alliance One International, Inc.* | | | 23,100 | | | | 67,914 | | |
| Schweitzer-Mauduit International, Inc. | | | 6,500 | | | | 130,130 | | |
| | | | 198,044 | | |
| Water Utilities (0.1%) | |
| American States Water Co. | | | 3,100 | | | | 102,238 | | |
| Wireless Telecommunication Services (0.1%) | |
| EMS Technologies, Inc.* | | | 3,300 | | | | 85,371 | | |
| TOTAL COMMON STOCKS (Cost $164,278,861) | | | 144,384,599 | | |
| SHORT-TERM INVESTMENT (0.5%) | |
| | | Par
(000) | | | |
| State Street Bank and Trust Co. Euro Time Deposit, 0.010%, 1/02/09 (Cost $707,000) | | $ | 707 | | | | 707,000 | | |
| TOTAL INVESTMENTS AT VALUE (107.2%) (Cost $164,985,861) | | | 145,091,599 | | |
| LIABILITIES IN EXCESS OF OTHER ASSETS (-7.2%) | | | (9,732,738 | ) | |
| NET ASSETS (100.0%) | | $ | 135,358,861 | | |
* Non-income producing security.
See Accompanying Notes to Financial Statements.
23
Credit Suisse Trust — Small Cap Core I Portfolio
Statement of Assets and Liabilities
December 31, 2008
| Assets | |
| Investments at value (Cost $164,985,861) (Note 2) | | $ | 145,091,599 | | |
| Cash | | | 925 | | |
| Receivable for investments sold | | | 3,032,144 | | |
| Dividend receivable | | | 173,570 | | |
| Receivable for portfolio shares sold | | | 8,180 | | |
| Prepaid expenses | | | 3,589 | | |
| Total Assets | | | 148,310,007 | | |
| Liabilities | |
| Advisory fee payable (Note 3) | | | 80,763 | | |
| Administrative services fee payable (Note 3) | | | 32,611 | | |
| Payable for portfolio shares redeemed | | | 9,347,236 | | |
| Payable for investments purchased | | | 3,323,854 | | |
| Trustees' fee payable | | | 2,574 | | |
| Other accrued expenses payable | | | 164,108 | | |
| Total Liabilities | | | 12,951,146 | | |
| Net Assets | |
| Capital stock, $.001 par value (Note 6) | | | 13,396 | | |
| Paid-in capital (Note 6) | | | 290,168,092 | | |
| Undistributed net investment income | | | 1,272,039 | | |
| Accumulated net realized loss on investments and futures contracts | | | (136,200,404 | ) | |
| Net unrealized depreciation on investments | | | (19,894,262 | ) | |
| Net Assets | | $ | 135,358,861 | | |
| Shares outstanding | | | 13,395,562 | | |
| Net asset value, offering price, and redemption price per share | | $ | 10.10 | | |
See Accompanying Notes to Financial Statements.
24
Credit Suisse Trust — Small Cap Core I Portfolio
Statement of Operations
For the Year Ended December 31, 2008
| Investment Income (Note 2) | |
| Dividends | | $ | 2,735,904 | | |
| Interest | | | 11,797 | | |
| Securities lending | | | 687,269 | | |
| Foreign taxes withheld | | | (1,215 | ) | |
| Total investment income | | | 3,433,755 | | |
| Expenses | |
| Investment advisory fees (Note 3) | | | 1,521,315 | | |
| Administrative services fees (Note 3) | | | 315,116 | | |
| Custodian fees | | | 93,757 | | |
| Audit and tax fees | | | 41,219 | | |
| Trustees' fees | | | 17,285 | | |
| Legal fees | | | 11,047 | | |
| Transfer agent fees | | | 8,496 | | |
| Insurance expense | | | 7,892 | | |
| Commitment fees (Note 4) | | | 2,427 | | |
| Interest expense (Note 4) | | | 2,160 | | |
| Miscellaneous expense | | | 3,617 | | |
| Total expenses | | | 2,024,331 | | |
| Net investment income | | | 1,409,424 | | |
| Net Realized and Unrealized Gain (Loss) from Investments | |
| Net realized loss from investments | | | (54,412,902 | ) | |
| Net change in unrealized appreciation (depreciation) from investments | | | (31,582,633 | ) | |
| Net realized and unrealized loss from investments | | | (85,995,535 | ) | |
| Net decrease in net assets resulting from operations | | $ | (84,586,111 | ) | |
See Accompanying Notes to Financial Statements.
25
Credit Suisse Trust — Small Cap Core I Portfolio
Statements of Changes in Net Assets
| | | For the Year
Ended
December 31, 2008 | | For the Year
Ended
December 31, 2007 | |
| From Operations | |
| Net investment income | | $ | 1,409,424 | | | $ | 309,689 | | |
| Net realized loss from investments and futures contracts | | | (54,412,902 | ) | | | (3,684,662 | ) | |
| Net change in unrealized appreciation (depreciation) from investments | | | (31,582,633 | ) | | | 4,775,268 | | |
| Net increase (decrease) in net assets resulting from operations | | | (84,586,111 | ) | | | 1,400,295 | | |
| From Dividends | |
| Dividends from net investment income | | | (171,245 | ) | | | — | | |
| Net decrease in net assets resulting from dividends | | | (171,245 | ) | | | — | | |
| From Capital Share Transactions (Note 6) | |
| Proceeds from sale of shares | | | 3,551,338 | | | | 4,376,948 | | |
| Exchange value of shares due to merger | | | — | | | | 27,490,187 | | |
| Reinvestment of dividends | | | 171,245 | | | | — | | |
| Net asset value of shares redeemed | | | (70,461,294 | ) | | | (159,747,764 | ) | |
| Net decrease in net assets from capital share transactions | | | (66,738,711 | ) | | | (127,880,629 | ) | |
| Net decrease in net assets | | | (151,496,067 | ) | | | (126,480,334 | ) | |
| Net Assets | |
| Beginning of year | | | 286,854,928 | | | | 413,335,262 | | |
| End of year | | $ | 135,358,861 | | | $ | 286,854,928 | | |
| Undistributed net investment income | | $ | 1,272,039 | | | $ | 175,341 | | |
See Accompanying Notes to Financial Statements.
26
Credit Suisse Trust — Small Cap Core I Portfolio
Financial Highlights
(For a Share of the Portfolio Outstanding Throughout Each Year)
| | | For the Year Ended December 31, | |
| | | 2008 | | 2007 | | 2006 | | 2005 | | 2004 | |
| Per share data | |
| Net asset value, beginning of year | | $ | 15.47 | | | $ | 15.60 | | | $ | 14.89 | | | $ | 15.30 | | | $ | 13.80 | | |
| INVESTMENT OPERATIONS | |
| Net investment income (loss) | | | 0.10 | | | | 0.02 | | | | (0.14 | ) | | | (0.14 | ) | | | (0.14 | ) | |
Net gain (loss) on investments and futures
contracts (both realized and unrealized) | | | (5.46 | ) | | | (0.15 | ) | | | 0.85 | | | | (0.27 | ) | | | 1.64 | | |
| Total from investment operations | | | (5.36 | ) | | | (0.13 | ) | | | 0.71 | | | | (0.41 | ) | | | 1.50 | | |
| LESS DIVIDENDS | |
| Dividends from net investment income | | | (0.01 | ) | | | — | | | | — | | | | — | | | | — | | |
| Net asset value, end of year | | $ | 10.10 | | | $ | 15.47 | | | $ | 15.60 | | | $ | 14.89 | | | $ | 15.30 | | |
| Total return1 | | | (34.66 | )% | | | (0.83 | )% | | | 4.77 | % | | | (2.68 | )% | | | 10.87 | % | |
| RATIOS AND SUPPLEMENTAL DATA | |
| Net assets, end of year (000s omitted) | | $ | 135,359 | | | $ | 286,855 | | | $ | 413,335 | | | $ | 557,377 | | | $ | 767,104 | | |
| Ratio of expenses to average net assets | | | 0.93 | % | | | 0.92 | % | | | 1.11 | % | | | 1.14 | % | | | 1.10 | % | |
Ratio of net investment income (loss) to average
net assets | | | 0.65 | % | | | 0.08 | % | | | (0.75 | )% | | | (0.84 | )% | | | (0.92 | )% | |
| Portfolio turnover rate | | | 204 | % | | | 203 | % | | | 208 | % | | | 82 | % | | | 99 | % | |
1 Total returns are historical and assume changes in share price and reinvestment of all dividends and distributions. Total returns do not reflect charges and expenses attributable to any particular variable contract or plan.
See Accompanying Notes to Financial Statements.
27
Credit Suisse Trust — Small Cap Core I Portfolio
Notes to Financial Statements
December 31, 2008
Note 1. Organization
Credit Suisse Trust (the "Trust") is an open-end management investment company registered under the Investment Company Act of 1940, as amended (the "1940 Act"), and currently offers eight managed investment portfolios of which one, the Small Cap Core I Portfolio (the "Portfolio"), is included in this report. The Portfolio is a diversified investment fund that seeks capital growth. Shares of the Portfolio are not available directly to individual investors but may be offered only through (a) variable annuity contracts and variable life insurance contracts offered by separate accounts of certain insurance companies and (b) tax-qualified pension and retirement plans. The Portfolio may not be available in connection with a particular contract or plan. The Trust was organized under the laws of the Commonwealth of Massachusetts as a business trust on March 15, 1995.
Effective as of the close of business on April 27, 2007, the Portfolio acquired all of the net assets of Credit Suisse Trust Small Cap Core II Portfolio ("Small Cap Core II") in a tax-free exchange of shares. The Portfolio was also the accounting survivor in the tax-free exchange. The shares exchanged were 1,666,592 shares (valued at $27,490,187) of the Portfolio for 2,324,973 shares of Small Cap Core II. The Small Cap Core II Portfolio's net assets of $27,490,187 at that date, which included $1,820,166 of unrealized appreciation, were combined with those of the Portfolio. The aggregate net assets of Small Cap Core II and the Portfolio immediately before the acquisition were $27,490,187 and $383,162,531, respectively, and the combined net assets of the Portfolio after the acquisition were $410,652,718.
Note 2. Significant Accounting Policies
A) SECURITY VALUATION — The net asset value of the Portfolio is determined daily as of the close of regular trading on the New York Stock Exchange, Inc. (the "Exchange") on each day the Exchange is open for business. Equity investments are valued at market value, which is generally determined using the closing price on the exchange or market on which the security is primarily traded at the time of valuation (the "Valuation Time"). If no sales are reported, equity investments are generally valued at the most recent bid quotation as of the Valuation Time or at the lowest asked quotation in the case of a short sale of securities. Debt securities with a remaining maturity greater than 60 days are valued in accordance with the price supplied by a pricing service, which may use a matrix, formula or other objective method that takes into consideration market indices, yield curves and other specific adjustments. Debt obligations that will matur e in 60 days or less are valued on the basis of amortized cost, which approximates market value, unless it is determined that
28
Credit Suisse Trust — Small Cap Core I Portfolio
Notes to Financial Statements (continued)
December 31, 2008
Note 2. Significant Accounting Policies
using this method would not represent fair value. Investments in mutual funds are valued at the mutual fund's closing net asset value per share on the day of valuation. Securities and other assets for which market quotations are not readily available, or whose values have been materially affected by events occurring before the Portfolio's Valuation Time but after the close of the securities' primary markets, are valued at fair value as determined in good faith by, or under the direction of, the Board of Trustees under procedures established by the Board of Trustees. The Portfolio may utilize a service provided by an independent third party which has been approved by the Board of Trustees to fair value certain securities. When fair-value pricing is employed, the prices of securities used by a portfolio to calculate its net asset value may differ from quoted or published prices for the same securities.
The Portfolio adopted Financial Accounting Standards Board Statement of Financial Accounting Standards No. 157, Fair Value Measurements ("FAS 157"), effective January 1, 2008. In accordance with FAS 157, fair value is defined as the price that the Portfolio would receive upon selling an investment in a timely transaction to an independent buyer in the principal or most advantageous market of the investment. FAS 157 established a three-tier hierarchy to maximize the use of observable market data and minimize the use of unobservable inputs and to establish classification of fair value measurements for disclosure purposes. Inputs refer broadly to the assumptions that market participants would use in pricing the asset or liability, including assumptions about risk, for example, the risk inherent in a particular valuation technique used to measure fair value including such a pricing model and/or the risk inherent in the inputs to the valuation te chnique. Inputs may be observable or unobservable. Observable inputs are inputs that reflect the assumptions market participants would use in pricing the asset or liability developed based on market data obtained from sources independent of the reporting entity. Unobservable inputs are inputs that reflect the reporting entity's own assumptions about the assumptions market participants would use in pricing the asset or liability developed based on the best information available in the circumstances. The three-tier hierarchy of inputs is summarized in the three broad Levels listed below.
• Level 1 – quoted prices in active markets for identical investments
• Level 2 – other significant observable inputs (including quoted prices for similar investments, interest rates, prepayment speeds, credit risk, etc.)
• Level 3 – significant unobservable inputs (including the Portfolio's own assumptions in determining the fair value of investments)
29
Credit Suisse Trust — Small Cap Core I Portfolio
Notes to Financial Statements (continued)
December 31, 2008
Note 2. Significant Accounting Policies
The inputs or methodology used for valuing securities are not necessarily an indication of the risk associated with investing in those securities.
The following is a summary of the inputs used as of December 31, 2008 in valuing the Portfolio's investments carried at value:
| Valuation Inputs | | Investments in
Securities | | Other Financial
Instruments* | |
| Level 1 – Quoted Prices | | $ | 144,384,599 | | | $ | — | | |
| Level 2 – Other Significant Observable Inputs | | | 707,000 | | | | — | | |
| Level 3 – Significant Unobservable Inputs | | | — | | | | — | | |
| Total | | $ | 145,091,599 | | | $ | — | | |
*Other financial instruments include futures, forwards and swap contracts.
B) SECURITY TRANSACTIONS AND INVESTMENT INCOME — Security transactions are accounted for on a trade date basis. Interest income is recorded on the accrual basis. Dividends are recorded on the ex-dividend date. The cost of investments sold is determined by use of the specific identification method for both financial reporting and income tax purposes.
C) DIVIDENDS AND DISTRIBUTIONS TO SHAREHOLDERS — Dividends from net investment income and distributions of net realized capital gains, if any, are declared and paid at least annually. However, to the extent that a net realized capital gain can be reduced by a capital loss carryforward, such gain will not be distributed. Income and capital gain distributions are determined in accordance with federal income tax regulations, which may differ from accounting principles generally accepted in the United States of America ("GAAP").
D) FEDERAL INCOME TAXES — No provision is made for federal taxes as it is the Portfolio's intention to continue to qualify for and elect the tax treatment applicable to regulated investment companies under the Internal Revenue Code of 1986, as amended, and to make the requisite distributions to its shareholders, which will be sufficient to relieve it from federal income and excise taxes.
During June 2006, the Financial Accounting Standards Board ("FASB") issued FASB Interpretation 48 ("FIN 48" or the "Interpretation"), Accounting for Uncertainty in Income Taxes – an interpretation of FASB statement 109. The Portfolio has reviewed its current tax positions and has determined that no provision for income tax is required in the Portfolio's financial statements. The Portfolio's federal tax returns for the prior three fiscal years remain subject to examination by the Internal Revenue Service.
30
Credit Suisse Trust — Small Cap Core I Portfolio
Notes to Financial Statements (continued)
December 31, 2008
Note 2. Significant Accounting Policies
E) USE OF ESTIMATES — The preparation of financial statements in conformity with GAAP requires management to make estimates and assumptions that affect the reported amounts of assets and liabilities and disclosure of contingent assets and liabilities at the date of the financial statements and the reported amounts of income and expenses during the reporting period. Actual results could differ from these estimates.
F) SHORT-TERM INVESTMENTS — The Portfolio, together with other funds/portfolios advised by Credit Suisse Asset Management, LLC ("Credit Suisse"), an indirect, wholly-owned subsidiary of Credit Suisse Group AG, pools available cash into either a short-term variable rate time deposit issued by State Street Bank and Trust Company ("SSB"), the Portfolio's custodian, or a money market fund advised by Credit Suisse. The short-term time deposit issued by SSB is a variable rate account classified as a short-term investment.
G) FUTURES — The Portfolio may enter into futures contracts to the extent permitted by its investment policies and objectives. Upon entering into a futures contract, the Portfolio is required to deposit cash and/or pledge U.S. Government securities as initial margin. Subsequent payments, which are dependent on the daily fluctuations in the value of the underlying instrument, are made or received by the Portfolio each day (daily variation margin) and are recorded as unrealized gains or losses until the contracts are closed. When the contracts are closed, the Portfolio records a realized gain or loss equal to the difference between the proceeds from (or cost of) the closing transactions and the Portfolio's basis in the contract. Risks of entering into futures contracts for hedging purposes include the possibility that a change in the value of the contract may not correlate with the changes in the value of the underlying instruments. In ad dition, the purchase of a futures contract involves the risk that the Portfolio could lose more than the original margin deposit and subsequent payments may be required for a futures transaction. At December 31, 2008, the Portfolio had no open futures contracts.
H) SECURITIES LENDING — Loans of securities are required at all times to be secured by collateral at least equal to 102% of the market value of domestic securities on loan (including any accrued interest thereon) and 105% of the market value of foreign securities on loan (including any accrued interest thereon). Cash collateral received by the Portfolio in connection with securities lending activity may be pooled together with cash collateral for other funds/portfolios advised by Credit Suisse and may be invested in a variety of investments, including certain Credit Suisse-advised funds, funds advised by SSB, the Portfolio's securities lending agent, or money market instruments. However, in the event of default or bankruptcy by the other party to the
31
Credit Suisse Trust — Small Cap Core I Portfolio
Notes to Financial Statements (continued)
December 31, 2008
Note 2. Significant Accounting Policies
agreement, realization and/or retention of the collateral may be subject to legal proceedings.
SSB has been engaged by the Portfolio to act as the Portfolio's securities lending agent. The Portfolio's securities lending arrangement provides that the Portfolio and SSB will share the net income earned from securities lending activities. During the year ended December 31, 2008, total earnings from the Portfolio's investment in cash collateral received in connection with securities lending arrangements was $1,926,379, of which $1,108,510 was rebated to borrowers (brokers). The Portfolio retained $687,269 in income from the cash collateral investment, and SSB, as lending agent, was paid $130,600. The Portfolio may also be entitled to certain minimum amounts of income from its securities lending activities. Securities lending income is accrued as earned.
Note 3. Transactions with Affiliates and Related Parties
Credit Suisse serves as investment adviser for the Portfolio. For its investment advisory services, Credit Suisse is entitled to receive a fee from the Portfolio at an annual rate of 0.70% of the Portfolio's average daily net assets. For the year ended December 31, 2008, investment advisory fees earned were $1,521,315.
Credit Suisse Asset Management Securities, Inc. ("CSAMSI"), an affiliate of Credit Suisse, and SSB serve as co-administrators to the Portfolio. For its co-administrative services, CSAMSI currently receives a fee calculated at an annual rate of 0.09% of the Portfolio's average daily net assets. For the year ended December 31, 2008, co-administrative services fees earned by CSAMSI were $195,598.
For its co-administrative services, SSB receives a fee, exclusive of out-of-pocket expenses, calculated in total for all the Credit Suisse funds/portfolios co-administered by SSB and allocated based upon the relative average net assets of each fund/portfolio, subject to an annual minimum fee. For the year ended December 31, 2008, co-administrative services fees earned by SSB (including out-of-pocket expenses) were $119,518.
In addition to serving as the Portfolio's co-administrator, CSAMSI currently serves as distributor of the Portfolio's shares without compensation.
Merrill Corporation ("Merrill"), an affiliate of Credit Suisse, has been engaged by the Portfolio to provide certain financial printing and fulfillment services. For the year ended December 31, 2008, Merrill was paid $22,251 for its services to the Portfolio.
32
Credit Suisse Trust — Small Cap Core I Portfolio
Notes to Financial Statements (continued)
December 31, 2008
Note 4. Line of Credit
The Portfolio, together with other funds/portfolios advised by Credit Suisse (collectively, the "Participating Funds"), participates in a $50 million committed, unsecured line of credit facility ("Credit Facility") for temporary or emergency purposes with SSB. Under the terms of the Credit Facility, the Participating Funds pay an aggregate commitment fee at a rate of 0.10% per annum on the average unused amount of the Credit Facility, which is allocated among the Participating Funds in such manner as is determined by the governing Boards of the Participating Funds. In addition, the Participating Funds pay interest on borrowings at the Federal Funds rate plus 0.50%. At December 31, 2008, the Portfolio had no loans outstanding under the Credit Facility. During the year ended December 31, 2008, the Portfolio had borrowings under the Credit Facility as follows:
Average Daily
Loan Balance | | Weighted Average
Interest Rate% | | Maximum Daily
Loan Outstanding | |
| $ | 2,729,000 | | | | 3.562 | % | | $ | 2,901,000 | | |
Note 5. Purchases and Sales of Securities
For the year ended December 31, 2008, purchases and sales of investment securities (excluding short-term investments) were $446,350,365 and $496,842,463, respectively.
Note 6. Capital Share Transactions
The Trust is authorized to issue an unlimited number of full and fractional shares of beneficial interest, $.001 par value per share. Transactions in capital shares of the Portfolio were as follows:
| | | For the Year Ended
December 31, 2008 | | For the Year Ended
December 31, 2007 | |
| Shares sold | | | 280,324 | | | | 281,131 | | |
| Shares exchanged due to merger | | | — | | | | 1,666,592 | | |
| Shares issued in reinvestment of dividends | | | 11,794 | | | | — | | |
| Shares redeemed | | | (5,438,133 | ) | | | (9,907,124 | ) | |
| Net decrease | | | (5,146,015 | ) | | | (7,959,401 | ) | |
On December 31, 2008, the number of shareholders that held 5% or more of the outstanding shares of the Portfolio was as follows:
Number of
Shareholders | | Approximate Percentage
of Outstanding Shares | |
| | 4 | | | | 84 | % | |
33
Credit Suisse Trust — Small Cap Core I Portfolio
Notes to Financial Statements (continued)
December 31, 2008
Note 6. Capital Share Transactions
Some of the shareholders are omnibus accounts, which hold shares on behalf of individual shareholders.
Note 7. Federal Income Taxes
Income and capital gain distributions are determined in accordance with federal income tax regulations, which may differ from GAAP.
The tax characteristics of dividends and distributions paid during the year ended December 31, 2008 by the Portfolio were as follows:
| | | Ordinary Income | |
| | | 2008 | |
| | $ | 171,245 | | |
The tax basis components of distributable earnings differ from the amounts reflected in the Statement of Assets and Liabilities by temporary book/tax differences. These differences are primarily due to losses deferred on wash sales, unused capital loss carryforwards, current year post-October loss deferrals, security lending transactions and return of capital on Real Estate Investment Trusts. At December 31, 2008, the components of distributable earnings on a tax basis were as follows:
| Undistributed net investment income | | $ | 1,240,631 | | |
| Accumulated realized loss | | | (93,635,149 | ) | |
| Unrealized depreciation | | | (30,079,714 | ) | |
| Deferral of post-October capital losses | | | (32,348,395 | ) | |
| | | $ | (154,822,627 | ) | |
At December 31, 2008, the Portfolio had capital loss carryforwards available to offset possible future capital gains as follows:
| | | Expires December 31, | |
| | | 2010 | | 2011 | | 2016 | |
| | $ | 70,469,127 | | | $ | 5,258,187 | | | $ | 17,907,835 | | |
During the tax year ended December 31, 2008, the Portfolio did not utilize any of the capital loss carryforward.
It is uncertain whether the Portfolio will be able to realize the benefits of the capital loss carryforward before they expire.
At December 31, 2008, the identified cost for federal income tax purposes, as well as the gross unrealized appreciation from investments for those securities having an excess of value over cost, gross unrealized depreciation from investments for those securities having an excess of cost over value and the net
34
Credit Suisse Trust — Small Cap Core I Portfolio
Notes to Financial Statements (continued)
December 31, 2008
Note 7. Federal Income Taxes
unrealized depreciation from investments were $175,171,313, $8,224,270, $(38,303,984) and $(30,079,714), respectively.
At December 31, 2008, the Portfolio reclassified $141,481 to accumulated gain (loss) from undistributed net investment income, to account for current period permanent book/ tax differences which arose principally from differing book/tax treatments of dividends received from Real Estate Investment Trusts. Net assets were not affected by these reclassifications.
Note 8. Contingencies
In the normal course of business, the Portfolio may provide general indemnifications pursuant to certain contracts and organizational documents. The Portfolio's maximum exposure under these arrangements is dependent on future claims that may be made against the Portfolio and, therefore, cannot be estimated; however, based on experience, the risk of loss from such claims is considered remote.
Note 9. Recent Accounting Pronouncements
In March 2008, FASB issued Statement of Financial Accounting Standards No. 161, Disclosures about Derivative Instruments and Hedging Activities ("FAS 161"), an amendment of FASB Statement No. 133. FAS 161 requires enhanced disclosures about (a) how and why an entity uses derivative instruments, (b) how derivative instruments and hedging activities are accounted for, and (c) how derivative instruments and related hedging activities affect a fund's financial position, financial performance, and cash flows. Management of the Portfolio does not believe the adoption of FAS 161 will materially impact the financial statement amounts, but will require additional disclosures. This will include qualitative and quantitative disclosures on derivative positions existing at period end and the effect of usin g derivatives during the reporting period. FAS 161 is effective for financial statements issued for fiscal years and interim periods beginning after November 15, 2008.
35
Credit Suisse Trust — Small Cap Core I Portfolio
Report of Independent Registered Public Accounting Firm
To the Board of Trustees of Credit Suisse Trust and Shareholders of
Credit Suisse Trust — Small Cap Core I Portfolio:
In our opinion, the accompanying statement of assets and liabilities, including the schedule of investments, and the related statements of operations and of changes in net assets and the financial highlights present fairly, in all material respects, the financial position of Small Cap Core I Portfolio (the "Portfolio"), a portfolio of the Credit Suisse Trust, at December 31, 2008, the results of its operations for the year then ended and the changes in its net assets and financial highlights the periods presented, in conformity with accounting principles generally accepted in the United States of America. These financial statements and financial highlights (hereafter referred to as "financial statements") are the responsibility of the Portfolio's management; our responsibility is to express an opinion on these financial statements based on our audits. We conducted our audits of these financial statements in accordance with the standards of t he Public Company Accounting Oversight Board (United States). Those standards require that we plan and perform the audit to obtain reasonable assurance about whether the financial statements are free of material misstatement. An audit includes examining, on a test basis, evidence supporting the amounts and disclosures in the financial statements, assessing the accounting principles used and significant estimates made by management, and evaluating the overall financial statement presentation. We believe that our audit, which included confirmation of securities at December 31, 2008 by correspondence with the custodian and brokers, provides a reasonable basis for our opinion.
PricewaterhouseCoopers LLP
Baltimore, Maryland
February 24, 2009
36
Credit Suisse Trust — Small Cap Core I Portfolio
Board Approval of Advisory Agreement (unaudited)
In approving the renewal of the current Advisory Agreement, the Board of Trustees, including the Independent Trustees, at a meeting held on November 18 and 19, 2008, considered the following factors with respect to the Small Cap Core I Portfolio (the "Portfolio"):
Investment Advisory Fee Rates
The Board reviewed and considered the contractual advisory fee rate of 0.70% ("Contractual Advisory Fee") in light of the extent and quality of the advisory services provided by Credit Suisse Asset Management, LLC ("Credit Suisse").
Additionally, the Board received and considered information comparing the Portfolio's Contractual Advisory Fee and the Portfolio's overall expenses with those of funds in both the relevant expense group ("Expense Group") and universe of funds ("Expense Universe") provided by Lipper Inc., an independent provider of investment company data.
Nature, Extent and Quality of the Services under the Advisory Agreement
The Board received and considered information regarding the nature, extent and quality of services provided to the Portfolio by Credit Suisse under the Advisory Agreement. The Board also noted information received at regular meetings throughout the year related to the services rendered by Credit Suisse. The Board reviewed background information about Credit Suisse, including its Form ADV. The Board considered the background and experience of Credit Suisse's senior management and the expertise of, and the amount of attention given to the Portfolio by, senior personnel of Credit Suisse. In addition, the Board reviewed the qualifications, backgrounds and responsibilities of the portfolio management team primarily responsible for the day-to-day portfolio management of the Portfolio and the extent of the resources devoted to research and analysis of actual and potential investments. The Board also received and considered information about the nat ure, extent and quality of services and fee rates offered to other Credit Suisse clients for comparable services.
Portfolio Performance
The Board received and considered the performance results of the Portfolio over time, along with comparisons both to the relevant performance group ("Performance Group") and universe of funds ("Performance Universe") for the Portfolio. The Board was provided with a description of the methodology
37
Credit Suisse Trust — Small Cap Core I Portfolio
Board Approval of Advisory Agreement (unaudited) (continued)
used to arrive at the funds included in the Performance Group and the Performance Universe.
Credit Suisse Profitability
The Board received and considered a profitability analysis of Credit Suisse based on the fees payable under the Advisory Agreement for the Portfolio, including other relationships between the Portfolio on the one hand and Credit Suisse affiliates on the other. The Board received profitability information for the other funds in the Credit Suisse family of funds.
Economies of Scale
The Board considered whether economies of scale in the provision of services to the Portfolio were being passed along to the shareholders. Accordingly, the Board considered whether alternative fee structures (such as breakpoint fee structures) would be more appropriate or reasonable taking into consideration economies of scale or other efficiencies that might accrue from increases in the Portfolio's asset levels.
Other Benefits to Credit Suisse
The Board considered other benefits received by Credit Suisse and its affiliates as a result of their relationship with the Portfolio. Such benefits include, among others, research arrangements with brokers who execute transactions on behalf of the Portfolio, administrative and brokerage relationships with affiliates of Credit Suisse and benefits potentially derived from an increase in Credit Suisse's businesses as a result of its relationship with the Portfolio (such as the ability to market to shareholders other financial products offered by Credit Suisse and its affiliates).
The Board considered the standards applied in seeking best execution, whether and to what extent soft dollar credits are sought and how any such credits are utilized, any benefits that may be achieved by using an affiliated broker and the existence of quality controls applicable to brokerage allocation procedures. The Board also reviewed Credit Suisse's method for allocating portfolio investment opportunities among its advisory clients.
38
Credit Suisse Trust — Small Cap Core I Portfolio
Board Approval of Advisory Agreement (unaudited) (continued)
Conclusions
In selecting Credit Suisse, and approving the Advisory Agreement and the investment advisory fee under such agreement, the Board concluded that:
• The Contractual Advisory Fee was below the median for the Portfolio's Expense Group. The Board considered the fee to be reasonable.
• The Portfolio's performance was above the median of its Performance Group and Performance Universe for the one year period, but was among the lowest compared to its Performance Group and Performance Universe for the two, three, four, five and ten year periods. The Board noted the recent improvement in performance and the changes in the Portfolio's investment strategies and portfolio management that had gone into effect on December 1, 2006. The Board stated that it would continue to monitor steps undertaken by Credit Suisse to improve performance.
• Aside from performance (as described above), the Board was satisfied with the nature and extent of the investment advisory services provided to the Portfolio by Credit Suisse and that, based on dialogue with management and counsel, the services provided by Credit Suisse under the Advisory Agreement are typical of, and consistent with, those provided to similar mutual funds by other investment advisers.
• In light of the costs of providing investment management and other services to the Portfolio and Credit Suisse's ongoing commitment to the Portfolio, the profits and other ancillary benefits that Credit Suisse and its affiliates received were considered reasonable.
• Credit Suisse's profitability based on fees payable under the Advisory Agreement was reasonable in light of the nature, extent and quality of the services provided to the Portfolio thereunder.
• In light of the amount of the Contractual Advisory Fee, the Portfolio's current fee structure (without breakpoints) was considered reasonable.
No single factor reviewed by the Board was identified by the Board as the principal factor in determining whether to approve the Advisory Agreement. The Independent Trustees were advised by separate independent legal counsel throughout the process.
39
Credit Suisse Trust — Small Cap Core I Portfolio
Information Concerning Trustees and Officers (unaudited)
Name, Address
(Year of Birth) | | Position(s)
Held with
Trust | | Term
of Office1
and
Length
of Time
Served | | Principal
Occupation(s) During
Past Five Years | | Number of
Portfolios in
Fund
Complex
Overseen by
Trustee | | Other
Directorships
Held by
Trustee | |
| Independent Trustees | |
|
Enrique Arzac
c/o Credit Suisse Asset Management, LLC
Attn: General Counsel Eleven Madison Avenue New York, New York
10010
(1941) | | Trustee,
Audit Committee Chairman and Nominating Committee Member | | Since 2005 | | Professor of Finance and Economics, Graduate School of Business, Columbia University since 1971. | | | 33 | | | Director of Epoch Holding Corporation
(an investment management and investment advisory services company); Director of The Adams Express Company (a closed-end investment company); Director of Petroleum and Resources Corporation
(a closed-end investment company). | |
|
Jeffrey E. Garten2
Box 208200
New Haven, Connecticut 06520-8200
(1946) | | Trustee,
Audit and Nominating Committee Member | | Since 1998 | | The Juan Trippe Professor in the Practice of International Trade, Finance and Business from July 2005 to present; Partner and Chairman of Garten Rothkopf (consulting firm) from October 2005 to present; Dean of Yale School of Management from November 1995 to June 2005. | | | 26 | | | Director of Aetna, Inc. (insurance company); Director of CarMax Group (used car dealers). | |
|
1 Each Trustee and Officer serves until his or her respective successor has been duly elected and qualified.
2 Mr. Garten was initially appointed as a Trustee of the Portfolio on February 6, 1998. He resigned as Trustee on February 3, 2000 and was subsequently reappointed on December 21, 2000.
40
Credit Suisse Trust — Small Cap Core I Portfolio
Information Concerning Trustees and Officers (unaudited) (continued)
Name, Address
(Year of Birth) | | Position(s)
Held with
Trust | | Term
of Office1
and
Length
of Time
Served | | Principal
Occupation(s) During
Past Five Years | | Number of
Portfolios in
Fund
Complex
Overseen by
Trustee | | Other
Directorships
Held by
Trustee | |
| Independent Trustees | |
|
Peter F. Krogh
SFS/ICC 702
Georgetown University Washington, DC
20057
(1937) | | Trustee,
Audit and Nominating Committee Member | | Since 2001 | | Dean Emeritus and Distinguished Professor of International Affairs at the Edmund A. Walsh School of Foreign Service, Georgetown University from June 1995 to present. | | | 26 | | | Director of Carlisle Companies Incorporated (diversified manufacturing company). | |
|
Steven N. Rappaport
Lehigh Court, LLC
555 Madison Avenue
29th Floor
New York, New York
10022
(1948) | | Chairman of the Board of Trustees, Audit Committee Member and Nominating Committee Chairman | | Trustee since 1999 and Chairman since 2005 | | Partner of Lehigh Court, LLC and RZ Capital (private investment firms) from July 2002 to present. | | | 33 | | | Director of iCAD, Inc. (surgical and medical instruments and apparatus company); Director of Presstek, Inc. (digital imaging technologies company); Director of Wood Resources, LLC. (plywood manufacturing company). | |
|
41
Credit Suisse Trust — Small Cap Core I Portfolio
Information Concerning Trustees and Officers (unaudited) (continued)
Name, Address
(Year of Birth) | | Position(s)
Held with
Trust | | Term
of Office1
and
Length
of Time
Served | | Principal Occupation(s) During Past Five Years | |
| Officers | |
|
George R. Hornig
Credit Suisse Asset Management, LLC
Eleven Madison Avenue New York, New York
10010
(1954) | | Chief Executive Officer and President | | Since 2008 | | Managing Director of Credit Suisse; Co-Chief Operating Officer of Asset Management and Head of Asset Management Americas; Associated with Credit Suisse since 1999; Officer of other Credit Suisse Funds. | |
|
Michael A. Pignataro
Credit Suisse Asset Management, LLC
Eleven Madison Avenue New York, New York
10010
(1959) | | Chief Financial Officer | | Since 1999 | | Director and Director of Fund Administration of Credit Suisse; Associated with Credit Suisse or its predecessor since 1984; Officer of other Credit Suisse Funds. | |
|
Emidio Morizio
Credit Suisse Asset Management, LLC
Eleven Madison Avenue New York, New York
10010
(1966) | | Chief Compliance Officer | | Since 2004 | | Director and Global Head of Compliance of Credit Suisse; Associated with Credit Suisse since July 2000; Officer of other Credit Suisse Funds. | |
|
J. Kevin Gao
Credit Suisse Asset Management, LLC
Eleven Madison Avenue New York, New York
10010
(1967) | | Chief Legal Officer since 2006, Vice President and Secretary since 2004 | | Since 2004 | | Director and Legal Counsel of Credit Suisse; Associated with Credit Suisse since July 2003; Associated with the law firm of Willkie Farr & Gallagher LLP from 1998 to 2003; Officer of other Credit Suisse Funds. | |
|
Cecilia Chau
Credit Suisse Asset Management, LLC
Eleven Madison Avenue New York, New York
10010
(1973) | | Treasurer | | Since 2008 | | Assistant Vice President of Credit Suisse since June 2007; Associated with Alliance Bernstein L.P. from January 2007 to May 2007; Associated with Credit Suisse from August 2000 to December 2006; Officer of other Credit Suisse Funds. | |
|
The Statement of Additional Information includes additional information about the Trustees and is available, without charge, upon request, by calling 800-222-8977.
42
Credit Suisse Trust — Small Cap Core I Portfolio
Tax Information Letter
December 31, 2008 (unaudited)
Important Tax Information for Corporate Shareholders
Corporate shareholders should note for the year ended December 31, 2008, the percentage of the Portfolio's investment income (i.e., net investment income plus short-term capital gains) that qualified for the intercorporate dividends received deduction is 100%.
43
Credit Suisse Trust — Small Cap Core I Portfolio
Proxy Voting and Portfolio Holdings Information (unaudited)
Information regarding how the Portfolio voted proxies related to its portfolio securities during the 12 month period ended June 30 of each year, as well as the policies and procedures that the Portfolio uses to determine how to vote proxies relating to its portfolio securities are available:
• By calling 1-800-222-8977
• On the Portfolio's website, www.credit-suisse.com/us
• On the website of the Securities and Exchange Commission, www.sec.gov.
The Portfolio files a complete schedule of its portfolio holdings for the first and third quarters of its fiscal year with the SEC on Form N-Q. The Portfolio's Forms N-Q are available on the SEC's website at www.sec.gov and may be reviewed and copied at the SEC's Public Reference Room in Washington, DC. Information on the operation of the SEC's Public Reference Room may be obtained by calling 1-202-551-8090.
44

P.O. BOX 55030, BOSTON, MA 02205-5030
800-222-8977 n WWW.credit-suisse.com/us
CREDIT SUISSE ASSET MANAGEMENT SECURITIES, INC., DISTRIBUTOR. TRSCC I-AR-1208
Item 2. Code of Ethics.
The registrant has adopted a code of ethics applicable to its Chief Executive Officer, President, Chief Financial Officer and Chief Accounting Officer, or persons performing similar functions. A copy of the code is filed as Exhibit 12(a)(1) to this Form. There were no amendments to the code during the fiscal year ended December 31, 2008. There were no waivers or implicit waivers from the code granted by the registrant during the fiscal year ended December 31, 2008.
Item 3. Audit Committee Financial Expert.
The registrant’s governing board has determined that it has two audit committee financial experts serving on its audit committee: Enrique R. Arzac and Steven N. Rappaport. Each audit committee financial expert is “independent” for purposes of this item.
Item 4. Principal Accountant Fees and Services.
(a) through (d). The information in the table below is provided for services rendered to the registrant by its independent registered public accounting firm, PricewaterhouseCoopers LLP (“PwC”), for its fiscal years ended December 31, 2007 and December 31, 2008.
| | 2007 | | 2008 | |
Audit Fees | | $ | 210,529 | | $ | 219,000 | |
Audit-Related Fees(1) | | $ | 26,720 | | $ | 27,200 | |
Tax Fees(2) | | $ | 20,720 | | $ | 12,800 | |
All Other Fees | | — | | — | |
Total | | $ | 257,969 | | $ | 259,000 | |
(1) Services include agreed-upon procedures in connection with the registrant’s semi-annual financial statements ($26,720 for 2007 and $ 27,200 for 2008).
(2) Tax services in connection with the registrant’s excise tax calculations and review of the registrant’s applicable tax returns.
The information in the table below is provided with respect to non-audit services that directly relate to the registrant’s operations and financial reporting and that were rendered by PwC to the registrant’s investment adviser, Credit Suisse Asset Management, LLC (“Credit Suisse”), and any service provider to the registrant controlling, controlled by or under common control with Credit Suisse that provided ongoing services to the registrant (“Covered Services Provider”), for the registrant’s fiscal years ended December 31, 2007 and December 31, 2008.
2
| | 2007 | | 2008 | |
Audit-Related Fees | | N/A | | N/A | |
Tax Fees | | N/A | | N/A | |
All Other Fees | | N/A | | N/A | |
Total | | N/A | | N/A | |
(e)(1) Pre-Approval Policies and Procedures. The Audit Committee (“Committee”) of the registrant is responsible for pre-approving (i) all audit and permissible non-audit services to be provided by the independent registered public accounting firm to the registrant and (ii) all permissible non-audit services to be provided by the independent registered public accounting firm to Credit Suisse and any Covered Services Provider if the engagement relates directly to the operations and financial reporting of the registrant. The Committee may delegate its responsibility to pre-approve any such audit and permissible non-audit services to the Chairperson of the Committee, and the Chairperson shall report to the Committee, at its next regularly scheduled meeting after the Chairperson’s pre-approval of such services, his or her decision(s). The Committee may also establish detailed pre-approval policies and procedures for pre-approval of such services in accordance with applicable laws, including the delegation of some or all of the Committee’s pre-approval responsibilities to other persons (other than Credit Suisse or the registrant’s officers). Pre-approval by the Committee of any permissible non-audit services shall not be required so long as: (i) the aggregate amount of all such permissible non-audit services provided to the registrant, Credit Suisse and any Covered Services Provider constitutes not more than 5% of the total amount of revenues paid by the registrant to its independent registered public accounting firm during the fiscal year in which the permissible non-audit services are provided; (ii) the permissible non-audit services were not recognized by the registrant at the time of the engagement to be non-audit services; and (iii) such services are promptly brought to the attention of the Committee and approved by the Committee (or its delegate(s)) prior to the completion of the audit.
(e)(2) The information in the table below sets forth the percentages of fees for services (other than audit, review or attest services) rendered by PwC to the registrant for which the pre-approval requirement was waived pursuant to Rule 2-01(c)(7)(i)(C) of Regulation S-X:
| | 2007 | | 2008 | |
Audit-Related Fees | | N/A | | N/A | |
Tax Fees | | N/A | | N/A | |
All Other Fees | | N/A | | N/A | |
Total | | N/A | | N/A | |
3
The information in the table below sets forth the percentages of fees for services (other than audit, review or attest services) rendered by PwC to Credit Suisse and any Covered Services Provider required to be approved pursuant to Rule 2-01(c)(7)(ii) of Regulation S-X, for the registrant’s fiscal years ended December 31, 2007 and December 31, 2008:
| | 2007 | | 2008 | |
Audit-Related Fees | | N/A | | N/A | |
Tax Fees | | N/A | | N/A | |
All Other Fees | | N/A | | N/A | |
Total | | N/A | | N/A | |
(f) Not Applicable.
(g) The aggregate fees billed by PwC for non-audit services rendered to the registrant, Credit Suisse and Covered Service Providers for the fiscal years ended December 31, 2007 and December 31, 2008 were $47,440 and $40,000, respectively.
(h) Not Applicable.
Item 5. Audit Committee of Listed Registrants.
Form N-CSR disclosure requirement is not applicable to the registrant.
Item 6. Schedule of Investments.
Included as part of the report to shareholders filed under Item 1 of this Form.
4
Item 7. Disclosure of Proxy Voting Policies and Procedures for Closed-End Management Investment Companies.
Form N-CSR disclosure requirement is not applicable to the registrant.
Item 8. Portfolio Managers of Closed-End Management Investment Companies.
Form N-CSR disclosure requirement is not applicable to the registrant.
Item 9. Purchases of Equity Securities by Closed-End Management Investment Company and Affiliated Purchasers.
Form N-CSR disclosure requirement is not applicable to the registrant.
Item 10. Submission of Matters to a Vote of Security Holders.
None
Item 11. Controls and Procedures.
(a) As of a date within 90 days from the filing date of this report, the principal executive officer and principal financial officer concluded that the registrant’s disclosure controls and procedures (as defined in Rule 30a-3(c) under the Investment Company Act of 1940 (the “Act”)) were effective based on their evaluation of the disclosure controls and procedures required by Rule 30a-3(b) under the Act and Rules 13a-15(b) or 15d-15(b) under the Securities Exchange Act of 1934.
(b) There were no changes in registrant’s internal control over financial reporting (as defined in Rule 30a-3(d) under the Act) that occurred during the second fiscal quarter of the period covered by this report that have materially affected, or are reasonably likely to materially affect, the registrant’s internal control over financial reporting.
Item 12. Exhibits.
(a)(1) | Registrant’s Code of Ethics is an exhibit to this report. |
| |
(a)(2) | The certifications of the registrant as required by Rule 30a-2(a) under the Act are exhibits to this report. |
| |
(a)(3) | Not applicable. |
| |
(b) | The certifications of the registrant as required by Rule 30a-2(b) under the Act are an exhibit to this report. |
5
SIGNATURES
Pursuant to the requirements of the Securities Exchange Act of 1934 and the Investment Company Act of 1940, the registrant has duly caused this report to be signed on its behalf by the undersigned, thereunto duly authorized.
CREDIT SUISSE TRUST
/s/ George R. Hornig | |
Name: George R. Hornig |
Title: Chief Executive Officer |
Date: March 6, 2009 |
Pursuant to the requirements of the Securities Exchange Act of 1934 and the Investment Company Act of 1940, this report has been signed below by the following persons on behalf of the registrant and in the capacities and on the dates indicated.
/s/ George R. Hornig | |
Name: George R. Hornig |
Title: Chief Executive Officer |
Date: March 6, 2009 |
|
/s/ Michael A. Pignataro | |
Name: Michael A. Pignataro |
Title: Chief Financial Officer |
Date: March 6, 2009 |