UNITED STATES
SECURITIES AND EXCHANGE COMMISSION
Washington, D.C. 20549
FORM N-CSR
CERTIFIED SHAREHOLDER REPORT OF REGISTERED
MANAGEMENT INVESTMENT COMPANIES
Investment Company Act file number | 811-07261 |
|
CREDIT SUISSE TRUST |
(Exact name of registrant as specified in charter) |
|
Eleven Madison Avenue, New York, New York | | 10010 |
(Address of principal executive offices) | | (Zip code) |
|
John G. Popp Credit Suisse Trust Eleven Madison Avenue New York, New York 10010 |
(Name and address of agent for service) |
|
Registrant’s telephone number, including area code: | (212) 325-2000 | |
|
Date of fiscal year end: | December 31st | |
|
Date of reporting period: | January 1, 2011 to December 31, 2011 | |
| | | | | | | | | |
Item 1. Reports to Stockholders.

CREDIT SUISSE FUNDS
Annual Report
December 31, 2011
CREDIT SUISSE TRUST
n COMMODITY RETURN STRATEGY
PORTFOLIO
Credit Suisse Trust (the "Trust") shares are not available directly to individual investors, but may be offered only through certain insurance products and pension and retirement plans.
The Trust's investment objectives, risks, charges and expenses (which should be considered carefully before investing), and more complete information about the Trust, are provided in the Prospectus, which should be read carefully before investing. You may obtain additional copies by calling 877-870-2874 or by writing to Credit Suisse Trust, P.O. Box 55030, Boston, MA 02205-5030.
Credit Suisse Asset Management Securities, Inc., Distributor, is located at Eleven Madison Avenue, New York, NY 10010. The Trust is advised by Credit Suisse Asset Management, LLC.
The views of the Portfolio's management are as of the date of the letter and the Portfolio holdings described in this document are as of December 31, 2011; these views and Portfolio holdings may have changed subsequent to these dates. Nothing in this document is a recommendation to purchase or sell securities.
Portfolio shares are not deposits or other obligations of Credit Suisse Asset Management, LLC ("Credit Suisse") or any affiliate, are not FDIC-insured and are not guaranteed by Credit Suisse or any affiliate. Portfolio investments are subject to investment risks, including loss of your investment.
Credit Suisse Trust — Commodity Return Strategy Portfolio
Annual Investment Adviser's Report
December 31, 2011 (unaudited)
January 30, 2012
We are pleased to present this Annual Report which covers the activities of the Credit Suisse Trust — Commodity Return Strategy Portfolio for the year ended December 31, 2011.
Dear Shareholder:
For the 12-month period ended December 31, 2011, the Credit Suisse Trust — Commodity Return Strategy Portfolio (the "Portfolio") decreased 12.65%.1 Its benchmark, the Dow Jones-UBS Commodity Index Total Return2 ("DJ-UBS Index"), lost 13.32% and the S&P 500 Index3 gained 2.11%.
Market Review: A disappointing period for commodities
For the year ended December 31, 2011, commodities were markedly lower, with the DJ-UBS Index decreasing by 13.32%. Stocks and bonds both outperformed commodities for the period, with the S&P 500 Index gaining 2.11%, the Dow Jones Industrial Average increasing 8.38% and the Barclays Capital Global Aggregate Bond Index rising 5.64%.
Commodity sectors were down, with four out of five trading lower. Precious metals was the only sector positive for the year whereas energy, agriculture, livestock, and industrial materials finished down for the year. Uncertainty surrounding the European debt crisis and the delayed resolution of the U.S. debt limit expansion continued to weigh on markets during the second half of the year to offset the gains made in 2010. Macroeconomic sentiment recovered slightly in October following the EU summit agreement to institute greater bank capital requirements and to increase the size of the region's rescue fund. However, macroeconomic uncertainties appear likely to continue in 2012.
The market remains focused on the ongoing debt crisis in Europe and its potential impact on global economic growth. However, there were some encouraging signs in December, including better than expected U.S. economic data. Sentiment appears to have improved, as evidenced by the University of Michigan Survey of Consumer Confidence, which rebounded to its highest level since the spring. The Philadelphia Federal Reserve Business Outlook Survey also improved, increasing sharply to its highest level since the second quarter. Further, the People's Bank of China signaled a shift from tightening to easing, while major global central banks cooperated to bring down European bank borrowing costs.
Outlook and Strategy: Diversification and Potential Upside
The Portfolio seeks total return and is designed to achieve positive return relative to the performance of the DJ-UBS Index. To do so, the Portfolio invests in commodity-linked derivative instruments and fixed-income securities. The DJ-UBS Index, the Portfolio's benchmark, is a broadly diversified futures index
1
Credit Suisse Trust — Commodity Return Strategy Portfolio
Annual Investment Adviser's Report (continued)
December 31, 2011 (unaudited)
composed of futures contracts on 19 physical commodities. The DJ-UBS Index is weighted among commodity sectors using dollar-adjusted liquidity and production data and is rebalanced as of the beginning of each calendar year.
The Portfolio gains exposure to commodity markets by investing in commodity index-linked structured notes whose principal and/or coupon payments are linked to the DJ-UBS Index and, by investment in its wholly-owned subsidiary (the "Subsidiary"), primarily through commodity index-linked swap agreements on the DJ-UBS Index, but also futures contracts on individual commodities.
For the twelve-month period ended December 31, 2011, the Portfolio outperformed the benchmark. The Portfolio's outperformance over the benchmark can largely be attributed to successful positioning along the commodity forward curves, particularly in the energy and agriculture sectors. This was implemented through favorable structuring of commodity-linked swaps and structured notes. Within the fixed income portion of the portfolio, the team maintained exposure to U.S. Treasury and Agency debt. This positioning also contributed to outperformance through a rally in floating rate holdings amid an accommodative Fed policy and increased LIBOR rates due to weakness in the Eurozone.
Precious metals was the strongest performing sector for the year, returning 4.56%. Despite periods of market liquidation due to macroeconomic uncertainty in August, September and December, gold was helped by increased physical and investment demand from Asia and continued strong global demand for currency alternatives. Gold was up by 9.63% for the period. Silver, however, ended the period down 10.15% as it lost ground due to weakening investor interest and a softer industrial demand outlook.
Livestock was the second best performing sector despite higher corn prices and the USDA's November Cold Storage Report, which revealed the lowest level of frozen meat and poultry inventories since 2003. Lean hogs posted losses of 4.56%, while live cattle was down by 1.00%.
Agriculture also ended the year lower, decreasing by 14.35%, as six out of its seven constituents posted losses. Grains were relatively weak as production expectations increased for the 2011-2012 crop year. Up 1.14%, corn led the agriculture sector as gains in late 2010 and early 2011 were driven by lower yields paired with strong export demand. In the fourth quarter, grains were supported by potential bad weather conditions in South America as poor production aggravated tight inventory levels, especially for corn. Wheat decreased by 33.98% as better-than-expected supply weighed on grains for most of the year. Amidst concerns over robust supplies and reduced demand due to weak economic growth, cotton declined 21.70%.
2
Credit Suisse Trust — Commodity Return Strategy Portfolio
Annual Investment Adviser's Report (continued)
December 31, 2011 (unaudited)
Despite heating oil and gasoline being the top two performers for the period (posting gains of 10.68% and 14.52%, respectively), energy was the second worst performing sector, losing 15.97%. Refining margins strengthened sharply throughout the period as U.S. refiners purchased relatively cheap North American crude oil and were able to sell petroleum products, like heating oil and gasoline, to global markets. Fundamental data releases remain broadly supportive for crude oil and petroleum products and demand remains healthy versus historical standards. The potential for supply shocks continues in the Middle East, North Africa and Nigeria, and spare capacity is especially tight outside of the United States. Additionally, due to strong production in the United States keeping inventories comfortable on top of continued warmer-than-normal temperatures, natural gas lost 47.10%, making it the worst performing constituent in the Index.
Industrial metals was the weakest sector, losing 24.23% for the year. The sector posted losses during the summer and fall of 2011 as economic concerns grew. All four of its constituents dropped as concerns over a growth slowdown in the developed world weighed on the sector. Zinc led the base metals lower, losing 27.76%, as refined stocks were forecasted to remain above the equivalent of 100 days of consumption for the foreseeable future. Nickel dropped 24.68%, as nickel pig iron production continued to increase despite potentially falling demand in the face of recession. Copper, down 24.41%, sold off sharply over the summer and was able to recover only some of the losses during the fourth quarter despite record-setting Chinese imports driven by lower prices and low levels of domestic inventories. Aluminum was the best relative performer in the sector, falling 21.68%, despite reports of Chinese smelter cutbacks at the end of the period.
In the fixed income portion of the portfolio, holdings maintained a bias toward high quality, short-term assets exclusively limited to bonds issued by U.S. Government-Sponsored Enterprises (GSE's) and U.S. Treasury-issued debt. In the current credit environment, we remain confident in our high quality fixed income positions, which have performed well over the last year.
The global manufacturing Purchasing Managers Index ("PMI") improved in December, indicating that Europe's problems may not completely curtail global economic growth. Additionally, in the United States, the Institute for Supply Management ("ISM") Manufacturing Index rose to a six-month high in December, with both leading new orders and coincident production indices hitting eight-month highs. Even in Europe, the PMI reports rose slightly in December, while PMI surveys in the emerging markets were also encouraging. We expect shifts to more accommodative policies will also be supportive.
Despite these improvements, the European debt crisis will likely continue to weigh on economic growth and investor sentiment. However, fundamentals for
3
Credit Suisse Trust — Commodity Return Strategy Portfolio
Annual Investment Adviser's Report (continued)
December 31, 2011 (unaudited)
key commodities remain largely supportive, with generally tight inventory levels and continued strong demand. The threat of supply shocks is particularly acute for the petroleum products and certain agricultural crops. And, while precious metals have lost their luster of late, demand for currency alternatives and hard assets is likely to remain strong amid continued loose monetary policies. In our opinion, investors may derive long-term diversification benefits as well as potential inflation protection through a strategic allocation to commodities.
The Credit Suisse Commodities Management Team
Nelson Louie
Christopher Burton
This Portfolio is non-diversified, which means it may invest a greater proportion of its assets in the securities of a smaller number of issuers than a diversified mutual fund and may therefore be subject to greater volatility. Exposure to commodity markets should only form a small part of a diversified portfolio. Investment in commodity markets may not be suitable for all investors. The Portfolio's investment in commodity-linked derivative instruments may subject the Portfolio to greater volatility than investment in traditional securities, particularly in investments involving leverage.
The use of derivatives such as commodity-linked structured notes, swaps and futures entails substantial risks, including risk of loss of a significant portion of their principal value, lack of a secondary market, increased volatility, correlation risk, liquidity risk, interest-rate risk, market risk, credit risk, valuation risk and tax risk. Gains and losses from speculative positions in derivatives may be much greater than the derivative's cost. At any time, the risk of loss of any individual security held by the Portfolio could be significantly higher than 50% of the security's value. For a detailed discussion of these and other risks, please refer to the Portfolio's prospectus, which should be read carefully before investing.
In addition to historical information, this report contains forward-looking statements, which may concern, among other things, domestic and foreign market, industry and economic trends and developments and government regulation and their potential impact on the Portfolio's investments. These statements are subject to risks and uncertainties and actual trends, developments and regulations in the future, and their impact on the Portfolio could be materially different from those projected, anticipated or implied. The Portfolio has no obligation to update or revise forward-looking statements.
4
Credit Suisse Trust — Commodity Return Strategy Portfolio
Annual Investment Adviser's Report (continued)
December 31, 2011 (unaudited)
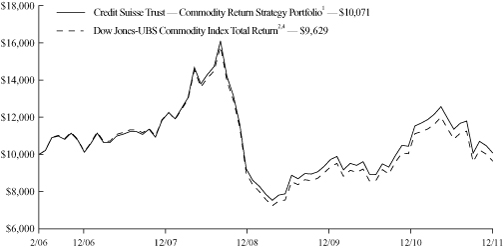
Comparison of Change in Value of $10,000 Investment in the
Credit Suisse Trust — Commodity Return Strategy Portfolio1 and the
Dow Jones-UBS Commodity Index Total Return2,4
from Inception (2/28/06).
5
Credit Suisse Trust — Commodity Return Strategy Portfolio
Annual Investment Adviser's Report (continued)
December 31, 2011 (unaudited)
Average Annual Returns as of December 31, 20111
| 1 Year | | 5 Years | | Since
Inception | |
| | (12.65 | )% | | | (1.09 | )% | | | 0.12 | % | |
Returns represent past performance and include change in share price and reinvestment of dividends and capital gains. Past performance cannot guarantee future results. The current performance of the Portfolio may be lower or higher than the figures shown. Returns and share price will fluctuate, and redemption value may be more or less than original cost. The performance results do not reflect the deduction of taxes that a shareholder would pay on portfolio distributions or the redemption of portfolio shares. Performance includes the effect of deducting expenses, but does not include charges and expenses attributable to any particular variable contract or plan. Accordingly, the Prospectus of the sponsoring Participating Insurance Company separate account or plan documents or other informational materials supplied by plan sponsors should be carefully reviewed for information on relevant charges and expenses. Excluding these charges and expenses from quotations of performance has the effect of increasing the performance quoted, and the effect of these charges should be considered when comparing performance to that other mutual funds. Performance information current to the most recent month-end is available at www.credit-suisse.com/us.
The annualized gross expense ratio is 1.06%. The annualized net expense ratio after fee waivers and/or expense reimbursements is 1.05%.
1 Fee waivers and/or expense reimbursements may reduce expenses for the Portfolio, without which performance would be lower. Waivers and/or reimbursements may be discontinued at any time.
2 The Dow Jones-UBS Commodity Index Total Return is composed of futures contracts on 19 physical commodities. An index does not have transaction costs; investors may not invest directly in an index.
3 The Standard & Poor's 500 Index is an unmanaged index (with no defined investment objective) of common stocks, includes reinvestment of dividends, and is a registered trademark of The McGraw-Hill Companies, Inc. An index does not have transaction costs; investors may not invest directly in an index.
4 Performance for the benchmark is not available for the period beginning February 28, 2006. For that reason, performance for the benchmark is shown for the period beginning March 1, 2006.
6
Credit Suisse Trust — Commodity Return Strategy Portfolio
Annual Investment Adviser's Report (continued)
December 31, 2011 (unaudited)
Information About Your Portfolio's Expenses
As an investor in the Portfolio, you incur two types of costs: ongoing expenses and transaction costs. Ongoing expenses include management fees, distribution and service (12b-1) fees and other Portfolio expenses. Examples of transaction costs include sales charges (loads), redemption fees and account maintenance fees, which are not shown in this section and which would result in higher total expenses. The following table is intended to help you understand your ongoing expenses of investing in the Portfolio and to help you compare these expenses with the ongoing expenses of investing in other mutual funds. The table is based on an investment of $1,000 made at the beginning of the six month period ended December 31, 2011.
The table illustrates your Portfolio's expenses in two ways:
• Actual Portfolio Return. This helps you estimate the actual dollar amount of ongoing expenses paid on a $1,000 investment in the Portfolio using the Portfolio's actual return during the period. To estimate the expenses you paid over the period, simply divide your account value by $1,000 (for example, an $8,600 account value divided by $1,000 = 8.6), then multiply the result by the number in the "Expenses Paid per $1,000" line under the share class you hold.
• Hypothetical 5% Portfolio Return. This helps you to compare your Portfolio's ongoing expenses with those of other mutual funds using the Portfolio's actual expense ratio and a hypothetical rate of return of 5% per year before expenses. Examples using a 5% hypothetical portfolio return may be found in the shareholder reports of other mutual funds. The hypothetical account values and expenses may not be used to estimate the actual ending account balance or expenses you paid for the period.
Please note that the expenses shown in these tables are meant to highlight your ongoing expenses only and do not reflect any transaction costs, such as sales charges (loads) or redemption fees. If these transaction costs had been included, your costs would have been higher. The "Expenses Paid per $1,000" line of the tables is useful in comparing ongoing expenses only and will not help you determine the relative total expenses of owning different funds.
7
Credit Suisse Trust — Commodity Return Strategy Portfolio
Annual Investment Adviser's Report (continued)
December 31, 2011 (unaudited)
Expenses and Value for a $1,000 Investment
for the six month period ended December 31, 2011
| Actual Portfolio Return | |
| Beginning Account Value 7/1/11 | | $ | 1,000.00 | | |
| Ending Account Value 12/31/11 | | $ | 887.20 | | |
| Expenses Paid per $1,000* | | $ | 4.99 | | |
| Hypothetical 5% Portfolio Return | |
| Beginning Account Value 7/1/11 | | $ | 1,000.00 | | |
| Ending Account Value 12/31/11 | | $ | 1,019.91 | | |
| Expenses Paid per $1,000* | | $ | 5.35 | | |
| Annualized Expense Ratio* | | | 1.05 | % | |
* Expenses are equal to the Portfolio's annualized expense ratio multiplied by the average account value over the period, multiplied by the number of days in the most recent fiscal half year period, then divided by 365.
The "Expenses Paid per $1,000" and the "Annualized Expense Ratio" in the tables are based on actual expenses paid by the Portfolio during the period, net of fee waivers and/or expense reimbursements. If those fee waivers and/or expense reimbursements had not been in effect, the Portfolio's actual expenses would have been higher. Expenses do not reflect additional charges and expenses that are, or may be, imposed under the variable contracts or plans. Such charges and expenses are described in the prospectus of the insurance company separate account or in the plan documents or other informational materials supplied by plan sponsors. The Portfolio's expenses should be considered with these charges and expenses in evaluating the overall cost of investing in the separate account.
For more information, please refer to the Portfolio's prospectus.
Sector Breakdown*
| United States Agency Obligations | | | 54.3 | % | |
| Wholly-Owned Subsidiary | | | 18.0 | % | |
| United States Treasury Obligations | | | 13.6 | % | |
| Commodity Indexed Structured Notes | | | 12.1 | % | |
| Short-Term Investment | | | 2.0 | % | |
| Total | | | 100.0 | % | |
* Expressed as a percentage of total investments (excluding securities lending collateral if applicable) and may vary over time.
8
Credit Suisse Trust — Commodity Return Strategy Portfolio
Schedule of Investments
December 31, 2011
Par
(000) | | | | Ratings†
(S&P/Moody's) | | Maturity | | Rate% | | Value | |
| COMMODITY INDEXED STRUCTURED NOTES (12.2%) | |
| $ | 4,400 | | | BNP Paribas, Commodity Index
Linked Senior Unsecured Notes# | | (AA-, Aa2) | | 02/27/12 | | | 0.438 | | | $ | 3,980,680 | | |
| | 2,900 | | | Deutsche Bank AG London, Commodity Index
Linked Senior Unsecured Notes# | | (A+, Aa3) | | 12/17/12 | | | 0.135 | | | | 2,736,440 | | |
| | 1,500 | | | Deutsche Bank AG London, Commodity Index
Linked Senior Unsecured Notes# | | (A+, Aa3) | | 01/11/13 | | | 0.128 | | | | 1,507,050 | | |
| | 5,500 | | | Svensk AB Exportkredit, Commodity Index
Linked Senior Unsecured Notes# | | (AA+, Aa1) | | 11/21/12 | | | 0.000 | | | | 5,222,242 | | |
| TOTAL COMMODITY INDEXED STRUCTURED NOTES (Cost $14,300,000) | | | 13,446,412 | | |
| UNITED STATES AGENCY OBLIGATIONS (54.4%) | |
| | 2,500 | | | Federal Farm Credit Bank# | | (AA+, Aaa) | | 07/02/12 | | | 0.285 | | | | 2,502,778 | | |
| | 3,100 | | | Federal Farm Credit Bank# | | (AA+, Aaa) | | 08/27/12 | | | 0.484 | | | | 3,106,392 | | |
| | 3,000 | | | Federal Farm Credit Bank# | | (AA+, Aaa) | | 10/12/12 | | | 0.296 | | | | 3,003,417 | | |
| | 6,000 | | | Federal Farm Credit Bank# | | (AA+, Aaa) | | 08/22/13 | | | 0.311 | | | | 6,009,810 | | |
| | 2,500 | | | Federal Farm Credit Bank# | | (AA+, Aaa) | | 05/02/14 | | | 0.271 | | | | 2,502,500 | | |
| | 3,000 | | | Federal Home Loan Banks# | | (AA+, Aaa) | | 09/04/12 | | | 0.145 | | | | 3,000,939 | | |
| | 2,000 | | | Federal Home Loan Banks | | (AA+, Aaa) | | 10/24/12 | | | 0.350 | | | | 2,000,238 | | |
| | 3,000 | | | Federal Home Loan Banks | | (AA+, Aaa) | | 11/07/12 | | | 0.125 | | | | 2,997,399 | | |
| | 3,000 | | | Federal Home Loan Banks | | (AA+, Aaa) | | 11/19/12 | | | 0.200 | | | | 2,999,163 | | |
| | 3,000 | | | Federal Home Loan Banks# | | (AA+, Aaa) | | 03/15/13 | | | 0.300 | | | | 3,003,921 | | |
| | 2,000 | | | Federal Home Loan Banks | | (AA+, Aaa) | | 05/17/13 | | | 0.320 | | | | 2,000,180 | | |
| | 2,500 | | | Federal Home Loan Mortgage Corp. | | (AA+, Aaa) | | 12/28/12 | | | 0.750 | | | | 2,513,425 | | |
| | 4,000 | | | Federal Home Loan Mortgage Corp.# | | (AA+, Aaa) | | 03/21/13 | | | 0.247 | | | | 4,004,628 | | |
| | 2,500 | | | Federal National Mortgage Association# | | (AA+, Aaa) | | 08/23/12 | | | 0.312 | | | | 2,502,403 | | |
| | 2,500 | | | Federal National Mortgage Association# | | (AA+, Aaa) | | 11/23/12 | | | 0.312 | | | | 2,503,132 | | |
| | 4,000 | | | Federal National Mortgage Association# | | (AA+, Aaa) | | 12/03/12 | | | 0.270 | | | | 4,004,068 | | |
| | 1,076 | | | Federal National Mortgage Association§ | | (AA+, Aaa) | | 12/28/12 | | | 0.375 | | | | 1,078,548 | | |
| | 1,500 | | | Federal National Mortgage Association | | (AA+, Aaa) | | 08/23/13 | | | 0.550 | | | | 1,501,107 | | |
| | 3,000 | | | Federal National Mortgage Association# | | (AA+, Aaa) | | 11/08/13 | | | 0.245 | | | | 3,002,109 | | |
| | 3,000 | | | Freddie Mac Discount Notes | | (AA+, Aaa) | | 02/21/12 | | | 0.120 | | | | 2,999,490 | | |
| | 3,000 | | | Freddie Mac Discount Notes | | (AA+, Aaa) | | 02/23/12 | | | 0.100 | | | | 2,999,558 | | |
| TOTAL UNITED STATES AGENCY OBLIGATIONS (Cost $60,184,446) | | | 60,235,205 | | |
| UNITED STATES TREASURY OBLIGATIONS (13.6%) | |
| | 3,000 | | | United States Treasury Notes | | (AA+, Aaa) | | 01/31/12 | | | 0.875 | | | | 3,001,563 | | |
| | 4,000 | | | United States Treasury Notes | | (AA+, Aaa) | | 02/29/12 | | | 0.875 | | | | 4,005,940 | | |
| | 3,000 | | | United States Treasury Notes | | (AA+, Aaa) | | 03/31/12 | | | 1.000 | | | | 3,007,383 | | |
| | 3,000 | | | United States Treasury Notes | | (AA+, Aaa) | | 07/15/12 | | | 1.500 | | | | 3,023,088 | | |
| | 2,000 | | | United States Treasury Notes | | (AA+, Aaa) | | 08/31/12 | | | 0.375 | | | | 2,003,828 | | |
| TOTAL UNITED STATES TREASURY OBLIGATIONS (Cost $15,035,912) | | | 15,041,802 | | |
| SHORT-TERM INVESTMENTS (2.8%) | |
| | 2,188 | | | State Street Bank and Trust Co. Euro Time Deposit | | | | | | 01/03/12 | | | 0.010 | | | | 2,188,000 | | |
Number of
Shares | | | | | |
| | 887,530 | | | State Street Navigator Prime Portfolio, 0.28%§§ | | | 887,530 | | |
| TOTAL SHORT-TERM INVESTMENTS (Cost $3,075,530) | | | 3,075,530 | | |
See Accompanying Notes to Financial Statements.
9
Credit Suisse Trust — Commodity Return Strategy Portfolio
Schedule of Investments (continued)
December 31, 2011
Number of
Shares | | | | Value | |
| WHOLLY-OWNED SUBSIDIARY (18.0%) | |
| | 32,776,881 | | | Credit Suisse Cayman Commodity Fund II, Ltd.^
(Cost $17,546,949) | | $ | 19,949,505 | | |
| TOTAL INVESTMENTS AT VALUE (101.0%) (Cost $110,142,837) | | | 111,748,454 | | |
| LIABILITIES IN EXCESS OF OTHER ASSETS (-1.0%) | | | (1,060,873 | ) | |
| NET ASSETS (100.0%) | | $ | 110,687,581 | | |
† Credit ratings given by the Standard & Poor's Division of The McGraw-Hill Companies, Inc. ("S&P") and Moody's Investors Service, Inc. ("Moody's") are unaudited.
# Variable rate obligations — The interest rate is the rate as of December 31, 2011.
§ Security or portion thereof is out on loan.
§§ Represents security purchased with cash collateral received for securities on loan. The rate shown is the annualized one-day yield at December 31, 2011.
^ Affiliated issuer. See Note 2.
See Accompanying Notes to Financial Statements.
10
Credit Suisse Trust — Commodity Return Strategy Portfolio
Statement of Assets and Liabilities
December 31, 2011
| Assets | |
Investments at value, including collateral for securities on loan of $887,530
Cost $92,595,888) (Note 2) | | $ | 91,798,9491 | | |
| Investment in wholly-owned subsidiary at value (Cost $17,546,949) (Note 2) | | | 19,949,505 | | |
| Cash | | | 972 | | |
| Interest receivable | | | 79,573 | | |
| Receivable for portfolio shares sold | | | 1,971 | | |
| Prepaid expenses and other assets | | | 3,024 | | |
| Total Assets | | | 111,833,994 | | |
| Liabilities | |
| Advisory fee payable (Note 3) | | | 43,588 | | |
| Administrative services fee payable (Note 3) | | | 15,599 | | |
| Shareholder servicing/Distribution fee payable (Note 3) | | | 23,790 | | |
| Payable upon return of securities loaned (Note 2) | | | 887,530 | | |
| Payable for portfolio shares redeemed | | | 116,178 | | |
| Trustees' fee payable | | | 5,370 | | |
| Other accrued expenses payable | | | 54,358 | | |
| Total Liabilities | | | 1,146,413 | | |
| Net Assets | |
| Capital stock, $.001 par value (Note 6) | | | 15,455 | | |
| Paid-in capital (Note 6) | | | 110,544,635 | | |
| Accumulated net realized loss on investments | | | (1,478,126 | ) | |
| Net unrealized appreciation from investments | | | 1,605,617 | | |
| Net Assets | | $ | 110,687,581 | | |
| Shares outstanding | | | 15,454,558 | | |
| Net asset value, offering price and redemption price per share | | $ | 7.16 | | |
1 Including $869,894 of securities on loan.
See Accompanying Notes to Financial Statements.
11
Credit Suisse Trust — Commodity Return Strategy Portfolio
Statement of Operations
For the Year Ended December 31, 2011
| Investment Income (Note 2) | |
| Interest | | $ | 227,697 | | |
| Securities lending | | | 11,658 | | |
| Total investment income | | | 239,355 | | |
| Expenses | |
| Investment advisory fees (Note 3) | | | 640,730 | | |
| Administrative services fees (Note 3) | | | 165,242 | | |
| Shareholder servicing/Distribution fees (Note 3) | | | 320,365 | | |
| Trustees' fees | | | 57,597 | | |
| Printing fees (Note 3) | | | 50,879 | | |
| Audit and tax fees | | | 44,650 | | |
| Legal fees | | | 42,703 | | |
| Transfer agent fees | | | 22,574 | | |
| Custodian fees | | | 8,367 | | |
| Insurance expense | | | 5,828 | | |
| Commitment fees (Note 4) | | | 553 | | |
| Miscellaneous expense | | | 3,880 | | |
| Total expenses | | | 1,363,368 | | |
| Less: fees waived (Note 3) | | | (17,835 | ) | |
| Net expenses | | | 1,345,533 | | |
| Net investment loss | | | (1,106,178 | ) | |
| Net Realized and Unrealized Gain (Loss) from Investments | |
| Net realized gain from investments | | | 1,348,384 | | |
| Net realized gain from investment in wholly-owned subsidiary | | | 3,878,006 | | |
| Net change in unrealized appreciation (depreciation) from investments | | | (7,147,328 | ) | |
| Net change in unrealized appreciation (depreciation) from investment in wholly-owned subsidiary1 | | | (13,874,116 | ) | |
| Net realized and unrealized loss from investments | | | (15,795,054 | ) | |
| Net decrease in net assets resulting from operations | | $ | (16,901,232 | ) | |
1 There was no income recognized from the investment in wholly-owned subsidiary.
See Accompanying Notes to Financial Statements.
12
Credit Suisse Trust — Commodity Return Strategy Portfolio
Statements of Changes in Net Assets
| | | For the Year Ended December 31, | |
| | | 2011 | | 2010 | |
| From Operations | |
| Net investment loss | | $ | (1,106,178 | ) | | $ | (800,268 | ) | |
| Net realized gain from investments | | | 5,226,390 | | | | 9,574,542 | | |
| Net change in unrealized appreciation (depreciation) from investments | | | (21,021,444 | ) | | | 8,653,868 | | |
| Net increase (decrease) in net assets resulting from operations | | | (16,901,232 | ) | | | 17,428,142 | | |
| From Dividends | |
| Dividends from net investment income | | | (3,160,655 | ) | | | (7,343,593 | ) | |
| From Capital Share Transactions (Note 6) | |
| Proceeds from sale of shares | | | 20,003,630 | | | | 12,409,547 | | |
| Reinvestment of dividends | | | 3,159,123 | | | | 7,341,817 | | |
| Net asset value of shares redeemed | | | (16,738,527 | ) | | | (13,721,276 | ) | |
| Net increase in net assets from capital share transactions | | | 6,424,226 | | | | 6,030,088 | | |
| Net increase (decrease) in net assets | | | (13,637,661 | ) | | | 16,114,637 | | |
| Net Assets | |
| Beginning of year | | | 124,325,242 | | | | 108,210,605 | | |
| End of year | | $ | 110,687,581 | | | $ | 124,325,242 | | |
| Accumulated net investment loss | | $ | — | | | $ | (19,203,746 | ) | |
See Accompanying Notes to Financial Statements.
13
Credit Suisse Trust — Commodity Return Strategy Portfolio
Financial Highlights
(For a Share of the Portfolio Outstanding Throughout Each Year)
| | | For the Year Ended December 31, | |
| | | 2011 | | 2010 | | 2009 | | 2008 | | 2007 | |
| Per share data | |
| Net asset value, beginning of year | | $ | 8.40 | | | $ | 7.66 | | | $ | 7.11 | | | $ | 11.58 | | | $ | 10.37 | | |
| INVESTMENT OPERATIONS | |
| Net investment income (loss)1 | | | (0.07 | ) | | | (0.06 | ) | | | (0.04 | ) | | | 0.15 | | | | 0.54 | | |
Net gain (loss) on investments, investment in
wholly-owned subsidiary and futures contracts
(both realized and unrealized) | | | (0.97 | ) | | | 1.33 | | | | 1.43 | | | | (3.80 | ) | | | 1.22 | | |
| Total from investment operations | | | (1.04 | ) | | | 1.27 | | | | 1.39 | | | | (3.65 | ) | | | 1.76 | | |
| LESS DIVIDENDS AND DISTRIBUTIONS | |
| Dividends from net investment income | | | (0.20 | ) | | | (0.53 | ) | | | (0.84 | ) | | | (0.15 | ) | | | (0.55 | ) | |
| Distributions from net realized gains | | | — | | | | — | | | | — | | | | (0.67 | ) | | | — | | |
| Total dividends and distributions | | | (0.20 | ) | | | (0.53 | ) | | | (0.84 | ) | | | (0.82 | ) | | | (0.55 | ) | |
| Net asset value, end of year | | $ | 7.16 | | | $ | 8.40 | | | $ | 7.66 | | | $ | 7.11 | | | $ | 11.58 | | |
| Total return2 | | | (12.65 | )% | | | 16.66 | % | | | 19.48 | % | | | (33.72 | )% | | | 17.33 | % | |
| RATIOS AND SUPPLEMENTAL DATA | |
| Net assets, end of year (000s omitted) | | $ | 110,688 | | | $ | 124,325 | | | $ | 108,211 | | | $ | 69,919 | | | $ | 56,624 | | |
| Ratio of expenses to average net assets | | | 1.05 | % | | | 0.95 | % | | | 0.95 | % | | | 0.95 | % | | | 0.95 | % | |
Ratio of net investment income (loss) to
average net assets | | | (0.86 | )% | | | (0.75 | )% | | | (0.52 | )% | | | 1.35 | % | | | 4.06 | % | |
Decrease reflected in above operating expense
ratios due to waivers/reimbursements | | | 0.01 | % | | | 0.14 | % | | | 0.25 | % | | | 0.11 | % | | | 0.08 | % | |
| Portfolio turnover rate | | | 165 | % | | | 118 | % | | | 53 | % | | | 140 | % | | | 93 | % | |
1 Per share information is calculated using the average shares outstanding method.
2 Total returns are historical and assume changes in share price and reinvestment of all dividends and distributions. Had certain expenses not been reduced during the years shown, total returns would have been lower. Total returns do not reflect charges and expenses attributable to any particular variable contract or plan.
See Accompanying Notes to Financial Statements.
14
Credit Suisse Trust — Commodity Return Strategy Portfolio
Notes to Financial Statements
December 31, 2011
Note 1. Organization
Credit Suisse Trust (the "Trust") is an open-end management investment company registered under the Investment Company Act of 1940, as amended (the "1940 Act"), which currently offers the Commodity Return Strategy Portfolio (the "Portfolio"). The Portfolio is a non-diversified open-end management investment company that seeks total return. Shares of the Portfolio are not available directly to individual investors but may be offered only through (a) variable annuity contracts and variable life insurance contracts offered by separate accounts of certain insurance companies and (b) tax-qualified pension and retirement plans. The Portfolio may not be available in connection with a particular contract or plan. The Trust was organized under the laws of the Commonwealth of Massachusetts as a business trust on March 15, 1995.
Note 2. Significant Accounting Policies
A) SECURITY VALUATION — The net asset value of the Portfolio is determined daily as of the close of regular trading on the New York Stock Exchange, Inc. (the "Exchange") on each day the Exchange is open for business. Equity investments are valued at market value, which is generally determined using the closing price on the exchange or market on which the security is primarily traded at the time of valuation (the "Valuation Time"). If no sales are reported, equity investments are generally valued at the most recent bid quotation as of the Valuation Time or at the lowest asked quotation in the case of a short sale of securities. Equity investments are generally categorized as Level 1. Investments in open-end investment companies are valued at their net asset value each business day and are generally categorized as Level 1. Debt securities with a remaining maturity greater than 60 days are valued in accordance with the price supplied by a pricing service, which may use a matrix, formula or other objective method that takes into consideration market indices, yield curves and other specific adjustments. Debt obligations that will mature in 60 days or less are valued on the basis of amortized cost, which approximates market value, unless it is determined that using this method would not represent fair value. Debt securities are generally categorized as Level 2. Structured note agreements are valued in accordance with a dealer-supplied valuation based on changes in the value of the underlying index and are generally categorized as Level 2. The Portfolio's investment in the Credit Suisse Cayman Commodity Fund II, Ltd., a wholly-owned and controlled Cayman Islands subsidiary, (the "Subsidiary"), is valued at the Subsidiary's net asset value each business day and is generally categorized as Level 2. Securities, structured note agreements and other assets for which market
15
Credit Suisse Trust — Commodity Return Strategy Portfolio
Notes to Financial Statements (continued)
December 31, 2011
Note 2. Significant Accounting Policies
quotations are not readily available, or whose values have been materially affected by events occurring before the Portfolio's Valuation Time but after the close of the securities' primary markets, are valued at fair value as determined in good faith by, or under the direction of, the Board of Trustees under procedures established by the Board of Trustees and are generally categorized as Level 3. The Portfolio may utilize a service provided by an independent third party which has been approved by the Board of Trustees to fair value certain securities. When fair value pricing is employed, the prices of securities used by a portfolio to calculate its net asset value may differ from quoted or published prices for the same securities.
In accordance with the authoritative guidance on fair value measurements and disclosures under accounting principles generally accepted in the United States of America ("GAAP"), the Portfolio discloses the fair value of its investments in a hierarchy that prioritizes the inputs to valuation techniques used to measure the fair value. In accordance with GAAP, fair value is defined as the price that the Portfolio would receive upon selling an investment in a timely transaction to an independent buyer in the principal or most advantageous market of the investment. GAAP established a three-tier hierarchy to maximize the use of observable market data and minimize the use of unobservable inputs and to establish classification of fair value measurements for disclosure purposes. Inputs refer broadly to the assumptions that market participants would use in pricing the asset or liability, including assumptions about risk, for example, the risk inherent in a particular valuation technique used to measure fair value including such a pricing model and/or the risk inherent in the inputs to the valuation technique. Inputs may be observable or unobservable. Observable inputs are inputs that reflect the assumptions market participants would use in pricing the asset or liability developed based on market data obtained from sources independent of the reporting entity. Unobservable inputs are inputs that reflect the reporting entity's own assumptions about the assumptions market participants would use in pricing the asset or liability developed based on the best information available in the circumstances. In accordance with the Portfolio's valuation procedures, factors used in determining value may include, but are not limited to, the type of the security, the size of the holding, the initial cost of the security, the existence of any contractual restrictions on the security's disposition, the price and extent of public trading in similar securities of the issuer or of comparable companies, quotations or evaluated prices from broker-dealers and/or pricing services, information obtained from the issuer, analysts, and/or the appropriate stock exchange (for exchange-traded securities), an analysis of
16
Credit Suisse Trust — Commodity Return Strategy Portfolio
Notes to Financial Statements (continued)
December 31, 2011
Note 2. Significant Accounting Policies
the company's or issuer's financial statements, an evaluation of the forces that influence the issuer and the market(s) in which the security is purchased and sold and with respect to debt securities, the maturity, coupon, creditworthiness, currency denomination, and the movement of the market in which the security is normally traded. The three-tier hierarchy of inputs is summarized in the three broad Levels listed below.
• Level 1 – quoted prices in active markets for identical investments
• Level 2 – other significant observable inputs (including quoted prices for similar investments, interest rates, prepayment speeds, credit risk, etc.)
• Level 3 – significant unobservable inputs (including the Portfolio's own assumptions in determining the fair value of investments)
The inputs or methodology used for valuing securities are not necessarily an indication of the risk associated with investing in those securities.
The following is a summary of the inputs used as of December 31, 2011 in valuing the Portfolio's investments carried at value:
| | | Level 1 | | Level 2 | | Level 3 | | Total | |
| Investments in Securities | |
| Commodity Indexed Structured Notes | | $ | — | | | $ | 13,446,412 | | | $ | — | | | $ | 13,446,412 | | |
| United States Agency Obligations | | | — | | | | 60,235,205 | | | | — | | | | 60,235,205 | | |
| United States Treasury Obligations | | | — | | | | 15,041,802 | | | | — | | | | 15,041,802 | | |
| Short-Term Investments | | | 887,530 | | | | 2,188,000 | | | | — | | | | 3,075,530 | | |
| Wholly-Owned Subsidiary | | | — | | | | 19,949,505 | | | | — | | | | 19,949,505 | | |
| Other Financial Instruments* | | | — | | | | — | | | | — | | | | — | | |
| | | $ | 887,530 | | | $ | 110,860,924 | | | $ | — | | | $ | 111,748,454 | | |
*Other financial instruments include futures, forwards and swap contracts.
The Portfolio adopted FASB amendments to authoritative guidance which require the Portfolio to disclose details of significant transfers in and out of Level 1 and Level 2 measurements and Level 2 and Level 3 measurements and the reasons for the transfers. For the year ended December 31, 2011, there were no significant transfers in and out of Level 1, Level 2 and Level 3.
B) DERIVATIVE INSTRUMENTS AND HEDGING ACTIVITIES — The Portfolio adopted amendments to authoritative guidance on disclosures about derivative instruments and hedging activities which require that the Portfolio disclose (a) how and why an entity uses derivative instruments, (b) how derivative instruments and hedging activities are accounted for, and (c) how derivative instruments and related hedging activities affect a portfolio's
17
Credit Suisse Trust — Commodity Return Strategy Portfolio
Notes to Financial Statements (continued)
December 31, 2011
Note 2. Significant Accounting Policies
financial position, financial performance, and cash flows. The Portfolio has not entered into any derivative or hedging activities during the period covered by this report. However, the Portfolio does invest in derivative instruments indirectly through the Subsidiary. Derivatives activity within the Subsidiary is discussed in the notes to the Subsidiary's financial statements, which should be read in conjunction with this report.
C) SECURITY TRANSACTIONS AND INVESTMENT INCOME — Security transactions are accounted for on a trade date basis. Interest income is recorded on the accrual basis. The Portfolio amortizes premiums and accretes discounts using the effective interest method. Dividends are recorded on the ex-dividend date. The cost of investments sold is determined by use of the specific identification method for both financial reporting and income tax purposes.
D) DIVIDENDS AND DISTRIBUTIONS TO SHAREHOLDERS — Dividends from net investment income, if any, are declared and paid quarterly. Distributions of net realized capital gains, if any, are declared and paid at least annually. However, to the extent that a net realized capital gain can be reduced by a capital loss carryforward, such gain will not be distributed. Income and capital gain distributions are determined in accordance with federal income tax regulations, which may differ from GAAP.
E) FEDERAL INCOME TAXES — No provision is made for federal taxes as it is the Portfolio's intention to continue to qualify for and elect the tax treatment applicable to regulated investment companies ("RIC") under the Internal Revenue Code of 1986, as amended (the "Code"), and to make the requisite distributions to its shareholders, which will be sufficient to relieve it from federal income and excise taxes.
In order to qualify as a RIC under the Code, the Portfolio must meet certain requirements regarding the source of its income, the diversification of its assets and the distribution of its income. One of these requirements is that the Portfolio derive at least 90% of its gross income for each taxable year from dividends, interest, payments with respect to certain securities loans, gains from the sale or other disposition of stock, securities or foreign currencies, other income derived with respect to its business of investing in such stock, securities or currencies or net income derived from interests in certain publicly traded partnerships ("Qualifying Income"). The Portfolio may seek to track the performance of the Dow Jones-UBS Commodity Index Total Return ("DJ-UBS Index") through investing in structured notes designed to track the performance of the DJ-UBS Index. The Portfolio has received a private letter
18
Credit Suisse Trust — Commodity Return Strategy Portfolio
Notes to Financial Statements (continued)
December 31, 2011
Note 2. Significant Accounting Policies
ruling from the IRS which confirms that the Portfolio's use of certain types of structured notes designed to track the performance of the DJ-UBS Index produce Qualifying Income. In addition, the Portfolio may, through its investment in the Subsidiary, seek to track the performance of the DJ-UBS Index by the Subsidiary's investments in commodity-linked swaps and/or futures contracts. The Portfolio has obtained a private letter ruling from the IRS that its investment in the Subsidiary will produce Qualifying Income. If the Portfolio is unable to ensure continued qualification as a RIC, the Portfolio may be required to change its investment objective, policies or techniques, or may be liquidated. If the Portfolio fails to qualify as a RIC, the Portfolio will be subject to federal income tax on its net income and capital gains at regular corporate rates (without reduction for distributions to shareholders). If the Portfolio were to fail to qualify as a RIC and become subject to federal income tax, shareholders of the Portfolio would be subject to the risk of diminished returns. If the Portfolio should fail to qualify as a RIC, it would be considered as a single investment, which may result in variable contracts invested in the Portfolio not being treated as annuity, endowment or life insurance contracts under the Code. All income and gain inside the variable contracts would be taxed currently to the holders, and the contracts would remain subject to taxation as ordinary income thereafter, even if they become adequately diversified.
The Portfolio adopted the authoritative guidance for uncertainty in income taxes and recognizes a tax benefit or liability from an uncertain position only if it is more likely than not that the position is sustainable based solely on its technical merits and consideration of the relevant taxing authority's widely understood administrative practices and procedures. The Portfolio has reviewed its current tax positions and has determined that no provision for income tax is required in the Portfolio's financial statements. The Portfolio's federal tax returns for the prior three fiscal years remain subject to examination by the Internal Revenue Service.
F) USE OF ESTIMATES — The preparation of financial statements in conformity with GAAP requires management to make estimates and assumptions that affect the reported amounts of assets and liabilities and disclosure of contingent assets and liabilities at the date of the financial statements and the reported amounts of income and expenses during the reporting period. Actual results could differ from these estimates.
G) SHORT-TERM INVESTMENTS — The Portfolio, together with other funds/portfolios advised by Credit Suisse Asset Management, LLC ("Credit
19
Credit Suisse Trust — Commodity Return Strategy Portfolio
Notes to Financial Statements (continued)
December 31, 2011
Note 2. Significant Accounting Policies
Suisse"), an indirect, wholly-owned subsidiary of Credit Suisse Group AG, pools available cash into a short-term variable rate time deposit issued by State Street Bank and Trust Company ("SSB"), the Portfolio's custodian. The short-term time deposit issued by SSB is a variable rate account classified as a short-term investment.
H) COMMODITY INDEXED STRUCTURED NOTES — The Portfolio may invest in structured notes whose value is based on the price movements of the DJ-UBS Index. The structured notes are often leveraged, increasing the volatility of each note's value relative to the change in the underlying linked financial element. The value of these notes will rise and fall in response to changes in the underlying commodity index. Structured notes may entail a greater degree of market risk than other types of debt securities because the investor bears the risk of the underlying commodity index. Structured notes may also be more volatile, less liquid, and more difficult to accurately price than less complex securities or more traditional debt securities. Fluctuations in the value of the structured notes are recorded as unrealized gains and losses in the accompanying financial statements. Net payments are recorded as interest income. These notes are subject to prepayment, credit and interest risks. The Portfolio has the option to request prepayment from the issuer. At maturity, or when a note is sold, the Portfolio records a realized gain or loss. At December 31, 2011, the value of these securities comprised 12.2% of the Portfolio's net assets and resulted in unrealized depreciation of $(853,588).
I) INVESTMENT IN CAYMAN COMMODITY FUND II, LTD. — The Portfolio may invest up to 25% of its total assets in the Subsidiary, which invests primarily in commodity futures and swap contracts, as well as fixed income securities and other investments intended to serve as margin or collateral for the Subsidiary's derivative positions. The Portfolio wholly owns and controls the Subsidiary, and the Portfolio and Subsidiary are both managed by Credit Suisse.
The Portfolio does not consolidate the assets, liabilities, capital or operations of the Subsidiary into its financial statements. Rather, the Subsidiary is separately presented as an investment in the Portfolio's Schedule of Investments. Unrealized appreciation or depreciation on the Portfolio's investment in the Subsidiary is recorded in the Portfolio's Statement of Assets and Liabilities and Portfolio's Statement of Operations.
For tax purposes, the Subsidiary is an exempted Cayman investment company. The Subsidiary has received an undertaking from the Government
20
Credit Suisse Trust — Commodity Return Strategy Portfolio
Notes to Financial Statements (continued)
December 31, 2011
Note 2. Significant Accounting Policies
of the Cayman Islands exempting it from all local income, profits and capital gains taxes through June of 2027. No such taxes are levied in the Cayman Islands at the present time. For U.S. income tax purposes, the Subsidiary is a Controlled Foreign Corporation and as such is not subject to U.S. income tax. However, as a wholly-owned Controlled Foreign Corporation, the Subsidiary's net income and capital gain, to the extent of its earnings and profits, will be included each year in the Portfolio's investment company taxable income.
| | | Beginning
Shares | | Subscriptions | | Redemptions | | Ending
Shares | | Dividend
Income | | Value
of affiliates
at 12/31/11 | |
Credit Suisse Cayman
Commodity Fund II, Ltd. | | | 20,922,783 | | | | 26,368,368 | | | | (14,514,270 | ) | | | 32,776,881 | | | $ | — | | | $ | 19,949,505 | | |
J) SECURITIES LENDING — Loans of securities are required at all times to be secured by collateral at least equal to 102% of the market value of domestic securities on loan (including any accrued interest thereon) and 105% of the market value of foreign securities on loan (including any accrued interest thereon). Cash collateral received by the Portfolio in connection with securities lending activity may be pooled together with cash collateral for other funds/portfolios advised by Credit Suisse and may be invested in a variety of investments, including funds advised by SSB, the Portfolio's securities lending agent, or money market instruments. However, in the event of default or bankruptcy by the other party to the agreement, realization and/or retention of the collateral may be subject to legal proceedings.
SSB has been engaged by the Portfolio to act as the Portfolio's securities lending agent. The Portfolio's securities lending arrangement provides that the Portfolio and SSB will share the net income earned from securities lending activities. During the year ended December 31, 2011, total earnings from the Portfolio's investment in cash collateral received in connection with securities lending arrangements was $19,594, of which $5,014 was rebated to borrowers (brokers). The Portfolio retained $11,658 in income from the cash collateral investment, and SSB, as lending agent, was paid $2,922. Securities lending income is accrued as earned.
K) OTHER — In the normal course of business the Portfolio trades financial instruments and enters into financial transactions where risk of potential loss exists due to changes in the market (market risk) or failure of the other party to a transaction to perform (credit risk). Similar to credit risk, the Portfolio may be exposed to counterparty risk, or the risk that an institution or other entity with which the Portfolio has unsettled or open transactions will default. The
21
Credit Suisse Trust — Commodity Return Strategy Portfolio
Notes to Financial Statements (continued)
December 31, 2011
Note 2. Significant Accounting Policies
potential loss could exceed the value of the financial assets recorded in the financial statements. Financial assets, which potentially expose the Portfolio to credit risk, consist principally of cash due from counterparties and investments. The extent of the Portfolio's exposure to credit and counterparty risks in respect to these financial assets approximates their carrying value as recorded in the Portfolio's Statement of Assets and Liabilities.
L) SUBSEQUENT EVENTS — In preparing the financial statements as of December 31, 2011, management considered the impact of subsequent events for potential recognition or disclosure in these financial statements through the date of release of this report.
Note 3. Transactions with Affiliates and Related Parties
The Portfolio has entered into an Investment Advisory Agreement (the "Advisory Agreement") with Credit Suisse. For its investment advisory services, Credit Suisse is entitled to receive a fee from the Portfolio at an annual rate of 0.50% of the Portfolio's average daily net assets. For the year ended December 31, 2011, investment advisory fees earned and voluntarily waived were $640,730 and $17,835, respectively. Credit Suisse will not recapture from the Portfolio any fees it waived during the year ended December 31, 2011. Effective January 1, 2011, Credit Suisse waives fees and reimburses expenses so that the Portfolio's annual operating expenses will not exceed 1.05% of the Portfolio's average daily net assets. Fee waivers and expense reimbursements are voluntary and may be discontinued by Credit Suisse at any time.
Credit Suisse Asset Management Securities, Inc. ("CSAMSI"), an affiliate of Credit Suisse, and SSB serve as co-administrators to the Portfolio. For its co-administrative services, CSAMSI currently receives a fee calculated at an annual rate of 0.09% of the Portfolio's average daily net assets. For the year ended December 31, 2011, co-administrative services fees earned by CSAMSI were $115,332.
For its co-administrative services, SSB receives a fee, exclusive of out-of-pocket expenses, calculated in total for all the Credit Suisse funds/portfolios co-administered by SSB and allocated based upon the relative average net assets of each fund/portfolio, subject to an annual minimum fee. For the year ended December 31, 2011, co-administrative services fees earned by SSB (including out-of-pocket expenses) were $49,910.
22
Credit Suisse Trust — Commodity Return Strategy Portfolio
Notes to Financial Statements (continued)
December 31, 2011
Note 3. Transactions with Affiliates and Related Parties
In addition to serving as the Portfolio's co-administrator, CSAMSI currently serves as distributor of the Portfolio's shares. Pursuant to distribution plans adopted by the Portfolio pursuant to Rule 12b-1 under the 1940 Act, CSAMSI receives fees for its distribution services. These fees are calculated at an annual rate of 0.25% of the average daily net assets.
Merrill Corporation ("Merrill"), an affiliate of Credit Suisse, has been engaged by the Portfolio to provide certain financial printing services. For the year ended December 31, 2011, Merrill was paid $20,348 for its services by the Portfolio.
Note 4. Line of Credit
The Portfolio, together with other funds/portfolios advised by Credit Suisse (collectively, the "Participating Funds"), participates in a committed, unsecured line of credit facility ("Credit Facility") for temporary or emergency purposes with SSB. Under the terms of the Credit Facility, the Participating Funds pay an aggregate commitment fee on the average unused amount of the Credit Facility, which is allocated among the Participating Funds in such manner as is determined by the governing Boards of the Participating Funds. In addition, the Participating Funds pay interest on borrowings at either the Overnight Federal Funds rate or the Overnight LIBOR rate plus a spread. At December 31, 2011, and during the year ended December 31, 2011, the Portfolio had no borrowings under the Credit Facility.
Note 5. Purchases and Sales of Securities
For the year ended December 31, 2011, purchases and sales of investment securities (excluding short-term investments) and U.S. Government and Agency Obligations were as follows:
| Investment Securities | | U.S. Government/
Agency Obligations | |
| Purchases | | Sales | | Purchases | | Sales | |
| $ | 43,700,000 | | | $ | 39,337,861 | | | $ | 166,733,786 | | | $ | 147,026,501 | | |
23
Credit Suisse Trust — Commodity Return Strategy Portfolio
Notes to Financial Statements (continued)
December 31, 2011
Note 6. Capital Share Transactions
The Trust is authorized to issue an unlimited number of full and fractional shares of beneficial interest, $.001 par value per share. Transactions in capital shares of the Portfolio were as follows:
| | | For the Year Ended
December 31, 2011 | | For the Year Ended
December 31, 2010 | |
| Shares sold | | | 2,350,284 | | | | 1,639,663 | | |
| Shares issued in reinvestment of dividends | | | 386,674 | | | | 888,325 | | |
| Shares redeemed | | | (2,078,701 | ) | | | (1,853,391 | ) | |
| Net increase | | | 658,257 | | | | 674,597 | | |
On December 31, 2011, the number of shareholders that held 5% or more of the outstanding shares of the Portfolio was as follows:
Number of
Shareholders | | Approximate Percentage
of Outstanding Shares | |
| | 1 | | | | 93 | % | |
Some of the shareholders are omnibus accounts, which hold shares on behalf of individual shareholders.
Note 7. Federal Income Taxes
Income and capital gain distributions are determined in accordance with federal income tax regulations, which may differ from GAAP.
The tax characteristics of dividends paid during the years ended December 31, 2011 and 2010, respectively, by the Portfolio were as follows:
| Ordinary Income | |
| 2011 | | 2010 | |
| $ | 3,160,655 | | | $ | 7,343,593 | | |
At December 31, 2011, the components of distributable earnings on a tax basis were as follows:
| Accumulated realized loss | | $ | (1,478,126 | ) | |
| Unrealized depreciation | | | (43,611,764 | ) | |
| | | $ | (45,089,890 | ) | |
24
Credit Suisse Trust — Commodity Return Strategy Portfolio
Notes to Financial Statements (continued)
December 31, 2011
Note 7. Federal Income Taxes
At December 31, 2011, the Portfolio had capital loss carryforwards available to offset possible future capital gains as follows:
Expires December 31,
2017 | |
| $ | 1,478,126 | | |
During the tax year ended December 31, 2011, the Portfolio utilized $1,348,384 of the capital loss carryforwards.
Under the Regulated Investment Company Modernization Act of 2010, the Portfolio will be permitted to carry forward capital losses incurred in taxable years beginning after December 22, 2010 for an unlimited period. However, any losses incurred during those future taxable years will be required to be utilized prior to the losses incurred in pre-enactment taxable years. As a result of this ordering rule, pre-enactment capital loss carryforwards may be more likely to expire unused. Additionally, post-enactment capital losses that are carried forward will retain their character as either short-term or long-term capital losses rather than being considered all short-term as under previous law. It is uncertain whether the Portfolio will be able to realize the full benefits of the capital loss carryforward before it expires.
At December 31, 2011, the identified cost for federal income tax purposes, as well as the gross unrealized appreciation from investments for those securities having an excess of value over cost, gross unrealized depreciation from investments for those securities having an excess of cost over value and the net unrealized depreciation from investments were $155,360,218, $2,467,611, $(46,079,375) and $(43,611,764), respectively.
At December 31, 2011, the Portfolio reclassified $23,470,579 from accumulated net investment loss and $22,853,051 from accumulated net realized loss to paid in capital, to adjust for current period permanent book/tax differences of net operating losses, distributions re-designations and the Subsidiary cumulative income/loss. Net assets were not affected by these reclassifications.
Note 8. Contingencies
In the normal course of business, the Portfolio may provide general indemnifications pursuant to certain contracts and organizational documents. The Portfolio's maximum exposure under these arrangements is dependent on future claims that may be made against the Portfolio and, therefore, cannot be estimated; however, based on experience, the risk of loss from such claims is considered remote.
25
Credit Suisse Trust — Commodity Return Strategy Portfolio
Report of Independent Registered Public Accounting Firm
To the Board of Trustees and Shareholders of
Credit Suisse Trust — Commodity Return Strategy Portfolio:
In our opinion, the accompanying statement of assets and liabilities, including the schedule of investments, and the related statements of operations and of changes in net assets and the financial highlights present fairly, in all material respects, the financial position of Credit Suisse Trust — Commodity Return Strategy Portfolio (the "Portfolio") at December 31, 2011, the results of its operations for the year then ended and the changes in its net assets and financial highlights for the periods presented, in conformity with accounting principles generally accepted in the United States of America. These financial statements and financial highlights (hereafter referred to as "financial statements") are the responsibility of the Portfolio's management. Our responsibility is to express an opinion on these financial statements based on our audit. We conducted our audit of these financial statements in accordance with the standards of the Public Company Accounting Oversight Board (United States). Those standards require that we plan and perform the audit to obtain reasonable assurance about whether the financial statements are free of material misstatement. An audit includes examining, on a test basis, evidence supporting the amounts and disclosures in the financial statements, assessing the accounting principles used and significant estimates made by management, and evaluating the overall financial statement presentation. We believe that our audit, which included confirmation of securities at December 31, 2011 by correspondence with the custodian, brokers and the transfer agent of the wholly owned subsidiary, provides a reasonable basis for our opinion.
PricewaterhouseCoopers LLP
Boston, Massachusetts
February 22, 2012
26
Credit Suisse Trust — Commodity Return Strategy Portfolio
Board Approval of Advisory Agreement (unaudited)
In approving the renewal of the current Advisory Agreement, the Board of Trustees (the "Board") of the Credit Suisse Trust (the "Trust") — Commodity Return Strategy Portfolio (the "Portfolio"), including all of the Trustees who are not "interested persons" of the Trust defined in the Investment Company Act of 1940 (the "Independent Trustees"), at a meeting held on November 15 and 16, 2011, considered the following factors:
Investment Advisory Fee Rates and Expenses
The Board reviewed and considered the contractual advisory fee rate of 0.50% for the Portfolio ("Gross Advisory Fee") in light of the extent and quality of the advisory services provided by Credit Suisse Asset Management, LLC ("Credit Suisse"). The Board also reviewed and considered the voluntary fee waivers currently in place for the Portfolio and considered the actual fee rate of 0.42% paid by the Portfolio after taking waivers into account ("Net Advisory Fee") as of September 30, 2011. The Board acknowledged that voluntary fee waivers could be discontinued at any time.
Additionally, the Board received and considered information comparing the Portfolio's Gross Advisory Fee, the combined Gross Advisory Fee and gross administration fee (together, the "Gross Management Fee"), the Gross Management Fee less waivers and/or reimbursements (the "Net Management Fee"), and the Portfolio's net total expenses with those of funds in the relevant expense group ("Expense Group") provided by an independent provider of investment company data. The Board also received and considered information comparing the Portfolio's net total expenses and Net Management Fee to the funds in the relevant Morningstar category ("Morningstar Category"). The Board was provided with a description of the methodology used to arrive at the funds included in the Expense Group and Morningstar Category.
Nature, Extent and Quality of the Services under the Advisory Agreement
The Board received and considered information regarding the nature, extent and quality of services provided to the Portfolio by Credit Suisse under the Advisory Agreement. The Board also noted information received at regular meetings throughout the year related to the services rendered by Credit Suisse. The Board reviewed background information about Credit Suisse, including its Form ADV. The Board considered the background and experience of Credit Suisse's senior management and the expertise of, and the amount of attention given to the Portfolio by, senior personnel of Credit Suisse. In addition, the Board reviewed the qualifications, backgrounds and responsibilities of the
27
Credit Suisse Trust — Commodity Return Strategy Portfolio
Board Approval of Advisory Agreement (unaudited) (continued)
portfolio management team primarily responsible for the day-to-day portfolio management of the Portfolio and the extent of the resources devoted to research and analysis of actual and potential investments. The Board evaluated the ability of Credit Suisse, based on its resources, reputation and other attributes, to attract and retain qualified investment professionals, including research, advisory, and supervisory personnel. The Board also received and considered information about the nature, extent and quality of services and fee rates offered to other Credit Suisse clients for comparable services.
Portfolio Performance
The Board received and considered performance results of the Portfolio over time, along with comparisons both to the Expense Group and the Morningstar Category for the Portfolio.
Credit Suisse Profitability
The Board received and considered a profitability analysis of Credit Suisse based on the fees payable under the Advisory Agreement for the Portfolio, including any fee waivers, as well as other relationships between the Portfolio on the one hand and Credit Suisse affiliates on the other. The Board also considered Credit Suisse's methodology for allocating costs to the Portfolio, recognizing that cost allocation methodologies are inherently subjective. The Board received profitability information for the other funds in the Credit Suisse family of funds.
Economies of Scale
The Board considered information regarding whether there have been economies of scale with respect to the management of the Portfolio, whether the Portfolio has appropriately benefited from any economies of scale, and whether there is potential for realization of any further economies of scale. Accordingly, the Board considered whether breakpoints in the Portfolio's advisory fee structure would be appropriate or reasonable taking into consideration economies of scale or other efficiencies that might accrue from increases in the Portfolio's asset levels.
Other Benefits to Credit Suisse
The Board considered other benefits received by Credit Suisse and its affiliates as a result of their relationship with the Portfolio. Such benefits
28
Credit Suisse Trust — Commodity Return Strategy Portfolio
Board Approval of Advisory Agreement (unaudited) (continued)
include, among others, benefits potentially derived from an increase in Credit Suisse's businesses as a result of its relationship with the Portfolio (such as the ability to market to shareholders other financial products offered by Credit Suisse and its affiliates) and the fees paid to affiliates of Credit Suisse for co-administration and distribution services.
The Board considered the standards applied in seeking best execution and reviewed Credit Suisse's method for allocating portfolio investment opportunities among its advisory clients.
Other Factors and Broader Review
As discussed above, the Board reviews detailed materials received from Credit Suisse as part of the annual re-approval process. The Board also reviews and assesses the quality of the services that the Portfolio receives throughout the year. In this regard, the Board reviews reports of Credit Suisse at least quarterly, which include, among other things, detailed portfolio and market reviews, detailed fund performance reports and Credit Suisse's compliance procedures.
Conclusions
In selecting Credit Suisse, and approving the Advisory Agreement and the investment advisory fee under such agreement, the Board concluded that:
• The Gross Advisory Fee, Gross Management Fee, Net Management Fee, and the net total expenses were at or below the median of the Expense Group, and the Board considered the fees to be reasonable.
• The Portfolio's performance was the same as the median of the Expense Group for the three year period ended September 30, 2011, but was below the median for the year-to-date, one and five year periods. The Portfolio underperformed its Morningstar Category average for the year-to-date and one year periods ended September 30, 2011, but outperformed the Morningstar Category average for the three and five year periods. Credit Suisse discussed the reasons for the Portfolio's underperformance. The Board indicated that it would continue to monitor the Portfolio's performance.
• The Board was satisfied with the nature, extent and quality of the investment advisory services provided to the Portfolio by Credit Suisse and that, based on dialogue with management and counsel, the services provided by Credit Suisse under the Advisory Agreement are typical of,
29
Credit Suisse Trust — Commodity Return Strategy Portfolio
Board Approval of Advisory Agreement (unaudited) (continued)
and consistent with, those provided to similar mutual funds by other investment advisers.
• In light of the costs of providing investment management and other services to the Portfolio and Credit Suisse's ongoing commitment to the Portfolio and willingness to waive fees, Credit Suisse's profitability based on fees payable under the Advisory Agreement, as well as other ancillary benefits that Credit Suisse and its affiliates received, were considered reasonable.
• In light of the information received and considered by the Board, the Portfolio's current fee structure was considered reasonable.
No single factor reviewed by the Board was identified by the Board as the principal factor in determining whether to approve the Advisory Agreement. The Independent Trustees were advised by separate independent legal counsel throughout the process.
30
Credit Suisse Trust — Commodity Return Strategy Portfolio
Information Concerning Trustees and Officers (unaudited)
Name, Address
(Year of Birth) | | Position(s)
Held with
Trust | | Term
of Office1
and
Length
of Time
Served | | Principal
Occupation(s) During
Past Five Years | | Number of
Portfolios
in Fund
Complex
Overseen
by Trustee | | Other
Directorships
Held by Trustee | |
| Independent Trustees | | | | | | | | | | | |
|
Enrique Arzac
c/o Credit Suisse Asset
Management, LLC
Attn: General Counsel
One Madison Avenue
New York, New York
10010
(1941) | | Trustee, Audit Committee Chairman and Nominating Committee Member | | Since Portfolio Inception | | Professor of Finance and Economics, Graduate School of Business, Columbia University since 1971. | | | 6 | | | Director of Epoch Holding Corporation (an investment management and investment advisory services company); Director of The Adams Express Company, Director of Petroleum and Resources Corporation, Director of Aberdeen Asset Management-advised Funds (six closed-end investment companies); Director of Mirae Asset Discovery Funds (open-end investment companies). | |
|
Jeffrey E. Garten
c/o Credit Suisse Asset
Management, LLC
Attn: General Counsel
One Madison Avenue
New York, New York
10010
(1946) | | Trustee, Audit and Nominating Committee Member | | Since Portfolio Inception | | The Juan Trippe Professor in the Practice of International Trade, Finance and Business from July 2005 to present; Partner and Chairman of Garten Rothkopf (consulting firm) from October 2005 to present; Dean of Yale School of Management from November 1995 to June 2005. | | | 4 | | | Director of Aetna, Inc. (insurance company); Director of CarMax Group (used car dealers); Member of Standard & Poor's Board of Managers (credit rating agency). | |
|
1 Each Trustee and Officer serves until his or her respective successor has been duly elected and qualified.
31
Credit Suisse Trust — Commodity Return Strategy Portfolio
Information Concerning Trustees and Officers (unaudited) (continued)
Name, Address
(Year of Birth) | | Position(s)
Held with
Trust | | Term
of Office1
and
Length
of Time
Served | | Principal
Occupation(s) During
Past Five Years | | Number of
Portfolios
in Fund
Complex
Overseen
by Trustee | | Other
Directorships
Held by Trustee | |
| Independent Trustees | | | | | | | | | | | |
|
Peter F. Krogh
c/o Credit Suisse Asset
Management, LLC
Attn: General Counsel
One Madison Avenue
New York, New York
10010
(1937) | | Trustee, Audit and Nominating Committee Member | | Since Portfolio Inception | | Dean Emeritus and Distinguished Professor of International Affairs at the Edmund A. Walsh School of Foreign Service, Georgetown University from June 1995 to present. | | | 4 | | | | None | | |
|
Steven N. Rappaport
Lehigh Court, LLC
555 Madison Avenue
29th Floor
New York, New York
10022
(1948) | | Chairman of the Board of Trustees, Audit Committee Member and Nominating Committee Chairman | | Since Portfolio Inception | | Partner of Lehigh Court, LLC and RZ Capital (private investment firms) from July 2002 to present. | | | 6 | | | Director of iCAD, Inc. (surgical and medical instruments and apparatus company); Director of Presstek, Inc. (digital imaging technologies company); Director of Wood Resources, LLC. (plywood manufacturing company); Director of Aberdeen Asset Management-advised Funds (five closed-end investment companies). | |
|
32
Credit Suisse Trust — Commodity Return Strategy Portfolio
Information Concerning Trustees and Officers (unaudited) (continued)
Name, Address
(Year of Birth) | | Position(s)
Held with
Trust | | Term
of Office1
and
Length
of Time
Served | | Principal Occupation(s) During Past Five Years | |
| Officers** | | | | | | | |
|
John G. Popp
Credit Suisse Asset Management, LLC
Eleven Madison Avenue
New York, New York 10010
(1956) | | Chief Executive Officer and President | | Since 2010 | | Managing Director of Credit Suisse; Group Manager and Senior Portfolio Manager for Performing Credit Strategies; Associated with Credit Suisse or its predecessor since 1997; Officer of other Credit Suisse Funds. | |
|
Michael A. Pignataro
Credit Suisse Asset Management, LLC
Eleven Madison Avenue
New York, New York 10010
(1959) | | Chief Financial Officer | | Since Portfolio Inception | | Director and Director of Fund Administration of Credit Suisse; Associated with Credit Suisse or its predecessor since 1984; Officer of other Credit Suisse Funds. | |
|
Emidio Morizio
Credit Suisse Asset Management, LLC
One Madison Avenue
New York, New York 10010
(1966) | | Chief Compliance Officer | | Since Portfolio Inception | | Managing Director and Global Head of Compliance of Credit Suisse; Associated with Credit Suisse since July 2000; Officer of other Credit Suisse Funds. | |
|
Roger Machlis
Credit Suisse Asset Management, LLC
One Madison Avenue
New York, New York 10010
(1961) | | Chief Legal Officer | | Since 2010 | | Managing Director and General Counsel for Credit Suisse; Associated with Credit Suisse Group AG since July 1997; Officer of other Credit Suisse Funds. | |
|
Cecilia Chau
Credit Suisse Asset Management, LLC
Eleven Madison Avenue
New York, New York 10010
(1973) | | Treasurer | | Since 2008 | | Vice President of Credit Suisse since 2009; Assistant Vice President of Credit Suisse from June 2007 to December 2008; Associated with Alliance Bernstein L.P. from January 2007 to May 2007; Associated with Credit Suisse from August 2000 to December 2006; Officer of other Credit Suisse Funds. | |
|
Karen Regan
Credit Suisse Asset Management, LLC
One Madison Avenue
New York, New York 10010
(1963) | | Vice President and Secretary | | Since 2010 | | Vice President of Credit Suisse; Associated with Credit Suisse since December 2004; Officer of other Credit Suisse Funds. | |
|
**The officers of the Portfolio shown are officers that make policy decisions.
The Statement of Additional Information includes additional information about the Trustees and is available, without charge, upon request, by calling 877-870-2874.
33
Credit Suisse Trust — Commodity Return Strategy Portfolio
Proxy Voting and Portfolio Holdings Information (unaudited)
Information regarding how the Portfolio voted proxies related to its portfolio securities during the 12 month period ended June 30 of each year, as well as the policies and procedures that the Portfolio uses to determine how to vote proxies relating to its portfolio securities are available:
• By calling 1-877-870-2874
• On the Portfolio's website, www.credit-suisse.com/us
• On the website of the Securities and Exchange Commission, www.sec.gov.
The Portfolio files a complete schedule of its portfolio holdings for the first and third quarters of its fiscal year with the SEC on Form N-Q. The Portfolio's Forms N-Q are available on the SEC's website at www.sec.gov and may be reviewed and copied at the SEC's Public Reference Room in Washington, DC. Information on the operation of the SEC's Public Reference Room may be obtained by calling 1-202-551-8090.
34

n CREDIT SUISSE
CAYMAN COMMODITY FUND II, LTD.
for the Year Ended December 31, 2011
35
Credit Suisse Cayman Commodity Fund II, Ltd.
Schedule of Investments
December 31, 2011
Par
(000) | |
| | Ratings†
(S&P/Moody's) | | Maturity | | Rate% | | Value | |
| UNITED STATES AGENCY OBLIGATIONS (62.6%) | | | |
| $ | 1,500 | | | Fannie Mae Discount Notes | | (AA+, Aaa) | | 01/05/12 | | | 0.135 | | | $ | 1,499,978 | | |
| | 1,000 | | | Federal Farm Credit Bank# | | (AA+, Aaa) | | 03/15/13 | | | 0.248 | | | | 1,000,914 | | |
| | 1,000 | | | Federal Home Loan Banks | | (AA+, Aaa) | | 01/18/12 | | | 0.100 | | | | 999,985 | | |
| | 975 | | | Federal Home Loan Banks | | (AA+, Aaa) | | 09/14/12 | | | 2.000 | | | | 987,082 | | |
| | 1,000 | | | Federal Home Loan Banks# | | (AA+, Aaa) | | 04/05/13 | | | 0.260 | | | | 998,404 | | |
| | 1,000 | | | Federal Home Loan Mortgage Corp. | | (AA+, Aaa) | | 12/28/12 | | | 0.625 | | | | 1,004,139 | | |
| | 1,000 | | | Federal National Mortgage Association# | | (AA+, Aaa) | | 08/23/12 | | | 0.312 | | | | 1,000,961 | | |
| | 1,000 | | | Federal National Mortgage Association | | (AA+, Aaa) | | 12/28/12 | | | 0.375 | | | | 1,002,368 | | |
| | 2,000 | | | Freddie Mac Discount Notes | | (AA+, Aaa) | | 01/23/12 | | | 0.126 | | | | 1,999,846 | | |
| | 1,000 | | | Freddie Mac Discount Notes^^ | | (AA+, Aaa) | | 02/23/12 | | | 0.100 | | | | 999,852 | | |
| | 1,000 | | | Freddie Mac Discount Notes | | (AA+, Aaa) | | 05/22/12 | | | 0.100 | | | | 999,961 | | |
| TOTAL UNITED STATES AGENCY OBLIGATIONS (Cost $12,491,868) | | | 12,493,490 | | |
| UNITED STATES TREASURY OBLIGATIONS (10.1%) | | | |
| | 1,000 | | | United States Treasury Notes | | (AA+, Aaa) | | 04/30/12 | | | 1.000 | | | | 1,003,281 | | |
| | 1,000 | | | United States Treasury Notes | | (AA+, Aaa) | | 01/31/13 | | | 0.625 | | | | 1,005,039 | | |
| TOTAL UNITED STATES TREASURY OBLIGATIONS (Cost $2,007,551) | | | 2,008,320 | | |
| SHORT-TERM INVESTMENT (6.3%) | | | |
| | 1,249 | | | State Street Bank and Trust Co. Euro
Time Deposit (Cost $1,249,000) | | | | | | 01/03/12 | | | 0.010 | | | | 1,249,000 | | |
| TOTAL INVESTMENTS AT VALUE (79.0%) (Cost $15,748,419) | | | 15,750,810 | | |
| OTHER ASSETS IN EXCESS OF LIABILITIES (21.0%) | | | 4,198,695 | | |
| NET ASSETS (100.0%) | | $ | 19,949,505 | | |
† Credit ratings given by the Standard & Poor's Division of the McGraw-Hill Companies, Inc. ("S&P") and Moody's Investors Service, Inc. ("Moody's") are unaudited.
# Variable rate obligations — The interest rate is the rate as of December 31, 2011.
^^ Collateral segregated for swap contracts.
See Accompanying Notes to Financial Statements.
36
Credit Suisse Cayman Commodity Fund II, Ltd.
Statement of Assets and Liabilities
December 31, 2011
| Assets | |
| Investments at value (Cost $15,748,419) (Note 2) | | $ | 15,750,810 | | |
| Cash | | | 214 | | |
| Cash segregated at brokers for futures contracts and swap contracts | | | 4,387,455 | | |
| Interest receivable | | | 11,496 | | |
| Receivable from investment adviser (Note 3) | | | 3,051 | | |
| Variation margin receivable (Note 2) | | | 2,590 | | |
| Total Assets | | | 20,155,616 | | |
| Liabilities | |
| Administrative services fee payable (Note 3) | | | 1,895 | | |
| Unrealized depreciation on open swap contracts | | | 177,557 | | |
| Other accrued expenses payable | | | 26,659 | | |
| Total Liabilities | | | 206,111 | | |
| Net Assets | |
| Par value of participating shares (Note 4) | | | 32,777 | | |
| Paid-in capital (Note 4) | | | 40,367,223 | | |
| Undistributed net investment income | | | 386,517 | | |
| Accumulated net realized loss on investments, futures contracts and swap contracts | | | (20,666,450 | ) | |
| Net unrealized depreciation from investments, futures contracts and swap contracts | | | (170,562 | ) | |
| Net Assets | | $ | 19,949,505 | | |
| Shares outstanding | | | 32,776,881 | | |
| Net asset value, offering price and redemption price per share | | $ | 0.61 | | |
See Accompanying Notes to Financial Statements.
37
Credit Suisse Cayman Commodity Fund II, Ltd.
Statement of Operations
For the Year Ended December 31, 2011
| Investment Income (Note 2) | |
| Interest | | $ | 39,125 | | |
| Expenses | |
| Administrative services fees (Note 3) | | | 10,165 | | |
| Audit fees | | | 24,480 | | |
| Custodian fees | | | 6,614 | | |
| Miscellaneous expense | | | 380 | | |
| Total expenses | | | 41,639 | | |
| Less: fees reimbursed (Note 3) | | | (41,639 | ) | |
| Net expenses | | | — | | |
| Net investment income | | | 39,125 | | |
| Net Realized and Unrealized Gain (Loss) from Investments, Futures Contracts and Swap Contracts | |
| Net realized gain from investments | | | 4,504 | | |
| Net realized gain from futures contracts | | | 118,050 | | |
| Net realized loss from swap contracts | | | (4,681,349 | ) | |
Net change in unrealized appreciation (depreciation) from investments, futures contracts and
swap contracts | | | (5,476,440 | ) | |
| Net realized and unrealized loss from investments, futures contracts and swap contracts | | | (10,035,235 | ) | |
| Net decrease in net assets resulting from operations | | $ | (9,996,110 | ) | |
See Accompanying Notes to Financial Statements.
38
Credit Suisse Cayman Commodity Fund II, Ltd.
Statements of Changes in Net Assets
| | | For the Year
Ended
December 31, 2011 | | For the Year
Ended
December 31, 2010 | |
| From Operations | |
| Net investment income | | $ | 39,125 | | | $ | 49,189 | | |
Net realized gain (loss) from investments, futures contracts and
swap contracts | | | (4,558,795 | ) | | | 5,347,626 | | |
Net change in unrealized appreciation (depreciation) from investments,
futures contracts and swap contracts | | | (5,476,440 | ) | | | 5,570,772 | | |
| Net increase (decrease) in net assets resulting from operations | | | (9,996,110 | ) | | | 10,967,587 | | |
| From Capital Share Transactions (Note 4) | |
| Proceeds from sale of shares | | | 22,000,000 | | | | 4,000,000 | | |
| Net asset value of shares redeemed | | | (16,000,000 | ) | | | (16,000,000 | ) | |
| Net increase (decrease) in net assets from capital share transactions | | | 6,000,000 | | | | (12,000,000 | ) | |
| Net decrease in net assets | | | (3,996,110 | ) | | | (1,032,413 | ) | |
| Net Assets | |
| Beginning of year | | | 23,945,615 | | | | 24,978,028 | | |
End of year (including undistributed net investment income
of $386,517 and $347,392, respectively) | | $ | 19,949,505 | | | $ | 23,945,615 | | |
See Accompanying Notes to Financial Statements.
39
Credit Suisse Cayman Commodity Fund II, Ltd.
Notes to Financial Statements
December 31, 2011
Note 1. Organization
Credit Suisse Cayman Commodity Fund II, Ltd. (the "Fund") is organized as a Cayman Islands Company. The Fund intends to carry on the business of an investment company. The Fund's investment manager is Credit Suisse Asset Management, LLC ("Credit Suisse"). As of December 31, 2011, 100% of the Fund's participating shares were owned by Credit Suisse Trust-Commodity Return Strategy Portfolio (the "Parent Fund").
Note 2. Significant Accounting Policies
A) SECURITY VALUATION — The net asset value of the Fund is determined daily as of the close of regular trading on the New York Stock Exchange, Inc. (the "Exchange") on each day the Exchange is open for business. Equity investments are valued at market value, which is generally determined using the closing price on the exchange or market on which the security is primarily traded at the time of valuation (the "Valuation Time"). If no sales are reported, equity investments are generally valued at the most recent bid quotation as of the Valuation Time or at the lowest asked quotation in the case of a short sale of securities. Equity investments are generally categorized as Level 1. Investments in open-end investment companies are valued at their net asset value each business day and are generally categorized as Level 1. Futures contracts are valued at the settlement prices established each day on the exchange on which they are traded and are generally categorized as Level 1. Debt securities with a remaining maturity greater than 60 days are valued in accordance with the price supplied by a pricing service, which may use a matrix, formula or other objective method that takes into consideration market indices, yield curves and other specific adjustments. Debt obligations that will mature in 60 days or less are valued on the basis of amortized cost, which approximates market value, unless it is determined that using this method would not represent fair value. Debt securities are generally categorized as Level 2. Swap contracts are generally valued at a price at which the counterparty to such contract would repurchase the instrument or terminate the contract and are generally categorized as Level 2. Securities, swap and futures contracts and other assets for which market quotations are not readily available, or whose values have been materially affected by events occurring before the Fund's Valuation Time but after the close of the securities' primary markets, are valued at fair value as determined in good faith by, or under the direction of, the Board of Directors under procedures established by the Board of Directors and are generally categorized as Level 3. The Fund may utilize a service provided by an independent third party which has been approved by
40
Credit Suisse Cayman Commodity Fund II, Ltd.
Notes to Financial Statements (continued)
December 31, 2011
Note 2. Significant Accounting Policies
the Board of Directors to fair value certain securities. When fair value pricing is employed, the prices of securities used by a fund to calculate its net asset value may differ from quoted or published prices for the same securities.
In accordance with the authoritative guidance on fair value measurements and disclosures under accounting principles generally accepted in the United States of America ("GAAP"), the Fund discloses the fair value of its investments in a hierarchy that prioritizes the inputs to valuation techniques used to measure the fair value. In accordance with GAAP, fair value is defined as the price that the Fund would receive upon selling an investment in a timely transaction to an independent buyer in the principal or most advantageous market of the investment. GAAP established a three-tier hierarchy to maximize the use of observable market data and minimize the use of unobservable inputs and to establish classification of fair value measurements for disclosure purposes. Inputs refer broadly to the assumptions that market participants would use in pricing the asset or liability, including assumptions about risk, for example, the risk inherent in a particular valuation technique used to measure fair value including such a pricing model and/or the risk inherent in the inputs to the valuation technique. Inputs may be observable or unobservable. Observable inputs are inputs that reflect the assumptions market participants would use in pricing the asset or liability developed based on market data obtained from sources independent of the reporting entity. Unobservable inputs are inputs that reflect the reporting entity's own assumptions about the assumptions market participants would use in pricing the asset or liability developed based on the best information available in the circumstances. In accordance with the Fund's valuation procedures, factors used in determining value may include, but are not limited to, the type of the security, the size of the holding, the initial cost of the security, the existence of any contractual restrictions on the security's disposition, the price and extent of public trading in similar securities of the issuer or of comparable companies, quotations or evaluated prices from broker-dealers and/or pricing services, information obtained from the issuer, analysts, and/or the appropriate stock exchange (for exchange-traded securities), an analysis of the company's or issuer's financial statements, an evaluation of the forces that influence the issuer and the market(s) in which the security is purchased and sold and with respect to debt securities, the maturity, coupon, creditworthiness, currency denomination, and the movement of the market in which the security is
41
Credit Suisse Cayman Commodity Fund II, Ltd.
Notes to Financial Statements (continued)
December 31, 2011
Note 2. Significant Accounting Policies
normally traded. The three-tier hierarchy of inputs is summarized in the three broad Levels listed below.
• Level 1 – quoted prices in active markets for identical investments
• Level 2 – other significant observable inputs (including quoted prices for similar investments, interest rates, prepayment speeds, credit risk, etc.)
• Level 3 – significant unobservable inputs (including the Fund's own assumptions in determining the fair value of investments)
The inputs or methodology used for valuing securities are not necessarily an indication of the risk associated with investing in those securities.
The following is a summary of the inputs used as of December 31, 2011 in valuing the Fund's investments carried at value:
| | | Level 1 | | Level 2 | | Level 3 | | Total | |
| Investments in Securities | |
| United States Agency Obligations | | $ | — | | | $ | 12,493,490 | | | $ | — | | | $ | 12,493,490 | | |
| United States Treasury Obligations | | | — | | | | 2,008,320 | | | | — | | | | 2,008,320 | | |
| Short-Term Investment | | | — | | | | 1,249,000 | | | | — | | | | 1,249,000 | | |
| Other Financial Instruments* | |
| Futures | | | 4,604 | | | | — | | | | — | | | | 4,604 | | |
| Swaps | | | — | | | | (177,557 | ) | | | — | | | | (177,557 | ) | |
| | | $ | 4,604 | | | $ | 15,573,253 | | | $ | — | | | $ | 15,577,857 | | |
*Other financial instruments include futures, forwards and swap contracts.
The Fund adopted FASB amendments to authoritative guidance which require the Fund to disclose details of significant transfers in and out of Level 1 and Level 2 measurements and Level 2 and Level 3 measurements and the reasons for the transfers. For the year ended December 31, 2011, there were no significant transfers in and out of Level 1, Level 2 and Level 3.
B) DERIVATIVE INSTRUMENTS AND HEDGING ACTIVITIES — The Fund adopted amendments to authoritative guidance on disclosures about derivative instruments and hedging activities which require that the Fund disclose (a) how and why an entity uses derivative instruments, (b) how derivative instruments and hedging activities are accounted for, and (c) how derivative instruments and related hedging activities affect a fund's financial position, financial performance, and cash flows.
42
Credit Suisse Cayman Commodity Fund II, Ltd.
Notes to Financial Statements (continued)
December 31, 2011
Note 2. Significant Accounting Policies
Fair Values of Derivative Instruments as of December 31, 2011
| | | Asset Derivatives | | Liability Derivatives | |
| | | Balance Sheet
Location | | Fair Value | | Balance Sheet
Location | | Fair Value | |
Futures Contracts
on Commodities | | Variation margin receivable,
Net Assets - Unrealized
Appreciation | | $ | 4,604 | * | | Variation margin payable,
Liabilities - Unrealized
Depreciation | | $ | 0 | | |
Commodity Index
Swaps | | Net Assets - Unrealized
Appreciation | | | 0 | | | Liabilities - Unrealized
Depreciation | | | 177,557 | | |
| Total | | | | $ | 4,604 | | | | | $ | 177,557 | | |
*Includes cumulative appreciation/depreciation of futures contracts as reported in the Statement of Assets and Liabilities and Notes to Financial Statements. Only the current day's variation margin is reported within the Statement of Assets and Liabilities.
Effect of Derivative Instruments on the Statement of Operations
Amount of Realized Gain (Loss) on Derivatives Recognized
Futures Contracts on Commodities | | $ | 118,050 | | |
| Commodity Index Swaps | | | (4,681,349 | ) | |
| Total | | $ | (4,563,299 | ) | |
Change in Unrealized Appreciation (Depreciation) on Derivatives Recognized
Futures Contracts on Commodities | | $ | (336,609 | ) | |
| Commodity Index Swaps | | | (5,136,910 | ) | |
| Total | | $ | (5,473,519 | ) | |
The notional amount of futures contracts and commodity index swaps at year ended are reflected in the Notes to Financial Statements. The notional amounts of long and short open positions of futures contracts and open positions of commodity index swaps at each month end throughout the reporting period averaged approximately 8.1% and 62.0%, respectively of net assets of the Parent Fund.
C) SECURITY TRANSACTIONS AND INVESTMENT INCOME — Security transactions are accounted for on a trade date basis. Interest income is recorded on the accrual basis. The Fund amortizes premiums and accretes discounts using the effective interest method. Dividends are recorded on the ex-dividend date. The cost of investments sold is determined by use of the specific identification method for both financial reporting and income tax purposes.
D) INCOME TAXES — The Fund has received an undertaking from the Government of the Cayman Islands exempting it from all local income, profits and capital gains taxes through June of 2027. No such taxes are levied in the Cayman Islands at the present time. The Fund is a Controlled Foreign
43
Credit Suisse Cayman Commodity Fund II, Ltd.
Notes to Financial Statements (continued)
December 31, 2011
Note 2. Significant Accounting Policies
Corporation under U.S. tax laws and as such is not subject to U.S. income tax. Therefore, the Fund is not required to record a tax provision.
The Fund adopted the authoritative guidance for uncertainty in income taxes and recognizes a tax benefit or liability from an uncertain position only if it is more likely than not that the position is sustainable based solely on its technical merits and consideration of the relevant taxing authority's widely understood administrative practices and procedures. The Fund has reviewed its current tax positions and has determined that no provision for income tax is required in the Fund's financial statements.
E) USE OF ESTIMATES — The preparation of financial statements in conformity with GAAP requires management to make estimates and assumptions that affect the reported amounts of assets and liabilities and disclosure of contingent assets and liabilities at the date of the financial statements and the reported amounts of income and expenses during the reporting period. Actual results could differ from these estimates.
F) SHORT-TERM INVESTMENTS — The Fund, together with other funds/portfolios advised by Credit Suisse, an indirect, wholly-owned subsidiary of Credit Suisse Group AG, pools available cash into a short-term variable rate time deposit issued by State Street Bank and Trust Company ("SSB"), the Fund's custodian. The short-term time deposit issued by SSB is a variable rate account classified as a short-term investment.
G) FUTURES — The Fund may enter into futures contracts to the extent permitted by its investment policies and objectives. The Fund may use futures contracts to gain exposure to, or hedge against changes in commodities. Upon entering into a futures contract, the Fund is required to deposit cash and/or pledge U.S. Government securities as initial margin. Subsequent payments, which are dependent on the daily fluctuations in the value of the underlying instrument, are made or received by the Fund each day (daily variation margin) and are recorded as unrealized gains or losses until the contracts are closed. When the contracts are closed, the Fund records a realized gain or loss equal to the difference between the proceeds from (or cost of) the closing transactions and the Fund's basis in the contract. Risks of entering into futures contracts for hedging purposes include the possibility that a change in the value of the contract may not correlate with the changes in the value of the underlying instruments. With futures, there is minimal counterparty credit risk to the Fund since futures are exchange traded and the exchange's clearinghouse, as counterparty to all exchange traded futures, guarantees the futures against
44
Credit Suisse Cayman Commodity Fund II, Ltd.
Notes to Financial Statements (continued)
December 31, 2011
Note 2. Significant Accounting Policies
default. In addition, the purchase of a futures contract involves the risk that the Fund could lose more than the original margin deposit and subsequent payments may be required for a futures transaction. At December 31, 2011, the Fund had the following open futures contracts:
| Contract Description | | Notional
Value | | Unrealized
Appreciation (Depreciation) | |
| Contracts to Purchase | | | | | | | |
| Energy | | | 3,678,170 | | | $ | (34,325 | ) | |
| | | $ | (34,325 | ) | |
| Contracts To Sell | | | | | | | |
| Energy | | | (3,663,000 | ) | | $ | 38,929 | | |
| | | $ | 38,929 | | |
| Net unrealized appreciation (depreciation) | | | | $ | 4,604 | | |
H) SWAPS — The Fund may enter into commodity index swap contracts either for hedging purposes or to seek to increase total return. A swap contract is an agreement that obligates two parties to exchange a series of cash flows at specified intervals based upon or calculated by reference to changes in specified prices or rates for a specified amount of an underlying asset or notional principal amount. The Fund will enter into commodity index swap contracts only on a net basis, which means that the two payment streams are netted out, with the Fund receiving or paying, as the case may be, only the net amount of the two payments. Risks may arise as a result of the failure of the counterparty to the swap contract to comply with the terms of the swap contract. The extent of the Fund's exposure to credit and counterparty risks is the discounted net value of the cash flows to be received from/paid to the counterparty over the contract's remaining life, to the extent that the amount is positive. These risks are mitigated by having a master netting arrangement between the Fund and the counterparty and by the posting of collateral by the counterparty to the Fund to cover the Fund's exposure to the counterparty. Therefore, the Fund considers the creditworthiness of each counterparty to a swap contract in evaluating potential credit risk. Additionally, risks may arise from unanticipated movements in interest rates or in the value of the underlying reference asset or index.
The Fund may enter into total return swap contracts, involving commitments to pay interest in exchange for a market-linked return, both based on notional amounts. To the extent the total return of the security or index underlying the
45
Credit Suisse Cayman Commodity Fund II, Ltd.
Notes to Financial Statements (continued)
December 31, 2011
Note 2. Significant Accounting Policies
transactions exceeds or falls short of the offsetting interest rate obligation, the Fund will receive a payment from or make a payment to the counterparty.
The Fund records unrealized gains or losses on a daily basis representing the value and the current net receivable or payable relating to open swap contracts. Net amounts received or paid on the swap contract are recorded as realized gains or losses. Fluctuations in the value of swap contracts are recorded for financial statement purposes as unrealized appreciation or depreciation on swap contracts. Realized gains and losses from terminated swaps are included in net realized gains/losses on swap contracts transactions. At December 31, 2011, the Fund had the following outstanding swap contracts:
| Currency | | Notional
Amount | | Expiration
Date | | Counterparty | | Receive | | Pay | | Unrealized
Appreciation/
(Depreciation) | |
| USD | $ | | | | 28,186,604 | | | 1/26/2012 | | Bank of America | | Commodity Index
Return | | Fee plus
Treasury Bill Rate | | $ | (66,148 | ) | |
| USD | $ | | | | 7,692,821 | | | 1/26/2012 | | Bank of America | | Commodity Index
Return | | Fee plus
Treasury Bill Rate | | | (23,888 | ) | |
| USD | $ | | | | 10,204,033 | | | 1/26/2012 | | Barclays | | Commodity Index
Return | | Fee plus
Treasury Bill Rate | | | (24,604 | ) | |
| USD | $ | | | | 7,684,795 | | | 1/26/2012 | | Barclays | | Commodity Index
Return | | Fee plus
Treasury Bill Rate | | | (22,348 | ) | |
| USD | $ | | | | 1,082,752 | | | 1/26/2012 | | Citi | | Commodity Index
Return | | Fee plus
Treasury Bill Rate | | | (2,592 | ) | |
| USD | $ | | | | 2,091,139 | | | 1/26/2012 | | JPMorgan Chase | | Commodity Index
Return | | Fee plus
Treasury Bill Rate | | | (5,001 | ) | |
| USD | $ | | | | 2,897,719 | | | 1/26/2012 | | Morgan Stanley
Capital Group | | Commodity Index
Return | | Fee plus
Treasury Bill Rate | | | (8,427 | ) | |
| USD | $ | | | | 1,083,023 | | | 1/26/2012 | | Morgan Stanley
Capital Group | | Commodity Index
Return | | Fee plus
Treasury Bill Rate | | | (2,595 | ) | |
| USD | $ | | | | 5,731,923 | | | 1/26/2012 | | Societe Generale | | Commodity Index
Return | | Fee plus
Treasury Bill Rate | | | (13,795 | ) | |
| USD | $ | | | | 815,380 | | | 1/26/2012 | | Societe Generale | | Commodity Index
Return | | Fee plus
Treasury Bill Rate | | | (2,369 | ) | |
| USD | $ | | | | 2,405,842 | | | 1/26/2012 | | UBS | | Commodity Index
Return | | Fee plus
Treasury Bill Rate | | | (5,790 | ) | |
| | | $ | (177,557 | ) | |
I) SUBSEQUENT EVENTS — In preparing the financial statements as of December 31, 2011, management considered the impact of subsequent events for potential recognition or disclosure in these financial statements through the date of release of this report.
46
Credit Suisse Cayman Commodity Fund II, Ltd.
Notes to Financial Statements (continued)
December 31, 2011
Note 3. Transactions with Affiliates and Related Parties
Credit Suisse recognizes that it receives compensation for performing investment advisory services for the Parent Fund pursuant to a separate investment advisory agreement and agrees to receive no additional compensation for rendering its services to the Fund. During the year ended December 31, 2011, Credit Suisse voluntarily reimbursed the Fund $41,639 in Fund expenses. Credit Suisse will not recapture from the Fund any fees it waived or expenses it reimbursed during the year ended December 31, 2011. Fee waivers and expense reimbursements are voluntary and may be discontinued by Credit Suisse at any time.
SSB serves as administrator to the Fund. For its administrative services, SSB receives a fee, exclusive of out-of-pocket expenses, calculated in total for all the Credit Suisse funds/portfolios co-administered by SSB and allocated based upon the relative average net assets for each fund/portfolio, subject to annual minimum fee. For the year ended December 31, 2011, administrative services fees earned by SSB were $10,165.
Note 4. Capital Share Transactions
The Fund issued 100,000 participating shares for $1,000,000 on July 27, 2007 in conjunction with the initial capitalization of the Fund. Transactions in capital shares of the Fund were as follows:
| | | For the Year Ended
December 31, 2011 | | For the Year Ended
December 31, 2010 | |
| | | Shares | | Value | | Shares | | Value | |
| Shares sold | | | 26,368,368 | | | $ | 22,000,000 | | | | 7,866,274 | | | $ | 4,000,000 | | |
| Shares redeemed | | | (14,514,270 | ) | | | (16,000,000 | ) | | | (21,617,459 | ) | | | (16,000,000 | ) | |
| Net increase (decrease) | | | 11,854,098 | | | $ | 6,000,000 | | | | (13,751,185 | ) | | $ | (12,000,000 | ) | |
Note 5. Financial Highlights
The following represents the total return of the Fund for the years noted. Total returns were calculated based upon the daily returns of the Fund during the years represented.
| | | For the Year Ended
December 31, 2011 | | For the Year Ended
December 31, 2010 | |
| Total Return | | | (46.49 | )% | | | 58.33 | % | |
47
Credit Suisse Cayman Commodity Fund II, Ltd.
Notes to Financial Statements (continued)
December 31, 2011
Note 5. Financial Highlights
The following represents certain financial ratios of the Fund for the years noted. The computation of the net investment income and total expense ratios were based upon the daily net assets of the Fund during these years.
| | | For the Year Ended
December 31, 2011 | | For the Year Ended
December 31, 2010 | |
| Ratio to Average Net Assets: | |
| Net investment income | | | 0.17 | % | | | 0.22 | % | |
| Total expenses (before expense reimbursement) | | | 0.18 | % | | | 0.28 | % | |
| Total expenses (after expense reimbursement) | | | 0.00 | % | | | 0.00 | % | |
Note 6. Contingencies
In the normal course of business, the Fund may provide general indemnifications pursuant to certain contracts and organizational documents. The Fund's maximum exposure under these arrangements is dependent on future claims that may be made against the Fund and, therefore, cannot be estimated; however, based on experience, the risk of loss from such claims is considered remote.
48
Credit Suisse Cayman Commodity Fund II, Ltd.
Report of Independent Registered Public Accounting Firm
To the Board of Directors and Shareholders of
Credit Suisse Cayman Commodity Fund II, Ltd.:
In our opinion, the accompanying statement of assets and liabilities, including the schedule of investments and the related statements of operations and of changes in net assets present fairly, in all material respects, the financial position of Credit Suisse Cayman Commodity Fund II, Ltd. (the "Fund"), at December 31, 2011, the results of its operations for the year then ended and the changes in its net assets for the periods presented, in conformity with accounting principles generally accepted in the United States of America. These financial statements are the responsibility of the Fund's management. Our responsibility is to express an opinion on these financial statements based on our audit. We conducted our audit of these financial statements in accordance with auditing standards generally accepted in the United States of America. Those standards require that we plan and perform the audit to obtain reasonable assurance about whether the financial statements are free of material misstatement. An audit includes examining, on a test basis, evidence supporting the amounts and disclosures in the financial statements, assessing the accounting principles used and significant estimates made by management, and evaluating the overall financial statement presentation. We believe that our audit, which included confirmation of securities at December 31, 2011 by correspondence with the custodian and brokers, provides a reasonable basis for our opinion.
PricewaterhouseCoopers LLP
Boston, Massachusetts
February 22, 2012
49
This page intentionally left blank
50
This page intentionally left blank
51
This page intentionally left blank
52

P.O. BOX 55030, BOSTON, MA 02205-5030
877-870-2874 n www.credit-suisse.com/us
CREDIT SUISSE ASSET MANAGEMENT SECURITIES, INC., DISTRIBUTOR. TRCOM-AR-1211
Item 2. Code of Ethics.
The registrant has adopted a code of ethics applicable to its Chief Executive Officer, President, Chief Financial Officer and Chief Accounting Officer, or persons performing similar functions. A copy of the code is filed as Exhibit 12(a)(1) to this Form. There were no amendments to the code during the fiscal year ended December 31, 2011. There were no waivers or implicit waivers from the code granted by the registrant during the fiscal year ended December 31, 2011.
Item 3. Audit Committee Financial Expert.
The registrant’s governing board has determined that it has two audit committee financial experts serving on its audit committee: Enrique R. Arzac and Steven N. Rappaport. Each audit committee financial expert is “independent” for purposes of this item.
Item 4. Principal Accountant Fees and Services.
(a) through (d). The information in the table below is provided for services rendered to the registrant by its independent registered public accounting firm, PricewaterhouseCoopers LLP (“PwC”), for its fiscal years ended December 31, 2010 and December 31, 2011.
| | 2010 | | 2011 | |
Audit Fees | | $ | 138,500 | | $ | 38,250 | |
Audit-Related Fees(1) | | $ | 10,200 | | $ | 10,500 | |
Tax Fees(2) | | $ | 8,400 | | $ | 8,700 | |
All Other Fees | | — | | — | |
Total | | $ | 157,100 | | $ | 57,450 | |
(1) Services include agreed-upon procedures in connection with the registrant’s semi-annual financial statements ($10,200 for 2010 and $10,500 for 2011).
(2) Tax services in connection with the registrant’s excise tax calculations and review of the registrant’s applicable tax returns.
The information in the table below is provided with respect to non-audit services that directly relate to the registrant’s operations and financial reporting and that were rendered by PwC to the registrant’s investment adviser, Credit Suisse Asset Management, LLC (“Credit Suisse”), and any service provider to the registrant controlling, controlled by or under common control with Credit Suisse that provided ongoing services to the registrant (“Covered Services Provider”), for the registrant’s fiscal years ended December 31, 2010 and December 31, 2011.
| | 2010 | | 2011 | |
Audit-Related Fees | | N/A | | N/A | |
Tax Fees | | N/A | | N/A | |
All Other Fees | | N/A | | N/A | |
Total | | N/A | | N/A | |
2
(e)(1) Pre-Approval Policies and Procedures. The Audit Committee (“Committee”) of the registrant is responsible for pre-approving (i) all audit and permissible non-audit services to be provided by the independent registered public accounting firm to the registrant and (ii) all permissible non-audit services to be provided by the independent registered public accounting firm to Credit Suisse and any Covered Services Provider if the engagement relates directly to the operations and financial reporting of the registrant. The Committee may delegate its responsibility to pre-approve any such audit and permissible non-audit services to the Chairperson of the Committee, and the Chairperson shall report to the Committee, at its next regularly scheduled meeting after the Chairperson’s pre-approval of such services, his or her decision(s). The Committee may also establish detailed pre-approval policies and procedures for pre-approval of such services in accordance with applicable laws, including the delegation of some or all of the Committee’s pre-approval responsibilities to other persons (other than Credit Suisse or the registrant’s officers). Pre-approval by the Committee of any permissible non-audit services shall not be required so long as: (i) the aggregate amount of all such permissible non-audit services provided to the registrant, Credit Suisse and any Covered Services Provider constitutes not more than 5% of the total amount of revenues paid by the registrant to its independent registered public accounting firm during the fiscal year in which the permissible non-audit services are provided; (ii) the permissible non-audit services were not recognized by the registrant at the time of the engagement to be non-audit services; and (iii) such services are promptly brought to the attention of the Committee and approved by the Committee (or its delegate(s)) prior to the completion of the audit.
(e)(2) The information in the table below sets forth the percentages of fees for services (other than audit, review or attest services) rendered by PwC to the registrant for which the pre-approval requirement was waived pursuant to Rule 2-01(c)(7)(i)(C) of Regulation S-X:
| | 2010 | | 2011 | |
Audit-Related Fees | | N/A | | N/A | |
Tax Fees | | N/A | | N/A | |
All Other Fees | | N/A | | N/A | |
Total | | N/A | | N/A | |
3
The information in the table below sets forth the percentages of fees for services (other than audit, review or attest services) rendered by PwC to Credit Suisse and any Covered Services Provider required to be approved pursuant to Rule 2-01(c)(7)(ii) of Regulation S-X, for the registrant’s fiscal years ended December 31, 2010 and December 31, 2011:
| | 2010 | | 2011 | |
Audit-Related Fees | | N/A | | N/A | |
Tax Fees | | N/A | | N/A | |
All Other Fees | | N/A | | N/A | |
Total | | N/A | | N/A | |
(f) Not Applicable.
(g) The aggregate fees billed by PwC for non-audit services rendered to the registrant, Credit Suisse and Covered Service Providers for the fiscal years ended December 31, 2010 and December 31, 2011 were $18,600 and $19,200, respectively.
(h) Not Applicable.
Item 5. Audit Committee of Listed Registrants.
Form N-CSR disclosure requirement is not applicable to the registrant.
Item 6. Schedule of Investments.
Included as part of the report to shareholders filed under Item 1 of this Form.
4
Item 7. Disclosure of Proxy Voting Policies and Procedures for Closed-End Management Investment Companies.
Form N-CSR disclosure requirement is not applicable to the registrant.
Item 8. Portfolio Managers of Closed-End Management Investment Companies.
Form N-CSR disclosure requirement is not applicable to the registrant.
Item 9. Purchases of Equity Securities by Closed-End Management Investment Company and Affiliated Purchasers.
Form N-CSR disclosure requirement is not applicable to the registrant.
Item 10. Submission of Matters to a Vote of Security Holders.
None
Item 11. Controls and Procedures.
(a) As of a date within 90 days from the filing date of this report, the principal executive officer and principal financial officer concluded that the registrant’s disclosure controls and procedures (as defined in Rule 30a-3(c) under the Investment Company Act of 1940 (the “Act”)) were effective based on their evaluation of the disclosure controls and procedures required by Rule 30a-3(b) under the Act and Rules 13a-15(b) or 15d-15(b) under the Securities Exchange Act of 1934.
(b) There were no changes in registrant’s internal control over financial reporting (as defined in Rule 30a-3(d) under the Act) that occurred during the second fiscal quarter of the period covered by this report that have materially affected, or are reasonably likely to materially affect, the registrant’s internal control over financial reporting.
Item 12. Exhibits.
(a)(1) Registrant’s Code of Ethics is an exhibit to this report.
(a)(2) The certifications of the registrant as required by Rule 30a-2(a) under the Act are exhibits to this report.
(a)(3) Not applicable.
(b) The certifications of the registrant as required by Rule 30a-2(b) under the Act are an exhibit to this report.
5
SIGNATURES
Pursuant to the requirements of the Securities Exchange Act of 1934 and the Investment Company Act of 1940, the registrant has duly caused this report to be signed on its behalf by the undersigned, thereunto duly authorized.
CREDIT SUISSE TRUST | |
| |
/s/ John G. Popp | |
Name: | John G. Popp | |
Title: | Chief Executive Officer | |
Date: | March 2, 2012 | |
Pursuant to the requirements of the Securities Exchange Act of 1934 and the Investment Company Act of 1940, this report has been signed below by the following persons on behalf of the registrant and in the capacities and on the dates indicated.
/s/ John G. Popp | |
Name: | John G. Popp | |
Title: | Chief Executive Officer | |
Date: | March 2, 2012 | |
| |
/s/ Michael A. Pignataro | |
Name: | Michael A. Pignataro | |
Title: | Chief Financial Officer | |
Date: | March 2, 2012 | |
6