UNITED STATES
SECURITIES AND EXCHANGE COMMISSION
Washington, D.C. 20549
FORM N-CSR
CERTIFIED SHAREHOLDER REPORT OF REGISTERED
MANAGEMENT INVESTMENT COMPANIES
Investment Company Act file number | 811-07261 |
|
CREDIT SUISSE TRUST |
(Exact name of registrant as specified in charter) |
|
Eleven Madison Avenue, New York, New York | | 10010 |
(Address of principal executive offices) | | (Zip code) |
|
John G. Popp Credit Suisse Trust Eleven Madison Avenue New York, New York 10010 |
(Name and address of agent for service) |
|
Registrant’s telephone number, including area code: | (212) 325-2000 | |
|
Date of fiscal year end: | December 31st | |
|
Date of reporting period: | January 1, 2010 to December 31, 2010 | |
| | | | | | | | |
Item 1. Reports to Stockholders.

CREDIT SUISSE FUNDS
Annual Report
December 31, 2010
CREDIT SUISSE TRUST
n COMMODITY RETURN STRATEGY
PORTFOLIO
Credit Suisse Trust (the "Trust") shares are not available directly to individual investors, but may be offered only through certain insurance products and pension and retirement plans.
The Trust's investment objectives, risks, charges and expenses (which should be considered carefully before investing), and more complete information about the Trust, are provided in the Prospectus, which should be read carefully before investing. You may obtain additional copies by calling 800-222-8977 or by writing to Credit Suisse Trust, P.O. Box 55030, Boston, MA 02205-5030.
Credit Suisse Asset Management Securities, Inc., Distributor, is located at Eleven Madison Avenue, New York, NY 10010. The Trust is advised by Credit Suisse Asset Management, LLC.
The views of the Portfolio's management are as of the date of the letter and the Portfolio holdings described in this document are as of December 31, 2010; these views and Portfolio holdings may have changed subsequent to these dates. Nothing in this document is a recommendation to purchase or sell securities.
Portfolio shares are not deposits or other obligations of Credit Suisse Asset Management, LLC ("Credit Suisse") or any affiliate, are not FDIC-insured and are not guaranteed by Credit Suisse or any affiliate. Portfolio investments are subject to investment risks, including loss of your investment.
Credit Suisse Trust — Commodity Return Strategy Portfolio
Annual Investment Adviser's Report
December 31, 2010 (unaudited)
February 3, 2011
Dear Shareholder:
For the year ended December 31, 2010, the Credit Suisse Trust — Commodity Return Strategy Portfolio (the "Portfolio") had a gain of 16.66%.1 Its benchmark, the Dow Jones-UBS Commodity Index Total Return2 ("DJ-UBS Index") increased 16.83%. The S&P 500 Index3 had a return of 15.06%.
Market Review: A strong period for commodities
For the year ending December 31, 2010, commodities were markedly higher, with the DJ-UBS Index rising 16.83%.
Although commodity prices were largely driven by macroeconomic factors in the beginning of 2010, fundamental factors became increasingly important as the year progressed. Fears emanating from the Eurozone concerning sovereign debt defaults and slower-than-expected growth in the United States led policy makers to ease monetary policy drastically. Conversely, Asian economies and other developed regions experienced overheating economies and rising inflation rates. As a result of these macroeconomic concerns, the U.S. Dollar was stronger for the first half of the year, though gains were largely erased during the second half as caution abated. Need for the gamut of raw materials increased as the year progressed due to robust demand growth in emerging markets and greater than expected demand from developed markets. Global demand for precious metals continued to rise even as investors seemed to re-embrace risk — resulting in sig nificant gains regardless of the currency measure utilized.
Strategic Review and Outlook: Fundamentals may drive commodities going forward
The Portfolio seeks total return and is designed to achieve positive return relative to the performance of the DJ-UBS Index. To do so, the Portfolio invests in commodity-linked derivative instruments and fixed-income securities. The DJ-UBS Index, the Portfolio's benchmark, is a broadly diversified futures index composed of futures contracts on 19 physical commodities. The DJ-UBS Index is weighted among commodity sectors using dollar-adjusted liquidity and production data and is rebalanced as of the beginning of each calendar year.
For the 12-month period ended December 31, 2010, the Portfolio slightly underperformed the benchmark. The Portfolio gains exposure to commodity markets by investing in commodity index-linked structured notes whose principal and/or coupon payments are linked to the DJ-UBS Index and, by investment in its wholly-owned subsidiary (the "Subsidiary"), primarily through commodity index-linked swap agreements on the DJ-UBS Index, but also futures
1
Credit Suisse Trust — Commodity Return Strategy Portfolio
Annual Investment Adviser's Report (continued)
December 31, 2010 (unaudited)
contracts on individual commodities. During the year ended December 31, 2010, the Subsidiary invested in commodity index-linked swap agreements and futures contracts on individual commodities, primarily energy, metals and agriculture, to help the Portfolio achieve positive returns relative to the DJ-UBS Index. The Portfolio's investments in commodity index-linked structured notes and its Subsidiary's investment in commodity index-linked swap agreements and futures had a positive effect on the portfolio's overall performance during the period. However, once fund expenses were taken into account, the investments' positive performance was not high enough to outperform the benchmark.
Two of the top three performing commodities were in the agriculture sector, which rose 38.49%. Cotton, whose prices rallied due to rising demand from Asian textile mills and diminishing supply levels, rose 98.16% for the year. Coffee prices also increased significantly, by 66.99%, due to inclement weather in key markets and existing tight inventory levels. Industrial metals performed well during the year, rising 16.24% as nickel, returning 32.19%, led the sector higher. Precious metals continued to appreciate throughout 2010 to end the year as the best-performing sector, up 42.66%. Concerns over multiple monetary easing measures in the developed regions, sovereign debt downgrades in Europe, and mixed global economic data continued to lead many investors and Central Banks to increase their allocations to gold and silver. For the ninth quarter in a row gold prices increased, climbing 8.40% for the quarter and 28.72% for the year . Silver reached multi-decade highs over the course of 2010, rising 81.83% — benefitting not only from an increase in industrial demand, but also from its usage as a store of value.
The livestock sector rose 9.27% amid modestly lower inventory levels, increased demand, and sharply higher feed prices. Although the energy complex had a positive fourth quarter, it ended 2010 as the year's worst performing sector, declining 10.55% as healthy inventory levels and concerns over the global economy falling back into recession took their toll. Natural gas, which declined 40.59%, was the year's worst performer and one of only two commodities to yield a negative return for the year.
In the fixed income portion of the Portfolio, we maintain holdings in high quality, short-term securities — specifically debt issued by the U.S Treasury and U.S. Government-Sponsored Enterprises (GSE's). In the current credit environment, we remain confident in our high quality fixed income positions, which have provided the desired liquidity and performance during the past 12 months.
As indicators of economic growth and activity remain mixed, we believe global economic growth will resume, albeit at a slower pace than what might be expected compared to past recoveries. While macroeconomic uncertainty is likely
2
Credit Suisse Trust — Commodity Return Strategy Portfolio
Annual Investment Adviser's Report (continued)
December 31, 2010 (unaudited)
to continue for some time, we believe commodity fundamentals will improve and will increasingly become the dominant drivers of commodity prices and returns as conditions normalize. This should lead to a normalization of cross asset and cross commodity correlations as well. The structural shift of economic growth from developed to developing markets seems set to continue as well. We expect demand from developing economies to continue to increase for a broad range of commodities — supporting prices, while developed economies increasingly recover from the demand destruction that took place during the financial crisis and global recession.
The exact implications of the Federal Reserve's efforts to stimulate the U.S. economy and the swollen debt loads and deficits around the developed world are still somewhat unclear. However, the odds of higher than expected inflation over time have increased. During periods of unexpected inflation, commodities have outperformed the traditional asset classes of stocks and bonds. We believe investors will continue to benefit from the diversification benefits provided by commodities, along with the potential protection commodities may provide from unexpected inflation.
The Credit Suisse Commodities Management Team
Nelson Louie
Christopher Burton
This Portfolio is non-diversified, which means it may invest a greater proportion of its assets in the securities of a smaller number of issuers than a diversified mutual fund and may therefore be subject to greater volatility. Exposure to commodity markets should only form a small part of a diversified portfolio. Investment in commodity markets may not be suitable for all investors. The Portfolio's investment in commodity-linked derivative instruments may subject the Portfolio to greater volatility than investment in traditional securities, particularly in investments involving leverage.
The use of derivatives such as commodity-linked structured notes, swaps and futures entails substantial risks, including risk of loss of a significant portion of their principal value, lack of a secondary market, increased volatility, correlation risk, liquidity risk, interest-rate risk, market risk, credit risk, valuation risk and tax risk. Gains and losses from speculative positions in derivatives may be much greater than the derivative's cost.
3
Credit Suisse Trust — Commodity Return Strategy Portfolio
Annual Investment Adviser's Report (continued)
December 31, 2010 (unaudited)
At any time, the risk of loss of any individual security held by the Portfolio could be significantly higher than 50% of the security's value. For a detailed discussion of these and other risks, please refer to the Portfolio's Prospectus, which should be read carefully before investing.
In addition to historical information, this report contains forward-looking statements, which may concern, among other things, domestic and foreign market, industry and economic trends and developments and government regulation and their potential impact on the Portfolio's investments. These statements are subject to risks and uncertainties and actual trends, developments and regulations in the future, and their impact on the Portfolio could be materially different from those projected, anticipated or implied. The Portfolio has no obligation to update or revise forward-looking statements.
4
Credit Suisse Trust — Commodity Return Strategy Portfolio
Annual Investment Adviser's Report (continued)
December 31, 2010 (unaudited)
Comparison of Change in Value of $10,000 Investment in the
Credit Suisse Trust — Commodity Return Strategy Portfolio1 and the
Dow Jones-UBS Commodity Index Total Return2, 4 from Inception (2/28/06).

Average Annual Returns as of December 31, 20101
| | 1 Year | | Since
Inception | |
| | | | | | 16.66 | % | | | 2.98 | % | |
Returns represent past performance and include change in share price and reinvestment of dividends and capital gains. Past performance cannot guarantee future results. The current performance of the Portfolio may be lower or higher than the figures shown. Returns and share price will fluctuate, and redemption value may be more or less than original cost. The performance results do not reflect the deduction of taxes that a shareholder would pay on portfolio distributions or the redemption of portfolio shares. Performance includes the effect of deducting expenses, but does not include charges and expenses attributable to any particular variable contract or plan. Accordingly, the Prospectus of the sponsoring Participating Insurance Comp any separate account or plan documents or other informational materials supplied by plan sponsors should be carefully reviewed for information on relevant charges and expenses. Excluding these charges and expenses from quotations of performance has the effect of increasing the performance quoted, and the effect of these charges should be considered when comparing performance to that of other mutual funds. Performance information current to the most recent month-end is available at www.credit-suisse.com/us.
The annualized gross expense ratio is 1.09%. The annualized net expense ratio after fee waivers and/or expense reimbursements is 0.95%.
1 Fee waivers and/or expense reimbursements may reduce expenses for the Portfolio, without which performance would be lower. Waivers and/or reimbursements may be discontinued at any time.
2 The Dow Jones-UBS Commodity Index Total Return is composed of futures contracts on 19 physical commodities. Investors cannot invest directly in an index.
3 The Standard & Poor's 500 Index is an unmanaged index (with no defined investment objective) of common stocks, includes reinvestment of dividends, and is a registered trademark of The McGraw-Hill Companies, Inc. Investors cannot invest directly in an index.
4 Performance for the benchmark is not available for the period beginning February 28, 2006. For that reason, performance for the benchmark is shown for the period beginning March 1, 2006.
5
Credit Suisse Trust — Commodity Return Strategy Portfolio
Annual Investment Adviser's Report (continued)
December 31, 2010 (unaudited)
Information About Your Portfolio's Expenses
As an investor of the Portfolio, you incur two types of costs: ongoing expenses and transaction costs. Ongoing expenses include management fees, distribution and service (12b-1) fees and other Portfolio expenses. Examples of transaction costs include sales charges (loads), redemption fees and account maintenance fees, which are not shown in this section and which would result in higher total expenses. The following table is intended to help you understand your ongoing expenses of investing in the Portfolio and to help you compare these expenses with the ongoing expenses of investing in other mutual funds. The table is based on an investment of $1,000 made at the beginning of the six month period ended December 31, 2010.
The table illustrates your Portfolio's expenses in two ways:
• Actual Portfolio Return. This helps you estimate the actual dollar amount of ongoing expenses paid on a $1,000 investment in the Portfolio using the Portfolio's actual return during the period. To estimate the expenses you paid over the period, simply divide your account value by $1,000 (for example, an $8,600 account value divided by $1,000 = 8.6), then multiply the result by the number in the "Expenses Paid per $1,000" line under the share class you hold.
• Hypothetical 5% Portfolio Return. This helps you to compare your Portfolio's ongoing expenses with those of other mutual funds using the Portfolio's actual expense ratio and a hypothetical rate of return of 5% per year before expenses. Examples using a 5% hypothetical portfolio return may be found in the shareholder reports of other mutual funds. The hypothetical account values and expenses may not be used to estimate the actual ending account balance or expenses you paid for the period.
Please note that the expenses shown in these tables are meant to highlight your ongoing expenses only and do not reflect any transaction costs, such as sales charges (loads) or redemption fees. If these transaction costs had been included, your costs would have been higher. The "Expenses Paid per $1,000" line of the tables is useful in comparing ongoing expenses only and will not help you determine the relative total expenses of owning different funds.
6
Credit Suisse Trust — Commodity Return Strategy Portfolio
Annual Investment Adviser's Report (continued)
December 31, 2010 (unaudited)
Expenses and Value for a $1,000 Investment
for the six month period ended December 31, 2010
| Actual Portfolio Return | |
| Beginning Account Value 7/1/10 | | $ | 1,000.00 | | |
| Ending Account Value 12/31/10 | | $ | 1,293.20 | | |
| Expenses Paid per $1,000* | | $ | 5.49 | | |
| Hypothetical 5% Portfolio Return | |
| Beginning Account Value 7/1/10 | | $ | 1,000.00 | | |
| Ending Account Value 12/31/10 | | $ | 1,020.42 | | |
| Expenses Paid per $1,000* | | $ | 4.84 | | |
| Annualized Expense Ratio* | | | 0.95 | % | |
* Expenses are equal to the Portfolio's annualized expense ratio multiplied by the average account value over the period, multiplied by the number of days in the most recent fiscal half year period, then divided by 365.
The "Expenses Paid per $1,000" and the "Annualized Expense Ratio" in the tables are based on actual expenses paid by the Portfolio during the period, net of fee waivers and/or expense reimbursements. If those fee waivers and/or expense reimbursements had not been in effect, the Portfolio's actual expenses would have been higher. Expenses do not reflect additional charges and expenses that are, or may be, imposed under the variable contracts or plans. Such charges and expenses are described in the prospectus of the insurance company separate account or in the plan documents or other informational materials supplied by plan sponsors. The Portfolio's expenses should be considered with these charges and expenses in evaluating the overall cost of investing in the separate account.
For more information, please refer to the Portfolio's prospectus.
7
Credit Suisse Trust — Commodity Return Strategy Portfolio
Annual Investment Adviser's Report (continued)
December 31, 2010 (unaudited)
| Sector Breakdown* | |
| United States Agency Obligations | | | 57.4 | % | |
| Wholly-Owned Subsidiary | | | 19.2 | % | |
| Commodity Indexed Structured Notes | | | 16.8 | % | |
| United States Treasury Obligations | | | 5.2 | % | |
| Short-Term Investment | | | 1.4 | % | |
| Total | | | 100.0 | % | |
* Expressed as a percentage of total investments (excluding securities lending collateral if applicable) and may vary over time.
8
Credit Suisse Trust — Commodity Return Strategy Portfolio
Schedule of Investments
December 31, 2010
Par
(000) | | | | Ratings†
(S&P/Moody's) | | Maturity | | Rate% | | Value | |
| COMMODITY INDEXED STRUCTURED NOTES (16.8%) | |
| $ | 4,400 | | | BNP Paribas, Commodity Index
Linked Senior Unsecured Notes# | | (AA, Aa2) | | 02/27/12 | | | 0.234 | | | $ | 5,981,360 | | |
| | 1,500 | | | Deutsche Bank AG London, Commodity Index
Linked Senior Unsecured Notes# | | (A+, Aa3) | | 02/15/11 | | | 0.100 | | | | 2,116,800 | | |
| | 2,700 | | | Deutsche Bank AG London, Commodity Index
Linked Senior Unsecured Notes# | | (A+, Aa3) | | 04/21/11 | | | 0.101 | | | | 4,428,540 | | |
| | 6,000 | | | Svensk AB Exportkredit, Commodity Index
Linked Senior Unsecured Notes# | | (AA+, Aa1) | | 04/15/11 | | | 0.019 | | | | 8,412,477 | | |
| TOTAL COMMODITY INDEXED STRUCTURED NOTES (Cost $14,600,000) | | | 20,939,177 | | |
| UNITED STATES AGENCY OBLIGATIONS (57.6%) | |
| | 2,500 | | | Fannie Mae Discount Notes | | (AAA, Aaa) | | 01/18/11 | | | 0.300 | | | | 2,499,646 | | |
| | 3,000 | | | Fannie Mae Discount Notes | | (AAA, Aaa) | | 05/02/11 | | | 0.233 | | | | 2,998,809 | | |
| | 2,500 | | | Federal Farm Credit Bank# | | (AAA, Aaa) | | 07/02/12 | | | 0.412 | | | | 2,505,575 | | |
| | 3,100 | | | Federal Farm Credit Bank# | | (AAA, Aaa) | | 08/27/12 | | | 0.451 | | | | 3,109,319 | | |
| | 3,000 | | | Federal Farm Credit Bank# | | (AAA, Aaa) | | 10/12/12 | | | 0.282 | | | | 3,000,462 | | |
| | 2,500 | | | Federal Home Loan Bank Discount Notes | | (AAA, Aaa) | | 04/20/11 | | | 0.200 | | | | 2,499,258 | | |
| | 2,500 | | | Federal Home Loan Banks | | (AAA, Aaa) | | 04/20/11 | | | 0.200 | | | | 2,500,330 | | |
| | 3,500 | | | Federal Home Loan Banks | | (AAA, Aaa) | | 05/03/11 | | | 0.340 | | | | 3,502,138 | | |
| | 2,500 | | | Federal Home Loan Banks | | (AAA, Aaa) | | 06/10/11 | | | 0.580 | | | | 2,504,380 | | |
| | 2,500 | | | Federal Home Loan Banks§ | | (AAA, Aaa) | | 10/21/11 | | | 0.300 | | | | 2,499,173 | | |
| | 3,000 | | | Federal Home Loan Banks | | (AAA, Aaa) | | 11/18/11 | | | 0.400 | | | | 2,999,109 | | |
| | 2,500 | | | Federal Home Loan Banks | | (AAA, Aaa) | | 12/09/11 | | | 0.400 | | | | 2,499,398 | | |
| | 3,000 | | | Federal Home Loan Banks | | (AAA, Aaa) | | 12/07/12 | | | 0.700 | | | | 2,988,336 | | |
| | 2,500 | | | Federal Home Loan Mortgage Corp.# | | (AAA, Aaa) | | 02/02/12 | | | 0.181 | | | | 2,498,735 | | |
| | 2,500 | | | Federal Home Loan Mortgage Corp.# | | (AAA, Aaa) | | 02/16/12 | | | 0.221 | | | | 2,499,692 | | |
| | 2,500 | | | Federal Home Loan Mortgage Corp. | | (AAA, Aaa) | | 04/20/12 | | | 0.500 | | | | 2,497,323 | | |
| | 2,500 | | | Federal National Mortgage Association# | | (AAA, Aaa) | | 08/23/12 | | | 0.281 | | | | 2,500,577 | | |
| | 2,500 | | | Federal National Mortgage Association# | | (AAA, Aaa) | | 11/23/12 | | | 0.281 | | | | 2,500,185 | | |
| | 3,000 | | | Federal National Mortgage Association# | | (AAA, Aaa) | | 12/03/12 | | | 0.390 | | | | 3,004,173 | | |
| | 5,000 | | | Freddie Mac Discount Notes | | (AAA, Aaa) | | 01/05/11 | | | 0.210 | | | | 4,999,883 | | |
| | 2,500 | | | Freddie Mac Discount Notes | | (AAA, Aaa) | | 02/08/11 | | | 0.170 | | | | 2,499,551 | | |
| | 5,000 | | | Freddie Mac Discount Notes | | (AAA, Aaa) | | 02/24/11 | | | 0.155 | | | | 4,998,837 | | |
| | 2,500 | | | Freddie Mac Discount Notes§ | | (AAA, Aaa) | | 04/05/11 | | | 0.230 | | | | 2,499,360 | | |
| | 2,000 | | | Freddie Mac Discount Notes | | (AAA, Aaa) | | 05/04/11 | | | 0.400 | | | | 1,999,194 | | |
| | 3,000 | | | Freddie Mac Discount Notes | | (AAA, Aaa) | | 05/17/11 | | | 0.250 | | | | 2,998,659 | | |
| TOTAL UNITED STATES AGENCY OBLIGATIONS (Cost $71,592,378) | | | 71,602,102 | | |
| UNITED STATES TREASURY OBLIGATIONS (5.2%) | |
| | 3,500 | | | United States Treasury Bills | | (AAA, Aaa) | | 05/19/11 | | | 0.181 | | | | 3,498,149 | | |
| | 3,000 | | | United States Treasury Notes§ | | (AAA, Aaa) | | 02/28/11 | | | 0.875 | | | | 3,003,633 | | |
| TOTAL UNITED STATES TREASURY OBLIGATIONS (Cost $6,500,294) | | | 6,501,782 | | |
| SHORT-TERM INVESTMENTS (6.7%) | |
| | 1,688 | | | State Street Bank and Trust Co. Euro Time Deposit | | | | | | 01/03/11 | | | 0.010 | | | | 1,688,000 | | |
Number of
Shares | | | | | |
| | 6,645,000 | | | State Street Navigator Prime Portfolio, 0.3426%§§ | | | 6,645,000 | | |
| TOTAL SHORT-TERM INVESTMENTS (Cost $8,333,000) | | | 8,333,000 | | |
See Accompanying Notes to Financial Statements.
9
Credit Suisse Trust — Commodity Return Strategy Portfolio
Schedule of Investments (continued)
December 31, 2010
Number of
Shares | | | | Value | |
| WHOLLY-OWNED SUBSIDIARY (19.3%) | |
| | 20,922,783 | | | Credit Suisse Cayman Commodity Fund II, Ltd.^
(Cost $7,668,943) | | $ | 23,945,615 | | |
| TOTAL INVESTMENTS AT VALUE (105.6%) (Cost $108,694,615) | | | 131,321,676 | | |
| LIABILITIES IN EXCESS OF OTHER ASSETS (-5.6%) | | | (6,996,434 | ) | |
| NET ASSETS (100.0%) | | $ | 124,325,242 | | |
† Credit ratings given by the Standard & Poor's Division of The McGraw-Hill Companies, Inc. ("S&P") and Moody's Investors Service, Inc. ("Moody's") are unaudited.
# Variable rate obligations — The interest rate is the rate as of December 31, 2010.
§ Security or portion thereof is out on loan.
§§ Represents security purchased with cash collateral received for securities on loan. The rate shown is the annualized seven-day yield at December 31, 2010.
^ Affiliated issuer. See Note 3.
See Accompanying Notes to Financial Statements.
10
Credit Suisse Trust — Commodity Return Strategy Portfolio
Statement of Assets and Liabilities
December 31, 2010
| Assets | |
Investments at value, including collateral for securities on loan of $6,645,000
(Cost $101,025,672) (Note 2) | | $ | 107,376,0611 | | |
| Investment in wholly-owned subsidiary at value (Cost $7,668,943) (Note 2) | | | 23,945,615 | | |
| Cash | | | 728 | | |
| Interest receivable | | | 31,910 | | |
| Prepaid expenses and other assets | | | 5,320 | | |
| Total Assets | | | 131,359,634 | | |
| Liabilities | |
| Advisory fee payable (Note 3) | | | 32,672 | | |
| Administrative services fee payable (Note 3) | | | 23,782 | | |
| Shareholder servicing/Distribution fee payable (Note 3) | | | 25,138 | | |
| Payable upon return of securities loaned (Note 2) | | | 6,645,000 | | |
| Payable for portfolio shares redeemed | | | 225,044 | | |
| Trustees' fee payable | | | 112 | | |
| Other accrued expenses payable | | | 82,644 | | |
| Total Liabilities | | | 7,034,392 | | |
| Net Assets | |
| Capital stock, $.001 par value (Note 6) | | | 14,796 | | |
| Paid-in capital (Note 6) | | | 150,444,698 | | |
| Accumulated net investment loss | | | (19,203,746 | ) | |
| Accumulated net realized loss on investments | | | (29,557,567 | ) | |
| Net unrealized appreciation from investments | | | 22,627,061 | | |
| Net Assets | | $ | 124,325,242 | | |
| Shares outstanding | | | 14,796,301 | | |
| Net asset value, offering price and redemption price per share | | $ | 8.40 | | |
1 Including $6,511,649 of securities on loan.
See Accompanying Notes to Financial Statements.
11
Credit Suisse Trust — Commodity Return Strategy Portfolio
Statement of Operations
For the Year Ended December 31, 2010
| Investment Income (Note 2) | |
| Interest | | $ | 203,407 | | |
| Securities lending | | | 6,590 | | |
| Total investment income | | | 209,997 | | |
| Expenses | |
| Investment advisory fees (Note 3) | | | 531,719 | | |
| Administrative services fees (Note 3) | | | 151,629 | | |
| Shareholder servicing/Distribution fees (Note 3) | | | 265,859 | | |
| Printing fees (Note 3) | | | 60,736 | | |
| Legal fees | | | 57,240 | | |
| Trustees' fees | | | 25,870 | | |
| Transfer agent fees | | | 22,669 | | |
| Audit and tax fees | | | 20,871 | | |
| Insurance expense | | | 8,585 | | |
| Custodian fees | | | 7,250 | | |
| Commitment fees (Note 4) | | | 1,049 | | |
| Miscellaneous expense | | | 7,496 | | |
| Total expenses | | | 1,160,973 | | |
| Less: fees waived (Note 3) | | | (150,708 | ) | |
| Net expenses | | | 1,010,265 | | |
| Net investment loss | | | (800,268 | ) | |
| Net Realized and Unrealized Gain (Loss) from Investments | |
| Net realized gain from investments | | | 9,166,100 | | |
| Net realized gain from investment in wholly-owned subsidiary | | | 408,442 | | |
| Net change in unrealized appreciation (depreciation) from investments | | | (1,905,277 | ) | |
| Net change in unrealized appreciation (depreciation) from investment in wholly-owned subsidiary1 | | | 10,559,145 | | |
| Net realized and unrealized gain from investments | | | 18,228,410 | | |
| Net increase in net assets resulting from operations | | $ | 17,428,142 | | |
1 There was no income recognized from the investment in wholly-owned subsidiary.
See Accompanying Notes to Financial Statements.
12
Credit Suisse Trust — Commodity Return Strategy Portfolio
Statements of Changes in Net Assets
| | | For the Year Ended December 31, | |
| | | 2010 | | 2009 | |
| From Operations | |
| Net investment loss | | $ | (800,268 | ) | | $ | (439,869 | ) | |
| Net realized gain (loss) from investments | | | 9,574,542 | | | | (28,640,354 | ) | |
| Net change in unrealized appreciation (depreciation) from investments | | | 8,653,868 | | | | 45,901,879 | | |
| Net increase in net assets resulting from operations | | | 17,428,142 | | | | 16,821,656 | | |
| From Dividends | |
| Dividends from net investment income | | | (7,343,593 | ) | | | (10,619,456 | ) | |
| From Capital Share Transactions (Note 6) | |
| Proceeds from sale of shares | | | 12,409,547 | | | | 25,522,866 | | |
| Reinvestment of dividends | | | 7,341,817 | | | | 10,619,456 | | |
| Net asset value of shares redeemed | | | (13,721,276 | ) | | | (4,053,406 | ) | |
| Net increase in net assets from capital share transactions | | | 6,030,088 | | | | 32,088,916 | | |
| Net increase in net assets | | | 16,114,637 | | | | 38,291,116 | | |
| Net Assets | |
| Beginning of year | | | 108,210,605 | | | | 69,919,489 | | |
| End of year | | $ | 124,325,242 | | | $ | 108,210,605 | | |
| Accumulated net investment loss | | $ | (19,203,746 | ) | | $ | (11,059,885 | ) | |
See Accompanying Notes to Financial Statements.
13
Credit Suisse Trust — Commodity Return Strategy Portfolio
Financial Highlights
(For a Share of the Portfolio Outstanding Throughout Each Period)
| | | For the Year Ended December 31, | | For the Period
Ended | |
| | | 2010 | | 2009 | | 2008 | | 2007 | | December 31, 20061 | |
| Per share data | |
| Net asset value, beginning of period | | $ | 7.66 | | | $ | 7.11 | | | $ | 11.58 | | | $ | 10.37 | | | $ | 10.00 | | |
| INVESTMENT OPERATIONS | |
| Net investment income (loss)2 | | | (0.06 | ) | | | (0.04 | ) | | | 0.15 | | | | 0.54 | | | | 0.38 | | |
Net gain (loss) on investments,
futures contracts and swap contracts
(both realized and unrealized) | | | 1.33 | | | | 1.43 | | | | (3.80 | ) | | | 1.22 | | | | 0.25 | | |
| Total from investment operations | | | 1.27 | | | | 1.39 | | | | (3.65 | ) | | | 1.76 | | | | 0.63 | | |
| LESS DIVIDENDS AND DISTRIBUTIONS | |
| Dividends from net investment income | | | (0.53 | ) | | | (0.84 | ) | | | (0.15 | ) | | | (0.55 | ) | | | (0.26 | ) | |
| Distributions from net realized gains | | | — | | | | — | | | | (0.67 | ) | | | — | | | | — | | |
| Total dividends and distributions | | | (0.53 | ) | | | (0.84 | ) | | | (0.82 | ) | | | (0.55 | ) | | | (0.26 | ) | |
| Net asset value, end of period | | $ | 8.40 | | | $ | 7.66 | | | $ | 7.11 | | | $ | 11.58 | | | $ | 10.37 | | |
| Total return3 | | | 16.66 | % | | | 19.48 | % | | | (33.72 | )% | | | 17.33 | % | | | 6.36 | % | |
| RATIOS AND SUPPLEMENTAL DATA | |
| Net assets, end of period (000s omitted) | | $ | 124,325 | | | $ | 108,211 | | | $ | 69,919 | | | $ | 56,624 | | | $ | 145,907 | | |
| Ratio of expenses to average net assets | | | 0.95 | % | | | 0.95 | % | | | 0.95 | % | | | 0.95 | % | | | 0.95 | %4 | |
Ratio of net investment income (loss)
to average net assets | | | (0.75 | )% | | | (0.52 | )% | | | 1.35 | % | | | 4.06 | % | | | 4.28 | %4 | |
Decrease reflected in above operating expense
ratios due to waivers/reimbursements | | | 0.14 | % | | | 0.25 | % | | | 0.11 | % | | | 0.08 | % | | | 0.31 | %4 | |
| Portfolio turnover rate | | | 118 | % | | | 53 | % | | | 140 | % | | | 93 | % | | | 27 | % | |
1 For the period February 28, 2006 (commencement of operations) through December 31, 2006.
2 Per share information is calculated using the average shares outstanding method.
3 Total returns are historical and assume changes in share price and reinvestment of all dividends and distributions. Had certain expenses not been reduced during the periods shown, total returns would have been lower. Total returns do not reflect charges and expenses attributable to any particular variable contract or plan. Total returns for periods less than one year are not annualized.
4 Annualized.
See Accompanying Notes to Financial Statements.
14
Credit Suisse Trust — Commodity Return Strategy Portfolio
Notes to Financial Statements
December 31, 2010
Note 1. Organization
Credit Suisse Trust (the "Trust") is an open-end management investment company registered under the Investment Company Act of 1940, as amended (the "1940 Act"), and currently offers three managed investment portfolios of which one, the Commodity Return Strategy Portfolio (the "Portfolio"), is included in this report. The Portfolio is a non-diversified open-end management investment company that seeks total return. Shares of the Portfolio are not available directly to individual investors but may be offered only through (a) variable annuity contracts and variable life insurance contracts offered by separate accounts of certain insurance companies and (b) tax-qualified pension and retirement plans. The Portfolio may not be available in connection with a particular contract or plan. The Trust was organized under the laws of the Commonwealth of Massachusetts as a business trust on March 15, 1995.
Note 2. Significant Accounting Policies
A) SECURITY VALUATION — The net asset value of the Portfolio is determined daily as of the close of regular trading on the New York Stock Exchange, Inc. (the "Exchange") on each day the Exchange is open for business. Debt securities with a remaining maturity greater than 60 days are valued in accordance with the price supplied by a pricing service, which may use a matrix, formula or other objective method that takes into consideration market indices, yield curves and other specific adjustments. Debt obligations that will mature in 60 days or less are valued on the basis of amortized cost, which approximates market value, unless it is determined that using this method would not represent fair value. Debt securities are generally categorized as Level 2. Equity investments are valued at market value, which is generally determined using the closing price on the exchange or market on which the security is primarily traded at t he time of valuation (the "Valuation Time"). If no sales are reported, equity investments are generally valued at the most recent bid quotation as of the Valuation Time or at the lowest asked quotation in the case of a short sale of securities. Equity investments are generally categorized as Level 1. Investments in open-end investment companies are valued at their net asset value each business day and are generally categorized as Level 1. Structured note agreements are valued in accordance with a dealer-supplied valuation based on changes in the value of the underlying index and are generally categorized as Level 2. The Portfolio's investment in the Credit Suisse Cayman Commodity Fund II, Ltd., a wholly-owned and controlled Cayman Islands subsidiary, (the "Subsidiary"), is valued at the Subsidiary's net asset value each business day and is generally categorized as
15
Credit Suisse Trust — Commodity Return Strategy Portfolio
Notes to Financial Statements (continued)
December 31, 2010
Note 2. Significant Accounting Policies
Level 2. Securities, structured note agreements and other assets for which market quotations are not readily available, or whose values have been materially affected by events occurring before the Portfolio's Valuation Time but after the close of the securities' primary markets, are valued at fair value as determined in good faith by, or under the direction of, the Board of Trustees under procedures established by the Board of Trustees and are generally categorized as Level 3. The Portfolio may utilize a service provided by an independent third party which has been approved by the Board of Trustees to fair value certain securities. When fair value pricing is employed, the prices of securities used by a portfolio to calculate its net asset value may differ from quoted or published prices for the same securities.
In accordance with the authoritative guidance on fair value measurements and disclosures under accounting principles generally accepted in the United States of America ("GAAP"), the Portfolio discloses the fair value of its investments in a hierarchy that prioritizes the inputs to valuation techniques used to measure the fair value. In accordance with GAAP, fair value is defined as the price that the Portfolio would receive upon selling an investment in a timely transaction to an independent buyer in the principal or most advantageous market of the investment. GAAP established a three-tier hierarchy to maximize the use of observable market data and minimize the use of unobservable inputs and to establish classification of fair value measurements for disclosure purposes. Inputs refer broadly to the assumptions that market participants would use in pricing the asset or liability, including assumptions about risk, for example, th e risk inherent in a particular valuation technique used to measure fair value including such a pricing model and/or the risk inherent in the inputs to the valuation technique. Inputs may be observable or unobservable. Observable inputs are inputs that reflect the assumptions market participants would use in pricing the asset or liability developed based on market data obtained from sources independent of the reporting entity. Unobservable inputs are inputs that reflect the reporting entity's own assumptions about the assumptions market participants would use in pricing the asset or liability developed based on the best information available in the circumstances. In accordance with the Portfolio's valuation procedures, factors used in determining value may include, but are not limited to, the type of the security, the size of the holding, the initial cost of the security, the existence of any contractual restrictions on the security's disposition, the price and extent of public trading in similar securities of the issuer or of comparable companies, quotations or evaluated prices from broker-dealers and/or pricing services, information obtained from the issuer, analysts, and/or
16
Credit Suisse Trust — Commodity Return Strategy Portfolio
Notes to Financial Statements (continued)
December 31, 2010
Note 2. Significant Accounting Policies
the appropriate stock exchange (for exchange-traded securities), an analysis of the company's or issuer's financial statements, an evaluation of the forces that influence the issuer and the market(s) in which the security is purchased and sold and with respect to debt securities, the maturity, coupon, creditworthiness, currency denomination, and the movement of the market in which the security is normally traded. The three-tier hierarchy of inputs is summarized in the three broad Levels listed below.
• Level 1 – quoted prices in active markets for identical investments
• Level 2 – other significant observable inputs (including quoted prices for similar investments, interest rates, prepayment speeds, credit risk, etc.)
• Level 3 – significant unobservable inputs (including the Portfolio's own assumptions in determining the fair value of investments)
The inputs or methodology used for valuing securities are not necessarily an indication of the risk associated with investing in those securities.
The following is a summary of the inputs used as of December 31, 2010 in valuing the Portfolio's investments carried at value:
| | | Level 1 | | Level 2 | | Level 3 | | Total | |
| Investments in Securities | |
| Commodity Indexed Structured Notes | | $ | — | | | $ | 20,939,177 | | | $ | — | | | $ | 20,939,177 | | |
| United States Agency Obligations | | | — | | | | 71,602,102 | | | | — | | | | 71,602,102 | | |
| United States Treasury Obligations | | | — | | | | 6,501,782 | | | | — | | | | 6,501,782 | | |
| Short-Term Investments | | | 6,645,000 | | | | 1,688,000 | | | | — | | | | 8,333,000 | | |
| Wholly-Owned Subsidiary | | | — | | | | 23,945,615 | | | | — | | | | 23,945,615 | | |
| Other Financial Instruments* | | | — | | | | — | | | | — | | | | — | | |
| | | $ | 6,645,000 | | | $ | 124,676,676 | | | $ | — | | | $ | 131,321,676 | | |
*Other financial instruments include futures, forwards and swap contracts.
Effective January 1, 2010, the Portfolio adopted FASB amendments to authoritative guidance which requires the Portfolio to disclose details of significant transfers in and out of Level 1 and Level 2 measurements and the reasons for the transfers. For the year ended December 31, 2010, there were no significant transfers in and out of Level 1 and Level 2.
B) DERIVATIVE INSTRUMENTS AND HEDGING ACTIVITIES — Effective January 1, 2009, the Portfolio adopted amendments to authoritative guidance on disclosures about derivative instruments and hedging activities which require that the Portfolio disclose (a) how and why an entity uses derivative instruments, (b) how derivative instruments and hedging activities are
17
Credit Suisse Trust — Commodity Return Strategy Portfolio
Notes to Financial Statements (continued)
December 31, 2010
Note 2. Significant Accounting Policies
accounted for, and (c) how derivative instruments and related hedging activities affect a portfolio's financial position, financial performance, and cash flows. The Portfolio has not entered into any derivative or hedging activities during the period covered by this report. However, the Portfolio does invest in derivative instruments in the Subsidiary.
C) SECURITY TRANSACTIONS AND INVESTMENT INCOME — Security transactions are accounted for on a trade date basis. Interest income is recorded on the accrual basis. The Portfolio amortizes premiums and accretes discounts using the effective interest method. Dividends are recorded on the ex-dividend date. The cost of investments sold is determined by use of the specific identification method for both financial reporting and income tax purposes.
D) DIVIDENDS AND DISTRIBUTIONS TO SHAREHOLDERS — Dividends from net investment income are declared and paid quarterly. Distributions of net realized capital gains, if any, are declared and paid at least annually. However, to the extent that a net realized capital gain can be reduced by a capital loss carryforward, such gain will not be distributed. Income and capital gain distributions are determined in accordance with federal income tax regulations, which may differ from GAAP.
E) FEDERAL INCOME TAXES — No provision is made for federal taxes as it is the Portfolio's intention to continue to qualify for and elect the tax treatment applicable to regulated investment companies ("RIC") under the Internal Revenue Code of 1986, as amended (the "Code"), and to make the requisite distributions to its shareholders, which will be sufficient to relieve it from federal income and excise taxes.
In order to qualify as a RIC under the Code, the Portfolio must meet certain requirements regarding the source of its income, the diversification of its assets and the distribution of its income. One of these requirements is that the Portfolio derive at least 90% of its gross income for each taxable year from dividends, interest, payments with respect to certain securities loans, gains from the sale or other disposition of stock, securities or foreign currencies, other income derived with respect to its business of investing in such stock, securities or currencies or net income derived from interests in certain publicly traded partnerships ("Qualifying Income"). The Portfolio may seek to track the performance of the Dow Jones-UBS Commodity Index Total Return ("DJ-UBS Index") through investing in structured notes designed to track the performance of the DJ-UBS Index. The Portfolio has received a private letter ruling from the I RS which confirms that the Portfolio's use of certain types of structured notes designed to
18
Credit Suisse Trust — Commodity Return Strategy Portfolio
Notes to Financial Statements (continued)
December 31, 2010
Note 2. Significant Accounting Policies
track the performance of the DJ-UBS Index produce Qualifying Income. In addition, the Portfolio may, through its investment in the Subsidiary, seek to track the performance of the DJ-UBS Index by the Subsidiary's investments in commodity-linked swaps and/or futures contracts. The Portfolio has obtained a private letter ruling from the IRS that its investment in the Subsidiary will produce Qualifying Income. If the Portfolio is unable to ensure continued qualification as a RIC, the Portfolio may be required to change its investment objective, policies or techniques, or may be liquidated. If the Portfolio fails to qualify as a RIC, the Portfolio will be subject to federal income tax on its net income and capital gains at regular corporate rates (without reduction for distributions to shareholders). If the Portfolio were to fail to qualify as a RIC and become subject to federal income tax, shareholders of the Portfolio would be s ubject to the risk of diminished returns. If the Portfolio should fail to qualify as a RIC, it would be considered as a single investment, which may result in variable contracts invested in the Portfolio not being treated as annuity, endowment or life insurance contracts under the Code. All income and gain inside the variable contracts would be taxed currently to the holders, and the contracts would remain subject to taxation as ordinary income thereafter, even if they become adequately diversified.
The Portfolio adopted the authoritative guidance for uncertainty in income taxes and recognizes a tax benefit or liability from an uncertain position only if it is more likely than not that the position is sustainable based solely on its technical merits and consideration of the relevant taxing authority's widely understood administrative practices and procedures. The Portfolio has reviewed its current tax positions and has determined that no provision for income tax is required in the Portfolio's financial statements. The Portfolio's federal tax returns for the prior three fiscal years remain subject to examination by the Internal Revenue Service.
F) USE OF ESTIMATES — The preparation of financial statements in conformity with GAAP requires management to make estimates and assumptions that affect the reported amounts of assets and liabilities and disclosure of contingent assets and liabilities at the date of the financial statements and the reported amounts of income and expenses during the reporting period. Actual results could differ from these estimates.
G) SHORT-TERM INVESTMENTS — The Portfolio, together with other funds/portfolios advised by Credit Suisse Asset Management, LLC ("Credit Suisse"), an indirect, wholly-owned subsidiary of Credit Suisse Group AG, pools available cash into a short-term variable rate time deposit issued by State
19
Credit Suisse Trust — Commodity Return Strategy Portfolio
Notes to Financial Statements (continued)
December 31, 2010
Note 2. Significant Accounting Policies
Street Bank and Trust Company ("SSB"), the Portfolio's custodian. The short-term time deposit issued by SSB is a variable rate account classified as a short-term investment.
H) COMMODITY INDEX-LINKED STRUCTURED NOTES — The Portfolio may invest in structured notes whose value is based on the price movements of a commodity index. The structured notes are often leveraged, increasing the volatility of each note's value relative to the change in the underlying linked financial element. The value of these notes will rise and fall in response to changes in the underlying commodity index. Structured notes may entail a greater degree of market risk than other types of debt securities because the investor bears the risk of the underlying commodity index. Structured notes may also be more volatile, less liquid, and more difficult to accurately price than less complex securities or more traditional debt securities. Fluctuations in the value of the structured notes are recorded as unrealized gains and losses in the accompanying financial statements. Net payments are recorded as interest income. These note s are subject to prepayment, credit and interest risks. The Portfolio has the option to request prepayment from the issuer. At maturity, or when a note is sold, the Portfolio records a realized gain or loss. At December 31, 2010, the value of these securities comprised 16.8% of the Portfolio's net assets and resulted in unrealized appreciation of $6,339,177.
I) INVESTMENT IN CAYMAN COMMODITY FUND II, LTD. — The Portfolio may invest up to 25% of its total assets in the Subsidiary, which invests primarily in commodity and financial futures, and swap contracts, as well as fixed income securities and other investments intended to serve as margin or collateral for the Subsidiary's derivatives positions. The Portfolio wholly owns and controls the Subsidiary, and the Portfolio and Subsidiary are both managed by Credit Suisse.
The Portfolio does not consolidate the assets, liabilities, capital or operations of the Subsidiary into its financial statements. Rather, the Subsidiary is separately presented as an investment in the Portfolio's Schedule of Investments. Unrealized appreciation or depreciation on the Portfolio's investment in the Subsidiary is recorded in the Portfolio's Statement of Assets and Liabilities and Portfolio's Statement of Operations.
For tax purposes, the Subsidiary is an exempted Cayman investment company. The Subsidiary has received an undertaking from the Government of the Cayman Islands exempting it from all local income, profits and capital gains taxes through June of 2027. No such taxes are levied in the Cayman Islands at the present time. For U.S. income tax purposes, the Subsidiary is a
20
Credit Suisse Trust — Commodity Return Strategy Portfolio
Notes to Financial Statements (continued)
December 31, 2010
Note 2. Significant Accounting Policies
Controlled Foreign Corporation and as such is not subject to U.S. income tax. However, as a wholly-owned Controlled Foreign Corporation, the Subsidiary's net income and capital gain, to the extent of its earnings and profits, will be included each year in the Portfolio's investment company taxable income.
| | | Beginning
Shares | | Subscriptions | | Redemptions | | Ending
Shares | | Dividend
Income | | Value
of affiliates
at 12/31/10 | |
Credit Suisse Cayman
Commodity Fund II, Ltd. | | | 34,673,968 | | | | 7,866,274 | | | | (21,617,459 | ) | | | 20,922,783 | | | $ | — | | | $ | 23,945,615 | | |
J) SECURITIES LENDING — Loans of securities are required at all times to be secured by collateral at least equal to 102% of the market value of domestic securities on loan (including any accrued interest thereon) and 105% of the market value of foreign securities on loan (including any accrued interest thereon). Cash collateral received by the Portfolio in connection with securities lending activity may be pooled together with cash collateral for other funds/portfolios advised by Credit Suisse and may be invested in a variety of investments, including funds advised by SSB, the Portfolio's securities lending agent, or money market instruments. However, in the event of default or bankruptcy by the other party to the agreement, realization and/or retention of the collateral may be subject to legal proceedings.
SSB has been engaged by the Portfolio to act as the Portfolio's securities lending agent. The Portfolio's securities lending arrangement provides that the Portfolio and SSB will share the net income earned from securities lending activities. During the year ended December 31, 2010, total earnings from the Portfolio's investment in cash collateral received in connection with securities lending arrangements was $22,261, of which $14,032 was rebated to borrowers (brokers). The Portfolio retained $6,590 in income from the cash collateral investment, and SSB, as lending agent, was paid $1,639. Securities lending income is accrued as earned.
K) OTHER — In the normal course of business the Portfolio trades financial instruments and enters into financial transactions where risk of potential loss exists due to changes in the market (market risk) or failure of the other party to a transaction to perform (credit risk). Similar to credit risk, the Portfolio may be exposed to counterparty risk, or the risk that an institution or other entity with which the Portfolio has unsettled or open transactions will default. The potential loss could exceed the value of the financial assets recorded in the financial statements. Financial assets, which potentially expose the Portfolio to credit risk, consist principally of cash due from counterparties and investments. The extent of the Portfolio's exposure to credit and counterparty risks in respect
21
Credit Suisse Trust — Commodity Return Strategy Portfolio
Notes to Financial Statements (continued)
December 31, 2010
Note 2. Significant Accounting Policies
to these financial assets approximates their carrying value as recorded in the Portfolio's Statement of Assets and Liabilities.
L) SUBSEQUENT EVENTS — In preparing the financial statements as of December 31, 2010, management considered the impact of subsequent events for potential recognition or disclosure in these financial statements.
Note 3. Transactions with Affiliates and Related Parties
Credit Suisse serves as investment adviser for the Portfolio. For its investment advisory services, Credit Suisse is entitled to receive a fee from the Portfolio at an annual rate of 0.50% of the Portfolio's average daily net assets. For the year ended December 31, 2010, investment advisory fees earned and voluntarily waived were $531,719 and $150,708, respectively. Credit Suisse will not recapture from the Portfolio any fees it waived during the year ended December 31, 2010. Effective January 1, 2011, Credit Suisse will waive fees and reimburse expenses so that the Portfolio's annual operating expenses will not exceed 1.05% of the Portfolio's average daily net assts. Fee waivers and expense reimbursements are voluntary and may be discontinued by Credit Suisse at any time.
Credit Suisse Asset Management Securities, Inc. ("CSAMSI"), an affiliate of Credit Suisse, and SSB serve as co-administrators to the Portfolio. For its co-administrative services, CSAMSI currently receives a fee calculated at an annual rate of 0.09% of the Portfolio's average daily net assets. For the year ended December 31, 2010, co-administrative services fees earned by CSAMSI were $95,710.
For its co-administrative services, SSB receives a fee, exclusive of out-of-pocket expenses, calculated in total for all the Credit Suisse funds/portfolios co-administered by SSB and allocated based upon the relative average net assets of each fund/portfolio, subject to an annual minimum fee. For the year ended December 31, 2010, co-administrative services fees earned by SSB (including out-of-pocket expenses) were $55,919.
In addition to serving as the Portfolio's co-administrator, CSAMSI currently serves as distributor of the Portfolio's shares. Pursuant to distribution plans adopted by the Portfolio pursuant to Rule 12b-1 under the 1940 Act, CSAMSI receives fees for its distribution services. These fees are calculated at an annual rate of 0.25% of the average daily net assets.
Merrill Corporation ("Merrill"), an affiliate of Credit Suisse, has been engaged by the Portfolio to provide certain financial printing services. For the year ended December 31, 2010, Merrill was paid $26,062 for its services by the Portfolio.
22
Credit Suisse Trust — Commodity Return Strategy Portfolio
Notes to Financial Statements (continued)
December 31, 2010
Note 4. Line of Credit
The Portfolio, together with other funds/portfolios advised by Credit Suisse (collectively, the "Participating Funds"), participates in a committed, unsecured line of credit facility ("Credit Facility") for temporary or emergency purposes with SSB. Under the terms of the Credit Facility, the Participating Funds pay an aggregate commitment fee on the average unused amount of the Credit Facility, which is allocated among the Participating Funds in such manner as is determined by the governing Boards of the Participating Funds. In addition, the Participating Funds pay interest on borrowings at either the Overnight Federal Funds rate or the Overnight LIBOR rate plus a spread. At December 31, 2010, and during the year ended December 31, 2010, the Portfolio had no borrowings under the Credit Facility.
Note 5. Purchases and Sales of Securities
For the year ended December 31, 2010, purchases and sales of investment securities (excluding short-term investments) and U.S. Government and Agency Obligations were as follows:
| Investment Securities | | U.S. Government/
Agency Obligations | |
| Purchases | | Sales | | Purchases | | Sales | |
| $ | 18,600,000 | | | $ | 37,553,741 | | | $ | 66,122,801 | | | $ | 48,328,635 | | |
Note 6. Capital Share Transactions
The Trust is authorized to issue an unlimited number of full and fractional shares of beneficial interest, $.001 par value per share. Transactions in capital shares of the Portfolio were as follows:
| | | For the Year Ended
December 31, 2010 | | For the Year Ended
December 31, 2009 | |
| Shares sold | | | 1,639,663 | | | | 3,454,889 | | |
| Shares issued in reinvestment of dividends | | | 888,325 | | | | 1,387,148 | | |
| Shares redeemed | | | (1,853,391 | ) | | | (558,672 | ) | |
| Net increase | | | 674,597 | | | | 4,283,365 | | |
On December 31, 2010, the number of shareholders that held 5% or more of the outstanding shares of the Portfolio was as follows:
Number of
Shareholders | | Approximate Percentage
of Outstanding Shares | |
| | 1 | | | | 93 | % | |
23
Credit Suisse Trust — Commodity Return Strategy Portfolio
Notes to Financial Statements (continued)
December 31, 2010
Note 6. Capital Share Transactions
Some of the shareholders are omnibus accounts, which hold shares on behalf of individual shareholders.
Note 7. Federal Income Taxes
Income and capital gain distributions are determined in accordance with federal income tax regulations, which may differ from GAAP.
The tax characteristics of dividends and distributions paid during the years ended December 31, 2010 and 2009, respectively, by the Portfolio were as follows:
| Ordinary Income | |
| 2010 | | 2009 | |
| $ | 7,343,593 | | | $ | 10,619,456 | | |
The tax basis components of distributable earnings differ from the amounts reflected in the Statement of Assets and Liabilities by temporary book/tax differences. These differences are primarily due to differing treatments of earnings and redemptions from the investments in the wholly-owned, affiliated subsidiary. At December 31, 2010, the components of distributable earnings on a tax basis were as follows:
| Undistributed net investment income | | $ | 3,160,584 | | |
| Accumulated realized loss | | | (2,826,510 | ) | |
| Unrealized depreciation | | | (26,468,326 | ) | |
| | | $ | (26,134,252 | ) | |
At December 31, 2010, the Portfolio had capital loss carryforwards available to offset possible future capital gains as follows:
| | Expires December 31,
2017 | |
| | | $ | 2,826,510 | | |
During the tax year ended December 31, 2010, the Portfolio utilized $9,166,100 of the capital loss carryforwards.
It is uncertain whether the Portfolio will be able to realize the benefits of the capital loss carryforward before it expires.
24
Credit Suisse Trust — Commodity Return Strategy Portfolio
Notes to Financial Statements (continued)
December 31, 2010
Note 7. Federal Income Taxes
At December 31, 2010, the identified cost for federal income tax purposes, as well as the gross unrealized appreciation from investments for those securities having an excess of value over cost, gross unrealized depreciation from investments for those securities having an excess of cost over value and the net unrealized depreciation from investments were $157,790,002, $22,644,174, $(49,112,500) and $(26,468,326), respectively.
Note 8. Contingencies
In the normal course of business, the Portfolio may provide general indemnifications pursuant to certain contracts and organizational documents. The Portfolio's maximum exposure under these arrangements is dependent on future claims that may be made against the Portfolio and, therefore, cannot be estimated; however, based on experience, the risk of loss from such claims is considered remote.
25
Credit Suisse Trust — Commodity Return Strategy Portfolio
Report of Independent Registered Public Accounting Firm
To the Board of Trustees and Shareholders of
Credit Suisse Trust — Commodity Return Strategy Portfolio:
In our opinion, the accompanying statement of assets and liabilities, including the schedule of investments, and the related statements of operations and of changes in net assets and the financial highlights present fairly, in all material respects, the financial position of Credit Suisse Trust — Commodity Return Strategy Portfolio (the "Portfolio") at December 31, 2010, the results of its operations for the year then ended and the changes in its net assets and financial highlights for the periods presented, in conformity with accounting principles generally accepted in the United States of America. These financial statements and financial highlights (hereafter referred to as "financial statements") are the responsibility of the Portfolio's management. Our responsibility is to express an opinion on these financial statements based on our audit. We conducted our audit of these financial statements in accordance with the st andards of the Public Company Accounting Oversight Board (United States). Those standards require that we plan and perform the audit to obtain reasonable assurance about whether the financial statements are free of material misstatement. An audit includes examining, on a test basis, evidence supporting the amounts and disclosures in the financial statements, assessing the accounting principles used and significant estimates made by management, and evaluating the overall financial statement presentation. We believe that our audit, which included confirmation of securities at December 31, 2010 by correspondence with the custodian and brokers, provides a reasonable basis for our opinion.
PricewaterhouseCoopers LLC
Boston, Massachusetts
February 22, 2011
26
Credit Suisse Trust — Commodity Return Strategy Portfolio
Board Approval of Advisory Agreement (unaudited)
In approving the renewal of the current Advisory Agreement, the Board of Trustees (the "Board") of the Credit Suisse Trust — Commodity Return Strategy Portfolio (the "Portfolio"), including a majority of the Trustees who are not "interested persons" of the Portfolio as defined in the Investment Company Act of 1940 (the "Independent Trustees"), at a meeting held on November 15 and 16, 2010, considered the following factors:
Investment Advisory Fee Rates and Expenses
The Board reviewed and considered the contractual advisory fee rate of 0.50% for the Portfolio ("Contractual Advisory Fee") in light of the extent and quality of the advisory services provided by Credit Suisse Asset Management, LLC ("Credit Suisse"). The Board also reviewed and considered the voluntary fee waivers currently in place for the Portfolio and considered the actual fee rate of 0.25% paid by the Portfolio after taking waivers into account ("Net Advisory Fee") as of September 30, 2010. The Board acknowledged that voluntary fee waivers could be discontinued at any time.
Additionally, the Board received and considered information comparing the Portfolio's Contractual Advisory Fee, Net Advisory Fee and the Portfolio's overall expenses with those of funds in both the relevant expense group ("Expense Group") and universe of funds ("Expense Universe") provided by Lipper Inc., an independent provider of investment company data.
The Board noted that Credit Suisse proposed to reduce the voluntary fee waiver so that the Portfolio's total expense ratio would be in line with the Lipper median.
Nature, Extent and Quality of the Services under the Advisory Agreement
The Board received and considered information regarding the nature, extent and quality of services provided to the Portfolio by Credit Suisse under the Advisory Agreement. The Board also noted information received at regular meetings throughout the year related to the services rendered by Credit Suisse. The Board reviewed background information about Credit Suisse, including its Form ADV. The Board considered the background and experience of Credit Suisse's senior management and the expertise of, and the amount of attention given to the Portfolio by, senior personnel of Credit Suisse. In addition, the Board reviewed the qualifications, backgrounds and responsibilities of the portfolio management team primarily responsible for the day-to-day portfolio management of the Portfolio and the extent of the resources devoted to research and analysis of actual and potential investments. The Board evaluated the
27
Credit Suisse Trust — Commodity Return Strategy Portfolio
Board Approval of Advisory Agreement (unaudited) (continued)
ability of Credit Suisse, based on its resources, reputation and other attributes, to attract and retain qualified investment professionals, including research, advisory, and supervisory personnel. The Board also received and considered information about the nature, extent and quality of services and fee rates offered to other Credit Suisse clients for comparable services.
Portfolio Performance
The Board received and considered performance results of the Portfolio over time, along with comparisons both to the relevant performance group ("Performance Group") and universe of funds ("Performance Universe") for the Portfolio. The Board was provided with a description of the methodology used to arrive at the funds included in the Performance Group and the Performance Universe.
Credit Suisse Profitability
The Board received and considered a profitability analysis of Credit Suisse based on the fees payable under the Advisory Agreement for the Portfolio, including any fee waivers, as well as other relationships between the Portfolio on the one hand and Credit Suisse affiliates on the other. The Board also considered Credit Suisse's methodology for allocating costs to the Portfolio, recognizing that cost allocation methodologies are inherently subjective. The Board received profitability information for the other funds in the Credit Suisse family of funds.
Economies of Scale
The Board considered information regarding whether there have been economies of scale with respect to the management of the Portfolio, whether the Portfolio has appropriately benefited from any economies of scale, and whether there is potential for realization of any further economies of scale. Accordingly, the Board considered whether breakpoints in the Portfolio's advisory fee structure would be appropriate or reasonable taking into consideration economies of scale or other efficiencies that might accrue from increases in the Portfolio's asset levels.
Other Benefits to Credit Suisse
The Board considered other benefits received by Credit Suisse and its affiliates as a result of their relationship with the Portfolio. Such benefits
28
Credit Suisse Trust — Commodity Return Strategy Portfolio
Board Approval of Advisory Agreement (unaudited) (continued)
include, among others, benefits potentially derived from an increase in Credit Suisse's businesses as a result of its relationship with the Portfolio (such as the ability to market to shareholders other financial products offered by Credit Suisse and its affiliates) and the fees paid to affiliates of Credit Suisse for co-administration and distribution services.
The Board considered the standards applied in seeking best execution and reviewed Credit Suisse's method for allocating portfolio investment opportunities among its advisory clients.
Other Factors and Broader Review
As discussed above, the Board reviews detailed materials received from Credit Suisse as part of the annual re-approval process. The Board also reviews and assesses the quality of the services that the Portfolio receives throughout the year. In this regard, the Board reviews reports of Credit Suisse at least quarterly, which include, among other things, detailed portfolio and market reviews, detailed fund performance reports and Credit Suisse's compliance procedures.
Conclusions
In selecting Credit Suisse, and approving the Advisory Agreement and the investment advisory fee under such agreement, the Board concluded that:
• The combined Contractual Advisory Fee and co-administration fee, as well as the Net Advisory Fee, were among the lowest in the Expense Group, and the Board considered the fee to be reasonable.
• The Portfolio commenced operations on February 28, 2006 and therefore performance information was shown only for the one, two, three and four year periods. The Portfolio's performance was above the median of its Performance Group for the two and three year periods and above the median of its Performance Universe for the one, two, three and four year periods.
• The Board was satisfied with the nature, extent and quality of the investment advisory services provided to the Portfolio by Credit Suisse and that, based on dialogue with management and counsel, the services provided by Credit Suisse under the Advisory Agreement are typical of, and consistent with, those provided to similar mutual funds by other investment advisers.
29
Credit Suisse Trust — Commodity Return Strategy Portfolio
Board Approval of Advisory Agreement (unaudited) (continued)
• In light of the costs of providing investment management and other services to the Portfolio and Credit Suisse's ongoing commitment to the Portfolio and willingness to waive fees, Credit Suisse's profitability based on fees payable under the Advisory Agreement, as well as other ancillary benefits that Credit Suisse and its affiliates received, were considered reasonable.
• In light of the combined Contractual Advisory Fee and co-administration fee, as well as the fee waivers and the Net Advisory Fee, the Portfolio's current fee structure (without breakpoints) was considered reasonable.
No single factor reviewed by the Board was identified by the Board as the principal factor in determining whether to approve the Advisory Agreement. The Independent Trustees were advised by separate independent legal counsel throughout the process.
30
Credit Suisse Trust — Commodity Return Strategy Portfolio
Information Concerning Trustees and Officers (unaudited)
Name, Address
(Year of Birth) | | Position(s)
Held with
Trust | | Term
of Office1
and
Length
of Time
Served | | Principal
Occupation(s) During
Past Five Years | | Number of
Portfolios in
Fund
Complex
Overseen by
Trustee | | Other
Directorships
Held by Trustee | |
| Independent Trustees | | | | | | | | | | | |
|
Enrique Arzac
c/o Credit Suisse Asset Management, LLC
Attn: General Counsel Eleven Madison Avenue New York, New York
10010
(1941) | | Trustee,
Audit Committee Chairman and Nominating Committee Member | | Since Portfolio Inception | | Professor of Finance and Economics, Graduate School of Business, Columbia University since 1971. | | | 9 | | | Director of Epoch Holding Corporation (an investment management and investment advisory services company); Director of Starcomms PLC., (telecommunications company); Director of Mirae Asset Discovery Funds (6 open-end portfolios); Director of Aberdeen Asia-Pacific Income Investment Company Limited (a Canadian closed-end fund); Director of The Adams Express Company, Petroleum and Resources Corporation, Aberdeen Chile Fund, Inc., Aberdeen Indonesia Fund, Inc., Aberdeen Israel Fund, Inc., Aberdeen Latin America Equity Fund, Inc. and Aberdeen Emerging Markets Telecommunications and Infrastructure Fund, Inc. (each a closed-end investment company). | |
|
1 Each Trustee and Officer serves until his or her respective successor has been duly elected and qualified.
31
Credit Suisse Trust — Commodity Return Strategy Portfolio
Information Concerning Trustees and Officers (unaudited) (continued)
Name, Address
(Year of Birth) | | Position(s)
Held with
Trust | | Term
of Office1
and
Length
of Time
Served | | Principal
Occupation(s) During
Past Five Years | | Number of
Portfolios in
Fund
Complex
Overseen by
Trustee | | Other
Directorships
Held by Trustee | |
| Independent Trustees | | | | | | | | | | | |
|
Jeffrey E. Garten
Box 208200
New Haven, Connecticut 06520-8200
(1946) | | Trustee,
Audit and Nominating Committee Member | | Since Portfolio Inception | | The Juan Trippe Professor in the Practice of International Trade, Finance and Business from July 2005 to present; Partner and Chairman of Garten Rothkopf (consulting firm) from October 2005 to present; Dean of Yale School of Management from November 1995 to June 2005. | | | 7 | | | Director of Aetna, Inc. (insurance company); Director of CarMax Group (used car dealers); Member of Standard & Poor's Board of Managers. | |
|
Peter F. Krogh
c/o Credit Suisse Asset Management, LLC
Attn: General Counsel Eleven Madison Avenue New York, New York
10010
(1937) | | Trustee, Audit and Nominating Committee Member | | Since Portfolio Inception | | Dean Emeritus and Distinguished Professor of International Affairs at the Edmund A. Walsh School of Foreign Service, Georgetown University from June 1995 to June 2009. | | | 7 | | | None | |
|
32
Credit Suisse Trust — Commodity Return Strategy Portfolio
Information Concerning Trustees and Officers (unaudited) (continued)
Name, Address
(Year of Birth) | | Position(s)
Held with
Trust | | Term
of Office1
and
Length
of Time
Served | | Principal
Occupation(s) During
Past Five Years | | Number of
Portfolios in
Fund
Complex
Overseen by
Trustee | | Other
Directorships
Held by Trustee | |
| Independent Trustees | | | | | | | | | | | |
|
Steven N. Rappaport
Lehigh Court, LLC
555 Madison Avenue
29th Floor
New York, New York
10022
(1948) | | Chairman of the Board of Trustees, Audit Committee Member and Nominating Committee Chairman | | Since Portfolio Inception | | Partner of Lehigh Court, LLC and RZ Capital (private investment firms) from July 2002 to present. | | | 9 | | | Director of iCAD, Inc. (a surgical and medical instruments and apparatus company); Director of Presstek, Inc. (digital imaging technologies company); Director of Wood Resources, LLC. (plywood manufacturing company); Director of Aberdeen Chile Fund, Inc., Aberdeen Indonesia Fund, Inc., Aberdeen Israel Fund, Inc., Aberdeen Latin America Equity Fund, Inc. and Aberdeen Emerging Markets Telecommunications and Infrastructure Fund, Inc. (each a closed-end investment company). | |
|
33
Credit Suisse Trust — Commodity Return Strategy Portfolio
Information Concerning Trustees and Officers (unaudited) (continued)
Name, Address
(Year of Birth) | | Position(s)
Held with
Trust | | Term
of Office1
and
Length
of Time
Served | | Principal Occupation(s) During Past Five Years | |
| Officers** | | | | | | | |
|
John G. Popp
Credit Suisse Asset Management, LLC
Eleven Madison Avenue New York, New York
10010
(1956) | | Chief Executive Officer and President | | Since 2010 | | Managing Director of Credit Suisse; Group Manager and Senior Portfolio Manager for Performing Credit Strategies; Associated with Credit Suisse or its predecessor since 1997; Officer of other Credit Suisse Funds. | |
|
Michael A. Pignataro
Credit Suisse Asset Management, LLC
Eleven Madison Avenue New York, New York
10010
(1959) | | Chief Financial Officer | | Since Portfolio Inception | | Director and Director of Fund Administration of Credit Suisse; Associated with Credit Suisse or its predecessor since 1984; Officer of other Credit Suisse Funds. | |
|
Emidio Morizio
Credit Suisse Asset Management, LLC
One Madison Avenue
New York, New York
10010
(1966) | | Chief Compliance Officer | | Since Portfolio Inception | | Managing Director and Global Head of Compliance of Credit Suisse; Associated with Credit Suisse since July 2000; Officer of other Credit Suisse Funds. | |
|
Roger Machlis
Credit Suisse Asset Management, LLC
One Madison Avenue
New York, New York
10010
(1961) | | Chief Legal Officer | | Since 2010 | | Managing Director and General Counsel for Credit Suisse; Associated with Credit Suisse Group AG since 1997; Officer of other Credit Suisse Funds. | |
|
Cecilia Chau
Credit Suisse Asset Management, LLC
Eleven Madison Avenue New York, New York
10010
(1973) | | Treasurer | | Since 2008 | | Vice President of Credit Suisse since 2009; Assistant Vice President of Credit Suisse from June 2007 to December 2008; Associated with Alliance Bernstein L.P. from January 2007 to May 2007; Associated with Credit Suisse from August 2000 to December 2006; Officer of other Credit Suisse Funds. | |
|
Karen Regan
Credit Suisse Asset Management, LLC
Eleven Madison Avenue New York, New York
10010
(1963) | | Vice President and Secretary | | Since 2010 | | Vice President of Credit Suisse; Associated with Credit Suisse since December 2004; Officer of other Credit Suisse Funds | |
|
** The officers of the Portfolio shown are officers that make policy decisions.
The Statement of Additional Information includes additional information about the Trustees and is available, without charge, upon request, by calling 800-222-8977.
34
Credit Suisse Trust — Commodity Return Strategy Portfolio
Proxy Voting and Portfolio Holdings Information (unaudited)
Information regarding how the Portfolio voted proxies related to its portfolio securities during the 12 month period ended June 30 of each year, as well as the policies and procedures that the Portfolio uses to determine how to vote proxies relating to its portfolio securities are available:
• By calling 1-800-222-8977
• On the Portfolio's website, www.credit-suisse.com/us
• On the website of the Securities and Exchange Commission, www.sec.gov.
The Portfolio files a complete schedule of its portfolio holdings for the first and third quarters of its fiscal year with the SEC on Form N-Q. The Portfolio's Forms N-Q are available on the SEC's website at www.sec.gov and may be reviewed and copied at the SEC's Public Reference Room in Washington, DC. Information on the operation of the SEC's Public Reference Room may be obtained by calling 1-202-551-8090.
35
This page intentionally left blank
36

n CREDIT SUISSE
CAYMAN COMMODITY FUND II, LTD.
for the Year Ended December 31, 2010
37
Credit Suisse Cayman Commodity Fund II, Ltd.
Schedule of Investments
December 31, 2010
Par
(000) | |
| | Ratings†
(S&P/Moody's) | | Maturity | | Rate% | | Value | |
| UNITED STATES AGENCY OBLIGATIONS (61.5%) | | | |
| $ | 1,220 | | | Fannie Mae Discount Notes‡‡ | | (AAA, Aaa) | | 01/18/11 | | | 0.300 | | | $ | 1,219,827 | | |
| | 1,000 | | | Fannie Mae Discount Notes | | (AAA, Aaa) | | 02/15/11 | | | 0.150 | | | | 999,812 | | |
| | 1,000 | | | Fannie Mae Discount Notes | | (AAA, Aaa) | | 05/02/11 | | | 0.240 | | | | 999,603 | | |
| | 2,000 | | | Fannie Mae Discount Notes | | (AAA, Aaa) | | 05/16/11 | | | 0.210 | | | | 1,999,114 | | |
| | 1,000 | | | Federal Farm Credit Bank# | | (AAA, Aaa) | | 12/07/11 | | | 0.230 | | | | 999,460 | | |
| | 1,500 | | | Federal Home Loan Bank Discount Notes | | (AAA, Aaa) | | 03/23/11 | | | 0.170 | | | | 1,499,703 | | |
| | 1,000 | | | Federal Home Loan Bank Discount Notes | | (AAA, Aaa) | | 04/11/11 | | | 0.170 | | | | 999,728 | | |
| | 1,000 | | | Federal Home Loan Banks | | (AAA, Aaa) | | 04/01/11 | | | 0.350 | | | | 1,000,471 | | |
| | 1,000 | | | Federal National Mortgage Association# | | (AAA, Aaa) | | 08/23/12 | | | 0.281 | | | | 1,000,231 | | |
| | 1,000 | | | Freddie Mac Discount Notes | | (AAA, Aaa) | | 02/24/11 | | | 0.155 | | | | 999,768 | | |
| | 1,000 | | | Freddie Mac Discount Notes | | (AAA, Aaa) | | 04/26/11 | | | 0.240 | | | | 999,686 | | |
| | 1,000 | | | Freddie Mac Discount Notes | | (AAA, Aaa) | | 05/04/11 | | | 0.400 | | | | 999,597 | | |
| | 1,000 | | | Freddie Mac Discount Notes^^ | | (AAA, Aaa) | | 06/01/11 | | | 0.250 | | | | 999,379 | | |
| TOTAL UNITED STATES AGENCY OBLIGATIONS (Cost $14,711,067) | | | 14,716,379 | | |
| SHORT-TERM INVESTMENT (15.5%) | | | |
| | 3,715 | | | State Street Bank and Trust Co. Euro
Time Deposit (Cost $3,715,000) | | | | | | 01/03/11 | | | 0.010 | | | | 3,715,000 | | |
| TOTAL INVESTMENTS AT VALUE (77.0%) (Cost $18,426,067) | | | 18,431,379 | | |
| OTHER ASSETS IN EXCESS OF LIABILITIES (23.0%) | | | 5,514,236 | | |
| NET ASSETS (100.0%) | | $ | 23,945,615 | | |
† Credit ratings given by the Standard & Poor's Division of the McGraw-Hill Companies, Inc. ("S&P") and Moody's Investors Service, Inc. ("Moody's") are unaudited.
‡‡ Collateral segregated for futures contracts.
^^ Collateral segregated for swap contracts.
# Variable rate obligations — The interest rate is the rate as of December 31, 2010.
See Accompanying Notes to Financial Statements.
38
Credit Suisse Cayman Commodity Fund II, Ltd.
Statement of Assets and Liabilities
December 31, 2010
| Assets | |
| Investments at value (Cost $18,426,067) (Note 2) | | $ | 18,431,379 | | |
| Cash | | | 266 | | |
| Unrealized appreciation on swaps | | | 4,959,353 | | |
| Cash segregated at brokers for futures contracts and swap contracts | | | 2,077,455 | | |
| Receivable from investment adviser (Note 3) | | | 7,378 | | |
| Interest receivable | | | 1,977 | | |
| Total Assets | | | 25,477,808 | | |
| Liabilities | |
| Administrative services fee payable (Note 3) | | | 2,995 | | |
| Payable for investments purchased | | | 1,499,440 | | |
| Variation margin payable (Note 2) | | | 4,570 | | |
| Other accrued expenses payable | | | 25,188 | | |
| Total Liabilities | | | 1,532,193 | | |
| Net Assets | |
| Par value of participating shares (Note 4) | | | 20,923 | | |
| Paid-in capital (Note 4) | | | 34,379,077 | | |
| Undistributed net investment income | | | 347,392 | | |
| Accumulated net realized loss on investments, futures contracts and swap contracts | | | (16,107,655 | ) | |
| Net unrealized appreciation from investments, futures contracts and swap contracts | | | 5,305,878 | | |
| Net Assets | | $ | 23,945,615 | | |
| Shares outstanding | | | 20,922,783 | | |
| Net asset value, offering price and redemption price per share | | $ | 1.14 | | |
See Accompanying Notes to Financial Statements.
39
Credit Suisse Cayman Commodity Fund II, Ltd.
Statement of Operations
For the Year Ended December 31, 2010
| Investment Income (Note 2) | |
| Interest | | $ | 49,189 | | |
| Expenses | |
| Administrative services fees (Note 3) | | | 15,267 | | |
| Audit fees | | | 24,000 | | |
| Custodian fees | | | 13,811 | | |
| Legal fees | | | 9,113 | | |
| Miscellaneous expense | | | 250 | | |
| Total expenses | | | 62,441 | | |
| Less: fees reimbursed (Note 3) | | | (62,441 | ) | |
| Net expenses | | | — | | |
| Net investment income | | | 49,189 | | |
| Net Realized and Unrealized Gain (Loss) from Investments, Futures Contracts and Swap Contracts | |
| Net realized gain from investments | | | 4,512 | | |
| Net realized loss from futures contracts | | | (510,897 | ) | |
| Net realized gain from swap contracts | | | 5,854,011 | | |
Net change in unrealized appreciation (depreciation) from investments, futures contracts and
swap contracts | | | 5,570,772 | | |
| Net realized and unrealized gain from investments, futures contracts and swap contracts | | | 10,918,398 | | |
| Net increase in net assets resulting from operations | | $ | 10,967,587 | | |
See Accompanying Notes to Financial Statements.
40
Credit Suisse Cayman Commodity Fund II, Ltd.
Statements of Changes in Net Assets
| | | For the Year
Ended
December 31, 2010 | | For the Year
Ended
December 31, 2009 | |
| From Operations | |
| Net investment income | | $ | 49,189 | | | $ | 57,407 | | |
Net realized gain from investments, futures contracts and
swap contracts | | | 5,347,626 | | | | 13,446,712 | | |
Net change in unrealized appreciation (depreciation) from investments,
futures contracts and swap contracts | | | 5,570,772 | | | | (2,206,126 | ) | |
| Net increase in net assets resulting from operations | | | 10,967,587 | | | | 11,297,993 | | |
| From Capital Share Transactions (Note 4) | |
| Proceeds from sale of shares | | | 4,000,000 | | | | 4,000,000 | | |
| Net asset value of shares redeemed | | | (16,000,000 | ) | | | (7,000,000 | ) | |
| Net decrease in net assets from capital share transactions | | | (12,000,000 | ) | | | (3,000,000 | ) | |
| Net increase (decrease) in net assets | | | (1,032,413 | ) | | | 8,297,993 | | |
| Net Assets | |
| Beginning of year | | | 24,978,028 | | | | 16,680,035 | | |
End of year (including undistributed net investment income
of $347,392, and $298,203, respectively) | | $ | 23,945,615 | | | $ | 24,978,028 | | |
See Accompanying Notes to Financial Statements.
41
Credit Suisse Cayman Commodity Fund II, Ltd.
Notes to Financial Statements
December 31, 2010
Note 1. Organization
Credit Suisse Cayman Commodity Fund II, Ltd. (the "Fund") is organized as a Cayman Islands Company. The Fund intends to carry on the business of an investment company. The Fund's investment manager is Credit Suisse Asset Management, LLC ("Credit Suisse"). As of December 31, 2010, 100% of the Fund's participating shares were owned by Credit Suisse Trust — Commodity Return Strategy Portfolio.
Note 2. Significant Accounting Policies
A) SECURITY VALUATION — The net asset value of the Fund is determined daily as of the close of regular trading on the New York Stock Exchange, Inc. (the "Exchange") on each day the Exchange is open for business. Debt securities with a remaining maturity greater than 60 days are valued in accordance with the price supplied by a pricing service, which may use a matrix, formula or other objective method that takes into consideration market indices, yield curves and other specific adjustments. Debt obligations that will mature in 60 days or less are valued on the basis of amortized cost, which approximates market value, unless it is determined that using this method would not represent fair value. Debt securities are generally categorized as Level 2. Equity investments are valued at market value, which is generally determined using the closing price on the exchange or market on which the security is primarily traded at the ti me of valuation (the "Valuation Time"). If no sales are reported, equity investments are generally valued at the most recent bid quotation as of the Valuation Time or at the lowest asked quotation in the case of a short sale of securities. Equity investments are generally categorized as Level 1. Investments in open-end investment companies are valued at their net asset value each business day and are generally categorized as Level 1. Swap contracts are generally valued at a price at which the counterparty to such contract would repurchase the instrument or terminate the contract and are generally categorized as Level 2. Futures contracts are valued at the settlement prices established each day on the exchange on which they are traded and are generally categorized as Level 1. Securities, swap and futures contracts and other assets for which market quotations are not readily available, or whose values have been materially affected by events occurring before the Fund's Valuation Time but after the close of the securities' primary markets, are valued at fair value as determined in good faith by, or under the direction of, the Board of Directors under procedures established by the Board of Directors and are generally categorized as Level 3. The Fund may utilize a service provided by an independent third party which has been approved by the Board of Directors
42
Credit Suisse Cayman Commodity Fund II, Ltd.
Notes to Financial Statements (continued)
December 31, 2010
Note 2. Significant Accounting Policies
to fair value certain securities. When fair value pricing is employed, the prices of securities used by a fund to calculate its net asset value may differ from quoted or published prices for the same securities.
In accordance with the authoritative guidance on fair value measurements and disclosures under accounting principles generally accepted in the United States of America ("GAAP"), the Fund discloses the fair value of its investments in a hierarchy that prioritizes the inputs to valuation techniques used to measure the fair value. In accordance with GAAP, fair value is defined as the price that the Fund would receive upon selling an investment in a timely transaction to an independent buyer in the principal or most advantageous market of the investment. GAAP established a three-tier hierarchy to maximize the use of observable market data and minimize the use of unobservable inputs and to establish classification of fair value measurements for disclosure purposes. Inputs refer broadly to the assumptions that market participants would use in pricing the asset or liability, including assumptions about risk, for example, the risk inh erent in a particular valuation technique used to measure fair value including such a pricing model and/or the risk inherent in the inputs to the valuation technique. Inputs may be observable or unobservable. Observable inputs are inputs that reflect the assumptions market participants would use in pricing the asset or liability developed based on market data obtained from sources independent of the reporting entity. Unobservable inputs are inputs that reflect the reporting entity's own assumptions about the assumptions market participants would use in pricing the asset or liability developed based on the best information available in the circumstances. In accordance with the Fund's valuation procedures, factors used in determining value may include, but are not limited to, the type of the security, the size of the holding, the initial cost of the security, the existence of any contractual restrictions on the security's disposition, the price and extent of public trading in similar securities of the issuer o r of comparable companies, quotations or evaluated prices from broker-dealers and/or pricing services, information obtained from the issuer, analysts, and/or the appropriate stock exchange (for exchange-traded securities), an analysis of the company's or issuer's financial statements, an evaluation of the forces that influence the issuer and the market(s) in which the security is purchased and sold and with respect to debt securities, the maturity, coupon, creditworthiness, currency denomination, and the movement of the market in which the security is normally traded. The
43
Credit Suisse Cayman Commodity Fund II, Ltd.
Notes to Financial Statements (continued)
December 31, 2010
Note 2. Significant Accounting Policies
three-tier hierarchy of inputs is summarized in the three broad Levels listed below.
• Level 1 – quoted prices in active markets for identical investments
• Level 2 – other significant observable inputs (including quoted prices for similar investments, interest rates, prepayment speeds, credit risk, etc.)
• Level 3 – significant unobservable inputs (including the Fund's own assumptions in determining the fair value of investments)
The inputs or methodology used for valuing securities are not necessarily an indication of the risk associated with investing in those securities.
The following is a summary of the inputs used as of December 31, 2010 in valuing the Fund's investments carried at value:
| | | Level 1 | | Level 2 | | Level 3 | | Total | |
| Investments in Securities | |
| United States Agency Obligations | | $ | — | | | $ | 14,716,379 | | | $ | — | | | $ | 14,716,379 | | |
| Short-Term Investment | | | — | | | | 3,715,000 | | | | — | | | | 3,715,000 | | |
| Other Financial Instruments* | |
| Futures | | | 341,213 | | | | — | | | | — | | | | 341,213 | | |
| Swaps | | | — | | | | 4,959,353 | | | | — | | | | 4,959,353 | | |
| | | $ | 341,213 | | | $ | 23,390,732 | | | $ | — | | | $ | 23,731,945 | | |
*Other financial instruments include futures, forwards and swap contracts.
Effective January 1, 2010, the Fund adopted FASB amendments to authoritative guidance which requires the Fund to disclose details of significant transfers in and out of Level 1 and Level 2 measurements and the reasons for the transfers. For the year ended December 31, 2010, there were no significant transfers in and out of Level 1 and Level 2.
B) DERIVATIVE INSTRUMENTS AND HEDGING ACTIVITIES — Effective January 1, 2009, the Fund adopted amendments to authoritative guidance on disclosures about derivative instruments and hedging activities which require that the Fund disclose (a) how and why an entity uses derivative instruments, (b) how derivative instruments and hedging activities are accounted for, and (c) how derivative instruments and related hedging activities affect a fund's financial position, financial performance, and cash flows.
44
Credit Suisse Cayman Commodity Fund II, Ltd.
Notes to Financial Statements (continued)
December 31, 2010
Note 2. Significant Accounting Policies
Fair Values of Derivative Instruments as of December 31, 2010
| | | Asset Derivatives | | Liability Derivatives | |
| | | Balance Sheet
Location | | Fair Value | | Balance Sheet
Location | | Fair Value | |
Futures Contracts
on Commodities | | Variation margin receivable,
Net Assets - Unrealized
Appreciation | | $ | 341,213 | * | | Variation margin payable,
Liabilities - Unrealized
Depreciation | | $ | 0 | | |
Commodity Index
Swaps | | Net Assets - Unrealized
Appreciation | | | 4,959,353 | | | Liabilities - Unrealized
Depreciation | | | 0 | | |
| Total | | | | $ | 5,300,566 | | | | | $ | 0 | | |
*Includes cumulative appreciation/depreciation of futures contracts as reported in the Statement of Assets and Liabilities and Notes to Financial Statements. Only the current day's variation margin is reported within the Statement of Assets and Liabilities.
Effect of Derivative Instruments on the Statement of Operations
Amount of Realized Gain (Loss) on Derivatives Recognized in Income
Futures Contracts on Commodities | | $ | (510,897 | ) | |
| Commodity Index Swaps | | | 5,854,011 | | |
| Total | | $ | 5,343,114 | | |
Change in Unrealized Appreciation (Depreciation) on Derivatives Recognized in Income
Futures Contracts on Commodities | | $ | 395,490 | | |
| Commodity Index Swaps | | | 5,168,626 | | |
| Total | | $ | 5,564,116 | | |
The notional amount of futures contracts and commodity index swaps at year ended are reflected in the Notes to Financial Statements and the volume of these open positions relative to the net assets of the Portfolio is generally representative of open positions throughout the reporting period for the Portfolio.
C) SECURITY TRANSACTIONS AND INVESTMENT INCOME — Security transactions are accounted for on a trade date basis. Interest income is recorded on the accrual basis. The Fund amortizes premiums and accretes discounts using the effective interest method. Dividends are recorded on the ex-dividend date. The cost of investments sold is determined by use of the specific identification method for both financial reporting and income tax purposes.
D) INCOME TAXES — The Fund has received an undertaking from the Government of the Cayman Islands exempting it from all local income, profits and capital gains taxes through June of 2027. No such taxes are levied in the Cayman Islands at the present time. The Fund is a Controlled Foreign Corporation under U.S. tax laws and as such is not subject to U.S. income tax. Therefore, the Fund is not required to record a tax provision.
45
Credit Suisse Cayman Commodity Fund II, Ltd.
Notes to Financial Statements (continued)
December 31, 2010
Note 2. Significant Accounting Policies
The Fund adopted the authoritative guidance for uncertainty in income taxes and recognizes a tax benefit or liability from an uncertain position only if it is more likely than not that the position is sustainable based solely on its technical merits and consideration of the relevant taxing authority's widely understood administrative practices and procedures. The Fund has reviewed its current tax positions and has determined that no provision for income tax is required in the Fund's financial statements.
E) USE OF ESTIMATES — The preparation of financial statements in conformity with GAAP requires management to make estimates and assumptions that affect the reported amounts of assets and liabilities and disclosure of contingent assets and liabilities at the date of the financial statements and the reported amounts of income and expenses during the reporting period. Actual results could differ from these estimates.
F) SHORT-TERM INVESTMENTS — The Fund, together with other funds/portfolios advised by Credit Suisse, an indirect, wholly-owned subsidiary of Credit Suisse Group AG, pools available cash into a short-term variable rate time deposit issued by State Street Bank and Trust Company ("SSB"), the Fund's custodian. The short-term time deposit issued by SSB is a variable rate account classified as a short-term investment.
G) FUTURES — The Fund may enter into futures contracts to the extent permitted by its investment policies and objectives. The Fund may use futures contracts to gain exposure to, or hedge against changes in commodities. Upon entering into a futures contract, the Fund is required to deposit cash and/or pledge U.S. Government securities as initial margin. Subsequent payments, which are dependent on the daily fluctuations in the value of the underlying instrument, are made or received by the Fund each day (daily variation margin) and are recorded as unrealized gains or losses until the contracts are closed. When the contracts are closed, the Fund records a realized gain or loss equal to the difference between the proceeds from (or cost of) the closing transactions and the Fund basis in the contract. Risks of entering into futures contracts for hedging purposes include the possibility that a change in the value of the contract may not correlate with the changes in the value of the underlying instruments. With futures, there is minimal counterparty credit risk to the Fund since futures are exchange traded and the exchange's clearinghouse, as counterparty to all exchange traded futures, guarantees the futures against default. In addition, the purchase of a futures contract involves the risk that the Fund could lose more than the original margin deposit and subsequent
46
Credit Suisse Cayman Commodity Fund II, Ltd.
Notes to Financial Statements (continued)
December 31, 2010
Note 2. Significant Accounting Policies
payments may be required for a futures transaction. At December 31, 2010, the Fund had the following open futures contracts:
| Contract Description | | Notional
Value | | Unrealized
Appreciation (Depreciation) | |
| Contracts to Purchase | | | | | | | | | |
| Agriculture | | | 851,920 | | | $ | 98,865 | | |
| Energy | | | 3,781,020 | | | | 424,940 | | |
| | | $ | 523,805 | | |
| Contracts To Sell | | | | | | | | | |
| Agriculture | | | (1,082,440 | ) | | $ | (102,587 | ) | |
| Energy | | | (3,746,580 | ) | | | (80,005 | ) | |
| | | $ | (182,592 | ) | |
Net unrealized appreciation
(depreciation) | | | | $ | 341,213 | | |
H) SWAPS — The Fund may enter into commodity index swap contracts for hedging purposes or to seek to increase total return. A swap contract is an agreement that obligates two parties to exchange a series of cash flows at specified intervals based upon or calculated by reference to changes in specified prices or rates for a specified amount of an underlying asset or notional principal amount. The Fund will enter into commodity index swap contracts only on a net basis, which means that the two payment streams are netted out, with the Fund receiving or paying, as the case may be, only the net amount of the two payments. Risks may arise as a result of the failure of the counterparty to the swap contract to comply with the terms of the swap contract. The Fund's maximum risk of loss from the counterparty credit risk is the discounted net value of the cash flows to be received from/paid to the counterparty over the contract's re maining life, to the extent that the amount is positive. This risk is mitigated by having a master netting arrangement between the Fund and the counterparty and by the posting of collateral by the counterparty to the Fund to cover the Fund's exposure to the counterparty. Therefore, the Fund considers the creditworthiness of each counterparty to a swap contract in evaluating potential credit risk. Additionally, risks may arise from unanticipated movements in interest rates or in the value of the underlying reference asset or index.
The Fund may enter into total return swap contracts, involving commitments to pay interest in exchange for a market-linked return, both based on notional amounts. To the extent the total return of the security or index underlying the
47
Credit Suisse Cayman Commodity Fund II, Ltd.
Notes to Financial Statements (continued)
December 31, 2010
Note 2. Significant Accounting Policies
transactions exceeds or falls short of the offsetting interest rate obligation, the Fund will receive a payment from or make a payment to the counterparty.
The Fund records unrealized gains or losses on a daily basis representing the value and the current net receivable or payable relating to open swap contracts. Net amounts received or paid on the swap contract are recorded as realized gains or losses. Fluctuations in the value of swap contracts are recorded for financial statement purposes as unrealized appreciation or depreciation on swap contracts. Realized gains and losses from terminated swaps are included in net realized gains/losses on swap contracts transactions. At December 31, 2010, the Fund had the following outstanding swap contracts:
| Currency | | Notional
Amount | | Expiration
Date | | Counterparty | | Receive | | Pay | | Unrealized
Appreciation/
(Depreciation) | |
| USD | | $ | 19,741,663 | | | 1/4/2011 | | Barclays | | Commodity Index
Return | | Fee plus
Treasury Bill Rate | | $ | 1,431,880 | | |
| USD | | $ | 1,738,997 | | | 1/4/2011 | | UBS | | Commodity Index
Return | | Fee plus
Treasury Bill Rate | | | 126,159 | | |
| USD | | $ | 800,000 | | | 1/4/2011 | | UBS | | Commodity Index
Return | | Fee plus
Treasury Bill Rate | | | 19,036 | | |
| USD | | $ | 1,126,516 | | | 1/4/2011 | | Morgan Stanley
Capital Group | | Commodity Index
Return | | Fee plus
Treasury Bill Rate | | | 81,680 | | |
| USD | | $ | 39,591,226 | | | 1/4/2011 | | Bank of America | | Commodity Index
Return | | Fee plus
Treasury Bill Rate | | | 2,868,445 | | |
| USD | | $ | 5,962,101 | | | 1/4/2011 | | Societe Generale | | Commodity Index
Return | | Fee plus
Treasury Bill Rate | | | 432,153 | | |
| | | $ | 4,959,353 | | |
I) SUBSEQUENT EVENTS — In preparing the financial statements as of December 31, 2010, management considered the impact of subsequent events for potential recognition or disclosure in these financial statements.
Note 3. Transactions with Affiliates and Related Parties
Credit Suisse recognizes that it receives compensation for performing investment advisory services for the Credit Suisse Trust — Commodity Return Strategy Portfolio pursuant to a separate investment advisory agreement and agrees to receive no additional compensation for rendering its services to the Fund. During the year ended December 31, 2010, Credit Suisse voluntarily reimbursed the Fund $62,441 in Fund expenses. Credit Suisse will not recapture from the Fund any fees it waived or expenses it reimbursed during the year
48
Credit Suisse Cayman Commodity Fund II, Ltd.
Notes to Financial Statements (continued)
December 31, 2010
Note 3. Transactions with Affiliates and Related Parties
ended December 31, 2010. Fee waivers and expense reimbursements are voluntary and may be discontinued by Credit Suisse at any time.
SSB serves as administrator to the Fund. For its administrative services, SSB receives a fee, exclusive of out-of-pocket expenses, calculated in total for all the Credit Suisse funds/portfolios co-administered by SSB and allocated based upon the relative average net assets for each fund/ portfolio, subject to annual minimum fee. For the year ended December 31, 2010, administrative services fees earned by SSB were $15,267.
Note 4. Capital Share Transactions
The Fund issued 100,000 participating shares for $1,000,000 on July 27, 2007 in conjunction with the initial capitalization of the Fund. Transactions in capital shares of the Fund were as follows:
| | | For the Year Ended
December 31, 2010 | | For the Year Ended
December 31, 2009 | |
| | | Shares | | Value | | Shares | | Value | |
| Shares sold | | | 7,866,274 | | | $ | 4,000,000 | | | | 11,899,312 | | | $ | 4,000,000 | | |
| Shares redeemed | | | (21,617,459 | ) | | | (16,000,000 | ) | | | (15,252,402 | ) | | | (7,000,000 | ) | |
| Net decrease | | | (13,751,185 | ) | | $ | (12,000,000 | ) | | | (3,353,090 | ) | | $ | (3,000,000 | ) | |
Note 5. Financial Highlights
The following represents the total return of the Fund for the year ended December 31, 2010 and the year ended December 31, 2009, respectively. Total returns were calculated based upon the daily returns of the Fund during the years represented.
| | | For the Year Ended
December 31, 2010 | | For the Year Ended
December 31, 2009 | |
| Total Return | | | 58.33 | % | | | 63.64 | % | |
The following represents certain financial ratios of the Fund for the years noted. The computation of the net investment income and total expense ratios were based upon the daily net assets of the Fund during these years.
| | | For the Year Ended
December 31, 2010 | | For the Year Ended
December 31, 2009 | |
| Ratio to Average Net Assets: | |
| Net investment income | | | 0.22 | % | | | 0.31 | % | |
| Total expenses (before expense reimbursement) | | | 0.28 | % | | | 0.18 | % | |
| Total expenses (after expense reimbursement) | | | 0.00 | % | | | 0.00 | % | |
49
Credit Suisse Cayman Commodity Fund II, Ltd.
Notes to Financial Statements (continued)
December 31, 2010
Note 6. Contingencies
In the normal course of business, the Fund may provide general indemnifications pursuant to certain contracts and organizational documents. The Fund's maximum exposure under these arrangements is dependent on future claims that may be made against the Fund and, therefore, cannot be estimated; however, based on experience, the risk of loss from such claims is considered remote.
50
Credit Suisse Cayman Commodity Fund II, Ltd.
Report of Independent Registered Public Accounting Firm
To the Board of Directors and Shareholders of
Credit Suisse Cayman Commodity Fund II, Ltd.:
In our opinion, the accompanying statement of assets and liabilities, including the schedule of investments and the related statements of operations and of changes in net asset present fairly, in all material respects, the financial position of Credit Suisse Cayman Commodity Fund II, Ltd. (the "Fund"), at December 31, 2010, the results of its operations for the year then ended and the changes in its net assets for the periods presented, in conformity with accounting principles generally accepted in the United States of America. These financial statements are the responsibility of the Fund's management. Our responsibility is to express an opinion on these financial statements based on our audit. We conducted our audit of these financial statements in accordance with the standards of the Public Company Accounting Oversight Board (United States). Those standards require that we plan and perform the audit to obtain reasonable assu rance about whether the financial statements are free of material misstatement. An audit includes examining, on a test basis, evidence supporting the amounts and disclosures in the financial statements, assessing the accounting principles used and significant estimates made by management, and evaluating the overall financial statement presentation. We believe that our audit, which included confirmation of securities at December 31, 2010 by correspondence with the custodian and brokers, provides a reasonable basis for our opinion.
PricewaterhouseCoopers LLP
Boston, Massachusetts
February 22, 2011
51
This page intentionally left blank

P.O. BOX 55030, BOSTON, MA 02205-5030
800-222-8977 n www.credit-suisse.com/us
CREDIT SUISSE ASSET MANAGEMENT SECURITIES, INC., DISTRIBUTOR. TRCOM-AR-1210

CREDIT SUISSE FUNDS
Annual Report
December 31, 2010
CREDIT SUISSE TRUST
n INTERNATIONAL EQUITY FLEX III PORTFOLIO
Credit Suisse Trust (the "Trust") shares are not available directly to individual investors, but may be offered only through certain insurance products and pension and retirement plans.
The Trust's investment objectives, risks, charges and expenses (which should be considered carefully before investing), and more complete information about the Trust, are provided in the Prospectus, which should be read carefully before investing. You may obtain additional copies by calling 800-222-8977 or by writing to Credit Suisse Trust, P.O. Box 55030, Boston, MA 02205-5030.
Credit Suisse Asset Management Securities, Inc., Distributor, is located at Eleven Madison Avenue, New York, NY 10010. The Trust is advised by Credit Suisse Asset Management, LLC.
The views of the Portfolio's management are as of the date of the letter and the Portfolio holdings described in this document are as of December 31, 2010; these views and Portfolio holdings may have changed subsequent to these dates. Nothing in this document is a recommendation to purchase or sell securities.
Portfolio shares are not deposits or other obligations of Credit Suisse Asset Management, LLC ("Credit Suisse") or any affiliate, are not FDIC-insured and are not guaranteed by Credit Suisse or any affiliate. Portfolio investments are subject to investment risks, including loss of your investment.
Credit Suisse Trust — International Equity Flex III Portfolio
Annual Investment Adviser's Report
December 31, 2010 (unaudited)
February 3, 2011
Dear Shareholder:
For the year ended December 31, 2010, the Credit Suisse Trust — International Equity Flex III Portfolio (the "Portfolio") had a gain of 12.23%1 versus an increase of 7.75% for the MSCI EAFE Index Net Dividends.2
Market Review: A positive end to a challenging year
The year ended December 31, 2010, was a volatile one for equities. After three quarters of choppy trading, global equity markets had a robust fourth quarter and, in general, finished the year higher. For the 12-month period, the MSCI World Index increased 11.76%, while the Dow Jones Euro STOXX Index gained 2.69%, and the FTSE All Share Index rose 14.52%. In Japan, the Topix Index finished the year up 0.96%.
Fairly encouraging economic data reports and cooperative central bankers in the United States and Europe combined with impressive economic growth in developing regions to help ease investor concerns about the threat of a double-dip recession. This change in sentiment boosted stock prices, especially during the last month of the year. Additionally, the U.S. Federal Reserve's anti-deflationary policy of implementing multiple quantitative easing measures — the first worth approximately $1.7 trillion and the second worth approximately $600 billion — together with the extension of Bush-era tax cuts injected liquidity into the global markets. In Europe, sovereign debt worries led the European Central Bank to inject liquidity into the region's troubled banks. In Asia, developing economies were on the verge of overheating, especially in China. The People's Bank of China acted several times throughout the course of the year t o curb inflation by raising bank reserve requirements, but these actions were not enough to dampen equity prices in surrounding economies.
Additionally in the global market, Moody's downgraded Ireland's sovereign debt five times, warned Spain about looming debt problems, and placed Greece's sovereign debt under review for a possible downgrade. As of November 2010, inflation in China was reported at 5.10%, while the growth rate approached 9.6% over the period. Also, the Federal Reserve's dollar swap lines to the European Central Bank and the Bank of Japan were extended to August 1, 2011.
Strategic Review and Outlook: Cautiously optimistic for the future
For the year ended December 31, 2010, the Portfolio outperformed the benchmark due, in part, to both the Europe and Japan models. Momentum was a strong positive driver in Europe as many of the Mediterranean countries
1
Credit Suisse Trust — International Equity Flex III Portfolio
Annual Investment Adviser's Report (continued)
December 31, 2010 (unaudited)
consistently underperformed Germany and the Nordic region throughout the year. And in Japan, our model benefited from the value factor as investors continued to seek bargains in a depressed economy. Overall, long positions were broadly supportive of portfolio outperformance, while short positions detracted from performance. Based on country positioning, long positions in the equities of Japan, the United Kingdom, and Sweden, as well as short positions in Spain and Italy supported portfolio performance. Short positions in the equities of Switzerland and France detracted from portfolio performance. Considering sector positioning, long positions in the industrials, materials, and consumer staples sectors, as well as short positions in the utilities sector, benefitted portfolio performance, while short positions in the consumer discretionary and energy sectors detracted from portfolio results.
Looking forward, we believe the European sovereign debt worries that were prevalent throughout the year may likely continue. Additionally, we expect that developing economies, led by China, may continue to grow at an outsized pace as 2011 progresses. This could force Central Bankers in these regions to take additional steps in order to cool their economies and mitigate any inflationary threats.
Credit Suisse Quantitative Equities Group
Mika Toikka
Timothy Schwider
Short sales expose the Portfolio to the risk that it will be required to cover its short position at a time when the securities have appreciated in value, thus resulting in a loss to the Portfolio. The Portfolio's loss on a short sale could theoretically be unlimited in a case where the Portfolio is unable to close out its short position.
The use of leverage subjects the Portfolio to the risk of magnified capital losses that can occur when losses affect an asset base that has been enlarged by borrowings or the creation of liabilities. The net asset value of the Portfolio, when employing leverage, will be more volatile and sensitive to market movements. Leverage may involve the creation of a liability that requires the Portfolio to pay interest.
International investing entails special risk considerations, including currency fluctuations, lower liquidity, economic and political risks, and differences in accounting methods.
2
Credit Suisse Trust — International Equity Flex III Portfolio
Annual Investment Adviser's Report (continued)
December 31, 2010 (unaudited)
Active and frequent trading increases transaction costs, which could detract from the Portfolio's performance.
In addition to historical information, this report contains forward-looking statements, which may concern, among other things, domestic and foreign market, industry and economic trends and developments and government regulation and their potential impact on the Portfolio's investments. These statements are subject to risks and uncertainties and actual trends, developments and regulations in the future, and their impact on the Portfolio could be materially different from those projected, anticipated or implied. The Portfolio has no obligation to update or revise forward-looking statements.
3
Credit Suisse Trust — International Equity Flex III Portfolio
Annual Investment Adviser's Report (continued)
December 31, 2010 (unaudited)
Comparison of Change in Value of $10,000 Investment in the
Credit Suisse Trust — International Equity Flex III Portfolio1 and the
MSCI EAFE Index Net Dividends2 for Ten Years.
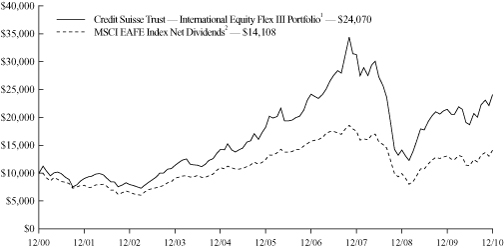
4
Credit Suisse Trust — International Equity Flex III Portfolio
Annual Investment Adviser's Report (continued)
December 31, 2010 (unaudited)
Average Annual Returns as of December 31, 20101
1 Year | |
5 Years | |
10 Years | | Since
Inception3 | |
| | 12.23 | % | | | 5.70 | % | | | 9.18 | % | | | 7.21 | % | |
Returns represent past performance and include change in share price and reinvestment of dividends and capital gains. Past performance cannot guarantee future results. The current performance of the Portfolio may be lower or higher than the figures shown. Returns and share price will fluctuate, and redemption value may be more or less than original cost. The performance results do not reflect the deduction of taxes that a shareholder would pay on portfolio distributions or the redemption of portfolio shares. Performance includes the effect of deducting expenses, but does not include charges and expenses attributable to any particular variable contract or plan. Accordingly, the Prospectus of the sponsoring Participating Insurance Com pany separate account or plan documents or other informational materials supplied by plan sponsors should be carefully reviewed for information on relevant charges and expenses. Excluding these charges and expenses from quotations of performance has the effect of increasing the performance quoted, and the effect of these charges should be considered when comparing performance to that of other mutual funds. Performance information current to the most recent month-end is available at www.credit-suisse.com/us.
The annualized gross expense ratio is 2.43%. The annualized net expense ratio after fee waivers and/or expense reimbursements is 1.99%.
1 Fee waivers and/or expense reimbursements may reduce expenses for the Portfolio, without which performance would be lower. Waivers and/or reimbursements may be discontinued at any time.
2 The Morgan Stanley Capital International EAFE (Europe, Australasia, Far East) Index Net Dividends is a free float-adjusted market capitalization index that is designed to measure developed-market equity performance, excluding the U.S. and Canada. It is the exclusive property of Morgan Stanley Capital International Inc. Investors cannot invest directly in an index.
3 Inception date 12/31/97.
5
Credit Suisse Trust — International Equity Flex III Portfolio
Annual Investment Adviser's Report (continued)
December 31, 2010 (unaudited)
Information About Your Portfolio's Expenses
As an investor of the Portfolio, you incur two types of costs: ongoing expenses and transaction costs. Ongoing expenses include management fees, distribution and service (12b-1) fees and other Portfolio expenses. Examples of transaction costs include sales charges (loads), redemption fees and account maintenance fees, which are not shown in this section and which would result in higher total expenses. The following table is intended to help you understand your ongoing expenses of investing in the Portfolio and to help you compare these expenses with the ongoing expenses of investing in other mutual funds. The table is based on an investment of $1,000 made at the beginning of the six month period ended December 31, 2010.
The table illustrates your Portfolio's expenses in two ways:
• Actual Portfolio Return. This helps you estimate the actual dollar amount of ongoing expenses paid on a $1,000 investment in the Portfolio using the Portfolio's actual return during the period. To estimate the expenses you paid over the period, simply divide your account value by $1,000 (for example, an $8,600 account value divided by $1,000 = 8.6), then multiply the result by the number in the "Expenses Paid per $1,000" line under the share class you hold.
• Hypothetical 5% Portfolio Return. This helps you to compare your Portfolio's ongoing expenses with those of other mutual funds using the Portfolio's actual expense ratio and a hypothetical rate of return of 5% per year before expenses. Examples using a 5% hypothetical portfolio return may be found in the shareholder reports of other mutual funds. The hypothetical account values and expenses may not be used to estimate the actual ending account balance or expenses you paid for the period.
Please note that the expenses shown in these tables are meant to highlight your ongoing expenses only and do not reflect any transaction costs, such as sales charges (loads) or redemption fees. If these transaction costs had been included, your costs would have been higher. The "Expenses Paid per $1,000" line of the tables is useful in comparing ongoing expenses only and will not help you determine the relative total expenses of owning different funds.
6
Credit Suisse Trust — International Equity Flex III Portfolio
Annual Investment Adviser's Report (continued)
December 31, 2010 (unaudited)
Expenses and Value for a $1,000 Investment
for the six month period ended December 31, 2010
| Actual Portfolio Return | |
| Beginning Account Value 7/1/10 | | $ | 1,000.00 | | |
| Ending Account Value 12/31/10 | | $ | 1,287.00 | | |
| Expenses Paid per $1,000* | | $ | 9.51 | | |
| Hypothetical 5% Portfolio Return | |
| Beginning Account Value 7/1/10 | | $ | 1,000.00 | | |
| Ending Account Value 12/31/10 | | $ | 1,016.89 | | |
| Expenses Paid per $1,000* | | $ | 8.39 | | |
| Annualized Expense Ratio* | | | 1.65 | % | |
* Expenses are equal to the Portfolio's annualized expense ratio multiplied by the average account value over the period, multiplied by the number of days in the most recent fiscal half year period, then divided by 365.
The "Expenses Paid per $1,000" and the "Annualized Expense Ratio" in the tables are based on actual expenses paid by the Portfolio during the period, net of fee waivers and/or expense reimbursements. If those fee waivers and/or expense reimbursements had not been in effect, the Portfolio's actual expenses would have been higher. Expenses do not reflect additional charges and expenses that are, or may be, imposed under the variable contracts or plans. Such charges and expenses are described in the prospectus of the insurance company separate account or in the plan documents or other informational materials supplied by plan sponsors. The Portfolio's expenses should be considered with these charges and expenses in evaluating the overall cost of investing in the separate account.
For more information, please refer to the Portfolio's prospectus.
7
Credit Suisse Trust — International Equity Flex III Portfolio
Annual Investment Adviser's Report (continued)
December 31, 2010 (unaudited)
SECTOR BREAKDOWN*
| | | Long | | Short | | Net | |
| Financials | | | 29.6 | % | | | (5.2 | )% | | | 24.4 | % | |
| Industrials | | | 20.0 | % | | | (5.4 | )% | | | 14.6 | % | |
| Energy | | | 10.2 | % | | | (0.7 | )% | | | 9.5 | % | |
| Materials | | | 12.5 | % | | | (3.0 | )% | | | 9.5 | % | |
| Consumer Staples | | | 10.5 | % | | | (1.9 | )% | | | 8.6 | % | |
| Health Care | | | 10.9 | % | | | (2.5 | )% | | | 8.4 | % | |
| Consumer Discretionary | | | 11.8 | % | | | (4.1 | )% | | | 7.7 | % | |
| Telecommunication Services | | | 7.1 | % | | | (0.5 | )% | | | 6.6 | % | |
| Information Technology | | | 5.9 | % | | | (1.0 | )% | | | 4.9 | % | |
| Utilities | | | 6.0 | % | | | (0.9 | )% | | | 5.1 | % | |
| Short-Term Investments | | | 0.7 | % | | | (0.0 | )% | | | 0.7 | % | |
| Total | | | 125.2 | % | | | (25.2 | )% | | | 100.0 | % | |
* Expressed as a percentage of total long/short investments, respectively, (excluding security lending collateral if applicable) and may vary over time.
8
Credit Suisse Trust — International Equity Flex III Portfolio
Schedule of Investments
December 31, 2010
| | | Number of
Shares | | Value | |
| LONG STOCK POSITIONS (124.5%) | |
| COMMON STOCKS (123.6%) | |
| Asia (3.2%) | |
| Diversified Financial Services (3.2%) | |
| iShares MSCI Pacific ex-Japan Index Fund§ | | | 87,803 | | | $ | 4,124,985 | | |
| TOTAL ASIA | | | 4,124,985 | | |
| Australia (6.7%) | |
| Air Freight & Logistics (0.0%) | |
| Toll Holdings, Ltd.§ | | | 5,727 | | | | 33,681 | | |
| Airlines (0.0%) | |
| Qantas Airways, Ltd.* | | | 9,568 | | | | 24,912 | | |
| Beverages (0.1%) | |
| Coca-Cola Amatil, Ltd. | | | 4,837 | | | | 53,905 | | |
| Foster's Group, Ltd. | | | 16,635 | | | | 96,917 | | |
| | | | 150,822 | | |
| Biotechnology (0.2%) | |
| CSL, Ltd. | | | 4,854 | | | | 180,588 | | |
| Capital Markets (0.1%) | |
| Macquarie Group, Ltd. | | | 2,868 | | | | 108,765 | | |
| Chemicals (0.1%) | |
| DuluxGroup, Ltd. | | | 3,103 | | | | 8,741 | | |
| Incitec Pivot, Ltd. | | | 13,901 | | | | 56,479 | | |
| Nufarm, Ltd.* | | | 1,630 | | | | 8,592 | | |
| Orica, Ltd. | | | 3,103 | | | | 79,309 | | |
| | | | 153,121 | | |
| Commercial Banks (1.8%) | |
| Australia & New Zealand Banking Group, Ltd. | | | 21,593 | | | | 516,886 | | |
| Bendigo and Adelaide Bank, Ltd. | | | 3,018 | | | | 30,803 | | |
| Commonwealth Bank of Australia§ | | | 13,226 | | | | 688,742 | | |
| National Australia Bank, Ltd. | | | 18,065 | | | | 439,249 | | |
| Suncorp Group, Ltd. | | | 10,956 | | | | 96,694 | | |
| Westpac Banking Corp.§ | | | 25,365 | | | | 577,507 | | |
| | | | 2,349,881 | | |
| Commercial Services & Supplies (0.1%) | |
| Brambles, Ltd. | | | 12,173 | | | | 88,864 | | |
| Construction & Engineering (0.0%) | |
| Leighton Holdings, Ltd.§ | | | 1,285 | | | | 40,591 | | |
| Construction Materials (0.0%) | |
| Boral, Ltd. | | | 5,132 | | | | 25,443 | | |
| Containers & Packaging (0.1%) | |
| Amcor, Ltd. | | | 10,524 | | | | 72,827 | | |
See Accompanying Notes to Financial Statements.
9
Credit Suisse Trust — International Equity Flex III Portfolio
Schedule of Investments (continued)
December 31, 2010
| | | Number of
Shares | | Value | |
| LONG STOCK POSITIONS | |
| COMMON STOCKS | |
| Australia | |
| Diversified Financial Services (0.4%) | |
| ASX, Ltd. | | | 1,484 | | | $ | 57,329 | | |
| iShares MSCI Australia Index Fund | | | 18,568 | | | | 472,370 | | |
| | | | 529,699 | | |
| Diversified Telecommunication Services (0.1%) | |
| Telstra Corp., Ltd.§ | | | 37,543 | | | | 107,343 | | |
| Electric Utilities (0.0%) | |
| SP AusNet | | | 11,478 | | | | 10,234 | | |
| Energy Equipment & Services (0.0%) | |
| WorleyParsons, Ltd. | | | 1,426 | | | | 39,142 | | |
| Food & Staples Retailing (0.5%) | |
| Metcash, Ltd. | | | 6,596 | | | | 27,774 | | |
| Wesfarmers, Ltd. | | | 8,665 | | | | 284,484 | | |
| Wesfarmers, Ltd. | | | 1,309 | | | | 43,394 | | |
| Woolworths, Ltd. | | | 10,684 | | | | 295,686 | | |
| | | | 651,338 | | |
| Food Products (0.0%) | |
| Goodman Fielder, Ltd. | | | 11,304 | | | | 15,591 | | |
| Health Care Equipment & Supplies (0.0%) | |
| Cochlear, Ltd. | | | 485 | | | | 40,013 | | |
| Health Care Providers & Services (0.0%) | |
| Sonic Healthcare, Ltd. | | | 3,181 | | | | 37,897 | | |
| Hotels, Restaurants & Leisure (0.1%) | |
| Aristocrat Leisure, Ltd.§ | | | 3,448 | | | | 10,576 | | |
| Crown, Ltd. | | | 4,340 | | | | 36,734 | | |
| TABCORP Holdings, Ltd. | | | 5,239 | | | | 38,178 | | |
| Tatts Group, Ltd. | | | 10,447 | | | | 27,647 | | |
| | | | 113,135 | | |
| Industrial Conglomerates (0.0%) | |
| CSR, Ltd.§ | | | 12,406 | | | | 21,358 | | |
| Insurance (0.3%) | |
| AMP, Ltd.§ | | | 17,660 | | | | 95,770 | | |
| AXA Asia Pacific Holdings, Ltd. | | | 8,909 | | | | 57,659 | | |
| Insurance Australia Group, Ltd. | | | 17,922 | | | | 71,335 | | |
| QBE Insurance Group, Ltd. | | | 8,831 | | | | 164,362 | | |
| | | | 389,126 | | |
| IT Services (0.0%) | |
| Computershare, Ltd. | | | 3,832 | | | | 42,329 | | |
| Media (0.0%) | |
| Fairfax Media, Ltd.§ | | | 18,247 | | | | 26,223 | | |
See Accompanying Notes to Financial Statements.
10
Credit Suisse Trust — International Equity Flex III Portfolio
Schedule of Investments (continued)
December 31, 2010
| | | Number of
Shares | | Value | |
| LONG STOCK POSITIONS | |
| COMMON STOCKS | |
| Australia | |
| Metals & Mining (1.7%) | |
| Alumina, Ltd. | | | 21,036 | | | $ | 53,593 | | |
| BHP Billiton, Ltd.§ | | | 28,931 | | | | 1,348,284 | | |
| BlueScope Steel, Ltd. | | | 15,718 | | | | 36,204 | | |
| Fortescue Metals Group, Ltd.* | | | 10,669 | | | | 71,676 | | |
| Newcrest Mining, Ltd. | | | 4,169 | | | | 173,305 | | |
| OneSteel, Ltd. | | | 11,451 | | | | 30,402 | | |
| OZ Minerals, Ltd.§ | | | 26,908 | | | | 47,628 | | |
| Rio Tinto, Ltd.§ | | | 3,756 | | | | 329,625 | | |
| Sims Metal Management, Ltd. | | | 1,389 | | | | 30,619 | | |
| | | | 2,121,336 | | |
| Multi-Utilities (0.1%) | |
| AGL Energy, Ltd.§ | | | 3,869 | | | | 60,447 | | |
| Multiline Retail (0.0%) | |
| Harvey Norman Holdings, Ltd.§ | | | 4,704 | | | | 14,179 | | |
| Oil, Gas & Consumable Fuels (0.4%) | |
| Caltex Australia, Ltd. | | | 1,163 | | | | 17,128 | | |
| Dart Energy, Ltd.*§ | | | 2,525 | | | | 2,983 | | |
| Energy Resources of Australia, Ltd.§ | | | 575 | | | | 6,562 | | |
| Origin Energy, Ltd. | | | 7,570 | | | | 129,356 | | |
| Paladin Energy, Ltd.*§ | | | 5,564 | | | | 28,105 | | |
| Santos, Ltd. | | | 7,170 | | | | 96,746 | | |
| Woodside Petroleum, Ltd. | | | 4,689 | | | | 204,705 | | |
| | | | 485,585 | | |
| Real Estate Investment Trusts (0.4%) | |
| CFS Retail Property Trust§ | | | 14,987 | | | | 27,028 | | |
| Dexus Property Group§ | | | 41,087 | | | | 33,473 | | |
| Goodman Group§ | | | 52,342 | | | | 34,862 | | |
| GPT Group | | | 15,995 | | | | 48,268 | | |
| Mirvac Group | | | 23,177 | | | | 29,144 | | |
| Stockland§ | | | 20,543 | | | | 75,837 | | |
| Westfield Group | | | 17,905 | | | | 175,771 | | |
| Westfield Retail Trust* | | | 17,905 | | | | 47,169 | | |
| | | | 471,552 | | |
| Real Estate Management & Development (0.1%) | |
| Lend Lease Corp., Ltd. | | | 5,378 | | | | 47,590 | | |
| Road & Rail (0.0%) | |
| Asciano Group* | | | 23,963 | | | | 39,206 | | |
| Textiles, Apparel & Luxury Goods (0.0%) | |
| Billabong International, Ltd.§ | | | 1,743 | | | | 14,567 | | |
See Accompanying Notes to Financial Statements.
11
Credit Suisse Trust — International Equity Flex III Portfolio
Schedule of Investments (continued)
December 31, 2010
| | | Number of
Shares | | Value | |
| LONG STOCK POSITIONS | |
| COMMON STOCKS | |
| Australia | |
| Transportation Infrastructure (0.1%) | |
| Macquarie Airports | | | 6,208 | | | $ | 19,017 | | |
| Macquarie Atlas Roads Group*§ | | | 4,636 | | | | 7,210 | | |
| Transurban Group§ | | | 10,009 | | | | 52,662 | | |
| | | | 78,889 | | |
| TOTAL AUSTRALIA | | | 8,586,274 | | |
| Austria (1.0%) | |
| Air Freight & Logistics (0.3%) | |
| Oesterreichische Post AG | | | 10,552 | | | | 350,301 | | |
| Construction & Engineering (0.2%) | |
| Strabag SE BR | | | 9,658 | | | | 266,492 | | |
| Insurance (0.1%) | |
| Vienna Insurance Group | | | 1,245 | | | | 65,144 | | |
| Machinery (0.2%) | |
| Andritz AG | | | 2,963 | | | | 273,970 | | |
| Metals & Mining (0.2%) | |
| Voestalpine AG | | | 6,124 | | | | 294,065 | | |
| Real Estate Management & Development (0.0%) | |
| Immofinanz Anspt Nachb*§^ | | | 2,201 | | | | 0 | | |
| TOTAL AUSTRIA | | | 1,249,972 | | |
| Belgium (1.4%) | |
| Beverages (0.7%) | |
| Anheuser-Busch InBev NV | | | 15,313 | | | | 878,404 | | |
| Diversified Telecommunication Services (0.3%) | |
| Belgacom SA | | | 13,259 | | | | 447,211 | | |
| Electrical Equipment (0.2%) | |
| Bekaert SA | | | 2,382 | | | | 274,415 | | |
| Food & Staples Retailing (0.2%) | |
| Colruyt SA | | | 2,129 | | | | 108,691 | | |
| Delhaize Group SA | | | 1,260 | | | | 93,547 | | |
| | | | 202,238 | | |
| TOTAL BELGIUM | | | 1,802,268 | | |
| Bermuda (0.3%) | |
| Energy Equipment & Services (0.1%) | |
| Seadrill, Ltd.§ | | | 4,752 | | | | 162,735 | | |
| Insurance (0.2%) | |
| Catlin Group, Ltd. | | | 42,468 | | | | 246,511 | | |
| TOTAL BERMUDA | | | 409,246 | | |
See Accompanying Notes to Financial Statements.
12
Credit Suisse Trust — International Equity Flex III Portfolio
Schedule of Investments (continued)
December 31, 2010
| | | Number of
Shares | | Value | |
| LONG STOCK POSITIONS | |
| COMMON STOCKS | |
| Cyprus (0.1%) | |
| Energy Equipment & Services (0.1%) | |
| ProSafe SE | | | 20,969 | | | $ | 167,689 | | |
| TOTAL CYPRUS | | | 167,689 | | |
| Denmark (2.3%) | |
| Beverages (0.3%) | |
| Carlsberg AS Class B | | | 3,645 | | | | 367,396 | | |
| Commercial Banks (0.0%) | |
| Danske Bank AS* | | | 1,123 | | | | 28,920 | | |
| Construction & Engineering (0.0%) | |
| FLSmidth & Co. AS | | | 631 | | | | 60,626 | | |
| Food Products (0.2%) | |
| Danisco AS | | | 2,785 | | | | 256,481 | | |
| Health Care Equipment & Supplies (0.4%) | |
| Coloplast AS Class B | | | 3,475 | | | | 474,200 | | |
| Insurance (0.2%) | |
| Topdanmark AS* | | | 996 | | | | 132,219 | | |
| Tryg AS | | | 3,682 | | | | 170,507 | | |
| | | | 302,726 | | |
| Marine (0.5%) | |
| A P Moller - Maersk AS Class A | | | 21 | | | | 185,781 | | |
| A P Moller - Maersk AS Class B | | | 46 | | | | 418,207 | | |
| | | | 603,988 | | |
| Pharmaceuticals (0.7%) | |
| H Lundbeck AS§ | | | 7,989 | | | | 152,834 | | |
| Novo Nordisk AS Class B§ | | | 6,933 | | | | 784,366 | | |
| | | | 937,200 | | |
| TOTAL DENMARK | | | 3,031,537 | | |
| Finland (3.9%) | |
| Communications Equipment (0.4%) | |
| Nokia Oyj | | | 56,707 | | | | 589,722 | | |
| Construction & Engineering (0.3%) | |
| YIT Oyj | | | 13,988 | | | | 350,906 | | |
| Electric Utilities (0.5%) | |
| Fortum Oyj | | | 20,735 | | | | 627,892 | | |
| Food & Staples Retailing (0.2%) | |
| Kesko Oyj B Shares | | | 5,374 | | | | 252,114 | | |
| Insurance (0.4%) | |
| Sampo Oyj A Shares | | | 19,819 | | | | 532,031 | | |
See Accompanying Notes to Financial Statements.
13
Credit Suisse Trust — International Equity Flex III Portfolio
Schedule of Investments (continued)
December 31, 2010
| | | Number of
Shares | | Value | |
| LONG STOCK POSITIONS | |
| COMMON STOCKS | |
| Finland | |
| Machinery (1.1%) | |
| Kone Oyj Class B | | | 9,137 | | | $ | 509,482 | | |
| Konecranes Oyj | | | 5,238 | | | | 217,276 | | |
| Metso Oyj | | | 6,684 | | | | 375,373 | | |
| Wartsila Oyj | | | 4,840 | | | | 370,275 | | |
| | | | 1,472,406 | | |
| Paper & Forest Products (0.6%) | |
| Stora Enso Oyj R Shares§ | | | 23,266 | | | | 240,372 | | |
| UPM-Kymmene Oyj | | | 29,123 | | | | 518,314 | | |
| | | | 758,686 | | |
| Pharmaceuticals (0.4%) | |
| Orion Oyj Class B§ | | | 21,272 | | | | 467,525 | | |
| TOTAL FINLAND | | | 5,051,282 | | |
| France (11.8%) | |
| Aerospace & Defense (0.3%) | |
| Safran SA | | | 4,325 | | | | 153,916 | | |
| Zodiac Aerospace | | | 2,380 | | | | 179,663 | | |
| | | | 333,579 | | |
| Auto Components (0.3%) | |
| Compagnie Generale des Etablissements Michelin Class B | | | 4,024 | | | | 289,998 | | |
| Valeo SA* | | | 821 | | | | 46,780 | | |
| | | | 336,778 | | |
| Automobiles (0.3%) | |
| PSA Peugeot Citroen* | | | 3,084 | | | | 117,642 | | |
| Renault SA*§ | | | 3,962 | | | | 231,542 | | |
| | | | 349,184 | | |
| Building Products (0.2%) | |
| Cie de Saint-Gobain | | | 5,659 | | | | 292,613 | | |
| Chemicals (0.2%) | |
| Arkema SA | | | 3,644 | | | | 263,811 | | |
| Commercial Banks (1.5%) | |
| BNP Paribas | | | 17,130 | | | | 1,095,230 | | |
| Credit Agricole SA | | | 16,929 | | | | 216,109 | | |
| Natixis* | | | 36,398 | | | | 170,929 | | |
| Societe Generale | | | 8,184 | | | | 442,083 | | |
| | | | 1,924,351 | | |
| Commercial Services & Supplies (0.0%) | |
| Societe BIC SA | | | 590 | | | | 50,921 | | |
See Accompanying Notes to Financial Statements.
14
Credit Suisse Trust — International Equity Flex III Portfolio
Schedule of Investments (continued)
December 31, 2010
| | | Number of
Shares | | Value | |
| LONG STOCK POSITIONS | |
| COMMON STOCKS | |
| France | |
| Construction & Engineering (0.9%) | |
| Bouygues SA | | | 11,597 | | | $ | 502,473 | | |
| Vinci SA | | | 13,348 | | | | 729,217 | | |
| | | | 1,231,690 | | |
| Diversified Financial Services (0.2%) | |
| Eurazeo | | | 4,450 | | | | 331,495 | | |
| Diversified Telecommunication Services (0.7%) | |
| France Telecom SA | | | 40,877 | | | | 858,741 | | |
| Electrical Equipment (0.9%) | |
| Legrand SA | | | 11,192 | | | | 458,312 | | |
| Nexans SA | | | 598 | | | | 47,289 | | |
| Schneider Electric SA | | | 4,169 | | | | 627,535 | | |
| | | | 1,133,136 | | |
| Energy Equipment & Services (0.2%) | |
| Technip SA | | | 2,779 | | | | 257,880 | | |
| Food & Staples Retailing (0.1%) | |
| Carrefour SA | | | 3,438 | | | | 142,314 | | |
| Food Products (0.0%) | |
| Danone | | | 668 | | | | 42,167 | | |
| Industrial Conglomerates (0.1%) | |
| Wendel | | | 1,720 | | | | 159,174 | | |
| Insurance (1.0%) | |
| AXA SA | | | 34,320 | | | | 573,512 | | |
| CNP Assurances | | | 15,893 | | | | 287,979 | | |
| SCOR SE | | | 18,418 | | | | 469,900 | | |
| | | | 1,331,391 | | |
| IT Services (0.0%) | |
| Cap Gemini SA | | | 503 | | | | 23,607 | | |
| Machinery (0.2%) | |
| Vallourec SA | | | 2,035 | | | | 214,797 | | |
| Media (0.8%) | |
| M6-Metropole Television | | | 2,379 | | | | 57,857 | | |
| PagesJaunes Groupe§ | | | 24,298 | | | | 221,816 | | |
| Vivendi SA | | | 29,538 | | | | 801,296 | | |
| | | | 1,080,969 | | |
| Multi-Utilities (0.8%) | |
| GDF Suez | | | 22,489 | | | | 810,864 | | |
| Veolia Environnement SA | | | 6,145 | | | | 180,578 | | |
| | | | 991,442 | | |
See Accompanying Notes to Financial Statements.
15
Credit Suisse Trust — International Equity Flex III Portfolio
Schedule of Investments (continued)
December 31, 2010
| | | Number of
Shares | | Value | |
| LONG STOCK POSITIONS | |
| COMMON STOCKS | |
| France | |
| Office Electronics (0.1%) | |
| Neopost SA§ | | | 1,132 | | | $ | 99,108 | | |
| Oil, Gas & Consumable Fuels (1.4%) | |
| Total SA | | | 32,938 | | | | 1,761,242 | | |
| Pharmaceuticals (1.0%) | |
| Ipsen SA§ | | | 1,853 | | | | 56,797 | | |
| Sanofi-Aventis SA | | | 18,568 | | | | 1,195,078 | | |
| | | | 1,251,875 | | |
| Real Estate Investment Trusts (0.3%) | |
| Fonciere Des Regions§ | | | 3,816 | | | | 370,772 | | |
| Mercialys SA | | | 1 | | | | 38 | | |
| | | | 370,810 | | |
| Textiles, Apparel & Luxury Goods (0.3%) | |
| Christian Dior SA | | | 962 | | | | 138,138 | | |
| LVMH Moet Hennessy Louis Vuitton SA | | | 1,189 | | | | 196,602 | | |
| | | | 334,740 | | |
| TOTAL FRANCE | | | 15,167,815 | | |
| Germany (9.9%) | |
| Automobiles (1.0%) | |
| Bayerische Motoren Werke AG§ | | | 7,901 | | | | 624,938 | | |
| Daimler AG*§ | | | 9,121 | | | | 619,592 | | |
| Volkswagen AG§ | | | 761 | | | | 108,365 | | |
| | | | 1,352,895 | | |
| Capital Markets (0.2%) | |
| Deutsche Bank AG | | | 6,207 | | | | 325,874 | | |
| Chemicals (1.1%) | |
| BASF SE§ | | | 10,358 | | | | 829,841 | | |
| Lanxess AG | | | 3,325 | | | | 262,462 | | |
| Linde AG | | | 528 | | | | 80,189 | | |
| Symrise AG | | | 9,380 | | | | 258,023 | | |
| | | | 1,430,515 | | |
| Computers & Peripherals (0.2%) | |
| Wincor Nixdorf AG | | | 2,700 | | | | 221,888 | | |
| Construction & Engineering (0.1%) | |
| Bilfinger Berger AG | | | 1,088 | | | | 92,460 | | |
| Diversified Telecommunication Services (0.6%) | |
| Deutsche Telekom AG§ | | | 63,770 | | | | 825,297 | | |
| Electric Utilities (0.7%) | |
| E.ON AG | | | 27,545 | | | | 844,492 | | |
See Accompanying Notes to Financial Statements.
16
Credit Suisse Trust — International Equity Flex III Portfolio
Schedule of Investments (continued)
December 31, 2010
| | | Number of
Shares | | Value | |
| LONG STOCK POSITIONS | |
| COMMON STOCKS | |
| Germany | |
| Electrical Equipment (0.1%) | |
| Tognum AG | | | 6,961 | | | $ | 183,961 | | |
| Food Products (0.2%) | |
| Suedzucker AG | | | 9,400 | | | | 252,026 | | |
| Health Care Providers & Services (0.3%) | |
| Fresenius SE | | | 4,690 | | | | 395,102 | | |
| Hotels, Restaurants & Leisure (0.2%) | |
| TUI AG*§ | | | 20,085 | | | | 282,859 | | |
| Household Products (0.2%) | |
| Henkel AG & Co. KGaA | | | 5,481 | | | | 283,705 | | |
| Industrial Conglomerates (1.2%) | |
| Siemens AG | | | 12,166 | | | | 1,512,970 | | |
| Insurance (1.7%) | |
| Allianz SE | | | 8,728 | | | | 1,041,090 | | |
| Hannover Rueckversicherung AG | | | 8,608 | | | | 463,585 | | |
| Muenchener Rueckversicherungs AG§ | | | 4,918 | | | | 747,776 | | |
| | | | 2,252,451 | | |
| Life Sciences Tools & Services (0.1%) | |
| Gerresheimer AG* | | | 2,115 | | | | 93,325 | | |
| Machinery (0.1%) | |
| GEA Group AG | | | 2,468 | | | | 71,601 | | |
| Metals & Mining (0.3%) | |
| Aurubis AG | | | 6,610 | | | | 389,148 | | |
| Multi-Utilities (0.2%) | |
| RWE AG | | | 2,995 | | | | 200,820 | | |
| Pharmaceuticals (0.9%) | |
| Bayer AG§ | | | 11,585 | | | | 862,134 | | |
| Merck KGaA | | | 2,779 | | | | 223,360 | | |
| Stada Arzneimittel AG | | | 922 | | | | 31,530 | | |
| | | | 1,117,024 | | |
| Semiconductors & Semiconductor Equipment (0.1%) | |
| Infineon Technologies AG* | | | 19,038 | | | | 178,155 | | |
| Software (0.3%) | |
| SAP AG | | | 6,910 | | | | 353,811 | | |
| Textiles, Apparel & Luxury Goods (0.1%) | |
| Adidas AG | | | 1,188 | | | | 77,581 | | |
| TOTAL GERMANY | | | 12,737,960 | | |
See Accompanying Notes to Financial Statements.
17
Credit Suisse Trust — International Equity Flex III Portfolio
Schedule of Investments (continued)
December 31, 2010
| | | Number of
Shares | | Value | |
| LONG STOCK POSITIONS | |
| COMMON STOCKS | |
| Greece (0.3%) | |
| Commercial Banks (0.1%) | |
| Bank of Greece | | | 788 | | | $ | 30,592 | | |
| National Bank of Greece SA* | | | 11,016 | | | | 89,982 | | |
| | | | 120,574 | | |
| Electric Utilities (0.1%) | |
| Public Power Corp. SA | | | 7,529 | | | | 109,105 | | |
| Hotels, Restaurants & Leisure (0.1%) | |
| OPAP SA | | | 12,501 | | | | 217,307 | | |
| TOTAL GREECE | | | 446,986 | | |
| Hong Kong (2.1%) | |
| Diversified Financial Services (2.1%) | |
| iShares MSCI Hong Kong Index Fund§ | | | 140,878 | | | | 2,664,003 | | |
| TOTAL HONG KONG | | | 2,664,003 | | |
| Israel (0.6%) | |
| Chemicals (0.0%) | |
| Israel Chemicals, Ltd. | | | 1,555 | | | | 26,685 | | |
| Commercial Banks (0.1%) | |
| Bank Hapoalim BM* | | | 12,051 | | | | 62,865 | | |
| Bank Leumi Le-Israel BM | | | 7,305 | | | | 37,518 | | |
| | | | 100,383 | | |
| Diversified Telecommunication Services (0.1%) | |
| Bezeq Israeli Telecommunication Corp., Ltd. | | | 21,142 | | | | 64,492 | | |
| Pharmaceuticals (0.4%) | |
| Teva Pharmaceutical Industries, Ltd. ADR | | | 11,700 | | | | 609,921 | | |
| TOTAL ISRAEL | | | 801,481 | | |
| Italy (2.4%) | |
| Auto Components (0.2%) | |
| Pirelli & C. SpA§ | | | 27,040 | | | | 219,674 | | |
| Automobiles (0.3%) | |
| Fiat SpA | | | 18,390 | | | | 381,818 | | |
| Construction Materials (0.0%) | |
| Italcementi SpA§ | | | 3,275 | | | | 27,836 | | |
| Electric Utilities (1.0%) | |
| Enel SpA | | | 157,903 | | | | 794,364 | | |
| Terna Rete Elettrica Nazionale SpA | | | 113,052 | | | | 479,679 | | |
| | | | 1,274,043 | | |
| Electrical Equipment (0.0%) | |
| Prysmian SpA | | | 2,420 | | | | 41,405 | | |
See Accompanying Notes to Financial Statements.
18
Credit Suisse Trust — International Equity Flex III Portfolio
Schedule of Investments (continued)
December 31, 2010
| | | Number of
Shares | | Value | |
| LONG STOCK POSITIONS | |
| COMMON STOCKS | |
| Italy | |
| Media (0.1%) | |
| Mediaset SpA§ | | | 11,047 | | | $ | 67,165 | | |
| Oil, Gas & Consumable Fuels (0.8%) | |
| ENI SpA | | | 49,911 | | | | 1,098,211 | | |
| TOTAL ITALY | | | 3,110,152 | | |
| Japan (28.0%) | |
| Air Freight & Logistics (0.0%) | |
| VANTEC Corp. | | | 15 | | | | 22,301 | | |
| Auto Components (0.8%) | |
| Aisan Industry Co., Ltd. | | | 6,026 | | | | 54,121 | | |
| Aisin Seiki Co., Ltd. | | | 2,789 | | | | 98,378 | | |
| Alpha Corp. | | | 1,500 | | | | 15,889 | | |
| Bridgestone Corp.§ | | | 6,400 | | | | 123,323 | | |
| Calsonic Kansei Corp.* | | | 11,000 | | | | 43,774 | | |
| Denso Corp.§ | | | 3,622 | | | | 124,651 | | |
| Kanto Auto Works, Ltd. | | | 4,056 | | | | 34,941 | | |
| Koito Manufacturing Co., Ltd.§ | | | 3,000 | | | | 46,688 | | |
| NHK Spring Co., Ltd.§ | | | 3,000 | | | | 32,549 | | |
| Nihon Tokushu Toryo Co., Ltd. | | | 2,100 | | | | 8,909 | | |
| OSAKA Titanium Technologies Co., Ltd.§ | | | 5,400 | | | | 56,227 | | |
| Pacific Industrial Co., Ltd. | | | 5,200 | | | | 28,559 | | |
| Sanden Corp. | | | 16,000 | | | | 63,579 | | |
| The Yokohama Rubber Co., Ltd | | | 15,809 | | | | 81,510 | | |
| Tokai Rika Co., Ltd. | | | 1,200 | | | | 22,636 | | |
| Tokai Rubber Industries, Inc. | | | 2,900 | | | | 39,983 | | |
| Topre Corp. | | | 2,833 | | | | 21,506 | | |
| Toyo Tire & Rubber Co., Ltd.§ | | | 27,725 | | | | 66,720 | | |
| Toyota Industries Corp. | | | 1,200 | | | | 37,166 | | |
| Unipres Corp.§ | | | 3,924 | | | | 78,001 | | |
| | | | 1,079,110 | | |
| Automobiles (1.9%) | |
| Daihatsu Motor Co., Ltd. | | | 4,000 | | | | 61,259 | | |
| Fuji Heavy Industries, Ltd. | | | 11,103 | | | | 85,714 | | |
| Honda Motor Co., Ltd.§ | | | 18,292 | | | | 722,720 | | |
| Isuzu Motors, Ltd.§ | | | 6,921 | | | | 31,307 | | |
| Nissan Motor Co., Ltd.§ | | | 35,600 | | | | 337,123 | | |
| Suzuki Motor Corp. | | | 4,731 | | | | 116,262 | | |
| Toyota Motor Corp.§ | | | 27,245 | | | | 1,073,717 | | |
| Yamaha Motor Co., Ltd.* | | | 461 | | | | 7,489 | | |
| | | | 2,435,591 | | |
| Beverages (0.1%) | |
| Kirin Holdings Co., Ltd.§ | | | 8,823 | | | | 123,528 | | |
| Mikuni Coca-Cola Bottling Co., Ltd.§ | | | 3,489 | | | | 31,706 | | |
| Oenon Holdings, Inc.§ | | | 8,000 | | | | 19,880 | | |
| | | | 175,114 | | |
See Accompanying Notes to Financial Statements.
19
Credit Suisse Trust — International Equity Flex III Portfolio
Schedule of Investments (continued)
December 31, 2010
| | | Number of
Shares | | Value | |
| LONG STOCK POSITIONS | |
| COMMON STOCKS | |
| Japan | |
| Building Products (0.3%) | |
| Aica Kogyo Co., Ltd. | | | 1,168 | | | $ | 13,724 | | |
| Asahi Glass Co., Ltd.§ | | | 13,000 | | | | 151,346 | | |
| Bunka Shutter Co., Ltd. | | | 5,174 | | | | 13,612 | | |
| Daikin Industries, Ltd. | | | 1,054 | | | | 37,272 | | |
| JS Group Corp. | | | 3,700 | | | | 81,247 | | |
| Komatsu Wall Industry Co., Ltd. | | | 1,200 | | | | 11,351 | | |
| Nippon Sheet Glass Co., Ltd. | | | 23,626 | | | | 63,437 | | |
| Toli Corp.§ | | | 7,000 | | | | 12,122 | | |
| | | | 384,111 | | |
| Capital Markets (0.4%) | |
| Daiwa Securities Group, Inc.§ | | | 35,981 | | | | 184,762 | | |
| Mizuho Securities Co., Ltd.§ | | | 40,000 | | | | 114,180 | | |
| Nomura Holdings, Inc.§ | | | 26,457 | | | | 168,048 | | |
| Tokai Tokyo Financial Holdings, Inc. | | | 23,573 | | | | 89,145 | | |
| | | | 556,135 | | |
| Chemicals (1.9%) | |
| Achilles Corp. | | | 3,912 | | | | 5,679 | | |
| ADEKA Corp. | | | 3,300 | | | | 36,417 | | |
| Air Water, Inc. | | | 7,000 | | | | 89,247 | | |
| Arakawa Chemical Industries, Ltd. | | | 3,100 | | | | 32,194 | | |
| Asahi Kasei Corp. | | | 23,996 | | | | 156,249 | | |
| Chugoku Marine Paints, Ltd. | | | 7,759 | | | | 65,770 | | |
| Daicel Chemical Industries, Ltd.§ | | | 9,000 | | | | 65,561 | | |
| Daiso Co., Ltd. | | | 8,000 | | | | 24,094 | | |
| Denki Kagaku Kogyo KK | | | 12,000 | | | | 56,876 | | |
| DIC Corp. | | | 22,000 | | | | 49,087 | | |
| Ebara-Udylite Co., Ltd. | | | 800 | | | | 16,784 | | |
| Fujikura Kasei Co., Ltd. | | | 6,657 | | | | 45,764 | | |
| Hitachi Chemical Co., Ltd. | | | 1,200 | | | | 24,757 | | |
| Ihara Chemical Industry Co., Ltd. | | | 3,000 | | | | 9,623 | | |
| JSR Corp. | | | 2,300 | | | | 42,735 | | |
| Kaneka Corp. | | | 19,000 | | | | 131,411 | | |
| Konishi Co., Ltd. | | | 1,700 | | | | 20,486 | | |
| Kuraray Co., Ltd. | | | 1,500 | | | | 21,435 | | |
| Mitsubishi Chemical Holdings Corp. | | | 26,047 | | | | 176,128 | | |
| Mitsubishi Gas Chemical Co., Inc. | | | 5,124 | | | | 36,280 | | |
| Mitsui Chemicals, Inc. | | | 8,000 | | | | 28,552 | | |
| Nihon Parkerizing Co., Ltd. | | | 2,000 | | | | 28,772 | | |
| Nippon Kayaku Co., Ltd. | | | 2,000 | | | | 21,107 | | |
| Nippon Soda Co., Ltd. | | | 20,554 | | | | 97,853 | | |
| Nippon Valqua Industries, Ltd. | | | 3,000 | | | | 9,119 | | |
| Nissan Chemical Industries, Ltd. | | | 6,000 | | | | 77,496 | | |
| Nitto Denko Corp. | | | 1,600 | | | | 75,120 | | |
| Okura Industrial Co., Ltd.* | | | 3,666 | | | | 10,593 | | |
| Sakata INX Corp. | | | 8,000 | | | | 40,209 | | |
See Accompanying Notes to Financial Statements.
20
Credit Suisse Trust — International Equity Flex III Portfolio
Schedule of Investments (continued)
December 31, 2010
| | | Number of
Shares | | Value | |
| LONG STOCK POSITIONS | |
| COMMON STOCKS | |
| Japan | |
| Chemicals | |
| Sanyo Chemical Industries, Ltd. | | | 3,643 | | | $ | 30,349 | | |
| Sekisui Plastics Co., Ltd. | | | 5,000 | | | | 22,526 | | |
| Shikoku Chemicals Corp. | | | 3,393 | | | | 20,380 | | |
| Shin-Etsu Chemical Co., Ltd.§ | | | 6,500 | | | | 350,695 | | |
| Showa Denko KK§ | | | 10,000 | | | | 22,458 | | |
| Sumitomo Bakelite Co., Ltd. | | | 9,466 | | | | 55,611 | | |
| Sumitomo Chemical Co., Ltd.§ | | | 27,184 | | | | 133,586 | | |
| Sumitomo Seika Chemicals Co., Ltd. | | | 10,000 | | | | 43,270 | | |
| Taiyo Nippon Sanso Corp.§ | | | 4,000 | | | | 35,248 | | |
| Toagosei Co., Ltd.§ | | | 13,000 | | | | 60,724 | | |
| Toray Industries, Inc.§ | | | 3,000 | | | | 17,903 | | |
| Tosoh Corp.§ | | | 16,261 | | | | 52,714 | | |
| Toyo Ink Manufacturing Co., Ltd. | | | 6,000 | | | | 29,417 | | |
| Ube Industries, Ltd. | | | 35,000 | | | | 104,914 | | |
| | | | 2,475,193 | | |
| Commercial Banks (2.7%) | |
| Fukuoka Financial Group, Inc. | | | 18,000 | | | | 77,995 | | |
| Hokuhoku Financial Group, Inc. | | | 59,193 | | | | 120,126 | | |
| Kiyo Holdings, Inc. | | | 41,649 | | | | 58,060 | | |
| Mitsubishi UFJ Financial Group, Inc. | | | 167,931 | | | | 906,453 | | |
| Mizuho Financial Group, Inc.§ | | | 273,954 | | | | 514,442 | | |
| Resona Holdings, Inc.§ | | | 8,003 | | | | 47,753 | | |
| Senshu Ikeda Holdings, Inc.§ | | | 5,000 | | | | 7,129 | | |
| Shinsei Bank, Ltd.*§ | | | 19,000 | | | | 24,754 | | |
| Sumitomo Mitsui Financial Group, Inc.§ | | | 18,696 | | | | 662,665 | | |
| The Akita Bank, Ltd. | | | 6,000 | | | | 17,801 | | |
| The Bank of Nagoya, Ltd. | | | 9,000 | | | | 28,999 | | |
| The Bank of Saga, Ltd. | | | 13,000 | | | | 36,815 | | |
| The Bank of Yokohama, Ltd. | | | 19,000 | | | | 98,078 | | |
| The Chiba Bank, Ltd. | | | 9,992 | | | | 64,858 | | |
| The Chiba Kogyo Bank, Ltd.* | | | 4,663 | | | | 27,902 | | |
| The Daishi Bank, Ltd. | | | 23,039 | | | | 71,116 | | |
| The Ehime Bank, Ltd.§ | | | 7,000 | | | | 18,619 | | |
| The Eighteenth Bank, Ltd. | | | 6,666 | | | | 18,587 | | |
| The Gunma Bank, Ltd. | | | 11,992 | | | | 65,710 | | |
| The Higashi-Nippon Bank, Ltd. | | | 16,000 | | | | 35,011 | | |
| The Hiroshima Bank, Ltd§ | | | 1,885 | | | | 7,936 | | |
| The Hokuetsu Bank, Ltd. | | | 19,000 | | | | 39,221 | | |
| The Hyakujushi Bank, Ltd. | | | 9,000 | | | | 33,065 | | |
| The Joyo Bank, Ltd. | | | 10,000 | | | | 43,879 | | |
| The Keiyo Bank, Ltd. | | | 16,968 | | | | 83,916 | | |
| The Mie Bank, Ltd. | | | 13,211 | | | | 36,211 | | |
| The Nishi-Nippon City Bank, Ltd. | | | 5,997 | | | | 18,158 | | |
| The Ogaki Kyoritsu Bank, Ltd. | | | 32,000 | | | | 101,124 | | |
| The Shizuoka Bank, Ltd. | | | 8,000 | | | | 73,636 | | |
See Accompanying Notes to Financial Statements.
21
Credit Suisse Trust — International Equity Flex III Portfolio
Schedule of Investments (continued)
December 31, 2010
| | | Number of
Shares | | Value | |
| LONG STOCK POSITIONS | |
| COMMON STOCKS | |
| Japan | |
| Commercial Banks | |
| The Sumitomo Trust & Banking Co., Ltd.§ | | | 4,720 | | | $ | 29,600 | | |
| The Tohoku Bank, Ltd. | | | 6,418 | | | | 10,598 | | |
| The Tokyo Tomin Bank, Ltd.§ | | | 554 | | | | 7,904 | | |
| The Yachiyo Bank, Ltd. | | | 1,750 | | | | 45,939 | | |
| | | | 3,434,060 | | |
| Commercial Services & Supplies (0.6%) | |
| Central Security Patrols Co., Ltd. | | | 600 | | | | 6,246 | | |
| Dai Nippon Printing Co., Ltd. | | | 13,000 | | | | 176,508 | | |
| Duskin Co., Ltd. | | | 1,200 | | | | 22,663 | | |
| Itoki Corp. | | | 3,037 | | | | 8,197 | | |
| Kokuyo Co., Ltd.§ | | | 800 | | | | 6,905 | | |
| Kyodo Printing Co., Ltd.§ | | | 9,000 | | | | 21,264 | | |
| Nichiban Co., Ltd. | | | 3,000 | | | | 11,154 | | |
| Nippon Kanzai Co., Ltd.§ | | | 550 | | | | 9,095 | | |
| Nippon Kucho Service Co., Ltd. | | | 800 | | | | 7,174 | | |
| Nissha Printing Co., Ltd.§ | | | 800 | | | | 21,174 | | |
| Oyo Corp. | | | 2,156 | | | | 17,930 | | |
| Pronexus, Inc. | | | 1,800 | | | | 9,793 | | |
| Secom Co., Ltd. | | | 2,653 | | | | 125,488 | | |
| Sohgo Security Services Co., Ltd. | | | 3,976 | | | | 47,058 | | |
| Tokyu Community Corp. | | | 600 | | | | 17,848 | | |
| Toppan Forms Co., Ltd. | | | 7,100 | | | | 72,744 | | |
| Toppan Printing Co., Ltd. | | | 16,746 | | | | 152,554 | | |
| Tosho Printing Co., Ltd.* | | | 5,499 | | | | 8,919 | | |
| | | | 742,714 | | |
| Communications Equipment (0.1%) | |
| Denki Kogyo Co., Ltd. | | | 10,009 | | | | 48,975 | | |
| Hitachi Kokusai Electric, Inc. | | | 3,000 | | | | 29,724 | | |
| NEC Mobiling, Ltd. | | | 1,200 | | | | 35,082 | | |
| | | | 113,781 | | |
| Computers & Peripherals (0.4%) | |
| Fujitsu, Ltd.§ | | | 32,000 | | | | 221,940 | | |
| NEC Corp.§ | | | 47,260 | | | | 141,550 | | |
| Toshiba Corp. | | | 29,871 | | | | 162,288 | | |
| | | | 525,778 | | |
| Construction & Engineering (0.7%) | |
| Ando Corp. | | | 13,500 | | | | 19,088 | | |
| Asunaro Aoki Construction Co., Ltd. | | | 2,500 | | | | 10,514 | | |
| Chugai Ro Co., Ltd. | | | 8,000 | | | | 29,407 | | |
| CTI Engineering Co., Ltd. | | | 2,071 | | | | 11,572 | | |
| Hazama Corp.* | | | 11,866 | | | | 9,916 | | |
| Hibiya Engineering, Ltd. | | | 2,000 | | | | 18,909 | | |
See Accompanying Notes to Financial Statements.
22
Credit Suisse Trust — International Equity Flex III Portfolio
Schedule of Investments (continued)
December 31, 2010
| | | Number of
Shares | | Value | |
| LONG STOCK POSITIONS | |
| COMMON STOCKS | |
| Japan | |
| Construction & Engineering | |
| Ichiken Co., Ltd. | | | 5,800 | | | $ | 8,423 | | |
| Kajima Corp.§ | | | 36,000 | | | | 95,556 | | |
| Mirait Holdings Corp.* | | | 5,300 | | | | 37,379 | | |
| Nakano Corp. | | | 3,500 | | | | 9,802 | | |
| Nippo Corp. | | | 8,735 | | | | 60,788 | | |
| Nippon Koei Co., Ltd. | | | 8,000 | | | | 24,019 | | |
| Nishimatsu Construction Co., Ltd. | | | 34,268 | | | | 44,577 | | |
| Obayashi Corp. | | | 23,992 | | | | 110,255 | | |
| Obayashi Road Corp. | | | 11,000 | | | | 20,807 | | |
| Okumura Corp. | | | 5,000 | | | | 19,014 | | |
| Seibu Electric Industry Co., Ltd. | | | 1,998 | | | | 8,514 | | |
| Shimizu Corp. | | | 10,000 | | | | 42,643 | | |
| Shinnihon Corp. | | | 2,308 | | | | 6,011 | | |
| Sumitomo Densetsu Co., Ltd. | | | 5,058 | | | | 21,458 | | |
| Taihei Kogyo Co., Ltd. | | | 5,968 | | | | 27,959 | | |
| Taisei Corp. | | | 51,379 | | | | 119,927 | | |
| The Nippon Road Co., Ltd. | | | 18,000 | | | | 42,966 | | |
| Toa Corp. | | | 27,000 | | | | 31,541 | | |
| TOA ROAD Corp. | | | 6,833 | | | | 10,761 | | |
| Toda Corp. | | | 12,000 | | | | 44,520 | | |
| Tokyu Construction Co., Ltd. | | | 2,516 | | | | 7,611 | | |
| Yahagi Construction Co., Ltd. | | | 2,000 | | | | 11,690 | | |
| Yondenko Corp. | | | 3,000 | | | | 12,491 | | |
| | | | 918,118 | | |
| Construction Materials (0.0%) | |
| Sumitomo Osaka Cement Co., Ltd.§ | | | 3,515 | | | | 7,942 | | |
| Consumer Finance (0.0%) | |
| Jaccs Co., Ltd. | | | 13,000 | | | | 36,703 | | |
| Pocket Card Co., Ltd. | | | 5,600 | | | | 16,814 | | |
| | | | 53,517 | | |
| Containers & Packaging (0.0%) | |
| Hokkan Holdings, Ltd. | | | 6,333 | | | | 19,070 | | |
| Tomoku Co., Ltd. | | | 4,000 | | | | 11,213 | | |
| Toyo Seikan Kaisha, Ltd.§ | | | 1,260 | | | | 23,894 | | |
| | | | 54,177 | | |
| Distributors (0.1%) | |
| Happinet Corp. | | | 800 | | | | 10,636 | | |
| Nice Holdings, Inc. | | | 7,000 | | | | 15,396 | | |
| Sankyo Seiko Co., Ltd. | | | 7,412 | | | | 26,636 | | |
| Yokohama Reito Co., Ltd.§ | | | 2,000 | | | | 13,701 | | |
| | | | 66,369 | | |
See Accompanying Notes to Financial Statements.
23
Credit Suisse Trust — International Equity Flex III Portfolio
Schedule of Investments (continued)
December 31, 2010
| | | Number of
Shares | | Value | |
| LONG STOCK POSITIONS | |
| COMMON STOCKS | |
| Japan | |
| Diversified Consumer Services (0.0%) | |
| Studio Alice Co., Ltd. | | | 1,700 | | | $ | 16,066 | | |
| Tac Co., Ltd. | | | 3,400 | | | | 14,242 | | |
| Watabe Wedding Corp. | | | 1,040 | | | | 11,495 | | |
| | | | 41,803 | | |
| Diversified Financial Services (0.2%) | |
| Century Tokyo Leasing Corp. | | | 5,200 | | | | 84,336 | | |
| Daiko Clearing Services Corp. | | | 2,066 | | | | 7,931 | | |
| Fuyo General Lease Co., Ltd. | | | 1,600 | | | | 52,343 | | |
| ORIX Corp.§ | | | 760 | | | | 74,539 | | |
| Ricoh Leasing Co., Ltd. | | | 1,000 | | | | 27,441 | | |
| | | | 246,590 | | |
| Diversified Telecommunication Services (0.3%) | |
| Nippon Telegraph & Telephone Corp. | | | 7,800 | | | | 355,567 | | |
| Electric Utilities (0.9%) | |
| Chubu Electric Power Co., Inc.§ | | | 10,897 | | | | 267,783 | | |
| Kyushu Electric Power Co., Inc. | | | 1,100 | | | | 24,653 | | |
| The Kansai Electric Power Co., Inc. | | | 11,500 | | | | 283,873 | | |
| The Okinawa Electric Power Co., Inc. | | | 200 | | | | 9,972 | | |
| The Tokyo Electric Power Co., Inc. | | | 17,100 | | | | 417,378 | | |
| Tohoku Electric Power Co., Inc.§ | | | 6,700 | | | | 149,327 | | |
| | | | 1,152,986 | | |
| Electrical Equipment (0.4%) | |
| Denyo Co., Ltd. | | | 2,600 | | | | 21,432 | | |
| Fuji Electric Holdings Co., Ltd. | | | 10,000 | | | | 31,022 | | |
| Helios Techno Holdings Co., Ltd. | | | 2,743 | | | | 7,579 | | |
| Mitsubishi Electric Corp.§ | | | 13,654 | | | | 142,824 | | |
| Nidec Corp.§ | | | 600 | | | | 60,564 | | |
| Sumitomo Electric Industries, Ltd. | | | 15,200 | | | | 210,272 | | |
| Ushio, Inc.§ | | | 685 | | | | 13,020 | | |
| | | | 486,713 | | |
| Electronic Equipment, Instruments & Components (1.6%) | |
| Ai Holdings Corp.§ | | | 12,648 | | | | 46,548 | | |
| Alps Electric Co., Ltd. | | | 1,000 | | | | 11,553 | | |
| Canon Electronics, Inc. | | | 700 | | | | 19,730 | | |
| Citizen Holdings Co., Ltd. | | | 2,500 | | | | 17,172 | | |
| Elematec Corp.§ | | | 1,100 | | | | 15,571 | | |
| Excel Co., Ltd. | | | 1,300 | | | | 16,298 | | |
| FUJIFILM Holdings Corp. | | | 3,192 | | | | 115,092 | | |
| Hakuto Co., Ltd. | | | 6,100 | | | | 61,492 | | |
| Hitachi, Ltd. | | | 67,874 | | | | 360,732 | | |
| Hochiki Corp. | | | 3,000 | | | | 15,776 | | |
| Hosiden Corp. | | | 8,080 | | | | 94,855 | | |
| HOYA Corp.§ | | | 8,200 | | | | 198,477 | | |
See Accompanying Notes to Financial Statements.
24
Credit Suisse Trust — International Equity Flex III Portfolio
Schedule of Investments (continued)
December 31, 2010
| | | Number of
Shares | | Value | |
| LONG STOCK POSITIONS | |
| COMMON STOCKS | |
| Japan | |
| Electronic Equipment, Instruments & Components | |
| ITC Networks Corp. | | | 2,654 | | | $ | 15,307 | | |
| JBCC Holdings, Inc. | | | 3,234 | | | | 20,746 | | |
| Kaga Electronics Co., Ltd. | | | 5,200 | | | | 66,394 | | |
| Kanematsu Electronics, Ltd. | | | 1,600 | | | | 16,390 | | |
| Keyence Corp.§ | | | 182 | | | | 52,568 | | |
| Kyocera Corp. | | | 2,186 | | | | 222,325 | | |
| Mitsumi Electric Co., Ltd. | | | 800 | | | | 14,635 | | |
| Murata Manufacturing Co., Ltd. | | | 718 | | | | 50,173 | | |
| Nippon Electric Glass Co., Ltd. | | | 2,000 | | | | 28,738 | | |
| Nohmi Bosai, Ltd. | | | 5,666 | | | | 36,886 | | |
| Omron Corp. | | | 1,700 | | | | 44,848 | | |
| ONO Sokki Co., Ltd.* | | | 4,000 | | | | 13,654 | | |
| Optex Co., Ltd. | | | 1,100 | | | | 16,313 | | |
| Osaki Electric Co., Ltd. | | | 3,174 | | | | 27,499 | | |
| Ryosan Co., Ltd. | | | 1,700 | | | | 43,982 | | |
| Ryoyo Electro Corp. | | | 6,400 | | | | 74,434 | | |
| Sanshin Electronics Co., Ltd. | | | 800 | | | | 6,627 | | |
| Shinko Shoji Co., Ltd. | | | 3,396 | | | | 28,287 | | |
| Siix Corp. | | | 2,900 | | | | 34,010 | | |
| SMK Corp. | | | 7,000 | | | | 38,430 | | |
| Sumida Corp. | | | 1,625 | | | | 17,697 | | |
| Tachibana Eletech Co., Ltd. | | | 1,965 | | | | 16,526 | | |
| TDK Corp.§ | | | 2,082 | | | | 144,301 | | |
| Tomen Devices Corp. | | | 600 | | | | 13,923 | | |
| Tomen Electronics Corp. | | | 1,680 | | | | 24,691 | | |
| Toyo Corp. | | | 5,100 | | | | 54,575 | | |
| | | | 2,097,255 | | |
| Energy Equipment & Services (0.0%) | |
| Toyo Kanetsu KK | | | 30,203 | | | | 53,719 | | |
| Food & Staples Retailing (0.6%) | |
| Aeon Co., Ltd.§ | | | 10,598 | | | | 132,383 | | |
| Belc Co., Ltd. | | | 2,200 | | | | 25,792 | | |
| Cawachi, Ltd. | | | 900 | | | | 18,538 | | |
| Cocokara fine, Inc. | | | 1,900 | | | | 40,262 | | |
| Echo Trading Co., Ltd. | | | 1,234 | | | | 12,623 | | |
| Itochu-Shokuhin Co., Ltd. | | | 954 | | | | 33,596 | | |
| Kasumi Co., Ltd.§ | | | 7,593 | | | | 42,245 | | |
| Kato Sangyo Co., Ltd. | | | 3,260 | | | | 54,573 | | |
| Kirindo Co., Ltd. | | | 3,154 | | | | 15,460 | | |
| Ministop Co., Ltd. | | | 800 | | | | 13,861 | | |
| Okuwa Co., Ltd. | | | 5,000 | | | | 52,252 | | |
| Ryoshoku, Ltd. | | | 600 | | | | 13,346 | | |
| S Foods, Inc. | | | 1,000 | | | | 8,572 | | |
| Seven & I Holdings Co., Ltd. | | | 7,600 | | | | 202,403 | | |
| Universe Co., Ltd. | | | 1,000 | | | | 15,055 | | |
See Accompanying Notes to Financial Statements.
25
Credit Suisse Trust — International Equity Flex III Portfolio
Schedule of Investments (continued)
December 31, 2010
| | | Number of
Shares | | Value | |
| LONG STOCK POSITIONS | |
| COMMON STOCKS | |
| Japan | |
| Food & Staples Retailing | |
| UNY Co., Ltd.§ | | | 6,000 | | | $ | 60,489 | | |
| Valor Co., Ltd. | | | 8,900 | | | | 76,764 | | |
| | | | 818,214 | | |
| Food Products (0.6%) | |
| Ajinomoto Co., Inc. | | | 3,089 | | | | 32,122 | | |
| Chubu Shiryo Co., Ltd | | | 2,333 | | | | 15,924 | | |
| J-Oil Mills, Inc. | | | 30,457 | | | | 95,479 | | |
| Kyodo Shiryo Co., Ltd. | | | 23,000 | | | | 28,322 | | |
| Maruha Nichiro Holdings, Inc. | | | 26,794 | | | | 44,547 | | |
| MEIJI Holdings Co., Ltd. | | | 2,100 | | | | 94,865 | | |
| Mitsui Sugar Co., Ltd. | | | 12,000 | | | | 45,488 | | |
| Morinaga & Co., Ltd. | | | 23,428 | | | | 55,105 | | |
| Morinaga Milk Industry Co., Ltd. | | | 3,532 | | | | 14,965 | | |
| Nichimo Co., Ltd. | | | 5,000 | | | | 10,016 | | |
| Nichirei Corp. | | | 6,000 | | | | 27,663 | | |
| Nippon Flour Mills Co., Ltd. | | | 19,261 | | | | 95,332 | | |
| Nippon Meat Packers, Inc. | | | 2,000 | | | | 26,088 | | |
| Nippon Suisan Kaisha, Ltd.§ | | | 18,059 | | | | 56,870 | | |
| Prima Meat Packers, Ltd. | | | 27,882 | | | | 31,211 | | |
| Showa Sangyo Co., Ltd. | | | 4,000 | | | | 11,718 | | |
| Starzen Co., Ltd. | | | 8,000 | | | | 23,343 | | |
| Warabeya Nichiyo Co., Ltd. | | | 3,225 | | | | 42,033 | | |
| Yonekyu Corp. | | | 6,136 | | | | 50,898 | | |
| | | | 801,989 | | |
| Gas Utilities (0.2%) | |
| Osaka Gas Co., Ltd. | | | 21,000 | | | | 81,490 | | |
| Toho Gas Co., Ltd. | | | 3,000 | | | | 14,992 | | |
| Tokyo Gas Co., Ltd. | | | 25,000 | | | | 110,823 | | |
| | | | 207,305 | | |
| Health Care Equipment & Supplies (0.1%) | |
| Aloka Co., Ltd. | | | 2,210 | | | | 28,581 | | |
| Nipro Corp. | | | 4,000 | | | | 80,120 | | |
| Terumo Corp. | | | 400 | | | | 22,458 | | |
| | | | 131,159 | | |
| Health Care Providers & Services (0.1%) | |
| As One Corp. | | | 1,133 | | | | 23,319 | | |
| Mediceo Paltac Holdings Co., Ltd. | | | 5,224 | | | | 57,544 | | |
| Ship Healthcare Holdings, Inc. | | | 2,000 | | | | 26,193 | | |
| | | | 107,056 | | |
| Hotels, Restaurants & Leisure (0.2%) | |
| Hurxley Corp. | | | 1,850 | | | | 11,398 | | |
| Kyoritsu Maintenance Co., Ltd. | | | 2,926 | | | | 49,762 | | |
See Accompanying Notes to Financial Statements.
26
Credit Suisse Trust — International Equity Flex III Portfolio
Schedule of Investments (continued)
December 31, 2010
| | | Number of
Shares | | Value | |
| LONG STOCK POSITIONS | |
| COMMON STOCKS | |
| Japan | |
| Hotels, Restaurants & Leisure | |
| McDonald's Holdings Co. Japan, Ltd.§ | | | 760 | | | $ | 19,063 | | |
| Pacific Golf Group International Holdings KK§ | | | 120 | | | | 83,063 | | |
| Resort Solution Co., Ltd. | | | 4,000 | | | | 7,835 | | |
| Tokyo Dome Corp. | | | 31,796 | | | | 86,331 | | |
| | | | 257,452 | | |
| Household Durables (1.1%) | |
| Casio Computer Co., Ltd.§ | | | 8,242 | | | | 66,222 | | |
| Corona Corp. | | | 2,420 | | | | 23,424 | | |
| Foster Electric Co., Ltd. | | | 700 | | | | 20,661 | | |
| Fuji Corp. | | | 3,600 | | | | 19,171 | | |
| Fujitsu General, Ltd.§ | | | 9,000 | | | | 54,094 | | |
| Hitachi Koki Co., Ltd.§ | | | 2,090 | | | | 19,611 | | |
| Mitsui Home Co., Ltd. | | | 5,000 | | | | 26,449 | | |
| PanaHome Corp. | | | 11,000 | | | | 69,392 | | |
| Panasonic Corp. | | | 21,880 | | | | 309,243 | | |
| Pioneer Corp.* | | | 5,900 | | | | 24,323 | | |
| Sangetsu Co., Ltd. | | | 2,300 | | | | 53,907 | | |
| Sanyo Housing Nagoya Co., Ltd. | | | 22 | | | | 22,604 | | |
| Sharp Corp.§ | | | 11,983 | | | | 123,097 | | |
| Sony Corp.§ | | | 10,838 | | | | 388,023 | | |
| Sumitomo Forestry Co., Ltd. | | | 8,800 | | | | 77,133 | | |
| Tact Home Co., Ltd. | | | 28 | | | | 32,713 | | |
| Token Corp. | | | 690 | | | | 25,932 | | |
| | | | 1,355,999 | | |
| Independent Power Producers & Energy Traders (0.1%) | |
| Electric Power Development Co., Ltd.§ | | | 2,800 | | | | 87,782 | | |
| Insurance (0.4%) | |
| Mitsui Sumitomo Insurance Group Holdings, Inc. | | | 4,881 | | | | 121,970 | | |
| NKSJ Holdings, Inc.* | | | 13,573 | | | | 99,672 | | |
| T&D Holdings, Inc.§ | | | 1,650 | | | | 41,666 | | |
| The Dai-ichi Life Insurance Co., Ltd. | | | 54 | | | | 87,484 | | |
| Tokio Marine Holdings, Inc. | | | 7,548 | | | | 224,467 | | |
| | | | 575,259 | | |
| Internet & Catalog Retail (0.1%) | |
| Image Holdings Co., Ltd.*§ | | | 2,818 | | | | 9,295 | | |
| Nissen Holdings Co., Ltd. | | | 8,063 | | | | 41,256 | | |
| Scroll Corp. | | | 4,883 | | | | 20,940 | | |
| Senshukai Co., Ltd.§ | | | 1,825 | | | | 11,183 | | |
| | | | 82,674 | | |
| Internet Software & Services (0.0%) | |
| Asahi Net, Inc. | | | 2,000 | | | | 7,783 | | |
| eAccess, Ltd.§ | | | 76 | | | | 45,805 | | |
| | | | 53,588 | | |
See Accompanying Notes to Financial Statements.
27
Credit Suisse Trust — International Equity Flex III Portfolio
Schedule of Investments (continued)
December 31, 2010
| | | Number of
Shares | | Value | |
| LONG STOCK POSITIONS | |
| COMMON STOCKS | |
| Japan | |
| IT Services (0.1%) | |
| Argo Graphics, Inc. | | | 800 | | | $ | 10,281 | | |
| CAC Corp.§ | | | 4,500 | | | | 34,702 | | |
| JBIS Holdings, Inc. | | | 2,368 | | | | 9,781 | | |
| NEC Fielding, Ltd. | | | 1,300 | | | | 16,845 | | |
| NS Solutions Corp. | | | 1,300 | | | | 28,322 | | |
| NTT Data Corp. | | | 12 | | | | 41,426 | | |
| Obic Co., Ltd. | | | 40 | | | | 8,223 | | |
| Panasonic Electric Works Information Systems Co., Ltd. | | | 400 | | | | 10,862 | | |
| | | | 160,442 | | |
| Leisure Equipment & Products (0.3%) | |
| Daikoku Denki Co., Ltd. | | | 1,100 | | | | 14,046 | | |
| GLOBERIDE, Inc.§ | | | 16,666 | | | | 20,094 | | |
| Mizuno Corp. | | | 12,607 | | | | 64,817 | | |
| Namco Bandai Holdings, Inc.§ | | | 7,700 | | | | 82,622 | | |
| Nikon Corp. | | | 2,900 | | | | 58,603 | | |
| Roland Corp. | | | 600 | | | | 7,452 | | |
| Sankyo Co., Ltd. | | | 754 | | | | 42,528 | | |
| Sega Sammy Holdings, Inc. | | | 700 | | | | 13,290 | | |
| SRI Sports, Ltd. | | | 33 | | | | 36,458 | | |
| Yamaha Corp. | | | 2,100 | | | | 25,953 | | |
| | | | 365,863 | | |
| Machinery (1.6%) | |
| Aida Engineering, Ltd. | | | 4,300 | | | | 19,611 | | |
| Amada Co., Ltd. | | | 5,279 | | | | 42,826 | | |
| Bando Chemical Industries, Ltd. | | | 12,703 | | | | 50,432 | | |
| CKD Corp. | | | 1,000 | | | | 8,540 | | |
| Daido Kogyo Co., Ltd. | | | 4,000 | | | | 7,961 | | |
| Daifuku Co., Ltd. | | | 16,000 | | | | 111,709 | | |
| Ebara Corp.* | | | 8,000 | | | | 39,185 | | |
| Fanuc, Ltd.§ | | | 2,058 | | | | 314,908 | | |
| Hitachi Zosen Corp.§ | | | 32,158 | | | | 48,644 | | |
| Hosokawa Micron Corp. | | | 2,250 | | | | 9,395 | | |
| IHI Corp.§ | | | 17,000 | | | | 37,782 | | |
| JTEKT Corp. | | | 7,792 | | | | 91,524 | | |
| Kato Works Co., Ltd. | | | 14,836 | | | | 32,752 | | |
| Kito Corp. | | | 3 | | | | 2,924 | | |
| Komatsu, Ltd. | | | 6,448 | | | | 194,268 | | |
| Kubota Corp.§ | | | 4,000 | | | | 37,724 | | |
| Kyokuto Kaihatsu Kogyo Co., Ltd. | | | 4,914 | | | | 20,598 | | |
| Maezawa Kyuso Industries Co., Ltd. | | | 632 | | | | 7,788 | | |
| Makita Corp. | | | 2,889 | | | | 117,682 | | |
| Max Co., Ltd. | | | 4,000 | | | | 47,283 | | |
| Minebea Co., Ltd. | | | 6,878 | | | | 43,192 | | |
| Mitsubishi Heavy Industries, Ltd.§ | | | 20,000 | | | | 74,948 | | |
| Mitsuboshi Belting Co., Ltd. | | | 6,000 | | | | 34,808 | | |
See Accompanying Notes to Financial Statements.
28
Credit Suisse Trust — International Equity Flex III Portfolio
Schedule of Investments (continued)
December 31, 2010
| | | Number of
Shares | | Value | |
| LONG STOCK POSITIONS | |
| COMMON STOCKS | |
| Japan | |
| Machinery | |
| Mitsui Engineering & Shipbuilding Co., Ltd.§ | | | 30,072 | | | $ | 79,375 | | |
| Nachi-Fujikoshi Corp. | | | 3,000 | | | | 10,052 | | |
| Nippon Yusoki Co., Ltd. | | | 3,666 | | | | 9,439 | | |
| NSK, Ltd. | | | 7,580 | | | | 68,241 | | |
| NTN Corp. | | | 21,796 | | | | 115,147 | | |
| O-M, Ltd. | | | 9,333 | | | | 37,154 | | |
| Obara Corp. | | | 1,339 | | | | 14,170 | | |
| Oiles Corp. | | | 1,300 | | | | 24,031 | | |
| Ryobi, Ltd.*§ | | | 3,000 | | | | 13,692 | | |
| Sasebo Heavy Industries Co., Ltd.§ | | | 44,190 | | | | 90,243 | | |
| Shinmaywa Industries, Ltd. | | | 10,000 | | | | 43,180 | | |
| SMC Corp. | | | 193 | | | | 32,969 | | |
| Sumitomo Heavy Industries, Ltd. | | | 5,908 | | | | 37,829 | | |
| Tadano, Ltd.§ | | | 1,286 | | | | 6,902 | | |
| TOKYO KEIKI, Inc. | | | 8,058 | | | | 12,423 | | |
| Tokyo Kikai Seisakusho, Ltd.* | | | 20,000 | | | | 18,899 | | |
| Tsurumi Manufacturing Co., Ltd. | | | 2,000 | | | | 13,544 | | |
| | | | 2,023,774 | | |
| Marine (0.2%) | |
| Iino Kaiun Kaisha Ltd.§ | | | 4,500 | | | | 20,247 | | |
| Japan Transcity Corp. | | | 7,500 | | | | 26,010 | | |
| Kawasaki Kisen Kaisha, Ltd.§ | | | 10,000 | | | | 43,583 | | |
| Mitsui OSK Lines, Ltd. | | | 10,000 | | | | 67,832 | | |
| Nippon Yusen KK§ | | | 22,706 | | | | 100,070 | | |
| | | | 257,742 | | |
| Media (0.2%) | |
| Amuse, Inc. | | | 800 | | | | 9,561 | | |
| Avex Group Holdings, Inc. | | | 1,959 | | | | 28,629 | | |
| Horipro, Inc. | | | 1,635 | | | | 14,158 | | |
| Nippon Television Network Corp. | | | 290 | | | | 45,530 | | |
| SKY Perfect JSAT Holdings, Inc.§ | | | 227 | | | | 87,655 | | |
| Tow Co., Ltd. | | | 2,666 | | | | 15,522 | | |
| TV Asahi Corp. | | | 5 | | | | 8,693 | | |
| Zenrin Co., Ltd.§ | | | 2,100 | | | | 23,404 | | |
| | | | 233,152 | | |
| Metals & Mining (0.7%) | |
| Aichi Steel Corp. | | | 5,000 | | | | 34,199 | | |
| Dowa Holdings Co., Ltd. | | | 4,000 | | | | 26,160 | | |
| JFE Holdings, Inc. | | | 4,300 | | | | 149,247 | | |
| Kobe Steel, Ltd. | | | 16,621 | | | | 42,041 | | |
| Maruichi Steel Tube, Ltd. | | | 500 | | | | 10,613 | | |
| Mitsubishi Materials Corp.*§ | | | 7,262 | | | | 23,101 | | |
| Mitsui Mining & Smelting Co., Ltd. | | | 14,000 | | | | 46,093 | | |
| Nichia Steel Works, Ltd. | | | 9,000 | | | | 23,796 | | |
See Accompanying Notes to Financial Statements.
29
Credit Suisse Trust — International Equity Flex III Portfolio
Schedule of Investments (continued)
December 31, 2010
| | | Number of
Shares | | Value | |
| LONG STOCK POSITIONS | |
| COMMON STOCKS | |
| Japan | |
| Metals & Mining | |
| Nippon Steel Corp. | | | 31,977 | | | $ | 114,676 | | |
| Nittetsu Mining Co., Ltd. | | | 18,799 | | | | 94,500 | | |
| Pacific Metals Co., Ltd.§ | | | 5,000 | | | | 42,353 | | |
| Sumitomo Metal Industries, Ltd. | | | 20,263 | | | | 49,727 | | |
| Sumitomo Metal Mining Co., Ltd. | | | 5,000 | | | | 87,182 | | |
| Toho Zinc Co., Ltd. | | | 8,000 | | | | 42,482 | | |
| Tokyo Tekko Co., Ltd. | | | 14,039 | | | | 36,919 | | |
| Yamato Kogyo Co., Ltd. | | | 300 | | | | 9,029 | | |
| Yodogawa Steel Works, Ltd. | | | 4,000 | | | | 18,580 | | |
| | | | 850,698 | | |
| Office Electronics (0.9%) | |
| Brother Industries, Ltd. | | | 6,500 | | | | 96,033 | | |
| Canon, Inc.§ | | | 14,814 | | | | 761,722 | | |
| Konica Minolta Holdings, Inc. | | | 4,173 | | | | 43,175 | | |
| Ricoh Co., Ltd. | | | 12,985 | | | | 189,533 | | |
| Toshiba TEC Corp. | | | 5,000 | | | | 24,164 | | |
| | | | 1,114,627 | | |
| Oil, Gas & Consumable Fuels (0.5%) | |
| AOC Holdings, Inc.*§ | | | 9,474 | | | | 64,512 | | |
| Cosmo Oil Co., Ltd.§ | | | 17,802 | | | | 58,198 | | |
| Idemitsu Kosan Co., Ltd. | | | 100 | | | | 10,608 | | |
| INPEX Corp. | | | 17 | | | | 99,374 | | |
| Itochu Enex Co., Ltd. | | | 12,836 | | | | 69,466 | | |
| JX Holdings, Inc. | | | 23,700 | | | | 160,547 | | |
| San-Ai Oil Co., Ltd. | | | 8,800 | | | | 43,259 | | |
| Showa Shell Sekiyu KK§ | | | 11,500 | | | | 105,182 | | |
| Sinanen Co., Ltd. | | | 2,000 | | | | 9,201 | | |
| TonenGeneral Sekiyu KK§ | | | 7,614 | | | | 83,165 | | |
| | | | 703,512 | | |
| Paper & Forest Products (0.1%) | |
| Chuetsu Pulp & Paper Co., Ltd. | | | 7,000 | | | | 12,667 | | |
| Nakabayashi Co., Ltd. | | | 3,428 | | | | 7,720 | | |
| Nippon Paper Group, Inc.§ | | | 3,200 | | | | 83,853 | | |
| | | | 104,240 | | |
| Personal Products (0.1%) | |
| Kao Corp. | | | 3,000 | | | | 80,710 | | |
| Pharmaceuticals (1.1%) | |
| ASKA Pharmaceutical Co., Ltd. | | | 4,833 | | | | 36,446 | | |
| Astellas Pharma, Inc.§ | | | 7,900 | | | | 300,557 | | |
| Daiichi Sankyo Co., Ltd.§ | | | 4,891 | | | | 106,936 | | |
| Eisai Co., Ltd.§ | | | 5,300 | | | | 191,675 | | |
| Kaken Pharmaceutical Co., Ltd. | | | 6,000 | | | | 72,850 | | |
| Kyorin Co., Ltd. | | | 2,000 | | | | 34,904 | | |
See Accompanying Notes to Financial Statements.
30
Credit Suisse Trust — International Equity Flex III Portfolio
Schedule of Investments (continued)
December 31, 2010
| | | Number of
Shares | | Value | |
| LONG STOCK POSITIONS | |
| COMMON STOCKS | |
| Japan | |
| Pharmaceuticals | |
| Mochida Pharmaceutical Co., Ltd.§ | | | 7,000 | | | $ | 74,990 | | |
| Ono Pharmaceutical Co., Ltd. | | | 1,600 | | | | 74,689 | | |
| Shionogi & Co., Ltd. | | | 1,000 | | | | 19,728 | | |
| Takeda Pharmaceutical Co., Ltd.§ | | | 10,700 | | | | 526,197 | | |
| | | | 1,438,972 | | |
| Professional Services (0.0%) | |
| Pasona Group, Inc. | | | 23 | | | | 17,169 | | |
| Real Estate Investment Trusts (0.3%) | |
| Japan Prime Realty Investment Corp.§ | | | 20 | | | | 61,565 | | |
| Japan Real Estate Investment Corp. | | | 6 | | | | 62,223 | | |
| Japan Retail Fund Investment Corp. | | | 49 | | | | 93,803 | | |
| Nippon Building Fund, Inc.§ | | | 3 | | | | 30,777 | | |
| Nomura Real Estate Office Fund, Inc. | | | 15 | | | | 108,332 | | |
| | | | 356,700 | | |
| Real Estate Management & Development (0.5%) | |
| Airport Facilities Co., Ltd. | | | 6,700 | | | | 29,176 | | |
| Daito Trust Construction Co., Ltd. | | | 1,393 | | | | 95,301 | | |
| Daiwa House Industry Co., Ltd. | | | 3,000 | | | | 36,788 | | |
| Mitsubishi Estate Co., Ltd. | | | 8,559 | | | | 158,346 | | |
| Mitsui Fudosan Co., Ltd. | | | 6,910 | | | | 137,470 | | |
| Nisshin Fudosan Co., Ltd. | | | 4,900 | | | | 39,733 | | |
| Sumitomo Realty & Development Co., Ltd. | | | 1,000 | | | | 23,815 | | |
| Tokyo Tatemono Co., Ltd.§ | | | 11,000 | | | | 50,753 | | |
| Tokyu Land Corp. | | | 21,811 | | | | 109,260 | | |
| | | | 680,642 | | |
| Road & Rail (0.7%) | |
| Central Japan Railway Co.§ | | | 22 | | | | 184,100 | | |
| East Japan Railway Co. | | | 4,300 | | | | 279,316 | | |
| ICHINEN HOLDINGS Co., Ltd. | | | 4,050 | | | | 20,843 | | |
| KRS Corp. | | | 960 | | | | 10,166 | | |
| Maruwn Corp. | | | 2,300 | | | | 6,172 | | |
| Nippon Express Co., Ltd. | | | 16,000 | | | | 71,929 | | |
| Sankyu, Inc. | | | 10,000 | | | | 45,342 | | |
| Senko Co., Ltd. | | | 6,800 | | | | 24,271 | | |
| Tokyu Corp. | | | 13,000 | | | | 59,531 | | |
| Tonami Holdings Co., Ltd. | | | 6,332 | | | | 12,083 | | |
| West Japan Railway Co. | | | 39 | | | | 145,720 | | |
| | | | 859,473 | | |
| Semiconductors & Semiconductor Equipment (0.2%) | |
| Dainippon Screen Manufacturing Co., Ltd.* | | | 2,000 | | | | 14,157 | | |
| Elpida Memory, Inc.*§ | | | 1,900 | | | | 21,998 | | |
| Mimasu Semiconductor Industry Co., Ltd. | | | 4,800 | | | | 55,595 | | |
| Rohm Co., Ltd.§ | | | 600 | | | | 39,061 | | |
See Accompanying Notes to Financial Statements.
31
Credit Suisse Trust — International Equity Flex III Portfolio
Schedule of Investments (continued)
December 31, 2010
| | | Number of
Shares | | Value | |
| LONG STOCK POSITIONS | |
| COMMON STOCKS | |
| Japan | |
| Semiconductors & Semiconductor Equipment | |
| Shinko Electric Industries Co., Ltd.§ | | | 1,700 | | | $ | 18,986 | | |
| Tokyo Electron, Ltd.§ | | | 1,966 | | | | 123,912 | | |
| | | | 273,709 | | |
| Software (0.4%) | |
| Computer Engineering & Consulting, Ltd. | | | 1,900 | | | | 9,793 | | |
| Computer Institute of Japan, Ltd. | | | 2,504 | | | | 8,503 | | |
| Jastec Co., Ltd. | | | 1,088 | | | | 6,391 | | |
| Konami Corp.§ | | | 2,523 | | | | 53,437 | | |
| Nintendo Co., Ltd.§ | | | 1,200 | | | | 350,709 | | |
| SRA Holdings | | | 2,884 | | | | 31,852 | | |
| Trend Micro, Inc.*§ | | | 1,500 | | | | 49,330 | | |
| | | | 510,015 | | |
| Specialty Retail (0.4%) | |
| Aoyama Trading Co., Ltd. | | | 2,333 | | | | 42,104 | | |
| Arc Land Sakamoto Co., Ltd. | | | 2,052 | | | | 25,166 | | |
| Chiyoda Co., Ltd.§ | | | 4,004 | | | | 53,076 | | |
| DCM Holdings Co., Ltd.§ | | | 16,900 | | | | 106,276 | | |
| EDION Corp. | | | 2,400 | | | | 21,501 | | |
| Fast Retailing Co., Ltd. | | | 72 | | | | 11,433 | | |
| Geo Corp. | | | 43 | | | | 48,920 | | |
| Hard Off Corp. Co., Ltd. | | | 1,600 | | | | 8,235 | | |
| Hikari Tsushin, Inc.§ | | | 1,287 | | | | 28,039 | | |
| K's Holding Corp. | | | 300 | | | | 8,152 | | |
| Keiyo Co., Ltd.§ | | | 6,073 | | | | 31,113 | | |
| Right On Co., Ltd.§ | | | 3,307 | | | | 18,916 | | |
| T-Gaia Corp.§ | | | 33 | | | | 58,680 | | |
| Taka-Q, Ltd. | | | 4,000 | | | | 8,020 | | |
| Top Culture Co., Ltd. | | | 1,433 | | | | 6,372 | | |
| Yamada Denki Co., Ltd.§ | | | 268 | | | | 18,252 | | |
| | | | 494,255 | | |
| Textiles, Apparel & Luxury Goods (0.3%) | |
| Atsugi Co., Ltd. | | | 26,926 | | | | 34,766 | | |
| Daidoh, Ltd.§ | | | 1,036 | | | | 9,209 | | |
| Kurabo Industries, Ltd. | | | 22,418 | | | | 40,537 | | |
| Nisshinbo Holdings, Inc. | | | 8,969 | | | | 98,002 | | |
| Onward Holdings Co., Ltd.§ | | | 3,000 | | | | 25,946 | | |
| Tasaki Shinju Co., Ltd.* | | | 7,679 | | | | 6,705 | | |
| The Japan Wool Textile Co., Ltd. | | | 3,000 | | | | 24,444 | | |
| Toyobo Co., Ltd. | | | 40,000 | | | | 71,340 | | |
| Yamato International, Inc. | | | 1,600 | | | | 7,363 | | |
| | | | 318,312 | | |
| Thrifts & Mortgage Finance (0.0%) | |
| Asax Co., Ltd. | | | 7 | | | | 7,668 | | |
See Accompanying Notes to Financial Statements.
32
Credit Suisse Trust — International Equity Flex III Portfolio
Schedule of Investments (continued)
December 31, 2010
| | | Number of
Shares | | Value | |
| LONG STOCK POSITIONS | |
| COMMON STOCKS | |
| Japan | |
| Tobacco (0.1%) | |
| Japan Tobacco, Inc. | | | 50 | | | $ | 184,822 | | |
| Trading Companies & Distributors (1.7%) | |
| Furusato Industries, Ltd. | | | 1,416 | | | | 9,165 | | |
| Hanwa Co., Ltd.§ | | | 20,159 | | | | 92,536 | | |
| Inaba Denki Sangyo Co., Ltd | | | 3,013 | | | | 85,203 | | |
| Inabata & Co., Ltd. | | | 3,466 | | | | 21,013 | | |
| ITOCHU Corp. | | | 15,621 | | | | 157,558 | | |
| Iwatani Corp. | | | 16,000 | | | | 48,240 | | |
| Jalux, Inc.* | | | 1,900 | | | | 15,961 | | |
| Japan Pulp & Paper Co., Ltd. | | | 9,273 | | | | 33,043 | | |
| JFE Shoji Holdings, Inc.§ | | | 10,000 | | | | 46,521 | | |
| Kamei Corp. | | | 5,000 | | | | 24,172 | | |
| Kanaden Corp. | | | 1,000 | | | | 6,061 | | |
| Kanematsu Corp.*§ | | | 110,000 | | | | 105,359 | | |
| Kuroda Electric Co., Ltd. | | | 5,937 | | | | 83,093 | | |
| Kyokuto Boeki Kaisha, Ltd. | | | 4,666 | | | | 8,482 | | |
| Marubeni Corp. | | | 24,827 | | | | 173,991 | | |
| Mitsubishi Corp. | | | 12,115 | | | | 326,862 | | |
| Mitsui & Co., Ltd.§ | | | 17,183 | | | | 283,024 | | |
| NEC Capital Solutions Ltd. | | | 4,055 | | | | 60,084 | | |
| Onoken Co., Ltd. | | | 4,800 | | | | 43,917 | | |
| Sato Shoji Corp. | | | 1,500 | | | | 9,265 | | |
| Seika Corp. | | | 10,759 | | | | 27,511 | | |
| Shinwa Co., Ltd. | | | 800 | | | | 9,671 | | |
| Sojitz Corp.§ | | | 31,281 | | | | 68,471 | | |
| Sumikin Bussan Corp. | | | 25,666 | | | | 61,874 | | |
| Sumitomo Corp.§ | | | 14,379 | | | | 202,629 | | |
| Tokyo Sangyo Co., Ltd. | | | 2,500 | | | | 7,753 | | |
| Toyota Tsusho Corp. | | | 4,300 | | | | 75,378 | | |
| Tsubakimoto Kogyo Co., Ltd. | | | 4,000 | | | | 10,858 | | |
| Yamazen Corp. | | | 4,600 | | | | 24,594 | | |
| | | | 2,122,289 | | |
| Transportation Infrastructure (0.1%) | |
| Mitsui-Soko Co., Ltd. | | | 21,000 | | | | 87,416 | | |
| Nissin Corp. | | | 10,500 | | | | 26,798 | | |
| The Yasuda Warehouse Co., Ltd. | | | 3,000 | | | | 17,938 | | |
| | | | 132,152 | | |
| Wireless Telecommunication Services (0.6%) | |
| KDDI Corp.§ | | | 41 | | | | 236,684 | | |
| NTT DoCoMo, Inc. | | | 172 | | | | 299,870 | | |
| Softbank Corp. | | | 6,400 | | | | 220,906 | | |
| | | | 757,460 | | |
| TOTAL JAPAN | | | 36,005,519 | | |
See Accompanying Notes to Financial Statements.
33
Credit Suisse Trust — International Equity Flex III Portfolio
Schedule of Investments (continued)
December 31, 2010
| | | Number of
Shares | | Value | |
| LONG STOCK POSITIONS | |
| COMMON STOCKS | |
| Luxembourg (0.6%) | |
| Energy Equipment & Services (0.4%) | |
| Tenaris SA | | | 23,178 | | | $ | 570,661 | | |
| Metals & Mining (0.2%) | |
| ArcelorMittal | | | 6,805 | | | | 259,992 | | |
| TOTAL LUXEMBOURG | | | 830,653 | | |
| Netherlands (3.6%) | |
| Beverages (0.1%) | |
| Heineken NV | | | 2,445 | | | | 120,390 | | |
| Chemicals (0.4%) | |
| Koninklijke DSM NV | | | 9,361 | | | | 535,698 | | |
| Construction & Engineering (0.3%) | |
| Imtech NV | | | 3,171 | | | | 120,930 | | |
| Koninklijke BAM Groep NV | | | 13,118 | | | | 81,005 | | |
| Koninklijke Boskalis Westminster NV | | | 2,561 | | | | 122,759 | | |
| | | | 324,694 | | |
| Construction Materials (0.0%) | |
| James Hardie Industries NV* | | | 3,734 | | | | 25,949 | | |
| Diversified Financial Services (0.2%) | |
| ING Groep NV* | | | 20,482 | | | | 200,601 | | |
| Diversified Telecommunication Services (0.5%) | |
| Koninklijke KPN NV | | | 47,006 | | | | 689,258 | | |
| Energy Equipment & Services (0.0%) | |
| Fugro NV | | | 381 | | | | 31,493 | | |
| Food & Staples Retailing (0.4%) | |
| Koninklijke Ahold NV | | | 38,283 | | | | 507,711 | | |
| Food Products (1.1%) | |
| CSM | | | 8,039 | | | | 282,692 | | |
| Nutreco Holding NV | | | 4,491 | | | | 342,433 | | |
| Unilever NV | | | 25,667 | | | | 803,889 | | |
| | | | 1,429,014 | | |
| Industrial Conglomerates (0.2%) | |
| Koninklijke Philips Electronics NV | | | 7,813 | | | | 240,465 | | |
| Insurance (0.1%) | |
| Brit Insurance Holdings NV* | | | 7,257 | | | | 118,756 | | |
| Real Estate Investment Trusts (0.3%) | |
| Wereldhave NV | | | 4,219 | | | | 413,994 | | |
| TOTAL NETHERLANDS | | | 4,638,023 | | |
See Accompanying Notes to Financial Statements.
34
Credit Suisse Trust — International Equity Flex III Portfolio
Schedule of Investments (continued)
December 31, 2010
| | | Number of
Shares | | Value | |
| LONG STOCK POSITIONS | |
| COMMON STOCKS | |
| Norway (1.2%) | |
| Chemicals (0.2%) | |
| Yara International ASA§ | | | 4,911 | | | $ | 286,972 | | |
| Diversified Telecommunication Services (0.4%) | |
| Telenor ASA | | | 35,726 | | | | 584,426 | | |
| Energy Equipment & Services (0.1%) | |
| Aker Solutions ASA§ | | | 6,137 | | | | 105,107 | | |
| Industrial Conglomerates (0.0%) | |
| Orkla ASA | | | 1,304 | | | | 12,769 | | |
| Insurance (0.1%) | |
| Storebrand ASA* | | | 9,405 | | | | 70,841 | | |
| Oil, Gas & Consumable Fuels (0.4%) | |
| StatoilHydro ASA§ | | | 20,021 | | | | 478,711 | | |
| TOTAL NORWAY | | | 1,538,826 | | |
| Portugal (0.7%) | |
| Commercial Banks (0.2%) | |
| Banco Comercial Portugues SA R Shares§ | | | 257,922 | | | | 201,363 | | |
| Electric Utilities (0.2%) | |
| EDP - Energias de Portugal SA | | | 58,709 | | | | 196,244 | | |
| Food & Staples Retailing (0.1%) | |
| Jeronimo Martins SGPS SA | | | 11,594 | | | | 177,472 | | |
| Transportation Infrastructure (0.2%) | |
| Brisa Auto-Estradas de Portugal SA§ | | | 41,522 | | | | 290,765 | | |
| TOTAL PORTUGAL | | | 865,844 | | |
| Singapore (1.3%) | |
| Diversified Financial Services (1.3%) | |
| iShares MSCI Singapore Index Fund | | | 117,181 | | | | 1,622,957 | | |
| TOTAL SINGAPORE | | | 1,622,957 | | |
| Spain (4.7%) | |
| Commercial Banks (1.1%) | |
| Banco Bilbao Vizcaya Argentaria SA§ | | | 44,255 | | | | 452,784 | | |
| Banco Popular Espanol SA§ | | | 23,637 | | | | 122,359 | | |
| Banco Santander SA | | | 74,783 | | | | 800,000 | | |
| | | | 1,375,143 | | |
| Construction & Engineering (0.7%) | |
| ACS Actividades de Construccion y Servicios SA§ | | | 6,137 | | | | 289,350 | | |
| Ferrovial SA§ | | | 22,908 | | | | 229,668 | | |
| Fomento de Construcciones y Contratas SA§ | | | 16,852 | | | | 445,551 | | |
| | | | 964,569 | | |
See Accompanying Notes to Financial Statements.
35
Credit Suisse Trust — International Equity Flex III Portfolio
Schedule of Investments (continued)
December 31, 2010
| | | Number of
Shares | | Value | |
| LONG STOCK POSITIONS | |
| COMMON STOCKS | |
| Spain | |
| Diversified Financial Services (0.4%) | |
| Criteria Caixacorp SA§ | | | 86,328 | | | $ | 462,886 | | |
| Diversified Telecommunication Services (1.2%) | |
| Telefonica SA | | | 64,778 | | | | 1,484,685 | | |
| Electric Utilities (0.6%) | |
| Endesa SA§ | | | 16,037 | | | | 417,175 | | |
| Iberdrola SA§ | | | 41,275 | | | | 321,285 | | |
| | | | 738,460 | | |
| Food Products (0.1%) | |
| Ebro Foods SA | | | 3,352 | | | | 71,395 | | |
| IT Services (0.0%) | |
| Indra Sistemas SA§ | | | 2,660 | | | | 45,772 | | |
| Media (0.1%) | |
| Gestevision Telecinco SA | | | 14,685 | | | | 162,394 | | |
| Oil, Gas & Consumable Fuels (0.4%) | |
| Repsol YPF SA | | | 19,618 | | | | 551,530 | | |
| Specialty Retail (0.1%) | |
| Inditex SA§ | | | 2,111 | | | | 158,636 | | |
| TOTAL SPAIN | | | 6,015,470 | | |
| Sweden (6.0%) | |
| Building Products (0.2%) | |
| Assa Abloy AB Class B | | | 7,310 | | | | 206,291 | | |
| Capital Markets (0.0%) | |
| Ratos AB B Shares | | | 1,148 | | | | 42,462 | | |
| Commercial Banks (0.3%) | |
| Nordea Bank AB | | | 9,808 | | | | 106,685 | | |
| Svenska Handelsbanken AB A Shares | | | 10,407 | | | | 332,804 | | |
| | | | 439,489 | | |
| Commercial Services & Supplies (0.2%) | |
| Securitas AB B Shares§ | | | 26,901 | | | | 315,142 | | |
| Communications Equipment (0.3%) | |
| Telefonaktiebolaget LM Ericsson B Shares | | | 37,100 | | | | 430,124 | | |
| Construction & Engineering (0.4%) | |
| Skanska AB B Shares§ | | | 26,025 | | | | 516,153 | | |
| Diversified Financial Services (0.2%) | |
| Industrivarden AB A Shares | | | 13,775 | | | | 245,554 | | |
| Diversified Telecommunication Services (0.5%) | |
| Tele2 AB B Shares | | | 20,612 | | | | 427,827 | | |
| TeliaSonera AB | | | 22,443 | | | | 178,241 | | |
| | | | 606,068 | | |
See Accompanying Notes to Financial Statements.
36
Credit Suisse Trust — International Equity Flex III Portfolio
Schedule of Investments (continued)
December 31, 2010
| | | Number of
Shares | | Value | |
| LONG STOCK POSITIONS | |
| COMMON STOCKS | |
| Sweden | |
| Health Care Equipment & Supplies (0.1%) | |
| Elekta AB B Shares | | | 2,757 | | | $ | 106,015 | | |
| Getinge AB B Shares | | | 912 | | | | 19,100 | | |
| | | | 125,115 | | |
| Household Durables (0.3%) | |
| Electrolux AB Series B | | | 3,617 | | | | 102,685 | | |
| Husqvarna AB B Shares§ | | | 26,464 | | | | 221,221 | | |
| | | | 323,906 | | |
| Machinery (2.0%) | |
| Alfa Laval AB§ | | | 25,190 | | | | 532,058 | | |
| Atlas Copco AB A Shares§ | | | 24,549 | | | | 619,960 | | |
| Atlas Copco AB B Shares | | | 8,305 | | | | 188,081 | | |
| Hexagon AB B Shares | | | 8,284 | | | | 177,991 | | |
| Sandvik AB | | | 4,473 | | | | 87,313 | | |
| Scania AB B Shares | | | 22,031 | | | | 507,344 | | |
| SKF AB B Shares | | | 11,817 | | | | 337,359 | | |
| Volvo AB B Shares* | | | 3,287 | | | | 57,927 | | |
| | | | 2,508,033 | | |
| Metals & Mining (0.2%) | |
| Boliden AB | | | 9,733 | | | | 198,382 | | |
| Paper & Forest Products (0.6%) | |
| Holmen AB B Shares | | | 8,392 | | | | 276,373 | | |
| Svenska Cellulosa AB B Shares§ | | | 33,678 | | | | 531,958 | | |
| | | | 808,331 | | |
| Pharmaceuticals (0.0%) | |
| Meda AB | | | 6,083 | | | | 46,391 | | |
| Specialty Retail (0.3%) | |
| Hennes & Mauritz AB B Shares | | | 11,503 | | | | 383,268 | | |
| Tobacco (0.4%) | |
| Swedish Match AB | | | 18,371 | | | | 532,581 | | |
| TOTAL SWEDEN | | | 7,727,290 | | |
| Switzerland (7.7%) | |
| Biotechnology (0.1%) | |
| BB Biotech AG | | | 1,860 | | | | 123,302 | | |
| Building Products (0.0%) | |
| Geberit AG | | | 134 | | | | 31,080 | | |
| Capital Markets (0.4%) | |
| Julius Baer Group, Ltd. | | | 1,065 | | | | 50,022 | | |
| UBS AG* | | | 29,606 | | | | 487,603 | | |
| | | | 537,625 | | |
See Accompanying Notes to Financial Statements.
37
Credit Suisse Trust — International Equity Flex III Portfolio
Schedule of Investments (continued)
December 31, 2010
| | | Number of
Shares | | Value | |
| LONG STOCK POSITIONS | |
| COMMON STOCKS | |
| Switzerland | |
| Chemicals (0.2%) | |
| Clariant AG* | | | 4,398 | | | $ | 89,391 | | |
| Syngenta AG | | | 317 | | | | 93,213 | | |
| | | | 182,604 | | |
| Diversified Telecommunication Services (0.3%) | |
| Swisscom AG | | | 974 | | | | 429,489 | | |
| Electrical Equipment (0.2%) | |
| ABB, Ltd.* | | | 10,029 | | | | 224,623 | | |
| Energy Equipment & Services (0.2%) | |
| Transocean, Ltd.* | | | 3,500 | | | | 241,861 | | |
| Food Products (2.0%) | |
| Nestle SA§ | | | 43,771 | | | | 2,572,244 | | |
| Insurance (0.9%) | |
| Baloise Holding AG | | | 4,988 | | | | 486,720 | | |
| Helvetia Holding AG | | | 703 | | | | 271,231 | | |
| Zurich Financial Services AG | | | 1,357 | | | | 352,511 | | |
| | | | 1,110,462 | | |
| Machinery (0.4%) | |
| Schindler Holding AG | | | 3,520 | | | | 417,695 | | |
| Sulzer AG | | | 706 | | | | 108,043 | | |
| | | | 525,738 | | |
| Pharmaceuticals (2.6%) | |
| Novartis AG | | | 31,630 | | | | 1,867,711 | | |
| Roche Holding AG§ | | | 10,399 | | | | 1,529,161 | | |
| | | | 3,396,872 | | |
| Textiles, Apparel & Luxury Goods (0.4%) | |
| Compagnie Financiere Richemont SA Class A | | | 2,170 | | | | 128,001 | | |
| The Swatch Group AG | | | 2,652 | | | | 214,652 | | |
| The Swatch Group AG BR Shares | | | 322 | | | | 144,017 | | |
| | | | 486,670 | | |
| TOTAL SWITZERLAND | | | 9,862,570 | | |
| United Kingdom (23.8%) | |
| Aerospace & Defense (0.2%) | |
| BAE Systems PLC | | | 51,584 | | | | 266,816 | | |
| Rolls-Royce Group PLC* | | | 5,323 | | | | 52,081 | | |
| | | | 318,897 | | |
| Auto Components (0.1%) | |
| GKN PLC | | | 28,693 | | | | 100,013 | | |
| Beverages (0.1%) | |
| Diageo PLC | | | 9,561 | | | | 177,892 | | |
See Accompanying Notes to Financial Statements.
38
Credit Suisse Trust — International Equity Flex III Portfolio
Schedule of Investments (continued)
December 31, 2010
| | | Number of
Shares | | Value | |
| LONG STOCK POSITIONS | |
| COMMON STOCKS | |
| United Kingdom | |
| Biotechnology (0.0%) | |
| Genus PLC | | | 2,410 | | | $ | 32,380 | | |
| Capital Markets (1.1%) | |
| 3i Group PLC§ | | | 93,478 | | | | 482,246 | | |
| Aberdeen Asset Management PLC | | | 709 | | | | 2,259 | | |
| Collins Stewart PLC | | | 22,253 | | | | 27,263 | | |
| Intermediate Capital Group PLC | | | 15,921 | | | | 83,292 | | |
| Man Group PLC | | | 79,206 | | | | 368,814 | | |
| Schroders PLC§ | | | 16,491 | | | | 480,225 | | |
| | | | 1,444,099 | | |
| Chemicals (0.4%) | |
| Croda International PLC§ | | | 15,111 | | | | 384,125 | | |
| Filtrona PLC | | | 23,480 | | | | 89,286 | | |
| Yule Catto & Co. PLC | | | 10,068 | | | | 31,684 | | |
| | | | 505,095 | | |
| Commercial Banks (2.8%) | |
| Barclays PLC | | | 175,194 | | | | 727,103 | | |
| HSBC Holdings PLC§ | | | 172,331 | | | | 1,768,654 | | |
| Lloyds Banking Group PLC* | | | 169,979 | | | | 176,207 | | |
| Royal Bank of Scotland Group PLC* | | | 122,888 | | | | 75,785 | | |
| Standard Chartered PLC | | | 33,487 | | | | 907,805 | | |
| | | | 3,655,554 | | |
| Communications Equipment (0.1%) | |
| Spirent Communications PLC | | | 49,379 | | | | 114,377 | | |
| Construction & Engineering (0.5%) | |
| Carillion PLC | | | 73,636 | | | | 444,491 | | |
| Interserve PLC | | | 49,053 | | | | 177,363 | | |
| | | | 621,854 | | |
| Consumer Finance (0.1%) | |
| International Personal Finance PLC | | | 12,131 | | | | 73,155 | | |
| Containers & Packaging (0.1%) | |
| DS Smith PLC | | | 50,627 | | | | 160,443 | | |
| Distributors (0.1%) | |
| Inchcape PLC* | | | 11,753 | | | | 65,829 | | |
| Diversified Telecommunication Services (0.5%) | |
| BT Group PLC | | | 232,403 | | | | 662,849 | | |
| Electronic Equipment, Instruments & Components (0.4%) | |
| Diploma PLC | | | 12,909 | | | | 56,288 | | |
| Domino Printing Sciences | | | 4,080 | | | | 41,543 | | |
| Electrocomponents PLC | | | 16,786 | | | | 70,021 | | |
See Accompanying Notes to Financial Statements.
39
Credit Suisse Trust — International Equity Flex III Portfolio
Schedule of Investments (continued)
December 31, 2010
| | | Number of
Shares | | Value | |
| LONG STOCK POSITIONS | |
| COMMON STOCKS | |
| United Kingdom | |
| Electronic Equipment, Instruments & Components | |
| Premier Farnell PLC | | | 63,264 | | | $ | 284,269 | | |
| TT electronics PLC | | | 23,115 | | | | 62,534 | | |
| | | | 514,655 | | |
| Energy Equipment & Services (0.1%) | |
| Petrofac, Ltd. | | | 6,404 | | | | 159,790 | | |
| Food & Staples Retailing (0.5%) | |
| J Sainsbury PLC | | | 60,191 | | | | 355,102 | | |
| Tesco PLC | | | 39,089 | | | | 260,290 | | |
| | | | 615,392 | | |
| Food Products (0.3%) | |
| Unilever PLC | | | 12,690 | | | | 391,428 | | |
| Health Care Providers & Services (0.0%) | |
| Synergy Health PLC | | | 2,704 | | | | 37,164 | | |
| Hotels, Restaurants & Leisure (0.1%) | |
| Compass Group PLC | | | 4,761 | | | | 43,392 | | |
| Rank Group PLC | | | 25,848 | | | | 51,246 | | |
| | | | 94,638 | | |
| Household Durables (0.0%) | |
| Persimmon PLC | | | 7,958 | | | | 52,006 | | |
| Household Products (0.1%) | |
| McBride PLC | | | 12,202 | | | | 35,957 | | |
| Reckitt Benckiser Group PLC | | | 2,260 | | | | 124,857 | | |
| | | | 160,814 | | |
| Independent Power Producers & Energy Traders (0.4%) | |
| International Power PLC | | | 77,148 | | | | 530,563 | | |
| Industrial Conglomerates (0.2%) | |
| Cookson Group PLC* | | | 14,567 | | | | 150,643 | | |
| Smiths Group PLC | | | 3,104 | | | | 60,595 | | |
| | | | 211,238 | | |
| Insurance (1.2%) | |
| Aviva PLC | | | 47,328 | | | | 292,142 | | |
| Legal & General Group PLC | | | 324,760 | | | | 493,931 | | |
| Old Mutual PLC | | | 293,461 | | | | 567,498 | | |
| RSA Insurance Group PLC | | | 66,965 | | | | 131,468 | | |
| | | | 1,485,039 | | |
| IT Services (0.1%) | |
| Computacenter PLC§ | | | 12,316 | | | | 74,487 | | |
| Machinery (0.8%) | |
| Fenner PLC§ | | | 28,820 | | | | 161,758 | | |
| IMI PLC | | | 14,043 | | | | 208,161 | | |
See Accompanying Notes to Financial Statements.
40
Credit Suisse Trust — International Equity Flex III Portfolio
Schedule of Investments (continued)
December 31, 2010
| | | Number of
Shares | | Value | |
| LONG STOCK POSITIONS | |
| COMMON STOCKS | |
| United Kingdom | |
| Machinery | |
| Melrose PLC | | | 40,514 | | | $ | 197,320 | | |
| Senior PLC | | | 76,831 | | | | 181,278 | | |
| The Weir Group PLC§ | | | 10,816 | | | | 301,762 | | |
| | | | 1,050,279 | | |
| Media (0.3%) | |
| Euromoney Institutional Investor PLC§ | | | 5,536 | | | | 60,042 | | |
| Pearson PLC | | | 13,527 | | | | 214,070 | | |
| Trinity Mirror PLC* | | | 68,091 | | | | 74,092 | | |
| | | | 348,204 | | |
| Metals & Mining (2.8%) | |
| Anglo American PLC | | | 7,222 | | | | 379,391 | | |
| BHP Billiton PLC | | | 35,346 | | | | 1,428,013 | | |
| Hill & Smith Holdings PLC | | | 8,340 | | | | 36,234 | | |
| Kazakhmys PLC | | | 2,757 | | | | 70,279 | | |
| Rio Tinto PLC | | | 19,699 | | | | 1,410,081 | | |
| Xstrata PLC | | | 12,091 | | | | 287,716 | | |
| | | | 3,611,714 | | |
| Multi-Utilities (0.6%) | |
| Centrica PLC§ | | | 142,459 | | | | 741,228 | | |
| Multiline Retail (0.4%) | |
| Next PLC | | | 14,858 | | | | 460,817 | | |
| Oil, Gas & Consumable Fuels (4.9%) | |
| BG Group PLC | | | 18,153 | | | | 369,787 | | |
| BP PLC | | | 241,265 | | | | 1,785,832 | | |
| Royal Dutch Shell PLC A Shares§ | | | 66,871 | | | | 2,662,957 | | |
| Royal Dutch Shell PLC B Shares | | | 44,881 | | | | 1,492,467 | | |
| | | | 6,311,043 | | |
| Paper & Forest Products (0.3%) | |
| Mondi PLC | | | 51,962 | | | | 419,733 | | |
| Pharmaceuticals (2.3%) | |
| AstraZeneca PLC | | | 26,864 | | | | 1,229,462 | | |
| GlaxoSmithKline PLC | | | 78,587 | | | | 1,530,435 | | |
| Shire PLC | | | 9,599 | | | | 232,426 | | |
| | | | 2,992,323 | | |
| Specialty Retail (0.3%) | |
| Kingfisher PLC | | | 41,374 | | | | 171,166 | | |
| WH Smith PLC | | | 19,525 | | | | 149,503 | | |
| | | | 320,669 | | |
| Thrifts & Mortgage Finance (0.1%) | |
| Paragon Group of Cos. PLC | | | 45,025 | | | | 126,780 | | |
See Accompanying Notes to Financial Statements.
41
Credit Suisse Trust — International Equity Flex III Portfolio
Schedule of Investments (continued)
December 31, 2010
| | | Number of
Shares | | Value | |
| LONG STOCK POSITIONS | |
| COMMON STOCKS | |
| United Kingdom | |
| Tobacco (0.4%) | |
| British American Tobacco PLC | | | 14,789 | | | $ | 571,267 | | |
| Trading Companies & Distributors (0.1%) | |
| Bunzl PLC | | | 4,102 | | | | 46,252 | | |
| Wolseley PLC* | | | 3,100 | | | | 99,655 | | |
| | | | 145,907 | | |
| Wireless Telecommunication Services (1.0%) | |
| Vodafone Group PLC | | | 481,635 | | | | 1,269,679 | | |
| TOTAL UNITED KINGDOM | | | 30,629,294 | | |
| TOTAL COMMON STOCKS (Cost $132,077,454) | | | 159,088,096 | | |
| PREFERRED STOCKS (0.9%) | |
| Germany (0.9%) | |
| Automobiles (0.5%) | |
| Porsche Automobil Holding SE | | | 2,009 | | | | 161,102 | | |
| Volkswagen AG | | | 2,434 | | | | 397,293 | | |
| | | | 558,395 | | |
| Health Care Providers & Services (0.0%) | |
| Fresenius SE | | | 411 | | | | 35,351 | | |
| Household Products (0.4%) | |
| Henkel AG & Co. KGaA | | | 8,924 | | | | 555,473 | | |
| TOTAL GERMANY | | | 1,149,219 | | |
| TOTAL PREFERRED STOCKS (Cost $830,877) | | | 1,149,219 | | |
| TOTAL LONG STOCK POSITIONS (Cost $132,908,331) | | | 160,237,315 | | |
| RIGHTS (0.0%) | |
| United Kingdom (0.0%) | |
| Chemicals (0.0%) | |
| Yule Catto & Co. PLC, strike price 1.16 GBP, expires 01/17/11* (Cost $6,760) | | | 13,424 | | | | 18,548 | | |
| TOTAL UNITED KINGDOM | | | 18,548 | | |
| WARRANTS (0.0%) | |
| Italy (0.0%) | |
| Capital Markets (0.0%) | |
| Mediobanca SpA, strike price 0.04 EUR, expires 03/18/11* | | | 4,093 | | | | 30 | | |
| Commercial Banks (0.0%) | |
| Unione di Banche Italiane SCPA, strike price 12.30 EUR, expires 06/30/11* | | | 1,496 | | | | 7 | | |
| TOTAL ITALY | | | 37 | | |
| TOTAL WARRANTS (Cost $0) | | | 37 | | |
See Accompanying Notes to Financial Statements.
42
Credit Suisse Trust — International Equity Flex III Portfolio
Schedule of Investments (continued)
December 31, 2010
| | | Number of
Shares | | Value | |
| SHORT-TERM INVESTMENTS (9.1%) | |
| State Street Navigator Prime Portfolio, 0.3426%§§ | | | 10,797,489 | | | $ | 10,797,489 | | |
| | | Par
(000) | | | |
| State Street Bank and Trust Co. Euro Time Deposit, 0.010%, 01/03/11 | | $ | 898 | | | | 898,000 | | |
| TOTAL SHORT-TERM INVESTMENTS (Cost $11,695,489) | | | 11,695,489 | | |
| TOTAL INVESTMENTS AT VALUE (133.6%) (Cost $144,610,580) | | | 171,951,389 | | |
| TOTAL SECURITIES SOLD SHORT (-25.2%) (Proceeds $30,249,352) | | | (32,413,945 | ) | |
| LIABILITIES IN EXCESS OF OTHER ASSETS (-8.4%) | | | (10,789,051 | ) | |
| NET ASSETS (100.0%) | | $ | 128,748,393 | | |
| | | Number of
Shares | | | |
| SHORT STOCK POSITIONS (-25.2%) | |
| COMMON STOCKS (-25.2%) | |
| Austria (-0.1%) | |
| Metals & Mining (-0.1%) | |
| Randgold Resources, Ltd. | | | (851 | ) | | | (70,471 | ) | |
| TOTAL AUSTRIA | | | (70,471 | ) | |
| Belgium (-0.9%) | |
| Chemicals (-0.1%) | |
| Solvay SA | | | (1,513 | ) | | | (161,961 | ) | |
| Commercial Banks (-0.1%) | |
| Dexia SA* | | | (33,069 | ) | | | (115,338 | ) | |
| KBC Groep NV* | | | (1,359 | ) | | | (46,487 | ) | |
| | | | (161,825 | ) | |
| Diversified Financial Services (-0.4%) | |
| Ackermans & van Haaren NV | | | (436 | ) | | | (36,550 | ) | |
| Groupe Bruxelles Lambert SA | | | (3,529 | ) | | | (298,090 | ) | |
| Nationale A Portefeuille | | | (2,288 | ) | | | (112,398 | ) | |
| | | | (447,038 | ) | |
| Insurance (-0.1%) | |
| Fortis | | | (50,000 | ) | | | (114,729 | ) | |
| Real Estate Investment Trusts (-0.2%) | |
| Cofinimmo | | | (1,625 | ) | | | (212,366 | ) | |
| Wireless Telecommunication Services (-0.0%) | |
| Mobistar SA | | | (398 | ) | | | (25,927 | ) | |
| TOTAL BELGIUM | | | (1,123,846 | ) | |
See Accompanying Notes to Financial Statements.
43
Credit Suisse Trust — International Equity Flex III Portfolio
Schedule of Investments (continued)
December 31, 2010
| | | Number of
Shares | | Value | |
| SHORT STOCK POSITIONS | |
| COMMON STOCKS | |
| Canada (0.0%) | |
| Independent Power Producers & Energy Traders (-0.0%) | |
| Etrion Corp.* | | | (7,234 | ) | | $ | (4,982 | ) | |
| TOTAL CANADA | | | (4,982 | ) | |
| Denmark (-0.5%) | |
| Chemicals (-0.1%) | |
| Novozymes AS B Shares | | | (1,151 | ) | | | (161,273 | ) | |
| Electrical Equipment (-0.1%) | |
| Vestas Wind Systems AS* | | | (4,029 | ) | | | (128,132 | ) | |
| Marine (-0.1%) | |
| D/S Norden | | | (2,267 | ) | | | (82,749 | ) | |
| Road & Rail (-0.2%) | |
| DSV AS | | | (12,918 | ) | | | (287,548 | ) | |
| TOTAL DENMARK | | | (659,702 | ) | |
| Finland (-0.7%) | |
| Diversified Financial Services (-0.2%) | |
| Pohjola Bank PLC | | | (19,177 | ) | | | (230,971 | ) | |
| Diversified Telecommunication Services (-0.1%) | |
| Elisa Oyj | | | (7,604 | ) | | | (166,204 | ) | |
| Media (-0.2%) | |
| Sanoma Oyj | | | (10,774 | ) | | | (234,591 | ) | |
| Metals & Mining (-0.2%) | |
| Rautaruukki Oyj | | | (9,180 | ) | | | (216,406 | ) | |
| Oil, Gas & Consumable Fuels (-0.0%) | |
| Neste Oil Oyj | | | (1,588 | ) | | | (25,492 | ) | |
| TOTAL FINLAND | | | (873,664 | ) | |
| France (-3.4%) | |
| Aerospace & Defense (-0.0%) | |
| Thales SA | | | (1,564 | ) | | | (54,997 | ) | |
| Airlines (-0.2%) | |
| Air France-KLM* | | | (15,869 | ) | | | (290,820 | ) | |
| Beverages (-0.2%) | |
| Pernod-Ricard SA | | | (2,056 | ) | | | (194,289 | ) | |
| Communications Equipment (-0.1%) | |
| Alcatel-Lucent* | | | (20,985 | ) | | | (61,633 | ) | |
| Construction & Engineering (-0.2%) | |
| Eiffage SA | | | (4,993 | ) | | | (221,326 | ) | |
| Construction Materials (-0.1%) | |
| Imerys SA | | | (1,974 | ) | | | (132,276 | ) | |
See Accompanying Notes to Financial Statements.
44
Credit Suisse Trust — International Equity Flex III Portfolio
Schedule of Investments (continued)
December 31, 2010
| | | Number of
Shares | | Value | |
| SHORT STOCK POSITIONS | |
| COMMON STOCKS | |
| France | |
| Diversified Telecommunication Services (-0.2%) | |
| Iliad SA | | | (2,192 | ) | | $ | (239,459 | ) | |
| Electric Utilities (-0.1%) | |
| Electricite de France | | | (4,128 | ) | | | (170,192 | ) | |
| Energy Equipment & Services (-0.1%) | |
| Cie Generale de Geophysique-Veritas* | | | (2,133 | ) | | | (65,370 | ) | |
| Food & Staples Retailing (-0.1%) | |
| Casino Guichard Perrachon SA | | | (1,514 | ) | | | (148,307 | ) | |
| Health Care Equipment & Supplies (-0.3%) | |
| BioMerieux | | | (2,345 | ) | | | (232,331 | ) | |
| Cie Generale d'Optique Essilor International SA | | | (3,123 | ) | | | (202,007 | ) | |
| | | | (434,338 | ) | |
| Hotels, Restaurants & Leisure (-0.4%) | |
| Accor SA | | | (6,568 | ) | | | (293,868 | ) | |
| Sodexo | | | (2,447 | ) | | | (169,516 | ) | |
| | | | (463,384 | ) | |
| Media (-0.5%) | |
| JC Decaux SA* | | | (6,959 | ) | | | (215,112 | ) | |
| Lagardere SCA | | | (2,137 | ) | | | (88,453 | ) | |
| Publicis Groupe | | | (5,797 | ) | | | (303,682 | ) | |
| Societe Television Francaise 1 | | | (4,556 | ) | | | (79,513 | ) | |
| | | | (686,760 | ) | |
| Metals & Mining (-0.1%) | |
| Eramet | | | (428 | ) | | | (147,449 | ) | |
| Professional Services (-0.2%) | |
| Bureau Veritas SA | | | (480 | ) | | | (36,569 | ) | |
| Teleperformance | | | (7,073 | ) | | | (239,736 | ) | |
| | | | (276,305 | ) | |
| Real Estate Investment Trusts (-0.3%) | |
| ICADE | | | (2,388 | ) | | | (244,800 | ) | |
| Klepierre | | | (2,222 | ) | | | (80,568 | ) | |
| Unibail-Rodamco SE | | | (460 | ) | | | (91,436 | ) | |
| | | | (416,804 | ) | |
| Transportation Infrastructure (-0.3%) | |
| Aeroports de Paris | | | (3,050 | ) | | | (242,002 | ) | |
| Groupe Eurotunnel SA | | | (13,572 | ) | | | (119,905 | ) | |
| | | | (361,907 | ) | |
| TOTAL FRANCE | | | (4,365,616 | ) | |
See Accompanying Notes to Financial Statements.
45
Credit Suisse Trust — International Equity Flex III Portfolio
Schedule of Investments (continued)
December 31, 2010
| | | Number of
Shares | | Value | |
| SHORT STOCK POSITIONS | |
| COMMON STOCKS | |
| Germany (-2.1%) | |
| Aerospace & Defense (-0.1%) | |
| MTU Aero Engines Holding AG | | | (1,533 | ) | | $ | (103,912 | ) | |
| Airlines (-0.2%) | |
| Deutsche Lufthansa AG* | | | (12,477 | ) | | | (272,473 | ) | |
| Chemicals (-0.2%) | |
| K+S AG | | | (1,302 | ) | | | (98,520 | ) | |
| Wacker Chemie AG | | | (1,055 | ) | | | (184,656 | ) | |
| | | | (283,176 | ) | |
| Construction Materials (-0.3%) | |
| HeidelbergCement AG | | | (5,206 | ) | | | (328,026 | ) | |
| Food & Staples Retailing (-0.0%) | |
| Metro AG | | | (770 | ) | | | (55,794 | ) | |
| Health Care Providers & Services (-0.5%) | |
| Celesio AG | | | (6,499 | ) | | | (162,594 | ) | |
| Fresenius Medical Care AG & Co. KGaA | | | (1,911 | ) | | | (110,300 | ) | |
| Rhoen-Klinikum AG | | | (17,000 | ) | | | (375,654 | ) | |
| | | | (648,548 | ) | |
| Industrial Conglomerates (-0.1%) | |
| Rheinmetall AG | | | (753 | ) | | | (60,557 | ) | |
| Internet Software & Services (-0.0%) | |
| United Internet AG | | | (1,943 | ) | | | (31,738 | ) | |
| Machinery (-0.0%) | |
| MAN SE | | | (473 | ) | | | (56,558 | ) | |
| Metals & Mining (-0.2%) | |
| Salzgitter AG | | | (3,558 | ) | | | (276,162 | ) | |
| Personal Products (-0.2%) | |
| Beiersdorf AG | | | (4,720 | ) | | | (262,941 | ) | |
| Software (-0.0%) | |
| Software AG | | | (217 | ) | | | (31,932 | ) | |
| Transportation Infrastructure (-0.3%) | |
| Fraport AG Frankfurt Airport Services Worldwide | | | (5,529 | ) | | | (350,450 | ) | |
| TOTAL GERMANY | | | (2,762,267 | ) | |
| Italy (-2.7%) | |
| Aerospace & Defense (-0.3%) | |
| Finmeccanica SpA | | | (29,040 | ) | | | (331,692 | ) | |
| Capital Markets (-0.2%) | |
| Mediobanca SpA | | | (24,993 | ) | | | (223,804 | ) | |
See Accompanying Notes to Financial Statements.
46
Credit Suisse Trust — International Equity Flex III Portfolio
Schedule of Investments (continued)
December 31, 2010
| | | Number of
Shares | | Value | |
| SHORT STOCK POSITIONS | |
| COMMON STOCKS | |
| Italy | |
| Commercial Banks (-0.7%) | |
| Banca Monte dei Paschi di Siena SpA* | | | (49,999 | ) | | $ | (57,309 | ) | |
| Banca Popolare di Milano Scarl | | | (49,999 | ) | | | (175,918 | ) | |
| Banco Popolare SC | | | (49,999 | ) | | | (227,840 | ) | |
| Intesa Sanpaolo SpA | | | (50,000 | ) | | | (136,465 | ) | |
| Unione di Banche Italiane SCPA | | | (31,513 | ) | | | (277,586 | ) | |
| | | | (875,118 | ) | |
| Diversified Financial Services (-0.1%) | |
| Exor SpA | | | (5,407 | ) | | | (179,163 | ) | |
| Diversified Telecommunication Services (-0.0%) | |
| Telecom Italia SpA | | | (49,999 | ) | | | (54,632 | ) | |
| Energy Equipment & Services (-0.1%) | |
| Saipem SpA | | | (3,185 | ) | | | (157,870 | ) | |
| Food Products (-0.1%) | |
| Parmalat SpA | | | (47,472 | ) | | | (130,730 | ) | |
| Gas Utilities (-0.1%) | |
| Snam Rete Gas SpA | | | (16,341 | ) | | | (81,693 | ) | |
| Hotels, Restaurants & Leisure (-0.2%) | |
| Autogrill SpA* | | | (17,137 | ) | | | (243,573 | ) | |
| Insurance (-0.2%) | |
| Assicurazioni Generali SpA | | | (6,705 | ) | | | (128,162 | ) | |
| Societa Cattolica di Assicurazioni Scrl | | | (6,889 | ) | | | (175,958 | ) | |
| | | | (304,120 | ) | |
| Multi-Utilities (-0.2%) | |
| A2A SpA | | | (50,000 | ) | | | (69,089 | ) | |
| ACEA SpA* | | | (20,533 | ) | | | (237,084 | ) | |
| | | | (306,173 | ) | |
| Oil, Gas & Consumable Fuels (-0.1%) | |
| Saras SpA* | | | (49,999 | ) | | | (106,002 | ) | |
| Textiles, Apparel & Luxury Goods (-0.2%) | |
| Luxottica Group SpA | | | (6,526 | ) | | | (200,281 | ) | |
| Transportation Infrastructure (-0.2%) | |
| Atlantia SpA | | | (15,913 | ) | | | (326,237 | ) | |
| TOTAL ITALY | | | (3,521,088 | ) | |
| Japan (-5.9%) | |
| Air Freight & Logistics (-0.1%) | |
| Kintetsu World Express, Inc. | | | (700 | ) | | | (19,948 | ) | |
| Yamato Holdings Co., Ltd. | | | (3,000 | ) | | | (42,601 | ) | |
| Yusen Air & Sea Service Co., Ltd. | | | (1,400 | ) | | | (20,351 | ) | |
| | | | (82,900 | ) | |
See Accompanying Notes to Financial Statements.
47
Credit Suisse Trust — International Equity Flex III Portfolio
Schedule of Investments (continued)
December 31, 2010
| | | Number of
Shares | | Value | |
| SHORT STOCK POSITIONS | |
| COMMON STOCKS | |
| Japan | |
| Auto Components (-0.3%) | |
| Exedy Corp. | | | (500 | ) | | $ | (16,184 | ) | |
| FCC Co., Ltd. | | | (800 | ) | | | (18,600 | ) | |
| Futaba Industrial Co., Ltd.* | | | (2,700 | ) | | | (19,512 | ) | |
| Kayaba Industry Co., Ltd. | | | (4,000 | ) | | | (30,562 | ) | |
| Keihin Corp. | | | (700 | ) | | | (15,715 | ) | |
| Musashi Seimitsu Industry Co., Ltd. | | | (700 | ) | | | (17,379 | ) | |
| Nifco, Inc. | | | (700 | ) | | | (18,932 | ) | |
| Nissan Shatai Co., Ltd. | | | (3,000 | ) | | | (26,120 | ) | |
| Nissin Kogyo Co., Ltd. | | | (1,100 | ) | | | (20,478 | ) | |
| Press Kogyo Co., Ltd.* | | | (5,000 | ) | | | (23,896 | ) | |
| Showa Corp.* | | | (2,200 | ) | | | (16,752 | ) | |
| Stanley Electric Co., Ltd. | | | (800 | ) | | | (14,892 | ) | |
| T RAD Co., Ltd. | | | (7,000 | ) | | | (28,722 | ) | |
| Tachi-S Co., Ltd. | | | (400 | ) | | | (6,532 | ) | |
| Takata Corp. | | | (800 | ) | | | (23,583 | ) | |
| Teikoku Piston Ring Co., Ltd. | | | (2,300 | ) | | | (23,265 | ) | |
| Toyoda Gosei Co., Ltd. | | | (900 | ) | | | (21,079 | ) | |
| Toyota Boshoku Corp. | | | (800 | ) | | | (14,080 | ) | |
| | | | (356,283 | ) | |
| Beverages (-0.1%) | |
| Coca-Cola Central Japan Co., Ltd. | | | (1,600 | ) | | | (21,377 | ) | |
| Coca-Cola West Co., Ltd. | | | (900 | ) | | | (16,308 | ) | |
| Ito En, Ltd. | | | (1,300 | ) | | | (21,608 | ) | |
| Sapporo Holdings, Ltd. | | | (5,000 | ) | | | (22,608 | ) | |
| Takara Holdings, Inc. | | | (1,000 | ) | | | (5,875 | ) | |
| | | | (87,776 | ) | |
| Building Products (-0.1%) | |
| Central Glass Co., Ltd. | | | (5,000 | ) | | | (23,201 | ) | |
| Nitto Boseki Co., Ltd. | | | (4,000 | ) | | | (10,067 | ) | |
| Noritz Corp. | | | (1,100 | ) | | | (19,405 | ) | |
| Sanwa Holdings Corp. | | | (5,000 | ) | | | (15,754 | ) | |
| Sekisui Jushi Corp. | | | (2,000 | ) | | | (20,407 | ) | |
| Takasago Thermal Engineering Co., Ltd. | | | (2,000 | ) | | | (16,728 | ) | |
| TOTO, Ltd. | | | (5,000 | ) | | | (36,172 | ) | |
| | | | (141,734 | ) | |
| Capital Markets (-0.1%) | |
| Jafco Co., Ltd. | | | (800 | ) | | | (23,153 | ) | |
| Marusan Securities Co., Ltd. | | | (2,900 | ) | | | (17,307 | ) | |
| Matsui Securities Co., Ltd. | | | (3,300 | ) | | | (23,399 | ) | |
| Mizuho Investors Securities Co., Ltd.* | | | (16,000 | ) | | | (17,305 | ) | |
| Okasan Securities Group, Inc. | | | (4,000 | ) | | | (16,438 | ) | |
| SBI Holdings, Inc. | | | (279 | ) | | | (42,118 | ) | |
| | | | (139,720 | ) | |
See Accompanying Notes to Financial Statements.
48
Credit Suisse Trust — International Equity Flex III Portfolio
Schedule of Investments (continued)
December 31, 2010
| | | Number of
Shares | | Value | |
| SHORT STOCK POSITIONS | |
| COMMON STOCKS | |
| Japan | |
| Chemicals (-0.3%) | |
| Dainichiseika Color & Chemicals Manufacturing Co., Ltd. | | | (4,000 | ) | | $ | (21,853 | ) | |
| Kansai Paint Co., Ltd. | | | (3,000 | ) | | | (28,997 | ) | |
| KUREHA Corp. | | | (3,000 | ) | | | (18,073 | ) | |
| Lintec Corp. | | | (700 | ) | | | (18,505 | ) | |
| Mitsubishi Chemical Holdings Corp. | | | (3,138 | ) | | | (21,219 | ) | |
| Nippon Paint Co., Ltd. | | | (3,000 | ) | | | (22,958 | ) | |
| NOF Corp. | | | (5,000 | ) | | | (24,419 | ) | |
| Okamoto Industries, Inc. | | | (4,000 | ) | | | (16,554 | ) | |
| Sakai Chemical Industry Co., Ltd. | | | (4,000 | ) | | | (19,789 | ) | |
| Shin-Etsu Polymer Co., Ltd. | | | (1,300 | ) | | | (8,110 | ) | |
| T Hasegawa Co., Ltd. | | | (1,000 | ) | | | (16,992 | ) | |
| Taiyo Ink Manufacturing Co., Ltd. | | | (600 | ) | | | (19,197 | ) | |
| Takasago International Corp. | | | (1,000 | ) | | | (5,972 | ) | |
| Takiron Co., Ltd. | | | (2,000 | ) | | | (6,858 | ) | |
| Teijin, Ltd. | | | (9,000 | ) | | | (38,358 | ) | |
| Tenma Corp. | | | (1,400 | ) | | | (15,432 | ) | |
| Tokai Carbon Co., Ltd. | | | (3,000 | ) | | | (18,596 | ) | |
| Tokuyama Corp. | | | (3,000 | ) | | | (15,479 | ) | |
| Tokyo Ohka Kogyo Co., Ltd. | | | (1,100 | ) | | | (23,600 | ) | |
| | | | (360,961 | ) | |
| Commercial Banks (-0.5%) | |
| Aozora Bank, Ltd. | | | (14,000 | ) | | | (28,906 | ) | |
| Bank of the Ryukyus, Ltd. | | | (2,500 | ) | | | (29,495 | ) | |
| Mizuho Trust & Banking Co., Ltd.* | | | (8,700 | ) | | | (8,971 | ) | |
| Sapporo Hokuyo Holdings, Inc. | | | (8,300 | ) | | | (38,824 | ) | |
| Suruga Bank, Ltd. | | | (3,000 | ) | | | (27,867 | ) | |
| The 77 Bank, Ltd. | | | (5,000 | ) | | | (26,442 | ) | |
| The Aichi Bank, Ltd. | | | (400 | ) | | | (24,846 | ) | |
| The Awa Bank, Ltd. | | | (3,000 | ) | | | (18,082 | ) | |
| The Bank of Kyoto, Ltd. | | | (3,000 | ) | | | (28,387 | ) | |
| The Bank of Okinawa, Ltd. | | | (700 | ) | | | (27,139 | ) | |
| The Chugoku Bank, Ltd. | | | (4,000 | ) | | | (48,318 | ) | |
| The Chukyo Bank, Ltd. | | | (5,000 | ) | | | (13,104 | ) | |
| The Fukui Bank, Ltd. | | | (7,000 | ) | | | (21,643 | ) | |
| The Fukushima Bank, Ltd. | | | (33,000 | ) | | | (19,860 | ) | |
| The Hachijuni Bank, Ltd. | | | (4,000 | ) | | | (22,310 | ) | |
| The Hokkoku Bank, Ltd. | | | (4,000 | ) | | | (13,896 | ) | |
| The Hyakugo Bank, Ltd. | | | (5,000 | ) | | | (21,532 | ) | |
| The Iyo Bank, Ltd. | | | (4,000 | ) | | | (31,946 | ) | |
| The Kagoshima Bank, Ltd. | | | (2,000 | ) | | | (13,366 | ) | |
| The Musashino Bank, Ltd. | | | (200 | ) | | | (6,050 | ) | |
| The Nanto Bank, Ltd. | | | (6,000 | ) | | | (30,024 | ) | |
| The Oita Bank, Ltd. | | | (7,000 | ) | | | (25,067 | ) | |
| The San-In Godo Bank, Ltd. | | | (3,000 | ) | | | (21,595 | ) | |
| The Shiga Bank, Ltd. | | | (3,000 | ) | | | (16,304 | ) | |
See Accompanying Notes to Financial Statements.
49
Credit Suisse Trust — International Equity Flex III Portfolio
Schedule of Investments (continued)
December 31, 2010
| | | Number of
Shares | | Value | |
| SHORT STOCK POSITIONS | |
| COMMON STOCKS | |
| Japan | |
| Commercial Banks | |
| The Tochigi Bank, Ltd. | | | (4,000 | ) | | $ | (18,935 | ) | |
| The Tsukuba Bank, Ltd.* | | | (7,600 | ) | | | (26,504 | ) | |
| The Yamagata Bank, Ltd. | | | (6,000 | ) | | | (27,742 | ) | |
| The Yamanashi Chuo Bank, Ltd. | | | (2,000 | ) | | | (8,987 | ) | |
| Yamaguchi Financial Group, Inc. | | | (2,000 | ) | | | (20,163 | ) | |
| | | | (666,305 | ) | |
| Commercial Services & Supplies (-0.0%) | |
| Moshi Moshi Hotline, Inc. | | | (1,100 | ) | | | (28,870 | ) | |
| Park24 Co., Ltd. | | | (1,500 | ) | | | (16,032 | ) | |
| Pilot Corp. | | | (10 | ) | | | (17,690 | ) | |
| | | | (62,592 | ) | |
| Communications Equipment (-0.0%) | |
| Icom, Inc. | | | (800 | ) | | | (21,912 | ) | |
| Uniden Corp.* | | | (6,000 | ) | | | (18,475 | ) | |
| | | | (40,387 | ) | |
| Computers & Peripherals (-0.0%) | |
| Eizo Nanao Corp. | | | (400 | ) | | | (9,369 | ) | |
| Japan Digital Laboratory Co., Ltd. | | | (2,200 | ) | | | (24,992 | ) | |
| Melco Holdings, Inc. | | | (700 | ) | | | (24,428 | ) | |
| | | | (58,789 | ) | |
| Construction & Engineering (-0.3%) | |
| Chiyoda Corp. | | | (2,000 | ) | | | (19,830 | ) | |
| Chudenko Corp. | | | (2,700 | ) | | | (32,200 | ) | |
| COMSYS Holdings Corp. | | | (2,000 | ) | | | (21,267 | ) | |
| Kandenko Co., Ltd. | | | (3,000 | ) | | | (20,124 | ) | |
| Kinden Corp. | | | (4,166 | ) | | | (38,430 | ) | |
| Maeda Road Construction Co., Ltd. | | | (1,000 | ) | | | (7,989 | ) | |
| NEC Networks & System Integration Corp. | | | (2,400 | ) | | | (31,125 | ) | |
| Nippon Densetsu Kogyo Co., Ltd. | | | (2,000 | ) | | | (19,282 | ) | |
| Penta-Ocean Construction Co., Ltd. | | | (11,000 | ) | | | (18,643 | ) | |
| Sanki Engineering Co., Ltd. | | | (2,000 | ) | | | (13,732 | ) | |
| SHO-BOND Holdings Co., Ltd. | | | (800 | ) | | | (16,865 | ) | |
| Taihei Dengyo Kaisha, Ltd. | | | (3,000 | ) | | | (24,539 | ) | |
| Taikisha, Ltd. | | | (1,900 | ) | | | (33,646 | ) | |
| Toshiba Plant Systems & Services Corp. | | | (2,000 | ) | | | (28,671 | ) | |
| | | | (326,343 | ) | |
| Consumer Finance (-0.0%) | |
| Aeon Credit Service Co., Ltd. | | | (1,900 | ) | | | (26,763 | ) | |
| Hitachi Capital Corp. | | | (1,200 | ) | | | (18,499 | ) | |
| | | | (45,262 | ) | |
See Accompanying Notes to Financial Statements.
50
Credit Suisse Trust — International Equity Flex III Portfolio
Schedule of Investments (continued)
December 31, 2010
| | | Number of
Shares | | Value | |
| SHORT STOCK POSITIONS | |
| COMMON STOCKS | |
| Japan | |
| Containers & Packaging (-0.1%) | |
| FP Corp. | | | (300 | ) | | $ | (16,619 | ) | |
| Fuji Seal International, Inc. | | | (400 | ) | | | (9,238 | ) | |
| Nihon Yamamura Glass Co., Ltd. | | | (7,000 | ) | | | (19,199 | ) | |
| Rengo Co., Ltd. | | | (4,000 | ) | | | (27,102 | ) | |
| | | | (72,158 | ) | |
| Distributors (-0.0%) | |
| Canon Marketing Japan, Inc. | | | (1,300 | ) | | | (18,485 | ) | |
| Doshisha Co., Ltd. | | | (700 | ) | | | (16,350 | ) | |
| | | | (34,835 | ) | |
| Diversified Consumer Services (-0.0%) | |
| Benesse Corp. | | | (700 | ) | | | (32,241 | ) | |
| Diversified Financial Services (-0.0%) | |
| IBJ Leasing Co., Ltd. | | | (900 | ) | | | (22,618 | ) | |
| Japan Securities Finance Co., Ltd. | | | (2,800 | ) | | | (20,469 | ) | |
| | | | (43,087 | ) | |
| Electric Utilities (-0.1%) | |
| Hokkaido Electric Power Co., Inc. | | | (1,600 | ) | | | (32,707 | ) | |
| Hokuriku Electric Power Co. | | | (1,499 | ) | | | (36,846 | ) | |
| Shikoku Electric Power Co., Inc. | | | (600 | ) | | | (17,642 | ) | |
| The Chugoku Electric Power Co., Inc | | | (800 | ) | | | (16,254 | ) | |
| | | | (103,449 | ) | |
| Electrical Equipment (-0.1%) | |
| Cosel Co., Ltd. | | | (1,400 | ) | | | (20,694 | ) | |
| Daihen Corp. | | | (2,000 | ) | | | (9,723 | ) | |
| Fujikura, Ltd. | | | (4,000 | ) | | | (20,141 | ) | |
| Futaba Corp. | | | (900 | ) | | | (17,499 | ) | |
| Hitachi Cable, Ltd. | | | (8,000 | ) | | | (22,016 | ) | |
| Mabuchi Motor Co., Ltd. | | | (400 | ) | | | (20,583 | ) | |
| Nippon Signal Co., Ltd. | | | (2,000 | ) | | | (15,851 | ) | |
| Nitto Kogyo Corp. | | | (1,700 | ) | | | (19,210 | ) | |
| SWCC Showa Holdings Co., Ltd.* | | | (20,000 | ) | | | (23,071 | ) | |
| | | | (168,788 | ) | |
| Electronic Equipment, Instruments & Components (-0.2%) | |
| CMK Corp. | | | (5,500 | ) | | | (31,249 | ) | |
| Hamamatsu Photonics KK | | | (500 | ) | | | (18,246 | ) | |
| Hirose Electric Co., Ltd. | | | (441 | ) | | | (49,608 | ) | |
| Hitachi High-Technologies Corp. | | | (1,000 | ) | | | (23,325 | ) | |
| Horiba, Ltd. | | | (600 | ) | | | (16,976 | ) | |
| Ibiden Co., Ltd. | | | (1,200 | ) | | | (37,681 | ) | |
| Koa Corp. | | | (2,000 | ) | | | (25,558 | ) | |
| Shimadzu Corp. | | | (3,000 | ) | | | (23,261 | ) | |
| Tamura Corp. | | | (6,000 | ) | | | (18,258 | ) | |
See Accompanying Notes to Financial Statements.
51
Credit Suisse Trust — International Equity Flex III Portfolio
Schedule of Investments (continued)
December 31, 2010
| | | Number of
Shares | | Value | |
| SHORT STOCK POSITIONS | |
| COMMON STOCKS | |
| Japan | |
| Electronic Equipment, Instruments & Components | |
| Yamatake Corp. | | | (400 | ) | | $ | (9,452 | ) | |
| Yaskawa Electric Corp. | | | (3,000 | ) | | | (28,277 | ) | |
| Yokogawa Electric Corp. | | | (3,600 | ) | | | (28,537 | ) | |
| | | | (310,428 | ) | |
| Food & Staples Retailing (-0.2%) | |
| Circle K Sunkus Co., Ltd. | | | (1,300 | ) | | | (20,844 | ) | |
| FamilyMart Co., Ltd. | | | (700 | ) | | | (26,363 | ) | |
| Lawson, Inc. | | | (600 | ) | | | (29,651 | ) | |
| Matsumotokiyoshi Holdings Co., Ltd. | | | (900 | ) | | | (19,524 | ) | |
| Sugi Holdings Co., Ltd. | | | (1,400 | ) | | | (33,704 | ) | |
| Sundrug Co., Ltd. | | | (1,100 | ) | | | (32,028 | ) | |
| Tsuruha Holdings, Inc. | | | (400 | ) | | | (19,070 | ) | |
| Yaoko Co., Ltd. | | | (800 | ) | | | (24,428 | ) | |
| | | | (205,612 | ) | |
| Food Products (-0.3%) | |
| Dydo Drinco, Inc. | | | (600 | ) | | | (23,072 | ) | |
| Hokuto Corp. | | | (800 | ) | | | (18,589 | ) | |
| Itoham Foods, Inc. | | | (5,000 | ) | | | (17,974 | ) | |
| Kikkoman Corp. | | | (2,000 | ) | | | (22,372 | ) | |
| Marudai Food Co., Ltd. | | | (6,000 | ) | | | (19,573 | ) | |
| Nisshin Seifun Group, Inc. | | | (2,000 | ) | | | (25,344 | ) | |
| Nissin Foods Holdings Co., Ltd. | | | (1,196 | ) | | | (42,848 | ) | |
| QP Corp. | | | (2,500 | ) | | | (31,714 | ) | |
| Sakata Seed Corp. | | | (2,400 | ) | | | (32,384 | ) | |
| Toyo Suisan Kaisha, Ltd. | | | (1,000 | ) | | | (22,226 | ) | |
| Yakult Honsha Co., Ltd. | | | (1,200 | ) | | | (34,537 | ) | |
| Yamazaki Baking Co., Ltd. | | | (3,224 | ) | | | (38,861 | ) | |
| | | | (329,494 | ) | |
| Gas Utilities (-0.0%) | |
| Shizuoka Gas Co., Ltd. | | | (3,500 | ) | | | (20,923 | ) | |
| Health Care Equipment & Supplies (-0.1%) | |
| Hitachi Medical Corp. | | | (2,000 | ) | | | (19,735 | ) | |
| Hogy Medical Co., Ltd. | | | (400 | ) | | | (19,460 | ) | |
| Jeol, Ltd. | | | (3,000 | ) | | | (10,508 | ) | |
| Nihon Kohden Corp. | | | (1,000 | ) | | | (21,529 | ) | |
| Olympus Corp. | | | (900 | ) | | | (27,128 | ) | |
| Sysmex Corp. | | | (400 | ) | | | (27,694 | ) | |
| | | | (126,054 | ) | |
| Health Care Providers & Services (-0.1%) | |
| BML, Inc. | | | (500 | ) | | | (14,010 | ) | |
| Miraca Holdings, Inc. | | | (500 | ) | | | (20,092 | ) | |
| Nichii Gakkan Co. | | | (2,600 | ) | | | (22,910 | ) | |
See Accompanying Notes to Financial Statements.
52
Credit Suisse Trust — International Equity Flex III Portfolio
Schedule of Investments (continued)
December 31, 2010
| | | Number of
Shares | | Value | |
| SHORT STOCK POSITIONS | |
| COMMON STOCKS | |
| Japan | |
| Health Care Providers & Services | |
| Suzuken Co., Ltd. | | | (700 | ) | | $ | (21,366 | ) | |
| Toho Holdings Co., Ltd. | | | (2,100 | ) | | | (28,708 | ) | |
| | | | (107,086 | ) | |
| Hotels, Restaurants & Leisure (-0.2%) | |
| Accordia Golf Co., Ltd. | | | (36 | ) | | | (34,908 | ) | |
| Doutor Nichires Holdings Co., Ltd. | | | (700 | ) | | | (9,541 | ) | |
| HIS Co., Ltd. | | | (1,500 | ) | | | (37,290 | ) | |
| Kisoji Co., Ltd. | | | (800 | ) | | | (17,014 | ) | |
| Kura Corp. | | | (1,400 | ) | | | (21,943 | ) | |
| Oriental Land Co. Japan, Ltd. | | | (400 | ) | | | (37,036 | ) | |
| Plenus Co., Ltd. | | | (2,000 | ) | | | (30,566 | ) | |
| Saizeriya Co., Ltd. | | | (1,600 | ) | | | (32,349 | ) | |
| | | | (220,647 | ) | |
| Household Durables (-0.1%) | |
| Alpine Electronics, Inc. | | | (1,600 | ) | | | (22,714 | ) | |
| Arnest One Corp. | | | (800 | ) | | | (10,260 | ) | |
| Cleanup Corp. | | | (2,800 | ) | | | (19,124 | ) | |
| Funai Electric Co., Ltd. | | | (500 | ) | | | (17,371 | ) | |
| Rinnai Corp. | | | (500 | ) | | | (30,513 | ) | |
| Sekisui Chemical Co., Ltd. | | | (4,000 | ) | | | (28,647 | ) | |
| Takamatsu Construction Group Co., Ltd. | | | (700 | ) | | | (9,439 | ) | |
| | | | (138,068 | ) | |
| Household Products (-0.1%) | |
| Lion Corp. | | | (3,000 | ) | | | (16,363 | ) | |
| Pigeon Corp. | | | (1,000 | ) | | | (33,987 | ) | |
| Unicharm Corp. | | | (900 | ) | | | (35,776 | ) | |
| | | | (86,126 | ) | |
| Industrial Conglomerates (-0.0%) | |
| Hankyu Hanshin Holdings, Inc. | | | (3,000 | ) | | | (13,919 | ) | |
| Insurance (-0.1%) | |
| Sony Financial Holdings, Inc. | | | (12 | ) | | | (48,379 | ) | |
| The Fuji Fire & Marine Insurance Co., Ltd.* | | | (11,000 | ) | | | (14,971 | ) | |
| | | | (63,350 | ) | |
| Internet & Catalog Retail (-0.0%) | |
| Rakuten, Inc.* | | | (35 | ) | | | (29,320 | ) | |
| Internet Software & Services (-0.0%) | |
| Kakaku.com, Inc. | | | (3 | ) | | | (17,824 | ) | |
| Yahoo! Japan Corp. | | | (89 | ) | | | (34,437 | ) | |
| | | | (52,261 | ) | |
See Accompanying Notes to Financial Statements.
53
Credit Suisse Trust — International Equity Flex III Portfolio
Schedule of Investments (continued)
December 31, 2010
| | | Number of
Shares | | Value | |
| SHORT STOCK POSITIONS | |
| COMMON STOCKS | |
| Japan | |
| IT Services (-0.1%) | |
| Ines Corp. | | | (2,200 | ) | | $ | (17,902 | ) | |
| Information Services International-Dentsu, Ltd. | | | (2,300 | ) | | | (16,573 | ) | |
| Itochu Techno-Science Corp. | | | (500 | ) | | | (18,725 | ) | |
| NET One Systems Co., Ltd. | | | (14 | ) | | | (20,694 | ) | |
| Nihon Unisys, Ltd. | | | (3,000 | ) | | | (23,972 | ) | |
| TKC | | | (800 | ) | | | (16,933 | ) | |
| | | | (114,799 | ) | |
| Leisure Equipment & Products (-0.0%) | |
| Nidec Copal Corp. | | | (1,100 | ) | | | (19,715 | ) | |
| Shimano, Inc. | | | (500 | ) | | | (25,374 | ) | |
| | | | (45,089 | ) | |
| Machinery (-0.4%) | |
| Aichi Corp. | | | (4,000 | ) | | | (17,164 | ) | |
| Asahi Diamond Industrial Co., Ltd. | | | (1,000 | ) | | | (18,983 | ) | |
| Daiwa Industries, Ltd. | | | (3,000 | ) | | | (15,245 | ) | |
| Fujitec Co., Ltd. | | | (2,000 | ) | | | (10,171 | ) | |
| Furukawa Co., Ltd.* | | | (14,000 | ) | | | (16,514 | ) | |
| Glory, Ltd. | | | (700 | ) | | | (17,248 | ) | |
| Hino Motors, Ltd. | | | (6,000 | ) | | | (32,380 | ) | |
| Komori Corp. | | | (1,700 | ) | | | (20,092 | ) | |
| Kurita Water Industries, Ltd. | | | (1,300 | ) | | | (40,852 | ) | |
| Makino Milling Machine Co., Ltd.* | | | (4,000 | ) | | | (32,824 | ) | |
| Miura Co., Ltd. | | | (700 | ) | | | (18,665 | ) | |
| Mori Seiki Co., Ltd. | | | (1,900 | ) | | | (22,448 | ) | |
| Nabtesco Corp. | | | (1,000 | ) | | | (21,284 | ) | |
| Nippon Thompson Co., Ltd. | | | (3,000 | ) | | | (24,134 | ) | |
| Noritake Co., Ltd. | | | (4,000 | ) | | | (14,273 | ) | |
| OSG Corp. | | | (3,000 | ) | | | (36,169 | ) | |
| Shima Seiki Manufacturing, Ltd. | | | (900 | ) | | | (21,646 | ) | |
| Takuma Co., Ltd.* | | | (6,000 | ) | | | (16,644 | ) | |
| The Japan Steel Works, Ltd. | | | (3,000 | ) | | | (31,278 | ) | |
| THK Co., Ltd. | | | (1,300 | ) | | | (29,766 | ) | |
| Tocalo Co., Ltd. | | | (1,100 | ) | | | (21,165 | ) | |
| Toshiba Machine Co., Ltd. | | | (4,000 | ) | | | (20,172 | ) | |
| Tsukishima Kikai Co., Ltd. | | | (2,000 | ) | | | (14,817 | ) | |
| Union Tool Co. | | | (900 | ) | | | (25,855 | ) | |
| | | | (539,789 | ) | |
| Marine (-0.0%) | |
| Inui Steamship Co., Ltd. | | | (5,700 | ) | | | (33,837 | ) | |
| Media (-0.1%) | |
| Asatsu-DK, Inc. | | | (1,000 | ) | | | (27,232 | ) | |
| Dentsu, Inc. | | | (500 | ) | | | (15,465 | ) | |
| Gakken Co., Ltd. | | | (10,000 | ) | | | (21,944 | ) | |
See Accompanying Notes to Financial Statements.
54
Credit Suisse Trust — International Equity Flex III Portfolio
Schedule of Investments (continued)
December 31, 2010
| | | Number of
Shares | | Value | |
| SHORT STOCK POSITIONS | |
| COMMON STOCKS | |
| Japan | |
| Media | |
| Hakuhodo DY Holdings, Inc. | | | (429 | ) | | $ | (24,525 | ) | |
| Jupiter Telecommunications Co., Ltd. | | | (38 | ) | | | (39,907 | ) | |
| Toho Co., Ltd. | | | (1,400 | ) | | | (22,471 | ) | |
| | | | (151,544 | ) | |
| Metals & Mining (-0.2%) | |
| Aichi Steel Corp. | | | (4,000 | ) | | | (27,359 | ) | |
| Furukawa-Sky Aluminum Corp. | | | (4,000 | ) | | | (11,639 | ) | |
| Godo Steel, Ltd. | | | (5,000 | ) | | | (10,606 | ) | |
| Hitachi Metals, Ltd. | | | (2,000 | ) | | | (23,934 | ) | |
| Neturen Co., Ltd. | | | (1,400 | ) | | | (11,731 | ) | |
| Nippon Denko Co., Ltd. | | | (3,000 | ) | | | (23,727 | ) | |
| Nippon Yakin Kogyo Co., Ltd.* | | | (5,500 | ) | | | (16,211 | ) | |
| Nisshin Steel Co., Ltd. | | | (10,000 | ) | | | (22,218 | ) | |
| Osaka Steel Co., Ltd. | | | (1,100 | ) | | | (19,546 | ) | |
| Sanyo Special Steel Co., Ltd. | | | (3,000 | ) | | | (18,055 | ) | |
| Tokyo Rope Manufacturing Co., Ltd. | | | (9,000 | ) | | | (29,940 | ) | |
| Tokyo Steel Manufacturing Co., Ltd. | | | (3,300 | ) | | | (35,889 | ) | |
| Toyo Kohan Co., Ltd. | | | (4,000 | ) | | | (24,588 | ) | |
| | | | (275,443 | ) | |
| Multiline Retail (-0.2%) | |
| Don Quijote Co., Ltd. | | | (1,200 | ) | | | (36,552 | ) | |
| Fuji Co., Ltd. | | | (1,600 | ) | | | (33,531 | ) | |
| H2O Retailing Corp. | | | (2,000 | ) | | | (14,574 | ) | |
| Isetan Mitsukoshi Holdings, Ltd. | | | (3,400 | ) | | | (39,447 | ) | |
| Izumi Co., Ltd. | | | (1,200 | ) | | | (17,664 | ) | |
| J Front Retailing Co., Ltd. | | | (5,000 | ) | | | (27,276 | ) | |
| Marui Group Co., Ltd. | | | (3,304 | ) | | | (26,855 | ) | |
| Takashimaya Co., Ltd. | | | (5,000 | ) | | | (42,750 | ) | |
| | | | (238,649 | ) | |
| Oil, Gas & Consumable Fuels (-0.1%) | |
| Japan Petroleum Exploration Co. | | | (1,000 | ) | | | (37,962 | ) | |
| Kanto Natural Gas Development, Ltd. | | | (3,000 | ) | | | (16,165 | ) | |
| Nippon Gas Co., Ltd. | | | (1,500 | ) | | | (20,736 | ) | |
| | | | (74,863 | ) | |
| Paper & Forest Products (-0.0%) | |
| Daio Paper Corp. | | | (2,000 | ) | | | (14,370 | ) | |
| Mitsubishi Paper Mills, Ltd.* | | | (24,000 | ) | | | (28,616 | ) | |
| | | | (42,986 | ) | |
| Personal Products (-0.1%) | |
| Aderans Holdings Co., Ltd.* | | | (1,300 | ) | | | (17,413 | ) | |
| Fancl Corp. | | | (1,500 | ) | | | (22,509 | ) | |
| Kobayashi Pharmaceutical Co., Ltd. | | | (700 | ) | | | (32,511 | ) | |
See Accompanying Notes to Financial Statements.
55
Credit Suisse Trust — International Equity Flex III Portfolio
Schedule of Investments (continued)
December 31, 2010
| | | Number of
Shares | | Value | |
| SHORT STOCK POSITIONS | |
| COMMON STOCKS | |
| Japan | |
| Personal Products | |
| Kose Corp. | | | (1,200 | ) | | $ | (31,024 | ) | |
| Mandom Corp. | | | (700 | ) | | | (18,955 | ) | |
| Milbon Co., Ltd. | | | (770 | ) | | | (20,262 | ) | |
| | | | (142,674 | ) | |
| Pharmaceuticals (-0.3%) | |
| Chugai Pharmaceutical Co., Ltd. | | | (1,900 | ) | | | (34,827 | ) | |
| Hisamitsu Pharmaceutical Co., Inc. | | | (800 | ) | | | (33,659 | ) | |
| Kissei Pharmaceutical Co., Ltd. | | | (1,000 | ) | | | (19,657 | ) | |
| Kyowa Hakko Kirin Co., Ltd. | | | (3,000 | ) | | | (30,842 | ) | |
| Mitsubishi Tanabe Pharma Corp. | | | (1,000 | ) | | | (16,875 | ) | |
| Nippon Shinyaku Co., Ltd. | | | (2,000 | ) | | | (28,634 | ) | |
| Rohto Pharmaceutical Co., Ltd. | | | (1,000 | ) | | | (11,699 | ) | |
| Santen Pharmaceutical Co., Ltd. | | | (1,019 | ) | | | (35,366 | ) | |
| Taisho Pharmaceutical Co., Ltd. | | | (1,339 | ) | | | (29,296 | ) | |
| Torii Pharmaceutical Co., Ltd. | | | (1,000 | ) | | | (21,677 | ) | |
| Towa Pharmaceutical Co., Ltd. | | | (400 | ) | | | (22,213 | ) | |
| Tsumura & Co. | | | (1,400 | ) | | | (45,279 | ) | |
| | | | (330,024 | ) | |
| Professional Services (-0.0%) | |
| Meitec Corp.* | | | (1,300 | ) | | | (27,758 | ) | |
| Real Estate Management & Development (-0.1%) | |
| Aeon Mall Co., Ltd. | | | (1,068 | ) | | | (28,600 | ) | |
| Daibiru Corp. | | | (2,700 | ) | | | (22,169 | ) | |
| Goldcrest Co., Ltd. | | | (730 | ) | | | (19,041 | ) | |
| Iida Home Max | | | (2,400 | ) | | | (25,986 | ) | |
| Nomura Real Estate Holdings, Inc. | | | (700 | ) | | | (12,715 | ) | |
| NTT Urban Development Corp. | | | (24 | ) | | | (23,585 | ) | |
| Shoei Co., Ltd./Chiyoda-ku | | | (2,300 | ) | | | (20,970 | ) | |
| | | | (153,066 | ) | |
| Road & Rail (-0.1%) | |
| Fukuyama Transporting Co., Ltd. | | | (4,000 | ) | | | (21,251 | ) | |
| Hitachi Transport System, Ltd. | | | (2,000 | ) | | | (30,934 | ) | |
| Keihin Electric Express Railway Co., Ltd. | | | (2,983 | ) | | | (26,338 | ) | |
| Keio Corp. | | | (5,000 | ) | | | (34,092 | ) | |
| Keisei Electric Railway Co., Ltd. | | | (4,000 | ) | | | (26,653 | ) | |
| Nippon Konpo Unyu Soko Co., Ltd. | | | (1,000 | ) | | | (12,156 | ) | |
| Nishi-Nippon Railroad Co., Ltd. | | | (4,000 | ) | | | (16,753 | ) | |
| Tobu Railway Co., Ltd. | | | (4,000 | ) | | | (22,457 | ) | |
| | | | (190,634 | ) | |
| Semiconductors & Semiconductor Equipment (-0.1%) | |
| Advantest Corp. | | | (1,400 | ) | | | (31,509 | ) | |
| Mitsui High-Tec, Inc.* | | | (1,900 | ) | | | (11,180 | ) | |
See Accompanying Notes to Financial Statements.
56
Credit Suisse Trust — International Equity Flex III Portfolio
Schedule of Investments (continued)
December 31, 2010
| | | Number of
Shares | | Value | |
| SHORT STOCK POSITIONS | |
| COMMON STOCKS | |
| Japan | |
| Semiconductors & Semiconductor Equipment | |
| Sanken Electric Co., Ltd. | | | (2,000 | ) | | $ | (8,783 | ) | |
| Shinkawa, Ltd. | | | (2,900 | ) | | | (29,635 | ) | |
| Sumco Corp.* | | | (1,100 | ) | | | (15,680 | ) | |
| | | | (96,787 | ) | |
| Software (-0.1%) | |
| Capcom Co., Ltd. | | | (1,000 | ) | | | (16,054 | ) | |
| DTS Corp. | | | (1,200 | ) | | | (14,853 | ) | |
| Fuji Soft, Inc. | | | (800 | ) | | | (13,806 | ) | |
| NSD Co., Ltd. | | | (1,600 | ) | | | (18,895 | ) | |
| Oracle Corp. | | | (500 | ) | | | (24,536 | ) | |
| Square Enix Co., Ltd. | | | (1,100 | ) | | | (19,477 | ) | |
| Sumisho Computer Systems Corp. | | | (1,000 | ) | | | (17,902 | ) | |
| | | | (125,523 | ) | |
| Specialty Retail (-0.2%) | |
| ABC-Mart, Inc. | | | (800 | ) | | | (28,525 | ) | |
| Alpen Co., Ltd. | | | (900 | ) | | | (16,022 | ) | |
| AOKI Holdings, Inc. | | | (1,200 | ) | | | (21,683 | ) | |
| Autobacs Seven Co., Ltd. | | | (500 | ) | | | (19,621 | ) | |
| Komeri Co., Ltd. | | | (1,000 | ) | | | (22,923 | ) | |
| Nishimatsuya Chain Co., Ltd. | | | (2,500 | ) | | | (24,239 | ) | |
| Nitori Co., Ltd. | | | (444 | ) | | | (38,839 | ) | |
| Point, Inc. | | | (300 | ) | | | (13,155 | ) | |
| Shimachu Co., Ltd. | | | (900 | ) | | | (21,027 | ) | |
| Shimamura Co., Ltd. | | | (300 | ) | | | (27,797 | ) | |
| Tsutsumi Jewelry Co., Ltd. | | | (600 | ) | | | (15,988 | ) | |
| USS Co., Ltd. | | | (379 | ) | | | (30,961 | ) | |
| Xebio Co., Ltd. | | | (1,600 | ) | | | (34,566 | ) | |
| | | | (315,346 | ) | |
| Textiles, Apparel & Luxury Goods (-0.1%) | |
| Asics Corp. | | | (2,051 | ) | | | (26,279 | ) | |
| Gunze, Ltd. | | | (3,000 | ) | | | (12,647 | ) | |
| Wacoal Holdings Corp. | | | (2,000 | ) | | | (28,686 | ) | |
| | | | (67,612 | ) | |
| Trading Companies & Distributors (-0.1%) | |
| MISUMI Corp. | | | (900 | ) | | | (22,354 | ) | |
| Nagase & Co., Ltd. | | | (1,000 | ) | | | (12,921 | ) | |
| Shinsho Corp. | | | (4,000 | ) | | | (9,930 | ) | |
| Trusco Nakayama Corp. | | | (1,400 | ) | | | (23,472 | ) | |
| | | | (68,677 | ) | |
| Transportation Infrastructure (-0.1%) | |
| Japan Airport Terminal Co., Ltd. | | | (1,900 | ) | | | (29,282 | ) | |
| Kamigumi Co., Ltd. | | | (3,964 | ) | | | (33,211 | ) | |
See Accompanying Notes to Financial Statements.
57
Credit Suisse Trust — International Equity Flex III Portfolio
Schedule of Investments (continued)
December 31, 2010
| | | Number of
Shares | | Value | |
| SHORT STOCK POSITIONS | |
| COMMON STOCKS | |
| Japan | |
| Transportation Infrastructure | |
| Mitsubishi Logistics Corp. | | | (2,000 | ) | | $ | (26,529 | ) | |
| The Sumitomo Warehouse Co., Ltd. | | | (2,000 | ) | | | (10,515 | ) | |
| | | | (99,537 | ) | |
| TOTAL JAPAN | | | (7,661,535 | ) | |
| Luxembourg (-0.4%) | |
| Media (-0.1%) | |
| SES SA | | | (1,553 | ) | | | (37,126 | ) | |
| Personal Products (-0.2%) | |
| Oriflame Cosmetics SA | | | (4,876 | ) | | | (256,843 | ) | |
| Wireless Telecommunication Services (-0.1%) | |
| Millicom International Cellular SA | | | (1,695 | ) | | | (162,764 | ) | |
| TOTAL LUXEMBOURG | | | (456,733 | ) | |
| Netherlands (-1.9%) | |
| Aerospace & Defense (-0.0%) | |
| European Aeronautic Defence & Space Co. NV* | | | (2,008 | ) | | | (47,041 | ) | |
| Air Freight & Logistics (-0.1%) | |
| TNT NV | | | (4,529 | ) | | | (120,243 | ) | |
| Beverages (-0.1%) | |
| Heineken Holding NV | | | (1,436 | ) | | | (62,696 | ) | |
| Chemicals (-0.2%) | |
| Akzo Nobel NV | | | (3,523 | ) | | | (220,051 | ) | |
| Computers & Peripherals (-0.0%) | |
| Gemalto NV | | | (1,091 | ) | | | (46,658 | ) | |
| Energy Equipment & Services (-0.1%) | |
| SBM Offshore NV | | | (7,414 | ) | | | (166,997 | ) | |
| Insurance (-0.2%) | |
| Aegon NV* | | | (44,783 | ) | | | (275,224 | ) | |
| Life Sciences Tools & Services (-0.2%) | |
| QIAGEN NV* | | | (13,750 | ) | | | (270,929 | ) | |
| Media (-0.5%) | |
| Reed Elsevier NV | | | (23,707 | ) | | | (294,652 | ) | |
| Wolters Kluwer NV | | | (14,039 | ) | | | (309,094 | ) | |
| | | | (603,746 | ) | |
| Professional Services (-0.1%) | |
| Randstad Holding NV* | | | (1,526 | ) | | | (80,964 | ) | |
| Real Estate Investment Trusts (-0.2%) | |
| Corio NV | | | (4,233 | ) | | | (272,862 | ) | |
See Accompanying Notes to Financial Statements.
58
Credit Suisse Trust — International Equity Flex III Portfolio
Schedule of Investments (continued)
December 31, 2010
| | | Number of
Shares | | Value | |
| SHORT STOCK POSITIONS | |
| COMMON STOCKS | |
| Netherlands | |
| Semiconductors & Semiconductor Equipment (-0.1%) | |
| STMicroelectronics NV | | | (10,410 | ) | | $ | (108,683 | ) | |
| Transportation Infrastructure (-0.1%) | |
| Koninklijke Vopak NV | | | (2,611 | ) | | | (123,926 | ) | |
| TOTAL NETHERLANDS | | | (2,400,020 | ) | |
| Norway (-0.2%) | |
| Commercial Banks (-0.0%) | |
| DnB NOR ASA | | | (1,002 | ) | | | (14,151 | ) | |
| Metals & Mining (-0.2%) | |
| Norsk Hydro ASA | | | (36,391 | ) | | | (269,087 | ) | |
| TOTAL NORWAY | | | (283,238 | ) | |
| Spain (-0.6%) | |
| Airlines (-0.2%) | |
| Iberia Lineas Aereas de Espana SA* | | | (50,000 | ) | | | (215,389 | ) | |
| Electric Utilities (-0.1%) | |
| Acciona SA | | | (1,554 | ) | | | (110,738 | ) | |
| Electrical Equipment (-0.1%) | |
| Gamesa Corp. Tecnologica SA* | | | (10,703 | ) | | | (82,257 | ) | |
| Independent Power Producers & Energy Traders (-0.1%) | |
| Iberdrola Renovables SA | | | (50,000 | ) | | | (178,396 | ) | |
| Machinery (-0.1%) | |
| Zardoya Otis SA | | | (14,568 | ) | | | (206,284 | ) | |
| TOTAL SPAIN | | | (793,064 | ) | |
| Sweden (-0.7%) | |
| Commercial Banks (-0.1%) | |
| Skandinaviska Enskilda Banken AB A Shares | | | (19,141 | ) | | | (159,879 | ) | |
| Diversified Financial Services (-0.1%) | |
| Kinnevik Investment AB | | | (6,627 | ) | | | (135,016 | ) | |
| Internet & Catalog Retail (-0.0%) | |
| CDON Group AB* | | | (1,005 | ) | | | (4,649 | ) | |
| Machinery (-0.1%) | |
| Volvo AB* | | | (8,361 | ) | | | (143,057 | ) | |
| Media (-0.1%) | |
| Modern Times Group AB B Shares | | | (1,005 | ) | | | (66,610 | ) | |
| Metals & Mining (-0.2%) | |
| SSAB AB A Shares | | | (14,518 | ) | | | (244,790 | ) | |
| Real Estate Management & Development (-0.1%) | |
| Castellum AB | | | (9,483 | ) | | | (129,182 | ) | |
| TOTAL SWEDEN | | | (883,183 | ) | |
See Accompanying Notes to Financial Statements.
59
Credit Suisse Trust — International Equity Flex III Portfolio
Schedule of Investments (continued)
December 31, 2010
| | | Number of
Shares | | Value | |
| SHORT STOCK POSITIONS | |
| COMMON STOCKS | |
| Switzerland (-2.6%) | |
| Biotechnology (-0.2%) | |
| Actelion, Ltd.* | | | (2,601 | ) | | $ | (142,869 | ) | |
| Basilea Pharmaceutica AG* | | | (1,619 | ) | | | (112,935 | ) | |
| | | | (255,804 | ) | |
| Construction Materials (-0.2%) | |
| Holcim, Ltd. | | | (2,722 | ) | | | (206,621 | ) | |
| Electric Utilities (-0.1%) | |
| BKW FMB Energie AG | | | (1,176 | ) | | | (89,172 | ) | |
| Food Products (-0.1%) | |
| Aryzta AG* | | | (3,379 | ) | | | (156,571 | ) | |
| Health Care Equipment & Supplies (-0.6%) | |
| Nobel Biocare Holding AG | | | (9,992 | ) | | | (189,048 | ) | |
| Sonova Holding AG | | | (1,281 | ) | | | (165,643 | ) | |
| Straumann Holding AG | | | (1,077 | ) | | | (247,406 | ) | |
| Synthes, Inc. | | | (1,459 | ) | | | (197,544 | ) | |
| | | | (799,641 | ) | |
| Insurance (-0.3%) | |
| Swiss Life Holding AG* | | | (1,790 | ) | | | (258,979 | ) | |
| Swiss Reinsurance Co., Ltd. | | | (3,169 | ) | | | (170,536 | ) | |
| | | | (429,515 | ) | |
| Life Sciences Tools & Services (-0.1%) | |
| Lonza Group AG | | | (2,416 | ) | | | (194,257 | ) | |
| Machinery (-0.1%) | |
| Georg Fischer AG* | | | (256 | ) | | | (144,810 | ) | |
| Marine (-0.1%) | |
| Kuehne + Nagel International AG | | | (532 | ) | | | (74,247 | ) | |
| Oil, Gas & Consumable Fuels (-0.2%) | |
| Petroplus Holdings AG* | | | (17,025 | ) | | | (225,089 | ) | |
| Professional Services (-0.1%) | |
| Adecco SA | | | (2,915 | ) | | | (191,759 | ) | |
| Real Estate Management & Development (-0.5%) | |
| PSP Swiss Property AG* | | | (2,711 | ) | | | (217,907 | ) | |
| Swiss Prime Site AG* | | | (5,445 | ) | | | (407,499 | ) | |
| | | | (625,406 | ) | |
| TOTAL SWITZERLAND | | | (3,392,892 | ) | |
| United Kingdom (-2.5%) | |
| Aerospace & Defense (-0.0%) | |
| Cobham PLC | | | (16,984 | ) | | | (54,231 | ) | |
See Accompanying Notes to Financial Statements.
60
Credit Suisse Trust — International Equity Flex III Portfolio
Schedule of Investments (continued)
December 31, 2010
| | | Number of
Shares | | Value | |
| SHORT STOCK POSITIONS | |
| COMMON STOCKS | |
| United Kingdom | |
| Chemicals (-0.1%) | |
| Johnson Matthey PLC | | | (2,756 | ) | | $ | (88,175 | ) | |
| Commercial Services & Supplies (-0.1%) | |
| G4S PLC | | | (16,317 | ) | | | (65,002 | ) | |
| Serco Group PLC | | | (6,678 | ) | | | (58,215 | ) | |
| | | | (123,217 | ) | |
| Construction & Engineering (-0.1%) | |
| Balfour Beatty PLC | | | (13,826 | ) | | | (67,891 | ) | |
| Containers & Packaging (-0.0%) | |
| Rexam PLC | | | (8,272 | ) | | | (43,140 | ) | |
| Food & Staples Retailing (-0.1%) | |
| WM Morrison Supermarkets PLC | | | (42,076 | ) | | | (176,535 | ) | |
| Food Products (-0.1%) | |
| Associated British Foods PLC | | | (4,367 | ) | | | (80,960 | ) | |
| Health Care Equipment & Supplies (-0.1%) | |
| Smith & Nephew PLC | | | (9,314 | ) | | | (98,759 | ) | |
| Hotels, Restaurants & Leisure (-0.3%) | |
| Carnival PLC | | | (5,054 | ) | | | (236,063 | ) | |
| Ladbrokes PLC | | | (49,999 | ) | | | (96,415 | ) | |
| Thomas Cook Group PLC | | | (18,473 | ) | | | (54,912 | ) | |
| | | | (387,390 | ) | |
| Household Durables (-0.2%) | |
| Berkeley Group Holdings PLC* | | | (16,298 | ) | | | (227,686 | ) | |
| Independent Power Producers & Energy Traders (-0.0%) | |
| Drax Group PLC | | | (8,303 | ) | | | (48,027 | ) | |
| Insurance (-0.1%) | |
| Admiral Group PLC | | | (2,922 | ) | | | (69,403 | ) | |
| Internet & Catalog Retail (-0.0%) | |
| Home Retail Group PLC | | | (15,455 | ) | | | (45,863 | ) | |
| Machinery (-0.1%) | |
| Invensys PLC | | | (13,872 | ) | | | (76,990 | ) | |
| Media (-0.2%) | |
| Reed Elsevier PLC | | | (36,311 | ) | | | (308,009 | ) | |
| Metals & Mining (-0.2%) | |
| Antofagasta PLC | | | (5,116 | ) | | | (129,995 | ) | |
| Fresnillo PLC | | | (1,892 | ) | | | (49,717 | ) | |
| Lonmin PLC* | | | (4,527 | ) | | | (139,938 | ) | |
| | | | (319,650 | ) | |
See Accompanying Notes to Financial Statements.
61
Credit Suisse Trust — International Equity Flex III Portfolio
Schedule of Investments (continued)
December 31, 2010
| | | Number of
Shares | | Value | |
| SHORT STOCK POSITIONS | |
| COMMON STOCKS | |
| United Kingdom | |
| Multi-Utilities (-0.1%) | |
| United Utilities Group PLC | | | (7,847 | ) | | $ | (72,903 | ) | |
| Multiline Retail (-0.1%) | |
| Marks & Spencer Group PLC | | | (15,274 | ) | | | (88,448 | ) | |
| Oil, Gas & Consumable Fuels (-0.1%) | |
| Tullow Oil PLC | | | (4,030 | ) | | | (79,917 | ) | |
| Professional Services (-0.1%) | |
| The Capita Group PLC | | | (13,685 | ) | | | (149,458 | ) | |
| Real Estate Investment Trusts (-0.2%) | |
| Hammerson PLC | | | (42,004 | ) | | | (274,885 | ) | |
| Road & Rail (-0.0%) | |
| Firstgroup PLC | | | (9,292 | ) | | | (58,058 | ) | |
| Software (-0.2%) | |
| Autonomy Corp. PLC* | | | (6,313 | ) | | | (149,146 | ) | |
| The Sage Group PLC | | | (16,996 | ) | | | (72,903 | ) | |
| | | | (222,049 | ) | |
| TOTAL UNITED KINGDOM | | | (3,161,644 | ) | |
| TOTAL COMMON STOCKS (Proceeds $30,249,352) | | | (32,413,945 | ) | |
| TOTAL SECURITIES SOLD SHORT (Proceeds $30,249,352) | | | | $ | (32,413,945 | ) | |
INVESTMENT ABBREVIATION
ADR = America Depository Receipt
* Non-income producing security.
§ Security or portion thereof is out on loan.
§§ Represents security purchased with cash collateral received for securities on loan. The rate shown is the annualized seven day yield at December 31, 2010.
^ Not readily marketable security; security is valued at fair value as determined in good faith by, or under the direction of, the Board of Trustees.
See Accompanying Notes to Financial Statements.
62
Credit Suisse Trust — International Equity Flex III Portfolio
Statement of Assets and Liabilities
December 31, 2010
| Assets | |
Investments at value, including collateral for securities on loan of $10,797,489
(Cost $144,610,580) (Note 2) | | $ | 171,951,3891 | | |
| Cash | | | 848 | | |
| Foreign currency at value (cost $47,141) | | | 48,220 | | |
| Cash segregated at brokers for short sales | | | 33,817,253 | | |
| Dividend and interest receivable | | | 215,811 | | |
| Receivable for portfolio shares sold | | | 39,034 | | |
| Receivable for investments sold | | | 533 | | |
| Prepaid expenses and other assets | | | 8,107 | | |
| Total Assets | | | 206,081,195 | | |
| Liabilities | |
| Advisory fee payable (Note 3) | | | 48,626 | | |
| Administrative services fee payable (Note 3) | | | 50,371 | | |
| Payable upon return of securities loaned (Note 2) | | | 44,614,742 | | |
| Securities sold short, at value (Proceeds $30,249,352) (Note 2) | | | 32,413,945 | | |
| Payable for portfolio shares redeemed | | | 49,108 | | |
| Dividend expense payable on securities sold short | | | 19,108 | | |
| Trustees' fee payable | | | 112 | | |
| Other accrued expenses payable | | | 136,790 | | |
| Total Liabilities | | | 77,332,802 | | |
| Net Assets | |
| Capital stock, $.001 par value (Note 6) | | | 19,603 | | |
| Paid-in capital (Note 6) | | | 119,606,306 | | |
| Undistributed net investment income | | | 2,889,920 | | |
| Accumulated net realized loss on investments, short sales and foreign currency transactions | | | (18,956,082 | ) | |
| Net unrealized appreciation from investments, short sales and foreign currency translations | | | 25,188,646 | | |
| Net Assets | | $ | 128,748,393 | | |
| Shares outstanding | | | 19,602,527 | | |
| Net asset value, offering price and redemption price per share | | $ | 6.57 | | |
1 Including $42,701,658 of securities on loan.
See Accompanying Notes to Financial Statements.
63
Credit Suisse Trust — International Equity Flex III Portfolio
Statement of Operations
For the Year Ended December 31, 2010
| Investment Income (Note 2) | |
| Dividends | | $ | 5,104,918 | | |
| Interest | | | 57 | | |
| Securities lending | | | 210,575 | | |
| Foreign taxes withheld | | | (465,588 | ) | |
| Total investment income | | | 4,849,962 | | |
| Expenses | |
| Investment advisory fees (Note 3) | | | 1,220,310 | | |
| Administrative services fees (Note 3) | | | 273,915 | | |
| Dividend expense for securities sold short | | | 774,362 | | |
| Custodian fees | | | 279,053 | | |
| Short sales expense | | | 172,760 | | |
| Printing fees (Note 3) | | | 64,882 | | |
| Audit and tax fees | | | 52,233 | | |
| Transfer agent fees | | | 29,165 | | |
| Trustees' fees | | | 24,895 | | |
| Legal fees | | | 23,293 | | |
| Insurance expense | | | 7,016 | | |
| Commitment fees (Note 4) | | | 1,599 | | |
| Miscellaneous expense | | | 34,600 | | |
| Total expenses | | | 2,958,083 | | |
| Less: fees waived (Note 3) | | | (533,368 | ) | |
| Net expenses | | | 2,424,715 | | |
| Net investment income | | | 2,425,247 | | |
Net Realized and Unrealized Gain (Loss) from Investments, Short Sales and Foreign Currency
Related Items | |
| Net realized gain from investments | | | 5,673,272 | | |
| Net realized loss from short sales | | | (167,512 | ) | |
| Net realized loss from foreign currency transactions | | | (8,963 | ) | |
| Net change in unrealized appreciation (depreciation) from investments | | | 7,645,202 | | |
| Net change in unrealized appreciation (depreciation) from short sales | | | (1,806,202 | ) | |
| Net change in unrealized appreciation (depreciation) from foreign currency translations | | | 12,907 | | |
| Net realized and unrealized gain from investments, short sales and foreign currency related items | | | 11,348,704 | | |
| Net increase in net assets resulting from operations | | $ | 13,773,951 | | |
See Accompanying Notes to Financial Statements.
64
Credit Suisse Trust — International Equity Flex III Portfolio
Statements of Changes in Net Assets
| | | For the Year
Ended
December 31, 2010 | | For the Year
Ended
December 31, 2009 | |
| From Operations | |
| Net investment income | | $ | 2,425,247 | | | $ | 999,305 | | |
Net realized gain from investments, short sales and foreign
currency transactions | | | 5,496,797 | | | | 2,408,103 | | |
Net change in unrealized appreciation (depreciation) from investments,
short sales and foreign currency translations | | | 5,851,907 | | | | 21,660,958 | | |
| Net increase in net assets resulting from operations | | | 13,773,951 | | | | 25,068,366 | | |
| From Dividends and Distributions | |
| Dividends from net investment income | | | (119,025 | ) | | | (1,577,832 | ) | |
| Distributions from net realized gains | | | — | | | | (2,147,844 | ) | |
| Net decrease in net assets resulting from dividends and distributions | | | (119,025 | ) | | | (3,725,676 | ) | |
| From Capital Share Transactions (Note 6) | |
| Proceeds from sale of shares | | | 16,551,125 | | | | 17,093,006 | | |
| Exchange value of shares due to merger | | | — | | | | 59,791,876 | | |
| Reinvestment of dividends and distributions | | | 119,025 | | | | 3,725,676 | | |
| Net asset value of shares redeemed | | | (32,096,551 | ) | | | (24,678,017 | ) | |
| Net increase (decrease) in net assets from capital share transactions | | | (15,426,401 | ) | | | 55,932,541 | | |
| Net increase (decrease) in net assets | | | (1,771,475 | ) | | | 77,275,231 | | |
| Net Assets | |
| Beginning of year | | | 130,519,868 | | | | 53,244,637 | | |
| End of year | | $ | 128,748,393 | | | $ | 130,519,868 | | |
| Undistributed net investment income | | $ | 2,889,920 | | | $ | 118,830 | | |
See Accompanying Notes to Financial Statements.
65
Credit Suisse Trust — International Equity Flex III Portfolio
Statement of Cash Flows
For the Year Ended December 31, 2010
| Cash Flows from Operating Activities | |
| Dividends, interest and securities lending income received | | $ | 4,793,089 | | | | | | |
| Gain received from litigation | | | 69,614 | | | | | | |
| Operating expenses paid | | | (1,677,147 | ) | | | | | |
| Dividend expense paid on securities sold short | | | (767,987 | ) | | | | | |
| Purchases of long-term securities | | | (252,070,202 | ) | | | | | |
| Proceeds from sales of long-term securities | | | 259,240,815 | | | | | | |
| Purchases to cover securities sold short | | | (141,776,252 | ) | | | | | |
| Proceeds from securities sold short | | | 146,593,574 | | | | | | |
| Proceeds from short-term securities, net | | | 995,000 | | | | | | |
| Net cash provided by operating activities | | | | | | $ | 15,400,504 | | |
| Cash Flows from Financing Activities | |
| Proceeds from sale of shares | | | 16,724,112 | | | | | | |
| Cost of shares redeemed | | | (32,234,360 | ) | | | | | |
| Net cash used by financing activities | | | | | | | (15,510,248 | ) | |
| Effect of exchange rate on cash | | | | | | | 3,944 | | |
| Net decrease in cash | | | | | | | (105,800 | ) | |
| Cash — beginning of year | | | | | | | 154,868 | | |
| Cash — end of year | | | | | | $ | 49,068 | | |
RECONCILIATION OF NET INCREASE IN NET ASSETS FROM OPERATIONS TO
NET CASH PROVIDED BY OPERATING ACTIVITIES | |
| Net increase in net assets resulting from operations | | | | | | $ | 13,773,951 | | |
Adjustments to Reconcile Net Increase in Net Assets from Operations to
Net Cash Provided by Operating Activities | |
| Change in dividends and interest receivable | | $ | (56,873 | ) | | | | | |
| Change in accrued expenses | | | (36,209 | ) | | | | | |
| Change in prepaid expenses and other assets | | | 3,061 | | | | | | |
| Change in advisory fee payable | | | 6,354 | | | | | | |
| Change in dividend expense payable on securities sold short | | | 6,375 | | | | | | |
| Purchases of long-term securities | | | (252,070,202 | ) | | | | | |
| Proceeds from sales of long-term securities | | | 259,240,815 | | | | | | |
| Purchases to cover securities sold short | | | (141,776,252 | ) | | | | | |
| Proceeds from securities sold short | | | 146,593,574 | | | | | | |
| Proceeds from short-term securities, net | | | 995,000 | | | | | | |
Net change in unrealized appreciation from investments, short sales and
foreign currency translations | | | (5,851,907 | ) | | | | | |
| Net realized gain from investments, short sales and foreign currency transactions | | | (5,427,183 | ) | | | | | |
| Total adjustments | | | | | | | 1,626,553 | | |
| Net cash provided by operating activities | | | | $ | 15,400,504 | | |
| Non-Cash Activity: | |
| Dividend reinvestments | | | | $ | 119,025 | | |
See Accompanying Notes to Financial Statements.
66
Credit Suisse Trust — International Equity Flex III Portfolio
Financial Highlights
(For a Share of the Portfolio Outstanding Throughout Each Year)
| | | For the Year Ended December 31, | |
| | | 2010 | | 2009 | | 2008 | | 2007 | | 2006 | |
| Per share data | |
| Net asset value, beginning of year | | $ | 5.86 | | | $ | 4.08 | | | $ | 23.58 | | | $ | 21.85 | | | $ | 16.82 | | |
| INVESTMENT OPERATIONS | |
| Net investment income | | | 0.12 | | | | 0.08 | | | | 0.25 | | | | 0.37 | | | | 0.21 | | |
Net gain (loss) on investments, short sales
and foreign currency related items
(both realized and unrealized) | | | 0.60 | | | | 2.01 | | | | (10.11 | )1 | | | 5.58 | | | | 5.19 | | |
| Total from investment operations | | | 0.72 | | | | 2.09 | | | | (9.86 | ) | | | 5.95 | | | | 5.40 | | |
| LESS DIVIDENDS AND DISTRIBUTIONS | |
| Dividends from net investment income | | | (0.01 | ) | | | (0.13 | ) | | | (0.34 | ) | | | (0.37 | ) | | | (0.11 | ) | |
| Distributions from net realized gains | | | — | | | | (0.18 | ) | | | (9.30 | ) | | | (3.85 | ) | | | (0.26 | ) | |
| Total dividends and distributions | | | (0.01 | ) | | | (0.31 | ) | | | (9.64 | ) | | | (4.22 | ) | | | (0.37 | ) | |
| Net asset value, end of year | | $ | 6.57 | | | $ | 5.86 | | | $ | 4.08 | | | $ | 23.58 | | | $ | 21.85 | | |
| Total return2 | | | 12.23 | % | | | 51.62 | % | | | (54.80 | )% | | | 29.44 | % | | | 32.51 | % | |
| RATIOS AND SUPPLEMENTAL DATA | |
| Net assets, end of year (000s omitted) | | $ | 128,748 | | | $ | 130,520 | | | $ | 53,245 | | | $ | 179,817 | | | $ | 242,319 | | |
| Ratio of expenses to average net assets | | | 1.99 | % | | | 1.14 | % | | | 1.04 | % | | | 1.30 | % | | | 1.36 | % | |
Ratio of expenses to average net assets
excluding short sales dividend expense | | | 1.35 | % | | | 1.08 | % | | | — | | | | — | | | | — | | |
Ratio of net investment income to
average net assets | | | 1.99 | % | | | 1.57 | % | | | 1.40 | % | | | 0.94 | % | | | 1.11 | % | |
Decrease reflected in above operating expense
ratios due to waivers/reimbursements | | | 0.44 | % | | | 0.40 | % | | | 0.25 | % | | | 0.15 | % | | | 0.23 | % | |
| Portfolio turnover rate | | | 213 | % | | | 196 | % | | | 61 | % | | | 62 | % | | | 80 | % | |
1 The investment adviser fully reimbursed the Portfolio for a loss on a transaction not meeting the Portfolio's investment guidelines, which otherwise would have reduced the amount by $0.01.
2 Total returns are historical and assume changes in share price and reinvestment of all dividends and distributions. Had certain expenses not been reduced during the years shown, total returns would have been lower. Total returns do not reflect charges and expenses attributable to any particular variable contract or plan.
See Accompanying Notes to Financial Statements.
67
Credit Suisse Trust — International Equity Flex III Portfolio
Notes to Financial Statements
December 31, 2010
Note 1. Organization
Credit Suisse Trust (the "Trust") is an open-end management investment company registered under the Investment Company Act of 1940, as amended (the "1940 Act"), and currently offers three managed investment portfolios of which one, the International Equity Flex III Portfolio (the "Portfolio"), is included in this report. The Portfolio is a diversified investment fund that seeks capital appreciation. Shares of the Portfolio are not available directly to individual investors but may be offered only through (a) variable annuity contracts and variable life insurance contracts offered by separate accounts of certain insurance companies and (b) tax-qualified pension and retirement plans. The Portfolio may not be available in connection with a particular contract or plan. The Trust was organized under the laws of the Commonwealth of Massachusetts as a business trust on March 15, 1995. Effective May 1, 2009, the name of the Portfolio was changed from Emerging Markets Portfolio.
Note 2. Significant Accounting Policies
A) SECURITY VALUATION — The net asset value of the Portfolio is determined daily as of the close of regular trading on the New York Stock Exchange, Inc. (the "Exchange") on each day the Exchange is open for business. Equity investments are valued at market value, which is generally determined using the closing price on the exchange or market on which the security is primarily traded at the time of valuation (the "Valuation Time"). If no sales are reported, equity investments are generally valued at the most recent bid quotation as of the Valuation Time or at the lowest asked quotation in the case of a short sale of securities. Equity investments are generally categorized as Level 1. Debt securities with a remaining maturity greater than 60 days are valued in accordance with the price supplied by a pricing service, which may use a matrix, formula or other objective method that takes into consideration market indices, yield curves and other specific adjustments. For certain international equity securities, in order to adjust for events which may occur between the close of the foreign stock exchanges and the close of the Exchange, the Portfolio may utilize a fair valuation service provided by an independent third party which has been approved by the Board of Trustees. Securities priced using this fair valuation model are generally categorized as Level 2. Debt obligations that will mature in 60 days or less are valued on the basis of amortized cost, which approximates market value, unless it is determined that using this method would not represent fair value. Debt securities are generally categorized as Level 2. Investments in open-end investment companies are valued at their net asset value each business day and are generally categorized as Level 1. Securities and other assets for
68
Credit Suisse Trust — International Equity Flex III Portfolio
Notes to Financial Statements (continued)
December 31, 2010
Note 2. Significant Accounting Policies
which market quotations are not readily available, or whose values have been materially affected by events occurring before the Portfolio's Valuation Time but after the close of the securities' primary markets, are valued at fair value as determined in good faith by, or under the direction of, the Board of Trustees under procedures established by the Board of Trustees and are generally categorized as Level 3. When fair value pricing is employed, the prices of securities used by a portfolio to calculate its net asset value may differ from quoted or published prices for the same securities.
In accordance with the authoritative guidance on fair value measurements and disclosures under accounting principles generally accepted in the United States of America ("GAAP"), the Portfolio discloses the fair value of its investments in a hierarchy that prioritizes the inputs to valuation techniques used to measure the fair value. In accordance with GAAP, fair value is defined as the price that the Portfolio would receive upon selling an investment in a timely transaction to an independent buyer in the principal or most advantageous market of the investment. GAAP established a three-tier hierarchy to maximize the use of observable market data and minimize the use of unobservable inputs and to establish classification of fair value measurements for disclosure purposes. Inputs refer broadly to the assumptions that market participants would use in pricing the asset or liability, including assumptions about risk, for example, th e risk inherent in a particular valuation technique used to measure fair value including such a pricing model and/or the risk inherent in the inputs to the valuation technique. Inputs may be observable or unobservable. Observable inputs are inputs that reflect the assumptions market participants would use in pricing the asset or liability developed based on market data obtained from sources independent of the reporting entity. Unobservable inputs are inputs that reflect the reporting entity's own assumptions about the assumptions market participants would use in pricing the asset or liability developed based on the best information available in the circumstances. In accordance with the Portfolio's valuation procedures, factors used in determining value may include, but are not limited to, the type of the security, the size of the holding, the initial cost of the security, the existence of any contractual restrictions on the security's disposition, the price and extent of public trading in similar securities of the issuer or of comparable companies, quotations or evaluated prices from broker-dealers and/or pricing services, information obtained from the issuer, analysts, and/or the appropriate stock exchange (for exchange-traded securities), an analysis of the company's or issuer's financial statements, an evaluation of the forces that influence the issuer and the market(s) in which the security is purchased and
69
Credit Suisse Trust — International Equity Flex III Portfolio
Notes to Financial Statements (continued)
December 31, 2010
Note 2. Significant Accounting Policies
sold and with respect to debt securities, the maturity, coupon, creditworthiness, currency denomination, and the movement of the market in which the security is normally traded. The three-tier hierarchy of inputs is summarized in the three broad Levels listed below.
• Level 1 – quoted prices in active markets for identical investments
• Level 2 – other significant observable inputs (including quoted prices for similar investments, interest rates, prepayment speeds, credit risk, etc.)
• Level 3 – significant unobservable inputs (including the Portfolio's own assumptions in determining the fair value of investments)
The inputs or methodology used for valuing securities are not necessarily an indication of the risk associated with investing in those securities.
The following is a summary of the inputs used as of December 31, 2010 in valuing the Portfolio's investments carried at value:
| | | Level 1 | | Level 2 | | Level 3 | | Total | |
| Investments In Securities | |
| Common Stocks | |
| Asia | | $ | 4,124,985 | | | $ | — | | | $ | — | | | $ | 4,124,985 | | |
| Australia | | | 727,829 | | | | 7,858,445 | | | | — | | | | 8,586,274 | | |
| Austria | | | — | | | | 1,249,972 | | | | — | | | | 1,249,972 | | |
| Belgium | | | — | | | | 1,802,268 | | | | — | | | | 1,802,268 | | |
| Bermuda | | | — | | | | 409,246 | | | | — | | | | 409,246 | | |
| Cyprus | | | — | | | | 167,689 | | | | — | | | | 167,689 | | |
| Denmark | | | — | | | | 3,031,537 | | | | — | | | | 3,031,537 | | |
| Finland | | | — | | | | 5,051,282 | | | | — | | | | 5,051,282 | | |
| France | | | 370,772 | | | | 14,797,043 | | | | — | | | | 15,167,815 | | |
| Germany | | | — | | | | 12,737,960 | | | | — | | | | 12,737,960 | | |
| Greece | | | — | | | | 446,986 | | | | — | | | | 446,986 | | |
| Hong Kong | | | 2,664,003 | | | | — | | | | — | | | | 2,664,003 | | |
| Israel | | | 710,304 | | | | 91,177 | | | | — | | | | 801,481 | | |
| Italy | | | — | | | | 3,110,152 | | | | — | | | | 3,110,152 | | |
| Japan | | | 37,379 | | | | 35,968,140 | | | | — | | | | 36,005,519 | | |
| Luxembourg | | | — | | | | 830,653 | | | | — | | | | 830,653 | | |
| Netherlands | | | 1,243,832 | | | | 3,394,191 | | | | — | | | | 4,638,023 | | |
| Norway | | | — | | | | 1,538,826 | | | | — | | | | 1,538,826 | | |
| Portugal | | | — | | | | 865,844 | | | | — | | | | 865,844 | | |
| Singapore | | | 1,622,957 | | | | — | | | | — | | | | 1,622,957 | | |
| Spain | | | — | | | | 6,015,470 | | | | — | | | | 6,015,470 | | |
| Sweden | | | — | | | | 7,727,290 | | | | — | | | | 7,727,290 | | |
| Switzerland | | | — | | | | 9,862,570 | | | | — | | | | 9,862,570 | | |
| United Kingdom | | | 350,551 | | | | 30,278,743 | | | | — | | | | 30,629,294 | | |
| Preferred Stocks | |
| Germany | | | 397,293 | | | | 751,926 | | | | — | | | | 1,149,219 | | |
| Rights | |
| United Kingdom | | | 18,548 | | | | — | | | | — | | | | 18,548 | | |
70
Credit Suisse Trust — International Equity Flex III Portfolio
Notes to Financial Statements (continued)
December 31, 2010
Note 2. Significant Accounting Policies
| | | Level 1 | | Level 2 | | Level 3 | | Total | |
| Warrants | |
| Italy | | $ | 37 | | | $ | — | | | $ | — | | | $ | 37 | | |
| Short-Term Investments | | | 10,797,489 | | | | 898,000 | | | | — | | | | 11,695,489 | | |
| Securities Sold Short | |
| Common Stocks | |
| Austria | | | — | | | | (70,471 | ) | | | — | | | | (70,471 | ) | |
| Belgium | | | (212,366 | ) | | | (911,480 | ) | | | — | | | | (1,123,846 | ) | |
| Canada | | | (4,982 | ) | | | — | | | | — | | | | (4,982 | ) | |
| Denmark | | | — | | | | (659,702 | ) | | | — | | | | (659,702 | ) | |
| Finland | | | — | | | | (873,664 | ) | | | — | | | | (873,664 | ) | |
| France | | | (80,568 | ) | | | (4,285,048 | ) | | | — | | | | (4,365,616 | ) | |
| Germany | | | (262,941 | ) | | | (2,499,326 | ) | | | — | | | | (2,762,267 | ) | |
| Italy | | | — | | | | (3,521,088 | ) | | | — | | | | (3,521,088 | ) | |
| Japan | | | — | | | | (7,661,535 | ) | | | — | | | | (7,661,535 | ) | |
| Luxembourg | | | — | | | | (456,733 | ) | | | — | | | | (456,733 | ) | |
| Netherlands | | | — | | | | (2,400,020 | ) | | | — | | | | (2,400,020 | ) | |
| Norway | | | — | | | | (283,238 | ) | | | — | | | | (283,238 | ) | |
| Spain | | | — | | | | (793,064 | ) | | | — | | | | (793,064 | ) | |
| Sweden | | | (4,649 | ) | | | (878,534 | ) | | | — | | | | (883,183 | ) | |
| Switzerland | | | — | | | | (3,392,892 | ) | | | — | | | | (3,392,892 | ) | |
| United Kingdom | | | — | | | | (3,161,644 | ) | | | — | | | | (3,161,644 | ) | |
| Other Financial Instruments* | | | — | | | | — | | | | — | | | | — | | |
| | | $ | 22,500,473 | | | $ | 117,036,971 | | | $ | — | | | $ | 139,537,444 | | |
*Other financial instruments include futures, forwards and swap contracts.
Effective January 1, 2010, the Portfolio adopted FASB amendments to authoritative guidance which requires the Portfolio to disclose details of significant transfers in and out of Level 1 and Level 2 measurements and the reasons for the transfers. For the year ended December 31, 2010, as a result of the fair value pricing procedures for international investments utilized by the Portfolio, certain securities may have transferred in and out of Level 1 and Level 2 measurements during the period. The only investment held by the Portfolio whose fair value was determined using Level 3 inputs had a value of $0 at December 31, 2010.
B) DERIVATIVE INSTRUMENTS AND HEDGING ACTIVITIES — Effective January 1, 2009, the Portfolio adopted amendments to authoritative guidance on disclosures about derivative instruments and hedging activities which require that the Portfolio disclose (a) how and why an entity uses derivative instruments, (b) how derivative instruments and hedging activities are accounted for, and (c) how derivative instruments and related hedging activities affect a portfolio's financial position, financial performance, and cash flows. The Portfolio has not entered into any derivative or hedging activities during the period covered by this report.
71
Credit Suisse Trust — International Equity Flex III Portfolio
Notes to Financial Statements (continued)
December 31, 2010
Note 2. Significant Accounting Policies
C) SECURITY TRANSACTIONS AND INVESTMENT INCOME — Security transactions are accounted for on a trade date basis. Interest income is recorded on the accrual basis. Dividends and dividend expense on short sales are recorded on the ex-dividend date. The cost of investments sold is determined by use of the specific identification method for both financial reporting and income tax purposes.
D) DIVIDENDS AND DISTRIBUTIONS TO SHAREHOLDERS — Dividends from net investment income and distributions of net realized capital gains, if any, are declared and paid at least annually. However, to the extent that a net realized capital gain can be reduced by a capital loss carryforward, such gain will not be distributed. Income and capital gain distributions are determined in accordance with federal income tax regulations, which may differ from GAAP.
E) FEDERAL INCOME TAXES — No provision is made for federal taxes as it is the Portfolio's intention to continue to qualify for and elect the tax treatment applicable to regulated investment companies under the Internal Revenue Code of 1986, as amended, and to make the requisite distributions to its shareholders, which will be sufficient to relieve it from federal income and excise taxes.
The Portfolio adopted the authoritative guidance for uncertainty in income taxes and recognizes a tax benefit or liability from an uncertain position only if it is more likely than not that the position is sustainable based solely on its technical merits and consideration of the relevant taxing authority's widely understood administrative practices and procedures. The Portfolio has reviewed its current tax positions and has determined that no provision for income tax is required in the Portfolio's financial statements. The Portfolio's federal tax returns for the prior three fiscal years remain subject to examination by the Internal Revenue Service.
F) USE OF ESTIMATES — The preparation of financial statements in conformity with GAAP requires management to make estimates and assumptions that affect the reported amounts of assets and liabilities and disclosure of contingent assets and liabilities at the date of the financial statements and the reported amounts of income and expenses during the reporting period. Actual results could differ from these estimates.
G) SHORT-TERM INVESTMENTS — The Portfolio, together with other funds/portfolios advised by Credit Suisse Asset Management, LLC ("Credit Suisse"), an indirect, wholly-owned subsidiary of Credit Suisse Group AG, pools available cash into a short-term variable rate time deposit issued by State
72
Credit Suisse Trust — International Equity Flex III Portfolio
Notes to Financial Statements (continued)
December 31, 2010
Note 2. Significant Accounting Policies
Street Bank and Trust Company ("SSB"), the Portfolio's custodian. The short-term time deposit issued by SSB is a variable rate account classified as a short-term investment.
H) SHORT SALES — The Portfolio enters into short sales transactions collateralized by cash deposits received from brokers in connection with securities lending activities (see note I) and securities. Cash deposits are shown as cash segregated at brokers on the Statement of Assets and Liabilities. The collateral amounts required are determined daily by reference to the market value of the short positions. Short sales expose the Portfolio to the risk that it will be required to cover its short position at a time when the securities have appreciated in value, thus resulting in a loss to the Portfolio. The Portfolio's loss on a short sale could theoretically be unlimited in a case where the Portfolio is unable, for whatever reason, to close out its short position. Short sales also involve transaction and other costs that will reduce potential gains and increase potential portfolio losses. The use by the Portfolio of short sal es in combination with long positions in its portfolio in an attempt to improve performance may not be successful and may result in greater losses or lower positive returns than if the Portfolio held only long positions. It is possible that the Portfolio's long equity positions will decline in value at the same time that the value of the securities it has sold short increases, thereby increasing potential losses to the Portfolio. In addition, the Portfolio's short selling strategies may limit its ability to fully benefit from increases in the equity markets. Short selling also involves a form of financial leverage that may exaggerate any losses realized by the Portfolio. Also, there is the risk that the counterparty to a short sale may fail to honor its contractual terms, causing a loss to the Portfolio.
I) SECURITIES LENDING — Loans of securities are required at all times to be secured by collateral at least equal to 102% of the market value of domestic securities on loan (including any accrued interest thereon) and 105% of the market value of foreign securities on loan (including any accrued interest thereon). Cash collateral received by the Portfolio in connection with securities lending activity is either in the form of cash segregated at brokers or pooled together with cash collateral for other funds/portfolios advised by Credit Suisse and may be invested in a variety of investments, including funds advised by SSB, the Portfolio's securities lending agent, or money market instruments. However, in the event of default or bankruptcy by the other party to the agreement, realization and/or retention of the collateral may be subject to legal proceedings.
SSB has been engaged by the Portfolio to act as the Portfolio's securities lending agent. The Portfolio's securities lending arrangement provides that
73
Credit Suisse Trust — International Equity Flex III Portfolio
Notes to Financial Statements (continued)
December 31, 2010
Note 2. Significant Accounting Policies
the Portfolio and SSB will share the net income earned from securities lending activities. During the year ended December 31, 2010, total earnings from the Portfolio's investment in cash collateral received in connection with securities lending arrangements was $284,077, of which $18,898 was rebated to borrowers (brokers). The Portfolio retained $210,575 in income from the cash collateral investment, and SSB, as lending agent, was paid $54,604. Securities lending income is accrued as earned.
J) FOREIGN CURRENCY TRANSACTIONS — The books and records of the Portfolio are maintained in U.S. dollars. Transactions denominated in foreign currencies are recorded at the current prevailing exchange rates. All assets and liabilities denominated in foreign currencies are translated into U.S. dollar amounts at the current exchange rate at the end of the period. Translation gains or losses resulting from changes in the exchange rate during the reporting period and realized gains and losses on the settlement of foreign currency transactions are reported in the results of operations for the current period. The Portfolio does not isolate that portion of realized gains and losses on investments in equity securities which is due to changes in the for eign exchange rate from that which is due to changes in market prices of equity securities. The Portfolio isolates that portion of realized gains and losses on investments in debt securities which is due to changes in the foreign exchange rate from that which is due to changes in market prices of debt securities.
K) OTHER — The Portfolio invests in securities of foreign countries which involve certain risks in addition to those inherent in domestic investments. Such risks generally include, among others, currency risk (fluctuations in currency exchange rates), information risk (key information may be inaccurate or unavailable) and political risk (expropriation, nationalization or the imposition of capital or currency controls or punitive taxes). Other risks of investing in foreign securities include liquidity and valuation risks.
L) SUBSEQUENT EVENTS — In preparing the financial statements as of December 31, 2010, management considered the impact of subsequent events for potential recognition or disclosure in these financial statements.
Note 3. Transactions with Affiliates and Related Parties
Credit Suisse serves as investment adviser for the Portfolio. For its investment advisory services, Credit Suisse is entitled to receive a fee from the Portfolio at an annual rate of 1.00% of the Portfolio's average daily net assets. For the year ended December 31, 2010, investment advisory fees earned and
74
Credit Suisse Trust — International Equity Flex III Portfolio
Notes to Financial Statements (continued)
December 31, 2010
Note 3. Transactions with Affiliates and Related Parties
voluntarily waived were $1,220,310 and $533,368, respectively. Credit Suisse will not recapture from the Portfolio any fees it waived during the year ended December 31, 2010. Effective January 1, 2011, Credit Suisse will waive fees and reimburse expenses so that the Portfolio's annual operating expenses, excluding dividend expense for securities sold short, will not exceed 1.45% of the Portfolio's average daily net assts. Fee waivers and expense reimbursements are voluntary and may be discontinued by Credit Suisse at any time.
Credit Suisse Asset Management Securities, Inc. ("CSAMSI"), an affiliate of Credit Suisse, and SSB serve as co-administrators to the Portfolio. For its co-administrative services, CSAMSI currently receives a fee calculated at an annual rate of 0.09% of the Portfolio's average daily net assets. For the year ended December 31, 2010, co-administrative services fees earned by CSAMSI were $109,828.
For its co-administrative services, SSB receives a fee, exclusive of out-of-pocket expenses, calculated in total for all the Credit Suisse funds/portfolios co-administered by SSB and allocated based upon the relative average net assets of each fund/portfolio, subject to an annual minimum fee. For the year ended December 31, 2010, co-administrative services fees earned by SSB (including out-of-pocket expenses) were $164,087.
In addition to serving as the Portfolio's co-administrator, CSAMSI currently serves as distributor of the Portfolio's shares without compensation.
Merrill Corporation ("Merrill"), an affiliate of Credit Suisse, has been engaged by the Portfolio to provide certain financial printing services. For the year ended December 31, 2010, Merrill was paid $39,926 for its services by the Portfolio.
Note 4. Line of Credit
The Portfolio, together with other funds/portfolios advised by Credit Suisse (collectively, the "Participating Funds"), participates in a committed, unsecured line of credit facility ("Credit Facility") for temporary or emergency purposes with SSB. Under the terms of the Credit Facility, the Participating Funds pay an aggregate commitment fee on the average unused amount of the Credit Facility, which is allocated among the Participating Funds in such manner as is determined by the governing Boards of the Participating Funds. In addition, the Participating Funds pay interest on borrowings at either the Overnight Federal Funds rate or the Overnight LIBOR rate plus a spread. At December 31,
75
Credit Suisse Trust — International Equity Flex III Portfolio
Notes to Financial Statements (continued)
December 31, 2010
Note 4. Line of Credit
2010, and during the year ended December 31, 2010, the Portfolio had no borrowings under the Credit Facility.
Note 5. Purchases and Sales of Securities
For the year ended December 31, 2010, purchases and sales of investment securities (excluding short sales and short-term investments) were $251,635,673 and $259,062,017, respectively. Securities sold short and purchases to cover securities sold short were $146,013,190 and $141,201,677, respectively.
Note 6. Capital Share Transactions
The Trust is authorized to issue an unlimited number of full and fractional shares of beneficial interest, $.001 par value per share. Transactions in capital shares of the Portfolio were as follows:
| | | For the Year Ended
December 31, 2010 | | For the Year Ended
December 31, 2009 | |
| Shares sold | | | 2,807,356 | | | | 3,357,893 | | |
| Shares exchanged due to merger | | | — | | | | 10,314,385 | | |
| Shares issued in reinvestment of dividends and distributions | | | 20,557 | | | | 643,468 | | |
| Shares redeemed | | | (5,511,004 | ) | | | (5,091,113 | ) | |
| Net increase (decrease) | | | (2,683,091 | ) | | | 9,224,633 | | |
On December 31, 2010, the number of shareholders that held 5% or more of the outstanding shares of the Portfolio was as follows:
Number of
Shareholders | | Approximate Percentage
of Outstanding Shares | |
| | 5 | | | | 81 | % | |
Some of the shareholders are omnibus accounts, which hold shares on behalf of individual shareholders.
Note 7. Federal Income Taxes
Income and capital gain distributions are determined in accordance with federal income tax regulations, which may differ from GAAP.
The tax characteristics of dividends and distributions paid during the years ended December 31, 2010 and 2009, respectively, by the Portfolio were as follows:
| Ordinary Income | | Long-Term Capital Gain | |
| 2010 | | 2009 | | 2010 | | 2009 | |
| $ | 119,025 | | | $ | 1,577,884 | | | $ | 0 | | | $ | 2,147,792 | | |
76
Credit Suisse Trust — International Equity Flex III Portfolio
Notes to Financial Statements (continued)
December 31, 2010
Note 7. Federal Income Taxes
The tax basis components of distributable earnings differ from the amounts reflected in the Statement of Assets and Liabilities by temporary book/tax differences. These differences are primarily due to losses deferred on wash sales and mark-to-market income from Passive Foreign Investment Companies.
At December 31, 2010, the components of distributable earnings on a tax basis were as follows:
| Undistributed net investment income | | $ | 3,400,012 | | |
| Accumulated realized loss | | | (16,291,883 | ) | |
| Unrealized appreciation | | | 22,024,893 | | |
| Deferral of post-October capital losses | | | (10,538 | ) | |
| | | $ | 9,122,484 | | |
At December 31, 2010, the Portfolio had capital loss carryforwards available to offset possible future capital gains as follows:
| Expires December 31, | |
| 2016 | | 2017 | |
| $ | 14,924,052 | | | $ | 1,367,831 | | |
During the tax year ended December 31, 2010, the Portfolio utilized $6,352,852 of the capital loss carryforwards.
It is uncertain whether the Portfolio will be able to realize the benefits of the capital loss carryforwards before they expire.
Included in the Portfolio's capital loss carryforwards which expire in 2016 is $5,420,346, acquired in the Credit Suisse Trust — International Equity Flex I Portfolio merger, which is subject to limitations.
Included in the Portfolio's capital loss carryforwards which expire in 2016 is $9,503,706, acquired in the Credit Suisse Trust — International Equity Flex II Portfolio merger, which is subject to limitations.
At December 31, 2010, the identified cost for federal income tax purposes, as well as the gross unrealized appreciation from investments for those securities having an excess of value over cost, gross unrealized depreciation from investments for those securities having an excess of cost over value and the net unrealized appreciation from investments were $147,774,335, $26,347,233, $(2,170,179) and $24,177,054, respectively.
At December 31, 2010, the identified proceeds for federal income tax purposes, as well as the gross unrealized appreciation from securities sold
77
Credit Suisse Trust — International Equity Flex III Portfolio
Notes to Financial Statements (continued)
December 31, 2010
Note 7. Federal Income Taxes
short for those securities having an excess of proceeds over value, gross unrealized depreciation from investments for those securities having an excess of value over proceeds and the net unrealized depreciation from securities sold short were $(30,249,352), $670,984, $(2,835,577) and $(2,164,593), respectively.
At December 31, 2010, the Portfolio reclassified $464,868 to undistributed net investment income and $1,596,146 to paid in capital from accumulated realized loss, to adjust for current period permanent book/tax differences which arose principally from foreign currency gain/(loss), reclassification of short sale substitute payments and Passive Foreign Investment Companies. Net assets were not affected by these reclassifications.
Note 8. Acquisition of Credit Suisse Trust — International Equity Flex I Portfolio and Credit Suisse Trust — International Equity Flex II Portfolio
On December 11, 2009, Credit Suisse Trust — International Equity Flex III Portfolio acquired all of the net assets of Credit Suisse Trust — International Equity Flex I Portfolio and Credit Suisse Trust — International Equity Flex II Portfolio, both open-end investment companies, pursuant to a plan of reorganization approved by the Board of Trustees on August 18, 2009. The purpose of the transaction was to combine three funds managed by Credit Suisse with comparable investment objectives and strategies. The acquisition was accomplished by a tax-free exchange of 2,140,708 shares of Credit Suisse Trust — International Equity Flex I Portfolio valued at $21,716,138 and 4,055,155 shares of Credit Suisse Trust — International Equity Flex II Portfolio valued at $38,075,738 for 10,314,385 shares of Credit Suisse Trust — International Equity Flex III Portfolio. The investment portfolios of Credit Suisse Tru st — International Equity Flex I Portfolio and Credit Suisse Trust — International Equity Flex II Portfolio had a fair value at December 11, 2009 of $21,695,471 and $38,080,582 and identified costs of $18,350,197 and $32,684,366, respectively, which were the principal assets acquired by Credit Suisse Trust — International Equity Flex III Portfolio. For financial reporting purposes, assets received and shares issued by Credit Suisse Trust — International Equity Flex III Portfolio were recorded at fair value; however the cost basis of the investments received from Credit Suisse Trust — International Equity Flex I Portfolio and Credit Suisse Trust — International Equity Flex II Portfolio were carried forward to align ongoing reporting of Credit Suisse Trust — International Equity Flex III Portfolio's realized and unrealized gains and losses with amounts distributable to shareholders for tax purposes. Immediately prior
78
Credit Suisse Trust — International Equity Flex III Portfolio
Notes to Financial Statements (continued)
December 31, 2010
Note 8. Acquisition of Credit Suisse Trust — International Equity Flex I Portfolio and Credit Suisse Trust — International Equity Flex II Portfolio
to the merger, the net assets of Credit Suisse Trust — International Equity Flex III Portfolio were $69,332,521.
Credit Suisse Trust — International Equity Flex III Portfolio pro forma results of operations for the year ended December 31, 2009 are as follows:
| Net investment income | | $ | 2,421,2591 | | |
Net gain from investments, short sales and foreign currency
related items | | | 38,720,0892 | | |
| Net increase in net assets resulting from operations | | $ | 41,141,348 | | |
Because the combined investment portfolios have been managed as a single integrated portfolio since the acquisition was completed, it is not practicable to separate the amounts of net investment income and net gain on investments of Credit Suisse Trust — International Equity Flex I Portfolio and Credit Suisse Trust — International Equity Flex II Portfolio that have been included in Credit Suisse Trust — International Equity Flex III Portfolio's statement of operations since December 11, 2009.
1 $999,305 as reported, plus $784,313 and $475,788 for Credit Suisse Trust — International Equity Flex I Portfolio and Credit Suisse Trust — International Equity Flex II Portfolio, respectively, premerger, plus $161,853 of pro-forma gross expenses eliminated.
2 $24,069,061 as reported, plus $6,002,603 and $8,648,425 for Credit Suisse Trust — International Equity Flex I Portfolio and Credit Suisse Trust — International Equity Flex II Portfolio, respectively, premerger.
Note 9. Contingencies
In the normal course of business, the Portfolio may provide general indemnifications pursuant to certain contracts and organizational documents. The Portfolio's maximum exposure under these arrangements is dependent on future claims that may be made against the Portfolio and, therefore, cannot be estimated; however, based on experience, the risk of loss from such claims is considered remote.
79
Credit Suisse Trust — International Equity Flex III Portfolio
Report of Independent Registered Public Accounting Firm
To the Board of Trustees and Shareholders of
Credit Suisse Trust — International Equity Flex III Portfolio:
In our opinion, the accompanying statement of assets and liabilities, including the schedule of investments, and the related statements of operations and of changes in net assets and of cash flows and the financial highlights present fairly, in all material respects, the financial position of Credit Suisse Trust — International Equity Flex III Portfolio (the "Portfolio"), at December 31, 2010, the results of its operations and its cash flow for the year then ended and the changes in its net assets and financial highlights for the periods presented, in conformity with accounting principles generally accepted in the United States of America. These financial statements and financial highlights (hereafter referred to as "financial statements") are the responsibility of the Portfolio's management. Our responsibility is to express an opinion on these financial statements based on our audit. We conducted our audit of these finan cial statements in accordance with the standards of the Public Company Accounting Oversight Board (United States). Those standards require that we plan and perform the audit to obtain reasonable assurance about whether the financial statements are free of material misstatement. An audit includes examining, on a test basis, evidence supporting the amounts and disclosures in the financial statements, assessing the accounting principles used and significant estimates made by management, and evaluating the overall financial statement presentation. We believe that our audit, which included confirmation of securities at December 31, 2010 by correspondence with the custodian and brokers, provides a reasonable basis for our opinion.
PricewaterhouseCoopers LLP
Boston, Massachusetts
February 23, 2011
80
Credit Suisse Trust — International Equity Flex III Portfolio
Board Approval of Advisory Agreement (unaudited)
In approving the renewal of the current Advisory Agreement, the Board of Trustees (the "Board") of the Credit Suisse Trust — International Equity Flex III Portfolio (the "Portfolio"), including a majority of the Trustees who are not "interested persons" of the Fund as defined in the Investment Company Act of 1940 (the "Independent Trustees"), at a meeting held on November 15 and 16, 2010, considered the following factors:
Investment Advisory Fee Rates and Expenses
The Board reviewed and considered the contractual advisory fee rate of 1.00% for the Portfolio ("Contractual Advisory Fee") in light of the extent and quality of the advisory services provided by Credit Suisse Asset Management, LLC ("Credit Suisse"). The Board also reviewed and considered the voluntary fee waivers currently in place for the Portfolio and considered the actual fee rate of 0.57% paid by the Portfolio after taking waivers into account ("Net Advisory Fee") as of September 30, 2010. The Board acknowledged that voluntary fee waivers could be discontinued at any time.
Additionally, the Board received and considered information comparing the Portfolio's Contractual Advisory Fee, Net Advisory Fee and the Portfolio's overall expenses with those of funds in both the relevant expense group ("Expense Group") and universe of funds ("Expense Universe") provided by Lipper Inc., an independent provider of investment company data.
The Board noted that Credit Suisse planned to reduce the voluntary fee waiver so that the Portfolio's total expense ratio would be in line with the Lipper median.
Nature, Extent and Quality of the Services under the Advisory Agreement
The Board received and considered information regarding the nature, extent and quality of services provided to the Portfolio by Credit Suisse under the Advisory Agreement. The Board also noted information received at regular meetings throughout the year related to the services rendered by Credit Suisse. The Board reviewed background information about Credit Suisse, including its Form ADV. The Board considered the background and experience of Credit Suisse's senior management and the expertise of, and the amount of attention given to the Portfolio by, senior personnel of Credit Suisse. In addition, the Board reviewed the qualifications, backgrounds and responsibilities of the portfolio management team primarily responsible for the day-to-day portfolio management of the Portfolio and the extent of the resources devoted to research and analysis of actual and potential investments. The Board evaluated the
81
Credit Suisse Trust — International Equity Flex III Portfolio
Board Approval of Advisory Agreement (unaudited) (continued)
ability of Credit Suisse, based on its resources, reputation and other attributes, to attract and retain qualified investment professionals, including research, advisory, and supervisory personnel. The Board also received and considered information about the nature, extent and quality of services and fee rates offered to other Credit Suisse clients for comparable services.
Portfolio Performance
The Board received and considered performance results of the Portfolio over time, along with comparisons both to the relevant performance group ("Performance Group") and universe of funds ("Performance Universe") for the Portfolio. The Board was provided with a description of the methodology used to arrive at the funds included in the Performance Group and the Performance Universe.
Credit Suisse Profitability
The Board received and considered a profitability analysis of Credit Suisse based on the fees payable under the Advisory Agreement for the Portfolio, including any fee waivers, as well as other relationships between the Portfolio on the one hand and Credit Suisse affiliates on the other. The Board also considered Credit Suisse's methodology for allocating costs to the Portfolio, recognizing that cost allocation methodologies are inherently subjective. The Board received profitability information for the other funds in the Credit Suisse family of funds.
Economies of Scale
The Board considered information regarding whether there have been economies of scale with respect to the management of the Portfolio, whether the Portfolio has appropriately benefited from any economies of scale, and whether there is potential for realization of any further economies of scale. Accordingly, the Board considered whether breakpoints in the Portfolio's advisory fee structure would be appropriate or reasonable taking into consideration economies of scale or other efficiencies that might accrue from increases in the Portfolio's asset levels.
Other Benefits to Credit Suisse
The Board considered other benefits received by Credit Suisse and its affiliates as a result of their relationship with the Portfolio. Such benefits
82
Credit Suisse Trust — International Equity Flex III Portfolio
Board Approval of Advisory Agreement (unaudited) (continued)
include, among others, benefits potentially derived from an increase in Credit Suisse's businesses as a result of its relationship with the Portfolio (such as the ability to market to shareholders other financial products offered by Credit Suisse and its affiliates) and the fees paid to affiliates of Credit Suisse for co-administration and distribution services.
The Board considered the standards applied in seeking best execution, and also reviewed Credit Suisse's method for allocating portfolio investment opportunities among its advisory clients. Credit Suisse confirmed there were no soft dollar arrangements during the past year.
Other Factors and Broader Review
As discussed above, the Board reviews detailed materials received from Credit Suisse as part of the annual re-approval process. The Board also reviews and assesses the quality of the services that the Portfolio receives throughout the year. In this regard, the Board reviews reports of Credit Suisse at least quarterly, which include, among other things, detailed portfolio and market reviews, detailed fund performance reports and Credit Suisse's compliance procedures.
Conclusions
In selecting Credit Suisse and approving the Advisory Agreement and the investment advisory fee under such agreement, the Board concluded that:
• Although the combined Contractual Advisory Fee and co-administration fee were near the highest in the Expense Group, the fees were reasonable, recognizing that the Net Advisory Fee was among the lowest in the Expense Group.
• The Portfolio's performance was at or above the median for all periods in the Performance Group and Performance Universe. The Board also noted the change to the Portfolio's investment strategy that occurred in 2009.
• The Board was satisfied with the nature, extent and quality of the investment advisory services provided to the Portfolio by Credit Suisse and that, based on dialogue with management and counsel, the services provided by Credit Suisse under the Advisory Agreement are typical of, and consistent with, those provided to similar mutual funds by other investment advisers.
• In light of the costs of providing investment management and other services to the Portfolio and Credit Suisse's ongoing commitment to the
83
Credit Suisse Trust — International Equity Flex III Portfolio
Board Approval of Advisory Agreement (unaudited) (continued)
Portfolio and willingness to waive fees, Credit Suisse's profitability based on fees payable under the Advisory Agreement, as well as other ancillary benefits that Credit Suisse and its affiliates received, were considered reasonable.
• In light of the fee waivers and the Net Advisory Fee, the Portfolio's current fee structure (without breakpoints) was considered reasonable.
No single factor reviewed by the Board was identified by the Board as the principal factor in determining whether to approve the Advisory Agreement. The Independent Trustees were advised by separate independent legal counsel throughout the process.
84
Credit Suisse Trust — International Equity Flex III Portfolio
Information Concerning Trustees and Officers (unaudited)
Name, Address
(Year of Birth) | |
Position(s)
Held with
Trust | | Term
of Office1
and
Length
of Time
Served | |
Principal
Occupation(s) During
Past Five Years | | Number of
Portfolios in
Fund
Complex
Overseen by
Trustee | |
Other
Directorships
Held by Trustee | |
| Independent Trustees | | | | | | | | | | | |
|
Enrique Arzac
c/o Credit Suisse Asset
Management, LLC
Attn: General Counsel
Eleven Madison Avenue
New York, New York
10010
(1941) | | Trustee, Audit Committee Chairman and Nominating Committee Member | | Since
2005 | | Professor of Finance and Economics, Graduate School of Business, Columbia University since 1971. | | | 9 | | | Director of Epoch Holding Corporation (an investment management and investment advisory services company); Director of Starcomms PLC., (telecommunications company); Director of Mirae Asset Discovery Funds (6 open-end portfolios); Director of Aberdeen Asia-Pacific Income Investment Company Limited (a Canadian closed-end fund); Director of The Adams Express Company, Petroleum and Resources Corporation, Aberdeen Chile Fund, Inc., Aberdeen Indonesia Fund, Inc., Aberdeen Israel Fund, Inc., Aberdeen Latin America Equity Fund, Inc. and Aberdeen Emerging Markets Telecommunications and Infrastructure Fund, Inc. (each a closed-end investment company). | |
|
1 Each Trustee and Officer serves until his or her respective successor has been duly elected and qualified.
85
Credit Suisse Trust — International Equity Flex III Portfolio
Information Concerning Trustees and Officers (unaudited) (continued)
Name, Address
(Year of Birth) | |
Position(s)
Held with
Trust | | Term
of Office1
and
Length
of Time
Served | |
Principal
Occupation(s) During
Past Five Years | | Number of
Portfolios in
Fund
Complex
Overseen by
Trustee | |
Other
Directorships
Held by Trustee | |
| Independent Trustees | | | | | | | | | | | |
|
Jeffrey E. Garten2
Box 208200
New Haven, Connecticut
06520-8200
(1946) | | Trustee, Audit and Nominating Committee Member | | Since 1998 | | The Juan Trippe Professor in the Practice of International Trade, Finance and Business from July 2005 to present; Partner and Chairman of Garten Rothkopf (consulting firm) from October 2005 to present; Dean of Yale School of Management from November 1995 to June 2005. | | | 7 | | | Director of Aetna, Inc. (insurance company); Director of CarMax Group (used car dealers); Member of Standard & Poor's Board of Managers. | |
|
Peter F. Krogh
c/o Credit Suisse Asset
Management, LLC
Attn: General Counsel
Eleven Madison Avenue
New York, New York
10010
(1937) | | Trustee, Audit and Nominating Committee Member | | Since 2001 | | Dean Emeritus and Distinguished Professor of International Affairs at the Edmund A. Walsh School of Foreign Service, Georgetown University from June 1995 to June 2009. | | | 7 | | | None | |
|
2 Mr. Garten was initially appointed as a Trustee of the Portfolio on February 6, 1998. He resigned as Trustee on February 3, 2000 and was subsequently reappointed on December 21, 2000.
86
Credit Suisse Trust — International Equity Flex III Portfolio
Information Concerning Trustees and Officers (unaudited) (continued)
Name, Address
(Year of Birth) | |
Position(s)
Held with
Trust | | Term
of Office1
and
Length
of Time
Served | |
Principal
Occupation(s) During
Past Five Years | | Number of
Portfolios in
Fund
Complex
Overseen by
Trustee | |
Other
Directorships
Held by Trustee | |
| Independent Trustees | | | | | | | | | | | |
|
Steven N. Rappaport
Lehigh Court, LLC
555 Madison Avenue
29th Floor
New York, New York
10022
(1948) | | Chairman of the Board of Trustees, Audit Committee Member and Nominating Committee Chairman | | Trustee since 1999 and Chairman since 2005 | | Partner of Lehigh Court, LLC and RZ Capital (private investment firms) from July 2002 to present. | | | 9 | | | Director of iCAD, Inc. (a surgical and medical instruments and apparatus company); Director of Presstek, Inc. (digital imaging technologies company); Director of Wood Resources, LLC. (plywood manufacturing company); Director of Aberdeen Chile Fund, Inc., Aberdeen Indonesia Fund, Inc., Aberdeen Israel Fund, Inc., Aberdeen Latin America Equity Fund, Inc. and Aberdeen Emerging Markets Telecommunications and Infrastructure Fund, Inc. (each a closed-end investment company). | |
|
87
Credit Suisse Trust — International Equity Flex III Portfolio
Information Concerning Trustees and Officers (unaudited) (continued)
Name, Address
(Year of Birth) | |
Position(s)
Held with
Trust | | Term
of Office1
and
Length
of Time
Served | |
Principal Occupation(s) During Past Five Years | |
| Officers** | | | | | | | |
|
John G. Popp
Credit Suisse Asset
Management, LLC
Eleven Madison Avenue
New York, New York 10010
(1956) | | Chief Executive Officer and President | | Since 2010 | | Managing Director of Credit Suisse; Group Manager and Senior Portfolio Manager for Performing Credit Strategies; Associated with Credit Suisse or its predecessor since 1997; Officer of other Credit Suisse Funds. | |
|
Michael A. Pignataro
Credit Suisse Asset
Management, LLC
Eleven Madison Avenue
New York, New York 10010
(1959) | | Chief Financial Officer | | Since 1999 | | Director and Director of Fund Administration of Credit Suisse; Associated with Credit Suisse or its predecessor since 1984; Officer of other Credit Suisse Funds. | |
|
Emidio Morizio
Credit Suisse Asset
Management, LLC
One Madison Avenue
New York, New York 10010
(1966) | | Chief Compliance Officer | | Since 2004 | | Managing Director and Global Head of Compliance of Credit Suisse; Associated with Credit Suisse since July 2000; Officer of other Credit Suisse Funds. | |
|
Roger Machlis
Credit Suisse Asset
Management, LLC
One Madison Avenue
New York, New York 10010
(1961) | | Chief Legal Officer | | Since 2010 | | Managing Director and General Counsel for Credit Suisse; Associated with Credit Suisse Group AG since 1997; Officer of other Credit Suisse Funds. | |
|
Cecilia Chau
Credit Suisse Asset
Management, LLC
Eleven Madison Avenue
New York, New York 10010
(1973) | | Treasurer | | Since 2008 | | Vice President of Credit Suisse since 2009; Assistant Vice President of Credit Suisse from June 2007 to December 2008; Associated with Alliance Bernstein L.P. from January 2007 to May 2007; Associated with Credit Suisse from August 2000 to December 2006; Officer of other Credit Suisse Funds. | |
|
Karen Regan
Credit Suisse Asset
Management, LLC
Eleven Madison Avenue
New York, New York 10010
(1963) | | Vice President and Secretary | | Since 2010 | | Vice President of Credit Suisse; Associated with Credit Suisse since December 2004; Officer of other Credit Suisse Funds | |
|
** The officers of the Portfolio shown are officers that make policy decisions.
The Statement of Additional Information includes additional information about the Trustees and is available, without charge, upon request, by calling 800-222-8977.
88
Credit Suisse Trust — International Equity Flex III Portfolio
Proxy Voting and Portfolio Holdings Information (unaudited)
Information regarding how the Portfolio voted proxies related to its portfolio securities during the 12 month period ended June 30 of each year, as well as the policies and procedures that the Portfolio uses to determine how to vote proxies relating to its portfolio securities are available:
• By calling 1-800-222-8977
• On the Portfolio's website, www.credit-suisse.com/us
• On the website of the Securities and Exchange Commission, www.sec.gov.
The Portfolio files a complete schedule of its portfolio holdings for the first and third quarters of its fiscal year with the SEC on Form N-Q. The Portfolio's Forms N-Q are available on the SEC's website at www.sec.gov and may be reviewed and copied at the SEC's Public Reference Room in Washington, DC. Information on the operation of the SEC's Public Reference Room may be obtained by calling 1-202-551-8090.
89
This page intentionally left blank
This page intentionally left blank
This page intentionally left blank

P.O. BOX 55030, BOSTON, MA 02205-5030
800-222-8977 n www.credit-suisse.com/us
CREDIT SUISSE ASSET MANAGEMENT SECURITIES, INC., DISTRIBUTOR. TREMK-AR-1210

CREDIT SUISSE FUNDS
Annual Report
December 31, 2010
CREDIT SUISSE TRUST
n U.S. EQUITY FLEX I PORTFOLIO
Credit Suisse Trust (the "Trust") shares are not available directly to individual investors, but may be offered only through certain insurance products and pension and retirement plans.
The Trust's investment objectives, risks, charges and expenses (which should be considered carefully before investing), and more complete information about the Trust, are provided in the Prospectus, which should be read carefully before investing. You may obtain additional copies by calling 800-222-8977 or by writing to Credit Suisse Trust, P.O. Box 55030, Boston, MA 02205-5030.
Credit Suisse Asset Management Securities, Inc., Distributor, is located at Eleven Madison Avenue, New York, NY 10010. The Trust is advised by Credit Suisse Asset Management, LLC.
The views of the Portfolio's management are as of the date of the letter and the Portfolio holdings described in this document are as of December 31, 2010; these views and Portfolio holdings may have changed subsequent to these dates. Nothing in this document is a recommendation to purchase or sell securities.
Portfolio shares are not deposits or other obligations of Credit Suisse Asset Management, LLC ("Credit Suisse") or any affiliate, are not FDIC-insured and are not guaranteed by Credit Suisse or any affiliate. Portfolio investments are subject to investment risks, including loss of your investment.
Credit Suisse Trust — U.S. Equity Flex I Portfolio
Annual Investment Adviser's Report
December 31, 2010 (unaudited)
February 2, 2011
Dear Shareholder:
For the year ended December 31, 2010, the Credit Suisse Trust — U.S. Equity Flex I Portfolio (the "Portfolio") had a gain of 14.46%, versus an increase of 16.93% for the Russell 3000® Index.1
Market Review: A positive end to a challenging year
The year ended December 31, 2010, was a volatile one for equities. After three quarters of choppy trading, global equity markets had a robust fourth quarter and, in general, finished the year higher. Fairly encouraging economic data reports and cooperative central bankers in the United States and Europe combined with impressive economic growth in developing regions to help ease investor concerns about the threat of a double-dip recession. This change in sentiment boosted stock prices, especially during the last month of the year. Additionally, the U.S. Federal Reserve's anti-deflationary policy of implementing multiple quantitative easing measures — the first worth approximately $1.7 trillion and the second worth approximately $600 billion — together with the extension of Bush-era tax cuts injected liquidity into the global markets. For the 12-month period, the S&P 500 Index gained 15.06%, while the Dow Jones Ind ustrial Average rose 14.06%.
As of December 31, 2010, the target U.S. Federal Funds rate remained at 0.00%-0.25% and the discount rate held at 0.75%. The Conference Board Consumer Confidence Index (a survey based on a representative sample of 5,000 U.S. households) decreased unexpectedly in December, dropping from 54.3 in November to 52.5 (for context, the Index measured 100 in 1985 meaning complete confidence). In the private sector, employment continued to increase in many industries, as 113,000 jobs were added. Conversely, the public sector continued to lay off workers, losing 10,000 jobs in December. Overall, the unemployment rate decreased to 9.4% in December. Each of the 10 sectors within the S&P 500 posted gains for the year. Consumer discretionary posted the largest increase, gaining 25.72%, while health care was the weakest performer, gaining only 0.71% for the year.
Strategic Review and Outlook: Cautiously optimistic for the future
For the year ended December 31, 2010, the Portfolio underperformed the benchmark despite strong performance. In general, long positions led to outperformance while short positions detracted from portfolio results. Allocations to the financial and energy sectors benefitted portfolio returns, while stock selection in utilities detracted from portfolio results. As each sector finished
1
Credit Suisse Trust — U.S. Equity Flex I Portfolio
Annual Investment Adviser's Report (continued)
December 31, 2010 (unaudited)
the year in positive territory, short positions generally detracted from portfolio performance — especially in the consumer discretionary and information technology sectors.
During the year, quantitative models in general were challenged by a prolonged period of high correlation and low volatility. In the United States, as the market oscillated between fears of a double dip recession and hope of potential economic growth, there were fewer opportunities to identify individual stock outperformance. As a result, transaction costs and the volatile environment resulted in underperformance.
Although we expect the market to remain challenging in the near term, we are comfortable with our proactive long-term investment process going forward.
Credit Suisse Quantitative Equities Group
Mika Toikka
Timothy Schwider
Short sales expose the Portfolio to the risk that it will be required to cover its short position at a time when the securities have appreciated in value, thus resulting in a loss to the Portfolio. The Portfolio's loss on a short sale could theoretically be unlimited in a case where the Portfolio is unable to close out its short position.
The use of leverage subjects the Portfolio to the risk of magnified capital losses that can occur when losses affect an asset base that has been enlarged by borrowings or the creation of liabilities. The net asset value of the Portfolio, when employing leverage, will be more volatile and sensitive to market movements. Leverage may involve the creation of a liability that requires the Portfolio to pay interest.
Investments in small to medium-sized companies may be more volatile and less liquid than investments in larger companies.
Active and frequent increases transaction costs, which could detract from the Portfolio's performance.
In addition to historical information, this report contains forward-looking statements, which may concern, among other things, domestic and foreign market, industry and economic trends and developments and government regulation and their potential impact on the Portfolio's investments. These statements are subject to risks and uncertainties and actual trends, developments and regulations in the future, and their impact on the Portfolio could be materially different from those projected, anticipated or implied. The Portfolio has no obligation to update or revise forward-looking statements.
2
Credit Suisse Trust — U.S. Equity Flex I Portfolio
Annual Investment Adviser's Report (continued)
December 31, 2010 (unaudited)
Comparison of Change in Value of $10,000 Investment in the
Credit Suisse Trust — U.S. Equity Flex I Portfolio and
the Russell 3000® Index1 for Ten Years.

3
Credit Suisse Trust — U.S. Equity Flex I Portfolio
Annual Investment Adviser's Report (continued)
December 31, 2010 (unaudited)
Average Annual Returns as of December 31, 2010
| 1 Year | | 5 Years | | 10 Years | | Since
Inception2 | |
| | 14.46 | % | | | (0.62 | )% | | | (1.43 | )% | | | 4.29 | % | |
Returns represent past performance and include change in share price and reinvestment of dividends and capital gains. Past performance cannot guarantee future results. The current performance of the Portfolio may be lower or higher than the figures shown. Returns and share price will fluctuate, and redemption value may be more or less than original cost. The performance results do not reflect the deduction of taxes that a shareholder would pay on portfolio distributions or the redemption of portfolio shares. Performance includes the effect of deducting expenses, but does not include charges and expenses attributable to any particular variable contract or plan. Accordingly, the Prospectus of the sponsoring Participating Insurance Com pany separate account or plan documents or other informational materials supplied by plan sponsors should be carefully reviewed for information on relevant charges and expenses. Excluding these charges and expenses from quotations of performance has the effect of increasing the performance quoted, and the effect of these charges should be considered when comparing performance to that of other mutual funds. Performance information current to the most recent month-end is available at www.credit-suisse.com/us.
The annualized gross and net expense ratios are 1.66%.
1 The Russell 3000® Index measures the performance of the 3,000 largest U.S. companies based on total market capitalization, which represent approximately 98% of the investable U.S. equity market. It is an unmanaged index of common stocks that includes reinvestment of dividends and is compiled by Frank Russell Company. Investors cannot invest directly in an index.
2 Inception date 6/30/95.
4
Credit Suisse Trust — U.S. Equity Flex I Portfolio
Annual Investment Adviser's Report (continued)
December 31, 2010 (unaudited)
Information About Your Portfolio's Expenses
As an investor of the Portfolio, you incur two types of costs: ongoing expenses and transaction costs. Ongoing expenses include management fees, distribution and service (12b-1) fees and other Portfolio expenses. Examples of transaction costs include sales charges (loads), redemption fees and account maintenance fees, which are not shown in this section and which would result in higher total expenses. The following table is intended to help you understand your ongoing expenses of investing in the Portfolio and to help you compare these expenses with the ongoing expenses of investing in other mutual funds. The table is based on an investment of $1,000 made at the beginning of the six month period ended December 31, 2010.
The table illustrates your Portfolio's expenses in two ways:
• Actual Portfolio Return. This helps you estimate the actual dollar amount of ongoing expenses paid on a $1,000 investment in the Portfolio using the Portfolio's actual return during the period. To estimate the expenses you paid over the period, simply divide your account value by $1,000 (for example, an $8,600 account value divided by $1,000 = 8.6), then multiply the result by the number in the "Expenses Paid per $1,000" line under the share class you hold.
• Hypothetical 5% Portfolio Return. This helps you to compare your Portfolio's ongoing expenses with those of other mutual funds using the Portfolio's actual expense ratio and a hypothetical rate of return of 5% per year before expenses. Examples using a 5% hypothetical portfolio return may be found in the shareholder reports of other mutual funds. The hypothetical account values and expenses may not be used to estimate the actual ending account balance or expenses you paid for the period.
Please note that the expenses shown in these tables are meant to highlight your ongoing expenses only and do not reflect any transaction costs, such as sales charges (loads) or redemption fees. If these transaction costs had been included, your costs would have been higher. The "Expenses Paid per $1,000" line of the tables is useful in comparing ongoing expenses only and will not help you determine the relative total expenses of owning different funds.
5
Credit Suisse Trust — U.S. Equity Flex I Portfolio
Annual Investment Adviser's Report (continued)
December 31, 2010 (unaudited)
Expenses and Value for a $1,000 Investment
for the six month period ended December 31, 2010
| Actual Portfolio Return | |
| Beginning Account Value 7/1/10 | | $ | 1,000.00 | | |
| Ending Account Value 12/31/10 | | $ | 1,242.20 | | |
| Expenses Paid per $1,000* | | $ | 8.82 | | |
| Hypothetical 5% Portfolio Return | |
| Beginning Account Value 7/1/10 | | $ | 1,000.00 | | |
| Ending Account Value 12/31/10 | | $ | 1,017.34 | | |
| Expenses Paid per $1,000* | | $ | 7.93 | | |
| Annualized Expense Ratio* | | | 1.56 | % | |
* Expenses are equal to the Portfolio's annualized expense ratio multiplied by the average account value over the period, multiplied by the number of days in the most recent fiscal half year period, then divided by 365.
The "Expenses Paid per $1,000" and the "Annualized Expense Ratio" in the tables are based on actual expenses paid by the Portfolio during the period, net of fee waivers and/or expense reimbursements. If those fee waivers and/or expense reimbursements had not been in effect, the Portfolio's actual expenses would have been higher. Expenses do not reflect additional charges and expenses that are, or may be, imposed under the variable contracts or plans. Such charges and expenses are described in the prospectus of the insurance company separate account or in the plan documents or other informational materials supplied by plan sponsors. The Portfolio's expenses should be considered with these charges and expenses in evaluating the overall cost of investing in the separate account.
For more information, please refer to the Portfolio's prospectus.
6
Credit Suisse Trust — U.S. Equity Flex I Portfolio
Annual Investment Adviser's Report (continued)
December 31, 2010 (unaudited)
SECTOR BREAKDOWN*
| | | Long | | Short | | Net | |
| Financials | | | 23.4 | % | | | (4.1 | )% | | | 19.3 | % | |
| Information Technology | | | 20.2 | % | | | (3.7 | )% | | | 16.5 | % | |
| Health Care | | | 16.2 | % | | | (2.3 | )% | | | 13.9 | % | |
| Consumer Discretionary | | | 15.8 | % | | | (3.6 | )% | | | 12.2 | % | |
| Energy | | | 12.6 | % | | | (1.8 | )% | | | 10.8 | % | |
| Industrials | | | 13.0 | % | | | (3.8 | )% | | | 9.2 | % | |
| Consumer Staples | | | 6.5 | % | | | (1.4 | )% | | | 5.1 | % | |
| Telecommunication Services | | | 5.0 | % | | | (0.3 | )% | | | 4.7 | % | |
| Utilities | | | 5.4 | % | | | (1.3 | )% | | | 4.1 | % | |
| Materials | | | 5.8 | % | | | (1.7 | )% | | | 4.1 | % | |
| Short-Term Investments | | | 0.1 | % | | | (0.0 | )% | | | 0.1 | % | |
| Total | | | 124.0 | % | | | (24.0 | )% | | | 100.0 | % | |
* Expressed as a percentage of total long/short investments, respectively, (excluding security lending collateral if applicable) and may vary over time.
7
Credit Suisse Trust — U.S. Equity Flex I Portfolio
Schedule of Investments
December 31, 2010
| | | Number of
Shares | | Value | |
| LONG STOCK POSITIONS (124.0%) | |
| COMMON STOCKS (124.0%) | |
| Aerospace & Defense (3.0%) | |
| Aerovironment, Inc.*§ | | | 3,400 | | | $ | 91,222 | | |
| Northrop Grumman Corp.§ | | | 22,700 | | | | 1,470,506 | | |
| The Boeing Co.§ | | | 45,600 | | | | 2,975,856 | | |
| | | | 4,537,584 | | |
| Air Freight & Logistics (1.0%) | |
| United Parcel Service, Inc. Class B | | | 21,900 | | | | 1,589,502 | | |
| Airlines (0.0%) | |
| Republic Airways Holdings, Inc.*§ | | | 9,400 | | | | 68,808 | | |
| Auto Components (1.0%) | |
| Autoliv, Inc.§ | | | 6,511 | | | | 513,978 | | |
| BorgWarner, Inc.*§ | | | 3,500 | | | | 253,260 | | |
| Lear Corp.*§ | | | 7,800 | | | | 769,938 | | |
| | | | 1,537,176 | | |
| Automobiles (0.2%) | |
| Ford Motor Co.*§ | | | 19,500 | | | | 327,405 | | |
| Beverages (1.0%) | |
| Brown-Forman Corp. Class B§ | | | 1,200 | | | | 83,544 | | |
| Dr. Pepper Snapple Group, Inc. | | | 38,700 | | | | 1,360,692 | | |
| Molson Coors Brewing Co. Class B§ | | | 1,400 | | | | 70,266 | | |
| | | | 1,514,502 | | |
| Biotechnology (6.0%) | |
| Alexion Pharmaceuticals, Inc.*§ | | | 6,000 | | | | 483,300 | | |
| Amgen, Inc.* | | | 42,800 | | | | 2,349,720 | | |
| Cephalon, Inc.*§ | | | 69,097 | | | | 4,264,667 | | |
| Gilead Sciences, Inc.*§ | | | 58,600 | | | | 2,123,664 | | |
| | | | 9,221,351 | | |
| Building Products (0.1%) | |
| Griffon Corp.*§ | | | 6,652 | | | | 84,746 | | |
| Capital Markets (2.8%) | |
| Ameriprise Financial, Inc. | | | 7,400 | | | | 425,870 | | |
| Federated Investors, Inc. Class B§ | | | 1,100 | | | | 28,787 | | |
| Northern Trust Corp.§ | | | 3,400 | | | | 188,394 | | |
| SEI Investments Co. | | | 40,100 | | | | 953,979 | | |
| State Street Corp. | | | 19,800 | | | | 917,532 | | |
| The Bank of New York Mellon Corp. | | | 3,800 | | | | 114,760 | | |
| Waddell & Reed Financial, Inc. Class A | | | 48,200 | | | | 1,700,978 | | |
| | | | 4,330,300 | | |
| Chemicals (4.1%) | |
| E.I. Du Pont de Nemours & Co. | | | 29,000 | | | | 1,446,520 | | |
| Eastman Chemical Co.§ | | | 700 | | | | 58,856 | | |
| Huntsman Corp. | | | 22,800 | | | | 355,908 | | |
See Accompanying Notes to Financial Statements.
8
Credit Suisse Trust — U.S. Equity Flex I Portfolio
Schedule of Investments (continued)
December 31, 2010
| | | Number of
Shares | | Value | |
| LONG STOCK POSITIONS | |
| COMMON STOCKS | |
| Chemicals | |
| Lubrizol Corp.§ | | | 16,872 | | | $ | 1,803,279 | | |
| Minerals Technologies, Inc.§ | | | 10,000 | | | | 654,100 | | |
| PPG Industries, Inc. | | | 22,800 | | | | 1,916,796 | | |
| | | | 6,235,459 | | |
| Commercial Banks (2.9%) | |
| CapitalSource, Inc. | | | 84,600 | | | | 600,660 | | |
| CIT Group, Inc.* | | | 6,900 | | | | 324,990 | | |
| Comerica, Inc.§ | | | 7,800 | | | | 329,472 | | |
| Community Bank System, Inc. | | | 9,100 | | | | 252,707 | | |
| International Bancshares Corp.§ | | | 32,000 | | | | 640,960 | | |
| M&T Bank Corp.§ | | | 8,200 | | | | 713,810 | | |
| Sterling Bancshares, Inc.§ | | | 50,300 | | | | 353,106 | | |
| Tompkins Financial Corp.§ | | | 770 | | | | 30,153 | | |
| Umpqua Holdings Corp.§ | | | 34,000 | | | | 414,120 | | |
| Wells Fargo & Co. | | | 24,600 | | | | 762,354 | | |
| | | | 4,422,332 | | |
| Commercial Services & Supplies (0.4%) | |
| Clean Harbors, Inc.*§ | | | 4,600 | | | | 386,768 | | |
| Healthcare Services Group, Inc.§ | | | 6,300 | | | | 102,501 | | |
| SYKES Enterprises, Inc.*§ | | | 5,200 | | | | 105,352 | | |
| | | | 594,621 | | |
| Communications Equipment (1.7%) | |
| Cisco Systems, Inc.* | | | 90,100 | | | | 1,822,723 | | |
| QUALCOMM, Inc. | | | 3,400 | | | | 168,266 | | |
| Tellabs, Inc. | | | 88,565 | | | | 600,471 | | |
| | | | 2,591,460 | | |
| Computers & Peripherals (2.9%) | |
| Apple, Inc.* | | | 10,991 | | | | 3,545,257 | | |
| EMC Corp.* | | | 19,800 | | | | 453,420 | | |
| Lexmark International, Inc. Class A* | | | 9,600 | | | | 334,272 | | |
| QLogic Corp.*§ | | | 3,300 | | | | 56,166 | | |
| | | | 4,389,115 | | |
| Construction Materials (0.0%) | |
| Martin Marietta Materials, Inc.§ | | | 600 | | | | 55,344 | | |
| Consumer Finance (1.7%) | |
| American Express Co. | | | 18,500 | | | | 794,020 | | |
| Capital One Financial Corp.§ | | | 43,600 | | | | 1,855,616 | | |
| | | | 2,649,636 | | |
| Containers & Packaging (0.0%) | |
| Ball Corp. | | | 1,000 | | | | 68,050 | | |
See Accompanying Notes to Financial Statements.
9
Credit Suisse Trust — U.S. Equity Flex I Portfolio
Schedule of Investments (continued)
December 31, 2010
| | | Number of
Shares | | Value | |
| LONG STOCK POSITIONS | |
| COMMON STOCKS | |
| Diversified Consumer Services (2.1%) | |
| Career Education Corp.*§ | | | 16,700 | | | $ | 346,191 | | |
| Coinstar, Inc.*§ | | | 400 | | | | 22,576 | | |
| DeVry, Inc. | | | 28,334 | | | | 1,359,465 | | |
| ITT Educational Services, Inc.* | | | 400 | | | | 25,476 | | |
| Sotheby's | | | 18,361 | | | | 826,245 | | |
| Strayer Education, Inc.§ | | | 200 | | | | 30,444 | | |
| Weight Watchers International, Inc.§ | | | 17,000 | | | | 637,330 | | |
| | | | 3,247,727 | | |
| Diversified Financial Services (4.0%) | |
| Citigroup, Inc.* | | | 230,000 | | | | 1,087,900 | | |
| JPMorgan Chase & Co. | | | 89,900 | | | | 3,813,558 | | |
| Moody's Corp.§ | | | 43,400 | | | | 1,151,836 | | |
| | | | 6,053,294 | | |
| Diversified Telecommunication Services (3.0%) | |
| AT&T, Inc. | | | 151,407 | | | | 4,448,338 | | |
| Cbeyond, Inc.*§ | | | 2,000 | | | | 30,560 | | |
| Qwest Communications International, Inc. | | | 20,300 | | | | 154,483 | | |
| | | | 4,633,381 | | |
| Electric Utilities (2.9%) | |
| Exelon Corp.§ | | | 67,800 | | | | 2,823,192 | | |
| Great Plains Energy, Inc.§ | | | 28,100 | | | | 544,859 | | |
| Pinnacle West Capital Corp.§ | | | 6,000 | | | | 248,700 | | |
| Westar Energy, Inc.§ | | | 34,300 | | | | 862,988 | | |
| | | | 4,479,739 | | |
| Electrical Equipment (0.3%) | |
| Belden, Inc.§ | | | 600 | | | | 22,092 | | |
| Hubbell, Inc. Class B | | | 600 | | | | 36,078 | | |
| Rockwell Automation, Inc.§ | | | 5,900 | | | | 423,089 | | |
| | | | 481,259 | | |
| Electronic Equipment, Instruments & Components (0.3%) | |
| Itron, Inc.* | | | 2,000 | | | | 110,900 | | |
| Vishay Intertechnology, Inc.* | | | 24,695 | | | | 362,523 | | |
| | | | 473,423 | | |
| Energy Equipment & Services (2.3%) | |
| Atwood Oceanics, Inc.*§ | | | 3,600 | | | | 134,532 | | |
| Baker Hughes, Inc. | | | 17,500 | | | | 1,000,475 | | |
| Diamond Offshore Drilling, Inc. | | | 800 | | | | 53,496 | | |
| Dril-Quip, Inc.* | | | 300 | | | | 23,316 | | |
| National-Oilwell Varco, Inc. | | | 13,200 | | | | 887,700 | | |
| Oceaneering International, Inc.* | | | 15,900 | | | | 1,170,717 | | |
| SEACOR Holdings, Inc.§ | | | 2,800 | | | | 283,052 | | |
| | | | 3,553,288 | | |
See Accompanying Notes to Financial Statements.
10
Credit Suisse Trust — U.S. Equity Flex I Portfolio
Schedule of Investments (continued)
December 31, 2010
| | | Number of
Shares | | Value | |
| LONG STOCK POSITIONS | |
| COMMON STOCKS | |
| Food & Staples Retailing (0.3%) | |
| Casey's General Stores, Inc. | | | 500 | | | $ | 21,255 | | |
| Ruddick Corp.§ | | | 12,400 | | | | 456,816 | | |
| | | | 478,071 | | |
| Food Products (2.2%) | |
| ConAgra Foods, Inc. | | | 2,800 | | | | 63,224 | | |
| H.J. Heinz Co.§ | | | 36,900 | | | | 1,825,074 | | |
| Tyson Foods, Inc. Class A | | | 88,358 | | | | 1,521,525 | | |
| | | | 3,409,823 | | |
| Health Care Equipment & Supplies (0.7%) | |
| Greatbatch, Inc.*§ | | | 1,300 | | | | 31,395 | | |
| The Cooper Cos., Inc.§ | | | 18,000 | | | | 1,014,120 | | |
| | | | 1,045,515 | | |
| Health Care Providers & Services (2.5%) | |
| CIGNA Corp. | | | 4,200 | | | | 153,972 | | |
| Emergency Medical Services Corp. Class A* | | | 10,542 | | | | 681,119 | | |
| Express Scripts, Inc.*§ | | | 5,300 | | | | 286,465 | | |
| Health Net, Inc.* | | | 19,000 | | | | 518,510 | | |
| Humana, Inc.* | | | 32,400 | | | | 1,773,576 | | |
| PharMerica Corp.*§ | | | 9,300 | | | | 106,485 | | |
| Tenet Healthcare Corp.*§ | | | 5,300 | | | | 35,457 | | |
| UnitedHealth Group, Inc. | | | 8,800 | | | | 317,768 | | |
| | | | 3,873,352 | | |
| Health Care Technology (0.7%) | |
| Cerner Corp.*§ | | | 11,400 | | | | 1,080,036 | | |
| Hotels, Restaurants & Leisure (0.5%) | |
| Brinker International, Inc.§ | | | 25,700 | | | | 536,616 | | |
| DineEquity, Inc.* | | | 2,600 | | | | 128,388 | | |
| Hyatt Hotels Corp. Class A* | | | 500 | | | | 22,880 | | |
| MGM Resorts International*§ | | | 2,600 | | | | 38,610 | | |
| Wendy's/Arby's Group, Inc. Class A§ | | | 4,600 | | | | 21,252 | | |
| | | | 747,746 | | |
| Household Durables (0.9%) | |
| Harman International Industries, Inc.* | | | 12,200 | | | | 564,860 | | |
| Libbey, Inc.*§ | | | 11,900 | | | | 184,093 | | |
| Newell Rubbermaid, Inc. | | | 4,200 | | | | 76,356 | | |
| Whirlpool Corp.§ | | | 6,700 | | | | 595,161 | | |
| | | | 1,420,470 | | |
| Household Products (1.0%) | |
| Church & Dwight Co., Inc.§ | | | 21,201 | | | | 1,463,293 | | |
| Independent Power Producers & Energy Traders (0.8%) | |
| Constellation Energy Group, Inc. | | | 41,600 | | | | 1,274,208 | | |
See Accompanying Notes to Financial Statements.
11
Credit Suisse Trust — U.S. Equity Flex I Portfolio
Schedule of Investments (continued)
December 31, 2010
| | | Number of
Shares | | Value | |
| LONG STOCK POSITIONS | |
| COMMON STOCKS | |
| Industrial Conglomerates (1.7%) | |
| 3M Co. | | | 14,300 | | | $ | 1,234,090 | | |
| General Electric Co. | | | 70,300 | | | | 1,285,787 | | |
| | | | 2,519,877 | | |
| Insurance (8.4%) | |
| ACE, Ltd.§ | | | 1,100 | | | | 68,475 | | |
| Aflac, Inc. | | | 41,800 | | | | 2,358,774 | | |
| American International Group, Inc.*§ | | | 1,300 | | | | 74,906 | | |
| Berkshire Hathaway, Inc. Class B* | | | 62,341 | | | | 4,994,137 | | |
| Fidelity National Financial, Inc. Class A | | | 28,400 | | | | 388,512 | | |
| Marsh & McLennan Cos., Inc. | | | 11,700 | | | | 319,878 | | |
| Prudential Financial, Inc. | | | 28,400 | | | | 1,667,364 | | |
| The Travelers Cos., Inc.§ | | | 40,300 | | | | 2,245,113 | | |
| Unitrin, Inc.§ | | | 28,600 | | | | 701,844 | | |
| Wesco Financial Corp. | | | 100 | | | | 36,841 | | |
| | | | 12,855,844 | | |
| Internet & Catalog Retail (0.7%) | |
| Amazon.com, Inc.* | | | 2,500 | | | | 450,000 | | |
| Expedia, Inc.§ | | | 3,800 | | | | 95,342 | | |
| NetFlix, Inc.*§ | | | 400 | | | | 70,280 | | |
| priceline.com, Inc.*§ | | | 1,000 | | | | 399,550 | | |
| | | | 1,015,172 | | |
| Internet Software & Services (5.7%) | |
| AOL, Inc.* | | | 1,581 | | | | 37,486 | | |
| Earthlink, Inc.§ | | | 174,452 | | | | 1,500,287 | | |
| eBay, Inc.*§ | | | 25,300 | | | | 704,099 | | |
| Google, Inc. Class A* | | | 7,600 | | | | 4,514,172 | | |
| j2 Global Communications, Inc.*§ | | | 28,200 | | | | 816,390 | | |
| Rackspace Hosting, Inc.*§ | | | 700 | | | | 21,987 | | |
| United Online, Inc.§ | | | 22,700 | | | | 149,820 | | |
| Yahoo!, Inc.* | | | 58,300 | | | | 969,529 | | |
| | | | 8,713,770 | | |
| IT Services (1.7%) | |
| Alliance Data Systems Corp.*§ | | | 700 | | | | 49,721 | | |
| CSG Systems International, Inc.*§ | | | 3,500 | | | | 66,290 | | |
| International Business Machines Corp. | | | 15,000 | | | | 2,201,400 | | |
| MAXIMUS, Inc.§ | | | 3,200 | | | | 209,856 | | |
| | | | 2,527,267 | | |
| Leisure Equipment & Products (0.3%) | |
| Polaris Industries, Inc.§ | | | 5,600 | | | | 436,912 | | |
| Machinery (5.7%) | |
| AGCO Corp.*§ | | | 7,500 | | | | 379,950 | | |
| Badger Meter, Inc. | | | 1,800 | | | | 79,596 | | |
See Accompanying Notes to Financial Statements.
12
Credit Suisse Trust — U.S. Equity Flex I Portfolio
Schedule of Investments (continued)
December 31, 2010
| | | Number of
Shares | | Value | |
| LONG STOCK POSITIONS | |
| COMMON STOCKS | |
| Machinery | |
| Caterpillar, Inc.§ | | | 15,300 | | | $ | 1,432,998 | | |
| Danaher Corp.§ | | | 37,700 | | | | 1,778,309 | | |
| Eaton Corp. | | | 3,100 | | | | 314,681 | | |
| Graco, Inc.§ | | | 7,700 | | | | 303,765 | | |
| Navistar International Corp.*§ | | | 12,500 | | | | 723,875 | | |
| Oshkosh Corp.*§ | | | 3,100 | | | | 109,244 | | |
| Parker Hannifin Corp. | | | 14,500 | | | | 1,251,350 | | |
| The Toro Co.§ | | | 1,000 | | | | 61,640 | | |
| Timken Co. | | | 46,250 | | | | 2,207,512 | | |
| | | | 8,642,920 | | |
| Media (3.2%) | |
| Ascent Media Corp. Class A*§ | | | 2,500 | | | | 96,900 | | |
| DISH Network Corp. Class A* | | | 2,800 | | | | 55,048 | | |
| Harte-Hanks, Inc. | | | 6,614 | | | | 84,461 | | |
| John Wiley & Sons, Inc. Class A§ | | | 500 | | | | 22,620 | | |
| Liberty Global, Inc. Class A*§ | | | 2,300 | | | | 81,374 | | |
| National CineMedia, Inc.§ | | | 11,800 | | | | 234,938 | | |
| News Corp. Class A | | | 208,900 | | | | 3,041,584 | | |
| The New York Times Co. Class A*§ | | | 104,827 | | | | 1,027,305 | | |
| The Washington Post Co. Class B§ | | | 124 | | | | 54,498 | | |
| Viacom, Inc. Class B | | | 1,700 | | | | 67,337 | | |
| Virgin Media, Inc.§ | | | 3,655 | | | | 99,562 | | |
| | | | 4,865,627 | | |
| Metals & Mining (1.3%) | |
| Freeport-McMoRan Copper & Gold, Inc. | | | 16,100 | | | | 1,933,449 | | |
| United States Steel Corp.§ | | | 1,700 | | | | 99,314 | | |
| | | | 2,032,763 | | |
| Multi-Utilities (1.7%) | |
| DTE Energy Co. | | | 56,000 | | | | 2,537,920 | | |
| Multiline Retail (2.0%) | |
| Big Lots, Inc.* | | | 5,400 | | | | 164,484 | | |
| Dollar General Corp.*§ | | | 800 | | | | 24,536 | | |
| Family Dollar Stores, Inc.§ | | | 29,100 | | | | 1,446,561 | | |
| Sears Holdings Corp.*§ | | | 600 | | | | 44,250 | | |
| Target Corp. | | | 23,500 | | | | 1,413,055 | | |
| | | | 3,092,886 | | |
| Oil, Gas & Consumable Fuels (10.3%) | |
| Arch Coal, Inc.§ | | | 21,400 | | | | 750,284 | | |
| Chevron Corp. | | | 72,600 | | | | 6,624,750 | | |
| ConocoPhillips | | | 9,400 | | | | 640,140 | | |
| Devon Energy Corp. | | | 15,800 | | | | 1,240,458 | | |
| EXCO Resources, Inc.§ | | | 1,600 | | | | 31,072 | | |
| Exxon Mobil Corp. | | | 23,249 | | | | 1,699,967 | | |
See Accompanying Notes to Financial Statements.
13
Credit Suisse Trust — U.S. Equity Flex I Portfolio
Schedule of Investments (continued)
December 31, 2010
| | | Number of
Shares | | Value | |
| LONG STOCK POSITIONS | |
| COMMON STOCKS | |
| Oil, Gas & Consumable Fuels | |
| Hess Corp. | | | 7,900 | | | $ | 604,666 | | |
| Marathon Oil Corp.§ | | | 1,500 | | | | 55,545 | | |
| Murphy Oil Corp. | | | 2,500 | | | | 186,375 | | |
| Occidental Petroleum Corp. | | | 12,500 | | | | 1,226,250 | | |
| Tesoro Corp.*§ | | | 118,500 | | | | 2,196,990 | | |
| Valero Energy Corp. | | | 24,200 | | | | 559,504 | | |
| | | | 15,816,001 | | |
| Paper & Forest Products (0.3%) | |
| Domtar Corp. | | | 3,935 | | | | 298,745 | | |
| MeadWestvaco Corp.§ | | | 6,700 | | | | 175,272 | | |
| | | | 474,017 | | |
| Personal Products (1.0%) | |
| Inter Parfums, Inc.§ | | | 1,800 | | | | 33,930 | | |
| The Estee Lauder Cos., Inc. Class A§ | | | 17,800 | | | | 1,436,460 | | |
| | | | 1,470,390 | | |
| Pharmaceuticals (6.3%) | |
| Abbott Laboratories | | | 75,900 | | | | 3,636,369 | | |
| Eli Lilly & Co.§ | | | 131,600 | | | | 4,611,264 | | |
| Endo Pharmaceuticals Holdings, Inc.* | | | 31,500 | | | | 1,124,865 | | |
| Indevus Pharmaceuticals, Inc. (Escrow shares)*§^ | | | 2,200 | | | | 0 | | |
| Medicis Pharmaceutical Corp. Class A§ | | | 4,800 | | | | 128,592 | | |
| Nektar Therapeutics*§ | | | 2,100 | | | | 26,985 | | |
| Valeant Pharmaceuticals International, Inc.§ | | | 1,068 | | | | 30,214 | | |
| XenoPort, Inc.* | | | 9,000 | | | | 76,680 | | |
| | | | 9,634,969 | | |
| Professional Services (0.0%) | |
| Verisk Analytics, Inc. Class A*§ | | | 1,300 | | | | 44,304 | | |
| Real Estate Investment Trusts (3.2%) | |
| Chimera Investment Corp.§ | | | 10,471 | | | | 43,036 | | |
| Entertainment Properties Trust | | | 19,700 | | | | 911,125 | | |
| General Growth Properties, Inc.§ | | | 5,500 | | | | 85,140 | | |
| Getty Realty Corp.§ | | | 3,700 | | | | 115,736 | | |
| Government Properties Income Trust§ | | | 6,600 | | | | 176,814 | | |
| HCP, Inc. | | | 13,400 | | | | 492,986 | | |
| Home Properties, Inc.§ | | | 10,600 | | | | 588,194 | | |
| Hospitality Properties Trust | | | 2,100 | | | | 48,384 | | |
| Inland Real Estate Corp.§ | | | 6,800 | | | | 59,840 | | |
| Investors Real Estate Trust§ | | | 45,800 | | | | 410,826 | | |
| Lexington Realty Trust§ | | | 129,500 | | | | 1,029,525 | | |
| ProLogis | | | 21,800 | | | | 314,792 | | |
| Public Storage§ | | | 700 | | | | 70,994 | | |
| Realty Income Corp.§ | | | 1,200 | | | | 41,040 | | |
| Saul Centers, Inc.§ | | | 2,100 | | | | 99,435 | | |
| Starwood Property Trust, Inc.§ | | | 17,400 | | | | 373,752 | | |
| | | | 4,861,619 | | |
See Accompanying Notes to Financial Statements.
14
Credit Suisse Trust — U.S. Equity Flex I Portfolio
Schedule of Investments (continued)
December 31, 2010
| | | Number of
Shares | | Value | |
| LONG STOCK POSITIONS | |
| COMMON STOCKS | |
| Real Estate Management & Development (0.2%) | |
| Forest City Enterprises, Inc. Class A*§ | | | 1,500 | | | $ | 25,035 | | |
| Jones Lang LaSalle, Inc. | | | 2,900 | | | | 243,368 | | |
| The Howard Hughes Corp.*§ | | | 275 | | | | 14,965 | | |
| The St. Joe Co.*§ | | | 1,200 | | | | 26,220 | | |
| | | | 309,588 | | |
| Road & Rail (0.6%) | |
| Celadon Group, Inc.*§ | | | 4,100 | | | | 60,639 | | |
| Norfolk Southern Corp. | | | 4,900 | | | | 307,818 | | |
| Union Pacific Corp. | | | 5,200 | | | | 481,832 | | |
| | | | 850,289 | | |
| Semiconductors & Semiconductor Equipment (4.6%) | |
| Altera Corp.§ | | | 43,900 | | | | 1,561,962 | | |
| Analog Devices, Inc. | | | 48,000 | | | | 1,808,160 | | |
| Atmel Corp.* | | | 5,000 | | | | 61,600 | | |
| First Solar, Inc.*§ | | | 600 | | | | 78,084 | | |
| FormFactor, Inc.*§ | | | 15,500 | | | | 137,640 | | |
| Intel Corp. | | | 146,600 | | | | 3,082,998 | | |
| LSI Corp.*§ | | | 8,400 | | | | 50,316 | | |
| Microchip Technology, Inc.§ | | | 2,000 | | | | 68,420 | | |
| MKS Instruments, Inc.* | | | 7,300 | | | | 178,777 | | |
| Veeco Instruments, Inc.*§ | | | 500 | | | | 21,480 | | |
| | | | 7,049,437 | | |
| Software (3.4%) | |
| Blackbaud, Inc.§ | | | 932 | | | | 24,139 | | |
| Microsoft Corp. | | | 15,400 | | | | 429,968 | | |
| Novell, Inc.* | | | 5,462 | | | | 32,335 | | |
| Oracle Corp. | | | 133,700 | | | | 4,184,810 | | |
| VMware, Inc. Class A*§ | | | 6,200 | | | | 551,242 | | |
| | | | 5,222,494 | | |
| Specialty Retail (4.6%) | |
| Aeropostale, Inc.*§ | | | 25,686 | | | | 632,903 | | |
| American Eagle Outfitters, Inc.§ | | | 42,700 | | | | 624,701 | | |
| AnnTaylor Stores Corp.*§ | | | 5,000 | | | | 136,950 | | |
| AutoZone, Inc.*§ | | | 1,500 | | | | 408,885 | | |
| Best Buy Co., Inc.§ | | | 7,500 | | | | 257,175 | | |
| J. Crew Group, Inc.*§ | | | 15,000 | | | | 647,100 | | |
| Ltd Brands, Inc. | | | 4,600 | | | | 141,358 | | |
| Office Depot, Inc.*§ | | | 4,200 | | | | 22,680 | | |
| RadioShack Corp.§ | | | 1,500 | | | | 27,735 | | |
| Rent-A-Center, Inc.§ | | | 50,100 | | | | 1,617,228 | | |
| Ross Stores, Inc. | | | 600 | | | | 37,950 | | |
| Talbots, Inc.* | | | 6,300 | | | | 53,676 | | |
| The Dress Barn, Inc.*§ | | | 33,800 | | | | 892,996 | | |
| TJX Cos., Inc. | | | 5,500 | | | | 244,145 | | |
| Williams-Sonoma, Inc.§ | | | 37,400 | | | | 1,334,806 | | |
| | | | 7,080,288 | | |
See Accompanying Notes to Financial Statements.
15
Credit Suisse Trust — U.S. Equity Flex I Portfolio
Schedule of Investments (continued)
December 31, 2010
| | | Number of
Shares | | Value | |
| LONG STOCK POSITIONS | |
| COMMON STOCKS | |
| Textiles, Apparel & Luxury Goods (0.2%) | |
| The Timberland Co. Class A* | | | 14,800 | | | $ | 363,932 | | |
| Thrifts & Mortgage Finance (0.2%) | |
| Dime Community Bancshares§ | | | 7,100 | | | | 103,589 | | |
| NewAlliance Bancshares, Inc. | | | 5,787 | | | | 86,689 | | |
| Oritani Financial Corp. | | | 7,600 | | | | 93,024 | | |
| | | | 283,302 | | |
| Tobacco (1.1%) | |
| Philip Morris International, Inc. | | | 27,900 | | | | 1,632,987 | | |
| Trading Companies & Distributors (0.3%) | |
| United Rentals, Inc.*§ | | | 10,000 | | | | 227,500 | | |
| Watsco, Inc.§ | | | 3,300 | | | | 208,164 | | |
| | | | 435,664 | | |
| Wireless Telecommunication Services (2.0%) | |
| MetroPCS Communications, Inc.* | | | 96,800 | | | | 1,222,584 | | |
| Sprint Nextel Corp.*§ | | | 42,100 | | | | 178,083 | | |
| Telephone & Data Systems, Inc.§ | | | 43,220 | | | | 1,579,691 | | |
| | | | 2,980,358 | | |
| TOTAL COMMON STOCKS (Cost $172,954,284) | | | 189,682,613 | | |
| TOTAL LONG STOCK POSITIONS (Cost $172,954,284) | | | 189,682,613 | | |
| SHORT-TERM INVESTMENTS (15.1%) | |
| State Street Navigator Prime Portfolio, 0.3426%§§ | | | 22,947,299 | | | | 22,947,299 | | |
| | | Par
(000) | | | |
| State Street Bank and Trust Co. Euro Time Deposit, 0.010%, 01/03/11 | | $ | 224 | | | | 224,000 | | |
| TOTAL SHORT-TERM INVESTMENTS (Cost $23,171,299) | | | 23,171,299 | | |
| TOTAL INVESTMENTS AT VALUE (139.1%) (Cost $196,125,583) | | | 212,853,912 | | |
| TOTAL SECURITIES SOLD SHORT (-24.0%) (Proceeds $29,720,590) | | | (36,685,611 | ) | |
| LIABILITIES IN EXCESS OF OTHER ASSETS (-15.1%) | | | (23,171,236 | ) | |
| NET ASSETS (100.0%) | | $ | 152,997,065 | | |
See Accompanying Notes to Financial Statements.
16
Credit Suisse Trust — U.S. Equity Flex I Portfolio
Schedule of Investments (continued)
December 31, 2010
| | | Number of
Shares | | Value | |
| SHORT STOCK POSITIONS (-24.0%) | |
| COMMON STOCKS (-24.0%) | |
| Aerospace & Defense (-0.5%) | |
| Alliant Techsystems, Inc.* | | | (400 | ) | | $ | (29,772 | ) | |
| BE Aerospace, Inc.* | | | (1,200 | ) | | | (44,436 | ) | |
| Ceradyne, Inc.* | | | (1,000 | ) | | | (31,530 | ) | |
| Cubic Corp. | | | (600 | ) | | | (28,290 | ) | |
| Curtiss-Wright Corp. | | | (1,000 | ) | | | (33,200 | ) | |
| DigitalGlobe, Inc.* | | | (1,000 | ) | | | (31,710 | ) | |
| Esterline Technologies Corp.* | | | (400 | ) | | | (27,436 | ) | |
| General Dynamics Corp. | | | (500 | ) | | | (35,480 | ) | |
| Goodrich Corp. | | | (300 | ) | | | (26,421 | ) | |
| Hexcel Corp.* | | | (1,400 | ) | | | (25,326 | ) | |
| Honeywell International, Inc. | | | (800 | ) | | | (42,528 | ) | |
| ITT Corp. | | | (500 | ) | | | (26,055 | ) | |
| L-3 Communications Holdings, Inc. | | | (400 | ) | | | (28,196 | ) | |
| Lockheed Martin Corp. | | | (600 | ) | | | (41,946 | ) | |
| Precision Castparts Corp. | | | (400 | ) | | | (55,684 | ) | |
| Raytheon Co. | | | (500 | ) | | | (23,170 | ) | |
| Rockwell Collins, Inc. | | | (600 | ) | | | (34,956 | ) | |
| Spirit Aerosystems Holdings, Inc. Class A* | | | (1,600 | ) | | | (33,296 | ) | |
| Teledyne Technologies, Inc.* | | | (600 | ) | | | (26,382 | ) | |
| TransDigm Group, Inc.* | | | (500 | ) | | | (36,005 | ) | |
| Triumph Group, Inc. | | | (500 | ) | | | (44,705 | ) | |
| United Technologies Corp. | | | (900 | ) | | | (70,848 | ) | |
| | | | (777,372 | ) | |
| Air Freight & Logistics (-0.1%) | |
| CH Robinson Worldwide, Inc. | | | (500 | ) | | | (40,095 | ) | |
| Expeditors International of Washington, Inc. | | | (600 | ) | | | (32,760 | ) | |
| FedEx Corp. | | | (300 | ) | | | (27,903 | ) | |
| | | | (100,758 | ) | |
| Airlines (-0.1%) | |
| AMR Corp.* | | | (3,200 | ) | | | (24,928 | ) | |
| JetBlue Airways Corp.* | | | (4,200 | ) | | | (27,762 | ) | |
| Southwest Airlines Co. | | | (2,400 | ) | | | (31,152 | ) | |
| | | | (83,842 | ) | |
| Auto Components (-0.3%) | |
| American Axle & Manufacturing Holdings, Inc.* | | | (3,000 | ) | | | (38,580 | ) | |
| Cooper Tire & Rubber Co. | | | (1,500 | ) | | | (35,370 | ) | |
| Dana Holding Corp.* | | | (2,900 | ) | | | (49,909 | ) | |
| Drew Industries, Inc. | | | (1,100 | ) | | | (24,992 | ) | |
| Federal Mogul Corp.* | | | (1,800 | ) | | | (37,170 | ) | |
| Gentex Corp. | | | (1,400 | ) | | | (41,384 | ) | |
| Johnson Controls, Inc. | | | (1,200 | ) | | | (45,840 | ) | |
| Modine Manufacturing Co.* | | | (2,900 | ) | | | (44,950 | ) | |
| Superior Industries International, Inc. | | | (1,500 | ) | | | (31,830 | ) | |
| Tenneco, Inc.* | | | (900 | ) | | | (37,044 | ) | |
See Accompanying Notes to Financial Statements.
17
Credit Suisse Trust — U.S. Equity Flex I Portfolio
Schedule of Investments (continued)
December 31, 2010
| | | Number of
Shares | | Value | |
| SHORT STOCK POSITIONS | |
| COMMON STOCKS | |
| Auto Components | |
| The Goodyear Tire & Rubber Co.* | | | (2,600 | ) | | $ | (30,810 | ) | |
| TRW Automotive Holdings Corp.* | | | (800 | ) | | | (42,160 | ) | |
| | | | (460,039 | ) | |
| Automobiles (-0.0%) | |
| Harley-Davidson, Inc. | | | (1,000 | ) | | | (34,670 | ) | |
| Thor Industries, Inc. | | | (700 | ) | | | (23,772 | ) | |
| | | | (58,442 | ) | |
| Beverages (-0.2%) | |
| Central European Distribution Corp.* | | | (1,300 | ) | | | (29,770 | ) | |
| Constellation Brands, Inc. Class A* | | | (1,900 | ) | | | (42,085 | ) | |
| Hansen Natural Corp.* | | | (800 | ) | | | (41,824 | ) | |
| PepsiCo, Inc. | | | (1,400 | ) | | | (91,462 | ) | |
| The Boston Beer Co., Inc. Class A* | | | (300 | ) | | | (28,527 | ) | |
| The Coca-Cola Co. | | | (1,500 | ) | | | (98,655 | ) | |
| | | | (332,323 | ) | |
| Biotechnology (-0.3%) | |
| Acorda Therapeutics, Inc.* | | | (1,000 | ) | | | (27,260 | ) | |
| Amylin Pharmaceuticals, Inc.* | | | (1,600 | ) | | | (23,536 | ) | |
| Biogen Idec, Inc.* | | | (400 | ) | | | (26,820 | ) | |
| BioMarin Pharmaceutical, Inc.* | | | (1,600 | ) | | | (43,088 | ) | |
| Cepheid, Inc.* | | | (1,700 | ) | | | (38,675 | ) | |
| Cubist Pharmaceuticals, Inc.* | | | (1,200 | ) | | | (25,680 | ) | |
| Dendreon Corp.* | | | (800 | ) | | | (27,936 | ) | |
| Human Genome Sciences, Inc.* | | | (1,000 | ) | | | (23,890 | ) | |
| Incyte Corp., Ltd.* | | | (2,200 | ) | | | (36,432 | ) | |
| Onyx Pharmaceuticals, Inc.* | | | (800 | ) | | | (29,496 | ) | |
| Pharmasset, Inc.* | | | (1,000 | ) | | | (43,410 | ) | |
| Savient Pharmaceuticals, Inc.* | | | (2,000 | ) | | | (22,280 | ) | |
| Seattle Genetics, Inc.* | | | (1,600 | ) | | | (23,920 | ) | |
| United Therapeutics Corp.* | | | (600 | ) | | | (37,932 | ) | |
| Vertex Pharmaceuticals, Inc.* | | | (800 | ) | | | (28,024 | ) | |
| | | | (458,379 | ) | |
| Building Products (-0.2%) | |
| A.O. Smith Corp. | | | (750 | ) | | | (28,560 | ) | |
| Ameron International Corp. | | | (400 | ) | | | (30,548 | ) | |
| Armstrong World Industries, Inc. | | | (700 | ) | | | (30,100 | ) | |
| Lennox International, Inc. | | | (600 | ) | | | (28,374 | ) | |
| Masco Corp. | | | (2,700 | ) | | | (34,182 | ) | |
| Owens Corning* | | | (1,200 | ) | | | (37,380 | ) | |
| Simpson Manufacturing Co., Inc. | | | (1,100 | ) | | | (34,001 | ) | |
| Universal Forest Products, Inc. | | | (1,000 | ) | | | (38,900 | ) | |
| | | | (262,045 | ) | |
See Accompanying Notes to Financial Statements.
18
Credit Suisse Trust — U.S. Equity Flex I Portfolio
Schedule of Investments (continued)
December 31, 2010
| | | Number of
Shares | | Value | |
| SHORT STOCK POSITIONS | |
| COMMON STOCKS | |
| Capital Markets (-0.5%) | |
| Affiliated Managers Group, Inc.* | | | (400 | ) | | $ | (39,688 | ) | |
| E*Trade Financial Corp.* | | | (2,000 | ) | | | (32,000 | ) | |
| Eaton Vance Corp. | | | (900 | ) | | | (27,207 | ) | |
| Franklin Resources, Inc. | | | (300 | ) | | | (33,363 | ) | |
| Greenhill & Co., Inc. | | | (300 | ) | | | (24,504 | ) | |
| Invesco, Ltd. | | | (1,900 | ) | | | (45,714 | ) | |
| Investment Technology Group, Inc.* | | | (1,600 | ) | | | (26,192 | ) | |
| Janus Capital Group, Inc. | | | (2,200 | ) | | | (28,534 | ) | |
| KBW, Inc. | | | (1,100 | ) | | | (30,712 | ) | |
| Knight Capital Group, Inc. Class A* | | | (2,200 | ) | | | (30,338 | ) | |
| Legg Mason, Inc. | | | (1,100 | ) | | | (39,897 | ) | |
| MF Global Holdings Ltd.* | | | (3,700 | ) | | | (30,932 | ) | |
| Morgan Stanley | | | (1,200 | ) | | | (32,652 | ) | |
| optionsXpress Holdings, Inc. | | | (1,900 | ) | | | (29,773 | ) | |
| Piper Jaffray Cos.* | | | (1,000 | ) | | | (35,010 | ) | |
| Raymond James Financial, Inc. | | | (1,200 | ) | | | (39,240 | ) | |
| Stifel Financial Corp.* | | | (600 | ) | | | (37,224 | ) | |
| T. Rowe Price Group, Inc. | | | (700 | ) | | | (45,178 | ) | |
| TD Ameritrade Holding Corp. | | | (1,700 | ) | | | (32,283 | ) | |
| The Charles Schwab Corp. | | | (1,900 | ) | | | (32,509 | ) | |
| The Goldman Sachs Group, Inc. | | | (300 | ) | | | (50,448 | ) | |
| | | | (723,398 | ) | |
| Chemicals (-0.7%) | |
| Air Products & Chemicals, Inc. | | | (500 | ) | | | (45,475 | ) | |
| Albemarle Corp. | | | (600 | ) | | | (33,468 | ) | |
| Arch Chemicals, Inc. | | | (800 | ) | | | (30,344 | ) | |
| Cabot Corp. | | | (1,000 | ) | | | (37,650 | ) | |
| Calgon Carbon Corp.* | | | (1,600 | ) | | | (24,192 | ) | |
| Celanese Corp. Series A | | | (1,000 | ) | | | (41,170 | ) | |
| CF Industries Holdings, Inc. | | | (300 | ) | | | (40,545 | ) | |
| Cytec Industries, Inc. | | | (500 | ) | | | (26,530 | ) | |
| Ecolab, Inc. | | | (800 | ) | | | (40,336 | ) | |
| Ferro Corp.* | | | (2,900 | ) | | | (42,456 | ) | |
| H.B. Fuller Co. | | | (1,200 | ) | | | (24,624 | ) | |
| International Flavors & Fragrances, Inc. | | | (600 | ) | | | (33,354 | ) | |
| Monsanto Co. | | | (800 | ) | | | (55,712 | ) | |
| Nalco Holding Co. | | | (1,300 | ) | | | (41,522 | ) | |
| NewMarket Corp. | | | (300 | ) | | | (37,011 | ) | |
| Olin Corp. | | | (1,700 | ) | | | (34,884 | ) | |
| OM Group, Inc.* | | | (900 | ) | | | (34,659 | ) | |
| PolyOne Corp.* | | | (3,000 | ) | | | (37,470 | ) | |
| Praxair, Inc. | | | (400 | ) | | | (38,188 | ) | |
| Rockwood Holdings, Inc.* | | | (1,200 | ) | | | (46,944 | ) | |
| RPM International, Inc. | | | (1,800 | ) | | | (39,780 | ) | |
| Sensient Technologies Corp. | | | (1,200 | ) | | | (44,076 | ) | |
| Sigma-Aldrich Corp. | | | (600 | ) | | | (39,936 | ) | |
See Accompanying Notes to Financial Statements.
19
Credit Suisse Trust — U.S. Equity Flex I Portfolio
Schedule of Investments (continued)
December 31, 2010
| | | Number of
Shares | | Value | |
| SHORT STOCK POSITIONS | |
| COMMON STOCKS | |
| Chemicals | |
| Solutia, Inc.* | | | (1,500 | ) | | $ | (34,620 | ) | |
| The Dow Chemical Co. | | | (1,100 | ) | | | (37,554 | ) | |
| The Mosaic Co. | | | (600 | ) | | | (45,816 | ) | |
| The Scotts Miracle-Gro Co. Class A | | | (500 | ) | | | (25,385 | ) | |
| The Sherwin-Williams Co. | | | (500 | ) | | | (41,875 | ) | |
| Valspar Corp. | | | (1,100 | ) | | | (37,928 | ) | |
| W.R. Grace & Co.* | | | (1,200 | ) | | | (42,156 | ) | |
| | | | (1,135,660 | ) | |
| Commercial Banks (-0.8%) | |
| Associated Banc-Corp. | | | (2,100 | ) | | | (31,815 | ) | |
| Bancfirst Corp. | | | (600 | ) | | | (24,714 | ) | |
| Bank of Hawaii Corp. | | | (700 | ) | | | (33,047 | ) | |
| BB&T Corp. | | | (1,300 | ) | | | (34,177 | ) | |
| Cathay General Bancorp | | | (2,600 | ) | | | (43,420 | ) | |
| Chemical Financial Corp. | | | (1,200 | ) | | | (26,580 | ) | |
| City National Corp. | | | (500 | ) | | | (30,680 | ) | |
| Columbia Banking System, Inc. | | | (1,600 | ) | | | (33,696 | ) | |
| Commerce Bancshares, Inc. | | | (777 | ) | | | (30,870 | ) | |
| Cullen/Frost Bankers, Inc. | | | (500 | ) | | | (30,560 | ) | |
| Danvers Bancorp, Inc. | | | (1,600 | ) | | | (28,272 | ) | |
| East West Bancorp, Inc. | | | (1,900 | ) | | | (37,145 | ) | |
| Fifth Third Bancorp | | | (2,300 | ) | | | (33,764 | ) | |
| First Financial Bancorp | | | (1,500 | ) | | | (27,720 | ) | |
| First Horizon National Corp.* | | | (2,357 | ) | | | (27,765 | ) | |
| FirstMerit Corp. | | | (1,505 | ) | | | (29,784 | ) | |
| Fulton Financial Corp. | | | (2,700 | ) | | | (27,918 | ) | |
| Hancock Holding Co. | | | (900 | ) | | | (31,374 | ) | |
| Iberiabank Corp. | | | (500 | ) | | | (29,565 | ) | |
| Investors Bancorp, Inc.* | | | (2,100 | ) | | | (27,552 | ) | |
| KeyCorp | | | (3,700 | ) | | | (32,745 | ) | |
| Marshall & Ilsley Corp. | | | (4,400 | ) | | | (30,448 | ) | |
| National Penn Bancshares, Inc. | | | (4,100 | ) | | | (32,923 | ) | |
| NBT Bancorp, Inc. | | | (1,100 | ) | | | (26,565 | ) | |
| Old National Bancorp | | | (2,200 | ) | | | (26,158 | ) | |
| PNC Financial Services Group, Inc. | | | (500 | ) | | | (30,360 | ) | |
| PrivateBancorp, Inc. | | | (2,200 | ) | | | (31,636 | ) | |
| Prosperity Bancshares, Inc. | | | (900 | ) | | | (35,352 | ) | |
| Regions Financial Corp. | | | (3,900 | ) | | | (27,300 | ) | |
| SunTrust Banks, Inc. | | | (1,400 | ) | | | (41,314 | ) | |
| Susquehanna Bancshares, Inc. | | | (3,000 | ) | | | (29,040 | ) | |
| SVB Financial Group* | | | (800 | ) | | | (42,440 | ) | |
| TCF Financial Corp. | | | (1,900 | ) | | | (28,139 | ) | |
| Trustmark Corp. | | | (1,200 | ) | | | (29,808 | ) | |
| UMB Financial Corp. | | | (800 | ) | | | (33,136 | ) | |
| Valley National Bancorp | | | (2,315 | ) | | | (33,105 | ) | |
| Webster Financial Corp. | | | (1,700 | ) | | | (33,490 | ) | |
| Zions Bancorporation | | | (1,300 | ) | | | (31,499 | ) | |
| | | | (1,195,876 | ) | |
See Accompanying Notes to Financial Statements.
20
Credit Suisse Trust — U.S. Equity Flex I Portfolio
Schedule of Investments (continued)
December 31, 2010
| | | Number of
Shares | | Value | |
| SHORT STOCK POSITIONS | |
| COMMON STOCKS | |
| Commercial Services & Supplies (-0.6%) | |
| ABM Industries, Inc. | | | (1,500 | ) | | $ | (39,450 | ) | |
| American Reprographics Co.* | | | (3,200 | ) | | | (24,288 | ) | |
| Avery Dennison Corp. | | | (900 | ) | | | (38,106 | ) | |
| Cintas Corp. | | | (1,300 | ) | | | (36,348 | ) | |
| Consolidated Graphics, Inc.* | | | (500 | ) | | | (24,215 | ) | |
| Copart, Inc.* | | | (900 | ) | | | (33,615 | ) | |
| Corrections Corp. of America* | | | (1,600 | ) | | | (40,096 | ) | |
| Covanta Holding Corp. | | | (1,600 | ) | | | (27,504 | ) | |
| Deluxe Corp. | | | (1,500 | ) | | | (34,530 | ) | |
| Herman Miller, Inc. | | | (1,500 | ) | | | (37,950 | ) | |
| HNI Corp. | | | (1,000 | ) | | | (31,200 | ) | |
| Iron Mountain, Inc. | | | (1,300 | ) | | | (32,513 | ) | |
| Knoll, Inc. | | | (2,200 | ) | | | (36,806 | ) | |
| Mine Safety Appliances Co. | | | (1,200 | ) | | | (37,356 | ) | |
| Multi-Color Corp. | | | (1,100 | ) | | | (21,406 | ) | |
| Pitney Bowes, Inc. | | | (1,100 | ) | | | (26,598 | ) | |
| R. R. Donnelley & Sons Co. | | | (1,600 | ) | | | (27,952 | ) | |
| Republic Services, Inc. | | | (1,100 | ) | | | (32,846 | ) | |
| Rollins, Inc. | | | (1,950 | ) | | | (38,513 | ) | |
| Schawk, Inc. | | | (1,900 | ) | | | (39,102 | ) | |
| Steelcase, Inc. Class A | | | (2,900 | ) | | | (30,653 | ) | |
| Stericycle, Inc.* | | | (500 | ) | | | (40,460 | ) | |
| Tetra Tech, Inc.* | | | (1,400 | ) | | | (35,084 | ) | |
| The Brink's Co. | | | (1,100 | ) | | | (29,568 | ) | |
| The Geo Group, Inc.* | | | (1,400 | ) | | | (34,524 | ) | |
| US Ecology, Inc. | | | (1,600 | ) | | | (27,808 | ) | |
| Waste Connections, Inc. | | | (1,050 | ) | | | (28,906 | ) | |
| Waste Management, Inc. | | | (1,000 | ) | | | (36,870 | ) | |
| | | | (924,267 | ) | |
| Communications Equipment (-0.4%) | |
| Acme Packet, Inc.* | | | (800 | ) | | | (42,528 | ) | |
| ADTRAN, Inc. | | | (800 | ) | | | (28,968 | ) | |
| Arris Group, Inc.* | | | (2,800 | ) | | | (31,416 | ) | |
| Aruba Networks, Inc.* | | | (1,600 | ) | | | (33,408 | ) | |
| Black Box Corp. | | | (800 | ) | | | (30,632 | ) | |
| Blue Coat Systems, Inc.* | | | (800 | ) | | | (23,896 | ) | |
| Brocade Communications Systems, Inc.* | | | (5,000 | ) | | | (26,450 | ) | |
| Comtech Telecommunications Corp. | | | (700 | ) | | | (19,411 | ) | |
| F5 Networks, Inc.* | | | (300 | ) | | | (39,048 | ) | |
| Harmonic, Inc.* | | | (3,700 | ) | | | (31,709 | ) | |
| Harris Corp. | | | (600 | ) | | | (27,180 | ) | |
| InterDigital, Inc.* | | | (1,300 | ) | | | (54,132 | ) | |
| JDS Uniphase Corp.* | | | (2,600 | ) | | | (37,648 | ) | |
| Juniper Networks, Inc.* | | | (900 | ) | | | (33,228 | ) | |
| Motorola, Inc.* | | | (3,700 | ) | | | (33,559 | ) | |
| Plantronics, Inc. | | | (1,000 | ) | | | (37,220 | ) | |
See Accompanying Notes to Financial Statements.
21
Credit Suisse Trust — U.S. Equity Flex I Portfolio
Schedule of Investments (continued)
December 31, 2010
| | | Number of
Shares | | Value | |
| SHORT STOCK POSITIONS | |
| COMMON STOCKS | |
| Communications Equipment | |
| Polycom, Inc.* | | | (900 | ) | | $ | (35,082 | ) | |
| Riverbed Technology, Inc.* | | | (1,600 | ) | | | (56,272 | ) | |
| Tekelec* | | | (2,000 | ) | | | (23,820 | ) | |
| Viasat, Inc.* | | | (700 | ) | | | (31,087 | ) | |
| | | | (676,694 | ) | |
| Computers & Peripherals (-0.1%) | |
| Dell, Inc.* | | | (1,900 | ) | | | (25,745 | ) | |
| Diebold, Inc. | | | (1,100 | ) | | | (35,255 | ) | |
| Intermec, Inc.* | | | (2,100 | ) | | | (26,586 | ) | |
| NCR Corp.* | | | (2,500 | ) | | | (38,425 | ) | |
| NetApp, Inc.* | | | (600 | ) | | | (32,976 | ) | |
| SanDisk Corp.* | | | (800 | ) | | | (39,888 | ) | |
| Western Digital Corp.* | | | (1,200 | ) | | | (40,680 | ) | |
| | | | (239,555 | ) | |
| Construction & Engineering (-0.2%) | |
| Aecom Technology Corp.* | | | (1,100 | ) | | | (30,767 | ) | |
| Fluor Corp. | | | (600 | ) | | | (39,756 | ) | |
| Granite Construction, Inc. | | | (1,200 | ) | | | (32,916 | ) | |
| Jacobs Engineering Group, Inc.* | | | (1,000 | ) | | | (45,850 | ) | |
| KBR, Inc. | | | (1,000 | ) | | | (30,470 | ) | |
| MasTec, Inc.* | | | (2,500 | ) | | | (36,475 | ) | |
| Quanta Services, Inc.* | | | (1,600 | ) | | | (31,872 | ) | |
| The Shaw Group, Inc.* | | | (800 | ) | | | (27,384 | ) | |
| Tutor Perini Corp. | | | (1,500 | ) | | | (32,115 | ) | |
| URS Corp.* | | | (700 | ) | | | (29,127 | ) | |
| | | | (336,732 | ) | |
| Construction Materials (-0.1%) | |
| Eagle Materials, Inc. | | | (1,300 | ) | | | (36,725 | ) | |
| Vulcan Materials Co. | | | (1,000 | ) | | | (44,360 | ) | |
| | | | (81,085 | ) | |
| Consumer Finance (-0.1%) | |
| Cash America International, Inc. | | | (900 | ) | | | (33,237 | ) | |
| Discover Financial Services | | | (2,100 | ) | | | (38,913 | ) | |
| EZCORP, Inc. Class A* | | | (1,600 | ) | | | (43,408 | ) | |
| First Cash Financial Services, Inc.* | | | (900 | ) | | | (27,891 | ) | |
| Nelnet, Inc. Class A | | | (1,000 | ) | | | (23,690 | ) | |
| SLM Corp.* | | | (2,600 | ) | | | (32,734 | ) | |
| The Student Loan Corp. | | | (1,200 | ) | | | (38,928 | ) | |
| | | | (238,801 | ) | |
| Containers & Packaging (-0.2%) | |
| Aptargroup, Inc. | | | (600 | ) | | | (28,542 | ) | |
| Bemis Co., Inc. | | | (1,100 | ) | | | (35,926 | ) | |
| Boise, Inc. | | | (4,100 | ) | | | (32,513 | ) | |
See Accompanying Notes to Financial Statements.
22
Credit Suisse Trust — U.S. Equity Flex I Portfolio
Schedule of Investments (continued)
December 31, 2010
| | | Number of
Shares | | Value | |
| SHORT STOCK POSITIONS | |
| COMMON STOCKS | |
| Containers & Packaging | |
| Crown Holdings, Inc.* | | | (1,100 | ) | | $ | (36,718 | ) | |
| Greif, Inc. Class A | | | (500 | ) | | | (30,950 | ) | |
| Owens-Illinois, Inc.* | | | (1,000 | ) | | | (30,700 | ) | |
| Packaging Corp. of America | | | (1,100 | ) | | | (28,424 | ) | |
| Rock-Tenn Co. Class A | | | (500 | ) | | | (26,975 | ) | |
| Sealed Air Corp. | | | (1,600 | ) | | | (40,720 | ) | |
| Silgan Holdings, Inc. | | | (1,000 | ) | | | (35,810 | ) | |
| Sonoco Products Co. | | | (800 | ) | | | (26,936 | ) | |
| Temple-Inland, Inc. | | | (1,500 | ) | | | (31,860 | ) | |
| | | | (386,074 | ) | |
| Distributors (-0.1%) | |
| Genuine Parts Co. | | | (800 | ) | | | (41,072 | ) | |
| LKQ Corp.* | | | (1,600 | ) | | | (36,352 | ) | |
| Pool Corp. | | | (1,400 | ) | | | (31,556 | ) | |
| | | | (108,980 | ) | |
| Diversified Consumer Services (-0.1%) | |
| Apollo Group, Inc. Class A* | | | (600 | ) | | | (23,694 | ) | |
| Grand Canyon Education, Inc.* | | | (1,400 | ) | | | (27,426 | ) | |
| H&R Block, Inc. | | | (2,200 | ) | | | (26,202 | ) | |
| Hillenbrand, Inc. | | | (1,400 | ) | | | (29,134 | ) | |
| K12, Inc.* | | | (800 | ) | | | (22,928 | ) | |
| Lincoln Educational Services Corp. | | | (1,400 | ) | | | (21,714 | ) | |
| Matthews International Corp. Class A | | | (800 | ) | | | (27,984 | ) | |
| Regis Corp. | | | (1,300 | ) | | | (21,580 | ) | |
| Service Corp. International | | | (4,000 | ) | | | (33,000 | ) | |
| | | | (233,662 | ) | |
| Diversified Financial Services (-0.2%) | |
| Bank of America Corp. | | | (2,300 | ) | | | (30,682 | ) | |
| CME Group, Inc. | | | (100 | ) | | | (32,175 | ) | |
| Interactive Brokers Group, Inc. Class A | | | (1,700 | ) | | | (30,294 | ) | |
| IntercontinentalExchange, Inc.* | | | (300 | ) | | | (35,745 | ) | |
| Leucadia National Corp. | | | (1,300 | ) | | | (37,934 | ) | |
| MSCI, Inc. Class A* | | | (700 | ) | | | (27,272 | ) | |
| PHH Corp.* | | | (1,500 | ) | | | (34,725 | ) | |
| Pico Holdings, Inc.* | | | (1,000 | ) | | | (31,800 | ) | |
| Portfolio Recovery Associates, Inc.* | | | (500 | ) | | | (37,600 | ) | |
| The NASDAQ OMX Group, Inc.* | | | (1,500 | ) | | | (35,565 | ) | |
| | | | (333,792 | ) | |
| Diversified Telecommunication Services (-0.1%) | |
| CenturyTel, Inc. | | | (900 | ) | | | (41,553 | ) | |
| Frontier Communications Corp. | | | (3,800 | ) | | | (36,974 | ) | |
| Hughes Communications, Inc.* | | | (600 | ) | | | (24,264 | ) | |
| tw telecom, Inc.* | | | (1,500 | ) | | | (25,575 | ) | |
| Windstream Corp. | | | (2,200 | ) | | | (30,668 | ) | |
| | | | (159,034 | ) | |
See Accompanying Notes to Financial Statements.
23
Credit Suisse Trust — U.S. Equity Flex I Portfolio
Schedule of Investments (continued)
December 31, 2010
| | | Number of
Shares | | Value | |
| SHORT STOCK POSITIONS | |
| COMMON STOCKS | |
| Electric Utilities (-0.5%) | |
| Allete, Inc. | | | (700 | ) | | $ | (26,082 | ) | |
| American Electric Power Co., Inc. | | | (900 | ) | | | (32,382 | ) | |
| DPL, Inc. | | | (1,000 | ) | | | (25,710 | ) | |
| Duke Energy Corp. | | | (2,000 | ) | | | (35,620 | ) | |
| Edison International | | | (800 | ) | | | (30,880 | ) | |
| El Paso Electric Co.* | | | (1,200 | ) | | | (33,036 | ) | |
| Entergy Corp. | | | (400 | ) | | | (28,332 | ) | |
| FirstEnergy Corp. | | | (900 | ) | | | (33,318 | ) | |
| Hawaiian Electric Industries, Inc. | | | (1,500 | ) | | | (34,185 | ) | |
| IDACORP, Inc. | | | (1,000 | ) | | | (36,980 | ) | |
| ITC Holdings Corp. | | | (600 | ) | | | (37,188 | ) | |
| MGE Energy, Inc. | | | (800 | ) | | | (34,208 | ) | |
| Northeast Utilities | | | (1,300 | ) | | | (41,444 | ) | |
| NV Energy, Inc. | | | (2,700 | ) | | | (37,935 | ) | |
| Pepco Holdings, Inc. | | | (1,900 | ) | | | (34,675 | ) | |
| PNM Resources, Inc. | | | (2,300 | ) | | | (29,946 | ) | |
| Portland General Electric Co. | | | (1,300 | ) | | | (28,210 | ) | |
| PPL Corp. | | | (1,100 | ) | | | (28,952 | ) | |
| Progress Energy, Inc. | | | (800 | ) | | | (34,784 | ) | |
| Southern Co. | | | (900 | ) | | | (34,407 | ) | |
| UIL Holdings Corp. | | | (1,100 | ) | | | (32,956 | ) | |
| Unisource Energy Corp. | | | (700 | ) | | | (25,088 | ) | |
| | | | (716,318 | ) | |
| Electrical Equipment (-0.3%) | |
| Acuity Brands, Inc. | | | (800 | ) | | | (46,136 | ) | |
| AMETEK, Inc. | | | (1,200 | ) | | | (47,100 | ) | |
| Brady Corp. Class A | | | (900 | ) | | | (29,349 | ) | |
| Emerson Electric Co. | | | (900 | ) | | | (51,453 | ) | |
| EnerSys* | | | (1,200 | ) | | | (38,544 | ) | |
| Franklin Electric Co., Inc. | | | (500 | ) | | | (19,460 | ) | |
| General Cable Corp.* | | | (1,300 | ) | | | (45,617 | ) | |
| GrafTech International, Ltd.* | | | (2,000 | ) | | | (39,680 | ) | |
| II-VI, Inc.* | | | (900 | ) | | | (41,724 | ) | |
| Polypore International, Inc.* | | | (1,100 | ) | | | (44,803 | ) | |
| Roper Industries, Inc. | | | (400 | ) | | | (30,572 | ) | |
| Thomas & Betts Corp.* | | | (600 | ) | | | (28,980 | ) | |
| Woodward Governor Co. | | | (1,100 | ) | | | (41,316 | ) | |
| | | | (504,734 | ) | |
| Electronic Equipment, Instruments & Components (-0.5%) | |
| Amphenol Corp. Class A | | | (800 | ) | | | (42,224 | ) | |
| Anixter International, Inc. | | | (700 | ) | | | (41,811 | ) | |
| Arrow Electronics, Inc.* | | | (1,100 | ) | | | (37,675 | ) | |
| Avnet, Inc.* | | | (1,000 | ) | | | (33,030 | ) | |
| AVX Corp. | | | (1,900 | ) | | | (29,317 | ) | |
| Checkpoint Systems, Inc.* | | | (1,400 | ) | | | (28,770 | ) | |
| Coherent, Inc.* | | | (700 | ) | | | (31,598 | ) | |
See Accompanying Notes to Financial Statements.
24
Credit Suisse Trust — U.S. Equity Flex I Portfolio
Schedule of Investments (continued)
December 31, 2010
| | | Number of
Shares | | Value | |
| SHORT STOCK POSITIONS | |
| COMMON STOCKS | |
| Electronic Equipment, Instruments & Components | |
| Corning, Inc. | | | (1,700 | ) | | $ | (32,844 | ) | |
| FLIR Systems, Inc.* | | | (1,100 | ) | | | (32,725 | ) | |
| Ingram Micro, Inc. Class A* | | | (1,800 | ) | | | (34,362 | ) | |
| IPG Photonics Corp.* | | | (1,300 | ) | | | (41,106 | ) | |
| Jabil Circuit, Inc. | | | (1,900 | ) | | | (38,171 | ) | |
| Littelfuse, Inc. | | | (800 | ) | | | (37,648 | ) | |
| Multi-Fineline Electronix, Inc.* | | | (1,300 | ) | | | (34,437 | ) | |
| National Instruments Corp. | | | (1,100 | ) | | | (41,404 | ) | |
| Plexus Corp.* | | | (1,100 | ) | | | (34,034 | ) | |
| Rofin-Sinar Technologies, Inc.* | | | (1,400 | ) | | | (49,616 | ) | |
| SYNNEX Corp.* | | | (900 | ) | | | (28,080 | ) | |
| Tech Data Corp.* | | | (800 | ) | | | (35,216 | ) | |
| Trimble Navigation, Ltd.* | | | (800 | ) | | | (31,944 | ) | |
| | | | (716,012 | ) | |
| Energy Equipment & Services (-0.6%) | |
| Bristow Group, Inc.* | | | (900 | ) | | | (42,615 | ) | |
| Cameron International Corp.* | | | (811 | ) | | | (41,142 | ) | |
| CARBO Ceramics, Inc. | | | (500 | ) | | | (51,770 | ) | |
| Complete Production Services, Inc.* | | | (1,500 | ) | | | (44,325 | ) | |
| Dresser-Rand Group, Inc.* | | | (800 | ) | | | (34,072 | ) | |
| Exterran Holdings, Inc.* | | | (1,300 | ) | | | (31,135 | ) | |
| FMC Technologies, Inc.* | | | (400 | ) | | | (35,564 | ) | |
| Gulfmark Offshore, Inc. Class A* | | | (900 | ) | | | (27,360 | ) | |
| Halliburton Co. | | | (800 | ) | | | (32,664 | ) | |
| Helix Energy Solutions Group, Inc.* | | | (3,200 | ) | | | (38,848 | ) | |
| Helmerich & Payne, Inc. | | | (700 | ) | | | (33,936 | ) | |
| Hornbeck Offshore Services, Inc.* | | | (1,400 | ) | | | (29,232 | ) | |
| Lufkin Industries, Inc. | | | (700 | ) | | | (43,673 | ) | |
| Nabors Industries, Ltd.* | | | (1,400 | ) | | | (32,844 | ) | |
| Patterson-UTI Energy, Inc. | | | (2,000 | ) | | | (43,100 | ) | |
| Pride International, Inc.* | | | (1,100 | ) | | | (36,300 | ) | |
| Rowan Cos., Inc.* | | | (1,000 | ) | | | (34,910 | ) | |
| Schlumberger, Ltd. | | | (900 | ) | | | (75,150 | ) | |
| Superior Energy Services, Inc.* | | | (1,300 | ) | | | (45,487 | ) | |
| Tetra Technologies, Inc.* | | | (2,800 | ) | | | (33,236 | ) | |
| Tidewater, Inc. | | | (600 | ) | | | (32,304 | ) | |
| Unit Corp.* | | | (800 | ) | | | (37,184 | ) | |
| | | | (856,851 | ) | |
| Food & Staples Retailing (-0.3%) | |
| BJ's Wholesale Club, Inc.* | | | (800 | ) | | | (38,320 | ) | |
| Costco Wholesale Corp. | | | (600 | ) | | | (43,326 | ) | |
| CVS Caremark Corp. | | | (1,200 | ) | | | (41,724 | ) | |
| Pricesmart, Inc. | | | (900 | ) | | | (34,227 | ) | |
| Safeway, Inc. | | | (1,400 | ) | | | (31,486 | ) | |
| SUPERVALU, Inc. | | | (2,400 | ) | | | (23,112 | ) | |
| Sysco Corp. | | | (1,100 | ) | | | (32,340 | ) | |
See Accompanying Notes to Financial Statements.
25
Credit Suisse Trust — U.S. Equity Flex I Portfolio
Schedule of Investments (continued)
December 31, 2010
| | | Number of
Shares | | Value | |
| SHORT STOCK POSITIONS | |
| COMMON STOCKS | |
| Food & Staples Retailing | |
| The Kroger Co. | | | (1,400 | ) | | $ | (31,304 | ) | |
| United Natural Foods, Inc.* | | | (800 | ) | | | (29,344 | ) | |
| Wal-Mart Stores, Inc. | | | (1,800 | ) | | | (97,074 | ) | |
| Walgreen Co. | | | (1,300 | ) | | | (50,648 | ) | |
| Weis Markets, Inc. | | | (600 | ) | | | (24,198 | ) | |
| Whole Foods Market, Inc.* | | | (900 | ) | | | (45,531 | ) | |
| Winn-Dixie Stores, Inc.* | | | (3,800 | ) | | | (27,246 | ) | |
| | | | (549,880 | ) | |
| Food Products (-0.5%) | |
| Archer-Daniels-Midland Co. | | | (1,200 | ) | | | (36,096 | ) | |
| Campbell Soup Co. | | | (900 | ) | | | (31,275 | ) | |
| Chiquita Brands International, Inc.* | | | (1,800 | ) | | | (25,236 | ) | |
| Darling International, Inc.* | | | (3,700 | ) | | | (49,136 | ) | |
| Dean Foods Co.* | | | (3,100 | ) | | | (27,404 | ) | |
| Flowers Foods, Inc. | | | (1,300 | ) | | | (34,983 | ) | |
| General Mills, Inc. | | | (1,000 | ) | | | (35,590 | ) | |
| Hormel Foods Corp. | | | (700 | ) | | | (35,882 | ) | |
| Kellogg Co. | | | (600 | ) | | | (30,648 | ) | |
| Kraft Foods, Inc. Class A | | | (1,500 | ) | | | (47,265 | ) | |
| McCormick & Co., Inc. | | | (800 | ) | | | (37,224 | ) | |
| Mead Johnson Nutrition Co. | | | (600 | ) | | | (37,350 | ) | |
| Ralcorp Holdings, Inc.* | | | (500 | ) | | | (32,505 | ) | |
| Sanderson Farms, Inc. | | | (500 | ) | | | (19,575 | ) | |
| Smithfield Foods, Inc.* | | | (1,800 | ) | | | (37,134 | ) | |
| Snyders-Lance, Inc. | | | (1,100 | ) | | | (25,784 | ) | |
| The Hain Celestial Group, Inc.* | | | (1,200 | ) | | | (32,472 | ) | |
| The Hershey Co. | | | (500 | ) | | | (23,575 | ) | |
| The J.M. Smucker Co. | | | (600 | ) | | | (39,390 | ) | |
| Tootsie Roll Industries, Inc. | | | (1,236 | ) | | | (35,807 | ) | |
| TreeHouse Foods, Inc.* | | | (800 | ) | | | (40,872 | ) | |
| | | | (715,203 | ) | |
| Gas Utilities (-0.3%) | |
| AGL Resources, Inc. | | | (600 | ) | | | (21,510 | ) | |
| Atmos Energy Corp. | | | (800 | ) | | | (24,960 | ) | |
| Energen Corp. | | | (600 | ) | | | (28,956 | ) | |
| National Fuel Gas Co. | | | (500 | ) | | | (32,810 | ) | |
| New Jersey Resources Corp. | | | (700 | ) | | | (30,177 | ) | |
| Nicor, Inc. | | | (600 | ) | | | (29,952 | ) | |
| Northwest Natural Gas Co. | | | (500 | ) | | | (23,235 | ) | |
| ONEOK, Inc. | | | (800 | ) | | | (44,376 | ) | |
| Questar Corp. | | | (2,000 | ) | | | (34,820 | ) | |
| South Jersey Industries, Inc. | | | (800 | ) | | | (42,256 | ) | |
| Southwest Gas Corp. | | | (700 | ) | | | (25,669 | ) | |
| The Laclede Group, Inc. | | | (900 | ) | | | (32,886 | ) | |
| UGI Corp. | | | (900 | ) | | | (28,422 | ) | |
| WGL Holdings, Inc. | | | (800 | ) | | | (28,616 | ) | |
| | | | (428,645 | ) | |
See Accompanying Notes to Financial Statements.
26
Credit Suisse Trust — U.S. Equity Flex I Portfolio
Schedule of Investments (continued)
December 31, 2010
| | | Number of
Shares | | Value | |
| SHORT STOCK POSITIONS | |
| COMMON STOCKS | |
| Health Care Equipment & Supplies (-0.6%) | |
| Alere, Inc.* | | | (800 | ) | | $ | (29,280 | ) | |
| American Medical Systems Holdings, Inc.* | | | (1,400 | ) | | | (26,404 | ) | |
| Baxter International, Inc. | | | (700 | ) | | | (35,434 | ) | |
| Beckman Coulter, Inc. | | | (600 | ) | | | (45,138 | ) | |
| Becton, Dickinson and Co. | | | (500 | ) | | | (42,260 | ) | |
| Boston Scientific Corp.* | | | (4,200 | ) | | | (31,794 | ) | |
| CR Bard, Inc. | | | (400 | ) | | | (36,708 | ) | |
| DENTSPLY International, Inc. | | | (1,000 | ) | | | (34,170 | ) | |
| Edwards Lifesciences Corp.* | | | (500 | ) | | | (40,420 | ) | |
| Gen-Probe, Inc.* | | | (800 | ) | | | (46,680 | ) | |
| Haemonetics Corp.* | | | (400 | ) | | | (25,272 | ) | |
| Hill-Rom Holdings, Inc. | | | (800 | ) | | | (31,496 | ) | |
| Hologic, Inc.* | | | (1,600 | ) | | | (30,112 | ) | |
| Integra LifeSciences Holdings* | | | (800 | ) | | | (37,840 | ) | |
| Intuitive Surgical, Inc.* | | | (100 | ) | | | (25,775 | ) | |
| Kinetic Concepts, Inc.* | | | (800 | ) | | | (33,504 | ) | |
| Masimo Corp. | | | (1,200 | ) | | | (34,884 | ) | |
| Medtronic, Inc. | | | (900 | ) | | | (33,381 | ) | |
| NxStage Medical, Inc.* | | | (1,400 | ) | | | (34,832 | ) | |
| ResMed, Inc.* | | | (800 | ) | | | (27,712 | ) | |
| Sirona Dental Systems, Inc.* | | | (800 | ) | | | (33,424 | ) | |
| St. Jude Medical, Inc.* | | | (900 | ) | | | (38,475 | ) | |
| STERIS Corp. | | | (800 | ) | | | (29,168 | ) | |
| Stryker Corp. | | | (600 | ) | | | (32,220 | ) | |
| Teleflex, Inc. | | | (600 | ) | | | (32,286 | ) | |
| Varian Medical Systems, Inc.* | | | (500 | ) | | | (34,640 | ) | |
| West Pharmaceutical Services, Inc. | | | (800 | ) | | | (32,960 | ) | |
| Zimmer Holdings, Inc.* | | | (600 | ) | | | (32,208 | ) | |
| | | | (948,477 | ) | |
| Health Care Providers & Services (-0.7%) | |
| AMERIGROUP Corp.* | | | (800 | ) | | | (35,136 | ) | |
| AmerisourceBergen Corp. | | | (1,100 | ) | | | (37,532 | ) | |
| Brookdale Senior Living, Inc.* | | | (2,400 | ) | | | (51,384 | ) | |
| Catalyst Health Solutions, Inc.* | | | (600 | ) | | | (27,894 | ) | |
| Centene Corp.* | | | (1,400 | ) | | | (35,476 | ) | |
| Chemed Corp. | | | (600 | ) | | | (38,106 | ) | |
| Community Health Systems, Inc.* | | | (900 | ) | | | (33,633 | ) | |
| Coventry Health Care, Inc.* | | | (1,300 | ) | | | (34,320 | ) | |
| DaVita, Inc.* | | | (400 | ) | | | (27,796 | ) | |
| Health Management Associates, Inc. Class A* | | | (3,400 | ) | | | (32,436 | ) | |
| Healthspring, Inc.* | | | (1,500 | ) | | | (39,795 | ) | |
| Henry Schein, Inc.* | | | (400 | ) | | | (24,556 | ) | |
| HMS Holdings Corp.* | | | (500 | ) | | | (32,385 | ) | |
| Kindred Healthcare, Inc.* | | | (1,400 | ) | | | (25,718 | ) | |
| Laboratory Corp. of America Holdings* | | | (500 | ) | | | (43,960 | ) | |
| Landauer, Inc. | | | (400 | ) | | | (23,988 | ) | |
See Accompanying Notes to Financial Statements.
27
Credit Suisse Trust — U.S. Equity Flex I Portfolio
Schedule of Investments (continued)
December 31, 2010
| | | Number of
Shares | | Value | |
| SHORT STOCK POSITIONS | |
| COMMON STOCKS | |
| Health Care Providers & Services | |
| LifePoint Hospitals, Inc.* | | | (1,000 | ) | | $ | (36,750 | ) | |
| Lincare Holdings, Inc. | | | (1,200 | ) | | | (32,196 | ) | |
| Magellan Health Services, Inc.* | | | (600 | ) | | | (28,368 | ) | |
| McKesson Corp. | | | (500 | ) | | | (35,190 | ) | |
| Medco Health Solutions, Inc.* | | | (700 | ) | | | (42,889 | ) | |
| Mednax, Inc.* | | | (600 | ) | | | (40,374 | ) | |
| Molina Healthcare, Inc.* | | | (1,000 | ) | | | (27,850 | ) | |
| Omnicare, Inc. | | | (1,200 | ) | | | (30,468 | ) | |
| Patterson Cos., Inc. | | | (1,000 | ) | | | (30,630 | ) | |
| Quest Diagnostics, Inc. | | | (600 | ) | | | (32,382 | ) | |
| RehabCare Group, Inc.* | | | (1,600 | ) | | | (37,920 | ) | |
| Universal American Corp. | | | (1,600 | ) | | | (32,720 | ) | |
| Universal Health Services, Inc. Class B | | | (800 | ) | | | (34,736 | ) | |
| VCA Antech, Inc.* | | | (1,400 | ) | | | (32,606 | ) | |
| WellCare Health Plans, Inc.* | | | (1,000 | ) | | | (30,220 | ) | |
| | | | (1,049,414 | ) | |
| Health Care Technology (-0.0%) | |
| Allscripts-Misys Heathcare Solutions, Inc.* | | | (1,400 | ) | | | (26,978 | ) | |
| Hotels, Restaurants & Leisure (-0.8%) | |
| Ameristar Casinos, Inc. | | | (1,800 | ) | | | (28,134 | ) | |
| Bally Technologies, Inc.* | | | (900 | ) | | | (37,971 | ) | |
| Bob Evans Farms, Inc. | | | (1,100 | ) | | | (36,256 | ) | |
| Carnival Corp. | | | (700 | ) | | | (32,277 | ) | |
| CEC Entertainment, Inc.* | | | (900 | ) | | | (34,947 | ) | |
| Chipotle Mexican Grill, Inc.* | | | (200 | ) | | | (42,532 | ) | |
| Choice Hotels International, Inc. | | | (1,000 | ) | | | (38,270 | ) | |
| Cracker Barrel Old Country Store, Inc. | | | (500 | ) | | | (27,385 | ) | |
| Darden Restaurants, Inc. | | | (600 | ) | | | (27,864 | ) | |
| Domino's Pizza, Inc.* | | | (2,400 | ) | | | (38,280 | ) | |
| Gaylord Entertainment Co.* | | | (1,100 | ) | | | (39,534 | ) | |
| International Game Technology | | | (1,600 | ) | | | (28,304 | ) | |
| International Speedway Corp. Class A | | | (1,100 | ) | | | (28,787 | ) | |
| Interval Leisure Group, Inc.* | | | (2,200 | ) | | | (35,508 | ) | |
| Jack in the Box, Inc.* | | | (1,400 | ) | | | (29,582 | ) | |
| Life Time Fitness, Inc.* | | | (700 | ) | | | (28,693 | ) | |
| Marriott International, Inc. Class A | | | (900 | ) | | | (37,386 | ) | |
| McDonald's Corp. | | | (1,200 | ) | | | (92,112 | ) | |
| Panera Bread Co. Class A* | | | (300 | ) | | | (30,363 | ) | |
| Papa John's International, Inc.* | | | (1,000 | ) | | | (27,700 | ) | |
| Penn National Gaming, Inc.* | | | (1,000 | ) | | | (35,150 | ) | |
| Pinnacle Entertainment, Inc.* | | | (2,600 | ) | | | (36,452 | ) | |
| Ruby Tuesday, Inc.* | | | (2,100 | ) | | | (27,426 | ) | |
| Scientific Games Corp. Class A* | | | (3,100 | ) | | | (30,876 | ) | |
| Sonic Corp.* | | | (2,800 | ) | | | (28,336 | ) | |
| Speedway Motorsports, Inc. | | | (2,100 | ) | | | (32,172 | ) | |
| Starwood Hotels & Resorts Worldwide, Inc. | | | (500 | ) | | | (30,390 | ) | |
See Accompanying Notes to Financial Statements.
28
Credit Suisse Trust — U.S. Equity Flex I Portfolio
Schedule of Investments (continued)
December 31, 2010
| | | Number of
Shares | | Value | |
| SHORT STOCK POSITIONS | |
| COMMON STOCKS | |
| Hotels, Restaurants & Leisure | |
| Texas Roadhouse, Inc. Class A* | | | (2,400 | ) | | $ | (41,208 | ) | |
| The Cheesecake Factory, Inc.* | | | (1,300 | ) | | | (39,858 | ) | |
| Vail Resorts, Inc.* | | | (800 | ) | | | (41,632 | ) | |
| WMS Industries, Inc.* | | | (600 | ) | | | (27,144 | ) | |
| Wyndham Worldwide Corp. | | | (900 | ) | | | (26,964 | ) | |
| Wynn Resorts, Ltd. | | | (300 | ) | | | (31,152 | ) | |
| Yum! Brands, Inc. | | | (800 | ) | | | (39,240 | ) | |
| | | | (1,189,885 | ) | |
| Household Durables (-0.3%) | |
| D.R. Horton, Inc. | | | (2,500 | ) | | | (29,825 | ) | |
| Ethan Allen Interiors, Inc. | | | (2,200 | ) | | | (44,022 | ) | |
| Jarden Corp. | | | (1,200 | ) | | | (37,044 | ) | |
| KB Home | | | (2,200 | ) | | | (29,678 | ) | |
| Leggett & Platt, Inc. | | | (1,000 | ) | | | (22,760 | ) | |
| Lennar Corp. Class A | | | (1,800 | ) | | | (33,750 | ) | |
| M.D.C. Holdings, Inc. | | | (1,000 | ) | | | (28,770 | ) | |
| Meritage Homes Corp.* | | | (1,500 | ) | | | (33,300 | ) | |
| Mohawk Industries, Inc.* | | | (700 | ) | | | (39,732 | ) | |
| Stanley Black & Decker, Inc. | | | (400 | ) | | | (26,748 | ) | |
| Tempur-Pedic International, Inc.* | | | (1,000 | ) | | | (40,060 | ) | |
| The Ryland Group, Inc. | | | (1,900 | ) | | | (32,357 | ) | |
| Toll Brothers, Inc.* | | | (2,000 | ) | | | (38,000 | ) | |
| Tupperware Brands Corp. | | | (700 | ) | | | (33,369 | ) | |
| Universal Electronics, Inc.* | | | (1,600 | ) | | | (45,392 | ) | |
| | | | (514,807 | ) | |
| Household Products (-0.2%) | |
| Clorox Co. | | | (600 | ) | | | (37,968 | ) | |
| Colgate-Palmolive Co. | | | (600 | ) | | | (48,222 | ) | |
| Energizer Holdings, Inc.* | | | (500 | ) | | | (36,450 | ) | |
| Kimberly-Clark Corp. | | | (700 | ) | | | (44,128 | ) | |
| The Procter & Gamble Co. | | | (1,500 | ) | | | (96,495 | ) | |
| | | | (263,263 | ) | |
| Independent Power Producers & Energy Traders (-0.1%) | |
| Calpine Corp.* | | | (2,300 | ) | | | (30,682 | ) | |
| NRG Energy, Inc.* | | | (1,800 | ) | | | (35,172 | ) | |
| The AES Corp.* | | | (3,200 | ) | | | (38,976 | ) | |
| | | | (104,830 | ) | |
| Industrial Conglomerates (-0.1%) | |
| Carlisle Cos., Inc. | | | (900 | ) | | | (35,766 | ) | |
| Textron, Inc. | | | (1,300 | ) | | | (30,732 | ) | |
| Tyco International, Ltd.* | | | (830 | ) | | | (34,395 | ) | |
| | | | (100,893 | ) | |
See Accompanying Notes to Financial Statements.
29
Credit Suisse Trust — U.S. Equity Flex I Portfolio
Schedule of Investments (continued)
December 31, 2010
| | | Number of
Shares | | Value | |
| SHORT STOCK POSITIONS | |
| COMMON STOCKS | |
| Insurance (-0.9%) | |
| Alleghany Corp.* | | | (100 | ) | | $ | (30,637 | ) | |
| American Equity Investment Life Holding Co. | | | (1,900 | ) | | | (23,845 | ) | |
| American Financial Group, Inc. | | | (900 | ) | | | (29,061 | ) | |
| American National Insurance Co. | | | (300 | ) | | | (25,686 | ) | |
| Amtrust Financial Services, Inc. | | | (1,300 | ) | | | (22,750 | ) | |
| AON Corp. | | | (800 | ) | | | (36,808 | ) | |
| Arthur J. Gallagher & Co. | | | (1,000 | ) | | | (29,080 | ) | |
| Assurant, Inc. | | | (600 | ) | | | (23,112 | ) | |
| Brown & Brown, Inc. | | | (1,700 | ) | | | (40,698 | ) | |
| Chubb Corp. | | | (700 | ) | | | (41,748 | ) | |
| Cincinnati Financial Corp. | | | (1,200 | ) | | | (38,028 | ) | |
| CNA Financial Corp.* | | | (1,000 | ) | | | (27,050 | ) | |
| CNO Financial Group, Inc.* | | | (5,400 | ) | | | (36,612 | ) | |
| Delphi Financial Group, Inc. Class A | | | (1,300 | ) | | | (37,492 | ) | |
| Employers Holdings, Inc. | | | (1,800 | ) | | | (31,464 | ) | |
| Erie Indemnity Co. Class A | | | (600 | ) | | | (39,282 | ) | |
| FBL Financial Group, Inc. Class A | | | (1,000 | ) | | | (28,670 | ) | |
| Harleysville Group, Inc. | | | (800 | ) | | | (29,392 | ) | |
| Hartford Financial Services Group, Inc. | | | (1,500 | ) | | | (39,735 | ) | |
| HCC Insurance Holdings, Inc. | | | (1,100 | ) | | | (31,834 | ) | |
| Hilltop Holdings, Inc.* | | | (2,300 | ) | | | (22,816 | ) | |
| Lincoln National Corp. | | | (1,100 | ) | | | (30,591 | ) | |
| Loews Corp. | | | (900 | ) | | | (35,019 | ) | |
| Markel Corp.* | | | (100 | ) | | | (37,813 | ) | |
| Mercury General Corp. | | | (800 | ) | | | (34,408 | ) | |
| MetLife, Inc. | | | (700 | ) | | | (31,108 | ) | |
| Navigators Group, Inc.* | | | (600 | ) | | | (30,210 | ) | |
| Old Republic International Corp. | | | (2,300 | ) | | | (31,349 | ) | |
| Principal Financial Group, Inc. | | | (1,100 | ) | | | (35,816 | ) | |
| ProAssurance Corp.* | | | (400 | ) | | | (24,240 | ) | |
| Protective Life Corp. | | | (1,500 | ) | | | (39,960 | ) | |
| Reinsurance Group of America, Inc. | | | (700 | ) | | | (37,597 | ) | |
| RLI Corp. | | | (500 | ) | | | (26,285 | ) | |
| Safety Insurance Group, Inc. | | | (600 | ) | | | (28,542 | ) | |
| Selective Insurance Group, Inc. | | | (1,500 | ) | | | (27,225 | ) | |
| StanCorp Financial Group, Inc. | | | (700 | ) | | | (31,598 | ) | |
| The Allstate Corp. | | | (1,000 | ) | | | (31,880 | ) | |
| The Hanover Insurance Group, Inc. | | | (800 | ) | | | (37,376 | ) | |
| The Progressive Corp. | | | (1,700 | ) | | | (33,779 | ) | |
| Torchmark Corp. | | | (400 | ) | | | (23,896 | ) | |
| Tower Group, Inc. | | | (1,200 | ) | | | (30,696 | ) | |
| Transatlantic Holdings, Inc. | | | (600 | ) | | | (30,972 | ) | |
| W.R. Berkley Corp. | | | (1,200 | ) | | | (32,856 | ) | |
| XL Group PLC | | | (1,300 | ) | | | (28,366 | ) | |
| | | | (1,397,382 | ) | |
See Accompanying Notes to Financial Statements.
30
Credit Suisse Trust — U.S. Equity Flex I Portfolio
Schedule of Investments (continued)
December 31, 2010
| | | Number of
Shares | | Value | |
| SHORT STOCK POSITIONS | |
| COMMON STOCKS | |
| Internet & Catalog Retail (-0.0%) | |
| HSN, Inc.* | | | (1,100 | ) | | $ | (33,704 | ) | |
| Internet Software & Services (-0.2%) | |
| Akamai Technologies, Inc.* | | | (700 | ) | | | (32,935 | ) | |
| DealerTrack Holdings, Inc.* | | | (1,500 | ) | | | (30,105 | ) | |
| Equinix, Inc.* | | | (300 | ) | | | (24,378 | ) | |
| GSI Commerce, Inc.* | | | (1,100 | ) | | | (25,520 | ) | |
| IAC/InterActiveCorp* | | | (1,400 | ) | | | (40,180 | ) | |
| Monster Worldwide, Inc.* | | | (2,100 | ) | | | (49,623 | ) | |
| SAVVIS, Inc.* | | | (1,600 | ) | | | (40,832 | ) | |
| ValueClick, Inc.* | | | (2,300 | ) | | | (36,869 | ) | |
| | | | (280,442 | ) | |
| IT Services (-0.6%) | |
| Automatic Data Processing, Inc. | | | (900 | ) | | | (41,652 | ) | |
| Broadridge Financial Solutions, Inc. | | | (1,300 | ) | | | (28,509 | ) | |
| CACI International, Inc. Class A* | | | (500 | ) | | | (26,700 | ) | |
| Cognizant Technology Solutions Corp. Class A* | | | (600 | ) | | | (43,974 | ) | |
| Convergys Corp.* | | | (2,600 | ) | | | (34,242 | ) | |
| CoreLogic, Inc. | | | (1,442 | ) | | | (26,706 | ) | |
| DST Systems, Inc. | | | (600 | ) | | | (26,610 | ) | |
| Fidelity National Information Services, Inc. | | | (900 | ) | | | (24,651 | ) | |
| Fiserv, Inc.* | | | (600 | ) | | | (35,136 | ) | |
| Forrester Research, Inc. | | | (800 | ) | | | (28,232 | ) | |
| Gartner, Inc.* | | | (1,000 | ) | | | (33,200 | ) | |
| Global Payments, Inc. | | | (600 | ) | | | (27,726 | ) | |
| iGate Corp. | | | (1,500 | ) | | | (29,565 | ) | |
| Jack Henry & Associates, Inc. | | | (1,100 | ) | | | (32,065 | ) | |
| ManTech International Corp. Class A* | | | (700 | ) | | | (28,931 | ) | |
| Paychex, Inc. | | | (1,100 | ) | | | (34,001 | ) | |
| SAIC, Inc.* | | | (1,700 | ) | | | (26,962 | ) | |
| SRA International, Inc. Class A* | | | (1,600 | ) | | | (32,720 | ) | |
| Syntel, Inc. | | | (700 | ) | | | (33,453 | ) | |
| Teradata Corp.* | | | (700 | ) | | | (28,812 | ) | |
| The Western Union Co. | | | (2,000 | ) | | | (37,140 | ) | |
| TNS, Inc.* | | | (1,300 | ) | | | (27,040 | ) | |
| Total System Services, Inc. | | | (1,900 | ) | | | (29,222 | ) | |
| Unisys Corp.* | | | (900 | ) | | | (23,301 | ) | |
| VeriFone Holdings, Inc.* | | | (1,300 | ) | | | (50,128 | ) | |
| Visa, Inc. Class A | | | (600 | ) | | | (42,228 | ) | |
| Wright Express Corp.* | | | (900 | ) | | | (41,400 | ) | |
| | | | (874,306 | ) | |
| Leisure Equipment & Products (-0.1%) | |
| Brunswick Corp. | | | (1,600 | ) | | | (29,984 | ) | |
| Hasbro, Inc. | | | (700 | ) | | | (33,026 | ) | |
| Mattel, Inc. | | | (1,300 | ) | | | (33,059 | ) | |
| | | | (96,069 | ) | |
See Accompanying Notes to Financial Statements.
31
Credit Suisse Trust — U.S. Equity Flex I Portfolio
Schedule of Investments (continued)
December 31, 2010
| | | Number of
Shares | | Value | |
| SHORT STOCK POSITIONS | |
| COMMON STOCKS | |
| Life Sciences Tools & Services (-0.3%) | |
| Agilent Technologies, Inc.* | | | (1,000 | ) | | $ | (41,430 | ) | |
| Bio-Rad Laboratories, Inc. Class A* | | | (300 | ) | | | (31,155 | ) | |
| Charles River Laboratories International, Inc.* | | | (800 | ) | | | (28,432 | ) | |
| Covance, Inc.* | | | (700 | ) | | | (35,987 | ) | |
| Life Technologies Corp.* | | | (700 | ) | | | (38,850 | ) | |
| Mettler-Toledo International, Inc.* | | | (300 | ) | | | (45,363 | ) | |
| Paraxel International Corp.* | | | (1,100 | ) | | | (23,353 | ) | |
| PerkinElmer, Inc. | | | (1,300 | ) | | | (33,566 | ) | |
| Pharmaceutical Product Development, Inc. | | | (900 | ) | | | (24,426 | ) | |
| Techne Corp. | | | (400 | ) | | | (26,268 | ) | |
| Thermo Fisher Scientific, Inc.* | | | (900 | ) | | | (49,824 | ) | |
| Waters Corp.* | | | (400 | ) | | | (31,084 | ) | |
| | | | (409,738 | ) | |
| Machinery (-1.0%) | |
| Actuant Corp. Class A | | | (1,600 | ) | | | (42,592 | ) | |
| Albany International Corp. Class A | | | (1,300 | ) | | | (30,797 | ) | |
| American Railcar Industries, Inc.* | | | (2,100 | ) | | | (46,473 | ) | |
| ArvinMeritor, Inc.* | | | (2,000 | ) | | | (41,040 | ) | |
| Astec Industries, Inc.* | | | (1,100 | ) | | | (35,651 | ) | |
| Barnes Group, Inc. | | | (1,700 | ) | | | (35,139 | ) | |
| Briggs & Stratton Corp. | | | (1,400 | ) | | | (27,566 | ) | |
| Cascade Corp. | | | (700 | ) | | | (33,096 | ) | |
| CLARCOR, Inc. | | | (700 | ) | | | (30,023 | ) | |
| Columbus McKinnon Corp.* | | | (2,200 | ) | | | (44,704 | ) | |
| Cummins, Inc. | | | (300 | ) | | | (33,003 | ) | |
| Donaldson Co., Inc. | | | (600 | ) | | | (34,968 | ) | |
| Dover Corp. | | | (500 | ) | | | (29,225 | ) | |
| ESCO Technologies, Inc. | | | (900 | ) | | | (34,056 | ) | |
| Flowserve Corp. | | | (200 | ) | | | (23,844 | ) | |
| FreightCar America, Inc. | | | (1,300 | ) | | | (37,622 | ) | |
| Gardner Denver, Inc. | | | (500 | ) | | | (34,410 | ) | |
| Harsco Corp. | | | (1,200 | ) | | | (33,984 | ) | |
| IDEX Corp. | | | (1,000 | ) | | | (39,120 | ) | |
| Illinois Tool Works, Inc. | | | (600 | ) | | | (32,040 | ) | |
| Joy Global, Inc. | | | (400 | ) | | | (34,700 | ) | |
| Kaydon Corp. | | | (900 | ) | | | (36,648 | ) | |
| Kennametal, Inc. | | | (1,100 | ) | | | (43,406 | ) | |
| Lincoln Electric Holdings, Inc. | | | (500 | ) | | | (32,635 | ) | |
| Mueller Industries, Inc. | | | (1,200 | ) | | | (39,240 | ) | |
| NACCO Industries, Inc. Class A | | | (300 | ) | | | (32,511 | ) | |
| Nordson Corp. | | | (500 | ) | | | (45,940 | ) | |
| PACCAR, Inc. | | | (700 | ) | | | (40,194 | ) | |
| Pentair, Inc. | | | (1,000 | ) | | | (36,510 | ) | |
| Robbins & Myers, Inc. | | | (1,200 | ) | | | (42,936 | ) | |
| Snap-on, Inc. | | | (700 | ) | | | (39,606 | ) | |
| SPX Corp. | | | (600 | ) | | | (42,894 | ) | |
See Accompanying Notes to Financial Statements.
32
Credit Suisse Trust — U.S. Equity Flex I Portfolio
Schedule of Investments (continued)
December 31, 2010
| | | Number of
Shares | | Value | |
| SHORT STOCK POSITIONS | |
| COMMON STOCKS | |
| Machinery | |
| Tennant Co. | | | (800 | ) | | $ | (30,728 | ) | |
| Terex Corp.* | | | (1,300 | ) | | | (40,352 | ) | |
| The Manitowoc Co., Inc. | | | (2,000 | ) | | | (26,220 | ) | |
| The Middleby Corp.* | | | (400 | ) | | | (33,768 | ) | |
| Trinity Industries, Inc. | | | (1,400 | ) | | | (37,254 | ) | |
| Valmont Industries, Inc. | | | (400 | ) | | | (35,492 | ) | |
| WABCO Holdings, Inc.* | | | (800 | ) | | | (48,744 | ) | |
| Wabtec Corp. | | | (800 | ) | | | (42,312 | ) | |
| Watts Water Technologies, Inc. Class A | | | (1,000 | ) | | | (36,590 | ) | |
| | | | (1,498,033 | ) | |
| Marine (-0.0%) | |
| Alexander & Baldwin, Inc. | | | (900 | ) | | | (36,027 | ) | |
| Kirby Corp.* | | | (700 | ) | | | (30,835 | ) | |
| | | | (66,862 | ) | |
| Media (-0.5%) | |
| Cablevision Systems Corp. Group A | | | (1,300 | ) | | | (43,992 | ) | |
| CBS Corp. Class B | | | (2,000 | ) | | | (38,100 | ) | |
| Cinemark Holdings, Inc. | | | (1,900 | ) | | | (32,756 | ) | |
| Comcast Corp. Class A | | | (1,700 | ) | | | (37,349 | ) | |
| Discovery Communications, Inc. Class A* | | | (700 | ) | | | (29,190 | ) | |
| DreamWorks Animation SKG, Inc. Class A* | | | (900 | ) | | | (26,523 | ) | |
| E.W. Scripps Co. Class A* | | | (3,100 | ) | | | (31,465 | ) | |
| Lamar Advertising Co. Class A* | | | (1,200 | ) | | | (47,808 | ) | |
| Liberty Media Corp. - Capital Series A* | | | (500 | ) | | | (31,280 | ) | |
| Liberty Media Corp. - Starz Series A* | | | (500 | ) | | | (33,240 | ) | |
| Live Nation Entertainment, Inc.* | | | (3,400 | ) | | | (38,828 | ) | |
| Meredith Corp. | | | (1,000 | ) | | | (34,650 | ) | |
| Morningstar, Inc. | | | (600 | ) | | | (31,848 | ) | |
| Omnicom Group, Inc. | | | (800 | ) | | | (36,640 | ) | |
| Regal Entertainment Group Class A | | | (2,100 | ) | | | (24,654 | ) | |
| Rentrak Corp.* | | | (1,100 | ) | | | (33,176 | ) | |
| Scripps Networks Interactive, Inc. Class A | | | (700 | ) | | | (36,225 | ) | |
| The Interpublic Group of Cos., Inc.* | | | (3,300 | ) | | | (35,046 | ) | |
| The McGraw-Hill Cos., Inc. | | | (800 | ) | | | (29,128 | ) | |
| The Walt Disney Co. | | | (1,400 | ) | | | (52,514 | ) | |
| Time Warner Cable, Inc. | | | (600 | ) | | | (39,618 | ) | |
| Time Warner, Inc. | | | (1,300 | ) | | | (41,821 | ) | |
| Valassis Communications, Inc.* | | | (1,000 | ) | | | (32,350 | ) | |
| | | | (818,201 | ) | |
| Metals & Mining (-0.5%) | |
| Alcoa, Inc. | | | (2,300 | ) | | | (35,397 | ) | |
| Allegheny Technologies, Inc. | | | (600 | ) | | | (33,108 | ) | |
| Allied Nevada Gold Corp.* | | | (1,200 | ) | | | (31,572 | ) | |
| AMCOL International Corp. | | | (1,000 | ) | | | (31,000 | ) | |
| Carpenter Technology Corp. | | | (900 | ) | | | (36,216 | ) | |
See Accompanying Notes to Financial Statements.
33
Credit Suisse Trust — U.S. Equity Flex I Portfolio
Schedule of Investments (continued)
December 31, 2010
| | | Number of
Shares | | Value | |
| SHORT STOCK POSITIONS | |
| COMMON STOCKS | |
| Metals & Mining | |
| Cliffs Natural Resources, Inc. | | | (600 | ) | | $ | (46,806 | ) | |
| Coeur d'Alene Mines Corp.* | | | (1,900 | ) | | | (51,908 | ) | |
| Commercial Metals Co. | | | (2,000 | ) | | | (33,180 | ) | |
| Compass Minerals International, Inc. | | | (400 | ) | | | (35,708 | ) | |
| Contango ORE, Inc.* | | | (60 | ) | | | (630 | ) | |
| Globe Specialty Metals, Inc. | | | (1,900 | ) | | | (32,471 | ) | |
| Kaiser Aluminum Corp. | | | (800 | ) | | | (40,072 | ) | |
| Nucor Corp. | | | (1,000 | ) | | | (43,820 | ) | |
| Reliance Steel & Aluminum Co. | | | (800 | ) | | | (40,880 | ) | |
| Royal Gold, Inc. | | | (700 | ) | | | (38,241 | ) | |
| RTI International Metals, Inc.* | | | (1,200 | ) | | | (32,376 | ) | |
| Schnitzer Steel Industries, Inc. Class A | | | (700 | ) | | | (46,473 | ) | |
| Southern Copper Corp. | | | (800 | ) | | | (38,992 | ) | |
| Steel Dynamics, Inc. | | | (1,800 | ) | | | (32,940 | ) | |
| Titanium Metals Corp.* | | | (1,300 | ) | | | (22,334 | ) | |
| Walter Energy, Inc. | | | (400 | ) | | | (51,136 | ) | |
| Worthington Industries, Inc. | | | (2,000 | ) | | | (36,800 | ) | |
| | | | (792,060 | ) | |
| Multi-Utilities (-0.4%) | |
| Alliant Energy Corp. | | | (1,000 | ) | | | (36,770 | ) | |
| Ameren Corp. | | | (1,100 | ) | | | (31,009 | ) | |
| Black Hills Corp. | | | (1,100 | ) | | | (33,000 | ) | |
| CenterPoint Energy, Inc. | | | (1,700 | ) | | | (26,724 | ) | |
| CH Energy Group, Inc. | | | (500 | ) | | | (24,445 | ) | |
| CMS Energy Corp. | | | (1,500 | ) | | | (27,900 | ) | |
| Consolidated Edison, Inc. | | | (800 | ) | | | (39,656 | ) | |
| Dominion Resources, Inc. | | | (900 | ) | | | (38,448 | ) | |
| MDU Resources Group, Inc. | | | (1,300 | ) | | | (26,351 | ) | |
| NorthWestern Corp. | | | (1,000 | ) | | | (28,830 | ) | |
| OGE Energy Corp. | | | (900 | ) | | | (40,986 | ) | |
| PG&E Corp. | | | (800 | ) | | | (38,272 | ) | |
| Public Service Enterprise Group, Inc. | | | (1,100 | ) | | | (34,991 | ) | |
| SCANA Corp. | | | (700 | ) | | | (28,420 | ) | |
| Sempra Energy | | | (800 | ) | | | (41,984 | ) | |
| TECO Energy, Inc. | | | (1,500 | ) | | | (26,700 | ) | |
| Vectren Corp. | | | (1,400 | ) | | | (35,532 | ) | |
| Wisconsin Energy Corp. | | | (500 | ) | | | (29,430 | ) | |
| Xcel Energy, Inc. | | | (1,500 | ) | | | (35,325 | ) | |
| | | | (624,773 | ) | |
| Multiline Retail (-0.2%) | |
| 99 Cents Only Stores* | | | (1,500 | ) | | | (23,910 | ) | |
| Dillard's, Inc. Class A | | | (1,200 | ) | | | (45,528 | ) | |
| Dollar Tree, Inc.* | | | (800 | ) | | | (44,864 | ) | |
| Fred's, Inc. Class A | | | (2,000 | ) | | | (27,520 | ) | |
| J.C. Penney Co., Inc. | | | (1,000 | ) | | | (32,310 | ) | |
See Accompanying Notes to Financial Statements.
34
Credit Suisse Trust — U.S. Equity Flex I Portfolio
Schedule of Investments (continued)
December 31, 2010
| | | Number of
Shares | | Value | |
| SHORT STOCK POSITIONS | |
| COMMON STOCKS | |
| Multiline Retail | |
| Kohl's Corp.* | | | (600 | ) | | $ | (32,604 | ) | |
| Macy's, Inc. | | | (1,500 | ) | | | (37,950 | ) | |
| Nordstrom, Inc. | | | (800 | ) | | | (33,904 | ) | |
| | | | (278,590 | ) | |
| Office Electronics (-0.0%) | |
| Xerox Corp. | | | (2,933 | ) | | | (33,788 | ) | |
| Zebra Technologies Corp. Class A* | | | (1,100 | ) | | | (41,789 | ) | |
| | | | (75,577 | ) | |
| Oil, Gas & Consumable Fuels (-1.3%) | |
| Anadarko Petroleum Corp. | | | (700 | ) | | | (53,312 | ) | |
| Apache Corp. | | | (500 | ) | | | (59,615 | ) | |
| Berry Petroleum Co. Class A | | | (1,100 | ) | | | (48,070 | ) | |
| Bill Barrett Corp.* | | | (1,000 | ) | | | (41,130 | ) | |
| Brigham Exploration Co.* | | | (1,600 | ) | | | (43,584 | ) | |
| Cabot Oil & Gas Corp. | | | (1,200 | ) | | | (45,420 | ) | |
| Carrizo Oil & Gas, Inc.* | | | (1,200 | ) | | | (41,388 | ) | |
| Chesapeake Energy Corp. | | | (1,700 | ) | | | (44,047 | ) | |
| Cimarex Energy Co. | | | (400 | ) | | | (35,412 | ) | |
| Comstock Resources, Inc.* | | | (1,200 | ) | | | (29,472 | ) | |
| Concho Resources, Inc.* | | | (500 | ) | | | (43,835 | ) | |
| Consol Energy, Inc. | | | (800 | ) | | | (38,992 | ) | |
| Contango Oil & Gas Co.* | | | (600 | ) | | | (34,758 | ) | |
| Continental Resources, Inc.* | | | (600 | ) | | | (35,310 | ) | |
| CVR Energy, Inc.* | | | (3,500 | ) | | | (53,130 | ) | |
| Delek US Holdings, Inc. | | | (3,800 | ) | | | (27,664 | ) | |
| Denbury Resources, Inc.* | | | (2,100 | ) | | | (40,089 | ) | |
| El Paso Corp. | | | (2,800 | ) | | | (38,528 | ) | |
| EOG Resources, Inc. | | | (400 | ) | | | (36,564 | ) | |
| EQT Corp. | | | (1,100 | ) | | | (49,324 | ) | |
| Forest Oil Corp.* | | | (1,100 | ) | | | (41,767 | ) | |
| Frontier Oil Corp.* | | | (2,300 | ) | | | (41,423 | ) | |
| Holly Corp. | | | (1,300 | ) | | | (53,001 | ) | |
| Massey Energy Co. | | | (900 | ) | | | (48,285 | ) | |
| Newfield Exploration Co.* | | | (500 | ) | | | (36,055 | ) | |
| Noble Energy, Inc. | | | (400 | ) | | | (34,432 | ) | |
| Northern Oil & Gas, Inc.* | | | (1,400 | ) | | | (38,094 | ) | |
| Peabody Energy Corp. | | | (700 | ) | | | (44,786 | ) | |
| Penn Virginia Corp. | | | (2,100 | ) | | | (35,322 | ) | |
| Petrohawk Energy Corp.* | | | (2,000 | ) | | | (36,500 | ) | |
| Pioneer Natural Resources Co. | | | (600 | ) | | | (52,092 | ) | |
| Plains Exploration & Production Co.* | | | (1,100 | ) | | | (35,354 | ) | |
| QEP Resources, Inc. | | | (800 | ) | | | (29,048 | ) | |
| Quicksilver Resources, Inc.* | | | (2,000 | ) | | | (29,480 | ) | |
| Range Resources Corp. | | | (1,100 | ) | | | (49,478 | ) | |
| Rosetta Resources, Inc.* | | | (1,200 | ) | | | (45,168 | ) | |
See Accompanying Notes to Financial Statements.
35
Credit Suisse Trust — U.S. Equity Flex I Portfolio
Schedule of Investments (continued)
December 31, 2010
| | | Number of
Shares | | Value | |
| SHORT STOCK POSITIONS | |
| COMMON STOCKS | |
| Oil, Gas & Consumable Fuels | |
| SandRidge Energy, Inc.* | | | (4,600 | ) | | $ | (33,672 | ) | |
| SM Energy Co. | | | (700 | ) | | | (41,251 | ) | |
| Southern Union Co. | | | (1,100 | ) | | | (26,477 | ) | |
| Southwestern Energy Co.* | | | (1,100 | ) | | | (41,173 | ) | |
| Spectra Energy Corp. | | | (1,500 | ) | | | (37,485 | ) | |
| Stone Energy Corp.* | | | (2,100 | ) | | | (46,809 | ) | |
| Sunoco, Inc. | | | (800 | ) | | | (32,248 | ) | |
| Swift Energy Co.* | | | (1,000 | ) | | | (39,150 | ) | |
| The Williams Cos., Inc. | | | (1,400 | ) | | | (34,608 | ) | |
| Venoco, Inc.* | | | (1,600 | ) | | | (29,520 | ) | |
| Whiting Petroleum Corp.* | | | (300 | ) | | | (35,157 | ) | |
| World Fuel Services Corp. | | | (1,300 | ) | | | (47,008 | ) | |
| | | | (1,934,487 | ) | |
| Paper & Forest Products (-0.2%) | |
| Buckeye Technologies, Inc. | | | (2,300 | ) | | | (48,323 | ) | |
| Clearwater Paper Corp.* | | | (400 | ) | | | (31,320 | ) | |
| Deltic Timber Corp. | | | (600 | ) | | | (33,804 | ) | |
| International Paper Co. | | | (1,400 | ) | | | (38,136 | ) | |
| KapStone Paper & Packaging Corp.* | | | (2,200 | ) | | | (33,660 | ) | |
| Louisiana-Pacific Corp.* | | | (3,400 | ) | | | (32,164 | ) | |
| Schweitzer-Mauduit International, Inc. | | | (400 | ) | | | (25,168 | ) | |
| Wausau Paper Corp. | | | (2,900 | ) | | | (24,969 | ) | |
| | | | (267,544 | ) | |
| Personal Products (-0.1%) | |
| Avon Products, Inc. | | | (1,000 | ) | | | (29,060 | ) | |
| Elizabeth Arden, Inc.* | | | (1,700 | ) | | | (39,117 | ) | |
| Nu Skin Enterprises, Inc. Class A | | | (900 | ) | | | (27,234 | ) | |
| | | | (95,411 | ) | |
| Pharmaceuticals (-0.4%) | |
| Allergan, Inc. | | | (600 | ) | | | (41,202 | ) | |
| Bristol-Myers Squibb Co. | | | (1,300 | ) | | | (34,424 | ) | |
| Forest Laboratories, Inc.* | | | (900 | ) | | | (28,782 | ) | |
| Impax Laboratories, Inc.* | | | (1,500 | ) | | | (30,165 | ) | |
| Johnson & Johnson | | | (1,900 | ) | | | (117,515 | ) | |
| Merck & Co., Inc. | | | (2,800 | ) | | | (100,912 | ) | |
| Par Pharmaceutical Cos., Inc.* | | | (1,200 | ) | | | (46,212 | ) | |
| Perrigo Co. | | | (500 | ) | | | (31,665 | ) | |
| Pfizer, Inc. | | | (1,900 | ) | | | (33,269 | ) | |
| Salix Pharmaceuticals, Ltd.* | | | (600 | ) | | | (28,176 | ) | |
| Viropharma, Inc.* | | | (2,300 | ) | | | (39,836 | ) | |
| Watson Pharmaceuticals, Inc.* | | | (500 | ) | | | (25,825 | ) | |
| | | | (557,983 | ) | |
See Accompanying Notes to Financial Statements.
36
Credit Suisse Trust — U.S. Equity Flex I Portfolio
Schedule of Investments (continued)
December 31, 2010
| | | Number of
Shares | | Value | |
| SHORT STOCK POSITIONS | |
| COMMON STOCKS | |
| Professional Services (-0.3%) | |
| Administaff, Inc. | | | (1,300 | ) | | $ | (38,090 | ) | |
| CoStar Group, Inc.* | | | (500 | ) | | | (28,780 | ) | |
| Dolan Media Co.* | | | (2,500 | ) | | | (34,800 | ) | |
| Dun & Bradstreet Corp. | | | (400 | ) | | | (32,836 | ) | |
| Equifax, Inc. | | | (1,000 | ) | | | (35,600 | ) | |
| FTI Consulting, Inc.* | | | (700 | ) | | | (26,096 | ) | |
| Huron Consulting Group, Inc.* | | | (1,200 | ) | | | (31,740 | ) | |
| IHS, Inc. Class A* | | | (500 | ) | | | (40,195 | ) | |
| Korn/Ferry International* | | | (1,700 | ) | | | (39,287 | ) | |
| Manpower, Inc. | | | (600 | ) | | | (37,656 | ) | |
| Robert Half International, Inc. | | | (1,100 | ) | | | (33,660 | ) | |
| The Corporate Executive Board Co. | | | (800 | ) | | | (30,040 | ) | |
| Towers Watson & Co. Class A | | | (600 | ) | | | (31,236 | ) | |
| | | | (440,016 | ) | |
| Real Estate Investment Trusts (-1.3%) | |
| Alexander's, Inc. | | | (100 | ) | | | (41,228 | ) | |
| Alexandria Real Estate Equities, Inc. | | | (400 | ) | | | (29,304 | ) | |
| AMB Property Corp. | | | (1,200 | ) | | | (38,052 | ) | |
| Annaly Capital Management, Inc. | | | (1,600 | ) | | | (28,672 | ) | |
| Anworth Mortgage Asset Corp. | | | (3,200 | ) | | | (22,400 | ) | |
| Apartment Investment & Management Co. Class A | | | (1,400 | ) | | | (36,176 | ) | |
| AvalonBay Communities, Inc. | | | (300 | ) | | | (33,765 | ) | |
| BioMed Realty Trust, Inc. | | | (1,800 | ) | | | (33,570 | ) | |
| Boston Properties, Inc. | | | (300 | ) | | | (25,830 | ) | |
| Brandywine Realty Trust | | | (2,700 | ) | | | (31,455 | ) | |
| BRE Properties, Inc. | | | (900 | ) | | | (39,150 | ) | |
| Camden Property Trust | | | (500 | ) | | | (26,990 | ) | |
| Capstead Mortgage Corp. | | | (2,100 | ) | | | (26,439 | ) | |
| CBL & Associates Properties, Inc. | | | (2,200 | ) | | | (38,500 | ) | |
| Colonial Properties Trust | | | (1,700 | ) | | | (30,685 | ) | |
| CommonWealth REIT | | | (1,100 | ) | | | (28,061 | ) | |
| Corporate Office Properties Trust | | | (900 | ) | | | (31,455 | ) | |
| Cousins Properties, Inc. | | | (3,804 | ) | | | (31,725 | ) | |
| Developers Diversified Realty Corp. | | | (2,600 | ) | | | (36,634 | ) | |
| DiamondRock Hospitality Co.* | | | (3,404 | ) | | | (40,848 | ) | |
| Digital Realty Trust, Inc. | | | (500 | ) | | | (25,770 | ) | |
| Douglas Emmett, Inc. | | | (1,900 | ) | | | (31,540 | ) | |
| Duke Realty Corp. | | | (2,300 | ) | | | (28,658 | ) | |
| EastGroup Properties, Inc. | | | (500 | ) | | | (21,160 | ) | |
| Equity Lifestyle Properties, Inc. | | | (500 | ) | | | (27,965 | ) | |
| Equity One, Inc. | | | (1,600 | ) | | | (29,088 | ) | |
| Equity Residential | | | (700 | ) | | | (36,365 | ) | |
| Essex Property Trust, Inc. | | | (300 | ) | | | (34,266 | ) | |
| Extra Space Storage, Inc. | | | (2,300 | ) | | | (40,020 | ) | |
| Federal Realty Investment Trust | | | (500 | ) | | | (38,965 | ) | |
| Franklin Street Properties Corp. | | | (2,100 | ) | | | (29,925 | ) | |
See Accompanying Notes to Financial Statements.
37
Credit Suisse Trust — U.S. Equity Flex I Portfolio
Schedule of Investments (continued)
December 31, 2010
| | | Number of
Shares | | Value | |
| SHORT STOCK POSITIONS | |
| COMMON STOCKS | |
| Real Estate Investment Trusts | |
| Healthcare Realty Trust, Inc. | | | (1,100 | ) | | $ | (23,287 | ) | |
| Host Hotels & Resorts, Inc. | | | (2,085 | ) | | | (37,259 | ) | |
| Kilroy Realty Corp. | | | (1,000 | ) | | | (36,470 | ) | |
| Kimco Realty Corp. | | | (2,100 | ) | | | (37,884 | ) | |
| LaSalle Hotel Properties | | | (1,400 | ) | | | (36,960 | ) | |
| Liberty Property Trust | | | (1,100 | ) | | | (35,112 | ) | |
| Mack-Cali Realty Corp. | | | (1,000 | ) | | | (33,060 | ) | |
| Medical Properties Trust, Inc. | | | (3,000 | ) | | | (32,490 | ) | |
| MFA Financial, Inc. | | | (3,300 | ) | | | (26,928 | ) | |
| Mid-America Apartment Communities, Inc. | | | (500 | ) | | | (31,745 | ) | |
| National Health Investors, Inc. | | | (700 | ) | | | (31,514 | ) | |
| Nationwide Health Properties, Inc. | | | (800 | ) | | | (29,104 | ) | |
| OMEGA Healthcare Investors, Inc. | | | (1,200 | ) | | | (26,928 | ) | |
| Post Properties, Inc. | | | (1,300 | ) | | | (47,190 | ) | |
| Potlatch Corp. | | | (700 | ) | | | (22,785 | ) | |
| PS Business Parks, Inc. | | | (500 | ) | | | (27,860 | ) | |
| Rayonier, Inc. | | | (600 | ) | | | (31,512 | ) | |
| Redwood Trust, Inc. | | | (1,700 | ) | | | (25,381 | ) | |
| Regency Centers Corp. | | | (900 | ) | | | (38,016 | ) | |
| Senior Housing Properties Trust | | | (1,600 | ) | | | (35,104 | ) | |
| Simon Property Group, Inc. | | | (297 | ) | | | (29,548 | ) | |
| SL Green Realty Corp. | | | (600 | ) | | | (40,506 | ) | |
| Sovran Self Storage, Inc. | | | (900 | ) | | | (33,129 | ) | |
| Sunstone Hotel Investors, Inc.* | | | (2,700 | ) | | | (27,891 | ) | |
| Tanger Factory Outlet Centers, Inc. | | | (800 | ) | | | (40,952 | ) | |
| Taubman Centers, Inc. | | | (800 | ) | | | (40,384 | ) | |
| The Macerich Co. | | | (837 | ) | | | (39,649 | ) | |
| UDR, Inc. | | | (1,500 | ) | | | (35,280 | ) | |
| Ventas, Inc. | | | (500 | ) | | | (26,240 | ) | |
| Washington Real Estate Investment Trust | | | (1,100 | ) | | | (34,089 | ) | |
| Weingarten Realty Investors | | | (1,600 | ) | | | (38,016 | ) | |
| Weyerhaeuser Co. | | | (2,082 | ) | | | (39,412 | ) | |
| | | | (2,066,346 | ) | |
| Real Estate Management & Development (-0.0%) | |
| CB Richard Ellis Group, Inc. Class A* | | | (1,700 | ) | | | (34,816 | ) | |
| Forestar Group, Inc.* | | | (1,200 | ) | | | (23,160 | ) | |
| | | | (57,976 | ) | |
| Road & Rail (-0.3%) | |
| Amerco, Inc.* | | | (300 | ) | | | (28,812 | ) | |
| Avis Budget Group, Inc.* | | | (2,300 | ) | | | (35,788 | ) | |
| Con-way, Inc. | | | (900 | ) | | | (32,913 | ) | |
| CSX Corp. | | | (700 | ) | | | (45,227 | ) | |
| Genesee & Wyoming, Inc. Class A* | | | (700 | ) | | | (37,065 | ) | |
| Heartland Express, Inc. | | | (1,700 | ) | | | (27,234 | ) | |
| Hertz Global Holdings, Inc.* | | | (2,400 | ) | | | (34,776 | ) | |
See Accompanying Notes to Financial Statements.
38
Credit Suisse Trust — U.S. Equity Flex I Portfolio
Schedule of Investments (continued)
December 31, 2010
| | | Number of
Shares | | Value | |
| SHORT STOCK POSITIONS | |
| COMMON STOCKS | |
| Road & Rail | |
| J.B. Hunt Transport Services, Inc. | | | (1,000 | ) | | $ | (40,810 | ) | |
| Kansas City Southern* | | | (900 | ) | | | (43,074 | ) | |
| Landstar System, Inc. | | | (800 | ) | | | (32,752 | ) | |
| Old Dominion Freight Line, Inc.* | | | (1,350 | ) | | | (43,186 | ) | |
| Werner Enterprises, Inc. | | | (1,500 | ) | | | (33,900 | ) | |
| | | | (435,537 | ) | |
| Semiconductors & Semiconductor Equipment (-0.9%) | |
| Advanced Micro Devices, Inc.* | | | (3,100 | ) | | | (25,358 | ) | |
| Applied Materials, Inc. | | | (2,400 | ) | | | (33,720 | ) | |
| Applied Micro Circuits Corp.* | | | (3,000 | ) | | | (32,040 | ) | |
| Atheros Communications, Inc.* | | | (1,100 | ) | | | (39,512 | ) | |
| ATMI, Inc.* | | | (1,300 | ) | | | (25,922 | ) | |
| Broadcom Corp. Class A | | | (1,000 | ) | | | (43,550 | ) | |
| Cabot Microelectronics Corp.* | | | (800 | ) | | | (33,160 | ) | |
| Cree, Inc.* | | | (500 | ) | | | (32,945 | ) | |
| Cymer, Inc.* | | | (800 | ) | | | (36,056 | ) | |
| Diodes, Inc.* | | | (1,800 | ) | | | (48,582 | ) | |
| Fairchild Semiconductor International, Inc.* | | | (2,700 | ) | | | (42,147 | ) | |
| Hittite Microwave Corp.* | | | (500 | ) | | | (30,520 | ) | |
| Integrated Device Technology, Inc.* | | | (3,100 | ) | | | (20,646 | ) | |
| International Rectifier Corp.* | | | (1,600 | ) | | | (47,504 | ) | |
| Intersil Corp. Class A | | | (2,100 | ) | | | (32,067 | ) | |
| KLA-Tencor Corp. | | | (1,000 | ) | | | (38,640 | ) | |
| Lam Research Corp.* | | | (900 | ) | | | (46,602 | ) | |
| Linear Technology Corp. | | | (800 | ) | | | (27,672 | ) | |
| Maxim Integrated Products, Inc. | | | (1,600 | ) | | | (37,792 | ) | |
| MEMC Electronic Materials, Inc.* | | | (2,700 | ) | | | (30,402 | ) | |
| Micron Technology, Inc.* | | | (2,800 | ) | | | (22,456 | ) | |
| Microsemi Corp.* | | | (1,500 | ) | | | (34,350 | ) | |
| Monolithic Power Systems, Inc.* | | | (1,200 | ) | | | (19,824 | ) | |
| National Semiconductor Corp. | | | (2,100 | ) | | | (28,896 | ) | |
| Netlogic Microsystems, Inc.* | | | (800 | ) | | | (25,128 | ) | |
| Novellus Systems, Inc.* | | | (1,300 | ) | | | (42,016 | ) | |
| NVIDIA Corp.* | | | (2,900 | ) | | | (44,660 | ) | |
| OmniVision Technologies, Inc.* | | | (1,200 | ) | | | (35,532 | ) | |
| ON Semiconductor Corp.* | | | (3,700 | ) | | | (36,556 | ) | |
| PMC-Sierra, Inc.* | | | (3,700 | ) | | | (31,783 | ) | |
| Rambus, Inc.* | | | (1,700 | ) | | | (34,816 | ) | |
| RF Micro Devices, Inc.* | | | (4,600 | ) | | | (33,810 | ) | |
| Semtech Corp.* | | | (1,500 | ) | | | (33,960 | ) | |
| Silicon Laboratories, Inc.* | | | (500 | ) | | | (23,010 | ) | |
| Skyworks Solutions, Inc.* | | | (1,400 | ) | | | (40,082 | ) | |
| Teradyne, Inc.* | | | (2,500 | ) | | | (35,100 | ) | |
| Tessera Technologies, Inc.* | | | (1,400 | ) | | | (31,010 | ) | |
| Texas Instruments, Inc. | | | (1,000 | ) | | | (32,500 | ) | |
| TriQuint Semiconductor, Inc.* | | | (3,000 | ) | | | (35,070 | ) | |
See Accompanying Notes to Financial Statements.
39
Credit Suisse Trust — U.S. Equity Flex I Portfolio
Schedule of Investments (continued)
December 31, 2010
| | | Number of
Shares | | Value | |
| SHORT STOCK POSITIONS | |
| COMMON STOCKS | |
| Semiconductors & Semiconductor Equipment | |
| Varian Semiconductor Equipment Associates, Inc.* | | | (900 | ) | | $ | (33,273 | ) | |
| Xilinx, Inc. | | | (1,200 | ) | | | (34,776 | ) | |
| Zoran Corp.* | | | (3,500 | ) | | | (30,800 | ) | |
| | | | (1,424,245 | ) | |
| Software (-0.9%) | |
| ACI Worldwide, Inc.* | | | (1,400 | ) | | | (37,618 | ) | |
| Adobe Systems, Inc.* | | | (900 | ) | | | (27,702 | ) | |
| ANSYS, Inc.* | | | (700 | ) | | | (36,449 | ) | |
| Ariba, Inc.* | | | (2,000 | ) | | | (46,980 | ) | |
| Aspen Technology, Inc.* | | | (2,500 | ) | | | (31,750 | ) | |
| Autodesk, Inc.* | | | (900 | ) | | | (34,380 | ) | |
| BMC Software, Inc.* | | | (700 | ) | | | (32,998 | ) | |
| CA, Inc. | | | (1,300 | ) | | | (31,772 | ) | |
| Cadence Design Systems, Inc.* | | | (4,200 | ) | | | (34,692 | ) | |
| Citrix Systems, Inc.* | | | (500 | ) | | | (34,205 | ) | |
| CommVault Systems, Inc.* | | | (1,000 | ) | | | (28,620 | ) | |
| Compuware Corp.* | | | (3,900 | ) | | | (45,513 | ) | |
| Concur Technologies, Inc.* | | | (500 | ) | | | (25,965 | ) | |
| Electronic Arts, Inc.* | | | (1,700 | ) | | | (27,846 | ) | |
| EPIQ Systems, Inc. | | | (2,300 | ) | | | (31,579 | ) | |
| FactSet Research Systems, Inc. | | | (400 | ) | | | (37,504 | ) | |
| Fair Isaac Corp. | | | (1,200 | ) | | | (28,044 | ) | |
| Informatica Corp.* | | | (900 | ) | | | (39,627 | ) | |
| Intuit, Inc.* | | | (500 | ) | | | (24,650 | ) | |
| JDA Software Group, Inc.* | | | (1,000 | ) | | | (28,000 | ) | |
| Lawson Software, Inc.* | | | (3,200 | ) | | | (29,600 | ) | |
| Mentor Graphics Corp.* | | | (2,700 | ) | | | (32,400 | ) | |
| MICROS Systems, Inc.* | | | (800 | ) | | | (35,088 | ) | |
| MicroStrategy, Inc. Class A* | | | (300 | ) | | | (25,641 | ) | |
| Netscout Systems, Inc.* | | | (1,100 | ) | | | (25,311 | ) | |
| Nuance Communications, Inc.* | | | (1,700 | ) | | | (30,906 | ) | |
| Parametric Technology Corp.* | | | (1,800 | ) | | | (40,554 | ) | |
| Progress Software Corp.* | | | (800 | ) | | | (33,856 | ) | |
| Quest Software, Inc.* | | | (1,100 | ) | | | (30,514 | ) | |
| Red Hat, Inc.* | | | (900 | ) | | | (41,085 | ) | |
| Rovi Corp.* | | | (700 | ) | | | (43,407 | ) | |
| Salesforce.com, Inc.* | | | (400 | ) | | | (52,800 | ) | |
| Solera Holdings, Inc. | | | (700 | ) | | | (35,924 | ) | |
| Symantec Corp.* | | | (1,800 | ) | | | (30,132 | ) | |
| Synopsys, Inc.* | | | (1,500 | ) | | | (40,365 | ) | |
| Taleo Corp. Class A* | | | (1,000 | ) | | | (27,650 | ) | |
| TIBCO Software, Inc.* | | | (2,000 | ) | | | (39,420 | ) | |
| Tyler Technologies, Inc.* | | | (1,300 | ) | | | (26,988 | ) | |
| Ultimate Software Group, Inc.* | | | (700 | ) | | | (34,041 | ) | |
| | | | (1,321,576 | ) | |
See Accompanying Notes to Financial Statements.
40
Credit Suisse Trust — U.S. Equity Flex I Portfolio
Schedule of Investments (continued)
December 31, 2010
| | | Number of
Shares | | Value | |
| SHORT STOCK POSITIONS | |
| COMMON STOCKS | |
| Specialty Retail (-0.8%) | |
| Aaron's, Inc. | | | (1,400 | ) | | $ | (28,546 | ) | |
| Abercrombie & Fitch Co. Class A | | | (800 | ) | | | (46,104 | ) | |
| Advance Auto Parts, Inc. | | | (500 | ) | | | (33,075 | ) | |
| Asbury Automotive Group, Inc.* | | | (1,700 | ) | | | (31,416 | ) | |
| Bebe Stores, Inc. | | | (3,400 | ) | | | (20,264 | ) | |
| Bed Bath & Beyond, Inc.* | | | (800 | ) | | | (39,320 | ) | |
| CarMax, Inc.* | | | (1,400 | ) | | | (44,632 | ) | |
| Chico's FAS, Inc. | | | (2,200 | ) | | | (26,466 | ) | |
| Collective Brands, Inc.* | | | (1,300 | ) | | | (27,430 | ) | |
| Dick's Sporting Goods, Inc.* | | | (1,000 | ) | | | (37,500 | ) | |
| Foot Locker, Inc. | | | (2,200 | ) | | | (43,164 | ) | |
| hhgregg, Inc.* | | | (1,100 | ) | | | (23,045 | ) | |
| Hibbett Sports, Inc.* | | | (1,300 | ) | | | (47,970 | ) | |
| Home Depot, Inc. | | | (900 | ) | | | (31,554 | ) | |
| HOT Topic, Inc. | | | (4,600 | ) | | | (28,842 | ) | |
| Jo-Ann Stores, Inc.* | | | (800 | ) | | | (48,176 | ) | |
| JOS. A. Bank Clothiers, Inc.* | | | (900 | ) | | | (36,288 | ) | |
| Lowe's Cos., Inc. | | | (1,700 | ) | | | (42,636 | ) | |
| Monro Muffler, Inc. | | | (900 | ) | | | (31,131 | ) | |
| O'Reilly Automotive, Inc. | | | (700 | ) | | | (42,294 | ) | |
| OfficeMax, Inc.* | | | (2,600 | ) | | | (46,020 | ) | |
| Penske Automotive Group, Inc.* | | | (2,000 | ) | | | (34,840 | ) | |
| PetSmart, Inc. | | | (1,000 | ) | | | (39,820 | ) | |
| Pier 1 Imports, Inc.* | | | (3,100 | ) | | | (32,550 | ) | |
| Sally Beauty Holdings, Inc.* | | | (3,200 | ) | | | (46,496 | ) | |
| Staples, Inc. | | | (1,400 | ) | | | (31,878 | ) | |
| The Cato Corp. Class A | | | (1,000 | ) | | | (27,410 | ) | |
| The Gap, Inc. | | | (1,800 | ) | | | (39,852 | ) | |
| The Men's Wearhouse, Inc. | | | (1,400 | ) | | | (34,972 | ) | |
| Tiffany & Co. | | | (700 | ) | | | (43,589 | ) | |
| Tractor Supply Co. | | | (700 | ) | | | (33,943 | ) | |
| Ulta Salon Cosmetics & Fragrance, Inc.* | | | (1,100 | ) | | | (37,400 | ) | |
| Urban Outfitters, Inc.* | | | (900 | ) | | | (32,229 | ) | |
| | | | (1,190,852 | ) | |
| Textiles, Apparel & Luxury Goods (-0.4%) | |
| Carter's, Inc.* | | | (1,200 | ) | | | (35,412 | ) | |
| Coach, Inc. | | | (700 | ) | | | (38,717 | ) | |
| Columbia Sportswear Co. | | | (500 | ) | | | (30,150 | ) | |
| CROCS, Inc.* | | | (2,000 | ) | | | (34,240 | ) | |
| Deckers Outdoor Corp.* | | | (600 | ) | | | (47,844 | ) | |
| Fossil, Inc.* | | | (600 | ) | | | (42,288 | ) | |
| Hanesbrands, Inc.* | | | (1,200 | ) | | | (30,480 | ) | |
| Iconix Brand Group, Inc.* | | | (2,000 | ) | | | (38,620 | ) | |
| K-Swiss, Inc. Class A* | | | (2,200 | ) | | | (27,434 | ) | |
| Maidenform Brands, Inc.* | | | (800 | ) | | | (19,016 | ) | |
| NIKE, Inc. Class B | | | (500 | ) | | | (42,710 | ) | |
See Accompanying Notes to Financial Statements.
41
Credit Suisse Trust — U.S. Equity Flex I Portfolio
Schedule of Investments (continued)
December 31, 2010
| | | Number of
Shares | | Value | |
| SHORT STOCK POSITIONS | |
| COMMON STOCKS | |
| Textiles, Apparel & Luxury Goods | |
| Phillips-Van Heusen Corp. | | | (600 | ) | | $ | (37,806 | ) | |
| Polo Ralph Lauren Corp. | | | (400 | ) | | | (44,368 | ) | |
| Steven Madden, Ltd.* | | | (750 | ) | | | (31,290 | ) | |
| The Warnaco Group, Inc.* | | | (500 | ) | | | (27,535 | ) | |
| VF Corp. | | | (300 | ) | | | (25,854 | ) | |
| Wolverine World Wide, Inc. | | | (1,200 | ) | | | (38,256 | ) | |
| | | | (592,020 | ) | |
| Thrifts & Mortgage Finance (-0.2%) | |
| Astoria Financial Corp. | | | (2,100 | ) | | | (29,211 | ) | |
| Brookline Bancorp, Inc. | | | (2,700 | ) | | | (29,295 | ) | |
| First Niagara Financial Group, Inc. | | | (2,500 | ) | | | (34,950 | ) | |
| Hudson City Bancorp, Inc. | | | (2,300 | ) | | | (29,302 | ) | |
| New York Community Bancorp, Inc. | | | (1,500 | ) | | | (28,275 | ) | |
| Ocwen Financial Corp.* | | | (2,900 | ) | | | (27,666 | ) | |
| People's United Financial, Inc. | | | (2,000 | ) | | | (28,020 | ) | |
| Provident Financial Services, Inc. | | | (2,300 | ) | | | (34,799 | ) | |
| Radian Group, Inc. | | | (3,400 | ) | | | (27,438 | ) | |
| Washington Federal, Inc. | | | (1,700 | ) | | | (28,764 | ) | |
| | | | (297,720 | ) | |
| Tobacco (-0.1%) | |
| Altria Group, Inc. | | | (1,100 | ) | | | (27,082 | ) | |
| Lorillard, Inc. | | | (400 | ) | | | (32,824 | ) | |
| Reynolds American, Inc. | | | (1,200 | ) | | | (39,144 | ) | |
| Universal Corp. | | | (800 | ) | | | (32,560 | ) | |
| | | | (131,610 | ) | |
| Trading Companies & Distributors (-0.2%) | |
| Applied Industrial Technologies, Inc. | | | (1,200 | ) | | | (38,976 | ) | |
| Fastenal Co. | | | (500 | ) | | | (29,955 | ) | |
| GATX Corp. | | | (1,100 | ) | | | (38,808 | ) | |
| MSC Industrial Direct Co., Inc. Class A | | | (500 | ) | | | (32,345 | ) | |
| RSC Holdings, Inc.* | | | (3,900 | ) | | | (37,986 | ) | |
| TAL International Group, Inc. | | | (1,100 | ) | | | (33,957 | ) | |
| WESCO International, Inc.* | | | (700 | ) | | | (36,960 | ) | |
| WW Grainger, Inc. | | | (300 | ) | | | (41,433 | ) | |
| | | | (290,420 | ) | |
| Water Utilities (-0.1%) | |
| American States Water Co. | | | (600 | ) | | | (20,682 | ) | |
| American Water Works Co., Inc. | | | (1,600 | ) | | | (40,464 | ) | |
| Aqua America, Inc. | | | (1,300 | ) | | | (29,224 | ) | |
| SJW Corp. | | | (1,000 | ) | | | (26,470 | ) | |
| | | | (116,840 | ) | |
See Accompanying Notes to Financial Statements.
42
Credit Suisse Trust — U.S. Equity Flex I Portfolio
Schedule of Investments (continued)
December 31, 2010
| | | Number of
Shares | | Value | |
| SHORT STOCK POSITIONS | |
| COMMON STOCKS | |
| Wireless Telecommunication Services (-0.1%) | |
| American Tower Corp. Class A* | | | (700 | ) | | $ | (36,148 | ) | |
| Crown Castle International Corp.* | | | (800 | ) | | | (35,064 | ) | |
| NII Holdings, Inc.* | | | (700 | ) | | | (31,262 | ) | |
| NTELOS Holdings Corp. | | | (1,500 | ) | | | (28,575 | ) | |
| SBA Communications Corp. Class A* | | | (900 | ) | | | (36,846 | ) | |
| United States Cellular Corp.* | | | (600 | ) | | | (29,964 | ) | |
| USA Mobility, Inc. | | | (1,600 | ) | | | (28,432 | ) | |
| | | | (226,291 | ) | |
| TOTAL COMMON STOCKS (Proceeds $29,720,590) | | | (36,685,611 | ) | |
| TOTAL SECURITIES SOLD SHORT (Proceeds $29,720,590) | | $ | (36,685,611 | ) | |
* Non-income producing security.
§ Security or portion thereof is out on loan.
§§ Represents security purchased with cash collateral received for securities on loan. The rate shown is the annualized seven-day yield at December 31, 2010.
^ Not readily marketable security; security is valued at fair value as determined in good faith by, or under the direction of, the Board of Trustees.
See Accompanying Notes to Financial Statements.
43
Credit Suisse Trust — U.S. Equity Flex I Portfolio
Statement of Assets and Liabilities
December 31, 2010
| Assets | |
Investments at value, including collateral for securities on loan of $22,947,299
(Cost $196,125,583) (Note 2) | | $ | 212,853,9121 | | |
| Cash | | | 870 | | |
| Cash segregated at brokers for short sales | | | 37,770,923 | | |
| Dividend and interest receivable | | | 193,721 | | |
| Receivable for portfolio shares sold | | | 16,201 | | |
| Prepaid expenses and other assets | | | 9,087 | | |
| Total Assets | | | 250,844,714 | | |
| Liabilities | |
| Advisory fee payable (Note 3) | | | 90,596 | | |
| Administrative services fee payable (Note 3) | | | 54,821 | | |
| Payable upon return of securities loaned (Note 2) | | | 60,718,222 | | |
| Securities sold short, at value (Proceeds $29,720,590) (Note 2) | | | 36,685,611 | | |
| Payable for portfolio shares redeemed | | | 110,042 | | |
| Dividend expense payable on securities sold short | | | 41,543 | | |
| Trustees' fee payable | | | 112 | | |
| Other accrued expenses payable | | | 146,702 | | |
| Total Liabilities | | | 97,847,649 | | |
| Net Assets | |
| Capital stock, $.001 par value (Note 6) | | | 10,738 | | |
| Paid-in capital (Note 6) | | | 213,026,215 | | |
| Undistributed net investment income | | | 729,475 | | |
| Accumulated net realized loss on investments, short sales and foreign currency transactions | | | (70,532,671 | ) | |
| Net unrealized appreciation from investments and short sales | | | 9,763,308 | | |
| Net Assets | | $ | 152,997,065 | | |
| Shares outstanding | | | 10,737,789 | | |
| Net asset value, offering price and redemption price per share | | $ | 14.25 | | |
1 Including $59,089,024 of securities on loan.
See Accompanying Notes to Financial Statements.
44
Credit Suisse Trust — U.S. Equity Flex I Portfolio
Statement of Operations
For the Year Ended December 31, 2010
| Investment Income (Note 2) | |
| Dividends | | $ | 3,189,794 | | |
| Interest | | | 275 | | |
| Securities lending | | | 57,338 | | |
| Total investment income | | | 3,247,407 | | |
| Expenses | |
| Investment advisory fees (Note 3) | | | 1,057,186 | | |
| Administrative services fees (Note 3) | | | 305,573 | | |
| Dividend expense for securities sold short | | | 576,858 | | |
| Short sales expense | | | 198,111 | | |
| Custodian fees | | | 112,566 | | |
| Printing fees (Note 3) | | | 107,825 | | |
| Audit and tax fees | | | 39,529 | | |
| Transfer agent fees | | | 32,784 | | |
| Trustees' fees | | | 25,870 | | |
| Legal fees | | | 22,442 | | |
| Insurance expense | | | 12,071 | | |
| Commitment fees (Note 4) | | | 1,439 | | |
| Miscellaneous expense | | | 10,176 | | |
| Total expenses | | | 2,502,430 | | |
| Net investment income | | | 744,977 | | |
Net Realized and Unrealized Gain (Loss) from Investments, Short Sales and Foreign Currency
Related Items | |
| Net realized gain from investments | | | 20,978,640 | | |
| Net realized loss from short sales | | | (4,548,462 | ) | |
| Net realized loss from foreign currency transactions | | | (6 | ) | |
| Net change in unrealized appreciation (depreciation) from investments | | | 6,817,947 | | |
| Net change in unrealized appreciation (depreciation) from short sales | | | (3,903,657 | ) | |
| Net realized and unrealized gain from investments, short sales and foreign currency related items | | | 19,344,462 | | |
| Net increase in net assets resulting from operations | | $ | 20,089,439 | | |
See Accompanying Notes to Financial Statements.
45
Credit Suisse Trust — U.S. Equity Flex I Portfolio
Statements of Changes in Net Assets
| | | For the Year
Ended
December 31, 2010 | | For the Year
Ended
December 31, 2009 | |
| From Operations | |
| Net investment income | | $ | 744,977 | | | $ | 454,374 | | |
Net realized gain from investments, short sales and foreign currency
transactions | | | 16,430,172 | | | | 5,010,866 | | |
Net change in unrealized appreciation (depreciation) from investments,
short sales and foreign currency translations | | | 2,914,290 | | | | 24,524,443 | | |
| Net increase in net assets resulting from operations | | | 20,089,439 | | | | 29,989,683 | | |
| From Dividends | |
| Dividends from net investment income | | | (225,568 | ) | | | (1,448,705 | ) | |
| From Capital Share Transactions (Note 6) | |
| Proceeds from sale of shares | | | 2,600,157 | | | | 3,732,464 | | |
| Exchange value of shares due to merger | | | — | | | | 34,189,262 | | |
| Reinvestment of dividends | | | 225,568 | | | | 1,448,705 | | |
| Net asset value of shares redeemed | | | (32,808,579 | ) | | | (40,154,222 | ) | |
| Net decrease in net assets from capital share transactions | | | (29,982,854 | ) | | | (783,791 | ) | |
| Net increase (decrease) in net assets | | | (10,118,983 | ) | | | 27,757,187 | | |
| Net Assets | |
| Beginning of year | | | 163,116,048 | | | | 135,358,861 | | |
| End of year | | $ | 152,997,065 | | | $ | 163,116,048 | | |
| Undistributed net investment income | | $ | 729,475 | | | $ | 283,879 | | |
See Accompanying Notes to Financial Statements.
46
Credit Suisse Trust — U.S. Equity Flex I Portfolio
Statement of Cash Flows
For the Year Ended December 31, 2010
| Cash Flows from Operating Activities | |
| Dividends, interest and securities lending income received | | $ | 3,225,990 | | | | | | |
| Gain received from litigation | | | 568,720 | | | | | | |
| Operating expenses paid | | | (2,016,721 | ) | | | | | |
| Dividend expense paid on securities sold short | | | (585,053 | ) | | | | | |
| Purchases of long-term securities | | | (893,481,496 | ) | | | | | |
| Proceeds from sales of long-term securities | | | 923,083,090 | | | | | | |
| Purchases to cover securities sold short | | | (49,674,746 | ) | | | | | |
| Proceeds from securities sold short | | | 42,146,868 | | | | | | |
| Proceeds from short-term securities, net | | | 6,987,000 | | | | | | |
| Net cash provided by operating activities | | | | | | $ | 30,253,652 | | |
| Cash Flows from Financing Activities | |
| Proceeds from sale of shares | | | 2,601,029 | | | | | | |
| Cost of shares redeemed | | | (32,854,592 | ) | | | | | |
| Net cash used by financing activities | | | | | | | (30,253,563 | ) | |
| Effect of exchange rate on cash | | | | | | | (5 | ) | |
| Net increase in cash | | | | | | | 84 | | |
| Cash — beginning of year | | | | | | | 786 | | |
| Cash — end of year | | | | | | $ | 870 | | |
RECONCILIATION OF NET INCREASE IN NET ASSETS FROM OPERATIONS TO
NET CASH PROVIDED BY OPERATING ACTIVITIES | |
| Net increase in net assets resulting from operations | | | | | | $ | 20,089,439 | | |
Adjustments to Reconcile Net Increase in Net Assets from Operations to
Net Cash Provided by Operating Activities | |
| Change in dividends and interest receivable | | $ | (21,417 | ) | | | | | |
| Change in accrued expenses | | | (92,739 | ) | | | | | |
| Change in prepaid expenses and other assets | | | 7,211 | | | | | | |
| Change in advisory fee payable | | | (5,621 | ) | | | | | |
| Change in dividend expense payable on securities sold short | | | (8,195 | ) | | | | | |
| Purchases of long-term securities | | | (893,481,496 | ) | | | | | |
| Proceeds from sales of long-term securities | | | 923,083,090 | | | | | | |
| Purchases to cover securities sold short | | | (49,674,746 | ) | | | | | |
| Proceeds from securities sold short | | | 42,146,868 | | | | | | |
| Proceeds from short-term securities, net | | | 6,987,000 | | | | | | |
| Net change in unrealized appreciation from investments and short sales | | | (2,914,290 | ) | | | | | |
| Net realized gain from investments, short sales and foreign currency transactions | | | (15,861,452 | ) | | | | | |
| Total adjustments | | | | | | | 10,164,213 | | |
| Net cash provided by operating activities | | | | $ | 30,253,652 | | |
| Non-Cash Activity: | |
| Dividend reinvestments | | | | $ | 225,568 | | |
See Accompanying Notes to Financial Statements.
47
Credit Suisse Trust — U.S. Equity Flex I Portfolio
Financial Highlights
(For a Share of the Portfolio Outstanding Throughout Each Year)
| | | For the Year Ended December 31, | |
| | | 2010 | | 2009 | | 2008 | | 2007 | | 2006 | |
| Per share data | |
| Net asset value, beginning of year | | $ | 12.47 | | | $ | 10.10 | | | $ | 15.47 | | | $ | 15.60 | | | $ | 14.89 | | |
| INVESTMENT OPERATIONS | |
| Net investment income (loss) | | | 0.07 | | | | 0.06 | | | | 0.10 | | | | 0.02 | | | | (0.14 | ) | |
Net gain (loss) on investments, short sales, foreign
currency related items and futures contracts
(both realized and unrealized) | | | 1.73 | | | | 2.44 | | | | (5.46 | ) | | | (0.15 | ) | | | 0.85 | | |
| Total from investment operations | | | 1.80 | | | | 2.50 | | | | (5.36 | ) | | | (0.13 | ) | | | 0.71 | | |
| LESS DIVIDENDS | |
| Dividends from net investment income | | | (0.02 | ) | | | (0.13 | ) | | | (0.01 | ) | | | — | | | | — | | |
| Net asset value, end of year | | $ | 14.25 | | | $ | 12.47 | | | $ | 10.10 | | | $ | 15.47 | | | $ | 15.60 | | |
| Total return1 | | | 14.46 | % | | | 24.79 | % | | | (34.66 | )% | | | (0.83 | )% | | | 4.77 | % | |
| RATIOS AND SUPPLEMENTAL DATA | |
| Net assets, end of year (000s omitted) | | $ | 152,997 | | | $ | 163,116 | | | $ | 135,359 | | | $ | 286,855 | | | $ | 413,335 | | |
| Ratio of expenses to average net assets | | | 1.66 | % | | | 1.81 | % | | | 0.93 | % | | | 0.92 | % | | | 1.11 | % | |
Ratio of expenses to average net assets
excluding short sales dividend expense | | | 1.27 | % | | | 1.56 | % | | | — | | | | — | | | | — | | |
Ratio of net investment income (loss)
to average net assets | | | 0.49 | % | | | 0.34 | % | | | 0.65 | % | | | 0.08 | % | | | (0.75 | )% | |
| Portfolio turnover rate | | | 439 | % | | | 643 | % | | | 204 | % | | | 203 | % | | | 208 | % | |
1 Total returns are historical and assume changes in share price and reinvestment of all dividends and distributions. Total returns do not reflect charges and expenses attributable to any particular variable contract or plan.
See Accompanying Notes to Financial Statements.
48
Credit Suisse Trust — U.S. Equity Flex I Portfolio
Notes to Financial Statements
December 31, 2010
Note 1. Organization
Credit Suisse Trust (the "Trust") is an open-end management investment company registered under the Investment Company Act of 1940, as amended (the "1940 Act"), and currently offers three managed investment portfolios of which one, the U.S. Equity Flex I Portfolio (the "Portfolio"), is included in this report. The Portfolio is a diversified investment fund that seeks capital growth. Shares of the Portfolio are not available directly to individual investors but may be offered only through (a) variable annuity contracts and variable life insurance contracts offered by separate accounts of certain insurance companies and (b) tax-qualified pension and retirement plans. The Portfolio may not be available in connection with a particular contract or plan. The Trust was organized under the laws of the Commonwealth of Massachusetts as a business trust on March 15, 1995. Effective May 1, 2009, the name of the Portfolio was changed from Small Cap Core I Portfolio.
Note 2. Significant Accounting Policies
A) SECURITY VALUATION — The net asset value of the Portfolio is determined daily as of the close of regular trading on the New York Stock Exchange, Inc. (the "Exchange") on each day the Exchange is open for business. Equity investments are valued at market value, which is generally determined using the closing price on the exchange or market on which the security is primarily traded at the time of valuation (the "Valuation Time"). If no sales are reported, equity investments are generally valued at the most recent bid quotation as of the Valuation Time or at the lowest asked quotation in the case of a short sale of securities. Equity investments are generally categorized as Level 1. Debt securities with a remaining maturity greater than 60 days are valued in accordance with the price supplied by a pricing service, which may use a matrix, formula or other objective method that takes into consideration market indices, yield curves and other specific adjustments. Debt obligations that will mature in 60 days or less are valued on the basis of amortized cost, which approximates market value, unless it is determined that using this method would not represent fair value. Debt securities are generally categorized as Level 2. Investments in open-end investment companies are valued at their net asset value each business day and are generally categorized as Level 1. Securities and other assets for which market quotations are not readily available, or whose values have been materially affected by events occurring before the Portfolio's Valuation Time but after the close of the securities' primary markets, are valued at fair value as determined in good faith by, or under the direction of, the Board of Trustees under procedures
49
Credit Suisse Trust — U.S. Equity Flex I Portfolio
Notes to Financial Statements (continued)
December 31, 2010
Note 2. Significant Accounting Policies
established by the Board of Trustees and are generally categorized as Level 3. The Portfolio may utilize a service provided by an independent third party which has been approved by the Board of Trustees to fair value certain securities. When fair value pricing is employed, the prices of securities used by a portfolio to calculate its net asset value may differ from quoted or published prices for the same securities.
In accordance with the authoritative guidance on fair value measurements and disclosures under accounting principles generally accepted in the United States of America ("GAAP"), the Portfolio discloses the fair value of its investments in a hierarchy that prioritizes the inputs to valuation techniques used to measure the fair value. In accordance with GAAP, fair value is defined as the price that the Portfolio would receive upon selling an investment in a timely transaction to an independent buyer in the principal or most advantageous market of the investment. GAAP established a three-tier hierarchy to maximize the use of observable market data and minimize the use of unobservable inputs and to establish classification of fair value measurements for disclosure purposes. Inputs refer broadly to the assumptions that market participants would use in pricing the asset or liability, including assumptions about risk, for example, th e risk inherent in a particular valuation technique used to measure fair value including such a pricing model and/or the risk inherent in the inputs to the valuation technique. Inputs may be observable or unobservable. Observable inputs are inputs that reflect the assumptions market participants would use in pricing the asset or liability developed based on market data obtained from sources independent of the reporting entity. Unobservable inputs are inputs that reflect the reporting entity's own assumptions about the assumptions market participants would use in pricing the asset or liability developed based on the best information available in the circumstances. In accordance with the Portfolio's valuation procedures, factors used in determining value may include, but are not limited to, the type of the security, the size of the holding, the initial cost of the security, the existence of any contractual restrictions on the security's disposition, the price and extent of public trading in similar securities of the issuer or of comparable companies, quotations or evaluated prices from broker-dealers and/or pricing services, information obtained from the issuer, analysts, and/or the appropriate stock exchange (for exchange-traded securities), an analysis of the company's or issuer's financial statements, an evaluation of the forces that influence the issuer and the market(s) in which the security is purchased and sold and with respect to debt securities, the maturity, coupon, creditworthiness, currency denomination, and the movement of the market in which the security
50
Credit Suisse Trust — U.S. Equity Flex I Portfolio
Notes to Financial Statements (continued)
December 31, 2010
Note 2. Significant Accounting Policies
is normally traded. The three-tier hierarchy of inputs is summarized in the three broad Levels listed below.
• Level 1 – quoted prices in active markets for identical investments
• Level 2 – other significant observable inputs (including quoted prices for similar investments, interest rates, prepayment speeds, credit risk, etc.)
• Level 3 – significant unobservable inputs (including the Portfolio's own assumptions in determining the fair value of investments)
The inputs or methodology used for valuing securities are not necessarily an indication of the risk associated with investing in those securities.
The following is a summary of the inputs used as of December 31, 2010 in valuing the Portfolio's investments carried at value:
| | | Level 1 | | Level 2 | | Level 3 | | Total | |
| Investments in Securities | |
| Common Stocks | | $ | 189,682,613 | | | $ | — | | | $ | — | | | $ | 189,682,613 | | |
| Short-Term Investments | | | 22,947,299 | | | | 224,000 | | | | — | | | | 23,171,299 | | |
| Securities Sold Short | |
| Common Stocks | | | (36,685,611 | ) | | | — | | | | — | | | | (36,685,611 | ) | |
| Other Financial Instruments* | | | — | | | | — | | | | — | | | | — | | |
| | | $ | 175,944,301 | | | $ | 224,000 | | | $ | — | | | $ | 176,168,301 | | |
*Other financial instruments include futures, forwards and swap contracts.
Effective January 1, 2010, the Portfolio adopted FASB amendments to authoritative guidance which requires the Portfolio to disclose details of significant transfers in and out of Level 1 and Level 2 measurements and the reasons for the transfers. For the year ended December 31, 2010, there were no significant transfers in and out of Level 1 and Level 2. The only investment held by the Portfolio whose fair value was determined using Level 3 inputs had a value of $0 at December 31, 2010.
B) DERIVATIVE INSTRUMENTS AND HEDGING ACTIVITIES — Effective January 1, 2009, the Portfolio adopted amendments to authoritative guidance on disclosures about derivative instruments and hedging activities which require that the Portfolio disclose (a) how and why an entity uses derivative instruments, (b) how derivative instruments and hedging activities are accounted for, and (c) how derivative instruments and related hedging activities affect a portfolio's financial position, financial performance, and cash flows. The Portfolio has not entered into any derivative or hedging activities during the period covered by this report.
51
Credit Suisse Trust — U.S. Equity Flex I Portfolio
Notes to Financial Statements (continued)
December 31, 2010
Note 2. Significant Accounting Policies
C) SECURITY TRANSACTIONS AND INVESTMENT INCOME — Security transactions are accounted for on a trade date basis. Interest income is recorded on the accrual basis. Dividends and dividend expense on short sales are recorded on the ex-dividend date. The cost of investments sold is determined by use of the specific identification method for both financial reporting and income tax purposes.
D) DIVIDENDS AND DISTRIBUTIONS TO SHAREHOLDERS — Dividends from net investment income and distributions of net realized capital gains, if any, are declared and paid at least annually. However, to the extent that a net realized capital gain can be reduced by a capital loss carryforward, such gain will not be distributed. Income and capital gain distributions are determined in accordance with federal income tax regulations, which may differ from GAAP.
E) FEDERAL INCOME TAXES — No provision is made for federal taxes as it is the Portfolio's intention to continue to qualify for and elect the tax treatment applicable to regulated investment companies under the Internal Revenue Code of 1986, as amended, and to make the requisite distributions to its shareholders, which will be sufficient to relieve it from federal income and excise taxes.
The Portfolio adopted the authoritative guidance for uncertainty in income taxes and recognizes a tax benefit or liability from an uncertain position only if it is more likely than not that the position is sustainable based solely on its technical merits and consideration of the relevant taxing authority's widely understood administrative practices and procedures. The Portfolio has reviewed its current tax positions and has determined that no provision for income tax is required in the Portfolio's financial statements. The Portfolio's federal tax returns for the prior three fiscal years remain subject to examination by the Internal Revenue Service.
F) USE OF ESTIMATES — The preparation of financial statements in conformity with GAAP requires management to make estimates and assumptions that affect the reported amounts of assets and liabilities and disclosure of contingent assets and liabilities at the date of the financial statements and the reported amounts of income and expenses during the reporting period. Actual results could differ from these estimates.
G) SHORT-TERM INVESTMENTS — The Portfolio, together with other funds/portfolios advised by Credit Suisse Asset Management, LLC ("Credit Suisse"), an indirect, wholly-owned subsidiary of Credit Suisse Group AG, pools available cash into a short-term variable rate time deposit issued by State Street
52
Credit Suisse Trust — U.S. Equity Flex I Portfolio
Notes to Financial Statements (continued)
December 31, 2010
Note 2. Significant Accounting Policies
Bank and Trust Company ("SSB"), the Portfolio's custodian. The short-term time deposit issued by SSB is a variable rate account classified as a short-term investment.
H) SHORT SALES — The Portfolio enters into short sales transactions collateralized by cash deposits received from brokers in connection with securities lending activities (see note I) and securities. Cash deposits are shown as cash segregated at brokers on the Statement of Assets and Liabilities. The collateral amounts required are determined daily by reference to the market value of the short positions. Short sales expose the Portfolio to the risk that it will be required to cover its short position at a time when the securities have appreciated in value, thus resulting in a loss to the Portfolio. The Portfolio's loss on a short sale could theoretically be unlimited in a case where the Portfolio is unable, for whatever reason, to close out its short position. Short sales also involve transaction and other costs that will reduce potential gains and increase potential portfolio losses. The use by the Portfolio of short sal es in combination with long positions in its portfolio in an attempt to improve performance may not be successful and may result in greater losses or lower positive returns than if the Portfolio held only long positions. It is possible that the Portfolio's long equity positions will decline in value at the same time that the value of the securities it has sold short increases, thereby increasing potential losses to the Portfolio. In addition, the Portfolio's short selling strategies may limit its ability to fully benefit from increases in the equity markets. Short selling also involves a form of financial leverage that may exaggerate any losses realized by the Portfolio. Also, there is the risk that the counterparty to a short sale may fail to honor its contractual terms, causing a loss to the Portfolio.
I) SECURITIES LENDING — Loans of securities are required at all times to be secured by collateral at least equal to 102% of the market value of domestic securities on loan (including any accrued interest thereon) and 105% of the market value of foreign securities on loan (including any accrued interest thereon). Cash collateral received by the Portfolio in connection with securities lending activity is either in the form of cash segregated at brokers or pooled together with cash collateral for other funds/portfolios advised by Credit Suisse and may be invested in a variety of investments, including funds advised by SSB, the Portfolio's securities lending agent, or money market instruments. However, in the event of default or bankruptcy by the other party to the agreement, realization and/or retention of the collateral may be subject to legal proceedings.
SSB has been engaged by the Portfolio to act as the Portfolio's securities lending agent. The Portfolio's securities lending arrangement provides that
53
Credit Suisse Trust — U.S. Equity Flex I Portfolio
Notes to Financial Statements (continued)
December 31, 2010
Note 2. Significant Accounting Policies
the Portfolio and SSB will share the net income earned from securities lending activities. During the year ended December 31, 2010, total earnings from the Portfolio's investment in cash collateral received in connection with securities lending arrangements was $142,099, of which $71,102 was rebated to borrowers (brokers). The Portfolio retained $57,338 in income from the cash collateral investment, and SSB, as lending agent, was paid $13,659. Securities lending income is accrued as earned.
J) SUBSEQUENT EVENTS — In preparing the financial statements as of December 31, 2010, management considered the impact of subsequent events for potential recognition or disclosure in these financial statements.
Note 3. Transactions with Affiliates and Related Parties
Credit Suisse serves as investment adviser for the Portfolio. For its investment advisory services, Credit Suisse is entitled to receive a fee from the Portfolio at an annual rate of 0.70% of the Portfolio's average daily net assets. For the year ended December 31, 2010, investment advisory fees earned were $1,057,186.
Credit Suisse Asset Management Securities, Inc. ("CSAMSI"), an affiliate of Credit Suisse, and SSB serve as co-administrators to the Portfolio. For its co-administrative services, CSAMSI currently receives a fee calculated at an annual rate of 0.09% of the Portfolio's average daily net assets. For the year ended December 31, 2010, co-administrative services fees earned by CSAMSI were $135,924.
For its co-administrative services, SSB receives a fee, exclusive of out-of-pocket expenses, calculated in total for all the Credit Suisse funds/portfolios co-administered by SSB and allocated based upon the relative average net assets of each fund/portfolio, subject to an annual minimum fee. For the year ended December 31, 2010, co-administrative services fees earned by SSB (including out-of-pocket expenses) were $169,649.
In addition to serving as the Portfolio's co-administrator, CSAMSI currently serves as distributor of the Portfolio's shares without compensation.
Merrill Corporation ("Merrill"), an affiliate of Credit Suisse, has been engaged by the Portfolio to provide certain financial printing services. For the year ended December 31, 2010, Merrill was paid $33,231 for its services by the Portfolio.
54
Credit Suisse Trust — U.S. Equity Flex I Portfolio
Notes to Financial Statements (continued)
December 31, 2010
Note 4. Line of Credit
The Portfolio, together with other funds/portfolios advised by Credit Suisse (collectively, the "Participating Funds"), participates in a committed, unsecured line of credit facility ("Credit Facility") for temporary or emergency purposes with SSB. Under the terms of the Credit Facility, the Participating Funds pay an aggregate commitment fee on the average unused amount of the Credit Facility, which is allocated among the Participating Funds in such manner as is determined by the governing Boards of the Participating Funds. In addition, the Participating Funds pay interest on borrowings at either the Overnight Federal Funds rate or the Overnight LIBOR rate plus a spread. At December 31, 2010, and during the year ended December 31, 2010, the Portfolio had no borrowings under the Credit Facility.
Note 5. Purchases and Sales of Securities
For the year ended December 31, 2010, purchases and sales of investment securities (excluding short sales and short-term investments) were $889,998,621 and $919,629,609, respectively. Securities sold short and purchases to cover securities sold short were $41,378,427 and $49,038,184, respectively.
Note 6. Capital Share Transactions
The Trust is authorized to issue an unlimited number of full and fractional shares of beneficial interest, $.001 par value per share. Transactions in capital shares of the Portfolio were as follows:
| | | For the Year Ended
December 31, 2010 | | For the Year Ended
December 31, 2009 | |
| Shares sold | | | 204,142 | | | | 360,363 | | |
| Shares exchanged due to merger | | | — | | | | 2,981,912 | | |
| Shares issued in reinvestment of dividends | | | 18,459 | | | | 123,854 | | |
| Shares redeemed | | | (2,570,415 | ) | | | (3,776,088 | ) | |
| Net decrease | | | (2,347,814 | ) | | | (309,959 | ) | |
On December 31, 2010, the number of shareholders that held 5% or more of the outstanding shares of the Portfolio was as follows:
Number of
Shareholders | | Approximate Percentage
of Outstanding Shares | |
| | 4 | | | | 81 | % | |
Some of the shareholders are omnibus accounts, which hold shares on behalf of individual shareholders.
55
Credit Suisse Trust — U.S. Equity Flex I Portfolio
Notes to Financial Statements (continued)
December 31, 2010
Note 7. Federal Income Taxes
Income and capital gain distributions are determined in accordance with federal income tax regulations, which may differ from GAAP.
The tax characteristics of dividends and distributions paid during the years ended December 31, 2010 and 2009, respectively, by the Portfolio were as follows:
| Ordinary Income | |
| 2010 | | 2009 | |
| $ | 225,568 | | | $ | 1,448,705 | | |
The tax basis components of distributable earnings differ from the amounts reflected in the Statement of Assets and Liabilities by temporary book/tax differences. These differences are primarily due to differing treatments of losses deferred due to wash sales, cumulative basis adjustments on partnerships and Real Estate Investment Trusts.
At December 31, 2010, the components of distributable earnings on a tax basis were as follows:
| Undistributed net investment income | | $ | 724,935 | | |
| Accumulated realized loss | | | (67,363,786 | ) | |
| Unrealized appreciation | | | 6,794,587 | | |
| Deferral of post-October capital losses | | | (195,624 | ) | |
| | | $ | (60,039,888 | ) | |
At December 31, 2010, the Portfolio had capital loss carryforwards available to offset possible future capital gains as follows:
| Expires December 31, | |
| 2011 | | 2015 | | 2016 | | 2017 | |
| $ | 5,258,188 | | | $ | 545,703 | | | $ | 26,551,318 | | | $ | 35,008,577 | | |
During the tax year ended December 31, 2010, the Portfolio utilized $16,667,739 of the capital loss carryforwards and $54,354,354 of the capital loss carryforwards expired.
It is uncertain whether the Portfolio will be able to realize the benefits of the capital loss carryforwards before they expire.
Included in the Portfolio's capital loss carryforwards which expire in 2016 is $3,621,034, acquired in the Credit Suisse Trust — U.S. Equity Flex II Portfolio merger, which is subject to limitations.
Included in the Portfolio's capital loss carryforwards which expire in 2015 and 2016 is $203,448 and $4,060,451 respectively, acquired in the Credit Suisse Trust — U.S. Equity Flex III Portfolio merger, which is subject to limitations.
56
Credit Suisse Trust — U.S. Equity Flex I Portfolio
Notes to Financial Statements (continued)
December 31, 2010
Note 7. Federal Income Taxes
Included in the Portfolio's capital loss carryforwards which expire in 2015 and 2016 is $342,255 and $961,998 respectively, acquired in the Credit Suisse Trust — U.S. Equity Flex IV Portfolio merger, which is subject to limitations.
At December 31, 2010, the identified cost for federal income tax purposes, as well as the gross unrealized appreciation from investments for those securities having an excess of value over cost, gross unrealized depreciation from investments for those securities having an excess of cost over value and the net unrealized appreciation from investments were $199,094,304, $15,944,807, $(2,185,199) and $13,759,608, respectively.
At December 31, 2010, the identified proceeds for federal income tax purposes, as well as the gross unrealized appreciation from securities sold short for those securities having an excess of proceeds over value, gross unrealized depreciation from investments for those securities having an excess of value over proceeds and the net unrealized depreciation from securities sold short were $(29,720,590), $385,477, $(7,350,498) and $(6,965,021), respectively.
At December 31, 2010, the Portfolio reclassified $73,813 from undistributed net investment income and $54,345,868 from paid-in capital to accumulated net realized loss, to adjust for current period permanent book/tax differences which arose principally from foreign currency gain/(loss), real estate investment trusts, reclassification of short sale substitute payments and expiration of capital loss carryforwards. Net assets were not affected by these reclassifications.
Note 8. Acquisition of Credit Suisse Trust — U.S. Equity Flex II Portfolio, Credit Suisse Trust — U.S. Equity Flex III Portfolio and Credit Suisse Trust — U.S. Equity Flex IV Portfolio
On October 2, 2009, Credit Suisse Trust — U.S. Equity Flex I Portfolio acquired all of the net assets of Credit Suisse Trust — U.S. Equity Flex II Portfolio, Credit Suisse Trust — U.S. Equity Flex III Portfolio and Credit Suisse Trust — U.S. Equity Flex IV Portfolio, all of which are open-end investment companies, pursuant to a plan of reorganization approved by the Board of Trustees on May 12, 2009. The purpose of the transaction was to combine four funds managed by Credit Suisse with comparable investment objectives and strategies. The acquisition was accomplished by a tax-free exchange of 1,284,769 shares of Credit Suisse Trust — U.S. Equity Flex II Portfolio valued at $11,153,778, 1,203,118 shares of Credit Suisse Trust — U.S. Equity Flex III Portfolio valued at $13,133,970 and 1,026,788 shares of Credit Suisse Trust — U.S. Equity Flex IV Portfolio valued at $9,901,514 for 2,981,912 share s of Credit Suisse Trust — U.S. Equity Flex I Portfolio. The investment portfolios of Credit Suisse Trust — U.S. Equity Flex II Portfolio, Credit Suisse Trust — U.S. Equity Flex III Portfolio and Credit Suisse Trust — U.S. Equity Flex IV Portfolio had a
57
Credit Suisse Trust — U.S. Equity Flex I Portfolio
Notes to Financial Statements (continued)
December 31, 2010
Note 8. Acquisition of Credit Suisse Trust — U.S. Equity Flex II Portfolio, Credit Suisse Trust — U.S. Equity Flex III Portfolio and Credit Suisse Trust — U.S. Equity Flex IV Portfolio
fair value at October 2, 2009 of $11,132,420, $13,104,370 and $9,878,210 and identified costs of $10,483,399, $12,252,732 and $9,160,031, respectively, which were the principal assets acquired by Credit Suisse Trust — U.S. Equity Flex I Portfolio. For financial reporting purposes, assets received and shares issued by Credit Suisse Trust — U.S. Equity Flex I Portfolio were recorded at fair value; however the cost basis of the investments received from Credit Suisse Trust — U.S. Equity Flex II Portfolio , Credit Suisse Trust — U.S. Equity Flex III Portfolio and Credit Suisse Trust — U.S. Equity Flex IV Portfolio were carried forward to align ongoing reporting of Credit Suisse Trust — U.S. Equity Flex I Portfolio's realized and unrealized gains and losses with amounts distributable to shareholders for tax purposes. Immediately prior to the merger, the net assets of Credit Suisse Trust — U.S. Equ ity Flex I Portfolio were $132,557,155.
Credit Suisse Trust — U.S. Equity Flex I Portfolio pro forma results of operations for the year ended December 31, 2009 are as follows:
| Net investment income | | $ | 815,5731 | | |
| Net gain from investments, short sales and foreign currency related items | | | 35,210,7702 | | |
| Net increase in net assets resulting from operations | | $ | 36,026,343 | | |
Because the combined investment portfolios have been managed as a single integrated portfolio since the acquisition was completed, it is not practicable to separate the amounts of net investment income and net gain on investments of Credit Suisse Trust — U.S. Equity Flex II Portfolio, Credit Suisse Trust — U.S. Equity Flex III Portfolio and Credit Suisse Trust — U.S. Equity Flex IV Portfolio that have been included in Credit Suisse Trust — U.S. Equity Flex I Portfolio's statement of operations since October 2, 2009.
1 $454,374 as reported, plus $152,979, $78,352 and $86,228 for Credit Suisse Trust — U.S. Equity Flex II Portfolio, Credit Suisse Trust — U.S. Equity Flex III Portfolio and Credit Suisse Trust — U.S. Equity Flex IV Portfolio, respectively, premerger, plus $43,640 of pro-forma gross expenses eliminated.
2 $29,535,309 as reported, plus $1,785,307, $2,097,371 and $1,792,783 for Credit Suisse Trust — U.S. Equity Flex II Portfolio, Credit Suisse Trust — U.S. Equity Flex III Portfolio and Credit Suisse Trust — U.S. Equity Flex IV Portfolio respectively, premerger.
Note 9. Contingencies
In the normal course of business, the Portfolio may provide general indemnifications pursuant to certain contracts and organizational documents. The Portfolio's maximum exposure under these arrangements is dependent on future claims that may be made against the Portfolio and, therefore, cannot be estimated; however, based on experience, the risk of loss from such claims is considered remote.
58
Credit Suisse Trust — U.S. Equity Flex I Portfolio
Report of Independent Registered Public Accounting Firm
To the Board of Trustees and Shareholders of
Credit Suisse Trust — US Equity Flex I Portfolio:
In our opinion, the accompanying statement of assets and liabilities, including the schedule of investments, and the related statements of operations and of changes in net assets and of cash flows and the financial highlights present fairly, in all material respects, the financial position of Credit Suisse Trust — US Equity Flex I Portfolio (the "Portfolio"), at December 31, 2010, the results of its operations and its cash flow for the year then ended and the changes in its net assets and financial highlights for the periods presented, in conformity with accounting principles generally accepted in the United States of America. These financial statements and financial highlights (hereafter referred to as "financial statements") are the responsibility of the Portfolio's management. Our responsibility is to express an opinion on these financial statements based on our audit. We conducted our audit of these financial statemen ts in accordance with the standards of the Public Company Accounting Oversight Board (United States). Those standards require that we plan and perform the audit to obtain reasonable assurance about whether the financial statements are free of material misstatement. An audit includes examining, on a test basis, evidence supporting the amounts and disclosures in the financial statements, assessing the accounting principles used and significant estimates made by management, and evaluating the overall financial statement presentation. We believe that our audit, which included confirmation of securities at December 31, 2010 by correspondence with the custodian and brokers, provides a reasonable basis for our opinion.
PricewaterhouseCoopers LLP
Boston, Massachusetts
February 22, 2011
59
Credit Suisse Trust — U.S. Equity Flex I Portfolio
Board Approval of Advisory Agreement (unaudited)
In approving the renewal of the current Advisory Agreement, the Board of Trustees (the "Board") of the Credit Suisse Trust — US Equity Flex I Portfolio (the "Portfolio"), including a majority of the Trustees who are not "interested persons" of the Fund as defined in the Investment Company Act of 1940 (the "Independent Trustees"), at a meeting held on November 15 and 16, 2010, considered the following factors:
Investment Advisory Fee Rates and Expenses
The Board reviewed and considered the contractual advisory fee rate of 0.70% for the Portfolio ("Contractual Advisory Fee") in light of the extent and quality of the advisory services provided by Credit Suisse Asset Management, LLC ("Credit Suisse"). The Board also reviewed and considered the actual fee rate of 0.70% paid by the Portfolio ("Net Advisory Fee") as of September 30, 2010.
Additionally, the Board received and considered information comparing the Portfolio's Contractual Advisory Fee, Net Advisory Fee and the Portfolio's overall expenses with those of funds in both the relevant expense group ("Expense Group") and universe of funds ("Expense Universe") provided by Lipper Inc., an independent provider of investment company data.
Nature, Extent and Quality of the Services under the Advisory Agreement
The Board received and considered information regarding the nature, extent and quality of services provided to the Portfolio by Credit Suisse under the Advisory Agreement. The Board also noted information received at regular meetings throughout the year related to the services rendered by Credit Suisse. The Board reviewed background information about Credit Suisse, including its Form ADV. The Board considered the background and experience of Credit Suisse's senior management and the expertise of, and the amount of attention given to the Portfolio by, senior personnel of Credit Suisse. In addition, the Board reviewed the qualifications, backgrounds and responsibilities of the portfolio management team primarily responsible for the day-to-day portfolio management of the Portfolio and the extent of the resources devoted to research and analysis of actual and potential investments. The Board evaluated the ability of Credit Suisse, based on its resources, reputation and other attributes, to attract and retain qualified investment professionals, including research, advisory, and supervisory personnel. The Board also received and considered information about the nature, extent and quality of services and fee rates offered to other Credit Suisse clients for comparable services.
60
Credit Suisse Trust — U.S. Equity Flex I Portfolio
Board Approval of Advisory Agreement (unaudited) (continued)
Portfolio Performance
The Board received and considered performance results of the Portfolio over time, along with comparisons both to the relevant performance group ("Performance Group") and universe of funds ("Performance Universe") for the Portfolio. The Board was provided with a description of the methodology used to arrive at the funds included in the Performance Group and the Performance Universe.
Credit Suisse Profitability
The Board received and considered a profitability analysis of Credit Suisse based on the fees payable under the Advisory Agreement for the Portfolio, as well as other relationships between the Portfolio on the one hand and Credit Suisse affiliates on the other. The Board also considered Credit Suisse's methodology for allocating costs to the Portfolio, recognizing that cost allocation methodologies are inherently subjective. The Board received profitability information for the other funds in the Credit Suisse family of funds.
Economies of Scale
The Board considered information regarding whether there have been economies of scale with respect to the management of the Portfolio, whether the Portfolio has appropriately benefited from any economies of scale, and whether there is potential for realization of any further economies of scale. Accordingly, the Board considered whether breakpoints in the Portfolio's advisory fee structure would be appropriate or reasonable taking into consideration economies of scale or other efficiencies that might accrue from increases in the Portfolio's asset levels.
Other Benefits to Credit Suisse
The Board considered other benefits received by Credit Suisse and its affiliates as a result of their relationship with the Portfolio. Such benefits include, among others, benefits potentially derived from an increase in Credit Suisse's businesses as a result of its relationship with the Portfolio (such as the ability to market to shareholders other financial products offered by Credit Suisse and its affiliates) and the fees paid to affiliates of Credit Suisse for co-administration and distribution services.
The Board considered the standards applied in seeking best execution, and also reviewed Credit Suisse's method for allocating portfolio investment opportunities among its advisory clients. Credit Suisse confirmed there were no soft dollar arrangements during the past year.
61
Credit Suisse Trust — U.S. Equity Flex I Portfolio
Board Approval of Advisory Agreement (unaudited) (continued)
Other Factors and Broader Review
As discussed above, the Board reviews detailed materials received from Credit Suisse as part of the annual re-approval process. The Board also reviews and assesses the quality of the services that the Portfolio receives throughout the year. In this regard, the Board reviews reports of Credit Suisse at least quarterly, which include, among other things, detailed portfolio and market reviews, detailed fund performance reports and Credit Suisse's compliance procedures.
Conclusions
In selecting Credit Suisse, and approving the Advisory Agreement and the investment advisory fee under such agreement, the Board concluded that:
• The combined Contractual Advisory Fee and co-administration fee were below the median of the Expense Group. In addition, the Net Advisory Fee was lower than the median of the Expense Group. The Board concluded the fee was reasonable.
• The Portfolio's performance was at or above the median for all periods in the Performance Group and Performance Universe. The Board noted the change to the Portfolio's investment strategy that occurred in 2009.
• The Board was satisfied with the nature, extent and quality of the investment advisory services provided to the Portfolio by Credit Suisse and that, based on dialogue with management and counsel, the services provided by Credit Suisse under the Advisory Agreement are typical of, and consistent with, those provided to similar mutual funds by other investment advisers.
• In light of the costs of providing investment management and other services to the Portfolio and Credit Suisse's ongoing commitment to the Portfolio and willingness to waive fees, Credit Suisse's profitability based on fees payable under the Advisory Agreement, as well as other ancillary benefits that Credit Suisse and its affiliates received, were considered reasonable.
• In light of the combined Contractual Advisory Fee and co-administration fee, as well as the Net Advisory Fee, the Portfolio's current fee structure (without breakpoints) was considered reasonable.
No single factor reviewed by the Board was identified by the Board as the principal factor in determining whether to approve the Advisory Agreement. The Independent Trustees were advised by separate independent legal counsel throughout the process.
62
Credit Suisse Trust — U.S. Equity Flex I Portfolio
Information Concerning Trustees and Officers (unaudited)
Name, Address
(Year of Birth) | | Position(s)
Held with
Trust | | Term
of Office1
and
Length
of Time
Served | | Principal
Occupation(s) During
Past Five Years | | Number of
Portfolios in
Fund
Complex
Overseen by
Trustee | | Other
Directorships
Held by Trustee | |
| Independent Trustees | | | | | | | | | | | |
|
Enrique Arzac
c/o Credit Suisse Asset
Management, LLC
Attn: General Counsel
Eleven Madison Avenue
New York, New York
10010
(1941) | | Trustee,
Audit Committee Chairman and Nominating Committee Member | | Since 2005 | | Professor of Finance and Economics, Graduate School of Business, Columbia University since 1971. | | | 9 | | | Director of Epoch Holding Corporation (an investment management and investment advisory services company); Director of Starcomms PLC., (telecommunications company); Director of Mirae Asset Discovery Funds (6 open-end portfolios); Director of Aberdeen Asia-Pacific Income Investment Company Limited (a Canadian closed-end fund); Director of The Adams Express Company, Petroleum and Resources Corporation, Aberdeen Chile Fund, Inc., Aberdeen Indonesia Fund, Inc., Aberdeen Israel Fund, Inc., Aberdeen Latin America Equity Fund, Inc. and Aberdeen Emerging Markets Telecommunications and Infrastructure Fund, Inc. (each a closed-end investment company). | |
|
1 Each Trustee and Officer serves until his or her respective successor has been duly elected and qualified.
63
Credit Suisse Trust — U.S. Equity Flex I Portfolio
Information Concerning Trustees and Officers (unaudited) (continued)
Name, Address
(Year of Birth) | | Position(s)
Held with
Trust | | Term
of Office1
and
Length
of Time
Served | | Principal
Occupation(s) During
Past Five Years | | Number of
Portfolios in
Fund
Complex
Overseen by
Trustee | | Other
Directorships
Held by Trustee | |
| Independent Trustees | | | | | | | | | | | |
|
Jeffrey E. Garten2
Box 208200
New Haven, Connecticut
06520-8200
(1946) | | Trustee,
Audit and Nominating Committee Member | | Since 1998 | | The Juan Trippe Professor in the Practice of International Trade, Finance and Business from July 2005 to present; Partner and Chairman of Garten Rothkopf (consulting firm) from October 2005 to present; Dean of Yale School of Management from November 1995 to June 2005. | | | 7 | | | Director of Aetna, Inc. (insurance company); Director of CarMax Group (used car dealers); Member of Standard & Poor's Board of Managers. | |
|
Peter F. Krogh
c/o Credit Suisse Asset
Management, LLC
Attn: General Counsel
Eleven Madison Avenue
New York, New York
10010
(1937) | | Trustee,
Audit and Nominating Committee Member | | Since
2001 | | Dean Emeritus and Distinguished Professor of International Affairs at the Edmund A. Walsh School of Foreign Service, Georgetown University from June 1995 to June 2009. | | | 7 | | | None | |
|
2 Mr. Garten was initially appointed as a Trustee of the Portfolio on February 6, 1998. He resigned as Trustee on February 3, 2000 and was subsequently reappointed on December 21, 2000.
64
Credit Suisse Trust — U.S. Equity Flex I Portfolio
Information Concerning Trustees and Officers (unaudited) (continued)
Name, Address
(Year of Birth) | | Position(s)
Held with
Trust | | Term
of Office1
and
Length
of Time
Served | | Principal
Occupation(s) During
Past Five Years | | Number of
Portfolios in
Fund
Complex
Overseen by
Trustee | | Other
Directorships
Held by Trustee | |
| Independent Trustees | | | | | | | | | | | |
|
Steven N. Rappaport
Lehigh Court, LLC
555 Madison Avenue
29th Floor
New York, New York
10022
(1948) | | Chairman of the Board of Trustees, Audit Committee Member and Nominating Committee Chairman | | Trustee since 1999 and Chairman since 2005 | | Partner of Lehigh Court, LLC and RZ Capital (private investment firms) from July 2002 to present. | | | 9 | | | Director of iCAD, Inc. (a surgical and medical instruments and apparatus company); Director of Presstek, Inc. (digital imaging technologies company); Director of Wood Resources, LLC. (plywood manufacturing company); Director of Aberdeen Chile Fund, Inc., Aberdeen Indonesia Fund, Inc., Aberdeen Israel Fund, Inc., Aberdeen Latin America Equity Fund, Inc. and Aberdeen Emerging Markets Telecommunications and Infrastructure Fund, Inc. (each a closed-end investment company). | |
|
65
Credit Suisse Trust — U.S. Equity Flex I Portfolio
Information Concerning Trustees and Officers (unaudited) (continued)
Name, Address
(Year of Birth) | | Position(s)
Held with
Trust | | Term
of Office1
and
Length
of Time
Served | | Principal Occupation(s) During Past Five Years | |
| Officers** | | | | | | | |
|
John G. Popp
Credit Suisse Asset
Management, LLC
Eleven Madison Avenue
New York, New York 10010
(1956) | | Chief Executive Officer and President | | Since 2010 | | Managing Director of Credit Suisse; Group Manager and Senior Portfolio Manager for Performing Credit Strategies; Associated with Credit Suisse or its predecessor since 1997; Officer of other Credit Suisse Funds. | |
|
Michael A. Pignataro
Credit Suisse Asset
Management, LLC
Eleven Madison Avenue
New York, New York 10010
(1959) | | Chief Financial Officer | | Since 1999 | | Director and Director of Fund Administration of Credit Suisse; Associated with Credit Suisse or its predecessor since 1984; Officer of other Credit Suisse Funds. | |
|
Emidio Morizio
Credit Suisse Asset
Management, LLC
One Madison Avenue
New York, New York 10010
(1966) | | Chief Compliance Officer | | Since 2004 | | Managing Director and Global Head of Compliance of Credit Suisse; Associated with Credit Suisse since July 2000; Officer of other Credit Suisse Funds. | |
|
Roger Machlis
Credit Suisse Asset
Management, LLC
One Madison Avenue
New York, New York 10010
(1961) | | Chief Legal Officer | | Since 2010 | | Managing Director and General Counsel for Credit Suisse; Associated with Credit Suisse Group AG since 1997; Officer of other Credit Suisse Funds. | |
|
Cecilia Chau
Credit Suisse Asset
Management, LLC
Eleven Madison Avenue
New York, New York 10010
(1973) | | Treasurer | | Since 2008 | | Vice President of Credit Suisse since 2009; Assistant Vice President of Credit Suisse from June 2007 to December 2008; Associated with Alliance Bernstein L.P. from January 2007 to May 2007; Associated with Credit Suisse from August 2000 to December 2006; Officer of other Credit Suisse Funds. | |
|
Karen Regan
Credit Suisse Asset
Management, LLC
Eleven Madison Avenue
New York, New York 10010
(1963) | | Vice President and Secretary | | Since 2010 | | Vice President of Credit Suisse; Associated with Credit Suisse since December 2004; Officer of other Credit Suisse Funds | |
|
** The officers of the Portfolio shown are officers that make policy decisions.
The Statement of Additional Information includes additional information about the Trustees and is available, without charge, upon request, by calling 800-222-8977.
66
Credit Suisse Trust — U.S. Equity Flex I Portfolio
Tax Information Letter
December 31, 2010 (unaudited)
Important Tax Information for Corporate Shareholders
Corporate shareholders should note for the year ended December 31, 2010, the percentage of the Portfolio's investment income (i.e., net investment income plus short-term capital gains) that qualified for the intercorporate dividends received deduction is 100%.
67
Credit Suisse Trust — U.S. Equity Flex I Portfolio
Proxy Voting and Portfolio Holdings Information (unaudited)
Information regarding how the Portfolio voted proxies related to its portfolio securities during the 12 month period ended June 30 of each year, as well as the policies and procedures that the Portfolio uses to determine how to vote proxies relating to its portfolio securities are available:
• By calling 1-800-222-8977
• On the Portfolio's website, www.credit-suisse.com/us
• On the website of the Securities and Exchange Commission, www.sec.gov.
The Portfolio files a complete schedule of its portfolio holdings for the first and third quarters of its fiscal year with the SEC on Form N-Q. The Portfolio's Forms N-Q are available on the SEC's website at www.sec.gov and may be reviewed and copied at the SEC's Public Reference Room in Washington, DC. Information on the operation of the SEC's Public Reference Room may be obtained by calling 1-202-551-8090.
68

P.O. BOX 55030, BOSTON, MA 02205-5030
800-222-8977 n WWW.credit-suisse.com/us
CREDIT SUISSE ASSET MANAGEMENT SECURITIES, INC., DISTRIBUTOR. TRSCC I-AR-1210
Item 2. Code of Ethics.
The registrant has adopted a code of ethics applicable to its Chief Executive Officer, President, Chief Financial Officer and Chief Accounting Officer, or persons performing similar functions. A copy of the code is filed as Exhibit 12(a)(1) to this Form. There were no amendments to the code during the fiscal year ended December 31, 2010. There were no waivers or implicit waivers from the code granted by the registrant during the fiscal year ended December 31, 2010.
Item 3. Audit Committee Financial Expert.
The registrant’s governing board has determined that it has two audit committee financial experts serving on its audit committee: Enrique R. Arzac and Steven N. Rappaport. Each audit committee financial expert is “independent” for purposes of this item.
Item 4. Principal Accountant Fees and Services.
(a) through (d). The information in the table below is provided for services rendered to the registrant by its independent registered public accounting firm, PricewaterhouseCoopers LLP (“PwC”), for its fiscal years ended December 31, 2009 and December 31, 2010.
| | 2009 | | 2010 | |
Audit Fees | | $ | 134,000 | | $ | 138,500 | |
Audit-Related Fees(1) | | $ | 27,200 | | $ | 10,200 | |
Tax Fees(2) | | $ | 8,400 | | $ | 8,400 | |
All Other Fees | | — | | — | |
Total | | $ | 169,600 | | $ | 157,100 | |
(1) Services include agreed-upon procedures in connection with the registrant’s semi-annual financial statements ($27,200 for 2009 and $10,200 for 2010).
(2) Tax services in connection with the registrant’s excise tax calculations and review of the registrant’s applicable tax returns.
The information in the table below is provided with respect to non-audit services that directly relate to the registrant’s operations and financial reporting and that were rendered by PwC to the registrant’s investment adviser, Credit Suisse Asset Management, LLC (“Credit Suisse”), and any service provider to the registrant controlling, controlled by or under common control with Credit Suisse that provided ongoing services to the registrant (“Covered Services Provider”), for the registrant’s fiscal years ended December 31, 2009 and December 31, 2010.
| | 2009 | | 2010 | |
Audit-Related Fees | | N/A | | N/A | |
Tax Fees | | N/A | | N/A | |
All Other Fees | | N/A | | N/A | |
Total | | N/A | | N/A | |
(e)(1) Pre-Approval Policies and Procedures. The Audit Committee (“Committee”) of the registrant is responsible for pre-approving (i) all audit and permissible non-audit services to be provided by the independent registered public accounting firm to the registrant and (ii) all permissible non-audit services to be provided by the independent registered public accounting firm to Credit Suisse and any Covered Services Provider if the engagement relates directly to the operations and financial reporting of the registrant. The Committee may delegate its responsibility to pre-approve any such audit and permissible non-audit services to the Chairperson of the Committee, and the Chairperson shall report to the Committee, at its next regularly scheduled meeting after the Chairperson’s pre-approval of such services, his or her decision(s). The Committee may also establish d etailed pre-approval policies and procedures for pre-approval of such services in accordance with applicable laws, including the delegation of some or all of the Committee’s pre-approval responsibilities to other persons (other than Credit Suisse or the registrant’s officers). Pre-approval by the Committee of any permissible non-audit services shall not be required so long as: (i) the aggregate amount of all such permissible non-audit services provided to the registrant, Credit Suisse and any Covered Services Provider constitutes not more than 5% of the total amount of revenues paid by the registrant to its independent registered public accounting firm during the fiscal year in which the permissible non-audit services are provided; (ii) the permissible non-audit services were not recognized by the registrant at the time of the engagement to be non-audit services; and (iii) such services are promptly brought to the attention of the Committee and approved by the Committee (or its delegate(s)) prior to the completion of the audit.
(e)(2) The information in the table below sets forth the percentages of fees for services (other than audit, review or attest services) rendered by PwC to the registrant for which the pre-approval requirement was waived pursuant to Rule 2-01(c)(7)(i)(C) of Regulation S-X:
| | 2009 | | 2010 | |
Audit-Related Fees | | N/A | | N/A | |
Tax Fees | | N/A | | N/A | |
All Other Fees | | N/A | | N/A | |
Total | | N/A | | N/A | |
The information in the table below sets forth the percentages of fees for services (other than audit, review or attest services) rendered by PwC to Credit Suisse and any Covered Services Provider required to be approved pursuant to Rule 2-01(c)(7)(ii) of Regulation S-X, for the registrant’s fiscal years ended December 31, 2009 and December 31, 2010:
| | 2009 | | 2010 | |
Audit-Related Fees | | N/A | | N/A | |
Tax Fees | | N/A | | N/A | |
All Other Fees | | N/A | | N/A | |
Total | | N/A | | N/A | |
(f) Not Applicable.
(g) The aggregate fees billed by PwC for non-audit services rendered to the registrant, Credit Suisse and Covered Service Providers for the fiscal years ended December 31, 2009 and December 31, 2010 were $35,600 and $18,600, respectively.
(h) Not Applicable.
Item 5. Audit Committee of Listed Registrants.
Form N-CSR disclosure requirement is not applicable to the registrant.
Item 6. Schedule of Investments.
Included as part of the report to shareholders filed under Item 1 of this Form.
Item 7. Disclosure of Proxy Voting Policies and Procedures for Closed-End Management Investment Companies.
Form N-CSR disclosure requirement is not applicable to the registrant.
Item 8. Portfolio Managers of Closed-End Management Investment Companies.
Form N-CSR disclosure requirement is not applicable to the registrant.
Item 9. Purchases of Equity Securities by Closed-End Management Investment Company and Affiliated Purchasers.
Form N-CSR disclosure requirement is not applicable to the registrant.
Item 10. Submission of Matters to a Vote of Security Holders.
None
Item 11. Controls and Procedures.
(a) As of a date within 90 days from the filing date of this report, the principal executive officer and principal financial officer concluded that the registrant’s disclosure controls and procedures (as defined in Rule 30a-3(c) under the Investment Company Act of 1940 (the “Act”)) were effective based on their evaluation of the disclosure controls and procedures required by Rule 30a-3(b) under the Act and Rules 13a-15(b) or 15d-15(b) under the Securities Exchange Act of 1934.
(b) There were no changes in registrant’s internal control over financial reporting (as defined in Rule 30a-3(d) under the Act) that occurred during the second fiscal quarter of the period covered by this report that have materially affected, or are reasonably likely to materially affect, the registrant’s internal control over financial reporting.
Item 12. Exhibits.
(a)(1) Registrant’s Code of Ethics is an exhibit to this report.
(a)(2) The certifications of the registrant as required by Rule 30a-2(a) under the Act are exhibits to this report.
(a)(3) Not applicable.
(b) The certifications of the registrant as required by Rule 30a-2(b) under the Act are an exhibit to this report.
SIGNATURES
Pursuant to the requirements of the Securities Exchange Act of 1934 and the Investment Company Act of 1940, the registrant has duly caused this report to be signed on its behalf by the undersigned, thereunto duly authorized.
| CREDIT SUISSE TRUST |
| |
| /s/ John G. Popp | |
| Name: | John G. Popp |
| Title: | Chief Executive Officer |
| Date: | March 2, 2011 |
| | | |
Pursuant to the requirements of the Securities Exchange Act of 1934 and the Investment Company Act of 1940, this report has been signed below by the following persons on behalf of the registrant and in the capacities and on the dates indicated.
| /s/ John G. Popp | |
| Name: | John G. Popp |
| Title: | Chief Executive Officer |
| Date: | March 2, 2011 |
| | |
| /s/ Michael A. Pignataro | |
| Name: | Michael A. Pignataro |
| Title: | Chief Financial Officer |
| Date: | March 2, 2011 |
| | | |