UNITED STATES
SECURITIES AND EXCHANGE COMMISSION
Washington, D.C. 20549
FORM N-CSR
CERTIFIED SHAREHOLDER REPORT OF REGISTERED
MANAGEMENT INVESTMENT COMPANIES
Investment Company Act file number 811-07319
Fidelity Covington Trust
(Exact name of registrant as specified in charter)
245 Summer St., Boston, Massachusetts 02210
(Address of principal executive offices) (Zip code)
Margaret Carey, Secretary
245 Summer St.
Boston, Massachusetts 02210
(Name and address of agent for service)
Registrant's telephone number, including area code:
617-563-7000
Date of fiscal year end: | May 31 |
Date of reporting period: | May 31, 2024 |
Item 1.
Reports to Stockholders
ANNUAL SHAREHOLDER REPORT | AS OF MAY 31, 2024 | This report describes changes to the Fund that occurred during the reporting period. | |
| | Fidelity® Disruptors ETF Fidelity® Disruptors ETF : FDIF Principal U.S. Listing Exchange : NASDAQ NASDAQ/NMS Global Market | |
prospectus/sec. You can also request this information by contacting us at 1-800-FIDELITY or by sending an e-mail to fidfunddocuments@fidelity.com.
| Costs of a $10,000 investment | Costs paid as a percentage of a $10,000 investment | ||
| Fidelity® Disruptors ETF | $ 0 A | 0.00%B |
- •Global equities gained considerably for the 12 months ending May 31, 2024, as global economic expansion and, perhaps most notably, a slowing in the pace of inflation and a shift to more-dovish monetary policy in some markets provided a favorable backdrop for risk assets. Performance was driven by a narrow set of technology-focused firms riding high-growth megatrends, fanned by enthusiasm for artificial intelligence.
- •Against this backdrop, stock picks in the United States and Japan detracted from the fund's performance versus the industry index. Positioning in China also hurt. By segment, the primary detractors were picks in the industrial machinery & supplies & components and transaction & payment processing services groups.
- •The fund's non-benchmark stake in Flywire returned -44% and was the largest individual relative detractor. Other notable relative detractors included overweight positions in SolarEdge Technologies (-82%) and Liberty Broadband (-26%).
- •In contrast, from a regional standpoint, security selection in Singapore, and stock picks and an overweight in Taiwan, contributed to the fund's performance versus the industry index. By segment, market selection was the primary contributor, especially in semiconductors.
- •The fund's stake in Nvidia gained 186% and was the top individual relative contributor. Nvidia was the fund's largest holding. An underweight position in Apple (8%) and an overweight in Taiwan Semiconductor (+46%) also notably helped. Taiwan Semiconductor was also among our biggest holdings.
- •Notable changes in positioning include decreased exposure to China and a higher allocation to the United States and Taiwan. By segment, notable changes in positioning include increased exposure to the semiconductors group.
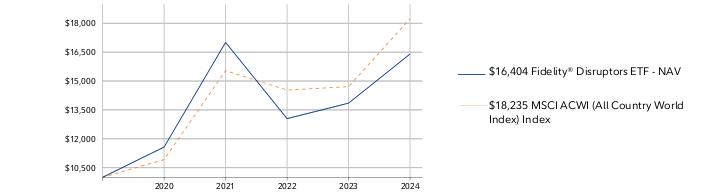
Fidelity® Disruptors ETF | $10,000 | $11,570 | $17,007 | $13,046 | $13,851 |
MSCI ACWI (All Country World Index) Index | $10,000 | $10,918 | $15,538 | $14,529 | $14,708 |
| 2020 | 2021 | 2022 | 2023 | 2024 |
 |
| 1 Year | Life of Fund | |
Fidelity® Disruptors ETF - NAV A | 18.43% | 12.74% |
Fidelity® Disruptors ETF - Market Price B | 18.03% | 12.65% |
MSCI ACWI (All Country World Index) Index A | 23.98% | 15.67% |
Visit www.fidelity.com for more recent performance information. |
The Fund's past performance is not a good predictor of the Fund's future performance. The graph and table do not reflect the deduction of taxes that a shareholder would pay on fund distributions or redemption of fund shares. |
KEY FACTS | ||
| Fund Size | $95,867,608 | |
| Number of Holdings | 7 | |
| Total Advisory Fee | $17 | |
| Portfolio Turnover | 4% |
(as of May 31, 2024)
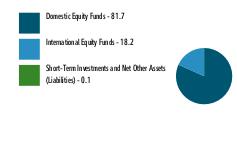
| Domestic Equity Funds | 81.7 |
| International Equity Funds | 18.2 |
| Short-Term Investments and Net Other Assets (Liabilities) | 0.1 |
ASSET ALLOCATION (% of Fund's net assets) |
 |
TOP HOLDINGS (% of Fund's net assets) | ||
| Fidelity Disruptive Communications ETF | 23.0 | |
| Fidelity Disruptive Technology ETF | 20.8 | |
| Fidelity Disruptive Finance ETF | 20.5 | |
| Fidelity Disruptive Automation ETF | 18.2 | |
| Fidelity Disruptive Medicine ETF | 17.4 | |
| 99.9 | ||
The fees associated with this class changed during the reporting year. The variations in class fees are primarily the result of the following changes:
| Fidelity Disruptors ETF converted from Fidelity Disruptors Fund on June 16, 2023. This move, approved by the Board of Trustees in November 2022, was deemed in the best interest of shareholders. The new ETF and its former corresponding fund have identical investment objectives and fundamental investment policies and have substantially similar investment strategies. Returns prior to the conversion are those of the former corresponding fund. Fidelity believes that the conversion will provide multiple benefits for investors of the fund, including lower net expenses, additional trading flexibility, increased portfolio holdings transparency and the potential for enhanced tax efficiency. |
| Fidelity, the Fidelity Investments Logo and all other Fidelity trademarks or service marks used herein are trademarks or service marks of FMR LLC. Any third-party marks that are used herein are trademarks or service marks of their respective owners. © 2024 FMR LLC. All rights reserved. | ||
1.9913348.100 7027-TSRA-0724 |  | For additional information about the Fund; including its prospectus, financial information, holdings and proxy information, scan the QR code or visit fundresearch.fidelity.com/prospectus/sec |
ANNUAL SHAREHOLDER REPORT | AS OF MAY 31, 2024 | This report describes changes to the Fund that occurred during the reporting period. | |
| | Fidelity® Disruptive Medicine ETF Fidelity® Disruptive Medicine ETF : FMED Principal U.S. Listing Exchange : NASDAQ NASDAQ/NMS Global Market | |
prospectus/sec. You can also request this information by contacting us at 1-800-FIDELITY or by sending an e-mail to fidfunddocuments@fidelity.com.
| Costs of a $10,000 investment | Costs paid as a percentage of a $10,000 investment | ||
| Fidelity® Disruptive Medicine ETF | $ 48 | 0.50% |
- •Global equities gained considerably for the 12 months ending May 31, 2024, as global economic expansion and, perhaps most notably, a slowing in the pace of inflation and a shift to more-dovish monetary policy in some markets provided a favorable backdrop for risk assets. Performance was driven by a narrow set of technology-focused firms riding high-growth megatrends, fanned by enthusiasm for artificial intelligence.
- •Against this backdrop, stock picking in the United States and picks in emerging markets, primarily in China, detracted from the fund's performance versus the industry index. By segment, market selection was the primary detractor, especially an underweight in pharmaceuticals. Stock selection in health care services also hurt.
- •The fund's stake in agilon health returned -68% and was the biggest individual relative detractor. This period we increased our position. Holdings in Penumbra (-39%), which was among the fund's biggest holdings this period, and 10x Genomics (-58%) also hurt. All of these detractors were non-benchmark positions.
- •In contrast, from a regional standpoint, an overweight in the United States and an underweight in emerging markets, primarily in China, contributed to the fund's performance versus the industry index. By segment, the biggest contributor to performance versus the index was security selection in biotechnology.
- •The top individual relative contributor was an overweight in Boston Scientific (+47%), the fund's biggest holding. Other top relative contributors included an overweight in Eli Lilly (+92%) - also among the fund's largest holdings at period end - and a non-index stake in Janux Therapeutics (353%). This period we decreased our investment in Eli Lilly.
- •Notable changes in positioning include increased exposure to the health care services and health care technology industries.
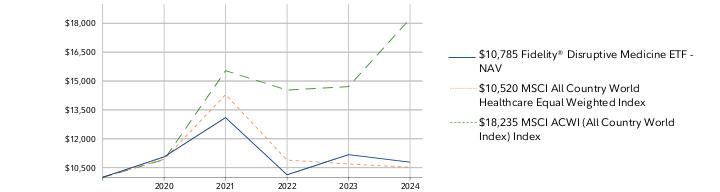
Fidelity® Disruptive Medicine ETF | $10,000 | $11,060 | $13,100 | $10,128 | $11,176 |
MSCI All Country World Healthcare Equal Weighted Index | $10,000 | $10,932 | $14,293 | $10,893 | $10,690 |
MSCI ACWI (All Country World Index) Index | $10,000 | $10,918 | $15,538 | $14,529 | $14,708 |
| 2020 | 2021 | 2022 | 2023 | 2024 |
 |
| 1 Year | Life of Fund | |
Fidelity® Disruptive Medicine ETF - NAV A | -3.50% | 1.85% |
Fidelity® Disruptive Medicine ETF - Market Price B | -3.45% | 1.86% |
MSCI All Country World Healthcare Equal Weighted Index A | -1.59% | 1.24% |
MSCI ACWI (All Country World Index) Index A | 23.98% | 15.67% |
Visit www.fidelity.com for more recent performance information. |
The Fund's past performance is not a good predictor of the Fund's future performance. The graph and table do not reflect the deduction of taxes that a shareholder would pay on fund distributions or redemption of fund shares. |
KEY FACTS | ||
| Fund Size | $49,925,123 | |
| Number of Holdings | 62 | |
| Total Advisory Fee | $237,616 | |
| Portfolio Turnover | 33% |
(as of May 31, 2024)
MARKET SECTORS (% of Fund's net assets) | ||
| Health Care | 99.1 | |
| Common Stocks | 99.1 |
| Short-Term Investments and Net Other Assets (Liabilities) | 0.9 |
ASSET ALLOCATION (% of Fund's net assets) |
 |
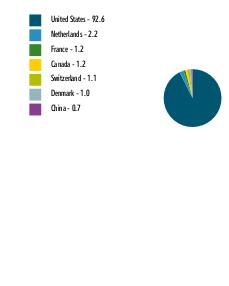
| United States | 92.6 |
| Netherlands | 2.2 |
| France | 1.2 |
| Canada | 1.2 |
| Switzerland | 1.1 |
| Denmark | 1.0 |
| China | 0.7 |
GEOGRAPHIC DIVERSIFICATION (% of Fund's net assets) |
 |
TOP HOLDINGS (% of Fund's net assets) | ||
| Boston Scientific Corp | 6.7 | |
| Unitedhealth Group Inc | 4.3 | |
| Danaher Corp | 3.9 | |
| Intuitive Surgical Inc | 3.8 | |
| Centene Corp | 3.5 | |
| Alnylam Pharmaceuticals Inc | 3.3 | |
| Insulet Corp | 3.2 | |
| Stryker Corp | 2.7 | |
| Regeneron Pharmaceuticals Inc | 2.6 | |
| Eli Lilly & Co | 2.5 | |
| 36.5 | ||
The fees associated with this class changed during the reporting year. The variations in class fees are primarily the result of the following changes:
| Fidelity Disruptive Medicine ETF converted from Fidelity Disruptive Medicine Fund on June 9, 2023. This move, approved by the Board of Trustees in November 2022, was deemed in the best interest of shareholders. The new ETF and its former corresponding fund have identical investment objectives and fundamental investment policies and have substantially similar investment strategies. Returns prior to the conversion are those of the former corresponding fund. Fidelity believes that the conversion will provide multiple benefits for investors of the fund, including lower net expenses, additional trading flexibility, increased portfolio holdings transparency and the potential for enhanced tax efficiency. |
| Fidelity, the Fidelity Investments Logo and all other Fidelity trademarks or service marks used herein are trademarks or service marks of FMR LLC. Any third-party marks that are used herein are trademarks or service marks of their respective owners. © 2024 FMR LLC. All rights reserved. | ||
1.9913346.100 6998-TSRA-0724 |  | For additional information about the Fund; including its prospectus, financial information, holdings and proxy information, scan the QR code or visit fundresearch.fidelity.com/prospectus/sec |
ANNUAL SHAREHOLDER REPORT | AS OF MAY 31, 2024 | This report describes changes to the Fund that occurred during the reporting period. | |
| | Fidelity® Disruptive Technology ETF Fidelity® Disruptive Technology ETF : FDTX Principal U.S. Listing Exchange : NASDAQ NASDAQ/NMS Global Market | |
prospectus/sec. You can also request this information by contacting us at 1-800-FIDELITY or by sending an e-mail to fidfunddocuments@fidelity.com.
| Costs of a $10,000 investment | Costs paid as a percentage of a $10,000 investment | ||
| Fidelity® Disruptive Technology ETF | $ 56 | 0.50% |
- •Global equities gained considerably for the 12 months ending May 31, 2024, as global economic expansion and, perhaps most notably, a slowing in the pace of inflation and a shift to more-dovish monetary policy in some markets provided a favorable backdrop for risk assets. Performance was driven by a narrow set of technology-focused firms riding high-growth megatrends, fanned by enthusiasm for artificial intelligence.
- •Against this backdrop, stock picking and an overweight in the United States and security selection and an underweight in emerging markets, primarily in China, contributed to the fund's performance versus the industry index. By segment, security selection was the primary contributor, especially within semiconductors and interactive media & services.
- •The top individual relative contributor was an overweight in Nvidia (+189%), the fund's largest holding. Other notable relative contributors included a non-index stake in Meta Platforms (+74%) and an overweight in Taiwan Semiconductor (+52%). Meta Platforms and Taiwan Semiconductor were also among our largest holdings.
- •In contrast, from a regional standpoint, security selection in Europe ex U.K., primarily in Netherlands, and an underweight in Japan detracted from the fund's performance versus the industry index. By segment, the primary detractors from performance versus the index were stock selection and an underweight in technology hardware, storage & peripherals.
- •The fund's stake in SolarEdge Technologies returned -83% and was the biggest individual relative detractor. This period we increased our investment. Other notable relative detractors included our non-index stake in Farfetch (-70%), which was not held at period end, and an overweight in MongoDB (-20%), which was among the fund's biggest holdings this period.
- •Notable changes in positioning include increased exposure to Taiwan. By segment, notable changes include higher allocations to the semiconductors and movies & entertainment groups.
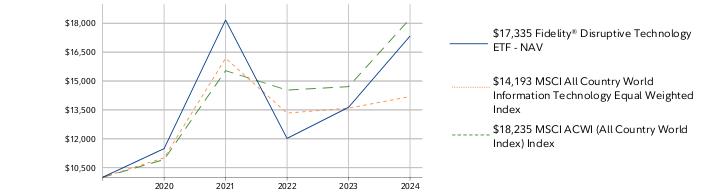
Fidelity® Disruptive Technology ETF | $10,000 | $11,490 | $18,169 | $12,018 | $13,635 |
MSCI All Country World Information Technology Equal Weighted Index | $10,000 | $11,010 | $16,179 | $13,334 | $13,590 |
MSCI ACWI (All Country World Index) Index | $10,000 | $10,918 | $15,538 | $14,529 | $14,708 |
| 2020 | 2021 | 2022 | 2023 | 2024 |
 |
| 1 Year | Life of Fund | |
Fidelity® Disruptive Technology ETF - NAV A | 27.13% | 14.26% |
Fidelity® Disruptive Technology ETF - Market Price B | 26.91% | 14.21% |
MSCI All Country World Information Technology Equal Weighted Index A | 4.44% | 8.86% |
MSCI ACWI (All Country World Index) Index A | 23.98% | 15.67% |
Visit www.fidelity.com for more recent performance information. |
The Fund's past performance is not a good predictor of the Fund's future performance. The graph and table do not reflect the deduction of taxes that a shareholder would pay on fund distributions or redemption of fund shares. |
KEY FACTS | ||
| Fund Size | $148,077,531 | |
| Number of Holdings | 48 | |
| Total Advisory Fee | $574,952 | |
| Portfolio Turnover | 25% |
(as of May 31, 2024)
MARKET SECTORS (% of Fund's net assets) | ||
| Information Technology | 68.3 | |
| Communication Services | 19.9 | |
| Consumer Discretionary | 6.7 | |
| Health Care | 2.2 | |
| Financials | 1.7 | |
| Industrials | 1.0 | |
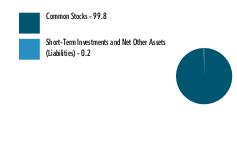
| Common Stocks | 99.8 |
| Short-Term Investments and Net Other Assets (Liabilities) | 0.2 |
ASSET ALLOCATION (% of Fund's net assets) |
 |
| United States | 74.2 |
| Netherlands | 7.6 |
| Taiwan | 5.9 |
| Japan | 3.9 |
| Singapore | 2.5 |
| China | 1.6 |
| Germany | 1.4 |
| Korea (South) | 1.3 |
| Canada | 1.1 |
| Others | 0.5 |
GEOGRAPHIC DIVERSIFICATION (% of Fund's net assets) |
 |
TOP HOLDINGS (% of Fund's net assets) | ||
| NVIDIA Corp | 8.0 | |
| Taiwan Semiconductor Manufacturing Co Ltd ADR | 5.9 | |
| Microsoft Corp | 5.2 | |
| ASML Holding NV | 4.5 | |
| Salesforce Inc | 4.4 | |
| Meta Platforms Inc Class A | 4.4 | |
| Alphabet Inc Class C | 4.2 | |
| Netflix Inc | 4.2 | |
| Amazon.com Inc | 4.0 | |
| Adobe Inc | 3.5 | |
| 48.3 | ||
The fees associated with this class changed during the reporting year. The variations in class fees are primarily the result of the following changes:
| Fidelity Disruptive Technology ETF converted from Fidelity Disruptive Technology Fund on June 9, 2023. This move, approved by the Board of Trustees in November 2022, was deemed in the best interest of shareholders. The new ETF and its former corresponding fund have identical investment objectives and fundamental investment policies and have substantially similar investment strategies. Returns prior to the conversion are those of the former corresponding fund. Fidelity believes that the conversion will provide multiple benefits for investors of the fund, including lower net expenses, additional trading flexibility, increased portfolio holdings transparency and the potential for enhanced tax efficiency. |
| Fidelity, the Fidelity Investments Logo and all other Fidelity trademarks or service marks used herein are trademarks or service marks of FMR LLC. Any third-party marks that are used herein are trademarks or service marks of their respective owners. © 2024 FMR LLC. All rights reserved. | ||
1.9913347.100 6999-TSRA-0724 |  | For additional information about the Fund; including its prospectus, financial information, holdings and proxy information, scan the QR code or visit fundresearch.fidelity.com/prospectus/sec |
ANNUAL SHAREHOLDER REPORT | AS OF MAY 31, 2024 | This report describes changes to the Fund that occurred during the reporting period. | |
| | Fidelity® Disruptive Communications ETF Fidelity® Disruptive Communications ETF : FDCF Principal U.S. Listing Exchange : NASDAQ NASDAQ/NMS Global Market | |
prospectus/sec. You can also request this information by contacting us at 1-800-FIDELITY or by sending an e-mail to fidfunddocuments@fidelity.com.
| Costs of a $10,000 investment | Costs paid as a percentage of a $10,000 investment | ||
| Fidelity® Disruptive Communications ETF | $ 59 | 0.50% |
- •Global equities gained considerably for the 12 months ending May 31, 2024, as global economic expansion and, perhaps most notably, a slowing in the pace of inflation and a shift to more-dovish monetary policy in some markets provided a favorable backdrop for risk assets. Performance was driven by a narrow set of technology-focused firms riding high-growth megatrends, fanned by enthusiasm for artificial intelligence.
- •Against this backdrop, security selection and an overweight in the United States and picks and an underweight in emerging markets contributed to the fund's performance versus the industry index. By segment, security selection was the primary contributor, especially within semiconductors.
- •The top individual relative contributor was our non-index stake in Nvidia (+194%), which was one of the fund's biggest holdings. This period, we reduced our investment in Nvidia to manage the position size. Other notable relative contributors included Meta Platforms (+76%) and a non-index stake in Arista Networks (+80%). Meta Platforms and Arista Networks were also among the fund's largest holdings.
- •In contrast, from a regional standpoint, underweights in Europe ex U.K. and Japan detracted from the fund's performance versus the industry index. By segment, the primary detractor was an underweight in wireless telecommunication services.
- •The biggest individual relative detractor was an overweight in Liberty Broadband (-27%), which was among the fund's largest holdings this period. Other notable relative detractors included an overweight in Naver (-24%) - which was a position we established this period - and a non-holding of Tencent Music Entertainment Group, an index component that gained 110%.
- •Notable changes in positioning include increased exposure to China and Singapore. By segment, notable changes in positioning include higher allocations to the application software and broadline retail industries.
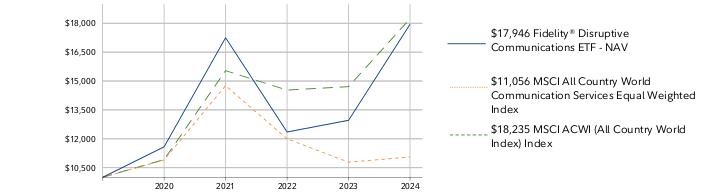
Fidelity® Disruptive Communications ETF | $10,000 | $11,580 | $17,249 | $12,353 | $12,959 |
MSCI All Country World Communication Services Equal Weighted Index | $10,000 | $10,902 | $14,759 | $11,998 | $10,785 |
MSCI ACWI (All Country World Index) Index | $10,000 | $10,918 | $15,538 | $14,529 | $14,708 |
| 2020 | 2021 | 2022 | 2023 | 2024 |
 |
| 1 Year | Life of Fund | |
Fidelity® Disruptive Communications ETF - NAV A | 38.49% | 15.23% |
Fidelity® Disruptive Communications ETF - Market Price B | 38.63% | 15.26% |
MSCI All Country World Communication Services Equal Weighted Index A | 2.52% | 2.46% |
MSCI ACWI (All Country World Index) Index A | 23.98% | 15.67% |
Visit www.fidelity.com for more recent performance information. |
The Fund's past performance is not a good predictor of the Fund's future performance. The graph and table do not reflect the deduction of taxes that a shareholder would pay on fund distributions or redemption of fund shares. |
KEY FACTS | ||
| Fund Size | $50,995,279 | |
| Number of Holdings | 38 | |
| Total Advisory Fee | $205,567 | |
| Portfolio Turnover | 35% |
(as of May 31, 2024)
MARKET SECTORS (% of Fund's net assets) | ||
| Communication Services | 46.4 | |
| Information Technology | 30.2 | |
| Consumer Discretionary | 10.8 | |
| Real Estate | 5.0 | |
| Industrials | 4.0 | |
| Energy | 2.2 | |
| Common Stocks | 98.6 |
| Short-Term Investments and Net Other Assets (Liabilities) | 1.4 |
ASSET ALLOCATION (% of Fund's net assets) |
 |
| United States | 71.0 |
| China | 8.8 |
| Singapore | 7.3 |
| Taiwan | 3.6 |
| Spain | 2.8 |
| India | 2.2 |
| Korea (South) | 2.0 |
| Japan | 1.3 |
| France | 1.0 |
GEOGRAPHIC DIVERSIFICATION (% of Fund's net assets) |
 |
TOP HOLDINGS (% of Fund's net assets) | ||
| Sea Ltd Class A ADR | 7.3 | |
| NVIDIA Corp | 6.6 | |
| Alphabet Inc Class A | 5.7 | |
| Meta Platforms Inc Class A | 5.6 | |
| Snap Inc Class A | 5.2 | |
| Arista Networks Inc | 5.1 | |
| American Tower Corp | 5.0 | |
| Amazon.com Inc | 5.0 | |
| PDD Holdings Inc Class A ADR | 4.4 | |
| T-Mobile US Inc | 3.7 | |
| 53.6 | ||
The fees associated with this class changed during the reporting year. The variations in class fees are primarily the result of the following changes:
| Fidelity Disruptive Communications ETF converted from Fidelity Disruptive Communications Fund on June 9, 2023. This move, approved by the Board of Trustees in November 2022, was deemed in the best interest of shareholders. The new ETF and its former corresponding fund have identical investment objectives and fundamental investment policies and have substantially similar investment strategies. Returns prior to the conversion are those of the former corresponding fund. Fidelity believes that the conversion will provide multiple benefits for investors of the fund, including lower net expenses, additional trading flexibility, increased portfolio holdings transparency and the potential for enhanced tax efficiency. |
| Fidelity, the Fidelity Investments Logo and all other Fidelity trademarks or service marks used herein are trademarks or service marks of FMR LLC. Any third-party marks that are used herein are trademarks or service marks of their respective owners. © 2024 FMR LLC. All rights reserved. | ||
1.9913344.100 6996-TSRA-0724 |  | For additional information about the Fund; including its prospectus, financial information, holdings and proxy information, scan the QR code or visit fundresearch.fidelity.com/prospectus/sec |
ANNUAL SHAREHOLDER REPORT | AS OF MAY 31, 2024 | This report describes changes to the Fund that occurred during the reporting period. | |
| | Fidelity® Disruptive Automation ETF Fidelity® Disruptive Automation ETF : FBOT Principal U.S. Listing Exchange : NASDAQ NASDAQ/NMS Global Market | |
prospectus/sec. You can also request this information by contacting us at 1-800-FIDELITY or by sending an e-mail to fidfunddocuments@fidelity.com.
| Costs of a $10,000 investment | Costs paid as a percentage of a $10,000 investment | ||
| Fidelity® Disruptive Automation ETF | $ 51 | 0.51% |
- •Global equities gained considerably for the 12 months ending May 31, 2024, as global economic expansion and, perhaps most notably, a slowing in the pace of inflation and a shift to more-dovish monetary policy in some markets provided a favorable backdrop for risk assets. Performance was driven by a narrow set of technology-focused firms riding high-growth megatrends, fanned by enthusiasm for artificial intelligence.
- •Against this backdrop, stock picks in Japan and stock selection in emerging markets, primarily in China, detracted from the fund's performance versus the industry index. By segment, security selection was the primary detractor, especially within industrial machinery & supplies & components.
- •The fund's stake in OPT Machine Vision Tech returned -59% and was the largest individual relative detractor. Positions in Dongguan Yiheda Automation (-48%) and Estun Automation (-42%) also hurt. All of these detractors were non-benchmark positions.
- •In contrast, from a regional standpoint, an overweight in the United States and an underweight in emerging markets, primarily in China, contributed to the fund's performance versus the industry index. By segment, the biggest contributor to performance versus the index was security selection in semiconductors.
- •The fund's stake in Nvidia gained 187% and was the top individual relative contributor. Nvidia was the fund's top holding. Our positions in Taiwan Semiconductor (+38%) and Teradyne (+38%) notably helped; both were also among our biggest holdings. All of these contributors were non-benchmark holdings.
- •Notable changes in positioning include decreased exposure to China and a higher allocation to the United States. By segment, notable changes in positioning include increased exposure to the semiconductor materials & equipment segment.
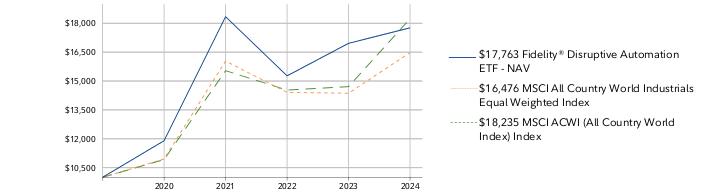
Fidelity® Disruptive Automation ETF | $10,000 | $11,900 | $18,342 | $15,269 | $16,957 |
MSCI All Country World Industrials Equal Weighted Index | $10,000 | $10,954 | $16,036 | $14,410 | $14,366 |
MSCI ACWI (All Country World Index) Index | $10,000 | $10,918 | $15,538 | $14,529 | $14,708 |
| 2020 | 2021 | 2022 | 2023 | 2024 |
 |
| 1 Year | Life of Fund | |
Fidelity® Disruptive Automation ETF - NAV A | 4.76% | 14.94% |
Fidelity® Disruptive Automation ETF - Market Price B | 4.39% | 14.84% |
MSCI All Country World Industrials Equal Weighted Index A | 14.68% | 12.86% |
MSCI ACWI (All Country World Index) Index A | 23.98% | 15.67% |
Visit www.fidelity.com for more recent performance information. |
The Fund's past performance is not a good predictor of the Fund's future performance. The graph and table do not reflect the deduction of taxes that a shareholder would pay on fund distributions or redemption of fund shares. |
KEY FACTS | ||
| Fund Size | $103,474,825 | |
| Number of Holdings | 46 | |
| Total Advisory Fee | $527,623 | |
| Portfolio Turnover | 52% |
(as of May 31, 2024)
MARKET SECTORS (% of Fund's net assets) | ||
| Information Technology | 50.2 | |
| Industrials | 40.4 | |
| Consumer Discretionary | 4.6 | |
| Communication Services | 2.4 | |
| Health Care | 2.1 | |
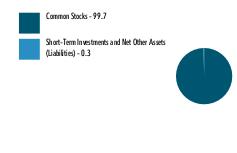
| Common Stocks | 99.7 |
| Short-Term Investments and Net Other Assets (Liabilities) | 0.3 |
ASSET ALLOCATION (% of Fund's net assets) |
 |
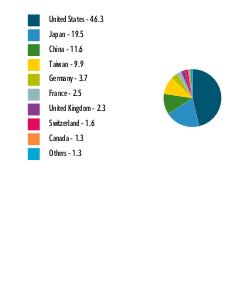
| United States | 46.3 |
| Japan | 19.5 |
| China | 11.6 |
| Taiwan | 9.9 |
| Germany | 3.7 |
| France | 2.5 |
| United Kingdom | 2.3 |
| Switzerland | 1.6 |
| Canada | 1.3 |
| Others | 1.3 |
GEOGRAPHIC DIVERSIFICATION (% of Fund's net assets) |
 |
TOP HOLDINGS (% of Fund's net assets) | ||
| NVIDIA Corp | 8.4 | |
| Taiwan Semiconductor Manufacturing Co Ltd | 7.8 | |
| PTC Inc | 5.4 | |
| Keyence Corp | 5.2 | |
| Teradyne Inc | 5.0 | |
| Siemens AG | 2.9 | |
| Recruit Holdings Co Ltd | 2.7 | |
| FANUC Corp | 2.7 | |
| Deere & Co | 2.6 | |
| Synopsys Inc | 2.6 | |
| 45.3 | ||
The fees associated with this class changed during the reporting year. The variations in class fees are primarily the result of the following changes:
| Fidelity Disruptive Automation ETF converted from Fidelity Disruptive Automation Fund on June 9, 2023. This move, approved by the Board of Trustees in November 2022, was deemed in the best interest of shareholders. The new ETF and its former corresponding fund have identical investment objectives and fundamental investment policies and have substantially similar investment strategies. Returns prior to the conversion are those of the former corresponding fund. Fidelity believes that the conversion will provide multiple benefits for investors of the fund, including lower net expenses, additional trading flexibility, increased portfolio holdings transparency and the potential for enhanced tax efficiency. |
| Fidelity, the Fidelity Investments Logo and all other Fidelity trademarks or service marks used herein are trademarks or service marks of FMR LLC. Any third-party marks that are used herein are trademarks or service marks of their respective owners. © 2024 FMR LLC. All rights reserved. | ||
1.9913343.100 6995-TSRA-0724 |  | For additional information about the Fund; including its prospectus, financial information, holdings and proxy information, scan the QR code or visit fundresearch.fidelity.com/prospectus/sec |
ANNUAL SHAREHOLDER REPORT | AS OF MAY 31, 2024 | This report describes changes to the Fund that occurred during the reporting period. | |
| | Fidelity® Disruptive Finance ETF Fidelity® Disruptive Finance ETF : FDFF Principal U.S. Listing Exchange : NASDAQ NASDAQ/NMS Global Market | |
prospectus/sec. You can also request this information by contacting us at 1-800-FIDELITY or by sending an e-mail to fidfunddocuments@fidelity.com.
| Costs of a $10,000 investment | Costs paid as a percentage of a $10,000 investment | ||
| Fidelity® Disruptive Finance ETF | $ 55 | 0.50% |
- •Global equities gained considerably for the 12 months ending May 31, 2024, as global economic expansion and, perhaps most notably, a slowing in the pace of inflation and a shift to more-dovish monetary policy in some markets provided a favorable backdrop for risk assets. Performance was driven by a narrow set of technology-focused firms riding high-growth megatrends, fanned by enthusiasm for artificial intelligence.
- •Against this backdrop, an overweight in the United States and an underweight in emerging markets, primarily in China, contributed to the fund's performance versus the industry index. By segment, security selection was the primary contributor, especially within financial exchanges & data.
- •The fund's non-index stake in MicroStrategy gained 265% and was the top individual relative contributor. Other notable contributors included a non-index stake in Baldwin Insurance (+65%), which was one of the fund's largest holdings, and an overweight in Coinbase Global (+210%). The positions in MicroStrategy and Coinbase Global were established this period.
- •In contrast, from a regional standpoint, stock picks in the United States and stock selection and an underweight in Europe ex U.K. detracted from the fund's performance versus the industry index. By segment, the primary detractor was an overweight in transaction & payment processing services.
- •The fund's non-index stake in Flywire returned -43% and was the biggest individual relative detractor. We increased our investment in Flywire during the period. A non-index stake in dLocal returned -23% and was the second-largest detractor. Both Flywire and dLocal were among the fund's largest holdings this period. Our stake in Worldline (-67%), which was not held at period end, also hurt.
- •Notable changes in positioning include increased exposure to the U.K. and a lower allocation to Uruguay. By segment, notable changes include increased exposure to the financial exchanges & data industry and a lower allocation to property & casualty insurance.
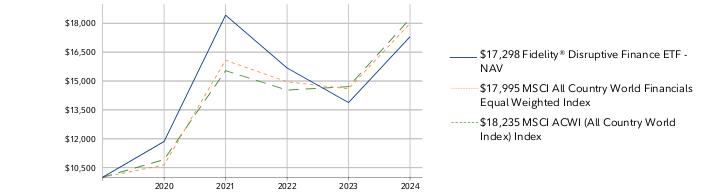
Fidelity® Disruptive Finance ETF | $10,000 | $11,860 | $18,420 | $15,678 | $13,881 |
MSCI All Country World Financials Equal Weighted Index | $10,000 | $10,643 | $16,076 | $14,962 | $14,597 |
MSCI ACWI (All Country World Index) Index | $10,000 | $10,918 | $15,538 | $14,529 | $14,708 |
| 2020 | 2021 | 2022 | 2023 | 2024 |
 |
| 1 Year | Life of Fund | |
Fidelity® Disruptive Finance ETF - NAV A | 24.62% | 14.20% |
Fidelity® Disruptive Finance ETF - Market Price B | 24.42% | 14.16% |
MSCI All Country World Financials Equal Weighted Index A | 23.28% | 15.30% |
MSCI ACWI (All Country World Index) Index A | 23.98% | 15.67% |
Visit www.fidelity.com for more recent performance information. |
The Fund's past performance is not a good predictor of the Fund's future performance. The graph and table do not reflect the deduction of taxes that a shareholder would pay on fund distributions or redemption of fund shares. |
KEY FACTS | ||
| Fund Size | $43,213,068 | |
| Number of Holdings | 45 | |
| Total Advisory Fee | $213,489 | |
| Portfolio Turnover | 34% |
(as of May 31, 2024)
MARKET SECTORS (% of Fund's net assets) | ||
| Financials | 88.2 | |
| Industrials | 5.9 | |
| Information Technology | 3.7 | |
| Real Estate | 1.1 | |
| Consumer Discretionary | 0.9 | |
| Common Stocks | 99.8 |
| Short-Term Investments and Net Other Assets (Liabilities) | 0.2 |
ASSET ALLOCATION (% of Fund's net assets) |
 |
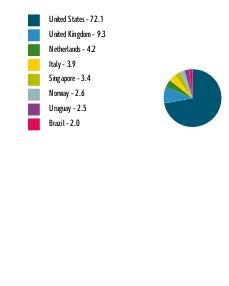
| United States | 72.1 |
| United Kingdom | 9.3 |
| Netherlands | 4.2 |
| Italy | 3.9 |
| Singapore | 3.4 |
| Norway | 2.6 |
| Uruguay | 2.5 |
| Brazil | 2.0 |
GEOGRAPHIC DIVERSIFICATION (% of Fund's net assets) |
 |
TOP HOLDINGS (% of Fund's net assets) | ||
| Visa Inc Class A | 6.1 | |
| Mastercard Inc Class A | 5.6 | |
| BlackRock Inc | 5.4 | |
| Baldwin Insurance Group Inc/The Class A | 5.1 | |
| Capital One Financial Corp | 4.8 | |
| Equifax Inc | 4.6 | |
| Adyen NV | 4.2 | |
| FinecoBank Banca Fineco SpA | 3.9 | |
| Flywire Corp | 3.8 | |
| DBS Group Holdings Ltd | 3.4 | |
| 46.9 | ||
The fees associated with this class changed during the reporting year. The variations in class fees are primarily the result of the following changes:
| Fidelity Disruptive Finance ETF converted from Fidelity Disruptive Finance Fund on June 9, 2023. This move, approved by the Board of Trustees in November 2022, was deemed in the best interest of shareholders. The new ETF and its former corresponding fund have identical investment objectives and fundamental investment policies and have substantially similar investment strategies. Returns prior to the conversion are those of the former corresponding fund. Fidelity believes that the conversion will provide multiple benefits for investors of the fund, including lower net expenses, additional trading flexibility, increased portfolio holdings transparency and the potential for enhanced tax efficiency. |
| Fidelity, the Fidelity Investments Logo and all other Fidelity trademarks or service marks used herein are trademarks or service marks of FMR LLC. Any third-party marks that are used herein are trademarks or service marks of their respective owners. © 2024 FMR LLC. All rights reserved. | ||
1.9913345.100 6997-TSRA-0724 |  | For additional information about the Fund; including its prospectus, financial information, holdings and proxy information, scan the QR code or visit fundresearch.fidelity.com/prospectus/sec |
Item 2.
Code of Ethics
As of the end of the period, May 31, 2024, Fidelity Covington Trust (the trust) has adopted a code of ethics, as defined in Item 2 of Form N-CSR, that applies to its President and Treasurer and its Chief Financial Officer. A copy of the code of ethics is filed as an exhibit to this Form N-CSR.
Item 3.
Audit Committee Financial Expert
The Board of Trustees of the trust has determined that Donald F. Donahue is an audit committee financial expert, as defined in Item 3 of Form N-CSR. Mr. Donahue is independent for purposes of Item 3 of Form N-CSR.
Item 4.
Principal Accountant Fees and Services
Fees and Services
The following table presents fees billed by Deloitte & Touche LLP, the member firms of Deloitte Touche Tohmatsu, and their respective affiliates (collectively, “Deloitte Entities”) in each of the last two fiscal years for services rendered to Fidelity Disruptors ETF (the “Fund”):
Services Billed by Deloitte Entities
May 31, 2024 FeesA,B
Audit Fees | Audit-Related Fees | Tax Fees | All Other Fees | |
Fidelity Disruptors ETF | $12,500 | $- | $7,500 | $400 |
May 31, 2023 FeesA,B
Audit Fees | Audit-Related Fees | Tax Fees | All Other Fees | |
Fidelity Disruptors ETF | $- | $- | $- | $- |
A Amounts may reflect rounding.
B Fidelity Disruptors ETF commenced operations on June 16, 2023.
The following table presents fees billed by PricewaterhouseCoopers LLP (“PwC”) in each of the last two fiscal years for services rendered to Fidelity Disruptive Automation ETF, Fidelity Disruptive Communications ETF, Fidelity Disruptive Finance ETF, Fidelity Disruptive Medicine ETF, and Fidelity Disruptive Technology ETF (the “Funds”):
Services Billed by PwC
May 31, 2024 FeesA,B | Audit Fees | Audit-Related Fees | Tax Fees | All Other Fees |
Fidelity Disruptive Automation ETF | $32,000 | $- | $7,900 | $900 |
Fidelity Disruptive Communications ETF | $32,000 | $- | $7,900 | $900 |
Fidelity Disruptive Finance ETF | $32,000 | $- | $7,900 | $900 |
Fidelity Disruptive Medicine ETF | $32,200 | $- | $7,900 | $900 |
Fidelity Disruptive Technology ETF | $32,200 | $- | $7,900 | $900 |
May 31, 2023 FeesA,B
Audit Fees | Audit-Related Fees | Tax Fees | All Other Fees | |
Fidelity Disruptive Automation ETF | $- | $- | $- | $- |
Fidelity Disruptive Communications ETF | $- | $- | $- | $- |
Fidelity Disruptive Finance ETF | $- | $- | $- | $- |
Fidelity Disruptive Medicine ETF | $- | $- | $- | $- |
Fidelity Disruptive Technology ETF | $- | $- | $- | $- |
A Amounts may reflect rounding.
B Fidelity Disruptive Automation ETF, Fidelity Disruptive Communications ETF, Fidelity Disruptive Finance ETF, Fidelity Disruptive Medicine ETF, and Fidelity Disruptive Technology ETF commenced operations on June 9, 2023.
The following table(s) present(s) fees billed by Deloitte Entities and PwC that were required to be approved by the Audit Committee for services that relate directly to the operations and financial reporting of the Fund(s) and that are rendered on behalf of Fidelity Management & Research Company LLC ("FMR") and entities controlling, controlled by, or under common control with FMR (not including any sub-adviser whose
role is primarily portfolio management and is subcontracted with or overseen by another investment adviser) that provide ongoing services to the Fund(s) (“Fund Service Providers”):
Services Billed by Deloitte Entities
May 31, 2024A,B | May 31, 2023A,B | |
Audit-Related Fees | $200,000 | $80,000 |
Tax Fees | $- | $- |
All Other Fees | $935,000 | $- |
A Amounts may reflect rounding.
B May include amounts billed prior to the Fidelity Disruptors ETF’s commencement of operations.
Services Billed by PwC
May 31, 2024A,B | May 31, 2023 A | |
Audit-Related Fees | $9,367,800 | $8,604,200 |
Tax Fees | $61,000 | $1,000 |
All Other Fees | $- | $- |
A Amounts may reflect rounding.
B May include amounts billed prior to the Fidelity Disruptive Automation ETF, Fidelity Disruptive Communications ETF, Fidelity Disruptive Finance ETF, Fidelity Disruptive Medicine ETF, and Fidelity Disruptive Technology ETF’s commencement of operations.
“Audit-Related Fees” represent fees billed for assurance and related services that are reasonably related to the performance of the fund audit or the review of the fund's financial statements and that are not reported under Audit Fees.
“Tax Fees” represent fees billed for tax compliance, tax advice or tax planning that relate directly to the operations and financial reporting of the fund.
“All Other Fees” represent fees billed for services provided to the fund or Fund Service Provider, a significant portion of which are assurance related, that relate directly to the operations and financial reporting of the fund, excluding those services that are reported under Audit Fees, Audit-Related Fees or Tax Fees.
Assurance services must be performed by an independent public accountant.
* * *
The aggregate non-audit fees billed by Deloitte Entities and PwC for services rendered to the Fund(s), FMR (not including any sub-adviser whose role is primarily portfolio management and is subcontracted with or overseen by another investment adviser), and any Fund Service Provider for each of the last two fiscal years of the Fund(s) are as follows:
Billed By | May 31, 2024A,B,C | May 31, 2023A,B,C | |
Deloitte Entities | $5,167,400 | $2,048,000 | |
PwC | $14,907,400 | $14,058,000 |
A Amounts may reflect rounding.
B May include amounts billed prior to the Fidelity Disruptors ETF’s commencement of operations.
C May include amounts billed prior to the Fidelity Disruptive Automation ETF, Fidelity Disruptive Communications ETF, Fidelity Disruptive Finance ETF, Fidelity Disruptive Medicine ETF, and Fidelity Disruptive Technology ETF’s commencement of operations.
The trust's Audit Committee has considered non-audit services that were not pre-approved that were provided by Deloitte Entities and PwC to Fund Service Providers to be compatible with maintaining the independence of Deloitte Entities and PwC in its(their) audit of the Fund(s), taking into account representations from Deloitte Entities and PwC, in accordance with Public Company Accounting Oversight Board rules, regarding its independence from the Fund(s) and its(their) related entities and FMR’s review of the appropriateness and permissibility under applicable law of such non-audit services prior to their provision to the Fund(s) Service Providers.
Audit Committee Pre-Approval Policies and Procedures
The trust’s Audit Committee must pre-approve all audit and non-audit services provided by a fund’s independent registered public accounting firm relating to the operations or financial reporting of the fund. Prior to the commencement of any audit or non-audit services to a fund, the Audit Committee reviews the services to determine whether they are appropriate and permissible under applicable law.
The Audit Committee has adopted policies and procedures to, among other purposes, provide a framework for the Committee’s consideration of non-audit services by the audit firms that audit the Fidelity funds. The policies and procedures require that any non-audit service provided by a fund audit firm to a Fidelity fund and any non-audit service provided by a fund auditor to a Fund Service Provider that relates directly to the operations and financial reporting of a Fidelity fund (“Covered Service”) are subject to approval by the Audit Committee before such service is provided.
All Covered Services must be approved in advance of provision of the service either: (i) by formal resolution of the Audit Committee, or (ii) by oral or written approval of the service by the Chair of the Audit Committee (or if the Chair is unavailable, such other member of the Audit Committee as may be designated by the Chair to act in the Chair’s absence). The approval contemplated by (ii) above is permitted where the Treasurer determines that action on such an engagement is necessary before the next meeting of the Audit Committee.
Non-audit services provided by a fund audit firm to a Fund Service Provider that do not relate directly to the operations and financial reporting of a Fidelity fund are reported to the Audit Committee periodically.
Non-Audit Services Approved Pursuant to Rule 2-01(c)(7)(i)(C) and (ii) of Regulation S-X (“De Minimis Exception”)
There were no non-audit services approved or required to be approved by the Audit Committee pursuant to the De Minimis Exception during the Fund’s(s’) last two fiscal years relating to services provided to (i) the Fund(s) or (ii) any Fund Service Provider that relate directly to the operations and financial reporting of the Fund(s).
Item 5.
Audit Committee of Listed Registrants
The Audit Committee is a separately-designated standing audit committee in accordance with Section 3(a)(58)(A) of the Securities Exchange Act of 1934. As of June 30, 2024, the members of the Audit Committee were Donald F. Donahue, Thomas P. Bostick, Thomas Kennedy and Susan Tomasky.
Item 6.
Investments
(a)
Not applicable.
(b)
Not applicable.
Item 7.
Financial Statements and Financial Highlights for Open-End Management Investment Companies


Contents
| Common Stocks - 99.6% | |||
| Shares | Value ($) | ||
| COMMUNICATION SERVICES - 2.4% | |||
| Interactive Media & Services - 2.4% | |||
| Alphabet, Inc. Class C | 14,169 | 2,464,839 | |
| CONSUMER DISCRETIONARY - 4.6% | |||
| Automobile Components - 0.7% | |||
| Mobileye Global, Inc. Class A (a)(b) | 30,484 | 782,219 | |
| Automobiles - 2.8% | |||
| BYD Co. Ltd. (H Shares) | 38,119 | 1,070,397 | |
| Tesla, Inc. (a) | 10,102 | 1,798,964 | |
| 2,869,361 | |||
| Broadline Retail - 1.1% | |||
| Amazon.com, Inc. (a) | 6,374 | 1,124,629 | |
TOTAL CONSUMER DISCRETIONARY | 4,776,209 | ||
| HEALTH CARE - 2.1% | |||
| Health Care Equipment & Supplies - 2.1% | |||
| Intuitive Surgical, Inc. (a) | 5,356 | 2,153,755 | |
| INDUSTRIALS - 40.2% | |||
| Electrical Equipment - 4.4% | |||
| AMETEK, Inc. | 10,060 | 1,705,975 | |
| Rockwell Automation, Inc. | 6,228 | 1,603,897 | |
| Sensata Technologies, Inc. PLC | 29,083 | 1,201,710 | |
| 4,511,582 | |||
| Industrial Conglomerates - 2.8% | |||
| Siemens AG | 15,309 | 2,927,860 | |
| Machinery - 30.3% | |||
| Airtac International Group | 73,550 | 2,309,902 | |
| ATS Corp. (a) | 43,306 | 1,379,615 | |
| AutoStore Holdings Ltd. (a)(c) | 394,595 | 556,387 | |
| Daifuku Co. Ltd. | 111,632 | 1,947,429 | |
| Deere & Co. | 7,235 | 2,711,389 | |
| Dongguan Yiheda Automation Co. Ltd. | 468,264 | 1,463,295 | |
| Estun Automation Co. Ltd. (A Shares) | 856,222 | 1,790,065 | |
| FANUC Corp. | 96,615 | 2,702,505 | |
| HIWIN Technologies Corp. | 311,677 | 2,135,234 | |
| Kardex Holding AG | 6,025 | 1,662,576 | |
| Leader Harmonious Drive Systems Co. Ltd. (A Shares) | 108,107 | 1,717,949 | |
| Misumi Group, Inc. | 144,228 | 2,473,423 | |
| Shenzhen Inovance Technology Co. Ltd. (A Shares) | 310,606 | 2,485,105 | |
| SMC Corp. | 5,227 | 2,619,400 | |
| Symbotic, Inc. (a)(b) | 31,178 | 1,233,713 | |
| THK Co. Ltd. | 113,469 | 2,191,961 | |
| 31,379,948 | |||
| Professional Services - 2.7% | |||
| Recruit Holdings Co. Ltd. | 55,991 | 2,829,724 | |
TOTAL INDUSTRIALS | 41,649,114 | ||
| INFORMATION TECHNOLOGY - 50.3% | |||
| Electronic Equipment, Instruments & Components - 9.6% | |||
| Keyence Corp. | 12,101 | 5,439,352 | |
| OPT Machine Vision Tech Co. Ltd. | 125,257 | 1,165,266 | |
| Renishaw PLC | 45,913 | 2,340,186 | |
| Teledyne Technologies, Inc. (a) | 2,458 | 975,703 | |
| 9,920,507 | |||
| IT Services - 2.4% | |||
| Accenture PLC Class A | 8,745 | 2,468,626 | |
| Semiconductors & Semiconductor Equipment - 21.2% | |||
| NVIDIA Corp. | 7,888 | 8,647,848 | |
| Taiwan Semiconductor Manufacturing Co. Ltd. | 319,035 | 8,064,774 | |
| Teradyne, Inc. | 36,945 | 5,207,028 | |
| 21,919,650 | |||
| Software - 17.1% | |||
| Altair Engineering, Inc. Class A (a)(b) | 11,844 | 1,034,337 | |
| Autodesk, Inc. (a) | 5,586 | 1,126,138 | |
| Dassault Systemes SA | 63,678 | 2,561,308 | |
| Manhattan Associates, Inc. (a) | 5,746 | 1,261,477 | |
| Microsoft Corp. | 3,399 | 1,411,027 | |
| Nemetschek SE | 9,503 | 861,503 | |
| PTC, Inc. (a) | 31,948 | 5,630,516 | |
| Synopsys, Inc. (a) | 4,708 | 2,640,246 | |
| UiPath, Inc. Class A (a) | 98,073 | 1,202,375 | |
| 17,728,927 | |||
TOTAL INFORMATION TECHNOLOGY | 52,037,710 | ||
| TOTAL COMMON STOCKS (Cost $91,821,724) | 103,081,627 | ||
| Money Market Funds - 1.7% | |||
| Shares | Value ($) | ||
| Fidelity Cash Central Fund 5.39% (d) | 179,954 | 179,990 | |
| Fidelity Securities Lending Cash Central Fund 5.39% (d)(e) | 1,508,799 | 1,508,950 | |
| TOTAL MONEY MARKET FUNDS (Cost $1,688,940) | 1,688,940 | ||
| TOTAL INVESTMENT IN SECURITIES - 101.3% (Cost $93,510,664) | 104,770,567 |
NET OTHER ASSETS (LIABILITIES) - (1.3)% | (1,295,742) |
| NET ASSETS - 100.0% | 103,474,825 |
| (a) | Non-income producing |
| (b) | Security or a portion of the security is on loan at period end. |
| (c) | Security exempt from registration under Rule 144A of the Securities Act of 1933. These securities may be resold in transactions exempt from registration, normally to qualified institutional buyers. At the end of the period, the value of these securities amounted to $556,387 or 0.5% of net assets. |
| (d) | Affiliated fund that is generally available only to investment companies and other accounts managed by Fidelity Investments. The rate quoted is the annualized seven-day yield of the fund at period end. A complete unaudited listing of the fund's holdings as of its most recent quarter end is available upon request. In addition, each Fidelity Central Fund's financial statements, which are not covered by the Fund's Report of Independent Registered Public Accounting Firm, are available on the SEC's website or upon request. |
| (e) | Investment made with cash collateral received from securities on loan. |
| Affiliate | Value, beginning of period ($) | Purchases ($) | Sales Proceeds ($) | Dividend Income ($) | Realized Gain (loss) ($) | Change in Unrealized appreciation (depreciation) ($) | Value, end of period ($) | % ownership, end of period |
| Fidelity Cash Central Fund 5.39% | 794,696 | 19,410,348 | 20,025,054 | 37,149 | - | - | 179,990 | 0.0% |
| Fidelity Securities Lending Cash Central Fund 5.39% | 2,079,750 | 43,043,443 | 43,614,243 | 74,779 | - | - | 1,508,950 | 0.0% |
| Total | 2,874,446 | 62,453,791 | 63,639,297 | 111,928 | - | - | 1,688,940 | |
| Valuation Inputs at Reporting Date: | ||||
| Description | Total ($) | Level 1 ($) | Level 2 ($) | Level 3 ($) |
Investments in Securities: | ||||
| Equities: | ||||
Communication Services | 2,464,839 | 2,464,839 | - | - |
Consumer Discretionary | 4,776,209 | 4,776,209 | - | - |
Health Care | 2,153,755 | 2,153,755 | - | - |
Industrials | 41,649,114 | 41,649,114 | - | - |
Information Technology | 52,037,710 | 52,037,710 | - | - |
| Money Market Funds | 1,688,940 | 1,688,940 | - | - |
| Total Investments in Securities: | 104,770,567 | 104,770,567 | - | - |
| Statement of Assets and Liabilities | ||||
| May 31, 2024 | ||||
| Assets | ||||
| Investment in securities, at value (including securities loaned of $1,436,245) - See accompanying schedule: | ||||
Unaffiliated issuers (cost $91,821,724) | $ | 103,081,627 | ||
Fidelity Central Funds (cost $1,688,940) | 1,688,940 | |||
| Total Investment in Securities (cost $93,510,664) | $ | 104,770,567 | ||
| Cash | 17,327 | |||
| Foreign currency held at value (cost $8,257) | 8,250 | |||
| Dividends receivable | 133,198 | |||
| Reclaims receivable | 102,119 | |||
| Distributions receivable from Fidelity Central Funds | 1,579 | |||
| Receivable from investment adviser for expense reductions | 4,551 | |||
Total assets | 105,037,591 | |||
| Liabilities | ||||
| Accrued management fee | $ | 43,789 | ||
| Other payables and accrued expenses | 10,027 | |||
| Collateral on securities loaned | 1,508,950 | |||
| Total liabilities | 1,562,766 | |||
| Net Assets | $ | 103,474,825 | ||
| Net Assets consist of: | ||||
| Paid in capital | $ | 102,616,054 | ||
| Total accumulated earnings (loss) | 858,771 | |||
| Net Assets | $ | 103,474,825 | ||
Net Asset Value, offering price and redemption price per share ($103,474,825 ÷ 4,005,492 shares) | $ | 25.83 | ||
| Statement of Operations | ||||
Year ended May 31, 2024 | ||||
| Investment Income | ||||
| Dividends | $ | 843,778 | ||
| Interest | 944 | |||
| Income from Fidelity Central Funds (including $74,779 from security lending) | 111,928 | |||
| Total income | 956,650 | |||
| Expenses | ||||
| Management fee | $ | 527,623 | ||
| Independent trustees' fees and expenses | 522 | |||
| Interest | 814 | |||
| Miscellaneous | 7,617 | |||
| Total expenses before reductions | 536,576 | |||
| Expense reductions | (5,060) | |||
| Total expenses after reductions | 531,516 | |||
| Net Investment income (loss) | 425,134 | |||
| Realized and Unrealized Gain (Loss) | ||||
| Net realized gain (loss) on: | ||||
| Investment Securities: | ||||
| Unaffiliated issuers | (2,950,306) | |||
| Redemptions in-kind | 3,097,957 | |||
| Foreign currency transactions | (16,588) | |||
| Total net realized gain (loss) | 131,063 | |||
| Change in net unrealized appreciation (depreciation) on: | ||||
| Investment Securities: | ||||
| Unaffiliated issuers | 3,062,022 | |||
| Assets and liabilities in foreign currencies | (3,129) | |||
| Total change in net unrealized appreciation (depreciation) | 3,058,893 | |||
| Net gain (loss) | 3,189,956 | |||
| Net increase (decrease) in net assets resulting from operations | $ | 3,615,090 | ||
See Organization and Merger information note regarding reorganization from mutual fund to exchange traded fund.
| Statement of Changes in Net Assets | ||||
Year ended May 31, 2024 | Year ended May 31, 2023 | |||
| Increase (Decrease) in Net Assets | ||||
| Operations | ||||
| Net investment income (loss) | $ | 425,134 | $ | 478,333 |
| Net realized gain (loss) | 131,063 | (4,420,381) | ||
| Change in net unrealized appreciation (depreciation) | 3,058,893 | 12,045,246 | ||
| Net increase (decrease) in net assets resulting from operations | 3,615,090 | 8,103,198 | ||
| Distributions to shareholders | (600,970) | (182,874) | ||
| Share transactions - net increase (decrease) | - | (19,835,179) | ||
| Share transactions | ||||
| Proceeds from sales of shares | 8,359,190 | - | ||
| Reinvestment of distributions | 249,235 | - | ||
| Cost of shares redeemed | (19,873,274) | - | ||
Net increase (decrease) in net assets resulting from share transactions | (11,264,849) | (19,835,179) | ||
| Total increase (decrease) in net assets | (8,250,729) | (11,914,855) | ||
| Net Assets | ||||
| Beginning of period | 111,725,554 | 123,640,409 | ||
| End of period | $ | 103,474,825 | $ | 111,725,554 |
| Other Information | ||||
| Shares | ||||
| Sold | 323,637 | 5,260,948 | ||
| Issued in reinvestment of distributions | 9,878 | 8,292 | ||
| Redeemed | (834,365) | (6,297,436) | ||
| Net increase (decrease) | (500,850) | (1,028,196) | ||
Fidelity® Disruptive Automation ETF |
| Years ended May 31, | 2024 A | 2023 A | 2022 A | 2021 A | 2020 A,B | |||||
Selected Per-Share Data | ||||||||||
| Net asset value, beginning of period | $ | 24.80 | $ | 22.33 | $ | 27.34 | $ | 17.80 | $ | 14.96 |
| Income from Investment Operations | ||||||||||
Net investment income (loss) C,D | .10 | .05 | (.09) | .02 | (.02) | |||||
| Net realized and unrealized gain (loss) | 1.07 | 2.42 | (4.37) | 9.60 | 2.86 | |||||
| Total from investment operations | 1.17 | 2.47 | (4.46) | 9.62 | 2.84 | |||||
| Distributions from net investment income | (.14) | - | - | (.06) | - | |||||
| Distributions from net realized gain | - | - | (.55) | (.03) | - | |||||
| Total distributions | (.14) | - | (.55) | (.08) E | - | |||||
| Net asset value, end of period | $ | 25.83 | $ | 24.80 | $ | 22.33 | $ | 27.34 | $ | 17.80 |
Total Return F,G,H | 4.76 % | 11.05% | (16.75)% | 54.13% | 19.00% | |||||
Ratios to Average Net Assets D,I,J | ||||||||||
| Expenses before reductions | .51% | .85% | 1.00% | 1.01% K | 1.01% K,L | |||||
| Expenses net of fee waivers, if any | .51 % | .85% | 1.00% | 1.01% K | 1.01% K,L | |||||
| Expenses net of all reductions | .50% | .85% | 1.00% | 1.01% K | 1.01% K,L | |||||
| Net investment income (loss) | .40% | .23% | (.33)% | .06% | (.47)% L | |||||
| Supplemental Data | ||||||||||
| Net assets, end of period (000 omitted) | $ | 103,475 | $ | 111,726 | $ | 36,333 | $ | 111,910 | $ | 5,308 |
Portfolio turnover rate M | 52 % N | 26% N | 22% | 14% | 6% O |
| Common Stocks - 98.6% | |||
| Shares | Value ($) | ||
| COMMUNICATION SERVICES - 46.5% | |||
| Diversified Telecommunication Services - 2.9% | |||
| Cellnex Telecom SA (a) | 39,804 | 1,448,138 | |
| Entertainment - 11.7% | |||
| Netflix, Inc. (b) | 1,792 | 1,149,783 | |
| Sea Ltd. ADR (b) | 54,806 | 3,700,503 | |
| Spotify Technology SA (b) | 1,900 | 563,882 | |
| Ubisoft Entertainment SA (b) | 23,473 | 571,023 | |
| 5,985,191 | |||
| Interactive Media & Services - 24.8% | |||
| Alphabet, Inc. Class A | 16,710 | 2,882,475 | |
| Bumble, Inc. (b) | 45,016 | 526,687 | |
| Match Group, Inc. (b) | 26,780 | 820,271 | |
| Meta Platforms, Inc. Class A | 6,121 | 2,857,466 | |
| NAVER Corp. | 8,300 | 1,021,612 | |
| Pinterest, Inc. Class A (b) | 28,239 | 1,171,636 | |
| Snap, Inc. Class A (b) | 175,691 | 2,638,879 | |
| Tencent Holdings Ltd. | 16,159 | 743,441 | |
| 12,662,467 | |||
| Media - 3.3% | |||
| EchoStar Corp. Class A (b) | 17,658 | 339,034 | |
| Liberty Broadband Corp. Class A (b) | 25,024 | 1,357,302 | |
| 1,696,336 | |||
| Wireless Telecommunication Services - 3.8% | |||
| T-Mobile U.S., Inc. | 10,913 | 1,909,338 | |
TOTAL COMMUNICATION SERVICES | 23,701,470 | ||
| CONSUMER DISCRETIONARY - 10.8% | |||
| Broadline Retail - 10.8% | |||
| Alibaba Group Holding Ltd. sponsored ADR | 9,003 | 705,295 | |
| Amazon.com, Inc. (b) | 14,357 | 2,533,149 | |
| PDD Holdings, Inc. ADR (b) | 15,032 | 2,251,493 | |
| 5,489,937 | |||
| ENERGY - 2.1% | |||
| Oil, Gas & Consumable Fuels - 2.1% | |||
| Reliance Industries Ltd. GDR (a) | 15,780 | 1,096,710 | |
| INDUSTRIALS - 4.0% | |||
| Construction & Engineering - 1.4% | |||
| Dycom Industries, Inc. (b) | 3,995 | 718,940 | |
| Ground Transportation - 2.6% | |||
| Uber Technologies, Inc. (b) | 20,367 | 1,314,894 | |
TOTAL INDUSTRIALS | 2,033,834 | ||
| INFORMATION TECHNOLOGY - 30.2% | |||
| Communications Equipment - 5.1% | |||
| Arista Networks, Inc. (b) | 8,778 | 2,612,772 | |
| IT Services - 2.3% | |||
| Cloudflare, Inc. (b) | 6,288 | 425,635 | |
| Twilio, Inc. Class A (b) | 12,558 | 720,829 | |
| 1,146,464 | |||
| Semiconductors & Semiconductor Equipment - 15.0% | |||
| Impinj, Inc. (b) | 4,083 | 668,265 | |
| NVIDIA Corp. | 3,016 | 3,306,531 | |
| NXP Semiconductors NV | 2,831 | 770,315 | |
| ON Semiconductor Corp. (b) | 5,376 | 392,663 | |
| Renesas Electronics Corp. | 36,049 | 673,003 | |
| Taiwan Semiconductor Manufacturing Co. Ltd. sponsored ADR | 12,031 | 1,817,162 | |
| 7,627,939 | |||
| Software - 7.8% | |||
| Cadence Design Systems, Inc. (b) | 4,376 | 1,252,893 | |
| Microsoft Corp. | 3,721 | 1,544,699 | |
| Synopsys, Inc. (b) | 1,095 | 614,076 | |
| Zoom Video Communications, Inc. Class A (b) | 9,613 | 589,661 | |
| 4,001,329 | |||
TOTAL INFORMATION TECHNOLOGY | 15,388,504 | ||
| REAL ESTATE - 5.0% | |||
| Equity Real Estate Investment Trusts (REITs) - 5.0% | |||
| American Tower Corp. | 13,101 | 2,564,390 | |
| TOTAL COMMON STOCKS (Cost $39,291,978) | 50,274,845 | ||
| Money Market Funds - 0.8% | |||
| Shares | Value ($) | ||
Fidelity Cash Central Fund 5.39% (c) (Cost $391,277) | 391,199 | 391,277 | |
| TOTAL INVESTMENT IN SECURITIES - 99.4% (Cost $39,683,255) | 50,666,122 |
NET OTHER ASSETS (LIABILITIES) - 0.6% | 329,157 |
| NET ASSETS - 100.0% | 50,995,279 |
| (a) | Security exempt from registration under Rule 144A of the Securities Act of 1933. These securities may be resold in transactions exempt from registration, normally to qualified institutional buyers. At the end of the period, the value of these securities amounted to $2,544,848 or 5.0% of net assets. |
| (b) | Non-income producing |
| (c) | Affiliated fund that is generally available only to investment companies and other accounts managed by Fidelity Investments. The rate quoted is the annualized seven-day yield of the fund at period end. A complete unaudited listing of the fund's holdings as of its most recent quarter end is available upon request. In addition, each Fidelity Central Fund's financial statements, which are not covered by the Fund's Report of Independent Registered Public Accounting Firm, are available on the SEC's website or upon request. |
| Affiliate | Value, beginning of period ($) | Purchases ($) | Sales Proceeds ($) | Dividend Income ($) | Realized Gain (loss) ($) | Change in Unrealized appreciation (depreciation) ($) | Value, end of period ($) | % ownership, end of period |
| Fidelity Cash Central Fund 5.39% | 149,758 | 2,101,909 | 1,860,390 | 9,008 | - | - | 391,277 | 0.0% |
| Fidelity Securities Lending Cash Central Fund 5.39% | - | 3,216,247 | 3,216,247 | 331 | - | - | - | 0.0% |
| Total | 149,758 | 5,318,156 | 5,076,637 | 9,339 | - | - | 391,277 | |
| Valuation Inputs at Reporting Date: | ||||
| Description | Total ($) | Level 1 ($) | Level 2 ($) | Level 3 ($) |
Investments in Securities: | ||||
| Equities: | ||||
Communication Services | 23,701,470 | 23,701,470 | - | - |
Consumer Discretionary | 5,489,937 | 5,489,937 | - | - |
Energy | 1,096,710 | 1,096,710 | - | - |
Industrials | 2,033,834 | 2,033,834 | - | - |
Information Technology | 15,388,504 | 15,388,504 | - | - |
Real Estate | 2,564,390 | 2,564,390 | - | - |
| Money Market Funds | 391,277 | 391,277 | - | - |
| Total Investments in Securities: | 50,666,122 | 50,666,122 | - | - |
| Statement of Assets and Liabilities | ||||
| May 31, 2024 | ||||
| Assets | ||||
| Investment in securities, at value - See accompanying schedule: | ||||
Unaffiliated issuers (cost $39,291,978) | $ | 50,274,845 | ||
Fidelity Central Funds (cost $391,277) | 391,277 | |||
| Total Investment in Securities (cost $39,683,255) | $ | 50,666,122 | ||
| Foreign currency held at value (cost $7,164) | 7,167 | |||
| Receivable for fund shares sold | 3,384,049 | |||
| Dividends receivable | 9,859 | |||
| Distributions receivable from Fidelity Central Funds | 1,704 | |||
| Receivable from investment adviser for expense reductions | 1,018 | |||
Total assets | 54,069,919 | |||
| Liabilities | ||||
| Payable for investments purchased | $ | 3,051,806 | ||
| Accrued management fee | 19,687 | |||
| Other payables and accrued expenses | 3,147 | |||
| Total liabilities | 3,074,640 | |||
| Net Assets | $ | 50,995,279 | ||
| Net Assets consist of: | ||||
| Paid in capital | $ | 48,260,497 | ||
| Total accumulated earnings (loss) | 2,734,782 | |||
| Net Assets | $ | 50,995,279 | ||
Net Asset Value, offering price and redemption price per share ($50,995,279 ÷ 1,507,063 shares) | $ | 33.84 | ||
| Statement of Operations | ||||
Year ended May 31, 2024 | ||||
| Investment Income | ||||
| Dividends | $ | 140,799 | ||
| Interest | 183 | |||
| Income from Fidelity Central Funds (including $331 from security lending) | 9,339 | |||
| Total income | 150,321 | |||
| Expenses | ||||
| Management fee | $ | 205,567 | ||
| Independent trustees' fees and expenses | 196 | |||
| Miscellaneous | 2,217 | |||
| Total expenses before reductions | 207,980 | |||
| Expense reductions | (1,186) | |||
| Total expenses after reductions | 206,794 | |||
| Net Investment income (loss) | (56,473) | |||
| Realized and Unrealized Gain (Loss) | ||||
| Net realized gain (loss) on: | ||||
| Investment Securities: | ||||
| Unaffiliated issuers | 2,058,855 | |||
| Redemptions in-kind | 641,168 | |||
| Foreign currency transactions | (4,052) | |||
| Total net realized gain (loss) | 2,695,971 | |||
| Change in net unrealized appreciation (depreciation) on: | ||||
| Investment Securities: | ||||
| Unaffiliated issuers | 10,821,500 | |||
| Assets and liabilities in foreign currencies | (106) | |||
| Total change in net unrealized appreciation (depreciation) | 10,821,394 | |||
| Net gain (loss) | 13,517,365 | |||
| Net increase (decrease) in net assets resulting from operations | $ | 13,460,892 | ||
See Organization and Merger information note regarding reorganization from mutual fund to exchange traded fund.
| Statement of Changes in Net Assets | ||||
Year ended May 31, 2024 | Year ended May 31, 2023 | |||
| Increase (Decrease) in Net Assets | ||||
| Operations | ||||
| Net investment income (loss) | $ | (56,473) | $ | (15,475) |
| Net realized gain (loss) | 2,695,971 | (5,754,830) | ||
| Change in net unrealized appreciation (depreciation) | 10,821,394 | 6,648,437 | ||
| Net increase (decrease) in net assets resulting from operations | 13,460,892 | 878,132 | ||
| Share transactions - net increase (decrease) | - | (9,971,399) | ||
| Share transactions | ||||
| Proceeds from sales of shares | 6,157,751 | - | ||
| Cost of shares redeemed | (6,604,379) | - | ||
Net increase (decrease) in net assets resulting from share transactions | (446,628) | (9,971,399) | ||
| Total increase (decrease) in net assets | 13,014,264 | (9,093,267) | ||
| Net Assets | ||||
| Beginning of period | 37,981,015 | 47,074,282 | ||
| End of period | $ | 50,995,279 | $ | 37,981,015 |
| Other Information | ||||
| Shares | ||||
| Sold | 203,661 | 1,803,846 | ||
| Redeemed | (251,280) | (2,265,568) | ||
| Net increase (decrease) | (47,619) | (461,722) | ||
Fidelity® Disruptive Communications ETF |
| Years ended May 31, | 2024 A | 2023 A | 2022 A | 2021 A | 2020 A,B | |||||
Selected Per-Share Data | ||||||||||
| Net asset value, beginning of period | $ | 24.44 | $ | 23.29 | $ | 34.12 | $ | 23.21 | $ | 20.05 |
| Income from Investment Operations | ||||||||||
Net investment income (loss) C,D | (.04) | (.10) E | (.26) | (.26) | - F | |||||
| Net realized and unrealized gain (loss) | 9.44 | 1.25 | (8.93) | 11.59 | 3.16 | |||||
| Total from investment operations | 9.40 | 1.15 | (9.19) | 11.33 | 3.16 | |||||
| Distributions from net investment income | - | - | - | - F | - | |||||
| Distributions from net realized gain | - | - | (1.64) | (.41) | - | |||||
| Total distributions | - | - | (1.64) | (.42) G | - | |||||
| Net asset value, end of period | $ | 33.84 | $ | 24.44 | $ | 23.29 | $ | 34.12 | $ | 23.21 |
Total Return H,I,J | 38.49 % | 4.91% | (28.39)% | 48.96% | 15.80% | |||||
Ratios to Average Net Assets C,K,L | ||||||||||
| Expenses before reductions | .51% | .79% | .99% M | 1.01% M | 1.01% M,N | |||||
| Expenses net of fee waivers, if any | .50 % | .79% | .99% M | 1.01% M | 1.01% M,N | |||||
| Expenses net of all reductions | .50% | .79% | .99% M | 1.01% M | 1.01% M,N | |||||
| Net investment income (loss) | (.14)% | (.44)% E | (.81)% | (.83)% | (.23)% N | |||||
| Supplemental Data | ||||||||||
| Net assets, end of period (000 omitted) | $ | 50,995 | $ | 37,981 | $ | 7,746 | $ | 36,731 | $ | 2,880 |
Portfolio turnover rate O | 35 % P | 31% | 32% | 39% | 0% Q |
| Common Stocks - 99.8% | |||
| Shares | Value ($) | ||
| CONSUMER DISCRETIONARY - 1.0% | |||
| Broadline Retail - 1.0% | |||
| MercadoLibre, Inc. (a) | 237 | 408,962 | |
| FINANCIALS - 88.1% | |||
| Banks - 12.0% | |||
| DBS Group Holdings Ltd. | 55,761 | 1,485,227 | |
| DNB Bank ASA | 57,859 | 1,131,129 | |
| FinecoBank SpA | 103,465 | 1,666,569 | |
| Nu Holdings Ltd. (a) | 39,400 | 468,072 | |
| Pathward Financial, Inc. | 7,882 | 420,189 | |
| SVB Financial Group (a) | 3,206 | 160 | |
| 5,171,346 | |||
| Capital Markets - 23.2% | |||
| BlackRock, Inc. Class A | 3,032 | 2,340,795 | |
| Blue Owl Capital, Inc. Class A | 50,200 | 903,098 | |
| Cboe Global Markets, Inc. | 4,109 | 710,816 | |
| Coinbase Global, Inc. (a) | 5,187 | 1,171,847 | |
| Intercontinental Exchange, Inc. | 10,250 | 1,372,475 | |
| London Stock Exchange Group PLC | 12,225 | 1,427,229 | |
| MarketAxess Holdings, Inc. | 2,400 | 477,432 | |
| MSCI, Inc. | 960 | 475,373 | |
| Tradeweb Markets, Inc. Class A | 5,912 | 644,467 | |
| Virtu Financial, Inc. Class A | 23,049 | 507,078 | |
| 10,030,610 | |||
| Consumer Finance - 7.7% | |||
| Ally Financial, Inc. | 13,044 | 508,325 | |
| Capital One Financial Corp. | 15,206 | 2,092,802 | |
| NerdWallet, Inc. (a) | 52,620 | 734,049 | |
| 3,335,176 | |||
| Financial Services - 36.2% | |||
| Adyen BV (a)(b) | 1,423 | 1,829,362 | |
| Apollo Global Management, Inc. | 10,414 | 1,209,690 | |
| AvidXchange Holdings, Inc. (a) | 72,543 | 768,230 | |
| Block, Inc. Class A (a) | 13,729 | 879,754 | |
| Dlocal Ltd. (a) | 116,285 | 1,064,008 | |
| Fiserv, Inc. (a) | 4,817 | 721,394 | |
| Flywire Corp. (a) | 94,554 | 1,621,601 | |
| MasterCard, Inc. Class A | 5,379 | 2,404,790 | |
| PennyMac Financial Services, Inc. | 5,279 | 478,541 | |
| Repay Holdings Corp. (a) | 41,227 | 401,551 | |
| Shift4 Payments, Inc. (a)(c) | 4,947 | 332,834 | |
| UWM Holdings Corp. Class A (c) | 57,300 | 422,301 | |
| Visa, Inc. Class A | 9,613 | 2,619,160 | |
| Wise PLC (a) | 86,635 | 899,164 | |
| 15,652,380 | |||
| Insurance - 9.0% | |||
| Beazley PLC | 61,070 | 536,947 | |
| Hiscox Ltd. | 78,891 | 1,148,017 | |
| The Baldwin Insurance Group, Inc. Class A, (a) | 65,263 | 2,198,058 | |
| 3,883,022 | |||
TOTAL FINANCIALS | 38,072,534 | ||
| INDUSTRIALS - 5.8% | |||
| Professional Services - 5.8% | |||
| Equifax, Inc. | 8,558 | 1,980,236 | |
| Verisk Analytics, Inc. | 2,140 | 540,949 | |
| 2,521,185 | |||
| INFORMATION TECHNOLOGY - 3.8% | |||
| Software - 3.8% | |||
| Bill Holdings, Inc. (a) | 6,564 | 341,656 | |
| MicroStrategy, Inc. Class A (a)(c) | 647 | 986,345 | |
| Pagaya Technologies Ltd. Class A (a) | 24,600 | 290,526 | |
| 1,618,527 | |||
| REAL ESTATE - 1.1% | |||
| Equity Real Estate Investment Trusts (REITs) - 1.1% | |||
| American Homes 4 Rent Class A | 13,374 | 481,999 | |
| TOTAL COMMON STOCKS (Cost $37,028,751) | 43,103,207 | ||
| Money Market Funds - 4.0% | |||
| Shares | Value ($) | ||
| Fidelity Cash Central Fund 5.39% (d) | 84,610 | 84,627 | |
| Fidelity Securities Lending Cash Central Fund 5.39% (d)(e) | 1,661,159 | 1,661,325 | |
| TOTAL MONEY MARKET FUNDS (Cost $1,745,952) | 1,745,952 | ||
| TOTAL INVESTMENT IN SECURITIES - 103.8% (Cost $38,774,703) | 44,849,159 |
NET OTHER ASSETS (LIABILITIES) - (3.8)% | (1,636,091) |
| NET ASSETS - 100.0% | 43,213,068 |
| (a) | Non-income producing |
| (b) | Security exempt from registration under Rule 144A of the Securities Act of 1933. These securities may be resold in transactions exempt from registration, normally to qualified institutional buyers. At the end of the period, the value of these securities amounted to $1,829,362 or 4.2% of net assets. |
| (c) | Security or a portion of the security is on loan at period end. |
| (d) | Affiliated fund that is generally available only to investment companies and other accounts managed by Fidelity Investments. The rate quoted is the annualized seven-day yield of the fund at period end. A complete unaudited listing of the fund's holdings as of its most recent quarter end is available upon request. In addition, each Fidelity Central Fund's financial statements, which are not covered by the Fund's Report of Independent Registered Public Accounting Firm, are available on the SEC's website or upon request. |
| (e) | Investment made with cash collateral received from securities on loan. |
| Affiliate | Value, beginning of period ($) | Purchases ($) | Sales Proceeds ($) | Dividend Income ($) | Realized Gain (loss) ($) | Change in Unrealized appreciation (depreciation) ($) | Value, end of period ($) | % ownership, end of period |
| Fidelity Cash Central Fund 5.39% | - | 5,058,354 | 4,973,727 | 14,743 | - | - | 84,627 | 0.0% |
| Fidelity Securities Lending Cash Central Fund 5.39% | 334,700 | 13,778,129 | 12,451,504 | 3,485 | - | - | 1,661,325 | 0.0% |
| Total | 334,700 | 18,836,483 | 17,425,231 | 18,228 | - | - | 1,745,952 | |
| Valuation Inputs at Reporting Date: | ||||
| Description | Total ($) | Level 1 ($) | Level 2 ($) | Level 3 ($) |
Investments in Securities: | ||||
| Equities: | ||||
Consumer Discretionary | 408,962 | 408,962 | - | - |
Financials | 38,072,534 | 38,072,534 | - | - |
Industrials | 2,521,185 | 2,521,185 | - | - |
Information Technology | 1,618,527 | 1,618,527 | - | - |
Real Estate | 481,999 | 481,999 | - | - |
| Money Market Funds | 1,745,952 | 1,745,952 | - | - |
| Total Investments in Securities: | 44,849,159 | 44,849,159 | - | - |
| Statement of Assets and Liabilities | ||||
| May 31, 2024 | ||||
| Assets | ||||
| Investment in securities, at value (including securities loaned of $1,615,077) - See accompanying schedule: | ||||
Unaffiliated issuers (cost $37,028,751) | $ | 43,103,207 | ||
Fidelity Central Funds (cost $1,745,952) | 1,745,952 | |||
| Total Investment in Securities (cost $38,774,703) | $ | 44,849,159 | ||
| Cash | 7,046 | |||
| Dividends receivable | 37,960 | |||
| Distributions receivable from Fidelity Central Funds | 806 | |||
| Receivable from investment adviser for expense reductions | 759 | |||
Total assets | 44,895,730 | |||
| Liabilities | ||||
| Accrued management fee | $ | 18,169 | ||
| Other payables and accrued expenses | 3,168 | |||
| Collateral on securities loaned | 1,661,325 | |||
| Total liabilities | 1,682,662 | |||
| Net Assets | $ | 43,213,068 | ||
| Net Assets consist of: | ||||
| Paid in capital | $ | 43,693,994 | ||
| Total accumulated earnings (loss) | (480,926) | |||
| Net Assets | $ | 43,213,068 | ||
Net Asset Value, offering price and redemption price per share ($43,213,068 ÷ 1,444,580 shares) | $ | 29.91 | ||
| Statement of Operations | ||||
Year ended May 31, 2024 | ||||
| Investment Income | ||||
| Dividends | $ | 554,167 | ||
| Interest | 8 | |||
| Income from Fidelity Central Funds (including $3,485 from security lending) | 18,228 | |||
| Total income | 572,403 | |||
| Expenses | ||||
| Management fee | $ | 213,489 | ||
| Independent trustees' fees and expenses | 210 | |||
| Miscellaneous | 2,004 | |||
| Total expenses before reductions | 215,703 | |||
| Expense reductions | (1,333) | |||
| Total expenses after reductions | 214,370 | |||
| Net Investment income (loss) | 358,033 | |||
| Realized and Unrealized Gain (Loss) | ||||
| Net realized gain (loss) on: | ||||
| Investment Securities: | ||||
| Unaffiliated issuers | 195,433 | |||
| Redemptions in-kind | 2,555,169 | |||
| Foreign currency transactions | 4,426 | |||
| Total net realized gain (loss) | 2,755,028 | |||
| Change in net unrealized appreciation (depreciation) on: | ||||
| Investment Securities: | ||||
| Unaffiliated issuers | 5,958,514 | |||
| Assets and liabilities in foreign currencies | 640 | |||
| Total change in net unrealized appreciation (depreciation) | 5,959,154 | |||
| Net gain (loss) | 8,714,182 | |||
| Net increase (decrease) in net assets resulting from operations | $ | 9,072,215 | ||
See Organization and Merger information note regarding reorganization from mutual fund to exchange traded fund.
| Statement of Changes in Net Assets | ||||
Year ended May 31, 2024 | Year ended May 31, 2023 | |||
| Increase (Decrease) in Net Assets | ||||
| Operations | ||||
| Net investment income (loss) | $ | 358,033 | $ | 429,106 |
| Net realized gain (loss) | 2,755,028 | (5,165,409) | ||
| Change in net unrealized appreciation (depreciation) | 5,959,154 | (2,264,698) | ||
| Net increase (decrease) in net assets resulting from operations | 9,072,215 | (7,001,001) | ||
| Distributions to shareholders | (404,620) | (3,640,977) | ||
| Share transactions - net increase (decrease) | - | (13,799,786) | ||
| Share transactions | ||||
| Proceeds from sales of shares | 2,694,257 | - | ||
| Reinvestment of distributions | 224,111 | - | ||
| Cost of shares redeemed | (9,192,595) | - | ||
Net increase (decrease) in net assets resulting from share transactions | (6,274,227) | (13,799,786) | ||
| Total increase (decrease) in net assets | 2,393,368 | (24,441,764) | ||
| Net Assets | ||||
| Beginning of period | 40,819,700 | 65,261,464 | ||
| End of period | $ | 43,213,068 | $ | 40,819,700 |
| Other Information | ||||
| Shares | ||||
| Sold | 100,156 | 2,055,446 | ||
| Issued in reinvestment of distributions | 9,007 | 136,875 | ||
| Redeemed | (349,456) | (2,748,212) | ||
| Net increase (decrease) | (240,293) | (555,891) | ||
Fidelity® Disruptive Finance ETF |
| Years ended May 31, | 2024 A | 2023 A | 2022 A | 2021 A | 2020 A,B | |||||
Selected Per-Share Data | ||||||||||
| Net asset value, beginning of period | $ | 24.23 | $ | 29.04 | $ | 34.73 | $ | 22.63 | $ | 19.08 |
| Income from Investment Operations | ||||||||||
Net investment income (loss) C,D | .23 | .12 | .04 | .21 E | .06 | |||||
| Net realized and unrealized gain (loss) | 5.70 | (3.38) | (5.10) | 12.24 | 3.49 | |||||
| Total from investment operations | 5.93 | (3.26) | (5.06) | 12.45 | 3.55 | |||||
| Distributions from net investment income | (.25) | - | (.08) | (.10) | - | |||||
| Distributions from net realized gain | - | (1.55) | (.55) | (.25) | - | |||||
| Total distributions | (.25) | (1.55) | (.63) | (.35) | - | |||||
| Net asset value, end of period | $ | 29.91 | $ | 24.23 | $ | 29.04 | $ | 34.73 | $ | 22.63 |
Total Return F,G,H | 24.62 % | (11.46)% | (14.88)% | 55.31% | 18.60% | |||||
Ratios to Average Net Assets D,I,J | ||||||||||
| Expenses before reductions | .51% | .86% | 1.00% | 1.01% K | 1.01% K,L | |||||
| Expenses net of fee waivers, if any | .50 % | .86% | 1.00% | 1.01% K | 1.01% K,L | |||||
| Expenses net of all reductions | .50% | .86% | 1.00% | 1.01% K | 1.01% K,L | |||||
| Net investment income (loss) | .84% | .48% | .12% | .72% E | 1.99% L | |||||
| Supplemental Data | ||||||||||
| Net assets, end of period (000 omitted) | $ | 43,213 | $ | 40,820 | $ | 18,486 | $ | 48,219 | $ | 2,373 |
Portfolio turnover rate M | 34 % N | 22% | 43% | 18% | 0% O |
| Common Stocks - 99.0% | |||
| Shares | Value ($) | ||
| HEALTH CARE - 99.0% | |||
| Biotechnology - 27.1% | |||
| Alnylam Pharmaceuticals, Inc. (a) | 10,861 | 1,612,098 | |
| ALX Oncology Holdings, Inc. (a) | 16,876 | 179,392 | |
| Arcellx, Inc. (a) | 3,964 | 206,128 | |
| Argenx SE ADR (a) | 3,016 | 1,118,996 | |
| Arrowhead Pharmaceuticals, Inc. (a) | 13,711 | 314,667 | |
| Ascendis Pharma A/S sponsored ADR (a) | 3,865 | 522,162 | |
| Cytokinetics, Inc. (a) | 11,735 | 569,265 | |
| Exact Sciences Corp. (a) | 21,530 | 978,539 | |
| Intellia Therapeutics, Inc. (a)(b) | 8,350 | 178,523 | |
| Janux Therapeutics, Inc. (a) | 14,042 | 751,247 | |
| Keros Therapeutics, Inc. (a) | 5,273 | 247,146 | |
| Legend Biotech Corp. ADR (a) | 27,359 | 1,094,634 | |
| Natera, Inc. (a) | 4,327 | 460,955 | |
| Regeneron Pharmaceuticals, Inc. (a) | 1,343 | 1,316,355 | |
| Repligen Corp. (a) | 5,625 | 838,631 | |
| Sarepta Therapeutics, Inc. (a) | 4,931 | 640,340 | |
| Tyra Biosciences, Inc. (a) | 15,907 | 258,012 | |
| Vaxcyte, Inc. (a) | 9,285 | 652,457 | |
| Vertex Pharmaceuticals, Inc. (a) | 1,141 | 519,543 | |
| Xenon Pharmaceuticals, Inc. (a) | 15,469 | 588,905 | |
| Zai Lab Ltd. ADR (a) | 18,315 | 325,641 | |
| Zentalis Pharmaceuticals, Inc. (a)(b) | 14,082 | 167,294 | |
| 13,540,930 | |||
| Health Care Equipment & Supplies - 32.1% | |||
| Align Technology, Inc. (a) | 1,845 | 474,552 | |
| Boston Scientific Corp. (a) | 43,779 | 3,308,379 | |
| DexCom, Inc. (a) | 7,307 | 867,852 | |
| Edwards Lifesciences Corp. (a) | 13,000 | 1,129,570 | |
| Glaukos Corp. (a) | 8,600 | 969,392 | |
| Inspire Medical Systems, Inc. (a) | 5,824 | 924,793 | |
| Insulet Corp. (a) | 9,134 | 1,618,453 | |
| Intuitive Surgical, Inc. (a) | 4,550 | 1,829,646 | |
| iRhythm Technologies, Inc. (a) | 2,803 | 247,253 | |
| Masimo Corp. (a) | 6,888 | 857,556 | |
| Penumbra, Inc. (a) | 6,186 | 1,172,061 | |
| ResMed, Inc. | 3,444 | 710,601 | |
| Stryker Corp. | 3,887 | 1,325,817 | |
| Tandem Diabetes Care, Inc. (a)(b) | 11,178 | 572,649 | |
| 16,008,574 | |||
| Health Care Providers & Services - 14.1% | |||
| agilon health, Inc. (a) | 82,494 | 519,712 | |
| Centene Corp. (a)(b) | 24,261 | 1,736,845 | |
| Guardant Health, Inc. (a) | 12,326 | 334,035 | |
| Humana, Inc. | 1,976 | 707,645 | |
| LifeStance Health Group, Inc. (a)(b) | 184,461 | 1,027,448 | |
| Privia Health Group, Inc. (a) | 33,946 | 589,642 | |
| UnitedHealth Group, Inc. | 4,288 | 2,124,147 | |
| 7,039,474 | |||
| Health Care Technology - 4.3% | |||
| Doximity, Inc. (a)(b) | 11,973 | 332,011 | |
| Evolent Health, Inc. Class A (a) | 21,528 | 456,178 | |
| Phreesia, Inc. (a) | 24,534 | 464,183 | |
| Veeva Systems, Inc. Class A (a) | 5,181 | 902,789 | |
| 2,155,161 | |||
| Life Sciences Tools & Services - 13.5% | |||
| 10X Genomics, Inc. (a) | 23,248 | 521,220 | |
| Bio-Techne Corp. | 12,588 | 971,668 | |
| Bruker Corp. | 8,363 | 547,860 | |
| Danaher Corp. | 7,509 | 1,928,311 | |
| Lonza Group AG | 1,063 | 572,996 | |
| Sartorius Stedim Biotech | 2,996 | 593,760 | |
| Thermo Fisher Scientific, Inc. | 1,907 | 1,083,138 | |
| West Pharmaceutical Services, Inc. | 1,620 | 536,884 | |
| 6,755,837 | |||
| Pharmaceuticals - 7.9% | |||
| Edgewise Therapeutics, Inc. (a) | 14,957 | 256,213 | |
| Eli Lilly & Co. | 1,513 | 1,241,174 | |
| Merck & Co., Inc. | 9,600 | 1,205,184 | |
| Royalty Pharma PLC | 37,697 | 1,033,275 | |
| Structure Therapeutics, Inc. ADR (a) | 6,300 | 215,460 | |
| 3,951,306 | |||
| TOTAL COMMON STOCKS (Cost $47,074,873) | 49,451,282 | ||
| Money Market Funds - 8.0% | |||
| Shares | Value ($) | ||
| Fidelity Cash Central Fund 5.39% (c) | 460,771 | 460,863 | |
| Fidelity Securities Lending Cash Central Fund 5.39% (c)(d) | 3,522,348 | 3,522,700 | |
| TOTAL MONEY MARKET FUNDS (Cost $3,983,563) | 3,983,563 | ||
| TOTAL INVESTMENT IN SECURITIES - 107.0% (Cost $51,058,436) | 53,434,845 |
NET OTHER ASSETS (LIABILITIES) - (7.0)% | (3,509,722) |
| NET ASSETS - 100.0% | 49,925,123 |
| (a) | Non-income producing |
| (b) | Security or a portion of the security is on loan at period end. |
| (c) | Affiliated fund that is generally available only to investment companies and other accounts managed by Fidelity Investments. The rate quoted is the annualized seven-day yield of the fund at period end. A complete unaudited listing of the fund's holdings as of its most recent quarter end is available upon request. In addition, each Fidelity Central Fund's financial statements, which are not covered by the Fund's Report of Independent Registered Public Accounting Firm, are available on the SEC's website or upon request. |
| (d) | Investment made with cash collateral received from securities on loan. |
| Affiliate | Value, beginning of period ($) | Purchases ($) | Sales Proceeds ($) | Dividend Income ($) | Realized Gain (loss) ($) | Change in Unrealized appreciation (depreciation) ($) | Value, end of period ($) | % ownership, end of period |
| Fidelity Cash Central Fund 5.39% | - | 5,864,562 | 5,403,699 | 27,663 | - | - | 460,863 | 0.0% |
| Fidelity Securities Lending Cash Central Fund 5.39% | 461,500 | 21,312,551 | 18,251,351 | 3,703 | - | - | 3,522,700 | 0.0% |
| Total | 461,500 | 27,177,113 | 23,655,050 | 31,366 | - | - | 3,983,563 | |
| Valuation Inputs at Reporting Date: | ||||
| Description | Total ($) | Level 1 ($) | Level 2 ($) | Level 3 ($) |
Investments in Securities: | ||||
| Equities: | ||||
Health Care | 49,451,282 | 49,451,282 | - | - |
| Money Market Funds | 3,983,563 | 3,983,563 | - | - |
| Total Investments in Securities: | 53,434,845 | 53,434,845 | - | - |
| Statement of Assets and Liabilities | ||||
| May 31, 2024 | ||||
| Assets | ||||
| Investment in securities, at value (including securities loaned of $3,472,410) - See accompanying schedule: | ||||
Unaffiliated issuers (cost $47,074,873) | $ | 49,451,282 | ||
Fidelity Central Funds (cost $3,983,563) | 3,983,563 | |||
| Total Investment in Securities (cost $51,058,436) | $ | 53,434,845 | ||
| Cash | 5,198 | |||
| Dividends receivable | 29,460 | |||
| Distributions receivable from Fidelity Central Funds | 2,313 | |||
| Receivable from investment adviser for expense reductions | 2,387 | |||
Total assets | 53,474,203 | |||
| Liabilities | ||||
| Accrued management fee | $ | 21,472 | ||
| Other payables and accrued expenses | 4,908 | |||
| Collateral on securities loaned | 3,522,700 | |||
| Total liabilities | 3,549,080 | |||
| Net Assets | $ | 49,925,123 | ||
| Net Assets consist of: | ||||
| Paid in capital | $ | 58,722,875 | ||
| Total accumulated earnings (loss) | (8,797,752) | |||
| Net Assets | $ | 49,925,123 | ||
Net Asset Value, offering price and redemption price per share ($49,925,123 ÷ 2,123,806 shares) | $ | 23.51 | ||
| Statement of Operations | ||||
Year ended May 31, 2024 | ||||
| Investment Income | ||||
| Dividends | $ | 138,052 | ||
| Income from Fidelity Central Funds (including $3,703 from security lending) | 31,366 | |||
| Total income | 169,418 | |||
| Expenses | ||||
| Management fee | $ | 237,616 | ||
| Independent trustees' fees and expenses | 228 | |||
| Miscellaneous | 3,773 | |||
| Total expenses before reductions | 241,617 | |||
| Expense reductions | (3,499) | |||
| Total expenses after reductions | 238,118 | |||
| Net Investment income (loss) | (68,700) | |||
| Realized and Unrealized Gain (Loss) | ||||
| Net realized gain (loss) on: | ||||
| Investment Securities: | ||||
| Unaffiliated issuers | (1,019,841) | |||
| Redemptions in-kind | 654,546 | |||
| Foreign currency transactions | (8,568) | |||
| Total net realized gain (loss) | (373,863) | |||
| Change in net unrealized appreciation (depreciation) on: | ||||
| Investment Securities: | ||||
| Unaffiliated issuers | (680,240) | |||
| Assets and liabilities in foreign currencies | 7,253 | |||
| Total change in net unrealized appreciation (depreciation) | (672,987) | |||
| Net gain (loss) | (1,046,850) | |||
| Net increase (decrease) in net assets resulting from operations | $ | (1,115,550) | ||
See Organization and Merger information note regarding reorganization from mutual fund to exchange traded fund.
| Statement of Changes in Net Assets | ||||
Year ended May 31, 2024 | Year ended May 31, 2023 | |||
| Increase (Decrease) in Net Assets | ||||
| Operations | ||||
| Net investment income (loss) | $ | (68,700) | $ | (65,769) |
| Net realized gain (loss) | (373,863) | (6,730,978) | ||
| Change in net unrealized appreciation (depreciation) | (672,987) | 11,521,551 | ||
| Net increase (decrease) in net assets resulting from operations | (1,115,550) | 4,724,804 | ||
| Share transactions - net increase (decrease) | - | (13,925,552) | ||
| Share transactions | ||||
| Proceeds from sales of shares | 11,592,851 | - | ||
| Cost of shares redeemed | (3,749,043) | - | ||
Net increase (decrease) in net assets resulting from share transactions | 7,843,808 | (13,925,552) | ||
| Total increase (decrease) in net assets | 6,728,258 | (9,200,748) | ||
| Net Assets | ||||
| Beginning of period | 43,196,865 | 52,397,613 | ||
| End of period | $ | 49,925,123 | $ | 43,196,865 |
| Other Information | ||||
| Shares | ||||
| Sold | 500,368 | 2,183,358 | ||
| Redeemed | (149,500) | (2,768,145) | ||
| Net increase (decrease) | 350,868 | (584,787) | ||
Fidelity® Disruptive Medicine ETF |
| Years ended May 31, | 2024 A | 2023 A | 2022 A | 2021 A | 2020 A,B | |||||
Selected Per-Share Data | ||||||||||
| Net asset value, beginning of period | $ | 24.36 | $ | 22.08 | $ | 28.82 | $ | 24.52 | $ | 22.17 |
| Income from Investment Operations | ||||||||||
Net investment income (loss) C,D | (.03) | (.11) | (.20) | (.16) | (.02) | |||||
| Net realized and unrealized gain (loss) | (.82) | 2.39 | (6.25) | 4.66 | 2.37 | |||||
| Total from investment operations | (.85) | 2.28 | (6.45) | 4.50 | 2.35 | |||||
| Distributions from net realized gain | - | - | (.29) | (.20) | - | |||||
| Total distributions | - | - | (.29) | (.20) | - | |||||
| Net asset value, end of period | $ | 23.51 | $ | 24.36 | $ | 22.08 | $ | 28.82 | $ | 24.52 |
Total Return E,F,G | (3.50) % | 10.34% | (22.68)% | 18.44% | 10.60% | |||||
Ratios to Average Net Assets D,H,I | ||||||||||
| Expenses before reductions | .51% | .84% | 1.00% | 1.01% J | 1.01% J,K | |||||
| Expenses net of fee waivers, if any | .50 % | .84% | 1.00% | 1.01% J | 1.01% J,K | |||||
| Expenses net of all reductions | .50% | .84% | 1.00% | 1.01% J | 1.01% J,K | |||||
| Net investment income (loss) | (.14)% | (.51)% | (.70)% | (.58)% | (.75)% K | |||||
| Supplemental Data | ||||||||||
| Net assets, end of period (000 omitted) | $ | 49,925 | $ | 43,197 | $ | 11,027 | $ | 32,331 | $ | 5,666 |
Portfolio turnover rate L | 33 % M | 39% | 47% | 44% | 0% N,O |
| Common Stocks - 99.8% | |||
| Shares | Value ($) | ||
| COMMUNICATION SERVICES - 19.9% | |||
| Entertainment - 8.9% | |||
| Netflix, Inc. (a) | 9,802 | 6,289,159 | |
| Sea Ltd. ADR (a) | 53,903 | 3,639,531 | |
| Spotify Technology SA (a) | 5,890 | 1,748,034 | |
| Universal Music Group NV | 48,141 | 1,492,888 | |
| Universal Music Group NV rights (a)(b) | 47,136 | 13,809 | |
| 13,183,421 | |||
| Interactive Media & Services - 10.1% | |||
| Alphabet, Inc. Class C | 36,168 | 6,291,785 | |
| Meta Platforms, Inc. Class A | 13,669 | 6,381,099 | |
| Snap, Inc. Class A (a) | 147,052 | 2,208,721 | |
| 14,881,605 | |||
| Wireless Telecommunication Services - 0.9% | |||
| T-Mobile U.S., Inc. | 7,912 | 1,384,284 | |
TOTAL COMMUNICATION SERVICES | 29,449,310 | ||
| CONSUMER DISCRETIONARY - 6.8% | |||
| Broadline Retail - 6.1% | |||
| Amazon.com, Inc. (a) | 33,403 | 5,893,625 | |
| Global-e Online Ltd. (a) | 24,696 | 771,009 | |
| PDD Holdings, Inc. ADR (a) | 15,920 | 2,384,498 | |
| 9,049,132 | |||
| Hotels, Restaurants & Leisure - 0.7% | |||
| Airbnb, Inc. Class A (a) | 6,801 | 985,669 | |
TOTAL CONSUMER DISCRETIONARY | 10,034,801 | ||
| FINANCIALS - 1.7% | |||
| Financial Services - 1.7% | |||
| Adyen BV (a)(c) | 886 | 1,139,013 | |
| Block, Inc. Class A (a) | 20,812 | 1,333,633 | |
| 2,472,646 | |||
| HEALTH CARE - 2.2% | |||
| Health Care Equipment & Supplies - 2.2% | |||
| Hoya Corp. | 26,500 | 3,211,713 | |
| INDUSTRIALS - 1.0% | |||
| Ground Transportation - 1.0% | |||
| Uber Technologies, Inc. (a) | 22,821 | 1,473,324 | |
| INFORMATION TECHNOLOGY - 68.2% | |||
| IT Services - 5.7% | |||
| Accenture PLC Class A | 5,398 | 1,523,801 | |
| MongoDB, Inc. Class A (a) | 14,229 | 3,358,898 | |
| Shopify, Inc. Class A (a) | 27,838 | 1,646,618 | |
| Snowflake, Inc. (a) | 13,866 | 1,888,272 | |
| 8,417,589 | |||
| Semiconductors & Semiconductor Equipment - 30.6% | |||
| Advantest Corp. | 77,491 | 2,617,936 | |
| ASML Holding NV (Netherlands) | 6,996 | 6,610,251 | |
| BE Semiconductor Industries NV | 13,575 | 1,988,490 | |
| Infineon Technologies AG | 50,300 | 2,009,835 | |
| Marvell Technology, Inc. | 69,038 | 4,750,505 | |
| Micron Technology, Inc. | 20,980 | 2,622,500 | |
| NVIDIA Corp. | 10,827 | 11,869,963 | |
| ON Semiconductor Corp. (a) | 42,016 | 3,068,849 | |
| SolarEdge Technologies, Inc. (a) | 22,141 | 1,084,688 | |
| Taiwan Semiconductor Manufacturing Co. Ltd. sponsored ADR | 57,606 | 8,700,810 | |
| 45,323,827 | |||
| Software - 29.4% | |||
| Adobe, Inc. (a) | 11,721 | 5,213,032 | |
| Atlassian Corp. PLC Class A, (a) | 8,763 | 1,374,564 | |
| Confluent, Inc. (a)(d) | 114,808 | 2,981,564 | |
| Crowdstrike Holdings, Inc. (a) | 6,102 | 1,914,014 | |
| Datadog, Inc. Class A (a) | 21,183 | 2,333,943 | |
| HashiCorp, Inc. (a) | 32,549 | 1,092,995 | |
| HubSpot, Inc. (a) | 4,418 | 2,699,619 | |
| Intuit, Inc. | 5,290 | 3,049,368 | |
| Microsoft Corp. | 18,316 | 7,603,521 | |
| Palo Alto Networks, Inc. (a) | 10,134 | 2,988,618 | |
| Salesforce, Inc. | 27,550 | 6,458,822 | |
| Synopsys, Inc. (a) | 5,940 | 3,331,152 | |
| Workday, Inc. Class A (a) | 11,846 | 2,504,837 | |
| 43,546,049 | |||
| Technology Hardware, Storage & Peripherals - 2.5% | |||
| Apple, Inc. | 9,692 | 1,863,287 | |
| Samsung Electronics Co. Ltd. | 36,000 | 1,913,543 | |
| 3,776,830 | |||
TOTAL INFORMATION TECHNOLOGY | 101,064,295 | ||
| TOTAL COMMON STOCKS (Cost $121,090,314) | 147,706,089 | ||
| Money Market Funds - 1.1% | |||
| Shares | Value ($) | ||
| Fidelity Cash Central Fund 5.39% (e) | 385,826 | 385,903 | |
| Fidelity Securities Lending Cash Central Fund 5.39% (e)(f) | 1,251,350 | 1,251,475 | |
| TOTAL MONEY MARKET FUNDS (Cost $1,637,378) | 1,637,378 | ||
| TOTAL INVESTMENT IN SECURITIES - 100.9% (Cost $122,727,692) | 149,343,467 |
NET OTHER ASSETS (LIABILITIES) - (0.9)% | (1,265,936) |
| NET ASSETS - 100.0% | 148,077,531 |
| (a) | Non-income producing |
| (b) | Security or a portion of the security purchased on a delayed delivery or when-issued basis. |
| (c) | Security exempt from registration under Rule 144A of the Securities Act of 1933. These securities may be resold in transactions exempt from registration, normally to qualified institutional buyers. At the end of the period, the value of these securities amounted to $1,139,013 or 0.8% of net assets. |
| (d) | Security or a portion of the security is on loan at period end. |
| (e) | Affiliated fund that is generally available only to investment companies and other accounts managed by Fidelity Investments. The rate quoted is the annualized seven-day yield of the fund at period end. A complete unaudited listing of the fund's holdings as of its most recent quarter end is available upon request. In addition, each Fidelity Central Fund's financial statements, which are not covered by the Fund's Report of Independent Registered Public Accounting Firm, are available on the SEC's website or upon request. |
| (f) | Investment made with cash collateral received from securities on loan. |
| Affiliate | Value, beginning of period ($) | Purchases ($) | Sales Proceeds ($) | Dividend Income ($) | Realized Gain (loss) ($) | Change in Unrealized appreciation (depreciation) ($) | Value, end of period ($) | % ownership, end of period |
| Fidelity Cash Central Fund 5.39% | 478,846 | 12,403,225 | 12,496,168 | 44,106 | - | - | 385,903 | 0.0% |
| Fidelity Securities Lending Cash Central Fund 5.39% | 3,121,750 | 15,012,348 | 16,882,623 | 956 | - | - | 1,251,475 | 0.0% |
| Total | 3,600,596 | 27,415,573 | 29,378,791 | 45,062 | - | - | 1,637,378 | |
| Valuation Inputs at Reporting Date: | ||||
| Description | Total ($) | Level 1 ($) | Level 2 ($) | Level 3 ($) |
Investments in Securities: | ||||
| Equities: | ||||
Communication Services | 29,449,310 | 29,449,310 | - | - |
Consumer Discretionary | 10,034,801 | 10,034,801 | - | - |
Financials | 2,472,646 | 2,472,646 | - | - |
Health Care | 3,211,713 | 3,211,713 | - | - |
Industrials | 1,473,324 | 1,473,324 | - | - |
Information Technology | 101,064,295 | 101,064,295 | - | - |
| Money Market Funds | 1,637,378 | 1,637,378 | - | - |
| Total Investments in Securities: | 149,343,467 | 149,343,467 | - | - |
| Statement of Assets and Liabilities | ||||
| May 31, 2024 | ||||
| Assets | ||||
| Investment in securities, at value (including securities loaned of $1,150,471) - See accompanying schedule: | ||||
Unaffiliated issuers (cost $121,090,314) | $ | 147,706,089 | ||
Fidelity Central Funds (cost $1,637,378) | 1,637,378 | |||
| Total Investment in Securities (cost $122,727,692) | $ | 149,343,467 | ||
| Foreign currency held at value (cost $189) | 191 | |||
| Dividends receivable | 66,163 | |||
| Distributions receivable from Fidelity Central Funds | 1,242 | |||
| Receivable from investment adviser for expense reductions | 5,186 | |||
Total assets | 149,416,249 | |||
| Liabilities | ||||
| Payable for investments purchased on a delayed delivery basis | $ | 13,809 | ||
| Accrued management fee | 62,528 | |||
| Other payables and accrued expenses | 10,906 | |||
| Collateral on securities loaned | 1,251,475 | |||
| Total liabilities | 1,338,718 | |||
| Net Assets | $ | 148,077,531 | ||
| Net Assets consist of: | ||||
| Paid in capital | $ | 152,044,771 | ||
| Total accumulated earnings (loss) | (3,967,240) | |||
| Net Assets | $ | 148,077,531 | ||
Net Asset Value, offering price and redemption price per share ($148,077,531 ÷ 4,788,469 shares) | $ | 30.92 | ||
| Statement of Operations | ||||
Year ended May 31, 2024 | ||||
| Investment Income | ||||
| Dividends | $ | 369,212 | ||
| Income from Fidelity Central Funds (including $956 from security lending) | 45,062 | |||
| Total income | 414,274 | |||
| Expenses | ||||
| Management fee | $ | 574,952 | ||
| Independent trustees' fees and expenses | 522 | |||
| Miscellaneous | 8,542 | |||
| Total expenses before reductions | 584,016 | |||
| Expense reductions | (5,674) | |||
| Total expenses after reductions | 578,342 | |||
| Net Investment income (loss) | (164,068) | |||
| Realized and Unrealized Gain (Loss) | ||||
| Net realized gain (loss) on: | ||||
| Investment Securities: | ||||
| Unaffiliated issuers | (6,133,519) | |||
| Redemptions in-kind | 1,393,703 | |||
| Foreign currency transactions | (4,177) | |||
| Total net realized gain (loss) | (4,743,993) | |||
| Change in net unrealized appreciation (depreciation) on: | ||||
| Investment Securities: | ||||
| Unaffiliated issuers | 29,872,181 | |||
| Assets and liabilities in foreign currencies | 4,349 | |||
| Total change in net unrealized appreciation (depreciation) | 29,876,530 | |||
| Net gain (loss) | 25,132,537 | |||
| Net increase (decrease) in net assets resulting from operations | $ | 24,968,469 | ||
See Organization and Merger information note regarding reorganization from mutual fund to exchange traded fund.
| Statement of Changes in Net Assets | ||||
Year ended May 31, 2024 | Year ended May 31, 2023 | |||
| Increase (Decrease) in Net Assets | ||||
| Operations | ||||
| Net investment income (loss) | $ | (164,068) | $ | (164,342) |
| Net realized gain (loss) | (4,743,993) | (24,265,561) | ||
| Change in net unrealized appreciation (depreciation) | 29,876,530 | 33,937,798 | ||
| Net increase (decrease) in net assets resulting from operations | 24,968,469 | 9,507,895 | ||
| Distributions to shareholders | - | (1,210,975) | ||
| Share transactions - net increase (decrease) | - | (12,866,094) | ||
| Share transactions | ||||
| Proceeds from sales of shares | 32,417,022 | - | ||
| Cost of shares redeemed | (10,852,977) | - | ||
Net increase (decrease) in net assets resulting from share transactions | 21,564,045 | (12,866,094) | ||
| Total increase (decrease) in net assets | 46,532,514 | (4,569,174) | ||
| Net Assets | ||||
| Beginning of period | 101,545,017 | 106,114,191 | ||
| End of period | $ | 148,077,531 | $ | 101,545,017 |
| Other Information | ||||
| Shares | ||||
| Sold | 1,048,177 | 5,396,940 | ||
| Issued in reinvestment of distributions | - | 55,606 | ||
| Redeemed | (434,792) | (6,149,268) | ||
| Net increase (decrease) | 613,385 | (696,722) | ||
Fidelity® Disruptive Technology ETF |
| Years ended May 31, | 2024 A | 2023 A | 2022 A | 2021 A | 2020 A,B | |||||
Selected Per-Share Data | ||||||||||
| Net asset value, beginning of period | $ | 24.32 | $ | 21.70 | $ | 33.25 | $ | 21.11 | $ | 18.37 |
| Income from Investment Operations | ||||||||||
Net investment income (loss) C,D | (.04) | (.09) E | (.26) | (.24) | (.02) | |||||
| Net realized and unrealized gain (loss) | 6.64 | 2.97 | (10.79) | 12.51 | 2.76 | |||||
| Total from investment operations | 6.60 | 2.88 | (11.05) | 12.27 | 2.74 | |||||
| Distributions from net realized gain | - | (.26) | (.50) | (.13) | - | |||||
| Total distributions | - | (.26) | (.50) | (.13) | - | |||||
| Net asset value, end of period | $ | 30.92 | $ | 24.32 | $ | 21.70 | $ | 33.25 | $ | 21.11 |
Total Return F,G,H | 27.13 % | 13.45% | (33.85)% | 58.13% | 14.90% | |||||
Ratios to Average Net Assets D,I,J | ||||||||||
| Expenses before reductions | .51% | .87% | .99% K | 1.01% K | 1.01% K,L | |||||
| Expenses net of fee waivers, if any | .50 % | .87% | .99% K | 1.01% K | 1.01% K,L | |||||
| Expenses net of all reductions | .50% | .87% | .99% K | 1.01% K | 1.01% K,L | |||||
| Net investment income (loss) | (.14)% | (.42)% E | (.78)% | (.77)% | (.62)% L | |||||
| Supplemental Data | ||||||||||
| Net assets, end of period (000 omitted) | $ | 148,078 | $ | 101,545 | $ | 34,802 | $ | 130,244 | $ | 6,198 |
Portfolio turnover rate M | 25 % N | 28% | 33% | 29% | 0% O,P |
| Current ETFs | Former Mutual Funds (Predecessor Funds) |
| Fidelity Disruptive Automation ETF | Fidelity Disruptive Automation Fund |
| Fidelity Disruptive Communications ETF | Fidelity Disruptive Communications Fund |
| Fidelity Disruptive Finance ETF | Fidelity Disruptive Finance Fund |
| Fidelity Disruptive Medicine ETF | Fidelity Disruptive Medicine Fund |
| Fidelity Disruptive Technology ETF | Fidelity Disruptive Technology Fund |
| Fidelity Central Fund | Investment Manager | Investment Objective | Investment Practices | Expense RatioA |
| Fidelity Money Market Central Funds | Fidelity Management & Research Company LLC (FMR) | Each fund seeks to obtain a high level of current income consistent with the preservation of capital and liquidity. | Short-term Investments | Less than .005% |
| Tax cost ($) | Gross unrealized appreciation ($) | Gross unrealized depreciation ($) | Net unrealized appreciation (depreciation) ($) | |
| Fidelity Disruptive Automation ETF | 93,849,761 | 23,549,871 | (12,629,065) | 10,920,806 |
Fidelity Disruptive Communications ETF | 40,931,480 | 17,465,814 | (7,731,172) | 9,734,642 |
| Fidelity Disruptive Finance ETF | 39,025,813 | 11,423,142 | (5,599,796) | 5,823,346 |
| Fidelity Disruptive Medicine ETF | 51,222,461 | 9,860,036 | (7,647,652) | 2,212,384 |
| Fidelity Disruptive Technology ETF | 123,829,902 | 39,690,715 | (14,177,150) | 25,513,565 |
| Undistributed ordinary income ($) | Capital loss carryforward ($) | Net unrealized appreciation (depreciation) on securities and other investments ($) | |
| Fidelity Disruptive Automation ETF | 64,444 | (10,111,538) | 10,905,865 |
Fidelity Disruptive Communications ETF | - | (6,961,406) | 9,734,377 |
| Fidelity Disruptive Finance ETF | 190,848 | (6,495,442) | 5,823,669 |
| Fidelity Disruptive Medicine ETF | 236,380 | (11,253,526) | 2,219,394 |
| Fidelity Disruptive Technology ETF | - | (29,411,535) | 25,514,811 |
| Short-term ($) | Long-term ($) | Total capital loss carryforward ($) | |
| Fidelity Disruptive Automation ETF | (2,949,356) | (7,162,182) | (10,111,538) |
Fidelity Disruptive Communications ETF | (4,704,590) | (2,256,816) | (6,961,406) |
| Fidelity Disruptive Finance ETF | (4,383,267) | (2,112,175) | (6,495,442) |
| Fidelity Disruptive Medicine ETF | (7,080,374) | (4,173,152) | (11,253,526) |
| Fidelity Disruptive Technology ETF | (3,662,027) | (25,749,508) | (29,411,535) |
Ordinary losses ($) | |
Fidelity Disruptive Communications ETF | (38,189) |
| Fidelity Disruptive Technology ETF | (70,516) |
| May 31, 2024 | |||||
| Ordinary Income ($) | Total ($) | ||||
| Fidelity Disruptive Automation ETF | 600,970 | 600,970 | |||
| Fidelity Disruptive Finance ETF | 404,620 | 404,620 | |||
| May 31, 2023 | |||||
| Ordinary Income ($) | Long-term Capital Gains ($) | Total ($) | |||
| Fidelity Disruptive Automation Fund | 182,874 | - | 182,874 | ||
| Fidelity Disruptive Finance Fund | 304,444 | 3,336,533 | 3,640,977 | ||
| Fidelity Disruptive Technology Fund | - | 1,210,975 | 1,210,975 | ||
| Purchases ($) | Sales ($) | |
| Fidelity Disruptive Automation ETF | 50,632,488 | 51,074,352 |
| Fidelity Disruptive Communications ETF | 14,948,290 | 13,375,973 |
| Fidelity Disruptive Finance ETF | 14,409,000 | 13,301,962 |
| Fidelity Disruptive Medicine ETF | 16,786,578 | 14,401,574 |
| Fidelity Disruptive Technology ETF | 26,235,273 | 28,142,393 |
| In-Kind Subscriptions ($) | In-Kind Redemptions ($) | |
| Fidelity Disruptive Automation ETF | 3,597,594 | 12,583,950 |
| Fidelity Disruptive Communications ETF | 1,267,995 | 3,895,711 |
| Fidelity Disruptive Finance ETF | - | 7,379,978 |
| Fidelity Disruptive Medicine ETF | 7,607,367 | 2,474,632 |
| Fidelity Disruptive Technology ETF | 28,591,609 | 4,587,682 |
| Shares | Total net realized gain or loss ($) | Total Proceeds ($) | |
| Fidelity Disruptive Automation Fund | 210,398 | 2,526,540 | 4,955,947 |
| Fee Rate | |
| Fidelity Disruptive Automation ETF | .50% |
| Fidelity Disruptive Communications ETF | .50% |
| Fidelity Disruptive Finance ETF | .50% |
| Fidelity Disruptive Medicine ETF | .50% |
| Fidelity Disruptive Technology ETF | .50% |
| Management Fee Annual % of Average Net Assets | Expense Contract Annual % of Average Net Assets | |
| Fidelity Disruptive Automation Fund | 1.00% | .50% |
| Fidelity Disruptive Communications Fund | 1.00% | .50% |
| Fidelity Disruptive Finance Fund | 1.00% | .50% |
| Fidelity Disruptive Medicine Fund | 1.00% | .50% |
| Fidelity Disruptive Technology Fund | 1.00% | .50% |
| Amount ($) | |
| Fidelity Disruptive Automation ETF | 147 |
| Fidelity Disruptive Communications ETF | 105 |
| Fidelity Disruptive Finance ETF | 316 |
| Fidelity Disruptive Medicine ETF | 365 |
| Fidelity Disruptive Technology ETF | 141 |
| Borrower or Lender | Average Loan Balance ($) | Weighted Average Interest Rate | Interest Expense ($) | |
| Fidelity Disruptive Automation ETF | Borrower | 5,516,000 | 5.32% | 814 |
| Purchases ($) | Sales ($) | Realized Gain (Loss)($) | |
| Fidelity Disruptive Automation ETF | 1,063,013 | 1,075,914 | 253,185 |
| Fidelity Disruptive Communications ETF | 11,648 | 504,625 | 166,015 |
| Fidelity Disruptive Finance ETF | 1,955,770 | 1,402,362 | 812,533 |
| Fidelity Disruptive Medicine ETF | 844,166 | 347,881 | 101,333 |
| Fidelity Disruptive Technology ETF | 1,335,652 | 166,170 | (563,289) |
| Total Security Lending Fees Paid to NFS ($) | Security Lending Income From Securities Loaned to NFS ($) | Value of Securities Loaned to NFS at Period End ($) | |
| Fidelity Disruptive Automation ETF | 7,975 | 4,974 | - |
| Fidelity Disruptive Communications ETF | 32 | - | - |
| Fidelity Disruptive Finance ETF | 366 | 1 | - |
| Fidelity Disruptive Medicine ETF | 386 | - | - |
| Fidelity Disruptive Technology ETF | 99 | - | - |
| Reimbursement ($) | |
| Fidelity Disruptive Automation ETF | 4,551 |
| Fidelity Disruptive Communications ETF | 1,018 |
| Fidelity Disruptive Finance ETF | 759 |
| Fidelity Disruptive Medicine ETF | 2,387 |
| Fidelity Disruptive Technology ETF | 5,186 |
| Custodian credits ($) | |
| Fidelity Disruptive Automation ETF | 509 |
Fidelity Disruptive Communications ETF | 168 |
| Fidelity Disruptive Finance ETF | 574 |
| Fidelity Disruptive Medicine ETF | 1,112 |
| Fidelity Disruptive Technology ETF | 488 |
Year ended May 31, 2023 | |
| Fidelity Disruptive Automation Fund | |
| Distributions to shareholders | |
| Fidelity Disruptive Automation Fund | $- |
| Loyalty Class 1 | 70,285 |
| Loyalty Class 2 | 370 |
| Class F | 112,219 |
Total | $182,874 |
| Fidelity Disruptive Finance Fund | |
| Distributions to shareholders | |
| Fidelity Disruptive Finance Fund | $889,399 |
| Loyalty Class 1 | 1,176,792 |
| Loyalty Class 2 | 9,204 |
| Class F | 1,565,582 |
Total | $3,640,977 |
| Fidelity Disruptive Technology Fund | |
| Distributions to shareholders | |
| Fidelity Disruptive Technology Fund | $403,963 |
| Loyalty Class 1 | 534,280 |
| Loyalty Class 2 | 1,388 |
| Class F | 271,344 |
Total | $1,210,975 |
| Shares | Dollars | |
Year ended May 31, 2023 | Year ended May 31, 2023 | |
| Fidelity Disruptive Automation Fund | ||
| Fidelity Disruptive Automation Fund | ||
| Shares sold | 4,549,471 | $106,491,639 |
| Reinvestment of distributions | - | - |
| Shares redeemed | (1,670,230) | (35,221,801) |
| Net increase (decrease) | 2,879,241 | $71,269,838 |
| Loyalty Class 1 | ||
| Shares sold | 687,455 | $14,592,727 |
| Reinvestment of distributions | 3,054 | 65,051 |
| Shares redeemed | (3,399,293) | (78,288,179) |
| Net increase (decrease) | (2,708,784) | $(63,630,401) |
| Loyalty Class 2 | ||
| Shares sold | 831 | $17,906 |
| Reinvestment of distributions | 17 | 370 |
| Shares redeemed | (7,730) | (180,614) |
| Net increase (decrease) | (6,882) | $(162,338) |
| Class F | ||
| Shares sold | 23,191 | $512,114 |
| Reinvestment of distributions | 5,221 | 112,219 |
| Shares redeemed | (1,220,183) | (27,936,611) |
| Net increase (decrease) | (1,191,771) | $(27,312,278) |
| Fidelity Disruptive Communications Fund | ||
| Fidelity Disruptive Communications Fund | ||
| Shares sold | 1,574,930 | $36,001,186 |
| Reinvestment of distributions | - | - |
| Shares redeemed | (352,668) | (7,507,221) |
| Net increase (decrease) | 1,222,262 | $28,493,965 |
| Loyalty Class 1 | ||
| Shares sold | 118,546 | $2,583,699 |
| Reinvestment of distributions | - | - |
| Shares redeemed | (741,539) | (16,870,638) |
| Net increase (decrease) | (622,993) | $(14,286,939) |
| Loyalty Class 2 | ||
| Shares sold | 234 | $5,415 |
| Reinvestment of distributions | - | - |
| Shares redeemed | (5,580) | (129,686) |
| Net increase (decrease) | (5,346) | $(124,271) |
| Class F | ||
| Shares sold | 110,136 | $2,260,556 |
| Reinvestment of distributions | - | - |
| Shares redeemed | (1,165,781) | (26,314,710) |
| Net increase (decrease) | (1,055,645) | $(24,054,154) |
| Fidelity Disruptive Finance Fund | ||
| Fidelity Disruptive Finance Fund | ||
| Shares sold | 1,667,868 | $41,586,096 |
| Reinvestment of distributions | 33,977 | 860,296 |
| Shares redeemed | (653,573) | (16,387,983) |
| Net increase (decrease) | 1,048,272 | $26,058,409 |
| Loyalty Class 1 | ||
| Shares sold | 262,880 | $6,806,499 |
| Reinvestment of distributions | 41,011 | 1,037,086 |
| Shares redeemed | (1,019,650) | (25,336,391) |
| Net increase (decrease) | (715,759) | $(17,492,806) |
| Loyalty Class 2 | ||
| Shares sold | 653 | $17,290 |
| Reinvestment of distributions | 362 | 9,204 |
| Shares redeemed | (6,443) | (160,502) |
| Net increase (decrease) | (5,428) | $(134,008) |
| Class F | ||
| Shares sold | 124,045 | $3,122,008 |
| Reinvestment of distributions | 61,525 | 1,565,581 |
| Shares redeemed | (1,068,546) | (26,918,970) |
| Net increase (decrease) | (882,976) | $(22,231,381) |
| Fidelity Disruptive Medicine Fund | ||
| Fidelity Disruptive Medicine Fund | ||
| Shares sold | 1,872,264 | $47,165,060 |
| Reinvestment of distributions | - | - |
| Shares redeemed | (598,763) | (13,951,368) |
| Net increase (decrease) | 1,273,501 | $33,213,692 |
| Loyalty Class 1 | ||
| Shares sold | 219,552 | $5,140,188 |
| Reinvestment of distributions | - | - |
| Shares redeemed | (976,902) | (24,624,657) |
| Net increase (decrease) | (757,350) | $(19,484,469) |
| Loyalty Class 2 | ||
| Shares sold | 69 | $1,704 |
| Reinvestment of distributions | - | - |
| Shares redeemed | (4,672) | (120,139) |
| Net increase (decrease) | (4,603) | $(118,435) |
| Class F | ||
| Shares sold | 91,473 | $2,265,715 |
| Reinvestment of distributions | - | - |
| Shares redeemed | (1,187,808) | (29,802,055) |
| Net increase (decrease) | (1,096,335) | $(27,536,340) |
| Fidelity Disruptive Technology Fund | ||
| Fidelity Disruptive Technology Fund | ||
| Shares sold | 4,693,753 | $100,997,985 |
| Reinvestment of distributions | 18,804 | 392,082 |
| Shares redeemed | (2,141,414) | (42,810,625) |
| Net increase (decrease) | 2,571,143 | $58,579,442 |
| Loyalty Class 1 | ||
| Shares sold | 577,993 | $11,797,211 |
| Reinvestment of distributions | 23,915 | 499,555 |
| Shares redeemed | (2,750,511) | (59,530,327) |
| Net increase (decrease) | (2,148,603) | $(47,233,561) |
| Loyalty Class 2 | ||
| Shares sold | 62 | $1,295 |
| Reinvestment of distributions | 66 | 1,388 |
| Shares redeemed | (5,683) | (125,896) |
| Net increase (decrease) | (5,555) | $(123,213) |
| Class F | ||
| Shares sold | 125,132 | $2,389,168 |
| Reinvestment of distributions | 12,821 | 271,344 |
| Shares redeemed | (1,251,660) | (26,749,274) |
| Net increase (decrease) | (1,113,707) | $(24,088,762) |
| Predecessor Funds | New ETFs |
| Fidelity Disruptive Automation Fund | Fidelity Disruptive Automation ETF |
| Fidelity Disruptive Communications Fund | Fidelity Disruptive Communications ETF |
| Fidelity Disruptive Finance Fund | Fidelity Disruptive Finance ETF |
| Fidelity Disruptive Medicine Fund | Fidelity Disruptive Medicine ETF |
| Fidelity Disruptive Technology Fund | Fidelity Disruptive Technology ETF |
| Predecessor Fund/Accounting Survivor | Investments ($) | Unrealized appreciation (depreciation) ($) | Net Assets ($) | Shares Exchanged | Shares Exchanged Ratio |
| Fidelity Disruptive Automation Fund | 111,001,230 | 9,648,810 | 111,488,793 | 4,459,561 | .6686440000 |
| Fidelity Disruptive Communications Fund | 38,182,670 | 416,225 | 38,176,192 | 1,527,044 | .4988520000 |
| Fidelity Disruptive Finance Fund | 41,565,870 | 1,661,222 | 41,616,228 | 1,664,653 | .5240880000 |
| Fidelity Disruptive Medicine Fund | 43,523,861 | 4,291,008 | 43,537,456 | 1,741,504 | .4511440000 |
| Fidelity Disruptive Technology Fund | 102,251,358 | 1,677,809 | 102,438,029 | 4,097,527 | .5443240000 |
| Acquiring ETF | Net Assets ($) | Total net assets after the acquisition ($) |
| Fidelity Disruptive Automation ETF | 25 | 111,488,818 |
| Fidelity Disruptive Communications ETF | 25 | 38,176,217 |
| Fidelity Disruptive Finance ETF | 25 | 41,616,253 |
| Fidelity Disruptive Medicine ETF | 25 | 43,537,481 |
| Fidelity Disruptive Technology ETF | 25 | 102,438,054 |
| ETF name | Net investment income (loss) | Total net realized gain (loss) | Total change in net unrealized appreciation (depreciation) | Net increase (decrease) in net assets resulting from operations |
| Fidelity Disruptive Automation ETF | 425,597 | 131,063 | 3,058,893 | 3,615,553 |
| Fidelity Disruptive Communications ETF | (56,364) | 2,695,971 | 10,821,394 | 13,461,001 |
| Fidelity Disruptive Finance ETF | 358,188 | 2,755,028 | 5,959,154 | 9,072,370 |
| Fidelity Disruptive Medicine ETF | (68,608) | (373,863) | (672,987) | (1,115,458) |
| Fidelity Disruptive Technology ETF | (163,618) | (4,743,993) | 29,876,530 | 24,968,919 |
| Fidelity Disruptive Automation ETF | |
| June 2023 | 28% |
| September 2023 | 33% |
| December 2023 | 33% |
| March 2024 | 43% |
Fidelity Disruptive Finance ETF | |
| June 2023 | 91% |
| September 2023 | 100% |
| December 2023 | 100% |
| March 2024 | 100% |
| Fidelity Disruptive Automation ETF | |
| June 2023 | 100% |
| September 2023 | 100% |
| December 2023 | 100% |
| March 2024 | 100% |
Fidelity Disruptive Finance ETF | |
| June 2023 | 100% |
| September 2023 | 100% |
| December 2023 | 100% |
| March 2024 | 100% |
| Pay Date | Income | Taxes | |
| Fidelity Disruptive Automation ETF | 06/07/23 | $0.0349 | $0.0086 |
 |


Contents
| Domestic Equity Funds - 81.7% | |||
| Shares | Value ($) | ||
| Fidelity Disruptive Communications ETF (a)(b)(c) | 649,081 | 22,010,331 | |
| Fidelity Disruptive Finance ETF (c) | 657,260 | 19,652,013 | |
| Fidelity Disruptive Medicine ETF (a)(b)(c) | 710,553 | 16,712,709 | |
| Fidelity Disruptive Technology ETF (a)(b)(c) | 645,363 | 19,967,527 | |
| TOTAL DOMESTIC EQUITY FUNDS (Cost $67,271,226) | 78,342,580 | ||
| International Equity Funds - 18.2% | |||
| Shares | Value ($) | ||
Fidelity Disruptive Automation ETF (b)(c) (Cost $13,281,004) | 673,163 | 17,401,255 | |
| Short-Term Funds - 2.8% | |||
| Shares | Value ($) | ||
| Fidelity Cash Central Fund 5.39% (d) | 108,550 | 108,572 | |
| Fidelity Securities Lending Cash Central Fund 5.39% (d)(e) | 2,627,487 | 2,627,750 | |
| TOTAL SHORT-TERM FUNDS (Cost $2,736,322) | 2,736,322 | ||
| TOTAL INVESTMENT IN SECURITIES - 102.7% (Cost $83,288,552) | 98,480,157 |
NET OTHER ASSETS (LIABILITIES) - (2.7)% | (2,612,549) |
| NET ASSETS - 100.0% | 95,867,608 |
| ETF | - | EXCHANGE-TRADED FUND |
| (a) | Non-income producing |
| (b) | Security or a portion of the security is on loan at period end. |
| (c) | Affiliated Fund |
| (d) | Affiliated fund that is generally available only to investment companies and other accounts managed by Fidelity Investments. The rate quoted is the annualized seven-day yield of the fund at period end. A complete unaudited listing of the fund's holdings as of its most recent quarter end is available upon request. In addition, each Fidelity Central Fund's financial statements, which are not covered by the Fund's Report of Independent Registered Public Accounting Firm, are available on the SEC's website or upon request. |
| (e) | Investment made with cash collateral received from securities on loan. |
| Affiliate | Value, beginning of period ($) | Purchases ($) | Sales Proceeds ($) | Dividend Income ($) | Realized Gain (loss) ($) | Change in Unrealized appreciation (depreciation) ($) | Value, end of period ($) | % ownership, end of period |
| Fidelity Cash Central Fund 5.39% | - | 2,356,036 | 2,247,464 | 10,742 | - | - | 108,572 | 0.0% |
| Fidelity Securities Lending Cash Central Fund 5.39% | - | 11,521,611 | 8,893,861 | 40,780 | - | - | 2,627,750 | 0.0% |
| Total | - | 13,877,647 | 11,141,325 | 51,522 | - | - | 2,736,322 | |
| Affiliate | Value, beginning of period ($) | Purchases ($) | Sales Proceeds ($) | Dividend Income ($) | Realized Gain (loss) ($) | Change in Unrealized appreciation (depreciation) ($) | Value, end of period ($) |
| Fidelity Disruptive Automation ETF | 19,063,965 | 1,583,286 | 3,889,264 | 98,733 | 1,080,450 | (437,182) | 17,401,255 |
| Fidelity Disruptive Communications ETF | 19,096,640 | 1,305,349 | 4,748,593 | - | 572,398 | 5,784,537 | 22,010,331 |
| Fidelity Disruptive Finance ETF | 18,203,265 | 2,153,088 | 4,616,938 | 180,372 | 805,412 | 3,107,186 | 19,652,013 |
| Fidelity Disruptive Medicine ETF | 18,733,959 | 2,533,359 | 3,893,785 | - | 61,897 | (722,721) | 16,712,709 |
| Fidelity Disruptive Technology ETF | 20,318,052 | 1,424,590 | 6,299,020 | - | 556,710 | 3,967,195 | 19,967,527 |
| 95,415,881 | 8,999,672 | 23,447,600 | 279,105 | 3,076,867 | 11,699,015 | 95,743,835 |
| Valuation Inputs at Reporting Date: | ||||
| Description | Total ($) | Level 1 ($) | Level 2 ($) | Level 3 ($) |
Investments in Securities: | ||||
| Domestic Equity Funds | 78,342,580 | 78,342,580 | - | - |
| International Equity Funds | 17,401,255 | 17,401,255 | - | - |
| Short-Term Funds | 2,736,322 | 2,736,322 | - | - |
| Total Investments in Securities: | 98,480,157 | 98,480,157 | - | - |
| Statement of Assets and Liabilities | ||||
| May 31, 2024 | ||||
| Assets | ||||
| Investment in securities, at value (including securities loaned of $2,550,661) - See accompanying schedule: | ||||
Fidelity Central Funds (cost $2,736,322) | $ | 2,736,322 | ||
Other affiliated issuers (cost $80,552,230) | 95,743,835 | |||
| Total Investment in Securities (cost $83,288,552) | $ | 98,480,157 | ||
| Cash | 8,827 | |||
| Distributions receivable from Fidelity Central Funds | 12,003 | |||
| Receivable from investment adviser for expense reductions | 2,404 | |||
Total assets | 98,503,391 | |||
| Liabilities | ||||
| Other payables and accrued expenses | $ | 8,033 | ||
| Collateral on securities loaned | 2,627,750 | |||
| Total liabilities | 2,635,783 | |||
| Net Assets | $ | 95,867,608 | ||
| Net Assets consist of: | ||||
| Paid in capital | $ | 96,057,194 | ||
| Total accumulated earnings (loss) | (189,586) | |||
| Net Assets | $ | 95,867,608 | ||
Net Asset Value, offering price and redemption price per share ($95,867,608 ÷ 3,425,062 shares) | $ | 27.99 | ||
| Statement of Operations | ||||
Year ended May 31, 2024 | ||||
| Investment Income | ||||
| Dividends: | ||||
| Affiliated issuers | $ | 279,105 | ||
| Income from Fidelity Central Funds (including $40,780 from security lending) | 51,522 | |||
| Total income | 330,627 | |||
| Expenses | ||||
| Management fee | $ | 24,042 | ||
| Independent trustees' fees and expenses | 453 | |||
| Proxy | 5,036 | |||
| Total expenses before reductions | 29,531 | |||
| Expense reductions | (26,576) | |||
| Total expenses after reductions | 2,955 | |||
| Net Investment income (loss) | 327,672 | |||
| Realized and Unrealized Gain (Loss) | ||||
| Net realized gain (loss) on: | ||||
| Investment Securities: | ||||
| Redemptions in-kind | 3,811,976 | |||
| Affiliated issuers | (735,109) | |||
| Total net realized gain (loss) | 3,076,867 | |||
| Change in net unrealized appreciation (depreciation) on: | ||||
| Investment Securities: | ||||
| Affiliated issuers | 11,699,015 | |||
| Total change in net unrealized appreciation (depreciation) | 11,699,015 | |||
| Net gain (loss) | 14,775,882 | |||
| Net increase (decrease) in net assets resulting from operations | $ | 15,103,554 | ||
See Organization and Merger information note regarding reorganization from mutual fund to exchange traded fund.
| Statement of Changes in Net Assets | ||||
Year ended May 31, 2024 | Year ended May 31, 2023 | |||
| Increase (Decrease) in Net Assets | ||||
| Operations | ||||
| Net investment income (loss) | $ | 327,672 | $ | (438,548) |
| Net realized gain (loss) | 3,076,867 | (11,203,876) | ||
| Change in net unrealized appreciation (depreciation) | 11,699,015 | 14,746,550 | ||
| Net increase (decrease) in net assets resulting from operations | 15,103,554 | 3,104,126 | ||
| Distributions to shareholders | (204,878) | - | ||
| Share transactions - net increase (decrease) | - | (33,405,540) | ||
| Share transactions | ||||
| Proceeds from sales of shares | 6,190,582 | - | ||
| Cost of shares redeemed | (20,630,421) | - | ||
Net increase (decrease) in net assets resulting from share transactions | (14,439,839) | (33,405,540) | ||
| Total increase (decrease) in net assets | 458,837 | (30,301,414) | ||
| Net Assets | ||||
| Beginning of period | 95,408,771 | 125,710,185 | ||
| End of period | $ | 95,867,608 | $ | 95,408,771 |
| Other Information | ||||
| Shares | ||||
| Sold | 225,397 | 4,434,170 | ||
| Redeemed | (827,857) | (6,032,531) | ||
| Net increase (decrease) | (602,460) | (1,598,361) | ||
Fidelity® Disruptors ETF |
| Years ended May 31, | 2024 A | 2023 A | 2022 A | 2021 A | 2020 A,B | |||||
Selected Per-Share Data | ||||||||||
| Net asset value, beginning of period | $ | 23.69 | $ | 22.31 | $ | 29.44 | $ | 20.17 | $ | 17.43 |
| Income from Investment Operations | ||||||||||
Net investment income (loss) C,D | .09 | (.10) | (.21) | (.21) | (.02) | |||||
| Net realized and unrealized gain (loss) | 4.27 | 1.48 | (6.54) | 9.67 | 2.76 | |||||
| Total from investment operations | 4.36 | 1.38 | (6.75) | 9.46 | 2.74 | |||||
| Distributions from net investment income | (.06) | - | - | - | - | |||||
| Distributions from net realized gain | - | - | (.38) | (.19) | - | |||||
| Total distributions | (.06) | - | (.38) | (.19) | - | |||||
| Net asset value, end of period | $ | 27.99 | $ | 23.69 | $ | 22.31 | $ | 29.44 | $ | 20.17 |
Total Return E,F,G | 18.43 % | 6.17% | (23.29)% | 46.99% | 15.70% | |||||
Ratios to Average Net Assets D,H,I | ||||||||||
| Expenses before reductions | .03% | .90% | 1.00% | 1.01% J | 1.01% J,K | |||||
| Expenses net of fee waivers, if any | - % L | .82% | 1.00% | 1.01% J | 1.01% J,K | |||||
| Expenses net of all reductions | -% L | .82% | 1.00% | 1.01% J | 1.01% J,K | |||||
| Net investment income (loss) | .35% | (.50)% | (.69)% | (.77)% | (1.01)% K | |||||
| Supplemental Data | ||||||||||
| Net assets, end of period (000 omitted) | $ | 95,868 | $ | 95,409 | $ | 48,579 | $ | 141,385 | $ | 19,310 |
Portfolio turnover rate M | 4 % N | 12% | 22% | 3% | 0% O |
| Fidelity Central Fund | Investment Manager | Investment Objective | Investment Practices | Expense RatioA |
| Fidelity Money Market Central Funds | Fidelity Management & Research Company LLC (FMR) | Each fund seeks to obtain a high level of current income consistent with the preservation of capital and liquidity. | Short-term Investments | Less than .005% |
| Gross unrealized appreciation | $16,160,986 |
| Gross unrealized depreciation | (1,289,506) |
| Net unrealized appreciation (depreciation) | $14,871,480 |
| Tax Cost | $83,608,677 |
| Capital loss carryforward | $(15,061,066) |
| Net unrealized appreciation (depreciation) on securities and other investments | $14,871,480 |
Short-term | $(5,351,974) |
Long-term | (9,709,092) |
| Total capital loss carryforward | $(15,061,066) |
| May 31, 2024 | May 31, 2023 | |
| Ordinary Income | $204,878 | $- |
| Total | $204,878 | $- |
| Purchases ($) | Sales ($) | |
| Fidelity Disruptors ETF | 3,428,436 | 8,494,012 |
| In-Kind Subscriptions ($) | In-Kind Redemptions ($) | |
| Fidelity Disruptors ETF | 5,571,236 | 14,953,590 |
| Management Fee Annual % of Average Net Assets | Expense Contract Annual % of Average Net Assets | |
| Fidelity Disruptors Fund | 1.00% | .50% |
| Amount ($) | |
| Fidelity Disruptors ETF | 22 |
| Total Security Lending Fees Paid to NFS ($) | Security Lending Income From Securities Loaned to NFS ($) | Value of Securities Loaned to NFS at Period End ($) | |
| Fidelity Disruptors ETF | 4,461 | - | - |
| Reimbursement ($) | |
| Fidelity Disruptors ETF | 2,404 |
| Management Fee Waiver Annual % of Average Net Assets | Management Fee Waiver ($) | |
| Fidelity Disruptors Fund | .50% | 24,025 |
| Shares | Dollars | |
Year ended May 31, 2023 | Year ended May 31, 2023 | |
| Fidelity Disruptors Fund | ||
| Fidelity Disruptors Fund | ||
| Shares sold | 3,703,937 | $84,461,331 |
| Reinvestment of distributions | - | - |
| Shares redeemed | (1,852,955) | (38,815,504) |
| Net increase (decrease) | 1,850,982 | $45,645,827 |
| Loyalty Class 1 | ||
| Shares sold | 730,233 | $15,839,358 |
| Reinvestment of distributions | - | - |
| Shares redeemed | (4,173,700) | (94,754,589) |
| Net increase (decrease) | (3,443,467) | $(78,915,231) |
| Loyalty Class 2 | ||
| Reinvestment of distributions | - | - |
| Shares redeemed | (5,876) | (136,136) |
| Net increase (decrease) | (5,876) | $(136,136) |
| Predecessor Fund/Accounting Survivor | Investments ($) | Unrealized appreciation (depreciation) ($) | Net Assets ($) | Shares Exchanged | Shares Exchanged Ratio |
| Fidelity Disruptors Fund | 98,438,042 | 8,954,987 | 98,615,698 | 3,944,631 | .5736680000 |
| Acquiring ETF | Net Assets ($) | Total net assets after the acquisition ($) |
| Fidelity Disruptors ETF | 25 | 98,615,723 |
| Net investment income (loss) | $327,689 |
| Total net realized gain (loss) | 3,076,867 |
| Total change in net unrealized appreciation (depreciation) | 11,699,015 |
| Net increase (decrease) in net assets resulting from operations | $15,103,571 |
 |
Item 8.
Changes in and Disagreements with Accountants for Open-End Management Investment Companies
See Item 7.
Item 9.
Proxy Disclosures for Open-End Management Investment Companies
See Item 7.
Item 10.
Remuneration Paid to Directors, Officers, and Others of Open-End Management Investment Companies
See Item 7.
Item 11.
Statement Regarding Basis for Approval of Investment Advisory Contract
See Item 7.
Item 12.
Disclosure of Proxy Voting Policies and Procedures for Closed-End Management Investment Companies
Not applicable.
Item 13.
Portfolio Managers of Closed-End Management Investment Companies
Not applicable.
Item 14.
Purchase of Equity Securities by Closed-End Management Investment Company and Affiliated Purchasers
Not applicable.
Item 15.
Submission of Matters to a Vote of Security Holders
There were no material changes to the procedures by which shareholders may recommend nominees to the trust’s Board of Trustees.
Item 16.
Controls and Procedures
(a)(i) The President and Treasurer and the Chief Financial Officer have concluded that the trust’s disclosure controls and procedures (as defined in Rule 30a-3(c) under the Investment Company Act) provide reasonable assurances that material information relating to the trust is made known to them by the appropriate persons, based on their evaluation of these controls and procedures as of a date within 90 days of the filing date of this report.
(a)(ii) There was no change in the trust’s internal control over financial reporting (as defined in Rule 30a-3(d) under the Investment Company Act) that occurred during the period covered by this report that has materially affected, or is reasonably likely to materially affect, the trust’s internal control over financial reporting.
Item 17.
Disclosure of Securities Lending Activities for Closed-End Management Investment Companies
Not applicable.
Item 18.
Recovery of Erroneously Awarded Compensation
(a)
Not applicable.
(b)
Not applicable.
Item 19.
Exhibits
(a) | (1) | Code of Ethics pursuant to Item 2 of Form N-CSR is filed and attached hereto as EX-99.CODE ETH. |
(a) | (2) | |
(a) | (3) | Not applicable. |
(b) |
SIGNATURES
Pursuant to the requirements of the Securities Exchange Act of 1934 and the Investment Company Act of 1940, the registrant has duly caused this report to be signed on its behalf by the undersigned, thereunto duly authorized.
Fidelity Covington Trust
By: | /s/Stacie M. Smith |
Stacie M. Smith | |
President and Treasurer (Principal Executive Officer) | |
Date: | July 23, 2024 |
Pursuant to the requirements of the Securities Exchange Act of 1934 and the Investment Company Act of 1940, this report has been signed below by the following persons on behalf of the registrant and in the capacities and on the dates indicated.
By: | /s/Stacie M. Smith |
Stacie M. Smith | |
President and Treasurer (Principal Executive Officer) | |
Date: | July 23, 2024 |
By: | /s/John J. Burke III |
John J. Burke III | |
Chief Financial Officer (Principal Financial Officer) | |
Date: | July 23, 2024 |