UNITED STATES
SECURITIES AND EXCHANGE COMMISSION
Washington, D.C. 20549
FORM N-CSR
CERTIFIED SHAREHOLDER REPORT OF REGISTERED
MANAGEMENT INVESTMENT COMPANIES
Investment Company Act file number 811-07319
Fidelity Covington Trust
(Exact name of registrant as specified in charter)
245 Summer St., Boston, MA 02210
(Address of principal executive offices) (Zip code)
Cynthia Lo Bessette, Secretary
245 Summer St.
Boston, Massachusetts 02210
(Name and address of agent for service)
Registrant’s telephone number, including area code: 617-563-7000
Date of fiscal year end: August 31
Date of reporting period: February 28, 2022
| Item 1. | Reports to Stockholders |


| Note to Shareholders | 3 | |
| Investment Summary | 4 | |
| Schedule of Investments | 6 | |
| Financial Statements | 24 | |
| Notes to Financial Statements | 29 | |
| Shareholder Expense Example | 33 | |
| Liquidity Risk Management Program | 34 |
| Semi-Annual Report | 2 |
| 3 | Semi-Annual Report |
| (by issuer, excluding cash equivalents) | % of fund’s net assets |
| Occidental Petroleum Corp. | 3.0 |
| CCO Holdings LLC / CCO Holdings Capital Corp. | 1.8 |
| Tenet Healthcare Corp. | 1.7 |
| Uber Technologies, Inc. | 1.5 |
| TransDigm, Inc. | 1.4 |
| 9.4 |
| % of fund's net assets | ||
| Energy | 14.1 | |
| Industrials | 13.9 | |
| Communication Services | 13.0 | |
| Consumer Discretionary | 11.3 | |
| Materials | 11.2 | |

| Semi-Annual Report | 4 |
| % of fund's net assets | |
| Ally Financial, Inc. | 4.8 |
| Wells Fargo & Co. | 4.0 |
| Morgan Stanley | 3.6 |
| KKR Group Finance Co. IX LLC | 3.6 |
| Citizens Financial Group, Inc. | 3.2 |
| Truist Financial Corp. | 3.0 |
| Discover Financial Services | 3.0 |
| JPMorgan Chase & Co. | 2.9 |
| The Charles Schwab Corp. | 2.7 |
| Goldman Sachs Group, Inc. | 2.5 |
| 33.3 |
| % of fund's net assets | ||
| Financials | 76.4 | |
| Utilities | 5.3 | |
| Communication Services | 5.2 | |
| Energy | 5.0 | |
| Consumer Discretionary | 2.6 | |
| 5 | Semi-Annual Report |
| Nonconvertible Bonds – 98.5% | |||
| Principal Amount | Value | ||
| COMMUNICATION SERVICES – 13.0% | |||
| Diversified Telecommunication Services – 3.0% | |||
| Acuris Finance U.S., Inc. / Acuris Finance Sarl 5.00% 5/1/28 (a) | $ 735,000 | $ 681,712 | |
| Altice France SA: | |||
5.125% 7/15/29 (a) | 1,390,000 | 1,257,950 | |
5.50% 10/15/29 (a) | 410,000 | 375,663 | |
| Ciena Corp. 4.00% 1/31/30 (a) | 2,000,000 | 1,969,640 | |
| Frontier Communications Holdings LLC: | |||
5.00% 5/1/28 (a) | 607,000 | 589,245 | |
6.00% 1/15/30 (a) | 455,000 | 423,832 | |
| Level 3 Financing, Inc. 5.375% 5/1/25 | 98,000 | 98,357 | |
| Lumen Technologies, Inc.: | |||
4.50% 1/15/29 (a) | 755,000 | 631,886 | |
5.375% 6/15/29 (a) | 375,000 | 326,036 | |
6.875% 1/15/28 | 330,000 | 318,140 | |
| Telecom Italia Capital S.A. 7.20% 7/18/36 | 1,056,000 | 1,071,840 | |
| Telecom Italia Capital SA 7.721% 6/4/38 | 758,000 | 784,716 | |
| Telesat Canada / Telesat LLC 4.875% 6/1/27 (a) | 355,000 | 252,050 | |
| 8,781,067 | |||
| Entertainment – 1.4% | |||
| Live Nation Entertainment, Inc.: | |||
3.75% 1/15/28 (a) | 2,520,000 | 2,418,520 | |
4.875% 11/1/24 (a) | 1,364,000 | 1,377,435 | |
| Playtika Holding Corp. 4.25% 3/15/29 (a) | 145,000 | 134,850 | |
| 3,930,805 | |||
| Hotels, Restaurants & Leisure – 0.2% | |||
| Boyne USA, Inc. 4.75% 5/15/29 (a) | 500,000 | 491,250 | |
| Jacobs Entertainment, Inc. 6.75% 2/15/29 (a) | 170,000 | 170,637 | |
| 661,887 | |||
| Interactive Media & Services – 1.3% | |||
| Match Group Holdings II LLC 3.625% 10/1/31 (a) | 2,350,000 | 2,191,375 | |
| TripAdvisor, Inc. 7.00% 7/15/25 (a) | 1,450,000 | 1,500,750 | |
| 3,692,125 | |||
| Media – 7.0% | |||
| Altice Financing SA 5.75% 8/15/29 (a) | 700,000 | 637,875 | |
| Cable One, Inc. 4.00% 11/15/30 (a) | 1,703,000 | 1,575,241 | |
| | |||
| Principal Amount | Value | ||
| CCO Holdings LLC / CCO Holdings Capital Corp.: | |||
4.25% 1/15/34 (a) | $ 3,115,000 | $ 2,863,931 | |
4.50% 5/1/32 | 2,345,000 | 2,227,750 | |
| Cimpress PLC 7.00% 6/15/26 (a) | 665,000 | 658,350 | |
| CSC Holdings LLC: | |||
4.50% 11/15/31 (a) | 1,350,000 | 1,228,500 | |
5.00% 11/15/31 (a) | 815,000 | 678,488 | |
| DIRECTV Holdings LLC / DIRECTV Financing Co., Inc. 5.875% 8/15/27 (a) | 715,000 | 714,757 | |
| DISH DBS Corp.: | |||
5.125% 6/1/29 | 1,515,000 | 1,278,281 | |
5.75% 12/1/28 (a) | 600,000 | 573,750 | |
| Gray Escrow II, Inc. 5.375% 11/15/31 (a) | 370,000 | 356,184 | |
| iHeartCommunications, Inc. 4.75% 1/15/28 (a) | 232,000 | 224,460 | |
| Iliad Holding SASU 7.00% 10/15/28 (a) | 500,000 | 497,330 | |
| Lamar Media Corp. 3.625% 1/15/31 | 2,069,000 | 1,942,264 | |
| Liberty Interactive LLC 8.25% 2/1/30 | 244,000 | 239,120 | |
| NEWS Corp. 5.125% 2/15/32 | 800,000 | 818,000 | |
| Summer BC Bidco B LLC 5.50% 10/31/26 (a) | 700,000 | 675,500 | |
| TEGNA, Inc. 5.00% 9/15/29 | 88,000 | 87,758 | |
| Univision Communications, Inc. 4.50% 5/1/29 (a) | 768,000 | 735,118 | |
| Virgin Media Vendor Financing Notes IV DAC 5.00% 7/15/28 (a) | 400,000 | 380,000 | |
| VZ Secured Financing BV 5.00% 1/15/32 (a) | 1,000,000 | 955,000 | |
| Windstream Escrow LLC / Windstream Escrow Finance Corp. 7.75% 8/15/28 (a) | 266,000 | 268,500 | |
| WMG Acquisition Corp. 3.75% 12/1/29 (a) | 600,000 | 573,000 | |
| 20,189,157 | |||
| Wireless Telecommunication Services – 0.1% | |||
| United States Cellular Corp. 6.70% 12/15/33 | 305,000 | 332,450 | |
| TOTAL COMMUNICATION SERVICES | 37,587,491 | ||
| Semi-Annual Report | 6 |
| Nonconvertible Bonds – continued | |||
| Principal Amount | Value | ||
| CONSUMER DISCRETIONARY – 11.3% | |||
| Auto Components – 0.2% | |||
| Tenneco, Inc. 5.125% 4/15/29 (a) | $ 180,000 | $178,650 | |
| The Goodyear Tire & Rubber Co. 5.625% 4/30/33 | 337,000 | 324,145 | |
| 502,795 | |||
| Automobiles – 1.2% | |||
| Ford Motor Credit Co. LLC 2.90% 2/10/29 | 3,000,000 | 2,801,250 | |
| Jaguar Land Rover Automotive PLC 5.50% 7/15/29 (a) | 650,000 | 624,839 | |
| 3,426,089 | |||
| Hotels, Restaurants & Leisure – 6.2% | |||
| 1011778 BC ULC / New Red Finance, Inc.: | |||
4.00% 10/15/30 (a) | 645,000 | 595,819 | |
4.375% 1/15/28 (a) | 273,000 | 267,881 | |
| Bloomin' Brands, Inc. / OSI Restaurant Partners LLC 5.125% 4/15/29 (a) | 295,000 | 288,354 | |
| Boyd Gaming Corp. 4.75% 6/15/31 (a) | 275,000 | 270,188 | |
| Caesars Entertainment, Inc.: | |||
4.625% 10/15/29 (a) | 645,000 | 611,944 | |
6.25% 7/1/25 (a) | 869,000 | 901,066 | |
| Carnival Corp.: | |||
4.00% 8/1/28 (a) | 820,000 | 783,100 | |
6.00% 5/1/29 (a) | 500,000 | 482,500 | |
7.625% 3/1/26 (a) | 880,000 | 904,631 | |
9.875% 8/1/27 (a) | 410,000 | 460,225 | |
| Cinemark USA, Inc. 5.875% 3/15/26 (a) | 300,000 | 295,500 | |
| Empire Resorts, Inc. 7.75% 11/1/26 (a) | 350,000 | 349,125 | |
| Everi Holdings, Inc. 5.00% 7/15/29 (a) | 565,000 | 554,040 | |
| Fertitta Entertainment LLC / Fertitta Entertainment Finance Co., Inc. 6.75% 1/15/30 (a) | 500,000 | 475,968 | |
| FirstCash, Inc. 5.625% 1/1/30 (a) | 2,750,000 | 2,730,750 | |
| Hilton Grand Vacations Borrower Escrow LLC / Hilton Grand Vacations Borrower Esc: | |||
4.875% 7/1/31 (a) | 400,000 | 381,000 | |
5.00% 6/1/29 (a) | 550,000 | 539,000 | |
| Lindblad Expeditions LLC 6.75% 2/15/27 (a) | 500,000 | 502,500 | |
| Marriott Ownership Resorts, Inc. 4.50% 6/15/29 (a) | 340,000 | 322,150 | |
| | |||
| Principal Amount | Value | ||
| MGM Resorts International 6.75% 5/1/25 | $ 351,000 | $ 363,285 | |
| Papa John's International, Inc. 3.875% 9/15/29 (a) | 200,000 | 186,000 | |
| Penn National Gaming, Inc. 4.125% 7/1/29 (a) | 230,000 | 212,750 | |
| Premier Entertainment Sub LLC / Premier Entertainment Finance Corp. 5.875% 9/1/31 (a) | 400,000 | 360,000 | |
| Raptor Acquisition Corp. / Raptor Co-Issuer LLC 4.875% 11/1/26 (a) | 405,000 | 391,058 | |
| Royal Caribbean Cruises Ltd.: | |||
5.25% 11/15/22 | 376,000 | 378,820 | |
5.375% 7/15/27 (a) | 265,000 | 260,325 | |
5.50% 8/31/26 (a) | 1,100,000 | 1,094,802 | |
| Station Casinos LLC 4.625% 12/1/31 (a) | 515,000 | 485,388 | |
| TKC Holdings, Inc. 6.875% 5/15/28 (a) | 300,000 | 297,000 | |
| Travel + Leisure Co.: | |||
4.50% 12/1/29 (a) | 655,000 | 625,525 | |
6.60% 10/1/25 | 34,000 | 36,307 | |
6.625% 7/31/26 (a) | 270,000 | 288,225 | |
| Viking Ocean Cruises Ship VII Ltd. 5.625% 2/15/29 (a) | 235,000 | 220,560 | |
| Wyndham Hotels & Resorts, Inc. 4.375% 8/15/28 (a) | 533,000 | 525,005 | |
| Wynn Las Vegas LLC / Wynn Las Vegas Capital Corp. 5.50% 3/1/25 (a) | 75,000 | 76,064 | |
| Yum! Brands, Inc.: | |||
3.625% 3/15/31 | 140,000 | 130,820 | |
4.75% 1/15/30 (a) | 150,000 | 152,250 | |
6.875% 11/15/37 | 272,000 | 310,080 | |
| 18,110,005 | |||
| Household Durables ��� 0.6% | |||
| Ashton Woods USA LLC / Ashton Woods Finance Co. 4.625% 4/1/30 (a) | 165,000 | 155,513 | |
| LGI Homes, Inc. 4.00% 7/15/29 (a) | 860,000 | 802,530 | |
| Tempur Sealy International, Inc. 3.875% 10/15/31 (a) | 495,000 | 444,686 | |
| WASH Multifamily Acquisition, Inc. 5.75% 4/15/26 (a) | 280,000 | 282,237 | |
| 1,684,966 | |||
| Leisure Products – 0.1% | |||
| Vista Outdoor, Inc. 4.50% 3/15/29 (a) | 310,000 | 290,625 | |
| 7 | Semi-Annual Report |
| Nonconvertible Bonds – continued | |||
| Principal Amount | Value | ||
| CONSUMER DISCRETIONARY – continued | |||
| Specialty Retail – 2.6% | |||
| Ambience Merger Sub, Inc. 4.875% 7/15/28 (a) | $ 235,000 | $ 217,375 | |
| Asbury Automotive Group, Inc.: | |||
4.75% 3/1/30 | 1,414,000 | 1,371,580 | |
5.00% 2/15/32 (a) | 205,000 | 198,991 | |
| BlueLinx Holdings, Inc. 6.00% 11/15/29 (a) | 350,000 | 341,250 | |
| Carvana Co. 4.875% 9/1/29 (a) | 900,000 | 750,339 | |
| Foot Locker, Inc. 4.00% 10/1/29 (a) | 150,000 | 136,500 | |
| Group 1 Automotive, Inc. 4.00% 8/15/28 (a) | 2,100,000 | 2,023,875 | |
| LCM Investments Holdings II LLC 4.875% 5/1/29 (a) | 125,000 | 119,103 | |
| LSF9 Atlantis Holdings LLC / Victra Finance Corp. 7.75% 2/15/26 (a) | 600,000 | 577,500 | |
| Macy's Retail Holdings LLC 5.875% 4/1/29 (a) | 600,000 | 613,500 | |
| Magic Mergeco, Inc. 5.25% 5/1/28 (a) | 355,000 | 331,925 | |
| PetSmart, Inc. / PetSmart Finance Corp. 4.75% 2/15/28 (a) | 145,000 | 144,637 | |
| Sonic Automotive, Inc. 4.875% 11/15/31 (a) | 500,000 | 472,500 | |
| Victoria's Secret & Co. 4.625% 7/15/29 (a) | 230,000 | 216,200 | |
| 7,515,275 | |||
| Textiles, Apparel & Luxury Goods – 0.4% | |||
| Crocs, Inc.: | |||
4.125% 8/15/31 (a) | 435,000 | 370,838 | |
4.25% 3/15/29 (a) | 150,000 | 132,750 | |
| Kontoor Brands, Inc. 4.125% 11/15/29 (a) | 100,000 | 94,250 | |
| Wolverine World Wide, Inc. 4.00% 8/15/29 (a) | 665,000 | 613,462 | |
| 1,211,300 | |||
| TOTAL CONSUMER DISCRETIONARY | 32,741,055 | ||
| CONSUMER STAPLES – 3.9% | |||
| Food & Staples Retailing – 0.1% | |||
| U.S. Foods, Inc.: | |||
4.625% 6/1/30 (a) | 145,000 | 140,995 | |
4.75% 2/15/29 (a) | 240,000 | 237,408 | |
| 378,403 | |||
| | |||
| Principal Amount | Value | ||
| Food Products – 1.4% | |||
| C&S Group Enterprises LLC 5.00% 12/15/28 (a) | $ 150,000 | $ 130,500 | |
| Lamb Weston Holdings, Inc. 4.125% 1/31/30 (a) | 805,000 | 778,837 | |
| Performance Food Group, Inc. 4.25% 8/1/29 (a) | 560,000 | 534,240 | |
| Post Holdings, Inc.: | |||
4.50% 9/15/31 (a) | 535,000 | 495,544 | |
4.625% 4/15/30 (a) | 2,200,000 | 2,071,212 | |
5.50% 12/15/29 (a) | 210,000 | 211,761 | |
| 4,222,094 | |||
| Household Products – 1.2% | |||
| Resideo Funding, Inc. 4.00% 9/1/29 (a) | 3,373,000 | 3,032,732 | |
| Ritchie Bros Holdings, Inc. 4.75% 12/15/31 (a) | 150,000 | 149,037 | |
| Spectrum Brands, Inc. 3.875% 3/15/31 (a) | 350,000 | 320,611 | |
| 3,502,380 | |||
| Personal Products – 0.5% | |||
| Avon Products, Inc. 6.50% 3/15/23 | 100,000 | 101,625 | |
| Coty Inc./HFC Prestige Products, Inc./HFC Prestige International U.S. LLC 4.75% 1/15/29 (a) | 500,000 | 486,250 | |
| HLF Financing Sarl LLC / Herbalife International, Inc. 4.875% 6/1/29 (a) | 430,000 | 394,525 | |
| Prestige Brands, Inc. 3.75% 4/1/31 (a) | 440,000 | 405,438 | |
| 1,387,838 | |||
| Tobacco – 0.7% | |||
| Turning Point Brands, Inc. 5.625% 2/15/26 (a) | 1,400,000 | 1,365,000 | |
| Vector Group Ltd. 5.75% 2/1/29 (a) | 680,000 | 627,300 | |
| 1,992,300 | |||
| TOTAL CONSUMER STAPLES | 11,483,015 | ||
| ENERGY – 14.1% | |||
| Energy Equipment & Services – 0.6% | |||
| Bristow Group, Inc. 6.875% 3/1/28 (a) | 300,000 | 303,516 | |
| CGG SA 8.75% 4/1/27 (a) | 140,000 | 136,500 | |
| Nabors Industries, Inc. 7.375% 5/15/27 (a) | 200,000 | 206,500 | |
| Oceaneering International, Inc. 4.65% 11/15/24 | 375,000 | 369,047 | |
| Semi-Annual Report | 8 |
| Nonconvertible Bonds – continued | |||
| Principal Amount | Value | ||
| ENERGY – continued | |||
| Energy Equipment & Services – continued | |||
| Patterson-UTI Energy, Inc. 5.15% 11/15/29 | $ 150,000 | $ 149,637 | |
| Tervita Corp. 11.00% 12/1/25 (a) | 160,000 | 182,400 | |
| USA Compression Partners LP / USA Compression Finance Corp. 6.875% 4/1/26 | 49,000 | 49,208 | |
| Weatherford International Ltd. 6.50% 9/15/28 (a) | 350,000 | 362,338 | |
| 1,759,146 | |||
| Oil, Gas & Consumable Fuels – 13.5% | |||
| Aethon United BR LP / Aethon United Finance Corp. 8.25% 2/15/26 (a) | 185,000 | 195,932 | |
| Antero Midstream Partners LP / Antero Midstream Finance Corp. 5.375% 6/15/29 (a) | 515,000 | 517,575 | |
| Antero Resources Corp.: | |||
5.375% 3/1/30 (a) | 100,000 | 101,875 | |
8.375% 7/15/26 (a) | 275,000 | 301,813 | |
| Ascent Resources Utica Holdings LLC / ARU Finance Corp. 5.875% 6/30/29 (a) | 100,000 | 95,127 | |
| Baytex Energy Corp. 8.75% 4/1/27 (a) | 145,000 | 155,428 | |
| Buckeye Partners LP: | |||
4.125% 3/1/25 (a) | 100,000 | 99,693 | |
4.50% 3/1/28 (a) | 330,000 | 313,500 | |
5.85% 11/15/43 | 215,000 | 187,306 | |
| California Resources Corp. 7.125% 2/1/26 (a) | 290,000 | 301,600 | |
| Calumet Specialty Products Partners LP / Calumet Finance Corp. 8.125% 1/15/27 (a) | 300,000 | 297,750 | |
| CITGO Petroleum Corp.: | |||
6.375% 6/15/26 (a) | 315,000 | 312,575 | |
7.00% 6/15/25 (a) | 224,000 | 224,000 | |
| Civitas Resources, Inc. 5.00% 10/15/26 (a) | 1,100,000 | 1,083,830 | |
| CNX Midstream Partners LP 4.75% 4/15/30 (a) | 120,000 | 115,950 | |
| CNX Resources Corp. 6.00% 1/15/29 (a) | 200,000 | 204,240 | |
| Colgate Energy Partners III LLC 5.875% 7/1/29 (a) | 400,000 | 411,712 | |
| Comstock Resources, Inc. 5.875% 1/15/30 (a) | 285,000 | 275,719 | |
| Coronado Finance Pty Ltd. 10.75% 5/15/26 (a) | 180,000 | 193,608 | |
| | |||
| Principal Amount | Value | ||
| CQP Holdco LP / BIP-V Chinook Holdco LLC 5.50% 6/15/31 (a) | $ 700,000 | $ 696,500 | |
| Crestwood Midstream Partners LP / Crestwood Midstream Finance Corp. 6.00% 2/1/29 (a) | 275,000 | 277,164 | |
| DCP Midstream LP 7.375% (b)(c) | 143,000 | 135,135 | |
| Delek Logistics Partners LP / Delek Logistics Finance Corp. 7.125% 6/1/28 (a) | 195,000 | 190,653 | |
| DT Midstream, Inc. 4.125% 6/15/29 (a) | 800,000 | 772,000 | |
| Encino Acquisition Partners Holdings LLC 8.50% 5/1/28 (a) | 300,000 | 303,750 | |
| Energy Ventures Gom LLC / EnVen Finance Corp. 11.75% 4/15/26 (a) | 101,000 | 102,730 | |
| EnLink Midstream Partners LP 5.45% 6/1/47 | 480,000 | 406,800 | |
| Enviva Partners LP / Enviva Partners Finance Corp. 6.50% 1/15/26 (a) | 222,000 | 228,904 | |
| EQM Midstream Partners LP: | |||
4.50% 1/15/29 (a) | 450,000 | 420,188 | |
6.50% 7/1/27 (a) | 331,000 | 346,190 | |
6.50% 7/15/48 | 285,000 | 277,875 | |
| EQT Corp. 7.50% 2/1/30 | 171,000 | 203,962 | |
| Ferrellgas LP / Ferrellgas Finance Corp. 5.375% 4/1/26 (a) | 500,000 | 470,020 | |
| Genesis Energy LP / Genesis Energy Finance Corp. 8.00% 1/15/27 | 625,000 | 631,784 | |
| Harvest Midstream I LP 7.50% 9/1/28 (a) | 250,000 | 252,325 | |
| Hess Midstream Operations LP 4.25% 2/15/30 (a) | 175,000 | 168,931 | |
| Hilcorp Energy I LP / Hilcorp Finance Co.: | |||
6.00% 2/1/31 (a) | 425,000 | 430,419 | |
6.25% 11/1/28 (a) | 60,000 | 61,160 | |
| Holly Energy Partners LP / Holly Energy Finance Corp. 5.00% 2/1/28 (a) | 65,000 | 62,075 | |
| Howard Midstream Energy Partners LLC 6.75% 1/15/27 (a) | 300,000 | 297,750 | |
| 9 | Semi-Annual Report |
| Nonconvertible Bonds – continued | |||
| Principal Amount | Value | ||
| ENERGY – continued | |||
| Oil, Gas & Consumable Fuels – continued | |||
| Independence Energy Finance LLC 7.25% 5/1/26 (a) | $ 600,000 | $ 598,500 | |
| Ithaca Energy North Sea PLC 9.00% 7/15/26 (a) | 500,000 | 503,750 | |
| Laredo Petroleum, Inc. 7.75% 7/31/29 (a) | 500,000 | 485,792 | |
| Matador Resources Co. 5.875% 9/15/26 | 197,000 | 199,955 | |
| MEG Energy Corp. 5.875% 2/1/29 (a) | 330,000 | 333,600 | |
| Moss Creek Resources Holdings, Inc. 7.50% 1/15/26 (a) | 310,000 | 274,350 | |
| Murphy Oil Corp.: | |||
5.75% 8/15/25 | 980,000 | 998,375 | |
6.375% 7/15/28 | 300,000 | 310,860 | |
| New Fortress Energy, Inc. 6.50% 9/30/26 (a) | 630,000 | 604,242 | |
| Northern Oil and Gas, Inc. 8.125% 3/1/28 (a) | 210,000 | 220,694 | |
| NuStar Logistics LP 6.375% 10/1/30 | 325,000 | 329,251 | |
| Oasis Midstream Partners LP / OMP Finance Corp. 8.00% 4/1/29 (a) | 700,000 | 744,786 | |
| Oasis Petroleum, Inc. 6.375% 6/1/26 (a) | 300,000 | 305,250 | |
| Occidental Petroleum Corp.: | |||
6.125% 1/1/31 | 5,410,000 | 6,151,711 | |
6.625% 9/1/30 | 2,201,000 | 2,561,227 | |
7.50% 5/1/31 | 40,000 | 48,500 | |
| Parkland Corp. 4.625% 5/1/30 (a) | 1,820,000 | 1,722,175 | |
| Parkland Fuel Corp. 5.875% 7/15/27 (a) | 512,000 | 518,216 | |
| PBF Holding Co. LLC / PBF Finance Corp.: | |||
6.00% 2/15/28 | 315,000 | 230,463 | |
9.25% 5/15/25 (a) | 285,000 | 287,850 | |
| PDC Energy, Inc. 6.125% 9/15/24 | 433,000 | 436,247 | |
| Range Resources Corp.: | |||
4.75% 2/15/30 (a) | 500,000 | 489,375 | |
8.25% 1/15/29 | 679,000 | 744,062 | |
| Renewable Energy Group, Inc. 5.875% 6/1/28 (a) | 220,000 | 237,600 | |
| Rockcliff Energy II LLC 5.50% 10/15/29 (a) | 500,000 | 495,625 | |
| Rockies Express Pipeline LLC 4.80% 5/15/30 (a) | 745,000 | 720,787 | |
| | |||
| Principal Amount | Value | ||
| SM Energy Co.: | |||
6.50% 7/15/28 | $ 95,000 | $ 97,375 | |
6.75% 9/15/26 | 85,000 | 85,850 | |
| Solaris Midstream Holdings LLC 7.625% 4/1/26 (a) | 260,000 | 266,500 | |
| Southwestern Energy Co.: | |||
4.75% 2/1/32 | 500,000 | 497,210 | |
5.375% 3/15/30 | 300,000 | 309,750 | |
7.75% 10/1/27 | 300,000 | 316,500 | |
| Summit Midstream Holdings LLC / Summit Midstream Finance Corp. 8.50% 10/15/26 (a) | 300,000 | 297,000 | |
| Sunoco LP / Sunoco Finance Corp.: | |||
4.50% 5/15/29 | 301,000 | 288,448 | |
4.50% 4/30/30 (a) | 2,000,000 | 1,910,160 | |
| Superior Plus LP / Superior General Partner, Inc. 4.50% 3/15/29 (a) | 145,000 | 138,294 | |
| Tallgrass Energy Partners LP / Tallgrass Energy Finance Corp. 6.00% 9/1/31 (a) | 500,000 | 471,250 | |
| Tap Rock Resources LLC 7.00% 10/1/26 (a) | 240,000 | 241,464 | |
| Teine Energy Ltd. 6.875% 4/15/29 (a) | 85,000 | 86,063 | |
| Venture Global Calcasieu Pass LLC 4.125% 8/15/31 (a) | 360,000 | 356,400 | |
| Vine Energy Holdings LLC 6.75% 4/15/29 (a) | 300,000 | 317,160 | |
| Western Midstream Operating LP 5.75% 2/1/50 | 715,000 | 727,512 | |
| 39,085,727 | |||
| Pipeline – 0.0% | |||
| NuStar Logistics LP 5.625% 4/28/27 | 160,000 | 160,143 | |
| TOTAL ENERGY | 41,005,016 | ||
| FINANCIALS – 9.6% | |||
| Banks – 0.2% | |||
| UniCredit SpA 7.296% 4/2/34 (a)(c) | 428,000 | 465,647 | |
| Capital Markets – 1.5% | |||
| Brightsphere Investment Group, Inc. 4.80% 7/27/26 | 1,263,000 | 1,224,731 | |
| Coinbase Global, Inc. 3.625% 10/1/31 (a) | 1,450,000 | 1,277,124 | |
| ION Trading Technologies Sarl 5.75% 5/15/28 (a) | 530,000 | 520,725 | |
| Jane Street Group / JSG Finance, Inc. 4.50% 11/15/29 (a) | 165,000 | 160,875 | |
| Semi-Annual Report | 10 |
| Nonconvertible Bonds – continued | |||
| Principal Amount | Value | ||
| FINANCIALS – continued | |||
| Capital Markets – continued | |||
| LPL Holdings, Inc. 4.375% 5/15/31 (a) | $ 1,350,000 | $ 1,316,250 | |
| 4,499,705 | |||
| Consumer Finance – 3.9% | |||
| Credit Acceptance Corp. 6.625% 3/15/26 | 371,000 | 382,620 | |
| Curo Group Holdings Corp. 7.50% 8/1/28 (a) | 500,000 | 443,750 | |
| Enova International, Inc. 8.50% 9/15/25 (a) | 325,000 | 323,375 | |
| goeasy Ltd.: | |||
4.375% 5/1/26 (a) | 2,115,000 | 2,076,613 | |
5.375% 12/1/24 (a) | 282,000 | 283,410 | |
| LD Holdings Group LLC 6.125% 4/1/28 (a) | 215,000 | 191,726 | |
| Nationstar Mortgage Holdings, Inc. 5.75% 11/15/31 (a) | 440,000 | 425,700 | |
| Navient Corp.: | |||
4.875% 3/15/28 | 500,000 | 467,500 | |
5.50% 3/15/29 | 500,000 | 472,500 | |
| OneMain Finance Corp. 3.875% 9/15/28 | 2,315,000 | 2,144,269 | |
| PennyMac Financial Services, Inc. 5.75% 9/15/31 (a) | 600,000 | 565,500 | |
| PRA Group, Inc.: | |||
5.00% 10/1/29 (a) | 1,800,000 | 1,746,000 | |
7.375% 9/1/25 (a) | 1,261,000 | 1,323,987 | |
| Rocket Mortgage LLC / Rocket Mortgage Co-Issuer, Inc. 4.00% 10/15/33 (a) | 530,000 | 493,297 | |
| World Acceptance Corp. 7.00% 11/1/26 (a) | 100,000 | 94,400 | |
| 11,434,647 | |||
| Diversified Financial Services – 2.9% | |||
| Allied Universal Holdco LLC / Allied Universal Finance Corp. 6.625% 7/15/26 (a) | 191,000 | 195,641 | |
| Burford Capital Global Finance LLC 6.25% 4/15/28 (a) | 600,000 | 621,750 | |
| Castlelake Aviation Finance DAC 5.00% 4/15/27 (a) | 215,000 | 204,250 | |
| Compass Group Diversified Holdings LLC: | |||
5.00% 1/15/32 (a) | 500,000 | 467,500 | |
5.25% 4/15/29 (a) | 1,865,000 | 1,802,765 | |
| Deutsche Bank AG: | |||
3.729% 1/14/32 (c) | 300,000 | 283,154 | |
4.875% 12/1/32 (c) | 134,000 | 135,413 | |
| | |||
| Principal Amount | Value | ||
| Global Aircraft Leasing Co. Ltd. 6.50% 9/15/24 (a) | $ 510,335 | $ 484,818 | |
| Icahn Enterprises LP / Icahn Enterprises Finance Corp.: | |||
4.375% 2/1/29 | 300,000 | 278,250 | |
4.75% 9/15/24 | 412,000 | 410,970 | |
5.25% 5/15/27 | 138,000 | 136,965 | |
6.25% 5/15/26 | 482,000 | 486,201 | |
| Jefferies Finance LLC / JFIN Co-Issuer Corp. 5.00% 8/15/28 (a) | 700,000 | 673,750 | |
| Midcap Financial Issuer Trust 5.625% 1/15/30 (a) | 250,000 | 228,125 | |
| Oxford Finance LLC / Oxford Finance Co-Issuer II, Inc. 6.375% 2/1/27 (a) | 500,000 | 511,720 | |
| StoneX Group, Inc. 8.625% 6/15/25 (a) | 951,000 | 996,172 | |
| VistaJet Malta Finance PLC / XO Management Holding, Inc. 6.375% 2/1/30 (a) | 500,000 | 475,770 | |
| 8,393,214 | |||
| Insurance – 0.6% | |||
| Alliant Holdings Intermediate LLC / Alliant Holdings Co-Issuer 4.25% 10/15/27 (a) | 600,000 | 579,000 | |
| AmWINS Group, Inc. 4.875% 6/30/29 (a) | 450,000 | 428,625 | |
| HUB International Ltd. 5.625% 12/1/29 (a) | 255,000 | 242,250 | |
| Ryan Specialty Group LLC 4.375% 2/1/30 (a) | 500,000 | 481,025 | |
| 1,730,900 | |||
| Thrifts & Mortgage Finance – 0.5% | |||
| Freedom Mortgage Corp. 6.625% 1/15/27 (a) | 700,000 | 645,750 | |
| MGIC Investment Corp. 5.25% 8/15/28 | 50,000 | 50,625 | |
| NMI Holdings, Inc. 7.375% 6/1/25 (a) | 727,000 | 781,419 | |
| 1,477,794 | |||
| TOTAL FINANCIALS | 28,001,907 | ||
| HEALTH CARE – 9.4% | |||
| Biotechnology – 0.2% | |||
| Emergent BioSolutions, Inc. 3.875% 8/15/28 (a) | 295,000 | 263,880 | |
| Grifols Escrow Issuer SA 4.75% 10/15/28 (a) | 250,000 | 235,625 | |
| 499,505 | |||
| 11 | Semi-Annual Report |
| Nonconvertible Bonds – continued | |||
| Principal Amount | Value | ||
| HEALTH CARE – continued | |||
| Health Care Equipment & Supplies – 0.5% | |||
| Avantor Funding, Inc. 3.875% 11/1/29 (a) | $ 1,600,000 | $ 1,539,696 | |
| Health Care Providers & Services – 5.1% | |||
| AMN Healthcare, Inc. 4.00% 4/15/29 (a) | 1,180,000 | 1,119,938 | |
| Cano Health LLC 6.25% 10/1/28 (a) | 75,000 | 66,587 | |
| CHS / Community Health Systems, Inc. 6.875% 4/15/29 (a) | 785,000 | 761,215 | |
| DaVita, Inc. 3.75% 2/15/31 (a) | 919,000 | 839,736 | |
| Encompass Health Corp. 4.75% 2/1/30 | 300,000 | 286,470 | |
| MEDNAX, Inc. 5.375% 2/15/30 (a) | 500,000 | 497,500 | |
| ModivCare Escrow Issuer, Inc. 5.00% 10/1/29 (a) | 455,000 | 428,337 | |
| ModivCare, Inc. 5.875% 11/15/25 (a) | 935,000 | 938,544 | |
| Molina Healthcare, Inc.: | |||
3.875% 5/15/32 (a) | 60,000 | 58,782 | |
4.375% 6/15/28 (a) | 2,819,000 | 2,815,476 | |
| Mozart Debt Merger Sub, Inc.: | |||
3.875% 4/1/29 (a) | 1,300,000 | 1,233,485 | |
5.25% 10/1/29 (a) | 730,000 | 697,150 | |
| Tenet Healthcare Corp.: | |||
4.375% 1/15/30 (a) | 500,000 | 482,615 | |
4.875% 1/1/26 (a) | 20,000 | 20,136 | |
6.125% 10/1/28 (a) | 4,380,000 | 4,436,940 | |
| 14,682,911 | |||
| Pharmaceuticals – 3.6% | |||
| AdaptHealth LLC 5.125% 3/1/30 (a) | 1,200,000 | 1,107,000 | |
| Bausch Health Companies, Inc. 5.00% 2/15/29 (a) | 2,080,000 | 1,683,625 | |
| Bausch Health Cos., Inc. 4.875% 6/1/28 (a) | 1,760,000 | 1,690,603 | |
| Catalent Pharma Solutions, Inc. 3.50% 4/1/30 (a) | 255,000 | 237,380 | |
| CHS/Community Health Systems, Inc. 5.25% 5/15/30 (a) | 680,000 | 658,655 | |
| Embecta Corp. 5.00% 2/15/30 (a) | 800,000 | 789,000 | |
| Endo Luxembourg Finance Co. I Sarl / Endo US, Inc. 6.125% 4/1/29 (a) | 296,000 | 278,240 | |
| Jazz Securities DAC 4.375% 1/15/29 (a) | 215,000 | 212,949 | |
| | |||
| Principal Amount | Value | ||
| Option Care Health, Inc. 4.375% 10/31/29 (a) | $ 125,000 | $ 120,625 | |
| Organon & Co. / Organon Foreign Debt Co-Issuer BV 5.125% 4/30/31 (a) | 200,000 | 199,654 | |
| Organon Finance 1 LLC 4.125% 4/30/28 (a) | 340,000 | 334,427 | |
| Par Pharmaceutical, Inc. 7.50% 4/1/27 (a) | 575,000 | 575,946 | |
| Syneos Health, Inc. 3.625% 1/15/29 (a) | 2,225,000 | 2,101,290 | |
| US Acute Care Solutions LLC 6.375% 3/1/26 (a) | 500,000 | 492,500 | |
| 10,481,894 | |||
| TOTAL HEALTH CARE | 27,204,006 | ||
| INDUSTRIALS – 13.9% | |||
| Aerospace & Defense – 1.5% | |||
| Howmet Aerospace, Inc. 6.75% 1/15/28 | 263,000 | 292,494 | |
| TransDigm, Inc.: | |||
6.25% 3/15/26 (a) | 3,672,000 | 3,777,570 | |
8.00% 12/15/25 (a) | 315,000 | 328,929 | |
| 4,398,993 | |||
| Air Freight & Logistics – 0.4% | |||
| Cargo Aircraft Management, Inc. 4.75% 2/1/28 (a) | 1,090,000 | 1,054,575 | |
| Airlines – 1.1% | |||
| Air Canada 3.875% 8/15/26 (a) | 510,000 | 495,207 | |
| American Airlines, Inc. 11.75% 7/15/25 (a) | 869,000 | 1,053,849 | |
| American Airlines, Inc. / AAdvantage Loyalty IP Ltd. 5.50% 4/20/26 (a) | 700,000 | 716,478 | |
| United Airlines Holdings, Inc. 4.875% 1/15/25 | 295,000 | 293,525 | |
| United Airlines, Inc. 4.375% 4/15/26 (a) | 665,000 | 663,298 | |
| 3,222,357 | |||
| Building Products – 0.1% | |||
| Thor Industries, Inc. 4.00% 10/15/29 (a) | 380,000 | 346,750 | |
| Commercial Services & Supplies – 4.5% | |||
| Allied Universal Holdco LLC / Allied Universal Finance Corp. 6.00% 6/1/29 (a) | 330,000 | 306,900 | |
| APi Escrow Corp. 4.75% 10/15/29 (a) | 500,000 | 472,500 | |
| Aramark Services, Inc. 5.00% 4/1/25 (a) | 150,000 | 151,079 | |
| Semi-Annual Report | 12 |
| Nonconvertible Bonds – continued | |||
| Principal Amount | Value | ||
| INDUSTRIALS – continued | |||
| Commercial Services & Supplies – continued | |||
| Avis Budget Car Rental LLC / Avis Budget Finance, Inc. 5.75% 7/15/27 (a) | $ 376,000 | $ 378,606 | |
| CONDOR MERGER SUB, Inc. 7.375% 2/15/30 (a) | 500,000 | 480,397 | |
| CoreCivic, Inc. 8.25% 4/15/26 | 200,000 | 203,000 | |
| CoreLogic, Inc. 4.50% 5/1/28 (a) | 630,000 | 597,712 | |
| Covert Mergeco, Inc. 4.875% 12/1/29 (a) | 680,000 | 650,681 | |
| Garda World Security Corp. 6.00% 6/1/29 (a) | 300,000 | 272,250 | |
| GFL Environmental, Inc. 4.00% 8/1/28 (a) | 2,450,000 | 2,275,878 | |
| HealthEquity, Inc. 4.50% 10/1/29 (a) | 170,000 | 161,815 | |
| Madison IAQ LLC 4.125% 6/30/28 (a) | 420,000 | 397,314 | |
| Nielsen Finance LLC / Nielsen Finance Co.: | |||
4.50% 7/15/29 (a) | 795,000 | 714,224 | |
5.875% 10/1/30 (a) | 2,090,000 | 2,024,081 | |
| PROG Holdings, Inc. 6.00% 11/15/29 (a) | 1,800,000 | 1,728,000 | |
| Rent-A-Center, Inc. 6.375% 2/15/29 (a) | 155,000 | 148,413 | |
| Sabre GLBL, Inc. 9.25% 4/15/25 (a) | 212,000 | 239,085 | |
| Shift4 Payments LLC / Shift4 Payments Finance Sub, Inc. 4.625% 11/1/26 (a) | 525,000 | 520,737 | |
| The ADT Corp. 4.875% 7/15/32 (a) | 152,000 | 141,740 | |
| The Hertz Corp. 5.00% 12/1/29 (a) | 450,000 | 419,760 | |
| ZipRecruiter, Inc. 5.00% 1/15/30 (a) | 800,000 | 787,696 | |
| 13,071,868 | |||
| Construction & Engineering – 1.5% | |||
| Arcosa, Inc. 4.375% 4/15/29 (a) | 570,000 | 540,075 | |
| Dycom Industries, Inc. 4.50% 4/15/29 (a) | 1,100,000 | 1,058,750 | |
| Fluor Corp. 4.25% 9/15/28 | 548,000 | 536,355 | |
| Global Infrastructure Solutions, Inc. 5.625% 6/1/29 (a) | 350,000 | 345,625 | |
| | |||
| Principal Amount | Value | ||
| Great Lakes Dredge & Dock Corp. 5.25% 6/1/29 (a) | $ 380,000 | $ 380,543 | |
| IEA Energy Services LLC 6.625% 8/15/29 (a) | 400,000 | 370,000 | |
| Pike Corp. 5.50% 9/1/28 (a) | 500,000 | 481,250 | |
| PowerTeam Services LLC 9.033% 12/4/25 (a) | 205,000 | 205,554 | |
| Railworks Holdings LP / Railworks Rally, Inc. 8.25% 11/15/28 (a) | 300,000 | 306,000 | |
| 4,224,152 | |||
| Electrical Equipment – 0.4% | |||
| EnerSys 4.375% 12/15/27 (a) | 1,177,000 | 1,165,230 | |
| Machinery – 1.2% | |||
| ATS Automation Tooling Systems, Inc. 4.125% 12/15/28 (a) | 140,000 | 134,925 | |
| Dana, Inc. 4.50% 2/15/32 | 500,000 | 469,375 | |
| FXI Holdings, Inc. 12.25% 11/15/26 (a) | 173,000 | 185,229 | |
| Meritor, Inc. 6.25% 6/1/25 (a) | 341,000 | 354,545 | |
| Terex Corp. 5.00% 5/15/29 (a) | 715,000 | 708,014 | |
| Vertiv Group Corp. 4.125% 11/15/28 (a) | 1,650,000 | 1,513,875 | |
| 3,365,963 | |||
| Marine – 0.0% | |||
| Seaspan Corp. 5.50% 8/1/29 (a) | 30,000 | 28,575 | |
| Professional Services – 0.8% | |||
| ASGN, Inc. 4.625% 5/15/28 (a) | 70,000 | 69,125 | |
| TriNet Group, Inc. 3.50% 3/1/29 (a) | 2,475,000 | 2,328,307 | |
| 2,397,432 | |||
| Road & Rail – 1.5% | |||
| Uber Technologies, Inc.: | |||
4.50% 8/15/29 (a) | 2,950,000 | 2,824,183 | |
7.50% 5/15/25 (a) | 1,457,000 | 1,515,644 | |
| 4,339,827 | |||
| Trading Companies & Distributors – 0.6% | |||
| Fortress Transportation and Infrastructure Investors LLC: | |||
5.50% 5/1/28 (a) | 500,000 | 477,500 | |
6.50% 10/1/25 (a) | 1,100,000 | 1,113,750 | |
| 1,591,250 | |||
| 13 | Semi-Annual Report |
| Nonconvertible Bonds – continued | |||
| Principal Amount | Value | ||
| INDUSTRIALS – continued | |||
| Transportation Infrastructure – 0.3% | |||
| First Student Bidco, Inc. / First Transit Parent, Inc. 4.00% 7/31/29 (a) | $ 1,065,000 | $ 1,006,417 | |
| TOTAL INDUSTRIALS | 40,213,389 | ||
| INFORMATION TECHNOLOGY – 5.2% | |||
| Communications Equipment – 0.1% | |||
| CommScope Technologies LLC 6.00% 6/15/25 (a) | 322,000 | 314,977 | |
| Electronic Equipment, Instruments & Components – 1.3% | |||
| Atkore, Inc. 4.25% 6/1/31 (a) | 975,000 | 945,097 | |
| II-VI, Inc. 5.00% 12/15/29 (a) | 2,390,000 | 2,387,419 | |
| TTM Technologies, Inc. 4.00% 3/1/29 (a) | 455,000 | 419,737 | |
| 3,752,253 | |||
| Internet Software & Services – 0.0% | |||
| GrubHub Holdings, Inc. 5.50% 7/1/27 (a) | 115,000 | 102,638 | |
| IT Services – 1.2% | |||
| Arches Buyer, Inc. 4.25% 6/1/28 (a) | 500,000 | 473,500 | |
| Booz Allen Hamilton, Inc. 4.00% 7/1/29 (a) | 50,000 | 49,336 | |
| Diebold Nixdorf, Inc. 9.375% 7/15/25 (a) | 222,000 | 229,830 | |
| Go Daddy Operating Co. LLC / GD Finance Co., Inc. 3.50% 3/1/29 (a) | 480,000 | 454,642 | |
| Minerva Merger Sub, Inc. 6.50% 2/15/30 (a) | 500,000 | 481,360 | |
| Rackspace Technology Global, Inc. 3.50% 2/15/28 (a) | 200,000 | 181,500 | |
| Skillz, Inc. 10.25% 12/15/26 (a) | 200,000 | 183,036 | |
| The Dun & Bradstreet Corp. 5.00% 12/15/29 (a) | 600,000 | 576,000 | |
| Unisys Corp. 6.875% 11/1/27 (a) | 735,000 | 773,587 | |
| 3,402,791 | |||
| Software – 2.3% | |||
| Clarivate Science Holdings Corp. 4.875% 7/1/29 (a) | 415,000 | 390,789 | |
| Consensus Cloud Solutions, Inc. 6.50% 10/15/28 (a) | 330,000 | 332,376 | |
| Elastic N.V. 4.125% 7/15/29 (a) | 1,240,000 | 1,137,700 | |
| | |||
| Principal Amount | Value | ||
| Fair Isaac Corp. 4.00% 6/15/28 (a) | $ 2,183,000 | $ 2,142,068 | |
| J2 Global, Inc. 4.625% 10/15/30 (a) | 1,122,000 | 1,079,353 | |
| MicroStrategy, Inc. 6.125% 6/15/28 (a) | 125,000 | 120,000 | |
| Open Text Holdings, Inc. 4.125% 12/1/31 (a) | 1,100,000 | 1,045,000 | |
| PTC, Inc. 3.625% 2/15/25 (a) | 70,000 | 69,650 | |
| Xerox Corp. 4.80% 3/1/35 | 250,000 | 223,750 | |
| 6,540,686 | |||
| Technology Hardware, Storage & Peripherals – 0.3% | |||
| NCR Corp. 5.125% 4/15/29 (a) | 880,000 | 870,100 | |
| TOTAL INFORMATION TECHNOLOGY | 14,983,445 | ||
| MATERIALS – 11.2% | |||
| Chemicals – 4.5% | |||
| Cerdia Finanz GmbH 10.50% 2/15/27 (a) | 300,000 | 299,064 | |
| Consolidated Energy Finance SA 5.625% 10/15/28 (a) | 440,000 | 406,692 | |
| CVR Partners LP / CVR Nitrogen Finance Corp. 6.125% 6/15/28 (a) | 320,000 | 322,000 | |
| Diamond BC BV 4.625% 10/1/29 (a) | 255,000 | 232,104 | |
| EverArc Escrow Sarl 5.00% 10/30/29 (a) | 500,000 | 462,500 | |
| GPD Cos., Inc. 10.125% 4/1/26 (a) | 200,000 | 210,000 | |
| INEOS Quattro Finance 2 PLC 3.375% 1/15/26 (a) | 500,000 | 477,500 | |
| LSB Industries, Inc. 6.25% 10/15/28 (a) | 175,000 | 175,875 | |
| NOVA Chemicals Corp. 4.25% 5/15/29 (a) | 455,000 | 426,372 | |
| Nufarm Australia Ltd. / Nufarm Americas, Inc. 5.00% 1/27/30 (a) | 455,000 | 449,313 | |
| Olin Corp.: | |||
5.00% 2/1/30 | 146,000 | 147,095 | |
5.625% 8/1/29 | 317,000 | 330,641 | |
| SCIH Salt Holdings, Inc. 4.875% 5/1/28 (a) | 515,000 | 487,962 | |
| SCIL IV LLC / SCIL USA Holdings LLC 5.375% 11/1/26 (a) | 365,000 | 364,420 | |
| SPCM SA 3.375% 3/15/30 (a) | 1,050,000 | 950,386 | |
| Semi-Annual Report | 14 |
| Nonconvertible Bonds – continued | |||
| Principal Amount | Value | ||
| MATERIALS – continued | |||
| Chemicals – continued | |||
| Sunnova Energy Corp. 5.875% 9/1/26 (a) | $ 1,000,000 | $ 915,120 | |
| The Chemours Co. LLC 4.625% 11/15/29 (a) | 2,280,000 | 2,111,850 | |
| The Scotts Miracle-Gro Co.: | |||
4.375% 2/1/32 | 3,015,000 | 2,783,146 | |
4.50% 10/15/29 | 215,000 | 207,475 | |
| Trinseo Materials Operating SCA / Trinseo Materials Finance, Inc. 5.125% 4/1/29 (a) | 400,000 | 379,000 | |
| Unifrax Escrow Issuer Corp. 5.25% 9/30/28 (a) | 600,000 | 574,500 | |
| WR Grace Holdings LLC 5.625% 8/15/29 (a) | 270,000 | 258,525 | |
| 12,971,540 | |||
| Construction Materials – 2.5% | |||
| Builders FirstSource, Inc. 4.25% 2/1/32 (a) | 1,500,000 | 1,439,873 | |
| Eco Material Technologies, Inc. 7.875% 1/31/27 (a) | 500,000 | 505,595 | |
| New Enterprise Stone & Lime Co., Inc. 5.25% 7/15/28 (a) | 600,000 | 583,500 | |
| Patrick Industries, Inc. 4.75% 5/1/29 (a) | 2,422,000 | 2,210,547 | |
| PGT Innovations, Inc. 4.375% 10/1/29 (a) | 1,700,000 | 1,597,694 | |
| Standard Industries, Inc. 4.375% 7/15/30 (a) | 1,167,000 | 1,104,892 | |
| 7,442,101 | |||
| Containers & Packaging – 1.0% | |||
| Canpack SA / Canpack U.S. LLC 3.875% 11/15/29 (a) | 1,000,000 | 910,625 | |
| Graphic Packaging International LLC 3.75% 2/1/30 (a) | 150,000 | 142,931 | |
| Intertape Polymer Group, Inc. 4.375% 6/15/29 (a) | 355,000 | 336,451 | |
| LABL, Inc. 5.875% 11/1/28 (a) | 320,000 | 306,288 | |
| Mauser Packaging Solutions Holding Co. 5.50% 4/15/24 (a) | 82,000 | 81,590 | |
| OI European Group BV 4.75% 2/15/30 (a) | 300,000 | 287,247 | |
| Pactiv Evergreen Group Issuer LLC / Pactiv Evergreen Group Issuer, Inc. 4.375% 10/15/28 (a) | 833,000 | 769,484 | |
| 2,834,616 | |||
| | |||
| Principal Amount | Value | ||
| Metals & Mining – 2.6% | |||
| Allegheny Technologies, Inc.: | |||
4.875% 10/1/29 | $ 340,000 | $ 328,947 | |
5.125% 10/1/31 | 100,000 | 97,250 | |
| Cleveland-Cliffs, Inc. 5.875% 6/1/27 | 596,000 | 613,940 | |
| Coeur Mining, Inc. 5.125% 2/15/29 (a) | 100,000 | 88,220 | |
| Commercial Metals Co. 4.125% 1/15/30 | 1,000,000 | 967,500 | |
| Compass Minerals International, Inc. 6.75% 12/1/27 (a) | 176,000 | 182,750 | |
| Eldorado Gold Corp. 6.25% 9/1/29 (a) | 300,000 | 300,000 | |
| ERO Copper Corp. 6.50% 2/15/30 (a) | 500,000 | 483,810 | |
| First Quantum Minerals Ltd. 6.875% 10/15/27 (a) | 500,000 | 529,185 | |
| Hudbay Minerals, Inc. 4.50% 4/1/26 (a) | 225,000 | 217,406 | |
| Kaiser Aluminum Corp. 4.625% 3/1/28 (a) | 650,000 | 613,775 | |
| Mineral Resources Ltd. 8.125% 5/1/27 (a) | 883,000 | 930,020 | |
| Novelis Corp. 3.875% 8/15/31 (a) | 745,000 | 686,331 | |
| Perenti Finance Pty Ltd. 6.50% 10/7/25 (a) | 500,000 | 498,700 | |
| Tacora Resources, Inc. 8.25% 5/15/26 (a) | 300,000 | 295,125 | |
| United States Steel Corp. 6.875% 3/1/29 | 635,000 | 652,462 | |
| 7,485,421 | |||
| Paper & Forest Products – 0.6% | |||
| Boise Cascade Co. 4.875% 7/1/30 (a) | 20,000 | 20,069 | |
| Louisiana Pacific Corp. 3.625% 3/15/29 (a) | 300,000 | 280,920 | |
| Pearl Merger Sub, Inc. 6.75% 10/1/28 (a) | 580,000 | 579,449 | |
| Resolute Forest Products, Inc. 4.875% 3/1/26 (a) | 615,000 | 584,557 | |
| Sylvamo Corp. 7.00% 9/1/29 (a) | 250,000 | 250,551 | |
| 1,715,546 | |||
| TOTAL MATERIALS | 32,449,224 | ||
| 15 | Semi-Annual Report |
| Nonconvertible Bonds – continued | |||
| Principal Amount | Value | ||
| REAL ESTATE – 5.5% | |||
| Equity Real Estate Investment Trusts (REITs) – 4.3% | |||
| American Finance Trust, Inc. / American Finance Operating Partner LP 4.50% 9/30/28 (a) | $ 1,015,000 | $ 945,726 | |
| Apollo Commercial Real Estate Finance, Inc. 4.625% 6/15/29 (a) | 815,000 | 735,537 | |
| Blackstone Mortgage Trust, Inc. 3.75% 1/15/27 (a) | 645,000 | 609,525 | |
| Brookfield Property REIT, Inc. / BPR Cumulus LLC / BPR Nimbus LLC / GGSI Sellco LL 4.50% 4/1/27 (a) | 715,000 | 666,738 | |
| CTR Partnership LP / CareTrust Capital Corp. 3.875% 6/30/28 (a) | 345,000 | 329,475 | |
| HAT Holdings I LLC / HAT Holdings II LLC: | |||
3.375% 6/15/26 (a) | 2,020,000 | 1,913,950 | |
6.00% 4/15/25 (a) | 1,240,000 | 1,278,911 | |
| Iron Mountain Information Management Services, Inc. 5.00% 7/15/32 (a) | 560,000 | 532,000 | |
| Iron Mountain, Inc.: | |||
5.00% 7/15/28 (a) | 340,000 | 336,794 | |
5.25% 7/15/30 (a) | 415,000 | 411,778 | |
| iStar, Inc. 4.25% 8/1/25 | 365,000 | 364,482 | |
| Ladder Capital Finance Holdings LLLP / Ladder Capital Finance Corp. 4.75% 6/15/29 (a) | 440,000 | 426,250 | |
| RHP Hotel Properties LP / RHP Finance Corp. 4.50% 2/15/29 (a) | 420,000 | 396,900 | |
| RLJ Lodging Trust LP 4.00% 9/15/29 (a) | 715,000 | 671,335 | |
| Service Properties Trust: | |||
4.375% 2/15/30 | 585,000 | 509,377 | |
4.95% 2/15/27 | 30,000 | 27,900 | |
7.50% 9/15/25 | 265,000 | 278,316 | |
| Starwood Property Trust, Inc.: | |||
3.75% 12/31/24 (a) | 1,000,000 | 978,750 | |
4.375% 1/15/27 (a) | 500,000 | 485,269 | |
| Uniti Group LP / Uniti Fiber Holdings, Inc. / CSL Capital LLC 6.00% 1/15/30 (a) | 500,000 | 446,955 | |
| 12,345,968 | |||
| | |||
| Principal Amount | Value | ||
| Real Estate Management & Development – 1.2% | |||
| Brookfield Residential Properties, Inc. / Brookfield Residential U.S. LLC 5.00% 6/15/29 (a) | $ 800,000 | $ 753,000 | |
| Howard Hughes Corp. 4.125% 2/1/29 (a) | 1,000,000 | 946,250 | |
| Kennedy-Wilson, Inc. 4.75% 3/1/29 to 2/1/30 | 1,414,000 | 1,355,592 | |
| Realogy Group LLC / Realogy Co-Issuer Corp. 5.25% 4/15/30 (a) | 500,000 | 476,500 | |
| 3,531,342 | |||
| TOTAL REAL ESTATE | 15,877,310 | ||
| UTILITIES – 1.4% | |||
| Electric Utilities – 0.8% | |||
| Clearway Energy Operating LLC 3.75% 1/15/32 (a) | 840,000 | 785,442 | |
| NRG Energy, Inc.: | |||
3.875% 2/15/32 (a) | 745,000 | 690,779 | |
6.625% 1/15/27 | 10,000 | 10,335 | |
| Pattern Energy Operations LP / Pattern Energy Operations, Inc. 4.50% 8/15/28 (a) | 163,000 | 159,164 | |
| Vistra Operations Co. LLC: | |||
5.00% 7/31/27 (a) | 5,000 | 5,037 | |
5.625% 2/15/27 (a) | 615,000 | 629,705 | |
| 2,280,462 | |||
| Independent Power and Renewable Electricity Producers – 0.2% | |||
| Leeward Renewable Energy Operations LLC 4.25% 7/1/29 (a) | 570,000 | 550,050 | |
| Multi-Utilities – 0.4% | |||
| Calpine Corp. 3.75% 3/1/31 (a) | 1,176,000 | 1,070,160 | |
| Talen Energy Supply LLC 6.50% 6/1/25 | 200,000 | 82,000 | |
| 1,152,160 | |||
| TOTAL UTILITIES | 3,982,672 | ||
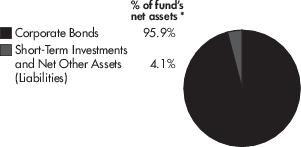
| TOTAL NONCONVERTIBLE BONDS (Cost $298,618,546) | 285,528,530 | ||
| Semi-Annual Report | 16 |
| Money Market Fund – 0.5% | |||
| Shares | Value | ||
| Fidelity Cash Central Fund, 0.07% (d) (Cost $1,399,451) | 1,399,171 | $ 1,399,451 | |
| TOTAL INVESTMENT IN SECURITIES – 99.0% (Cost $300,017,997) | 286,927,981 | ||
| NET OTHER ASSETS (LIABILITIES) – 1.0% | 2,960,458 | ||
| NET ASSETS – 100.0% | $289,888,439 | ||
| Legend | ||
| (a) | Security is exempt from registration under Rule 144A of the Securities Act of 1933. These securities may be resold in transactions exempt from registration, normally to qualified institutional buyers. At the end of the period, the value of these securities amounted to $236,073,124 or 81.4% of net assets. | |
| (b) | Security is perpetual in nature with no stated maturity date. | |
| (c) | Coupon rates for floating and adjustable rate securities reflect the rates in effect at period end. | |
| (d) | Affiliated fund that is generally available only to investment companies and other accounts managed by Fidelity Investments. The rate quoted is the annualized seven-day yield of the fund at period end. A complete unaudited listing of the fund's holdings as of its most recent quarter end is available upon request. In addition, each Fidelity Central Fund's financial statements are available on the SEC's website or upon request. | |
| Fund | Value, beginning of period | Purchases | Sales Proceeds | Dividend Income | Realized Gain/Loss | Change in Unrealized appreciation (depreciation) | Value, end of period | % ownership, end of period | ||||||
| Fidelity Cash Central Fund, 0.07% | $7,567,723 | $57,524,852 | $63,693,124 | $1,910 | $— | $— | $1,399,451 | 0.0% |
| 17 | Semi-Annual Report |
| Description | Total | Level 1 | Level 2 | Level 3 |
| Investments in Securities: | ||||||||
| Corporate Bonds | $ 285,528,530 | $ — | $ 285,528,530 | $ — | ||||
| Money Market Funds | 1,399,451 | 1,399,451 | — | — | ||||
| Total Investments in Securities: | $ 286,927,981 | $ 1,399,451 | $ 285,528,530 | $ — |
| United States of America | 84.8% |
| Canada | 5.7% |
| Luxembourg | 1.6% |
| Netherlands | 1.1% |
| France | 1.1% |
| Others (Individually Less Than 1%) | 4.7% |
| 99.0% |
| Semi-Annual Report | 18 |
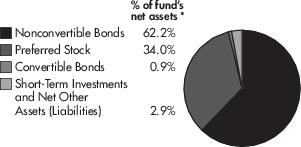
| Nonconvertible Bonds – 62.2% | |||
| Principal Amount | Value | ||
| COMMUNICATION SERVICES – 2.6% | |||
| Media – 1.9% | |||
| ViacomCBS, Inc. 6.25% 2/28/57 (a) | $ 593,000 | $ 599,523 | |
| Wireless Telecommunication Services – 0.7% | |||
| Vodafone Group PLC 7.00% 4/4/79 (a) | 190,000 | 210,900 | |
| TOTAL COMMUNICATION SERVICES | 810,423 | ||
| CONSUMER DISCRETIONARY – 1.0% | |||
| Automobiles – 1.0% | |||
| General Motors Financial Co., Inc. 5.70% (a)(b) | 297,000 | 308,963 | |
| ENERGY – 4.1% | |||
| Energy Equipment & Services – 0.1% | |||
| DCP Midstream Operating LP 3 month U.S. LIBOR + 3.850% 5.85% 5/21/43 (a)(c) | 12,000 | 11,160 | |
| Oil, Gas & Consumable Fuels – 4.0% | |||
| BP Capital Markets PLC 4.875% (a)(b) | 325,000 | 322,107 | |
| Buckeye Partners LP 6.375% 1/22/78 (a) | 49,000 | 40,915 | |
| DCP Midstream LP 7.375% (a)(b) | 53,000 | 50,085 | |
| Enbridge, Inc. 5.75% 7/15/80 (a) | 106,000 | 110,536 | |
| EnLink Midstream Partners LP 6.00% (a)(b) | 28,000 | 20,090 | |
| Enterprise Products Operating LLC: | |||
4.875% 8/16/77 (a) | 57,000 | 48,876 | |
5.25% 8/16/77 (a) | 106,000 | 100,580 | |
5.375% 2/15/78 (a) | 57,000 | 52,949 | |
| Plains All American Pipeline LP 6.125% (a)(b) | 80,000 | 65,776 | |
| TransCanada Trust: | |||
5.30% 3/15/77 (a) | 136,000 | 130,560 | |
5.50% 9/15/79 (a) | 108,000 | 108,940 | |
5.625% 5/20/75 (a) | 80,000 | 79,600 | |
5.875% 8/15/76 (a) | 109,000 | 111,997 | |
| 1,243,011 | |||
| TOTAL ENERGY | 1,254,171 | ||
| FINANCIALS – 50.4% | |||
| Banks – 14.7% | |||
| Huntington Bancshares, Inc.: | |||
4.45% (a)(b) | 484,000 | 481,580 | |
5.625% (a)(b) | 296,000 | 313,020 | |
5.70% (a)(b) | 324,000 | 318,492 | |
| | |||
| Principal Amount | Value | ||
| JPMorgan Chase & Co.: | |||
5.00% (a)(b) | $ 296,000 | $ 297,850 | |
6.10% (a)(b) | 271,000 | 282,179 | |
| SVB Financial Group: | |||
4.25% (a)(b) | 110,000 | 105,737 | |
4.70% (a)(b) | 56,000 | 52,780 | |
| Truist Financial Corp.: | |||
5.10% (a)(b) | 403,000 | 418,112 | |
5.125% (a)(b) | 955,000 | 940,675 | |
| Wells Fargo & Co.: | |||
3.90% (a)(b) | 134,000 | 128,975 | |
5.90% (a)(b) | 1,232,000 | 1,241,240 | |
| 4,580,640 | |||
| Capital Markets – 11.6% | |||
| Goldman Sachs Group, Inc.: | |||
4.125% (a)(b) | 25,000 | 23,731 | |
4.40% (a)(b) | 810,000 | 785,700 | |
5.00% (a)(b) | 539,000 | 519,219 | |
5.30% (a)(b) | 243,000 | 253,024 | |
| Morgan Stanley: | |||
5.30% (a)(b) | 1,133,000 | 1,128,391 | |
5.875% (a)(b) | 109,000 | 116,691 | |
| State Street Corp. 5.625% (a)(b) | 53,000 | 52,199 | |
| The Bank of New York Mellon Corp. 3.75% (a)(b) | 81,000 | 75,357 | |
| The Charles Schwab Corp. 4.00% (a)(b) | 701,000 | 648,824 | |
| 3,603,136 | |||
| Consumer Finance – 12.0% | |||
| Ally Financial, Inc. 4.70% (a)(b) | 1,564,000 | 1,491,860 | |
| American Express Co. 3.55% (a)(b) | 27,000 | 24,975 | |
| Capital One Financial Corp. 3.95% (a)(b) | 270,000 | 253,268 | |
| Citizens Financial Group, Inc. 6.00% (a)(b) | 1,052,000 | 1,007,290 | |
| Discover Financial Services 5.50% (a)(b) | 934,000 | 917,235 | |
| M&T Bank Corp. 3.50% (a)(b) | 25,000 | 22,813 | |
| 3,717,441 | |||
| Diversified Financial Services – 9.7% | |||
| Aircastle Ltd. 5.25% (a)(b)(c) | 191,000 | 182,405 | |
| Apollo Management Holdings LP 4.95% 1/14/50 (a)(c) | 524,000 | 518,087 | |
| Bank of America Corp. 5.875% (a)(b) | 728,000 | 747,110 | |
| 19 | Semi-Annual Report |
| Nonconvertible Bonds – continued | |||
| Principal Amount | Value | ||
| FINANCIALS – continued | |||
| Diversified Financial Services – continued | |||
| Citigroup, Inc.: | |||
3.875% (a)(b) | $ 460,000 | $ 438,150 | |
4.15% (a)(b) | 80,000 | 76,300 | |
5.95% (a)(b) | 376,000 | 389,630 | |
6.30% (a)(b) | 649,000 | 656,593 | |
| 3,008,275 | |||
| Insurance – 2.4% | |||
| American International Group, Inc.: | |||
| 3 month U.S. LIBOR + 2.868% 5.75% 4/1/48 (a) | 109,000 | 111,997 | |
8.175% 5/15/68 (a) | 8,000 | 11,264 | |
| Assurant, Inc. 7.00% 3/27/48 (a) | 53,000 | 58,035 | |
| MetLife, Inc.: | |||
6.40% 12/15/66 | 269,000 | 301,603 | |
10.75% 8/1/69 | 108,000 | 167,400 | |
| Nationwide Financial Services, Inc. 6.75% 5/15/87 | 6,000 | 6,825 | |
| PartnerRe Finance B LLC 4.50% 10/1/50 (a) | 57,000 | 55,860 | |
| SBL Holdings, Inc. 6.50% (a)(b)(c) | 29,000 | 27,043 | |
| 740,027 | |||
| TOTAL FINANCIALS | 15,649,519 | ||
| INDUSTRIALS – 0.7% | |||
| Trading Companies & Distributors – 0.7% | |||
| Air Lease Corp.: | |||
4.125% (a)(b) | 46,000 | 41,630 | |
4.65% (a)(b) | 189,000 | 180,023 | |
| TOTAL INDUSTRIALS | 221,653 | ||
| UTILITIES – 3.4% | |||
| Multi-Utilities – 3.4% | |||
| CenterPoint Energy, Inc. 6.125% (a)(b) | 81,000 | 79,988 | |
| CMS Energy Corp. 3.75% 12/1/50 (a) | 219,000 | 197,453 | |
| Edison International: | |||
5.00% (a)(b) | 54,000 | 51,704 | |
5.375% (a)(b) | 161,000 | 158,786 | |
| Emera, Inc. 6.75% 6/15/76 (a) | 105,000 | 114,122 | |
| NextEra Energy Capital Holdings, Inc. 5.65% 5/1/79 (a) | 274,000 | 289,696 | |
| | |||
| Principal Amount | Value | ||
| Sempra Energy 4.875% (a)(b) | $ 161,000 | $ 163,818 | |
| TOTAL UTILITIES | 1,055,567 | ||
| TOTAL NONCONVERTIBLE BONDS (Cost $20,627,353) | 19,300,296 | ||
| Preferred Stock – 34.0% | |||
| COMMUNICATION SERVICES – 2.6% | |||
| Diversified Telecommunication Services – 1.4% | |||
| AT&T, Inc. 4.75% (b) | 19,500 | 426,855 | |
| Wireless Telecommunication Services – 1.2% | |||
| United States Cellular Corp.: | |||
| 5.50% 3/01/70 | 8,050 | 187,968 | |
| 6.25% 9/01/69 | 7,450 | 183,121 | |
| 371,089 | |||
| TOTAL COMMUNICATION SERVICES | 797,944 | ||
| CONSUMER DISCRETIONARY – 1.6% | |||
| Automobiles – 1.6% | |||
| Ford Motor Co. 6.00% 12/1/59 | 20,200 | 509,040 | |
| ENERGY – 0.9% | |||
| Oil, Gas & Consumable Fuels – 0.9% | |||
| DCP Midstream LP: | |||
| 7.875% (a)(b) | 650 | 15,438 | |
| 7.95% (a)(b) | 650 | 15,671 | |
| Enbridge, Inc. 6.375% 4/15/78 (a) | 2,050 | 53,156 | |
| Energy Transfer LP: | |||
| 7.375% (a)(b) | 1,965 | 46,099 | |
| 7.60% (a)(b) | 2,755 | 67,415 | |
| 7.625% (a)(b) | 1,410 | 34,263 | |
| NuStar Energy LP: | |||
| 7.625% (a)(b) | 1,350 | 27,999 | |
| 9.00% (a)(b) | 650 | 15,594 | |
| TOTAL ENERGY | 275,635 | ||
| FINANCIALS – 26.0% | |||
| Banks – 11.7% | |||
| Bank of America Corp.: | |||
| 4.25% (b) | 4,000 | 86,080 | |
| 4.375% (b) | 27,650 | 611,894 | |
| Bank of Hawaii Corp. 4.375% (b) | 650 | 15,171 | |
| Citizens Financial Group, Inc. 5.00% (b) | 19,500 | 475,410 | |
| Cullen/Frost Bankers, Inc. 4.45% (b) | 2,700 | 60,345 | |
| First Republic Bank: | |||
| 4.00% (b) | 14,150 | 286,962 | |
| 4.125% (b) | 16,800 | 352,968 | |
| 4.50% (b) | 1,450 | 31,770 | |
| Semi-Annual Report | 20 |
| Preferred Stock – continued | |||
| Principal Amount | Value | ||
| FINANCIALS continued | |||
| Banks continued | |||
| 4.70% (b) | $ 16,000 | $ 363,840 | |
| Huntington Bancshares, Inc. 4.50% (b) | 6,700 | 145,189 | |
| JPMorgan Chase & Co.: | |||
| 4.20% (b) | 600 | 12,876 | |
| 4.55% (b) | 40,400 | 911,828 | |
| SVB Financial Group 5.25% (b) | 1,350 | 33,766 | |
| Truist Financial Corp. 4.75% (b) | 3,400 | 78,982 | |
| Wells Fargo & Co.: | |||
| 4.25% (b) | 650 | 13,683 | |
| 4.70% (b) | 3,350 | 76,681 | |
| 4.75% (b) | 3,350 | 76,547 | |
| 3,633,992 | |||
| Capital Markets – 3.9% | |||
| Morgan Stanley: | |||
| 4.25% (b) | 2,000 | 43,300 | |
| 5.85% (a)(b) | 10,750 | 290,142 | |
| Stifel Financial Corp.: | |||
| 4.50% (b) | 650 | 13,592 | |
| 6.125% (b) | 700 | 17,941 | |
| The Charles Schwab Corp. 4.45% (b) | 36,400 | 840,476 | |
| 1,205,451 | |||
| Consumer Finance – 4.4% | |||
| Capital One Financial Corp.: | |||
| 4.25% (b) | 610 | 12,828 | |
| 4.625% (b) | 1,350 | 30,146 | |
| 4.80% (b) | 26,250 | 599,812 | |
| Navient Corp. 6.00% 12/15/43 | 2,700 | 61,371 | |
| Synchrony Financial 5.625% (b) | 27,000 | 667,980 | |
| 1,372,137 | |||
| Diversified Financial Services – 0.2% | |||
| Equitable Holdings, Inc. 4.30% (b) | 1,300 | 27,482 | |
| Voya Financial, Inc. 5.35% (a)(b) | 1,300 | 33,878 | |
| 61,360 | |||
| Insurance – 5.6% | |||
| AEGON Funding Co. LLC 5.10% 12/15/49 | 6,700 | 162,274 | |
| Assurant, Inc. 5.25% 1/15/61 | 5,400 | 131,652 | |
| Athene Holding Ltd. 4.875% (b) | 2,050 | 43,891 | |
| KKR Group Finance Co. IX LLC 4.625% 4/1/61 | 49,180 | 1,120,320 | |
| PartnerRe Ltd. 4.875% (b) | 2,650 | 62,911 | |
| RenaissanceRe Holdings Ltd. 4.20% (b) | 1,300 | 27,885 | |
| W R Berkley Corp. 4.25% 9/30/60 | 8,800 | 200,288 | |
| 1,749,221 | |||
| Real Estate Investment Trusts (Reits) – 0.2% | |||
| Brookfield Property Partners LP: | |||
| 5.75% (b) | 1,300 | 28,093 | |
| | |||
| Principal Amount | Value | ||
| 6.375% (b) | $ 700 | $ 16,028 | |
| 44,121 | |||
| TOTAL FINANCIALS | 8,066,282 | ||
| REAL ESTATE – 1.0% | |||
| Equity Real Estate Investment Trusts (Reits) – 1.0% | |||
| Public Storage: | |||
| 3.95% (b) | 650 | 13,637 | |
| 4.00% (b) | 13,500 | 282,690 | |
| 4.00% (b) | 725 | 15,196 | |
| Summit Hotel Properties, Inc. 5.875% (b) | 650 | 15,431 | |
| TOTAL REAL ESTATE | 326,954 | ||
| UTILITIES – 1.9% | |||
| Electric Utilities – 1.2% | |||
| Pacific Gas and Electric Co. 6.00% (b) | 580 | 17,690 | |
| The Southern Co.: | |||
| 4.20% 10/15/60 | 8,050 | 180,320 | |
| 4.95% 1/30/80 | 7,450 | 182,152 | |
| 380,162 | |||
| Independent Power And Renewable Electricity Producers – 0.2% | |||
| Brookfield Renewable Partners LP 5.25% (b) | 2,020 | 45,834 | |
| Multi-Utilities – 0.5% | |||
| Brookfield Infrastructure Partners LP: | |||
| 5.00% (b) | 700 | 14,833 | |
| 5.125% (b) | 700 | 15,232 | |
| DTE Energy Co. 4.375% 10/15/80 | 700 | 15,918 | |
| SCE Trust II 5.10% (b) | 580 | 12,772 | |
| SCE Trust III 5.75% (a)(b) | 1,300 | 30,888 | |
| SCE Trust V 5.45% (a)(b) | 1,300 | 30,511 | |
| SCE Trust VI 5.00% (b) | 2,000 | 42,760 | |
| 162,914 | |||
| TOTAL UTILITIES | 588,910 | ||
| TOTAL PREFERRED STOCKS (Cost $11,934,188) | 10,564,765 | ||
| Convertible Bonds – 0.9% | |||
| ENERGY – 0.9% | |||
| Oil, Gas & Consumable Fuels – 0.9% | |||
| Enbridge, Inc.: | |||
| 5.50% 7/15/77 (a) | 106,000 | 103,951 | |
| 6.00% 1/15/77 (a) | 58,000 | 60,446 | |
| 6.25% 3/01/78 (a) | 103,000 | 106,522 | |
| TOTAL ENERGY | 270,919 | ||
| TOTAL CONVERTIBLE BONDS (Cost $287,537) | 270,919 | ||
| 21 | Semi-Annual Report |
| Money Market Fund – 2.2% | |||
| Shares | Value | ||
| Fidelity Cash Central Fund, 0.07% (d) (Cost $676,419) | 676,284 | $ 676,419 | |
| TOTAL INVESTMENT IN SECURITIES – 99.3% (Cost $33,525,497) | 30,812,399 | ||
| NET OTHER ASSETS (LIABILITIES) – 0.7% | 212,512 | ||
| NET ASSETS – 100.0% | $ 31,024,911 | ||
| Legend | ||
| (a) | Coupon rates for floating and adjustable rate securities reflect the rates in effect at period end. | |
| (b) | Security is perpetual in nature with no stated maturity date. | |
| (c) | Security is exempt from registration under Rule 144A of the Securities Act of 1933. These securities may be resold in transactions exempt from registration, normally to qualified institutional buyers. At the end of the period, the value of these securities amounted to $738,695 or 2.4% of net assets. | |
| (d) | Affiliated fund that is generally available only to investment companies and other accounts managed by Fidelity Investments. The rate quoted is the annualized seven-day yield of the fund at period end. A complete unaudited listing of the fund's holdings as of its most recent quarter end is available upon request. In addition, each Fidelity Central Fund's financial statements are available on the SEC's website or upon request. | |
| Fund | Value, beginning of period | Purchases | Sales Proceeds | Dividend Income | Realized Gain/Loss | Change in Unrealized appreciation (depreciation) | Value, end of period | % ownership, end of period | ||||||
| Fidelity Cash Central Fund, 0.07% | $90,574 | $22,160,717 | $21,574,872 | $206 | $— | $— | $676,419 | 0.0% |
| Description | Total | Level 1 | Level 2 | Level 3 |
| Investments in Securities: | ||||||||
| Corporate Bonds | $ 19,300,296 | $ — | $ 19,300,296 | $ — | ||||
| Preferred Stocks | 10,564,765 | 10,564,765 | — | — | ||||
| Convertible Bonds | 270,919 | — | 270,919 | — | ||||
| Money Market Funds | 676,419 | 676,419 | — | — | ||||
| Total Investments in Securities: | $ 30,812,399 | $ 11,241,184 | $ 19,571,215 | $ — |
| Semi-Annual Report | 22 |
| Fidelity High Yield Factor ETF | Fidelity Preferred Securities & Income ETF | ||
| Assets | |||
| Investments in securities, at value – See accompanying schedule: | |||
| Unaffiliated issuers | $285,528,530 | $30,135,980 | |
| Fidelity Central Funds | 1,399,451 | 676,419 | |
| Total Investments in Securities | $286,927,981 | $30,812,399 | |
| Cash | — | 29,705 | |
| Dividends receivable | 150 | 54,118 | |
| Interest receivable | 4,170,437 | 253,494 | |
| Total assets | 291,098,568 | 31,149,716 | |
| Liabilities | |||
| Distributions payable | 1,103,200 | 109,350 | |
| Accrued management fees | 106,929 | 15,455 | |
| Total liabilities | 1,210,129 | 124,805 | |
| Net Assets | $289,888,439 | $31,024,911 | |
| Net Assets consist of: | |||
| Paid in capital | $302,674,872 | $33,737,595 | |
| Total accumulated earnings (loss) | (12,786,433) | (2,712,684) | |
| Net Assets | $289,888,439 | $31,024,911 | |
| Shares outstanding | 5,600,000 | 1,350,000 | |
| Net Asset Value per share | $ 51.77 | $ 22.98 | |
| Investments at cost – Unaffiliated issuers | $298,618,546 | $32,849,078 | |
| Investments at cost – Fidelity Central Funds | 1,399,451 | 676,419 | |
| Investments at cost | $300,017,997 | $33,525,497 |
| Semi-Annual Report | 24 |
| Fidelity High Yield Factor ETF | Fidelity Preferred Securities & Income ETF | ||
| Investment Income | |||
| Dividends | $ — | $ 167,607 | |
| Interest | 6,947,817 | 224,835 | |
| Income from Fidelity Central Funds | 1,910 | 206 | |
| Total income | 6,949,727 | 392,648 | |
| Expenses | |||
| Management fees | 660,236 | 56,014 | |
| Independent trustees' fees and expenses | 498 | 22 | |
| Total expenses before reductions | 660,734 | 56,036 | |
| Expense reductions | (8) | (17) | |
| Total expenses | 660,726 | 56,019 | |
| Net investment income (loss) | 6,289,001 | 336,629 | |
| Realized and Unrealized Gain (Loss) | |||
| Net realized gain (loss) on investment securities | 756,011 | 604 | |
| Net realized gain (loss) on In-kind redemptions | 292,120 | — | |
| Total net realized gain (loss) | 1,048,131 | 604 | |
| Change in net unrealized appreciation (depreciation) on investment securities | (18,431,633) | (2,737,090) | |
| Net gain (loss) | (17,383,502) | (2,736,486) | |
| Net increase (decrease) in net assets resulting from operations | $(11,094,501) | $(2,399,857) |
| 25 | Semi-Annual Report |
| Fidelity High Yield Factor ETF | Fidelity Preferred Securities & Income ETF | ||||||
| Six months ended February 28, 2022 (Unaudited) | Year ended August 31, 2021 | Six months ended February 28, 2022 (Unaudited) | Year ended August 31, 2021A | ||||
| Increase (Decrease) in Net Assets | |||||||
| Operations | |||||||
| Net investment income (loss) | $ 6,289,001 | $ 8,344,776 | $ 336,629 | $ 35,065 | |||
| Net realized gain (loss) | 1,048,131 | 6,352,506 | 604 | 15 | |||
| Change in net unrealized appreciation (depreciation) | (18,431,633) | 1,726,252 | (2,737,090) | 23,993 | |||
| Net increase (decrease) in net assets resulting from operations | (11,094,501) | 16,423,534 | (2,399,857) | 59,073 | |||
| Distributions to shareholders | (12,499,600) | (10,587,700) | (337,850) | (34,050) | |||
| Share transactions | |||||||
| Proceeds from sales of shares | 79,674,063 | 165,591,594 | 27,462,316 | 6,275,279 | |||
| Cost of shares redeemed | (43,723,473) | (8,316,699) | — | — | |||
| Net increase (decrease) in net assets resulting from share transactions | 35,950,590 | 157,274,895 | 27,462,316 | 6,275,279 | |||
| Total increase (decrease) in net assets | 12,356,489 | 163,110,729 | 24,724,609 | 6,300,302 | |||
| Net Assets | |||||||
| Beginning of period | 277,531,950 | 114,421,221 | 6,300,302 | — | |||
| End of period | $289,888,439 | $277,531,950 | $31,024,911 | $6,300,302 | |||
| Other Information | |||||||
| Shares | |||||||
| Sold | 1,450,000 | 3,000,000 | 1,100,000 | 250,000 | |||
| Redeemed | (800,000) | (150,000) | — | — | |||
| Net increase (decrease) | 650,000 | 2,850,000 | 1,100,000 | 250,000 | |||
| A | For the period June 15, 2021 (commencement of operations) to August 31, 2021. |
| Semi-Annual Report | 26 |
| Fidelity High Yield Factor ETF | |||||||||
| Six months ended February 28, 2022 (Unaudited) | Year ended August 31, 2021 | Year ended August 31, 2020 | Year ended August 31, 2019 | Year ended August 31, 2018A | |||||
| Selected Per-Share Data | |||||||||
| Net asset value, beginning of period | $ 56.07 | $ 54.49 | $ 52.32 | $ 50.21 | $ 50.00 | ||||
| Income from Investment Operations | |||||||||
| Net investment income (loss)B,C | 1.169 | 2.250 | 2.518 | 2.589 | 0.578 | ||||
| Net realized and unrealized gain (loss) | (3.182) | 2.335 | 2.323 | 2.006 | 0.209 | ||||
| Total from investment operations | (2.013) | 4.585 | 4.841 | 4.595 | 0.787 | ||||
| Distributions from net investment income | (1.157) | (2.195) | (2.429) | (2.485) | (0.577) | ||||
| Distributions from net realized gain | (1.128) | (0.808) | (0.242) | — | — | ||||
| Total distributions | (2.285) | (3.003) | (2.671) | (2.485) | (0.577) | ||||
| Net asset value, end of period | $ 51.77 | $ 56.07 | $ 54.49 | $ 52.32 | $ 50.21 | ||||
| Total ReturnD,E,F | (3.69)% | 8.66% | 9.61% | 9.48% | 1.59% | ||||
| Ratios to Average Net AssetsB,G,H | |||||||||
| Expenses before reductions | .45% I | .45% | .45% | .44% J | .45% I | ||||
| Expenses net of fee waivers, if any | .45% I | .45% | .45% | .44% J | .45% I | ||||
| Expenses net of all reductions | .45% I | .45% | .45% | .44% J | .45% I | ||||
| Net investment income (loss) | 4.32% I | 4.07% | 4.84% | 5.03% | 5.21% I | ||||
| Supplemental Data | |||||||||
| Net assets, end of period (000 omitted) | $289,888 | $277,532 | $114,421 | $68,016 | $12,553 | ||||
| Portfolio turnover rateK | 34% L,M | 177% M | 179% M | 76% | 8% L | ||||
| A | For the period June 12, 2018 (commencement of operations) to August 31, 2018. |
| B | Net investment income (loss) is affected by the timing of the declaration of dividends by any underlying mutual funds or exchange-traded funds (ETFs). Net investment income (loss) of any such underlying funds is not included in the Fund's net investment income (loss) ratio. |
| C | Calculated based on average shares outstanding during the period. |
| D | Based on net asset value. |
| E | Total returns for periods of less than one year are not annualized. |
| F | Total returns would have been lower if certain expenses had not been reduced during the applicable periods shown. |
| G | Expense ratios reflect operating expenses of the class. Expenses before reductions do not reflect amounts reimbursed, waived, or reduced through arrangements with the investment advisor, brokerage services, or other offset arrangements, if applicable, and do not represent the amount paid by the class during periods when reimbursements, waivers or reductions occur. |
| H | Fees and expenses of any underlying mutual funds or exchange-traded funds (ETFs) are not included in the Fund’s expense ratio. The Fund indirectly bears its proportionate share of these expenses. For additional expense information related to investments in Fidelity Central Funds, please refer to the "Investments in Fidelity Central Funds" note found in the Notes to Financial Statements section of the most recent Annual or Semi-Annual report. |
| I | Annualized. |
| J | The size and fluctuation of net assets and expense amounts may cause ratios to differ from contractual rates. |
| K | Amount does not include the portfolio activity of any underlying mutual funds or exchange-traded funds (ETFs). |
| L | Amount not annualized. |
| M | Portfolio turnover rate excludes securities received or delivered in-kind. |
| 27 | Semi-Annual Report |
| Fidelity Preferred Securities & Income ETF | |||
| Six months ended February 28, 2022 (Unaudited) | Year ended August 31, 2021A | ||
| Selected Per-Share Data | |||
| Net asset value, beginning of period | $ 25.20 | $ 25.00 | |
| Income from Investment Operations | |||
| Net investment income (loss)B,C | 0.434 | 0.170 | |
| Net realized and unrealized gain (loss) | (2.268) | 0.187 | |
| Total from investment operations | (1.834) | 0.357 | |
| Distributions from net investment income | (0.386) | (0.157) | |
| Total distributions | (0.386) | (0.157) | |
| Net asset value, end of period | $ 22.98 | $ 25.20 | |
| Total ReturnD,E | (7.35)% | 1.44% | |
| Ratios to Average Net AssetsB,F,G,H | |||
| Expenses before reductions | .61% I | .59% | |
| Expenses net of fee waivers, if any | .61% I | .59% | |
| Expenses net of all reductions | .61% I | .59% | |
| Net investment income (loss) | 3.64% | 3.16% | |
| Supplemental Data | |||
| Net assets, end of period (000 omitted) | $31,025 | $ 6,300 | |
| Portfolio turnover rateJ,K | 0% | 0% | |
| A | For the period June 15, 2021 (commencement of operations) to August 31, 2021. |
| B | Net investment income (loss) is affected by the timing of the declaration of dividends by any underlying mutual funds or exchange-traded funds (ETFs). Net investment income (loss) of any such underlying funds is not included in the Fund's net investment income (loss) ratio. |
| C | Calculated based on average shares outstanding during the period. |
| D | Based on net asset value. |
| E | Total returns for periods of less than one year are not annualized. |
| F | Annualized. |
| G | Expense ratios reflect operating expenses of the class. Expenses before reductions do not reflect amounts reimbursed, waived, or reduced through arrangements with the investment advisor, brokerage services, or other offset arrangements, if applicable, and do not represent the amount paid by the class during periods when reimbursements, waivers or reductions occur. |
| H | Fees and expenses of any underlying mutual funds or exchange-traded funds (ETFs) are not included in the Fund’s expense ratio. The Fund indirectly bears its proportionate share of these expenses. For additional expense information related to investments in Fidelity Central Funds, please refer to the "Investments in Fidelity Central Funds" note found in the Notes to Financial Statements section of the most recent Annual or Semi-Annual report. |
| I | The size and fluctuation of net assets and expense amounts may cause ratios to differ from contractual rates. |
| J | Amount does not include the portfolio activity of any underlying mutual funds or exchange-traded funds (ETFs). |
| K | Amount not annualized. |
| Semi-Annual Report | 28 |
For the period ended February 28, 2022 (Unaudited)
| Fidelity Central Fund | Investment Manager | Investment Objective | Investment Practices | Expense Ratio(a) |
| Fidelity Money Market Central Funds | Fidelity Management & Research Company LLC (FMR) | Each fund seeks to obtain a high level of current income consistent with the preservation of capital and liquidity. | Short-term Investments | Less than .005% |
| 29 | Semi-Annual Report |
Debt securities, including restricted securities, are valued based on evaluated prices received from third party pricing vendors or from brokers who make markets in such securities. Corporate bonds are valued by pricing vendors who utilize matrix pricing which considers yield or price of bonds of comparable quality, coupon, maturity and type or by broker-supplied prices. When independent prices are unavailable or unreliable, debt securities may be valued utilizing pricing methodologies which consider similar factors that would be used by third party pricing vendors. For foreign debt securities, when significant market or security specific events arise, valuations may be determined in good faith in accordance with procedures adopted by the Board. Debt securities are generally categorized as Level 2 in the hierarchy but may be Level 3 depending on the circumstances. Certain Funds invest a significant portion of its assets in below investment grade securities. The value of these securities can be more volatile due to changes in the credit quality of the issuer and is sensitive to changes in economic, market and regulatory conditions.
| Semi-Annual Report | 30 |
Book-tax differences are primarily due to prior period premium and discount on debt securities, redemptions in kind and losses deferred due to wash sales and excise tax regulations.
| Tax cost | Gross unrealized appreciation | Gross unrealized depreciation | Net unrealized appreciation (depreciation) | |
| Fidelity High Yield Factor ETF | $ 300,029,729 | $ 1,181,509 | $ (14,283,257) | $ (13,101,748) |
| Fidelity Preferred Securities & Income ETF | 33,525,497 | 608 | (2,713,706) | (2,713,098) |
| Purchases ($) | Sales ($) | |
| Fidelity High Yield Factor ETF | 95,692,682 | 96,112,674 |
| Fidelity Preferred Securities & Income ETF | 26,788,240 | 9,625 |
| In-kind Subscriptions ($) | In-kind Redemptions ($) | |
| Fidelity High Yield Factor ETF | 75,117,300 | 42,704,807 |
| Fidelity Preferred Securities & Income ETF | — | — |
| Fee Rate | |
| Fidelity High Yield Factor ETF | .45% |
| Fidelity Preferred Securities & Income ETF | .59% |
| Amount | |
| Fidelity Preferred Securities & Income ETF | $ 171 |
| Amount | |
| Fidelity High Yield Factor ETF | $ 8 |
| Fidelity Preferred Securities & Income ETF | 17 |
| 31 | Semi-Annual Report |
| Semi-Annual Report | 32 |
| Annualized Expense RatioA | Beginning Account Value September 1, 2021 | Ending Account Value February 28, 2022 | Expenses Paid During PeriodB September 1, 2021 to February 28, 2022 | |
| Fidelity High Yield Factor ETF | 0.45% | |||
| Actual | $ 1,000.00 | $ 963.10 | $ 2.19 | |
| Hypothetical C | $ 1,000.00 | $ 1,022.56 | $ 2.26 | |
| Fidelity Preferred Securities & Income ETF | 0.61% | |||
| Actual | $ 1,000.00 | $ 926.50 | $ 2.91 | |
| Hypothetical C | $ 1,000.00 | $ 1,021.77 | $ 3.06 |
| A | Annualized expense ratio reflects expenses net of applicable fee waivers. |
| B | Expenses are equal to the annualized expense ratio, multiplied by the average account value over the period, multiplied by 181/365 (to reflect the one-half year period). The fees and expenses of any Underlying Funds are not included in each annualized expense ratio. |
| C | 5% return per year before expenses. |
| 33 | Semi-Annual Report |
| Semi-Annual Report | 34 |


| Semi-Annual Report | 2 |
| 3 | Semi-Annual Report |
| (by issuer, excluding cash equivalents) | % of fund’s net assets |
| Block, Inc. | 2.0 |
| OneMain Finance Corp. | 1.7 |
| Vistra Operations Co. LLC | 1.6 |
| Darling Ingredients, Inc. | 1.6 |
| Uber Technologies, Inc. | 1.6 |
| 8.5 |
| % of fund's net assets | ||
| Consumer Discretionary | 17.1 | |
| Industrials | 13.3 | |
| Energy | 13.1 | |
| Information Technology | 13.1 | |
| Communication Services | 12.4 | |
| Semi-Annual Report | 4 |
| Nonconvertible Bonds – 95.9% | |||
| Principal Amount | Value | ||
| COMMUNICATION SERVICES – 12.4% | |||
| Commercial Services & Supplies – 2.8% | |||
| APX Group, Inc. 5.75% 7/15/29 (a) | $ 40,000 | $ 35,848 | |
| Block, Inc. 2.75% 6/1/26 (a) | 210,000 | 203,700 | |
| The Hertz Corp. 4.625% 12/1/26 (a) | 50,000 | 47,625 | |
| 287,173 | |||
| Communications Equipment – 0.6% | |||
| CommScope, Inc. 4.75% 9/1/29 (a) | 70,000 | 65,275 | |
| Diversified Telecommunication Services – 3.1% | |||
| Altice France Holding SA 6.00% 2/15/28 (a) | 110,000 | 96,800 | |
| Level 3 Financing, Inc. 3.75% 7/15/29 (a) | 180,000 | 160,545 | |
| Lumen Technologies, Inc. 5.375% 6/15/29 (a) | 60,000 | 52,166 | |
| 309,511 | |||
| Interactive Media & Services – 0.5% | |||
| Match Group, Inc. 4.625% 6/1/28 (a) | 50,000 | 50,150 | |
| Internet Software & Services – 0.3% | |||
| Photo Holdings Merger Sub, Inc. 8.50% 10/1/26 (a) | 30,000 | 29,790 | |
| Media – 4.8% | |||
| Altice Financing SA 5.75% 8/15/29 (a) | 90,000 | 82,012 | |
| Beasley Mezzanine Holdings LLC 8.625% 2/1/26 (a) | 30,000 | 29,100 | |
| Deluxe Corp. 8.00% 6/1/29 (a) | 30,000 | 30,750 | |
| DIRECTV Holdings LLC / DIRECTV Financing Co., Inc. 5.875% 8/15/27 (a) | 50,000 | 49,983 | |
| Front Range BidCo, Inc. 6.125% 3/1/28 (a) | 30,000 | 27,877 | |
| Gannett Holdings LLC 6.00% 11/1/26 (a) | 50,000 | 49,750 | |
| News Corp. 3.875% 5/15/29 (a) | 70,000 | 67,025 | |
| Nexstar Broadcasting, Inc. 4.75% 11/1/28 (a) | 30,000 | 29,100 | |
| TEGNA, Inc. 4.75% 3/15/26 (a) | 30,000 | 30,200 | |
| Univision Communications, Inc. 9.50% 5/1/25 (a) | 30,000 | 31,650 | |
| UPC Broadband Finco BV 4.875% 7/15/31 (a) | 30,000 | 28,650 | |
| | |||
| Principal Amount | Value | ||
| Virgin Media Finance PLC 5.00% 7/15/30 (a) | $ 30,000 | $ 28,200 | |
| 484,297 | |||
| Wireless Telecommunication Services – 0.3% | |||
| Millicom International Cellular SA 4.50% 4/27/31 (a) | 30,000 | 27,930 | |
| TOTAL COMMUNICATION SERVICES | 1,254,126 | ||
| CONSUMER DISCRETIONARY – 17.1% | |||
| Automobiles – 1.1% | |||
| American Axle & Manufacturing, Inc. 5.00% 10/1/29 | 40,000 | 37,950 | |
| Mclaren Finance PLC 7.50% 8/1/26 (a) | 70,000 | 69,650 | |
| 107,600 | |||
| Diversified Consumer Services – 1.2% | |||
| Adtalem Global Education, Inc. 5.50% 3/1/28 (a) | 70,000 | 62,610 | |
| Sotheby's 7.375% 10/15/27 (a) | 30,000 | 31,239 | |
| StoneMor, Inc. 8.50% 5/15/29 (a) | 30,000 | 30,225 | |
| 124,074 | |||
| Entertainment – 0.5% | |||
| Cinemark USA, Inc. 5.25% 7/15/28 (a) | 50,000 | 47,690 | |
| Hotels, Restaurants & Leisure – 4.0% | |||
| 1011778 BC ULC / New Red Finance, Inc. 3.50% 2/15/29 (a) | 30,000 | 28,275 | |
| Hilton Domestic Operating Co., Inc. 3.625% 2/15/32 (a) | 100,000 | 95,060 | |
| MGM Resorts International 4.75% 10/15/28 | 30,000 | 29,869 | |
| Wynn Las Vegas LLC / Wynn Las Vegas Capital Corp. 5.25% 5/15/27 (a) | 120,000 | 118,800 | |
| Yum! Brands, Inc. 4.625% 1/31/32 | 130,000 | 127,400 | |
| 399,404 | |||
| Household Durables – 2.6% | |||
| Taylor Morrison Communities, Inc. 5.125% 8/1/30 (a) | 160,000 | 159,462 | |
| WASH Multifamily Acquisition, Inc. 5.75% 4/15/26 (a) | 100,000 | 100,799 | |
| 260,261 | |||
| Household Products – 0.5% | |||
| ACCO Brands Corp. 4.25% 3/15/29 (a) | 60,000 | 55,950 | |
| 5 | Semi-Annual Report |
| Nonconvertible Bonds – continued | |||
| Principal Amount | Value | ||
| CONSUMER DISCRETIONARY – continued | |||
| Internet & Direct Marketing Retail – 0.8% | |||
| Terrier Media Buyer, Inc. 8.875% 12/15/27 (a) | $ 80,000 | $ 82,000 | |
| Leisure Products – 0.3% | |||
| Life Time, Inc. 8.00% 4/15/26 (a) | 30,000 | 29,927 | |
| Multiline Retail – 0.4% | |||
| Nordstrom, Inc. 4.375% 4/1/30 | 50,000 | 45,910 | |
| Pharmaceuticals – 0.3% | |||
| Horizon Therapeutics USA, Inc. 5.50% 8/1/27 (a) | 30,000 | 30,563 | |
| Specialty Retail – 3.9% | |||
| Ambience Merger Sub, Inc. 4.875% 7/15/28 (a) | 30,000 | 27,750 | |
| Bath & Body Works, Inc. 6.95% 3/1/33 | 30,000 | 31,725 | |
| Carvana Co. 5.625% 10/1/25 (a) | 100,000 | 95,925 | |
| Macy's Retail Holdings LLC 5.875% 4/1/29 (a) | 30,000 | 30,675 | |
| Magic Mergeco, Inc. 5.25% 5/1/28 (a) | 70,000 | 65,450 | |
| Party City Holdings, Inc. 8.75% 2/15/26 (a) | 30,000 | 30,018 | |
| Rite Aid Corp. 8.00% 11/15/26 (a) | 30,000 | 28,558 | |
| The Gap, Inc. 3.625% 10/1/29 (a) | 60,000 | 54,330 | |
| Victoria's Secret & Co. 4.625% 7/15/29 (a) | 30,000 | 28,200 | |
| 392,631 | |||
| Textiles, Apparel & Luxury Goods – 1.5% | |||
| Crocs, Inc. 4.125% 8/15/31 (a) | 70,000 | 59,675 | |
| Hanesbrands, Inc. 4.625% 5/15/24 (a) | 90,000 | 91,238 | |
| 150,913 | |||
| TOTAL CONSUMER DISCRETIONARY | 1,726,923 | ||
| CONSUMER STAPLES – 3.1% | |||
| Food & Staples Retailing – 1.0% | |||
| Albertsons Cos., Inc. / Safeway Inc. / New Albertsons LP / Albertsons LLC 3.25% 3/15/26 (a) | 50,000 | 48,135 | |
| TreeHouse Foods, Inc. 4.00% 9/1/28 | 30,000 | 27,375 | |
| | |||
| Principal Amount | Value | ||
| U.S. Foods, Inc. 4.625% 6/1/30 (a) | $ 30,000 | $ 29,171 | |
| 104,681 | |||
| Food Products – 1.6% | |||
| Darling Ingredients, Inc. 5.25% 4/15/27 (a) | 160,000 | 162,810 | |
| Personal Products – 0.5% | |||
| HLF Financing Sarl LLC / Herbalife International, Inc. 4.875% 6/1/29 (a) | 50,000 | 45,875 | |
| TOTAL CONSUMER STAPLES | 313,366 | ||
| ENERGY – 13.1% | |||
| Energy Equipment & Services – 2.0% | |||
| Atlantica Sustainable Infrastructure PLC 4.125% 6/15/28 (a) | 40,000 | 38,500 | |
| CGG SA 8.75% 4/1/27 (a) | 40,000 | 39,000 | |
| Nabors Industries, Inc. 7.375% 5/15/27 (a) | 30,000 | 30,975 | |
| TechnipFMC PLC 6.50% 2/1/26 (a) | 30,000 | 30,975 | |
| TerraForm Power Operating LLC 4.75% 1/15/30 (a) | 30,000 | 29,439 | |
| Weatherford International Ltd. 8.625% 4/30/30 (a) | 30,000 | 30,399 | |
| 199,288 | |||
| Oil, Gas & Consumable Fuels – 11.1% | |||
| Archrock Partners LP / Archrock Partners Finance Corp. 6.25% 4/1/28 (a) | 30,000 | 30,000 | |
| California Resources Corp. 7.125% 2/1/26 (a) | 100,000 | 104,000 | |
| CCO Holdings LLC / CCO Holdings Capital Corp. 4.75% 2/1/32 (a) | 70,000 | 68,075 | |
| CNX Resources Corp. 6.00% 1/15/29 (a) | 40,000 | 40,848 | |
| Crestwood Midstream Partners LP / Crestwood Midstream Finance Corp. 6.00% 2/1/29 (a) | 30,000 | 30,236 | |
| CVR Energy, Inc. 5.25% 2/15/25 (a) | 90,000 | 87,123 | |
| MEG Energy Corp. 5.875% 2/1/29 (a) | 150,000 | 151,636 | |
| Northern Oil and Gas, Inc. 8.125% 3/1/28 (a) | 30,000 | 31,528 | |
| Occidental Petroleum Corp. 5.50% 12/1/25 | 140,000 | 150,458 | |
| Semi-Annual Report | 6 |
| Nonconvertible Bonds – continued | |||
| Principal Amount | Value | ||
| ENERGY – continued | |||
| Oil, Gas & Consumable Fuels – continued | |||
| Oceaneering International, Inc. 6.00% 2/1/28 | $ 50,000 | $ 49,750 | |
| Renewable Energy Group, Inc. 5.875% 6/1/28 (a) | 50,000 | 54,000 | |
| SM Energy Co. 6.50% 7/15/28 | 30,000 | 30,750 | |
| Southwestern Energy Co. 5.375% 2/1/29 | 70,000 | 72,014 | |
| Teine Energy Ltd. 6.875% 4/15/29 (a) | 70,000 | 70,875 | |
| Western Midstream Operating LP 3.60% 2/1/25 | 150,000 | 150,375 | |
| 1,121,668 | |||
| TOTAL ENERGY | 1,320,956 | ||
| FINANCIALS – 3.5% | |||
| Consumer Finance – 2.9% | |||
| Ally Financial, Inc. 4.70% (b)(c) | 80,000 | 76,310 | |
| Finance of America Funding LLC 7.875% 11/15/25 (a) | 50,000 | 46,500 | |
| OneMain Finance Corp. 3.875% 9/15/28 | 180,000 | 166,725 | |
| 289,535 | |||
| Diversified Financial Services – 0.3% | |||
| Coinbase Global, Inc. 3.375% 10/1/28 (a) | 30,000 | 27,334 | |
| Thrifts & Mortgage Finance – 0.3% | |||
| Radian Group, Inc. 6.625% 3/15/25 | 30,000 | 31,763 | |
| TOTAL FINANCIALS | 348,632 | ||
| HEALTH CARE – 5.1% | |||
| Aerospace & Defense – 0.3% | |||
| Howmet Aerospace, Inc. 3.00% 1/15/29 | 30,000 | 28,463 | |
| Health Care Providers & Services – 1.4% | |||
| Akumin Escrow, Inc. 7.50% 8/1/28 (a) | 30,000 | 25,650 | |
| Cano Health LLC 6.25% 10/1/28 (a) | 65,000 | 57,709 | |
| Tenet Healthcare Corp. 4.375% 1/15/30 (a) | 30,000 | 28,957 | |
| U.S. Renal Care, Inc. 10.625% 7/15/27 (a) | 30,000 | 29,850 | |
| 142,166 | |||
| Life Sciences Tools & Services – 0.5% | |||
| IQVIA, Inc. 5.00% 5/15/27 (a) | 50,000 | 51,146 | |
| | |||
| Principal Amount | Value | ||
| Pharmaceuticals – 2.9% | |||
| Catalent Pharma Solutions, Inc. 3.50% 4/1/30 (a) | $ 70,000 | $ 65,163 | |
| Charles River Laboratories International, Inc. 3.75% 3/15/29 (a) | 70,000 | 67,284 | |
| CHS/Community Health Systems, Inc. 5.25% 5/15/30 (a) | 50,000 | 48,431 | |
| Jazz Securities DAC 4.375% 1/15/29 (a) | 70,000 | 69,332 | |
| Syneos Health, Inc. 3.625% 1/15/29 (a) | 50,000 | 47,220 | |
| 297,430 | |||
| TOTAL HEALTH CARE | 519,205 | ||
| INDUSTRIALS – 13.3% | |||
| Aerospace & Defense – 1.3% | |||
| Bombardier, Inc. 6.00% 2/15/28 (a) | 50,000 | 47,750 | |
| Triumph Group, Inc. 8.875% 6/1/24 (a) | 80,000 | 85,362 | |
| 133,112 | |||
| Automobiles – 0.3% | |||
| Rivian Holdings LLC/Rivian LLC/Rivian Automotive LLC 6 month U.S. LIBOR + 5.625% 6.625% 10/15/26 (a)(c) | 30,000 | 30,150 | |
| Commercial Services & Supplies – 4.7% | |||
| Covert Mergeco, Inc. 4.875% 12/1/29 (a) | 60,000 | 57,413 | |
| HealthEquity, Inc. 4.50% 10/1/29 (a) | 70,000 | 66,629 | |
| KAR Auction Services, Inc. 5.125% 6/1/25 (a) | 80,000 | 81,010 | |
| Nielsen Finance LLC / Nielsen Finance Co. 4.50% 7/15/29 (a) | 90,000 | 80,856 | |
| Pitney Bowes, Inc. 6.875% 3/15/27 (a) | 30,000 | 28,234 | |
| PROG Holdings, Inc. 6.00% 11/15/29 (a) | 40,000 | 38,400 | |
| Rent-A-Center, Inc. 6.375% 2/15/29 (a) | 50,000 | 47,875 | |
| Stericycle, Inc. 3.875% 1/15/29 (a) | 80,000 | 74,500 | |
| 474,917 | |||
| Construction & Engineering – 2.6% | |||
| AECOM 5.125% 3/15/27 | 50,000 | 51,250 | |
| Brand Industrial Services, Inc. 8.50% 7/15/25 (a) | 30,000 | 27,525 | |
| 7 | Semi-Annual Report |
| Nonconvertible Bonds – continued | |||
| Principal Amount | Value | ||
| INDUSTRIALS – continued | |||
| Construction & Engineering – continued | |||
| IEA Energy Services LLC 6.625% 8/15/29 (a) | $ 40,000 | $ 37,000 | |
| Pike Corp. 5.50% 9/1/28 (a) | 5,000 | 4,813 | |
| PowerTeam Services LLC 9.033% 12/4/25 (a) | 30,000 | 30,081 | |
| VM Consolidated, Inc. 5.50% 4/15/29 (a) | 110,000 | 108,087 | |
| 258,756 | |||
| Containers & Packaging – 1.2% | |||
| Berry Global Escrow Corp. 5.625% 7/15/27 (a) | 120,000 | 122,952 | |
| Electric Utilities – 0.5% | |||
| Energizer Holdings, Inc. 4.375% 3/31/29 (a) | 60,000 | 54,075 | |
| Health Care Providers & Services – 0.5% | |||
| Lifepoint Health, Inc. Co. 5.375% 1/15/29 (a) | 50,000 | 47,010 | |
| Machinery – 0.3% | |||
| Allison Transmission, Inc. 3.75% 1/30/31 (a) | 30,000 | 27,863 | |
| Road & Rail – 1.6% | |||
| Uber Technologies, Inc. 4.50% 8/15/29 (a) | 170,000 | 162,749 | |
| Transportation Infrastructure – 0.3% | |||
| Fly Leasing Ltd. 7.00% 10/15/24 (a) | 30,000 | 28,772 | |
| TOTAL INDUSTRIALS | 1,340,356 | ||
| INFORMATION TECHNOLOGY – 13.1% | |||
| Electronic Equipment, Instruments & Components – 1.1% | |||
| Atkore, Inc. 4.25% 6/1/31 (a) | 30,000 | 29,080 | |
| SBA Communications Corp. 3.125% 2/1/29 | 60,000 | 55,728 | |
| Sensata Technologies BV 4.00% 4/15/29 (a) | 30,000 | 28,800 | |
| 113,608 | |||
| IT Services – 4.6% | |||
| Austin BidCo, Inc. 7.125% 12/15/28 (a) | 40,000 | 39,100 | |
| Black Knight InfoServ LLC 3.625% 9/1/28 (a) | 30,000 | 28,399 | |
| Diebold Nixdorf, Inc. 9.375% 7/15/25 (a) | 30,000 | 31,058 | |
| Entegris, Inc. 3.625% 5/1/29 (a) | 110,000 | 103,125 | |
| | |||
| Principal Amount | Value | ||
| Go Daddy Operating Co. LLC / GD Finance Co., Inc. 3.50% 3/1/29 (a) | $ 160,000 | $ 151,547 | |
| Minerva Merger Sub, Inc. 6.50% 2/15/30 (a) | 30,000 | 28,882 | |
| Tempo Acquisition LLC / Tempo Acquisition Finance Corp. 5.75% 6/1/25 (a) | 30,000 | 30,600 | |
| The Dun & Bradstreet Corp. 5.00% 12/15/29 (a) | 50,000 | 48,000 | |
| 460,711 | |||
| Semiconductors & Semiconductor Equipment – 0.5% | |||
| ON Semiconductor Corp. 3.875% 9/1/28 (a) | 50,000 | 49,562 | |
| Software – 5.3% | |||
| Clarivate Science Holdings Corp. 3.875% 7/1/28 (a) | 170,000 | 160,650 | |
| Elastic N.V. 4.125% 7/15/29 (a) | 110,000 | 100,925 | |
| Open Text Corp. 3.875% 12/1/29 (a) | 170,000 | 160,442 | |
| Twilio, Inc. 3.625% 3/15/29 | 70,000 | 66,889 | |
| Twitter, Inc. 3.875% 12/15/27 (a) | 50,000 | 49,156 | |
| 538,062 | |||
| Technology Hardware, Storage & Peripherals – 1.6% | |||
| NCR Corp. 5.125% 4/15/29 (a) | 160,000 | 158,200 | |
| TOTAL INFORMATION TECHNOLOGY | 1,320,143 | ||
| MATERIALS – 9.2% | |||
| Chemicals – 3.6% | |||
| Methanex Corp. 5.125% 10/15/27 | 70,000 | 71,057 | |
| NOVA Chemicals Corp. 4.25% 5/15/29 (a) | 30,000 | 28,112 | |
| Nufarm Australia Ltd. / Nufarm Americas, Inc. 5.00% 1/27/30 (a) | 30,000 | 29,625 | |
| Olympus Water US Holding Corp. 6.25% 10/1/29 (a) | 60,000 | 55,050 | |
| Sunnova Energy Corp. 5.875% 9/1/26 (a) | 30,000 | 27,454 | |
| The Chemours Co. LLC 4.625% 11/15/29 (a) | 30,000 | 27,787 | |
| Valvoline, Inc. 3.625% 6/15/31 (a) | 140,000 | 125,390 | |
| 364,475 | |||
| Semi-Annual Report | 8 |
| Nonconvertible Bonds – continued | |||
| Principal Amount | Value | ||
| MATERIALS – continued | |||
| Construction Materials – 0.4% | |||
| Patrick Industries, Inc. 4.75% 5/1/29 (a) | $ 50,000 | $ 45,635 | |
| Containers & Packaging – 1.6% | |||
| Ardagh Packaging Finance PLC / Ardagh Holdings USA, Inc. 5.25% 8/15/27 (a) | 30,000 | 28,517 | |
| Crown Americas LLC / Crown Americas Capital Corp. VI 4.75% 2/1/26 | 80,000 | 81,376 | |
| Flex Acquisition Co., Inc. 6.875% 1/15/25 (a) | 50,000 | 50,109 | |
| 160,002 | |||
| Media – 0.4% | |||
| Cornerstone Building Brands, Inc. 6.125% 1/15/29 (a) | 40,000 | 38,300 | |
| Metals & Mining – 2.2% | |||
| Allegheny Technologies, Inc. 4.875% 10/1/29 | 50,000 | 48,374 | |
| Coeur Mining, Inc. 5.125% 2/15/29 (a) | 30,000 | 26,466 | |
| Constellium SE 3.75% 4/15/29 (a) | 30,000 | 27,582 | |
| FMG Resources August 2006 Pty Ltd. 4.375% 4/1/31 (a) | 30,000 | 29,109 | |
| IAMGOLD Corp. 5.75% 10/15/28 (a) | 40,000 | 36,175 | |
| Infrabuild Australia Pty Ltd. 12.00% 10/1/24 (a) | 50,000 | 51,000 | |
| 218,706 | |||
| Paper & Forest Products – 1.0% | |||
| Mercer International, Inc. 5.125% 2/1/29 | 70,000 | 68,452 | |
| Pearl Merger Sub, Inc. 6.75% 10/1/28 (a) | 30,000 | 29,971 | |
| 98,423 | |||
| TOTAL MATERIALS | 925,541 | ||
| REAL ESTATE – 3.2% | |||
| Equity Real Estate Investment Trusts (REITs) – 2.1% | |||
| Brookfield Property REIT, Inc. / BPR Cumulus LLC / BPR Nimbus LLC / GGSI Sellco LL 4.50% 4/1/27 (a) | 70,000 | 65,275 | |
| iStar, Inc. 5.50% 2/15/26 | 30,000 | 30,664 | |
| New Residential Investment Corp. 6.25% 10/15/25 (a) | 30,000 | 29,422 | |
| | |||
| Principal Amount | Value | ||
| Uniti Group LP / Uniti Fiber Holdings, Inc. / CSL Capital LLC 6.00% 1/15/30 (a) | $ 100,000 | $ 89,391 | |
| 214,752 | |||
| Real Estate Management & Development – 1.1% | |||
| Brookfield Residential Properties, Inc. / Brookfield Residential U.S. LLC 5.00% 6/15/29 (a) | 60,000 | 56,475 | |
| Realogy Group LLC / Realogy Co-Issuer Corp. 5.25% 4/15/30 (a) | 50,000 | 47,650 | |
| 104,125 | |||
| TOTAL REAL ESTATE | 318,877 | ||
| UTILITIES – 2.8% | |||
| Consumer Finance – 0.9% | |||
| NextEra Energy Operating Partners LP 3.875% 10/15/26 (a) | 90,000 | 88,919 | |
| Electric Utilities – 1.6% | |||
| Vistra Operations Co. LLC 4.375% 5/1/29 (a) | 170,000 | 164,737 | |
| Multi-Utilities – 0.3% | |||
| DPL, Inc. 4.125% 7/1/25 | 30,000 | 29,850 | |
| TOTAL UTILITIES | 283,506 | ||
| TOTAL NONCONVERTIBLE BONDS (Cost $9,633,041) | 9,671,631 | ||
| Money Market Fund – 2.9% | |||
| Shares | |||
| Fidelity Cash Central Fund, 0.07% (d) (Cost $291,953) | 291,895 | 291,953 | |
| TOTAL INVESTMENT IN SECURITIES – 98.8% (Cost $9,924,994) | 9,963,584 | ||
| NET OTHER ASSETS (LIABILITIES) – 1.2% | 123,086 | ||
| NET ASSETS – 100.0% | $ 10,086,670 | ||
| 9 | Semi-Annual Report |
| Legend | ||
| (a) | Security is exempt from registration under Rule 144A of the Securities Act of 1933. These securities may be resold in transactions exempt from registration, normally to qualified institutional buyers. At the end of the period, the value of these securities amounted to $8,111,154 or 80.4% of net assets. | |
| (b) | Security is perpetual in nature with no stated maturity date. | |
| (c) | Coupon rates for floating and adjustable rate securities reflect the rates in effect at period end. | |
| (d) | Affiliated fund that is generally available only to investment companies and other accounts managed by Fidelity Investments. The rate quoted is the annualized seven-day yield of the fund at period end. A complete unaudited listing of the fund's holdings as of its most recent quarter end is available upon request. In addition, each Fidelity Central Fund's financial statements are available on the SEC's website or upon request. | |
| Fund | Value, beginning of period | Purchases | Sales Proceeds | Dividend Income | Realized Gain/Loss | Change in Unrealized appreciation (depreciation) | Value, end of period | % ownership, end of period | ||||||
| Fidelity Cash Central Fund, 0.07% | $— | $2,500,000 | $2,208,047 | $6 | $— | $— | $291,953 | 0.0% |
| Description | Total | Level 1 | Level 2 | Level 3 |
| Investments in Securities: | ||||||||
| Corporate Bonds | $ 9,671,631 | $ — | $ 9,671,631 | $ — | ||||
| Money Market Funds | 291,953 | 291,953 | — | — | ||||
| Total Investments in Securities: | $ 9,963,584 | $ 291,953 | $ 9,671,631 | $ — |
| United States of America | 83.5% |
| Canada | 6.7% |
| Luxembourg | 2.0% |
| United Kingdom | 1.6% |
| Netherlands | 1.6% |
| Australia | 1.1% |
| Others (Individually Less Than 1%) | 2.3% |
| 98.8% |
| Semi-Annual Report | 10 |
| Fidelity Sustainable High Yield ETF | |
| Assets | |
| Investments in securities, at value – See accompanying schedule: | |
| Unaffiliated issuers | $ 9,671,631 |
| Fidelity Central Funds | 291,953 |
| Total Investments in Securities | $ 9,963,584 |
| Cash | 50,483 |
| Distributions receivable from Fidelity Central Funds | 6 |
| Interest receivable | 129,836 |
| Total assets | 10,143,909 |
| Liabilities | |
| Payable for investments purchased | |
| Regular delivery | 55,065 |
| Accrued management fees | 2,174 |
| Total liabilities | 57,239 |
| Net Assets | $10,086,670 |
| Net Assets consist of: | |
| Paid in capital | $10,029,358 |
| Total accumulated earnings (loss) | 57,312 |
| Net Assets | $10,086,670 |
| Shares outstanding | 200,000 |
| Net Asset Value per share | $ 50.43 |
| Investments at cost – Unaffiliated issuers | $ 9,633,041 |
| Investments at cost – Fidelity Central Funds | 291,953 |
| Investments at cost | $ 9,924,994 |
| Semi-Annual Report | 12 |
| Fidelity Sustainable High Yield ETFA | |
| Investment Income | |
| Interest | $ 20,890 |
| Income from Fidelity Central Funds | 6 |
| Total income | 20,896 |
| Expenses | |
| Management fees | 2,174 |
| Total expenses | 2,174 |
| Net investment income (loss) | 18,722 |
| Realized and Unrealized Gain (Loss) | |
| Change in net unrealized appreciation (depreciation) on investment securities | 38,590 |
| Net gain (loss) | 38,590 |
| Net increase (decrease) in net assets resulting from operations | $ 57,312 |
| A | For the period February 15, 2022 (commencement of operations) to February 28, 2022. |
| 13 | Semi-Annual Report |
| Fidelity Sustainable High Yield ETF | |
| Six months ended February 28, 2022A (Unaudited) | |
| Increase (Decrease) in Net Assets | |
| Operations | |
| Net investment income (loss) | $ 18,722 |
| Net realized gain (loss) | — |
| Change in net unrealized appreciation (depreciation) | 38,590 |
| Net increase (decrease) in net assets resulting from operations | 57,312 |
| Distributions to shareholders | — |
| Share transactions | |
| Proceeds from sales of shares | 10,029,358 |
| Net increase (decrease) in net assets resulting from share transactions | 10,029,358 |
| Total increase (decrease) in net assets | 10,086,670 |
| Net Assets | |
| Beginning of period | — |
| End of period | $10,086,670 |
| Other Information | |
| Shares | |
| Sold | 200,000 |
| Redeemed | — |
| Net increase (decrease) | 200,000 |
| A | For the period February 15, 2022 (commencement of operations) to February 28, 2022. |
| Semi-Annual Report | 14 |
| Fidelity Sustainable High Yield ETF | |
| Six months ended February 28, 2022A (Unaudited) | |
| Selected Per-Share Data | |
| Net asset value, beginning of period | $ 50.00 |
| Income from Investment Operations | |
| Net investment income (loss)B,C | 0.094 |
| Net realized and unrealized gain (loss) | 0.336 |
| Total from investment operations | 0.430 |
| Net asset value, end of period | $ 50.43 |
| Total ReturnD,E | 0.87% |
| Ratios to Average Net AssetsB,F,G,H | |
| Expenses before reductions | .57% I |
| Expenses net of fee waivers, if any | .57% I |
| Expenses net of all reductions | .57% I |
| Net investment income (loss) | 4.87% |
| Supplemental Data | |
| Net assets, end of period (000 omitted) | $10,087 |
| Portfolio turnover rateJ,K | 0% |
| A | For the period February 15, 2022 (commencement of operations) to February 28, 2022. |
| B | Net investment income (loss) is affected by the timing of the declaration of dividends by any underlying mutual funds or exchange-traded funds (ETFs). Net investment income (loss) of any such underlying funds is not included in the Fund's net investment income (loss) ratio. |
| C | Calculated based on average shares outstanding during the period. |
| D | Based on net asset value. |
| E | Total returns for periods of less than one year are not annualized. |
| F | Annualized. |
| G | Expense ratios reflect operating expenses of the class. Expenses before reductions do not reflect amounts reimbursed, waived, or reduced through arrangements with the investment advisor, brokerage services, or other offset arrangements, if applicable, and do not represent the amount paid by the class during periods when reimbursements, waivers or reductions occur. |
| H | Fees and expenses of any underlying mutual funds or exchange-traded funds (ETFs) are not included in the Fund’s expense ratio. The Fund indirectly bears its proportionate share of these expenses. For additional expense information related to investments in Fidelity Central Funds, please refer to the "Investments in Fidelity Central Funds" note found in the Notes to Financial Statements section of the most recent Annual or Semi-Annual report. |
| I | The size and fluctuation of net assets and expense amounts may cause ratios to differ from contractual rates. |
| J | Amount does not include the portfolio activity of any underlying mutual funds or exchange-traded funds (ETFs). |
| K | Amount not annualized. |
| 15 | Semi-Annual Report |
For the period ended February 28, 2022 (Unaudited)
| Fidelity Central Fund | Investment Manager | Investment Objective | Investment Practices | Expense Ratio(a) |
| Fidelity Money Market Central Funds | Fidelity Management & Research Company LLC (FMR) | Each fund seeks to obtain a high level of current income consistent with the preservation of capital and liquidity. | Short-term Investments | Less than .005% |
| Semi-Annual Report | 16 |
| 17 | Semi-Annual Report |
As of period end, the cost and unrealized appreciation (depreciation) in securities, and derivatives if applicable, for federal income tax purposes were as follows:
| Tax cost | Gross unrealized appreciation | Gross unrealized depreciation | Net unrealized appreciation (depreciation) | |
| Fidelity Sustainable High Yield ETF | $ 9,924,994 | $ 78,454 | $ (39,864) | $ 38,590 |
| Purchases ($) | Sales ($) | |
| Fidelity Sustainable High Yield ETF | 9,631,708 | — |
| Semi-Annual Report | 18 |
| Annualized Expense RatioA | Beginning Account Value | Ending Account Value February 28, 2022 | Expenses Paid During Period | |
| Fidelity Sustainable High Yield ETF | 0.57% | |||
| Actual | $ 1,000.00 | $ 1,008.70 | $ 2.84B | |
| Hypothetical C | $ 1,000.00 | $ 1,021.97 | $ 2.86D |
| A | Annualized expense ratio reflects expenses net of applicable fee waivers. |
| B | Actual expenses are equal to the Fund's annualized expense ratio, multiplied by the average account value over the period, multiplied by 14/365 (to reflect the period February 15, 2022 to February 28, 2022). |
| C | 5% return per year before expenses. |
| D | Hypothetical expenses are equal to the Fund's annualized expense ratio, multiplied by the average account value over the period, multiplied by 181/365 (to reflect the one-half year period). |
| 19 | Semi-Annual Report |
| Semi-Annual Report | 20 |
| 21 | Semi-Annual Report |
| Item 2. | Code of Ethics |
Not applicable.
| Item 3. | Audit Committee Financial Expert |
Not applicable.
| Item 4. | Principal Accountant Fees and Services |
Not applicable.
| Item 5. | Audit Committee of Listed Registrants |
Not applicable.
| Item 6. | Investments |
| (a) | Not applicable. |
| (b) | Not applicable |
| Item 7. | Disclosure of Proxy Voting Policies and Procedures for Closed-End Management Investment Companies |
Not applicable.
| Item 8. | Portfolio Managers of Closed-End Management Investment Companies |
Not applicable.
| Item 9. | Purchase of Equity Securities by Closed-End Management Investment Company and Affiliated Purchasers |
Not applicable.
| Item 10. | Submission of Matters to a Vote of Security Holders |
There were no material changes to the procedures by which shareholders may recommend nominees to the Fidelity Covington Trust’s Board of Trustees.
| Item 11. | Controls and Procedures |
(a)(i) The President and Treasurer and the Chief Financial Officer have concluded that the Fidelity Covington Trust’s (the “Trust”) disclosure controls and procedures (as defined in Rule 30a-3(c) under the Investment Company Act) provide reasonable assurances that material information relating to the Trust is made known to them by the appropriate persons, based on their evaluation of these controls and procedures as of a date within 90 days of the filing date of this report.
(a)(ii) There was no change in the Trust’s internal control over financial reporting (as defined in Rule 30a-3(d) under the Investment Company Act) that occurred during the period covered by this report that has materially affected, or is reasonably likely to materially affect, the Trust’s internal control over financial reporting.
| Item 12. | Disclosure of Securities Lending Activities for Closed-End Management Investment Companies |
Not applicable.
| Item 13. | Exhibits |
SIGNATURES
Pursuant to the requirements of the Securities Exchange Act of 1934 and the Investment Company Act of 1940, the registrant has duly caused this report to be signed on its behalf by the undersigned, thereunto duly authorized.
Fidelity Covington Trust
| By: | /s/ Stacie M. Smith | |
| Stacie M. Smith | ||
| President and Treasurer | ||
| Date: | April 21, 2022 | |
Pursuant to the requirements of the Securities Exchange Act of 1934 and the Investment Company Act of 1940, this report has been signed below by the following persons on behalf of the registrant and in the capacities and on the dates indicated.
| By: | /s/ Stacie M. Smith | |
| Stacie M. Smith | ||
| President and Treasurer | ||
| Date: | April 21, 2022 | |
| By: | /s/ John J. Burke III | |
| John J. Burke III | ||
| Chief Financial Officer | ||
| Date: | April 21, 2022 | |