UNITED STATES
SECURITIES AND EXCHANGE COMMISSION
Washington, D.C. 20549
FORM N-CSR
CERTIFIED SHAREHOLDER REPORT OF REGISTERED
MANAGEMENT INVESTMENT COMPANIES
Investment Company Act file number 811-07319
Fidelity Covington Trust
(Exact name of registrant as specified in charter)
245 Summer St., Boston, MA 02210
(Address of principal executive offices) (Zip code)
Cynthia Lo Bessette, Secretary
245 Summer St.
Boston, Massachusetts 02210
(Name and address of agent for service)
Registrant’s telephone number, including area code: 617-563-7000
Date of fiscal year end: June 30
Date of reporting period: December 31, 2021
| Item 1. | Reports to Stockholders |


| Annual Report | 2 |
| 3 | Annual Report |
| % of fund's net assets | |
| Vestas Wind Systems A/S | 4.4 |
| Orsted AS | 4.2 |
| Enphase Energy, Inc. | 3.6 |
| China Longyuan Power Group Corp. Ltd. | 3.1 |
| Verbund AG | 3.0 |
| Plug Power, Inc. | 3.0 |
| Northland Power, Inc. | 2.8 |
| Xinyi Solar Holdings Ltd. | 2.7 |
| First Solar, Inc. | 2.7 |
| EDP Renovaveis S.A. | 2.6 |
| 32.1 |
| % of fund's net assets | ||
| Utilities | 54.2 | |
| Industrials | 27.7 | |
| Information Technology | 18.1 | |
| Annual Report | 4 |
| % of fund's net assets | |
| SAP SE | 4.4 |
| Salesforce.com, Inc. | 4.3 |
| Shopify, Inc. Class A | 4.0 |
| ServiceNow, Inc. | 4.0 |
| Equinix, Inc. | 3.4 |
| Snowflake, Inc. Class A | 3.2 |
| Digital Realty Trust, Inc. | 3.0 |
| Atlassian Corp. PLC Class A | 2.9 |
| Workday, Inc. Class A | 2.9 |
| Datadog, Inc. Class A | 2.8 |
| 34.9 |
| % of fund's net assets | ||
| Information Technology | 91.9 | |
| Real Estate | 8.1 | |

| 5 | Annual Report |
| % of fund's net assets | |
| Intuitive Surgical, Inc. | 4.9 |
| Cerner Corp. | 4.3 |
| DexCom, Inc. | 4.3 |
| ResMed, Inc. | 4.1 |
| Veeva Systems, Inc. Class A | 3.9 |
| Sonova Holding AG | 3.5 |
| Nuance Communications, Inc. | 3.0 |
| Insulet Corp. | 3.0 |
| Teladoc Health, Inc. | 2.9 |
| Tandem Diabetes Care, Inc. | 2.9 |
| 36.8 |
| % of fund's net assets | ||
| Health Care | 88.7 | |
| Information Technology | 5.3 | |
| Consumer Discretionary | 3.2 | |
| Consumer Staples | 2.6 | |
| Annual Report | 6 |
| % of fund's net assets | |
| Uber Technologies, Inc. | 4.7 |
| Tesla, Inc. | 4.5 |
| NVIDIA Corp. | 4.3 |
| Intel Corp. | 3.9 |
| QUALCOMM, Inc. | 3.9 |
| Aptiv PLC | 3.8 |
| NIO, Inc. ADR | 3.4 |
| Samsung SDI Co. Ltd. | 3.2 |
| Analog Devices, Inc. | 2.9 |
| XPeng, Inc. ADR | 2.8 |
| 37.4 |
| % of fund's net assets | ||
| Information Technology | 36.1 | |
| Consumer Discretionary | 33.0 | |
| Industrials | 18.4 | |
| Materials | 12.4 | |
| 7 | Annual Report |
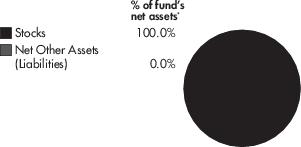
| Common Stocks – 100.0% | ||
| Shares | Value | |
| INDUSTRIALS – 27.7% | ||
| Electrical Equipment – 27.7% | ||
| Array Technologies, Inc. (a) | 20,743 | $ 325,458 |
| Ballard Power Systems, Inc. | 31,011 | 390,108 |
| Bloom Energy Corp. Class A (a) | 17,048 | 373,862 |
| China High Speed Transmission Equipment Group Co. Ltd. | 248,000 | 178,772 |
| CS Wind Corp. | 6,097 | 336,970 |
| Doosan Fuel Cell Co. Ltd. | 8,494 | 342,975 |
| Nordex SE | 20,365 | 322,143 |
| Plug Power, Inc. (a) | 20,875 | 589,301 |
| PowerCell Sweden AB | 12,427 | 254,062 |
| Siemens Gamesa Renewable Energy S.A. (a) | 20,385 | 488,441 |
| Sunrun, Inc. (a) | 13,899 | 476,736 |
| TPI Composites, Inc. (a) | 14,702 | 219,942 |
| Vestas Wind Systems A/S | 28,698 | 877,581 |
| Xinjiang Goldwind Science & Technology Co. Ltd. | 155,400 | 303,373 |
| TOTAL INDUSTRIALS | 5,479,724 | |
| INFORMATION TECHNOLOGY – 18.1% | ||
| Electronic Equipment, Instruments & Components – 3.9% | ||
| Itron, Inc. (a) | 6,469 | 443,256 |
| Landis+Gyr Group AG | 4,927 | 333,910 |
| 777,166 | ||
| Semiconductors & Semiconductor Equipment – 14.2% | ||
| Canadian Solar, Inc. | 9,531 | 298,225 |
| Enphase Energy, Inc. (a) | 3,846 | 703,587 |
| First Solar, Inc. (a) | 6,052 | 527,492 |
| JinkoSolar Holding Co. Ltd. | 7,249 | 333,164 |
| Maxeon Solar Technologies Ltd. | 11,940 | 165,966 |
| SMA Solar Technology AG | 5,637 | 239,621 |
| Xinyi Solar Holdings Ltd. | 316,000 | 535,834 |
| 2,803,889 | ||
| TOTAL INFORMATION TECHNOLOGY | 3,581,055 | |
| UTILITIES – 54.2% | ||
| Electric Utilities – 7.3% | ||
| Orsted AS | 6,589 | 841,426 |
| Verbund AG | 5,292 | 595,186 |
| 1,436,612 | ||
| | ||
| Shares | Value | |
| Independent Power and Renewable Electricity Producers – 46.9% | ||
| Atlantica Sustainable Infrastructure PLC | 10,002 | $ 357,672 |
| Azure Power Global Ltd. | 9,315 | 169,067 |
| Boralex, Inc. | 13,917 | 382,094 |
| Brookfield Renewable Corp. Class A | 13,269 | 488,993 |
| China Datang Corp. Renewable Power Co. Ltd. | 739,000 | 340,291 |
| China Longyuan Power Group Corp. Ltd. | 261,000 | 609,289 |
| Clearway Energy, Inc. Class C | 11,126 | 400,870 |
| Concord New Energy Group Ltd. | 2,350,000 | 247,169 |
| Drax Group PLC | 54,493 | 446,539 |
| EDP Renovaveis S.A. | 21,025 | 523,621 |
| Encavis AG | 19,324 | 341,935 |
| ERG SpA | 10,741 | 347,385 |
| Falck Renewables SpA | 30,496 | 300,329 |
| Innergex Renewable Energy, Inc. | 24,490 | 360,617 |
| Meridian Energy Ltd. | 139,535 | 463,333 |
| Neoen S.A. | 8,910 | 386,654 |
| Northland Power, Inc. | 18,217 | 547,310 |
| Ormat Technologies, Inc. | 5,501 | 436,229 |
| RENOVA, Inc. | 7,900 | 142,832 |
| Scatec ASA | 21,518 | 372,733 |
| Solaria Energia y Medio Ambiente S.A. | 17,604 | 342,730 |
| Sunnova Energy International, Inc. (a) | 12,169 | 339,758 |
| TransAlta Renewables, Inc. | 22,854 | 339,241 |
| West Holdings Corp. | 5,600 | 278,651 |
| Xinyi Energy Holdings Ltd. | 576,000 | 315,473 |
| 9,280,815 | ||
| TOTAL UTILITIES | 10,717,427 | |
| TOTAL COMMON STOCKS (Cost $21,467,188) | 19,778,206 | |
| TOTAL INVESTMENT IN SECURITIES – 100.0% (Cost $21,467,188) | 19,778,206 | |
| NET OTHER ASSETS (LIABILITIES) – 0.0% | 6,143 | |
| NET ASSETS – 100.0% | $19,784,349 | |
| Legend | ||
| (a) | Non-income producing. | |
| Fund | Value, beginning of period | Purchases | Sales Proceeds | Dividend Income | Realized Gain/Loss | Change in Unrealized appreciation (depreciation) | Value, end of period | % ownership, end of period | ||||||
| Fidelity Cash Central Fund, 0.08% | $— | $2,987,323 | $2,987,323 | $14 | $— | $— | $— | 0.0% |
| Annual Report | 8 |
| Description | Total | Level 1 | Level 2 | Level 3 |
| Investments in Securities: | ||||||||
| Equities: | ||||||||
| Industrials | $ 5,479,724 | $ 5,479,724 | $ — | $ — | ||||
| Information Technology | 3,581,055 | 3,581,055 | — | — | ||||
| Utilities | 10,717,427 | 10,717,427 | — | — | ||||
| Total Investments in Securities: | $ 19,778,206 | $ 19,778,206 | $ — | $ — |
| United States of America | 26.9% |
| China | 12.3% |
| Canada | 11.7% |
| Denmark | 8.7% |
| Spain | 6.8% |
| Germany | 4.6% |
| United Kingdom | 4.1% |
| South Korea | 3.4% |
| Italy | 3.3% |
| Austria | 3.0% |
| New Zealand | 2.3% |
| Hong Kong | 2.2% |
| Japan | 2.1% |
| France | 2.0% |
| Norway | 1.9% |
| Switzerland | 1.7% |
| Sweden | 1.3% |
| Others (Individually Less Than 1%) | 1.7% |
| 100.0% |
| 9 | Annual Report |
| Common Stocks – 100.0% | ||
| Shares | Value | |
| INFORMATION TECHNOLOGY – 91.9% | ||
| Communications Equipment – 1.1% | ||
| Netscout Systems, Inc. (a) | 6,829 | $ 225,903 |
| IT Services – 15.2% | ||
| Atos SE | 5,914 | 251,463 |
| DigitalOcean Holdings, Inc. | 1,990 | 159,857 |
| MongoDB, Inc. (a) | 1,016 | 537,819 |
| Shopify, Inc. Class A (a) | 588 | 810,762 |
| Snowflake, Inc. Class A (a) | 1,877 | 635,834 |
| SolarWinds Corp. | 9,317 | 132,208 |
| Twilio, Inc. Class A (a) | 2,063 | 543,270 |
| 3,071,213 | ||
| Software – 65.0% | ||
| Alteryx, Inc. Class A (a) | 3,753 | 227,057 |
| Anaplan, Inc. (a) | 6,737 | 308,891 |
| Atlassian Corp. PLC Class A (a) | 1,551 | 591,381 |
| Avaya Holdings Corp. (a) | 9,497 | 188,041 |
| Box, Inc. Class A (a) | 9,438 | 247,181 |
| C3.ai, Inc. (a) | 6,626 | 207,063 |
| Citrix Systems, Inc. | 4,173 | 394,724 |
| CommVault Systems, Inc. (a) | 3,512 | 242,047 |
| Coupa Software, Inc. (a) | 2,063 | 326,057 |
| Datadog, Inc. Class A (a) | 3,156 | 562,115 |
| Datto Holding Corp. | 5,425 | 142,949 |
| Dropbox, Inc. Class A (a) | 12,166 | 298,554 |
| Dynatrace, Inc. (a) | 5,872 | 354,375 |
| Elastic N.V. (a) | 2,675 | 329,266 |
| Five9, Inc. (a) | 2,386 | 327,646 |
| HubSpot, Inc. (a) | 644 | 424,493 |
| Kingdee International Software Group Co. Ltd. | 105,000 | 323,230 |
| MicroStrategy, Inc. Class A (a) | 397 | 216,163 |
| New Relic, Inc. (a) | 2,700 | 296,892 |
| Nice Ltd. (a) | 1,401 | 428,393 |
| Nutanix, Inc. Class A (a) | 8,919 | 284,159 |
| Open Text Corp. | 7,718 | 366,852 |
| Pegasystems, Inc. | 2,319 | 259,311 |
| Qualtrics International, Inc. (a) | 6,848 | 242,419 |
| Salesforce.com, Inc. (a) | 3,418 | 868,616 |
| | ||
| Shares | Value | |
| SAP SE | 6,266 | $ 889,999 |
| ServiceNow, Inc. (a) | 1,244 | 807,493 |
| Splunk, Inc. (a) | 3,563 | 412,310 |
| Teradata Corp. (a) | 6,073 | 257,920 |
| The Sage Group PLC | 34,113 | 393,938 |
| UiPath, Inc. (a) | 8,005 | 345,256 |
| VMware, Inc. Class A (a) | 3,808 | 441,271 |
| Workday, Inc. Class A (a) | 2,157 | 589,249 |
| Zoom Video Communications, Inc. Class A (a) | 2,808 | 516,419 |
| 13,111,730 | ||
| Technology Hardware, Storage & Peripherals – 10.6% | ||
| Hewlett Packard Enterprise Co. | 27,995 | 441,481 |
| NetApp, Inc. | 4,694 | 431,801 |
| Pure Storage, Inc. Class A (a) | 10,003 | 325,598 |
| Seagate Technology Holdings PLC | 4,144 | 468,189 |
| Western Digital Corp. (a) | 7,079 | 461,622 |
| 2,128,691 | ||
| TOTAL INFORMATION TECHNOLOGY | 18,537,537 | |
| REAL ESTATE – 8.1% | ||
| Equity Real Estate Investment Trusts (REITs) – 8.1% | ||
| CyrusOne, Inc. | 3,883 | 348,383 |
| Digital Realty Trust, Inc. | 3,385 | 598,705 |
| Equinix, Inc. | 809 | 684,284 |
| TOTAL REAL ESTATE | 1,631,372 | |
| TOTAL COMMON STOCKS (Cost $20,937,677) | 20,168,909 | |
| TOTAL INVESTMENT IN SECURITIES – 100.0% (Cost $20,937,677) | 20,168,909 | |
| NET OTHER ASSETS (LIABILITIES) – 0.0% | 9,722 | |
| NET ASSETS – 100.0% | $20,178,631 | |
| Legend | ||
| (a) | Non-income producing. | |
| Fund | Value, beginning of period | Purchases | Sales Proceeds | Dividend Income | Realized Gain/Loss | Change in Unrealized appreciation (depreciation) | Value, end of period | % ownership, end of period | ||||||
| Fidelity Cash Central Fund, 0.08% | $— | $926,935 | $926,935 | $4 | $— | $— | $— | 0.0% |
| Annual Report | 10 |
| Description | Total | Level 1 | Level 2 | Level 3 |
| Investments in Securities: | ||||||||
| Equities: | ||||||||
| Information Technology | $ 18,537,537 | $ 18,537,537 | $ — | $ — | ||||
| Real Estate | 1,631,372 | 1,631,372 | — | — | ||||
| Total Investments in Securities: | $ 20,168,909 | $ 20,168,909 | $ — | $ — |
| United States of America | 77.5% |
| Canada | 5.9% |
| Germany | 4.4% |
| Australia | 2.9% |
| Ireland | 2.3% |
| Israel | 2.1% |
| United Kingdom | 2.0% |
| Cayman Islands | 1.6% |
| France | 1.3% |
| 100.0% |
| 11 | Annual Report |
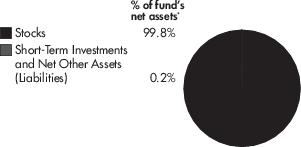
| Common Stocks – 99.8% | ||
| Shares | Value | |
| CONSUMER DISCRETIONARY – 3.2% | ||
| Household Durables – 0.8% | ||
| Vuzix Corp. (a) | 11,115 | $ 96,367 |
| Internet & Direct Marketing Retail – 2.4% | ||
| JD Health International, Inc. | 34,200 | 269,562 |
| TOTAL CONSUMER DISCRETIONARY | 365,929 | |
| CONSUMER STAPLES – 2.6% | ||
| Food & Staples Retailing – 2.6% | ||
| Shop Apotheke Europe N.V. | 1,073 | 138,250 |
| Zur Rose Group AG | 591 | 152,753 |
| TOTAL CONSUMER STAPLES | 291,003 | |
| HEALTH CARE – 88.7% | ||
| Health Care Equipment & Supplies – 41.0% | ||
| Axonics, Inc. (a) | 3,352 | 187,712 |
| Cochlear Ltd. | 1,928 | 302,947 |
| Demant A/S | 4,908 | 251,469 |
| DexCom, Inc. (a) | 898 | 482,181 |
| Fisher & Paykel Healthcare Corp. Ltd. | 14,329 | 321,387 |
| ICU Medical, Inc. (a) | 990 | 234,967 |
| Inogen, Inc. (a) | 3,750 | 127,500 |
| Insulet Corp. (a) | 1,280 | 340,569 |
| Integra LifeSciences Holdings Corp. (a) | 3,561 | 238,551 |
| Intuitive Surgical, Inc. (a) | 1,537 | 552,244 |
| iRhythm Technologies, Inc. (a) | 1,888 | 222,199 |
| Nevro Corp. (a) | 2,191 | 177,624 |
| ResMed, Inc. | 1,775 | 462,352 |
| Sonova Holding AG | 1,003 | 393,869 |
| Tandem Diabetes Care, Inc. (a) | 2,136 | 321,511 |
| 4,617,082 | ||
| Health Care Providers & Services – 10.0% | ||
| Apollo Medical Holdings, Inc. (a) | 2,295 | 168,636 |
| CorVel Corp. (a) | 855 | 177,840 |
| Ping An Healthcare and Technology Co. Ltd. | 47,000 | 170,908 |
| Premier, Inc. Class A | 6,075 | 250,108 |
| R1 RCM, Inc. (a) | 8,320 | 212,077 |
| Tivity Health, Inc. (a) | 5,654 | 149,492 |
| 1,129,061 | ||
| Health Care Technology – 37.7% | ||
| Alibaba Health Information Technology Ltd. | 228,000 | 192,722 |
| Allscripts Healthcare Solutions, Inc. (a) | 10,480 | 193,356 |
| American Well Corp. Class A (a) | 22,354 | 135,018 |
| Cerner Corp. | 5,241 | 486,732 |
| Change Healthcare, Inc. (a) | 11,292 | 241,423 |
| CompuGroup Medical SE & Co. KgaA | 2,279 | 184,398 |
| Computer Programs & Systems, Inc. (a) | 3,456 | 101,261 |
| | ||
| Shares | Value | |
| Health Catalyst, Inc. (a) | 4,120 | $ 163,234 |
| Inspire Medical Systems, Inc. (a) | 1,113 | 256,057 |
| JMDC, Inc. | 2,200 | 163,918 |
| Medical Data Vision Co. Ltd. | 7,800 | 84,398 |
| Multiplan Corp. (a) | 32,672 | 144,737 |
| NextGen Healthcare, Inc. (a) | 8,149 | 144,971 |
| OptimizeRx Corp. (a) | 2,253 | 139,934 |
| Phreesia, Inc. (a) | 3,431 | 142,935 |
| Pro Medicus Ltd. | 4,259 | 193,346 |
| Sectra AB | 8,305 | 183,641 |
| Teladoc Health, Inc. (a) | 3,502 | 321,554 |
| Veeva Systems, Inc. Class A (a) | 1,715 | 438,148 |
| Vocera Communications, Inc. (a) | 2,919 | 189,268 |
| Yidu Tech, Inc. | 54,000 | 145,800 |
| 4,246,851 | ||
| TOTAL HEALTH CARE | 9,992,994 | |
| INFORMATION TECHNOLOGY – 5.3% | ||
| IT Services – 1.0% | ||
| Infocom Corp. | 5,800 | 109,901 |
| Software – 4.3% | ||
| Model N, Inc. (a) | 4,819 | 144,715 |
| Nuance Communications, Inc. (a) | 6,183 | 342,043 |
| 486,758 | ||
| TOTAL INFORMATION TECHNOLOGY | 596,659 | |
| TOTAL COMMON STOCKS (Cost $11,552,367) | 11,246,585 | |
| Money Market Fund – 0.2% | ||
| Fidelity Cash Central Fund, 0.08% (b) (Cost $18,419) | 18,416 | 18,419 |
| TOTAL INVESTMENT IN SECURITIES – 100.0% (Cost $11,570,786) | 11,265,004 | |
| NET OTHER ASSETS (LIABILITIES) – 0.0% | 59 | |
| NET ASSETS – 100.0% | $ 11,265,063 | |
| Legend | ||
| (a) | Non-income producing. | |
| (b) | Affiliated fund that is generally available only to investment companies and other accounts managed by Fidelity Investments. The rate quoted is the annualized seven-day yield of the fund at period end. A complete unaudited listing of the fund's holdings as of its most recent quarter end is available upon request. In addition, each Fidelity Central Fund's financial statements are available on the SEC's website or upon request. | |
| Annual Report | 12 |
| Fund | Value, beginning of period | Purchases | Sales Proceeds | Dividend Income | Realized Gain/Loss | Change in Unrealized appreciation (depreciation) | Value, end of period | % ownership, end of period | ||||||
| Fidelity Cash Central Fund, 0.08% | $— | $145,863 | $127,444 | $1 | $— | $— | $18,419 | 0.0% |
| Description | Total | Level 1 | Level 2 | Level 3 |
| Investments in Securities: | ||||||||
| Equities: | ||||||||
| Consumer Discretionary | $ 365,929 | $ 365,929 | $ — | $ — | ||||
| Consumer Staples | 291,003 | 291,003 | — | — | ||||
| Health Care | 9,992,994 | 9,992,994 | — | — | ||||
| Information Technology | 596,659 | 596,659 | — | — | ||||
| Money Market Fund | 18,419 | 18,419 | — | — | ||||
| Total Investments in Securities: | $ 11,265,004 | $ 11,265,004 | $ — | $ — |
| United States of America | 71.1% |
| China | 5.2% |
| Switzerland | 4.9% |
| Australia | 4.4% |
| Japan | 3.2% |
| New Zealand | 2.9% |
| Denmark | 2.2% |
| Bermuda | 1.7% |
| Germany | 1.6% |
| Sweden | 1.6% |
| Netherlands | 1.2% |
| 100.0% |
| 13 | Annual Report |
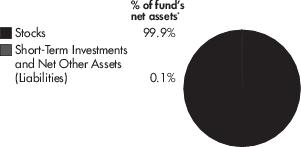
| Common Stocks – 99.9% | ||
| Shares | Value | |
| CONSUMER DISCRETIONARY – 33.0% | ||
| Auto Components – 19.0% | ||
| Aptiv PLC (a) | 10,681 | $ 1,761,831 |
| Faurecia SE | 20,584 | 979,162 |
| Gentex Corp. | 29,094 | 1,013,926 |
| Hella GmbH & Co. KGaA | 3,696 | 260,591 |
| Hella GmbH & Co. KGaA | 6,670 | 452,073 |
| Lear Corp. | 6,200 | 1,134,290 |
| Luminar Technologies, Inc. (a) | 47,715 | 806,861 |
| Valeo S.A. | 31,371 | 948,244 |
| Veoneer, Inc. (a) | 21,483 | 762,217 |
| Visteon Corp. (a) | 6,516 | 724,188 |
| 8,843,383 | ||
| Automobiles – 14.0% | ||
| Arcimoto, Inc. | 34,158 | 265,749 |
| ElectraMeccanica Vehicles Corp. | 117,745 | 268,459 |
| Li Auto, Inc. ADR (a) | 30,849 | 990,253 |
| NIO, Inc. ADR (a) | 50,574 | 1,602,184 |
| Tesla, Inc. (a) | 1,989 | 2,101,936 |
| XPeng, Inc. ADR (a) | 25,591 | 1,287,995 |
| 6,516,576 | ||
| TOTAL CONSUMER DISCRETIONARY | 15,359,959 | |
| INDUSTRIALS – 18.4% | ||
| Electrical Equipment – 11.2% | ||
| Ballard Power Systems, Inc. | 54,209 | 681,931 |
| Blink Charging Co. (a) | 15,075 | 399,638 |
| Bloom Energy Corp. Class A (a) | 29,799 | 653,492 |
| ChargePoint Holdings, Inc. | 33,960 | 646,938 |
| Doosan Fuel Cell Co. Ltd. | 14,833 | 598,935 |
| FuelCell Energy, Inc. (a) | 84,596 | 439,899 |
| Plug Power, Inc. (a) | 36,486 | 1,030,000 |
| PowerCell Sweden AB | 21,712 | 443,888 |
| Romeo Power, Inc. (a) | 92,869 | 338,972 |
| 5,233,693 | ||
| Road & Rail – 7.2% | ||
| Lyft, Inc. Class A (a) | 27,749 | 1,185,715 |
| Uber Technologies, Inc. (a) | 51,708 | 2,168,116 |
| 3,353,831 | ||
| TOTAL INDUSTRIALS | 8,587,524 | |
| INFORMATION TECHNOLOGY – 36.1% | ||
| Electronic Equipment, Instruments & Components – 4.0% | ||
| Samsung SDI Co. Ltd. | 2,720 | 1,498,717 |
| Velodyne Lidar, Inc. (a) | 77,727 | 360,653 |
| 1,859,370 | ||
| Semiconductors & Semiconductor Equipment – 32.1% | ||
| Allegro MicroSystems, Inc. (a) | 11,374 | 411,511 |
| Ambarella, Inc. (a) | 2,904 | 589,193 |
| | ||
| Shares | Value | |
| ams AG (a) | 28,417 | $ 517,566 |
| Analog Devices, Inc. | 7,636 | 1,342,180 |
| CEVA, Inc. (a) | 6,820 | 294,897 |
| Infineon Technologies AG | 25,682 | 1,190,419 |
| Intel Corp. | 35,520 | 1,829,280 |
| Melexis N.V. | 3,352 | 399,486 |
| NVIDIA Corp. | 6,715 | 1,974,949 |
| NXP Semiconductors N.V. | 5,245 | 1,194,706 |
| ON Semiconductor Corp. (a) | 14,395 | 977,708 |
| QUALCOMM, Inc. | 9,905 | 1,811,327 |
| SiTime Corp. (a) | 1,678 | 490,882 |
| Skyworks Solutions, Inc. | 5,838 | 905,707 |
| STMicroelectronics N.V. | 19,867 | 988,659 |
| 14,918,470 | ||
| TOTAL INFORMATION TECHNOLOGY | 16,777,840 | |
| MATERIALS – 12.4% | ||
| Chemicals – 8.9% | ||
| Albemarle Corp. | 4,698 | 1,098,252 |
| Chunbo Co. Ltd. | 1,973 | 578,581 |
| LG Chem Ltd. | 1,985 | 1,026,940 |
| Livent Corp. (a) | 28,885 | 704,216 |
| SK IE Technology Co. Ltd. | 5,224 | 738,281 |
| 4,146,270 | ||
| Metals & Mining – 3.5% | ||
| Allkem Ltd. | 117,760 | 890,421 |
| Ganfeng Lithium Co. Ltd. | 46,800 | 736,549 |
| 1,626,970 | ||
| TOTAL MATERIALS | 5,773,240 | |
| TOTAL COMMON STOCKS (Cost $48,085,354) | 46,498,563 | |
| Money Market Fund – 0.1% | ||
| Fidelity Cash Central Fund, 0.08% (b) (Cost $19,901) | 19,897 | 19,901 |
| TOTAL INVESTMENT IN SECURITIES – 100.0% (Cost $48,105,255) | 46,518,464 | |
| NET OTHER ASSETS (LIABILITIES) – 0.0% | 6,785 | |
| NET ASSETS – 100.0% | $46,525,249 | |
| Legend | ||
| (a) | Non-income producing. | |
| (b) | Affiliated fund that is generally available only to investment companies and other accounts managed by Fidelity Investments. The rate quoted is the annualized seven-day yield of the fund at period end. A complete unaudited listing of the fund's holdings as of its most recent quarter end is available upon request. In addition, each Fidelity Central Fund's financial statements are available on the SEC's website or upon request. | |
| Annual Report | 14 |
| Fund | Value, beginning of period | Purchases | Sales Proceeds | Dividend Income | Realized Gain/Loss | Change in Unrealized appreciation (depreciation) | Value, end of period | % ownership, end of period | ||||||
| Fidelity Cash Central Fund, 0.08% | $— | $4,386,107 | $4,366,206 | $13 | $— | $— | $19,901 | 0.0% |
| Description | Total | Level 1 | Level 2 | Level 3 |
| Investments in Securities: | ||||||||
| Equities: | ||||||||
| Consumer Discretionary | $ 15,359,959 | $ 15,359,959 | $ — | $ — | ||||
| Industrials | 8,587,524 | 8,587,524 | — | — | ||||
| Information Technology | 16,777,840 | 16,777,840 | — | — | ||||
| Materials | 5,773,240 | 5,773,240 | — | — | ||||
| Money Market Fund | 19,901 | 19,901 | — | — | ||||
| Total Investments in Securities: | $ 46,518,464 | $ 46,518,464 | $ — | $ — |
| United States of America | 55.3% |
| South Korea | 9.6% |
| China | 6.5% |
| France | 4.1% |
| Germany | 4.1% |
| United Kingdom | 3.8% |
| Cayman Islands | 3.4% |
| Sweden | 2.6% |
| Netherlands | 2.6% |
| Switzerland | 2.1% |
| Canada | 2.0% |
| Australia | 1.9% |
| Austria | 1.1% |
| Others (Individually Less Than 1%) | 0.9% |
| 100.0% |
| 15 | Annual Report |
| Fidelity Clean Energy ETF | Fidelity Cloud Computing ETF | Fidelity Digital Health ETF | Fidelity Electric Vehicles and Future Transportation ETF | ||||
| Assets | |||||||
| Investments in securities, at value – See accompanying schedule: | |||||||
| Unaffiliated issuers | $19,778,206 | $20,168,909 | $11,246,585 | $46,498,563 | |||
| Fidelity Central Funds | — | — | 18,419 | 19,901 | |||
| Total Investments in Securities | $19,778,206 | $20,168,909 | $11,265,004 | $46,518,464 | |||
| Cash | 3,436 | 861 | — | — | |||
| Foreign currency held at value (cost $2,547, $2,341, $1,633 and $1,153, respectively) | 2,571 | 2,378 | 1,644 | 1,174 | |||
| Dividends receivable | 6,669 | 12,958 | 1,720 | 19,529 | |||
| Distributions receivable from Fidelity Central Funds | 2 | — | 1 | 3 | |||
| Total assets | 19,790,884 | 20,185,106 | 11,268,369 | 46,539,170 | |||
| Liabilities | |||||||
| Accrued management fees | 6,535 | 6,475 | 3,306 | 13,921 | |||
| Total liabilities | 6,535 | 6,475 | 3,306 | 13,921 | |||
| Net Assets | $19,784,349 | $20,178,631 | $11,265,063 | $46,525,249 | |||
| Net Assets consist of: | |||||||
| Paid in capital | $21,727,169 | $21,083,683 | $11,559,219 | $48,120,128 | |||
| Total accumulated earnings (loss) | (1,942,820) | (905,052) | (294,156) | (1,594,879) | |||
| Net Assets | $19,784,349 | $20,178,631 | $11,265,063 | $46,525,249 | |||
| Shares outstanding | 800,000 | 800,000 | 450,000 | 1,700,000 | |||
| Net Asset Value per share | $ 24.73 | $ 25.22 | $ 25.03 | $ 27.37 | |||
| Investments at cost – Unaffiliated issuers | $21,467,188 | $20,937,677 | $11,552,367 | $48,085,354 | |||
| Investments at cost – Fidelity Central Funds | — | — | 18,419 | 19,901 | |||
| Investments at cost | $21,467,188 | $20,937,677 | $11,570,786 | $48,105,255 |
| Annual Report | 16 |
| Fidelity Clean Energy ETFA | Fidelity Cloud Computing ETFA | Fidelity Digital Health ETFA | Fidelity Electric Vehicles and Future Transportation ETFA | ||||
| Investment Income | |||||||
| Dividends | $ 22,964 | $ 18,337 | $ 5,778 | $ 48,709 | |||
| Non-Cash dividends | — | — | 458 | — | |||
| Special dividends | — | 21,175 | — | — | |||
| Income from Fidelity Central Funds | 14 | 4 | 1 | 13 | |||
| Income before foreign taxes withheld | 22,978 | 39,516 | 6,237 | 48,722 | |||
| Less foreign taxes withheld | (2,298) | — | — | (4,894) | |||
| Total income | 20,680 | 39,516 | 6,237 | 43,828 | |||
| Expenses | |||||||
| Management fees | 13,220 | 14,549 | 7,649 | 26,241 | |||
| Independent trustees' fees and expenses | 5 | 6 | 3 | 9 | |||
| Total expenses | 13,225 | 14,555 | 7,652 | 26,250 | |||
| Net investment income (loss) | 7,455 | 24,961 | (1,415) | 17,578 | |||
| Realized and Unrealized Gain (Loss) | |||||||
| Net realized gain (loss) on investment securities | (249,913) | (135,494) | 13,126 | (504,837) | |||
| Net realized gain (loss) on In-kind redemptions | — | — | — | 495,282 | |||
| Net realized gain (loss) on futures contracts | — | 1,460 | — | — | |||
| Net realized gain (loss) on foreign currency transactions | (3,449) | (48) | (95) | 2,048 | |||
| Total net realized gain (loss) | (253,362) | (134,082) | 13,031 | (7,507) | |||
| Change in net unrealized appreciation (depreciation) on investment securities | (1,688,982) | (768,768) | (305,782) | (1,586,791) | |||
| Change in net unrealized appreciation (depreciation) on assets and liabilities in foreign currencies | 69 | 37 | 10 | (9) | |||
| Total change in net unrealized appreciation (depreciation) | (1,688,913) | (768,731) | (305,772) | (1,586,800) | |||
| Net gain (loss) | (1,942,275) | (902,813) | (292,741) | (1,594,307) | |||
| Net increase (decrease) in net assets resulting from operations | $(1,934,820) | $(877,852) | $(294,156) | $(1,576,729) |
| A | For the period October 5, 2021 (commencement of operations) to December 31, 2021. |
| 17 | Annual Report |
| Fidelity Clean Energy ETF | Fidelity Cloud Computing ETF | Fidelity Digital Health ETF | Fidelity Electric Vehicles and Future Transportation ETF | ||||
| Six months ended December 31, 2021A (Unaudited) | Six months ended December 31, 2021A (Unaudited) | Six months ended December 31, 2021A (Unaudited) | Six months ended December 31, 2021A (Unaudited) | ||||
| Increase (Decrease) in Net Assets | |||||||
| Operations | |||||||
| Net investment income (loss) | $ 7,455 | $ 24,961 | $ (1,415) | $ 17,578 | |||
| Net realized gain (loss) | (253,362) | (134,082) | 13,031 | (7,507) | |||
| Change in net unrealized appreciation (depreciation) | (1,688,913) | (768,731) | (305,772) | (1,586,800) | |||
| Net increase (decrease) in net assets resulting from operations | (1,934,820) | (877,852) | (294,156) | (1,576,729) | |||
| Distributions to shareholders | (8,000) | (27,200) | — | (18,150) | |||
| Share transactions | |||||||
| Proceeds from sales of shares | 21,727,169 | 21,083,683 | 11,559,219 | 52,098,695 | |||
| Cost of shares redeemed | — | — | — | (3,978,567) | |||
| Net increase (decrease) in net assets resulting from share transactions | 21,727,169 | 21,083,683 | 11,559,219 | 48,120,128 | |||
| Total increase (decrease) in net assets | 19,784,349 | 20,178,631 | 11,265,063 | 46,525,249 | |||
| Net Assets | |||||||
| Beginning of period | — | — | — | — | |||
| End of period | $19,784,349 | $20,178,631 | $11,265,063 | $46,525,249 | |||
| Other Information | |||||||
| Shares | |||||||
| Sold | 800,000 | 800,000 | 450,000 | 1,850,000 | |||
| Redeemed | — | — | — | (150,000) | |||
| Net increase (decrease) | 800,000 | 800,000 | 450,000 | 1,700,000 |
| A | For the period October 5, 2021 (commencement of operations) to December 31, 2021. |
| Annual Report | 18 |
| Fidelity Clean Energy ETF | |
| Six months ended December 31, 2021A (Unaudited) | |
| Selected Per-Share Data | |
| Net asset value, beginning of period | $ 25.12 |
| Income from Investment Operations | |
| Net investment income (loss)B | 0.01 |
| Net realized and unrealized gain (loss) | (0.39) |
| Total from investment operations | (0.38) |
| Distributions from net investment income | (0.01) |
| Total distributions | (0.01) |
| Net asset value, end of period | $ 24.73 |
| Total ReturnC,D | (1.49)% |
| Ratios to Average Net AssetsE,F | |
| Expenses before reductions | .39% |
| Expenses net of fee waivers, if any | .39% |
| Expenses net of all reductions | .39% |
| Net investment income (loss) | .22% |
| Supplemental Data | |
| Net assets, end of period (000 omitted) | $19,784 |
| Portfolio turnover rateG,H,I | 12% |
| A | For the period October 5, 2021 (commencement of operations) to December 31, 2021. |
| B | Calculated based on average shares outstanding during the period. |
| C | Based on net asset value. |
| D | Total returns for periods of less than one year are not annualized. |
| E | Annualized. |
| F | Expense ratios reflect operating expenses of the class. Expenses before reductions do not reflect amounts reimbursed, waived, or reduced through arrangements with the investment advisor, brokerage services, or other offset arrangements, if applicable, and do not represent the amount paid by the class during periods when reimbursements, waivers or reductions occur. |
| G | Amount does not include the portfolio activity of any underlying mutual funds or exchange-traded funds (ETFs). |
| H | Amount not annualized. |
| I | Portfolio turnover rate excludes securities received or delivered in-kind. |
| 19 | Annual Report |
| Fidelity Cloud Computing ETF | |
| Six months ended December 31, 2021A (Unaudited) | |
| Selected Per-Share Data | |
| Net asset value, beginning of period | $ 25.20 |
| Income from Investment Operations | |
| Net investment income (loss)B | 0.04 C |
| Net realized and unrealized gain (loss) | 0.01 D |
| Total from investment operations | 0.05 |
| Distributions from net investment income | (0.03) |
| Total distributions | (0.03) |
| Net asset value, end of period | $ 25.22 |
| Total ReturnE,F | 0.22% |
| Ratios to Average Net AssetsG,H | |
| Expenses before reductions | .39% |
| Expenses net of fee waivers, if any | .39% |
| Expenses net of all reductions | .39% |
| Net investment income (loss) | .24% C |
| Supplemental Data | |
| Net assets, end of period (000 omitted) | $20,179 |
| Portfolio turnover rateI,J,K | 10% |
| A | For the period October 5, 2021 (commencement of operations) to December 31, 2021. |
| B | Calculated based on average shares outstanding during the period. |
| C | Net investment income per share reflects one or more large, non-recurring dividend(s) which amounted to $0.03 per share. Such dividends are not annualized in the ratio of net investment income (loss) to average net assets. Excluding such non-recurring dividend(s), the ratio of net investment income (loss) to average net assets would have been 0.10%. |
| D | The amount shown for a share outstanding does not correspond with the aggregate net gain (loss) on investments for the period due to the timing of share transactions in relation to fluctuating market values of the investments of a Fund. |
| E | Based on net asset value. |
| F | Total returns for periods of less than one year are not annualized. |
| G | Annualized. |
| H | Expense ratios reflect operating expenses of the class. Expenses before reductions do not reflect amounts reimbursed, waived, or reduced through arrangements with the investment advisor, brokerage services, or other offset arrangements, if applicable, and do not represent the amount paid by the class during periods when reimbursements, waivers or reductions occur. |
| I | Amount does not include the portfolio activity of any underlying mutual funds or exchange-traded funds (ETFs). |
| J | Amount not annualized. |
| K | Portfolio turnover rate excludes securities received or delivered in-kind. |
| Annual Report | 20 |
| Fidelity Digital Health ETF | |
| Six months ended December 31, 2021A (Unaudited) | |
| Selected Per-Share Data | |
| Net asset value, beginning of period | $ 25.10 |
| Income from Investment Operations | |
| Net investment income (loss)B | (—) C |
| Net realized and unrealized gain (loss) | (0.07) |
| Total from investment operations | (0.07) |
| Net asset value, end of period | $ 25.03 |
| Total ReturnD,E | (0.27)% |
| Ratios to Average Net AssetsF,G,H | |
| Expenses before reductions | .39% |
| Expenses net of fee waivers, if any | .39% |
| Expenses net of all reductions | .39% |
| Net investment income (loss) | (.07)% |
| Supplemental Data | |
| Net assets, end of period (000 omitted) | $11,265 |
| Portfolio turnover rateI,J,K | 12% |
| A | For the period October 5, 2021 (commencement of operations) to December 31, 2021. |
| B | Calculated based on average shares outstanding during the period. |
| C | Amount represents less than $0.005 per share. |
| D | Based on net asset value. |
| E | Total returns for periods of less than one year are not annualized. |
| F | Annualized. |
| G | Expense ratios reflect operating expenses of the class. Expenses before reductions do not reflect amounts reimbursed, waived, or reduced through arrangements with the investment advisor, brokerage services, or other offset arrangements, if applicable, and do not represent the amount paid by the class during periods when reimbursements, waivers or reductions occur. |
| H | Fees and expenses of any underlying mutual funds or exchange-traded funds (ETFs) are not included in the Fund’s expense ratio. The Fund indirectly bears its proportionate share of these expenses. For additional expense information related to investments in Fidelity Central Funds, please refer to the "Investments in Fidelity Central Funds" note found in the Notes to Financial Statements section of the most recent Annual or Semi-Annual report. |
| I | Amount does not include the portfolio activity of any underlying mutual funds or exchange-traded funds (ETFs). |
| J | Amount not annualized. |
| K | Portfolio turnover rate excludes securities received or delivered in-kind. |
| 21 | Annual Report |
| Fidelity Electric Vehicles and Future Transportation ETF | |
| Six months ended December 31, 2021A (Unaudited) | |
| Selected Per-Share Data | |
| Net asset value, beginning of period | $ 25.20 |
| Income from Investment Operations | |
| Net investment income (loss)B | 0.02 |
| Net realized and unrealized gain (loss) | 2.16 C |
| Total from investment operations | 2.18 |
| Distributions from net investment income | (0.01) |
| Total distributions | (0.01) |
| Net asset value, end of period | $ 27.37 |
| Total ReturnD,E | 8.67% |
| Ratios to Average Net AssetsF,G,H | |
| Expenses before reductions | .39% |
| Expenses net of fee waivers, if any | .39% |
| Expenses net of all reductions | .39% |
| Net investment income (loss) | .26% |
| Supplemental Data | |
| Net assets, end of period (000 omitted) | $46,525 |
| Portfolio turnover rateI,J,K | 9% |
| A | For the period October 5, 2021 (commencement of operations) to December 31, 2021. |
| B | Calculated based on average shares outstanding during the period. |
| C | The amount shown for a share outstanding does not correspond with the aggregate net gain (loss) on investments for the period due to the timing of share transactions in relation to fluctuating market values of the investments of a Fund. |
| D | Based on net asset value. |
| E | Total returns for periods of less than one year are not annualized. |
| F | Annualized. |
| G | Expense ratios reflect operating expenses of the class. Expenses before reductions do not reflect amounts reimbursed, waived, or reduced through arrangements with the investment advisor, brokerage services, or other offset arrangements, if applicable, and do not represent the amount paid by the class during periods when reimbursements, waivers or reductions occur. |
| H | Fees and expenses of any underlying mutual funds or exchange-traded funds (ETFs) are not included in the Fund’s expense ratio. The Fund indirectly bears its proportionate share of these expenses. For additional expense information related to investments in Fidelity Central Funds, please refer to the "Investments in Fidelity Central Funds" note found in the Notes to Financial Statements section of the most recent Annual or Semi-Annual report. |
| I | Amount does not include the portfolio activity of any underlying mutual funds or exchange-traded funds (ETFs). |
| J | Amount not annualized. |
| K | Portfolio turnover rate excludes securities received or delivered in-kind. |
| Annual Report | 22 |
For the period ended December 31, 2021 (Unaudited)
| Fidelity Central Fund | Investment Manager | Investment Objective | Investment Practices | Expense Ratio(a) |
| Fidelity Money Market Central Funds | Fidelity Management & Research Company LLC (FMR) | Each fund seeks to obtain a high level of current income consistent with the preservation of capital and liquidity. | Short-term Investments | Less than .005% |
| 23 | Annual Report |
| Annual Report | 24 |
ex-dividend date. Non-cash dividends included in dividend income, if any, are recorded at the fair market value of the securities received. Income and capital gain distributions from Fidelity Central Funds, if any, are recorded on the ex-dividend date. Investment income is recorded net of foreign taxes withheld where recovery of such taxes is uncertain. Funds may file withholding tax reclaims in certain jurisdictions to recover a portion of amounts previously withheld. Any withholding tax reclaims income is included in the Statement of Operations in dividends. Any receivables for withholding tax reclaims are included in the Statement of Assets and Liabilities in dividends receivable. Large, non-recurring dividends recognized by the Funds are presented separately on the Statement of Operations as "Special Dividends" and the impact of these dividends is presented in the Financial Highlights.
| Tax cost | Gross unrealized appreciation | Gross unrealized depreciation | Net unrealized appreciation (depreciation) | |
| Fidelity Clean Energy ETF | $ 21,511,927 | $ 284,421 | $ (2,018,142) | $ (1,733,721) |
| Fidelity Cloud Computing ETF | 20,940,816 | 816,229 | (1,588,136) | (771,907) |
| Fidelity Digital Health ETF | 11,581,093 | 493,520 | (809,609) | (316,089) |
| Fidelity Electric Vehicles and Future Transportation ETF | 48,139,301 | 1,055,052 | (2,675,889) | (1,620,837) |
| 25 | Annual Report |
Equity Risk Equity risk relates to the fluctuations in the value of financial instruments as a result of changes in market prices (other than those arising from interest rate risk or foreign exchange risk), whether caused by factors specific to an individual investment, its issuer, or all factors affecting all instruments traded in a market or market segment.
| Purchases ($) | Sales ($) | |
| Fidelity Clean Energy ETF | 5,592,267 | 1,941,735 |
| Fidelity Cloud Computing ETF | 2,109,772 | 1,848,544 |
| Fidelity Digital Health ETF | 1,605,983 | 1,150,677 |
| Fidelity Electric Vehicles and Future Transportation ETF | 8,895,644 | 3,062,177 |
| In-kind Subscriptions ($) | In-kind Redemptions ($) | |
| Fidelity Clean Energy ETF | 18,066,569 | — |
| Fidelity Cloud Computing ETF | 20,844,391 | — |
| Fidelity Digital Health ETF | 11,084,228 | — |
| Fidelity Electric Vehicles and Future Transportation ETF | 46,165,237 | 3,903,794 |
| Fee Rate | |
| Fidelity Clean Energy ETF | .39% |
| Fidelity Cloud Computing ETF | .39% |
| Fidelity Digital Health ETF | .39% |
| Fidelity Electric Vehicles and Future Transportation ETF | .39% |
| Annual Report | 26 |
Interfund Trades. Funds may purchase from or sell securities to other Fidelity Funds under procedures adopted by the Board. The procedures have been designed to ensure these interfund trades are executed in accordance with Rule 17a-7 of the 1940 Act. Any interfund trades are included within the respective purchases and sales amounts shown in the Purchases and Sales of Investments note. During the period there were no interfund trades.
| 27 | Annual Report |
| Annualized Expense RatioA | Beginning Account Value | Ending Account Value December 31, 2021 | Expenses Paid During Period | |
| Fidelity Clean Energy ETF | 0.39% | |||
| Actual | $ 1,000.00 | $ 985.10 | $ 0.92B | |
| Hypothetical C | $ 1,000.00 | $ 1,023.24 | $ 1.99D | |
| Fidelity Cloud Computing ETF | 0.39% | |||
| Actual | $ 1,000.00 | $ 1,002.20 | $ 0.93B | |
| Hypothetical C | $ 1,000.00 | $ 1,023.24 | $ 1.99D | |
| Fidelity Digital Health ETF | 0.39% | |||
| Actual | $ 1,000.00 | $ 997.30 | $ 0.93B | |
| Hypothetical C | $ 1,000.00 | $ 1,023.24 | $ 1.99D | |
| Fidelity Electric Vehicles And Future Transportation ETF | 0.39% | |||
| Actual | $ 1,000.00 | $ 1,086.70 | $ 0.97B | |
| Hypothetical C | $ 1,000.00 | $ 1,023.24 | $ 1.99D |
| A | Annualized expense ratio reflects expenses net of applicable fee waivers. |
| B | Actual expenses are equal to the Fund's annualized expense ratio, multiplied by the average account value over the period, multiplied by 87/365 (to reflect the period October 5, 2021 to December 31, 2021). |
| C | 5% return per year before expenses. |
| D | Hypothetical expenses are equal to the Fund's annualized expense ratio, multiplied by the average account value over the period, multiplied by 184/365 (to reflect the one-half year period). |
| Annual Report | 28 |
| 29 | Annual Report |
| Annual Report | 30 |
| Item 2. | Code of Ethics |
Not applicable.
| Item 3. | Audit Committee Financial Expert |
Not applicable.
| Item 4. | Principal Accountant Fees and Services |
Not applicable.
| Item 5. | Audit Committee of Listed Registrants |
Not applicable.
| Item 6. | Investments |
| (a) | Not applicable. |
| (b) | Not applicable |
| Item 7. | Disclosure of Proxy Voting Policies and Procedures for Closed-End Management Investment Companies |
Not applicable.
| Item 8. | Portfolio Managers of Closed-End Management Investment Companies |
Not applicable.
| Item 9. | Purchase of Equity Securities by Closed-End Management Investment Company and Affiliated Purchasers |
Not applicable.
| Item 10. | Submission of Matters to a Vote of Security Holders |
There were no material changes to the procedures by which shareholders may recommend nominees to the Fidelity Covington Trust’s Board of Trustees.
| Item 11. | Controls and Procedures |
(a)(i) The President and Treasurer and the Chief Financial Officer have concluded that the Fidelity Covington Trust’s (the “Trust”) disclosure controls and procedures (as defined in Rule 30a-3(c) under the Investment Company Act) provide reasonable assurances that material information relating to the Trust is made known to them by the appropriate persons, based on their evaluation of these controls and procedures as of a date within 90 days of the filing date of this report.
(a)(ii) There was no change in the Trust’s internal control over financial reporting (as defined in Rule 30a-3(d) under the Investment Company Act) that occurred during the period covered by this report that has materially affected, or is reasonably likely to materially affect, the Trust’s internal control over financial reporting.
| Item 12. | Disclosure of Securities Lending Activities for Closed-End Management Investment Companies |
Not applicable.
| Item 13. | Exhibits |
SIGNATURES
Pursuant to the requirements of the Securities Exchange Act of 1934 and the Investment Company Act of 1940, the registrant has duly caused this report to be signed on its behalf by the undersigned, thereunto duly authorized.
Fidelity Covington Trust
| By: | /s/ Stacie M. Smith | |
| Stacie M. Smith | ||
| President and Treasurer | ||
| Date: | February 18, 2022 | |
Pursuant to the requirements of the Securities Exchange Act of 1934 and the Investment Company Act of 1940, this report has been signed below by the following persons on behalf of the registrant and in the capacities and on the dates indicated.
| By: | /s/ Stacie M. Smith | |
| Stacie M. Smith | ||
| President and Treasurer | ||
| Date: | February 18, 2022 | |
| By: | /s/ John J. Burke III | |
| John J. Burke III | ||
| Chief Financial Officer | ||
| Date: | February 18, 2022 | |