UNITED STATES
SECURITIES AND EXCHANGE COMMISSION
Washington, D.C. 20549
FORM N-CSR
CERTIFIED SHAREHOLDER REPORT OF REGISTERED
MANAGEMENT INVESTMENT COMPANIES
Investment Company Act file number 811-07319
Fidelity Covington Trust
(Exact name of registrant as specified in charter)
245 Summer St., Boston, MA 02210
(Address of principal executive offices) (Zip code)
Cynthia Lo Bessette, Secretary
245 Summer St.
Boston, Massachusetts 02210
(Name and address of agent for service)
Registrant’s telephone number, including area code: 617-563-7000
Date of fiscal year end: October 31
Date of reporting period: April 30, 2022
| Item 1. | Reports to Stockholders |


| Note to Shareholders | 3 | |
| Investment Summary | 4 | |
| Schedule of Investments | 8 | |
| Financial Statements | 26 | |
| Notes to Financial Statements | 34 | |
| Shareholder Expense Example | 39 | |
| Liquidity Risk Management Program | 40 |
| Semi-Annual Report | 2 |
| 3 | Semi-Annual Report |
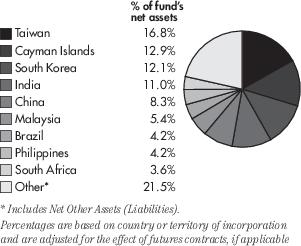
| % of fund's net assets | |
| Taiwan Semiconductor Manufacturing Co. Ltd. | 3.9 |
| Samsung Electronics Co. Ltd. | 3.5 |
| Aldar Properties PJSC | 2.3 |
| Ruentex Development Co. Ltd. | 2.2 |
| Manila Electric Co. | 1.8 |
| Petronas Gas Bhd | 1.7 |
| China Vanke Co. Ltd. | 1.7 |
| Alibaba Group Holding Ltd. ADR | 1.7 |
| Guangdong Investment Ltd. | 1.7 |
| Longfor Group Holdings Ltd. | 1.6 |
| 22.1 |
| % of fund's net assets | ||
| Financials | 17.9 | |
| Communication Services | 15.8 | |
| Information Technology | 15.2 | |
| Industrials | 10.9 | |
| Consumer Staples | 9.7 | |
| Consumer Discretionary | 9.5 | |
| Real Estate | 7.8 | |
| Utilities | 5.5 | |
| Materials | 5.0 | |
| Energy | 1.6 | |
| % of funds's net assets | ||
| Stocks and Equity Futures | 99.8% | |
| Net Other Assets (Liabilities) | 0.2% | |
| Semi-Annual Report | 4 |
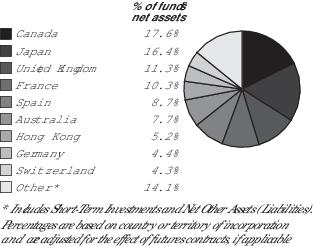
| % of fund's net assets | |
| Endesa S.A. | 2.9 |
| Enel SpA | 2.9 |
| Power Assets Holdings Ltd. | 2.8 |
| Telefonica S.A. | 2.7 |
| Orange S.A. | 2.7 |
| Barrick Gold Corp. | 2.6 |
| Emera, Inc. | 2.4 |
| Enbridge, Inc. | 2.3 |
| TOTAL S.A. | 2.3 |
| Repsol S.A. | 2.3 |
| 25.9 |
| % of fund's net assets | ||
| Financials | 26.2 | |
| Materials | 15.6 | |
| Energy | 12.8 | |
| Communication Services | 11.8 | |
| Utilities | 11.0 | |
| Industrials | 9.2 | |
| Health Care | 4.3 | |
| Consumer Discretionary | 4.2 | |
| Consumer Staples | 2.5 | |
| Information Technology | 1.6 | |
| % of funds's net assets | ||
| Stocks and Equity Futures | 100.0% | |
| Short-Term Investments and Net Other Assets (Liabilities) | 0.0% | |
| 5 | Semi-Annual Report |
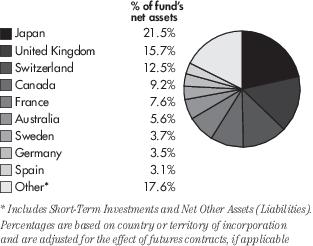
| % of fund's net assets | |
| Nestle S.A. | 2.5 |
| Roche Holding AG | 1.8 |
| AstraZeneca PLC | 1.6 |
| Novartis AG | 1.5 |
| Novo Nordisk A/S Class B | 1.5 |
| SSE PLC | 1.5 |
| Osaka Gas Co. Ltd. | 1.5 |
| Sino Land Co. Ltd. | 1.4 |
| KDDI Corp. | 1.4 |
| Safestore Holdings PLC | 1.4 |
| 16.1 |
| % of fund's net assets | ||
| Health Care | 15.9 | |
| Financials | 15.5 | |
| Consumer Staples | 14.3 | |
| Industrials | 11.5 | |
| Communication Services | 9.5 | |
| Utilities | 8.8 | |
| Real Estate | 7.4 | |
| Consumer Discretionary | 6.5 | |
| Information Technology | 4.3 | |
| Materials | 4.2 | |
| Energy | 1.3 | |
| % of funds's net assets | ||
| Stocks and Equity Futures | 99.8% | |
| Short-Term Investments and Net Other Assets (Liabilities) | 0.2% | |
| Semi-Annual Report | 6 |
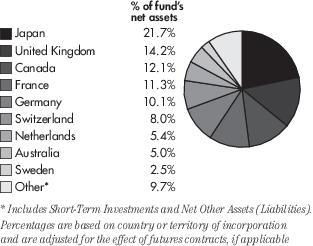
| % of fund's net assets | |
| Nestle S.A. | 2.7 |
| Roche Holding AG | 1.8 |
| ASML Holding N.V. | 1.8 |
| Shell PLC | 1.7 |
| LVMH Moet Hennessy Louis Vuitton SE | 1.5 |
| Novartis AG | 1.5 |
| Sanofi | 1.4 |
| Securitas AB Class B | 1.4 |
| Rio Tinto PLC | 1.4 |
| Canadian National Railway Co. | 1.4 |
| 16.6 |
| % of fund's net assets | ||
| Financials | 19.7 | |
| Industrials | 15.7 | |
| Health Care | 11.1 | |
| Consumer Discretionary | 10.0 | |
| Consumer Staples | 9.8 | |
| Materials | 8.7 | |
| Information Technology | 8.1 | |
| Energy | 5.8 | |
| Communication Services | 4.2 | |
| Utilities | 3.6 | |
| Real Estate | 2.4 | |
| % of funds's net assets | ||
| Stocks and Equity Futures | 99.8% | |
| Short-Term Investments and Net Other Assets (Liabilities) | 0.2% | |
| 7 | Semi-Annual Report |
| Common Stocks – 98.2% | ||
| Shares | Value | |
| BRAZIL – 3.5% | ||
| Ambev S.A. | 91,200 | $ 267,401 |
| Banco Bradesco S.A. | 36,630 | 132,993 |
| BB Seguridade Participacoes S.A. | 19,000 | 97,567 |
| Petro Rio S.A. (a) | 1,800 | 9,705 |
| Telefonica Brasil S.A. | 17,000 | 182,591 |
| Vale S.A. | 8,500 | 142,960 |
| TOTAL BRAZIL | 833,217 | |
| CAYMAN ISLANDS – 12.9% | ||
| Alibaba Group Holding Ltd. ADR (a) | 4,141 | 402,050 |
| ANTA Sports Products Ltd. | 7,000 | 81,945 |
| Autohome, Inc. ADR | 4,668 | 135,699 |
| Bosideng International Holdings Ltd. | 146,000 | 73,687 |
| Hengan International Group Co. Ltd. | 49,000 | 232,318 |
| Huazhu Group Ltd. ADR | 330 | 9,979 |
| JD.com, Inc. (a) | 7,873 | 266,509 |
| JD.com, Inc. ADR (a) | 2,200 | 135,652 |
| Kingboard Holdings Ltd. | 18,500 | 84,175 |
| Kingboard Laminates Holdings Ltd. | 50,500 | 78,522 |
| Li Auto, Inc. ADR (a) | 608 | 13,637 |
| Li Ning Co. Ltd. | 12,500 | 99,651 |
| Longfor Group Holdings Ltd. (b) | 75,500 | 375,279 |
| NetEase, Inc. ADR | 2,593 | 247,191 |
| New Oriental Education & Technology, Inc. ADR | 338 | 4,242 |
| NIO, Inc. ADR (a) | 3,058 | 51,068 |
| Pinduoduo, Inc. ADR (a) | 985 | 42,444 |
| Shenzhou International Group Holdings Ltd. | 5,500 | 76,337 |
| SITC International Holdings Co. Ltd. | 66,000 | 222,912 |
| Topsports International Holdings Ltd. (b) | 82,000 | 63,333 |
| Trip.com Group Ltd. ADR (a) | 1,037 | 24,525 |
| Vipshop Holdings Ltd. ADR (a) | 817 | 6,258 |
| Want Want China Holdings Ltd. | 255,000 | 230,425 |
| XPeng, Inc. ADR (a) | 705 | 17,350 |
| Zhongsheng Group Holdings Ltd. | 10,000 | 66,657 |
| TOTAL CAYMAN ISLANDS | 3,041,845 | |
| CHILE – 0.2% | ||
| Falabella S.A. | 13,702 | 38,469 |
| TOTAL CHILE | 38,469 | |
| CHINA – 8.3% | ||
| Agricultural Bank of China Ltd. Class H | 250,000 | 94,314 |
| Anhui Conch Cement Co. Ltd. Class H | 16,500 | 90,216 |
| Bank of China Ltd. Class H | 348,000 | 137,494 |
| Bank of Communications Co. Ltd. Class H | 137,000 | 95,511 |
| China Cinda Asset Management Co. Ltd. | 285,000 | 48,310 |
| China Coal Energy Co. Ltd. | 65,000 | 55,422 |
| China Construction Bank Corp. Class H | 341,000 | 242,946 |
| | ||
| Shares | Value | |
| China Shenhua Energy Co. Ltd. Class H | 18,500 | $ 59,654 |
| China Tower Corp. Ltd. (b) | 1,504,000 | 176,352 |
| China Vanke Co. Ltd. | 171,800 | 408,143 |
| Dongfeng Motor Group Co. Ltd. | 82,000 | 60,302 |
| GF Securities Co. Ltd. Class H | 32,600 | 41,217 |
| Industrial & Commercial Bank of China Ltd. Class H | 281,000 | 169,757 |
| PICC Property & Casualty Co. Ltd. Class H | 70,000 | 71,908 |
| Postal Savings Bank of China Co. Ltd. Class H (b) | 91,000 | 69,588 |
| The People's Insurance Co. Group of China Ltd. Class H | 177,000 | 56,848 |
| TravelSky Technology Ltd. Class H | 46,000 | 70,001 |
| TOTAL CHINA | 1,947,983 | |
| CYPRUS – 0.0% | ||
| TCS Group Holding PLC (c) | 789 | 990 |
| TOTAL CYPRUS | 990 | |
| HONG KONG – 2.6% | ||
| China Merchants Port Holdings Co. Ltd. | 130,000 | 228,316 |
| Guangdong Investment Ltd. | 306,000 | 393,900 |
| TOTAL HONG KONG | 622,216 | |
| INDIA – 11.0% | ||
| Bajaj Auto Ltd. | 1,901 | 92,748 |
| Bharat Electronics Ltd. | 80,905 | 252,476 |
| Coal India Ltd. | 18,123 | 43,350 |
| Deepak Nitrite Ltd. | 2,160 | 65,741 |
| Federal Bank Ltd. | 48,311 | 60,671 |
| Hero MotoCorp Ltd. | 2,565 | 84,110 |
| Hindustan Petroleum Corp. Ltd. | 9,712 | 34,341 |
| Hindustan Unilever Ltd. | 9,771 | 285,662 |
| ICICI Bank Ltd. | 19,241 | 187,093 |
| Indian Energy Exchange Ltd. (b) | 20,103 | 56,423 |
| Indus Towers Ltd. (a) | 50,496 | 138,060 |
| Infosys Ltd. | 10,676 | 218,925 |
| Kotak Mahindra Bank Ltd. | 5,252 | 123,034 |
| L&T Technology Services Ltd. (b) | 3,572 | 191,194 |
| Max Financial Services Ltd. (a) | 5,502 | 54,529 |
| Mindtree Ltd. | 432 | 20,074 |
| NMDC Ltd. | 32,641 | 68,598 |
| SBI Life Insurance Co. Ltd. (b) | 4,943 | 71,485 |
| State Bank of India | 13,033 | 84,616 |
| Tata Consultancy Services Ltd. | 3,133 | 145,362 |
| Tata Elxsi Ltd. | 273 | 27,663 |
| Vedanta Ltd. | 16,117 | 86,096 |
| Wipro Ltd. | 6,890 | 45,860 |
| Zee Entertainment Enterprises Ltd. | 45,953 | 149,174 |
| TOTAL INDIA | 2,587,285 | |
| Semi-Annual Report | 8 |
| Common Stocks – continued | ||
| Shares | Value | |
| INDONESIA – 2.1% | ||
| Astra International Tbk PT | 148,500 | $ 77,594 |
| Bank Central Asia Tbk PT | 257,800 | 144,487 |
| Telkom Indonesia Persero Tbk PT | 719,000 | 229,136 |
| United Tractors Tbk PT | 23,200 | 48,450 |
| TOTAL INDONESIA | 499,667 | |
| JERSEY – 0.2% | ||
| WNS Holdings Ltd. ADR (a) | 612 | 47,963 |
| TOTAL JERSEY | 47,963 | |
| LUXEMBOURG – 0.1% | ||
| Ternium S.A. ADR | 636 | 27,284 |
| TOTAL LUXEMBOURG | 27,284 | |
| MALAYSIA – 5.4% | ||
| CIMB Group Holdings Bhd | 65,000 | 77,639 |
| DiGi.Com Bhd | 188,200 | 165,137 |
| Hong Leong Bank Bhd | 14,700 | 70,841 |
| Malayan Banking Bhd | 48,451 | 100,942 |
| Nestle Malaysia Bhd | 6,300 | 192,755 |
| Petronas Chemicals Group Bhd | 13,600 | 31,926 |
| Petronas Gas Bhd | 105,700 | 412,263 |
| PPB Group Bhd | 56,200 | 221,779 |
| TOTAL MALAYSIA | 1,273,282 | |
| MARSHALL ISLANDS – 1.0% | ||
| Star Bulk Carriers Corp. | 8,823 | 247,926 |
| TOTAL MARSHALL ISLANDS | 247,926 | |
| MEXICO – 2.6% | ||
| Banco del Bajio S.A. (b) | 35,100 | 86,664 |
| Grupo Aeroportuario del Sureste SAB de CV Class B | 10,290 | 224,556 |
| Grupo Mexico S.A.B. de C.V. | 10,700 | 50,080 |
| Kimberly-Clark de Mexico SAB de CV Class A | 154,800 | 216,099 |
| Orbia Advance Corp. SAB de CV | 11,200 | 26,946 |
| TOTAL MEXICO | 604,345 | |
| PHILIPPINES – 4.2% | ||
| Globe Telecom, Inc. | 2,790 | 121,316 |
| International Container Terminal Services Inc. | 64,630 | 266,914 |
| Manila Electric Co. | 63,180 | 426,484 |
| PLDT, Inc. | 4,765 | 170,319 |
| TOTAL PHILIPPINES | 985,033 | |
| POLAND – 0.3% | ||
| Asseco Poland S.A. | 2,276 | 39,980 |
| | ||
| Shares | Value | |
| Polskie Gornictwo Naftowe i Gazownictwo S.A. | 19,758 | $ 27,738 |
| TOTAL POLAND | 67,718 | |
| QATAR – 0.9% | ||
| Qatar Islamic Bank SAQ | 13,023 | 87,577 |
| Qatar National Bank QPSC | 21,032 | 134,274 |
| TOTAL QATAR | 221,851 | |
| RUSSIA – 0.3% | ||
| Gazprom PJSC (c) | 14,450 | 1,987 |
| Inter RAO UES PJSC (a)(c) | 7,348,600 | 53,227 |
| MMC Norilsk Nickel PJSC (c) | 188 | 1,643 |
| Mobile TeleSystems PJSC (c) | 15,647 | 15,584 |
| Sberbank of Russia PJSC (c) | 38,410 | 310 |
| Surgutneftegas PJSC (c) | 56,600 | 910 |
| VTB Bank PJSC (c) | 91,900,000 | 4,613 |
| TOTAL RUSSIA | 78,274 | |
| SAUDI ARABIA – 2.4% | ||
| Al Rajhi Bank | 4,667 | 219,738 |
| Jarir Marketing Co. | 993 | 50,831 |
| SABIC Agri-Nutrients Co. | 1,535 | 66,543 |
| Southern Province Cement Co. | 2,961 | 52,734 |
| The Saudi National Bank | 8,682 | 182,862 |
| TOTAL SAUDI ARABIA | 572,708 | |
| SOUTH AFRICA – 3.6% | ||
| African Rainbow Minerals Ltd. | 4,197 | 69,495 |
| AVI Ltd. | 40,423 | 175,762 |
| Capitec Bank Holdings Ltd. | 1,006 | 141,405 |
| Discovery Ltd. (a) | 3,683 | 35,456 |
| Kumba Iron Ore Ltd. | 1,708 | 57,667 |
| Momentum Metropolitan Holdings | 8,832 | 9,398 |
| Mr Price Group Ltd. | 4,010 | 54,531 |
| Rand Merchant Investment Holdings Ltd. | 33,736 | 57,612 |
| Truworths International Ltd. | 13,107 | 46,606 |
| Vodacom Group Ltd. | 19,997 | 192,153 |
| TOTAL SOUTH AFRICA | 840,085 | |
| SOUTH KOREA – 12.1% | ||
| Cheil Worldwide, Inc. | 6,211 | 125,110 |
| DB HiTek Co. Ltd. | 104 | 5,606 |
| DGB Financial Group, Inc. | 14,453 | 102,874 |
| GS Engineering & Construction Corp. | 6,875 | 230,170 |
| GS Holdings Corp. | 1,151 | 40,047 |
| Hankook Tire & Technology Co. Ltd. | 3,490 | 96,836 |
| Hyundai Glovis Co. Ltd. | 1,653 | 275,061 |
| Iljin Materials Co. Ltd. | 48 | 3,363 |
| KT&G Corp. | 3,629 | 238,659 |
| 9 | Semi-Annual Report |
| Common Stocks – continued | ||
| Shares | Value | |
| SOUTH KOREA – continued | ||
| Kumho Petrochemical Co. Ltd. | 292 | $ 35,919 |
| L&F Co. Ltd. (a) | 62 | 10,825 |
| LEENO Industrial, Inc. | 44 | 6,204 |
| LG Display Co. Ltd. | 581 | 7,748 |
| LG Innotek Co. Ltd. | 37 | 10,281 |
| LG Uplus Corp. | 10,433 | 116,291 |
| Lotte Chemical Corp. | 218 | 34,106 |
| NCSoft Corp. | 305 | 102,355 |
| Pearl Abyss Corp. (a) | 1,541 | 83,675 |
| POSCO | 276 | 63,506 |
| Samsung Electro-Mechanics Co. Ltd. | 155 | 20,486 |
| Samsung Electronics Co. Ltd. | 15,319 | 822,055 |
| Samsung SDI Co. Ltd. | 143 | 69,565 |
| Samsung SDS Co. Ltd. | 69 | 8,158 |
| SK Hynix, Inc. | 1,426 | 127,727 |
| Woongjin Coway Co. Ltd. | 1,670 | 94,270 |
| Woori Financial Group, Inc. | 10,376 | 121,852 |
| TOTAL SOUTH KOREA | 2,852,749 | |
| TAIWAN – 16.8% | ||
| ASE Technology Holding Co. Ltd. | 16,000 | 51,894 |
| Asustek Computer, Inc. | 3,000 | 36,335 |
| Catcher Technology Co. Ltd. | 6,000 | 29,516 |
| Cathay Financial Holding Co. Ltd. | 58,000 | 122,984 |
| Chicony Electronics Co. Ltd. | 10,000 | 27,989 |
| Chipbond Technology Corp. | 12,000 | 27,318 |
| Chunghwa Telecom Co. Ltd. | 51,000 | 226,663 |
| Compal Electronics Inc. | 38,000 | 28,685 |
| Elan Microelectronics Corp. | 5,000 | 25,614 |
| eMemory Technology, Inc. | 1,000 | 43,596 |
| Far EasTone Telecommunications Co. Ltd. | 76,000 | 213,493 |
| Feng Hsin Steel Co. Ltd. | 25,000 | 70,567 |
| Gigabyte Technology Co. Ltd. | 6,000 | 22,086 |
| Hon Hai Precision Industry Co. Ltd. | 40,000 | 138,420 |
| International Games System Co. Ltd. | 6,000 | 148,598 |
| Lite-On Technology Corp. | 16,000 | 35,284 |
| MediaTek, Inc. | 5,000 | 140,795 |
| Novatek Microelectronics Corp. | 2,000 | 27,039 |
| Phison Electronics Corp. | 2,000 | 26,293 |
| Pou Chen Corp. | 70,000 | 73,502 |
| Quanta Computer, Inc. | 15,000 | 42,646 |
| Radiant Opto-Electronics Corp. | 9,000 | 31,297 |
| Realtek Semiconductor Corp. | 2,000 | 27,650 |
| Ruentex Development Co. Ltd. | 192,000 | 510,037 |
| Simplo Technology Co. Ltd. | 2,000 | 19,779 |
| SinoPac Financial Holdings Co. Ltd. | 167,000 | 103,399 |
| Taichung Commercial Bank Co. Ltd. | 177,000 | 89,775 |
| Taishin Financial Holding Co. Ltd. | 143,000 | 94,119 |
| Taiwan Fertilizer Co. Ltd. | 31,000 | 78,774 |
| Taiwan Mobile Co. Ltd. | 51,000 | 187,732 |
| | ||
| Shares | Value | |
| Taiwan Semiconductor Manufacturing Co. Ltd. | 51,000 | $ 930,875 |
| Tripod Technology Corp. | 7,000 | 29,448 |
| Union Bank Of Taiwan (a) | 165,000 | 90,685 |
| Voltronic Power Technology Corp. | 5,000 | 221,370 |
| TOTAL TAIWAN | 3,974,257 | |
| THAILAND – 1.5% | ||
| Advanced Info Service PCL | 3,000 | 18,832 |
| Advanced Info Service PCL NVDR | 25,000 | 156,935 |
| Intouch Holdings PCL | 71,100 | 145,314 |
| Intouch Holdings PCL Class F | 3,700 | 7,562 |
| The Siam Cement PCL | 300 | 3,241 |
| The Siam Cement PCL NVDR | 1,800 | 19,445 |
| TOTAL THAILAND | 351,329 | |
| TURKEY – 2.4% | ||
| BIM Birlesik Magazalar AS | 38,276 | 215,264 |
| Enka Insaat ve Sanayi AS | 194,666 | 207,953 |
| Haci Omer Sabanci Holding AS | 53,228 | 71,802 |
| Turkiye Garanti Bankasi AS | 67,991 | 68,558 |
| TOTAL TURKEY | 563,577 | |
| UNITED ARAB EMIRATES – 3.6% | ||
| Aldar Properties PJSC | 352,588 | 542,362 |
| Dubai Islamic Bank PJSC | 41,565 | 72,990 |
| Emirates Telecommunications Group Co. PJSC | 24,496 | 233,419 |
| TOTAL UNITED ARAB EMIRATES | 848,771 | |
| UNITED STATES OF AMERICA – 0.2% | ||
| Yum China Holdings, Inc. | 961 | 40,170 |
| TOTAL UNITED STATES OF AMERICA | 40,170 | |
| TOTAL COMMON STOCKS (Cost $24,532,667) | 23,168,994 | |
| Preferred Stock – 0.7% | ||
| BRAZIL – 0.7% | ||
| Itausa - Investimentos Itau S.A. | 51,810 | 96,355 |
| Petroleo Brasileiro S.A. | 9,600 | 58,699 |
| TOTAL BRAZIL | 155,054 | |
| Semi-Annual Report | 10 |
| Preferred Stock – continued | ||
| Shares | Value | |
| RUSSIA – 0.0% | ||
| Transneft PJSC (c) | 12 | $ 4,574 |
| TOTAL RUSSIA | 4,574 | |
| TOTAL PREFERRED STOCKS (Cost $197,514) | 159,628 | |
| TOTAL INVESTMENT IN SECURITIES – 98.9% (Cost $24,730,181) | 23,328,622 | |
| NET OTHER ASSETS (LIABILITIES) – 1.1% | 266,210 | |
| NET ASSETS – 100.0% | $ 23,594,832 | |
| Categorizations in the Schedule of Investments are based on country or territory of incorporation. | ||
| Legend | ||
| (a) | Non-income producing. | |
| (b) | Security is exempt from registration under Rule 144A of the Securities Act of 1933. These securities may be resold in transactions exempt from registration, normally to qualified institutional buyers. At the end of the period, the value of these securities amounted to $1,090,318 or 4.6% of net assets. | |
| (c) | Level 3 security. | |
| Futures Contracts | |||||
| Number of contracts | Expiration Date | Notional Amount | Value | Unrealized Appreciation/ (Depreciation) | |
| Purchased | |||||
| Equity Index Contract | |||||
| ICE MSCI EAFE Index Contracts (United States) | 4 | June 2022 | $211,480 | $2,247 | $2,247 |
| Fund | Value, beginning of period | Purchases | Sales Proceeds | Dividend Income | Realized Gain/Loss | Change in Unrealized appreciation (depreciation) | Value, end of period | % ownership, end of period | ||||||
| Fidelity Cash Central Fund, 0.32% | $50,336 | $816,493 | $866,829 | $59 | $— | $— | $— | 0.0% |
| 11 | Semi-Annual Report |
| Description | Total | Level 1 | Level 2 | Level 3 |
| Investments in Securities: | ||||||||
| Equities: | ||||||||
| Communication Services | $ 3,688,691 | $ 3,673,107 | $ — | $ 15,584 | ||||
| Consumer Discretionary | 2,245,293 | 2,245,293 | — | — | ||||
| Consumer Staples | 2,276,124 | 2,276,124 | — | — | ||||
| Energy | 321,604 | 318,707 | — | 2,897 | ||||
| Financials | 4,190,150 | 4,184,237 | — | 5,913 | ||||
| Industrials | 2,568,848 | 2,568,848 | — | — | ||||
| Information Technology | 3,613,102 | 3,613,102 | — | — | ||||
| Materials | 1,143,487 | 1,141,844 | — | 1,643 | ||||
| Real Estate | 1,835,821 | 1,835,821 | — | — | ||||
| Utilities | 1,285,874 | 1,232,647 | — | 53,227 | ||||
| Preferred Stock | 159,628 | 155,054 | — | 4,574 | ||||
| Total Investments in Securities: | $ 23,328,622 | $ 23,244,784 | $ — | $ 83,838 |
| Derivative Instruments: | ||||||||
| Assets | ||||||||
| Futures Contracts | $ 2,247 | $ 2,247 | $ — | $ — | ||||
| Total Assets | $ 2,247 | $ 2,247 | — | $ — | ||||
| Total Derivative Instruments: | $ 2,247 | $ 2,247 | $ — | $ — |
| Primary Risk/ Derivative Type | Value | ||
| Asset | Liabilities | ||
| Equity Risk | |||
| Futures Contracts(a) | $2,247 | $0 | |
| Total Equity Risk | 2,247 | 0 | |
| Total Value of Derivatives | $2,247 | $0 | |
| (a) | Reflects gross cumulative appreciation (depreciation) on futures contracts as presented in the Schedule of Investments. In the Statement of Assets and Liabilities, the period end daily variation margin is included in receivable or payable for daily variation margin on futures contracts, and the net cumulative appreciation (depreciation) is included in total accumulated earnings (loss). |
| Semi-Annual Report | 12 |
| Common Stocks – 99.2% | ||
| Shares | Value | |
| AUSTRALIA – 7.7% | ||
| Australia & New Zealand Banking Group Ltd. | 74,555 | $ 1,446,423 |
| BHP Group Ltd. | 67,396 | 2,299,438 |
| Fortescue Metals Group Ltd. | 97,445 | 1,497,863 |
| Sonic Healthcare Ltd. | 10,277 | 268,252 |
| Wesfarmers Ltd. | 10,868 | 381,611 |
| Westpac Banking Corp. | 96,209 | 1,632,014 |
| Woolworths Group Ltd. | 9,238 | 252,818 |
| TOTAL AUSTRALIA | 7,778,419 | |
| BERMUDA – 0.4% | ||
| Jardine Matheson Holdings Ltd. | 6,882 | 365,641 |
| TOTAL BERMUDA | 365,641 | |
| CANADA – 17.6% | ||
| Barrick Gold Corp. | 114,832 | 2,574,185 |
| BCE, Inc. | 40,340 | 2,155,801 |
| Canadian National Railway Co. | 6,631 | 783,859 |
| Emera, Inc. | 49,373 | 2,396,313 |
| Enbridge, Inc. | 53,901 | 2,364,297 |
| Great-West Lifeco, Inc. | 34,668 | 961,335 |
| Manulife Financial Corp. | 61,405 | 1,206,912 |
| Royal Bank of Canada | 17,028 | 1,728,714 |
| TC Energy Corp. | 41,452 | 2,203,876 |
| The Bank of Nova Scotia | 21,146 | 1,345,978 |
| TOTAL CANADA | 17,721,270 | |
| FINLAND – 0.6% | ||
| Kone Oyj Class B | 8,520 | 414,265 |
| Orion Oyj Class B | 5,264 | 207,914 |
| TOTAL FINLAND | 622,179 | |
| FRANCE – 10.3% | ||
| Atos SE | 4,892 | 120,763 |
| AXA S.A. | 46,217 | 1,241,344 |
| BNP Paribas S.A. | 21,864 | 1,146,467 |
| Bouygues S.A. | 15,186 | 526,273 |
| Carrefour S.A. | 9,075 | 193,005 |
| Danone S.A. | 3,577 | 217,508 |
| Faurecia SE | 11,291 | 250,974 |
| La Francaise des Jeux SAEM (a) | 12,697 | 476,986 |
| Orange S.A. | 225,474 | 2,692,143 |
| Sanofi | 4,336 | 462,824 |
| Schneider Electric SE | 4,885 | 709,628 |
| TOTAL S.A. | 46,816 | 2,332,374 |
| TOTAL FRANCE | 10,370,289 | |
| GERMANY – 4.4% | ||
| Allianz SE | 6,642 | 1,514,909 |
| BASF SE | 29,904 | 1,590,296 |
| | ||
| Shares | Value | |
| Daimler AG | 5,970 | $ 422,599 |
| SAP SE | 2,790 | 287,150 |
| Siemens AG | 5,253 | 652,696 |
| TOTAL GERMANY | 4,467,650 | |
| HONG KONG – 5.2% | ||
| BOC Hong Kong Holdings Ltd. | 342,500 | 1,250,629 |
| Hang Seng Bank Ltd. | 66,900 | 1,189,443 |
| Power Assets Holdings Ltd. | 419,500 | 2,825,663 |
| TOTAL HONG KONG | 5,265,735 | |
| IRELAND – 1.6% | ||
| Smurfit Kappa Group PLC | 36,769 | 1,577,955 |
| TOTAL IRELAND | 1,577,955 | |
| ITALY – 2.9% | ||
| Enel SpA | 439,706 | 2,884,331 |
| TOTAL ITALY | 2,884,331 | |
| JAPAN – 16.4% | ||
| Canon, Inc. | 8,800 | 203,427 |
| Honda Motor Co. Ltd. | 13,700 | 361,534 |
| Iida Group Holdings Co. Ltd. | 14,200 | 227,752 |
| ITOCHU Corp. | 20,400 | 619,117 |
| Japan Tobacco, Inc. | 20,500 | 351,820 |
| JXTG Holdings, Inc. | 419,700 | 1,477,826 |
| Kajima Corp. | 42,900 | 480,125 |
| Mitsubishi Corp. | 19,800 | 669,832 |
| Mitsui & Co. Ltd. | 25,200 | 612,689 |
| Mizuho Financial Group, Inc. | 112,800 | 1,374,304 |
| Nintendo Co. Ltd. | 4,900 | 2,265,815 |
| Nomura Holdings, Inc. | 305,300 | 1,178,218 |
| Otsuka Holdings Co. Ltd. | 9,900 | 333,388 |
| Seiko Epson Corp. | 12,000 | 168,385 |
| Sekisui House Ltd. | 16,000 | 278,975 |
| Shin-Etsu Chemical Co. Ltd. | 13,100 | 1,818,489 |
| SoftBank Corp. | 183,300 | 2,143,404 |
| Sumitomo Corp. | 36,000 | 572,816 |
| Takeda Pharmaceutical Co. Ltd. | 13,800 | 401,453 |
| Tokyo Electron Ltd. | 600 | 256,931 |
| Toyota Motor Corp. | 44,135 | 761,530 |
| TOTAL JAPAN | 16,557,830 | |
| NETHERLANDS – 1.6% | ||
| ASR Nederland N.V. | 24,015 | 1,098,003 |
| BE Semiconductor Industries N.V. | 2,238 | 138,684 |
| Koninklijke Ahold Delhaize N.V. | 6,351 | 188,202 |
| Koninklijke Philips N.V. | 8,061 | 212,599 |
| TOTAL NETHERLANDS | 1,637,488 | |
| 13 | Semi-Annual Report |
| Common Stocks – continued | ||
| Shares | Value | |
| NORWAY – 1.9% | ||
| Yara International ASA | 36,812 | $ 1,899,365 |
| TOTAL NORWAY | 1,899,365 | |
| SINGAPORE – 0.2% | ||
| Venture Corp. Ltd. | 19,200 | 238,453 |
| TOTAL SINGAPORE | 238,453 | |
| SPAIN – 8.7% | ||
| ACS Actividades de Construccion y Servicios S.A. | 18,777 | 487,098 |
| Endesa S.A. | 140,249 | 2,963,553 |
| Industria de Diseno Textil S.A. | 13,479 | 285,815 |
| Repsol S.A. | 153,365 | 2,311,205 |
| Telefonica S.A. | 567,097 | 2,771,735 |
| TOTAL SPAIN | 8,819,406 | |
| SWEDEN – 4.1% | ||
| Investor AB | 64,580 | 1,260,429 |
| Skandinaviska Enskilda Banken AB | 94,290 | 1,073,999 |
| Swedbank AB Class A | 65,727 | 1,053,353 |
| Telefonaktiebolaget LM Ericsson | 17,537 | 142,092 |
| Volvo AB Class B (b) | 36,275 | 586,869 |
| TOTAL SWEDEN | 4,116,742 | |
| SWITZERLAND – 4.3% | ||
| ABB Ltd. | 15,364 | 468,526 |
| Cie Financiere Richemont S.A. | 3,373 | 401,361 |
| Lonza Group AG | 252 | 150,164 |
| Nestle S.A. | 5,487 | 712,267 |
| Novartis AG | 5,801 | 517,019 |
| Roche Holding AG | 1,677 | 626,122 |
| Zurich Insurance Group AG | 3,176 | 1,459,000 |
| TOTAL SWITZERLAND | 4,334,459 | |
| UNITED KINGDOM – 11.3% | ||
| AstraZeneca PLC | 4,955 | 664,901 |
| BAE Systems PLC | 64,905 | 603,013 |
| BP PLC | 463,315 | 2,277,616 |
| British American Tobacco PLC | 6,438 | 270,939 |
| Direct Line Insurance Group PLC | 307,017 | 977,912 |
| | ||
| Shares | Value | |
| GlaxoSmithKline PLC | 19,473 | $ 439,337 |
| Imperial Brands PLC | 6,969 | 145,768 |
| Legal & General Group PLC | 349,630 | 1,106,620 |
| M&G PLC | 443,796 | 1,193,493 |
| Persimmon PLC | 12,510 | 329,833 |
| RELX PLC | 20,075 | 603,136 |
| Rio Tinto PLC | 31,991 | 2,291,799 |
| The Sage Group PLC | 19,643 | 181,856 |
| Unilever PLC | 6,446 | 300,977 |
| TOTAL UNITED KINGDOM | 11,387,200 | |
| TOTAL COMMON STOCKS (Cost $105,167,791) | 100,044,412 | |
| Money Market Funds – 0.3% | ||
| Fidelity Cash Central Fund, 0.32% (c) | 101,678 | 101,698 |
| Fidelity Securities Lending Cash Central Fund, 0.32% (c)(d) | 171,683 | 171,700 |
| TOTAL MONEY MARKET FUNDS (Cost $273,398) | 273,398 | |
| TOTAL INVESTMENT IN SECURITIES – 99.5% (Cost $105,441,189) | 100,317,810 | |
| NET OTHER ASSETS (LIABILITIES) – 0.5% | 537,806 | |
| NET ASSETS – 100.0% | $100,855,616 | |
| Categorizations in the Schedule of Investments are based on country or territory of incorporation. | ||
| Legend | ||
| (a) | Security is exempt from registration under Rule 144A of the Securities Act of 1933. These securities may be resold in transactions exempt from registration, normally to qualified institutional buyers. At the end of the period, the value of these securities amounted to $476,986 or 0.5% of net assets. | |
| (b) | Security or a portion of the security is on loan at period end. | |
| (c) | Affiliated fund that is generally available only to investment companies and other accounts managed by Fidelity Investments. The rate quoted is the annualized seven-day yield of the fund at period end. A complete unaudited listing of the fund's holdings as of its most recent quarter end is available upon request. In addition, each Fidelity Central Fund's financial statements are available on the SEC's website or upon request. | |
| (d) | Investment made with cash collateral received from securities on loan. | |
| Semi-Annual Report | 14 |
| Futures Contracts | |||||
| Number of contracts | Expiration Date | Notional Amount | Value | Unrealized Appreciation/ (Depreciation) | |
| Purchased | |||||
| Equity Index Contract | |||||
| CME E-mini Russell 2000 Index Contracts (United States) | 8 | June 2022 | $798,640 | $(44,993) | $(44,993) |
| Fund | Value, beginning of period | Purchases | Sales Proceeds | Dividend Income | Realized Gain/Loss | Change in Unrealized appreciation (depreciation) | Value, end of period | % ownership, end of period | ||||||
| Fidelity Cash Central Fund, 0.32% | $ 56,466 | $20,231,927 | $20,186,695 | $ 194 | $— | $— | $101,698 | 0.0% | ||||||
| Fidelity Securities Lending Cash Central Fund, 0.32% | 4,768,155 | 10,603,926 | 15,200,381 | 12,395 | — | — | $171,700 | 0.0% | ||||||
| Total | $4,824,621 | $30,835,853 | $35,387,076 | $12,589 | $— | $— | $273,398 |
| 15 | Semi-Annual Report |
| Description | Total | Level 1 | Level 2 | Level 3 |
| Investments in Securities: | ||||||||
| Equities: | ||||||||
| Communication Services | $ 12,028,898 | $ 12,028,898 | $ — | $ — | ||||
| Consumer Discretionary | 4,178,970 | 4,178,970 | — | — | ||||
| Consumer Staples | 2,633,304 | 2,633,304 | — | — | ||||
| Energy | 12,967,194 | 12,967,194 | — | — | ||||
| Financials | 26,439,499 | 26,439,499 | — | — | ||||
| Health Care | 4,283,973 | 4,283,973 | — | — | ||||
| Industrials | 9,155,583 | 9,155,583 | — | — | ||||
| Information Technology | 1,737,741 | 1,737,741 | — | — | ||||
| Materials | 15,549,390 | 15,549,390 | — | — | ||||
| Utilities | 11,069,860 | 11,069,860 | — | — | ||||
| Money Market Funds | 273,398 | 273,398 | — | — | ||||
| Total Investments in Securities: | $ 100,317,810 | $ 100,317,810 | $ — | $ — |
| Derivative Instruments: | ||||||||
| Liabilities | ||||||||
| Futures Contracts | $ (44,993) | $ (44,993) | $ — | $ — | ||||
| Total Liabilities | $ (44,993) | $ (44,993) | $ — | $ — | ||||
| Total Derivative Instruments: | $ (44,993) | $ (44,993) | $ — | $ — |
| Primary Risk/ Derivative Type | Value | ||
| Asset | Liabilities | ||
| Equity Risk | |||
| Futures Contracts(a) | $0 | $(44,993) | |
| Total Equity Risk | 0 | (44,993) | |
| Total Value of Derivatives | $0 | $(44,993) | |
| (a) | Reflects gross cumulative appreciation (depreciation) on futures contracts as presented in the Schedule of Investments. In the Statement of Assets and Liabilities, the period end daily variation margin is included in receivable or payable for daily variation margin on futures contracts, and the net cumulative appreciation (depreciation) is included in total accumulated earnings (loss). |
| Semi-Annual Report | 16 |
| Common Stocks – 99.2% | ||
| Shares | Value | |
| AUSTRALIA – 5.6% | ||
| ASX Ltd. | 838 | $ 51,614 |
| BHP Group Ltd. | 2,623 | 89,492 |
| Commonwealth Bank of Australia | 1,813 | 133,840 |
| Fortescue Metals Group Ltd. | 1,720 | 26,439 |
| JB Hi-Fi Ltd. | 1,148 | 43,214 |
| Medibank Pvt Ltd. | 20,729 | 47,139 |
| Rio Tinto Ltd. | 344 | 27,583 |
| Sonic Healthcare Ltd. | 5,725 | 149,435 |
| Suncorp Group Ltd. | 6,185 | 50,371 |
| Telstra Corp. Ltd. | 69,398 | 199,244 |
| Wesfarmers Ltd. | 1,573 | 55,233 |
| TOTAL AUSTRALIA | 873,604 | |
| AUSTRIA – 0.2% | ||
| OMV AG | 107 | 5,543 |
| Raiffeisen Bank International AG | 1,814 | 21,012 |
| TOTAL AUSTRIA | 26,555 | |
| BELGIUM – 0.3% | ||
| Sofina S.A. | 140 | 43,422 |
| TOTAL BELGIUM | 43,422 | |
| BERMUDA – 0.5% | ||
| Jardine Matheson Holdings Ltd. | 1,377 | 73,160 |
| TOTAL BERMUDA | 73,160 | |
| CANADA – 9.2% | ||
| Bank of Montreal | 684 | 72,898 |
| Canadian Apartment Properties REIT | 4,096 | 161,270 |
| Canadian Imperial Bank of Commerce | 524 | 58,228 |
| Canadian National Railway Co. | 673 | 79,556 |
| Canadian Natural Resources Ltd. | 455 | 28,306 |
| Canadian Utilities Ltd. | 6,510 | 196,719 |
| CGI, Inc. (a) | 339 | 27,172 |
| Constellation Software, Inc. | 21 | 33,222 |
| Crescent Point Energy Corp. | 2,244 | 15,627 |
| Empire Co. Ltd. | 3,367 | 111,781 |
| Great-West Lifeco, Inc. | 1,044 | 28,950 |
| Loblaw Cos. Ltd. | 1,414 | 130,010 |
| Manulife Financial Corp. | 2,664 | 52,361 |
| National Bank of Canada | 573 | 40,225 |
| Open Text Corp. | 571 | 22,986 |
| Power Corp. of Canada | 1,225 | 36,231 |
| Royal Bank of Canada | 1,221 | 123,958 |
| Stantec, Inc. | 738 | 34,052 |
| TFI International, Inc. | 413 | 33,394 |
| The Bank of Nova Scotia | 1,211 | 77,082 |
| West Fraser Timber Co. Ltd. | 494 | 43,643 |
| | ||
| Shares | Value | |
| Whitecap Resources, Inc. | 2,083 | $ 17,162 |
| TOTAL CANADA | 1,424,833 | |
| DENMARK – 2.9% | ||
| Coloplast A/S Class B | 525 | 71,402 |
| Novo Nordisk A/S Class B | 2,016 | 232,240 |
| Novozymes A/S Class B | 568 | 39,809 |
| Pandora A/S | 413 | 36,841 |
| Ringkjoebing Landbobank A/S | 413 | 51,074 |
| SimCorp A/S | 307 | 21,769 |
| TOTAL DENMARK | 453,135 | |
| FINLAND – 0.8% | ||
| Kone Oyj Class B | 1,109 | 53,923 |
| Orion Oyj Class B | 1,625 | 64,183 |
| TOTAL FINLAND | 118,106 | |
| FRANCE – 7.6% | ||
| Bureau Veritas S.A. | 1,722 | 49,830 |
| Dassault Systemes SE | 862 | 38,680 |
| Edenred | 725 | 36,743 |
| EssilorLuxottica S.A. | 230 | 39,744 |
| Hermes International | 28 | 35,047 |
| La Francaise des Jeux SAEM (b) | 377 | 14,163 |
| Legrand S.A. | 593 | 53,025 |
| L'Oreal S.A. | 372 | 136,923 |
| LVMH Moet Hennessy Louis Vuitton SE | 162 | 105,874 |
| Pernod Ricard S.A. | 487 | 101,545 |
| Publicis Groupe S.A. | 2,847 | 172,938 |
| Sanofi | 1,590 | 169,716 |
| Schneider Electric SE | 619 | 89,920 |
| Societe Generale S.A. (a) | 1,877 | 45,880 |
| Sodexo S.A. | 183 | 13,923 |
| Teleperformance | 153 | 55,314 |
| TOTAL S.A. | 490 | 24,412 |
| TOTAL FRANCE | 1,183,677 | |
| GERMANY – 3.5% | ||
| Deutsche Post AG | 1,264 | 54,565 |
| GEA Group AG | 911 | 35,722 |
| Knorr-Bremse AG | 420 | 30,280 |
| Merck KGaA | 396 | 73,923 |
| Siemens Healthineers AG (b) | 1,185 | 64,081 |
| TAG Immobilien AG | 8,560 | 172,119 |
| Uniper SE | 4,307 | 111,411 |
| TOTAL GERMANY | 542,101 | |
| HONG KONG – 1.4% | ||
| Sino Land Co. Ltd. | 167,532 | 222,916 |
| TOTAL HONG KONG | 222,916 | |
| 17 | Semi-Annual Report |
| Common Stocks – continued | ||
| Shares | Value | |
| IRELAND – 0.4% | ||
| Kingspan Group PLC | 667 | $ 62,667 |
| TOTAL IRELAND | 62,667 | |
| ISRAEL – 1.9% | ||
| Bank Hapoalim BM | 5,879 | 54,857 |
| Bank Leumi Le-Israel BM | 6,028 | 63,680 |
| ICL Group Ltd. | 3,519 | 38,839 |
| Israel Discount Bank Ltd. Class A | 8,699 | 51,805 |
| Mizrahi Tefahot Bank Ltd. | 1,461 | 54,434 |
| Nice Ltd. (a) | 131 | 26,944 |
| TOTAL ISRAEL | 290,559 | |
| ITALY – 2.3% | ||
| Assicurazioni Generali SpA | 3,268 | 62,401 |
| Moncler SpA | 700 | 37,130 |
| Recordati Industria Chimica e Farmaceutica SpA | 1,208 | 58,609 |
| Snam SpA | 36,476 | 201,021 |
| TOTAL ITALY | 359,161 | |
| JAPAN – 21.5% | ||
| Advance Residence Investment Corp. | 71 | 195,365 |
| Astellas Pharma, Inc. | 7,100 | 108,396 |
| Bandai Namco Holdings, Inc. | 600 | 41,027 |
| CyberAgent, Inc. | 13,600 | 145,489 |
| Dai Nippon Printing Co. Ltd. | 2,200 | 46,170 |
| Daito Trust Construction Co. Ltd. | 1,900 | 183,606 |
| Daiwa Securities Group, Inc. | 10,800 | 53,016 |
| Food & Life Cos. Ltd. | 1,200 | 28,759 |
| FUJIFILM Holdings Corp. | 700 | 38,755 |
| Fujitsu Ltd. | 300 | 43,266 |
| Hitachi Ltd. | 1,600 | 74,986 |
| Honda Motor Co. Ltd. | 2,100 | 55,418 |
| Hoya Corp. | 1,000 | 100,262 |
| Iida Group Holdings Co. Ltd. | 1,700 | 27,266 |
| Inpex Corp. | 1,200 | 14,190 |
| ITOCHU Corp. | 2,400 | 72,837 |
| Japan Tobacco, Inc. | 6,200 | 106,404 |
| Kajima Corp. | 4,300 | 48,124 |
| Kao Corp. | 2,600 | 104,975 |
| KDDI Corp. | 6,400 | 214,140 |
| Medipal Holdings Corp. | 5,200 | 85,449 |
| Mitsui & Co. Ltd. | 3,000 | 72,939 |
| Nippon Telegraph & Telephone Corp. | 6,700 | 198,942 |
| Nissan Chemical Corp. | 900 | 48,001 |
| Nitori Holdings Co. Ltd. | 300 | 30,912 |
| NOF Corp. | 1,100 | 41,433 |
| Nomura Research Institute Ltd. | 1,200 | 34,362 |
| Obayashi Corp. | 6,300 | 43,569 |
| | ||
| Shares | Value | |
| Obic Co. Ltd. | 300 | $ 44,643 |
| Open House Group Co. Ltd. | 700 | 27,231 |
| ORIX Corp. | 3,700 | 67,797 |
| Osaka Gas Co. Ltd. | 12,700 | 229,867 |
| Otsuka Corp. | 1,000 | 32,996 |
| Secom Co. Ltd. | 800 | 56,647 |
| Sekisui House Ltd. | 2,100 | 36,616 |
| Shimano, Inc. | 200 | 35,968 |
| Shionogi & Co. Ltd. | 1,600 | 89,793 |
| Sojitz Corp. | 3,000 | 46,010 |
| Sony Corp. | 1,000 | 86,601 |
| Sumitomo Mitsui Trust Holdings, Inc. | 1,900 | 59,115 |
| Taisei Corp. | 1,600 | 43,532 |
| The Shizuoka Bank Ltd. | 8,200 | 53,228 |
| Toppan Printing Co. Ltd. | 2,700 | 44,847 |
| Toyo Suisan Kaisha Ltd. | 2,800 | 86,555 |
| Trend Micro, Inc. | 700 | 39,225 |
| TOTAL JAPAN | 3,338,729 | |
| JERSEY – 0.8% | ||
| Experian PLC | 1,513 | 53,036 |
| Man Group PLC | 24,508 | 72,309 |
| TOTAL JERSEY | 125,345 | |
| LUXEMBOURG – 0.3% | ||
| B&M European Value Retail S.A. | 6,268 | 38,576 |
| Tenaris S.A. | 493 | 7,703 |
| TOTAL LUXEMBOURG | 46,279 | |
| NETHERLANDS – 2.2% | ||
| ASML Holding N.V. | 224 | 129,498 |
| Koninklijke Ahold Delhaize N.V. | 2,991 | 88,634 |
| NN Group N.V. | 1,117 | 55,313 |
| Wolters Kluwer N.V. | 698 | 71,117 |
| TOTAL NETHERLANDS | 344,562 | |
| NORWAY – 0.9% | ||
| Equinor ASA | 350 | 12,061 |
| Norsk Hydro ASA | 4,467 | 38,329 |
| Orkla ASA | 7,812 | 64,029 |
| Yara International ASA | 648 | 33,434 |
| TOTAL NORWAY | 147,853 | |
| PORTUGAL – 0.4% | ||
| Jeronimo Martins SGPS S.A. | 3,142 | 65,630 |
| TOTAL PORTUGAL | 65,630 | |
| SINGAPORE – 1.5% | ||
| DBS Group Holdings Ltd. | 2,700 | 66,322 |
| Oversea-Chinese Banking Corp. Ltd. | 6,681 | 59,945 |
| Semi-Annual Report | 18 |
| Common Stocks – continued | ||
| Shares | Value | |
| SINGAPORE – continued | ||
| Singapore Exchange Ltd. | 5,900 | $ 41,828 |
| United Overseas Bank Ltd. | 2,700 | 58,638 |
| TOTAL SINGAPORE | 226,733 | |
| SPAIN – 3.1% | ||
| Banco de Sabadell S.A. | 62,152 | 48,782 |
| Enagas S.A. | 9,027 | 195,889 |
| Industria de Diseno Textil S.A. | 1,937 | 41,073 |
| Red Electrica Corp. S.A. | 9,943 | 200,714 |
| TOTAL SPAIN | 486,458 | |
| SWEDEN – 3.7% | ||
| Atlas Copco AB Class A | 1,259 | 58,095 |
| Epiroc AB | 2,295 | 47,243 |
| Essity AB Class B | 2,914 | 77,660 |
| Evolution Gaming Group AB (b) | 427 | 44,752 |
| Getinge AB | 1,716 | 50,218 |
| Investor AB | 4,049 | 79,026 |
| Kinnevik AB (a) | 2,049 | 40,820 |
| Lundin Energy AB | 162 | 6,782 |
| Securitas AB Class B | 3,231 | 38,584 |
| Skandinaviska Enskilda Banken AB | 5,088 | 57,954 |
| Swedish Match AB | 10,054 | 80,733 |
| TOTAL SWEDEN | 581,867 | |
| SWITZERLAND – 12.5% | ||
| Bachem Holding AG | 90 | 39,778 |
| Chocoladefabriken Lindt & Spruengli AG | 8 | 90,331 |
| Cie Financiere Richemont S.A. | 551 | 65,565 |
| EMS-Chemie Holding AG | 33 | 29,799 |
| Galenica AG (b) | 763 | 56,597 |
| Geberit AG | 84 | 48,462 |
| Givaudan S.A. | 11 | 44,141 |
| Kuehne + Nagel International AG | 177 | 50,165 |
| Logitech International S.A. | 405 | 26,887 |
| Nestle S.A. | 2,949 | 382,810 |
| Novartis AG | 2,680 | 238,857 |
| Partners Group Holding AG | 52 | 56,117 |
| Roche Holding AG | 763 | 284,872 |
| Sika AG | 151 | 46,825 |
| Sonova Holding AG | 189 | 69,163 |
| Straumann Holding AG | 420 | 50,431 |
| Swisscom AG | 341 | 202,636 |
| Tecan Group AG | 115 | 35,022 |
| The Swatch Group AG | 156 | 40,903 |
| UBS Group AG | 5,055 | 87,049 |
| TOTAL SWITZERLAND | 1,946,410 | |
| | ||
| Shares | Value | |
| UNITED KINGDOM – 15.7% | ||
| Admiral Group PLC | 1,689 | $ 53,522 |
| AstraZeneca PLC | 1,882 | 252,542 |
| Auto Trader Group PLC (b) | 21,461 | 171,042 |
| Avast PLC (b) | 4,084 | 28,919 |
| Barclays PLC | 33,236 | 61,841 |
| British American Tobacco PLC | 3,495 | 147,085 |
| Croda International PLC | 352 | 34,489 |
| Diageo PLC | 3,301 | 166,543 |
| GlaxoSmithKline PLC | 7,128 | 160,817 |
| Greggs PLC | 1,265 | 37,323 |
| Halma PLC | 958 | 29,769 |
| IG Group Holdings PLC | 5,902 | 60,428 |
| IMI PLC | 1,892 | 32,187 |
| Imperial Brands PLC | 3,655 | 76,450 |
| J Sainsbury PLC | 18,239 | 53,423 |
| Phoenix Group Holdings PLC | 7,410 | 56,657 |
| RELX PLC | 2,487 | 74,720 |
| Rightmove PLC | 22,118 | 171,724 |
| Rio Tinto PLC | 886 | 63,472 |
| Royal Mail PLC | 6,911 | 29,900 |
| Safestore Holdings PLC | 13,240 | 209,448 |
| Shell PLC | 1,428 | 38,959 |
| SSE PLC | 9,895 | 232,127 |
| The Sage Group PLC | 3,220 | 29,811 |
| Unilever PLC | 3,539 | 165,243 |
| TOTAL UNITED KINGDOM | 2,438,441 | |
| TOTAL COMMON STOCKS (Cost $15,674,038) | 15,422,203 | |
| Money Market Fund – 0.1% | ||
| Fidelity Cash Central Fund, 0.32% (c) (Cost $20,015) | 20,011 | 20,015 |
| TOTAL INVESTMENT IN SECURITIES – 99.3% (Cost $15,694,053) | 15,442,218 | |
| NET OTHER ASSETS (LIABILITIES) – 0.7% | 102,064 | |
| NET ASSETS – 100.0% | $ 15,544,282 | |
| 19 | Semi-Annual Report |
| Categorizations in the Schedule of Investments are based on country or territory of incorporation. | ||
| Legend | ||
| (a) | Non-income producing. | |
| (b) | Security is exempt from registration under Rule 144A of the Securities Act of 1933. These securities may be resold in transactions exempt from registration, normally to qualified institutional buyers. At the end of the period, the value of these securities amounted to $379,554 or 2.4% of net assets. | |
| (c) | Affiliated fund that is generally available only to investment companies and other accounts managed by Fidelity Investments. The rate quoted is the annualized seven-day yield of the fund at period end. A complete unaudited listing of the fund's holdings as of its most recent quarter end is available upon request. In addition, each Fidelity Central Fund's financial statements are available on the SEC's website or upon request. | |
| Futures Contracts | |||||
| Number of contracts | Expiration Date | Notional Amount | Value | Unrealized Appreciation/ (Depreciation) | |
| Purchased | |||||
| Equity Index Contract | |||||
| CME E-mini Russell 2000 Index Contracts (United States) | 1 | June 2022 | $99,830 | $(1,419) | $(1,419) |
| Fund | Value, beginning of period | Purchases | Sales Proceeds | Dividend Income | Realized Gain/Loss | Change in Unrealized appreciation (depreciation) | Value, end of period | % ownership, end of period | ||||||
| Fidelity Cash Central Fund, 0.32% | $119,828 | $446,004 | $545,817 | $45 | $— | $— | $20,015 | 0.0% |
| Semi-Annual Report | 20 |
| Description | Total | Level 1 | Level 2 | Level 3 |
| Investments in Securities: | ||||||||
| Equities: | ||||||||
| Communication Services | $ 1,476,155 | $ 1,476,155 | $ — | $ — | ||||
| Consumer Discretionary | 1,019,159 | 1,019,159 | — | — | ||||
| Consumer Staples | 2,236,764 | 2,236,764 | — | — | ||||
| Energy | 170,745 | 170,745 | — | — | ||||
| Financials | 2,411,169 | 2,411,169 | — | — | ||||
| Health Care | 2,505,786 | 2,505,786 | — | — | ||||
| Industrials | 1,758,578 | 1,758,578 | — | — | ||||
| Information Technology | 685,647 | 685,647 | — | — | ||||
| Materials | 645,728 | 645,728 | — | — | ||||
| Real Estate | 1,144,724 | 1,144,724 | — | — | ||||
| Utilities | 1,367,748 | 1,367,748 | — | — | ||||
| Money Market Fund | 20,015 | 20,015 | — | — | ||||
| Total Investments in Securities: | $ 15,442,218 | $ 15,442,218 | $ — | $ — |
| Derivative Instruments: | ||||||||
| Liabilities | ||||||||
| Futures Contracts | $ (1,419) | $ (1,419) | $ — | $ — | ||||
| Total Liabilities | $ (1,419) | $ (1,419) | $ — | $ — | ||||
| Total Derivative Instruments: | $ (1,419) | $ (1,419) | $ — | $ — |
| Primary Risk/ Derivative Type | Value | ||
| Asset | Liabilities | ||
| Equity Risk | |||
| Futures Contracts(a) | $0 | $(1,419) | |
| Total Equity Risk | 0 | (1,419) | |
| Total Value of Derivatives | $0 | $(1,419) | |
| (a) | Reflects gross cumulative appreciation (depreciation) on futures contracts as presented in the Schedule of Investments. In the Statement of Assets and Liabilities, the period end daily variation margin is included in receivable or payable for daily variation margin on futures contracts, and the net cumulative appreciation (depreciation) is included in total accumulated earnings (loss). |
| 21 | Semi-Annual Report |
| Common Stocks – 99.1% | ||
| Shares | Value | |
| AUSTRALIA – 5.0% | ||
| Aristocrat Leisure Ltd. | 13,906 | $ 332,638 |
| ASX Ltd. | 6,667 | 410,634 |
| BHP Group Ltd. | 15,868 | 541,390 |
| Fortescue Metals Group Ltd. | 13,727 | 211,003 |
| Macquarie Group Ltd. | 3,573 | 525,554 |
| TOTAL AUSTRALIA | 2,021,219 | |
| AUSTRIA – 0.8% | ||
| ams AG (a) | 13,267 | 165,931 |
| OMV AG | 3,241 | 167,878 |
| TOTAL AUSTRIA | 333,809 | |
| CANADA – 12.1% | ||
| Alimentation Couche-Tard, Inc. | 8,148 | 364,606 |
| Bausch Health Cos., Inc. (a) | 12,518 | 239,086 |
| Canadian National Railway Co. | 4,687 | 554,056 |
| Canadian Natural Resources Ltd. | 7,608 | 473,309 |
| CGI, Inc. (a) | 5,416 | 434,111 |
| Fairfax Financial Holdings Ltd. | 884 | 488,235 |
| Fortis, Inc. | 3,587 | 175,442 |
| Manulife Financial Corp. | 24,094 | 473,566 |
| Onex Corp. | 5,896 | 356,099 |
| Power Corp. of Canada | 13,817 | 408,656 |
| Suncor Energy, Inc. | 12,218 | 441,475 |
| West Fraser Timber Co. Ltd. | 5,137 | 453,831 |
| TOTAL CANADA | 4,862,472 | |
| CAYMAN ISLANDS – 1.2% | ||
| CK Asset Holdings Ltd. | 29,000 | 197,371 |
| CK Hutchison Holdings Ltd. | 41,500 | 291,965 |
| TOTAL CAYMAN ISLANDS | 489,336 | |
| DENMARK – 0.8% | ||
| AP Moller - Maersk A/S Class B | 109 | 319,674 |
| TOTAL DENMARK | 319,674 | |
| FRANCE – 11.3% | ||
| Atos SE | 5,902 | 145,696 |
| AXA S.A. | 13,873 | 372,615 |
| BNP Paribas S.A. | 6,694 | 351,009 |
| Bouygues S.A. | 12,586 | 436,169 |
| Carrefour S.A. | 14,330 | 304,768 |
| Cie de Saint-Gobain | 7,444 | 442,362 |
| LVMH Moet Hennessy Louis Vuitton SE | 927 | 605,833 |
| Publicis Groupe S.A. | 6,246 | 379,407 |
| Sanofi | 5,398 | 576,182 |
| Societe Generale S.A. (a) | 9,393 | 229,595 |
| Sodexo S.A. | 3,029 | 230,456 |
| | ||
| Shares | Value | |
| TOTAL S.A. | 8,738 | $ 435,327 |
| TOTAL FRANCE | 4,509,419 | |
| GERMANY – 10.1% | ||
| Allianz SE | 2,085 | 475,547 |
| Bayerische Motoren Werke AG | 3,767 | 311,999 |
| Daimler AG | 5,842 | 413,539 |
| Deutsche Bank AG (a) | 24,307 | 246,836 |
| Deutsche Post AG | 9,492 | 409,756 |
| Fresenius Medical Care AG & Co. KGaA | 4,665 | 292,525 |
| Fresenius SE & Co. KGaA | 7,881 | 281,015 |
| HeidelbergCement AG | 5,623 | 327,802 |
| RWE AG | 12,115 | 505,989 |
| SAP SE | 4,144 | 426,504 |
| Vonovia SE | 8,324 | 333,693 |
| TOTAL GERMANY | 4,025,205 | |
| HONG KONG – 1.2% | ||
| AIA Group Ltd. | 47,400 | 469,702 |
| TOTAL HONG KONG | 469,702 | |
| ITALY – 1.2% | ||
| Enel SpA | 74,872 | 491,136 |
| TOTAL ITALY | 491,136 | |
| JAPAN – 21.7% | ||
| Brother Industries Ltd. | 20,900 | 365,218 |
| Chubu Electric Power Co., Inc. | 26,400 | 267,342 |
| Daiwa House Industry Co. Ltd. | 11,900 | 288,682 |
| Fujitsu Ltd. | 3,100 | 447,079 |
| Hitachi Ltd. | 9,100 | 426,483 |
| Honda Motor Co. Ltd. | 15,400 | 406,395 |
| Iida Group Holdings Co. Ltd. | 16,900 | 271,057 |
| Japan Tobacco, Inc. | 30,300 | 520,007 |
| JXTG Holdings, Inc. | 41,400 | 145,775 |
| Kajima Corp. | 30,000 | 335,752 |
| KDDI Corp. | 10,100 | 337,940 |
| Mitsubishi Corp. | 13,800 | 466,852 |
| Mitsubishi Electric Corp. | 34,000 | 359,000 |
| Mitsui & Co. Ltd. | 17,600 | 427,910 |
| Mizuho Financial Group, Inc. | 32,200 | 392,310 |
| NEC Corp. | 9,200 | 358,598 |
| Nippon Steel Corp. | 30,600 | 488,783 |
| Otsuka Holdings Co. Ltd. | 10,900 | 367,063 |
| Panasonic Corp. | 38,800 | 347,541 |
| SoftBank Group Corp. | 7,500 | 305,013 |
| Sony Corp. | 6,000 | 519,605 |
| Sumitomo Mitsui Financial Group, Inc. | 13,000 | 392,830 |
| Takeda Pharmaceutical Co. Ltd. | 15,200 | 442,180 |
| TOTAL JAPAN | 8,679,415 | |
| Semi-Annual Report | 22 |
| Common Stocks – continued | ||
| Shares | Value | |
| LUXEMBOURG – 1.0% | ||
| ArcelorMittal S.A. | 13,761 | $ 408,150 |
| TOTAL LUXEMBOURG | 408,150 | |
| NETHERLANDS – 5.4% | ||
| ASML Holding N.V. | 1,252 | 723,797 |
| Koninklijke Ahold Delhaize N.V. | 9,939 | 294,528 |
| Koninklijke Philips N.V. | 10,969 | 289,294 |
| NN Group N.V. | 5,818 | 288,103 |
| Prosus N.V. | 5,868 | 288,413 |
| Randstad N.V. | 4,950 | 265,591 |
| TOTAL NETHERLANDS | 2,149,726 | |
| SINGAPORE – 1.7% | ||
| CapitaLand Integrated Commercial Trust | 71,000 | 119,799 |
| Oversea-Chinese Banking Corp. Ltd. | 30,800 | 276,350 |
| Singapore Telecommunications Ltd. | 133,300 | 267,391 |
| TOTAL SINGAPORE | 663,540 | |
| SPAIN – 0.9% | ||
| Banco Santander S.A. | 118,186 | 351,162 |
| TOTAL SPAIN | 351,162 | |
| SWEDEN – 2.5% | ||
| Essity AB Class B | 10,066 | 268,266 |
| Securitas AB Class B | 47,115 | 562,637 |
| Telefonaktiebolaget LM Ericsson | 23,117 | 187,304 |
| TOTAL SWEDEN | 1,018,207 | |
| SWITZERLAND – 8.0% | ||
| Adecco Group AG | 7,684 | 302,009 |
| Galenica AG (b) | 1,693 | 125,582 |
| Nestle S.A. | 8,263 | 1,072,619 |
| Novartis AG | 6,773 | 603,649 |
| Roche Holding AG | 1,943 | 725,435 |
| UBS Group AG | 22,878 | 393,969 |
| TOTAL SWITZERLAND | 3,223,263 | |
| UNITED KINGDOM – 14.2% | ||
| Anglo American PLC | 11,703 | 526,895 |
| | ||
| Shares | Value | |
| Barclays PLC | 118,257 | $ 220,035 |
| British American Tobacco PLC | 11,784 | 495,922 |
| GlaxoSmithKline PLC | 24,495 | 552,640 |
| HSBC Holdings PLC | 77,620 | 488,527 |
| Imperial Brands PLC | 14,428 | 301,785 |
| J Sainsbury PLC | 76,233 | 223,293 |
| Kingfisher PLC | 89,445 | 284,452 |
| RELX PLC | 14,950 | 449,160 |
| Rio Tinto PLC | 7,751 | 555,273 |
| Royal Mail PLC | 55,913 | 241,905 |
| Shell PLC | 24,074 | 656,788 |
| Standard Chartered PLC | 36,094 | 250,054 |
| Vodafone Group PLC | 281,662 | 429,798 |
| TOTAL UNITED KINGDOM | 5,676,527 | |
| TOTAL COMMON STOCKS (Cost $42,183,371) | 39,691,962 | |
| Money Market Fund – 0.1% | ||
| Fidelity Cash Central Fund, 0.32% (c) (Cost $62,233) | 62,220 | 62,233 |
| TOTAL INVESTMENT IN SECURITIES – 99.2% (Cost $42,245,604) | 39,754,195 | |
| NET OTHER ASSETS (LIABILITIES) – 0.8% | 300,790 | |
| NET ASSETS – 100.0% | $ 40,054,985 | |
| Categorizations in the Schedule of Investments are based on country or territory of incorporation. | ||
| Legend | ||
| (a) | Non-income producing. | |
| (b) | Security is exempt from registration under Rule 144A of the Securities Act of 1933. These securities may be resold in transactions exempt from registration, normally to qualified institutional buyers. At the end of the period, the value of these securities amounted to $125,582 or 0.3% of net assets. | |
| (c) | Affiliated fund that is generally available only to investment companies and other accounts managed by Fidelity Investments. The rate quoted is the annualized seven-day yield of the fund at period end. A complete unaudited listing of the fund's holdings as of its most recent quarter end is available upon request. In addition, each Fidelity Central Fund's financial statements are available on the SEC's website or upon request. | |
| Futures Contracts | |||||
| Number of contracts | Expiration Date | Notional Amount | Value | Unrealized Appreciation/ (Depreciation) | |
| Purchased | |||||
| Equity Index Contract | |||||
| CME E-mini Russell 2000 Index Contracts (United States) | 3 | June 2022 | $299,490 | $(12,076) | $(12,076) |
| 23 | Semi-Annual Report |
| Fund | Value, beginning of period | Purchases | Sales Proceeds | Dividend Income | Realized Gain/Loss | Change in Unrealized appreciation (depreciation) | Value, end of period | % ownership, end of period | ||||||
| Fidelity Cash Central Fund, 0.32% | $33,305 | $3,454,095 | $3,425,167 | $ 49 | $— | $— | $62,233 | 0.0% | ||||||
| Fidelity Securities Lending Cash Central Fund, 0.32% | — | 348,006 | 348,006 | 1,188 | — | — | $ — | 0.0% | ||||||
| Total | $33,305 | $3,802,101 | $3,773,173 | $1,237 | $— | $— | $62,233 |
| Description | Total | Level 1 | Level 2 | Level 3 |
| Investments in Securities: | ||||||||
| Equities: | ||||||||
| Communication Services | $ 1,719,549 | $ 1,719,549 | $ — | $ — | ||||
| Consumer Discretionary | 4,011,928 | 4,011,928 | — | — | ||||
| Consumer Staples | 3,845,794 | 3,845,794 | — | — | ||||
| Energy | 2,320,552 | 2,320,552 | — | — | ||||
| Financials | 7,861,388 | 7,861,388 | — | — | ||||
| Health Care | 4,494,651 | 4,494,651 | — | — | ||||
| Industrials | 6,291,281 | 6,291,281 | — | — | ||||
| Information Technology | 3,254,238 | 3,254,238 | — | — | ||||
| Materials | 3,513,127 | 3,513,127 | — | — | ||||
| Real Estate | 939,545 | 939,545 | — | — | ||||
| Utilities | 1,439,909 | 1,439,909 | — | — | ||||
| Money Market Fund | 62,233 | 62,233 | — | — | ||||
| Total Investments in Securities: | $ 39,754,195 | $ 39,754,195 | $ — | $ — |
| Derivative Instruments: | ||||||||
| Liabilities | ||||||||
| Futures Contracts | $ (12,076) | $ (12,076) | $ — | $ — | ||||
| Total Liabilities | $ (12,076) | $ (12,076) | $ — | $ — | ||||
| Total Derivative Instruments: | $ (12,076) | $ (12,076) | $ — | $ — |
| Primary Risk/ Derivative Type | Value | ||
| Asset | Liabilities | ||
| Equity Risk | |||
| Futures Contracts(a) | $0 | $(12,076) | |
| Total Equity Risk | 0 | (12,076) | |
| Total Value of Derivatives | $0 | $(12,076) | |
| (a) | Reflects gross cumulative appreciation (depreciation) on futures contracts as presented in the Schedule of Investments. In the Statement of Assets and Liabilities, the period end daily variation margin is included in receivable or payable for daily variation margin on futures contracts, and the net cumulative appreciation (depreciation) is included in total accumulated earnings (loss). |
| Semi-Annual Report | 24 |
| Fidelity Emerging Markets Multifactor ETF | Fidelity International High Dividend ETF | Fidelity International Multifactor ETF | Fidelity International Value Factor ETF | ||||
| Assets | |||||||
| Investments in securities, at value (including securities loaned of $—, $163,401, $— and $—, respectively) – See accompanying schedule: | |||||||
| Unaffiliated issuers | $23,328,622 | $100,044,412 | $15,422,203 | $39,691,962 | |||
| Fidelity Central Funds | — | 273,398 | 20,015 | 62,233 | |||
| Total Investments in Securities | $23,328,622 | $100,317,810 | $15,442,218 | $39,754,195 | |||
| Segregated cash with brokers for derivative instruments | 12,612 | 42,082 | 5,260 | 15,781 | |||
| Cash | — | — | 1,885 | — | |||
| Foreign currency held at value (cost $77,465, $77,855, $19,877 and $86,673, respectively) | 77,405 | 78,402 | 19,554 | 85,105 | |||
| Receivable for investments sold | 154,699 | — | — | — | |||
| Dividends receivable | 59,738 | 563,500 | 52,050 | 144,354 | |||
| Reclaims receivable | — | 179,619 | 29,740 | 82,027 | |||
| Receivable for daily variation margin on futures contracts | 945 | — | — | — | |||
| Distributions receivable from Fidelity Central Funds | — | 1,295 | — | — | |||
| Total assets | 23,634,021 | 101,182,708 | 15,550,707 | 40,081,462 | |||
| Liabilities | |||||||
| Payable to custodian bank | 5,529 | 81,317 | — | — | |||
| Payable for investments purchased | — | 31,255 | — | 10,395 | |||
| Accrued management fees | 8,940 | 32,726 | 5,164 | 12,297 | |||
| Payable for daily variation margin on futures contracts | — | 10,094 | 1,261 | 3,785 | |||
| Other payables and accrued expenses | 24,720 | — | — | — | |||
| Collateral on securities loaned, at value | — | 171,700 | — | — | |||
| Total liabilities | 39,189 | 327,092 | 6,425 | 26,477 | |||
| Net Assets | $23,594,832 | $100,855,616 | $15,544,282 | $40,054,985 | |||
| Net Assets consist of: | |||||||
| Paid in capital | $25,680,930 | $105,556,849 | $16,170,396 | $42,829,477 | |||
| Total accumulated earnings (loss) | (2,086,098) | (4,701,233) | (626,114) | (2,774,492) | |||
| Net Assets | $23,594,832 | $100,855,616 | $15,544,282 | $40,054,985 | |||
| Shares outstanding | 1,000,000 | 5,000,000 | 600,000 | 1,800,000 | |||
| Net Asset Value per share | $ 23.59 | $ 20.17 | $ 25.91 | $ 22.25 | |||
| Investments at cost – Unaffiliated issuers | $24,730,181 | $105,167,791 | $15,674,038 | $42,183,371 | |||
| Investments at cost – Fidelity Central Funds | — | 273,398 | 20,015 | 62,233 | |||
| Investments at cost | $24,730,181 | $105,441,189 | $15,694,053 | $42,245,604 |
| Semi-Annual Report | 26 |
| Fidelity Emerging Markets Multifactor ETF | Fidelity International High Dividend ETF | Fidelity International Multifactor ETF | Fidelity International Value Factor ETF | ||||
| Investment Income | |||||||
| Dividends | $ 337,699 | $ 2,107,780 | $ 228,115 | $ 754,077 | |||
| Non-Cash dividends | 51,822 | 123,341 | 17,874 | — | |||
| Interest | 1 | 14 | 1 | 2 | |||
| Income from Fidelity Central Funds (including $—, $12,395, $— and $1,188, from security lending, respectively) | 59 | 12,589 | 45 | 1,237 | |||
| Income before foreign taxes withheld | 389,581 | 2,243,724 | 246,035 | 755,316 | |||
| Less foreign taxes withheld | (36,132) | (178,794) | (30,109) | (53,633) | |||
| Total income | 353,449 | 2,064,930 | 215,926 | 701,683 | |||
| Expenses | |||||||
| Management fees | 48,284 | 179,869 | 33,022 | 77,421 | |||
| Independent trustees' fees and expenses | 36 | 148 | 29 | 67 | |||
| Total expenses before reductions | 48,320 | 180,017 | 33,051 | 77,488 | |||
| Expense reductions | (2) | (1) | (9) | (2) | |||
| Total expenses | 48,318 | 180,016 | 33,042 | 77,486 | |||
| Net investment income (loss) | 305,131 | 1,884,914 | 182,884 | 624,197 | |||
| Realized and Unrealized Gain (Loss) | |||||||
| Net realized gain (loss) on investment securities (net of foreign taxes of $45,517, $-, $-, $-, respectively.) | (333,210) | (311,363) | (539,217) | (656,962) | |||
| Net realized gain (loss) on In-kind redemptions | — | 7,060,605 | 376,924 | 2,106,211 | |||
| Net realized gain (loss) on futures contracts | (11,684) | (127,397) | (27,625) | (21,106) | |||
| Net realized gain (loss) on foreign currency transactions | (12,412) | (5,858) | (2,739) | (5,781) | |||
| Total net realized gain (loss) | (357,306) | 6,615,987 | (192,657) | 1,422,362 | |||
| Change in net unrealized appreciation (depreciation) on investment securities (net of decrease in deferred foreign taxes of $29,103, $-, $- and $-, respectively.) | (1,476,366) | (11,598,633) | (1,834,482) | (4,682,555) | |||
| Change in net unrealized appreciation (depreciation) on futures contracts | 2,247 | (48,426) | 1,579 | (13,793) | |||
| Change in net unrealized appreciation (depreciation) on assets and liabilities in foreign currencies | 2,323 | (31,655) | (4,542) | (13,325) | |||
| Total change in net unrealized appreciation (depreciation) | (1,471,796) | (11,678,714) | (1,837,445) | (4,709,673) | |||
| Net gain (loss) | (1,829,102) | (5,062,727) | (2,030,102) | (3,287,311) | |||
| Net increase (decrease) in net assets resulting from operations | $(1,523,971) | $ (3,177,813) | $(1,847,218) | $(2,663,114) |
| 27 | Semi-Annual Report |
| Fidelity Emerging Markets Multifactor ETF | Fidelity International High Dividend ETF | ||||||
| Six months ended April 30, 2022 (Unaudited) | Year ended October 31, 2021 | Six months ended April 30, 2022 (Unaudited) | Year ended October 31, 2021 | ||||
| Increase (Decrease) in Net Assets | |||||||
| Operations | |||||||
| Net investment income (loss) | $ 305,131 | $ 500,688 | $ 1,884,914 | $ 2,736,527 | |||
| Net realized gain (loss) | (357,306) | 136,954 | 6,615,987 | 2,501,097 | |||
| Change in net unrealized appreciation (depreciation) | (1,471,796) | 259,838 | (11,678,714) | 16,555,183 | |||
| Net increase (decrease) in net assets resulting from operations | (1,523,971) | 897,480 | (3,177,813) | 21,792,807 | |||
| Distributions to shareholders | (234,000) | (465,600) | (1,839,700) | (2,688,900) | |||
| Share transactions | |||||||
| Proceeds from sales of shares | 4,649,877 | 11,022,150 | 54,108,330 | 17,802,806 | |||
| Cost of shares redeemed | — | — | (30,432,276) | — | |||
| Net increase (decrease) in net assets resulting from share transactions | 4,649,877 | 11,022,150 | 23,676,054 | 17,802,806 | |||
| Total increase (decrease) in net assets | 2,891,906 | 11,454,030 | 18,658,541 | 36,906,713 | |||
| Net Assets | |||||||
| Beginning of period | 20,702,926 | 9,248,896 | 82,197,075 | 45,290,362 | |||
| End of period | $23,594,832 | $20,702,926 | $100,855,616 | $82,197,075 | |||
| Other Information | |||||||
| Shares | |||||||
| Sold | 200,000 | 400,000 | 2,500,000 | 900,000 | |||
| Redeemed | — | — | (1,400,000) | — | |||
| Net increase (decrease) | 200,000 | 400,000 | 1,100,000 | 900,000 | |||
| Semi-Annual Report | 28 |
| Fidelity International Multifactor ETF | Fidelity International Value Factor ETF | ||||||
| Six months ended April 30, 2022 (Unaudited) | Year ended October 31, 2021 | Six months ended April 30, 2022 (Unaudited) | Year ended October 31, 2021 | ||||
| Increase (Decrease) in Net Assets | |||||||
| Operations | |||||||
| Net investment income (loss) | $ 182,884 | $ 305,654 | $ 624,197 | $ 953,166 | |||
| Net realized gain (loss) | (192,657) | 299,275 | 1,422,362 | 2,419,526 | |||
| Change in net unrealized appreciation (depreciation) | (1,837,445) | 1,701,847 | (4,709,673) | 3,280,854 | |||
| Net increase (decrease) in net assets resulting from operations | (1,847,218) | 2,306,776 | (2,663,114) | 6,653,546 | |||
| Distributions to shareholders | (292,800) | (291,700) | (801,100) | (1,020,000) | |||
| Share transactions | |||||||
| Proceeds from sales of shares | 2,824,049 | 8,431,231 | 11,974,615 | 26,441,620 | |||
| Cost of shares redeemed | (2,787,735) | — | (9,904,849) | (4,879,284) | |||
| Net increase (decrease) in net assets resulting from share transactions | 36,314 | 8,431,231 | 2,069,766 | 21,562,336 | |||
| Total increase (decrease) in net assets | (2,103,704) | 10,446,307 | (1,394,448) | 27,195,882 | |||
| Net Assets | |||||||
| Beginning of period | 17,647,986 | 7,201,679 | 41,449,433 | 14,253,551 | |||
| End of period | $15,544,282 | $17,647,986 | $40,054,985 | $41,449,433 | |||
| Other Information | |||||||
| Shares | |||||||
| Sold | 100,000 | 300,000 | 500,000 | 1,100,000 | |||
| Redeemed | (100,000) | — | (400,000) | (200,000) | |||
| Net increase (decrease) | — | 300,000 | 100,000 | 900,000 | |||
| 29 | Semi-Annual Report |
| Fidelity Emerging Markets Multifactor ETF | |||||||
| Six months ended April 30, 2022 (Unaudited) | Year ended October 31, 2021 | Year ended October 31, 2020 | Year ended October 31, 2019A | ||||
| Selected Per-Share Data | |||||||
| Net asset value, beginning of period | $ 25.88 | $ 23.12 | $24.68 | $25.00 | |||
| Income from Investment Operations | |||||||
| Net investment income (loss)B | 0.36 | 0.72 | 0.55 | 0.50 | |||
| Net realized and unrealized gain (loss) | (2.38) | 2.67 | (1.57) | (0.34) | |||
| Total from investment operations | (2.02) | 3.39 | (1.02) | 0.16 | |||
| Distributions from net investment income | (0.27) | (0.63) | (0.54) | (0.48) | |||
| Total distributions | (0.27) | (0.63) | (0.54) | (0.48) | |||
| Net asset value, end of period | $ 23.59 | $ 25.88 | $23.12 | $24.68 | |||
| Total ReturnC,D,E | (7.83)% | 14.55% | (4.03)% | 0.66% | |||
| Ratios to Average Net AssetsF,G | |||||||
| Expenses before reductions | .45% H | .45% | .45% | .45% H | |||
| Expenses net of fee waivers, if any | .45% H | .45% | .45% | .45% H | |||
| Expenses net of all reductions | .45% H | .45% | .45% | .45% H | |||
| Net investment income (loss) | 2.84% H | 2.64% | 2.39% | 3.05% H | |||
| Supplemental Data | |||||||
| Net assets, end of period (000 omitted) | $23,595 | $20,703 | $9,249 | $9,872 | |||
| Portfolio turnover rateI | 31% J,K | 65% K | 66% | 34% J,K | |||
| A | For the period February 26, 2019 (commencement of operations) through October 31, 2019. |
| B | Calculated based on average shares outstanding during the period. |
| C | Based on net asset value. |
| D | Total returns for periods of less than one year are not annualized. |
| E | Total returns would have been lower if certain expenses had not been reduced during the applicable periods shown. |
| F | Expense ratios reflect operating expenses of the class. Expenses before reductions do not reflect amounts reimbursed, waived, or reduced through arrangements with the investment adviser, brokerage services, or other offset arrangements, if applicable, and do not represent the amount paid by the class during periods when reimbursements, waivers or reductions occur. |
| G | Fees and expenses of any underlying mutual funds or exchange-traded funds (ETFs) are not included in the Fund’s expense ratio. The Fund indirectly bears its proportionate share of these expenses. For additional expense information related to investments in Fidelity Central Funds, please refer to the "Investments in Fidelity Central Funds" note found in the Notes to Financial Statements section of the most recent Annual or Semi-Annual report. |
| H | Annualized. |
| I | Amount does not include the portfolio activity of any underlying mutual funds or exchange-traded funds (ETFs). |
| J | Amount not annualized. |
| K | Portfolio turnover rate excludes securities received or delivered in-kind. |
| Semi-Annual Report | 30 |
| Fidelity International High Dividend ETF | |||||||||
| Six months ended April 30, 2022 (Unaudited) | Year ended October 31, 2021 | Year ended October 31, 2020 | Year ended October 31, 2019 | Year ended October 31, 2018A | |||||
| Selected Per-Share Data | |||||||||
| Net asset value, beginning of period | $ 21.08 | $ 15.10 | $ 20.96 | $ 20.56 | $ 25.08 | ||||
| Income from Investment Operations | |||||||||
| Net investment income (loss)B | 0.43 | 0.77 | 0.60 | 1.04 | 0.82 | ||||
| Net realized and unrealized gain (loss) | (0.93) | 5.95 | (5.81) | 0.31 | (4.63) | ||||
| Total from investment operations | (0.50) | 6.72 | (5.21) | 1.35 | (3.81) | ||||
| Distributions from net investment income | (0.41) | (0.74) | (0.65) | (0.95) | (0.71) | ||||
| Total distributions | (0.41) | (0.74) | (0.65) | (0.95) | (0.71) | ||||
| Net asset value, end of period | $ 20.17 | $ 21.08 | $ 15.10 | $ 20.96 | $ 20.56 | ||||
| Total ReturnC,D,E | (2.36)% | 44.78% | (24.98)% | 6.84% | (15.44)% | ||||
| Ratios to Average Net AssetsF,G | |||||||||
| Expenses before reductions | .39% H | .39% | .39% | .39% | .39% H | ||||
| Expenses net of fee waivers, if any | .39% H | .39% | .39% | .39% | .39% H | ||||
| Expenses net of all reductions | .39% H | .39% | .39% | .39% | .39% H | ||||
| Net investment income (loss) | 4.09% H | 3.82% | 3.38% | 5.07% | 4.59% H | ||||
| Supplemental Data | |||||||||
| Net assets, end of period (000 omitted) | $100,856 | $82,197 | $45,290 | $44,022 | $18,500 | ||||
| Portfolio turnover rateI,J | 66% K | 67% | 82% | 47% | 42% K | ||||
| A | For the period January 16, 2018 (commencement of operations) through October 31, 2018. |
| B | Calculated based on average shares outstanding during the period. |
| C | Based on net asset value. |
| D | Total returns for periods of less than one year are not annualized. |
| E | Total returns would have been lower if certain expenses had not been reduced during the applicable periods shown. |
| F | Expense ratios reflect operating expenses of the class. Expenses before reductions do not reflect amounts reimbursed, waived, or reduced through arrangements with the investment adviser, brokerage services, or other offset arrangements, if applicable, and do not represent the amount paid by the class during periods when reimbursements, waivers or reductions occur. |
| G | Fees and expenses of any underlying mutual funds or exchange-traded funds (ETFs) are not included in the Fund’s expense ratio. The Fund indirectly bears its proportionate share of these expenses. For additional expense information related to investments in Fidelity Central Funds, please refer to the "Investments in Fidelity Central Funds" note found in the Notes to Financial Statements section of the most recent Annual or Semi-Annual report. |
| H | Annualized. |
| I | Amount does not include the portfolio activity of any underlying mutual funds or exchange-traded funds (ETFs). |
| J | Portfolio turnover rate excludes securities received or delivered in-kind. |
| K | Amount not annualized. |
| 31 | Semi-Annual Report |
| Fidelity International Multifactor ETF | |||||||
| Six months ended April 30, 2022 (Unaudited) | Year ended October 31, 2021 | Year ended October 31, 2020 | Year ended October 31, 2019A | ||||
| Selected Per-Share Data | |||||||
| Net asset value, beginning of period | $ 29.41 | $ 24.01 | $26.18 | $ 25.05 | |||
| Income from Investment Operations | |||||||
| Net investment income (loss)B | 0.30 | 0.65 | 0.57 | 0.55 | |||
| Net realized and unrealized gain (loss) | (3.31) | 5.34 | (2.07) | 1.12 | |||
| Total from investment operations | (3.01) | 5.99 | (1.50) | 1.67 | |||
| Distributions from net investment income | (0.49) | (0.59) | (0.67) | (0.54) | |||
| Total distributions | (0.49) | (0.59) | (0.67) | (0.54) | |||
| Net asset value, end of period | $ 25.91 | $ 29.41 | $24.01 | $ 26.18 | |||
| Total ReturnC,D,E | (10.39)% | 25.08% | (5.73)% | 6.72% | |||
| Ratios to Average Net AssetsF,G | |||||||
| Expenses before reductions | .39% H | .39% | .39% | .39% H | |||
| Expenses net of fee waivers, if any | .39% H | .39% | .39% | .39% H | |||
| Expenses net of all reductions | .39% H | .39% | .39% | .39% H | |||
| Net investment income (loss) | 2.16% H | 2.28% | 2.29% | 3.18% H | |||
| Supplemental Data | |||||||
| Net assets, end of period (000 omitted) | $15,544 | $17,648 | $7,202 | $10,473 | |||
| Portfolio turnover rateI,J | 33% K | 74% | 69% | 35% K | |||
| A | For the period February 26, 2019 (commencement of operations) through October 31, 2019. |
| B | Calculated based on average shares outstanding during the period. |
| C | Based on net asset value. |
| D | Total returns for periods of less than one year are not annualized. |
| E | Total returns would have been lower if certain expenses had not been reduced during the applicable periods shown. |
| F | Expense ratios reflect operating expenses of the class. Expenses before reductions do not reflect amounts reimbursed, waived, or reduced through arrangements with the investment adviser, brokerage services, or other offset arrangements, if applicable, and do not represent the amount paid by the class during periods when reimbursements, waivers or reductions occur. |
| G | Fees and expenses of any underlying mutual funds or exchange-traded funds (ETFs) are not included in the Fund’s expense ratio. The Fund indirectly bears its proportionate share of these expenses. For additional expense information related to investments in Fidelity Central Funds, please refer to the "Investments in Fidelity Central Funds" note found in the Notes to Financial Statements section of the most recent Annual or Semi-Annual report. |
| H | Annualized. |
| I | Amount does not include the portfolio activity of any underlying mutual funds or exchange-traded funds (ETFs). |
| J | Portfolio turnover rate excludes securities received or delivered in-kind. |
| K | Amount not annualized. |
| Semi-Annual Report | 32 |
| Fidelity International Value Factor ETF | |||||||||
| Six months ended April 30, 2022 (Unaudited) | Year ended October 31, 2021 | Year ended October 31, 2020 | Year ended October 31, 2019 | Year ended October 31, 2018A | |||||
| Selected Per-Share Data | |||||||||
| Net asset value, beginning of period | $ 24.38 | $ 17.82 | $ 21.89 | $ 20.89 | $ 25.00 | ||||
| Income from Investment Operations | |||||||||
| Net investment income (loss)B | 0.38 | 0.79 | 0.51 | 0.80 | 0.62 | ||||
| Net realized and unrealized gain (loss) | (2.03) | 6.54 | (4.09) | 1.05 | (4.18) | ||||
| Total from investment operations | (1.65) | 7.33 | (3.58) | 1.85 | (3.56) | ||||
| Distributions from net investment income | (0.48) | (0.77) | (0.49) | (0.85) | (0.55) | ||||
| Total distributions | (0.48) | (0.77) | (0.49) | (0.85) | (0.55) | ||||
| Net asset value, end of period | $ 22.25 | $ 24.38 | $ 17.82 | $ 21.89 | $ 20.89 | ||||
| Total ReturnC,D,E | (6.85)% | 41.36% | (16.32)% | 9.04% | (14.46)% | ||||
| Ratios to Average Net AssetsF,G | |||||||||
| Expenses before reductions | .39% H | .39% | .39% | .39% | .39% H | ||||
| Expenses net of fee waivers, if any | .39% H | .39% | .39% | .39% | .39% H | ||||
| Expenses net of all reductions | .39% H | .39% | .39% | .39% | .39% H | ||||
| Net investment income (loss) | 3.15% H | 3.32% | 2.60% | 3.74% | 3.38% H | ||||
| Supplemental Data | |||||||||
| Net assets, end of period (000 omitted) | $40,055 | $41,449 | $14,254 | $13,135 | $12,532 | ||||
| Portfolio turnover rateI | 26% J,K | 101% K | 76% K | 56% | 65% J,K | ||||
| A | For the period January 16, 2018 (commencement of operations) through October 31, 2018. |
| B | Calculated based on average shares outstanding during the period. |
| C | Based on net asset value. |
| D | Total returns for periods of less than one year are not annualized. |
| E | Total returns would have been lower if certain expenses had not been reduced during the applicable periods shown. |
| F | Expense ratios reflect operating expenses of the class. Expenses before reductions do not reflect amounts reimbursed, waived, or reduced through arrangements with the investment adviser, brokerage services, or other offset arrangements, if applicable, and do not represent the amount paid by the class during periods when reimbursements, waivers or reductions occur. |
| G | Fees and expenses of any underlying mutual funds or exchange-traded funds (ETFs) are not included in the Fund’s expense ratio. The Fund indirectly bears its proportionate share of these expenses. For additional expense information related to investments in Fidelity Central Funds, please refer to the "Investments in Fidelity Central Funds" note found in the Notes to Financial Statements section of the most recent Annual or Semi-Annual report. |
| H | Annualized. |
| I | Amount does not include the portfolio activity of any underlying mutual funds or exchange-traded funds (ETFs). |
| J | Amount not annualized. |
| K | Portfolio turnover rate excludes securities received or delivered in-kind. |
| 33 | Semi-Annual Report |
For the period ended April 30, 2022 (Unaudited)
| Fidelity Central Fund | Investment Manager | Investment Objective | Investment Practices | Expense Ratio(a) |
| Fidelity Money Market Central Funds | Fidelity Management & Research Company LLC (FMR) | Each fund seeks to obtain a high level of current income consistent with the preservation of capital and liquidity. | Short-term Investments | Less than .005% |
| Semi-Annual Report | 34 |
Equity securities, including restricted securities, for which market quotations are readily available, are valued at the last reported sale price or official closing price as reported by a third party pricing vendor on the primary market or exchange on which they are traded and are categorized as Level 1 in the hierarchy. In the event there were no sales during the day or closing prices are not available, securities are valued at the last quoted bid price or may be valued using the last available price and are generally categorized as Level 2 in the hierarchy. For foreign equity securities, when market or security specific events arise, comparisons to the valuation of American Depositary Receipts (ADRs), futures contracts, Exchange-Traded Funds (ETFs) and certain indexes as well as quoted prices for similar securities may be used and would be categorized as Level 2 in the hierarchy. For equity securities, including restricted securities, where observable inputs are limited, assumptions about market activity and risk are used and these securities may be categorized as Level 3 in the hierarchy.
| 35 | Semi-Annual Report |
Distributions are declared and recorded on the ex-dividend date. Income and capital gain distributions are determined in accordance with income tax regulations, which may differ from GAAP.
| Tax cost | Gross unrealized appreciation | Gross unrealized depreciation | Net unrealized appreciation (depreciation) | |
| Fidelity Emerging Markets Multifactor ETF | $ 24,866,654 | $ 1,648,498 | $ (3,186,530) | $ (1,538,032) |
| Fidelity International High Dividend ETF | 105,825,258 | 2,990,162 | (8,497,610) | (5,507,448) |
| Fidelity International Multifactor ETF | 15,833,503 | 927,234 | (1,318,519) | (391,285) |
| Fidelity International Value Factor ETF | 42,449,275 | 1,776,625 | (4,471,705) | (2,695,080) |
| Short-term | Long-term | Total capital loss carryforward | |
| Fidelity Emerging Markets Multifactor ETF | $ (279,322) | $ (93,236) | $ (372,558) |
| Fidelity International High Dividend ETF | (1,312,216) | (4,653,304) | (5,965,520) |
| Fidelity International Multifactor ETF | (81,871) | — | (81,871) |
| Fidelity International Value Factor ETF | — | (1,590,085) | (1,590,085) |
| Semi-Annual Report | 36 |
Investing in derivatives may involve greater risks than investing in the underlying assets directly and, to varying degrees, may involve risk of loss in excess of any initial investment and collateral received and amounts recognized in the Statements of Assets and Liabilities. In addition, there may be the risk that the change in value of the derivative contract does not correspond to the change in value of the underlying instrument.
| Purchases ($) | Sales ($) | |
| Fidelity Emerging Markets Multifactor ETF | 10,021,625 | 6,558,522 |
| Fidelity International High Dividend ETF | 62,764,177 | 59,611,584 |
| Fidelity International Multifactor ETF | 5,674,893 | 5,532,695 |
| Fidelity International Value Factor ETF | 10,269,916 | 10,372,459 |
| In-Kind Subscriptions ($) | In-Kind Redemptions ($) | |
| Fidelity Emerging Markets Multifactor ETF | 1,041,928 | — |
| Fidelity International High Dividend ETF | 50,294,221 | 30,243,066 |
| Fidelity International Multifactor ETF | 2,689,595 | 2,779,745 |
| Fidelity International Value Factor ETF | 11,596,670 | 9,783,189 |
| 37 | Semi-Annual Report |
| Total Security Lending Fees Paid to NFS | Security Lending Income From Securities Loaned to NFS | Value of Securities Loaned to NFS at Period End | |
| Fidelity International High Dividend ETF | $ 1,339 | $ — | $ — |
| Fidelity International Value Factor ETF | 129 | — | — |
| Amount | |
| Fidelity Emerging Markets Multifactor ETF | $ 2 |
| Fidelity International High Dividend ETF | 1 |
| Fidelity International Multifactor ETF | 9 |
| Fidelity International Value Factor ETF | 2 |
| Semi-Annual Report | 38 |
| Annualized Expense RatioA | Beginning Account Value November 1, 2021 | Ending Account Value April 30, 2022 | Expenses Paid During PeriodB November 1, 2021 to April 30, 2022 | |
| Fidelity Emerging Markets Multifactor ETF | 0.45% | |||
| Actual | $ 1,000.00 | $ 921.70 | $ 2.14 | |
| Hypothetical C | $ 1,000.00 | $ 1,022.56 | $ 2.26 | |
| Fidelity International High Dividend ETF | 0.39% | |||
| Actual | $ 1,000.00 | $ 976.40 | $ 1.91 | |
| Hypothetical C | $ 1,000.00 | $ 1,022.86 | $ 1.96 | |
| Fidelity International Multifactor ETF | 0.39% | |||
| Actual | $ 1,000.00 | $ 896.10 | $ 1.83 | |
| Hypothetical C | $ 1,000.00 | $ 1,022.86 | $ 1.96 | |
| Fidelity International Value Factor ETF | 0.39% | |||
| Actual | $ 1,000.00 | $ 931.50 | $ 1.87 | |
| Hypothetical C | $ 1,000.00 | $ 1,022.86 | $ 1.96 |
| A | Annualized expense ratio reflects expenses net of applicable fee waivers. |
| B | Expenses are equal to the annualized expense ratio, multiplied by the average account value over the period, multiplied by 184/365 (to reflect the one-half year period). The fees and expenses of any Underlying Funds are not included in each annualized expense ratio. |
| C | 5% return per year before expenses. |
| 39 | Semi-Annual Report |
| Semi-Annual Report | 40 |
| Item 2. | Code of Ethics |
Not applicable.
| Item 3. | Audit Committee Financial Expert |
Not applicable.
| Item 4. | Principal Accountant Fees and Services |
Not applicable.
| Item 5. | Audit Committee of Listed Registrants |
Not applicable.
| Item 6. | Investments |
| (a) | Not applicable. |
| (b) | Not applicable |
| Item 7. | Disclosure of Proxy Voting Policies and Procedures for Closed-End Management Investment Companies |
Not applicable.
| Item 8. | Portfolio Managers of Closed-End Management Investment Companies |
Not applicable.
| Item 9. | Purchase of Equity Securities by Closed-End Management Investment Company and Affiliated Purchasers |
Not applicable.
| Item 10. | Submission of Matters to a Vote of Security Holders |
There were no material changes to the procedures by which shareholders may recommend nominees to the Fidelity Covington Trust’s Board of Trustees.
| Item 11. | Controls and Procedures |
(a)(i) The President and Treasurer and the Chief Financial Officer have concluded that the Fidelity Covington Trust’s (the “Trust”) disclosure controls and procedures (as defined in Rule 30a-3(c) under the Investment Company Act) provide reasonable assurances that material information relating to the Trust is made known to them by the appropriate persons, based on their evaluation of these controls and procedures as of a date within 90 days of the filing date of this report.
(a)(ii) There was no change in the Trust’s internal control over financial reporting (as defined in Rule 30a-3(d) under the Investment Company Act) that occurred during the period covered by this report that has materially affected, or is reasonably likely to materially affect, the Trust’s internal control over financial reporting.
| Item 12. | Disclosure of Securities Lending Activities for Closed-End Management Investment Companies |
Not applicable.
| Item 13. | Exhibits |
SIGNATURES
Pursuant to the requirements of the Securities Exchange Act of 1934 and the Investment Company Act of 1940, the registrant has duly caused this report to be signed on its behalf by the undersigned, thereunto duly authorized.
Fidelity Covington Trust
| By: | /s/ Stacie M. Smith | |
| Stacie M. Smith | ||
| President and Treasurer | ||
| Date: | June 21, 2022 | |
Pursuant to the requirements of the Securities Exchange Act of 1934 and the Investment Company Act of 1940, this report has been signed below by the following persons on behalf of the registrant and in the capacities and on the dates indicated.
| By: | /s/ Stacie M. Smith | |
| Stacie M. Smith | ||
| President and Treasurer | ||
| Date: | June 21, 2022 | |
| By: | /s/ John J. Burke III | |
| John J. Burke III | ||
| Chief Financial Officer | ||
| Date: | June 21, 2022 | |