UNITED STATES
SECURITIES AND EXCHANGE COMMISSION
Washington, D.C. 20549
FORM N-CSR
CERTIFIED SHAREHOLDER REPORT OF REGISTERED
MANAGEMENT INVESTMENT COMPANIES
Investment Company Act File No. 811-09054
CREDIT SUISSE OPPORTUNITY FUNDS
(Exact Name of Registrant as Specified in Charter)
Eleven Madison Avenue, New York, New York 10010
(Address of Principal Executive Offices) (Zip Code)
John G. Popp
Credit Suisse Opportunity Funds
Eleven Madison Avenue
New York, New York 10010
Registrant’s telephone number, including area code: (212) 325-2000
Date of fiscal year end: October 31st
Date of reporting period: November 1, 2022 to October 31, 2023
Item 1. Reports to Stockholders.

CREDIT SUISSE FUNDS
Annual Report
October 31, 2023
◼ CREDIT SUISSE
FLOATING RATE HIGH INCOME FUND
The Fund's investment objectives, risks, charges and expenses (which should be considered carefully before investing), and more complete information about the Fund, are provided in the Prospectus, which should be read carefully before investing. You may obtain additional copies by calling 877-870-2874 or by visiting our website at www.credit-suisse.com/us/funds.
Credit Suisse Securities (USA) LLC, Distributor, is located at Eleven Madison Avenue, New York, NY 10010. Credit Suisse Funds are advised by Credit Suisse Asset Management, LLC.
Investors in the Credit Suisse Funds should be aware that they may be eligible to purchase Class I shares (where offered) directly or through certain intermediaries. Such shares are not subject to a sales charge. Investors in the Credit Suisse Funds should also be aware that they may be eligible for a reduction or waiver of the sales charge with respect to Class A or C shares (where offered). For more information, please review the relevant prospectuses or consult your financial representative.
Fund shares are not deposits or other obligations of Credit Suisse Asset Management, LLC ("Credit Suisse") or any affiliate, are not FDIC-insured and are not guaranteed by Credit Suisse or any affiliate. Fund investments are subject to investment risks, including loss of your investment.
Credit Suisse Floating Rate High Income Fund
Annual Investment Adviser's Report
October 31, 2023 (unaudited)
October 31, 2023
Dear Shareholder:
We are pleased to present this Annual Report covering the activities of the Credit Suisse Floating Rate High Income Fund (the "Fund") for the 12-month period ended October 31, 2023 the ("Period").
Performance Summary
11/01/2022 – 10/31/2023
Fund & Benchmark | | Performance | |
| Class I1 | | | 11.36 | % | |
| Class A1,2 | | | 11.07 | % | |
| Class C1,2 | | | 10.24 | % | |
| Credit Suisse Leveraged Loan Index3 | | | 11.56 | % | |
Performance shown for the Fund's Class A and Class C Shares does not reflect sales charges, which are a maximum of 4.75% and 1.00%, respectively.2
Market Review: A positive period for loans
The annual period ended October 31, 2023, was positive for the loan asset class, as a resilient U.S. economy was further buoyed by the impact of high coupons due to Fed rate hikes. The Credit Suisse Leveraged Loan Index (the "Index"), the Fund's benchmark, registered a return of 11.56% for the Period. The Index saw positive returns in 10 out of 12 months during the Period. The senior loan discount margin, assuming a three-year average life, tightened by 77 basis points to 578 basis points. The average price of the Index finished the period 2.34 points higher, at 94.12.
From a quality standpoint, single B-rated issues outperformed the Index for the Period. The middle tier returned 12.59%, while the upper and lower tier returned 9.32% and 6.81%, respectively for the Period.
The Index was led by housing and energy, returning 14.84% and 14.08%, respectively for the Period. Media, telecommunications and healthcare were the largest sector laggards, returning 7.93% and 9.91%, respectively.
Within loans, fund flows have been more modest of late, with outflows of only -$4.7 billion during the six-month period ended October 31, 2023 — compared to -$26.6 billion for the Period, according to JPMorgan. Collateralized Loan Obligation issuance faced ongoing challenges, finding fleeting opportunities within narrow windows where asset-liability arbitrage aligns. There has been $123 billion gross/$111.1 billion net issuance during the Period. Loan issuance has remained subdued with only $330.7 billion of gross issuance and $82.9 billion of net issuance for the Period.
1
Credit Suisse Floating Rate High Income Fund
Annual Investment Adviser's Report (continued)
October 31, 2023 (unaudited)
Strategic Review and Outlook: Credit selection continues to be critical
For the Period, the Fund slightly underperformed the Index. Positive sector selection within information technology and healthcare, and an out of benchmark allocation to structured products contributed to returns. Positive selection in B-rated positions also contributed to relative performance. However, negative selection within media and telecommunications detracted from relative performance.
Amidst a resilient technical market outlook, corporate profits have been impacted, as companies navigate heightened borrowing costs due to elevated interest rates, higher (though easing) inflation metrics, tighter labor market, and higher wages. Notably, the month of October 2023 recorded seven defaults, marking the highest count in the past three years, according to JPMorgan. This brings the par-weighted default rate in loans to 3.08%.
In this environment, we believe credit selection will continue to be paramount to capture opportunities, as the impacts of higher cost of capital and other risks spread through the global economy.
The Credit Suisse Credit Investments Group Team
John G. Popp
Thomas J. Flannery
Louis I. Farano
Wing Chan
David Mechlin
Joshua Shedroff
Senior secured floating rate loans ("Senior Loans") typically hold the most senior position in the issuer's capital structure. Senior Loans are subject to the risk that a court could subordinate a Senior Loan to presently existing or future indebtedness or take other action detrimental to the holders of Senior Loans.
High yield bonds are bonds rated below BBB- by S&P or Baa3 by Moody's that are also known as "junk bonds." Such bonds entail greater risks than those found in higher- rated securities.
Additional principal risk factors for the Fund include conflict of interest risk, credit risk, foreign securities risk, illiquidity risk, interest rate risk, LIBOR risk, market risk, prepayment risk and valuation risk. Before you invest, please make sure you understand
2
Credit Suisse Floating Rate High Income Fund
Annual Investment Adviser's Report (continued)
October 31, 2023 (unaudited)
the risks that apply to the Fund. As with any mutual fund, you could lose money over any period of time.
Investments in the Fund are not bank deposits and are not insured or guaranteed by the Federal Deposit Insurance Corporation or any government agency. For a detailed discussion of these and other risks, please refer to the Fund's Prospectus, which should be read carefully before investing.
In addition to historical information, this report contains forward-looking statements, which may concern, among other things, domestic and foreign markets, industry and economic trends and developments and government regulation, and their potential impact on the Fund's investments. These statements are subject to risks and uncertainties and actual trends, developments and regulations in the future, and their impact on the Fund, could be materially different from those projected, anticipated or implied. The Fund has no obligation to update or revise forward-looking statements.
The views of the Fund's management are as of the date of this letter and the Fund holdings described in this document are as of October 31, 2023; these views and Fund holdings may have changed subsequent to these dates. Nothing in this document is a recommendation to purchase or sell securities.
3
Credit Suisse Floating Rate High Income Fund
Annual Investment Adviser's Report (continued)
October 31, 2023 (unaudited)
Comparison of Change in Value of $10,000 Investment in the
Credit Suisse Floating Rate High Income Fund1,2 and the
Credit Suisse Leveraged Loan Index3 for Ten Years
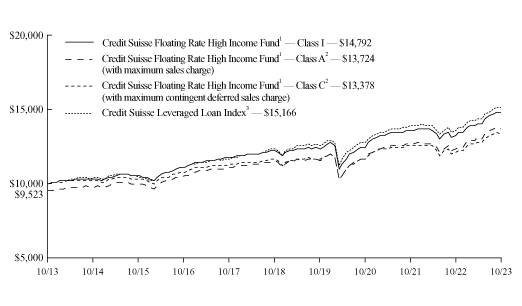
1 Fee waivers and/or expense reimbursements reduce expenses for the Fund, without which performance would be lower. Effective April 22, 2019, the Fund entered into a written contract to limit expenses to 0.70% of the Fund's average daily net assets for Class I shares, 0.95% of the Fund's average daily net assets for Class A shares and 1.70% of the Fund's average daily net assets for Class C shares through at least February 28, 2025. This limit excludes certain expenses, as set forth in the Fund's Prospectus.
2 Total return for the Fund's Class A shares for the reporting period, based on offering price (including maximum sales charge of 4.75%), was 5.79%. Total return for the Fund's Class C shares for the reporting period, based on redemption value including maximum contingent deferred sales charge ("CDSC") of 1.00%, was 9.24%.
3 Credit Suisse Leveraged Loan Index is an unmanaged index that is designed to mirror the investable universe of the U.S. dollar denominated institutional leveraged loan market. The Index does not have transaction costs and investors cannot invest directly in the Index.
4
Credit Suisse Floating Rate High Income Fund
Annual Investment Adviser's Report (continued)
October 31, 2023 (unaudited)
Average Annual Returns as of October 31, 20231
| | | 1 Year | | 5 Years | | 10 Years | |
Class I | | | 11.36 | % | | | 3.91 | % | | | 3.99 | % | |
Class A Without Sales Charge | | | 11.07 | % | | | 3.63 | % | | | 3.72 | % | |
Class A With Maximum Sales Charge | | | 5.79 | % | | | 2.63 | % | | | 3.22 | % | |
Class C Without CDSC | | | 10.24 | % | | | 2.86 | % | | | 2.95 | % | |
Class C With CDSC | | | 9.24 | % | | | 2.86 | % | | | 2.95 | % | |
Returns represent past performance and include change in share price and reinvestment of dividends, capital gains, and return of capital distributions, if any. Past performance cannot guarantee future results. The current performance of the Fund may be lower or higher than the figures shown. Returns and share price will fluctuate, and redemption value may be more or less than original cost. The performance results do not reflect the deduction of taxes that a shareholder would pay on Fund distributions or the redemption of Fund shares. Performance information current to the most recent month end is available at www.credit-suisse.com/us/funds.
The annual gross expense ratios are 0.81% for Class I shares, 1.06% for Class A shares and 1.81% for Class C shares. The annual net expense ratios after fee waivers and/or expense reimbursements are 0.70% for Class I shares, 0.95% for Class A shares and 1.70% for Class C shares.
1 Fee waivers and/or expense reimbursements reduce expenses for the Fund, without which performance would be lower. Effective April 22, 2019, the Fund entered into a written contract to limit expenses to 0.70% of the Fund's average daily net assets for Class I shares, 0.95% of the Fund's average daily net assets for Class A shares and 1.70% of the Fund's average daily net assets for Class C shares through at least February 28, 2025. This limit excludes certain expenses, as set forth in the Fund's Prospectus.
5
Credit Suisse Floating Rate High Income Fund
Annual Investment Adviser's Report (continued)
October 31, 2023 (unaudited)
Information About Your Fund's Expenses
As an investor of the Fund, you incur two types of costs: ongoing expenses and transaction costs. Ongoing expenses include management fees, distribution and service (12b-1) fees and other Fund expenses. Examples of transaction costs include sales charges (loads), redemption fees and account maintenance fees, which are not shown in this section and which would result in higher total expenses. The following table is intended to help you understand your ongoing expenses of investing in the Fund and to help you compare these expenses with the ongoing expenses of investing in other mutual funds. The table is based on an investment of $1,000 made at the beginning of the six months ended October 31, 2023.
The table illustrates your Fund's expenses in two ways:
• Actual Fund Return. This helps you estimate the actual dollar amount of ongoing expenses paid on a $1,000 investment in the Fund using the Fund's actual return during the period. To estimate the expenses you paid over the period, simply divide your account value by $1,000 (for example, an $8,600 account value divided by $1,000 = 8.6), then multiply the result by the number in the "Expenses Paid per $1,000" line.
• Hypothetical 5% Fund Return. This helps you to compare the Fund's ongoing expenses with those of other mutual funds using the Fund's actual expense ratio and a hypothetical rate of return of 5% per year before expenses. Examples using a 5% hypothetical fund return may be found in the shareholder reports of other mutual funds. The hypothetical account values and expenses may not be used to estimate the actual ending account balance or expenses you paid for the period.
Please note that the expenses shown in these tables are meant to highlight your ongoing expenses only and do not reflect any transaction costs, such as sales charges (loads) or redemption fees. If these transaction costs had been included, your costs would have been higher. The "Expenses Paid per $1,000" line of the tables is useful in comparing ongoing expenses only and will not help you determine the relative total expenses of owning different funds.
6
Credit Suisse Floating Rate High Income Fund
Annual Investment Adviser's Report (continued)
October 31, 2023 (unaudited)
Expenses and Value for a $1,000 Investment
for the six-month period ended October 31, 2023
Actual Fund Return | | Class I | | Class A | | Class C | |
Beginning Account Value 05/01/23 | | $ | 1,000.00 | | | $ | 1,000.00 | | | $ | 1,000.00 | | |
Ending Account Value 10/31/23 | | $ | 1,051.50 | | | $ | 1,050.20 | | | $ | 1,046.20 | | |
Expenses Paid per $1,000* | | $ | 3.62 | | | $ | 4.91 | | | $ | 8.77 | | |
Hypothetical 5% Fund Return | |
Beginning Account Value 05/01/23 | | $ | 1,000.00 | | | $ | 1,000.00 | | | $ | 1,000.00 | | |
Ending Account Value 10/31/23 | | $ | 1,021.68 | | | $ | 1,020.42 | | | $ | 1,016.64 | | |
Expenses Paid per $1,000* | | $ | 3.57 | | | $ | 4.84 | | | $ | 8.64 | | |
| | | Class I | | Class A | | Class C | |
Annualized Expense Ratios* | | | 0.70 | % | | | 0.95 | % | | | 1.70 | % | |
* Expenses are equal to the Fund's annualized expense ratio for each share class, multiplied by the average account value over the period, multiplied by 184/365 to reflect the one-half year period.
The "Expenses Paid per $1,000" and the "Annualized Expense Ratios" in the tables are based on actual expenses paid by the Fund during the period, net of fee waivers and/or actual expense reimbursements, if applicable. If those fee waivers and/or expense reimbursements had not been in effect, the Fund's actual expenses would have been higher. Expenses do not reflect additional charges and expenses that are, or may be, imposed under the variable contracts or plans. Such charges and expenses are described in the prospectus of the insurance company separate account or in the plan documents or other informational materials supplied by plan sponsors. The Fund's expenses should be considered with these charges and expenses in evaluating the overall cost of investing in the separate account.
For more information, please refer to the Fund's Prospectus.
7
Credit Suisse Floating Rate High Income Fund
Annual Investment Adviser's Report (continued)
October 31, 2023 (unaudited)
Credit Quality Breakdown*
(% of Total Investments as of October 31, 2023)
S&P Ratings** | | | |
A | | | 0.3 | % | |
AAA | | | 0.6 | | |
BBB | | | 4.2 | | |
BB | | | 15.0 | | |
B | | | 56.4 | | |
CCC | | | 10.7 | | |
CC | | | 0.3 | | |
D | | | 0.1 | | |
NR | | | 7.0 | | |
Subtotal | | | 94.6 | | |
Equity and Other | | | 5.4 | | |
Total | | | 100.0 | % | |
* Expressed as a percentage of total investments (excluding securities lending collateral if applicable) and may vary over time.
** Credit Quality is based on ratings provided by the S&P Global Ratings Division of S&P Global Inc. ("S&P"). S&P is a main provider of ratings for credit assets classes and is widely used amongst industry participants. The NR category consists of securities that have not been rated by S&P.
8
Credit Suisse Floating Rate High Income Fund
Schedule of Investments
October 31, 2023
Par
(000) | |
| | Ratings†
(S&P/Moody's) | | Maturity | | Rate% | | Value | |
| BANK LOANS (80.3%) | | | |
| Advertising (0.8%) | | | |
$ | 11,970 | | | MH Sub I LLC, 1 mo. USD Term
SOFR + 4.250%(1) | | (B, B1) | | 05/03/28 | | | 9.574 | | | $ | 11,458,761 | | |
| | 2,611 | | | MH Sub I LLC (1st Lien Term Loan),
1 mo. USD Term SOFR + 3.750%(1) | | (B, B1) | | 09/13/24 | | | 9.189 | | | | 2,617,144 | | |
| | 1,376 | | | MH Sub I LLC (Incremental Term Loan),
1 mo. USD Term SOFR + 3.750%(1) | | (B, B1) | | 09/13/24 | | | 9.189 | | | | 1,377,716 | | |
| | | | 15,453,621 | | |
| Aerospace & Defense (1.9%) | | | |
| | 4,750 | | | Amentum Government Services
Holdings LLC, 1 mo. USD Term
SOFR + 8.750%(1) | | (NR, NR) | | 01/31/28 | | | 14.189 | | | | 4,326,965 | | |
| | 6,000 | | | Amentum Government Services
Holdings LLC, 1 mo. USD Term
SOFR + 7.500%(1) | | (NR, NR) | | 02/15/30 | | | 12.935 | | | | 5,415,000 | | |
| | 2,895 | | | Amentum Government Services
Holdings LLC, 1 mo. USD Term
SOFR + 4.000%(1) | | (B, B2) | | 02/15/29 | | | 9.335 | | | | 2,840,237 | | |
| | 4,185 | | | Brown Group Holding LLC,
1 mo. USD Term SOFR + 3.750%,
3 mo. USD Term SOFR + 3.750%(1) | |
(B+, B2) | |
07/02/29 | | |
9.066 -
9.133 | | | | 4,182,763 | | |
| | 6,176 | | | Brown Group Holding LLC,
1 mo. USD Term SOFR + 2.750%(1) | | (B+, B2) | | 06/07/28 | | | 8.075 | | | | 6,074,611 | | |
| | 1,996 | | | Fly Funding II SARL,
3 mo. USD LIBOR + 1.750%(1) | | (CCC+, B3) | | 08/11/25 | | | 7.380 | | | | 1,903,269 | | |
| | 1,785 | | | KKR Apple Bidco LLC,
1 mo. USD Term SOFR + 2.750%(1) | | (B, B2) | | 09/22/28 | | | 8.189 | | | | 1,753,422 | | |
| | 3,758 | | | KKR Apple Bidco LLC,
1 mo. USD Term SOFR + 4.000%(1) | | (B, B2) | | 09/22/28 | | | 9.324 | | | | 3,755,397 | | |
| | 6,880 | | | Peraton Corp., 1 mo. USD Term
SOFR + 3.750%(1) | | (B, B1) | | 02/01/28 | | | 9.174 | | | | 6,762,376 | | |
| | | | 37,014,040 | | |
| Air Transportation (0.2%) | | | |
| | 4,454 | | | United Airlines, Inc.,
1 mo. USD Term SOFR + 3.750%(1) | | (BB, Ba1) | | 04/21/28 | | | 9.189 | | | | 4,451,042 | | |
| Auto Parts & Equipment (2.6%) | | | |
| | 12,870 | | | Autokiniton U.S. Holdings, Inc.,
1 mo. USD Term SOFR + 4.500%(1) | | (B, B2) | | 04/06/28 | | | 9.939 | | | | 12,660,692 | | |
| | 750 | | | Clarios Global LP,
1 mo. USD Term SOFR + 3.750%(1) | | (B+, B1) | | 05/06/30 | | | 9.074 | | | | 749,813 | | |
| | 6,786 | | | Dealer Tire Financial LLC,
1 mo. USD Term SOFR + 4.500%(1) | | (B-, B1) | | 12/14/27 | | | 9.824 | | | | 6,799,231 | | |
| | 8,214 | | | Garrett Motion, Inc., 3 mo. USD Term
SOFR + 4.500%(1) | | (BB-, Ba2) | | 04/30/28 | | | 9.883 | | | | 8,234,821 | | |
| | 1,735 | | | Gates Global LLC, 1 mo. USD Term
SOFR + 2.500%(1) | | (B+, Ba3) | | 03/31/27 | | | 7.924 | | | | 1,734,151 | | |
See Accompanying Notes to Financial Statements.
9
Credit Suisse Floating Rate High Income Fund
Schedule of Investments (continued)
October 31, 2023
Par
(000) | |
| | Ratings†
(S&P/Moody's) | | Maturity | | Rate% | | Value | |
| BANK LOANS (continued) | | | |
| Auto Parts & Equipment (continued) | | | |
$ | 2,749 | | | Jason Group, Inc., 1 mo. USD Term
SOFR + 6.000%, 0.000% PIK(1),(2) | | (NR, WR) | | 08/28/25 | | | 11.439 | | | $ | 2,432,479 | | |
| | 5,159 | | | Les Schwab Tire Centers,
1 mo. USD Term SOFR + 3.250%(1) | | (B, B2) | | 11/02/27 | | | 8.692 | | | | 5,148,633 | | |
| | 2,099 | | | PAI Holdco, Inc., 3 mo. USD Term
SOFR + 3.750%(1) | | (B-, B3) | | 10/28/27 | | | 9.395 | | | | 1,996,170 | | |
| | 5,125 | | | RVR Dealership Holdings LLC,
1 mo. USD Term SOFR + 3.750%(1) | | (BB-, B2) | | 02/08/28 | | | 9.182 | | | | 4,476,147 | | |
| | 6,899 | | | TI Group Automotive Systems LLC,
3 mo. EUR EURIBOR + 3.250%(1),(3) | | (BBB-, Ba3) | | 12/16/26 | | | 7.222 | | | | 7,306,387 | | |
| | | | 51,538,524 | | |
| Banking (0.1%) | | | |
| | 2,666 | | | Citco Funding LLC, 3 mo. USD Term
SOFR + 3.500%(1) | | (BB, Ba2) | | 04/27/28 | | | 8.888 | | | | 2,672,294 | | |
| Brokerage (0.2%) | | | |
| | 3,297 | | | Jane Street Group LLC, 1 mo. USD Term
SOFR + 2.750%(1) | | (BB, Ba2) | | 01/26/28 | | | 8.189 | | | | 3,293,492 | | |
| Building & Construction (0.7%) | | | |
| | 6,361 | | | Latham Pool Products, Inc.,
3 mo. USD Term SOFR + 4.000%(1) | | (BB-, B1) | | 02/23/29 | | | 9.527 | | | | 6,088,449 | | |
| | 4,187 | | | Pike Corp., 1 mo. USD Term
SOFR + 3.000%(1) | | (B, Ba3) | | 01/21/28 | | | 8.439 | | | | 4,183,778 | | |
| | 3,012 | | | Service Logic Acquisition, Inc.,
1 mo. USD Term SOFR + 4.000%,
3 mo. USD Term SOFR + 4.000%(1) | |
(B, B2) | |
10/29/27 | | |
9.439 -
9.645 | | | | 3,004,099 | | |
| | | | 13,276,326 | | |
| Building Materials (2.2%) | | | |
| | 5,724 | | | Core & Main LP, 1 mo. USD Term
SOFR + 2.500%, 3 mo. USD Term
SOFR + 2.500%(1) | |
(B+, B1) | |
07/27/28 | | |
7.839 -
7.912 | | | | 5,724,246 | | |
| | 9,725 | | | Cornerstone Building Brands, Inc.,
1 mo. USD Term SOFR + 3.250%(1) | | (B, B2) | | 04/12/28 | | | 8.685 | | | | 9,271,640 | | |
| | 3,625 | | | Cornerstone Building Brands, Inc.,
1 mo. USD Term SOFR + 5.625%(1) | | (B, B2) | | 08/01/28 | | | 10.960 | | | | 3,588,657 | | |
| | 525 | | | CPG International, Inc.,
1 mo. USD Term SOFR + 2.500%(1) | | (BB-, B1) | | 04/28/29 | | | 7.924 | | | | 524,504 | | |
| | 1,654 | | | GYP Holdings III Corp.,
1 mo. USD Term SOFR + 3.000%(1) | | (BB-, Ba2) | | 05/12/30 | | | 8.324 | | | | 1,660,623 | | |
| | 6,186 | | | Oscar AcquisitionCo LLC,
3 mo. USD Term SOFR + 4.500%(1) | | (B, B1) | | 04/29/29 | | | 9.990 | | | | 6,036,199 | | |
| | 1,294 | | | Park River Holdings, Inc.,
3 mo. USD Term SOFR + 3.250%(1) | | (B-, B2) | | 12/28/27 | | | 8.907 | | | | 1,226,372 | | |
| | 12,958 | | | SRS Distribution, Inc., 1 mo. USD Term
SOFR + 3.500%(1) | | (B-, B3) | | 06/02/28 | | | 8.939 | | | | 12,682,816 | | |
| | 1,989 | | | SRS Distribution, Inc., 1 mo. USD Term
SOFR + 3.500%(1) | | (B-, B3) | | 06/02/28 | | | 8.825 | | | | 1,943,169 | | |
| | | | 42,658,226 | | |
See Accompanying Notes to Financial Statements.
10
Credit Suisse Floating Rate High Income Fund
Schedule of Investments (continued)
October 31, 2023
Par
(000) | |
| | Ratings†
(S&P/Moody's) | | Maturity | | Rate% | | Value | |
| BANK LOANS (continued) | | | |
| Cable & Satellite TV (0.4%) | | | |
$ | 7,000 | | | Ziggo BV, 6 mo. EUR
EURIBOR + 3.000%(1),(3) | | (B+, B1) | | 01/31/29 | | | 6.928 | | | $ | 7,041,664 | | |
| | 738 | | | Ziggo Financing Partnership, 1 mo.
USD Term SOFR + 2.500%(1) | | (B+, B1) | | 04/30/28 | | | 7.949 | | | | 723,286 | | |
| | | | 7,764,950 | | |
| Chemicals (3.7%) | | | |
| | 4,078 | | | Ascend Performance Materials
Operations LLC, 3 mo. USD Term
SOFR + 4.750%(1) | | (B+, Ba3) | | 08/27/26 | | | 10.318 | | | | 3,857,633 | | |
| | 4,000 | | | CeramTec AcquiCo GmbH, 3 mo. EUR
EURIBOR + 3.500%(1),(3) | | (B, B2) | | 03/16/29 | | | 7.283 | | | | 4,130,459 | | |
| | 3,455 | | | CPC Acquisition Corp., 3 mo. USD Term
SOFR + 7.750%(1) | | (CCC-, Caa3) | | 12/29/28 | | | 13.402 | | | | 1,698,740 | | |
| | 3,477 | | | CPC Acquisition Corp., 3 mo. USD Term
SOFR + 3.750%(1) | | (CCC+, Caa1) | | 12/29/27 | | | 9.402 | | | | 2,752,769 | | |
| | 1,869 | | | Eastman Chemical Co., 3 mo. USD Term
SOFR + 5.250%(1) | | (B, B2) | | 11/01/28 | | | 10.902 | | | | 1,756,599 | | |
| | 10,890 | | | Hexion Holdings Corp., 3 mo. USD Term
SOFR + 4.500%(1) | | (B-, B2) | | 03/15/29 | | | 10.033 | | | | 10,097,938 | | |
| | 9,181 | | | Luxembourg Investment Co. 428 SARL,
3 mo. USD Term SOFR + 5.000%(1) | | (CCC+, B3) | | 01/03/29 | | | 10.540 | | | | 6,415,168 | | |
| | 2,668 | | | Nouryon Finance BV, 1 mo. USD Term
SOFR + 4.000%(1) | | (B+, B2) | | 04/03/28 | | | 9.434 | | | | 2,612,728 | | |
| | 5,147 | | | PMHC II, Inc., 3 mo. USD Term
SOFR + 4.250%(1) | | (B-, B3) | | 04/23/29 | | | 9.807 | | | | 4,684,728 | | |
| | 7,468 | | | Polar U.S. Borrower LLC,
3 mo. USD Term SOFR + 4.750%(1) | |
(CCC, Caa1) | | |
10/15/25 | | | | 10.243 -
10.244 | | | | 5,643,931 | | |
| | 8,210 | | | Ravago Holdings America, Inc.,
3 mo. USD Term SOFR + 2.500%(1) | | (NR, B1) | | 03/04/28 | | | 8.152 | | | | 8,065,834 | | |
| | 2,583 | | | RelaDyne, Inc., 1 mo. USD Term
SOFR + 4.250%(1) | | (B, B2) | | 12/22/28 | | | 9.574 | | | | 2,568,975 | | |
| | 5,444 | | | RelaDyne, Inc., 1 mo. USD Term
SOFR + 5.000%(1),(4) | | (B, B2) | | 12/22/28 | | | 10.324 | | | | 5,430,006 | | |
| | 1,119 | | | Starfruit Finco BV, 1 mo. USD Term
SOFR + 4.000%(1) | | (B+, B2) | | 04/03/28 | | | 9.419 | | | | 1,094,872 | | |
| | 10,489 | | | Vantage Specialty Chemicals, Inc.,
1 mo. USD Term SOFR + 4.750%(1) | | (B-, B2) | | 10/26/26 | | | 10.085 | | | | 10,113,000 | | |
| | 2,198 | | | Zep, Inc., 3 mo. USD Term
SOFR + 4.000%(1) | | (NR, NR) | | 10/02/28 | | | 9.390 | | | | 2,071,787 | | |
| | | | 72,995,167 | | |
| Diversified Capital Goods (1.7%) | | | |
| | 11,312 | | | Dynacast International LLC,
3 mo. USD Term SOFR + 4.500%(1) | | (B-, B2) | | 07/22/25 | | | 10.017 | | | | 10,605,329 | | |
| | 1,980 | | | Dynacast International LLC,
3 mo. USD Term SOFR + 9.000%(1) | | (CCC, Caa2) | | 10/22/25 | | | 14.517 | | | | 1,517,705 | | |
| | 2,999 | | | Electrical Components International, Inc.,
3 mo. USD Term SOFR + 4.250%(1) | | (B-, B2) | | 06/26/25 | | | 9.773 | | | | 2,976,337 | | |
See Accompanying Notes to Financial Statements.
11
Credit Suisse Floating Rate High Income Fund
Schedule of Investments (continued)
October 31, 2023
Par
(000) | |
| | Ratings†
(S&P/Moody's) | | Maturity | | Rate% | | Value | |
| BANK LOANS (continued) | | | |
| Diversified Capital Goods (continued) | | | |
$ | 2,000 | | | Electrical Components International, Inc.,
3 mo. USD Term SOFR + 8.500%(1),(4),(5) | | (CCC, Caa2) | | 06/26/26 | | | 14.023 | | | $ | 1,760,000 | | |
| | 4,898 | | | Electrical Components International, Inc.,
U.S. (Fed) Prime Rate + 7.500%(1),(4) | | (B-, B2) | | 06/26/25 | | | 16.000 | | | | 4,702,056 | | |
| | 11,219 | | | Topgolf Callaway Brands Corp.,
1 mo. USD Term SOFR + 3.500%(1) | | (B+, B1) | | 03/15/30 | | | 8.924 | | | | 11,181,892 | | |
| | | | 32,743,319 | | |
| Electric - Generation (0.7%) | | | |
| | 13,932 | | | Brookfield WEC Holdings, Inc.,
1 mo. USD Term SOFR + 2.750%(1) | | (B, B2) | | 08/01/25 | | | 8.189 | | | | 13,932,393 | | |
| Electronics (2.6%) | | | |
| | 2,128 | | | Entegris, Inc., 1 mo. USD Term
SOFR + 2.500%, 3 mo. USD Term
SOFR + 2.500%(1) | |
(BB, Baa3) | |
07/06/29 | | |
7.825 -
7.890 | | | | 2,132,642 | | |
| | 3,950 | | | Escape Velocity Holdings, Inc.,
3 mo. USD Term SOFR + 4.250%(1) | | (B, B3) | | 10/08/28 | | | 9.902 | | | | 3,836,382 | | |
| | 7,000 | | | Idemia Group,
3 mo. EUR EURIBOR + 4.750%(1),(3) | | (B, B2) | | 09/22/28 | | | 8.722 | | | | 7,390,378 | | |
| | 11,965 | | | Idemia Group, 3 mo. USD Term
SOFR + 4.750%(1) | | (B, B2) | | 09/30/28 | | | 10.140 | | | | 11,987,836 | | |
| | 7,589 | | | II-VI, Inc., 1 mo. USD Term
SOFR + 2.750%(1) | | (BB-, Ba2) | | 07/02/29 | | | 8.189 | | | | 7,585,008 | | |
| | 1,548 | | | Infinite Bidco LLC, 3 mo. USD Term
SOFR + 7.000%(1) | | (CCC, Caa2) | | 03/02/29 | | | 12.645 | | | | 1,363,197 | | |
| | 7,073 | | | Ingram Micro, Inc., 3 mo. USD Term
SOFR + 3.000%(1) | | (BB-, B1) | | 06/30/28 | | | 8.653 | | | | 7,063,712 | | |
| | 1,000 | | | MaxLinear, Inc., 1 mo. USD Term
SOFR + 2.250%(1),(4) | | (BB, Ba3) | | 06/23/28 | | | 7.689 | | | | 985,000 | | |
| | 2,898 | | | MKS Instruments, Inc., 1 mo. USD Term
SOFR + 2.500%(1) | | (BB, Ba1) | | 08/17/27 | | | 7.924 | | | | 2,888,315 | | |
| | 7,158 | | | MKS Instruments, Inc., 1 mo. USD Term
SOFR + 2.500%(1) | | (BB, Ba1) | | 08/17/29 | | | 7.819 | | | | 7,122,409 | | |
| | | | 52,354,879 | | |
| Energy - Exploration & Production (0.6%) | | | |
| | 9,082 | | | CQP Holdco LP, 3 mo. USD Term
SOFR + 3.500%(1) | | (BB, B1) | | 06/05/28 | | | 8.990 | | | | 9,084,604 | | |
| | 1,637 | | | GIP Pilot Acquisition Partners LP,
3 mo. USD Term SOFR + 3.000%(1),(4) | | (BB-, Ba3) | | 10/04/30 | | | 8.388 | | | | 1,636,777 | | |
| | 750 | | | Limetree Bay Terminals LLC,
3 mo. USD Term SOFR + 4.000%(1) | | (CCC, Caa2) | | 02/15/24 | | | 10.652 | | | | 693,957 | | |
| | 15,907 | | | PES Holdings LLC, 3.000% PIK(1),(2),(6) | | (NR, WR) | | 12/31/24 | | | 3.000 | | | | 278,380 | | |
| | | | 11,693,718 | | |
| Environmental (0.3%) | | | |
| | 2,192 | | | LRS Holdings LLC, 1 mo. USD Term
SOFR + 4.250%(1),(4) | | (B, B3) | | 08/31/28 | | | 9.689 | | | | 2,153,189 | | |
See Accompanying Notes to Financial Statements.
12
Credit Suisse Floating Rate High Income Fund
Schedule of Investments (continued)
October 31, 2023
Par
(000) | |
| | Ratings†
(S&P/Moody's) | | Maturity | | Rate% | | Value | |
| BANK LOANS (continued) | | | |
| Environmental (continued) | | | |
$ | 3,839 | | | Patriot Container Corp., 1 mo. USD Term
SOFR + 3.750%(1) | | (CCC+, B2) | | 03/20/25 | | | 9.075 | | | $ | 3,638,844 | | |
| | | | 5,792,033 | | |
| Food & Drug Retailers (1.0%) | | | |
| | 6,950 | | | Packaging Coordinators Midco, Inc.,
3 mo. USD Term SOFR + 3.500%(1) | | (B-, B2) | | 11/30/27 | | | 9.152 | | | | 6,874,250 | | |
| | 3,925 | | | Sharp Midco LLC, 3 mo. USD Term
SOFR + 4.000%(1),(4) | | (B-, B2) | | 12/31/28 | | | 9.490 | | | | 3,905,525 | | |
| | 8,948 | | | WOOF Holdings, Inc., 3 mo. USD Term
SOFR + 3.750%(1) | | (CCC+, B3) | | 12/21/27 | | | 9.397 | | | | 7,292,486 | | |
| | 2,923 | | | WOOF Holdings, Inc., 3 mo. USD Term
SOFR + 7.250%(1) | | (CCC-, Caa2) | | 12/21/28 | | | 12.749 | | | | 2,009,776 | | |
| | | | 20,082,037 | | |
| Food - Wholesale (0.9%) | | | |
| | 7,178 | | | AI Aqua Merger Sub, Inc.,
1 mo. USD Term SOFR + 3.750%,
3 mo. USD Term SOFR + 3.750%(1) | |
(B, B3) | |
07/31/28 | | |
9.082 -
9.144 | | | | 7,053,583 | | |
| | 4,172 | | | B&G Foods, Inc., 1 mo. USD Term
SOFR + 2.500%(1) | | (B+, B1) | | 10/10/26 | | | 7.827 | | | | 4,089,867 | | |
| | 2,000 | | | Froneri International Ltd.,
6 mo. EUR EURIBOR + 2.125%(1),(3) | | (BB-, B1) | | 01/29/27 | | | 6.097 | | | | 2,069,077 | | |
| | 5,000 | | | Zara U.K. Midco Ltd.,
6 mo. EUR EURIBOR + 5.750%(1),(3),(5) | | (B-, Caa1) | | 01/31/25 | | | 9.698 | | | | 3,841,534 | | |
| | | | 17,054,061 | | |
| Gaming (0.9%) | | | |
| | 6,024 | | | Arcis Golf LLC, 1 mo. USD Term
SOFR + 4.250%(1) | | (B+, B2) | | 11/24/28 | | | 9.691 | | | | 6,033,565 | | |
| | 4,192 | | | Fertitta Entertainment LLC,
1 mo. USD Term SOFR + 4.000%(1) | | (B, B2) | | 01/27/29 | | | 9.324 | | | | 4,106,381 | | |
| | 3,036 | | | PENN Entertainment, Inc.,
1 mo. USD Term SOFR + 2.750%(1) | | (BB, Ba3) | | 05/03/29 | | | 8.174 | | | | 3,035,576 | | |
| | 4,096 | | | Scientific Games International, Inc.,
1 mo. USD Term SOFR + 3.000%(1) | | (BB, Ba3) | | 04/14/29 | | | 8.435 | | | | 4,097,762 | | |
| | 1,496 | | | Stars Group Holdings BV,
3 mo. USD Term SOFR + 2.250%(1) | | (BBB-, Ba1) | | 07/21/26 | | | 7.902 | | | | 1,497,335 | | |
| | | | 18,770,619 | | |
| Gas Distribution (0.8%) | | | |
| | 6,077 | | | BCP Renaissance Parent LLC,
3 mo. USD Term SOFR + 3.500%(1) | | (B+, B2) | | 10/31/28 | | | 8.896 | | | | 6,052,029 | | |
| | 9,183 | | | Traverse Midstream Partners LLC,
3 mo. USD Term SOFR + 3.750%(1) | | (B+, B2) | | 02/16/28 | | | 9.240 | | | | 9,177,001 | | |
| | | | 15,229,030 | | |
See Accompanying Notes to Financial Statements.
13
Credit Suisse Floating Rate High Income Fund
Schedule of Investments (continued)
October 31, 2023
Par
(000) | |
| | Ratings†
(S&P/Moody's) | | Maturity | | Rate% | | Value | |
| BANK LOANS (continued) | | | |
| Health Facilities (1.1%) | | | |
$ | 1,900 | | | Bayou Intermediate II LLC,
3 mo. USD Term SOFR + 4.500%(1) | | (B-, B2) | | 08/02/28 | | | 10.128 | | | $ | 1,824,307 | | |
| | 4,774 | | | Carestream Health, Inc., 3 mo. USD Term
SOFR + 7.500%(1) | | (B-, Caa1) | | 09/30/27 | | | 12.990 | | | | 3,552,843 | | |
| | 1,503 | | | EyeCare Partners LLC, 3 mo. USD Term
SOFR + 3.750%(1) | | (CCC, Caa1) | | 02/18/27 | | | 9.395 | | | | 832,536 | | |
| | 3,444 | | | Insulet Corp., 1 mo. USD Term
SOFR + 3.250%(1) | | (B+, Ba2) | | 05/04/28 | | | 8.689 | | | | 3,437,585 | | |
| | 7,221 | | | Loire Finco Luxembourg SARL,
1 mo. USD Term SOFR + 3.750%(1) | | (B, B3) | | 04/21/27 | | | 9.174 | | | | 7,079,081 | | |
| | 5,583 | | | Surgery Center Holdings, Inc.,
1 mo. USD Term SOFR + 3.750%(1) | | (B-, B1) | | 08/31/26 | | | 9.203 | | | | 5,584,450 | | |
| | | | 22,310,802 | | |
| Health Services (5.1%) | | | |
| | 1,539 | | | ADMI Corp., 1 mo. USD Term
SOFR + 3.000%(1) | | (B-, B3) | | 04/30/25 | | | 8.439 | | | | 1,517,057 | | |
| | 12,816 | | | ADMI Corp., 1 mo. USD Term
SOFR + 3.375%(1) | | (B-, B3) | | 12/23/27 | | | 8.814 | | | | 11,542,083 | | |
| | 12,636 | | | Athenahealth Group, Inc.,
1 mo. USD Term SOFR + 3.250%(1) | | (B-, B2) | | 02/15/29 | | | 8.577 | | | | 12,274,634 | | |
| | 9,403 | | | Learning Care Group, Inc.,
3 mo. USD Term SOFR + 4.750%(1) | |
(B, B2) | |
08/11/28 | | | 10.117 -
10.171 | | | | 9,423,606 | | |
| | 4,741 | | | MedAssets Software Intermediate
Holdings, Inc., 1 mo. USD Term
SOFR + 6.750%(1) | | (CCC-, Caa3) | | 12/17/29 | | | 12.189 | | | | 2,878,757 | | |
| | 1,990 | | | MedAssets Software Intermediate
Holdings, Inc., 1 mo. USD Term
SOFR + 4.000%(1) | | (CCC+, B3) | | 12/18/28 | | | 9.439 | | | | 1,579,482 | | |
| | 2,621 | | | Pacific Dental Services LLC,
1 mo. USD Term SOFR + 3.500%,
3 mo. USD Term SOFR + 3.500%(1) | |
(B, B1) | |
05/05/28 | | |
8.936 -
8.953 | | | | 2,612,302 | | |
| | 4,121 | | | PetVet Care Centers LLC,
1 mo. USD Term SOFR + 3.500%(1) | | (B-, B2) | | 02/14/25 | | | 8.924 | | | | 4,121,948 | | |
| | 1,405 | | | PetVet Care Centers LLC,
1 mo. USD Term SOFR + 5.000%(1) | | (B-, B2) | | 02/14/25 | | | 10.424 | | | | 1,406,867 | | |
| | 4,334 | | | PointClickCare Technologies, Inc.,
3 mo. USD Term SOFR + 4.000%(1),(4) | | (B, B2) | | 12/29/27 | | | 9.390 | | | | 4,334,000 | | |
| | 4,789 | | | PointClickCare Technologies, Inc.,
3 mo. USD Term SOFR + 3.000%(1) | | (B, B2) | | 12/29/27 | | | 8.765 | | | | 4,782,876 | | |
| | 12,490 | | | Radiology Partners, Inc.,
1 mo. USD Term SOFR + 4.250%(1) | | (CCC+, B3) | | 07/09/25 | | | 10.179 | | | | 9,364,610 | | |
| | 4,983 | | | Select Medical Corp., 1 mo. USD Term
SOFR + 3.000%(1) | | (BB-, Ba2) | | 03/06/27 | | | 8.324 | | | | 4,976,338 | | |
| | 2,200 | | | Southern Veterinary Partners LLC,
1 mo. USD Term SOFR + 7.750%(1) | | (CCC, Caa2) | | 10/05/28 | | | 13.174 | | | | 2,119,326 | | |
| | 11,917 | | | Southern Veterinary Partners LLC,
1 mo. USD Term SOFR + 4.000%(1) | | (B-, B2) | | 10/05/27 | | | 9.439 | | | | 11,804,840 | | |
See Accompanying Notes to Financial Statements.
14
Credit Suisse Floating Rate High Income Fund
Schedule of Investments (continued)
October 31, 2023
Par
(000) | |
| | Ratings†
(S&P/Moody's) | | Maturity | | Rate% | | Value | |
| BANK LOANS (continued) | | | |
| Health Services (continued) | | | |
$ | 7,633 | | | U.S. Radiology Specialists, Inc.,
3 mo. USD Term SOFR + 5.250%(1) | | (B-, B3) | | 12/15/27 | | | 10.740 | | | $ | 7,232,466 | | |
| | 886 | | | Western Dental Services, Inc.,
3 mo. USD Term SOFR + 4.500%(1) | | (CCC+, B3) | | 08/18/28 | | | 10.184 | | | | 687,738 | | |
| | 8,295 | | | Western Dental Services, Inc. (2021
Term Loan B), 3 mo. USD Term
SOFR + 4.500%(1) | | (CCC+, B3) | | 08/18/28 | | | 10.184 | | | | 6,436,358 | | |
| | 1,948 | | | Women's Care Enterprises LLC,
3 mo. USD Term SOFR + 4.500%(1) | | (B-, B2) | | 01/15/28 | | | 10.053 | | | | 1,733,419 | | |
| | | | 100,828,707 | | |
| Hotels (0.7%) | | | |
| | 6,975 | | | Alterra Mountain Co., 1 mo. USD Term
SOFR + 3.500%(1) | | (B+, B1) | | 08/17/28 | | | 8.939 | | | | 6,986,335 | | |
| | 1,034 | | | Alterra Mountain Co., 1 mo. USD Term
SOFR + 3.750%(1) | | (B+, B1) | | 05/31/30 | | | 9.174 | | | | 1,035,914 | | |
| | 2,448 | | | Compass III Ltd., 1 mo. EUR
EURIBOR + 4.000%(1),(3),(4) | | (B-, B3) | | 05/09/25 | | | 7.862 | | | | 2,580,595 | | |
| | 2,665 | | | RHP Hotel Properties LP,
1 mo. USD Term SOFR + 2.750%(1) | | (BB-, Ba3) | | 05/18/30 | | | 8.074 | | | | 2,670,036 | | |
| | | | 13,272,880 | | |
| Insurance Brokerage (3.3%) | | | |
| | 10,052 | | | Alliant Holdings Intermediate LLC,
1 mo. USD LIBOR + 3.500%(1) | | (B, B2) | | 11/05/27 | | | 8.939 | | | | 10,029,141 | | |
| | 5,802 | | | AmWINS Group, Inc., 1 mo. USD Term
SOFR + 2.750%(1) | | (B+, Ba3) | | 02/19/28 | | | 8.189 | | | | 5,797,540 | | |
| | 3,227 | | | AssuredPartners, Inc., 1 mo. USD Term
SOFR + 3.500%(1) | | (B, B2) | | 02/12/27 | | | 8.824 | | | | 3,203,219 | | |
| | 2,777 | | | AssuredPartners, Inc. (2021 Term
Loan B), 1 mo. USD Term
SOFR + 3.500%(1) | | (B, B2) | | 02/12/27 | | | 8.939 | | | | 2,755,763 | | |
| | 6,565 | | | AssuredPartners, Inc.(2020 Term
Loan B), 1 mo. USD Term
SOFR + 3.500%(1) | | (B, B2) | | 02/12/27 | | | 8.939 | | | | 6,516,221 | | |
| | 1,225 | | | Howden Group Holdings Ltd.,
1 mo. USD Term SOFR + 4.000%(1) | | (B, B2) | | 04/18/30 | | | 9.324 | | | | 1,225,147 | | |
| | 20,209 | | | HUB International Ltd., 3 mo. USD Term
SOFR + 4.250%(1) | | (B, B2) | | 06/20/30 | | | 9.662 | | | | 20,222,077 | | |
| | 4,277 | | | Hyperion Insurance Group Ltd.,
1 mo. USD Term SOFR + 3.250%(1) | | (B, B2) | | 11/12/27 | | | 8.689 | | | | 4,248,526 | | |
| | 7,076 | | | Hyperion Insurance Group Ltd.,
1 mo. EUR EURIBOR + 3.500%(1),(3) | | (B, B2) | | 11/12/27 | | | 7.375 | | | | 7,378,802 | | |
| | 3,250 | | | USI, Inc., 3 mo. USD Term
SOFR + 3.750%(1) | | (B, B1) | | 11/22/29 | | | 9.140 | | | | 3,245,225 | | |
| | | | 64,621,661 | | |
See Accompanying Notes to Financial Statements.
15
Credit Suisse Floating Rate High Income Fund
Schedule of Investments (continued)
October 31, 2023
Par
(000) | |
| | Ratings†
(S&P/Moody's) | | Maturity | | Rate% | | Value | |
| BANK LOANS (continued) | | | |
| Investments & Misc. Financial Services (5.5%) | | | |
$ | 7,318 | | | Altisource Solutions SARL, 3 mo. USD
Term SOFR + 9.500%(1),(5) | | (CCC-, Caa2) | | 04/30/25 | | | 14.240 | | | $ | 5,909,456 | | |
| | 6,327 | | | Ankura Consulting Group LLC,
1 mo. USD Term SOFR + 4.500%(1) | | (B-, B2) | | 03/17/28 | | | 9.939 | | | | 6,277,323 | | |
| | 4,763 | | | AqGen Ascensus, Inc., 3 mo. USD Term
SOFR + 6.500%(1) | | (CCC, Caa2) | | 08/02/29 | | | 12.176 | | | | 4,560,299 | | |
| | 5,482 | | | AqGen Island Holdings, Inc.,
1 mo. USD Term SOFR + 3.500%(1) | | (B-, B2) | | 08/02/28 | | | 8.939 | | | | 5,387,999 | | |
| | 5,766 | | | Citadel Securities LP, 1 mo. USD Term
SOFR + 2.500%(1) | | (BBB-, Baa3) | | 07/29/30 | | | 7.939 | | | | 5,752,182 | | |
| | 5,404 | | | CTC Holdings LP, 3 mo. USD Term
SOFR + 5.000%(1),(4) | | (B+, B1) | | 02/20/29 | | | 10.344 | | | | 5,336,636 | | |
| | 9,153 | | | Deerfield Dakota Holding LLC,
3 mo. USD Term SOFR + 3.750%(1) | | (B-, B2) | | 04/09/27 | | | 9.140 | | | | 8,851,361 | | |
| | 1,199 | | | EIG Management Co. LLC,
1 mo. USD Term SOFR + 3.750%(1),(4) | | (BB, Ba2) | | 02/22/25 | | | 9.177 | | | | 1,199,239 | | |
| | 12,567 | | | Galaxy U.S. Opco, Inc., 3 mo. USD Term
SOFR + 4.750%(1) | | (B-, B3) | | 04/29/29 | | | 10.133 | | | | 11,718,742 | | |
| | 15,000 | | | GTCR W Merger Sub LLC(7) | | (BB, Ba3) | | 09/20/30 | | | 0.000 | | | | 14,912,475 | | |
| | 6,418 | | | Hudson River Trading LLC,
1 mo. USD Term SOFR + 3.000%(1) | | (BB-, Ba3) | | 03/20/28 | | | 8.439 | | | | 6,334,891 | | |
| | 4,981 | | | Jump Financial LLC, 3 mo. USD Term
SOFR + 4.500%(1),(4) | | (BB-, Ba2) | | 08/07/28 | | | 10.152 | | | | 4,794,183 | | |
| | 2,071 | | | Kestra Advisor Services Holdings A, Inc.,
3 mo. USD Term SOFR + 4.250%(1) | | (B-, B2) | | 06/03/26 | | | 9.740 | | | | 2,060,154 | | |
| | 4,105 | | | Mariner Wealth Advisors LLC,
3 mo. USD Term SOFR + 3.250%(1) | | (B-, Ba3) | | 08/18/28 | | | 8.876 | | | | 4,051,282 | | |
| | 8,471 | | | Resolute Investment Managers, Inc.,
3 mo. USD LIBOR + 4.250%(1) | | (CC, Caa2) | | 04/30/24 | | | 9.790 | | | | 5,357,785 | | |
| | 8,436 | | | Sedgwick Claims Management Services,
Inc., 1 mo. USD Term SOFR + 3.750%(1) | | (B+, B2) | | 02/24/28 | | | 9.074 | | | | 8,416,795 | | |
| | 8,903 | | | VFH Parent LLC, 1 mo. USD Term
SOFR + 3.000%(1) | | (B+, Ba3) | | 01/13/29 | | | 8.427 | | | | 8,859,238 | | |
| | | | 109,780,040 | | |
| Machinery (3.3%) | | | |
| | 7,158 | | | 19th Holdings Golf LLC, 3 mo. USD
Term SOFR + 3.350%(1),(4) | | (B, B1) | | 02/07/29 | | | 8.678 | | | | 6,800,456 | | |
| | 2,841 | | | Alloy Finco Ltd., 3 mo. GBP
LIBOR + 6.750%(1),(8) | | (NR, Caa1) | | 12/06/24 | | | 12.057 | | | | 3,370,128 | | |
| | 3,347 | | | Alloy Finco Ltd., 3 mo. USD Term
SOFR + 6.500%(1) | | (NR, Caa1) | | 12/06/24 | | | 12.062 | | | | 3,294,862 | | |
| | 4,680 | | | Alloy Finco Ltd. (GBP Holdco PIK Term
Loan), 0.500% Cash, 13.500% PIK(1),(2),(8) | | (NR, NR) | | 03/06/25 | | | 14.000 | | | | 5,551,650 | | |
| | 5,088 | | | Alloy Finco Ltd. (USD Holdco PIK Term
Loan), 0.500% Cash, 13.500% PIK(1),(2),(5) | | (NR, NR) | | 03/06/25 | | | 14.000 | | | | 5,000,609 | | |
| | 11,890 | | | CPM Holdings, Inc., 1 mo. USD Term
SOFR + 4.500%(1) | | (B, B2) | | 09/28/28 | | | 9.827 | | | | 11,899,415 | | |
See Accompanying Notes to Financial Statements.
16
Credit Suisse Floating Rate High Income Fund
Schedule of Investments (continued)
October 31, 2023
Par
(000) | |
| | Ratings†
(S&P/Moody's) | | Maturity | | Rate% | | Value | |
| BANK LOANS (continued) | | | |
| Machinery (continued) | | | |
$ | 331 | | | Griffon Corp., 3 mo. USD Term
SOFR + 2.250%(1) | | (BB, Ba2) | | 01/24/29 | | | 7.791 | | | $ | 330,553 | | |
| | 5,576 | | | LSF12 Badger Bidco LLC, 1 mo.
USD Term SOFR + 6.000%(1),(4) | | (B, B2) | | 08/30/30 | | | 11.324 | | | | 5,575,916 | | |
| | 3,696 | | | LTI Holdings, Inc., 1 mo. USD Term
SOFR + 6.750%(1),(5) | | (CCC+, Caa2) | | 09/06/26 | | | 12.189 | | | | 3,303,151 | | |
| | 10,685 | | | LTI Holdings, Inc., 1 mo. USD Term
SOFR + 3.500%(1) | | (B-, B2) | | 09/06/25 | | | 8.939 | | | | 10,201,859 | | |
| | 5,934 | | | LTI Holdings, Inc., 1 mo. USD Term
SOFR + 4.750%(1) | | (B-, B2) | | 07/24/26 | | | 10.189 | | | | 5,681,946 | | |
| | 4,527 | | | Pro Mach Group, Inc., 1 mo. USD Term
SOFR + 4.000%(1) | | (B-, B1) | | 08/31/28 | | | 9.439 | | | | 4,523,184 | | |
| | | | 65,533,729 | | |
| Media - Diversified (0.4%) | | | |
| | 1,589 | | | Cast & Crew Payroll LLC,
1 mo. USD Term SOFR + 3.500%(1) | | (B, B1) | | 02/09/26 | | | 9.075 | | | | 1,570,148 | | |
| | 3,069 | | | Technicolor Creative Studios,
3 mo. EUR EURIBOR + 5.000%(1),(3),(4),(9) | | (NR, NR) | | 06/07/30 | | | 8.795 | | | | — | | |
| | 519 | | | Technicolor Creative Studios,
3 mo. EUR EURIBOR + 4.172%(1),(3),(4),(9) | | (NR, NR) | | 07/31/26 | | | 8.141 | | | | 548,559 | | |
| | 1,454 | | | Technicolor Creative Studios,
6 mo. EUR EURIBOR + 0.500%(1),(3) | | (NR, NR) | | 07/31/26 | | | 3.835 | | | | 1,431,912 | | |
| | 1,360 | | | Technicolor Creative Studios,
6 mo. EUR EURIBOR + 0.500%(1),(3) | | (NR, NR) | | 07/31/26 | | | 4.429 | | | | 1,339,598 | | |
| | 7,599 | | | Technicolor Creative Studios,
3 mo. EUR EURIBOR + 5.000%(1),(3),(4) | | (NR, NR) | | 08/06/33 | | | 8.486 | | | | 3,815,184 | | |
| | | | 8,705,401 | | |
| Media Content (0.2%) | | | |
| | 3,868 | | | Recorded Books, Inc., 1 mo. USD Term
SOFR + 4.000%(1) | | (B-, B3) | | 08/29/25 | | | 9.324 | | | | 3,866,183 | | |
| Medical Products (2.7%) | | | |
| | 7,239 | | | Artivion, Inc., 1 mo. USD Term
SOFR + 3.500%(1) | | (B-, B2) | | 06/01/27 | | | 8.939 | | | | 7,028,678 | | |
| | 6,290 | | | Covetrus, Inc., 3 mo. USD Term
SOFR + 5.000%(1) | | (B-, B1) | | 10/13/29 | | | 10.390 | | | | 6,168,587 | | |
| | 3,641 | | | Femur Buyer, Inc., 3 mo. USD Term
SOFR + 4.500%(1) | | (CCC+, Caa1) | | 03/05/26 | | | 10.152 | | | | 3,415,605 | | |
| | 7,308 | | | Femur Buyer, Inc., 3 mo. USD Term
SOFR + 5.500%(1),(4) | | (CCC+, NR) | | 08/05/25 | | | 11.152 | | | | 6,626,590 | | |
| | 2,260 | | | Maravai Intermediate Holdings
LLC, 3 mo. USD Term SOFR + 3.000%(1) | | (B, B1) | | 10/19/27 | | | 8.397 | | | | 2,201,122 | | |
| | 11,550 | | | Medline Borrower LP, 1 mo. USD Term
SOFR + 3.250%(1) | | (B+, B1) | | 10/23/28 | | | 8.689 | | | | 11,488,269 | | |
| | 5,197 | | | Sotera Health Holdings LLC,
3 mo. USD Term SOFR + 2.750%(1) | | (BB-, B1) | | 12/11/26 | | | 8.395 | | | | 5,162,123 | | |
See Accompanying Notes to Financial Statements.
17
Credit Suisse Floating Rate High Income Fund
Schedule of Investments (continued)
October 31, 2023
Par
(000) | |
| | Ratings†
(S&P/Moody's) | | Maturity | | Rate% | | Value | |
| BANK LOANS (continued) | | | |
| Medical Products (continued) | | | |
$ | 9,264 | | | Viant Medical Holdings, Inc.,
1 mo. USD Term SOFR + 3.750%(1) | | (B-, B3) | | 07/02/25 | | | 9.189 | | | $ | 9,099,867 | | |
| | 1,500 | | | Viant Medical Holdings, Inc.,
1 mo. USD Term SOFR + 7.750%(1),(5) | | (CCC, Caa3) | | 07/02/26 | | | 13.075 | | | | 1,420,320 | | |
| | | | 52,611,161 | | |
| Oil Refining & Marketing (0.6%) | | | |
| | 11,743 | | | EG Finco Ltd., 1 mo. EUR
EURIBOR + 4.000%(1),(3) | | (B-, WR) | | 02/07/25 | | | 7.868 | | | | 12,387,528 | | |
| Packaging (2.6%) | | | |
| | 2,046 | | | Altium Packaging LLC, 1 mo. USD Term
SOFR + 2.750%(1) | | (B+, B2) | | 02/03/28 | | | 8.189 | | | | 2,014,730 | | |
| | 2,058 | | | Anchor Glass Container Corp.,
3 mo. USD Term SOFR + 9.000%(1) | | (CCC-, Caa3) | | 06/07/26 | | | 14.371 | | | | 884,013 | | |
| | 6,754 | | | Anchor Glass Container Corp.,
3 mo. USD Term SOFR + 5.000%,
6 mo. USD Term SOFR + 5.000%(1) | |
(CCC+, Caa1) | |
12/07/25 | | |
10.628 -
10.896 | | | | 5,568,040 | | |
| | 4,537 | | | Berry Global, Inc., 1 mo. USD Term
SOFR + 1.750%(1) | | (BBB-, Ba1) | | 07/01/26 | | | 7.201 | | | | 4,538,278 | | |
| | 3,917 | | | Flint Group Midco Ltd., 3 mo. USD Term
SOFR + 4.250%, 0.750% PIK(1),(2) | | (NR, NR) | | 12/31/26 | | | 10.674 | | | | 3,675,124 | | |
| | 1,316 | | | Flint Group Packaging INKS North
America Holdings LLC, 3 mo. EUR
EURIBOR + 4.250%, 0.750% PIK(1),(2),(3) | | (NR, NR) | | 12/31/26 | | | 9.002 | | | | 1,298,188 | | |
| | 426 | | | Flint Group Packaging INKS North
America Holdings LLC, 3 mo. EUR
EURIBOR + 0.100%, 6.900% PIK(1),(2),(3) | | (NR, NR) | | 12/31/27 | | | 15.104 | | | | 73,588 | | |
| | 320 | | | Flint Group Packaging INKS North
America Holdings LLC, 3 mo. EUR
EURIBOR + 0.100%, 6.900% PIK(1),(2),(3) | | (NR, NR) | | 12/31/27 | | | 11.002 | | | | 241,138 | | |
| | 1,910 | | | Flint Group Topco Ltd. (USD First Lien
HoldCo Facility), 3 mo. USD Term
SOFR + 0.100%, 6.900% PIK(1),(2) | | (NR, NR) | | 12/31/27 | | | 12.674 | | | | 1,375,067 | | |
| | 2,547 | | | Flint Group Topco Ltd. (USD Second
Lien HoldCo Facility), 3 mo. USD Term
SOFR + 0.100%, 6.900% PIK(1),(2) | | (NR, NR) | | 12/31/27 | | | 12.674 | | | | 460,558 | | |
| | 5,723 | | | Mauser Packaging Solutions Holding
Co., 1 mo. USD Term SOFR + 4.000%(1) | | (B, B2) | | 08/14/26 | | | 9.319 | | | | 5,565,248 | | |
| | 13,682 | | | Proampac PG Borrower LLC,
3 mo. USD Term SOFR + 4.500%,
U.S. (Fed) Prime Rate + 3.500%(1) | |
(B-, B3) | |
09/15/28 | | |
9.888 -
12.000 | | | | 13,519,574 | | |
| | 1,044 | | | Strategic Materials Holdings Corp.,
3 mo. USD Term SOFR + 0.000%(1),(4),(9) | | (NR, NR) | | 09/01/30 | | | 5.411 | | | | 1,054,882 | | |
| | 2,270 | | | Strategic Materials, Inc.(5),(6),(10) | | (D, Caa3) | | 11/01/24 | | | 0.000 | | | | 1,464,581 | | |
| | 4,375 | | | Strategic Materials, Inc.(5),(6),(10) | | (D, C) | | 10/31/25 | | | 0.000 | | | | 120,312 | | |
| | 5,376 | | | Technimark Holdings LLC, 1 mo.
USD Term SOFR + 3.750%(1) | | (B-, B2) | | 07/07/28 | | | 9.189 | | | | 5,214,963 | | |
See Accompanying Notes to Financial Statements.
18
Credit Suisse Floating Rate High Income Fund
Schedule of Investments (continued)
October 31, 2023
Par
(000) | |
| | Ratings†
(S&P/Moody's) | | Maturity | | Rate% | | Value | |
| BANK LOANS (continued) | | | |
| Packaging (continued) | | | |
$ | 3,761 | | | TricorBraun Holdings, Inc.,
1 mo. USD Term SOFR + 3.250%(1) | | (B-, B2) | | 03/03/28 | | | 8.689 | | | $ | 3,651,668 | | |
| | | | 50,719,952 | | |
| Personal & Household Products (1.9%) | | | |
| | 3,656 | | | ABG Intermediate Holdings 2 LLC,
1 mo. USD Term SOFR + 3.500%(1) | | (BB-, B1) | | 12/21/28 | | | 8.924 | | | | 3,652,401 | | |
| | 2,361 | | | ABG Intermediate Holdings 2 LLC(11) | | (BB-, B1) | | 12/21/28 | | | 4.000 | | | | 2,359,778 | | |
| | 13,127 | | | ABG Intermediate Holdings 2 LLC,
1 mo. USD Term SOFR + 4.000%(1) | | (BB-, B1) | | 12/21/28 | | | 9.424 | | | | 13,121,321 | | |
| | 8,000 | | | Keter Group BV (EUR Term Loan B),
3 mo. EUR EURIBOR + 4.250%,
2.000% PIK(1),(2),(3) | | (CCC+, Caa2) | | 03/31/25 | | | 10.198 | | | | 7,885,218 | | |
| | 6,180 | | | Keter Group BV (EUR Term Loan B3A),
3 mo. EUR EURIBOR + 4.250%,
2.000% PIK(1),(2),(3) | | (CCC+, Caa2) | | 03/31/25 | | | 10.198 | | | | 6,091,331 | | |
| | 4,685 | | | Serta Simmons Bedding LLC,
3 mo. USD Term SOFR + 7.500%(1) | | (NR, NR) | | 06/29/28 | | | 12.900 | | | | 4,638,522 | | |
| | | | 37,748,571 | | |
| Pharmaceuticals (1.0%) | | | |
| | 4,973 | | | Alkermes, Inc., 1 mo. USD Term
SOFR + 2.500%(1),(4) | | (BB, Ba3) | | 03/12/26 | | | 7.949 | | | | 4,935,976 | | |
| | 9,191 | | | Certara LP, 3 mo. USD Term
SOFR + 3.500%(1),(4) | | (B+, B1) | | 08/15/26 | | | 9.184 | | | | 9,190,850 | | |
| | 5,013 | | | ICON Luxembourg SARL,
3 mo. USD Term SOFR + 2.250%(1) | | (BBB-, Ba1) | | 07/03/28 | | | 7.902 | | | | 5,021,955 | | |
| | 1,249 | | | PRA Health Sciences, Inc.,
3 mo. USD Term SOFR + 2.250%(1) | | (BBB-, Ba1) | | 07/03/28 | | | 7.902 | | | | 1,251,223 | | |
| | | | 20,400,004 | | |
| Rail (0.3%) | | | |
| | 5,367 | | | Genesee & Wyoming, Inc.,
3 mo. USD Term SOFR + 2.000%(1) | | (BB+, Ba2) | | 12/30/26 | | | 7.490 | | | | 5,369,579 | | |
| Real Estate Development & Management (0.4%) | | | |
| | 7,359 | | | BIFM CA Buyer, Inc., 1 mo. USD Term
SOFR + 3.500%(1) | | (B, B3) | | 06/01/26 | | | 8.939 | | | | 7,326,318 | | |
| Real Estate Investment Trusts (0.6%) | | | |
| | 7,854 | | | Claros Mortgage Trust, Inc.,
1 mo. USD Term SOFR + 4.500%(1),(4) | | (B, Ba3) | | 08/09/26 | | | 9.939 | | | | 7,480,569 | | |
| | 2,693 | | | Starwood Property Trust, Inc.,
1 mo. USD Term SOFR + 3.250%(1) | | (BB, Ba2) | | 07/26/26 | | | 8.674 | | | | 2,692,633 | | |
| | 2,293 | | | Starwood Property Trust, Inc.,
1 mo. USD Term SOFR + 3.250%(1) | | (BB, Ba2) | | 11/18/27 | | | 8.574 | | | | 2,284,089 | | |
| | | | 12,457,291 | | |
| Recreation & Travel (1.1%) | | | |
| | 2,154 | | | Bulldog Purchaser, Inc., 3 mo. USD Term
SOFR + 7.750%(1) | | (CCC-, Caa3) | | 09/04/26 | | | 13.273 | | | | 1,956,403 | | |
See Accompanying Notes to Financial Statements.
19
Credit Suisse Floating Rate High Income Fund
Schedule of Investments (continued)
October 31, 2023
Par
(000) | |
| | Ratings†
(S&P/Moody's) | | Maturity | | Rate% | | Value | |
| BANK LOANS (continued) | | | |
| Recreation & Travel (continued) | | | |
$ | 6,908 | | | Bulldog Purchaser, Inc.,
3 mo. USD Term SOFR + 3.750%(1) | | (B-, B3) | | 09/05/25 | | | 9.273 | | | $ | 6,716,348 | | |
| | 7,774 | | | Hornblower Sub LLC, 3 mo. USD
LIBOR + 4.500%(1) | | (CCC-, Caa2) | | 04/27/25 | | | 10.152 | | | | 2,895,755 | | |
| | 2,000 | | | Hornblower Sub LLC, U.S. (Fed)
Prime Rate + 7.125%(1) | | (NR, NR) | | 11/20/25 | | | 15.625 | | | | 2,003,760 | | |
| | 2,000 | | | Hornblower Sub LLC (Incremental
Term Loan), U.S. (Fed) Prime
Rate + 7.125%(1) | | (NR, NR) | | 11/10/25 | | | 15.625 | | | | 2,003,760 | | |
| | 5,773 | | | Hornblower Sub LLC (Super Priority
Term Loan), U.S. (Fed) Prime
Rate + 7.125%(1) | | (NR, NR) | | 11/10/25 | | | 15.625 | | | | 5,784,050 | | |
| | | | 21,360,076 | | |
| Restaurants (1.4%) | | | |
| | 8,467 | | | 1011778 BC Unlimited Liability Co.,
1 mo. USD Term SOFR + 2.250%(1) | | (BB+, Ba2) | | 09/20/30 | | | 7.574 | | | | 8,396,903 | | |
| | 5,367 | | | Flynn Restaurant Group LP,
1 mo. USD Term SOFR + 4.250%(1) | | (B, B2) | | 12/01/28 | | | 9.689 | | | | 5,354,040 | | |
| | 8,709 | | | IRB Holding Corp., 1 mo. USD Term
SOFR + 3.000%(1) | | (B+, B2) | | 12/15/27 | | | 8.424 | | | | 8,626,866 | | |
| | 1,529 | | | K-Mac Holdings Corp., 1 mo. USD Term
SOFR + 6.750%(1) | | (CCC, Caa2) | | 07/21/29 | | | 12.174 | | | | 1,447,298 | | |
| | 3,905 | | | Tacala LLC, 1 mo. USD Term
SOFR + 3.500%(1) | | (B-, B2) | | 02/05/27 | | | 9.439 | | | | 3,893,302 | | |
| | | | 27,718,409 | | |
| Software - Services (14.9%) | | | |
| | 13,311 | | | Applied Systems, Inc., 3 mo. USD Term
SOFR + 4.500%(1) | | (B-, B2) | | 09/18/26 | | | 9.890 | | | | 13,357,227 | | |
| | 6,176 | | | AQ Carver Buyer, Inc., 3 mo. USD Term
SOFR + 5.500%(1) | | (B, B2) | | 08/02/29 | | | 10.880 | | | | 6,187,699 | | |
| | 2,692 | | | AQA Acquisition Holding, Inc.,
3 mo. USD Term SOFR + 4.250%(1) | | (B-, B2) | | 03/03/28 | | | 9.895 | | | | 2,676,182 | | |
| | 10,675 | | | Aston FinCo SARL, 1 mo. USD Term
SOFR + 4.250%(1) | | (B-, B3) | | 10/09/26 | | | 9.689 | | | | 9,249,790 | | |
| | 8,837 | | | Astra Acquisition Corp., 3 mo. USD Term
SOFR + 5.250%(1) | | (B-, Caa1) | | 10/25/28 | | | 10.902 | | | | 6,088,022 | | |
| | 1,000 | | | Camelot U.S. Acquisition LLC,
1 mo. USD Term SOFR + 3.000%(1) | | (B+, B1) | | 10/30/26 | | | 8.439 | | | | 1,000,000 | | |
| | 4,552 | | | Cardinal Parent, Inc., 3 mo. USD Term
SOFR + 4.500%(1) | | (CCC+, B3) | | 11/12/27 | | | 10.040 | | | | 4,153,427 | | |
| | 18,440 | | | Ceridian HCM Holding, Inc.,
1 mo. USD Term SOFR + 2.500%(1) | | (B+, Ba3) | | 04/30/25 | | | 7.939 | | | | 18,458,776 | | |
| | 4,956 | | | CommerceHub, Inc., 3 mo. USD Term
SOFR + 4.000%(1) | | (B, B2) | | 12/29/27 | | | 9.522 | | | | 4,762,343 | | |
| | 9,578 | | | ConnectWise LLC, 1 mo. USD Term
SOFR + 3.500%(1) | | (NR, B2) | | 09/29/28 | | | 8.939 | | | | 9,347,902 | | |
See Accompanying Notes to Financial Statements.
20
Credit Suisse Floating Rate High Income Fund
Schedule of Investments (continued)
October 31, 2023
Par
(000) | |
| | Ratings†
(S&P/Moody's) | | Maturity | | Rate% | | Value | |
| BANK LOANS (continued) | | | |
| Software - Services (continued) | | | |
$ | 9,164 | | | Corel Corp., 3 mo. USD Term
SOFR + 5.000%(1) | | (B-, B2) | | 07/02/26 | | | 10.523 | | | $ | 8,739,859 | | |
| | 5,734 | | | Cornerstone OnDemand, Inc.,
1 mo. USD Term SOFR + 3.750%(1) | | (B-, B2) | | 10/16/28 | | | 9.189 | | | | 5,427,521 | | |
| | 3,577 | | | DCert Buyer, Inc., 1 mo. USD Term
SOFR + 4.000%(1) | | (B-, B2) | | 10/16/26 | | | 9.324 | | | | 3,519,177 | | |
| | 2,083 | | | DCert Buyer, Inc., 1 mo. USD Term
SOFR + 7.000%(1) | | (CCC, Caa2) | | 02/19/29 | | | 12.324 | | | | 1,878,623 | | |
| | 5,200 | | | E2open LLC, 1 mo. USD Term
SOFR + 3.500%(1) | | (B, B2) | | 02/04/28 | | | 8.939 | | | | 5,140,632 | | |
| | 4,491 | | | EAB Global, Inc., 1 mo. USD Term
SOFR + 3.500%(1) | | (B-, B2) | | 08/16/28 | | | 8.939 | | | | 4,426,865 | | |
| | 499 | | | EagleView Technology Corp.,
3 mo. USD Term SOFR + 3.500%(1) | | (B, B2) | | 08/14/25 | | | 9.153 | | | | 475,502 | | |
| | 3,383 | | | Endure Digital, Inc., 6 mo. USD Term
SOFR + 3.500%(1) | | (B, B2) | | 02/10/28 | | | 9.422 | | | | 3,148,976 | | |
| | 3,430 | | | EverCommerce, Inc., 1 mo. USD Term
SOFR + 3.250%(1) | | (B+, B1) | | 07/06/28 | | | 8.689 | | | | 3,433,224 | | |
| | 3,072 | | | Evertec Group LLC(4),(7) | | (BB-, Ba3) | | 09/30/30 | | | 0.000 | | | | 3,072,312 | | |
| | 10,960 | | | Flexera Software LLC, 1 mo. USD Term
SOFR + 3.750%(1) | | (B-, B1) | | 03/03/28 | | | 9.189 | | | | 10,844,941 | | |
| | 2,698 | | | Genuine Financial Holdings LLC,
3 mo. USD Term SOFR + 4.000%(1) | | (B, B2) | | 09/27/30 | | | 9.400 | | | | 2,674,505 | | |
| | 5,294 | | | GHX Ultimate Parent Corp.,
3 mo. USD Term SOFR + 4.750%(1) | | (B-, B2) | | 06/30/27 | | | 10.117 | | | | 5,304,358 | | |
| | 4,875 | | | IGT Holding IV AB, 3 mo. USD Term
SOFR + 3.400%(1) | | (B, B2) | | 03/31/28 | | | 8.962 | | | | 4,854,696 | | |
| | 700 | | | Marcel LUX IV SARL, 1 mo. USD Term
SOFR + 4.000%(1),(4) | | (B+, B2) | | 12/31/27 | | | 9.425 | | | | 694,667 | | |
| | 5,171 | | | Marcel LUX IV SARL(4),(7) | | (B+, B2) | | 10/26/30 | | | 0.000 | | | | 5,145,458 | | |
| | 770 | | | Marcel LUX IV SARL, 3 mo. USD Term
SOFR + 3.250%(1),(4) | | (B+, B2) | | 03/15/26 | | | 8.675 | | | | 770,293 | | |
| | 4,305 | | | Mitnick Corporate Purchaser, Inc.,
3 mo. USD Term SOFR + 4.500%(1) | | (B-, B3) | | 05/02/29 | | | 9.983 | | | | 4,029,849 | | |
| | 1,429 | | | Mosel Bidco SE, 3 mo. USD Term
SOFR + 4.750%(1),(4) | | (B, B2) | | 09/16/30 | | | 10.146 | | | | 1,427,214 | | |
| | 6,693 | | | NAB Holdings LLC, 3 mo. USD Term
SOFR + 3.000%(1) | | (B+, B1) | | 11/23/28 | | | 8.540 | | | | 6,657,355 | | |
| | 18,017 | | | Open Text Corp., 1 mo. USD Term
SOFR + 2.750%(1) | | (BBB-, Ba1) | | 01/31/30 | | | 8.174 | | | | 18,023,128 | | |
| | 17,011 | | | Polaris Newco LLC, 1 mo. USD Term
SOFR + 4.000%(1) | | (B-, B2) | | 06/02/28 | | | 9.439 | | | | 16,097,019 | | |
| | 13,000 | | | Project Alpha Intermediate Holding, Inc.,
3 mo. USD Term SOFR + 4.750%(1) | | (B, B2) | | 10/28/30 | | | 10.075 | | | | 12,646,595 | | |
| | 499 | | | Project Boost Purchaser LLC,
1 mo. USD Term SOFR + 3.500%(1) | | (B-, B2) | | 06/01/26 | | | 8.939 | | | | 496,382 | | |
| | 2,864 | | | Project Boost Purchaser LLC,
1 mo. USD Term SOFR + 3.500%(1) | | (B-, B2) | | 05/30/26 | | | 8.939 | | | | 2,850,124 | | |
See Accompanying Notes to Financial Statements.
21
Credit Suisse Floating Rate High Income Fund
Schedule of Investments (continued)
October 31, 2023
Par
(000) | |
| | Ratings†
(S&P/Moody's) | | Maturity | | Rate% | | Value | |
| BANK LOANS (continued) | | | |
| Software - Services (continued) | | | |
$ | 3,552 | | | Project Ruby Ultimate Parent Corp.,
1 mo. USD Term SOFR + 3.250%(1) | | (B, B2) | | 03/10/28 | | | 8.689 | | | $ | 3,487,982 | | |
| | 15,172 | | | Quest Software U.S. Holdings, Inc.,
3 mo. USD Term SOFR + 4.250%(1) | | (CCC+, B2) | | 02/01/29 | | | 9.783 | | | | 12,057,883 | | |
| | 7,743 | | | Redstone Holdco 2 LP, 1 mo. USD Term
SOFR + 4.750%(1) | | (B-, B3) | | 04/27/28 | | | 10.189 | | | | 6,530,300 | | |
| | 1,580 | | | Rinchem Co., Inc., 3 mo. USD Term
SOFR + 4.250%(1) | | (CCC+, B3) | | 03/02/29 | | | 9.740 | | | | 1,403,569 | | |
| | 3,528 | | | SkillSoft Corp., 1 mo. USD Term
SOFR + 5.250%(1) | | (B-, B2) | | 07/14/28 | | | 10.699 | | | | 3,246,747 | | |
| | 1,022 | | | Sovos Compliance LLC, 1 mo. USD
Term SOFR + 4.500%(1) | | (B-, B3) | | 08/11/28 | | | 9.939 | | | | 1,002,916 | | |
| | 3,403 | | | SS&C European Holdings SARL,
1 mo. USD Term SOFR + 1.750%(1) | | (BB+, Ba2) | | 04/16/25 | | | 7.189 | | | | 3,404,497 | | |
| | 3,417 | | | SS&C Technologies, Inc., 1 mo. USD
Term SOFR + 1.750%(1) | | (BB+, Ba2) | | 04/16/25 | | | 7.189 | | | | 3,419,062 | | |
| | 6,775 | | | Storable, Inc., 1 mo. USD Term
SOFR + 3.500%, 3 mo. USD Term
SOFR + 3.500%(1) | |
(B, B2) | |
04/17/28 | | |
8.824 -
8.837 | | | | 6,718,917 | | |
| | 3,969 | | | Symplr Software, Inc., 3 mo. USD Term
SOFR + 4.500%(1) | | (B-, B3) | | 12/22/27 | | | 9.983 | | | | 3,490,292 | | |
| | 4,130 | | | Transact Holdings, Inc., 1 mo. USD Term
SOFR + 4.250%(1) | | (B, B2) | | 04/30/26 | | | 9.689 | | | | 4,136,110 | | |
| | 975 | | | Ultimate Software Group, Inc.,
1 mo. USD Term SOFR + 5.250%(1) | | (CCC, Caa1) | | 05/03/27 | | | 10.764 | | | | 975,731 | | |
| | 13,741 | | | Ultimate Software Group, Inc.,
3 mo. USD Term SOFR + 3.250%(1) | | (B-, B1) | | 05/04/26 | | | 8.764 | | | | 13,686,005 | | |
| | 11,408 | | | Ultimate Software Group, Inc.,
3 mo. USD Term SOFR + 3.750%(1) | | (B-, B1) | | 05/04/26 | | | 9.233 | | | | 11,399,194 | | |
| | 5,693 | | | Virtusa Corp., 1 mo. USD Term
SOFR + 3.750%(1) | | (B, B1) | | 02/11/28 | | | 9.174 | | | | 5,664,054 | | |
| | 3,228 | | | VS Buyer LLC, 1 mo. USD Term
SOFR + 3.250%(1) | | (B, B1) | | 02/28/27 | | | 8.674 | | | | 3,207,423 | | |
| | 2,261 | | | VT Topco, Inc., 3 mo. USD Term
SOFR + 4.250%(1) | | (B, B2) | | 08/09/30 | | | 9.661 | | | | 2,260,136 | | |
| | 2,408 | | | World Wide Technology Holding Co. LLC,
1 mo. USD Term SOFR + 3.250%(1) | | (BB, Ba3) | | 03/01/30 | | | 8.686 | | | | 2,410,910 | | |
| | | | 295,562,371 | | |
| Specialty Retail (0.2%) | | | |
| | 4,432 | | | Mister Car Wash Holdings, Inc.,
1 mo. USD Term SOFR + 3.000%(1) | | (B, B2) | | 05/14/26 | | | 8.424 | | | | 4,428,788 | | |
| Steel Producers/Products (0.2%) | | | |
| | 3,539 | | | Grinding Media, Inc., 3 mo. USD Term
SOFR + 4.000%(1),(4) | | (B, B2) | | 10/12/28 | | | 9.684 | | | | 3,450,542 | | |
| Support - Services (5.0%) | | | |
| | 8,709 | | | Allied Universal Holdco LLC,
1 mo. USD Term SOFR + 3.750%(1) | | (B, B3) | | 05/12/28 | | | 9.174 | | | | 8,287,242 | | |
See Accompanying Notes to Financial Statements.
22
Credit Suisse Floating Rate High Income Fund
Schedule of Investments (continued)
October 31, 2023
Par
(000) | |
| | Ratings†
(S&P/Moody's) | | Maturity | | Rate% | | Value | |
| BANK LOANS (continued) | | | |
| Support - Services (continued) | | | |
$ | 4,264 | | | Belfor Holdings, Inc.(4),(7) | | (B, B1) | | 10/25/30 | | | 0.000 | | | $ | 4,263,796 | | |
| | 2,254 | | | Centuri Group, Inc., 1 mo. USD Term
SOFR + 2.500%(1) | | (B+, Ba2) | | 08/27/28 | | | 7.939 | | | | 2,253,955 | | |
| | 7,726 | | | CoreLogic, Inc., 1 mo. USD Term
SOFR + 3.500%(1) | | (B-, B2) | | 06/02/28 | | | 8.939 | | | | 7,051,598 | | |
| | 10,000 | | | Fugue Finance BV, 3 mo. EUR
EURIBOR + 4.250%(1),(3) | | (B, B1) | | 01/31/28 | | | 8.144 | | | | 10,589,816 | | |
| | 992 | | | Fugue Finance BV, 3 mo. USD Term
SOFR + 4.000%(1) | | (B, B1) | | 01/31/28 | | | 9.354 | | | | 992,207 | | |
| | 10,356 | | | Global Education Management Systems
Establishment, 3 mo. USD Term
SOFR + 4.750%(1) | | (B, B2) | | 07/31/26 | | | 10.434 | | | | 10,393,410 | | |
| | 3,557 | | | KUEHG Corp., 3 mo. USD Term
SOFR + 5.000%(1) | | (B, B2) | | 06/12/30 | | | 10.390 | | | | 3,560,652 | | |
| | 4,430 | | | LaserShip, Inc., 2 mo. USD Term
SOFR + 7.500%(1) | | (CCC-, Caa3) | | 05/07/29 | | | 13.396 | | | | 3,632,279 | | |
| | 10,802 | | | LaserShip, Inc., 3 mo. USD Term
SOFR + 4.500%(1) | | (CCC+, B3) | | 05/07/28 | | | 10.396 | | | | 9,722,029 | | |
| | 13,402 | | | Nuvei Technologies Corp.,
1 mo. USD Term SOFR + 2.500%(1) | | (BB-, Ba3) | | 09/29/25 | | | 7.939 | | | | 13,409,924 | | |
| | 1,897 | | | Savage Enterprises LLC,
1 mo. USD Term SOFR + 3.250%(1) | | (BB-, B1) | | 09/15/28 | | | 8.689 | | | | 1,899,787 | | |
| | 7,730 | | | SRAM LLC, 1 mo. USD Term
SOFR + 2.750%(1) | | (BB-, B1) | | 05/18/28 | | | 8.189 | | | | 7,710,271 | | |
| | 1,668 | | | Trans Union LLC, 1 mo. USD Term
SOFR + 2.250%(1) | | (BBB-, Ba2) | | 12/01/28 | | | 7.689 | | | | 1,666,921 | | |
| | 3,025 | | | TruGreen Ltd. Partnership,
3 mo. USD Term SOFR + 8.500%(1) | | (CCC, Caa3) | | 11/02/28 | | | 14.145 | | | | 2,001,552 | | |
| | 11,628 | | | Wrench Group LLC, 3 mo. USD Term
SOFR + 4.000%(1) | | (B-, B2) | | 04/30/26 | | | 9.652 | | | | 11,584,106 | | |
| | 499 | | | Wrench Group LLC, 3 mo. USD Term
SOFR + 4.500%(1),(4) | | (B-, B2) | | 04/30/26 | | | 9.990 | | | | 497,503 | | |
| | | | 99,517,048 | | |
| Tech Hardware & Equipment (1.3%) | | | |
| | 13,187 | | | Atlas CC Acquisition Corp.,
3 mo. USD Term SOFR + 4.250%(1) | | (B, Caa1) | | 05/25/28 | | | 9.934 | | | | 12,282,885 | | |
| | 2,682 | | | Atlas CC Acquisition Corp.,
3 mo. USD Term SOFR + 4.250%(1) | | (B+, B1) | | 05/25/28 | | | 9.934 | | | | 2,498,214 | | |
| | 10,003 | | | Vertiv Group Corp., 1 mo. USD Term
SOFR + 2.750%(1) | | (BB-, B1) | | 03/02/27 | | | 8.179 | | | | 9,996,927 | | |
| | | | 24,778,026 | | |
| Telecom - Wireless (0.7%) | | | |
| | 5,045 | | | Eagle Broadband Investments LLC,
3 mo. USD Term SOFR + 3.000%(1) | | (B+, B2) | | 11/12/27 | | | 8.652 | | | | 4,936,551 | | |
| | 4,144 | | | SBA Senior Finance II LLC,
1 mo. USD Term SOFR + 1.750%(1) | | (BBB-, Ba2) | | 04/11/25 | | | 7.180 | | | | 4,146,646 | | |
See Accompanying Notes to Financial Statements.
23
Credit Suisse Floating Rate High Income Fund
Schedule of Investments (continued)
October 31, 2023
Par
(000) | |
| | Ratings†
(S&P/Moody's) | | Maturity | | Rate% | | Value | |
| BANK LOANS (continued) | | | |
| Telecom - Wireless (continued) | | | |
$ | 7,108 | | | Xplornet Communications, Inc.,
3 mo. USD Term SOFR + 4.000%(1) | | (CCC+, B2) | | 10/02/28 | | | 9.652 | | | $ | 4,835,245 | | |
| | | | 13,918,442 | | |
| Telecom - Wireline Integrated & Services (1.7%) | | | |
| | 798 | | | Altice France SA, 3 mo. USD
LIBOR + 4.000%(1) | | (B-, B2) | | 08/14/26 | | | 9.626 | | | | 746,955 | | |
| | 12,487 | | | Altice France SA, 3 mo. USD Term
SOFR + 5.500%(1) | | (B-, B2) | | 08/15/28 | | | 10.894 | | | | 11,120,935 | | |
| | 6,267 | | | Ciena Corp.(7) | | (BB+, WR) | | 10/24/30 | | | 0.000 | | | | 6,277,852 | | |
| | 15,037 | | | Patagonia Holdco LLC, 3 mo. USD Term
SOFR + 5.750%(1),(4) | | (NR, B1) | | 08/01/29 | | | 11.117 | | | | 13,044,511 | | |
| | 2,215 | | | TVC Albany, Inc., 1 mo. USD Term
SOFR + 3.500%(1) | | (B-, B2) | | 07/23/25 | | | 8.939 | | | | 2,175,565 | | |
| | 945 | | | Voyage Australia Pty. Ltd.,
3 mo. USD Term SOFR + 3.500%(1) | | (BB-, B1) | | 07/20/28 | | | 9.177 | | | | 935,648 | | |
| | | | 34,301,466 | | |
| Theaters & Entertainment (1.8%) | | | |
| | 1,451 | | | Herschend Entertainment Co. LLC,
1 mo. USD Term SOFR + 3.750%(1) | | (BB-, B1) | | 08/27/28 | | | 9.189 | | | | 1,453,776 | | |
| | 4,301 | | | NAI Entertainment Holdings LLC,
1 mo. USD Term SOFR + 3.000%(1),(5) | | (B, B3) | | 05/08/25 | | | 8.448 | | | | 4,164,086 | | |
| | 12,476 | | | UFC Holdings LLC, 3 mo. USD Term
SOFR + 2.750%(1) | | (BB, Ba3) | | 04/29/26 | | | 8.399 | | | | 12,478,056 | | |
| | 17,728 | | | William Morris Endeavor Entertainment
LLC, 1 mo. USD Term SOFR + 2.750%(1) | | (BB-, B3) | | 05/18/25 | | | 8.189 | | | | 17,736,076 | | |
| | | | 35,831,994 | | |
| TOTAL BANK LOANS (Cost $1,665,234,664) | | | 1,587,576,740 | | |
| CORPORATE BONDS (9.1%) | | | |
| Auto Parts & Equipment (0.1%) | | | |
| | 3,000 | | | TI Automotive Finance PLC, Rule 144A,
Company Guaranteed Notes
(Callable 04/15/24 @ 101.88)(3),(12) | | (BB, B3) | | 04/15/29 | | | 3.750 | | | | 2,652,360 | | |
| Brokerage (0.1%) | | | |
| | 1,856 | | | StoneX Group, Inc., Rule 144A,
Senior Secured Notes
(Callable 12/01/23 @ 102.16)(12) | | (BB-, Ba3) | | 06/15/25 | | | 8.625 | | | | 1,863,907 | | |
| Building & Construction (0.1%) | | | |
| | 2,895 | | | Pike Corp., Rule 144A, Company
Guaranteed Notes
(Callable 12/01/23 @ 102.75)(12) | | (CCC+, B3) | | 09/01/28 | | | 5.500 | | | | 2,463,486 | | |
See Accompanying Notes to Financial Statements.
24
Credit Suisse Floating Rate High Income Fund
Schedule of Investments (continued)
October 31, 2023
Par
(000) | |
| | Ratings†
(S&P/Moody's) | | Maturity | | Rate% | | Value | |
| CORPORATE BONDS (continued) | | | |
| Building Materials (0.2%) | | | |
$ | 2,535 | | | Advanced Drainage Systems, Inc.,
Rule 144A, Company Guaranteed
Notes (Callable 07/15/25 @ 103.19)(12) | | (BB-, Ba2) | | 06/15/30 | | | 6.375 | | | $ | 2,393,384 | | |
| | 2,974 | | | GYP Holdings III Corp., Rule 144A,
Company Guaranteed Notes
(Callable 05/01/24 @ 102.31)(12) | | (B, B1) | | 05/01/29 | | | 4.625 | | | | 2,445,907 | | |
| | | | 4,839,291 | | |
| Cable & Satellite TV (0.4%) | | | |
| | 1,000 | | | CSC Holdings LLC, Rule 144A,
Company Guaranteed Notes
(Callable 11/15/26 @ 102.25)(12) | | (B, B2) | | 11/15/31 | | | 4.500 | | | | 661,472 | | |
| | 9,000 | | | Telenet Finance Luxembourg Notes
SARL, Rule 144A, Senior Secured
Notes (Callable 11/13/23 @ 102.75)(12) | | (BB-, Ba3) | | 03/01/28 | | | 5.500 | | | | 8,045,370 | | |
| | | | 8,706,842 | | |
| Chemicals (0.7%) | | | |
| | 1,854 | | | HB Fuller Co., Global Senior Unsecured
Notes (Callable 12/01/23 @ 102.13) | | (BB-, Ba3) | | 10/15/28 | | | 4.250 | | | | 1,608,429 | | |
| | 4,000 | | | Herens Holdco SARL, Rule 144A,
Senior Secured Notes
(Callable 05/15/24 @ 102.38)(12) | | (B-, B2) | | 05/15/28 | | | 4.750 | | | | 3,102,132 | | |
| | 4,750 | | | Polar U.S. Borrower LLC/Schenectady
International Group, Inc., Rule 144A,
Senior Unsecured Notes
(Callable 12/01/23 @ 103.38)(12) | | (CCC-, Caa3) | | 05/15/26 | | | 6.750 | | | | 2,118,096 | | |
| | 8,000 | | | Vibrantz Technologies, Inc., Rule 144A,
Senior Unsecured Notes
(Callable 02/15/25 @ 104.50)(12),(13) | | (CCC+, Caa2) | | 02/15/30 | | | 9.000 | | | | 6,375,950 | | |
| | | | 13,204,607 | | |
| Diversified Capital Goods (0.1%) | | | |
| | 3,367 | | | Atkore, Inc., Rule 144A, Senior
Unsecured Notes
(Callable 06/01/26 @ 102.13)(12) | | (BB, Ba2) | | 06/01/31 | | | 4.250 | | | | 2,786,832 | | |
| Electronics (0.1%) | | | |
| | 1,637 | | | Synaptics, Inc., Rule 144A, Company
Guaranteed Notes
(Callable 06/15/24 @ 102.00)(12) | | (B+, Ba3) | | 06/15/29 | | | 4.000 | | | | 1,352,612 | | |
| Gas Distribution (0.1%) | | | |
| | 3,000 | | | New Fortress Energy, Inc., Rule 144A,
Senior Secured Notes
(Callable 12/01/23 @ 103.25)(12) | | (BB, B1) | | 09/30/26 | | | 6.500 | | | | 2,691,600 | | |
| Health Services (0.1%) | | | |
| | 2,000 | | | RP Escrow Issuer LLC, Rule 144A,
Senior Secured Notes
(Callable 12/01/23 @ 102.63)(12),(13) | | (CCC+, B3) | | 12/15/25 | | | 5.250 | | | | 1,427,140 | | |
See Accompanying Notes to Financial Statements.
25
Credit Suisse Floating Rate High Income Fund
Schedule of Investments (continued)
October 31, 2023
Par
(000) | |
| | Ratings†
(S&P/Moody's) | | Maturity | | Rate% | | Value | |
| CORPORATE BONDS (continued) | | | |
| Insurance Brokerage (0.6%) | | | |
$ | 4,750 | | | Jones Deslauriers Insurance
Management, Inc., Rule 144A,
Senior Secured Notes
(Callable 03/15/26 @ 104.25)(12) | | (B-, B2) | | 03/15/30 | | | 8.500 | | | $ | 4,671,349 | | |
| | 1,000 | | | Jones Deslauriers Insurance
Management, Inc., Rule 144A,
Senior Unsecured Notes
(Callable 12/15/25 @ 105.25)(12) | | (CCC, Caa2) | | 12/15/30 | | | 10.500 | | | | 993,443 | | |
| | 3,000 | | | NFP Corp., Rule 144A,
Senior Secured Notes
(Callable 10/01/25 @ 103.75)(12) | | (B, B1) | | 10/01/30 | | | 7.500 | | | | 2,842,400 | | |
| | 4,054 | | | NFP Corp., Rule 144A,
Senior Unsecured Notes
(Callable 12/01/23 @ 103.44)(12) | | (CCC+, Caa2) | | 08/15/28 | | | 6.875 | | | | 3,461,848 | | |
| | | | 11,969,040 | | |
| Investments & Misc. Financial Services (0.6%) | | | |
| | 8,631 | | | Armor Holdco, Inc., Rule 144A,
Company Guaranteed Notes
(Callable 11/15/24 @ 104.25)(12) | | (CCC+, Caa1) | | 11/15/29 | | | 8.500 | | | | 7,540,403 | | |
| | 1,946 | | | Compass Group Diversified Holdings
LLC, Rule 144A, Company
Guaranteed Notes
(Callable 04/15/24 @ 102.63)(12) | | (B+, B1) | | 04/15/29 | | | 5.250 | | | | 1,663,791 | | |
| | 3,000 | | | Compass Group Diversified Holdings LLC,
Rule 144A, Senior Unsecured Notes
(Callable 01/15/27 @ 102.50)(12) | | (B+, B1) | | 01/15/32 | | | 5.000 | | | | 2,364,466 | | |
| | | | 11,568,660 | | |
| Machinery (0.3%) | | | |
| | 6,508 | | | Arcosa, Inc., Rule 144A,
Company Guaranteed Notes
(Callable 04/15/24 @ 102.19)(12) | | (BB, Ba2) | | 04/15/29 | | | 4.375 | | | | 5,685,682 | | |
| Metals & Mining - Excluding Steel (0.3%) | | | |
| | 2,975 | | | ERO Copper Corp., Rule 144A,
Company Guaranteed Notes
(Callable 02/15/25 @ 103.25)(12) | | (B, B1) | | 02/15/30 | | | 6.500 | | | | 2,521,998 | | |
| | 3,154 | | | Taseko Mines Ltd., Rule 144A,
Senior Secured Notes
(Callable 12/01/23 @ 103.50)(12),(13) | | (B-, B3) | | 02/15/26 | | | 7.000 | | | | 2,864,339 | | |
| | | | 5,386,337 | | |
| Packaging (0.4%) | | | |
| | 2,000 | | | Chart Industries, Inc., Rule 144A,
Senior Secured Notes
(Callable 01/01/26 @ 103.75)(12) | | (B+, Ba3) | | 01/01/30 | | | 7.500 | | | | 1,966,328 | | |
See Accompanying Notes to Financial Statements.
26
Credit Suisse Floating Rate High Income Fund
Schedule of Investments (continued)
October 31, 2023
Par
(000) | |
| | Ratings†
(S&P/Moody's) | | Maturity | | Rate% | | Value | |
| CORPORATE BONDS (continued) | | | |
| Packaging (continued) | | | |
$ | 6,675 | | | TriMas Corp., Rule 144A,
Company Guaranteed Notes
(Callable 04/15/24 @ 102.06)(12) | | (BB-, Ba3) | | 04/15/29 | | | 4.125 | | | $ | 5,552,740 | | |
| | | | 7,519,068 | | |
| Personal & Household Products (0.1%) | | | |
| | 1,700 | | | MajorDrive Holdings IV LLC, Rule 144A,
Senior Unsecured Notes
(Callable 06/01/24 @ 103.19)(12) | | (CCC+, Caa2) | | 06/01/29 | | | 6.375 | | | | 1,319,973 | | |
| Recreation & Travel (0.5%) | | | |
| | 1,500 | | | Boyne USA, Inc., Rule 144A,
Senior Unsecured Notes
(Callable 05/15/24 @ 102.38)(12) | | (B, B1) | | 05/15/29 | | | 4.750 | | | | 1,307,758 | | |
| | 4,000 | | | SeaWorld Parks & Entertainment, Inc.,
Rule 144A, Company Guaranteed Notes
(Callable 08/15/24 @ 102.63)(12),(13) | | (B, B2) | | 08/15/29 | | | 5.250 | | | | 3,475,720 | | |
| | 3,625 | | | Six Flags Entertainment Corp.,
Rule 144A, Company Guaranteed Notes
(Callable 05/15/26 @ 103.63)(12),(13) | | (B, B3) | | 05/15/31 | | | 7.250 | | | | 3,315,954 | | |
| | 1,672 | | | Speedway Motorsports LLC/Speedway
Funding II, Inc., Rule 144A,
Senior Unsecured Notes
(Callable 12/01/23 @ 101.22)(12) | | (BB, B2) | | 11/01/27 | | | 4.875 | | | | 1,493,990 | | |
| | | | 9,593,422 | | |
| Software - Services (1.3%) | | | |
| | 1,500 | | | Elastic NV, Rule 144A, Senior Unsecured
Notes (Callable 07/15/24 @ 102.06)(12) | | (B+, B1) | | 07/15/29 | | | 4.125 | | | | 1,265,907 | | |
| | 4,962 | | | Newfold Digital Holdings Group, Inc.,
Rule 144A, Senior Unsecured Notes
(Callable 02/15/24 @ 103.00)(12),(13) | | (CCC+, Caa2) | | 02/15/29 | | | 6.000 | | | | 3,265,211 | | |
| | 4,100 | | | Open Text Corp., Rule 144A,
Company Guaranteed Notes
(Callable 12/01/24 @ 101.94)(12) | | (BB-, Ba3) | | 12/01/29 | | | 3.875 | | | | 3,358,367 | | |
| | 9,180 | | | Presidio Holdings, Inc., Rule 144A,
Company Guaranteed Notes
(Callable 12/01/23 @ 104.13)(12),(13) | | (CCC+, Caa1) | | 02/01/28 | | | 8.250 | | | | 8,696,199 | | |
| | 11,561 | | | Virtusa Corp., Rule 144A,
Senior Unsecured Notes
(Callable 12/15/23 @ 103.56)(12) | | (CCC+, Caa1) | | 12/15/28 | | | 7.125 | | | | 9,159,714 | | |
| | | | 25,745,398 | | |
| Specialty Retail (0.3%) | | | |
| | 3,745 | | | Eagle Intermediate Global Holding
BV/Eagle U.S. Finance LLC, Rule 144A,
Senior Secured Notes
(Callable 11/13/23 @ 101.88)(12) | | (NR, Caa3) | | 05/01/25 | | | 7.500 | | | | 2,495,106 | | |
See Accompanying Notes to Financial Statements.
27
Credit Suisse Floating Rate High Income Fund
Schedule of Investments (continued)
October 31, 2023
Par
(000) | |
| | Ratings†
(S&P/Moody's) | | Maturity | | Rate% | | Value | |
| CORPORATE BONDS (continued) | | | |
| Specialty Retail (continued) | | | |
$ | 102 | | | Eagle Intermediate Global Holding
BV/Eagle U.S. Finance LLC, Rule 144A,
Senior Secured Notes
(Callable 11/13/23 @ 101.88)(4),(9),(12) | | (NR, NR) | | 05/01/25 | | | 7.500 | | | $ | 66,357 | | |
| | 137 | | | Eagle Intermediate Global Holding
BV/Ruyi U.S. Finance LLC (4),(9) | | (NR, NR) | | 05/01/25 | | | 0.000 | | | | 75,090 | | |
| | 1,850 | | | Group 1 Automotive, Inc., Rule 144A,
Company Guaranteed Notes
(Callable 12/01/23 @ 102.00)(12) | | (BB+, Ba2) | | 08/15/28 | | | 4.000 | | | | 1,595,508 | | |
| | 1,449 | | | Murphy Oil USA, Inc., Rule 144A,
Company Guaranteed Notes
(Callable 02/15/26 @ 101.88)(12) | | (BB+, Ba2) | | 02/15/31 | | | 3.750 | | | | 1,165,694 | | |
| | | | 5,397,755 | | |
| Steel Producers/Products (0.3%) | | | |
| | 7,503 | | | TMS International Corp., Rule 144A,
Senior Unsecured Notes
(Callable 04/15/24 @ 103.13)(12) | | (B, Caa1) | | 04/15/29 | | | 6.250 | | | | 5,927,675 | | |
| Support - Services (1.7%) | | | |
| | 5,251 | | | Allied Universal Holdco LLC/Allied
Universal Finance Corp., Rule 144A,
Senior Unsecured Notes
(Callable 12/01/23 @ 102.44)(12) | | (CCC+, Caa2) | | 07/15/27 | | | 9.750 | | | | 4,569,994 | | |
| | 6,455 | | | Allied Universal Holdco LLC/Allied
Universal Finance Corp., Rule 144A,
Senior Unsecured Notes
(Callable 06/01/24 @ 103.00)(12),(13) | | (CCC+, Caa2) | | 06/01/29 | | | 6.000 | | | | 4,690,364 | | |
| | 1,471 | | | Allied Universal Holdco LLC/Allied
Universal Finance Corp./Atlas Luxco
4 SARL, Rule 144A, Senior Secured
Notes (Callable 06/01/24 @ 101.81)(3),(12) | | (B, B3) | | 06/01/28 | | | 3.625 | | | | 1,257,327 | | |
| | 3,557 | | | Allied Universal Holdco LLC/Allied
Universal Finance Corp./Atlas Luxco
4 SARL, Rule 144A, Senior Secured
Notes (Callable 06/01/24 @ 102.31)(12) | | (B, B3) | | 06/01/28 | | | 4.625 | | | | 2,902,639 | | |
| | 11,000 | | | CoreLogic, Inc., Rule 144A,
Senior Secured Notes
(Callable 05/01/24 @ 102.25)(12) | | (B-, B2) | | 05/01/28 | | | 4.500 | | | | 8,729,160 | | |
| | 9,565 | | | GEMS MENASA Cayman Ltd./GEMS
Education Delaware LLC, Rule 144A,
Senior Secured Notes
(Callable 12/01/23 @ 101.78)(12) | | (B, B2) | | 07/31/26 | | | 7.125 | | | | 9,217,025 | | |
| | 2,250 | | | H&E Equipment Services, Inc.,
Rule 144A, Company Guaranteed
Notes (Callable 12/15/23 @ 101.94)(12) | | (BB-, B1) | | 12/15/28 | | | 3.875 | | | | 1,908,137 | | |
| | | | 33,274,646 | | |
See Accompanying Notes to Financial Statements.
28
Credit Suisse Floating Rate High Income Fund
Schedule of Investments (continued)
October 31, 2023
Par
(000) | |
| | Ratings†
(S&P/Moody's) | | Maturity | | Rate% | | Value | |
| CORPORATE BONDS (continued) | | | |
| Telecom - Wireline Integrated & Services (0.6%) | | | |
$ | 3,775 | | | Altice France SA, Rule 144A,
Senior Secured Notes
(Callable 10/15/24 @ 102.75)(12) | | (B-, B2) | | 10/15/29 | | | 5.500 | | | $ | 2,595,985 | | |
| | 5,221 | | | LCPR Senior Secured Financing DAC,
Rule 144A, Senior Secured Notes
(Callable 12/01/23 @ 101.69)(12) | | (B+, B1) | | 10/15/27 | | | 6.750 | | | | 4,715,555 | | |
| | 3,000 | | | LCPR Senior Secured Financing DAC,
Rule 144A, Senior Secured Notes
(Callable 07/15/24 @ 102.56)(12) | | (B+, B1) | | 07/15/29 | | | 5.125 | | | | 2,340,624 | | |
| | 2,064 | | | Level 3 Financing, Inc., Rule 144A,
Company Guaranteed Notes
(Callable 12/01/23 @ 102.13)(12) | | (CCC+, B3) | | 07/01/28 | | | 4.250 | | | | 1,169,055 | | |
| | 2,000 | | | Level 3 Financing, Inc., Rule 144A,
Company Guaranteed Notes
(Callable 01/15/24 @ 101.81)(12) | | (CCC+, B3) | | 01/15/29 | | | 3.625 | | | | 1,023,750 | | |
| | | | 11,844,969 | | |
| Transport Infrastructure/Services (0.1%) | | | |
| | 2,200 | | | XPO, Inc., Rule 144A, Senior Secured
Notes (Callable 06/01/25 @ 103.13)(12) | | (BBB-, Ba1) | | 06/01/28 | | | 6.250 | | | | 2,111,769 | | |
| TOTAL CORPORATE BONDS (Cost $204,097,815) | | | 179,333,071 | | |
| ASSET BACKED SECURITIES (5.4%) | | | |
| Collateralized Debt Obligations (5.4%) | | | |
| | 3,000 | | | ALM Ltd., 2020-1A, Rule 144A,
3 mo. USD Term SOFR + 6.262%(1),(12) | | (BB-, NR) | | 10/15/29 | | | 11.655 | | | | 2,800,608 | | |
| | 3,500 | | | Anchorage Capital CLO 16 Ltd.,
2020-16A, Rule 144A,
3 mo. USD Term SOFR + 3.982%(1),(12) | | (NR, NR) | | 01/19/35 | | | 9.378 | | | | 3,372,190 | | |
| | 1,250 | | | Anchorage Capital CLO 3-R Ltd.,
2014-3RA, Rule 144A,
3 mo. USD Term SOFR + 2.112%(1),(12) | | (A, NR) | | 01/28/31 | | | 7.502 | | | | 1,215,665 | | |
| | 1,740 | | | Anchorage Capital CLO Ltd., 2018-10A,
Rule 144A, 3 mo. USD Term
SOFR + 1.462%(1),(12) | | (AAA, NR) | | 10/15/31 | | | 6.855 | | | | 1,735,188 | | |
| | 2,500 | | | Ares XXXIV CLO Ltd., 2015-2A,
Rule 144A, 3 mo. USD Term
SOFR + 1.512%(1),(12) | | (AAA, Aaa) | | 04/17/33 | | | 6.914 | | | | 2,483,620 | | |
| | 2,500 | | | Battalion CLO XXI Ltd., 2021-21A,
Rule 144A, 3 mo. USD Term
SOFR + 3.562%(1),(12) | | (NR, Baa3) | | 07/15/34 | | | 8.955 | | | | 2,306,224 | | |
| | 1,750 | | | Benefit Street Partners CLO X Ltd.,
2016-10A, Rule 144A,
3 mo. USD Term SOFR + 7.012%(1),(12) | | (BB-, NR) | | 04/20/34 | | | 12.427 | | | | 1,648,661 | | |
| | 2,100 | | | BlueMountain CLO Ltd., 2015-3A,
Rule 144A, 3 mo. USD Term
SOFR + 5.662%(1),(12) | | (B+, NR) | | 04/20/31 | | | 11.077 | | | | 1,705,686 | | |
See Accompanying Notes to Financial Statements.
29
Credit Suisse Floating Rate High Income Fund
Schedule of Investments (continued)
October 31, 2023
Par
(000) | |
| | Ratings†
(S&P/Moody's) | | Maturity | | Rate% | | Value | |
| ASSET BACKED SECURITIES (continued) | | | |
| Collateralized Debt Obligations (continued) | | | |
$ | 5,500 | | | BlueMountain CLO Ltd., 2016-2A,
Rule 144A, 3 mo. USD Term
SOFR + 4.562%(1),(12) | | (BBB-, NR) | | 08/20/32 | | | 9.941 | | | $ | 5,220,234 | | |
| | 3,000 | | | BlueMountain Fuji U.S. CLO III Ltd.,
2017-3A, Rule 144A, 3 mo. USD Term
SOFR + 1.962%(1),(12) | | (A, NR) | | 01/15/30 | | | 7.355 | | | | 2,904,418 | | |
| | 750 | | | Carlyle Global Market Strategies
CLO Ltd., 2014-3RA, Rule 144A,
3 mo. USD Term SOFR + 5.662%(1),(12) | | (BB-, NR) | | 07/27/31 | | | 11.049 | | | | 637,109 | | |
| | 2,000 | | | Carlyle Global Market Strategies
CLO Ltd., 2014-5A, Rule 144A,
3 mo. USD Term SOFR + 3.412%(1),(12) | | (BBB-, NR) | | 07/15/31 | | | 8.805 | | | | 1,866,762 | | |
| | 2,625 | | | CIFC Funding Ltd., 2014-1A, Rule 144A,
3 mo. USD Term SOFR + 6.112%(1),(12) | | (B+, NR) | | 01/18/31 | | | 11.507 | | | | 2,323,425 | | |
| | 4,000 | | | Crown Point CLO IV Ltd., 2018-4A,
Rule 144A, 3 mo. USD Term
SOFR + 3.012%(1),(12) | | (NR, Baa3) | | 04/20/31 | | | 8.427 | | | | 3,672,568 | | |
| | 3,807 | | | Dewolf Park CLO Ltd., 2017-1A,
Rule 144A, 3 mo. USD Term
SOFR + 1.182%(1),(12) | | (NR, Aaa) | | 10/15/30 | | | 6.575 | | | | 3,793,420 | | |
| | 1,750 | | | Dryden 86 CLO Ltd., 2020-86A,
Rule 144A, 3 mo. USD Term
SOFR + 3.462%(1),(12) | | (BBB-, NR) | | 07/17/34 | | | 8.864 | | | | 1,635,557 | | |
| | 7,000 | | | Galaxy XXII CLO Ltd., 2016-22A,
Rule 144A, 3 mo. USD Term
SOFR + 1.462%(1),(12) | | (AAA, NR) | | 04/16/34 | | | 6.855 | | | | 6,897,836 | | |
| | 5,000 | | | Galaxy XXVIII CLO Ltd., 2018-28A,
Rule 144A, 3 mo. USD Term
SOFR + 3.262%(1),(12) | | (BBB-, NR) | | 07/15/31 | | | 8.655 | | | | 4,787,877 | | |
| | 3,500 | | | Greywolf CLO II Ltd., 2013-1A,
Rule 144A, 3 mo. USD Term
SOFR + 4.460%(1),(12) | | (BBB-, NR) | | 04/15/34 | | | 9.854 | | | | 3,338,004 | | |
| | 2,800 | | | Greywolf CLO III Ltd., 2020-3RA,
Rule 144A, 3 mo. USD Term
SOFR + 2.710%(1),(12) | | (A, NR) | | 04/15/33 | | | 8.122 | | | | 2,767,500 | | |
| | 1,000 | | | Greywolf CLO III Ltd., 2020-3RA,
Rule 144A, 3 mo. USD Term
SOFR + 3.610%(1),(12) | | (BBB-, NR) | | 04/15/33 | | | 9.022 | | | | 952,266 | | |
| | 2,000 | | | Greywolf CLO III Ltd., 2020-3RA,
Rule 144A, 3 mo. USD Term
SOFR + 7.180%(1),(12) | | (BB-, NR) | | 04/15/33 | | | 12.592 | | | | 1,824,466 | | |
| | 3,390 | | | Greywolf CLO IV Ltd., 2019-1A,
Rule 144A, 3 mo. USD Term
SOFR + 3.910%(1),(12) | | (BBB-, NR) | | 04/17/34 | | | 9.313 | | | | 3,261,952 | | |
| | 3,950 | | | Greywolf CLO V Ltd., 2015-1A,
Rule 144A, 3 mo. USD Term
SOFR + 3.262%(1),(12) | | (BBB-, NR) | | 01/27/31 | | | 8.640 | | | | 3,748,921 | | |
See Accompanying Notes to Financial Statements.
30
Credit Suisse Floating Rate High Income Fund
Schedule of Investments (continued)
October 31, 2023
Par
(000) | |
| | Ratings†
(S&P/Moody's) | | Maturity | | Rate% | | Value | |
| ASSET BACKED SECURITIES (continued) | | | |
| Collateralized Debt Obligations (continued) | | | |
$ | 2,500 | | | KKR CLO 14 Ltd., Rule 144A,
3 mo. USD Term SOFR + 6.412%(1),(12) | | (NR, B1) | | 07/15/31 | | | 11.805 | | | $ | 2,341,226 | | |
| | 3,250 | | | KKR Financial CLO Ltd., 2013-1A,
Rule 144A, 3 mo. USD Term
SOFR + 6.342%(1),(12) | | (NR, Ba3) | | 04/15/29 | | | 11.735 | | | | 3,074,976 | | |
| | 1,900 | | | Marble Point CLO XVII Ltd., 2020-1A,
Rule 144A, 3 mo. USD Term
SOFR + 7.082%(1),(12) | | (NR, Ba3) | | 04/20/33 | | | 12.497 | | | | 1,681,870 | | |
| | 3,450 | | | Marble Point CLO XVIII Ltd., 2020-2A,
Rule 144A, 3 mo. USD Term
SOFR + 7.962%(1),(12) | | (NR, Ba3) | | 10/15/34 | | | 13.355 | | | | 3,041,820 | | |
| | 5,275 | | | Marble Point CLO XXIII Ltd., 2021-4A,
Rule 144A, 3 mo. USD
LIBOR + 5.750%(1),(12) | | (NR, Ba1) | | 01/22/35 | | | 11.424 | | | | 4,903,463 | | |
| | 2,250 | | | Octagon Investment Partners 26 Ltd.,
2016-1A, Rule 144A, 3 mo. USD Term
SOFR + 3.112%(1),(12) | | (BBB-, NR) | | 07/15/30 | | | 8.505 | | | | 2,107,130 | | |
| | 3,580 | | | Signal Peak CLO 5 Ltd., 2018-5A,
Rule 144A, 3 mo. USD Term
SOFR + 2.912%(1),(12) | | (BBB-, NR) | | 04/25/31 | | | 8.290 | | | | 3,404,705 | | |
| | 4,690 | | | Stratus CLO Ltd., 2021-1A,
Rule 144A, 3 mo. USD Term
SOFR + 1.062%(1),(12) | | (NR, Aaa) | | 12/29/29 | | | 6.477 | | | | 4,663,815 | | |
| | 3,000 | | | Venture 35 CLO Ltd., 2018-35A,
Rule 144A, 3 mo. USD Term
SOFR + 3.762%(1),(12) | | (NR, Baa1) | | 10/22/31 | | | 9.174 | | | | 2,618,099 | | |
| | 3,000 | | | Venture XIII CLO Ltd., 2013-13A,
Rule 144A, 3 mo. USD Term
SOFR + 3.562%(1),(12) | | (NR, A3) | | 09/10/29 | | | 8.973 | | | | 2,853,730 | | |
| | 3,278 | | | Venture XXIII CLO Ltd., 2016-23A,
Rule 144A, 3 mo. USD Term
SOFR + 5.332%(1),(12) | | (NR, Ba1) | | 07/19/34 | | | 10.728 | | | | 2,837,223 | | |
| | 1,750 | | | Vibrant CLO 1X Ltd., 2018-9A,
Rule 144A, 3 mo. USD Term
SOFR + 3.462%(1),(12) | | (NR, Baa3) | | 07/20/31 | | | 8.877 | | | | 1,578,079 | | |
| | 1,500 | | | Vibrant CLO VI Ltd., 2017-6A,
Rule 144A, 3 mo. USD Term
SOFR + 6.012%(1),(12) | | (NR, Ba3) | | 06/20/29 | | | 11.409 | | | | 1,297,267 | | |
| | 3,000 | | | Voya CLO Ltd., 2014-4A, Rule 144A,
3 mo. USD Term SOFR + 3.612%(1),(12) | | (BBB-, NR) | | 07/14/31 | | | 9.005 | | | | 2,743,237 | | |
| TOTAL ASSET BACKED SECURITIES (Cost $111,601,252) | | | 106,046,797 | | |
Shares | | | | | | | | | | | |
| COMMON STOCKS (1.0%) | | | |
| Auto Parts & Equipment (0.1%) | | | |
| | 311,079 | | | Jason, Inc.(4),(10) | | | | | | | | | | | | | | | 3,369,919 | | |
See Accompanying Notes to Financial Statements.
31
Credit Suisse Floating Rate High Income Fund
Schedule of Investments (continued)
October 31, 2023
Shares | | | | | | | | | | Value | |
| COMMON STOCKS (continued) | | | |
| Chemicals (0.6%) | | | |
| | 31,756 | | | Project Investor Holdings LLC(4),(5),(9),(10) | | | | | | | | | | | | | | $ | 318 | | |
| | 529,264 | | | Proppants Holdings LLC(4),(5),(9),(10) | | | | | | | | | | | | | | | 10,585 | | |
| | 191,054 | | | Utex Industries(10) | | | | | | | | | | | | | | | 11,749,821 | | |
| | | | 11,760,724 | | |
| Energy - Exploration & Production (0.0%) | | | |
| | 926,254 | | | PES Energy, Class A(4),(5),(9),(10) | | | | | | | | | | | | | | | 9,263 | | |
| Machinery (0.0%) | | | |
| | 6,708,021 | | | Alloy Topco Ltd.(4),(8),(9),(10) | | | | | | | | | | | | | | | — | | |
| Packaging (0.0%) | | | |
| | 2,646,421 | | | Campfire Topco Ltd.(3),(4),(9),(10) | | | | | | | | | | | | | | | — | | |
| Personal & Household Products (0.1%) | | | |
| | 196,189 | | | Serta Simmons Common(10) | | | | | | | | | | | | | | | 2,158,079 | | |
| Pharmaceuticals (0.0%) | | | |
| | 156,133 | | | Akorn, Inc.(10) | | | | | | | | | | | | | | | 78,066 | | |
| Private Placement (0.1%) | | | |
| | 397,839 | | | Technicolor Creative Studios SA(10),(14) | | | | | | | | | | | | | | | 678,208 | | |
| | 2,437,234 | | | Vantiva SA(10),(14) | | | | | | | | | | | | | | | 329,233 | | |
| | | | 1,007,441 | | |
| Recreation & Travel (0.1%) | | | |
| | 115,069 | | | Cineworld Group PLC(10) | | | | | | | | | | | | | | | 2,364,668 | | |
| Software - Services (0.0%) | | | |
| | 3,935 | | | Skillsoft Corp.(10) | | | | | | | | | | | | | | | 73,978 | | |
| Specialty Retail (0.0%) | | | |
| | 141 | | | Eagle Investments Holding Co. LLC, Class B(4),(9),(10) | | | | | | | | | | | | | | | 1 | | |
| Theaters & Entertainment (0.0%) | | | |
| | 1,153,846 | | | Vantiva SA(3),(10) | | | | | | | | | | | | | | | 157,606 | | |
| TOTAL COMMON STOCKS (Cost $36,306,961) | | | 20,979,745 | | |
| WARRANTS (0.0%) | | | |
| Chemicals (0.0%) | | | |
| | 132,316 | | | Project Investor Holdings LLC, expires 02/20/2022(4),(5),(9),(10) | | | | | | | | | | | | | | | — | | |
Investments & Misc. Financial Services (0.0%) | | | |
| | 53,116 | | | Altisource Solutions SARL, expires 05/31/2027(4),(9),(10) | | | | | | | | | | | | | | | 167,953 | | |
| Private Placement (0.0%) | | | |
| | 11,774,620 | | | Technicolor Creative Studios SA(10),(14) | | | | | | | | | | | | | | | 201,098 | | |
| Recreation & Travel (0.0%) | | | |
| | 526,589 | | | Cineworld Group PLC, expires 12/21/2025(4),(8),(10) | | | | | | | | | | | | | | | — | | |
| TOTAL WARRANTS (Cost $68,804) | | | 369,051 | | |
See Accompanying Notes to Financial Statements.
32
Credit Suisse Floating Rate High Income Fund
Schedule of Investments (continued)
October 31, 2023
Shares | | | | | | | | | | Value | |
| SHORT-TERM INVESTMENTS (5.5%) | |
| | 85,399,356 | | | State Street Institutional U.S. Government
Money Market Fund — Premier Class, 5.31% | | | | | | | | | | | | | | $ | 85,399,356 | | |
| | 24,183,893 | | | State Street Navigator Securities Lending
Government Money Market Portfolio, 5.36%(15) | | | | | | | | | | | | | | | 24,183,893 | | |
| TOTAL SHORT-TERM INVESTMENTS (Cost $109,583,249) | | | 109,583,249 | | |
| TOTAL INVESTMENTS AT VALUE (101.3%) (Cost $2,126,892,745) | | | 2,003,888,653 | | |
| LIABILITIES IN EXCESS OF OTHER ASSETS (-1.3%) | | | (25,886,176 | ) | |
| NET ASSETS (100.0%) | | $ | 1,978,002,477 | | |
† Credit ratings given by the S&P Global Ratings Division of S&P Global Inc. ("S&P") and Moody's Investors Service, Inc. ("Moody's") are unaudited.
(1) Variable rate obligation — The interest rate shown is the rate in effect as of October 31, 2023. The rate may be subject to a cap and floor.
(2) PIK: Payment-in-kind security for which part of the income earned may be paid as additional principal.
(3) This security is denominated in Euro.
(4) Security is valued using significant unobservable inputs.
(5) Illiquid security.
(6) Bond is currently in default.
(7) The rates on certain variable rate securities are not based on a published reference rate and spread but are determined by the issuer or agent and are based on current market conditions. These securities do not indicate a reference rate and spread in their description above. The interest rate shown is the rate in effect as of October 31, 2023.
(8) This security is denominated in British Pound.
(9) Not readily marketable security; security is valued at fair value as determined in good faith by Credit Suisse Asset Management, LLC as the Fund's valuation designee under the oversight of the Board of Trustees.
(10) Non-income producing security.
(11) All or a portion is an unfunded loan commitment.
(12) Security exempt from registration under Rule 144A of the Securities Act of 1933, as amended. These securities may be resold in transactions exempt from registration, normally to qualified institutional buyers. At October 31, 2023, these securities amounted to a value of $283,696,349 or 14.3% of net assets.
(13) Security or portion thereof is out on loan (See Note 2-J).
(14) Security is held through holdings of 100 shares of the CIG Special Purpose SPC — Credit Suisse Floating Rate High Income Fund Segregated Portfolio, an affiliated entity.
(15) Represents security purchased with cash collateral received for securities on loan.
See Accompanying Notes to Financial Statements.
33
Credit Suisse Floating Rate High Income Fund
Schedule of Investments (continued)
October 31, 2023
INVESTMENT ABBREVIATIONS
1 mo. = 1 month
2 mo. = 2 month
3 mo. = 3 month
6 mo. = 6 month
EURIBOR = Euro Interbank Offered Rate
NR = Not Rated
LIBOR = London Interbank Offered Rate
WR = Withdrawn Rating
SARL = société à responsabilité limitée
SOFR = Secured Overnight Financing Rate
Forward Foreign Currency Contracts
Forward
Currency to be
Purchased | | Forward
Currency to be
Sold | | Expiration
Date | | Counterparty | | Value on
Settlement
Date | | Current
Value/
Notional | | Unrealized
Appreciation | |
EUR | 500,000 | | | USD | 534,381 | | | 10/07/24 | | Deutsche Bank AG | | $ | 534,381 | | | $ | 537,424 | | | $ | 3,043 | | |
USD | 88,919,437 | | | EUR | 82,089,326 | | | 09/26/24 | | Deutsche Bank AG | | | (88,919,437 | ) | | | (88,182,837 | ) | | | 736,600 | | |
USD | 8,914,389 | | | GBP | 7,312,859 | | | 10/07/24 | | Morgan Stanley | | | (8,914,389 | ) | | | (8,894,552 | ) | | | 19,837 | | |
Total Unrealized Appreciation | | $ | 759,480 | | |
Forward Foreign Currency Contracts
Forward
Currency to be
Purchased | | Forward
Currency to be
Sold | | Expiration
Date | | Counterparty | | Value on
Settlement
Date | | Current
Value/
Notional | | Unrealized
Depreciation | |
USD | 5,613,705 | | | EUR | 5,241,360 | | | 10/07/24 | | Morgan Stanley | | $ | (5,613,705 | ) | | $ | (5,633,663 | ) | | $ | (19,958 | ) | |
Total Unrealized Depreciation | | $ | (19,958 | ) | |
Total Net Unrealized Appreciation/(Depreciation) | | $ | 739,522 | | |
Currency Abbreviations:
EUR = Euro
USD = United States Dollar
GBP = British Pound
See Accompanying Notes to Financial Statements.
34
Credit Suisse Floating Rate High Income Fund
Statement of Assets and Liabilities
October 31, 2023
Assets | |
Investments at value, including collateral for securities on loan of $24,183,893
(Cost $2,126,892,745) (Note 2) | | $ | 2,003,888,6531 | | |
Cash | | | 6,321,753 | | |
Foreign currency at value (Cost $463,625) | | | 461,416 | | |
Cash segregated at brokers for forwards contracts (Note 2) | | | 616,401 | | |
Receivable for investments sold | | | 23,344,645 | | |
Interest receivable | | | 21,804,424 | | |
Receivable for Fund shares sold | | | 15,956,126 | | |
Unrealized appreciation on forward foreign currency contracts (Note 2) | | | 759,480 | | |
Prepaid expenses and other assets | | | 86,680 | | |
Total assets | | | 2,073,239,578 | | |
Liabilities | |
Investment advisory fee payable (Note 3) | | | 906,142 | | |
Administrative services fee payable (Note 3) | | | 61,366 | | |
Shareholder servicing/Distribution fee payable (Note 3) | | | 63,065 | | |
Payable for investments purchased | | | 58,884,889 | | |
Payable upon return of securities loaned (Note 2) | | | 24,183,893 | | |
Payable for Fund shares redeemed | | | 4,492,366 | | |
Dividend payable | | | 3,007,647 | | |
Unfunded loan commitments (Note 2) | | | 2,731,128 | | |
Unrealized depreciation on forward foreign currency contracts (Note 2) | | | 19,958 | | |
Trustees' fee payable | | | 17,353 | | |
Accrued expenses | | | 869,294 | | |
Total liabilities | | | 95,237,101 | | |
Net Assets | |
Capital stock, $.001 par value (Note 6) | | | 313,735 | | |
Paid-in capital (Note 6) | | | 2,319,899,775 | | |
Total distributable earnings (loss) | | | (342,211,033 | ) | |
Net assets | | $ | 1,978,002,477 | | |
I Shares | |
Net assets | | $ | 1,816,028,408 | | |
Shares outstanding | | | 288,186,128 | | |
Net asset value, offering price and redemption price per share | | $ | 6.30 | | |
A Shares | |
Net assets | | $ | 116,439,409 | | |
Shares outstanding | | | 18,382,646 | | |
Net asset value and redemption price per share | | $ | 6.33 | | |
Maximum offering price per share (net asset value/(1-4.75%)) | | $ | 6.65 | | |
C Shares | |
Net assets | | $ | 45,534,660 | | |
Shares outstanding | | | 7,166,025 | | |
Net asset value and offering price per share | | $ | 6.35 | | |
1 Includes $23,748,625 of securities on loan.
See Accompanying Notes to Financial Statements.
35
Credit Suisse Floating Rate High Income Fund
Statement of Operations
For the Year Ended October 31, 2023
Investment Income | |
Interest | | $ | 213,099,827 | | |
Dividends | | | 33,323 | | |
Securities lending (net of rebates) | | | 76,366 | | |
Total investment income | | | 213,209,516 | | |
Expenses | |
Investment advisory fees (Note 3) | | | 13,444,968 | | |
Administrative services fees (Note 3) | | | 368,519 | | |
Shareholder servicing/Distribution fees (Note 3) | |
Class A | | | 287,034 | | |
Class C | | | 469,310 | | |
Transfer agent fees | | | 2,330,830 | | |
Commitment fees (Note 4) | | | 724,846 | | |
Custodian fees | | | 517,922 | | |
Printing fees | | | 192,176 | | |
Legal fees | | | 166,400 | | |
Registration fees | | | 153,192 | | |
Trustees' fees | | | 77,195 | | |
Insurance expense | | | 59,926 | | |
Audit and tax fees | | | 53,275 | | |
Miscellaneous expense | | | 59,608 | | |
Total expenses | | | 18,905,201 | | |
Less: fees waived and expenses reimbursed (Note 3) | | | (2,434,488 | ) | |
Net expenses | | | 16,470,713 | | |
Net investment income | | | 196,738,803 | | |
Net Realized and Unrealized Gain (Loss) from Investments, Foreign Currency and
Forward Foreign Currency Contracts | |
Net realized loss from investments | | | (71,430,157 | ) | |
Net realized loss from foreign currency transactions | | | (802,405 | ) | |
Net realized loss from forward foreign currency contracts | | | (5,435,115 | ) | |
Net change in unrealized appreciation (depreciation) from investments | | | 123,796,631 | | |
Net change in unrealized appreciation (depreciation) from foreign currency
translations | | | (332,062 | ) | |
Net change in unrealized appreciation (depreciation) from forward foreign
currency contracts | | | 2,636,563 | | |
Net realized and unrealized gain from investments, foreign currency
transactions and forward foreign currency contracts | | | 48,433,455 | | |
Net increase in net assets resulting from operations | | $ | 245,172,258 | | |
See Accompanying Notes to Financial Statements.
36
Credit Suisse Floating Rate High Income Fund
Statements of Changes in Net Assets
| | | For the Year
Ended
October 31, 2023 | | For the Year
Ended
October 31, 2022 | |
From Operations | |
Net investment income | | $ | 196,738,803 | | | $ | 143,254,040 | | |
Net realized loss from investments, foreign currency
transactions and forward foreign currency contracts | | | (77,667,677 | ) | | | (26,444,863 | ) | |
Net change in unrealized appreciation (depreciation)
from investments, foreign currency translations and
forward foreign currency contracts | | | 126,101,132 | | | | (203,595,151 | ) | |
Net increase (decrease) in net assets resulting from operations | | | 245,172,258 | | | | (86,785,974 | ) | |
From Distributions | |
From distributable earnings | |
Class I | | | (182,837,373 | ) | | | (135,067,532 | ) | |
Class A | | | (9,847,877 | ) | | | (5,617,339 | ) | |
Class C | | | (3,663,893 | ) | | | (2,076,206 | ) | |
Return of capital | |
Class I | | | (626,387 | ) | | | — | | |
Class A | | | (33,738 | ) | | | — | | |
Class C | | | (12,552 | ) | | | — | | |
Net decrease in net assets resulting from distributions | | | (197,021,820 | ) | | | (142,761,077 | ) | |
| From Capital Share Transactions (Note 6) | |
Proceeds from sale of shares | | | 737,057,328 | | | | 1,763,525,560 | | |
Reinvestment of distributions | | | 161,320,735 | | | | 117,879,709 | | |
Net asset value of shares redeemed | | | (1,514,656,539 | ) | | | (2,080,789,616 | ) | |
Net decrease in net assets from capital share transactions | | | (616,278,476 | ) | | | (199,384,347 | ) | |
Net decrease in net assets | | | (568,128,038 | ) | | | (428,931,398 | ) | |
Net Assets | |
Beginning of year | | | 2,546,130,515 | | | | 2,975,061,913 | | |
End of year | | $ | 1,978,002,477 | | | $ | 2,546,130,515 | | |
See Accompanying Notes to Financial Statements.
37
Credit Suisse Floating Rate High Income Fund
Financial Highlights
(For a Class I Share of the Fund Outstanding Throughout Each Year)
| | | For the Year Ended October 31, | |
| | | 2023 | | 2022 | | 2021 | | 2020 | | 2019 | |
Per share data | |
Net asset value, beginning of year | | $ | 6.171 | | | $ | 6.62 | | | $ | 6.31 | | | $ | 6.56 | | | $ | 6.811 | | |
INVESTMENT OPERATIONS | |
Net investment income2 | | | 0.55 | | | | 0.29 | | | | 0.24 | | | | 0.30 | | | | 0.35 | | |
Net gain (loss) from investments, foreign
currency transactions and forward
foreign currency contracts (both realized
and unrealized) | | | 0.14 | | | | (0.45 | ) | | | 0.31 | | | | (0.25 | ) | | | (0.25 | ) | |
Total from investment operations | | | 0.69 | | | | (0.16 | ) | | | 0.55 | | | | 0.05 | | | | 0.10 | | |
LESS DIVIDENDS AND DISTRIBUTIONS | |
Dividends from net investment income | | | (0.56 | ) | | | (0.29 | ) | | | (0.24 | ) | | | (0.30 | ) | | | (0.35 | ) | |
Return of capital | | | (0.00 | )3 | | | — | | | | — | | | | — | | | | — | | |
Total dividends and distributions | | | (0.56 | ) | | | (0.29 | ) | | | (0.24 | ) | | | (0.30 | ) | | | (0.35 | ) | |
Net asset value, end of year | | $ | 6.30 | | | $ | 6.171 | | | $ | 6.62 | | | $ | 6.31 | | | $ | 6.56 | | |
Total return4 | | | 11.54 | % | | | (2.42 | )% | | | 8.86 | % | | | 0.92 | % | | | 1.47 | % | |
RATIOS AND SUPPLEMENTAL DATA | |
Net assets, end of year (000s omitted) | | $ | 1,816,028 | | | $ | 2,376,866 | | | $ | 2,770,167 | | | $ | 1,699,373 | | | $ | 2,199,606 | | |
Ratio of net expenses to average
net assets | | | 0.70 | % | | | 0.70 | % | | | 0.70 | % | | | 0.70 | % | | | 0.70 | % | |
Ratio of net investment income to
average net assets | | | 8.79 | % | | | 4.54 | % | | | 3.62 | % | | | 4.80 | % | | | 5.18 | % | |
Decrease reflected in above operating
expense ratios due to
waivers/reimbursements | | | 0.11 | % | | | 0.09 | % | | | 0.07 | % | | | 0.09 | % | | | 0.08 | % | |
Portfolio turnover rate5 | | | 35 | % | | | 47 | % | | | 54 | % | | | 30 | % | | | 23 | % | |
1 Includes adjustments in accordance with accounting principles generally accepted in the United States of America and as such, the net asset values for financial reporting purposes and the returns based upon net asset values may differ from the net asset values and returns for shareholder transactions.
2 Per share information is calculated using the average shares outstanding method.
3 This amount represents less than $0.01 per share.
4 Total returns are historical and include change in share price, reinvestment of all distributions and no sales charge. Had certain expenses not been reduced during the years shown, total returns would have been lower.
5 Portfolio turnover is calculated by dividing the lesser of total purchases or sales of portfolio securities for the reporting period by the monthly average of portfolio securities owned during the reporting period. Excluded from both the numerator and denominator are amounts relating to derivatives and securities whose maturities or expiration dates at the time of acquisition were one year or less.
See Accompanying Notes to Financial Statements.
38
Credit Suisse Floating Rate High Income Fund
Financial Highlights
(For a Class A Share of the Fund Outstanding Throughout Each Year)
| | | For the Year Ended October 31, | |
| | | 2023 | | 2022 | | 2021 | | 2020 | | 2019 | |
Per share data | |
Net asset value, beginning of year | | $ | 6.21 | | | $ | 6.65 | | | $ | 6.34 | | | $ | 6.59 | | | $ | 6.841 | | |
INVESTMENT OPERATIONS | |
Net investment income2 | | | 0.54 | | | | 0.28 | | | | 0.23 | | | | 0.29 | | | | 0.33 | | |
Net gain (loss) from investments, foreign currency
transactions and forward foreign currency
contracts (both realized and unrealized) | | | 0.12 | | | | (0.44 | ) | | | 0.31 | | | | (0.25 | ) | | | (0.25 | ) | |
Total from investment operations | | | 0.66 | | | | (0.16 | ) | | | 0.54 | | | | 0.04 | | | | 0.08 | | |
LESS DIVIDENDS AND DISTRIBUTIONS | |
Dividends from net investment income | | | (0.54 | ) | | | (0.28 | ) | | | (0.23 | ) | | | (0.29 | ) | | | (0.33 | ) | |
Return of capital | | | (0.00 | )3 | | | — | | | | — | | | | — | | | | — | | |
Total dividends and distributions | | | (0.54 | ) | | | (0.28 | ) | | | (0.23 | ) | | | (0.29 | ) | | | (0.33 | ) | |
Net asset value, end of year | | $ | 6.33 | | | $ | 6.21 | | | $ | 6.65 | | | $ | 6.34 | | | $ | 6.59 | | |
Total return4 | | | 11.07 | % | | | (2.48 | )% | | | 8.57 | % | | | 0.70 | % | | | 1.23 | % | |
RATIOS AND SUPPLEMENTAL DATA | |
Net assets, end of year (000s omitted) | | $ | 116,439 | | | $ | 116,540 | | | $ | 144,713 | | | $ | 146,803 | | | $ | 199,328 | | |
Ratio of net expenses to average net assets | | | 0.95 | % | | | 0.95 | % | | | 0.95 | % | | | 0.95 | % | | | 0.95 | % | |
Ratio of net investment income to average
net assets | | | 8.59 | % | | | 4.25 | % | | | 3.41 | % | | | 4.54 | % | | | 4.93 | % | |
Decrease reflected in above operating expense
ratios due to waivers/reimbursements | | | 0.11 | % | | | 0.09 | % | | | 0.07 | % | | | 0.09 | % | | | 0.08 | % | |
Portfolio turnover rate5 | | | 35 | % | | | 47 | % | | | 54 | % | | | 30 | % | | | 23 | % | |
1 Includes adjustments in accordance with accounting principles generally accepted in the United States of America and as such, the net asset values for financial reporting purposes and the returns based upon net asset values may differ from the net asset values and returns for shareholder transactions.
2 Per share information is calculated using the average shares outstanding method.
3 This amount represents less than $0.01 per share.
4 Total returns are historical and include change in share price, reinvestment of all distributions and no sales charge. Had certain expenses not been reduced during the years shown, total returns would have been lower.
5 Portfolio turnover is calculated by dividing the lesser of total purchases or sales of portfolio securities for the reporting period by the monthly average of portfolio securities owned during the reporting period. Excluded from both the numerator and denominator are amounts relating to derivatives and securities whose maturities or expiration dates at the time of acquisition were one year or less.
See Accompanying Notes to Financial Statements.
39
Credit Suisse Floating Rate High Income Fund
Financial Highlights
(For a Class C Share of the Fund Outstanding Throughout Each Year)
| | | For the Year Ended October 31, | |
| | | 2023 | | 2022 | | 2021 | | 2020 | | 2019 | |
Per share data | |
Net asset value, beginning of year | | $ | 6.221 | | | $ | 6.68 | | | $ | 6.36 | | | $ | 6.61 | | | $ | 6.871 | | |
INVESTMENT OPERATIONS | |
Net investment income2 | | | 0.50 | | | | 0.23 | | | | 0.18 | | | | 0.24 | | | | 0.28 | | |
Net gain (loss) from investments, foreign currency
transactions and forward foreign currency
contracts (both realized and unrealized) | | | 0.13 | | | | (0.46 | ) | | | 0.32 | | | | (0.25 | ) | | | (0.26 | ) | |
Total from investment operations | | | 0.63 | | | | (0.23 | ) | | | 0.50 | | | | (0.01 | ) | | | 0.02 | | |
LESS DIVIDENDS AND DISTRIBUTIONS | |
Dividends from net investment income | | | (0.50 | ) | | | (0.23 | ) | | | (0.18 | ) | | | (0.24 | ) | | | (0.28 | ) | |
Return of capital | | | (0.00 | )3 | | | — | | | | — | | | | — | | | | — | | |
Total dividends and distributions | | | (0.50 | ) | | | (0.23 | ) | | | (0.18 | ) | | | (0.24 | ) | | | (0.28 | ) | |
Net asset value, end of year | | $ | 6.35 | | | $ | 6.221 | | | $ | 6.68 | | | $ | 6.36 | | | $ | 6.61 | | |
Total return4 | | | 10.42 | % | | | (3.48 | )% | | | 7.90 | % | | | (0.05 | )% | | | 0.34 | % | |
RATIOS AND SUPPLEMENTAL DATA | |
Net assets, end of year (000s omitted) | | $ | 45,535 | | | $ | 52,725 | | | $ | 60,182 | | | $ | 58,959 | | | $ | 87,380 | | |
Ratio of net expenses to average net assets | | | 1.70 | % | | | 1.70 | % | | | 1.70 | % | | | 1.70 | % | | | 1.70 | % | |
Ratio of net investment income to average
net assets | | | 7.82 | % | | | 3.54 | % | | | 2.66 | % | | | 3.83 | % | | | 4.19 | % | |
Decrease reflected in above operating expense
ratios due to waivers/reimbursements | | | 0.11 | % | | | 0.09 | % | | | 0.07 | % | | | 0.09 | % | | | 0.08 | % | |
Portfolio turnover rate5 | | | 35 | % | | | 47 | % | | | 54 | % | | | 30 | % | | | 23 | % | |
1 Includes adjustments in accordance with accounting principles generally accepted in the United States of America and as such, the net asset values for financial reporting purposes and the returns based upon net asset values may differ from the net asset values and returns for shareholder transactions.
2 Per share information is calculated using the average shares outstanding method.
3 This amount represents less than $0.01 per share.
4 Total returns are historical and include change in share price, reinvestment of all distributions and no sales charge. Had certain expenses not been reduced during the years shown, total returns would have been lower.
5 Portfolio turnover is calculated by dividing the lesser of total purchases or sales of portfolio securities for the reporting period by the monthly average of portfolio securities owned during the reporting period. Excluded from both the numerator and denominator are amounts relating to derivatives and securities whose maturities or expiration dates at the time of acquisition were one year or less.
See Accompanying Notes to Financial Statements.
40
Credit Suisse Floating Rate High Income Fund
Notes to Financial Statements
October 31, 2023
Credit Suisse Floating Rate High Income Fund (the "Fund"), a series of Credit Suisse Opportunity Funds (the "Trust"), a Delaware statutory trust, is registered under the Investment Company Act of 1940, as amended (the "1940 Act"), as a diversified open-end management investment company that seeks to provide a high level of current income and, secondarily, capital appreciation. The Trust was organized under the laws of the State of Delaware as a business trust on May 31, 1995.
The Fund offers three classes of shares: Class I shares, Class A shares and Class C shares. Each class of shares represents an equal pro rata interest in the Fund, except the share classes bear different expenses. Class A shares are sold subject to a front-end sales charge of up to 4.75%. Class C shares are sold subject to a CDSC of 1.00% if the shares are redeemed within the first year of purchase. Class I shares are sold without a sales charge. Effective June 30, 2021, Class C shares, upon the eight year anniversary of purchase, will convert to Class A shares.
Note 2. Significant Accounting Policies
The following is a summary of significant accounting policies followed by the Fund in the preparation of its financial statements. The policies are in accordance with generally accepted accounting principles in the United States of America ("GAAP"). The preparation of financial statements requires management to make estimates and assumptions that affect the reported amounts and disclosures in the financial statements. Actual results could differ from those estimates. The Fund is considered an investment company for financial reporting purposes under GAAP and follows the accounting and reporting guidance in Financial Accounting Standards Board ("FASB") Accounting Standard Codification ("ASC") Topic 946 — Financial Services — Investment Companies.
A) SECURITY VALUATION — The Board of Trustees (the "Board") is responsible for the Fund's valuation process. The Board has delegated the supervision of the daily valuation process to Credit Suisse Asset Management, LLC, the Fund's investment adviser ("Credit Suisse" or the "Adviser"), who has established a Pricing Committee and a Pricing Group, which, pursuant to the policies adopted by the Board, are responsible for making fair valuation determinations and overseeing the Fund's pricing policies. The net asset value of the Fund is determined daily as of the close of regular trading on the New York Stock Exchange, Inc. (the "Exchange") on each day the Exchange is open for business. The valuations for fixed income securities (which may
41
Credit Suisse Floating Rate High Income Fund
Notes to Financial Statements (continued)
October 31, 2023
Note 2. Significant Accounting Policies (continued)
include, but are not limited to, corporate, government, municipal, mortgage-backed, collateralized mortgage obligations and asset-backed securities) and certain derivative instruments are typically the prices supplied by independent third party pricing services, which may use market prices or broker/dealer quotations or a variety of valuation techniques and methodologies. The independent third party pricing services use inputs that are observable such as issuer details, interest rates, yield curves, prepayment speeds, credit risks/spreads, default rates and quoted prices for similar securities. These pricing services generally price fixed income securities assuming orderly transactions of an institutional "round lot" size, but some trades occur in smaller "odd lot" sizes which may be effected at lower prices than institutional round lot trades. Structured note agreements are valued in accordance with a dealer-supplied valuation based on changes in the value of the underlying index. Futures contracts are valued daily at the settlement price established by the board of trade or exchange on which they are traded. Forward contracts are valued at the London closing spot rates and the London closing forward point rates on a daily basis. The currency forward contract pricing model derives the differential in point rates to the expiration date of the forward and calculates its present value. Equity securities for which market quotations are available are valued at the last reported sales price or official closing price on the primary market or exchange on which they trade. Investments in open-ended mutual funds are valued at the net asset value as reported on each business day and under normal circumstances. Securities for which market quotations are not readily available are valued at their fair value as determined in good faith by the Adviser, as the Board's valuation designee (as defined in Rule 2a-5 under the 1940 Act), in accordance with the Adviser's procedures. The Board oversees the Adviser in its role as valuation designee in accordance with the requirements of Rule 2a-5 under the 1940 Act. The Fund may utilize a service provided by an independent third party to fair value certain securities. When fair value pricing is employed, the prices of securities used by the Fund to calculate its net asset value may differ from quoted or published prices for the same securities. If independent third party pricing services are unable to supply prices for a portfolio investment, or if the prices supplied are deemed by the Adviser to be unreliable, the market price may be determined by the Adviser using quotations from one or more brokers/dealers or at the transaction price if the security has recently been purchased and no value has yet been obtained from a pricing service or pricing broker. When reliable prices are not readily available, such as when the value of a security has been significantly affected by events after the close of the exchange or market on
42
Credit Suisse Floating Rate High Income Fund
Notes to Financial Statements (continued)
October 31, 2023
Note 2. Significant Accounting Policies (continued)
which the security is principally traded, but before the Fund calculates its net asset value, these securities will be fair valued in good faith by the Pricing Group, in accordance with procedures established by the Adviser.
The Fund uses valuation techniques to measure fair value that are consistent with the market approach and/or income approach, depending on the type of security and the particular circumstance. The market approach uses prices and other relevant information generated by market transactions involving identical or comparable securities. The income approach uses valuation techniques to discount estimated future cash flows to present value.
GAAP established a disclosure hierarchy that categorizes the inputs to valuation techniques used to value assets and liabilities at each measurement date. These inputs are summarized in the three broad levels listed below:
• Level 1 – quoted prices in active markets for identical investments
• Level 2 – other significant observable inputs (including quoted prices for similar investments, interest rates, prepayment speeds, credit risk, etc.)
• Level 3 – significant unobservable inputs (including the Fund's own assumptions in determining the fair value of investments)
The inputs or methodologies used to value securities are not necessarily an indication of the risk associated with investing in those securities.
The following is a summary of the inputs used as of October 31, 2023 in valuing the Fund's assets and liabilities carried at fair value:
Assets | | Level 1 | | Level 2 | | Level 3 | | Total | |
Investments in Securities | |
Bank Loans | | $ | — | | | $ | 1,470,364,256 | | | $ | 117,212,484 | | | $ | 1,587,576,740 | | |
Corporate Bonds | | | — | | | | 179,191,624 | | | | 141,447 | | | | 179,333,071 | | |
Asset Backed Securities | | | — | | | | 106,046,797 | | | | — | | | | 106,046,797 | | |
Common Stocks | | | 2,232,057 | | | | 15,357,602 | | | | 3,390,086 | | | | 20,979,745 | | |
Warrants | | | — | | | | 201,098 | | | | 167,953 | | | | 369,051 | | |
Short-term Investments | | | 109,583,249 | | | | — | | | | — | | | | 109,583,249 | | |
| | | $ | 111,815,306 | | | $ | 1,771,161,377 | | | $ | 120,911,970 | | | $ | 2,003,888,653 | | |
Other Financial Instruments* | |
Forward Foreign Currency
Contracts | | $ | — | | | $ | 759,480 | | | $ | — | | | $ | 759,480 | | |
Liabilities | | | | | | | | | |
Other Financial Instruments* | |
Forward Foreign Currency
Contracts | | $ | — | | | $ | 19,958 | | | $ | — | | | $ | 19,958 | | |
* Other financial instruments include unrealized appreciation (depreciation) on forward foreign currency contracts.
43
Credit Suisse Floating Rate High Income Fund
Notes to Financial Statements (continued)
October 31, 2023
Note 2. Significant Accounting Policies (continued)
The following is a reconciliation of investments as of October 31, 2023 for which significant unobservable inputs were used in determining fair value.
| | | Bank
Loans | | Corporate
Bonds | | Common
Stocks | | Warrants | | Total | |
Balance as October 31, 2022 | | $ | 237,117,588 | | | $ | 152,391 | | | $ | 15,563,673 | | | $ | 0 | (1) | | $ | 252,833,652 | | |
Accrued discounts (premiums) | | | 616,921 | | | | — | | | | — | | | | — | | | | 616,921 | | |
Purchases | | | 47,276,618 | | | | — | | | | 2,109,462 | | | | — | | | | 49,386,080 | | |
Sales | | | (94,357,884 | ) | | | — | | | | (705,352 | ) | | | — | | | | (95,063,236 | ) | |
Realized gain (loss) | | | (18,380,389 | ) | | | — | | | | (449,019 | ) | | | — | | | | (18,829,408 | ) | |
Change in unrealized
appreciation (depreciation) | | | 23,521,652 | | | | (10,944 | ) | | | (1,378,857 | ) | | | 167,953 | | | | 22,299,804 | | |
Transfers into Level 3 | | | 32,296,524 | | | | — | | | | — | | | | — | | | | 32,296,524 | | |
Transfers out of Level 3 | | | (110,878,546 | ) | | | — | | | | (11,749,821 | ) | | | — | | | | (122,628,367 | ) | |
Balance as of October 31, 2023 | | $ | 117,212,484 | | | $ | 141,447 | | | $ | 3,390,086 | | | $ | 167,953 | | | $ | 120,911,970 | | |
Net change in unrealized
appreciation (depreciation)
from investments still held
as of October 31, 2023 | | $ | 1,170,807 | | | $ | (10,944 | ) | | $ | (327,160 | ) | | $ | 167,953 | | | $ | 1,000,656 | | |
(1) Includes zero valued securities.
| | | Quantitative Disclosure About Significant Unobservable Inputs | |
Asset Class | | Fair Value
At October 31, 2023 | | Valuation
Technique | | Unobservable
Input | | Price Range
(Weighted Average)* | |
Bank Loans | | $ | 4,363,743 | | | Income Approach | | Expected Remaining
Distribution | | $ | 0.00 – $1.06
| ($0.57) | |
| | | | 112,848,741 | | | Vendor pricing | | Single Broker Quote | | | 0.87 – 1.05 | (0.97) | |
Corporate Bonds | | | 141,447 | | | Income Approach | | Expected Remaining
Distribution | | | 0.55 – 0.65
| (0.60) | |
Common Stocks | | | 20,167 | | | Income Approach | | Expected Remaining
Distribution | | | 0.00 – 0.02
| (0.02) | |
| | | | 3,369,919 | | | Vendor pricing | | Single Broker Quote | | | 0.00 – 10.83 | (10.83) | |
Warrants | | | 0 | | | Income Approach | | Expected Remaining
Distribution | | | 0.00 (N/A)
| | |
| | | | 167,953 | | | Vendor pricing | | Single Broker Quote | | | 0.00 – 3.16 | (3.16) | |
* Weighted by relative fair value
Each fair value determination is based on a consideration of relevant factors, including both observable and unobservable inputs. Observable and unobservable inputs that Credit Suisse considers may include (i) the existence of any contractual restrictions on the disposition of securities; (ii) information obtained from the company, which may include an analysis of the company's financial statements, the company's products or intended markets or the company's technologies; (iii) the price of the same or similar security negotiated at arm's length in an issuer's completed subsequent round of financing; (iv) the price and extent of public trading in similar securities of the issuer or of comparable companies; or (v) a probability and time value adjusted analysis
44
Credit Suisse Floating Rate High Income Fund
Notes to Financial Statements (continued)
October 31, 2023
Note 2. Significant Accounting Policies (continued)
of contractual term. Where available and appropriate, multiple valuation methodologies are applied to confirm fair value. To the extent that valuation is based on models or inputs that are less observable or unobservable in the market, determining fair value requires more judgment. Because of the inherent uncertainty of valuation, those estimated values may be materially higher or lower than the values that would have been used had a ready market for the investments existed. Accordingly, the degree of judgment exercised by the Fund in determining fair value is greatest for investments categorized in Level 3. In some circumstances, the inputs used to measure fair value might be categorized within different levels of the fair value hierarchy. In those instances, the fair value measurement is categorized in its entirety in the fair value hierarchy based on the least observable input that is significant to the fair value measurement. Additionally, changes in the market environment and other events that may occur over the life of the investments may cause the gains or losses ultimately realized on these investments to be different from the valuations used at the date of these financial statements.
For the year ended October 31, 2023, $32,296,524 was transferred from Level 2 to Level 3 due to a lack of pricing source supported by observable inputs and $122,628,367 was transferred from Level 3 to Level 2 as a result of the availability of a pricing source supported by observable inputs. All transfers, if any, are assumed to occur at the end of the reporting period.
B) DERIVATIVE INSTRUMENTS AND HEDGING ACTIVITIES — The Fund adopted amendments to authoritative guidance on disclosures about derivative instruments and hedging activities which require that a fund disclose (a) how and why an entity uses derivative instruments, (b) how derivative instruments and hedging activities are accounted for and (c) how derivative instruments and related hedging activities affect a fund's financial position, financial performance and cash flows. For the year ended October 31, 2023, the Fund's derivatives did not qualify for hedge accounting as they are held at fair value.
The following table presents the fair value and the location of derivatives within the Statement of Assets and Liabilities at October 31, 2023 and the effect of these derivatives on the Statement of Operations for the year ended October 31, 2023.
Primary Underlying Risk | | Derivative
Assets | | Derivative
Liabilities | | Realized Gain
(Loss) | | Net Change in Unrealized
Appreciation (Depreciation) | |
Foreign currency exchange rate
Forward contracts | | $ | 759,480 | | | $ | 19,958 | | | $ | (5,435,115 | ) | | $ | 2,636,563 | | |
45
Credit Suisse Floating Rate High Income Fund
Notes to Financial Statements (continued)
October 31, 2023
Note 2. Significant Accounting Policies (continued)
For the year ended October 31, 2023, the Fund held an average monthly value on a net basis of $151,813,769 in forward foreign currency contracts.
The Fund is a party to International Swap and Derivatives Association, Inc. ("ISDA") Master Agreements ("Master Agreements") with certain counterparties that govern over-the-counter derivative (including total return, credit default and interest rate swaps) and foreign exchange contracts entered into by the Fund. The Master Agreements may contain provisions regarding, among other things, the parties' general obligations, representations, agreements, collateral requirements, events of default and early termination. Termination events applicable to the Fund may occur upon a decline in the Fund's net assets below a specified threshold over a certain period of time.
The following table presents by counterparty the Fund's derivative assets, net of related collateral held by the Fund, at October, 31 2023:
Counterparty | | Gross Amount of
Derivative Assets
Presented in the
Statement of Assets
and Liabilities(a) | | Financial
Instruments
and Derivatives
Available for Offset | | Non-Cash
Collateral
Received | | Cash
Collateral
Received | | Net Amount
of Derivative
Assets | |
Deutsche
Bank AG | | $ | 739,643 | | | $ | — | | | $ | — | | | $ | — | | | $ | 739,643 | | |
Morgan Stanley | | | 19,837 | | | | (19,837 | ) | | | — | | | | — | | | | — | | |
| | | $ | 759,480 | | | $ | (19,837 | ) | | $ | — | | | $ | — | | | $ | 739,643 | | |
The following table presents by counterparty the Fund's derivative liabilities, net of related collateral pledged by the Fund, at October 31, 2023:
Counterparty | | Gross Amount of
Derivative
Liabilities
Presented in the
Statement of Assets
and Liabilities(a) | | Financial
Instruments
and Derivatives
Available for Offset | | Non-Cash
Collateral
Pledged | | Cash
Collateral
Pledged | | Net Amount
of Derivative
Liabilities | |
Morgan Stanley | | $ | 19,958 | | | $ | (19,837 | ) | | $ | — | | | $ | — | | | $ | 121 | | |
(a) Forward foreign currency contracts are included.
C) FOREIGN CURRENCY TRANSACTIONS — The books and records of the Fund are maintained in U.S. dollars. Transactions denominated in foreign currencies are recorded at the current prevailing exchange rates. All assets and liabilities denominated in foreign currencies, including purchases and sales of investments, and income and expenses are translated into US dollar amounts on the date of those transactions.
46
Credit Suisse Floating Rate High Income Fund
Notes to Financial Statements (continued)
October 31, 2023
Note 2. Significant Accounting Policies (continued)
Reported net realized gain (loss) from foreign currency transactions arises from sales of foreign currencies; currency gains or losses realized between the trade and settlement dates on securities transactions; and the difference between the amounts of dividends, interest, and foreign withholding taxes recorded on the Fund's books and the U.S. dollar equivalent of the amounts actually received or paid. Net change in unrealized gains and losses on translation of assets and liabilities denominated in foreign currencies arises from changes in the fair values of assets and liabilities, other than investments at the end of the period, resulting from changes in exchange rates.
The Fund does not isolate that portion of the results of operations resulting from fluctuations in foreign exchange rates on investments from the fluctuations arising from changes in market prices of investments held. Such fluctuations are included with net realized and unrealized gain or loss from investments in the Statement of Operations.
D) SECURITY TRANSACTIONS AND INVESTMENT INCOME/EXPENSE — Security transactions are accounted for on a trade date basis. Interest income/expense is recorded on the accrual basis. The Fund amortizes premiums and accretes discounts using the effective interest method. Dividend income/expense is recorded on the ex-dividend date. Certain expenses are class-specific expenses, vary by class and are charged only to that class. Income, expenses (excluding class-specific expenses) and realized/unrealized gains/losses are allocated proportionately to each class of shares based upon the relative net asset value of the outstanding shares of that class. The cost of investments sold is determined by use of the specific identification method for both financial reporting and income tax purposes. To the extent any issuer defaults or a credit event occurs that impacts the issuer, the Fund may halt any additional interest income accruals and consider the realizability of interest accrued up to the date of default or credit event.
E) DIVIDENDS AND DISTRIBUTIONS TO SHAREHOLDERS — Dividends from net investment income, if any, are declared daily and paid monthly. Distributions of net realized capital gains, if any, are declared and paid at least annually. However, to the extent that a net realized capital gain can be reduced by a capital loss carryforward, such gain will not be distributed. Dividends and distributions to shareholders of the Fund are recorded on the ex-dividend date and are determined in accordance with federal income tax regulations, which may differ from GAAP.
47
Credit Suisse Floating Rate High Income Fund
Notes to Financial Statements (continued)
October 31, 2023
Note 2. Significant Accounting Policies (continued)
F) FEDERAL AND OTHER TAXES — No provision is made for federal taxes as it is the Fund's intention to continue to qualify as a regulated investment company ("RIC") under the Internal Revenue Code of 1986, as amended (the "Code"), and to make the requisite distributions to its shareholders, which will be sufficient to relieve it from federal income and excise taxes.
In order to qualify as a RIC under the Code, the Fund must meet certain requirements regarding the source of its income, the diversification of its assets and the distribution of its income. One of these requirements is that the Fund derive at least 90% of its gross income for each taxable year from dividends, interest, payments with respect to certain securities loans, gains from the sale or other disposition of stock, securities or foreign currencies, other income derived with respect to its business of investing in such stock, securities or currencies or net income derived from interests in certain publicly-traded partnerships ("Qualifying Income").
The Fund adopted the authoritative guidance for uncertainty in income taxes and recognizes a tax benefit or liability from an uncertain position only if it is more likely than not that the position is sustainable based solely on its technical merits and consideration of the relevant taxing authority's widely understood administrative practices and procedures. The Fund has reviewed its current tax positions and has determined that no provision for income tax is required in the Fund's financial statements. The Fund's federal and state income and federal excise tax returns for tax years for which the applicable statutes of limitations have not expired are subject to examination by the Internal Revenue Service and state departments of revenue.
G) CASH — The Fund's uninvested cash balance is held in an interest bearing variable rate demand deposit account at State Street Bank and Trust Company ("SSB"), the Fund's custodian.
H) FORWARD FOREIGN CURRENCY CONTRACTS — A forward foreign currency exchange contract ("forward currency contract") is a commitment to purchase or sell a foreign currency at the settlement date at a negotiated rate. The Fund will enter into forward currency contracts primarily for hedging foreign currency risk. Forward currency contracts are valued at the prevailing forward exchange rate of the underlying currencies and unrealized gain/loss is recorded daily. On the settlement date of the forward currency contract, the Fund records a realized gain or loss equal to the difference between the value of the contract at the time it was opened and the value of the contract at the time it was closed. Certain risks may arise upon entering into forward currency
48
Credit Suisse Floating Rate High Income Fund
Notes to Financial Statements (continued)
October 31, 2023
Note 2. Significant Accounting Policies (continued)
contracts from the potential inability of counterparties to meet the terms of their contracts. The maximum counterparty credit risk to the Fund is measured by the unrealized gain on appreciated contracts. Additionally, when utilizing forward currency contracts to hedge, the Fund forgoes the opportunity to profit from favorable exchange rate movements during the term of the contract. The Fund's open forward currency contracts at October 31, 2023 are disclosed in the Schedule of Investments. At October 31, 2023 the amount of restricted cash held at brokers related to forward foreign currency contracts was $616,401.
I) UNFUNDED LOAN COMMITMENTS — The Fund enters into certain agreements, all or a portion of which may be unfunded. The Fund is obligated to fund these loan commitments at the borrowers' discretion. Funded and unfunded portions of credit agreements are presented in the Schedule of Investments. As of October 31, 2023, unfunded commitments were as follows:
Borrower | | Maturity | | Rate | | Unfunded
Commitment | |
ABG Intermediate Holdings 2 LLC | | 12/21/28 | | | 4.000 | % | | $ | 2,731,128 | | |
Unfunded loan commitments and funded portions of credit agreements are marked to market daily and any unrealized appreciation or depreciation is included in the Statement of Assets and Liabilities and the Statement of Operations.
J) SECURITIES LENDING — The initial collateral received by the Fund is required to have a value of at least 102% of the market value of domestic securities on loan (including any accrued interest thereon) and 105% of the market value of foreign securities on loan (including any accrued interest thereon). The collateral is maintained thereafter at a value equal to at least 102% of the current market value of the securities on loan. The market value of loaned securities is determined at the close of each business day of the Fund and any additional required collateral is delivered to the Fund, or excess collateral returned by the Fund, on the next business day. Cash collateral received by the Fund in connection with securities lending activity may be pooled together with cash collateral for other funds/portfolios advised by Credit Suisse and may be invested in a variety of investments, including funds advised by SSB, the Fund's securities lending agent, or money market instruments. However, in the event of default or bankruptcy by the other party to the agreement, realization and/or retention of the collateral may be subject to legal proceedings. The remaining maturities of the securities lending
49
Credit Suisse Floating Rate High Income Fund
Notes to Financial Statements (continued)
October 31, 2023
Note 2. Significant Accounting Policies (continued)
transactions are considered overnight and continuous. Loans are subject to termination by the Fund or the borrower at any time.
SSB has been engaged by the Fund to act as the Fund's securities lending agent. As of October 31, 2023, the Fund had outstanding loans of securities to certain approved brokers for which the Fund received collateral:
Market Value of
Loaned Securities | | Market Value of
Cash Collateral | | Total Collateral | |
| $ | 23,748,625 | | | $ | 24,183,893 | | | $ | 24,183,893 | | |
The following table presents financial instruments that are subject to enforceable netting arrangements as of October 31, 2023.
Gross Amounts Not Offset in the Statement of Assets and Liabilities | |
Gross Asset
Amounts Presented in
the Statement of Assets
and Liabilities(a) | | Collateral
Received(b) | | Net Amount | |
| $ | 23,748,625 | | | $ | (23,748,625 | ) | | $ | — | | |
(a) Represents market value of loaned securities at year end.
(b) The actual collateral received is greater than the amount shown here due to collateral requirements of the security lending agreement.
The Fund's securities lending arrangement provides that the Fund and SSB will share the net income earned from securities lending activities. Securities lending income is accrued as earned. For the year ended October 31, 2023, total earnings received in connection with securities lending arrangements was $902,886, of which $801,127 was rebated to borrowers (brokers). The Fund retained $76,366 in income, and SSB, as lending agent, was paid $25,393.
K) OTHER — The high yield, fixed income securities in which the Fund invests will primarily consist of senior secured floating rate loans ("Senior Loans") issued by non-investment grade companies. Senior Loans are typically secured by specific collateral of the issuer and hold the most senior position in the issuer's capital structure. The interest rate on Senior Loans is periodically adjusted to a recognized base rate. While these characteristics may reduce interest rate risk and mitigate losses in the event of borrower default, the Senior Loans in which the Fund invests have below investment grade credit ratings and thereby are considered speculative because of the significant credit risk of their issuers.
The United Kingdom's Financial Conduct Authority (the "FCA"), which regulates LIBOR, has ceased publishing all LIBOR settings. In April 2023,
50
Credit Suisse Floating Rate High Income Fund
Notes to Financial Statements (continued)
October 31, 2023
Note 2. Significant Accounting Policies (continued)
however, the FCA announced that some USD LIBOR settings will continue to be published under a synthetic methodology until September 30, 2024 for certain legacy contracts. The Secured Overnight Financing Rate, or "SOFR," is a broad measure of the cost of borrowing cash overnight collateralized by U.S. Treasury securities in the purchase agreement ("repo") market and has been used increasingly on a voluntary basis in new instruments and transactions. On March 15, 2022, the Adjustable Interest Rate Act was signed into law, providing a statutory fallback mechanism to replace LIBOR with a benchmark rate that is selected by the Federal Reserve Board and based on SOFR for certain contracts that reference LIBOR without adequate fallback provisions. On December 16, 2022, the Federal Reserve Board adopted regulations implementing the Adjustable Interest Rate Act by identifying benchmark rates based on SOFR that will replace LIBOR in different categories of financial contracts after June 30, 2023. These regulations apply only to contracts governed by U.S. law, among other limitations. Neither the effect of the LIBOR transition process nor its ultimate success can yet be known. Not all existing LIBOR-based instruments may have alternative rate-setting provisions and there remains uncertainty regarding the willingness and ability of issuers to add alternative rate-setting provisions in certain existing instruments. Parties to contracts, securities or other instruments using LIBOR may disagree on transition rates or the application of applicable transition regulation, potentially resulting in uncertainty of performance and the possibility of litigation. The fund may have instruments linked to other interbank offered rates that may also cease to be published in the future.
Lower-rated debt securities (commonly known as "junk bonds") possess speculative characteristics and are subject to greater market fluctuations and risk of lost income and principal than higher-rated debt securities for a variety of reasons. Also, during an economic downturn or substantial period of rising interest rates, highly leveraged issuers may experience financial stress which would adversely affect their ability to service their principal and interest payment obligations, to meet projected business goals and to obtain additional financing.
In addition, periods of economic uncertainty and changes can be expected to result in increased volatility of market prices of lower-rated debt securities and the Fund's net asset value.
In the normal course of business, the Fund trades financial instruments and enters into financial transactions for which risk of potential loss exists due to
51
Credit Suisse Floating Rate High Income Fund
Notes to Financial Statements (continued)
October 31, 2023
Note 2. Significant Accounting Policies (continued)
changes in the market (market risk) or failure of the other party to a transaction to perform (credit risk). Similar to credit risk, the Fund may be exposed to counterparty risk, including with respect to securities lending, or the risk that an institution or other entity with which the Fund has unsettled or open transactions will default. The potential loss could exceed the value of the financial assets recorded in the financial statements. Financial assets, which potentially expose the Fund to credit risk, consist principally of cash due from counterparties and investments. The extent of the Fund's exposure to credit and counterparty risks in respect to these financial assets approximates their carrying value as recorded in the Fund's Statement of Assets and Liabilities.
Note 3. Transactions with Affiliates and Related Parties
Credit Suisse serves as investment adviser and co-administrator for the Fund. For its investment advisory and administration services, Credit Suisse is entitled to receive a fee from the Fund at an annual rate of 0.79% of the Fund's average daily net assets less than or equal to $100 million and 0.59% of the Fund's average daily net assets greater than $100 million. For the year ended October 31, 2023, investment advisory and administration fees earned and fees waived/expenses reimbursed by Credit Suisse were $13,444,968 and $2,434,488, respectively. Effective April 22, 2019, Credit Suisse has contractually agreed to limit expenses so that the Fund's annual operating expenses do not exceed 0.70% of the Fund's average daily net assets for Class I shares, 0.95% of the Fund's average daily net assets for Class A shares and 1.70% of the Fund's average daily net assets for Class C shares. The Fund is authorized to reimburse Credit Suisse for management fees previously waived and/or for expenses previously paid by Credit Suisse, provided, however, that any reimbursement must be paid at a date not more than thirty-six months following the applicable month during which such fees were waived or expenses were paid by Credit Suisse and the reimbursement does not cause the applicable class's aggregate expenses, on an annualized basis, to exceed either (i) the applicable expense limitation in effect at the time such fees were waived or such expenses were paid by Credit Suisse or (ii) the applicable expense limitation in effect at the time of such reimbursement. This contract may not be terminated before February 28, 2025. Prior to April 22, 2019, these expense limitations were voluntary. For the year ended October 31, 2023, there was no recoupment.
52
Credit Suisse Floating Rate High Income Fund
Notes to Financial Statements (continued)
October 31, 2023
Note 3. Transactions with Affiliates and Related Parties (continued)
The amounts waived and reimbursed by Credit Suisse, which are available for potential future recoupment by Credit Suisse, and the expiration schedule at October 31, 2023 are as follows:
| | | Fee waivers/expense
reimbursements
subject to
recoupment | | Expires
October 31,
2024 | | Expires
October 31,
2025 | | Expires
October 31,
2026 | |
Class I | | $ | 6,469,644 | | | $ | 1,570,467 | | | $ | 2,639,316 | | | $ | 2,259,861 | | |
Class A | | | 344,462 | | | | 104,171 | | | | 116,498 | | | | 123,793 | | |
Class C | | | 146,847 | | | | 43,325 | | | | 52,688 | | | | 50,834 | | |
Totals | | $ | 6,960,953 | | | $ | 1,717,963 | | | $ | 2,808,502 | | | $ | 2,434,488 | | |
Credit Suisse Securities (USA) LLC ("CSSU"), an affiliate of Credit Suisse, serves as the distributor of the Fund's shares. Pursuant to a distribution plan adopted by the Fund pursuant to Rule 12b-1 under the 1940 Act, CSSU receives fees for its distribution services. These fees are calculated at an annual rate of 0.25% of the average daily net assets of the Class A shares. For the Class C shares, the fee is calculated at an annual rate of 1.00% of the average daily net assets. For the year ended October 31, 2023, the Fund paid Rule 12b-1 distribution fees of $287,034 for Class A shares and $469,310 for Class C shares. Class I shares are not subject to Rule 12b-1 distribution fees.
For the year ended October 31, 2023, CSSU and its affiliates advised the Fund that they retained $19,864 from commissions earned on the sale of the Fund's Class A shares. There were no commissions earned on the sale of Class C shares.
The Fund from time to time purchases or sells loan investments in the secondary market through Credit Suisse or its affiliates acting in the capacity as broker-dealer. Credit Suisse or its affiliates may have acted in some type of agent capacity to the initial loan offering prior to such loan trading in the secondary market.
Note 4. Line of Credit
The Fund, together with other funds/portfolios advised by Credit Suisse (collectively, the "Participating Funds"), participates in a committed, unsecured line of credit facility ("Credit Facility"), with SSB in an aggregated amount of $250 million for temporary or emergency purposes on a first-come, first-served basis. Of the aggregate $250 million amount, $125 million is specifically designated for the Fund. The remaining $125 million is available to all Participating Funds, including the Fund. Under the terms of the Credit Facility,
53
Credit Suisse Floating Rate High Income Fund
Notes to Financial Statements (continued)
October 31, 2023
Note 4. Line of Credit (continued)
the Participating Funds pay an aggregate commitment fee on the average unused amount of the Credit Facility, which is allocated among the Participating Funds in such manner as is determined by the governing Boards of the Participating Funds. In addition, the Participating Funds pay interest on borrowings at either the Federal Funds Effective rate or the Overnight Bank Funding rate plus a spread. At October 31, 2023 and for the year ended October 31, 2023, the Fund had no borrowings outstanding under the Credit Facility. Additionally, the Fund and another Participating Fund are parties to a joint uncommitted line of credit facility with SSB in an aggregated amount of $200 million. For the year ended October 31, 2023, the line was not drawn upon and no fees were incurred.
Note 5. Purchases and Sales of Securities
For the year ended October 31, 2023, purchases and sales of investment securities (excluding short-term investments) and U.S. Government and Agency Obligations were as follows:
Investment Securities | | U.S. Government/
Agency Obligations | |
| Purchases | | Sales | | Purchases | | Sales | |
| $ | 743,438,625 | | | $ | 1,226,612,343 | | | $ | 0 | | | $ | 0 | | |
Note 6. Capital Share Transactions
The Fund is authorized to issue an unlimited number of full and fractional shares of beneficial interest, $0.001 par value per share. The Fund offers Class I, Class A, and Class C shares. Transactions in capital shares for each class of the Fund were as follows:
| | | Class I | |
| | | For the Year Ended
October 31, 2023 | | For the Year Ended
October 31, 2022 | |
| | | Shares | | Value | | Shares | | Value | |
Shares sold | | | 110,944,148 | | | $ | 696,216,807 | | | | 263,057,167 | | | $ | 1,709,725,854 | | |
Shares issued in reinvestment
of distributions | | | 23,910,029 | | | | 150,149,227 | | | | 17,491,279 | | | | 111,471,824 | | |
Shares redeemed | | | (231,689,918 | ) | | | (1,452,088,296 | ) | | | (313,952,658 | ) | | | (1,998,423,540 | ) | |
Net decrease | | | (96,835,741 | ) | | $ | (605,722,262 | ) | | | (33,404,212 | ) | | $ | (177,225,862 | ) | |
54
Credit Suisse Floating Rate High Income Fund
Notes to Financial Statements (continued)
October 31, 2023
Note 6. Capital Share Transactions (continued)
| | | Class A | |
| | | For the Year Ended
October 31, 2023 | | For the Year Ended
October 31, 2022 | |
| | | Shares | | Value | | Shares | | Value | |
Shares sold | | | 4,954,585 | | | $ | 31,321,019 | | | | 6,354,293 | | | $ | 41,672,297 | | |
Shares issued in reinvestment
of distributions | | | 1,273,924 | | | | 8,044,816 | | | | 725,588 | | | | 4,651,832 | | |
Shares redeemed | | | (6,626,901 | ) | | | (41,761,989 | ) | | | (10,045,508 | ) | | | (65,168,187 | ) | |
Net decrease | | | (398,392 | ) | | $ | (2,396,154 | ) | | | (2,965,627 | ) | | $ | (18,844,058 | ) | |
| | | Class C | |
| | | For the Year Ended
October 31, 2023 | | For the Year Ended
October 31, 2022 | |
| | | Shares | | Value | | Shares | | Value | |
Shares sold | | | 1,500,639 | | | $ | 9,519,502 | | | | 1,840,275 | | | $ | 12,127,409 | | |
Shares issued in reinvestment
of distributions | | | 493,655 | | | | 3,126,692 | | | | 273,702 | | | | 1,756,053 | | |
Shares redeemed | | | (3,298,938 | ) | | | (20,806,254 | ) | | | (2,658,789 | ) | | | (17,197,889 | ) | |
Net decrease | | | (1,304,644 | ) | | $ | (8,160,060 | ) | | | (544,812 | ) | | $ | (3,314,427 | ) | |
On October 31, 2023, the number of shareholders that held 5% or more of the outstanding shares of each class of the Fund was as follows:
| | | Number of
Shareholders | | Approximate Percentage
of Outstanding Shares | |
Class I | | | 8 | | | | 63 | % | |
Class A | | | 5 | | | | 76 | % | |
Class C | | | 6 | | | | 76 | % | |
The Fund's performance may be negatively impacted in the event one or more of the Fund's greater than 5% shareholders were to redeem at a given time. Some of the shareholders are omnibus accounts, which hold shares on behalf of individual shareholders.
Note 7. Income Tax Information and Distributions to Shareholders
Income and capital gain distributions are determined in accordance with federal income tax regulations, which may differ from GAAP.
The tax character of dividends paid by the Fund during the fiscal years ended October 31, 2023 and 2022, respectively, was as follows:
Ordinary Income | | Return of Capital | |
| 2023 | | 2022 | | 2023 | | 2022 | |
$ | 196,349,143 | | | $ | 142,761,077 | | | $ | 672,677 | | | $ | — | | |
55
Credit Suisse Floating Rate High Income Fund
Notes to Financial Statements (continued)
October 31, 2023
Note 7. Income Tax Information and Distributions to Shareholders (continued)
The tax basis components of distributable earnings differ from book basis by temporary book/tax differences. These differences are primarily due to differing treatments of dividends payable, wash sales, premium amortization, and forward contracts marked to market.
At October 31, 2023, the components of distributable earnings on a tax basis were as follows:
Accumulated net realized loss | | $ | (215,230,604 | ) | |
Unrealized depreciation | | | (123,972,782 | ) | |
| | | $ | (339,203,386 | ) | |
At October 31, 2023, the Fund had $32,477,202 of unlimited short-term capital loss carryforwards and $182,753,402 of unlimited long-term capital loss carryforwards available to offset possible future capital gains.
At October 31, 2023, the cost and net unrealized appreciation (depreciation) of investments and derivatives for income tax purposes were as follows:
Cost of Investments | | $ | 2,128,614,659 | | |
Unrealized appreciation | | $ | 16,553,103 | | |
Unrealized depreciation | | | (141,279,109 | ) | |
Net unrealized appreciation (depreciation) | | $ | (124,726,006 | ) | |
To adjust for current period permanent book/tax differences which arose principally from differing book/tax treatment of foreign currency gain (loss), return of capital, defaulted bonds, and premium amortization adjustments, paid-in capital was charged $672,677 and distributable earnings/loss was credited $672,677. Net assets were not affected by this reclassification.
Note 8. Contingencies
In the normal course of business, the Fund may provide general indemnifications pursuant to certain contracts and organizational documents. The Fund's maximum exposure under these arrangements is dependent on future claims that may be made against the Fund and, therefore, cannot be estimated; however, based on experience, the risk of loss from such claims is considered remote.
56
Credit Suisse Floating Rate High Income Fund
Notes to Financial Statements (continued)
October 31, 2023
On June 12, 2023 (the "Closing Date"), Credit Suisse Group AG ("CS Group") merged with and into UBS Group AG, a global financial services company ("UBS Group"), with UBS Group remaining as the surviving company (the "Transaction"), pursuant to a definitive merger agreement signed on March 19, 2023. CS Group was the ultimate parent company of Credit Suisse, the Fund's investment manager. As a result of the Transaction, Credit Suisse is now an indirect wholly-owned subsidiary of UBS Group.
The closing of the Transaction was deemed to result in an assignment of the Fund's investment advisory agreement with Credit Suisse (the "Prior Advisory Agreement"), resulting in its automatic termination as of the Closing Date. Prior to the Closing Date, the Board of the Fund approved a new investment advisory agreement with Credit Suisse (the "New Advisory Agreement"), which was then approved by shareholders at a joint special meeting of shareholders of the Fund and the other Credit Suisse funds held on August 24, 2023 and adjourned to September 26, 2023. In addition, prior to the Closing Date, the Board of the Fund approved an interim investment advisory agreement with Credit Suisse (the "Interim Advisory Agreement"). The Interim Advisory Agreement did not require shareholder approval. The Interim Advisory Agreement took effect upon the Closing Date when the Prior Advisory Agreement was deemed to have terminated, so that Credit Suisse could continue to manage the Fund following the Closing Date. The Interim Advisory Agreement terminated upon the shareholder approval of the corresponding New Advisory Agreement. The Interim Advisory Agreement contained the same terms and conditions as the corresponding Prior Advisory Agreement except for the effective and termination dates, the termination and escrow provisions required by Rule 15a-4 under the 1940 Act and certain non-material changes. During the period that the Interim Advisory Agreement was in effect, Credit Suisse's advisory fees were held in an interest-bearing escrow account, pursuant to Rule 15a-4.
In addition, on June 7, 2023, Credit Suisse and certain of its affiliates filed an application (the "Application") for a waiver from disqualification under Section 9(a) of the 1940 Act from serving as investment adviser to registered investment companies, including the Fund, in connection with a consent order and final judgment (the "Consent Judgment") filed in New Jersey Superior Court on October 24, 2022. The Consent Judgment was entered against certain of Credit Suisse's affiliates, but did not involve the Fund or the services that Credit Suisse and its affiliates provided to the Fund. Because Credit Suisse is an affiliate of the entities subject to the Consent Judgment, it could also be
57
Credit Suisse Floating Rate High Income Fund
Notes to Financial Statements (continued)
October 31, 2023
Note 9. UBS Merger (continued)
subject to disqualification under Section 9(a), despite not being involved in the conduct underlying the Consent Judgment. As requested in the Application, the SEC granted a temporary waiver from Section 9(a) to Credit Suisse and its affiliates, as well as to UBS Group and its affiliates ("UBS"), on June 7, 2023. The temporary waiver became effective on the Closing Date. Credit Suisse and certain of its affiliates also applied for a permanent order, which the SEC granted on July 5, 2023. The permanent order grants (i) a time-limited exemption from Section 9(a) (the "Time-Limited Exemption"), which enables Credit Suisse to provide investment advisory services to the Fund until the 12-month anniversary of the Closing Date (by which point such services are anticipated to be transitioned to one or more UBS asset management affiliates), and (ii) a permanent exemption from Section 9(a) for UBS.
No changes to the investment objective, principal investment strategies and policies, principal risks, fundamental and non-fundamental investment policies, or portfolio managers ("Fund-specific changes") (other than potential personnel changes outside of Credit Suisse's control) of the Fund are currently contemplated as a result of the Transaction or the Time-Limited Exemption. Although no Fund-specific changes are currently contemplated as a result of the Transaction, shareholders should note that Credit Suisse is expected to transition the investment advisory services that its currently provides to the Fund to one or more registered investment advisers affiliated with UBS on or prior to June 12, 2024 (the "UBS Transition"). In connection with, or following the completion of, the UBS Transition, it is possible that there could be Fund-specific changes. In addition, subject to Board approval, one or more Fund service providers may change prior to the expiration of the Time-Limited Exemption in connection with the UBS Transition. However, the exact structure and timing of the UBS Transition and Fund-specific changes (if any) related to the UBS Transition have not yet been finalized. It is expected that any Fund-specific changes related to the UBS Transition will be implemented without shareholder approval except to the extent such approvals are required under the federal securities laws. Shareholders of the Fund will be promptly notified of any material Fund-specific changes.
58
Credit Suisse Floating Rate High Income Fund
Notes to Financial Statements (continued)
October 31, 2023
Note 10. Subsequent Events
On December 13, 2023, the U.S. Securities and Exchange Commission (the "SEC") entered an administrative cease and desist order (the "Order") against Credit Suisse Securities (USA) LLC ("CSSU") and two affiliated Credit Suisse entities (collectively, the Credit Suisse Entities) alleging in the Order that the Credit Suisse Entities were ineligible to provide underwriting and investment advisory services to registered investment companies, including the Fund, during the period from October 24, 2022 to June 7, 2023 in violation of Section 9(a) of the Investment Company Act of 1940 (the "1940 Act") as a result of a consent order and final judgment (the "Consent Judgment") entered against CSSU in New Jersey Superior Court on October 24, 2022 involving the sale of mortgage-backed securities approximately fifteen years ago. The Consent Judgment did not involve registered investment companies or the services that the Credit Suisse Entities provided to registered investments companies or the Fund. Without admitting or denying the findings in the SEC's Order, the Credit Suisse Entities agreed to pay$10,080,220 in disgorgement, prejudgment interest and civil penalties and agree to cease and desist from committing or causing any violations or any future violations of Section 9(a) of the 1940 Act.
On October 24, 2022, as noted above, the Superior Court of New Jersey entered a Consent Judgement that resolved a case alleging that CSSU violated the antifraud provisions of the State of New Jersey securities laws in connection with its role as underwriter of residential mortgage-backed securities. As a result of this Consent Judgement, the SEC, as noted above, alleged that the Credit Suisse Entities were deemed ineligible from serving as principal underwriter or investment adviser to registered investment companies and employees' securities companies pursuant to Section 9(a) of the 1940 Act and that the Credit Suisse Entities continued to serve in these roles until the Commission granted them respective time-limited exemptions on June 7, 2023.
59
Credit Suisse Floating Rate High Income Fund
Report of Independent Registered Public Accounting Firm
To the Board of Trustees of Credit Suisse Opportunity Funds and
Shareholders of Credit Suisse Floating Rate High Income Fund
Opinion on the Financial Statements
We have audited the accompanying statement of assets and liabilities, including the schedule of investments, of Credit Suisse Floating Rate High Income Fund (one of the funds constituting Credit Suisse Opportunity Funds, referred to hereafter as the "Fund") as of October 31, 2023, the related statement of operations for the year ended October 31, 2023, the statement of changes in net assets for each of the two years in the period ended October 31, 2023, including the related notes, and the financial highlights for each of the four years in the period ended October 31, 2023 (collectively referred to as the "financial statements"). In our opinion, the financial statements present fairly, in all material respects, the financial position of the Fund as of October 31, 2023, the results of its operations for the year then ended, the changes in its net assets for each of the two years in the period ended October 31, 2023 and the financial highlights for each of the four years in the period ended October 31, 2023 in conformity with accounting principles generally accepted in the United States of America.
The financial statements of the Fund as of and for the year ended October 31, 2019 and the financial highlights for the year ended October 31, 2019 (not presented herein, other than the financial highlights) were audited by other auditors whose report dated December 20, 2019 expressed an unqualified opinion on those financial statements and financial highlights.
Basis for Opinion
These financial statements are the responsibility of the Fund's management. Our responsibility is to express an opinion on the Fund's financial statements based on our audits. We are a public accounting firm registered with the Public Company Accounting Oversight Board (United States) (PCAOB) and are required to be independent with respect to the Fund in accordance with the U.S. federal securities laws and the applicable rules and regulations of the Securities and Exchange Commission and the PCAOB.
We conducted our audits of these financial statements in accordance with the standards of the PCAOB. Those standards require that we plan and perform the audit to obtain reasonable assurance about whether the financial statements are free of material misstatement, whether due to error or fraud.
Our audits included performing procedures to assess the risks of material misstatement of the financial statements, whether due to error or fraud, and performing procedures that respond to those risks. Such procedures included
60
Credit Suisse Floating Rate High Income Fund
Report of Independent Registered Public Accounting Firm
examining, on a test basis, evidence regarding the amounts and disclosures in the financial statements. Our audits also included evaluating the accounting principles used and significant estimates made by management, as well as evaluating the overall presentation of the financial statements. Our procedures included confirmation of securities owned as of October 31, 2023 by correspondence with the custodian, transfer agent, agent banks and brokers; when replies were not received from agent banks and brokers, we performed other auditing procedures. We believe that our audits provide a reasonable basis for our opinion.
/S/PricewaterhouseCoopers LLP
New York, New York
December 27, 2023
We have served as the auditor of one or more investment companies in Credit Suisse Asset Management, LLC investment companies since 2020.
61
Credit Suisse Floating Rate High Income Fund
Shareholder Meeting Results (unaudited)
A special meeting of shareholders of Credit Suisse Floating Rate High Income Fund (the "Fund") was held at Eleven Madison Avenue, New York, NY 10010 on August 24, 2023 and adjourned to September 26, 2023. The following matter was voted upon by the shareholders of the Fund and the results are presented below.
1. Approval of a new Investment Advisory Agreement:
| | | Shares | | % of Total Shares
Outstanding | | % of Total Shares
Voted | |
For | | | 146,653,502 | | | | 42.92 | % | | | 85.71 | % | |
Against | | | 441,413 | | | | 0.13 | % | | | 0.26 | % | |
Abstain | | | 24,003,328 | | | | 7.02 | % | | | 14.03 | % | |
62
Credit Suisse Floating Rate High Income Fund
Board Approval of Interim and New Investment Management Agreements (unaudited)
The Fund's Board of Trustees (the "Board" and the members thereof, the "Board Members"), including a majority of the Board Members who are not "interested persons" of the Fund (as defined in the Investment Company Act of 1940, as amended (the "1940 Act")) (the "Independent Board Members"), unanimously approved the Fund's interim investment management agreement (the "Interim Management Agreement") and new investment management agreement with Credit Suisse Asset Management, LLC ("Credit Suisse") (the "New Management Agreement") at a meeting of the Board held on May 16, 2023 (the "May 2023 Board Meeting") after concluding that each of the approval of the Interim Management Agreement and New Management Agreement was in the best interests of the Fund and its shareholders. The factors considered by the Board in considering and approving the Interim Management Agreement and New Management Agreement are set out below.
In anticipation of the closing of the merger of Credit Suisse Group AG ("CS Group") with and into UBS Group AG, a global financial services company ("UBS Group"), with UBS Group remaining as the surviving company (the "Merger"), and in response to a request from the Board, representatives of UBS Group and its affiliates (collectively, "UBS") attended the May 2023 Board Meeting and provided information regarding the UBS asset management business and the investment advisory and principal underwriting services currently provided to the UBS family of registered investment companies (the "UBS Presentation").
The Board's evaluation of the Interim Management Agreement and New Management Agreement reflected information provided at the May 2023 Board Meeting as well as, where relevant, information relating to the Fund and Credit Suisse, that was previously furnished to the Board in connection with a special meeting held on November 9, 2022, where the Board discussed the information and materials relating to the renewal of the Fund's prior investment management agreement with Credit Suisse (the "Prior Management Agreement"), and at an in person meeting held on November 14-15, 2022 (the "November 2022 15(c) Meeting"), where the Board approved the renewal of the Prior Management Agreement (collectively, the "November 2022 15(c) Materials"), and information provided to the Board at other Board meetings throughout the year. The Board considered Credit Suisse's representations at the May 2023 Board Meeting that (i) no material changes to the information provided in the November 2022 15(c) Materials had occurred since the November 2022 15(c) Meeting, (ii) with respect to the Interim Management Agreement, the scope and quality of services under the Interim Management Agreement will be at least equivalent to the scope and quality of services provided under the Prior Management Agreement, and (iii) the
63
Credit Suisse Floating Rate High Income Fund
Board Approval of Interim and New Investment Management Agreements (unaudited) (continued)
personnel, resources and services provided to the Fund are not expected to change under the Interim Management Agreement and New Management Agreement and will be similar to those services provided under the Prior Management Agreement. The Board also considered that the Interim Management Agreement will be substantially similar to the Prior Management Agreement, including with respect to compensation, except for certain terms including the term, termination and escrow provisions required by Rule 15a-4 under the 1940 Act and certain non-material changes.
The Board, including all of the Independent Board Members, were assisted by experienced independent legal counsel throughout the Interim Management Agreement and New Management Agreement review process. The Independent Board Members discussed the proposed approval in private session with such counsel at which no representatives of management or Credit Suisse were present. Each Board Member, including each of the Independent Board Members, relied upon the advice of independent legal counsel and his or her own business judgment in determining the material factors to be considered in evaluating the Interim Management Agreement and New Management Agreement and the weight to be given to each such factor. The conclusions reached by the Board Members were based on a comprehensive evaluation of all of the information provided and were not the result of any one factor. Moreover, each Board Member may have afforded different weight to the various factors in reaching his or her conclusions with respect to the Interim Management Agreement and New Management Agreement.
On June 7, 2023, Credit Suisse and certain its affiliates filed an application with the Securities and Exchange Commission pursuant to Section 9(c) of the 1940 Act for temporary and permanent orders granting an exemption to Credit Suisse and its affiliates, as well as to UBS, from the prohibitions under Section 9(a) of the 1940 Act, in connection with a consent order and final judgment ("Consent Judgment") filed in New Jersey Superior Court on October 24, 2022, which was entered against certain of Credit Suisse's affiliates. Section 9(a) of the 1940 Act automatically prohibits entities that are, or whose affiliates are, subject to, among other things, certain court ordered "injunctions," from serving or acting as investment adviser of any investment company registered under the 1940 Act or a principal underwriter for any registered open-end investment company under the 1940 Act, or serving in various other capacities in respect of registered investment companies.
While the application for the Section 9(c) exemption was submitted and the temporary order (the "Temporary Order") granting a temporary exemption from Section 9(a) of the 1940 Act was granted to Credit Suisse and its affiliates,
64
Credit Suisse Floating Rate High Income Fund
Board Approval of Interim and New Investment Management Agreements (unaudited) (continued)
as well as to UBS, after the Board approved the Interim Management Agreement and New Management Agreement at the May 2023 Board Meeting, since shortly after the entry of the Consent Judgment in October 2022, the Board has been apprised of the Consent Judgment and the potential consequences thereof under Section 9(a) of the 1940 Act and have been provided with regular updates. In addition, the Board was apprised of the filing of the Section 9(c) exemption application and the implications of the Time-Limited Exemption (as defined below) prior to approving the submission of the New Management Agreement to shareholders at a meeting of the Board held on June 15, 2023.
The "Time-Limited Exemption" refers to the time-limited exemption from Section 9(a) of the 1940 Act for 12 months from the closing date of the Merger sought by Credit Suisse and certain of its affiliates to provide Credit Suisse and Credit Suisse Securities (USA) LLC ("CSSU") with adequate time to complete the CS Fund Servicing Reorganization (as defined below) while engaged in serving as investment adviser to the Fund and as underwriter to the Fund, respectively (collectively, "Fund Servicing Activities"). The "CS Fund Servicing Reorganization" refers to the process of (i) transitioning the Fund Servicing Activities that Credit Suisse and CSSU perform on behalf of one or more of the funds to other providers of such services, and/or (ii) restructuring the Temporary Order applicants' businesses such that Credit Suisse, and/or each other company that was an "affiliated person" of the settling entities in the Consent Judgement as of the date of the Section 9(c) application may provide Fund Servicing Activities without being subject to disqualification under Section 9(a) of the 1940 Act. Credit Suisse and certain of its affiliates also applied for a permanent order, which the SEC granted on July 5, 2023.
Investment Management Fee Rates and Expenses
The Board reviewed and considered the contractual advisory fees of the Fund under its Prior Management Agreement and its Interim Management Agreement and New Management Agreement (which fees are identical), in light of the extent and quality of the management services provided by Credit Suisse, as investment adviser.
The Board also considered that Credit Suisse and the Fund have entered into a contractual expense limitation agreement limiting the Fund's total net expenses and that this arrangement was expected to continue under the Interim Management Agreement and New Management Agreement. The Board noted that the Fund is authorized to reimburse Credit Suisse for management fees previously limited and/or for expenses previously reimbursed by Credit
65
Credit Suisse Floating Rate High Income Fund
Board Approval of Interim and New Investment Management Agreements (unaudited) (continued)
Suisse, provided, however, that any reimbursements must be paid at a date not more than thirty-six months following the applicable month during which such fees were limited or expenses were reimbursed by Credit Suisse and the reimbursements do not cause the Fund to exceed the applicable expense limitation at the time the fees are recouped. The Board also noted that the expense limitation agreement may not be terminated before February 28, 2024.
The November 2022 15(c) Materials included information comparing the Fund's contractual advisory fee, the Fund's contractual advisory fee less any waivers and/or reimbursements ("actual advisory fee"), and the Fund's overall expenses with those of funds in both the relevant expense group ("Expense Group") and universe of funds ("Expense Universe") provided by Broadridge, an independent provider of investment company data. The November 2023 15(c) Materials included a description of the methodology used to arrive at the funds included in the Expense Group and the Expense Universe. Each fund in the relevant Expense Group and Expense Universe was placed in one of five quintiles for each relevant comparison period, with the first quintile including the funds with the lowest relative expenses and the fifth quintile including funds with the highest relative expenses during the period. The Fund's Board noted that, with respect to the Fund's fees and expenses compared to its peers as presented in a report provided by Broadridge, the Fund's contractual advisory fees ranked in the fourth quintile relative to its Expense Group, the Fund's actual advisory fees and total expenses ranked in the second quintile relative to its Expense Group and Expense Universe.
Nature, Extent and Quality of the Services
The Board received and considered information regarding the nature, extent and quality of services provided to the Fund by Credit Suisse. The Board also noted information received at regular meetings throughout the year related to the services rendered by Credit Suisse which, in addition to portfolio management and investment management services, included credit analysis and research, supervising the day-to-day operations of the Fund's non-advisory functions which include accounting, administration, custody, transfer agent and other applicable third party service providers, overseeing and facilitating audits, overseeing the Fund's credit facility and supervising and/or preparing applicable Fund filings, disclosures and shareholder reports. The Board noted that the extensive investment management services provided by Credit Suisse included broad supervisory responsibility and oversight over other service providers to the Fund. The Board also considered Credit Suisse's compliance program with respect to the Fund. The Board noted that Credit
66
Credit Suisse Floating Rate High Income Fund
Board Approval of Interim and New Investment Management Agreements (unaudited) (continued)
Suisse reports to the Board about portfolio management and compliance matters on a periodic basis. The Board also reviewed background information about Credit Suisse including its Form ADV Part 2 — Disclosure Brochure and, with respect to Credit Suisse, Brochure Supplement and considered the background and experience of Credit Suisse's senior management and the expertise of, and the amount of attention given to the Fund by, senior personnel of Credit Suisse. In addition, the Board reviewed the qualifications, backgrounds and responsibilities of the portfolio management team primarily responsible for the day-to-day portfolio management of the Fund and the extent of the resources devoted to research and analysis of actual and potential investments, as well as the resources provided to them. The Board evaluated the ability of Credit Suisse based on its resources, reputation and other attributes, to attract and retain qualified investment professionals including research, advisory, and supervisory personnel. The Board also received and considered information about the nature, extent and quality of services and fee rates offered to other Credit Suisse clients for comparable services. The Board acknowledged Credit Suisse's representation that the services provided to the Fund are more extensive than the services provided in connection with other types of accounts, such as separate accounts, offered by Credit Suisse and the services are also more extensive from those offered and provided to a sub-advised fund. The Board also considered that the services provided by Credit Suisse have expanded over time as a result of regulatory and other developments.
Fund Performance
The Board considered information provided in the November 2022 15(c) Materials and at each subsequent quarterly meeting to consider the performance of the Fund. That information in the November 2022 15(c) Materials included performance results of the Fund over the previous year ended August 31, 2022 as well as over the two-, three-, four-, five-, and ten-year periods, as applicable, ended August 31, 2022 along with comparisons both to the relevant performance group ("Performance Group") and universe of funds ("Performance Universe") for the Fund for the same time periods provided by Broadridge. The November 2022 15(c) materials included a description of the methodology used to arrive at the funds included in the Performance Group and the Performance Universe. Each fund in the relevant Performance Universe was placed in one of five quintiles for each relevant comparison period, with the first quintile including the best performing funds and the fifth quintile including the worst performing funds during the period. The Fund's Board noted that, with respect to the Fund's performance compared
67
Credit Suisse Floating Rate High Income Fund
Board Approval of Interim and New Investment Management Agreements (unaudited) (continued)
to its peers as presented in a report provided by Broadridge, along with other information provided by Credit Suisse, the Fund's performance ranked in the first quintile relative to its Performance Universe for the one-, two-, three-, four-, five- and ten-year periods reported.
The Board also considered the investment performance of the Fund relative to its stated objectives.
The Board noted that at the May 2023 Board Meeting, the Board received information from Credit Suisse regarding the Fund's performance relative to its benchmark for each month of 2023 and each quarter from the quarter ended June 30, 2020 through the quarter ended March 31, 2023, in addition to relative to its select peers for the three-month and one-, three- and five-year and since inception periods ended March 31, 2023.
Credit Suisse Profitability
The Board referred to a profitability analysis of Credit Suisse provided in the November 2022 15(c) Materials based on the fees payable under the Prior Management Agreement and the Interim Management Agreement and the New Management Agreement for the Fund, including any fee waivers, as well as other relationships between the Fund on the one hand and Credit Suisse affiliates on the other. The Board's deliberations also reflected, in the context of Credit Suisse's profitability, Credit Suisse's methodology for allocating costs to the Fund, recognizing that cost allocation methodologies are inherently subjective. The Board had also received net profitability information for the Fund. The Board reviewed Credit Suisse's profit margin as reflected in the profitability analysis, as well as reviewing profitability in light of appropriate court cases and the services rendered to the Fund.
Economies of Scale
The Board considered information provided in the November 2022 15(c) Materials regarding whether there have been economies of scale with respect to the management of the Fund, whether the Fund has appropriately benefited from any economies of scale, and whether there is potential for realization of any further economies of scale for the Fund. The Board noted that the Fund's contractual advisory fee had breakpoints that would allow investors to benefit directly in the form of lower fees as Fund assets grow and also noted the contractual expense limitation currently in place between the Fund and Credit Suisse. The Board received information regarding Credit
68
Credit Suisse Floating Rate High Income Fund
Board Approval of Interim and New Investment Management Agreements (unaudited) (continued)
Suisse's profitability in connection with providing investment management services to the Fund, including Credit Suisse's costs in providing the services.
Other Benefits to Credit Suisse
The Board considered other benefits received by Credit Suisse and its affiliates as a result of their relationship with the Fund previously included in the November 2022 15(c) Materials. Such benefits included, among others, benefits potentially derived from an increase in Credit Suisse's businesses and its reputation as a result of its relationship with the Fund (such as the ability to market its advisory services to other clients and investors including separate account or third party sub-advised mandates or other financial products offered by Credit Suisse and its affiliates), as well as, with respect to the Fund, the fees paid to an affiliate of Credit Suisse for distribution services.
The Board considered the standards Credit Suisse applied in seeking best execution and Credit Suisse's policies and practices regarding soft dollars and reviewed Credit Suisse's method for allocating portfolio investment opportunities among its advisory clients, as provided in the November 2022 15(c) Materials.
Other Factors and Broader Review
As discussed above, the Board previously reviewed and referred to detailed materials received from Credit Suisse as part of this special approval process. The Board also reviews and assesses the quality of the services that the Fund receives throughout the year and reviews reports of Credit Suisse at least quarterly, which include, among other things, detailed portfolio and market reviews, detailed fund performance reports, and Credit Suisse's compliance procedures.
The Board also considered the information provided by the representatives of UBS during the UBS Presentation at the May 2023 Board Meeting. In particular, the Board considered the information regarding the investment advisory and principal underwriting services currently provided to the UBS family of registered investment companies.
In addition, the Board considered representations from Credit Suisse and UBS that there were no plans to make any changes to the investment objective(s), principal investment strategies and policies, principal risks, fundamental and non-fundamental investment policies or portfolio managers (other than potential personnel changes outside of Credit Suisse's control) of the Fund upon the closing of the Merger.
69
Credit Suisse Floating Rate High Income Fund
Board Approval of Interim and New Investment Management Agreements (unaudited) (continued)
Conclusions
After consideration of the foregoing, the Board reached the following conclusions regarding the Interim Management Agreement and the New Management Agreement (in addition to the conclusions set forth above):
• The contractual and net advisory fees for the Fund were reasonable in relation to the services provided by Credit Suisse.
• The Board was satisfied by the nature, extent and quality of the investment advisory services provided to the Fund by Credit Suisse and that, based on dialogue with management and counsel, the services to be provided by Credit Suisse under the Interim Management Agreement and the New Management Agreement are typical of, and consistent with, those provided to similar mutual funds by other investment advisers.
• In light of the costs of providing investment management and other services to the Fund and Credit Suisse's ongoing commitment to the Fund and willingness to waive fees (by agreeing to a contractual expense limitation), Credit Suisse's net profitability based on fees payable under the Interim Management Agreement and New Management Agreement, as well as other ancillary benefits that Credit Suisse and its affiliates received, were considered reasonable.
• In light of the information received and considered by the Board, the Fund's current fee structure was considered reasonable.
No single factor reviewed by the Board was identified by the Board as the principal factor in determining whether to approve the Interim Management Agreement and New Management Agreement. The Independent Board Members were advised by separate independent legal counsel throughout the process. After consideration of these factors, the Fund's Board concluded that the approval of the Interim Management Agreement and New Management Agreement was in the best interests of the Fund and the Fund's shareholders.
70
Credit Suisse Floating Rate High Income Fund
Information Concerning Trustees and Officers (unaudited)
Name, Address
(Year of Birth) | | Position(s)
Held with
Fund | | Term
of Office1
and
Length
of Time
Served | | Principal
Occupation(s) During
Past Five Years | | Number of
Portfolios
in Fund
Complex
Overseen
by Trustee | | Other
Trusteeships
Held by Trustee
During Past Five Years | |
Independent Trustees | | | | | | | | | | | |
Laura A. DeFelice
c/o Credit Suisse Asset
Management, LLC
Attn: General Counsel
Eleven Madison Avenue
New York, New York
10010
(1959) | | Chair of the Board (as of November 14, 2023). Trustee, Nominating and Audit Committee Member | | Since 2017 | | Managing Member of Acacia Properties LLC (multi-family and commercial real estate ownership and operation) from 2008 to present; Stonegate Advisors LLC (renewable energy and energy efficiency) from 2007 to present. | | | 9 | | | Director of the Lyric Opera of Chicago (performing arts) from December 2021 to present. | |
Samantha Kappagoda
c/o Credit Suisse Asset
Management, LLC
Attn: General Counsel
Eleven Madison Avenue
New York
New York 10010
(1968) | | Trustee, Nominating Committee Chair and Audit Committee Member | | Since 2023 | | Chief Economist, Risk Economics, Inc. (Economic Analysis) from 2009 to present; Co-Managing Member, Numerati Partners LLC (Research & Development Technology) from 2012 to present. | | | 9 | | | Director of Girl Scouts of Greater New York (non-profit) from 2014 to present; Visiting Scholar, Courant Institute of Mathematical Sciences, New York University (education) from 2011 to present; Director of Council for Economic Education (nonprofit) from 2014 to 2020; Director of Glynwood Center, Inc. (nonprofit) from 2010 to 2019. | |
1 Subject to the Trust's retirement policy, each Trustee may continue to serve as a Trustee until the last day of the calendar year in which the applicable Trustee attains age 75. The Board may determine to extend the terms of Trustees beyond age 75 on a case-by-case basis. Each officer serves until his or her respective successor has been duly elected and qualified.
71
Credit Suisse Floating Rate High Income Fund
Information Concerning Trustees and Officers (unaudited) (continued)
Name, Address
(Year of Birth) | | Position(s)
Held with
Fund | | Term
of Office1
and
Length
of Time
Served | | Principal
Occupation(s) During
Past Five Years | | Number of
Portfolios
in Fund
Complex
Overseen
by Trustee | | Other
Trusteeships
Held by Trustee
During Past Five Years | |
Independent Trustees | | | | | | | | | | | |
Mahendra R. Gupta
c/o Credit Suisse Asset
Management, LLC
Attn: General Counsel
Eleven Madison Avenue
New York, New York
10010
(1956) | | Trustee, Nominating Committee Member and Audit Committee Chairman | | Since 2017 | | Professor, Washington University in St. Louis from July 1990 to present; Partner, R.J. Mithaiwala (food manufacturing and retail, India) from March 1977 to present; Partner, F.F.B. Corporation (agriculture, India) from March 1977 to present; Partner, RPMG Research Corporation (benchmark research) from July 2001 to present. | | | 9 | | | Director of Caleres Inc. (footwear) from May 2012 to present; Chair of the finance committee at the Foundation of Barnes Jewish Hospital (healthcare) from January 2021 to present; Director of First Bank (finance) from February 2022 to present; Director of The Oasis Institute (not-for-profit) from February 2022 to present; Director of the Consortium for Graduate Study in Management from November 2017 to present; Director of Koch Development Corporation (Real Estate Developement) from November 2017 to December 2020; Director of Supernova (Fin-tech) from June 2014 to September 2018; Director of the Guardian Angels of St. Louis (not-for-profit) from July 2015 to December 2021. | |
1 Subject to the Trust's retirement policy, each Trustee may continue to serve as a Trustee until the last day of the calendar year in which the applicable Trustee attains age 75. The Board may determine to extend the terms of Trustees beyond age 75 on a case-by-case basis. Each officer serves until his or her respective successor has been duly elected and qualified.
72
Credit Suisse Floating Rate High Income Fund
Information Concerning Trustees and Officers (unaudited) (continued)
Name, Address
(Year of Birth) | | Position(s)
Held with
Fund | | Term
of Office1
and
Length
of Time
Served | | Principal
Occupation(s) During
Past Five Years | | Number of
Portfolios
in Fund
Complex
Overseen
by Trustee | | Other
Trusteeships
Held by Trustee
During Past Five Years | |
Independent Trustees | | | | | | | | | | | |
Steven N. Rappaport
c/o Credit Suisse Asset
Management, LLC
Attn: General Counsel
Eleven Madison Avenue
New York, New York
10010
(1948) | | Chairman of the Board (through November 14, 2023). Trustee, Nominating and Audit Committee Member | | Trustee since 2001 and Chairman since 2005 | | Partner of Lehigh Court, LLC and RZ Capital (private investment firms) from July 2002 to present; Partner of Backstage Acquisition Holdings, LLC (publication job postings) from November 2013 to 2018. | | | 9 | | | Director of abrdn Emerging Markets Equity Income Fund, Inc., (a closed-end investment company); Director of abrdn Funds (20 open-end portfolios); Director of iCAD, Inc. (surgical & medical instruments & apparatus company) from 2006 to 2018. | |
Interested Trustee | | | | | | | | | | | |
John G. Popp2
Credit Suisse Asset
Management, LLC
Eleven Madison Avenue
New York, New York
10010
(1956) | | Trustee, Chief Executive Officer and President | | Trustee since 2017
Chief Executive Officer and President since 2010 | | Managing Director of Credit Suisse; Global Head and Chief Investment Officer of the Credit Investments Group; Associated with Credit Suisse or its predecessor since 1997; President and Chief Executive Officer of other Credit Suisse Funds. | | | 9 | | | None. | |
1 Subject to the Trust's retirement policy, each Trustee may continue to serve as a Trustee until the last day of the calendar year in which the applicable Trustee attains age 75. The Board may determine to extend the terms of Trustees beyond age 75 on a case-by-case basis. Each officer serves until his or her respective successor has been duly elected and qualified.
2 Mr. Popp is an "interested person" of the Trust, as defined in the 1940 Act, by virtue of his current position as an officer of Credit Suisse.
73
Credit Suisse Floating Rate High Income Fund
Information Concerning Trustees and Officers (unaudited) (continued)
Name, Address
(Year of Birth) | | Position(s)
Held with
Fund | | Term of
Office
and
Length of
Time
Served | | Principal Occupation(s) During Past Five Years | |
Officers* | | | | | | | |
Brandi Sinkovich
Credit Suisse Asset
Management, LLC
Eleven Madison Avenue
New York, New York 10010
(1979) | | Chief Compliance Officer | | Since 2023 | | Director of Credit Suisse since 2023; Vice President and Regulatory Counsel, Exos Financial from 2022 to 2023; Vice President and Compliance Officer, Neuberger Berman from 2019 to 2022; Vice President, Compliance, Goldman Sachs from 2017 to 2019; Associated with Credit Suisse since 2023; Officer of other Credit Suisse Funds. | |
Lou Anne McInnis
Credit Suisse Asset
Management, LLC
Eleven Madison Avenue
New York, New York 10010
(1959) | | Chief Legal Officer | | Since 2015 | | Director of Credit Suisse; Associated with Credit Suisse since April 2015; Counsel at DLA Piper US LLP from 2011 to April 2015; Associated with Morgan Stanley Investment Management from 1997 to 2010; Officer of other Credit Suisse Funds. | |
Omar Tariq
Credit Suisse Asset
Management, LLC
Eleven Madison Avenue
New York, New York 10010
(1983) | | Chief Financial Officer and Treasurer | | Since 2019 | | Director of Credit Suisse since March 2019; Senior Manager of PriceWaterhouseCoopers, LLP from September 2010 to March 2019; Officer of other Credit Suisse Funds. | |
Karen Regan
Credit Suisse Asset
Management, LLC
Eleven Madison Avenue
New York, New York 10010
(1963) | | Vice President and Secretary | | Since 2010 | | Vice President of Credit Suisse; Associated with Credit Suisse since December 2004; Officer of other Credit Suisse Funds. | |
* The officers of the Fund shown are officers that make policy decisions.
The Statement of Additional Information includes additional information about the Trustees and is available, without charge, upon request, by calling 877-870-2874.
74
Credit Suisse Floating Rate High Income Fund
Proxy Voting and Portfolio Holdings Information (unaudited)
Information regarding how the Fund voted proxies related to its portfolio securities during the 12-month period ended June 30 of each year, as well as the policies and procedures that the Fund uses to determine how to vote proxies relating to its portfolio securities are available:
• By calling 1-877-870-2874
• On the Fund's website, www.credit-suisse.com/us/funds
• On the website of the Securities and Exchange Commission, www.sec.gov
The Fund files a complete schedule of its portfolio holdings for the first and third quarters of its fiscal year with the SEC as an exhibit to its reports on Form N-PORT, and for reporting periods ended prior to March 31, 2019, filed such information on Form N-Q. The Fund's Forms N-PORT and N-Q are available on the SEC's website at www.sec.gov.
75

P.O. BOX 219916, KANSAS CITY, MO 64121-9916
877-870-2874 ◼ www.credit-suisse.com/us
CREDIT SUISSE SECURITIES (USA) LLC, DISTRIBUTOR. FLHI-AR-1023

CREDIT SUISSE FUNDS
Annual Report
October 31, 2023
◼ CREDIT SUISSE
MANAGED FUTURES STRATEGY FUND
The Fund's investment objectives, risks, charges and expenses (which should be considered carefully before investing), and more complete information about the Fund, are provided in the Prospectus, which should be read carefully before investing. You may obtain additional copies by calling 877-870-2874 or by visiting our website at www.credit-suisse.com/us/funds.
Credit Suisse Securities (USA) LLC, Distributor, is located at Eleven Madison Avenue, New York, NY 10010. Credit Suisse Funds are advised by Credit Suisse Asset Management, LLC.
Investors in the Credit Suisse Funds should be aware that they may be eligible to purchase Class I shares (where offered) directly or through certain intermediaries. Such shares are not subject to a sales charge. Investors in the Credit Suisse Funds should also be aware that they may be eligible for a reduction or waiver of the sales charge with respect to Class A or C shares (where offered). For more information, please review the relevant prospectuses or consult your financial representative.
Fund shares are not deposits or other obligations of Credit Suisse Asset Management, LLC ("Credit Suisse") or any affiliate, are not FDIC-insured and are not guaranteed by Credit Suisse or any affiliate. Fund investments are subject to investment risks, including loss of your investment.
Credit Suisse Managed Futures Strategy Fund
Annual Investment Adviser's Report
October 31, 2023 (unaudited)
October 31, 2023
Dear Shareholder:
We are pleased to present this Annual Report covering the activities of the Credit Suisse Managed Futures Strategy Fund (the "Fund") for the twelve-month period ended October 31, 2023.
Performance Summary
11/01/2022 – 10/31/2023
Fund & Benchmark | | Performance | |
| Class I1 | | | -7.92 | % | |
| Class A1,2 | | | -8.15 | % | |
| Class C1,2 | | | -8.80 | % | |
| Credit Suisse Managed Futures Liquid Index3 | | | -7.72 | % | |
Performance shown for the Fund's Class A and Class C Shares does not reflect sales charges, which are a maximum of 5.25% and 1.00%, respectively.2
Market Review: Soaring interest rates and late cycle turbulence.
The twelve-month period ended October 31, 2023 (the "Period") saw the pressure of restrictive monetary policy and mounting fiscal concerns push US government bond yields higher, magnifying interest rate differentials across developed markets, and buffeting currencies such as the Japanese Yen. With developed market economies showing signs of late cycle fatigue and China remaining in the doldrums, investors were on edge and the price action across a range of asset classes was choppy. The Credit Suisse Managed Futures Liquid Index (the "Index") returned -7.72% for the Period.
In the closing months of 2022, markets stood at a crossroads. Indications of continued labor market strength focused attention on upside inflation risks, even as flagging economic data pointed to a potential monetary policy pivot which central bankers refused to publicly entertain as China's reopening loomed large. Interest rate markets vacillated, and commodity sectors exhibited increasing decorrelation. The US Dollar weakened against major peers. Equity markets strengthened as the prospect of China's economy regaining steam coincided with moderating inflation fears and supportive technical dynamics around year-end, even as the bankruptcy filing of troubled crypto exchange FTX momentarily weighed on sentiment.
In Q1 2023, markets focused on the balance between slowing growth in the US and Europe and resurgent post-reopening activity in China. Later, a widening banking crisis with clear linkages to the US Treasury market consumed market
1
Credit Suisse Managed Futures Strategy Fund
Annual Investment Adviser's Report (continued)
October 31, 2023 (unaudited)
attention, and investors contemplated implications for near-term growth and monetary policy. Yet, with economic data offering insufficient evidence of disinflation, policymakers felt little choice but to continue down the path of hiking. The period culminated with Silicon Valley Bank collapsing into receivership and UBS agreeing to buy Credit Suisse. Fixed income markets remained rangebound and choppy as investors reacted to shifting economic data and the anticipation of leadership changes at the Bank of Japan. Economically sensitive commodities softened as safe havens appreciated. The US Dollar weakened against European peers but lacked trading direction against other major currencies, and equity markets exhibited resilience in the face of a spate of headwinds.
Investors turned their attention to better-than-expected corporate earnings reports and the economic impact of advances in generative AI as markets moved into Q2 2023. The unfolding US debt ceiling crisis took center stage in May, calling into question the creditworthiness of the US government even as Joe Biden and then-House speaker Kevin McCarthy reached a deal to increase the debt-ceiling and cap federal spending on May 27th. Fixed income markets outside of Japan showed sensitivity to the risk of inflation expectations becoming de-anchored, but incoming Bank of Japan Governor Kazuo Ueda shocked markets in expressing reluctance to tweak the country's ultra-accommodative monetary policy. Commodities reversed sharply toward the end of the period as a weaker US Dollar coincided with pro-growth policy pronouncements from China, supply discipline on the part of OPEC+, and extreme weather across the Midwest and Great Plains. Currency trading became more disjointed over the period and equities continued their upward path.
Q3 2023 brought a chorus of guidance from developed market central bankers suggesting that policy interest rates would likely remain higher for longer. Investors absorbed Fitch's downgrade of US government debt to AA+ and the Financial Times' report of a notable uptick in banks' loan-loss rates by sending interest rates higher and reintroducing positive term premia in the US yield curve. Commodity markets diverged with Agriculture whipsawing, Industrial Metals and Precious Metals declining, and Energy moving higher as Saudi Arabia cut production and US stockpiles declined. The US Dollar attracted support on account of high US interest rates, relatively resilient economic growth, and haven status, particularly as disappointing European and Chinese growth soured sentiment later in the Period. As the quarter wound down, equity markets began to capitulate.
At the end of the Period, confidence disappeared. Signs that the Bank of Japan was taking steps toward monetary policy normalization underscored the
2
Credit Suisse Managed Futures Strategy Fund
Annual Investment Adviser's Report (continued)
October 31, 2023 (unaudited)
seemingly indefatigable rise in developed market interest rates. Commodities moved broadly sideways except for Precious Metals which spiked with the emergence of the Israel-Hamas war and mounting concern surrounding US government dysfunction and fiscal profligacy. Relative economic resilience continued to support the US Dollar while equity markets swooned.
Strategic Review and Outlook: Markets in transition
The Fund seeks to give investors industry representative and cost-efficient access to managed futures by aiming to capture the most significant trends across major asset classes — fixed income, commodities, currencies, and equities.
For the Period the Fund generated a loss — in line with the Fund's Index.
The Fund's exposure to fixed income instruments detracted. The Fund maintained fluid, and setting aside Japanese Government Bond positioning, short-biased exposure to the asset class, which proved susceptible to episodes of mounting systemic risk and frequent market reversals punctuating the period. Japanese Government Bond trading was particularly challenging. The Japanese Government Bond market exhibited notable volatility during the period as investors struggled to reconcile the implications of Kazuo Ueda's appointment to govern the Bank of Japan with the country's ultra-accommodative monetary policy and weak currency. US Treasury positioning generated a modest gain for period, but other exposures detracted. The Fund finished the annual period net short.
Commodity exposures also detracted from Fund performance during the period. Numerous events impacted the complex: rising interest rates and a strong US Dollar, dysfunction in Washington DC, disconsolate Chinese growth, fluctuating energy inventories, episodes of extreme weather, the outbreak of the Israel-Hamas war, and ongoing Russo-Ukrainian jockeying. The Fund generally maintained light, mercurial exposure to the asset class. Energy exposure, which moved from short-biased to long-biased, produced a gain, but the Fund's positioning elsewhere detracted. The Fund sustained losses in Agriculture, which saw large price moves but frequent reversals, and a more muted loss in Industrial Metals. Precious Metals showed sensitivity to periods of systemic risk and military conflict, as well as to shifting interest rates and numeraire effects, and detracted over the annual period. The Fund held mixed positioning at the end of October.
Currencies detracted during the Period. The Fund began the period with across-the-board short currency (long US Dollar) positioning, but the greenback's upward momentum stalled abruptly as interest rate differentials across the
3
Credit Suisse Managed Futures Strategy Fund
Annual Investment Adviser's Report (continued)
October 31, 2023 (unaudited)
Atlantic began to narrow, China's reopening propelled Asia-Pacific currencies higher, and expectations of policy recalibration at the Bank of Japan mounted. European currencies strengthened in the first half of the period on the back of persistently high European inflation. Other currencies lost direction as investors confronted a series of systemic shocks, China's post-reopening growth disappointed, and the Bank of Japan signaled a reluctance in committing to normalize monetary policy. In the second half of the period, trend reversals proved challenging for the Fund as investors reacted to the tug of war between inflation data and late cycle growth data in discounting monetary policy and, by extension, the relative appeal of major currencies. Short Japanese Yen positioning contributed to Fund performance, partially offsetting losses elsewhere in the asset class. The Fund held across-the-board short (long US Dollar) currency exposure at the end of the annual period.
The Fund's equity exposures detracted, as well. During the closing months of 2022, the Fund's positioning in the asset class turned constructive as markets rallied into year-end on the back of China's reopening and seasonal flow dynamics. Both US and Asian markets lost their footing in the first quarter and Fund positioning in those markets incurred losses. The former reacted to the intensification of the banking crisis and the latter to moderating growth expectations. Encouraged by first quarter corporate earnings which beating analyst expectations, both on revenues and earnings, investors momentarily set aside debt ceiling and hard landing fears in the second quarter, and markets moved higher to the benefit of the Fund. With UK inflation receding, the Bank of England left its policy rate unchanged at its September meeting and the FTSE 100 rebounded sharply off its 2023 lows, inflicting losses on the Fund's short position. The accumulating weight of rising interest rates and fiscal concerns caused cracks to emerge in the goldilocks soft landing scenario by mid-September, and markets collapsed, driving a combination of gains and losses on the Fund's mixed positioning. For the period, gains on Euro STOXX 50 and Nikkei 225 exposures proved insufficient to overcome losses elsewhere, and the Fund ended the annual period net short Equities.
The Quantitative Investment Strategies Group
Yung-Shin Kung
The Fund is non-diversified, which means it may invest a greater proportion of its assets in the securities of a smaller number of issuers than a diversified mutual fund and may therefore be subject to greater volatility. The Fund's investment in alternative
4
Credit Suisse Managed Futures Strategy Fund
Annual Investment Adviser's Report (continued)
October 31, 2023 (unaudited)
instruments may subject the Fund to greater volatility than investments in traditional securities, particularly in investments involving leverage.
The use of alternative assets and strategies entails substantial risks, including risk of loss of principal, arbitrage or fundamental risk, below investment grade securities risk, commodity exposure risks, counterparty risk, credit risk, currency risk, derivatives risk, equity exposure risk, fixed income risk, foreign securities risk, forwards risk, futures contracts risk, interest rate risk, leveraging risk, manager/model risk market risk, non-diversified status, options risk, portfolio turnover risk, repurchase agreements risk, short position risk, speculative exposure risk, subsidiary risk, swap agreements risk, and tax risk, and U.S. Government securities exposure risk. For a detailed discussion of these and other risks, please refer to the Fund's Prospectus, which should be read carefully before investing.
In addition to historical information, this report contains forward-looking statements, which may concern, among other things, domestic and foreign markets, industry and economic trends and developments, and government regulation, and their potential impact on the Fund's investments. These statements are subject to risks and uncertainties and actual trends, developments and regulations in the future, and their impact on the Fund could be materially different from those projected, anticipated, or implied. The Fund has no obligation to update or revise forward-looking statements.
The views of the Fund's management are as of the date of this letter and the Fund holdings described in this document are as of October 31, 2023; these views and Fund holdings may have changed subsequent to these dates. Nothing in this document is a recommendation to purchase or sell securities.
5
Credit Suisse Managed Futures Strategy Fund
Annual Investment Adviser's Report (continued)
October 31, 2023 (unaudited)
Comparison of Change in Value of $10,000 Investment in the
Credit Suisse Managed Futures Strategy Fund1 Class I Shares,
Class A Shares2, Class C Shares2 and Credit Suisse Managed Futures
Liquid Index3 for Ten Years

1 Fee waivers and/or expense reimbursements reduce expenses for the Fund, without which performance would be lower. The Fund entered into a written contract to limit expenses to 1.30% of the Fund's average daily net assets for Class I shares, 1.55% of the Fund's average daily net assets for Class A shares and 2.30% of the Fund's average daily net assets for Class C shares through at least February 28, 2025. This limit excludes certain expenses, as set forth in the Fund's Prospectus.
2 Total return for the Fund's Class A shares for the reporting period, based on offering price (including maximum sales charge of 5.25%), was (12.96)%. Total return for the Fund's Class C shares for the reporting period, based on redemption value including contingent Deferred sales charge ("CDSC") of 1.00%, was (9.56)%.
3 The Credit Suisse Managed Futures Liquid Index (the "Index") is a broadly diversified futures index currently composed of 14 futures contracts and 4 commodity indices which provide exposure to the asset classes. The Index uses a proprietary quantitative methodology to seek to identify price trends in each of the asset classes over a variety of time horizons. Components of the Index, which may change from time to time, are positioned either long or short based on the price trends within the asset classes determined using the Index's quantitative methodology. The Index does not have transaction costs and investors may not invest directly in the Index.
6
Credit Suisse Managed Futures Strategy Fund
Annual Investment Adviser's Report (continued)
October 31, 2023 (unaudited)
Average Annual Returns as of October 31, 20231
| | | 1 Year | | 5 Years | | 10 Years | |
Class I | | | (7.92 | )% | | | 5.07 | % | | | 3.95 | % | |
Class A Without Sales Charge | | | (8.15 | )% | | | 4.81 | % | | | 3.68 | % | |
Class A With Maximum Sales Charge | | | (12.96 | )% | | | 3.68 | % | | | 3.13 | % | |
Class C Without CDSC | | | (8.80 | )% | | | 4.03 | % | | | 2.92 | % | |
Class C With CDSC | | | (9.56 | )% | | | 4.03 | % | | | 2.92 | % | |
Returns represent past performance and include change in share price and reinvestment of dividends, capital gains, and return of capital distributions, if any. Past performance cannot guarantee future results. The current performance of the Fund may be lower or higher than the figures shown. Returns and share price will fluctuate, and redemption value may be more or less than original cost. The performance results do not reflect the deduction of taxes that a shareholder would pay on Fund distributions or the redemption of Fund shares. Performance information current to the most recent month end is available at www.credit-suisse.com/us/funds.
The annual gross expense ratios are 1.32% for Class I shares, 1.57% for Class A shares and 2.32% for Class C shares. The annual net expense ratios after fee waivers and/or expense reimbursements are 1.30% for Class I shares, 1.55% for Class A shares and 2.30% for Class C shares.
1 Fee waivers and/or expense reimbursements reduce expenses for the Fund, without which performance would be lower. The Fund has entered into a written contract to limit operating expenses to 1.30% of the Fund's average daily net assets for Class I shares, 1.55% of the Fund's average daily net assets for Class A shares and 2.30% of the Fund's average daily net assets for Class C shares through at least February 28, 2025. This limit excludes certain expenses, as set forth in the Fund's Prospectus.
7
Credit Suisse Managed Futures Strategy Fund
Annual Investment Adviser's Report (continued)
October 31, 2023 (unaudited)
Information About Your Fund's Expenses
As an investor of the Fund, you incur two types of costs: ongoing expenses and transaction costs. Ongoing expenses include management fees, distribution and service (12b-1) fees and other Fund expenses. Examples of transaction costs include sales charges (loads), redemption fees and account maintenance fees, which are not shown in this section and which would result in higher total expenses. The following table is intended to help you understand your ongoing expenses of investing in the Fund and to help you compare these expenses with the ongoing expenses of investing in other mutual funds. The table is based on an investment of $1,000 made at the beginning of the six months ended October 31, 2023.
The table illustrates your Fund's expenses in two ways:
• Actual Fund Return. This helps you estimate the actual dollar amount of ongoing expenses paid on a $1,000 investment in the Fund using the Fund's actual return during the period. To estimate the expenses you paid over the period, simply divide your account value by $1,000 (for example, an $8,600 account value divided by $1,000 = 8.6), then multiply the result by the number in the "Expenses Paid per $1,000" line.
• Hypothetical 5% Fund Return. This helps you to compare the Fund's ongoing expenses with those of other mutual funds using the Fund's actual expense ratio and a hypothetical rate of return of 5% per year before expenses. Examples using a 5% hypothetical fund return may be found in the shareholder reports of other mutual funds. The hypothetical account values and expenses may not be used to estimate the actual ending account balance or expenses you paid for the period.
Please note that the expenses shown in these tables are meant to highlight your ongoing expenses only and do not reflect any transaction costs, such as sales charges (loads) or redemption fees. If these transaction costs had been included, your costs would have been higher. The "Expenses Paid per $1,000" line of the tables is useful in comparing ongoing expenses only and will not help you determine the relative total expenses of owning different funds.
8
Credit Suisse Managed Futures Strategy Fund
Annual Investment Adviser's Report (continued)
October 31, 2023 (unaudited)
Expenses and Value for a $1,000 Investment
for the six-month period ended October 31, 2023
Actual Fund Return | | Class I | | Class A | | Class C | |
Beginning Account Value 05/01/23 | | $ | 1,000.00 | | | $ | 1,000.00 | | | $ | 1,000.00 | | |
Ending Account Value 10/31/23 | | $ | 992.70 | | | $ | 991.50 | | | $ | 987.50 | | |
Expenses Paid per $1,000* | | $ | 6.53 | | | $ | 7.78 | | | $ | 11.52 | | |
Hypothetical 5% Fund Return | |
Beginning Account Value 05/01/23 | | $ | 1,000.00 | | | $ | 1,000.00 | | | $ | 1,000.00 | | |
Ending Account Value 10/31/23 | | $ | 1,018.65 | | | $ | 1,017.39 | | | $ | 1,013.61 | | |
Expenses Paid per $1,000* | | $ | 6.61 | | | $ | 7.88 | | | $ | 11.67 | | |
| | | Class I | | Class A | | Class C | |
Annualized Expense Ratios* | | | 1.30 | % | | | 1.55 | % | | | 2.30 | % | |
* Expenses are equal to the Fund's annualized expense ratio for each share class, multiplied by the average account value over the period, multiplied by 184/365 to reflect the one-half year period.
The "Expenses Paid per $1,000" and the "Annualized Expense Ratios" in the tables are based on actual expenses paid by the Fund during the period, net of fee waivers and/or actual expense reimbursements, if applicable. If those fee waivers and/or expense reimbursements had not been in effect, the Fund's actual expenses would have been higher. Expenses do not reflect additional charges and expenses that are, or may be, imposed under the variable contracts or plans. Such charges and expenses are described in the prospectus of the insurance company separate account or in the plan documents or other informational materials supplied by plan sponsors. The Fund's expenses should be considered with these charges and expenses in evaluating the overall cost of investing in the separate account.
For more information, please refer to the Fund's Prospectus.
Portfolio Breakdown**
United States Treasury Obligations | | | 88.83 | % | |
Short-Term Investment | | | 11.17 | | |
Total | | | 100.00 | % | |
** Expressed as a percentage of total investments (excluding securities lending collateral, if applicable) and may vary over time.
9
Credit Suisse Managed Futures Strategy Fund
Consolidated Schedule of Investments
October 31, 2023
Par
(000) | |
| | Ratings†
(S&P/Moody's) | | Maturity | | Rate% | | Value | |
| UNITED STATES TREASURY OBLIGATIONS (75.3%) | | | |
$ | 12,400 | | | U.S. Treasury Bills(1) | | (AA+, Aaa) | | 11/02/23 | | | 4.601 | | | $ | 12,398,186 | | |
| | 12,400 | | | U.S. Treasury Bills(1) | | (AA+, Aaa) | | 11/30/23 | | | 4.526 | | | | 12,347,271 | | |
| | 24,800 | | | U.S. Treasury Bills(1) | | (AA+, Aaa) | | 12/28/23 | | | 4.621 | | | | 24,591,396 | | |
| | 12,400 | | | U.S. Treasury Bills(1) | | (AA+, Aaa) | | 01/25/24 | | | 4.729 | | | | 12,244,603 | | |
| | 12,400 | | | U.S. Treasury Bills(1) | | (AA+, Aaa) | | 02/22/24 | | | 4.330 | | | | 12,193,274 | | |
| | 24,800 | | | U.S. Treasury Bills(1) | | (AA+, Aaa) | | 03/21/24 | | | 4.732 | | | | 24,283,412 | | |
| | 12,400 | | | U.S. Treasury Bills(1) | | (AA+, Aaa) | | 04/18/24 | | | 4.753 | | | | 12,090,453 | | |
| | 12,400 | | | U.S. Treasury Bills(1) | | (AA+, Aaa) | | 05/16/24 | | | 4.949 | | | | 12,044,081 | | |
| | 24,800 | | | U.S. Treasury Bills(1) | | (AA+, Aaa) | | 06/13/24 | | | 5.058 | | | | 23,997,487 | | |
| | 12,400 | | | U.S. Treasury Bills(1) | | (AA+, Aaa) | | 07/11/24 | | | 5.040 | | | | 11,950,916 | | |
| | 12,400 | | | U.S. Treasury Bills(1) | | (AA+, Aaa) | | 08/08/24 | | | 5.156 | | | | 11,897,787 | | |
| | 24,800 | | | U.S. Treasury Bills(1) | | (AA+, Aaa) | | 09/05/24 | | | 5.153 | | | | 23,697,351 | | |
| TOTAL UNITED STATES TREASURY OBLIGATIONS (Cost $193,973,604) | | | 193,736,217 | | |
Shares | | | | | | | | | | | |
| SHORT-TERM INVESTMENTS (9.4%) | | | |
| | 24,349,750 | | | State Street Institutional U.S. Government Money Market Fund — Premier
Class, 5.31% (Cost $24,349,750) | | | | | | | | | | | | | | | 24,349,750 | | |
| TOTAL INVESTMENTS AT VALUE (84.7%) (Cost $218,323,354) | | | 218,085,967 | | |
| OTHER ASSETS IN EXCESS OF LIABILITIES (15.3%) | | | 39,248,231 | | |
| NET ASSETS (100.0%) | | $ | 257,334,198 | | |
† Credit ratings given by the S&P Global Ratings Division of S&P Global Inc. ("S&P") and Moody's Investors Service, Inc. ("Moody's") are unaudited.
(1) Securities are zero coupon. Rate presented is cost yield as of October 31, 2023.
Futures Contracts
Contract Description | | Currency | | Expiration
Date | | Number of
Contracts | | Notional
Value | | Net Unrealized
Appreciation
(Depreciation) | |
Contracts to Purchase | |
Index Contracts | |
Nikkei 225 Index Futures OSE | | JPY | | | | Dec 2023 | | | 54 | | | $ | 11,000,033 | | | $ | (537,338 | ) | |
Contracts to Sell | |
Foreign Exchange Contracts | |
| AUD Currency Futures | | USD | | | | Dec 2023 | | | (560 | ) | | | (35,571,200 | ) | | $ | 471,616 | | |
| CAD Currency Futures | | USD | | | | Dec 2023 | | | (987 | ) | | | (71,226,855 | ) | | | 1,934,364 | | |
| EUR Currency Futures | | USD | | | | Dec 2023 | | | (449 | ) | | | (59,506,531 | ) | | | 862,655 | | |
| GBP Currency Futures | | USD | | | | Dec 2023 | | | (825 | ) | | | (62,669,063 | ) | | | 157,422 | | |
| JPY Currency Futures | | USD | | | | Dec 2023 | | | (369 | ) | | | (30,656,981 | ) | | | 1,105,746 | | |
| | | $ | 4,531,803 | | |
See Accompanying Notes to Consolidated Financial Statements.
10
Credit Suisse Managed Futures Strategy Fund
Consolidated Schedule of Investments (continued)
October 31, 2023
Futures Contracts (continued)
Contract Description | | Currency | | Expiration
Date | | Number of
Contracts | | Notional
Value | | Net Unrealized
Appreciation
(Depreciation) | |
Index Contracts | |
Hang Seng Index Futures | | HKD | | | | Nov 2023 | | | (149 | ) | | $ | (16,323,237 | ) | | $ | (24,885 | ) | |
EURO Stoxx 50 Index Futures | | EUR | | | | Dec 2023 | | | (432 | ) | | | (18,584,593 | ) | | | 196,228 | | |
FTSE 100 Index Futures | | GBP | | | | Dec 2023 | | | (393 | ) | | | (34,946,177 | ) | | | 507,092 | | |
S&P 500 E Mini Index Futures | | USD | | | | Dec 2023 | | | (177 | ) | | | (37,278,412 | ) | | | (234,495 | ) | |
| | | $ | 443,940 | | |
Interest Rate Contracts | |
10YR Japanese Bond Futures | | JPY | | | | Dec 2023 | | | (152 | ) | | | (144,276,800 | ) | | $ | 1,300,675 | | |
10YR U.S. Treasury Note Futures | | USD | | | | Dec 2023 | | | (385 | ) | | | (40,876,172 | ) | | | 1,442,991 | | |
| EURO Bund Futures | | EUR | | | | Dec 2023 | | | (224 | ) | | | (30,540,698 | ) | | | 669,861 | | |
Long Gilt Futures | | GBP | | | | Dec 2023 | | | (233 | ) | | | (26,339,472 | ) | | | 195,996 | | |
| | | $ | 3,609,523 | | |
Total Net Unrealized Appreciation (Depreciation) | | $ | 8,047,928 | | |
Total Return Swap Contracts
Currency | | Notional
Amount | | Expiration
Date | | Counterparty | | Receive | | Pay | | Periodic
Payment
Frequency | | Upfront
Premiums
Paid/
(Received) | | Unrealized
Appreciation | |
USD | | | | $ | 19,366,545 | | |
01/22/24 | |
Goldman Sachs | | | (0.04 | )% | | Bloomberg
Agriculture
Index | | |
At
Maturity | | | $ | — | | | $ | 239,104 | | |
| | | $ | — | | | $ | 239,104 | | |
Total Return Swap Contracts
Currency | | Notional
Amount | | Expiration
Date | | Counterparty | | Receive | | Pay | | Periodic
Payment
Frequency | | Upfront
Premiums
Paid/
(Received) | | Unrealized
Depreciation | |
USD | | | | $ | 7,795,564 | | |
01/22/24
| |
Goldman Sachs
| | Bloomberg
Energy
Index | | | 0.09 | % | |
At
Maturity
| | $ | — | | | $ | (116,141 | ) | |
USD | | | | | 18,171,774 | | |
01/22/24
| |
Goldman Sachs
| | | (0.03 | )% | | Bloomberg
Industrial
Metals Index | |
At
Maturity
| | | — | | | | (277,809 | ) | |
USD | | | | | 11,117,816 | | |
01/22/24
| |
Goldman Sachs
| | Bloomberg
Precious
Metals Index | | | 0.07 | % | |
At
Maturity
| | | — | | | | (10,785 | ) | |
| | | $ | — | | | $ | (404,735 | ) | |
Total | | $ | — | | | $ | (165,631 | ) | |
See Accompanying Notes to Consolidated Financial Statements.
11
Credit Suisse Managed Futures Strategy Fund
Consolidated Schedule of Investments (continued)
October 31, 2023
Currency Abbreviations:
AUD = Australian Dollar
CAD = Canadian Dollar
EUR = Euro
GBP = British Pound
HKD = Hong Kong Dollar
JPY = Japanese Yen
USD = United States Dollar
See Accompanying Notes to Consolidated Financial Statements.
12
Credit Suisse Managed Futures Strategy Fund
Consolidated Statement of Assets and Liabilities
October 31, 2023
Assets | |
Investments at value (Cost $218,323,354) (Note 2) | | $ | 218,085,967 | | |
Cash | | | 1,724 | | |
Cash segregated at brokers for futures contracts and swap contracts (Note 2) | | | 37,064,452 | | |
Variation margin receivable on futures contracts (Note 2) | | | 1,634,023 | | |
Receivable for Fund shares sold | | | 1,120,156 | | |
Unrealized appreciation on open swap contracts (Note 2) | | | 239,104 | | |
Interest receivable | | | 126,242 | | |
Prepaid expenses | | | 45,179 | | |
Total assets | | | 258,316,847 | | |
Liabilities | |
Investment advisory fee payable (Note 3) | | | 260,469 | | |
Administrative services fee payable (Note 3) | | | 9,612 | | |
Shareholder servicing/Distribution fee payable (Note 3) | | | 2,160 | | |
Unrealized depreciation on open swap contracts (Note 2) | | | 404,735 | | |
Payable for Fund shares redeemed | | | 105,919 | | |
Trustees' fee payable | | | 17,353 | | |
Net payable for open swap contracts | | | 1,005 | | |
Accrued expenses | | | 181,396 | | |
Total liabilities | | | 982,649 | | |
Net Assets | |
Capital stock, $.001 par value (Note 6) | | | 27,021 | | |
Paid-in capital (Note 6) | | | 271,476,514 | | |
Total distributable earnings (loss) | | | (14,169,337 | ) | |
Net assets | | $ | 257,334,198 | | |
I Shares | |
Net assets | | $ | 247,916,307 | | |
Shares outstanding | | | 26,013,015 | | |
Net asset value, offering price and redemption price per share | | $ | 9.53 | | |
A Shares | |
Net assets | | $ | 9,349,902 | | |
Shares outstanding | | | 999,982 | | |
Net asset value and redemption price per share | | $ | 9.35 | | |
Maximum offering price per share (net asset value/(1-5.25%)) | | $ | 9.87 | | |
C Shares | |
Net assets | | $ | 67,989 | | |
Shares outstanding | | | 7,805 | | |
Net asset value and offering price per share | | $ | 8.71 | | |
See Accompanying Notes to Consolidated Financial Statements.
13
Credit Suisse Managed Futures Strategy Fund
Consolidated Statement of Operations
For the Year Ended October 31, 2023
Investment Income | |
Interest | | $ | 13,020,191 | | |
Total investment income | | | 13,020,191 | | |
Expenses | |
Investment advisory fees (Note 3) | | | 3,334,380 | | |
Administrative services fees (Note 3) | | | 66,586 | | |
Shareholder servicing/Distribution fees (Note 3) | |
Class A | | | 39,673 | | |
Class C | | | 6,191 | | |
Transfer agent fees | | | 445,241 | | |
Trustees' fees | | | 77,195 | | |
Printing fees | | | 73,170 | | |
Registration fees | | | 65,582 | | |
Custodian fees | | | 64,594 | | |
Audit and tax fees | | | 54,815 | | |
Legal fees | | | 23,177 | | |
Insurance expense | | | 10,082 | | |
Commitment fees (Note 4) | | | 6,754 | | |
Miscellaneous expense | | | 14,171 | | |
Total expenses | | | 4,281,611 | | |
Less: fees waived and expenses reimbursed (Note 3) | | | (67,772 | ) | |
Net expenses | | | 4,213,839 | | |
Net investment income | | | 8,806,352 | | |
Net Realized and Unrealized Gain (Loss) from Investments, Futures Contracts,
Swap Contracts and Foreign Currency Related Items | |
Net realized loss from investments | | | (951,092 | ) | |
Net realized loss from futures contracts | | | (15,512,794 | ) | |
Net realized loss from swap contracts | | | (18,141,313 | ) | |
Net realized gain from foreign currency transactions | | | 667,314 | | |
Net change in unrealized appreciation (depreciation) from investments | | | 1,451,563 | | |
Net change in unrealized appreciation (depreciation) from futures contracts | | | (5,378,732 | ) | |
Net change in unrealized appreciation (depreciation) from swap contracts | | | (700,275 | ) | |
Net change in unrealized appreciation (depreciation) from foreign currency translations | | | 49,936 | | |
Net realized and unrealized loss from investments, futures contracts, swap contracts
and foreign currency related items | | | (38,515,393 | ) | |
Net decrease in net assets resulting from operations | | $ | (29,709,041 | ) | |
See Accompanying Notes to Consolidated Financial Statements.
14
Credit Suisse Managed Futures Strategy Fund
Consolidated Statements of Changes in Net Assets
| | | For the Year
Ended
October 31, 2023 | | For the Year
Ended
October 31, 2022 | |
From Operations | |
Net investment income (loss) | | $ | 8,806,352 | | | $ | (2,327,310 | ) | |
Net realized gain (loss) from investments, futures contracts,
swap contracts and foreign currency transactions | | | (33,937,885 | ) | | | 98,818,937 | | |
Net change in unrealized appreciation (depreciation)
from investments, futures contracts, swap contracts
and foreign currency translations | | | (4,577,508 | ) | | | (11,391,719 | ) | |
Net increase (decrease) in net assets resulting from operations | | | (29,709,041 | ) | | | 85,099,908 | | |
From Distributions | |
From distributable earnings | |
Class I | | | (65,142,642 | ) | | | (30,898,287 | ) | |
Class A | | | (3,766,377 | ) | | | (1,197,838 | ) | |
Class C | | | (109,416 | ) | | | (59,319 | ) | |
Net decrease in net assets resulting from distributions | | | (69,018,435 | ) | | | (32,155,444 | ) | |
| From Capital Share Transactions (Note 6) | |
Proceeds from sale of shares | | | 99,232,556 | | | | 125,562,935 | | |
Reinvestment of distributions | | | 66,170,622 | | | | 30,992,733 | | |
Net asset value of shares redeemed | | | (272,315,569 | ) | | | (145,320,694 | ) | |
Net increase (decrease) in net assets from capital share
transactions | | | (106,912,391 | ) | | | 11,234,974 | | |
Net increase (decrease) in net assets | | | (205,639,867 | ) | | | 64,179,438 | | |
Net Assets | |
Beginning of year | | | 462,974,065 | | | | 398,794,627 | | |
End of year | | $ | 257,334,198 | | | $ | 462,974,065 | | |
See Accompanying Notes to Consolidated Financial Statements.
15
Credit Suisse Managed Futures Strategy Fund
Consolidated Financial Highlights
(For a Class I Share of the Fund Outstanding Throughout Each Year)
| | | For the Year Ended October 31, | |
| | | 2023 | | 2022 | | 2021 | | 2020 | | 2019 | |
Per share data | |
Net asset value, beginning of year | | $ | 12.31 | | | $ | 11.05 | | | $ | 9.26 | | | $ | 9.94 | | | $ | 9.79 | | |
INVESTMENT OPERATIONS | |
Net investment income (loss)1 | | | 0.28 | | | | (0.06 | ) | | | (0.13 | ) | | | (0.03 | ) | | | 0.04 | | |
Net gain (loss) from investments, futures contracts,
swap contracts and foreign currency transactions
(both realized and unrealized) | | | (1.19 | ) | | | 2.18 | | | | 1.92 | | | | (0.48 | ) | | | 0.11 | | |
Total from investment operations | | | (0.91 | ) | | | 2.12 | | | | 1.79 | | | | (0.51 | ) | | | 0.15 | | |
LESS DIVIDENDS AND DISTRIBUTIONS | |
Dividends from net investment income | | | (0.45 | ) | | | (0.86 | ) | | | — | | | | (0.17 | ) | | | — | | |
Distributions from net realized gains | | | (1.42 | ) | | | — | | | | — | | | | — | | | | — | | |
Total dividends and distributions | | | (1.87 | ) | | | (0.86 | ) | | | — | | | | (0.17 | ) | | | — | | |
Net asset value, end of year | | $ | 9.53 | | | $ | 12.31 | | | $ | 11.05 | | | $ | 9.26 | | | $ | 9.94 | | |
Total return2 | | | (7.92 | )% | | | 21.09 | % | | | 19.33 | % | | | (5.22 | )% | | | 1.53 | % | |
RATIOS AND SUPPLEMENTAL DATA | |
Net assets, end of year (000s omitted) | | $ | 247,916 | | | $ | 434,818 | | | $ | 382,293 | | | $ | 282,365 | | | $ | 318,590 | | |
Ratio of net expenses to average net assets | | | 1.30 | % | | | 1.30 | % | | | 1.30 | % | | | 1.30 | % | | | 1.30 | % | |
Ratio of net investment income (loss) to
average net assets | | | 2.76 | % | | | (0.52 | )% | | | (1.28 | )% | | | (0.34 | )% | | | 0.42 | % | |
Decrease reflected in above operating expense
ratios due to waivers/reimbursements | | | 0.02 | % | | | — | % | | | 0.02 | % | | | 0.05 | % | | | 0.02 | % | |
Portfolio turnover rate3 | | | — | % | | | — | % | | | — | % | | | — | % | | | — | % | |
1 Per share information is calculated using the average shares outstanding method.
2 Total returns are historical and include change in share price and reinvestment of all distributions. Had certain expenses not been reduced during the years shown, total returns would have been lower.
3 Portfolio turnover is calculated by dividing the lesser of total purchases or sales of portfolio securities for the reporting period by the monthly average of portfolio securities owned during the reporting period. Excluded from both the numerator and denominator are amounts relating to derivatives and securities whose maturities or expiration dates at the time of acquisition were one year or less.
See Accompanying Notes to Consolidated Financial Statements.
16
Credit Suisse Managed Futures Strategy Fund
Consolidated Financial Highlights
(For a Class A Share of the Fund Outstanding Throughout Each Year)
| | | For the Year Ended October 31, | |
| | | 2023 | | 2022 | | 2021 | | 2020 | | 2019 | |
Per share data | |
Net asset value, beginning of year | | $ | 12.11 | | | $ | 10.88 | | | $ | 9.14 | | | $ | 9.82 | | | $ | 9.69 | | |
INVESTMENT OPERATIONS | |
Net investment income (loss)1 | | | 0.24 | | | | (0.08 | ) | | | (0.16 | ) | | | (0.05 | ) | | | 0.01 | | |
Net gain (loss) from investments, futures contracts,
swap contracts and foreign currency transactions
(both realized and unrealized) | | | (1.16 | ) | | | 2.14 | | | | 1.90 | | | | (0.49 | ) | | | 0.12 | | |
Total from investment operations | | | (0.92 | ) | | | 2.06 | | | | 1.74 | | | | (0.54 | ) | | | 0.13 | | |
LESS DIVIDENDS AND DISTRIBUTIONS | |
Dividends from net investment income | | | (0.42 | ) | | | (0.83 | ) | | | — | | | | (0.14 | ) | | | — | | |
Distributions from net realized gains | | | (1.42 | ) | | | — | | | | — | | | | — | | | | — | | |
Total dividends and distributions | | | (1.84 | ) | | | (0.83 | ) | | | — | | | | (0.14 | ) | | | — | | |
Net asset value, end of year | | $ | 9.35 | | | $ | 12.11 | | | $ | 10.88 | | | $ | 9.14 | | | $ | 9.82 | | |
Total return2 | | | (8.15 | )% | | | 20.83 | % | | | 19.04 | % | | | (5.53 | )% | | | 1.34 | % | |
RATIOS AND SUPPLEMENTAL DATA | |
Net assets, end of year (000s omitted) | | $ | 9,350 | | | $ | 27,406 | | | $ | 15,682 | | | $ | 12,506 | | | $ | 24,234 | | |
Ratio of net expenses to average net assets | | | 1.55 | % | | | 1.55 | % | | | 1.55 | % | | | 1.55 | % | | | 1.55 | % | |
Ratio of net investment income (loss) to
average net assets | | | 2.45 | % | | | (0.68 | )% | | | (1.53 | )% | | | (0.51 | )% | | | 0.14 | % | |
Decrease reflected in above operating expense
ratios due to waivers/reimbursements | | | 0.02 | % | | | — | % | | | 0.02 | % | | | 0.05 | % | | | 0.02 | % | |
Portfolio turnover rate3 | | | — | % | | | — | % | | | — | % | | | — | % | | | — | % | |
1 Per share information is calculated using the average shares outstanding method.
2 Total returns are historical and include change in share price, reinvestment of all distributions and no sales charge. Had certain expenses not been reduced during the years shown, total returns would have been lower.
3 Portfolio turnover is calculated by dividing the lesser of total purchases or sales of portfolio securities for the reporting period by the monthly average of portfolio securities owned during the reporting period. Excluded from both the numerator and denominator are amounts relating to derivatives and securities whose maturities or expiration dates at the time of acquisition were one year or less.
See Accompanying Notes to Consolidated Financial Statements.
17
Credit Suisse Managed Futures Strategy Fund
Consolidated Financial Highlights
(For a Class C Share of the Fund Outstanding Throughout Each Year)
| | | For the Year Ended October 31, | |
| | | 2023 | | 2022 | | 2021 | | 2020 | | 2019 | |
Per share data | |
Net asset value, beginning of year | | $ | 11.39 | | | $ | 10.28 | | | $ | 8.70 | | | $ | 9.351 | | | $ | 9.29 | | |
INVESTMENT OPERATIONS | |
Net investment income (loss)2 | | | 0.17 | | | | (0.16 | ) | | | (0.22 | ) | | | (0.14 | ) | | | (0.06 | ) | |
Net gain (loss) from investments, futures contracts,
swap contracts and foreign currency transactions
(both realized and unrealized) | | | (1.10 | ) | | | 2.02 | | | | 1.80 | | | | (0.44 | ) | | | 0.12 | | |
Total from investment operations | | | (0.93 | ) | | | 1.86 | | | | 1.58 | | | | (0.58 | ) | | | 0.06 | | |
LESS DIVIDENDS AND DISTRIBUTIONS | |
Dividends from net investment income | | | (0.33 | ) | | | (0.75 | ) | | | — | | | | (0.07 | ) | | | — | | |
Distributions from net realized gains | | | (1.42 | ) | | | — | | | | — | | | | — | | | | — | | |
Total dividends and distributions | | | (1.75 | ) | | | (0.75 | ) | | | — | | | | (0.07 | ) | | | — | | |
Net asset value, end of year | | $ | 8.71 | | | $ | 11.39 | | | $ | 10.28 | | | $ | 8.70 | | | $ | 9.351 | | |
Total return3 | | | (8.80 | )% | | | 19.83 | % | | | 18.16 | % | | | (6.24 | )% | | | 0.65 | % | |
RATIOS AND SUPPLEMENTAL DATA | |
Net assets, end of year (000s omitted) | | $ | 68 | | | $ | 750 | | | $ | 820 | | | $ | 880 | | | $ | 324 | | |
Ratio of net expenses to average net assets | | | 2.30 | % | | | 2.30 | % | | | 2.30 | % | | | 2.30 | % | | | 2.30 | % | |
Ratio of net investment income (loss) to
average net assets | | | 1.81 | % | | | (1.52 | )% | | | (2.28 | )% | | | (1.56 | )% | | | (0.64 | )% | |
Decrease reflected in above operating expense
ratios due to waivers/reimbursements | | | 0.02 | % | | | — | % | | | 0.02 | % | | | 0.05 | % | | | 0.02 | % | |
Portfolio turnover rate4 | | | — | % | | | — | % | | | — | % | | | — | % | | | — | % | |
1 Includes adjustments in accordance with accounting principles generally accepted in the United States of America and as such, the net asset values for financial reporting purposes and the returns based upon net asset values may differ from the net asset values and returns for shareholder transactions.
2 Per share information is calculated using the average shares outstanding method.
3 Total returns are historical and include change in share price, reinvestment of all distributions and no sales charge. Had certain expenses not been reduced during the years shown, total returns would have been lower.
4 Portfolio turnover is calculated by dividing the lesser of total purchases or sales of portfolio securities for the reporting period by the monthly average of portfolio securities owned during the reporting period. Excluded from both the numerator and denominator are amounts relating to derivatives and securities whose maturities or expiration dates at the time of acquisition were one year or less.
See Accompanying Notes to Consolidated Financial Statements.
18
Credit Suisse Managed Futures Strategy Fund
Notes to Consolidated Financial Statements
October 31, 2023
Credit Suisse Managed Futures Strategy Fund (the "Fund"), a series of Credit Suisse Opportunity Funds (the "Trust"), a Delaware statutory trust, is registered under the Investment Company Act of 1940, as amended (the "1940 Act"), as a non-diversified open-end management investment company that seeks to achieve investment results that correspond generally to the risk and return patterns of managed futures funds. The Trust was organized under the laws of the State of Delaware as a business trust on May 31, 1995.
Credit Suisse Asset Management, LLC ("Credit Suisse" or the "Adviser"), the investment adviser to the Fund, is registered as an investment adviser with the Securities and Exchange Commission ("SEC") and as a Commodity Pool Operator with the Commodity Futures Trading Commission. The Fund seeks to achieve its investment objective by investing directly and/or indirectly through the Credit Suisse Cayman Managed Futures Strategy Fund, Ltd. (the "Subsidiary"), a wholly-owned subsidiary of the Fund organized under the laws of the Cayman Islands, in a combination of securities and derivative instruments. The Subsidiary invests in commodity-linked derivative instruments, such as swaps and futures, as well as other types of futures, swaps and options. The Subsidiary may also invest in debt securities, some of which are intended to serve as margin or collateral for the Subsidiary's derivatives positions.
The Subsidiary is managed by the same portfolio managers that manage the Fund and the accompanying financial statements reflect the financial position of the Fund and the Subsidiary and the results of operations on a consolidated basis. The consolidated financial statements include portfolio holdings of the Fund and the Subsidiary and all intercompany transactions and balances have been eliminated. The Fund may invest up to 25% of its total assets in the Subsidiary. As of October 31, 2023, the Fund held $43,581,577 in the Subsidiary, representing 16.9% of the Fund's consolidated net assets. For the year ended October 31, 2023, the net realized loss on securities and other financial instruments held in the Subsidiary was $18,235,560.
Subsequent references to the Fund within the Notes to Consolidated Financial Statements collectively refer to the Fund and the Subsidiary, unless the context otherwise requires.
The Fund offers three classes of shares: Class I shares, Class A shares and Class C shares. Each class of shares represents an equal pro rata interest in the Fund, except the share classes bear different expenses. Class A shares are sold subject to a front-end sales charge of up to 5.25%. Class C shares are sold subject to a contingent deferred sales charge ("CDSC") of 1.00% if the shares are
19
Credit Suisse Managed Futures Strategy Fund
Notes to Consolidated Financial Statements (continued)
October 31, 2023
Note 1. Organization (continued)
redeemed within the first year of purchase. Class I shares are sold without a sales charge. Effective June 30, 2021, Class C shares, upon the eight year anniversary of purchase, will convert to Class A shares.
Note 2. Significant Accounting Policies
The following is a summary of significant accounting policies followed by the Fund in the preparation of its consolidated financial statements. The policies are in accordance with generally accepted accounting principles in the United States of America ("GAAP"). The preparation of consolidated financial statements requires management to make estimates and assumptions that affect the reported amounts and disclosures in the consolidated financial statements. Actual results could differ from those estimates. The Fund is considered an investment company for financial reporting purposes under GAAP and follows the accounting and reporting guidance in Financial Accounting Standards Board ("FASB") Accounting Standards Codification ("ASC") Topic 946 — Financial Services — Investment Companies.
A) SECURITY VALUATION — The Board of Trustees (the "Board") is responsible for the Fund's valuation process. The Board has delegated the supervision of the daily valuation process to the Adviser, who has established a Pricing Committee and a Pricing Group, which, pursuant to the policies adopted by the Board, are responsible for making fair valuation determinations and overseeing the Fund's pricing policies. The net asset value of the Fund is determined daily as of the close of regular trading on the New York Stock Exchange, Inc. (the "Exchange") on each day the Exchange is open for business. The valuations for fixed income securities (which may include, but are not limited to, corporate, government, municipal, mortgage-backed, collateralized mortgage obligations and asset-backed securities) and certain derivative instruments are typically the prices supplied by independent third party pricing services, which may use market prices or broker/dealer quotations or a variety of valuation techniques and methodologies. The independent third party pricing services use inputs that are observable such as issuer details, interest rates, yield curves, prepayment speeds, credit risks/spreads, default rates and quoted prices for similar securities. These pricing services generally price fixed income securities assuming orderly transactions of an institutional "round lot" size, but some trades occur in smaller "odd lot" sizes which may be effected at lower prices than institutional round lot trades. Structured note agreements are valued in accordance with a dealer-supplied valuation based on changes in the value of the underlying index. Futures contracts are valued
20
Credit Suisse Managed Futures Strategy Fund
Notes to Consolidated Financial Statements (continued)
October 31, 2023
Note 2. Significant Accounting Policies (continued)
daily at the settlement price established by the board of trade or exchange on which they are traded. Forward contracts are valued at the London closing spot rates and the London closing forward point rates on a daily basis. The currency forward contract pricing model derives the differential in point rates to the expiration date of the forward and calculates its present value. Over-the-counter derivative financial instruments, such as swap agreements, generally derive their value from underlying asset prices, indices, reference rates, and other inputs or a combination of these factors. Equity securities for which market quotations are available are valued at the last reported sales price or official closing price on the primary market or exchange on which they trade. Investments in open-ended mutual funds are valued at the net asset value as reported on each business day and under normal circumstances. Securities for which market quotations are not readily available are valued at their fair value as determined in good faith by the Adviser, as the Board's valuation designee (as defined in Rule 2a-5 under the 1940 Act), in accordance with the Adviser's procedures. The Board oversees the Adviser in its role as valuation designee in accordance with the requirements of Rule 2a-5 under the 1940 Act. The Fund may utilize a service provided by an independent third party to fair value certain securities. When fair value pricing is employed, the prices of securities used by the Fund to calculate its net asset value may differ from quoted or published prices for the same securities. If independent third party pricing services are unable to supply prices for a portfolio investment, or if the prices supplied are deemed by the Adviser to be unreliable, the market price may be determined by the Adviser using quotations from one or more brokers/dealers or at the transaction price if the security has recently been purchased and no value has yet been obtained from a pricing service or pricing broker. When reliable prices are not readily available, such as when the value of a security has been significantly affected by events after the close of the exchange or market on which the security is principally traded, but before the Fund calculates its net asset value, these securities will be fair valued in good faith by the Pricing Group, in accordance with procedures established by the Adviser.
The Fund uses valuation techniques to measure fair value that are consistent with the market approach and/or income approach, depending on the type of security and the particular circumstance. The market approach uses prices and other relevant information generated by market transactions involving identical or comparable securities. The income approach uses valuation techniques to discount estimated future cash flows to present value.
21
Credit Suisse Managed Futures Strategy Fund
Notes to Consolidated Financial Statements (continued)
October 31, 2023
Note 2. Significant Accounting Policies (continued)
GAAP established a disclosure hierarchy that categorizes the inputs to valuation techniques used to value assets and liabilities at each measurement date. These inputs are summarized in the three broad levels listed below:
• Level 1 – quoted prices in active markets for identical investments
• Level 2 – other significant observable inputs (including quoted prices for similar investments, interest rates, prepayment speeds, credit risk, etc.)
• Level 3 – significant unobservable inputs (including the Fund's own assumptions in determining the fair value of investments)
The inputs or methodologies used to value securities are not necessarily an indication of the risk associated with investing in those securities.
The following is a summary of the inputs used as of October 31, 2023 in valuing the Fund's assets and liabilities carried at fair value:
Assets | | Level 1 | | Level 2 | | Level 3 | | Total | |
Investments in Securities | |
United States Treasury Obligations | | $ | — | | | $ | 193,736,217 | | | $ | — | | | $ | 193,736,217 | | |
Short-term Investments | | | 24,349,750 | | | | — | | | | — | | | | 24,349,750 | | |
| | | $ | 24,349,750 | | | $ | 193,736,217 | | | $ | — | | | $ | 218,085,967 | | |
Other Financial Instruments* | |
Futures Contracts | | $ | 8,844,646 | | | $ | — | | | $ | — | | | $ | 8,844,646 | | |
Swap Contracts | | | — | | | | 239,104 | | | | — | | | | 239,104 | | |
| | | $ | 8,844,646 | | | $ | 239,104 | | | $ | — | | | $ | 9,083,750 | | |
Liabilities | | | | | | | | | |
Other Financial Instruments* | |
Futures Contracts | | $ | 796,718 | | | $ | — | | | $ | — | | | $ | 796,718 | | |
Swap Contracts | | | — | | | | 404,735 | | | | — | | | | 404,735 | | |
| | | $ | 796,718 | | | $ | 404,735 | | | $ | — | | | $ | 1,201,453 | | |
* Other financial instruments include unrealized appreciation (depreciation) on futures and swap contracts.
For the year ended October 31, 2023, there were no transfers between Level 2 and Level 3. All transfers, if any, are assumed to occur at the end of the reporting period.
B) DERIVATIVE INSTRUMENTS AND HEDGING ACTIVITIES — The Fund has adopted a derivatives risk management program pursuant to Rule 18f-4 under the 1940 Act in order to assess and manage the Fund's derivatives risk, taking into account the Fund's derivatives transactions and how these transactions interact with the Fund's other investments. Because the Fund engages in derivatives transactions beyond a certain amount in order
22
Credit Suisse Managed Futures Strategy Fund
Notes to Consolidated Financial Statements (continued)
October 31, 2023
Note 2. Significant Accounting Policies (continued)
to pursue its investment objectives and policies, the Fund is required to comply with value at risk ("VaR") based limits on its leverage risk. The Fund adopted amendments to authoritative guidance on disclosures about derivative instruments and hedging activities which require that a fund disclose (a) how and why an entity uses derivative instruments, (b) how derivative instruments and hedging activities are accounted for and (c) how derivative instruments and related hedging activities affect a fund's financial position, financial performance and cash flows. For the year ended October 31, 2023, the Fund's derivatives did not qualify for hedge accounting as they are held at fair value.
The following table presents the fair value and the location of derivatives within the Consolidated Statement of Assets and Liabilities at October 31, 2023 and the effect of these derivatives on the Consolidated Statement of Operations for the year ended October 31, 2023.
Primary Underlying Risk | | Derivative
Assets(1) | | Derivative
Liabilities(1) | | Realized Gain
(Loss) | | Net Change in Unrealized
Appreciation (Depreciation) | |
Foreign currency exchange rate | |
Futures contracts(2) | | $ | 4,531,803 | | | $ | — | | | $ | (7,394,516 | ) | | $ | (1,111,772 | ) | |
Index Contracts | |
Futures contracts(2) | | | 703,320 | | | | 796,718 | | | | (5,035,772 | ) | | | (426,897 | ) | |
Swap contracts | | | 239,104 | | | | 404,735 | | | | (18,141,313 | ) | | | (700,275 | ) | |
Interest rate | |
Futures contracts(2) | | | 3,609,523 | | | | — | | | | (3,082,506 | ) | | | (3,840,063 | ) | |
Total | | $ | 9,083,750 | | | $ | 1,201,453 | | | $ | (33,654,107 | ) | | $ | (6,079,007 | ) | |
(1) Generally, the balance sheet location for asset derivatives is receivables/net unrealized appreciation (depreciation) and for liability derivatives is payables/net unrealized appreciation (depreciation).
(2) Includes cumulative appreciation (depreciation) of futures contracts as reported in the Consolidated Schedule of Investments. Only variation margin is reported within the receivables and/or payables on the Consolidated Statement of Assets and Liabilities.
The notional amount of futures contracts and swap contracts open at October 31, 2023 is reflected in the Consolidated Schedule of Investments. For the year ended October 31, 2023, the Fund held average monthly notional values of $201,724,204, $330,739,389 and $64,786,348 in long futures contracts, short futures contracts and swap contracts, respectively.
The Fund is a party to International Swap and Derivatives Association, Inc. ("ISDA") Master Agreements ("Master Agreements") with certain counterparties that govern over-the-counter derivative (including total return, credit default and interest rate swaps) and foreign exchange contracts entered into by the Fund. The Master Agreements may contain provisions regarding, among other things, the parties' general obligations, representations, agreements, collateral requirements, events of default and early termination.
23
Credit Suisse Managed Futures Strategy Fund
Notes to Consolidated Financial Statements (continued)
October 31, 2023
Note 2. Significant Accounting Policies (continued)
Termination events applicable to the Fund may occur upon a decline in the Fund's net assets below a specified threshold over a certain period of time.
The following table presents by counterparty the Fund's derivative assets, net of related collateral held by the Fund, at October 31, 2023:
Counterparty | | Gross Amount
of Derivative
Assets Presented in
the Consolidated
Statement of Assets
and Liabilities(a) | | Financial
Instruments
and Derivatives
Available for Offset | | Non-Cash
Collateral
Received | | Cash
Collateral
Received(b) | | Net Amount
of Derivative
Assets | |
Goldman Sachs | | $ | 239,104 | | | $ | (239,104 | ) | | $ | — | | | $ | — | | | $ | — | | |
The following table presents by counterparty the Fund's derivative liabilities, net of related collateral pledged by the Fund, October 31, 2023:
Counterparty | | Gross Amount
of Derivative
Liabilities Presented
in the Consolidated
Statement of Assets
and Liabilities(a) | | Financial
Instruments
and Derivatives
Available for Offset | | Non-Cash
Collateral
Pledged | | Cash
Collateral
Pledged(b) | | Net Amount
of Derivative
Liabilities | |
Goldman Sachs | | $ | 404,735 | | | $ | (239,104 | ) | | $ | — | | | $ | (165,631 | ) | | $ | — | | |
(a) Swap contracts are included.
(b) The actual collateral pledged may be more than the amounts shown.
C) SECURITY TRANSACTIONS AND INVESTMENT INCOME/EXPENSE — Security transactions are accounted for on a trade date basis. Interest income/expense is recorded on the accrual basis. The Fund amortizes premiums and accretes discounts using the effective interest method. Dividend income/expense is recorded on the ex-dividend date. Certain expenses are class-specific expenses, vary by class and are charged only to that class. Income, expenses (excluding class-specific expenses) and realized/unrealized gains/losses are allocated proportionately to each class of shares based upon the relative net asset value of the outstanding shares of that class. The cost of investments sold is determined by use of the specific identification method for both financial reporting and income tax purposes. To the extent any issuer defaults or a credit event occurs that impacts the issuer, the Fund may halt any additional interest income accruals and consider the realizability of interest accrued up to the date of default or credit event.
D) DIVIDENDS AND DISTRIBUTIONS TO SHAREHOLDERS — Dividends from net investment income, if any, are declared and paid quarterly. Distributions of net realized capital gains, if any, are declared and paid at least annually. However, to the extent that a net realized capital gain can be reduced
24
Credit Suisse Managed Futures Strategy Fund
Notes to Consolidated Financial Statements (continued)
October 31, 2023
Note 2. Significant Accounting Policies (continued)
by a capital loss carryforward, such gain will not be distributed. Dividends and distributions to shareholders of the Fund are recorded on the ex-dividend date and are determined in accordance with federal income tax regulations, which may differ from GAAP.
E) FEDERAL AND OTHER TAXES — No provision is made for federal taxes as it is the Fund's intention to continue to qualify as a regulated investment company ("RIC") under the Internal Revenue Code of 1986, as amended (the "Code"), and to make the requisite distributions to its shareholders, which will be sufficient to relieve it from federal income and excise taxes.
In order to qualify as a RIC under the Code, the Fund must meet certain requirements regarding the source of its income, the diversification of its assets and the distribution of its income. One of these requirements is that the Fund derive at least 90% of its gross income for each taxable year from dividends, interest, payments with respect to certain securities loans, gains from the sale or other disposition of stock, securities or foreign currencies, other income derived with respect to its business of investing in such stock, securities or currencies or net income derived from interests in certain publicly-traded partnerships ("Qualifying Income"). The Internal Revenue Service ("IRS") has issued a ruling that income realized from certain types of commodity-linked derivatives would not be Qualifying Income. As a result, the Fund's ability to realize income from investments in such commodity-linked derivatives as part of its investment strategy would be limited to a maximum of 10% of its gross income.
If the Fund is unable to ensure continued qualification as a RIC, the Fund may be required to change its investment objective, policies or techniques, or may be liquidated. If the Fund fails to qualify as a RIC, the Fund will be subject to federal income tax on its net income and capital gains at regular corporate rates (without reduction for distributions to shareholders). If the Fund were to fail to qualify as a RIC and become subject to federal income tax, shareholders of the Fund would be subject to the risk of diminished returns.
The Fund adopted the authoritative guidance for uncertainty in income taxes and recognizes a tax benefit or liability from an uncertain position only if it is more likely than not that the position is sustainable based solely on its technical merits and consideration of the relevant taxing authority's widely understood administrative practices and procedures. The Fund has reviewed its current tax positions and has determined that no provision for income tax is required in the Fund's financial statements. The Fund's federal and state income and federal excise tax returns for tax years for which the applicable statutes of
25
Credit Suisse Managed Futures Strategy Fund
Notes to Consolidated Financial Statements (continued)
October 31, 2023
Note 2. Significant Accounting Policies (continued)
limitations have not expired are subject to examination by the IRS and state departments of revenue.
F) CASH — The Fund's uninvested cash balance is held in an interest bearing variable rate demand deposit account at State Street Bank and Trust Company ("SSB"), the Fund's custodian.
G) FUTURES — The Fund may enter into futures contracts to the extent permitted by its investment policies and objectives. The Fund may use futures contracts to gain exposure to or hedge against changes in interest rates, equity and market price movements and/or currency risks. Upon entering into a futures contract, the Fund is required to deposit cash and/or pledge U.S. Government securities as initial margin with a Futures Commission Merchant ("FCM"). Subsequent payments, which are dependent on the daily fluctuations in the value of the underlying instrument, are made or received by the Fund each day (daily variation margin) and are recorded as unrealized gains or losses in the Consolidated Statement of Operations until the contracts are closed. When the contracts are closed, the Fund records a realized gain or loss equal to the difference between the proceeds from (or cost of) the closing transaction and the Fund's basis in the contract. Risks of entering into futures contracts for hedging purposes include the possibility that a change in the value of the contract may not correlate with the changes in the value of the underlying instruments. Futures have minimal counterparty credit risk because futures are exchange traded and the exchange's clearinghouse, as counterparty to all exchange-traded futures, guarantees the futures against default. In addition, the purchase of a futures contract involves the risk that the Fund could lose more than the original margin deposit and subsequent payments may be required for a futures transaction. The Fund's open futures contracts are disclosed in the Consolidated Schedule of Investments. At October 31, 2023, the amount of restricted cash held at brokers related to open futures contracts was $33,770,002.
The Commodity Exchange Act requires an FCM to segregate all customer transactions and assets from the FCM's proprietary activities. A customer's cash and other equity deposited with an FCM are considered commingled with all other customer funds subject to the FCM's segregation requirements. In the event of an FCM's insolvency, recovery may be limited to the Fund's pro-rata share of segregated customer funds available. It is possible that the recovery amount could be less than the total of cash and other equity deposited.
H) SWAPS — The Fund may enter into swap contracts either for hedging purposes or to seek to increase total return. A swap contract is an agreement
26
Credit Suisse Managed Futures Strategy Fund
Notes to Consolidated Financial Statements (continued)
October 31, 2023
Note 2. Significant Accounting Policies (continued)
that obligates two parties to exchange a series of cash flows at specified intervals based upon or calculated by reference to changes in specified prices or rates for a specified amount of an underlying asset or notional principal amount. The Fund will enter into swap contracts only on a net basis, which means that the two payment streams are netted out, with the Fund receiving or paying, as the case may be, only the net amount of the two payments. Risks may arise as a result of the failure of the counterparty to the swap contract to comply with the terms of the swap contract. The extent of the Fund's exposure to credit and counterparty risks is the discounted net value of the cash flows to be received from the counterparty over the contract's remaining life, to the extent that the amount is positive. These risks are mitigated by having a master netting arrangement between the Fund and the counterparty and by the posting of collateral by the counterparty to the Fund to cover the Fund's exposure to the counterparty. Therefore, the Fund considers the creditworthiness of each counterparty as well as the amounts posted by the counterparty pursuant to the master netting agreement to a swap contract in evaluating potential credit risk. Additionally, risks may arise from unanticipated movements in interest rates or in the value of the underlying reference asset or index.
The Fund may enter into total return swap contracts, involving commitments to pay interest in exchange for a market-linked return, both based on notional amounts. The Fund may invest in total return swap contracts for hedging purposes or to seek to increase total return. To the extent the total return of the security or index underlying the transaction exceeds or falls short of the offsetting interest rate obligation, the Fund will receive a payment from or make a payment to the counterparty.
The Fund records unrealized gains or losses on a daily basis representing the value and the current net receivable or payable relating to open swap contracts. Net amounts received or paid on the swap contract are recorded as realized gains or losses. Fluctuations in the value of swap contracts are recorded for financial statement purposes as unrealized appreciation or depreciation from swap contracts. Realized gains and losses from terminated swaps are included in net realized gains/losses from swap contracts. The Fund's open swap contracts are disclosed in the Consolidated Schedule of Investments. At October 31, 2023, the amount of restricted cash held at brokers related to open swap contracts was $3,294,450.
I) SECURITIES LENDING — The initial collateral received by the Fund is required to have a value of at least 102% of the market value of domestic securities on loan (including any accrued interest thereon) and 105% of the
27
Credit Suisse Managed Futures Strategy Fund
Notes to Consolidated Financial Statements (continued)
October 31, 2023
Note 2. Significant Accounting Policies (continued)
market value of foreign securities on loan (including any accrued interest thereon). The collateral is maintained thereafter at a value equal to at least 102% of the current market value of the securities on loan. The market value of loaned securities is determined at the close of each business day of the Fund and any additional required collateral is delivered to the Fund, or excess collateral returned by the Fund, on the next business day. Cash collateral received by the Fund in connection with securities lending activity may be pooled together with cash collateral for other funds/portfolios advised by Credit Suisse and may be invested in a variety of investments, including funds advised by SSB, the Fund's securities lending agent, or money market instruments. However, in the event of default or bankruptcy by the other party to the agreement, realization and/or retention of the collateral may be subject to legal proceedings. SSB has been engaged by the Fund to act as the Fund's securities lending agent. The Fund's securities lending arrangement provides that the Fund and SSB will share the net income earned from securities lending activities. Securities lending income is accrued as earned. At October 31, 2023 and for the year ended October 31, 2023, there were no securities out on loan.
J) OTHER — In the normal course of business, the Fund trades financial instruments and enters into financial transactions for which risk of potential loss exists due to changes in the market (market risk) or failure of the other party to a transaction to perform (credit risk). Similar to credit risk, the Fund may be exposed to counterparty risk, including with respect to securities lending, or the risk that an institution or other entity with which the Fund has unsettled or open transactions will default. The potential loss could exceed the value of the financial assets recorded in the consolidated financial statements. Financial assets, which potentially expose the Fund to credit risk, consist principally of cash due from counterparties and investments. The extent of the Fund's exposure to credit and counterparty risks in respect to these financial assets approximates their carrying value as recorded in the Fund's Consolidated Statement of Assets and Liabilities.
Note 3. Transactions with Affiliates and Related Parties
Credit Suisse serves as investment adviser and co-administrator for the Fund. For its investment advisory and administration services, Credit Suisse is entitled to receive a fee from the Fund at an annualized rate of 1.04% of the Fund's average daily net assets. For the year ended October 31, 2023, investment advisory and administration fees earned and fees waived/expenses reimbursed by Credit Suisse were $3,334,380 and $67,772, respectively. Credit Suisse has contractually agreed to limit expenses so that the Fund's annual
28
Credit Suisse Managed Futures Strategy Fund
Notes to Consolidated Financial Statements (continued)
October 31, 2023
Note 3. Transactions with Affiliates and Related Parties (continued)
operating expenses do not exceed 1.30% of the Fund's average daily net assets for Class I shares, 1.55% of the Fund's average daily net assets for Class A shares, and 2.30% of the Fund's average daily net assets for Class C shares. The Fund is authorized to reimburse Credit Suisse for management fees previously waived and/or for expenses previously paid by Credit Suisse, provided, however, that any reimbursement must be paid at a date not more than thirty-six months following the applicable month during which such fees were waived or expenses were paid by Credit Suisse and the reimbursement does not cause the applicable class's aggregate expenses, on an annualized basis, to exceed either (i) the applicable expense limitation in effect at the time such fees were waived or such expenses were paid by Credit Suisse or (ii) the applicable expense limitation in effect at the time of such reimbursement. This contract may not be terminated before February 28, 2025. For the year ended October 31, 2023, Credit Suisse recouped $49,814 ($47,032 in Class I, $2,674 in Class A, and $108 in Class C) of previously waived fees and expense reimbursements. For the year ended October 31, 2023, the fees waived/expenses reimbursed by Credit Suisse was $117,586. The net waived/expenses reimbursed amount for the year ended October 31, 2023 was $67,772.
The amounts waived and reimbursed by Credit Suisse, which are available for potential future recoupment by Credit Suisse, and the expiration schedule at October 31, 2023 are as follows:
| | | Fee waivers/expense
reimbursements
subject to
recoupment | | Expires
October 31,
2024 | | Expires
October 31,
2025 | | Expires
October 31,
2026 | |
Class I | | $ | 201,049 | | | $ | 66,980 | | | $ | 22,762 | | | $ | 111,307 | | |
Class A | | | 10,226 | | | | 2,749 | | | | 1,439 | | | | 6,038 | | |
Class C | | | 455 | | | | 167 | | | | 47 | | | | 241 | | |
Totals | | $ | 211,730 | | | $ | 69,896 | | | $ | 24,248 | | | $ | 117,586 | | |
Credit Suisse Securities (USA) LLC ("CSSU"), an affiliate of Credit Suisse, serves as the distributor of the Fund's shares. Pursuant to a distribution plan adopted by the Fund pursuant to Rule 12b-1 under the 1940 Act, CSSU receives fees for its distribution services. These fees are calculated at an annual rate of 0.25% of the average daily net assets of the Class A shares. For the Class C shares, the fee is calculated at an annual rate of 1.00% of the average daily net assets. For the year ended October 31, 2023, the Fund paid Rule 12b-1 distribution fees of $39,673 for Class A shares and $6,191 for Class C shares. Class I shares are not subject to Rule 12b-1 distribution fees.
29
Credit Suisse Managed Futures Strategy Fund
Notes to Consolidated Financial Statements (continued)
October 31, 2023
Note 3. Transactions with Affiliates and Related Parties (continued)
For the year ended October 31, 2023, CSSU and its affiliates advised the Fund that they retained $726 from commissions earned on the sale of the Fund's Class A shares. There were no commissions earned on the sale of Class C shares.
Note 4. Line of Credit
The Fund, together with other funds/portfolios advised by Credit Suisse (collectively, the "Participating Funds"), participates in a committed, unsecured line of credit facility ("Credit Facility"), with SSB in an aggregated amount of $125 million for temporary or emergency purposes under a first-come, first-served basis. Under the terms of the Credit Facility, the Participating Funds pay an aggregate commitment fee on the average unused amount of the Credit Facility, which is allocated among the Participating Funds in such manner as is determined by the governing Boards of the Participating Funds. In addition, the Participating Funds pay interest on borrowings at either the Federal Funds Effective rate or the Overnight Bank Funding rate plus a spread. At October 31, 2023 and for the year ended October 31, 2023, the Fund had no borrowings outstanding under the Credit Facility.
Note 5. Purchases and Sales of Securities
For the year ended October 31, 2023, purchases and sales of investment securities (excluding short-term investments) and U.S. Government and Agency Obligations were as follows:
Investment Securities | | U.S. Government/
Agency Obligations | |
| Purchases | | Sales | | Purchases | | Sales | |
| $ | 0 | | | $ | 0 | | | $ | 0 | | | $ | 0 | | |
Note 6. Capital Share Transactions
The Fund is authorized to issue an unlimited number of full and fractional shares of beneficial interest, $0.001 par value per share. The Fund offers Class I, Class A and Class C shares. Transactions in capital shares for each class of the Fund were as follows:
| | | Class I | |
| | | For the Year Ended
October 31, 2023 | | For the Year Ended
October 31, 2022 | |
| | | Shares | | Value | | Shares | | Value | |
Shares sold | | | 9,444,889 | | | $ | 93,693,073 | | | | 9,603,893 | | | $ | 105,688,915 | | |
Shares issued in reinvestment
of distributions | | | 6,324,027 | | | | 62,418,151 | | | | 3,008,390 | | | | 29,783,058 | | |
Shares redeemed | | | (25,069,492 | ) | | | (250,095,598 | ) | | | (11,898,154 | ) | | | (133,229,624 | ) | |
Net increase (decrease) | | | (9,300,576 | ) | | $ | (93,984,374 | ) | | | 714,129 | | | $ | 2,242,349 | | |
30
Credit Suisse Managed Futures Strategy Fund
Notes to Consolidated Financial Statements (continued)
October 31, 2023
Note 6. Capital Share Transactions (continued)
| | | Class A | |
| | | For the Year Ended
October 31, 2023 | | For the Year Ended
October 31, 2022 | |
| | | Shares | | Value | | Shares | | Value | |
Shares sold | | | 534,738 | | | $ | 5,472,987 | | | | 1,695,765 | | | $ | 19,382,820 | | |
Shares issued in reinvestment
of distributions | | | 375,660 | | | | 3,643,900 | | | | 118,022 | | | | 1,150,720 | | |
Shares redeemed | | | (2,173,693 | ) | | | (21,538,722 | ) | | | (992,002 | ) | | | (11,385,014 | ) | |
Net increase (decrease) | | | (1,263,295 | ) | | $ | (12,421,835 | ) | | | 821,785 | | | $ | 9,148,526 | | |
| | | Class C | |
| | | For the Year Ended
October 31, 2023 | | For the Year Ended
October 31, 2022 | |
| | | Shares | | Value | | Shares | | Value | |
Shares sold | | | 7,301 | | | $ | 66,497 | | | | 43,463 | | | $ | 491,200 | | |
Shares issued in reinvestment
of distributions | | | 11,944 | | | | 108,570 | | | | 6,380 | | | | 58,955 | | |
Shares redeemed | | | (77,219 | ) | | | (681,249 | ) | | | (63,832 | ) | | | (706,056 | ) | |
Net decrease | | | (57,974 | ) | | $ | (506,182 | ) | | | (13,989 | ) | | $ | (155,901 | ) | |
On October 31, 2023, the number of shareholders that held 5% or more of the outstanding shares of each class of the Fund was as follows:
| | | Number of
Shareholders | | Approximate Percentage
of Outstanding Shares | |
Class I | | | 5 | | | | 92 | % | |
Class A | | | 1 | | | | 70 | % | |
Class C | | | 4 | | | | 100 | % | |
The Fund's performance may be negatively impacted in the event one or more of the Fund's greater than 5% shareholders were to redeem at a given time. Some of the shareholders may be omnibus accounts, which hold shares on behalf of individual shareholders.
Note 7. Income Tax Information and Distributions to Shareholders
Income and capital gain distributions are determined in accordance with federal income tax regulations, which may differ from GAAP.
The tax character of dividends paid by the Fund during the fiscal years ended October 31, 2023 and 2022, respectively, was as follows:
Ordinary Income | | Long-Term Capital Gains | |
| 2023 | | 2022 | | 2023 | | 2022 | |
| $ | 36,781,911 | | | $ | 32,155,444 | | | $ | 32,236,524 | | | $ | 0 | | |
31
Credit Suisse Managed Futures Strategy Fund
Notes to Consolidated Financial Statements (continued)
October 31, 2023
Note 7. Income Tax Information and Distributions to Shareholders (continued)
The tax basis components of distributable earnings differ from book basis by temporary book/tax differences. These differences are primarily due to differing treatments of futures contracts marked to market, Subsidiary adjustments, organization costs, straddle deferral, and wash sales.
At October 31, 2023, the components of distributable earnings on a tax basis were as follows:
Accumulated net realized loss | | $ | (14,571,255 | ) | |
Unrealized appreciation | | | 416,137 | | |
| | | $ | (14,155,118 | ) | |
At October 31, 2023, the Fund had $7,460,471 of unlimited short-term capital loss carryforwards and $7,110,784 of unlimited long term capital loss carryforwards available to offset possible future capital gains.
At October 31, 2023, the cost and net unrealized appreciation (depreciation) of investments and derivatives for income tax purposes were as follows:
Cost of Investments | | $ | 225,552,127 | | |
Unrealized appreciation | | $ | 2,569,248 | | |
Unrealized depreciation | | | (2,153,111 | ) | |
Net unrealized appreciation (depreciation) | | $ | 416,137 | | |
To adjust for current period permanent book/tax differences which arose principally from differing book/tax treatment of foreign currency gain (loss), distribution in excess, net operating losses, and Subsidiary cumulative income (loss), paid-in capital was charged $18,600,697 and distributable earnings (loss) was credited $18,600,697. Net assets were not affected by this reclassification.
Note 8. Contingencies
In the normal course of business, the Fund may provide general indemnifications pursuant to certain contracts and organizational documents. The Fund's maximum exposure under these arrangements is dependent on future claims that may be made against the Fund and, therefore, cannot be estimated; however, based on experience, the risk of loss from such claims is considered remote.
Note 9. UBS Merger
On June 12, 2023 (the "Closing Date"), Credit Suisse Group AG ("CS Group") merged with and into UBS Group AG, a global financial services company ("UBS Group"), with UBS Group remaining as the surviving company (the
32
Credit Suisse Managed Futures Strategy Fund
Notes to Consolidated Financial Statements (continued)
October 31, 2023
Note 9. UBS Merger (continued)
"Transaction"), pursuant to a definitive merger agreement signed on March 19, 2023. CS Group was the ultimate parent company of Credit Suisse, the Fund's investment manager. As a result of the Transaction, Credit Suisse is now an indirect wholly-owned subsidiary of UBS Group.
The closing of the Transaction was deemed to result in an assignment of the Fund's investment advisory agreement with Credit Suisse (the "Prior Advisory Agreement"), resulting in its automatic termination as of the Closing Date. Prior to the Closing Date, the Board of the Fund approved a new investment advisory agreement with Credit Suisse (the "New Advisory Agreement"), which was then approved by shareholders at a joint special meeting of shareholders of the Fund and the other Credit Suisse funds held on August 24, 2023. In addition, prior to the Closing Date, the Board approved an interim investment advisory agreement with Credit Suisse (the "Interim Advisory Agreement"). The Interim Advisory Agreement did not require shareholder approval. The Interim Advisory Agreement took effect upon the Closing Date when the Prior Advisory Agreement was deemed to have terminated, so that Credit Suisse could continue to manage the Fund following the Closing Date. The Interim Advisory Agreement terminated upon the shareholder approval of the corresponding New Advisory Agreement. The Interim Advisory Agreement contained the same terms and conditions as the corresponding Prior Advisory Agreement except for the effective and termination dates, the termination and escrow provisions required by Rule 15a-4 under the 1940 Act and certain non-material changes. During the period that the Interim Advisory Agreement was in effect, Credit Suisse's advisory fees were held in an interest-bearing escrow account, pursuant to Rule 15a-4.
In addition, on June 7, 2023, Credit Suisse and certain of its affiliates filed an application (the "Application") for a waiver from disqualification under Section 9(a) of the 1940 Act from serving as investment adviser to registered investment companies, including the Fund, in connection with a consent order and final judgment (the "Consent Judgment") filed in New Jersey Superior Court on October 24, 2022. The Consent Judgment was entered against certain of Credit Suisse's affiliates, but did not involve the Fund or the services that Credit Suisse and its affiliates provided to the Fund. Because Credit Suisse is an affiliate of the entities subject to the Consent Judgment, it could also be subject to disqualification under Section 9(a), despite not being involved in the conduct underlying the Consent Judgment. As requested in the Application, the SEC granted a temporary waiver from Section 9(a) to Credit Suisse and its affiliates, as well as to UBS Group and its affiliates ("UBS"), on June 7, 2023.
33
Credit Suisse Managed Futures Strategy Fund
Notes to Consolidated Financial Statements (continued)
October 31, 2023
Note 9. UBS Merger (continued)
The temporary waiver became effective on the Closing Date. Credit Suisse and certain of its affiliates also applied for a permanent order, which the SEC granted on July 5, 2023. The permanent order grants (i) a time-limited exemption from Section 9(a) (the "Time-Limited Exemption"), which enables Credit Suisse to provide investment advisory services to the Fund until the 12-month anniversary of the Closing Date (by which point such services are anticipated to be transitioned to one or more UBS asset management affiliates), and (ii) a permanent exemption from Section 9(a) for UBS.
No changes to the investment objective, principal investment strategies and policies, principal risks, fundamental and non-fundamental investment policies, or portfolio managers ("Fund-specific changes") (other than potential personnel changes outside of Credit Suisse's control) of the Fund are currently contemplated as a result of the Transaction or the Time-Limited Exemption. Although no Fund-specific changes are currently contemplated as a result of the Transaction, shareholders should note that Credit Suisse is expected to transition the investment advisory services that its currently provides to the Fund to one or more registered investment advisers affiliated with UBS on or prior to June 12, 2024 (the "UBS Transition"). In connection with, or following the completion of, the UBS Transition, it is possible that there could be Fund-specific changes. In addition, subject to Board approval, one or more Fund service providers may change prior to the expiration of the Time-Limited Exemption in connection with the UBS Transition. However, the exact structure and timing of the UBS Transition and Fund-specific changes (if any) related to the UBS Transition have not yet been finalized. It is expected that any Fund-specific changes related to the UBS Transition will be implemented without shareholder approval except to the extent such approvals are required under the federal securities laws. Shareholders of the Fund will be promptly notified of any material Fund-specific changes.
Note 10. Subsequent Events
On December 13, 2023, the U.S. Securities and Exchange Commission (the "SEC") entered an administrative cease and desist order (the "Order") against Credit Suisse Securities (USA) LLC ("CSSU") and two affiliated Credit Suisse entities (collectively, the Credit Suisse Entities) alleging in the Order that the Credit Suisse Entities were ineligible to provide underwriting and investment advisory services to registered investment companies, including the Fund, during the period from October 24, 2022 to June 7, 2023 in violation of Section 9(a) of the Investment Company Act of 1940 (the "1940 Act") as a result
34
Credit Suisse Managed Futures Strategy Fund
Notes to Consolidated Financial Statements (continued)
October 31, 2023
Note 10. Subsequent Events (continued)
of a consent order and final judgment (the "Consent Judgment") entered against CSSU in New Jersey Superior Court on October 24, 2022 involving the sale of mortgage-backed securities approximately fifteen years ago. The Consent Judgment did not involve registered investment companies or the services that the Credit Suisse Entities provided to registered investments companies or the Fund. Without admitting or denying the findings in the SEC's Order, the Credit Suisse Entities agreed to pay$10,080,220 in disgorgement, prejudgment interest and civil penalties and agree to cease and desist from committing or causing any violations or any future violations of Section 9(a) of the 1940 Act.
On October 24, 2022, as noted above, the Superior Court of New Jersey entered a Consent Judgement that resolved a case alleging that CSSU violated the antifraud provisions of the State of New Jersey securities laws in connection with its role as underwriter of residential mortgage-backed securities. As a result of this Consent Judgement, the SEC, as noted above, alleged that the Credit Suisse Entities were deemed ineligible from serving as principal underwriter or investment adviser to registered investment companies and employees' securities companies pursuant to Section 9(a) of the 1940 Act and that the Credit Suisse Entities continued to serve in these roles until the Commission granted them respective time-limited exemptions on June 7, 2023.
35
Credit Suisse Managed Futures Strategy Fund
Report of Independent Registered Public Accounting Firm
To the Board of Trustees of Credit Suisse Opportunity Funds and
Shareholders of Credit Suisse Managed Futures Strategy Fund
Opinion on the Financial Statements
We have audited the accompanying consolidated statement of assets and liabilities, including the consolidated schedule of investments, of Credit Suisse Managed Futures Strategy Fund (one of the funds constituting Credit Suisse Opportunity Funds, referred to hereafter as the "Fund") as of October 31, 2023, the related consolidated statement of operations for the year ended October 31, 2023, the consolidated statement of changes in net assets for each of the two years in the period ended October 31, 2023, including the related notes, and the consolidated financial highlights for each of the four years in the period ended October 31, 2023 (collectively referred to as the "consolidated financial statements"). In our opinion, the consolidated financial statements present fairly, in all material respects, the financial position of the Fund as of October 31, 2023, the results of its operations for the year then ended, the changes in its net assets for each of the two years in the period ended October 31, 2023 and the financial highlights for each of the four years in the period ended October 31, 2023 in conformity with accounting principles generally accepted in the United States of America.
The consolidated financial statements of the Fund as of and for the year ended October 31, 2019 and the consolidated financial highlights for the year ended October 31, 2019 (not presented herein, other than the consolidated financial highlights) were audited by other auditors whose report dated December 20, 2019 expressed an unqualified opinion on those consolidated financial statements and consolidated financial highlights.
Basis for Opinion
These consolidated financial statements are the responsibility of the Fund's management. Our responsibility is to express an opinion on the Fund's consolidated financial statements based on our audits. We are a public accounting firm registered with the Public Company Accounting Oversight Board (United States) (PCAOB) and are required to be independent with respect to the Fund in accordance with the U.S. federal securities laws and the applicable rules and regulations of the Securities and Exchange Commission and the PCAOB.
We conducted our audits of these consolidated financial statements in accordance with the standards of the PCAOB. Those standards require that we plan and
36
Credit Suisse Managed Futures Strategy Fund
Report of Independent Registered Public Accounting Firm
perform the audit to obtain reasonable assurance about whether the consolidated financial statements are free of material misstatement, whether due to error or fraud.
Our audits included performing procedures to assess the risks of material misstatement of the consolidated financial statements, whether due to error or fraud, and performing procedures that respond to those risks. Such procedures included examining, on a test basis, evidence regarding the amounts and disclosures in the consolidated financial statements. Our audits also included evaluating the accounting principles used and significant estimates made by management, as well as evaluating the overall presentation of the consolidated financial statements. Our procedures included confirmation of securities owned as of October 31, 2023 by correspondence with the custodian, transfer agent, and brokers; when replies were not received from brokers, we performed other auditing procedures. We believe that our audits provide a reasonable basis for our opinion.
/s/PricewaterhouseCoopers LLP
New York, New York
December 27, 2023
We have served as the auditor of one or more investment companies in Credit Suisse Asset Management, LLC investment companies since 2020.
37
Credit Suisse Managed Futures Strategy Fund
Shareholder Meeting Results (unaudited)
A special meeting of shareholders of Credit Suisse Managed Futures Strategy Fund (the "Fund") was held at Eleven Madison Avenue, New York, NY 10010 on August 24, 2023. The following matter was voted upon by the shareholders of the Fund and the results are presented below.
1. Approval of a new Investment Advisory Agreement:
| | Shares | | % of Total Shares
Outstanding | | % of Total Shares
Voted | |
For | | | 15,938,012 | | | | 55.94 | % | | | 99.18 | % | |
Against | | | 35,801 | | | | 0.13 | % | | | 0.22 | % | |
Abstain | | | 95,597 | | | | 0.34 | % | | | 0.59 | % | |
38
Credit Suisse Managed Futures Strategy Fund
Board Approval of Interim and New Investment Management Agreements (unaudited)
The Fund's Board of Trustees (the "Board" and the members thereof, the "Board Members"), including a majority of the Board Members who are not "interested persons" of the Fund (as defined in the Investment Company Act of 1940, as amended (the "1940 Act")) (the "Independent Board Members"), unanimously approved the Fund's interim investment management agreement (the "Interim Management Agreement") and new investment management agreement with Credit Suisse Asset Management, LLC ("Credit Suisse") (the "New Management Agreement") at a meeting of the Board held on May 16, 2023 (the "May 2023 Board Meeting") after concluding that each of the approval of the Interim Management Agreement and New Management Agreement was in the best interests of the Fund and its shareholders. The factors considered by the Board in considering and approving the Interim Management Agreement and New Management Agreement are set out below.
In anticipation of the closing of the merger of Credit Suisse Group AG ("CS Group") with and into UBS Group AG, a global financial services company ("UBS Group"), with UBS Group remaining as the surviving company (the "Merger"), and in response to a request from the Board, representatives of UBS Group and its affiliates (collectively, "UBS") attended the May 2023 Board Meeting and provided information regarding the UBS asset management business and the investment advisory and principal underwriting services currently provided to the UBS family of registered investment companies (the "UBS Presentation").
The Board's evaluation of the Interim Management Agreement and New Management Agreement reflected information provided at the May 2023 Board Meeting as well as, where relevant, information relating to the Fund and Credit Suisse, that was previously furnished to the Board in connection with a special meeting held on November 9, 2022, where the Board discussed the information and materials relating to the renewal of the Fund's prior investment management agreement with Credit Suisse (the "Prior Management Agreement"), and at an in-person meeting held on November 14-15, 2022 (the "November 2022 15(c) Meeting"), where the Board approved the renewal of the Prior Management Agreement (collectively, the "November 2022 15(c) Materials"), and information provided to the Board at other Board meetings throughout the year. The Board considered Credit Suisse's representations at the May 2023 Board Meeting that (i) no material changes to the information provided in the November 2022 15(c) Materials had occurred since the November 2022 15(c) Meeting, (ii) with respect to the Interim Management Agreement, the scope and quality of services under the Interim Management Agreement will be at least equivalent to the scope and quality of services provided under the Prior Management Agreement, and (iii) the
39
Credit Suisse Managed Futures Strategy Fund
Board Approval of Interim and New Investment Management Agreements (unaudited) (continued)
personnel, resources and services provided to the Fund are not expected to change under the Interim Management Agreement and New Management Agreement and will be similar to those services provided under the Prior Management Agreement. The Board also considered that the Interim Management Agreement will be substantially similar to the Prior Management Agreement, including with respect to compensation, except for certain terms including the term, termination and escrow provisions required by Rule 15a-4 under the 1940 Act and certain non-material changes.
The Board, including all of the Independent Board Members, were assisted by experienced independent legal counsel throughout the Interim Management Agreement and New Management Agreement review process. The Independent Board Members discussed the proposed approval in private session with such counsel at which no representatives of management or Credit Suisse were present. Each Board Member, including each of the Independent Board Members, relied upon the advice of independent legal counsel and his or her own business judgment in determining the material factors to be considered in evaluating the Interim Management Agreement and New Management Agreement and the weight to be given to each such factor. The conclusions reached by the Board Members were based on a comprehensive evaluation of all of the information provided and were not the result of any one factor. Moreover, each Board Member may have afforded different weight to the various factors in reaching his or her conclusions with respect to the Interim Management Agreement and New Management Agreement.
On June 7, 2023, Credit Suisse and certain of its affiliates filed an application with the Securities and Exchange Commission pursuant to Section 9(c) of the 1940 Act for temporary and permanent orders granting an exemption to Credit Suisse and its affiliates, as well as to UBS, from the prohibitions under Section 9(a) of the 1940 Act, in connection with a consent order and final judgment ("Consent Judgment") filed in New Jersey Superior Court on October 24, 2022, which was entered against certain of Credit Suisse's affiliates. Section 9(a) of the 1940 Act automatically prohibits entities that are, or whose affiliates are, subject to, among other things, certain court ordered "injunctions," from serving or acting as investment adviser of any investment company registered under the 1940 Act or a principal underwriter for any registered open-end investment company under the 1940 Act, or serving in various other capacities in respect of registered investment companies.
While the application for the Section 9(c) exemption was submitted and the temporary order (the "Temporary Order") granting a temporary exemption
40
Credit Suisse Managed Futures Strategy Fund
Board Approval of Interim and New Investment Management Agreements (unaudited) (continued)
from Section 9(a) of the 1940 Act was granted to Credit Suisse and its affiliates, as well as to UBS, after the Board approved the Interim Management Agreement and New Management Agreement at the May 2023 Board Meeting, since shortly after the entry of the Consent Judgment in October 2022, the Board has been apprised of the Consent Judgment and the potential consequences thereof under Section 9(a) of the 1940 Act and have been provided with regular updates. In addition, the Board was apprised of the filing of the Section 9(c) exemption application and the implications of the Time-Limited Exemption (as defined below) prior to approving the submission of the New Management Agreement to shareholders at a meeting of the Board held on June 15, 2023.
The "Time-Limited Exemption" refers to the time-limited exemption from Section 9(a) of the 1940 Act for 12 months from the closing date of the Merger sought by Credit Suisse and certain of its affiliates to provide Credit Suisse and Credit Suisse Securities (USA) LLC ("CSSU") with adequate time to complete the CS Fund Servicing Reorganization (as defined below) while engaged in serving as investment adviser and underwriter to the Fund, respectively (collectively, "Fund Servicing Activities"). The "CS Fund Servicing Reorganization" refers to the process of (i) transitioning the Fund Servicing Activities that Credit Suisse and CSSU perform on behalf of one or more of the funds to other providers of such services, and/or (ii) restructuring the Temporary Order applicants' businesses such that Credit Suisse, Credit Suisse UK and/or each other company that was an "affiliated person" of the settling entities in the Consent Judgement as of the date of the Section 9(c) application may provide Fund Servicing Activities without being subject to disqualification under Section 9(a) of the 1940 Act. Credit Suisse and certain of its affiliates also applied for a permanent order, which the SEC granted on July 5, 2023.
Investment Management Fee Rates and Expenses
The Board reviewed and considered the contractual advisory fees of the Fund under its Prior Management Agreement and its Interim Management Agreement and New Management Agreement (which fees are identical), in light of the extent and quality of the management services provided by Credit Suisse, as investment adviser.
The Board also considered that Credit Suisse and the Fund have entered into a contractual expense limitation agreement limiting the Fund's total net expenses and that this arrangement was expected to continue under the Interim Management Agreement and New Management Agreement. The Board noted
41
Credit Suisse Managed Futures Strategy Fund
Board Approval of Interim and New Investment Management Agreements (unaudited) (continued)
that the Fund is authorized to reimburse Credit Suisse for management fees previously limited and/or for expenses previously reimbursed by Credit Suisse, provided, however, that any reimbursements must be paid at a date not more than thirty-six months following the applicable month during which such fees were limited or expenses were reimbursed by Credit Suisse and the reimbursements do not cause the Fund to exceed the applicable expense limitation at the time the fees are recouped. The Board also noted that the expense limitation agreement may not be terminated before February 28, 2024.
The November 2022 15(c) Materials included information comparing the Fund's contractual advisory fee, the Fund's contractual advisory fee less any waivers and/or reimbursements ("actual advisory fee"), and the Fund's overall expenses with those of funds in both the relevant expense group ("Expense Group") and universe of funds ("Expense Universe") provided by Broadridge, an independent provider of investment company data. The November 2022 15(c) Materials included a description of the methodology used to arrive at the funds included in the Expense Group and the Expense Universe. Each fund in the Expense Group and Expense Universe was placed in one of five quintiles for each relevant comparison period, with the first quintile including the funds with the lowest relative expenses and the fifth quintile including funds with the highest relative expenses during the period. The Fund's Board noted that, with respect to the Fund's fees and expenses compared to its peers as presented in a report provided by Broadridge, the Fund's contractual advisory fees ranked in the second quintile relative to its Expense Group, the Fund's actual advisory fees ranked in the third quintile relative to its Expense Group and Expense Universe, and the Fund's total expenses ranked in the first quintile relative to its Expense Group and Expense Universe.
Nature, Extent and Quality of the Services
The Board received and considered information regarding the nature, extent and quality of services provided to the Fund by Credit Suisse. The Board also noted information received at regular meetings throughout the year related to the services rendered by Credit Suisse which, in addition to portfolio management and investment management services, included credit analysis and research, supervising the day-to-day operations of the Fund's non-advisory functions which include accounting, administration, custody, transfer agent and other applicable third party service providers, overseeing and facilitating audits, overseeing the Fund's credit facility and supervising and/or preparing applicable Fund filings, disclosures and shareholder reports. The
42
Credit Suisse Managed Futures Strategy Fund
Board Approval of Interim and New Investment Management Agreements (unaudited) (continued)
Board noted that the extensive investment management services provided by Credit Suisse included broad supervisory responsibility and oversight over other service providers to the Fund. The Board also considered Credit Suisse's compliance program with respect to the Fund. The Board noted that Credit Suisse reports to the Board about portfolio management and compliance matters on a periodic basis. The Board also reviewed background information about Credit Suisse including its Form ADV Part 2 — Disclosure Brochure and Brochure Supplement and considered the background and experience of Credit Suisse's senior management and the expertise of, and the amount of attention given to the Fund by, senior personnel of Credit Suisse. In addition, the Board reviewed the qualifications, backgrounds and responsibilities of the portfolio management team primarily responsible for the day-to-day portfolio management of the Fund and the extent of the resources devoted to research and analysis of actual and potential investments, as well as the resources provided to them. The Board evaluated the ability of Credit Suisse based on its resources, reputation and other attributes, to attract and retain qualified investment professionals including research, advisory, and supervisory personnel. The Board also received and considered information about the nature, extent and quality of services and fee rates offered to other Credit Suisse clients for comparable services. The Board acknowledged Credit Suisse's representation that the services provided to the Fund are more extensive than the services provided in connection with other types of accounts, such as separate accounts, offered by Credit Suisse and the services are also more extensive from those offered and provided to a sub-advised fund. The Board also considered that the services provided by Credit Suisse have expanded over time as a result of regulatory and other developments.
Fund Performance
The Board considered information provided in the November 2022 15(c) Materials and at each subsequent quarterly meeting to consider the performance of the Fund. That information in the November 2022 15(c) Materials included performance results of the Fund over the previous year ended August 31, 2022 as well as over the two-, three-, four-, five-, and ten-year periods ended August 31, 2022 along with comparisons both to the relevant performance group ("Performance Group") and universe of funds ("Performance Universe") for the Fund for the same time periods provided by Broadridge. The November 2022 15(c) Materials included a description of the methodology used to arrive at the funds included in the Performance Group and the Performance Universe. Each fund in the Performance Universe was placed in one of five quintiles for each relevant comparison period, with the
43
Credit Suisse Managed Futures Strategy Fund
Board Approval of Interim and New Investment Management Agreements (unaudited) (continued)
first quintile including the best performing funds and the fifth quintile including the worst performing funds during the period. The Fund's performance ranked in the second quintile relative to its Performance Universe for the one- and two-year periods reported, the Fund's performance ranked in the third quintile relative to its Performance Universe for the three- and four-year periods reported, and the Fund's performance ranked in the fourth quintile relative to its Performance Universe for the five-year period reported.
The Board also considered the investment performance of the Fund relative to its stated objectives.
The Board noted that at the May 2023 Board Meeting, the Board received information from Credit Suisse regarding the Fund's performance relative to its benchmark for each month of 2023 and each quarter from the quarter ended June 30, 2020 through the quarter ended March 31, 2023, in addition to relative to its select peers for the three-month and one-, three- and five-year and since inception periods ended March 31, 2023.
Credit Suisse Profitability
The Board referred to a profitability analysis of Credit Suisse provided in the November 2022 15(c) Materials based on the fees payable under the Prior Management Agreement and the Interim Management Agreement and the New Management Agreement for the Fund, including any fee waivers, as well as other relationships between the Fund on the one hand and Credit Suisse affiliates on the other. The Board's deliberations also reflected, in the context of Credit Suisse's profitability, Credit Suisse's methodology for allocating costs to the Fund, recognizing that cost allocation methodologies are inherently subjective. The Board had also received net profitability information for the Fund. The Board reviewed Credit Suisse's profit margin as reflected in the profitability analysis, as well as reviewing profitability in light of appropriate court cases and the services rendered to the Fund.
Economies of Scale
The Board considered information provided in the November 2022 15(c) Materials regarding whether there have been economies of scale with respect to the management of the Fund, whether the Fund has appropriately benefited from any economies of scale, and whether there is potential for realization of any further economies of scale for the Fund. The Board considered that, if the Fund's asset levels grow, further economies of scale potentially could be realized (although this is not guaranteed) and also noted
44
Credit Suisse Managed Futures Strategy Fund
Board Approval of Interim and New Investment Management Agreements (unaudited) (continued)
the contractual expense limitations currently in place between the Fund and Credit Suisse. The Board received information regarding Credit Suisse's profitability in connection with providing investment management services to the Fund, including Credit Suisse's costs in providing the services.
Other Benefits to Credit Suisse
The Board considered other benefits received by Credit Suisse and its affiliates as a result of their relationship with the Fund previously included in the November 2022 15(c) Materials. Such benefits included, among others, benefits potentially derived from an increase in Credit Suisse's businesses and its reputation as a result of its relationship with the Fund (such as the ability to market its advisory services to other clients and investors including separate account or third party sub-advised mandates or other financial products offered by Credit Suisse and its affiliates), as well as, with respect to the Fund, the fees paid to an affiliate of Credit Suisse for distribution services.
The Board considered the standards Credit Suisse applied in seeking best execution and Credit Suisse's policies and practices regarding soft dollars and reviewed Credit Suisse's method for allocating portfolio investment opportunities among its advisory clients, as provided in the November 2022 15(c) Materials.
Other Factors and Broader Review
As discussed above, the Board previously reviewed and referred to detailed materials received from Credit Suisse as part of this special approval process. The Board also reviews and assesses the quality of the services that the Fund receives throughout the year and reviews reports of Credit Suisse at least quarterly, which include, among other things, detailed portfolio and market reviews, detailed Fund performance reports, and Credit Suisse's compliance procedures.
The Board also considered the information provided by the representatives of UBS during the UBS Presentation at the May 2023 Board Meeting. In particular, the Board considered the information regarding the investment advisory and principal underwriting services currently provided to the UBS family of registered investment companies.
In addition, the Board considered representations from Credit Suisse and UBS that there were no plans to make any changes to the investment objective(s), principal investment strategies and policies, principal risks,
45
Credit Suisse Managed Futures Strategy Fund
Board Approval of Interim and New Investment Management Agreements (unaudited) (continued)
fundamental and non-fundamental investment policies or portfolio managers (other than potential personnel changes outside of Credit Suisse's control) of the Fund upon the closing of the Merger.
Conclusions
After consideration of the foregoing, the Board reached the following conclusions regarding the Interim Management Agreement and the New Management Agreement (in addition to the conclusions set forth above):
• The contractual and net advisory fees for the Fund were reasonable in relation to the services provided by Credit Suisse.
• The Board was satisfied by the nature, extent and quality of the investment advisory services provided to the Fund by Credit Suisse and that, based on dialogue with management and counsel, the services to be provided by Credit Suisse under the Interim Management Agreement and the New Management Agreement are typical of, and consistent with, those provided to similar mutual funds by other investment advisers.
• In light of the costs of providing investment management and other services to the Fund and Credit Suisse's ongoing commitment to the Fund and willingness to waive fees (by agreeing to a contractual expense limitation), Credit Suisse's net profitability based on fees payable under the Interim Management Agreement and New Management Agreement, as well as other ancillary benefits that Credit Suisse and its affiliates received, were considered reasonable.
• In light of the information received and considered by the Board, the Fund's current fee structure was considered reasonable.
No single factor reviewed by the Board was identified by the Board as the principal factor in determining whether to approve the Interim Management Agreement and New Management Agreement. The Independent Board Members were advised by separate independent legal counsel throughout the process. After consideration of these factors, the Fund's Board concluded that the approval of the Interim Management Agreement and New Management Agreement was in the best interests of the Fund and the Fund's shareholders.
46
Credit Suisse Managed Futures Strategy Fund
Tax Information (unaudited)
The following information is provided pursuant to provisions of the Code:
The Fund hereby designates $32,236,524 as long-term capital gain distributions for purposes of the dividends paid deduction (including earnings and profits distributed to shareholders on redemption of Fund shares) for the year ended October 31, 2023.
47
Credit Suisse Managed Futures Strategy Fund
Information Concerning Trustees and Officers (unaudited)
Name, Address
(Year of Birth) | | Position(s)
Held with
Portfolio | | Term
of Office1
and
Length
of Time
Served | | Principal
Occupation(s) During
Past Five Years | | Number of
Portfolios
in Portfolio
Complex
Overseen
by Trustee | | Other
Trusteeships
Held by Trustee
During Past Five Years | |
Independent Trustees | | | | | | | | | | | |
Laura A. DeFelice
c/o Credit Suisse Asset Management, LLC
Attn: General Counsel
Eleven Madison Avenue
New York, New York
10010
(1959) | | Chair of the Board (as of November 14, 2023). Trustee, Nominating and Audit Committee Member | | Since 2017 | | Managing Member of Acacia Properties LLC (multi-family and commercial real estate ownership and operation) from 2008 to present; Stonegate Advisors LLC (renewable energy and energy efficiency) from 2007 to present. | | | 9 | | | Director of the Lyric Opera of Chicago (performing arts) from December 2021 to present. | |
Samantha Kappagoda
c/o Credit Suisse Asset
Management, LLC
Attn: General Counsel
Eleven Madison Avenue
New York, New York
10010
(1968) | | Trustee, Nominating Committee Chair and Audit Committee Member | | Since 2023 | | Chief Economist, Risk Economics, Inc. (Economic Analysis) from 2009 to present; Co-Managing Member, Numerati Partners LLC (Research & Development Technology) from 2012 to present. | | | 9 | | | Director of Girl Scouts of Greater New York (non-profit) from 2014 to present; Visiting Scholar, Courant Institute of Mathematical Sciences, New York University (education) from 2011 to present; Director of Council for Economic Education (nonprofit) from 2014 to 2020; Director of Glynwood Center, Inc. (nonprofit) from 2010 to 2019. | |
1 Subject to the Trust's retirement policy, each Trustee may continue to serve as a Trustee until the last day of the calendar year in which the applicable Trustee attains age 75. The Board may determine to extend the terms of Trustees beyond age 75 on a case-by-case basis. Each officer serves until his or her respective successor has been duly elected and qualified.
48
Credit Suisse Managed Futures Strategy Fund
Information Concerning Trustees and Officers (unaudited) (continued)
Name, Address
(Year of Birth) | | Position(s)
Held with
Portfolio | | Term
of Office1
and
Length
of Time
Served | | Principal
Occupation(s) During
Past Five Years | | Number of
Portfolios
in Portfolio
Complex
Overseen
by Trustee | | Other
Trusteeships
Held by Trustee
During Past Five Years | |
Independent Trustees | | | | | | | | | | | |
Mahendra R. Gupta
c/o Credit Suisse Asset Management, LLC
Attn: General Counsel
Eleven Madison Avenue
New York, New York
10010
(1956) | | Trustee, Nominating Committee Member and Audit Committee Chairman | | Since 2017 | | Professor, Washington University in St. Louis from July 1990 to present; Partner, R.J. Mithaiwala (food manufacturing and retail, India) from March 1977 to present; Partner, F.F.B. Corporation (agriculture, India) from March 1977 to present; Partner, RPMG Research Corporation (benchmark research) from July 2001 to present. | | | 9 | | | Director of Caleres Inc. (footwear) from May 2012 to present; Chair of the finance committee at the Foundation of Barnes Jewish Hospital (healthcare) from January 2018 to present; Director of First Bank (finance) from February 2022 to present; Director of ENDI Corporation (finance) from April 2022 to present; Director of The Oasis Institute (not-for-profit) from February 2022 to present; Director of the Consortium for Graduate Study in Management from November 2017 to present; Director of Koch Development Corporation (Real Estate Developement) from November 2017 to December 2020; Director of Supernova (Fin-tech) from June 2014 to September 2018; Director of the Guardian Angels of St. Louis (not-forprofit) from July 2015 to December 2021. | |
1 Subject to the Trust's retirement policy, each Trustee may continue to serve as a Trustee until the last day of the calendar year in which the applicable Trustee attains age 75. The Board may determine to extend the terms of Trustees beyond age 75 on a case-by-case basis. Each officer serves until his or her respective successor has been duly elected and qualified.
49
Credit Suisse Managed Futures Strategy Fund
Information Concerning Trustees and Officers (unaudited) (continued)
Name, Address
(Year of Birth) | | Position(s)
Held with
Portfolio | | Term
of Office1
and
Length
of Time
Served | | Principal
Occupation(s) During
Past Five Years | | Number of
Portfolios
in Portfolio
Complex
Overseen
by Trustee | | Other
Trusteeships
Held by Trustee
During Past Five Years | |
Independent Trustees | | | | | | | | | | | |
Steven N. Rappaport
c/o Credit Suisse Asset Management, LLC
Attn: General Counsel
Eleven Madison Avenue
New York, New York
10010
(1948) | | Chairman of the Board (through November 14, 2023). Trustee, Nominating and Audit Committee Member | | Trustee since Portfolio Inception and Chairman since 2005 | | Partner of Lehigh Court, LLC and RZ Capital (private investment firms) from July 2002 to present; Partner of Backstage Acquisition Holdings, LLC (publication job postings) from November 2013 to 2018. | | | 9 | | | Director of abrdn Emerging Markets Equity Income Fund, Inc. (a closed-end investment company); Director of abrdn Funds (20 open-end portfolios); Director of iCAD, Inc. (surgical & medical instruments & apparatus company) from 2006 to 2018. | |
Interested Trustee | | | | | | | | | | | |
John G. Popp2
Credit Suisse Asset
Management, LLC
Eleven Madison Avenue
New York, New York
10010
(1956) | | Trustee, Chief Executive Officer and President | | Trustee since 2017
Chief Executive Officer and President since 2010 | | Managing Director of Credit Suisse; Global Head and Chief Investment Officer of the Credit Investments Group; Associated with Credit Suisse or its predecessor since 1997; President and Chief Executive Officer of other Credit Suisse Funds. | | | 9 | | | None. | |
1 Subject to the Trust's retirement policy, each Trustee may continue to serve as a Trustee until the last day of the calendar year in which the applicable Trustee attains age 75. The Board may determine to extend the terms of Trustees beyond age 75 on a case-by-case basis. Each officer serves until his or her respective successor has been duly elected and qualified.
2 Mr. Popp is an "interested person" of the Trust, as defined in the 1940 Act, by virtue of his current position as an officer of Credit Suisse.
50
Credit Suisse Managed Futures Strategy Fund
Information Concerning Trustees and Officers (unaudited) (continued)
Name, Address
(Year of Birth) | | Position(s)
Held with
Portfolio | | Term of
Office
and
Length of
Time
Served | | Principal Occupation(s) During Past Five Years | |
Officers* | | | | | | | |
Brandi Sinkovich
Credit Suisse Asset
Management, LLC
Eleven Madison Avenue
New York, New York 10010
(1979) | | Chief Compliance Officer | | Since 2023 | | Director of Credit Suisse since 2023; Vice President and Regulatory Counsel, Exos Financial from 2022 to 2023; Vice President and Compliance Officer, Neuberger Berman from 2019 to 2022; Vice President, Compliance, Goldman Sachs from 2017 to 2019; Associated with Credit Suisse since 2023; Officer of other Credit Suisse Funds. | |
Lou Anne McInnis
Credit Suisse Asset Management, LLC
Eleven Madison Avenue
New York, New York 10010
(1959) | | Chief Legal Officer | | Since 2015 | | Director of Credit Suisse; Associated with Credit Suisse since April 2015; Counsel at DLA Piper US LLP from 2011 to April 2015; Associated with Morgan Stanley Investment Management from 1997 to 2010; Officer of other Credit Suisse Funds. | |
Omar Tariq
Credit Suisse Asset
Management, LLC
Eleven Madison Avenue
New York, New York 10010
(1983) | | Chief Financial Officer and Treasurer | | Since 2019 | | Director of Credit Suisse since 2019; Senior Manager of PricewaterhouseCoopers,LLP from September 2010 to March 2019; Officer of other Credit Suisse Funds. | |
Karen Regan
Credit Suisse Asset
Management, LLC
Eleven Madison Avenue
New York, New York 10010
(1963) | | Vice President and Secretary | | Since 2010 | | Vice President of Credit Suisse; Associated with Credit Suisse since December 2004; Officer of other Credit Suisse Funds. | |
* The officers of the Portfolio shown are officers that make policy decisions.
The Statement of Additional Information includes additional information about the Trustees and is available, without charge, upon request, by calling 877-870-2874.
51
Credit Suisse Managed Futures Strategy Fund
Proxy Voting and Portfolio Holdings Information (unaudited)
Information regarding how the Fund voted proxies related to its portfolio securities during the 12-month period ended June 30 of each year, as well as the policies and procedures that the Fund uses to determine how to vote proxies relating to its portfolio securities are available:
• By calling 1-877-870-2874
• On the Fund's website, www.credit-suisse.com/us/funds
• On the website of the Securities and Exchange Commission, www.sec.gov
The Fund files a complete schedule of its portfolio holdings for the first and third quarters of its fiscal year with the SEC as an exhibit to its reports on Form N-PORT, and for reporting periods ended prior to March 31, 2019, filed such information on Form N-Q. The Fund's Forms N-PORT and N-Q are available on the SEC's website at www.sec.gov.
52

P.O. BOX 219916, KANSAS CITY, MO 64121-9916
877-870-2874 ◼ www.credit-suisse.com/us/funds
CREDIT SUISSE SECURITIES (USA) LLC, DISTRIBUTOR. MFS-AR-1023

CREDIT SUISSE FUNDS
Annual Report
October 31, 2023
◼ CREDIT SUISSE
MULTIALTERNATIVE STRATEGY FUND
The Fund's investment objectives, risks, charges and expenses (which should be considered carefully before investing), and more complete information about the Fund, are provided in the Prospectus, which should be read carefully before investing. You may obtain additional copies by calling 877-870-2874 or by visiting our website at www.credit-suisse.com/us/funds.
Credit Suisse Securities (USA) LLC, Distributor, is located at Eleven Madison Avenue, New York, NY 10010. Credit Suisse Funds are advised by Credit Suisse Asset Management, LLC.
Investors in the Credit Suisse Funds should be aware that they may be eligible to purchase Class I shares (where offered) directly or through certain intermediaries. Such shares are not subject to a sales charge. Investors in the Credit Suisse Funds should also be aware that they may be eligible for a reduction or waiver of the sales charge with respect to Class A or C shares (where offered). For more information, please review the relevant prospectuses or consult your financial representative.
Fund shares are not deposits or other obligations of Credit Suisse Asset Management, LLC ("Credit Suisse") or any affiliate, are not FDIC-insured and are not guaranteed by Credit Suisse or any affiliate. Fund investments are subject to investment risks, including loss of your investment.
Credit Suisse Multialternative Strategy Fund
Annual Investment Adviser's Report
October 31, 2023 (unaudited)
October 31, 2023
Dear Shareholder:
We are pleased to present this Annual Report covering the activities of the Credit Suisse Multialternative Strategy Fund (the "Fund") for the twelve-month period ended October 31, 2023.
Performance Summary
11/01/2022 – 10/31/2023
Fund & Benchmark | | Performance | |
| Class I1 | | | 1.50 | % | |
| Class A1,2 | | | 1.15 | % | |
| ICE BofA US 3-Month Treasury Bill Index3 | | | 4.77 | % | |
Performance shown for the Fund's Class A shares does not reflect sales charges, which are a maximum of 5.25%.2
Market Review: Soaring interest rates and late cycle turbulence
The twelve-month period ended October 31, 2023 saw the pressure of restrictive monetary policy and mounting fiscal concerns push US government bond yields higher, magnifying interest rate differentials across developed markets, and buffeting currencies such as the Japanese Yen. With developed market economies showing signs of late cycle fatigue and China remaining in the doldrums, investors were on edge, and the price action across a range of asset classes was choppy. The ICE BofA US 3-Month Treasury Bill Index (the Fund's Benchmark) returned +4.77% for the period.
In the closing months of 2022, markets stood at a crossroads. Indications of continued labor market strength focused attention on upside inflation risks, even as flagging economic data pointed to a potential monetary policy pivot which central bankers refused to publicly entertain as China's reopening loomed large. Interest rate markets vacillated, and commodity sectors exhibited increasing decorrelation. The US Dollar weakened against major peers. Equity markets strengthened as the prospect of China's economy regaining steam coincided with moderating inflation fears and supportive technical dynamics around year-end, even as the bankruptcy filing of troubled crypto exchange FTX momentarily weighed on sentiment.
In Q1 2023, markets focused on the balance between slowing growth in the US and Europe and resurgent post-reopening activity in China. Later, a widening banking crisis with clear linkages to the US Treasury market consumed market attention, and investors contemplated implications for near-term growth and monetary policy. Yet, with economic data offering insufficient evidence of
1
Credit Suisse Multialternative Strategy Fund
Annual Investment Adviser's Report (continued)
October 31, 2023 (unaudited)
disinflation, policymakers felt little choice but to continue down the path of hiking. The period culminated with Silicon Valley Bank collapsing into receivership and UBS agreeing to buy Credit Suisse. Fixed income markets remained rangebound and choppy as investors reacted to shifting economic data and the anticipation of leadership changes at the Bank of Japan. Economically sensitive commodities softened as safe havens appreciated. The US Dollar weakened against European peers but lacked trading direction against other major currencies, and equity markets exhibited resilience in the face of a spate of headwinds.
Investors turned their attention to better-than-expected corporate earnings reports and the economic impact of advances in generative AI as markets moved into Q2 2023. The unfolding US debt ceiling crisis took center stage in May, calling into question the creditworthiness of the US government even as Joe Biden and then-House speaker Kevin McCarthy reached a deal to increase the debt-ceiling and cap federal spending on May 27th. Fixed income markets outside of Japan showed sensitivity to the risk of inflation expectations becoming de-anchored, but incoming Bank of Japan Governor Kazuo Ueda shocked markets in expressing reluctance to tweak the country's ultra-accommodative monetary policy. Commodities reversed sharply toward the end of the period as a weaker US Dollar coincided with pro-growth policy pronouncements from China, supply discipline on the part of OPEC+, and extreme weather across the Midwest and Great Plains. Currency trading became more disjointed over the period and equities continued their upward path.
Q3 2023 brought a chorus of guidance from developed market central bankers suggesting that policy interest rates would likely remain higher for longer. Investors absorbed Fitch's downgrade of US government debt to AA+ and the Financial Times' report of a notable uptick in banks' loan-loss rates by sending interest rates higher and reintroducing positive term premia in the US yield curve. Commodity markets diverged with Agriculture whipsawing, Industrial Metals and Precious Metals declining, and Energy moving higher as Saudi Arabia cut production and US stockpiles declined. The US Dollar attracted support on account of high US interest rates, relatively resilient economic growth, and haven status, particularly as disappointing European and Chinese growth soured sentiment later in the period. As the quarter wound down, equity markets began to capitulate.
At the end of the period, confidence disappeared. Signs that the Bank of Japan was taking steps toward monetary policy normalization underscored the seemingly indefatigable rise in developed market interest rates. Commodities moved broadly sideways except for Precious Metals which spiked with the
2
Credit Suisse Multialternative Strategy Fund
Annual Investment Adviser's Report (continued)
October 31, 2023 (unaudited)
emergence of the Israel-Hamas war and mounting concern surrounding US government dysfunction and fiscal profligacy. Relative economic resilience continued to support the US Dollar while equity markets swooned.
Strategic Review and Outlook: Markets in transition
The Fund is designed to serve as a core portfolio diversifier. Our process-driven approach blends quantitative techniques with disciplined oversight and seeks to deliver attractive long-term performance. The Fund seeks to achieve its investment objective by utilizing an investment process that allocates across a range of investment strategies including those that are Fundamental (Carry and Valuation) and Tactical (Flow, Intermediation, and Positioning) in nature. The program trades all major asset groups on a global basis, including corporate, real asset, and sovereign.
For the annual period ended October 31, 2023, the Fund underperformed its Benchmark.
The Fund's models saw the market in a primarily Transitory regime throughout the period. The Fund sought to evolve its strategy exposures accordingly, emphasizing breadth and balance in seeking returns with a low correlation to traditional portfolios.
Carry produced positive attribution during the period with Real Asset exposures, especially strategies capturing the rent available to commodity infrastructure providers, supporting gains. Concern surrounding the regulatory backdrop for mergers and acquisitions coincided with healthy deal spreads buoying risk arbitrage strategies. Carry in Commodity Infrastructure was the largest contributor to category performance, while Roll-Down in Fixed Income was the largest detractor.
Valuation delivered positive attribution. Against a backdrop of a skyrocketing interest rates and a wave of bank defaults, declining confidence in the US government, and rapidly shifting economic data, the pricing of many assets evolved over the course of the period, resulting in meaningful dispersion across Valuation strategies. The category's largest contributor, Quality in Equities (Cross-Sectional), benefitted from increasing preference for equity investments with more defensive characteristics. However, Buyback Activity in Equities, the category's largest detractor, struggled when investors reacted to escalating banking sector stress in March and early April and fled sectors such as Basic Materials and Financials which were recent beneficiaries of relatively high levels of corporate share repurchase activity.
3
Credit Suisse Multialternative Strategy Fund
Annual Investment Adviser's Report (continued)
October 31, 2023 (unaudited)
The Fund incurred losses across Flow strategies, especially those belonging to the Corporate asset group. While US equity markets appreciated over the course of the period, a small number of stocks drove that performance, reflecting both limited thematic leadership and limited opportunity for participation. Flow strategies, which seek to exploit lead-lag effects, produced mixed results. Equity investors reacted to surging interest rates by favoring companies offering front-loaded cash flows and limited financing needs, propelling healthy gains in Persistence in Equity Value Factor Performance Momentum in Structural Equity Themes detracted most as intensifying belt tightening weighed on companies at the forefront of longer-term socioeconomic transformation.
Intermediation contributed meaningfully to Fund performance. With commodity markets focused on the evolution of global growth in the aftermath of China's reopening and supply elasticity across key sectors, strategies seeking to profit from temporal gaps in supply and demand generally profited over the course of the period. The category's largest contributor, Seasonality in Commodities, profited as typical seasonal performance patterns within Agriculture and between Agriculture, Energy, and Livestock demonstrated persistence. Congestion in US Rates produced the second largest performance contribution within the category.
Positioning strategies incurred a disproportionate share of the Fund's losses during the period. While many markets experienced frequent reversals, others, particularly in the Real Asset group, saw more protracted moves in the face of structural changes in the global economy. The category's largest contributor, Positioning in Rates Volatility, benefitted from the period's tumult as a flurry of bank failures and a series of extraordinary response measures rocked investor sentiment and whipsawed interest rate markets. However, the category's largest detractor, Speculative Crowding in Commodities, suffered heavy losses as fundamentally oriented speculators stuck to their guns despite the backdrop of fluctuating risk appetite and large price moves.
Standing on the eve of the 2024 US election year, the world order appears in flux with populism and nationalism resurgent in many countries and technological advances posing new threats to established modes of production and incumbent power structures, just as the impact of a sustained period of high developed market interest rates manifests itself. We believe these conditions are potentially treacherous and underscore the value of the Multialternative Strategy's dynamic approach to promoting broad portfolio diversification.
4
Credit Suisse Multialternative Strategy Fund
Annual Investment Adviser's Report (continued)
October 31, 2023 (unaudited)
The Quantitative Investment Strategies Group
Yung-Shin Kung
The Fund is non-diversified, which means it may invest a greater proportion of its assets in the securities of a smaller number of issuers than a diversified mutual fund and may therefore be subject to greater volatility. The Fund's investment in alternative instruments may subject the Fund to greater volatility than investments in traditional securities, particularly in investments involving leverage.
The use of alternative assets and strategies entails substantial risks, including risk of loss of principal, arbitrage or fundamental risk, below investment grade securities risk, commodity exposure risks, convertible securities risk, correlation risk, counterparty risk, credit risk, derivatives risk, equity exposure risk, fixed income risk, foreign securities risk, forwards risk, futures contracts risk, hedged exposure risk, interest rate risk, leveraging risk, manager/model risk market risk, non-diversified status, options risk, portfolio turnover risk, risks of investing in other funds, short position risk, small- and mid- cap stock risk, speculative exposure risk, subsidiary risk, swap agreements risk and tax risk. For a detailed discussion of these and other risks, please refer to the Fund's Prospectus, which should be read carefully before investing.
In addition to historical information, this report contains forward-looking statements, which may concern, among other things, domestic and foreign markets, industry and economic trends and developments, and government regulation, and their potential impact on the Fund's investments. These statements are subject to risks and uncertainties and actual trends, developments and regulations in the future, and their impact on the Fund could be materially different from those projected, anticipated, or implied. The Fund has no obligation to update or revise forward-looking statements.
The views of the Fund's management are as of the date of this letter and the Fund holdings described in this document are as of October 31, 2023; these views and Fund holdings may have changed subsequent to these dates. Nothing in this document is a recommendation to purchase or sell securities.
5
Credit Suisse Multialternative Strategy Fund
Annual Investment Adviser's Report (continued)
October 31, 2023 (unaudited)
Comparison of Change in Value of $10,000 Investment in the
Credit Suisse Multialternative Strategy Fund1 Class I shares, Class A
shares2, and the ICE BofA US 3-Month Treasury Bill Index3 for Ten Years
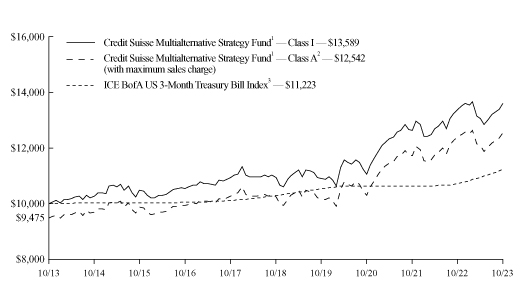
1 Fee waivers and/or expense reimbursements reduce expenses for the Fund, without which performance would be lower. The Fund has entered into a written contract limiting operating expenses to 0.85% of the Fund's average daily net assets for Class I shares and 1.10% of the Fund's average daily net assets for Class A shares at least through February 28, 2025. This limit excludes certain expenses, as set forth in the Fund's Prospectus.
2 Total return for the Fund's Class A shares for the reporting period, based on offering price (including maximum sales charge of 5.25%), was (4.18)%.
3 The ICE BofA US 3-Month Treasury Bill Index is comprised of a single issue purchased at the beginning of the month and held for a full month. Each month the Index is rebalanced and the issue selected is the outstanding Treasury Bill that matures closest to, but not beyond 3 months from the rebalancing date. The Index does not have transaction costs and investors may not invest directly in the Index.
6
Credit Suisse Multialternative Strategy Fund
Annual Investment Adviser's Report (continued)
October 31, 2023 (unaudited)
Average Annual Returns as of October 31, 20231
| | | 1 Year | | 5 Years | | 10 Years | |
Class I | | | 1.50 | % | | | 4.46 | % | | | 3.11 | % | |
Class A Without Sales Charge | | | 1.15 | % | | | 4.17 | % | | | 2.84 | % | |
Class A With Maximum Sales Charge | | | (4.18 | )% | | | 3.05 | % | | | 2.29 | % | |
Returns represent past performance and include change in share price and reinvestment of dividends, capital gains, and return of capital distributions, if any. Past performance cannot guarantee future results. The current performance of the Fund may be lower or higher than the figures shown. Returns and share price will fluctuate, and redemption value may be more or less than original cost. The performance results do not reflect the deduction of taxes that a shareholder would pay on Fund distributions or the redemption of Fund shares. Performance information current to the most recent month end is available at www.credit-suisse.com/us/funds.
The annual gross expense ratios are 1.23% for Class I shares and 1.48% for Class A shares. The annual net expense ratios after fee waivers and/or expense reimbursements are 0.85% for Class I shares and 1.10% for Class A.
1 Fee waivers and/or expense reimbursements reduce expenses for the Fund, without which performance would be lower. The Fund has entered into a written contract limiting operating expenses to 0.85% of the Fund's average daily net assets for Class I shares and 1.10% of the Fund's average daily net assets for Class A shares at least through February 28, 2025. This limit excludes certain expenses, as set forth in the Fund's Prospectus.
7
Credit Suisse Multialternative Strategy Fund
Annual Investment Adviser's Report (continued)
October 31, 2023 (unaudited)
Information About Your Fund's Expenses
As an investor of the Fund, you incur two types of costs: ongoing expenses and transaction costs. Ongoing expenses include management fees, distribution and service (12b-1) fees and other Fund expenses. Examples of transaction costs include sales charges (loads), redemption fees and account maintenance fees, which are not shown in this section and which would result in higher total expenses. The following table is intended to help you understand your ongoing expenses of investing in the Fund and to help you compare these expenses with the ongoing expenses of investing in other mutual funds. The table is based on an investment of $1,000 made at the beginning of the six months ended October 31, 2023.
The table illustrates your Fund's expenses in two ways:
• Actual Fund Return. This helps you estimate the actual dollar amount of ongoing expenses paid on a $1,000 investment in the Fund using the Fund's actual return during the period. To estimate the expenses you paid over the period, simply divide your account value by $1,000 (for example, an $8,600 account value divided by $1,000 = 8.6), then multiply the result by the number in the "Expenses Paid per $1,000" line.
• Hypothetical 5% Fund Return. This helps you to compare the Fund's ongoing expenses with those of other mutual funds using the Fund's actual expense ratio and a hypothetical rate of return of 5% per year before expenses. Examples using a 5% hypothetical fund return may be found in the shareholder reports of other mutual funds. The hypothetical account values and expenses may not be used to estimate the actual ending account balance or expenses you paid for the period.
Please note that the expenses shown in these tables are meant to highlight your ongoing expenses only and do not reflect any transaction costs, such as sales charges (loads) or redemption fees. If these transaction costs had been included, your costs would have been higher. The "Expenses Paid per $1,000" line of the tables is useful in comparing ongoing expenses only and will not help you determine the relative total expenses of owning different funds.
8
Credit Suisse Multialternative Strategy Fund
Annual Investment Adviser's Report (continued)
October 31, 2023 (unaudited)
Expenses and Value for a $1,000 Investment
for the six-month period ended October 31, 2023
Actual Fund Return | | Class I | | Class A | |
Beginning Account Value 05/01/23 | | $ | 1,000.00 | | | $ | 1,000.00 | | |
Ending Account Value 10/31/23 | | $ | 1,040.70 | | | $ | 1,039.10 | | |
Expenses Paid per $1,000* | | $ | 4.37 | | | $ | 5.65 | | |
Hypothetical 5% Fund Return | |
Beginning Account Value 05/01/23 | | $ | 1,000.00 | | | $ | 1,000.00 | | |
Ending Account Value 10/31/23 | | $ | 1,020.92 | | | $ | 1,019.66 | | |
Expenses Paid per $1,000* | | $ | 4.33 | | | $ | 5.60 | | |
| | | Class I | | Class A | |
Annualized Expense Ratios* | | | 0.85 | % | | | 1.10 | % | |
* Expenses are equal to the Fund's annualized expense ratio for each share class, multiplied by the average account value over the period, multiplied by 184/365 to reflect the one-half year period.
The "Expenses Paid per $1,000" and the "Annualized Expense Ratios" in the tables are based on actual expenses paid by the Fund during the period, net of fee waivers and/or actual expense reimbursements, if applicable. If those fee waivers and/or expense reimbursements had not been in effect, the Fund's actual expenses would have been higher. Expenses do not reflect additional charges and expenses that are, or may be, imposed under the variable contracts or plans. Such charges and expenses are described in the prospectus of the insurance company separate account or in the plan documents or other informational materials supplied by plan sponsors. The Fund's expenses should be considered with these charges and expenses in evaluating the overall cost of investing in the separate account.
For more information, please refer to the Fund's Prospectus.
9
Credit Suisse Multialternative Strategy Fund
Annual Investment Adviser's Report (continued)
October 31, 2023 (unaudited)
Investment Type Breakdown**
Common Stocks | | | 15.46 | % | |
Exchange-Traded Funds | | | 4.32 | | |
United States Treasury Obligations | | | 54.27 | | |
Short-Term Investment | | | 25.95 | | |
Total | | | 100.00 | % | |
** Expressed as a percentage of total investments (excluding securities lending collateral, if applicable) and may vary over time.
10
Credit Suisse Multialternative Strategy Fund
Consolidated Schedule of Investments
October 31, 2023
| | | Shares | | Value | |
| COMMON STOCKS (11.8%) | |
| BELGIUM (0.1%) | |
| Financial Services (0.1%) | |
Groupe Bruxelles Lambert NV | | | 3,381 | | | $ | 247,031 | | |
| BERMUDA (0.4%) | |
| Trading Companies & Distributors (0.4%) | |
Textainer Group Holdings Ltd. | | | 33,524 | | | | 1,646,699 | | |
| CANADA (0.5%) | |
| Broadline Retail (0.1%) | |
Canadian Tire Corp. Ltd., Class A(1) | | | 2,569 | | | | 247,527 | | |
| Capital Markets (0.1%) | |
Onex Corp. | | | 4,615 | | | | 258,367 | | |
| Chemicals (0.0%) | |
Nutrien Ltd. | | | 4,543 | | | | 243,733 | | |
| Consumer Staples Distribution & Retail (0.1%) | |
Empire Co. Ltd., Class A | | | 9,447 | | | | 258,589 | | |
| Metals & Mining - Excluding Steel (0.1%) | |
Kinross Gold Corp. | | | 47,377 | | | | 247,081 | | |
| Oil, Gas & Consumable Fuels (0.1%) | |
ARC Resources Ltd. | | | 15,893 | | | | 255,410 | | |
Imperial Oil Ltd. | | | 4,380 | | | | 249,344 | | |
Suncor Energy, Inc. | | | 7,760 | | | | 251,036 | | |
| | | | 755,790 | | |
| | | | 2,011,087 | | |
| DENMARK (0.2%) | |
| Air Freight & Logistics (0.0%) | |
DSV AS | | | 1,350 | | | | 201,528 | | |
| Beverages (0.1%) | |
Carlsberg AS, Class B | | | 1,997 | | | | 237,733 | | |
| Marine Transportation (0.0%) | |
AP Moller — Maersk AS, Class B | | | 140 | | | | 233,021 | | |
| Textiles, Apparel & Luxury Goods (0.1%) | |
Pandora AS | | | 2,434 | | | | 275,768 | | |
| | | | 948,050 | | |
| FINLAND (0.1%) | |
| Banks (0.0%) | |
Nordea Bank Abp | | | 23,374 | | | | 245,955 | | |
| Insurance (0.1%) | |
Sampo OYJ, Class A | | | 6,399 | | | | 251,404 | | |
| | | | 497,359 | | |
See Accompanying Notes to Consolidated Financial Statements.
11
Credit Suisse Multialternative Strategy Fund
Consolidated Schedule of Investments (continued)
October 31, 2023
| | | Shares | | Value | |
| COMMON STOCKS (continued) | |
| FRANCE (0.1%) | |
| Media (0.1%) | |
Vivendi SE | | | 28,755 | | | $ | 257,592 | | |
| Oil, Gas & Consumable Fuels (0.0%) | |
TotalEnergies SE | | | 3,828 | | | | 255,664 | | |
| | | | 513,256 | | |
| GERMANY (0.2%) | |
| Industrial Conglomerates (0.1%) | |
Siemens AG | | | 1,962 | | | | 260,084 | | |
| Media - Services (0.1%) | |
Scout24 SE(2) | | | 4,231 | | | | 260,021 | | |
| Textiles, Apparel & Luxury Goods (0.0%) | |
adidas AG | | | 1,445 | | | | 256,665 | | |
| | | | 776,770 | | |
| ITALY (0.2%) | |
| Banks (0.1%) | |
Intesa Sanpaolo SpA | | | 97,766 | | | | 254,493 | | |
UniCredit SpA | | | 10,495 | | | | 262,832 | | |
| | | | 517,325 | | |
| Oil, Gas & Consumable Fuels (0.1%) | |
Eni SpA | | | 15,636 | | | | 255,346 | | |
| | | | 772,671 | | |
| JERSEY (0.1%) | |
| Metals & Mining - Excluding Steel (0.1%) | |
Glencore PLC | | | 44,222 | | | | 233,851 | | |
| NETHERLANDS (0.2%) | |
| Consumer Staples Distribution & Retail (0.0%) | |
Koninklijke Ahold Delhaize NV | | | 8,364 | | | | 247,415 | | |
| Diversified Telecommunication Services (0.1%) | |
Koninklijke KPN NV | | | 76,482 | | | | 256,802 | | |
| Insurance (0.1%) | |
NN Group NV | | | 7,837 | | | | 251,090 | | |
| | | | 755,307 | | |
| NORWAY (0.4%) | |
| Entertainment (0.3%) | |
Kahoot! ASA(3) | | | 427,469 | | | | 1,338,936 | | |
| Oil, Gas & Consumable Fuels (0.1%) | |
Equinor ASA | | | 8,016 | | | | 268,704 | | |
| | | | 1,607,640 | | |
See Accompanying Notes to Consolidated Financial Statements.
12
Credit Suisse Multialternative Strategy Fund
Consolidated Schedule of Investments (continued)
October 31, 2023
| | | Shares | | Value | |
| COMMON STOCKS (continued) | |
| SPAIN (0.2%) | |
| Banks (0.1%) | |
Banco Bilbao Vizcaya Argentaria SA | | | 32,054 | | | $ | 251,914 | | |
CaixaBank SA | | | 62,726 | | | | 254,750 | | |
| | | | 506,664 | | |
| Oil, Gas & Consumable Fuels (0.1%) | |
Repsol SA | | | 17,100 | | | | 250,120 | | |
| | | | 756,784 | | |
| SWITZERLAND (0.3%) | |
| Construction Materials (0.0%) | |
Holcim AG(3) | | | 4,103 | | | | 253,568 | | |
| Electrical Equipment (0.1%) | |
ABB Ltd. | | | 7,604 | | | | 255,365 | | |
| Insurance (0.1%) | |
Swiss Life Holding AG | | | 400 | | | | 256,799 | | |
| Pharmaceuticals (0.1%) | |
Novartis AG | | | 2,720 | | | | 254,533 | | |
| | | | 1,020,265 | | |
| UNITED KINGDOM (1.7%) | |
| Banks (0.2%) | |
Barclays PLC | | | 130,740 | | | | 209,498 | | |
Lloyds Banking Group PLC | | | 468,331 | | | | 227,561 | | |
NatWest Group PLC | | | 88,162 | | | | 191,509 | | |
Standard Chartered PLC | | | 27,414 | | | | 209,846 | | |
| | | | 838,414 | | |
| Capital Markets (0.1%) | |
Abrdn PLC | | | 133,418 | | | | 254,289 | | |
| Consumer Staples Distribution & Retail (0.1%) | |
Tesco PLC | | | 79,736 | | | | 261,228 | | |
| Financial Services (0.6%) | |
Network International Holdings PLC(2),(3) | | | 561,464 | | | | 2,652,549 | | |
| Hotels, Restaurants & Leisure (0.1%) | |
InterContinental Hotels Group PLC | | | 3,421 | | | | 242,022 | | |
Whitbread PLC | | | 5,999 | | | | 242,848 | | |
| | | | 484,870 | | |
| Multi-Utilities (0.1%) | |
Centrica PLC | | | 135,731 | | | | 259,402 | | |
| Oil, Gas & Consumable Fuels (0.1%) | |
| BP PLC | | | 39,104 | | | | 238,376 | | |
Shell PLC | | | 7,974 | | | | 256,554 | | |
| | | | 494,930 | | |
See Accompanying Notes to Consolidated Financial Statements.
13
Credit Suisse Multialternative Strategy Fund
Consolidated Schedule of Investments (continued)
October 31, 2023
| | | Shares | | Value | |
| COMMON STOCKS (continued) | |
| UNITED KINGDOM (continued) | |
| Textiles, Apparel & Luxury Goods (0.3%) | |
Burberry Group PLC | | | 10,888 | | | $ | 224,033 | | |
Capri Holdings Ltd.(3) | | | 20,543 | | | | 1,051,391 | | |
| | | | 1,275,424 | | |
| Tobacco (0.1%) | |
Imperial Brands PLC | | | 12,465 | | | | 265,119 | | |
| | | | 6,786,225 | | |
| UNITED STATES (7.1%) | |
| Biotechnology (0.4%) | |
Point Biopharma Global, Inc.(3) | | | 40,537 | | | | 513,199 | | |
Seagen, Inc.(3) | | | 5,599 | | | | 1,191,523 | | |
| | | | 1,704,722 | | |
| Capital Markets (0.1%) | |
Avantax, Inc.(3) | | | 19,473 | | | | 502,598 | | |
| Chemicals (0.4%) | |
Chase Corp. | | | 12,973 | | | | 1,648,349 | | |
| Commercial Services & Supplies (0.1%) | |
SP Plus Corp.(3) | | | 9,807 | | | | 495,548 | | |
| Food Products (0.4%) | |
Sovos Brands, Inc.(3) | | | 72,497 | | | | 1,573,910 | | |
| Healthcare Technology (0.4%) | |
NextGen Healthcare, Inc.(3) | | | 63,220 | | | | 1,512,222 | | |
| Insurance (0.6%) | |
Argo Group International Holdings Ltd. | | | 16,331 | | | | 487,317 | | |
National Western Life Group, Inc., Class A | | | 3,403 | | | | 1,629,697 | | |
| | | | 2,117,014 | | |
| Oil, Gas & Consumable Fuels (2.0%) | |
Earthstone Energy, Inc., Class A(3) | | | 127,992 | | | | 2,709,590 | | |
Hess Corp. | | | 16,762 | | | | 2,420,433 | | |
Pioneer Natural Resources Co. | | | 10,808 | | | | 2,583,112 | | |
| | | | 7,713,135 | | |
| Software (1.8%) | |
EngageSmart, Inc.(3) | | | 122,156 | | | | 2,766,833 | | |
New Relic, Inc.(3) | | | 32,428 | | | | 2,810,535 | | |
Splunk, Inc.(3) | | | 11,437 | | | | 1,683,069 | | |
| | | | 7,260,437 | | |
| Specialty Retail (0.1%) | |
Chico's FAS, Inc.(3) | | | 66,798 | | | | 499,649 | | |
See Accompanying Notes to Consolidated Financial Statements.
14
Credit Suisse Multialternative Strategy Fund
Consolidated Schedule of Investments (continued)
October 31, 2023
| | | Shares | | Value | |
| COMMON STOCKS (continued) | |
| UNITED STATES (continued) | |
| Technology Hardware & Storage (0.4%) | |
Avid Technology, Inc.(3) | | | 54,949 | | | $ | 1,484,722 | | |
| Trading Companies & Distributors (0.4%) | |
Veritiv Corp. | | | 9,678 | | | | 1,639,550 | | |
| | | | 28,151,856 | | |
| TOTAL COMMON STOCKS (Cost $47,231,675) | | | 46,724,851 | | |
| EXCHANGE-TRADED FUNDS (3.3%) | |
| UNITED STATES (3.3%) | |
| Commingled Funds (0.9%) | |
Invesco QQQ Trust Series 1 | | | 4,170 | | | | 1,463,128 | | |
iShares 3-7 Year Treasury Bond ETF | | | 19,729 | | | | 2,215,369 | | |
| | | | 3,678,497 | | |
| Energy - Integrated (0.6%) | |
Energy Select Sector SPDR Fund | | | 25,202 | | | | 2,146,958 | | |
| Financial Services (1.6%) | |
Consumer Discretionary Select Sector SPDR Fund | | | 9,290 | | | | 1,413,009 | | |
iShares MSCI EAFE Value ETF | | | 30,198 | | | | 1,426,252 | | |
SPDR S&P 500 ETF Trust | | | 8,705 | | | | 3,640,431 | | |
| | | | 6,479,692 | | |
| Technology (0.2%) | |
Technology Select Sector SPDR Fund(1) | | | 4,546 | | | | 745,590 | | |
| TOTAL EXCHANGE-TRADED FUNDS (Cost $13,425,346) | | | 13,050,737 | | |
Par
(000) | |
| | Ratings†
(S&P/Moody's) | | Maturity | | Rate% | |
| |
| UNITED STATES TREASURY OBLIGATIONS† (41.3%) | | | |
$ | 9,000 | | | U.S. Treasury Bills(4) | | (AA+, Aaa) | | 11/02/23 | | | 4.602 | | | | 8,998,683 | | |
| | 9,000 | | | U.S. Treasury Bills(4) | | (AA+, Aaa) | | 11/30/23 | | | 4.370 | | | | 8,961,729 | | |
| | 24,000 | | | U.S. Treasury Bills(4) | | (AA+, Aaa) | | 12/28/23 | | | 4.908 | | | | 23,798,125 | | |
| | 9,000 | | | U.S. Treasury Bills(4) | | (AA+, Aaa) | | 01/25/24 | | | 4.642 | | | | 8,887,212 | | |
| | 9,000 | | | U.S. Treasury Bills(4) | | (AA+, Aaa) | | 02/22/24 | | | 4.291 | | | | 8,849,957 | | |
| | 24,000 | | | U.S. Treasury Bills(4) | | (AA+, Aaa) | | 03/21/24 | | | 4.919 | | | | 23,500,077 | | |
| | 9,000 | | | U.S. Treasury Bills(4) | | (AA+, Aaa) | | 04/18/24 | | | 4.691 | | | | 8,775,329 | | |
| | 9,000 | | | U.S. Treasury Bills(4) | | (AA+, Aaa) | | 05/16/24 | | | 4.925 | | | | 8,741,671 | | |
| | 24,000 | | | U.S. Treasury Bills(4) | | (AA+, Aaa) | | 06/13/24 | | | 5.088 | | | | 23,223,375 | | |
| | 9,000 | | | U.S. Treasury Bills(4) | | (AA+, Aaa) | | 07/11/24 | | | 5.040 | | | | 8,674,052 | | |
| | 9,000 | | | U.S. Treasury Bills(4) | | (AA+, Aaa) | | 08/08/24 | | | 5.156 | | | | 8,635,490 | | |
| | 24,000 | | | U.S. Treasury Bills(4) | | (AA+, Aaa) | | 09/05/24 | | | 5.153 | | | | 22,932,920 | | |
| TOTAL UNITED STATES TREASURY OBLIGATIONS (Cost $164,152,159) | | | 163,978,620 | | |
See Accompanying Notes to Consolidated Financial Statements.
15
Credit Suisse Multialternative Strategy Fund
Consolidated Schedule of Investments (continued)
October 31, 2023
| | | Shares | | Value | |
| SHORT-TERM INVESTMENTS (20.0%) | |
State Street Institutional U.S. Government Money Market Fund — Premier
Class, 5.31% | | | 78,423,733 | | | $ | 78,423,733 | | |
State Street Navigator Securities Lending Government Money Market
Portfolio, 5.36%(5) | | | 876,341 | | | | 876,341 | | |
| TOTAL SHORT-TERM INVESTMENTS (Cost $79,300,074) | | | 79,300,074 | | |
| TOTAL INVESTMENTS AT VALUE (76.4%) (Cost $304,109,254) | | | 303,054,282 | | |
| OTHER ASSETS IN EXCESS OF LIABILITIES (23.6%) | | | 93,606,015 | | |
| NET ASSETS (100.0%) | | $ | 396,660,297 | | |
† Credit ratings given by the S&P Global Ratings Division of S&P Global Inc. ("S&P") and Moody's Investors Service, Inc. ("Moody's") are unaudited.
(1) Security or portion thereof is out on loan (See Note 2-M).
(2) Security exempt from registration pursuant to Regulation S under the Securities act of 1933, as amended. Regulation S applies to securities offering that are made outside of the United States and do not involve direct selling efforts in the United States and as such may have restrictions on resale.
(3) Non-income producing security.
(4) Securities are zero coupon. Rate presented is cost yield as of October 31, 2023.
(5) Represents security purchased with cash collateral received for securities on loan.
Futures Contracts
Contract Description | | Currency | | Expiration
Date | | Number of
Contracts | | Notional
Value | | Net Unrealized
Appreciation
(Depreciation) | |
Contracts to Purchase | |
Agriculture | |
Coffee "C" Futures | | USD | | | | Mar 2024 | | | 64 | | | $ | 3,957,600 | | | $ | 73,835 | | |
Corn Futures | | USD | | | | Mar 2024 | | | 216 | | | | 5,324,400 | | | | (18,821 | ) | |
Cotton No. 2 Futures | | USD | | | | Mar 2024 | | | 47 | | | | 1,962,485 | | | | (36,514 | ) | |
Wheat Futures | | USD | | | | Mar 2024 | | | 154 | | | | 4,506,425 | | | | (121,786 | ) | |
| | | $ | (103,286 | ) | |
Energy | |
Brent Crude Oil Futures | | USD | | | | Mar 2024 | | | 122 | | | | 10,234,580 | | | $ | (219,800 | ) | |
Index Contracts | |
EURO Stoxx 50 Index Dividend
Futures | | EUR | | | | Dec 2023 | | | 119 | | | | 1,799,954 | | | $ | 3,015 | | |
EURO Stoxx 50 Index Dividend
Futures | | EUR | | | | Dec 2024 | | | 1,309 | | | | 20,740,354 | | | | 1,023,992 | | |
Nikkei 225 Index Futures OSE | | JPY | | | | Dec 2023 | | | 8 | | | | 1,629,635 | | | | (58,539 | ) | |
| | | $ | 968,468 | | |
See Accompanying Notes to Consolidated Financial Statements.
16
Credit Suisse Multialternative Strategy Fund
Consolidated Schedule of Investments (continued)
October 31, 2023
Futures Contracts (continued)
Contract Description | | Currency | | Expiration
Date | | Number of
Contracts | | Notional
Value | | Net Unrealized
Appreciation
(Depreciation) | |
Industrial Metals | |
LME Lead Futures | | USD | | | | Nov 2023 | | | 34 | | | $ | 1,763,962 | | | $ | (35,420 | ) | |
LME Lead Futures | | USD | | | | Jan 2024 | | | 20 | | | | 1,042,875 | | | | (47,142 | ) | |
LME Nickel Futures | | USD | | | | Nov 2023 | | | 33 | | | | 3,549,348 | | | | (388,112 | ) | |
LME Nickel Futures | | USD | | | | Jan 2024 | | | 19 | | | | 2,063,400 | | | | (101,227 | ) | |
LME Primary Aluminum Futures | | USD | | | | Nov 2023 | | | 140 | | | | 7,870,275 | | | | 118,506 | | |
LME Primary Aluminum Futures | | USD | | | | Jan 2024 | | | 82 | | | | 4,613,320 | | | | (56,999 | ) | |
LME Zinc Futures | | USD | | | | Nov 2023 | | | 76 | | | | 4,603,700 | | | | (105,058 | ) | |
LME Zinc Futures | | USD | | | | Jan 2024 | | | 44 | | | | 2,670,261 | | | | (146,682 | ) | |
| | | $ | (762,134 | ) | |
Interest Rate Contracts | |
10YR AUD Bond Futures | | AUD | | | | Dec 2023 | | | 489 | | | | 33,513,664 | | | $ | (856,983 | ) | |
10YR U.S. Treasury Note Futures | | USD | | | | Dec 2023 | | | 75 | | | | 7,962,891 | | | | (3,479 | ) | |
| | | $ | (860,462 | ) | |
Livestock | |
Lean Hogs Futures | | USD | | | | Feb 2024 | | | 69 | | | | 2,066,550 | | | $ | 43,531 | | |
Live Cattle Futures | | USD | | | | Feb 2024 | | | 70 | | | | 5,169,500 | | | | 47,472 | | |
| | | $ | 91,003 | | |
Precious Metals | |
Copper Futures | | USD | | | | Mar 2024 | | | 70 | | | | 6,450,500 | | | $ | 34,580 | | |
Gold 100 oz. Futures | | USD | | | | Feb 2024 | | | 104 | | | | 20,951,840 | | | | (35,743 | ) | |
Silver Futures | | USD | | | | Mar 2024 | | | 50 | | | | 5,823,000 | | | | (16,974 | ) | |
| | | $ | (18,137 | ) | |
Contracts to Sell | |
Agriculture | |
Coffee "C" Futures | | USD | | | | Dec 2023 | | | (64 | ) | | | (4,015,200 | ) | | $ | (108,343 | ) | |
Corn Futures | | USD | | | | Dec 2023 | | | (216 | ) | | | (5,170,500 | ) | | | 15,006 | | |
Cotton No. 2 Futures | | USD | | | | Dec 2023 | | | (47 | ) | | | (1,908,670 | ) | | | 45,526 | | |
Wheat Futures | | USD | | | | Dec 2023 | | | (154 | ) | | | (4,283,125 | ) | | | 129,172 | | |
| | | $ | 81,361 | | |
Energy | |
Brent Crude Oil Futures | | USD | | | | Jan 2024 | | | (122 | ) | | | (10,372,440 | ) | | $ | 250,342 | | |
Foreign Exchange Contracts | |
| AUD Currency Futures | | USD | | | | Dec 2023 | | | (86 | ) | | | (5,462,720 | ) | | $ | 16,022 | | |
| CAD Currency Futures | | USD | | | | Dec 2023 | | | (152 | ) | | | (10,969,080 | ) | | | 200,271 | | |
EURO Currency Futures | | USD | | | | Dec 2023 | | | (69 | ) | | | (9,144,656 | ) | | | 30,053 | | |
See Accompanying Notes to Consolidated Financial Statements.
17
Credit Suisse Multialternative Strategy Fund
Consolidated Schedule of Investments (continued)
October 31, 2023
Futures Contracts (continued)
Contract Description | | Currency | | Expiration
Date | | Number of
Contracts | | Notional
Value | | Net Unrealized
Appreciation
(Depreciation) | |
| GBP Currency Futures | | USD | | | | Dec 2023 | | | (127 | ) | | $ | (9,647,238 | ) | | $ | 20,090 | | |
| JPY Currency Futures | | USD | | | | Dec 2023 | | | (57 | ) | | | (4,735,631 | ) | | | 104,940 | | |
| | | $ | 371,376 | | |
Index Contracts | |
S&P 500 E Mini Index Futures | | USD | | | | Dec 2023 | | | (195 | ) | | | (41,069,438 | ) | | $ | 1,859,512 | | |
EURO Stoxx 50 Index Futures | | EUR | | | | Dec 2023 | | | (305 | ) | | | (13,121,067 | ) | | | 556,524 | | |
Russell 2000 E-Mini Index Futures | | USD | | | | Dec 2023 | | | (222 | ) | | | (18,519,240 | ) | | | 1,507,311 | | |
FTSE 100 Index Futures | | GBP | | | | Dec 2023 | | | (61 | ) | | | (5,424,216 | ) | | | 68,434 | | |
Hang Seng Index Futures | | HKD | | | | Nov 2023 | | | (23 | ) | | | (2,519,694 | ) | | | (3,719 | ) | |
| | | $ | 3,988,062 | | |
Industrial Metals | |
LME Lead Futures | | USD | | | | Nov 2023 | | | (34 | ) | | | (1,763,962 | ) | | $ | 67,124 | | |
LME Lead Futures | | USD | | | | Jan 2024 | | | (20 | ) | | | (1,042,875 | ) | | | 9,645 | | |
LME Nickel Futures | | USD | | | | Nov 2023 | | | (33 | ) | | | (3,549,348 | ) | | | 319,084 | | |
LME Nickel Futures | | USD | | | | Jan 2024 | | | (19 | ) | | | (2,063,400 | ) | | | 66,299 | | |
LME Primary Aluminum Futures | | USD | | | | Nov 2023 | | | (140 | ) | | | (7,870,275 | ) | | | (54,827 | ) | |
LME Primary Aluminum Futures | | USD | | | | Jan 2024 | | | (82 | ) | | | (4,613,320 | ) | | | (60,346 | ) | |
LME Zinc Futures | | USD | | | | Nov 2023 | | | (76 | ) | | | (4,603,700 | ) | | | 164,811 | | |
LME Zinc Futures | | USD | | | | Jan 2024 | | | (44 | ) | | | (2,670,261 | ) | | | 60,621 | | |
| | | $ | 572,411 | | |
Interest Rate Contracts | |
10YR CAD Bond Futures | | CAD | | | | Dec 2023 | | | (407 | ) | | | (33,694,587 | ) | | $ | (85,577 | ) | |
10YR JGB Mini Futures | | JPY | | | | Dec 2023 | | | (147 | ) | | | (13,969,586 | ) | | | 64,537 | | |
| EURO Bund Futures | | EUR | | | | Dec 2023 | | | (139 | ) | | | (18,951,594 | ) | | | (46,471 | ) | |
Long Gilt Futures | | GBP | | | | Dec 2023 | | | (110 | ) | | | (12,434,944 | ) | | | (67,091 | ) | |
| | | $ | (134,602 | ) | |
Livestock | |
Lean Hogs Futures | | USD | | | | Dec 2023 | | | (69 | ) | | | (1,979,610 | ) | | $ | (44,672 | ) | |
Live Cattle Futures | | USD | | | | Dec 2023 | | | (70 | ) | | | (5,139,400 | ) | | | (49,578 | ) | |
| | | $ | (94,250 | ) | |
Precious Metals | |
Copper Futures | | USD | | | | Dec 2023 | | | (70 | ) | | | (6,385,750 | ) | | $ | (36,153 | ) | |
Gold 100 oz. Futures | | USD | | | | Dec 2023 | | | (104 | ) | | | (20,740,720 | ) | | | 35,227 | | |
Silver Futures | | USD | | | | Dec 2023 | | | (50 | ) | | | (5,738,000 | ) | | | 16,027 | | |
| | | $ | 15,101 | | |
Total Net Unrealized Appreciation (Depreciation) | | $ | 4,145,453 | | |
See Accompanying Notes to Consolidated Financial Statements.
18
Credit Suisse Multialternative Strategy Fund
Consolidated Schedule of Investments (continued)
October 31, 2023
Total Return Swap Contracts
Currency | | Notional
Amount | | Expiration
Date | | Counterparty | | Receive | | Pay | | Periodic
Payment
Frequency | | Upfront
Premiums
Paid/
(Received) | | Unrealized
Appreciation | |
USD | | | | $ | 39,595,619 | | | 01/19/24 | | Bank of
America | | Bank of
America
Equities
US Volatility
Carry Hourly
Hedged Index(a) | | 0.00% | |
Monthly | | $ | — | | | $ | 248,536 | | |
USD | | | | | 3,015,988 | | | 01/22/24 | | Bank of
America | | Alerian MLP
Infrastructure
Index (TR) | | 5.91% | | Monthly | | | — | | | | 0 | | |
USD | | | | | 49,455,860 | | | 01/19/24 | | Barclays
Bank PLC | | Barclays
EFS Custom
Commodity
Basket 18(a) | | 0.00% | | At Maturity | | | — | | | | 712,071 | | |
USD | | | | | 49,271,337 | | | 01/19/24 | | Barclays
Bank PLC | | Barclays
Month End
Rebalancing
Currency Index(a) | | 0.20% | | At Maturity | | | — | | | | 242,570 | | |
USD | | | | | 49,541,885 | | | 01/19/24 | | Barclays
Bank PLC | | Shiller Barclays
CAPE US
Mid-Month
Sector Market
Hedged ER
Index(a) | | 0.60% | | At Maturity | | | — | | | | 271,175 | | |
USD | | | | | 13,070,469 | | | 01/22/24 | | Barclays
Bank PLC | | (4.86)% | | Barclays CS
Custom
Short
Basket(a) | | Monthly | | | — | | | | 69,190 | | |
EUR | | | | | 49,023,670 | | | 01/19/24 | | BNP
Paribas | | BNP Paribas
Equity Low
Vol Europe
Index(a) | | 0.00% | | At Maturity | | | — | | | | 129,373 | | |
USD | | | | | 25,727,480 | | | 01/19/24 | | BNP
Paribas | | BNP Paribas
Buy Write
Call Gold
Daily Index(a) | | 0.50% | | At Maturity | | | — | | | | 93,202 | | |
USD | | | | | 13,549,390 | | | 01/19/24 | | BNP
Paribas | | BNP Paribas
Equity Low
VOL U.S.
Index(a) | | 0.35% | | At Maturity | | | — | | | | 44,060 | | |
USD | | | | | 49,288,184 | | | 01/22/24 | | Citigroup | | Citi Equity
US Tech
Congestion
Index
Series 1(c) | | 0.00% | | At Maturity | | | — | | | | 108,783 | | |
See Accompanying Notes to Consolidated Financial Statements.
19
Credit Suisse Multialternative Strategy Fund
Consolidated Schedule of Investments (continued)
October 31, 2023
Total Return Swap Contracts (continued)
Currency | | Notional
Amount | | Expiration
Date | | Counterparty | | Receive | | Pay | | Periodic
Payment
Frequency | | Upfront
Premiums
Paid/
(Received) | | Unrealized
Appreciation | |
USD | | | | $ | 766,030 | | | 02/23/24 | | Citigroup | | (5.21)% | | Vanguard
FTSE
Emerging
Market | |
Monthly | | $ | — | | | $ | 29,881 | | |
USD | | | | | 1,867,404 | | | 02/26/24 | | Citigroup | | (5.21)% | | Vanguard
FTSE
Emerging
Market | | Monthly | | | — | | | | 72,842 | | |
USD | | | | | 750,120 | | | 02/27/24 | | Citigroup | | (5.21)% | | Vanguard
FTSE
Emerging
Market | | Monthly | | | — | | | | 29,260 | | |
USD | | | | | 1,500,240 | | | 02/29/24 | | Citigroup | | (5.21)% | | Vanguard
FTSE
Emerging
Market | | Monthly | | | — | | | | 58,520 | | |
USD | | | | | 750,120 | | | 03/01/24 | | Citigroup | | (5.21)% | | Vanguard
FTSE
Emerging
Market | | Monthly | | | — | | | | 29,260 | | |
USD | | | | | 1,500,240 | | | 03/04/24 | | Citigroup | | (5.21)% | | Vanguard
FTSE
Emerging
Market | | Monthly | | | — | | | | 58,520 | | |
USD | | | | | 750,120 | | | 03/06/24 | | Citigroup | | (5.21)% | | Vanguard
FTSE
Emerging
Market | | Monthly | | | — | | | | 29,260 | | |
USD | | | | | 1,295,457 | | | 08/19/24 | | Citigroup | | (5.21)% | | Vanguard
FTSE
Emerging
Market | | Monthly | | | — | | | | 50,532 | | |
USD | | | | | 747,989 | | | 11/13/24 | | Citigroup | | (5.21)% | | Vanguard
FTSE
Emerging
Market | | Monthly | | | — | | | | 21,893 | | |
USD | | | | | 2,464,004 | | | 11/18/24 | | Citigroup | | (5.21)% | | Exxon
Mobil Corp. | | Monthly | | | — | | | | 151,817 | | |
USD | | | | | 2,327,241 | | | 11/25/24 | | Citigroup | | (5.21)% | | Chevron
Corp. | | Monthly | | | — | | | | 151,201 | | |
USD | | | | | 1,488,311 | | | 12/02/24 | | Citigroup | | Invesco
FTSE RAFI
Emerging
Market ETF | | 5.66% | | Monthly | | | — | | | | 2,156 | | |
USD | | | | | 48,912,766 | | | 01/22/24 | | Goldman
Sachs | | Goldman
Sachs DISP
U.S. Index(a) | | 0.00% | | At Maturity | | | — | | | | 47,444 | | |
See Accompanying Notes to Consolidated Financial Statements.
20
Credit Suisse Multialternative Strategy Fund
Consolidated Schedule of Investments (continued)
October 31, 2023
Total Return Swap Contracts (continued)
Currency | | Notional
Amount | | Expiration
Date | | Counterparty | | Receive | | Pay | | Periodic
Payment
Frequency | | Upfront
Premiums
Paid/
(Received) | | Unrealized
Appreciation | |
USD | | | | $ | 49,173,558 | | | 01/22/24 | | Goldman
Sachs | | Goldman
Sachs
Commodity
Strategy
Index(a) | | 0.00% | |
At Maturity | | $ | — | | | $ | 81,712 | | |
USD | | | | | 50,174,567 | | | 01/22/24 | | Goldman
Sachs | | Goldman
Sachs
Commodity
COT Strategy
COT3(a) | | 0.00% | | At Maturity | | | — | | | | 27,475 | | |
USD | | | | | 50,030,641 | | | 01/22/24 | | Goldman
Sachs | | Goldman
Sachs
Commodities
Seasonality
Index(a) | | 0.00% | | At Maturity | | | — | | | | 191,051 | | |
USD | | | | | 2,957,329 | | | 01/22/24 | | Goldman
Sachs | | (0.04)% | | Bloomberg
Agriculture
Index | | At Maturity | | | — | | | | 16,587 | | |
USD | | | | | 38,297,607 | | | 01/22/24 | | Goldman
Sachs | | Goldman
Sachs Tactical
Factor Suite
Value World
Top USD
Excess Return
Strategy(a) | | 0.04% | | At Maturity | | | — | | | | 141,931 | | |
USD | | | | | 28,683,547 | | | 01/22/24 | | Goldman
Sachs | | Goldman
Sachs VVOL
Carry ER(a) | | 0.00% | | At Maturity | | | — | | | | 324,866 | | |
USD | | | | | 49,224,325 | | | 01/17/24 | | JPMorgan
Chase | | J.P. Morgan
Seasonal
Spreads
Portfolio
Commodity
Index(a) | | 0.60% | | At Maturity | | | — | | | | 93,837 | | |
USD | | | | | 49,272,096 | | | 01/17/24 | | JPMorgan
Chase | | J.P. Morgan
Commodities
Fundamental
Value Index(a) | | 0.80% | | At Maturity | | | — | | | | 796,067 | | |
USD | | | | | 19,970,396 | | | 01/17/24 | | JPMorgan
Chase | | J.P. Morgan
Equities
Turn-of the
Month
Seasonality
Index(a) | | 0.00% | | At Maturity | | | — | | | | 110,915 | | |
USD | | | | | 25,200,000 | | | 01/22/24 | | JPMorgan
Chase | | J.P. Morgan
EMBI Global
Core | | 6.01% | | At Maturity | | | — | | | | 151,865 | | |
See Accompanying Notes to Consolidated Financial Statements.
21
Credit Suisse Multialternative Strategy Fund
Consolidated Schedule of Investments (continued)
October 31, 2023
Total Return Swap Contracts (continued)
Currency | | Notional
Amount | | Expiration
Date | | Counterparty | | Receive | | Pay | | Periodic
Payment
Frequency | | Upfront
Premiums
Paid/
(Received) | | Unrealized
Appreciation | |
USD | | | | $ | 2,700,000 | | | 12/20/23 | | Morgan
Stanley | | iBoxx $ Liquid
High Yield
Index | | 5.31% | |
Quarterly | | $ | — | | | $ | 3,670 | | |
USD | | | | | 49,195,212 | | | 01/17/24 | | Morgan
Stanley | | Morgan
Stanley
Commodities
Curve Carry
Index(a) | | 0.35% | | At Maturity | | | — | | | | 8,410 | | |
USD | | | | | 49,261,757 | | | 01/22/24 | | Societe
Generale | | SG US
Trend Index(b) | | 0.30% | | At Maturity | | | — | | | | 87,657 | | |
| | | | | | | | | | | | | $ | — | | | $ | 4,687,589 | | |
Total Return Swap Contracts
Currency | | Notional
Amount | | Expiration
Date | | Counterparty | | Receive | | Pay | | Periodic
Payment
Frequency | | Upfront
Premiums
Paid/
(Received) | | Unrealized
Depreciation | |
USD | | | | $ | 2,120,621 | | | 01/22/24 | | Bank of
America | | Alerian MLP
Infrastructure
Index (TR) | | 6.00% | |
Monthly | | $ | — | | | $ | (24,710 | ) | |
USD | | | | | 50,245,292 | | | 01/19/24 | | Barclays
Bank PLC | | Barclays
Commodity
Hedging
Insights 2
Index(a) | | 0.15% | | At Maturity | | | — | | | | (222,918 | ) | |
USD | | | | | 15,131,247 | | | 01/22/24 | | Barclays
Bank PLC | | Barclays
Equity
Buyback
USD Basket(a) | | 5.76% | | Monthly | | | — | | | | (39,053 | ) | |
USD | | | | | 39,542,896 | | | 01/22/24 | | Barclays
Bank PLC | | Barclays
Equity
Momentum
Thematic
Basket(a) | | 5.76% | | Monthly | | | — | | | | (67,028 | ) | |
USD | | | | | 13,000,103 | | | 01/22/24 | | Barclays
Bank PLC | | Barclays
CS Custom
Long
Basket(a) | | 5.76% | | Monthly | | | — | | | | (55,722 | ) | |
USD | | | | | 25,100,000 | | | 12/20/23 | | BNP
Paribas | | iBoxx $ Liquid
High Yield
Index | | 5.31% | | Quarterly | | | — | | | | (423,045 | ) | |
See Accompanying Notes to Consolidated Financial Statements.
22
Credit Suisse Multialternative Strategy Fund
Consolidated Schedule of Investments (continued)
October 31, 2023
Total Return Swap Contracts (continued)
Currency | | Notional
Amount | | Expiration
Date | | Counterparty | | Receive | | Pay | | Periodic
Payment
Frequency | | Upfront
Premiums
Paid/
(Received) | | Unrealized
Depreciation | |
USD | | | | $ | 49,233,205 | | | 01/19/24 | | BNP
Paribas | | BNP Paribas
Dynamic Pre
Roll Alpha
ex Agriculture
and Livestock
Index(a) | | 0.08% | |
At Maturity | | $ | — | | | $ | (1,329 | ) | |
USD | | | | | 48,705,351 | | | 01/19/24 | | BNP
Paribas | | BNP Alpha
Momentum
ex-Agriculture
and Livestock
Net Index(a) | | 0.30% | | At Maturity | | | — | | | | (92,981 | ) | |
USD | | | | | 30,395,588 | | | 01/22/24 | | BNP
Paribas | | Alerian MLP
Infrastructure
Index (TR) | | 5.96% | | Monthly | | | — | | | | (378,560 | ) | |
USD | | | | | 360,895 | | | 02/23/24 | | Citigroup | | Invesco
FTSE RAFI
Emerging
Market ETF | | 5.66% | | Monthly | | | — | | | | (13,888 | ) | |
USD | | | | | 2,223,320 | | | 02/26/24 | | Citigroup | | Invesco
FTSE RAFI
Emerging
Market ETF | | 5.66% | | Monthly | | | — | | | | (85,560 | ) | |
USD | | | | | 753,060 | | | 02/27/24 | | Citigroup | | Invesco
FTSE RAFI
Emerging
Market ETF | | 5.66% | | Monthly | | | — | | | | (28,980 | ) | |
USD | | | | | 1,506,120 | | | 02/29/24 | | Citigroup | | Invesco
FTSE RAFI
Emerging
Market ETF | | 5.66% | | Monthly | | | — | | | | (57,960 | ) | |
USD | | | | | 753,060 | | | 03/01/24 | | Citigroup | | Invesco
FTSE RAFI
Emerging
Market ETF | | 5.66% | | Monthly | | | — | | | | (28,980 | ) | |
USD | | | | | 1,506,120 | | | 03/04/24 | | Citigroup | | Invesco
FTSE RAFI
Emerging
Market ETF | | 5.66% | | Monthly | | | — | | | | (57,960 | ) | |
USD | | | | | 753,060 | | | 03/06/24 | | Citigroup | | Invesco
FTSE RAFI
Emerging
Market ETF | | 5.66% | | Monthly | | | — | | | | (28,980 | ) | |
USD | | | | | 1,234,516 | | | 08/19/24 | | Citigroup | | Invesco
FTSE RAFI
Emerging
Market ETF | | 5.66% | | Monthly | | | — | | | | (47,508 | ) | |
See Accompanying Notes to Consolidated Financial Statements.
23
Credit Suisse Multialternative Strategy Fund
Consolidated Schedule of Investments (continued)
October 31, 2023
Total Return Swap Contracts (continued)
Currency | | Notional
Amount | | Expiration
Date | | Counterparty | | Receive | | Pay | | Periodic
Payment
Frequency | | Upfront
Premiums
Paid/
(Received) | | Unrealized
Depreciation | |
USD | | | | $ | 2,574,407 | | | 09/23/24 | | Citigroup | | (5.21)% | | Permian
Resources
Corp. | |
Monthly | | $ | — | | | $ | (122,150 | ) | |
USD | | | | | 831,577 | | | 11/13/24 | | Citigroup | | Invesco
FTSE RAFI
Emerging
Market ETF | | 5.66% | | Monthly | | | — | | | | (27,158 | ) | |
USD | | | | | 1,541,424 | | | 12/02/24 | | Citigroup | | (5.21)% | | Vanguard
FTSE
Emerging
Market | | Monthly | | | — | | | | (5,655 | ) | |
USD | | | | | 326,850 | | | 12/02/24 | | Citigroup | | (5.21)% | | Chevron
Corp. | | Monthly | | | — | | | | (897 | ) | |
USD | | | | | 345,097 | | | 12/02/24 | | Citigroup | | (5.21)% | | Exxon
Mobil Corp. | | Monthly | | | — | | | | (821 | ) | |
USD | | | | | 1,053,330 | | | 01/22/24 | | Goldman
Sachs | | Bloomberg
Energy
Index | | 0.09% | | At Maturity | | | — | | | | (19,290 | ) | |
USD | | | | | 2,804,475 | | | 01/22/24 | | Goldman
Sachs | | (0.03)% | | Bloomberg
Industrial
Metals
Index | | At Maturity | | | — | | | | (32,057 | ) | |
USD | | | | | 45,480,867 | | | 01/22/24 | | Goldman
Sachs | | Goldman
Sachs RP
112 Long
Short Series
SR Excess
Return
Strategy(a) | | (0.60)% | | At Maturity | | | — | | | | (1,059,770 | ) | |
USD | | | | | 1,709,257 | | | 01/22/24 | | Goldman
Sachs | | Bloomberg
Precious
Metals
Index | | 0.07% | | At Maturity | | | — | | | | (1,452 | ) | |
USD | | | | | 5,766,906 | | | 01/22/24 | | Goldman
Sachs | | Goldman
Sachs Tactical
Factor Suite
Value World
Top USD
Excess Return
Strategy(a) | | 0.00% | | At Maturity | | | — | | | | (1,731 | ) | |
USD | | | | | 27,746,631 | | | 01/17/24 | | JPMorgan
Chase | | J.P. Morgan
Helix 3
Index(a) | | 0.60% | | At Maturity | | | — | | | | (275,791 | ) | |
See Accompanying Notes to Consolidated Financial Statements.
24
Credit Suisse Multialternative Strategy Fund
Consolidated Schedule of Investments (continued)
October 31, 2023
Total Return Swap Contracts (continued)
Currency | | Notional
Amount | | Expiration
Date | | Counterparty | | Receive | | Pay | | Periodic
Payment
Frequency | | Upfront
Premiums
Paid/
(Received) | | Unrealized
Depreciation | |
USD | | | | $ | 49,037,159 | | | 01/17/24 | | Morgan
Stanley | | Morgan
Stanley
LTC0 4%
volatility
target(a) | | 0.00% | |
At Maturity | | $ | — | | | $ | (88,713 | ) | |
USD | | | | | 49,267,375 | | | 01/17/24 | | Morgan
Stanley | | Morgan
Stanley
Soy Dynamic
Congestion
Index(a) | | 0.25% | | At Maturity | | | — | | | | (1,226 | ) | |
USD | | | | | 49,257,346 | | | 01/22/24 | | Societe
Generale | | SGI Coda
Index(a) | | 0.25% | | At Maturity | | | — | | | | (28,249 | ) | |
USD | | | | | 50,364,297 | | | 01/22/24 | | Societe
Generale | | SGI VRR
US Index —
Vol Roll on
Rates (USD —
Excess
Return)(a) | | 0.25% | | At Maturity | | | — | | | | (1,133,936 | ) | |
| | | | | | | | | | | | | | | | | $ | — | | | $ | (4,454,058 | ) | |
Total | | | | | | | | | | | | | | $ | — | | | $ | 233,531 | | |
(a) The index constituents are available on the Fund's website.
(b) The Index intends to track the performance of a strategy that trades the daily trend of the S&P 500 (the Underlying Index).
(c) The index intends to track the performance of a strategy that trades the daily trend of the Nasdaq Global Index.
Written Options
Number
of
Contracts | | Counterparty | | Put Written Options | | Expiration
Date | | Notional
Amount | | Premiums
Received | | Current
Value | | Net Unrealized
Appreciation
(Depreciation) | |
| | 117 | | | Goldman
Sachs | | S&P 500 Index,
strike @ $4,275 | | |
11/17/23 | | | $ | (11,700 | ) | | $ | (1,017,282 | ) | | $ | (1,230,255 | ) | | $ | (212,973 | ) | |
Currency Abbreviations:
AUD = Australian Dollar
CAD = Canadian Dollar
EUR = Euro
GBP = British Pound
HKD = Hong Kong Dollar
JPY = Japanese Yen
USD = United States Dollar
U.S. Treasury securities in the amount of $5,930,000 was received at the custodian bank as collateral for OTC swaps.
See Accompanying Notes to Consolidated Financial Statements.
25
Credit Suisse Multialternative Strategy Fund
Consolidated Statement of Assets and Liabilities
October 31, 2023
Assets | |
Investments at value, including collateral for securities on loan of $876,341
(Cost $304,109,254) (Note 2) | | $ | 303,054,2821 | | |
Cash | | | 630,304 | | |
Cash segregated at brokers for futures contracts, swap contracts and written
options (Note 2) | | | 99,691,788 | | |
Unrealized appreciation on open swap contracts (Note 2) | | | 4,687,589 | | |
Receivable for investments sold | | | 1,026,014 | | |
Receivable for Fund shares sold | | | 526,356 | | |
Dividend and interest receivable | | | 230,207 | | |
Prepaid expenses and other assets | | | 30,872 | | |
Total assets | | | 409,877,412 | | |
Liabilities | |
Investment advisory fee payable (Note 3) | | | 162,854 | | |
Administrative services fee payable (Note 3) | | | 22,467 | | |
Shareholder servicing/Distribution fee payable (Note 3) | | | 14,712 | | |
Payable for investments purchased | | | 5,975,591 | | |
Unrealized depreciation on open swap contracts (Note 2) | | | 4,454,058 | | |
Outstanding written options, at value (Proceeds $1,017,282) (Note 2) | | | 1,230,255 | | |
Payable upon return of securities loaned (Note 2) | | | 876,341 | | |
Variation margin payable on futures contracts (Note 2) | | | 232,722 | | |
Due to custodian for foreign currency at value (cost $57,838) | | | 59,349 | | |
Net payable for open swap contracts | | | 34,969 | | |
Trustees' fee payable | | | 17,353 | | |
Payable for Fund shares redeemed | | | 10,226 | | |
Accrued expenses | | | 126,218 | | |
Total liabilities | | | 13,217,115 | | |
Net Assets | |
Capital stock, $.001 par value (Note 6) | | | 43,319 | | |
Paid-in capital (Note 6) | | | 395,035,648 | | |
Total distributable earnings (loss) | | | 1,581,330 | | |
Net assets | | $ | 396,660,297 | | |
I Shares | |
Net assets | | $ | 326,370,484 | | |
Shares outstanding | | | 35,532,843 | | |
Net asset value, offering price and redemption price per share | | $ | 9.19 | | |
A Shares | |
Net assets | | $ | 70,289,813 | | |
Shares outstanding | | | 7,786,387 | | |
Net asset value and redemption price per share | | $ | 9.03 | | |
Maximum offering price per share (net asset value/(1-5.25%)) | | $ | 9.53 | | |
1 Includes $852,212 of securities on loan.
See Accompanying Notes to Consolidated Financial Statements.
26
Credit Suisse Multialternative Strategy Fund
Consolidated Statement of Operations
For the Year Ended October 31, 2023
Investment Income | |
Interest | | $ | 10,822,511 | | |
Dividends (net of foreign taxes withheld of $455,854) | | | 1,650,807 | | |
Securities lending (net of rebates) | | | 816,307 | | |
Total investment income | | | 13,289,625 | | |
Expenses | |
Investment advisory fees (Note 3) | | | 3,539,607 | | |
Administrative services fees (Note 3) | | | 73,261 | | |
Shareholder servicing/Distribution fees (Note 3) | |
Class A | | | 155,871 | | |
Transfer agent fees | | | 172,335 | | |
Custodian fees | | | 140,122 | | |
Trustees' fees | | | 77,195 | | |
Audit and tax fees | | | 54,815 | | |
Registration fees | | | 48,315 | | |
Printing fees | | | 32,685 | | |
Legal fees | | | 17,651 | | |
Insurance expense | | | 9,790 | | |
Commitment fees (Note 4) | | | 5,225 | | |
Miscellaneous expense | | | 12,738 | | |
Total expenses | | | 4,339,610 | | |
Less: fees waived and expenses reimbursed (Note 3) | | | (1,290,792 | ) | |
Net expenses | | | 3,048,818 | | |
Net investment income | | | 10,240,807 | | |
Net Realized and Unrealized Gain (Loss) from Investments, Futures Contracts,
Swap Contracts, Written Options, Foreign Currency and Forward Foreign
Currency Contracts | |
Net realized gain from investments | | | 792,630 | | |
Net realized loss from futures contracts | | | (2,502,487 | ) | |
Net realized loss from swap contracts | | | (6,339,495 | ) | |
Net realized loss from written options | | | (700,165 | ) | |
Net realized gain from foreign currency transactions | | | 110,544 | | |
Net realized gain from forward foreign currency contracts | | | 175,211 | | |
Net change in unrealized appreciation (depreciation) from investments | | | (2,312,894 | ) | |
Net change in unrealized appreciation (depreciation) from futures contracts | | | 3,682,308 | | |
Net change in unrealized appreciation (depreciation) from swap contracts | | | 105,786 | | |
Net change in unrealized appreciation (depreciation) from written options | | | (212,973 | ) | |
Net change in unrealized appreciation (depreciation) from foreign currency translations | | | (202,871 | ) | |
Net change in unrealized appreciation (depreciation) from forward foreign currency
contracts | | | (180,306 | ) | |
Net realized and unrealized loss from investments, futures contracts, swap contracts,
written options, foreign currency and forward foreign currency contracts | | | (7,584,712 | ) | |
Net increase in net assets resulting from operations | | $ | 2,656,095 | | |
See Accompanying Notes to Consolidated Financial Statements.
27
Credit Suisse Multialternative Strategy Fund
Consolidated Statements of Changes in Net Assets
| | | For the Year
Ended
October 31, 2023 | | For the Year
Ended
October 31, 2022 | |
From Operations | |
Net investment income | | $ | 10,240,807 | | | $ | 1,084,233 | | |
Net realized gain (loss) from investments, futures contracts, swap
contracts, written options, foreign currency transactions and
forward foreign currency contracts | | | (8,463,762 | ) | | | 6,296,111 | | |
Net change in unrealized appreciation (depreciation) from
investments, futures contracts, swap contracts, written options,
foreign currency translations and forward foreign currency
contracts | | | 879,050 | | | | 2,051,747 | | |
Net increase in net assets resulting from operations | | | 2,656,095 | | | | 9,432,091 | | |
From Distributions | |
From distributable earnings | |
Class I | | | (7,402,872 | ) | | | (1,614,218 | ) | |
Class A | | | (237,778 | ) | | | (490,483 | ) | |
Net decrease in net assets resulting from distributions | | | (7,640,650 | ) | | | (2,104,701 | ) | |
| From Capital Share Transactions (Note 6) | |
Proceeds from sale of shares | | | 190,835,112 | | | | 246,200,737 | | |
Reinvestment of distributions | | | 7,532,720 | | | | 2,060,098 | | |
Net asset value of shares redeemed | | | (67,177,534 | ) | | | (9,645,117 | ) | |
Net increase in net assets from capital
share transactions | | | 131,190,298 | | | | 238,615,718 | | |
Net increase in net assets | | | 126,205,743 | | | | 245,943,108 | | |
Net Assets | |
Beginning of year | | | 270,454,554 | | | | 24,511,446 | | |
End of year | | $ | 396,660,297 | | | $ | 270,454,554 | | |
See Accompanying Notes to Consolidated Financial Statements.
28
Credit Suisse Multialternative Strategy Fund
Consolidated Financial Highlights
(For a Class I Share of the Fund Outstanding Throughout Each Year)
| | | For the Year Ended October 31, | |
| | | 2023 | | 2022 | | 2021 | | 2020 | | 2019 | |
Per share data | |
Net asset value, beginning of year | | $ | 9.32 | | | $ | 9.581 | | | $ | 9.531 | | | $ | 9.86 | | | $ | 10.031 | | |
INVESTMENT OPERATIONS | |
Net investment income (loss)2 | | | 0.28 | | | | 0.10 | | | | (0.02 | ) | | | 0.04 | | | | 0.06 | | |
Net gain (loss) from investments, futures contracts,
swap contracts, written options, foreign currency
transactions and forward foreign currency
contracts (both realized and unrealized) | | | (0.15 | ) | | | 0.46 | | | | 1.25 | | | | 0.10 | | | | (0.06 | ) | |
Total from investment operations | | | 0.13 | | | | 0.56 | | | | 1.23 | | | | 0.14 | | | | 0.003 | | |
LESS DIVIDENDS AND DISTRIBUTIONS | |
Dividends from net investment income | | | (0.15 | ) | | | (0.82 | ) | | | (1.18 | ) | | | (0.47 | ) | | | — | | |
Distributions from net realized gains | | | (0.11 | ) | | | — | | | | — | | | | — | | | | (0.17 | ) | |
Total dividends and distributions | | | (0.26 | ) | | | (0.82 | ) | | | (1.18 | ) | | | (0.47 | ) | | | (0.17 | ) | |
Net asset value, end of year | | $ | 9.191 | | | $ | 9.32 | | | $ | 9.581 | | | $ | 9.531 | | | $ | 9.86 | | |
Total return4 | | | 1.39 | % | | | 6.25 | % | | | 13.87 | % | | | 1.46 | % | | | 0.11 | % | |
RATIOS AND SUPPLEMENTAL DATA | |
Net assets, end of year (000s omitted) | | $ | 326,370 | | | $ | 262,187 | | | $ | 18,749 | | | $ | 47,382 | | | $ | 74,486 | | |
Ratio of net expenses to average net assets | | | 0.85 | % | | | 0.85 | % | | | 0.85 | % | | | 0.85 | % | | | 0.85 | % | |
Ratio of expenses to average net assets excluding
securities sold short dividend expense | | | 0.85 | % | | | 0.85 | % | | | 0.85 | % | | | 0.85 | % | | | 0.85 | % | |
Ratio of net investment income (loss) to average
net assets | | | 3.06 | % | | | 1.13 | % | | | (0.16 | )% | | | 0.38 | % | | | 0.60 | % | |
Decrease reflected in above operating expense
ratios due to waivers/reimbursements | | | 0.38 | % | | | 0.58 | % | | | 1.41 | % | | | 1.09 | % | | | 1.13 | % | |
Portfolio turnover rate5 | | | 375 | % | | | 482 | % | | | 532 | % | | | 571 | % | | | 305 | % | |
1 Includes adjustments in accordance with accounting principles generally accepted in the United States of America and as such, the net asset values for financial reporting purposes and the returns based upon net asset values may differ from the net asset values and returns for shareholder transactions.
2 Per share information is calculated using the average shares outstanding method.
3 This amount represents less than $0.01 per share.
4 Total returns are historical and include change in share price and reinvestment of all distributions. Had certain expenses not been reduced during the years shown, total returns would have been lower.
5 Portfolio turnover is calculated by dividing the lesser of total purchases or sales of portfolio securities for the reporting period by the monthly average of portfolio securities owned during the reporting period. Excluded from both the numerator and denominator are amounts relating to derivatives and securities whose maturities or expiration dates at the time of acquisition were one year or less.
See Accompanying Notes to Consolidated Financial Statements.
29
Credit Suisse Multialternative Strategy Fund
Consolidated Financial Highlights
(For a Class A Share of the Fund Outstanding Throughout Each Year)
| | | For the Year Ended October 31, | |
| | | 2023 | | 2022 | | 2021 | | 2020 | | 2019 | |
Per share data | |
Net asset value, beginning of year | | $ | 9.161 | | | $ | 9.431 | | | $ | 9.391 | | | $ | 9.73 | | | $ | 9.921 | | |
INVESTMENT OPERATIONS | |
Net investment income (loss)2 | | | 0.25 | | | | 0.04 | | | | (0.04 | ) | | | (0.00 | )3 | | | 0.03 | | |
Net gain (loss) from investments, futures contracts,
swap contracts, written options, foreign currency
transactions and forward foreign currency
contracts (both realized and unrealized) | | | (0.15 | ) | | | 0.49 | | | | 1.24 | | | | 0.10 | | | | (0.05 | ) | |
Total from investment operations | | | 0.10 | | | | 0.53 | | | | 1.20 | | | | 0.10 | | | | (0.02 | ) | |
LESS DIVIDENDS AND DISTRIBUTIONS | |
Dividends from net investment income | | | (0.12 | ) | | | (0.80 | ) | | | (1.16 | ) | | | (0.44 | ) | | | — | | |
Distributions from net realized gains | | | (0.11 | ) | | | — | | | | — | | | | — | | | | (0.17 | ) | |
Total dividends and distributions | | | (0.23 | ) | | | (0.80 | ) | | | (1.16 | ) | | | (0.44 | ) | | | (0.17 | ) | |
Net asset value, end of year | | $ | 9.031 | | | $ | 9.161 | | | $ | 9.431 | | | $ | 9.391 | | | $ | 9.73 | | |
Total return4 | | | 1.15 | % | | | 5.94 | % | | | 13.64 | % | | | 1.10 | % | | | (0.10 | )% | |
RATIOS AND SUPPLEMENTAL DATA | |
Net assets, end of year (000s omitted) | | $ | 70,290 | | | $ | 8,267 | | | $ | 5,763 | | | $ | 4,350 | | | $ | 994 | | |
Ratio of net expenses to average net assets | | | 1.10 | % | | | 1.10 | % | | | 1.10 | % | | | 1.10 | % | | | 1.10 | % | |
Ratio of expenses to average net assets excluding
securities sold short dividend expense | | | 1.10 | % | | | 1.10 | % | | | 1.10 | % | | | 1.10 | % | | | 1.10 | % | |
Ratio of net investment income (loss) to average
net assets | | | 2.79 | % | | | 0.47 | % | | | (0.42 | )% | | | (0.04 | )% | | | 0.30 | % | |
Decrease reflected in above operating expense
ratios due to waivers/reimbursements | | | 0.38 | % | | | 0.58 | % | | | 1.41 | % | | | 1.09 | % | | | 1.13 | % | |
Portfolio turnover rate5 | | | 375 | % | | | 482 | % | | | 532 | % | | | 571 | % | | | 305 | % | |
1 Includes adjustments in accordance with accounting principles generally accepted in the United States of America and as such, the net asset values for financial reporting purposes and the returns based upon net asset values may differ from the net asset values and returns for shareholder transactions.
2 Per share information is calculated using the average shares outstanding method.
3 This amount represents less than $0.01 per share.
4 Total returns are historical and include change in share price, reinvestment of all distributions and no sales charge. Had certain expenses not been reduced during the years shown, total returns would have been lower.
5 Portfolio turnover is calculated by dividing the lesser of total purchases or sales of portfolio securities for the reporting period by the monthly average of portfolio securities owned during the reporting period. Excluded from both the numerator and denominator are amounts relating to derivatives and securities whose maturities or expiration dates at the time of acquisition were one year or less.
See Accompanying Notes to Consolidated Financial Statements.
30
Credit Suisse Multialternative Strategy Fund
Notes to Consolidated Financial Statements
October 31, 2023
Credit Suisse Multialternative Strategy Fund (the "Fund"), a series of Credit Suisse Opportunity Funds (the "Trust"), a Delaware statutory trust, is registered under the Investment Company Act of 1940, as amended (the "1940 Act"), as a non-diversified open-end management investment company that seeks to achieve total return consistent with the risk and return patterns of a diversified universe of hedge funds. The Trust was organized under the laws of the State of Delaware as a business trust on May 31, 1995.
Credit Suisse Asset Management, LLC ("Credit Suisse" or the "Adviser"), the investment adviser to the Fund, is registered as an investment adviser with the Securities and Exchange Commission ("SEC") and as a Commodity Pool Operator with the Commodity Futures Trading Commission. The Fund intends to gain exposure to commodity derivatives through investing in a wholly-owned subsidiary, Credit Suisse Cayman Multialternative Strategy Fund, Ltd. (the "Subsidiary"), organized under the laws of the Cayman Islands. The Subsidiary invests in commodity-linked derivative instruments, such as swaps and futures. The Subsidiary may also invest in debt securities, some of which are intended to serve as margin or collateral for the Subsidiary's derivatives positions.
The Subsidiary is managed by the same portfolio managers that manage the Fund and the accompanying financial statements reflect the financial position of the Fund and the Subsidiary and the results of operations on a consolidated basis. The consolidated financial statements include portfolio holdings of the Fund and the Subsidiary and all intercompany transactions and balances have been eliminated. The Fund may invest up to 25% of its total assets in the Subsidiary. As of October 31, 2023, the Fund held $47,665,675 in the Subsidiary, representing 12.0% of the Fund's consolidated net assets. For the year ended October 31, 2023, the net realized loss on securities and other financial instruments held in the Subsidiary was $7,389,915.
Subsequent references to the Fund within the Notes to Consolidated Financial Statements collectively refer to the Fund and the Subsidiary, unless the context otherwise requires.
The Fund offers two classes of shares: Class I shares and Class A shares. Each class of shares represents an equal pro rata interest in the Fund, except the share classes bear different expenses. Class A shares are sold subject to a front-end sales charge of up to 5.25%. Class I shares are sold without a sales charge.
31
Credit Suisse Multialternative Strategy Fund
Notes to Consolidated Financial Statements (continued)
October 31, 2023
Note 2. Significant Accounting Policies
The following is a summary of significant accounting policies followed by the Fund in the preparation of its consolidated financial statements. The policies are in accordance with generally accepted accounting principles in the United States of America ("GAAP"). The preparation of consolidated financial statements requires management to make estimates and assumptions that affect the reported amounts and disclosures in the consolidated financial statements. Actual results could differ from those estimates. The Fund is considered an investment company for financial reporting purposes under GAAP and follows the accounting and reporting guidance in Financial Accounting Standards Board ("FASB") Accounting Standards Codification ("ASC") Topic 946 — Financial Services — Investment Companies.
A) SECURITY VALUATION — The Board of Trustees (the "Board") is responsible for the Fund's valuation process. The Board has delegated the supervision of the daily valuation process to the Adviser), who has established a Pricing Committee and a Pricing Group, which, pursuant to the policies adopted by the Board, are responsible for making fair valuation determinations and overseeing the Fund's pricing policies. The net asset value of the Fund is determined daily as of the close of regular trading on the New York Stock Exchange, Inc. (the "Exchange") on each day the Exchange is open for business. For certain international equity securities, in order to adjust for events which may occur between the close of the foreign exchanges and the close of the Exchange, a fair valuation model may be used. This fair valuation model takes into account comparisons to the valuation of American Depository Receipts (ADRs), exchange-traded funds, futures contracts and certain indices and these securities are categorized as Level 2. The valuations for fixed income securities (which may include, but are not limited to, corporate, government, municipal, mortgage-backed, collateralized mortgage obligations and asset-backed securities) and certain derivative instruments are typically the prices supplied by independent third party pricing services, which may use market prices or broker/dealer quotations or a variety of valuation techniques and methodologies. The independent third party pricing services use inputs that are observable such as issuer details, interest rates, yield curves, prepayment speeds, credit risks/spreads, default rates and quoted prices for similar securities. These pricing services generally price fixed income securities assuming orderly transactions of an institutional "round lot" size, but some trades occur in smaller "odd lot" sizes which may be effected at lower prices than institutional round lot trades. Structured note agreements are valued in accordance with a dealer-supplied valuation based on changes in the value of the underlying index. Option contracts on securities, currencies, indices, futures
32
Credit Suisse Multialternative Strategy Fund
Notes to Consolidated Financial Statements (continued)
October 31, 2023
Note 2. Significant Accounting Policies (continued)
contracts, swaps and other instruments are valued at the mid-point between the last bid and ask quotations as of the close of trading on the exchange on which the option is traded. Futures contracts are valued daily at the settlement price established by the board of trade or exchange on which they are traded. Forward contracts are valued at the London closing spot rates and the London closing forward point rates on a daily basis. The currency forward contract pricing model derives the differential in point rates to the expiration date of the forward and calculates its present value. Over-the-counter derivative financial instruments, such as swap agreements, generally derive their value from underlying asset prices, indices, reference rates, and other inputs or a combination of these factors. Equity securities for which market quotations are available are valued at the last reported sales price or official closing price on the primary market or exchange on which they trade. Investments in open-ended mutual funds are valued at the net asset value as reported on each business day and under normal circumstances. Securities for which market quotations are not readily available are valued at their fair value as determined in good faith by the Adviser, as the Board's valuation designee (as defined in Rule 2a-5 under the 1940 Act), in accordance with the Adviser's procedures. The Board oversees the Adviser in its role as valuation designee in accordance with the requirements of Rule 2a-5 under the 1940 Act. The Fund may utilize a service provided by an independent third party to fair value certain securities. When fair value pricing is employed, the prices of securities used by the Fund to calculate its net asset value may differ from quoted or published prices for the same securities. If independent third party pricing services are unable to supply prices for a portfolio investment, or if the prices supplied are deemed by the Adviser to be unreliable, the market price may be determined by the Adviser using quotations from one or more brokers/dealers or at the transaction price if the security has recently been purchased and no value has yet been obtained from a pricing service or pricing broker. When reliable prices are not readily available, such as when the value of a security has been significantly affected by events after the close of the exchange or market on which the security is principally traded, but before the Fund calculates its net asset value, these securities will be fair valued in good faith by the Pricing Group, in accordance with procedures established by the Adviser.
The Fund uses valuation techniques to measure fair value that are consistent with the market approach and/or income approach, depending on the type of security and the particular circumstance. The market approach uses prices and other relevant information generated by market transactions involving
33
Credit Suisse Multialternative Strategy Fund
Notes to Consolidated Financial Statements (continued)
October 31, 2023
Note 2. Significant Accounting Policies (continued)
identical or comparable securities. The income approach uses valuation techniques to discount estimated future cash flows to present value.
GAAP established a disclosure hierarchy that categorizes the inputs to valuation techniques used to value assets and liabilities at each measurement date. These inputs are summarized in the three broad levels listed below:
• Level 1 – quoted prices in active markets for identical investments
• Level 2 – other significant observable inputs (including quoted prices for similar investments, interest rates, prepayment speeds, credit risk, etc.)
• Level 3 – significant unobservable inputs (including the Fund's own assumptions in determining the fair value of investments)
The inputs or methodologies used to value securities are not necessarily an indication of the risk associated with investing in those securities.
The following is a summary of the inputs used as of October 31, 2023 in valuing the Fund's assets and liabilities carried at fair value:
Assets | | Level 1 | | Level 2 | | Level 3 | | Total | |
Investments in Securities | |
Common Stocks | | $ | 32,861,033 | | | $ | 13,863,818 | | | $ | — | | | $ | 46,724,851 | | |
Exchange-traded Funds | | | 13,050,737 | | | | — | | | | — | | | | 13,050,737 | | |
United States Treasury Obligations | | | — | | | | 163,978,620 | | | | — | | | | 163,978,620 | | |
Short-term Investments | | | 79,300,074 | | | | — | | | | — | | | | 79,300,074 | | |
| | | $ | 125,211,844 | | | $ | 177,842,438 | | | $ | — | | | $ | 303,054,282 | | |
Other Financial Instruments* | |
Futures Contracts | | $ | 6,951,509 | | | $ | — | | | $ | — | | | $ | 6,951,509 | | |
Swap Contracts | | | — | | | | 4,687,589 | | | | — | | | | 4,687,589 | | |
| | $ | 6,951,509 | | | $ | 4,687,589 | | | $ | — | | | $ | 11,639,098 | | |
Liabilities | | | | | | | | | |
Other Financial Instruments* | |
Futures Contracts | | $ | 2,806,056 | | | $ | — | | | $ | — | | | $ | 2,806,056 | | |
Swap Contracts | | | — | | | | 4,454,058 | | | | — | | | | 4,454,058 | | |
Written Options | | | 1,230,255 | | | | — | | | | — | | | | 1,230,255 | | |
| | $ | 4,036,311 | | | $ | 4,454,058 | | | $ | — | | | $ | 8,490,369 | | |
* Other financial instruments include unrealized appreciation (depreciation) on futures and swaps. Written options are reported at value.
For the year ended October 31, 2023, there were no transfers between Level 2 and Level 3. All transfers, if any, are assumed to occur at the end of the reporting period.
34
Credit Suisse Multialternative Strategy Fund
Notes to Consolidated Financial Statements (continued)
October 31, 2023
Note 2. Significant Accounting Policies (continued)
B) DERIVATIVE INSTRUMENTS AND HEDGING ACTIVITIES — The Fund has adopted a derivatives risk management program pursuant to Rule 18f-4 under the 1940 Act in order to assess and manage the Fund's derivatives risk, taking into account the Fund's derivatives transactions and how these transactions interact with the Fund's other investments. Because the Fund engages in derivatives transactions beyond a certain amount in order to pursue its investment objectives and policies, the Fund is required to comply with value at risk ("VaR") based limits on its leverage risk. The Fund adopted amendments to authoritative guidance on disclosures about derivative instruments and hedging activities which require that a fund disclose (a) how and why an entity uses derivative instruments, (b) how derivative instruments and hedging activities are accounted for and (c) how derivative instruments and related hedging activities affect a fund's financial position, financial performance and cash flows. For the year ended October 31, 2023, the Fund's derivatives did not qualify for hedge accounting as they are held at fair value.
The following table presents the fair value and the location of derivatives within the Consolidated Statement of Assets and Liabilities at October 31, 2023 and the effect of these derivatives on the Consolidated Statement of Operations for the year ended October 31, 2023.
Primary Underlying Risk | | Derivative
Assets(1) | | Derivative
Liabilities(1) | | Realized Gain
(Loss) | | Net Change in Unrealized
Appreciation (Depreciation) | |
Foreign currency exchange rate | |
Forward contracts | | $ | — | | | $ | — | | | $ | 175,211 | | | $ | (180,306 | ) | |
Futures contracts(2) | | | 371,376 | | | | — | | | | (620,656 | ) | | | 314,426 | | |
Swap contracts | | | 242,570 | | | | — | | | | (375,980 | ) | | | 400,015 | | |
Interest rate | |
Futures contracts(2) | | | 64,537 | | | | 1,059,601 | | | | 3,429,051 | | | | (2,118,502 | ) | |
Swap contracts | | | 151,865 | | | | 1,409,727 | | | | 3,542,655 | | | | (1,069,990 | ) | |
Equity price | |
Futures contracts(2) | | | 5,018,788 | | | | 62,258 | | | | (5,543,654 | ) | | | 6,003,755 | | |
Swap contracts | | | 2,269,072 | | | | 2,133,071 | | | | (1,565,028 | ) | | | (388,097 | ) | |
Written options | | | — | | | | 1,230,255 | | | | (700,165 | ) | | | (212,973 | ) | |
Credit risk | |
Swap contracts | | | 3,670 | | | | 423,045 | | | | (355,440 | ) | | | (419,375 | ) | |
Commodity price | |
Futures contracts(2) | | | 1,496,808 | | | | 1,684,197 | | | | 232,772 | | | | (517,371 | ) | |
Swap contracts | | | 2,020,412 | | | | 488,215 | | | | (7,585,702 | ) | | | 1,583,233 | | |
Total | | $ | 11,639,098 | | | $ | 8,490,369 | | | $ | (9,366,936 | ) | | $ | 3,394,815 | | |
(1) Generally, the balance sheet location for asset derivatives is receivables/net unrealized appreciation (depreciation) and for liability derivatives is payables/net unrealized appreciation (depreciation).
(2) Includes cumulative appreciation (depreciation) of futures contracts as reported in the Consolidated Schedule of Investments. Only variation margin is reported within the receivables and/or payables on the Consolidated Statement of Assets and Liabilities.
35
Credit Suisse Multialternative Strategy Fund
Notes to Consolidated Financial Statements (continued)
October 31, 2023
Note 2. Significant Accounting Policies (continued)
For the year ended October 31, 2023, the Fund held average monthly value on a net basis of $2,798,589 in forward foreign currency contracts and average monthly notional values of $248,386,651 and $290,021,341 in long futures contracts and short futures contracts and $1,092,540,351 in swap contracts, respectively. For the year ended October 31, 2023, the Fund received average monthly premiums of $127,030 from put written options contracts.
The Fund is a party to International Swap and Derivatives Association, Inc. ("ISDA") Master Agreements ("Master Agreements") with certain counterparties that govern over-the-counter derivative (including total return, credit default and interest rate swaps) and foreign exchange contracts entered into by the Fund. The Master Agreements may contain provisions regarding, among other things, the parties' general obligations, representations, agreements, collateral requirements, events of default and early termination. Termination events applicable to the Fund may occur upon a decline in the Fund's net assets below a specified threshold over a certain period of time.
The following table presents by counterparty the Fund's derivative assets, net of related collateral held by the Fund, at October 31, 2023:
Counterparty | | Gross Amount of
Derivative Assets
Presented in the
Consolidated
Statement of Assets
and Liabilities(a) | | Financial
Instruments
and Derivatives
Available for Offset | | Non-Cash
Collateral
Received | | Cash
Collateral
Received(b) | | Net Amount
of Derivative
Assets | |
Bank of America | | $ | 248,536 | | | $ | (24,710 | ) | | $ | — | | | $ | — | | | $ | 223,826 | | |
Barclays Bank PLC | | | 1,295,006 | | | | (384,721 | ) | | | — | | | | — | | | | 910,285 | | |
BNP Paribas | | | 266,635 | | | | (266,635 | ) | | | — | | | | — | | | | — | | |
Citigroup | | | 793,925 | | | | (506,497 | ) | | | — | | | | — | | | | 287,428 | | |
Goldman Sachs | | | 831,066 | | | | (831,066 | ) | | | — | | | | — | | | | — | | |
JPMorgan Chase | | | 1,152,684 | | | | (275,791 | ) | | | — | | | | — | | | | 876,893 | | |
Morgan Stanley | | | 12,080 | | | | (12,080 | ) | | | — | | | | — | | | | — | | |
Societe Generale | | | 87,657 | | | | (87,657 | ) | | | — | | | | — | | | | — | | |
| | | $ | 4,687,589 | | | $ | (2,389,157 | ) | | $ | — | | | $ | — | | | $ | 2,298,432 | | |
The following table presents by counterparty the Fund's derivative liabilities, net of related collateral pledged by the Fund, at October 31, 2023:
Counterparty | | Gross Amount of
Derivative Liabilities
Presented in the
Consolidated
Statement of Assets
and Liabilities(a) | | Financial
Instruments
and Derivatives
Available for Offset | | Non-Cash
Collateral
Pledged | | Cash
Collateral
Pledged(b) | | Net Amount
of Derivative
Liabilities | |
Bank of America | | $ | 24,710 | | | $ | (24,710 | ) | | $ | — | | | $ | — | | | $ | — | | |
Barclays Bank PLC | | | 384,721 | | | | (384,721 | ) | | | — | | | | — | | | | — | | |
BNP Paribas | | | 895,915 | | | | (266,635 | ) | | | — | | | | (629,280 | ) | | | — | | |
36
Credit Suisse Multialternative Strategy Fund
Notes to Consolidated Financial Statements (continued)
October 31, 2023
Note 2. Significant Accounting Policies (continued)
Counterparty | | Gross Amount of
Derivative Liabilities
Presented in the
Consolidated
Statement of Assets
and Liabilities(a) | | Financial
Instruments
and Derivatives
Available for Offset | | Non-Cash
Collateral
Pledged | | Cash
Collateral
Pledged(b) | | Net Amount
of Derivative
Liabilities | |
Citigroup | | $ | 506,497 | | | $ | (506,497 | ) | | $ | — | | | $ | — | | | $ | — | | |
Goldman Sachs | | | 2,344,555 | | | | (831,066 | ) | | | — | | | | (1,513,489 | ) | | | — | | |
JPMorgan Chase | | | 275,791 | | | | (275,791 | ) | | | — | | | | — | | | | — | | |
Morgan Stanley | | | 89,939 | | | | (12,080 | ) | | | — | | | | (77,859 | ) | | | — | | |
Societe Generale | | | 1,162,185 | | | | (87,657 | ) | | | — | | | | (1,074,528 | ) | | | — | | |
| | | $ | 5,684,313 | | | $ | (2,389,157 | ) | | $ | — | | | $ | (3,295,156 | ) | | $ | — | | |
(a) Swap contracts and written options are included. Written options are reported at market value.
(b) The actual collateral pledged may be more than the amounts shown.
C) FOREIGN CURRENCY TRANSACTIONS — The books and records of the Fund are maintained in U.S. dollars. Transactions denominated in foreign currencies are recorded at the current prevailing exchange rates. All assets and liabilities denominated in foreign currencies, including purchases and sales of investments, and income and expenses, are translated into U.S. dollar amounts on the date of those transactions.
Reported net realized gain (loss) from foreign currency transactions arises from sales of foreign currencies; currency gains or losses realized between the trade and settlement dates on securities transactions; and the difference between the amounts of dividends, interest, and foreign withholding taxes recorded on the Fund's books and the U.S. dollar equivalent of the amounts actually received or paid. Net change in unrealized gains and losses on translation of assets and liabilities denominated in foreign currencies arises from changes in the fair values of assets and liabilities, other than investments, at the end of the period, resulting from changes in exchange rates.
The Fund does not isolate that portion of the results of operations resulting from fluctuations in foreign exchange rates on investments from the fluctuations arising from changes in market prices of investments held. Such fluctuations are included with net realized and unrealized gain or loss from investments in the Consolidated Statement of Operations.
D) SECURITY TRANSACTIONS AND INVESTMENT INCOME/EXPENSE — Security transactions are accounted for on a trade date basis. Interest income/expense is recorded on the accrual basis. The Fund amortizes premiums and accretes discounts using the effective interest method. Dividend income/expense is recorded on the ex-dividend date. Foreign dividend income is recorded on the ex-dividend date or as soon as practicable after the Fund
37
Credit Suisse Multialternative Strategy Fund
Notes to Consolidated Financial Statements (continued)
October 31, 2023
Note 2. Significant Accounting Policies (continued)
determines the existence of a dividend declaration after exercising reasonable due diligence. Certain expenses are class-specific expenses, vary by class and are charged only to that class. Income, expenses (excluding class-specific expenses) and realized/unrealized gains/losses are allocated proportionately to each class of shares based upon the relative net asset value of the outstanding shares of that class. The cost of investments sold is determined by use of the specific identification method for both financial reporting and income tax purposes. To the extent any issuer defaults or a credit event occurs that impacts the issuer, the Fund may halt any additional interest income accruals and consider the realizability of interest accrued up to the date of default or credit event.
E) DIVIDENDS AND DISTRIBUTIONS TO SHAREHOLDERS — Dividends from net investment income, if any, are declared and paid quarterly. Distributions of net realized capital gains, if any, are declared and paid at least annually. However, to the extent that a net realized capital gain can be reduced by a capital loss carryforward, such gain will not be distributed. Dividends and distributions to shareholders of the Fund are recorded on the ex-dividend date and are determined in accordance with federal income tax regulations, which may differ from GAAP.
F) FEDERAL AND OTHER TAXES — No provision is made for federal taxes as it is the Fund's intention to continue to qualify as a regulated investment company ("RIC") under the Internal Revenue Code of 1986, as amended (the "Code"), and to make the requisite distributions to its shareholders, which will be sufficient to relieve it from federal income and excise taxes.
In order to qualify as a RIC under the Code, the Fund must meet certain requirements regarding the source of its income, the diversification of its assets and the distribution of its income. One of these requirements is that the Fund derive at least 90% of its gross income for each taxable year from dividends, interest, payments with respect to certain securities loans, gains from the sale or other disposition of stock, securities or foreign currencies, other income derived with respect to its business of investing in such stock, securities or currencies or net income derived from interests in certain publicly-traded partnerships ("Qualifying Income"). The Internal Revenue Service ("IRS") has issued a ruling that income realized from certain types of commodity-linked derivatives would not be Qualifying Income. As a result, the Fund's ability to realize income from investments in such commodity-linked derivatives as part of its investment strategy would be limited to a maximum of 10% of its gross income.
38
Credit Suisse Multialternative Strategy Fund
Notes to Consolidated Financial Statements (continued)
October 31, 2023
Note 2. Significant Accounting Policies (continued)
If the Fund is unable to ensure continued qualification as a RIC, the Fund may be required to change its investment objective, policies or techniques, or may be liquidated. If the Fund fails to qualify as a RIC, the Fund will be subject to federal income tax on its net income and capital gains at regular corporate rates (without reduction for distributions to shareholders). If the Fund were to fail to qualify as a RIC and become subject to federal income tax, shareholders of the Fund would be subject to the risk of diminished returns. The Fund adopted the authoritative guidance for uncertainty in income taxes and recognizes a tax benefit or liability from an uncertain position only if it is more likely than not that the position is sustainable based solely on its technical merits and consideration of the relevant taxing authority's widely understood administrative practices and procedures. The Fund has reviewed its current tax positions and has determined that no provision for income tax is required in the Fund's financial statements. The Fund's federal and state income and federal excise tax returns for tax years for which the applicable statutes of limitations have not expired are subject to examination by the IRS and state departments of revenue.
G) CASH — The Fund's uninvested cash balance is held in an interest bearing variable rate demand deposit account at State Street Bank and Trust Company ("SSB"), the Fund's custodian.
H) SHORT SALES — When the Fund engages in a short sale, the collateral for the short position will be maintained by the Fund's custodian or qualified sub-custodian. While the short sale is open, the Fund will maintain in a segregated account an amount of liquid securities equal in value to its obligation to the securities sold short. The collateral amounts required are determined daily by reference to the market value of the short positions. Short sales expose the Fund to the risk that it will be required to cover its short position at a time when the securities have appreciated in value, thus resulting in a loss to the Fund. The Fund's loss on a short sale could theoretically be unlimited in a case where the Fund is unable, for whatever reason, to close out its short position. Short sales also involve transaction and other costs that will reduce potential gains and increase potential Fund losses. The use by the Fund of short sales in combination with long positions in the Fund in an attempt to improve performance may not be successful and may result in greater losses or lower positive returns than if the Fund held only long positions. It is possible that the Fund's long equity positions will decline in value at the same time that the value of the securities it has sold short increases, thereby increasing potential losses to the Fund. In addition, the Fund's short selling strategies
39
Credit Suisse Multialternative Strategy Fund
Notes to Consolidated Financial Statements (continued)
October 31, 2023
Note 2. Significant Accounting Policies (continued)
may limit its ability to fully benefit from increases in the equity markets. Short selling also involves a form of financial leverage that may exaggerate any losses realized by the Fund. Also, there is the risk that the counterparty to a short sale may fail to honor its contractual terms, causing a loss to the Fund. At October 31, 2023, the Fund had no open short positions.
I) FUTURES — The Fund may enter into futures contracts to the extent permitted by its investment policies and objectives. The Fund may use futures contracts to gain exposure to or hedge against changes in interest rates, equity and market price movements and/or currency risks. Upon entering into a futures contract, the Fund is required to deposit cash and/or pledge U.S. Government securities as initial margin with a Futures Commission Merchant ("FCM"). Subsequent payments, which are dependent on the daily fluctuations in the value of the underlying instrument, are made or received by the Fund each day (daily variation margin) and are recorded as unrealized gains or losses in the Consolidated Statement of Operations until the contracts are closed. When the contracts are closed, the Fund records a realized gain or loss equal to the difference between the proceeds from (or cost of) the closing transaction and the Fund's basis in the contract. Risks of entering into futures contracts for hedging purposes include the possibility that a change in the value of the contract may not correlate with the changes in the value of the underlying instruments. Futures have minimal counterparty credit risk because futures are exchange traded and the exchange's clearinghouse, as counterparty to all exchange-traded futures, guarantees the futures against default. In addition, the purchase of a futures contract involves the risk that the Fund could lose more than the original margin deposit and subsequent payments may be required for a futures transaction. The Fund's open futures contracts are disclosed in the Consolidated Schedule of Investments. At October 31, 2023, the amount of restricted cash held at brokers related to open futures contracts was $32,492,250.
The Commodity Exchange Act requires an FCM to segregate all customer transactions and assets from the FCM's proprietary activities. A customer's cash and other equity deposited with an FCM are considered commingled with all other customer funds subject to the FCM's segregation requirements. In the event of an FCM's insolvency, recovery may be limited to the Fund's pro-rata share of segregated customer funds available. It is possible that the recovery amount could be less than the total of cash and other equity deposited.
J) FORWARD FOREIGN CURRENCY CONTRACTS — A forward foreign currency exchange contract ("forward currency contract") is a commitment to
40
Credit Suisse Multialternative Strategy Fund
Notes to Consolidated Financial Statements (continued)
October 31, 2023
Note 2. Significant Accounting Policies (continued)
purchase or sell a foreign currency at the settlement date at a negotiated rate. The Fund will enter into forward currency contracts primarily for hedging foreign currency risk. Forward currency contracts are valued at the prevailing forward exchange rate of the underlying currencies and unrealized gain/loss is recorded daily. On the settlement date of the forward currency contract, the Fund records a realized gain or loss equal to the difference between the value of the contract at the time it was opened and the value of the contract at the time it was closed. Certain risks may arise upon entering into forward currency contracts from the potential inability of counterparties to meet the terms of their contracts. The maximum counterparty credit risk to the Fund is measured by the unrealized gain on appreciated contracts. Additionally, when utilizing forward currency contracts to hedge, the Fund forgoes the opportunity to profit from favorable exchange rate movements during the term of the contract. At October 31, 2023, the Fund held no open forward currency contracts.
K) SWAPS — The Fund may enter into swaps either for hedging purposes or to seek to increase total return. A swap contract is an agreement that obligates two parties to exchange a series of cash flows at specified intervals based upon or calculated by reference to changes in specified prices or rates for a specified amount of an underlying asset or notional principal amount. A centrally cleared swap is a transaction executed between the Fund and a counterparty, then cleared by a clearing member through a central clearinghouse. The central clearinghouse serves as the counterparty, with whom the Fund exchanges cash flows. The Fund will enter into swap contracts only on a net basis, which means that the two payment streams are netted out, with the Fund receiving or paying, as the case may be, only the net amount of the two payments. Risks may arise as a result of the failure of the counterparty to the swap contract to comply with the terms of the swap contract. The extent of the Fund's exposure to credit and counterparty risks is the discounted net value of the cash flows to be received from the counterparty over the contract's remaining life, to the extent that the amount is positive. These risks are mitigated by having a master netting arrangement between the Fund and the counterparty and by the posting of collateral by the counterparty to the Fund to cover the Fund's exposure to the counterparty. Therefore, the Fund considers the creditworthiness of each counterparty as well as the amounts posted by the counterparty pursuant to the master netting agreement to a swap contract in evaluating potential credit risk. Additionally, risks may arise from unanticipated movements in interest rates or in the value of the underlying reference asset or index.
41
Credit Suisse Multialternative Strategy Fund
Notes to Consolidated Financial Statements (continued)
October 31, 2023
Note 2. Significant Accounting Policies (continued)
The Fund may enter into total return swap contracts, involving commitments to pay interest in exchange for a market-linked return, both based on notional amounts. The Fund may invest in total return swap contracts for hedging purposes or to seek to increase total return. To the extent the total return of the security or index underlying the transaction exceeds or falls short of the offsetting interest rate obligation, the Fund will receive a payment from or make a payment to the counterparty.
The Fund may enter into credit default swap agreements either as a buyer or seller. The Fund may buy a credit default swap to attempt to mitigate the risk of default or credit quality deterioration in one or more individual holdings or in a segment of the fixed income securities market. The Fund may sell a credit default swap in an attempt to gain exposure to an underlying issuer's credit quality characteristics without investing directly in that issuer.
The Fund bears the risk of loss of the amount expected to be received under a credit default swap agreement in the event of the default or bankruptcy of the counterparty. The Fund will enter into swap agreements only with counterparties that meet certain standards of creditworthiness (generally, such counterparties would have to be eligible counterparties under the terms of the Fund's repurchase agreement guidelines). Credit default swap agreements are generally valued at a price at which the counterparty to such agreement would terminate the agreement.
The Fund records unrealized gains or losses on a daily basis representing the value and the current net receivable or payable relating to open swap contracts. Net amounts received or paid on the swap contract are recorded as realized gains or losses. Fluctuations in the value of swap contracts are recorded for financial statement purposes as unrealized appreciation or depreciation from swap contracts. Realized gains and losses from terminated swaps are included in net realized gains/losses from swap contracts. Upon entering into a centrally cleared swap, the Fund is required to deposit with a financial intermediary cash or securities ("initial margin") in an amount equal to a certain percentage of the notional amount of the swap. Subsequent payments ("variation margin") are made or received by the Fund dependent upon the daily fluctuations in the value of the swap. In a cleared swap transaction, counterparty risk is minimized as the central clearinghouse acts as the counterparty. The Fund's open swap contracts are disclosed in the Consolidated Schedule of Investments. At October 31, 2023, the amounts of restricted cash held at brokers related to open swap contracts for the Fund was $55,321,269.
42
Credit Suisse Multialternative Strategy Fund
Notes to Consolidated Financial Statements (continued)
October 31, 2023
Note 2. Significant Accounting Policies (continued)
L) OPTION CONTRACTS — The Fund will enter into options contracts to gain exposure to risk volatility based assets. When the Fund purchases an option, it pays a premium and the option is subsequently marked to market to reflect current value. Premiums paid for purchasing options which expire are treated as realized losses. Premiums paid for purchasing options which are exercised or closed are added to the cost or deducted from the proceeds on the underlying instrument to determine the realized gain or loss. The risk associated with purchasing options is limited to the premium paid.
When the Fund writes an option, an amount equal to the net premium received (the premium less commission) is recorded as a liability and is subsequently adjusted to the current value. Net premiums received for written options which expire are treated as realized gains. Net premiums received for written options which are exercised or closed are deducted from the cost or added to the proceeds on the underlying instrument or closing purchase transaction to determine the realized gain or loss. The Fund, as writer of a written option, bears the risk of an unfavorable change in the market value of the instrument underlying the written option.
Exchange-traded options have standardized contracts and are settled through a clearinghouse with fulfillment guaranteed by the credit of the exchange. Therefore, counterparty credit risks to the Fund are limited. Over-the-counter options are subject to the risk that the counterparty is unable or unwilling to meet its obligations under the option. At October 31, 2023, the Fund's open written option contracts are disclosed in the Consolidated Schedule of Investments. At October 31, 2023, the amount of restricted cash held at brokers related to option contracts was $11,878,269.
M) SECURITIES LENDING — The initial collateral received by the Fund is required to have a value of at least 102% of the market value of domestic securities on loan (including any accrued interest thereon) and 105% of the market value of foreign securities on loan (including any accrued interest thereon). The collateral is maintained thereafter at a value equal to at least 102% of the current market value of the securities on loan. The market value of loaned securities is determined at the close of each business day of the Fund and any additional required collateral is delivered to the Fund, or excess collateral returned by the Fund, on the next business day. Cash collateral received by the Fund in connection with securities lending activity may be pooled together with cash collateral for other funds/portfolios advised by Credit Suisse and may be invested in a variety of investments, including funds advised by SSB, the Fund's securities lending agent, or money market
43
Credit Suisse Multialternative Strategy Fund
Notes to Consolidated Financial Statements (continued)
October 31, 2023
Note 2. Significant Accounting Policies (continued)
instruments. However, in the event of default or bankruptcy by the other party to the agreement, realization and/or retention of the collateral may be subject to legal proceedings. The remaining maturities of the securities lending transactions are considered overnight and continuous. Loans are subject to termination by the Fund or the borrower at any time.
SSB has been engaged by the Fund to act as the Fund's securities lending agent. As of October 31, 2023, the Fund had outstanding loans of securities to certain approved brokers for which the Fund received collateral:
Market Value of
Loaned Securities | | Market Value of
Cash Collateral | | Total Collateral | |
| $ | 852,212 | | | $ | 876,341 | | | $ | 876,341 | | |
The following table presents financial instruments that are subject to enforceable netting arrangements as of October 31, 2023.
Gross Amounts Not Offset in the Consolidated Statement of Assets and Liabilities | |
Gross Asset
Amounts Presented in
the Consolidated
Statement of Assets
and Liabilities(a) | | Collateral
Received(b) | | Net Amount | |
| $ | 852,212 | | | $ | (852,212 | ) | | $ | — | | |
(a) Represents market value of loaned securities at year end.
(b) The actual collateral received is greater than the amount shown here due to collateral requirements of the security lending agreement.
The Fund's securities lending arrangement provides that the Fund and SSB will share the net income earned from securities lending activities. Securities lending income is accrued as earned. For the year ended October 31, 2023, total earnings received in connection with securities lending arrangements was $1,646,811, of which $558,246 was rebated to borrowers (brokers). The Fund retained $816,307 in income, and SSB, as lending agent, was paid $272,258.
N) OTHER — In the normal course of business, the Fund trades financial instruments and enters into financial transactions for which risk of potential loss exists due to changes in the market (market risk) or failure of the other party to a transaction to perform (credit risk). Similar to credit risk, the Fund may be exposed to counterparty risk, including with respect to securities lending, or the risk that an institution or other entity with which the Fund has unsettled or open transactions will default. The potential loss could exceed the value of the financial assets recorded in the consolidated financial statements. Financial assets, which potentially expose the Fund to credit risk, consist principally of cash due from counterparties and investments. The extent of the
44
Credit Suisse Multialternative Strategy Fund
Notes to Consolidated Financial Statements (continued)
October 31, 2023
Note 2. Significant Accounting Policies (continued)
Fund's exposure to credit and counterparty risks in respect to these financial assets approximates their carrying value as recorded in the Fund's Consolidated Statement of Assets and Liabilities.
O) FOREIGN INVESTMENTS RISK — The Fund may have elements of risk not typically associated with investments in the U.S. due to concentrated investments in a limited number of countries or regions, which may vary throughout the year. Such concentrations may subject the Fund to additional risks resulting from political or economic conditions in such countries or regions and the possible imposition of adverse governmental laws or currency exchange restrictions could cause the securities and their markets to be less liquid and their prices to be more volatile than those of comparable U.S. securities.
Because the Fund may invest a significant portion of its assets in these markets, it is subject to greater risks of adverse events that occur in those markets and may experience greater volatility than a Fund that is more broadly diversified geographically.
Note 3. Transactions with Affiliates and Related Parties
Credit Suisse serves as investment adviser and co-administrator for the Fund. Credit Suisse is entitled to receive a fee from the Fund at an annual rate of 1.04% of the Fund's average daily net assets. For the year ended October 31, 2023, investment advisory and administration fees earned and fees waived/expenses reimbursed by Credit Suisse were $3,539,607 and $1,290,792, respectively. Credit Suisse has contractually agreed to limit expenses so that the Fund's annual operating expenses do not exceed 0.85% of the Fund's average daily net assets for Class I shares and 1.10% of the Fund's average daily net assets for Class A shares. The Fund is authorized to reimburse Credit Suisse for management fees previously waived and/or for expenses previously paid by Credit Suisse, provided, however, that any reimbursement must be paid at a date not more than thirty-six months following the applicable month during which such fees were waived or expenses were paid by Credit Suisse and the reimbursement does not cause the applicable class's aggregate expenses, on an annualized basis, to exceed either (i) the applicable expense limitation in effect at the time such fees were waived or such expenses were paid by Credit Suisse or (ii) the applicable expense limitation in effect at the time of such reimbursement. This contract may not be terminated before February 28, 2025. For the year ended October 31, 2023, there was no recoupment.
45
Credit Suisse Multialternative Strategy Fund
Notes to Consolidated Financial Statements (continued)
October 31, 2023
Note 3. Transactions with Affiliates and Related Parties (continued)
The amounts waived and reimbursed by Credit Suisse, which are available for potential future recoupment by Credit Suisse, and the expiration schedule at October 31, 2023 are as follows:
| | | Fee waivers/expense
reimbursements
subject to
recoupment | | Expires
October 31,
2024 | | Expires
October 31,
2025 | | Expires
October 31,
2026 | |
Class I | | $ | 1,926,169 | | | $ | 330,661 | | | $ | 542,432 | | | $ | 1,053,076 | | |
Class A | | | 383,211 | | | | 67,926 | | | | 77,569 | | | | 237,716 | | |
Totals | | $ | 2,309,380 | | | $ | 398,587 | | | $ | 620,001 | | | $ | 1,290,792 | | |
Credit Suisse Securities (USA) LLC ("CSSU"), an affiliate of Credit Suisse, serves as the distributor of the Fund's shares. Pursuant to a distribution plan adopted by the Fund pursuant to Rule 12b-1 under the 1940 Act, CSSU receives fees for its distribution services. These fees are calculated at an annual rate of 0.25% of the average daily net assets of the Class A shares. For the year ended October 31, 2023, the Fund paid Rule 12b-1 distribution fees of $155,871 for Class A shares. Class I shares are not subject to Rule 12b-1 distribution fees.
For the year ended October 31, 2023, CSSU and its affiliates advised the Fund that they retained $148 from commissions earned on the sale of the Fund's Class A shares.
Note 4. Line of Credit
The Fund, together with other funds/portfolios advised by Credit Suisse (collectively, the "Participating Funds"), participates in a committed, unsecured line of credit facility ("Credit Facility"), with SSB in an aggregated amount of $125 million for temporary or emergency purposes under a first-come, first-served basis. Under the terms of the Credit Facility, the Participating Funds pay an aggregate commitment fee on the average unused amount of the Credit Facility, which is allocated among the Participating Funds in such manner as is determined by the governing Boards of the Participating Funds. In addition, the Participating Funds pay interest on borrowings at either the Federal Funds Effective rate or the Overnight Bank Funding rate plus a spread. At October 31, 2023 and for the year ended October 31, 2023, the Fund had no borrowings outstanding under the Credit Facility.
46
Credit Suisse Multialternative Strategy Fund
Notes to Consolidated Financial Statements (continued)
October 31, 2023
Note 5. Purchases and Sales of Securities
For the year ended October 31, 2023, purchases and sales of investment securities (excluding short-term investments) and U.S. Government and Agency Obligations were as follows:
Investment Securities | | U.S. Government/
Agency Obligations | |
| Purchases | | Sales | | Purchases | | Sales | |
| $ | 282,610,824 | | | $ | 248,729,911 | | | $ | 0 | | | $ | 0 | | |
Note 6. Capital Share Transactions
The Fund is authorized to issue an unlimited number of full and fractional shares of beneficial interest, $0.001 par value per share. The Fund offers Class I and Class A shares. Transactions in capital shares for each class of the Fund were as follows:
| | | Class I | |
| | | For the Year Ended
October 31, 2023 | | For the Year Ended
October 31, 2022 | |
| | | Shares | | Value | | Shares | | Value | |
Shares sold | | | 12,852,027 | | | $ | 117,455,361 | | | | 26,890,790 | | | $ | 242,363,843 | | |
Shares issued in reinvestment
of distributions | | | 799,167 | | | | 7,304,387 | | | | 180,966 | | | | 1,614,218 | | |
Shares redeemed | | | (6,256,423 | ) | | | (56,312,623 | ) | | | (890,652 | ) | | | (7,964,011 | ) | |
Net increase | | | 7,394,771 | | | $ | 68,447,125 | | | | 26,181,104 | | | $ | 236,014,050 | | |
| | | Class A | |
| | | For the Year Ended
October 31, 2023 | | For the Year Ended
October 31, 2022 | |
| | | Shares | | Value | | Shares | | Value | |
Shares sold | | | 8,098,012 | | | $ | 73,379,751 | | | | 431,533 | | | $ | 3,836,894 | | |
Shares issued in reinvestment
of distributions | | | 25,370 | | | | 228,333 | | | | 50,668 | | | | 445,880 | | |
Shares redeemed | | | (1,239,129 | ) | | | (10,864,911 | ) | | | (190,911 | ) | | | (1,681,106 | ) | |
Net increase | | | 6,884,253 | | | $ | 62,743,173 | | | | 291,290 | | | $ | 2,601,668 | | |
On October 31, 2023, the number of shareholders that held 5% or more of the outstanding shares of each class of the Fund was as follows:
| | | Number of
Shareholders | | Approximate Percentage
of Outstanding Shares | |
Class I | | | 3 | | | | 95 | % | |
Class A | | | 1 | | | | 95 | % | |
47
Credit Suisse Multialternative Strategy Fund
Notes to Consolidated Financial Statements (continued)
October 31, 2023
Note 6. Capital Share Transactions (continued)
The Fund's performance may be negatively impacted in the event one or more of the Fund's greater than 5% shareholders were to redeem at a given time. Some of the shareholders may be omnibus accounts, which hold shares on behalf of individual shareholders.
Note 7. Income Tax Information and Distributions to Shareholders
Income and capital gain distributions are determined in accordance with federal income tax regulations, which may differ from GAAP.
The tax character of dividends paid by the Fund during the fiscal years ended October 31, 2023 and 2022, respectively, was as follows:
Ordinary Income | | Long Term Capital Gains | |
| 2023 | | 2022 | | 2023 | | 2022 | |
| $ | 6,240,654 | | | $ | 2,104,701 | | | $ | 1,399,996 | | | $ | 0 | | |
The tax basis components of distributable earnings differ from book basis by temporary book/tax differences. These differences are primarily due to differing treatments of wash sales, marked to market of options contracts, futures contracts, swap contracts, Subsidiary adjustments and deferred organizational expenses.
At October 31, 2023, the components of distributable earnings on a tax basis were as follows:
Undistributed ordinary income | | $ | 9,639,363 | | |
Unrealized depreciation | | | (8,050,290 | ) | |
| | | $ | 1,589,073 | | |
At October 31, 2023, the cost and net unrealized appreciation (depreciation) of investments and derivatives for income tax purposes were as follows:
Cost of Investments | | $ | 315,270,582 | | |
Unrealized appreciation | | $ | 6,656,522 | | |
| Unrealized depreciation | | | (14,706,812 | ) | |
Net unrealized appreciation (depreciation) | | $ | (8,050,290 | ) | |
To adjust for current period permanent book/tax differences which arose principally from differing book/tax treatment of Subsidiary cumulative income/loss, foreign currency gain (loss), equalization distribution, return of capital distribution from REITs, capital gain distributions from REITs, futures gain (loss), swap income reclass to ordinary, adjustments to the prior period
48
Credit Suisse Multialternative Strategy Fund
Notes to Consolidated Financial Statements (continued)
October 31, 2023
Note 7. Income Tax Information and Distributions to Shareholders (continued)
accumulated balance, paid-in capital was charged $3,798,069 and distributable earnings/loss was credited $3,798,069. Net assets were not affected by this reclassification.
Note 8. Contingencies
In the normal course of business, the Fund may provide general indemnifications pursuant to certain contracts and organizational documents. The Fund's maximum exposure under these arrangements is dependent on future claims that may be made against the Fund and, therefore, cannot be estimated; however, based on experience, the risk of loss from such claims is considered remote.
Note 9. UBS Merger
On June 12, 2023 (the "Closing Date"), Credit Suisse Group AG ("CS Group") merged with and into UBS Group AG, a global financial services company ("UBS Group"), with UBS Group remaining as the surviving company (the "Transaction"), pursuant to a definitive merger agreement signed on March 19, 2023. CS Group was the ultimate parent company of Credit Suisse, the Fund's investment manager. As a result of the Transaction, Credit Suisse is now an indirect wholly-owned subsidiary of UBS Group.
The closing of the Transaction was deemed to result in an assignment of the Fund's investment advisory agreement with Credit Suisse (the "Prior Advisory Agreement"), resulting in its automatic termination as of the Closing Date. Prior to the Closing Date, the Board approved a new investment advisory agreement with Credit Suisse (the "New Advisory Agreement"), which was then approved by shareholders at a joint special meeting of shareholders of the Fund and the other Credit Suisse funds held on August 24, 2023. In addition, prior to the Closing Date, the Board approved an interim investment advisory agreement with Credit Suisse (the "Interim Advisory Agreement"). The Interim Advisory Agreement did not require shareholder approval. The Interim Advisory Agreement took effect upon the Closing Date when the Prior Advisory Agreement was deemed to have terminated, so that Credit Suisse could continue to manage the Fund following the Closing Date. The Interim Advisory Agreement terminated upon the shareholder approval of the corresponding New Advisory Agreement. The Interim Advisory Agreement contained the same terms and conditions as the corresponding Prior Advisory Agreement except for the effective and termination dates, the termination and escrow provisions required by Rule 15a-4 under the 1940 Act and certain
49
Credit Suisse Multialternative Strategy Fund
Notes to Consolidated Financial Statements (continued)
October 31, 2023
Note 9. UBS Merger (continued)
non-material changes. During the period that the Interim Advisory Agreement was in effect, Credit Suisse's advisory fees were held in an interest-bearing escrow account, pursuant to Rule 15a-4.
In addition, on June 7, 2023, Credit Suisse and certain of its affiliates filed an application (the "Application") for a waiver from disqualification under Section 9(a) of the 1940 Act from serving as investment adviser to registered investment companies, including the Fund, in connection with a consent order and final judgment (the "Consent Judgment") filed in New Jersey Superior Court on October 24, 2022. The Consent Judgment was entered against certain of Credit Suisse's affiliates, but did not involve the Fund or the services that Credit Suisse and its affiliates provided to the Fund. Because Credit Suisse is an affiliate of the entities subject to the Consent Judgment, it could also be subject to disqualification under Section 9(a), despite not being involved in the conduct underlying the Consent Judgment. As requested in the Application, the SEC granted a temporary waiver from Section 9(a) to Credit Suisse and its affiliates, as well as to UBS Group and its affiliates ("UBS"), on June 7, 2023. The temporary waiver became effective on the Closing Date. Credit Suisse and certain of its affiliates also applied for a permanent order, which the SEC granted on July 5, 2023. The permanent order grants (i) a time-limited exemption from Section 9(a) (the "Time-Limited Exemption"), which enables Credit Suisse to provide investment advisory services to the Fund until the 12-month anniversary of the Closing Date (by which point such services are anticipated to be transitioned to one or more UBS asset management affiliates), and (ii) a permanent exemption from Section 9(a) for UBS.
No changes to the investment objective, principal investment strategies and policies, principal risks, fundamental and non-fundamental investment policies, or portfolio managers ("Fund-specific changes") (other than potential personnel changes outside of Credit Suisse's control) of the Fund are currently contemplated as a result of the Transaction or the Time-Limited Exemption. Although no Fund-specific changes are currently contemplated as a result of the Transaction, shareholders should note that Credit Suisse is expected to transition the investment advisory services that its currently provides to the Fund to one or more registered investment advisers affiliated with UBS on or prior to June 12, 2024 (the "UBS Transition"). In connection with, or following the completion of, the UBS Transition, it is possible that there could be Fund-specific changes. In addition, subject to Board approval, one or more Fund service providers may change prior to the expiration of the Time-Limited Exemption in connection with the UBS Transition. However, the exact structure
50
Credit Suisse Multialternative Strategy Fund
Notes to Consolidated Financial Statements (continued)
October 31, 2023
Note 9. UBS Merger (continued)
and timing of the UBS Transition and Fund-specific changes (if any) related to the UBS Transition have not yet been finalized. It is expected that any Fund-specific changes related to the UBS Transition will be implemented without shareholder approval except to the extent such approvals are required under the federal securities laws. Shareholders of the Fund will be promptly notified of any material Fund-specific changes.
Note 10. Subsequent Events
On December 13, 2023, the U.S. Securities and Exchange Commission (the "SEC") entered an administrative cease and desist order (the "Order") against Credit Suisse Securities (USA) LLC ("CSSU") and two affiliated Credit Suisse entities (collectively, the Credit Suisse Entities) alleging in the Order that the Credit Suisse Entities were ineligible to provide underwriting and investment advisory services to registered investment companies, including the Fund, during the period from October 24, 2022 to June 7, 2023 in violation of Section 9(a) of the Investment Company Act of 1940 (the "1940 Act") as a result of a consent order and final judgment (the "Consent Judgment") entered against CSSU in New Jersey Superior Court on October 24, 2022 involving the sale of mortgage-backed securities approximately fifteen years ago. The Consent Judgment did not involve registered investment companies or the services that the Credit Suisse Entities provided to registered investments companies or the Fund. Without admitting or denying the findings in the SEC's Order, the Credit Suisse Entities agreed to pay$10,080,220 in disgorgement, prejudgment interest and civil penalties and agree to cease and desist from committing or causing any violations or any future violations of Section 9(a) of the 1940 Act.
On October 24, 2022, as noted above, the Superior Court of New Jersey entered a Consent Judgement that resolved a case alleging that CSSU violated the antifraud provisions of the State of New Jersey securities laws in connection with its role as underwriter of residential mortgage-backed securities. As a result of this Consent Judgement, the SEC, as noted above, alleged that the Credit Suisse Entities were deemed ineligible from serving as principal underwriter or investment adviser to registered investment companies and employees' securities companies pursuant to Section 9(a) of the 1940 Act and that the Credit Suisse Entities continued to serve in these roles until the Commission granted them respective time-limited exemptions on June 7, 2023.
51
Credit Suisse Multialternative Strategy Fund
Report of Independent Registered Public Accounting Firm
To the Board of Trustees of Credit Suisse Opportunity Funds and
Shareholders of Credit Suisse Multialternative Strategy Fund
Opinion on the Financial Statements
We have audited the accompanying consolidated statement of assets and liabilities, including the consolidated schedule of investments, of Credit Suisse Multialternative Strategy Fund (one of the funds constituting Credit Suisse Opportunity Funds, referred to hereafter as the "Fund") as of October 31, 2023, the related consolidated statement of operations for the year ended October 31, 2023, the consolidated statement of changes in net assets for each of the two years in the period ended October 31, 2023, including the related notes, and the consolidated financial highlights for each of the four years in the period ended October 31, 2023 (collectively referred to as the "consolidated financial statements"). In our opinion, the consolidated financial statements present fairly, in all material respects, the financial position of the Fund as of October 31, 2023, the results of its operations for the year then ended, the changes in its net assets for each of the two years in the period ended October 31, 2023 and the financial highlights for each of the four years in the period ended October 31, 2023 in conformity with accounting principles generally accepted in the United States of America.
The consolidated financial statements of the Fund as of and for the year ended October 31, 2019 and the consolidated financial highlights for the year ended October 31, 2019 (not presented herein, other than the consolidated financial highlights) were audited by other auditors whose report dated December 20, 2019 expressed an unqualified opinion on those consolidated financial statements and financial highlights.
Basis for Opinion
These consolidated financial statements are the responsibility of the Fund's management. Our responsibility is to express an opinion on the Fund's consolidated financial statements based on our audits. We are a public accounting firm registered with the Public Company Accounting Oversight Board (United States) (PCAOB) and are required to be independent with respect to the Fund in accordance with the U.S. federal securities laws and the applicable rules and regulations of the Securities and Exchange Commission and the PCAOB.
We conducted our audits of these consolidated financial statements in accordance with the standards of the PCAOB. Those standards require that we plan and perform the audit to obtain reasonable assurance about whether the consolidated
52
Credit Suisse Multialternative Strategy Fund
Report of Independent Registered Public Accounting Firm
financial statements are free of material misstatement, whether due to error or fraud.
Our audits included performing procedures to assess the risks of material misstatement of the consolidated financial statements, whether due to error or fraud, and performing procedures that respond to those risks. Such procedures included examining, on a test basis, evidence regarding the amounts and disclosures in the consolidated financial statements. Our audits also included evaluating the accounting principles used and significant estimates made by management, as well as evaluating the overall presentation of the consolidated financial statements. Our procedures included confirmation of securities owned as of October 31, 2023 by correspondence with the custodian, transfer agent, and brokers; when replies were not received from brokers, we performed other auditing procedures. We believe that our audits provide a reasonable basis for our opinion.
/s/PricewaterhouseCoopers LLP
New York, New York
December 27, 2023
We have served as the auditor of one or more investment companies in Credit Suisse Asset Management, LLC investment companies since 2020.
53
Credit Suisse Multialternative Strategy Fund
Shareholder Meeting Results (unaudited)
A special meeting of shareholders of Credit Suisse Multialternative Strategy Fund (the "Fund") was held at Eleven Madison Avenue, New York, NY 10010 on August 24, 2023. The following matter was voted upon by the shareholders of the Fund and the results are presented below.
1. Approval of a new Investment Advisory Agreement:
| | Shares | | % of Total Shares
Outstanding | | % of Total Shares
Voted | |
For | | | 32,442,226 | | | | 83.4 | % | | | 96.77 | % | |
Against | | | 49,873 | | | | 0.13 | % | | | 0.15 | % | |
Abstain | | | 1,032,319 | | | | 2.65 | % | | | 3.08 | % | |
54
Credit Suisse Multialternative Strategy Fund
Board Approval of Interim and New Investment Management Agreements (unaudited)
The Fund's Board of Trustees (the "Board" and the members thereof, the "Board Members"), including a majority of the Board Members who are not "interested persons" of the Fund (as defined in the Investment Company Act of 1940, as amended (the "1940 Act")) (the "Independent Board Members"), unanimously approved the Fund's interim investment management agreement (the "Interim Management Agreement") and new investment management agreement with Credit Suisse Asset Management, LLC ("Credit Suisse") (the "New Management Agreement") at a meeting of the Board held on May 16, 2023 (the "May 2023 Board Meeting") after concluding that each of the approval of the Interim Management Agreement and New Management Agreement was in the best interests of the Fund and its shareholders. The factors considered by the Board in considering and approving the Interim Management Agreement and New Management Agreement are set out below.
In anticipation of the closing of the merger of Credit Suisse Group AG ("CS Group") with and into UBS Group AG, a global financial services company ("UBS Group"), with UBS Group remaining as the surviving company (the "Merger"), and in response to a request from the Board, representatives of UBS Group and its affiliates (collectively, "UBS") attended the May 2023 Board Meeting and provided information regarding the UBS asset management business and the investment advisory and principal underwriting services currently provided to the UBS family of registered investment companies (the "UBS Presentation").
The Board's evaluation of the Interim Management Agreement and New Management Agreement reflected information provided at the May 2023 Board Meeting as well as, where relevant, information relating to the Fund and Credit Suisse, that was previously furnished to the Board in connection with a special meeting held on November 9, 2022, where the Board discussed the information and materials relating to the renewal of the Fund's prior investment management agreement with Credit Suisse (the "Prior Management Agreement"), and at an in-person meeting held on November 14-15, 2022 (the "November 2022 15(c) Meeting"), where the Board approved the renewal of the Prior Management Agreement (collectively, the "November 2022 15(c) Materials"), and information provided to the Board at other Board meetings throughout the year. The Board considered Credit Suisse's representations at the May 2023 Board Meeting that (i) no material changes to the information provided in the November 2022 15(c) Materials had occurred since the November 2022 15(c) Meeting, (ii) with respect to the Interim Management Agreement, the scope and quality of services under the Interim Management Agreement will be at least equivalent to the scope and quality of services provided under the Prior Management Agreement, and (iii) the
55
Credit Suisse Multialternative Strategy Fund
Board Approval of Interim and New Investment Management Agreements (unaudited) (continued)
personnel, resources and services provided to the Fund are not expected to change under the Interim Management Agreement and New Management Agreement and will be similar to those services provided under the Prior Management Agreement. The Board also considered that the Interim Management Agreement will be substantially similar to the Prior Management Agreement, including with respect to compensation, except for certain terms including the term, termination and escrow provisions required by Rule 15a-4 under the 1940 Act and certain non-material changes.
The Board, including all of the Independent Board Members, were assisted by experienced independent legal counsel throughout the Interim Management Agreement and New Management Agreement review process. The Independent Board Members discussed the proposed approval in private session with such counsel at which no representatives of management or Credit Suisse were present. Each Board Member, including each of the Independent Board Members, relied upon the advice of independent legal counsel and his or her own business judgment in determining the material factors to be considered in evaluating the Interim Management Agreement and New Management Agreement and the weight to be given to each such factor. The conclusions reached by the Board Members were based on a comprehensive evaluation of all of the information provided and were not the result of any one factor. Moreover, each Board Member may have afforded different weight to the various factors in reaching his or her conclusions with respect to the Interim Management Agreement and New Management Agreement.
On June 7, 2023, Credit Suisse and certain of its affiliates filed an application with the Securities and Exchange Commission pursuant to Section 9(c) of the 1940 Act for temporary and permanent orders granting an exemption to Credit Suisse and its affiliates, as well as to UBS, from the prohibitions under Section 9(a) of the 1940 Act, in connection with a consent order and final judgment ("Consent Judgment") filed in New Jersey Superior Court on October 24, 2022, which was entered against certain of Credit Suisse's affiliates. Section 9(a) of the 1940 Act automatically prohibits entities that are, or whose affiliates are, subject to, among other things, certain court ordered "injunctions," from serving or acting as investment adviser of any investment company registered under the 1940 Act or a principal underwriter for any registered open-end investment company under the 1940 Act, or serving in various other capacities in respect of registered investment companies.
While the application for the Section 9(c) exemption was submitted and the temporary order (the "Temporary Order") granting a temporary exemption from Section 9(a) of the 1940 Act was granted to Credit Suisse and its affiliates,
56
Credit Suisse Multialternative Strategy Fund
Board Approval of Interim and New Investment Management Agreements (unaudited) (continued)
as well as to UBS, after the Board approved the Interim Management Agreement and New Management Agreement at the May 2023 Board Meeting, since shortly after the entry of the Consent Judgment in October 2022, the Board has been apprised of the Consent Judgment and the potential consequences thereof under Section 9(a) of the 1940 Act and have been provided with regular updates. In addition, the Board was apprised of the filing of the Section 9(c) exemption application and the implications of the Time-Limited Exemption (as defined below) prior to approving the submission of the New Management Agreement to shareholders at a meeting of the Board held on June 15, 2023.
The "Time-Limited Exemption" refers to the time-limited exemption from Section 9(a) of the 1940 Act for 12 months from the closing date of the Merger sought by Credit Suisse and certain of its affiliates to provide Credit Suisse and Credit Suisse Securities (USA) LLC ("CSSU") with adequate time to complete the CS Fund Servicing Reorganization (as defined below) while engaged in serving as investment adviser and underwriter to the Fund, respectively (collectively, "Fund Servicing Activities"). The "CS Fund Servicing Reorganization" refers to the process of (i) transitioning the Fund Servicing Activities that Credit Suisse, Credit Suisse UK and CSSU perform on behalf of one or more of the funds to other providers of such services, and/or (ii) restructuring the Temporary Order applicants' businesses such that Credit Suisse, Credit Suisse UK and/or each other company that was an "affiliated person" of the settling entities in the Consent Judgement as of the date of the Section 9(c) application may provide Fund Servicing Activities without being subject to disqualification under Section 9(a) of the 1940 Act. Credit Suisse and certain of its affiliates also applied for a permanent order, which the SEC granted on July 5, 2023.
Investment Management Fee Rates and Expenses
The Board reviewed and considered the contractual advisory fees of the Fund under its Prior Management Agreement and its Interim Management Agreement and New Management Agreement (which fees are identical), in light of the extent and quality of the management services provided by Credit Suisse, as investment adviser.
The Board also considered that Credit Suisse and the Fund have entered into a contractual expense limitation agreement limiting the Fund's total net expenses and that this arrangement was expected to continue under the Interim Management Agreement and New Management Agreement. The Board noted that the Fund is authorized to reimburse Credit Suisse for advisory fees
57
Credit Suisse Multialternative Strategy Fund
Board Approval of Interim and New Investment Management Agreements (unaudited) (continued)
previously limited and/or for expenses previously reimbursed by Credit Suisse, provided, however, that any reimbursements must be paid at a date not more than thirty-six months following the applicable month during which such fees were limited or expenses were reimbursed by Credit Suisse and the reimbursements do not cause the Fund to exceed the applicable expense limitation at the time the fees are recouped. The Board also noted that the expense limitation agreement may not be terminated before February 28, 2024.
The November 2022 15(c) Materials included information comparing the Fund's contractual advisory fee, the Fund's contractual advisory fee less any waivers and/or reimbursements ("actual advisory fee"), and the Fund's overall expenses with those of funds in both the relevant expense group ("Expense Group") and universe of funds ("Expense Universe") provided by Broadridge, an independent provider of investment company data. The November 2022 15(c) Materials included a description of the methodology used to arrive at the funds included in the Expense Group and the Expense Universe. Each fund in the Expense Group and Expense Universe was placed in one of five quintiles for each relevant comparison period, with the first quintile including the funds with the lowest relative expenses and the fifth quintile including funds with the highest relative expenses during the period. The Fund's Board noted that, with respect to the Fund's fees and expenses compared to its peers as presented in a report provided by Broadridge, the Fund's contractual advisory fees ranked in the second quintile relative to its Expense Group, and the Fund's actual advisory fees and total expenses ranked in the first quintile relative to its Expense Group and Expense Universe.
Nature, Extent and Quality of the Services
The Board received and considered information regarding the nature, extent and quality of services provided to the Fund by Credit Suisse. The Board also noted information received at regular meetings throughout the year related to the services rendered by Credit Suisse which, in addition to portfolio management and investment management services, included credit analysis and research, supervising the day-to-day operations of the Fund's non-advisory functions which include accounting, administration, custody, transfer agent and other applicable third party service providers, overseeing and facilitating audits, overseeing the Fund's credit facility and supervising and/or preparing applicable Fund filings, disclosures and shareholder reports. The Board noted that the extensive investment management services provided by Credit Suisse included broad supervisory responsibility and oversight over other service providers to the Fund. The Board also considered Credit Suisse's
58
Credit Suisse Multialternative Strategy Fund
Board Approval of Interim and New Investment Management Agreements (unaudited) (continued)
compliance program with respect to the Fund. The Board noted that Credit Suisse reports to the Board about portfolio management and compliance matters on a periodic basis. The Board also reviewed background information about Credit Suisse including its Form ADV Part 2 — Disclosure Brochure and Brochure Supplement and considered the background and experience of Credit Suisse's senior management and the expertise of, and the amount of attention given to the Fund by, senior personnel of Credit Suisse. In addition, the Board reviewed the qualifications, backgrounds and responsibilities of the portfolio management team primarily responsible for the day-to-day portfolio management of the Fund and the extent of the resources devoted to research and analysis of actual and potential investments, as well as the resources provided to them. The Board evaluated the ability of Credit Suisse based on its resources, reputation and other attributes, to attract and retain qualified investment professionals including research, advisory, and supervisory personnel. The Board also received and considered information about the nature, extent and quality of services and fee rates offered to other Credit Suisse clients for comparable services. The Board acknowledged Credit Suisse's representation that the services provided to the Fund are more extensive than the services provided in connection with other types of accounts, such as separate accounts, offered by Credit Suisse and the services are also more extensive from those offered and provided to a sub-advised fund. The Board also considered that the services provided by Credit Suisse have expanded over time as a result of regulatory and other developments.
Fund Performance
The Board considered information provided in the November 2022 15(c) Materials and at each subsequent quarterly meeting to consider the performance of the Fund. That information in the November 2022 15(c) Materials included performance results of the Fund over the previous year ended August 31, 2022 as well as over the two-, three-, four-, five-, and ten-year periods ended August 31, 2022 along with comparisons both to the relevant performance group ("Performance Group") and universe of funds ("Performance Universe") for the Fund for the same time periods provided by Broadridge. The November 2022 15(c) Materials included a description of the methodology used to arrive at the funds included in the Performance Group and the Performance Universe. Each fund in the Performance Universe was placed in one of five quintiles for each relevant comparison period, with the first quintile including the best performing funds and the fifth quintile including the worst performing funds during the period. The Fund's Board noted that, with respect to the Fund's performance compared to its peers as
59
Credit Suisse Multialternative Strategy Fund
Board Approval of Interim and New Investment Management Agreements (unaudited) (continued)
presented in a report provided by Broadridge, along with other information provided by Credit Suisse, the Fund's performance ranked in the first quintile relative to its Performance Universe for the one-, two-, three-, four-, five-, and ten-year periods reported.
The Board also considered the investment performance of the Fund relative to its stated objectives.
The Board noted that at the May 2023 Board Meeting, the Board received information from Credit Suisse regarding the Fund's performance relative to its benchmark for each month of 2023 and each quarter from the quarter ended June 30, 2020 through the quarter ended March 31, 2023, in addition to relative to its select peers for the three-month and one-, three- and five-year and since inception periods ended March 31, 2023.
Credit Suisse Profitability
The Board referred to a profitability analysis of Credit Suisse provided in the November 2022 15(c) Materials based on the fees payable under the Prior Management Agreement and the Interim Management Agreement and the New Management Agreement for the Fund, including any fee waivers, as well as other relationships between the Fund on the one hand and Credit Suisse affiliates on the other. The Board's deliberations also reflected, in the context of Credit Suisse's profitability, Credit Suisse's methodology for allocating costs to the Fund, recognizing that cost allocation methodologies are inherently subjective. The Board had also received net profitability information for the Fund. The Board reviewed Credit Suisse's profit margin as reflected in the profitability analysis, as well as reviewing profitability in light of appropriate court cases and the services rendered to the Fund.
Economies of Scale
The Board considered information provided in the November 2022 15(c) Materials regarding whether there have been economies of scale with respect to the management of the Fund, whether the Fund has appropriately benefited from any economies of scale, and whether there is potential for realization of any further economies of scale for the Fund. The Board considered that, if the Fund's asset levels grow, further economies of scale potentially could be realized (although this is not guaranteed) and also noted the contractual expense limitations currently in place between the Fund and Credit Suisse. The Board received information regarding Credit Suisse's
60
Credit Suisse Multialternative Strategy Fund
Board Approval of Interim and New Investment Management Agreements (unaudited) (continued)
profitability in connection with providing investment management services to the Fund, including Credit Suisse's costs in providing the services.
Other Benefits to Credit Suisse
The Board considered other benefits received by Credit Suisse and its affiliates as a result of their relationship with the Fund previously included in the November 2022 15(c) Materials. Such benefits included, among others, benefits potentially derived from an increase in Credit Suisse's businesses and its reputation as a result of its relationship with the Fund (such as the ability to market its advisory services to other clients and investors including separate account or third party sub-advised mandates or other financial products offered by Credit Suisse and its affiliates), as well as, with respect to the Fund, the fees paid to an affiliate of Credit Suisse for distribution services.
The Board considered the standards Credit Suisse applied in seeking best execution and Credit Suisse's policies and practices regarding soft dollars and reviewed Credit Suisse's method for allocating portfolio investment opportunities among its advisory clients, as provided in the November 2022 15(c) Materials.
Other Factors and Broader Review
As discussed above, the Board previously reviewed and referred to detailed materials received from Credit Suisse as part of this special approval process. The Board also reviews and assesses the quality of the services that the Fund receives throughout the year and reviews reports of Credit Suisse at least quarterly, which include, among other things, detailed portfolio and market reviews, detailed Fund performance reports, and Credit Suisse's compliance procedures.
The Board also considered the information provided by the representatives of UBS during the UBS Presentation at the May 2023 Board Meeting. In particular, the Board considered the information regarding the investment advisory and principal underwriting services currently provided to the UBS family of registered investment companies.
In addition, the Board considered representations from Credit Suisse and UBS that there were no plans to make any changes to the investment objective(s), principal investment strategies and policies, principal risks, fundamental and non-fundamental investment policies or portfolio managers
61
Credit Suisse Multialternative Strategy Fund
Board Approval of Interim and New Investment Management Agreements (unaudited) (continued)
(other than potential personnel changes outside of Credit Suisse's control) of the Fund upon the closing of the Merger.
Conclusions
After consideration of the foregoing, the Board reached the following conclusions regarding the Interim Management Agreement and the New Management Agreement (in addition to the conclusions set forth above):
• The contractual and net advisory fees for the Fund were reasonable in relation to the services provided by Credit Suisse.
• The Board was satisfied by the nature, extent and quality of the investment advisory services provided to the Fund by Credit Suisse and that, based on dialogue with management and counsel, the services to be provided by Credit Suisse under the Interim Management Agreement and the New Management Agreement are typical of, and consistent with, those provided to similar mutual funds by other investment advisers.
• In light of the costs of providing investment management and other services to the Fund and Credit Suisse's ongoing commitment to the Fund and willingness to waive fees (by agreeing to a contractual expense limitation), Credit Suisse's net profitability based on fees payable under the Interim Management Agreement and New Management Agreement, as well as other ancillary benefits that Credit Suisse and its affiliates received, were considered reasonable.
• In light of the information received and considered by the Board, the Fund's current fee structure was considered reasonable.
No single factor reviewed by the Board was identified by the Board as the principal factor in determining whether to approve the Interim Management Agreement and New Management Agreement. The Independent Board Members were advised by separate independent legal counsel throughout the process. After consideration of these factors, the Fund's Board concluded that the approval of the Interim Management Agreement and New Management Agreement was in the best interests of the Fund and the Fund's shareholders.
62
Credit Suisse Multialternative Strategy Fund
Tax Information (unaudited)
The following information is provided pursuant to provisions of the Internal Revenue Code:
The Fund hereby designates $1,399,996 as long-term capital gain distributions for purposes of the dividends paid deduction (including earnings and profits distributed to shareholders on redemption of Fund shares) for the year ended October 31, 2023.
The Fund hereby designates $561,707 of ordinary dividends paid during the year that are considered qualified dividend income for the year ended October 31, 2023.
The Fund hereby designates 2.52% of ordinary dividends paid during the year that are eligible for the dividends received deduction available to certain corporate shareholders.
63
Credit Suisse Multialternative Strategy Fund
Information Concerning Trustees and Officers (unaudited)
Name, Address
(Year of Birth) | | Position(s)
Held with
Portfolio | | Term
of Office1
and
Length
of Time
Served | | Principal
Occupation(s) During
Past Five Years | | Number of
Portfolios
in Portfolio
Complex
Overseen
by Trustee | | Other
Trusteeships
Held by Trustee
During Past Five Years | |
Independent Trustees | | | | | | | | | | | |
Laura A. DeFelice
c/o Credit Suisse Asset Management, LLC
Attn: General Counsel
Eleven Madison Avenue
New York, New York
10010
(1959) | | Chair of the Board (as of November 14, 2023). Trustee, Nominating and Audit Committee Member | | Since 2017 | | Managing Member of Acacia Properties LLC (multi-family and commercial real estate ownership and operation) from 2008 to present; Stonegate Advisors LLC (renewable energy and energy efficiency) from 2007 to present. | | | 9 | | | Director of the Lyric Opera of Chicago (performing arts) from December 2021 to present. | |
Samantha Kappagoda
c/o Credit Suisse Asset Management, LLC
Attn: General Counsel
Eleven Madison Avenue
New York, New York 10010
(1968) | | Trustee, Nominating Committee Chair and Audit Committee Member | | Since 2023 | | Chief Economist, Risk Economics, Inc. (Economic Analysis) from 2009 to present; Co-Managing Member, Numerati Partners LLC (Research & Development Technology) from 2012 to present. | | | 9 | | | Director of Girl Scouts of Greater New York (non-profit) from 2014 to present; Visiting Scholar, Courant Institute of Mathematical Sciences, New York University (education) from 2011 to present; Director of Council for Economic Education (nonprofit) from 2014 to 2020; Director of Glynwood Center, Inc. (nonprofit) from 2010 to 2019. | |
1 Subject to the Trust's retirement policy, each Trustee may continue to serve as a Trustee until the last day of the calendar year in which the applicable Trustee attains age 75. The Board may determine to extend the terms of Trustees beyond age 75 on a case-by-case basis. Each officer serves until his or her respective successor has been duly elected and qualified.
64
Credit Suisse Multialternative Strategy Fund
Information Concerning Trustees and Officers (unaudited) (continued)
Name, Address
(Year of Birth) | | Position(s)
Held with
Portfolio | | Term
of Office1
and
Length
of Time
Served | | Principal
Occupation(s) During
Past Five Years | | Number of
Portfolios
in Portfolio
Complex
Overseen
by Trustee | | Other
Trusteeships
Held by Trustee
During Past Five Years | |
Independent Trustees | | | | | | | | | | | |
Mahendra R. Gupta
c/o Credit Suisse Asset Management, LLC
Attn: General Counsel
Eleven Madison Avenue
New York, New York
10010
(1956) | | Trustee, Nominating Committee Member and Audit Committee Chairman | | Since 2017 | | Professor, Washington University in St. Louis from July 1990 to present; Partner, R.J. Mithaiwala (food manufacturing and retail, India) from March 1977 to present; Partner, F.F.B. Corporation (agriculture, India) from March 1977 to present; Partner, RPMG Research Corporation (benchmark research) from July 2001 to present. | | | 9 | | | Director of Caleres Inc. (footwear) from May 2012 to present; Chair of the finance committee at the Foundation of Barnes Jewish Hospital (healthcare) from January 2018 to present; Director of First Bank (finance) from February 2022 to present; Director of ENDI Corporation (finance) from April 2022 to present; Director of The Oasis Institute (not-for-profit) from February 2022 to present; Director of the Consortium for Graduate Study in Management from November 2017 to present; Director of Koch Development Corporation (Real Estate Developement) from November 2017 to December 2020; Director of Supernova (Fin-tech) from June 2014 to September 2018; Director of the Guardian Angels of St. Louis (not-forprofit) from July 2015 to December 2021. | |
1 Subject to the Trust's retirement policy, each Trustee may continue to serve as a Trustee until the last day of the calendar year in which the applicable Trustee attains age 75. The Board may determine to extend the terms of Trustees beyond age 75 on a case-by-case basis. Each officer serves until his or her respective successor has been duly elected and qualified.
65
Credit Suisse Multialternative Strategy Fund
Information Concerning Trustees and Officers (unaudited) (continued)
Name, Address
(Year of Birth) | | Position(s)
Held with
Portfolio | | Term
of Office1
and
Length
of Time
Served | | Principal
Occupation(s) During
Past Five Years | | Number of
Portfolios
in Portfolio
Complex
Overseen
by Trustee | | Other
Trusteeships
Held by Trustee
During Past Five Years | |
Independent Trustees | | | | | | | | | | | |
Steven N. Rappaport
c/o Credit Suisse Asset Management, LLC
Attn: General Counsel
Eleven Madison Avenue
New York, New York
10010
(1948) | | Chairman of the Board (through November 14, 2023). Trustee, Nominating and Audit Committee Member | | Trustee since Portfolio Inception and Chairman since 2005 | | Partner of Lehigh Court, LLC and RZ Capital (private investment firms) from July 2002 to present; Partner of Backstage Acquisition Holdings, LLC (publication job postings) from November 2013 to 2018. | | | 9 | | | Director of abrdn Emerging Markets Equity Income Fund, Inc. (a closed-end investment company); Director of abrdn Funds (20 open-end portfolios); Director of iCAD, Inc. (surgical & medical instruments & apparatus company) from 2006 to 2018. | |
Interested Trustee | | | | | | | | | | | |
John G. Popp2
Credit Suisse Asset
Management, LLC
Eleven Madison Avenue
New York, New York
10010
(1956) | | Trustee, Chief Executive Officer and President | | Trustee since 2017
Chief Executive Officer and President since 2010 | | Managing Director of Credit Suisse; Global Head and Chief Investment Officer of the Credit Investments Group; Associated with Credit Suisse or its predecessor since 1997; President and Chief Executive Officer of other Credit Suisse Funds. | | | 9 | | | None. | |
1 Subject to the Trust's retirement policy, each Trustee may continue to serve as a Trustee until the last day of the calendar year in which the applicable Trustee attains age 75. The Board may determine to extend the terms of Trustees beyond age 75 on a case-by-case basis. Each officer serves until his or her respective successor has been duly elected and qualified.
2 Mr. Popp is an "interested person" of the Trust, as defined in the 1940 Act, by virtue of his current position as an officer of Credit Suisse.
66
Credit Suisse Multialternative Strategy Fund
Information Concerning Trustees and Officers (unaudited) (continued)
Name, Address
(Year of Birth) | | Position(s)
Held with
Portfolio | | Term of
Office
and
Length of
Time
Served | | Principal Occupation(s) During Past Five Years | |
Officers* | | | | | | | |
Brandi Sinkovich
Credit Suisse Asset Management, LLC
Eleven Madison Avenue New York, New York 10010
(1979) | | Chief Compliance Officer | | Since 2023 | | Director of Credit Suisse since 2023; Vice President and Regulatory Counsel, Exos Financial from 2022 to 2023; Vice President and Compliance Officer, Neuberger Berman from 2019 to 2022; Vice President, Compliance, Goldman Sachs from 2017 to 2019; Associated with Credit Suisse since 2023; Officer of other Credit Suisse Funds. | |
Lou Anne McInnis
Credit Suisse Asset Management, LLC
Eleven Madison Avenue
New York, New York 10010
(1959) | | Chief Legal Officer | | Since 2015 | | Director of Credit Suisse; Associated with Credit Suisse since April 2015; Counsel at DLA Piper US LLP from 2011 to April 2015; Associated with Morgan Stanley Investment Management from 1997 to 2010; Officer of other Credit Suisse Funds. | |
Omar Tariq
Credit Suisse Asset
Management, LLC
Eleven Madison Avenue
New York, New York 10010
(1983) | | Chief Financial Officer and Treasurer | | Since 2019 | | Director of Credit Suisse since 2019; Senior Manager of PricewaterhouseCoopers,LLP from September 2010 to March 2019; Officer of other Credit Suisse Funds. | |
Karen Regan
Credit Suisse Asset
Management, LLC
Eleven Madison Avenue
New York, New York 10010
(1963) | | Vice President and Secretary | | Since 2010 | | Vice President of Credit Suisse; Associated with Credit Suisse since December 2004; Officer of other Credit Suisse Funds. | |
* The officers of the Portfolio shown are officers that make policy decisions.
The Statement of Additional Information includes additional information about the Trustees and is available, without charge, upon request, by calling 877-870-2874.
67
Credit Suisse Multialternative Strategy Fund
Proxy Voting and Portfolio Holdings Information (unaudited)
Information regarding how the Fund voted proxies related to its portfolio securities during the 12-month period ended June 30 of each year, as well as the policies and procedures that the Fund uses to determine how to vote proxies relating to its portfolio securities are available:
• By calling 1-877-870-2874
• On the Fund's website, www.credit-suisse.com/us/funds
• On the website of the Securities and Exchange Commission, www.sec.gov
The Fund files a complete schedule of its portfolio holdings for the first and third quarters of its fiscal year with the SEC as an exhibit to its reports on Form N-PORT, and for reporting periods ended prior to March 31, 2019, filed such information on Form N-Q. The Fund's Forms N-PORT and N-Q are available on the SEC's website at www.sec.gov.
68

P.O. BOX 219916, KANSAS CITY, MO 64121-9916
877-870-2874 ◼ www.credit-suisse.com/us/funds
CREDIT SUISSE SECURITIES (USA) LLC, DISTRIBUTOR. MSF-AR-1023

CREDIT SUISSE FUNDS
Annual Report
October 31, 2023
◼ CREDIT SUISSE
STRATEGIC INCOME FUND
The Fund's investment objective, risks, charges and expenses (which should be considered carefully before investing), and more complete information about the Fund, are provided in the Prospectus, which should be read carefully before investing. You may obtain additional copies by calling 877-870-2874 or by visiting our website at www.credit-suisse.com/us/funds.
Credit Suisse Securities (USA) LLC, Distributor, is located at Eleven Madison Avenue, New York, NY 10010. Credit Suisse Funds are advised by Credit Suisse Asset Management, LLC.
Investors in the Credit Suisse Funds should be aware that they may be eligible to purchase Class I shares (where offered) directly or through certain intermediaries. Such shares are not subject to a sales charge. Investors in the Credit Suisse Funds should also be aware that they may be eligible for a reduction or waiver of the sales charge with respect to Class A or C shares (where offered). For more information, please review the relevant prospectuses or consult your financial representative.
Fund shares are not deposits or other obligations of Credit Suisse Asset Management, LLC ("Credit Suisse") or any affiliate, are not FDIC-insured and are not guaranteed by Credit Suisse or any affiliate. Fund investments are subject to investment risks, including loss of your investment.
Credit Suisse Strategic Income Fund
Annual Investment Adviser's Report
October 31, 2023 (unaudited)
October 31, 2023
Dear Shareholder:
We are pleased to present this Annual Report covering the activities of the Credit Suisse Strategic Income Fund (the "Fund") for the twelve-month period ended October 31, 2023 (the "Period").
Performance Summary
11/01/2022 – 10/31/2023
Fund & Benchmark | | Performance | |
| Class I1 | | | 10.57 | % | |
| Class A1,2 | | | 10.30 | % | |
| Class C1,2 | | | 9.36 | % | |
| ICE BofA 3-Month US Treasury Bill Index3 | | | 4.77 | % | |
Performance shown for the Fund's Class A and Class C Shares does not reflect sales charges, which are a maximum of 4.75% and 1.00%, respectively.2
Market Review: A positive period for loans and high yield assets
The twelve-month period ended October 31, 2023, (the "Period") was positive for the loan and high yield asset class, as a resilient U.S. economy and high coupons in floating rate instruments were offset by tightening financial conditions. The Credit Suisse Leveraged Loan Index registered a return of 11.56% for the Period, while the ICE BofA US High Yield Constrained Index gained 5.8%. The Fund's benchmark, the ICE BofA US 3-Month Treasury Index (the "Index"), returned 4.77% for the Period.
Technicals in the high yield market have been favorable for the Period, most notably due to a significant wave of rising stars (bonds upgraded from high yield to investment grade) as well as modest new issuance and high coupon reinvestment. Mutual fund flows, however, have been weak in recent years. For the Period, high yield mutual funds saw outflows of $22.8 billion. This follows more than $50 billion of outflows in the prior twelve-month period. Despite increasing activity from especially low volumes in 2022, capital markets have been fairly muted amid elevated rate volatility. Net new issuance volume, which excludes refinancing activity, was up 12% to $53.2 billion in the calendar year-to-date as of October 31, 2023.
Within loans, fund flows have been more modest of late, with outflows of only -$4.7 billion during the six month period ended October 31, 2023 — compared to -$26.6 billion for the Period, according to JPMorgan. Collateralized loan obligation issuance faces ongoing challenges, finding fleeting opportunities within
1
Credit Suisse Strategic Income Fund
Annual Investment Adviser's Report (continued)
October 31, 2023 (unaudited)
narrow windows where asset-liability arbitrage aligns. There was $123 billion gross/$111.1 billion net issuance during the Period. Loan issuance remained subdued with only $330.7 billion of gross issuance and $82.9 billion of net issuance.
Strategic Review and Outlook: Credit selection continues to be critical on the back of "higher for longer" rates
For the Period, all share classes of the Fund significantly outperformed the Index. Allocations to bank loans, high yield, and CLOs contributed to performance, and from a sector perspective, information technology, financial, and manufacturing added positively to returns. B2, B3 and B1 were the largest contributors to performance from a ratings perspective.
While certain interest rate-sensitive and cyclical areas of the economy showed signs of cracking, we did not see widespread signs of deterioration and corporate balance sheets remained relatively strong. The resiliency of the broader economy has led to expectations of higher rates for longer.
Amidst a resilient technical market outlook, corporate profits have been impacted, as companies navigate heightened borrowing costs due to elevated interest rates, higher (though easing) inflation metrics, tighter labor market, and higher wages. Although default rates remained below long-term historical averages over the Period, there was a noticeable increase in distressed activity throughout 2023. According to JPMorgan, the trailing twelve month default rate, including distressed exchanges, ended the Period at 2.60% for bonds and 3.08% for loans. We expect default activity to continue to increase in the near-term due to higher cost of capital.
In this environment, we believe credit selection will continue to be paramount to capture opportunities, as the impacts of higher cost of capital and other risks spread through the global economy.
The Credit Suisse Credit Investments Group
John G. Popp
Andrew H. Marshak
Thomas J. Flannery
Louis I. Farano
Wing Chan
David Mechlin
Joshua Shedroff
2
Credit Suisse Strategic Income Fund
Annual Investment Adviser's Report (continued)
October 31, 2023 (unaudited)
Senior secured floating rate loans ("Senior Loans") typically hold the most senior position in the issuer's capital structure. Senior Loans are subject to the risk that a court could subordinate a Senior Loan to presently existing or future indebtedness or take other action detrimental to the holders of Senior Loans.
High yield bonds are bonds rated below BBB- by S&P or Baa3 by Moody's that are also known as "junk bonds." Such bonds entail greater risks than those found in higher- rated securities.
CLOs are subject to the risk of substantial losses due to actual defaults, decrease of market value due to collateral defaults and disappearance of subordinate tranches, market anticipation of defaults, and investor aversion to CLO securities as a class. The risks of CLOs depend largely on the type of the underlying loans and the tranche of CLOs in which the Fund invests. In addition, CLOs carry risks including interest rate risk and credit risk.
Additional principal risk factors for the Fund include conflict of interest risk, convertible securities risk, credit risk, derivatives risk, extension risk, foreign securities risk, futures contracts risk, hedged exposure risk, illiquidity risk, interest rate risk, market risk, mortgage- and asset-backed securities risk, prepayment risk, short position risk, U.S. government securities risk and valuation risk. Before you invest, please make sure you understand the risks that apply to the Fund. As with any mutual fund, you could lose money over any period of time. Investments in the Fund are not bank deposits and are not insured or guaranteed by the Federal Deposit Insurance Corporation or any government agency. For a detailed discussion of these and other risks, please refer to the Fund's Prospectus, which should be read carefully before investing.
In addition to historical information, this report contains forward-looking statements, which may concern, among other things, domestic and foreign markets, industry and economic trends and developments and government regulation, and their potential impact on the Fund's investments. These statements are subject to risks and uncertainties and actual trends, developments and regulations in the future, and their impact on the Fund, could be materially different from those projected, anticipated or implied. The Fund has no obligation to update or revise forward-looking statements.
The views of the Fund's management are as of the date of this letter and the Fund holdings described in this document are as of October 31, 2023; these views and Fund holdings may have changed subsequent to these dates. Nothing in this document is a recommendation to purchase or sell securities.
3
Credit Suisse Strategic Income Fund
Annual Investment Adviser's Report (continued)
October 31, 2023 (unaudited)
Comparison of Change in Value of $10,000 Investment in the
Credit Suisse Strategic Income Fund1 Class I Shares,
Class A Shares2 , Class C Shares2 and the ICE BofA US
3-Month Treasury Bill Index3
For Ten Years
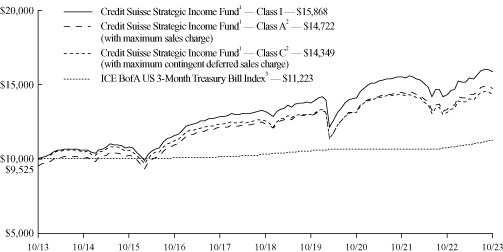
1 Fee waivers and/or expense reimbursements reduce expenses for the Fund, without which performance would be lower. Effective November 12, 2019, the Fund entered into a written contract to limit expenses to 0.79% of the Fund's average daily net assets for Class I shares, 1.04% of the Fund's average daily net assets for Class A shares and 1.79% of the Fund's average daily net assets for Class C shares through at least February 28, 2025. This limit excludes certain expenses, as set forth in the Fund's Prospectus.
2 Total return for the Fund's Class A shares for the reporting period, based on offering price (including maximum sales charge of 4.75%), was 5.11%. Total return for the Fund's Class C shares for the reporting period, based on redemption value (including maximum contingent deferred sales charge ("CDSC") of 1.00%), was 8.36%.
3 The ICE BofA US 3-Month Treasury Bill Index (the "Index") is comprised of a single issue purchased at the beginning of the month and held for a full month. Each month the Index is rebalanced and the issue selected is the outstanding Treasury Bill that matures closest to, but not beyond 3 months from the rebalancing date. The Index does not have transaction costs and investors may not invest directly in the Index.
4
Credit Suisse Strategic Income Fund
Annual Investment Adviser's Report (continued)
October 31, 2023 (unaudited)
Average Annual Returns as of October 31, 20231
| | | 1 Year | | 5 Years | | 10 Years | |
Class I | | | 10.57 | % | | | 3.82 | % | | | 4.73 | % | |
Class A Without Sales Charge | | | 10.30 | % | | | 3.56 | % | | | 4.45 | % | |
Class A With Maximum Sales Charge | | | 5.11 | % | | | 2.55 | % | | | 3.94 | % | |
Class C Without CDSC | | | 9.36 | % | | | 2.77 | % | | | 3.68 | % | |
Class C With CDSC | | | 8.36 | % | | | 2.77 | % | | | 3.68 | % | |
Returns represent past performance and include change in share price and reinvestment of dividends, capital gains, and return of capital distributions, if any. Past performance cannot guarantee future results. The current performance of the Fund may be lower or higher than the figures shown. Returns and share price will fluctuate, and redemption value may be more or less than original cost. The performance results do not reflect the deduction of taxes that a shareholder would pay on Fund distributions or the redemption of Fund shares. Performance information current to the most recent month end is available at www.credit-suisse.com/us/funds.
The annual gross expense ratios are 1.10% for Class I shares, 1.35% for Class A shares and 2.10% for Class C shares. The annual net expense ratios after fee waivers and/or expense reimbursements are 0.79% for Class I shares, 1.04% for Class A shares and 1.79% for Class C shares.
1 Fee waivers and/or expense reimbursements reduce expenses for the Fund, without which performance would be lower. Effective November 12, 2019, the Fund entered into a written contract to limit expenses to 0.79% of the Fund's average daily net assets for Class I shares, 1.04% of the Fund's average daily net assets for Class A shares and 1.79% of the Fund's average daily net assets for Class C shares through at least February 28, 2025. This limit excludes certain expenses, as set forth in the Fund's Prospectus.
5
Credit Suisse Strategic Income Fund
Annual Investment Adviser's Report (continued)
October 31, 2023 (unaudited)
Information About Your Fund's Expenses
As an investor of the Fund, you incur two types of costs: ongoing expenses and transaction costs. Ongoing expenses include management fees, distribution and service (12b-1) fees and other Fund expenses. Examples of transaction costs include sales charges (loads), redemption fees and account maintenance fees, which are not shown in this section and which would result in higher total expenses. The following table is intended to help you understand your ongoing expenses of investing in the Fund and to help you compare these expenses with the ongoing expenses of investing in other mutual funds. The table is based on an investment of $1,000 made at the beginning of the six months ended October 31, 2023.
The table illustrates your Fund's expenses in two ways:
• Actual Fund Return. This helps you estimate the actual dollar amount of ongoing expenses paid on a $1,000 investment in the Fund using the Fund's actual return during the period. To estimate the expenses you paid over the period, simply divide your account value by $1,000 (for example, an $8,600 account value divided by $1,000 = 8.6), then multiply the result by the number in the "Expenses Paid per $1,000" line.
• Hypothetical 5% Fund Return. This helps you to compare the Fund's ongoing expenses with those of other mutual funds using the Fund's actual expense ratio and a hypothetical rate of return of 5% per year before expenses. Examples using a 5% hypothetical fund return may be found in the shareholder reports of other mutual funds. The hypothetical account values and expenses may not be used to estimate the actual ending account balance or expenses you paid for the period.
Please note that the expenses shown in these tables are meant to highlight your ongoing expenses only and do not reflect any transaction costs, such as sales charges (loads) or redemption fees. If these transaction costs had been included, your costs would have been higher. The "Expenses Paid per $1,000" line of the tables is useful in comparing ongoing expenses only and will not help you determine the relative total expenses of owning different funds.
6
Credit Suisse Strategic Income Fund
Annual Investment Adviser's Report (continued)
October 31, 2023 (unaudited)
Expenses and Value for a $1,000 Investment
for the six-month period ended October 31, 2023
Actual Fund Return | | Class I | | Class A | | Class C | |
Beginning Account Value 05/01/23 | | $ | 1,000.00 | | | $ | 1,000.00 | | | $ | 1,000.00 | | |
Ending Account Value 10/31/23 | | $ | 1,027.70 | | | $ | 1,026.40 | | | $ | 1,021.50 | | |
Expenses Paid per $1,000* | | $ | 4.04 | | | $ | 5.31 | | | $ | 9.12 | | |
Hypothetical 5% Fund Return | |
Beginning Account Value 05/01/23 | | $ | 1,000.00 | | | $ | 1,000.00 | | | $ | 1,000.00 | | |
Ending Account Value 10/31/23 | | $ | 1,021.22 | | | $ | 1,019.96 | | | $ | 1,016.18 | | |
Expenses Paid per $1,000* | | $ | 4.02 | | | $ | 5.30 | | | $ | 9.10 | | |
| | | Class I | | Class A | | Class C | |
Annualized Expense Ratios* | | | 0.79 | % | | | 1.04 | % | | | 1.79 | % | |
* Expenses are equal to the Fund's annualized expense ratio for each share class, multiplied by the average account value over the period, multiplied by 184/365 to reflect the one-half year period.
The "Expenses Paid per $1,000" and the "Annualized Expense Ratios" in the tables are based on actual expenses paid by the Fund during the period, net of fee waivers and/or actual expense reimbursements, if applicable. If those fee waivers and/or expense reimbursements had not been in effect, the Fund's actual expenses would have been higher. Expenses do not reflect additional charges and expenses that are, or may be, imposed under the variable contracts or plans. Such charges and expenses are described in the prospectus of the insurance company separate account or in the plan documents or other informational materials supplied by plan sponsors. The Fund's expenses should be considered with these charges and expenses in evaluating the overall cost of investing in the separate account.
For more information, please refer to the Fund's Prospectus.
7
Credit Suisse Strategic Income Fund
Annual Investment Adviser's Report (continued)
October 31, 2023 (unaudited)
Credit Quality Breakdown*
(% of Total Investments as of October 31, 2023)
S&P Ratings** | | | |
A | | | 0.1 | % | |
BBB | | | 1.8 | | |
BB | | | 27.6 | | |
B | | | 43.6 | | |
CCC | | | 11.7 | | |
D | | | 0.1 | | |
NR | | | 5.3 | | |
Subtotal | | | 90.2 | | |
Equity and Other | | | 9.8 | | |
Total | | | 100.0 | % | |
* Expressed as a percentage of total investments (excluding securities lending collateral, if applicable) and may vary over time.
** Credit Quality is based on ratings provided by the S&P Global Ratings Division of S&P Global Inc. ("S&P"). S&P is a main provider of ratings for credit assets classes and is widely used amongst industry participants. The NR category consists of securities that have not been rated by S&P.
8
Credit Suisse Strategic Income Fund
Schedule of Investments
October 31, 2023
Par
(000) | |
| | Ratings†
(S&P/Moody's) | | Maturity | | Rate% | | Value | |
| CORPORATE BONDS (49.0%) | | | |
| Aerospace & Defense (0.2%) | | | |
$ | 750 | | | Bombardier, Inc., Rule 144A,
Senior Unsecured Notes
(Callable 02/01/26 @ 103.75)(1),(2) | | (B, B2) | | 02/01/29 | | | 7.500 | | | $ | 695,022 | | |
| Auto Parts & Equipment (0.7%) | | | |
| | 250 | | | Adient Global Holdings Ltd., Rule 144A,
Senior Secured Notes
(Callable 04/15/25 @ 103.50)(1) | | (BB+, Ba3) | | 04/15/28 | | | 7.000 | | | | 246,355 | | |
| | 1,500 | | | Clarios Global LP/Clarios U.S. Finance
Co., Rule 144A, Company Guaranteed
Notes (Callable 12/01/23 @ 102.13)(1) | | (B-, Caa1) | | 05/15/27 | | | 8.500 | | | | 1,480,477 | | |
| | 1,000 | | | TI Automotive Finance PLC, Rule 144A,
Company Guaranteed Notes
(Callable 04/15/24 @ 101.88)(1),(3) | | (BB, B3) | | 04/15/29 | | | 3.750 | | | | 884,120 | | |
| | | | 2,610,952 | | |
| Automakers (0.1%) | | | |
| | 250 | | | Winnebago Industries, Inc., Rule 144A,
Senior Secured Notes
(Callable 12/01/23 @ 103.13)(1) | | (BB+, Ba3) | | 07/15/28 | | | 6.250 | | | | 235,359 | | |
| Brokerage (0.4%) | | | |
| | 1,500 | | | StoneX Group, Inc., Rule 144A,
Senior Secured Notes
(Callable 12/01/23 @ 102.16)(1) | | (BB-, Ba3) | | 06/15/25 | | | 8.625 | | | | 1,506,390 | | |
| Building & Construction (0.8%) | | | |
| | 324 | | | Adams Homes, Inc., Rule 144A,
Company Guaranteed Notes
(Callable 11/16/23 @ 101.88)(1) | | (BB-, B2) | | 02/15/25 | | | 7.500 | | | | 317,860 | | |
| | 2,000 | | | Pike Corp., Rule 144A, Company
Guaranteed Notes
(Callable 12/01/23 @ 102.75)(1) | | (CCC+, B3) | | 09/01/28 | | | 5.500 | | | | 1,701,890 | | |
| | 1,100 | | | TopBuild Corp., Rule 144A, Company
Guaranteed Notes
(Callable 10/15/26 @ 102.06)(1) | | (BB+, Ba2) | | 02/15/32 | | | 4.125 | | | | 868,233 | | |
| | | | 2,887,983 | | |
| Building Materials (2.6%) | | | |
| | 2,000 | | | Advanced Drainage Systems, Inc.,
Rule 144A, Company Guaranteed
Notes (Callable 07/15/25 @ 103.19)(1) | | (BB-, Ba2) | | 06/15/30 | | | 6.375 | | | | 1,888,271 | | |
| | 500 | | | Builders FirstSource, Inc., Rule 144A,
Company Guaranteed Notes
(Callable 06/15/27 @ 103.19)(1) | | (BB-, Ba2) | | 06/15/32 | | | 6.375 | | | | 457,335 | | |
| | 1,690 | | | Foundation Building Materials, Inc.,
Rule 144A, Company Guaranteed
Notes (Callable 03/01/24 @ 103.00)(1) | | (CCC+, Caa1) | | 03/01/29 | | | 6.000 | | | | 1,395,610 | | |
See Accompanying Notes to Financial Statements.
9
Credit Suisse Strategic Income Fund
Schedule of Investments (continued)
October 31, 2023
Par
(000) | |
| | Ratings†
(S&P/Moody's) | | Maturity | | Rate% | | Value | |
| CORPORATE BONDS (continued) | | | |
| Building Materials (continued) | | | |
$ | 2,950 | | | Interface, Inc., Rule 144A, Company
Guaranteed Notes
(Callable 12/01/23 @ 102.75)(1) | | (B+, B1) | | 12/01/28 | | | 5.500 | | | $ | 2,482,779 | | |
| | 1,447 | | | Masonite International Corp., Rule 144A,
Company Guaranteed Notes
(Callable 12/01/23 @ 102.69)(1) | | (BB+, Ba2) | | 02/01/28 | | | 5.375 | | | | 1,334,214 | | |
| | 500 | | | Masonite International Corp., Rule 144A,
Company Guaranteed Notes
(Callable 08/15/29 @ 100.00)(1) | | (BB+, Ba2) | | 02/15/30 | | | 3.500 | | | | 396,504 | | |
| | 1,808 | | | MIWD Holdco II LLC/MIWD Finance
Corp., Rule 144A, Company
Guaranteed Notes
(Callable 02/01/25 @ 102.75)(1) | | (B, B3) | | 02/01/30 | | | 5.500 | | | | 1,436,836 | | |
| | 500 | | | Oscar AcquisitionCo LLC/Oscar Finance,
Inc., Rule 144A, Senior Unsecured
Notes (Callable 04/15/25 @ 104.75)(1),(2) | | (CCC+, Caa1) | | 04/15/30 | | | 9.500 | | | | 441,605 | | |
| | | | 9,833,154 | | |
| Cable & Satellite TV (1.6%) | | | |
| | 2,000 | | | Altice Financing SA, Rule 144A,
Senior Secured Notes
(Callable 12/01/23 @ 102.50)(1) | | (B, B3) | | 01/15/28 | | | 5.000 | | | | 1,628,431 | | |
| | 300 | | | CSC Holdings LLC, Rule 144A,
Company Guaranteed Notes
(Callable 11/15/26 @ 102.25)(1) | | (B, B2) | | 11/15/31 | | | 4.500 | | | | 198,441 | | |
| | 500 | | | CSC Holdings LLC, Rule 144A,
Senior Unsecured Notes
(Callable 01/15/25 @ 102.88)(1) | | (CCC+, Caa2) | | 01/15/30 | | | 5.750 | | | | 262,110 | | |
| | 2,400 | | | Telenet Finance Luxembourg Notes SARL,
Rule 144A, Senior Secured Notes
(Callable 11/13/23 @ 102.75)(1) | | (BB-, Ba3) | | 03/01/28 | | | 5.500 | | | | 2,145,432 | | |
| | 2,030 | | | UPC Broadband Finco BV, Rule 144A,
Senior Secured Notes
(Callable 07/15/26 @ 102.44)(1) | | (BB-, B1) | | 07/15/31 | | | 4.875 | | | | 1,613,688 | | |
| | | | 5,848,102 | | |
| Chemicals (2.8%) | | | |
| | 250 | | | Avient Corp., Rule 144A,
Senior Unsecured Notes
(Callable 12/01/23 @ 101.44)(1) | | (BB-, Ba3) | | 05/15/25 | | | 5.750 | | | | 245,078 | | |
| | 750 | | | Avient Corp., Rule 144A,
Senior Unsecured Notes
(Callable 08/01/25 @ 103.56)(1) | | (BB-, Ba3) | | 08/01/30 | | | 7.125 | | | | 721,461 | | |
| | 2,843 | | | HB Fuller Co., Global Senior
Unsecured Notes
(Callable 12/01/23 @ 102.13) | | (BB-, Ba3) | | 10/15/28 | | | 4.250 | | | | 2,466,431 | | |
See Accompanying Notes to Financial Statements.
10
Credit Suisse Strategic Income Fund
Schedule of Investments (continued)
October 31, 2023
Par
(000) | |
| | Ratings†
(S&P/Moody's) | | Maturity | | Rate% | | Value | |
| CORPORATE BONDS (continued) | | | |
| Chemicals (continued) | | | |
$ | 500 | | | Herens Holdco SARL, Rule 144A,
Senior Secured Notes
(Callable 05/15/24 @ 102.38)(1) | | (B-, B2) | | 05/15/28 | | | 4.750 | | | $ | 387,767 | | |
| | 1,400 | | | INEOS Finance PLC, Rule 144A,
Senior Secured Notes
(Callable 02/15/25 @ 103.38)(1),(2) | | (BB, Ba2) | | 05/15/28 | | | 6.750 | | | | 1,308,911 | | |
| | 450 | | | Olympus Water U.S. Holding Corp.,
Rule 144A, Senior Unsecured Notes
(Callable 10/01/24 @ 103.13)(1),(2) | | (CCC+, Caa2) | | 10/01/29 | | | 6.250 | | | | 337,912 | | |
| | 2,550 | | | Polar U.S. Borrower LLC/Schenectady
International Group, Inc., Rule 144A,
Senior Unsecured Notes
(Callable 12/01/23 @ 103.38)(1) | | (CCC-, Caa3) | | 05/15/26 | | | 6.750 | | | | 1,137,083 | | |
| | 1,500 | | | Tronox, Inc., Rule 144A,
Company Guaranteed Notes
(Callable 03/15/24 @ 102.31)(1) | | (BB-, B1) | | 03/15/29 | | | 4.625 | | | | 1,184,069 | | |
| | 3,000 | | | Vibrantz Technologies, Inc., Rule 144A,
Senior Unsecured Notes
(Callable 02/15/25 @ 104.50)(1),(2) | | (CCC+, Caa2) | | 02/15/30 | | | 9.000 | | | | 2,390,981 | | |
| | 427 | | | WR Grace Holdings LLC, Rule 144A,
Senior Secured Notes
(Callable 03/01/26 @ 103.69)(1) | | (B-, B1) | | 03/01/31 | | | 7.375 | | | | 396,209 | | |
| | | | 10,575,902 | | |
| Consumer/Commercial/Lease Financing (0.4%) | | | |
| | 1,500 | | | Cargo Aircraft Management, Inc.,
Rule 144A, Company Guaranteed Notes
(Callable 11/16/23 @ 102.38)(1) | | (BB, Ba2) | | 02/01/28 | | | 4.750 | | | | 1,321,192 | | |
| Diversified Capital Goods (0.5%) | | | |
| | 2,246 | | | Atkore, Inc., Rule 144A,
Senior Unsecured Notes
(Callable 06/01/26 @ 102.13)(1) | | (BB, Ba2) | | 06/01/31 | | | 4.250 | | | | 1,858,992 | | |
| Electronics (0.6%) | | | |
| | 1,900 | | | Coherent Corp., Rule 144A,
Company Guaranteed Notes
(Callable 12/14/24 @ 102.50)(1) | | (B+, B2) | | 12/15/29 | | | 5.000 | | | | 1,614,858 | | |
| | 535 | | | ON Semiconductor Corp., Rule 144A,
Company Guaranteed Notes
(Callable 12/01/23 @ 101.94)(1) | | (BB, Ba2) | | 09/01/28 | | | 3.875 | | | | 460,188 | | |
| | | | 2,075,046 | | |
| Energy - Exploration & Production (0.7%) | | | |
| | 500 | | | Civitas Resources, Inc., Rule 144A,
Company Guaranteed Notes
(Callable 07/01/25 @ 104.19)(1) | | (BB-, B1) | | 07/01/28 | | | 8.375 | | | | 503,550 | | |
See Accompanying Notes to Financial Statements.
11
Credit Suisse Strategic Income Fund
Schedule of Investments (continued)
October 31, 2023
Par
(000) | |
| | Ratings†
(S&P/Moody's) | | Maturity | | Rate% | | Value | |
| CORPORATE BONDS (continued) | | | |
| Energy - Exploration & Production (continued) | | | |
$ | 500 | | | Civitas Resources, Inc., Rule 144A,
Company Guaranteed Notes
(Callable 07/01/26 @ 104.38)(1) | | (BB-, B1) | | 07/01/31 | | | 8.750 | | | $ | 505,503 | | |
| | 58 | | | CNX Resources Corp., Rule 144A,
Company Guaranteed Notes
(Callable 12/01/23 @ 103.63)(1) | | (BB, B1) | | 03/14/27 | | | 7.250 | | | | 57,135 | | |
| | 250 | | | Matador Resources Co., Rule 144A,
Company Guaranteed Notes
(Callable 04/15/25 @ 103.44)(1) | | (BB-, B1) | | 04/15/28 | | | 6.875 | | | | 243,908 | | |
| | 1,000 | | | Northern Oil & Gas, Inc., Rule 144A,
Senior Unsecured Notes
(Callable 03/01/24 @ 104.06)(1) | | (B+, B2) | | 03/01/28 | | | 8.125 | | | | 986,700 | | |
| | 500 | | | Northern Oil & Gas, Inc., Rule 144A,
Senior Unsecured Notes
(Callable 06/15/26 @ 104.38)(1) | | (B+, B2) | | 06/15/31 | | | 8.750 | | | | 496,838 | | |
| | | | 2,793,634 | | |
| Environmental (0.1%) | | | |
| | 250 | | | Clean Harbors, Inc., Rule 144A,
Company Guaranteed Notes
(Callable 02/01/26 @ 103.19)(1) | | (BB+, Ba3) | | 02/01/31 | | | 6.375 | | | | 237,911 | | |
| | 250 | | | Darling Ingredients, Inc., Rule 144A,
Company Guaranteed Notes
(Callable 06/15/25 @ 103.00)(1) | | (BB+, Ba2) | | 06/15/30 | | | 6.000 | | | | 234,787 | | |
| | | | 472,698 | | |
| Food - Wholesale (0.4%) | | | |
| | 666 | | | U.S. Foods, Inc., Rule 144A,
Company Guaranteed Notes
(Callable 09/15/25 @ 103.44)(1) | | (BB-, B2) | | 09/15/28 | | | 6.875 | | | | 651,901 | | |
| | 684 | | | U.S. Foods, Inc., Rule 144A,
Company Guaranteed Notes
(Callable 09/15/26 @ 103.63)(1) | | (BB-, B2) | | 01/15/32 | | | 7.250 | | | | 669,447 | | |
| | | | 1,321,348 | | |
| Gaming (1.1%) | | | |
| | 400 | | | Boyd Gaming Corp., Rule 144A,
Company Guaranteed Notes
(Callable 06/15/26 @ 102.38)(1) | | (BB, B1) | | 06/15/31 | | | 4.750 | | | | 332,480 | | |
| | 500 | | | Caesars Entertainment, Inc., Rule 144A,
Senior Secured Notes
(Callable 02/15/26 @ 103.50)(1) | | (B+, Ba3) | | 02/15/30 | | | 7.000 | | | | 483,105 | | |
| | 910 | | | CDI Escrow Issuer, Inc., Rule 144A,
Senior Unsecured Notes
(Callable 04/01/25 @ 102.88)(1) | | (B+, B1) | | 04/01/30 | | | 5.750 | | | | 814,183 | | |
See Accompanying Notes to Financial Statements.
12
Credit Suisse Strategic Income Fund
Schedule of Investments (continued)
October 31, 2023
Par
(000) | |
| | Ratings†
(S&P/Moody's) | | Maturity | | Rate% | | Value | |
| CORPORATE BONDS (continued) | | | |
| Gaming (continued) | | | |
$ | 600 | | | Churchill Downs, Inc., Rule 144A,
Company Guaranteed Notes
(Callable 05/01/26 @ 103.38)(1) | | (B+, B1) | | 05/01/31 | | | 6.750 | | | $ | 554,250 | | |
| | 2,137 | | | Jacobs Entertainment, Inc., Rule 144A,
Senior Unsecured Notes
(Callable 02/15/25 @ 103.38)(1) | | (B, B2) | | 02/15/29 | | | 6.750 | | | | 1,818,309 | | |
| | | | 4,002,327 | | |
| Gas Distribution (2.1%) | | | |
| | 1,750 | | | CNX Midstream Partners LP, Rule 144A,
Company Guaranteed Notes
(Callable 04/15/25 @ 102.38)(1) | | (BB, B1) | | 04/15/30 | | | 4.750 | | | | 1,444,122 | | |
| | 750 | | | Genesis Energy LP/Genesis
Energy Finance Corp.,
Company Guaranteed Notes
(Callable 12/01/23 @ 100.00) | | (B, B3) | | 10/01/25 | | | 6.500 | | | | 733,340 | | |
| | 250 | | | Genesis Energy LP/Genesis
Energy Finance Corp.,
Global Company Guaranteed Notes
(Callable 01/15/24 @ 104.00) | | (B, B3) | | 01/15/27 | | | 8.000 | | | | 240,302 | | |
| | 625 | | | Genesis Energy LP/Genesis
Energy Finance Corp.,
Global Company Guaranteed Notes
(Callable 04/15/26 @ 104.44) | | (B, B3) | | 04/15/30 | | | 8.875 | | | | 604,799 | | |
| | 750 | | | Hess Midstream Operations LP,
Rule 144A, Company Guaranteed Notes
(Callable 10/15/25 @ 102.75)(1) | | (BB+, Ba2) | | 10/15/30 | | | 5.500 | | | | 682,371 | | |
| | 2,034 | | | New Fortress Energy, Inc., Rule 144A,
Senior Secured Notes
(Callable 12/01/23 @ 103.25)(1) | | (BB, B1) | | 09/30/26 | | | 6.500 | | | | 1,824,905 | | |
| | 1,500 | | | Rockies Express Pipeline LLC,
Rule 144A, Senior Unsecured Notes
(Callable 04/15/29 @ 100.00)(1) | | (BB+, Ba2) | | 07/15/29 | | | 4.950 | | | | 1,315,321 | | |
| | 1,250 | | | Rockies Express Pipeline LLC,
Rule 144A, Senior Unsecured Notes
(Callable 02/15/30 @ 100.00)(1) | | (BB+, Ba2) | | 05/15/30 | | | 4.800 | | | | 1,052,859 | | |
| | | | 7,898,019 | | |
| Health Facility (0.6%) | | | |
| | 2,560 | | | Option Care Health, Inc., Rule 144A,
Company Guaranteed Notes
(Callable 10/31/24 @ 102.19)(1) | | (B, B2) | | 10/31/29 | | | 4.375 | | | | 2,158,016 | | |
| Health Services (0.4%) | | | |
| | 250 | | | AMN Healthcare, Inc., Rule 144A,
Company Guaranteed Notes
(Callable 12/01/23 @ 101.16)(1) | | (BB-, Ba3) | | 10/01/27 | | | 4.625 | | | | 223,072 | | |
See Accompanying Notes to Financial Statements.
13
Credit Suisse Strategic Income Fund
Schedule of Investments (continued)
October 31, 2023
Par
(000) | |
| | Ratings†
(S&P/Moody's) | | Maturity | | Rate% | | Value | |
| CORPORATE BONDS (continued) | | | |
| Health Services (continued) | | | |
$ | 1,360 | | | AMN Healthcare, Inc., Rule 144A,
Company Guaranteed Notes
(Callable 04/15/24 @ 102.00)(1) | | (BB-, Ba3) | | 04/15/29 | | | 4.000 | | | $ | 1,128,563 | | |
| | | | 1,351,635 | | |
| Insurance Brokerage (1.5%) | | | |
| | 850 | | | Alliant Holdings Intermediate LLC/
Alliant Holdings Co-Issuer,
Rule 144A, Senior Secured Notes
(Callable 04/15/25 @ 103.38)(1) | | (B, B2) | | 04/15/28 | | | 6.750 | | | | 808,294 | | |
| | 750 | | | GTCR AP Finance, Inc., Rule 144A,
Senior Unsecured Notes
(Callable 12/01/23 @ 102.00)(1) | | (CCC+, Caa2) | | 05/15/27 | | | 8.000 | | | | 731,516 | | |
| | 800 | | | Jones Deslauriers Insurance
Management, Inc., Rule 144A,
Senior Secured Notes
(Callable 03/15/26 @ 104.25)(1) | | (B-, B2) | | 03/15/30 | | | 8.500 | | | | 786,754 | | |
| | 1,200 | | | Jones Deslauriers Insurance
Management, Inc., Rule 144A,
Senior Unsecured Notes
(Callable 12/15/25 @ 105.25)(1) | | (CCC, Caa2) | | 12/15/30 | | | 10.500 | | | | 1,192,131 | | |
| | 1,328 | | | NFP Corp., Rule 144A, Senior
Unsecured Notes
(Callable 12/01/23 @ 103.44)(1) | | (CCC+, Caa2) | | 08/15/28 | | | 6.875 | | | | 1,134,024 | | |
| | 1,250 | | | Ryan Specialty LLC, Rule 144A,
Senior Secured Notes
(Callable 02/01/25 @ 102.19)(1) | | (BB-, B1) | | 02/01/30 | | | 4.375 | | | | 1,072,018 | | |
| | | | 5,724,737 | | |
| Investments & Misc. Financial Services (3.7%) | | | |
| | 2,500 | | | Armor Holdco, Inc., Rule 144A,
Company Guaranteed Notes
(Callable 11/15/24 @ 104.25)(1) | | (CCC+, Caa1) | | 11/15/29 | | | 8.500 | | | | 2,184,105 | | |
| | 1,500 | | | Compass Group Diversified
Holdings LLC, Rule 144A, Company
Guaranteed Notes
(Callable 04/15/24 @ 102.63)(1) | | (B+, B1) | | 04/15/29 | | | 5.250 | | | | 1,282,470 | | |
| | 3,275 | | | Compass Group Diversified
Holdings LLC, Rule 144A,
Senior Unsecured Notes
(Callable 01/15/27 @ 102.50)(1) | | (B+, B1) | | 01/15/32 | | | 5.000 | | | | 2,581,209 | | |
| | 3,500 | | | GTCR W-2 Merger Sub LLC,
Rule 144A, Senior Secured Notes
(Callable 01/15/27 @ 103.75)(1) | | (BB, Ba3) | | 01/15/31 | | | 7.500 | | | | 3,458,875 | | |
See Accompanying Notes to Financial Statements.
14
Credit Suisse Strategic Income Fund
Schedule of Investments (continued)
October 31, 2023
Par
(000) | |
| | Ratings†
(S&P/Moody's) | | Maturity | | Rate% | | Value | |
| CORPORATE BONDS (continued) | | | |
| Investments & Misc. Financial Services (continued) | | | |
$ | 776 | | | Jane Street Group/JSG Finance, Inc.,
Rule 144A, Senior Secured Notes
(Callable 11/15/24 @ 102.25)(1),(2) | | (BB, Ba2) | | 11/15/29 | | | 4.500 | | | $ | 662,039 | | |
| | 1,400 | | | Paysafe Finance PLC/Paysafe
Holdings U.S. Corp., Rule 144A,
Senior Secured Notes
(Callable 06/15/24 @ 102.00)(1),(2) | | (B, B2) | | 06/15/29 | | | 4.000 | | | | 1,127,644 | | |
| | 2,650 | | | Shift4 Payments LLC/Shift4 Payments
Finance Sub, Inc., Rule 144A,
Company Guaranteed Notes
(Callable 12/01/23 @ 101.16)(1) | | (NR, Ba3) | | 11/01/26 | | | 4.625 | | | | 2,450,985 | | |
| | | | 13,747,327 | | |
| Machinery (2.5%) | | | |
| | 2,948 | | | Arcosa, Inc., Rule 144A,
Company Guaranteed Notes
(Callable 04/15/24 @ 102.19)(1) | | (BB, Ba2) | | 04/15/29 | | | 4.375 | | | | 2,575,505 | | |
| | 2,700 | | | ATS Corp., Rule 144A, Company
Guaranteed Notes
(Callable 12/15/23 @ 102.06)(1) | | (BB, B2) | | 12/15/28 | | | 4.125 | | | | 2,321,676 | | |
| | 2,200 | | | Dornoch Debt Merger Sub, Inc.,
Rule 144A, Senior Unsecured Notes
(Callable 10/15/24 @ 103.31)(1) | | (CCC, Caa2) | | 10/15/29 | | | 6.625 | | | | 1,733,105 | | |
| | 1,685 | | | Enviri Corp., Rule 144A, Company
Guaranteed Notes
(Callable 12/01/23 @ 101.44)(1) | | (B, B3) | | 07/31/27 | | | 5.750 | | | | 1,426,070 | | |
| | 250 | | | Hillenbrand, Inc., Global Company
Guaranteed Notes
(Callable 11/13/23 @ 101.44) | | (BB+, Ba1) | | 06/15/25 | | | 5.750 | | | | 245,241 | | |
| | 500 | | | Hillenbrand, Inc., Global Company
Guaranteed Notes
(Callable 03/01/26 @ 101.88) | | (BB+, Ba1) | | 03/01/31 | | | 3.750 | | | | 391,246 | | |
| | 300 | | | Regal Rexnord Corp., Rule 144A,
Company Guaranteed Notes
(Callable 12/15/29 @ 100.00)(1) | | (BB+, Baa3) | | 02/15/30 | | | 6.300 | | | | 283,040 | | |
| | 300 | | | Regal Rexnord Corp., Rule 144A,
Company Guaranteed Notes
(Callable 01/15/33 @ 100.00)(1) | | (BB+, Baa3) | | 04/15/33 | | | 6.400 | | | | 275,948 | | |
| | | | 9,251,831 | | |
| Managed Care (0.3%) | | | |
| | 1,475 | | | HealthEquity, Inc., Rule 144A,
Company Guaranteed Notes
(Callable 10/01/24 @ 102.25)(1) | | (B+, B2) | | 10/01/29 | | | 4.500 | | | | 1,264,731 | | |
See Accompanying Notes to Financial Statements.
15
Credit Suisse Strategic Income Fund
Schedule of Investments (continued)
October 31, 2023
Par
(000) | |
| | Ratings†
(S&P/Moody's) | | Maturity | | Rate% | | Value | |
| CORPORATE BONDS (continued) | | | |
| Media - Diversified (0.1%) | | | |
$ | 500 | | | News Corp., Rule 144A,
Company Guaranteed Notes
(Callable 02/15/27 @ 102.56)(1) | | (BB+, Ba1) | | 02/15/32 | | | 5.125 | | | $ | 432,212 | | |
| Media Content (0.5%) | | | |
| | 1,500 | | | Sirius XM Radio, Inc., Rule 144A,
Company Guaranteed Notes
(Callable 07/01/24 @ 102.75)(1) | | (BB, Ba3) | | 07/01/29 | | | 5.500 | | | | 1,331,384 | | |
| | 700 | | | Sirius XM Radio, Inc., Rule 144A,
Company Guaranteed Notes
(Callable 09/01/26 @ 101.94)(1) | | (BB, Ba3) | | 09/01/31 | | | 3.875 | | | | 527,312 | | |
| | | | 1,858,696 | | |
| Metals & Mining - Excluding Steel (2.2%) | | | |
| | 750 | | | Canpack SA/Canpack U.S. LLC,
Rule 144A, Company Guaranteed Notes
(Callable 11/15/24 @ 101.94)(1) | | (BB-, NR) | | 11/15/29 | | | 3.875 | | | | 589,740 | | |
| | 3,010 | | | ERO Copper Corp., Rule 144A,
Company Guaranteed Notes
(Callable 02/15/25 @ 103.25)(1) | | (B, B1) | | 02/15/30 | | | 6.500 | | | | 2,551,669 | | |
| | 2,750 | | | First Quantum Minerals Ltd., Rule 144A,
Company Guaranteed Notes
(Callable 06/01/26 @ 104.31)(1) | | (B+, NR) | | 06/01/31 | | | 8.625 | | | | 2,327,518 | | |
| | 1,845 | | | Kaiser Aluminum Corp., Rule 144A,
Company Guaranteed Notes
(Callable 06/01/26 @ 102.25)(1) | | (BB-, B2) | | 06/01/31 | | | 4.500 | | | | 1,367,014 | | |
| | 500 | | | Novelis Corp., Rule 144A,
Company Guaranteed Notes
(Callable 01/30/25 @ 102.38)(1) | | (BB, Ba3) | | 01/30/30 | | | 4.750 | | | | 424,746 | | |
| | 398 | | | Novelis Corp., Rule 144A,
Company Guaranteed Notes
(Callable 08/15/26 @ 101.94)(1) | | (BB, Ba3) | | 08/15/31 | | | 3.875 | | | | 311,219 | | |
| | 800 | | | Taseko Mines Ltd., Rule 144A,
Senior Secured Notes
(Callable 12/01/23 @ 103.50)(1),(2) | | (B-, B3) | | 02/15/26 | | | 7.000 | | | | 726,528 | | |
| | | | 8,298,434 | | |
| Non - Electric Utilities (0.2%) | | | |
| | 1,000 | | | Suburban Propane Partners LP/
Suburban Energy Finance Corp.,
Rule 144A, Senior Unsecured Notes
(Callable 06/01/26 @ 102.50)(1) | | (BB-, B1) | | 06/01/31 | | | 5.000 | | | | 827,341 | | |
See Accompanying Notes to Financial Statements.
16
Credit Suisse Strategic Income Fund
Schedule of Investments (continued)
October 31, 2023
Par
(000) | |
| | Ratings†
(S&P/Moody's) | | Maturity | | Rate% | | Value | |
| CORPORATE BONDS (continued) | | | |
| Packaging (1.6%) | | | |
$ | 350 | | | Ardagh Metal Packaging Finance
USA LLC/Ardagh Metal Packaging
Finance PLC, Rule 144A,
Senior Unsecured Notes
(Callable 05/15/24 @ 101.50)(1),(3) | | (B+, Caa1) | | 09/01/29 | | | 3.000 | | | $ | 273,974 | | |
| | 1,920 | | | Mauser Packaging Solutions Holding Co.,
Rule 144A, Senior Secured Notes
(Callable 08/15/24 @ 103.94)(1) | | (B, B2) | | 08/15/26 | | | 7.875 | | | | 1,805,864 | | |
| | 500 | | | Owens-Brockway Glass Container, Inc.,
Rule 144A, Company Guaranteed Notes
(Callable 05/15/26 @ 103.63)(1) | | (B+, B2) | | 05/15/31 | | | 7.250 | | | | 457,500 | | |
| | 250 | | | Sealed Air Corp./Sealed Air Corp. U.S.,
Rule 144A, Company Guaranteed Notes
(Callable 02/01/25 @ 103.06)(1) | | (BB+, Ba2) | | 02/01/28 | | | 6.125 | | | | 238,396 | | |
| | 700 | | | Trident TPI Holdings, Inc., Rule 144A,
Company Guaranteed Notes
(Callable 12/31/25 @ 106.38)(1) | | (CCC+, Caa2) | | 12/31/28 | | | 12.750 | | | | 716,191 | | |
| | 2,950 | | | TriMas Corp., Rule 144A, Company
Guaranteed Notes
(Callable 04/15/24 @ 102.06)(1) | | (BB-, Ba3) | | 04/15/29 | | | 4.125 | | | | 2,454,020 | | |
| | | | 5,945,945 | | |
| Personal & Household Products (0.9%) | | | |
| | 350 | | | Acushnet Co., Rule 144A,
Company Guaranteed Notes
(Callable 10/15/25 @ 103.69)(1) | | (BB, Ba3) | | 10/15/28 | | | 7.375 | | | | 350,975 | | |
| | 750 | | | CB High Ridge, Rule 144A,
Company Guaranteed Notes(1),(4),(5),(6),(7) | | (NR, NR) | | 03/15/25 | | | 0.000 | | | | 5,625 | | |
| | 2,290 | | | MajorDrive Holdings IV LLC,
Rule 144A, Senior Unsecured Notes
(Callable 06/01/24 @ 103.19)(1) | | (CCC+, Caa2) | | 06/01/29 | | | 6.375 | | | | 1,778,082 | | |
| | 375 | | | Mattel, Inc., Rule 144A,
Company Guaranteed Notes
(Callable 04/01/24 @ 101.88)(1) | | (BBB-, Baa3) | | 04/01/29 | | | 3.750 | | | | 321,217 | | |
| | 350 | | | Prestige Brands, Inc., Rule 144A,
Company Guaranteed Notes
(Callable 04/01/26 @ 101.88)(1) | | (BB, B1) | | 04/01/31 | | | 3.750 | | | | 276,850 | | |
| | 800 | | | Tempur Sealy International, Inc.,
Rule 144A, Company Guaranteed Notes
(Callable 10/15/26 @ 101.94)(1) | | (BB, Ba2) | | 10/15/31 | | | 3.875 | | | | 600,151 | | |
| | | | 3,332,900 | | |
| Pharmaceuticals (0.1%) | | | |
| | 922 | | | Emergent BioSolutions, Inc., Rule 144A,
Company Guaranteed Notes
(Callable 12/01/23 @ 101.94)(1) | | (CCC+, Caa3) | | 08/15/28 | | | 3.875 | | | | 363,443 | | |
See Accompanying Notes to Financial Statements.
17
Credit Suisse Strategic Income Fund
Schedule of Investments (continued)
October 31, 2023
Par
(000) | |
| | Ratings†
(S&P/Moody's) | | Maturity | | Rate% | | Value | |
| CORPORATE BONDS (continued) | | | |
| Real Estate Investment Trusts (1.2%) | | | |
$ | 1,690 | | | Global Net Lease, Inc./Global Net Lease
Operating Partnership LP, Rule 144A,
Company Guaranteed Notes
(Callable 09/15/27 @ 100.00)(1) | | (BBB-, WR) | | 12/15/27 | | | 3.750 | | | $ | 1,280,606 | | |
| | 2,400 | | | Starwood Property Trust, Inc.,
Rule 144A, Senior Unsecured Notes
(Callable 01/15/26 @ 100.00)(1) | | (BB-, Ba3) | | 07/15/26 | | | 3.625 | | | | 2,109,552 | | |
| | 1,150 | | | Starwood Property Trust, Inc.,
Rule 144A, Senior Unsecured Notes
(Callable 07/15/26 @ 100.00)(1) | | (BB-, Ba3) | | 01/15/27 | | | 4.375 | | | | 989,000 | | |
| | | | 4,379,158 | | |
| Recreation & Travel (2.0%) | | | |
| | 2,800 | | | Boyne USA, Inc., Rule 144A,
Senior Unsecured Notes
(Callable 05/15/24 @ 102.38)(1) | | (B, B1) | | 05/15/29 | | | 4.750 | | | | 2,441,148 | | |
| | 1,500 | | | SeaWorld Parks & Entertainment, Inc.,
Rule 144A, Company Guaranteed Notes
(Callable 08/15/24 @ 102.63)(1),(2) | | (B, B2) | | 08/15/29 | | | 5.250 | | | | 1,303,395 | | |
| | 750 | | | SeaWorld Parks & Entertainment, Inc.,
Rule 144A, Senior Secured Notes
(Callable 12/01/23 @ 102.19)(1) | | (BB, WR) | | 05/01/25 | | | 8.750 | | | | 760,864 | | |
| | 3,372 | | | Six Flags Entertainment Corp., Rule 144A,
Company Guaranteed Notes
(Callable 05/15/26 @ 103.63)(1) | | (B, B3) | | 05/15/31 | | | 7.250 | | | | 3,084,523 | | |
| | | | 7,589,930 | | |
| Restaurants (0.4%) | | | |
| | 1,300 | | | Papa John's International, Inc.,
Rule 144A, Company Guaranteed Notes
(Callable 09/15/24 @ 101.94)(1) | | (BB-, B1) | | 09/15/29 | | | 3.875 | | | | 1,067,687 | | |
| | 510 | | | Yum! Brands, Inc., Global Senior
Unsecured Notes
(Callable 04/01/27 @ 102.69) | | (BB, Ba3) | | 04/01/32 | | | 5.375 | | | | 457,713 | | |
| | | | 1,525,400 | | |
| Software - Services (4.4%) | | | |
| | 600 | | | Black Knight InfoServ LLC, Rule 144A,
Company Guaranteed Notes
(Callable 11/13/23 @ 101.81)(1) | | (A-, Ba3) | | 09/01/28 | | | 3.625 | | | | 535,500 | | |
| | 1,500 | | | Elastic NV, Rule 144A,
Senior Unsecured Notes
(Callable 07/15/24 @ 102.06)(1) | | (B+, B1) | | 07/15/29 | | | 4.125 | | | | 1,265,907 | | |
| | 4,095 | | | Newfold Digital Holdings Group, Inc.,
Rule 144A, Senior Unsecured Notes
(Callable 02/15/24 @ 103.00)(1) | | (CCC+, Caa2) | | 02/15/29 | | | 6.000 | | | | 2,694,687 | | |
See Accompanying Notes to Financial Statements.
18
Credit Suisse Strategic Income Fund
Schedule of Investments (continued)
October 31, 2023
Par
(000) | |
| | Ratings†
(S&P/Moody's) | | Maturity | | Rate% | | Value | |
| CORPORATE BONDS (continued) | | | |
| Software - Services (continued) | | | |
$ | 972 | | | Open Text Corp., Rule 144A,
Company Guaranteed Notes
(Callable 12/01/23 @ 101.94)(1) | | (BB-, Ba3) | | 02/15/28 | | | 3.875 | | | $ | 842,079 | | |
| | 3,000 | | | Open Text Corp., Rule 144A,
Company Guaranteed Notes
(Callable 12/01/24 @ 101.94)(1) | | (BB-, Ba3) | | 12/01/29 | | | 3.875 | | | | 2,457,342 | | |
| | 475 | | | Open Text Holdings, Inc., Rule 144A,
Company Guaranteed Notes
(Callable 12/01/26 @ 102.06)(1) | | (BB-, Ba3) | | 12/01/31 | | | 4.125 | | | | 373,135 | | |
| | 2,537 | | | Presidio Holdings, Inc., Rule 144A,
Company Guaranteed Notes
(Callable 12/01/23 @ 104.13)(1) | | (CCC+, Caa1) | | 02/01/28 | | | 8.250 | | | | 2,403,296 | | |
| | 4,575 | | | Virtusa Corp., Rule 144A,
Senior Unsecured Notes
(Callable 12/15/23 @ 103.56)(1) | | (CCC+, Caa1) | | 12/15/28 | | | 7.125 | | | | 3,624,746 | | |
| | 275 | | | VT Topco, Inc., Rule 144A,
Senior Secured Notes
(Callable 08/15/26 @ 104.25)(1) | | (B, B2) | | 08/15/30 | | | 8.500 | | | | 267,863 | | |
| | 2,203 | | | ZoomInfo Technologies LLC/ZoomInfo
Finance Corp., Rule 144A,
Company Guaranteed Notes
(Callable 02/01/24 @ 101.94)(1) | | (B+, B1) | | 02/01/29 | | | 3.875 | | | | 1,821,157 | | |
| | | | 16,285,712 | | |
| Specialty Retail (2.0%) | | | |
| | 370 | | | Asbury Automotive Group, Inc.,
Global Company Guaranteed Notes
(Callable 11/13/23 @ 102.25) | | (BB, B1) | | 03/01/28 | | | 4.500 | | | | 328,281 | | |
| | 67 | | | Asbury Automotive Group, Inc.,
Global Company Guaranteed Notes
(Callable 03/01/25 @ 102.38) | | (BB, B1) | | 03/01/30 | | | 4.750 | | | | 56,946 | | |
| | 48 | | | Eagle Intermediate Global
Holding BV/Eagle U.S. Finance LLC,
Rule 144A, Senior Secured Notes
(Callable 11/13/23 @ 101.88)(1),(5),(7) | | (NR, NR) | | 05/01/25 | | | 7.500 | | | | 31,227 | | |
| | 1,750 | | | Eagle Intermediate Global
Holding BV/Eagle U.S. Finance LLC,
Rule 144A, Senior Secured Notes
(Callable 11/13/23 @ 101.88)(1) | | (NR, Caa3) | | 05/01/25 | | | 7.500 | | | | 1,165,937 | | |
| | 64 | | | Eagle Intermediate Global
Holding BV/Ruyi U.S. Finance LLC(5),(7) | | (NR, NR) | | 05/01/25 | | | 0.000 | | | | 35,079 | | |
| | 1,575 | | | Group 1 Automotive, Inc., Rule 144A,
Company Guaranteed Notes
(Callable 12/01/23 @ 102.00)(1) | | (BB+, Ba2) | | 08/15/28 | | | 4.000 | | | | 1,358,338 | | |
See Accompanying Notes to Financial Statements.
19
Credit Suisse Strategic Income Fund
Schedule of Investments (continued)
October 31, 2023
Par
(000) | |
| | Ratings†
(S&P/Moody's) | | Maturity | | Rate% | | Value | |
| CORPORATE BONDS (continued) | | | |
| Specialty Retail (continued) | | | |
$ | 1,000 | | | LCM Investments Holdings II LLC,
Rule 144A, Senior Unsecured Notes
(Callable 05/01/24 @ 102.44)(1) | | (B+, B2) | | 05/01/29 | | | 4.875 | | | $ | 839,227 | | |
| | 500 | | | LCM Investments Holdings II LLC,
Rule 144A, Senior Unsecured Notes
(Callable 08/01/26 @ 104.13)(1) | | (B+, B2) | | 08/01/31 | | | 8.250 | | | | 475,557 | | |
| | 725 | | | Murphy Oil USA, Inc., Rule 144A,
Company Guaranteed Notes
(Callable 02/15/26 @ 101.88)(1) | | (BB+, Ba2) | | 02/15/31 | | | 3.750 | | | | 583,249 | | |
| | 1,225 | | | Sonic Automotive, Inc., Rule 144A,
Company Guaranteed Notes
(Callable 11/15/24 @ 102.31)(1) | | (BB-, B1) | | 11/15/29 | | | 4.625 | | | | 1,021,379 | | |
| | 1,545 | | | Sunoco LP/Sunoco Finance Corp.,
Rule 144A, Company Guaranteed Notes
(Callable 09/15/25 @ 103.50)(1) | | (BB, Ba3) | | 09/15/28 | | | 7.000 | | | | 1,505,003 | | |
| | | | 7,400,223 | | |
| Steel Producers/Products (0.7%) | | | |
| | 3,233 | | | TMS International Corp., Rule 144A,
Senior Unsecured Notes
(Callable 04/15/24 @ 103.13)(1) | | (B, Caa1) | | 04/15/29 | | | 6.250 | | | | 2,554,201 | | |
| Support - Services (4.5%) | | | |
| | 1,342 | | | Allied Universal Holdco LLC/Allied
Universal Finance Corp., Rule 144A,
Senior Unsecured Notes
(Callable 12/01/23 @ 102.44)(1) | | (CCC+, Caa2) | | 07/15/27 | | | 9.750 | | | | 1,167,955 | | |
| | 1,200 | | | Allied Universal Holdco LLC/Allied
Universal Finance Corp., Rule 144A,
Senior Unsecured Notes
(Callable 06/01/24 @ 103.00)(1),(2) | | (CCC+, Caa2) | | 06/01/29 | | | 6.000 | | | | 871,950 | | |
| | 944 | | | Allied Universal Holdco LLC/Allied
Universal Finance Corp./Atlas Luxco 4
SARL, Rule 144A, Senior Secured Notes
(Callable 06/01/24 @ 101.81)(1),(3) | | (B, B3) | | 06/01/28 | | | 3.625 | | | | 806,877 | | |
| | 1,750 | | | American Builders & Contractors
Supply Co., Inc., Rule 144A,
Senior Secured Notes
(Callable 12/01/23 @ 102.00)(1) | | (BB+, Ba2) | | 01/15/28 | | | 4.000 | | | | 1,572,485 | | |
| | 1,113 | | | ASGN, Inc., Rule 144A,
Company Guaranteed Notes
(Callable 12/01/23 @ 102.31)(1) | | (BB-, Ba3) | | 05/15/28 | | | 4.625 | | | | 986,426 | | |
| | 3,250 | | | CoreLogic, Inc., Rule 144A,
Senior Secured Notes
(Callable 05/01/24 @ 102.25)(1) | | (B-, B2) | | 05/01/28 | | | 4.500 | | | | 2,579,070 | | |
See Accompanying Notes to Financial Statements.
20
Credit Suisse Strategic Income Fund
Schedule of Investments (continued)
October 31, 2023
Par
(000) | |
| | Ratings†
(S&P/Moody's) | | Maturity | | Rate% | | Value | |
| CORPORATE BONDS (continued) | | | |
| Support - Services (continued) | | | |
$ | 250 | | | Gartner, Inc., Rule 144A,
Company Guaranteed Notes
(Callable 12/01/23 @ 102.25)(1) | | (BBB-, Ba1) | | 07/01/28 | | | 4.500 | | | $ | 225,396 | | |
| | 250 | | | Gartner, Inc., Rule 144A,
Company Guaranteed Notes
(Callable 06/15/24 @ 101.81)(1) | | (BBB-, Ba1) | | 06/15/29 | | | 3.625 | | | | 211,967 | | |
| | 3,885 | | | GEMS MENASA Cayman Ltd./GEMS
Education Delaware LLC, Rule 144A,
Senior Secured Notes
(Callable 12/01/23 @ 101.78)(1) | | (B, B2) | | 07/31/26 | | | 7.125 | | | | 3,743,664 | | |
| | 3,360 | | | H&E Equipment Services, Inc.,
Rule 144A, Company Guaranteed Notes
(Callable 12/15/23 @ 101.94)(1) | | (BB-, B1) | | 12/15/28 | | | 3.875 | | | | 2,849,485 | | |
| | 750 | | | TriNet Group, Inc., Rule 144A,
Company Guaranteed Notes
(Callable 03/01/24 @ 101.75)(1) | | (BB, Ba2) | | 03/01/29 | | | 3.500 | | | | 620,021 | | |
| | 500 | | | WESCO Distribution, Inc., Rule 144A,
Company Guaranteed Notes
(Callable 12/01/23 @ 103.63)(1) | | (BB, Ba3) | | 06/15/28 | | | 7.250 | | | | 497,376 | | |
| | 800 | | | ZipRecruiter, Inc., Rule 144A,
Senior Unsecured Notes
(Callable 01/15/25 @ 102.50)(1) | | (BB-, B2) | | 01/15/30 | | | 5.000 | | | | 625,660 | | |
| | | | 16,758,332 | | |
| Tech Hardware & Equipment (1.0%) | | | |
| | 1,000 | | | Entegris Escrow Corp., Rule 144A,
Senior Secured Notes
(Callable 01/15/29 @ 100.00)(1) | | (BB, Baa3) | | 04/15/29 | | | 4.750 | | | | 896,032 | | |
| | 1,951 | | | Vertiv Group Corp., Rule 144A,
Senior Secured Notes
(Callable 11/15/24 @ 102.06)(1) | | (BB-, B1) | | 11/15/28 | | | 4.125 | | | | 1,707,212 | | |
| | 1,650 | | | Viavi Solutions, Inc., Rule 144A,
Company Guaranteed Notes
(Callable 10/01/24 @ 101.88)(1) | | (BB+, Ba2) | | 10/01/29 | | | 3.750 | | | | 1,285,832 | | |
| | | | 3,889,076 | | |
| Telecom - Wireline Integrated & Services (1.8%) | | | |
| | 1,000 | | | Altice France SA, Rule 144A,
Senior Secured Notes
(Callable 04/15/24 @ 102.56)(1) | | (B-, B2) | | 07/15/29 | | | 5.125 | | | | 685,385 | | |
| | 1,770 | | | Altice France SA, Rule 144A,
Senior Secured Notes
(Callable 10/15/24 @ 102.75)(1) | | (B-, B2) | | 10/15/29 | | | 5.500 | | | | 1,217,190 | | |
| | 2,005 | | | LCPR Senior Secured Financing DAC,
Rule 144A, Senior Secured Notes
(Callable 12/01/23 @ 101.69)(1) | | (B+, B1) | | 10/15/27 | | | 6.750 | | | | 1,810,896 | | |
See Accompanying Notes to Financial Statements.
21
Credit Suisse Strategic Income Fund
Schedule of Investments (continued)
October 31, 2023
Par
(000) | |
| | Ratings†
(S&P/Moody's) | | Maturity | | Rate% | | Value | |
| CORPORATE BONDS (continued) | | | |
| Telecom - Wireline Integrated & Services (continued) | | | |
$ | 500 | | | LCPR Senior Secured Financing DAC,
Rule 144A, Senior Secured Notes
(Callable 07/15/24 @ 102.56)(1) | | (B+, B1) | | 07/15/29 | | | 5.125 | | | $ | 390,104 | | |
| | 1,500 | | | Level 3 Financing, Inc., Rule 144A,
Company Guaranteed Notes
(Callable 01/15/24 @ 101.81)(1) | | (CCC+, B3) | | 01/15/29 | | | 3.625 | | | | 767,813 | | |
| | 2,500 | | | Vmed O2 U.K. Financing I PLC,
Rule 144A, Senior Secured Notes
(Callable 01/31/26 @ 102.13)(1) | | (BB-, Ba3) | | 01/31/31 | | | 4.250 | | | | 1,968,533 | | |
| | | | 6,839,921 | | |
| Theaters & Entertainment (0.6%) | | | |
| | 500 | | | Live Nation Entertainment, Inc.,
Rule 144A, Company Guaranteed Notes
(Callable 12/01/23 @ 100.00)(1) | | (B+, B2) | | 11/01/24 | | | 4.875 | | | | 489,813 | | |
| | 500 | | | Live Nation Entertainment, Inc.,
Rule 144A, Company Guaranteed Notes
(Callable 12/01/23 @ 102.38)(1) | | (B+, B2) | | 10/15/27 | | | 4.750 | | | | 456,945 | | |
| | 1,500 | | | Live Nation Entertainment, Inc.,
Rule 144A, Senior Secured Notes
(Callable 12/01/23 @ 104.88)(1) | | (BB, Ba3) | | 05/15/27 | | | 6.500 | | | | 1,463,142 | | |
| | | | 2,409,900 | | |
| Transport Infrastructure/Services (0.4%) | | | |
| | 250 | | | XPO, Inc., Rule 144A,
Company Guaranteed Notes
(Callable 06/01/26 @ 103.56)(1) | | (BB-, Ba3) | | 06/01/31 | | | 7.125 | | | | 243,955 | | |
| | 1,250 | | | XPO, Inc., Rule 144A,
Senior Secured Notes
(Callable 06/01/25 @ 103.13)(1) | | (BBB-, Ba1) | | 06/01/28 | | | 6.250 | | | | 1,199,869 | | |
| | | | 1,443,824 | | |
| Trucking & Delivery (0.3%) | | | |
| | 1,252 | | | XPO Escrow Sub LLC, Rule 144A,
Company Guaranteed Notes
(Callable 11/15/24 @ 103.75)(1) | | (BB+, Baa3) | | 11/15/27 | | | 7.500 | | | | 1,250,529 | | |
| TOTAL CORPORATE BONDS (Cost $200,411,822) | | | 182,819,574 | | |
| BANK LOANS (37.7%) | | | |
| Advertising (0.5%) | | | |
| | 352 | | | MH Sub I LLC, 1 mo.
USD Term SOFR + 3.750%(8) | | (B, B1) | | 09/13/24 | | | 9.189 | | | | 352,320 | | |
| | 1,538 | | | MH Sub I LLC, 1 mo.
USD Term SOFR + 4.250%(8) | | (B, B1) | | 05/03/28 | | | 9.574 | | | | 1,472,650 | | |
| | | | 1,824,970 | | |
See Accompanying Notes to Financial Statements.
22
Credit Suisse Strategic Income Fund
Schedule of Investments (continued)
October 31, 2023
Par
(000) | |
| | Ratings†
(S&P/Moody's) | | Maturity | | Rate% | | Value | |
| BANK LOANS (continued) | | | |
| Aerospace & Defense (0.9%) | | | |
$ | 1,100 | | | Amentum Government Services
Holdings LLC, 1 mo. USD Term
SOFR + 7.500%(8) | | (NR, NR) | | 02/15/30 | | | 12.935 | | | $ | 992,750 | | |
| | 497 | | | Amentum Government Services
Holdings LLC, 1 mo. USD Term
SOFR + 4.000%(8) | | (B, B2) | | 02/15/29 | | | 9.335 | | | | 487,999 | | |
| | 1,462 | | | Brown Group Holding LLC,
1 mo. USD Term SOFR + 3.750%,
3 mo. USD Term SOFR + 3.750%(8) | |
(B+, B2) | |
07/02/29 | | |
9.066 -
9.133 | | | | 1,461,615 | | |
| | 250 | | | Brown Group Holding LLC(9) | | (B+, B2) | | 06/07/28 | | | 0.000 | | | | 245,885 | | |
| | | | 3,188,249 | | |
| Auto Parts & Equipment (1.3%) | | | |
| | 1,796 | | | Autokiniton U.S. Holdings, Inc.,
1 mo. USD Term SOFR + 4.500%(8) | | (B, B2) | | 04/06/28 | | | 9.939 | | | | 1,766,701 | | |
| | 373 | | | Dealer Tire Financial LLC,
1 mo. USD Term SOFR + 4.500%(8) | | (B-, B1) | | 12/14/27 | | | 9.824 | | | | 373,622 | | |
| | 1,500 | | | Garrett Motion, Inc.,
3 mo. USD Term SOFR + 4.500%(8) | | (BB-, Ba2) | | 04/30/28 | | | 9.883 | | | | 1,503,750 | | |
| | 207 | | | Jason Group, Inc.,
1 mo. USD Term SOFR + 6.000%,
0.000% PIK(8),(10) | | (NR, WR) | | 08/28/25 | | | 11.439 | | | | 183,565 | | |
| | 1,020 | | | RVR Dealership Holdings LLC,
1 mo. USD Term SOFR + 3.750%(8) | | (BB-, B2) | | 02/08/28 | | | 9.182 | | | | 891,033 | | |
| | | | 4,718,671 | | |
| Automakers (0.2%) | | | |
| | 600 | | | Fastlane Parent Co., Inc.(9) | | (B-, B3) | | 09/29/28 | | | 0.000 | | | | 594,023 | | |
| Banking (0.2%) | | | |
| | 640 | | | Harbourvest Partners LLC,
3 mo. USD Term SOFR + 3.000%(8) | | (BB+, Ba2) | | 04/22/30 | | | 8.390 | | | | 640,633 | | |
| Brokerage (0.2%) | | | |
| | 598 | | | DRW Holdings LLC,
1 mo. USD Term SOFR + 3.750%(8) | | (BB-, Ba3) | | 03/01/28 | | | 9.189 | | | | 596,818 | | |
| Building Materials (0.4%) | | | |
| | 177 | | | Cornerstone Building Brands, Inc.,
1 mo. USD Term SOFR + 5.625%(8) | | (B, B2) | | 08/01/28 | | | 10.960 | | | | 175,057 | | |
| | 1,334 | | | Oscar AcquisitionCo LLC,
3 mo. USD Term SOFR + 4.500%(8) | | (B, B1) | | 04/29/29 | | | 9.990 | | | | 1,301,189 | | |
| | | | 1,476,246 | | |
| Cable & Satellite TV (0.1%) | | | |
| | 471 | | | Altice Financing SA,
3 mo. USD Term SOFR + 5.000%(8) | | (B, B3) | | 10/31/27 | | | 10.394 | | | | 441,973 | | |
See Accompanying Notes to Financial Statements.
23
Credit Suisse Strategic Income Fund
Schedule of Investments (continued)
October 31, 2023
Par
(000) | |
| | Ratings†
(S&P/Moody's) | | Maturity | | Rate% | | Value | |
| BANK LOANS (continued) | | | |
| Chemicals (0.9%) | | | |
$ | 430 | | | CPC Acquisition Corp.,
3 mo. USD Term SOFR + 7.750%(8) | | (CCC-, Caa3) | | 12/29/28 | | | 13.402 | | | $ | 211,351 | | |
| | 452 | | | INEOS Enterprises
Holdings U.S. Finco LLC,
3 mo. USD Term SOFR + 3.750%(8) | | (BB, Ba3) | | 07/08/30 | | | 9.272 | | | | 444,464 | | |
| | 1,299 | | | Luxembourg Investment Co. 428 SARL,
3 mo. USD Term SOFR + 5.000%(8) | | (CCC+, B3) | | 01/03/29 | | | 10.540 | | | | 907,690 | | |
| | 1,726 | | | Vantage Specialty Chemicals, Inc.,
1 mo. USD Term SOFR + 4.750%(8) | | (B-, B2) | | 10/26/26 | | | 10.085 | | | | 1,664,201 | | |
| | | | 3,227,706 | | |
| Diversified Capital Goods (0.7%) | | | |
| | 1,549 | | | Dynacast International LLC,
3 mo. USD Term SOFR + 4.500%(8) | | (B-, B2) | | 07/22/25 | | | 10.017 | | | | 1,451,763 | | |
| | 581 | | | Dynacast International LLC,
3 mo. USD Term SOFR + 9.000%(8) | | (CCC, Caa2) | | 10/22/25 | | | 14.517 | | | | 445,198 | | |
| | 860 | | | Electrical Components International, Inc.,
3 mo. USD Term SOFR + 4.250%(8) | | (B-, B2) | | 06/26/25 | | | 9.772 | | | | 853,476 | | |
| | | | 2,750,437 | | |
| Electric - Generation (0.8%) | | | |
| | 2,888 | | | Brookfield WEC Holdings, Inc.,
1 mo. USD Term SOFR + 2.750%(8) | | (B, B2) | | 08/01/25 | | | 8.189 | | | | 2,888,100 | | |
| Electronics (0.5%) | | | |
| | 1,454 | | | Idemia Group,
3 mo. USD Term SOFR + 4.750%(8) | | (B, B2) | | 09/30/28 | | | 10.140 | | | | 1,456,353 | | |
| | 500 | | | Infinite Bidco LLC,
3 mo. USD Term SOFR + 7.000%(8) | | (CCC, Caa2) | | 03/02/29 | | | 12.645 | | | | 440,417 | | |
| | | | 1,896,770 | | |
| Energy - Exploration & Production (0.2%) | | | |
| | 315 | | | GIP Pilot Acquisition Partners LP,
3 mo. USD Term SOFR + 3.000%(7),(8) | | (BB-, Ba3) | | 10/04/30 | | | 8.388 | | | | 314,765 | | |
| | 500 | | | Limetree Bay Terminals LLC,
3 mo. USD Term SOFR + 4.000%(8) | | (CCC, Caa2) | | 02/15/24 | | | 10.652 | | | | 462,638 | | |
| | 908 | | | PES Holdings LLC, 3.000% PIK(4),(10) | | (NR, WR) | | 12/31/24 | | | 3.000 | | | | 15,889 | | |
| | | | 793,292 | | |
| Food & Drug Retailers (0.7%) | | | |
| | 1,655 | | | Packaging Coordinators Midco, Inc.,
3 mo. USD Term SOFR + 3.500%(8) | | (B-, B2) | | 11/30/27 | | | 9.152 | | | | 1,637,183 | | |
| | 533 | | | Sharp Midco LLC,
3 mo. USD Term SOFR + 4.500%(7),(8) | | (B-, B2) | | 12/31/28 | | | 9.896 | | | | 531,995 | | |
| | 866 | | | WOOF Holdings, Inc.,
3 mo. USD Term SOFR + 7.250%(8) | | (CCC-, Caa2) | | 12/21/28 | | | 12.748 | | | | 595,487 | | |
| | | | 2,764,665 | | |
See Accompanying Notes to Financial Statements.
24
Credit Suisse Strategic Income Fund
Schedule of Investments (continued)
October 31, 2023
Par
(000) | |
| | Ratings†
(S&P/Moody's) | | Maturity | | Rate% | | Value | |
| BANK LOANS (continued) | | | |
| Food - Wholesale (0.3%) | | | |
$ | 1,250 | | | B&G Foods, Inc.,
1 mo. USD Term SOFR + 2.500%(8) | | (B+, B1) | | 10/10/26 | | | 7.827 | | | $ | 1,225,450 | | |
| Gaming (0.4%) | | | |
| | 720 | | | Arcis Golf LLC,
1 mo. USD Term SOFR + 4.250%(8) | | (B+, B2) | | 11/24/28 | | | 9.691 | | | | 721,492 | | |
| | 683 | | | ECL Entertainment LLC,
3 mo. USD Term SOFR + 4.750%(8) | | (B+, B2) | | 08/31/30 | | | 10.140 | | | | 681,304 | | |
| | | | 1,402,796 | | |
| Gas Distribution (0.3%) | | | |
| | 1,015 | | | BCP Renaissance Parent LLC,
3 mo. USD Term SOFR + 3.500%(8) | | (B+, B2) | | 10/31/28 | | | 8.896 | | | | 1,010,658 | | |
| Health Facilities (1.1%) | | | |
| | 300 | | | Carestream Health, Inc.,
3 mo. USD Term SOFR + 7.500%(8) | | (B-, Caa1) | | 09/30/27 | | | 12.990 | | | | 223,215 | | |
| | 244 | | | EyeCare Partners LLC,
3 mo. USD Term SOFR + 3.750%(8) | | (CCC, Caa1) | | 02/18/27 | | | 9.395 | | | | 135,277 | | |
| | 1,000 | | | Insulet Corp.(9) | | (B+, Ba2) | | 05/04/28 | | | 0.000 | | | | 998,025 | | |
| | 1,951 | | | Loire Finco Luxembourg SARL,
1 mo. USD Term SOFR + 3.750%(8) | | (B, B3) | | 04/21/27 | | | 9.174 | | | | 1,912,162 | | |
| | 1,000 | | | Surgery Center Holdings, Inc.,
1 mo. USD Term SOFR + 3.750%(8) | | (B-, B1) | | 08/31/26 | | | 9.203 | | | | 1,000,275 | | |
| | | | 4,268,954 | | |
| Health Services (3.1%) | | | |
| | 249 | | | ADMI Corp.,
1 mo. USD Term SOFR + 3.000%(8) | | (B-, B3) | | 04/30/25 | | | 8.439 | | | | 245,815 | | |
| | 2,006 | | | ADMI Corp.,
1 mo. USD Term SOFR + 3.375%(8) | | (B-, B3) | | 12/23/27 | | | 8.814 | | | | 1,806,622 | | |
| | 888 | | | Athenahealth Group, Inc.,
1 mo. USD Term SOFR + 3.250%(8) | | (B-, B2) | | 02/15/29 | | | 8.577 | | | | 862,725 | | |
| | 1,414 | | | Learning Care Group, Inc.,
3 mo. USD Term SOFR + 4.750%(8) | |
(B, B2) | |
08/11/28 | | | 10.117 -
10.171 | | | | 1,416,914 | | |
| | 912 | | | MedAssets Software Intermediate
Holdings, Inc., 1 mo. USD Term
SOFR + 4.000%(8) | | (CCC+, B3) | | 12/18/28 | | | 9.439 | | | | 723,587 | | |
| | 322 | | | Pacific Dental Services LLC,
1 mo. USD Term SOFR + 3.500%,
3 mo. USD Term SOFR + 3.500%(8) | |
(B, B1) | |
05/05/28 | | |
8.936 -
8.953 | | | | 320,759 | | |
| | 536 | | | Pearl Intermediate Parent LLC(9) | | (B-, B2) | | 02/14/25 | | | 0.000 | | | | 536,287 | | |
| | 961 | | | PetVet Care Centers LLC,
1 mo. USD Term SOFR + 3.500%(8) | | (B-, B2) | | 02/14/25 | | | 8.924 | | | | 960,948 | | |
| | 117 | | | PetVet Care Centers LLC(9) | | (B-, B2) | | 02/14/25 | | | 0.000 | | | | 117,011 | | |
| | 1,398 | | | Radiology Partners, Inc.,
1 mo. USD Term SOFR + 4.250% | | (CCC+, B3) | | 07/09/25 | | | 10.179 | | | | 1,048,069 | | |
See Accompanying Notes to Financial Statements.
25
Credit Suisse Strategic Income Fund
Schedule of Investments (continued)
October 31, 2023
Par
(000) | |
| | Ratings†
(S&P/Moody's) | | Maturity | | Rate% | | Value | |
| BANK LOANS (continued) | | | |
| Health Services (continued) | | | |
$ | 346 | | | Southern Veterinary Partners LLC,
1 mo. USD Term SOFR + 4.000%(8) | | (B-, B2) | | 10/05/27 | | | 9.439 | | | $ | 342,354 | | |
| | 1,228 | | | Therapy Brands Holdings LLC,
1 mo. USD Term SOFR + 4.000%(8) | | (B-, B2) | | 05/18/28 | | | 9.439 | | | | 1,166,141 | | |
| | 1,170 | | | U.S. Radiology Specialists, Inc.,
3 mo. USD Term SOFR + 5.250%(8) | | (B-, B3) | | 12/15/27 | | | 10.740 | | | | 1,108,813 | | |
| | 110 | | | Western Dental Services, Inc.
(2021 Delayed Draw Term Loan),
3 mo. USD Term SOFR + 4.500%(8) | | (CCC+, B3) | | 08/18/28 | | | 10.184 | | | | 85,249 | | |
| | 975 | | | Western Dental Services, Inc.
(2021 Term Loan B),
3 mo. USD Term SOFR + 4.500%(8) | | (CCC+, B3) | | 08/18/28 | | | 10.184 | | | | 756,677 | | |
| | | | 11,497,971 | | |
| Hotels (0.1%) | | | |
| | 388 | | | Alterra Mountain Co.,
1 mo. USD Term SOFR + 3.750%(8) | | (B+, B1) | | 05/31/30 | | | 9.174 | | | | 388,468 | | |
| Insurance Brokerage (1.6%) | | | |
| | 1,347 | | | Alliant Holdings Intermediate LLC,
1 mo. USD Term SOFR + 3.500%(8) | | (B, B2) | | 11/05/27 | | | 8.835 | | | | 1,343,781 | | |
| | 980 | | | Howden Group Holdings Ltd.,
1 mo. USD Term SOFR + 4.000%(8) | | (B, B2) | | 04/18/30 | | | 9.324 | | | | 980,118 | | |
| | 3,089 | | | HUB International Ltd.,
3 mo. USD Term SOFR + 4.250%(8) | | (B, B2) | | 06/20/30 | | | 9.662 | | | | 3,090,871 | | |
| | 748 | | | Hyperion Insurance Group Ltd.,
1 mo. USD Term SOFR + 3.250%(8) | | (B, B2) | | 11/12/27 | | | 8.689 | | | | 743,016 | | |
| | | | 6,157,786 | | |
| Investments & Misc. Financial Services (2.0%) | | | |
| | 392 | | | Altisource Solutions SARL,
3 mo. USD Term SOFR + 9.500%(8),(11) | |
(CCC-, Caa2) | |
04/30/25 | | | 14.240 -
15.156 | | | | 316,578 | | |
| | 1,000 | | | AqGen Ascensus, Inc.,
3 mo. USD Term SOFR + 6.500%(8) | | (CCC, Caa2) | | 08/02/29 | | | 12.176 | | | | 957,505 | | |
| | 1,067 | | | Citadel Securities LP,
1 mo. USD Term SOFR + 2.500%(8) | | (BBB-, Baa3) | | 07/29/30 | | | 7.939 | | | | 1,064,409 | | |
| | 1,980 | | | Galaxy U.S. Opco, Inc.,
3 mo. USD Term SOFR + 4.750%(8) | | (B-, B3) | | 04/29/29 | | | 10.133 | | | | 1,846,350 | | |
| | 1,715 | | | HighTower Holdings LLC,
3 mo. USD Term SOFR + 4.000%(8) | | (B-, B2) | | 04/21/28 | | | 9.380 | | | | 1,684,987 | | |
| | 661 | | | Kestra Advisor Services Holdings A, Inc.,
3 mo. USD Term SOFR + 4.250%(8) | | (B-, B2) | | 06/03/26 | | | 9.740 | | | | 657,434 | | |
| | 980 | | | Mariner Wealth Advisors LLC,
3 mo. USD Term SOFR + 3.250%(8) | |
(B-, Ba3) | |
08/18/28 | | | 8.876 -
8.902 | | | | 967,324 | | |
| | | | 7,494,587 | | |
See Accompanying Notes to Financial Statements.
26
Credit Suisse Strategic Income Fund
Schedule of Investments (continued)
October 31, 2023
Par
(000) | |
| | Ratings†
(S&P/Moody's) | | Maturity | | Rate% | | Value | |
| BANK LOANS (continued) | | | |
| Machinery (2.2%) | | | |
$ | 1,484 | | | 19th Holdings Golf LLC,
3 mo. USD Term SOFR + 3.350%(7),(8) | | (B, B1) | | 02/07/29 | | | 8.678 | | | $ | 1,410,170 | | |
| | 280 | | | CPM Holdings, Inc.,
1 mo. USD Term SOFR + 3.500%(8) | | (B, B2) | | 11/17/25 | | | 9.818 | | | | 280,305 | | |
| | 197 | | | CPM Holdings, Inc.,
1 mo. USD Term SOFR + 8.250%(8) | | (B, B2) | | 11/16/26 | | | 13.567 | | | | 197,366 | | |
| | 750 | | | CPM Holdings, Inc.,
1 mo. USD Term SOFR + 4.500%(8) | | (B, B2) | | 09/28/28 | | | 9.827 | | | | 750,562 | | |
| | 2,000 | | | LSF12 Badger Bidco LLC,
1 mo. USD Term SOFR + 6.000%(7),(8) | | (B, B2) | | 08/30/30 | | | 11.324 | | | | 2,000,000 | | |
| | 411 | | | LTI Holdings, Inc.,
1 mo. USD Term SOFR + 6.750%(8),(11) | | (CCC+, Caa2) | | 09/06/26 | | | 12.189 | | | | 367,741 | | |
| | 2,410 | | | LTI Holdings, Inc.,
1 mo. USD Term SOFR + 3.500%(8) | | (B-, B2) | | 09/06/25 | | | 8.939 | | | | 2,300,873 | | |
| | 924 | | | LTI Holdings, Inc.,
1 mo. USD Term SOFR + 4.750%(8) | | (B-, B2) | | 07/24/26 | | | 10.189 | | | | 885,070 | | |
| | | | 8,192,087 | | |
| Media - Diversified (0.4%) | | | |
| | 499 | | | Cast & Crew Payroll LLC,
1 mo. USD Term SOFR + 3.500%(8) | | (B, B1) | | 02/09/26 | | | 9.075 | | | | 492,877 | | |
| | 392 | | | Technicolor Creative Studios,
3 mo. EUR EURIBOR + 5.000%(3),(5),(7),(8) | | (NR, NR) | | 06/05/30 | | | 8.795 | | | | — | | |
| | 66 | | | Technicolor Creative Studios,
3 mo. EUR EURIBOR + 4.172%(3),(5),(7),(8) | | (NR, NR) | | 07/31/26 | | | 8.141 | | | | 69,977 | | |
| | 185 | | | Technicolor Creative Studios,
6 mo. EUR EURIBOR + 0.500%(3),(8) | | (NR, NR) | | 07/31/26 | | | 3.835 | | | | 182,661 | | |
| | 174 | | | Technicolor Creative Studios,
6 mo. EUR EURIBOR + 0.500%(3),(8) | | (NR, NR) | | 07/31/26 | | | 4.429 | | | | 170,885 | | |
| | 969 | | | Technicolor Creative Studios,
3 mo. EUR EURIBOR + 5.000%(3),(7),(8) | | (NR, NR) | | 08/06/33 | | | 8.486 | | | | 486,683 | | |
| | | | 1,403,083 | | |
| Media Content (0.4%) | | | |
| | 1,505 | | | Recorded Books, Inc.,
1 mo. USD Term SOFR + 4.000%(8) | | (B-, B3) | | 08/29/25 | | | 9.324 | | | | 1,504,579 | | |
| Medical Products (1.1%) | | | |
| | 1,440 | | | Artivion, Inc.,
1 mo. USD Term SOFR + 3.500%(8) | | (B-, B2) | | 06/01/27 | | | 8.939 | | | | 1,398,401 | | |
| | 1,335 | | | Femur Buyer, Inc.,
3 mo. USD Term SOFR + 4.500%(8) | | (CCC+, Caa1) | | 03/05/26 | | | 10.152 | | | | 1,252,374 | | |
| | 700 | | | Femur Buyer, Inc.,
3 mo. USD Term SOFR + 5.500%(7),(8) | | (CCC+, NR) | | 08/05/25 | | | 11.152 | | | | 634,479 | | |
| | 997 | | | Viant Medical Holdings, Inc.,
1 mo. USD Term SOFR + 3.750%(8) | | (B-, B3) | | 07/02/25 | | | 9.189 | | | | 979,717 | | |
| | | | 4,264,971 | | |
See Accompanying Notes to Financial Statements.
27
Credit Suisse Strategic Income Fund
Schedule of Investments (continued)
October 31, 2023
Par
(000) | |
| | Ratings†
(S&P/Moody's) | | Maturity | | Rate% | | Value | |
| BANK LOANS (continued) | | | |
| Packaging (1.2%) | | | |
$ | 748 | | | Mauser Packaging Solutions Holding Co.,
1 mo. USD Term SOFR + 4.000%(8) | | (B, B2) | | 08/14/26 | | | 9.319 | | | $ | 727,483 | | |
| | 2,752 | | | Proampac PG Borrower LLC,
3 mo. USD Term SOFR + 4.500%,
U.S. (Fed) Prime Rate + 3.500%(8) | |
(B-, B3) | |
09/15/28 | | |
9.887 -
12.000 | | | | 2,719,777 | | |
| | 328 | | | Strategic Materials Holdings Corp.,
3 mo. USD Term SOFR + 0.000%(5),(7),(8) | | (NR, NR) | | 09/01/30 | | | 5.411 | | | | 330,997 | | |
| | 712 | | | Strategic Materials, Inc.(4),(6),(11) | | (D, Caa3) | | 11/01/24 | | | 0.000 | | | | 459,551 | | |
| | 645 | | | Strategic Materials, Inc.(4),(6),(11) | | (D, C) | | 10/31/25 | | | 0.000 | | | | 17,738 | | |
| | 337 | | | Technimark Holdings LLC,
1 mo. USD Term SOFR + 3.750%(8) | | (B-, B2) | | 07/07/28 | | | 9.189 | | | | 326,421 | | |
| | | | 4,581,967 | | |
| Personal & Household Products (0.8%) | | | |
| | 443 | | | ABG Intermediate Holdings 2 LLC(12) | | (BB-, B1) | | 12/21/28 | | | 4.000 | | | | 442,506 | | |
| | 2,310 | | | ABG Intermediate Holdings 2 LLC,
1 mo. USD Term SOFR + 4.000%(8) | | (BB-, B1) | | 12/21/28 | | | 9.325 | | | | 2,309,458 | | |
| | 121 | | | Serta Simmons Bedding LLC,
3 mo. USD Term SOFR + 7.500%(8) | | (NR, NR) | | 06/29/28 | | | 12.900 | | | | 120,183 | | |
| | | | 2,872,147 | | |
| Real Estate Development & Management (0.2%) | | | |
| | 748 | | | BIFM CA Buyer, Inc.,
1 mo. USD Term SOFR + 3.500%(8) | | (B, B3) | | 06/01/26 | | | 8.939 | | | | 744,774 | | |
| Real Estate Investment Trusts (0.2%) | | | |
| | 729 | | | Claros Mortgage Trust, Inc.,
1 mo. USD Term SOFR + 4.500%(7),(8) | | (B, Ba3) | | 08/09/26 | | | 9.939 | | | | 694,677 | | |
| Recreation & Travel (1.0%) | | | |
| | 1,418 | | | Bulldog Purchaser, Inc.,
3 mo. USD Term SOFR + 3.750%(8) | | (B-, B3) | | 09/05/25 | | | 9.272 | | | | 1,378,294 | | |
| | 858 | | | Hornblower Sub LLC,
3 mo. USD LIBOR + 4.500%(8) | | (CCC-, Caa2) | | 04/27/25 | | | 10.152 | | | | 319,646 | | |
| | 500 | | | Hornblower Sub LLC,
U.S. (Fed) Prime Rate + 7.125%(8) | | (NR, NR) | | 11/20/25 | | | 15.625 | | | | 500,940 | | |
| | 350 | | | Hornblower Sub LLC
(Incremental Term Loan),
U.S. (Fed) Prime Rate + 7.125%(8) | | (NR, NR) | | 11/10/25 | | | 15.625 | | | | 350,658 | | |
| | 1,134 | | | Hornblower Sub LLC
(Super Priority Term Loan),
U.S. (Fed) Prime Rate + 7.125%(8) | | (NR, NR) | | 11/10/25 | | | 15.625 | | | | 1,136,153 | | |
| | 249 | | | SeaWorld Parks & Entertainment, Inc.,
1 mo. USD Term SOFR + 3.000%(8) | | (BB, Ba2) | | 08/25/28 | | | 8.439 | | | | 248,626 | | |
| | | | 3,934,317 | | |
See Accompanying Notes to Financial Statements.
28
Credit Suisse Strategic Income Fund
Schedule of Investments (continued)
October 31, 2023
Par
(000) | |
| | Ratings†
(S&P/Moody's) | | Maturity | | Rate% | | Value | |
| BANK LOANS (continued) | | | |
| Restaurants (0.6%) | | | |
$ | 1,151 | | | 1011778 BC Unlimited Liability Co.,
1 mo. USD Term SOFR + 2.250%(8) | | (BB+, Ba2) | | 09/20/30 | | | 7.574 | | | $ | 1,141,658 | | |
| | 606 | | | Tacala LLC,
1 mo. USD Term SOFR + 3.500%(8) | | (B-, B2) | | 02/05/27 | | | 9.439 | | | | 604,371 | | |
| | 375 | | | Tacala LLC,
1 mo. USD Term SOFR + 7.500%(8) | | (CCC, Caa2) | | 02/04/28 | | | 13.439 | | | | 363,516 | | |
| | | | 2,109,545 | | |
| Software - Services (7.9%) | | | |
| | 1,220 | | | Applied Systems, Inc.,
3 mo. USD Term SOFR + 4.500%(8) | | (B-, B2) | | 09/18/26 | | | 9.890 | | | | 1,224,765 | | |
| | 926 | | | AQ Carver Buyer, Inc.,
3 mo. USD Term SOFR + 5.500%(8) | | (B, B2) | | 08/02/29 | | | 10.880 | | | | 928,155 | | |
| | 1,697 | | | Aston FinCo SARL,
1 mo. USD Term SOFR + 4.250%(8) | | (B-, B3) | | 10/09/26 | | | 9.689 | | | | 1,470,684 | | |
| | 1,126 | | | Astra Acquisition Corp.,
3 mo. USD Term SOFR + 5.250%(8) | | (B-, Caa1) | | 10/25/28 | | | 10.902 | | | | 775,822 | | |
| | 1,250 | | | Camelot U.S. Acquisition LLC,
1 mo. USD Term SOFR + 3.000%(8) | | (B+, B1) | | 10/30/26 | | | 8.439 | | | | 1,250,000 | | |
| | 247 | | | Cardinal Parent, Inc.,
3 mo. USD Term SOFR + 4.500%(8) | | (CCC+, B3) | | 11/12/27 | | | 10.040 | | | | 225,809 | | |
| | 1,714 | | | Ceridian HCM Holding, Inc.,
1 mo. USD Term SOFR + 2.500%(8) | | (B+, Ba3) | | 04/30/25 | | | 7.939 | | | | 1,715,815 | | |
| | 1,242 | | | ConnectWise LLC,
1 mo. USD Term SOFR + 3.500%(8) | | (NR, B2) | | 09/29/28 | | | 8.939 | | | | 1,211,987 | | |
| | 1,232 | | | Cornerstone OnDemand, Inc.,
1 mo. USD Term SOFR + 3.750%(8) | | (B-, B2) | | 10/16/28 | | | 9.189 | | | | 1,165,962 | | |
| | 1,250 | | | DCert Buyer, Inc.,
1 mo. USD Term SOFR + 7.000%(8) | | (CCC, Caa2) | | 02/19/29 | | | 12.324 | | | | 1,127,088 | | |
| | 559 | | | Evertec Group LLC(7),(9) | | (BB-, Ba3) | | 10/12/30 | | | 0.000 | | | | 558,602 | | |
| | 1,917 | | | Flexera Software LLC,
1 mo. USD Term SOFR + 3.750%(8) | | (B-, B1) | | 03/03/28 | | | 9.189 | | | | 1,896,415 | | |
| | 425 | | | Genuine Financial Holdings LLC,
3 mo. USD Term SOFR + 4.000%(8) | | (B, B2) | | 09/27/30 | | | 9.400 | | | | 420,814 | | |
| | 421 | | | IGT Holding IV AB,
3 mo. USD Term SOFR + 3.400%(8) | | (B, B2) | | 03/31/28 | | | 8.962 | | | | 419,071 | | |
| | 1,029 | | | Marcel LUX IV SARL(7),(9) | | (B+, B2) | | 10/26/30 | | | 0.000 | | | | 1,024,035 | | |
| | 220 | | | Mosel Bidco SE,
3 mo. USD Term SOFR + 4.750%(7),(8) | | (B, B2) | | 09/16/30 | | | 10.146 | | | | 219,725 | | |
| | 1,636 | | | Polaris Newco LLC,
1 mo. USD Term SOFR + 4.000%(8) | | (B-, B2) | | 06/02/28 | | | 9.439 | | | | 1,548,028 | | |
| | 2,500 | | | Project Alpha Intermediate Holding, Inc.,
3 mo. USD Term SOFR + 4.750%(8) | | (B, B2) | | 10/28/30 | | | 10.075 | | | | 2,432,037 | | |
| | 1,976 | | | Quest Software U.S. Holdings, Inc.,
3 mo. USD Term SOFR + 4.250%(8) | | (CCC+, B2) | | 02/01/29 | | | 9.783 | | | | 1,570,615 | | |
See Accompanying Notes to Financial Statements.
29
Credit Suisse Strategic Income Fund
Schedule of Investments (continued)
October 31, 2023
Par
(000) | |
| | Ratings†
(S&P/Moody's) | | Maturity | | Rate% | | Value | |
| BANK LOANS (continued) | | | |
| Software - Services (continued) | | | |
$ | 1,232 | | | Redstone Holdco 2 LP,
1 mo. USD Term SOFR + 4.750%(8) | | (B-, B3) | | 04/27/28 | | | 10.189 | | | $ | 1,038,897 | | |
| | 2,034 | | | Transact Holdings, Inc.,
1 mo. USD Term SOFR + 4.250%(8) | | (B, B2) | | 04/30/26 | | | 9.689 | | | | 2,036,975 | | |
| | 4,764 | | | Ultimate Software Group, Inc.,
3 mo. USD Term SOFR + 3.250%(8) | | (B-, B1) | | 05/04/26 | | | 8.764 | | | | 4,745,062 | | |
| | 411 | | | VT Topco, Inc.,
3 mo. USD Term SOFR + 4.250%(8) | | (B, B2) | | 08/09/30 | | | 9.661 | | | | 410,934 | | |
| | | | 29,417,297 | | |
| Specialty Retail (0.1%) | | | |
| | 500 | | | Mister Car Wash Holdings, Inc.(9) | | (B, B2) | | 05/14/26 | | | 0.000 | | | | 499,610 | | |
| Steel Producers/Products (0.2%) | | | |
| | 750 | | | Grinding Media, Inc.(7),(9) | | (B, B2) | | 10/12/28 | | | 0.000 | | | | 731,250 | | |
| Support - Services (1.8%) | | | |
| | 829 | | | Belfor Holdings, Inc.(7),(9) | | (B, B1) | | 10/25/30 | | | 0.000 | | | | 829,253 | | |
| | 494 | | | Global Education Management
Systems Establishment,
3 mo. USD Term SOFR + 4.750%(8) | | (B, B2) | | 07/31/26 | | | 10.434 | | | | 495,544 | | |
| | 988 | | | KUEHG Corp.,
3 mo. USD Term SOFR + 5.000%(8) | | (B, B2) | | 06/12/30 | | | 10.390 | | | | 989,070 | | |
| | 830 | | | LaserShip, Inc.,
2 mo. USD Term SOFR + 7.500%(8) | | (CCC-, Caa3) | | 05/07/29 | | | 13.396 | | | | 680,213 | | |
| | 1,470 | | | LaserShip, Inc.,
3 mo. USD Term SOFR + 4.500%(8) | | (CCC+, B3) | | 05/07/28 | | | 10.396 | | | | 1,323,000 | | |
| | 500 | | | Nuvei Technologies Corp.(9) | | (BB-, Ba3) | | 09/29/25 | | | 0.000 | | | | 500,312 | | |
| | 1,924 | | | Wrench Group LLC,
3 mo. USD Term SOFR + 4.000%(8) | | (B-, B2) | | 04/30/26 | | | 9.652 | | | | 1,916,363 | | |
| | | | 6,733,755 | | |
| Tech Hardware & Equipment (0.5%) | | | |
| | 1,231 | | | Atlas CC Acquisition Corp.,
3 mo. USD Term SOFR + 4.250%(8) | | (B, Caa1) | | 05/25/28 | | | 9.934 | | | | 1,146,318 | | |
| | 250 | | | Atlas CC Acquisition Corp.,
3 mo. USD Term SOFR + 4.250%(8) | | (B+, B1) | | 05/25/28 | | | 9.934 | | | | 233,150 | | |
| | 250 | | | CommScope, Inc.(9) | | (B, B1) | | 04/06/26 | | | 0.000 | | | | 212,500 | | |
| | 249 | | | Vertiv Group Corp.,
1 mo. USD Term SOFR + 2.750%(8) | | (BB-, B1) | | 03/02/27 | | | 8.179 | | | | 249,219 | | |
| | | | 1,841,187 | | |
| Telecom - Wireline Integrated & Services (1.0%) | | | |
| | 740 | | | Altice France SA,
3 mo. USD Term SOFR + 5.500%(8) | | (B-, B2) | | 08/15/28 | | | 10.894 | | | | 659,474 | | |
| | 2,222 | | | Patagonia Holdco LLC,
3 mo. USD Term SOFR + 5.750%(7),(8) | | (NR, B1) | | 08/01/29 | | | 11.117 | | | | 1,927,350 | | |
See Accompanying Notes to Financial Statements.
30
Credit Suisse Strategic Income Fund
Schedule of Investments (continued)
October 31, 2023
Par
(000) | |
| | Ratings†
(S&P/Moody's) | | Maturity | | Rate% | | Value | |
| BANK LOANS (continued) | | | |
| Telecom - Wireline Integrated & Services (continued) | | | |
$ | 929 | | | TVC Albany, Inc.,
1 mo. USD Term SOFR + 3.500%(8) | | (B-, B2) | | 07/23/25 | | | 8.939 | | | $ | 912,639 | | |
| | 438 | | | TVC Albany, Inc.,
1 mo. USD Term SOFR + 7.500%(7),(8),(11) | | (CCC, Caa2) | | 07/23/26 | | | 12.939 | | | | 429,844 | | |
| | | | 3,929,307 | | |
| Theaters & Entertainment (1.6%) | | | |
| | 2,493 | | | UFC Holdings LLC,
3 mo. USD Term SOFR + 2.750%(8) | | (BB, Ba3) | | 04/29/26 | | | 8.399 | | | | 2,493,438 | | |
| | 3,398 | | | William Morris Endeavor
Entertainment LLC,
1 mo. USD Term SOFR + 2.750%(8) | | (BB-, B3) | | 05/18/25 | | | 8.189 | | | | 3,399,321 | | |
| | | | 5,892,759 | | |
| TOTAL BANK LOANS (Cost $146,497,365) | | | 140,596,535 | | |
| ASSET BACKED SECURITIES (4.8%) | | | |
| Collateralized Debt Obligations (4.8%) | | | |
| | 1,350 | | | Anchorage Capital CLO 15 Ltd.,
2020-15A, Rule 144A,
3 mo. USD Term SOFR + 7.662%(1),(8) | | (NR, Ba3) | | 07/20/34 | | | 13.077 | | | | 1,235,155 | | |
| | 1,000 | | | Anchorage Capital CLO 4-R Ltd.,
2014-4RA, Rule 144A,
3 mo. USD Term SOFR + 2.862%(1),(8) | | (BBB-, NR) | | 01/28/31 | | | 8.252 | | | | 962,266 | | |
| | 1,250 | | | Anchorage Capital CLO Ltd., 2013-1A,
Rule 144A, 3 mo. USD Term
SOFR + 7.062%(1),(8) | | (NR, Ba3) | | 10/13/30 | | | 12.455 | | | | 1,167,252 | | |
| | 1,000 | | | Battalion CLO XIV Ltd., 2019-14A,
Rule 144A, 3 mo. USD Term
SOFR + 3.702%(1),(8) | | (NR, Baa3) | | 01/20/35 | | | 9.117 | | | | 919,913 | | |
| | 1,000 | | | BlueMountain CLO Ltd., 2016-2A,
Rule 144A, 3 mo. USD Term
SOFR + 4.562%(1),(8) | | (BBB-, NR) | | 08/20/32 | | | 9.941 | | | | 949,133 | | |
| | 1,000 | | | BlueMountain Fuji U.S. CLO I Ltd.,
2017-1A, Rule 144A,
3 mo. USD Term SOFR + 6.262%(1),(8) | | (BB-, NR) | | 07/20/29 | | | 11.677 | | | | 846,329 | | |
| | 1,000 | | | BlueMountain Fuji U.S. CLO III Ltd.,
2017-3A, Rule 144A,
3 mo. USD Term SOFR + 5.462%(1),(8) | | (BB-, NR) | | 01/15/30 | | | 10.856 | | | | 831,590 | | |
| | 750 | | | Carlyle Global Market Strategies CLO Ltd.,
2014-3RA, Rule 144A,
3 mo. USD Term SOFR + 5.662%(1),(8) | | (BB-, NR) | | 07/27/31 | | | 11.049 | | | | 637,109 | | |
| | 1,250 | | | CIFC Funding Ltd., 2013-2A,
Rule 144A, 3 mo. USD Term
SOFR + 6.782%(1),(8) | | (B+, NR) | | 10/18/30 | | | 12.177 | | | | 1,115,282 | | |
See Accompanying Notes to Financial Statements.
31
Credit Suisse Strategic Income Fund
Schedule of Investments (continued)
October 31, 2023
Par
(000) | |
| | Ratings†
(S&P/Moody's) | | Maturity | | Rate% | | Value | |
| ASSET BACKED SECURITIES (continued) | | | |
| Collateralized Debt Obligations (continued) | | | |
$ | 750 | | | CIFC Funding Ltd., 2014-1A, Rule 144A,
3 mo. USD Term SOFR + 6.112%(1),(8) | | (B+, NR) | | 01/18/31 | | | 11.507 | | | $ | 663,836 | | |
| | 750 | | | Goldentree Loan Opportunities XI Ltd.,
2015-11A, Rule 144A,
3 mo. USD Term SOFR + 5.662%(1),(8) | | (NR, Ba3) | | 01/18/31 | | | 11.057 | | | | 697,578 | | |
| | 1,225 | | | Greywolf CLO V Ltd., 2015-1A,
Rule 144A, 3 mo. USD Term
SOFR + 6.112%(1),(8) | | (BB-, NR) | | 01/27/31 | | | 11.490 | | | | 1,074,559 | | |
| | 500 | | | Halcyon Loan Advisors Funding Ltd.,
2015-2A, Rule 144A(1),(11) | | (NR, NR) | | 07/25/27 | | | 0.000 | | | | 75 | | |
| | 1,000 | | | KKR CLO 16 Ltd., Rule 144A,
3 mo. USD Term SOFR + 7.372%(1),(8) | | (BB-, NR) | | 10/20/34 | | | 12.787 | | | | 887,808 | | |
| | 500 | | | KKR CLO 20 Ltd., Rule 144A,
3 mo. USD Term SOFR + 5.762%(1),(8) | | (NR, Ba3) | | 10/16/30 | | | 11.156 | | | | 458,296 | | |
| | 750 | | | KKR Financial CLO Ltd., 2013-1A,
Rule 144A, 3 mo. USD Term
SOFR + 6.342%(1),(8) | | (NR, Ba3) | | 04/15/29 | | | 11.736 | | | | 709,610 | | |
| | 1,000 | | | Marble Point CLO XXIII Ltd.,
2021-4A, Rule 144A,
3 mo. USD LIBOR + 5.750%(1),(8) | | (NR, Ba1) | | 01/22/35 | | | 11.424 | | | | 929,566 | | |
| | 1,000 | | | Oaktree CLO Ltd., 2019-4A,
Rule 144A, 3 mo. USD Term
SOFR + 7.492%(1),(8) | | (BB-, NR) | | 10/20/32 | | | 12.907 | | | | 938,928 | | |
| | 670 | | | Stratus CLO Ltd., 2021-1A, Rule 144A,
3 mo. USD Term SOFR + 1.062%(1),(8) | | (NR, Aaa) | | 12/29/29 | | | 6.477 | | | | 666,259 | | |
| | 500 | | | Venture XXVIII CLO Ltd., 2017-28A,
Rule 144A, 3 mo. USD Term
SOFR + 6.412%(1),(8) | | (NR, Ba3) | | 07/20/30 | | | 11.827 | | | | 300,033 | | |
| | 1,000 | | | Vibrant CLO III Ltd., 2015-3A,
Rule 144A, 3 mo. USD Term
SOFR + 3.762%(1),(8) | | (NR, Ba1) | | 10/20/31 | | | 9.177 | | | | 907,439 | | |
| | 750 | | | Vibrant CLO VI Ltd., 2017-6A,
Rule 144A, 3 mo. USD Term
SOFR + 6.012%(1),(8) | | (NR, Ba3) | | 06/20/29 | | | 11.409 | | | | 648,633 | | |
| | 500 | | | Voya CLO Ltd., 2014-4A, Rule 144A,
3 mo. USD Term SOFR + 3.612%(1),(8) | | (BBB-, NR) | | 07/14/31 | | | 9.006 | | | | 457,206 | | |
| TOTAL ASSET BACKED SECURITIES (Cost $20,332,910) | | | 18,003,855 | | |
Shares | | | | | | | | | | | |
| COMMON STOCKS (0.7%) | | | |
| Auto Parts & Equipment (0.1%) | | | |
| | 23,475 | | | Jason, Inc.(6),(7) | | | | | | | | | | | | | | | 254,307 | | |
| Cable & Satellite TV (0.1%) | | | |
| | 54,000 | | | Altice USA, Inc., Class A(6) | | | | | | | | | | | | | | | 156,060 | | |
See Accompanying Notes to Financial Statements.
32
Credit Suisse Strategic Income Fund
Schedule of Investments (continued)
October 31, 2023
Shares | | | | | | | | | | Value | |
| COMMON STOCKS (continued) | | | |
| Chemicals (0.1%) | | | |
| | 1,512 | | | Project Investor Holdings LLC(5),(6),(7),(11) | | | | | | | | | | | | | | $ | 15 | | |
| | 25,202 | | | Proppants Holdings LLC(5),(6),(7),(11) | | | | | | | | | | | | | | | 504 | | |
| | 6,341 | | | UTEX Industries, Inc.(6) | | | | | | | | | | | | | | | 389,972 | | |
| | | | 390,491 | | |
| Energy - Exploration & Production (0.0%) | | | |
| | 37,190 | | | PES Energy, Class A(5),(6),(7),(11) | | | | | | | | | | | | | | | 372 | | |
| Metals & Mining - Excluding Steel (0.3%) | | | |
| | 1,100,000 | | | Taseko Mines Ltd.(2),(6) | | | | | | | | | | | | | | | 1,172,699 | | |
| Personal & Household Products (0.1%) | | | |
| | 29,405 | | | Serta Simmons Common(6) | | | | | | | | | | | | | | | 323,455 | | |
| Pharmaceuticals (0.0%) | | | |
| | 37,299 | | | Akorn, Inc.(6) | | | | | | | | | | | | | | | 18,649 | | |
| Private Placement (0.0%) | | | |
| | 50,013 | | | Technicolor Creative Studios SA(6),(13) | | | | | | | | | | | | | | | 85,259 | | |
| | 249,816 | | | Vantiva SA(6),(13) | | | | | | | | | | | | | | | 33,746 | | |
| | | | 119,005 | | |
| Recreation & Travel (0.0%) | | | |
| | 7,268 | | | Cineworld Group PLC(6) | | | | | | | | | | | | | | | 149,357 | | |
| Specialty Retail (0.0%) | | | |
| | 66 | | | Eagle Investments Holding Co. LLC, Class B(5),(6),(7) | | | | | | | | | | | | | | | 1 | | |
| Theaters & Entertainment (0.0%) | | | |
| | 134,615 | | | Vantiva SA(3),(6) | | | | | | | | | | | | | | | 18,387 | | |
| TOTAL COMMON STOCKS (Cost $4,638,673) | | | 2,602,783 | | |
| WARRANTS (0.0%) | | | |
| Chemicals (0.0%) | | | |
| | 6,300 | | | Project Investor Holdings LLC, expires 02/20/2022(5),(6),(7),(11) | | | | | | | | | | | | | | | — | | |
| Investments & Misc. Financial Services (0.0%) | | | |
| | 2,845 | | | Altisource Solutions SARL, expires 05/31/2027(5),(6),(7) | | | | | | | | | | | | | | | 8,996 | | |
| | 9,954 | | | CC Neuberger Principal Holdings III, expires 12/31/2027(6) | | | | | | | | | | | | | | | 2,088 | | |
| | 26,666 | | | DHC Acquisition Corp., expires 12/31/2027(6) | | | | | | | | | | | | | | | 1,333 | | |
| | 6,000 | | | Movella Holdings, Inc., expires 12/31/2027(6) | | | | | | | | | | | | | | | 121 | | |
| | 2,500 | | | Northern Star Investment Corp. IV, expires 12/31/2027(6) | | | | | | | | | | | | | | | 50 | | |
| | | | 12,588 | | |
| Private Placement (0.0%) | | | |
| | 1,502,025 | | | Technicolor Creative Studios SA(6),(13) | | | | | | | | | | | | | | | 25,653 | | |
| Recreation & Travel (0.0%) | | | |
| | 29,277 | | | Cineworld Group PLC, expires 12/21/2025(6),(7) | | | | | | | | | | | | | | | — | | |
| TOTAL WARRANTS (Cost $31,989) | | | 38,241 | | |
See Accompanying Notes to Financial Statements.
33
Credit Suisse Strategic Income Fund
Schedule of Investments (continued)
October 31, 2023
Shares | | | | | | | | | | Value | |
| SHORT-TERM INVESTMENTS (12.0%) | |
| | 34,647,317 | | | State Street Institutional U.S. Government
Money Market Fund — Premier Class, 5.31% | | | | | | | | | | | | | | $ | 34,647,317 | | |
| | 10,361,287 | | | State Street Navigator Securities Lending
Government Money Market Portfolio, 5.36%(14) | | | | | | | | | | | | | | | 10,361,287 | | |
| TOTAL SHORT-TERM INVESTMENTS (Cost $45,008,604) | | | 45,008,604 | | |
| TOTAL INVESTMENTS AT VALUE (104.2%) (Cost $416,921,363) | | | 389,069,592 | | |
| LIABILITIES IN EXCESS OF OTHER ASSETS (-4.2%) | | | (15,835,462 | ) | |
| NET ASSETS (100.0%) | | $ | 373,234,130 | | |
† Credit ratings given by the S&P Global Ratings Division of S&P Global Inc. ("S&P") and Moody's Investors Service, Inc. ("Moody's") are unaudited.
(1) Security exempt from registration under Rule 144A of the Securities Act of 1933, as amended. These securities may be resold in transactions exempt from registration, normally to qualified institutional buyers. At October 31, 2023, these securities amounted to a value of $195,264,051 or 52.3% of net assets.
(2) Security or portion thereof is out on loan (See Note 2-K).
(3) This security is denominated in Euro.
(4) Bond is currently in default.
(5) Not readily marketable security; security is valued at fair value as determined in good faith by Credit Suisse Asset Management, LLC as the Fund's valuation designee under the oversight of the Board of Trustees.
(6) Non-income producing security.
(7) Security is valued using significant unobservable inputs.
(8) Variable rate obligation — The interest rate shown is the rate in effect as of October 31, 2023. The rate may be subject to a cap and floor.
(9) The rates on certain variable rate securities are not based on a published reference rate and spread but are determined by the issuer or agent and are based on current market conditions. These securities do not indicate a reference rate and spread in their description above. The interest rate shown is the rate in effect as of October 31, 2023.
(10) PIK: Payment-in-kind security for which part of the income earned may be paid as additional principal.
(11) Illiquid security.
(12) All or a portion is an unfunded loan commitment.
(13) Security is held through holdings of 100 shares of the CIG Special Purpose SPC — Credit Suisse Strategic Income Fund Segregated Portfolio, an affiliated entity.
(14) Represents security purchased with cash collateral received for securities on loan.
See Accompanying Notes to Financial Statements.
34
Credit Suisse Strategic Income Fund
Schedule of Investments (continued)
October 31, 2023
INVESTMENT ABBREVIATIONS
1 mo. = 1 month
12 mo. = 12 month
2 mo. = 2 month
3 mo. = 3 month
6 mo. = 6 month
EURIBOR = Euro Interbank Offered Rate
LIBOR = London Interbank Offered Rate
NR = Not Rated
SARL = société à responsabilité limitée
SOFR = Secured Overnight Financing Rate
WR = Withdrawn Rating
Forward Foreign Currency Contracts
Forward
Currency to be
Purchased | | Forward
Currency to be
Sold | | Expiration
Date | | Counterparty | | Value on
Settlement
Date | | Current
Value/
Notional | | Unrealized
Appreciation | |
USD | 1,431,193 | | | CAD | 1,958,000 | | | 10/07/24 | | Deutsche Bank AG | | $ | (1,431,193 | ) | | $ | (1,417,770 | ) | | $ | 13,423 | | |
Total Unrealized Appreciation | | $ | 13,423 | | |
Forward Foreign Currency Contracts
Forward
Currency to be
Purchased | | Forward
Currency to be
Sold | | Expiration
Date | | Counterparty | | Value on
Settlement
Date | | Current
Value/
Notional | | Unrealized
Depreciation | |
CAD | 352,000 | | | USD | 257,354 | | | 10/07/24 | | Deutsche Bank AG | | $ | 257,354 | | | $ | 254,880 | | | $ | (2,474 | ) | |
USD | 3,123,383 | | | EUR | 2,916,216 | | | 10/07/24 | | Morgan Stanley | | | (3,123,383 | ) | | | (3,134,487 | ) | | | (11,104 | ) | |
Total Unrealized Depreciation | | $ | (13,578 | ) | |
Total Net Unrealized Appreciation/(Depreciation) | | $ | (155 | ) | |
Currency Abbreviations:
CAD = Canadian Dollar
EUR = Euro
USD = United States Dollar
See Accompanying Notes to Financial Statements.
35
Credit Suisse Strategic Income Fund
Statement of Assets and Liabilities
October 31, 2023
Assets | |
Investments at value, including collateral for securities on loan of $10,361,287
(Cost $416,921,363) (Note 2) | | $ | 389,069,5921 | | |
Interest receivable | | | 4,771,878 | | |
Receivable for Fund shares sold | | | 4,270,630 | | |
Receivable for investments sold | | | 640,491 | | |
Unrealized appreciation on forward foreign currency contracts (Note 2) | | | 13,423 | | |
Prepaid expenses and other assets | | | 62,122 | | |
Total assets | | | 398,828,136 | | |
Liabilities | |
Investment advisory fee payable (Note 3) | | | 179,742 | | |
Administrative services fee payable (Note 3) | | | 14,535 | | |
Shareholder servicing/Distribution fee payable (Note 3) | | | 31,636 | | |
Payable for investments purchased | | | 11,277,118 | | |
Payable upon return of securities loaned (Note 2) | | | 10,361,287 | | |
Due to custodian | | | 1,824,165 | | |
Payable for Fund shares redeemed | | | 1,086,953 | | |
Unfunded loan commitments (Note 2) | | | 442,690 | | |
Dividend payable | | | 211,009 | | |
Trustees' fee payable | | | 17,353 | | |
Unrealized depreciation on forward foreign currency contracts (Note 2) | | | 13,578 | | |
Due to custodian for foreign currency at value (cost $44) | | | 44 | | |
Accrued expenses | | | 133,896 | | |
Total liabilities | | | 25,594,006 | | |
Net Assets | |
Capital stock, $.001 par value (Note 6) | | | 41,109 | | |
Paid-in capital (Note 6) | | | 439,889,624 | | |
Total distributable earnings (loss) | | | (66,696,603 | ) | |
Net assets | | $ | 373,234,130 | | |
I Shares | |
Net assets | | $ | 316,613,077 | | |
Shares outstanding | | | 34,874,493 | | |
Net asset value, offering price and redemption price per share | | $ | 9.08 | | |
A Shares | |
Net assets | | $ | 25,795,461 | | |
Shares outstanding | | | 2,841,330 | | |
Net asset value and redemption price per share | | $ | 9.08 | | |
Maximum offering price per share (net asset value/(1-4.75%)) | | $ | 9.53 | | |
C Shares | |
Net assets | | $ | 30,825,592 | | |
Shares outstanding | | | 3,393,059 | | |
Net asset value, offering price and redemption price per share | | $ | 9.08 | | |
1 Includes $10,128,318 of securities on loan.
See Accompanying Notes to Financial Statements.
36
Credit Suisse Strategic Income Fund
Statement of Operations
For the Year Ended October 31, 2023
Investment Income | |
Interest | | $ | 28,553,082 | | |
Dividends | | | 4,147 | | |
Securities lending (net of rebates) | | | 108,226 | | |
Total investment income | | | 28,665,455 | | |
Expenses | |
Investment advisory fees (Note 3) | | | 2,695,487 | | |
Administrative services fees (Note 3) | | | 95,218 | | |
Shareholder servicing/Distribution fees (Note 3) | |
Class A | | | 55,924 | | |
Class C | | | 298,606 | | |
Transfer agent fees | | | 291,963 | | |
Custodian fees | | | 92,769 | | |
Trustees' fees | | | 77,195 | | |
Registration fees | | | 76,374 | | |
Audit and tax fees | | | 53,275 | | |
Commitment fees (Note 4) | | | 44,083 | | |
Printing fees | | | 41,987 | | |
Legal fees | | | 16,896 | | |
Insurance expense | | | 8,006 | | |
Miscellaneous expense | | | 23,383 | | |
Total expenses | | | 3,871,166 | | |
Less: fees waived and expenses reimbursed (Note 3) | | | (981,594 | ) | |
Net expenses | | | 2,889,572 | | |
Net investment income | | | 25,775,883 | | |
Net Realized and Unrealized Gain (Loss) from Investments, Foreign Currency and
Forward Foreign Currency Contracts | |
Net realized loss from investments | | | (18,365,242 | ) | |
Net realized loss from foreign currency transactions | | | (8,990 | ) | |
Net realized loss from forward foreign currency contracts | | | (13,487 | ) | |
Net change in unrealized appreciation (depreciation) from investments | | | 24,316,466 | | |
Net change in unrealized appreciation (depreciation) from foreign currency
translations | | | (693 | ) | |
Net change in unrealized appreciation (depreciation) from forward foreign
currency contracts | | | 21,924 | | |
Net realized and unrealized gain from investments, foreign currency and
forward foreign currency contracts | | | 5,949,978 | | |
Net increase in net assets resulting from operations | | $ | 31,725,861 | | |
See Accompanying Notes to Financial Statements.
37
Credit Suisse Strategic Income Fund
Statements of Changes in Net Assets
| | | For the Year
Ended
October 31, 2023 | | For the Year
Ended
October 31, 2022 | |
From Operations | |
Net investment income | | $ | 25,775,883 | | | $ | 21,589,882 | | |
Net realized loss from investments, foreign currency
transactions and forward foreign currency contracts | | | (18,387,719 | ) | | | (4,792,638 | ) | |
Net change in unrealized appreciation (depreciation)
from investments, foreign currency translations and
forward foreign currency contracts | | | 24,337,697 | | | | (51,790,551 | ) | |
Net increase (decrease) in net assets resulting from operations | | | 31,725,861 | | | | (34,993,307 | ) | |
From Distributions | |
From distributable earnings | |
Class I | | | (21,861,973 | ) | | | (19,082,360 | ) | |
Class A | | | (1,766,502 | ) | | | (1,236,778 | ) | |
Class C | | | (2,146,176 | ) | | | (1,367,736 | ) | |
Net decrease in net assets resulting from distributions | | | (25,774,651 | ) | | | (21,686,874 | ) | |
| From Capital Share Transactions (Note 6) | |
Proceeds from sale of shares | | | 253,132,745 | | | | 260,321,853 | | |
Reinvestment of distributions | | | 23,268,008 | | | | 20,728,194 | | |
Net asset value of shares redeemed | | | (324,419,661 | ) | | | (300,472,059 | ) | |
Net decrease in net assets from capital share transactions | | | (48,018,908 | ) | | | (19,422,012 | ) | |
Net decrease in net assets | | | (42,067,698 | ) | | | (76,102,193 | ) | |
Net Assets | |
Beginning of year | | | 415,301,828 | | | | 491,404,021 | | |
End of year | | $ | 373,234,130 | | | $ | 415,301,828 | | |
See Accompanying Notes to Financial Statements.
38
Credit Suisse Strategic Income Fund
Financial Highlights
(For a Class I Share of the Fund Outstanding Throughout Each Year)
| | | For the Year Ended October 31, | |
| | | 2023 | | 2022 | | 2021 | | 2020 | | 2019 | |
Per share data | |
Net asset value, beginning of year | | $ | 8.91 | | | $ | 10.12 | | | $ | 9.57 | | | $ | 9.88 | | | $ | 9.96 | | |
INVESTMENT OPERATIONS | |
Net investment income1 | | | 0.75 | | | | 0.47 | | | | 0.40 | | | | 0.51 | | | | 0.53 | | |
Net gain (loss) from investments, foreign currency
transactions and forward foreign currency
contracts (both realized and unrealized) | | | 0.17 | | | | (1.20 | ) | | | 0.56 | | | | (0.31 | ) | | | (0.08 | ) | |
Total from investment operations | | | 0.92 | | | | (0.73 | ) | | | 0.96 | | | | 0.20 | | | | 0.45 | | |
LESS DIVIDENDS AND DISTRIBUTIONS | |
Dividends from net investment income | | | (0.75 | ) | | | (0.48 | ) | | | (0.41 | ) | | | (0.51 | ) | | | (0.52 | ) | |
Return of capital | | | — | | | | — | | | | — | | | | — | | | | (0.01 | ) | |
Total dividends and distributions | | | (0.75 | ) | | | (0.48 | ) | | | (0.41 | ) | | | (0.51 | ) | | | (0.53 | ) | |
Net asset value, end of year | | $ | 9.08 | | | $ | 8.91 | | | $ | 10.12 | | | $ | 9.57 | | | $ | 9.88 | | |
Total return2 | | | 10.57 | % | | | (7.41 | )% | | | 10.11 | % | | | 2.21 | % | | | 4.68 | % | |
RATIOS AND SUPPLEMENTAL DATA | |
Net assets, end of year (000s omitted) | | $ | 316,613 | | | $ | 363,915 | | | $ | 420,435 | | | $ | 190,537 | | | $ | 230,330 | | |
Ratio of net expenses to average net assets | | | 0.79 | % | | | 0.79 | % | | | 0.79 | % | | | 0.80 | % | | | 0.99 | % | |
Ratio of net expenses to average net assets
excluding interest expense | | | 0.79 | % | | | 0.79 | % | | | 0.79 | % | | | 0.80 | % | | | 0.99 | % | |
Ratio of net investment income to average
net assets | | | 8.14 | % | | | 4.88 | % | | | 3.93 | % | | | 5.33 | % | | | 5.36 | % | |
Decrease reflected in above operating expense
ratios due to waivers/reimbursements | | | 0.31 | % | | | 0.29 | % | | | 0.26 | % | | | 0.31 | % | | | 0.10 | % | |
Portfolio turnover rate3 | | | 73 | % | | | 56 | % | | | 46 | % | | | 34 | % | | | 37 | % | |
1 Per share information is calculated using the average shares outstanding method.
2 Total returns are historical and include change in share price and reinvestment of all distributions. Had certain expenses not been reduced during the years shown, total returns would have been lower.
3 Portfolio turnover is calculated by dividing the lesser of total purchases or sales of portfolio securities for the reporting period by the monthly average of portfolio securities owned during the reporting period. Excluded from both the numerator and denominator are amounts relating to derivatives and securities whose maturities or expiration dates at the time of acquisition were one year or less.
See Accompanying Notes to Financial Statements.
39
Credit Suisse Strategic Income Fund
Financial Highlights
(For a Class A Share of the Fund Outstanding Throughout Each Year)
| | | For the Year Ended October 31, | |
| | | 2023 | | 2022 | | 2021 | | 2020 | | 2019 | |
Per share data | |
Net asset value, beginning of year | | $ | 8.91 | | | $ | 10.13 | | | $ | 9.57 | | | $ | 9.88 | | | $ | 9.96 | | |
INVESTMENT OPERATIONS | |
Net investment income1 | | | 0.72 | | | | 0.44 | | | | 0.38 | | | | 0.49 | | | | 0.51 | | |
Net gain (loss) from investments, foreign currency
transactions and forward foreign currency
contracts (both realized and unrealized) | | | 0.18 | | | | (1.21 | ) | | | 0.56 | | | | (0.31 | ) | | | (0.08 | ) | |
Total from investment operations | | | 0.90 | | | | (0.77 | ) | | | 0.94 | | | | 0.18 | | | | 0.43 | | |
LESS DIVIDENDS AND DISTRIBUTIONS | |
Dividends from net investment income | | | (0.73 | ) | | | (0.45 | ) | | | (0.38 | ) | | | (0.49 | ) | | | (0.50 | ) | |
Return of capital | | | — | | | | — | | | | — | | | | — | | | | (0.01 | ) | |
Total dividends and distributions | | | (0.73 | ) | | | (0.45 | ) | | | (0.38 | ) | | | (0.49 | ) | | | (0.51 | ) | |
Net asset value, end of year | | $ | 9.08 | | | $ | 8.91 | | | $ | 10.13 | | | $ | 9.57 | | | $ | 9.88 | | |
Total return2 | | | 10.30 | % | | | (7.73 | )% | | | 9.95 | % | | | 1.96 | % | | | 4.42 | % | |
RATIOS AND SUPPLEMENTAL DATA | |
Net assets, end of year (000s omitted) | | $ | 25,795 | | | $ | 21,933 | | | $ | 31,102 | | | $ | 34,254 | | | $ | 50,343 | | |
Ratio of net expenses to average net assets | | | 1.04 | % | | | 1.04 | % | | | 1.04 | % | | | 1.05 | % | | | 1.24 | % | |
Ratio of net expenses to average net assets
excluding interest expense | | | 1.04 | % | | | 1.04 | % | | | 1.04 | % | | | 1.05 | % | | | 1.24 | % | |
Ratio of net investment income to average
net assets | | | 7.90 | % | | | 4.62 | % | | | 3.78 | % | | | 5.10 | % | | | 5.13 | % | |
Decrease reflected in above operating expense
ratios due to waivers/reimbursements | | | 0.31 | % | | | 0.29 | % | | | 0.26 | % | | | 0.31 | % | | | 0.10 | % | |
Portfolio turnover rate3 | | | 73 | % | | | 56 | % | | | 46 | % | | | 34 | % | | | 37 | % | |
1 Per share information is calculated using the average shares outstanding method.
2 Total returns are historical and include change in share price, reinvestment of all distributions and no sales charge. Had certain expenses not been reduced during the years shown, total returns would have been lower.
3 Portfolio turnover is calculated by dividing the lesser of total purchases or sales of portfolio securities for the reporting period by the monthly average of portfolio securities owned during the reporting period. Excluded from both the numerator and denominator are amounts relating to derivatives and securities whose maturities or expiration dates at the time of acquisition were one year or less.
See Accompanying Notes to Financial Statements.
40
Credit Suisse Strategic Income Fund
Financial Highlights
(For a Class C Share of the Fund Outstanding Throughout Each Year)
| | | For the Year Ended October 31, | |
| | | 2023 | | 2022 | | 2021 | | 2020 | | 2019 | |
Per share data | |
Net asset value, beginning of year | | $ | 8.92 | | | $ | 10.13 | | | $ | 9.57 | | | $ | 9.88 | | | $ | 9.961 | | |
INVESTMENT OPERATIONS | |
Net investment income2 | | | 0.66 | | | | 0.37 | | | | 0.31 | | | | 0.41 | | | | 0.43 | | |
Net gain (loss) from investments, foreign currency
transactions and forward foreign currency
contracts (both realized and unrealized) | | | 0.16 | | | | (1.20 | ) | | | 0.56 | | | | (0.31 | ) | | | (0.08 | ) | |
Total from investment operations | | | 0.82 | | | | (0.83 | ) | | | 0.87 | | | | 0.10 | | | | 0.35 | | |
LESS DIVIDENDS AND DISTRIBUTIONS | |
Dividends from net investment income | | | (0.66 | ) | | | (0.38 | ) | | | (0.31 | ) | | | (0.41 | ) | | | (0.42 | ) | |
Return of capital | | | — | | | | — | | | | — | | | | — | | | | (0.01 | ) | |
Total dividends and distributions | | | (0.66 | ) | | | (0.38 | ) | | | (0.31 | ) | | | (0.41 | ) | | | (0.43 | ) | |
Net asset value, end of year | | $ | 9.08 | | | $ | 8.92 | | | $ | 10.13 | | | $ | 9.57 | | | $ | 9.88 | | |
Total return3 | | | 9.36 | % | | | (8.32 | )% | | | 9.13 | % | | | 1.19 | % | | | 3.64 | % | |
RATIOS AND SUPPLEMENTAL DATA | |
Net assets, end of year (000s omitted) | | $ | 30,826 | | | $ | 29,454 | | | $ | 39,867 | | | $ | 42,566 | | | $ | 53,410 | | |
Ratio of net expenses to average net assets | | | 1.79 | % | | | 1.79 | % | | | 1.79 | % | | | 1.80 | % | | | 1.99 | % | |
Ratio of net expenses to average net assets
excluding interest expense | | | 1.79 | % | | | 1.79 | % | | | 1.79 | % | | | 1.80 | % | | | 1.99 | % | |
Ratio of net investment income to average
net assets | | | 7.19 | % | | | 3.89 | % | | | 3.03 | % | | | 4.35 | % | | | 4.38 | % | |
Decrease reflected in above operating expense
ratios due to waivers/reimbursements | | | 0.31 | % | | | 0.29 | % | | | 0.26 | % | | | 0.31 | % | | | 0.10 | % | |
Portfolio turnover rate4 | | | 73 | % | | | 56 | % | | | 46 | % | | | 34 | % | | | 37 | % | |
1 Includes adjustments in accordance with accounting principles generally accepted in the United States of America and as such, the net asset values for financial reporting purposes and the returns based upon net asset values may differ from the net asset values and returns for shareholder transactions.
2 Per share information is calculated using the average shares outstanding method.
3 Total returns are historical and include change in share price, reinvestment of all distributions and no sales charge. Had certain expenses not been reduced during the years shown, total returns would have been lower.
4 Portfolio turnover is calculated by dividing the lesser of total purchases or sales of portfolio securities for the reporting period by the monthly average of portfolio securities owned during the reporting period. Excluded from both the numerator and denominator are amounts relating to derivatives and securities whose maturities or expiration dates at the time of acquisition were one year or less.
See Accompanying Notes to Financial Statements.
41
Credit Suisse Strategic Income Fund
Notes to Financial Statements
October 31, 2023
Credit Suisse Strategic Income Fund (the "Fund"), a series of Credit Suisse Opportunity Funds (the "Trust"), a Delaware statutory trust, is registered under the Investment Company Act of 1940, as amended (the "1940 Act"), as a non-diversified open-end management investment company that seeks total return. The Trust was organized under the laws of the State of Delaware as a business trust on May 31, 1995.
The Fund offers three classes of shares: Class I shares, Class A shares and Class C shares. Each class of shares represents an equal pro rata interest in the Fund, except the share classes bear different expenses. Class A shares are sold subject to a front-end sales charge of up to 4.75%. Class C shares are sold subject to a contingent deferred sales charge ("CDSC") of 1.00% if the shares are redeemed within the first year of purchase. Class I shares are sold without a sales charge. Effective June 30, 2021, Class C shares, upon the eight year anniversary of purchase, will convert to Class A shares.
Note 2. Significant Accounting Policies
The following is a summary of significant accounting policies followed by the Fund in the preparation of its financial statements. The policies are in accordance with generally accepted accounting principles in the United States of America ("GAAP"). The preparation of financial statements requires management to make estimates and assumptions that affect the reported amounts and disclosures in the financial statements. Actual results could differ from those estimates. The Fund is considered an investment company for financial reporting purposes under GAAP and follows the accounting and reporting guidance in Financial Accounting Standards Board ("FASB") Accounting Standards Codification ("ASC") Topic 946 — Financial Services — Investment Companies.
A) SECURITY VALUATION — The Board of Trustees (the "Board") is responsible for the Fund's valuation process. The Board has delegated the supervision of the daily valuation process to Credit Suisse Asset Management, LLC, the Fund's investment adviser ("Credit Suisse" or the "Adviser"), who has established a Pricing Committee and a Pricing Group, which, pursuant to the policies adopted by the Board, are responsible for making fair valuation determinations and overseeing the Fund's pricing policies. The net asset value of the Fund is determined daily as of the close of regular trading on the New York Stock Exchange, Inc. (the "Exchange") on each day the Exchange is open for business. The valuations for fixed income securities (which may include, but are not limited to, corporate, government, municipal, mortgage-backed,
42
Credit Suisse Strategic Income Fund
Notes to Financial Statements (continued)
October 31, 2023
Note 2. Significant Accounting Policies (continued)
collateralized mortgage obligations and asset-backed securities) and certain derivative instruments are typically the prices supplied by independent third party pricing services, which may use market prices or broker/dealer quotations or a variety of valuation techniques and methodologies. The independent third party pricing services use inputs that are observable such as issuer details, interest rates, yield curves, prepayment speeds, credit risks/spreads, default rates and quoted prices for similar securities. These pricing services generally price fixed income securities assuming orderly transactions of an institutional "round lot" size, but some trades occur in smaller "odd lot" sizes which may be effected at lower prices than institutional round lot trades. Structured note agreements are valued in accordance with a dealer-supplied valuation based on changes in the value of the underlying index. Futures contracts are valued daily at the settlement price established by the board of trade or exchange on which they are traded. Forward contracts are valued at the London closing spot rates and the London closing forward point rates on a daily basis. The currency forward contract pricing model derives the differential in point rates to the expiration date of the forward and calculates its present value. Equity securities for which market quotations are available are valued at the last reported sales price or official closing price on the primary market or exchange on which they trade. Investments in open-ended mutual funds are valued at the net asset value as reported on each business day and under normal circumstances. Securities for which market quotations are not readily available are valued at their fair value as determined in good faith by the Adviser, as the Board's valuation designee (as defined in Rule 2a-5 under the 1940 Act), in accordance with the Adviser's procedures. The Board oversees the Adviser in its role as valuation designee in accordance with the requirements of Rule 2a-5 under the 1940 Act. The Fund may utilize a service provided by an independent third party to fair value certain securities. When fair value pricing is employed, the prices of securities used by the Fund to calculate its net asset value may differ from quoted or published prices for the same securities. If independent third party pricing services are unable to supply prices for a portfolio investment, or if the prices supplied are deemed by the Adviser to be unreliable, the market price may be determined by the Adviser using quotations from one or more brokers/dealers or at the transaction price if the security has recently been purchased and no value has yet been obtained from a pricing service or pricing broker. When reliable prices are not readily available, such as when the value of a security has been significantly affected by events after the close of the exchange or market on which the security is principally traded, but before the Fund calculates its net
43
Credit Suisse Strategic Income Fund
Notes to Financial Statements (continued)
October 31, 2023
Note 2. Significant Accounting Policies (continued)
asset value, these securities will be fair valued in good faith by the Pricing Group, in accordance with procedures established by the Adviser.
The Fund uses valuation techniques to measure fair value that are consistent with the market approach and/or income approach, depending on the type of security and the particular circumstance. The market approach uses prices and other relevant information generated by market transactions involving identical or comparable securities. The income approach uses valuation techniques to discount estimated future cash flows to present value.
GAAP established a disclosure hierarchy that categorizes the inputs to valuation techniques used to value assets and liabilities at each measurement date. These inputs are summarized in the three broad levels listed below:
• Level 1 – quoted prices in active markets for identical investments
• Level 2 – other significant observable inputs (including quoted prices for similar investments, interest rates, prepayment speeds, credit risk, etc.)
• Level 3 – significant unobservable inputs (including the Fund's own assumptions in determining the fair value of investments)
The inputs or methodologies used to value securities are not necessarily an indication of the risk associated with investing in those securities.
The following is a summary of the inputs used as of October 31, 2023 in valuing the Fund's assets and liabilities carried at fair value:
Assets | | Level 1 | | Level 2 | | Level 3 | | Total | |
Investments in Securities | |
Corporate Bonds | | $ | — | | | $ | 182,747,643 | | | $ | 71,931 | | | $ | 182,819,574 | | |
Bank Loans | | | — | | | | 128,402,733 | | | | 12,193,802 | | | | 140,596,535 | | |
Asset Backed Securities | | | — | | | | 18,003,855 | | | | — | | | | 18,003,855 | | |
Common Stocks | | | 1,652,214 | | | | 695,370 | | | | 255,199 | | | | 2,602,783 | | |
Warrants | | | 3,592 | | | | 25,653 | | | | 8,996 | | | | 38,241 | | |
Short-term Investments | | | 45,008,604 | | | | — | | | | — | | | | 45,008,604 | | |
| | | $ | 46,664,410 | | | $ | 329,875,254 | | | $ | 12,529,928 | | | $ | 389,069,592 | | |
Other Financial Instruments* | |
Forward Foreign Currency Contracts | | $ | — | | | $ | 13,423 | | | $ | — | | | $ | 13,423 | | |
Liabilities | | | | | | | | | |
Other Financial Instruments* | |
Forward Foreign Currency Contracts | | $ | — | | | $ | 13,578 | | | $ | — | | | $ | 13,578 | | |
* Other financial instruments include unrealized appreciation (depreciation) on forward foreign currency contracts.
44
Credit Suisse Strategic Income Fund
Notes to Financial Statements (continued)
October 31, 2023
Note 2. Significant Accounting Policies (continued)
The following is a reconciliation of investments as of October 31, 2023 for which significant unobservable inputs were used in determining fair value.
| | | Corporate
Bonds | | Bank
Loans | | Common
Stocks | | Warrants | | Total | |
Balance as of October 31, 2022 | | $ | 83,406 | | | $ | 22,979,439 | | | $ | 545,688 | | | $ | 0 | (1) | | $ | 23,608,533 | | |
Accrued discounts (premiums) | | | (3,949 | ) | | | 28,494 | | | | — | | | | — | | | | 24,545 | | |
Purchases | | | — | | | | 8,509,959 | | | | 159,189 | | | | — | | | | 8,669,148 | | |
Sales | | | (17,653 | ) | | | (13,187,369 | ) | | | (2,648 | ) | | | — | | | | (13,207,670 | ) | |
Realized gain (loss) | | | (30,669 | ) | | | (824,191 | ) | | | 2,648 | | | | — | | | | (852,212 | ) | |
Change in unrealized
appreciation (depreciation) | | | 40,796 | | | | 1,434,631 | | | | (59,706 | ) | | | 8,996 | | | | 1,424,717 | | |
Transfers into Level 3 | | | — | | | | 3,051,871 | | | | — | | | | — | | | | 3,051,871 | | |
Transfers out of Level 3 | | | — | | | | (9,799,032 | ) | | | (389,972 | ) | | | — | | | | (10,189,004 | ) | |
Balance as of October 31, 2023 | | $ | 71,931 | | | $ | 12,193,802 | | | $ | 255,199 | | | $ | 8,996 | | | $ | 12,529,928 | | |
Net change in unrealized
appreciation (depreciation)
from investments still held
as of October 31, 2023 | | $ | (10,770 | ) | | $ | 54,818 | | | $ | (24,731 | ) | | $ | 8,996 | | | $ | 28,313 | | |
(1) Includes zero valued securities.
| | | Quantitative Disclosure About Significant Unobservable Inputs | |
Asset Class | | Fair Value
At October 31,
2023 | | Valuation
Technique | | Unobservable
Input | | Price Range
(Weighted Average)* | |
Corporate Bonds | | $ | 66,306 | | | Income Approach | | Expected Remaining
Distribution | | $0.55 – $0.65 ($0.60)
| |
| | | 5,625 | | | Vendor Pricing | | Single Broker Quote | | 0.01 (N/A) | |
| Bank Loans | | | 556,660 | | | Income Approach | | Expected Remaining
Distribution | | 0.00 – 1.06 (0.57)
| |
| | | 11,637,142 | | | Vendor Pricing | | Single Broker Quote | | 0.87 – 1.01 (0.96) | |
| Common Stocks | | | 892 | | | Income Approach | | Expected Remaining
Distribution | | 0.01 – 0.02 (0.02)
| |
| | | 254,307 | | | Vendor Pricing | | Single Broker Quote | | 10.83 (N/A) | |
| Warrants | | | 0 | | | Income Approach | | Expected Remaining
Distribution | | 0.00 (N/A)
| |
| | | 8,996 | | | Vendor Pricing | | Single Broker Quote | | 0.00 – 3.16 (3.16) | |
* Weighted by relative fair value
Each fair value determination is based on a consideration of relevant factors, including both observable and unobservable inputs. Observable and unobservable inputs that Credit Suisse considers may include (i) the existence of any contractual restrictions on the disposition of securities; (ii) information obtained from the company, which may include an analysis of the company's financial statements, the company's products or intended markets or the company's technologies; (iii) the price of the same or similar security negotiated at arm's length in an issuer's completed subsequent round of financing; (iv) the price and extent of public trading in similar securities of the issuer or of comparable companies; or (v) a probability and time value adjusted analysis
45
Credit Suisse Strategic Income Fund
Notes to Financial Statements (continued)
October 31, 2023
Note 2. Significant Accounting Policies (continued)
of contractual term. Where available and appropriate, multiple valuation methodologies are applied to confirm fair value. To the extent that valuation is based on models or inputs that are less observable or unobservable in the market, determining fair value requires more judgment. Because of the inherent uncertainty of valuation, those estimated values may be materially higher or lower than the values that would have been used had a ready market for the investments existed. Accordingly, the degree of judgment exercised by the Fund in determining fair value is greatest for investments categorized in Level 3. In some circumstances, the inputs used to measure fair value might be categorized within different levels of the fair value hierarchy. In those instances, the fair value measurement is categorized in its entirety in the fair value hierarchy based on the least observable input that is significant to the fair value measurement. Additionally, changes in the market environment and other events that may occur over the life of the investments may cause the gains or losses ultimately realized on these investments to be different from the valuations used at the date of these financial statements.
For the year ended October 31, 2023, $3,051,871 was transferred from Level 2 to Level 3 due to a lack of a pricing source supported by observable inputs and $10,189,004 was transferred from Level 3 to Level 2 as a result of the availability of a pricing source supported by observable inputs. All transfers, if any, are assumed to occur at the end of the reporting period.
B) DERIVATIVE INSTRUMENTS AND HEDGING ACTIVITIES — The Fund adopted amendments to authoritative guidance on disclosures about derivative instruments and hedging activities which require that a fund disclose (a) how and why an entity uses derivative instruments, (b) how derivative instruments and hedging activities are accounted for and (c) how derivative instruments and related hedging activities affect a fund's financial position, financial performance and cash flows. For the year ended October 31, 2023, the Fund's derivatives did not qualify for hedge accounting as they are held at fair value.
The following table presents the fair value and the location of derivatives within the Statement of Assets and Liabilities at October 31, 2023 and the effect of these derivatives on the Statement of Operations for the year ended October 31, 2023.
Primary Underlying Risk | | Derivative
Assets | | Derivative
Liabilities | | Realized Gain
(Loss) | | Net Change in Unrealized
Appreciation (Depreciation) | |
Foreign currency exchange rate | |
Forward contracts | | $ | 13,423 | | | $ | 13,578 | | | $ | (13,487 | ) | | $ | 21,924 | | |
46
Credit Suisse Strategic Income Fund
Notes to Financial Statements (continued)
October 31, 2023
Note 2. Significant Accounting Policies (continued)
For the year ended October 31, 2023, the Fund held an average monthly value on a net basis of $9,160,009 in forward foreign currency contracts.
The Fund is a party to International Swap and Derivatives Association, Inc. ("ISDA") Master Agreements ("Master Agreements") with certain counterparties that govern over-the-counter derivative (including total return, credit default and interest rate swaps) and foreign exchange contracts entered into by the Fund. The Master Agreements may contain provisions regarding, among other things, the parties' general obligations, representations, agreements, collateral requirements, events of default and early termination. Termination events applicable to the Fund may occur upon a decline in the Fund's net assets below a specified threshold over a certain period of time.
The following table presents by counterparty the Fund's derivative assets, net of related collateral held by the Fund, at October 31, 2023:
Counterparty | | Gross Amount of
Derivative Assets
Presented in the
Statement of Assets
and Liabilities(a) | | Financial
Instruments
and Derivatives
Available for Offset | | Non-Cash
Collateral
Received | | Cash
Collateral
Received | | Net Amount
of Derivative
Assets | |
Deutsche
Bank AG | | $ | 13,423 | | | $ | (2,474 | ) | | $ | — | | | $ | — | | | $ | 10,949 | | |
The following table presents by counterparty the Fund's derivative liabilities, net of related collateral pledged by the Fund, at October 31, 2023:
Counterparty | | Gross Amount of
Derivative Liabilities
Presented in the
Statement of Assets
and Liabilities(a) | | Financial
Instruments
and Derivatives
Available for Offset | | Non-Cash
Collateral
Pledged | | Cash
Collateral
Pledged | | Net Amount
of Derivative
Liabilities | |
Deutsche
Bank AG | | $ | 2,474 | | | $ | (2,474 | ) | | $ | — | | | $ | — | | | $ | — | | |
Morgan Stanley | | | 11,104 | | | | — | | | | — | | | | — | | | | 11,104 | | |
| | | $ | 13,578 | | | $ | (2,474 | ) | | $ | — | | | $ | — | | | $ | 11,104 | | |
(a) Forward foreign currency contracts are included.
C) FOREIGN CURRENCY TRANSACTIONS — The books and records of the Fund are maintained in U.S. dollars. Transactions denominated in foreign currencies are recorded at the current prevailing exchange rates. All assets and liabilities denominated in foreign currencies, including purchases and sales of investments, and income and expenses, are translated into U.S. dollar amounts on the date of those transactions.
47
Credit Suisse Strategic Income Fund
Notes to Financial Statements (continued)
October 31, 2023
Note 2. Significant Accounting Policies (continued)
Reported net realized gain (loss) from foreign currency transactions arises from sales of foreign currencies; currency gains or losses realized between the trade and settlement dates on securities transactions; and the difference between the amounts of dividends, interest, and foreign withholding taxes recorded on the Fund's books and the U.S. dollar equivalent of the amounts actually received or paid. Net change in unrealized gains and losses on translation of assets and liabilities denominated in foreign currencies arises from changes in the fair values of assets and liabilities, other than investments, at the end of the period, resulting from changes in exchange rates.
The Fund does not isolate that portion of the results of operations resulting from fluctuations in foreign exchange rates on investments from the fluctuations arising from changes in market prices of investments held. Such fluctuations are included with net realized and unrealized gain or loss from investments in the Statement of Operations.
D) SECURITY TRANSACTIONS AND INVESTMENT INCOME/EXPENSE — Security transactions are accounted for on a trade date basis. Interest income/expense is recorded on the accrual basis. The Fund amortizes premiums and accretes discounts using the effective interest method. Dividend income/expense is recorded on the ex-dividend date. Certain expenses are class-specific expenses, vary by class and are charged only to that class. Income, expenses (excluding class-specific expenses) and realized/unrealized gains/losses are allocated proportionately to each class of shares based upon the relative net asset value of the outstanding shares of that class. The cost of investments sold is determined by use of the specific identification method for both financial reporting and income tax purposes. To the extent any issuer defaults or a credit event occurs that impacts the issuer, the Fund may halt any additional interest income accruals and consider the realizability of interest accrued up to the date of default or credit event.
E) DIVIDENDS AND DISTRIBUTIONS TO SHAREHOLDERS — Dividends from net investment income, if any, are declared daily and paid monthly. Distributions of net realized capital gains, if any, are declared and paid at least annually. However, to the extent that a net realized capital gain can be reduced by a capital loss carryforward, such gain will not be distributed. Dividends and distributions to shareholders of the Fund are recorded on the ex-dividend date and are determined in accordance with federal income tax regulations, which may differ from GAAP.
F) FEDERAL AND OTHER TAXES — No provision is made for federal taxes as it is the Fund's intention to continue to qualify as a regulated investment company ("RIC") under the Internal Revenue Code of 1986, as amended (the
48
Credit Suisse Strategic Income Fund
Notes to Financial Statements (continued)
October 31, 2023
Note 2. Significant Accounting Policies (continued)
"Code"), and to make the requisite distributions to its shareholders, which will be sufficient to relieve it from federal income and excise taxes.
In order to qualify as a RIC under the Code, the Fund must meet certain requirements regarding the source of its income, the diversification of its assets and the distribution of its income. One of these requirements is that the Fund derive at least 90% of its gross income for each taxable year from dividends, interest, payments with respect to certain securities loans, gains from the sale or other disposition of stock, securities or foreign currencies, other income derived with respect to its business of investing in such stock, securities or currencies or net income derived from interests in certain publicly-traded partnerships ("Qualifying Income"). The Fund adopted the authoritative guidance for uncertainty in income taxes and recognizes a tax benefit or liability from an uncertain position only if it is more likely than not that the position is sustainable based solely on its technical merits and consideration of the relevant taxing authority's widely understood administrative practices and procedures. The Fund has reviewed its current tax positions and has determined that no provision for income tax is required in the Fund's financial statements. The Fund's federal and state income and federal excise tax returns for tax years for which the applicable statutes of limitations have not expired are subject to examination by the Internal Revenue Service and state departments of revenue.
G) CASH — The Fund's uninvested cash balance is held in an interest bearing variable rate demand deposit account at State Street Bank and Trust Company ("SSB"), the Fund's custodian.
H) FUTURES — The Fund may enter into futures contracts to the extent permitted by its investment policies and objectives. The Fund may use futures contracts to gain exposure to or hedge against changes in interest rates, equity and market price movements and/or currency risks. Upon entering into a futures contract, the Fund is required to deposit cash and/or pledge U.S. Government securities as initial margin with a Futures Commission Merchant ("FCM"). Subsequent payments, which are dependent on the daily fluctuations in the value of the underlying instrument, are made or received by the Fund each day (daily variation margin) and are recorded as unrealized gains or losses until the contracts are closed. When the contracts are closed, the Fund records a realized gain or loss equal to the difference between the proceeds from (or cost of) the closing transaction and the Fund's basis in the contract. Risks of entering into futures contracts for hedging purposes include the possibility that a change in the value of the contract may not correlate with the changes in the value of the underlying instruments. Futures have minimal counterparty credit risk because futures are exchange traded and the exchange's
49
Credit Suisse Strategic Income Fund
Notes to Financial Statements (continued)
October 31, 2023
Note 2. Significant Accounting Policies (continued)
clearinghouse, as counterparty to all exchange-traded futures, guarantees the futures against default. In addition, the purchase of a futures contract involves the risk that the Fund could lose more than the original margin deposit and subsequent payments may be required for a futures transaction. The Fund's open futures contracts are disclosed in the Schedule of Investments. At October 31, 2023, the Fund had no open futures contracts.
The Commodity Exchange Act requires an FCM to segregate all customer transactions and assets from the FCM's proprietary activities. A customer's cash and other equity deposited with an FCM are considered commingled with all other customer funds subject to the FCM's segregation requirements. In the event of an FCM's insolvency, recovery may be limited to the Fund's pro-rata share of segregated customer funds available. It is possible that the recovery amount could be less than the total of cash and other equity deposited.
I) FORWARD FOREIGN CURRENCY CONTRACTS — A forward foreign currency exchange contract ("forward currency contract") is a commitment to purchase or sell a foreign currency at the settlement date at a negotiated rate. The Fund will enter into forward currency contracts primarily for hedging foreign currency risk. Forward currency contracts are valued at the prevailing forward exchange rate of the underlying currencies and unrealized gain/loss is recorded daily. On the settlement date of the forward currency contract, the Fund records a realized gain or loss equal to the difference between the value of the contract at the time it was opened and the value of the contract at the time it was closed. Certain risks may arise upon entering into forward currency contracts from the potential inability of counterparties to meet the terms of their contracts. The maximum counterparty credit risk to the Fund is measured by the unrealized gain on appreciated contracts. Additionally, when utilizing forward currency contracts to hedge, the Fund forgoes the opportunity to profit from favorable exchange rate movements during the term of the contract. The Fund's open forward currency contracts at October 31, 2023 are disclosed in the Schedule of Investments.
J) UNFUNDED LOAN COMMITMENTS — The Fund enters into certain agreements, all or a portion of which may be unfunded. The Fund is obligated to fund these loan commitments at the borrowers' discretion. Funded and unfunded portions of credit agreements are presented on the Schedule of Investments. As of October 31, 2023, unfunded commitments were as follows:
Borrower | | Maturity | | Rate | | Unfunded
Commitment | |
ABG Intermediate Holdings 2 LLC | | 12/21/28 | | | 4.000 | % | | $ | 442,690 | | |
50
Credit Suisse Strategic Income Fund
Notes to Financial Statements (continued)
October 31, 2023
Note 2. Significant Accounting Policies (continued)
Unfunded loan commitments and funded portions of credit agreements are marked to market daily and any unrealized appreciation or depreciation is included in the Statement of Assets and Liabilities and the Statement of Operations.
K) SECURITIES LENDING — The initial collateral received by the Fund is required to have a value of at least 102% of the market value of domestic securities on loan (including any accrued interest thereon) and 105% of the market value of foreign securities on loan (including any accrued interest thereon). The collateral is maintained thereafter at a value equal to at least 102% of the current market value of the securities on loan. The market value of loaned securities is determined at the close of each business day of the Fund and any additional required collateral is delivered to the Fund, or excess collateral returned by the Fund, on the next business day. Cash collateral received by the Fund in connection with securities lending activity may be pooled together with cash collateral for other funds/portfolios advised by Credit Suisse and may be invested in a variety of investments, including funds advised by SSB, the Fund's securities lending agent, or money market instruments. However, in the event of default or bankruptcy by the other party to the agreement, realization and/or retention of the collateral may be subject to legal proceedings. The remaining maturities of the securities lending transactions are considered overnight and continuous. Loans are subject to termination by the Fund or the borrower at any time.
SSB has been engaged by the Fund to act as the Fund's securities lending agent. As of October 31, 2023, the Fund had outstanding loans of securities to certain approved brokers for which the Fund received collateral:
Market Value of
Loaned Securities | | Market Value of
Cash Collateral | | Total Collateral | |
| $ | 10,128,318 | | | $ | 10,361,287 | | | $ | 10,361,287 | | |
The following table presents financial instruments that are subject to enforceable netting arrangements as of October 31, 2023.
Gross Amounts Not Offset in the Statement of Assets and Liabilities | |
Gross Asset Amounts
Presented in the
Statement of Assets
and Liabilities(a) | | Collateral Received(b) | | Net Amount | |
| $ | 10,128,318 | | | $ | (10,128,318 | ) | | $ | — | | |
(a) Represents market value of loaned securities at year end.
(b) The actual collateral received is greater than the amount shown here due to collateral requirements of the security lending agreement.
51
Credit Suisse Strategic Income Fund
Notes to Financial Statements (continued)
October 31, 2023
Note 2. Significant Accounting Policies (continued)
The Fund's securities lending arrangement provides that the Fund and SSB will share the net income earned from securities lending activities. Securities lending income is accrued as earned. For the year ended October 31, 2023, total earnings received in connection with securities lending arrangements was $517,453, of which $373,189 was rebated to borrowers (brokers). The Fund retained $108,226 in income, and SSB, as lending agent, was paid $36,038.
L) OTHER — The high yield, fixed income securities in which the Fund invests will primarily consist of senior secured floating rate loans ("Senior Loans") issued by non-investment grade companies. Senior Loans are typically secured by specific collateral of the issuer and hold the most senior position in the issuer's capital structure. The interest rate on Senior Loans is periodically adjusted to a recognized base rate. While these characteristics may reduce interest rate risk and mitigate losses in the event of borrower default, the Senior Loans in which the Fund invests have below investment grade credit ratings and thereby are considered speculative because of the significant credit risk of their issuers.
The United Kingdom's Financial Conduct Authority (the "FCA"), which regulates LIBOR, has ceased publishing all LIBOR settings. In April 2023, however, the FCA announced that some USD LIBOR settings will continue to be published under a synthetic methodology until September 30, 2024 for certain legacy contracts. The Secured Overnight Financing Rate, or "SOFR," is a broad measure of the cost of borrowing cash overnight collateralized by U.S. Treasury securities in the purchase agreement ("repo") market and has been used increasingly on a voluntary basis in new instruments and transactions. On March 15, 2022, the Adjustable Interest Rate Act was signed into law, providing a statutory fallback mechanism to replace LIBOR with a benchmark rate that is selected by the Federal Reserve Board and based on SOFR for certain contracts that reference LIBOR without adequate fallback provisions. On December 16, 2022, the Federal Reserve Board adopted regulations implementing the Adjustable Interest Rate Act by identifying benchmark rates based on SOFR that will replace LIBOR in different categories of financial contracts after June 30, 2023. In April 2023, however, the FCA announced that some USD LIBOR settings will continue to be published under a synthetic methodology until September 30, 2024 for certain legacy contracts. These regulations apply only to contracts governed by U.S. law, among other limitations. Neither the effect of the LIBOR transition process nor its ultimate success can yet be known. Not all existing LIBOR-based instruments may have alternative rate-setting provisions and there remains uncertainty regarding the willingness and ability of issuers to add alternative rate-setting provisions in
52
Credit Suisse Strategic Income Fund
Notes to Financial Statements (continued)
October 31, 2023
Note 2. Significant Accounting Policies (continued)
certain existing instruments. Parties to contracts, securities or other instruments using LIBOR may disagree on transition rates or the application of applicable transition regulation, potentially resulting in uncertainty of performance and the possibility of litigation. The fund may have instruments linked to other interbank offered rates that may also cease to be published in the future.
Lower-rated debt securities (commonly known as "junk bonds") possess speculative characteristics and are subject to greater market fluctuations and risk of lost income and principal than higher-rated debt securities for a variety of reasons. Also, during an economic downturn or substantial period of rising interest rates, highly leveraged issuers may experience financial stress which would adversely affect their ability to service their principal and interest payment obligations, to meet projected business goals and to obtain additional financing.
In addition, periods of economic uncertainty and changes can be expected to result in increased volatility of market prices of lower-rated debt securities and the Fund's net asset value.
In the normal course of business, the Fund trades financial instruments and enters into financial transactions for which risk of potential loss exists due to changes in the market (market risk) or failure of the other party to a transaction to perform (credit risk). Similar to credit risk, the Fund may be exposed to counterparty risk, including with respect to securities lending, or the risk that an institution or other entity with which the Fund has unsettled or open transactions will default. The potential loss could exceed the value of the financial assets recorded in the financial statements. Financial assets, which potentially expose the Fund to credit risk, consist principally of cash due from counterparties and investments. The extent of the Fund's exposure to credit and counterparty risks in respect to these financial assets approximates their carrying value as recorded in the Fund's Statement of Assets and Liabilities.
Note 3. Transactions with Affiliates and Related Parties
Credit Suisse serves as investment adviser and co-administrator for the Fund. For its investment advisory and administration services, Credit Suisse is entitled to receive a fee from the Fund at an annualized rate of 0.84% of the Fund's average daily net assets. For the year ended October 31, 2023, investment advisory and administration fees earned and fees waived/expenses reimbursed by Credit Suisse were $2,695,487 and $981,594, respectively. Effective November 12, 2019, Credit Suisse contractually agreed to limit expenses so that the Fund's annual operating expenses do not exceed 0.79% of
53
Credit Suisse Strategic Income Fund
Notes to Financial Statements (continued)
October 31, 2023
Note 3. Transactions with Affiliates and Related Parties (continued)
the Fund's average daily net assets for Class I shares, 1.04% of the Fund's average daily net assets for Class A shares, and 1.79% of the Fund's average daily net assets for Class C shares. The Fund is authorized to reimburse Credit Suisse for management fees previously waived and/or for expenses previously paid by Credit Suisse, provided, however, that any reimbursement must be paid at a date not more than thirty-six months following the applicable month during which such fees were waived or expenses were paid by Credit Suisse and the reimbursement does not cause the applicable class's aggregate expenses, on an annualized basis, to exceed either (i) the applicable expense limitation in effect at the time such fees were waived or such expenses were paid by Credit Suisse or (ii) the applicable expense limitation in effect at the time of such reimbursement. This contract may not be terminated before February 28, 2025. For the year ended October 31, 2023, there was no recoupment.
The amounts waived and reimbursed by Credit Suisse, which are available for potential future recoupment by Credit Suisse, and the expiration schedule at October 31, 2023 are as follows:
| | | Fee waivers/expense
reimbursements
subject to
recoupment | | Expires
October 31,
2024 | | Expires
October 31,
2025 | | Expires
October 31,
2026 | |
Class I | | $ | 2,775,409 | | | $ | 810,885 | | | $ | 1,142,709 | | | $ | 821,815 | | |
Class A | | | 235,914 | | | | 89,377 | | | | 78,116 | | | | 68,421 | | |
Class C | | | 304,326 | | | | 110,388 | | | | 102,580 | | | | 91,358 | | |
Totals | | $ | 3,315,649 | | | $ | 1,010,650 | | | $ | 1,323,405 | | | $ | 981,594 | | |
Credit Suisse Asset Management Limited ("Credit Suisse U.K."), an affiliate of Credit Suisse, serves as sub-investment advisor to the Fund directly. Credit Suisse U.K.'s sub-investment advisor fees are paid by Credit Suisse.
Credit Suisse Securities (USA) LLC ("CSSU"), an affiliate of Credit Suisse, serves as the distributor of the Fund's shares. Pursuant to a distribution plan adopted by the Fund pursuant to Rule 12b-1 under the 1940 Act, CSSU receives fees for its distribution services. These fees are calculated at an annual rate of 0.25% of the average daily net assets of the Class A shares. For the Class C shares, the fee is calculated at an annual rate of 1.00% of the average daily net assets. For the year ended October 31, 2023, the Fund paid Rule 12b-1 distribution fees of $55,924 for Class A shares and $298,606 for Class C shares. Class I shares are not subject to Rule 12b-1 distribution fees.
For the year ended October 31, 2023, CSSU and its affiliates advised the Fund that they retained $9,569 from commissions earned on the sale of the Fund's
54
Credit Suisse Strategic Income Fund
Notes to Financial Statements (continued)
October 31, 2023
Note 3. Transactions with Affiliates and Related Parties (continued)
Class A shares. There were no commissions earned on the sale of Class C shares.
The Fund from time to time purchases or sells loan investments in the secondary market through Credit Suisse or its affiliates acting in the capacity as broker-dealer. Credit Suisse or its affiliates may have acted in some type of agent capacity to the initial loan offering prior to such loan trading in the secondary market.
Note 4. Line of Credit
The Fund, together with other funds/portfolios advised by Credit Suisse (collectively, the "Participating Funds"), participates in a committed, unsecured line of credit facility ("Credit Facility"), with SSB in an aggregated amount of $125 million for temporary or emergency purposes under a first-come, first-served basis. Under the terms of the Credit Facility, the Participating Funds pay an aggregate commitment fee on the average unused amount of the Credit Facility, which is allocated among the Participating Funds in such manner as is determined by the governing Boards of the Participating Funds. In addition, the Participating Funds pay interest on borrowings at either the Federal Funds Effective rate or the Overnight Bank Funding rate plus a spread. At October 31, 2023 and for the year ended October 31, 2023, the Fund had no borrowings outstanding under the Credit Facility. Additionally, the Fund and another Participating Fund are parties to a joint uncommitted line of credit facility with SSB in an aggregated amount of $200 million. For the year ended October 31, 2023, the line was not drawn upon and no fees were incurred.
Note 5. Purchases and Sales of Securities
For the year ended October 31, 2023, purchases and sales of investment securities (excluding short-term investments) and U.S. Government and Agency Obligations were as follows:
Investment Securities | | U.S. Government/
Agency Obligations | |
| Purchases | | Sales | | Purchases | | Sales | |
| $ | 223,744,769 | | | $ | 271,354,029 | | | $ | 0 | | | $ | 0 | | |
Note 6. Capital Share Transactions
The Fund is authorized to issue an unlimited number of full and fractional shares of beneficial interest, $0.001 par value per share. The Fund offers Class I,
55
Credit Suisse Strategic Income Fund
Notes to Financial Statements (continued)
October 31, 2023
Note 6. Capital Share Transactions (continued)
Class A and Class C shares. Transactions in capital shares for each class of the Fund were as follows:
| | | Class I | |
| | | For the Year Ended
October 31, 2023 | | For the Year Ended
October 31, 2022 | |
| | | Shares | | Value | | Shares | | Value | |
Shares sold | | | 22,998,520 | | | $ | 210,846,122 | | | | 26,570,333 | | | $ | 252,285,734 | | |
Shares issued in reinvestment
of distributions | | | 2,133,728 | | | | 19,560,498 | | | | 1,926,293 | | | | 18,213,793 | | |
Shares redeemed | | | (31,089,579 | ) | | | (282,854,090 | ) | | | (29,190,790 | ) | | | (278,016,801 | ) | |
Net decrease | | | (5,957,331 | ) | | $ | (52,447,470 | ) | | | (694,164 | ) | | $ | (7,517,274 | ) | |
| | | Class A | |
| | | For the Year Ended
October 31, 2023 | | For the Year Ended
October 31, 2022 | |
| | | Shares | | Value | | Shares | | Value | |
Shares sold | | | 3,808,781 | | | $ | 35,081,977 | | | | 712,909 | | | $ | 6,767,370 | | |
Shares issued in reinvestment
of distributions | | | 175,926 | | | | 1,613,666 | | | | 123,993 | | | | 1,172,677 | | |
Shares redeemed | | | (3,603,778 | ) | | | (33,123,535 | ) | | | (1,447,772 | ) | | | (13,808,263 | ) | |
Net increase (decrease) | | | 380,929 | | | $ | 3,572,108 | | | | (610,870 | ) | | $ | (5,868,216 | ) | |
| | | Class C | |
| | | For the Year Ended
October 31, 2023 | | For the Year Ended
October 31, 2022 | |
| | | Shares | | Value | | Shares | | Value | |
Shares sold | | | 785,243 | | | $ | 7,204,646 | | | | 128,901 | | | $ | 1,268,749 | | |
Shares issued in reinvestment
of distributions | | | 228,207 | | | | 2,093,844 | | | | 142,164 | | | | 1,341,724 | | |
Shares redeemed | | | (922,901 | ) | | | (8,442,036 | ) | | | (903,375 | ) | | | (8,646,995 | ) | |
Net increase (decrease) | | | 90,549 | | | $ | 856,454 | | | | (632,310 | ) | | $ | (6,036,522 | ) | |
On October 31, 2023, the number of shareholders that held 5% or more of the outstanding shares of each class of the Fund was as follows:
| | | Number of
Shareholders | | Approximate Percentage
of Outstanding Shares | |
Class I | | | 5 | | | | 79 | % | |
Class A | | | 4 | | | | 59 | % | |
Class C | | | 4 | | | | 83 | % | |
The Fund's performance may be negatively impacted in the event one or more of the Fund's greater than 5% shareholders were to redeem at a given time. Some of the shareholders may be omnibus accounts, which hold shares on behalf of individual shareholders.
56
Credit Suisse Strategic Income Fund
Notes to Financial Statements (continued)
October 31, 2023
Note 7. Income Tax Information and Distributions to Shareholders
Income and capital gain distributions are determined in accordance with federal income tax regulations, which may differ from GAAP.
The tax character of dividends paid by the Fund during the fiscal years ended October 31, 2023 and 2022, respectively, was as follows:
Ordinary Income | |
2023 | | 2022 | |
$ | 25,774,651 | | | $ | 21,686,874 | | |
The tax basis components of distributable earnings differ from book basis by temporary book/tax differences. These differences are primarily due to differing treatments of dividends payable, wash sales, forward contracts marked to market, deferred organizational expenses, defaulted bonds and premium amortization accruals.
At October 31, 2023, the components of distributable earnings on a tax basis were as follows:
Accumulated net realized loss | | $ | (38,270,572 | ) | |
Undistributed ordinary income | | | 125,904 | | |
Unrealized depreciation | | | (28,327,343 | ) | |
| | | $ | (66,472,011 | ) | |
At October 31, 2023, the Fund had $5,064,656 of unlimited short-term capital loss carryforwards and $33,205,916 of unlimited long-term capital loss carryforwards available to offset possible future capital gains.
At October 31, 2023, the cost and net unrealized appreciation (depreciation) of investments and derivatives for income tax purposes were as follows:
Cost of Investments | | $ | 417,396,328 | | |
Unrealized appreciation | | $ | 1,645,085 | | |
Unrealized depreciation | | | (29,971,821 | ) | |
Net unrealized appreciation (depreciation) | | $ | (28,326,736 | ) | |
To adjust for current period permanent book/tax differences which arose principally from differing book/tax treatment of foreign currency gain(loss), REIT/NRR non-taxable dividends adjustment to income, and adjustment to the prior period accumulated balance, premium amortization accruals, defaulted bonds income accruals, undistributed net investment income was credited $73,901 and accumulated net realized loss was debited $73,901. Net assets were not affected by this reclassification.
57
Credit Suisse Strategic Income Fund
Notes to Financial Statements (continued)
October 31, 2023
In the normal course of business, the Fund may provide general indemnifications pursuant to certain contracts and organizational documents. The Fund's maximum exposure under these arrangements is dependent on future claims that may be made against the Fund and, therefore, cannot be estimated; however, based on experience, the risk of loss from such claims is considered remote.
Note 9. UBS Merger
On June 12, 2023 (the "Closing Date"), Credit Suisse Group AG ("CS Group") merged with and into UBS Group AG, a global financial services company ("UBS Group"), with UBS Group remaining as the surviving company (the "Transaction"), pursuant to a definitive merger agreement signed on March 19, 2023. CS Group was the ultimate parent company of Credit Suisse, the Fund's investment manager. As a result of the Transaction, Credit Suisse is now an indirect wholly-owned subsidiary of UBS Group.
The closing of the Transaction was deemed to result in an assignment of the Fund's investment advisory agreement with Credit Suisse (the "Prior Advisory Agreement"), and the sub-advisory agreement between Credit Suisse and Credit Suisse U.K. with respect to the Fund (together with the Prior Advisory Agreement, the "Prior Agreements") resulting in each Prior Agreement's automatic termination as of the Closing Date. Prior to the Closing Date, the Board of the Fund approved a new investment advisory agreement with Credit Suisse (the "New Advisory Agreement") and a new sub-advisory agreement between Credit Suisse and Credit Suisse U.K., with respect to the Fund (together with the New Advisory Agreement, the "New Agreements"), each of which was then approved by shareholders at a joint special meeting of shareholders of the Fund and the other Credit Suisse funds held on August 24, 2023. In addition, prior to the Closing Date, the Board approved an interim investment advisory agreement with Credit Suisse (the "Interim Advisory Agreement") and an interim sub-advisory agreement between Credit Suisse and Credit Suisse U.K with respect to the Fund (together with the Interim Advisory Agreement, the "Interim Agreement"). The Interim Agreements did not require shareholder approval. The Interim Agreements took effect upon the Closing Date when the Prior Agreements were deemed to have terminated, so that Credit Suisse and Credit Suisse U.K. could continue to manage the Fund following the Closing Date. Each Interim Agreement terminated upon the shareholder approval of the corresponding New Agreement. The Interim Agreement contained the same terms and conditions as the corresponding Prior Agreement except for the effective and termination dates, the termination
58
Credit Suisse Strategic Income Fund
Notes to Financial Statements (continued)
October 31, 2023
Note 9. UBS Merger (continued)
and escrow provisions required by Rule 15a-4 under the 1940 Act and certain non-material changes. During the period that the Interim Agreement was in effect, Credit Suisse's advisory fees were held in an interest-bearing escrow account, pursuant to Rule 15a-4.
In addition, on June 7, 2023, Credit Suisse and certain of its affiliates filed an application (the "Application") for a waiver from disqualification under Section 9(a) of the 1940 Act from serving as investment adviser to registered investment companies, including the Fund, in connection with a consent order and final judgment (the "Consent Judgment") filed in New Jersey Superior Court on October 24, 2022. The Consent Judgment was entered against certain of Credit Suisse's affiliates, but did not involve the Fund or the services that Credit Suisse and its affiliates provided to the Fund. Because Credit Suisse is an affiliate of the entities subject to the Consent Judgment, it could also be subject to disqualification under Section 9(a), despite not being involved in the conduct underlying the Consent Judgment. As requested in the Application, the SEC granted a temporary waiver from Section 9(a) to Credit Suisse and its affiliates, as well as to UBS Group and its affiliates ("UBS"), on June 7, 2023. The temporary waiver became effective on the Closing Date. Credit Suisse and certain of its affiliates also applied for a permanent order, which the SEC granted on July 5, 2023. The permanent order grants (i) a time-limited exemption from Section 9(a) (the "Time-Limited Exemption"), which enables Credit Suisse to provide investment advisory services to the Fund until the 12-month anniversary of the Closing Date (by which point such services are anticipated to be transitioned to one or more UBS asset management affiliates), and (ii) a permanent exemption from Section 9(a) for UBS.
No changes to the investment objective, principal investment strategies and policies, principal risks, fundamental and non-fundamental investment policies, or portfolio managers ("Fund-specific changes") (other than potential personnel changes outside of Credit Suisse's control) of the Fund are currently contemplated as a result of the Transaction or the Time-Limited Exemption. Although no Fund-specific changes are currently contemplated as a result of the Transaction, shareholders should note that Credit Suisse is expected to transition the investment advisory services that its currently provides to the Fund to one or more registered investment advisers affiliated with UBS on or prior to June 12, 2024 (the "UBS Transition"). In connection with, or following the completion of, the UBS Transition, it is possible that there could be Fund-specific changes. In addition, subject to Board approval, one or more Fund service providers may change prior to the expiration of the Time-Limited Exemption in connection with the UBS Transition. However, the exact structure
59
Credit Suisse Strategic Income Fund
Notes to Financial Statements (continued)
October 31, 2023
Note 9. UBS Merger (continued)
and timing of the UBS Transition and Fund-specific changes (if any) related to the UBS Transition have not yet been finalized. It is expected that any Fund-specific changes related to the UBS Transition will be implemented without shareholder approval except to the extent such approvals are required under the federal securities laws. Shareholders of the Fund will be promptly notified of any material Fund-specific changes.
Note 10. Subsequent Events
On December 13, 2023, the U.S. Securities and Exchange Commission (the "SEC") entered an administrative cease and desist order (the "Order") against Credit Suisse Securities (USA) LLC ("CSSU") and two affiliated Credit Suisse entities (collectively, the Credit Suisse Entities) alleging in the Order that the Credit Suisse Entities were ineligible to provide underwriting and investment advisory services to registered investment companies, including the Fund, during the period from October 24, 2022 to June 7, 2023 in violation of Section 9(a) of the Investment Company Act of 1940 (the "1940 Act") as a result of a consent order and final judgment (the "Consent Judgment") entered against CSSU in New Jersey Superior Court on October 24, 2022 involving the sale of mortgage-backed securities approximately fifteen years ago. The Consent Judgment did not involve registered investment companies or the services that the Credit Suisse Entities provided to registered investments companies or the Fund. Without admitting or denying the findings in the SEC's Order, the Credit Suisse Entities agreed to pay$10,080,220 in disgorgement, prejudgment interest and civil penalties and agree to cease and desist from committing or causing any violations or any future violations of Section 9(a) of the 1940 Act.
On October 24, 2022, as noted above, the Superior Court of New Jersey entered a Consent Judgement that resolved a case alleging that CSSU violated the antifraud provisions of the State of New Jersey securities laws in connection with its role as underwriter of residential mortgage-backed securities. As a result of this Consent Judgement, the SEC, as noted above, alleged that the Credit Suisse Entities were deemed ineligible from serving as principal underwriter or investment adviser to registered investment companies and employees' securities companies pursuant to Section 9(a) of the 1940 Act and that the Credit Suisse Entities continued to serve in these roles until the Commission granted them respective time-limited exemptions on June 7, 2023.
60
Credit Suisse Strategic Income Fund
Report of Independent Registered Public Accounting Firm
To the Board of Trustees of Credit Suisse Opportunity Funds and
Shareholders of Credit Suisse Strategic Income Fund
Opinion on the Financial Statements
We have audited the accompanying statement of assets and liabilities, including the schedule of investments, of Credit Suisse Strategic Income Fund (one of the funds constituting Credit Suisse Opportunity Funds, referred to hereafter as the "Fund") as of October 31, 2023, the related statement of operations for the year ended October 31, 2023, the statement of changes in net assets for each of the two years in the period ended October 31, 2023, including the related notes, and the financial highlights for each of the four years in the period ended October 31, 2023 (collectively referred to as the "financial statements"). In our opinion, the financial statements present fairly, in all material respects, the financial position of the Fund as of October 31, 2023, the results of its operations for the year then ended, the changes in its net assets for each of the two years in the period ended October 31, 2023 and the financial highlights for each of the four years in the period ended October 31, 2023 in conformity with accounting principles generally accepted in the United States of America.
The financial statements of the Fund as of and for the year ended October 31, 2019 and the financial highlights for the year ended October 31, 2019 (not presented herein, other than the financial highlights) were audited by other auditors whose report dated December 20, 2019 expressed an unqualified opinion on those financial statements and financial highlights.
Basis for Opinion
These financial statements are the responsibility of the Fund's management. Our responsibility is to express an opinion on the Fund's financial statements based on our audits. We are a public accounting firm registered with the Public Company Accounting Oversight Board (United States) (PCAOB) and are required to be independent with respect to the Fund in accordance with the U.S. federal securities laws and the applicable rules and regulations of the Securities and Exchange Commission and the PCAOB.
We conducted our audits of these financial statements in accordance with the standards of the PCAOB. Those standards require that we plan and perform the audit to obtain reasonable assurance about whether the financial statements are free of material misstatement, whether due to error or fraud.
Our audits included performing procedures to assess the risks of material misstatement of the financial statements, whether due to error or fraud, and performing procedures that respond to those risks. Such procedures included
61
Credit Suisse Strategic Income Fund
Report of Independent Registered Public Accounting Firm
examining, on a test basis, evidence regarding the amounts and disclosures in the financial statements. Our audits also included evaluating the accounting principles used and significant estimates made by management, as well as evaluating the overall presentation of the financial statements. Our procedures included confirmation of securities owned as of October 31, 2023 by correspondence with the custodian, transfer agent, agent banks and brokers; when replies were not received from agent banks and brokers, we performed other auditing procedures. We believe that our audits provide a reasonable basis for our opinion.
/S/PricewaterhouseCoopers LLP
New York, New York
December 27, 2023
We have served as the auditor of one or more investment companies in Credit Suisse Asset Management, LLC investment companies since 2020.
62
Credit Suisse Strategic Income Fund
Shareholder Meeting Results (unaudited)
A special meeting of shareholders of Credit Suisse Strategy Income Fund (the "Fund") was held at Eleven Madison Avenue, New York, NY 10010 on August 24, 2023. The following matters were voted upon by the shareholders of the Fund and the results are presented below.
1. Approval of a new Investment Advisory Agreement:
| | | Shares | | % of Total Shares
Outstanding | | % of Total Shares
Voted | |
For | | | 16,044,005 | | | | 48.80 | % | | | 96.62 | % | |
Against | | | 76.145 | | | | 0.23 | % | | | 0.46 | % | |
Abstain | | | 485,114 | | | | 1.48 | % | | | 2.92 | % | |
2. Approval of a new Sub-Advisory Agreement:
| | Shares | | % of Total Shares
Outstanding | | % of Total Shares
Voted | |
For | | | 16,035,096 | | | | 48.77 | % | | | 96.57 | % | |
Against | | | 82,774 | | | | 0.25 | % | | | 0.5 | % | |
Abstain | | | 487,393 | | | | 1.48 | % | | | 2.94 | % | |
63
Credit Suisse Strategic Income Fund
Board Approval of Interim and New Investment Management Agreements and Interim and New Sub-Advisory Agreements (unaudited)
The Fund's Board of Trustees (the "Board" and the members thereof, the "Board Members"), including a majority of the Board Members who are not "interested persons" of the Fund (as defined in the Investment Company Act of 1940, as amended (the "1940 Act")) (the "Independent Board Members"), unanimously approved the Fund's interim investment management agreement (the "Interim Investment Management Agreement" and new investment management agreement with Credit Suisse Asset Management, LLC ("Credit Suisse") (the "New Investment Management Agreement") and an interim sub-advisory agreement (the "Interim Sub-Advisory Agreement" and together with the Interim Investment Management Agreement, the "Interim Management Agreements") and a new sub-advisory agreement between Credit Suisse and Credit Suisse Asset Management Limited ("Credit Suisse UK") with respect to the Fund (the "New Sub-Advisory Agreement" and together with the Interim Management Agreements, and New Investment Management Agreements, the "New Management Agreements") at a meeting of the Board held on May 16, 2023 (the "May 2023 Board Meeting") after concluding that the approval of the New Management Agreements was in the best interests of the Fund and its shareholders. The factors considered by the Board in considering and approving the New Management Agreements are set out below.
In anticipation of the closing of the merger of Credit Suisse Group AG ("CS Group") with and into UBS Group AG, a global financial services company ("UBS Group"), with UBS Group remaining as the surviving company (the "Merger"), and in response to a request from the Board, representatives of UBS Group and its affiliates (collectively, "UBS") attended the May 2023 Board Meeting and provided information regarding the UBS asset management business and the investment advisory and principal underwriting services currently provided to the UBS family of registered investment companies (the "UBS Presentation").
The Board's evaluation of the Interim Management Agreements and New Management Agreements reflected information provided at the May 2023 Board Meeting as well as, where relevant, information relating to the Fund, Credit Suisse and Credit Suisse UK, that was previously furnished to the Board in connection with a special meeting held on November 9, 2022, where the Board discussed the information and materials relating to the renewal of the Fund's prior investment management agreements with Credit Suisse and prior sub-advisory agreement between Credit Suisse and Credit Suisse UK (collectively, the "Prior Management Agreements"), and at an in-person meeting held on November 14-15, 2022 (the "November 2022 15(c) Meeting"), where the Board approved the renewal of the Prior Management Agreements
64
Credit Suisse Strategic Income Fund
Board Approval of Interim and New Investment Management Agreements and Interim and New Sub-Advisory Agreements (unaudited) (continued)
(collectively, the "November 2022 15(c) Materials"), and information provided to the Board at other Board meetings throughout the year. The Board considered Credit Suisse's representations at the May 2023 Board Meeting that (i) no material changes to the information provided in the November 2022 15(c) Materials had occurred since the November 2022 15(c) Meeting (ii) with respect to the Interim Management Agreements, the scope and quality of services under the Interim Management Agreements will be at least equivalent to the scope and quality of services provided under the Prior Management Agreements, and (iii) the personnel, resources and services provided to the Fund are not expected to change under the New Management Agreements and will be similar to those services provided under the Prior Management Agreements. The Board also considered that the Interim Management Agreements will be substantially similar to the Prior Management Agreements, including with respect to compensation, except for certain terms including the term, termination and escrow provisions required by Rule 15a-4 under the 1940 Act and certain non-material changes.
The Board, including all of the Independent Board Members, were assisted by experienced independent legal counsel throughout the Interim Management Agreements and New Management Agreements review process. The Independent Board Members discussed the proposed approvals in private session with such counsel at which no representatives of management, Credit Suisse or Credit Suisse UK were present. Each Board Member, including each of the Independent Board Members, relied upon the advice of independent legal counsel and his or her own business judgment in determining the material factors to be considered in evaluating the Interim Management Agreements and New Management Agreements and the weight to be given to each such factor. The conclusions reached by the Board Members were based on a comprehensive evaluation of all of the information provided and were not the result of any one factor. Moreover, each Board Member may have afforded different weight to the various factors in reaching his or her conclusions with respect to the Interim Management Agreements and New Management Agreements.
On June 7, 2023, Credit Suisse, Credit Suisse UK and certain of their affiliates filed an application with the Securities and Exchange Commission (the "Commission") pursuant to Section 9(c) of the 1940 Act for temporary and permanent orders granting an exemption to Credit Suisse, Credit Suisse UK and their affiliates, as well as to UBS, from the prohibitions under Section 9(a) of the 1940 Act, in connection with a consent order and final judgment ("Consent Judgment") filed in New Jersey Superior Court on October 24, 2022, which
65
Credit Suisse Strategic Income Fund
Board Approval of Interim and New Investment Management Agreements and Interim and New Sub-Advisory Agreements (unaudited) (continued)
was entered against certain of Credit Suisse's affiliates. Section 9(a) of the 1940 Act automatically prohibits entities that are, or whose affiliates are, subject to, among other things, certain court ordered "injunctions," from serving or acting as investment adviser of any investment company registered under the 1940 Act or a principal underwriter for any registered open-end investment company under the 1940 Act, or serving in various other capacities in respect of registered investment companies.
While the application for the Section 9(c) exemption was submitted and the temporary order (the "Temporary Order") granting a temporary exemption from Section 9(a) of the 1940 Act was granted to Credit Suisse, Credit Suisse UK and their affiliates, as well as to UBS, after the Board has the New Management Agreements at the May 2023 Board Meeting, since shortly after the entry of the Consent Judgment in October 2022, the Board has been apprised of the Consent Judgment and the potential consequences thereof under Section 9(a) of the 1940 Act and have been provided with regular updates. In addition, the Board was apprised of the filing of the Section 9(c) exemption application and the implications of the Time-Limited Exemption (as defined below) prior to approving the submission of the New Investment Management Agreements to shareholders at a meeting of the Board held on June 15, 2023.
The "Time-Limited Exemption" refers to the time-limited exemption from Section 9(a) of the 1940 Act for 12 months from the closing date of the Merger sought by Credit Suisse, Credit Suisse UK and certain of their affiliates to provide Credit Suisse, Credit Suisse UK and Credit Suisse Securities (USA) LLC ("CSSU") with adequate time to complete the CS Fund Servicing Reorganization (as defined below) while engaged in serving as investment adviser, sub-adviser and as underwriter to the Fund, respectively (collectively, "Fund Servicing Activities"). The "CS Fund Servicing Reorganization" refers to the process of (i) transitioning the Fund Servicing Activities that Credit Suisse, Credit Suisse UK and CSSU perform on behalf of one or more of the funds to other providers of such services, and/or (ii) restructuring the Temporary Order applicants' businesses such that Credit Suisse, Credit Suisse UK and/or each other company that was an "affiliated person" of the settling entities in the Consent Judgement as of the date of the Section 9(c) application may provide Fund Servicing Activities without being subject to disqualification under Section 9(a) of the 1940 Act. Credit Suisse and certain of its affiliates also applied for a permanent order, which the SEC granted on July 5, 2023.
66
Credit Suisse Strategic Income Fund
Board Approval of Interim and New Investment Management Agreements and Interim and New Sub-Advisory Agreements (unaudited) (continued)
Investment Management Fee Rates and Expenses
The Board reviewed and considered the contractual advisory fees of the fund under its Prior Management Agreements) and its Interim Management Agreements and New Management Agreements (which fees are identical), in light of the extent and quality of the management services provided by Credit Suisse, as investment adviser, and by Credit Suisse UK, as sub-adviser. The Board noted that the compensation paid to Credit Suisse UK does not increase the fees or expenses otherwise incurred by the Fund.
The Board also considered that Credit Suisse and the Fund have entered into a contractual expense limitation agreement limiting the Fund's total net expenses and that this arrangement was expected to continue under the Interim Management Agreements and New Management Agreements. The Board of the Fund noted that the Fund is authorized to reimburse Credit Suisse for management fees previously limited and/or for expenses previously reimbursed by Credit Suisse, provided, however, that any reimbursements must be paid at a date not more than thirty-six months following the applicable month during which such fees were limited or expenses were reimbursed by Credit Suisse and the reimbursements do not cause the Fund to exceed the applicable expense limitation at the time the fees are recouped. The Board also noted that the expense limitation agreement may not be terminated before February 28, 2024.
The November 2022 15(c) Materials included information comparing the Fund's contractual management fee, the Fund's contractual management fee less any waivers and/or reimbursements ("actual advisory fee"), and the Fund's overall expenses with those of funds in both the relevant expense group ("Expense Group") and universe of funds ("Expense Universe") provided by Broadridge, an independent provider of investment company data. The November 2022 15(c) Materials included a description of the methodology used to arrive at the funds included in the Expense Group and the Expense Universe. Each fund in the Expense Group and Expense Universe was placed in one of five quintiles for each relevant comparison period, with the first quintile including the funds with the lowest relative expenses and the fifth quintile including funds with the highest relative expenses during the period. The Fund's Board noted that, with respect to the Fund's fees and expenses compared to its peers as presented in a report provided by Broadridge: the Fund's contractual management fees ranked in the fifth quintile relative to its Expense Group, the Fund's actual management fees ranked in the fourth quintile relative to its Expense Group and the fifth quintile relative to its
67
Credit Suisse Strategic Income Fund
Board Approval of Interim and New Investment Management Agreements and Interim and New Sub-Advisory Agreements (unaudited) (continued)
Expense Universe, and the Fund's total expenses ranked in the fourth quintile of its Expense Group and Expense Universe.
Nature, Extent and Quality of the Services
The Board received and considered information regarding the nature, extent and quality of services provided to the Fund by Credit Suisse and by Credit Suisse UK. The Board also noted information received at regular meetings throughout the year related to the services rendered by Credit Suisse which, in addition to portfolio management and investment management services, included credit analysis and research, supervising the day-to-day operations of the Fund's non-advisory functions which include accounting, administration, custody, transfer agent and other applicable third party service providers, overseeing and facilitating audits, overseeing the Fund's credit facility and supervising and/or preparing applicable Fund filings, disclosures and shareholder reports. The Board noted that the extensive investment management services provided by Credit Suisse included broad supervisory responsibility and oversight over other service providers to the Fund. The Board also considered Credit Suisse's compliance program with respect to the Funds. The Board noted that Credit Suisse reports to the Board about portfolio management and compliance matters on a periodic basis. The Board also reviewed background information about Credit Suisse and Credit Suisse UK, including their respective Form ADV Part 2 — Disclosure Brochure and, with respect to Credit Suisse, Brochure Supplement and considered the background and experience of Credit Suisse's senior management and the expertise of, and the amount of attention given to the Fund by, senior personnel of Credit Suisse. In addition, the Board reviewed the qualifications, backgrounds and responsibilities of the portfolio management team primarily responsible for the day-to-day portfolio management of the Fund and the extent of the resources devoted to research and analysis of actual and potential investments, as well as the resources provided to them. The Board evaluated the ability of Credit Suisse and Credit Suisse UK, based on its resources, reputation and other attributes, to attract and retain qualified investment professionals including research, advisory, and supervisory personnel. The Board also received and considered information about the nature, extent and quality of services and fee rates offered to other Credit Suisse clients for comparable services. The Board acknowledged Credit Suisse's representation that the services provided to the Fund are more extensive than the services provided in connection with other types of accounts, such as separate accounts, offered by Credit Suisse and the services are also more extensive from those offered and provided to a sub-advised fund. The Board also considered that the
68
Credit Suisse Strategic Income Fund
Board Approval of Interim and New Investment Management Agreements and Interim and New Sub-Advisory Agreements (unaudited) (continued)
services provided by Credit Suisse have expanded over time as a result of regulatory and other developments.
In approving the Interim Sub-Advisory Agreement and New Sub-Advisory Agreement, the Board of the Fund considered the benefits of retaining Credit Suisse's affiliate as the Fund's sub-adviser and Credit Suisse UK's investment style.
Fund Performance
The Board considered information provided in the November 2022 15(c) Materials and at each subsequent quarterly meeting to consider the performance of the Fund. That information in the November 2022 15(c) Materials included performance results of the Fund over the previous year ended August 31, 2022 as well as over the two-, three-, four-, five-, and ten-year periods, ended August 31, 2022 along with comparisons both to the relevant performance group ("Performance Group") and universe of funds ("Performance Universe") for the Fund for the same time periods provided by Broadridge. The November 2022 15(c) Materials included a description of the methodology used to arrive at the funds included in the Performance Group and the Performance Universe. Each fund in the Performance Universe was placed in one of five quintiles for each relevant comparison period, with the first quintile including the best performing funds and the fifth quintile including the worst performing funds during the period. The Fund's Board noted that, with respect to the Fund's performance compared to its peers as presented in a report provided by Broadridge, along with other information provided by Credit Suisse. The Fund's performance ranked in the first quintile relative to its Performance Universe for the one-, two-, three-, four- and five-year periods reported.
The Board also considered the investment performance of the Fund relative to its stated objectives.
The Board noted that at the May 2023 Board Meeting, the Board received information from Credit Suisse regarding the Fund's performance relative to its benchmark and select peers for the three- and six-month and one-, three-, five-, and ten-year periods ended March 31, 2023.
Credit Suisse Profitability
The Board referred to a profitability analysis of Credit Suisse provided in the November 2022 15(c) Materials based on the fees payable under the Prior
69
Credit Suisse Strategic Income Fund
Board Approval of Interim and New Investment Management Agreements and Interim and New Sub-Advisory Agreements (unaudited) (continued)
Management Agreements and the Interim Management Agreements and the New Management Agreements for the Fund, including any fee waivers, as well as other relationships between the Fund on the one hand and Credit Suisse affiliates on the other. The Board's deliberations also reflected, in the context of Credit Suisse's profitability, Credit Suisse's methodology for allocating costs to the Fund, recognizing that cost allocation methodologies are inherently subjective. The Board had also received net profitability information for the Fund. The Board reviewed Credit Suisse's profit margin as reflected in the profitability analysis, as well as reviewing profitability in light of appropriate court cases and the services rendered to the Fund.
Economies of Scale
The Board considered information provided in the November 2022 15(c) Materials regarding whether there have been economies of scale with respect to the management of the Fund, whether the Fund has appropriately benefited from any economies of scale, and whether there is potential for realization of any further economies of scale for the Fund, the Board considered that, if the Fund's asset levels grow, further economies of scale potentially could be realized (although this is not guaranteed) and also noted the contractual expense limitations currently in place between the Fund and Credit Suisse. The Board received information regarding Credit Suisse's profitability in connection with providing investment management services to the Fund, including Credit Suisse's costs in providing the services.
Other Benefits to Credit Suisse
The Board considered other benefits received by Credit Suisse and its affiliates as a result of their relationship with the Fund previously included in the November 2022 15(c) Materials. Such benefits included, among others, benefits potentially derived from an increase in Credit Suisse's businesses and its reputation as a result of its relationship with the Fund (such as the ability to market its advisory services to other clients and investors including separate account or third party sub-advised mandates or other financial products offered by Credit Suisse and its affiliates), as well as, with respect to the Fund, the fees paid to an affiliate of Credit Suisse for distribution services.
The Board considered the standards Credit Suisse applied in seeking best execution and Credit Suisse's policies and practices regarding soft dollars and reviewed Credit Suisse's method for allocating portfolio investment opportunities among its advisory clients, as provided in the November 2022 15(c) Materials.
70
Credit Suisse Strategic Income Fund
Board Approval of Interim and New Investment Management Agreements and Interim and New Sub-Advisory Agreements (unaudited) (continued)
Other Factors and Broader Review
As discussed above, the Board previously reviewed and referred to detailed materials received from Credit Suisse as part of this special approval process. The Board also reviews and assesses the quality of the services that the Fund receives throughout the year and reviews reports of Credit Suisse at least quarterly, which include, among other things, detailed portfolio and market reviews, detailed Fund performance reports, and Credit Suisse's compliance procedures.
The Board also considered the information provided by the representatives of UBS during the UBS Presentation at the May 2023 Board Meeting. In particular, the Board considered the information regarding the investment advisory and principal underwriting services currently provided to the UBS family of registered investment companies.
In addition, the Board considered representations from Credit Suisse and UBS that there were no plans to make any changes to the investment objective(s), principal investment strategies and policies, principal risks, fundamental and non-fundamental investment policies or portfolio managers (other than potential personnel changes outside of Credit Suisse's control) of the Fund upon the closing of the Merger.
Conclusions
After consideration of the foregoing, the Board reached the following conclusions regarding the Interim and New Management Agreements and the Interim and New Sub-Advisory Agreements (in addition to the conclusions set forth above):
• The contractual and net advisory fees for the Fund were reasonable in relation to the services provided by Credit Suisse and Credit Suisse UK.
• The Board was satisfied by the nature, extent and quality of the investment advisory services provided to the Fund by Credit Suisse and Credit Suisse UK and that, based on dialogue with management and counsel, the services to be provided by Credit Suisse and Credit Suisse UK Interim Management Agreements, under the New Management Agreements, Interim Sub-Advisory and New Sub-Advisory Agreements, are typical of, and consistent with, those provided to similar mutual funds by other investment advisers.
71
Credit Suisse Strategic Income Fund
Board Approval of Interim and New Investment Management Agreements and Interim and New Sub-Advisory Agreements (unaudited) (continued)
• With respect to the Fund, in light of the costs of providing investment management and other services to the Fund and Credit Suisse's and Credit Suisse UK's ongoing commitment to the Fund and, with respect to Credit Suisse, willingness to waive fees, by agreeing to a contractual expense limitation and Credit Suisse's and Credit Suisse UK's, net profitability based on fees payable under the Interim Management Agreements, New Management Agreements, Interim Sub-Advisory and New Sub-Advisory Agreements, as well as other ancillary benefits that Credit Suisse and its affiliates received, were considered reasonable.
• In light of the information received and considered by the Board, the Fund's current fee structure was considered reasonable.
No single factor reviewed by the Board was identified by the Board as the principal factor in determining whether to approve the Interim Management Agreements and New Management Agreements. The Independent Board Members were advised by separate independent legal counsel throughout the process. After consideration of these factors, the Fund's Board concluded that the approval of the Interim Management Agreements and New Management Agreements was in the best interests of the Fund and the Fund's shareholders.
72
Credit Suisse Strategic Income Fund
Information Concerning Trustees and Officers (unaudited)
Name, Address
(Year of Birth) | | Position(s)
Held with
Portfolio | | Term
of Office1
and
Length
of Time
Served | | Principal
Occupation(s) During
Past Five Years | | Number of
Portfolios
in Portfolio
Complex
Overseen
by Trustee | | Other
Trusteeships
Held by Trustee
During Past Five Years | |
Independent Trustees | | | | | | | | | | | |
Laura A. DeFelice
c/o Credit Suisse Asset Management, LLC
Attn: General Counsel
Eleven Madison Avenue
New York, New York
10010
(1959) | | Chair of the Board (as of November 14, 2023). Trustee, Nominating and Audit Committee Member | | Since 2017 | | Managing Member of Acacia Properties LLC (multi-family and commercial real estate ownership and operation) from 2008 to present; Stonegate Advisors LLC (renewable energy and energy efficiency) from 2007 to present. | | | 9 | | | Director of the Lyric Opera of Chicago (performing arts) from December 2021 to present. | |
Samantha Kappagoda
c/o Credit Suisse Asset
Management, LLC
Attn: General Counsel
Eleven Madison Avenue
New York, New York
10010
(1968) | | Trustee, Nominating Committee Chair and Audit Committee Member | | Since 2023 | | Chief Economist, Risk Economics, Inc. (Economic Analysis) from 2009 to present; Co-Managing Member, Numerati Partners LLC (Research & Development Technology) from 2012 to present. | | | 9 | | | Director of Girl Scouts of Greater New York (non-profit) from 2014 to present; Visiting Scholar, Courant Institute of Mathematical Sciences, New York University (education) from 2011 to present; Director of Council for Economic Education (nonprofit) from 2014 to 2020; Director of Glynwood Center, Inc. (nonprofit) from 2010 to 2019. | |
1 Subject to the Trust's retirement policy, each Trustee may continue to serve as a Trustee until the last day of the calendar year in which the applicable Trustee attains age 75. The Board may determine to extend the terms of Trustees beyond age 75 on a case-by-case basis. Each officer serves until his or her respective successor has been duly elected and qualified.
73
Credit Suisse Strategic Income Fund
Information Concerning Trustees and Officers (unaudited) (continued)
Name, Address
(Year of Birth) | | Position(s)
Held with
Portfolio | | Term
of Office1
and
Length
of Time
Served | | Principal
Occupation(s) During
Past Five Years | | Number of
Portfolios
in Portfolio
Complex
Overseen
by Trustee | | Other
Trusteeships
Held by Trustee
During Past Five Years | |
Independent Trustees | | | | | | | | | | | |
Mahendra R. Gupta
c/o Credit Suisse Asset Management, LLC
Attn: General Counsel
Eleven Madison Avenue
New York, New York
10010
(1956) | | Trustee, Nominating Committee Member and Audit Committee Chairman | | Since 2017 | | Professor, Washington University in St. Louis from July 1990 to present; Partner, R.J. Mithaiwala (food manufacturing and retail, India) from March 1977 to present; Partner, F.F.B. Corporation (agriculture, India) from March 1977 to present; Partner, RPMG Research Corporation (benchmark research) from July 2001 to present. | | | 9 | | | Director of Caleres Inc. (footwear) from May 2012 to present; Chair of the finance committee at the Foundation of Barnes Jewish Hospital (healthcare) from January 2018 to present; Director of First Bank (finance) from February 2022 to present; Director of ENDI Corporation (finance) from April 2022 to present; Director of The Oasis Institute (not-for-profit) from February 2022 to present; Director of the Consortium for Graduate Study in Management from November 2017 to present; Director of Koch Development Corporation (Real Estate Developement) from November 2017 to December 2020; Director of Supernova (Fin-tech) from June 2014 to September 2018; Director of the Guardian Angels of St. Louis (not-forprofit) from July 2015 to December 2021. | |
1 Subject to the Trust's retirement policy, each Trustee may continue to serve as a Trustee until the last day of the calendar year in which the applicable Trustee attains age 75. The Board may determine to extend the terms of Trustees beyond age 75 on a case-by-case basis. Each officer serves until his or her respective successor has been duly elected and qualified.
74
Credit Suisse Strategic Income Fund
Information Concerning Trustees and Officers (unaudited) (continued)
Name, Address
(Year of Birth) | | Position(s)
Held with
Portfolio | | Term
of Office1
and
Length
of Time
Served | | Principal
Occupation(s) During
Past Five Years | | Number of
Portfolios
in Portfolio
Complex
Overseen
by Trustee | | Other
Trusteeships
Held by Trustee
During Past Five Years | |
Independent Trustees | | | | | | | | | | | |
Steven N. Rappaport
c/o Credit Suisse Asset Management, LLC
Attn: General Counsel
Eleven Madison Avenue
New York, New York
10010
(1948) | | Chairman of the Board (through November 14, 2023). Trustee, Nominating and Audit Committee Member | | Trustee since Portfolio Inception and Chairman since 2005 | | Partner of Lehigh Court, LLC and RZ Capital (private investment firms) from July 2002 to present; Partner of Backstage Acquisition Holdings, LLC (publication job postings) from November 2013 to 2018. | | | 9 | | | Director of abrdn Emerging Markets Equity Income Fund, Inc. (a closed-end investment company); Director of abrdn Funds (20 open-end portfolios); Director of iCAD, Inc. (surgical & medical instruments & apparatus company) from 2006 to 2018. | |
Interested Trustee | | | | | | | | | | | |
John G. Popp2
Credit Suisse Asset
Management, LLC
Eleven Madison Avenue
New York, New York
10010
(1956) | | Trustee, Chief Executive Officer and President | | Trustee since 2017
Chief Executive Officer and President since 2010 | | Managing Director of Credit Suisse; Global Head and Chief Investment Officer of the Credit Investments Group; Associated with Credit Suisse or its predecessor since 1997; President and Chief Executive Officer of other Credit Suisse Funds. | | | 9 | | | None. | |
1 Subject to the Trust's retirement policy, each Trustee may continue to serve as a Trustee until the last day of the calendar year in which the applicable Trustee attains age 75. The Board may determine to extend the terms of Trustees beyond age 75 on a case-by-case basis. Each officer serves until his or her respective successor has been duly elected and qualified.
2 Mr. Popp is an "interested person" of the Trust, as defined in the 1940 Act, by virtue of his current position as an officer of Credit Suisse.
75
Credit Suisse Strategic Income Fund
Information Concerning Trustees and Officers (unaudited) (continued)
Name, Address
(Year of Birth) | | Position(s)
Held with
Portfolio | | Term of
Office
and
Length of
Time
Served | | Principal Occupation(s) During Past Five Years | |
Officers* | | | | | | | |
Brandi Sinkovich
Credit Suisse Asset Management, LLC
Eleven Madison Avenue
New York, New York 10010
(1979) | | Chief Compliance Officer | | Since 2023 | | Director of Credit Suisse since 2023; Vice President and Regulatory Counsel, Exos Financial from 2022 to 2023; Vice President and Compliance Officer, Neuberger Berman from 2019 to 2022; Vice President, Compliance, Goldman Sachs from 2017 to 2019; Associated with Credit Suisse since 2023; Officer of other Credit Suisse Funds. | |
Lou Anne McInnis
Credit Suisse Asset Management, LLC
Eleven Madison Avenue
New York, New York 10010
(1959) | | Chief Legal Officer | | Since 2015 | | Director of Credit Suisse; Associated with Credit Suisse since April 2015; Counsel at DLA Piper US LLP from 2011 to April 2015; Associated with Morgan Stanley Investment Management from 1997 to 2010; Officer of other Credit Suisse Funds. | |
Omar Tariq
Credit Suisse Asset
Management, LLC
Eleven Madison Avenue
New York, New York 10010
(1983) | | Chief Financial Officer and Treasurer | | Since 2019 | | Director of Credit Suisse since 2019; Senior Manager of PricewaterhouseCoopers,LLP from September 2010 to March 2019; Officer of other Credit Suisse Funds. | |
Karen Regan
Credit Suisse Asset
Management, LLC
Eleven Madison Avenue
New York, New York 10010
(1963) | | Vice President and Secretary | | Since 2010 | | Vice President of Credit Suisse; Associated with Credit Suisse since December 2004; Officer of other Credit Suisse Funds. | |
* The officers of the Portfolio shown are officers that make policy decisions.
The Statement of Additional Information includes additional information about the Trustees and is available, without charge, upon request, by calling 877-870-2874.
76
Credit Suisse Strategic Income Fund
Proxy Voting and Portfolio Holdings Information (unaudited)
Information regarding how the Fund voted proxies related to its portfolio securities during the 12-month period ended June 30 of each year, as well as the policies and procedures that the Fund uses to determine how to vote proxies relating to its portfolio securities are available:
• By calling 1-877-870-2874
• On the Fund's website, www.credit-suisse.com/us/funds
• On the website of the Securities and Exchange Commission, www.sec.gov
The Fund files a complete schedule of its portfolio holdings for the first and third quarters of its fiscal year with the SEC as an exhibit to its reports on Form N-PORT, and for reporting periods ended prior to March 31, 2019, filed such information on Form N-Q. The Fund's Forms N-PORT and N-Q are available on the SEC's website at www.sec.gov.
77

P.O. BOX 219916, KANSAS CITY, MO 64121-9916
877-870-2874 ◼ www.credit-suisse.com/us/funds
CREDIT SUISSE SECURITIES (USA) LLC, DISTRIBUTOR. SIF-AR-1023
Item 2. Code of Ethics.
The registrant has adopted a code of ethics applicable to its Chief Executive Officer, President, Chief Financial Officer and Chief Accounting Officer, or persons performing similar functions. A copy of the code is filed as Exhibit 12(a)(1) to this Form. There were no amendments to the code during the fiscal year ended October 31, 2023. There were no waivers or implicit waivers from the code granted by the registrant during the fiscal year ended October 31, 2023.
Item 3. Audit Committee Financial Expert.
The registrant's governing board has determined that it has three audit committee financial experts serving on its audit committee: Laura DeFelice, Mahendra R. Gupta and Steven N. Rappaport. Each audit committee financial expert is "independent" for purposes of this item.
Item 4. Principal Accountant Fees and Services.
(a) through (d). The information in the table below is provided for services rendered to the registrant by its independent registered public accounting firm PricewaterhouseCoopers LLP (“PwC”), for its fiscal years ended October 31, 2022 and October 31, 2023.
| | | 2022 | | | 2023 | |
| Audit Fees | | $ | 175,600 | | | $ | 203,100 | |
| Audit-Related Fees1 | | $ | - | | | $ | - | |
| Tax Fees2 | | $ | 16,000 | | | $ | 18,000 | |
| All Other Fees | | $ | - | | | $ | - | |
| Total | | $ | 191,600 | | | $ | 221,100 | |
1 Services include agreed-upon procedures in connection with the registrant’s semi-annual financial statements ($0 for 2022 and $0 for 2023).
2 Tax services in connection with the registrant’s excise tax calculations and review of the registrant’s applicable tax returns.
The information in the table below is provided with respect to non-audit services that directly relate to the registrant’s operations and financial reporting and that were rendered by PwC to the registrant’s investment adviser, Credit Suisse Asset Management, LLC (“Credit Suisse”), and any service provider to the registrant controlling, controlled by or under common control with Credit Suisse that provided ongoing services to the registrant (“Covered Services Provider”), for the registrant’s fiscal years ended October 31, 2022 and October 31, 2023.
| | | 2022 | | | | 2023 | |
| Audit-Related Fees | | | N/A | | | | N/A | |
| Tax Fees | | | N/A | | | | N/A | |
| All Other Fees | | | N/A | | | | N/A | |
| Total | | | N/A | | | | N/A | |
(e)(1) Pre-Approval Policies and Procedures. The Audit Committee (“Committee”) of the registrant is responsible for pre-approving (i) all audit and permissible non-audit services to be provided by the independent registered public accounting firm to the registrant and (ii) all permissible non-audit services to be provided by the independent registered public accounting firm to Credit Suisse and any Covered Services Provider if the engagement relates directly to the operations and financial reporting of the registrant. The Committee may delegate its responsibility to pre-approve any such audit and permissible non-audit services to the Chairperson of the Committee, and the Chairperson shall report to the Committee, at its next regularly scheduled meeting after the Chairperson’s pre-approval of such services, his or her decision(s). The Committee may also establish detailed pre-approval policies and procedures for pre-approval of such services in accordance with applicable laws, including the delegation of some or all of the Committee’s pre-approval responsibilities to other persons (other than Credit Suisse or the registrant’s officers). Pre-approval by the Committee of any permissible non-audit services shall not be required so long as: (i) the aggregate amount of all such permissible non-audit services provided to the registrant, Credit Suisse and any Covered Services Provider constitutes not more than 5% of the total amount of revenues paid by the registrant to its independent registered public accounting firm during the fiscal year in which the permissible non-audit services are provided; (ii) the permissible non-audit services were not recognized by the registrant at the time of the engagement to be non-audit services; and (iii) such services are promptly brought to the attention of the Committee and approved by the Committee (or its delegate(s)) prior to the completion of the audit.
(e)(2) The information in the table below sets forth the percentages of fees for services (other than audit, review or attest services) rendered by PwC to the registrant for which the pre-approval requirement was waived pursuant to Rule 2-01(c)(7)(i)(C) of Regulation S-X:
| | | 2022 | | | | 2023 | |
| Audit-Related Fees | | | N/A | | | | N/A | |
| Tax Fees | | | N/A | | | | N/A | |
| All Other Fees | | | N/A | | | | N/A | |
| Total | | | N/A | | | | N/A | |
The information in the table below sets forth the percentages of fees for services (other than audit, review or attest services) rendered by PwC to Credit Suisse and any Covered Services Provider required to be approved pursuant to Rule 2-01(c)(7)(ii) of Regulation S-X, for the registrant’s fiscal years ended October 31, 2022 and October 31, 2023:
| | | 2022 | | | | 2023 | |
| Audit-Related Fees | | | N/A | | | | N/A | |
| Tax Fees | | | N/A | | | | N/A | |
| All Other Fees | | | N/A | | | | N/A | |
| Total | | | N/A | | | | N/A | |
(f) Not Applicable.
(g) The aggregate fees billed by PwC for non-audit services rendered to the registrant, Credit Suisse and Covered Service Providers for the fiscal years ended October 31, 2022 and October 31, 2023 were $0 and $0, respectively.
(h) Not Applicable.
(i) Not Applicable.
(j) Not Applicable.
Item 5. Audit Committee of Listed Registrants.
Form N-CSR disclosure requirement is not applicable to the registrant.
Item 6. Schedule of Investments.
Included as part of the report to shareholders filed under Item 1 of this Form.
Item 7. Disclosure of Proxy Voting Policies and Procedures for Closed-End Management Investment Companies.
Form N-CSR disclosure requirement is not applicable to the registrant.
Item 8. Portfolio Managers of Closed-End Management Investment Companies.
Form N-CSR disclosure requirement is not applicable to the registrant.
Item 9. Purchases of Equity Securities by Closed-End Management Investment Company and Affiliated Purchasers.
Form N-CSR disclosure requirement is not applicable to the registrant.
Item 10. Submission of Matters to a Vote of Security Holders.
None.
Item 11. Controls and Procedures.
(a) As of a date within 90 days from the filing date of this report, the principal executive officer and principal financial officer concluded that the registrant's disclosure controls and procedures (as defined in Rule 30a-3(c) under the Investment Company Act of 1940 (the “Act”)) were effective based on their evaluation of the disclosure controls and procedures required by Rule 30a-3(b) under the Act and Rules 13a-15(b) or 15d-15(b) under the Securities Exchange Act of 1934.
(b) There were no changes in registrant's internal control over financial reporting (as defined in Rule 30a-3(d) under the Act) that occurred during the most recent fiscal half-year covered by this report that have materially affected, or are reasonably likely to materially affect, the registrant’s internal control over financial reporting.
Item 12. Disclosure of Securities Lending Activities for Closed-End Management Investment Companies.
Form N-CSR disclosure requirement is not applicable to the registrant.
Item 13. Exhibits.
(a)(1) Registrant’s Code of Ethics is an exhibit to this report.
(a)(2) The certifications of the registrant as required by Rule 30a-2(a) under the Act are exhibits to this report.
(a)(3) Not applicable.
(b) The certifications of the registrant as required by Rule 30a-2(b) under the Act are an exhibit to this report.
(other) Iran related activities disclosure requirement.
SIGNATURES
Pursuant to the requirements of the Securities Exchange Act of 1934 and the Investment Company Act of 1940, the registrant has duly caused this report to be signed on its behalf by the undersigned, thereunto duly authorized.
| | CREDIT SUISSE OPPORTUNITY FUNDS | |
| | | |
| | /s/ John G. Popp | |
| | Name: | John G. Popp | |
| | Title: | Chief Executive Officer and President | |
| | Date: | January 5, 2024 | |
Pursuant to the requirements of the Securities Exchange Act of 1934 and the Investment Company Act of 1940, this report has been signed below by the following persons on behalf of the registrant and in the capacities and on the dates indicated.
| | /s/ John G. Popp | |
| | Name: | John G. Popp | |
| | Title: | Chief Executive Officer and President | |
| | Date: | January 5, 2024 | |
| | /s/ Omar Tariq | |
| | Name: | Omar Tariq | |
| | Title: | Chief Financial Officer and Treasurer | |
| | Date: | January 5, 2024 | |