UNITED STATES
SECURITIES AND EXCHANGE COMMISSION
Washington, D.C. 20549
FORM N-CSR
CERTIFIED SHAREHOLDER REPORT OF REGISTERED
MANAGEMENT INVESTMENT COMPANIES
Investment Company Act File No. 811-09054
---------------------------------------------------------------------
CREDIT SUISSE OPPORTUNITY FUNDS
------------------------------------------------------------------------
(Exact Name of Registrant as Specified in Charter)
Eleven Madison Avenue, New York, New York 10010
-------------------------------------------------------------------------
(Address of Principal Executive Offices) (Zip Code)
John G. Popp
Credit Suisse Opportunity Funds
Eleven Madison Avenue
New York, New York 10010
Registrant’s telephone number, including area code: (212) 325-2000
Date of fiscal year end: October 31st
Date of reporting period: November 1, 2020 to October 31, 2021
Item 1. Reports to Stockholders.

CREDIT SUISSE FUNDS
Annual Report
October 31, 2021
◼ CREDIT SUISSE
FLOATING RATE HIGH INCOME FUND
The Fund's investment objectives, risks, charges and expenses (which should be considered carefully before investing), and more complete information about the Fund, are provided in the Prospectus, which should be read carefully before investing. You may obtain additional copies by calling 877-870-2874 or by visiting our website at www.credit-suisse.com/us/funds.
Credit Suisse Securities (USA) LLC, Distributor, is located at Eleven Madison Avenue, New York, NY 10010. Credit Suisse Funds are advised by Credit Suisse Asset Management, LLC.
Investors in the Credit Suisse Funds should be aware that they may be eligible to purchase Class I shares (where offered) directly or through certain intermediaries. Such shares are not subject to a sales charge. Investors in the Credit Suisse Funds should also be aware that they may be eligible for a reduction or waiver of the sales charge with respect to Class A or C shares (where offered). For more information, please review the relevant prospectuses or consult your financial representative.
Fund shares are not deposits or other obligations of Credit Suisse Asset Management, LLC ("Credit Suisse") or any affiliate, are not FDIC-insured and are not guaranteed by Credit Suisse or any affiliate. Fund investments are subject to investment risks, including loss of your investment.
Credit Suisse Floating Rate High Income Fund
Annual Investment Adviser's Report
October 31, 2021 (unaudited)
December 2, 2021
Dear Shareholder:
We are pleased to present this Annual Report covering the activities of the Credit Suisse Floating Rate High Income Fund (the "Fund") for the 12-month period ended October 31, 2021.
Performance Summary
11/1/20 – 10/31/21
Fund & Benchmark | | Performance | |
| Class I1 | | | 8.86 | % | |
| Class A1,2 | | | 8.57 | % | |
| Class C1,2 | | | 7.90 | % | |
| Credit Suisse Leveraged Loan Index3 | | | 8.53 | % | |
Performance shown for the Fund's Class A and Class C Shares does not reflect sales charges, which are a maximum of 4.75% and 1.00%, respectively.2
Market Review: A positive period for loans
The 12-month period ended October 31, 2021, was a positive one for floating rate strategies, with the Credit Suisse Leveraged Loan Index (the "Index"), the Fund's benchmark, returning 8.53% for the year. The Index saw positive returns in each month of the period. The senior loan discount margin — assuming a three-year average life — tightened by 143 basis points during the period to 440 basis points, while the average price of the Index finished the year 5.66 points higher, at 98.53.
From a quality standpoint, lower-rated assets outperformed, with CCC/Split CCC and Split B returning 25.08% and 14.50%, respectively. Higher quality assets underperformed with Split BBB and BB returning 4.20% and 5.20%, respectively.
The Index was led by the energy and metals/minerals sectors, which returned 21.11% and 17.40% for the period, respectively. Conversely, utilities and food/tobacco were the largest sector laggards, retuning 4.11% and 5.81%, respectively.
According to JPMorgan, fund flows were positive in each month during the period, ultimately resulting in $33.7 billion of inflows, averaging about $2.8 billion per month. With $374.9 billion in gross issuance — including $161.8 billion net of refinancing — healthy collateralized loan obligation ("CLO") issuance contributed meaningfully to demand in the asset class.
1
Credit Suisse Floating Rate High Income Fund
Annual Investment Adviser's Report (continued)
October 31, 2021 (unaudited)
With loan managers experiencing inflows and the economy showing signs of stability, the loan market has been very receptive to new issues — with gross issuance of $790.4 billion and net loan issuance of $364.9 billion over the period. Additionally, year-to-date gross issuance ($732.8 billion) and net issuance ($336.8 billion) are up 104% and 119%, respectively, over the first 10 months of 2020.
The par-weighted default rate in loans ended October at 0.69% — a 10-year low.
Strategic Review and Outlook: Optimistic for the future
For the annual period ended October 31, 2021, the Fund's Class I-shares and A-shares outperformed the Index. Positive selection within bank loans and allocations to high yield and CLO asset classes added to relative returns. From a sector perspective, the greatest contributors to relative return included financials, gaming/leisure and aerospace.
Over the near term, we expect high levels of activity across capital markets and low default rates to continue on the back of the strong recovery we have seen in 2021. Although issuers have generally done an excellent job managing through inflationary pressures and labor shortages, we believe consumer spending and general economic activity could be pressured if these challenges persist well into 2022. From a sector standpoint, we believe we are positioned appropriately and defensively with overweights in technology, healthcare, packaging and services, which should see more muted impact to an economic slowdown. We also see elevated risk in certain issuers that are fully levered off of COVID-19 bump-inflated earnings, as some of these balance sheets will come under pressure regardless of economic activity. Given the strong technical backdrop, 2021 has not seen much dispersion in performance across sectors, but we do expect that to subside as we head into 2022.
The Credit Suisse Credit Investments Group Team
John G. Popp
Thomas J. Flannery
Louis I. Farano
Wing Chan
David Mechlin
Joshua Shedroff
2
Credit Suisse Floating Rate High Income Fund
Annual Investment Adviser's Report (continued)
October 31, 2021 (unaudited)
Senior secured floating rate loans ("Senior Loans") typically hold the most senior position in the issuer's capital structure. Senior Loans are subject to the risk that a court could subordinate a Senior Loan to presently existing or future indebtedness or take other action detrimental to the holders of Senior Loans.
High yield bonds are bonds rated below BBB- by S&P or Baa3 by Moody's that are also known as "junk bonds." Such bonds entail greater risks than those found in higher- rated securities.
Additional principal risk factors for the Fund include conflict of interest risk, credit risk, foreign securities risk, illiquidity risk, interest rate risk, LIBOR risk, market risk, prepayment risk and valuation risk. Before you invest, please make sure you understand the risks that apply to the Fund. As with any mutual fund, you could lose money over any period of time.
Investments in the Fund are not bank deposits and are not insured or guaranteed by the Federal Deposit Insurance Corporation or any government agency. For a detailed discussion of these and other risks, please refer to the Fund's Prospectus, which should be read carefully before investing.
In addition to historical information, this report contains forward-looking statements, which may concern, among other things, domestic and foreign markets, industry and economic trends and developments and government regulation, and their potential impact on the Fund's investments. These statements are subject to risks and uncertainties and actual trends, developments and regulations in the future, and their impact on the Fund, could be materially different from those projected, anticipated or implied. The Fund has no obligation to update or revise forward-looking statements.
The views of the Fund's management are as of the date of this letter and the Fund holdings described in this document are as of October 31, 2021; these views and Fund holdings may have changed subsequent to these dates. Nothing in this document is a recommendation to purchase or sell securities.
3
Credit Suisse Floating Rate High Income Fund
Annual Investment Adviser's Report (continued)
October 31, 2021 (unaudited)
Comparison of Change in Value of $10,000 Investment in the
Credit Suisse Floating Rate High Income Fund1,2 and the
Credit Suisse Leveraged Loan Index3 for Ten Years
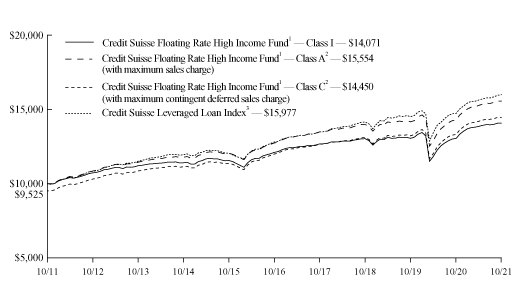
1 Fee waivers and/or expense reimbursements reduce expenses for the Fund, without which performance would be lower. Effective April 22, 2019, the Fund entered into a written contract to limit expenses to 0.70% of the Fund's average daily net assets for Class I shares, 0.95% of the Fund's average daily net assets for Class A shares and 1.70% of the Fund's average daily net assets for Class C shares through at least February 28, 2023. This limit excludes certain expenses, as set forth in the Fund's Prospectus.
2 Total return for the Fund's Class A shares for the reporting period, based on offering price (including maximum sales charge of 4.75%), was 3.35%. Total return for the Fund's Class C shares for the reporting period, based on redemption value (including maximum contingent deferred sales charge ("CDSC") of 1.00%), was 6.90%.
3 Credit Suisse Leveraged Loan Index is an unmanaged index that is designed to mirror the investable universe of the U.S. dollar denominated institutional leveraged loan market. The index does not have transaction costs and investors cannot invest directly in the index.
4
Credit Suisse Floating Rate High Income Fund
Annual Investment Adviser's Report (continued)
October 31, 2021 (unaudited)
Average Annual Returns as of October 31, 20211
| | | 1 Year | | 5 Years | | 10 Years | |
Class I | | | 8.86 | % | | | 4.08 | % | | | 4.52 | % | |
Class A Without Sales Charge | | | 8.57 | % | | | 3.79 | % | | | 4.25 | % | |
Class A With Maximum Sales Charge | | | 3.35 | % | | | 2.79 | % | | | 3.75 | % | |
Class C Without CDSC | | | 7.90 | % | | | 3.05 | % | | | 3.47 | % | |
Class C With CDSC | | | 6.90 | % | | | 3.05 | % | | | 3.47 | % | |
Returns represent past performance and include change in share price and reinvestment of dividends and capital gain distributions, if any. Past performance cannot guarantee future results. The current performance of the Fund may be lower or higher than the figures shown. Returns and share price will fluctuate, and redemption value may be more or less than original cost. The performance results do not reflect the deduction of taxes that a shareholder would pay on Fund distributions or the redemption of Fund shares. Performance information current to the most recent month end is available at www.credit-suisse.com/us/funds.
The annual gross expense ratios are 0.77% for Class I shares, 1.02% for Class A shares and 1.77% for Class C shares. The annual net expense ratios after fee waivers and/or expense reimbursements are 0.70% for Class I shares, 0.95% for Class A shares and 1.70% for Class C shares.
1 Fee waivers and/or expense reimbursements reduce expenses for the Fund, without which performance would be lower. Effective April 22, 2019, the Fund entered into a written contract to limit expenses to 0.70% of the Fund's average daily net assets for Class I shares, 0.95% of the Fund's average daily net assets for Class A shares and 1.70% of the Fund's average daily net assets for Class C shares through at least February 28, 2023. This limit excludes certain expenses, as set forth in the Fund's Prospectus.
5
Credit Suisse Floating Rate High Income Fund
Annual Investment Adviser's Report (continued)
October 31, 2021 (unaudited)
Information About Your Fund's Expenses
As an investor of the Fund, you incur two types of costs: ongoing expenses and transaction costs. Ongoing expenses include management fees, distribution and service (12b-1) fees and other Fund expenses. Examples of transaction costs include sales charges (loads), redemption fees and account maintenance fees, which are not shown in this section and which would result in higher total expenses. The following table is intended to help you understand your ongoing expenses of investing in the Fund and to help you compare these expenses with the ongoing expenses of investing in other mutual funds. The table is based on an investment of $1,000 made at the beginning of the six months ended October 31, 2021.
The table illustrates your Fund's expenses in two ways:
• Actual Fund Return. This helps you estimate the actual dollar amount of ongoing expenses paid on a $1,000 investment in the Fund using the Fund's actual return during the period. To estimate the expenses you paid over the period, simply divide your account value by $1,000 (for example, an $8,600 account value divided by $1,000 = 8.6), then multiply the result by the number in the "Expenses Paid per $1,000" line.
• Hypothetical 5% Fund Return. This helps you to compare the Fund's ongoing expenses with those of other mutual funds using the Fund's actual expense ratio and a hypothetical rate of return of 5% per year before expenses. Examples using a 5% hypothetical fund return may be found in the shareholder reports of other mutual funds. The hypothetical account values and expenses may not be used to estimate the actual ending account balance or expenses you paid for the period.
Please note that the expenses shown in these tables are meant to highlight your ongoing expenses only and do not reflect any transaction costs, such as sales charges (loads) or redemption fees. If these transaction costs had been included, your costs would have been higher. The "Expenses Paid per $1,000" line of the tables is useful in comparing ongoing expenses only and will not help you determine the relative total expenses of owning different funds.
6
Credit Suisse Floating Rate High Income Fund
Annual Investment Adviser's Report (continued)
October 31, 2021 (unaudited)
Expenses and Value for a $1,000 Investment
for the six-month period ended October 31, 2021
Actual Fund Return | | Class I | | Class A | | Class C | |
Beginning Account Value 05/01/21 | | $ | 1,000.00 | | | $ | 1,000.00 | | | $ | 1,000.00 | | |
Ending Account Value 10/31/21 | | $ | 1,019.70 | | | $ | 1,018.40 | | | $ | 1,016.10 | | |
Expenses Paid per $1,000* | | $ | 3.56 | | | $ | 4.83 | | | $ | 8.64 | | |
Hypothetical 5% Fund Return | |
Beginning Account Value 05/01/21 | | $ | 1,000.00 | | | $ | 1,000.00 | | | $ | 1,000.00 | | |
Ending Account Value 10/31/21 | | $ | 1,021.68 | | | $ | 1,020.42 | | | $ | 1,016.64 | | |
Expenses Paid per $1,000* | | $ | 3.57 | | | $ | 4.84 | | | $ | 8.64 | | |
| | | Class I | | Class A | | Class C | |
Annualized Expense Ratios* | | | 0.70 | % | | | 0.95 | % | | | 1.70 | % | |
* Expenses are equal to the Fund's annualized expense ratio for each share class, multiplied by the average account value over the period, multiplied by 184/365 to reflect the one-half year period.
The "Expenses Paid per $1,000" and the "Annualized Expense Ratios" in the tables are based on actual expenses paid by the Fund during the period, net of fee waivers and/or actual expense reimbursements, if applicable. If those fee waivers and/or expense reimbursements had not been in effect, the Fund's actual expenses would have been higher. Expenses do not reflect additional charges and expenses that are, or may be, imposed under the variable contracts or plans. Such charges and expenses are described in the prospectus of the insurance company separate account or in the plan documents or other informational materials supplied by plan sponsors. The Fund's expenses should be considered with these charges and expenses in evaluating the overall cost of investing in the separate account.
For more information, please refer to the Fund's Prospectus.
7
Credit Suisse Floating Rate High Income Fund
Annual Investment Adviser's Report (continued)
October 31, 2021 (unaudited)
Credit Quality Breakdown*
(% of Total Investments as of October 31, 2021)
S&P Ratings** | | | |
A | | | 0.4 | % | |
BBB | | | 2.2 | | |
BB | | | 18.0 | | |
B | | | 57.7 | | |
CCC | | | 8.7 | | |
CC | | | 0.1 | | |
D | | | 0.0 | 1 | |
NR | | | 3.5 | | |
Subtotal | | | 90.6 | | |
Equity and Other | | | 9.4 | | |
Total | | | 100.0 | % | |
* Expressed as a percentage of total investments (excluding securities lending collateral if applicable) and may vary over time.
** Credit Quality is based on ratings provided by the S&P Global Ratings Division of S&P Global Inc. ("S&P"). S&P is a main provider of ratings for credit assets classes and is widely used amongst industry participants. The NR category consists of securities that have not been rated by S&P.
1 This amount represents less than 0.1%.
8
Credit Suisse Floating Rate High Income Fund
Schedule of Investments
October 31, 2021
Par
(000) | |
| | Ratings†
(S&P/Moody's) | | Maturity | | Rate% | | Value | |
| BANK LOANS (85.3%) | | | |
| Advertising (0.1%) | | | |
$ | 4,279 | | | MH Sub I LLC, LIBOR 1M + 3.500%(1) | | (B, B2) | | 09/13/24 | | 3.587 | | $ | 4,269,663 | | |
| Aerospace & Defense (1.4%) | | | |
| | 4,016 | | | Amentum Government Services Holdings LLC,
LIBOR 1M + 3.500%(1) | | (B, B1) | | 01/29/27 | | 3.587 | | | 4,009,714 | | |
| | 4,750 | | | Amentum Government Services Holdings LLC,
LIBOR 1M + 8.750%(1) | | (NR, NR) | | 01/31/28 | | 10.000 | | | 4,782,680 | | |
| | 1,762 | | | Amentum Government Services Holdings LLC,
LIBOR 3M + 4.750%(1) | | (B, B1) | | 01/29/27 | | 5.500 | | | 1,767,699 | | |
| | 2,628 | | | Fly Funding II Sarl, LIBOR 3M + 1.750%(1) | | (BB+, Ba3) | | 08/11/25 | | 1.880 | | | 2,586,489 | | |
| | 5,525 | | | KKR Apple Bidco, LLC(2) | | (B+, B1) | | 09/22/28 | | 0.000 | | | 5,519,534 | | |
| | 4,350 | | | Peraton Corp., LIBOR 1M + 7.750%(1) | | (NR, NR) | | 02/01/29 | | 8.500 | | | 4,453,313 | | |
| | 18,912 | | | Peraton Corp., LIBOR 1M + 3.750%(1) | | (B+, B1) | | 02/01/28 | | 4.500 | | | 18,981,890 | | |
| | | | 42,101,319 | | |
| Air Transportation (0.5%) | | | |
| | 9,344 | | | Brown Group Holding LLC, LIBOR 3M + 2.750%(1) | | (B+, B1) | | 06/07/28 | | 3.250 | | | 9,333,633 | | |
| | 4,975 | | | United Airlines, Inc., LIBOR 3M + 3.750%(1) | | (BB-, Ba1) | | 04/21/28 | | 4.500 | | | 5,052,287 | | |
| | | | 14,385,920 | | |
| Auto Parts & Equipment (4.5%) | | | |
| | 11,338 | | | Adient U.S. LLC, LIBOR 1M + 3.500%(1) | | (BB-, Ba3) | | 04/08/28 | | 3.587 | | | 11,355,922 | | |
| | 2,233 | | | American Axle & Manufacturing, Inc.,
LIBOR 1M + 2.250%(1) | | (BB+, Ba1) | | 04/06/24 | | 3.000 | | | 2,232,786 | | |
| | 10,978 | | | Autokiniton U.S. Holdings, Inc.,
LIBOR 3M + 4.500%(1) | | (B, B2) | | 04/06/28 | | 5.000 | | | 11,004,944 | | |
| | 11,083 | | | Clarios Global LP, LIBOR 1M + 3.250%(1) | | (B, B1) | | 04/30/26 | | 3.337 | | | 11,030,086 | | |
| | 15,708 | | | CS Intermediate Holdco 2 LLC,
LIBOR 1M + 2.000%(1),(3) | | (B-, B1) | | 11/02/23 | | 2.750 | | | 14,673,200 | | |
| | 10,396 | | | Dayco Products LLC, LIBOR 3M + 4.250%(1) | | (CCC+, B3) | | 05/19/23 | | 4.371 | | | 10,161,777 | | |
| | 6,471 | | | Dealer Tire LLC, LIBOR 1M + 4.250%(1) | | (B-, B1) | | 12/12/25 | | 4.337 | | | 6,481,133 | | |
| | 8,397 | | | Garrett LX I Sarl, LIBOR 3M + 3.250%(1) | | (B+, Ba2) | | 04/30/28 | | 3.750 | | | 8,381,106 | | |
| | 7,968 | | | Gates Global LLC, LIBOR 1M + 2.500%(1) | | (B+, B1) | | 03/31/27 | | 3.250 | | | 7,958,730 | | |
| | 1,869 | | | Jason Group, Inc., LIBOR 3M + 1.000%
Cash, 9.000% PIK(1),(4) | | (CCC-, Caa3) | | 03/02/26 | | 11.000 | | | 1,852,166 | | |
| | 2,712 | | | Jason Group, Inc., LIBOR 3M + 2.000%
Cash, 4.000% PIK(1),(4) | | (B-, Caa1) | | 08/28/25 | | 7.000 | | | 2,699,250 | | |
| | 11,280 | | | Les Schwab Tire Centers, LIBOR 3M + 3.250%(1) | | (B, B2) | | 11/02/27 | | 4.000 | | | 11,290,898 | | |
| | 1,132 | | | PAI Holdco, Inc., LIBOR 3M + 3.500%(1) | | (B, B1) | | 10/28/27 | | 4.250 | | | 1,134,420 | | |
| | 3,613 | | | RVR Dealership Holdings LLC,
LIBOR 3M + 4.000%(1) | | (B+, B2) | | 02/08/28 | | 4.750 | | | 3,612,721 | | |
| | 345 | | | RVR Dealership Holdings LLC(2),(5) | | (B+, B2) | | 02/08/28 | | 2.000 | | | 344,609 | | |
| | 6,199 | | | Superior Industries International, Inc.,
LIBOR 1M + 4.000%(1),(3) | | (B, Ba3) | | 05/22/24 | | 4.087 | | | 6,198,816 | | |
| | 7,041 | | | TI Group Automotive Systems LLC,
EURIBOR 3M + 3.250%(1),(6) | | (BB+, Ba3) | | 12/16/26 | | 3.250 | | | 8,158,306 | | |
See Accompanying Notes to Financial Statements.
9
Credit Suisse Floating Rate High Income Fund
Schedule of Investments (continued)
October 31, 2021
Par
(000) | |
| | Ratings†
(S&P/Moody's) | | Maturity | | Rate% | | Value | |
| BANK LOANS (continued) | | | |
Auto Parts & Equipment | | | |
$ | 5,243 | | | TI Group Automotive Systems LLC,
LIBOR 3M + 3.250%(1) | | (BB+, Ba3) | | 12/16/26 | | 3.750 | | $ | 5,249,560 | | |
| | 10,096 | | | U.S. Farathane LLC, LIBOR 3M + 4.250%(1),(7) | | (CCC+, B2) | | 12/23/24 | | 5.250 | | | 9,591,561 | | |
| | | | 133,411,991 | | |
| Banking (0.5%) | | | |
| | 12,148 | | | Citco Funding LLC, LIBOR 6M + 2.500%(1) | | (NR, Ba3) | | 09/28/23 | | 2.658 | | | 12,132,389 | | |
| | 2,963 | | | Citco Funding LLC, LIBOR 6M + 3.250%(1),(7) | | (NR, Ba3) | | 09/28/23 | | 3.750 | | | 2,962,500 | | |
| | | | 15,094,889 | | |
| Brokerage (0.1%) | | | |
| | 2,119 | | | RE/MAX International, Inc.,
LIBOR 3M + 2.500%(1),(7) | | (BB, Ba3) | | 07/21/28 | | 3.000 | | | 2,108,778 | | |
| Building & Construction (0.4%) | | | |
| | 7,440 | | | MX Holdings U.S., Inc., LIBOR 1M + 2.500%(1) | | (B+, B1) | | 07/31/25 | | 3.250 | | | 7,430,140 | | |
| | 295 | | | Service Logic Acquisition, Inc.,
LIBOR 3M + 4.000%(1),(5) | | (B, B2) | | 10/29/27 | | 4.000 | | | 296,276 | | |
| | 2,777 | | | Service Logic Acquisition, Inc.,
LIBOR 2M + 4.000%, LIBOR 3M + 4.000%(1) | |
(B, B2) | |
10/29/27 | | 4.129 -
4.750 | | | 2,792,730 | | |
| | | | 10,519,146 | | |
| Building Materials (2.7%) | | | |
| | 5,533 | | | Chamberlain Group, Inc.(2) | | (B, B2) | | 11/03/28 | | 0.000 | | | 5,531,105 | | |
| | 13,497 | | | Core & Main LP, LIBOR 1M + 2.500%(1) | | (B+, Ba3) | | 07/27/28 | | 2.588 | | | 13,423,908 | | |
| | 17,558 | | | Cornerstone Building Brands, Inc.,
LIBOR 1M + 3.250%(1) | | (B+, B1) | | 04/12/28 | | 3.750 | | | 17,566,591 | | |
| | 7,109 | | | Floor & Decor Outlets of America, Inc.,
LIBOR 1M + 2.000%(1) | | (BB-, Ba2) | | 02/14/27 | | 2.090 | | | 7,042,819 | | |
| | 9,898 | | | Foundation Building Materials Holding Co. LLC,
LIBOR 1M + 3.250%(1) | | (B, B2) | | 02/03/28 | | 3.750 | | | 9,833,104 | | |
| | 1,452 | | | Hillman Group, Inc. (The) (Delayed Draw
Term Loan), LIBOR 1M + 2.750%(1),(5) | | (B+, B1) | | 07/14/28 | | 3.250 | | | 1,449,830 | | |
| | 6,061 | | | Hillman Group, Inc. (The) (Term Loan B1),
LIBOR 1M + 2.750%(1) | | (B+, B1) | | 07/14/28 | | 3.250 | | | 6,053,040 | | |
| | 12,898 | | | Park River Holdings, Inc., LIBOR 3M + 3.250%(1) | | (B-, B1) | | 12/28/27 | | 4.000 | | | 12,862,861 | | |
| | 1,490 | | | Standard Industries, Inc.,
LIBOR 3M + 2.500%(1) | | (BBB-, Baa3) | | 09/22/28 | | 3.000 | | | 1,489,758 | | |
| | 5,238 | | | Wilsonart LLC, LIBOR 3M + 3.500%(1) | | (B+, B2) | | 12/19/26 | | 4.500 | | | 5,248,792 | | |
| | | | 80,501,808 | | |
| Cable & Satellite TV (0.8%) | | | |
| | 15,072 | | | CSC Holdings LLC, LIBOR 1M + 2.250%(1) | | (BB, Ba3) | | 07/17/25 | | 2.340 | | | 14,758,376 | | |
| | 7,000 | | | Ziggo B.V., EURIBOR 6M + 3.000%(1),(6) | | (B+, B1) | | 01/31/29 | | 3.000 | | | 8,019,333 | | |
| | | | 22,777,709 | | |
See Accompanying Notes to Financial Statements.
10
Credit Suisse Floating Rate High Income Fund
Schedule of Investments (continued)
October 31, 2021
Par
(000) | |
| | Ratings†
(S&P/Moody's) | | Maturity | | Rate% | | Value | |
| BANK LOANS (continued) | | | |
| Chemicals (6.9%) | | | |
$ | 5,019 | | | Allnex (Luxembourg) & Cy S.C.A.,
EURIBOR 1M + 3.250%(1),(6) | | (B, B2) | | 09/13/23 | | 3.250 | | $ | 5,798,451 | | |
| | 1,689 | | | Allnex (Luxembourg) & Cy S.C.A.,
LIBOR 1M + 3.250%(1) | | (B, B2) | | 09/13/23 | | 4.000 | | | 1,690,570 | | |
| | 1,272 | | | Allnex U.S.A., Inc., LIBOR 1M + 3.250%(1) | | (B, B2) | | 09/13/23 | | 4.000 | | | 1,273,670 | | |
| | 2,705 | | | Aruba Investments, Inc., LIBOR 3M + 4.000%(1) | | (B-, B1) | | 11/24/27 | | 4.750 | | | 2,716,362 | | |
| | 10,341 | | | Ascend Performance Materials Operations LLC,
LIBOR 3M + 4.750%(1) | | (BB-, B1) | | 08/27/26 | | 5.500 | | | 10,456,057 | | |
| | 3,547 | | | ASP Chromaflo Dutch I B.V.,
LIBOR 1M + 3.500%(1),(7) | | (B, B2) | | 11/20/23 | | 4.500 | | | 3,556,304 | | |
| | 2,719 | | | ASP Chromaflo Intermediate Holdings, Inc.,
LIBOR 1M + 3.500%(1),(7) | | (B, B2) | | 11/20/23 | | 4.500 | | | 2,725,823 | | |
| | 25,943 | | | Atotech B.V., LIBOR 3M + 2.500%(1) | | (B+, B1) | | 03/18/28 | | 3.000 | | | 25,948,428 | | |
| | 7,286 | | | CeramTec AcquiCo GmbH,
EURIBOR 3M + 2.500%(1),(6) | | (B, B2) | | 03/07/25 | | 2.500 | | | 8,396,173 | | |
| | 2,149 | | | CPC Acquisition Corp., LIBOR 3M + 7.750%(1) | | (CCC, Caa2) | | 12/29/28 | | 8.500 | | | 2,157,381 | | |
| | 3,980 | | | CPC Acquisition Corp., LIBOR 3M + 3.750%(1) | | (B, B3) | | 12/29/27 | | 4.500 | | | 3,980,000 | | |
| | 1,902 | | | Flint Group GmbH, EURIBOR 3M + 4.250%(1),(6) | | (CCC+, Caa1) | | 09/21/23 | | 5.000 | | | 2,205,387 | | |
| | 550 | | | Flint Group GmbH, LIBOR 3M + 4.250%
Cash, 0.750% PIK(1),(4) | | (CCC+, Caa1) | | 09/21/23 | | 6.000 | | | 550,151 | | |
| | 3,327 | | | Flint Group U.S. LLC, LIBOR 3M + 4.250%
Cash, 0.750% PIK(1),(4) | | (CCC+, Caa1) | | 09/21/23 | | 6.000 | | | 3,327,962 | | |
| | 6,695 | | | Gemini HDPE LLC, LIBOR 3M + 3.000%(1) | | (BB, Ba3) | | 12/31/27 | | 3.500 | | | 6,702,462 | | |
| | 1,645 | | | GEON Performance Solutions, LLC,
LIBOR 3M + 4.750%(1) | | (B+, B2) | | 08/18/28 | | 5.500 | | | 1,663,114 | | |
| | 2,392 | | | Illuminate Buyer, LLC, LIBOR 1M + 3.500%(1) | | (B+, B1) | | 06/30/27 | | 3.587 | | | 2,388,355 | | |
| | 1,995 | | | INEOS Styrolution U.S. Holding LLC,
LIBOR 1M + 2.750%(1) | | (BB, Ba3) | | 01/29/26 | | 3.250 | | | 1,997,075 | | |
| | 2,349 | | | Ineos U.S. Finance LLC, LIBOR 1M + 2.000%(1) | | (BB, Ba2) | | 04/01/24 | | 2.087 | | | 2,336,832 | | |
| | 2,494 | | | LSF11 A5 Holdco LLC, LIBOR 3M + 3.750%(1) | | (B, B1) | | 10/15/28 | | 4.250 | | | 2,494,005 | | |
| | 8,099 | | | Luxembourg Investment Co. 428 S.a r.l.(2),(7) | | (B, B2) | | 10/20/28 | | 0.000 | | | 8,109,465 | | |
| | 6,688 | | | Messer Industries GmbH, LIBOR 3M + 2.500%(1) | | (BB-, B1) | | 03/01/26 | | 2.632 | | | 6,652,123 | | |
| | 6,400 | | | Orion Engineered Carbons GmbH,
LIBOR 3M + 2.250%(1) | | (BB, Ba2) | | 09/24/28 | | 2.750 | | | 6,412,000 | | |
| | 13,120 | | | PMHC II, Inc., LIBOR 12M + 3.500%(1) | | (B-, Caa1) | | 03/31/25 | | 4.500 | | | 13,054,103 | | |
| | 2,907 | | | PMHC II, Inc., LIBOR 12M + 7.750%(1),(3) | | (CCC+, Caa3) | | 03/30/26 | | 8.750 | | | 2,883,533 | | |
| | 11,414 | | | Polar U.S. Borrower LLC, LIBOR 1M + 4.750%,
PRIME + 3.750%(1) | |
(B-, B3) | |
10/15/25 | | 4.874 -
7.000 | | | 11,423,338 | | |
| | 8,378 | | | Ravago Holdings America, Inc.,
LIBOR 3M + 2.500%(1) | | (NR, B1) | | 03/04/28 | | 2.640 | | | 8,349,122 | | |
| | 9,398 | | | Solenis Holdings LLC, LIBOR 1M + 4.000%(1) | | (B-, B3) | | 06/26/25 | | 4.087 | | | 9,401,356 | | |
| | 6,000 | | | Solenis Holdings LLC, LIBOR 1M + 8.500%(1),(3) | | (CCC+, Caa1) | | 06/26/26 | | 8.587 | | | 6,011,280 | | |
| | 15,253 | | | Starfruit Finco B.V, LIBOR 1M + 2.750%(1) | | (B+, B2) | | 10/01/25 | | 2.839 | | | 15,162,664 | | |
| | 3,336 | | | Tronox Finance LLC, LIBOR 1M + 2.250%,
LIBOR 3M + 2.250%(1) | |
(BB-, Ba3) | |
03/13/28 | | 2.337 -
2.382 | | | 3,313,648 | | |
| | 1,452 | | | UTEX Industries, Inc., LIBOR 1M + 7.000%(1) | | (NR, NR) | | 12/03/25 | | 8.500 | | | 1,464,518 | | |
See Accompanying Notes to Financial Statements.
11
Credit Suisse Floating Rate High Income Fund
Schedule of Investments (continued)
October 31, 2021
Par
(000) | |
| | Ratings†
(S&P/Moody's) | | Maturity | | Rate% | | Value | |
| BANK LOANS (continued) | | | |
Chemicals | | | |
$ | 1,274 | | | UTEX Industries, Inc., LIBOR 1M + 5.250%(1) | | (NR, NR) | | 12/03/25 | | 11.000 | | $ | 1,257,304 | | |
| | 3,978 | | | Vantage Specialty Chemicals, Inc.,
LIBOR 3M + 8.250%(1),(3) | | (CCC-, Caa3) | | 10/27/25 | | 9.250 | | | 3,869,920 | | |
| | 13,822 | | | Zep, Inc., LIBOR 3M + 4.000%(1) | | (CCC+, B3) | | 08/12/24 | | 5.000 | | | 13,601,246 | | |
| | 2,250 | | | Zep, Inc., LIBOR 6M + 8.250%(1),(3) | | (CCC-, Caa3) | | 08/11/25 | | 9.250 | | | 2,211,750 | | |
| | | | 205,541,932 | | |
| Diversified Capital Goods (2.1%) | | | |
| | 4,907 | | | Callaway Golf Co., LIBOR 1M + 4.500%(1) | | (B, B1) | | 01/02/26 | | 4.588 | | | 4,942,237 | | |
| | 240 | | | DexKo Global, Inc. (Delayed Draw Term Loan)(2) | | (B-, B1) | | 10/04/28 | | 0.000 | | | 240,300 | | |
| | 1,260 | | | DexKo Global, Inc. (Term Loan B)(2) | | (B-, B1) | | 10/04/28 | | 0.000 | | | 1,261,575 | | |
| | 10,542 | | | Dynacast International LLC,
LIBOR 3M + 4.750%(1),(7) | | (CCC+, B2) | | 07/22/25 | | 5.750 | | | 10,568,234 | | |
| | 1,377 | | | Dynacast International LLC,
LIBOR 3M + 9.250%(1),(7) | | (CCC-, Caa2) | | 10/22/25 | | 10.250 | | | 1,418,060 | | |
| | 3,818 | | | Electrical Components International, Inc.,
LIBOR 3M + 4.250%(1) | | (B-, B2) | | 06/26/25 | | 4.349 | | | 3,792,566 | | |
| | 1,995 | | | Electrical Components International, Inc.,
PRIME + 7.500%(1),(7) | | (B-, B2) | | 06/26/25 | | 10.750 | | | 1,999,988 | | |
| | 6,025 | | | Filtration Group Corp.(2) | | (B, B3) | | 10/21/28 | | 0.000 | | | 6,027,747 | | |
| | 3,928 | | | GrafTech Finance, Inc., LIBOR 1M + 3.000%(1) | | (BB, Ba3) | | 02/12/25 | | 3.500 | | | 3,939,545 | | |
| | 11,476 | | | Hayward Industries, Inc., LIBOR 1M + 2.500%(1) | | (BB-, B2) | | 05/12/28 | | 3.000 | | | 11,459,773 | | |
| | 3,050 | | | Madison IAQ LLC(2) | | (B, B1) | | 06/21/28 | | 0.000 | | | 3,047,832 | | |
| | 14,949 | | | Vertiv Group Corp., LIBOR 1M + 2.750%(1) | | (BB-, B1) | | 03/02/27 | | 2.830 | | | 14,863,614 | | |
| | | | 63,561,471 | | |
| Electric - Integrated (0.2%) | | | |
| | 7,335 | | | Pacific Gas & Electric Co., LIBOR 3M + 3.000%(1) | | (BB-, B1) | | 06/23/25 | | 3.500 | | | 7,269,607 | | |
| Electronics (2.1%) | | | |
| | 4,205 | | | Brooks Automation, Inc., LIBOR 3M + 2.500%(1) | | (BB-, Ba3) | | 10/04/24 | | 2.630 | | | 4,194,253 | | |
| | 3,499 | | | EXC Holdings III Corp., LIBOR 3M + 3.500%(1),(7) | | (B-, B1) | | 12/02/24 | | 4.500 | | | 3,512,310 | | |
| | 3,131 | | | EXC Holdings III Corp., LIBOR 3M + 7.500%(1) | | (CCC+, Caa1) | | 12/01/25 | | 8.500 | | | 3,139,757 | | |
| | 12,210 | | | Idemia Group, LIBOR 3M + 4.500%(1) | | (B-, B3) | | 01/09/26 | | 5.250 | | | 12,251,288 | | |
| | 7,000 | | | Idemia Identity & Security France SAS,
EURIBOR 3M + 4.500%(1),(6) | | (B-, B3) | | 01/10/26 | | 4.500 | | | 8,140,318 | | |
| | 3,142 | | | Infinite Bidco LLC, LIBOR 1M + 3.750%(1) | | (B-, B2) | | 03/02/28 | | 4.250 | | | 3,147,357 | | |
| | 1,548 | | | Infinite Bidco LLC, LIBOR 1M + 7.000%(1),(7) | | (CCC, Caa2) | | 03/02/29 | | 7.500 | | | 1,563,095 | | |
| | 4,143 | | | MACOM Technology Solutions Holdings, Inc.,
LIBOR 1M + 2.250%(1) | | (BB, Ba2) | | 05/17/24 | | 2.337 | | | 4,128,130 | | |
| | 5,284 | | | Mirion Technologies, Inc.(2) | | (B, B1) | | 10/20/28 | | 0.000 | | | 5,274,230 | | |
| | 11,466 | | | MKS Instruments, Inc.(2) | | (BB, Ba1) | | 10/21/28 | | 0.000 | | | 11,465,698 | | |
| | 5,663 | | | Synaptics, Inc.(2) | | (BB-, Ba1) | | 10/21/28 | | 0.000 | | | 5,678,412 | | |
| | | | 62,494,848 | | |
See Accompanying Notes to Financial Statements.
12
Credit Suisse Floating Rate High Income Fund
Schedule of Investments (continued)
October 31, 2021
Par
(000) | |
| | Ratings†
(S&P/Moody's) | | Maturity | | Rate% | | Value | |
| BANK LOANS (continued) | | | |
| Energy - Exploration & Production (0.3%) | | | |
$ | 2,771 | | | CQP Holdco LP, LIBOR 1M + 3.750%(1) | | (B, B2) | | 06/05/28 | | 4.250 | | $ | 2,771,503 | | |
| | 4,683 | | | PES Holdings LLC(2),(8),(9) | | (NR, NR) | | 12/31/22 | | 0.000 | | | 3,301,570 | | |
| | 15,270 | | | PES Holdings LLC, 3.000% PIK(1),(4),(7),(8) | | (NR, NR) | | 12/31/22 | | 3.000 | | | 286,312 | | |
| | 4,534 | | | PES Holdings LLC, 7.000% PIK(1),(3),(4),(7),(8) | | (NR, NR) | | 12/31/22 | | 7.000 | | | 2,493,570 | | |
| | | | 8,852,955 | | |
| Environmental (0.2%) | | | |
| | 1,430 | | | GFL Environmental, Inc., LIBOR 3M + 3.000%(1) | | (BB-, Ba3) | | 05/30/25 | | 3.500 | | | 1,434,044 | | |
| | 3,920 | | | Patriot Container Corp., LIBOR 1M + 3.750%(1) | | (B, B2) | | 03/20/25 | | 4.750 | | | 3,912,271 | | |
| | | | 5,346,315 | | |
| Food & Drug Retailers (1.1%) | | | |
| | 2,999 | | | L1R HB Finance Ltd., EURIBOR 3M + 4.250%(1),(6) | | (B-, B3) | | 08/09/24 | | 4.250 | | | 3,265,772 | | |
| | 2,999 | | | L1R HB Finance Ltd., LIBOR 3M + 5.250%(1),(10) | | (B-, B3) | | 09/02/24 | | 5.326 | | | 3,834,740 | | |
| | 12,725 | | | Packaging Coordinators Midco, Inc.,
LIBOR 3M + 3.500%(1) | | (B-, B2) | | 11/30/27 | | 4.250 | | | 12,759,158 | | |
| | 12,528 | | | WOOF Holdings, Inc., LIBOR 3M + 3.750%(1) | | (B-, B2) | | 12/21/27 | | 4.500 | | | 12,559,137 | | |
| | 875 | | | WOOF Holdings, Inc., LIBOR 6M + 7.250%(1) | | (CCC, Caa2) | | 12/21/28 | | 8.000 | | | 886,803 | | |
| | | | 33,305,610 | | |
| Food - Wholesale (0.8%) | | | |
| | 959 | | | AI Aqua Merger Sub, Inc.(2) | | (B, B3) | | 07/31/28 | | 0.000 | | | 963,248 | | |
| | 7,668 | | | AI Aqua Merger Sub, Inc., LIBOR 1M + 4.000%(1) | | (B, B3) | | 07/31/28 | | 4.500 | | | 7,705,981 | | |
| | 2,272 | | | Sycamore Buyer LLC(2) | | (BB+, Ba3) | | 09/24/28 | | 0.000 | | | 2,268,726 | | |
| | 6,126 | | | United Natural Foods, Inc., LIBOR 1M + 3.500%(1) | | (BB-, B1) | | 10/22/25 | | 3.587 | | | 6,138,570 | | |
| | 1,764 | | | UTZ Quality Foods, LLC(2) | | (B, B1) | | 01/20/28 | | 0.000 | | | 1,762,692 | | |
| | 5,000 | | | Zara UK Midco Ltd., EURIBOR 6M + 5.750%(1),(3),(6) | | (B, B2) | | 01/31/25 | | 5.750 | | | 5,757,316 | | |
| | | | 24,596,533 | | |
| Gaming (1.1%) | | | |
| | 3,456 | | | Aristocrat Leisure Ltd., LIBOR 3M + 3.750%(1) | | (BB+, Ba1) | | 10/19/24 | | 4.750 | | | 3,468,848 | | |
| | 2,075 | | | Caesars Resort Collection LLC,
LIBOR 1M + 2.750%(1) | | (B+, B1) | | 12/23/24 | | 2.837 | | | 2,067,152 | | |
| | 7,843 | | | CBAC Borrower LLC, LIBOR 1M + 4.000%(1),(3) | | (B-, Caa2) | | 07/08/24 | | 4.087 | | | 7,765,029 | | |
| | 11,058 | | | Golden Nugget, Inc., LIBOR 2M + 2.500%(1) | | (B, B2) | | 10/04/23 | | 3.250 | | | 11,016,620 | | |
| | 9,376 | | | Twin River Worldwide Holdings, Inc.,
LIBOR 3M + 3.250%(1) | | (BB-, Ba2) | | 08/06/28 | | 3.750 | | | 9,378,574 | | |
| | | | 33,696,223 | | |
| Gas Distribution (0.2%) | | | |
| | 3,189 | | | Traverse Midstream Partners LLC(2) | | (B, B3) | | 09/27/24 | | 0.000 | | | 3,195,070 | | |
| | 4,130 | | | Traverse Midstream Partners LLC,
LIBOR 3M + 4.250%(1) | | (B, B3) | | 09/27/24 | | 5.250 | | | 4,136,909 | | |
| | | | 7,331,979 | | |
See Accompanying Notes to Financial Statements.
13
Credit Suisse Floating Rate High Income Fund
Schedule of Investments (continued)
October 31, 2021
Par
(000) | |
| | Ratings†
(S&P/Moody's) | | Maturity | | Rate% | | Value | |
| BANK LOANS (continued) | | | |
| Health Facilities (0.9%) | | | |
$ | 9,262 | | | Insulet Corp., LIBOR 1M + 3.250%(1) | | (B+, Ba3) | | 05/04/28 | | 3.750 | | $ | 9,287,859 | | |
| | 6,888 | | | Loire Finco Luxembourg Sarl,
LIBOR 1M + 3.750%(1) | | (B, B3) | | 04/21/27 | | 4.500 | | | 6,874,893 | | |
| | 9,000 | | | Medline Industries, Inc.(2) | | (B+, B1) | | 10/23/28 | | 0.000 | | | 9,016,875 | | |
| | | | 25,179,627 | | |
| Health Services (5.6%) | | | |
| | 464 | | | ADMI Corp., LIBOR 1M + 3.500%(1) | | (B, B2) | | 12/23/27 | | 4.000 | | | 464,130 | | |
| | 3,721 | | | ADMI Corp., LIBOR 1M + 3.125%(1) | | (B, B2) | | 12/23/27 | | 3.625 | | | 3,698,918 | | |
| | 2,307 | | | Agiliti Health, Inc., LIBOR 1M + 2.750%(1),(7) | | (B+, B1) | | 01/04/26 | | 3.500 | | | 2,306,786 | | |
| | 5,972 | | | Agiliti Health, Inc., LIBOR 1M + 2.750%(1),(7) | | (B+, B1) | | 01/04/26 | | 2.875 | | | 5,964,500 | | |
| | 18,247 | | | Athenahealth, Inc., LIBOR 3M + 4.250%(1) | | (B, B2) | | 02/11/26 | | 4.377 | | | 18,327,186 | | |
| | 7,325 | | | ATI Holdings Acquisition, Inc.,
LIBOR 6M + 3.500%(1) | | (B-, B3) | | 05/10/23 | | 4.500 | | | 6,928,505 | | |
| | 8,705 | | | Cambrex Corp., LIBOR 1M + 3.500%(1) | | (B, B2) | | 12/04/26 | | 4.250 | | | 8,723,377 | | |
| | 5,044 | | | Carestream Health, Inc., LIBOR 6M + 6.750%(1) | | (B-, B1) | | 05/08/23 | | 7.750 | | | 5,073,556 | | |
| | 1,474 | | | Electron BidCo, Inc.(2) | | (B, B1) | | 11/01/28 | | 0.000 | | | 1,473,868 | | |
| | 14,478 | | | KUEHG Corp., LIBOR 3M + 3.750%(1) | | (CCC+, B3) | | 02/21/25 | | 4.750 | | | 14,369,921 | | |
| | 8,990 | | | Learning Care Group, Inc.,
LIBOR 3M + 3.250%(1) | |
(CCC+, B3) | |
03/13/25 | | 3.379 -
4.250 | | | 8,895,389 | | |
| | 14,704 | | | MedAssets Software Intermediate Holdings,
Inc., LIBOR 3M + 3.750%(1) | | (B-, B2) | | 01/28/28 | | 4.500 | | | 14,738,963 | | |
| | 265 | | | Medical Solutions LLC(2) | | (B, B1) | | 10/05/28 | | 0.000 | | | 265,894 | | |
| | 1,393 | | | Medical Solutions LLC(2) | | (B, B1) | | 10/07/28 | | 0.000 | | | 1,395,946 | | |
| | 2,474 | | | Option Care Health, Inc.(2) | | (BB-, Ba3) | | 10/27/28 | | 0.000 | | | 2,473,189 | | |
| | 5,970 | | | PointClickCare Technologies, Inc.,
LIBOR 3M + 3.000%(1) | | (B+, B1) | | 12/29/27 | | 3.750 | | | 5,974,985 | | |
| | 15,128 | | | PPD, Inc., LIBOR 1M + 2.000%(1) | | (BB-, Ba2) | | 01/13/28 | | 2.500 | | | 15,120,600 | | |
| | 8,088 | | | Radiology Partners, Inc.,
LIBOR 1M + 4.250%(1) | |
(B-, B2) | |
07/09/25 | | 4.334 -
4.336 | | | 8,088,931 | | |
| | 1,284 | | | SCP Eye Care Services LLC,
LIBOR 3M + 4.500%(1),(5),(7) | | (B-, B3) | | 03/16/28 | | 4.500 | | | 1,286,924 | | |
| | 7,388 | | | SCP Eye Care Services LLC,
LIBOR 6M + 4.500%(1),(7) | | (B-, B3) | | 03/16/28 | | 5.250 | | | 7,405,999 | | |
| | 3,000 | | | Select Medical Corp., LIBOR 1M + 2.250%(1) | | (BB-, Ba2) | | 03/06/25 | | 2.340 | | | 2,987,625 | | |
| | 3,062 | | | Signify Health LLC, LIBOR 3M + 3.250%(1) | | (B, B1) | | 06/22/28 | | 3.750 | | | 3,056,259 | | |
| | 1,000 | | | Southern Veterinary Partners LLC,
LIBOR 6M + 7.750%(1) | | (CCC, Caa2) | | 10/05/28 | | 8.750 | | | 1,004,690 | | |
| | 1,012 | | | Southern Veterinary Partners LLC,
LIBOR 6M + 4.000%(1) | | (B-, NR) | | 10/05/27 | | 5.000 | | | 1,015,180 | | |
| | 7,298 | | | Southern Veterinary Partners LLC,
LIBOR 3M + 4.000%(1) | | (B-, B2) | | 10/05/27 | | 5.000 | | | 7,323,255 | | |
| | 1,817 | | | TTF Holdings LLC, LIBOR 1M + 4.000%(1),(7) | | (B+, B2) | | 03/24/28 | | 4.750 | | | 1,821,113 | | |
| | 8,122 | | | U.S. Radiology Specialists, Inc.,
LIBOR 3M + 5.500%(1) | | (B-, B3) | | 12/10/27 | | 6.250 | | | 8,164,300 | | |
See Accompanying Notes to Financial Statements.
14
Credit Suisse Floating Rate High Income Fund
Schedule of Investments (continued)
October 31, 2021
Par
(000) | |
| | Ratings†
(S&P/Moody's) | | Maturity | | Rate% | | Value | |
| BANK LOANS (continued) | | | |
Health Services | | | |
$ | 451 | | | Western Dental Services, Inc. (Delayed Draw
Term Loan), LIBOR 1M + 4.500%(1),(5) | | (B-, B3) | | 08/11/28 | | 5.250 | | $ | 452,165 | | |
| | 4,418 | | | Western Dental Services, Inc. (Term Loan B),
LIBOR 1M + 4.500%(1) | | (B-, B3) | | 08/11/28 | | 5.250 | | | 4,431,213 | | |
| | 1,988 | | | Women's Care Enterprises LLC(2) | | (B-, B2) | | 01/15/28 | | 0.000 | | | 1,989,368 | | |
| | | | 165,222,735 | | |
| Hotels (0.3%) | | | |
| | 5,000 | | | Compass III Ltd., EURIBOR 6M + 4.000%(1),(6) | | (B, B2) | | 05/09/25 | | 4.000 | | | 5,788,793 | | |
| | 3,000 | | | Compass IV Ltd., EURIBOR 6M + 8.000%(1),(6) | | (CCC, Caa2) | | 04/30/26 | | 9.000 | | | 3,490,565 | | |
| | | | 9,279,358 | | |
| Insurance Brokerage (3.3%) | | | |
| | 12,285 | | | Acrisure LLC, LIBOR 3M + 3.500%(1) | | (B, B2) | | 02/15/27 | | 3.632 | | | 12,143,562 | | |
| | 5,335 | | | Alliant Holdings Intermediate LLC,
LIBOR 1M + 3.250%(1) | | (B, B2) | | 05/09/25 | | 3.337 | | | 5,296,152 | | |
| | 5,725 | | | Alliant Holdings Intermediate LLC,
LIBOR 1M + 3.750%(1) | | (B, B2) | | 11/05/27 | | 4.250 | | | 5,725,031 | | |
| | 10,282 | | | Alliant Holdings Intermediate LLC(2) | | (B, B2) | | 11/19/27 | | 0.000 | | | 10,273,472 | | |
| | 2,370 | | | AmWINS Group, Inc., LIBOR 1M + 2.250%(1) | | (B+, Ba3) | | 02/19/28 | | 3.000 | | | 2,356,052 | | |
| | 7,291 | | | AssuredPartners, Inc., LIBOR 1M + 3.500%(1) | | (B, B1) | | 02/12/27 | | 3.587 | | | 7,251,950 | | |
| | 11,131 | | | Hub International Ltd.,
LIBOR 3M + 2.750%(1) | |
(B, B2) | |
04/25/25 | | 2.852 -
2.875 | | | 11,019,427 | | |
| | 8,310 | | | Hub International Ltd., LIBOR 3M + 3.250%(1) | | (B, B2) | | 04/25/25 | | 4.000 | | | 8,315,882 | | |
| | 7,222 | | | Hyperion Insurance Group Ltd.,
EURIBOR 1M + 3.500%(1),(6) | | (B, B2) | | 12/20/24 | | 3.500 | | | 8,343,688 | | |
| | 19,046 | | | NFP Corp., LIBOR 1M + 3.250%(1) | | (B, B1) | | 02/15/27 | | 3.337 | | | 18,843,902 | | |
| | 8,183 | | | Ryan Specialty Group LLC, LIBOR 1M + 3.000%(1) | | (BB-, B1) | | 09/01/27 | | 3.750 | | | 8,204,458 | | |
| | | | 97,773,576 | | |
| Investments & Misc. Financial Services (4.1%) | | | |
| | 2,488 | | | AlixPartners, LLP, LIBOR 1M + 2.750%(1) | | (B+, B1) | | 02/04/28 | | 3.250 | | | 2,482,065 | | |
| | 8,136 | | | Altisource Solutions Sarl,
LIBOR 3M + 4.000%(1),(3) | | (CCC-, Caa1) | | 04/03/24 | | 5.000 | | | 7,259,000 | | |
| | 4,763 | | | AqGen Ascensus, Inc.,
LIBOR 3M + 6.500%(1) | | (CCC, Caa2) | | 08/02/29 | | 7.000 | | | 4,762,690 | | |
| | 12,500 | | | AqGen Island Holdings, Inc.,
LIBOR 3M + 3.500%(1) | | (B-, B2) | | 08/02/28 | | 4.000 | | | 12,481,250 | | |
| | 7,958 | | | Citadel Securities LP, LIBOR 1M + 2.500%(1) | | (BBB-, Ba1) | | 02/02/28 | | 2.587 | | | 7,898,455 | | |
| | 9,848 | | | Deerfield Dakota Holding, LLC,
LIBOR 1M + 3.750%(1) | | (B-, B2) | | 04/09/27 | | 4.750 | | | 9,885,130 | | |
| | 12,653 | | | Ditech Holding Corp.(8),(9) | | (NR, NR) | | 06/30/22 | | 0.000 | | | 2,538,480 | | |
| | 1,225 | | | EIG Management Company, LLC,
LIBOR 1M + 3.750%(1) | | (BB, Ba2) | | 02/22/25 | | 4.500 | | | 1,225,005 | | |
| | 9,417 | | | Focus Financial Partners LLC,
LIBOR 1M + 2.000%(1) | | (BB-, Ba3) | | 07/03/24 | | 2.087 | | | 9,378,377 | | |
| | 2,306 | | | Focus Financial Partners LLC,
LIBOR 1M + 2.500%(1) | | (BB-, Ba3) | | 07/01/28 | | 3.000 | | | 2,298,002 | | |
See Accompanying Notes to Financial Statements.
15
Credit Suisse Floating Rate High Income Fund
Schedule of Investments (continued)
October 31, 2021
Par
(000) | |
| | Ratings†
(S&P/Moody's) | | Maturity | | Rate% | | Value | |
| BANK LOANS (continued) | | | |
Investments & Misc. Financial Services | | | |
$ | 533 | | | Focus Financial Partners LLC,
LIBOR 3M + 2.500%(1),(5) | | (BB-, Ba3) | | 06/24/28 | | 2.500 | | $ | 531,637 | | |
| | 15,804 | | | Hudson River Trading LLC, LIBOR 1M + 3.000%(1) | | (BB-, Ba2) | | 03/20/28 | | 3.087 | | | 15,733,853 | | |
| | 14,228 | | | Jane Street Group LLC, LIBOR 1M + 2.750%(1) | | (BB-, Ba2) | | 01/26/28 | | 2.837 | | | 14,097,187 | | |
| | 3,154 | | | Jump Financial, LLC, LIBOR 3M + 3.500%(1),(7) | | (BB-, Ba2) | | 08/02/28 | | 4.000 | | | 3,133,844 | | |
| | 2,114 | | | Kestra Advisor Services Holdings A, Inc.,
LIBOR 1M + 4.250%(1) | | (B, B3) | | 06/03/26 | | 4.340 | | | 2,112,321 | | |
| | 427 | | | Mariner Wealth Advisors LLC(2),(5),(7) | | (B, B1) | | 08/18/28 | | 1.875 | | | 425,744 | | |
| | 2,988 | | | Mariner Wealth Advisors LLC,
LIBOR 3M + 3.250%(1),(7) | | (B, B1) | | 08/18/28 | | 3.750 | | | 2,980,209 | | |
| | 2,356 | | | Resolute Investment Managers, Inc.,
LIBOR 3M + 4.250%(1),(7) | | (B+, Ba3) | | 04/30/24 | | 5.250 | | | 2,359,297 | | |
| | 4,326 | | | VFH Parent LLC, LIBOR 1M + 3.000%(1) | | (B+, Ba3) | | 03/01/26 | | 3.089 | | | 4,322,289 | | |
| | 3,462 | | | Virtus Investment Partners, Inc.,
LIBOR 1M + 2.250%(1) | | (BB+, Ba1) | | 09/28/28 | | 2.332 | | | 3,455,065 | | |
| | 3,500 | | | Walker & Dunlop, Inc.(2),(7) | | (BBB-, NR) | | 10/13/28 | | 0.000 | | | 3,497,813 | | |
| | 10,451 | | | Zebra Buyer LLC(2) | | (BB-, Ba2) | | 04/21/28 | | 0.000 | | | 10,488,798 | | |
| | | | 123,346,511 | | |
| Life Insurance (0.0%) | | | |
| | 1,161 | | | Vida Capital, Inc., LIBOR 1M + 6.000%(1),(7) | | (B-, B2) | | 10/01/26 | | 6.087 | | | 1,070,740 | | |
| Machinery (2.3%) | | | |
| | 4,804 | | | Alliance Laundry Systems LLC,
LIBOR 3M + 3.500%(1) | | (B, B2) | | 10/08/27 | | 4.250 | | | 4,819,411 | | |
| | 2,841 | | | Alloy Finco Ltd., LIBOR 3M + 6.750%(1),(10) | | (NR, Caa2) | | 03/06/24 | | 8.750 | | | 3,894,629 | | |
| | 3,569 | | | Alloy Finco Ltd. (GBP Holdco PIK Term Loan),
LIBOR 3M + 0.500% Cash, 13.500% PIK(1),(4),(7),(10) | | (NR, NR) | | 03/06/25 | | 14.000 | | | 5,014,505 | | |
| | 3,865 | | | Alloy Finco Ltd. (USD Holdco PIK Term Loan),
LIBOR 3M + 0.500% Cash, 13.500% PIK(1),(3),(4),(7) | | (NR, NR) | | 03/06/25 | | 14.000 | | | 3,866,777 | | |
| | 516 | | | CMBF LLC (Delayed Draw Term Loan)(2),(7) | | (B, B3) | | 08/02/28 | | 0.000 | | | 514,765 | | |
| | 1,734 | | | CMBF LLC (Term Loan)(2),(7) | | (B, B3) | | 08/02/28 | | 0.000 | | | 1,729,610 | | |
| | 4,393 | | | Cohu, Inc., LIBOR 3M + 3.000%(1) | | (B+, Ba3) | | 10/01/25 | | 3.172 | | | 4,385,881 | | |
| | 6,584 | | | CPM Holdings, Inc., LIBOR 1M + 3.500%(1) | | (B-, B2) | | 11/17/25 | | 3.582 | | | 6,563,779 | | |
| | 1,578 | | | CPM Holdings, Inc., LIBOR 1M + 8.250%(1),(3) | | (CCC+, Caa2) | | 11/15/26 | | 8.332 | | | 1,563,811 | | |
| | 5,952 | | | Engineered Machinery Holdings, Inc.,
LIBOR 3M + 3.750%(1) | | (B-, B2) | | 05/19/28 | | 4.500 | | | 5,968,115 | | |
| | 3,696 | | | LTI Holdings, Inc., LIBOR 1M + 6.750%(1),(3) | | (CCC+, Caa2) | | 09/06/26 | | 6.837 | | | 3,692,378 | | |
| | 9,909 | | | LTI Holdings, Inc., LIBOR 1M + 3.500%(1) | | (B-, B2) | | 09/06/25 | | 3.587 | | | 9,802,447 | | |
| | 478 | | | LTI Holdings, Inc., LIBOR 3M + 4.750%(1) | | (B-, B2) | | 07/24/26 | | 4.837 | | | 478,424 | | |
| | 795 | | | LTI Holdings, Inc., LIBOR 1M + 4.750%(1) | | (B-, B2) | | 07/24/26 | | 4.837 | | | 795,379 | | |
| | 836 | | | Pro Mach Group, Inc. (Delayed Draw
Term Loan), LIBOR 3M + 4.000%(1),(5) | | (B-, B2) | | 08/31/28 | | 5.000 | | | 841,163 | | |
| | 5,150 | | | Pro Mach Group, Inc. (Term Loan B),
LIBOR 3M + 4.000%(1) | | (B-, B2) | | 08/31/28 | | 5.000 | | | 5,181,562 | | |
| | 8,323 | | | Welbilt, Inc., LIBOR 1M + 2.500%(1) | | (B-, B2) | | 10/23/25 | | 2.587 | | | 8,302,653 | | |
| | | | 67,415,289 | | |
See Accompanying Notes to Financial Statements.
16
Credit Suisse Floating Rate High Income Fund
Schedule of Investments (continued)
October 31, 2021
Par
(000) | |
| | Ratings†
(S&P/Moody's) | | Maturity | | Rate% | | Value | |
| BANK LOANS (continued) | | | |
| Managed Care (0.6%) | | | |
$ | 18,458 | | | Inovalon Holdings, Inc., LIBOR 1M + 2.750%(1) | | (B+, B2) | | 04/02/25 | | 2.875 | | $ | 18,459,691 | | |
| Media - Diversified (0.6%) | | | |
| | 12,777 | | | Alchemy Copyrights, LLC, LIBOR 1M + 3.000%(1),(7) | | (B+, B1) | | 03/10/28 | | 3.500 | | | 12,809,397 | | |
| | 1,887 | | | Diamond Sports Group
LLC, LIBOR 1M + 3.250%(1) | | (CCC, Caa1) | | 08/24/26 | | 3.340 | | | 1,004,753 | | |
| | 2,604 | | | NEP/NCP Holdco, Inc., LIBOR 1M + 3.250%(1) | | (B, B3) | | 10/20/25 | | 3.337 | | | 2,533,960 | | |
| | 1,500 | | | NEP/NCP Holdco, Inc., LIBOR 1M + 7.000%(1),(3) | | (CCC, Caa2) | | 10/19/26 | | 7.087 | | | 1,457,250 | | |
| | | | 17,805,360 | | |
| Media Content (0.3%) | | | |
| | 8,250 | | | Recorded Books, Inc., LIBOR 1M + 4.000%(1) | | (B-, B3) | | 08/29/25 | | 4.084 | | | 8,264,437 | | |
| Medical Products (2.1%) | | | |
| | 14,736 | | | ABB Concise Optical Group LLC,
LIBOR 3M + 5.000%(1) | | (CCC+, B3) | | 06/15/23 | | 6.000 | | | 14,302,905 | | |
| | 9,526 | | | CPI Holdco LLC, LIBOR 1M + 3.750%(1) | | (B, B2) | | 11/04/26 | | 3.837 | | | 9,536,820 | | |
| | 7,393 | | | CryoLife, Inc., LIBOR 3M + 3.500%(1) | | (B, B1) | | 06/01/27 | | 4.500 | | | 7,417,276 | | |
| | 3,717 | | | Femur Buyer, Inc., LIBOR 3M + 4.500%(1) | | (CCC+, Caa1) | | 03/05/26 | | 4.632 | | | 3,500,592 | | |
| | 6,733 | | | Maravai Intermediate Holdings, LLC,
LIBOR 1M + 3.750%(1) | | (B+, B2) | | 10/19/27 | | 4.750 | | | 6,755,847 | | |
| | 18,776 | | | Sotera Health Holdings LLC,
LIBOR 3M + 2.750%(1) | | (BB-, B1) | | 12/11/26 | | 3.250 | | | 18,725,390 | | |
| | 2,468 | | | Viant Medical Holdings, Inc.,
LIBOR 1M + 3.750%(1) | | (CCC+, B3) | | 07/02/25 | | 3.837 | | | 2,400,533 | | |
| | | | 62,639,363 | | |
| Metals & Mining - Excluding Steel (0.0%) | | | |
| | 6,814 | | | Noranda Aluminum Acquisition Corp.(2),(7),(8),(9) | | (NR, NR) | | 02/28/19 | | 0.000 | | | 10,222 | | |
| Oil Refining & Marketing (0.5%) | | | |
| | 12,979 | | | EG Finco Ltd, EURIBOR 3M + 4.000%(1),(6) | | (B-, B3) | | 02/07/25 | | 4.000 | | | 14,932,709 | | |
| Packaging (2.3%) | | | |
| | 5,233 | | | Altium Packaging LLC(2) | | (B+, B2) | | 02/03/28 | | 0.000 | | | 5,189,601 | | |
| | 3,869 | | | Anchor Glass Container Corp.,
LIBOR 3M + 2.750%(1) | | (CCC+, Caa1) | | 12/07/23 | | 3.750 | | | 3,588,207 | | |
| | 2,058 | | | Anchor Glass Container Corp.,
LIBOR 3M + 7.750%(1),(3) | | (CCC-, Caa3) | | 12/07/24 | | 8.750 | | | 1,076,560 | | |
| | 2,942 | | | Anchor Glass Container Corp.,
LIBOR 3M + 5.000%(1),(7) | | (CCC+, Caa1) | | 12/07/23 | | 6.000 | | | 2,677,011 | | |
| | 9,873 | | | Flex Acquisition Co., Inc., LIBOR 3M + 3.000%(1) | | (B, B2) | | 06/29/25 | | 3.131 | | | 9,808,412 | | |
| | 4,187 | | | Flex Acquisition Co., Inc., LIBOR 3M + 3.500%(1) | | (B, B2) | | 02/23/28 | | 4.000 | | | 4,181,111 | | |
| | 2,000 | | | Graham Packaging Co., Inc.(2) | | (B, B1) | | 08/04/27 | | 0.000 | | | 1,997,840 | | |
| | 13,678 | | | Proampac PG Borrower LLC, LIBOR 1M + 3.750%,
LIBOR 3M + 3.750%(1) | |
(B-, B2) | |
11/03/25 | | 3.836 -
4.500 | | | 13,707,518 | | |
| | 1,042 | | | Reynolds Group Holdings, Inc.,
LIBOR 1M + 3.250%(1) | | (B+, B1) | | 02/05/26 | | 3.337 | | | 1,037,060 | | |
See Accompanying Notes to Financial Statements.
17
Credit Suisse Floating Rate High Income Fund
Schedule of Investments (continued)
October 31, 2021
Par
(000) | |
| | Ratings†
(S&P/Moody's) | | Maturity | | Rate% | | Value | |
| BANK LOANS (continued) | | | |
Packaging | | | |
$ | 3,461 | | | Ring Container Technologies Group, LLC,
LIBOR 3M + 3.750%(1) | | (B, B2) | | 08/12/28 | | 4.250 | | $ | 3,472,981 | | |
| | 2,312 | | | Strategic Materials, Inc.,
LIBOR 3M + 3.750%(1),(3) | | (CCC, Caa3) | | 11/01/24 | | 4.750 | | | 2,085,039 | | |
| | 4,375 | | | Strategic Materials, Inc.,
LIBOR 3M + 7.750%(1),(3),(7) | | (CC, C) | | 10/31/25 | | 8.750 | | | 2,515,625 | | |
| | 5,486 | | | Technimark LLC, LIBOR 3M + 3.750%(1) | | (B-, B2) | | 06/30/28 | | 4.250 | | | 5,479,392 | | |
| | 10,623 | | | TricorBraun Holdings, Inc., LIBOR 1M + 3.250%(1) | | (B-, B2) | | 03/03/28 | | 3.750 | | | 10,573,035 | | |
| | | | 67,389,392 | | |
| Packaging & Containers (0.1%) | | | |
| | 3,094 | | | Hyperion Insurance Group Ltd.,
LIBOR 1M + 3.250%(1) | | (B, B2) | | 11/12/27 | | 4.000 | | | 3,092,211 | | |
| Personal & Household Products (2.0%) | | | |
| | 6,709 | | | ABG Intermediate Holdings 2 LLC,
LIBOR 1M + 5.250%(1) | | (B, B2) | | 09/27/24 | | 6.250 | | | 6,726,037 | | |
| | 15,334 | | | ABG Intermediate Holdings 2 LLC,
LIBOR 3M + 3.250%(1) | | (B, B2) | | 09/27/24 | | 4.000 | | | 15,326,755 | | |
| | 7,283 | | | Anticimex International AB(2) | | (B, B2) | | 07/21/28 | | 0.000 | | | 7,287,672 | | |
| | 3,400 | | | Keter Group B.V., EURIBOR 3M + 4.250%(1),(6) | | (B-, B3) | | 10/31/23 | | 5.250 | | | 3,924,142 | | |
| | 5,329 | | | MajorDrive Holdings IV LLC,
LIBOR 3M + 4.000%(1) | | (B, B2) | | 05/12/28 | | 4.500 | | | 5,337,711 | | |
| | 3,649 | | | Serta Simmons Bedding, LLC,
LIBOR 1M + 7.500%(1) | | (B, B2) | | 08/10/23 | | 8.500 | | | 3,698,237 | | |
| | 6,485 | | | Serta Simmons Bedding, LLC,
LIBOR 1M + 7.500%(1) | | (B-, Caa2) | | 08/10/23 | | 8.500 | | | 6,133,031 | | |
| | 10,820 | | | Weber-Stephen Products LLC,
LIBOR 1M + 3.250%(1) | | (BB, B1) | | 10/30/27 | | 4.000 | | | 10,856,509 | | |
| | | | 59,290,094 | | |
| Pharmaceuticals (2.4%) | | | |
| | 4,334 | | | Akorn, Inc., LIBOR 3M + 7.500%(1) | | (CCC+, Caa2) | | 10/01/25 | | 8.500 | | | 4,381,620 | | |
| | 8,626 | | | Alkermes, Inc., LIBOR 3M + 2.500%(1),(7) | | (BB, Ba3) | | 03/12/26 | | 3.000 | | | 8,604,799 | | |
| | 10,820 | | | Bausch Health Companies, Inc.,
LIBOR 1M + 3.000%(1) | | (BB, Ba2) | | 06/02/25 | | 3.087 | | | 10,808,117 | | |
| | 3,146 | | | Bausch Health Companies, Inc.,
LIBOR 1M + 2.750%(1) | | (BB, Ba2) | | 11/27/25 | | 2.837 | | | 3,140,487 | | |
| | 9,379 | | | Certara, LP, LIBOR 1M + 3.500%(1) | | (B+, B2) | | 08/15/26 | | 3.587 | | | 9,384,806 | | |
| | 5,581 | | | Endo Luxembourg Finance Co. I Sarl,
LIBOR 3M + 5.000%(1) | | (B-, B3) | | 03/27/28 | | 5.750 | | | 5,456,877 | | |
| | 4,701 | | | Grifols Worldwide Operations U.S.A., Inc.,
LIBOR 1W + 2.000%(1) | | (BB, Ba3) | | 11/15/27 | | 2.074 | | | 4,639,445 | | |
| | 3,072 | | | Horizon Therapeutics U.S.A., Inc.,
LIBOR 1M + 2.000%(1) | | (BB+, Ba1) | | 03/15/28 | | 2.500 | | | 3,069,336 | | |
| | 8,120 | | | ICON Luxembourg Sarl (Term Loan),
LIBOR 3M + 2.500%(1) | | (BB+, Ba1) | | 07/03/28 | | 3.000 | | | 8,129,731 | | |
See Accompanying Notes to Financial Statements.
18
Credit Suisse Floating Rate High Income Fund
Schedule of Investments (continued)
October 31, 2021
Par
(000) | |
| | Ratings†
(S&P/Moody's) | | Maturity | | Rate% | | Value | |
| BANK LOANS (continued) | | | |
Pharmaceuticals | | | |
$ | 2,023 | | | ICON Luxembourg Sarl (Term Loan),
LIBOR 3M + 2.500%(1) | | (BB+, Ba1) | | 07/03/28 | | | 3.000 | | | $ | 2,025,527 | | |
| | 12,444 | | | Jazz Financing Lux Sarl, LIBOR 1M + 3.500%(1) | | (BB-, Ba2) | | 05/05/28 | | | 4.000 | | | | 12,476,478 | | |
| | | | 72,117,223 | | |
| Real Estate Development & Management (0.2%) | | | |
| | 4,975 | | | BIFM CA Buyer, Inc., LIBOR 1M + 3.750%(1) | | (B, B2) | | 06/01/26 | | | 3.837 | | | | 4,938,813 | | |
| Real Estate Investment Trusts (0.2%) | | | |
| | 2,469 | | | Blackstone Mortgage Trust, Inc.,
LIBOR 1M + 2.750%(1),(7) | | (B+, Ba2) | | 04/23/26 | | | 3.250 | | | | 2,468,844 | | |
| | 4,029 | | | Claros Mortgage Trust, Inc.,
LIBOR 1M + 5.000%(1),(7) | | (B+, Ba3) | | 08/09/26 | | | 6.000 | | | | 4,036,554 | | |
| | | | 6,505,398 | | |
| Recreation & Travel (1.7%) | | | |
| | 12,937 | | | Alterra Mountain Co., LIBOR 1M + 3.500%(1) | | (B, B2) | | 08/17/28 | | | 4.000 | | | | 12,932,555 | | |
| | 2,154 | | | Bulldog Purchaser, Inc., LIBOR 3M + 7.750%(1),(7) | | (CCC-, Caa3) | | 09/04/26 | | | 7.871 | | | | 2,046,154 | | |
| | 9,907 | | | Bulldog Purchaser, Inc., LIBOR 3M + 3.750%(1) | | (B-, B3) | | 09/05/25 | | | 3.871 | | | | 9,618,796 | | |
| | 1,261 | | | Crown Finance U.S., Inc., LIBOR 6M + 2.500%(1) | | (CCC, Caa2) | | 02/28/25 | | | 3.500 | | | | 1,045,570 | | |
| | 5,208 | | | Crown Finance U.S., Inc., LIBOR 6M + 2.750%(1) | | (CCC, Caa2) | | 09/30/26 | | | 3.750 | | | | 4,268,675 | | |
| | 7,920 | | | Hornblower Sub LLC, LIBOR 3M + 4.750%(1) | | (CCC-, Caa2) | | 04/27/25 | | | 5.750 | | | | 7,531,685 | | |
| | 5,773 | | | Hornblower Sub LLC, LIBOR 6M + 8.125%(1),(7) | | (NR, NR) | | 11/10/25 | | | 9.125 | | | | 6,076,289 | | |
| | 2,000 | | | Hornblower Sub LLC, LIBOR 3M + 8.125%(1),(7) | | (NR, NR) | | 11/10/25 | | | 9.125 | | | | 2,105,000 | | |
| | 3,980 | | | Richmond UK Bidco Ltd.,
LIBOR 1M + 4.250%(1),(10) | | (B-, B3) | | 03/03/24 | | | 4.333 | | | | 5,369,261 | | |
| | | | 50,993,985 | | |
| Restaurants (3.1%) | | | |
| | 14,780 | | | 1011778 B.C. Unlimited Liability Co.,
LIBOR 1M + 1.750%(1) | | (BB+, Ba2) | | 11/19/26 | | | 1.837 | | | | 14,521,759 | | |
| | 12,991 | | | Flynn Restaurant Group LP,
LIBOR 1M + 3.500%(1) | | (B, B2) | | 06/27/25 | | | 3.587 | | | | 12,849,824 | | |
| | 7,444 | | | IRB Holding Corp., LIBOR 3M + 3.250%(1) | | (B, B2) | | 12/15/27 | | | 4.250 | | | | 7,452,422 | | |
| | 13,323 | | | IRB Holding Corp., LIBOR 3M + 2.750%(1) | | (B, B2) | | 02/05/25 | | | 3.750 | | | | 13,307,484 | | |
| | 1,529 | | | K-Mac Holdings Corp., LIBOR 3M + 6.750%(1) | | (CCC, Caa2) | | 07/30/29 | | | 7.250 | | | | 1,537,127 | | |
| | 7,500 | | | K-Mac Holdings Corp., LIBOR 3M + 3.500%(1) | | (B-, B2) | | 07/21/28 | | | 4.000 | | | | 7,480,575 | | |
| | 1,500 | | | Miller's Ale House, Inc.(2),(3) | | (CCC+, Caa1) | | 05/30/25 | | | 0.000 | | | | 1,444,875 | | |
| | 16,121 | | | Tacala LLC, LIBOR 1M + 3.500%(1) | | (B-, B2) | | 02/05/27 | | | 4.250 | | | | 16,111,214 | | |
| | 17,334 | | | Whatabrands LLC, LIBOR 1M + 3.250%(1) | | (B, B2) | | 08/03/28 | | | 3.750 | | | | 17,346,099 | | |
| | | | 92,051,379 | | |
| Software - Services (14.4%) | | | |
| | 10,960 | | | Applied Systems, Inc.,
LIBOR 3M + 3.250%, PRIME + 2.250%(1) | |
(B-, B2) | |
09/19/24 | | | 3.750 -
5.500 | | | | 10,960,844 | | |
| | 442 | | | Applied Systems, Inc., LIBOR 3M + 5.500%(1) | | (CCC, Caa2) | | 09/19/25 | | | 6.250 | | | | 449,026 | | |
| | 10,896 | | | Aston FinCo Sarl, LIBOR 1M + 4.250%(1) | | (B-, B2) | | 10/09/26 | | | 4.339 | | | | 10,847,314 | | |
| | 6,938 | | | Astra Acquisition Corp.(2) | | (B-, B2) | | 10/25/28 | | | 0.000 | | | | 6,772,734 | | |
See Accompanying Notes to Financial Statements.
19
Credit Suisse Floating Rate High Income Fund
Schedule of Investments (continued)
October 31, 2021
Par
(000) | |
| | Ratings†
(S&P/Moody's) | | Maturity | | Rate% | | Value | |
| BANK LOANS (continued) | | | |
Software - Services | | | |
$ | 6,316 | | | Camelot U.S. Acquisition 1 Co.,
LIBOR 1M + 3.000%(1) | | (B, B1) | | 10/30/26 | | 4.000 | | $ | 6,335,646 | | |
| | 7,087 | | | Camelot U.S. Acquisition 1 Co.,
LIBOR 1M + 3.000%(1) | | (B, B1) | | 10/30/26 | | 3.087 | | | 7,058,195 | | |
| | 2,500 | | | Cardinal Parent, Inc.(2) | | (B-, B2) | | 11/12/27 | | 0.000 | | | 2,509,375 | | |
| | 3,000 | | | CCC Intelligent Solutions, Inc.(2) | | (B, B1) | | 09/21/28 | | 0.000 | | | 2,994,750 | | |
| | 14,879 | | | Ceridian HCM Holding, Inc.,
LIBOR 1W + 2.500%(1) | | (B+, B1) | | 04/30/25 | | 2.574 | | | 14,729,209 | | |
| | 5,600 | | | Cloudera, Inc., LIBOR 1M + 3.750%(1) | | (B-, B2) | | 10/08/28 | | 4.250 | | | 5,598,264 | | |
| | 1,758 | | | CommerceHub, Inc., LIBOR 1M + 7.000%(1) | | (CCC, Caa2) | | 12/29/28 | | 7.750 | | | 1,799,350 | | |
| | 6,879 | | | CommerceHub, Inc., LIBOR 3M + 4.000%(1) | | (B, B2) | | 12/29/27 | | 4.750 | | | 6,898,348 | | |
| | 4,893 | | | Corel Corp., LIBOR 3M + 5.000%(1) | | (B-, B2) | | 07/02/26 | | 5.121 | | | 4,906,688 | | |
| | 13,338 | | | DCert Buyer, Inc., LIBOR 1M + 4.000%(1) | | (B-, B2) | | 10/16/26 | | 4.087 | | | 13,362,143 | | |
| | 487 | | | DCert Buyer, Inc.(2) | | (CCC, Caa2) | | 02/16/29 | | 0.000 | | | 492,847 | | |
| | 4,547 | | | E2open, LLC, LIBOR 3M + 3.250%(1) | | (B, B2) | | 02/04/28 | | 3.750 | | | 4,559,197 | | |
| | 2,000 | | | E2open, LLC(2) | | (B, B2) | | 02/04/28 | | 0.000 | | | 2,004,580 | | |
| | 6,963 | | | EAB Global, Inc., LIBOR 6M + 3.500%(1) | | (B-, B2) | | 08/16/28 | | 4.000 | | | 6,936,115 | | |
| | 777 | | | Emerald TopCo, Inc., LIBOR 1M + 3.500%,
LIBOR 3M + 3.500%(1) | |
(B, B2) | |
07/24/26 | | 3.587 -
3.629 | | | 772,344 | | |
| | 5,488 | | | Endure Digital, Inc., LIBOR 6M + 3.500%(1) | | (B, B2) | | 02/10/28 | | 4.250 | | | 5,402,883 | | |
| | 4,080 | | | Epicor Software Corp., LIBOR 1M + 7.750%(1) | | (CCC, Caa2) | | 07/31/28 | | 8.750 | | | 4,200,360 | | |
| | 14,725 | | | Epicor Software Corp., LIBOR 1M + 3.250%(1) | | (B-, B2) | | 07/30/27 | | 4.000 | | | 14,728,680 | | |
| | 25,949 | | | Finastra U.S.A., Inc., LIBOR 6M + 3.500%(1) | | (B-, B2) | | 06/13/24 | | 4.500 | | | 25,853,562 | | |
| | 9,032 | | | Finastra U.S.A., Inc., LIBOR 3M + 7.250%(1) | | (CCC, Caa2) | | 06/13/25 | | 8.250 | | | 9,056,304 | | |
| | 6,453 | | | First Advantage Holdings LLC,
LIBOR 1M + 2.750%(1) | | (BB-, B1) | | 01/31/27 | | 2.837 | | | 6,446,789 | | |
| | 18,626 | | | Flexera Software LLC, LIBOR 3M + 3.750%(1) | | (B-, B1) | | 03/03/28 | | 4.500 | | | 18,671,462 | | |
| | 14,128 | | | GHX Ultimate Parent Corp.,
LIBOR 3M + 3.250%(1) | | (B, B2) | | 06/28/24 | | 4.250 | | | 14,159,141 | | |
| | 8,677 | | | Huskies Parent, Inc., PRIME + 3.000%(1) | | (B-, B2) | | 07/31/26 | | 6.250 | | | 8,678,928 | | |
| | 9,360 | | | Hyland Software, Inc., LIBOR 1M + 3.500%(1) | | (B-, B1) | | 07/01/24 | | 4.250 | | | 9,380,270 | | |
| | 4,975 | | | IGT Holding IV AB, LIBOR 3M + 3.750%(1) | | (B, B2) | | 03/31/28 | | 4.250 | | | 4,981,219 | | |
| | 4,505 | | | Instructure Holdings, Inc.(2),(7) | | (NR, B1) | | 10/30/28 | | 0.000 | | | 4,510,428 | | |
| | 2,041 | | | MA FinanceCo. LLC, LIBOR 1M + 2.750%(1) | | (BB-, B1) | | 06/21/24 | | 2.837 | | | 2,026,662 | | |
| | 700 | | | Marcel LUX IV Sarl, LIBOR 1M + 4.000%(1),(7) | | (BB-, B1) | | 12/31/27 | | 4.750 | | | 701,666 | | |
| | 2,989 | | | Marcel LUX IV Sarl, LIBOR 1M + 3.250%(1),(7) | | (BB-, B1) | | 03/15/26 | | 3.337 | | | 2,996,468 | | |
| | 2,000 | | | Mitchell International, Inc.,
LIBOR 1M + 3.750%(1) | | (B-, B2) | | 10/15/28 | | 4.250 | | | 1,985,060 | | |
| | 6,707 | | | Navicure, Inc., LIBOR 1M + 4.000%(1) | | (B-, B2) | | 10/22/26 | | 4.087 | | | 6,723,311 | | |
| | 9,000 | | | Newport Group, Inc.(2) | | (B, B2) | | 09/13/25 | | 0.000 | | | 8,988,750 | | |
| | 23,455 | | | Polaris Newco LLC, LIBOR 3M + 4.000%(1) | | (B-, B2) | | 06/02/28 | | 4.500 | | | 23,537,089 | | |
| | 15,261 | | | Project Alpha Intermediate Holding, Inc.,
LIBOR 1M + 4.000%(1) | | (B, B3) | | 04/26/24 | | 4.090 | | | 15,262,799 | | |
| | 4,972 | | | Project Boost Purchaser, LLC,
LIBOR 1M + 3.500%(1) | | (B-, B2) | | 06/01/26 | | 3.587 | | | 4,949,621 | | |
| | 499 | | | Project Boost Purchaser, LLC(2) | | (B-, B2) | | 05/30/26 | | 0.000 | | | 499,271 | | |
See Accompanying Notes to Financial Statements.
20
Credit Suisse Floating Rate High Income Fund
Schedule of Investments (continued)
October 31, 2021
Par
(000) | |
| | Ratings†
(S&P/Moody's) | | Maturity | | Rate% | | Value | |
| BANK LOANS (continued) | | | |
Software - Services | | | |
$ | 1,364 | | | Project Leopard Holdings, Inc.,
LIBOR 3M + 4.750%(1) | | (B, B2) | | 07/05/24 | | 5.750 | | $ | 1,371,133 | | |
| | 8,487 | | | Project Ruby Ultimate Parent Corp.,
LIBOR 1M + 3.250%(1) | | (B, B2) | | 03/03/28 | | 4.000 | | | 8,488,264 | | |
| | 16,043 | | | Proofpoint, Inc., LIBOR 3M + 3.250%(1) | | (B-, B2) | | 08/31/28 | | 3.750 | | | 15,993,748 | | |
| | 19,150 | | | RealPage, Inc., LIBOR 1M + 3.250%(1) | | (B, B2) | | 04/24/28 | | 3.750 | | | 19,132,574 | | |
| | 13,673 | | | Seattle Spinco, Inc., LIBOR 1M + 2.750%(1) | | (BB-, B1) | | 06/21/24 | | 2.837 | | | 13,576,436 | | |
| | 3,789 | | | SkillSoft Corp., LIBOR 3M + 4.750%(1) | | (B-, B2) | | 06/30/28 | | 5.500 | | | 3,822,374 | | |
| | 3,137 | | | SS&C European Holdings Sarl,
LIBOR 1M + 1.750%(1) | | (BB+, Ba2) | | 04/16/25 | | 1.837 | | | 3,108,603 | | |
| | 3,964 | | | SS&C Technologies, Inc., LIBOR 1M + 1.750%(1) | | (BB+, Ba2) | | 04/16/25 | | 1.837 | | | 3,929,045 | | |
| | 12,247 | | | Storable, Inc., LIBOR 6M + 3.250%(1) | | (B, B2) | | 04/17/28 | | 3.750 | | | 12,237,086 | | |
| | 16,145 | | | The Ultimate Software Group, Inc.,
LIBOR 1M + 3.750%(1) | | (B-, B1) | | 05/04/26 | | 3.837 | | | 16,189,823 | | |
| | 2,000 | | | TPG VIII Elf Purchaser, LLC(2),(7) | | (B+, B1) | | 10/14/28 | | 0.000 | | | 2,001,250 | | |
| | 6,026 | | | Turing Midco LLC, LIBOR 1M + 3.000%(1) | | (B+, B2) | | 03/23/28 | | 3.500 | | | 6,034,786 | | |
| | 2,107 | | | Verint Systems, Inc., LIBOR 1M + 2.000%(1) | | (BBB-, Ba1) | | 06/28/24 | | 2.082 | | | 2,107,095 | | |
| | 7,181 | | | Virtusa Corp., LIBOR 1M + 3.750%(1) | | (B+, B2) | | 02/11/28 | | 4.500 | | | 7,223,529 | | |
| | 10,624 | | | VS Buyer LLC, LIBOR 1M + 3.000%(1) | | (B, B1) | | 02/28/27 | | 3.087 | | | 10,604,533 | | |
| | | | 429,547,971 | | |
| Specialty Retail (0.8%) | | | |
| | 11,314 | | | Mister Car Wash Holdings, Inc.,
LIBOR 1M + 3.000%(1) | | (B, B2) | | 05/14/26 | | 3.089 | | | 11,297,717 | | |
| | 3,208 | | | Pilot Travel Centers LLC, LIBOR 1M + 2.000%(1) | | (BB+, Ba1) | | 07/28/28 | | 2.087 | | | 3,192,660 | | |
| | 10,000 | | | Restoration Hardware, Inc.(2) | | (BB, Ba2) | | 10/20/28 | | 0.000 | | | 10,002,100 | | |
| | | | 24,492,477 | | |
| Steel Producers/Products (0.4%) | | | |
| | 2,107 | | | Grinding Media, Inc., LIBOR 3M + 4.000%(1) | | (B, B2) | | 10/12/28 | | 4.122 | | | 2,115,386 | | |
| | 8,665 | | | Zekelman Industries, Inc., LIBOR 1M + 2.000%(1) | | (BB+, Ba3) | | 01/24/27 | | 2.086 | | | 8,595,994 | | |
| | | | 10,711,380 | | |
| Support - Services (5.3%) | | | |
| | 6,002 | | | Allied Universal Holdco LLC, LIBOR 3M + 3.750%(1) | | (B, B2) | | 05/12/28 | | 4.250 | | | 6,006,332 | | |
| | 3,746 | | | Beacon Roofing Supply, Inc.,
LIBOR 1M + 2.250%(1) | | (BB-, Ba3) | | 05/19/28 | | 2.337 | | | 3,726,036 | | |
| | 2,683 | | | Belron Finance U.S. LLC, LIBOR 3M + 2.750%(1) | | (BB+, Ba3) | | 04/13/28 | | 3.250 | | | 2,687,180 | | |
| | 4,589 | | | Centuri Group, Inc., LIBOR 3M + 2.500%(1) | | (BB-, Ba2) | | 08/27/28 | | 3.000 | | | 4,599,201 | | |
| | 14,342 | | | Change Healthcare Holdings LLC,
LIBOR 1M + 2.500%(1) | | (B+, B1) | | 03/01/24 | | 3.500 | | | 14,344,428 | | |
| | 8,000 | | | CoreLogic, Inc., LIBOR 1M + 3.500%(1) | | (B, B1) | | 06/02/28 | | 4.000 | | | 8,009,000 | | |
| | 3,025 | | | Global Education Management Systems
Establishment, LIBOR 3M + 5.000%(1) | | (B-, B3) | | 07/31/26 | | 6.000 | | | 3,044,661 | | |
| | 3,280 | | | LaserShip, Inc.(2) | | (CCC, Caa2) | | 05/07/29 | | 0.000 | | | 3,312,405 | | |
| | 7,500 | | | LaserShip, Inc., LIBOR 3M + 4.500%(1) | | (B-, B2) | | 05/07/28 | | 5.250 | | | 7,523,475 | | |
See Accompanying Notes to Financial Statements.
21
Credit Suisse Floating Rate High Income Fund
Schedule of Investments (continued)
October 31, 2021
Par
(000) | |
| | Ratings†
(S&P/Moody's) | | Maturity | | Rate% | | Value | |
| BANK LOANS (continued) | | | |
Support - Services | | | |
$ | 5,000 | | | MSX International, Inc.,
EURIBOR 3M + 4.500%(1),(3),(6) | | (B-, B3) | | 01/06/24 | | 4.500 | | $ | 5,732,377 | | |
| | 5,466 | | | Nuvei Technologies Corp.,
LIBOR 3M + 2.500%(1),(7) | |
(B+, Ba3) | |
09/29/25 | | 2.629-
3.000 | | |
5,479,183 | | |
| | 1,531 | | | Osmose Utilities Services, Inc.,
LIBOR 1M + 3.250%(1) | | (B, B2) | | 06/23/28 | | 3.750 | | | 1,528,849 | | |
| | 16,387 | | | Pike Corp., LIBOR 1M + 3.000%(1) | | (B, Ba3) | | 01/21/28 | | 3.090 | | | 16,382,943 | | |
| | 4,470 | | | Savage Enterprises LLC, LIBOR 1M + 3.250%(1) | | (BB-, B1) | | 09/15/28 | | 3.750 | | | 4,485,469 | | |
| | 12,186 | | | Sedgwick Claims Management Services, Inc.,
LIBOR 1M + 3.250%(1) | | (B, B2) | | 12/31/25 | | 3.337 | | | 12,074,757 | | |
| | 10,942 | | | SRAM, LLC, LIBOR 6M + 2.750%(1) | | (BB-, B1) | | 05/12/28 | | 3.250 | | | 10,939,444 | | |
| | 496 | | | St. George's University Scholastic Services(2) | | (B+, B2) | | 07/17/25 | | 0.000 | | | 496,329 | | |
| | 825 | | | St. George's University Scholastic Services(2) | | (B+, B2) | | 06/29/28 | | 0.000 | | | 821,778 | | |
| | 14,323 | | | Tempo Acquisition LLC, LIBOR 1M + 3.250%(1) | | (BB-, Ba3) | | 11/02/26 | | 3.750 | | | 14,376,875 | | |
| | 19 | | | Tempo Acquisition LLC, LIBOR 1M + 2.750%(1) | | (BB-, Ba3) | | 05/01/24 | | 2.837 | | | 19,398 | | |
| | 995 | | | Tiger Acquisition, LLC, LIBOR 3M + 3.250%(1) | | (B, B1) | | 06/01/28 | | 3.750 | | | 989,989 | | |
| | 6,717 | | | USS Ultimate Holdings, Inc.,
LIBOR 1M + 7.750%(1),(3) | | (CCC, Caa1) | | 08/25/25 | | 8.750 | | | 6,742,361 | | |
| | 2,872 | | | Waterlogic Holdings Ltd., LIBOR 3M + 4.750%(1) | | (B, B3) | | 08/04/28 | | 4.890 | | | 2,880,124 | | |
| | 17,883 | | | White Cap Buyer LLC, LIBOR 1M + 4.000%(1) | | (B, B2) | | 10/19/27 | | 4.500 | | | 17,944,352 | | |
| | 3,101 | | | Wrench Group LLC, LIBOR 3M + 4.000%(1),(7) | | (B-, B2) | | 04/30/26 | | 4.132 | | | 3,099,328 | | |
| | | | 157,246,274 | | |
| Tech Hardware & Equipment (0.5%) | | | |
| | 6,844 | | | CommScope, Inc., LIBOR 1M + 3.250%(1) | | (B, Ba3) | | 04/06/26 | | 3.337 | | | 6,763,529 | | |
| | 6,575 | | | Ingram Micro, Inc., LIBOR 3M + 3.500%(1) | | (BB-, B1) | | 06/30/28 | | 4.000 | | | 6,597,541 | | |
| | | | 13,361,070 | | |
| Telecom - Wireless (0.3%) | | | |
| | 3,942 | | | Eagle Broadband Investments LLC,
LIBOR 3M + 3.000%(1) | | (B+, B2) | | 11/12/27 | | 3.750 | | | 3,947,306 | | |
| | 4,988 | | | MetroNet Systems Holdings, LLC,
LIBOR 1M + 3.750%(1) | | (B-, B2) | | 05/26/28 | | 4.500 | | | 5,003,884 | | |
| | | | 8,951,190 | | |
| Telecom - Wireline Integrated & Services (2.1%) | | | |
| | 2,487 | | | Altice France S.A., LIBOR 3M + 4.000%(1) | | (B, B2) | | 08/14/26 | | 4.125 | | | 2,480,439 | | |
| | 9,042 | | | Altice France S.A., LIBOR 3M + 3.688%(1) | | (B, B2) | | 01/31/26 | | 3.811 | | | 8,959,166 | | |
| | 14,309 | | | CenturyLink, Inc., LIBOR 1M + 2.250%(1) | | (BBB-, Ba3) | | 03/15/27 | | 2.337 | | | 14,154,108 | | |
| | 3,821 | | | Cologix, Inc., LIBOR 1M + 3.750%(1) | | (B, B2) | | 05/01/28 | | 4.500 | | | 3,833,137 | | |
| | 833 | | | GTT Communications, Inc.(2),(8) | | (CCC-, NR) | | 05/31/25 | | 0.000 | | | 710,667 | | |
| | 7,269 | | | Level 3 Financing, Inc., LIBOR 1M + 1.750%(1) | | (BBB-, Ba1) | | 03/01/27 | | 1.837 | | | 7,181,879 | | |
| | 5,658 | | | Numericable Group S.A., LIBOR 3M + 2.750%(1) | | (B, B2) | | 07/31/25 | | 2.879 | | | 5,574,942 | | |
| | 2,262 | | | TVC Albany, Inc., LIBOR 1M + 3.500%(1) | | (B-, B2) | | 07/23/25 | | 3.590 | | | 2,241,407 | | |
| | 5,700 | | | Voyage Australia Pty Ltd., LIBOR 3M + 3.500%(1) | | (BB-, B1) | | 07/20/28 | | 4.000 | | | 5,721,375 | | |
| | 11,426 | | | Zayo Group Holdings, Inc., LIBOR 1M + 3.000%(1) | | (B, B1) | | 03/09/27 | | 3.087 | | | 11,263,892 | | |
| | | | 62,121,012 | | |
See Accompanying Notes to Financial Statements.
22
Credit Suisse Floating Rate High Income Fund
Schedule of Investments (continued)
October 31, 2021
Par
(000) | |
| | Ratings†
(S&P/Moody's) | | Maturity | | Rate% | | Value | |
| BANK LOANS (continued) | | | |
| Theaters & Entertainment (2.5%) | | | |
$ | 2,242 | | | Metro-Goldwyn-Mayer, Inc.,
LIBOR 1M + 2.500%(1) | | (BB-, Ba3) | | 07/03/25 | | 2.590 | | $ | 2,236,413 | | |
| | 16,830 | | | Metro-Goldwyn-Mayer, Inc.,
LIBOR 1M + 4.500%(1) | | (CCC+, B3) | | 07/03/26 | | 5.500 | | | 16,887,471 | | |
| | 4,791 | | | NAI Entertainment Holdings LLC,
LIBOR 1M + 2.500%(1),(3) | | (BB-, B3) | | 05/08/25 | | 3.500 | | | 4,707,522 | | |
| | 6,471 | | | Technicolor S.A., EURIBOR 6M + 3.000%
Cash, 3.000% PIK(1),(4),(6) | | (CCC, Caa3) | | 12/31/24 | | 6.000 | | | 7,353,396 | | |
| | 1,238 | | | Technicolor S.A., LIBOR 6M + 6.000%
Cash, 6.000% PIK(1),(4),(7) | | (B, Caa1) | | 06/30/24 | | 12.150 | | | 1,331,139 | | |
| | 1,947 | | | Technicolor S.A., LIBOR 3M + 2.750%
Cash, 3.000% PIK(1),(4) | | (CCC, Caa3) | | 12/31/24 | | 5.900 | | | 1,911,793 | | |
| | 16,486 | | | UFC Holdings LLC, LIBOR 6M + 2.750%(1) | | (B, B2) | | 04/29/26 | | 3.500 | | | 16,413,161 | | |
| | 23,691 | | | William Morris Endeavor Entertainment LLC,
LIBOR 1M + 2.750%(1) | | (B, B3) | | 05/18/25 | | 2.840 | | | 23,289,142 | | |
| | | | 74,130,037 | | |
| Transport Infrastructure/Services (0.1%) | | | |
| | 3,817 | | | AI Mistral Holdco Ltd., LIBOR 1M + 3.000%(1),(7) | | (CCC+, Caa2) | | 03/11/24 | | 4.000 | | | 3,301,756 | | |
| Trucking & Delivery (0.3%) | | | |
| | 7,565 | | | American Trailer World Corp.,
LIBOR 1M + 3.750%(1) | | (B, B3) | | 03/03/28 | | 4.500 | | | 7,543,782 | | |
| TOTAL BANK LOANS (Cost $2,569,730,966) | | | 2,536,353,758 | | |
| CORPORATE BONDS (7.8%) | | | |
| Auto Parts & Equipment (0.3%) | | | |
| | 1,345 | | | Clarios U.S. Finance Co., Rule 144A,
Company Guaranteed Notes
(Callable 05/15/22 @ 104.25)(11) | | (CCC+, Caa1) | | 05/15/27 | | 8.500 | | | 1,430,434 | | |
| | 6,665 | | | Cooper-Standard Automotive, Inc., Rule 144A,
Company Guaranteed Notes
(Callable 11/15/21 @ 102.81)(11) | | (CCC, Caa1) | | 11/15/26 | | 5.625 | | | 5,357,960 | | |
| | 2,000 | | | TI Automotive Finance PLC, Rule 144A,
Senior Unsecured Notes
(Callable 04/15/24 @ 101.88)(6),(11) | | (B+, B3) | | 04/15/29 | | 3.750 | | | 2,322,764 | | |
| | | | 9,111,158 | | |
| Brokerage (0.1%) | | | |
| | 2,017 | | | StoneX Group, Inc., Rule 144A,
Senior Secured Notes
(Callable 06/15/22 @ 104.31)(11) | | (BB-, Ba3) | | 06/15/25 | | 8.625 | | | 2,145,584 | | |
| Building Materials (0.1%) | | | |
| | 2,860 | | | Park River Holdings, Inc., Rule 144A,
Senior Unsecured Notes
(Callable 08/01/24 @ 103.38)(11) | | (CCC, Caa1) | | 08/01/29 | | 6.750 | | | 2,807,333 | | |
See Accompanying Notes to Financial Statements.
23
Credit Suisse Floating Rate High Income Fund
Schedule of Investments (continued)
October 31, 2021
Par
(000) | |
| | Ratings†
(S&P/Moody's) | | Maturity | | Rate% | | Value | |
| CORPORATE BONDS (continued) | | | |
| Cable & Satellite TV (0.4%) | | | |
$ | 1,000 | | | CSC Holdings LLC, Rule 144A,
Company Guaranteed Notes
(Callable 11/15/26 @ 102.25)(11) | | (BB, Ba3) | | 11/15/31 | | 4.500 | | $ | 970,225 | | |
| | 8,000 | | | Telenet Finance Luxembourg Notes Sarl,
Rule 144A, Senior Secured Notes
(Callable 12/01/22 @ 102.75)(11) | | (BB-, Ba3) | | 03/01/28 | | 5.500 | | | 8,360,000 | | |
| | 2,181 | | | Ziggo B.V., Rule 144A, Senior Secured Notes
(Callable 01/15/22 @ 102.75)(11) | | (B+, B1) | | 01/15/27 | | 5.500 | | | 2,238,251 | | |
| | | | 11,568,476 | | |
| Chemicals (0.2%) | | | |
| | 4,000 | | | Herens Holdco Sarl, Rule 144A,
Senior Secured Notes
(Callable 05/15/24 @ 102.38)(11) | | (B, B2) | | 05/15/28 | | 4.750 | | | 3,973,200 | | |
| | 3,250 | | | Schenectady International Group, Inc., Rule 144A,
Senior Unsecured Notes
(Callable 05/15/23 @ 103.38)(11) | | (CCC+, Caa2) | | 05/15/26 | | 6.750 | | | 3,241,534 | | |
| | | | 7,214,734 | | |
| Consumer/Commercial/Lease Financing (0.2%) | | | |
| | 6,815 | | | Cargo Aircraft Management, Inc., Rule 144A,
Company Guaranteed Notes
(Callable 02/01/23 @ 102.38)(11) | | (BB, Ba3) | | 02/01/28 | | 4.750 | | | 6,977,401 | | |
| Diversified Capital Goods (0.1%) | | | |
| | 2,000 | | | Atkore, Inc., Rule 144A,
Senior Unsecured Notes
(Callable 06/01/26 @ 102.13)(11) | | (BB-, Ba3) | | 06/01/31 | | 4.250 | | | 2,022,550 | | |
| Energy - Exploration & Production (0.2%) | | | |
| | 7,600 | | | W&T Offshore, Inc., Rule 144A,
Secured Notes
(Callable 11/29/21 @ 102.44)(11) | | (B, Caa2) | | 11/01/23 | | 9.750 | | | 7,419,272 | | |
| Gaming (0.1%) | | | |
| | 1,862 | | | Golden Nugget, Inc., Rule 144A,
Senior Unsecured Notes
(Callable 11/29/21 @ 100.00)(11) | | (CCC, Caa2) | | 10/15/24 | | 6.750 | | | 1,868,983 | | |
| Gas Distribution (0.1%) | | | |
| | 3,000 | | | New Fortress Energy, Inc., Rule 144A,
Senior Secured Notes
(Callable 03/31/23 @ 103.25)(11) | | (B+, B1) | | 09/30/26 | | 6.500 | | | 2,920,260 | | |
See Accompanying Notes to Financial Statements.
24
Credit Suisse Floating Rate High Income Fund
Schedule of Investments (continued)
October 31, 2021
Par
(000) | |
| | Ratings†
(S&P/Moody's) | | Maturity | | Rate% | | Value | |
| CORPORATE BONDS (continued) | | | |
| Health Facility (0.4%) | | | |
$ | 11,740 | | | Mozart Debt Merger Sub, Inc., Rule 144A,
Senior secured Notes
(Callable 10/01/24 @ 101.94)(11) | | (B+, B1) | | 04/01/29 | | 3.875 | | $ | 11,704,428 | | |
| Health Services (0.6%) | | | |
| | 10,204 | | | Owens & Minor, Inc.,
Global Senior Secured Notes
(Callable 09/15/24 @ 100.00) | | (BB-, Ba2) | | 12/15/24 | | 4.375 | | | 10,726,955 | | |
| | 1,500 | | | Owens & Minor, Inc., Rule 144A,
Company Guaranteed Notes
(Callable 03/31/24 @ 102.25)(11) | | (B, B1) | | 03/31/29 | | 4.500 | | | 1,507,500 | | |
| | 2,040 | | | Radiology Partners, Inc., Rule 144A,
Company Guaranteed Notes
(Callable 02/01/23 @ 104.63)(11) | | (CCC, Caa2) | | 02/01/28 | | 9.250 | | | 2,165,807 | | |
| | 2,000 | | | RP Escrow Issuer LLC, Rule 144A,
Senior Secured Notes
(Callable 12/15/22 @ 102.63)(11) | | (B-, B2) | | 12/15/25 | | 5.250 | | | 2,002,500 | | |
| | | | 16,402,762 | | |
| Insurance Brokerage (0.2%) | | | |
| | 1,801 | | | Acrisure Finance, Inc., Rule 144A,
Senior Unsecured Notes
(Callable 11/29/21 @ 101.75)(11) | | (CCC+, Caa2) | | 11/15/25 | | 7.000 | | | 1,821,261 | | |
| | 1,260 | | | Alliant Holdings Co-Issuer, Rule 144A,
Senior Secured Notes
(Callable 10/15/23 @ 102.13)(11) | | (B, B2) | | 10/15/27 | | 4.250 | | | 1,258,425 | | |
| | 3,500 | | | NFP Corp., Rule 144A, Senior Secured Notes
(Callable 08/15/23 @ 102.44)(11) | | (B, B1) | | 08/15/28 | | 4.875 | | | 3,556,875 | | |
| | | | 6,636,561 | | |
| Investments & Misc. Financial Services (0.2%) | | | |
| | 4,000 | | | Armor Holdco, Inc., Rule 144A,
Senior Unsecured Notes
(Callable 11/15/24 @ 104.25)(11) | | (CCC+, Caa1) | | 11/15/29 | | 8.500 | | | 4,000,000 | | |
| | 3,000 | | | Compass Group Diversified Holdings LLC,
Rule 144A, Company Guaranteed Notes
(Callable 04/15/24 @ 102.63)(11) | | (B+, B1) | | 04/15/29 | | 5.250 | | | 3,123,750 | | |
| | | | 7,123,750 | | |
| Machinery (0.1%) | | | |
| | 3,650 | | | Arcosa, Inc., Rule 144A, Company Guaranteed
Notes (Callable 04/15/24 @ 102.19)(11) | | (BB, Ba2) | | 04/15/29 | | 4.375 | | | 3,709,312 | | |
| Media Content (0.2%) | | | |
| | 4,250 | | | Diamond Sports Finance Co., Rule 144A,
Senior Secured Notes
(Callable 08/15/22 @ 102.69)(11) | | (CCC, Caa1) | | 08/15/26 | | 5.375 | | | 2,409,771 | | |
See Accompanying Notes to Financial Statements.
25
Credit Suisse Floating Rate High Income Fund
Schedule of Investments (continued)
October 31, 2021
Par
(000) | |
| | Ratings†
(S&P/Moody's) | | Maturity | | Rate% | | Value | |
| CORPORATE BONDS (continued) | | | |
Media Content | | | |
$ | 4,000 | | | WMG Acquisition Corp., Rule 144A,
Senior Secured Notes
(Callable 07/15/25 @ 101.94)(11) | | (BB+, Ba3) | | 07/15/30 | | 3.875 | | $ | 4,150,280 | | |
| | | | 6,560,051 | | |
| Metals & Mining - Excluding Steel (0.1%) | | | |
| | 4,000 | | | Taseko Mines Ltd., Rule 144A,
Senior Secured Notes
(Callable 02/15/23 @ 103.50)(11) | | (B-, Caa1) | | 02/15/26 | | 7.000 | | | 4,140,000 | | |
| Packaging (0.4%) | | | |
| | 10,350 | | | TriMas Corp., Rule 144A,
Company Guaranteed Notes
(Callable 04/15/24 @ 102.06)(11) | | (BB-, Ba3) | | 04/15/29 | | 4.125 | | | 10,493,140 | | |
| Pharmaceuticals (0.3%) | | | |
| | 355 | | | Bausch Health Americas, Inc., Rule 144A,
Company Guaranteed Notes
(Callable 04/01/22 @ 104.63)(11) | | (B, B3) | | 04/01/26 | | 9.250 | | | 377,631 | | |
| | 2,000 | | | Bausch Health Cos., Inc., Rule 144A,
Company Guaranteed Notes
(Callable 02/15/24 @ 103.13)(11) | | (B, B3) | | 02/15/29 | | 6.250 | | | 1,940,570 | | |
| | 1,000 | | | Bausch Health Cos., Inc., Rule 144A,
Company Guaranteed Notes
(Callable 02/15/26 @ 102.63)(11) | | (B, B3) | | 02/15/31 | | 5.250 | | | 900,640 | | |
| | 6,825 | | | Jazz Securities DAC, Rule 144A,
Senior Secured Notes
(Callable 07/15/24 @ 102.19)(11) | | (BB-, Ba2) | | 01/15/29 | | 4.375 | | | 7,021,219 | | |
| | | | 10,240,060 | | |
| Real Estate Investment Trusts (0.5%) | | | |
| | 1,070 | | | iStar, Inc., Global Senior Unsecured Notes
(Callable 08/15/22 @ 102.75) | | (BB, Ba3) | | 02/15/26 | | 5.500 | | | 1,112,800 | | |
| | 6,308 | | | iStar, Inc., Senior Unsecured Notes
(Callable 05/01/25 @ 100.00) | | (BB, Ba3) | | 08/01/25 | | 4.250 | | | 6,473,585 | | |
| | 4,634 | | | Starwood Property Trust, Inc., Rule 144A,
Senior Unsecured Notes
(Callable 08/01/23 @ 100.00)(11) | | (B+, Ba3) | | 11/01/23 | | 5.500 | | | 4,871,493 | | |
| | 1,137 | | | Starwood Property Trust, Inc., Rule 144A,
Senior Unsecured Notes
(Callable 01/15/26 @ 100.00)(11) | | (B+, Ba3) | | 07/15/26 | | 3.625 | | | 1,138,472 | | |
| | | | 13,596,350 | | |
| Recreation & Travel (0.3%) | | | |
| | 1,296 | | | Six Flags Entertainment Corp., Rule 144A,
Company Guaranteed Notes
(Callable 11/29/21 @ 101.22)(11) | | (B-, B3) | | 07/31/24 | | 4.875 | | | 1,307,340 | | |
See Accompanying Notes to Financial Statements.
26
Credit Suisse Floating Rate High Income Fund
Schedule of Investments (continued)
October 31, 2021
Par
(000) | |
| | Ratings†
(S&P/Moody's) | | Maturity | | Rate% | | Value | |
| CORPORATE BONDS (continued) | | | |
Recreation & Travel | | | |
$ | 1,194 | | | Six Flags Entertainment Corp., Rule 144A,
Company Guaranteed Notes
(Callable 04/15/22 @ 102.75)(11),(12) | | (B-, B3) | | 04/15/27 | | 5.500 | | $ | 1,237,283 | | |
| | 2,500 | | | Six Flags Theme Parks, Inc., Rule 144A,
Senior Secured Notes
(Callable 07/01/22 @ 103.50)(11) | | (BB-, Ba2) | | 07/01/25 | | 7.000 | | | 2,659,375 | | |
| | 2,634 | | | Speedway Funding II, Inc., Rule 144A,
Senior Unsecured Notes
(Callable 11/01/22 @ 102.44)(11) | | (BB-, B2) | | 11/01/27 | | 4.875 | | | 2,695,056 | | |
| | | | 7,899,054 | | |
| Software - Services (0.4%) | | | |
| | 4,561 | | | Austin BidCo, Inc., Rule 144A,
Senior Unsecured Notes
(Callable 12/15/23 @ 103.56)(11) | | (CCC+, Caa2) | | 12/15/28 | | 7.125 | | | 4,716,485 | | |
| | 4,350 | | | Elastic NV, Rule 144A,
Senior Unsecured Notes
(Callable 07/15/24 @ 102.06)(11) | | (B+, B1) | | 07/15/29 | | 4.125 | | | 4,333,189 | | |
| | 2,555 | | | Endure Digital, Inc., Rule 144A,
Senior Unsecured Notes
(Callable 02/15/24 @ 103.00)(11) | | (CCC+, Caa2) | | 02/15/29 | | 6.000 | | | 2,354,969 | | |
| | | | 11,404,643 | | |
| Support - Services (1.6%) | | | |
| | 3,557 | | | Allied Universal Finance Corp., Rule 144A,
Senior Secured Notes
(Callable 06/01/24 @ 102.31)(11) | | (B, B2) | | 06/01/28 | | 4.625 | | | 3,529,255 | | |
| | 5,698 | | | Allied Universal Finance Corp., Rule 144A,
Senior Secured Notes
(Callable 06/01/24 @ 102.31)(11) | | (B, B2) | | 06/01/28 | | 4.625 | | | 5,659,083 | | |
| | 9,455 | | | Allied Universal Finance Corp., Rule 144A,
Senior Unsecured Notes
(Callable 06/01/24 @ 103.00)(11) | | (CCC+, Caa1) | | 06/01/29 | | 6.000 | | | 9,332,321 | | |
| | 11,000 | | | CoreLogic, Inc., Rule 144A,
Senior Secured Notes
(Callable 05/01/24 @ 102.25)(11) | | (B, B1) | | 05/01/28 | | 4.500 | | | 10,882,520 | | |
| | 7,565 | | | Gems Education Delaware LLC, Rule 144A,
Senior Secured Notes
(Callable 07/31/22 @ 103.56)(11) | | (B-, B3) | | 07/31/26 | | 7.125 | | | 7,839,231 | | |
| | 9,474 | | | GYP Holdings III Corp., Rule 144A,
Company Guaranteed Notes
(Callable 05/01/24 @ 102.31)(11) | | (B, B2) | | 05/01/29 | | 4.625 | | | 9,367,418 | | |
| | | | 46,609,828 | | |
See Accompanying Notes to Financial Statements.
27
Credit Suisse Floating Rate High Income Fund
Schedule of Investments (continued)
October 31, 2021
Par
(000) | |
| | Ratings†
(S&P/Moody's) | | Maturity | | Rate% | | Value | |
| CORPORATE BONDS (continued) | | | |
| Tech Hardware & Equipment (0.3%) | | | |
$ | 1,400 | | | CommScope, Inc., Rule 144A,
Company Guaranteed Notes
(Callable 03/01/22 @ 104.13)(11) | | (CCC+, B3) | | 03/01/27 | | 8.250 | | $ | 1,428,490 | | |
| | 1,700 | | | CommScope, Inc., Rule 144A,
Senior Secured Notes
(Callable 09/01/24 @ 102.38)(11) | | (B, Ba3) | | 09/01/29 | | 4.750 | | | 1,670,165 | | |
| | 6,000 | | | Imola Merger Corp., Rule 144A,
Senior Secured Notes
(Callable 05/15/24 @ 102.38)(11) | | (BB-, B1) | | 05/15/29 | | 4.750 | | | 6,172,200 | | |
| | | | 9,270,855 | | |
| Telecom - Wireline Integrated & Services (0.2%) | | | |
| | 7,000 | | | GTT Communications, Inc., Rule 144A,
Company Guaranteed Notes
(Callable 11/29/21 @ 103.94)(8),(11) | | (D, Wr) | | 12/31/24 | | 0.000 | | | 857,500 | | |
| | 2,000 | | | LCPR Senior Secured Financing DAC, Rule 144A,
Senior Secured Notes
(Callable 10/15/22 @ 103.38)(11) | | (B+, B1) | | 10/15/27 | | 6.750 | | | 2,102,500 | | |
| | 3,000 | | | LCPR Senior Secured Financing DAC, Rule 144A,
Senior Secured Notes
(Callable 07/15/24 @ 102.56)(11) | | (B+, B1) | | 07/15/29 | | 5.125 | | | 3,026,550 | | |
| | | | 5,986,550 | | |
| Theaters & Entertainment (0.2%) | | | |
| | 2,081 | | | Technicolor S.A., Tranche 1 Notes(6) | | (NR, NR) | | 06/30/24 | | 6.000 | | | 2,588,379 | | |
| | 2,590 | | | Technicolor S.A., Tranche 2 Notes(6) | | (NR, NR) | | 06/30/24 | | 6.000 | | | 3,222,644 | | |
| | | | 5,811,023 | | |
| TOTAL CORPORATE BONDS (Cost $236,272,143) | | | 231,644,118 | | |
| ASSET BACKED SECURITIES (3.3%) | | | |
| Collateralized Debt Obligations (3.3%) | | | |
| | 6,000 | | | ALM Ltd., 2020-1A, Rule 144A,
LIBOR 3M + 6.000%(1),(11) | | (BB-, NR) | | 10/15/29 | | 6.124 | | | 6,001,836 | | |
| | 3,500 | | | Anchorage Capital CLO 16 Ltd., 2020-16A,
Rule 144A, LIBOR 3M + 4.180%(1),(11) | | (BBB-, NR) | | 10/20/31 | | 4.312 | | | 3,513,520 | | |
| | 2,500 | | | Battalion CLO Ltd., 2021-21A, Rule 144A,
LIBOR 3M + 3.300%(1),(11) | | (NR, Baa3) | | 07/15/34 | | 3.432 | | | 2,504,613 | | |
| | 1,500 | | | Battalion CLO XIV Ltd., 2019-14A, Rule 144A,
LIBOR 3M + 3.950%(1),(11) | | (NR, Baa3) | | 04/20/32 | | 4.082 | | | 1,502,301 | | |
| | 1,750 | | | Benefit Street Partners CLO X Ltd., 2016-10A,
Rule 144A, LIBOR 3M + 6.750%(1),(11) | | (BB-, NR) | | 04/20/34 | | 6.882 | | | 1,733,841 | | |
| | 2,100 | | | BlueMountain CLO Ltd., 2015-3A, Rule 144A,
LIBOR 3M + 5.400%(1),(11) | | (B, NR) | | 04/20/31 | | 5.532 | | | 1,970,075 | | |
| | 5,500 | | | BlueMountain CLO Ltd., 2016-2A, Rule 144A,
LIBOR 3M + 4.300%(1),(11) | | (BBB-, NR) | | 08/20/32 | | 4.431 | | | 5,493,372 | | |
| | 4,115 | | | Capital Automotive LLC, 2017-1A, Rule 144A(11) | | (A+, NR) | | 04/15/47 | | 3.870 | | | 4,128,682 | | |
See Accompanying Notes to Financial Statements.
28
Credit Suisse Floating Rate High Income Fund
Schedule of Investments (continued)
October 31, 2021
Par
(000) | |
| | Ratings†
(S&P/Moody's) | | Maturity | | Rate% | | Value | |
| ASSET BACKED SECURITIES (continued) | | | |
Collateralized Debt Obligations | | | |
$ | 2,484 | | | Capital Automotive LLC, 2017-1A, Rule 144A(11) | | (A+, NR) | | 04/15/47 | | 4.180 | | $ | 2,597,874 | | |
| | 750 | | | Carlyle Global Market Strategies CLO Ltd.,
2014-3RA, Rule 144A, LIBOR 3M + 5.400%(1),(11) | | (B+, NR) | | 07/27/31 | | 5.535 | | | 694,978 | | |
| | 2,000 | | | Carlyle Global Market Strategies CLO Ltd.,
2014-5A, Rule 144A, LIBOR 3M + 3.150%(1),(11) | | (BBB-, NR) | | 07/15/31 | | 3.274 | | | 1,948,672 | | |
| | 2,625 | | | CIFC Funding Ltd., 2014-1A, Rule 144A,
LIBOR 3M + 5.850%(1),(11) | | (B+, NR) | | 01/18/31 | | 5.972 | | | 2,512,926 | | |
| | 4,000 | | | Crown Point CLO IV Ltd., 2018-4A, Rule 144A,
LIBOR 3M + 2.750%(1),(11) | | (NR, Baa3) | | 04/20/31 | | 2.882 | | | 3,847,536 | | |
| | 1,750 | | | Dryden 86 CLO Ltd., 2020-86A, Rule 144A,
LIBOR 3M + 3.200%(1),(11) | | (BBB-, NR) | | 07/17/34 | | 3.322 | | | 1,751,743 | | |
| | 3,500 | | | Elevation CLO Ltd., 2014-2A, Rule 144A,
LIBOR 3M + 3.200%(1),(11) | | (NR, Baa3) | | 10/15/29 | | 3.324 | | | 3,453,100 | | |
| | 5,000 | | | Galaxy XVIII CLO Ltd., 2018-28A, Rule 144A,
LIBOR 3M + 3.000%(1),(11) | | (BBB-, NR) | | 07/15/31 | | 3.124 | | | 4,978,125 | | |
| | 3,500 | | | Greywolf CLO II Ltd., 2013-1A, Rule 144A,
LIBOR 3M + 4.200%(1),(11) | | (BBB-, NR) | | 04/15/34 | | 4.324 | | | 3,492,023 | | |
| | 2,000 | | | Greywolf CLO III Ltd., 2020-3RA, Rule 144A,
LIBOR 3M + 6.920%(1),(11) | | (BB-, NR) | | 04/15/33 | | 7.048 | | | 1,986,782 | | |
| | 2,000 | | | Greywolf CLO IV Ltd., 2019-1A, Rule 144A,
LIBOR 3M + 3.650%(1),(11) | | (BBB-, NR) | | 04/17/34 | | 3.772 | | | 2,005,070 | | |
| | 6,000 | | | Greywolf CLO V Ltd., 2015-1A, Rule 144A,
LIBOR 3M + 2.000%(1),(11) | | (A, NR) | | 01/27/31 | | 2.124 | | | 6,004,782 | | |
| | 3,950 | | | Greywolf CLO V Ltd., 2015-1A, Rule 144A,
LIBOR 3M + 3.000%(1),(11) | | (BBB-, NR) | | 01/27/31 | | 3.124 | | | 3,939,769 | | |
| | 3,250 | | | KKR Financial CLO Ltd., 2013-1A, Rule 144A,
LIBOR 3M + 6.080%(1),(11) | | (NR, Ba3) | | 04/15/29 | | 6.204 | | | 3,190,304 | | |
| | 1,900 | | | Marble Point CLO XVII Ltd., 2020-1A, Rule 144A,
LIBOR 3M + 6.820%(1),(11) | | (NR, Ba3) | | 04/20/33 | | 6.952 | | | 1,869,414 | | |
| | 1,750 | | | Marble Point CLO XXI Ltd., 2021-3A, Rule 144A,
LIBOR 3M + 2.300%(1),(11) | | (NR, A2) | | 10/17/34 | | 2.429 | | | 1,751,185 | | |
| | 1,500 | | | Neuberger Berman Loan Advisers CLO 43 Ltd.,
2021-43A, Rule 144A, LIBOR 3M + 3.100%(1),(11) | | (BBB-, NR) | | 07/17/35 | | 3.211 | | | 1,505,204 | | |
| | 2,250 | | | Octagon Investment Partners 26 Ltd., 2016-1A,
Rule 144A, LIBOR 3M + 2.850%(1),(11) | | (BBB-, NR) | | 07/15/30 | | 2.974 | | | 2,233,944 | | |
| | 3,500 | | | Shackleton CLO Ltd., 2014-6RA, Rule 144A,
LIBOR 3M + 2.970%(1),(11) | | (NR, Baa2) | | 07/17/28 | | 3.092 | | | 3,503,090 | | |
| | 4,125 | | | Silver Creek CLO Ltd., 2014-1A, Rule 144A,
LIBOR 3M + 3.350%(1),(11) | | (NR, Baa3) | | 07/20/30 | | 3.482 | | | 4,123,185 | | |
| | 3,000 | | | Venture CLO Ltd., 2017-28AA, Rule 144A,
LIBOR 3M + 2.400%(1),(11) | | (NR, A2) | | 10/20/29 | | 2.532 | | | 3,002,685 | | |
| | 3,000 | | | Venture CLO Ltd., 2018-35A, Rule 144A,
LIBOR 3M + 3.500%(1),(11) | | (NR, Baa3) | | 10/22/31 | | 3.628 | | | 2,902,746 | | |
See Accompanying Notes to Financial Statements.
29
Credit Suisse Floating Rate High Income Fund
Schedule of Investments (continued)
October 31, 2021
Par
(000) | |
| | Ratings†
(S&P/Moody's) | | Maturity | | Rate% | | Value | |
| ASSET BACKED SECURITIES (continued) | | | |
Collateralized Debt Obligations | | | |
$ | 3,000 | | | Venture XIII CLO Ltd., 2013-13A, Rule 144A,
LIBOR 3M + 3.300%(1),(11) | | (NR, A3) | | 09/10/29 | | 3.416 | | $ | 2,989,488 | | |
| | 1,500 | | | Vibrant CLO VI Ltd., 2017-6A, Rule 144A,
LIBOR 3M + 5.750%(1),(11) | | (NR, B1) | | 06/20/29 | | 5.872 | | | 1,360,928 | | |
| | 3,000 | | | Voya CLO Ltd., 2014-4A, Rule 144A,
LIBOR 3M + 3.350%(1),(11) | | (BBB-, NR) | | 07/14/31 | | 3.477 | | | 2,893,533 | | |
| TOTAL ASSET BACKED SECURITIES (Cost $97,955,920) | | | 97,387,326 | | |
Number of
Shares | |
| |
| |
| |
| |
| |
| COMMON STOCKS (0.8%) | | | |
| Auto Parts & Equipment (0.1%) | | | |
| | 151,253 | | | Jason Group, Inc.(9) | | | | | | | | | 1,588,156 | | |
| Building & Construction (0.0%) | | | |
| | 6 | | | White Forest Resources, Inc.(7),(9),(13) | | | | | | | | | — | | |
| Chemicals (0.3%) | | | |
| | 31,756 | | | Project Investor Holdings LLC(3),(7),(9),(13) | | | | | | | | | 317 | | |
| | 529,264 | | | Proppants Holdings LLC(3),(7),(9),(13) | | | | | | | | | 5,293 | | |
| | 191,054 | | | UTEX Industries, Inc.(9) | | | | | | | | | 9,170,592 | | |
| | | | 9,176,202 | | |
| Energy - Exploration & Production (0.1%) | | | |
| | 194,068 | | | Patterson-UTI Energy, Inc.(9) | | | | | | | | | 1,661,222 | | |
| | 872,375 | | | PES Energy, Inc.(3),(7),(9),(13) | | | | | | | | | 8,724 | | |
| | | | 1,669,946 | | |
| Machinery (0.0%) | | | |
| | 6,675,439 | | | Doncasters U.S. Finance LLC(7),(9),(10),(13) | | | | | | | | | — | | |
| Pharmaceuticals (0.1%) | | | |
| | 156,133 | | | Akorn Holding Company LLC(9) | | | | | | | | | 1,610,200 | | |
| Private Placement (0.2%) | | | |
| | 2,723,899 | | | Technicolor S.A. EUR 27.0(9),(14) | | | | | | | | | 8,747,444 | | |
| Software - Services (0.0%) | | | |
| | 78,712 | | | Skillsoft Corp.(9) | | | | | | | | | 907,038 | | |
| Support - Services (0.0%) | | | |
| | 779 | | | Sprint Industrial Holdings LLC, Class G(3),(7),(9),(13) | | | | | | | | | — | | |
| | 71 | | | Sprint Industrial Holdings LLC, Class H(3),(7),(9),(13) | | | | | | | | | — | | |
| | 172 | | | Sprint Industrial Holdings LLC, Class I(3),(7),(9),(13) | | | | | | | | | 900 | | |
| | | | 900 | | |
| TOTAL COMMON STOCKS (Cost $29,900,209) | | | 23,699,886 | | |
See Accompanying Notes to Financial Statements.
30
Credit Suisse Floating Rate High Income Fund
Schedule of Investments (continued)
October 31, 2021
Number of
Shares | |
| |
| |
| |
| |
Value | |
| WARRANTS (0.0%) | | | |
| Chemicals (0.0%) | | | |
| | 132,316 | | | Project Investor Holdings LLC, expires 02/20/2022(3),(7),(9),(13) | | | | | | | | | | | | | | $ | — | | |
| Recreation & Travel (0.0%) | | | |
| | 526,589 | | | Cineworld Group, expires 12/21/2025(9) | | | | | | | | | | | | | | | 204,317 | | |
| TOTAL WARRANTS (Cost $68,804) | | | 204,317 | | |
| SHORT-TERM INVESTMENTS (9.1%) | | | |
| | 271,633,978 | | | State Street Institutional U.S. Government
Money Market Fund — Premier Class, 0.03% | | | | | | | | | | | | | | | 271,633,978 | | |
| | 340,515 | | | State Street Navigator Securities Lending
Government Money Market Portfolio, 0.03%(15) | | | | | | | | | | | | | | | 340,515 | | |
| TOTAL SHORT-TERM INVESTMENTS (Cost $271,974,493) | | | 271,974,493 | | |
| TOTAL INVESTMENTS AT VALUE (106.3%) (Cost $3,205,902,535) | | | 3,161,263,898 | | |
| LIABILITIES IN EXCESS OF OTHER ASSETS (-6.3%) | | | (186,201,985 | ) | |
| NET ASSETS (100.0%) | | $ | 2,975,061,913 | | |
† Credit ratings given by the S&P Global Ratings Division of S&P Global Inc. ("S&P") and Moody's Investors Service, Inc. ("Moody's") are unaudited.
(1) Variable rate obligation — The interest rate shown is the rate in effect as of October 31, 2021. The rate may be subject to a cap and floor.
(2) The rates on certain variable rate securities are not based on a published reference rate and spread but are determined by the issuer or agent and are based on current market conditions. These securities do not indicate a reference rate and spread in their description above. The interest rate shown is the rate in effect as of October 31, 2021.
(3) Illiquid security.
(4) PIK: Payment-in-kind security for which part of the income earned may be paid as additional principal.
(5) All or a portion is an unfunded loan commitment (See note 2-I).
(6) This security is denominated in Euro.
(7) Security is valued using significant unobservable inputs.
(8) Bond is currently in default.
(9) Non-income producing security.
(10) This security is denominated in British Pound.
(11) Security exempt from registration under Rule 144A of the Securities Act of 1933, as amended. These securities may be resold in transactions exempt from registration, normally to qualified institutional buyers. At October 31, 2021, these securities amounted to a value of $304,907,081 or 10.2% of net assets.
(12) Security or portion thereof is out on loan (See note 2-J).
(13) Not readily marketable security; security is valued at fair value as determined in good faith by, or under the direction of, the Board of Trustees.
(14) Security is held through holdings of 100 shares of the CIG Special Purpose SPC — Credit Suisse Floating Rate High Income Fund Segregated Portfolio, an affiliated entity.
(15) Represents security purchased with cash collateral received for securities on loan. The rate shown is the annualized one-day yield at October 31, 2021.
See Accompanying Notes to Financial Statements.
31
Credit Suisse Floating Rate High Income Fund
Schedule of Investments (continued)
October 31, 2021
INVESTMENT ABBREVIATIONS
1M = 1 Month
1W = 1 Week
2M = 2 Month
3M = 3 Month
6M = 6 Month
12M = 12 Month
EURIBOR = Euro Interbank Offered Rate
LIBOR = London Interbank Offered Rate
NR = Not Rated
Sarl - société à responsabilité limitée
Forward Foreign Currency Contracts
Forward
Currency to be
Purchased (Local) | | Forward
Currency to be
Sold (Local) | | Expiration
Date | | Counterparty | | Value on
Settlement Date | | Current
Value/
Notional | | Net Unrealized
Appreciation | |
EUR | 650,000 | | | USD | 758,071 | | | 10/12/22 | | Deutsche Bank AG | | $ | 758,071 | | | $ | 758,675 | | | $ | 604 | | |
| | | $ | 604 | | |
Forward
Currency to be
Purchased (Local) | | Forward
Currency to be
Sold (Local) | | Expiration
Date | | Counterparty | | Value on
Settlement Date | | Current
Value/
Notional | | Net Unrealized
Depreciation | |
USD | 109,124,717 | | | EUR | 93,522,619 | | | 10/12/22 | | Morgan Stanley | | $ | (109,124,717 | ) | | $ | (109,158,859 | ) | | $ | (34,142 | ) | |
USD | 18,249,462 | | | GBP | 13,425,539 | | | 10/12/22 | | Deutsche Bank AG | | | (18,249,462 | ) | | | (18,326,696 | ) | | | (77,234 | ) | |
| | | $ | (111,376 | ) | |
| | | $ | (110,772 | ) | |
Currency Abbreviations:
EUR = Euro
GBP = British Pound
USD = United States Dollar
See Accompanying Notes to Financial Statements.
32
Credit Suisse Floating Rate High Income Fund
Statement of Assets and Liabilities
October 31, 2021
Assets | |
Investments at value, including collateral for securities on loan of $340,515
(Cost $3,205,902,535) (Note 2) | | $ | 3,161,263,8981 | | |
Foreign currency at value (Cost $402,958) | | | 401,940 | | |
Cash segregated at broker for forwards contracts (Note 2) | | | 50,000 | | |
Receivable for investments sold | | | 54,718,228 | | |
Receivable for Fund shares sold | | | 53,228,744 | | |
Interest receivable | | | 13,488,637 | | |
Unrealized appreciation on forward foreign currency contracts (Note 2) | | | 604 | | |
Prepaid expenses and other assets | | | 153,591 | | |
Total assets | | | 3,283,305,642 | | |
Liabilities | |
Investment advisory fee payable (Note 3) | | | 1,104,771 | | |
Administrative services fee payable (Note 3) | | | 137,709 | | |
Shareholder servicing/Distribution fee payable (Note 3) | | | 81,750 | | |
Payable for investments purchased | | | 295,617,180 | | |
Unfunded loan commitments (Note 2) | | | 5,172,078 | | |
Payable for Fund shares redeemed | | | 3,067,818 | | |
Dividend payable | | | 1,543,454 | | |
Payable upon return of securities loaned (Note 2) | | | 340,515 | | |
Unrealized depreciation on forward foreign currency contracts (Note 2) | | | 111,376 | | |
Trustees' fee payable | | | 16,394 | | |
Accrued expenses | | | 1,050,684 | | |
Total liabilities | | | 308,243,729 | | |
Net Assets | |
Capital stock, $.001 par value (Note 6) | | | 449,188 | | |
Paid-in capital (Note 6) | | | 3,136,099,822 | | |
Total distributable earnings (loss) | | | (161,487,097 | ) | |
Net assets | | $ | 2,975,061,913 | | |
I Shares | |
Net assets | | $ | 2,770,167,196 | | |
Shares outstanding | | | 418,426,081 | | |
Net asset value, offering price and redemption price per share | | $ | 6.62 | | |
A Shares | |
Net assets | | $ | 144,713,120 | | |
Shares outstanding | | | 21,746,665 | | |
Net asset value and redemption price per share | | $ | 6.65 | | |
Maximum offering price per share (net asset value/(1-4.75%)) | | $ | 6.98 | | |
C Shares | |
Net assets | | $ | 60,181,597 | | |
Shares outstanding | | | 9,015,481 | | |
Net asset value and offering price per share | | $ | 6.68 | | |
1 Includes $333,958 of securities on loan.
See Accompanying Notes to Financial Statements.
33
Credit Suisse Floating Rate High Income Fund
Statement of Operations
For the Year Ended October 31, 2021
Investment Income | |
Interest | | $ | 104,913,791 | | |
Dividends | | | 3,180 | | |
Securities lending (net of rebates) | | | 6,137 | | |
Total investment income | | | 104,923,108 | | |
Expenses | |
Investment advisory fees (Note 3) | | | 14,518,062 | | |
Administrative services fees (Note 3) | | | 385,357 | | |
Shareholder servicing/Distribution fees (Note 3) | |
Class A | | | 360,496 | | |
Class C | | | 602,267 | | |
Transfer agent fees (Note 3) | | | 2,209,899 | | |
Commitment fees (Note 4) | | | 665,738 | | |
Custodian fees | | | 419,925 | | |
Insurance expense | | | 108,565 | | |
Registration fees | | | 107,904 | | |
Printing fees | | | 70,190 | | |
Legal fees | | | 68,170 | | |
Trustees' fees | | | 64,527 | | |
Audit and tax fees | | | 38,398 | | |
Miscellaneous expense | | | 48,758 | | |
Total expenses | | | 19,668,256 | | |
Less: fees waived and expenses reimbursed (Note 3) | | | (1,717,963 | ) | |
Net expenses | | | 17,950,293 | | |
Net investment income | | | 86,972,815 | | |
Net Realized and Unrealized Gain (Loss) from Investments, Foreign Currency and
Forward Foreign Currency Contracts | |
Net realized loss from investments | | | (23,173,431 | ) | |
Net realized gain from foreign currency transactions | | | 147,060 | | |
Net realized gain from forward foreign currency contracts | | | 398,346 | | |
Net change in unrealized appreciation (depreciation) from investments | | | 121,941,645 | | |
Net change in unrealized appreciation (depreciation) from foreign currency translations | | | 2,036 | | |
Net change in unrealized appreciation (depreciation) from forward foreign currency contracts | | | (1,187,752 | ) | |
Net realized and unrealized gain from investments, foreign currency and forward foreign
currency contracts | | | 98,127,904 | | |
Net increase in net assets resulting from operations | | $ | 185,100,719 | | |
See Accompanying Notes to Financial Statements.
34
Credit Suisse Floating Rate High Income Fund
Statements of Changes in Net Assets
| | | For the Year
Ended
October 31, 2021 | | For the Year
Ended
October 31, 2020 | |
From Operations | |
Net investment income | | $ | 86,972,815 | | | $ | 93,031,616 | | |
Net realized loss from investments, foreign currency transactions
and forward foreign currency contracts | | | (22,628,025 | ) | | | (66,504,389 | ) | |
Net change in unrealized appreciation (depreciation) from investments,
foreign currency translations and forward foreign currency contracts | | | 120,755,929 | | | | (31,377,270 | ) | |
Net increase (decrease) in net assets resulting from operations | | | 185,100,719 | | | | (4,850,043 | ) | |
From Distributions | |
From distributable earnings | |
Class I | | | (81,531,192 | ) | | | (82,928,381 | ) | |
Class A | | | (4,978,097 | ) | | | (7,380,308 | ) | |
Class C | | | (1,626,826 | ) | | | (2,732,307 | ) | |
Net decrease in net assets resulting from distributions | | | (88,136,115 | ) | | | (93,040,996 | ) | |
| From Capital Share Transactions (Note 6) | |
Proceeds from sale of shares | | | 1,590,427,767 | | | | 719,070,271 | | |
Reinvestment of dividends | | | 71,710,776 | | | | 78,676,976 | | |
Net asset value of shares redeemed | | | (689,176,103 | ) | | | (1,281,035,675 | ) | |
Net increase (decrease) in net assets from capital share transactions | | | 972,962,440 | | | | (483,288,428 | ) | |
Net increase (decrease) in net assets | | | 1,069,927,044 | | | | (581,179,467 | ) | |
Net Assets | |
Beginning of year | | | 1,905,134,869 | | | | 2,486,314,336 | | |
End of year | | $ | 2,975,061,913 | | | $ | 1,905,134,869 | | |
See Accompanying Notes to Financial Statements.
35
Credit Suisse Floating Rate High Income Fund
Financial Highlights
(For a Class I Share of the Fund Outstanding Throughout Each Year)
| | | For the Year Ended October 31, | |
| | | 2021 | | 2020 | | 2019 | | 2018 | | 2017 | |
Per share data | |
Net asset value, beginning of year | | $ | 6.31 | | | $ | 6.56 | | | $ | 6.811 | | | $ | 6.87 | | | $ | 6.77 | | |
INVESTMENT OPERATIONS | |
Net investment income2 | | | 0.24 | | | | 0.30 | | | | 0.35 | | | | 0.29 | | | | 0.28 | | |
Net gain (loss) from investments, foreign currency
transactions and forward foreign currency
contracts (both realized and unrealized) | | | 0.31 | | | | (0.25 | ) | | | (0.25 | ) | | | (0.06 | ) | | | 0.10 | | |
Total from investment operations | | | 0.55 | | | | 0.05 | | | | 0.10 | | | | 0.23 | | | | 0.38 | | |
LESS DIVIDENDS AND DISTRIBUTIONS | |
Dividends from net investment income | | | (0.24 | ) | | | (0.30 | ) | | | (0.35 | ) | | | (0.29 | ) | | | (0.27 | ) | |
Return of capital | | | — | | | | — | | | | — | | | | — | | | | (0.01 | ) | |
Total dividends and distributions | | | (0.24 | ) | | | (0.30 | ) | | | (0.35 | ) | | | (0.29 | ) | | | (0.28 | ) | |
Net asset value, end of year | | $ | 6.62 | | | $ | 6.31 | | | $ | 6.56 | | | $ | 6.811 | | | $ | 6.87 | | |
Total return3 | | | 8.86 | % | | | 0.92 | % | | | 1.47 | % | | | 3.45 | % | | | 5.75 | % | |
RATIOS AND SUPPLEMENTAL DATA | |
Net assets, end of year (000s omitted) | | $ | 2,770,167 | | | $ | 1,699,373 | | | $ | 2,199,606 | | | $ | 3,704,519 | | | $ | 3,236,360 | | |
Ratio of net expenses to average net assets | | | 0.70 | % | | | 0.70 | % | | | 0.70 | % | | | 0.70 | % | | | 0.70 | % | |
Ratio of net investment income to average
net assets | | | 3.62 | % | | | 4.80 | % | | | 5.18 | % | | | 4.29 | % | | | 4.12 | % | |
Decrease reflected in above operating expense
ratios due to waivers/reimbursements | | | 0.07 | % | | | 0.09 | % | | | 0.08 | % | | | 0.06 | % | | | 0.07 | % | |
Portfolio turnover rate4 | | | 54 | % | | | 30 | % | | | 23 | % | | | 45 | % | | | 64 | % | |
1 Includes adjustments in accordance with accounting principles generally accepted in the United States of America and as such, the net asset values for financial reporting purposes and the returns based upon net asset values may differ from the net asset values and returns for shareholder transactions.
2 Per share information is calculated using the average shares outstanding method.
3 Total returns are historical and include change in share price, reinvestment of all dividends and distributions and no sales charge. Had certain expenses not been reduced during the periods shown, total returns would have been lower.
4 Portfolio turnover is calculated by dividing the lesser of total purchases or sales of portfolio securities for the reporting period by the monthly average of portfolio securities owned during the reporting period. Excluded from both the numerator and denominator are amounts relating to derivatives and securities whose maturities or expiration dates at the time of acquisition were one year or less.
See Accompanying Notes to Financial Statements.
36
Credit Suisse Floating Rate High Income Fund
Financial Highlights
(For a Class A Share of the Fund Outstanding Throughout Each Year)
| | | For the Year Ended October 31, | |
| | | 2021 | | 2020 | | 2019 | | 2018 | | 2017 | |
Per share data | |
Net asset value, beginning of year | | $ | 6.34 | | | $ | 6.59 | | | $ | 6.841 | | | $ | 6.90 | | | $ | 6.80 | | |
INVESTMENT OPERATIONS | |
Net investment income2 | | | 0.23 | | | | 0.29 | | | | 0.33 | | | | 0.28 | | | | 0.27 | | |
Net gain (loss) from investments, foreign currency
transactions and forward foreign currency
contracts (both realized and unrealized) | | | 0.31 | | | | (0.25 | ) | | | (0.25 | ) | | | (0.06 | ) | | | 0.10 | | |
Total from investment operations | | | 0.54 | | | | 0.04 | | | | 0.08 | | | | 0.22 | | | | 0.37 | | |
LESS DIVIDENDS AND DISTRIBUTIONS | |
Dividends from net investment income | | | (0.23 | ) | | | (0.29 | ) | | | (0.33 | ) | | | (0.28 | ) | | | (0.26 | ) | |
Return of capital | | | — | | | | — | | | | — | | | | — | | | | (0.01 | ) | |
Total dividends and distributions | | | (0.23 | ) | | | (0.29 | ) | | | (0.33 | ) | | | (0.28 | ) | | | (0.27 | ) | |
Net asset value, end of year | | $ | 6.65 | | | $ | 6.34 | | | $ | 6.59 | | | $ | 6.841 | | | $ | 6.90 | | |
Total return3 | | | 8.57 | % | | | 0.70 | % | | | 1.23 | % | | | 3.20 | % | | | 5.48 | % | |
RATIOS AND SUPPLEMENTAL DATA | |
Net assets, end of year (000s omitted) | | $ | 144,713 | | | $ | 146,803 | | | $ | 199,328 | | | $ | 289,959 | | | $ | 284,456 | | |
Ratio of net expenses to average net assets | | | 0.95 | % | | | 0.95 | % | | | 0.95 | % | | | 0.95 | % | | | 0.95 | % | |
Ratio of net investment income to average
net assets | | | 3.41 | % | | | 4.54 | % | | | 4.93 | % | | | 4.03 | % | | | 3.87 | % | |
Decrease reflected in above operating expense
ratios due to waivers/reimbursements | | | 0.07 | % | | | 0.09 | % | | | 0.08 | % | | | 0.06 | % | | | 0.07 | % | |
Portfolio turnover rate4 | | | 54 | % | | | 30 | % | | | 23 | % | | | 45 | % | | | 64 | % | |
1 Includes adjustments in accordance with accounting principles generally accepted in the United States of America and as such, the net asset values for financial reporting purposes and the returns based upon net asset values may differ from the net asset values and returns for shareholder transactions.
2 Per share information is calculated using the average shares outstanding method.
3 Total returns are historical and include change in share price, reinvestment of all dividends and distributions and no sales charge. Had certain expenses not been reduced during the periods shown, total returns would have been lower.
4 Portfolio turnover is calculated by dividing the lesser of total purchases or sales of portfolio securities for the reporting period by the monthly average of portfolio securities owned during the reporting period. Excluded from both the numerator and denominator are amounts relating to derivatives and securities whose maturities or expiration dates at the time of acquisition were one year or less.
See Accompanying Notes to Financial Statements.
37
Credit Suisse Floating Rate High Income Fund
Financial Highlights
(For a Class C Share of the Fund Outstanding Throughout Each Year)
| | | For the Year Ended October 31, | |
| | | 2021 | | 2020 | | 2019 | | 2018 | | 2017 | |
Per share data | |
Net asset value, beginning of year | | $ | 6.36 | | | $ | 6.61 | | | $ | 6.871 | | | $ | 6.92 | | | $ | 6.82 | | |
INVESTMENT OPERATIONS | |
Net investment income2 | | | 0.18 | | | | 0.24 | | | | 0.28 | | | | 0.23 | | | | 0.22 | | |
Net gain (loss) from investments, foreign currency
transactions and forward foreign currency
contracts (both realized and unrealized) | | | 0.32 | | | | (0.25 | ) | | | (0.26 | ) | | | (0.05 | ) | | | 0.10 | | |
Total from investment operations | | | 0.50 | | | | (0.01 | ) | | | 0.02 | | | | 0.18 | | | | 0.32 | | |
LESS DIVIDENDS AND DISTRIBUTIONS | |
Dividends from net investment income | | | (0.18 | ) | | | (0.24 | ) | | | (0.28 | ) | | | (0.23 | ) | | | (0.21 | ) | |
Return of capital | | | — | | | | — | | | | — | | | | — | | | | (0.01 | ) | |
Total dividends and distributions | | | (0.18 | ) | | | (0.24 | ) | | | (0.28 | ) | | | (0.23 | ) | | | (0.22 | ) | |
Net asset value, end of year | | $ | 6.68 | | | $ | 6.36 | | | $ | 6.61 | | | $ | 6.871 | | | $ | 6.92 | | |
Total return3 | | | 7.90 | % | | | (0.05 | )% | | | 0.34 | % | | | 2.58 | % | | | 4.69 | % | |
RATIOS AND SUPPLEMENTAL DATA | |
Net assets, end of year (000s omitted) | | $ | 60,182 | | | $ | 58,959 | | | $ | 87,380 | | | $ | 116,877 | | | $ | 118,654 | | |
Ratio of net expenses to average net assets | | | 1.70 | % | | | 1.70 | % | | | 1.70 | % | | | 1.70 | % | | | 1.70 | % | |
Ratio of net investment income to average
net assets | | | 2.66 | % | | | 3.83 | % | | | 4.19 | % | | | 3.28 | % | | | 3.13 | % | |
Decrease reflected in above operating expense
ratios due to waivers/reimbursements | | | 0.07 | % | | | 0.09 | % | | | 0.08 | % | | | 0.06 | % | | | 0.07 | % | |
Portfolio turnover rate4 | | | 54 | % | | | 30 | % | | | 23 | % | | | 45 | % | | | 64 | % | |
1 Includes adjustments in accordance with accounting principles generally accepted in the United States of America and as such, the net asset values for financial reporting purposes and the returns based upon net asset values may differ from the net asset values and returns for shareholder transactions.
2 Per share information is calculated using the average shares outstanding method.
3 Total returns are historical and include change in share price, reinvestment of all dividends and distributions and no sales charge. Had certain expenses not been reduced during the periods shown, total returns would have been lower.
4 Portfolio turnover is calculated by dividing the lesser of total purchases or sales of portfolio securities for the reporting period by the monthly average of portfolio securities owned during the reporting period. Excluded from both the numerator and denominator are amounts relating to derivatives and securities whose maturities or expiration dates at the time of acquisition were one year or less.
See Accompanying Notes to Financial Statements.
38
Credit Suisse Floating Rate High Income Fund
Notes to Financial Statements
October 31, 2021
Credit Suisse Floating Rate High Income Fund (the "Fund"), a series of Credit Suisse Opportunity Funds (the "Trust"), a Delaware statutory trust, is registered under the Investment Company Act of 1940, as amended (the "1940 Act"), as a diversified open-end management investment company that seeks to provide a high level of current income and, secondarily, capital appreciation. The Trust was organized under the laws of the State of Delaware as a business trust on May 31, 1995.
The Fund offers three classes of shares: Class I shares, Class A shares and Class C shares. Each class of shares represents an equal pro rata interest in the Fund, except the share classes bear different expenses. Class A shares are sold subject to a front-end sales charge of up to 4.75%. Class C shares are sold subject to a CDSC of 1.00% if the shares are redeemed within the first year of purchase. Class I shares are sold without a sales charge. Effective June 30, 2021, Class C shares, upon the eight year anniversary of purchase, will convert to Class A shares.
Note 2. Significant Accounting Policies
The following is a summary of significant accounting policies followed by the Fund in the preparation of its financial statements. The policies are in accordance with generally accepted accounting principles in the United States of America ("GAAP"). The preparation of financial statements requires management to make estimates and assumptions that affect the reported amounts and disclosures in the financial statements. Actual results could differ from those estimates. The Fund is considered an investment company for financial reporting purposes under GAAP and follows the accounting and reporting guidance in Financial Accounting Standards Board ("FASB") Accounting Standard Codification ("ASC") Topic 946 — Financial Services — Investment Companies.
A) SECURITY VALUATION — The Board of Trustees (the "Board") is responsible for the Fund's valuation process. The Board has delegated the supervision of the daily valuation process to Credit Suisse Asset Management, LLC, the Fund's investment adviser ("Credit Suisse" or the "Adviser"), who has established a Pricing Committee which, pursuant to the policies adopted by the Board, is responsible for making fair valuation determinations and overseeing the Fund's pricing policies. The net asset value of the Fund is determined daily as of the close of regular trading on the New York Stock Exchange, Inc. (the "Exchange") on each day the Exchange is open for business.
39
Credit Suisse Floating Rate High Income Fund
Notes to Financial Statements (continued)
October 31, 2021
Note 2. Significant Accounting Policies (continued)
The valuations for fixed income securities (which may include, but are not limited to, corporate, government, municipal, mortgage-backed, collateralized mortgage obligations and asset-backed securities) and certain derivative instruments are typically the prices supplied by independent third party pricing services, which may use market prices or broker/dealer quotations or a variety of valuation techniques and methodologies. The independent third party pricing services use inputs that are observable such as issuer details, interest rates, yield curves, prepayment speeds, credit risks/spreads, default rates and quoted prices for similar securities. These pricing services generally price fixed income securities assuming orderly transactions of an institutional "round lot" size, but some trades occur in smaller "odd lot" sizes which may be effected at lower prices than institutional round lot trades. Structured note agreements are valued in accordance with a dealer-supplied valuation based on changes in the value of the underlying index. Futures contracts are valued daily at the settlement price established by the board of trade or exchange on which they are traded. Forward contracts are valued at the London closing spot rates and the London closing forward point rates on a daily basis. The currency forward contract pricing model derives the differential in point rates to the expiration date of the forward and calculates its present value. Equity securities for which market quotations are available are valued at the last reported sales price or official closing price on the primary market or exchange on which they trade. The Fund may utilize a service provided by an independent third party which has been approved by the Board to fair value certain securities. When fair value pricing is employed, the prices of securities used by the Fund to calculate its net asset value may differ from quoted or published prices for the same securities. If independent third party pricing services are unable to supply prices for a portfolio investment, or if the prices supplied are deemed by the investment adviser to be unreliable, the market price may be determined by the investment adviser using quotations from one or more brokers/dealers or at the transaction price if the security has recently been purchased and no value has yet been obtained from a pricing service or pricing broker. When reliable prices are not readily available, such as when the value of a security has been significantly affected by events after the close of the exchange or market on which the security is principally traded, but before the Fund calculates its net asset value, these securities will be fair valued in good faith by the Pricing Committee, in accordance with procedures adopted by the Board.
40
Credit Suisse Floating Rate High Income Fund
Notes to Financial Statements (continued)
October 31, 2021
Note 2. Significant Accounting Policies (continued)
The Fund uses valuation techniques to measure fair value that are consistent with the market approach and/or income approach, depending on the type of security and the particular circumstance. The market approach uses prices and other relevant information generated by market transactions involving identical or comparable securities. The income approach uses valuation techniques to discount estimated future cash flows to present value.
GAAP established a disclosure hierarchy that categorizes the inputs to valuation techniques used to value assets and liabilities at each measurement date. These inputs are summarized in the three broad levels listed below:
• Level 1 – quoted prices in active markets for identical investments
• Level 2 – other significant observable inputs (including quoted prices for similar investments, interest rates, prepayment speeds, credit risk, etc.)
• Level 3 – significant unobservable inputs (including the Fund's own assumptions in determining the fair value of investments)
The inputs or methodologies used to value securities are not necessarily an indication of the risk associated with investing in those securities.
The following is a summary of the inputs used as of October 31, 2021 in valuing the Fund's assets and liabilities carried at fair value:
Assets | | Level 1 | | Level 2 | | Level 3 | | Total | |
Investments in Securities | |
Bank Loans | | $ | — | | | $ | 2,375,308,019 | | | $ | 161,045,739 | | | $ | 2,536,353,758 | | |
Corporate Bonds | | | — | | | | 231,644,118 | | | | — | | | | 231,644,118 | | |
Asset Backed Securities | | | — | | | | 97,387,326 | | | | — | | | | 97,387,326 | | |
Common Stocks | | | 2,568,260 | | | | 21,116,392 | | | | 15,234 | | | | 23,699,886 | | |
Warrants | | | — | | | | 204,317 | | | | 0 | (1) | | | 204,317 | | |
Short-term Investments | | | 271,633,978 | | | | 340,515 | | | | — | | | | 271,974,493 | | |
| | | $ | 274,202,238 | | | $ | 2,726,000,687 | | | $ | 161,060,973 | | | $ | 3,161,263,898 | | |
Other Financial Instruments* | |
Forward Foreign Currency Contracts | | $ | — | | | $ | 604 | | | $ | — | | | $ | 604 | | |
Liabilities | | Level 1 | | Level 2 | | Level 3 | | Total | |
Other Financial Instruments* | |
Forward Foreign Currency Contracts | | $ | — | | | $ | 111,376 | | | $ | — | | | $ | 111,376 | | |
* Other financial instruments include unrealized appreciation (depreciation) on forward foreign currency contracts.
(1) Includes zero valued securities.
41
Credit Suisse Floating Rate High Income Fund
Notes to Financial Statements (continued)
October 31, 2021
Note 2. Significant Accounting Policies (continued)
The following is a reconciliation of investments as of October 31, 2021 for which significant unobservable inputs were used in determining fair value.
| | | Bank
Loans | | Corporate
Bonds | | Common
Stocks | | Warrants | | Total | |
Balance as of October 31, 2020 | | $ | 183,482,529 | | | $ | 1,229,671 | | | $ | 2,665,140 | | | $ | 0 | (1) | | $ | 187,377,340 | | |
Accrued discounts (premiums) | | | 609,135 | | | | 25,768 | | | | — | | | | — | | | | 634,903 | | |
Purchases | | | 144,019,749 | | | | 58,153 | | | | — | | | | — | | | | 144,077,902 | | |
Sales | | | (96,411,979 | ) | | | (1,616,306 | ) | | | (4,238,547 | ) | | | — | | | | (102,266,832 | ) | |
Realized gain (loss) | | | 13,806 | | | | (188,573 | ) | | | 1,264,570 | | | | — | | | | 1,089,803 | | |
Change in unrealized appreciation
(depreciation) | | | 5,831,870 | | | | 491,287 | | | | 1,903,503 | | | | — | | | | 8,226,660 | | |
Transfers into Level 3 | | | 20,244,954 | | | | — | | | | 8,724 | | | | — | | | | 20,253,678 | | |
Transfers out of Level 3 | | | (96,744,325 | ) | | | — | | | | (1,588,156 | ) | | | — | | | | (98,332,481 | ) | |
Balance as of October 31, 2021 | | $ | 161,045,739 | | | $ | — | | | $ | 15,234 | | | $ | 0 | (1) | | $ | 161,060,973 | | |
Net change in unrealized appreciation
(depreciation) from investments still
held as of October 31, 2021 | | $ | 4,270,517 | | | $ | — | | | $ | (570,707 | ) | | $ | — | | | $ | 3,699,810 | | |
(1) Includes zero valued securities.
| | Quantitative Disclosure About Significant Unobservable Inputs | |
| Asset Class | | Fair Value
At 10/31/2021 | | Valuation
Technique | | Unobservable
Input | | Range
(Weighted Average)* | |
Bank Loans | | $ | 161,045,739 | | | Vendor pricing | | Single Broker Quote | | $ | 0.00 – $1.41 | ($0.99) | |
| Common Stocks | | $ | 15,234 | | | Income Approach | | Expected Remaining
Distribution | | $ | 0.00 – $5.22
| ($0.32) | |
| Warrants | | $ | 0 | | | Income Approach | | Expected Remaining
Distribution | | | $0.00 (N/A)
| | |
* Weighted by relative fair value
Each fair value determination is based on a consideration of relevant factors, including both observable and unobservable inputs. Observable and unobservable inputs that Credit Suisse considers may include (i) the existence of any contractual restrictions on the disposition of securities; (ii) information obtained from the company, which may include an analysis of the company's financial statements, the company's products or intended markets or the company's technologies; (iii) the price of the same or similar security negotiated at arm's length in an issuer's completed subsequent round of financing; (iv) the price and extent of public trading in similar securities of the issuer or of comparable companies; or (v) a probability and time value adjusted analysis of contractual term. Where available and appropriate, multiple valuation methodologies are applied to confirm fair value. To the extent that valuation is based on models or inputs that are less observable or unobservable in the
42
Credit Suisse Floating Rate High Income Fund
Notes to Financial Statements (continued)
October 31, 2021
Note 2. Significant Accounting Policies (continued)
market, determining fair value requires more judgment. Because of the inherent uncertainty of valuation, those estimated values may be materially higher or lower than the values that would have been used had a ready market for the investments existed. Accordingly, the degree of judgment exercised by the Fund in determining fair value is greatest for investments categorized in Level 3. In some circumstances, the inputs used to measure fair value might be categorized within different levels of the fair value hierarchy. In those instances, the fair value measurement is categorized in its entirety in the fair value hierarchy based on the least observable input that is significant to the fair value measurement. Additionally, changes in the market environment and other events that may occur over the life of the investments may cause the gains or losses ultimately realized on these investments to be different from the valuations used at the date of these financial statements.
For the year ended October 31, 2021, $20,253,678 was transferred from Level 2 to Level 3 due to a lack of pricing source supported by observable inputs and $98,332,481 was transferred from Level 3 to Level 2 as a result of the availability of a pricing source supported by observable inputs. All transfers, if any, are assumed to occur at the end of the reporting period.
B) DERIVATIVE INSTRUMENTS AND HEDGING ACTIVITIES — The Fund adopted amendments to authoritative guidance on disclosures about derivative instruments and hedging activities which require that a fund disclose (a) how and why an entity uses derivative instruments, (b) how derivative instruments and hedging activities are accounted for and (c) how derivative instruments and related hedging activities affect a fund's financial position, financial performance and cash flows. For the year ended October 31, 2021, the Fund's derivatives did not qualify for hedge accounting as they are held at fair value.
The following table presents the fair value and the location of derivatives within the Statement of Assets and Liabilities at October 31, 2021 and the effect of these derivatives on the Statement of Operations for the year ended October 31, 2021.
Primary Underlying Risk | | Derivative
Assets | | Derivative
Liabilities | | Realized Gain
(Loss) | | Change in Unrealized
Appreciation (Depreciation) | |
Foreign currency exchange rate
Forward contracts | | $ | 604 | | | $ | 111,376 | | | $ | 398,346 | | | $ | (1,187,752 | ) | |
43
Credit Suisse Floating Rate High Income Fund
Notes to Financial Statements (continued)
October 31, 2021
Note 2. Significant Accounting Policies (continued)
For the year ended October 31, 2021, the Fund held an average monthly value on a net basis of $176,364,742 in forward foreign currency contracts.
The Fund is a party to International Swap and Derivatives Association, Inc. ("ISDA") Master Agreements ("Master Agreements") with certain counterparties that govern over-the-counter derivative (including Total Return, Credit Default and Interest Rate Swaps) and foreign exchange contracts entered into by the Fund. The Master Agreements may contain provisions regarding, among other things, the parties' general obligations, representations, agreements, collateral requirements, events of default and early termination. Termination events applicable to the Fund may occur upon a decline in the Fund's net assets below a specified threshold over a certain period of time.
The following table presents by counterparty the Fund's derivative assets, net of related collateral held by the Fund, at October 31, 2021:
Counterparty | | Gross Amount of
Derivative
Assets Presented in
the Consolidated
Statement of Assets
and Liabilities(a) | | Financial
Instruments
and Derivatives
Available for Offset | | Non-Cash
Collateral
Received | | Cash
Collateral
Received(b) | | Net Amount
of Derivative
Assets | |
Deutsche Bank AG | | $ | 604 | | | $ | (604 | ) | | $ | — | | | $ | — | | | $ | — | | |
The following table presents by counterparty the Fund's derivative liabilities, net of related collateral pledged by the Fund, at October 31, 2021:
Counterparty | | Gross Amount of
Derivative
Liabilities Presented in
the Consolidated
Statement of Assets
and Liabilities(a) | | Financial
Instruments
and Derivatives
Available for Offset | | Non-Cash
Collateral
Pledged | | Cash
Collateral
Pledged(b) | | Net Amount
of Derivative
Liabilities | |
Deutsche Bank AG | | $ | 77,234 | | | $ | (604 | ) | | $ | — | | | $ | (50,000 | ) | | $ | 26,630 | | |
Morgan Stanley | | | 34,142 | | | | — | | | | — | | | | — | | | | 34,142 | | |
| | | $ | 111,376 | | | $ | (604 | ) | | $ | — | | | $ | (50,000 | ) | | $ | 60,772 | | |
(a) Forward foreign currency contracts are included.
(b) The actual collateral pledged may be more than the amounts shown.
C) FOREIGN CURRENCY TRANSACTIONS — The books and records of the Fund are maintained in U.S. dollars. Transactions denominated in foreign currencies are recorded at the current prevailing exchange rates. All assets and liabilities denominated in foreign currencies, including purchases and sales of investments, and income and expenses are translated into US dollar amounts on the date of those transactions.
44
Credit Suisse Floating Rate High Income Fund
Notes to Financial Statements (continued)
October 31, 2021
Note 2. Significant Accounting Policies (continued)
Reported net realized gain (loss) from foreign currency transactions arises from sales of foreign currencies; currency gains or losses realized between the trade and settlement dates on securities transactions; and the difference between the amounts of dividends, interest, and foreign withholding taxes recorded on the Fund's books and the U.S. dollar equivalent of the amounts actually received or paid. Net change in unrealized gains and losses on translation of assets and liabilities denominated in foreign currencies arises from changes in the fair values of assets and liabilities, other than investments at the end of the period, resulting from changes in exchange rates.
The Fund does not isolate that portion of the results of operations resulting from fluctuations in foreign exchange rates on investments from the fluctuations arising from changes in market prices of investments held. Such fluctuations are included with net realized and unrealized gain or loss from investments in the Statement of Operations.
D) SECURITY TRANSACTIONS AND INVESTMENT INCOME/EXPENSE — Security transactions are accounted for on a trade date basis. Interest income/expense is recorded on the accrual basis. The Fund amortizes premiums and accretes discounts using the effective interest method. Dividend income/expense is recorded on the ex-dividend date. Certain expenses are class-specific expenses, vary by class and are charged only to that class. Income, expenses (excluding class-specific expenses) and realized/unrealized gains/losses are allocated proportionately to each class of shares based upon the relative net asset value of the outstanding shares of that class. The cost of investments sold is determined by use of the specific identification method for both financial reporting and income tax purposes. To the extent any issuer defaults or a credit event occurs that impacts the issuer, the Fund may halt any additional interest income accruals and consider the realizability of interest accrued up to the date of default or credit event.
E) DIVIDENDS AND DISTRIBUTIONS TO SHAREHOLDERS — Dividends from net investment income, if any, are declared daily and paid monthly. Distributions of net realized capital gains, if any, are declared and paid at least annually. However, to the extent that a net realized capital gain can be reduced by a capital loss carryforward, such gain will not be distributed. Dividends and distributions to shareholders of the Fund are recorded on the ex-dividend date and are determined in accordance with federal income tax regulations, which may differ from GAAP.
45
Credit Suisse Floating Rate High Income Fund
Notes to Financial Statements (continued)
October 31, 2021
Note 2. Significant Accounting Policies (continued)
F) FEDERAL AND OTHER TAXES — No provision is made for federal taxes as it is the Fund's intention to continue to qualify as a regulated investment company ("RIC") under the Internal Revenue Code of 1986, as amended (the "Code"), and to make the requisite distributions to its shareholders, which will be sufficient to relieve it from federal income and excise taxes.
In order to qualify as a RIC under the Code, the Fund must meet certain requirements regarding the source of its income, the diversification of its assets and the distribution of its income. One of these requirements is that the Fund derive at least 90% of its gross income for each taxable year from dividends, interest, payments with respect to certain securities loans, gains from the sale or other disposition of stock, securities or foreign currencies, other income derived with respect to its business of investing in such stock, securities or currencies or net income derived from interests in certain publicly-traded partnerships ("Qualifying Income").
The Fund adopted the authoritative guidance for uncertainty in income taxes and recognizes a tax benefit or liability from an uncertain position only if it is more likely than not that the position is sustainable based solely on its technical merits and consideration of the relevant taxing authority's widely understood administrative practices and procedures. The Fund has reviewed its current tax positions and has determined that no provision for income tax is required in the Fund's financial statements. The Fund's federal and state income and federal excise tax returns for tax years for which the applicable statutes of limitations have not expired are subject to examination by the Internal Revenue Service and state departments of revenue.
G) CASH — The Fund's uninvested cash balance is held in an interest bearing variable rate demand deposit account at State Street Bank and Trust Company ("SSB"), the Fund's custodian.
H) FORWARD FOREIGN CURRENCY CONTRACTS — A forward foreign currency exchange contract ("forward currency contract") is a commitment to purchase or sell a foreign currency at the settlement date at a negotiated rate. The Fund will enter into forward currency contracts primarily for hedging foreign currency risk. Forward currency contracts are valued at the prevailing forward exchange rate of the underlying currencies and unrealized gain/loss is recorded daily. On the settlement date of the forward currency contract, the Fund records a realized gain or loss equal to the difference between the value of the contract at the time it was opened and the value of the contract at the time it was closed. Certain risks may arise upon entering into forward currency contracts from the potential inability of counterparties to meet the terms of
46
Credit Suisse Floating Rate High Income Fund
Notes to Financial Statements (continued)
October 31, 2021
Note 2. Significant Accounting Policies (continued)
their contracts. The maximum counterparty credit risk to the Fund is measured by the unrealized gain on appreciated contracts. Additionally, when utilizing forward currency contracts to hedge, the Fund forgoes the opportunity to profit from favorable exchange rate movements during the term of the contract. The Fund's open forward currency contracts at October 31, 2021 are disclosed in the Schedule of Investments. At October 31, 2021, the amount of restricted cash held at brokers related to forward foreign currency contracts was $50,000.
I) UNFUNDED LOAN COMMITMENTS — The Fund enters into certain agreements, all or a portion of which may be unfunded. The Fund is obligated to fund these loan commitments at the borrowers' discretion. Funded and unfunded portions of credit agreements are presented in the Schedule of Investments. As of October 31, 2021, unfunded commitments were as follows:
Borrower | | Maturity | | Rate | | Unfunded
Commitment | |
Focus Financial Partners LLC | | 06/24/28 | | | 2.500 | | | $ | 533,438 | | |
Hillman Group, Inc. (The) (Delayed Draw Term Loan) | | 07/14/28 | | | 3.250 | | | $ | 1,335,613 | | |
Mariner Wealth Advisors LLC | | 08/18/28 | | | 1.875 | | | $ | 426,811 | | |
Pro Mach Group, Inc. (Delayed Draw Term Loan) | | 08/31/28 | | | 2.500 | | | $ | 668,853 | | |
RVR Dealership Holdings LLC | | 02/08/28 | | | 2.000 | | | $ | 304,444 | | |
SCP Eye Care Services LLC | | 03/16/28 | | | 4.500 | | | $ | 1,283,715 | | |
Service Logic Acquisition, Inc. | | 10/29/27 | | | 4.000 | | | $ | 294,619 | | |
Western Dental Services, Inc. (Delayed Draw Term Loan) | | 08/11/28 | | | 5.250 | | | $ | 324,585 | | |
Unfunded loan commitments and funded portions of credit agreements are marked to market daily and any unrealized appreciation or depreciation is included in the Statement of Assets and Liabilities and the Statement of Operations.
J) SECURITIES LENDING — The initial collateral received by the Fund is required to have a value of at least 102% of the market value of domestic securities on loan (including any accrued interest thereon) and 105% of the market value of foreign securities on loan (including any accrued interest thereon). The collateral is maintained thereafter at a value equal to at least 102% of the current market value of the securities on loan. The market value of loaned securities is determined at the close of each business day of the Fund and any additional required collateral is delivered to the Fund, or excess collateral returned by the Fund, on the next business day. Cash collateral received by the Fund in connection with securities lending activity may be pooled together with cash collateral for other funds/portfolios advised by Credit Suisse and may be invested in a variety of investments, including funds advised by SSB, the Fund's securities lending agent, or money market instruments. However, in the event of default or bankruptcy by the other party
47
Credit Suisse Floating Rate High Income Fund
Notes to Financial Statements (continued)
October 31, 2021
Note 2. Significant Accounting Policies (continued)
to the agreement, realization and/or retention of the collateral may be subject to legal proceedings. The remaining maturities of the securities lending transactions are considered overnight and continuous. Loans are subject to termination by the Fund or the borrower at any time.
SSB has been engaged by the Fund to act as the Fund's securities lending agent. As of October 31, 2021, the Fund had outstanding loans of securities to certain approved brokers for which the Fund received collateral:
Market Value of
Loaned Securities | | Market Value of
Cash Collateral | | Total Collateral | |
| $ | 333,958 | | | $ | 340,515 | | | $ | 340,515 | | |
The following table presents financial instruments that are subject to enforceable netting arrangements as of October 31, 2021.
Gross Amounts Not Offset in the Statement of Assets and Liabilities | |
Gross Asset Amounts
Presented in
Statement of Assets
and Liabilities(a) | | Collateral Received(b) | | Net Amount
(not less than $0) | |
| $ | 333,958 | | | $ | (333,958 | ) | | $ | — | | |
(a) Represents market value of loaned securities at year end.
(b) The actual collateral received is greater than the amount shown here due to collateral requirements of the security lending agreement.
The Fund's securities lending arrangement provides that the Fund and SSB will share the net income earned from securities lending activities. Securities lending income is accrued as earned. During the year ended October 31, 2021, total earnings from the Fund's investment in cash collateral received in connection with securities lending arrangements was $8,179, of which $0 was rebated to borrowers (brokers). The Fund retained $6,137 in income from the cash collateral investment, and SSB, as lending agent, was paid $2,042.
K) OTHER — The high yield, fixed income securities in which the Fund invests will primarily consist of senior secured floating rate loans ("Senior Loans") issued by non-investment grade companies. Senior Loans are typically secured by specific collateral of the issuer and hold the most senior position in the issuer's capital structure. The interest rate on Senior Loans is periodically adjusted to a recognized base rate, typically the London Interbank Offered Rate ("LIBOR"). While these characteristics may reduce interest rate risk and mitigate losses in the event of borrower default, the Senior Loans in which the Fund invests have below investment grade credit ratings and thereby are considered speculative because of the significant credit risk of their issuers.
48
Credit Suisse Floating Rate High Income Fund
Notes to Financial Statements (continued)
October 31, 2021
Note 2. Significant Accounting Policies (continued)
In July 2017, the Financial Conduct Authority, the United Kingdom's financial regulatory body, announced a desire to phase out the use of LIBOR by the end of 2021. The FCA and ICE Benchmark Administrator have since announced that most LIBOR settings will no longer be published after December 31, 2021 and a majority of U.S. dollar LIBOR settings will cease publication after June 30, 2023. It is possible that a subset of LIBOR settings will be published after these dates on a "synthetic" basis, but any such publications would be considered non-representative of the underlying market. The U.S. Federal Reserve, based on the recommendations of the New York Federal Reserve's Alternative Reference Rate Committee (comprised of major derivative market participants and their regulators), has begun publishing the Secured Overnight Financing Rate ("SOFR") that is intended to replace U.S. dollar LIBOR. Proposals for alternative reference rates for other currencies have also been announced or have already begun publication. Markets are slowly developing in response to these new reference rates. Uncertainty related to the liquidity impact of the change in rates, and how to appropriately adjust these rates at the time of transition, poses risks for the Fund. The effect of any changes to, or discontinuation of, LIBOR on the Fund will depend on, among other things, (1) existing fallback or termination provisions in individual contracts and (2) whether, how, and when industry participants develop and adopt new reference rates and fallbacks for both legacy and new instruments and contracts. In addition, there are obstacles to converting certain longer-term securities and transactions to a new reference rate or rates and the effectiveness of one alternative reference rate versus multiple alternative reference rates in new or existing financial instruments and products has not been determined.
The transition away from LIBOR might lead to increased volatility and illiquidity in markets for instruments whose terms currently reference LIBOR, reduced values of LIBOR-related investments, reduced effectiveness of hedging strategies, increased costs for certain LIBOR-related instruments, increased difficulty in borrowing or refinancing, and prolonged adverse market conditions for the Fund. Furthermore, the risks associated with the expected discontinuation of LIBOR and related transition may be exacerbated if the work necessary to effect an orderly transition to an alternative reference rate is not completed in a timely manner.
49
Credit Suisse Floating Rate High Income Fund
Notes to Financial Statements (continued)
October 31, 2021
Note 2. Significant Accounting Policies (continued)
Lower-rated debt securities (commonly known as "junk bonds") possess speculative characteristics and are subject to greater market fluctuations and risk of lost income and principal than higher-rated debt securities for a variety of reasons. Also, during an economic downturn or substantial period of rising interest rates, highly leveraged issuers may experience financial stress which would adversely affect their ability to service their principal and interest payment obligations, to meet projected business goals and to obtain additional financing.
In addition, periods of economic uncertainty and changes can be expected to result in increased volatility of market prices of lower-rated debt securities and the Fund's net asset value.
Note 3. Transactions with Affiliates and Related Parties
Credit Suisse serves as investment adviser and co-administrator for the Fund. For its investment advisory and administration services, Credit Suisse is entitled to receive a fee from the Fund at an annual rate of 0.79% of the Fund's average daily net assets less than or equal to $100 million and 0.59% of the Fund's average daily net assets greater than $100 million. For the year ended October 31, 2021, investment advisory and administration fees earned and waived by Credit Suisse were $14,518,062 and $1,717,963, respectively. Effective April 22, 2019, Credit Suisse has contractually agreed to limit expenses so that the Fund's annual operating expenses do not exceed 0.70% of the Fund's average daily net assets for Class I shares, 0.95% of the Fund's average daily net assets for Class A shares and 1.70% of the Fund's average daily net assets for Class C shares. The Fund is authorized to reimburse Credit Suisse for management fees previously limited and/or for expenses previously reimbursed by Credit Suisse, provided, however, that any reimbursements must be paid at a date not more than thirty-six months following the applicable month during which such fees were limited or expenses were reimbursed by Credit Suisse and the reimbursements do not cause the Fund to exceed the applicable expense limitation at the time the fees are recouped. This contract may not be terminated before February 28, 2023. Prior to April 22, 2019, these expense limitations were voluntary. For the year ended October 31, 2021, there was no recoupment.
50
Credit Suisse Floating Rate High Income Fund
Notes to Financial Statements (continued)
October 31, 2021
Note 3. Transactions with Affiliates and Related Parties (continued)
The amounts waived and reimbursed by Credit Suisse, which are available for potential future recoupment by Credit Suisse, and the expiration schedule at October 31, 2021 are as follows:
| | | Fee waivers/expense
reimbursements
subject to
recoupment | | Expires
October 31,
2022 | | Expires
October 31,
2023 | | Expires
October 31,
2024 | |
Class I | | $ | 4,125,862 | | | $ | 962,994 | | | $ | 1,592,401 | | | $ | 1,570,467 | | |
Class A | | | 339,485 | | | | 85,810 | | | | 149,504 | | | | 104,171 | | |
Class C | | | 147,710 | | | | 38,540 | | | | 65,845 | | | | 43,325 | | |
Totals | | $ | 4,613,057 | | | $ | 1,087,344 | | | $ | 1,807,750 | | | $ | 1,717,963 | | |
For its co-administrative services, SSB receives a fee, exclusive of out-of-pocket expenses, calculated in total for all the Credit Suisse funds/portfolios co-administered by SSB and allocated based upon the relative average net assets of each fund/portfolio, subject to an annual minimum fee. For the year ended October 31, 2021, co-administrative services fees earned by SSB (including out-of-pocket expenses) with respect to the Fund were $385,357.
Credit Suisse Securities (USA) LLC ("CSSU"), an affiliate of Credit Suisse, serves as the distributor of the Fund's shares. Pursuant to a distribution plan adopted by the Fund pursuant to Rule 12b-1 under the 1940 Act, CSSU receives fees for its distribution services. These fees are calculated at an annual rate of 0.25% of the average daily net assets of the Class A shares. For the Class C shares, the fee is calculated at an annual rate of 1.00% of the average daily net assets. For the year ended October 31, 2021, the Fund paid Rule 12b-1 distribution fees of $360,496 for Class A shares and $602,267 for Class C shares. Class I shares are not subject to Rule 12b-1 distribution fees.
For the year ended October 31, 2021, CSSU and its affiliates advised the Fund that they retained $7,965 from commissions earned on the sale of the Fund's Class A shares. There were no commissions earned on sale of Class C shares.
The Fund from time to time purchases or sells loan investments in the secondary market through Credit Suisse or its affiliates acting in the capacity as broker-dealer. Credit Suisse or its affiliates may have acted in some type of agent capacity to the initial loan offering prior to such loan trading in the secondary market.
51
Credit Suisse Floating Rate High Income Fund
Notes to Financial Statements (continued)
October 31, 2021
The Fund, together with other funds/portfolios advised by Credit Suisse (collectively, the "Participating Funds"), participates in a committed, unsecured line of credit facility ("Credit Facility"), with SSB in an aggregated amount of $250 million for temporary or emergency purposes on a first-come, first-served basis. Of the aggregate $250 million amount, $125 million is specifically designated for the Fund. The remaining $125 million is available to all Participating Funds. Under the terms of the Credit Facility, the Participating Funds pay an aggregate commitment fee on the average unused amount of the Credit Facility, which is allocated among the Participating Funds in such manner as is determined by the governing Boards of the Participating Funds. In addition, the Participating Funds pay interest on borrowings at either the Overnight Federal Funds rate or the Overnight LIBOR rate plus a spread. At October 31, 2021 and during the year ended October 31, 2021, the Fund had no borrowings outstanding under the Credit Facility. Additionally, the Fund and another Participating Fund are parties to a joint uncommitted line of credit facility with SSB in an aggregated amount of $200 million. For the year ended October 31, 2021, the line was not drawn upon and no fees were incurred.
Note 5. Purchases and Sales of Securities
For the year ended October 31, 2021, purchases and sales of investment securities (excluding short-term investments) and U.S. Government and Agency Obligations were as follows:
Investment Securities | | U.S. Government/
Agency Obligations | |
| Purchases | | Sales | | Purchases | | Sales | |
| $ | 2,234,477,744 | | | $ | 1,248,009,348 | | | $ | 0 | | | $ | 0 | | |
Note 6. Capital Share Transactions
The Fund is authorized to issue an unlimited number of full and fractional shares of beneficial interest, $.001 par value per share. The Fund offers Class I, Class A, and Class C shares. Transactions in capital shares for each class of the Fund were as follows:
| | | Class I | |
| | | For the Year Ended
October 31, 2021 | | For the Year Ended
October 31, 2020 | |
| | | Shares | | Value | | Shares | | Value | |
Shares sold | | | 233,381,020 | | | $ | 1,540,312,453 | | | | 105,357,409 | | | $ | 654,408,114 | | |
Shares issued in reinvestment
of dividends | | | 10,023,454 | | | | 66,090,692 | | | | 11,199,651 | | | | 70,211,111 | | |
Shares redeemed | | | (94,395,982 | ) | | | (622,551,167 | ) | | | (182,534,553 | ) | | | (1,137,880,314 | ) | |
Net increase (decrease) | | | 149,008,492 | | | $ | 983,851,978 | | | | (65,977,493 | ) | | $ | (413,261,089 | ) | |
52
Credit Suisse Floating Rate High Income Fund
Notes to Financial Statements (continued)
October 31, 2021
Note 6. Capital Share Transactions (continued)
| | | Class A | |
| | | For the Year Ended
October 31, 2021 | | For the Year Ended
October 31, 2020 | |
| | | Shares | | Value | | Shares | | Value | |
Shares sold | | | 5,919,178 | | | $ | 39,117,850 | | | | 8,979,849 | | | $ | 56,395,517 | | |
Shares issued in reinvestment
of dividends | | | 639,553 | | | | 4,234,283 | | | | 997,862 | | | | 6,292,616 | | |
Shares redeemed | | | (7,965,320 | ) | | | (52,587,397 | ) | | | (17,060,130 | ) | | | (108,156,221 | ) | |
Net decrease | | | (1,406,589 | ) | | $ | (9,235,264 | ) | | | (7,082,419 | ) | | $ | (45,468,088 | ) | |
| | | Class C | |
| | | For the Year Ended
October 31, 2021 | | For the Year Ended
October 31, 2020 | |
| | | Shares | | Value | | Shares | | Value | |
Shares sold | | | 1,655,530 | | | $ | 10,997,464 | | | | 1,290,936 | | | $ | 8,266,641 | | |
Shares issued in reinvestment
of dividends | | | 208,626 | | | | 1,385,801 | | | | 344,202 | | | | 2,173,249 | | |
Shares redeemed | | | (2,118,451 | ) | | | (14,037,539 | ) | | | (5,578,227 | ) | | | (34,999,140 | ) | |
Net decrease | | | (254,295 | ) | | $ | (1,654,274 | ) | | | (3,943,089 | ) | | $ | (24,559,250 | ) | |
On October 31, 2021, the number of shareholders that held 5% or more of the outstanding shares of each class of the Fund was as follows:
| | | Number of
Shareholders | | Approximate Percentage
of Outstanding Shares | |
Class I | | | 5 | | | | 53 | % | |
Class A | | | 6 | | | | 73 | % | |
Class C | | | 6 | | | | 77 | % | |
The Fund's performance may be negatively impacted in the event one or more of the Fund's greater than 5% shareholders were to redeem at a given time. Some of the shareholders are omnibus accounts, which hold shares on behalf of individual shareholders.
Note 7. Income Tax Information and Distributions to Shareholders
Income and capital gain distributions are determined in accordance with federal income tax regulations, which may differ from GAAP.
The tax character of dividends paid by the Fund during the fiscal years ended October 31, 2021 and 2020, respectively, was as follows:
| | Ordinary Income | |
| | | 2021 | | 2020 | |
| | | | | $ | 88,136,115 | | | $ | 93,040,996 | | |
53
Credit Suisse Floating Rate High Income Fund
Notes to Financial Statements (continued)
October 31, 2021
Note 7. Income Tax Information and Distributions to Shareholders (continued)
The tax basis components of distributable earnings differ from book basis by temporary book/tax differences. These differences are primarily due to differing treatments of dividends payable, wash sales, premium amortization, defaulted bond accruals, grantor trust basis adjustments and forward contracts marked to market.
At October 31, 2021, the components of distributable earnings on a tax basis were as follows:
Accumulated net realized loss | | $ | (118,823,425 | ) | |
Undistributed ordinary income | | | 4,280,575 | | |
Unrealized depreciation | | | (45,400,793 | ) | |
| | | $ | (159,943,643 | ) | |
At October 31, 2021, the Fund had $19,528,776 of unlimited short-term capital loss carryforwards and $99,294,649 of unlimited long-term capital loss carryforwards available to offset possible future capital gains.
At October 31, 2021, the cost and net unrealized appreciation (depreciation) of investments and derivatives for income tax purposes were as follows:
Cost of Investments | | $ | 3,206,546,479 | | |
Unrealized appreciation | | $ | 30,925,985 | | |
Unrealized depreciation | | | (76,319,338 | ) | |
Net unrealized appreciation (depreciation) | | $ | (45,393,353 | ) | |
To adjust for current period permanent book/tax differences which arose principally from differing book/tax treatment of foreign currency gain (loss), defaulted bonds, and premium amortization adjustments, distributions in excess of net investment income was credited $2,972,552 and accumulated net realized loss was debited $2,972,552. Net assets were not affected by this reclassification.
Note 8. Contingencies
In the normal course of business, the Fund may provide general indemnifications pursuant to certain contracts and organizational documents. The Fund's maximum exposure under these arrangements is dependent on future claims that may be made against the Fund and, therefore, cannot be estimated; however, based on experience, the risk of loss from such claims is considered remote.
54
Credit Suisse Floating Rate High Income Fund
Notes to Financial Statements (continued)
October 31, 2021
Note 9. Subsequent Events
In preparing the financial statements as of October 31, 2021, management considered the impact of subsequent events for potential recognition or disclosure in these financial statements through the date of release of this report. No such events requiring recognition or disclosure were identified through the date of the release of this report.
55
Credit Suisse Floating Rate High Income Fund
Report of Independent Registered Public Accounting Firm
To the Board of Trustees of Credit Suisse Opportunity Funds and
Shareholders of Credit Suisse Floating Rate High Income Fund
Opinion on the Financial Statements
We have audited the accompanying statement of assets and liabilities, including the schedule of investments, of Credit Suisse Floating Rate High Income Fund (one of the funds constituting Credit Suisse Opportunity Funds, referred to hereafter as the "Fund") as of October 31, 2021, the related statement of operations for the year ended October 31, 2021, the statement of changes in net assets for each of the two years in the period ended October 31, 2021, including the related notes, and the financial highlights for each of the two years in the period ended October 31, 2021 (collectively referred to as the "financial statements"). In our opinion, the financial statements present fairly, in all material respects, the financial position of the Fund as of October 31, 2021, the results of its operations for the year then ended, and the changes in its net assets and the financial highlights for each of the two years in the period ended October 31, 2021 in conformity with accounting principles generally accepted in the United States of America.
The financial statements of the Fund as of and for the year ended October 31, 2019 and the financial highlights for the years ended October 31, 2019, 2018 and 2017 (not presented herein, other than the financial highlights) were audited by other auditors whose report dated December 20, 2019 expressed an unqualified opinion on those financial statements and financial highlights.
Basis for Opinion
These financial statements are the responsibility of the Fund's management. Our responsibility is to express an opinion on the Fund's financial statements based on our audits. We are a public accounting firm registered with the Public Company Accounting Oversight Board (United States) (PCAOB) and are required to be independent with respect to the Fund in accordance with the U.S. federal securities laws and the applicable rules and regulations of the Securities and Exchange Commission and the PCAOB.
We conducted our audits of these financial statements in accordance with the standards of the PCAOB. Those standards require that we plan and perform the audit to obtain reasonable assurance about whether the financial statements are free of material misstatement, whether due to error or fraud.
Our audits included performing procedures to assess the risks of material misstatement of the financial statements, whether due to error or fraud, and performing procedures that respond to those risks. Such procedures included
56
Credit Suisse Floating Rate High Income Fund
Report of Independent Registered Public Accounting Firm
examining, on a test basis, evidence regarding the amounts and disclosures in the financial statements. Our audits also included evaluating the accounting principles used and significant estimates made by management, as well as evaluating the overall presentation of the financial statements. Our procedures included confirmation of securities owned as of October 31, 2021 by correspondence with the custodian, transfer agent, agent banks and brokers; when replies were not received from agent banks and brokers, we performed other auditing procedures. We believe that our audits provide a reasonable basis for our opinion.
/S/PricewaterhouseCoopers LLP
New York, New York
December 29, 2021
We have served as the auditor of one or more investment companies in Credit Suisse Asset Management, LLC investment companies since 2020.
57
Credit Suisse Floating Rate High Income Fund
Information Concerning Trustees and Officers (unaudited)
Name, Address
(Year of Birth) | | Position(s)
Held with
Fund | | Term
of Office1
and
Length
of Time
Served | | Principal
Occupation(s) During
Past Five Years | | Number of
Portfolios
in Fund
Complex
Overseen
by Trustee | | Other
Trusteeships
Held by Trustee
During Past Five Years | |
Independent Trustees | | | | | | | | | | | |
Laura A. DeFelice
c/o Credit Suisse Asset
Management, LLC
Attn: General Counsel
Eleven Madison Avenue
New York, New York
10010
(1959) | | Trustee, Nominating and Audit Committee member | | Since 2017 | | Partner of Acacia Properties LLC (multi-family and commercial real estate ownership and operation) from 2008 to present; Stonegate Advisors LLC (renewable energy and energy efficiency) from 2007 to present. | | | 9 | | | None. | |
Jeffrey E. Garten
c/o Credit Suisse Asset
Management, LLC
Attn: General Counsel
Eleven Madison Avenue
New York, New York
10010
(1946) | | Trustee, Nominating and Audit Committee member | | Since 2001 | | Dean Emeritus of Yale School of Management from July 2015 to present; Partner and Chairman of Garten Rothkopf (consulting firm) from October 2005 to June 2017. | | | 9 | | | Director of Aetna, Inc. (insurance company) from January 1999 to 2019; Director of CarMax Group (used car dealers) from January 2002 to 2019; Director of Miller Buckfire & Co., LLC (financial restructuring) from January 2008 to 2019. | |
Mahendra R. Gupta
c/o Credit Suisse Asset
Management, LLC
Attn: General Counsel
Eleven Madison Avenue
New York, New York
10010
(1956) | | Trustee, Nominating Committee member and Audit Committee Chairman | | Since 2017 | | Professor, Washington University in St. Louis from July 1990 to present; Partner, R.J. Mithaiwala (food manufacturing and retail, India) from March 1977 to present; Partner, F.F.B. Corporation (agriculture, India) from March 1977 to present; Partner, RPMG Research Corporation (benchmark research) from July 2001 to present. | | | 9 | | | Director of Caleres
Inc. (footwear) from May 2012 to present; Director of Koch Development Corporation (real estate development) from November 2017 to present; Director of Supernova (fin-tech) from June 2014 to September 2018. | |
1 Subject to the Trust's retirement policy, each Trustee may continue to serve as a Trustee until the last day of the calendar year in which the applicable Trustee attains age 75. The Board may determine to extend the terms of Trustees beyond age 75 on a case-by-case basis. Each officer serves until his or her respective successor has been duly elected and qualified.
58
Credit Suisse Floating Rate High Income Fund
Information Concerning Trustees and Officers (unaudited) (continued)
Name, Address
(Year of Birth) | | Position(s)
Held with
Fund | | Term
of Office1
and
Length
of Time
Served | | Principal
Occupation(s) During
Past Five Years | | Number of
Portfolios
in Fund
Complex
Overseen
by Trustee | | Other
Trusteeships
Held by Trustee
During Past Five Years | |
Independent Trustees | | | | | | | | | | | |
Steven N. Rappaport
c/o Credit Suisse Asset Management, LLC
Attn: General Counsel
Eleven Madison Avenue
New York, New York
10010
(1948) | | Chairman of the Board, Nominating Committee Chairman and Audit Committee member | | Trustee since 2001 and Chairman since 2005 | | Partner of Lehigh Court, LLC and RZ Capital (private investment firms) from July 2002 to present; Partner of Backstage Acquisition Holdings, LLC (publication job postings) from November 2013 to 2018. | | | 9 | | | Director of Aberdeen Emerging Markets Equity Income Fund, Inc., (a closed-end investment company); Director of Aberdeen Funds (18 open-end portfolios); Director of iCAD, Inc. (surgical & medical instruments & apparatus company) from 2006 to 2018. | |
Interested Trustee | | | | | | | | | | | |
John G. Popp2
Credit Suisse Asset
Management, LLC
Eleven Madison Avenue
New York, New York
10010
(1956) | | Trustee, Chief Executive Officer and President | | Trustee since 2017
Chief Executive Officer and President since 2010 | | Managing Director of Credit Suisse; Global Head and Chief Investment Officer of the Credit Investments Group; Associated with Credit Suisse or its predecessor since 1997; Officer of other Credit Suisse Funds. | | | 9 | | | None. | |
1 Subject to the Trust's retirement policy, each Trustee may continue to serve as a Trustee until the last day of the calendar year in which the applicable Trustee attains age 75. The Board may determine to extend the terms of Trustees beyond age 75 on a case-by-case basis. Each officer serves until his or her respective successor has been duly elected and qualified.
2 Mr. Popp is an "interested person" of the Trust, as defined in the 1940 Act, by virtue of his current position as an officer of Credit Suisse.
59
Credit Suisse Floating Rate High Income Fund
Information Concerning Trustees and Officers (unaudited) (continued)
Name, Address
(Year of Birth) | | Position(s)
Held with
Fund | | Term of
Office
and
Length of
Time
Served | | Principal Occupation(s) During Past Five Years | |
Officers* | | | | | | | |
Emidio Morizio**
Credit Suisse Asset
Management, LLC
Eleven Madison Avenue
New York, New York 10010
(1966) | | Chief Compliance Officer | | Since Fund Inception | | Managing Director and Global Head of Compliance of Credit Suisse since 2010; Associated with Credit Suisse since July 2000; Officer of other Credit Suisse Funds. | |
Lou Anne McInnis
Credit Suisse Asset Management, LLC
Eleven Madison Avenue
New York, New York 10010
(1959) | | Chief Legal Officer | | Since 2015 | | Director of Credit Suisse; Associated with Credit Suisse since April 2015; Counsel at DLA Piper US LLP from 2011 to April 2015; Associated with Morgan Stanley Investment Management from 1997 to 2010; Officer of other Credit Suisse Funds. | |
Omar Tariq
Credit Suisse Asset
Management, LLC
Eleven Madison Avenue
New York, New York 10010
(1983) | | Chief Financial Officer and Treasurer | | Since 2019 | | Director of Credit Suisse since March 2019; Senior Manager of PriceWaterhouseCoopers, LLP from September 2010 to March 2019; Officer of other Credit Suisse Funds. | |
Karen Regan
Credit Suisse Asset
Management, LLC
Eleven Madison Avenue
New York, New York 10010
(1963) | | Vice President and Secretary | | Since 2010 | | Vice President of Credit Suisse; Associated with Credit Suisse since December 2004; Officer of other Credit Suisse Funds. | |
* The officers of the Fund shown are officers that make policy decisions.
** Effective December 16, 2021, Jason Gossett replaced Emidio Morizio as Interim Chief Compliance Officer. Mr. Gossett has been a Vice President of Credit Suisse since 2018 and has been associated with Credit Suisse since June 2015. Mr. Gossett also serves as an officer of other Credit Suisse funds.
The Statement of Additional Information includes additional information about the Trustees and is available, without charge, upon request, by calling 877-870-2874.
60
Credit Suisse Floating Rate High Income Fund
Proxy Voting and Portfolio Holdings Information (unaudited)
Information regarding how the Fund voted proxies related to its portfolio securities during the 12-month period ended June 30 of each year, as well as the policies and procedures that the Fund uses to determine how to vote proxies relating to its portfolio securities are available:
• By calling 1-877-870-2874
• On the Fund's website, www.credit-suisse.com/us/funds
• On the website of the Securities and Exchange Commission, www.sec.gov
The Fund files a complete schedule of its portfolio holdings for the first and third quarters of its fiscal year with the SEC as an exhibit to its reports on Form N-PORT, and for reporting periods ended prior to March 31, 2019, filed such information on Form N-Q. The Fund's Forms N-PORT and N-Q are available on the SEC's website at www.sec.gov.
61

P.O. BOX 219916, KANSAS CITY, MO 64121-9916
877-870-2874 ◼ www.credit-suisse.com/us
CREDIT SUISSE SECURITIES (USA) LLC, DISTRIBUTOR. FLHI-AR-1021

CREDIT SUISSE FUNDS
Annual Report
October 31, 2021
◼ CREDIT SUISSE
MANAGED FUTURES STRATEGY FUND
The Fund's investment objectives, risks, charges and expenses (which should be considered carefully before investing), and more complete information about the Fund, are provided in the Prospectus, which should be read carefully before investing. You may obtain additional copies by calling 877-870-2874 or by visiting our website at www.credit-suisse.com/us/funds.
Credit Suisse Securities (USA) LLC, Distributor, is located at Eleven Madison Avenue, New York, NY 10010. Credit Suisse Funds are advised by Credit Suisse Asset Management, LLC.
Investors in the Credit Suisse Funds should be aware that they may be eligible to purchase Class I shares (where offered) directly or through certain intermediaries. Such shares are not subject to a sales charge. Investors in the Credit Suisse Funds should also be aware that they may be eligible for a reduction or waiver of the sales charge with respect to Class A or C shares (where offered). For more information, please review the relevant prospectuses or consult your financial representative.
Fund shares are not deposits or other obligations of Credit Suisse Asset Management, LLC ("Credit Suisse") or any affiliate, are not FDIC-insured and are not guaranteed by Credit Suisse or any affiliate. Fund investments are subject to investment risks, including loss of your investment.
Credit Suisse Managed Futures Strategy Fund
Annual Investment Adviser's Report
October 31, 2021 (unaudited)
December 1, 2021
Dear Shareholder:
We are pleased to present this Annual Report covering the activities of the Credit Suisse Managed Futures Strategy Fund (the "Fund") for the 12-month period ended October 31, 2021.
Performance Summary
11/1/20 – 10/31/21
Fund & Benchmark | | Performance | |
| Class I1 | | | 19.33 | % | |
| Class A1,2 | | | 19.04 | % | |
| Class C1,2 | | | 18.16 | % | |
| Credit Suisse Managed Futures Liquid Index3 | | | 19.58 | % | |
Performance shown for the Fund's Class A and Class C Shares does not reflect sales charges, which are a maximum of 5.25% and 1.00%, respectively.2
Market Review: A somewhat surprising period
The 12-month period ended October 31, 2021, was marked by the impact of pandemic support packages and vaccination rollouts. The Credit Suisse Managed Futures Liquid Index (the Fund's Benchmark) was up +19.58% for the period, while the Credit Suisse Managed Futures Hedge Fund Index increased 19.20%. Toward the end of 2020, investor exuberance led to a rally in risk assets following successful vaccination development efforts, accommodative fiscal and monetary policy, and U.S. election results. 2021 saw increased risk-on sentiment as several themes, such as retail market participation, reflation, and reopening optimism converged.
2020 — a year marked by precipitous slumps and sharp rebounds — closed on a positive note. Global equities rallied as investors weighed the impact of government support measures and the vaccination progress. And, while precious metals provided a haven against inflation concerns, energy prices remained capped. The future burden of fiscal and monetary stimuli ratcheted up inflation expectations, weighing on the U.S. dollar.
The new year began with unfavorable weather conditions buoying crop prices. Precious metals declined, as the concerns around the disorderly presidential handover in the U.S. receded. Energy prices rose on the prospect of accelerating economic growth and ongoing supply discipline maintained by OPEC+ partners. The U.S. dollar delivered its first monthly gain since September of 2020, as investors reacted to higher yields. Commodities such as agriculture and
1
Credit Suisse Managed Futures Strategy Fund
Annual Investment Adviser's Report (continued)
October 31, 2021 (unaudited)
industrial metals also posted gains as pent-up demand coupled with weather conditions, supply chain challenges, green initiatives, and market imbalances in the U.S. drove prices higher. The Treasury yield curve steepened on the prospect of accelerating post-pandemic growth and rising inflation expectations.
While reopening-driven portfolio repositioning continued to be a dominant and profitable market theme, idiosyncratic events also influenced trend formation at the start of Q2 2021. An uptrend within commodities developed in congruence with the rigidity of global supply chains, which came increasingly into focus. Stock markets continued to rise on the back of solid economic prints, supportive policy, and robust corporate earnings.
In Q3 2021, rising COVID-19 Delta variant cases introduced uncertainty into the reopening narrative, driving defensive flows into safe heavens and pushing interest rates lower. Investors weighed the impact of the evolving U.S. budget framework on currency fundamentals. A volatile mixture of high inflation readings globally and supply bottlenecks, as well as fiscal and monetary policy uncertainty in the U.S. drove interest rates higher again, whereas weak economic data in Europe and the looming U.S. debt ceiling added to the jitters undermining investor confidence in equity markets.
Toward the quarter-end, inflationary pressure and tightening monetary conditions weighed on the U.S. dollar and bond prices worldwide, while equities gained and commodity prices rallied, reflecting a multifaceted supply inelasticity.
Strategic Review and Outlook: A good period overall
The Fund seeks to give investors diverse and fee-efficient access to managed futures by aiming to capture the most significant trends across major asset classes — fixed income, currencies, commodities, and equities.
For the annual period ended October 31, 2021, the Fund's Class I shares returned 19.33% — in line with the Benchmark.
Exposure to fixed income instruments, which detracted during the last two months of Q4 2020, fluctuated as yields around the world reacted to a confluence of factors: vaccine rollouts, uncertainty around the U.S. election outcome, and continued monetary support by governments. As investors digested President Biden's policy initiatives and inflation concerns mounted, bond yields did an about-turn during Q1 2021 — leading to positive contribution from net short exposures. The program held short exposure to all fixed income instruments during the second quarter with the exception of Japanese government bonds, which flipped short as well by the end of Q3. Expanding vaccination efforts and improving economic data pressured bond yields higher. Investors, however,
2
Credit Suisse Managed Futures Strategy Fund
Annual Investment Adviser's Report (continued)
October 31, 2021 (unaudited)
reassessed growth expectations and inflation risks, flattening the U.S. curve and causing the program to compound losses.
Long currency positioning (short U.S. dollar) across the board toward the culmination of 2020 led to a positive attribution profile as the U.S. dollar weakened against major rivals. The British pound appreciated on the news of the announcement of a Brexit trade deal, while the Australian dollar gained against the greenback as a rebound in China's economy and recovering iron-ore prices bolstered demand for the currency. The new year started with the U.S. dollar demonstrating resilience and appreciating against several peers. Short Japanese yen exposure posted gains in the face of rising U.S. interest rates and widening yield differentials. Long exposure to the Canadian dollar provided a boost, as a burgeoning economic recovery gained momentum despite the reinstatement of lockdowns.
During Q2 2021, the U.S. dollar depreciated against major peers as yield differentials stabilized and economies outside the U.S. showed accelerating evidence of socioeconomic normalization. The Fed's hawkish pivot in June, however, helped the greenback recoup some of its losses. Subsequently, the program shorted all currencies (long U.S. dollar) and finished Q3 with modest gains. Nonetheless, a combination of easing pandemic restrictions and expectations of accelerated monetary policy tightening drove appreciation in the Canadian dollar, the Australian dollar, and the British pound, causing the program's positioning in these currencies to flip long. Losses in these currencies were offset to some extent by gains in Japanese yen and Euro positioning.
Rising levels of government spending, burgeoning post-pandemic demand, ramped-up focus on environmentally-sensitive projects, and low interest rates fueling inflation all helped commodities to realize unprecedented gains during the period. Long exposure to agriculture, energy, and industrial metals drove the program's performance upside for most of the period. Precious metals prices oscillated with investors moving in and out of the safe-haven on cues from other asset classes until the Fed's hawkish pivot toward the end of Q2 dampened investor enthusiasm for this commodity, for which the program held a short exposure throughout October 2021.
Equity positions contributed positively to performance toward the end of 2020, as stocks climbed worldwide, propelling global benchmarks to fresh records. The uptrend in stocks during the first quarter of 2021 was challenged by concerns around the impact of inflationary dynamics on growth normalization. During Q2, the majority of the program's long equity exposures contributed to returns as investors remained sanguine. Signs of inflation, lofty equity valuations, and the accelerating proliferation of COVID-19 variants were all insufficient to roil
3
Credit Suisse Managed Futures Strategy Fund
Annual Investment Adviser's Report (continued)
October 31, 2021 (unaudited)
markets as money managers sought to keep pace with their benchmarks into the quarter end. However, in Q3, Chinese regulatory reforms dampened investor sentiment toward the region, and the program's exposure to Asian equity indices switched from long to short. In contrast, Japanese investors reacted favorably to rising global inflation and our Nikkei positioning turned long during the last weeks of the quarter. The program's long exposure to U.S. and European equities persisted throughout the period, in spite of weak economic data and the looming U.S. debt ceiling. All in all, equity positioning produced mixed results with Asian exposures continuing to challenge and leading the asset class overall to detract from returns over the period.
The Quantitative Investment Strategies Group
Yung-Shin Kung
The Fund is non-diversified, which means it may invest a greater proportion of its assets in the securities of a smaller number of issuers than a diversified mutual fund and may therefore be subject to greater volatility. The Fund's investment in alternative instruments may subject the Fund to greater volatility than investments in traditional securities, particularly in investments involving leverage.
The use of alternative assets and strategies entails substantial risks, including risk of loss of principal, commodity exposure risks, credit risk, currency risk, derivatives risk, equity exposure risk, exchange-traded notes risk, fixed income risk, foreign securities risk, forwards risk, futures contracts risk, interest rate risk, leveraging risk, market risk, non-diversified status, options risk, portfolio turnover risk, repurchase agreements risk, short position risk, speculative exposure risk, structured note risk, subsidiary risk, swap agreements risk and tax risk. For a detailed discussion of these and other risks, please refer to the Fund's Prospectus, which should be read carefully before investing.
In addition to historical information, this report contains forward-looking statements, which may concern, among other things, domestic and foreign markets, industry and economic trends and developments and government regulation, and their potential impact on the Fund's investments. These statements are subject to risks and uncertainties and actual trends, developments and regulations in the future, and their impact on the Fund, could be materially different from those projected, anticipated or implied. The Fund has no obligation to update or revise forward-looking statements.
4
Credit Suisse Managed Futures Strategy Fund
Annual Investment Adviser's Report (continued)
October 31, 2021 (unaudited)
The views of the Fund's management are as of the date of this letter and the Fund holdings described in this document are as of October 31, 2021; these views and Fund holdings may have changed subsequent to these dates. Nothing in this document is a recommendation to purchase or sell securities.
5
Credit Suisse Managed Futures Strategy Fund
Annual Investment Adviser's Report (continued)
October 31, 2021 (unaudited)
Comparison of Change in Value of $10,000 Investment in the
Credit Suisse Managed Futures Strategy Fund1 Class I Shares,
Class A Shares2, Class C Shares2 and Credit Suisse Managed Futures
Liquid Index3 from Inception (9/28/12)
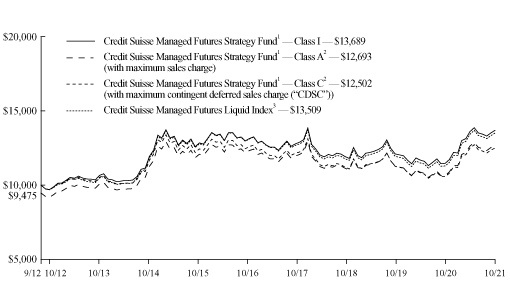
1 Fee waivers and/or expense reimbursements reduce expenses for the Fund, without which performance would be lower. The Fund entered into a written contract to limit expenses to 1.30% of the Fund's average daily net assets for Class I shares, 1.55% of the Fund's average daily net assets for Class A shares and 2.30% of the Fund's average daily net assets for Class C shares through at least February 28, 2023. This limit excludes certain expenses, as set forth in the Fund's Prospectus.
2 Total return for the Fund's Class A shares for the reporting period, based on offering price (including maximum sales charge of 5.25%), was 12.75%. Total return for the Fund's Class C shares for the reporting period, based on redemption value including Contingent Deferred Sales Charge ("CDSC") of 1.00%, was 17.16%.
3 The Credit Suisse Managed Futures Liquid Index is a broadly diversified futures index currently composed of 14 futures contracts and 4 commodity indices which provide exposure to the asset classes. The Index uses a proprietary quantitative methodology to seek to identify price trends in each of the asset classes over a variety of time horizons. Components of the Index, which may change from time to time, are positioned either long or short based on the price trends within the asset classes determined using the Index's quantitative methodology. The Index does not have transaction costs and investors may not invest directly in the Index.
6
Credit Suisse Managed Futures Strategy Fund
Annual Investment Adviser's Report (continued)
October 31, 2021 (unaudited)
Average Annual Returns as of October 31, 20211
| | | 1 Year | | 5 Years | | Since
Inception2 | |
Class I | | | 19.33 | % | | | 1.07 | % | | | 3.51 | % | |
Class A Without Sales Charge | | | 19.04 | % | | | 0.82 | % | | | 3.26 | % | |
Class A With Maximum Sales Charge | | | 12.75 | % | | | (0.25 | )% | | | 2.66 | % | |
Class C Without CDSC | | | 18.16 | % | | | 0.08 | % | | | 2.49 | % | |
Class C With CDSC | | | 17.16 | % | | | 0.08 | % | | | 2.49 | % | |
Returns represent past performance and include change in share price and reinvestment of dividends and capital gain distributions, if any. Past performance cannot guarantee future results. The current performance of the Fund may be lower or higher than the figures shown. Returns and share price will fluctuate, and redemption value may be more or less than original cost. The performance results do not reflect the deduction of taxes that a shareholder would pay on Fund distributions or the redemption of Fund shares. Performance information current to the most recent month end is available at www.credit-suisse.com/us/funds.
The annual gross expense ratios are 1.32% for Class I shares, 1.57% for Class A shares and 2.32% for Class C shares. The annual net expense ratios after fee waivers and/or expense reimbursements are 1.30% for Class I shares, 1.55% for Class A shares and 2.30% for Class C shares.
1 Fee waivers and/or expense reimbursements reduce expenses for the Fund, without which performance would be lower. The Fund has entered into a written contract to limit operating expenses to 1.30% of the Fund's average daily net assets for Class I shares, 1.55% of the Fund's average daily net assets for Class A shares and 2.30% of the Fund's average daily net assets for Class C shares through at least February 28, 2023. This limit excludes certain expenses, as set forth in the Fund's Prospectus.
2 Inception Date: September 28, 2012.
7
Credit Suisse Managed Futures Strategy Fund
Annual Investment Adviser's Report (continued)
October 31, 2021 (unaudited)
Information About Your Fund's Expenses
As an investor of the Fund, you incur two types of costs: ongoing expenses and transaction costs. Ongoing expenses include management fees, distribution and service (12b-1) fees and other Fund expenses. Examples of transaction costs include sales charges (loads), redemption fees and account maintenance fees, which are not shown in this section and which would result in higher total expenses. The following table is intended to help you understand your ongoing expenses of investing in the Fund and to help you compare these expenses with the ongoing expenses of investing in other mutual funds. The table is based on an investment of $1,000 made at the beginning of the six months ended October 31, 2021.
The table illustrates your Fund's expenses in two ways:
• Actual Fund Return. This helps you estimate the actual dollar amount of ongoing expenses paid on a $1,000 investment in the Fund using the Fund's actual return during the period. To estimate the expenses you paid over the period, simply divide your account value by $1,000 (for example, an $8,600 account value divided by $1,000 = 8.6), then multiply the result by the number in the "Expenses Paid per $1,000" line.
• Hypothetical 5% Fund Return. This helps you to compare the Fund's ongoing expenses with those of other mutual funds using the Fund's actual expense ratio and a hypothetical rate of return of 5% per year before expenses. Examples using a 5% hypothetical fund return may be found in the shareholder reports of other mutual funds. The hypothetical account values and expenses may not be used to estimate the actual ending account balance or expenses you paid for the period.
Please note that the expenses shown in these tables are meant to highlight your ongoing expenses only and do not reflect any transaction costs, such as sales charges (loads) or redemption fees. If these transaction costs had been included, your costs would have been higher. The "Expenses Paid per $1,000" line of the tables is useful in comparing ongoing expenses only and will not help you determine the relative total expenses of owning different funds.
8
Credit Suisse Managed Futures Strategy Fund
Annual Investment Adviser's Report (continued)
October 31, 2021 (unaudited)
Expenses and Value for a $1,000 Investment
for the six-month period ended October 31, 2021
Actual Fund Return | | Class I | | Class A | | Class C | |
Beginning Account Value 05/01/21 | | $ | 1,000.00 | | | $ | 1,000.00 | | | $ | 1,000.00 | | |
Ending Account Value 10/31/21 | | $ | 1,006.40 | | | $ | 1,004.60 | | | $ | 1,001.00 | | |
Expenses Paid per $1,000* | | $ | 6.57 | | | $ | 7.83 | | | $ | 11.60 | | |
Hypothetical 5% Fund Return | |
Beginning Account Value 05/01/21 | | $ | 1,000.00 | | | $ | 1,000.00 | | | $ | 1,000.00 | | |
Ending Account Value 10/31/21 | | $ | 1,018.65 | | | $ | 1,017.39 | | | $ | 1,013.61 | | |
Expenses Paid per $1,000* | | $ | 6.61 | | | $ | 7.88 | | | $ | 11.67 | | |
| | | Class I | | Class A | | Class C | |
Annualized Expense Ratios* | | | 1.30 | % | | | 1.55 | % | | | 2.30 | % | |
* Expenses are equal to the Fund's annualized expense ratio for each share class, multiplied by the average account value over the period, multiplied by 184/365 to reflect the one-half year period.
The "Expenses Paid per $1,000" and the "Annualized Expense Ratios" in the tables are based on actual expenses paid by the Fund during the period, net of fee waivers and/or actual expense reimbursements, if applicable. If those fee waivers and/or expense reimbursements had not been in effect, the Fund's actual expenses would have been higher. Expenses do not reflect additional charges and expenses that are, or may be, imposed under the variable contracts or plans. Such charges and expenses are described in the prospectus of the insurance company separate account or in the plan documents or other informational materials supplied by plan sponsors. The Fund's expenses should be considered with these charges and expenses in evaluating the overall cost of investing in the separate account.
For more information, please refer to the Fund's Prospectus.
Portfolio Breakdown**
United States Treasury Obligations | | | 60.96 | % | |
Short-Term Investment | | | 39.04 | | |
Total | | | 100.00 | % | |
** Expressed as a percentage of total investments (excluding securities lending collateral, if applicable) and may vary over time.
9
Credit Suisse Managed Futures Strategy Fund
Consolidated Schedule of Investments
October 31, 2021
Par
(000) | |
| | Ratings†
(S&P/Moody's) | | Maturity | | Rate% | | Value | |
| UNITED STATES TREASURY OBLIGATIONS (51.7%) | | | |
$ | 126,200 | | | United States Treasury Bills(1) | | (AA+, Aaa) | | 11/04/21 | | | 0.046 | | | $ | 126,199,517 | | |
| | 5,000 | | | United States Treasury Bills(1) | | (AA+, Aaa) | | 04/21/22 | | | 0.038 | | | | 4,998,634 | | |
| | 15,000 | | | United States Treasury Bills(1) | | (AA+, Aaa) | | 05/19/22 | | | 0.040 | | | | 14,994,403 | | |
| | 15,000 | | | United States Treasury Bills(1) | | (AA+, Aaa) | | 06/16/22 | | | 0.056 | | | | 14,992,433 | | |
| | 15,000 | | | United States Treasury Bills(1) | | (AA+, Aaa) | | 07/14/22 | | | 0.063 | | | | 14,990,437 | | |
| | 15,000 | | | United States Treasury Bills(1) | | (AA+, Aaa) | | 08/11/22 | | | 0.074 | | | | 14,987,856 | | |
| | 15,000 | | | United States Treasury Bills(1) | | (AA+, Aaa) | | 09/08/22 | | | 0.078 | | | | 14,984,677 | | |
| TOTAL UNITED STATES TREASURY OBLIGATIONS (Cost $206,164,515) | | | 206,147,957 | | |
| SHORT-TERM INVESTMENTS (33.1%) | | | |
Number of
Shares | |
| |
| |
| |
| |
| |
| | 132,041,815 | | | State Street Institutional U.S. Government Money Market Fund - Premier Class, 0.03%
(Cost $132,041,815) | | | | | | | | | | | | | | | 132,041,815 | | |
| TOTAL INVESTMENTS AT VALUE (84.8%) (Cost $338,206,330) | | | 338,189,772 | | |
| OTHER ASSETS IN EXCESS OF LIABILITIES (15.2%) | | | 60,604,855 | | |
| NET ASSETS (100.0%) | | $ | 398,794,627 | | |
† Credit ratings given by the S&P Global Ratings Division of S&P Global Inc. ("S&P") and Moody's Investors Service, Inc. ("Moody's") are unaudited.
(1) Securities are zero coupon. Rate presented is yield to maturity as of October 31, 2021.
Futures Contracts
Contract Description | | Currency | | Expiration
Date | | Number of
Contracts | | Notional
Value | | Net Unrealized
Appreciation
(Depreciation) | |
Contracts to Purchase | |
Foreign Exchange Contracts | | | | | | | | | | | |
| AUD Currency Futures | | USD | | | | Dec 2021 | | | 53 | | | $ | 3,989,045 | | | $ | (321 | ) | |
| CAD Currency Futures | | USD | | | | Dec 2021 | | | 1,025 | | | | 82,825,125 | | | | 66,781 | | |
| | | $ | 66,460 | | |
Index Contracts | |
EURO Stoxx 50 Index Futures | | EUR | | | | Dec 2021 | | | 731 | | | | 35,842,871 | | | $ | 916,256 | | |
FTSE 100 Index Futures | | GBP | | | | Dec 2021 | | | 387 | | | | 38,321,874 | | | | 817,494 | | |
Nikkei 225 Index Futures OSE | | JPY | | | | Dec 2021 | | | 114 | | | | 28,773,690 | | | | (268,230 | ) | |
S&P 500 E Mini Index Futures | | USD | | | | Dec 2021 | | | 105 | | | | 24,134,250 | | | | 631,646 | | |
| | | $ | 2,097,166 | | |
See Accompanying Notes to Consolidated Financial Statements.
10
Credit Suisse Managed Futures Strategy Fund
Consolidated Schedule of Investments (continued)
October 31, 2021
Futures Contracts (continued)
Contract Description | | Currency | | Expiration
Date | | Number of
Contracts | | Notional
Value | | Net Unrealized
Appreciation
(Depreciation) | |
Contracts to Sell | |
Foreign Exchange Contracts | |
| EUR Currency Futures | | USD | | | | Dec 2021 | | | (774 | ) | | $ | (111,925,238 | ) | | $ | 2,634,413 | | |
| GBP Currency Futures | | USD | | | | Dec 2021 | | | (82 | ) | | | (7,015,612 | ) | | | 1,230 | | |
| JPY Currency Futures | | USD | | | | Dec 2021 | | | (1,121 | ) | | | (123,029,750 | ) | | | 3,407,459 | | |
| | | $ | 6,043,102 | | |
Index Contracts | |
Hang Seng Index Futures | | HKD | | | | Nov 2021 | | | (139 | ) | | | (22,607,234 | ) | | $ | 699,518 | | |
Interest Rate Contracts | |
10YR Japanese Bond Futures | | JPY | | | | Dec 2021 | | | (269 | ) | | | (356,983,819 | ) | | $ | 482,909 | | |
10YR U.S. Treasury Note Futures | | USD | | | | Dec 2021 | | | (1,348 | ) | | | (176,187,813 | ) | | | 1,323,168 | | |
| EURO Bund Futures | | EUR | | | | Dec 2021 | | | (1,019 | ) | | | (198,253,340 | ) | | | 2,405,115 | | |
Long Gilt Futures | | GBP | | | | Dec 2021 | | | (862 | ) | | | (147,603,711 | ) | | | 2,217,318 | | |
| | | $ | 6,428,510 | | |
| | | $ | 15,334,756 | | |
Total Return Swap Contracts
Currency | | Notional
Amount | | Expiration
Date | | Counterparty | | Receive | | Pay | | Periodic
Payment
Frequency | | Upfront
Premiums
Paid/
(Received) | | Net Unrealized
Appreciation
(Depreciation) | |
USD | | | | $ | 28,703,919 | | |
12/07/21 | |
Bank of America | | (0.02)% | | Bloomberg
Precious
Metals Index | | At
Maturity | | $ | — | | | $ | 6,288 | | |
USD | | | | | 60,230,407 | | | 12/07/21 | | Bank of America | | Bloomberg
Agriculture
Index | | 0.10% | | At
Maturity | | | — | | | | 1,394,679 | | |
USD | | | | | 3,647,435 | | | 12/07/21 | | Bank of America | | Bloomberg
Industrial
Metals Index | | 0.10% | | At
Maturity | | | — | | | | 97,714 | | |
USD | | | | | 3,038,004 | | | 12/07/21 | | Bank of America | | Bloomberg
Energy Index | | 0.07% | | At
Maturity | | | — | | | | 596,656 | | |
USD | | | | | 23,500,329 | | | 12/07/21 | | Goldman Sachs | | Bloomberg
Energy Index | | 0.07% | | At
Maturity | | | — | | | | 4,695,621 | | |
USD | | | | | 47,245,040 | | | 12/07/21 | | Goldman Sachs | | Bloomberg
Industrial
Metals Index | | 0.10% | | At
Maturity | | | — | | | | 1,577,506 | | |
| | | $ | — | | | $ | 8,368,464 | | |
See Accompanying Notes to Consolidated Financial Statements.
11
Credit Suisse Managed Futures Strategy Fund
Consolidated Schedule of Investments (continued)
October 31, 2021
Currency Abbreviations:
AUD = Australian Dollar
CAD = Canadian Dollar
EUR = Euro
GBP = British Pound
HKD = Hong Kong Dollar
JPY = Japanese Yen
USD = United States Dollar
U.S. Treasury securities in the amount of $3,074,705 was received at the custodian bank as collateral for OTC swaps.
See Accompanying Notes to Consolidated Financial Statements.
12
Credit Suisse Managed Futures Strategy Fund
Consolidated Statement of Assets and Liabilities
October 31, 2021
Assets | |
Investments at value (Cost $338,206,330) (Note 2) | | $ | 338,189,772 | | |
Foreign currency at value (Cost $268) | | | 269 | | |
Cash segregated at brokers for futures contracts and swap contracts (Note 2) | | | 48,708,584 | | |
Unrealized appreciation on open swap contracts (Note 2) | | | 8,368,464 | | |
Variation margin receivable on futures contracts (Note 2) | | | 3,839,340 | | |
Receivable for Fund shares sold | | | 425,604 | | |
Interest receivable | | | 3,963 | | |
Prepaid expenses | | | 51,558 | | |
Total assets | | | 399,587,554 | | |
Liabilities | |
Investment advisory fee payable (Note 3) | | | 317,674 | | |
Administrative services fee payable (Note 3) | | | 19,657 | | |
Shareholder servicing/Distribution fee payable (Note 3) | | | 4,026 | | |
Payable for Fund shares redeemed | | | 123,532 | | |
Net payable for open swap contracts | | | 22,970 | | |
Trustees' fee payable | | | 16,394 | | |
Accrued expenses | | | 288,674 | | |
Total liabilities | | | 792,927 | | |
Net Assets | |
Capital stock, $.001 par value (Note 6) | | | 36,121 | | |
Paid-in capital (Note 6) | | | 373,395,955 | | |
Total distributable earnings (loss) | | | 25,362,551 | | |
Net assets | | $ | 398,794,627 | | |
I Shares | |
Net assets | | $ | 382,292,722 | | |
Shares outstanding | | | 34,599,462 | | |
Net asset value, offering price and redemption price per share | | $ | 11.05 | | |
A Shares | |
Net assets | | $ | 15,682,084 | | |
Shares outstanding | | | 1,441,492 | | |
Net asset value and redemption price per share | | $ | 10.88 | | |
Maximum offering price per share (net asset value/(1-5.25%)) | | $ | 11.48 | | |
C Shares | |
Net assets | | $ | 819,821 | | |
Shares outstanding | | | 79,768 | | |
Net asset value and offering price per share | | $ | 10.28 | | |
See Accompanying Notes to Consolidated Financial Statements.
13
Credit Suisse Managed Futures Strategy Fund
Consolidated Statement of Operations
For the Year Ended October 31, 2021
Investment Income | |
Interest | | $ | 68,001 | | |
Total investment income | | | 68,001 | | |
Expenses | |
Investment advisory fees (Note 3) | | | 3,758,069 | | |
Administrative services fees (Note 3) | | | 55,951 | | |
Shareholder servicing/Distribution fees (Note 3) | |
Class A | | | 35,235 | | |
Class C | | | 8,451 | | |
Transfer agent fees (Note 3) | | | 568,745 | | |
Registration fees | | | 79,475 | | |
Trustees' fees | | | 64,527 | | |
Printing fees | | | 61,840 | | |
Audit and tax fees | | | 56,305 | | |
Custodian fees | | | 43,685 | | |
Legal fees | | | 24,816 | | |
Insurance expense | | | 15,645 | | |
Commitment fees (Note 4) | | | 13,727 | | |
Miscellaneous expense | | | 11,036 | | |
Total expenses | | | 4,797,507 | | |
Less: fees waived and expenses reimbursed (Note 3) | | | (56,234 | ) | |
Net expenses | | | 4,741,273 | | |
Net investment loss | | | (4,673,272 | ) | |
Net Realized and Unrealized Gain (Loss) from Investments, Futures Contracts, Swap Contracts
and Foreign Currency Related Items | |
Net realized gain from futures contracts | | | 12,287,820 | | |
Net realized gain from swap contracts | | | 35,545,049 | | |
Net realized loss from foreign currency transactions | | | (13,279 | ) | |
Net change in unrealized appreciation (depreciation) from investments | | | (39,001 | ) | |
Net change in unrealized appreciation (depreciation) from futures contracts | | | 14,259,384 | | |
Net change in unrealized appreciation (depreciation) from swap contracts | | | 3,206,347 | | |
Net change in unrealized appreciation (depreciation) from foreign currency translations | | | (166,772 | ) | |
Net realized and unrealized gain from investments, futures contracts, swap contracts
and foreign currency related items | | | 65,079,548 | | |
Net increase in net assets resulting from operations | | $ | 60,406,276 | | |
See Accompanying Notes to Consolidated Financial Statements.
14
Credit Suisse Managed Futures Strategy Fund
Consolidated Statements of Changes in Net Assets
| | | For the Year
Ended
October 31, 2021 | | For the Year
Ended
October 31, 2020 | |
From Operations | |
Net investment loss | | $ | (4,673,272 | ) | | $ | (1,064,126 | ) | |
Net realized gain (loss) from investments, futures contracts,
swap contracts and foreign currency transactions | | | 47,819,590 | | | | (14,691,962 | ) | |
Net change in unrealized appreciation (depreciation) from investments,
futures contracts, swap contracts and foreign currency translations | | | 17,259,958 | | | | (758,723 | ) | |
Net increase (decrease) in net assets resulting from operations | | | 60,406,276 | | | | (16,514,811 | ) | |
From Distributions | |
From distributable earnings | |
Class I | | | — | | | | (5,362,443 | ) | |
Class A | | | — | | | | (337,689 | ) | |
Class C | | | — | | | | (2,304 | ) | |
Net decrease in net assets resulting from dividends | | | — | | | | (5,702,436 | ) | |
| From Capital Share Transactions (Note 6) | |
Proceeds from sale of shares | | | 115,449,710 | | | | 191,735,094 | | |
Reinvestment of dividends | | | — | | | | 5,402,378 | | |
Net asset value of shares redeemed | | | (72,812,475 | ) | | | (222,317,282 | ) | |
Net increase (decrease) in net assets from capital share transactions | | | 42,637,235 | | | | (25,179,810 | ) | |
Net increase (decrease) in net assets | | | 103,043,511 | | | | (47,397,057 | ) | |
Net Assets | |
Beginning of year | | | 295,751,116 | | | | 343,148,173 | | |
End of year | | $ | 398,794,627 | | | $ | 295,751,116 | | |
See Accompanying Notes to Consolidated Financial Statements.
15
Credit Suisse Managed Futures Strategy Fund
Consolidated Financial Highlights
(For a Class I Share of the Fund Outstanding Throughout Each Year)
| | | For the Year Ended October 31, | |
| | | 2021 | | 2020 | | 2019 | | 2018 | | 2017 | |
Per share data | |
Net asset value, beginning of year | | $ | 9.26 | | | $ | 9.94 | | | $ | 9.79 | | | $ | 10.49 | | | $ | 10.94 | | |
INVESTMENT OPERATIONS | |
Net investment income (loss)1 | | | (0.13 | ) | | | (0.03 | ) | | | 0.04 | | | | (0.02 | ) | | | (0.10 | ) | |
Net gain (loss) from investments, futures contracts,
swap contracts and foreign currency related items
(both realized and unrealized) | | | 1.92 | | | | (0.48 | ) | | | 0.11 | | | | (0.68 | ) | | | (0.06 | ) | |
Total from investment operations | | | 1.79 | | | | (0.51 | ) | | | 0.15 | | | | (0.70 | ) | | | (0.16 | ) | |
LESS DIVIDENDS AND DISTRIBUTIONS | |
Dividends from net investment income | | | — | | | | (0.17 | ) | | | — | | | | — | | | | — | | |
Distributions from net realized gains | | | — | | | | — | | | | — | | | | — | | | | (0.29 | ) | |
Total dividends and distributions | | | — | | | | (0.17 | ) | | | — | | | | — | | | | (0.29 | ) | |
Net asset value, end of year | | $ | 11.05 | | | $ | 9.26 | | | $ | 9.94 | | | $ | 9.79 | | | $ | 10.49 | �� | |
Total return2 | | | 19.33 | % | | | (5.22 | )% | | | 1.53 | % | | | (6.67 | )% | | | (1.60 | )% | |
RATIOS AND SUPPLEMENTAL DATA | |
Net assets, end of year (000s omitted) | | $ | 382,293 | | | $ | 282,365 | | | $ | 318,590 | | | $ | 227,703 | | | $ | 201,478 | | |
Ratio of net expenses to average net assets | | | 1.30 | % | | | 1.30 | % | | | 1.30 | % | | | 1.30 | % | | | 1.30 | % | |
Ratio of net investment income (loss) to
average net assets | | | (1.28 | )% | | | (0.34 | )% | | | 0.42 | % | | | (0.15 | )% | | | (0.99 | )% | |
Decrease reflected in above operating expense
ratios due to waivers/reimbursements | | | 0.02 | % | | | 0.05 | % | | | 0.02 | % | | | 0.03 | % | | | 0.09 | % | |
Portfolio turnover rate3 | | | — | % | | | — | % | | | — | % | | | — | % | | | — | % | |
1 Per share information is calculated using the average shares outstanding method.
2 Total returns are historical and include change in share price and reinvestment of all dividends and distributions. Had certain expenses not been reduced during the periods shown, total returns would have been lower.
3 Portfolio turnover is calculated by dividing the lesser of total purchases or sales of portfolio securities for the reporting period by the monthly average of portfolio securities owned during the reporting period. Excluded from both the numerator and denominator are amounts relating to derivatives and securities whose maturities or expiration dates at the time of acquisition were one year or less.
See Accompanying Notes to Consolidated Financial Statements.
16
Credit Suisse Managed Futures Strategy Fund
Consolidated Financial Highlights
(For a Class A Share of the Fund Outstanding Throughout Each Year)
| | | For the Year Ended October 31, | |
| | | 2021 | | 2020 | | 2019 | | 2018 | | 2017 | |
Per share data | |
Net asset value, beginning of year | | $ | 9.14 | | | $ | 9.82 | | | $ | 9.69 | | | $ | 10.41 | | | $ | 10.88 | | |
INVESTMENT OPERATIONS | |
Net investment income (loss)1 | | | (0.16 | ) | | | (0.05 | ) | | | 0.01 | | | | (0.05 | ) | | | (0.12 | ) | |
Net gain (loss) from investments, futures contracts,
swap contracts and foreign currency related items
(both realized and unrealized) | | | 1.90 | | | | (0.49 | ) | | | 0.12 | | | | (0.67 | ) | | | (0.06 | ) | |
Total from investment operations | | | 1.74 | | | | (0.54 | ) | | | 0.13 | | | | (0.72 | ) | | | (0.18 | ) | |
LESS DIVIDENDS AND DISTRIBUTIONS | |
Dividends from net investment income | | | — | | | | (0.14 | ) | | | — | | | | — | | | | — | | |
Distributions from net realized gains | | | — | | | | — | | | | — | | | | — | | | | (0.29 | ) | |
Total dividends and distributions | | | — | | | | (0.14 | ) | | | — | | | | — | | | | (0.29 | ) | |
Net asset value, end of year | | $ | 10.88 | | | $ | 9.14 | | | $ | 9.82 | | | $ | 9.69 | | | $ | 10.41 | | |
Total return2 | | | 19.04 | % | | | (5.53 | )% | | | 1.34 | % | | | (6.92 | )% | | | (1.79 | )% | |
RATIOS AND SUPPLEMENTAL DATA | |
Net assets, end of year (000s omitted) | | $ | 15,682 | | | $ | 12,506 | | | $ | 24,234 | | | $ | 50,474 | | | $ | 98,756 | | |
Ratio of net expenses to average net assets | | | 1.55 | % | | | 1.55 | % | | | 1.55 | % | | | 1.55 | % | | | 1.55 | % | |
Ratio of net investment income (loss) to
average net assets | | | (1.53 | )% | | | (0.51 | )% | | | 0.14 | % | | | (0.50 | )% | | | (1.20 | )% | |
Decrease reflected in above operating expense
ratios due to waivers/reimbursements | | | 0.02 | % | | | 0.05 | % | | | 0.02 | % | | | 0.03 | % | | | 0.09 | % | |
Portfolio turnover rate3 | | | — | % | | | — | % | | | — | % | | | — | % | | | — | % | |
1 Per share information is calculated using the average shares outstanding method.
2 Total returns are historical and include change in share price, reinvestment of all dividends and distributions and no sales charge. Had certain expenses not been reduced during the years shown, total returns would have been lower.
3 Portfolio turnover is calculated by dividing the lesser of total purchases or sales of portfolio securities for the reporting period by the monthly average of portfolio securities owned during the reporting period. Excluded from both the numerator and denominator are amounts relating to derivatives and securities whose maturities or expiration dates at the time of acquisition were one year or less.
See Accompanying Notes to Consolidated Financial Statements.
17
Credit Suisse Managed Futures Strategy Fund
Consolidated Financial Highlights
(For a Class C Share of the Fund Outstanding Throughout Each Year)
| | | For the Year Ended October 31, | |
| | | 2021 | | 2020 | | 2019 | | 2018 | | 2017 | |
Per share data | |
Net asset value, beginning of year | | $ | 8.70 | | | $ | 9.351 | | | $ | 9.29 | | | $ | 10.06 | | | $ | 10.60 | | |
INVESTMENT OPERATIONS | |
Net investment loss2 | | | (0.22 | ) | | | (0.14 | ) | | | (0.06 | ) | | | (0.12 | ) | | | (0.20 | ) | |
Net gain (loss) from investments, futures contracts,
swap contracts and foreign currency related items
(both realized and unrealized) | | | 1.80 | | | | (0.44 | ) | | | 0.12 | | | | (0.65 | ) | | | (0.05 | ) | |
Total from investment operations | | | 1.58 | | | | (0.58 | ) | | | 0.06 | | | | (0.77 | ) | | | (0.25 | ) | |
LESS DIVIDENDS AND DISTRIBUTIONS | |
Dividends from net investment income | | | — | | | | (0.07 | ) | | | — | | | | — | | | | — | | |
Distributions from net realized gains | | | — | | | | — | | | | — | | | | — | | | | (0.29 | ) | |
Total dividends and distributions | | | — | | | | (0.07 | ) | | | — | | | | — | | | | (0.29 | ) | |
Net asset value, end of year | | $ | 10.28 | | | $ | 8.70 | | | $ | 9.351 | | | $ | 9.29 | | | $ | 10.06 | | |
Total return3 | | | 18.16 | % | | | (6.24 | )% | | | 0.65 | % | | | (7.65 | )% | | | (2.52 | )% | |
RATIOS AND SUPPLEMENTAL DATA | |
Net assets, end of year (000s omitted) | | $ | 820 | | | $ | 880 | | | $ | 324 | | | $ | 1,658 | | | $ | 3,365 | | |
Ratio of net expenses to average net assets | | | 2.30 | % | | | 2.30 | % | | | 2.30 | % | | | 2.30 | % | | | 2.30 | % | |
Ratio of net investment loss to average net assets | | | (2.28 | )% | | | (1.56 | )% | | | (0.64 | )% | | | (1.22 | )% | | | (2.01 | )% | |
Decrease reflected in above operating expense
ratios due to waivers/reimbursements | | | 0.02 | % | | | 0.05 | % | | | 0.02 | % | | | 0.04 | % | | | 0.09 | % | |
Portfolio turnover rate4 | | | — | % | | | — | % | | | — | % | | | — | % | | | — | % | |
1 Includes adjustments in accordance with accounting principles generally accepted in the United States of America and as such, the net asset values for financial reporting purposes and the returns based upon net asset values may differ from the net asset values and returns for shareholder transactions.
2 Per share information is calculated using the average shares outstanding method.
3 Total returns are historical and include change in share price, reinvestment of all dividends and distributions and no sales charge. Had certain expenses not been reduced during the years shown, total returns would have been lower.
4 Portfolio turnover is calculated by dividing the lesser of total purchases or sales of portfolio securities for the reporting period by the monthly average of portfolio securities owned during the reporting period. Excluded from both the numerator and denominator are amounts relating to derivatives and securities whose maturities or expiration dates at the time of acquisition were one year or less.
See Accompanying Notes to Consolidated Financial Statements.
18
Credit Suisse Managed Futures Strategy Fund
Notes to Consolidated Financial Statements
October 31, 2021
Credit Suisse Managed Futures Strategy Fund (the "Fund"), a series of Credit Suisse Opportunity Funds (the "Trust"), a Delaware statutory trust, is registered under the Investment Company Act of 1940, as amended (the "1940 Act"), as a non-diversified open-end management investment company that seeks to achieve investment results that correspond generally to the risk and return patterns of managed futures funds. The Trust was organized under the laws of the State of Delaware as a business trust on May 31, 1995.
Credit Suisse Asset Management, LLC ("Credit Suisse"), the investment adviser to the Fund, is registered as an investment adviser with the Securities and Exchange Commission and as a Commodity Pool Operator with the Commodity Futures Trading Commission. The Fund seeks to achieve its investment objective by investing directly and/or indirectly through the Credit Suisse Cayman Managed Futures Strategy Fund, Ltd. (the "Subsidiary"), a wholly-owned subsidiary of the Fund organized under the laws of the Cayman Islands, in a combination of securities and derivative instruments. The Subsidiary invests in commodity-linked derivative instruments, such as swaps and futures, as well as other types of futures, swaps and options. The Subsidiary may also invest in debt securities, some of which are intended to serve as margin or collateral for the Subsidiary's derivatives positions.
The Subsidiary is managed by the same portfolio managers that manage the Fund and the accompanying financial statements reflect the financial position of the Fund and the Subsidiary and the results of operations on a consolidated basis. The consolidated financial statements include portfolio holdings of the Fund and the Subsidiary and all intercompany transactions and balances have been eliminated. The Fund may invest up to 25% of its total assets in the Subsidiary. As of October 31, 2021, the Fund held $70,049,820 in the Subsidiary, representing 17.6% of the Fund's consolidated net assets. For the year ended October 31, 2021, the net realized gain on securities and other financial instruments held in the Subsidiary was $35,545,049.
Subsequent references to the Fund within the Notes to Consolidated Financial Statements collectively refer to the Fund and the Subsidiary, unless the context otherwise requires.
The Fund offers three classes of shares: Class I shares, Class A shares and Class C shares. Each class of shares represents an equal pro rata interest in the Fund, except the share classes bear different expenses. Class A shares are sold subject to a front-end sales charge of up to 5.25%. Class C shares are sold subject to a contingent deferred sales charge ("CDSC") of 1.00% if the shares are redeemed within the first year of purchase. Class I shares are sold without a
19
Credit Suisse Managed Futures Strategy Fund
Notes to Consolidated Financial Statements (continued)
October 31, 2021
Note 1. Organization (continued)
sales charge. Effective June 30, 2021, Class C shares, upon the eight year anniversary of purchase, will convert to Class A shares.
Note 2. Significant Accounting Policies
The following is a summary of significant accounting policies followed by the Fund in the preparation of its consolidated financial statements. The policies are in accordance with generally accepted accounting principles in the United States of America ("GAAP"). The preparation of consolidated financial statements requires management to make estimates and assumptions that affect the reported amounts and disclosures in the consolidated financial statements. Actual results could differ from those estimates. The Fund is considered an investment company for financial reporting purposes under GAAP and follows the accounting and reporting guidance in Financial Accounting Standards Board ("FASB") Accounting Standards Codification ("ASC") Topic 946 — Financial Services — Investment Companies.
A) SECURITY VALUATION — The Board of Trustees (the "Board") is responsible for the Fund's valuation process. The Board has delegated the supervision of the daily valuation process to Credit Suisse Asset Management, LLC, the Fund's investment adviser ("Credit Suisse" or the "Adviser"), who has established a Pricing Committee which, pursuant to the policies adopted by the Board, is responsible for making fair valuation determinations and overseeing the Fund's pricing policies. The net asset value of the Fund is determined daily as of the close of regular trading on the New York Stock Exchange, Inc. (the "Exchange") on each day the Exchange is open for business. The valuations for fixed income securities (which may include, but are not limited to, corporate, government, municipal, mortgage-backed, collateralized mortgage obligations and asset-backed securities) and certain derivative instruments are typically the prices supplied by independent third party pricing services, which may use market prices or broker/dealer quotations or a variety of valuation techniques and methodologies. The independent third party pricing services use inputs that are observable such as issuer details, interest rates, yield curves, prepayment speeds, credit risks/spreads, default rates and quoted prices for similar securities. These pricing services generally price fixed income securities assuming orderly transactions of an institutional "round lot" size, but some trades occur in smaller "odd lot" sizes which may be effected at lower prices than institutional round lot trades. Structured note
20
Credit Suisse Managed Futures Strategy Fund
Notes to Consolidated Financial Statements (continued)
October 31, 2021
Note 2. Significant Accounting Policies (continued)
agreements are valued in accordance with a dealer-supplied valuation based on changes in the value of the underlying index. Futures contracts are valued daily at the settlement price established by the board of trade or exchange on which they are traded. Forward contracts are valued at the London closing spot rates and the London closing forward point rates on a daily basis. The currency forward contract pricing model derives the differential in point rates to the expiration date of the forward and calculates its present value. Over-the-counter derivative financial instruments, such as swap agreements, generally derive their value from underlying asset prices, indices, reference rates, and other inputs or a combination of these factors. Equity securities for which market quotations are available are valued at the last reported sales price or official closing price on the primary market or exchange on which they trade. The Fund may utilize a service provided by an independent third party which has been approved by the Board to fair value certain securities. When fair value pricing is employed, the prices of securities used by the Fund to calculate its net asset value may differ from quoted or published prices for the same securities. If independent third party pricing services are unable to supply prices for a portfolio investment, or if the prices supplied are deemed by the investment adviser to be unreliable, the market price may be determined by the investment adviser using quotations from one or more brokers/dealers or at the transaction price if the security has recently been purchased and no value has yet been obtained from a pricing service or pricing broker. When reliable prices are not readily available, such as when the value of a security has been significantly affected by events after the close of the exchange or market on which the security is principally traded, but before the Fund calculates its net asset value, these securities will be fair valued in good faith by the Pricing Committee, in accordance with procedures adopted by the Board.
The Fund uses valuation techniques to measure fair value that are consistent with the market approach and/or income approach, depending on the type of security and the particular circumstance. The market approach uses prices and other relevant information generated by market transactions involving identical or comparable securities. The income approach uses valuation techniques to discount estimated future cash flows to present value.
GAAP established a disclosure hierarchy that categorizes the inputs to valuation techniques used to value assets and liabilities at each measurement date. These inputs are summarized in the three broad levels listed below:
• Level 1 – quoted prices in active markets for identical investments
21
Credit Suisse Managed Futures Strategy Fund
Notes to Consolidated Financial Statements (continued)
October 31, 2021
Note 2. Significant Accounting Policies (continued)
• Level 2 – other significant observable inputs (including quoted prices for similar investments, interest rates, prepayment speeds, credit risk, etc.)
• Level 3 – significant unobservable inputs (including the Fund's own assumptions in determining the fair value of investments)
The inputs or methodologies used to value securities are not necessarily an indication of the risk associated with investing in those securities.
The following is a summary of the inputs used as of October 31, 2021 in valuing the Fund's assets and liabilities carried at fair value:
Assets | | Level 1 | | Level 2 | | Level 3 | | Total | |
Investments in Securities | |
United States Treasury Obligations | | $ | — | | | $ | 206,147,957 | | | $ | — | | | $ | 206,147,957 | | |
Short-term Investment | | | 132,041,815 | | | | — | | | | — | | | | 132,041,815 | | |
| | | $ | 132,041,815 | | | $ | 206,147,957 | | | $ | — | | | $ | 338,189,772 | | |
Other Financial Instruments* | |
Futures Contracts | | $ | 15,603,307 | | | $ | — | | | $ | — | | | $ | 15,603,307 | | |
Swap Contracts | | | — | | | | 8,368,464 | | | | — | | | | 8,368,464 | | |
Liabilities | | Level 1 | | Level 2 | | Level 3 | | Total | |
Other Financial Instruments* | |
Futures Contracts | | $ | 268,551 | | | $ | — | | | $ | — | | | $ | 268,551 | | |
* Other financial instruments include unrealized appreciation (depreciation) on futures and swap contracts.
For the year ended October 31, 2021, there were no transfers among Level 2 and Level 3. All transfers, if any, are assumed to occur at the end of the reporting period.
B) DERIVATIVE INSTRUMENTS AND HEDGING ACTIVITIES — The Fund adopted amendments to authoritative guidance on disclosures about derivative instruments and hedging activities which require that a fund disclose (a) how and why an entity uses derivative instruments, (b) how derivative instruments and hedging activities are accounted for and (c) how derivative instruments and related hedging activities affect a fund's financial position, financial performance and cash flows. For the year ended October 31, 2021, the Fund's derivatives did not qualify for hedge accounting as they are held at fair value.
22
Credit Suisse Managed Futures Strategy Fund
Notes to Consolidated Financial Statements (continued)
October 31, 2021
Note 2. Significant Accounting Policies (continued)
The following table presents the fair value and the location of derivatives within the Consolidated Statement of Assets and Liabilities at October 31, 2021 and the effect of these derivatives on the Consolidated Statement of Operations for the year ended October 31, 2021.
Primary Underlying Risk | | Derivative
Assets(1) | | Derivative
Liabilities(1) | | Realized Gain
(Loss) | | Change in Unrealized
Appreciation (Depreciation) | |
Foreign currency exchange rate | |
Futures contracts(2) | | $ | 6,109,883 | | | $ | 321 | | | $ | 6,463,042 | | | $ | 7,085,712 | | |
Index Contracts | |
Futures contracts(2) | | | 3,064,914 | | | | 268,230 | | | | 5,545,226 | | | | 2,037,105 | | |
Swap contracts | | | 8,368,464 | | | | — | | | | 35,545,049 | | | | 3,206,347 | | |
Interest rate | |
Futures contracts(2) | | | 6,428,510 | | | | — | | | | 279,552 | | | | 5,136,567 | | |
Total | | $ | 23,971,771 | | | $ | 268,551 | | | $ | 47,832,869 | | | $ | 17,465,731 | | |
(1) Generally, the balance sheet location for asset derivatives is receivables/net unrealized appreciation (depreciation) and for liability derivatives is payables/net unrealized appreciation (depreciation).
(2) Includes cumulative appreciation (depreciation) of futures contracts as reported in the Consolidated Schedule of Investments. Only variation margin is reported within the receivables and/or payables on the Consolidated Statement of Assets and Liabilities.
The notional amount of futures contracts and swap contracts open at October 31, 2021 is reflected in the Consolidated Schedule of Investments. For the year ended October 31, 2021, the Fund held average monthly notional values of $447,198,749, $513,776,093 and $129,667,072 in long futures contracts, short futures contracts and swap contracts, respectively.
The Fund is a party to International Swap and Derivatives Association, Inc. ("ISDA") Master Agreements ("Master Agreements") with certain counterparties that govern over-the-counter derivative (including Total Return, Credit Default and Interest Rate Swaps) and foreign exchange contracts entered into by the Fund. The Master Agreements may contain provisions regarding, among other things, the parties' general obligations, representations, agreements, collateral requirements, events of default and early termination. Termination events applicable to the Fund may occur upon a decline in the Fund's net assets below a specified threshold over a certain period of time.
23
Credit Suisse Managed Futures Strategy Fund
Notes to Consolidated Financial Statements (continued)
October 31, 2021
Note 2. Significant Accounting Policies (continued)
The following table presents by counterparty the Fund's derivative assets, net of related collateral held by the Fund, at October 31, 2021:
Counterparty | | Gross Amount of
Derivative Assets
Presented in the
Consolidated
Statement of Assets
and Liabilities(a) | | Financial
Instruments
and Derivatives
Available for Offset | | Non-Cash
Collateral
Received(b) | | Cash
Collateral
Received(b) | | Net Amount
of Derivative
Assets | |
Bank of America | | $ | 2,095,337 | | | $ | — | | | $ | — | | | $ | — | | | $ | 2,095,337 | | |
Goldman Sachs | | | 6,273,127 | | | | — | | | | (3,074,705 | ) | | | — | | | | 3,198,422 | | |
| | | $ | 8,368,464 | | | $ | | | | $ | (3,074,705 | ) | | $ | | | | $ | 5,293,759 | | |
(a) Swap contracts are included.
(b) The actual collateral pledged may be more than the amounts shown.
C) SECURITY TRANSACTIONS AND INVESTMENT INCOME/EXPENSE — Security transactions are accounted for on a trade date basis. Interest income/expense is recorded on the accrual basis. The Fund amortizes premiums and accretes discounts using the effective interest method. Dividend income/expense is recorded on the ex-dividend date. Certain expenses are class-specific expenses, vary by class and are charged only to that class. Income, expenses (excluding class-specific expenses) and realized/unrealized gains/losses are allocated proportionately to each class of shares based upon the relative net asset value of the outstanding shares of that class. The cost of investments sold is determined by use of the specific identification method for both financial reporting and income tax purposes. To the extent any issuer defaults or a credit event occurs that impacts the issuer, the Fund may halt any additional interest income accruals and consider the realizability of interest accrued up to the date of default or credit event.
D) DIVIDENDS AND DISTRIBUTIONS TO SHAREHOLDERS — Dividends from net investment income, if any, are declared and paid quarterly. Distributions of net realized capital gains, if any, are declared and paid at least annually. However, to the extent that a net realized capital gain can be reduced by a capital loss carryforward, such gain will not be distributed. Dividends and distributions to shareholders of the Fund are recorded on the ex-dividend date and are determined in accordance with federal income tax regulations, which may differ from GAAP.
E) FEDERAL AND OTHER TAXES — No provision is made for federal taxes as it is the Fund's intention to continue to qualify as a regulated investment company ("RIC") under the Internal Revenue Code of 1986, as amended (the "Code"), and to make the requisite distributions to its shareholders, which will be sufficient to relieve it from federal income and excise taxes.
24
Credit Suisse Managed Futures Strategy Fund
Notes to Consolidated Financial Statements (continued)
October 31, 2021
Note 2. Significant Accounting Policies (continued)
In order to qualify as a RIC under the Code, the Fund must meet certain requirements regarding the source of its income, the diversification of its assets and the distribution of its income. One of these requirements is that the Fund derive at least 90% of its gross income for each taxable year from dividends, interest, payments with respect to certain securities loans, gains from the sale or other disposition of stock, securities or foreign currencies, other income derived with respect to its business of investing in such stock, securities or currencies or net income derived from interests in certain publicly-traded partnerships ("Qualifying Income"). The Internal Revenue Service ("IRS") has issued a ruling that income realized from certain types of commodity-linked derivatives would not be Qualifying Income. As a result, the Fund's ability to realize income from investments in such commodity-linked derivatives as part of its investment strategy would be limited to a maximum of 10% of its gross income.
If the Fund is unable to ensure continued qualification as a RIC, the Fund may be required to change its investment objective, policies or techniques, or may be liquidated. If the Fund fails to qualify as a RIC, the Fund will be subject to federal income tax on its net income and capital gains at regular corporate rates (without reduction for distributions to shareholders). If the Fund were to fail to qualify as a RIC and become subject to federal income tax, shareholders of the Fund would be subject to the risk of diminished returns.
The Fund adopted the authoritative guidance for uncertainty in income taxes and recognizes a tax benefit or liability from an uncertain position only if it is more likely than not that the position is sustainable based solely on its technical merits and consideration of the relevant taxing authority's widely understood administrative practices and procedures. The Fund has reviewed its current tax positions and has determined that no provision for income tax is required in the Fund's financial statements. The Fund's federal and state income and federal excise tax returns for tax years for which the applicable statutes of limitations have not expired are subject to examination by the Internal Revenue Service and state departments of revenue.
F) CASH — The Fund's uninvested cash balance is held in an interest bearing variable rate demand deposit account at State Street Bank and Trust Company ("SSB"), the Fund's custodian.
G) FUTURES — The Fund may enter into futures contracts to the extent permitted by its investment policies and objectives. The Fund may use futures contracts to gain exposure to or hedge against changes in interest rates, equity and market price movements and/or currency risks. Upon entering into a
25
Credit Suisse Managed Futures Strategy Fund
Notes to Consolidated Financial Statements (continued)
October 31, 2021
Note 2. Significant Accounting Policies (continued)
futures contract, the Fund is required to deposit cash and/or pledge U.S. Government securities as initial margin with a Futures Commission Merchant ("FCM"). Subsequent payments, which are dependent on the daily fluctuations in the value of the underlying instrument, are made or received by the Fund each day (daily variation margin) and are recorded as unrealized gains or losses in the Consolidated Statement of Operations until the contracts are closed. When the contracts are closed, the Fund records a realized gain or loss equal to the difference between the proceeds from (or cost of) the closing transaction and the Fund's basis in the contract. Risks of entering into futures contracts for hedging purposes include the possibility that a change in the value of the contract may not correlate with the changes in the value of the underlying instruments. Futures have minimal counterparty credit risk because futures are exchange traded and the exchange's clearinghouse, as counterparty to all exchange-traded futures, guarantees the futures against default. In addition, the purchase of a futures contract involves the risk that the Fund could lose more than the original margin deposit and subsequent payments may be required for a futures transaction. The Fund's open futures contracts are disclosed in the Consolidated Schedule of Investments. At October 31, 2021, the amount of restricted cash held at brokers related to open futures contracts was $44,528,584.
The Commodity Exchange Act requires an FCM to segregate all customer transactions and assets from the FCM's proprietary activities. A customer's cash and other equity deposited with an FCM are considered commingled with all other customer funds subject to the FCM's segregation requirements. In the event of an FCM's insolvency, recovery may be limited to the Fund's pro-rata share of segregated customer funds available. It is possible that the recovery amount could be less than the total of cash and other equity deposited.
H) SWAPS — The Fund may enter into swap contracts either for hedging purposes or to seek to increase total return. A swap contract is an agreement that obligates two parties to exchange a series of cash flows at specified intervals based upon or calculated by reference to changes in specified prices or rates for a specified amount of an underlying asset or notional principal amount. The Fund will enter into swap contracts only on a net basis, which means that the two payment streams are netted out, with the Fund receiving or paying, as the case may be, only the net amount of the two payments. Risks may arise as a result of the failure of the counterparty to the swap contract to comply with the terms of the swap contract. The extent of the Fund's exposure to credit and counterparty risks is the discounted net value of the cash flows
26
Credit Suisse Managed Futures Strategy Fund
Notes to Consolidated Financial Statements (continued)
October 31, 2021
Note 2. Significant Accounting Policies (continued)
to be received from the counterparty over the contract's remaining life, to the extent that the amount is positive. These risks are mitigated by having a master netting arrangement between the Fund and the counterparty and by the posting of collateral by the counterparty to the Fund to cover the Fund's exposure to the counterparty. Therefore, the Fund considers the creditworthiness of each counterparty as well as the amounts posted by the counterparty pursuant to the master netting agreement to a swap contract in evaluating potential credit risk. Additionally, risks may arise from unanticipated movements in interest rates or in the value of the underlying reference asset or index.
The Fund may enter into total return swap contracts, involving commitments to pay interest in exchange for a market-linked return, both based on notional amounts. The Fund may invest in total return swap contracts for hedging purposes or to seek to increase total return. To the extent the total return of the security or index underlying the transaction exceeds or falls short of the offsetting interest rate obligation, the Fund will receive a payment from or make a payment to the counterparty.
The Fund records unrealized gains or losses on a daily basis representing the value and the current net receivable or payable relating to open swap contracts. Net amounts received or paid on the swap contract are recorded as realized gains or losses. Fluctuations in the value of swap contracts are recorded for financial statement purposes as unrealized appreciation or depreciation from swap contracts. Realized gains and losses from terminated swaps are included in net realized gains/losses from swap contracts. The Fund's open swap contracts are disclosed in the Consolidated Schedule of Investments. At October 31, 2021, the amount of restricted cash held at brokers related to open swap contracts was $4,180,000.
I) SECURITIES LENDING — The initial collateral received by the Fund is required to have a value of at least 102% of the market value of domestic securities on loan (including any accrued interest thereon) and 105% of the market value of foreign securities on loan (including any accrued interest thereon). The collateral is maintained thereafter at a value equal to at least 102% of the current market value of the securities on loan. The market value of loaned securities is determined at the close of each business day of the Fund and any additional required collateral is delivered to the Fund, or excess collateral returned by the Fund, on the next business day. Cash collateral received by the Fund in connection with securities lending activity may be pooled together with cash collateral for other funds/portfolios advised by
27
Credit Suisse Managed Futures Strategy Fund
Notes to Consolidated Financial Statements (continued)
October 31, 2021
Note 2. Significant Accounting Policies (continued)
Credit Suisse and may be invested in a variety of investments, including funds advised by SSB, the Fund's securities lending agent, or money market instruments. However, in the event of default or bankruptcy by the other party to the agreement, realization and/or retention of the collateral may be subject to legal proceedings.
SSB has been engaged by the Fund to act as the Fund's securities lending agent. The Fund's securities lending arrangement provides that the Fund and SSB will share the net income earned from securities lending activities. Securities lending income is accrued as earned. At October 31, 2021 and during the year ended October 31, 2021, there were no securities out on loan.
J) OTHER — In the normal course of business the Fund trades financial instruments and enters into financial transactions for which risk of potential loss exists due to changes in the market (market risk) or failure of the other party to a transaction to perform (credit risk). Similar to credit risk, the Fund may be exposed to counterparty risk, including with respect to securities lending, or the risk that an institution or other entity with which the Fund has unsettled or open transactions will default. The potential loss could exceed the value of the financial assets recorded in the consolidated financial statements. Financial assets, which potentially expose the Fund to credit risk, consist principally of cash due from counterparties and investments. The extent of the Fund's exposure to credit and counterparty risks in respect to these financial assets approximates their carrying value as recorded in the Fund's Consolidated Statement of Assets and Liabilities.
Note 3. Transactions with Affiliates and Related Parties
Credit Suisse serves as investment adviser and co-administrator for the Fund. For its investment advisory and administration services, Credit Suisse is entitled to receive a fee from the Fund at an annualized rate of 1.04% of the Fund's average daily net assets. For the year ended October 31, 2021, investment advisory and administration fees by Credit Suisse were $3,758,069. Credit Suisse has contractually agreed to limit expenses so that the Fund's annual operating expenses do not exceed 1.30% of the Fund's average daily net assets for Class I shares, 1.55% of the Fund's average daily net assets for Class A shares, and 2.30% of the Fund's average daily net assets for Class C shares. The Fund is authorized to reimburse Credit Suisse for management fees previously limited and/or for expenses previously reimbursed by Credit Suisse, provided, however, that any reimbursements must be paid at a date not more than thirty-six months following the applicable month during which
28
Credit Suisse Managed Futures Strategy Fund
Notes to Consolidated Financial Statements (continued)
October 31, 2021
Note 3. Transactions with Affiliates and Related Parties (continued)
such fees were limited or expenses were reimbursed by Credit Suisse and the reimbursements do not cause the Fund to exceed the applicable expense limitation in the contract at the time the fees are recouped. This contract may not be terminated before February 28, 2023. For the year ended October 31, 2021, Credit Suisse recouped $13,662 ($13,120 in Class I , $510 in Class A, and $32 in Class C) of previously waived fees and expense reimbursements. For the year ended October 31, 2021, the fees waived/expenses reimbursed by Credit Suisse were $69,896. The net fees waived were $56,234.
The amounts waived and reimbursed by Credit Suisse, which are available for potential future recoupment by Credit Suisse, and the expiration schedule at October 31, 2021 are as follows:
| | | Fee waivers/expense
reimbursements
subject to
recoupment | | Expires
October 31,
2023 | | Expires
October 31,
2024 | |
Class I | | $ | 213,172 | | | $ | 146,192 | | | $ | 66,980 | | |
Class A | | | 11,533 | | | | 8,784 | | | | 2,749 | | |
Class C | | | 371 | | | | 204 | | | | 167 | | |
Totals | | $ | 225,076 | | | $ | 155,180 | | | $ | 69,896 | | |
For its co-administrative services, SSB receives a fee, exclusive of out-of-pocket expenses, calculated in total for all the Credit Suisse funds/portfolios co-administered by SSB and allocated based upon the relative average net assets of each fund/portfolio, subject to an annual minimum fee. For the year ended October 31, 2021, co-administrative services fees earned by SSB (including out-of-pocket expenses) with respect to the Fund were $55,951.
Credit Suisse Securities (USA) LLC ("CSSU"), an affiliate of Credit Suisse, serves as the distributor of the Fund's shares. Pursuant to a distribution plan adopted by the Fund pursuant to Rule 12b-1 under the 1940 Act, CSSU receives fees for its distribution services. These fees are calculated at an annual rate of 0.25% of the average daily net assets of the Class A shares. For the Class C shares, the fee is calculated at an annual rate of 1.00% of the average daily net assets. For the year ended October 31, 2021, the Fund paid Rule 12b-1 distribution fees of $35,235 for Class A shares and $8,451 for Class C shares. Class I shares are not subject to Rule 12b-1 distribution fees.
There were no commissions earned on the sale of Class A and Class C shares.
29
Credit Suisse Managed Futures Strategy Fund
Notes to Consolidated Financial Statements (continued)
October 31, 2021
The Fund, together with other funds/portfolios advised by Credit Suisse (collectively, the "Participating Funds"), participates in a committed, unsecured line of credit facility ("Credit Facility"), with SSB in an aggregated amount of $125 million for temporary or emergency purposes under a first-come, first-served basis. Under the terms of the Credit Facility, the Participating Funds pay an aggregate commitment fee on the average unused amount of the Credit Facility, which is allocated among the Participating Funds in such manner as is determined by the governing Boards of the Participating Funds. In addition, the Participating Funds pay interest on borrowings at either the Overnight Federal Funds rate or the Overnight LIBOR rate plus a spread. At October 31, 2021 and during the year ended October 31, 2021, the Fund had no borrowings outstanding under the Credit Facility.
Note 5. Purchases and Sales of Securities
For the year ended October 31, 2021, purchases and sales of investment securities (excluding short-term investments) and U.S. Government and Agency Obligations were as follows:
Investment Securities | | U.S. Government/
Agency Obligations | |
| Purchases | | Sales | | Purchases | | Sales | |
| $ | 0 | | | $ | 0 | | | $ | 0 | | | $ | 0 | | |
Note 6. Capital Share Transactions
The Fund is authorized to issue an unlimited number of full and fractional shares of beneficial interest, $.001 par value per share. The Fund offers Class I, Class A and Class C shares. Transactions in capital shares for each class of the Fund were as follows:
| | | Class I | |
| | | For the Year Ended
October 31, 2021 | | For the Year Ended
October 31, 2020 | |
| | | Shares | | Value | | Shares | | Value | |
Shares sold | | | 10,628,646 | | | $ | 109,149,311 | | | | 19,547,998 | | | $ | 184,362,937 | | |
Shares issued in reinvestment
of dividends | | | — | | | | — | | | | 527,497 | | | | 5,121,989 | | |
Shares redeemed | | | (6,519,723 | ) | | | (67,300,320 | ) | | | (21,621,662 | ) | | | (204,884,402 | ) | |
Net increase (decrease) | | | 4,108,923 | | | $ | 41,848,991 | | | | (1,546,167 | ) | | $ | (15,399,476 | ) | |
30
Credit Suisse Managed Futures Strategy Fund
Notes to Consolidated Financial Statements (continued)
October 31, 2021
Note 6. Capital Share Transactions (continued)
| | | Class A | |
| | | For the Year Ended
October 31, 2021 | | For the Year Ended
October 31, 2020 | |
| | | Shares | | Value | | Shares | | Value | |
Shares sold | | | 594,107 | | | $ | 6,290,399 | | | | 703,557 | | | $ | 6,656,657 | | |
Shares issued in reinvestment
of dividends | | | — | | | | — | | | | 28,998 | | | | 278,377 | | |
Shares redeemed | | | (520,822 | ) | | | (5,300,627 | ) | | | (1,832,787 | ) | | | (17,301,635 | ) | |
Net increase (decrease) | | | 73,285 | | | $ | 989,772 | | | | (1,100,232 | ) | | $ | (10,366,601 | ) | |
| | | Class C | |
| | | For the Year Ended
October 31, 2021 | | For the Year Ended
October 31, 2020 | |
| | | Shares | | Value | | Shares | | Value | |
Shares sold | | | 1,013 | | | $ | 10,000 | | | | 81,189 | | | $ | 715,500 | | |
Shares issued in reinvestment
of dividends | | | — | | | | — | | | | 219 | | | | 2,012 | | |
Shares redeemed | | | (22,402 | ) | | | (211,528 | ) | | | (14,924 | ) | | | (131,245 | ) | |
Net increase (decrease) | | | (21,389 | ) | | $ | (201,528 | ) | | | 66,484 | | | $ | 586,267 | | |
On October 31, 2021, the number of shareholders that held 5% or more of the outstanding shares of each class of the Fund was as follows:
| | | Number of
Shareholders | | Approximate Percentage
of Outstanding Shares | |
Class I | | | 5 | | | | 89 | % | |
Class A | | | 1 | | | | 75 | % | |
Class C | | | 1 | | | | 95 | % | |
The Fund's performance may be negatively impacted in the event one or more of the Fund's greater than 5% shareholders were to redeem at a given time. Some of the shareholders may be omnibus accounts, which hold shares on behalf of individual shareholders.
Note 7. Income Tax Information and Distributions to Shareholders
Income and capital gain distributions are determined in accordance with federal income tax regulations, which may differ from GAAP.
The tax character of dividends paid by the Fund during the fiscal years ended October 31, 2021 and 2020, respectively, was as follows:
Ordinary Income | |
| 2021 | | 2020 | |
| $ | 0 | | | $ | 5,702,436 | | |
31
Credit Suisse Managed Futures Strategy Fund
Notes to Consolidated Financial Statements (continued)
October 31, 2021
Note 7. Income Tax Information and Distributions to Shareholders (continued)
The tax basis components of distributable earnings differ from book basis by temporary book/tax differences. These differences are primarily due to differing treatments of futures contracts marked to market, Subsidiary adjustments and deferred operational expenses. At October 31, 2021, the components of distributable earnings on a tax basis were as follows:
Accumulated net realized loss | | $ | (7,046,979 | ) | |
Undistributed ordinary income | | | 32,148,267 | | |
Unrealized appreciation | | | 765,550 | | |
| | | $ | 25,866,838 | | |
For the year ended October 31, 2021, capital loss carry over used in current year was $25,953,185.
At October 31, 2021, the Fund had $7,046,979 of unlimited short-term capital loss carryforwards available to offset possible future capital gains.
At October 31, 2021, the cost and net unrealized appreciation (depreciation) of investments and derivatives for income tax purposes were as follows:
Cost of Investments | | $ | 365,150,501 | | |
Unrealized appreciation | | $ | 1,166,239 | | |
Unrealized depreciation | | | (268,551 | ) | |
Net unrealized appreciation (depreciation) | | $ | 897,688 | | |
To adjust for current period permanent book/tax differences which arose principally from differing book/tax treatment of foreign currency gain (loss), equalization, non-deductible excise expense, and Subsidiary cumulative income (loss), paid-in capital was credited $1,835,014 and distributable earnings (loss) was charged $1,835,014. Net assets were not affected by this reclassification.
Note 8. Contingencies
In the normal course of business, the Fund may provide general indemnifications pursuant to certain contracts and organizational documents. The Fund's maximum exposure under these arrangements is dependent on future claims that may be made against the Fund and, therefore, cannot be estimated; however, based on experience, the risk of loss from such claims is considered remote.
32
Credit Suisse Managed Futures Strategy Fund
Notes to Consolidated Financial Statements (continued)
October 31, 2021
Note 9. Subsequent Events
In preparing the financial statements as of October 31, 2021, management considered the impact of subsequent events for potential recognition or disclosure in these financial statements through the date of release of this report. No such events requiring recognition or disclosure were identified through the date of the release of this report.
33
Credit Suisse Managed Futures Strategy Fund
Report of Independent Registered Public Accounting Firm
To the Board of Trustees of Credit Suisse Opportunity Funds and
Shareholders of Credit Suisse Managed Futures Strategy Fund
Opinion on the Financial Statements
We have audited the accompanying consolidated statement of assets and liabilities, including the consolidated schedule of investments, of Credit Suisse Managed Futures Strategy Fund (one of the funds constituting Credit Suisse Opportunity Funds, referred to hereafter as the "Fund") as of October 31, 2021, the related consolidated statement of operations for the year ended October 31, 2021, the consolidated statement of changes in net assets for each of the two years in the period ended October 31, 2021, including the related notes, and the consolidated financial highlights for each of the two years in the period ended October 31, 2021 (collectively referred to as the "consolidated financial statements"). In our opinion, the consolidated financial statements present fairly, in all material respects, the financial position of the Fund as of October 31, 2021, the results of its operations for the year then ended, and the changes in its net assets and the financial highlights for each of the two years in the period ended October 31, 2021 in conformity with accounting principles generally accepted in the United States of America.
The consolidated financial statements of the Fund as of and for the year ended October 31, 2019 and the consolidated financial highlights for the years ended October 31, 2019, 2018 and 2017 (not presented herein, other than the consolidated financial highlights) were audited by other auditors whose report dated December 20, 2019 expressed an unqualified opinion on those consolidated financial statements and consolidated financial highlights.
Basis for Opinion
These consolidated financial statements are the responsibility of the Fund's management. Our responsibility is to express an opinion on the Fund's consolidated financial statements based on our audits. We are a public accounting firm registered with the Public Company Accounting Oversight Board (United States) (PCAOB) and are required to be independent with respect to the Fund in accordance with the U.S. federal securities laws and the applicable rules and regulations of the Securities and Exchange Commission and the PCAOB.
We conducted our audits of these consolidated financial statements in accordance with the standards of the PCAOB. Those standards require that we plan and perform the audit to obtain reasonable assurance about whether the consolidated financial statements are free of material misstatement, whether due to error or fraud.
34
Credit Suisse Managed Futures Strategy Fund
Report of Independent Registered Public Accounting Firm
Our audits included performing procedures to assess the risks of material misstatement of the consolidated financial statements, whether due to error or fraud, and performing procedures that respond to those risks. Such procedures included examining, on a test basis, evidence regarding the amounts and disclosures in the consolidated financial statements. Our audits also included evaluating the accounting principles used and significant estimates made by management, as well as evaluating the overall presentation of the consolidated financial statements. Our procedures included confirmation of securities owned as of October 31, 2021 by correspondence with the custodian, transfer agent, and brokers; when replies were not received from brokers, we performed other auditing procedures. We believe that our audits provide a reasonable basis for our opinion.
/s/PricewaterhouseCoopers LLP
New York, New York
December 29, 2021
We have served as the auditor of one or more investment companies in Credit Suisse Asset Management, LLC investment companies since 2020.
35
Credit Suisse Managed Futures Strategy Fund
Information Concerning Trustees and Officers (unaudited)
Name, Address
(Year of Birth) | | Position(s)
Held with
Fund | | Term
of Office1
and
Length
of Time
Served | | Principal
Occupation(s) During
Past Five Years | | Number of
Portfolios
in Fund
Complex
Overseen
by Trustee | | Other
Trusteeships
Held by Trustee
During Past Five Years | |
Independent Trustees | | | | | | | | | | | |
Laura A. DeFelice
c/o Credit Suisse Asset
Management, LLC
Attn: General Counsel
Eleven Madison Avenue
New York, New York
10010
(1959) | | Trustee, Nominating and Audit Committee member | | Since 2017 | | Partner of Acacia Properties LLC (multi-family and commercial real estate ownership and operation) from 2008 to present; Stonegate Advisors LLC (renewable energy and energy efficiency) from 2007 to present. | | | 9 | | | None | |
Jeffrey E. Garten
c/o Credit Suisse Asset Management, LLC
Attn: General Counsel Eleven Madison Avenue New York, New York 10010
(1946) | | Trustee, Nominating and Audit Committee member | | Since Fund Inception | | Dean Emeritus of Yale School of Management from July 2015 to present; Partner and Chairman of Garten Rothkopf (consulting firm) from October 2005 to June 2017. | | | 9 | | | Director of Aetna, Inc. (insurance company) from January 1999 to 2019; Director of CarMax Group (used car dealers) from January 2002 to 2019; Director of Miller Buckfire & Co., LLC (financial restructuring) from January 2008 to 2019. | |
1 Subject to the Trust's retirement policy, each Trustee may continue to serve as a Trustee until the last day of the calendar year in which the applicable Trustee attains age 75. The Board may determine to extend the terms of Trustees beyond age 75 on a case-by-case basis. Each officer serves until his or her respective successor has been duly elected and qualified.
36
Credit Suisse Managed Futures Strategy Fund
Information Concerning Trustees and Officers (unaudited) (continued)
Name, Address
(Year of Birth) | | Position(s)
Held with
Fund | | Term
of Office1
and
Length
of Time
Served | | Principal
Occupation(s) During
Past Five Years | | Number of
Portfolios
in Fund
Complex
Overseen
by Trustee | | Other
Trusteeships
Held by Trustee
During Past Five Years | |
Independent Trustees | | | | | | | | | | | |
Mahendra R. Gupta
c/o Credit Suisse Asset
Management, LLC
Attn: General Counsel
Eleven Madison Avenue
New York, New York
10010
(1956) | | Trustee, Nominating Committee member and Audit Committee Chairman | | Since 2017 | | Professor, Washington University in St. Louis from July 1990 to present; Partner, R.J. Mithaiwala (food manufacturing and retail, India) from March 1977 to present; Partner, F.F.B. Corporation (agriculture, India) from March 1977 to present; Partner, RPMG Research Corporation (benchmark research) from July 2001 to present. | | | 9 | | | Director of Caleres Inc. (footwear) from May 2012 to present; Director of Koch Development Corporation (real estate development) from November 2017 to present; Director of Supernova (fin-tech) from June 2014 to September 2018. | |
1 Subject to the Trust's retirement policy, each Trustee may continue to serve as a Trustee until the last day of the calendar year in which the applicable Trustee attains age 75. The Board may determine to extend the terms of Trustees beyond age 75 on a case-by-case basis. Each officer serves until his or her respective successor has been duly elected and qualified.
37
Credit Suisse Managed Futures Strategy Fund
Information Concerning Trustees and Officers (unaudited) (continued)
Name, Address
(Year of Birth) | | Position(s)
Held with
Fund | | Term
of Office1
and
Length
of Time
Served | | Principal
Occupation(s) During
Past Five Years | | Number of
Portfolios
in Fund
Complex
Overseen
by Trustee | | Other
Trusteeships
Held by Trustee
During Past Five Years | |
Independent Trustees | | | | | | | | | | | |
Steven N. Rappaport
c/o Credit Suisse Asset
Management, LLC
Attn: General Counsel
Eleven Madison Avenue
New York, New York
10010
(1948) | | Chairman of the Board, Nominating Committee Chairman and Audit Committee member | | Trustee since Fund Inception and Chairman since 2005 | | Partner of Lehigh Court, LLC and RZ Capital (private investment firms) from July 2002 to present; Partner of Backstage Acquisition Holdings, LLC (publication job postings) from November 2013 to 2018. | | | 9 | | | Director of Aberdeen Emerging Markets Equity Income Fund, Inc., (a closed-end investment company); Director of Aberdeen Funds (18 open-end portfolios); Director of iCAD, Inc. (surgical & medical instruments & apparatus company) from 2006 to 2018. | |
Interested Trustee | | | | | | | | | | | |
John G. Popp2
Credit Suisse Asset
Management, LLC
Eleven Madison Avenue
New York, New York
10010
(1956) | | Trustee, Chief Executive Officer and President | | Trustee since 2017
Chief Executive Officer and President since 2010 | | Managing Director of Credit Suisse; Global Head and Chief Investment Officer of the Credit Investments Group; Associated with Credit Suisse or its predecessor since 1997; Officer of other Credit Suisse Funds. | | | 9 | | | None. | |
1 Subject to the Trust's retirement policy, each Trustee may continue to serve as a Trustee until the last day of the calendar year in which the applicable Trustee attains age 75. The Board may determine to extend the terms of Trustees beyond age 75 on a case-by-case basis. Each officer serves until his or her respective successor has been duly elected and qualified.
2 Mr. Popp is an "interested person" of the Trust, as defined in the 1940 Act, by virtue of his current position as an officer of Credit Suisse.
38
Credit Suisse Managed Futures Strategy Fund
Information Concerning Trustees and Officers (unaudited) (continued)
Name, Address
(Year of Birth) | | Position(s)
Held with
Fund | | Term of
Office
and
Length of
Time
Served | | Principal Occupation(s) During Past Five Years | |
Officers* | | | | | | | |
Emidio Morizio**
Credit Suisse Asset
Management, LLC
Eleven Madison Avenue
New York, New York 10010
(1966) | | Chief Compliance Officer | | Since Fund Inception | | Managing Director and Global Head of Compliance of Credit Suisse since 2010; Associated with Credit Suisse since July 2000; Officer of other Credit Suisse Funds. | |
Lou Anne McInnis
Credit Suisse Asset Management, LLC
Eleven Madison Avenue
New York, New York 10010
(1959) | | Chief Legal Officer | | Since 2015 | | Director of Credit Suisse; Associated with Credit Suisse since April 2015; Counsel at DLA Piper US LLP from 2011 to April 2015; Associated with Morgan Stanley Investment Management from 1997 to 2010; Officer of other Credit Suisse Funds. | |
Omar Tariq
Credit Suisse Asset
Management, LLC
Eleven Madison Avenue
New York, New York 10010
(1983) | | Chief Financial Officer and Treasurer | | Since 2019 | | Director of Credit Suisse since March 2019; Senior Manager of PriceWaterhouseCoopers, LLP from September 2010 to March 2019; Officer of other Credit Suisse Funds. | |
Karen Regan
Credit Suisse Asset
Management, LLC
Eleven Madison Avenue
New York, New York 10010
(1963) | | Vice President and Secretary | | Since 2010 | | Vice President of Credit Suisse; Associated with Credit Suisse since December 2004; Officer of other Credit Suisse Funds. | |
* The officers of the Fund shown are officers that make policy decisions.
** Effective December 16, 2021, Jason Gossett replaced Emidio Morizio as Interim Chief Compliance Officer. Mr. Gossett has been a Vice President of Credit Suisse since 2018 and has been associated with Credit Suisse since June 2015. Mr. Gossett also serves as an officer of other Credit Suisse funds.
The Statement of Additional Information includes additional information about the Trustees and is available, without charge, upon request, by calling 877-870-2874.
39
Credit Suisse Managed Futures Strategy Fund
Proxy Voting and Portfolio Holdings Information (unaudited)
Information regarding how the Fund voted proxies related to its portfolio securities during the 12-month period ended June 30 of each year, as well as the policies and procedures that the Fund uses to determine how to vote proxies relating to its portfolio securities are available:
• By calling 1-877-870-2874
• On the Fund's website, www.credit-suisse.com/us/funds
• On the website of the Securities and Exchange Commission, www.sec.gov
The Fund files a complete schedule of its portfolio holdings for the first and third quarters of its fiscal year with the SEC as an exhibit to its reports on Form N-PORT, and for reporting periods ended prior to March 31, 2019, filed such information on Form N-Q. The Fund's Forms N-PORT and N-Q are available on the SEC's website at www.sec.gov.
40

P.O. BOX 219916, KANSAS CITY, MO 64121-9916
877-870-2874 ◼ www.credit-suisse.com/us/funds
CREDIT SUISSE SECURITIES (USA) LLC, DISTRIBUTOR. MFS-AR-1021

CREDIT SUISSE FUNDS
Annual Report
October 31, 2021
◼ CREDIT SUISSE
MULTIALTERNATIVE STRATEGY FUND
The Fund's investment objectives, risks, charges and expenses (which should be considered carefully before investing), and more complete information about the Fund, are provided in the Prospectus, which should be read carefully before investing. You may obtain additional copies by calling 877-870-2874 or by visiting our website at www.credit-suisse.com/us/funds.
Credit Suisse Securities (USA) LLC, Distributor, is located at Eleven Madison Avenue, New York, NY 10010. Credit Suisse Funds are advised by Credit Suisse Asset Management, LLC.
Investors in the Credit Suisse Funds should be aware that they may be eligible to purchase Class I shares (where offered) directly or through certain intermediaries. Such shares are not subject to a sales charge. Investors in the Credit Suisse Funds should also be aware that they may be eligible for a reduction or waiver of the sales charge with respect to Class A or C shares (where offered). For more information, please review the relevant prospectuses or consult your financial representative.
Fund shares are not deposits or other obligations of Credit Suisse Asset Management, LLC ("Credit Suisse") or any affiliate, are not FDIC-insured and are not guaranteed by Credit Suisse or any affiliate. Fund investments are subject to investment risks, including loss of your investment.
Credit Suisse Multialternative Strategy Fund
Annual Investment Adviser's Report
October 31, 2021 (unaudited)
December 1, 2021
Dear Shareholder:
We are pleased to present this Annual Report covering the activities of the Credit Suisse Multialternative Strategy Fund (the "Fund") for the 12-month period ended October 31, 2021.
Performance Summary
11/01/20 – 10/31/21
Fund & Benchmark | | Performance | |
| Class I1 | | | 14.23 | % | |
| Class A1,2 | | | 13.88 | % | |
| ICE BoFA US 3-Month Treasury Bill Index3 | | | 0.06 | % | |
| Credit Suisse Liquid Alternative Beta Index4 | | | 19.36 | % | |
Performance shown for the Fund's Class A shares does not reflect sales charges, which are a maximum of 5.25%.2
Market Review: An interesting period with ups and downs
The 12-month period ended October 31, 2021, was marked by the impact of pandemic support packages and vaccination rollouts. The ICE BofA US 3-Month Treasury Bill Index (the Benchmark for the Fund) was up +0.06% for the period. Toward the end of 2020, investor exuberance led to a rally in risk assets following successful vaccination development efforts, accommodative fiscal and monetary policy, and U.S. election results. 2021 saw increased risk-on sentiment as several themes, such as retail market participation, reflation and reopening optimism converged.
2020 — a year marked by precipitous slumps and unexpected rebounds — closed on a positive note. Global equities rallied as investors weighed the impact of government support measures and the vaccination progress. And, while precious metals provided a haven against inflation concerns, energy prices remained capped. The future burden of fiscal and monetary stimuli ratcheted up inflation expectations, weighing on the U.S. dollar.
The new year began with unfavorable weather conditions buoying crop prices. Precious metals declined, as the concerns around the disorderly presidential handover in the U.S. receded. Energy prices rose on the prospect of accelerating economic growth and ongoing supply discipline maintained by OPEC+ partners. The U.S. dollar delivered its first monthly gain since September of 2020, as investors reacted to higher yields. Commodities such as agriculture and industrial metals also posted gains as pent-up demand coupled with weather
1
Credit Suisse Multialternative Strategy Fund
Annual Investment Adviser's Report (continued)
October 31, 2021 (unaudited)
conditions, supply chain challenges, green initiatives, and market imbalances in the U.S. drove prices higher. The Treasury yield curve steepened on the prospect of accelerating post-pandemic growth and rising inflation expectations.
While reopening-driven portfolio repositioning continued to be a dominant and profitable market theme, idiosyncratic events also influenced trend formation at the start of Q2 2021. An uptrend within commodities developed in congruence with the rigidity of global supply chains, which came increasingly into focus. Stock markets continued to rise on the back of solid economic prints, supportive policy, and robust corporate earnings.
In Q3 2021, rising COVID-19 Delta variant cases introduced uncertainty into the reopening narrative, driving defensive flows into safe heavens and pushing interest rates lower. Investors weighed the impact of the evolving U.S. budget framework on currency fundamentals. A volatile mixture of high inflation readings globally and supply bottlenecks, as well as fiscal and monetary policy uncertainty in the U.S. drove interest rates higher again, whereas weak economic data in Europe and the looming U.S. debt ceiling added to the jitters undermining investor confidence in equity markets.
Toward the quarter-end, inflationary pressure and tightening monetary conditions weighed on the U.S. dollar and bond prices worldwide, while equities gained and commodity prices rallied, reflecting a multifaceted supply inelasticity.
Strategic Review and Outlook: A good time for portfolio diversifiers
The Fund is designed to serve as a core portfolio diversifier. Our process-driven approach blends quantitative techniques with disciplined oversight and seeks to deliver attractive long-term performance. The Fund seeks to achieve its investment objective by utilizing an investment process that allocates across a range of investment strategies including those that are fundamental (carry and valuation) and tactical (flow, intermediation, and positioning) in nature. The program trades all major asset groups on a global basis, including corporate, real asset, and sovereign.
For the annual period ended October 31, 2021, the Fund's Class A and I shares both outperformed the Benchmark.
Carry reported strong performance in the period with strategies seeking to monetize volatility dynamics supporting gains, as the VIX subsided to pre-pandemic levels and fears of prolonged pandemic-driven contraction began to fade. Corporate volatility and merger arbitrage positions were the largest contributors to performance.
2
Credit Suisse Multialternative Strategy Fund
Annual Investment Adviser's Report (continued)
October 31, 2021 (unaudited)
Valuation strategies delivered positive returns. Real asset fundamental exposures drove gains as supply-demand dynamics in the commodity markets evolved. Strategies focused on isolating quality in equities, however, detracted from returns.
Flow strategies were profitable for the period, with corporate exposures focused on capturing the impact of structural changes in the economy, making up the bulk of the attribution along with cross-sectional real asset exposures. Sovereign exposures, on the other hand, struggled.
Overall performance for intermediation strategies was negative, with sovereign congestion exposures designing to profit from investor duration extension activity suffering losses that real asset congestion positions were unable to overcome.
Positioning strategies experienced the greatest headwinds during the period, with declines from dispersion trades more than offsetting the gains from strategies seeking to capture short-term price reversion dynamics within energy.
Looking ahead, we believe uncertainty will continue to persist with the evolution of the pandemic, supply chain bottlenecks and global political climate, and elevated upside inflation risks overhanging the markets. We believe these conditions underscore the value of managing uncertainty through portfolio diversification. In our view, our Multialternative Strategy remains well-positioned in that regard. The program seeks to provide non-traditional investment exposures, while targeting a low correlation to traditional stock and bond market risks, offering investors the potential benefits of portfolio breadth and balance.
The Quantitative Investment Strategies Group
Yung-Shin Kung
The Fund is non-diversified, which means it may invest a greater proportion of its assets in the securities of a smaller number of issuers than a diversified mutual fund and may therefore be subject to greater volatility. The Fund's investment in alternative instruments may subject the Fund to greater volatility than investments in traditional securities, particularly in investments involving leverage.
The use of alternative assets and strategies entails substantial risks, including risk of loss of principal, arbitrage or fundamental risk, below investment grade securities risk, commodity exposure risks, credit risk, derivatives risk, exchange-traded notes risk, fixed
3
Credit Suisse Multialternative Strategy Fund
Annual Investment Adviser's Report (continued)
October 31, 2021 (unaudited)
income risk, foreign securities risk, forwards risk, futures contracts risk, interest rate risk, leveraging risk, market risk, non-diversified status, options risk, portfolio turnover risk, risks of investing in other funds, small- and mid- cap stock risk, speculative exposure risk, subsidiary risk, swap agreements risk and tax risk. For a detailed discussion of these and other risks, please refer to the Fund's Prospectus, which should be read carefully before investing.
In addition to historical information, this report contains forward-looking statements, which may concern, among other things, domestic and foreign markets, industry and economic trends and developments and government regulation, and their potential impact on the Fund's investments. These statements are subject to risks and uncertainties and actual trends, developments and regulations in the future, and their impact on the Fund, could be materially different from those projected, anticipated or implied. The Fund has no obligation to update or revise forward-looking statements.
The views of the Fund's management are as of the date of this letter and the Fund holdings described in this document are as of October 31, 2021; these views and Fund holdings may have changed subsequent to these dates. Nothing in this document is a recommendation to purchase or sell securities.
4
Credit Suisse Multialternative Strategy Fund
Annual Investment Adviser's Report (continued)
October 31, 2021 (unaudited)
Comparison of Change in Value of $10,000 Investment in the
Credit Suisse Multialternative Strategy Fund1 Class I shares, Class A
shares2, the ICE BoFA US 3-Month Treasury Bill Index3, and the Credit
Suisse Liquid Alternative Beta Index4 from Inception (03/30/12)

1 Fee waivers and/or expense reimbursements reduce expenses for the Fund, without which performance would be lower. The Fund has entered into a written contract limiting operating expenses to 0.85% of the Fund's average daily net assets for Class I shares and 1.10% of the Fund's average daily net assets for Class A shares at least through February 28, 2023. This limit excludes certain expenses, as set forth in the Fund's Prospectus.
2 Total return for the Fund's Class A shares for the reporting period, based on offering price (including maximum sales charge of 5.25%), was 7.90%.
3 The ICE BoFA US 3-Month Treasury Bill Index is comprised of a single issue purchased at the beginning of the month and held for a full month. Each month the index is rebalanced and the issue selected is the outstanding Treasury Bill that matures closest to, but not beyond 3 months from the rebalancing date. The index does not have transaction costs and investors may not invest directly in the index.
4 Credit Suisse Liquid Alternative Beta Index reflects the return of a dynamic basket of liquid, investable market factors selected and weighted in accordance with an algorithm that aims to approximate the aggregate returns of the universe of hedge fund managers as represented by the Credit Suisse Hedge Fund Index. The index does not have transaction costs and investors may not invest directly in the index.
5
Credit Suisse Multialternative Strategy Fund
Annual Investment Adviser's Report (continued)
October 31, 2021 (unaudited)
Average Annual Returns as of October 31, 20211
| | | 1 Year | | 5 Years | | Since
Inception2 | |
Class I | | | 14.23 | % | | | 3.68 | % | | | 3.04 | % | |
Class A Without Sales Charge | | | 13.88 | % | | | 3.40 | % | | | 2.78 | % | |
Class A With Maximum Sales Charge | | | 7.90 | % | | | 2.29 | % | | | 2.21 | % | |
Returns represent past performance and include change in share price and reinvestment of dividends and capital gain distributions, if any. Past performance cannot guarantee future results. The current performance of the Fund may be lower or higher than the figures shown. Returns and share price will fluctuate, and redemption value may be more or less than original cost. The performance results do not reflect the deduction of taxes that a shareholder would pay on Fund distributions or the redemption of Fund shares. Performance information current to the most recent month end is available at www.credit-suisse.com/us/funds.
The annual gross expense ratios are 2.26% for Class I shares and 2.51% for Class A shares. The annual net expense ratios after fee waivers and/or expense reimbursements are 0.85% for Class I shares and 1.10% for Class A.
1 Fee waivers and/or expense reimbursements reduce expenses for the Fund, without which performance would be lower. The Fund has entered into a written contract limiting operating expenses to 0.85% of the Fund's average daily net assets for Class I shares and 1.10% of the Fund's average daily net assets for Class A shares at least through February 28, 2023. This limit excludes certain expenses, as set forth in the Fund's Prospectus.
2 Inception Date: March 30, 2012.
6
Credit Suisse Multialternative Strategy Fund
Annual Investment Adviser's Report (continued)
October 31, 2021 (unaudited)
Information About Your Fund's Expenses
As an investor of the Fund, you incur two types of costs: ongoing expenses and transaction costs. Ongoing expenses include management fees, distribution and service (12b-1) fees and other Fund expenses. Examples of transaction costs include sales charges (loads), redemption fees and account maintenance fees, which are not shown in this section and which would result in higher total expenses. The following table is intended to help you understand your ongoing expenses of investing in the Fund and to help you compare these expenses with the ongoing expenses of investing in other mutual funds. The table is based on an investment of $1,000 made at the beginning of the six months ended October 31, 2021.
The table illustrates your Fund's expenses in two ways:
• Actual Fund Return. This helps you estimate the actual dollar amount of ongoing expenses paid on a $1,000 investment in the Fund using the Fund's actual return during the period. To estimate the expenses you paid over the period, simply divide your account value by $1,000 (for example, an $8,600 account value divided by $1,000 = 8.6), then multiply the result by the number in the "Expenses Paid per $1,000" line.
• Hypothetical 5% Fund Return. This helps you to compare the Fund's ongoing expenses with those of other mutual funds using the Fund's actual expense ratio and a hypothetical rate of return of 5% per year before expenses. Examples using a 5% hypothetical fund return may be found in the shareholder reports of other mutual funds. The hypothetical account values and expenses may not be used to estimate the actual ending account balance or expenses you paid for the period.
Please note that the expenses shown in these tables are meant to highlight your ongoing expenses only and do not reflect any transaction costs, such as sales charges (loads) or redemption fees. If these transaction costs had been included, your costs would have been higher. The "Expenses Paid per $1,000" line of the tables is useful in comparing ongoing expenses only and will not help you determine the relative total expenses of owning different funds.
7
Credit Suisse Multialternative Strategy Fund
Annual Investment Adviser's Report (continued)
October 31, 2021 (unaudited)
Expenses and Value for a $1,000 Investment
for the six-month period ended October 31, 2021
Actual Fund Return | | Class I | | Class A | |
Beginning Account Value 05/01/21 | | $ | 1,000.00 | | | $ | 1,000.00 | | |
Ending Account Value 10/31/21 | | $ | 1,025.60 | | | $ | 1,023.80 | | |
Expenses Paid per $1,000* | | $ | 4.34 | | | $ | 5.61 | | |
Hypothetical 5% Fund Return | | | | | |
Beginning Account Value 05/01/21 | | $ | 1,000.00 | | | $ | 1,000.00 | | |
Ending Account Value 10/31/21 | | $ | 1,020.92 | | | $ | 1,019.66 | | |
Expenses Paid per $1,000* | | $ | 4.33 | | | $ | 5.60 | | |
| | | Class I | | Class A | |
Annualized Expense Ratios* | | | 0.85 | % | | | 1.10 | % | |
* Expenses are equal to the Fund's annualized expense ratio for each share class, multiplied by the average account value over the period, multiplied by 184/365 to reflect the one-half year period.
The "Expenses Paid per $1,000" and the "Annualized Expense Ratios" in the tables are based on actual expenses paid by the Fund during the period, net of fee waivers and/or actual expense reimbursements, if applicable. If those fee waivers and/or expense reimbursements had not been in effect, the Fund's actual expenses would have been higher. Expenses do not reflect additional charges and expenses that are, or may be, imposed under the variable contracts or plans. Such charges and expenses are described in the prospectus of the insurance company separate account or in the plan documents or other informational materials supplied by plan sponsors. The Fund's expenses should be considered with these charges and expenses in evaluating the overall cost of investing in the separate account.
For more information, please refer to the Fund's Prospectus.
8
Credit Suisse Multialternative Strategy Fund
Annual Investment Adviser's Report (continued)
October 31, 2021 (unaudited)
Investment Type Breakdown**
Common Stocks | | | 30.53 | % | |
Exchange-Traded Funds | | | 31.07 | | |
United States Treasury Obligations | | | 7.74 | | |
Short-Term Investments | | | 30.66 | | |
Total | | | 100.00 | % | |
** Expressed as a percentage of total investments (excluding securities lending collateral, if applicable) and may vary over time.
9
Credit Suisse Multialternative Strategy Fund
Consolidated Schedule of Investments
October 31, 2021
| | | Number of
Shares | | Value | |
| COMMON STOCKS (19.3%) | |
| BELGIUM (0.2%) | |
| Food & Staples Retailing (0.1%) | |
Etablissements Franz Colruyt NV | | | 624 | | | $ | 30,670 | | |
| Insurance (0.1%) | |
Ageas S.A. | | | 626 | | | | 30,487 | | |
| | | | 61,157 | | |
| DENMARK (0.8%) | |
| Beverages (0.1%) | |
Carlsberg A/S, Class B | | | 190 | | | | 31,404 | | |
| Building Products (0.1%) | |
ROCKWOOL International A/S, Class B | | | 72 | | | | 32,961 | | |
| Chemicals (0.1%) | |
Novozymes A/S, Class B | | | 453 | | | | 33,357 | | |
| Marine (0.3%) | |
AP Moller - Maersk A/S, Class A | | | 12 | | | | 32,982 | | |
AP Moller - Maersk A/S, Class B | | | 11 | | | | 31,910 | | |
| | | | 64,892 | | |
| Pharmaceuticals (0.2%) | |
Novo Nordisk A/S, Class B | | | 321 | | | | 35,236 | | |
| | | | 197,850 | | |
| FRANCE (0.8%) | |
| Building Products (0.1%) | |
Cie de Saint-Gobain | | | 460 | | | | 31,780 | | |
| Construction & Engineering (0.3%) | |
Eiffage SA | | | 306 | | | | 31,529 | | |
Vinci SA | | | 297 | | | | 31,787 | | |
| | | | 63,316 | | |
| Media (0.1%) | |
Vivendi SE | | | 2,456 | | | | 31,674 | | |
| Real Estate Investment Trusts (0.2%) | |
Klepierre S.A.(1) | | | 1,378 | | | | 32,840 | | |
| Textiles, Apparel & Luxury Goods (0.1%) | |
Kering SA | | | 43 | | | | 32,308 | | |
| | | | 191,918 | | |
| IRELAND (0.4%) | |
| Building Products (0.1%) | |
Johnson Controls International PLC | | | 458 | | | | 33,603 | | |
| Construction Materials (0.1%) | |
CRH PLC | | | 661 | | | | 31,666 | | |
See Accompanying Notes to Consolidated Financial Statements.
10
Credit Suisse Multialternative Strategy Fund
Consolidated Schedule of Investments (continued)
October 31, 2021
| | | Number of
Shares | | Value | |
| COMMON STOCKS (continued) | |
IRELAND | |
| Technology Hardware & Storage (0.2%) | |
Seagate Technology Holdings PLC | | | 385 | | | $ | 34,292 | | |
| | | | 99,561 | | |
| JERSEY (0.1%) | |
| Media (0.1%) | |
WPP PLC | | | 2,288 | | | | 33,126 | | |
| NETHERLANDS (1.1%) | |
| Chemicals (0.3%) | |
Akzo Nobel NV | | | 284 | | | | 32,671 | | |
Koninklijke DSM NV | | | 155 | | | | 33,901 | | |
| | | | 66,572 | | |
| Food & Staples Retailing (0.1%) | |
Koninklijke Ahold Delhaize NV | | | 932 | | | | 30,353 | | |
| Insurance (0.2%) | |
NN Group NV | | | 592 | | | | 31,680 | | |
| Oil, Gas & Consumable Fuels (0.1%) | |
Koninklijke Vopak NV | | | 788 | | | | 31,395 | | |
| Professional Services (0.1%) | |
Wolters Kluwer NV | | | 292 | | | | 30,611 | | |
| Semiconductor Equipment & Products (0.3%) | |
ASM International NV | | | 79 | | | | 35,793 | | |
| ASML Holding NV | | | 41 | | | | 33,365 | | |
| | | | 69,158 | | |
| | | | 259,769 | | |
| NORWAY (0.3%) | |
| Chemicals (0.1%) | |
Yara International ASA | | | 600 | | | | 31,315 | | |
| Media (0.2%) | |
Schibsted ASA, Class A | | | 626 | | | | 32,299 | | |
| | | | 63,614 | | |
| SWEDEN (0.2%) | |
| Machinery (0.1%) | |
Volvo AB, Class A | | | 1,351 | | | | 31,937 | | |
| Tobacco (0.1%) | |
Swedish Match AB | | | 3,503 | | | | 30,885 | | |
| | | | 62,822 | | |
See Accompanying Notes to Consolidated Financial Statements.
11
Credit Suisse Multialternative Strategy Fund
Consolidated Schedule of Investments (continued)
October 31, 2021
| | | Number of
Shares | | Value | |
| COMMON STOCKS (continued) | |
| UNITED KINGDOM (1.7%) | |
| Banks (0.4%) | |
Barclays PLC | | | 11,922 | | | $ | 32,951 | | |
Natwest Group PLC | | | 10,051 | | | | 30,354 | | |
Standard Chartered PLC | | | 5,185 | | | | 35,123 | | |
| | | | 98,428 | | |
| Capital Markets (0.1%) | |
Abrdn PLC | | | 8,844 | | | | 30,792 | | |
| Household Durables (0.1%) | |
The Berkeley Group Holdings PLC | | | 518 | | | | 30,948 | | |
| Industrial Conglomerates (0.1%) | |
Melrose Industries PLC | | | 12,988 | | | | 28,067 | | |
| Insurance (0.3%) | |
Aviva PLC | | | 5,710 | | | | 30,860 | | |
Direct Line Insurance Group PLC | | | 7,806 | | | | 31,250 | | |
| | | | 62,110 | | |
| Internet Software & Services (0.1%) | |
Auto Trader Group PLC(2) | | | 3,839 | | | | 31,878 | | |
| Metals/Mining (0.2%) | |
Anglo American PLC | | | 862 | | | | 32,846 | | |
| Oil, Gas & Consumable Fuels (0.3%) | |
| BP PLC | | | 6,643 | | | | 31,877 | | |
Royal Dutch Shell PLC, Class B | | | 1,370 | | | | 31,490 | | |
| | | | 63,367 | | |
| Software (0.1%) | |
The Sage Group PLC | | | 3,186 | | | | 31,035 | | |
| | | | 409,471 | | |
| UNITED STATES (13.7%) | |
| Biotechnology (0.1%) | |
Biogen, Inc.(1) | | | 110 | | | | 29,335 | | |
| Building Products (0.3%) | |
Masco Corp. | | | 562 | | | | 36,839 | | |
Owens Corning | | | 365 | | | | 34,095 | | |
| | | | 70,934 | | |
| Capital Markets (0.3%) | |
Ameriprise Financial, Inc. | | | 119 | | | | 35,954 | | |
SEI Investments Co. | | | 530 | | | | 33,411 | | |
| | | | 69,365 | | |
See Accompanying Notes to Consolidated Financial Statements.
12
Credit Suisse Multialternative Strategy Fund
Consolidated Schedule of Investments (continued)
October 31, 2021
| | | Number of
Shares | | Value | |
| COMMON STOCKS (continued) | |
UNITED STATES | |
| Chemicals (0.4%) | |
Celanese Corp., | | | 209 | | | $ | 33,756 | | |
DuPont de Nemours, Inc. | | | 459 | | | | 31,946 | | |
The Sherwin-Williams Co. | | | 112 | | | | 35,460 | | |
| | | | 101,162 | | |
| Commercial Services & Supplies (1.5%) | |
Covanta Holding Corp. | | | 18,216 | | | | 367,599 | | |
| Consumer Finance (0.1%) | |
Ally Financial, Inc. | | | 603 | | | | 28,787 | | |
| Containers & Packaging (0.1%) | |
Sealed Air Corp. | | | 578 | | | | 34,287 | | |
| Distributor (0.1%) | |
LKQ Corp. | | | 620 | | | | 34,150 | | |
| Diversified Financial Services (0.3%) | |
Berkshire Hathaway, Inc. Class B(1) | | | 115 | | | | 33,006 | | |
Voya Financial, Inc. | | | 508 | | | | 35,443 | | |
| | | | 68,449 | | |
| Electronic Equipment, Instruments & Components (0.3%) | |
Arrow Electronics, Inc.(1) | | | 284 | | | | 32,873 | | |
CDW Corp. | | | 171 | | | | 31,917 | | |
| | | | 64,790 | | |
| Food & Staples Retailing (0.1%) | |
The Kroger Co. | | | 771 | | | | 30,856 | | |
| Food Products (1.6%) | |
Sanderson Farms, Inc. | | | 1,844 | | | | 349,346 | | |
The J.M. Smucker Co. | | | 260 | | | | 31,943 | | |
| | | | 381,289 | | |
| Healthcare Equipment & Supplies (0.4%) | |
Intersect ENT, Inc.(1) | | | 2,595 | | | | 69,987 | | |
The Cooper Cos., Inc. | | | 76 | | | | 31,686 | | |
| | | | 101,673 | | |
| Healthcare Providers & Services (0.9%) | |
Anthem, Inc. | | | 86 | | | | 37,421 | | |
Cardinal Health, Inc. | | | 635 | | | | 30,360 | | |
Cigna Corp. | | | 157 | | | | 33,537 | | |
DaVita, Inc.(1) | | | 268 | | | | 27,668 | | |
HCA Healthcare, Inc. | | | 129 | | | | 32,309 | | |
McKesson Corp. | | | 156 | | | | 32,429 | | |
Quest Diagnostics, Inc. | | | 216 | | | | 31,705 | | |
| | | | 225,429 | | |
See Accompanying Notes to Consolidated Financial Statements.
13
Credit Suisse Multialternative Strategy Fund
Consolidated Schedule of Investments (continued)
October 31, 2021
| | | Number of
Shares | | Value | |
| COMMON STOCKS (continued) | |
UNITED STATES | |
| Healthcare Technology (0.7%) | |
Cerner Corp. | | | 443 | | | $ | 32,910 | | |
Inovalon Holdings, Inc., Class A(1) | | | 3,325 | | | | 135,627 | | |
| | | | 168,537 | | |
| Hotels, Restaurants & Leisure (0.1%) | |
Domino's Pizza, Inc. | | | 65 | | | | 31,783 | | |
| Household Durables (0.3%) | |
NVR, Inc.(1) | | | 7 | | | | 34,264 | | |
PulteGroup, Inc. | | | 679 | | | | 32,646 | | |
| | | | 66,910 | | |
| Industrial Conglomerates (1.0%) | |
General Electric Co. | | | 306 | | | | 32,090 | | |
Raven Industries, Inc.(1) | | | 3,824 | | | | 221,104 | | |
| | | | 253,194 | | |
| Insurance (1.1%) | |
Aflac, Inc. | | | 608 | | | | 32,631 | | |
Alleghany Corp.(1) | | | 50 | | | | 32,569 | | |
American Financial Group, Inc. | | | 253 | | | | 34,418 | | |
Globe Life, Inc. | | | 351 | | | | 31,246 | | |
Loews Corp. | | | 578 | | | | 32,409 | | |
MetLife, Inc. | | | 505 | | | | 31,714 | | |
The Allstate Corp. | | | 245 | | | | 30,299 | | |
The Hartford Financial Services Group, Inc. | | | 444 | | | | 32,381 | | |
| | | | 257,667 | | |
| Internet & Catalog Retail (0.2%) | |
eBay, Inc. | | | 464 | | | | 35,598 | | |
| IT Services (0.4%) | |
Cognizant Technology Solutions Corp., Class A | | | 425 | | | | 33,188 | | |
Gartner, Inc.(1) | | | 103 | | | | 34,187 | | |
Jack Henry & Associates, Inc. | | | 190 | | | | 31,631 | | |
| | | | 99,006 | | |
| Life Sciences Tools & Services (0.1%) | |
Mettler-Toledo International, Inc.(1) | | | 23 | | | | 34,060 | | |
| Media (0.6%) | |
Altice U.S.A., Inc., Class A(1) | | | 1,505 | | | | 24,532 | | |
Charter Communications, Inc., Class A(1) | | | 43 | | | | 29,020 | | |
Fox Corp. Class A | | | 778 | | | | 30,918 | | |
Fox Corp. Class B | | | 840 | | | | 31,046 | | |
Sirius XM Holdings, Inc.(3) | | | 5,113 | | | | 31,138 | | |
| | | | 146,654 | | |
See Accompanying Notes to Consolidated Financial Statements.
14
Credit Suisse Multialternative Strategy Fund
Consolidated Schedule of Investments (continued)
October 31, 2021
| | | Number of
Shares | | Value | |
| COMMON STOCKS (continued) | |
UNITED STATES | |
| Media - Services (0.2%) | |
Alphabet, Inc. Class C(1) | | | 12 | | | $ | 35,585 | | |
| Mortgage Real Estate Investment Trusts (0.1%) | |
AGNC Investment Corp. | | | 1,987 | | | | 31,633 | | |
| Multi-Utilities (0.1%) | |
Dominion Resources, Inc. | | | 427 | | | | 32,422 | | |
| Multiline Retail (0.3%) | |
Dollar General Corp. | | | 150 | | | | 33,228 | | |
Dollar Tree, Inc.(1) | | | 326 | | | | 35,130 | | |
| | | | 68,358 | | |
| Road & Rail (0.5%) | |
Kansas City Southern | | | 115 | | | | 35,679 | | |
Norfolk Southern Corp. | | | 130 | | | | 38,096 | | |
Union Pacific Corp. | | | 159 | | | | 38,383 | | |
| | | | 112,158 | | |
| Semiconductor Equipment & Products (0.1%) | |
Intel Corp. | | | 588 | | | | 28,812 | | |
| Software (0.1%) | |
Oracle Corp. | | | 363 | | | | 34,826 | | |
| Specialty Retail (1.0%) | |
Advance Auto Parts, Inc. | | | 152 | | | | 34,279 | | |
AutoZone, Inc.(1) | | | 19 | | | | 33,912 | | |
Bath & Body Works, Inc. | | | 495 | | | | 34,200 | | |
Best Buy Co., Inc. | | | 300 | | | | 36,672 | | |
Lowe's Cos., Inc. | | | 154 | | | | 36,008 | | |
O'Reilly Automotive, Inc.(1) | | | 51 | | | | 31,738 | | |
Ulta Beauty, Inc.(1) | | | 86 | | | | 31,593 | | |
| | | | 238,402 | | |
| Technology Hardware & Storage (0.3%) | |
Apple, Inc. | | | 222 | | | | 33,256 | | |
HP, Inc. | | | 1,140 | | | | 34,576 | | |
| | | | 67,832 | | |
| | | | 3,351,542 | | |
| TOTAL COMMON STOCKS (Cost $4,742,877) | | | 4,730,830 | | |
| EXCHANGE-TRADED FUNDS (19.7%) | |
| UNITED STATES (19.7%) | |
| Commingled Funds (11.8%) | |
Invesco QQQ Trust Series 1 | | | 477 | | | | 184,174 | | |
iShares 3-7 Year Treasury Bond ETF(3) | | | 9,964 | | | | 1,285,854 | | |
iShares Russell 1000 Value Index Fund | | | 1,112 | | | | 182,969 | | |
Vanguard Short-Term Inflation-Protected Securities ETF | | | 23,962 | | | | 1,247,701 | | |
| | | | 2,900,698 | | |
See Accompanying Notes to Consolidated Financial Statements.
15
Credit Suisse Multialternative Strategy Fund
Consolidated Schedule of Investments (continued)
October 31, 2021
| | | Number of
Shares | | Value | |
| EXCHANGE-TRADED FUNDS (continued) | |
UNITED STATES | |
| Diversified Financial Services (2.3%) | |
SPDR S&P 500 ETF Trust | | | 1,202 | | | $ | 552,019 | | |
| Energy - Integrated (3.7%) | |
Alerian MLP ETF(3) | | | 25,805 | | | | 904,723 | | |
| Health Care (0.8%) | |
Health Care Select Sector SPDR Fund | | | 1,367 | | | | 182,932 | | |
| Technology (1.1%) | |
Technology Select Sector SPDR Fund | | | 1,701 | | | | 274,763 | | |
| TOTAL EXCHANGE-TRADED FUNDS (Cost $4,485,905) | | | 4,815,135 | | |
Par
(000) | |
| | Ratings†
(S&P/Moody's) | | Maturity | | Rate% | |
| |
| UNITED STATES TREASURY OBLIGATIONS (4.9%) | | | |
$ | 300 | | | United States Treasury Bills(4) | | (AA+, Aaa) | | 11/04/21 | | | 0.040 | | | | 299,999 | | |
| | 400 | | | United States Treasury Bills(4) | | (AA+, Aaa) | | 06/16/22 | | | 0.056 | | | | 399,798 | | |
| | 400 | | | United States Treasury Bills(4) | | (AA+, Aaa) | | 07/14/22 | | | 0.063 | | | | 399,745 | | |
| | 100 | | | United States Treasury Bills(4) | | (AA+, Aaa) | | 09/08/22 | | | 0.078 | | | | 99,898 | | |
| TOTAL UNITED STATES TREASURY OBLIGATIONS (Cost $1,199,612) | | | 1,199,440 | | |
| | | Number of
Shares | | | |
| SHORT-TERM INVESTMENTS (27.5%) | |
State Street Institutional U.S. Government Money Market Fund - Premier Class, 0.03% | | | 4,752,203 | | | | 4,752,203 | | |
State Street Navigator Securities Lending Government Money Market Portfolio, 0.03%(5) | | | 1,996,810 | | | | 1,996,810 | | |
| TOTAL SHORT-TERM INVESTMENTS (Cost $6,749,013) | | | 6,749,013 | | |
| TOTAL INVESTMENTS AT VALUE (71.4%) (Cost $17,177,407) | | | 17,494,418 | | |
| OTHER ASSETS IN EXCESS OF LIABILITIES (28.6%) | | | 7,017,028 | | |
| NET ASSETS (100.0%) | | $ | 24,511,446 | | |
† Credit ratings given by the S&P Global Ratings Division of S&P Global Inc. ("S&P") and Moody's Investors Service, Inc. ("Moody's") are unaudited.
(1) Non-income producing security.
(2) Security exempt from registration pursuant to Regulation S under the Securities act of 1933, as amended. Regulation S applies to securities offering that are made outside of the United States and do not involve direct selling efforts in the United States and as such may have restrictions on resale.
(3) Security or portion thereof is out on loan (See note 2-M).
(4) Securities are zero coupon. Rate presented is yield to maturity as of October 31, 2021.
(5) Represents security purchased with cash collateral received for securities on loan. The rate shown is the annualized one-day yield at October 31, 2021.
See Accompanying Notes to Consolidated Financial Statements.
16
Credit Suisse Multialternative Strategy Fund
Consolidated Schedule of Investments (continued)
October 31, 2021
Forward Foreign Currency Contracts
Forward
Currency to be
Purchased (Local) | | Forward
Currency to be
Sold (Local) | | Expiration
Date | | Counterparty | | Value on
Settlement Date | | Current
Value/
Notional | | Net Unrealized
Appreciation | |
NOK | 224,988 | | | USD | 26,380 | | | 12/15/21 | | JPMorgan Chase | | $ | 26,380 | | | $ | 26,588 | | | $ | 208 | | |
USD | 85,745 | | | DKK | 538,549 | | | 12/15/21 | | BNP Paribas | | | (85,745 | ) | | | (83,868 | ) | | | 1,877 | | |
USD | 110,276 | | | DKK | 696,529 | | | 12/15/21 | | Goldman Sachs | | | (110,276 | ) | | | (108,470 | ) | | | 1,806 | | |
USD | 25,077 | | | DKK | 160,139 | | | 12/15/21 | | JPMorgan Chase | | | (25,077 | ) | | | (24,938 | ) | | | 139 | | |
USD | 384,581 | | | EUR | 327,261 | | | 12/15/21 | | JPMorgan Chase | | | (384,581 | ) | | | (379,115 | ) | | | 5,466 | | |
USD | 251,119 | | | EUR | 212,093 | | | 12/15/21 | | Morgan Stanley | | | (251,119 | ) | | | (245,698 | ) | | | 5,421 | | |
USD | 104,693 | | | GBP | 76,314 | | | 12/15/21 | | Goldman Sachs | | | (104,693 | ) | | | (104,623 | ) | | | 70 | | |
USD | 153,742 | | | GBP | 111,481 | | | 12/15/21 | | JPMorgan Chase | | | (153,742 | ) | | | (152,835 | ) | | | 907 | | |
USD | 121,417 | | | GBP | 87,656 | | | 12/15/21 | | Societe Generale | | | (121,417 | ) | | | (120,172 | ) | | | 1,245 | | |
USD | 6,973 | | | NOK | 58,266 | | | 12/15/21 | | Goldman Sachs | | | (6,973 | ) | | | (6,886 | ) | | | 87 | | |
| | | $ | 17,226 | | |
Forward Foreign Currency Contracts
Forward
Currency to be
Purchased (Local) | | Forward
Currency to be
Sold (Local) | | Expiration
Date | | Counterparty | | Value on
Settlement Date | | Current
Value/
Notional | | Net Unrealized
Depreciation | |
DKK | 49,342 | | | USD | 7,713 | | | 12/15/21 | | Goldman Sachs | | $ | 7,713 | | | $ | 7,684 | | | $ | (29 | ) | |
EUR | 36,227 | | | USD | 42,111 | | | 12/15/21 | | JPMorgan Chase | | | 42,111 | | | | 41,967 | | | | (144 | ) | |
USD | 106,915 | | | NOK | 923,895 | | | 12/15/21 | | JPMorgan Chase | | | (106,915 | ) | | | (109,181 | ) | | | (2,266 | ) | |
USD | 12,364 | | | SEK | 107,879 | | | 12/15/21 | | Goldman Sachs | | | (12,364 | ) | | | (12,568 | ) | | | (204 | ) | |
USD | 36,749 | | | SEK | 316,602 | | | 12/15/21 | | JPMorgan Chase | | | (36,749 | ) | | | (36,886 | ) | | | (137 | ) | |
| | | $ | (2,780 | ) | |
| | | $ | 14,446 | | |
Futures Contracts
Contract Description | | Currency | | Expiration
Date | | Number of
Contracts | | Notional
Value | | Net Unrealized
Appreciation
(Depreciation) | |
Contracts to Purchase | |
Agriculture | |
Coffee "C" Futures | | USD | | | | Mar 2022 | | | 6 | | | $ | 464,963 | | | $ | 2,527 | | |
Corn Futures | | USD | | | | Mar 2022 | | | 23 | | | | 662,687 | | | | 22,551 | | |
Cotton No. 2 Futures | | USD | | | | Mar 2022 | | | 4 | | | | 222,440 | | | | 4,214 | | |
Wheat Futures | | USD | | | | Mar 2022 | | | 15 | | | | 588,750 | | | | 9,106 | | |
| | | $ | 38,398 | | |
Energy | |
Brent Crude Oil Futures | | USD | | | | Mar 2022 | | | 13 | | | | 1,058,590 | | | $ | (10,144 | ) | |
Foreign Exchange Contracts | |
| CAD Currency Futures | | USD | | | | Dec 2021 | | | 4 | | | | 323,220 | | | $ | (51 | ) | |
Index Contracts | |
FTSE 100 Index Futures | | GBP | | | | Dec 2021 | | | 2 | | | | 198,046 | | | $ | 3,570 | | |
See Accompanying Notes to Consolidated Financial Statements.
17
Credit Suisse Multialternative Strategy Fund
Consolidated Schedule of Investments (continued)
October 31, 2021
Futures Contracts (continued)
Contract Description | | Currency | | Expiration
Date | | Number of
Contracts | | Notional
Value | | Net Unrealized
Appreciation
(Depreciation) | |
Industrial Metals | |
LME Nickel Futures | | USD | | | | Nov 2021 | | | 3 | | | $ | 351,468 | | | $ | 13,547 | | |
LME Nickel Futures | | USD | | | | Jan 2022 | | | 3 | | | | 350,298 | | | | 15,040 | | |
LME Primary Aluminum Futures | | USD | | | | Nov 2021 | | | 10 | | | | 678,063 | | | | (75,406 | ) | |
LME Primary Aluminum Futures | | USD | | | | Jan 2022 | | | 10 | | | | 679,500 | | | | (44,918 | ) | |
LME Zinc Futures | | USD | | | | Nov 2021 | | | 5 | | | | 430,281 | | | | 27,275 | | |
LME Zinc Futures | | USD | | | | Jan 2022 | | | 5 | | | | 423,156 | | | | 40,163 | | |
| | | $ | (24,299 | ) | |
Interest Rate Contracts | |
10YR AUD Bond Futures | | AUD | | | | Dec 2021 | | | 40 | | | | 4,051,474 | | | $ | (226,757 | ) | |
10YR U.S. Treasury Note Futures | | USD | | | | Dec 2021 | | | 18 | | | | 2,352,656 | | | | (2,687 | ) | |
| EURO Bund Futures | | EUR | | | | Dec 2021 | | | 3 | | | | 583,670 | | | | (2,472 | ) | |
| | | $ | (231,916 | ) | |
Livestock | |
Lean Hogs Futures | | USD | | | | Feb 2022 | | | 6 | | | | 188,820 | | | $ | 6,287 | | |
Live Cattle Futures | | USD | | | | Feb 2022 | | | 8 | | | | 429,520 | | | | (4,741 | ) | |
| | | $ | 1,546 | | |
Precious Metals | |
Copper Futures | | USD | | | | Mar 2022 | | | 6 | | | | 651,000 | | | $ | (10,945 | ) | |
Gold 100 OZ Futures | | USD | | | | Feb 2022 | | | 8 | | | | 1,428,720 | | | | (10,407 | ) | |
Silver Futures | | USD | | | | Mar 2022 | | | 3 | | | | 359,880 | | | | (5,335 | ) | |
| | | $ | (26,687 | ) | |
Contracts to Sell | |
Agriculture | |
Coffee "C" Futures | | USD | | | | Dec 2021 | | | (6 | ) | | | (458,887 | ) | | $ | (2,555 | ) | |
Corn Futures | | USD | | | | Dec 2021 | | | (23 | ) | | | (653,488 | ) | | | (23,462 | ) | |
Cotton No. 2 Futures | | USD | | | | Dec 2021 | | | (4 | ) | | | (229,700 | ) | | | (6,805 | ) | |
Wheat Futures | | USD | | | | Dec 2021 | | | (15 | ) | | | (579,562 | ) | | | (9,619 | ) | |
| | | $ | (42,441 | ) | |
Energy | |
Brent Crude Oil Futures | | USD | | | | Jan 2022 | | | (13 | ) | | | (1,088,360 | ) | | $ | 8,426 | | |
Foreign Exchange Contracts | |
| EUR Currency Futures | | USD | | | | Dec 2021 | | | (3 | ) | | | (433,819 | ) | | $ | 7,677 | | |
| JPY Currency Futures | | USD | | | | Dec 2021 | | | (5 | ) | | | (548,750 | ) | | | 10,442 | | |
| | | $ | 18,119 | | |
See Accompanying Notes to Consolidated Financial Statements.
18
Credit Suisse Multialternative Strategy Fund
Consolidated Schedule of Investments (continued)
October 31, 2021
Futures Contracts (continued)
Contract Description | | Currency | | Expiration
Date | | Number of
Contracts | | Notional
Value | | Net Unrealized
Appreciation
(Depreciation) | |
Index Contracts | |
Hang Seng Index Futures | | HKD | | | | Nov 2021 | | | (1 | ) | | $ | (162,642 | ) | | $ | 5,033 | | |
EURO Stoxx 50 Index Futures | | EUR | | | | Dec 2021 | | | (26 | ) | | | (1,274,849 | ) | | | (37,042 | ) | |
S&P 500 E Mini Index Futures | | USD | | | | Dec 2021 | | | (10 | ) | | | (2,298,500 | ) | | | (62,186 | ) | |
Russell 2000 E-Mini Index Futues | | USD | | | | Dec 2021 | | | (20 | ) | | | (2,295,300 | ) | | | (58,076 | ) | |
| | | $ | (152,271 | ) | |
Industrial Metals | |
LME Nickel Futures | | USD | | | | Jan 2022 | | | (3 | ) | | | (350,298 | ) | | $ | (12,632 | ) | |
LME Nickel Futures | | USD | | | | Nov 2021 | | | (3 | ) | | | (351,468 | ) | | | (16,030 | ) | |
LME Primary Aluminum Futures | | USD | | | | Nov 2021 | | | (10 | ) | | | (678,063 | ) | | | 47,097 | | |
LME Primary Aluminum Futures | | USD | | | | Jan 2022 | | | (10 | ) | | | (679,500 | ) | | | 73,285 | | |
LME Zinc Futures | | USD | | | | Nov 2021 | | | (5 | ) | | | (430,281 | ) | | | (47,648 | ) | |
LME Zinc Futures | | USD | | | | Jan 2022 | | | (5 | ) | | | (423,156 | ) | | | (20,850 | ) | |
| | | $ | 23,222 | | |
Interest Rate Contracts | |
10YR CAD Bond Futures | | CAD | | | | Dec 2021 | | | (13 | ) | | | (1,478,238 | ) | | $ | 7,306 | | |
10YR JGB Mini Futures | | JPY | | | | Dec 2021 | | | (36 | ) | | | (4,776,532 | ) | | | 6,651 | | |
Long Gilt Futures | | GBP | | | | Dec 2021 | | | (28 | ) | | | (4,794,552 | ) | | | 26,706 | | |
| | | $ | 40,663 | | |
Livestock | |
Lean Hogs Futures | | USD | | | | Dec 2021 | | | (6 | ) | | | (182,580 | ) | | $ | (5,803 | ) | |
Live Cattle Futures | | USD | | | | Dec 2021 | | | (8 | ) | | | (413,680 | ) | | | 3,689 | | |
| | | $ | (2,114 | ) | |
Precious Metals | |
Copper Futures | | USD | | | | Dec 2021 | | | (6 | ) | | | (655,200 | ) | | $ | 9,730 | | |
Gold 100 OZ Futures | | USD | | | | Dec 2021 | | | (8 | ) | | | (1,427,120 | ) | | | 10,343 | | |
Silver Futures | | USD | | | | Dec 2021 | | | (3 | ) | | | (359,235 | ) | | | 5,230 | | |
| | | $ | 25,303 | | |
| | | $ | (330,676 | ) | |
See Accompanying Notes to Consolidated Financial Statements.
19
Credit Suisse Multialternative Strategy Fund
Consolidated Schedule of Investments (continued)
October 31, 2021
Total Return Swap Contracts
Currency | | Notional
Amount | | Expiration
Date | | Counterparty | | Receive | | Pay | | Periodic
Payment
Frequency | | Upfront
Premiums
Paid/
(Received) | | Net Unrealized
Appreciation | |
USD | | | | $ | 267,104 | | | 12/07/21 | | Bank of
America | | Bloomberg
Agriculture
Index | | 0.10% | | At Maturity | | $ | — | | | $ | 4,753 | | |
USD | | | | | 55,583 | | | 12/07/21 | | Bank of
America | | Bloomberg
Industrial
Metals
Index | | 0.10% | | At Maturity | | | — | | | | 1,489 | | |
USD | | | | | 43,793 | | | 12/07/21 | | Bank of
America | | Bloomberg
Energy
Index | | 0.07% | | At Maturity | | | — | | | | 8,601 | | |
USD | | | | | 2,634,966 | | | 05/25/22 | | Bank of
America | | BAML USD
Custom Equity
Basket(b) | | 0.54% | | Monthly | | | — | | | | 37,749 | | |
USD | | | | | 608,652 | | | 12/06/21 | | BNP Paribas | | BNP Paribas
Buy Write
Call Gold
Daily Index(b) | | 0.50% | | At Maturity | | | — | | | | 13,353 | | |
USD | | | | | 731,130 | | | 12/06/21 | | BNP Paribas | | BNP Alpha
Momentum
ex-Agriculture
and Livestock
Net Index(b) | | 0.30% | | At Maturity | | | — | | | | 5,002 | | |
USD | | | | | 300,000 | | | 03/21/22 | | BNP Paribas | | iBoxx $ Liquid
High Yield
Index | | 0.12% | | Quarterly | | | (79 | ) | | | 1,166 | | |
USD | | | | | 3,939,679 | | | 12/06/21 | | Goldman
Sachs | | Goldman Sachs
VVOL Carry
ER(b) | | 0.00% | | At Maturity | | | — | | | | 142,550 | | |
USD | | | | | 432,128 | | | 12/06/21 | | Goldman
Sachs | | Goldman Sachs
RP 109 Long
Short Series
SR Excess
Return
Strategy(b) | | (0.60)% | | At Maturity | | | — | | | | 6,758 | | |
USD | | | | | 769,355 | | | 12/06/21 | | Goldman
Sachs | | Goldman Sachs
Tactical Factor
Suite Value
World Bottom
USD Excess
Return
Strategy(b) | | 0.40% | | At Maturity | | | — | | | | 6,607 | | |
USD | | | | | 80,335 | | | 12/07/21 | | Goldman
Sachs | | Bloomberg
Energy
Index | | 0.07% | | At Maturity | | | — | | | | 6,649 | | |
See Accompanying Notes to Consolidated Financial Statements.
20
Credit Suisse Multialternative Strategy Fund
Consolidated Schedule of Investments (continued)
October 31, 2021
Total Return Swap Contracts (continued)
Currency | | Notional
Amount | | Expiration
Date | | Counterparty | | Receive | | Pay | | Periodic
Payment
Frequency | | Upfront
Premiums
Paid/
(Received) | | Net Unrealized
Appreciation | |
USD | | | | $ | 171,661 | | | 12/07/21 | | Goldman
Sachs | | Bloomberg
Industrial
Metals Index | | 0.10% | | At Maturity | | $ | — | | | $ | 1,386 | | |
USD | | | | | 67,840 | | | 04/29/22 | | Goldman
Sachs | | Meridian
Bancorp, Inc. | | 0.46% | | Monthly | | | — | | | | 6,400 | | |
USD | | | | | 385,710 | | | 04/29/22 | | Goldman
Sachs | | (0.29)% | | New York
Community
Bancorp. | | Monthly | | | — | | | | 28,720 | | |
USD | | | | | 402,911 | | | 04/29/22 | | Goldman
Sachs | | Welbilt, Inc. | | 0.46% | | Monthly | | | — | | | | 1,367 | | |
USD | | | | | 132,358 | | | 06/10/22 | | Goldman
Sachs | | (0.29)% | | Gray
Television,
Inc. | | Monthly | | | — | | | | 953 | | |
USD | | | | | 332,839 | | | 06/10/22 | | Goldman
Sachs | | (0.29)% | | Old National
Bancorp. | | Monthly | | | — | | | | 3,280 | | |
USD | | | | | 305,135 | | | 06/10/22 | | Goldman
Sachs | | Meredith Corp. | | 0.46% | | Monthly | | | — | | | | 21,359 | | |
EUR | | | | | 71,925 | | | 06/27/22 | | Goldman
Sachs | | Solarpack Corp. | | (0.11)% | | Monthly | | | — | | | | 409 | | |
GBP | | | | | 118,619 | | | 08/04/22 | | Goldman
Sachs | | Meggitt PLC | | 0.50% | | Monthly | | | — | | | | 995 | | |
USD | | | | | 386,972 | | | 08/04/22 | | Goldman
Sachs | | (0.29)% | | Citizens
Financial
Group | | Monthly | | | — | | | | 12,717 | | |
USD | | | | | 73 | | | 08/11/22 | | Goldman
Sachs | | (0.29)% | | Penn
National
Gaming, Inc. | | Monthly | | | — | | | | 1 | | |
USD | | | | | 39,550 | | | 08/18/22 | | Goldman
Sachs | | (0.29)% | | Chesapeake
Energry
Corp. | | Monthly | | | — | | | | 1,879 | | |
USD | | | | | 316,311 | | | 09/09/22 | | Goldman
Sachs | | Hill-Rom
Holdings,
Inc. | | 0.45% | | Monthly | | | — | | | | 8,514 | | |
USD | | | | | 9,294 | | | 09/22/22 | | Goldman
Sachs | | (0.30)% | | First
Interstate
BancSystem,
Inc. | | Monthly | | | — | | | | 191 | | |
USD | | | | | 17,609 | | | 09/26/22 | | Goldman
Sachs | | Kadmon
Holdings,
Inc. | | 0.45% | | Monthly | | | — | | | | 1,130 | | |
USD | | | | | 373,800 | | | 10/20/22 | | Goldman
Sachs | | (0.29)% | | Columbia
Banking
System,
Inc. | | Monthly | | | — | | | | 13,592 | | |
See Accompanying Notes to Consolidated Financial Statements.
21
Credit Suisse Multialternative Strategy Fund
Consolidated Schedule of Investments (continued)
October 31, 2021
Total Return Swap Contracts (continued)
Currency | | Notional
Amount | | Expiration
Date | | Counterparty | | Receive | | Pay | | Periodic
Payment
Frequency | | Upfront
Premiums
Paid/
(Received) | | Net Unrealized
Appreciation | |
USD | | | | $ | 290,501 | | | 10/24/22 | | Goldman
Sachs | | (0.29)% | | Vanguard
FTSE
Emerging
Market ETF | | Monthly | | $ | — | | | $ | 6,501 | | |
USD | | | | | 158,279 | | | 10/28/22 | | Goldman
Sachs | | (0.29)% | | Vanguard
FTSE
Emerging
Market
ETF | | Monthly | | | — | | | | 1,689 | | |
USD | | | | | 4,783,941 | | | 12/06/21 | | JPMorgan
Chase | | J.P. Morgan
Commodities
Fundamental
Value
Index(b) | | 0.80% | | At Maturity | | | — | | | | 143,518 | | |
USD | | | | | 1,012,356 | | | 12/06/21 | | JPMorgan
Chase | | J.P. Morgan
Helix 3
Index(a) | | 0.60% | | At Maturity | | | — | | | | 1,860 | | |
USD | | | | | 791,515 | | | 12/06/21 | | JPMorgan
Chase | | J.P. Morgan
Rates U.S.
Volatility
Carry
Index(b) | | 0.00% | | At Maturity | | | — | | | | 2,083 | | |
USD | | | | | 2,219,999 | | | 12/20/21 | | JPMorgan
Chase | | iBoxx $ Liquid
High Yield
Index | | 0.13% | | Quarterly | | | (1 | ) | | | 26,444 | | |
USD | | | | | 107,605 | | | 03/21/22 | | JPMorgan
Chase | | Xilinx, Inc. | | 0.49% | | Monthly | | | — | | | | 20,015 | | |
USD | | | | | 45,592 | | | 03/21/22 | | JPMorgan
Chase | | Aerojet
Rocketdyne
Holdings, Inc. | | 0.49% | | Monthly | | | — | | | | 2,863 | | |
USD | | | | | 93,169 | | | 03/21/22 | | JPMorgan
Chase | | Magellan
Health, Inc. | | 0.49% | | Monthly | | | — | | | | 49 | | |
USD | | | | | 44,682 | | | 03/21/22 | | JPMorgan
Chase | | Change
Healthcare,
Inc. | | 0.49% | | Monthly | | | — | | | | 1,435 | | |
USD | | | | | 85,598 | | | 03/24/22 | | JPMorgan
Chase | | Xilinx, Inc. | | 0.49% | | Monthly | | | — | | | | 15,922 | | |
USD | | | | | 36,399 | | | 03/24/22 | | JPMorgan
Chase | | Aerojet
Rocketdyne
Holdings, Inc. | | 0.49% | | Monthly | | | — | | | | 2,285 | | |
USD | | | | | 168,730 | | | 03/24/22 | | JPMorgan
Chase | | (0.31)% | | M & T
Bank Corp. | | Monthly | | | — | | | | 7,339 | | |
USD | | | | | 35,671 | | | 03/24/22 | | JPMorgan
Chase | | Change
Healthcare,
Inc. | | 0.49% | | Monthly | | | — | | | | 1,146 | | |
USD | | | | | 103,894 | | | 03/24/22 | | JPMorgan
Chase | | Forterra, Inc. | | 0.49% | | Monthly | | | — | | | | 747 | | |
See Accompanying Notes to Consolidated Financial Statements.
22
Credit Suisse Multialternative Strategy Fund
Consolidated Schedule of Investments (continued)
October 31, 2021
Total Return Swap Contracts (continued)
Currency | | Notional
Amount | | Expiration
Date | | Counterparty | | Receive | | Pay | | Periodic
Payment
Frequency | | Upfront
Premiums
Paid/
(Received) | | Net Unrealized
Appreciation | |
USD | | | | $ | 74,308 | | | 03/24/22 | | JPMorgan
Chase | | Magellan
Health, Inc. | | 0.49% | | Monthly | | $ | — | | | $ | 39 | | |
USD | | | | | 199,578 | | | 04/11/22 | | JPMorgan
Chase | | Xilinx, Inc. | | 0.49% | | Monthly | | | — | | | | 37,122 | | |
USD | | | | | 84,932 | | | 04/11/22 | | JPMorgan
Chase | | Aerojet
Rocketdyne
Holdings, Inc. | | 0.49% | | Monthly | | | — | | | | 5,333 | | |
USD | | | | | 441,823 | | | 04/11/22 | | JPMorgan
Chase | | Athene
Holding Ltd. | | 0.49% | | Monthly | | | — | | | | 112,431 | | |
USD | | | | | 173,353 | | | 04/11/22 | | JPMorgan
Chase | | Magellan
Health, Inc. | | 0.49% | | Monthly | | | — | | | | 91 | | |
USD | | | | | 176,112 | | | 04/11/22 | | JPMorgan
Chase | | (0.31)% | | M & T
Bank Corp. | | Monthly | | | — | | | | 7,660 | | |
USD | | | | | 107,608 | | | 04/11/22 | | JPMorgan
Chase | | Forterra, Inc. | | 0.49% | | Monthly | | | — | | | | 774 | | |
USD | | | | | 83,231 | | | 04/11/22 | | JPMorgan
Chase | | Change
Healthcare,
Inc. | | 0.49% | | Monthly | | | — | | | | 2,673 | | |
USD | | | | | 368,296 | | | 05/23/22 | | JPMorgan
Chase | | (0.31)% | | Webster
Financial
Corp. | | Monthly | | | — | | | | 2,094 | | |
USD | | | | | 48,378 | | | 05/23/22 | | JPMorgan
Chase | | Magnachip
Semiconductor
Corp. | | 0.49% | | Monthly | | | — | | | | 3,269 | | |
USD | | | | | 359,876 | | | 05/23/22 | | JPMorgan
Chase | | PPD, Inc. | | 0.49% | | Monthly | | | — | | | | 1,918 | | |
USD | | | | | 201,645 | | | 06/20/22 | | JPMorgan
Chase | | Ferro Corp. | | 0.49% | | Monthly | | | — | | | | 6,537 | | |
USD | | | | | 269,572 | | | 06/20/22 | | JPMorgan
Chase | | Extraction
Oil & Gas,
Inc. | | 0.49% | | Monthly | | | — | | | | 39,258 | | |
EUR | | | | | 358,669 | | | 08/08/22 | | JPMorgan
Chase | | Grandvision
NV | | (0.11)% | | Monthly | | | — | | | | 631 | | |
EUR | | | | | 71,612 | | | 09/05/22 | | JPMorgan
Chase | | Akka
Technologies | | (0.21)% | | Monthly | | | — | | | | 422 | | |
USD | | | | | 224,383 | | | 10/24/22 | | JPMorgan
Chase | | GreenSky,
Inc. | | 0.50% | | Monthly | | | — | | | | 16,745 | | |
USD | | | | | 1,793,483 | | | 12/06/21 | | Macquarie
Bank Ltd. | | Macquarie
WTI Intraday
Mean
Reversion(d) | | 0.15% | | At Maturity | | | — | | | | 230 | | |
USD | | | | | 5,063,728 | | | 12/06/21 | | Morgan
Stanley | | Morgan
Stanley
Commodities
Curve Carry
Index(b) | | 0.35% | | At Maturity | | | — | | | | 20,423 | | |
See Accompanying Notes to Consolidated Financial Statements.
23
Credit Suisse Multialternative Strategy Fund
Consolidated Schedule of Investments (continued)
October 31, 2021
Total Return Swap Contracts (continued)
Currency | | Notional
Amount | | Expiration
Date | | Counterparty | | Receive | | Pay | | Periodic
Payment
Frequency | | Upfront
Premiums
Paid/
(Received) | | Net Unrealized
Appreciation | |
USD | | | | $ | 2,951,185 | | | 12/06/21 | | Societe
Generale | | SGI VRR
US Index(a) | | 0.28% | | At Maturity | | $ | — | | | $ | 123,640 | | |
USD | | | | | 4,984,282 | | | 02/17/22 | | Societe
Generale | | SGI Coda
Index(b) | | 0.25% | | At Maturity | | | — | | | | 10,843 | | |
| | | | | | | | | | | | | | | $ | (80 | ) | | $ | 963,599 | | |
Total Return Swap Contracts
Currency | | Notional
Amount | | Expiration
Date | | Counterparty | | Receive | | Pay | | Periodic
Payment
Frequency | | Upfront
Premiums
Paid/
(Received) | | Net Unrealized
Depreciation | |
USD | | | | $ | 2,552,230 | | | 12/03/21 | | Bank of
America | | Bank of
America
Equities
US Volatility
Carry Hourly
Hedged
Index(b) | | 0.00% | | Monthly | | $ | — | | | $ | (32,168 | ) | |
USD | | | | | 121,596 | | | 12/07/21 | | Bank of
America | | (0.02)% | | Bloomberg
Precious
Metals
Index | | At Maturity | | | — | | | | (2,794 | ) | |
USD | | | | | 1,783,753 | | | 12/17/21 | | Bank of
America | | BofA Daily
Listed Put
Ratio and
Call Ratio
Index – US(b) | | 0.05% | | Quarterly | | | — | | | | (10,265 | ) | |
USD | | | | | 4,937,448 | | | 12/06/21 | | Barclays
Bank PLC | | Barclays
Commodity
Hedging
Insight 2
Index(b) | | 0.15% | | At Maturity | | | — | | | | (8,546 | ) | |
USD | | | | | 3,135,436 | | | 12/06/21 | | Barclays
Bank PLC | | Shiller Barclays
CAPE US
Mid-Month
Sector Market
Hedged ER
Index(b) | | 0.60% | | At Maturity | | | — | | | | (12,657 | ) | |
USD | | | | | 5,097,885 | | | 12/06/21 | | Barclays
Bank PLC | | Barclays
Month End
Rebalancing
Currency
Index(b) | | 0.20% | | At Maturity | | | — | | | | (48,414 | ) | |
See Accompanying Notes to Consolidated Financial Statements.
24
Credit Suisse Multialternative Strategy Fund
Consolidated Schedule of Investments (continued)
October 31, 2021
Total Return Swap Contracts (continued)
Currency | | Notional
Amount | | Expiration
Date | | Counterparty | | Receive | | Pay | | Periodic
Payment
Frequency | | Upfront
Premiums
Paid/
(Received) | | Net Unrealized
Depreciation | |
EUR | | | | $ | 4,987,086 | | | 12/06/21 | | BNP Paribas | | BNP Paribas
Equity Low
Vol Europe
Index(b) | | 0.00% | | At Maturity | | $ | — | | | $ | (40,027 | ) | |
USD | | | | | 1,583,647 | | | 12/06/21 | | Citigroup | | Citi Equity
US Tech
Congestion
Index
Series 1(b) | | 0.00% | | At Maturity | | | — | | | | (15,578 | ) | |
USD | | | | | 2,649,035 | | | 02/24/22 | | Citigroup | | Citi Pure
Estimates
Momentum
US Long-Short
TR Index(b) | | 0.95% | | At Maturity | | | — | | | | (26,554 | ) | |
USD | | | | | 4,244,746 | | | 12/06/21 | | Goldman
Sachs | | Goldman Sachs
Commodities
Seasonality
Index(b) | | 0.00% | | At Maturity | | | — | | | | (82,089 | ) | |
USD | | | | | 5,039,837 | | | 12/06/21 | | Goldman
Sachs | | Goldman Sachs
Commodity
Strategy
Index(b) | | 0.00% | | At Maturity | | | — | | | | (8,964 | ) | |
USD | | | | | 3,758,115 | | | 12/06/21 | | Goldman
Sachs | | Goldman Sachs
DISP U.S.
Index(b) | | 0.00% | | At Maturity | | | — | | | | (31,369 | ) | |
USD | | | | | 800,825 | | | 12/06/21 | | Goldman
Sachs | | Goldman Sachs
RP 110 Long
Short Series
SR Excess
Return
Strategy(b) | | (0.60)% | | At Maturity | | | — | | | | (24,946 | ) | |
USD | | | | | 381,255 | | | 04/29/22 | | Goldman
Sachs | | Flagstar
Bancorp,
Inc. | | 0.46% | | Monthly | | | — | | | | (43,705 | ) | |
USD | | | | | 68,253 | | | 04/29/22 | | Goldman
Sachs | | (0.29)% | | Independent
Bank Corp. | | Monthly | | | — | | | | (6,107 | ) | |
USD | | | | | 361,960 | | | 05/20/22 | | Goldman
Sachs | | Domtar Corp. | | 0.46% | | Monthly | | | — | | | | (3,740 | ) | |
USD | | | | | 267,655 | | | 05/20/22 | | Goldman
Sachs | | (0.29)% | | Bonanza
Creek Energy,
Inc. | | Monthly | | | — | | | | (37,073 | ) | |
USD | | | | | 52 | | | 05/26/22 | | Goldman
Sachs | | (0.29)% | | Glacier
Bancorp, Inc. | | Monthly | | | — | | | | (3 | ) | |
USD | | | | | 330,378 | | | 06/10/22 | | Goldman
Sachs | | First Midwest
Bancorp, Inc. | | 0.46% | | Monthly | | | — | | | | (2,723 | ) | |
USD | | | | | 418,089 | | | 08/04/22 | | Goldman
Sachs | | Investors
Bancorp, Inc. | | 0.46% | | Monthly | | | — | | | | (11,170 | ) | |
See Accompanying Notes to Consolidated Financial Statements.
25
Credit Suisse Multialternative Strategy Fund
Consolidated Schedule of Investments (continued)
October 31, 2021
Total Return Swap Contracts (continued)
Currency | | Notional
Amount | | Expiration
Date | | Counterparty | | Receive | | Pay | | Periodic
Payment
Frequency | | Upfront
Premiums
Paid/
(Received) | | Net Unrealized
Depreciation | |
GBP | | | | $ | 335,412 | | | 08/18/22 | | Goldman
Sachs | | Avast PLC | | 0.50% | | Monthly | | $ | — | | | $ | (1,441 | ) | |
USD | | | | | 33,406 | | | 08/18/22 | | Goldman
Sachs | | (0.29)% | | NortonLifeLock,
Inc. | | Monthly | | | — | | | | (265 | ) | |
USD | | | | | 42,198 | | | 08/18/22 | | Goldman
Sachs | | Vine Energy,
Inc. | | 0.46% | | Monthly | | | — | | | | (1,639 | ) | |
USD | | | | | 366,123 | | | 09/09/22 | | Goldman
Sachs | | American
National
Group, Inc. | | 0.45% | | Monthly | | | — | | | | (1,690 | ) | |
USD | | | | | 9,032 | | | 09/22/22 | | Goldman
Sachs | | Great Western
Bancorp, Inc. | | 0.45% | | Monthly | | | — | | | | (179 | ) | |
USD | | | | | 369,171 | | | 10/06/22 | | Goldman
Sachs | | Acceleron
Pharma, Inc. | | 0.46% | | Monthly | | | — | | | | (2,348 | ) | |
USD | | | | | 373,387 | | | 10/20/22 | | Goldman
Sachs | | Umpqua
Holdings Corp. | | 0.46% | | Monthly | | | — | | | | (11,136 | ) | |
USD | | | | | 290,421 | | | 10/21/22 | | Goldman
Sachs | | Invesco
FTSE RAFI
Emerging
Market ETF | | 0.46% | | Monthly | | | — | | | | (7,574 | ) | |
USD | | | | | 156,544 | | | 10/28/22 | | Goldman
Sachs | | Invesco
FTSE RAFI
Emerging
Market ETF | | 0.46% | | Monthly | | | — | | | | (2,309 | ) | |
USD | | | | | 2,432,064 | | | 12/06/21 | | JPMorgan
Chase | | J.P. Morgan
Seasonal
Spreads
Portfolio(a) | | 0.60% | | At Maturity | | | — | | | | (3,376 | ) | |
USD | | | | | 3,799,999 | | | 12/06/21 | | JPMorgan
Chase | | J.P. Morgan
EMBI
Global Core(a) | | 0.43% | | At Maturity | | | (1 | ) | | | (101,686 | ) | |
USD | | | | | 4,813,360 | | | 12/06/21 | | JPMorgan
Chase | | J.P. Morgan
Equities
Turn-of the
Month
Seasonality
Index(b) | | 0.00% | | At Maturity | | | — | | | | (196,475 | ) | |
USD | | | | | 124,412 | | | 03/21/22 | | JPMorgan
Chase | | (0.31)% | | Advanced
Micro Devices,
Inc. | | Monthly | | | — | | | | (22,509 | ) | |
USD | | | | | 98,857 | | | 03/24/22 | | JPMorgan
Chase | | (0.31)% | | Advanced
Micro Devices,
Inc. | | Monthly | | | — | | | | (17,886 | ) | |
USD | | | | | 166,752 | | | 03/24/22 | | JPMorgan
Chase | | Peoples United
Financial | | 0.49% | | Monthly | | | — | | | | (7,436 | ) | |
See Accompanying Notes to Consolidated Financial Statements.
26
Credit Suisse Multialternative Strategy Fund
Consolidated Schedule of Investments (continued)
October 31, 2021
Total Return Swap Contracts (continued)
Currency | | Notional
Amount | | Expiration
Date | | Counterparty | | Receive | | Pay | | Periodic
Payment
Frequency | | Upfront
Premiums
Paid/
(Received) | | Net Unrealized
Depreciation | |
USD | | | | $ | 230,803 | | | 04/11/22 | | JPMorgan
Chase | | (0.31)% | | Advanced
Micro Devices,
Inc. | | Monthly | | $ | — | | | $ | (41,758 | ) | |
USD | | | | | 450,484 | | | 04/11/22 | | JPMorgan
Chase | | (0.31)% | | Apollo
Global
Management,
Inc. | | Monthly | | | — | | | | (112,713 | ) | |
USD | | | | | 174,108 | | | 04/11/22 | | JPMorgan
Chase | | Peoples United
Financial | | 0.49% | | Monthly | | | — | | | | (7,764 | ) | |
CAD | | | | | 79,784 | | | 04/18/22 | | JPMorgan
Chase | | Shaw
Communications,
Inc. | | 0.88% | | Monthly | | | — | | | | (2,953 | ) | |
USD | | | | | 283,361 | | | 05/23/22 | | JPMorgan
Chase | | Nuance
Communications,
Inc. | | 0.49% | | Monthly | | | — | | | | (1,230 | ) | |
USD | | | | | 363,668 | | | 05/23/22 | | JPMorgan
Chase | | Sterling
Bancorp. | | 0.49% | | Monthly | | | — | | | | (3,958 | ) | |
USD | | | | | 228,014 | | | 10/24/22 | | JPMorgan
Chase | | (0.30)% | | Goldman Sachs
Group, Inc. | | Monthly | | | — | | | | (16,276 | ) | |
USD | | | | | 5,024,464 | | | 12/06/21 | | Morgan
Stanley | | Morgan Stanley
Soy Dynamic
Congestion
Index(b) | | 0.25% | | At Maturity | | | — | | | | (4,565 | ) | |
USD | | | | | 1,265,347 | | | 12/06/21 | | Morgan
Stanley | | GC Intraday
Momentum
Index(e) | | 0.15% | | At Maturity | | | — | | | | (17,399 | ) | |
USD | | | | | 200,000 | | | 12/20/21 | | Morgan
Stanley | | 0.13% | | iBoxx $ Liquid
High
Yield Index | | Quarterly | | | 1 | | | | (4,433 | ) | |
USD | | | | | 2,930,163 | | | 12/06/21 | | Societe
Generale | | SG US
Trend Index(c) | | 0.30% | | At Maturity | | | — | | | | (37,089 | ) | |
| | | | | | | | | | | | | | | | | $ | 0 | | | $ | (1,076,979 | ) | |
| | | | | | | | | | | | | | | | | $ | (80 | ) | | $ | (113,380 | ) | |
(a) The index constituents are available on the counterparty's website.
(b) The index constituents are available on the Fund's website.
(c) The Index intends to track the performance of a strategy that trades the daily trend of the S&P 500 (the Underlying Index).
(d) The index intends to track the performance of a strategy that trades the daily trend of crude oil futures.
(e) The Index intends to track the performance of a strategy that trades the daily trend of the GC COMEX Gold Futures.
See Accompanying Notes to Consolidated Financial Statements.
27
Credit Suisse Multialternative Strategy Fund
Consolidated Schedule of Investments (continued)
October 31, 2021
WRITTEN OPTIONS
Number of
Contracts | | Counterparty | | Put Written Options | | Expiration
Date | | Notional
Amount | | Premiums
Received | | Current
Value | | Net Unrealized
Appreciation
(Depreciation) | |
| | 1 | | | Goldman Sachs | | S&P 500 Index, strike @ $4,435 | | 11/19/21 | | | 100 | | | $ | 6,228 | | | $ | (1,940 | ) | | $ | 4,288 | | |
Currency Abbreviations:
AUD = Australian Dollar
CAD = Canadian Dollar
DKK = Danish Krone
EUR = Euro
GBP = British Pound
HKD = Hong Kong Dollar
JPY = Japanese Yen
NOK = Norwegian Krone
SEK = Swedish Krona
USD = United States Dollar
See Accompanying Notes to Consolidated Financial Statements.
28
Credit Suisse Multialternative Strategy Fund
Consolidated Statement of Assets and Liabilities
October 31, 2021
Assets | |
Investments at value, including collateral for securities on loan of $1,996,810
(Cost $17,177,407) (Note 2) | | $ | 17,494,4181 | | |
Cash | | | 368,390 | | |
Foreign currency at value (Cost $29,275) | | | 53,250 | | |
Cash segregated at brokers for futures contracts, swap contracts and written options (Note 2) | | | 8,819,206 | | |
Unrealized appreciation on open swap contracts (Note 2) | | | 963,599 | | |
Net receivable for open swap contracts | | | 159,755 | | |
Receivable for Fund shares sold | | | 29,753 | | |
Unrealized appreciation on forward foreign currency contracts (Note 2) | | | 17,226 | | |
Dividend and interest receivable | | | 4,660 | | |
Prepaid expenses and other assets | | | 17,221 | | |
Total assets | | | 27,927,478 | | |
Liabilities | |
Investment advisory fee payable (Note 3) | | | 4,057 | | |
Administrative services fee payable (Note 3) | | | 5,806 | | |
Shareholder servicing/Distribution fee payable (Note 3) | | | 1,229 | | |
Payable upon return of securities loaned (Note 2) | | | 1,996,810 | | |
Unrealized depreciation on open swap contracts (Note 2) | | | 1,076,979 | | |
Variation margin payable on futures contracts (Note 2) | | | 68,145 | | |
Payable for investments purchased | | | 60,251 | | |
Trustees' fee payable | | | 16,394 | | |
Payable for Fund shares redeemed | | | 4,134 | | |
Unrealized depreciation on forward foreign currency contracts (Note 2) | | | 2,780 | | |
Outstanding written options, at value (Proceeds $6,228) (Note 2) | | | 1,940 | | |
Accrued expenses | | | 177,507 | | |
Total liabilities | | | 3,416,032 | | |
Net Assets | |
Capital stock, $.001 par value (Note 6) | | | 2,568 | | |
Paid-in capital (Note 6) | | | 28,578,948 | | |
Total distributable earnings (loss) | | | (4,070,070 | ) | |
Net assets | | $ | 24,511,446 | | |
I Shares | |
Net assets | | $ | 18,748,836 | | |
Shares outstanding | | | 1,956,968 | | |
Net asset value, offering price and redemption price per share | | $ | 9.58 | | |
A Shares | |
Net assets | | $ | 5,762,610 | | |
Shares outstanding | | | 610,844 | | |
Net asset value and redemption price per share | | $ | 9.43 | | |
Maximum offering price per share (net asset value/(1-5.25%)) | | $ | 9.95 | | |
1 Includes $1,937,963 of securities on loan.
See Accompanying Notes to Consolidated Financial Statements.
29
Credit Suisse Multialternative Strategy Fund
Consolidated Statement of Operations
For the Year Ended October 31, 2021
Investment Income | |
Dividends (net of foreign taxes withheld of $6,278) | | $ | 157,479 | | |
Non Cash Income1 | | | 25,445 | | |
Securities lending (net of rebates) | | | 14,358 | | |
Total investment income | | | 197,282 | | |
Expenses | |
Investment advisory fees (Note 3) | | | 299,253 | | |
Administrative services fees (Note 3) | | | 29,529 | | |
Shareholder servicing/Distribution fees (Note 3) | |
Class A | | | 13,161 | | |
Trustees' fees | | | 64,167 | | |
Custodian fees | | | 56,309 | | |
Transfer agent fees (Note 3) | | | 51,297 | | |
Registration fees | | | 47,054 | | |
Audit and tax fees | | | 45,598 | | |
Legal fees | | | 17,592 | | |
Printing fees | | | 16,254 | | |
Commitment fees (Note 4) | | | 12,553 | | |
Insurance expense | | | 1,538 | | |
Miscellaneous expense | | | 8,146 | | |
Total expenses | | | 662,451 | | |
Less: fees waived and expenses reimbursed (Note 3) | | | (404,708 | ) | |
Net expenses | | | 257,743 | | |
Net investment loss | | | (60,461 | ) | |
Net Realized and Unrealized Gain (Loss) from Investments, Futures Contracts, Swap Contracts,
Written Options, Foreign Currency and Forward Foreign Currency Contracts | |
Net realized gain from investments | | | 1,198,581 | | |
Net realized loss from futures contracts | | | (215,820 | ) | |
Net realized gain from swap contracts | | | 3,720,545 | | |
Net realized gain from written options | | | 67,990 | | |
Net realized loss from foreign currency transactions | | | (23,782 | ) | |
Net realized loss from forward foreign currency contracts | | | (73,813 | ) | |
Net change in unrealized appreciation (depreciation) from investments | | | 326,385 | | |
Net change in unrealized appreciation (depreciation) from futures contracts | | | (186,708 | ) | |
Net change in unrealized appreciation (depreciation) from swap contracts | | | (21,348 | ) | |
Net change in unrealized appreciation (depreciation) from written options | | | 4,288 | | |
Net change in unrealized appreciation (depreciation) from foreign currency translations | | | 12,661 | | |
Net change in unrealized appreciation (depreciation) from forward foreign currency contracts | | | (60,577 | ) | |
Net realized and unrealized gain from investments, futures contracts, swap contracts,
written options, foreign currency and forward foreign currency contracts | | | 4,748,402 | | |
Net increase in net assets resulting from operations | | $ | 4,687,941 | | |
1 Represents non-cash distributions in connection with capital changes for certain investments held by the Fund recorded on ex-date and based on fair value.
See Accompanying Notes to Consolidated Financial Statements.
30
Credit Suisse Multialternative Strategy Fund
Consolidated Statements of Changes in Net Assets
| | | For the Year
Ended
October 31, 2021 | | For the Year
Ended
October 31, 2020 | |
From Operations | |
Net investment income (loss) | | $ | (60,461 | ) | | $ | 189,765 | | |
Net realized gain from investments, futures contracts, swap contracts,
written options, foreign currency transactions and forward foreign
currency contracts | | | 4,673,701 | | | | 1,685,200 | | |
Net change in unrealized appreciation (depreciation) from investments,
futures contracts, swap contracts, written options, foreign currency
translations and forward foreign currency contracts | | | 74,701 | | | | (732,499 | ) | |
Net increase in net assets resulting from operations | | | 4,687,941 | | | | 1,142,466 | | |
From Distributions | |
From distributable earnings | |
Class I | | | (2,050,351 | ) | | | (3,436,401 | ) | |
Class A | | | (505,029 | ) | | | (45,957 | ) | |
Net decrease in net assets resulting from distribution | | | (2,555,380 | ) | | | (3,482,358 | ) | |
| From Capital Share Transactions (Note 6) | |
Proceeds from sale of shares | | | 12,246,511 | | | | 57,996,880 | | |
Reinvestment of dividends and distributions | | | 2,540,608 | | | | 3,466,462 | | |
Net asset value of shares redeemed | | | (44,140,673 | ) | | | (82,871,881 | ) | |
Net decrease in net assets from capital share transactions | | | (29,353,554 | ) | | | (21,408,539 | ) | |
Net decrease in net assets | | | (27,220,993 | ) | | | (23,748,431 | ) | |
Net Assets | |
Beginning of year | | | 51,732,439 | | | | 75,480,870 | | |
End of year | | $ | 24,511,446 | | | $ | 51,732,439 | | |
See Accompanying Notes to Consolidated Financial Statements.
31
Credit Suisse Multialternative Strategy Fund
Consolidated Financial Highlights
(For a Class I Share of the Fund Outstanding Throughout Each Year)
| | | For the Year Ended October 31, | |
| | | 2021 | | 2020 | | 2019 | | 2018 | | 2017 | |
Per share data | |
Net asset value, beginning of year | | $ | 9.531 | | | $ | 9.86 | | | $ | 10.031 | | | $ | 10.54 | | | $ | 10.391 | | |
INVESTMENT OPERATIONS | |
Net investment income (loss)2 | | | (0.02 | ) | | | 0.04 | | | | 0.06 | | | | 0.05 | | | | (0.04 | ) | |
Net gain (loss) from investments, futures contracts,
swap contracts, written options and foreign
currency related items (both realized and unrealized) | | | 1.25 | | | | 0.10 | | | | (0.06 | ) | | | (0.08 | ) | | | 0.41 | | |
Total from investment operations | | | 1.23 | | | | 0.14 | | | | 0.003 | | | | (0.03 | ) | | | 0.37 | | |
LESS DIVIDENDS AND DISTRIBUTIONS | |
Dividends from net investment income | | | (1.18 | ) | | | (0.47 | ) | | | — | | | | — | | | | (0.04 | ) | |
Distributions from net realized gains | | | — | | | | — | | | | (0.17 | ) | | | (0.48 | ) | | | (0.18 | ) | |
Total dividends and distributions | | | (1.18 | ) | | | (0.47 | ) | | | (0.17 | ) | | | (0.48 | ) | | | (0.22 | ) | |
Net asset value, end of year | | $ | 9.581 | | | $ | 9.531 | | | $ | 9.86 | | | $ | 10.031 | | | $ | 10.54 | | |
Total return4 | | | 13.87 | % | | | 1.46 | % | | | 0.11 | % | | | (0.29 | )% | | | 3.68 | % | |
RATIOS AND SUPPLEMENTAL DATA | |
Net assets, end of year (000s omitted) | | $ | 18,749 | | | $ | 47,382 | | | $ | 74,486 | | | $ | 104,886 | | | $ | 102,227 | | |
Ratio of net expenses to average net assets | | | 0.85 | % | | | 0.85 | % | | | 0.85 | % | | | 0.89 | % | | | 1.00 | % | |
Ratio of expenses to average net assets excluding
securities sold short dividend expense | | | 0.85 | % | | | 0.85 | % | | | 0.85 | % | | | 0.85 | % | | | 0.85 | % | |
Ratio of net investment income (loss) to average
net assets | | | (0.16 | )% | | | 0.38 | % | | | 0.60 | % | | | 0.44 | % | | | (0.40 | )% | |
Decrease reflected in above operating expense
ratios due to waivers/reimbursements | | | 1.41 | % | | | 1.09 | % | | | 1.13 | % | | | 0.95 | % | | | 0.68 | % | |
Portfolio turnover rate5 | | | 532 | % | | | 571 | % | | | 305 | % | | | 1,373 | % | | | 586 | % | |
1 Includes adjustments in accordance with accounting principles generally accepted in the United States of America and as such, the net asset values for financial reporting purposes and the returns based upon net asset values may differ from the net asset values and returns for shareholder transactions.
2 Per share information is calculated using the average shares outstanding method.
3 This amount represents less than $0.01 per share.
4 Total returns are historical and include change in share price and reinvestment of all dividends and distributions. Had certain expenses not been reduced during the years shown, total returns would have been lower.
5 Portfolio turnover is calculated by dividing the lesser of total purchases or sales of portfolio securities for the reporting period by the monthly average of portfolio securities owned during the reporting period. Excluded from both the numerator and denominator are amounts relating to derivatives and securities whose maturities or expiration dates at the time of acquisition were one year or less.
See Accompanying Notes to Consolidated Financial Statements.
32
Credit Suisse Multialternative Strategy Fund
Consolidated Financial Highlights
(For a Class A Share of the Fund Outstanding Throughout Each Year)
| | | For the Year Ended October 31, | |
| | | 2021 | | 2020 | | 2019 | | 2018 | | 2017 | |
Per share data | |
Net asset value, beginning of year | | $ | 9.391 | | | $ | 9.73 | | | $ | 9.921 | | | $ | 10.47 | | | $ | 10.31 | | |
INVESTMENT OPERATIONS | |
Net investment income (loss)2 | | | (0.04 | ) | | | (0.00 | )3 | | | 0.03 | | | | 0.02 | | | | (0.07 | ) | |
Net gain (loss) from investments, futures contracts,
swap contracts, written options and foreign
currency related items (both realized and unrealized) | | | 1.24 | | | | 0.10 | | | | (0.05 | ) | | | (0.09 | ) | | | 0.42 | | |
Total from investment operations | | | 1.20 | | | | 0.10 | | | | (0.02 | ) | | | (0.07 | ) | | | 0.35 | | |
LESS DIVIDENDS AND DISTRIBUTIONS | |
Dividends from net investment income | | | (1.16 | ) | | | (0.44 | ) | | | — | | | | — | | | | (0.01 | ) | |
Distributions from net realized gains | | | — | | | | — | | | | (0.17 | ) | | | (0.48 | ) | | | (0.18 | ) | |
Total dividends and distributions | | | (1.16 | ) | | | (0.44 | ) | | | (0.17 | ) | | | (0.48 | ) | | | (0.19 | ) | |
Net asset value, end of year | | $ | 9.431 | | | $ | 9.391 | | | $ | 9.73 | | | $ | 9.921 | | | $ | 10.47 | | |
Total return4 | | | 13.64 | % | | | 1.10 | % | | | (0.10 | )% | | | (0.68 | )% | | | 3.45 | % | |
RATIOS AND SUPPLEMENTAL DATA | |
Net assets, end of year (000s omitted) | | $ | 5,763 | | | $ | 4,350 | | | $ | 994 | | | $ | 1,414 | | | $ | 1,267 | | |
Ratio of net expenses to average net assets | | | 1.10 | % | | | 1.10 | % | | | 1.10 | % | | | 1.14 | % | | | 1.26 | % | |
Ratio of expenses to average net assets excluding
securities sold short dividend expense | | | 1.10 | % | | | 1.10 | % | | | 1.10 | % | | | 1.10 | % | | | 1.10 | % | |
Ratio of net investment income (loss) to average
net assets | | | (0.42 | )% | | | (0.04 | )% | | | 0.30 | % | | | 0.19 | % | | | (0.65 | )% | |
Decrease reflected in above operating expense
ratios due to waivers/reimbursements | | | 1.41 | % | | | 1.09 | % | | | 1.13 | % | | | 0.94 | % | | | 0.68 | % | |
Portfolio turnover rate5 | | | 532 | % | | | 571 | % | | | 305 | % | | | 1,373 | % | | | 586 | % | |
1 Includes adjustments in accordance with accounting principles generally accepted in the United States of America and as such, the net asset values for financial reporting purposes and the returns based upon net asset values may differ from the net asset values and returns for shareholder transactions.
2 Per share information is calculated using the average shares outstanding method.
3 This amount represents less than $0.01 per share.
4 Total returns are historical and include change in share price, reinvestment of all dividends and distributions and no sales charge. Had certain expenses not been reduced during the years shown, total returns would have been lower.
5 Portfolio turnover is calculated by dividing the lesser of total purchases or sales of portfolio securities for the reporting period by the monthly average of portfolio securities owned during the reporting period. Excluded from both the numerator and denominator are amounts relating to derivatives and securities whose maturities or expiration dates at the time of acquisition were one year or less.
See Accompanying Notes to Consolidated Financial Statements.
33
Credit Suisse Multialternative Strategy Fund
Notes to Consolidated Financial Statements
October 31, 2021
Credit Suisse Multialternative Strategy Fund (the "Fund"), a series of Credit Suisse Opportunity Funds (the "Trust"), a Delaware statutory trust, is registered under the Investment Company Act of 1940, as amended (the "1940 Act"), as a non-diversified open-end management investment company that seeks to achieve total return consistent with the risk and return patterns of a diversified universe of hedge funds. The Trust was organized under the laws of the State of Delaware as a business trust on May 31, 1995.
Credit Suisse Asset Management, LLC ("Credit Suisse"), the investment adviser to the Fund, is registered as an investment adviser with the Securities and Exchange Commission and as a Commodity Pool Operator with the Commodity Futures Trading Commission. The Fund intends to gain exposure to commodity derivatives through investing in a wholly-owned subsidiary, Credit Suisse Cayman Multialternative Strategy Fund, Ltd. (the "Subsidiary"), organized under the laws of the Cayman Islands. The Subsidiary invests in commodity-linked derivative instruments, such as swaps and futures. The Subsidiary may also invest in debt securities, some of which are intended to serve as margin or collateral for the Subsidiary's derivatives positions.
The Subsidiary is managed by the same portfolio managers that manage the Fund and the accompanying financial statements reflect the financial position of the Fund and the Subsidiary and the results of operations on a consolidated basis. The consolidated financial statements include portfolio holdings of the Fund and the Subsidiary and all intercompany transactions and balances have been eliminated. The Fund may invest up to 25% of its total assets in the Subsidiary. As of October 31, 2021, the Fund held $5,808,955 in the Subsidiary, representing 23.7% of the Fund's consolidated net assets. For the year ended October 31, 2021, the net realized gain on securities and other financial instruments held in the Subsidiary was $1,685,737.
Subsequent references to the Fund within the Notes to Consolidated Financial Statements collectively refer to the Fund and the Subsidiary, unless the context otherwise requires.
The Fund offers two classes of shares: Class I shares and Class A shares. Each class of shares represents an equal pro rata interest in the Fund, except the share classes bear different expenses. Class A shares are sold subject to a front-end sales charge of up to 5.25%. Class I shares are sold without a sales charge.
34
Credit Suisse Multialternative Strategy Fund
Notes to Consolidated Financial Statements (continued)
October 31, 2021
Note 2. Significant Accounting Policies
The following is a summary of significant accounting policies followed by the Fund in the preparation of its consolidated financial statements. The policies are in accordance with generally accepted accounting principles in the United States of America ("GAAP"). The preparation of consolidated financial statements requires management to make estimates and assumptions that affect the reported amounts and disclosures in the consolidated financial statements. Actual results could differ from those estimates. The Fund is considered an investment company for financial reporting purposes under GAAP and follows the accounting and reporting guidance in Financial Accounting Standards Board ("FASB") Accounting Standards Codification ("ASC") Topic 946 — Financial Services — Investment Companies.
A) SECURITY VALUATION — The Board of Trustees (the "Board") is responsible for the Fund's valuation process. The Board has delegated the supervision of the daily valuation process to Credit Suisse Asset Management, LLC, the Fund's investment adviser ("Credit Suisse" or the "Adviser"), who has established a Pricing Committee which, pursuant to the policies adopted by the Board, is responsible for making fair valuation determinations and overseeing the Fund's pricing policies. The net asset value of the Fund is determined daily as of the close of regular trading on the New York Stock Exchange, Inc. (the "Exchange") on each day the Exchange is open for business. For certain international equity securities, in order to adjust for events which may occur between the close of the foreign exchanges and the close of the Exchange, a fair valuation model may be used. This fair valuation model takes into account comparisons to the valuation of American Depository Receipts (ADRs), exchange-traded funds, futures contracts and certain indices and these securities are categorized as Level 2. The valuations for fixed income securities (which may include, but are not limited to, corporate, government, municipal, mortgage-backed, collateralized mortgage obligations and asset-backed securities) and certain derivative instruments are typically the prices supplied by independent third party pricing services, which may use market prices or broker/dealer quotations or a variety of valuation techniques and methodologies. The independent third party pricing services use inputs that are observable such as issuer details, interest rates, yield curves, prepayment speeds, credit risks/spreads, default rates and quoted prices for similar securities. These pricing services generally price fixed income securities assuming orderly transactions of an institutional "round lot" size, but some trades occur in smaller "odd lot" sizes which may be effected at lower prices
35
Credit Suisse Multialternative Strategy Fund
Notes to Consolidated Financial Statements (continued)
October 31, 2021
Note 2. Significant Accounting Policies (continued)
than institutional round lot trades. Structured note agreements are valued in accordance with a dealer-supplied valuation based on changes in the value of the underlying index. Option contracts on securities, currencies, indices, futures contracts, swaps and other instruments are valued at the mid-point between the last bid and ask quotations as of the close of trading on the exchange on which the option is traded. Futures contracts are valued daily at the settlement price established by the board of trade or exchange on which they are traded. Forward contracts are valued at the London closing spot rates and the London closing forward point rates on a daily basis. The currency forward contract pricing model derives the differential in point rates to the expiration date of the forward and calculates its present value. Over-the-counter derivative financial instruments, such as swap agreements, generally derive their value from underlying asset prices, indices, reference rates, and other inputs or a combination of these factors. Equity securities for which market quotations are available are valued at the last reported sales price or official closing price on the primary market or exchange on which they trade. The Fund may utilize a service provided by an independent third party which has been approved by the Board to fair value certain securities. When fair value pricing is employed, the prices of securities used by the Fund to calculate its net asset value may differ from quoted or published prices for the same securities. If independent third party pricing services are unable to supply prices for a portfolio investment, or if the prices supplied are deemed by the investment adviser to be unreliable, the market price may be determined by the investment adviser using quotations from one or more brokers/dealers or at the transaction price if the security has recently been purchased and no value has yet been obtained from a pricing service or pricing broker. When reliable prices are not readily available, such as when the value of a security has been significantly affected by events after the close of the exchange or market on which the security is principally traded, but before the Fund calculates its net asset value, these securities will be fair valued in good faith by the Pricing Committee, in accordance with procedures adopted by the Board.
The Fund uses valuation techniques to measure fair value that are consistent with the market approach and/or income approach, depending on the type of security and the particular circumstance. The market approach uses prices and other relevant information generated by market transactions involving identical or comparable securities. The income approach uses valuation techniques to discount estimated future cash flows to present value.
36
Credit Suisse Multialternative Strategy Fund
Notes to Consolidated Financial Statements (continued)
October 31, 2021
Note 2. Significant Accounting Policies (continued)
GAAP established a disclosure hierarchy that categorizes the inputs to valuation techniques used to value assets and liabilities at each measurement date. These inputs are summarized in the three broad levels listed below:
• Level 1 – quoted prices in active markets for identical investments
• Level 2 – other significant observable inputs (including quoted prices for similar investments, interest rates, prepayment speeds, credit risk, etc.)
• Level 3 – significant unobservable inputs (including the Fund's own assumptions in determining the fair value of investments)
The inputs or methodologies used to value securities are not necessarily an indication of the risk associated with investing in those securities.
The following is a summary of the inputs used as of October 31, 2021 in valuing the Fund's assets and liabilities carried at fair value:
Assets | | Level 1 | | Level 2 | | Level 3 | | Total | |
Investments in Securities | |
Common Stocks | | $ | 3,419,437 | | | $ | 1,311,393 | | | $ | — | | | $ | 4,730,830 | | |
Exchange-traded Funds | | | 4,815,135 | | | | — | | | | — | | | | 4,815,135 | | |
United States Treasury Obligations | | | — | | | | 1,199,440 | | | | — | | | | 1,199,440 | | |
Short-term Investments | | | 4,752,203 | | | | 1,996,810 | | | | — | | | | 6,749,013 | | |
| | | $ | 12,986,775 | | | $ | 4,507,643 | | | $ | — | | | $ | 17,494,418 | | |
Other Financial Instruments* | |
Forward Foreign Currency Contracts | | $ | — | | | $ | 17,226 | | | $ | — | | | $ | 17,226 | | |
Futures Contracts | | | 365,895 | | | | — | | | | — | | | | 365,895 | | |
Swap Contracts | | | — | | | | 963,599 | | | | — | | | | 963,599 | | |
Liabilities | | Level 1 | | Level 2 | | Level 3 | | Total | |
Other Financial Instruments* | |
Forward Foreign Currency Contracts | | $ | — | | | $ | 2,780 | | | $ | — | | | $ | 2,780 | | |
Futures Contracts | | | 696,571 | | | | — | | | | — | | | | 696,571 | | |
Swap Contracts | | | — | | | | 1,076,979 | | | | — | | | | 1,076,979 | | |
Written Options | | | 1,940 | | | | — | | | | — | | | | 1,940 | | |
* Other financial instruments include unrealized appreciation (depreciation) on forward foreign currency contracts, futures and swap contracts. Written options are reported at value.
For the year ended October 31, 2021, there were no transfers among Level 2 and Level 3. All transfers, if any, are assumed to occur at the end of the reporting period.
B) DERIVATIVE INSTRUMENTS AND HEDGING ACTIVITIES — The Fund adopted amendments to authoritative guidance on disclosures about derivative instruments and hedging activities which require that a fund disclose (a) how
37
Credit Suisse Multialternative Strategy Fund
Notes to Consolidated Financial Statements (continued)
October 31, 2021
Note 2. Significant Accounting Policies (continued)
and why an entity uses derivative instruments, (b) how derivative instruments and hedging activities are accounted for and (c) how derivative instruments and related hedging activities affect a fund's financial position, financial performance and cash flows. For the year ended October 31, 2021, the Fund's derivatives did not qualify for hedge accounting as they are held at fair value.
The following table presents the fair value and the location of derivatives within the Consolidated Statement of Assets and Liabilities at October 31, 2021 and the effect of these derivatives on the Consolidated Statement of Operations for the year ended October 31, 2021.
Primary Underlying Risk | | Derivative
Assets(1) | | Derivative
Liabilities(1) | | Realized Gain
(Loss) | | Change in Unrealized
Appreciation (Depreciation) | |
Foreign currency exchange rate | |
Forward contracts | | $ | 17,226 | | | $ | 2,780 | | | $ | (73,813 | ) | | $ | (60,577 | ) | |
Futures contracts(2) | | | 18,119 | | | | 51 | | | | 70,514 | | | | 28,476 | | |
Swap contracts | | | — | | | | 48,414 | | | | (107,675 | ) | | | (48,414 | ) | |
Interest rate | |
Futures contracts(2) | | | 40,663 | | | | 231,916 | | | | (175,829 | ) | | | (124,327 | ) | |
Swap contracts | | | 127,583 | | | | 101,686 | | | | 239,170 | | | | 38,337 | | |
Equity price | |
Futures contracts(2) | | | 8,603 | | | | 157,304 | | | | (194,616 | ) | | | (63,300 | ) | |
Swap contracts | | | 592,159 | | | | 794,713 | | | | 1,566,126 | | | | (179,986 | ) | |
Written options | | | — | | | | 1,940 | | | | 67,990 | | | | 4,288 | | |
Credit risk | |
Swap contracts | | | 27,610 | | | | 4,433 | | | | 230,737 | | | | (83,105 | ) | |
Commodity price | |
Futures contracts(2) | | | 298,510 | | | | 307,300 | | | | 84,111 | | | | (27,557 | ) | |
Swap contracts | | | 216,247 | | | | 127,733 | | | | 1,792,187 | | | | 251,820 | | |
Total | | $ | 1,346,720 | | | $ | 1,778,270 | | | $ | 3,498,902 | | | $ | (264,345 | ) | |
(1) Generally, the balance sheet location for asset derivatives is receivables/net unrealized appreciation (depreciation) and for liability derivatives is payables/net unrealized appreciation (depreciation).
(2) Includes cumulative appreciation (depreciation) of futures contracts as reported in the Schedule of Investments. Only variation margin is reported within the receivables and/or payables on the Statement of Assets and Liabilities.
For the year ended October 31, 2021, the Fund held average monthly value on a net basis of $2,895,787 in forward foreign currency contracts and average monthly notional values of $18,870,149 and $20,517,271 in long futures contracts and short futures contracts and $129,003,641 in swap contracts, respectively. For the year ended October 31, 2021, the Fund received average monthly premiums of $5,083 from put written options contracts.
The Fund is a party to International Swap and Derivatives Association, Inc. ("ISDA") Master Agreements ("Master Agreements") with certain counterparties that govern over-the-counter derivative (including Total Return,
38
Credit Suisse Multialternative Strategy Fund
Notes to Consolidated Financial Statements (continued)
October 31, 2021
Note 2. Significant Accounting Policies (continued)
Credit Default and Interest Rate Swaps) and foreign exchange contracts entered into by the Fund. The Master Agreements may contain provisions regarding, among other things, the parties' general obligations, representations, agreements, collateral requirements, events of default and early termination. Termination events applicable to the Fund may occur upon a decline in the Fund's net assets below a specified threshold over a certain period of time.
The following table presents by counterparty the Fund's derivative assets, net of related collateral held by the Fund, at October 31, 2021:
Counterparty | | Gross Amount of
Derivative Assets
Presented in the
Consolidated
Statement of Assets
and Liabilities(a) | | Financial
Instruments
and Derivatives
Available for Offset | | Non-Cash
Collateral
Received(b) | | Cash
Collateral
Received(b) | | Net Amount
of Derivative
Assets | |
Bank of America | | $ | 52,592 | | | $ | (45,227 | ) | | $ | — | | | $ | — | | | $ | 7,365 | | |
BNP Paribas | | | 21,398 | | | | (21,398 | ) | | | — | | | | — | | | | — | | |
Goldman Sachs | | | 275,610 | | | | (275,610 | ) | | | — | | | | — | | | | — | | |
JPMorgan Chase | | | 469,423 | | | | (469,423 | ) | | | — | | | | — | | | | — | | |
Macquarie Bank Ltd. | | | 230 | | | | — | | | | — | | | | — | | | | 230 | | |
Morgan Stanley | | | 25,844 | | | | (25,844 | ) | | | — | | | | — | | | | — | | |
Societe Generale | | | 135,728 | | | | (37,089 | ) | | | — | | | | — | | | | 98,639 | | |
| | | $ | 980,825 | | | $ | (874,591 | ) | | $ | — | | | $ | — | | | $ | 106,234 | | |
The following table presents by counterparty the Fund's derivative liabilities, net of related collateral pledged by the Fund, at October 31, 2021:
Counterparty | | Gross Amount of
Derivative Liabilities
Presented in the
Consolidated
Statement of Assets
and Liabilities(a) | | Financial
Instruments
and Derivatives
Available for Offset | | Non-Cash
Collateral
Pledged(b) | | Cash
Collateral
Pledged(b) | | Net Amount
of Derivative
Liabilities | |
Bank of America | | $ | 45,227 | | | $ | (45,227 | ) | | $ | — | | | $ | — | | | $ | — | | |
Barclays Bank PLC | | | 69,617 | | | | — | | | | — | | | | — | | | | 69,617 | | |
BNP Paribas | | | 40,027 | | | | (21,398 | ) | | | — | | | | — | | | | 18,629 | | |
Citigroup | | | 42,132 | | | | — | | | | | | | | 42,132 | | |
Goldman Sachs | | | 282,643 | | | | (275,610 | ) | | | — | | | | (7,033 | ) | | | — | | |
JPMorgan Chase | | | 538,567 | | | | (469,423 | ) | | | — | | | | (69,144 | ) | | | — | | |
Morgan Stanley | | | 26,397 | | | | (25,844 | ) | | | — | | | | (553 | ) | | | — | | |
Societe Generale | | | 37,089 | | | | (37,089 | ) | | | — | | | | — | | | | — | | |
| | | $ | 1,081,699 | | | $ | (874,591 | ) | | $ | — | | | $ | (76,730 | ) | | $ | 130,378 | | |
(a) Swap contracts, written options and forward foreign currency exchange contracts are included. Written options are reported at market value.
(b) The actual collateral pledged may be more than the amounts shown.
C) FOREIGN CURRENCY TRANSACTIONS — The books and records of the Fund are maintained in U.S. dollars. Transactions denominated in foreign
39
Credit Suisse Multialternative Strategy Fund
Notes to Consolidated Financial Statements (continued)
October 31, 2021
Note 2. Significant Accounting Policies (continued)
currencies are recorded at the current prevailing exchange rates. All assets and liabilities denominated in foreign currencies, including purchases and sales of investments, and income and expenses, are translated into U.S. dollar amounts on the date of those transactions.
Reported net realized gain (loss) from foreign currency transactions arises from sales of foreign currencies; currency gains or losses realized between the trade and settlement dates on securities transactions; and the difference between the amounts of dividends, interest, and foreign withholding taxes recorded on the Fund's books and the U.S. dollar equivalent of the amounts actually received or paid. Net change in unrealized gains and losses on translation of assets and liabilities denominated in foreign currencies arises from changes in the fair values of assets and liabilities, other than investments, at the end of the period, resulting from changes in exchange rates.
The Fund does not isolate that portion of the results of operations resulting from fluctuations in foreign exchange rates on investments from the fluctuations arising from changes in market prices of investments held. Such fluctuations are included with net realized and unrealized gain or loss from investments in the Consolidated Statement of Operations.
D) SECURITY TRANSACTIONS AND INVESTMENT INCOME/EXPENSE — Security transactions are accounted for on a trade date basis. Interest income/expense is recorded on the accrual basis. The Fund amortizes premiums and accretes discounts using the effective interest method. Dividend income/expense is recorded on the ex-dividend date. Foreign dividend income is recorded on the ex-dividend date or as soon as practicable after the Fund determines the existence of a dividend declaration after exercising reasonable due diligence. Certain expenses are class-specific expenses, vary by class and are charged only to that class. Income, expenses (excluding class-specific expenses) and realized/unrealized gains/losses are allocated proportionately to each class of shares based upon the relative net asset value of the outstanding shares of that class. The cost of investments sold is determined by use of the specific identification method for both financial reporting and income tax purposes. To the extent any issuer defaults or a credit event occurs that impacts the issuer, the Fund may halt any additional interest income accruals and consider the realizability of interest accrued up to the date of default or credit event.
E) DIVIDENDS AND DISTRIBUTIONS TO SHAREHOLDERS — Dividends from net investment income, if any, are declared and paid quarterly.
40
Credit Suisse Multialternative Strategy Fund
Notes to Consolidated Financial Statements (continued)
October 31, 2021
Note 2. Significant Accounting Policies (continued)
Distributions of net realized capital gains, if any, are declared and paid at least annually. However, to the extent that a net realized capital gain can be reduced by a capital loss carryforward, such gain will not be distributed. Dividends and distributions to shareholders of the Fund are recorded on the ex-dividend date and are determined in accordance with federal income tax regulations, which may differ from GAAP.
F) FEDERAL AND OTHER TAXES — No provision is made for federal taxes as it is the Fund's intention to continue to qualify as a regulated investment company ("RIC") under the Internal Revenue Code of 1986, as amended (the "Code"), and to make the requisite distributions to its shareholders, which will be sufficient to relieve it from federal income and excise taxes.
In order to qualify as a RIC under the Code, the Fund must meet certain requirements regarding the source of its income, the diversification of its assets and the distribution of its income. One of these requirements is that the Fund derive at least 90% of its gross income for each taxable year from dividends, interest, payments with respect to certain securities loans, gains from the sale or other disposition of stock, securities or foreign currencies, other income derived with respect to its business of investing in such stock, securities or currencies or net income derived from interests in certain publicly-traded partnerships ("Qualifying Income"). The Internal Revenue Service ("IRS") has issued a ruling that income realized from certain types of commodity-linked derivatives would not be Qualifying Income. As a result, the Fund's ability to realize income from investments in such commodity-linked derivatives as part of its investment strategy would be limited to a maximum of 10% of its gross income.
If the Fund is unable to ensure continued qualification as a RIC, the Fund may be required to change its investment objective, policies or techniques, or may be liquidated. If the Fund fails to qualify as a RIC, the Fund will be subject to federal income tax on its net income and capital gains at regular corporate rates (without reduction for distributions to shareholders). If the Fund were to fail to qualify as a RIC and become subject to federal income tax, shareholders of the Fund would be subject to the risk of diminished returns. The Fund adopted the authoritative guidance for uncertainty in income taxes and recognizes a tax benefit or liability from an uncertain position only if it is more likely than not that the position is sustainable based solely on its technical merits and consideration of the relevant taxing authority's widely understood administrative practices and procedures. The Fund has reviewed its current tax positions and has determined that no provision for income tax is required
41
Credit Suisse Multialternative Strategy Fund
Notes to Consolidated Financial Statements (continued)
October 31, 2021
Note 2. Significant Accounting Policies (continued)
in the Fund's financial statements. The Fund's federal and state income and federal excise tax returns for tax years for which the applicable statutes of limitations have not expired are subject to examination by the Internal Revenue Service and state departments of revenue.
G) CASH — The Fund's uninvested cash balance is held in an interest bearing variable rate demand deposit account at State Street Bank and Trust Company ("SSB"), the Fund's custodian.
H) SHORT SALES — When the Fund engages in a short sale, the collateral for the short position will be maintained by the Fund's custodian or qualified sub-custodian. While the short sale is open, the Fund will maintain in a segregated account an amount of liquid securities equal in value to its obligation to the securities sold short. The collateral amounts required are determined daily by reference to the market value of the short positions. Short sales expose the Fund to the risk that it will be required to cover its short position at a time when the securities have appreciated in value, thus resulting in a loss to the Fund. The Fund's loss on a short sale could theoretically be unlimited in a case where the Fund is unable, for whatever reason, to close out its short position. Short sales also involve transaction and other costs that will reduce potential gains and increase potential Fund losses. The use by the Fund of short sales in combination with long positions in the Fund in an attempt to improve performance may not be successful and may result in greater losses or lower positive returns than if the Fund held only long positions. It is possible that the Fund's long equity positions will decline in value at the same time that the value of the securities it has sold short increases, thereby increasing potential losses to the Fund. In addition, the Fund's short selling strategies may limit its ability to fully benefit from increases in the equity markets. Short selling also involves a form of financial leverage that may exaggerate any losses realized by the Fund. Also, there is the risk that the counterparty to a short sale may fail to honor its contractual terms, causing a loss to the Fund. At October 31, 2021, the Fund had no open short positions.
I) FUTURES — The Fund may enter into futures contracts to the extent permitted by its investment policies and objectives. The Fund may use futures contracts to gain exposure to or hedge against changes in interest rates, equity and market price movements and/or currency risks. Upon entering into a futures contract, the Fund is required to deposit cash and/or pledge U.S. Government securities as initial margin with a Futures Commission Merchant ("FCM"). Subsequent payments, which are dependent on the daily fluctuations in the value of the underlying instrument, are made or received by the Fund
42
Credit Suisse Multialternative Strategy Fund
Notes to Consolidated Financial Statements (continued)
October 31, 2021
Note 2. Significant Accounting Policies (continued)
each day (daily variation margin) and are recorded as unrealized gains or losses in the Consolidated Statement of Operations until the contracts are closed. When the contracts are closed, the Fund records a realized gain or loss equal to the difference between the proceeds from (or cost of) the closing transaction and the Fund's basis in the contract. Risks of entering into futures contracts for hedging purposes include the possibility that a change in the value of the contract may not correlate with the changes in the value of the underlying instruments. Futures have minimal counterparty credit risk because futures are exchange traded and the exchange's clearinghouse, as counterparty to all exchange-traded futures, guarantees the futures against default. In addition, the purchase of a futures contract involves the risk that the Fund could lose more than the original margin deposit and subsequent payments may be required for a futures transaction. The Fund's open futures contracts are disclosed in the Consolidated Schedule of Investments. At October 31, 2021, the amount of restricted cash held at brokers related to open futures contracts was $1,971,811.
The Commodity Exchange Act requires an FCM to segregate all customer transactions and assets from the FCM's proprietary activities. A customer's cash and other equity deposited with an FCM are considered commingled with all other customer funds subject to the FCM's segregation requirements. In the event of an FCM's insolvency, recovery may be limited to the Fund's pro-rata share of segregated customer funds available. It is possible that the recovery amount could be less than the total of cash and other equity deposited.
J) FORWARD FOREIGN CURRENCY CONTRACTS — A forward foreign currency exchange contract ("forward currency contract") is a commitment to purchase or sell a foreign currency at the settlement date at a negotiated rate. The Fund will enter into forward currency contracts primarily for hedging foreign currency risk. Forward currency contracts are valued at the prevailing forward exchange rate of the underlying currencies and unrealized gain/loss is recorded daily. On the settlement date of the forward currency contract, the Fund records a realized gain or loss equal to the difference between the value of the contract at the time it was opened and the value of the contract at the time it was closed. Certain risks may arise upon entering into forward currency contracts from the potential inability of counterparties to meet the terms of their contracts. The maximum counterparty credit risk to the Fund is measured by the unrealized gain on appreciated contracts. Additionally, when utilizing forward currency contracts to hedge, the Fund forgoes the opportunity to profit from favorable exchange rate movements during the term of the contract. The
43
Credit Suisse Multialternative Strategy Fund
Notes to Consolidated Financial Statements (continued)
October 31, 2021
Note 2. Significant Accounting Policies (continued)
Fund's open forward currency contracts are disclosed in the Consolidated Schedule of Investments. At October 31, 2021, the amount of restricted cash held at brokers related to open forward foreign currency contracts was $0.
K) SWAPS — The Fund may enter into swaps either for hedging purposes or to seek to increase total return. A swap contract is an agreement that obligates two parties to exchange a series of cash flows at specified intervals based upon or calculated by reference to changes in specified prices or rates for a specified amount of an underlying asset or notional principal amount. A centrally cleared swap is a transaction executed between the Fund and a counterparty, then cleared by a clearing member through a central clearinghouse. The central clearinghouse serves as the counterparty, with whom the Fund exchanges cash flows. The Fund will enter into swap contracts only on a net basis, which means that the two payment streams are netted out, with the Fund receiving or paying, as the case may be, only the net amount of the two payments. Risks may arise as a result of the failure of the counterparty to the swap contract to comply with the terms of the swap contract. The extent of the Fund's exposure to credit and counterparty risks is the discounted net value of the cash flows to be received from the counterparty over the contract's remaining life, to the extent that the amount is positive. These risks are mitigated by having a master netting arrangement between the Fund and the counterparty and by the posting of collateral by the counterparty to the Fund to cover the Fund's exposure to the counterparty. Therefore, the Fund considers the creditworthiness of each counterparty as well as the amounts posted by the counterparty pursuant to the master netting agreement to a swap contract in evaluating potential credit risk. Additionally, risks may arise from unanticipated movements in interest rates or in the value of the underlying reference asset or index.
The Fund may enter into total return swap contracts, involving commitments to pay interest in exchange for a market-linked return, both based on notional amounts. The Fund may invest in total return swap contracts for hedging purposes or to seek to increase total return. To the extent the total return of the security or index underlying the transaction exceeds or falls short of the offsetting interest rate obligation, the Fund will receive a payment from or make a payment to the counterparty.
The Fund may enter into credit default swap agreements either as a buyer or seller. The Fund may buy a credit default swap to attempt to mitigate the risk of default or credit quality deterioration in one or more individual holdings or in a segment of the fixed income securities market. The Fund may sell a
44
Credit Suisse Multialternative Strategy Fund
Notes to Consolidated Financial Statements (continued)
October 31, 2021
Note 2. Significant Accounting Policies (continued)
credit default swap in an attempt to gain exposure to an underlying issuer's credit quality characteristics without investing directly in that issuer.
The Fund bears the risk of loss of the amount expected to be received under a credit default swap agreement in the event of the default or bankruptcy of the counterparty. The Fund will enter into swap agreements only with counterparties that meet certain standards of creditworthiness (generally, such counterparties would have to be eligible counterparties under the terms of the Fund's repurchase agreement guidelines). Credit default swap agreements are generally valued at a price at which the counterparty to such agreement would terminate the agreement.
The Fund records unrealized gains or losses on a daily basis representing the value and the current net receivable or payable relating to open swap contracts. Net amounts received or paid on the swap contract are recorded as realized gains or losses. Fluctuations in the value of swap contracts are recorded for financial statement purposes as unrealized appreciation or depreciation from swap contracts. Realized gains and losses from terminated swaps are included in net realized gains/losses from swap contracts. Upon entering into a centrally cleared swap, the Fund is required to deposit with a financial intermediary cash or securities ("initial margin") in an amount equal to a certain percentage of the notional amount of the swap. Subsequent payments ("variation margin") are made or received by the Fund dependent upon the daily fluctuations in the value of the swap. In a cleared swap transaction, counterparty risk is minimized as the central clearinghouse acts as the counterparty. The Fund's open swap contracts are disclosed in the Consolidated Schedule of Investments. At October 31, 2021, the amounts of restricted cash held at brokers related to open swap contracts for the Fund was $5,597,462.
L) OPTION CONTRACTS — The Fund will enter into options contracts to gain exposure to risk volatility based assets. When the Fund purchases an option, it pays a premium and the option is subsequently marked to market to reflect current value. Premiums paid for purchasing options which expire are treated as realized losses. Premiums paid for purchasing options which are exercised or closed are added to the cost or deducted from the proceeds on the underlying instrument to determine the realized gain or loss. The risk associated with purchasing options is limited to the premium paid.
When the Fund writes an option, an amount equal to the net premium received (the premium less commission) is recorded as a liability and is
45
Credit Suisse Multialternative Strategy Fund
Notes to Consolidated Financial Statements (continued)
October 31, 2021
Note 2. Significant Accounting Policies (continued)
subsequently adjusted to the current value. Net premiums received for written options which expire are treated as realized gains. Net premiums received for written options which are exercised or closed are deducted from the cost or added to the proceeds on the underlying instrument or closing purchase transaction to determine the realized gain or loss. The Fund, as writer of a written option, bears the risk of an unfavorable change in the market value of the instrument underlying the written option.
Exchange-traded options have standardized contracts and are settled through a clearing house with fulfillment guaranteed by the credit of the exchange. Therefore, counterparty credit risks to the Fund are limited. Over-the-counter options are subject to the risk that the counterparty is unable or unwilling to meet its obligations under the option. The Fund's exchange-traded written options are disclosed in the Consolidated Schedule of Investments. At October 31, 2021, the amount of restricted cash held at brokers related to option contracts was $1,249,933.
M) SECURITIES LENDING — The initial collateral received by the Fund is required to have a value of at least 102% of the market value of domestic securities on loan (including any accrued interest thereon) and 105% of the market value of foreign securities on loan (including any accrued interest thereon). The collateral is maintained thereafter at a value equal to at least 102% of the current market value of the securities on loan. The market value of loaned securities is determined at the close of each business day of the Fund and any additional required collateral is delivered to the Fund, or excess collateral returned by the Fund, on the next business day. Cash collateral received by the Fund in connection with securities lending activity may be pooled together with cash collateral for other funds/portfolios advised by Credit Suisse and may be invested in a variety of investments, including funds advised by SSB, the Fund's securities lending agent, or money market instruments. However, in the event of default or bankruptcy by the other party to the agreement, realization and/or retention of the collateral may be subject to legal proceedings. The remaining maturities of the securities lending transactions are considered overnight and continuous. Loans are subject to termination by the Fund or the borrower at any time.
46
Credit Suisse Multialternative Strategy Fund
Notes to Consolidated Financial Statements (continued)
October 31, 2021
Note 2. Significant Accounting Policies (continued)
SSB has been engaged by the Fund to act as the Fund's securities lending agent. As of October 31, 2021, the Fund had outstanding loans of securities to certain approved brokers for which the Fund received collateral:
Market Value of
Loaned Securities | | Market Value of
Cash Collateral | | Total Collateral | |
| $ | 1,937,963 | | | $ | 1,996,810 | | | $ | 1,996,810 | | |
The following table presents financial instruments that are subject to enforceable netting arrangements as of October 31, 2021.
Gross Amounts Not Offset in the Statement of Assets and Liabilities | |
Gross Asset Amounts
Presented in Statement of
Assets and Liabilities(a) | | Collateral Received(b) | | Net Amount
(not less than $0) | |
| $ | 1,937,963 | | | $ | (1,937,963 | ) | | $ | — | | |
(a) Represents market value of loaned securities at year end.
(b) The actual collateral received is greater than the amount shown here due to collateral requirements of the security lending agreement.
During the year ended October 31, 2021, total earnings from the Fund's investment in cash collateral received in connection with securities lending arrangements was $19,190, of which $0 was rebated to borrowers (brokers). The Fund retained $14,358 in income from the cash collateral investment, and SSB, as lending agent, was paid $4,832. Securities lending income is accrued as earned.
N) OTHER — In the normal course of business the Fund trades financial instruments and enters into financial transactions for which risk of potential loss exists due to changes in the market (market risk) or failure of the other party to a transaction to perform (credit risk). Similar to credit risk, the Fund may be exposed to counterparty risk, including with respect to securities lending, or the risk that an institution or other entity with which the Fund has unsettled or open transactions will default. The potential loss could exceed the value of the financial assets recorded in the consolidated financial statements. Financial assets, which potentially expose the Fund to credit risk, consist principally of cash due from counterparties and investments. The extent of the Fund's exposure to credit and counterparty risks in respect to these financial assets approximates their carrying value as recorded in the Fund's Consolidated Statement of Assets and Liabilities.
O) FOREIGN INVESTMENTS RISK — The Fund may have elements of risk not typically associated with investments in the U.S. due to concentrated investments in a limited number of countries or regions, which may vary
47
Credit Suisse Multialternative Strategy Fund
Notes to Consolidated Financial Statements (continued)
October 31, 2021
Note 2. Significant Accounting Policies (continued)
throughout the year. Such concentrations may subject the Fund to additional risks resulting from political or economic conditions in such countries or regions and the possible imposition of adverse governmental laws or currency exchange restrictions could cause the securities and their markets to be less liquid and their prices to be more volatile than those of comparable U.S. securities.
Because the Fund may invest a significant portion of its assets in these markets, it is subject to greater risks of adverse events that occur in those markets and may experience greater volatility than a Fund that is more broadly diversified geographically.
Note 3. Transactions with Affiliates and Related Parties
Credit Suisse serves as investment adviser and co-administrator for the Fund. Credit Suisse is entitled to receive a fee from the Fund at an annual rate of 1.04% of the Fund's average daily net assets. For the year ended October 31, 2021, investment advisory and administration fees earned and fees waived/expenses reimbursed by Credit Suisse were $299,253 and $404,708, respectively. Credit Suisse has contractually agreed to limit expenses so that the Fund's annual operating expenses do not exceed 0.85% of the Fund's average daily net assets for Class I shares and 1.10% of the Fund's average daily net assets for Class A shares. The Fund is authorized to reimburse Credit Suisse for management fees previously limited and/or for expenses previously reimbursed by Credit Suisse, provided, however, that any reimbursements must be paid at a date not more than thirty-six months following the applicable month during which such fees were limited or expenses were reimbursed by Credit Suisse and the reimbursements do not cause the Fund to exceed the applicable expense limitation in the contract at the time the fees are recouped. This contract may not be terminated before February 28, 2023. For the year ended October 31, 2021, there was no recoupment.
The amounts waived and reimbursed by Credit Suisse, which are available for potential future recoupment by Credit Suisse, and the expiration schedule at October 31, 2021 are as follows:
| | | Fee waivers/expense
reimbursements
subject to
recoupment | | Expires
October 31,
2022* | | Expires
October 31,
2023 | | Expires
October 31,
2024 | |
Class I | | $ | 1,733,386 | | | $ | 853,318 | | | $ | 549,407 | | | $ | 330,661 | | |
Class A | | | 108,723 | | | | 12,498 | | | | 22,178 | | | | 74,047 | | |
Totals | | $ | 1,842,109 | | | $ | 865,816 | | | $ | 571,585 | | | $ | 404,708 | | |
* The Subsidiary expenses are not eligible for recoupment.
48
Credit Suisse Multialternative Strategy Fund
Notes to Consolidated Financial Statements (continued)
October 31, 2021
Note 3. Transactions with Affiliates and Related Parties (continued)
For its co-administrative services, SSB receives a fee, exclusive of out-of-pocket expenses, calculated in total for all the Credit Suisse funds/portfolios co-administered by SSB and allocated based upon the relative average net assets of each fund/portfolio, subject to an annual minimum fee. For the year ended October 31, 2021, co-administrative services fees earned by SSB (including out-of-pocket expenses) with respect to the Fund were $29,529.
Credit Suisse Securities (USA) LLC ("CSSU"), an affiliate of Credit Suisse, serves as the distributor of the Fund's shares. Pursuant to a distribution plan adopted by the Fund pursuant to Rule 12b-1 under the 1940 Act, CSSU receives fees for its distribution services. These fees are calculated at an annual rate of 0.25% of the average daily net assets of the Class A shares. For the year ended October 31, 2021, the Fund paid Rule 12b-1 distribution fees of $13,161 for Class A shares. Class I shares are not subject to Rule 12b-1 distribution fees.
For the year ended October 31, 2021, CSSU and its affiliates advised the Fund that they retained $1,998 from commissions earned on the sale of the Fund's Class A shares.
Note 4. Line of Credit
The Fund, together with other funds/portfolios advised by Credit Suisse (collectively, the "Participating Funds"), participates in a committed, unsecured line of credit facility ("Credit Facility"), with SSB in an aggregated amount of $125 million for temporary or emergency purposes under a first-come, first-served basis. Under the terms of the Credit Facility, the Participating Funds pay an aggregate commitment fee on the average unused amount of the Credit Facility, which is allocated among the Participating Funds in such manner as is determined by the governing Boards of the Participating Funds. In addition, the Participating Funds pay interest on borrowings at either the Overnight Federal Funds rate or the Overnight LIBOR rate plus a spread. At October 31, 2021 and during the year ended October 31, 2021, the Fund had no borrowings outstanding under the Credit Facility.
Note 5. Purchases and Sales of Securities
For the year ended October 31, 2021, purchases and sales of investment securities (excluding short-term investments) and U.S. Government and Agency Obligations were as follows:
Investment Securities | | U.S. Government/
Agency Obligations | |
| Purchases | | Sales | | Purchases | | Sales | |
| $ | 36,878,289 | | | $ | 38,253,357 | | | $ | 0 | | | $ | 0 | | |
49
Credit Suisse Multialternative Strategy Fund
Notes to Consolidated Financial Statements (continued)
October 31, 2021
Note 6. Capital Share Transactions
The Fund is authorized to issue an unlimited number of full and fractional shares of beneficial interest, $.001 par value per share. The Fund offers Class I and Class A shares. Transactions in capital shares for each class of the Fund were as follows:
| | | Class I | |
| | | For the Year Ended
October 31, 2021 | | For the Year Ended
October 31, 2020 | |
| | | Shares | | Value | | Shares | | Value | |
Shares sold | | | 1,024,349 | | | $ | 9,604,665 | | | | 5,647,278 | | | $ | 53,675,203 | | |
Shares issued in reinvestment
of dividends and distributions | | | 228,783 | | | | 2,036,171 | | | | 363,815 | | | | 3,430,774 | | |
Shares redeemed | | | (4,269,635 | ) | | | (42,302,380 | ) | | | (8,591,776 | ) | | | (82,034,685 | ) | |
Net decrease | | | (3,016,503 | ) | | $ | (30,661,544 | ) | | | (2,580,683 | ) | | $ | (24,928,708 | ) | |
| | | Class A | |
| | | For the Year Ended
October 31, 2021 | | For the Year Ended
October 31, 2020 | |
| | | Shares | | Value | | Shares | | Value | |
Shares sold | | | 285,740 | | | $ | 2,641,846 | | | | 444,731 | | | $ | 4,321,677 | | |
Shares issued in reinvestment
of dividends and distributions | | | 57,387 | | | | 504,437 | | | | 3,829 | | | | 35,688 | | |
Shares redeemed | | | (195,443 | ) | | | (1,838,293 | ) | | | (87,567 | ) | | | (837,196 | ) | |
Net increase | | | 147,684 | | | $ | 1,307,990 | | | | 360,993 | | | $ | 3,520,169 | | |
On October 31, 2021, the number of shareholders that held 5% or more of the outstanding shares of each class of the Fund was as follows:
| | | Number of
Shareholders | | Approximate Percentage
of Outstanding Shares | |
Class I | | | 3 | | | | 91 | % | |
Class A | | | 2 | | | | 80 | % | |
The Fund's performance may be negatively impacted in the event one or more of the Fund's greater than 5% shareholders were to redeem at a given time. Some of the shareholders may be omnibus accounts, which hold shares on behalf of individual shareholders.
50
Credit Suisse Multialternative Strategy Fund
Notes to Consolidated Financial Statements (continued)
October 31, 2021
Note 7. Income Tax Information and Distributions to Shareholders
Income and capital gain distributions are determined in accordance with federal income tax regulations, which may differ from GAAP.
The tax character of dividends paid by the Fund during the fiscal years ended October 31, 2021 and 2020, respectively, was as follows:
Ordinary Income | |
| 2021 | | 2020 | |
| $ | 2,555,380 | | | $ | 3,482,358 | | |
The tax basis components of distributable earnings differ from book basis by temporary book/tax differences. These differences are primarily due to differing treatments of wash sales, mark to market of forward contracts, futures contracts, swap contracts, options, non REIT return of capital basis adjustments, Subsidiary adjustments and deferred organizational expenses.
At October 31, 2021, the components of distributable earnings on a tax basis were as follows:
Undistributed net investment income | | $ | 2,104,684 | | |
Accumulated net realized loss | | | (5,896,619 | ) | |
Unrealized depreciation | | | (270,489 | ) | |
| | | $ | (4,062,424 | ) | |
For the year ended October 31, 2021, capital loss carry over used in current year was $2,156,447.
At October 31, 2021, the Fund had $5,654,883 of unlimited short-term capital loss carryforwards and $241,736 of unlimited long-term capital loss carryforwards available to offset possible future capital gains.
At October 31, 2021, the cost and net unrealized appreciation (depreciation) of investments and derivatives for income tax purposes were as follows:
Cost of Investments | | $ | 23,082,063 | | |
Unrealized appreciation | | $ | 2,600,760 | | |
Unrealized depreciation | | | (2,888,794 | ) | |
Net unrealized appreciation (depreciation) | | $ | (288,034 | ) | |
To adjust for current period permanent book/tax differences which arose principally from differing book/tax treatment of foreign currency gain/loss, equalization, return of capital distributions from real estate investment trusts, capital gain distributions from real estate investment trusts, Subsidiary cumulative income/loss and swap gain/loss, paid-in capital was credited $233,985 and distributable earnings/loss was charged $233,985. Net assets were not affected by this reclassification.
51
Credit Suisse Multialternative Strategy Fund
Notes to Consolidated Financial Statements (continued)
October 31, 2021
In the normal course of business, the Fund may provide general indemnifications pursuant to certain contracts and organizational documents. The Fund's maximum exposure under these arrangements is dependent on future claims that may be made against the Fund and, therefore, cannot be estimated; however, based on experience, the risk of loss from such claims is considered remote.
Note 9. Subsequent Events
In preparing the financial statements as of October 31, 2021, management considered the impact of subsequent events for potential recognition or disclosure in these financial statements through the date of release of this report. No such events requiring recognition or disclosure were identified through the date of the release of this report.
52
Credit Suisse Multialternative Strategy Fund
Report of Independent Registered Public Accounting Firm
To the Board of Trustees of Credit Suisse Opportunity Funds and
Shareholders of Credit Suisse Multialternative Strategy Fund
Opinion on the Financial Statements
We have audited the accompanying consolidated statement of assets and liabilities, including the consolidated schedule of investments, of Credit Suisse Multialternative Strategy Fund (one of the funds constituting Credit Suisse Opportunity Funds, referred to hereafter as the "Fund") as of October 31, 2021, the related consolidated statement of operations for the year ended October 31, 2021, the consolidated statement of changes in net assets for each of the two years in the period ended October 31, 2021, including the related notes, and the consolidated financial highlights for each of the two years in the period ended October 31, 2021 (collectively referred to as the "consolidated financial statements"). In our opinion, the consolidated financial statements present fairly, in all material respects, the financial position of the Fund as of October 31, 2021, the results of its operations for the year then ended, and the changes in its net assets and the financial highlights for each of the two years in the period ended October 31, 2021 in conformity with accounting principles generally accepted in the United States of America.
The consolidated financial statements of the Fund as of and for the year ended October 31, 2019 and the consolidated financial highlights for the years ended October 31, 2019, 2018 and 2017 (not presented herein, other than the consolidated financial highlights) were audited by other auditors whose report dated December 20, 2019 expressed an unqualified opinion on those consolidated financial statements and financial highlights.
Basis for Opinion
These consolidated financial statements are the responsibility of the Fund's management. Our responsibility is to express an opinion on the Fund's consolidated financial statements based on our audits. We are a public accounting firm registered with the Public Company Accounting Oversight Board (United States) (PCAOB) and are required to be independent with respect to the Fund in accordance with the U.S. federal securities laws and the applicable rules and regulations of the Securities and Exchange Commission and the PCAOB.
We conducted our audits of these consolidated financial statements in accordance with the standards of the PCAOB. Those standards require that we plan and perform the audit to obtain reasonable assurance about whether the consolidated financial statements are free of material misstatement, whether due to error or fraud.
53
Credit Suisse Multialternative Strategy Fund
Report of Independent Registered Public Accounting Firm
Our audits included performing procedures to assess the risks of material misstatement of the consolidated financial statements, whether due to error or fraud, and performing procedures that respond to those risks. Such procedures included examining, on a test basis, evidence regarding the amounts and disclosures in the consolidated financial statements. Our audits also included evaluating the accounting principles used and significant estimates made by management, as well as evaluating the overall presentation of the consolidated financial statements. Our procedures included confirmation of securities owned as of October 31, 2021 by correspondence with the custodian, transfer agent, and brokers; when replies were not received from brokers, we performed other auditing procedures. We believe that our audits provide a reasonable basis for our opinion.
/s/PricewaterhouseCoopers LLP
New York, New York
December 29, 2021
We have served as the auditor of one or more investment companies in Credit Suisse Asset Management, LLC investment companies since 2020.
54
Credit Suisse Multialternative Strategy Fund
Information Concerning Trustees and Officers (unaudited)
Name, Address
(Year of Birth) | | Position(s)
Held with
Fund | | Term
of Office1
and
Length
of Time
Served | | Principal
Occupation(s) During
Past Five Years | | Number of
Portfolios
in Fund
Complex
Overseen
by Trustee | | Other
Trusteeships
Held by Trustee
During Past Five Years | |
Independent Trustees | | | | | | | | | | | |
Laura A. DeFelice
c/o Credit Suisse Asset
Management, LLC
Attn: General Counsel
Eleven Madison Avenue
New York, New York
10010
(1959) | | Trustee, Nominating and Audit Committee member | | Since 2017 | | Partner of Acacia Properties LLC (multi-family and commercial real estate ownership and operation) from 2008 to present; Stonegate Advisors LLC (renewable energy and energy efficiency) from 2007 to present. | | | 9 | | | None | |
Jeffrey E. Garten
c/o Credit Suisse Asset Management, LLC
Attn: General Counsel
Eleven Madison Avenue
New York, New York
10010
(1946) | | Trustee, Nominating and Audit Committee member | | Since Fund Inception | | Dean Emeritus of Yale School of Management from July 2015 to present; Partner and Chairman of Garten Rothkopf (consulting firm) from October 2005 to June 2017. | | | 9 | | | Director of Aetna, Inc. (insurance company) from January 1999 to 2019; Director of CarMax Group (used car dealers) from January 2002 to 2019; Director of Miller Buckfire & Co., LLC (financial restructuring) from January 2008 to 2019. | |
1 Subject to the Trust's retirement policy, each Trustee may continue to serve as a Trustee until the last day of the calendar year in which the applicable Trustee attains age 75. The Board may determine to extend the terms of Trustees beyond age 75 on a case-by-case basis. Each officer serves until his or her respective successor has been duly elected and qualified.
55
Credit Suisse Multialternative Strategy Fund
Information Concerning Trustees and Officers (unaudited) (continued)
Name, Address
(Year of Birth) | | Position(s)
Held with
Fund | | Term
of Office1
and
Length
of Time
Served | | Principal
Occupation(s) During
Past Five Years | | Number of
Portfolios
in Fund
Complex
Overseen
by Trustee | | Other
Trusteeships
Held by Trustee
During Past Five Years | |
Independent Trustees | | | | | | | | | | | |
Mahendra R. Gupta
c/o Credit Suisse Asset
Management, LLC
Attn: General Counsel
Eleven Madison Avenue
New York, New York
10010
(1956) | | Trustee, Nominating Committee member and Audit Committee Chairman | | Since 2017 | | Professor, Washington University in St. Louis from July 1990 to present; Partner, R.J. Mithaiwala (food manufacturing and retail, India) from March 1977 to present; Partner, F.F.B. Corporation (agriculture, India) from March 1977 to present; Partner, RPMG Research Corporation (benchmark research) from July 2001 to present. | | | 9 | | | Director of Caleres Inc. (footwear) from May 2012 to present; Director of Koch Development Corporation (real estate development) from November 2017 to present; Director of Supernova (fin-tech) from June 2014 to September 2018. | |
Steven N. Rappaport
c/o Credit Suisse Asset Management, LLC
Attn: General Counsel
Eleven Madison Avenue
New York, New York
10010
(1948) | | Chairman of the Board, Nominating Committee Chairman and Audit Committee member | | Trustee since Fund Inception and Chairman since 2005 | | Partner of Lehigh Court, LLC and RZ Capital (private investment firms) from July 2002 to present; Partner of Backstage Acquisition Holdings, LLC (publication job postings) from November 2013 to 2018. | | | 9 | | | Director of Aberdeen Emerging Markets Equity Income Fund, Inc., (a closed-end investment company); Director of Aberdeen Funds (18 open-end portfolios); Director of iCAD, Inc. (surgical & medical instruments & apparatus company) from 2006 to 2018. | |
1 Subject to the Trust's retirement policy, each Trustee may continue to serve as a Trustee until the last day of the calendar year in which the applicable Trustee attains age 75. The Board may determine to extend the terms of Trustees beyond age 75 on a case-by-case basis. Each officer serves until his or her respective successor has been duly elected and qualified.
56
Credit Suisse Multialternative Strategy Fund
Information Concerning Trustees and Officers (unaudited) (continued)
Name, Address
(Year of Birth) | | Position(s)
Held with
Fund | | Term
of Office1
and
Length
of Time
Served | | Principal
Occupation(s) During
Past Five Years | | Number of
Portfolios
in Fund
Complex
Overseen
by Trustee | | Other
Trusteeships
Held by Trustee
During Past Five Years | |
Interested Trustee | | | | | | | | | | | |
John G. Popp2
Credit Suisse Asset
Management, LLC
Eleven Madison Avenue
New York, New York
10010
(1956) | | Trustee, Chief Executive Officer and President | | Trustee since 2017
Chief Executive Officer and President since 2010 | | Managing Director of Credit Suisse; Global Head and Chief Investment Officer of the Credit Investments Group; Associated with Credit Suisse or its predecessor since 1997; Officer of other Credit Suisse Funds. | | | 9 | | | None. | |
1 Subject to the Trust's retirement policy, each Trustee may continue to serve as a Trustee until the last day of the calendar year in which the applicable Trustee attains age 75. The Board may determine to extend the terms of Trustees beyond age 75 on a case-by-case basis. Each officer serves until his or her respective successor has been duly elected and qualified.
2 Mr. Popp is an "interested person" of the Trust, as defined in the 1940 Act, by virtue of his current position as an officer of Credit Suisse.
57
Credit Suisse Multialternative Strategy Fund
Information Concerning Trustees and Officers (unaudited) (continued)
Name, Address
(Year of Birth) | | Position(s)
Held with
Fund | | Term of
Office
and
Length of
Time
Served | | Principal Occupation(s) During Past Five Years | |
Officers* | | | | | | | |
Emidio Morizio**
Credit Suisse Asset
Management, LLC
Eleven Madison Avenue
New York, New York 10010
(1966) | | Chief Compliance Officer | | Since Fund Inception | | Managing Director and Global Head of Compliance of Credit Suisse since 2010; Associated with Credit Suisse since July 2000; Officer of other Credit Suisse Funds. | |
Lou Anne McInnis
Credit Suisse Asset Management, LLC
Eleven Madison Avenue
New York, New York 10010
(1959) | | Chief Legal Officer | | Since 2015 | | Director of Credit Suisse; Associated with Credit Suisse since April 2015; Counsel at DLA Piper US LLP from 2011 to April 2015; Associated with Morgan Stanley Investment Management from 1997 to 2010; Officer of other Credit Suisse Funds. | |
Omar Tariq
Credit Suisse Asset
Management, LLC
Eleven Madison Avenue
New York, New York 10010
(1983) | | Chief Financial Officer and Treasurer | | Since 2019 | | Director of Credit Suisse since March 2019; Senior Manager of PriceWaterhouseCoopers, LLP from September 2010 to March 2019; Officer of other Credit Suisse Funds. | |
Karen Regan
Credit Suisse Asset
Management, LLC
Eleven Madison Avenue
New York, New York 10010
(1963) | | Vice President and Secretary | | Since 2010 | | Vice President of Credit Suisse; Associated with Credit Suisse since December 2004; Officer of other Credit Suisse Funds. | |
* The officers of the Fund shown are officers that make policy decisions.
** Effective December 16, 2021, Jason Gossett replaced Emidio Morizio as Interim Chief Compliance Officer. Mr. Gossett has been a Vice President of Credit Suisse since 2018 and has been associated with Credit Suisse since June 2015. Mr. Gossett also serves as an officer of other Credit Suisse funds.
The Statement of Additional Information includes additional information about the Trustees and is available, without charge, upon request, by calling 877-870-2874.
58
Credit Suisse Multialternative Strategy Fund
Proxy Voting and Portfolio Holdings Information (unaudited)
Information regarding how the Fund voted proxies related to its portfolio securities during the 12-month period ended June 30 of each year, as well as the policies and procedures that the Fund uses to determine how to vote proxies relating to its portfolio securities are available:
• By calling 1-877-870-2874
• On the Fund's website, www.credit-suisse.com/us/funds
• On the website of the Securities and Exchange Commission, www.sec.gov
The Fund files a complete schedule of its portfolio holdings for the first and third quarters of its fiscal year with the SEC as an exhibit to its reports on Form N-PORT, and for reporting periods ended prior to March 31, 2019, filed such information on Form N-Q. The Fund's Forms N-PORT and N-Q are available on the SEC's website at www.sec.gov.
59

P.O. BOX 219916, KANSAS CITY, MO 64121-9916
877-870-2874 ◼ www.credit-suisse.com/us/funds
CREDIT SUISSE SECURITIES (USA) LLC, DISTRIBUTOR. MSF-AR-1021

CREDIT SUISSE FUNDS
Annual Report
October 31, 2021
◼ CREDIT SUISSE
STRATEGIC INCOME FUND
The Fund's investment objective, risks, charges and expenses (which should be considered carefully before investing), and more complete information about the Fund, are provided in the Prospectus, which should be read carefully before investing. You may obtain additional copies by calling 877-870-2874 or by visiting our website at www.credit-suisse.com/us/funds.
Credit Suisse Securities (USA) LLC, Distributor, is located at Eleven Madison Avenue, New York, NY 10010. Credit Suisse Funds are advised by Credit Suisse Asset Management, LLC.
Investors in the Credit Suisse Funds should be aware that they may be eligible to purchase Class I shares (where offered) directly or through certain intermediaries. Such shares are not subject to a sales charge. Investors in the Credit Suisse Funds should also be aware that they may be eligible for a reduction or waiver of the sales charge with respect to Class A or C shares (where offered). For more information, please review the relevant prospectuses or consult your financial representative.
Fund shares are not deposits or other obligations of Credit Suisse Asset Management, LLC ("Credit Suisse") or any affiliate, are not FDIC-insured and are not guaranteed by Credit Suisse or any affiliate. Fund investments are subject to investment risks, including loss of your investment.
Credit Suisse Strategic Income Fund
Annual Investment Adviser's Report
October 31, 2021 (unaudited)
December 2, 2021
Dear Shareholder:
We are pleased to present this Annual Report covering the activities of the Credit Suisse Strategic Income Fund (the "Fund") for the 12-month period ended October 31, 2021.
Performance Summary
11/1/20 – 10/31/21
Fund & Benchmark | | Performance | |
| Class I1 | | | 10.11 | % | |
| Class A1,2 | | | 9.95 | % | |
| Class C1,2 | | | 9.13 | % | |
ICE BofA US 3-Month Treasury
Bill Index3 | | | 0.06 | % | |
Performance shown for the Fund's Class A and Class C Shares does not reflect sales charges, which are a maximum of 4.75% and 1.00%, respectively.2
Market Review: A positive period for strategic income
The annual period ended October 31, 2021 was positive for below-investment-grade asset classes, as a broader economic reopening following the most difficult stages of the COVID-19 pandemic led to improved corporate fundamentals and stable market technicals.
The ICE BofA US 3-Month Treasury Bill Index (the "Index"), the Fund's benchmark, returned 0.06% for the period while the ICE BofA US High Yield Constrained Index and the Credit Suisse Leveraged Loan Index, returned 10.75% and 8.53%, respectively. Both the high yield and bank loan asset classes ended the 2020 calendar year with significant momentum. They continued to deliver positive returns in 2021 despite several pockets of weakness driven by higher, longer-term U.S. treasury yields due to growing fears of inflationary pressure as the economy recovers.
Default rates have reached historical lows due to investor optimism and active primary issuance. According to JPMorgan, default activity within high yield, including distressed exchanges, ended the period at 0.44%, down 643 basis points over the prior annual period. The par-weighted default rate in loans ended October at 0.69% — a 10-year low. We expect default activity to remain muted as business fundamentals improve and healthy conditions persist in the capital markets.
1
Credit Suisse Strategic Income Fund
Annual Investment Adviser's Report (continued)
October 31, 2021 (unaudited)
Strategic Review and Outlook: Optimistic for the future
For the period ended October 31, 2021, the Fund outperformed its benchmark due to positive allocations in the high yield, bank loan and collateralized loan obligation ("CLO") assets. All of these asset classes produced positive returns for the year. Sectors that contributed the most to positive returns include media/telecommunications and gaming/leisure.
Over the near term, we expect high levels of activity across capital markets and low default rates to continue on the back of the strong recovery we have seen in 2021. Although high yield and bank loan issuers have generally done an excellent job managing through inflationary pressures and labor shortages, we believe consumer spending and general economic activity could be pressured if these challenges persist well into 2022. From an asset class perspective, we continue to be constructive based on continued fundamental improvement for high yield and bank loans and positively view the floating nature of the bank loan asset class. We have also positioned with allocations to defensive sectors such as technology, healthcare, packaging and services, which should see more muted impact in a volatile economic environment. Given the strong technical backdrop, 2021 has not seen much dispersion in performance across sectors, but we do expect that to subside as we head into 2022.
The Credit Suisse Credit Investments Group
John G. Popp
Andrew H. Marshak
Thomas J. Flannery
Louis I. Farano
Wing Chan
David Mechlin
Joshua Shredoff
Senior secured floating rate loans ("Senior Loans") typically hold the most senior position in the issuer's capital structure. Senior Loans are subject to the risk that a court could subordinate a Senior Loan to presently existing or future indebtedness or take other action detrimental to the holders of Senior Loans.
High yield bonds are bonds rated below BBB- by S&P or Baa3 by Moody's that are also known as "junk bonds." Such bonds entail greater risks than those found in higher- rated securities.
2
Credit Suisse Strategic Income Fund
Annual Investment Adviser's Report (continued)
October 31, 2021 (unaudited)
CLOs are subject to the risk of substantial losses due to actual defaults, decrease of market value due to collateral defaults and disappearance of subordinate tranches, market anticipation of defaults, and investor aversion to CLO securities as a class. The risks of CLOs depend largely on the type of the underlying loans and the tranche of CLOs in which the Fund invests. In addition, CLOs carry risks including interest rate risk and credit risk.
Additional principal risk factors for the Fund include conflict of interest risk, convertible securities risk, credit risk, derivatives risk, extension risk, foreign securities risk, futures contracts risk, hedged exposure risk, illiquidity risk, interest rate risk, LIBOR risk, market risk, mortgage- and asset-backed securities risk, prepayment risk, short position risk, U.S. government securities risk and valuation risk. Before you invest, please make sure you understand the risks that apply to the Fund. As with any mutual fund, you could lose money over any period of time. Investments in the Fund are not bank deposits and are not insured or guaranteed by the Federal Deposit Insurance Corporation or any government agency. For a detailed discussion of these and other risks, please refer to the Fund's Prospectus, which should be read carefully before investing.
In addition to historical information, this report contains forward-looking statements, which may concern, among other things, domestic and foreign markets, industry and economic trends and developments and government regulation, and their potential impact on the Fund's investments. These statements are subject to risks and uncertainties and actual trends, developments and regulations in the future, and their impact on the Fund, could be materially different from those projected, anticipated or implied. The Fund has no obligation to update or revise forward-looking statements.
The views of the Fund's management are as of the date of this letter and the Fund holdings described in this document are as of October 31, 2021; these views and Fund holdings may have changed subsequent to these dates. Nothing in this document is a recommendation to purchase or sell securities.
3
Credit Suisse Strategic Income Fund
Annual Investment Adviser's Report (continued)
October 31, 2021 (unaudited)
Comparison of Change in Value of $10,000 Investment in the
Credit Suisse Strategic Income Fund1 Class I Shares,
Class A Shares2, Class C Shares2 and the ICE BofA
US 3-Month Treasury Bill Index3
from Inception (9/28/12)
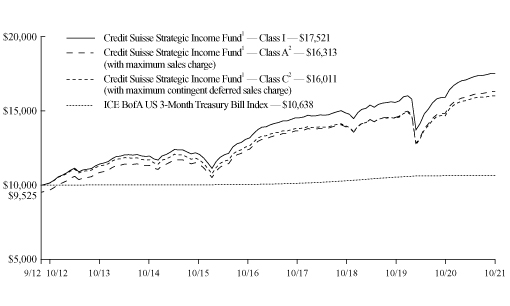
1 Fee waivers and/or expense reimbursements reduce expenses for the Fund, without which performance would be lower. Effective November 12, 2019, the Fund entered into a written contract to limit expenses to 0.79% of the Fund's average daily net assets for Class I shares, 1.04% of the Fund's average daily net assets for Class A shares and 1.79% of the Fund's average daily net assets for Class C shares through at least February 28, 2023. This limit excludes certain expenses, as set forth in the Fund's Prospectus.
2 Total return for the Fund's Class A shares for the reporting period, based on offering price (including maximum sales charge of 4.75%), was 4.70%. Total return for the Fund's Class C shares for the reporting period, based on redemption value (including maximum contingent deferred sales charge ("CDSC") of 1.00%), was 8.13%.
3 The ICE BofA US 3-Month Treasury Bill Index is comprised of a single issue purchased at the beginning of the month and held for a full month. Each month the index is rebalanced and the issue selected is the outstanding Treasury Bill that matures closest to, but not beyond 3 months from the rebalancing date. The index does not have transaction costs and investors may not invest directly in the index.
4
Credit Suisse Strategic Income Fund
Annual Investment Adviser's Report (continued)
October 31, 2021 (unaudited)
Average Annual Returns as of October 31, 20211
| | | 1 Year | | 5 Years | | Since
Inception2 | |
Class I | | | 10.11 | % | | | 6.02 | % | | | 6.36 | % | |
Class A Without Sales Charge | | | 9.95 | % | | | 5.76 | % | | | 6.10 | % | |
Class A With Maximum Sales Charge | | | 4.70 | % | | | 4.73 | % | | | 5.53 | % | |
Class C Without CDSC | | | 9.13 | % | | | 4.97 | % | | | 5.31 | % | |
Class C With CDSC | | | 8.13 | % | | | 4.97 | % | | | 5.31 | % | |
Returns represent past performance and include change in share price and reinvestment of dividends and capital gain distributions, if any. Past performance cannot guarantee future results. The current performance of the Fund may be lower or higher than the figures shown. Returns and share price will fluctuate, and redemption value may be more or less than original cost. The performance results do not reflect the deduction of taxes that a shareholder would pay on Fund distributions or the redemption of Fund shares. Performance information current to the most recent month end is available at www.credit-suisse.com/us/funds.
The annual gross expense ratios are 1.05% for Class I shares, 1.30% for Class A shares and 2.05% for Class C shares. The annual net expense ratios after fee waivers and/or expense reimbursements are 0.79% for Class I shares, 1.04% for Class A shares and 1.79% for Class C shares.
1 Fee waivers and/or expense reimbursements reduce expenses for the Fund, without which performance would be lower. Effective November 12, 2019, the Fund entered into a written contract to limit expenses to 0.79% of the Fund's average daily net assets for Class I shares, 1.04% of the Fund's average daily net assets for Class A shares and 1.79% of the Fund's average daily net assets for Class C shares through at least February 28, 2023. This limit excludes certain expenses, as set forth in the Fund's Prospectus.
2 Inception Date: September 28, 2012.
5
Credit Suisse Strategic Income Fund
Annual Investment Adviser's Report (continued)
October 31, 2021 (unaudited)
Information About Your Fund's Expenses
As an investor of the Fund, you incur two types of costs: ongoing expenses and transaction costs. Ongoing expenses include management fees, distribution and service (12b-1) fees and other Fund expenses. Examples of transaction costs include sales charges (loads), redemption fees and account maintenance fees, which are not shown in this section and which would result in higher total expenses. The following table is intended to help you understand your ongoing expenses of investing in the Fund and to help you compare these expenses with the ongoing expenses of investing in other mutual funds. The table is based on an investment of $1,000 made at the beginning of the six months ended October 31, 2021.
The table illustrates your Fund's expenses in two ways:
• Actual Fund Return. This helps you estimate the actual dollar amount of ongoing expenses paid on a $1,000 investment in the Fund using the Fund's actual return during the period. To estimate the expenses you paid over the period, simply divide your account value by $1,000 (for example, an $8,600 account value divided by $1,000 = 8.6), then multiply the result by the number in the "Expenses Paid per $1,000" line.
• Hypothetical 5% Fund Return. This helps you to compare the Fund's ongoing expenses with those of other mutual funds using the Fund's actual expense ratio and a hypothetical rate of return of 5% per year before expenses. Examples using a 5% hypothetical fund return may be found in the shareholder reports of other mutual funds. The hypothetical account values and expenses may not be used to estimate the actual ending account balance or expenses you paid for the period.
Please note that the expenses shown in these tables are meant to highlight your ongoing expenses only and do not reflect any transaction costs, such as sales charges (loads) or redemption fees. If these transaction costs had been included, your costs would have been higher. The "Expenses Paid per $1,000" line of the tables is useful in comparing ongoing expenses only and will not help you determine the relative total expenses of owning different funds.
6
Credit Suisse Strategic Income Fund
Annual Investment Adviser's Report (continued)
October 31, 2021 (unaudited)
Expenses and Value for a $1,000 Investment
for the six-month period ended October 31, 2021
Actual Fund Return | | Class I | | Class A | | Class C | |
Beginning Account Value 05/01/21 | | $ | 1,000.00 | | | $ | 1,000.00 | | | $ | 1,000.00 | | |
Ending Account Value 10/31/21 | | $ | 1,018.70 | | | $ | 1,018.40 | | | $ | 1,014.60 | | |
Expenses Paid per $1,000* | | $ | 4.02 | | | $ | 5.29 | | | $ | 9.09 | | |
Hypothetical 5% Fund Return | |
Beginning Account Value 05/01/21 | | $ | 1,000.00 | | | $ | 1,000.00 | | | $ | 1,000.00 | | |
Ending Account Value 10/31/21 | | $ | 1,021.22 | | | $ | 1,019.96 | | | $ | 1,016.18 | | |
Expenses Paid per $1,000* | | $ | 4.02 | | | $ | 5.30 | | | $ | 9.10 | | |
| | | Class I | | Class A | | Class C | |
Annualized Expense Ratios* | | | 0.79 | % | | | 1.04 | % | | | 1.79 | % | |
* Expenses are equal to the Fund's annualized expense ratio for each share class, multiplied by the average account value over the period, multiplied by 184/365 to reflect the one-half year period.
The "Expenses Paid per $1,000" and the "Annualized Expense Ratios" in the tables are based on actual expenses paid by the Fund during the period, net of fee waivers and/or actual expense reimbursements, if applicable. If those fee waivers and/or expense reimbursements had not been in effect, the Fund's actual expenses would have been higher. Expenses do not reflect additional charges and expenses that are, or may be, imposed under the variable contracts or plans. Such charges and expenses are described in the prospectus of the insurance company separate account or in the plan documents or other informational materials supplied by plan sponsors. The Fund's expenses should be considered with these charges and expenses in evaluating the overall cost of investing in the separate account.
For more information, please refer to the Fund's Prospectus.
7
Credit Suisse Strategic Income Fund
Annual Investment Adviser's Report (continued)
October 31, 2021 (unaudited)
Credit Quality Breakdown*
(% of Total Investments as of October 31, 2021)
S&P Ratings** | |
BBB | | | 1.2 | % | |
BB | | | 18.6 | | |
B | | | 53.6 | | |
CCC | | | 14.4 | | |
CC | | | 0.1 | | |
D | | | 0.01 | | |
NR | | | 2.9 | | |
Subtotal | | | 90.8 | | |
Equity and Other | | | 9.2 | | |
Total | | | 100.0 | % | |
* Expressed as a percentage of total investments (excluding securities lending collateral, if applicable) and may vary over time.
** Credit Quality is based on ratings provided by the S&P Global Ratings Division of S&P Global Inc. ("S&P"). S&P is a main provider of ratings for credit assets classes and is widely used amongst industry participants. The NR category consists of securities that have not been rated by S&P.
1 This amount represents less than 0.1%.
8
Credit Suisse Strategic Income Fund
Schedule of Investments
October 31, 2021
Par
(000) | |
| | Ratings†
(S&P/Moody's) | | Maturity | | Rate% | | Value | |
| CORPORATE BONDS (33.5%) | | | |
| Advertising (0.0%) | | | |
$ | 109 | | | TripAdvisor, Inc., Rule 144A, Company
Guaranteed Notes
(Callable 07/15/22 @ 103.50)(1) | | (BB-, B1) | | 07/15/25 | | | 7.000 | | | $ | 115,404 | | |
| Aerospace & Defense (0.2%) | | | |
| | 250 | | | KBR, Inc., Rule 144A, Company Guaranteed
Notes (Callable 09/30/23 @ 102.38)(1) | | (BB-, Ba3) | | 09/30/28 | | | 4.750 | | | | 255,771 | | |
| | 500 | | | Science Applications International Corp.,
Rule 144A, Company Guaranteed Notes
(Callable 04/01/23 @ 102.44)(1) | | (BB-, B1) | | 04/01/28 | | | 4.875 | | | | 515,625 | | |
| | 250 | | | TransDigm, Inc., Global Company Guaranteed
Notes (Callable 03/15/22 @ 103.75) | | (B-, B3) | | 03/15/27 | | | 7.500 | | | | 262,500 | | |
| | | | 1,033,896 | | |
| Auto Parts & Equipment (0.7%) | | | |
| | 1,835 | | | Clarios U.S. Finance Co., Rule 144A,
Company Guaranteed Notes
(Callable 05/15/22 @ 104.25)(1) | | (CCC+, Caa1) | | 05/15/27 | | | 8.500 | | | | 1,951,559 | | |
| | 650 | | | Cooper-Standard Automotive, Inc.,
Rule 144A, Company Guaranteed Notes
(Callable 11/15/21 @ 102.81)(1) | | (CCC, Caa1) | | 11/15/26 | | | 5.625 | | | | 522,532 | | |
| | 950 | | | Dornoch Debt Merger Sub, Inc.,
Rule 144A, Senior Unsecured Notes
(Callable 10/15/24 @ 103.31)(1) | | (CCC, Caa1) | | 10/15/29 | | | 6.625 | | | | 938,125 | | |
| | | | 3,412,216 | | |
| Automakers (0.1%) | | | |
| | 400 | | | Thor Industries, Inc., Rule 144A,
Company Guaranteed Notes
(Callable 10/15/24 @ 102.00)(1) | | (BB-, B1) | | 10/15/29 | | | 4.000 | | | | 396,620 | | |
| | 250 | | | Winnebago Industries, Inc., Rule 144A,
Senior Secured Notes
(Callable 07/15/23 @ 103.13)(1) | | (BB+, Ba3) | | 07/15/28 | | | 6.250 | | | | 269,687 | | |
| | | | 666,307 | | |
| Brokerage (0.3%) | | | |
| | 1,298 | | | StoneX Group, Inc., Rule 144A,
Senior Secured Notes
(Callable 06/15/22 @ 104.31)(1) | | (BB-, Ba3) | | 06/15/25 | | | 8.625 | | | | 1,380,747 | | |
| Building & Construction (0.5%) | | | |
| | 1,000 | | | Installed Building Products, Inc., Rule 144A,
Company Guaranteed Notes
(Callable 02/01/23 @ 102.88)(1) | | (B+, B1) | | 02/01/28 | | | 5.750 | | | | 1,048,750 | | |
| | 750 | | | TopBuild Corp., Rule 144A, Company
Guaranteed Notes
(Callable 03/15/24 @ 101.81)(1) | | (BB+, Ba2) | | 03/15/29 | | | 3.625 | | | | 754,942 | | |
See Accompanying Notes to Financial Statements.
9
Credit Suisse Strategic Income Fund
Schedule of Investments (continued)
October 31, 2021
Par
(000) | |
| | Ratings†
(S&P/Moody's) | | Maturity | | Rate% | | Value | |
| CORPORATE BONDS (continued) | | | |
Building & Construction | | | |
$ | 500 | | | TopBuild Corp., Rule 144A, Company
Guaranteed Notes
(Callable 10/15/26 @ 102.06)(1) | | (BB+, Ba2) | | 02/15/32 | | | 4.125 | | | $ | 505,000 | | |
| | | | 2,308,692 | | |
| Building Materials (1.8%) | | | |
| | 700 | | | Advanced Drainage Systems, Inc.,
Rule 144A, Company Guaranteed Notes
(Callable 09/30/22 @ 102.50)(1) | | (B+, Ba2) | | 09/30/27 | | | 5.000 | | | | 728,875 | | |
| | 250 | | | Boise Cascade Co., Rule 144A, Company
Guaranteed Notes
(Callable 07/01/25 @ 102.44)(1) | | (BB-, Ba2) | | 07/01/30 | | | 4.875 | | | | 262,813 | | |
| | 400 | | | Builders FirstSource, Inc., Rule 144A,
Company Guaranteed Notes
(Callable 03/01/25 @ 102.50)(1) | | (BB-, Ba3) | | 03/01/30 | | | 5.000 | | | | 423,006 | | |
| | 1,230 | | | Foundation Building Materials, Inc.,
Rule 144A, Company Guaranteed Notes
(Callable 03/01/24 @ 103.00)(1) | | (CCC+, Caa1) | | 03/01/29 | | | 6.000 | | | | 1,188,869 | | |
| | 1,400 | | | James Hardie International Finance DAC,
Rule 144A, Company Guaranteed Notes
(Callable 01/15/23 @ 102.50)(1) | | (BB+, Ba1) | | 01/15/28 | | | 5.000 | | | | 1,457,750 | | |
| | 750 | | | Masonite International Corp., Rule 144A,
Company Guaranteed Notes
(Callable 02/01/23 @ 102.69)(1) | | (BB+, Ba1) | | 02/01/28 | | | 5.375 | | | | 788,437 | | |
| | 375 | | | Park River Holdings, Inc., Rule 144A,
Company Guaranteed Notes
(Callable 02/01/24 @ 102.81)(1) | | (CCC, Caa1) | | 02/01/29 | | | 5.625 | | | | 350,368 | | |
| | 1,550 | | | Park River Holdings, Inc., Rule 144A,
Senior Unsecured Notes
(Callable 08/01/24 @ 103.38)(1) | | (CCC, Caa1) | | 08/01/29 | | | 6.750 | | | | 1,521,457 | | |
| | 1,200 | | | PGT Innovations, Inc., Rule 144A,
Company Guaranteed Notes
(Callable 08/01/24 @ 102.19)(1) | | (B+, B2) | | 10/01/29 | | | 4.375 | | | | 1,195,500 | | |
| | 500 | | | WESCO Distribution, Inc., Rule 144A,
Company Guaranteed Notes
(Callable 06/15/22 @ 103.56)(1) | | (BB-, B1) | | 06/15/25 | | | 7.125 | | | | 530,625 | | |
| | 500 | | | WESCO Distribution, Inc., Rule 144A,
Company Guaranteed Notes
(Callable 06/15/23 @ 103.63)(1) | | (BB-, B1) | | 06/15/28 | | | 7.250 | | | | 552,080 | | |
| | | | 8,999,780 | | |
| Cable & Satellite TV (0.8%) | | | |
| | 300 | | | CSC Holdings LLC, Rule 144A, Company
Guaranteed Notes
(Callable 11/15/26 @ 102.25)(1) | | (BB, Ba3) | | 11/15/31 | | | 4.500 | | | | 291,068 | | |
See Accompanying Notes to Financial Statements.
10
Credit Suisse Strategic Income Fund
Schedule of Investments (continued)
October 31, 2021
Par
(000) | |
| | Ratings†
(S&P/Moody's) | | Maturity | | Rate% | | Value | |
| CORPORATE BONDS (continued) | | | |
Cable & Satellite TV | | | |
$ | 500 | | | CSC Holdings LLC, Rule 144A, Senior
Unsecured Notes
(Callable 01/15/25 @ 102.88)(1) | | (B+, B3) | | 01/15/30 | | | 5.750 | | | $ | 493,975 | | |
| | 614 | | | Midcontinent Finance Corp., Rule 144A,
Company Guaranteed Notes
(Callable 08/15/22 @ 102.69)(1) | | (B+, B3) | | 08/15/27 | | | 5.375 | | | | 637,792 | | |
| | 1,600 | | | Telenet Finance Luxembourg Notes Sarl,
Rule 144A, Senior Secured Notes
(Callable 12/01/22 @ 102.75)(1) | | (BB-, Ba3) | | 03/01/28 | | | 5.500 | | | | 1,672,000 | | |
| | 500 | | | UPC Broadband Finco B.V., Rule 144A,
Senior Secured Notes
(Callable 07/15/26 @ 102.44)(1) | | (BB-, B1) | | 07/15/31 | | | 4.875 | | | | 508,962 | | |
| | 398 | | | Ziggo B.V., Rule 144A, Senior Secured Notes
(Callable 01/15/22 @ 102.75)(1) | | (B+, B1) | | 01/15/27 | | | 5.500 | | | | 408,448 | | |
| | | | 4,012,245 | | |
| Chemicals (1.0%) | | | |
| | 250 | | | Avient Corp., Rule 144A, Senior Unsecured
Notes (Callable 05/15/22 @ 102.88)(1) | | (BB-, Ba3) | | 05/15/25 | | | 5.750 | | | | 261,562 | | |
| | 250 | | | GCP Applied Technologies, Inc., Rule 144A,
Company Guaranteed Notes
(Callable 11/15/21 @ 102.75)(1) | | (BB, B1) | | 04/15/26 | | | 5.500 | | | | 256,312 | | |
| | 500 | | | Herens Holdco Sarl, Rule 144A, Senior
Secured Notes (Callable 05/15/24 @ 102.38)(1) | | (B, B2) | | 05/15/28 | | | 4.750 | | | | 496,650 | | |
| | 1,540 | | | Ingevity Corp., Rule 144A, Company
Guaranteed Notes
(Callable 11/29/21 @ 102.25)(1) | | (NR, Ba3) | | 02/01/26 | | | 4.500 | | | | 1,557,325 | | |
| | 250 | | | Minerals Technologies, Inc., Rule 144A,
Company Guaranteed Notes
(Callable 07/01/23 @ 102.50)(1) | | (BB-, Ba3) | | 07/01/28 | | | 5.000 | | | | 257,805 | | |
| | 450 | | | Olympus Water U.S. Holding Corp.,
Rule 144A, Senior Unsecured Notes
(Callable 10/01/24 @ 103.13)(1) | | (CCC+, Caa2) | | 10/01/29 | | | 6.250 | | | | 449,512 | | |
| | 52 | | | Reichhold Industries, Inc., Rule 144A,
Senior Secured Notes(1),(2),(3),(4),(5),(6) | | (NR, NR) | | 05/01/18 | | | 0.000 | | | | 706 | | |
| | 1,050 | | | Schenectady International Group, Inc.,
Rule 144A, Senior Unsecured Notes
(Callable 05/15/23 @ 103.38)(1) | | (CCC+, Caa2) | | 05/15/26 | | | 6.750 | | | | 1,047,265 | | |
| | 500 | | | Trinseo Materials Finance, Inc., Rule 144A,
Company Guaranteed Notes
(Callable 04/01/24 @ 102.56)(1) | | (B, B2) | | 04/01/29 | | | 5.125 | | | | 502,025 | | |
| | | | 4,829,162 | | |
| Consumer/Commercial/Lease Financing (0.7%) | | | |
| | 3,520 | | | Cargo Aircraft Management, Inc., Rule 144A,
Company Guaranteed Notes
(Callable 02/01/23 @ 102.38)(1) | | (BB, Ba3) | | 02/01/28 | | | 4.750 | | | | 3,603,882 | | |
See Accompanying Notes to Financial Statements.
11
Credit Suisse Strategic Income Fund
Schedule of Investments (continued)
October 31, 2021
Par
(000) | |
| | Ratings†
(S&P/Moody's) | | Maturity | | Rate% | | Value | |
| CORPORATE BONDS (continued) | | | |
| Diversified Capital Goods (0.4%) | | | |
$ | 625 | | | Atkore, Inc., Rule 144A, Senior Unsecured
Notes (Callable 06/01/26 @ 102.13)(1) | | (BB-, Ba3) | | 06/01/31 | | | 4.250 | | | $ | 632,047 | | |
| | 200 | | | Madison IAQ LLC, Rule 144A, Senior Secured
Notes (Callable 06/30/24 @ 102.06)(1) | | (B, B1) | | 06/30/28 | | | 4.125 | | | | 199,214 | | |
| | 1,000 | | | Vertiv Group Corp., Rule 144A, Senior Secured
Notes (Callable 11/15/24 @ 102.06)(1) | | (BB-, B1) | | 11/15/28 | | | 4.125 | | | | 998,750 | | |
| | | | 1,830,011 | | |
| Electric-Integrated (0.0%) | | | |
| | 125 | | | PG&E Corp., Global Senior Secured Notes
(Callable 07/01/25 @ 102.63)(7) | | (BB-, B1) | | 07/01/30 | | | 5.250 | | | | 130,750 | | |
| Electronics (0.6%) | |
| | 500 | | | Entegris, Inc., Rule 144A, Company Guaranteed
Notes (Callable 05/01/24 @ 102.72)(1) | | (BB, Ba2) | | 05/01/29 | | | 3.625 | | | | 504,375 | | |
| | 750 | | | Sensata Technologies B.V., Rule 144A,
Company Guaranteed Notes
(Callable 04/15/24 @ 102.00)(1) | | (BB+, Ba3) | | 04/15/29 | | | 4.000 | | | | 762,683 | | |
| | 500 | | | Sensata Technologies Inc., Rule 144A,
Company Guaranteed Notes
(Callable 11/15/29 @ 100.00)(1) | | (BB+, Ba3) | | 02/15/30 | | | 4.375 | | | | 528,317 | | |
| | 1,000 | | | Synaptics, Inc., Rule 144A, Company
Guaranteed Notes
(Callable 06/15/24 @ 102.00)(1),(7) | | (B+, Ba3) | | 06/15/29 | | | 4.000 | | | | 1,011,345 | | |
| | | | 2,806,720 | | |
| Energy - Exploration & Production (0.5%) | | | |
| | 625 | | | CNX Resources Corp., Rule 144A,
Company Guaranteed Notes
(Callable 03/14/22 @ 105.44)(1) | | (BB-, B1) | | 03/14/27 | | | 7.250 | | | | 665,312 | | |
| | 375 | | | CNX Resources Corp., Rule 144A,
Company Guaranteed Notes
(Callable 01/15/24 @ 104.50)(1) | | (BB-, B1) | | 01/15/29 | | | 6.000 | | | | 396,094 | | |
| | 250 | | | Laredo Petroleum, Inc., Rule 144A,
Company Guaranteed Notes
(Callable 07/31/24 @ 103.88)(1),(7) | | (B, B3) | | 07/31/29 | | | 7.750 | | | | 246,695 | | |
| | 1,250 | | | W&T Offshore, Inc., Rule 144A, Secured Notes
(Callable 11/29/21 @ 102.44)(1) | | (B, Caa2) | | 11/01/23 | | | 9.750 | | | | 1,220,275 | | |
| | | | 2,528,376 | | |
| Environmental (0.1%) | | | |
| | 250 | | | Stericycle, Inc., Rule 144A,
Company Guaranteed Notes
(Callable 11/15/23 @ 101.94)(1) | | (BB-, NR) | | 01/15/29 | | | 3.875 | | | | 246,563 | | |
See Accompanying Notes to Financial Statements.
12
Credit Suisse Strategic Income Fund
Schedule of Investments (continued)
October 31, 2021
Par
(000) | |
| | Ratings†
(S&P/Moody's) | | Maturity | | Rate% | | Value | |
| CORPORATE BONDS (continued) | | | |
| Food - Wholesale (0.2%) | | | |
$ | 497 | | | Lamb Weston Holdings, Inc., Rule 144A,
Company Guaranteed Notes
(Callable 01/31/25 @ 102.06)(1) | | (BB+, Ba3) | | 01/31/30 | | | 4.125 | | | $ | 498,094 | | |
| | 225 | | | Lamb Weston Holdings, Inc., Rule 144A,
Company Guaranteed Notes
(Callable 01/31/27 @ 102.19)(1) | | (BB+, Ba3) | | 01/31/32 | | | 4.375 | | | | 225,615 | | |
| | 250 | | | U.S. Foods, Inc., Rule 144A,
Company Guaranteed Notes
(Callable 02/15/24 @ 102.38)(1) | | (B+, Caa1) | | 02/15/29 | | | 4.750 | | | | 253,255 | | |
| | | | 976,964 | | |
| Gaming (1.0%) | | | |
| | 400 | | | Boyd Gaming Corp., Rule 144A,
Company Guaranteed Notes
(Callable 06/15/26 @ 102.38)(1) | | (B, Caa1) | | 06/15/31 | | | 4.750 | | | | 412,007 | | |
| | 391 | | | Churchill Downs, Inc., Rule 144A,
Company Guaranteed Notes
(Callable 01/15/23 @ 102.38)(1) | | (B+, B1) | | 01/15/28 | | | 4.750 | | | | 404,685 | | |
| | 1,320 | | | Golden Nugget, Inc., Rule 144A,
Senior Unsecured Notes
(Callable 11/29/21 @ 100.00)(1) | | (CCC, Caa2) | | 10/15/24 | | | 6.750 | | | | 1,324,950 | | |
| | 1,950 | | | Jacobs Entertainment, Inc., Rule 144A,
Secured Notes (Callable 11/29/21 @ 103.94)(1) | | (B-, B3) | | 02/01/24 | | | 7.875 | | | | 2,010,937 | | |
| | 700 | | | MGP Finance Co-Issuer, Inc.,
Global Company Guaranteed Notes
(Callable 11/01/26 @ 100.00) | | (BB-, B1) | | 02/01/27 | | | 5.750 | | | | 798,875 | | |
| | | | 4,951,454 | | |
| Gas Distribution (1.0%) | | | |
| | 750 | | | Genesis Energy Finance Corp.,
Company Guaranteed Notes
(Callable 11/29/21 @ 103.25) | | (B, B1) | | 10/01/25 | | | 6.500 | | | | 746,914 | | |
| | 450 | | | Genesis Energy Finance Corp.,
Company Guaranteed Notes
(Callable 11/29/21 @ 104.69) | | (B, B1) | | 05/15/26 | | | 6.250 | | | | 436,136 | | |
| | 1,155 | | | Hess Midstream Operations LP, Rule 144A,
Company Guaranteed Notes
(Callable 06/15/23 @ 102.56)(1) | | (BB+, Ba3) | | 06/15/28 | | | 5.125 | | | | 1,201,142 | | |
| | 500 | | | Hess Midstream Operations LP, Rule 144A,
Company Guaranteed Notes
(Callable 02/15/25 @ 102.13)(1) | | (BB+, Ba3) | | 02/15/30 | | | 4.250 | | | | 500,625 | | |
| | 1,034 | | | New Fortress Energy, Inc., Rule 144A, Senior
Secured Notes (Callable 03/31/23 @ 103.25)(1) | | (B+, B1) | | 09/30/26 | | | 6.500 | | | | 1,006,516 | | |
| | 500 | | | Rockies Express Pipeline LLC, Rule 144A,
Senior Unsecured Notes
(Callable 02/15/30 @ 100.00)(1) | | (BB+, Ba2) | | 05/15/30 | | | 4.800 | | | | 533,125 | | |
See Accompanying Notes to Financial Statements.
13
Credit Suisse Strategic Income Fund
Schedule of Investments (continued)
October 31, 2021
Par
(000) | |
| | Ratings†
(S&P/Moody's) | | Maturity | | Rate% | | Value | |
| CORPORATE BONDS (continued) | | | |
Gas Distribution | | | |
$ | 250 | | | Targa Resources Partners Finance Corp.,
Rule 144A, Company Guaranteed Notes
(Callable 07/15/26 @ 102.00)(1) | | (BB+, Ba2) | | 01/15/32 | | | 4.000 | | | $ | 258,305 | | |
| | | | 4,682,763 | | |
| Health Facilities (0.5%) | | | |
| | 2,000 | | | Mozart Debt Merger Sub, Inc., Rule 144A,
Senior secured Notes
(Callable 10/01/24 @ 101.94)(1) | | (B+, B1) | | 04/01/29 | | | 3.875 | | | | 1,993,940 | | |
| | 275 | | | Surgery Center Holdings, Inc., Rule 144A,
Company Guaranteed Notes
(Callable 04/15/22 @ 105.00)(1) | | (CCC, Caa2) | | 04/15/27 | | | 10.000 | | | | 295,559 | | |
| | | | 2,289,499 | | |
| Health Services (1.5%) | | | |
| | 1,000 | | | 180 Medical Inc., Rule 144A,
Company Guaranteed Notes
(Callable 10/07/24 @ 101.94)(1) | | (BB+, Ba2) | | 10/15/29 | | | 3.875 | | | | 1,006,887 | | |
| | 250 | | | AMN Healthcare, Inc., Rule 144A,
Company Guaranteed Notes
(Callable 10/01/22 @ 102.31)(1) | | (BB-, Ba3) | | 10/01/27 | | | 4.625 | | | | 257,193 | | |
| | 360 | | | AMN Healthcare, Inc., Rule 144A,
Company Guaranteed Notes
(Callable 04/15/24 @ 102.00)(1) | | (BB-, Ba3) | | 04/15/29 | | | 4.000 | | | | 365,882 | | |
| | 500 | | | DaVita, Inc., Rule 144A, Company Guaranteed
Notes (Callable 06/01/25 @ 102.31)(1) | | (B+, Ba3) | | 06/01/30 | | | 4.625 | | | | 503,105 | | |
| | 950 | | | HealthEquity, Inc., Rule 144A,
Company Guaranteed Notes
(Callable 10/01/24 @ 102.25)(1) | | (B, B3) | | 10/01/29 | | | 4.500 | | | | 961,875 | | |
| | 150 | | | Ortho-Clinical Diagnostics S.A., Rule 144A,
Senior Unsecured Notes
(Callable 06/01/22 @ 103.69)(1) | | (CCC+, B3) | | 06/01/25 | | | 7.375 | | | | 157,658 | | |
| | 1,538 | | | Owens & Minor, Inc., Global Senior Secured
Notes (Callable 09/15/24 @ 100.00) | | (BB-, Ba2) | | 12/15/24 | | | 4.375 | | | | 1,616,822 | | |
| | 500 | | | Owens & Minor, Inc., Rule 144A,
Company Guaranteed Notes
(Callable 03/31/24 @ 102.25)(1),(7) | | (B, B1) | | 03/31/29 | | | 4.500 | | | | 502,500 | | |
| | 1,250 | | | Radiology Partners, Inc., Rule 144A,
Company Guaranteed Notes
(Callable 02/01/23 @ 104.63)(1) | | (CCC, Caa2) | | 02/01/28 | | | 9.250 | | | | 1,327,087 | | |
| | 250 | | | RP Escrow Issuer LLC, Rule 144A, Senior
Secured Notes (Callable 12/15/22 @ 102.63)(1) | | (B-, B2) | | 12/15/25 | | | 5.250 | | | | 250,313 | | |
| | 393 | | | Service Corp., International, Global Senior
Unsecured Notes (Callable 05/15/26 @ 102.00) | | (BB, Ba3) | | 05/15/31 | | | 4.000 | | | | 401,896 | | |
| | | | 7,351,218 | | |
See Accompanying Notes to Financial Statements.
14
Credit Suisse Strategic Income Fund
Schedule of Investments (continued)
October 31, 2021
Par
(000) | |
| | Ratings†
(S&P/Moody's) | | Maturity | | Rate% | | Value | |
| CORPORATE BONDS (continued) | | | |
| Insurance Brokerage (1.2%) | | | |
$ | 630 | | | Acrisure Finance, Inc., Rule 144A,
Senior Unsecured Notes
(Callable 11/29/21 @ 101.75)(1) | | (CCC+, Caa2) | | 11/15/25 | | | 7.000 | | | $ | 637,088 | | |
| | 500 | | | Acrisure Finance, Inc., Rule 144A,
Senior Unsecured Notes
(Callable 08/01/22 @ 107.59)(1) | | (CCC+, Caa2) | | 08/01/26 | | | 10.125 | | | | 553,460 | | |
| | 550 | | | Alliant Holdings Co-Issuer, Rule 144A,
Senior Secured Notes
(Callable 10/15/23 @ 102.13)(1) | | (B, B2) | | 10/15/27 | | | 4.250 | | | | 549,313 | | |
| | 500 | | | Alliant Holdings Co-Issuer, Rule 144A,
Senior Unsecured Notes
(Callable 10/15/22 @ 103.38)(1) | | (CCC+, Caa2) | | 10/15/27 | | | 6.750 | | | | 516,875 | | |
| | 600 | | | Alliant Holdings Co-Issuer, Rule 144A,
Senior Unsecured Notes
(Callable 11/01/24 @ 102.94)(1) | | (CCC+, Caa2) | | 11/01/29 | | | 5.875 | | | | 603,690 | | |
| | 750 | | | GTCR AP Finance, Inc., Rule 144A,
Senior Unsecured Notes
(Callable 05/15/22 @ 104.00)(1) | | (CCC+, Caa2) | | 05/15/27 | | | 8.000 | | | | 790,312 | | |
| | 725 | | | NFP Corp., Rule 144A, Senior Secured
Notes (Callable 08/15/23 @ 102.44)(1) | | (B, B1) | | 08/15/28 | | | 4.875 | | | | 736,781 | | |
| | 1,500 | | | NFP Corp., Rule 144A, Senior Unsecured
Notes (Callable 08/15/23 @ 103.44)(1) | | (CCC+, Caa2) | | 08/15/28 | | | 6.875 | | | | 1,526,217 | | |
| | | | 5,913,736 | | |
| Investments & Misc. Financial Services (0.6%) | | | |
| | 1,500 | | | Armor Holdco, Inc., Senior Unsecured Notes(1) | | (CCC+, Caa1) | | 11/15/29 | | | 8.500 | | | | 1,500,000 | | |
| | 1,500 | | | Compass Group Diversified Holdings LLC,
Rule 144A, Company Guaranteed Notes
(Callable 04/15/24 @ 102.63)(1) | | (B+, B1) | | 04/15/29 | | | 5.250 | | | | 1,561,875 | | |
| | 50 | | | Square, Inc., Rule 144A, Senior Unsecured
Notes (Callable 03/01/31 @ 100.00)(1) | | (BB, Ba2) | | 06/01/31 | | | 3.500 | | | | 51,312 | | |
| | | | 3,113,187 | | |
| Machinery (0.9%) | | | |
| | 1,750 | | | Arcosa., Inc., Rule 144A, Company Guaranteed
Notes (Callable 04/15/24 @ 102.19)(1) | | (BB, Ba2) | | 04/15/29 | | | 4.375 | | | | 1,778,437 | | |
| | 1,600 | | | ATS Automation Tooling Systems, Inc.,
Rule 144A, Company Guaranteed Notes
(Callable 12/15/23 @ 102.06)(1) | | (B+, B2) | | 12/15/28 | | | 4.125 | | | | 1,616,000 | | |
| | 225 | | | Granite U.S. Holdings Corp., Rule 144A,
Company Guaranteed Notes
(Callable 10/01/22 @ 105.50)(1) | | (CCC+, Caa1) | | 10/01/27 | | | 11.000 | | | | 246,736 | | |
| | 350 | | | Harsco Corp., Rule 144A, Company Guaranteed
Notes (Callable 07/31/22 @ 102.88)(1) | | (B+, B1) | | 07/31/27 | | | 5.750 | | | | 364,373 | | |
| | 250 | | | Hillenbrand, Inc., Global Company Guaranteed
Notes (Callable 06/15/22 @ 102.88) | | (BB+, Ba1) | | 06/15/25 | | | 5.750 | | | | 263,750 | | |
| | | | 4,269,296 | | |
See Accompanying Notes to Financial Statements.
15
Credit Suisse Strategic Income Fund
Schedule of Investments (continued)
October 31, 2021
Par
(000) | |
| | Ratings†
(S&P/Moody's) | | Maturity | | Rate% | | Value | |
| CORPORATE BONDS (continued) | | | |
| Managed Care (0.1%) | | | |
$ | 540 | | | Centene Corp., Global Senior Unsecured Notes
(Callable 12/15/24 @ 102.31) | | (BBB-, Ba1) | | 12/15/29 | | | 4.625 | | | $ | 583,200 | | |
| Media - Diversified (0.1%) | | | |
| | 250 | | | National CineMedia LLC, Global Senior
Unsecured Notes (Callable 11/29/21 @ 102.88) | | (CCC-, Caa3) | | 08/15/26 | | | 5.750 | | | | 201,094 | | |
| | 200 | | | National CineMedia LLC, Rule 144A, Senior
Secured Notes (Callable 04/15/23 @ 102.94)(1),(7) | | (CCC+, B3) | | 04/15/28 | | | 5.875 | | | | 184,883 | | |
| | | | 385,977 | | |
| Media Content (0.6%) | | | |
| | 325 | | | Diamond Sports Finance Co., Rule 144A,
Company Guaranteed Notes
(Callable 08/15/22 @ 103.31)(1) | | (CC, Ca) | | 08/15/27 | | | 6.625 | | | | 97,500 | | |
| | 2,000 | | | Diamond Sports Finance Co., Rule 144A,
Senior Secured Notes
(Callable 08/15/22 @ 102.69)(1) | | (CCC, Caa1) | | 08/15/26 | | | 5.375 | | | | 1,134,010 | | |
| | 733 | | | Sirius XM Radio, Inc., Rule 144A,
Company Guaranteed Notes
(Callable 07/01/24 @ 102.75)(1) | | (BB, Ba3) | | 07/01/29 | | | 5.500 | | | | 791,640 | | |
| | 250 | | | Sirius XM Radio, Inc., Rule 144A,
Company Guaranteed Notes
(Callable 07/01/25 @ 102.06)(1) | | (BB, Ba3) | | 07/01/30 | | | 4.125 | | | | 248,731 | | |
| | 500 | | | WMG Acquisition Corp., Rule 144A, Senior
Secured Notes (Callable 07/15/25 @ 101.94)(1) | | (BB+, Ba3) | | 07/15/30 | | | 3.875 | | | | 518,785 | | |
| | | | 2,790,666 | | |
| Medical Products (0.1%) | | | |
| | 500 | | | Avantor Funding, Inc., Rule 144A,
Company Guaranteed Notes
(Callable 07/15/23 @ 102.31)(1) | | (BB-, B2) | | 07/15/28 | | | 4.625 | | | | 519,350 | | |
| Metals & Mining - Excluding Steel (0.9%) | | | |
| | 750 | | | Canpack U.S. LLC, Rule 144A,
Company Guaranteed Notes
(Callable 11/15/24 @ 101.94)(1) | | (BB, NR) | | 11/15/29 | | | 3.875 | | | | 745,733 | | |
| | 1,250 | | | First Quantum Minerals Ltd., Rule 144A,
Company Guaranteed Notes
(Callable 11/09/21 @ 101.81)(1) | | (B, Wr) | | 04/01/23 | | | 7.250 | | | | 1,271,562 | | |
| | 1,000 | | | First Quantum Minerals Ltd., Rule 144A,
Company Guaranteed Notes
(Callable 11/09/21 @ 101.63)(1) | | (B, NR) | | 03/01/24 | | | 6.500 | | | | 1,016,250 | | |
| | 500 | | | First Quantum Minerals Ltd., Rule 144A,
Company Guaranteed Notes
(Callable 11/09/21 @ 105.16)(1) | | (B, NR) | | 03/01/26 | | | 6.875 | | | | 521,250 | | |
| | 954 | | | Taseko Mines Ltd., Rule 144A , Senior Secured
Notes (Callable 02/15/23 @ 103.50)(1) | | (B-, Caa1) | | 02/15/26 | | | 7.000 | | | | 987,390 | | |
| | | | 4,542,185 | | |
See Accompanying Notes to Financial Statements.
16
Credit Suisse Strategic Income Fund
Schedule of Investments (continued)
October 31, 2021
Par
(000) | |
| | Ratings†
(S&P/Moody's) | | Maturity | | Rate% | | Value | |
| CORPORATE BONDS (continued) | | | |
| Oil Refining & Marketing (0.4%) | | | |
$ | 1,760 | | | ITT Holdings LLC, Rule 144A,
Senior Unsecured Notes
(Callable 08/01/24 @ 103.25)(1) | | (B, B2) | | 08/01/29 | | | 6.500 | | | $ | 1,771,361 | | |
| Packaging (2.5%) | | | |
| | 375 | | | Ardagh Metal Packaging Finance PLC,
Rule 144A, Senior Secured Notes
(Callable 05/15/24 @ 101.63)(1) | | (BB, Ba2) | | 09/01/28 | | | 3.250 | | | | 367,500 | | |
| | 300 | | | Ardagh Metal Packaging Finance PLC,
Rule 144A, Senior Unsecured Notes
(Callable 05/15/24 @ 102.00)(1) | | (B+, B3) | | 09/01/29 | | | 4.000 | | | | 298,695 | | |
| | 130 | | | Crown Americas Capital Corp. VI,
Global Company Guaranteed Notes
(Callable 11/29/21 @ 103.56) | | (BB-, Ba3) | | 02/01/26 | | | 4.750 | | | | 134,102 | | |
| | 2,500 | | | Flex Acquisition Co., Inc., Rule 144A,
Senior Unsecured Notes
(Callable 11/29/21 @ 101.72)(1) | | (CCC+, Caa2) | | 01/15/25 | | | 6.875 | | | | 2,528,125 | | |
| | 705 | | | Intertape Polymer Group, Inc., Rule 144A,
Company Guaranteed Notes
(Callable 06/15/24 @ 102.19)(1) | | (B+, Ba3) | | 06/15/29 | | | 4.375 | | | | 707,707 | | |
| | 475 | | | Pactiv Evergreen Group Issuer LLC,
Rule 144A, Senior Secured Notes
(Callable 10/15/23 @ 102.00)(1) | | (B+, B1) | | 10/15/27 | | | 4.000 | | | | 465,381 | | |
| | 4,340 | | | Plastipak Holdings, Inc., Rule 144A,
Senior Unsecured Notes
(Callable 11/29/21 @ 101.56)(1) | | (B, B3) | | 10/15/25 | | | 6.250 | | | | 4,424,109 | | |
| | 475 | | | Silgan Holdings, Inc.,
Global Company Guaranteed Notes
(Callable 11/29/21 @ 101.19) | | (BB, Ba3) | | 03/15/25 | | | 4.750 | | | | 480,938 | | |
| | 2,700 | | | TriMas Corp., Rule 144A,
Company Guaranteed Notes
(Callable 04/15/24 @ 102.06)(1) | | (BB-, Ba3) | | 04/15/29 | | | 4.125 | | | | 2,737,341 | | |
| | | | 12,143,898 | | |
| Personal & Household Products (0.2%) | | | |
| | 750 | | | High Ridge Brands Co., Rule 144A,
Senior Unsecured Notes(1),(2),(3),(5),(6) | | (NR, NR) | | 03/15/25 | | | 0.000 | | | | 6,563 | | |
| | 375 | | | MajorDrive Holdings IV LLC, Rule 144A,
Senior Unsecured Notes
(Callable 06/01/24 @ 103.19)(1) | | (CCC+, Caa2) | | 06/01/29 | | | 6.375 | | | | 361,312 | | |
| | 375 | | | Mattel, Inc., Rule 144A, Company Guaranteed
Notes (Callable 04/01/24 @ 101.88)(1) | | (BB, Ba2) | | 04/01/29 | | | 3.750 | | | | 390,019 | | |
| | 350 | | | Prestige Brands, Inc., Rule 144A,
Company Guaranteed Notes
(Callable 04/01/26 @ 101.88)(1) | | (B+, B2) | | 04/01/31 | | | 3.750 | | | | 338,625 | | |
| | | | 1,096,519 | | |
See Accompanying Notes to Financial Statements.
17
Credit Suisse Strategic Income Fund
Schedule of Investments (continued)
October 31, 2021
Par
(000) | |
| | Ratings†
(S&P/Moody's) | | Maturity | | Rate% | | Value | |
| CORPORATE BONDS (continued) | | | |
| Pharmaceuticals (1.4%) | | | |
$ | 500 | | | Bausch Health Cos., Inc., Rule 144A,
Company Guaranteed Notes
(Callable 12/15/21 @ 104.50)(1) | | (B, B3) | | 12/15/25 | | | 9.000 | | | $ | 525,160 | | |
| | 950 | | | Bausch Health Cos., Inc., Rule 144A,
Company Guaranteed Notes
(Callable 01/15/23 @ 103.50)(1) | | (B, B3) | | 01/15/28 | | | 7.000 | | | | 963,656 | | |
| | 500 | | | Bausch Health Cos., Inc., Rule 144A,
Company Guaranteed Notes
(Callable 02/15/24 @ 103.13)(1) | | (B, B3) | | 02/15/29 | | | 6.250 | | | | 485,143 | | |
| | 375 | | | Bausch Health Cos., Inc., Rule 144A,
Company Guaranteed Notes
(Callable 02/15/26 @ 102.63)(1) | | (B, B3) | | 02/15/31 | | | 5.250 | | | | 337,740 | | |
| | 922 | | | Emergent BioSolutions, Inc., Rule 144A,
Company Guaranteed Notes
(Callable 08/15/23 @ 101.94)(1) | | (BB-, Ba3) | | 08/15/28 | | | 3.875 | | | | 886,272 | | |
| | 250 | | | Endo U.S., Inc., Rule 144A, Senior Secured
Notes (Callable 04/01/24 @ 104.59)(1) | | (B-, B3) | | 04/01/29 | | | 6.125 | | | | 246,270 | | |
| | 450 | | | Grifols Escrow Issuer S.A., Rule 144A,
Senior Unsecured Notes
(Callable 10/15/24 @ 102.38)(1) | | (B, B3) | | 10/15/28 | | | 4.750 | | | | 457,313 | | |
| | 750 | | | Horizon Therapeutics U.S.A., Inc., Rule 144A,
Company Guaranteed Notes
(Callable 08/01/22 @ 104.13)(1) | | (B+, Ba3) | | 08/01/27 | | | 5.500 | | | | 791,250 | | |
| | 2,250 | | | Jazz Securities DAC, Rule 144A, Senior Secured
Notes (Callable 07/15/24 @ 102.19)(1) | | (BB-, Ba2) | | 01/15/29 | | | 4.375 | | | | 2,314,687 | | |
| | | | 7,007,491 | | |
| Real Estate Development & Management (0.8%) | | | |
| | 2,125 | | | Newmark Group, Inc., Global Senior Unsecured
Notes (Callable 10/15/23 @ 100.00) | | (BB+, NR) | | 11/15/23 | | | 6.125 | | | | 2,297,656 | | |
| | 1,754 | | | WeWork Cos., Inc., Rule 144A,
Company Guaranteed Notes(1) | | (CCC+, Wr) | | 05/01/25 | | | 7.875 | | | | 1,779,942 | | |
| | | | 4,077,598 | | |
| Real Estate Investment Trusts (1.2%) | | | |
| | 1,000 | | | Blackstone Mortgage Trust, Inc. Rule 144A,
Senior Secured Notes
(Callable 10/15/26 @ 100.00)(1) | | (B+, Ba2) | | 01/15/27 | | | 3.750 | | | | 996,100 | | |
| | 1,000 | | | Global Net Lease Operating Partnership LP,
Rule 144A, Company Guaranteed Notes
(Callable 09/15/27 @ 100.00)(1) | | (BBB-, Ba3) | | 12/15/27 | | | 3.750 | | | | 989,316 | | |
| | 500 | | | iStar, Inc., Global Senior Unsecured Notes
(Callable 08/15/22 @ 102.75) | | (BB, Ba3) | | 02/15/26 | | | 5.500 | | | | 520,000 | | |
| | 500 | | | iStar, Inc., Senior Unsecured Notes
(Callable 07/01/24 @ 100.00) | | (BB, Ba3) | | 10/01/24 | | | 4.750 | | | | 528,875 | | |
| | 1,500 | | | iStar, Inc., Senior Unsecured Notes
(Callable 05/01/25 @ 100.00) | | (BB, Ba3) | | 08/01/25 | | | 4.250 | | | | 1,539,375 | | |
See Accompanying Notes to Financial Statements.
18
Credit Suisse Strategic Income Fund
Schedule of Investments (continued)
October 31, 2021
Par
(000) | |
| | Ratings†
(S&P/Moody's) | | Maturity | | Rate% | | Value | |
| CORPORATE BONDS (continued) | | | |
Real Estate Investment Trusts | | | |
$ | 250 | | | MPT Finance Corp., Global Company
Guaranteed Notes (Callable 11/29/21 @ 102.63) | | (BBB-, Ba1) | | 08/01/26 | | | 5.250 | | | $ | 257,813 | | |
| | 450 | | | RLJ Lodging Trust LP ,Rule 144A, Senior
Secured Notes (Callable 09/15/24 @ 102.00)(1) | | (BB-, Ba3) | | 09/15/29 | | | 4.000 | | | | 449,685 | | |
| | 214 | | | Starwood Property Trust, Inc., Global Senior
Unsecured Notes (Callable 11/29/21 @ 100.00) | | (B+, Wr) | | 12/15/21 | | | 5.000 | | | | 214,401 | | |
| | 250 | | | Starwood Property Trust, Inc., Rule 144A,
Senior Unsecured Notes
(Callable 08/01/23 @ 100.00)(1) | | (B+, Ba3) | | 11/01/23 | | | 5.500 | | | | 262,813 | | |
| | | | 5,758,378 | | |
| Recreation & Travel (1.7%) | | | |
| | 550 | | | Boyne U.S.A., Inc., Rule 144A, Senior Unsecured
Notes (Callable 05/15/24 @ 102.38)(1) | | (B, B1) | | 05/15/29 | | | 4.750 | | | | 563,063 | | |
| | 642 | | | Canada's Wonderland Co., Global Company
Guaranteed Notes (Callable 04/15/22 @ 102.69) | | (CCC+, B3) | | 04/15/27 | | | 5.375 | | | | 662,063 | | |
| | 750 | | | Cedar Fair LP, Global Company Guaranteed
Notes (Callable 07/15/24 @ 102.63) | | (CCC+, B3) | | 07/15/29 | | | 5.250 | | | | 778,125 | | |
| | 185 | | | Powdr Corp., Rule 144A, Senior Secured
Notes (Callable 08/01/22 @ 103.00)(1) | | (B-, B1) | | 08/01/25 | | | 6.000 | | | | 193,834 | | |
| | 875 | | | SeaWorld Parks & Entertainment, Inc.,
Rule 144A, Company Guaranteed Notes
(Callable 08/15/24 @ 102.63)(1) | | (B-, Caa1) | | 08/15/29 | | | 5.250 | | | | 892,500 | | |
| | 250 | | | SeaWorld Parks & Entertainment, Inc.,
Rule 144A, Senior Secured Notes
(Callable 05/01/22 @ 104.38)(1) | | (BB-, Ba3) | | 05/01/25 | | | 8.750 | | | | 266,875 | | |
| | 2,250 | | | Six Flags Entertainment Corp., Rule 144A,
Company Guaranteed Notes
(Callable 11/29/21 @ 101.22)(1) | | (B-, B3) | | 07/31/24 | | | 4.875 | | | | 2,269,687 | | |
| | 200 | | | Six Flags Theme Parks, Inc., Rule 144A,
Senior Secured Notes
(Callable 07/01/22 @ 103.50)(1) | | (BB-, Ba2) | | 07/01/25 | | | 7.000 | | | | 212,750 | | |
| | 2,585 | | | Speedway Funding II, Inc., Rule 144A,
Senior Unsecured Notes
(Callable 11/01/22 @ 102.44)(1) | | (BB-, B2) | | 11/01/27 | | | 4.875 | | | | 2,644,920 | | |
| | | | 8,483,817 | | |
| Software - Services (2.9%) | | | |
| | 3,200 | | | Austin BidCo, Inc., Rule 144A,
Senior Unsecured Notes
(Callable 12/15/23 @ 103.56)(1) | | (CCC+, Caa2) | | 12/15/28 | | | 7.125 | | | | 3,309,088 | | |
| | 600 | | | Black Knight InfoServ LLC, Rule 144A,
Company Guaranteed Notes
(Callable 09/01/23 @ 101.81)(1) | | (BB-, Ba3) | | 09/01/28 | | | 3.625 | | | | 597,750 | | |
| | 250 | | | CA Magnum Holdings, Rule 144A,
Senior Secured Notes
(Callable 10/31/23 @ 102.69)(1) | | (NR, B1) | | 10/31/26 | | | 5.375 | | | | 256,697 | | |
See Accompanying Notes to Financial Statements.
19
Credit Suisse Strategic Income Fund
Schedule of Investments (continued)
October 31, 2021
Par
(000) | |
| | Ratings†
(S&P/Moody's) | | Maturity | | Rate% | | Value | |
| CORPORATE BONDS (continued) | | | |
Software - Services | | | |
$ | 2,000 | | | Elastic NV, Rule 144A, Senior Unsecured
Notes (Callable 07/15/24 @ 102.06)(1) | | (B+, B1) | | 07/15/29 | | | 4.125 | | | $ | 1,992,271 | | |
| | 2,825 | | | Endure Digital, Inc., Rule 144A,
Senior Unsecured Notes
(Callable 02/15/24 @ 103.00)(1) | | (CCC+, Caa2) | | 02/15/29 | | | 6.000 | | | | 2,603,831 | | |
| | 790 | | | GD Finance Co., Inc., Rule 144A,
Company Guaranteed Notes
(Callable 06/01/22 @ 102.63)(1) | | (BB-, Ba3) | | 12/01/27 | | | 5.250 | | | | 820,612 | | |
| | 2,730 | | | Granite Merger Sub 2, Inc., Rule 144A,
Company Guaranteed Notes
(Callable 07/15/22 @ 108.25)(1) | | (CCC+, Caa1) | | 07/15/27 | | | 11.000 | | | | 3,115,612 | | |
| | 1,400 | | | Paysafe Holdings U.S. Corp., Rule 144A,
Senior Secured Notes
(Callable 06/15/24 @ 102.00)(1) | | (B+, B1) | | 06/15/29 | | | 4.000 | | | | 1,328,250 | | |
| | | | 14,024,111 | | |
| Specialty Retail (1.3%) | | | |
| | 370 | | | Asbury Automotive Group, Inc.,
Global Company Guaranteed Notes
(Callable 03/01/23 @ 102.25) | | (BB, B1) | | 03/01/28 | | | 4.500 | | | | 376,938 | | |
| | 67 | | | Asbury Automotive Group, Inc.,
Global Company Guaranteed Notes
(Callable 03/01/25 @ 102.38) | | (BB, B1) | | 03/01/30 | | | 4.750 | | | | 68,424 | | |
| | 500 | | | eG Global Finance PLC, Rule 144A, Senior
Secured Notes (Callable 11/29/21 @ 104.25)(1) | | (B-, B3) | | 10/30/25 | | | 8.500 | | | | 518,307 | | |
| | 325 | | | Group 1 Automotive, Inc., Rule 144A,
Company Guaranteed Notes
(Callable 08/15/23 @ 102.00)(1) | | (BB+, Ba2) | | 08/15/28 | | | 4.000 | | | | 325,471 | | |
| | 750 | | | Lithia Motors, Inc., Rule 144A,
Company Guaranteed Notes
(Callable 12/15/22 @ 103.47)(1) | | (BB+, Ba2) | | 12/15/27 | | | 4.625 | | | | 793,871 | | |
| | 375 | | | Lithia Motors, Inc., Rule 144A,
Senior Unsecured Notes
(Callable 06/01/24 @ 101.94)(1) | | (BB+, Ba2) | | 06/01/29 | | | 3.875 | | | | 389,066 | | |
| | 375 | | | Murphy Oil U.S.A., Inc., Rule 144A,
Company Guaranteed Notes
(Callable 02/15/26 @ 101.88)(1) | | (BB+, Ba2) | | 02/15/31 | | | 3.750 | | | | 369,375 | | |
| | 250 | | | Papa John's International, Inc., Rule 144A,
Company Guaranteed Notes
(Callable 09/15/24 @ 101.94)(1) | | (BB-, B1) | | 09/15/29 | | | 3.875 | | | | 244,688 | | |
| | 500 | | | Penske Automotive Group, Inc.,
Company Guaranteed Notes
(Callable 06/15/24 @ 101.88) | | (BB-, Ba3) | | 06/15/29 | | | 3.750 | | | | 497,880 | | |
| | 1,750 | | | Ruyi U.S. Finance LLC, Rule 144A,
Senior Secured Notes
(Callable 11/29/21 @ 105.63)(1) | | (NR, Caa1) | | 05/01/25 | | | 7.500 | | | | 1,682,922 | | |
See Accompanying Notes to Financial Statements.
20
Credit Suisse Strategic Income Fund
Schedule of Investments (continued)
October 31, 2021
Par
(000) | |
| | Ratings†
(S&P/Moody's) | | Maturity | | Rate% | | Value | |
| CORPORATE BONDS (continued) | | | |
Specialty Retail | | | |
$ | 225 | | | Sonic Automotive, Inc., Rule 144A,
Company Guaranteed Notes
(Callable 11/15/24 @ 102.31)(1) | | (BB-, B1) | | 11/15/29 | | | 4.625 | | | $ | 225,934 | | |
| | 1,000 | | | Wolverine World Wide, Inc., Rule 144A,
Company Guaranteed Notes
(Callable 08/15/24 @ 102.00)(1) | | (BB-, Ba2) | | 08/15/29 | | | 4.000 | | | | 988,560 | | |
| | | | 6,481,436 | | |
| Support - Services (3.2%) | | | |
| | 756 | | | Allied Universal Finance Corp., Rule 144A,
Senior Secured Notes
(Callable 06/01/24 @ 102.31)(1) | | (B, B2) | | 06/01/28 | | | 4.625 | | | | 750,103 | | |
| | 1,194 | | | Allied Universal Finance Corp., Rule 144A,
Senior Secured Notes
(Callable 06/01/24 @ 102.31)(1) | | (B, B2) | | 06/01/28 | | | 4.625 | | | | 1,185,845 | | |
| | 1,950 | | | Allied Universal Finance Corp., Rule 144A,
Senior Unsecured Notes
(Callable 06/01/24 @ 103.00)(1) | | (CCC+, Caa1) | | 06/01/29 | | | 6.000 | | | | 1,924,699 | | |
| | 355 | | | APi Group DE, Inc., Rule 144A,
Company Guaranteed Notes
(Callable 07/15/24 @ 102.06)(1) | | (B, B1) | | 07/15/29 | | | 4.125 | | | | 353,669 | | |
| | 1,613 | | | ASGN, Inc., Rule 144A, Company Guaranteed
Notes (Callable 05/15/23 @ 102.31)(1) | | (BB-, Ba3) | | 05/15/28 | | | 4.625 | | | | 1,667,439 | | |
| | 2,500 | | | CoreLogic, Inc., Rule 144A, Senior Secured
Notes (Callable 05/01/24 @ 102.25)(1) | | (B, B1) | | 05/01/28 | | | 4.500 | | | | 2,473,300 | | |
| | 300 | | | CPI CG, Inc., Rule 144A, Senior Secured Notes
(Callable 03/15/23 @ 104.31)(1) | | (B-, B3) | | 03/15/26 | | | 8.625 | | | | 324,375 | | |
| | 250 | | | Gartner, Inc., Rule 144A, Company Guaranteed
Notes (Callable 07/01/23 @ 102.25)(1) | | (BB+, Ba3) | | 07/01/28 | | | 4.500 | | | | 260,613 | | |
| | 250 | | | Gartner, Inc., Rule 144A, Company Guaranteed
Notes (Callable 06/15/24 @ 101.81)(1) | | (BB+, Ba3) | | 06/15/29 | | | 3.625 | | | | 251,563 | | |
| | 2,285 | | | Gems Education Delaware LLC, Rule 144A,
Senior Secured Notes
(Callable 07/31/22 @ 103.56)(1) | | (B-, B3) | | 07/31/26 | | | 7.125 | | | | 2,367,831 | | |
| | 2,750 | | | GYP Holdings III Corp., Rule 144A,
Company Guaranteed Notes
(Callable 05/01/24 @ 102.31)(1) | | (B, B2) | | 05/01/29 | | | 4.625 | | | | 2,719,062 | | |
| | 735 | | | Korn Ferry, Rule 144A, Company Guaranteed
Notes (Callable 12/15/22 @ 102.31)(1) | | (BB, Ba3) | | 12/15/27 | | | 4.625 | | | | 758,887 | | |
| | 500 | | | White Cap Buyer LLC, Rule 144A,
Senior Unsecured Notes
(Callable 10/15/23 @ 103.44)(1) | | (CCC+, Caa1) | | 10/15/28 | | | 6.875 | | | | 515,580 | | |
| | 390 | | | Williams Scotsman International, Inc.,
Rule 144A, Senior Secured Notes
(Callable 08/15/23 @ 102.31)(1) | | (B+, B3) | | 08/15/28 | | | 4.625 | | | | 403,650 | | |
| | | | 15,956,616 | | |
See Accompanying Notes to Financial Statements.
21
Credit Suisse Strategic Income Fund
Schedule of Investments (continued)
October 31, 2021
Par
(000) | |
| | Ratings†
(S&P/Moody's) | | Maturity | | Rate% | | Value | |
| CORPORATE BONDS (continued) | | | |
| Tech Hardware & Equipment (0.7%) | | | |
$ | 486 | | | CommScope Technologies LLC, Rule 144A,
Company Guaranteed Notes
(Callable 03/15/22 @ 102.50)(1),(7) | | (CCC+, B3) | | 03/15/27 | | | 5.000 | | | $ | 451,909 | | |
| | 786 | | | CommScope, Inc., Rule 144A,
Company Guaranteed Notes
(Callable 03/01/22 @ 104.13)(1) | | (CCC+, B3) | | 03/01/27 | | | 8.250 | | | | 801,995 | | |
| | 1,014 | | | CommScope, Inc., Rule 144A, Senior Secured
Notes (Callable 09/01/24 @ 102.38)(1) | | (B, Ba3) | | 09/01/29 | | | 4.750 | | | | 996,205 | | |
| | 1,000 | | | Imola Merger Corp., Rule 144A, Senior Secured
Notes (Callable 05/15/24 @ 102.38)(1) | | (BB-, B1) | | 05/15/29 | | | 4.750 | | | | 1,028,700 | | |
| | | | 3,278,809 | | |
| Telecom - Wireline Integrated & Services (0.3%) | | | |
| | 1,125 | | | GTT Communications, Inc., Rule 144A,
Company Guaranteed Notes
(Callable 11/29/21 @ 103.94)(1),(2) | | (D, Wr) | | 12/31/24 | | | 0.000 | | | | 137,812 | | |
| | 1,000 | | | LCPR Senior Secured Financing DAC,
Rule 144A, Senior Secured Notes
(Callable 10/15/22 @ 103.38)(1) | | (B+, B1) | | 10/15/27 | | | 6.750 | | | | 1,051,250 | | |
| | 500 | | | LCPR Senior Secured Financing DAC,
Rule 144A, Senior Secured Notes
(Callable 07/15/24 @ 102.56)(1) | | (B+, B1) | | 07/15/29 | | | 5.125 | | | | 504,425 | | |
| | | | 1,693,487 | | |
| Theaters & Entertainment (0.4%) | | | |
| | 500 | | | Live Nation Entertainment, Inc., Rule 144A,
Company Guaranteed Notes
(Callable 11/29/21 @ 101.22)(1) | | (B-, B3) | | 11/01/24 | | | 4.875 | | | | 506,545 | | |
| | 650 | | | Live Nation Entertainment, Inc., Rule 144A,
Company Guaranteed Notes
(Callable 10/15/22 @ 103.56)(1) | | (B-, B3) | | 10/15/27 | | | 4.750 | | | | 663,812 | | |
| | 500 | | | Live Nation Entertainment, Inc., Rule 144A,
Senior Secured Notes
(Callable 05/15/23 @ 104.88)(1) | | (B+, B1) | | 05/15/27 | | | 6.500 | | | | 548,125 | | |
| | | | 1,718,482 | | |
| Transport Infrastructure/Services (0.1%) | | | |
| | 661 | | | Navios Maritime Finance II U.S., Inc.,
Rule 144A, Senior Secured Notes
(Callable 11/09/21 @ 100.00)(1) | | (CCC-, Caa2) | | 08/15/22 | | | 11.250 | | | | 659,024 | | |
| TOTAL CORPORATE BONDS (Cost $164,042,712) | | | 164,425,273 | | |
See Accompanying Notes to Financial Statements.
22
Credit Suisse Strategic Income Fund
Schedule of Investments (continued)
October 31, 2021
Par
(000) | |
| | Ratings†
(S&P/Moody's) | | Maturity | | Rate% | | Value | |
| BANK LOANS (56.1%) | | | |
| Advertising (0.1%) | | | |
$ | 728 | | | MH Sub I LLC, LIBOR 1M + 3.500%(8) | | (B, B2) | | 09/13/24 | | | 3.587 | | | $ | 726,841 | | |
| Aerospace & Defense (0.9%) | | | |
| | 992 | | | Amentum Government Services Holdings LLC,
LIBOR 1M + 3.500%(8) | | (B, B1) | | 01/29/27 | | | 3.587 | | | | 990,810 | | |
| | 3,354 | | | Peraton Corp., LIBOR 1M + 3.750%(8) | | (B+, B1) | | 02/01/28 | | | 4.500 | | | | 3,366,632 | | |
| | | | 4,357,442 | | |
| Air Transportation (0.3%) | | | |
| | 1,402 | | | Brown Group Holding LLC,
LIBOR 3M + 2.750%(8) | | (B+, B1) | | 06/07/28 | | | 3.250 | | | | 1,400,045 | | |
| Auto Parts & Equipment (2.2%) | | | |
| | 1,496 | | | Adient U.S. LLC, LIBOR 1M + 3.500%(8) | | (BB-, Ba3) | | 04/08/28 | | | 3.587 | | | | 1,498,651 | | |
| | 1,397 | | | Autokiniton U.S. Holdings, Inc.,
LIBOR 3M + 4.500%(8) | | (B, B2) | | 04/06/28 | | | 5.000 | | | | 1,399,991 | | |
| | 1,281 | | | Clarios Global LP, LIBOR 1M + 3.250%(8) | | (B, B1) | | 04/30/26 | | | 3.337 | | | | 1,274,900 | | |
| | 1,955 | | | Dayco Products LLC, LIBOR 3M + 4.250%(8) | | (CCC+, B3) | | 05/19/23 | | | 4.371 | | | | 1,910,917 | | |
| | 380 | | | Dealer Tire LLC, LIBOR 1M + 4.250%(8) | | (B-, B1) | | 12/12/25 | | | 4.337 | | | | 380,204 | | |
| | 141 | | | Jason Group, Inc., LIBOR 3M + 1.000%
Cash, 9.000% PIK(8),(9) | | (CCC-, Caa3) | | 03/02/26 | | | 11.000 | | | | 139,772 | | |
| | 205 | | | Jason Group, Inc., LIBOR 3M + 2.000%
Cash, 4.000%PIK(8),(9) | | (B-, Caa1) | | 08/28/25 | | | 7.000 | | | | 203,697 | | |
| | 1,379 | | | Les Schwab Tire Centers, LIBOR 3M + 3.250%(8) | | (B, B2) | | 11/02/27 | | | 4.000 | | | | 1,380,028 | | |
| | 1,001 | | | RVR Dealership Holdings LLC,
LIBOR 3M + 4.000%(8) | | (B+, B2) | | 02/08/28 | | | 4.750 | | | | 1,000,967 | | |
| | 40 | | | RVR Dealership Holdings, LLC(10),(11) | | (B+, B2) | | 02/08/28 | | | 2.000 | | | | 40,086 | | |
| | 995 | | | Tenneco, Inc., LIBOR 1M + 3.000%(8) | | (B+, Ba3) | | 10/01/25 | | | 3.087 | | | | 980,429 | | |
| | 731 | | | U.S. Farathane LLC, LIBOR 3M + 4.250%(5),(8) | | (CCC+, B2) | | 12/23/24 | | | 5.250 | | | | 694,688 | | |
| | | | 10,904,330 | | |
| Brokerage (0.2%) | | | |
| | 1,115 | | | DRW Holdings LLC, LIBOR 1M + 3.750%(8) | | (BB-, Ba3) | | 03/01/28 | | | 3.837 | | | | 1,113,378 | | |
| Building & Construction (0.2%) | | | |
| | 540 | | | TRC Companies, Inc., LIBOR 1M + 4.500%(5),(8) | | (B, B2) | | 06/21/24 | | | 5.250 | | | | 539,363 | | |
| | 245 | | | TRC Companies, Inc., LIBOR 1M + 3.500%(8) | | (B, B2) | | 06/21/24 | | | 4.500 | | | | 245,280 | | |
| | | | 784,643 | | |
| Building Materials (1.6%) | | | |
| | 709 | | | Chamberlain Group, Inc.(10) | | (B, B2) | | 11/03/28 | | | 0.000 | | | | 709,116 | | |
| | 1,222 | | | CHI Overhead Doors, Inc., LIBOR 1M + 3.500%(8) | | (B, B2) | | 07/31/25 | | | 4.500 | | | | 1,227,020 | | |
| | 2,711 | | | Cornerstone Building Brands, Inc.,
LIBOR 1M + 3.250%(8) | | (B+, B1) | | 04/12/28 | | | 3.750 | | | | 2,712,514 | | |
| | 748 | | | Foundation Building Materials Holding Co.
LLC, LIBOR 1M + 3.250%(8) | | (B, B2) | | 02/03/28 | | | 3.750 | | | | 743,217 | | |
| | 2,115 | | | Park River Holdings, Inc., LIBOR 3M + 3.250%(8) | | (B-, B1) | | 12/28/27 | | | 4.000 | | | | 2,108,910 | | |
| | 575 | | | Standard Industries, Inc., LIBOR 3M + 2.500%(8) | | (BBB-, Baa3) | | 09/22/28 | | | 3.000 | | | | 575,306 | | |
| | | | 8,076,083 | | |
See Accompanying Notes to Financial Statements.
23
Credit Suisse Strategic Income Fund
Schedule of Investments (continued)
October 31, 2021
Par
(000) | |
| | Ratings†
(S&P/Moody's) | | Maturity | | Rate% | | Value | |
| BANK LOANS (continued) | | | |
| Chemicals (3.9%) | | | |
$ | 398 | | | Allnex (Luxembourg) & Cy S.C.A.,
LIBOR 1M + 3.250%(8) | | (B, B2) | | 09/13/23 | | | 4.000 | | | $ | 398,266 | | |
| | 300 | | | Allnex U.S.A., Inc., LIBOR 1M + 3.250%(8) | | (B, B2) | | 09/13/23 | | | 4.000 | | | | 300,050 | | |
| | 947 | | | Ascend Performance Materials Operations LLC,
LIBOR 3M + 4.750%(8) | | (BB-, B1) | | 08/27/26 | | | 5.500 | | | | 957,127 | | |
| | 871 | | | ASP Chromaflo Dutch I B.V.,
LIBOR 1M + 3.500%(5),(8) | | (B, B2) | | 11/20/23 | | | 4.500 | | | | 873,017 | | |
| | 678 | | | ASP Chromaflo Intermediate Holdings, Inc.,
LIBOR 1M + 3.500%(5),(8) | | (B, B2) | | 11/20/23 | | | 4.500 | | | | 679,390 | | |
| | 2,494 | | | Atotech B.V., LIBOR 3M + 2.500%(8) | | (B+, B1) | | 03/18/28 | | | 3.000 | | | | 2,494,274 | | |
| | 430 | | | CPC Acquisition Corp., LIBOR 3M + 7.750%(8) | | (CCC, Caa2) | | 12/29/28 | | | 8.500 | | | | 431,476 | | |
| | 382 | | | GEON Performance Solutions, LLC,
LIBOR 3M + 4.750%(8) | | (B+, B2) | | 08/18/28 | | | 5.500 | | | | 386,498 | | |
| | 623 | | | LSF11 A5 Holdco LLC, LIBOR 3M + 3.750%(8) | | (B, B1) | | 10/15/28 | | | 4.250 | | | | 623,501 | | |
| | 862 | | | Luxembourg Investment Co. 428 S.a r.l.(5),(10) | | (B, B2) | | 10/20/28 | | | 0.000 | | | | 862,709 | | |
| | 3,198 | | | PMHC II, Inc., LIBOR 12M + 3.500%(8) | | (B-, Caa1) | | 03/31/25 | | | 4.500 | | | | 3,182,336 | | |
| | 1,152 | | | Polar U.S. Borrower LLC, LIBOR 1M + 4.750%,
PRIME + 3.750%(8) | |
(B-, B3) | |
10/15/25 | | | 4.874 -
7.000 | | | | 1,152,986 | | |
| | 2,681 | | | Solenis Holdings LLC, LIBOR 1M + 4.000%(8) | | (B-, B3) | | 06/26/25 | | | 4.087 | | | | 2,681,590 | | |
| | 500 | | | Solenis Holdings LLC, LIBOR 1M + 8.500%(4),(8) | | (CCC+, Caa1) | | 06/26/26 | | | 8.587 | | | | 500,940 | | |
| | 48 | | | UTEX Industries, Inc., LIBOR 1M + 7.000%(8) | | (NR, NR) | | 12/03/25 | | | 8.500 | | | | 48,609 | | |
| | 42 | | | UTEX Industries, Inc., LIBOR 1M + 5.250%(8) | | (NR, NR) | | 12/03/25 | | | 11.000 | | | | 41,732 | | |
| | 794 | | | Vantage Specialty Chemicals, Inc.,
LIBOR 3M + 3.500%(8) | | (CCC+, Caa1) | | 10/28/24 | | | 4.500 | | | | 780,915 | | |
| | 455 | | | Vantage Specialty Chemicals, Inc.,
LIBOR 3M + 8.250%(4),(8) | | (CCC-, Caa3) | | 10/27/25 | | | 9.250 | | | | 442,672 | | |
| | 2,190 | | | Zep, Inc., LIBOR 3M + 4.000%(8) | | (CCC+, B3) | | 08/12/24 | | | 5.000 | | | | 2,154,705 | | |
| | | | 18,992,793 | | |
| Diversified Capital Goods (1.6%) | | | |
| | 2,452 | | | Callaway Golf Co., LIBOR 1M + 4.500%(8) | | (B, B1) | | 01/02/26 | | | 4.588 | | | | 2,469,118 | | |
| | 1,580 | | | Dynacast International LLC,
LIBOR 3M + 4.750%(5),(8) | | (CCC+, B2) | | 07/22/25 | | | 5.750 | | | | 1,584,263 | | |
| | 593 | | | Dynacast International LLC,
LIBOR 3M + 9.250%(5),(8) | | (CCC-, Caa2) | | 10/22/25 | | | 10.250 | | | | 610,380 | | |
| | 237 | | | Filtration Group Corp.(10) | | (B, B3) | | 10/21/28 | | | 0.000 | | | | 236,868 | | |
| | 615 | | | GrafTech Finance, Inc., LIBOR 1M + 3.000%(8) | | (BB, Ba3) | | 02/12/25 | | | 3.500 | | | | 617,028 | | |
| | 998 | | | Madison IAQ LLC, LIBOR 6M + 3.250%(8) | | (B, B1) | | 06/21/28 | | | 3.750 | | | | 996,667 | | |
| | 1,349 | | | Vertiv Group Corp., LIBOR 1M + 2.750%(8) | | (BB-, B1) | | 03/02/27 | | | 2.830 | | | | 1,341,315 | | |
| | | | 7,855,639 | | |
| Electronics (1.4%) | | | |
| | 500 | | | CPI International, Inc., LIBOR 1M + 7.250%(4),(5),(8) | | (CCC, Caa2) | | 07/26/25 | | | 8.250 | | | | 467,208 | | |
| | 3,859 | | | Idemia Group, LIBOR 3M + 4.500%(8) | | (B-, B3) | | 01/09/26 | | | 5.250 | | | | 3,872,430 | | |
| | 998 | | | Infinite Bidco LLC, LIBOR 1M + 3.750%(8) | | (B-, B2) | | 03/02/28 | | | 4.250 | | | | 999,161 | | |
| | 500 | | | Infinite Bidco LLC, LIBOR 1M + 7.000%(5),(8) | | (CCC, Caa2) | | 03/02/29 | | | 7.500 | | | | 505,000 | | |
| | 1,271 | | | MKS Instruments, Inc.(10) | | (BB, Ba1) | | 10/21/28 | | | 0.000 | | | | 1,271,142 | | |
| | | | 7,114,941 | | |
See Accompanying Notes to Financial Statements.
24
Credit Suisse Strategic Income Fund
Schedule of Investments (continued)
October 31, 2021
Par
(000) | |
| | Ratings†
(S&P/Moody's) | | Maturity | | Rate% | | Value | |
| BANK LOANS (continued) | | | |
| Energy - Exploration & Production (0.1%) | | | |
$ | 730 | | | Oryx Midstream Services Permian Basin LLC,
LIBOR 3M + 3.250%(8) | | (BB-, Ba3) | | 10/05/28 | | | 3.750 | | | $ | 727,774 | | |
| | 872 | | | PES Holdings LLC, 3.000% PIK(2),(5),(9) | | (NR, NR) | | 12/31/22 | | | 3.000 | | | | 16,342 | | |
| | | | 744,116 | | |
| Food & Drug Retailers (0.9%) | | | |
| | 1,990 | | | Packaging Coordinators Midco, Inc.,
LIBOR 3M + 3.500%(8) | | (B-, B2) | | 11/30/27 | | | 4.250 | | | | 1,995,393 | | |
| | 1,493 | | | WOOF Holdings, Inc., LIBOR 3M + 3.750%(8) | | (B-, B2) | | 12/21/27 | | | 4.500 | | | | 1,496,238 | | |
| | 866 | | | WOOF Holdings, Inc., LIBOR 6M + 7.250%(8) | | (CCC, Caa2) | | 12/21/28 | | | 8.000 | | | | 877,535 | | |
| | | | 4,369,166 | | |
| Food - Wholesale (0.5%) | | | |
| | 182 | | | AI Aqua Merger Sub, Inc.(10) | | (B, B3) | | 07/31/28 | | | 0.000 | | | | 182,444 | | |
| | 1,452 | | | AI Aqua Merger Sub, Inc.,
LIBOR 1M + 4.000%(8) | | (B, B3) | | 07/31/28 | | | 4.500 | | | | 1,459,554 | | |
| | 211 | | | U.S. Foods, Inc., LIBOR 1M + 2.000%(8) | | (BB-, B3) | | 09/13/26 | | | 2.087 | | | | 207,630 | | |
| | 690 | | | United Natural Foods, Inc.,
LIBOR 1M + 3.500%(8) | | (BB-, B1) | | 10/22/25 | | | 3.587 | | | | 691,316 | | |
| | | | 2,540,944 | | |
| Gaming (0.3%) | | | |
| | 944 | | | CBAC Borrower LLC, LIBOR 1M + 4.000%(4),(8) | | (B-, Caa2) | | 07/08/24 | | | 4.087 | | | | 934,298 | | |
| | 329 | | | Golden Nugget, Inc., LIBOR 2M + 2.500%(8) | | (B, B2) | | 10/04/23 | | | 3.250 | | | | 327,822 | | |
| | | | 1,262,120 | | |
| Gas Distribution (0.5%) | | | |
| | 1,000 | | | AL NGPL Holdings LLC, LIBOR 3M + 3.750%(8) | | (B+, Ba3) | | 04/14/28 | | | 4.750 | | | | 1,004,375 | | |
| | 1,307 | | | Traverse Midstream Partners LLC
LIBOR 3M + 4.250%(8) | | (B, B3) | | 09/27/24 | | | 5.250 | | | | 1,309,411 | | |
| | | | 2,313,786 | | |
| Health Facilities (1.0%) | | | |
| | 998 | | | Insulet Corp., LIBOR 1M + 3.250%(8) | | (B+, Ba3) | | 05/04/28 | | | 3.750 | | | | 1,000,308 | | |
| | 1,990 | | | Loire Finco Luxembourg Sarl,
LIBOR 1M + 3.750%(8) | | (B, B3) | | 04/21/27 | | | 4.500 | | | | 1,986,291 | | |
| | 1,000 | | | Medline Industries, Inc.(10) | | (B+, B1) | | 10/23/28 | | | 0.000 | | | | 1,001,875 | | |
| | 103 | | | Western Dental Services, Inc.,
(Delayed Draw Term Loan),
LIBOR 1M + 4.500%(8),(11) | | (B-, B3) | | 08/11/28 | | | 5.250 | | | | 102,955 | | |
| | 1,006 | | | Western Dental Services, Inc., (Term Loan B),
LIBOR 1M + 4.500%(8) | | (B-, B3) | | 08/11/28 | | | 5.250 | | | | 1,008,967 | | |
| | | | 5,100,396 | | |
| Health Services (0.2%) | | | |
| | 1,000 | | | Electron BidCo, Inc.(10) | | (B, B1) | | 11/01/28 | | | 0.000 | | | | 1,000,125 | | |
| Health Services (5.4%) | | | |
| | 1,292 | | | ADMI Corp., LIBOR 1M + 3.125%(8) | | (B, B2) | | 12/23/27 | | | 3.625 | | | | 1,284,202 | | |
| | 769 | | | Agiliti Health, Inc., LIBOR 1M + 2.750%(5),(8) | | (B+, B1) | | 01/04/26 | | | 3.500 | | | | 768,929 | | |
See Accompanying Notes to Financial Statements.
25
Credit Suisse Strategic Income Fund
Schedule of Investments (continued)
October 31, 2021
Par
(000) | |
| | Ratings†
(S&P/Moody's) | | Maturity | | Rate% | | Value | |
| BANK LOANS (continued) | | | |
Health Services | | | |
$ | 1,023 | | | Agiliti Health, Inc., LIBOR 1M + 2.750%(5),(8) | | (B+, B1) | | 01/04/26 | | | 2.875 | | | $ | 1,022,206 | | |
| | 2,245 | | | Athenahealth, Inc., LIBOR 3M + 4.250%(8) | | (B, B2) | | 02/11/26 | | | 4.377 | | | | 2,255,038 | | |
| | 1,139 | | | ATI Holdings Acquisition, Inc.(10) | | (B-, B3) | | 05/10/23 | | | 0.000 | | | | 1,076,968 | | |
| | 317 | | | Carestream Health, Inc., LIBOR 6M + 6.750%(8) | | (B-, B1) | | 05/08/23 | | | 7.750 | | | | 318,757 | | |
| | 653 | | | CHG Healthcare Services, Inc.,
LIBOR 3M + 3.500%(8) | | (B, B1) | | 09/29/28 | | | 4.000 | | | | 653,945 | | |
| | 2,452 | | | KUEHG Corp., LIBOR 3M + 3.750%(8) | | (CCC+, B3) | | 02/21/25 | | | 4.750 | | | | 2,433,924 | | |
| | 1,711 | | | Learning Care Group, Inc., LIBOR 3M + 3.250%(8) | | (CCC+, B3) | | 03/13/25 | | | 4.250 | | | | 1,693,530 | | |
| | 1,995 | | | MedAssets Software Intermediate
Holdings, Inc., LIBOR 3M + 3.750%(8) | | (B-, B2) | | 01/28/28 | | | 4.500 | | | | 1,999,678 | | |
| | 160 | | | Medical Solutions L.L.C.(10) | | (B, B1) | | 10/05/28 | | | 0.000 | | | | 160,300 | | |
| | 840 | | | Medical Solutions L.L.C.(10) | | (B, B1) | | 10/07/28 | | | 0.000 | | | | 841,575 | | |
| | 971 | | | Navicure, Inc., LIBOR 1M + 4.000%(8) | | (B-, B2) | | 10/22/26 | | | 4.087 | | | | 973,233 | | |
| | 998 | | | Pacific Dental Services LLC,
LIBOR 1M + 3.250%(8) | | (B, B1) | | 05/05/28 | | | 4.000 | | | | 1,001,869 | | |
| | 1,489 | | | PetVet Care Centers LLC, LIBOR 1M + 3.500%(8) | | (B, B2) | | 02/14/25 | | | 4.250 | | | | 1,489,077 | | |
| | 1,990 | | | PPD, Inc., LIBOR 1M + 2.000%(8) | | (BB-, Ba2) | | 01/13/28 | | | 2.500 | | | | 1,989,075 | | |
| | 500 | | | Radiology Partners, Inc.,
LIBOR 1M + 4.250%(8) | |
(B-, B2) | |
07/09/25 | | | 4.334 -
4.336 | | | | 500,035 | | |
| | 295 | | | SCP Eye Care Services LLC,
LIBOR 3M + 4.500%(5),(8),(11) | | (B-, B3) | | 03/16/28 | | | 4.500 | | | | 296,193 | | |
| | 1,700 | | | SCP Eye Care Services LLC,
LIBOR 6M + 4.500%(5),(8) | | (B-, B3) | | 03/16/28 | | | 5.250 | | | | 1,704,535 | | |
| | 254 | | | Therapy Brands Holdings LLC,
LIBOR 3M + 4.000%(5),(8),(11) | | (B-, B2) | | 05/12/28 | | | 4.000 | | | | 254,237 | | |
| | 996 | | | Therapy Brands Holdings LLC,
LIBOR 3M + 4.000%(5),(8) | | (B-, B2) | | 05/18/28 | | | 4.750 | | | | 995,763 | | |
| | 434 | | | TTF Holdings LLC, LIBOR 1M + 4.000%(5),(8) | | (B+, B2) | | 03/24/28 | | | 4.750 | | | | 435,192 | | |
| | 2,161 | | | U.S. Radiology Specialists, Inc.,
LIBOR 3M + 5.500%(8) | | (B-, B3) | | 12/10/27 | | | 6.250 | | | | 2,172,465 | | |
| | | | 26,320,726 | | |
| Insurance Brokerage (1.5%) | | | |
| | 398 | | | Acrisure LLC, LIBOR 3M + 3.500%(8) | | (B, B2) | | 02/15/27 | | | 3.632 | | | | 393,489 | | |
| | 895 | | | Alliant Holdings Intermediate LLC,
LIBOR 1M + 3.750%(8) | | (B, B2) | | 11/05/27 | | | 4.250 | | | | 895,113 | | |
| | 1,291 | | | Alliant Holdings Intermediate, LLC(10) | | (B, B2) | | 11/19/27 | | | 0.000 | | | | 1,290,282 | | |
| | 497 | | | AssuredPartners, Inc., LIBOR 1M + 3.500%(8) | | (B, B1) | | 02/12/27 | | | 3.587 | | | | 494,775 | | |
| | 1,869 | | | NFP Corp., LIBOR 1M + 3.250%(8) | | (B, B1) | | 02/15/27 | | | 3.337 | | | | 1,848,974 | | |
| | 2,569 | | | Ryan Specialty Group LLC,
LIBOR 1M + 3.000%(8) | | (BB-, B1) | | 09/01/27 | | | 3.750 | | | | 2,576,076 | | |
| | | | 7,498,709 | | |
| Investments & Misc. Financial Services (2.7%) | | | |
| | 1,493 | | | AlixPartners, LLP, LIBOR 1M + 2.750%(8) | | (B+, B1) | | 02/04/28 | | | 3.250 | | | | 1,489,239 | | |
| | 436 | | | Altisource Solutions Sarl,
LIBOR 3M + 4.000%(4),(8) | | (CCC-, Caa1) | | 04/03/24 | | | 5.000 | | | | 388,875 | | |
See Accompanying Notes to Financial Statements.
26
Credit Suisse Strategic Income Fund
Schedule of Investments (continued)
October 31, 2021
Par
(000) | |
| | Ratings†
(S&P/Moody's) | | Maturity | | Rate% | | Value | |
| BANK LOANS (continued) | | | |
Investments & Misc. Financial Services | | | |
$ | 1,000 | | | AqGen Ascensus, Inc., LIBOR 3M + 6.500%(8) | | (CCC, Caa2) | | 08/02/29 | | | 7.000 | | | $ | 1,000,000 | | |
| | 1,286 | | | AqGen Island Holdings, Inc.,
LIBOR 3M + 3.500%(8) | | (B-, B2) | | 08/02/28 | | | 4.000 | | | | 1,284,071 | | |
| | 374 | | | Ditech Holding Corp.(2),(6) | | (NR, NR) | | 06/30/22 | | | 0.000 | | | | 74,955 | | |
| | 918 | | | Focus Financial Partners LLC,
LIBOR 1M + 2.000%(8) | | (BB-, Ba3) | | 07/03/24 | | | 2.087 | | | | 913,738 | | |
| | 200 | | | HighTower Holdings LLC,
LIBOR 3M + 4.000%(8),(11) | | (B-, B2) | | 04/21/28 | | | 4.000 | | | | 200,600 | | |
| | 1,550 | | | HighTower Holdings LLC, LIBOR 3M + 4.000%(8) | | (B-, B2) | | 04/21/28 | | | 4.750 | | | | 1,554,650 | | |
| | 2,607 | | | Hudson River Trading LLC,
LIBOR 1M + 3.000%(8) | | (BB-, Ba2) | | 03/20/28 | | | 3.087 | | | | 2,595,540 | | |
| | 1,115 | | | Jane Street Group LLC, LIBOR 1M + 2.750%(8) | | (BB-, Ba2) | | 01/26/28 | | | 2.837 | | | | 1,105,186 | | |
| | 403 | | | Kestra Advisor Services Holdings A, Inc.,
LIBOR 1M + 4.250%(8) | | (B, B3) | | 06/03/26 | | | 4.340 | | | | 402,347 | | |
| | 125 | | | Mariner Wealth Advisors LLC(5),(10),(11) | | (B, B1) | | 08/18/28 | | | 1.875 | | | | 124,688 | | |
| | 875 | | | Mariner Wealth Advisors LLC,
LIBOR 3M + 3.250%(5),(8) | | (B, B1) | | 08/18/28 | | | 3.750 | | | | 872,812 | | |
| | 1,359 | | | VFH Parent LLC, LIBOR 1M + 3.000%(8) | | (B+, Ba3) | | 03/01/26 | | | 3.089 | | | | 1,358,177 | | |
| | | | 13,364,878 | | |
| Machinery (1.6%) | | | |
| | 960 | | | Alliance Laundry Systems LLC,
LIBOR 3M + 3.500%(8) | | (B, B2) | | 10/08/27 | | | 4.250 | | | | 962,807 | | |
| | 346 | | | ASP Blade Holdings, Inc.(10) | | (B-, B1) | | 10/13/28 | | | 0.000 | | | | 347,000 | | |
| | 229 | | | CMBF LLC, LIBOR 3M + 3.000%(5),(8),(11) | | (B, B3) | | 08/02/28 | | | 3.000 | | | | 228,784 | | |
| | 771 | | | CMBF LLC, LIBOR 1M + 6.000%(5),(8) | | (B, B3) | | 08/02/28 | | | 6.500 | | | | 768,716 | | |
| | 285 | | | CPM Holdings, Inc., LIBOR 1M + 3.500%(8) | | (B-, B2) | | 11/17/25 | | | 3.582 | | | | 284,586 | | |
| | 197 | | | CPM Holdings, Inc., LIBOR 1M + 8.250%(4),(8) | | (CCC+, Caa2) | | 11/15/26 | | | 8.332 | | | | 195,476 | | |
| | 411 | | | LTI Holdings, Inc., LIBOR 1M + 6.750%(4),(8) | | (CCC+, Caa2) | | 09/06/26 | | | 6.837 | | | | 411,074 | | |
| | 1,460 | | | LTI Holdings, Inc., LIBOR 1M + 3.500%(8) | | (B-, B2) | | 09/06/25 | | | 3.587 | | | | 1,444,691 | | |
| | 996 | | | Penn Engineering & Manufacturing Corp.,
LIBOR 1M + 2.500%(5),(8) | | (BB-, B1) | | 06/27/24 | | | 3.500 | | | | 998,712 | | |
| | 167 | | | Pro Mach Group, Inc., (Delayed Draw Term Loan),
LIBOR 3M + 4.000%(8),(11) | | (B-, B2) | | 08/31/28 | | | 5.000 | | | | 168,233 | | |
| | 1,030 | | | Pro Mach Group, Inc., (Term Loan B),
LIBOR 3M + 4.000%(8) | | (B-, B2) | | 08/31/28 | | | 5.000 | | | | 1,036,312 | | |
| | 1,000 | | | Welbilt, Inc., LIBOR 1M + 2.500%(8) | | (B-, B2) | | 10/23/25 | | | 2.587 | | | | 997,500 | | |
| | | | 7,843,891 | | |
| Managed Care (0.4%) | | | |
| | 1,872 | | | Inovalon Holdings, Inc., LIBOR 1M + 2.750%(8) | | (B+, B2) | | 04/02/25 | | | 2.875 | | | | 1,872,250 | | |
| Media - Diversified (0.1%) | |
| | 969 | | | Diamond Sports Group LLC,
LIBOR 1M + 3.250%(8) | | (CCC, Caa1) | | 08/24/26 | | | 3.340 | | | | 516,110 | | |
| Medical Products (1.7%) | | | |
| | 1,526 | | | ABB Concise Optical Group LLC,
LIBOR 3M + 5.000%(8) | | (CCC+, B3) | | 06/15/23 | | | 6.000 | | | | 1,481,209 | | |
| | 1,489 | | | CPI Holdco LLC, LIBOR 1M + 3.750%(8) | | (B, B2) | | 11/04/26 | | | 3.837 | | | | 1,490,377 | | |
See Accompanying Notes to Financial Statements.
27
Credit Suisse Strategic Income Fund
Schedule of Investments (continued)
October 31, 2021
Par
(000) | |
| | Ratings†
(S&P/Moody's) | | Maturity | | Rate% | | Value | |
| BANK LOANS (continued) | | | |
Medical Products | | | |
$ | 1,471 | | | CryoLife, Inc., LIBOR 3M + 3.500%(8) | | (B, B1) | | 06/01/27 | | | 4.500 | | | $ | 1,475,715 | | |
| | 1,363 | | | Femur Buyer, Inc., LIBOR 3M + 4.500%(8) | | (CCC+, Caa1) | | 03/05/26 | | | 4.632 | | | | 1,283,536 | | |
| | 2,400 | | | Sotera Health Holdings LLC,
LIBOR 3M + 2.750%(8) | | (BB-, B1) | | 12/11/26 | | | 3.250 | | | | 2,393,496 | | |
| | | | 8,124,333 | | |
| Metals & Mining - Excluding Steel (0.0%) | | | |
| | 200 | | | Noranda Aluminum Acquisition Corp.(2),(5),(6) | | (NR, NR) | | 02/28/19 | | | 0.000 | | | | 300 | | |
| Packaging (0.9%) | | | |
| | 970 | | | Charter NEX U.S., Inc., LIBOR 1M + 3.750%(8) | | (B, B2) | | 12/01/27 | | | 4.500 | | | | 974,064 | | |
| | 100 | | | Flex Acquisition Co., Inc., LIBOR 3M + 3.000%(8) | | (B, B2) | | 06/29/25 | | | 3.131 | | | | 99,307 | | |
| | 498 | | | Flex Acquisition Co., Inc., LIBOR 3M + 3.500%(8) | | (B, B2) | | 02/23/28 | | | 4.000 | | | | 496,774 | | |
| | 1,561 | | | Proampac PG Borrower LLC,
LIBOR 3M + 3.750%(8) | | (B-, B2) | | 11/03/25 | | | 4.500 | | | | 1,564,419 | | |
| | 726 | | | Strategic Materials, Inc., LIBOR 3M + 3.750%(4),(8) | | (CCC, Caa3) | | 11/01/24 | | | 4.750 | | | | 654,236 | | |
| | 645 | | | Strategic Materials, Inc.,
LIBOR 3M + 7.750%(4),(5),(8) | | (CC, C) | | 10/31/25 | | | 8.750 | | | | 370,875 | | |
| | 343 | | | Technimark LLC, LIBOR 3M + 3.750%(8) | | (B-, B2) | | 06/30/28 | | | 4.250 | | | | 342,972 | | |
| | | | 4,502,647 | | |
| Packaging & Containers (0.2%) | | | |
| | 879 | | | Hyperion Insurance Group Ltd.,
LIBOR 1M + 3.250%(8) | | (B, B2) | | 11/12/27 | | | 4.000 | | | | 878,469 | | |
| Personal & Household Products (1.7%) | | | |
| | 935 | | | ABG Intermediate Holdings 2 LLC,
LIBOR 1M + 5.250%(8) | | (B, B2) | | 09/27/24 | | | 6.250 | | | | 937,386 | | |
| | 1,287 | | | ABG Intermediate Holdings 2 LLC,
LIBOR 3M + 3.250%(8) | | (B, B2) | | 09/27/24 | | | 4.000 | | | | 1,286,677 | | |
| | 1,079 | | | Anticimex International AB(10) | | (B, B2) | | 07/21/28 | | | 0.000 | | | | 1,079,414 | | |
| | 250 | | | Lakeshore Intermediate LLC,
LIBOR 3M + 3.500%(5),(8) | | (B, B2) | | 09/29/28 | | | 4.000 | | | | 250,681 | | |
| | 349 | | | MajorDrive Holdings IV LLC,
LIBOR 3M + 4.000%(8) | | (B, B2) | | 05/12/28 | | | 4.500 | | | | 349,706 | | |
| | 1,362 | | | MND Holdings III Corp.,
LIBOR 3M + 3.500%(4),(8) | | (CCC+, Caa1) | | 06/19/24 | | | 4.500 | | | | 1,320,513 | | |
| | 972 | | | Serta Simmons Bedding, LLC,
LIBOR 1M + 7.500%(8) | | (B-, Caa2) | | 08/10/23 | | | 8.500 | | | | 919,214 | | |
| | 1,983 | | | Weber-Stephen Products LLC,
LIBOR 1M + 3.250%(8) | | (BB, B1) | | 10/30/27 | | | 4.000 | | | | 1,989,420 | | |
| | | | 8,133,011 | | |
| Pharmaceuticals (0.7%) | | | |
| | 438 | | | Akorn, Inc., LIBOR 3M + 7.500%(8) | | (CCC+, Caa2) | | 10/01/25 | | | 8.500 | | | | 442,930 | | |
| | 441 | | | Bausch Health Companies, Inc.,
LIBOR 1M + 2.750%(8) | | (BB, Ba2) | | 11/27/25 | | | 2.837 | | | | 440,113 | | |
| | 381 | | | Curia Global, Inc., LIBOR 3M + 3.750%(8) | | (B, B2) | | 08/30/26 | | | 4.500 | | | | 382,141 | | |
| | 520 | | | Endo Luxembourg Finance Co. I Sarl,
LIBOR 3M + 5.000%(8) | | (B-, B3) | | 03/27/28 | | | 5.750 | | | | 508,725 | | |
See Accompanying Notes to Financial Statements.
28
Credit Suisse Strategic Income Fund
Schedule of Investments (continued)
October 31, 2021
Par
(000) | |
| | Ratings†
(S&P/Moody's) | | Maturity | | Rate% | | Value | |
| BANK LOANS (continued) | | | |
Pharmaceuticals | | | |
$ | 1,198 | | | ICON Luxembourg Sarl (Term Loan),
LIBOR 3M + 2.500%(8) | | (BB+, Ba1) | | 07/03/28 | | | 3.000 | | | $ | 1,199,311 | | |
| | 298 | | | ICON Luxembourg Sarl (Term Loan),
LIBOR 3M + 2.500%(8) | | (BB+, Ba1) | | 07/03/28 | | | 3.000 | | | | 298,809 | | |
| | | | 3,272,029 | | |
| Real Estate Development & Management (0.2%) | | | |
| | 1,215 | | | Cushman & Wakefield U.S. Borrower LLC,
LIBOR 1M + 2.750%(8) | | (BB-, Ba3) | | 08/21/25 | | | 2.837 | | | | 1,208,711 | | |
| Real Estate Investment Trusts (0.3%) | | | |
| | 712 | | | Blackstone Mortgage Trust, Inc.,
LIBOR 1M + 2.750%(5),(8) | | (B+, Ba2) | | 04/23/26 | | | 3.250 | | | | 712,300 | | |
| | 742 | | | Claros Mortgage Trust, Inc.,
LIBOR 1M + 5.000%(5),(8) | | (B+, Ba3) | | 08/09/26 | | | 6.000 | | | | 743,816 | | |
| | | | 1,456,116 | | |
| Recreation & Travel (0.9%) | | | |
| | 1,949 | | | Bulldog Purchaser, Inc., LIBOR 3M + 3.750%(8) | | (B-, B3) | | 09/05/25 | | | 3.871 | | | | 1,892,033 | | |
| | 62 | | | Crown Finance U.S., Inc., LIBOR 6M + 2.500%(8) | | (CCC, Caa2) | | 02/28/25 | | | 3.500 | | | | 51,303 | | |
| | 348 | | | Crown Finance U.S., Inc., LIBOR 3M + 2.750%(8) | | (CCC, Caa2) | | 09/30/26 | | | 3.750 | | | | 285,448 | | |
| | 874 | | | Hornblower Sub LLC, LIBOR 3M + 4.750%(8) | | (CCC-, Caa2) | | 04/27/25 | | | 5.750 | | | | 831,381 | | |
| | 1,134 | | | Hornblower Sub LLC, LIBOR 6M + 8.125%(5),(8) | | (NR, NR) | | 11/10/25 | | | 8.281 | | | | 1,193,557 | | |
| | 350 | | | Hornblower Sub LLC, LIBOR 3M + 8.125%(5),(8) | | (NR, NR) | | 11/10/25 | | | 9.125 | | | | 368,375 | | |
| | | | 4,622,097 | | |
| Restaurants (2.6%) | | | |
| | 2,987 | | | Flynn Restaurant Group LP, LIBOR 1M + 3.500%(8) | | (B, B2) | | 06/27/25 | | | 3.587 | | | | 2,954,701 | | |
| | 993 | | | IRB Holding Corp., LIBOR 3M + 3.250%(8) | | (B, B2) | | 12/15/27 | | | 4.250 | | | | 993,656 | | |
| | 2,464 | | | IRB Holding Corp., LIBOR 3M + 2.750%(8) | | (B, B2) | | 02/05/25 | | | 2.882 | | | | 2,461,004 | | |
| | 688 | | | K-Mac Holdings Corp., LIBOR 3M + 6.750%(8) | | (CCC, Caa2) | | 07/30/29 | | | 7.250 | | | | 691,657 | | |
| | 500 | | | K-Mac Holdings Corp.(10) | | (B-, B2) | | 07/21/28 | | | 0.000 | | | | 498,705 | | |
| | 479 | | | Miller's Ale House, Inc., LIBOR 1M + 4.750%(4),(8) | | (CCC+, Caa1) | | 05/30/25 | | | 4.836 | | | | 461,750 | | |
| | 1,974 | | | Tacala LLC, LIBOR 1M + 3.500%(8) | | (B-, B2) | | 02/05/27 | | | 4.250 | | | | 1,972,754 | | |
| | 375 | | | Tacala LLC, LIBOR 1M + 7.500%(8) | | (CCC, Caa2) | | 02/04/28 | | | 8.250 | | | | 375,624 | | |
| | 2,510 | | | Whatabrands LLC, LIBOR 1M + 3.250%(8) | | (B, B2) | | 08/03/28 | | | 3.750 | | | | 2,511,682 | | |
| | | | 12,921,533 | | |
| Software - Services (10.8%) | | | |
| | 1,727 | | | Applied Systems, Inc., LIBOR 3M + 3.250%(8) | | (B-, B2) | | 09/19/24 | | | 3.750 | | | | 1,726,816 | | |
| | 989 | | | Applied Systems, Inc., LIBOR 3M + 5.500%(8) | | (CCC, Caa2) | | 09/19/25 | | | 6.250 | | | | 1,004,923 | | |
| | 1,732 | | | Aston FinCo Sarl, LIBOR 1M + 4.250%(8) | | (B-, B2) | | 10/09/26 | | | 4.339 | | | | 1,724,685 | | |
| | 925 | | | Astra Acquisition Corp.(10) | | (B-, B2) | | 10/25/28 | | | 0.000 | | | | 903,031 | | |
| | 1,244 | | | Ceridian HCM Holding, Inc.,
LIBOR 1 Week + 2.500%(8) | | (B+, B1) | | 04/30/25 | | | 2.574 | | | | 1,231,042 | | |
| | 933 | | | Cloudera, Inc., LIBOR 1M + 3.750%(8) | | (B-, B2) | | 10/08/28 | | | 4.250 | | | | 933,044 | | |
| | 1,492 | | | CommerceHub, Inc., LIBOR 3M + 4.000%(8) | | (B, B2) | | 12/29/27 | | | 4.750 | | | | 1,496,065 | | |
| | 1,355 | | | DCert Buyer, Inc., LIBOR 1M + 4.000%(8) | | (B-, B2) | | 10/16/26 | | | 4.087 | | | | 1,357,024 | | |
| | 686 | | | EAB Global, Inc., LIBOR 6M + 3.500%(8) | | (B-, B2) | | 08/16/28 | | | 4.000 | | | | 683,563 | | |
See Accompanying Notes to Financial Statements.
29
Credit Suisse Strategic Income Fund
Schedule of Investments (continued)
October 31, 2021
Par
(000) | |
| | Ratings†
(S&P/Moody's) | | Maturity | | Rate% | | Value | |
| BANK LOANS (continued) | | | |
Software - Services | | | |
$ | 884 | | | Emerald TopCo, Inc., LIBOR 1M + 3.500%,
LIBOR 3M + 3.500%(8) | | (B, B2) | | 07/24/26 | | | 3.587 -
3.629 | | | $ | 878,446 | | |
| | 600 | | | Epicor Software Corp., LIBOR 1M + 7.750%(8) | | (CCC, Caa2) | | 07/31/28 | | | 8.750 | | | | 617,700 | | |
| | 2,181 | | | Epicor Software Corp., LIBOR 1M + 3.250%(8) | | (B-, B2) | | 07/30/27 | | | 4.000 | | | | 2,181,201 | | |
| | 3,764 | | | Finastra U.S.A., Inc., LIBOR 6M + 3.500%(8) | | (B-, B2) | | 06/13/24 | | | 4.500 | | | | 3,750,207 | | |
| | 2,140 | | | Finastra U.S.A., Inc., LIBOR 3M + 7.250%(8) | | (CCC, Caa2) | | 06/13/25 | | | 8.250 | | | | 2,145,427 | | |
| | 738 | | | First Advantage Holdings LLC,
LIBOR 1M + 2.750%(8) | | (BB-, B1) | | 01/31/27 | | | 2.837 | | | | 737,729 | | |
| | 2,484 | | | Flexera Software LLC, LIBOR 3M + 3.750%(8) | | (B-, B1) | | 03/03/28 | | | 4.500 | | | | 2,489,661 | | |
| | 1,250 | | | GHX Ultimate Parent Corp.(10) | | (B, B2) | | 06/28/24 | | | 0.000 | | | | 1,250,000 | | |
| | 1,861 | | | Huskies Parent, Inc., PRIME + 3.000%(8) | | (B-, B2) | | 07/31/26 | | | 6.250 | | | | 1,861,308 | | |
| | 972 | | | Hyland Software, Inc., LIBOR 1M + 3.500%(8) | | (B-, B1) | | 07/01/24 | | | 4.250 | | | | 974,467 | | |
| | 429 | | | IGT Holding IV AB, LIBOR 3M + 3.750%(8) | | (B, B2) | | 03/31/28 | | | 4.250 | | | | 429,993 | | |
| | 250 | | | MA FinanceCo. LLC, LIBOR 3M + 4.250%(8) | | (BB-, B1) | | 06/05/25 | | | 5.250 | | | | 252,105 | | |
| | 323 | | | MA FinanceCo. LLC, LIBOR 1M + 2.750%(8) | | (BB-, B1) | | 06/21/24 | | | 2.837 | | | | 321,080 | | |
| | 500 | | | Mitchell International, Inc., LIBOR 1M + 3.750%(8) | | (B-, B2) | | 10/15/28 | | | 4.250 | | | | 496,265 | | |
| | 1,205 | | | Newport Group, Inc., LIBOR 3M + 3.500%(8) | | (B, B2) | | 09/13/25 | | | 3.632 | | | | 1,203,297 | | |
| | 3,186 | | | Polaris Newco LLC, LIBOR 3M + 4.000%(8) | | (B-, B2) | | 06/02/28 | | | 4.500 | | | | 3,197,573 | | |
| | 2,722 | | | Project Alpha Intermediate Holding, Inc.,
LIBOR 1M + 4.000%(8) | | (B, B3) | | 04/26/24 | | | 4.090 | | | | 2,722,609 | | |
| | 1,097 | | | Project Boost Purchaser, LLC,
LIBOR 1M + 3.500%(8) | | (B-, B2) | | 06/01/26 | | | 3.587 | | | | 1,092,028 | | |
| | 481 | | | Project Ruby Ultimate Parent Corp.,
LIBOR 1M + 3.250%(8) | | (B, B2) | | 03/03/28 | | | 4.000 | | | | 481,218 | | |
| | 2,379 | | | Proofpoint, Inc., LIBOR 3M + 3.250%(8) | | (B-, B2) | | 08/31/28 | | | 3.750 | | | | 2,371,697 | | |
| | 2,000 | | | RealPage, Inc., LIBOR 1M + 3.250%(8) | | (B, B2) | | 04/24/28 | | | 3.750 | | | | 1,998,180 | | |
| | 2,083 | | | Redstone Buyer LLC, LIBOR 3M + 4.750%(8) | | (B, B1) | | 04/27/28 | | | 5.500 | | | | 2,007,491 | | |
| | 2,184 | | | Seattle Spinco, Inc., LIBOR 1M + 2.750%(8) | | (BB-, B1) | | 06/21/24 | | | 2.837 | | | | 2,168,356 | | |
| | 632 | | | SkillSoft Corp., LIBOR 3M + 4.750%(8) | | (B-, B2) | | 06/30/28 | | | 5.500 | | | | 637,062 | | |
| | 2,409 | | | The Ultimate Software Group, Inc.,
LIBOR 1M + 3.750%(8) | | (B-, B1) | | 05/04/26 | | | 3.837 | | | | 2,415,701 | | |
| | 1,000 | | | TPG VIII Elf Purchaser, LLC(5),(10) | | (B+, B1) | | 10/14/28 | | | 0.000 | | | | 1,000,625 | | |
| | 1,685 | | | Virtusa Corp., LIBOR 1M + 3.750%(8) | | (B+, B2) | | 02/11/28 | | | 4.500 | | | | 1,694,538 | | |
| | 417 | | | VS Buyer LLC, LIBOR 1M + 3.000%(8) | | (B, B1) | | 02/28/27 | | | 3.087 | | | | 416,181 | | |
| | | | 52,852,338 | | |
| Specialty Retail (0.6%) | | | |
| | 849 | | | EG America LLC, LIBOR 3M + 4.000%(8) | | (B-, B3) | | 02/07/25 | | | 4.132 | | | | 847,388 | | |
| | 1,495 | | | Mister Car Wash Holdings, Inc.,
LIBOR 1M + 3.000%(8) | | (B, B2) | | 05/14/26 | | | 3.089 | | | | 1,493,039 | | |
| | 741 | | | Restoration Hardware, Inc.(10) | | (BB, Ba2) | | 10/20/28 | | | 0.000 | | | | 741,356 | | |
| | | | 3,081,783 | | |
| Steel Producers/Products (0.1%) | | | |
| | 368 | | | Grinding Media, Inc., LIBOR 3M + 4.000%(8) | | (B, B2) | | 10/12/28 | | | 4.122 | | | | 369,823 | | |
See Accompanying Notes to Financial Statements.
30
Credit Suisse Strategic Income Fund
Schedule of Investments (continued)
October 31, 2021
Par
(000) | |
| | Ratings†
(S&P/Moody's) | | Maturity | | Rate% | | Value | |
| BANK LOANS (continued) | | | |
| Support - Services (2.5%) | | | |
$ | 864 | | | APFS Staffing Holdings, Inc.,
LIBOR 1M + 4.750%(8) | | (B, B2) | | 04/15/26 | | | 4.837 | | | $ | 863,504 | | |
| | 995 | | | Belfor Holdings, Inc., LIBOR 1M + 4.000%(5),(8) | | (B, B1) | | 04/06/26 | | | 4.087 | | | | 999,886 | | |
| | 2,385 | | | Change Healthcare Holdings LLC,
LIBOR 1M + 2.500%(8) | | (B+, B1) | | 03/01/24 | | | 3.500 | | | | 2,385,899 | | |
| | 299 | | | LaserShip, Inc.(10) | | (CCC, Caa2) | | 05/07/29 | | | 0.000 | | | | 301,871 | | |
| | 1,500 | | | LaserShip, Inc., LIBOR 3M + 4.500%(8) | | (B-, B2) | | 05/07/28 | | | 5.250 | | | | 1,504,695 | | |
| | 438 | | | Osmose Utilities Services, Inc.,
LIBOR 1M + 3.250%(8) | | (B, B2) | | 06/23/28 | | | 3.750 | | | | 437,385 | | |
| | 959 | | | Pike Corp., LIBOR 1M + 3.000%(8) | | (B, Ba3) | | 01/21/28 | | | 3.090 | | | | 958,684 | | |
| | 995 | | | Protective Industrial Products, Inc.,
LIBOR 1 Week + 3.750%(8) | | (B-, B2) | | 01/20/28 | | | 4.500 | | | | 996,557 | | |
| | 327 | | | USS Ultimate Holdings, Inc.,
LIBOR 1M + 7.750%(4),(8) | | (CCC, Caa1) | | 08/25/25 | | | 8.750 | | | | 328,500 | | |
| | 2,386 | | | White Cap Buyer LLC, LIBOR 1M + 4.000%(8) | | (B, B2) | | 10/19/27 | | | 4.500 | | | | 2,394,593 | | |
| | 1,214 | | | Wrench Group LLC, LIBOR 3M + 4.000%(5),(8) | | (B-, B2) | | 04/30/26 | | | 4.132 | | | | 1,212,986 | | |
| | | | 12,384,560 | | |
| Tech Hardware & Equipment (0.6%) | | | |
| | 588 | | | CommScope, Inc., LIBOR 1M + 3.250%(8) | | (B, Ba3) | | 04/06/26 | | | 3.337 | | | | 581,530 | | |
| | 998 | | | Ingram Micro, Inc., LIBOR 3M + 3.500%(8) | | (BB-, B1) | | 06/30/28 | | | 4.000 | | | | 1,000,991 | | |
| | 1,134 | | | Ultra Clean Holdings, Inc., LIBOR 1M + 3.750%(8) | | (B+, B1) | | 08/27/25 | | | 3.837 | | | | 1,137,281 | | |
| | | | 2,719,802 | | |
| Telecom - Wireless (0.4%) | | | |
| | 1,987 | | | Eagle Broadband Investments LLC,
LIBOR 3M + 3.000%(8) | | (B+, B2) | | 11/12/27 | | | 3.750 | | | | 1,989,982 | | |
| Telecom - Wireline Integrated & Services (1.4%) | | | |
| | 480 | | | Altice Financing S.A., LIBOR 3M + 2.750%(8) | | (B, B2) | | 01/31/26 | | | 2.874 | | | | 471,471 | | |
| | 500 | | | Altice France S.A.(10) | | (B, B2) | | 08/14/26 | | | 0.000 | | | | 498,250 | | |
| | 1,466 | | | Altice France S.A., LIBOR 3M + 3.688%(8) | | (B, B2) | | 01/31/26 | | | 3.811 | | | | 1,452,294 | | |
| | 1,404 | | | CenturyLink, Inc., LIBOR 1M + 2.250%(8) | | (BBB-, Ba3) | | 03/15/27 | | | 2.337 | | | | 1,388,723 | | |
| | 764 | | | Cologix, Inc., LIBOR 1M + 3.750%(8) | | (B, B2) | | 05/01/28 | | | 4.500 | | | | 766,627 | | |
| | 323 | | | GTT Communications, Inc.(2) | | (CCC-, NR) | | 05/31/25 | | | 0.000 | | | | 275,991 | | |
| | 497 | | | Numericable Group S.A., LIBOR 3M + 2.750%(8) | | (B, B2) | | 07/31/25 | | | 2.879 | | | | 490,089 | | |
| | 949 | | | TVC Albany, Inc., LIBOR 1M + 3.500%(8) | | (B-, B2) | | 07/23/25 | | | 3.590 | | | | 940,259 | | |
| | 438 | | | TVC Albany, Inc., LIBOR 1M + 7.500%(4),(5),(8) | | (CCC, Caa2) | | 07/23/26 | | | 7.590 | | | | 425,469 | | |
| | | | 6,709,173 | | |
| Theaters & Entertainment (2.3%) | | | |
| | 2,704 | | | Metro-Goldwyn-Mayer, Inc.,
LIBOR 1M + 4.500%(8) | | (CCC+, B3) | | 07/03/26 | | | 5.500 | | | | 2,713,528 | | |
| | 900 | | | Technicolor S.A., LIBOR 3M + 2.750%
Cash, 3.000% PIK(8),(9) | | (CCC, Caa3) | | 12/31/24 | | | 5.900 | | | | 883,914 | | |
| | 313 | | | Technicolor S.A.
(Incremental New Money Term Loan),
LIBOR 6M + 6.000% Cash, 6.000% PIK(5),(8),(9) | | (B, Caa1) | | 06/30/24 | | | 12.500 | | | | 336,410 | | |
See Accompanying Notes to Financial Statements.
31
Credit Suisse Strategic Income Fund
Schedule of Investments (continued)
October 31, 2021
Par
(000) | |
| | Ratings†
(S&P/Moody's) | | Maturity | | Rate% | | Value | |
| BANK LOANS (continued) | | | |
Theaters & Entertainment | | | |
$ | 971 | | | Technicolor S.A. (New Money Term Loan),
LIBOR 6M + 6.000% Cash, 6.000% PIK(5),(8),(9) | | (B, Caa1) | | 06/30/24 | | | 12.500 | | | $ | 1,044,003 | | |
| | 168 | | | TopGolf International, Inc.,
LIBOR 3M + 6.250%(5),(8) | | (B-, B3) | | 02/08/26 | | | 7.000 | | | | 171,394 | | |
| | 2,685 | | | UFC Holdings LLC, LIBOR 6M + 2.750%(8) | | (B, B2) | | 04/29/26 | | | 3.500 | | | | 2,673,106 | | |
| | 3,437 | | | William Morris Endeavor Entertainment LLC,
LIBOR 1M + 2.750%(8) | | (B, B3) | | 05/18/25 | | | 2.840 | | | | 3,378,503 | | |
| | | | 11,200,858 | | |
Trucking & Delivery (0.6%) | | | |
| | 1,247 | | | American Trailer World Corp.,
LIBOR 1M + 3.750%(8) | | (B, B3) | | 03/03/28 | | | 4.500 | | | | 1,243,371 | | |
| | 1,963 | | | Transplace Holdings, Inc., LIBOR 6M + 3.750%(4),(8) | | (B-, B1) | | 10/07/24 | | | 4.750 | | | | 1,964,059 | | |
| | | | 3,207,430 | | |
| TOTAL BANK LOANS (Cost $276,617,044) | | | 275,708,347 | | |
| ASSET BACKED SECURITIES (3.9%) | | | |
| Collateralized Debt Obligations (3.9%) | | | |
| | 1,000 | | | ALM Ltd., 2020 1A D, Rule 144A,
LIBOR 3M + 6.000%(1),(8) | | (BB-, NR) | | 10/15/29 | | | 6.124 | | | | 1,000,306 | | |
| | 1,350 | | | Anchorage Capital CLO 15 Ltd., 2020-15A,
Rule 144A, LIBOR 3M + 7.400%(1),(8) | | (NR, Ba3) | | 07/20/34 | | | 7.532 | | | | 1,351,068 | | |
| | 1,000 | | | Anchorage Capital CLO 21 Ltd., 2021-21A,
Rule 144A, LIBOR 3M + 7.350%(1),(8) | | (NR, Ba3) | | 10/20/34 | | | 7.487 | | | | 993,786 | | |
| | 1,000 | | | Battalion CLO XV Ltd., 2020-15A, Rule 144A,
LIBOR 3M + 6.350%(1),(8) | | (BB-, NR) | | 01/17/33 | | | 6.472 | | | | 1,000,466 | | |
| | 1,000 | | | BlueMountain CLO Ltd., 2016-2, Rule 144A,
LIBOR 3M + 4.300%(1),(8) | | (BBB-, NR) | | 08/20/32 | | | 4.431 | | | | 998,795 | | |
| | 750 | | | BlueMountain Fuji U.S. CLO III Ltd., 2017-3A,
Rule 144A, LIBOR 3M + 5.200%(1),(8) | | (BB-, NR) | | 01/15/30 | | | 5.324 | | | | 719,721 | | |
| | 750 | | | Carlyle Global Market Strategies CLO Ltd.,
2014-3RA, Rule 144A, LIBOR 3M + 5.400%(1),(8) | | (B+, NR) | | 07/27/31 | | | 5.535 | | | | 694,978 | | |
| | 750 | | | CIFC Funding Ltd., 2014-1A, Rule 144A,
LIBOR 3M + 5.850%(1),(8) | | (B+, NR) | | 01/18/31 | | | 5.972 | | | | 717,979 | | |
| | 750 | | | Goldentree Loan Opportunities XI Ltd.,
2015-11A, Rule 144A, LIBOR 3M + 5.400%(1),(8) | | (NR, Ba3) | | 01/18/31 | | | 5.522 | | | | 730,795 | | |
| | 1,225 | | | Greywolf CLO V Ltd., 2015-1A, Rule 144A,
LIBOR 3M + 5.850%(1),(8) | | (B+, NR) | | 01/27/31 | | | 5.974 | | | | 1,203,841 | | |
| | 500 | | | Halcyon Loan Advisors Funding Ltd.,
2015-2A, Rule 144A(1),(4),(8) | | (NR, NR) | | 07/25/27 | | | 0.000 | | | | 12,500 | | |
| | 500 | | | KKR CLO Ltd., 20, Rule 144A,
LIBOR 3M + 5.500%(1),(8) | | (NR, Ba3) | | 10/16/30 | | | 5.622 | | | | 476,953 | | |
| | 1,000 | | | KKR CLO Ltd., Rule 144A,
LIBOR 3M + 7.110%(1),(8) | | (BB-, NR) | | 10/20/34 | | | 7.242 | | | | 988,539 | | |
| | 750 | | | KKR Financial CLO Ltd., 2013-1A, Rule 144A,
LIBOR 3M + 6.080%(1),(8) | | (NR, Ba3) | | 04/15/29 | | | 6.204 | | | | 736,224 | | |
See Accompanying Notes to Financial Statements.
32
Credit Suisse Strategic Income Fund
Schedule of Investments (continued)
October 31, 2021
Par
(000) | |
| | Ratings†
(S&P/Moody's) | | Maturity | | Rate% | | Value | |
| ASSET BACKED SECURITIES (continued) | | | |
Collateralized Debt Obligations | | | |
$ | 1,000 | | | Neuberger Berman Loan Advisers
CLO 43 Ltd., 2021-43A, Rule 144A,
LIBOR 3M + 3.100%(1),(8) | | (BBB-, NR) | | 07/17/35 | | | 3.211 | | | $ | 1,003,469 | | |
| | 1,000 | | | Oaktree CLO Ltd., 2019-4A, Rule 144A,
LIBOR 3M + 7.230%(1),(8) | | (BB-, NR) | | 10/20/32 | | | 7.362 | | | | 1,000,423 | | |
| | 1,000 | | | Octagon Investment Partners 31 LLC,
2017-1A, Rule 144A, LIBOR 3M + 6.300%(1),(8) | | (NR, Ba3) | | 07/20/30 | | | 6.432 | | | | 993,852 | | |
| | 500 | | | Shackleton CLO Ltd., 2014-6RA, Rule 144A,
LIBOR 3M + 2.970%(1),(8) | | (NR, Baa2) | | 07/17/28 | | | 3.092 | | | | 500,441 | | |
| | 1,000 | | | Silver Creek CLO Ltd., 2014-1A, Rule 144A,
LIBOR 3M + 3.350%(1),(8) | | (NR, Baa3) | | 07/20/30 | | | 3.482 | | | | 999,560 | | |
| | 500 | | | Venture CLO Ltd., 2018-35A, Rule 144A,
LIBOR 3M + 3.500%(1),(8) | | (NR, Baa3) | | 10/22/31 | | | 3.628 | | | | 483,791 | | |
| | 500 | | | Venture XXVIII CLO Ltd., 2017-28A,
Rule 144A, LIBOR 3M + 6.150%(1),(8) | | (NR, Ba3) | | 07/20/30 | | | 6.282 | | | | 465,934 | | |
| | 750 | | | Vibrant CLO VI Ltd., 2017-6A, Rule 144A,
LIBOR 3M + 5.750%(1),(8) | | (NR, B1) | | 06/20/29 | | | 5.872 | | | | 680,464 | | |
| | 500 | | | Voya CLO Ltd., 2014-4A, Rule 144A,
LIBOR 3M + 3.350%(1),(8) | | (BBB-, NR) | | 07/14/31 | | | 3.477 | | | | 482,255 | | |
| | 750 | | | Wind River CLO Ltd., 2015-2A, Rule 144A,
LIBOR 3M + 5.550%(1),(8) | | (NR, Ba2) | | 10/15/27 | | | 5.674 | | | | 747,913 | | |
| TOTAL ASSET BACKED SECURITIES (Cost $19,720,731) | | | 18,984,053 | | |
Number of
Shares | |
| |
| |
| |
| |
| |
| COMMON STOCKS (2.6%) | | | |
| Auto Parts & Equipment (0.0%) | |
| | 11,414 | | | Jason Group, Inc.(6) | | | | | | | | | | | | | | | 119,849 | | |
| Building & Construction (0.0%) | |
| | 2 | | | White Forest Resources, Inc.(3),(5),(6) | | | | | | | | | | | | | | | — | | |
| Cable & Satellite TV (0.2%) | |
| | 54,000 | | | Altice U.S.A., Inc., Class A(6) | | | | | | | | | | | | | | | 880,200 | | |
| Chemicals (0.1%) | |
| | 1,512 | | | Project Investor Holdings LLC(3),(4),(5),(6) | | | | | | | | | | | | | | | 15 | | |
| | 25,202 | | | Proppants Holdings LLC(3),(4),(5),(6) | | | | | | | | | | | | | | | 252 | | |
| | 6,341 | | | UTEX Industries, Inc.(6) | | | | | | | | | | | | | | | 304,368 | | |
| | | | 304,635 | | |
| Energy - Exploration & Production (0.1%) | |
| | 53,197 | | | Patterson-UTI Energy, Inc.(6) | | | | | | | | | | | | | | | 455,366 | | |
| | 37,190 | | | PES Energy, Inc.(3),(4),(5),(6) | | | | | | | | | | | | | | | 372 | | |
| | | | 455,738 | | |
| Investments & Misc. Financial Services (1.5%) | |
| | 7,000 | | | Accelerate Acquisition Corp.(6) | | | | | | | | | | | | | | | 68,180 | | |
| | 43,189 | | | ArcLight Clean Transition Corp. II(6) | | | | | | | | | | | | | | | 421,525 | | |
| | 48,000 | | | Ares Acquisition Corp.(6),(7) | | | | | | | | | | | | | | | 472,320 | | |
See Accompanying Notes to Financial Statements.
33
Credit Suisse Strategic Income Fund
Schedule of Investments (continued)
October 31, 2021
Number of
Shares | |
| |
| |
| |
| |
Value | |
| COMMON STOCKS (continued) | | | |
Investments & Misc. Financial Services | |
| | 10,000 | | | Cartesian Growth Corp.(6) | | | | | | | | | | | | | | $ | 99,300 | | |
| | 49,770 | | | CC Neuberger Principal Holdings III(6) | | | | | | | | | | | | | | | 488,741 | | |
| | 80,000 | | | DHC Acquisition Corp.(6) | | | | | | | | | | | | | | | 781,600 | | |
| | 10,000 | | | EJF Acquisition Corp.(6) | | | | | | | | | | | | | | | 99,900 | | |
| | 90,953 | | | FTAC Hera Acquisition Corp.(6) | | | | | | | | | | | | | | | 890,430 | | |
| | 40,000 | | | Gores Holdings VII, Inc.(6) | | | | | | | | | | | | | | | 395,200 | | |
| | 35,000 | | | Gores Holdings VIII, Inc., Class A(6) | | | | | | | | | | | | | | | 342,650 | | |
| | 8,253 | | | Gores Metropoulos II, Inc.(6),(7) | | | | | | | | | | | | | | | 82,695 | | |
| | 19,603 | | | Gores Technology Partners, Inc.(6) | | | | | | | | | | | | | | | 193,874 | | |
| | 50,000 | | | Hudson Executive Investment Corp. III(6) | | | | | | | | | | | | | | | 487,500 | | |
| | 155,000 | | | KKR Acquisition Holdings I Corp.(6) | | | | | | | | | | | | | | | 1,517,450 | | |
| | 42,000 | | | Mason Industrial Technology, Inc.(6) | | | | | | | | | | | | | | | 410,340 | | |
| | 15,000 | | | Northern Star Investment Corp. IV(6) | | | | | | | | | | | | | | | 146,700 | | |
| | 30,000 | | | Pathfinder Acquisition Corp.(6) | | | | | | | | | | | | | | | 298,200 | | |
| | 10,000 | | | Pivotal Investment Corp. III(6) | | | | | | | | | | | | | | | 98,000 | | |
| | 15,000 | | | Warburg Pincus Capital l Corp.(6) | | | | | | | | | | | | | | | 146,250 | | |
| | | | 7,440,855 | | |
| Metals & Mining - Excluding Steel (0.4%) | |
| | 1,100,000 | | | Taseko Mines Ltd.(6) | | | | | | | | | | | | | | | 2,316,163 | | |
| Pharmaceuticals (0.1%) | |
| | 37,299 | | | Akorn Holding Company LLC(6) | | | | | | | | | | | | | | | 384,664 | | |
| Private Placement (0.2%) | |
| | 279,199 | | | Technicolor S.A. EUR 27.0(6),(12) | | | | | | | | | | | | | | | 896,611 | | |
| Support - Services (0.0%) | |
| | 87 | | | Sprint Industrial Holdings LLC, Class G(3),(4),(5),(6) | | | | | | | | | | | | | | | — | | |
| | 8 | | | Sprint Industrial Holdings LLC, Class H(3),(4),(5),(6) | | | | | | | | | | | | | | | — | | |
| | 19 | | | Sprint Industrial Holdings LLC, Class I(3),(4),(5),(6) | | | | | | | | | | | | | | | 100 | | |
| | | | 100 | | |
| TOTAL COMMON STOCKS (Cost $11,957,461) | | | 12,798,815 | | |
| WARRANTS (0.0%) | | | |
| Chemicals (0.0%) | |
| | 6,300 | | | Project Investor Holdings LLC,
expires 02/20/2022(3),(4),(5),(6) | | | | | | | | | | | | | | | — | | |
| Investments & Misc. Financial Services (0.0%) | |
| | 2,333 | | | Accelerate Acquisition Corp. expires 12/31/2027(6) | | | | | | | | | | | | | | | 2,263 | | |
| | 8,637 | | | ArcLight Clean Transition Corp. II expires 02/04/2023(6) | | | | | | | | | | | | | | | 10,278 | | |
| | 8,200 | | | Ares Acquisition Corp. expires 12/31/2027(6) | | | | | | | | | | | | | | | 9,922 | | |
| | 3,333 | | | Cartesian Growth Corp. expires 12/31/2027(6) | | | | | | | | | | | | | | | 4,233 | | |
| | 9,954 | | | CC Neuberger Principal Holdings III expires 12/31/2027(6) | | | | | | | | | | | | | | | 11,646 | | |
| | 26,666 | | | DHC Acquisition Corp. expires 12/31/2027(6) | | | | | | | | | | | | | | | 22,663 | | |
| | 3,333 | | | EJF Acquisition Corp. expires 02/28/2027(6) | | | | | | | | | | | | | | | 6,166 | | |
| | 22,738 | | | FTAC Hera Acquisition Corp. expires 12/31/2027(6) | | | | | | | | | | | | | | | 22,965 | | |
See Accompanying Notes to Financial Statements.
34
Credit Suisse Strategic Income Fund
Schedule of Investments (continued)
October 31, 2021
Number of
Shares | |
| |
| |
| |
| |
Value | |
| WARRANTS (continued) | | | |
Investments & Misc. Financial Services | |
| | 12,000 | | | Gores Guggenheim, Inc., expires 12/31/2027(6) | | | | | | | | | | | | | | $ | 32,400 | | |
| | 5,000 | | | Gores Holdings VII, Inc. expires 12/31/2027(6) | | | | | | | | | | | | | | | 6,200 | | |
| | 4,375 | | | Gores Holdings VIII, Inc. expires 12/31/2027(6) | | | | | | | | | | | | | | | 5,250 | | |
| | 1,650 | | | Gores Metropoulos II, Inc. expires 01/31/2028(6) | | | | | | | | | | | | | | | 3,003 | | |
| | 3,920 | | | Gores Technology Partners, Inc., expires 12/31/2027(6) | | | | | | | | | | | | | | | 4,822 | | |
| | 10,000 | | | Hudson Executive Investment Corp. III expires 12/31/2028(6) | | | | | | | | | | | | | | | 8,299 | | |
| | 38,750 | | | KKR Acquisition Holdings I Corp. expires 12/31/2027(6) | | | | | | | | | | | | | | | 37,588 | | |
| | 14,000 | | | Mason Industrial Technology, Inc. expires 12/31/2027(6) | | | | | | | | | | | | | | | 10,153 | | |
| | 2,500 | | | Northern Star Investment Corp. IV expires 12/31/2027(6) | | | | | | | | | | | | | | | 2,350 | | |
| | 6,000 | | | Pathfinder Acquisition Corp. expires 12/31/2027(6) | | | | | | | | | | | | | | | 5,700 | | |
| | 2,000 | | | Pivotal Investment Corp. III expires 12/31/2027(6) | | | | | | | | | | | | | | | 1,900 | | |
| | 3,000 | | | Warburg Pincus Capital expires 02/17/2022(6) | | | | | | | | | | | | | | | 2,700 | | |
| | | | 210,501 | | |
Recreation & Travel (0.0%) | |
| | 29,276 | | | Cineworld Group, expires 12/21/2025(6) | | | | | | | | | | | | | | | 11,360 | | |
| TOTAL WARRANTS (Cost $180,668) | | | 221,861 | | |
SHORT-TERM INVESTMENTS (7.4%) | |
| | 33,559,059 | | | State Street Institutional U.S. Government Money Market Fund —
Premier Class, 0.03% | | | | | | | | | | | | | | | 33,559,059 | | |
| | 2,821,513 | | | State Street Navigator Securities Lending Government Money
Market Portfolio, 0.03%(13) | | | | | | | | | | | | | | | 2,821,513 | | |
| TOTAL SHORT-TERM INVESTMENTS (Cost $36,380,572) | | | 36,380,572 | | |
| TOTAL INVESTMENTS AT VALUE (103.5%) (Cost $508,899,188) | | | 508,518,921 | | |
| LIABILITIES IN EXCESS OF OTHER ASSETS (-3.5%) | | | (17,114,900 | ) | |
| NET ASSETS (100.0%) | | $ | 491,404,021 | | |
† Credit ratings given by the S&P Global Ratings Division of S&P Global Inc. ("S&P") and Moody's Investors Service, Inc. ("Moody's") are unaudited.
(1) Security exempt from registration under Rule 144A of the Securities Act of 1933, as amended. These securities may be resold in transactions exempt from registration, normally to qualified institutional buyers. At October 31, 2021, these securities amounted to a value of $169,610,799 or 34.5% of net assets.
(2) Bond is currently in default.
(3) Not readily marketable security; security is valued at fair value as determined in good faith by, or under the direction of, the Board of Trustees.
(4) Illiquid security.
(5) Security is valued using significant unobservable inputs.
(6) Non-income producing security.
(7) Security or portion thereof is out on loan (See note 2-K).
(8) Variable rate obligation — The interest rate shown is the rate in effect as of October 31, 2021. The rate may be subject to a cap and floor.
See Accompanying Notes to Financial Statements.
35
Credit Suisse Strategic Income Fund
Schedule of Investments (continued)
October 31, 2021
(9) PIK: Payment-in-kind security for which part of the income earned may be paid as additional principal.
(10) The rates on certain variable rate securities are not based on a published reference rate and spread but are determined by the issuer or agent and are based on current market conditions. These securities do not indicate a reference rate and spread in their description above. The interest rate shown is the rate in effect as of October 31, 2021.
(11) All or a portion is an unfunded loan commitment (See note 2-J).
(12) Security is held through holdings of 100 shares of the CIG Special Purpose SPC — Credit Suisse Strategic Income Fund Segregated Portfolio, an affiliated entity.
(13) Represents security purchased with cash collateral received for securities on loan. The rate shown is the annualized one-day yield at October 31, 2021.
INVESTMENT ABBREVIATIONS
1M = 1 Month
2M = 2 Month
3M = 3 Month
6M = 6 Month
12M = 12 Month
LIBOR = London Interbank Offered Rate
NR = Not Rated
Sarl - société à responsabilité limitée
Forward Foreign Currency Contracts
Forward
Currency to be
Purchased (Local) | | Forward
Currency to be
Sold (Local) | | Expiration
Date | | Counterparty | | Value on
Settlement Date | | Current
Value/
Notional | | Net Unrealized
Appreciation | |
USD | 504,797 | | | CAD | 627,000 | | | 10/12/22 | | Deutsche Bank AG | | $ | (504,797 | ) | | $ | (503,937 | ) | | $ | 860 | | |
| | | $ | 860 | | |
Forward
Currency to be
Purchased (Local) | | Forward
Currency to be
Sold (Local) | | Expiration
Date | | Counterparty | | Value on
Settlement Date | | Current
Value/
Notional | | Net Unrealized
Depreciation | |
CAD | 451,000 | | | USD | 363,895 | | | 10/12/22 | | Deutsche Bank AG | | $ | 363,895 | | | $ | 362,481 | | | $ | (1,414 | ) | |
USD | 2,156,249 | | | CAD | 2,706,000 | | | 10/12/22 | | Morgan Stanley | | | (2,156,249 | ) | | | (2,174,887 | ) | | | (18,638 | ) | |
USD | 15,282 | | | GBP | 11,242 | | | 10/12/22 | | Deutsche Bank AG | | | (15,282 | ) | | | (15,347 | ) | | | (65 | ) | |
| | | $ | (20,117 | ) | |
| | | $ | (19,257 | ) | |
Currency Abbreviations:
CAD = Canadian Dollar
GBP = British Pound
USD = United States Dollar
See Accompanying Notes to Financial Statements.
36
Credit Suisse Strategic Income Fund
Statement of Assets and Liabilities
October 31, 2021
Assets | |
Investments at value, including collateral for securities on loan of $2,821,513
(Cost $508,899,188) (Note 2) | | $ | 508,518,9211 | | |
Receivable for Fund shares sold | | | 7,040,611 | | |
Receivable for investments sold | | | 6,147,635 | | |
Interest receivable | | | 3,600,710 | | |
Unrealized appreciation on forward foreign currency contracts (Note 2) | | | 860 | | |
Prepaid expenses and other assets | | | 63,952 | | |
Total assets | | | 525,372,689 | | |
Liabilities | |
Investment advisory fee payable (Note 3) | | | 256,078 | | |
Administrative services fee payable (Note 3) | | | 42,792 | | |
Shareholder servicing/Distribution fee payable (Note 3) | | | 40,674 | | |
Payable for investments purchased | | | 28,313,624 | | |
Payable upon return of securities loaned (Note 2) | | | 2,821,513 | | |
Unfunded loan commitments (Note 2) | | | 1,311,785 | | |
Payable for Fund shares redeemed | | | 858,304 | | |
Dividend payable | | | 53,956 | | |
Unrealized depreciation on forward foreign currency contracts (Note 2) | | | 20,117 | | |
Trustees' fee payable | | | 16,394 | | |
Accrued expenses | | | 233,431 | | |
Total liabilities | | | 33,968,668 | | |
Net Assets | |
Capital stock, $.001 par value (Note 6) | | | 48,532 | | |
Paid-in capital (Note 6) | | | 507,323,120 | | |
Total distributable earnings (loss) | | | (15,967,631 | ) | |
Net assets | | $ | 491,404,021 | | |
I Shares | |
Net assets | | $ | 420,435,216 | | |
Shares outstanding | | | 41,525,988 | | |
Net asset value, offering price and redemption price per share | | $ | 10.12 | | |
A Shares | |
Net assets | | $ | 31,101,709 | | |
Shares outstanding | | | 3,071,271 | | |
Net asset value and redemption price per share | | $ | 10.13 | | |
Maximum offering price per share (net asset value/(1-4.75%)) | | $ | 10.64 | | |
C Shares | |
Net assets | | $ | 39,867,096 | | |
Shares outstanding | | | 3,934,820 | | |
Net asset value, offering price and redemption price per share | | $ | 10.13 | | |
1 Includes $2,750,619 of securities on loan.
See Accompanying Notes to Financial Statements.
37
Credit Suisse Strategic Income Fund
Statement of Operations
For the Year Ended October 31, 2021
Investment Income | |
Interest | | $ | 18,112,057 | | |
Securities lending (net of rebates) | | | 9,027 | | |
Total investment income | | | 18,121,084 | | |
Expenses | |
Investment advisory fees (Note 3) | | | 3,208,814 | | |
Administrative services fees (Note 3) | | | 119,193 | | |
Shareholder servicing/Distribution fees (Note 3) | |
Class A | | | 84,435 | | |
Class C | | | 417,218 | | |
Transfer agent fees (Note 3) | | | 320,887 | | |
Registration fees | | | 71,129 | | |
Trustees' fees | | | 64,527 | | |
Custodian fees | | | 61,868 | | |
Commitment fees (Note 4) | | | 56,561 | | |
Audit and tax fees | | | 42,798 | | |
Printing fees | | | 29,940 | | |
Legal fees | | | 19,509 | | |
Insurance expense | | | 16,954 | | |
Miscellaneous expense | | | 16,284 | | |
Total expenses | | | 4,530,117 | | |
Less: fees waived and expenses reimbursed (Note 3) | | | (1,010,650 | ) | |
Net expenses | | | 3,519,467 | | |
Net investment income | | | 14,601,617 | | |
Net Realized and Unrealized Gain (Loss) from Investments, Foreign Currency and
Forward Foreign Currency Contracts | |
Net realized loss from investments | | | (586,732 | ) | |
Net realized gain from foreign currency transactions | | | 14,062 | | |
Net realized loss from forward foreign currency contracts | | | (53,760 | ) | |
Net change in unrealized appreciation (depreciation) from investments | | | 17,042,794 | | |
Net change in unrealized appreciation (depreciation) from forward foreign currency contracts | | | (34,490 | ) | |
Net realized and unrealized gain from investments, foreign currency and forward
foreign currency contracts | | | 16,381,874 | | |
Net increase in net assets resulting from operations | | $ | 30,983,491 | | |
See Accompanying Notes to Financial Statements.
38
Credit Suisse Strategic Income Fund
Statements of Changes in Net Assets
| | | For the Year
Ended
October 31, 2021 | | For the Year
Ended
October 31, 2020 | |
From Operations | |
Net investment income | | $ | 14,601,617 | | | $ | 14,985,889 | | |
Net realized loss from investments, foreign currency transactions and
forward foreign currency contracts | | | (626,430 | ) | | | (7,081,794 | ) | |
Net change in unrealized appreciation (depreciation) from investments and
forward foreign currency contracts | | | 17,008,304 | | | | (8,971,681 | ) | |
Net increase (decrease) in net assets resulting from operations | | | 30,983,491 | | | | (1,067,586 | ) | |
From Distributions | |
From distributable earnings | |
Class I | | | (12,170,148 | ) | | | (10,858,414 | ) | |
Class A | | | (1,290,771 | ) | | | (2,121,306 | ) | |
Class C | | | (1,279,536 | ) | | | (2,075,223 | ) | |
Net decrease in net assets resulting from dividends | | | (14,740,455 | ) | | | (15,054,943 | ) | |
| From Capital Share Transactions (Note 6) | |
Proceeds from sale of shares | | | 291,942,975 | | | | 124,396,241 | | |
Reinvestment of dividends | | | 14,084,105 | | | | 14,181,493 | | |
Net asset value of shares redeemed | | | (98,223,482 | ) | | | (189,181,077 | ) | |
Net increase (decrease) in net assets from capital share transactions | | | 207,803,598 | | | | (50,603,343 | ) | |
Net increase (decrease) in net assets | | | 224,046,634 | | | | (66,725,872 | ) | |
Net Assets | |
Beginning of year | | | 267,357,387 | | | | 334,083,259 | | |
End of year | | $ | 491,404,021 | | | $ | 267,357,387 | | |
See Accompanying Notes to Financial Statements.
39
Credit Suisse Strategic Income Fund
Financial Highlights
(For a Class I Share of the Fund Outstanding Throughout Each Year)
| | | For the Year Ended October 31, | |
| | | 2021 | | 2020 | | 2019 | | 2018 | | 2017 | |
Per share data | |
Net asset value, beginning of year | | $ | 9.57 | | | $ | 9.88 | | | $ | 9.96 | | | $ | 10.24 | | | $ | 9.73 | | |
INVESTMENT OPERATIONS | |
Net investment income1 | | | 0.40 | | | | 0.51 | | | | 0.53 | | | | 0.51 | | | | 0.54 | | |
Net gain (loss) from investments and foreign currency
related items (both realized and unrealized) | | | 0.56 | | | | (0.31 | ) | | | (0.08 | ) | | | (0.27 | ) | | | 0.52 | | |
Total from investment operations | | | 0.96 | | | | 0.20 | | | | 0.45 | | | | 0.24 | | | | 1.06 | | |
LESS DIVIDENDS | |
Dividends from net investment income | | | (0.41 | ) | | | (0.51 | ) | | | (0.52 | ) | | | (0.52 | ) | | | (0.53 | ) | |
Return of capital | | | — | | | | — | | | | (0.01 | ) | | | (0.00 | )2 | | | (0.02 | ) | |
Total dividends | | | (0.41 | ) | | | (0.51 | ) | | | (0.53 | ) | | | (0.52 | ) | | | (0.55 | ) | |
Net asset value, end of year | | $ | 10.12 | | | $ | 9.57 | | | $ | 9.88 | | | $ | 9.96 | | | $ | 10.24 | | |
Total return3 | | | 10.11 | % | | | 2.21 | % | | | 4.68 | % | | | 2.34 | % | | | 11.11 | % | |
RATIOS AND SUPPLEMENTAL DATA | |
Net assets, end of year (000s omitted) | | $ | 420,435 | | | $ | 190,537 | | | $ | 230,330 | | | $ | 175,189 | | | $ | 114,605 | | |
Ratio of net expenses to average net assets | | | 0.79 | % | | | 0.80 | % | | | 0.99 | % | | | 0.99 | % | | | 0.99 | % | |
Ratio of expenses to average net assets excluding
interest expense | | | 0.79 | % | | | 0.80 | % | | | 0.99 | % | | | 0.99 | % | | | 0.99 | % | |
Ratio of net investment income to average net assets | | | 3.93 | % | | | 5.33 | % | | | 5.36 | % | | | 5.08 | % | | | 5.34 | % | |
Decrease reflected in above operating expense ratios
due to waivers/reimbursements | | | 0.26 | % | | | 0.31 | % | | | 0.10 | % | | | 0.17 | % | | | 0.26 | % | |
Portfolio turnover rate4 | | | 46 | % | | | 34 | % | | | 37 | % | | | 45 | % | | | 79 | % | |
1 Per share information is calculated using the average shares outstanding method.
2 This amount represents less than $0.01 or $(0.01) per share.
3 Total returns are historical and include change in share price and reinvestment of all dividends and distributions. Had certain expenses not been reduced during the periods shown, total returns would have been lower.
4 Portfolio turnover is calculated by dividing the lesser of total purchases or sales of portfolio securities for the reporting period by the monthly average of portfolio securities owned during the reporting period. Excluded from both the numerator and denominator are amounts relating to derivatives and securities whose maturities or expiration dates at the time of acquisition were one year or less.
See Accompanying Notes to Financial Statements.
40
Credit Suisse Strategic Income Fund
Financial Highlights
(For a Class A Share of the Fund Outstanding Throughout Each Year)
| | | For the Year Ended October 31, | |
| | | 2021 | | 2020 | | 2019 | | 2018 | | 2017 | |
Per share data | |
Net asset value, beginning of year | | $ | 9.57 | | | $ | 9.88 | | | $ | 9.96 | | | $ | 10.24 | | | $ | 9.74 | | |
INVESTMENT OPERATIONS | |
Net investment income1 | | | 0.38 | | | | 0.49 | | | | 0.51 | | | | 0.49 | | | | 0.51 | | |
Net gain (loss) from investments and foreign currency
related items (both realized and unrealized) | | | 0.56 | | | | (0.31 | ) | | | (0.08 | ) | | | (0.28 | ) | | | 0.51 | | |
Total from investment operations | | | 0.94 | | | | 0.18 | | | | 0.43 | | | | 0.21 | | | | 1.02 | | |
LESS DIVIDENDS | |
Dividends from net investment income | | | (0.38 | ) | | | (0.49 | ) | | | (0.50 | ) | | | (0.49 | ) | | | (0.50 | ) | |
Return of capital | | | — | | | | — | | | | (0.01 | ) | | | (0.00 | )2 | | | (0.02 | ) | |
Total dividends | | | (0.38 | ) | | | (0.49 | ) | | | (0.51 | ) | | | (0.49 | ) | | | (0.52 | ) | |
Net asset value, end of year | | $ | 10.13 | | | $ | 9.57 | | | $ | 9.88 | | | $ | 9.96 | | | $ | 10.24 | | |
Total return3 | | | 9.95 | % | | | 1.96 | % | | | 4.42 | % | | | 2.09 | % | | | 10.71 | % | |
RATIOS AND SUPPLEMENTAL DATA | |
Net assets, end of year (000s omitted) | | $ | 31,102 | | | $ | 34,254 | | | $ | 50,343 | | | $ | 44,930 | | | $ | 36,961 | | |
Ratio of net expenses to average net assets | | | 1.04 | % | | | 1.05 | % | | | 1.24 | % | | | 1.24 | % | | | 1.24 | % | |
Ratio of expenses to average net assets excluding
interest expense | | | 1.04 | % | | | 1.05 | % | | | 1.24 | % | | | 1.24 | % | | | 1.24 | % | |
Ratio of net investment income to average net assets | | | 3.78 | % | | | 5.10 | % | | | 5.13 | % | | | 4.84 | % | | | 4.99 | % | |
Decrease reflected in above operating expense ratios
due to waivers/reimbursements | | | 0.26 | % | | | 0.31 | % | | | 0.10 | % | | | 0.17 | % | | | 0.26 | % | |
Portfolio turnover rate4 | | | 46 | % | | | 34 | % | | | 37 | % | | | 45 | % | | | 79 | % | |
1 Per share information is calculated using the average shares outstanding method.
2 This amount represents less than $0.01 or $(0.01) per share.
3 Total returns are historical and include change in share price, reinvestment of all dividends and distributions and no sales charge. Had certain expenses not been reduced during the years shown, total returns would have been lower.
4 Portfolio turnover is calculated by dividing the lesser of total purchases or sales of portfolio securities for the reporting period by the monthly average of portfolio securities owned during the reporting period. Excluded from both the numerator and denominator are amounts relating to derivatives and securities whose maturities or expiration dates at the time of acquisition were one year or less.
See Accompanying Notes to Financial Statements.
41
Credit Suisse Strategic Income Fund
Financial Highlights
(For a Class C Share of the Fund Outstanding Throughout Each Year)
| | | For the Year Ended October 31, | |
| | | 2021 | | 2020 | | 2019 | | 2018 | | 2017 | |
Per share data | |
Net asset value, beginning of year | | $ | 9.57 | | | $ | 9.88 | | | $ | 9.961 | | | $ | 10.24 | | | $ | 9.74 | | |
INVESTMENT OPERATIONS | |
Net investment income2 | | | 0.31 | | | | 0.41 | | | | 0.43 | | | | 0.41 | | | | 0.43 | | |
Net gain (loss) from investments and foreign currency
related items (both realized and unrealized) | | | 0.56 | | | | (0.31 | ) | | | (0.08 | ) | | | (0.28 | ) | | | 0.52 | | |
Total from investment operations | | | 0.87 | | | | 0.10 | | | | 0.35 | | | | 0.13 | | | | 0.95 | | |
LESS DIVIDENDS | |
Dividends from net investment income | | | (0.31 | ) | | | (0.41 | ) | | | (0.42 | ) | | | (0.41 | ) | | | (0.43 | ) | |
Return of capital | | | — | | | | — | | | | (0.01 | ) | | | (0.00 | )3 | | | (0.02 | ) | |
Total dividends | | | (0.31 | ) | | | (0.41 | ) | | | (0.43 | ) | | | (0.41 | ) | | | (0.45 | ) | |
Net asset value, end of year | | $ | 10.13 | | | $ | 9.57 | | | $ | 9.88 | | | $ | 9.961 | | | $ | 10.24 | | |
Total return4 | | | 9.13 | % | | | 1.19 | % | | | 3.64 | % | | | 1.33 | % | | | 9.88 | % | |
RATIOS AND SUPPLEMENTAL DATA | |
Net assets, end of year (000s omitted) | | $ | 39,867 | | | $ | 42,566 | | | $ | 53,410 | | | $ | 46,586 | | | $ | 31,411 | | |
Ratio of net expenses to average net assets | | | 1.79 | % | | | 1.80 | % | | | 1.99 | % | | | 1.99 | % | | | 1.99 | % | |
Ratio of expenses to average net assets excluding
interest expense | | | 1.79 | % | | | 1.80 | % | | | 1.99 | % | | | 1.99 | % | | | 1.99 | % | |
Ratio of net investment income to average net assets | | | 3.03 | % | | | 4.35 | % | | | 4.38 | % | | | 4.09 | % | | | 4.25 | % | |
Decrease reflected in above operating expense ratios
due to waivers/reimbursements | | | 0.26 | % | | | 0.31 | % | | | 0.10 | % | | | 0.17 | % | | | 0.26 | % | |
Portfolio turnover rate5 | | | 46 | % | | | 34 | % | | | 37 | % | | | 45 | % | | | 79 | % | |
1 Includes adjustments in accordance with accounting principles generally accepted in the United States of America and as such, the net asset values for financial reporting purposes and the returns based upon net asset values may differ from the net asset values and returns for shareholder transactions.
2 Per share information is calculated using the average shares outstanding method.
3 This amount represents less than $0.01 or $(0.01) per share.
4 Total returns are historical and include change in share price, reinvestment of all dividends and distributions and no sales charge. Had certain expenses not been reduced during the years shown, total returns would have been lower.
5 Portfolio turnover is calculated by dividing the lesser of total purchases or sales of portfolio securities for the reporting period by the monthly average of portfolio securities owned during the reporting period. Excluded from both the numerator and denominator are amounts relating to derivatives and securities whose maturities or expiration dates at the time of acquisition were one year or less.
See Accompanying Notes to Financial Statements.
42
Credit Suisse Strategic Income Fund
Notes to Financial Statements
October 31, 2021
Credit Suisse Strategic Income Fund (the "Fund"), a series of Credit Suisse Opportunity Funds (the "Trust"), a Delaware statutory trust, is registered under the Investment Company Act of 1940, as amended (the "1940 Act"), as a non-diversified open-end management investment company that seeks total return. The Trust was organized under the laws of the State of Delaware as a business trust on May 31, 1995.
The Fund offers three classes of shares: Class I shares, Class A shares and Class C shares. Each class of shares represents an equal pro rata interest in the Fund, except the share classes bear different expenses. Class A shares are sold subject to a front-end sales charge of up to 4.75%. Class C shares are sold subject to a contingent deferred sales charge ("CDSC") of 1.00% if the shares are redeemed within the first year of purchase. Class I shares are sold without a sales charge. Effective June 30, 2021, Class C shares, upon the eight year anniversary of purchase, will convert to Class A shares.
Note 2. Significant Accounting Policies
The following is a summary of significant accounting policies followed by the Fund in the preparation of its financial statements. The policies are in accordance with generally accepted accounting principles in the United States of America ("GAAP"). The preparation of financial statements requires management to make estimates and assumptions that affect the reported amounts and disclosures in the financial statements. Actual results could differ from those estimates. The Fund is considered an investment company for financial reporting purposes under GAAP and follows the accounting and reporting guidance in Financial Accounting Standards Board ("FASB") Accounting Standards Codification ("ASC") Topic 946 — Financial Services — Investment Companies.
A) SECURITY VALUATION — The Board of Trustees (the "Board") is responsible for the Fund's valuation process. The Board has delegated the supervision of the daily valuation process to Credit Suisse Asset Management, LLC, the Fund's investment adviser ("Credit Suisse" or the "Adviser"), who has established a Pricing Committee which, pursuant to the policies adopted by the Board, is responsible for making fair valuation determinations and overseeing the Fund's pricing policies. The net asset value of the Fund is determined daily as of the close of regular trading on the New York Stock Exchange, Inc. (the "Exchange") on each day the Exchange is open for business.
43
Credit Suisse Strategic Income Fund
Notes to Financial Statements (continued)
October 31, 2021
Note 2. Significant Accounting Policies (continued)
The valuations for fixed income securities (which may include, but are not limited to, corporate, government, municipal, mortgage-backed, collateralized mortgage obligations and asset-backed securities) and certain derivative instruments are typically the prices supplied by independent third party pricing services, which may use market prices or broker/dealer quotations or a variety of valuation techniques and methodologies. The independent third party pricing services use inputs that are observable such as issuer details, interest rates, yield curves, prepayment speeds, credit risks/spreads, default rates and quoted prices for similar securities. These pricing services generally price fixed income securities assuming orderly transactions of an institutional "round lot" size, but some trades occur in smaller "odd lot" sizes which may be effected at lower prices than institutional round lot trades. Structured note agreements are valued in accordance with a dealer-supplied valuation based on changes in the value of the underlying index. Futures contracts are valued daily at the settlement price established by the board of trade or exchange on which they are traded. Forward contracts are valued at the London closing spot rates and the London closing forward point rates on a daily basis. The currency forward contract pricing model derives the differential in point rates to the expiration date of the forward and calculates its present value. Equity securities for which market quotations are available are valued at the last reported sales price or official closing price on the primary market or exchange on which they trade. The Fund may utilize a service provided by an independent third party which has been approved by the Board to fair value certain securities. When fair value pricing is employed, the prices of securities used by the Fund to calculate its net asset value may differ from quoted or published prices for the same securities. If independent third party pricing services are unable to supply prices for a portfolio investment, or if the prices supplied are deemed by the investment adviser to be unreliable, the market price may be determined by the investment adviser using quotations from one or more brokers/dealers or at the transaction price if the security has recently been purchased and no value has yet been obtained from a pricing service or pricing broker. When reliable prices are not readily available, such as when the value of a security has been significantly affected by events after the close of the exchange or market on which the security is principally traded, but before the Fund calculates its net asset value, these securities will be fair valued in good faith by the Pricing Committee, in accordance with procedures adopted by the Board.
The Fund uses valuation techniques to measure fair value that are consistent with the market approach and/or income approach, depending on the type of
44
Credit Suisse Strategic Income Fund
Notes to Financial Statements (continued)
October 31, 2021
Note 2. Significant Accounting Policies (continued)
security and the particular circumstance. The market approach uses prices and other relevant information generated by market transactions involving identical or comparable securities. The income approach uses valuation techniques to discount estimated future cash flows to present value.
GAAP established a disclosure hierarchy that categorizes the inputs to valuation techniques used to value assets and liabilities at each measurement date. These inputs are summarized in the three broad levels listed below:
• Level 1 – quoted prices in active markets for identical investments
• Level 2 – other significant observable inputs (including quoted prices for similar investments, interest rates, prepayment speeds, credit risk, etc.)
• Level 3 – significant unobservable inputs (including the Fund's own assumptions in determining the fair value of investments)
The inputs or methodologies used to value securities are not necessarily an indication of the risk associated with investing in those securities.
The following is a summary of the inputs used as of October 31, 2021 in valuing the Fund's assets and liabilities carried at fair value:
Assets | | Level 1 | | Level 2 | | Level 3 | | Total | |
Investments in Securities | |
Corporate Bonds | | $ | — | | | $ | 164,418,004 | | | $ | 7,269 | | | $ | 164,425,273 | | |
Bank Loans | | | — | | | | 251,574,543 | | | | 24,133,804 | | | | 275,708,347 | | |
Asset Backed Securities | | | — | | | | 18,984,053 | | | | — | | | | 18,984,053 | | |
Common Stocks | | | 11,092,584 | | | | 1,705,492 | | | | 739 | | | | 12,798,815 | | |
Warrants | | | 210,501 | | | | 11,360 | | | | 0 | (1) | | | 221,861 | | |
Short-term Investments | | | 33,559,059 | | | | 2,821,513 | | | | — | | | | 36,380,572 | | |
| | | $ | 44,862,144 | | | $ | 439,514,965 | | | $ | 24,141,812 | | | $ | 508,518,921 | | |
Other Financial Instruments* | |
Forward Foreign Currency Contracts | | $ | — | | | $ | 860 | | | $ | — | | | $ | 860 | | |
Liabilities | | Level 1 | | Level 2 | | Level 3 | | Total | |
Other Financial Instruments* | |
Forward Foreign Currency Contracts | | $ | — | | | $ | 20,117 | | | $ | — | | | $ | 20,117 | | |
(1) Included a zero valued security.
* Other financial instruments include unrealized appreciation(depreciation) on forward foreign currency contracts.
45
Credit Suisse Strategic Income Fund
Notes to Financial Statements (continued)
October 31, 2021
Note 2. Significant Accounting Policies (continued)
The following is a reconciliation of investments as of October 31, 2021 for which significant unobservable inputs were used in determining fair value.
| | | Corporate
Bonds | | Bank
Loans | | Common
Stocks | | Warrants | | Total | |
Balance as of October 31, 2020 | | $ | 146,871 | | | $ | 12,986,029 | | | $ | 313,201 | | | $ | 0 | (1) | | $ | 13,446,101 | | |
Accrued discounts (premiums) | | | 1,557 | | | | 12,749 | | | | — | | | | — | | | | 14,306 | | |
Purchases | | | 15,416 | | | | 25,575,090 | | | | — | | | | — | | | | 25,590,506 | | |
Sales | | | (280,276 | ) | | | (13,288,142 | ) | | | (970,305 | ) | | | — | | | | (14,538,723 | ) | |
Realized gain (loss) | | | (12,482 | ) | | | 22,718 | | | | 215,925 | | | | — | | | | 226,161 | | |
Change in unrealized appreciation
(depreciation) | | | 136,183 | | | | 665,572 | | | | 561,395 | | | | — | | | | 1,363,150 | | |
Transfers into Level 3 | | | — | | | | 1,568,149 | | | | 372 | | | | — | | | | 1,568,521 | | |
Transfers out of Level 3 | | | — | | | | (3,408,361 | ) | | | (119,849 | ) | | | — | | | | (3,528,210 | ) | |
Balance as of October 31, 2021 | | $ | 7,269 | | | $ | 24,133,804 | | | $ | 739 | | | $ | 0 | (1) | | $ | 24,141,812 | | |
Net change in unrealized
appreciation (depreciation)
from investments still held as of
October 31, 2021 | | $ | 6,563 | | | $ | 445,391 | | | $ | (27,118 | ) | | $ | — | | | $ | 424,836 | | |
(1) Includes zero valued securities.
| | Quantitative Disclosure About Significant Unobservable Inputs | |
| Asset Class | | Fair Value
At 10/31/2021 | | Valuation
Technique | | Unobservable
Input | | Range
(Weighted Average)* | |
Corporate Bonds | | $ | 706 | | | Income Approach | | Expected Remaining
Distribution | | | $0.01 (N/A)
| | |
| | $ | 6,563 | | | Vendor Pricing | | Single Broker Quote | | | $0.01 (N/A) | | |
Bank Loans | | $ | 24,133,804 | | | Vendor Pricing | | Single Broker Quote | | $ | 0.00 – $1.08 | ($1.00) | |
Common Stocks | | $ | 739 | | | Income Approach | | Expected Remaining
Distribution | | $ | 0.00 – $5.22
| ($0.72) | |
Warrants | | $ | 0 | | | Income Approach | | Expected Remaining
Distribution | | | $0.00 (N/A)
| | |
* Weighted by relative fair value
Each fair value determination is based on a consideration of relevant factors, including both observable and unobservable inputs. Observable and unobservable inputs that Credit Suisse considers may include (i) the existence of any contractual restrictions on the disposition of securities; (ii) information obtained from the company, which may include an analysis of the company's financial statements, the company's products or intended markets or the company's technologies; (iii) the price of the same or similar security negotiated at arm's length in an issuer's completed subsequent round of financing; (iv) the price and extent of public trading in similar securities of the issuer or of comparable companies; or (v) a probability and time value adjusted analysis of contractual term. Where available and appropriate, multiple valuation methodologies are applied to confirm fair value. To the extent that valuation
46
Credit Suisse Strategic Income Fund
Notes to Financial Statements (continued)
October 31, 2021
Note 2. Significant Accounting Policies (continued)
is based on models or inputs that are less observable or unobservable in the market, determining fair value requires more judgment. Because of the inherent uncertainty of valuation, those estimated values may be materially higher or lower than the values that would have been used had a ready market for the investments existed. Accordingly, the degree of judgment exercised by the Fund in determining fair value is greatest for investments categorized in Level 3. In some circumstances, the inputs used to measure fair value might be categorized within different levels of the fair value hierarchy. In those instances, the fair value measurement is categorized in its entirety in the fair value hierarchy based on the least observable input that is significant to the fair value measurement. Additionally, changes in the market environment and other events that may occur over the life of the investments may cause the gains or losses ultimately realized on these investments to be different from the valuations used at the date of these financial statements.
For the year ended October 31, 2021, $1,568,521 was transferred from Level 2 to Level 3 due to a lack of a pricing source supported by observable inputs and $3,528,210 was transferred from Level 3 to Level 2 as a result of the availability of a pricing source supported by observable inputs. All transfers, if any, are assumed to occur at the end of the reporting period.
B) DERIVATIVE INSTRUMENTS AND HEDGING ACTIVITIES — The Fund adopted amendments to authoritative guidance on disclosures about derivative instruments and hedging activities which require that a fund disclose (a) how and why an entity uses derivative instruments, (b) how derivative instruments and hedging activities are accounted for and (c) how derivative instruments and related hedging activities affect a fund's financial position, financial performance and cash flows. For the year ended October 31, 2021, the Fund's derivatives did not qualify for hedge accounting as they are held at fair value.
The following table presents the fair value and the location of derivatives within the Statement of Assets and Liabilities at October 31, 2021 and the effect of these derivatives on the Statement of Operations for the year ended October 31, 2021.
Primary Underlying Risk | | Derivative
Assets | | Derivative
Liabilities | | Realized Gain
(Loss) | | Change in Unrealized
Appreciation (Depreciation) | |
Foreign currency exchange rate | |
Forward contracts | | $ | 860 | | | $ | 20,117 | | | $ | (53,760 | ) | | $ | (34,490 | ) | |
47
Credit Suisse Strategic Income Fund
Notes to Financial Statements (continued)
October 31, 2021
Note 2. Significant Accounting Policies (continued)
For the year ended October 31, 2021, the Fund held an average monthly value on a net basis of $6,853,619 in forward foreign currency contracts.
The Fund is a party to International Swap and Derivatives Association, Inc. ("ISDA") Master Agreements ("Master Agreements") with certain counterparties that govern over-the-counter derivative (including Total Return, Credit Default and Interest Rate Swaps) and foreign exchange contracts entered into by the Fund. The Master Agreements may contain provisions regarding, among other things, the parties' general obligations, representations, agreements, collateral requirements, events of default and early termination. Termination events applicable to the Fund may occur upon a decline in the Fund's net assets below a specified threshold over a certain period of time.
The following table presents by counterparty the Fund's derivative assets, net of related collateral held by the Fund, at October 31, 2021:
Counterparty | | Gross Amount of
Derivative Assets
Presented in the
Statement of Assets
and Liabilities(a) | | Financial
Instruments
and Derivatives
Available for Offset | | Non-Cash
Collateral
Received | | Cash
Collateral
Received | | Net Amount
of Derivative
Assets | |
Deutsche Bank AG | | $ | 860 | | | $ | (860 | ) | | $ | — | | | $ | — | | | $ | — | | |
The following table presents by counterparty the Fund's derivative liabilities, net of related collateral pledged by the Fund, at October 31, 2021:
Counterparty | | Gross Amount of
Liabilities
Presented in
the Consolidated
Statement of Assets
and Liabilities(a) | | Financial
Instruments
and Derivatives
Available for Offset | | Non-Cash
Collateral
Pledged | | Cash
Collateral
Pledged | | Net Amount
of Derivative
Liabilities | |
Deutsche Bank AG | | $ | 1,479 | | | $ | (860 | ) | | $ | — | | | $ | — | | | $ | 619 | | |
Morgan Stanley | | | 18,638 | | | | — | | | | — | | | | — | | | | 18,638 | | |
| | | $ | 20,117 | | | $ | (860 | ) | | $ | — | | | $ | — | | | $ | 19,257 | | |
(a) Forward foreign currency contracts are included.
C) FOREIGN CURRENCY TRANSACTIONS — The books and records of the Fund are maintained in U.S. dollars. Transactions denominated in foreign currencies are recorded at the current prevailing exchange rates. All assets and liabilities denominated in foreign currencies, including purchases and sales of investments, and income and expenses, are translated into U.S. dollar amounts on the date of those transactions.
Reported net realized gain (loss) from foreign currency transactions arises from sales of foreign currencies; currency gains or losses realized between the
48
Credit Suisse Strategic Income Fund
Notes to Financial Statements (continued)
October 31, 2021
Note 2. Significant Accounting Policies (continued)
trade and settlement dates on securities transactions; and the difference between the amounts of dividends, interest, and foreign withholding taxes recorded on the Fund's books and the U.S. dollar equivalent of the amounts actually received or paid. Net change in unrealized gains and losses on translation of assets and liabilities denominated in foreign currencies arises from changes in the fair values of assets and liabilities, other than investments, at the end of the period, resulting from changes in exchange rates.
The Fund does not isolate that portion of the results of operations resulting from fluctuations in foreign exchange rates on investments from the fluctuations arising from changes in market prices of investments held. Such fluctuations are included with net realized and unrealized gain or loss from investments in the Statement of Operations.
D) SECURITY TRANSACTIONS AND INVESTMENT INCOME/EXPENSE — Security transactions are accounted for on a trade date basis. Interest income/expense is recorded on the accrual basis. The Fund amortizes premiums and accretes discounts using the effective interest method. Dividend income/expense is recorded on the ex-dividend date. Certain expenses are class-specific expenses, vary by class and are charged only to that class. Income, expenses (excluding class-specific expenses) and realized/unrealized gains/losses are allocated proportionately to each class of shares based upon the relative net asset value of the outstanding shares of that class. The cost of investments sold is determined by use of the specific identification method for both financial reporting and income tax purposes. To the extent any issuer defaults or a credit event occurs that impacts the issuer, the Fund may halt any additional interest income accruals and consider the realizability of interest accrued up to the date of default or credit event.
E) DIVIDENDS AND DISTRIBUTIONS TO SHAREHOLDERS — Dividends from net investment income, if any, are declared daily and paid monthly. Distributions of net realized capital gains, if any, are declared and paid at least annually. However, to the extent that a net realized capital gain can be reduced by a capital loss carryforward, such gain will not be distributed. Dividends and distributions to shareholders of the Fund are recorded on the ex-dividend date and are determined in accordance with federal income tax regulations, which may differ from GAAP.
F) FEDERAL AND OTHER TAXES — No provision is made for federal taxes as it is the Fund's intention to continue to qualify as a regulated investment company ("RIC") under the Internal Revenue Code of 1986, as amended (the
49
Credit Suisse Strategic Income Fund
Notes to Financial Statements (continued)
October 31, 2021
Note 2. Significant Accounting Policies (continued)
"Code"), and to make the requisite distributions to its shareholders, which will be sufficient to relieve it from federal income and excise taxes.
In order to qualify as a RIC under the Code, the Fund must meet certain requirements regarding the source of its income, the diversification of its assets and the distribution of its income. One of these requirements is that the Fund derive at least 90% of its gross income for each taxable year from dividends, interest, payments with respect to certain securities loans, gains from the sale or other disposition of stock, securities or foreign currencies, other income derived with respect to its business of investing in such stock, securities or currencies or net income derived from interests in certain publicly-traded partnerships ("Qualifying Income"). The Fund adopted the authoritative guidance for uncertainty in income taxes and recognizes a tax benefit or liability from an uncertain position only if it is more likely than not that the position is sustainable based solely on its technical merits and consideration of the relevant taxing authority's widely understood administrative practices and procedures. The Fund has reviewed its current tax positions and has determined that no provision for income tax is required in the Fund's financial statements. The Fund's federal and state income and federal excise tax returns for tax years for which the applicable statutes of limitations have not expired are subject to examination by the Internal Revenue Service and state departments of revenue.
G) CASH — The Fund's uninvested cash balance is held in an interest bearing variable rate demand deposit account at State Street Bank and Trust Company ("SSB"), the Fund's custodian.
H) FUTURES — The Fund may enter into futures contracts to the extent permitted by its investment policies and objectives. The Fund may use futures contracts to gain exposure to or hedge against changes in interest rates, equity and market price movements and/or currency risks. Upon entering into a futures contract, the Fund is required to deposit cash and/or pledge U.S. Government securities as initial margin with a Futures Commission Merchant ("FCM"). Subsequent payments, which are dependent on the daily fluctuations in the value of the underlying instrument, are made or received by the Fund each day (daily variation margin) and are recorded as unrealized gains or losses until the contracts are closed. When the contracts are closed, the Fund records a realized gain or loss equal to the difference between the proceeds from (or cost of) the closing transaction and the Fund's basis in the contract. Risks of entering into futures contracts for hedging purposes include the possibility that a change in the value of the contract may not correlate with the changes in the value of the underlying instruments. Futures have minimal counterparty
50
Credit Suisse Strategic Income Fund
Notes to Financial Statements (continued)
October 31, 2021
Note 2. Significant Accounting Policies (continued)
credit risk because futures are exchange traded and the exchange's clearinghouse, as counterparty to all exchange-traded futures, guarantees the futures against default. In addition, the purchase of a futures contract involves the risk that the Fund could lose more than the original margin deposit and subsequent payments may be required for a futures transaction. The Fund's open futures contracts are disclosed in the Schedule of Investments. At October 31, 2021, the Fund had no open futures contracts.
The Commodity Exchange Act requires an FCM to segregate all customer transactions and assets from the FCM's proprietary activities. A customer's cash and other equity deposited with an FCM are considered commingled with all other customer funds subject to the FCM's segregation requirements. In the event of an FCM's insolvency, recovery may be limited to the Fund's pro-rata share of segregated customer funds available. It is possible that the recovery amount could be less than the total of cash and other equity deposited.
I) FORWARD FOREIGN CURRENCY CONTRACTS — A forward foreign currency exchange contract ("forward currency contract") is a commitment to purchase or sell a foreign currency at the settlement date at a negotiated rate. The Fund will enter into forward currency contracts primarily for hedging foreign currency risk. Forward currency contracts are valued at the prevailing forward exchange rate of the underlying currencies and unrealized gain/loss is recorded daily. On the settlement date of the forward currency contract, the Fund records a realized gain or loss equal to the difference between the value of the contract at the time it was opened and the value of the contract at the time it was closed. Certain risks may arise upon entering into forward currency contracts from the potential inability of counterparties to meet the terms of their contracts. The maximum counterparty credit risk to the Fund is measured by the unrealized gain on appreciated contracts. Additionally, when utilizing forward currency contracts to hedge, the Fund forgoes the opportunity to profit from favorable exchange rate movements during the term of the contract. The Fund's open forward currency contracts at October 31, 2021 are disclosed in the Schedule of Investments.
J) UNFUNDED LOAN COMMITMENTS — The Fund enters into certain agreements, all or a portion of which may be unfunded. The Fund is obligated to fund these loan commitments at the borrowers' discretion. Funded and
51
Credit Suisse Strategic Income Fund
Notes to Financial Statements (continued)
October 31, 2021
Note 2. Significant Accounting Policies (continued)
unfunded portions of credit agreements are presented on the Schedule of Investments. As of October 31, 2021, unfunded commitments were as follows:
Borrower | | Maturity | | Rate | | Unfunded
Commitment | |
CMBF LLC | | 08/02/2028 | | | 3.000 | | | $ | 229,358 | | |
HighTower Holdings LLC | | 04/21/2028 | | | 4.000 | | | $ | 200,000 | | |
Mariner Wealth Advisors LLC | | 08/18/2028 | | | 1.875 | | | $ | 125,000 | | |
Pro Mach Group, Inc. (Delayed Draw Term Loan) | | 08/31/2028 | | | 2.500 | | | $ | 133,771 | | |
RVR Dealership Holdings, LLC | | 02/08/2028 | | | 2.000 | | | $ | 33,392 | | |
SCP Eye Care Services LLC | | 03/16/2028 | | | 4.500 | | | $ | 295,454 | | |
Therapy Brands Holdings LLC | | 05/12/2028 | | | 4.000 | | | $ | 254,237 | | |
Western Dental Services, Inc. (Delayed Draw Term Loan) | | 08/11/2028 | | | 5.250 | | | $ | 40,573 | | |
Unfunded loan commitments and funded portions of credit agreements are marked to market daily and any unrealized appreciation or depreciation is included in the Statement of Assets and Liabilities and the Statement of Operations.
K) SECURITIES LENDING — The initial collateral received by the Fund is required to have a value of at least 102% of the market value of domestic securities on loan (including any accrued interest thereon) and 105% of the market value of foreign securities on loan (including any accrued interest thereon). The collateral is maintained thereafter at a value equal to at least 102% of the current market value of the securities on loan. The market value of loaned securities is determined at the close of each business day of the Fund and any additional required collateral is delivered to the Fund, or excess collateral returned by the Fund, on the next business day. Cash collateral received by the Fund in connection with securities lending activity may be pooled together with cash collateral for other funds/portfolios advised by Credit Suisse and may be invested in a variety of investments, including funds advised by SSB, the Fund's securities lending agent, or money market instruments. However, in the event of default or bankruptcy by the other party to the agreement, realization and/or retention of the collateral may be subject to legal proceedings. The remaining maturities of the securities lending transactions are considered overnight and continuous. Loans are subject to termination by the Fund or the borrower at any time.
SSB has been engaged by the Fund to act as the Fund's securities lending agent. As of October 31, 2021 the Fund had outstanding loans of securities to certain approved brokers for which the Fund received collateral:
Market Value of
Loaned Securities | | Market Value of
Cash Collateral | | Total Collateral | |
| $ | 2,750,619 | | | $ | 2,821,513 | | | $ | 2,821,513 | | |
52
Credit Suisse Strategic Income Fund
Notes to Financial Statements (continued)
October 31, 2021
Note 2. Significant Accounting Policies (continued)
The following table presents financial instruments that are subject to enforceable netting arrangements as of October 31, 2021.
Gross Amounts Not Offset in the Statement of Assets and Liabilities | |
Gross Asset Amounts
Presented in
Statement of Assets
and Liabilities(a) | | Collateral Received(b) | | Net Amount
(not less than $0) | |
| $ | 2,750,619 | | | $ | (2,750,619 | ) | | $ | — | | |
(a) Represents market value of loaned securities at year end.
(b) The actual collateral received is greater than the amount shown here due to collateral requirements of the security lending agreement.
The Fund's securities lending arrangement provides that the Fund and SSB will share the net income earned from securities lending activities. Securities lending income is accrued as earned. During the year ended October 31, 2021, total earnings from the Fund's investment in cash collateral received in connection with securities lending arrangements was $12,028. The Fund retained $9,027 in income from the cash collateral investment, and SSB, as lending agent, was paid $3,001.
L) OTHER — The high yield, fixed income securities in which the Fund invests will primarily consist of senior secured floating rate loans ("Senior Loans") issued by non-investment grade companies. Senior Loans are typically secured by specific collateral of the issuer and hold the most senior position in the issuer's capital structure. The interest rate on Senior Loans is periodically adjusted to a recognized base rate, typically the London Interbank Offered Rate ("LIBOR"). While these characteristics may reduce interest rate risk and mitigate losses in the event of borrower default, the Senior Loans in which the Fund invests have below investment grade credit ratings and thereby are considered speculative because of the significant credit risk of their issuers.
In July 2017, the Financial Conduct Authority, the United Kingdom's financial regulatory body, announced a desire to phase out the use of LIBOR by the end of 2021. The FCA and ICE Benchmark Administrator have since announced that most LIBOR settings will no longer be published after December 31, 2021 and a majority of U.S. dollar LIBOR settings will cease publication after June 30, 2023. It is possible that a subset of LIBOR settings will be published after these dates on a "synthetic" basis, but any such publications would be considered non-representative of the underlying market. The U.S. Federal Reserve, based on the recommendations of the New York Federal Reserve's Alternative Reference Rate Committee (comprised of major derivative market participants and their regulators), has begun publishing the Secured Overnight Financing Rate ("SOFR") that is intended to replace U.S. dollar LIBOR. Proposals for alternative
53
Credit Suisse Strategic Income Fund
Notes to Financial Statements (continued)
October 31, 2021
Note 2. Significant Accounting Policies (continued)
reference rates for other currencies have also been announced or have already begun publication. Markets are slowly developing in response to these new reference rates. Uncertainty related to the liquidity impact of the change in rates, and how to appropriately adjust these rates at the time of transition, poses risks for the Fund. The effect of any changes to, or discontinuation of, LIBOR on the Fund will depend on, among other things, (1) existing fallback or termination provisions in individual contracts and (2) whether, how, and when industry participants develop and adopt new reference rates and fallbacks for both legacy and new instruments and contracts. In addition, there are obstacles to converting certain longer-term securities and transactions to a new reference rate or rates and the effectiveness of one alternative reference rate versus multiple alternative reference rates in new or existing financial instruments and products has not been determined.
The transition away from LIBOR might lead to increased volatility and illiquidity in markets for instruments whose terms currently reference LIBOR, reduced values of LIBOR-related investments, reduced effectiveness of hedging strategies, increased costs for certain LIBOR-related instruments, increased difficulty in borrowing or refinancing, and prolonged adverse market conditions for the Fund. Furthermore, the risks associated with the expected discontinuation of LIBOR and related transition may be exacerbated if the work necessary to effect an orderly transition to an alternative reference rate is not completed in a timely manner.
Lower-rated debt securities (commonly known as "junk bonds") possess speculative characteristics and are subject to greater market fluctuations and risk of lost income and principal than higher-rated debt securities for a variety of reasons. Also, during an economic downturn or substantial period of rising interest rates, highly leveraged issuers may experience financial stress which would adversely affect their ability to service their principal and interest payment obligations, to meet projected business goals and to obtain additional financing.
In addition, periods of economic uncertainty and changes can be expected to result in increased volatility of market prices of lower-rated debt securities and the Fund's net asset value.
Note 3. Transactions with Affiliates and Related Parties
Credit Suisse serves as investment adviser and co-administrator for the Fund. For its investment advisory and administration services, Credit Suisse is entitled to receive a fee from the Fund at an annualized rate of 0.84% of the
54
Credit Suisse Strategic Income Fund
Notes to Financial Statements (continued)
October 31, 2021
Note 3. Transactions with Affiliates and Related Parties (continued)
Fund's average daily net assets. For the year ended October 31, 2021, investment advisory and administration fees earned and fees waived/expenses reimbursed by Credit Suisse were $3,208,814 and $1,010,650, respectively. Effective November 12, 2019, Credit Suisse has contractually agreed to limit expenses so that the Fund's annual operating expenses do not exceed 0.79% of the Fund's average daily net assets for Class I shares, 1.04% of the Fund's average daily net assets for Class A shares, and 1.79% of the Fund's average daily net assets for Class C shares. The Fund is authorized to reimburse Credit Suisse for management fees previously limited and/or for expenses previously reimbursed by Credit Suisse under the contractual expense limitation arrangement, provided, however, that any reimbursements must be paid at a date not more than thirty-six months following the applicable month during which such fees were limited or expenses were reimbursed by Credit Suisse and the reimbursements do not cause the Fund to exceed the applicable expense limitation at the time the fees are recouped. This contract may not be terminated before February 28, 2023. For the year ended October 31, 2021, there was no recoupment.
The amounts waived and reimbursed by Credit Suisse, which are available for potential future recoupment by Credit Suisse, and the expiration schedule at October 31, 2021 are as follows:
| | | Fee waivers/expense
reimbursements
subject to
Recoupment | | Expires
October 31,
2022 | | Expires
October 31,
2023 | | Expires
October 31,
2024 | |
Class I | | $ | 1,545,511 | | | $ | 101,003 | | | $ | 633,623 | | | $ | 810,885 | | |
Class A | | | 242,311 | | | | 23,286 | | | | 129,648 | | | | 89,377 | | |
Class C | | | 284,346 | | | | 24,206 | | | | 149,752 | | | | 110,388 | | |
Totals | | $ | 2,072,168 | | | $ | 148,495 | | | $ | 913,023 | | | $ | 1,010,650 | | |
Credit Suisse Asset Management Limited ("Credit Suisse U.K."), an affiliate of Credit Suisse, serves as sub-investment advisor to the Fund directly. Credit Suisse U.K.'s sub-investment advisor fees are paid by Credit Suisse.
For its co-administrative services, SSB receives a fee, exclusive of out-of-pocket expenses, calculated in total for all the Credit Suisse funds/portfolios co-administered by SSB and allocated based upon the relative average net assets of each fund/portfolio, subject to an annual minimum fee. For the year ended October 31, 2021, co-administrative services fees earned by SSB (including out-of-pocket expenses) with respect to the Fund were $119,193.
55
Credit Suisse Strategic Income Fund
Notes to Financial Statements (continued)
October 31, 2021
Note 3. Transactions with Affiliates and Related Parties (continued)
Credit Suisse Securities (USA) LLC ("CSSU"), an affiliate of Credit Suisse, serves as the distributor of the Fund's shares. Pursuant to a distribution plan adopted by the Fund pursuant to Rule 12b-1 under the 1940 Act, CSSU receives fees for its distribution services. These fees are calculated at an annual rate of 0.25% of the average daily net assets of the Class A shares. For the Class C shares, the fee is calculated at an annual rate of 1.00% of the average daily net assets. For the year ended October 31, 2021, the Fund paid Rule 12b-1 distribution fees of $84,435 for Class A shares and $417,218 for Class C shares. Class I shares are not subject to Rule 12b-1 distribution fees.
For the year ended October 31, 2021, CSSU and its affiliates advised the Fund that they retained $2,372 from commissions earned on the sale of the Fund's Class A shares. There were no commissions earned on the sale of Class C shares.
The Fund from time to time purchases or sells loan investments in the secondary market through Credit Suisse or its affiliates acting in the capacity as broker-dealer. Credit Suisse or its affiliates may have acted in some type of agent capacity to the initial loan offering prior to such loan trading in the secondary market.
Note 4. Line of Credit
The Fund, together with other funds/portfolios advised by Credit Suisse (collectively, the "Participating Funds"), participates in a committed, unsecured line of credit facility ("Credit Facility"), with SSB in an aggregated amount of $125 million for temporary or emergency purposes under a first-come, first-served basis. Under the terms of the Credit Facility, the Participating Funds pay an aggregate commitment fee on the average unused amount of the Credit Facility, which is allocated among the Participating Funds in such manner as is determined by the governing Boards of the Participating Funds. In addition, the Participating Funds pay interest on borrowings at either the Overnight Federal Funds rate or the Overnight LIBOR rate plus a spread. At October 31, 2021 and during the year ended October 31, 2021, the Fund had no borrowings outstanding under the Credit Facility. Additionally, the Fund and another Participating Fund are parties to a joint uncommitted line of credit facility with SSB in an aggregated amount of $200 million. For the year ended October 31, 2021, the line was not drawn upon and no fees were incurred.
56
Credit Suisse Strategic Income Fund
Notes to Financial Statements (continued)
October 31, 2021
Note 5. Purchases and Sales of Securities
For the year ended October 31, 2021, purchases and sales of investment securities (excluding short-term investments) and U.S. Government and Agency Obligations were as follows:
Investment Securities | | U.S. Government/
Agency Obligations | |
| Purchases | | Sales | | Purchases | | Sales | |
| $ | 366,928,234 | | | $ | 166,398,340 | | | $ | 0 | | | $ | 0 | | |
Note 6. Capital Share Transactions
The Fund is authorized to issue an unlimited number of full and fractional shares of beneficial interest, $.001 par value per share. The Fund offers Class I, Class A and Class C shares. Transactions in capital shares for each class of the Fund were as follows:
| | | Class I | |
| | | For the Year Ended
October 31, 2021 | | For the Year Ended
October 31, 2020 | |
| | | Shares | | Value | | Shares | | Value | |
Shares sold | | | 27,727,218 | | | $ | 279,750,393 | | | | 11,123,159 | | | $ | 105,707,914 | | |
Shares issued in reinvestment
of dividends | | | 1,151,173 | | | | 11,626,749 | | | | 1,079,949 | | | | 10,216,382 | | |
Shares redeemed | | | (7,267,430 | ) | | | (73,254,477 | ) | | | (15,611,202 | ) | | | (143,404,187 | ) | |
Net increase (decrease) | | | 21,610,961 | | | $ | 218,122,665 | | | | (3,408,094 | ) | | $ | (27,479,891 | ) | |
| | | Class A | |
| | | For the Year Ended
October 31, 2021 | | For the Year Ended
October 31, 2020 | |
| | | Shares | | Value | | Shares | | Value | |
Shares sold | | | 863,110 | | | $ | 8,668,674 | | | | 1,408,775 | | | $ | 13,744,180 | | |
Shares issued in reinvestment
of dividends | | | 120,331 | | | | 1,212,609 | | | | 207,019 | | | | 1,959,547 | | |
Shares redeemed | | | (1,491,869 | ) | | | (15,058,786 | ) | | | (3,132,169 | ) | | | (29,980,635 | ) | |
Net decrease | | | (508,428 | ) | | $ | (5,177,503 | ) | | | (1,516,375 | ) | | $ | (14,276,908 | ) | |
| | | Class C | |
| | | For the Year Ended
October 31, 2021 | | For the Year Ended
October 31, 2020 | |
| | | Shares | | Value | | Shares | | Value | |
Shares sold | | | 349,829 | | | $ | 3,523,908 | | | | 515,512 | | | $ | 4,944,147 | | |
Shares issued in reinvestment
of dividends | | | 123,495 | | | | 1,244,747 | | | | 212,292 | | | | 2,005,564 | | |
Shares redeemed | | | (984,529 | ) | | | (9,910,219 | ) | | | (1,687,057 | ) | | | (15,796,255 | ) | |
Net decrease | | | (511,205 | ) | | $ | (5,141,564 | ) | | | (959,253 | ) | | $ | (8,846,544 | ) | |
57
Credit Suisse Strategic Income Fund
Notes to Financial Statements (continued)
October 31, 2021
Note 6. Capital Share Transactions (continued)
On October 31, 2021, the number of shareholders that held 5% or more of the outstanding shares of each class of the Fund was as follows:
| | | Number of
Shareholders | | Approximate Percentage
of Outstanding Shares | |
Class I | | | 5 | | | | 62 | % | |
Class A | | | 5 | | | | 70 | % | |
Class C | | | 4 | | | | 87 | % | |
The Fund's performance may be negatively impacted in the event one or more of the Fund's greater than 5% shareholders were to redeem at a given time. Some of the shareholders may be omnibus accounts, which hold shares on behalf of individual shareholders.
Note 7. Income Tax Information and Distributions to Shareholders
Income and capital gain distributions are determined in accordance with federal income tax regulations, which may differ from GAAP.
The tax character of dividends paid by the Fund during the fiscal years ended October 31, 2021 and 2020, respectively, was as follows:
Ordinary Income | |
2021 | | 2020 | |
$ | 14,740,455 | | | $ | 15,054,943 | | |
The tax basis components of distributable earnings differ from book basis by temporary book/tax differences. These differences are primarily due to differing treatments of dividends payable, wash sales, forwards, deferred organizational expenses, defaulted bonds and premium amortization accruals.
At October 31, 2021, the components of distributable earnings on a tax basis were as follows:
Accumulated net realized loss | | $ | (15,354,548 | ) | |
Undistributed ordinary income | | | 94,638 | | |
Unrealized depreciation | | | (633,392 | ) | |
| | | $ | (15,893,302 | ) | |
At October 31, 2021, the Fund had $1,428,766 of unlimited short-term capital loss carryforwards and $13,925,782 of unlimited long term capital loss carryforwards available to offset possible future capital gains.
58
Credit Suisse Strategic Income Fund
Notes to Financial Statements (continued)
October 31, 2021
Note 7. Income Tax Information and Distributions to Shareholders (continued)
At October 31, 2021, the cost and net unrealized appreciation (depreciation) of investments and derivatives for income tax purposes were as follows:
Cost of Investments | | $ | 509,133,056 | | |
Unrealized appreciation | | $ | 7,405,179 | | |
Unrealized depreciation | | | (8,038,571 | ) | |
Net unrealized appreciation (depreciation) | | $ | (633,392 | ) | |
To adjust for current period permanent book/tax differences which arose principally from differing book/tax treatment of foreign currency gain (loss), defaulted bonds and premium amortization adjustments, distributions in excess of net investment income was credited $ 133,864 and accumulated net realized loss was debited $133,864. Net assets were not affected by this reclassification.
Note 8. Contingencies
In the normal course of business, the Fund may provide general indemnifications pursuant to certain contracts and organizational documents. The Fund's maximum exposure under these arrangements is dependent on future claims that may be made against the Fund and, therefore, cannot be estimated; however, based on experience, the risk of loss from such claims is considered remote.
Note 9. Subsequent Events
In preparing the financial statements as of October 31, 2021, management considered the impact of subsequent events for potential recognition or disclosure in these financial statements through the date of release of this report. No such events requiring recognition or disclosure were identified through the date of the release of this report.
59
Credit Suisse Strategic Income Fund
Report of Independent Registered Public Accounting Firm
To the Board of Trustees of Credit Suisse Opportunity Funds and Shareholders of Credit Suisse Strategic Income Fund
Opinion on the Financial Statements
We have audited the accompanying statement of assets and liabilities, including the schedule of investments, of Credit Suisse Strategic Income Fund (one of the funds constituting Credit Suisse Opportunity Funds, referred to hereafter as the "Fund") as of October 31, 2021, the related statement of operations for the year ended October 31, 2021, the statement of changes in net assets for each of the two years in the period ended October 31, 2021, including the related notes, and the financial highlights for each of the two years in the period ended October 31, 2021 (collectively referred to as the "financial statements"). In our opinion, the financial statements present fairly, in all material respects, the financial position of the Fund as of October 31, 2021, the results of its operations for the year then ended, and the changes in its net assets and the financial highlights for each of the two years in the period ended October 31, 2021 in conformity with accounting principles generally accepted in the United States of America.
The financial statements of the Fund as of and for the year ended October 31, 2019 and the financial highlights for the years ended October 31, 2019, 2018 and 2017 (not presented herein, other than the financial highlights) were audited by other auditors whose report dated December 20, 2019 expressed an unqualified opinion on those financial statements and financial highlights.
Basis for Opinion
These financial statements are the responsibility of the Fund's management. Our responsibility is to express an opinion on the Fund's financial statements based on our audits. We are a public accounting firm registered with the Public Company Accounting Oversight Board (United States) (PCAOB) and are required to be independent with respect to the Fund in accordance with the U.S. federal securities laws and the applicable rules and regulations of the Securities and Exchange Commission and the PCAOB.
We conducted our audits of these financial statements in accordance with the standards of the PCAOB. Those standards require that we plan and perform the audit to obtain reasonable assurance about whether the financial statements are free of material misstatement, whether due to error or fraud.
Our audits included performing procedures to assess the risks of material misstatement of the financial statements, whether due to error or fraud, and performing procedures that respond to those risks. Such procedures included examining, on a test basis, evidence regarding the amounts and disclosures in
60
Credit Suisse Strategic Income Fund
Report of Independent Registered Public Accounting Firm
the financial statements. Our audits also included evaluating the accounting principles used and significant estimates made by management, as well as evaluating the overall presentation of the financial statements. Our procedures included confirmation of securities owned as of October 31, 2021 by correspondence with the custodian, transfer agent, agent banks and brokers; when replies were not received from agent banks and brokers, we performed other auditing procedures. We believe that our audits provide a reasonable basis for our opinion.
/s/PricewaterhouseCoopers LLP
New York, New York
December 29, 2021
We have served as the auditor of one or more investment companies in Credit Suisse Asset Management, LLC investment companies since 2020.
61
Credit Suisse Strategic Income Fund
Information Concerning Trustees and Officers (unaudited)
Name, Address
(Year of Birth) | | Position(s)
Held with
Fund | | Term
of Office1
and
Length
of Time
Served | | Principal
Occupation(s) During
Past Five Years | | Number of
Portfolios
in Fund
Complex
Overseen
by Trustee | | Other
Trusteeships
Held by Trustee
During Past Five Years | |
Independent Trustees | | | | | | | | | | | |
Laura A. DeFelice
c/o Credit Suisse Asset
Management, LLC
Attn: General Counsel
Eleven Madison Avenue
New York, New York
10010
(1959) | | Trustee, Nominating and Audit Committee member | | Since 2017 | | Partner of Acacia Properties LLC (multi-family and commercial real estate ownership and operation) from 2008 to present; Stonegate Advisors LLC (renewable energy and energy efficiency) from 2007 to present. | | | 9 | | | None. | |
Jeffrey E. Garten
c/o Credit Suisse Asset Management, LLC Attn: General Counsel Eleven Madison Avenue New York, New York
10010
(1946) | | Trustee, Nominating and Audit Committee member | | Since Fund Inception | | Dean Emeritus of Yale School of Management from July 2015 to present; Partner and Chairman of Garten Rothkopf (consulting firm) from October 2005 to June 2017. | | | 9 | | | Director of Aetna, Inc. (insurance company) from January 1999 to 2019; Director of CarMax Group (used car dealers) from January 2002 to 2019; Director of Miller Buckfire & Co., LLC (financial restructuring) from January 2008 to 2019. | |
1 Subject to the Trust's retirement policy, each Trustee may continue to serve as a Trustee until the last day of the calendar year in which the applicable Trustee attains age 75. The Board may determine to extend the terms of Trustees beyond age 75 on a case-by-case basis. Each officer serves until his or her respective successor has been duly elected and qualified.
62
Credit Suisse Strategic Income Fund
Information Concerning Trustees and Officers (unaudited) (continued)
Name, Address
(Year of Birth) | | Position(s)
Held with
Fund | | Term
of Office1
and
Length
of Time
Served | | Principal
Occupation(s) During
Past Five Years | | Number of
Portfolios
in Fund
Complex
Overseen
by Trustee | | Other
Trusteeships
Held by Trustee
During Past Five Years | |
Independent Trustees | | | | | | | | | | | |
Mahendra R. Gupta
c/o Credit Suisse Asset
Management, LLC
Attn: General Counsel
Eleven Madison Avenue
New York, New York
10010
(1956) | | Trustee, Nominating Committee member and Audit Committee Chairman | | Since 2017 | | Professor, Washington University in St. Louis from July 1990 to present; Partner, R.J. Mithaiwala (food manufacturing and retail, India) from March 1977 to present; Partner, F.F.B. Corporation (agriculture, India) from March 1977 to present; Partner, RPMG Research Corporation (benchmark research) from July 2001 to present. | | | 9 | | | Director of Caleres Inc. (footwear) from May 2012 to present; Director of Koch Development Corporation (real estate development) from November 2017 to present; Director of Supernova (fin-tech) from June 2014 to September 2018. | |
1 Subject to the Trust's retirement policy, each Trustee may continue to serve as a Trustee until the last day of the calendar year in which the applicable Trustee attains age 75. The Board may determine to extend the terms of Trustees beyond age 75 on a case-by-case basis. Each officer serves until his or her respective successor has been duly elected and qualified.
63
Credit Suisse Strategic Income Fund
Information Concerning Trustees and Officers (unaudited) (continued)
Name, Address
(Year of Birth) | | Position(s)
Held with
Fund | | Term
of Office1
and
Length
of Time
Served | | Principal
Occupation(s) During
Past Five Years | | Number of
Portfolios
in Fund
Complex
Overseen
by Trustee | | Other
Trusteeships
Held by Trustee
During Past Five Years | |
Independent Trustees | | | | | | | | | | | |
Steven N. Rappaport
c/o Credit Suisse Asset Management, LLC
Attn: General Counsel
Eleven Madison Avenue
New York, New York
10010
(1948) | | Chairman of the Board, Nominating Committee Chairman and Audit Committee member | | Trustee since Fund Inception and Chairman since 2005 | | Partner of Lehigh Court, LLC and RZ Capital (private investment firms) from July 2002 to present; Partner of Backstage Acquisition Holdings, LLC (publication job postings) from November 2013 to 2018. | | | 9 | | | Director of Aberdeen Emerging Markets Equity Income Fund, Inc., (a closed-end investment company); Director of Aberdeen Funds (18 open-end portfolios); Director of iCAD, Inc. (surgical & medical instruments & apparatus company) from 2006 to 2018. | |
Interested Trustee | | | | | | | | | | | |
John G. Popp2
Credit Suisse Asset
Management, LLC
Eleven Madison Avenue
New York, New York
10010
(1956) | | Trustee, Chief Executive Officer and President | | Trustee since 2017
Chief Executive Officer and President since 2010 | | Managing Director of Credit Suisse; Global Head and Chief Investment Officer of the Credit Investments Group; Associated with Credit Suisse or its predecessor since 1997; Officer of other Credit Suisse Funds. | | | 9 | | | None. | |
1 Subject to the Trust's retirement policy, each Trustee may continue to serve as a Trustee until the last day of the calendar year in which the applicable Trustee attains age 75. The Board may determine to extend the terms of Trustees beyond age 75 on a case-by-case basis. Each officer serves until his or her respective successor has been duly elected and qualified.
2 Mr. Popp is an "interested person" of the Trust, as defined in the 1940 Act, by virtue of his current position as an officer of Credit Suisse.
64
Credit Suisse Strategic Income Fund
Information Concerning Trustees and Officers (unaudited) (continued)
Name, Address
(Year of Birth) | | Position(s)
Held with
Fund | | Term of
Office
and
Length of
Time
Served | | Principal Occupation(s) During Past Five Years | |
Officers* | | | | | | | |
Emidio Morizio**
Credit Suisse Asset
Management, LLC
Eleven Madison Avenue
New York, New York 10010
(1966) | | Chief Compliance Officer | | Since Fund Inception | | Managing Director and Global Head of Compliance of Credit Suisse since 2010; Associated with Credit Suisse since July 2000; Officer of other Credit Suisse Funds. | |
Lou Anne McInnis
Credit Suisse Asset Management, LLC
Eleven Madison Avenue
New York, New York 10010
(1959) | | Chief Legal Officer | | Since 2015 | | Director of Credit Suisse; Associated with Credit Suisse since April 2015; Counsel at DLA Piper US LLP from 2011 to April 2015; Associated with Morgan Stanley Investment Management from 1997 to 2010; Officer of other Credit Suisse Funds. | |
Omar Tariq
Credit Suisse Asset
Management, LLC
Eleven Madison Avenue
New York, New York 10010
(1983) | | Chief Financial Officer and Treasurer | | Since 2019 | | Director of Credit Suisse since March 2019; Senior Manager of PriceWaterhouseCoopers, LLP from September 2010 to March 2019; Officer of other Credit Suisse Funds. | |
Karen Regan
Credit Suisse Asset
Management, LLC
Eleven Madison Avenue
New York, New York 10010
(1963) | | Vice President and Secretary | | Since 2010 | | Vice President of Credit Suisse; Associated with Credit Suisse since December 2004; Officer of other Credit Suisse Funds. | |
* The officers of the Fund shown are officers that make policy decisions.
** Effective December 16, 2021, Jason Gossett replaced Emidio Morizio as Interim Chief Compliance Officer. Mr. Gossett has been a Vice President of Credit Suisse since 2018 and has been associated with Credit Suisse since June 2015. Mr. Gossett also serves as an officer of other Credit Suisse funds.
The Statement of Additional Information includes additional information about the Trustees and is available, without charge, upon request, by calling 877-870-2874.
65
Credit Suisse Strategic Income Fund
Proxy Voting and Portfolio Holdings Information (unaudited)
Information regarding how the Fund voted proxies related to its portfolio securities during the 12-month period ended June 30 of each year, as well as the policies and procedures that the Fund uses to determine how to vote proxies relating to its portfolio securities are available:
• By calling 1-877-870-2874
• On the Fund's website, www.credit-suisse.com/us/funds
• On the website of the Securities and Exchange Commission, www.sec.gov
The Fund files a complete schedule of its portfolio holdings for the first and third quarters of its fiscal year with the SEC as an exhibit to its reports on Form N-PORT, and for reporting periods ended prior to March 31, 2019, filed such information on Form N-Q. The Fund's Forms N-PORT and N-Q are available on the SEC's website at www.sec.gov.
66

P.O. BOX 219916, KANSAS CITY, MO 64121-9916
877-870-2874 ◼ www.credit-suisse.com/us/funds
CREDIT SUISSE SECURITIES (USA) LLC, DISTRIBUTOR. SIF-AR-1021
Item 2. Code of Ethics.
The registrant has adopted a code of ethics applicable to its Chief Executive Officer, President, Chief Financial Officer and Chief Accounting Officer, or persons performing similar functions. A copy of the code is filed as Exhibit 12(a)(1) to this Form. There were no amendments to the code during the fiscal year ended October 31, 2021. There were no waivers or implicit waivers from the code granted by the registrant during the fiscal year ended October 31, 2021.
Item 3. Audit Committee Financial Expert.
The registrant's governing board has determined that it has two audit committee financial experts serving on its audit committee: Mahendra R. Gupta and Steven N. Rappaport. Each audit committee financial expert is "independent" for purposes of this item.
Item 4. Principal Accountant Fees and Services.
(a) through (d). The information in the table below is provided for services rendered to the registrant showing the amount of fees billed to the registrant during the registrant’s last two fiscal years by PricewaterhouseCoopers LLP (“PwC”), the registrant’s current independent registered public accounting firm, and the registrant’s former independent registered public accounting firm. The tax fees billed to the registrant for the fiscal year 2020 are the only fees that have been billed to the registrant by its former independent registered public accounting firm. For engagements with PwC and the registrant’s former independent registered public accounting firm the Audit Committee approved in advance all audit services and non-audit services that PwC and the registrant’s former independent registered public accounting firm provided to the registrant for its fiscal years ended October 31, 2020 and October 31, 2021.
| | | 2020 | | | 2021 | |
| Audit Fees | | $ | 175,600 | | | $ | 175,600 | |
| Audit-Related Fees1 | | $ | - | | | $ | - | |
| Tax Fees2 | | $ | 19,760 | | | $ | 16,000 | |
| All Other Fees | | $ | - | | | $ | - | |
| Total | | $ | 195,360 | | | $ | 191,600 | |
1 Services include agreed-upon procedures in connection with the registrant’s semi-annual financial statements ($0 for 2020 and $0 for 2021).
2 Tax services in connection with the registrant’s excise tax calculations and review of the registrant’s applicable tax returns.
The information in the table below is provided with respect to non-audit services that directly relate to the registrant’s operations and financial reporting and that were rendered by PwC to the registrant’s investment adviser, Credit Suisse Asset Management, LLC (“Credit Suisse”), and any service provider to the registrant controlling, controlled by or under common control with Credit Suisse that provided ongoing services to the registrant (“Covered Services Provider”), for the registrant’s fiscal years ended October 31, 2020 and October 31, 2021.
| | | | 2020 | | | | 2021 | |
| Audit-Related Fees | | | N/A | | | | N/A | |
| Tax Fees | | | N/A | | | | N/A | |
| All Other Fees | | | N/A | | | | N/A | |
| Total | | | N/A | | | | N/A | |
(e)(1) Pre-Approval Policies and Procedures. The Audit Committee (“Committee”) of the registrant is responsible for pre-approving (i) all audit and permissible non-audit services to be provided by the independent registered public accounting firm to the registrant and (ii) all permissible non-audit services to be provided by the independent registered public accounting firm to Credit Suisse and any Covered Services Provider if the engagement relates directly to the operations and financial reporting of the registrant. The Committee may delegate its responsibility to pre-approve any such audit and permissible non-audit services to the Chairperson of the Committee, and the Chairperson shall report to the Committee, at its next regularly scheduled meeting after the Chairperson’s pre-approval of such services, his or her decision(s). The Committee may also establish detailed pre-approval policies and procedures for pre-approval of such services in accordance with applicable laws, including the delegation of some or all of the Committee’s pre-approval responsibilities to other persons (other than Credit Suisse or the registrant’s officers). Pre-approval by the Committee of any permissible non-audit services shall not be required so long as: (i) the aggregate amount of all such permissible non-audit services provided to the registrant, Credit Suisse and any Covered Services Provider constitutes not more than 5% of the total amount of revenues paid by the registrant to its independent registered public accounting firm during the fiscal year in which the permissible non-audit services are provided; (ii) the permissible non-audit services were not recognized by the registrant at the time of the engagement to be non-audit services; and (iii) such services are promptly brought to the attention of the Committee and approved by the Committee (or its delegate(s)) prior to the completion of the audit.
(e)(2) The information in the table below sets forth the percentages of fees for services (other than audit, review or attest services) rendered by PwC to the registrant for which the pre-approval requirement was waived pursuant to Rule 2-01(c)(7)(i)(C) of Regulation S-X:
| | | | 2020 | | | | 2021 | |
| Audit-Related Fees | | | N/A | | | | N/A | |
| Tax Fees | | | N/A | | | | N/A | |
| All Other Fees | | | N/A | | | | N/A | |
| Total | | | N/A | | | | N/A | |
The information in the table below sets forth the percentages of fees for services (other than audit, review or attest services) rendered by PwC to Credit Suisse and any Covered Services Provider required to be approved pursuant to Rule 2-01(c)(7)(ii) of Regulation S-X, for the registrant’s fiscal years ended October 31, 2020 and October 31, 2021:
| | | | 2020 | | | | 2021 | |
| Audit-Related Fees | | | N/A | | | | N/A | |
| Tax Fees | | | N/A | | | | N/A | |
| All Other Fees | | | N/A | | | | N/A | |
| Total | | | N/A | | | | N/A | |
(f) Not Applicable.
(g) The aggregate fees billed by the registrant’s former independent registered public accounting firm for the fiscal year ended October 31, 2020 were $19,760 and by PwC for the fiscal year ended October 31, 2021 were $16,000 for non-audit services rendered to the registrant, Credit Suisse and Covered Service Providers.
(h) Not Applicable.
Item 5. Audit Committee of Listed Registrants.
Form N-CSR disclosure requirement is not applicable to the registrant.
Item 6. Schedule of Investments.
Included as part of the report to shareholders filed under Item 1 of this Form.
Item 7. Disclosure of Proxy Voting Policies and Procedures for Closed-End Management Investment Companies.
Form N-CSR disclosure requirement is not applicable to the registrant.
Item 8. Portfolio Managers of Closed-End Management Investment Companies.
Form N-CSR disclosure requirement is not applicable to the registrant.
Item 9. Purchases of Equity Securities by Closed-End Management Investment Company and Affiliated Purchasers.
Form N-CSR disclosure requirement is not applicable to the registrant.
Item 10. Submission of Matters to a Vote of Security Holders.
None.
Item 11. Controls and Procedures.
(a) As of a date within 90 days from the filing date of this report, the principal executive officer and principal financial officer concluded that the registrant's disclosure controls and procedures (as defined in Rule 30a-3(c) under the Investment Company Act of 1940 (the “Act”)) were effective based on their evaluation of the disclosure controls and procedures required by Rule 30a-3(b) under the Act and Rules 13a-15(b) or 15d-15(b) under the Securities Exchange Act of 1934.
(b) There were no changes in registrant's internal control over financial reporting (as defined in Rule 30a-3(d) under the Act) that occurred during the most recent fiscal half-year covered by this report that have materially affected, or are reasonably likely to materially affect, the registrant’s internal control over financial reporting.
Item 12. Disclosure of Securities Lending Activities for Closed-End Management Investment Companies.
Form N-CSR disclosure requirement is not applicable to the registrant.
Item 13. Exhibits.
(other) Iran related activities disclosure requirement.
SIGNATURES
Pursuant to the requirements of the Securities Exchange Act of 1934 and the Investment Company Act of 1940, the registrant has duly caused this report to be signed on its behalf by the undersigned, thereunto duly authorized.
| | CREDIT SUISSE OPPORTUNITY FUNDS | |
| | | |
| | /s/ John G. Popp | |
| | Name: John G. Popp | |
| | Title: Chief Executive Officer and President | |
| | Date: January 6, 2022 | |
Pursuant to the requirements of the Securities Exchange Act of 1934 and the Investment Company Act of 1940, this report has been signed below by the following persons on behalf of the registrant and in the capacities and on the dates indicated.
| | /s/ John G. Popp | |
| | Name: John G. Popp | |
| | Title: Chief Executive Officer and President | |
| | Date: January 6, 2022 | |
| | | |
| | /s/ Omar Tariq | |
| | Name: Omar Tariq | |
| | Title: Chief Financial Officer and Treasurer | |
| | Date: January 6, 2022 | |