UNITED STATES
SECURITIES AND EXCHANGE COMMISSION
Washington, D.C. 20549
FORM N-CSR
CERTIFIED SHAREHOLDER REPORT OF REGISTERED
MANAGEMENT INVESTMENT COMPANIES
Investment Company Act file number | 811-09054 |
|
CREDIT SUISSE OPPORTUNITY FUNDS |
(Exact name of registrant as specified in charter) |
|
Eleven Madison Avenue, New York, New York | | 10010 |
(Address of principal executive offices) | | (Zip code) |
|
John G. Popp Credit Suisse Opportunity Funds Eleven Madison Avenue New York, New York 10010 |
(Name and address of agent for service) |
|
Registrant’s telephone number, including area code: | (212) 325-2000 | |
|
Date of fiscal year end: | October 31st | |
|
Date of reporting period: | November 1, 2017 to October 31, 2018 | |
| | | | | | | | | |
Item 1. Reports to Stockholders.
2

CREDIT SUISSE FUNDS
Annual Report
October 31, 2018
n CREDIT SUISSE
FLOATING RATE HIGH INCOME FUND
The Fund's investment objectives, risks, charges and expenses (which should be considered carefully before investing), and more complete information about the Fund, are provided in the Prospectus, which should be read carefully before investing. You may obtain additional copies by calling 877-870-2874 or by visiting our website at www.credit-suisse.com/us/funds.
Credit Suisse Securities (USA) LLC, Distributor, is located at Eleven Madison Avenue, New York, NY 10010. Credit Suisse Funds are advised by Credit Suisse Asset Management, LLC.
Investors in the Credit Suisse Funds should be aware that they may be eligible to purchase Class I shares (where offered) directly or through certain intermediaries. Such shares are not subject to a sales charge. Investors in the Credit Suisse Funds should also be aware that they may be eligible for a reduction or waiver of the sales charge with respect to Class A or C shares (where offered). For more information, please review the relevant prospectuses or consult your financial representative.
Fund shares are not deposits or other obligations of Credit Suisse Asset Management, LLC ("Credit Suisse") or any affiliate, are not FDIC-insured and are not guaranteed by Credit Suisse or any affiliate. Fund investments are subject to investment risks, including loss of your investment.
Credit Suisse Floating Rate High Income Fund
Annual Investment Adviser's Report
October 31, 2018 (unaudited)
November 23, 2018
Dear Shareholder:
We are pleased to present this Annual Report covering the activities of the Credit Suisse Floating Rate High Income Fund (the "Fund") for the 12-month period ended October 31, 2018.
Performance Summary
11/1/2017 – 10/31/2018
Fund & Benchmark | | Performance | |
Class I1 | | | 3.45 | % | |
Class A1,2 | | | 3.20 | % | |
Class C1,2 | | | 2.58 | % | |
Credit Suisse Leveraged Loan Index3 | | | 4.89 | % | |
Performance shown for the Fund's Class A and Class C Shares does not reflect sales charges, which are a maximum of 4.75% and 1.00%, respectively.2
Market Review: A steady period for the asset class
The 12-month period ended October 31, 2018 was a positive one for the senior secured loan asset class. The Credit Suisse Leveraged Loan Index (the "Index"), the Fund's benchmark, returned 4.89% for the period. The discount margin for senior loans, using a three-year average life assumption, tightened 0.18% during the period to end the period at +398 basis points. The average price of the Index increased 0.27 points to finish the period at $98.38.
From a quality point of view, the lower rated portion of the Index outperformed for the year. CCC/Split CCC posted the highest returns, at 9.94%, followed by Split B loans, which returned 8.74% during the period. Split BBB and BB-rated loans underperformed with respective returns of 3.66% and 3.96%.
From an industry perspective, retail, energy, and food & drug were the top performers, with respective returns of 8.22%, 8.19% and 7.47%. Conversely, consumer durables, consumer non-durables and food/tobacco lagged with returns of -0.88%, 3.50% and 3.88%, respectively.
The year was characterized by steady gains, with the Index posting positive returns each month, as demand for the asset class continued. Leveraged loan mutual funds experienced a net inflow of $12.41 billion, which includes 10 consecutive months of positive flows through October. Additionally, CLO creation was robust with gross issuance of $275 billion that included $130 billion in new vehicles, according to JPMorgan.
1
Credit Suisse Floating Rate High Income Fund
Annual Investment Adviser's Report (continued)
October 31, 2018 (unaudited)
In terms of supply, JPMorgan reports gross loan issuance of $793 billion and net issuance of $287 billion (ex-refinancing/repricing transactions) for the last 12 months. To put this in context, with $268 billion year to date, 2018 is on pace to be the highest reported net issuance year the loan market has experienced.
Market fundamentals remain strong, as the trailing 12-month U.S. leveraged loan par-weighted default rate ended the period at 1.92% — significantly below the 3.0 – 3.5% historical average.
Strategic Review and Outlook: Fundamentals and economic data remain solid
For the annual period ended October 31, 2018, the Fund underperformed the Index. This underperformance is largely attributable to negative security selection in the media/telecommunications and information technology sectors. In addition, an underweight to the retail sector also detracted from relative performance.
We expect to see volatility in the near term due to investor concerns over the economic and credit cycle, recent LBO issuance, trade tensions, Brexit and escalating geopolitical tensions in the Middle East. Over the long term, we continue to be constructive on the leveraged loan market given the stable economic backdrop and senior secured and floating rate features of the asset class.
The Credit Suisse Credit Investments Group Team
John G. Popp
Thomas J. Flannery
Louis I. Farano
Wing Chan
Senior secured floating rate loans ("Senior Loans") typically hold the most senior position in the issuer's capital structure. Senior Loans are subject to the risk that a court could subordinate a Senior Loan to presently existing or future indebtedness or take other action detrimental to the holders of Senior Loans.
High yield bonds are bonds rated below BBB- by S&P or Baa3 by Moody's that are also known as "junk bonds." Such bonds entail greater risks than those found in higher-rated securities.
2
Credit Suisse Floating Rate High Income Fund
Annual Investment Adviser's Report (continued)
October 31, 2018 (unaudited)
Additional principal risk factors for the Fund include conflict of interest risk, credit risk, foreign securities risk, interest rate risk, liquidity risk, market risk, prepayment risk and valuation risk. Before you invest, please make sure you understand the risks that apply to the Fund. As with any mutual fund, you could lose money over any period of time.
Investments in the Fund are not bank deposits and are not insured or guaranteed by the Federal Deposit Insurance Corporation or any government agency. For a detailed discussion of these and other risks, please refer to the Fund's Prospectus, which should be read carefully before investing.
In addition to historical information, this report contains forward-looking statements, which may concern, among other things, domestic and foreign markets, industry and economic trends and developments and government regulation, and their potential impact on the Fund's investments. These statements are subject to risks and uncertainties and actual trends, developments and regulations in the future, and their impact on the Fund, could be materially different from those projected, anticipated or implied. The Fund has no obligation to update or revise forward-looking statements.
The views of the Fund's management are as of the date of this letter and the Fund holdings described in this document are as of October 31, 2018; these views and Fund holdings may have changed subsequent to these dates. Nothing in this document is a recommendation to purchase or sell securities.
3
Credit Suisse Floating Rate High Income Fund
Annual Investment Adviser's Report (continued)
October 31, 2018 (unaudited)
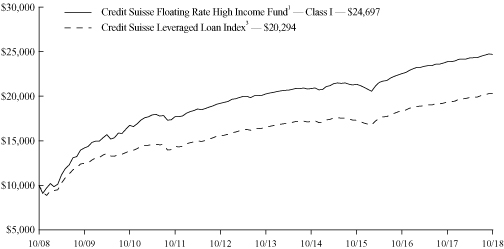
Comparison of Change in Value of $10,000 Investment in the
Credit Suisse Floating Rate High Income Fund1 Class I shares and the
Credit Suisse Leveraged Loan Index3 for Ten Years
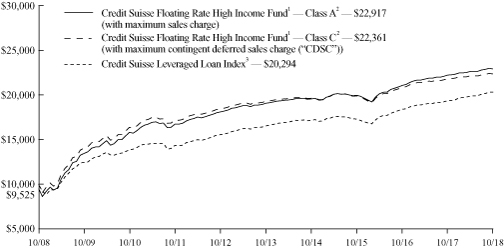
Comparison of Change in Value of $10,000 Investment in the
Credit Suisse Floating Rate High Income Fund1 Class A shares2,
Class C shares2 and the Credit Suisse
Leveraged Loan Index3 for Ten Years
1 Fee waivers and/or expense reimbursements reduce expenses for the Fund, without which performance would be lower. Voluntary waivers and/or expense reimbursements may be discontinued at any time.
4
Credit Suisse Floating Rate High Income Fund
Annual Investment Adviser's Report (continued)
October 31, 2018 (unaudited)
2 Total return for the Fund's Class A shares for the reporting period, based on offering price (including maximum sales charge of 4.75%), was (1.65)%. Total return for the Fund's Class C shares for the reporting period, based on redemption value (including maximum contingent deferred sales charge ("CDSC") of 1.00%), was 1.59%.
3 Credit Suisse Leveraged Loan Index is an unmanaged index that is designed to mirror the investable universe of the U.S. dollar denominated institutional leveraged loan market. The index does not have transaction costs and investors cannot invest directly in the index.
Average Annual Returns as of October 31, 20181
| | | 1 Year | | 5 Years | | 10 Years | |
Class I | | | 3.45 | % | | | 4.04 | % | | | 9.46 | % | |
Class A Without Sales Charge | | | 3.20 | % | | | 3.75 | % | | | 9.18 | % | |
Class A With Maximum Sales Charge | | | (1.65 | )% | | | 2.74 | % | | | 8.65 | % | |
Class C Without CDSC | | | 2.58 | % | | | 3.01 | % | | | 8.38 | % | |
Class C With CDSC | | | 1.59 | % | | | 3.01 | % | | | 8.38 | % | |
Returns represent past performance and include change in share price and reinvestment of dividends and capital gain distributions, if any. Past performance cannot guarantee future results. The current performance of the Fund may be lower or higher than the figures shown. Returns and share price will fluctuate, and redemption value may be more or less than original cost. The performance results do not reflect the deduction of taxes that a shareholder would pay on Fund distributions or the redemption of Fund shares. Performance information current to the most recent month end is available at www.credit-suisse.com/us/funds.
The annual gross expense ratios are 0.76% for Class I shares, 1.01% for Class A shares, and 1.76% for Class C shares. The annual net expense ratios after fee waivers and/or expense reimbursements are 0.70% for Class I shares, 0.95% for Class A shares and 1.70% for Class C shares.
1 Fee waivers and/or expense reimbursements reduce expenses for the Fund, without which performance would be lower. Voluntary waivers and/or reimbursements may be discontinued at any time.
5
Credit Suisse Floating Rate High Income Fund
Annual Investment Adviser's Report (continued)
October 31, 2018 (unaudited)
Information About Your Fund's Expenses
As an investor of the Fund, you incur two types of costs: ongoing expenses and transaction costs. Ongoing expenses include management fees, distribution and service (12b-1) fees and other Fund expenses. Examples of transaction costs include sales charges (loads), redemption fees and account maintenance fees, which are not shown in this section and which would result in higher total expenses. The following table is intended to help you understand your ongoing expenses of investing in the Fund and to help you compare these expenses with the ongoing expenses of investing in other mutual funds. The table is based on an investment of $1,000 made at the beginning of the six months ended October 31, 2018.
The table illustrates your Fund's expenses in two ways:
• Actual Fund Return. This helps you estimate the actual dollar amount of ongoing expenses paid on a $1,000 investment in the Fund using the Fund's actual return during the period. To estimate the expenses you paid over the period, simply divide your account value by $1,000 (for example, an $8,600 account value divided by $1,000 = 8.6), then multiply the result by the number in the "Expenses Paid per $1,000" line.
• Hypothetical 5% Fund Return. This helps you to compare the Fund's ongoing expenses with those of other mutual funds using the Fund's actual expense ratio and a hypothetical rate of return of 5% per year before expenses. Examples using a 5% hypothetical fund return may be found in the shareholder reports of other mutual funds. The hypothetical account values and expenses may not be used to estimate the actual ending account balance or expenses you paid for the period.
Please note that the expenses shown in these tables are meant to highlight your ongoing expenses only and do not reflect any transaction costs, such as sales charges (loads) or redemption fees. If these transaction costs had been included, your costs would have been higher. The "Expenses Paid per $1,000" line of the tables is useful in comparing ongoing expenses only and will not help you determine the relative total expenses of owning different funds.
6
Credit Suisse Floating Rate High Income Fund
Annual Investment Adviser's Report (continued)
October 31, 2018 (unaudited)
Expenses and Value for a $1,000 Investment
for the six-month period ended October 31, 2018
Actual Fund Return | | Class I | | Class A | | Class C | |
Beginning Account Value 05/01/18 | | $ | 1,000.00 | | | $ | 1,000.00 | | | $ | 1,000.00 | | |
Ending Account Value 10/31/18 | | $ | 1,016.40 | | | $ | 1,013.70 | | | $ | 1,011.30 | | |
Expenses Paid per $1,000* | | $ | 3.56 | | | $ | 4.82 | | | $ | 8.62 | | |
Hypothetical 5% Fund Return | |
Beginning Account Value 05/01/18 | | $ | 1,000.00 | | | $ | 1,000.00 | | | $ | 1,000.00 | | |
Ending Account Value 10/31/18 | | $ | 1,021.68 | | | $ | 1,020.42 | | | $ | 1,016.64 | | |
Expenses Paid per $1,000* | | $ | 3.57 | | | $ | 4.84 | | | $ | 8.64 | | |
| | | Class I | | Class A | | Class C | |
Annualized Expense Ratios* | | | 0.70 | % | | | 0.95 | % | | | 1.70 | % | |
* Expenses are equal to the Fund's annualized expense ratio for each share class, multiplied by the average account value over the period, multiplied by 184/365 to reflect the one-half year period.
The "Expenses Paid per $1,000" and the "Annualized Expense Ratios" in the tables are based on actual expenses paid by the Fund during the period, net of fee waivers and/or actual expense reimbursements, if applicable. If those fee waivers and/or expense reimbursements had not been in effect, the Fund's actual expenses would have been higher. Expenses do not reflect additional charges and expenses that are, or may be, imposed under the variable contracts or plans. Such charges and expenses are described in the prospectus of the insurance company separate account or in the plan documents or other informational materials supplied by plan sponsors. The Fund's expenses should be considered with these charges and expenses in evaluating the overall cost of investing in the separate account.
For more information, please refer to the Fund's Prospectus.
7
Credit Suisse Floating Rate High Income Fund
Annual Investment Adviser's Report (continued)
October 31, 2018 (unaudited)
Credit Quality Breakdown*
(% of Total Investments as of October 31, 2018)
S&P Ratings** | |
A | | | 1.1 | % | |
BBB | | | 10.6 | | |
BB | | | 34.0 | | |
B | | | 45.3 | | |
CCC | | | 5.7 | | |
CC | | | 0.01 | | |
NR | | | 3.1 | | |
Subtotal | | | 99.8 | | |
Equity and Other | | | 0.2 | | |
Total | | | 100.0 | % | |
* Expressed as a percentage of total investments (excluding securities lending collateral, if applicable) and may vary over time.
** Credit Quality is based on ratings provided by the Standard & Poor's Division of The McGraw-Hill Companies, Inc. (S&P"). S&P is a main provider of ratings for credit assets classes and is widely used amongst industry participants. The NR category consists of securities that have not been rated by S&P.
1 This amount represents less than 0.1%.
8
Credit Suisse Floating Rate High Income Fund
Schedule of Investments
October 31, 2018
Par
(000) | |
| | Ratings†
(S&P/Moody's) | | Maturity | | Rate% | | Value | |
| BANK LOANS (81.8%) | | | |
| Advertising (0.2%) | | | |
$ | 1,985 | | | MH Sub I LLC, LIBOR 1M + 3.750%(1) | | (B, B2) | | 09/13/24 | | | 6.030 | | | $ | 1,994,351 | | |
| | 5,980 | | | MH Sub I LLC, LIBOR 1M + 7.500%(1) | | (CCC+, Caa2) | | 09/15/25 | | | 9.780 | | | | 6,039,800 | | |
| | | | 8,034,151 | | |
| Aerospace & Defense (1.3%) | | | |
| | 30,156 | | | Avolon TLB Borrower 1 (US) LLC,
LIBOR 1M + 2.000%(1) | | (BBB-, Ba1) | | 01/15/25 | | | 4.280 | | | | 30,118,710 | | |
| | 4,151 | | | Fly Funding II Sarl, LIBOR 3M + 2.000%(1) | | (BB+, Ba2) | | 02/09/23 | | | 4.340 | | | | 4,148,858 | | |
| | 8,754 | | | Sequa Mezzanine Holdings LLC,
LIBOR 3M + 5.000%(1) | | (CCC+, B3) | | 11/28/21 | | | 7.408 | | | | 8,661,417 | | |
| | 7,151 | | | Swissport Financing Sarl,
EURIBOR 3M + 4.375%(1),(2) | | (B-, B2) | | 02/08/22 | | | 4.375 | | | | 8,155,294 | | |
| | 2,218 | | | TransDigm, Inc., LIBOR 1M + 2.500%(1) | | (B+, Ba2) | | 06/09/23 | | | 4.802 | | | | 2,211,129 | | |
| | | | 53,295,408 | | |
| Air Transportation (0.9%) | | | |
| | 10,405 | | | American Airlines, Inc., LIBOR 1M + 2.000%(1) | | (BB+, Ba1) | | 12/14/23 | | | 4.280 | | | | 10,350,566 | | |
| | 20,297 | | | American Airlines, Inc., LIBOR 1M + 1.750%(1) | | (BB+, Ba1) | | 06/27/25 | | | 4.045 | | | | 19,906,534 | | |
| | 5,000 | | | American Airlines, Inc., LIBOR 1M + 2.00%(1) | | (BB+, Ba1) | | 04/28/23 | | | 4.295 | | | | 4,973,125 | | |
| | | | 35,230,225 | | |
| Auto Parts & Equipment (1.6%) | | | |
| | 19,430 | | | American Axle & Manufacturing, Inc.,
LIBOR 1M + 2.250%(1) | | (BB, Ba2) | | 04/06/24 | | | 4.621 | | | | 19,371,976 | | |
| | 21,245 | | | CS Intermediate Holdco 2 LLC,
LIBOR 1M + 2.000%(1) | | (BBB-, Ba1) | | 11/02/23 | | | 4.302 | | | | 21,307,951 | | |
| | 9,974 | | | Jason, Inc., LIBOR 3M + 4.500%(1),(3) | | (B, B2) | | 06/30/21 | | | 6.886 | | | | 9,948,713 | | |
| | 2,993 | | | L&W, Inc., LIBOR 1M + 4.000%(1) | | (B+, B2) | | 05/22/25 | | | 6.287 | | | | 3,008,405 | | |
| | 13,819 | | | U.S. Farathane LLC, LIBOR 3M + 3.500%(1),(4) | | (B+, B2) | | 12/23/21 | | | 5.886 | | | | 13,801,861 | | |
| | | | 67,438,906 | | |
| Automakers (0.7%) | | | |
| | 5,609 | | | FCA U.S. LLC, LIBOR 1M + 2.000%(1) | | (BBB-, Baa2) | | 12/31/18 | | | 4.300 | | | | 5,621,080 | | |
| | 12,262 | | | TI Group Automotive Systems LLC,
EURIBOR 3M + 2.750%(1),(2) | | (BB-, B1) | | 06/30/22 | | | 3.500 | | | | 13,968,922 | | |
| | 8,981 | | | TI Group Automotive Systems LLC,
LIBOR 1M + 2.500%(1) | | (BB-, B1) | | 06/30/22 | | | 4.802 | | | | 8,962,334 | | |
| | | | 28,552,336 | | |
| Banking (0.3%) | | | |
| | 11,540 | | | Citco Funding LLC, LIBOR 1M + 2.500%(1) | | (B+, Ba3) | | 09/28/23 | | | 4.802 | | | | 11,600,195 | | |
| Building & Construction (1.0%) | | | |
| | 9,000 | | | Apleona Ltd., LIBOR 3M + 4.250%(1),(5) | | (B, B2) | | 09/01/23 | | | 5.049 | | | | 11,601,576 | | |
| | 22,991 | | | Installed Building Products, Inc.,
LIBOR 1M + 2.500%(1) | | (BB, B1) | | 04/15/25 | | | 4.802 | | | | 22,890,256 | | |
| | 1,995 | | | PGT, Inc., LIBOR 1M + 3.500%(1) | | (BB, Ba1) | | 02/16/22 | | | 5.796 | | | | 2,002,569 | | |
See Accompanying Notes to Financial Statements.
9
Credit Suisse Floating Rate High Income Fund
Schedule of Investments (continued)
October 31, 2018
Par
(000) | |
| | Ratings†
(S&P/Moody's) | | Maturity | | Rate% | | Value | |
| BANK LOANS (continued) | | | |
Building & Construction | | | |
$ | 4,276 | | | SiteOne Landscape Supply, Inc.,
LIBOR 1M + 2.750%(1) | | (BB, B2) | | 10/29/24 | | | 5.030 | | | $ | 4,297,766 | | |
| | | | 40,792,167 | | |
| Building Materials (3.2%) | | | |
| | 3,990 | | | Airxcel, Inc., LIBOR 1M + 4.500%(1) | | (B, B3) | | 04/28/25 | | | 6.802 | | | | 3,942,619 | | |
| | 1,775 | | | Airxcel, Inc., LIBOR 1M + 8.750%(1),(4) | | (CCC+, Caa2) | | 04/27/26 | | | 11.052 | | | | 1,717,313 | | |
| | 27,059 | | | American Builders & Contractors Supply Co., Inc.,
LIBOR 1M + 2.000%(1) | | (BB+, B1) | | 10/31/23 | | | 4.302 | | | | 26,838,715 | | |
| | 6,991 | | | Beacon Roofing Supply, Inc.,
LIBOR 3M + 2.250%(1) | | (BB+, B1) | | 01/02/25 | | | 4.527 | | | | 6,938,135 | | |
| | 5,927 | | | C.H.I. Overhead Doors, Inc.,
LIBOR 1M + 3.250%(1) | | (B, B2) | | 07/29/22 | | | 5.552 | | | | 5,935,067 | | |
| | 7,455 | | | Floor & Decor Outlets of America, Inc.,
LIBOR 1M + 2.500%(1),(4) | | (BB, B1) | | 09/30/23 | | | 4.810 | | | | 7,492,236 | | |
| | 10,332 | | | HD Supply, Inc., LIBOR 3M + 1.750%(1) | | (BBB-, Ba2) | | 10/17/23 | | | 4.030 | | | | 10,341,267 | | |
| | 20,696 | | | Priso Acquisition Corp., LIBOR 1M + 3.000%(1) | | (B+, B2) | | 05/08/22 | | | 5.302 | | | | 20,756,496 | | |
| | 17,262 | | | Summit Materials Cos. I LLC,
LIBOR 1M + 2.000%(1) | | (BBB-, Ba2) | | 11/21/24 | | | 4.302 | | | | 17,205,608 | | |
| | 30,310 | | | Wilsonart LLC, LIBOR 3M + 3.250%(1) | | (B+, B2) | | 12/19/23 | | | 5.640 | | | | 30,329,425 | | |
| | | | 131,496,881 | | |
| Cable & Satellite TV (3.1%) | | | |
| | 11,441 | | | Altice U.S. Finance I Corp., LIBOR 1M + 2.250%(1) | | (BB, NR) | | 07/28/25 | | | 4.552 | | | | 11,437,783 | | |
| | 17,244 | | | Charter Communications Operating LLC,
LIBOR 1M + 2.000%(1) | | (BBB-, Ba1) | | 04/30/25 | | | 4.310 | | | | 17,264,967 | | |
| | 24,902 | | | CSC Holdings LLC, LIBOR 1M + 2.250%(1) | | (BB-, Ba2) | | 07/17/25 | | | 4.530 | | | | 24,880,215 | | |
| | 5,000 | | | Unitymedia Finance LLC, LIBOR 1M + 2.250%(1) | | (BB-, Ba3) | | 09/30/25 | | | 4.530 | | | | 5,000,325 | | |
| | 25,000 | | | Unitymedia Finance LLC, LIBOR 1M + 2.250%(1) | | (BB-, Ba3) | | 01/15/26 | | | 4.530 | | | | 24,993,125 | | |
| | 11,000 | | | Virgin Media Bristol LLC, LIBOR 1M + 2.500%(1) | | (BB-, Ba3) | | 01/15/26 | | | 4.780 | | | | 11,003,410 | | |
| | 15,000 | | | Ziggo Secured Finance B.V.,
EURIBOR 6M + 3.000%(1),(2) | | (BB-, B1) | | 04/15/25 | | | 3.000 | | | | 16,999,821 | | |
| | 14,500 | | | Ziggo Secured Finance Partnership,
LIBOR 1M + 2.500%(1) | | (BB-, B1) | | 04/15/25 | | | 4.780 | | | | 14,237,985 | | |
| | | | 125,817,631 | | |
| Chemicals (9.8%) | | | |
| | 9,800 | | | Allnex (Luxembourg) & Cy S.C.A.,
EURIBOR 3M + 3.250%(1),(2) | | (B, B1) | | 09/13/23 | | | 3.250 | | | | 11,135,701 | | |
| | 1,858 | | | Allnex (Luxembourg) & Cy S.C.A.,
LIBOR 3M + 3.250%(1) | | (B, B1) | | 09/13/23 | | | 5.567 | | | | 1,859,992 | | |
| | 1,400 | | | Allnex U.S.A., Inc., LIBOR 3M + 3.250%(1) | | (B, B1) | | 09/13/23 | | | 5.567 | | | | 1,401,311 | | |
| | 26,761 | | | Alpha 3 B.V., LIBOR 3M + 3.000%(1) | | (B, B1) | | 01/31/24 | | | 5.386 | | | | 26,806,834 | | |
| | 15,195 | | | Ascend Performance Materials Operations LLC,
LIBOR 3M + 5.250%(1) | | (B+, B2) | | 08/12/22 | | | 7.636 | | | | 15,261,850 | | |
| | 3,398 | | | ASP Chromaflo Dutch I B.V.,
LIBOR 1M + 3.500%(1),(4) | | (B, B2) | | 11/20/23 | | | 5.802 | | | | 3,397,949 | | |
See Accompanying Notes to Financial Statements.
10
Credit Suisse Floating Rate High Income Fund
Schedule of Investments (continued)
October 31, 2018
Par
(000) | |
| | Ratings†
(S&P/Moody's) | | Maturity | | Rate% | | Value | |
| BANK LOANS (continued) | | | |
Chemicals | | | |
$ | 4,063 | | | ASP Chromaflo Intermediate Holdings, Inc.,
LIBOR 1M + 8.000%(1) | | (CCC, Caa2) | | 11/14/24 | | | 10.302 | | | $ | 4,065,059 | | |
| | 2,613 | | | ASP Chromaflo Intermediate Holdings, Inc.,
LIBOR 1M + 3.500%(1),(4) | | (B, B2) | | 11/18/23 | | | 5.802 | | | | 2,613,165 | | |
| | 27,058 | | | Axalta Coating Systems U.S. Holdings, Inc.,
LIBOR 3M + 1.750%(1) | | (BBB-, Ba1) | | 06/01/24 | | | 4.136 | | | | 27,028,368 | | |
| | 4,900 | | | Azelis Finance S.A., LIBOR 1W + 3.750%(1),(4) | | (B, B2) | | 12/16/22 | | | 5.976 | | | | 4,936,976 | | |
| | 1,715 | | | Colouroz Investment 2 LLC,
LIBOR 3M + 7.250%(1) | | (CCC, Caa2) | | 09/06/22 | | | 9.737 | | | | 1,450,784 | | |
| | 9,757 | | | CTC AcquiCo GmbH, EURIBOR 3M + 3.000%(1),(2) | | (B, B2) | | 03/07/25 | | | 3.000 | | | | 11,075,856 | | |
| | 1,182 | | | Ferro Corp., LIBOR 3M + 2.250%(1) | | (BB-, Ba3) | | 02/14/24 | | | 4.636 | | | | 1,183,674 | | |
| | 6,330 | | | Ferro Corp., LIBOR 3M + 2.250%(1) | | (BB-, Ba3) | | 02/14/24 | | | 4.636 | | | | 6,331,991 | | |
| | 6,195 | | | Ferro Corp., LIBOR 3M + 2.250%(1) | | (BB-, Ba3) | | 02/14/24 | | | 4.636 | | | | 6,197,268 | | |
| | 1,945 | | | Flint Group GmbH, EURIBOR 3M + 3.000%(1),(2) | | (B-, B3) | | 09/07/21 | | | 3.750 | | | | 2,131,365 | | |
| | 278 | | | Flint Group GmbH, LIBOR 3M + 3.000%(1) | | (B-, B3) | | 09/07/21 | | | 5.487 | | | | 264,225 | | |
| | 1,679 | | | Flint Group U.S. LLC, LIBOR 3M + 3.000%(1) | | (B-, B3) | | 09/07/21 | | | 5.487 | | | | 1,598,344 | | |
| | 14,493 | | | Gemini HDPE LLC, LIBOR 3M + 2.500%(1) | | (BB, Ba2) | | 08/07/24 | | | 5.027 | | | | 14,535,426 | | |
| | 29,983 | | | H.B. Fuller Co., LIBOR 1M + 2.000%(1) | | (BB+, Ba2) | | 10/20/24 | | | 4.280 | | | | 29,913,876 | | |
| | 3,870 | | | Houghton International, Inc.,
LIBOR 1M + 8.500%(1) | | (B-, Caa1) | | 12/20/20 | | | 10.802 | | | | 3,882,113 | | |
| | 15,295 | | | Houghton International, Inc.,
LIBOR 1M + 3.250%(1) | | (B+, B1) | | 12/20/19 | | | 5.552 | | | | 15,347,609 | | |
| | 6,103 | | | INEOS Styrolution Group GmbH,
LIBOR 3M + 2.000%(1) | | (BB+, Ba2) | | 03/30/24 | | | 4.386 | | | | 6,110,190 | | |
| | 27,375 | | | Ineos U.S. Finance LLC, LIBOR 1M + 2.000%(1) | | (BB+, Ba1) | | 03/31/24 | | | 4.302 | | | | 27,370,622 | | |
| | 3,023 | | | MacDermid, Inc., LIBOR 1M + 3.000%(1) | | (BB-, B2) | | 06/07/23 | | | 5.302 | | | | 3,030,421 | | |
| | 7,686 | | | PMHC II, Inc., LIBOR 6M + 3.500%(1) | | (B-, B3) | | 03/31/25 | | | 6.151 | | | | 7,483,770 | | |
| | 3,500 | | | PMHC II, Inc., LIBOR 3M + 7.750%(1) | | (CCC+, Caa2) | | 03/30/26 | | | 10.513 | | | | 3,298,750 | | |
| | 13,067 | | | PQ Corp., LIBOR 3M + 2.500%(1) | | (BB-, B2) | | 02/08/25 | | | 5.027 | | | | 13,070,739 | | |
| | 6,061 | | | Preferred Proppants LLC, LIBOR 3M + 5.750%(1),(4) | | (NR, NR) | | 07/27/20 | | | 10.136 | | | | 3,788,094 | | |
| | 13,098 | | | Preferred Proppants LLC, LIBOR 3M + 7.750%(1),(4) | | (NR, NR) | | 07/27/20 | | | 10.136 | | | | 7,204,149 | | |
| | 12,938 | | | Ravago Holdings America, Inc.,
LIBOR 1M + 2.750%(1),(4) | | (BB-, B2) | | 06/30/23 | | | 5.060 | | | | 13,018,524 | | |
| | 20,000 | | | Schenectady International Group, Inc.,
LIBOR 3M + 4.750%(1) | | (B, B2) | | 10/15/25 | | | 7.186 | | | | 19,937,500 | | |
| | 2,377 | | | Sonneborn LLC, LIBOR 1M + 3.750%(1),(4) | | (B+, B1) | | 12/10/20 | | | 6.052 | | | | 2,406,666 | | |
| | 419 | | | Sonneborn Refined Products B.V.,
LIBOR 1M + 3.750%(1),(4) | | (B+, B1) | | 12/10/20 | | | 6.052 | | | | 424,707 | | |
| | 29,050 | | | Starfruit Finco B.V, LIBOR 1M + 3.250%(1) | | (B+, B1) | | 10/01/25 | | | 5.506 | | | | 28,998,146 | | |
| | 4,496 | | | Tronox Blocked Borrower LLC,
LIBOR 1M + 3.000%(1) | | (BB-, Ba3) | | 09/23/24 | | | 5.302 | | | | 4,497,696 | | |
| | 10,376 | | | Tronox Finance LLC, LIBOR 1M + 3.000%(1) | | (BB-, Ba3) | | 09/23/24 | | | 5.302 | | | | 10,379,299 | | |
| | 23,195 | | | Univar, Inc., LIBOR 1M + 2.250%(1) | | (BB, B1) | | 07/01/24 | | | 4.552 | | | | 23,219,890 | | |
| | 22,755 | | | UTEX Industries, Inc., LIBOR 1M + 4.000%(1) | | (CCC+, B3) | | 05/22/21 | | | 6.302 | | | | 22,385,150 | | |
| | 2,978 | | | Vantage Specialty Chemicals, Inc.,
LIBOR 1M + 3.500%(1) | | (B-, B3) | | 10/28/24 | | | 5.806 | | | | 2,989,604 | | |
See Accompanying Notes to Financial Statements.
11
Credit Suisse Floating Rate High Income Fund
Schedule of Investments (continued)
October 31, 2018
Par
(000) | |
| | Ratings†
(S&P/Moody's) | | Maturity | | Rate% | | Value | |
| BANK LOANS (continued) | | | |
Chemicals | | | |
$ | 3,978 | | | Vantage Specialty Chemicals, Inc.,
LIBOR 3M + 8.250%(1) | | (CCC, Caa2) | | 10/27/25 | | | 10.777 | | | $ | 4,004,783 | | |
| | 7,205 | | | Zep, Inc., LIBOR 3M + 4.000%(1) | | (CCC+, B2) | | 08/12/24 | | | 6.386 | | | | 6,804,244 | | |
| | 2,250 | | | Zep, Inc., LIBOR 3M + 8.250%(1) | | (CCC-, Caa2) | | 08/11/25 | | | 10.636 | | | | 2,154,375 | | |
| | | | 404,997,055 | | |
| Diversified Capital Goods (1.0%) | | | |
| | 16,133 | | | Cortes NP Acquisition Corp.,
LIBOR 3M + 4.000%(1) | | (B, B1) | | 11/30/23 | | | 6.313 | | | | 15,991,592 | | |
| | 1,074 | | | Douglas Dynamics Holdings, Inc.,
LIBOR 1M + 3.000%(1) | | (BB-, B2) | | 12/31/21 | | | 5.310 | | | | 1,076,675 | | |
| | 3,455 | | | Dynacast International LLC,
LIBOR 3M + 3.250%(1) | | (B, B1) | | 01/28/22 | | | 5.636 | | | | 3,461,739 | | |
| | 3,990 | | | Electrical Components International, Inc.,
LIBOR 3M + 4.250%(1),(4) | | (B, B1) | | 06/26/25 | | | 6.636 | | | | 3,980,025 | | |
| | 4,987 | | | Filtration Group Corp., LIBOR 1M + 3.000%(1) | | (B, B2) | | 03/29/25 | | | 5.302 | | | | 5,014,625 | | |
| | 8,666 | | | Hayward Industries, Inc., LIBOR 1M + 3.500%(1) | | (B, B3) | | 08/05/24 | | | 5.795 | | | | 8,690,617 | | |
| | 1,588 | | | Horizon Global Corp., LIBOR 1M + 6.000%(1) | | (CCC+, B2) | | 06/30/21 | | | 8.302 | | | | 1,543,277 | | |
| | | | 39,758,550 | | |
| Electric - Generation (0.4%) | | | |
| | 14,609 | | | Brookfield WEC Holdings, Inc.,
LIBOR 1M + 3.750%(1) | | (B, B2) | | 08/01/25 | | | 6.052 | | | | 14,719,656 | | |
| Electronics (3.1%) | | | |
| | 16,693 | | | Brooks Automation, Inc., LIBOR 3M + 2.500%(1) | | (BB-, B1) | | 10/04/24 | | | 4.910 | | | | 16,765,949 | | |
| | 2,481 | | | EXC Holdings III Corp., LIBOR 3M + 3.500%(1),(4) | | (B-, B2) | | 12/02/24 | | | 5.886 | | | | 2,493,656 | | |
| | 6,500 | | | Lumentum Holdings(1),(4),(6) | | (BB, Ba2) | | 08/07/25 | | | 2.500 | | | | 6,532,500 | | |
| | 26,151 | | | M/A-COM Technology Solutions Holdings, Inc.,
LIBOR 1M + 2.250%(1) | | (B, B2) | | 05/17/24 | | | 4.552 | | | | 25,379,906 | | |
| | 14,425 | | | Microchip Technology, Inc.,
LIBOR 1M + 2.000%(1) | | (BB+, Baa3) | | 05/29/25 | | | 4.310 | | | | 14,392,959 | | |
| | 13,300 | | | Oberthur Technologies S.A.,
LIBOR 3M + 3.750%(1) | | (B-, B2) | | 01/10/24 | | | 5.992 | | | | 13,391,400 | | |
| | 7,000 | | | Oberthur Technologies S.A.,
EURIBOR 3M + 3.750%(1),(2) | | (B-, B2) | | 01/10/24 | | | 3.750 | | | | 7,972,787 | | |
| | 16,680 | | | Seattle Spinco, Inc., LIBOR 1M + 2.500%(1) | | (BB-, B1) | | 06/21/24 | | | 4.802 | | | | 16,661,321 | | |
| | 8,366 | | | Sophia LP, LIBOR 3M + 3.250%(1) | | (B, B2) | | 09/30/22 | | | 5.636 | | | | 8,394,353 | | |
| | 13,990 | | | Tempo Acquisition LLC, LIBOR 1M + 3.000%(1) | | (B, B1) | | 05/01/24 | | | 5.302 | | | | 14,017,882 | | |
| | | | 126,002,713 | | |
| Energy - Exploration & Production (0.4%) | | | |
| | 5,474 | | | PES Holdings LLC, LIBOR 3M + 6.250%(1) | | (B+, Ba2) | | 12/31/22 | | | 8.636 | | | | 5,466,739 | | |
| | 13,476 | | | PES Holdings LLC, LIBOR 3M + 3.500%(1),(4) | | (B-, B2) | | 12/31/22 | | | 8.886 | | | | 11,252,334 | | |
| | | | 16,719,073 | | |
See Accompanying Notes to Financial Statements.
12
Credit Suisse Floating Rate High Income Fund
Schedule of Investments (continued)
October 31, 2018
Par
(000) | |
| | Ratings†
(S&P/Moody's) | | Maturity | | Rate% | | Value | |
| BANK LOANS (continued) | | | |
| Environmental (0.6%) | | | |
$ | 1,619 | | | GFL Environmental, Inc., Prime + 1.750%(1) | | (B+, B2) | | 05/30/25 | | | 7.000 | | | $ | 1,597,023 | | |
| | 22,785 | | | GFL Environmental, Inc., LIBOR 3M + 2.750%(1) | | (B+, B2) | | 05/30/25 | | | 5.136 | | | | 22,471,989 | | |
| | | | 24,069,012 | | |
| Food & Drug Retailers (0.2%) | | | |
| | 3,000 | | | Holland & Barrett International,
EURIBOR 3M + 4.250%(1),(2) | | (B, B2) | | 08/09/24 | | | 4.250 | | | | 3,319,489 | | |
| | 3,000 | | | Holland & Barrett International,
LIBOR 3M + 5.250%(1),(5) | | (B, B2) | | 09/02/24 | | | 6.054 | | | | 3,659,162 | | |
| | 3,251 | | | Smart & Final Stores LLC, LIBOR 1M + 3.500%(1) | | (B, Caa1) | | 11/15/22 | | | 5.802 | | | | 3,150,610 | | |
| | | | 10,129,261 | | |
| Food - Wholesale (1.8%) | | | |
| | 13,553 | | | Allflex Holdings III, Inc., LIBOR 3M + 3.250%(1) | | (B, B2) | | 07/20/20 | | | 5.699 | | | | 13,617,175 | | |
| | 904 | | | Allflex Holdings III, Inc., LIBOR 3M + 7.000%(1) | | (B-, Caa2) | | 07/19/21 | | | 9.477 | | | | 908,930 | | |
| | 9,930 | | | Dole Food Co., Inc., LIBOR 3M + 2.750%(1) | | (B, B1) | | 04/06/24 | | | 5.049 | | | | 9,914,942 | | |
| | 2,000 | | | Jacobs Douwe Egberts International B.V.,
EURIBOR 1M + 2.250%(1),(2) | | (BB, Ba2) | | 11/02/21 | | | 2.250 | | | | 2,272,331 | | |
| | 15,899 | | | JBS USA LLC, LIBOR 3M + 2.500%(1) | | (BB+, Ba2) | | 10/30/22 | | | 4.844 | | | | 15,923,050 | | |
| | 22,026 | | | U.S. Foods, Inc., LIBOR 1M + 2.000%(1) | | (BBB-, Ba3) | | 06/27/23 | | | 4.302 | | | | 22,019,207 | | |
| | 5,250 | | | United Natural Foods, Inc., LIBOR 1M + 4.250%(1) | | (B+, B2) | | 10/22/25 | | | 6.552 | | | | 4,941,562 | | |
| | 5,000 | | | Zara UK Midco Ltd.(1),(2),(3),(4),(6) | | (B, B2) | | 01/31/25 | | | 5.750 | | | | 5,297,006 | | |
| | | | 74,894,203 | | |
| Forestry & Paper (0.3%) | | | |
| | 10,894 | | | Pregis Corp., LIBOR 3M + 3.500%(1),(4) | | (B, B2) | | 05/14/21 | | | 5.886 | | | | 10,771,401 | | |
| Gaming (3.1%) | | | |
| | 14,919 | | | Aristocrat Technologies, Inc.,
LIBOR 3M + 1.750%(1) | | (BB+, Ba1) | | 10/19/24 | | | 4.219 | | | | 14,882,512 | | |
| | 7,019 | | | CBAC Borrower LLC, LIBOR 1M + 4.000%(1) | | (B, B3) | | 07/05/24 | | | 6.302 | | | | 7,056,310 | | |
| | 13,800 | | | Eldorado Resorts LLC, LIBOR 3M + 2.250%(1) | | (BB, Ba1) | | 04/17/24 | | | 4.563 | | | | 13,830,361 | | |
| | 4,447 | | | Gateway Casinos & Entertainment Ltd.,
LIBOR 3M + 3.000%(1) | | (BB-, Ba3) | | 12/01/23 | | | 5.386 | | | | 4,464,909 | | |
| | 4,000 | | | GVC Holdings PLC, EURIBOR 3M + 2.750%(1),(2) | | (BB, Ba2) | | 03/02/23 | | | 2.750 | | | | 4,551,460 | | |
| | 15,000 | | | Jackpotjoy PLC, LIBOR 3M + 5.250%(1),(5) | | (B+, B1) | | 12/06/24 | | | 5.974 | | | | 19,277,982 | | |
| | 25,283 | | | Las Vegas Sands LLC, LIBOR 1M + 1.750%(1) | | (BBB-, Ba1) | | 03/27/25 | | | 4.052 | | | | 25,219,519 | | |
| | 23,366 | | | MGM Growth Properties Operating Partnership LP,
LIBOR 1M + 2.000%(1) | | (BB+, Ba3) | | 03/21/25 | | | 4.302 | | | | 23,324,006 | | |
| | 2,808 | | | Penn National Gaming, Inc.,
LIBOR 3M + 2.250%(1) | | (BB, Ba2) | | 10/15/25 | | | 4.581 | | | | 2,819,952 | | |
| | 10,000 | | | Stars Group Holdings B.V.,
EURIBOR 3M + 3.750%(1),(2) | | (B+, B1) | | 07/10/25 | | | 3.750 | | | | 11,459,946 | | |
| | | | 126,886,957 | | |
See Accompanying Notes to Financial Statements.
13
Credit Suisse Floating Rate High Income Fund
Schedule of Investments (continued)
October 31, 2018
Par
(000) | |
| | Ratings†
(S&P/Moody's) | | Maturity | | Rate% | | Value | |
| BANK LOANS (continued) | | | |
| Gas Distribution (0.6%) | | | |
$ | 12,246 | | | Messer Industries LLC(1),(6) | | (BB-, B1) | | 10/01/25 | | | 2.500 | | | $ | 12,263,997 | | |
| | 10,864 | | | Oryx Southern Delaware Holdings LLC,
LIBOR 1M + 3.250%(1) | | (B+, B2) | | 02/28/25 | | | 5.552 | | | | 10,746,268 | | |
| | | | 23,010,265 | | |
| Health Facilities (0.8%) | | | |
| | 11,619 | | | Prospect Medical Holdings, Inc.,
LIBOR 1M + 5.500%(1),(4) | | (B, B1) | | 02/22/24 | | | 7.813 | | | | 11,720,415 | | |
| | 6,516 | | | Surgery Center Holdings, Inc.,
LIBOR 3M + 3.250%(1) | | (B, B1) | | 09/02/24 | | | 5.570 | | | | 6,513,197 | | |
| | 13,841 | | | Western Dental Services, Inc.,
LIBOR 1M + 4.500%(1) | | (B-, B3) | | 06/23/23 | | | 6.802 | | | | 13,923,346 | | |
| | | | 32,156,958 | | |
| Health Services (1.2%) | | | |
| | 4,218 | | | Auris Luxembourg III Sarl,
LIBOR 3M + 3.000%(1),(4) | | (B+, B1) | | 01/17/22 | | | 5.386 | | | | 4,217,826 | | |
| | 6,000 | | | Auris Luxembourg III Sarl(1),(2),(6) | | (B+, B2) | | 07/20/25 | | | 4.000 | | | | 6,872,670 | | |
| | 8,000 | | | Auris Luxembourg III Sarl(1),(6) | | (B+, B2) | | 07/20/25 | | | 3.500 | | | | 8,068,360 | | |
| | 6,890 | | | Onex Carestream Finance LP,
LIBOR 1M + 4.000%(1) | | (B, B1) | | 06/07/19 | | | 6.302 | | | | 6,883,876 | | |
| | 13,701 | | | Sotera Health Holdings LLC,
LIBOR 1M + 3.000%(1) | | (B, B1) | | 05/15/22 | | | 5.302 | | | | 13,734,165 | | |
| | 3,902 | | | Universal Health Services, Inc.,
LIBOR 1M + 1.750%(1) | | (BBB-, Ba1) | | 10/18/25 | | | 4.052 | | | | 3,917,073 | | |
| | 250 | | | Universal Hospital Services, Inc.(1),(4),(6) | | (B, B1) | | 10/18/25 | | | 3.000 | | | | 251,875 | | |
| | 992 | | | Valitas Health Services, Inc.,
LIBOR 3M + 12.000%(1),(4),(7) | | (NR, NR) | | 12/31/19 | | | 14.331 | | | | 942,554 | | |
| | 1,481 | | | Valitas Health Services, Inc.,
LIBOR 3M + 12.000%(1),(4),(7) | | (NR, NR) | | 12/31/19 | | | 14.386 | | | | 1,406,493 | | |
| | 3,168 | | | Valitas Health Services, Inc.,
LIBOR 3M + 5.000%(1),(3),(4),(7) | | (NR, NR) | | 04/14/22 | | | 9.195 | | | | 1,267,119 | | |
| | 1,057 | | | Valitas Health Services, Inc.,
LIBOR 3M + 12.000%(1),(4),(7) | | (NR, NR) | | 12/31/19 | | | 14.346 | | | | 1,004,117 | | |
| | 1,268 | | | Valitas Health Services, Inc.,
LIBOR 3M + 12.000%(1),(3),(4),(7) | | (NR, NR) | | 12/31/19 | | | 14.445 | | | | 1,204,940 | | |
| | | | 49,771,068 | | |
| Hotels (2.1%) | | | |
| | 16,604 | | | Belmond Interfin Ltd., LIBOR 1M + 2.750%(1) | | (BB, B2) | | 07/03/24 | | | 5.052 | | | | 16,652,308 | | |
| | 5,000 | | | Compass III Ltd., EURIBOR 6M + 4.500%(1),(2) | | (B+, B2) | | 05/07/25 | | | 4.500 | | | | 5,715,526 | | |
| | 3,000 | | | Compass IV Ltd., EURIBOR 6M + 8.000%(1),(2),(4) | | (CCC+, Caa2) | | 04/30/26 | | | 9.000 | | | | 3,394,899 | | |
| | 16,809 | | | ESH Hospitality, Inc., LIBOR 1M + 2.000%(1) | | (BB+, Ba2) | | 08/30/23 | | | 4.302 | | | | 16,807,502 | | |
| | 27,395 | | | Playa Resorts Holding B.V., LIBOR 1M + 2.750%(1) | | (B+, B2) | | 04/29/24 | | | 5.050 | | | | 27,052,863 | | |
| | 7,250 | | | Wyndham Hotels & Resorts, Inc.,
LIBOR 1M + 1.750%(1) | | (BBB-, Baa3) | | 05/30/25 | | | 4.052 | | | | 7,256,054 | | |
See Accompanying Notes to Financial Statements.
14
Credit Suisse Floating Rate High Income Fund
Schedule of Investments (continued)
October 31, 2018
Par
(000) | |
| | Ratings†
(S&P/Moody's) | | Maturity | | Rate% | | Value | |
| BANK LOANS (continued) | | | |
Hotels | | | |
$ | 10,400 | | | Wynn Resorts, Ltd., LIBOR 1M + 2.250%(1) | | (BB-, Ba3) | | 10/22/24 | | | 4.550 | | | $ | 10,369,164 | | |
| | | | 87,248,316 | | |
| Insurance Brokerage (3.6%) | | | |
| | 20,986 | | | Acrisure LLC, LIBOR 1M + 4.250%(1) | | (B, B2) | | 11/22/23 | | | 6.552 | | | | 21,073,438 | | |
| | 6,234 | | | Acrisure LLC, LIBOR 1M + 3.750%(1) | | (B, B2) | | 11/22/23 | | | 6.052 | | | | 6,246,096 | | |
| | 31,984 | | | Alliant Holdings I, Inc., LIBOR 1M + 3.000%(1) | | (B, B2) | | 05/09/25 | | | 5.280 | | | | 32,004,188 | | |
| | 13,508 | | | AmWINS Group, Inc., LIBOR 1M + 2.750%(1) | | (B+, B1) | | 01/25/24 | | | 5.047 | | | | 13,548,577 | | |
| | 10,503 | | | AssuredPartners, Inc., LIBOR 1M + 3.250%(1) | | (B, B2) | | 10/22/24 | | | 5.552 | | | | 10,491,192 | | |
| | 25,320 | | | Hub International Ltd., LIBOR 3M + 3.000%(1) | | (B, B2) | | 04/25/25 | | | 5.490 | | | | 25,280,549 | | |
| | 694 | | | Hyperion Insurance Group Ltd.,
LIBOR 1M + 3.500%(1) | | (B, B2) | | 12/20/24 | | | 5.813 | | | | 697,908 | | |
| | 9,450 | | | Hyperion Insurance Group Ltd.,
EURIBOR 1M + 3.500%(1),(2) | | (B, B2) | | 12/13/24 | | | 3.500 | | | | 10,712,228 | | |
| | 22,852 | | | NFP Corp., LIBOR 1M + 3.000%(1) | | (B, B2) | | 01/08/24 | | | 5.302 | | | | 22,812,418 | | |
| | 3,755 | | | USI, Inc., LIBOR 3M + 3.000%(1) | | (B, B2) | | 05/16/24 | | | 5.386 | | | | 3,738,832 | | |
| | | | 146,605,426 | | |
| Investments & Misc. Financial Services (1.5%) | | | |
| | 13,472 | | | Altisource Solutions Sarl, LIBOR 3M + 4.000%(1) | | (B+, B3) | | 03/29/24 | | | 6.386 | | | | 13,499,970 | | |
| | 5,132 | | | Compass Group Diversified Holdings LLC,
LIBOR 1M + 2.500%(1) | | (BB, Ba3) | | 04/17/25 | | | 4.802 | | | | 5,149,014 | | |
| | 18,180 | | | Ditech Holding Corp., LIBOR 1M + 6.000%(1) | | (CCC+, Caa2) | | 06/30/22 | | | 8.302 | | | | 16,953,081 | | |
| | 9,839 | | | Fortress Investment Group LLC,
LIBOR 1M + 2.000%(1) | | (BB, Baa3) | | 12/27/22 | | | 4.302 | | | | 9,846,644 | | |
| | 5,750 | | | Global Payments, Inc., LIBOR 3M + 1.750%(1) | | (BBB-, Ba2) | | 10/17/25 | | | 4.086 | | | | 5,744,624 | | |
| | 4,330 | | | Ocwen Financial Corp., LIBOR 1M + 5.000%(1) | | (B+, B3) | | 12/05/20 | | | 7.280 | | | | 4,343,772 | | |
| | 4,154 | | | VFH Parent LLC, LIBOR 3M +2.750%(1),(4) | | (NR, NR) | | 12/30/21 | | | 5.089 | | | | 4,169,473 | | |
| | | | 59,706,578 | | |
| Machinery (1.6%) | | | |
| | 11,880 | | | Clark Equipment Co., LIBOR 3M + 2.000%(1) | | (BB, Ba3) | | 05/18/24 | | | 4.377 | | | | 11,876,709 | | |
| | 7,000 | | | Cohu, Inc., LIBOR 3M + 3.000%(1) | | (BB-, B1) | | 09/20/25 | | | 5.396 | | | | 7,017,500 | | |
| | 1,486 | | | CPM Acquisition Corp., LIBOR 1M + 8.250%(1) | | (B-, Caa1) | | 04/10/23 | | | 10.552 | | | | 1,498,791 | | |
| | 2,348 | | | CPM Holdings, Inc.(1),(6) | | (B, B2) | | 10/24/25 | | | 6.175 | | | | 2,364,748 | | |
| | 1,977 | | | CPM Holdings, Inc.(1),(6) | | (B-, Caa2) | | 10/24/26 | | | 10.675 | | | | 1,984,425 | | |
| | 7,965 | | | CPM Holdings, Inc., LIBOR 1M + 3.500%(1) | | (B, B1) | | 04/11/22 | | | 5.802 | | | | 8,021,810 | | |
| | 6,428 | | | Doncasters Finance U.S. LLC,
LIBOR 3M + 3.750%(1),(5) | | (B-, Caa1) | | 04/09/20 | | | 4.750 | | | | 7,650,366 | | |
| | 4,146 | | | LTI Holdings, Inc., LIBOR 1M + 6.750%(1) | | (CCC+, Caa2) | | 09/06/26 | | | 9.052 | | | | 4,138,080 | | |
| | 14,020 | | | LTI Holdings, Inc., LIBOR 1M + 3.500%(1) | | (B-, B2) | | 09/06/25 | | | 5.802 | | | | 14,024,416 | | |
| | 8,762 | | | Welbilt, Inc., LIBOR 1M +2.500%(1),(4) | | (BB-, B1) | | 10/23/25 | | | 4.782 | | | | 8,761,538 | | |
| | | | 67,338,383 | | |
| Managed Care (0.2%) | | | |
| | 8,229 | | | Inovalon Holdings, Inc., LIBOR 1M + 3.500%(1) | | (B, B2) | | 04/02/25 | | | 5.813 | | | | 8,222,545 | | |
See Accompanying Notes to Financial Statements.
15
Credit Suisse Floating Rate High Income Fund
Schedule of Investments (continued)
October 31, 2018
Par
(000) | |
| | Ratings†
(S&P/Moody's) | | Maturity | | Rate% | | Value | |
| BANK LOANS (continued) | | | |
| Media - Diversified (0.3%) | | | |
$ | 6,250 | | | NEP/NCP Holdco, Inc., LIBOR 3M + 3.250%(1) | | (B+, B1) | | 10/20/25 | | | 5.474 | | | $ | 6,284,375 | | |
| | 5,000 | | | NEP/NCP Holdco, Inc., LIBOR 1M + 7.000%(1) | | (CCC+, Caa1) | | 10/19/26 | | | 9.302 | | | | 5,018,750 | | |
| | | | 11,303,125 | | |
| Media Content (1.2%) | | | |
| | 5,000 | | | All3Media International, LIBOR 1M + 4.250%(1),(5) | | (B, B2) | | 06/30/21 | | | 5.250 | | | | 6,434,171 | | |
| | 1,750 | | | DLG Acquisitions Ltd., EURIBOR 6M + 7.250%(1),(2) | | (CCC+, Caa2) | | 06/30/22 | | | 8.250 | | | | 1,998,015 | | |
| | 7,960 | | | Lions Gate Capital Holdings LLC,
LIBOR 1M + 2.250%(1) | | (BB-, Ba2) | | 03/24/25 | | | 4.552 | | | | 7,945,115 | | |
| | 23,431 | | | MTL Publishing LLC, LIBOR 1M + 2.250%(1) | | (BB-, Ba3) | | 08/20/23 | | | 4.530 | | | | 23,470,508 | | |
| | 7,701 | | | WMG Acquisition Corp., LIBOR 1M + 2.125%(1) | | (B+, Ba3) | | 11/01/23 | | | 4.427 | | | | 7,682,749 | | |
| | | | 47,530,558 | | |
| Medical Products (1.0%) | | | |
| | 15,201 | | | ABB Concise Optical Group LLC,
LIBOR 1M + 5.000%(1) | | (B-, B2) | | 06/15/23 | | | 7.280 | | | | 15,289,807 | | |
| | 18,361 | | | Avantor, Inc., LIBOR 1M + 4.000%(1) | | (B, B2) | | 11/21/24 | | | 6.302 | | | | 18,517,596 | | |
| | 4,275 | | | Convatec, Inc., LIBOR 3M + 2.000%(1),(4) | | (BB, Ba3) | | 10/25/21 | | | 4.386 | | | | 4,275,000 | | |
| | 2,000 | | | Lifescan Global Corp., LIBOR 3M + 6.000%(1) | | (B+, B2) | | 09/27/24 | | | 8.396 | | | | 1,957,500 | | |
| | | | 40,039,903 | | |
| Metals & Mining - Excluding Steel (0.2%) | | | |
| | 1,749 | | | Global Brass & Copper, Inc.,
LIBOR 1M + 2.500%(1),(4) | | (BB, B1) | | 05/29/25 | | | 4.813 | | | | 1,752,999 | | |
| | 5,678 | | | GrafTech Finance, Inc., LIBOR 1M + 3.500%(1) | | (B+, B1) | | 02/12/25 | | | 5.802 | | | | 5,692,320 | | |
| | 7,529 | | | Noranda Aluminum Acquisition Corp.,
PRIME + 3.500%(1),(8) | | (NR, NR) | | 02/28/19 | | | 8.750 | | | | 32,939 | | |
| | | | 7,478,258 | | |
| Non - Electric Utilities (0.1%) | | | |
| | 5,695 | | | BCP Raptor LLC, LIBOR 2M + 4.250%(1) | | (B, B3) | | 06/24/24 | | | 6.641 | | | | 5,635,070 | | |
| Oil Field Equipment & Services (0.1%) | | | |
| | 5,544 | | | Seadrill Partners Finco LLC,
LIBOR 3M + 6.000%(1) | | (CCC+, Caa2) | | 02/21/21 | | | 8.386 | | | | 5,158,852 | | |
| Oil Refining & Marketing (0.6%) | | | |
| | 17,413 | | | EG Finco Ltd., EURIBOR 3M + 4.000%(1),(2) | | (B, B2) | | 02/07/25 | | | 4.000 | | | | 19,814,158 | | |
| | 3,500 | | | EG Finco Ltd., LIBOR 3M + 8.000%(1) | | (CCC+, Caa1) | | 04/20/26 | | | 10.386 | | | | 3,480,313 | | |
| | | | 23,294,471 | | |
| Packaging (2.1%) | | | |
| | 3,990 | | | Anchor Glass Container Corp.,
LIBOR 1M + 2.750%(1) | | (B-, B2) | | 12/07/23 | | | 5.076 | | | | 3,567,967 | | |
| | 5,425 | | | Anchor Glass Container Corp.,
LIBOR 1M + 7.750%(1) | | (CCC, Caa1) | | 12/07/24 | | | 10.040 | | | | 3,657,345 | | |
| | 6,752 | | | Berry Global, Inc., LIBOR 3M + 1.750%(1) | | (BBB-, Ba2) | | 02/08/20 | | | 4.027 | | | | 6,750,605 | | |
| | 12,069 | | | Berry Global, Inc., LIBOR 2M + 1.750%(1) | | (BBB-, Ba2) | | 01/06/21 | | | 4.027 | | | | 12,059,084 | | |
See Accompanying Notes to Financial Statements.
16
Credit Suisse Floating Rate High Income Fund
Schedule of Investments (continued)
October 31, 2018
Par
(000) | |
| | Ratings†
(S&P/Moody's) | | Maturity | | Rate% | | Value | |
| BANK LOANS (continued) | | | |
Packaging | | | |
$ | 21,872 | | | Flex Acquisition Co., Inc., LIBOR 3M + 3.000%(1) | | (B, B1) | | 12/29/23 | | | 5.256 | | | $ | 21,858,825 | | |
| | 8,000 | | | Klockner-Pentaplast of America, Inc.,
EURIBOR 3M + 4.750%(1),(2) | | (B, B3) | | 06/30/22 | | | 4.750 | | | | 8,596,084 | | |
| | 2,228 | | | Klockner-Pentaplast of America, Inc.,
LIBOR 1M + 4.250%(1) | | (B, B3) | | 06/30/22 | | | 6.552 | | | | 2,151,913 | | |
| | 11,405 | | | Proampac PG Borrower LLC,
LIBOR 3M + 3.500%(1) | | (B, B3) | | 11/18/23 | | | 5.841 | | | | 11,445,190 | | |
| | 2,500 | | | Proampac PG Borrower LLC,
LIBOR 3M + 8.500%(1) | | (CCC+, Caa2) | | 11/18/24 | | | 10.810 | | | | 2,520,837 | | |
| | 9,741 | | | Reynolds Group Holdings, Inc.,
LIBOR 1M + 2.750%(1) | | (B+, B1) | | 02/05/23 | | | 5.052 | | | | 9,759,882 | | |
| | 4,375 | | | Strategic Materials, Inc.,
LIBOR 3M + 7.750%(1),(4) | | (CCC+, Caa2) | | 10/27/25 | | | 10.094 | | | | 4,046,875 | | |
| | | | 86,414,607 | | |
| Personal & Household Products (1.7%) | | | |
| | 3,472 | | | Comfort Holding LLC, LIBOR 1M + 4.750%(1) | | (CCC+, Caa1) | | 02/05/24 | | | 7.052 | | | | 3,292,908 | | |
| | 2,389 | | | Comfort Holding LLC, LIBOR 1M + 10.000%(1) | | (CCC-, Caa3) | | 02/03/25 | | | 12.302 | | | | 2,263,203 | | |
| | 1,750 | | | Keter Group B.V., EURIBOR 3M + 4.250%(1),(2) | | (B, NR) | | 10/31/23 | | | 5.250 | | | | 1,807,901 | | |
| | 10,000 | | | Keter Group B.V., EURIBOR 3M + 4.250%(1),(2) | | (B, B3) | | 10/31/23 | | | 5.250 | | | | 10,330,862 | | |
| | 6,912 | | | Prestige Brands, Inc., LIBOR 1M + 2.000%(1) | | (BB, Ba3) | | 01/26/24 | | | 4.302 | | | | 6,929,717 | | |
| | 22,667 | | | Serta Simmons Bedding LLC,
LIBOR 1M + 3.500%(1) | | (B-, B3) | | 11/08/23 | | | 5.775 | | | | 20,501,538 | | |
| | 6,612 | | | Serta Simmons Bedding LLC,
LIBOR 3M + 8.000%(1) | | (CCC, Caa2) | | 11/08/24 | | | 10.277 | | | | 5,179,395 | | |
| | 1,824 | | | TricorBraun Holdings, Inc., LIBOR 3M + 3.750%(1) | | (B, B2) | | 11/30/23 | | | 6.103 | | | | 1,834,013 | | |
| | 18,106 | | | TricorBraun Holdings, Inc., LIBOR 3M + 3.750%(1) | | (B, B2) | | 11/30/23 | | | 6.136 | | | | 18,201,187 | | |
| | | | 70,340,724 | | |
| Pharmaceuticals (2.0%) | | | |
| | 2,193 | | | Alkermes, Inc., LIBOR 1M + 2.250%(1) | | (BB, Ba3) | | 03/23/23 | | | 4.540 | | | | 2,203,012 | | |
| | 16,752 | | | Endo Luxembourg Finance Co. I Sarl,
LIBOR 1M + 4.250%(1) | | (BB-, Ba2) | | 04/29/24 | | | 6.563 | | | | 16,851,657 | | |
| | 17,375 | | | Grifols Worldwide Operations U.S.A., Inc.,
LIBOR 1W + 2.250%(1) | | (BB+, Ba2) | | 01/31/25 | | | 4.467 | | | | 17,410,244 | | |
| | 5,663 | | | IQVIA Inc., LIBOR 3M + 2.000%(1) | | (BBB-, Ba1) | | 01/17/25 | | | 4.386 | | | | 5,675,301 | | |
| | 15,155 | | | RPI Finance Trust, LIBOR 3M + 2.000%(1) | | (BBB-, Baa3) | | 03/27/23 | | | 4.386 | | | | 15,186,249 | | |
| | 22,878 | | | Valeant Pharmaceuticals International, Inc.,
LIBOR 1M + 3.000%(1) | | (BB-, Ba3) | | 06/01/25 | | | 5.274 | | | | 22,918,521 | | |
| | | | 80,244,984 | | |
| Real Estate Development & Management (1.2%) | | | |
| | 12,628 | | | Capital Automotive LP, LIBOR 1M + 2.500%(1) | | (B, B1) | | 03/24/24 | | | 4.810 | | | | 12,646,831 | | |
| | 4,397 | | | Capital Automotive LP, LIBOR 1M + 6.000%(1) | | (CCC+, B3) | | 03/24/25 | | | 8.310 | | | | 4,478,940 | | |
| | 8,940 | | | Forest City Enterprises, LP(1),(6) | | (B+, B2) | | 10/24/25 | | | 4.000 | | | | 8,988,064 | | |
| | 24,000 | | | Hanjin International Corp., LIBOR 3M + 2.500%(1),(4) | | (B+, Ba3) | | 10/18/20 | | | 4.945 | | | | 24,000,000 | | |
| | | | 50,113,835 | | |
See Accompanying Notes to Financial Statements.
17
Credit Suisse Floating Rate High Income Fund
Schedule of Investments (continued)
October 31, 2018
Par
(000) | |
| | Ratings†
(S&P/Moody's) | | Maturity | | Rate% | | Value | |
| BANK LOANS (continued) | | | |
| Real Estate Investment Trusts (1.0%) | | | |
$ | 19,366 | | | iStar, Inc., LIBOR 1M + 2.750%(1) | | (BB-, Ba2) | | 06/28/23 | | | 5.028 | | | $ | 19,402,415 | | |
| | 22,705 | | | VICI Properties 1 LLC, LIBOR 1M + 2.000%(1) | | (BBB-, Ba3) | | 12/20/24 | | | 4.280 | | | | 22,679,896 | | |
| | | | 42,082,311 | | |
| Recreation & Travel (1.7%) | | | |
| | 737 | | | Bulldog Purchaser, Inc.(1),(6) | | (CCC+, Caa2) | | 08/21/26 | | | 3.875 | | | | 737,763 | | |
| | 1,417 | | | Bulldog Purchaser, Inc., LIBOR 1M + 7.750%(1) | | (CCC+, Caa2) | | 09/04/26 | | | 10.052 | | | | 1,418,775 | | |
| | 4,890 | | | Bulldog Purchaser, Inc.(1),(4),(6),(9) | | (B+, B2) | | 08/22/25 | | | 1.875 | | | | 4,852,852 | | |
| | 5,310 | | | Bulldog Purchaser, Inc., LIBOR 1M + 3.750%(1) | | (B+, B2) | | 08/22/25 | | | 6.052 | | | | 5,313,795 | | |
| | 16,588 | | | Crown Finance U.S., Inc., LIBOR 1M + 2.500%(1) | | (BB-, B1) | | 02/28/25 | | | 4.802 | | | | 16,540,234 | | |
| | 9,215 | | | Intrawest Resorts Holdings, Inc.,
LIBOR 1M + 3.000%(1) | | (B, B2) | | 07/31/24 | | | 5.302 | | | | 9,238,016 | | |
| | 5,281 | | | NCL Corp. Ltd., LIBOR 1M + 1.750%(1),(4) | | (BBB-, Ba2) | | 10/10/21 | | | 4.052 | | | | 5,287,436 | | |
| | 4,128 | | | Richmond UK Bidco Ltd., LIBOR 1M + 4.250%(1),(5) | | (B, B2) | | 03/03/24 | | | 4.976 | | | | 5,155,719 | | |
| | 21,686 | | | SeaWorld Parks & Entertainment, Inc.,
LIBOR 1M + 3.000%(1) | | (B, B2) | | 03/31/24 | | | 5.302 | | | | 21,676,106 | | |
| | | | 70,220,696 | | |
| Restaurants (1.4%) | | | |
| | 32,180 | | | 1011778 B.C. Unlimited Liability Co.,
LIBOR 1M + 2.250%(1) | | (B+, Ba3) | | 02/16/24 | | | 4.552 | | | | 32,095,486 | | |
| | 15,457 | | | Golden Nugget, Inc., LIBOR 3M + 2.750%(1) | | (B+, Ba3) | | 10/04/23 | | | 5.230 | | | | 15,494,136 | | |
| | 8,985 | | | K-Mac Holdings Corp., LIBOR 1M + 3.250%(1) | | (B-, B2) | | 03/14/25 | | | 5.530 | | | | 9,003,690 | | |
| | 2,985 | | | KFC Holding Co., LIBOR 1M + 1.750%(1) | | (BBB-, Ba1) | | 04/03/25 | | | 4.037 | | | | 2,988,418 | | |
| | | | 59,581,730 | | |
| Software - Services (9.4%) | | | |
| | 17,240 | | | Almonde, Inc., LIBOR 3M + 3.500%(1) | | (B-, B2) | | 06/13/24 | | | 5.886 | | | | 17,165,751 | | |
| | 4,078 | | | Almonde, Inc., LIBOR 3M + 7.250%(1) | | (CCC, Caa2) | | 06/13/25 | | | 9.636 | | | | 4,027,804 | | |
| | 14,681 | | | Altran Technologies S.A.,
EURIBOR 3M + 2.750%(1),(2) | | (BB, Ba2) | | 03/20/25 | | | 2.750 | | | | 16,708,818 | | |
| | 5,445 | | | Applied Systems, Inc., LIBOR 3M + 3.000%(1) | | (B, B1) | | 09/19/24 | | | 5.386 | | | | 5,505,412 | | |
| | 7,000 | | | Compuware Corp., LIBOR 1M + 3.500%(1) | | (B, B1) | | 08/22/25 | | | 5.787 | | | | 7,067,095 | | |
| | 11,516 | | | Cypress Intermediate Holdings III, Inc.,
LIBOR 1M + 3.000%(1) | | (B, B2) | | 04/26/24 | | | 5.310 | | | | 11,546,689 | | |
| | 28,758 | | | Epicor Software Corp., LIBOR 1M + 3.250%(1) | | (B-, B2) | | 06/01/22 | | | 5.560 | | | | 28,868,117 | | |
| | 13,803 | | | Evertec Group LLC, LIBOR 1M + 2.500%(1) | | (B+, B2) | | 04/17/20 | | | 4.790 | | | | 13,808,485 | | |
| | 4,823 | | | Evertec Group LLC, LIBOR 1M + 2.500%(1) | | (B+, B2) | | 01/17/20 | | | 4.790 | | | | 4,822,537 | | |
| | 23,477 | | | First Data Corp., LIBOR 1M + 2.000%(1) | | (BB, Ba2) | | 07/08/22 | | | 4.287 | | | | 23,426,120 | | |
| | 16,940 | | | Flexera Software LLC, LIBOR 1M + 3.250%(1) | | (B-, B1) | | 02/26/25 | | | 5.560 | | | | 17,059,872 | | |
| | 2,500 | | | Flexera Software LLC, LIBOR 1M + 7.250%(1) | | (CCC+, Caa1) | | 02/26/26 | | | 9.560 | | | | 2,519,800 | | |
| | 10,448 | | | GHX Ultimate Parent Corp., LIBOR 3M + 3.250%(1) | | (B, B3) | | 06/28/24 | | | 5.636 | | | | 10,474,239 | | |
| | 30,250 | | | Go Daddy Operating Co. LLC,
LIBOR 1M + 2.250%(1) | | (BB-, Ba3) | | 02/15/24 | | | 4.552 | | | | 30,318,029 | | |
| | 3,916 | | | Greeneden U.S. Holdings II LLC,
EURIBOR 3M + 3.500%(1),(2) | | (B, B2) | | 12/01/23 | | | 3.500 | | | | 4,464,773 | | |
See Accompanying Notes to Financial Statements.
18
Credit Suisse Floating Rate High Income Fund
Schedule of Investments (continued)
October 31, 2018
Par
(000) | |
| | Ratings†
(S&P/Moody's) | | Maturity | | Rate% | | Value | |
| BANK LOANS (continued) | | | |
Software - Services | | | |
$ | 14,679 | | | Greeneden U.S. Holdings II LLC,
LIBOR 1M + 3.500%(1) | | (B, B2) | | 12/01/23 | | | 5.802 | | | $ | 14,752,479 | | |
| | 4,000 | | | Hyland Software, Inc., LIBOR 1M + 7.000%(1) | | (CCC, Caa1) | | 07/07/25 | | | 9.302 | | | | 4,028,000 | | |
| | 19,361 | | | Infor (U.S.), Inc., LIBOR 3M + 2.750%(1) | | (B, B1) | | 02/01/22 | | | 5.136 | | | | 19,315,386 | | |
| | 9,797 | | | Infor (U.S.), Inc., EURIBOR 3M + 2.250%(1),(2) | | (B, B1) | | 02/01/22 | | | 3.250 | | | | 11,149,823 | | |
| | 17,544 | | | Kronos, Inc., LIBOR 3M + 3.000%(1) | | (B, B2) | | 11/01/23 | | | 5.343 | | | | 17,594,452 | | |
| | 7,580 | | | Kronos, Inc., LIBOR 3M + 8.250%(1) | | (CCC, Caa2) | | 11/01/24 | | | 10.593 | | | | 7,715,333 | | |
| | 14,807 | | | MA FinanceCo. LLC, LIBOR 1M + 2.250%(1) | | (BB-, B1) | | 11/19/21 | | | 4.552 | | | | 14,729,644 | | |
| | 2,470 | | | MA FinanceCo. LLC, LIBOR 1M + 2.500%(1) | | (BB-, B1) | | 06/21/24 | | | 4.802 | | | | 2,467,157 | | |
| | 4,705 | | | Misys Europe S.A., EURIBOR 3M + 3.250%(1),(2) | | (B-, B2) | | 06/13/24 | | | 4.250 | | | | 5,386,786 | | |
| | 2,948 | | | Mitchell International, Inc., LIBOR 1M + 3.250%(1) | | (B-, B2) | | 11/29/24 | | | 5.552 | | | | 2,940,085 | | |
| | 1,778 | | | Mitchell International, Inc., LIBOR 1M + 7.250%(1) | | (CCC, Caa2) | | 12/01/25 | | | 9.552 | | | | 1,789,165 | | |
| | 13,829 | | | Project Alpha Intermediate Holding, Inc.,
LIBOR 3M + 3.500%(1) | | (B-, B3) | | 04/26/24 | | | 5.940 | | | | 13,794,653 | | |
| | 18,278 | | | Solera LLC, LIBOR 1M + 2.750%(1) | | (B, Ba3) | | 03/03/23 | | | 5.052 | | | | 18,285,335 | | |
| | 10,021 | | | SS&C Technologies Holdings Europe Sarl,
LIBOR 1M + 2.250%(1) | | (BB, Ba3) | | 04/16/25 | | | 4.552 | | | | 9,983,000 | | |
| | 5,268 | | | SS&C Technologies, Inc., LIBOR 1M + 2.250%(1) | | (BB, Ba3) | | 07/08/22 | | | 4.552 | | | | 5,269,877 | | |
| | 25,855 | | | SS&C Technologies, Inc., LIBOR 1M + 2.250%(1) | | (BB, Ba3) | | 04/16/25 | | | 4.552 | | | | 25,755,935 | | |
| | 10,867 | | | Verint Systems, Inc., LIBOR 1M + 2.000%(1) | | (BBB-, Ba2) | | 06/28/24 | | | 4.274 | | | | 10,899,129 | | |
| | 1,685 | | | Wall Street Systems Delaware, Inc.,
EURIBOR 3M + 3.000%(1),(2) | | (B, B2) | | 11/21/24 | | | 4.000 | | | | 1,931,211 | | |
| | 2,177 | | | Wall Street Systems Delaware, Inc.,
LIBOR 3M + 3.000%(1) | | (B, B2) | | 11/21/24 | | | 5.386 | | | | 2,171,555 | | |
| | | | 387,742,546 | | |
| Specialty Retail (0.1%) | | | |
| | 2,881 | | | Boing U.S. Holdco, Inc., LIBOR 3M + 7.500%(1),(4) | | (CCC+, Caa1) | | 10/03/25 | | | 9.843 | | | | 2,881,000 | | |
| | 2,543 | | | Mister Car Wash Holdings, Inc.,
LIBOR 2M + 3.250%(1) | | (B-, B1) | | 08/20/21 | | | 5.544 | | | | 2,557,176 | | |
| | | | 5,438,176 | | |
| Steel Producers/Products (1.1%) | | | |
| | 24,839 | | | Atkore International, Inc., LIBOR 3M + 2.750%(1) | | (BB-, B2) | | 12/22/23 | | | 5.140 | | | | 24,885,228 | | |
| | 22,100 | | | Zekelman Industries, Inc., LIBOR 3M + 2.250%(1) | | (BB-, B1) | | 06/14/21 | | | 4.623 | | | | 22,093,394 | | |
| | | | 46,978,622 | | |
| Support - Services (5.4%) | | | |
| | 14,800 | | | Allied Universal Holdco LLC, LIBOR 3M + 3.750%(1) | | (B-, B2) | | 07/28/22 | | | 6.136 | | | | 14,702,938 | | |
| | 9,991 | | | ASGN, Inc., LIBOR 1M + 2.000%(1) | | (BB, Ba2) | | 04/02/25 | | | 4.302 | | | | 10,023,576 | | |
| | 6,048 | | | Belron Finance U.S. LLC, LIBOR 3M + 2.250%(1) | | (BB, Ba3) | | 11/07/24 | | | 4.593 | | | | 6,072,310 | | |
| | 28,704 | | | Brand Energy & Infrastructure Services, Inc.,
LIBOR 3M + 4.250%(1) | | (B, B3) | | 06/21/24 | | | 6.732 | | | | 28,869,574 | | |
| | 33,128 | | | Change Healthcare Holdings LLC,
LIBOR 1M + 2.750%(1) | | (B+, Ba3) | | 03/01/24 | | | 5.052 | | | | 33,129,682 | | |
| | 14,297 | | | Geo Group, Inc. (The), LIBOR 1M + 2.000%(1) | | (BB+, Ba3) | | 03/22/24 | | | 4.310 | | | | 14,264,646 | | |
See Accompanying Notes to Financial Statements.
19
Credit Suisse Floating Rate High Income Fund
Schedule of Investments (continued)
October 31, 2018
Par
(000) | |
| | Ratings†
(S&P/Moody's) | | Maturity | | Rate% | | Value | |
| BANK LOANS (continued) | | | |
Support - Services | | | |
$ | 5,000 | | | MSX International, Inc.,
EURIBOR 3M + 4.750%(1),(2) | | (NR, B2) | | 01/06/24 | | | 4.750 | | | $ | 5,723,939 | | |
| | 2,953 | | | Pike Corp., LIBOR 1M + 3.500%(1) | | (B, B2) | | 03/23/25 | | | 5.810 | | | | 2,974,250 | | |
| | 13,663 | | | PODS LLC, LIBOR 3M + 2.750%(1) | | (B+, B2) | | 12/06/24 | | | 5.034 | | | | 13,598,737 | | |
| | 6,355 | | | Sabre GLBL, Inc., LIBOR 1M + 2.000%(1) | | (BB, Ba2) | | 02/22/24 | | | 4.302 | | | | 6,360,736 | | |
| | 14,347 | | | SAI Global Ltd., LIBOR 1M + 4.500%(1) | | (CCC+, B3) | | 12/20/23 | | | 5.500 | | | | 13,468,395 | | |
| | 28,341 | | | Sedgwick Claims Management Services, Inc.,
LIBOR 1M + 2.750%(1) | | (B, B2) | | 03/01/21 | | | 5.052 | | | | 28,369,620 | | |
| | 12,675 | | | Sedgwick Claims Management Services, Inc.,
LIBOR 3M + 5.750%(1) | | (CCC+, Caa2) | | 02/28/22 | | | 8.054 | | | | 12,710,680 | | |
| | 1,929 | | | Sprint Industrial Holdings LLC,
LIBOR 3M + 5.750%(1),(3),(4) | | (CCC+, Caa1) | | 05/14/19 | | | 8.136 | | | | 1,875,712 | | |
| | 2,837 | | | Sprint Industrial Holdings LLC,
LIBOR 3M + 12.250%(1),(3),(4) | | (CC, Caa3) | | 11/14/19 | | | 13.500 | | | | 978,675 | | |
| | 5,985 | | | Tradesmen International, Inc.,
LIBOR 1M + 4.500%(1),(4) | | (B, B2) | | 02/16/24 | | | 6.794 | | | | 6,007,253 | | |
| | 8,641 | | | Trans Union LLC, LIBOR 1M + 2.000%(1) | | (BB+, Ba2) | | 04/10/23 | | | 4.302 | | | | 8,639,694 | | |
| | 3,464 | | | United Rentals, Inc., LIBOR 1M + 1.750%(1) | | (BBB-, Baa3) | | 10/31/25 | | | 4.052 | | | | 3,481,597 | | |
| | 6,717 | | | USS Ultimate Holdings, Inc.,
LIBOR 1M + 7.750%(1) | | (CCC+, Caa2) | | 08/25/25 | | | 10.052 | | | | 6,742,361 | | |
| | 4,426 | | | Worldpay LLC, LIBOR 1M + 1.500%(1) | | (BBB-, Ba2) | | 01/16/23 | | | 3.780 | | | | 4,421,049 | | |
| | | | 222,415,424 | | |
| Tech Hardware & Equipment (0.6%) | | | |
| | 18,988 | | | CDW LLC, LIBOR 1M + 1.750%(1) | | (BBB-, Ba1) | | 08/17/23 | | | 4.060 | | | | 19,047,111 | | |
| | 7,525 | | | Western Digital Corp., LIBOR 1M + 1.750%(1) | | (BBB-, Baa2) | | 04/29/23 | | | 4.044 | | | | 7,492,105 | | |
| | | | 26,539,216 | | |
| Telecom - Wireless (1.4%) | | | |
| | 24,470 | | | SBA Senior Finance II LLC, LIBOR 1M + 2.000%(1) | | (BB+, B1) | | 04/11/25 | | | 4.310 | | | | 24,449,159 | | |
| | 34,878 | | | Sprint Communications, Inc.,
LIBOR 1M + 2.500%(1) | | (BB-, Ba2) | | 02/02/24 | | | 4.813 | | | | 34,905,556 | | |
| | | | 59,354,715 | | |
| Telecom - Wireline Integrated & Services (2.2%) | | | |
| | 20,818 | | | CenturyLink, Inc., LIBOR 1M + 2.750%(1) | | (BBB-, Ba3) | | 01/31/25 | | | 5.052 | | | | 20,622,522 | | |
| | 4,020 | | | Ciena Corp., LIBOR 1M + 2.000%(1) | | (BB, Ba1) | | 09/26/25 | | | 4.280 | | | | 4,030,923 | | |
| | 31,780 | | | Level 3 Financing, Inc., LIBOR 1M + 2.250%(1) | | (BBB-, Ba1) | | 02/22/24 | | | 4.530 | | | | 31,842,130 | | |
| | 6,969 | | | MTN Infrastructure TopCo, Inc.,
LIBOR 1M + 3.000%(1) | | (B, B2) | | 11/15/24 | | | 5.302 | | | | 6,986,162 | | |
| | 26,318 | | | Zayo Group LLC, LIBOR 1M + 2.250%(1) | | (BB, Ba2) | | 01/19/24 | | | 4.552 | | | | 26,383,775 | | |
| | 2,687 | | | Zayo Group LLC, LIBOR 3M + 2.000%(1) | | (BB, Ba2) | | 01/19/21 | | | 4.302 | | | | 2,691,580 | | |
| | | | 92,557,092 | | |
See Accompanying Notes to Financial Statements.
20
Credit Suisse Floating Rate High Income Fund
Schedule of Investments (continued)
October 31, 2018
Par
(000) | |
| | Ratings†
(S&P/Moody's) | | Maturity | | Rate% | | Value | |
| BANK LOANS (continued) | | | |
| Theaters & Entertainment (1.6%) | | | |
$ | 10,580 | | | Metro-Goldwyn-Mayer, Inc., LIBOR 1M + 4.500%(1) | | (B-, B2) | | 07/03/26 | | | 6.810 | | | $ | 10,615,971 | | |
| | 9,443 | | | NAI Entertainment Holdings LLC,
LIBOR 1M + 2.500%(1) | | (BB, B1) | | 05/08/25 | | | 4.810 | | | | 9,443,364 | | |
| | 324 | | | NEG Holdings LLC, LIBOR 3M + 8.000%(1),(3),(4),(7) | | (B-, B3) | | 10/17/22 | | | 10.386 | | | | 302,127 | | |
| | 7,000 | | | Technicolor S.A., EURIBOR 3M + 3.000%(1),(2),(4) | | (B+, B1) | | 12/06/23 | | | 3.000 | | | | 7,594,264 | | |
| | 2,933 | | | Technicolor S.A., LIBOR 3M + 2.750%(1) | | (B+, B1) | | 12/06/23 | | | 5.067 | | | | 2,793,206 | | |
| | 6,500 | | | Technicolor S.A., EURIBOR 3M + 3.500%(1),(2) | | (B+, B1) | | 12/06/23 | | | 3.500 | | | | 7,010,390 | | |
| | 27,840 | | | William Morris Endeavor Entertainment LLC,
LIBOR 2M + 2.750%(1) | | (B, B2) | | 05/18/25 | | | 5.280 | | | | 27,840,125 | | |
| | | | 65,599,447 | | |
| Transport Infrastructure/Services (0.2%) | | | |
| | 7,096 | | | AI Mistral Holdco Ltd., LIBOR 1M + 3.000%(1) | | (B, B1) | | 03/09/24 | | | 5.302 | | | | 7,067,060 | | |
| Trucking & Delivery (0.6%) | | | |
| | 11,100 | | | Navios Maritime Partners LP,
LIBOR 3M + 5.000%(1) | | (BB-, B3) | | 09/14/20 | | | 7.340 | | | | 11,127,764 | | |
| | 13,706 | | | XPO Logistics, Inc., LIBOR 3M + 2.000%(1) | | (BBB-, Baa3) | | 02/24/25 | | | 4.509 | | | | 13,753,796 | | |
| | | | 24,881,560 | | |
| TOTAL BANK LOANS (Cost $3,385,261,097) | | | 3,363,278,302 | | |
| CORPORATE BONDS (8.7%) | | | |
| Auto Parts & Equipment (0.1%) | | | |
| | 6,250 | | | Cooper-Standard Automotive, Inc., Rule 144A,
Company Guaranteed Notes
(Callable 11/15/21 @ 102.81)(10) | | (B+, B1) | | 11/15/26 | | | 5.625 | | | | 5,937,500 | | |
| Brokerage (0.2%) | | | |
| | 1,800 | | | Jefferies Finance LLC, Rule 144A,
Senior Unsecured Notes
(Callable 12/03/18 @ 103.44)(10) | | (B+, B1) | | 04/15/22 | | | 6.875 | | | | 1,813,500 | | |
| | 5,000 | | | Jefferies Finance LLC, Rule 144A,
Senior Unsecured Notes
(Callable 12/03/18 @ 103.75)(10) | | (B+, B1) | | 04/15/21 | | | 7.500 | | | | 5,050,000 | | |
| | 3,500 | | | LPL Holdings, Inc., Rule 144A,
Company Guaranteed Notes
(Callable 03/15/20 @ 104.31)(10) | | (BB-, B2) | | 09/15/25 | | | 5.750 | | | | 3,408,125 | | |
| | | | 10,271,625 | | |
| Building Materials (0.8%) | | | |
| | 2,000 | | | American Builders & Contractors Supply Co., Inc.,
Rule 144A, Senior Unsecured Notes
(Callable 12/15/18 @ 104.31)(10) | | (B+, B3) | | 12/15/23 | | | 5.750 | | | | 1,980,000 | | |
| | 23,250 | | | Omnimax International, Inc., Rule 144A,
Senior Secured Notes
(Callable 11/16/18 @ 104.50)(10) | | (B-, Caa1) | | 08/15/20 | | | 12.000 | | | | 24,150,938 | | |
See Accompanying Notes to Financial Statements.
21
Credit Suisse Floating Rate High Income Fund
Schedule of Investments (continued)
October 31, 2018
Par
(000) | |
| | Ratings†
(S&P/Moody's) | | Maturity | | Rate% | | Value | |
| CORPORATE BONDS (continued) | | | |
Building Materials | | | |
$ | 5,635 | | | PriSo Acquisition Corp., Rule 144A,
Senior Unsecured Notes
(Callable 12/03/18 @ 104.50)(10) | | (CCC+, Caa1) | | 05/15/23 | | | 9.000 | | | $ | 5,797,006 | | |
| | 1,496 | | | U.S. Concrete, Inc.,
Global Company Guaranteed Notes
(Callable 06/01/19 @ 104.78) | | (BB-, B3) | | 06/01/24 | | | 6.375 | | | | 1,400,630 | | |
| | | | 33,328,574 | | |
| Cable & Satellite TV (0.9%) | | | |
| | 4,000 | | | Altice Financing S.A., Rule 144A,
Senior Secured Notes
(Callable 05/15/21 @ 103.75)(10) | | (B+, B1) | | 05/15/26 | | | 7.500 | | | | 3,770,000 | | |
| | 755 | | | Altice Financing S.A., Rule 144A,
Senior Secured Notes
(Callable 12/03/18 @ 104.97)(10) | | (B+, B1) | | 02/15/23 | | | 6.625 | | | | 749,186 | | |
| | 5,000 | | | Altice France S.A., Rule 144A,
Senior Secured Notes
(Callable 05/01/21 @ 103.69)(10) | | (B, B1) | | 05/01/26 | | | 7.375 | | | | 4,804,700 | | |
| | 3,200 | | | Altice U.S. Finance I Corp., Rule 144A,
Senior Secured Notes
(Callable 05/15/21 @ 102.75)(10) | | (BB, Ba3) | | 05/15/26 | | | 5.500 | | | | 3,124,992 | | |
| | 1,900 | | | Block Communications, Inc., Rule 144A,
Senior Unsecured Notes
(Callable 02/15/20 @ 103.44)(10) | | (BB-, Ba3) | | 02/15/25 | | | 6.875 | | | | 1,935,625 | | |
| | 2,500 | | | CSC Holdings LLC, Rule 144A,
Company Guaranteed Notes
(Callable 02/01/23 @ 102.69)(10) | | (BB-, Ba2) | | 02/01/28 | | | 5.375 | | | | 2,362,500 | | |
| | 1,000 | | | CSC Holdings LLC, Rule 144A,
Company Guaranteed Notes
(Callable 10/15/20 @ 103.31)(10) | | (BB-, Ba2) | | 10/15/25 | | | 6.625 | | | | 1,050,000 | | |
| | 1,008 | | | CSC Holdings LLC, Rule 144A,
Senior Unsecured Notes
(Callable 10/15/20 @ 105.44)(10) | | (B-, B2) | | 10/15/25 | | | 10.875 | | | | 1,165,500 | | |
| | 7,250 | | | Midcontinent Finance Corp., Rule 144A,
Company Guaranteed Notes
(Callable 12/03/18 @ 105.16)(10) | | (B, B3) | | 08/15/23 | | | 6.875 | | | | 7,594,375 | | |
| | 7,800 | | | Telenet Finance Luxembourg Notes Sarl,
Rule 144A, Senior Secured Notes
(Callable 12/01/22 @ 102.75)(10) | | (BB-, Ba3) | | 03/01/28 | | | 5.500 | | | | 7,273,500 | | |
| | 2,730 | | | Ziggo B.V., Rule 144A,
Senior Secured Notes
(Callable 01/15/22 @ 102.75)(10) | | (BB-, B1) | | 01/15/27 | | | 5.500 | | | | 2,511,600 | | |
| | | | 36,341,978 | | |
See Accompanying Notes to Financial Statements.
22
Credit Suisse Floating Rate High Income Fund
Schedule of Investments (continued)
October 31, 2018
Par
(000) | |
| | Ratings†
(S&P/Moody's) | | Maturity | | Rate% | | Value | |
| CORPORATE BONDS (continued) | | | |
| Chemicals (0.2%) | | | |
$ | 4,500 | | | Alpha 2 B.V., 8.75% Cash, 9.50% PIK,
Rule 144A, Senior Unsecured Notes
(Callable 06/01/19 @ 102.00)(10),(11) | | (CCC+, Caa1) | | 06/01/23 | | | 8.750 | | | $ | 4,505,625 | | |
| | 2,500 | | | Kronos International, Inc., Reg S,
Senior Secured Notes
(Callable 09/15/20 @ 102.81)(2),(12) | | (BB-, B2) | | 09/15/25 | | | 3.750 | | | | 2,615,999 | | |
| | 1,750 | | | Nufarm Americas, Inc., Rule 144A,
Company Guaranteed Notes
(Callable 04/30/21 @ 102.88)(10) | | (BB-, B1) | | 04/30/26 | | | 5.750 | | | | 1,642,812 | | |
| | | | 8,764,436 | | |
| Electronics (0.3%) | | | |
| | 7,300 | | | Entegris, Inc., Rule 144A,
Company Guaranteed Notes
(Callable 11/10/20 @ 103.47)(10) | | (BB, Ba2) | | 02/10/26 | | | 4.625 | | | | 6,818,638 | | |
| | 4,750 | | | Sensata Technologies B.V., Rule 144A,
Company Guaranteed Notes(10) | | (BB+, Ba3) | | 10/01/25 | | | 5.000 | | | | 4,607,500 | | |
| | | | 11,426,138 | | |
| Energy - Exploration & Production (0.3%) | | | |
| | 11,000 | | | W&T Offshore, Inc., Rule 144A, Secured Notes
(Callable 11/01/20 @ 104.88)(10) | | (B, B3) | | 11/01/23 | | | 9.750 | | | | 10,672,200 | | |
| Food - Wholesale (0.1%) | | | |
| | 3,950 | | | U.S. Foods, Inc., Rule 144A,
Company Guaranteed Notes
(Callable 06/15/19 @ 102.94)(10) | | (BB, B2) | | 06/15/24 | | | 5.875 | | | | 3,930,250 | | |
| Health Services (0.4%) | | | |
| | 14,906 | | | AMN Healthcare, Inc., Rule 144A,
Company Guaranteed Notes
(Callable 10/01/19 @ 103.84)(10) | | (BB-, Ba2) | | 10/01/24 | | | 5.125 | | | | 14,402,923 | | |
| | 2,000 | | | Sotera Health Holdings LLC, Rule 144A,
Senior Unsecured Notes
(Callable 12/03/18 @ 104.88)(10) | | (CCC+, Caa1) | | 05/15/23 | | | 6.500 | | | | 1,960,000 | | |
| | | | 16,362,923 | | |
| Insurance Brokerage (0.2%) | | | |
| | 5,000 | | | Acrisure Finance, Inc., Rule 144A,
Senior Unsecured Notes
(Callable 11/15/20 @ 103.50)(10) | | (CCC+, Caa2) | | 11/15/25 | | | 7.000 | | | | 4,487,500 | | |
| | 2,000 | | | HUB International Ltd., Rule 144A,
Senior Unsecured Notes
(Callable 05/01/21 @ 103.50)(10) | | (CCC+, Caa2) | | 05/01/26 | | | 7.000 | | | | 1,957,000 | | |
| | | | 6,444,500 | | |
See Accompanying Notes to Financial Statements.
23
Credit Suisse Floating Rate High Income Fund
Schedule of Investments (continued)
October 31, 2018
Par
(000) | |
| | Ratings†
(S&P/Moody's) | | Maturity | | Rate% | | Value | |
| CORPORATE BONDS (continued) | | | |
| Investments & Misc. Financial Services (0.1%) | | | |
$ | 2,500 | | | Compass Group Diversified Holdings LLC,
Rule 144A, Senior Unsecured Notes
(Callable 05/01/21 @ 104.00)(10) | | (B-, B3) | | 05/01/26 | | | 8.000 | | | $ | 2,562,500 | | |
| Media - Diversified (0.1%) | | | |
| | 2,000 | | | National CineMedia LLC,
Global Senior Secured Notes
(Callable 12/03/18 @ 102.00) | | (B+, Ba3) | | 04/15/22 | | | 6.000 | | | | 2,030,000 | | |
| | 1,000 | | | National CineMedia LLC,
Global Senior Unsecured Notes
(Callable 08/15/21 @ 102.88) | | (B-, B3) | | 08/15/26 | | | 5.750 | | | | 950,000 | | |
| | | | 2,980,000 | | |
| Media Content (0.2%) | | | |
| | 3,500 | | | EMI Music Publishing Group North
America Holdings, Inc., Rule 144A,
Company Guaranteed Notes
(Callable 06/15/19 @ 105.72)(10) | | (B, B3) | | 06/15/24 | | | 7.625 | | | | 3,766,875 | | |
| | 2,500 | | | WMG Acquisition Corp., Rule 144A,
Senior Secured Notes
(Callable 08/01/19 @ 102.50)(10) | | (B+, Ba3) | | 08/01/23 | | | 5.000 | | | | 2,478,125 | | |
| | 4,000 | | | WMG Acquisition Corp., Rule 144A,
Senior Secured Notes
(Callable 11/01/19 @ 103.66)(10) | | (B+, Ba3) | | 11/01/24 | | | 4.875 | | | | 3,920,000 | | |
| | | | 10,165,000 | | |
| Medical Products (0.0%) | | | |
| | 1,000 | | | Sotera Health Topco, Inc., 8.125% Cash,
8.875% PIK, Rule 144A,
Senior Unsecured Notes
(Callable 12/03/18 @ 101.00)(10),(11) | | (CCC+, Caa2) | | 11/01/21 | | | 8.125 | | | | 985,000 | | |
| Metals & Mining - Excluding Steel (0.7%) | | | |
| | 4,750 | | | Cleveland-Cliffs, Inc., Rule 144A,
Senior Secured Notes
(Callable 01/15/21 @ 102.44)(10) | | (BB-, Ba2) | | 01/15/24 | | | 4.875 | | | | 4,548,125 | | |
| | 11,665 | | | Kaiser Aluminum Corp.,
Global Company Guaranteed Notes
(Callable 05/15/19 @ 104.41) | | (BB+, Ba3) | | 05/15/24 | | | 5.875 | | | | 11,708,744 | | |
| | 2,100 | | | Noranda Aluminum Acquisition Corp.,
Global Senior Unsecured Notes
(Callable 12/10/18 @ 100.00)(4),(7) | | (NR, NR) | | 06/01/19 | | | 11.000 | | | | — | | |
| | 10,820 | | | Taseko Mines Ltd., Rule 144A,
Senior Secured Notes
(Callable 06/15/19 @ 104.38)(10) | | (B, B3) | | 06/15/22 | | | 8.750 | | | | 10,684,750 | | |
| | | 26,941,619 | | |
See Accompanying Notes to Financial Statements.
24
Credit Suisse Floating Rate High Income Fund
Schedule of Investments (continued)
October 31, 2018
Par
(000) | |
| | Ratings†
(S&P/Moody's) | | Maturity | | Rate% | | Value | |
| CORPORATE BONDS (continued) | | | |
| Oil Field Equipment & Services (0.3%) | | | |
$ | 5,600 | | | FTS International, Inc.,
Global Senior Secured Notes
(Callable 12/03/18 @ 103.13) | | (B, B3) | | 05/01/22 | | | 6.250 | | | $ | 5,348,000 | | |
| | 5,250 | | | Pioneer Energy Services Corp.,
Global Company Guaranteed Notes
(Callable 12/03/18 @ 103.06) | | (CCC, Caa2) | | 03/15/22 | | | 6.125 | | | | 4,501,875 | | |
| | 3,000 | | | Shelf Drilling Holdings Ltd., Rule 144A,
Company Guaranteed Notes
(Callable 02/15/21 @ 106.19)(10) | | (B-, B2) | | 02/15/25 | | | 8.250 | | | | 3,018,750 | | |
| | | | 12,868,625 | | |
| Oil Refining & Marketing (0.2%) | | | |
| | 7,522 | | | Coffeyville Finance, Inc.,
Global Company Guaranteed Notes
(Callable 12/03/18 @ 102.17) | | (BB-, B1) | | 11/01/22 | | | 6.500 | | | | 7,606,623 | | |
| Packaging (0.8%) | | | |
| | 1,600 | | | Ardagh Holdings U.S.A., Inc., Rule 144A,
Company Guaranteed Notes
(Callable 02/15/20 @ 104.50)(10) | | (B, B3) | | 02/15/25 | | | 6.000 | | | | 1,504,000 | | |
| | 17,000 | | | Ardagh Holdings U.S.A., Inc., Rule 144A,
Senior Secured Notes
(Callable 05/15/19 @ 102.31)(10) | | (BB, Ba3) | | 05/15/23 | | | 4.625 | | | | 16,575,000 | | |
| | 1,900 | | | Flex Acquisition Co., Inc., Rule 144A,
Senior Unsecured Notes
(Callable 01/15/20 @ 103.44)(10) | | (CCC+, Caa1) | | 01/15/25 | | | 6.875 | | | | 1,786,000 | | |
| | 2,200 | | | Owens-Brockway Glass Container, Inc.,
Rule 144A, Company Guaranteed Notes(10) | | (BB-, B1) | | 08/15/23 | | | 5.875 | | | | 2,200,000 | | |
| | 10,275 | | | TriMas Corp., Rule 144A,
Company Guaranteed Notes
(Callable 10/15/20 @ 102.44)(10) | | (BB-, Ba3) | | 10/15/25 | | | 4.875 | | | | 9,732,531 | | |
| | | | 31,797,531 | | |
| Personal & Household Products (0.0%) | | | |
| | 1,004 | | | Mattel, Inc., Rule 144A,
Company Guaranteed Notes
(Callable 12/31/20 @ 105.06)(10) | | (BB-, B1) | | 12/31/25 | | | 6.750 | | | | 963,840 | | |
| Pharmaceuticals (0.5%) | | | |
| | 1,000 | | | Bausch Health Cos., Inc., Rule 144A,
Company Guaranteed Notes
(Callable 04/01/22 @ 104.63)(10) | | (B-, B3) | | 04/01/26 | | | 9.250 | | | | 1,051,250 | | |
| | 1,170 | | | Bausch Health Cos., Inc., Rule 144A,
Company Guaranteed Notes
(Callable 12/03/18 @ 102.94)(10) | | (B-, B3) | | 05/15/23 | | | 5.875 | | | | 1,120,275 | | |
See Accompanying Notes to Financial Statements.
25
Credit Suisse Floating Rate High Income Fund
Schedule of Investments (continued)
October 31, 2018
Par
(000) | |
| | Ratings†
(S&P/Moody's) | | Maturity | | Rate% | | Value | |
| CORPORATE BONDS (continued) | | | |
Pharmaceuticals | | | |
$ | 5,000 | | | Bausch Health Cos., Inc., Rule 144A,
Senior Secured Notes
(Callable 03/15/19 @ 103.25)(10) | | (BB-, Ba2) | | 03/15/22 | | | 6.500 | | | $ | 5,187,500 | | |
| | 3,000 | | | Bausch Health Cos., Inc., Rule 144A,
Senior Secured Notes
(Callable 11/01/20 @ 102.75)(10) | | (BB-, Ba2) | | 11/01/25 | | | 5.500 | | | | 2,951,250 | | |
| | 11,204 | | | Owens & Minor, Inc.,
Global Company Guaranteed Notes
(Callable 09/15/24 @ 100.00) | | (BB, B1) | | 12/15/24 | | | 4.375 | | | | 9,509,395 | | |
| | | | 19,819,670 | | |
| Real Estate Investment Trusts (0.4%) | | | |
| | 3,850 | | | iStar, Inc., Senior Unsecured Notes
(Callable 06/15/20 @ 100.00) | | (BB-, B1) | | 09/15/20 | | | 4.625 | | | | 3,830,750 | | |
| | 5,000 | | | iStar, Inc., Senior Unsecured Notes
(Callable 09/15/19 @ 102.63) | | (BB-, B1) | | 09/15/22 | | | 5.250 | | | | 4,850,000 | | |
| | 4,938 | | | iStar, Inc., Senior Unsecured Notes
(Callable 12/03/18 @ 100.00) | | (BB-, B1) | | 07/01/19 | | | 5.000 | | | | 4,944,173 | | |
| | 1,000 | | | iStar, Inc., Senior Unsecured Notes
(Callable 12/03/18 @ 103.25) | | (BB-, B1) | | 07/01/21 | | | 6.500 | | | | 1,012,500 | | |
| | | | 14,637,423 | | |
| Recreation & Travel (0.4%) | | | |
| | 4,000 | | | Six Flags Entertainment Corp., Rule 144A,
Company Guaranteed Notes
(Callable 04/15/22 @ 102.75)(10) | | (BB-, B2) | | 04/15/27 | | | 5.500 | | | | 3,805,000 | | |
| | 11,728 | | | Six Flags Entertainment Corp., Rule 144A,
Company Guaranteed Notes
(Callable 07/31/19 @ 103.66)(10) | | (BB-, B2) | | 07/31/24 | | | 4.875 | | | | 11,112,280 | | |
| | | | 14,917,280 | | |
| Software - Services (0.5%) | | | |
| | 10,845 | | | CDK Global, Inc., Global Senior Unsecured Notes
(Callable 06/01/22 @ 102.44) | | (BB+, Ba1) | | 06/01/27 | | | 4.875 | | | | 10,207,856 | | |
| | 2,295 | | | Epicor Software Corp., Rule 144A, Secured Notes
(Callable 12/03/18 @ 102.00),
LIBOR 3M + 7.250%(1),(4),(7),(10) | | (NR, NR) | | 06/30/23 | | | 9.650 | | | | 2,317,950 | | |
| | 5,500 | | | First Data Corp., Rule 144A, Secured Notes
(Callable 01/15/19 @ 102.88)(10) | | (B+, B2) | | 01/15/24 | | | 5.750 | | | | 5,555,000 | | |
| | 3,487 | | | Solera Finance, Inc., Rule 144A,
Senior Unsecured Notes
(Callable 03/01/19 @ 107.88)(10) | | (CCC+, Caa1) | | 03/01/24 | | | 10.500 | | | | 3,800,935 | | |
| | | | 21,881,741 | | |
See Accompanying Notes to Financial Statements.
26
Credit Suisse Floating Rate High Income Fund
Schedule of Investments (continued)
October 31, 2018
Par
(000) | |
| | Ratings†
(S&P/Moody's) | | Maturity | | Rate% | | Value | |
| CORPORATE BONDS (continued) | | | |
| Specialty Retail (0.1%) | | | |
$ | 3,500 | | | Penske Automotive Group, Inc.,
Company Guaranteed Notes
(Callable 05/15/21 @ 102.75) | | (B+, Ba3) | | 05/15/26 | | | 5.500 | | | $ | 3,342,500 | | |
| | 1,000 | | | Penske Automotive Group, Inc.,
Company Guaranteed Notes
(Callable 12/01/19 @ 102.69) | | (B+, Ba3) | | 12/01/24 | | | 5.375 | | | | 976,250 | | |
| | | | 4,318,750 | | |
| Support - Services (0.4%) | | | |
| | 6,325 | | | Avison Young Canada, Inc., Rule 144A,
Senior Secured Notes
(Callable 12/15/19 @ 104.75)(10) | | (B, B3) | | 12/15/21 | | | 9.500 | | | | 6,641,250 | | |
| | 2,417 | | | IHS Markit Ltd., Rule 144A,
Company Guaranteed Notes
(Callable 08/01/22 @ 100.00)(10) | | (BBB-, Ba1) | | 11/01/22 | | | 5.000 | | | | 2,479,358 | | |
| | 4,285 | | | Sotheby's, Rule 144A,
Company Guaranteed Notes
(Callable 12/15/20 @ 103.66)(10) | | (BB-, Ba3) | | 12/15/25 | | | 4.875 | | | | 3,979,694 | | |
| | 3,000 | | | URS Fox U.S. LP,
Global Company Guaranteed Notes
(Callable 01/01/22 @ 100.00) | | (B+, NR) | | 04/01/22 | | | 5.000 | | | | 2,992,500 | | |
| | 1,900 | | | WeWork Cos., Inc., Rule 144A,
Company Guaranteed Notes(10),(13) | | (B+, NR) | | 05/01/25 | | | 7.875 | | | | 1,752,750 | | |
| | | | 17,845,552 | | |
| Tech Hardware & Equipment (0.1%) | | | |
| | 3,000 | | | CommScope Technologies LLC, Rule 144A,
Company Guaranteed Notes
(Callable 03/15/22 @ 102.50)(10) | | (BB-, Ba3) | | 03/15/27 | | | 5.000 | | | | 2,685,510 | | |
| Telecom - Wireless (0.1%) | | | |
| | 2,000 | | | Sprint Spectrum Co. II LLC, Rule 144A,
Senior Secured Notes(10) | | (NR, Baa2) | | 03/20/28 | | | 5.152 | | | | 2,005,000 | | |
| | 2,000 | | | T-Mobile U.S.A., Inc., Company Guaranteed Notes
(Callable 04/15/19 @ 104.50) | | (BB+, Ba2) | | 04/15/24 | | | 6.000 | | | | 2,055,000 | | |
| | | | 4,060,000 | | |
| Telecom - Wireline Integrated & Services (0.2%) | | | |
| | 7,000 | | | GTT Communications, Inc., Rule 144A,
Company Guaranteed Notes
(Callable 12/31/19 @ 105.91)(10),(13) | | (CCC+, Caa1) | | 12/31/24 | | | 7.875 | | | | 6,615,000 | | |
| | 1,800 | | | QTS Finance Corp., Rule 144A,
Company Guaranteed Notes
(Callable 11/15/20 @ 103.56)(10) | | (BB, B1) | | 11/15/25 | | | 4.750 | | | | 1,687,500 | | |
| | | | 8,302,500 | | |
See Accompanying Notes to Financial Statements.
27
Credit Suisse Floating Rate High Income Fund
Schedule of Investments (continued)
October 31, 2018
Par
(000) | |
| | Ratings†
(S&P/Moody's) | | Maturity | | Rate% | | Value | |
| CORPORATE BONDS (continued) | | | |
| Theaters & Entertainment (0.1%) | | | |
$ | 775 | | | AMC Entertainment Holdings, Inc.,
Global Company Guaranteed Notes
(Callable 05/15/22 @ 103.06)(13) | | (B-, B3) | | 05/15/27 | | | 6.125 | | | $ | 713,000 | | |
| | 3,800 | | | AMC Entertainment Holdings, Inc.,
Global Company Guaranteed Notes
(Callable 11/15/21 @ 102.94)(13) | | (B-, B3) | | 11/15/26 | | | 5.875 | | | | 3,496,000 | | |
| | 1,000 | | | Carmike Cinemas, Inc., Rule 144A,
Secured Notes (Callable 12/03/18 @ 104.50)(10) | | (BB-, Ba2) | | 06/15/23 | | | 6.000 | | | | 1,015,000 | | |
| | | | 5,224,000 | | |
| TOTAL CORPORATE BONDS (Cost $361,557,696) | | | 354,043,288 | | |
| ASSET BACKED SECURITIES (4.7%) | | | |
| Collateralized Debt Obligations (4.7%) | | | |
| | 3,500 | | | ALM V Ltd., 2012-5A, Rule 144A,
LIBOR 3M + 5.250%(1),(10) | | (NR, Ba3) | | 10/18/27 | | | 7.695 | | | | 3,503,583 | | |
| | 5,000 | | | Ares XXXVIII CLO Ltd., 2015-38A, Rule 144A,
LIBOR 3M + 5.050%(1),(10) | | (NR, Ba3) | | 04/20/30 | | | 7.519 | | | | 4,875,415 | | |
| | 2,000 | | | Atlas Senior Loan Fund III Ltd., 2013-1A,
Rule 144A, LIBOR 3M + 6.000%(1),(10) | | (BB-, NR) | | 11/17/27 | | | 8.312 | | | | 2,001,086 | | |
| | 5,000 | | | Atlas Senior Loan Fund V Ltd., Rule 144A,
LIBOR 3M + 2.600%(1),(10) | | (A, NR) | | 07/16/29 | | | 5.036 | | | | 5,015,846 | | |
| | 2,150 | | | Barings CLO Ltd., 2018-3A, Rule 144A,
LIBOR 3M + 2.900%(1),(10) | | (BBB-, NR) | | 07/20/29 | | | 5.369 | | | | 2,145,081 | | |
| | 3,750 | | | Battalion CLO VII Ltd., 2014-7A, Rule 144A,
LIBOR 3M + 1.040%(1),(10) | | (NR, Aaa) | | 07/17/28 | | | 3.489 | | | | 3,751,270 | | |
| | 2,100 | | | BlueMountain CLO Ltd., 2015-3A, Rule 144A,
LIBOR 3M + 5.400%(1),(10) | | (BB-, NR) | | 04/20/31 | | | 7.869 | | | | 2,089,319 | | |
| | 2,900 | | | Bowman Park CLO Ltd., 2014-1A, Rule 144A,
LIBOR 3M + 5.400%(1),(10) | | (BB-, NR) | | 11/23/25 | | | 7.710 | | | | 2,900,326 | | |
| | 4,487 | | | Capital Automotive LLC, 2017-1A, Rule 144A(10) | | (A+, NR) | | 04/15/47 | | | 3.870 | | | | 4,445,212 | | |
| | 2,709 | | | Capital Automotive LLC, 2017-1A, Rule 144A(10) | | (A+, NR) | | 04/15/47 | | | 4.180 | | | | 2,673,004 | | |
| | 750 | | | Carlyle Global Market Strategies CLO Ltd.,
2014-3RA, Rule 144A, LIBOR 3M + 5.400%(1),(10) | | (BB-, NR) | | 07/27/31 | | | 7.488 | | | | 746,046 | | |
| | 1,850 | | | Carlyle Global Market Strategies CLO Ltd.,
2015-2A, Rule 144A, LIBOR 3M + 6.150%(1),(10) | | (NR, B1) | | 04/27/27 | | | 8.659 | | | | 1,827,426 | | |
| | 2,000 | | | Carlyle U.S. CLO Ltd., 2017-2A,
Rule 144A(1),(3),(6),(10),(14) | | (NR, NR) | | 07/20/31 | | | 0.000 | | | | 1,793,828 | | |
| | 4,500 | | | Cent CLO 21 Ltd., 2014-21A, Rule 144A,
LIBOR 3M + 2.350%(1),(10) | | (A, NR) | | 07/27/30 | | | 4.859 | | | | 4,494,780 | | |
| | 3,000 | | | CIFC Funding Ltd., 2013-3RA, Rule 144A,
LIBOR 3M + 5.900%(1),(10) | | (NR, Ba3) | | 04/24/31 | | | 8.250 | | | | 2,995,236 | | |
| | 2,625 | | | CIFC Funding Ltd., 2014-1A, Rule 144A,
LIBOR 3M + 5.850%(1),(10) | | (BB-, NR) | | 01/18/31 | | | 8.295 | | | | 2,586,077 | | |
| | 1,750 | | | CIFC Funding Ltd., 2014-3A, Rule 144A,
LIBOR 3M + 2.350%(1),(10) | | (A, NR) | | 10/22/31 | | | 4.819 | | | | 1,754,373 | | |
See Accompanying Notes to Financial Statements.
28
Credit Suisse Floating Rate High Income Fund
Schedule of Investments (continued)
October 31, 2018
Par
(000) | |
| | Ratings†
(S&P/Moody's) | | Maturity | | Rate% | | Value | |
| ASSET BACKED SECURITIES (continued) | | | |
Collateralized Debt Obligations | | | |
$ | 5,000 | | | Crown Point CLO Ltd., 2018-4A, Rule 144A,
LIBOR 3M + 2.750%(1),(10) | | (NR, Baa3) | | 04/20/31 | | | 5.219 | | | $ | 4,965,475 | | |
| | 2,000 | | | Dryden 33 Senior Loan Fund, 2014-33A,
Rule 144A, LIBOR 3M + 4.350%(1),(10) | | (BBB, NR) | | 10/15/28 | | | 6.786 | | | | 2,006,081 | | |
| | 5,250 | | | Dryden 55 CLO Ltd., 2018-55A, Rule 144A,
LIBOR 3M + 2.850%(1),(10) | | (BBB-, NR) | | 04/15/31 | | | 5.286 | | | | 5,212,930 | | |
| | 1,000 | | | Elevation CLO Ltd., 2014-2A, Rule 144A,
LIBOR 3M + 3.200%(1),(10) | | (NR, Baa3) | | 10/15/29 | | | 5.636 | | | | 1,002,997 | | |
| | 1,970 | | | FOCUS Brands Funding LLC, 2017-1A,
Rule 144A(10) | | (BBB, NR) | | 04/30/47 | | | 3.857 | | | | 1,979,792 | | |
| | 8,126 | | | FOCUS Brands Funding LLC, 2017-1A,
Rule 144A(10) | | (BBB, NR) | | 04/30/47 | | | 5.093 | | | | 8,249,173 | | |
| | 5,000 | | | Galaxy CLO XVIII Ltd., 2018 28A,
Rule 144A, LIBOR 3M + 3.000%(1),(10) | | (BBB-, NR) | | 07/15/31 | | | 5.339 | | | | 4,947,420 | | |
| | 5,500 | | | Gallatin CLO IX 2018-1 Ltd., 2018-1A,
Rule 144A, LIBOR 3M + 1.050%(1),(10) | | (NR, Aaa) | | 01/21/28 | | | 3.485 | | | | 5,502,996 | | |
| | 3,250 | | | Goldentree Loan Opportunities XI Ltd.,
2015-11A, Rule 144A, LIBOR 3M + 5.400%(1),(10) | | (NR, Ba3) | | 01/18/31 | | | 7.845 | | | | 3,217,825 | | |
| | 1,250 | | | Greywolf CLO III Ltd., 2018-3RA, Rule 144A,
LIBOR 3M + 2.250%(1),(10) | | (A, NR) | | 10/22/28 | | | 4.719 | | | | 1,253,109 | | |
| | 2,125 | | | Greywolf CLO III Ltd., 2018-3RA, Rule 144A,
LIBOR 3M + 3.150%(1),(10) | | (BBB-, NR) | | 10/22/28 | | | 5.619 | | | | 2,135,576 | | |
| | 3,000 | | | Greywolf CLO III Ltd., 2018-3RA, Rule 144A,
LIBOR 3M + 5.500%(1),(10) | | (BB-, NR) | | 10/22/28 | | | 7.969 | | | | 3,015,513 | | |
| | 4,750 | | | Greywolf CLO IV Ltd., 2014-2A, Rule 144A,
LIBOR 3M + 2.350%(1),(10) | | (A, NR) | | 01/17/27 | | | 4.799 | | | | 4,754,997 | | |
| | 2,450 | | | Greywolf CLO IV Ltd., 2014-2A, Rule 144A,
LIBOR 3M + 5.600%(1),(10) | | (BB, NR) | | 01/17/27 | | | 8.049 | | | | 2,452,190 | | |
| | 6,000 | | | Greywolf CLO V Ltd., 2015-1A, Rule 144A,
LIBOR 3M + 2.000%(1),(10) | | (A, NR) | | 01/27/31 | | | 4.490 | | | | 5,966,808 | | |
| | 3,950 | | | Greywolf CLO V Ltd., 2015-1A, Rule 144A,
LIBOR 3M + 3.000%(1),(10) | | (BBB-, NR) | | 01/27/31 | | | 5.490 | | | | 3,955,813 | | |
| | 3,350 | | | Greywolf CLO V Ltd., 2015-1A, Rule 144A,
LIBOR 3M + 5.850%(1),(10) | | (BB-, NR) | | 01/27/31 | | | 8.340 | | | | 3,317,059 | | |
| | 2,250 | | | Greywolf CLO VI Ltd., 2018-1A, Rule 144A,
LIBOR 3M + 5.750%(1),(10) | | (BB-, NR) | | 04/26/31 | | | 8.258 | | | | 2,210,348 | | |
| | 3,000 | | | Highbridge Loan Management 12-2018 Ltd.,
12A-18, Rule 144A, LIBOR 3M + 1.850%(1),(10) | | (A, NR) | | 07/18/31 | | | 4.222 | | | | 2,986,122 | | |
| | 4,500 | | | Highbridge Loan Management Ltd., 7A-2015,
Rule 144A, LIBOR 3M + 1.700%(1),(10) | | (A, NR) | | 03/15/27 | | | 4.014 | | | | 4,481,762 | | |
| | 2,500 | | | KKR CLO Ltd., 20E, Rule 144A,
LIBOR 3M + 5.500%(1),(10) | | (NR, Ba3) | | 10/16/30 | | | 7.936 | | | | 2,463,628 | | |
| | 6,000 | | | KKR CLO Ltd.,13ER, Rule 144A,
LIBOR 3M + 4.950%(1),(10) | | (NR, Ba3) | | 01/16/28 | | | 7.386 | | | | 5,833,638 | | |
| | 3,250 | | | KKR Financial CLO Ltd., 2013-1A, Rule 144A,
LIBOR 3M + 6.080%(1),(10) | | (NR, Ba3) | | 04/15/29 | | | 8.516 | | | | 3,257,097 | | |
See Accompanying Notes to Financial Statements.
29
Credit Suisse Floating Rate High Income Fund
Schedule of Investments (continued)
October 31, 2018
Par
(000) | |
| | Ratings†
(S&P/Moody's) | | Maturity | | Rate% | | Value | |
| ASSET BACKED SECURITIES (continued) | | | |
Collateralized Debt Obligations | | | |
$ | 2,250 | | | Octagon Investment Partners 26 Ltd., 2016-1A,
Rule 144A, LIBOR 3M + 2.850%(1),(10) | | (BBB-, NR) | | 07/15/30 | | | 5.286 | | | $ | 2,230,610 | | |
| | 3,750 | | | Rockford Tower CLO Ltd., 2017-1A, Rule 144A,
LIBOR 3M + 2.550%(1),(10) | | (NR, A2) | | 04/15/29 | | | 4.986 | | | | 3,769,503 | | |
| | 3,500 | | | Shackleton CLO Ltd., 2014-6RA, Rule 144A,
LIBOR 3M + 2.970%(1),(10) | | (NR, Baa3) | | 07/17/28 | | | 5.306 | | | | 3,478,356 | | |
| | 2,500 | | | Silver Creek CLO Ltd., 2014-1A, Rule 144A,
LIBOR 3M + 2.300%(1),(10) | | (NR, A2) | | 07/20/30 | | | 4.769 | | | | 2,507,054 | | |
| | 4,750 | | | Venture 31 CLO Ltd., 2018-31A, Rule 144A,
LIBOR 3M + 2.820%(1),(10) | | (NR, Baa3) | | 04/20/31 | | | 5.289 | | | | 4,717,006 | | |
| | 3,000 | | | Venture 35 CLO Ltd., 2018-35A, Rule 144A,
LIBOR 3M + 3.500%(1),(10),(14) | | (NR, Baa3) | | 10/22/31 | | | 0.000 | | | | 3,000,000 | | |
| | 3,000 | | | Venture CLO Ltd., 2017-28AA, Rule 144A,
LIBOR 3M + 2.400%(1),(10) | | (NR, A2) | | 10/20/29 | | | 4.869 | | | | 3,006,865 | | |
| | 3,000 | | | Venture XIII CLO Ltd., 2013-13A, Rule 144A,
LIBOR 3M + 3.300%(1),(10) | | (NR, Baa2) | | 09/10/29 | | | 5.627 | | | | 3,010,569 | | |
| | 6,000 | | | Venture XVII CLO Ltd., 2014-17A, Rule 144A,
LIBOR 3M + 2.820%(1),(10) | | (NR, Baa3) | | 04/15/27 | | | 5.256 | | | | 5,979,786 | | |
| | 4,500 | | | Venture XX CLO Ltd., 2015-20A, Rule 144A,
LIBOR 3M + 1.900%(1),(10) | | (A, NR) | | 04/15/27 | | | 4.336 | | | | 4,503,501 | | |
| | 2,000 | | | Vibrant CLO IV Ltd., 2016-4A, Rule 144A,
LIBOR 3M + 6.750%(1),(10) | | (NR, Ba3) | | 07/20/28 | | | 9.219 | | | | 2,012,401 | | |
| | 2,150 | | �� | Vibrant CLO V Ltd., 2016-5A, Rule 144A,
LIBOR 3M + 7.000%(1),(10) | | (NR, Ba3) | | 01/20/29 | | | 9.469 | | | | 2,187,908 | | |
| | 4,500 | | | Vibrant CLO VI Ltd., 2017-6A, Rule 144A,
LIBOR 3M + 2.600%(1),(10) | | (NR, A2) | | 06/20/29 | | | 4.938 | | | | 4,521,933 | | |
| | 2,500 | | | Vibrant CLO VI Ltd., 2017-6A, Rule 144A,
LIBOR 3M + 3.900%(1),(10) | | (NR, Baa3) | | 06/20/29 | | | 6.238 | | | | 2,511,997 | | |
| | 1,500 | | | Vibrant Clo VI Ltd., 2017-6A, Rule 144A,
LIBOR 3M + 5.750%(1),(10) | | (NR, Ba3) | | 06/20/29 | | | 8.088 | | | | 1,500,155 | | |
| | 3,000 | | | Voya CLO Ltd., 2014-4A, Rule 144A,
LIBOR 3M + 3.350%(1),(10) | | (BBB-, NR) | | 07/14/31 | | | 5.786 | | | | 3,013,120 | | |
| | 3,000 | | | Voya CLO Ltd., 2017-1A, Rule 144A(1),(3),(6),(10),(14) | | (NR, NR) | | 04/17/30 | | | 0.000 | | | | 2,286,489 | | |
| | 1,489 | | | Wendys Funding LLC, 2018-1A, Rule 144A(10) | | (BBB, NR) | | 03/15/48 | | | 3.573 | | | | 1,436,644 | | |
| | 2,481 | | | Wendys Funding LLC, 2018-1A, Rule 144A(10) | | (BBB, NR) | | 03/15/48 | | | 3.884 | | | | 2,374,556 | | |
| TOTAL ASSET BACKED SECURITIES (Cost $193,740,807) | | | 192,814,710 | | |
Number of
Shares | | | | | | | | | | | |
| COMMON STOCKS (0.2%) | | | |
| Auto Parts & Equipment (0.1%) | | | |
| | 134,659 | | | UCI International, Inc.(3),(4),(7),(15) | | | | | | | | | | | | | | | 2,827,839 | | |
| Building & Construction (0.0%) | | | |
| | 6 | | | White Forest Resources, Inc.(3),(4),(7),(15) | | | | | | | | | | | | | | | 19 | | |
See Accompanying Notes to Financial Statements.
30
Credit Suisse Floating Rate High Income Fund
Schedule of Investments (continued)
October 31, 2018
Number of
Shares | |
| |
| | | | | | Value | |
| COMMON STOCKS (continued) | | | |
| Chemicals (0.0%) | | | |
| | 9,785 | | | Huntsman Corp.(3) | | | | | | | | | | | | | | $ | 214,096 | | |
| Energy - Exploration & Production (0.1%) | | | |
| | 764,616 | | | PES Energy, Inc.(4),(15) | | | | | | | | | | | | | | | 5,352,312 | | |
| Health Services (0.0%) | | | |
| | 268,452 | | | Valitas Health Services, Inc.(4),(7) | | | | | | | | | | | | | | | 26,845 | | |
| Printing & Publishing (0.0%) | | | |
| | 708 | | | F & W Media, Inc.(3),(4),(7) | | | | | | | | | | | | | | | 71 | | |
| Support - Services (0.0%) | | | |
| | 779 | | | Sprint Industrial Holdings LLC, Class G(4),(7),(15) | | | | | | | | | | | | | | | 8 | | |
| | 71 | | | Sprint Industrial Holdings LLC, Class H(4),(7),(15) | | | | | | | | | | | | | | | 1 | | |
| | 172 | | | Sprint Industrial Holdings LLC, Class I(4),(7),(15) | | | | | | | | | | | | | | | 1 | | |
| | | | 10 | | |
| Theaters & Entertainment (0.0%) | | | |
| | 40 | | | NEG Holdings LLC, Litigation Trust Units(3),(4),(7),(15) | | | | | | | | | | | | | | | 40 | | |
| TOTAL COMMON STOCKS (Cost $9,870,158) | | | 8,421,232 | | |
| SHORT-TERM INVESTMENT (0.3%) | | | |
| | 12,583,625 | | | State Street Navigator Securities Lending
Government Money Market Portfolio, 2.22%(16)
(Cost $12,583,625) | | | | | | | | | | | | | | | 12,583,625 | | |
| TOTAL INVESTMENTS AT VALUE (95.7%) (Cost $3,963,013,383) | | | 3,931,141,157 | | |
| OTHER ASSETS IN EXCESS OF LIABILITIES (4.3%) | | | 180,213,973 | | |
| NET ASSETS (100.0%) | | $ | 4,111,355,130 | | |
† Credit ratings given by the Standard & Poor's Division of The McGraw-Hill Companies, Inc. ("S&P") and Moody's Investors Service, Inc. ("Moody's") are unaudited.
(1) Variable rate obligation — The interest rate shown is the rate in effect as of October 31, 2018.
(2) This security is denominated in Euro.
(3) Illiquid security (unaudited).
(4) Security is valued using significant unobservable inputs.
(5) This security is denominated in British Pound.
(6) The rates on certain variable rate securities are not based on a published reference rate and spread but are determined by the issuer or agent and are based on current market conditions. These securities do not indicate a reference rate and spread in their description above. The interest rate shown is the rate in effect as of October 31, 2018.
(7) Not readily marketable security; security is valued at fair value as determined in good faith by, or under the direction of, the Board of Trustees.
(8) Bond is currently in default.
(9) All or a portion is an unfunded loan commitment (See note 2-I).
See Accompanying Notes to Financial Statements.
31
Credit Suisse Floating Rate High Income Fund
Schedule of Investments (continued)
October 31, 2018
(10) Security exempt from registration under Rule 144A of the Securities Act of 1933, as amended. These securities may be resold in transactions exempt from registration, normally to qualified institutional buyers. At October 31, 2018, these securities amounted to a value of $462,766,203 or 11.3% of net assets.
(11) PIK: Payment-in-kind security for which part of the income earned may be paid as additional principal.
(12) REG S: Securities sold under Regulation S may not be offered, sold or delivered within the United States or to, or for the account or benefit of, U.S. persons, except pursuant to an exemption from, or in a transaction not subject to, the registration requirements of the Securities Act of 1933.
(13) Security or portion thereof is out on loan (See note 2-J).
(14) Zero-coupon security.
(15) Non-income producing security.
(16) Represents security purchased with cash collateral received for securities on loan. The rate shown is the annualized one-day yield at October 31, 2018.
INVESTMENT ABBREVIATIONS
1M = 1 Month
1W = 1 Week
2M = 2 Month
3M = 3 Month
6M = 6 Month
EURIBOR = Euro Interbank Offered Rate
LIBOR = London Interbank Offered Rate
NR = Not Rated
Sarl - société à responsabilité limitée
Forward Foreign Currency Contracts
Forward
Currency to be
Purchased (Local) | | Forward
Currency to be
Sold (Local) | | Expiration
Date | | Counterparty | | Value on
Settlement Date | | Current
Value/
Notional | | Net Unrealized
Appreciation
(Depreciation) | |
USD | 225,900,185 | | | EUR | 189,816,521 | | | 10/11/19 | | Morgan Stanley | | $ | (225,900,185 | ) | | $ | (222,001,503 | ) | | $ | 3,898,682 | | |
USD | 84,480,441 | | | GBP | 62,863,317 | | | 10/11/19 | | Morgan Stanley | | | (84,480,441 | ) | | | (81,767,649 | ) | | | 2,712,792 | | |
| | | $ | 6,611,474 | | |
Currency Abbreviations:
EUR = Euro
GBP = British Pound
USD = United States Dollar
See Accompanying Notes to Financial Statements.
32
Credit Suisse Floating Rate High Income Fund
Statement of Assets and Liabilities
October 31, 2018
Assets | |
Investments at value, including collateral for securities on loan of $12,583,625
(Cost $3,963,013,383) (Note 2) | | $ | 3,931,141,1571 | | |
Cash | | | 269,973,500 | | |
Foreign currency at value (Cost $27,686,613) | | | 26,792,925 | | |
Receivable for investments sold | | | 22,064,428 | | |
Interest receivable | | | 17,519,768 | | |
Receivable for Fund shares sold | | | 15,686,114 | | |
Unrealized appreciation on forward foreign currency contracts (Note 2) | | | 6,611,474 | | |
Prepaid expenses and other assets | | | 167,527 | | |
Total assets | | | 4,289,956,893 | | |
Liabilities | |
Investment advisory fee payable (Note 3) | | | 1,694,832 | | |
Administrative services fee payable (Note 3) | | | 146,021 | | |
Shareholder servicing/Distribution fee payable (Note 3) | | | 159,459 | | |
Payable for investments purchased | | | 144,356,158 | | |
Payable upon return of securities loaned (Note 2) | | | 12,583,625 | | |
Payable for Fund shares redeemed | | | 12,339,148 | | |
Unfunded loan commitments (Note 2) | | | 3,529,275 | | |
Dividend payable | | | 2,379,868 | | |
Trustees' fees payable | | | 22,609 | | |
Accrued expenses | | | 1,390,768 | | |
Total liabilities | | | 178,601,763 | | |
Net Assets | |
Capital stock, $.001 par value (Note 6) | | | 603,523 | | |
Paid-in capital (Note 6) | | | 4,145,046,699 | | |
Total distributable earnings (loss) | | | (34,295,092 | ) | |
Net assets | | $ | 4,111,355,130 | | |
I Shares | |
Net assets | | $ | 3,704,518,937 | | |
Shares outstanding | | | 544,131,431 | | |
Net asset value, offering price and redemption price per share | | $ | 6.81 | | |
A Shares | |
Net assets | | $ | 289,958,782 | | |
Shares outstanding | | | 42,367,720 | | |
Net asset value and redemption price per share | | $ | 6.84 | | |
Maximum offering price per share (net asset value/(1-4.75%)) | | $ | 7.18 | | |
C Shares | |
Net assets | | $ | 116,877,411 | | |
Shares outstanding | | | 17,024,063 | | |
Net asset value and offering price per share | | $ | 6.87 | | |
1 Includes $12,244,626 of securities on loan.
See Accompanying Notes to Financial Statements.
33
Credit Suisse Floating Rate High Income Fund
Statement of Operations
For the Year Ended October 31, 2018
Investment Income | |
Interest | | $ | 192,137,142 | | |
Dividends | | | 5,993 | | |
Securities lending (net of rebates) | | | 57,240 | | |
Total investment income | | | 192,200,375 | | |
Expenses | |
Investment advisory fees (Note 3) | | | 22,948,260 | | |
Administrative services fees (Note 3) | | | 560,774 | | |
Shareholder servicing/Distribution fees (Note 3) | |
Class A | | | 698,804 | | |
Class B1 | | | 1,211 | | |
Class C | | | 1,168,374 | | |
Transfer agent fees (Note 3) | | | 3,420,656 | | |
Commitment fees (Note 4) | | | 808,732 | | |
Custodian fees | | | 788,165 | | |
Registration fees | | | 206,103 | | |
Printing fees | | | 185,321 | | |
Legal fees | | | 108,885 | | |
Insurance expense | | | 77,544 | | |
Trustees' fees | | | 65,159 | | |
Audit and tax fees | | | 62,620 | | |
Miscellaneous expense | | | 45,035 | | |
Total expenses | | | 31,145,643 | | |
Less: fees waived (Note 3) | | | (2,287,751 | ) | |
Net expenses | | | 28,857,892 | | |
Net investment income | | | 163,342,483 | | |
Net Realized and Unrealized Gain (Loss) from Investments, Foreign Currency and
Forward Foreign Currency Contracts | |
Net realized gain from investments | | | 2,465,395 | | |
Net realized gain from foreign currency transactions | | | 540,570 | | |
Net realized gain from forward foreign currency contracts | | | 2,278,670 | | |
Net change in unrealized appreciation (depreciation) from investments | | | (49,531,048 | ) | |
Net change in unrealized appreciation (depreciation) from foreign currency translations | | | (416,589 | ) | |
Net change in unrealized appreciation (depreciation) from forward foreign currency contracts | | | 11,507,201 | | |
Net realized and unrealized loss from investments, foreign currency and forward foreign
currency contracts | | | (33,155,801 | ) | |
Net increase in net assets resulting from operations | | $ | 130,186,682 | | |
1 The Class B shares were terminated on December 15, 2017 and are no longer offered.
See Accompanying Notes to Financial Statements.
34
Credit Suisse Floating Rate High Income Fund
Statements of Changes in Net Assets
| | | For the Year
Ended
October 31, 2018 | | For the Year
Ended
October 31, 2017 | |
From Operations | |
Net investment income | | $ | 163,342,483 | | | $ | 131,733,364 | | |
Net realized gain (loss) from investments, foreign currency transactions
and forward foreign currency contracts | | | 5,284,635 | | | | (12,622,313 | ) | |
Net change in unrealized appreciation (depreciation) from investments,
foreign currency translations and forward foreign currency contracts | | | (38,440,436 | ) | | | 55,874,138 | | |
Net increase in net assets resulting from operations | | | 130,186,682 | | | | 174,985,189 | | |
From Distributions | | | | | |
From distributable earnings | | | | | |
Class I | | | (148,009,901 | ) | | | (114,409,144 | ) | |
Class A | | | (11,246,262 | ) | | | (10,409,756 | ) | |
Class B* | | | (3,343 | ) | | | (47,250 | ) | |
Class C | | | (3,827,480 | ) | | | (3,659,108 | ) | |
Return of capital | |
Class I shares | | | — | | | | (2,668,965 | ) | |
Class A shares | | | — | | | | (242,841 | ) | |
Class B shares | | | — | | | | (1,102 | ) | |
Class C shares | | | — | | | | (85,361 | ) | |
Net decrease in net assets resulting from distributions and return of capital | | | (163,086,986 | ) | | | (131,523,527 | )1 | |
| From Capital Share Transactions (Note 6) | |
Proceeds from sale of shares | | | 1,638,251,437 | | | | 1,622,987,334 | | |
Reinvestment of dividends | | | 136,274,585 | | | | 91,243,668 | | |
Net asset value of shares redeemed | | | (1,270,696,540 | ) | | | (898,835,466 | ) | |
Net increase in net assets from capital share transactions | | | 503,829,482 | | | | 815,395,536 | | |
Net increase in net assets | | | 470,929,178 | | | | 858,857,198 | | |
Net Assets | |
Beginning of year | | | 3,640,425,952 | | | | 2,781,568,754 | | |
End of year | | $ | 4,111,355,130 | | | $ | 3,640,425,9522 | | |
1 Distributions include $(114,409,144), $(10,409,756), $(47,250) and $(3,659,108) of dividends from net investment income for Class I, Class A, Class B* and Class C, respectively. Prior year information has been conformed to current year presentation.
2 Distributions in excess of net investment income as of October 31, 2017 were $(3,346,513).
* The Class B shares were terminated on December 15, 2017 and are no longer offered.
See Accompanying Notes to Financial Statements.
35
Credit Suisse Floating Rate High Income Fund
Financial Highlights
(For a Class I Share of the Fund Outstanding Throughout Each Year)
| | | For the Year Ended October 31, | |
| | | 2018 | | 2017 | | 2016 | | 2015 | | 2014 | |
Per share data | |
Net asset value, beginning of year | | $ | 6.87 | | | $ | 6.77 | | | $ | 6.72 | | | $ | 6.86 | | | $ | 6.94 | | |
INVESTMENT OPERATIONS | |
Net investment income1 | | | 0.29 | | | | 0.28 | | | | 0.32 | | | | 0.29 | | | | 0.28 | | |
Net gain (loss) from investments, foreign currency
transactions and forward foreign currency
contracts (both realized and unrealized) | | | (0.06 | ) | | | 0.10 | | | | 0.05 | | | | (0.14 | ) | | | (0.08 | ) | |
Total from investment operations | | | 0.23 | | | | 0.38 | | | | 0.37 | | | | 0.15 | | | | 0.20 | | |
REDEMPTION FEES | | | — | | | | — | | | | — | | | | — | | | | 0.002 | | |
LESS DIVIDENDS AND DISTRIBUTIONS | |
Dividends from net investment income | | | (0.29 | ) | | | (0.27 | ) | | | (0.31 | ) | | | (0.29 | ) | | | (0.28 | ) | |
Distributions from net realized gains | | | — | | | | — | | | | — | | | | (0.00 | )3 | | | — | | |
Return of capital | | | — | | | | (0.01 | ) | | | (0.01 | ) | | | (0.00 | )3 | | | — | | |
Total dividends and distributions | | | (0.29 | ) | | | (0.28 | ) | | | (0.32 | ) | | | (0.29 | ) | | | (0.28 | ) | |
Net asset value, end of year | | $ | 6.814 | | | $ | 6.87 | | | $ | 6.77 | | | $ | 6.72 | | | $ | 6.86 | | |
Total return5 | | | 3.45 | % | | | 5.75 | % | | | 5.79 | % | | | 2.33 | % | | | 2.94 | % | |
RATIOS AND SUPPLEMENTAL DATA | |
Net assets, end of year (000s omitted) | | $ | 3,704,519 | | | $ | 3,236,360 | | | $ | 2,438,027 | | | $ | 2,167,955 | | | $ | 1,343,741 | | |
Ratio of net expenses to average net assets | | | 0.70 | % | | | 0.70 | % | | | 0.70 | % | | | 0.70 | % | | | 0.70 | % | |
Ratio of expenses to average net assets
excluding interest expense | | | 0.70 | % | | | 0.70 | % | | | 0.70 | % | | | 0.70 | % | | | 0.70 | %6 | |
Ratio of net investment income to average
net assets | | | 4.29 | % | | | 4.12 | % | | | 4.87 | % | | | 4.29 | % | | | 4.04 | % | |
Decrease reflected in above operating expense
ratios due to waivers/reimbursements | | | 0.06 | % | | | 0.07 | % | | | 0.11 | % | | | 0.07 | % | | | 0.07 | % | |
Portfolio turnover rate | | | 45 | % | | | 64 | % | | | 48 | % | | | 46 | % | | | 57 | % | |
1 Per share information is calculated using the average shares outstanding method.
2 This amount represents less than $0.01 per share.
3 This amount represents less than $(0.01) per share.
4 Includes adjustments in accordance with accounting principles generally accepted in the United States of America and as such, the net asset values for financial reporting purposes and the returns based upon net asset values may differ from the net asset values and returns for shareholder transactions.
5 Total returns are historical and include change in share price and reinvestment of all dividends and distributions. Had certain expenses not been reduced during the years shown, total returns would have been lower.
6 Included to conform with current year presentation.
See Accompanying Notes to Financial Statements.
36
Credit Suisse Floating Rate High Income Fund
Financial Highlights
(For a Class A Share of the Fund Outstanding Throughout Each Year)
| | | For the Year Ended October 31, | |
| | | 2018 | | 2017 | | 2016 | | 2015 | | 2014 | |
Per share data | |
Net asset value, beginning of year | | $ | 6.90 | | | $ | 6.80 | | | $ | 6.75 | | | $ | 6.89 | | | $ | 6.98 | | |
INVESTMENT OPERATIONS | |
Net investment income1 | | | 0.28 | | | | 0.27 | | | | 0.31 | | | | 0.28 | | | | 0.26 | | |
Net gain (loss) from investments, foreign currency
transactions and forward foreign currency
contracts (both realized and unrealized) | | | (0.06 | ) | | | 0.10 | | | | 0.05 | | | | (0.14 | ) | | | (0.09 | ) | |
Total from investment operations | | | 0.22 | | | | 0.37 | | | | 0.36 | | | | 0.14 | | | | 0.17 | | |
REDEMPTION FEES | | | — | | | | — | | | | — | | | | — | | | | 0.002 | | |
LESS DIVIDENDS AND DISTRIBUTIONS | |
Dividends from net investment income | | | (0.28 | ) | | | (0.26 | ) | | | (0.30 | ) | | | (0.28 | ) | | | (0.26 | ) | |
Distributions from net realized gains | | | — | | | | — | | | | — | | | | (0.00 | )3 | | | — | | |
Return of capital | | | — | | | | (0.01 | ) | | | (0.01 | ) | | | (0.00 | )3 | | | — | | |
Total dividends and distributions | | | (0.28 | ) | | | (0.27 | ) | | | (0.31 | ) | | | (0.28 | ) | | | (0.26 | ) | |
Net asset value, end of year | | $ | 6.844 | | | $ | 6.90 | | | $ | 6.80 | | | $ | 6.75 | | | $ | 6.89 | | |
Total return5 | | | 3.20 | % | | | 5.48 | % | | | 5.52 | % | | | 2.09 | % | | | 2.53 | % | |
RATIOS AND SUPPLEMENTAL DATA | |
Net assets, end of year (000s omitted) | | $ | 289,959 | | | $ | 284,456 | | | $ | 227,399 | | | $ | 286,805 | | | $ | 358,095 | | |
Ratio of net expenses to average net assets | | | 0.95 | % | | | 0.95 | % | | | 0.95 | % | | | 0.95 | % | | | 0.95 | % | |
Ratio of expenses to average net assets
excluding interest expense | | | 0.95 | % | | | 0.95 | % | | | 0.95 | % | | | 0.95 | % | | | 0.95 | %6 | |
Ratio of net investment income to average
net assets | | | 4.03 | % | | | 3.87 | % | | | 4.63 | % | | | 4.06 | % | | | 3.79 | % | |
Decrease reflected in above operating expense
ratios due to waivers/reimbursements | | | 0.06 | % | | | 0.07 | % | | | 0.11 | % | | | 0.07 | % | | | 0.07 | % | |
Portfolio turnover rate | | | 45 | % | | | 64 | % | | | 48 | % | | | 46 | % | | | 57 | % | |
1 Per share information is calculated using the average shares outstanding method.
2 This amount represents less than $0.01 per share.
3 This amount represents less than $(0.01) per share.
4 Includes adjustments in accordance with accounting principles generally accepted in the United States of America and as such, the net asset values for financial reporting purposes and the returns based upon net asset values may differ from the net asset values and returns for shareholder transactions.
5 Total returns are historical and include change in share price, reinvestment of all dividends and distributions and no sales charge. Had certain expenses not been reduced during the years shown, total returns would have been lower.
6 Included to conform with current year presentation.
See Accompanying Notes to Financial Statements.
37
Credit Suisse Floating Rate High Income Fund
Financial Highlights
(For a Class C Share of the Fund Outstanding Throughout Each Year)
| | | For the Year Ended October 31, | |
| | | 2018 | | 2017 | | 2016 | | 2015 | | 2014 | |
Per share data | |
Net asset value, beginning of year | | $ | 6.92 | | | $ | 6.82 | | | $ | 6.77 | | | $ | 6.91 | | | $ | 7.00 | | |
INVESTMENT OPERATIONS | |
Net investment income1 | | | 0.23 | | | | 0.22 | | | | 0.26 | | | | 0.23 | | | | 0.21 | | |
Net gain (loss) from investments, foreign currency
transactions and forward foreign currency
contracts (both realized and unrealized) | | | (0.05 | ) | | | 0.10 | | | | 0.05 | | | | (0.14 | ) | | | (0.09 | ) | |
Total from investment operations | | | 0.18 | | | | 0.32 | | | | 0.31 | | | | 0.09 | | | | 0.12 | | |
REDEMPTION FEES | | | — | | | | — | | | | — | | | | — | | | | 0.002 | | |
LESS DIVIDENDS AND DISTRIBUTIONS | |
Dividends from net investment income | | | (0.23 | ) | | | (0.21 | ) | | | (0.25 | ) | | | (0.23 | ) | | | (0.21 | ) | |
Distributions from net realized gains | | | — | | | | — | | | | — | | | | (0.00 | )3 | | | — | | |
Return of capital | | | — | | | | (0.01 | ) | | | (0.01 | ) | | | (0.00 | )3 | | | — | | |
Total dividends and distributions | | | (0.23 | ) | | | (0.22 | ) | | | (0.26 | ) | | | (0.23 | ) | | | (0.21 | ) | |
Net asset value, end of year | | $ | 6.874 | | | $ | 6.92 | | | $ | 6.82 | | | $ | 6.77 | | | $ | 6.91 | | |
Total return5 | | | 2.58 | % | | | 4.69 | % | | | 4.73 | % | | | 1.33 | % | | | 1.77 | % | |
RATIOS AND SUPPLEMENTAL DATA | |
Net assets, end of year (000s omitted) | | $ | 116,877 | | | $ | 118,654 | | | $ | 114,343 | | | $ | 134,433 | | | $ | 170,015 | | |
Ratio of net expenses to average net assets | | | 1.70 | % | | | 1.70 | % | | | 1.70 | % | | | 1.70 | % | | | 1.70 | % | |
Ratio of expenses to average net assets
excluding interest expense | | | 1.70 | % | | | 1.70 | % | | | 1.70 | % | | | 1.70 | % | | | 1.70 | %6 | |
Ratio of net investment income to average
net assets | | | 3.28 | % | | | 3.13 | % | | | 3.89 | % | | | 3.32 | % | | | 3.04 | % | |
Decrease reflected in above operating expense
ratios due to waivers/reimbursements | | | 0.06 | % | | | 0.07 | % | | | 0.11 | % | | | 0.07 | % | | | 0.07 | % | |
Portfolio turnover rate | | | 45 | % | | | 64 | % | | | 48 | % | | | 46 | % | | | 57 | % | |
1 Per share information is calculated using the average shares outstanding method.
2 This amount represents less than $0.01 per share.
3 This amount represents less than $(0.01) per share.
4 Includes adjustments in accordance with accounting principles generally accepted in the United States of America and as such, the net asset values for financial reporting purposes and the returns based upon net asset values may differ from the net asset values and returns for shareholder transactions.
5 Total returns are historical and include change in share price, reinvestment of all dividends and distributions and no sales charge. Had certain expenses not been reduced during the years shown, total returns would have been lower.
6 Included to conform with current year presentation.
See Accompanying Notes to Financial Statements.
38
Credit Suisse Floating Rate High Income Fund
Notes to Financial Statements
October 31, 2018
Credit Suisse Floating Rate High Income Fund (the "Fund"), a series of the Credit Suisse Opportunity Funds (the "Trust"), a Delaware statutory trust, is registered under the Investment Company Act of 1940, as amended (the "1940 Act"), as a diversified open-end management investment company that seeks to provide a high level of current income and, secondarily, capital appreciation. The Trust was organized under the laws of the State of Delaware as a business trust on May 31, 1995.
The Fund offers three classes of shares: Class I shares, Class A shares and Class C shares. Each class of shares represents an equal pro rata interest in the Fund, except the share classes bear different expenses. Class A shares are sold subject to a front-end sales charge of up to 4.75%. Class C shares are sold subject to a CDSC of 1.00% if the shares are redeemed within the first year of purchase. Class I shares are sold without a sales charge. Class B shares were terminated on December 15, 2017 and are no longer offered.
Note 2. Significant Accounting Policies
The following is a summary of significant accounting policies followed by the Fund in the preparation of its financial statements. The policies are in accordance with generally accepted accounting principles in the United States of America ("GAAP"). The preparation of financial statements requires management to make estimates and assumptions that affect the reported amounts and disclosures in the financial statements. Actual results could differ from those estimates. The Fund is considered an investment company for financial reporting purposes under GAAP and follows the accounting and reporting guidance in Financial Accounting Standards Board's ("FASB") Accounting Standard Codification ("ASC") Topic 946 — Financial Services — Investment Companies.
A) SECURITY VALUATION — The Board of Trustees (the "Board") is responsible for the Fund's valuation process. The Board has delegated the supervision of the daily valuation process to Credit Suisse who has established a Pricing Committee which, pursuant to the policies adopted by the Board, is responsible for making fair valuation determinations and overseeing the Fund's pricing policies. The net asset value of the Fund is determined daily as of the close of regular trading on the New York Stock Exchange, Inc. (the "Exchange") on each day the Exchange is open for business. The valuations for fixed income securities (which may include, but are not limited to, corporate, government, municipal, mortgage-backed, collateralized mortgage obligations and asset-backed securities) and certain derivative instruments are
39
Credit Suisse Floating Rate High Income Fund
Notes to Financial Statements (continued)
October 31, 2018
Note 2. Significant Accounting Policies (continued)
typically the prices supplied by independent third party pricing services, which may use market prices or broker/dealer quotations or a variety of valuation techniques and methodologies. The independent third party pricing services use inputs that are observable such as issuer details, interest rates, yield curves, prepayment speeds, credit risks/spreads, default rates and quoted prices for similar securities. These pricing services generally price fixed income securities assuming orderly transactions of an institutional "round lot" size, but some trades occur in smaller "odd lot" sizes which may be effected at lower prices than institutional round lot trades. Structured note agreements are valued in accordance with a dealer-supplied valuation based on changes in the value of the underlying index. Futures contracts are valued daily at the settlement price established by the board of trade or exchange on which they are traded. Forward contracts are valued at the London closing spot rates and the London closing forward point rates on a daily basis. The currency forward contract pricing model derives the differential in point rates to the expiration date of the forward and calculates its present value. Equity securities for which market quotations are available are valued at the last reported sales price or official closing price on the primary market or exchange on which they trade. The Fund may utilize a service provided by an independent third party which has been approved by the Board to fair value certain securities. When fair value pricing is employed, the prices of securities used by the Fund to calculate its net asset value may differ from quoted or published prices for the same securities. If independent third party pricing services are unable to supply prices for a portfolio investment, or if the prices supplied are deemed by the investment adviser to be unreliable, the market price may be determined by the investment adviser using quotations from one or more brokers/dealers or at the transaction price if the security has recently been purchased and no value has yet been obtained from a pricing service or pricing broker. When reliable prices are not readily available, such as when the value of a security has been significantly affected by events after the close of the exchange or market on which the security is principally traded, but before the Fund calculates its net asset value, these securities will be fair valued in good faith by the Pricing Committee, in accordance with procedures adopted by the Board.
The Fund uses valuation techniques to measure fair value that are consistent with the market approach and/or income approach, depending on the type of security and the particular circumstance. The market approach uses prices and other relevant information generated by market transactions involving identical or comparable securities. The income approach uses valuation techniques to discount estimated future cash flows to present value.
40
Credit Suisse Floating Rate High Income Fund
Notes to Financial Statements (continued)
October 31, 2018
Note 2. Significant Accounting Policies (continued)
GAAP established a disclosure hierarchy that categorizes the inputs to valuation techniques used to value assets and liabilities at each measurement date. These inputs are summarized in the three broad levels listed below:
• Level 1 – quoted prices in active markets for identical investments
• Level 2 – other significant observable inputs (including quoted prices for similar investments, interest rates, prepayment speeds, credit risk, etc.)
• Level 3 – significant unobservable inputs (including the Fund's own assumptions in determining the fair value of investments)
The inputs or methodologies used to value securities are not necessarily an indication of the risk associated with investing in those securities.
The following is a summary of the inputs used as of October 31, 2018 in valuing the Fund's assets and liabilities carried at fair value:
Assets | | Level 1 | | Level 2 | | Level 3 | | Total | |
Investments in Securities | |
Bank Loans | | $ | — | | | $ | 3,150,344,903 | | | $ | 212,933,399 | | | $ | 3,363,278,302 | | |
Corporate Bonds | | | — | | | | 351,725,338 | | | | 2,317,950 | (1) | | | 354,043,288 | | |
Asset Backed Securities | | | — | | | | 192,814,710 | | | | — | | | | 192,814,710 | | |
Common Stocks | | | 214,096 | | | | — | | | | 8,207,136 | | | | 8,421,232 | | |
Short-term Investments | | | — | | | | 12,583,625 | | | | — | | | | 12,583,625 | | |
| | | $ | 214,096 | | | $ | 3,707,468,576 | | | $ | 223,458,485 | | | $ | 3,931,141,157 | | |
Other Financial Instruments* | |
Forward Foreign Currency Contracts | | $ | — | | | $ | 6,611,474 | | | $ | — | | | $ | 6,611,474 | | |
* Other financial instruments include unrealized appreciation (depreciation) on forward foreign currency contracts.
(1) Includes zero valued securities
The following is a reconciliation of investments as of October 31, 2018 for which significant unobservable inputs were used in determining fair value. All transfers, if any, are assumed to occur at the end of the reporting period.
| | | Bank
Loans | | Corporate
Bonds | | Asset
Backed
Securities | | Common
Stocks | | Total | |
Balance as of October 31, 2017 | | $ | 224,726,885 | | | $ | 3,007,500 | | | $ | 7,363,213 | | | $ | 2,658,845 | | | $ | 237,756,443 | | |
Accrued discounts (premiums) | | | 888,240 | | | | (1,382 | ) | | | 12,619 | | | | — | | | | 899,477 | | |
Purchases | | | 179,449,964 | | | | 2,302,648 | | | | 2,035,600 | | | | 6,881,544 | | | | 190,669,756 | | |
Sales | | | (149,467,470 | ) | | | (3,019,068 | ) | | | (2,562,500 | ) | | | — | | | | (155,049,038 | ) | |
Realized gain (loss) | | | 415,227 | | | | 8,963 | | | | 47,861 | | | | — | | | | 472,051 | | |
Change in unrealized appreciation
(depreciation) | | | (10,769,011 | ) | | | 19,289 | | | | (79,995 | ) | | | (1,333,253 | ) | | | (12,162,970 | ) | |
Transfers into Level 3 | | | 44,524,690 | | | | — | | | | — | | | | — | | | | 44,524,690 | | |
Transfers out of Level 3 | | | (76,835,126 | ) | | | — | | | | (6,816,798 | ) | | | — | | | | (83,651,924 | ) | |
Balance as of October 31, 2018 | | $ | 212,933,399 | | | $ | 2,317,950 | (1) | | $ | — | | | $ | 8,207,136 | | | $ | 223,458,485 | (1) | |
41
Credit Suisse Floating Rate High Income Fund
Notes to Financial Statements (continued)
October 31, 2018
Note 2. Significant Accounting Policies (continued)
| | | Bank
Loans | | Corporate
Bonds | | Asset
Backed
Securities | | Common
Stocks | | Total | |
Net change in unrealized appreciation
(depreciation) from investments
still held as of October 31, 2018 | | $ | (8,676,990 | ) | | $ | 15,600 | | | $ | — | | | $ | (1,333,252 | ) | | $ | (9,994,642 | ) | |
(1) Includes zero valued securities
| | | Quantitative Disclosure About Significant Unobservable Inputs | |
Asset Class | | Fair Value
At 10/31/2018 | | Valuation
Technique | | Unobservable
Input | | Range
(Weighted Average
per share) | |
Bank Loans | | $ | 302,127 | | | Market Approach | | Comparable Bond Price | | | N/A | | |
| | | $ | 1,267,119 | | | Market Approach | | EBITDA Multiples | | | N/A | | |
| | | $ | 4,558,103
| | | Market Approach
| | Discount for Illiquidity and
EBITDA Multiples | | | N/A | | |
| | | $ | 206,806,050 | | | Vendor pricing | | Single Broker Quote | | $ | 0.35 – $1.13 | ($0.95) | |
Corporate
Bonds | | $ | 0
| | | Income Approach
| | Expected Remaining
distribution | | | N/A | | |
| | | $ | 2,317,950 | | | Vendor pricing | | Single Broker Quote | | | N/A | | |
Common
Stocks | | $ | 10
| | | Market Approach/
Income Approach | | Comparable Bond Price,
Discounted Cash Flows | | | N/A | | |
| | | $ | 59
| | | Market Approach
| | Discount for Illiquidity and
EBITDA Multiples | | $ | 1.00 – $3.29 | ($1.30) | |
| | | $ | 26,845 | | | Market Approach | | Enterprise Value | | | N/A | | |
| | | $ | 8,180,222 | | | Vendor pricing | | Single Broker Quote | | $ | 0.10 – $21.00 | ($9.09) | |
Each fair value determination is based on a consideration of relevant factors, including both observable and unobservable inputs. Observable and unobservable inputs that Credit Suisse Asset Management LLC, the Fund's investment adviser ("Credit Suisse" or the "Adviser") considers may include (i) the existence of any contractual restrictions on the disposition of securities; (ii) information obtained from the company, which may include an analysis of the company's financial statements, the company's products or intended markets or the company's technologies; (iii) the price of the same or similar security negotiated at arm's length in an issuer's completed subsequent round of financing; (iv) the price and extent of public trading in similar securities of the issuer or of comparable companies; or (v) a probability and time value adjusted analysis of contractual term. Where available and appropriate, multiple valuation methodologies are applied to confirm fair value. To the extent that valuation is based on models or inputs that are less observable or unobservable in the market, determining fair value requires more judgment. Because of the inherent uncertainty of valuation, those estimated values may be materially higher or lower than the values that would have been used had a ready market for the investments existed. Accordingly, the degree of judgment exercised by the Fund in determining fair value is greatest for
42
Credit Suisse Floating Rate High Income Fund
Notes to Financial Statements (continued)
October 31, 2018
Note 2. Significant Accounting Policies (continued)
investments categorized in Level 3. In some circumstances, the inputs used to measure fair value might be categorized within different levels of the fair value hierarchy. In those instances, the fair value measurement is categorized in its entirety in the fair value hierarchy based on the least observable input that is significant to the fair value measurement. Additionally, changes in the market environment and other events that may occur over the life of the investments may cause the gains or losses ultimately realized on these investments to be different from the valuations used at the date of these financial statements.
For the year ended October 31, 2018, there were no transfers between Level 1 and Level 2, but there was $44,524,690 transferred from Level 2 to Level 3 due to a lack of pricing source supported by observable inputs and $83,651,924 transferred from Level 3 to Level 2 as a result of the availability of a pricing source supported by observable inputs. All transfers, if any, are assumed to occur at the end of the reporting period.
B) DERIVATIVE INSTRUMENTS AND HEDGING ACTIVITIES — The Fund adopted amendments to authoritative guidance on disclosures about derivative instruments and hedging activities which require that a fund disclose (a) how and why an entity uses derivative instruments, (b) how derivative instruments and hedging activities are accounted for and (c) how derivative instruments and related hedging activities affect a fund's financial position, financial performance and cash flows. For the year ended October 31, 2018, the Fund's derivatives did not qualify for hedge accounting as they are held at fair value.
The following table presents the fair value and the location of derivatives within the Statement of Assets and Liabilities at October 31, 2018 and the effect of these derivatives on the Statement of Operations for the year ended October 31, 2018.
Primary Underlying Risk | | Derivative
Assets | | Derivative
Liabilities | | Realized
Gain (Loss) | | Change in Unrealized
Appreciation (Depreciation) | |
Foreign currency exchange rate | |
Forward contracts | | $ | 6,611,474 | | | $ | — | | | $ | 2,278,670 | | | $ | 11,507,201 | | |
For the year ended October 31, 2018, the Fund held an average monthly value on a net basis of $284,150,317 in forward foreign currency contracts.
The Fund is a party to International Swap and Derivatives Association, Inc. ("ISDA") Master Agreements ("Master Agreements") with certain counterparties that govern over-the-counter derivative (including Total Return, Credit Default and Interest Rate Swaps) and foreign exchange contracts entered
43
Credit Suisse Floating Rate High Income Fund
Notes to Financial Statements (continued)
October 31, 2018
Note 2. Significant Accounting Policies (continued)
into by the Fund. The Master Agreements may contain provisions regarding, among other things, the parties' general obligations, representations, agreements, collateral requirements, events of default and early termination. Termination events applicable to the Fund may occur upon a decline in the Fund's net assets below a specified threshold over a certain period of time.
The following table presents by counterparty the Fund's derivative assets, net of related collateral held by the Fund, at October 31, 2018:
| Counterparty | | Gross Amount of
Derivative Assets
Presented in the
Statement of Assets
and Liabilities(a) | | Financial
Instruments
and Derivatives
Available for Offset | | Non-Cash
Collateral
Received | | Cash
Collateral
Received | | Net Amount
of Derivative
Assets | |
Morgan Stanley | | $ | 6,611,474 | | | $ | — | | | $ | — | | | $ | — | | | $ | 6,611,474 | | |
(a) Forward foreign currency contracts are included.
C) FOREIGN CURRENCY TRANSACTIONS — The books and records of the Fund are maintained in U.S. dollars. Transactions denominated in foreign currencies are recorded at the current prevailing exchange rates. All assets and liabilities denominated in foreign currencies, including purchases and sales of investments, and income and expenses, are translated into US dollar amounts on the date of those transactions.
Reported net realized gain (loss) from foreign currency transactions arises from sales of foreign currencies; currency gains or losses realized between the trade and settlement dates on securities transactions; and the difference between the amounts of dividends, interest, and foreign withholding taxes recorded on the Fund's books and the U.S. dollar equivalent of the amounts actually received or paid. Net change in unrealized gains and losses on translation of assets and liabilities denominated in foreign currencies arises from changes in the fair values of assets and liabilities, other than investments at the end of the period, resulting from changes in exchange rates.
The Fund does not isolate that portion of the results of operations resulting from fluctuations in foreign exchange rates on investments from the fluctuations arising from changes in market prices of investments held. Such fluctuations are included with net realized and unrealized gain or loss from investments in the Statement of Operations.
D) SECURITY TRANSACTIONS AND INVESTMENT INCOME/EXPENSE — Security transactions are accounted for on a trade date basis. Interest income/expense is recorded on the accrual basis. The Fund amortizes
44
Credit Suisse Floating Rate High Income Fund
Notes to Financial Statements (continued)
October 31, 2018
Note 2. Significant Accounting Policies (continued)
premiums and accretes discounts using the effective interest method. Dividend income/expense is recorded on the ex-dividend date. Certain expenses are class-specific expenses, vary by class and are charged only to that class. Income, expenses (excluding class-specific expenses) and realized/unrealized gains/losses are allocated proportionately to each class of shares based upon the relative net asset value of the outstanding shares of that class. The cost of investments sold is determined by use of the specific identification method for both financial reporting and income tax purposes. To the extent any issuer defaults or a credit event occurs that impacts the issuer, the Fund may halt any additional interest income accruals and consider the realizability of interest accrued up to the date of default or credit event.
E) DIVIDENDS AND DISTRIBUTIONS TO SHAREHOLDERS — Dividends from net investment income, if any, are declared daily and paid monthly. Distributions of net realized capital gains, if any, are declared and paid at least annually. However, to the extent that a net realized capital gain can be reduced by a capital loss carryforward, such gain will not be distributed. Dividends and distributions to shareholders of the Fund are recorded on the ex-dividend date and are determined in accordance with federal income tax regulations, which may differ from GAAP.
F) FEDERAL AND OTHER TAXES — No provision is made for federal taxes as it is the Fund's intention to continue to qualify as a regulated investment company ("RIC") under the Internal Revenue Code of 1986, as amended (the "Code"), and to make the requisite distributions to its shareholders, which will be sufficient to relieve it from federal income and excise taxes.
In order to qualify as a RIC under the Code, the Fund must meet certain requirements regarding the source of its income, the diversification of its assets and the distribution of its income. One of these requirements is that the Fund derive at least 90% of its gross income for each taxable year from dividends, interest, payments with respect to certain securities loans, gains from the sale or other disposition of stock, securities or foreign currencies, other income derived with respect to its business of investing in such stock, securities or currencies or net income derived from interests in certain publicly-traded partnerships ("Qualifying Income").
The Fund adopted the authoritative guidance for uncertainty in income taxes and recognizes a tax benefit or liability from an uncertain position only if it is more likely than not that the position is sustainable based solely on its technical merits and consideration of the relevant taxing authority's widely understood
45
Credit Suisse Floating Rate High Income Fund
Notes to Financial Statements (continued)
October 31, 2018
Note 2. Significant Accounting Policies (continued)
administrative practices and procedures. The Fund has reviewed its current tax positions and has determined that no provision for income tax is required in the Fund's financial statements. The Fund's federal and state income and federal excise tax returns for tax years for which the applicable statutes of limitations have not expired are subject to examination by the Internal Revenue Service and state departments of revenue.
G) CASH — The Fund's uninvested cash balance is held in an interest bearing variable rate demand deposit account at State Street Bank and Trust Company ("SSB"), the Fund's custodian.
H) FORWARD FOREIGN CURRENCY CONTRACTS — A forward foreign currency exchange contract ("forward currency contract") is a commitment to purchase or sell a foreign currency at the settlement date at a negotiated rate. The Fund will enter into forward currency contracts primarily for hedging foreign currency risk. Forward currency contracts are valued at the prevailing forward exchange rate of the underlying currencies and unrealized gain/loss is recorded daily. On the settlement date of the forward currency contract, the Fund records a realized gain or loss equal to the difference between the value of the contract at the time it was opened and the value of the contract at the time it was closed. Certain risks may arise upon entering into forward currency contracts from the potential inability of counterparties to meet the terms of their contracts. The maximum counterparty credit risk to the Fund is measured by the unrealized gain on appreciated contracts. Additionally, when utilizing forward currency contracts to hedge, the Fund forgoes the opportunity to profit from favorable exchange rate movements during the term of the contract. The Fund's open forward currency contracts at October 31, 2018 are disclosed in the Schedule of Investments.
I) UNFUNDED LOAN COMMITMENTS — The Fund enters into certain agreements, all or a portion of which may be unfunded. The Fund is obligated to fund these loan commitments at the borrowers' discretion. Funded and unfunded portions of credit agreements are presented in the Schedule of Investments. As of October 31, 2018, unfunded commitments were as follows:
| Borrower | | Maturity | | Rate | | Unfunded
Commitment | |
| Bulldog Purchaser, Inc. | | 08/22/25 | | | 1.875 | | | $ | 3,529,275 | | |
Unfunded loan commitments and funded portions of credit agreements are marked to market daily and any unrealized appreciation or depreciation is included in the Statement of Assets and Liabilities and the Statement of Operations.
46
Credit Suisse Floating Rate High Income Fund
Notes to Financial Statements (continued)
October 31, 2018
Note 2. Significant Accounting Policies (continued)
J) SECURITIES LENDING — The initial collateral received by the Fund is required to have a value of at least 102% of the market value of domestic securities on loan (including any accrued interest thereon) and 105% of the market value of foreign securities on loan (including any accrued interest thereon). The collateral is maintained thereafter at a value equal to at least 102% of the current market value of the securities on loan. The market value of loaned securities is determined at the close of each business day of the Fund and any additional required collateral is delivered to the Fund, or excess collateral returned by the Fund, on the next business day. Cash collateral received by the Fund in connection with securities lending activity may be pooled together with cash collateral for other funds/portfolios advised by Credit Suisse and may be invested in a variety of investments, including funds advised by SSB, the Fund's securities lending agent, or money market instruments. However, in the event of default or bankruptcy by the other party to the agreement, realization and/or retention of the collateral may be subject to legal proceedings.
SSB has been engaged by the Fund to act as the Fund's securities lending agent. As of October 31, 2018, the Fund had investment securities on loan with a fair value of $12,244,626. Collateral received for securities loaned and a related liability of $12,583,625 are presented gross in the Statement of Assets and Liabilities. The collateral for securities loaned is valued consistently to the other investments held by the Fund and is included in Level 2 of the fair value hierarchy. As of October 31, 2018, the value of the related collateral exceeded the value of the securities loaned.
The Fund's securities lending arrangement provides that the Fund and SSB will share the net income earned from securities lending activities. Securities lending income is accrued as earned. During the year ended October 31, 2018, total earnings from the Fund's investment in cash collateral received in connection with securities lending arrangements was $134,280 of which $57,975 was rebated to borrowers (brokers). The Fund retained $57,240 in income from the cash collateral investment, and SSB, as lending agent, was paid $19,065.
K) OTHER — The high yield, fixed income securities in which the Fund invests will primarily consist of senior secured floating rate loans ("Senior Loans") issued by non-investment grade companies. Senior Loans are typically secured by specific collateral of the issuer and hold the most senior position in the issuer's capital structure. The interest rate on Senior Loans is periodically adjusted to a recognized base rate, typically the London Interbank Offered Rate ("LIBOR"). While these characteristics may reduce interest rate risk and
47
Credit Suisse Floating Rate High Income Fund
Notes to Financial Statements (continued)
October 31, 2018
Note 2. Significant Accounting Policies (continued)
mitigate losses in the event of borrower default, the Senior Loans in which the Fund invests have below investment grade credit ratings and thereby are considered speculative because of the significant credit risk of their issuers.
Lower-rated debt securities (commonly known as "junk bonds") possess speculative characteristics and are subject to greater market fluctuations and risk of lost income and principal than higher-rated debt securities for a variety of reasons. Also, during an economic downturn or substantial period of rising interest rates, highly leveraged issuers may experience financial stress which would adversely affect their ability to service their principal and interest payment obligations, to meet projected business goals and to obtain additional financing.
In addition, periods of economic uncertainty and changes can be expected to result in increased volatility of market prices of lower-rated debt securities and the Fund's net asset value.
L) NEW ACCOUNTING PRONOUNCEMENTS — In March 2017, the FASB issued Accounting Standards Update 2017-08, Receivables — Nonrefundable Fees and Other Costs (Subtopic 310-20): Premium Amortization On Purchased Callable Debt Securities ("ASU 2017-08"). The update shortens the amortization period for the premium on certain purchased callable debt securities to the earliest call date. ASU 2017-08 will be effective for annual periods beginning after December 15, 2018. Management is currently assessing the potential impact of these changes to future financial statements.
Also, in August 2018, the FASB issued Accounting Standards Update 2018-13, Fair Value Measurement (Topic 820): Disclosure Framework — Changes to the Disclosure Requirements for Fair Value Measurement ("ASU 2018-13"). The update provides guidance that eliminates, adds and modifies certain disclosure requirements for fair value measurements. ASU 2018-13 will be effective for annual periods beginning after December 15, 2019. Management is currently assessing the potential impact of these changes to future financial statements.
M) SUBSEQUENT EVENTS — In preparing the financial statements as of October 31, 2018, management considered the impact of subsequent events for potential recognition or disclosure in these financial statements through the date of release of this report. No such events requiring recognition or disclosure were identified through the date of the release of this report.
48
Credit Suisse Floating Rate High Income Fund
Notes to Financial Statements (continued)
October 31, 2018
Note 3. Transactions with Affiliates and Related Parties
Credit Suisse serves as investment adviser and co-administrator for the Fund. For its investment advisory and administration services, Credit Suisse is entitled to receive a fee from the Fund at an annual rate of 0.79% of the Fund's average daily net assets less than or equal to $100 million and 0.59% of the Fund's average daily net assets greater than $100 million. For the year ended October 31, 2018, investment advisory and administration fees earned and voluntarily waived by Credit Suisse were $22,948,260 and $2,287,751, respectively.
For its co-administrative services, SSB receives a fee, exclusive of out-of-pocket expenses, calculated in total for all the Credit Suisse funds/portfolios co-administered by SSB and allocated based upon the relative average net assets of each fund/portfolio, subject to an annual minimum fee. For the year ended October 31, 2018, co-administrative services fees earned by SSB (including out-of-pocket expenses) with respect to the Fund were $560,774.
Credit Suisse Securities (USA) LLC ("CSSU"), an affiliate of Credit Suisse, serves as the distributor of the Fund's shares. Pursuant to a distribution plan adopted by the Fund pursuant to Rule 12b-1 under the 1940 Act, CSSU receives fees for its distribution services. These fees are calculated at an annual rate of 0.25% of the average daily net assets of the Class A shares. For the Class B and Class C shares, the fee is calculated at an annual rate of 1.00% of the average daily net assets. For the year ended October 31, 2018, the Fund paid Rule 12b-1 distribution fees of $698,804 for Class A shares and $1,168,374 for Class C shares. For the period November 1, 2017 through December 15, 2017, the Fund paid Rule 12b-1 distribution fees of $1,211 for Class B shares. Class I shares are not subject to Rule 12b-1 distribution fees.
Certain brokers, dealers and financial representatives provide transfer agent-related services to the Fund and receive compensation from the Fund. For the year ended October 31, 2018, the Fund paid $1,771,350 which is included within transfer agent fees in the Statement of Operations.
For the year ended October 31, 2018, CSSU and its affiliates advised the Fund that they retained $34,442 from commissions earned on the sale of the Fund's Class A shares. There were no commissions earned on the sale of Class C shares.
The Fund from time to time purchases or sells loan investments in the secondary market through Credit Suisse or its affiliates acting in the capacity as broker-dealer. Credit Suisse or its affiliates may have acted in some type of agent capacity to the initial loan offering prior to such loan trading in the secondary market.
49
Credit Suisse Floating Rate High Income Fund
Notes to Financial Statements (continued)
October 31, 2018
The Fund, together with other funds/portfolios advised by Credit Suisse (collectively, the "Participating Funds"), participates in a committed, unsecured line of credit facility ("Credit Facility"), with SSB in an aggregated amount of $250 million for temporary or emergency purposes on a first-come, first-served basis. Under the terms of the Credit Facility, the Participating Funds pay an aggregate commitment fee on the average unused amount of the Credit Facility, which is allocated among the Participating Funds in such manner as is determined by the governing Boards of the Participating Funds. In addition, the Participating Funds pay interest on borrowings at either the Overnight Federal Funds rate or the Overnight LIBOR rate plus a spread. At October 31, 2018 and during the year ended October 31, 2018, the Fund had no borrowings outstanding under the Credit Facility. Additionally, the Fund is party to a joint uncommitted line of credit facility with SSB. For the year ended October 31, 2018, the line was not drawn upon and no fees were incurred.
Note 5. Purchases and Sales of Securities
For the year ended October 31, 2018, purchases and sales of investment securities (excluding short-term investments) were $2,152,898,032 and $1,636,219,432, respectively.
Note 6. Capital Share Transactions
The Fund is authorized to issue an unlimited number of full and fractional shares of beneficial interest, $.001 par value per share. The Fund offers Class I, Class A, and Class C shares. Class B shares are shown but not offered. Transactions in capital shares for each class of the Fund were as follows:
| | | Class I | |
| | | For the Year Ended
October 31, 2018 | | For the Year Ended
October 31, 2017 | |
| | | Shares | | Value | | Shares | | Value | |
Shares sold | | | 220,405,496 | | | $ | 1,508,511,813 | | | | 211,638,545 | | | $ | 1,447,924,544 | | |
Shares issued in reinvestment
of dividends | | | 18,071,264 | | | | 123,621,374 | | | | 11,561,446 | | | | 79,147,727 | | |
Shares redeemed | | | (165,704,354 | ) | | | (1,134,496,890 | ) | | | (112,136,288 | ) | | | (766,942,041 | ) | |
Net increase | | | 72,772,406 | | | $ | 497,636,297 | | | | 111,063,703 | | | $ | 760,130,230 | | |
50
Credit Suisse Floating Rate High Income Fund
Notes to Financial Statements (continued)
October 31, 2018
Note 6. Capital Share Transactions (continued)
| | | Class A | |
| | | For the Year Ended
October 31, 2018 | | For the Year Ended
October 31, 2017 | |
| | | Shares | | Value | | Shares | | Value | |
Shares sold | | | 15,677,994 | | | $ | 107,844,265 | | | | 21,006,156 | | | $ | 144,468,807 | | |
Shares issued in reinvestment
of dividends | | | 1,391,492 | | | | 9,571,666 | | | | 1,324,811 | | | | 9,114,328 | | |
Shares redeemed | | | (15,913,531 | ) | | | (109,490,069 | ) | | | (14,547,205 | ) | | | (100,063,098 | ) | |
Net increase | | | 1,155,955 | | | $ | 7,925,862 | | | | 7,783,762 | | | $ | 53,520,037 | | |
| | | Class B1 | |
| | | For the Year Ended
October 31, 2018 | | For the Year Ended
October 31, 2017 | |
| | | Shares | | Value | | Shares | | Value | |
Shares sold | | | — | | | $ | — | | | | 70 | | | $ | 483 | | |
Shares issued in reinvestment
of dividends | | | 226 | | | | 1,568 | | | | 4,360 | | | | 30,138 | | |
Shares redeemed | | | (138,051 | ) | | | (955,344 | ) | | | (129,977 | ) | | | (898,047 | ) | |
Net decrease | | | (137,825 | ) | | $ | (953,776 | ) | | | (125,547 | ) | | $ | (867,426 | ) | |
| | | Class C | |
| | | For the Year Ended
October 31, 2018 | | For the Year Ended
October 31, 2017 | |
| | | Shares | | Value | | Shares | | Value | |
Shares sold | | | 3,171,735 | | | $ | 21,895,359 | | | | 4,437,086 | | | $ | 30,593,500 | | |
Shares issued in reinvestment
of dividends | | | 446,361 | | | | 3,079,977 | | | | 427,766 | | | | 2,951,475 | | |
Shares redeemed | | | (3,730,669 | ) | | | (25,754,237 | ) | | | (4,485,008 | ) | | | (30,932,280 | ) | |
Net increase (decrease) | | | (112,573 | ) | | $ | (778,901 | ) | | | 379,844 | | | $ | 2,612,695 | | |
1 The Class B shares were terminated on December 15, 2017 and are no longer offered.
On October 31, 2018, the number of shareholders that held 5% or more of the outstanding shares of each class of the Fund was as follows:
| | | Number of
Shareholders | | Approximate Percentage
of Outstanding Shares | |
Class I | | | 5 | | | | 62 | % | |
Class A | | | 4 | | | | 62 | % | |
Class C | | | 5 | | | | 73 | % | |
The Fund's performance may be negatively impacted in the event one or more of the Fund's greater than 5% shareholders were to redeem at a given time. Some of the shareholders are omnibus accounts, which hold shares on behalf of individual shareholders.
51
Credit Suisse Floating Rate High Income Fund
Notes to Financial Statements (continued)
October 31, 2018
Note 7. Income Tax Information and Distributions to Shareholders
Income and capital gain distributions are determined in accordance with federal income tax regulations, which may differ from GAAP.
The tax character of dividends paid by the Fund during the fiscal years ended October 31, 2018 and 2017, respectively, was as follows:
| Ordinary Income | | Return of Capital | |
| 2018 | | 2017 | | 2018 | | 2017 | |
| $ | 163,086,986 | | | $ | 128,525,258 | | | $ | — | | | $ | 2,998,269 | | |
The tax basis components of distributable earnings differ from the amounts reflected in the Statement of Assets and Liabilities by temporary book/tax differences. These differences are primarily due to differing treatments of dividends payable, wash sales, forward contracts marked to market and income from defaulted bonds. At October 31, 2018, the components of distributable earnings on a tax basis were as follows:
Accumulated net realized loss | | $ | (1,784,509 | ) | |
Undistributed ordinary income | | | 2,404,593 | | |
Unrealized depreciation | | | (32,535,308 | ) | |
| | $ | (31,915,224 | ) | |
At October 31, 2018, the Fund had $1,784,509 of unlimited long-term capital loss carryforwards available to offset possible future capital gains.
During the tax year ended October 31, 2018, the Fund utilized $13,778,937 of loss carryforwards.
At October 31, 2018, the cost and net unrealized appreciation (depreciation) of investments and derivatives for income tax purposes were as follows:
Cost of Investments | | $ | 3,969,771,534 | | |
Unrealized appreciation | | $ | 27,371,685 | | |
Unrealized depreciation | | | (59,390,588 | ) | |
Net unrealized appreciation (depreciation) | | $ | (32,018,903 | ) | |
To adjust for current period permanent book/tax differences which arose principally from differing book/tax treatment of foreign currency gain/loss and defaulted bonds, distributable earnings/loss was credited $30, and paid-in capital was charged $30. Net assets were not affected by this reclassification.
52
Credit Suisse Floating Rate High Income Fund
Notes to Financial Statements (continued)
October 31, 2018
In the normal course of business, the Fund may provide general indemnifications pursuant to certain contracts and organizational documents. The Fund's maximum exposure under these arrangements is dependent on future claims that may be made against the Fund and, therefore, cannot be estimated; however, based on experience, the risk of loss from such claims is considered remote.
53
Credit Suisse Floating Rate High Income Fund
Report of Independent Registered Public Accounting Firm
To the Board of Trustees and Shareholders
Credit Suisse Floating Rate High Income Fund:
Opinion on the Financial Statements
We have audited the accompanying statement of assets and liabilities of Credit Suisse Floating Rate High Income Fund (the "Fund"), a series of the Credit Suisse Opportunity Funds, including the schedule of investments, as of October 31, 2018, and the related statement of operations for the year then ended, the statements of changes in net assets for each of the years in the two-year period then ended, and the related notes (collectively, the "financial statements") and the financial highlights for each of the years in the four-year period then ended. In our opinion, the financial statements and financial highlights present fairly, in all material respects, the financial position of Credit Suisse Floating Rate High Income Fund as of October 31, 2018, the results of its operations for the year then ended, the changes in its net assets for each of the years in the two-year period then ended, and the financial highlights for each of the years in the four-year period then ended, in conformity with U.S. generally accepted accounting principles. The financial highlights for the year ended October 31, 2014 were audited by other independent registered public accountants whose report, dated December 29, 2014, expressed an unqualified opinion on those financial highlights.
Basis for Opinion
These financial statements and financial highlights are the responsibility of the Fund's management. Our responsibility is to express an opinion on these financial statements and financial highlights based on our audits. We are a public accounting firm registered with the Public Company Accounting Oversight Board (United States) (PCAOB) and are required to be independent with respect to the Fund in accordance with the U.S. federal securities laws and the applicable rules and regulations of the Securities and Exchange Commission and the PCAOB.
We conducted our audits in accordance with the standards of the PCAOB. Those standards require that we plan and perform the audit to obtain reasonable assurance about whether the financial statements and financial highlights are free of material misstatement, whether due to error or fraud. Our audits included performing procedures to assess the risks of material misstatement of the financial statements and financial highlights, whether due to error or fraud, and performing procedures that respond to those risks. Such procedures included examining, on a test basis, evidence regarding the amounts and disclosures in the financial statements and financial highlights. Such procedures also included confirmation of securities owned as of October 31, 2018, by correspondence with the custodian and brokers or by other appropriate auditing procedures. Our
54
Credit Suisse Floating Rate High Income Fund
Report of Independent Registered Public Accounting Firm (continued)
audits also included evaluating the accounting principles used and significant estimates made by management, as well as evaluating the overall presentation of the financial statements and financial highlights. We believe that our audits provide a reasonable basis for our opinion.

We have served as the auditor of one or more Credit Suisse Asset Management, LLC investment companies since 2015.
New York, New York
December 28, 2018
55
Credit Suisse Floating Rate High Income Fund
Information Concerning Trustees and Officers (unaudited)
Name, Address
(Year of Birth) | | Position(s)
Held with
Fund | | Term
of Office1
and
Length
of Time
Served | | Principal
Occupation(s) During
Past Five Years | | Number of
Portfolios
in Fund
Complex
Overseen
by Trustee | | Other
Trusteeships
Held by Trustee
During Past Five Years | |
Independent Trustees | | | | | | | | | | | |
Laura A. DeFelice
c/o Credit Suisse Asset
Management, LLC
Attn: General Counsel
Eleven Madison Avenue
New York, New York
10010
(1959) | | Trustee, Nominating and Audit Committee member | | Since 2017 | | Partner of Acacia Properties LLC (multi-family and commercial real estate ownership and operation) from 2008 to present; Stonegate Advisors LLC (renewable energy and energy efficiency) from 2007 to present. | | | 8 | | | None. | |
Jeffrey E. Garten
c/o Credit Suisse Asset Management, LLC
Attn: General Counsel Eleven Madison Avenue New York, New York 10010
(1946) | | Trustee, Nominating and Audit Committee member | | Since 2001 | | Dean Emeritus of Yale School of Management from July 2015 to present; The Juan Trippe Professor in the Practice of International Trade, Finance and Business, from July 2005 to July 2015; Partner and Chairman of Garten Rothkopf (consulting firm) from October 2005 to June 2017. | | | 8 | | | Director of Aetna, Inc. (insurance company); Director of CarMax Group (used car dealers); Director of Miller Buckfire & Co., LLC (financial restructuring); Member of Standard & Poor's Board of Managers (credit rating agency) from December 2011 to November 2014. | |
1 Subject to the Trust's retirement policy, each Trustee may continue to serve as a Trustee until the last day of the calendar year in which the applicable Trustee attains age 75. Officer serves until his or her respective successor has been duly elected and qualified.
56
Credit Suisse Floating Rate High Income Fund
Information Concerning Trustees and Officers (unaudited) (continued)
Name, Address
(Year of Birth) | | Position(s)
Held with
Fund | | Term
of Office1
and
Length
of Time
Served | | Principal
Occupation(s) During
Past Five Years | | Number of
Portfolios
in Fund
Complex
Overseen
by Trustee | | Other
Trusteeships
Held by Trustee
During Past Five Years | |
Independent Trustees | | | | | | | | | | | |
Mahendra R. Gupta
c/o Credit Suisse Asset
Management, LLC
Attn: General Counsel
Eleven Madison Avenue
New York, New York
10010
(1956) | | Trustee, Nominating Committee member and Audit Committee Chairman | | Since 2017 | | Professor, Washington University in St. Louis from July 1990 to present; Dean of Olin Business School at Washington University in St. Louis from July 2005 to July 2016; Partner, R.J. Mithaiwala (food manufacturing and retail, India) from March 1977 to present; Partner, F.F.B. Corporation (agriculture, India) from March 1977 to present; Partner, RPMG Research Corporation (benchmark research) from July 2001 to present. | | | 8 | | | Director of Caleres
Inc. (footwear) from May 2012 to present; Director of Koch Development Corporation (real estate development) from November 2017 to present; Director of Supernova (fin-tech) from June 2014 to present. | |
1 Subject to the Trust's retirement policy, each Trustee may continue to serve as a Trustee until the last day of the calendar year in which the applicable Trustee attains age 75. Officer serves until his or her respective successor has been duly elected and qualified.
57
Credit Suisse Floating Rate High Income Fund
Information Concerning Trustees and Officers (unaudited) (continued)
Name, Address
(Year of Birth) | | Position(s)
Held with
Fund | | Term
of Office1
and
Length
of Time
Served | | Principal
Occupation(s) During
Past Five Years | | Number of
Portfolios
in Fund
Complex
Overseen
by Trustee | | Other
Trusteeships
Held by Trustee
During Past Five Years | |
Independent Trustees | | | | | | | | | | | |
Steven N. Rappaport
Lehigh Court, LLC
555 Madison Avenue
29th Floor
New York, New York
10022
(1948) | | Chairman of the Board, Nominating Committee Chairman and Audit Committee member | | Trustee since 2001 and Chairman since 2005 | | Partner of Lehigh Court, LLC and RZ Capital (private investment firms) from July 2002 to present; Partner of Backstage Acquisition Holdings, LLC (publication job postings) from November 2013 to present. | | | 9 | | | Director of iCAD, Inc. (surgical and medical instruments and apparatus company); Director of Aberdeen Emerging Markets Equity Income Fund, Inc., (a closed-end investment company); Director of Aberdeen Funds (30 open-end portfolios); Director of Wood Resources, LLC (plywood manufacturing company) from 2003 to October 2013. | |
Interested Trustee | | | | | | | | | | | |
John G. Popp2
Credit Suisse Asset
Management, LLC
Eleven Madison Avenue
New York, New York
10010
(1956) | | Trustee, Chief Executive Officer and President | | Trustee since 2017
Chief Executive Officer and President since 2010 | | Managing Director of Credit Suisse; Global Head and Chief Investment Officer of the Credit Investments Group; Associated with Credit Suisse or its predecessor since 1997; President and Chief Executive Officer of other Credit Suisse Funds. | | | 9 | | | None. | |
1 Subject to the Trust's retirement policy, each Trustee may continue to serve as a Trustee until the last day of the calendar year in which the applicable Trustee attains age 75. Officer serves until his or her respective successor has been duly elected and qualified.
2 Mr. Popp is an "interested person" of the Trust, as defined in the 1940 Act, by virtue of his current position as an officer of Credit Suisse.
58
Credit Suisse Floating Rate High Income Fund
Information Concerning Trustees and Officers (unaudited) (continued)
Name, Address
(Year of Birth) | | Position(s)
Held with
Fund | | Term of
Office1
and
Length of
Time
Served | | Principal Occupation(s) During Past Five Years | |
Officers* | | | | | | | |
Emidio Morizio
Credit Suisse Asset
Management, LLC
Eleven Madison Avenue
New York, New York 10010
(1966) | | Chief Compliance Officer | | Since Fund Inception | | Managing Director and Global Head of Compliance of Credit Suisse since 2010; Associated with Credit Suisse since July 2000; Officer of other Credit Suisse Funds. | |
Lou Anne McInnis
Credit Suisse Asset Management, LLC
Eleven Madison Avenue
New York, New York 10010
(1959) | | Chief Legal Officer | | Since 2015 | | Director of Credit Suisse; Associated with Credit Suisse since April 2015; Counsel at DLA Piper US LLP from 2011 to April 2015; Associated with Morgan Stanley Investment Management from 1997 to 2010; Officer of other Credit Suisse Funds. | |
Laurie Pecha
Credit Suisse Asset
Management, LLC
Eleven Madison Avenue
New York, New York 10010
(1961) | | Chief Financial Officer and Treasurer | | Chief Financial Officer since 2016 and Treasurer since 2018 | | Director of Credit Suisse since August 2016; Senior Consultant of Spectra Professional Services, LLC from January 2012 to July 2016; Vice President of Legg Mason & Co. from March 2007 to December 2011; Officer of other Credit Suisse Funds. | |
Karen Regan
Credit Suisse Asset
Management, LLC
Eleven Madison Avenue
New York, New York 10010
(1963) | | Vice President and Secretary | | Since 2010 | | Vice President of Credit Suisse; Associated with Credit Suisse since December 2004; Officer of other Credit Suisse Funds. | |
1 Subject to the Trust's retirement policy, each Trustee may continue to serve as a Trustee until the last day of the calendar year in which the applicable Trustee attains age 75. Officer serves until his or her respective successor has been duly elected and qualified.
* The officers of the Fund shown are officers that make policy decisions.
The Statement of Additional Information includes additional information about the Trustees and is available, without charge, upon request, by calling 877-870-2874.
59
Credit Suisse Floating Rate High Income Fund
Proxy Voting and Portfolio Holdings Information (unaudited)
Information regarding how the Fund voted proxies related to its portfolio securities during the 12-month period ended June 30 of each year, as well as the policies and procedures that the Fund uses to determine how to vote proxies relating to its portfolio securities are available:
• By calling 1-877-870-2874
�� On the Fund's website, www.credit-suisse.com/us/funds
• On the website of the Securities and Exchange Commission, www.sec.gov
The Fund files a complete schedule of its portfolio holdings for the first and third quarters of its fiscal year with the SEC on Form N-Q. The Fund's Forms N-Q are available on the SEC's website at www.sec.gov and may be reviewed and copied at the SEC's Public Reference Room in Washington, DC. Information on the operation of the SEC's Public Reference Room may be obtained by calling 1-202-551-8090.
60

P.O. BOX 219916, KANSAS CITY, MO 64121-9916
877-870-2874 n www.credit-suisse.com/us
CREDIT SUISSE SECURITIES (USA) LLC, DISTRIBUTOR. FLHI-AR-1018

CREDIT SUISSE FUNDS
Annual Report
October 31, 2018
n CREDIT SUISSE
MANAGED FUTURES STRATEGY FUND
The Fund's investment objectives, risks, charges and expenses (which should be considered carefully before investing), and more complete information about the Fund, are provided in the Prospectus, which should be read carefully before investing. You may obtain additional copies by calling 877-870-2874 or by visiting our website at www.credit-suisse.com/us/funds.
Credit Suisse Securities (USA) LLC, Distributor, is located at Eleven Madison Avenue, New York, NY 10010. Credit Suisse Funds are advised by Credit Suisse Asset Management, LLC.
Investors in the Credit Suisse Funds should be aware that they may be eligible to purchase Class I shares (where offered) directly or through certain intermediaries. Such shares are not subject to a sales charge. Investors in the Credit Suisse Funds should also be aware that they may be eligible for a reduction or waiver of the sales charge with respect to Class A or C shares (where offered). For more information, please review the relevant prospectuses or consult your financial representative.
Fund shares are not deposits or other obligations of Credit Suisse Asset Management, LLC ("Credit Suisse") or any affiliate, are not FDIC-insured and are not guaranteed by Credit Suisse or any affiliate. Fund investments are subject to investment risks, including loss of your investment.
Credit Suisse Managed Futures Strategy Fund
Annual Investment Adviser's Report
October 31, 2018 (unaudited)
November 23, 2018
Dear Shareholder:
We are pleased to present this Annual Report covering the activities of the Credit Suisse Managed Futures Strategy Fund (the "Fund") for the 12-month period ended October 31, 2018.
Performance Summary
11/1/2017 – 10/31/2018
Fund & Benchmark | | Performance | |
| Class I1 | | | -6.67 | % | |
| Class A1,2 | | | -6.92 | % | |
| Class C1,2 | | | -7.65 | % | |
| Credit Suisse Managed Futures Liquid Index3 | | | -7.12 | % | |
Performance shown for the Fund's Class A and Class C Shares does not reflect sales charges, which are a maximum of 5.25% and 1.00%, respectively.2
Market Review: A tough period for managed futures overall
The annual period ended October 31, 2018 was a tough one for the managed futures industry, as a number of underlying markets experienced medium- to long-term trend reversals. The Credit Suisse Managed Futures Hedge Fund Index returned -5.04% over the period, while the Credit Suisse Managed Futures Liquid Index, the Fund's benchmark (the "Benchmark"), returned -7.12% over the same period.
Strategic Review and Outlook: Relative outperformance in a challenging period
The managed futures strategy seeks to identify and profit from price trends — upward or downward — in four broad asset classes — commodities, bonds, equities and currencies.
For the annual period ended October 31, 2018, the Fund's Class I and Class A shares outperformed the Benchmark.
From an asset class perspective, currencies were the sole positive contributor to Fund performance. The Fund accumulated short positions (against the U.S. Dollar (USD)) across markets, as the dollar trended upward. These short positions generated profits as the strengthening trend in the USD persisted throughout 2018.
Equity positioning was the largest detractor from Fund performance, as prevailing trends encountered sharp reversals. Equity markets were particularly
1
Credit Suisse Managed Futures Strategy Fund
Annual Investment Adviser's Report (continued)
October 31, 2018 (unaudited)
sensitive to global trade tensions, which led to the outperformance of U.S. indices, relative to their Chinese and European counterparts.
Fixed income exposures also detracted from Fund performance. The combination of conflicting inflation data, asynchronous central banking policy and political risks contributed to volatile, choppy markets which saw little in the way of sustained trends.
Commodities positioning was a more modest detractor, as profits were limited to long energy exposure which benefitted from a gradual increase in crude oil prices. Offsetting these gains were losses in the agriculture, precious metal and industrial metal markets. Precious metals reacted in sympathy with the choppy fixed income markets, while agriculture and industrial metal markets shared a common sensitivity to waxing and waning trade and tariff tensions which blunted price trends.
We continue to believe that the unique return profile of managed futures may appeal to investors searching for portfolio diversifiers and sources of uncorrelated returns.
The Quantitative Investment Strategies Group
Yung-Shin Kung
Sheel Dhande
The Fund is non-diversified, which means it may invest a greater proportion of its assets in the securities of a smaller number of issuers than a diversified mutual fund and may therefore be subject to greater volatility. The Fund's investment in alternative instruments may subject the Fund to greater volatility than investments in traditional securities, particularly in investments involving leverage.
The use of alternative assets and strategies entails substantial risks, including risk of loss of principal, commodity exposure risks, credit risk, currency risk, derivatives risk, equity exposure risk, exchange-traded notes risk, fixed income risk, foreign securities risk, forwards risk, futures contracts risk, interest rate risk, leveraging risk, market risk, options risk, portfolio turnover risk, repurchase agreements risk, short position risk, speculative exposure risk, structured note risk, subsidiary risk, swap agreements risk, tax risk and U.S. government securities risk. For a detailed discussion of these and other risks, please refer to the Fund's Prospectus, which should be read carefully before investing.
2
Credit Suisse Managed Futures Strategy Fund
Annual Investment Adviser's Report (continued)
October 31, 2018 (unaudited)
In addition to historical information, this report contains forward-looking statements, which may concern, among other things, domestic and foreign markets, industry and economic trends and developments and government regulation, and their potential impact on the Fund's investments. These statements are subject to risks and uncertainties and actual trends, developments and regulations in the future, and their impact on the Fund, could be materially different from those projected, anticipated or implied. The Fund has no obligation to update or revise forward-looking statements.
The views of the Fund's management are as of the date of this letter and the Fund holdings described in this document are as of October 31, 2018; these views and Fund holdings may have changed subsequent to these dates. Nothing in this document is a recommendation to purchase or sell securities.
3
Credit Suisse Managed Futures Strategy Fund
Annual Investment Adviser's Report (continued)
October 31, 2018 (unaudited)
Comparison of Change in Value of $10,000 Investment in the
Credit Suisse Managed Futures Strategy Fund1 Class I Shares,
Class A Shares2, Class C Shares2 and Credit Suisse Managed Futures
Liquid Index3 from Inception (9/28/12)
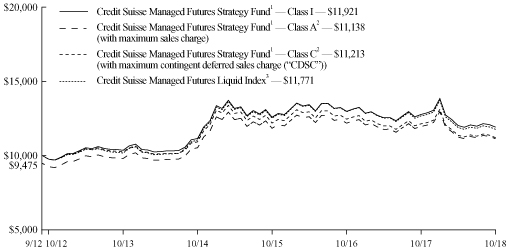
1 Fee waivers and/or expense reimbursements reduce expenses for the Fund, without which performance would be lower. The Fund entered into a written contract to limit expenses to 1.30% of the Fund's average daily net assets for Class I shares, 1.55% of the Fund's average daily net assets for Class A shares and 2.30% of the Fund's average daily net assets for Class C shares through at least February 28, 2020. This limit excludes certain expenses, as set forth in the Fund's Prospectus.
2 Total return for the Fund's Class A shares for the reporting period, based on offering price (including maximum sales charge of 5.25%), was (11.83)%. Total return for the Fund's Class C shares for the reporting period, based on redemption value including Contingent Deferred Sales Charge ("CDSC") of 1.00%, was (8.58)%.
3 The Credit Suisse Managed Futures Liquid Index is a broadly diversified futures index currently composed of 14 futures contracts and 4 commodity indices which provide exposure to the asset classes. The Index uses a proprietary quantitative methodology to seek to identify price trends in each of the asset classes over a variety of time horizons. Components of the Index, which may change from time to time, are positioned either long or short based on the price trends within the asset classes determined using the Index's quantitative methodology. The Index does not have transaction costs and investors may not invest directly in the Index.
4
Credit Suisse Managed Futures Strategy Fund
Annual Investment Adviser's Report (continued)
October 31, 2018 (unaudited)
Average Annual Returns as of October 31, 20181
| | | 1 Year | | 5 Years | | Since
Inception2 | |
Class I | | | (6.67 | )% | | | 2.85 | % | | | 2.93 | % | |
Class A Without Sales Charge | | | (6.92 | )% | | | 2.57 | % | | | 2.68 | % | |
Class A With Maximum Sales Charge | | | (11.83 | )% | | | 1.48 | % | | | 1.78 | % | |
Class C Without CDSC | | | (7.65 | )% | | | 1.81 | % | | | 1.90 | % | |
Class C With CDSC | | | (8.58 | )% | | | 1.81 | % | | | 1.90 | % | |
Returns represent past performance and include change in share price and reinvestment of dividends and capital gain distributions, if any. Past performance cannot guarantee future results. The current performance of the Fund may be lower or higher than the figures shown. Returns and share price will fluctuate, and redemption value may be more or less than original cost. The performance results do not reflect the deduction of taxes that a shareholder would pay on Fund distributions or the redemption of Fund shares. Performance information current to the most recent month end is available at www.credit-suisse.com/us/funds.
The annual gross expense ratios are 1.33% for Class I shares, 1.58% for Class A shares and 2.34% for Class C shares. The annual net expense ratios after fee waivers and/or expense reimbursements are 1.30% for Class I shares, 1.55% for Class A shares and 2.30% for Class C shares.
1 Fee waivers and/or expense reimbursements reduce expenses for the Fund, without which performance would be lower. The Fund has entered into a written contract to limit expenses to 1.30% of the Fund's average daily net assets for Class I shares, 1.55% of the Fund's average daily net assets for Class A shares and 2.30% of the Fund's average daily net assets for Class C shares through at least February 28, 2020. This limit excludes certain expenses, as set forth in the Fund's Prospectus.
2 Inception Date: September 28, 2012.
5
Credit Suisse Managed Futures Strategy Fund
Annual Investment Adviser's Report (continued)
October 31, 2018 (unaudited)
Information About Your Fund's Expenses
As an investor of the Fund, you incur two types of costs: ongoing expenses and transaction costs. Ongoing expenses include management fees, distribution and service (12b-1) fees and other Fund expenses. Examples of transaction costs include sales charges (loads), redemption fees and account maintenance fees, which are not shown in this section and which would result in higher total expenses. The following table is intended to help you understand your ongoing expenses of investing in the Fund and to help you compare these expenses with the ongoing expenses of investing in other mutual funds. The table is based on an investment of $1,000 made at the beginning of the six months ended October 31, 2018.
The table illustrates your Fund's expenses in two ways:
• Actual Fund Return. This helps you estimate the actual dollar amount of ongoing expenses paid on a $1,000 investment in the Fund using the Fund's actual return during the period. To estimate the expenses you paid over the period, simply divide your account value by $1,000 (for example, an $8,600 account value divided by $1,000 = 8.6), then multiply the result by the number in the "Expenses Paid per $1,000" line.
• Hypothetical 5% Fund Return. This helps you to compare the Fund's ongoing expenses with those of other mutual funds using the Fund's actual expense ratio and a hypothetical rate of return of 5% per year before expenses. Examples using a 5% hypothetical fund return may be found in the shareholder reports of other mutual funds. The hypothetical account values and expenses may not be used to estimate the actual ending account balance or expenses you paid for the period.
Please note that the expenses shown in these tables are meant to highlight your ongoing expenses only and do not reflect any transaction costs, such as sales charges (loads) or redemption fees. If these transaction costs had been included, your costs would have been higher. The "Expenses Paid per $1,000" line of the tables is useful in comparing ongoing expenses only and will not help you determine the relative total expenses of owning different funds.
6
Credit Suisse Managed Futures Strategy Fund
Annual Investment Adviser's Report (continued)
October 31, 2018 (unaudited)
Expenses and Value for a $1,000 Investment
for the six-month period ended October 31, 2018
Actual Fund Return | | Class I | | Class A | | Class C | |
Beginning Account Value 05/01/18 | | $ | 1,000.00 | | | $ | 1,000.00 | | | $ | 1,000.00 | | |
Ending Account Value 10/31/18 | | $ | 990.90 | | | $ | 989.80 | | | $ | 986.20 | | |
Expenses Paid per $1,000* | | $ | 6.52 | | | $ | 7.77 | | | $ | 11.51 | | |
Hypothetical 5% Fund Return | |
Beginning Account Value 05/01/18 | | $ | 1,000.00 | | | $ | 1,000.00 | | | $ | 1,000.00 | | |
Ending Account Value 10/31/18 | | $ | 1,018.65 | | | $ | 1,017.39 | | | $ | 1,013.61 | | |
Expenses Paid per $1,000* | | $ | 6.61 | | | $ | 7.88 | | | $ | 11.67 | | |
| | | Class I | | Class A | | Class C | |
Annualized Expense Ratios* | | | 1.30 | % | | | 1.55 | % | | | 2.30 | % | |
* Expenses are equal to the Fund's annualized expense ratio for each share class, multiplied by the average account value over the period, multiplied by 184/365 to reflect the one-half year period.
The "Expenses Paid per $1,000" and the "Annualized Expense Ratios" in the tables are based on actual expenses paid by the Fund during the period, net of fee waivers and/or actual expense reimbursements, if applicable. If those fee waivers and/or expense reimbursements had not been in effect, the Fund's actual expenses would have been higher. Expenses do not reflect additional charges and expenses that are, or may be, imposed under the variable contracts or plans. Such charges and expenses are described in the prospectus of the insurance company separate account or in the plan documents or other informational materials supplied by plan sponsors. The Fund's expenses should be considered with these charges and expenses in evaluating the overall cost of investing in the separate account.
For more information, please refer to the Fund's Prospectus.
Portfolio Breakdown*
United States Treasury Obligations | | | 100.00 | % | |
Total | | | 100.00 | % | |
* Expressed as a percentage of total investments (excluding securities lending collateral, if applicable) and may vary over time.
7
Credit Suisse Managed Futures Strategy Fund
Consolidated Schedule of Investments
October 31, 2018
Par
(000) | | | | Ratings†
(S&P/Moody's) | | Maturity | | Rate%(1) | | Value | �� |
| UNITED STATES TREASURY OBLIGATIONS (60.0%) | | | |
$ | 45,000 | | | United States Treasury Bills | | (AA+, Aaa) | | 03/28/19 | | | 2.191 | | | $ | 44,568,417 | | |
| | 40,000 | | | United States Treasury Bills | | (AA+, Aaa) | | 04/25/19 | | | 2.236 | | | | 39,533,820 | | |
| | 85,000 | | | United States Treasury Bills | | (AA+, Aaa) | | 06/20/19 | | | 2.252 | | | | 83,659,638 | | |
| TOTAL UNITED STATES TREASURY OBLIGATIONS (Cost $167,934,620) | | | 167,761,875 | | |
| TOTAL INVESTMENTS AT VALUE (60.0%) (Cost $167,934,620) | | | 167,761,875 | | |
| OTHER ASSETS IN EXCESS OF LIABILITIES (40.0%) | | | 112,072,399 | | |
| NET ASSETS (100.0%) | | $ | 279,834,274 | | |
† Credit ratings given by the Standard & Poor's Division of The McGraw-Hill Companies, Inc. ("S&P") and Moody's Investors Service, Inc. ("Moody's") are unaudited.
(1) Securities are zero coupon. Rate presented is yield to maturity as of October 31, 2018.
Futures Contracts
Contract Description | | Currency | | Expiration
Date | | Number of
Contracts | | Notional
Value | | Net Unrealized
Appreciation
(Depreciation) | |
Contracts to Purchase | |
Interest Rate Contracts | |
10YR Japanese Bond Futures | | JPY | | | | Dec 2018 | | | 195 | | | $ | 260,270,701 | | | $ | (191,524 | ) | |
German EURO Bund Futures | | EUR | | | | Dec 2018 | | | 670 | | | | 121,660,280 | | | | 479,415 | | |
Long Gilt Futures | | GBP | | | | Dec 2018 | | | 719 | | | | 112,458,301 | | | | (258,847 | ) | |
| | | $ | 29,044 | | |
Contracts to Sell | |
Foreign Exchange Contracts | |
| AUD Currency Futures | | USD | | | | Dec 2018 | | | (758 | ) | | | (53,643,660 | ) | | $ | 790,370 | | |
| CAD Currency Futures | | USD | | | | Dec 2018 | | | (839 | ) | | | (63,759,805 | ) | | | 694,055 | | |
| EUR Currency Futures | | USD | | | | Dec 2018 | | | (452 | ) | | | (64,158,575 | ) | | | 1,751,697 | | |
| GBP Currency Futures | | USD | | | | Dec 2018 | | | (778 | ) | | | (62,220,550 | ) | | | 1,146,373 | | |
| JPY Currency Futures | | USD | | | | Dec 2018 | | | (526 | ) | | | (58,356,412 | ) | | | 1,160,375 | | |
| | | $ | 5,542,870 | | |
Index Contracts | |
Hang Seng Index Futures | | HKD | | | | Nov 2018 | | | (141 | ) | | | (22,402,550 | ) | | $ | 53,283 | | |
EURO Stoxx 50 Index Futures | | EUR | | | | Dec 2018 | | | (1,104 | ) | | | (39,953,318 | ) | | | 1,335,430 | | |
FTSE 100 Index Futures | | GBP | | | | Dec 2018 | | | (446 | ) | | | (40,523,903 | ) | | | (776,275 | ) | |
Nikkei 225 Index Futures OSE | | JPY | | | | Dec 2018 | | | (105 | ) | | | (20,357,096 | ) | | | (425,000 | ) | |
S&P 500 E Mini Index Futures | | USD | | | | Dec 2018 | | | (227 | ) | | | (30,770,985 | ) | | | (394,720 | ) | |
| | | $ | (207,282 | ) | |
Interest Rate Contracts | |
10YR U.S. Treasury Note Futures | | USD | | | | Dec 2018 | | | (1,238 | ) | | | (146,625,625 | ) | | $ | 1,159,442 | | |
| | $ | 6,524,074 | | |
See Accompanying Notes to Consolidated Financial Statements.
8
Credit Suisse Managed Futures Strategy Fund
Consolidated Schedule of Investments (continued)
October 31, 2018
Total Return Swap Contracts
Currency | | Notional
Amount | | Expiration
Date | | Counterparty | | Receive | | Pay | | Upfront
Premiums
Paid | | Upfront
Premiums
Received | | Net Unrealized
Appreciation
(Depreciation) | |
USD | | | | $ | 19,024,579 | | | 05/16/19 | | Goldman Sachs | | 0.20% | | Bloomberg
Agriculture
Index | | $ | — | | | $ | — | | | $ | 1,933,171 | | |
USD | | | | | 5,348,224 | | | 05/16/19 | | Goldman Sachs | | Bloomberg
Energy Index | | 0.20% | | | — | | | | — | | | | 146,019 | | |
USD | | | | | 24,571,136 | | | 05/16/19 | | Goldman Sachs | | 0.20% | | Bloomberg
Precious
Metals Index | | | — | | | | — | | | | 1,921,418 | | |
USD | | | | | 3,597,893 | | | 05/16/19 | | Goldman Sachs | | Bloomberg
Energy Index | | 0.20% | | | — | | | | — | | | | (37,383 | ) | |
USD | | | | | 930,945 | | | 05/16/19 | | Goldman Sachs | | 0.20% | | Bloomberg
Industrial
Metals Index | | | — | | | | — | | | | 79,711 | | |
USD | | | | | 3,633,283 | | | 05/16/19 | | Goldman Sachs | | 0.20% | | Bloomberg
Industrial
Metals Index | | | — | | | | — | | | | 345,459 | | |
USD | | | | | 3,637,099 | | | 05/16/19 | | Goldman Sachs | | 0.20% | | Bloomberg
Industrial
Metals Index | | | — | | | | — | | | | 310,768 | | |
USD | | | | | 7,381,882 | | | 05/16/19 | | Goldman Sachs | | 0.20% | | Bloomberg
Industrial
Metals Index | | | — | | | | — | | | | 459,786 | | |
USD | | | | | 4,089,793 | | | 05/16/19 | | Goldman Sachs | | 0.20% | | Bloomberg
Industrial
Metals Index | | | — | | | | — | | | | 284,345 | | |
USD | | | | | 3,200,514 | | | 05/16/19 | | Goldman Sachs | | Bloomberg
Energy Index | | 0.20% | | | — | | | | — | | | | 52,209 | | |
USD | | | | | 2,977,945 | | | 05/16/19 | | Goldman Sachs | | Bloomberg
Energy Index | | 0.20% | | | — | | | | — | | | | 128,039 | | |
USD | | | | | 3,220,412 | | | 05/16/19 | | Goldman Sachs | | Bloomberg
Energy Index | | 0.20% | | | — | | | | — | | | | 7,979 | | |
USD | | | | | 6,440,541 | | | 05/16/19 | | Goldman Sachs | | Bloomberg
Energy Index | | 0.20% | | | — | | | | — | | | | 48,269 | | |
USD | | | | | 3,969,677 | | | 05/16/19 | | Goldman Sachs | | 0.20% | | Bloomberg
Agriculture
Index | | | — | | | | — | | | | 70,345 | | |
USD | | | | | 2,846,437 | | | 05/16/19 | | Goldman Sachs | | 0.20% | | Bloomberg
Industrial
Metals Index | | | — | | | | — | | | | 95,659 | | |
USD | | | | | 2,918,724 | | | 05/16/19 | | Goldman Sachs | | 0.20% | | Bloomberg
Industrial
Metals Index | | | — | | | | — | | | | 166,015 | | |
| | | $ | 6,011,809 | | |
See Accompanying Notes to Consolidated Financial Statements.
9
Credit Suisse Managed Futures Strategy Fund
Consolidated Schedule of Investments (continued)
October 31, 2018
Currency Abbreviations:
AUD = Australian Dollar
CAD = Canadian Dollar
EUR = Euro
GBP = British Pound
HKD = Hong Kong Dollar
JPY = Japanese Yen
USD = United States Dollar
See Accompanying Notes to Consolidated Financial Statements.
10
Credit Suisse Managed Futures Strategy Fund
Consolidated Statement of Assets and Liabilities
October 31, 2018
Assets | |
Investments at value (Cost $167,934,620) (Note 2) | | $ | 167,761,875 | | |
Cash | | | 87,497,564 | | |
Cash segregated at brokers for futures contracts (Note 2) | | | 19,862,850 | | |
Unrealized appreciation on open swap contracts (Note 2) | | | 6,049,192 | | |
Receivable for Fund shares sold | | | 439,728 | | |
Net receivable for terminated total return swap contracts | | | 31,614 | | |
Prepaid expenses | | | 46,518 | | |
Total assets | | | 281,689,341 | | |
Liabilities | |
Investment advisory fee payable (Note 3) | | | 297,536 | | |
Administrative services fee payable (Note 3) | | | 9,671 | | |
Shareholder servicing/Distribution fee payable (Note 3) | | | 12,600 | | |
Variation margin payable on futures contracts (Note 2) | | | 754,776 | | |
Payable for Fund shares redeemed | | | 505,967 | | |
Unrealized depreciation on open swap contracts (Note 2) | | | 37,383 | | |
Trustees' fees payable | | | 22,609 | | |
Due to custodian for foreign currency at value (cost $1,018) | | | 972 | | |
Accrued expenses | | | 213,553 | | |
Total liabilities | | | 1,855,067 | | |
Net Assets | |
Capital stock, $.001 par value (Note 6) | | | 28,651 | | |
Paid-in capital (Note 6) | | | 288,628,989 | | |
Total distributable earnings (loss) | | | (8,823,366 | ) | |
Net assets | | $ | 279,834,274 | | |
I Shares | |
Net assets | | $ | 227,703,015 | | |
Shares outstanding | | | 23,262,414 | | |
Net asset value, offering price and redemption price per share | | $ | 9.79 | | |
A Shares | |
Net assets | | $ | 50,473,700 | | |
Shares outstanding | | | 5,209,842 | | |
Net asset value and redemption price per share | | $ | 9.69 | | |
Maximum offering price per share (net asset value/(1-5.25%)) | | $ | 10.23 | | |
C Shares | |
Net assets | | $ | 1,657,559 | | |
Shares outstanding | | | 178,404 | | |
Net asset value and offering price per share | | $ | 9.29 | | |
See Accompanying Notes to Consolidated Financial Statements.
11
Credit Suisse Managed Futures Strategy Fund
Consolidated Statement of Operations
For the Year Ended October 31, 2018
Investment Income | |
Interest | | $ | 3,571,364 | | |
Total investment income | | | 3,571,364 | | |
Expenses | |
Investment advisory fees (Note 3) | | | 3,304,684 | | |
Administrative services fees (Note 3) | | | 44,097 | | |
Shareholder servicing/Distribution fees (Note 3) | |
Class A | | | 188,219 | | |
Class C | | | 28,564 | | |
Transfer agent fees (Note 3) | | | 476,028 | | |
Registration fees | | | 86,922 | | |
Custodian fees | | | 86,133 | | |
Trustees' fees | | | 65,159 | | |
Audit and tax fees | | | 55,446 | | |
Printing fees | | | 52,864 | | |
Legal fees | | | 43,396 | | |
Commitment fees (Note 4) | | | 11,057 | | |
Insurance expense | | | 5,187 | | |
Miscellaneous expense | | | 9,592 | | |
Total expenses | | | 4,457,348 | | |
Less: fees waived (Note 3) | | | (109,708 | ) | |
Net expenses | | | 4,347,640 | | |
Net investment loss | | | (776,276 | ) | |
Net Realized and Unrealized Gain (Loss) from Investments, Futures Contracts, Swap Contracts
and Foreign Currency Related Items | |
Net realized loss from investments | | | (186,810 | ) | |
Net realized loss from futures contracts | | | (23,492,832 | ) | |
Net realized loss from swap contracts | | | (9,053,096 | ) | |
Net change in unrealized appreciation (depreciation) from investments | | | (165,626 | ) | |
Net change in unrealized appreciation (depreciation) from futures contracts | | | 3,454,460 | | |
Net change in unrealized appreciation (depreciation) from swap contracts | | | 5,046,367 | | |
Net change in unrealized appreciation (depreciation) from foreign currency translations | | | (84,149 | ) | |
Net realized and unrealized loss from investments, futures contracts, swap contracts
and foreign currency related items | | | (24,481,686 | ) | |
Net decrease in net assets resulting from operations | | $ | (25,257,962 | ) | |
See Accompanying Notes to Consolidated Financial Statements.
12
Credit Suisse Managed Futures Strategy Fund
Consolidated Statements of Changes in Net Assets
| | | For the Year
Ended
October 31, 2018 | | For the Year
Ended
October 31, 2017 | |
From Operations | |
Net investment loss | | $ | (776,276 | ) | | $ | (2,395,879 | ) | |
Net realized loss from investments, futures contracts, swap contracts and
foreign currency transactions | | | (32,732,738 | ) | | | (2,668,655 | ) | |
Net change in unrealized appreciation (depreciation) from investments,
futures contracts, swap contracts and foreign currency translations | | | 8,251,052 | | | | 2,660,211 | | |
Net decrease in net assets resulting from operations | | | (25,257,962 | ) | | | (2,404,323 | ) | |
From Distributions | |
From distributable earnings | |
Class I | | | — | | | | (3,535,179 | ) | |
Class A | | | — | | | | (1,012,105 | ) | |
Class C | | | — | | | | (100,296 | ) | |
Net decrease in net assets resulting from dividends and distributions | | | — | | | | (4,647,580 | )1 | |
| From Capital Share Transactions (Note 6) | |
Proceeds from sale of shares | | | 242,032,418 | | | | 290,761,733 | | |
Reinvestment of dividends and distributions | | | — | | | | 4,172,001 | | |
Net asset value of shares redeemed | | | (240,538,724 | ) | | | (153,607,206 | ) | |
Net increase in net assets from capital share transactions | | | 1,493,694 | | | | 141,326,528 | | |
Net increase (decrease) in net assets | | | (23,764,268 | ) | | | 134,274,625 | | |
Net Assets | |
Beginning of year | | | 303,598,542 | | | | 169,323,917 | | |
End of year | | $ | 279,834,274 | | | $ | 303,598,5422 | | |
1 Distributions include $(3,535,179), $(1,012,105) and $(100,296) from net realized gains for Class I, Class A and Class C, respectively. Prior year amounts have been conformed to current year presentation.
2 Distributions in excess of net investment income as of October 31, 2017 were $(35,543).
See Accompanying Notes to Consolidated Financial Statements.
13
Credit Suisse Managed Futures Strategy Fund
Consolidated Financial Highlights
(For a Class I Share of the Fund Outstanding Throughout Each Year)
| | | For the Year Ended October 31, | |
| | | 2018 | | 2017 | | 2016 | | 2015 | | 2014 | |
Per share data | |
Net asset value, beginning of year | | $ | 10.49 | | | $ | 10.94 | | | $ | 11.53 | | | $ | 10.851 | | | $ | 10.36 | | |
INVESTMENT OPERATIONS | |
Net investment loss2 | | | (0.02 | ) | | | (0.10 | ) | | | (0.15 | ) | | | (0.16 | ) | | | (0.17 | ) | |
Net gain (loss) from investments, futures contracts,
swap contracts and foreign currency related items
(both realized and unrealized) | | | (0.68 | ) | | | (0.06 | ) | | | 0.49 | | | | 1.51 | | | | 0.95 | | |
Total from investment operations | | | (0.70 | ) | | | (0.16 | ) | | | 0.34 | | | | 1.35 | | | | 0.78 | | |
REDEMPTION FEES | | | — | | | | — | | | | — | | | | — | | | | 0.003 | | |
LESS DIVIDENDS AND DISTRIBUTIONS | |
Dividends from net investment income | | | — | | | | — | | | | (0.52 | ) | | | (0.04 | ) | | | — | | |
Distributions from net realized gains | | | — | | | | (0.29 | ) | | | (0.41 | ) | | | (0.63 | ) | | | (0.29 | ) | |
Total dividends and distributions | | | — | | | | (0.29 | ) | | | (0.93 | ) | | | (0.67 | ) | | | (0.29 | ) | |
Net asset value, end of year | | $ | 9.79 | | | $ | 10.49 | | | $ | 10.94 | | | $ | 11.53 | | | $ | 10.851 | | |
Total return4 | | | (6.67 | )% | | | (1.60 | )% | | | 3.12 | % | | | 12.88 | % | | | 7.73 | % | |
RATIOS AND SUPPLEMENTAL DATA | |
Net assets, end of year (000s omitted) | | $ | 227,703 | | | $ | 201,478 | | | $ | 127,597 | | | $ | 72,606 | | | $ | 69,190 | | |
Ratio of net expenses to average net assets | | | 1.30 | % | | | 1.30 | % | | | 1.30 | % | | | 1.32 | % | | | 1.71 | % | |
Ratio of net investment loss to average net assets | | | (0.15 | )% | | | (0.99 | )% | | | (1.29 | )% | | | (1.31 | )% | | | (1.68 | )% | |
Decrease reflected in above operating expense
ratios due to waivers/reimbursements | | | 0.03 | % | | | 0.09 | % | | | 0.05 | % | | | 0.15 | % | | | 0.10 | % | |
Portfolio turnover rate | | | — | % | | | — | % | | | — | % | | | — | % | | | — | % | |
1 Includes adjustments in accordance with accounting principles generally accepted in the United States of America and as such, the net asset values for financial reporting purposes and the returns based upon net asset values may differ from the net asset values and returns for shareholder transactions.
2 Per share information is calculated using the average shares outstanding method.
3 This amount represents less than $0.01 per share.
4 Total returns are historical and include change in share price and reinvestment of all dividends and distributions. Had certain expenses not been reduced during the periods shown, total returns would have been lower.
See Accompanying Notes to Consolidated Financial Statements.
14
Credit Suisse Managed Futures Strategy Fund
Consolidated Financial Highlights
(For a Class A Share of the Fund Outstanding Throughout Each Year)
| | | For the Year Ended October 31, | |
| | | 2018 | | 2017 | | 2016 | | 2015 | | 2014 | |
Per share data | |
Net asset value, beginning of year | | $ | 10.41 | | | $ | 10.88 | | | $ | 11.47 | | | $ | 10.80 | | | $ | 10.35 | | |
INVESTMENT OPERATIONS | |
Net investment loss1 | | | (0.05 | ) | | | (0.12 | ) | | | (0.17 | ) | | | (0.19 | ) | | | (0.20 | ) | |
Net gain (loss) from investments, futures contracts,
swap contracts and foreign currency related items
(both realized and unrealized) | | | (0.67 | ) | | | (0.06 | ) | | | 0.48 | | | | 1.50 | | | | 0.94 | | |
Total from investment operations | | | (0.72 | ) | | | (0.18 | ) | | | 0.31 | | | | 1.31 | | | | 0.74 | | |
REDEMPTION FEES | | | — | | | | — | | | | — | | | | — | | | | 0.002 | | |
LESS DIVIDENDS AND DISTRIBUTIONS | |
Dividends from net investment income | | | — | | | | — | | | | (0.49 | ) | | | (0.01 | ) | | | — | | |
Distributions from net realized gains | | | — | | | | (0.29 | ) | | | (0.41 | ) | | | (0.63 | ) | | | (0.29 | ) | |
Total dividends and distributions | | | — | | | | (0.29 | ) | | | (0.90 | ) | | | (0.64 | ) | | | (0.29 | ) | |
Net asset value, end of year | | $ | 9.69 | | | $ | 10.41 | | | $ | 10.88 | | | $ | 11.47 | | | $ | 10.80 | | |
Total return3 | | | (6.92 | )% | | | (1.79 | )% | | | 2.87 | % | | | 12.47 | % | | | 7.35 | % | |
RATIOS AND SUPPLEMENTAL DATA | |
Net assets, end of year (000s omitted) | | $ | 50,474 | | | $ | 98,756 | | | $ | 38,060 | | | $ | 20,200 | | | $ | 3,294 | | |
Ratio of net expenses to average net assets | | | 1.55 | % | | | 1.55 | % | | | 1.55 | % | | | 1.56 | % | | | 1.96 | % | |
Ratio of net investment loss to average net assets | | | (0.50 | )% | | | (1.20 | )% | | | (1.54 | )% | | | (1.55 | )% | | | (1.93 | )% | |
Decrease reflected in above operating expense
ratios due to waivers/reimbursements | | | 0.03 | % | | | 0.09 | % | | | 0.05 | % | | | 0.15 | % | | | 0.10 | % | |
Portfolio turnover rate | | | — | % | | | — | % | | | — | % | | | — | % | | | — | % | |
1 Per share information is calculated using the average shares outstanding method.
2 This amount represents less than $0.01 per share.
3 Total returns are historical and include change in share price, reinvestment of all dividends and distributions and no sales charge. Had certain expenses not been reduced during the years shown, total returns would have been lower.
See Accompanying Notes to Consolidated Financial Statements.
15
Credit Suisse Managed Futures Strategy Fund
Consolidated Financial Highlights
(For a Class C Share of the Fund Outstanding Throughout Each Year)
| | | For the Year Ended October 31, | |
| | | 2018 | | 2017 | | 2016 | | 2015 | | 2014 | |
Per share data | |
Net asset value, beginning of year | | $ | 10.06 | | | $ | 10.60 | | | $ | 11.19 | | | $ | 10.62 | | | $ | 10.25 | | |
INVESTMENT OPERATIONS | |
Net investment loss1 | | | (0.12 | ) | | | (0.20 | ) | | | (0.25 | ) | | | (0.27 | ) | | | (0.27 | ) | |
Net gain (loss) from investments, futures contracts,
swap contracts and foreign currency related items
(both realized and unrealized) | | | (0.65 | ) | | | (0.05 | ) | | | 0.48 | | | | 1.47 | | | | 0.93 | | |
Total from investment operations | | | (0.77 | ) | | | (0.25 | ) | | | 0.23 | | | | 1.20 | | | | 0.66 | | |
REDEMPTION FEES | | | — | | | | — | | | | — | | | | — | | | | 0.002 | | |
LESS DIVIDENDS AND DISTRIBUTIONS | |
Dividends from net investment income | | | — | | | | — | | | | (0.41 | ) | | | — | | | | — | | |
Distributions from net realized gains | | | — | | | | (0.29 | ) | | | (0.41 | ) | | | (0.63 | ) | | | (0.29 | ) | |
Total dividends and distributions | | | — | | | | (0.29 | ) | | | (0.82 | ) | | | (0.63 | ) | | | (0.29 | ) | |
Net asset value, end of year | | $ | 9.29 | | | $ | 10.06 | | | $ | 10.60 | | | $ | 11.19 | | | $ | 10.62 | | |
Total return3 | | | (7.65 | )% | | | (2.52 | )% | | | 2.13 | % | | | 11.60 | % | | | 6.62 | % | |
RATIOS AND SUPPLEMENTAL DATA | |
Net assets, end of year (000s omitted) | | $ | 1,658 | | | $ | 3,365 | | | $ | 3,667 | | | $ | 2,920 | | | $ | 1,558 | | |
Ratio of net expenses to average net assets | | | 2.30 | % | | | 2.30 | % | | | 2.30 | % | | | 2.32 | % | | | 2.71 | % | |
Ratio of net investment loss to average net assets | | | (1.22 | )% | | | (2.01 | )% | | | (2.29 | )% | | | (2.31 | )% | | | (2.68 | )% | |
Decrease reflected in above operating expense
ratios due to waivers/reimbursements | | | 0.04 | % | | | 0.09 | % | | | 0.05 | % | | | 0.15 | % | | | 0.10 | % | |
Portfolio turnover rate | | | — | % | | | — | % | | | — | % | | | — | % | | | — | % | |
1 Per share information is calculated using the average shares outstanding method.
2 This amount represents less than $0.01 per share.
3 Total returns are historical and include change in share price, reinvestment of all dividends and distributions and no sales charge. Had certain expenses not been reduced during the years shown, total returns would have been lower.
See Accompanying Notes to Consolidated Financial Statements.
16
Credit Suisse Managed Futures Strategy Fund
Notes to Consolidated Financial Statements
October 31, 2018
Credit Suisse Managed Futures Strategy Fund (the "Fund"), a series of the Credit Suisse Opportunity Funds (the "Trust"), a Delaware statutory trust, is registered under the Investment Company Act of 1940, as amended (the "1940 Act"), as a non-diversified open-end management investment company that seeks to achieve investment results that correspond generally to the risk and return patterns of managed futures funds. The Trust was organized under the laws of the State of Delaware as a business trust on May 31, 1995.
Credit Suisse Asset Management, LLC ("Credit Suisse"), the investment adviser to the Fund, is registered as an investment adviser with the Securities and Exchange Commission and as a Commodity Pool Operator with the Commodity Futures Trading Commission. The Fund seeks to achieve its investment objective by investing directly and/or indirectly through the Credit Suisse Cayman Managed Futures Strategy Fund, Ltd. (the "Subsidiary"), a wholly-owned subsidiary of the Fund organized under the laws of the Cayman Islands, in a combination of securities and derivative instruments. The Subsidiary invests in commodity-linked derivative instruments, such as swaps and futures, as well as other types of futures, swaps and options. The Subsidiary may also invest in debt securities, some of which are intended to serve as margin or collateral for the Subsidiary's derivatives positions.
The Subsidiary is managed by the same portfolio managers that manage the Fund and the accompanying financial statements reflect the financial position of the Fund and the Subsidiary and the results of operations on a consolidated basis. The consolidated financial statements include portfolio holdings of the Fund and the Subsidiary and all intercompany transactions and balances have been eliminated. The Fund may invest up to 25% of its total assets in the Subsidiary. As of October 31, 2018, the Fund held $15,989,181 in the Subsidiary, representing 5.7% of the Fund's consolidated net assets. For the year ended October 31, 2018, the net realized loss on securities and other financial instruments held in the Subsidiary was $9,053,096.
Subsequent references to the Fund within the Notes to Consolidated Financial Statements collectively refer to the Fund and the Subsidiary.
The Fund offers three classes of shares: Class I shares, Class A shares and Class C shares. Each class of shares represents an equal pro rata interest in the Fund, except the share classes bear different expenses. Class A shares are sold subject to a front-end sales charge of up to 5.25%. Class C shares are sold subject to a contingent deferred sales charge ("CDSC") of 1.00% if the shares are redeemed within the first year of purchase. Class I shares are sold without a sales charge.
17
Credit Suisse Managed Futures Strategy Fund
Notes to Consolidated Financial Statements (continued)
October 31, 2018
Note 2. Significant Accounting Policies
The following is a summary of significant accounting policies followed by the Fund in the preparation of its consolidated financial statements. The policies are in accordance with generally accepted accounting principles in the United States of America ("GAAP"). The preparation of consolidated financial statements requires management to make estimates and assumptions that affect the reported amounts and disclosures in the consolidated financial statements. Actual results could differ from those estimates. The Fund is considered an investment company for financial reporting purposes under GAAP and follows the accounting and reporting guidance in Financial Accounting Standards Board's ("FASB") Accounting Standards Codification ("ASC") Topic 946 — Financial Services — Investment Companies.
A) SECURITY VALUATION — The Board of Trustees (the "Board") is responsible for the Fund's valuation process. The Board has delegated the supervision of the daily valuation process to Credit Suisse who has established a Pricing Committee which, pursuant to the policies adopted by the Board, is responsible for making fair valuation determinations and overseeing the Fund's pricing policies. The net asset value of the Fund is determined daily as of the close of regular trading on the New York Stock Exchange, Inc. (the "Exchange") on each day the Exchange is open for business. The valuations for fixed income securities (which may include, but are not limited to, corporate, government, municipal, mortgage-backed, collateralized mortgage obligations and asset-backed securities) and certain derivative instruments are typically the prices supplied by independent third party pricing services, which may use market prices or broker/dealer quotations or a variety of valuation techniques and methodologies. The independent third party pricing services use inputs that are observable such as issuer details, interest rates, yield curves, prepayment speeds, credit risks/spreads, default rates and quoted prices for similar securities. These pricing services generally price fixed income securities assuming orderly transactions of an institutional "round lot" size, but some trades occur in smaller "odd lot" sizes which may be effected at lower prices than institutional round lot trades. Structured note agreements are valued in accordance with a dealer-supplied valuation based on changes in the value of the underlying index. Futures contracts are valued daily at the settlement price established by the board of trade or exchange on which they are traded. Forward contracts are valued at the London closing spot rates and the London closing forward point rates on a daily basis. The currency forward contract pricing model derives the differential in point rates to the expiration date of the forward and calculates its present value. Equity securities for which market
18
Credit Suisse Managed Futures Strategy Fund
Notes to Consolidated Financial Statements (continued)
October 31, 2018
Note 2. Significant Accounting Policies (continued)
quotations are available are valued at the last reported sales price or official closing price on the primary market or exchange on which they trade. The Fund may utilize a service provided by an independent third party which has been approved by the Board to fair value certain securities. When fair value pricing is employed, the prices of securities used by the Fund to calculate its net asset value may differ from quoted or published prices for the same securities. If independent third party pricing services are unable to supply prices for a portfolio investment, or if the prices supplied are deemed by the investment adviser to be unreliable, the market price may be determined by the investment adviser using quotations from one or more brokers/dealers or at the transaction price if the security has recently been purchased and no value has yet been obtained from a pricing service or pricing broker. When reliable prices are not readily available, such as when the value of a security has been significantly affected by events after the close of the exchange or market on which the security is principally traded, but before the Fund calculates its net asset value, these securities will be fair valued in good faith by the Pricing Committee, in accordance with procedures adopted by the Board.
The Fund uses valuation techniques to measure fair value that are consistent with the market approach and/or income approach, depending on the type of security and the particular circumstance. The market approach uses prices and other relevant information generated by market transactions involving identical or comparable securities. The income approach uses valuation techniques to discount estimated future cash flows to present value.
GAAP established a disclosure hierarchy that categorizes the inputs to valuation techniques used to value assets and liabilities at each measurement date. These inputs are summarized in the three broad levels listed below:
• Level 1 – quoted prices in active markets for identical investments
• Level 2 – other significant observable inputs (including quoted prices for similar investments, interest rates, prepayment speeds, credit risk, etc.)
• Level 3 – significant unobservable inputs (including the Fund's own assumptions in determining the fair value of investments)
The inputs or methodologies used to value securities are not necessarily an indication of the risk associated with investing in those securities.
19
Credit Suisse Managed Futures Strategy Fund
Notes to Consolidated Financial Statements (continued)
October 31, 2018
Note 2. Significant Accounting Policies (continued)
The following is a summary of the inputs used as of October 31, 2018 in valuing the Fund's assets and liabilities carried at fair value:
Assets | | Level 1 | | Level 2 | | Level 3 | | Total | |
Investments in Securities | |
United States Treasury Obligations | | $ | — | | | $ | 167,761,875 | | | $ | — | | | $ | 167,761,875 | | |
| | | $ | — | | | $ | 167,761,875 | | | $ | — | | | $ | 167,761,875 | | |
Other Financial Instruments* | |
Futures Contracts | | $ | 8,570,440 | | | $ | — | | | $ | — | | | $ | 8,570,440 | | |
Swap Contracts | | | — | | | | 6,049,192 | | | | — | | | | 6,049,192 | | |
Liabilities | | Level 1 | | Level 2 | | Level 3 | | Total | |
Other Financial Instruments* | |
Futures Contracts | | $ | 2,046,366 | | | $ | — | | | $ | — | | | $ | 2,046,366 | | |
Swap Contracts | | | — | | | | 37,383 | | | | — | | | | 37,383 | | |
* Other financial instruments include unrealized appreciation (depreciation) on futures and swap contracts.
For the year ended October 31, 2018, there were no transfers among Level 1, Level 2 and Level 3. All transfers, if any, are assumed to occur at the end of the reporting period.
B) DERIVATIVE INSTRUMENTS AND HEDGING ACTIVITIES — The Fund adopted amendments to authoritative guidance on disclosures about derivative instruments and hedging activities which require that a fund disclose (a) how and why an entity uses derivative instruments, (b) how derivative instruments and hedging activities are accounted for and (c) how derivative instruments and related hedging activities affect a fund's financial position, financial performance and cash flows. For the year ended October 31, 2018, the Fund's derivatives did not qualify for hedge accounting as they are held at fair value.
The following table presents the fair value and the location of derivatives within the Consolidated Statement of Assets and Liabilities at October 31, 2018 and the effect of these derivatives on the Consolidated Statement of Operations for the year ended October 31, 2018.
| Primary Underlying Risk | | Derivative
Assets | | Derivative
Liabilities | | Realized Gain
(Loss) | | Change in Unrealized
Appreciation (Depreciation) | |
Foreign currency exchange rate | |
Futures contracts | | $ | 5,542,870 | | | $ | — | | | $ | (3,642,197 | ) | | $ | 9,870,805 | | |
Index Contracts | |
Futures contracts | | | 1,388,713 | | | | 1,595,995 | | | | (13,576,044 | ) | | | (7,397,169 | ) | |
Interest rate | |
Futures contracts | | | 1,638,857 | | | | 450,371 | | | | (6,274,591 | ) | | | 980,824 | | |
Commodity Price | |
Total return swap contracts | | | 6,049,192 | | | | 37,383 | | | | (9,053,096 | ) | | | 5,046,367 | | |
Total | | $ | 14,619,632 | | | $ | 2,083,749 | | | $ | (32,545,928 | ) | | $ | 8,500,827 | | |
20
Credit Suisse Managed Futures Strategy Fund
Notes to Consolidated Financial Statements (continued)
October 31, 2018
Note 2. Significant Accounting Policies (continued)
The notional amount of futures contracts and swap contracts open at October 31, 2018 is reflected in the Consolidated Schedule of Investments. For the year ended October 31, 2018, the Fund held average monthly notional values on a net basis of $776,741,152, $437,352,652 and $130,664,117 in long futures contracts, short futures contracts and swap contracts, respectively.
The Fund is a party to International Swap and Derivatives Association, Inc. ("ISDA") Master Agreements ("Master Agreements") with certain counterparties that govern over-the-counter derivative (including Total Return, Credit Default and Interest Rate Swaps) and foreign exchange contracts entered into by the Fund. The Master Agreements may contain provisions regarding, among other things, the parties' general obligations, representations, agreements, collateral requirements, events of default and early termination. Termination events applicable to the Fund may occur upon a decline in the Fund's net assets below a specified threshold over a certain period of time.
The following table presents by counterparty the Fund's derivative assets, net of related collateral held by the Fund, at October 31, 2018:
Counterparty | | Gross Amount of
Assets Presented in
the Consolidated
Statement of Assets
and Liabilities(a) | | Financial
Instruments
and Derivatives
Available for Offset | | Non-Cash
Collateral
Received | | Cash
Collateral
Received | | Net Amount
of Derivative
Assets | |
Goldman Sachs | | $ | 6,049,192 | | | $ | (37,383 | ) | | $ | (773,738 | ) | | $ | — | | | $ | 5,238,071 | | |
The following table presents by counterparty the Fund's derivative liabilities, net of related collateral pledged by the Fund, at October 31, 2018:
Counterparty | | Gross Amount of
Liabilities Presented in
the Consolidated
Statement of Assets
and Liabilities(a) | | Financial
Instruments
and Derivatives
Available for Offset | | Non-Cash
Collateral
Pledged | | Cash
Collateral
Pledged | | Net Amount
of Derivative
Liabilities | |
Goldman Sachs | | $ | 37,383 | | | $ | (37,383 | ) | | $ | — | | | $ | — | | | $ | — | | |
(a) Swap contracts are included.
C) SECURITY TRANSACTIONS AND INVESTMENT INCOME/EXPENSE — Security transactions are accounted for on a trade date basis. Interest income/expense is recorded on the accrual basis. The Fund amortizes premiums and accretes discounts using the effective interest method. Dividend income/expense is recorded on the ex-dividend date. Certain expenses are class-specific expenses, vary by class and are charged only to that class. Income, expenses (excluding class-specific expenses) and realized/unrealized gains/losses
21
Credit Suisse Managed Futures Strategy Fund
Notes to Consolidated Financial Statements (continued)
October 31, 2018
Note 2. Significant Accounting Policies (continued)
are allocated proportionately to each class of shares based upon the relative net asset value of the outstanding shares of that class. The cost of investments sold is determined by use of the specific identification method for both financial reporting and income tax purposes. To the extent any issuer defaults or a credit event occurs that impacts the issuer, the Fund may halt any additional interest income accruals and consider the realizability of interest accrued up to the date of default or credit event.
D) DIVIDENDS AND DISTRIBUTIONS TO SHAREHOLDERS — Dividends from net investment income, if any, are declared and paid quarterly. Distributions of net realized capital gains, if any, are declared and paid at least annually. However, to the extent that a net realized capital gain can be reduced by a capital loss carryforward, such gain will not be distributed. Dividends and distributions to shareholders of the Fund are recorded on the ex-dividend date and are determined in accordance with federal income tax regulations, which may differ from GAAP.
E) FEDERAL AND OTHER TAXES — No provision is made for federal taxes as it is the Fund's intention to continue to qualify as a regulated investment company ("RIC") under the Internal Revenue Code of 1986, as amended (the "Code"), and to make the requisite distributions to its shareholders, which will be sufficient to relieve it from federal income and excise taxes.
In order to qualify as a RIC under the Code, the Fund must meet certain requirements regarding the source of its income, the diversification of its assets and the distribution of its income. One of these requirements is that the Fund derive at least 90% of its gross income for each taxable year from dividends, interest, payments with respect to certain securities loans, gains from the sale or other disposition of stock, securities or foreign currencies, other income derived with respect to its business of investing in such stock, securities or currencies or net income derived from interests in certain publicly-traded partnerships ("Qualifying Income"). The Internal Revenue Service ("IRS") has issued a ruling that income realized from certain types of commodity-linked derivatives would not be Qualifying Income. As a result, the Fund's ability to realize income from investments in such commodity-linked derivatives as part of its investment strategy would be limited to a maximum of 10% of its gross income. The IRS has issued private letter rulings to registered investment companies concluding that income derived from their investment in a wholly-owned subsidiary would constitute Qualifying Income to the fund. The IRS has indicated that the granting of these types of private letter rulings is currently suspended.
22
Credit Suisse Managed Futures Strategy Fund
Notes to Consolidated Financial Statements (continued)
October 31, 2018
Note 2. Significant Accounting Policies (continued)
If the Fund is unable to ensure continued qualification as a RIC, the Fund may be required to change its investment objective, policies or techniques, or may be liquidated. If the Fund fails to qualify as a RIC, the Fund will be subject to federal income tax on its net income and capital gains at regular corporate rates (without reduction for distributions to shareholders). If the Fund were to fail to qualify as a RIC and become subject to federal income tax, shareholders of the Fund would be subject to the risk of diminished returns.
The Fund adopted the authoritative guidance for uncertainty in income taxes and recognizes a tax benefit or liability from an uncertain position only if it is more likely than not that the position is sustainable based solely on its technical merits and consideration of the relevant taxing authority's widely understood administrative practices and procedures. The Fund has reviewed its current tax positions and has determined that no provision for income tax is required in the Fund's financial statements. The Fund's federal and state income and federal excise tax returns for tax years for which the applicable statutes of limitations have not expired are subject to examination by the Internal Revenue Service and state departments of revenue.
F) CASH — The Fund's uninvested cash balance is held in an interest bearing variable rate demand deposit account at State Street Bank and Trust Company ("SSB"), the Fund's custodian.
G) FUTURES — The Fund may enter into futures contracts to the extent permitted by its investment policies and objectives. The Fund may use futures contracts to gain exposure to or hedge against changes in interest rates, equity and market price movements and/or currency risks. Upon entering into a futures contract, the Fund is required to deposit cash and/or pledge U.S. Government securities as initial margin with a Futures Commission Merchant ("FCM"). Subsequent payments, which are dependent on the daily fluctuations in the value of the underlying instrument, are made or received by the Fund each day (daily variation margin) and are recorded as unrealized gains or losses in the Consolidated Statement of Operations until the contracts are closed. When the contracts are closed, the Fund records a realized gain or loss equal to the difference between the proceeds from (or cost of) the closing transaction and the Fund's basis in the contract. Risks of entering into futures contracts for hedging purposes include the possibility that a change in the value of the contract may not correlate with the changes in the value of the underlying instruments. Futures have minimal counterparty credit risk because futures are exchange traded and the exchange's clearinghouse, as counterparty to all
23
Credit Suisse Managed Futures Strategy Fund
Notes to Consolidated Financial Statements (continued)
October 31, 2018
Note 2. Significant Accounting Policies (continued)
exchange-traded futures, guarantees the futures against default. In addition, the purchase of a futures contract involves the risk that the Fund could lose more than the original margin deposit and subsequent payments may be required for a futures transaction. The Fund's open futures contracts are disclosed in the Consolidated Schedule of Investments. At October 31, 2018, the amount of restricted cash held at brokers related to open futures contracts was $19,862,850.
The Commodity Exchange Act requires an FCM to segregate all customer transactions and assets from the FCM's proprietary activities. A customer's cash and other equity deposited with an FCM are considered commingled with all other customer funds subject to the FCM's segregation requirements. In the event of an FCM's insolvency, recovery may be limited to the Fund's pro-rata share of segregated customer funds available. It is possible that the recovery amount could be less than the total of cash and other equity deposited.
H) SWAPS — The Fund may enter into swap contracts either for hedging purposes or to seek to increase total return. A swap contract is an agreement that obligates two parties to exchange a series of cash flows at specified intervals based upon or calculated by reference to changes in specified prices or rates for a specified amount of an underlying asset or notional principal amount. The Fund will enter into swap contracts only on a net basis, which means that the two payment streams are netted out, with the Fund receiving or paying, as the case may be, only the net amount of the two payments. Risks may arise as a result of the failure of the counterparty to the swap contract to comply with the terms of the swap contract. The extent of the Fund's exposure to credit and counterparty risks is the discounted net value of the cash flows to be received from the counterparty over the contract's remaining life, to the extent that the amount is positive. These risks are mitigated by having a master netting arrangement between the Fund and the counterparty and by the posting of collateral by the counterparty to the Fund to cover the Fund's exposure to the counterparty. Therefore, the Fund considers the creditworthiness of each counterparty as well as the amounts posted by the counterparty pursuant to the master netting agreement to a swap contract in evaluating potential credit risk. Additionally, risks may arise from unanticipated movements in interest rates or in the value of the underlying reference asset or index.
The Fund may enter into total return swap contracts, involving commitments to pay interest in exchange for a market-linked return, both based on notional
24
Credit Suisse Managed Futures Strategy Fund
Notes to Consolidated Financial Statements (continued)
October 31, 2018
Note 2. Significant Accounting Policies (continued)
amounts. The Fund may invest in total return swap contracts for hedging purposes or to seek to increase total return. To the extent the total return of the security or index underlying the transaction exceeds or falls short of the offsetting interest rate obligation, the Fund will receive a payment from or make a payment to the counterparty.
The Fund records unrealized gains or losses on a daily basis representing the value and the current net receivable or payable relating to open swap contracts. Net amounts received or paid on the swap contract are recorded as realized gains or losses. Fluctuations in the value of swap contracts are recorded for financial statement purposes as unrealized appreciation or depreciation from swap contracts. Realized gains and losses from terminated swaps are included in net realized gains/losses from swap contracts. The Fund's open swap contracts are disclosed in the Consolidated Schedule of Investments. At October 31, 2018, the amount of restricted cash held at brokers related to open swap contracts was $0.
I) SECURITIES LENDING — The initial collateral received by the Fund is required to have a value of at least 102% of the market value of domestic securities on loan (including any accrued interest thereon) and 105% of the market value of foreign securities on loan (including any accrued interest thereon). The collateral is maintained thereafter at a value equal to at least 102% of the current market value of the securities on loan. The market value of loaned securities is determined at the close of each business day of the Fund and any additional required collateral is delivered to the Fund, or excess collateral returned by the Fund, on the next business day. Cash collateral received by the Fund in connection with securities lending activity may be pooled together with cash collateral for other funds/portfolios advised by Credit Suisse and may be invested in a variety of investments, including funds advised by SSB, the Fund's securities lending agent, or money market instruments. However, in the event of default or bankruptcy by the other party to the agreement, realization and/or retention of the collateral may be subject to legal proceedings.
SSB has been engaged by the Fund to act as the Fund's securities lending agent. The Fund's securities lending arrangement provides that the Fund and SSB will share the net income earned from securities lending activities. Securities lending income is accrued as earned. At October 31, 2018 and during the year ended October 31, 2018, there were no securities out on loan.
25
Credit Suisse Managed Futures Strategy Fund
Notes to Consolidated Financial Statements (continued)
October 31, 2018
Note 2. Significant Accounting Policies (continued)
J) OTHER — In the normal course of business the Fund trades financial instruments and enters into financial transactions for which risk of potential loss exists due to changes in the market (market risk) or failure of the other party to a transaction to perform (credit risk). Similar to credit risk, the Fund may be exposed to counterparty risk, including securities lending, or the risk that an institution or other entity with which the Fund has unsettled or open transactions will default. The potential loss could exceed the value of the financial assets recorded in the consolidated financial statements. Financial assets, which potentially expose the Fund to credit risk, consist principally of cash due from counterparties and investments. The extent of the Fund's exposure to credit and counterparty risks in respect to these financial assets approximates their carrying value as recorded in the Fund's Consolidated Statement of Assets and Liabilities.
K) RECENT ACCOUNTING PRONOUNCEMENTS — In March 2017, the FASB issued Accounting Standards Update 2017-08, Receivables — Nonrefundable Fees and Other Costs (Subtopic 310-20): Premium Amortization On Purchased Callable Debt Securities ("ASU 2017-08"). The update shortens the amortization period for the premium on certain purchased callable debt securities to the earliest call date. ASU 2017-08 will be effective for annual periods beginning after December 15, 2018. Management is currently assessing the potential impact of these changes to future financial statements.
Also, in August 2018, the FASB issued Accounting Standards Update 2018-13, Fair Value Measurement (Topic 820): Disclosure Framework — Changes to the Disclosure Requirements for Fair Value Measurement ("ASU 2018-13"). The update provides guidance that eliminates, adds and modifies certain disclosure requirements for fair value measurements. ASU 2018-13 will be effective for annual periods beginning after December 15, 2019. Management is currently assessing the potential impact of these changes to future financial statements.
L) SUBSEQUENT EVENTS — In preparing the financial statements as of October 31, 2018, management considered the impact of subsequent events for potential recognition or disclosure in these financial statements through the date of release of this report. No such events requiring recognition or disclosure were identified through the date of the release of this report.
Note 3. Transactions with Affiliates and Related Parties
Credit Suisse serves as investment adviser and co-administrator for the Fund. For its investment advisory and administration services, Credit Suisse
26
Credit Suisse Managed Futures Strategy Fund
Notes to Consolidated Financial Statements (continued)
October 31, 2018
Note 3. Transactions with Affiliates and Related Parties (continued)
is entitled to receive a fee from the Fund at an annual rate of 1.04% of the Fund's average daily net assets. For the year ended October 31, 2018, investment advisory and administration fees earned and fees waived/expenses reimbursed by Credit Suisse were $3,304,684 and $109,708, respectively. Credit Suisse has contractually agreed to limit expenses so that the Fund's annual operating expenses do not exceed 1.30% of the Fund's average daily net assets for Class I shares, 1.55% of the Fund's average daily net assets for Class A shares, and 2.30% of the Fund's average daily net assets for Class C shares. The Fund is authorized to reimburse Credit Suisse for management fees previously limited and/or for expenses previously reimbursed by Credit Suisse, provided, however, that any reimbursements must be paid at a date not more than three years after the end of the fiscal year during which such fees were limited or expenses were reimbursed by Credit Suisse and the reimbursements do not cause the Fund to exceed the applicable expense limitation in the contract at the time the fees are recouped. This contract may not be terminated before May 1, 2020.
The amounts waived and reimbursed by Credit Suisse, which are available for potential future recoupment by Credit Suisse, and the expiration schedule at October 31, 2018 are as follows:
| | | Fee waivers/
expense
reimbursements
subject to
recoupment* | | Expires
October 31,
2019 | | Expires
October 31,
2020 | | Expires
October 31,
2021 | |
Class I | | $ | 124,854 | | | $ | 10,796 | | | $ | 76,199 | | | $ | 37,859 | | |
Class A | | | 48,229 | | | | 3,236 | | | | 32,707 | | | | 12,286 | | |
Class C | | | 2,632 | | | | 356 | | | | 1,765 | | | | 511 | | |
Totals | | $ | 175,715 | | | $ | 14,388 | | | $ | 110,671 | | | $ | 50,656 | | |
* The Subsidiary expenses are not eligible for recoupment.
For its co-administrative services, SSB receives a fee, exclusive of out-of-pocket expenses, calculated in total for all the Credit Suisse funds/portfolios co-administered by SSB and allocated based upon the relative average net assets of each fund/portfolio, subject to an annual minimum fee. For the year ended October 31, 2018, co-administrative services fees earned by SSB (including out-of-pocket expenses) with respect to the Fund were $44,097.
Credit Suisse Securities (USA) LLC ("CSSU"), an affiliate of Credit Suisse, serves as the distributor of the Fund's shares. Pursuant to a distribution plan adopted by the Fund pursuant to Rule 12b-1 under the 1940 Act, CSSU receives fees for its distribution services. These fees are calculated at an annual rate of
27
Credit Suisse Managed Futures Strategy Fund
Notes to Consolidated Financial Statements (continued)
October 31, 2018
Note 3. Transactions with Affiliates and Related Parties (continued)
0.25% of the average daily net assets of the Class A shares. For the Class C shares, the fee is calculated at an annual rate of 1.00% of the average daily net assets. For the year ended October 31, 2018, the Fund paid Rule 12b-1 distribution fees of $188,219 for Class A shares and $28,564 for Class C shares. Class I shares are not subject to Rule 12b-1 distribution fees.
Certain brokers, dealers and financial representatives provide transfer agent-related services to the Fund and receive compensation from the Fund. For the year ended October 31, 2018, the Fund paid $190,671, which is included within transfer agent fees in the Consolidated Statement of Operations.
For the year ended October 31, 2018, CSSU and its affiliates earned no commissions on the sale of the Fund's Class A and Class C shares.
Note 4. Line of Credit
The Fund, together with other funds/portfolios advised by Credit Suisse (collectively, the "Participating Funds"), participates in a committed, unsecured line of credit facility ("Credit Facility"), with SSB in an aggregated amount of $250 million for temporary or emergency purposes under a first-come, first-served basis. Under the terms of the Credit Facility, the Participating Funds pay an aggregate commitment fee on the average unused amount of the Credit Facility, which is allocated among the Participating Funds in such manner as is determined by the governing Boards of the Participating Funds. In addition, the Participating Funds pay interest on borrowings at either the Overnight Federal Funds rate or the Overnight LIBOR rate plus a spread. At October 31, 2018 and during the year ended October 31, 2018, the Fund had no borrowings outstanding under the Credit Facility.
Note 5. Purchases and Sales of Securities
For the year ended October 31, 2018, purchases and sales of investment securities (excluding short-term investments) and U.S. Government and Agency Obligations were as follows:
Investment Securities | | U.S. Government/
Agency Obligations | |
| Purchases | | Sales | | Purchases | | Sales | |
| $ | 0 | | | $ | 0 | | | $ | 0 | | | $ | 0 | | |
Note 6. Capital Share Transactions
The Fund is authorized to issue an unlimited number of full and fractional shares of beneficial interest, $.001 par value per share. The Fund offers Class I,
28
Credit Suisse Managed Futures Strategy Fund
Notes to Consolidated Financial Statements (continued)
October 31, 2018
Note 6. Capital Share Transactions (continued)
Class A and Class C shares. Transactions in capital shares for each class of the Fund were as follows:
| | | Class I | |
| | | For the Year Ended
October 31, 2018 | | For the Year Ended
October 31, 2017 | |
| | | Shares | | Value | | Shares | | Value | |
Shares sold | | | 20,225,666 | | | $ | 210,356,002 | | | | 18,009,249 | | | $ | 190,176,910 | | |
Shares issued in reinvestment
of dividends and distributions | | | — | | | | — | | | | 298,320 | | | | 3,263,624 | | |
Shares redeemed | | | (16,168,919 | ) | | | (164,239,926 | ) | | | (10,770,369 | ) | | | (113,846,649 | ) | |
Net increase | | | 4,056,747 | | | $ | 46,116,076 | | | | 7,537,200 | | | $ | 79,593,885 | | |
| | | Class A | |
| | | For the Year Ended
October 31, 2018 | | For the Year Ended
October 31, 2017 | |
| | | Shares | | Value | | Shares | | Value | |
Shares sold | | | 3,018,697 | | | $ | 31,323,369 | | | | 9,628,445 | | | $ | 99,722,720 | | |
Shares issued in reinvestment
of dividends and distributions | | | — | | | | — | | | | 74,667 | | | | 812,373 | | |
Shares redeemed | | | (7,297,035 | ) | | | (74,465,595 | ) | | | (3,714,041 | ) | | | (38,705,291 | ) | |
Net increase (decrease) | | | (4,278,338 | ) | | $ | (43,142,226 | ) | | | 5,989,071 | | | $ | 61,829,802 | | |
| | | Class C | |
| | | For the Year Ended
October 31, 2018 | | For the Year Ended
October 31, 2017 | |
| | | Shares | | Value | | Shares | | Value | |
Shares sold | | | 34,802 | | | $ | 353,047 | | | | 84,093 | | | $ | 862,103 | | |
Shares issued in reinvestment
of dividends and distributions | | | — | | | | — | | | | 9,074 | | | | 96,004 | | |
Shares redeemed | | | (190,957 | ) | | | (1,833,203 | ) | | | (104,516 | ) | | | (1,055,266 | ) | |
Net decrease | | | (156,155 | ) | | $ | (1,480,156 | ) | | | (11,349 | ) | | $ | (97,159 | ) | |
On October 31, 2018, the number of shareholders that held 5% or more of the outstanding shares of each class of the Fund was as follows:
| | | Number of
Shareholders | | Approximate Percentage
of Outstanding Shares | |
Class I | | | 4 | | | | 83 | % | |
Class A | | | 2 | | | | 58 | % | |
Class C | | | 4 | | | | 54 | % | |
The Fund's performance may be negatively impacted in the event one or more of the Fund's greater than 5% shareholders were to redeem at a given time. Some of the shareholders may be omnibus accounts, which hold shares on behalf of individual shareholders.
29
Credit Suisse Managed Futures Strategy Fund
Notes to Consolidated Financial Statements (continued)
October 31, 2018
Note 7 . Income Tax Information and Distributions to Shareholders
Income and capital gain distributions are determined in accordance with federal income tax regulations, which may differ from GAAP.
The tax character of distributions paid by the Fund during the fiscal years ended October 31, 2018 and 2017, respectively, was as follows:
Ordinary Income | | Long-Term Capital Gain | |
| 2018 | | 2017 | | 2018 | | 2017 | |
| $ | — | | | $ | 2,100,180 | | | $ | — | | | $ | 2,547,400 | | |
The tax basis components of distributable earnings differ from the amounts reflected in the Consolidated Statement of Assets and Liabilities by temporary book/tax differences. These differences are primarily due to differing treatments of futures contracts marked to market and offering expenses. At October 31, 2018, the components of distributable earnings on a tax basis were as follows:
Accumulated net realized loss | | $ | (13,912,274 | ) | |
Unrealized appreciation | | | 5,120,897 | | |
| | $ | (8,791,377 | ) | |
At October 31, 2018, the Fund had $4,324,334 of unlimited short-term capital loss carryforwards and $9,587,940 of unlimited long-term capital loss carryforwards available to offset possible future capital gains.
At October 31, 2018, the cost and net unrealized appreciation (depreciation) of investments and derivatives for income tax purposes were as follows:
Cost of Investments | | $ | 175,021,997 | | |
Unrealized appreciation | | $ | 14,619,632 | | |
Unrealized depreciation | | | (9,343,871 | ) | |
Net unrealized appreciation (depreciation) | | $ | 5,275,761 | | |
To adjust for current period permanent book/tax differences which arose principally from differing book/tax treatment of foreign currency gain/loss and Subsidiary cumulative income/loss, paid-in capital was charged $11,977,787, and distributable earnings/loss was credited $11,977,787. Net assets were not affected by this reclassification.
Note 8. Contingencies
In the normal course of business, the Fund may provide general indemnifications pursuant to certain contracts and organizational documents. The Fund's maximum exposure under these arrangements is dependent on future claims that may be made against the Fund and, therefore, cannot be estimated; however, based on experience, the risk of loss from such claims is considered remote.
30
Credit Suisse Managed Futures Strategy Fund
Report of Independent Registered Public Accounting Firm
To the Board of Trustees and Shareholders
Credit Suisse Managed Futures Strategy Fund:
Opinion on the Consolidated Financial Statements
We have audited the accompanying consolidated statement of assets and liabilities of Credit Suisse Managed Futures Strategy Fund (the "Fund"), a series of the Credit Suisse Opportunity Funds, including the consolidated schedule of investments, as of October 31, 2018, and the related consolidated statement of operations for the year then ended, the consolidated statements of changes in net assets for each of the years in the two-year period then ended, and the related notes (collectively, the "consolidated financial statements") and the consolidated financial highlights for each of the years in the four-year period then ended. In our opinion, the consolidated financial statements and consolidated financial highlights present fairly, in all material respects, the financial position of Credit Suisse Managed Futures Strategy Fund as of October 31, 2018, the results of its operations for the year then ended, the changes in its net assets for each of the years in the two-year period then ended, and the consolidated financial highlights for each of the years in the four-year period then ended, in conformity with U.S. generally accepted accounting principles. The consolidated financial highlights for the year ended October 31, 2014 were audited by other independent registered public accountants whose report, dated December 29, 2014, expressed an unqualified opinion on those consolidated financial highlights.
Basis for Opinion
These consolidated financial statements and consolidated financial highlights are the responsibility of the Fund's management. Our responsibility is to express an opinion on these consolidated financial statements and consolidated financial highlights based on our audits. We are a public accounting firm registered with the Public Company Accounting Oversight Board (United States) (PCAOB) and are required to be independent with respect to the Fund in accordance with the U.S. federal securities laws and the applicable rules and regulations of the Securities and Exchange Commission and the PCAOB.
We conducted our audits in accordance with the standards of the PCAOB. Those standards require that we plan and perform the audit to obtain reasonable assurance about whether the consolidated financial statements and consolidated financial highlights are free of material misstatement, whether due to error or fraud. Our audits included performing procedures to assess the risks of material misstatement of the consolidated financial statements and consolidated financial highlights, whether due to error or fraud, and performing procedures that
31
Credit Suisse Managed Futures Strategy Fund
Report of Independent Registered Public Accounting Firm (continued)
respond to those risks. Such procedures included examining, on a test basis, evidence regarding the amounts and disclosures in the consolidated financial statements and consolidated financial highlights. Such procedures also included confirmation of securities owned as of October 31, 2018, by correspondence with the custodian and brokers or by other appropriate auditing procedures. Our audits also included evaluating the accounting principles used and significant estimates made by management, as well as evaluating the overall presentation of the consolidated financial statements and consolidated financial highlights. We believe that our audits provide a reasonable basis for our opinion.

We have served as the auditor of one or more Credit Suisse Asset Management, LLC investment companies since 2015.
New York, New York
December 28, 2018
32
Credit Suisse Managed Futures Strategy Fund
Information Concerning Trustees and Officers (unaudited)
Name, Address
(Year of Birth) | | Position(s)
Held with
Fund | | Term
of Office1
and
Length
of Time
Served | | Principal
Occupation(s) During
Past Five Years | | Number of
Portfolios
in Fund
Complex
Overseen
by Trustee | | Other
Trusteeships
Held by Trustee
During Past Five Years | |
Independent Trustees | | | | | | | | | | | |
Laura A. DeFelice
c/o Credit Suisse Asset
Management, LLC
Attn: General Counsel
Eleven Madison Avenue
New York, New York
10010
(1959) | | Trustee, Nominating and Audit Committee member | | Since 2017 | | Partner of Acacia Properties LLC (multi-family and commercial real estate ownership and operation) from 2008 to present; Stonegate Advisors LLC (renewable energy and energy efficiency) from 2007 to present. | | | 8 | | | None | |
Jeffrey E. Garten
c/o Credit Suisse Asset Management, LLC
Attn: General Counsel Eleven Madison Avenue New York, New York 10010
(1946) | | Trustee, Nominating and Audit Committee member | | Since Fund Inception | | Dean Emeritus of Yale School of Management from July 2015 to present; The Juan Trippe Professor in the Practice of International Trade, Finance and Business, from July 2005 to July 2015; Partner and Chairman of Garten Rothkopf (consulting firm) from October 2005 to June 2017. | | | 8 | | | Director of Aetna, Inc. (insurance company); Director of CarMax Group (used car dealers); Director of Miller Buckfire & Co., LLC (financial restructuring); Member of Standard & Poor's Board of Managers (credit rating agency) from December 2011 to November 2014. | |
1 Subject to the Trust's retirement policy, each Trustee may continue to serve as a Trustee until the last day of the calendar year in which the applicable Trustee attains age 75. Officer serves until his or her respective successor has been duly elected and qualified.
33
Credit Suisse Managed Futures Strategy Fund
Information Concerning Trustees and Officers (unaudited) (continued)
Name, Address
(Year of Birth) | | Position(s)
Held with
Fund | | Term
of Office1
and
Length
of Time
Served | | Principal
Occupation(s) During
Past Five Years | | Number of
Portfolios
in Fund
Complex
Overseen
by Trustee | | Other
Trusteeships
Held by Trustee
During Past Five Years | |
Independent Trustees | | | | | | | | | | | |
Mahendra R. Gupta c/o Credit Suisse Asset Management, LLC Attn: General Counsel Eleven Madison Avenue New York, New York 10010
(1956) | | Trustee, Nominating Committee member and Audit Committee Chairman | | Since 2017 | | Professor, Washington University in St. Louis from July 1990 to present; Dean of Olin Business School at Washington University in St. Louis from July 2005 to July 2016; Partner, R.J. Mithaiwala (food manufacturing and retail, India) from March 1977 to present; Partner, F.F.B. Corporation (agriculture, India) from March 1977 to present; Partner, RPMG Research Corporation (benchmark research) from July 2001 to present. | | | 8 | | | Director of Caleres Inc. (footwear) from May 2012 to present; Director of Koch Development Corporation (real estate development) from November 2017 to present; Director of Supernova (fin-tech) from June 2014 to present. | |
1 Subject to the Trust's retirement policy, each Trustee may continue to serve as a Trustee until the last day of the calendar year in which the applicable Trustee attains age 75. Officer serves until his or her respective successor has been duly elected and qualified.
34
Credit Suisse Managed Futures Strategy Fund
Information Concerning Trustees and Officers (unaudited) (continued)
Name, Address
(Year of Birth) | | Position(s)
Held with
Fund | | Term
of Office1
and
Length
of Time
Served | | Principal
Occupation(s) During
Past Five Years | | Number of
Portfolios
in Fund
Complex
Overseen
by Trustee | | Other
Trusteeships
Held by Trustee
During Past Five Years | |
Independent Trustees | | | | | | | | | | | |
Steven N. Rappaport
Lehigh Court, LLC
555 Madison Avenue
29th Floor
New York, New York
10022
(1948) | | Chairman of the Board, Nominating Committee Chairman and Audit Committee member | | Trustee since Fund Inception and Chairman since 2005 | | Partner of Lehigh Court, LLC and RZ Capital (private investment firms) from July 2002 to present; Partner of Backstage Acquisition Holdings, LLC (publication job postings) from November 2013 to present. | | | 9 | | | Director of iCAD, Inc. (surgical and medical instruments and apparatus company); Director of Aberdeen Emerging Markets Equity Income Fund, Inc., (a closed-end investment company); Director of Aberdeen Funds (30 open-end portfolios); Director of Wood Resources, LLC (plywood manufacturing company) from 2003 to October 2013. | |
Interested Trustee | | | | | | | | | | | |
John G. Popp2
Credit Suisse Asset
Management, LLC
Eleven Madison Avenue
New York, New York
10010
(1956) | | Trustee, Chief Executive Officer and President | | Trustee since 2017
Chief Executive Officer and President since 2010 | | Managing Director of Credit Suisse; Global Head and Chief Investment Officer of the Credit Investments Group; Associated with Credit Suisse or its predecessor since 1997; President and Chief Executive Officer of other Credit Suisse Funds. | | | 9 | | | None | |
1 Subject to the Trust's retirement policy, each Trustee may continue to serve as a Trustee until the last day of the calendar year in which the applicable Trustee attains age 75. Officer serves until his or her respective successor has been duly elected and qualified.
2 Mr. Popp is an "interested person" of the Trust, as defined in the 1940 Act, by virtue of his current position as an officer of Credit Suisse.
35
Credit Suisse Managed Futures Strategy Fund
Information Concerning Trustees and Officers (unaudited) (continued)
Name, Address
(Year of Birth) | | Position(s)
Held with
Fund | | Term of
Office1
and
Length of
Time
Served | | Principal Occupation(s) During Past Five Years | |
Officers* | | | | | | | |
Emidio Morizio
Credit Suisse Asset
Management, LLC
Eleven Madison Avenue
New York, New York 10010
(1966) | | Chief Compliance Officer | | Since Fund Inception | | Managing Director and Global Head of Compliance of Credit Suisse since 2010; Associated with Credit Suisse since July 2000; Officer of other Credit Suisse Funds. | |
Lou Anne McInnis
Credit Suisse Asset Management, LLC
Eleven Madison Avenue
New York, New York 10010
(1959) | | Chief Legal Officer | | Since 2015 | | Director of Credit Suisse; Associated with Credit Suisse since April 2015; Counsel at DLA Piper US LLP from 2011 to April 2015; Associated with Morgan Stanley Investment Management from 1997 to 2010; Officer of other Credit Suisse Funds. | |
Laurie Pecha
Credit Suisse Asset
Management, LLC
Eleven Madison Avenue
New York, New York 10010
(1961) | | Chief Financial Officer and Treasurer | | Chief Financial Officer since 2016 and Treasurer since 2018 | | Director of Credit Suisse since August 2016; Senior Consultant of Spectra Professional Services, LLC from January 2012 to July 2016; Vice President of Legg Mason & Co. from March 2007 to December 2011; Officer of other Credit Suisse Funds. | |
Karen Regan
Credit Suisse Asset
Management, LLC
Eleven Madison Avenue
New York, New York 10010
(1963) | | Vice President and Secretary | | Since 2010 | | Vice President of Credit Suisse; Associated with Credit Suisse since December 2004; Officer of other Credit Suisse Funds. | |
1 Subject to the Trust's retirement policy, each Trustee may continue to serve as a Trustee until the last day of the calendar year in which the applicable Trustee attains age 75. Officer serves until his or her respective successor has been duly elected and qualified.
* The officers of the Fund shown are officers that make policy decisions.
The Statement of Additional Information includes additional information about the Trustees and is available, without charge, upon request, by calling 877-870-2874.
36
Credit Suisse Managed Futures Strategy Fund
Proxy Voting and Portfolio Holdings Information (unaudited)
Information regarding how the Fund voted proxies related to its portfolio securities during the 12-month period ended June 30 of each year, as well as the policies and procedures that the Fund uses to determine how to vote proxies relating to its portfolio securities are available:
• By calling 1-877-870-2874
• On the Fund's website, www.credit-suisse.com/us/funds
• On the website of the Securities and Exchange Commission, www.sec.gov
The Fund files a complete schedule of its portfolio holdings for the first and third quarters of its fiscal year with the SEC on Form N-Q. The Fund's Forms N-Q are available on the SEC's website at www.sec.gov and may be reviewed and copied at the SEC's Public Reference Room in Washington, DC. Information on the operation of the SEC's Public Reference Room may be obtained by calling 1-202-551-8090.
37

P.O. BOX 219916, KANSAS CITY, MO 64121-9916
877-870-2874 n www.credit-suisse.com/us/funds
CREDIT SUISSE SECURITIES (USA) LLC, DISTRIBUTOR. MFS-AR-1018

CREDIT SUISSE FUNDS
Annual Report
October 31, 2018
n CREDIT SUISSE
MULTIALTERNATIVE STRATEGY FUND
The Fund's investment objectives, risks, charges and expenses (which should be considered carefully before investing), and more complete information about the Fund, are provided in the Prospectus, which should be read carefully before investing. You may obtain additional copies by calling 877-870-2874 or by visiting our website at www.credit-suisse.com/us/funds.
Credit Suisse Securities (USA) LLC, Distributor, is located at Eleven Madison Avenue, New York, NY 10010. Credit Suisse Funds are advised by Credit Suisse Asset Management, LLC.
Investors in the Credit Suisse Funds should be aware that they may be eligible to purchase Class I shares (where offered) directly or through certain intermediaries. Such shares are not subject to a sales charge. Investors in the Credit Suisse Funds should also be aware that they may be eligible for a reduction or waiver of the sales charge with respect to Class A or C shares (where offered). For more information, please review the relevant prospectuses or consult your financial representative.
Fund shares are not deposits or other obligations of Credit Suisse Asset Management, LLC ("Credit Suisse") or any affiliate, are not FDIC-insured and are not guaranteed by Credit Suisse or any affiliate. Fund investments are subject to investment risks, including loss of your investment.
Credit Suisse Multialternative Strategy Fund
Annual Investment Adviser's Report
October 31, 2018 (unaudited)
November 23, 2018
Dear Shareholder:
We are pleased to present this Annual Report covering the activities of the Credit Suisse Multialternative Strategy Fund (the "Fund") for the 12-month period ended October 31, 2018.
Performance Summary
11/1/2017 – 10/31/2018(a)
Fund & Benchmark | | Performance | |
| Class I1 | | | -0.29 | % | |
| Class A1,2 | | | -0.68 | % | |
| Credit Suisse Hedge Fund Index3 | | | -0.45 | % | |
| Credit Suisse Liquid Alternative Beta Index4 | | | -2.43 | % | |
Performance shown for the Fund's Class A shares does not reflect sales charges, which are a maximum of 5.25%.2
Market Review: A disappointing period for multialternative strategies
The annual period ended October 31, 2018 was a challenging one for multialternative strategies. The Credit Suisse Hedge Fund Index, the Fund's primary benchmark, returned -0.45%, while the Credit Suisse Liquid Alternative Beta Index returned -2.43%.
Within the hedge fund space, fixed income arbitrage strategies generated the strongest performance, as they benefitted from changing inflation expectations, asynchronous central banking policy and an elevated level of interest rate volatility.
Emerging markets (EM) focused funds suffered most, as smaller currency carry differentials and a rising U.S. Dollar (USD) reduced investor appetite for EM assets.
Managed futures funds also struggled during the period, as price trend reversals were common, particularly in the equity and fixed income markets. Aside from the upward trend of the USD, persistent, exploitable trends were scarce.
(a) Class C performance for the period November 1, 2017 through February 14, 2018 was 0.85%. As of February 15, 2018, Class C has no shareholders.
1
Credit Suisse Multialternative Strategy Fund
Annual Investment Adviser's Report (continued)
October 31, 2018 (unaudited)
Strategic Review and Outlook: Mixed results from an interesting period
The Credit Suisse Multialternative Strategy Fund is designed to provide investors with efficient exposure to a variety of investment strategies spanning a broad range of markets and asset classes.
For the annual period ended October 31, 2018, the Fund's Class I shares outperformed its benchmarks. While the Fund experienced detractions in EM and managed futures strategies, larger exposure to profitable fixed income strategies led to the relative outperformance.
From an asset class attribution standpoint, profits were headlined by fixed income strategies, followed by equity and commodity strategies. Volatility, FX, and multi-asset strategies all detracted from Fund performance.
Within fixed income, carry and trend/momentum strategies were the most profitable styles. Carry strategies exploited the slope and curvature features of developed market yield curves, while trend/momentum strategy profits centered on the sharp upward move in short-term funding rates at the beginning of the year.
Value exposures in commodities also contributed meaningfully to Fund performance. Sources of gains included relative value positions in fundamentally linked commodity pairs, as well as positions designed to capture price reversion associated with speculative positioning dynamics across the commodity complex.
Consistent with the contours of hedge fund performance described above, the Fund's multi-asset trend/momentum strategies suffered losses as persistent, exploitable trends were scarce and many markets exhibited frequent, sharp reversals.
The Fund's FX value strategies incurred losses as EM currencies persistently trended lower in the face of flaring trade tensions and higher USD interest rates. Volatility liquidity/insurance strategies accounted for the Fund's largest losses over the period, following the reversal of historically low levels of realized volatility in equity markets.
The Quantitative Investment Strategies Group
Yung-Shin Kung
Sheel Dhande
The Fund is non-diversified, which means it may invest a greater proportion of its assets in the securities of a smaller number of issuers than a diversified mutual fund
2
Credit Suisse Multialternative Strategy Fund
Annual Investment Adviser's Report (continued)
October 31, 2018 (unaudited)
and may therefore be subject to greater volatility. The Fund's investment in alternative instruments may subject the Fund to greater volatility than investments in traditional securities, particularly in investments involving leverage.
The use of alternative assets and strategies entails substantial risks, including risk of loss of principal, arbitrage or fundamental risk, below investment grade securities risk, commodity exposure risks, concentration risk, credit risk, derivatives risk, exchange traded notes risk, fixed income risk, foreign securities risk, forwards risk, futures contracts risk, interest rate risk, leveraging risk, market risk, portfolio turnover risk, risks of investing in other funds, small- and mid- cap stock risk, speculative exposure risk, subsidiary risk, swap agreements risk and tax risk. For a detailed discussion of these and other risks, please refer to the Fund's Prospectus, which should be read carefully before investing.
In addition to historical information, this report contains forward-looking statements, which may concern, among other things, domestic and foreign markets, industry and economic trends and developments and government regulation, and their potential impact on the Fund's investments. These statements are subject to risks and uncertainties and actual trends, developments and regulations in the future, and their impact on the Fund, could be materially different from those projected, anticipated or implied. The Fund has no obligation to update or revise forward-looking statements.
The views of the Fund's management are as of the date of this letter and the Fund holdings described in this document are as of October 31, 2018; these views and Fund holdings may have changed subsequent to these dates. Nothing in this document is a recommendation to purchase or sell securities.
3
Credit Suisse Multialternative Strategy Fund
Annual Investment Adviser's Report (continued)
October 31, 2018 (unaudited)
Comparison of Change in Value of $10,000 Investment in the
Credit Suisse Multialternative Strategy Fund1 Class I shares,
Class A shares2, the Credit Suisse Hedge Fund Index3 and
the Credit Suisse Liquid Alternative Beta Index4
from Inception (03/30/12)
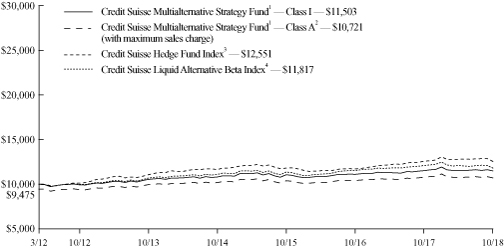
1 Fee waivers and/or expense reimbursements reduce expenses for the Fund, without which performance would be lower. The Fund entered into a written contract to limit expenses to 0.85% of the Fund's average daily net assets for Class I shares, 1.10% of the Fund's average daily net assets for Class A shares and 1.85% of the Fund's average daily net assets for Class C shares through at least February 28, 2020. This limit excludes certain expenses, as set forth in the Fund's Prospectus.
2 Total return for the Fund's Class A shares for the reporting period, based on offering price (including maximum sales charge of 5.25%), was (5.90)%. Total return for the Fund's Class C shares for the period November 1, 2017 through February 14, 2018, based on redemption value including maximum contingent deferred sales charge (CDSC) of 1.00%, was (0.11)%.
3 The Credit Suisse Hedge Fund Index is compiled by Credit Suisse Asset Management, LLC. It is an asset-weighted hedge fund index and includes only hedge funds. It is rebalanced semiannually, is shown net of all performance fees and provides a rules-based and investable index, enabling investors to utilize the performance of a diversified market barometer for the hedge fund industry. It is the exclusive property of Credit Suisse Asset Management, LLC. The index does not have transaction costs and investors may not invest directly in the index.
4 The Credit Suisse Liquid Alternative Beta Index reflects the return of a dynamic basket of liquid, investable market factors selected and weighted in accordance with an algorithm that aims to approximate the aggregate returns of the universe of hedge fund managers as represented by the Credit Suisse Hedge Fund Index. The index does not have transaction costs and investors may not invest directly in the index.
4
Credit Suisse Multialternative Strategy Fund
Annual Investment Adviser's Report (continued)
October 31, 2018 (unaudited)
Average Annual Returns as of October 31, 20181
| | | 1 Year | | 5 Years | | Since
Inception2 | |
Class I | | | (0.29 | )% | | | 1.73 | % | | | 2.15 | % | |
Class A Without Sales Charge | | | (0.68 | )% | | | 1.46 | % | | | 1.89 | % | |
Class A With Maximum Sales Charge | | | (5.90 | )% | | | 0.37 | % | | | 1.06 | % | |
Class C Without CDSC3 | | | 1.75 | % | | | 1.77 | % | | | 1.64 | % | |
Class C With CDSC3 | | | 0.78 | % | | | 1.77 | % | | | 1.64 | % | |
Returns represent past performance and include change in share price and reinvestment of dividends and capital gain distributions, if any. Past performance cannot guarantee future results. The current performance of the Fund may be lower or higher than the figures shown. Returns and share price will fluctuate, and redemption value may be more or less than original cost. The performance results do not reflect the deduction of taxes that a shareholder would pay on Fund distributions or the redemption of Fund shares. Performance information current to the most recent month end is available at www.credit-suisse.com/us/funds.
The annualized gross expense ratios are 1.84% for Class I shares and 2.08% for Class A shares. The annualized net expense ratios after fee waivers and/or expense reimbursements and excluding securities sold short dividend expense are 0.85% for Class I shares and 1.10% for Class A.
1 Fee waivers and/or expense reimbursements reduce expenses for the Fund, without which performance would be lower. The Fund entered into a written contract to limit expenses to 0.85% of the Fund's average daily net assets for Class I shares, 1.10% of the Fund's average daily net assets for Class A shares and 1.85% of the Fund's average daily net assets for Class C shares through at least February 28, 2020. This limit excludes certain expenses, as set forth in the Fund's Prospectus.
2 Inception Date: March 30, 2012.
3 Returns are for the one-year and five-year periods ending February 14, 2018, and for the period from inception through February 14, 2018. Class C was redeemed on February 15, 2018 and currently has no shareholders.
5
Credit Suisse Multialternative Strategy Fund
Annual Investment Adviser's Report (continued)
October 31, 2018 (unaudited)
Information About Your Fund's Expenses
As an investor of the Fund, you incur two types of costs: ongoing expenses and transaction costs. Ongoing expenses include management fees, distribution and service (12b-1) fees and other Fund expenses. Examples of transaction costs include sales charges (loads), redemption fees and account maintenance fees, which are not shown in this section and which would result in higher total expenses. The following table is intended to help you understand your ongoing expenses of investing in the Fund and to help you compare these expenses with the ongoing expenses of investing in other mutual funds. The table is based on an investment of $1,000 made at the beginning of the six months ended October 31, 2018.
The table illustrates your Fund's expenses in two ways:
• Actual Fund Return. This helps you estimate the actual dollar amount of ongoing expenses paid on a $1,000 investment in the Fund using the Fund's actual return during the period. To estimate the expenses you paid over the period, simply divide your account value by $1,000 (for example, an $8,600 account value divided by $1,000 = 8.6), then multiply the result by the number in the "Expenses Paid per $1,000" line.
• Hypothetical 5% Fund Return. This helps you to compare the Fund's ongoing expenses with those of other mutual funds using the Fund's actual expense ratio and a hypothetical rate of return of 5% per year before expenses. Examples using a 5% hypothetical fund return may be found in the shareholder reports of other mutual funds. The hypothetical account values and expenses may not be used to estimate the actual ending account balance or expenses you paid for the period.
Please note that the expenses shown in these tables are meant to highlight your ongoing expenses only and do not reflect any transaction costs, such as sales charges (loads) or redemption fees. If these transaction costs had been included, your costs would have been higher. The "Expenses Paid per $1,000" line of the tables is useful in comparing ongoing expenses only and will not help you determine the relative total expenses of owning different funds.
6
Credit Suisse Multialternative Strategy Fund
Annual Investment Adviser's Report (continued)
October 31, 2018 (unaudited)
Expenses and Value for a $1,000 Investment
for the six-month period ended October 31, 2018
Actual Fund Return | | Class I | | Class A | |
Beginning Account Value 05/01/18 | | $ | 1,000.00 | | | $ | 1,000.00 | | |
Ending Account Value 10/31/18 | | $ | 995.00 | | | $ | 993.00 | | |
Expenses Paid per $1,000* | | $ | 4.48 | | | $ | 5.73 | | |
Hypothetical 5% Fund Return | |
Beginning Account Value 05/01/18 | | $ | 1,000.00 | | | $ | 1,000.00 | | |
Ending Account Value 10/31/18 | | $ | 1,020.72 | | | $ | 1,019.46 | | |
Expenses Paid per $1,000* | | $ | 4.53 | | | $ | 5.80 | | |
| | | Class I | | Class A | |
Annualized Expense Ratios** | | | 0.89 | % | | | 1.14 | % | |
* Expenses are equal to the Fund's annualized expense ratio for each share class, multiplied by the average account value over the period, multiplied by 184/365 to reflect the one-half year period.
The "Expenses Paid per $1,000" and the "Annualized Expense Ratios" in the tables are based on actual expenses paid by the Fund during the period, net of fee waivers and/or actual expense reimbursements, if applicable. If those fee waivers and/or expense reimbursements had not been in effect, the Fund's actual expenses would have been higher. Expenses do not reflect additional charges and expenses that are, or may be, imposed under the variable contracts or plans. Such charges and expenses are described in the prospectus of the insurance company separate account or in the plan documents or other informational materials supplied by plan sponsors. The Fund's expenses should be considered with these charges and expenses in evaluating the overall cost of investing in the separate account.
For more information, please refer to the Fund's Prospectus.
7
Credit Suisse Multialternative Strategy Fund
Annual Investment Adviser's Report (continued)
October 31, 2018 (unaudited)
Investment Type Breakdown*
Common Stocks | | | 61.34 | % | |
Exchange-Traded Funds | | | 38.42 | | |
Purchased Options | | | 0.24 | | |
Total | | | 100.00 | % | |
* Expressed as a percentage of total investments (excluding securities lending collateral, if applicable) and may vary over time.
8
Credit Suisse Multialternative Strategy Fund
Consolidated Schedule of Investments
October 31, 2018
| | | Number of
Shares | | Value | |
| COMMON STOCKS (28.4%) | |
| BELGIUM (0.3%) | |
| Insurance (0.3%) | |
Ageas | | | 6,175 | | | $ | 309,075 | | |
| CANADA (1.1%) | |
| Metals & Mining (1.1%) | |
Nevsun Resources Ltd.(1) | | | 255,691 | | | | 1,139,000 | | |
| DENMARK (1.5%) | |
| Banks (0.2%) | |
Danske Bank AS | | | 9,963 | | | | 190,742 | | |
| Chemicals (0.3%) | |
Novozymes AS, Class B | | | 6,148 | | | | 303,720 | | |
| Electrical Equipment (0.3%) | |
Vestas Wind Systems AS | | | 5,038 | | | | 316,041 | | |
| Healthcare Equipment & Supplies (0.2%) | |
William Demant Holding AS(1) | | | 7,750 | | | | 254,841 | | |
| Pharmaceuticals (0.3%) | |
Novo Nordisk AS, Class B | | | 6,788 | | | | 293,248 | | |
| Textiles, Apparel & Luxury Goods (0.2%) | |
Pandora AS | | | 4,572 | | | | 285,828 | | |
| | | | 1,644,420 | | |
| FINLAND (0.3%) | |
| Computers & Peripherals (0.3%) | |
Nokia Oyj | | | 54,119 | | | | 305,803 | | |
| FRANCE (0.3%) | |
| Electrical Equipment (0.3%) | |
Schneider Electric SE | | | 3,736 | | | | 270,249 | | |
| GERMANY (0.9%) | |
| Insurance (0.6%) | |
Allianz SE, Reg S(2) | | | 1,508 | | | | 314,257 | | |
Muenchener Rueckversicherungs-Gesellschaft AG, Reg S(2) | | | 1,474 | | | | 316,705 | | |
| | | | 630,962 | | |
| Machinery (0.3%) | |
GEA Group AG | | | 9,221 | | | | 280,288 | | |
| | | | 911,250 | | |
| ISRAEL (1.8%) | |
| Household Durables (1.8%) | |
SodaStream International Ltd.(1) | | | 13,098 | | | | 1,878,122 | | |
See Accompanying Notes to Consolidated Financial Statements.
9
Credit Suisse Multialternative Strategy Fund
Consolidated Schedule of Investments (continued)
October 31, 2018
| | | Number of
Shares | | Value | |
| COMMON STOCKS (continued) | |
| ITALY (0.2%) | |
| Automobiles (0.2%) | |
Ferrari NV | | | 2,290 | | | $ | 268,258 | | |
| JERSEY (0.2%) | |
| Trading Companies & Distributors (0.2%) | |
Ferguson PLC | | | 3,847 | | | | 259,272 | | |
| NETHERLANDS (1.4%) | |
| Insurance (0.3%) | |
NN Group NV | | | 7,796 | | | | 334,863 | | |
| Media (0.3%) | |
Altice Europe NV, Class B(1) | | | 9,627 | | | | 22,980 | | |
Wolters Kluwer NV | | | 5,563 | | | | 315,726 | | |
| | | | 338,706 | | |
| Software (0.8%) | |
Gemalto NV(1) | | | 15,254 | | | | 870,399 | | |
| | | | 1,543,968 | | |
| SWEDEN (0.3%) | |
| Tobacco (0.3%) | |
Swedish Match AB | | | 6,205 | | | | 316,471 | | |
| SWITZERLAND (1.1%) | |
| Electrical Equipment (0.3%) | |
ABB Ltd., Reg S(2) | | | 13,877 | | | | 279,574 | | |
| Insurance (0.6%) | |
Baloise Holding AG, Reg S(2) | | | 2,088 | | | | 298,815 | | |
Swiss Re AG | | | 3,515 | | | | 317,562 | | |
| | | | 616,377 | | |
| Professional Services (0.2%) | |
SGS S.A., Reg S(2) | | | 114 | | | | 271,092 | | |
| | | | 1,167,043 | | |
| UNITED KINGDOM (6.9%) | |
| Airlines (0.3%) | |
International Consolidated Airlines Group S.A. | | | 34,905 | | | | 269,432 | | |
| Beverages (0.3%) | |
Diageo PLC | | | 8,817 | | | | 304,710 | | |
| Food Products (0.3%) | |
Unilever PLC | | | 5,688 | | | | 301,185 | | |
| Household Durables (0.3%) | |
Berkeley Group Holdings PLC | | | 6,307 | | | | 281,781 | | |
See Accompanying Notes to Consolidated Financial Statements.
10
Credit Suisse Multialternative Strategy Fund
Consolidated Schedule of Investments (continued)
October 31, 2018
| | | Number of
Shares | | Value | |
| COMMON STOCKS (continued) | |
UNITED KINGDOM | |
| Insurance (2.1%) | |
Jardine Lloyd Thompson Group PLC | | | 92,434 | | | $ | 2,227,507 | | |
| Internet Software & Services (0.3%) | |
Auto Trader Group PLC(3) | | | 56,036 | | | | 292,705 | | |
| Media (0.9%) | |
Pearson PLC | | | 26,892 | | | | 308,825 | | |
RELX PLC(1) | | | 30,341 | | | | 600,219 | | |
| | | 909,044 | | |
| Metals & Mining (0.5%) | |
Rio Tinto Ltd. | | | 5,225 | | | | 284,545 | | |
Rio Tinto PLC | | | 5,772 | | | | 280,136 | | |
| | | | 564,681 | | |
| Multi-Utilities (0.3%) | |
National Grid PLC | | | 28,218 | | | | 297,991 | | |
| Multiline Retail (0.2%) | |
Next PLC | | | 3,981 | | | | 264,376 | | |
| Professional Services (0.3%) | |
Experian PLC | | | 12,621 | | | | 290,170 | | |
| Real Estate Investment Trusts (0.5%) | |
Land Securities Group PLC | | | 25,038 | | | | 272,270 | | |
The British Land Co. PLC | | | 35,195 | | | | 265,710 | | |
| | | | 537,980 | | |
| Specialty Retail (0.2%) | |
Kingfisher PLC | | | 79,656 | | | | 258,565 | | |
| Textiles, Apparel & Luxury Goods (0.2%) | |
Burberry Group PLC | | | 10,953 | | | | 253,356 | | |
| Trading Companies & Distributors (0.2%) | |
Ashtead Group PLC | | | 10,531 | | | | 259,885 | | |
| | | 7,313,368 | | |
| UNITED STATES (12.1%) | |
| Healthcare Equipment & Supplies (0.4%) | |
K2M Group Holdings, Inc.(1) | | | 13,376 | | | | 366,235 | | |
| Insurance (2.8%) | |
Aspen Insurance Holdings, Ltd. | | | 44,435 | | | | 1,860,938 | | |
Navigators Group, Inc. | | | 16,183 | | | | 1,119,054 | | |
| | | | 2,979,992 | | |
| Multi-Utilities (1.7%) | |
Vectren Corp. | | | 25,267 | | | | 1,807,349 | | |
| Professional Services (1.7%) | |
Dun & Bradstreet Corp. | | | 13,045 | | | | 1,856,043 | | |
See Accompanying Notes to Consolidated Financial Statements.
11
Credit Suisse Multialternative Strategy Fund
Consolidated Schedule of Investments (continued)
October 31, 2018
| | | Number of
Shares | | Value | |
| COMMON STOCKS (continued) | |
UNITED STATES | |
| Real Estate Investment Trusts (1.9%) | |
Forest City Realty Trust, Inc. | | | 79,431 | | | $ | 1,998,484 | | |
| Semiconductor Equipment & Products (1.6%) | |
Integrated Device Technology, Inc.(1) | | | 36,535 | | | | 1,710,203 | | |
| Software (1.7%) | |
CA, Inc. | | | 41,333 | | | | 1,833,532 | | |
| Specialty Retail (0.3%) | |
Rent-A-Center, Inc.(1) | | | 24,465 | | | | 348,626 | | |
| | | 12,900,464 | | |
| TOTAL COMMON STOCKS (Cost $31,415,498) | | | 30,226,763 | | |
| EXCHANGE-TRADED FUNDS (17.8%) | |
| UNITED STATES (17.8%) | |
| Diversified Financial Services (17.8%) | |
Alerian MLP ETF(4) | | | 161,274 | | | | 1,583,711 | | |
Invesco FTSE RAFI Emerging Markets ETF | | | 416,048 | | | | 8,333,441 | | |
iShares U.S. Preferred Stock ETF(4) | | | 159,885 | | | | 5,778,244 | | |
Vanguard FTSE Emerging Markets ETF | | | 85,464 | | | | 3,235,667 | | |
| TOTAL EXCHANGE-TRADED FUNDS (Cost $19,727,278) | | | 18,931,063 | | |
Number of
Contracts | |
| | | | | | | | | |
| PURCHASED OPTIONS (0.1%) | |
| Put Purchased Options (0.1%) | |
| | 88 | | | S&P 500 Index, Strike @ 2,580, expires 11/16/18 (Cost $82,460) | | | | | | | | | | | | | | | 118,800 | | |
| SHORT-TERM INVESTMENT (2.9%) | |
State Street Navigator Securities Lending Government Money Market Portfolio, 2.22%(5)
(Cost $3,047,959) | | | 3,047,959 | | | | 3,047,959 | | |
| TOTAL INVESTMENTS AT VALUE (49.2%) (Cost $54,273,195) | | | 52,324,585 | | |
| OTHER ASSETS IN EXCESS OF LIABILITIES (50.8%) | | | 53,975,574 | | |
| NET ASSETS (100.0%) | | $ | 106,300,159 | | |
(1) Non-income producing security.
(2) REG S: Securities sold under Regulation S may not be offered, sold or delivered within the United States or to, or for the account or benefit of, U.S. persons, except pursuant to an exemption from, or in a transaction not subject to, the registration requirements of the Securities Act of 1933.
(3) Security exempt from registration under Rule 144A of the Securities Act of 1933, as amended. These securities may be resold in transactions exempt from registration, normally to qualified institutional buyers. At October 31, 2018, these securities amounted to a value of $292,705 or 0.3% of net assets.
(4) Security or portion thereof is out on loan (See note 2-M).
(5) Represents security purchased with cash collateral received for securities on loan. The rate shown is the annualized one-day yield at October 31, 2018.
See Accompanying Notes to Consolidated Financial Statements.
12
Credit Suisse Multialternative Strategy Fund
Consolidated Schedule of Investments (continued)
October 31, 2018
Forward Foreign Currency Contracts
Forward
Currency to be
Purchased (Local) | | Forward
Currency to be
Sold (Local) | | Expiration
Date | | Counterparty | | Value on
Settlement Date | | Current
Value/
Notional | | Net Unrealized
Appreciation
(Depreciation) | |
AUD | 1,403,705 | | | USD | 1,001,767 | | | 11/20/18 | | BNP Paribas | | $ | 1,001,767 | | | $ | 995,076 | | | $ | (6,691 | ) | |
CAD | 2,035,193 | | | USD | 1,590,479 | | | 12/19/18 | | Goldman Sachs | | | 1,590,479 | | | | 1,551,257 | | | | (39,222 | ) | |
EUR | 942,729 | | | USD | 1,096,689 | | | 12/19/18 | | Goldman Sachs | | | 1,096,689 | | | | 1,072,686 | | | | (24,003 | ) | |
GBP | 1,090,569 | | | USD | 1,442,801 | | | 11/20/18 | | BNP Paribas | | | 1,442,801 | | | | 1,394,537 | | | | (48,264 | ) | |
GBP | 3,298,910 | | | USD | 4,433,602 | | | 12/19/18 | | JPMorgan Chase | | | 4,433,602 | | | | 4,225,309 | | | | (208,293 | ) | |
NOK | 11,985,054 | | | USD | 1,472,794 | | | 11/20/18 | | BNP Paribas | | | 1,472,794 | | | | 1,426,993 | | | | (45,801 | ) | |
NZD | 7,238,946 | | | USD | 4,775,822 | | | 11/20/18 | | BNP Paribas | | | 4,775,822 | | | | 4,727,962 | | | | (47,860 | ) | |
USD | 2,335,769 | | | CAD | 3,019,552 | | | 11/19/18 | | BNP Paribas | | | (2,335,769 | ) | | | (2,299,991 | ) | | | 35,778 | | |
USD | 6,981,382 | | | EUR | 6,013,314 | | | 11/20/18 | | BNP Paribas | | | (6,981,382 | ) | | | (6,822,800 | ) | | | 158,582 | | |
USD | 3,171,491 | | | CHF | 3,129,961 | | | 11/20/18 | | BNP Paribas | | | (3,171,491 | ) | | | (3,116,503 | ) | | | 54,988 | | |
USD | 5,684,896 | | | JPY | 636,456,436 | | | 11/20/18 | | BNP Paribas | | | (5,684,896 | ) | | | (5,646,729 | ) | | | 38,167 | | |
USD | 1,250,317 | | | SEK | 11,089,851 | | | 11/20/18 | | BNP Paribas | | | (1,250,317 | ) | | | (1,215,101 | ) | | | 35,216 | | |
USD | 5,662,572 | | | EUR | 4,807,544 | | | 12/19/18 | | Goldman Sachs | | | (5,662,572 | ) | | | (5,470,274 | ) | | | 192,298 | | |
USD | 7,151,911 | | | GBP | 5,458,391 | | | 12/19/18 | | Goldman Sachs | | | (7,151,911 | ) | | | (6,991,214 | ) | | | 160,697 | | |
USD | 1,875,680 | | | DKK | 11,864,814 | | | 12/19/18 | | JPMorgan Chase | | | (1,875,680 | ) | | | (1,809,967 | ) | | | 65,713 | | |
USD | 1,301,949 | | | CHF | 1,247,624 | | | 12/19/18 | | JPMorgan Chase | | | (1,301,949 | ) | | | (1,246,201 | ) | | | 55,748 | | |
USD | 4,279,857 | | | GBP | 3,298,910 | | | 12/19/18 | | JPMorgan Chase | | | (4,279,857 | ) | | | (4,225,308 | ) | | | 54,549 | | |
USD | 2,709,411 | | | CAD | 3,515,644 | | | 12/19/18 | | Goldman Sachs | | | (2,709,411 | ) | | | (2,679,681 | ) | | | 29,730 | | |
USD | 153,834 | | | SEK | 1,381,741 | | | 12/19/18 | | JPMorgan Chase | | | (153,834 | ) | | | (151,866 | ) | | | 1,968 | | |
| | | $ | 463,300 | | |
Futures Contracts
Contract Description | | Currency | | Expiration
Date | | Number of
Contracts | | Notional
Value | | Net Unrealized
Appreciation
(Depreciation) | |
Contracts to Purchase | |
Agriculture | |
Coffee "C" Futures | | USD | | | | Mar 2019 | | | 78 | | | $ | 3,406,163 | | | $ | (103,974 | ) | |
Corn Futures | | USD | | | | Mar 2019 | | | 505 | | | | 9,487,687 | | | | (64,241 | ) | |
Cotton No. 2 Futures | | USD | | | | Mar 2019 | | | 55 | | | | 2,153,250 | | | | (15,791 | ) | |
Wheat Futures | | USD | | | | Mar 2019 | | | 303 | | | | 7,817,400 | | | | (34,405 | ) | |
| | | $ | (218,411 | ) | |
Energy | |
Brent Crude Oil Futures | | USD | | | | Mar 2019 | | | 170 | | | | 12,765,300 | | | $ | (275,086 | ) | |
Index Contracts | |
CBOE Volatility Index Futures | | USD | | | | Dec 2018 | | | 255 | | | | 5,042,625 | | | $ | 524,034 | | |
CBOE Volatility Index Futures | | USD | | | | Feb 2019 | | | 169 | | | | 3,341,975 | | | | 297,067 | | |
| | | $ | 821,101 | | |
See Accompanying Notes to Consolidated Financial Statements.
13
Credit Suisse Multialternative Strategy Fund
Consolidated Schedule of Investments (continued)
October 31, 2018
Futures Contracts (continued)
Contract Description | | Currency | | Expiration
Date | | Number of
Contracts | | Notional
Value | | Net Unrealized
Appreciation
(Depreciation) | |
Industrial Metals | |
LME Nickel Futures | | USD | | | | Nov 2018 | | | 96 | | | $ | 6,589,728 | | | $ | (981,840 | ) | |
LME Nickel Futures | | USD | | | | Jan 2019 | | | 58 | | | | 3,998,868 | | | | (454,607 | ) | |
LME Primary Aluminum Futures | | USD | | | | Nov 2018 | | | 214 | | | | 10,416,450 | | | | (696,007 | ) | |
LME Primary Aluminum Futures | | USD | | | | Jan 2019 | | | 129 | | | | 6,283,912 | | | | (347,609 | ) | |
LME Zinc Futures | | USD | | | | Nov 2018 | | | 97 | | | | 6,175,869 | | | | (227,631 | ) | |
LME Zinc Futures | | USD | | | | Jan 2019 | | | 58 | | | | 3,621,013 | | | | (67,555 | ) | |
| | | $ | (2,775,249 | ) | |
Interest Rate Contracts | |
10YR AUS Bond Futures | | AUD | | | | Dec 2018 | | | 94 | | | | 8,621,795 | | | $ | 31,402 | | |
10YR JGB Mini Futures | | JPY | | | | Dec 2018 | | | 69 | | | | 9,203,464 | | | | (10,871 | ) | |
| EURO Bund Futures | | EUR | | | | Dec 2018 | | | 181 | | | | 32,866,434 | | | | 89,915 | | |
Long Gilt Futures | | GBP | | | | Dec 2018 | | | 91 | | | | 14,233,248 | | | | 18,523 | | |
| | | $ | 128,969 | | |
Livestock | |
Lean Hogs Futures | | USD | | | | Feb 2019 | | | 96 | | | | 2,508,480 | | | $ | (30,909 | ) | |
Live Cattle Futures | | USD | | | | Feb 2019 | | | 129 | | | | 6,305,520 | | | | (18,407 | ) | |
| | | $ | (49,316 | ) | |
Precious Metals | |
Copper Futures | | USD | | | | Mar 2019 | | | 132 | | | | 8,837,400 | | | $ | (189,313 | ) | |
Gold100 OZ Futures | | USD | | | | Feb 2019 | | | 134 | | | | 16,358,720 | | | | (167,845 | ) | |
Silver Futures | | USD | | | | Mar 2019 | | | 63 | | | | 4,535,685 | | | | (74,134 | ) | |
| | | $ | (431,292 | ) | |
Contracts to Sell | |
Agriculture | |
Coffee "C" Futures | | USD | | | | Dec 2018 | | | (78 | ) | | | (3,296,475 | ) | | $ | 101,601 | | |
Corn Futures | | USD | | | | Dec 2018 | | | (505 | ) | | | (9,172,063 | ) | | | 60,434 | | |
Cotton No. 2 Futures | | USD | | | | Dec 2018 | | | (55 | ) | | | (2,113,650 | ) | | | 16,074 | | |
Wheat Futures | | USD | | | | Dec 2018 | | | (303 | ) | | | (7,582,575 | ) | | | (11,580 | ) | |
| | | $ | 166,529 | | |
Energy | |
Brent Crude Oil Futures | | USD | | | | Jan 2019 | | | (170 | ) | | | (12,756,800 | ) | | $ | 288,885 | | |
Foreign Exchange Contracts | |
| AUD Currency Futures | | USD | | | | Dec 2018 | | | (52 | ) | | | (3,680,040 | ) | | $ | 54,221 | | |
| CAD Currency Futures | | USD | | | | Dec 2018 | | | (58 | ) | | | (4,407,710 | ) | | | 51,427 | | |
EURO Currency Futures | | USD | | | | Dec 2018 | | | (31 | ) | | | (4,400,256 | ) | | | 119,767 | | |
| GBP Currency Futures | | USD | | | | Dec 2018 | | | (47 | ) | | | (3,758,825 | ) | | | 83,496 | | |
See Accompanying Notes to Consolidated Financial Statements.
14
Credit Suisse Multialternative Strategy Fund
Consolidated Schedule of Investments (continued)
October 31, 2018
Futures Contracts (continued)
Contract Description | | Currency | | Expiration
Date | | Number of
Contracts | | Notional
Value | | Net Unrealized
Appreciation
(Depreciation) | |
Contracts to Sell | |
| JPY Currency Futures | | USD | | | | Dec 2018 | | | (36 | ) | | $ | (3,993,975 | ) | | $ | 79,417 | | |
| | | $ | 388,328 | | |
Index Contracts | |
CBOE Volatility Index Futures | | USD | | | | Jan 2019 | | | (526 | ) | | | (10,480,550 | ) | | $ | (1,044,675 | ) | |
Hang Seng Index Futures | | HKD | | | | Nov 2018 | | | (10 | ) | | | (1,588,833 | ) | | | 3,779 | | |
FTSE 100 Index Futures | | GBP | | | | Dec 2018 | | | (31 | ) | | | (2,816,684 | ) | | | (53,924 | ) | |
Nikkei 225 Index Futures OSE | | JPY | | | | Dec 2018 | | | (7 | ) | | | (1,357,140 | ) | | | (25,498 | ) | |
S&P 500 E Mini Index Futures | | USD | | | | Dec 2018 | | | (178 | ) | | | (24,128,790 | ) | | | 1,407,519 | | |
EURO Stoxx 50 Index Futures | | EUR | | | | Dec 2018 | | | (424 | ) | | | (15,344,390 | ) | | | 753,302 | | |
| | | $ | 1,040,503 | | |
Industrial Metals | |
LME Nickel Futures | | USD | | | | Nov 2018 | | | (96 | ) | | | (6,589,728 | ) | | $ | 998,445 | | |
LME Nickel Futures | | USD | | | | Jan 2019 | | | (58 | ) | | | (3,998,868 | ) | | | 425,113 | | |
LME Primary Aluminum Futures | | USD | | | | Nov 2018 | | | (214 | ) | | | (10,416,450 | ) | | | 651,825 | | |
LME Primary Aluminum Futures | | USD | | | | Jan 2019 | | | (129 | ) | | | (6,283,913 | ) | | | 376,453 | | |
LME Zinc Futures | | USD | | | | Nov 2018 | | | (97 | ) | | | (6,175,869 | ) | | | 46,232 | | |
LME Zinc Futures | | USD | | | | Jan 2019 | | | (58 | ) | | | (3,621,012 | ) | | | 190,769 | | |
| | | $ | 2,688,837 | | |
Interest Rate Contracts | |
10YR CAD Bond Futures | | CAD | | | | Dec 2018 | | | (242 | ) | | | (24,352,027 | ) | | $ | 247,479 | | |
10YR U.S. Treasury Note Futures | | USD | | | | Dec 2018 | | | (145 | ) | | | (17,173,438 | ) | | | 91,423 | | |
| | | $ | 338,902 | | |
Livestock | |
Lean Hogs Futures | | USD | | | | Dec 2018 | | | (96 | ) | | | (2,244,480 | ) | | $ | (5,789 | ) | |
Live Cattle Futures | | USD | | | | Dec 2018 | | | (129 | ) | | | (6,034,620 | ) | | | 25,183 | | |
| | | $ | 19,394 | | |
Precious Metals | |
Copper Futures | | USD | | | | Dec 2018 | | | (132 | ) | | | (8,774,700 | ) | | $ | 185,812 | | |
Gold100 OZ Futures | | USD | | | | Dec 2018 | | | (134 | ) | | | (16,281,000 | ) | | | 163,205 | | |
Silver Futures | | USD | | | | Dec 2018 | | | (63 | ) | | | (4,498,830 | ) | | | 72,961 | | |
| | | $ | 421,978 | | |
| | | $ | 2,554,072 | | |
See Accompanying Notes to Consolidated Financial Statements.
15
Credit Suisse Multialternative Strategy Fund
Consolidated Schedule of Investments (continued)
October 31, 2018
Credit Default Swap Contracts Bought
Currency | | Notional
Amount | | Expiration
Date | | Counterparty | | Referenced
Obligation | | Rate
Received
(Paid) | | Credit
Received
at
10/31/2018 | | Market
Value | | Upfront
Premiums
Received | | Upfront
Premiums
Paid | | Net Unrealized
Appreciation
(Depreciation) | |
USD | | | | $ | 4,600,000 | | | 12/20/23 | | JPMorgan
Chase | | CDX HY
CDSI S31
5Y PRC Corp. | | | 5.0 | % | | $ | — | | | $ | (244,148 | ) | | $ | (327,864 | ) | | $ | — | | | $ | 83,716 | | |
Total Return Swap Contracts
Currency | | Notional
Amount | | Expiration
Date | | Counterparty | | Receive | | Pay | | Upfront
Premiums
Paid | | Upfront
Premiums
Received | | Net Unrealized
Appreciation
(Depreciation) | |
USD | | | | $ | 3,156,796 | | |
05/17/19 | |
Barclays
Bank PLC | | Barclays U.S.
Short Variance
Index(a) | |
0.40% | | $ | — | | | $ | — | | | $ | (19,709 | ) | |
USD | | | | | 11,191,919 | | |
06/18/19 | |
Barclays
Bank PLC | | Barclays
Hedging
Insights Index | |
0.15% | | | — | | | | — | | | | 179,431 | | |
USD | | | | | 4,887,714 | | |
06/18/19 | |
Barclays
Bank PLC | | Barclays
Hedging
Insights Index | |
0.15% | | | — | | | | — | | | | 47,955 | | |
USD | | | | | 15,279,122 | | |
06/18/19 | |
Barclays
Bank PLC | | Barclays
Hedging
Insights Index | |
0.15% | | | — | | | | — | | | | 104,766 | | |
USD | | | | | 766,926 | | |
06/18/19 | |
Barclays
Bank PLC | | Barclays
Hedging
Insights Index | |
0.15% | | | — | | | | — | | | | 7,373 | | |
USD | | | | | 480,000 | | |
12/20/18 | |
BNP
Paribas | | iBoxx $
Liquid High
Yield Index | |
2.37% | | | — | | | | — | | | | 4,664 | | |
USD | | | | | 1,000,001 | | |
12/20/18 | |
BNP
Paribas | | iBoxx $
Liquid High
Yield Index | |
2.37% | | | — | | | | — | | | | 14,227 | | |
USD | | | | | 5,360,000 | | |
06/20/19 | |
BNP
Paribas | |
2.37% | | iBoxx $
Liquid High
Yield Index | | | — | | | | — | | | | (167,875 | ) | |
USD | | | | | 8,087,711 | | |
06/21/19 | |
BNP
Paribas | |
2.22% | | Vanguard
FTSE Emerging
Market | | | — | | | | — | | | | 132,378 | | |
USD | | | | | 56,451 | | |
04/24/19 | |
Goldman Sachs | | Connecticut
Water
Service, Inc. | |
2.65% | | | — | | | | — | | | | (49 | ) | |
USD | | | | | 9,604,522 | | |
06/18/19 | |
Deutsche
Bank | | DB Trend
Intraday
Equity Index(b) | |
0.00% | | | — | | | | — | | | | 202,110 | | |
USD | | | | | 13,551,955 | | |
06/18/19 | |
Deutsche
Bank | | DB Trend
Intraday
Equity Index(b) | |
0.00% | | | — | | | | — | | | | 43,603 | | |
USD | | | | | 547,683 | | |
06/18/19 | |
Deutsche
Bank | | DB Trend
Intraday
Equity Index(b) | |
0.00% | | | — | | | | — | | | | 9,512 | | |
See Accompanying Notes to Consolidated Financial Statements.
16
Credit Suisse Multialternative Strategy Fund
Consolidated Schedule of Investments (continued)
October 31, 2018
Total Return Swap Contracts (continued)
Currency | | Notional
Amount | | Expiration
Date | | Counterparty | | Receive | | Pay | | Upfront
Premiums
Paid | | Upfront
Premiums
Received | | Net Unrealized
Appreciation
(Depreciation) | |
USD | | | | $ | 5,078,133 | | |
06/18/19 | |
Deutsche
Bank | | DB Trend
Intraday
Equity Index(b) | |
0.00% | | $ | — | | | $ | — | | | $ | 48,061 | | |
EUR | | | | | 535,529 | | | 11/20/18 | | Goldman Sachs | | Linde AG | | 1.00% | | | — | | | | — | | | | 42,436 | | |
USD | | | | | 558,744 | | | 11/20/18 | | Goldman Sachs | | 1.00% | | Linde PLC | | | — | | | | — | | | | (4,184 | ) | |
USD | | | | | 771,895 | | | 12/17/18 | | Goldman Sachs | | Aetna, Inc. | | 2.65% | | | — | | | | — | | | | (20,157 | ) | |
USD | | | | | 249,777 | | |
12/17/18 | |
Goldman Sachs | |
1.90% | | CVS
Health Corp. | | | — | | | | — | | | | 19,939 | | |
USD | | | | | 19,700,000 | | |
12/20/18 | |
Goldman Sachs | | iBoxx $
Liquid High
Yield Index | |
2.37% | | | — | | | | — | | | | (200,848 | ) | |
USD | | | | | 1,000,000 | | |
12/20/18 | |
Goldman Sachs | | Markit iBoxx
USD Liquid
Levera | |
2.37% | | | — | | | | — | | | | 6,858 | | |
USD | | | | | 294,513 | | |
01/14/19 | |
Goldman Sachs | | 1.90% | | Dominion
Energy, Inc. | | | — | | | | — | | | | 1,763 | | |
USD | | | | | 237,460 | | | 01/14/19 | | Goldman Sachs | | Scana Corp. | | 2.65% | | | — | | | | — | | | | 7,966 | | |
SEK | | | | | 528,403 | | | 01/21/19 | | Goldman Sachs | | 1.00% | | Tele2 AB-B | | | — | | | | — | | | | 15,641 | | |
SEK | | | | | 705,233 | | | 01/21/19 | | Goldman Sachs | | Comhem
Holding | | 1.00% | | | — | | | | — | | | | (21,824 | ) | |
USD | | | | | 661,397 | | | 03/18/19 | | Goldman Sachs | | 1.90% | | Cigna Corp. | | | — | | | | — | | | | 5,856 | | |
USD | | | | | 1,209,690 | | | 03/18/19 | | Goldman Sachs | | Express
Scripts
Holding Co. | | 2.65% | | | — | | | | — | | | | 11,841 | | |
USD | | | | | 206,389 | | | 03/18/19 | | Goldman Sachs | | 1.90% | | Lumentum
Holdings, Inc. | | | — | | | | — | | | | 1,015 | | |
USD | | | | | 502,813 | | | 03/18/19 | | Goldman Sachs | | Oclaro, Inc. | | 2.65% | | | — | | | | — | | | | (17,135 | ) | |
USD | | | | | 709,519 | | | 03/18/19 | | Goldman Sachs | | 1.90% | | Dominion
Energy, Inc. | | | — | | | | — | | | | 4,246 | | |
USD | | | | | 14,449 | | | 03/18/19 | | Goldman Sachs | | 1.90% | | Penn National
Gaming, Inc. | | | — | | | | — | | | | 2,771 | | |
USD | | | | | 37,327 | | | 03/18/19 | | Goldman Sachs | | Pinnacle
Entertainment,
Inc. | | 2.65% | | | — | | | | — | | | | (57 | ) | |
USD | | | | | 571,950 | | | 03/18/19 | | Goldman Sachs | | Scana Corp. | | 2.65% | | | — | | | | — | | | | 19,188 | | |
USD | | | | | 259,952 | | | 03/19/19 | | Goldman Sachs | | Pinnacle
Entertainment,
Inc. | | 2.65% | | | — | | | | — | | | | (399 | ) | |
USD | | | | | 100,604 | | | 03/19/19 | | Goldman Sachs | | 1.90% | | Penn National
Gaming, Inc. | | | — | | | | — | | | | 19,290 | | |
USD | | | | | 4,800,000 | | | 03/20/19 | | Goldman Sachs | | Markit iBoxx
USD Liquid
Levera | | 2.37% | | | — | | | | — | | | | (52,554 | ) | |
USD | | | | | 259,840 | | | 03/25/19 | | Goldman Sachs | | Connecticut
Water
Service, Inc. | | 2.65% | | | — | | | | — | | | | (225 | ) | |
USD | | | | | 373,518 | | | 03/25/19 | | Goldman Sachs | | 1.90% | | KLA-Tencor
Corp. | | | — | | | | — | | | | 29,328 | | |
See Accompanying Notes to Consolidated Financial Statements.
17
Credit Suisse Multialternative Strategy Fund
Consolidated Schedule of Investments (continued)
October 31, 2018
Total Return Swap Contracts (continued)
Currency | | Notional
Amount | | Expiration
Date | | Counterparty | | Receive | | Pay | | Upfront
Premiums
Paid | | Upfront
Premiums
Received | | Net Unrealized
Appreciation
(Depreciation) | |
USD | | | | $ | 889,498 | | | 03/25/19 | | Goldman Sachs | | Orbotech Ltd. | | 2.65% | | $ | — | | | $ | — | | | $ | (48,272 | ) | |
USD | | | | | 671,890 | | | 04/08/19 | | Goldman Sachs | | 1.90% | | CME Group,
Inc. | | | — | | | | — | | | | (5,732 | ) | |
GBP | | | | | 1,132,602 | | | 04/08/19 | | Goldman Sachs | | NEX Group
PLC | | 1.17% | | | — | | | | — | | | | 102,154 | | |
USD | | | | | 826,899 | | | 04/24/19 | | Goldman Sachs | | Aetna, Inc. | | 2.65% | | | — | | | | — | | | | (21,594 | ) | |
USD | | | | | 285,613 | | | 04/24/19 | | Goldman Sachs | | 1.90% | | Cigna Corp. | | | — | | | | — | | | | 2,529 | | |
USD | | | | | 145,897 | | | 04/24/19 | | Goldman Sachs | | 1.90% | | CME Group,
Inc. | | | — | | | | — | | | | (1,245 | ) | |
USD | | | | | 267,478 | | | 04/24/19 | | Goldman Sachs | | 2.65% | | CVS Health
Corp. | | | — | | | | — | | | | 21,352 | | |
USD | | | | | 81,161 | | | 04/24/19 | | Goldman Sachs | | 1.90% | | KLA-Tencor
Corp. | | | — | | | | — | | | | 6,373 | | |
USD | | | | | 89,080 | | | 04/24/19 | | Goldman Sachs | | 1.90% | | Lumentum
Holdings, Inc. | | | — | | | | — | | | | 438 | | |
USD | | | | | 218,280 | | | 04/22/19 | | Goldman Sachs | | 2.65% | | Dominion
Energy, Inc. | | | — | | | | — | | | | 1,306 | | |
USD | | | | | 522,403 | | | 04/22/19 | | Goldman Sachs | | Express
Scripts
Holding Co. | | 2.65% | | | — | | | | — | | | | 5,114 | | |
USD | | | | | 159,186 | | | 04/22/19 | | Goldman Sachs | | Pinnacle
Entertainment,
Inc. | | 2.65% | | | — | | | | — | | | | (244 | ) | |
USD | | | | | 61,612 | | | 04/22/19 | | Goldman Sachs | | 1.90% | | Penn
National
Gaming, Inc. | | | — | | | | — | | | | 11,814 | | |
USD | | | | | 193,361 | | | 04/22/19 | | Goldman Sachs | | Orbotech Ltd. | | 2.65% | | | — | | | | — | | | | (10,494 | ) | |
USD | | | | | 175,964 | | | 04/22/19 | | Goldman Sachs | | Scana Corp. | | 2.65% | | | — | | | | — | | | | 5,903 | | |
USD | | | | | 217,124 | | | 04/22/19 | | Goldman Sachs | | Oclaro, Inc. | | 2.65% | | | — | | | | — | | | | (7,399 | ) | |
USD | | | | | 299,245 | | | 04/22/19 | | Goldman Sachs | | 1.00% | | Linde PLC | | | — | | | | — | | | | (2,241 | ) | |
USD | | | | | 299,081 | | | 04/23/19 | | Goldman Sachs | | 1.00% | | Linde PLC | | | — | | | | — | | | | (2,240 | ) | |
GBP | | | | | 246,216 | | | 04/23/19 | | Goldman Sachs | | NEX
Group PLC | | 1.17% | | | — | | | | — | | | | 22,207 | | |
EUR | | | | | 412,675 | | | 04/23/19 | | Goldman Sachs | | Gemalto | | 0.08% | | | — | | | | — | | | | 1,133 | | |
EUR | | | | | 203,522 | | | 04/23/19 | | Goldman Sachs | | Linde AG | | 1.00% | | | — | | | | — | | | | 16,127 | | |
EUR | | | | | 203,316 | | | 04/23/19 | | Goldman Sachs | | Linde AG | | 1.00% | | | — | | | | — | | | | 16,111 | | |
USD | | | | | 1,687,291 | | | 05/16/19 | | Goldman Sachs | | 0.20% | | Bloomberg
Precious
Metals Index | | | — | | | | — | | | | 131,943 | | |
USD | | | | | 667,429 | | | 05/16/19 | | Goldman Sachs | | Bloomberg
Energy Index | | 0.20% | | | — | | | | — | | | | 5,002 | | |
USD | | | | | 1,309,139 | | | 05/16/19 | | Goldman Sachs | | 0.20% | | Bloomberg
Agriculture
Index | | | — | | | | — | | | | 133,027 | | |
USD | | | | | 1,241,830 | | | 05/16/19 | | Goldman Sachs | | Bloomberg
Energy Index | | 0.20% | | | — | | | | — | | | | 33,905 | | |
See Accompanying Notes to Consolidated Financial Statements.
18
Credit Suisse Multialternative Strategy Fund
Consolidated Schedule of Investments (continued)
October 31, 2018
Total Return Swap Contracts (continued)
Currency | | Notional
Amount | | Expiration
Date | | Counterparty | | Receive | | Pay | | Upfront
Premiums
Paid | | Upfront
Premiums
Received | | Net Unrealized
Appreciation
(Depreciation) | |
USD | | | | $ | 681,845 | | | 05/16/19 | | Goldman Sachs | | 0.20% | | Bloomberg
Industrial
Metals index | | $ | — | | | $ | — | | | $ | 64,831 | | |
USD | | | | | 769,077 | | | 05/16/19 | | Goldman Sachs | | 0.20% | | Bloomberg
Industrial
Metals index | | | — | | | | — | | | | 47,903 | | |
USD | | | | | 32,775,621 | | | 05/16/19 | | Goldman Sachs | | Goldman
Sachs
RP Equity
World Long
Short Series
53 Excess
Index(c) | | 0.20% | | | — | | | | — | | | | 5,425 | | |
USD | | | | | 344,740 | | | 07/01/19 | | Goldman Sachs | | 1.00% | | Linde PLC | | | — | | | | — | | | | (2,582 | ) | |
USD | | | | | 282,162 | | | 07/01/19 | | Goldman Sachs | | 1.90% | | Cigna Corp. | | | — | | | | — | | | | 2,498 | | |
GBP | | | | | 410,709 | | | 07/01/19 | | Goldman Sachs | | NEX
Group PLC | | 1.17% | | | — | | | | — | | | | 37,043 | | |
USD | | | | | 243,646 | | | 07/01/19 | | Goldman Sachs | | 1.90% | | CME Group,
Inc. | | | — | | | | — | | | | (2,079 | ) | |
USD | | | | | 214,452 | | | 07/01/19 | | Goldman Sachs | | Oclaro, Inc. | | 2.65% | | | — | | | | — | | | | (7,308 | ) | |
USD | | | | | 476,094 | | | 07/01/19 | | Goldman Sachs | | Aetna, Inc. | | 2.65% | | | — | | | | — | | | | (12,433 | ) | |
USD | | | | | 135,400 | | | 07/01/19 | | Goldman Sachs | | 1.90% | | KLA-Tencor
Corp. | | | — | | | | — | | | | 10,631 | | |
USD | | | | | 117,446 | | | 07/01/19 | | Goldman Sachs | | 1.90% | | Cadence
Bancorp. | | | — | | | | — | | | | 16,830 | | |
USD | | | | | 88,037 | | | 07/01/19 | | Goldman Sachs | | 1.90% | | Lumentum
Holdings, Inc. | | | — | | | | — | | | | 433 | | |
USD | | | | | 208,382 | | | 07/01/19 | | Goldman Sachs | | MB Financial,
Inc. | | 2.65% | | | — | | | | — | | | | (9,027 | ) | |
USD | | | | | 26 | | | 07/01/19 | | Goldman Sachs | | 1.94% | | Cohu, Inc. | | | — | | | | — | | | | 5 | | |
USD | | | | | 322,545 | | | 07/01/19 | | Goldman Sachs | | Orbotech Ltd. | | 2.65% | | | — | | | | — | | | | (17,504 | ) | |
USD | | | | | 102,767 | | | 07/01/19 | | Goldman Sachs | | 1.90% | | Penn National
Gaming, Inc. | | | — | | | | — | | | | 19,705 | | |
USD | | | | | 94,223 | | | 07/01/19 | | Goldman Sachs | | Service,Inc. | | Connecticut
Water
2.65% | | | — | | | | — | | | | (82 | ) | |
USD | | | | | 154,036 | | | 07/01/19 | | Goldman Sachs | | 1.90% | | CVS
Health Corp. | | | — | | | | — | | | | 12,296 | | |
USD | | | | | 265,560 | | | 07/01/19 | | Goldman Sachs | | Pinnacle
Entertainment,
Inc. | | 2.65% | | | — | | | | — | | | | (407 | ) | |
USD | | | | | 184,066 | | | 07/01/19 | | Goldman Sachs | | 1.90% | | Fifth
Third Bancorp. | | | — | | | | — | | | | 8,334 | | |
USD | | | | | 55,210 | | | 07/01/19 | | Goldman Sachs | | Guaranty
Bancorp. | | 2.65% | | | — | | | | — | | | | (7,515 | ) | |
USD | | | | | 55,632 | | | 07/01/19 | | Goldman Sachs | | 1.90% | | Independent
Bank Group,
Inc. | | | — | | | | — | | | | 7,741 | | |
See Accompanying Notes to Consolidated Financial Statements.
19
Credit Suisse Multialternative Strategy Fund
Consolidated Schedule of Investments (continued)
October 31, 2018
Total Return Swap Contracts (continued)
Currency | | Notional
Amount | | Expiration
Date | | Counterparty | | Receive | | Pay | | Upfront
Premiums
Paid | | Upfront
Premiums
Received | | Net Unrealized
Appreciation
(Depreciation) | |
USD | | | | $ | 293,493 | | | 07/01/19 | | Goldman Sachs | | Scana Corp. | | 2.65% | | $ | — | | | $ | — | | | $ | 9,846 | | |
USD | | | | | 364,064 | | | 07/01/19 | | Goldman Sachs | | 1.90% | | Dominion
Energy, Inc. | | | — | | | | — | | | | 2,179 | | |
USD | | | | | 515,969 | | | 07/01/19 | | Goldman Sachs | | Express
Scripts
Holding Co. | | 2.65% | | | — | | | | — | | | | 5,051 | | |
USD | | | | | 116,859 | | | 07/01/19 | | Goldman Sachs | | State Bank
Financial
Corp. | | 2.65% | | | — | | | | — | | | | (16,318 | ) | |
EUR | | | | | 288,220 | | | 07/01/19 | | Goldman Sachs | | Linde AG | | 1.00% | | | — | | | | — | | | | 22,839 | | |
USD | | | | | 611,607 | | | 07/05/19 | | Goldman Sachs | | 1.90% | | Conagra
Brands, Inc. | | | — | | | | — | | | | (36,598 | ) | |
USD | | | | | 1,811,039 | | | 07/05/19 | | Goldman Sachs | | Pinnacle
Foods, Inc. | | 2.65% | | | — | | | | — | | | | 58,041 | | |
USD | | | | | 46,307 | | | 07/05/19 | | Goldman Sachs | | Synnex Corp. | | 2.65% | | | — | | | | — | | | | (6,493 | ) | |
USD | | | | | 743,863 | | | 08/15/19 | | Goldman Sachs | | Beneficial
Bancorp, Inc. | | 2.65% | | | — | | | | — | | | | (58,738 | ) | |
USD | | | | | 625,267 | | | 08/15/19 | | Goldman Sachs | | 1.90% | | WSFS
Financial Corp. | | | — | | | | — | | | | 63,530 | | |
USD | | | | | 292,405 | | | 08/22/19 | | Goldman Sachs | | 1.90% | | Cabot
Microelectronics
Corp. | | | — | | | | — | | | | 7,159 | | |
USD | | | | | 1,099,766 | | | 08/22/19 | | Goldman Sachs | | KMG
Chemicals,
Inc. | | 2.65% | | | — | | | | — | | | | (3,798 | ) | |
USD | | | | | 2,077,018 | | | 08/22/19 | | Goldman Sachs | | Energen Corp. | | 2.65% | | | — | | | | — | | | | (358,230 | ) | |
USD | | | | | 2,097,745 | | | 08/22/19 | | Goldman Sachs | | 1.90% | | Diamondback
Energy, Inc. | | | — | | | | — | | | | 369,086 | | |
USD | | | | | 1,053,681 | | | 09/12/19 | | Goldman Sachs | | Engility
Holdings, Inc. | | 2.65% | | | — | | | | — | | | | (86,352 | ) | |
USD | | | | | 1,069,775 | | | 09/12/19 | | Goldman Sachs | | 1.90% | | Science
Applications
International
Corp. | | | — | | | | — | | | | 94,689 | | |
USD | | | | | 24,706,240 | | | 09/25/19 | | Goldman Sachs | | US CAD
Basket | | 2.65% | | | — | | | | — | | | | (1,303,125 | ) | |
USD | | | | | 1,330,093 | | | 10/03/19 | | Goldman Sachs | | Sonic Corp. | | 2.65% | | | — | | | | — | | | | (921 | ) | |
USD | | | | | 444,765 | | | 10/03/19 | | Goldman Sachs | | XO Group,
Inc. | | 2.65% | | | — | | | | — | | | | 1,289 | | |
USD | | | | | 447,787 | | | 10/10/19 | | Goldman Sachs | | Access
National
Corp. | | 2.66% | | | — | | | | — | | | | (50,836 | ) | |
USD | | | | | 447,120 | | | 10/10/19 | | Goldman Sachs | | 1.91% | | Union
Bankshares
Corp. | | | — | | | | — | | | | 55,739 | | |
USD | | | | | 1,645,223 | | | 10/17/19 | | Goldman Sachs | | Esterline
Technologies
Corp. | | 2.66% | | | — | | | | — | | | | (70 | ) | |
See Accompanying Notes to Consolidated Financial Statements.
20
Credit Suisse Multialternative Strategy Fund
Consolidated Schedule of Investments (continued)
October 31, 2018
Total Return Swap Contracts (continued)
Currency | | Notional
Amount | | Expiration
Date | | Counterparty | | Receive | | Pay | | Upfront
Premiums
Paid | | Upfront
Premiums
Received | | Net Unrealized
Appreciation
(Depreciation) | |
USD | | | | $ | 1,329,403 | | | 10/17/19 | | Goldman Sachs | | Imperva, Inc. | | 2.66% | | $ | — | | | $ | — | | | $ | (2,996 | ) | |
USD | | | | | 441,780 | | | 10/17/19 | | Goldman Sachs | | Cambium
Learning
Group, Inc. | | 2.66% | | | — | | | | — | | | | (257 | ) | |
USD | | | | | 10,000,000 | | | 12/19/18 | | JPMorgan
Chase | | J.P. Morgan
EMBI Global
Core | | 2.77% | | | — | | | | — | | | | (203,508 | ) | |
USD | | | | | 8,900,000 | | | 12/20/18 | | JPMorgan
Chase | | JPMorgan
Yield Index | | iBoxx $
Liquid High
2.37% | | | — | | | | — | | | | (66,658 | ) | |
USD | | | | | 2,720,000 | | | 03/20/19 | | JPMorgan
Chase | | iBoxx $
Liquid High
Yield Index | | 2.37% | | | — | | | | — | | | | 38,697 | | |
| | | | | | | | | JPMorgan | | State Bank | | | | | | | | | |
USD | | | | | 834,359 | | | 06/17/19 | | Chase | | Financial Corp. | | 2.63% | | | — | | | | — | | | | (116,507 | ) | |
| | | | | | | | | JPMorgan | | | | Cadence | | | | | | | |
USD | | | | | 838,574 | | | 06/17/19 | | Chase | | 1.88% | | Bancorp. | | | — | | | | — | | | | 120,169 | | |
USD | | | | | 1,487,630 | | | 06/24/19 | | JPMorgan
Chase | | MB Financial,
Inc. | | 2.63% | | | — | | | | — | | | | (64,443 | ) | |
USD | | | | | 1,314,244 | | | 06/24/19 | | JPMorgan
Chase | | 1.88% | | Fifth Third
Bancorp. | | | — | | | | — | | | | 59,506 | | |
USD | | | | | 181,624 | | | 06/28/19 | | JPMorgan
Chase | | Guaranty
Bancorp. | | 2.63% | | | — | | | | — | | | | (24,723 | ) | |
USD | | | | | 92,860 | | | 06/28/19 | | JPMorgan
Chase | | Guaranty
Bancorp. | | 2.63% | | | — | | | | — | | | | (12,640 | ) | |
USD | | | | | 181,764 | | | 06/28/19 | | JPMorgan
Chase | | 1.88% | | Independent
Bank Group,
Inc. | | | — | | | | — | | | | 25,291 | | |
USD | | | | | 93,976 | | | 06/28/19 | | JPMorgan
Chase | | 1.88% | | Independent
Bank Group,
Inc. | | | — | | | | — | | | | 13,076 | | |
USD | | | | | 20,363,983 | | | 11/16/18 | | JPMorgan
Chase | | J.P. Morgan
Seasonal
Spreads
Portfolio
Commodity
Index | | 0.60% | | | — | | | | — | | | | (19,419 | ) | |
USD | | | | | 7,776,139 | | | 08/16/19 | | JPMorgan
Chase | | JPMorgan
Helix 2
Index | | 0.70% | | | — | | | | — | | | | (23,778 | ) | |
USD | | | | | 45,154,059 | | | 08/16/19 | | JPMorgan
Chase | | JPMorgan
Helix 2
Index | | 0.70% | | | — | | | | — | | | | (138,070 | ) | |
See Accompanying Notes to Consolidated Financial Statements.
21
Credit Suisse Multialternative Strategy Fund
Consolidated Schedule of Investments (continued)
October 31, 2018
Total Return Swap Contracts (continued)
Currency | | Notional
Amount | | Expiration
Date | | Counterparty | | Receive | | Pay | | Upfront
Premiums
Paid | | Upfront
Premiums
Received | | Net Unrealized
Appreciation
(Depreciation) | |
USD | | | | $ | 33,081,404 | | | 08/16/19 | | JPMorgan
Chase | | J.P. Morgan
Seasonal
Spreads
Portfolio
Commodity
Index | | | 0.60 | % | | $ | — | | | $ | — | | | $ | (31,823 | ) | |
USD | | | | | 1,313,254 | | | 11/25/19 | | JPMorgan
Chase | | Endocyte, Inc. | | | 2.64 | % | | | — | | | | — | | | | 9,325 | | |
USD | | | | | 10,776,948 | | | 08/16/19 | | Macquarie
Bank Ltd. | | Macquarie
Commodity
Volatility
Basket 2 | | | 0.10 | % | | | — | | | | — | | | | (162,179 | ) | |
USD | | | | | 2,402,219 | | | 08/16/19 | | Macquarie
Bank Ltd. | | Macquarie
Commodity
Volatility
Basket 2 | | | 0.10 | % | | | — | | | | — | | | | (14,943 | ) | |
| | | $ | (778,994 | ) | |
(a) The index intends to provide exposure to a variance swap with underlying S&P 500 Index.
(b) The DB Trend Intraday Equity Index is a proprietary index of Deutsche Bank AG intended to track the performance of a strategy that trades the daily trend of the S&P 500 (the Underlying Index).
(c) The index intends to provide synthetic exposure to the performance of a basket comprising a 300% long position in the Goldman Sachs RP Equity World Long Short Series 37K Excess Return Strategy which, in turn, is an index that provides exposure to a basket comprised of a short position in the USD Goldman Sachs Overnight Money Market Index, a short position in the MSCI Daily TR Gross World USD, and a long position in certain equity investments. The top 50 constituent investments (based on absolute market value) held within the index are as follows:
Equity Name | | Ticker | | Total Weight | | 10/31/18 Price | | 10/31/18 Value | |
MSCI Daily TR Gross World USD Index | | GDDUWI | | | -257.94 | % | | $ | 8,309.11 | | | $ | (84,555,662 | ) | |
Cash | | NA | | | -41.98 | % | | | 1.00 | | | | (13,763,044 | ) | |
HORMEL FOODS CORP | | HRL | | | 1.39 | % | | | 43.64 | | | | 454,657 | | |
F5 NETWORKS INC | | FFIV | | | 1.37 | % | | | 175.28 | | | | 450,022 | | |
VERIZON COMMUNICATIONS INC | | VZ | | | 1.37 | % | | | 57.09 | | | | 448,937 | | |
ROSS STORES INC | | ROST | | | 1.35 | % | | | 99.00 | | | | 443,551 | | |
CA INC | | CA | | | 1.33 | % | | | 44.36 | | | | 436,386 | | |
EXELON CORP | | EXC | | | 1.32 | % | | | 43.81 | | | | 434,287 | | |
PROGRESSIVE CORP | | PGR | | | 1.32 | % | | | 69.70 | | | | 433,570 | | |
REGIONS FINANCIAL CORP | | RF | | | 1.32 | % | | | 16.97 | | | | 432,635 | | |
AGNC INVESTMENT CORP | | AGNC | | | 1.32 | % | | | 17.84 | | | | 432,388 | | |
CITIZENS FINANCIAL GROUP | | CFG | | | 1.32 | % | | | 37.35 | | | | 431,806 | | |
ANTHEM INC | | ANTM | | | 1.31 | % | | | 275.57 | | | | 430,964 | | |
NUCOR CORP | | NUE | | | 1.31 | % | | | 59.12 | | | | 430,827 | | |
TWENTY-FIRST CENTURY FOX-B | | FOX | | | 1.31 | % | | | 45.18 | | | | 429,626 | | |
ANNALY CAPITAL MANAGEMENT IN | | NLY | | | 1.31 | % | | | 9.87 | | | | 429,389 | | |
See Accompanying Notes to Consolidated Financial Statements.
22
Credit Suisse Multialternative Strategy Fund
Consolidated Schedule of Investments (continued)
October 31, 2018
Equity Name | | Ticker | | Total Weight | | 10/31/18 Price | | 10/31/18 Value | |
ZOETIS INC | | ZTS | | | 1.30 | % | | $ | 90.15 | | | $ | 427,674 | | |
FIDELITY NATIONAL INFO SERV | | FIS | | | 1.30 | % | | | 104.10 | | | | 426,882 | | |
APPLE INC | | AAPL | | | 1.30 | % | | | 218.86 | | | | 425,966 | | |
CLOROX COMPANY | | CLX | | | 1.30 | % | | | 148.45 | | | | 424,822 | | |
PUBLIC SERVICE ENTERPRISE GP | | PEG | | | 1.30 | % | | | 53.43 | | | | 424,745 | | |
HUMANA INC | | HUM | | | 1.29 | % | | | 320.41 | | | | 423,610 | | |
NISSAN MOTOR CO LTD | | 7201 JT | | | 1.29 | % | | | 1,027.50 | | | | 423,324 | | |
CHURCH & DWIGHT CO INC | | CHD | | | 1.29 | % | | | 59.37 | | | | 421,664 | | |
PFIZER INC | | PFE | | | 1.29 | % | | | 43.06 | | | | 421,312 | | |
NATIONAL GRID PLC | | NG/ LN | | | 1.28 | % | | | 8.29 | | | | 419,879 | | |
JAZZ PHARMACEUTICALS PLC | | JAZZ | | | 1.28 | % | | | 158.82 | | | | 419,851 | | |
JACK HENRY & ASSOCIATES INC | | JKHY | | | 1.28 | % | | | 149.83 | | | | 419,670 | | |
RESMED INC | | RMD | | | 1.28 | % | | | 105.92 | | | | 419,143 | | |
UNIVERSAL HEALTH SERVICES-B | | UHS | | | 1.28 | % | | | 121.56 | | | | 418,987 | | |
NTT DOCOMO INC | | 9437 JT | | | 1.27 | % | | | 2,844.50 | | | | 417,258 | | |
L'OREAL | | OR FP | | | 1.27 | % | | | 198.90 | | | | 416,660 | | |
STEEL DYNAMICS INC | | STLD | | | 1.27 | % | | | 39.60 | | | | 415,804 | | |
TOTAL SYSTEM SERVICES INC | | TSS | | | 1.26 | % | | | 91.15 | | | | 413,364 | | |
ARCHER-DANIELS-MIDLAND CO | | ADM | | | 1.26 | % | | | 47.25 | | | | 413,259 | | |
MCCORMICK & CO-NON VTG SHRS | | MKC | | | 1.26 | % | | | 144.00 | | | | 412,908 | | |
ACCENTURE PLC-CL A | | ACN | | | 1.25 | % | | | 157.62 | | | | 410,784 | | |
CAN IMPERIAL BK OF COMMERCE | | CM | | | 1.25 | % | | | 113.68 | | | | 410,550 | | |
AFLAC INC | | AFL | | | 1.25 | % | | | 43.07 | | | | 408,250 | | |
ROCKWELL COLLINS INC | | COL | | | 1.24 | % | | | 128.02 | | | | 407,548 | | |
AKAMAI TECHNOLOGIES INC | | AKAM | | | 1.24 | % | | | 72.25 | | | | 406,985 | | |
CENTERPOINT ENERGY INC | | CNP | | | 1.24 | % | | | 27.01 | | | | 406,430 | | |
REPSOL SA | | REP SQ | | | 1.23 | % | | | 15.82 | | | | 402,917 | | |
SWISSCOM AG-REG | | SCMN | | | 1.23 | % | | | 461.40 | | | | 402,191 | | |
DBS GROUP HOLDINGS LTD | | DBS | | | 1.22 | % | | | 23.46 | | | | 399,584 | | |
QUEST DIAGNOSTICS INC | | DGX | | | 1.22 | % | | | 94.11 | | | | 399,364 | | |
NIPPON TELEGRAPH & TELEPHONE | | 9432 JT | | | 1.21 | % | | | 4,750.00 | | | | 396,927 | | |
PHILLIPS 66 | | PSX | | | 1.15 | % | | | 102.82 | | | | 376,148 | | |
CENTENE CORP | | CNC | | | 1.14 | % | | | 130.32 | | | | 373,508 | | |
EXPEDITORS INTL WASH INC | | TXT | | | 1.14 | % | | | 67.18 | | | | 372,108 | | |
Written Options
Number of
Contracts | | Counterparty | | Put Written Options | | Expiration
Date | | Notional
Amount | | Premiums
Received | | Current
Value | | Net Unrealized
Appreciation
(Depreciation) | |
| | 48 | | | Jefferies &
Company, Inc. | | S&P 500 Index, Strike @ 2,710 | | 11/16/18 | | | 4,800 | | | $ | 111,934 | | | $ | (218,880 | ) | | $ | (106,946 | ) | |
| | 41 | | | Jefferies &
Company, Inc. | | S&P 500 Index, Strike @ 2,765 | | 11/16/18 | | | 4,100 | | | | 190,566 | | | | (304,630 | ) | | | (114,064 | ) | |
| | | | | | | | | | | | | | | $ | (221,010 | ) | |
See Accompanying Notes to Consolidated Financial Statements.
23
Credit Suisse Multialternative Strategy Fund
Consolidated Schedule of Investments (continued)
October 31, 2018
Currency Abbreviations:
AUD = Australian Dollar
CAD = Canadian Dollar
CHF = Swiss Franc
DKK = Danish Krone
EUR = Euro
GBP = British Pound
HKD = Hong Kong Dollar
JPY = Japanese Yen
NOK = Norwegian Krone
NZD = New Zealand Dollar
SEK = Swedish Krona
USD = United States Dollar
See Accompanying Notes to Consolidated Financial Statements.
24
Credit Suisse Multialternative Strategy Fund
Consolidated Statement of Assets and Liabilities
October 31, 2018
Assets | |
Investments at value, including collateral for securities on loan of $3,047,959
(Cost $54,273,195) (Note 2) | | $ | 52,324,5851 | | |
Cash | | | 13,984,735 | | |
Cash segregated held at brokers for futures contracts and swap contracts (Note 2) | | | 43,280,625 | | |
Variation margin receivable on futures contracts (Note 2) | | | 2,579,381 | | |
Unrealized appreciation on open swap contracts (Note 2) | | | 2,771,559 | | |
Unrealized appreciation on forward foreign currency contracts (Note 2) | | | 883,434 | | |
Receivable for Fund shares sold | | | 163,968 | | |
Net receivable for open swap contracts | | | 1,208,158 | | |
Receivable from investment adviser (Note 3) | | | 58,665 | | |
Dividend and interest receivable | | | 12,248 | | |
Prepaid expenses and other assets | | | 18,689 | | |
Total assets | | | 117,286,047 | | |
Liabilities | |
Administrative services fee payable (Note 3) | | | 9,559 | | |
Shareholder servicing/Distribution fee payable (Note 3) | | | 315 | | |
Unrealized depreciation on open swap contracts (Note 2) | | | 3,466,837 | | |
Payable upon return of securities loaned (Note 2) | | | 3,047,959 | | |
Net payable for terminated total return swap contracts | | | 2,011,237 | | |
Outstanding written options, at value (Proceeds $302,500) (Note 2) | | | 523,510 | | |
Unrealized depreciation on forward foreign currency contracts (Note 2) | | | 420,134 | | |
Payable to broker | | | 611,547 | | |
Due to custodian for foreign currency at value (cost $134,315) | | | 189,196 | | |
Trustees' fees payable | | | 22,609 | | |
Payable for Fund shares redeemed | | | 1,554 | | |
Upfront payments received on swap contracts (Note 2) | | | 327,864 | | |
Payable to broker for centrally cleared swaps | | | 7,967 | | |
Accrued expenses | | | 345,600 | | |
Total liabilities | | | 10,985,888 | | |
Net Assets | |
Capital stock, $.001 par value (Note 6) | | | 10,604 | | |
Paid-in capital (Note 6) | | | 105,988,288 | | |
Total distributable earnings (loss) | | | 301,267 | | |
Net assets | | $ | 106,300,159 | | |
I Shares | |
Net assets | | $ | 104,885,962 | | |
Shares outstanding | | | 10,461,061 | | |
Net asset value, offering price and redemption price per share | | $ | 10.03 | | |
A Shares | |
Net assets | | $ | 1,414,197 | | |
Shares outstanding | | | 142,502 | | |
Net asset value and redemption price per share | | $ | 9.92 | | |
Maximum offering price per share (net asset value/(1-5.25%)) | | $ | 10.47 | | |
1 Includes $2,946,189 of securities on loan.
See Accompanying Notes to Consolidated Financial Statements.
25
Credit Suisse Multialternative Strategy Fund
Consolidated Statement of Operations
For the Year Ended October 31, 2018
Investment Income | |
Dividends | | $ | 1,038,911 | | |
Interest | | | 370,704 | | |
Securities lending (net of rebates) | | | 18,925 | | |
Foreign taxes withheld | | | (15,316 | ) | |
Total investment income | | | 1,413,224 | | |
Expenses | |
Investment advisory fees (Note 3) | | | 1,108,755 | | |
Administrative services fees (Note 3) | | | 36,193 | | |
Shareholder servicing/Distribution fees (Note 3) | |
Class A | | | 3,440 | | |
Class C1 | | | 126 | | |
Custodian fees | | | 410,087 | | |
Dividend expense for securities sold short | | | 35,971 | | |
Transfer agent fees (Note 3) | | | 67,744 | | |
Trustees' fees | | | 65,159 | | |
Audit and tax fees | | | 56,904 | | |
Registration fees | | | 48,889 | | |
Legal fees | | | 37,020 | | |
Printing fees | | | 32,428 | | |
Commitment fees (Note 4) | | | 15,982 | | |
Insurance expense | | | 2,827 | | |
Miscellaneous expense | | | 34,204 | | |
Total expenses | | | 1,955,729 | | |
Less: fees waived (Note 3) | | | (1,009,998 | ) | |
Net expenses | | | 945,731 | | |
Net investment income | | | 467,493 | | |
Net Realized and Unrealized Gain (Loss) from Investments, Futures Contracts, Swap Contracts,
Written Options, Securities Sold Short and Foreign Currency Related Items | |
Net realized loss from investments | | | (535,159 | ) | |
Net realized loss from futures contracts | | | (714,947 | ) | |
Net realized gain from swap contracts | | | 1,848,214 | | |
Net realized gain from written options | | | 4,912 | | |
Net realized gain from securities sold short | | | 300,180 | | |
Net realized gain from foreign currency transactions | | | 105,988 | | |
Net realized loss from forward foreign currency contracts | | | (1,057,832 | ) | |
Net change in unrealized appreciation (depreciation) from investments | | | (2,007,926 | ) | |
Net change in unrealized appreciation (depreciation) from futures contracts | | | 2,391,090 | | |
Net change in unrealized appreciation (depreciation) from swap contracts | | | (1,337,769 | ) | |
Net change in unrealized appreciation (depreciation) from written options | | | (254,793 | ) | |
Net change in unrealized appreciation (depreciation) from securities sold short | | | (2,843 | ) | |
Net change in unrealized appreciation (depreciation) from foreign currency translations | | | (41,316 | ) | |
Net change in unrealized appreciation (depreciation) from forward foreign currency contracts | | | 376,270 | | |
Net realized and unrealized loss from investments, futures contracts, swap contracts,
written options, securities sold short and foreign currency related items | | | (925,931 | ) | |
Net decrease in net assets resulting from operations | | $ | (458,438 | ) | |
1 Class C was redeemed on February 15, 2018 and currently has no shareholders.
See Accompanying Notes to Consolidated Financial Statements.
26
Credit Suisse Multialternative Strategy Fund
Consolidated Statements of Changes in Net Assets
| | | For the Year
Ended
October 31, 2018 | | For the Year
Ended
October 31, 2017 | |
From Operations | |
Net investment income (loss) | | $ | 467,493 | | | $ | (464,324 | ) | |
Net realized gain from investments, futures contracts, swap contracts,
written options, securities sold short, foreign currency transactions
and forward foreign currency contracts | | | (48,644 | ) | | | 4,630,518 | | |
Net change in unrealized appreciation (depreciation) from investments,
futures contracts, swap contracts, written options, securities sold short,
foreign currency translations and forward foreign currency contracts | | | (877,287 | ) | | | (219,173 | ) | |
Net increase (decrease) in net assets resulting from operations | | | (458,438 | ) | | | 3,947,021 | | |
From Distributions | |
From distributable earnings | |
Class I | | | (4,686,749 | ) | | | (2,451,823 | ) | |
Class A | | | (61,137 | ) | | | (25,186 | ) | |
Class C* | | | (2,114 | ) | | | (1,733 | ) | |
Net decrease in net assets resulting from distributions | | | (4,750,000 | ) | | | (2,478,742 | )1 | |
| From Capital Share Transactions (Note 6) | |
Proceeds from sale of shares | | | 31,293,414 | | | | 38,604,603 | | |
Reinvestment of dividends and distributions | | | 4,729,725 | | | | 2,464,559 | | |
Net asset value of shares redeemed | | | (28,052,586 | ) | | | (55,367,169 | ) | |
Net increase (decrease) in net assets from capital share transactions | | | 7,970,553 | | | | (14,298,007 | ) | |
Net increase (decrease) in net assets | | | 2,762,115 | | | | (12,829,728 | ) | |
Net Assets | |
Beginning of year | | | 103,538,044 | | | | 116,367,772 | | |
End of year | | $ | 106,300,159 | | | $ | 103,538,0442 | | |
1 Distributions include $(430,003) and $(1,516) from net investment income for Class I and Class A, respectively, and $(2,021,820), $(23,670) and $(1,733) from net realized gains on investments for Class I, Class A, and Class C*, respectively. Prior year information has been conformed to current year presentation.
2 Distributions in excess of net investment income as of October 31, 2017 were $(721,070).
* Class C was fully redeemed on February 15, 2018 and currently has no shareholders.
See Accompanying Notes to Consolidated Financial Statements.
27
Credit Suisse Multialternative Strategy Fund
Consolidated Financial Highlights
(For a Class I Share of the Fund Outstanding Throughout Each Year)
| | | For the Year Ended October 31, | |
| | | 2018 | | 2017 | | 2016 | | 2015 | | 2014 | |
Per share data | |
Net asset value, beginning of year | | $ | 10.54 | | | $ | 10.391 | | | $ | 10.36 | | | $ | 10.42 | | | $ | 10.481 | | |
INVESTMENT OPERATIONS | |
Net investment income (loss)2 | | | 0.05 | | | | (0.04 | ) | | | (0.08 | ) | | | (0.01 | ) | | | (0.15 | ) | |
Net gain (loss) from investments, futures contracts,
swap contracts, written options, securities sold
short, foreign currency related items and forward
foreign currency contracts (both realized
and unrealized) | | | (0.08 | ) | | | 0.41 | | | | 0.13 | | | | 0.25 | | | | 0.42 | | |
Total from investment operations | | | (0.03 | ) | | | 0.37 | | | | 0.05 | | | | 0.24 | | | | 0.27 | | |
LESS DIVIDENDS AND DISTRIBUTIONS | |
Dividends from net investment income | | | — | | | | (0.04 | ) | | | — | | | | (0.18 | ) | | | — | | |
Distributions from net realized gains | | | (0.48 | ) | | | (0.18 | ) | | | (0.02 | ) | | | (0.12 | ) | | | (0.33 | ) | |
Total dividends and distributions | | | (0.48 | ) | | | (0.22 | ) | | | (0.02 | ) | | | (0.30 | ) | | | (0.33 | ) | |
Net asset value, end of year | | $ | 10.031 | | | $ | 10.54 | | | $ | 10.391 | | | $ | 10.36 | | | $ | 10.42 | | |
Total return3 | | | (0.29 | )% | | | 3.68 | % | | | 0.53 | % | | | 2.33 | % | | | 2.64 | % | |
RATIOS AND SUPPLEMENTAL DATA | |
Net assets, end of year (000s omitted) | | $ | 104,886 | | | $ | 102,227 | | | $ | 114,951 | | | $ | 13,015 | | | $ | 11,451 | | |
Ratio of net expenses to average net assets | | | 0.89 | % | | | 1.00 | % | | | 0.91 | % | | | 1.56 | % | | | 1.85 | % | |
Ratio of expenses to average net assets
excluding securities sold short dividend expense | | | 0.85 | % | | | 0.85 | % | | | 0.85 | % | | | 1.32 | % | | | 1.70 | % | |
Ratio of net investment income (loss) to
average net assets | | | 0.44 | % | | | (0.40 | )% | | | (0.79 | )% | | | (0.14 | )% | | | (1.47 | )% | |
Decrease reflected in above operating expense
ratios due to waivers/reimbursements | | | 0.95 | % | | | 0.68 | % | | | 0.65 | % | | | 2.34 | % | | | 2.48 | % | |
Portfolio turnover rate | | | 1,373 | % | | | 586 | % | | | 1,021 | % | | | 292 | % | | | 431 | % | |
1 Includes adjustments in accordance with accounting principles generally accepted in the United States of America and as such, the net asset values for financial reporting purposes and the returns based upon net asset values may differ from the net asset values and returns for shareholder transactions.
2 Per share information is calculated using the average shares outstanding method.
3 Total returns are historical and include change in share price and reinvestment of all dividends and distributions. Had certain expenses not been reduced during the years shown, total returns would have been lower.
See Accompanying Notes to Consolidated Financial Statements.
28
Credit Suisse Multialternative Strategy Fund
Consolidated Financial Highlights
(For a Class A Share of the Fund Outstanding Throughout Each Year)
| | | For the Year Ended October 31, | |
| | | 2018 | | 2017 | | 2016 | | 2015 | | 2014 | |
Per share data | |
Net asset value, beginning of year | | $ | 10.47 | | | $ | 10.31 | | | $ | 10.31 | | | $ | 10.37 | | | $ | 10.461 | | |
INVESTMENT OPERATIONS | |
Net investment income (loss)2 | | | 0.02 | | | | (0.07 | ) | | | (0.10 | ) | | | (0.05 | ) | | | (0.18 | ) | |
Net gain (loss) from investments, futures contracts,
swap contracts, written options, securities sold
short, foreign currency related items and forward
foreign currency contracts (both realized
and unrealized) | | | (0.09 | ) | | | 0.42 | | | | 0.12 | | | | 0.26 | | | | 0.42 | | |
Total from investment operations | | | (0.07 | ) | | | 0.35 | | | | 0.02 | | | | 0.21 | | | | 0.24 | | |
LESS DIVIDENDS AND DISTRIBUTIONS | |
Dividends from net investment income | | | — | | | | (0.01 | ) | | | — | | | | (0.15 | ) | | | — | | |
Distributions from net realized gains | | | (0.48 | ) | | | (0.18 | ) | | | (0.02 | ) | | | (0.12 | ) | | | (0.33 | ) | |
Total dividends and distributions | | | (0.48 | ) | | | (0.19 | ) | | | (0.02 | ) | | | (0.27 | ) | | | (0.33 | ) | |
Net asset value, end of year | | $ | 9.921 | | | $ | 10.47 | | | $ | 10.31 | | | $ | 10.31 | | | $ | 10.37 | | |
Total return3 | | | (0.68 | )% | | | 3.45 | % | | | 0.24 | % | | | 2.08 | % | | | 2.35 | % | |
RATIOS AND SUPPLEMENTAL DATA | |
Net assets, end of year (000s omitted) | | $ | 1,414 | | | $ | 1,267 | | | $ | 1,319 | | | $ | 320 | | | $ | 438 | | |
Ratio of net expenses to average net assets | | | 1.14 | % | | | 1.26 | % | | | 1.17 | % | | | 1.82 | % | | | 2.10 | % | |
Ratio of expenses to average net assets excluding
securities sold short dividend expense | | | 1.10 | % | | | 1.10 | % | | | 1.11 | % | | | 1.57 | % | | | 1.95 | % | |
Ratio of net investment income (loss) to
average net assets | | | 0.19 | % | | | (0.65 | )% | | | (0.98 | )% | | | (0.44 | )% | | | (1.73 | )% | |
Decrease reflected in above operating expense
ratios due to waivers/reimbursements | | | 0.94 | % | | | 0.68 | % | | | 0.65 | % | | | 2.33 | % | | | 2.48 | % | |
Portfolio turnover rate | | | 1,373 | % | | | 586 | % | | | 1,021 | % | | | 292 | % | | | 431 | % | |
1 Includes adjustments in accordance with accounting principles generally accepted in the United States of America and as such, the net asset values for financial reporting purposes and the returns based upon net asset values may differ from the net asset values and returns for shareholder transactions.
2 Per share information is calculated using the average shares outstanding method.
3 Total returns are historical and include change in share price, reinvestment of all dividends and distributions and no sales charge. Had certain expenses not been reduced during the years shown, total returns would have been lower.
See Accompanying Notes to Consolidated Financial Statements.
29
Credit Suisse Multialternative Strategy Fund
Notes to Consolidated Financial Statements
October 31, 2018
Credit Suisse Multialternative Strategy Fund (the "Fund"), a series of the Credit Suisse Opportunity Funds (the "Trust"), a Delaware statutory trust, is registered under the Investment Company Act of 1940, as amended (the "1940 Act"), as a non-diversified open-end management investment company that seeks to achieve total return consistent with the risk and return patterns of a diversified universe of hedge funds. The Trust was organized under the laws of the State of Delaware as a business trust on May 31, 1995.
Credit Suisse Asset Management, LLC ("Credit Suisse"), the investment adviser to the Fund, is registered as an investment adviser with the Securities and Exchange Commission and as a Commodity Pool Operator with the Commodity Futures Trading Commission. The Fund intends to gain exposure to commodity derivatives through investing in a wholly-owned subsidiary, Credit Suisse Cayman Multialternative Strategy Fund, Ltd. (the "Subsidiary"), organized under the laws of the Cayman Islands. The Subsidiary invests in commodity-linked derivative instruments, such as swaps and futures. The Subsidiary may also invest in debt securities, some of which are intended to serve as margin or collateral for the Subsidiary's derivatives positions.
The Subsidiary is managed by the same portfolio managers that manage the Fund and the accompanying financial statements reflect the financial position of the Fund and the Subsidiary and the results of operations on a consolidated basis. The consolidated financial statements include portfolio holdings of the Fund and the Subsidiary and all intercompany transactions and balances have been eliminated. The Fund may invest up to 25% of its total assets in the Subsidiary. As of October 31, 2018, the Fund held $9,214,784 in the Subsidiary, representing 8.7% of the Fund's consolidated net assets. For the year ended October 31, 2018, the net realized loss on securities and other financial instruments held in the Subsidiary was $390,176.
Subsequent references to the Fund within the Notes to Consolidated Financial Statements collectively refer to the Fund and the Subsidiary.
The Fund offers three classes of shares: Class I shares, Class A shares and Class C shares. Each class of shares represents an equal pro rata interest in the Fund, except the share classes bear different expenses. Class A shares are sold subject to a front-end sales charge of up to 5.25%. Class C shares are sold subject to a contingent deferred sales charge ("CDSC") of 1.00% if the shares are redeemed within the first year of purchase. Class I shares are sold without a sales charge. Class C was redeemed on February 15, 2018 and currently has no shareholders.
30
Credit Suisse Multialternative Strategy Fund
Notes to Consolidated Financial Statements (continued)
October 31, 2018
Note 2. Significant Accounting Policies
The following is a summary of significant accounting policies followed by the Fund in the preparation of itsconsolidated financial statements. The policies are in accordance with generally accepted accounting principles in the United States of America ("GAAP"). The preparation of consolidated financial statements requires management to make estimates and assumptions that affect the reported amounts and disclosures in theconsolidated financial statements. Actual results could differ from those estimates. The Fund is considered an investment company for financial reporting purposes under GAAP and follows the accounting and reporting guidance in Financial Accounting Standards Board's ("FASB") Accounting Standards Codification ("ASC") Topic 946 — Financial Services — Investment Companies.
A) SECURITY VALUATION — The Board of Trustees (the "Board") is responsible for the Fund's valuation process. The Board has delegated the supervision of the daily valuation process to Credit Suisse who has established a Pricing Committee which, pursuant to the policies adopted by the Board, is responsible for making fair valuation determinations and overseeing the Fund's pricing policies. The net asset value of the Fund is determined daily as of the close of regular trading on the New York Stock Exchange, Inc. (the "Exchange") on each day the Exchange is open for business. For certain international equity securities, in order to adjust for events which may occur between the close of the foreign exchanges and the close of the Exchange, a fair valuation model may be used. This fair valuation model takes into account comparisons to the valuation of American Depository Receipts (ADRs), exchange-traded funds, futures contracts and certain indices and these securities are categorized as Level 2. The valuations for fixed income securities (which may include, but are not limited to, corporate, government, municipal, mortgage-backed, collateralized mortgage obligations and asset-backed securities) and certain derivative instruments are typically the prices supplied by independent third party pricing services, which may use market prices or broker/dealer quotations or a variety of valuation techniques and methodologies. The independent third party pricing services use inputs that are observable such as issuer details, interest rates, yield curves, prepayment speeds, credit risks/spreads, default rates and quoted prices for similar securities. These pricing services generally price fixed income securities assuming orderly transactions of an institutional "round lot" size, but some trades occur in smaller "odd lot" sizes which may be effected at lower prices than institutional round lot trades. Structured note agreements are valued in accordance with a dealer-supplied valuation based on changes in the value of the underlying index. Option contracts on securities, currencies, indices, futures contracts, swaps and
31
Credit Suisse Multialternative Strategy Fund
Notes to Consolidated Financial Statements (continued)
October 31, 2018
Note 2. Significant Accounting Policies (continued)
other instruments are valued at the mid-point between the last bid and ask quotations as of the close of trading on the exchange on which the option is traded. Futures contracts are valued daily at the settlement price established by the board of trade or exchange on which they are traded. Forward contracts are valued at the London closing spot rates and the London closing forward point rates on a daily basis. The currency forward contract pricing model derives the differential in point rates to the expiration date of the forward and calculates its present value. Equity securities for which market quotations are available are valued at the last reported sales price or official closing price on the primary market or exchange on which they trade. The Fund may utilize a service provided by an independent third party which has been approved by the Board to fair value certain securities. When fair value pricing is employed, the prices of securities used by the Fund to calculate its net asset value may differ from quoted or published prices for the same securities. If independent third party pricing services are unable to supply prices for a portfolio investment, or if the prices supplied are deemed by the investment adviser to be unreliable, the market price may be determined by the investment adviser using quotations from one or more brokers/dealers or at the transaction price if the security has recently been purchased and no value has yet been obtained from a pricing service or pricing broker. When reliable prices are not readily available, such as when the value of a security has been significantly affected by events after the close of the exchange or market on which the security is principally traded, but before the Fund calculates its net asset value, these securities will be fair valued in good faith by the Pricing Committee, in accordance with procedures adopted by the Board.
The Fund uses valuation techniques to measure fair value that are consistent with the market approach and/or income approach, depending on the type of security and the particular circumstance. The market approach uses prices and other relevant information generated by market transactions involving identical or comparable securities. The income approach uses valuation techniques to discount estimated future cash flows to present value.
GAAP established a disclosure hierarchy that categorizes the inputs to valuation techniques used to value assets and liabilities at each measurement date. These inputs are summarized in the three broad levels listed below:
• Level 1 – quoted prices in active markets for identical investments
• Level 2 – other significant observable inputs (including quoted prices for similar investments, interest rates, prepayment speeds, credit risk, etc.)
32
Credit Suisse Multialternative Strategy Fund
Notes to Consolidated Financial Statements (continued)
October 31, 2018
Note 2. Significant Accounting Policies (continued)
• Level 3 – significant unobservable inputs (including the Fund's own assumptions in determining the fair value of investments)
The inputs or methodologies used to value securities are not necessarily an indication of the risk associated with investing in those securities.
The following is a summary of the inputs used as of October 31, 2018 in valuing the Fund's assets and liabilities carried at fair value:
Assets | | Level 1 | | Level 2 | | Level 3 | | Total | |
Investments in Securities | |
Common Stocks | | $ | 16,787,985 | | | $ | 13,438,778 | | | $ | — | | | $ | 30,226,763 | | |
Exchange-Traded Funds | | | 18,931,063 | | | | — | | | | — | | | | 18,931,063 | | |
Purchased Options | | | 118,800 | | | | — | | | | — | | | | 118,800 | | |
Short-term Investments | | | — | | | | 3,047,959 | | | | — | | | | 3,047,959 | | |
| | | $ | 35,837,848 | | | $ | 16,486,737 | | | $ | — | | | $ | 52,324,585 | | |
Other Financial Instruments* | |
Forward Foreign Currency Contracts | | $ | — | | | $ | 883,434 | | | $ | — | | | $ | 883,434 | | |
Futures Contracts | | | 7,455,763 | | | | — | | | | — | | | | 7,455,763 | | |
Swap Contracts** | | | — | | | | 2,771,559 | | | | — | | | | 2,771,559 | | |
Liabilities | | Level 1 | | Level 2 | | Level 3 | | Total | |
Other Financial Instruments* | |
Forward Foreign Currency Contracts | | $ | — | | | $ | 420,134 | | | $ | — | | | $ | 420,134 | | |
Futures Contracts | | | 4,901,691 | | | | — | | | | — | | | | 4,901,691 | | |
Swap Contracts** | | | — | | | | 3,466,837 | | | | — | | | | 3,466,837 | | |
Written Options | | | 523,510 | | | | — | | | | — | | | | 523,510 | | |
* Other financial instruments include unrealized appreciation (depreciation) on forward foreign currency contracts, futures and swap contracts. Purchased options and written options are reported at value.
** Value includes any premium paid or received with respect to swap contracts, if applicable.
For the year ended October 31, 2018, there were no transfers among Level 1, Level 2 and Level 3. All transfers, if any, are assumed to occur at the end of the reporting period.
B) DERIVATIVE INSTRUMENTS AND HEDGING ACTIVITIES — The Fund adopted amendments to authoritative guidance on disclosures about derivative instruments and hedging activities which require that a fund disclose (a) how and why an entity uses derivative instruments, (b) how derivative instruments and hedging activities are accounted for and (c) how derivative instruments and related hedging activities affect a fund's financial position, financial performance and cash flows. For the year ended October 31, 2018, the Fund's derivatives did not qualify for hedge accounting as they are held at fair value.
33
Credit Suisse Multialternative Strategy Fund
Notes to Consolidated Financial Statements (continued)
October 31, 2018
Note 2. Significant Accounting Policies (continued)
The following table presents the fair value and the location of derivatives within the Consolidated Statement of Assets and Liabilities at October 31, 2018 and the effect of these derivatives on the Consolidated Statement of Operations for the year ended October 31, 2018.
Primary Underlying Risk | | Derivative
Assets | | Derivative
Liabilities | | Realized
Gain (Loss) | | Change in
Unrealized
Appreciation
(Depreciation) | |
Foreign currency exchange rate | |
Forward contracts | | $ | 883,434 | | | $ | 420,134 | | | $ | (1,057,832 | ) | | $ | 376,270 | | |
Futures contracts | | | 388,328 | | | | — | | | | (15,186 | ) | | | 665,583 | | |
Interest rate | |
Futures contracts | | | 478,742 | | | | 10,832 | | | | 57,825 | | | | 459,321 | | |
Equity price | |
Futures contracts | | | 2,985,701 | | | | 1,124,097 | | | | (733,587 | ) | | | 1,558,137 | | |
Swap contracts | | | 2,771,559 | | | | 3,466,837 | | | | 1,848,214 | | | | (1,337,769 | ) | |
Purchased options | | | 118,800 | | | | — | | | | (887,145 | ) | | | 60,030 | | |
Written options | | | — | | | | 523,510 | | | | 4,912 | | | | (254,793 | ) | |
Commodity price | |
Futures contracts | | | 3,602,992 | | | | 3,766,762 | | | | (23,999 | ) | | | (291,951 | ) | |
Total | | $ | 11,229,556 | | | $ | 9,312,172 | | | $ | (806,798 | ) | | $ | 1,234,828 | | |
For the year ended October 31, 2018, the Fund held average monthly value on a net basis of $44,170,943 in forward foreign currency contracts and average monthly notional values on a net basis of $113,187,930 and $108,911,023 in long futures contracts and short futures contracts and $195,139,530 in swap contracts, respectively. For the year ended October 31, 2018, the Fund received average monthly premiums of $375,167 from written options contracts.
The Fund is a party to International Swap and Derivatives Association, Inc. ("ISDA") Master Agreements ("Master Agreements") with certain counterparties that govern over-the-counter derivative (including Total Return, Credit Default and Interest Rate Swaps) and foreign exchange contracts entered into by the Fund. The Master Agreements may contain provisions regarding, among other things, the parties' general obligations, representations, agreements, collateral requirements, events of default and early termination. Termination events applicable to the Fund may occur upon a decline in the Fund's net assets below a specified threshold over a certain period of time.
34
Credit Suisse Multialternative Strategy Fund
Notes to Consolidated Financial Statements (continued)
October 31, 2018
Note 2. Significant Accounting Policies (continued)
The following table presents by counterparty the Fund's derivative assets, net of related collateral held by the Fund, at October 31, 2018:
| Counterparty | | Gross Amount of
Derivative Assets
Presented in the
Consolidated
Statement of Assets
and Liabilities(a) | | Financial
Instruments
and Derivatives
Available for Offset | | Non-Cash
Collateral
Received | | Cash
Collateral
Received(b) | | Net Amount
of Derivative
Assets | |
Barclays Bank plc | | $ | 339,525 | | | $ | (19,709 | ) | | $ | — | | | $ | — | | | $ | 319,816 | | |
BNP Paribas | | | 474,000 | | | | (316,491 | ) | | | — | | | | — | | | | 157,509 | | |
Deuthche Bank | | | 303,286 | | | | — | | | | — | | | | — | | | | 303,286 | | |
Goldman Sachs | | | 2,010,424 | | | | (2,010,424 | ) | | | — | | | | — | | | | — | | |
JPMorgan Chase | | | 527,758 | | | | (527,758 | ) | | | — | | | | — | | | | — | | |
| | $ | 3,654,993 | | | $ | (2,874,382 | ) | | $ | — | | | $ | — | | | $ | 780,611 | | |
The following table presents by counterparty the Fund's derivative liabilities, net of related collateral pledged by the Fund, at October 31, 2018:
| Counterparty | | Gross Amount of
Derivative Liabilities
Presented in the
Consolidated
Statement of Assets
and Liabilities(a) | | Financial
Instruments
and Derivatives
Available for Offset | | Non-Cash
Collateral
Pledged | | Cash
Collateral
Pledged(b) | | Net Amount
of Derivative
Liabilities | |
Barclays Bank plc | | $ | 19,709 | | | $ | (19,709 | ) | | $ | — | | | $ | — | | | $ | — | | |
BNP Paribas | | | 316,491 | | | | (316,491 | ) | | | — | | | | — | | | | — | | |
Goldman Sachs | | | 2,463,787 | | | | (2,010,424 | ) | | | — | | | | (453,363 | ) | | | — | | |
Jefferies & Company | | | 523,510 | | | | (523,510 | ) | | | — | | | | — | | | | — | | |
JPMorgan Chase | | | 909,862 | | | | (527,758 | ) | | | — | | | | (382,104 | ) | | | — | | |
Macquarie Bank Ltd. | | | 177,122 | | | | — | | | | — | | | | (177,122 | ) | | | — | | |
| | $ | 4,410,481 | | | $ | (3,397,892 | ) | | $ | — | | | $ | (1,012,589 | ) | | $ | — | | |
(a) Swap contracts, written options and forward foreign currency exchange contracts are included. Written options are reported at market value.
(b) The actual collateral pledged may be more than the amounts shown.
C) FOREIGN CURRENCY TRANSACTIONS — The books and records of the Fund are maintained in U.S. dollars. Transactions denominated in foreign currencies are recorded at the current prevailing exchange rates. All assets and liabilities denominated in foreign currencies, including purchases and sales of investments, and income and expenses, are translated into US dollar amounts on the date of those transactions.
Reported net realized gain (loss) from foreign currency transactions arises from sales of foreign currencies; currency gains or losses realized between the trade and settlement dates on securities transactions; and the difference between the amounts of dividends, interest, and foreign withholding taxes recorded on the Fund's books and the U.S. dollar equivalent of the amounts
35
Credit Suisse Multialternative Strategy Fund
Notes to Consolidated Financial Statements (continued)
October 31, 2018
Note 2. Significant Accounting Policies (continued)
actually received or paid. Net change in unrealized gains and losses on translation of assets and liabilities denominated in foreign currencies arises from changes in the fair values of assets and liabilities, other than investments, at the end of the period, resulting from changes in exchange rates.
The Fund does not isolate that portion of the results of operations resulting from fluctuations in foreign exchange rates on investments from the fluctuations arising from changes in market prices of investments held. Such fluctuations are included with net realized and unrealized gain or loss from investments in the Consolidated Statement of Operations.
D) SECURITY TRANSACTIONS AND INVESTMENT INCOME/EXPENSE — Security transactions are accounted for on a trade date basis. Interest income/expense is recorded on the accrual basis. The Fund amortizes premiums and accretes discounts using the effective interest method. Dividend income/expense is recorded on the ex-dividend date. Foreign dividend income is recorded on the ex-dividend date or as soon as practicable after the Fund determines the existence of a dividend declaration after exercising reasonable due diligence. Certain expenses are class-specific expenses, vary by class and are charged only to that class. Income, expenses (excluding class-specific expenses) and realized/unrealized gains/losses are allocated proportionately to each class of shares based upon the relative net asset value of the outstanding shares of that class. The cost of investments sold is determined by use of the specific identification method for both financial reporting and income tax purposes. To the extent any issuer defaults or a credit event occurs that impacts the issuer, the Fund may halt any additional interest income accruals and consider the realizability of interest accrued up to the date of default or credit event.
E) DIVIDENDS AND DISTRIBUTIONS TO SHAREHOLDERS — Dividends from net investment income, if any, are declared and paid quarterly. Distributions of net realized capital gains, if any, are declared and paid at least annually. However, to the extent that a net realized capital gain can be reduced by a capital loss carryforward, such gain will not be distributed. Dividends and distributions to shareholders of the Fund are recorded on the ex-dividend date and are determined in accordance with federal income tax regulations, which may differ from GAAP.
F) FEDERAL AND OTHER TAXES — No provision is made for federal taxes as it is the Fund's intention to continue to qualify as a regulated investment company ("RIC") under the Internal Revenue Code of 1986, as amended (the
36
Credit Suisse Multialternative Strategy Fund
Notes to Consolidated Financial Statements (continued)
October 31, 2018
Note 2. Significant Accounting Policies (continued)
"Code"), and to make the requisite distributions to its shareholders, which will be sufficient to relieve it from federal income and excise taxes.
In order to qualify as a RIC under the Code, the Fund must meet certain requirements regarding the source of its income, the diversification of its assets and the distribution of its income. One of these requirements is that the Fund derive at least 90% of its gross income for each taxable year from dividends, interest, payments with respect to certain securities loans, gains from the sale or other disposition of stock, securities or foreign currencies, other income derived with respect to its business of investing in such stock, securities or currencies or net income derived from interests in certain publicly-traded partnerships ("Qualifying Income"). The Internal Revenue Service ("IRS") has issued a ruling that income realized from certain types of commodity-linked derivatives would not be Qualifying Income. As a result, the Fund's ability to realize income from investments in such commodity-linked derivatives as part of its investment strategy would be limited to a maximum of 10% of its gross income. The IRS has issued private letter rulings to registered investment companies concluding that income derived from their investment in a wholly-owned subsidiary would constitute Qualifying Income to the fund. The IRS has indicated that the granting of these types of private letter rulings is currently suspended.
If the Fund is unable to ensure continued qualification as a RIC, the Fund may be required to change its investment objective, policies or techniques, or may be liquidated. If the Fund fails to qualify as a RIC, the Fund will be subject to federal income tax on its net income and capital gains at regular corporate rates (without reduction for distributions to shareholders). If the Fund were to fail to qualify as a RIC and become subject to federal income tax, shareholders of the Fund would be subject to the risk of diminished returns. The Fund adopted the authoritative guidance for uncertainty in income taxes and recognizes a tax benefit or liability from an uncertain position only if it is more likely than not that the position is sustainable based solely on its technical merits and consideration of the relevant taxing authority's widely understood administrative practices and procedures. The Fund has reviewed its current tax positions and has determined that no provision for income tax is required in the Fund's financial statements. The Fund's federal and state income and federal excise tax returns for tax years for which the applicable statutes of limitations have not expired are subject to examination by the Internal Revenue Service and state departments of revenue.
37
Credit Suisse Multialternative Strategy Fund
Notes to Consolidated Financial Statements (continued)
October 31, 2018
Note 2. Significant Accounting Policies (continued)
G) CASH — The Fund's uninvested cash balance is held in an interest bearing variable rate demand deposit account at State Street Bank and Trust Company ("SSB"), the Fund's custodian.
H) SHORT SALES — When the Fund engages in a short sale, the collateral for the short position will be maintained by the Fund's custodian or qualified sub-custodian. While the short sale is open, the Fund will maintain in a segregated account an amount of liquid securities equal in value to its obligation to the securities sold short. The collateral amounts required are determined daily by reference to the market value of the short positions. Short sales expose the Fund to the risk that it will be required to cover its short position at a time when the securities have appreciated in value, thus resulting in a loss to the Fund. The Fund's loss on a short sale could theoretically be unlimited in a case where the Fund is unable, for whatever reason, to close out its short position. Short sales also involve transaction and other costs that will reduce potential gains and increase potential Fund losses. The use by the Fund of short sales in combination with long positions in the Fund in an attempt to improve performance may not be successful and may result in greater losses or lower positive returns than if the Fund held only long positions. It is possible that the Fund's long equity positions will decline in value at the same time that the value of the securities it has sold short increases, thereby increasing potential losses to the Fund. In addition, the Fund's short selling strategies may limit its ability to fully benefit from increases in the equity markets. Short selling also involves a form of financial leverage that may exaggerate any losses realized by the Fund. Also, there is the risk that the counterparty to a short sale may fail to honor its contractual terms, causing a loss to the Fund. At October 31, 2018, the amount of restricted cash held at brokers related to open short positions was $0.
I) FUTURES — The Fund may enter into futures contracts to the extent permitted by its investment policies and objectives. The Fund may use futures contracts to gain exposure to or hedge against changes in interest rates, equity and market price movements and/or currency risks. Upon entering into a futures contract, the Fund is required to deposit cash and/or pledge U.S. Government securities as initial margin with a Futures Commission Merchant ("FCM"). Subsequent payments, which are dependent on the daily fluctuations in the value of the underlying instrument, are made or received by the Fund each day (daily variation margin) and are recorded as unrealized gains or losses in the Consolidated Statement of Operations until the contracts are closed. When the contracts are closed, the Fund records a realized gain or loss equal
38
Credit Suisse Multialternative Strategy Fund
Notes to Consolidated Financial Statements (continued)
October 31, 2018
Note 2. Significant Accounting Policies (continued)
to the difference between the proceeds from (or cost of) the closing transaction and the Fund's basis in the contract. Risks of entering into futures contracts for hedging purposes include the possibility that a change in the value of the contract may not correlate with the changes in the value of the underlying instruments. Futures have minimal counterparty credit risk because futures are exchange traded and the exchange's clearinghouse, as counterparty to all exchange-traded futures, guarantees the futures against default. In addition, the purchase of a futures contract involves the risk that the Fund could lose more than the original margin deposit and subsequent payments may be required for a futures transaction. The Fund's open futures contracts are disclosed in the Consolidated Schedule of Investments. At October 31, 2018, the amount of restricted cash held at brokers related to open futures contracts was $3,866,863.
The Commodity Exchange Act requires an FCM to segregate all customer transactions and assets from the FCM's proprietary activities. A customer's cash and other equity deposited with an FCM are considered commingled with all other customer funds subject to the FCM's segregation requirements. In the event of an FCM's insolvency, recovery may be limited to the Fund's pro-rata share of segregated customer funds available. It is possible that the recovery amount could be less than the total of cash and other equity deposited.
J) FORWARD FOREIGN CURRENCY CONTRACTS — A forward foreign currency exchange contract ("forward currency contract") is a commitment to purchase or sell a foreign currency at the settlement date at a negotiated rate. The Fund will enter into forward currency contracts primarily for hedging foreign currency risk. Forward currency contracts are valued at the prevailing forward exchange rate of the underlying currencies and unrealized gain/loss is recorded daily. On the settlement date of the forward currency contract, the Fund records a realized gain or loss equal to the difference between the value of the contract at the time it was opened and the value of the contract at the time it was closed. Certain risks may arise upon entering into forward currency contracts from the potential inability of counterparties to meet the terms of their contracts. The maximum counterparty credit risk to the Fund is measured by the unrealized gain on appreciated contracts. Additionally, when utilizing forward currency contracts to hedge, the Fund forgoes the opportunity to profit from favorable exchange rate movements during the term of the contract. The Fund's open forward currency contracts at October 31, 2018 are disclosed in the Consolidated Schedule of Investments.
39
Credit Suisse Multialternative Strategy Fund
Notes to Consolidated Financial Statements (continued)
October 31, 2018
Note 2. Significant Accounting Policies (continued)
K) SWAPS — The Fund may enter into swaps either for hedging purposes or to seek to increase total return. A swap contract is an agreement that obligates two parties to exchange a series of cash flows at specified intervals based upon or calculated by reference to changes in specified prices or rates for a specified amount of an underlying asset or notional principal amount. A centrally cleared swap is a transaction executed between the Fund and a counterparty, then cleared by a clearing member through a central clearinghouse. The central clearinghouse serves as the counterparty, with whom the Fund exchanges cash flows. The Fund will enter into swap contracts only on a net basis, which means that the two payment streams are netted out, with the Fund receiving or paying, as the case may be, only the net amount of the two payments. Risks may arise as a result of the failure of the counterparty to the swap contract to comply with the terms of the swap contract. The extent of the Fund's exposure to credit and counterparty risks is the discounted net value of the cash flows to be received from the counterparty over the contract's remaining life, to the extent that the amount is positive. These risks are mitigated by having a master netting arrangement between the Fund and the counterparty and by the posting of collateral by the counterparty to the Fund to cover the Fund's exposure to the counterparty. Therefore, the Fund considers the creditworthiness of each counterparty as well as the amounts posted by the counterparty pursuant to the master netting agreement to a swap contract in evaluating potential credit risk. Additionally, risks may arise from unanticipated movements in interest rates or in the value of the underlying reference asset or index.
The Fund may enter into total return swap contracts, involving commitments to pay interest in exchange for a market-linked return, both based on notional amounts. The Fund may invest in total return swap contracts for hedging purposes or to seek to increase total return. To the extent the total return of the security or index underlying the transaction exceeds or falls short of the offsetting interest rate obligation, the Fund will receive a payment from or make a payment to the counterparty.
The Fund may enter into credit default swap agreements either as a buyer or seller. The Fund may buy a credit default swap to attempt to mitigate the risk of default or credit quality deterioration in one or more individual holdings or in a segment of the fixed income securities market. The Fund may sell a credit default swap in an attempt to gain exposure to an underlying issuer's credit quality characteristics without investing directly in that issuer.
40
Credit Suisse Multialternative Strategy Fund
Notes to Consolidated Financial Statements (continued)
October 31, 2018
Note 2. Significant Accounting Policies (continued)
The Fund bears the risk of loss of the amount expected to be received under a credit default swap agreement in the event of the default or bankruptcy of the counterparty. The Fund will enter into swap agreements only with counterparties that meet certain standards of creditworthiness (generally, such counterparties would have to be eligible counterparties under the terms of the Fund's repurchase agreement guidelines). Credit default swap agreements are generally valued at a price at which the counterparty to such agreement would terminate the agreement.
The Fund records unrealized gains or losses on a daily basis representing the value and the current net receivable or payable relating to open swap contracts. Net amounts received or paid on the swap contract are recorded as realized gains or losses. Fluctuations in the value of swap contracts are recorded for financial statement purposes as unrealized appreciation or depreciation from swap contracts. Realized gains and losses from terminated swaps are included in net realized gains/losses from swap contracts. Upon entering into a centrally cleared swap, the Fund is required to deposit with a financial intermediary cash or securities ("initial margin") in an amount equal to a certain percentage of the notional amount of the swap. Subsequent payments ("variation margin") are made or received by the Fund dependent upon the daily fluctuations in the value of the swap. In a cleared swap transaction, counterparty risk is minimized as the central clearinghouse acts as the counterparty. The Fund's open swap contracts are disclosed in the Consolidated Schedule of Investments. At October 31, 2018, the amounts of restricted cash held at brokers related to open swap contracts and centrally cleared swaps for the Fund were $39,413,762 and $0, respectively.
L) OPTION CONTRACTS — The Fund will enter into options contracts to gain exposure to risk volatility based assets. When the Fund purchases an option, it pays a premium and the option is subsequently marked to market to reflect current value. Premiums paid for purchasing options which expire are treated as realized losses. Premiums paid for purchasing options which are exercised or closed are added to the cost or deducted from the proceeds on the underlying instrument to determine the realized gain or loss. The risk associated with purchasing options is limited to the premium paid.
When the Fund writes an option, an amount equal to the net premium received (the premium less commission) is recorded as a liability and is subsequently adjusted to the current value. Net premiums received for written options which expire are treated as realized gains. Net premiums received for written options which are exercised or closed are deducted from the cost or
41
Credit Suisse Multialternative Strategy Fund
Notes to Consolidated Financial Statements (continued)
October 31, 2018
Note 2. Significant Accounting Policies (continued)
added to the proceeds on the underlying instrument or closing purchase transaction to determine the realized gain or loss. The Fund, as writer of a written option, bears the risk of an unfavorable change in the market value of the instrument underlying the written option.
Exchange-traded options have standardized contracts and are settled through a clearing house with fulfillment guaranteed by the credit of the exchange. Therefore, counterparty credit risks to the Fund are limited. Over-the-counter options are subject to the risk that the counterparty is unable or unwilling to meet its obligations under the option. The Fund's exchange-traded written options are disclosed in the Consolidated Schedule of Investments. At October 31, 2018, the amount of restricted cash held at brokers related to option contracts was $0.
M) SECURITIES LENDING — The initial collateral received by the Fund is required to have a value of at least 102% of the market value of domestic securities on loan (including any accrued interest thereon) and 105% of the market value of foreign securities on loan (including any accrued interest thereon). The collateral is maintained thereafter at a value equal to at least 102% of the current market value of the securities on loan. The market value of loaned securities is determined at the close of each business day of the Fund and any additional required collateral is delivered to the Fund, or excess collateral returned by the Fund, on the next business day. Cash collateral received by the Fund in connection with securities lending activity may be pooled together with cash collateral for other funds/portfolios advised by Credit Suisse and may be invested in a variety of investments, including funds advised by SSB, the Fund's securities lending agent, or money market instruments. However, in the event of default or bankruptcy by the other party to the agreement, realization and/or retention of the collateral may be subject to legal proceedings.
SSB has been engaged by the Fund to act as the Fund's securities lending agent. As of October 31, 2018, the Fund had investment securities on loan with a fair value of $2,946,189. Collateral received for securities loaned and a related liability of $3,047,959 are presented gross in the Consolidated Statement of Assets and Liabilities. The collateral for securities loaned is valued consistently to the other investments held by the Fund and is included in Level 2 of the fair value hierarchy. As of October 31, 2018, the value of the related collateral exceeded the value of the securities loaned.
42
Credit Suisse Multialternative Strategy Fund
Notes to Consolidated Financial Statements (continued)
October 31, 2018
Note 2. Significant Accounting Policies (continued)
During the year ended October 31, 2018, total earnings from the Fund's investment in cash collateral received in connection with securities lending arrangements was $45,017, of which $19,781 was rebated to borrowers (brokers). The Fund retained $18,925 in income from the cash collateral investment, and SSB, as lending agent, was paid $6,311. Securities lending income is accrued as earned.
N) OTHER — In the normal course of business the Fund trades financial instruments and enters into financial transactions for which risk of potential loss exists due to changes in the market (market risk) or failure of the other party to a transaction to perform (credit risk). Similar to credit risk, the Fund may be exposed to counterparty risk, including securities lending, or the risk that an institution or other entity with which the Fund has unsettled or open transactions will default. The potential loss could exceed the value of the financial assets recorded in the consolidated financial statements. Financial assets, which potentially expose the Fund to credit risk, consist principally of cash due from counterparties and investments. The extent of the Fund's exposure to credit and counterparty risks in respect to these financial assets approximates their carrying value as recorded in the Fund's Consolidated Statement of Assets and Liabilities.
O) FOREIGN INVESTMENTS RISK — The Fund may have elements of risk not typically associated with investments in the U.S. due to concentrated investments in a limited number of countries or regions, which may vary throughout the year. Such concentrations may subject the Fund to additional risks resulting from political or economic conditions in such countries or regions and the possible imposition of adverse governmental laws or currency exchange restrictions could cause the securities and their markets to be less liquid and their prices to be more volatile than those of comparable U.S. securities.
Because the Fund may invest a significant portion of its assets in these markets, it is subject to greater risks of adverse events that occur in those markets and may experience greater volatility than a Fund that is more broadly diversified geographically.
P) RECENT ACCOUNTING PRONOUNCEMENTS — In March 2017, the FASB issued Accounting Standards Update 2017-08, Receivables — Nonrefundable Fees and Other Costs (Subtopic 310-20): Premium Amortization On Purchased Callable Debt Securities ("ASU 2017-08"). The update shortens the amortization period for the premium on certain purchased callable debt securities to the earliest call date. ASU 2017-08 will be effective for annual periods beginning
43
Credit Suisse Multialternative Strategy Fund
Notes to Consolidated Financial Statements (continued)
October 31, 2018
Note 2. Significant Accounting Policies (continued)
after December 15, 2018. Management is currently assessing the potential impact of these changes to future financial statements.
Also, in August 2018, the FASB issued Accounting Standards Update 2018-13, Fair Value Measurement (Topic 820): Disclosure Framework — Changes to the Disclosure Requirements for Fair Value Measurement ("ASU 2018-13"). The update provides guidance that eliminates, adds and modifies certain disclosure requirements for fair value measurements. ASU 2018-13 will be effective for annual periods beginning after December 15, 2019. Management is currently assessing the potential impact of these changes to future financial statements.
Q) SUBSEQUENT EVENTS — In preparing the financial statements as of October 31, 2018, management considered the impact of subsequent events for potential recognition or disclosure in these financial statements through the date of release of this report. No such events requiring recognition or disclosure were identified through the date of the release of this report.
Note 3. Transactions with Affiliates and Related Parties
Credit Suisse serves as investment adviser and co-administrator for the Fund. Credit Suisse is entitled to receive a fee from the Fund at an annual rate of 1.04% of the Fund's average daily net assets. For the year ended year ended October 31, 2018, investment advisory and administration fees earned and fees waived/expenses reimbursed by Credit Suisse were $1,108,755 and $1,009,998, respectively. Credit Suisse has contractually agreed to limit expenses so that the Fund's annual operating expenses do not exceed 0.85% of the Fund's average daily net assets for Class I shares, 1.10% of the Fund's average daily net assets for Class A shares, and 1.85% of the Fund's average daily net assets for Class C shares. The Fund is authorized to reimburse Credit Suisse for management fees previously limited and/or for expenses previously reimbursed by Credit Suisse, provided, however, that any reimbursements must be paid at a date not more than three years after the end of the fiscal year during which such fees were limited or expenses were reimbursed by Credit Suisse and the reimbursements do not cause the Fund to exceed the applicable expense limitation in the contract at the time the fees are recouped. This contract may not be terminated before February 28, 2020. The amounts waived and reimbursed by Credit Suisse, which are available for potential future
44
Credit Suisse Multialternative Strategy Fund
Notes to Consolidated Financial Statements (continued)
October 31, 2018
Note 3. Transactions with Affiliates and Related Parties (continued)
recoupment by Credit Suisse, and the expiration schedule at October 31, 2018 are a follows:
| | | Fee waivers/expense
reimbursements
subject to
recoupment* | | Expires
October 31,
2019 | | Expires
October 31,
2020 | | Expires
October 31,
2021 | |
Class I | | $ | 2,238,117 | | | $ | 606,964 | | | $ | 701,219 | | | $ | 929,934 | | |
Class A | | | 27,219 | | | | 6,694 | | | | 8,368 | | | | 12,157 | | |
Class C | | | 1,549 | | | | 1,100 | | | | 358 | | | | 91 | | |
Totals | | $ | 2,266,885 | | | $ | 614,758 | | | $ | 709,945 | | | $ | 942,182 | | |
* The Subsidiary is not eligible for recoupment.
For its co-administrative services, SSB receives a fee, exclusive of out-of-pocket expenses, calculated in total for all the Credit Suisse funds/portfolios co-administered by SSB and allocated based upon the relative average net assets of each fund/portfolio, subject to an annual minimum fee. For the year ended October 31, 2018, co-administrative services fees earned by SSB (including out-of-pocket expenses) with respect to the Fund were $36,193.
Credit Suisse Securities (USA) LLC ("CSSU"), an affiliate of Credit Suisse, serves as the distributor of the Fund's shares. Pursuant to a distribution plan adopted by the Fund pursuant to Rule 12b-1 under the 1940 Act, CSSU receives fees for its distribution services. These fees are calculated at an annual rate of 0.25% of the average daily net assets of the Class A shares. For the Class C shares, the fee is calculated at an annual rate of 1.00% of the average daily net assets. For the year ended October 31, 2018, the Fund paid Rule 12b-1 distribution fees of $3,440 for Class A shares and $126 for Class C shares. Class I shares are not subject to Rule 12b-1 distribution fees.
Certain brokers, dealers and financial representatives provide transfer agent-related services to the Fund and receive compensation from the Fund. For the year ended October 31, 2018, the Fund paid $35,123, which is included within transfer agent fees in the Consolidated Statement of Operations.
For the year ended October 31, 2018, CSSU and its affiliates advised the Fund that there were no commissions earned on the sale of Class A and Class C shares.
Note 4. Line of Credit
The Fund, together with other funds/portfolios advised by Credit Suisse (collectively, the "Participating Funds"), participates in a committed, unsecured line of credit facility ("Credit Facility"), with SSB in an aggregated amount of
45
Credit Suisse Multialternative Strategy Fund
Notes to Consolidated Financial Statements (continued)
October 31, 2018
Note 4. Line of Credit (continued)
$250 million for temporary or emergency purposes under a first-come, first-served basis. Under the terms of the Credit Facility, the Participating Funds pay an aggregate commitment fee on the average unused amount of the Credit Facility, which is allocated among the Participating Funds in such manner as is determined by the governing Boards of the Participating Funds. In addition, the Participating Funds pay interest on borrowings at either the Overnight Federal Funds rate or the Overnight LIBOR rate plus a spread. At October 31, 2018 and during the year ended October 31, 2018, the Fund had no borrowings outstanding under the Credit Facility.
Note 5. Purchases and Sales of Securities
For the year ended October 31, 2018, purchases and sales of investment securities (excluding short-term investments) were as follows:
Investment Securities | |
| Purchases | | Sales | |
| $ | 547,881,013 | | | $ | 503,838,130 | | |
Note 6. Capital Share Transactions
The Fund is authorized to issue an unlimited number of full and fractional shares of beneficial interest, $.001 par value per share. The Fund offers Class I, Class A and Class C shares. Transactions in capital shares for each class of the Fund were as follows:
| | | Class I | |
| | | For the Year Ended
October 31, 2018 | | For the Year Ended
October 31, 2017 | |
| | | Shares | | Value | | Shares | | Value | |
Shares sold | | | 3,003,190 | | | $ | 30,529,151 | | | | 3,658,695 | | | $ | 37,970,122 | | |
Shares issued in reinvestment
of dividends and distributions | | | 462,544 | | | | 4,680,939 | | | | 236,955 | | | | 2,445,260 | | |
Shares redeemed | | | (2,700,628 | ) | | | (27,418,088 | ) | | | (5,265,549 | ) | | | (54,588,520 | ) | |
Net increase (decrease) | | | 765,106 | | | $ | 7,792,002 | | | | (1,369,899 | ) | | $ | (14,173,138 | ) | |
| | | Class A | |
| | | For the Year Ended
October 31, 2018 | | For the Year Ended
October 31, 2017 | |
| | | Shares | | Value | | Shares | | Value | |
Shares sold | | | 75,605 | | | $ | 764,263 | | | | 61,526 | | | $ | 634,481 | | |
Shares issued in reinvestment
of dividends and distributions | | | 4,859 | | | | 48,786 | | | | 1,789 | | | | 18,350 | | |
Shares redeemed | | | (58,975 | ) | | | (591,939 | ) | | | (70,220 | ) | | | (724,894 | ) | |
Net increase (decrease) | | | 21,489 | | | $ | 221,110 | | | | (6,905 | ) | | $ | (72,063 | ) | |
46
Credit Suisse Multialternative Strategy Fund
Notes to Consolidated Financial Statements (continued)
October 31, 2018
Note 6. Capital Share Transactions (continued)
| | | Class C1 | |
| | | For the Year Ended
October 31, 2018 | | For the Year Ended
October 31, 2017 | |
| | | Shares | | Value | | Shares | | Value | |
Shares issued in reinvestment
of dividends and distributions | | | — | | | $ | — | | | | 95 | | | $ | 949 | | |
Shares redeemed | | | (4,366 | ) | | | (42,559 | ) | | | (5,375 | ) | | | (53,755 | ) | |
Net decrease | | | (4,366 | ) | | $ | (42,559 | ) | | | (5,280 | ) | | $ | (52,806 | ) | |
1 Class C was redeemed on February 15, 2018 and currently has no shareholders.
On October 31, 2018, the number of shareholders that held 5% or more of the outstanding shares of each class of the Fund was as follows:
| | | Number of
Shareholders | | Approximate Percentage
of Outstanding Shares | |
Class I | | | 4 | | | | 99 | % | |
Class A | | | 4 | | | | 63 | % | |
Class C | | | 0 | | | | 0 | % | |
The Fund's performance may be negatively impacted in the event one or more of the Fund's greater than 5% shareholders were to redeem at a given time. Some of the shareholders may be omnibus accounts, which hold shares on behalf of individual shareholders.
Note 7. Income Tax Information and Distributions to Shareholders
Income and capital gain distributions are determined in accordance with federal income tax regulations, which may differ from GAAP.
The tax character of dividends paid by the Fund during the years ended October 31, 2018 and 2017, respectively, was as follows:
| Ordinary Income | | Long-Term Capital Gain | |
| 2018 | | 2017 | | 2018 | | 2017 | |
| $ | 4,589,753 | | | $ | 1,562,939 | | | $ | 160,247 | | | $ | 915,803 | | |
The tax basis components of distributable earnings differ from the amounts reflected in the Consolidated Statement of Assets and Liabilities by temporary book/tax differences. These differences are primarily due to differing treatments of wash sales, mark to market of forward contracts, futures contracts, swap contracts, options contracts and deferred organizational
47
Credit Suisse Multialternative Strategy Fund
Notes to Consolidated Financial Statements (continued)
October 31, 2018
Note 7. Income Tax Information and Distributions to Shareholders (continued)
expenses. At October 31, 2018, the components of distributable earnings on a tax basis were as follows:
Undistributed net investment income | | $ | 1,769,476 | | |
Accumulated net realized gain | | | 120,544 | | |
Unrealized depreciation | | | (1,570,530 | ) | |
| | | $ | 319,490 | | |
At October 31, 2018, the cost and net unrealized appreciation (depreciation) of investments and derivatives for income tax purposes were as follows:
Cost of Investments | | $ | 55,941,209 | | |
Unrealized appreciation | | $ | 11,096,991 | | |
Unrealized depreciation | | | (12,612,531) | | |
Net unrealized appreciation (depreciation) | | $ | (1,515,540 | ) | |
To adjust for current period permanent book/tax differences which arose principally from differing book/tax treatment of foreign currency gain/loss, ordinary loss netting to reduce short-term capital gains and swap gain/loss, paid-in capital was charged $573,838, and distributable earnings/loss was credited $573,838. Net assets were not affected by this reclassification.
Note 8. Contingencies
In the normal course of business, the Fund may provide general indemnifications pursuant to certain contracts and organizational documents. The Fund's maximum exposure under these arrangements is dependent on future claims that may be made against the Fund and, therefore, cannot be estimated; however, based on experience, the risk of loss from such claims is considered remote.
48
Credit Suisse Multialternative Strategy Fund
Report of Independent Registered Public Accounting Firm
To the Board of Trustees and Shareholders
Credit Suisse Multialternative Strategy Fund:
Opinion on the Consolidated Financial Statements
We have audited the accompanying consolidated statement of assets and liabilities of Credit Suisse Multialternative Strategy Fund (the "Fund"), a series of the Credit Suisse Opportunity Funds, including the consolidated schedule of investments, as of October 31, 2018, and the related consolidated statement of operations for the year then ended, the consolidated statements of changes in net assets for each of the years in the two-year period then ended, and the related notes (collectively, the "consolidated financial statements") and the consolidated financial highlights for each of the years in the four-year period then ended. In our opinion, the consolidated financial statements and consolidated financial highlights present fairly, in all material respects, the financial position of Credit Suisse Multialternative Strategy Fund as of October 31, 2018, the results of its operations for the year then ended, the changes in its net assets for each of the years in the two-year period then ended, and the consolidated financial highlights for each of the years in the four-year period then ended, in conformity with U.S. generally accepted accounting principles. The consolidated financial highlights for the year ended October 31, 2014 were audited by other independent registered public accountants whose report, dated December 29, 2014, expressed an unqualified opinion on those consolidated financial highlights.
Basis for Opinion
These consolidated financial statements and consolidated financial highlights are the responsibility of the Fund's management. Our responsibility is to express an opinion on these consolidated financial statements and consolidated financial highlights based on our audits. We are a public accounting firm registered with the Public Company Accounting Oversight Board (United States) (PCAOB) and are required to be independent with respect to the Fund in accordance with the U.S. federal securities laws and the applicable rules and regulations of the Securities and Exchange Commission and the PCAOB.
We conducted our audits in accordance with the standards of the PCAOB. Those standards require that we plan and perform the audit to obtain reasonable assurance about whether the consolidated financial statements and consolidated financial highlights are free of material misstatement, whether due to error or fraud. Our audits included performing procedures to assess the risks of material misstatement of the consolidated financial statements and consolidated financial
49
Credit Suisse Multialternative Strategy Fund
Report of Independent Registered Public Accounting Firm (continued)
highlights, whether due to error or fraud, and performing procedures that respond to those risks. Such procedures included examining, on a test basis, evidence regarding the amounts and disclosures in the consolidated financial statements and consolidated financial highlights. Such procedures also included confirmation of securities owned as of October 31, 2018, by correspondence with the custodian and brokers or by other appropriate auditing procedures. Our audits also included evaluating the accounting principles used and significant estimates made by management, as well as evaluating the overall presentation of the consolidated financial statements and consolidated financial highlights. We believe that our audits provide a reasonable basis for our opinion.
We have served as the auditor of one or more Credit Suisse Asset Management, LLC investment companies since 2015.
New York, New York
December 28, 2018
50
Credit Suisse Multialternative Strategy Fund
Information Concerning Trustees and Officers (unaudited)
Name, Address
(Year of Birth) | | Position(s)
Held with
Fund | | Term
of Office1
and
Length
of Time
Served | | Principal
Occupation(s) During
Past Five Years | | Number of
Portfolios
in Fund
Complex
Overseen
by Trustee | | Other
Trusteeships
Held by Trustee
During Past Five Years | |
Independent Trustees | | | | | | | | | | | |
Laura A. DeFelice
c/o Credit Suisse Asset
Management, LLC
Attn: General Counsel
Eleven Madison Avenue
New York, New York
10010
(1959) | | Trustee, Nominating and Audit Committee member | | Since 2017 | | Partner of Acacia Properties LLC (multi-family and commercial real estate ownership and operation) from 2008 to present; Stonegate Advisors LLC (renewable energy and energy efficiency) from 2007 to present. | | | 8 | | | None. | |
Jeffrey E. Garten
c/o Credit Suisse Asset Management, LLC
Attn: General Counsel Eleven Madison Avenue New York, New York 10010
(1946) | | Trustee, Nominating and Audit Committee member | | Since Fund Inception | | Dean Emeritus of Yale School of Management from July 2015 to present; The Juan Trippe Professor in the Practice of International Trade, Finance and Business, from July 2005 to July 2015; Partner and Chairman of Garten Rothkopf (consulting firm) from October 2005 to June 2017. | | | 8 | | | Director of Aetna, Inc. (insurance company); Director of CarMax Group (used car dealers); Director of Miller Buckfire & Co., LLC (financial restructuring); Member of Standard & Poor's Board of Managers (credit rating agency) from December 2011 to November 2014. | |
1 Subject to the Trust's retirement policy, each Trustee may continue to serve as a Trustee until the last day of the calendar year in which the applicable Trustee attains age 75.
51
Credit Suisse Multialternative Strategy Fund
Information Concerning Trustees and Officers (unaudited) (continued)
Name, Address
(Year of Birth) | | Position(s)
Held with
Fund | | Term
of Office1
and
Length
of Time
Served | | Principal
Occupation(s) During
Past Five Years | | Number of
Portfolios
in Fund
Complex
Overseen
by Trustee | | Other
Trusteeships
Held by Trustee
During Past Five Years | |
Independent Trustees | | | | | | | | | | | |
Mahendra R. Gupta
c/o Credit Suisse Asset
Management, LLC
Attn: General Counsel
Eleven Madison Avenue
New York, New York
10010
(1956) | | Trustee, Nominating Committee member and Audit Committee Chairman | | Since 2017 | | Professor, Washington University in St. Louis from July 1990 to present; Dean of Olin Business School at Washington University in St. Louis from July 2005 to July 2016; Partner, R.J. Mithaiwala (food manufacturing and retail, India) from March 1977 to present; Partner, F.F.B. Corporation (agriculture, India) from March 1977 to present; Partner, RPMG Research Corporation (benchmark research) from July 2001 to present. | | | 8 | | | Director of Caleres Inc. (footwear) from May 2012 to present; Director of Koch Development Corporation (real estate development) from November 2017 to present; Director of Supernova (fin-tech) from June 2014 to present. | |
1 Subject to the Trust's retirement policy, each Trustee may continue to serve as a Trustee until the last day of the calendar year in which the applicable Trustee attains age 75.
52
Credit Suisse Multialternative Strategy Fund
Information Concerning Trustees and Officers (unaudited) (continued)
Name, Address
(Year of Birth) | | Position(s)
Held with
Fund | | Term
of Office1
and
Length
of Time
Served | | Principal
Occupation(s) During
Past Five Years | | Number of
Portfolios
in Fund
Complex
Overseen
by Trustee | | Other
Trusteeships
Held by Trustee
During Past Five Years | |
Independent Trustees | | | | | | | | | | | |
Steven N. Rappaport
Lehigh Court, LLC
555 Madison Avenue
29th Floor
New York, New York
10022
(1948) | | Chairman of the Board, Nominating Committee Chairman and Audit Committee member | | Trustee Since Fund Inception and Chairman Since 2005 | | Partner of Lehigh Court, LLC and RZ Capital (private investment firms) from July 2002 to present; Partner of Backstage Acquisition Holdings, LLC (publication job postings) from November 2013 to present. | | | 9 | | | Director of iCAD, Inc. (surgical and medical instruments and apparatus company); Director of Aberdeen Emerging Markets Equity Income Fund, Inc., (a closed-end investment company); Director of Aberdeen Funds (30 open end portfolios); Director of Wood Resources, LLC (plywood manufacturing company) from 2003 to October 2013. | |
Interested Trustee | | | | | | | | | | | |
John G. Popp2
Credit Suisse Asset
Management, LLC
Eleven Madison Avenue
New York, New York
10010
(1956) | | Trustee, Chief Executive Officer and President | | Trustee since 2017
Chief Executive Officer and President since 2010 | | Managing Director of Credit Suisse; Global Head and Chief Investment Officer of the Credit Investments Group; Associated with Credit Suisse or its predecessor since 1997; President and Chief Executive Officer of other Credit Suisse Funds. | | | 9 | | | None. | |
1 Subject to the Trust's retirement policy, each Trustee may continue to serve as a Trustee until the last day of the calendar year in which the applicable Trustee attains age 75. Officer serves until his or her respective successor has been duly elected and qualified.
2 Mr. Popp is an "interested person" of the Trust, as defined in the 1940 Act, by virtue of his current position as an officer of Credit Suisse.
53
Credit Suisse Multialternative Strategy Fund
Information Concerning Trustees and Officers (unaudited) (continued)
Name, Address
(Year of Birth) | | Position(s)
Held with
Fund | | Term of
Office1
and
Length of
Time
Served | | Principal Occupation(s) During Past Five Years | |
Officers* | | | | | | | |
Emidio Morizio
Credit Suisse Asset
Management, LLC
Eleven Madison Avenue
New York, New York 10010
(1966) | | Chief Compliance Officer | | Since Fund Inception | | Managing Director and Global Head of Compliance of Credit Suisse since 2010; Associated with Credit Suisse since July 2000; Officer of other Credit Suisse Funds. | |
Lou Anne McInnis
Credit Suisse Asset Management, LLC
Eleven Madison Avenue
New York, New York 10010
(1959) | | Chief Legal Officer | | Since 2015 | | Director of Credit Suisse; Associated with Credit Suisse since April 2015; Counsel at DLA Piper US LLP from 2011 to April 2015; Associated with Morgan Stanley Investment Management from 1997 to 2010; Officer of other Credit Suisse Funds. | |
Laurie Pecha
Credit Suisse Asset
Management, LLC
Eleven Madison Avenue
New York, New York 10010
(1961) | | Chief Financial Officer and Treasurer | | Chief Financial Officer since 2016 and Treasurer since 2018 | | Director of Credit Suisse since August 2016; Senior Consultant of Spectra Professional Services, LLC from January 2012 to July 2016; Vice President of Legg Mason & Co. from March 2007 to December 2011; Officer of other Credit Suisse Funds. | |
Karen Regan
Credit Suisse Asset
Management, LLC
Eleven Madison Avenue
New York, New York 10010
(1963) | | Vice President and Secretary | | Since 2010 | | Vice President of Credit Suisse; Associated with Credit Suisse since December 2004; Officer of other Credit Suisse Funds. | |
1 Officer serves until his or her respective successor has been duly elected and qualified.
* The officers of the Fund shown are officers that make policy decisions.
The Statement of Additional Information includes additional information about the Trustees and is available, without charge, upon request, by calling 877-870-2874.
54
Credit Suisse Multialternative Strategy Fund
Proxy Voting and Portfolio Holdings Information (unaudited)
Information regarding how the Fund voted proxies related to its portfolio securities during the 12-month period ended June 30 of each year, as well as the policies and procedures that the Fund uses to determine how to vote proxies relating to its portfolio securities are available:
• By calling 1-877-870-2874
• On the Fund's website, www.credit-suisse.com/us/funds
• On the website of the Securities and Exchange Commission, www.sec.gov
The Fund files a complete schedule of its portfolio holdings for the first and third quarters of its fiscal year with the SEC on Form N-Q. The Fund's Forms N-Q are available on the SEC's website at www.sec.gov and may be reviewed and copied at the SEC's Public Reference Room in Washington, DC. Information on the operation of the SEC's Public Reference Room may be obtained by calling 1-202-551-8090.
55

P.O. BOX 219916, KANSAS CITY, MO 64121-9916
877-870-2874 n www.credit-suisse.com/us/funds
CREDIT SUISSE SECURITIES (USA) LLC, DISTRIBUTOR. MSF-AR-1018

CREDIT SUISSE FUNDS
Annual Report
October 31, 2018
n CREDIT SUISSE
STRATEGIC INCOME FUND
The Fund's investment objectives, risks, charges and expenses (which should be considered carefully before investing), and more complete information about the Fund, are provided in the Prospectus, which should be read carefully before investing. You may obtain additional copies by calling 877-870-2874 or by visiting our website at www.credit-suisse.com/us/funds.
Credit Suisse Securities (USA) LLC, Distributor, is located at Eleven Madison Avenue, New York, NY 10010. Credit Suisse Funds are advised by Credit Suisse Asset Management, LLC.
Investors in the Credit Suisse Funds should be aware that they may be eligible to purchase Class I shares (where offered) directly or through certain intermediaries. Such shares are not subject to a sales charge. Investors in the Credit Suisse Funds should also be aware that they may be eligible for a reduction or waiver of the sales charge with respect to Class A or C shares (where offered). For more information, please review the relevant prospectuses or consult your financial representative.
Fund shares are not deposits or other obligations of Credit Suisse Asset Management, LLC ("Credit Suisse") or any affiliate, are not FDIC-insured and are not guaranteed by Credit Suisse or any affiliate. Fund investments are subject to investment risks, including loss of your investment.
Credit Suisse Strategic Income Fund
Annual Investment Adviser's Report
October 31, 2018 (unaudited)
November 23, 2018
Dear Shareholder:
We are pleased to present this Annual Report covering the activities of the Credit Suisse Strategic Income Fund (the "Fund") for the 12-month period ended October 31, 2018.
Performance Summary
11/1/2017 – 10/31/18
Fund & Benchmark | | Performance | |
| Class I1 | | | 2.34 | % | |
| Class A1,2 | | | 2.09 | % | |
| Class C1,2 | | | 1.33 | % | |
ICE BofAML 3-Month
US Treasury Bill Index3 | | | 1.68 | % | |
Performance shown for the Fund's Class A and Class C Shares does not reflect sales charges, which are a maximum of 4.75% and 1.00%, respectively.2
Market Review: A mixed period overall
The annual period ended October 31, 2018 was a mixed one for the U.S. high yield and senior secured loan asset classes, with the ICE BofAML US High Yield Constrained Index returning 0.81%, while the Credit Suisse Leveraged Loan Index returned 4.89% for the period. In comparison, the ICE BofAML 3-Month US Treasury Bill Index (the "Benchmark"), the Fund's benchmark, returned 1.68% for the same period.
For the most part, supply and demand dynamics have been positive for the high yield asset class as light primary issuance has more than offset significant outflows from high yield mutual funds. Leveraged loan technicals have also been positive, though due to different factors. Leveraged loan mutual funds experienced a net inflow of $12.41 billion, which includes 10 consecutive months of positive flows through October. Additionally, CLO creation was robust with gross issuance of $275 billion that includes $130 billion in new vehicles, according to JPMorgan.
Default activity has been low compared to historical data points and as of October 31, 2018, the trailing 12-month default rate (including distressed exchanges) was 2.04% for high yield and 1.92% for senior secured loans.
1
Credit Suisse Strategic Income Fund
Annual Investment Adviser's Report (continued)
October 31, 2018 (unaudited)
Strategic Review and Outlook: Expecting broad-based demand to remain intact
For the 12-month period ended October 31, 2018, the Fund's I and A Class Shares outperformed the Benchmark. The Fund's outperformance is largely due to positive security selection within the senior secured loan and CLO asset classes. From a ratings perspective, B-rated positions contributed the most to returns.
We expect to see volatility in the near term due to investor concerns over the economic and credit cycle, recent LBO issuance, trade tensions, Brexit and escalating geopolitical tensions in the Middle East. Over the long term, we continue to be constructive on the leveraged loan market given the stable economic backdrop and senior secured and floating rate features of the asset class. We expect continued weakness and volatility in the high yield market until we see a stabilization in interest rates. We expect this volatility to provide attractive entry points into both the loan and high yield asset classes.
The Credit Suisse Credit Investments Group
John G. Popp
Andrew H. Marshak
Thomas J. Flannery
Louis I. Farano
Wing Chan
Senior secured floating rate loans ("Senior Loans") typically hold the most senior position in the issuer's capital structure. Senior Loans are subject to the risk that a court could subordinate a Senior Loan to presently existing or future indebtedness or take other action detrimental to the holders of Senior Loans.
High yield bonds are bonds rated below BBB- by S&P or Baa3 by Moody's that are also known as "junk bonds." Such bonds entail greater risks than those found in higher-rated securities.
CLOs are subject to the risk of substantial losses due to actual defaults, decrease of market value due to collateral defaults and disappearance of subordinate tranches, market anticipation of defaults, and investor aversion to CLO securities as a class. The risks of CLOs depend largely on the type of the underlying loans and the tranche of CLOs in which the Fund invests. In addition, CLOs carry risks including interest rate risk and credit risk.
2
Credit Suisse Strategic Income Fund
Annual Investment Adviser's Report (continued)
October 31, 2018 (unaudited)
Additional principal risk factors for the Fund include conflict of interest risk, convertible securities risk, credit risk, derivatives risk, extension risk, foreign securities risk, futures contracts risk, hedged exposure risk, interest rate risk, liquidity risk, market risk, mortgage- and asset-backed securities risk, prepayment risk, short position risk, U.S. government securities risk and valuation risk. Before you invest, please make sure you understand the risks that apply to the Fund. As with any mutual fund, you could lose money over any period of time. Investments in the Fund are not bank deposits and are not insured or guaranteed by the Federal Deposit Insurance Corporation or any government agency. For a detailed discussion of these and other risks, please refer to the Fund's Prospectus, which should be read carefully before investing.
In addition to historical information, this report contains forward-looking statements, which may concern, among other things, domestic and foreign markets, industry and economic trends and developments and government regulation, and their potential impact on the Fund's investments. These statements are subject to risks and uncertainties and actual trends, developments and regulations in the future, and their impact on the Fund, could be materially different from those projected, anticipated or implied. The Fund has no obligation to update or revise forward-looking statements.
The views of the Fund's management are as of the date of this letter and the Fund holdings described in this document are as of October 31, 2018; these views and Fund holdings may have changed subsequent to these dates. Nothing in this document is a recommendation to purchase or sell securities.
3
Credit Suisse Strategic Income Fund
Annual Investment Adviser's Report (continued)
October 31, 2018 (unaudited)
Comparison of Change in Value of $10,000 Investment in the
Credit Suisse Strategic Income Fund1 Class I Shares,
Class A Shares2, Class C Shares2 and the ICE BofAML
3-Month US Treasury Bill Index3
from Inception (9/28/12)
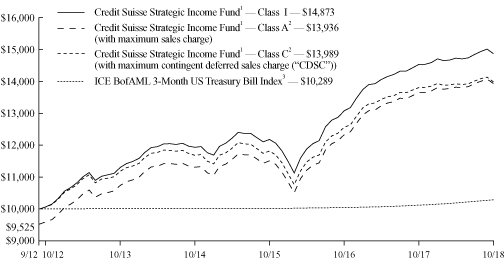
1 Fee waivers and/or expense reimbursements reduce expenses for the Fund, without which performance would be lower. Voluntary waivers and /or expense reimbursements may be discontinued at any time.
2 Total return for the Fund's Class A shares for the reporting period, based on offering price (including maximum sales charge of 4.75%), was (2.75)%. Total return for the Fund's Class C shares for the reporting period, based on redemption value including maximum contingent deferred sales charge ("CDSC") of 1.00%), was 0.35%.
3 The ICE BofAML 3-Month US Treasury Bill Index is comprised of a single issue purchased at the beginning of the month and held for a full month. Each month the index is rebalanced and the issue selected is the outstanding Treasury Bill that matures closest to, but not beyond 3 months from the rebalancing date. The index does not have transaction costs and investors may not invest directly in the index. The index was previously known as the BofA Merrill Lynch 3-Month US Treasury Bill Index.
4
Credit Suisse Strategic Income Fund
Annual Investment Adviser's Report (continued)
October 31, 2018 (unaudited)
Average Annual Returns as of October 31, 20181
| | | 1 Year | | 5 Years | | Since
Inception2 | |
Class I | | | 2.34 | % | | | 5.64 | % | | | 6.73 | % | |
Class A Without Sales Charge | | | 2.09 | % | | | 5.34 | % | | | 6.45 | % | |
Class A With Maximum Sales Charge | | | (2.75 | )% | | | 4.33 | % | | | 5.60 | % | |
Class C Without CDSC | | | 1.33 | % | | | 4.57 | % | | | 5.66 | % | |
Class C With CDSC | | | 0.35 | % | | | 4.57 | % | | | 5.66 | % | |
Returns represent past performance and include change in share price and reinvestment of dividends and capital gain distributions, if any. Past performance cannot guarantee future results. The current performance of the Fund may be lower or higher than the figures shown. Returns and share price will fluctuate, and redemption value may be more or less than original cost. The performance results do not reflect the deduction of taxes that a shareholder would pay on Fund distributions or the redemption of Fund shares. Performance information current to the most recent month end is available at www.credit-suisse.com/us/funds.
The annualized gross expense ratios are 1.16% for Class I shares, 1.41% for Class A shares and 2.16% for Class C shares. The annualized net expense ratios after fee waivers and/or expense reimbursements are 0.99% for Class I shares, 1.24% for Class A shares and 1.99% for Class C shares.
1 Fee waivers and/or expense reimbursements reduce expenses for the Fund, without which performance would be lower. Voluntary waivers and/or reimbursements may be discontinued at any time.
2 Inception Date: September 28, 2012.
5
Credit Suisse Strategic Income Fund
Annual Investment Adviser's Report (continued)
October 31, 2018 (unaudited)
Information About Your Fund's Expenses
As an investor of the Fund, you incur two types of costs: ongoing expenses and transaction costs. Ongoing expenses include management fees, distribution and service (12b-1) fees and other Fund expenses. Examples of transaction costs include sales charges (loads), redemption fees and account maintenance fees, which are not shown in this section and which would result in higher total expenses. The following table is intended to help you understand your ongoing expenses of investing in the Fund and to help you compare these expenses with the ongoing expenses of investing in other mutual funds. The table is based on an investment of $1,000 made at the beginning of the six months ended October 31, 2018.
The table illustrates your Fund's expenses in two ways:
• Actual Fund Return. This helps you estimate the actual dollar amount of ongoing expenses paid on a $1,000 investment in the Fund using the Fund's actual return during the period. To estimate the expenses you paid over the period, simply divide your account value by $1,000 (for example, an $8,600 account value divided by $1,000 = 8.6), then multiply the result by the number in the "Expenses Paid per $1,000" line.
• Hypothetical 5% Fund Return. This helps you to compare the Fund's ongoing expenses with those of other mutual funds using the Fund's actual expense ratio and a hypothetical rate of return of 5% per year before expenses. Examples using a 5% hypothetical fund return may be found in the shareholder reports of other mutual funds. The hypothetical account values and expenses may not be used to estimate the actual ending account balance or expenses you paid for the period.
Please note that the expenses shown in these tables are meant to highlight your ongoing expenses only and do not reflect any transaction costs, such as sales charges (loads) or redemption fees. If these transaction costs had been included, your costs would have been higher. The "Expenses Paid per $1,000" line of the tables is useful in comparing ongoing expenses only and will not help you determine the relative total expenses of owning different funds.
6
Credit Suisse Strategic Income Fund
Annual Investment Adviser's Report (continued)
October 31, 2018 (unaudited)
Expenses and Value for a $1,000 Investment
for the six-month period ended October 31, 2018
Actual Fund Return | | Class I | | Class A | | Class C | |
Beginning Account Value 05/01/18 | | $ | 1,000.00 | | | $ | 1,000.00 | | | $ | 1,000.00 | | |
Ending Account Value 10/31/18 | | $ | 1,009.70 | | | $ | 1,008.40 | | | $ | 1,004.60 | | |
Expenses Paid per $1,000* | | $ | 5.01 | | | $ | 6.28 | | | $ | 10.05 | | |
Hypothetical 5% Fund Return | |
Beginning Account Value 05/01/18 | | $ | 1,000.00 | | | $ | 1,000.00 | | | $ | 1,000.00 | | |
Ending Account Value 10/31/18 | | $ | 1,020.21 | | | $ | 1,018.95 | | | $ | 1,015.17 | | |
Expenses Paid per $1,000* | | $ | 5.04 | | | $ | 6.31 | | | $ | 10.11 | | |
| | | Class I | | Class A | | Class C | |
Annualized Expense Ratios* | | | 0.99 | % | | | 1.24 | % | | | 1.99 | % | |
* Expenses are equal to the Fund's annualized expense ratio for each share class, multiplied by the average account value over the period, multiplied by 184/365 to reflect the one-half year period.
The "Expenses Paid per $1,000" and the "Annualized Expense Ratios" in the tables are based on actual expenses paid by the Fund during the period, net of fee waivers and/or actual expense reimbursements, if applicable. If those fee waivers and/or expense reimbursements had not been in effect, the Fund's actual expenses would have been higher. Expenses do not reflect additional charges and expenses that are, or may be, imposed under the variable contracts or plans. Such charges and expenses are described in the prospectus of the insurance company separate account or in the plan documents or other informational materials supplied by plan sponsors. The Fund's expenses should be considered with these charges and expenses in evaluating the overall cost of investing in the separate account.
For more information, please refer to the Fund's Prospectus.
7
Credit Suisse Strategic Income Fund
Annual Investment Adviser's Report (continued)
October 31, 2018 (unaudited)
Credit Quality Breakdown*
(% of Total Investments as of October 31, 2018)
S&P Ratings** | |
BBB | | | 1.7 | % | |
BB | | | 32.9 | | |
B | | | 45.6 | | |
CCC | | | 14.1 | | |
CC | | | 0.2 | | |
NR | | | 4.8 | | |
Subtotal | | | 99.3 | | |
Equity and Other | | | 0.7 | | |
Total | | | 100.0 | % | |
* Expressed as a percentage of total investments (excluding securities lending collateral, if applicable) and may vary over time.
** Credit Quality is based on ratings provided by the Standard & Poor's Division of The McGraw-Hill Companies, Inc. (S&P"). S&P is a main provider of ratings for Credit Assets Classes and is widely used amongst industry participants. The NR category consists of securities that have not been rated by S&P.
8
Credit Suisse Strategic Income Fund
Schedule of Investments
October 31, 2018
Par
(000) | |
| | Ratings†
(S&P/Moody's) | | Maturity | | Rate% | | Value | |
| CORPORATE BONDS (48.7%) | | | |
| Air Transportation (0.1%) | |
$ | 300 | | | United Continental Holdings, Inc.,
Company Guaranteed Notes | | (BB, Ba3) | | 02/01/24 | | | 5.000 | | | $ | 295,125 | | |
| Auto Parts & Equipment (1.2%) | |
| | 1,350 | | | Cooper-Standard Automotive, Inc., Rule 144A,
Company Guaranteed Notes
(Callable 11/15/21 @ 102.81)(1) | | (B+, B1) | | 11/15/26 | | | 5.625 | | | | 1,282,500 | | |
| | 1,400 | | | Delphi Technologies PLC, Rule 144A,
Company Guaranteed Notes(1) | | (BB, B1) | | 10/01/25 | | | 5.000 | | | | 1,267,000 | | |
| | 750 | | | Stevens Holding Co., Inc., Rule 144A,
Company Guaranteed Notes
(Callable 10/01/23 @ 101.53)(1) | | (B+, B2) | | 10/01/26 | | | 6.125 | | | | 749,152 | | |
| | | | 3,298,652 | | |
| Brokerage (0.6%) | |
| | 1,500 | | | LPL Holdings, Inc., Rule 144A,
Company Guaranteed Notes
(Callable 03/15/20 @ 104.31)(1) | | (BB-, B2) | | 09/15/25 | | | 5.750 | | | | 1,460,625 | | |
| Building & Construction (0.3%) | |
| | 750 | | | TopBuild Corp., Rule 144A,
Company Guaranteed Notes
(Callable 05/01/21 @ 102.81)(1) | | (BB-, B1) | | 05/01/26 | | | 5.625 | | | | 716,250 | | |
| Building Materials (5.6%) | |
| | 900 | | | American Builders & Contractors Supply Co., Inc.,
Rule 144A, Company Guaranteed Notes
(Callable 05/15/21 @ 102.94)(1) | | (B+, B3) | | 05/15/26 | | | 5.875 | | | | 876,375 | | |
| | 350 | | | American Builders & Contractors Supply Co., Inc.,
Rule 144A, Senior Unsecured Notes
(Callable 12/15/18 @ 104.31)(1) | | (B+, B3) | | 12/15/23 | | | 5.750 | | | | 346,500 | | |
| | 1,500 | | | American Woodmark Corp., Rule 144A,
Company Guaranteed Notes
(Callable 03/15/21 @ 102.44)(1) | | (BB, Ba3) | | 03/15/26 | | | 4.875 | | | | 1,396,875 | | |
| | 1,100 | | | Anixter, Inc. Rule 144A,
Company Guaranteed Notes
(Callable 09/01/25 @ 100.00)(1) | | (BB, Ba3) | | 12/01/25 | | | 6.000 | | | | 1,105,500 | | |
| | 1,000 | | | Beacon Roofing Supply, Inc., Rule 144A,
Company Guaranteed Notes
(Callable 11/01/20 @ 102.44)(1) | | (B+, B3) | | 11/01/25 | | | 4.875 | | | | 901,250 | | |
| | 1,414 | | | BMC East LLC, Rule 144A, Senior Secured Notes
(Callable 10/01/19 @ 104.13)(1) | | (BB-, B2) | | 10/01/24 | | | 5.500 | | | | 1,329,160 | | |
| | 250 | | | James Hardie International Finance DAC,
Rule 144A, Company Guaranteed Notes
(Callable 01/15/21 @ 102.38)(1) | | (BB, Ba1) | | 01/15/25 | | | 4.750 | | | | 233,125 | | |
| | 1,000 | | | James Hardie International Finance DAC,
Rule 144A, Company Guaranteed Notes
(Callable 01/15/23 @ 102.50)(1) | | (BB, Ba1) | | 01/15/28 | | | 5.000 | | | | 911,250 | | |
See Accompanying Notes to Financial Statements.
9
Credit Suisse Strategic Income Fund
Schedule of Investments (continued)
October 31, 2018
Par
(000) | |
| | Ratings†
(S&P/Moody's) | | Maturity | | Rate% | | Value | |
| CORPORATE BONDS (continued) | | | |
Building Materials | |
$ | 500 | | | Jeld-Wen, Inc., Rule 144A,
Company Guaranteed Notes
(Callable 12/15/20 @ 102.31)(1) | | (BB-, B1) | | 12/15/25 | | | 4.625 | | | $ | 449,375 | | |
| | 500 | | | Jeld-Wen, Inc., Rule 144A,
Company Guaranteed Notes
(Callable 12/15/22 @ 102.44)(1) | | (BB-, B1) | | 12/15/27 | | | 4.875 | | | | 436,250 | | |
| | 575 | | | Masonite International Corp., Rule 144A,
Company Guaranteed Notes
(Callable 09/15/21 @ 102.88)(1) | | (BB+, Ba3) | | 09/15/26 | | | 5.750 | | | | 547,687 | | |
| | 2,300 | | | Omnimax International, Inc., Rule 144A,
Senior Secured Notes
(Callable 11/16/18 @ 104.50)(1) | | (B-, Caa1) | | 08/15/20 | | | 12.000 | | | | 2,389,125 | | |
| | 1,810 | | | PriSo Acquisition Corp., Rule 144A,
Senior Unsecured Notes
(Callable 12/03/18 @ 104.50)(1) | | (CCC+, Caa1) | | 05/15/23 | | | 9.000 | | | | 1,862,037 | | |
| | 800 | | | Standard Industries, Inc., Rule 144A,
Senior Unsecured Notes
(Callable 02/15/22 @ 102.50)(1) | | (BBB-, Ba2) | | 02/15/27 | | | 5.000 | | | | 732,000 | | |
| | 1,000 | | | Summit Materials Finance Corp., Rule 144A,
Company Guaranteed Notes
(Callable 06/01/20 @ 102.56)(1) | | (BB, B3) | | 06/01/25 | | | 5.125 | | | | 897,500 | | |
| | 150 | | | U.S. Concrete, Inc.,
Global Company Guaranteed Notes
(Callable 06/01/19 @ 104.78) | | (BB-, B3) | | 06/01/24 | | | 6.375 | | | | 140,438 | | |
| | 500 | | | USG Corp., Rule 144A,
Company Guaranteed Notes
(Callable 06/01/22 @ 102.44)(1) | | (BB+, Ba1) | | 06/01/27 | | | 4.875 | | | | 502,344 | | |
| | | | 15,056,791 | | |
| Cable & Satellite TV (3.0%) | |
| | 800 | | | Altice Financing S.A., Rule 144A,
Senior Secured Notes
(Callable 05/15/21 @ 103.75)(1) | | (B+, B1) | | 05/15/26 | | | 7.500 | | | | 754,000 | | |
| | 475 | | | Altice France S.A., Rule 144A,
Senior Secured Notes
(Callable 05/01/21 @ 103.69)(1) | | (B, B1) | | 05/01/26 | | | 7.375 | | | | 456,447 | | |
| | 200 | | | Altice U.S. Finance I Corp. Rule 144A,
Senior Secured Notes
(Callable 11/13/18 @ 104.03)(1) | | (BB, Ba3) | | 07/15/23 | | | 5.375 | | | | 200,462 | | |
| | 900 | | | Altice U.S. Finance I Corp., Rule 144A,
Senior Secured Notes
(Callable 05/15/21 @ 102.75)(1) | | (BB, Ba3) | | 05/15/26 | | | 5.500 | | | | 878,904 | | |
| | 500 | | | Block Communications, Inc., Rule 144A,
Senior Unsecured Notes
(Callable 02/15/20 @ 103.44)(1) | | (BB-, Ba3) | | 02/15/25 | | | 6.875 | | | | 509,375 | | |
See Accompanying Notes to Financial Statements.
10
Credit Suisse Strategic Income Fund
Schedule of Investments (continued)
October 31, 2018
Par
(000) | |
| | Ratings†
(S&P/Moody's) | | Maturity | | Rate% | | Value | |
| CORPORATE BONDS (continued) | | | |
Cable & Satellite TV | |
$ | 500 | | | Cable One, Inc., Rule 144A,
Company Guaranteed Notes
(Callable 12/03/18 @ 102.88)(1) | | (BB, B2) | | 06/15/22 | | | 5.750 | | | $ | 508,750 | | |
| | 550 | | | CSC Holdings LLC, Rule 144A,
Company Guaranteed Notes
(Callable 02/01/23 @ 102.69)(1) | | (BB-, Ba2) | | 02/01/28 | | | 5.375 | | | | 519,750 | | |
| | 300 | | | CSC Holdings LLC, Rule 144A,
Company Guaranteed Notes
(Callable 10/15/20 @ 103.31)(1) | | (BB-, Ba2) | | 10/15/25 | | | 6.625 | | | | 315,000 | | |
| | 251 | | | CSC Holdings LLC, Rule 144A,
Senior Unsecured Notes
(Callable 10/15/20 @ 105.44)(1) | | (B-, B2) | | 10/15/25 | | | 10.875 | | | | 290,219 | | |
| | 1,425 | | | Midcontinent Finance Corp., Rule 144A,
Company Guaranteed Notes
(Callable 12/03/18 @ 105.16)(1) | | (B, B3) | | 08/15/23 | | | 6.875 | | | | 1,492,687 | | |
| | 1,400 | | | Telenet Finance Luxembourg Notes Sarl,
Rule 144A, Senior Secured Notes
(Callable 12/01/22 @ 102.75)(1) | | (BB-, Ba3) | | 03/01/28 | | | 5.500 | | | | 1,305,500 | | |
| | 461 | | | Virgin Media Secured Finance PLC, Rule 144A,
Senior Secured Notes
(Callable 08/15/21 @ 102.75)(1) | | (BB-, Ba3) | | 08/15/26 | | | 5.500 | | | | 435,645 | | |
| | 500 | | | Ziggo B.V., Rule 144A, Senior Secured Notes
(Callable 01/15/22 @ 102.75)(1) | | (BB-, B1) | | 01/15/27 | | | 5.500 | | | | 460,000 | | |
| | | | 8,126,739 | | |
| Chemicals (3.6%) | |
| | 1,250 | | | Alpha 2 B.V., 8.75% Cash, 9.50% PIK, Rule 144A,
Senior Unsecured Notes
(Callable 06/01/19 @ 102.00)(1),(2) | | (CCC+, Caa1) | | 06/01/23 | | | 8.750 | | | | 1,251,562 | | |
| | 1,025 | | | Alpha U.S. Bidco, Inc., Rule 144A,
Company Guaranteed Notes
(Callable 02/01/20 @ 103.13)(1) | | (CCC+, Caa1) | | 02/01/25 | | | 6.250 | | | | 982,719 | | |
| | 900 | | | HB Fuller Co., Global Senior Unsecured Notes
(Callable 11/15/26 @ 100.00) | | (BB, B2) | | 02/15/27 | | | 4.000 | | | | 780,750 | | |
| | 1,500 | | | Ingevity Corp., Rule 144A,
Senior Unsecured Notes
(Callable 02/01/21 @ 102.25)(1) | | (NR, Ba3) | | 02/01/26 | | | 4.500 | | | | 1,402,500 | | |
| | 1,000 | | | Nufarm Americas, Inc., Rule 144A,
Company Guaranteed Notes
(Callable 04/30/21 @ 102.88)(1) | | (BB-, B1) | | 04/30/26 | | | 5.750 | | | | 938,750 | | |
| | 250 | | | PQ Corp., Rule 144A, Senior Secured Notes
(Callable 05/15/19 @ 103.38)(1) | | (BB-, B2) | | 11/15/22 | | | 6.750 | | | | 258,438 | | |
| | 52 | | | Reichhold Industries, Inc., Rule 144A,
Senior Secured Notes(1),(3),(4),(5),(6) | | (NR, NR) | | 05/01/19 | | | 9.000 | | | | 1,882 | | |
See Accompanying Notes to Financial Statements.
11
Credit Suisse Strategic Income Fund
Schedule of Investments (continued)
October 31, 2018
Par
(000) | |
| | Ratings†
(S&P/Moody's) | | Maturity | | Rate% | | Value | |
| CORPORATE BONDS (continued) | | | |
Chemicals | |
$ | 750 | | | Starfruit U.S. Holdco LLC, Rule 144A,
Senior Unsecured Notes
(Callable 10/01/21 @ 104.00)(1) | | (B-, Caa1) | | 10/01/26 | | | 8.000 | | | $ | 729,375 | | |
| | 1,000 | | | Trinseo Materials Finance, Inc., Rule 144A,
Company Guaranteed Notes
(Callable 09/01/20 @ 102.69)(1) | | (BB-, B2) | | 09/01/25 | | | 5.375 | | | | 929,300 | | |
| | 750 | | | Tronox, Inc., Rule 144A,
Company Guaranteed Notes
(Callable 04/15/21 @ 103.25)(1) | | (B-, B3) | | 04/15/26 | | | 6.500 | | | | 686,250 | | |
| | 1,695 | | | Venator Materials LLC, Rule 144A,
Company Guaranteed Notes
(Callable 07/15/20 @ 104.31)(1) | | (BB-, B2) | | 07/15/25 | | | 5.750 | | | | 1,453,462 | | |
| | 300 | | | Versum Materials, Inc., Rule 144A,
Company Guaranteed Notes
(Callable 09/30/21 @ 102.75)(1) | | (BB+, Ba3) | | 09/30/24 | | | 5.500 | | | | 297,750 | | |
| | | | 9,712,738 | | |
| Diversified Capital Goods (0.1%) | |
| | 350 | | | EnerSys, Rule 144A,
Company Guaranteed Notes
(Callable 01/30/23 @ 100.00)(1) | | (BB+, Ba2) | | 04/30/23 | | | 5.000 | | | | 347,375 | | |
| Electronics (0.9%) | |
| | 1,500 | | | Entegris, Inc., Rule 144A,
Company Guaranteed Notes
(Callable 11/10/20 @ 103.47)(1) | | (BB, Ba2) | | 02/10/26 | | | 4.625 | | | | 1,401,090 | | |
| | 1,000 | | | Sensata Technologies B.V., Rule 144A,
Company Guaranteed Notes(1) | | (BB+, Ba3) | | 10/01/25 | | | 5.000 | | | | 970,000 | | |
| | | | 2,371,090 | | |
| Energy - Exploration & Production (0.8%) | |
| | 800 | | | Jagged Peak Energy LLC, Rule 144A,
Company Guaranteed Notes
(Callable 05/01/21 @ 102.94)(1) | | (B, B3) | | 05/01/26 | | | 5.875 | | | | 782,000 | | |
| | 1,250 | | | W&T Offshore, Inc., Rule 144A, Secured Notes
(Callable 11/01/20 @ 104.88)(1) | | (B, B3) | | 11/01/23 | | | 9.750 | | | | 1,212,750 | | |
| | | | 1,994,750 | | |
| Food - Wholesale (1.2%) | |
| | 900 | | | Clearwater Seafoods, Inc., Rule 144A,
Senior Unsecured Notes
(Callable 05/01/20 @ 105.16)(1) | | (B+, B3) | | 05/01/25 | | | 6.875 | | | | 864,000 | | |
| | 225 | | | Lamb Weston Holdings, Inc., Rule 144A,
Company Guaranteed Notes
(Callable 11/01/21 @ 102.44)(1) | | (BB, Ba2) | | 11/01/26 | | | 4.875 | | | | 217,969 | | |
See Accompanying Notes to Financial Statements.
12
Credit Suisse Strategic Income Fund
Schedule of Investments (continued)
October 31, 2018
Par
(000) | |
| | Ratings†
(S&P/Moody's) | | Maturity | | Rate% | | Value | |
| CORPORATE BONDS (continued) | | | |
Food - Wholesale | |
$ | 2,000 | | | U.S. Foods, Inc., Rule 144A,
Company Guaranteed Notes
(Callable 06/15/19 @ 102.94)(1) | | (BB, B2) | | 06/15/24 | | | 5.875 | | | $ | 1,990,000 | | |
| | | | 3,071,969 | | |
| Gaming (1.2%) | |
| | 1,500 | | | Churchill Downs, Inc., Rule 144A,
Company Guaranteed Notes
(Callable 01/15/23 @ 102.38)(1) | | (B+, Ba3) | | 01/15/28 | | | 4.750 | | | | 1,372,500 | | |
| | 1,400 | | | Gateway Casinos & Entertainment Ltd.,
Rule 144A, Secured Notes
(Callable 03/01/20 @ 104.13)(1) | | (CCC+, Caa1) | | 03/01/24 | | | 8.250 | | | | 1,473,500 | | |
| | 450 | | | Jacobs Entertainment, Inc., Rule 144A,
Secured Notes
(Callable 02/01/20 @ 105.91)(1) | | (B, B2) | | 02/01/24 | | | 7.875 | | | | 475,312 | | |
| | | | 3,321,312 | | |
| Gas Distribution (0.9%) | |
| | 500 | | | CNX Midstream Finance Corp., Rule 144A,
Senior Unsecured Notes
(Callable 03/15/21 @ 104.88)(1) | | (BB-, B3) | | 03/15/26 | | | 6.500 | | | | 488,750 | | |
| | 500 | | | Genesis Energy Finance Corp.,
Company Guaranteed Notes
(Callable 02/15/21 @ 104.69) | | (B+, B1) | | 05/15/26 | | | 6.250 | | | | 452,500 | | |
| | 750 | | | Genesis Energy Finance Corp.,
Company Guaranteed Notes
(Callable 10/01/20 @ 104.88) | | (B+, B1) | | 10/01/25 | | | 6.500 | | | | 695,625 | | |
| | 650 | | | Holly Energy Finance Corp., Rule 144A,
Company Guaranteed Notes
(Callable 08/01/19 @ 104.50)(1) | | (BB, B2) | | 08/01/24 | | | 6.000 | | | | 654,875 | | |
| | | | 2,291,750 | | |
| Health Facilities (0.4%) | |
| | 500 | | | HCA, Inc.,
Company Guaranteed Notes
(Callable 03/01/26 @ 100.00) | | (BB-, Ba2) | | 09/01/26 | | | 5.375 | | | | 497,500 | | |
| | 250 | | | MPT Finance Corp.,
Global Company Guaranteed Notes
(Callable 05/01/19 @ 102.75) | | (BBB-, Ba1) | | 05/01/24 | | | 5.500 | | | | 253,750 | | |
| | 250 | | | Sabra Health Care LP,
Global Company Guaranteed Notes
(Callable 05/15/26 @ 100.00) | | (BBB-, Ba1) | | 08/15/26 | | | 5.125 | | | | 239,729 | | |
| | | | 990,979 | | |
See Accompanying Notes to Financial Statements.
13
Credit Suisse Strategic Income Fund
Schedule of Investments (continued)
October 31, 2018
Par
(000) | |
| | Ratings†
(S&P/Moody's) | | Maturity | | Rate% | | Value | |
| CORPORATE BONDS (continued) | | | |
| Health Services (1.0%) | |
$ | 500 | | | AMN Healthcare, Inc., Rule 144A,
Company Guaranteed Notes
(Callable 10/01/19 @ 103.84)(1) | | (BB-, Ba2) | | 10/01/24 | | | 5.125 | | | $ | 483,125 | | |
| | 900 | | | CareTrust Capital Corp.,
Company Guaranteed Notes
(Callable 06/01/20 @ 103.94) | | (BB, Ba3) | | 06/01/25 | | | 5.250 | | | | 879,750 | | |
| | 1,300 | | | Sotera Health Holdings LLC, Rule 144A,
Senior Unsecured Notes
(Callable 12/03/18 @ 104.88)(1) | | (CCC+, Caa1) | | 05/15/23 | | | 6.500 | | | | 1,274,000 | | |
| | | | 2,636,875 | | |
| Hotels (0.7%) | |
| | 2,000 | | | ESH Hospitality, Inc., Rule 144A,
Company Guaranteed Notes
(Callable 05/01/20 @ 102.63)(1) | | (BB-, Ba3) | | 05/01/25 | | | 5.250 | | | | 1,897,500 | | |
| Insurance Brokerage (1.5%) | |
| | 1,700 | | | Acrisure Finance, Inc., Rule 144A,
Senior Unsecured Notes
(Callable 11/15/20 @ 103.50)(1) | | (CCC+, Caa2) | | 11/15/25 | | | 7.000 | | | | 1,525,750 | | |
| | 400 | | | Alliant Holdings Co-Issuer, Rule 144A,
Senior Unsecured Notes
(Callable 11/13/18 @ 104.13)(1) | | (CCC+, Caa2) | | 08/01/23 | | | 8.250 | | | | 414,452 | | |
| | 1,300 | | | HUB International Ltd., Rule 144A,
Senior Unsecured Notes
(Callable 05/01/21 @ 103.50)(1) | | (CCC+, Caa2) | | 05/01/26 | | | 7.000 | | | | 1,272,050 | | |
| | 675 | | | NFP Corp., Rule 144A,
Senior Unsecured Notes
(Callable 07/15/20 @ 103.44)(1) | | (CCC+, Caa2) | | 07/15/25 | | | 6.875 | | | | 658,125 | | |
| | | | 3,870,377 | | |
| Investments & Misc. Financial Services (1.3%) | |
| | 2,000 | | | Compass Group Diversified Holdings LLC,
Rule 144A, Senior Unsecured Notes
(Callable 05/01/21 @ 104.00)(1) | | (B-, B3) | | 05/01/26 | | | 8.000 | | | | 2,050,000 | | |
| | 1,250 | | | Orchestra Co-Issuer, Inc.,
Rule 144A, Secured Notes
(Callable 06/15/19 @ 103.38)(1) | | (B-, B1) | | 06/15/22 | | | 6.750 | | | | 1,278,125 | | |
| | | | 3,328,125 | | |
| Machinery (0.6%) | |
| | 1,100 | | | Rexnord LLC, Rule 144A,
Company Guaranteed Notes
(Callable 12/15/20 @ 102.44)(1) | | (B+, B1) | | 12/15/25 | | | 4.875 | | | | 1,036,750 | | |
See Accompanying Notes to Financial Statements.
14
Credit Suisse Strategic Income Fund
Schedule of Investments (continued)
October 31, 2018
Par
(000) | |
| | Ratings†
(S&P/Moody's) | | Maturity | | Rate% | | Value | |
| CORPORATE BONDS (continued) | | | |
Machinery | |
$ | 500 | | | Terex Corp., Rule 144A,
Company Guaranteed Notes
(Callable 02/01/20 @ 104.22)(1) | | (BB, B2) | | 02/01/25 | | | 5.625 | | | $ | 476,250 | | |
| | | | 1,513,000 | | |
| Managed Care (0.1%) | |
| | 370 | | | WellCare Health Plans, Inc., Rule 144A,
Senior Unsecured Notes
(Callable 08/15/21 @ 104.03)(1) | | (BB, Ba2) | | 08/15/26 | | | 5.375 | | | | 370,000 | | |
| Media - Diversified (0.3%) | |
| | 650 | | | National CineMedia LLC,
Global Senior Secured Notes
(Callable 12/03/18 @ 102.00) | | (B+, Ba3) | | 04/15/22 | | | 6.000 | | | | 659,750 | | |
| | 250 | | | National CineMedia LLC,
Global Senior Unsecured Notes
(Callable 08/15/21 @ 102.88) | | (B-, B3) | | 08/15/26 | | | 5.750 | | | | 237,500 | | |
| | | | 897,250 | | |
| Media Content (0.6%) | |
| | 750 | | | EMI Music Publishing Group North America
Holdings, Inc., Rule 144A,
Company Guaranteed Notes
(Callable 06/15/19 @ 105.72)(1) | | (B, B3) | | 06/15/24 | | | 7.625 | | | | 807,188 | | |
| | 750 | | | WMG Acquisition Corp., Rule 144A,
Senior Secured Notes
(Callable 11/01/19 @ 103.66)(1) | | (B+, Ba3) | | 11/01/24 | | | 4.875 | | | | 735,000 | | |
| | | | 1,542,188 | | |
| Medical Products (0.5%) | |
| | 1,250 | | | Sotera Health Topco, Inc.,
8.125% Cash, 8.875% PIK,
Rule 144A, Senior Unsecured Notes
(Callable 12/03/18 @ 101.00)(1),(2) | | (CCC+, Caa2) | | 11/01/21 | | | 8.125 | | | | 1,231,250 | | |
| Metals & Mining - Excluding Steel (1.5%) | |
| | 1,300 | | | Cleveland-Cliffs, Inc., Rule 144A,
Senior Secured Notes
(Callable 01/15/21 @ 102.44)(1) | | (BB-, Ba2) | | 01/15/24 | | | 4.875 | | | | 1,244,750 | | |
| | 500 | | | First Quantum Minerals Ltd., Rule 144A,
Company Guaranteed Notes
(Callable 03/01/21 @ 105.16)(1) | | (B, NR) | | 03/01/26 | | | 6.875 | | | | 434,375 | | |
| | 1,000 | | | First Quantum Minerals Ltd., Rule 144A,
Company Guaranteed Notes
(Callable 09/01/20 @ 103.25)(1) | | (B, NR) | | 03/01/24 | | | 6.500 | | | | 878,750 | | |
See Accompanying Notes to Financial Statements.
15
Credit Suisse Strategic Income Fund
Schedule of Investments (continued)
October 31, 2018
Par
(000) | |
| | Ratings†
(S&P/Moody's) | | Maturity | | Rate% | | Value | |
| CORPORATE BONDS (continued) | | | |
Metals & Mining - Excluding Steel | |
$ | 2,975 | | | Noranda Aluminum Acquisition Corp.,
Global Senior Unsecured Notes
(Callable 12/10/18 @ 100.00)(3),(5),(6) | | (NR, NR) | | 06/01/19 | | | 11.000 | | | $ | — | | |
| | 1,500 | | | Taseko Mines Ltd., Rule 144A,
Senior Secured Notes
(Callable 06/15/19 @ 104.38)(1) | | (B, B3) | | 06/15/22 | | | 8.750 | | | | 1,481,250 | | |
| | | | 4,039,125 | | |
| Oil Field Equipment & Services (1.6%) | |
| | 500 | | | FTS International, Inc.,
Global Senior Secured Notes
(Callable 12/03/18 @ 103.13) | | (B, B3) | | 05/01/22 | | | 6.250 | | | | 477,500 | | |
| | 400 | | | KCA Deutag UK Finance PLC, Rule 144A,
Senior Secured Notes
(Callable 04/01/20 @ 109.88)(1) | | (B-, B3) | | 04/01/22 | | | 9.875 | | | | 388,000 | | |
| | 405 | | | Nor Offshore SPV Ltd., PIK,
Senior Secured Notes
(Callable 11/30/18 @ 100.00)(2) | | (NR, NR) | | 02/04/20 | | | 8.400 | | | | 145,960 | | |
| | 800 | | | Pioneer Energy Services Corp.,
Global Company Guaranteed Notes
(Callable 12/03/18 @ 103.06) | | (CCC, Caa2) | | 03/15/22 | | | 6.125 | | | | 686,000 | | |
| | 2,000 | | | Shelf Drilling Holdings Ltd., Rule 144A,
Company Guaranteed Notes
(Callable 02/15/21 @ 106.19)(1) | | (B-, B2) | | 02/15/25 | | | 8.250 | | | | 2,012,500 | | |
| | 325 | | | Transocean, Inc.,
Global Company Guaranteed Notes
(Callable 07/15/22 @ 100.00) | | (B-, Caa2) | | 10/15/22 | | | 5.800 | | | | 316,875 | | |
| | 225 | | | Trinidad Drilling Ltd., Rule 144A,
Company Guaranteed Notes
(Callable 02/15/20 @ 104.97)(1) | | (BB-, B3) | | 02/15/25 | | | 6.625 | | | | 226,125 | | |
| | | | 4,252,960 | | |
| Oil Refining & Marketing (0.2%) | |
| | 400 | | | Coffeyville Finance, Inc.,
Global Company Guaranteed Notes
(Callable 12/03/18 @ 102.17) | | (BB-, B1) | | 11/01/22 | | | 6.500 | | | | 404,500 | | |
| Packaging (2.6%) | |
| | 1,300 | | | Ardagh Holdings U.S.A., Inc., Rule 144A,
Company Guaranteed Notes
(Callable 02/15/20 @ 104.50)(1) | | (B, B3) | | 02/15/25 | | | 6.000 | | | | 1,222,000 | | |
| | 750 | | | Ardagh Holdings U.S.A., Inc., Rule 144A,
Senior Secured Notes
(Callable 05/15/19 @ 102.31)(1) | | (BB, Ba3) | | 05/15/23 | | | 4.625 | | | | 731,250 | | |
| | 400 | | | Ball Corp., Global Company Guaranteed Notes
(Callable 12/15/25 @ 100.00) | | (BB+, Ba1) | | 03/15/26 | | | 4.875 | | | | 396,500 | | |
See Accompanying Notes to Financial Statements.
16
Credit Suisse Strategic Income Fund
Schedule of Investments (continued)
October 31, 2018
Par
(000) | |
| | Ratings†
(S&P/Moody's) | | Maturity | | Rate% | | Value | |
| CORPORATE BONDS (continued) | | | |
Packaging | |
$ | 975 | | | Crown Americas Capital Corp., VI, Rule 144A,
Company Guaranteed Notes
(Callable 02/01/21 @ 103.56)(1) | | (BB-, Ba3) | | 02/01/26 | | | 4.750 | | | $ | 922,594 | | |
| | 1,500 | | | Flex Acquisition Co., Inc., Rule 144A,
Senior Unsecured Notes
(Callable 01/15/20 @ 103.44)(1) | | (CCC+, Caa1) | | 01/15/25 | | | 6.875 | | | | 1,410,000 | | |
| | 475 | | | Silgan Holdings, Inc.,
Global Senior Unsecured Notes
(Callable 03/15/20 @ 102.38) | | (BB-, Ba3) | | 03/15/25 | | | 4.750 | | | | 453,031 | | |
| | 2,010 | | | TriMas Corp., Rule 144A,
Company Guaranteed Notes
(Callable 10/15/20 @ 102.44)(1) | | (BB-, Ba3) | | 10/15/25 | | | 4.875 | | | | 1,903,882 | | |
| | | | 7,039,257 | | |
| Personal & Household Products (1.0%) | |
| | 750 | | | High Ridge Brands Co., Rule 144A,
Company Guaranteed Notes
(Callable 03/15/20 @ 104.44)(1) | | (CC, Caa3) | | 03/15/25 | | | 8.875 | | | | 333,750 | | |
| | 930 | | | Mattel, Inc., Rule 144A,
Company Guaranteed Notes
(Callable 12/31/20 @ 105.06)(1) | | (BB-, B1) | | 12/31/25 | | | 6.750 | | | | 892,800 | | |
| | 960 | | | Prestige Brands, Inc., Rule 144A,
Company Guaranteed Notes
(Callable 03/01/19 @ 104.78)(1) | | (B-, Caa1) | | 03/01/24 | | | 6.375 | | | | 952,800 | | |
| | 610 | | | Resideo Funding, Inc. Rule 144A,
Company Guaranteed Notes
(Callable 11/01/21 @ 104.59)(1) | | (BB+, B1) | | 11/01/26 | | | 6.125 | | | | 614,715 | | |
| | | | 2,794,065 | | |
| Pharmaceuticals (1.2%) | |
| | 425 | | | Bausch Health Cos., Inc., Rule 144A,
Company Guaranteed Notes
(Callable 12/03/18 @ 102.94)(1) | | (B-, B3) | | 05/15/23 | | | 5.875 | | | | 406,938 | | |
| | 500 | | | Bausch Health Cos., Inc., Rule 144A,
Company Guaranteed Notes
(Callable 12/15/21 @ 104.50)(1) | | (B-, B3) | | 12/15/25 | | | 9.000 | | | | 523,125 | | |
| | 750 | | | Bausch Health Cos., Inc., Rule 144A,
Senior Secured Notes
(Callable 11/01/20 @ 102.75)(1) | | (BB-, Ba2) | | 11/01/25 | | | 5.500 | | | | 737,812 | | |
| | 200 | | | Endo Finance LLC, Rule 144A,
Company Guaranteed Notes
(Callable 02/01/20 @ 103.00)(1) | | (CCC+, B3) | | 02/01/25 | | | 6.000 | | | | 168,500 | | |
| | 1,538 | | | Owens & Minor, Inc.,
Global Company Guaranteed Notes
(Callable 09/15/24 @ 100.00) | | (BB, B1) | | 12/15/24 | | | 4.375 | | | | 1,305,377 | | |
| | | | 3,141,752 | | |
See Accompanying Notes to Financial Statements.
17
Credit Suisse Strategic Income Fund
Schedule of Investments (continued)
October 31, 2018
Par
(000) | |
| | Ratings†
(S&P/Moody's) | | Maturity | | Rate% | | Value | |
| CORPORATE BONDS (continued) | | | |
| Real Estate Investment Trusts (0.8%) | |
$ | 1,250 | | | iStar, Inc., Senior Unsecured Notes
(Callable 04/01/19 @ 103.00) | | (BB-, B1) | | 04/01/22 | | | 6.000 | | | $ | 1,253,125 | | |
| | 250 | | | iStar, Inc., Senior Unsecured Notes
(Callable 06/15/20 @ 100.00) | | (BB-, B1) | | 09/15/20 | | | 4.625 | | | | 248,750 | | |
| | 250 | | | iStar, Inc., Senior Unsecured Notes
(Callable 09/15/19 @ 102.63) | | (BB-, B1) | | 09/15/22 | | | 5.250 | | | | 242,500 | | |
| | 500 | | | Starwood Property Trust, Inc.,
Global Senior Unsecured Notes
(Callable 09/15/21 @ 100.00) | | (BB-, Ba3) | | 12/15/21 | | | 5.000 | | | | 498,750 | | |
| | | | 2,243,125 | | |
| Recreation & Travel (1.6%) | |
| | 1,025 | | | Boyne U.S.A., Inc., Rule 144A,
Secured Notes
(Callable 05/01/21 @ 103.63)(1) | | (B, B2) | | 05/01/25 | | | 7.250 | | | | 1,073,687 | | |
| | 1,500 | | | Canada's Wonderland Co.,
Global Company Guaranteed Notes
(Callable 04/15/22 @ 102.69) | | (BB-, B1) | | 04/15/27 | | | 5.375 | | | | 1,438,125 | | |
| | 600 | | | Merlin Entertainments PLC, Rule 144A,
Senior Unsecured Notes
(Callable 03/17/26 @ 100.00)(1) | | (BB, Ba2) | | 06/15/26 | | | 5.750 | | | | 601,500 | | |
| | 1,250 | | | Six Flags Entertainment Corp., Rule 144A,
Company Guaranteed Notes
(Callable 07/31/19 @ 103.66)(1) | | (BB-, B2) | | 07/31/24 | | | 4.875 | | | | 1,184,375 | | |
| | | | 4,297,687 | | |
| Restaurants (0.8%) | |
| | 1,070 | | | Golden Nugget, Inc., Rule 144A,
Senior Unsecured Notes
(Callable 10/15/19 @ 103.38)(1) | | (CCC+, B3) | | 10/15/24 | | | 6.750 | | | | 1,070,000 | | |
| | 1,100 | | | New Red Finance, Inc., Rule 144A,
Secured Notes
(Callable 10/15/20 @ 102.50)(1) | | (B-, B3) | | 10/15/25 | | | 5.000 | | | | 1,034,000 | | |
| | | | 2,104,000 | | |
| Software - Services (2.0%) | |
| | 1,125 | | | CDK Global, Inc.,
Global Senior Unsecured Notes
(Callable 06/01/22 @ 102.44) | | (BB+, Ba1) | | 06/01/27 | | | 4.875 | | | | 1,058,906 | | |
| | 383 | | | Epicor Software Corp., Rule 144A,
Secured Notes
(Callable 12/03/18 @ 102.00),
LIBOR 3M + 7.250%(1),(5),(6),(7) | | (NR, NR) | | 06/30/23 | | | 9.650 | | | | 386,830 | | |
| | 750 | | | First Data Corp., Rule 144A,
Secured Notes
(Callable 01/15/19 @ 102.88)(1) | | (B+, B2) | | 01/15/24 | | | 5.750 | | | | 757,500 | | |
See Accompanying Notes to Financial Statements.
18
Credit Suisse Strategic Income Fund
Schedule of Investments (continued)
October 31, 2018
Par
(000) | |
| | Ratings†
(S&P/Moody's) | | Maturity | | Rate% | | Value | |
| CORPORATE BONDS (continued) | | | |
Software - Services | |
$ | 550 | | | Infor Software Parent, Inc.,
7.125% Cash, 7.875% PIK, Rule 144A,
Senior Unsecured Notes
(Callable 12/03/18 @ 101.78)(1),(2) | | (CCC, Caa2) | | 05/01/21 | | | 7.125 | | | $ | 551,375 | | |
| | 1,750 | | | Solera Finance, Inc., Rule 144A,
Senior Unsecured Notes
(Callable 03/01/19 @ 107.88)(1) | | (CCC+, Caa1) | | 03/01/24 | | | 10.500 | | | | 1,907,552 | | |
| | 655 | | | WEX, Inc., Rule 144A, Senior Secured Notes
(Callable 12/03/18 @ 102.38)(1) | | (BB-, Ba3) | | 02/01/23 | | | 4.750 | | | | 653,363 | | |
| | | | 5,315,526 | | |
| Specialty Retail (1.3%) | |
| | 1,400 | | | Lithia Motors, Inc., Rule 144A,
Company Guaranteed Notes
(Callable 08/01/20 @ 103.94)(1) | | (BB, Ba2) | | 08/01/25 | | | 5.250 | | | | 1,323,000 | | |
| | 500 | | | Penske Automotive Group, Inc.,
Company Guaranteed Notes
(Callable 05/15/21 @ 102.75) | | (B+, Ba3) | | 05/15/26 | | | 5.500 | | | | 477,500 | | |
| | 200 | | | Penske Automotive Group, Inc.,
Global Company Guaranteed Notes
(Callable 12/03/18 @ 101.92) | | (B+, Ba3) | | 10/01/22 | | | 5.750 | | | | 202,875 | | |
| | 1,500 | | | Ruyi U.S. Finance LLC, Rule 144A,
Senior Secured Notes
(Callable 05/01/21 @ 105.63)(1) | | (B, B1) | | 05/01/25 | | | 7.500 | | | | 1,455,000 | | |
| | | | 3,458,375 | | |
| Steel Producers/Products (0.4%) | |
| | 750 | | | Commercial Metals Co.,
Senior Unsecured Notes
(Callable 07/15/22 @ 102.69) | | (BB+, Ba2) | | 07/15/27 | | | 5.375 | | | | 696,563 | | |
| | 300 | | | Zekelman Industries, Inc., Rule 144A,
Senior Secured Notes
(Callable 06/15/19 @ 104.94)(1) | | (B, B3) | | 06/15/23 | | | 9.875 | | | | 321,000 | | |
| | | | 1,017,563 | | |
| Support - Services (3.2%) | |
| | 548 | | | AECOM, Global Company Guaranteed Notes
(Callable 12/15/26 @ 100.00) | | (BB-, Ba3) | | 03/15/27 | | | 5.125 | | | | 512,380 | | |
| | 650 | | | Ashtead Capital, Inc., Rule 144A,
Secured Notes
(Callable 08/01/21 @ 103.94)(1) | | (BBB-, Baa3) | | 08/01/26 | | | 5.250 | | | | 641,290 | | |
| | 600 | | | Avison Young Canada, Inc., Rule 144A,
Senior Secured Notes
(Callable 12/15/19 @ 104.75)(1) | | (B, B3) | | 12/15/21 | | | 9.500 | | | | 630,000 | | |
| | 500 | | | CoreCivic, Inc.,
Company Guaranteed Notes
(Callable 07/15/27 @ 100.00) | | (BB, Ba1) | | 10/15/27 | | | 4.750 | | | | 428,125 | | |
See Accompanying Notes to Financial Statements.
19
Credit Suisse Strategic Income Fund
Schedule of Investments (continued)
October 31, 2018
Par
(000) | |
| | Ratings†
(S&P/Moody's) | | Maturity | | Rate% | | Value | |
| CORPORATE BONDS (continued) | | | |
Support - Services | |
$ | 775 | | | Gartner, Inc., Rule 144A,
Company Guaranteed Notes
(Callable 04/01/20 @ 103.84)(1) | | (BB-, B1) | | 04/01/25 | | | 5.125 | | | $ | 771,125 | | |
| | 1,041 | | | KAR Auction Services, Inc., Rule 144A,
Company Guaranteed Notes
(Callable 06/01/20 @ 103.84)(1) | | (B, B3) | | 06/01/25 | | | 5.125 | | | | 981,142 | | |
| | 1,500 | | | Sotheby's, Rule 144A,
Company Guaranteed Notes
(Callable 12/15/20 @ 103.66)(1) | | (BB-, Ba3) | | 12/15/25 | | | 4.875 | | | | 1,393,125 | | |
| | 850 | | | United Rentals North America, Inc.,
Company Guaranteed Notes
(Callable 10/15/20 @ 102.31) | | (BB, Ba3) | | 10/15/25 | | | 4.625 | | | | 789,438 | | |
| | 750 | | | United Rentals North America, Inc.,
Global Company Guaranteed Notes
(Callable 12/15/21 @ 103.25) | | (BB, Ba3e) | | 12/15/26 | | | 6.500 | | | | 760,118 | | |
| | 1,625 | | | WeWork Cos., Inc., Rule 144A,
Company Guaranteed Notes(1) | | (B+, NR) | | 05/01/25 | | | 7.875 | | | | 1,499,062 | | |
| | 200 | | | Williams Scotsman International, Inc., Rule 144A,
Company Guaranteed Notes
(Callable 08/15/20 @ 103.44)(1) | | (B, B2) | | 08/15/23 | | | 6.875 | | | | 199,000 | | |
| | | | 8,604,805 | | |
| Tech Hardware & Equipment (0.6%) | |
| | 1,000 | | | CDW Finance Corp.,
Company Guaranteed Notes
(Callable 06/01/24 @ 100.00) | | (BB-, Ba2) | | 12/01/24 | | | 5.500 | | | | 1,015,000 | | |
| | 750 | | | CommScope Technologies LLC, Rule 144A,
Company Guaranteed Notes
(Callable 03/15/22 @ 102.50)(1) | | (BB-, Ba3) | | 03/15/27 | | | 5.000 | | | | 671,378 | | |
| | | | 1,686,378 | | |
| Telecom - Wireless (0.9%) | |
| | 1,000 | | | Sprint Spectrum Co. II LLC, Rule 144A,
Senior Secured Notes(1) | | (NR, Baa2) | | 03/20/28 | | | 5.152 | | | | 1,002,500 | | |
| | 250 | | | T-Mobile U.S.A., Inc.,
Company Guaranteed Notes
(Callable 02/01/21 @ 102.25) | | (BB+, Ba2) | | 02/01/26 | | | 4.500 | | | | 234,298 | | |
| | 1,300 | | | T-Mobile U.S.A., Inc.,
Company Guaranteed Notes
(Callable 02/01/23 @ 102.38) | | (BB+, Ba2) | | 02/01/28 | | | 4.750 | | | | 1,204,125 | | |
| | | | 2,440,923 | | |
| Telecom - Wireline Integrated & Services (0.9%) | |
| | 200 | | | Equinix, Inc., Senior Unsecured Notes
(Callable 05/15/22 @ 102.69) | | (BB+, B1) | | 05/15/27 | | | 5.375 | | | | 198,500 | | |
See Accompanying Notes to Financial Statements.
20
Credit Suisse Strategic Income Fund
Schedule of Investments (continued)
October 31, 2018
Par
(000) | |
| | Ratings†
(S&P/Moody's) | | Maturity | | Rate% | | Value | |
| CORPORATE BONDS (continued) | | | |
Telecom - Wireline Integrated & Services | |
$ | 1,125 | | | GTT Communications, Inc., Rule 144A,
Company Guaranteed Notes
(Callable 12/31/19 @ 105.91)(1) | | (CCC+, Caa1) | | 12/31/24 | | | 7.875 | | | $ | 1,063,125 | | |
| | 1,100 | | | QTS Finance Corp., Rule 144A,
Company Guaranteed Notes
(Callable 11/15/20 @ 103.56)(1) | | (BB, B1) | | 11/15/25 | | | 4.750 | | | | 1,031,250 | | |
| | 23 | | | Syniverse Holdings, Inc.,
Global Company Guaranteed Notes
(Callable 12/03/18 @ 100.00) | | (CCC+, Caa2) | | 01/15/19 | | | 9.125 | | | | 22,842 | | |
| | | | 2,315,717 | | |
| Theaters & Entertainment (1.3%) | |
| | 750 | | | AMC Entertainment Holdings, Inc.,
Global Company Guaranteed Notes
(Callable 05/15/22 @ 103.06) | | (B-, B3) | | 05/15/27 | | | 6.125 | | | | 690,000 | | |
| | 750 | | | Carmike Cinemas, Inc., Rule 144A,
Secured Notes
(Callable 12/03/18 @ 104.50)(1) | | (BB-, Ba2) | | 06/15/23 | | | 6.000 | | | | 761,250 | | |
| | 1,679 | | | Cinemark U.S.A., Inc.,
Global Company Guaranteed Notes
(Callable 12/03/18 @ 102.44) | | (BB, B2) | | 06/01/23 | | | 4.875 | | | | 1,647,519 | | |
| | 500 | | | Live Nation Entertainment, Inc., Rule 144A,
Company Guaranteed Notes
(Callable 11/01/19 @ 103.66)(1) | | (B+, B1) | | 11/01/24 | | | 4.875 | | | | 480,000 | | |
| | | | 3,578,769 | | |
| Transport Infrastructure/Services (0.3%) | |
| | 1,000 | | | Navios Maritime Finance II U.S., Inc., Rule 144A,
Senior Secured Notes
(Callable 12/03/18 @ 104.22)(1) | | (B, Caa2) | | 08/15/22 | | | 11.250 | | | | 873,750 | | |
| TOTAL CORPORATE BONDS (Cost $134,799,819) | | | 129,950,987 | | |
| BANK LOANS (39.8%) | | | |
| Auto Parts & Equipment (1.1%) | | | |
| | 979 | | | Dayco Products LLC,
LIBOR 3M + 4.250%(6),(7) | | (B, B2) | | 05/19/23 | | | 6.563 | | | | 981,922 | | |
| | 1,081 | | | L&W, Inc.,
LIBOR 1M + 4.000%(7) | | (B+, B2) | | 05/22/25 | | | 6.287 | | | | 1,086,369 | | |
| | 987 | | | Superior Industries International, Inc.,
LIBOR 1M + 4.000%(7) | | (B, B1) | | 05/22/24 | | | 6.302 | | | | 984,672 | | |
| | | | 3,052,963 | | |
| Building & Construction (0.2%) | |
| | 428 | | | SiteOne Landscape Supply, Inc.,
LIBOR 1M + 2.750%(7) | | (BB, B2) | | 10/29/24 | | | 5.030 | | | | 429,777 | | |
See Accompanying Notes to Financial Statements.
21
Credit Suisse Strategic Income Fund
Schedule of Investments (continued)
October 31, 2018
Par
(000) | |
| | Ratings†
(S&P/Moody's) | | Maturity | | Rate% | | Value | |
| BANK LOANS (continued) | | | |
| Building Materials (1.5%) | |
$ | 599 | | | Airxcel, Inc.,
LIBOR 1M + 4.500%(7) | | (B, B3) | | 04/28/25 | | | 6.802 | | | $ | 591,393 | | |
| | 577 | | | Fastener Acquisition, Inc.,
LIBOR 1M + 4.250%(7) | | (B+, B2) | | 03/28/25 | | | 6.600 | | | | 578,543 | | |
| | 461 | | | Fastener Acquisition, Inc.,
LIBOR 3M + 8.750%(7) | | (CCC+, Caa2) | | 03/30/26 | | | 11.136 | | | | 443,381 | | |
| | 759 | | | Foundation Building Materials Holding, Co. LLC,
LIBOR 1M + 3.250%(6),(7) | | (B+, B3) | | 08/13/25 | | | 5.530 | | | | 752,394 | | |
| | 499 | | | Henry Co. LLC,
LIBOR 1M + 4.000%(7) | | (B, B2) | | 10/05/23 | | | 6.302 | | | | 499,561 | | |
| | 1,006 | | | Priso Acquisition Corp.,
LIBOR 1M + 3.000%(7) | | (B+, B2) | | 05/08/22 | | | 5.302 | | | | 1,009,083 | | |
| | | | 3,874,355 | | |
| Cable & Satellite TV (0.2%) | |
| | 495 | | | Altice Financing S.A.,
LIBOR 1M + 2.750%(7) | | (B+, B1) | | 01/31/26 | | | 5.040 | | | | 484,791 | | |
| Chemicals (3.3%) | |
| | 419 | | | Allnex (Luxembourg) & Cy S.C.A.,
LIBOR 3M + 3.250%(7) | | (B, B1) | | 09/13/23 | | | 5.567 | | | | 419,702 | | |
| | 316 | | | Allnex U.S.A., Inc.,
LIBOR 3M + 3.250%(7) | | (B, B1) | | 09/13/23 | | | 5.567 | | | | 316,200 | | |
| | 429 | | | Colouroz Investment 2 LLC,
LIBOR 3M + 7.250%(7) | | (CCC, Caa2) | | 09/06/22 | | | 9.737 | | | | 362,696 | | |
| | 1,000 | | | Minerals Technologies, Inc.(6) | | (BB+, Ba2) | | 05/09/21 | | | 4.750 | | | | 1,003,750 | | |
| | 748 | | | PMHC II, Inc., LIBOR 6M + 3.500%(7) | | (B-, B3) | | 03/31/25 | | | 6.150 | | | | 728,482 | | |
| | 910 | | | Preferred Proppants LLC,
LIBOR 3M + 7.750%(6),(7) | | (NR, NR) | | 07/27/20 | | | 10.136 | | | | 500,627 | | |
| | 1,250 | | | Schenectady International Group, Inc.,
LIBOR 3M + 4.750%(7) | | (B, B2) | | 10/15/25 | | | 7.186 | | | | 1,246,094 | | |
| | 452 | | | Tronox Blocked Borrower LLC,
LIBOR 1M + 3.000%(7) | | (BB-, Ba3) | | 09/23/24 | | | 5.302 | | | | 451,733 | | |
| | 1,042 | | | Tronox Finance LLC,
LIBOR 1M + 3.000%(7) | | (BB-, Ba3) | | 09/23/24 | | | 5.302 | | | | 1,042,461 | | |
| | 744 | | | Vantage Specialty Chemicals, Inc.,
LIBOR 1M + 3.500%(7) | | (B-, B3) | | 10/28/24 | | | 5.810 | | | | 747,401 | | |
| | 205 | | | Vantage Specialty Chemicals, Inc.,
LIBOR 3M + 8.250%(7) | | (CCC, Caa2) | | 10/27/25 | | | 10.777 | | | | 206,432 | | |
| | 499 | | | Venator Materials Corp.,
LIBOR 1M + 3.000%(6),(7) | | (BB, Ba3) | | 08/08/24 | | | 5.302 | | | | 498,117 | | |
| | 1,489 | | | Zep, Inc.,
LIBOR 3M + 4.000%(7) | | (CCC+, B2) | | 08/12/24 | | | 6.386 | | | | 1,405,930 | | |
| | | | 8,929,625 | | |
See Accompanying Notes to Financial Statements.
22
Credit Suisse Strategic Income Fund
Schedule of Investments (continued)
October 31, 2018
Par
(000) | |
| | Ratings†
(S&P/Moody's) | | Maturity | | Rate% | | Value | |
| BANK LOANS (continued) | | | |
| Diversified Capital Goods (1.6%) | |
$ | 1,027 | | | Cortes NP Acquisition Corp.,
LIBOR 3M + 4.000%(7) | | (B, B1) | | 11/30/23 | | | 6.313 | | | $ | 1,018,294 | | |
| | 596 | | | Douglas Dynamics Holdings, Inc.,
LIBOR 1M + 3.000%(7) | | (BB-, B2) | | 12/31/21 | | | 5.310 | | | | 597,503 | | |
| | 986 | | | Dynacast International LLC,
LIBOR 3M + 3.250%(7) | | (B, B1) | | 01/28/22 | | | 5.636 | | | | 987,807 | | |
| | 496 | | | Element Materials Technology Group
U.S. Holdings, Inc.,
LIBOR 1M + 3.500%(7) | | (B, B1) | | 06/28/24 | | | 5.802 | | | | 498,731 | | |
| | 493 | | | Horizon Global Corp.,
LIBOR 1M + 6.000%(7) | | (CCC+, B2) | | 06/30/21 | | | 8.302 | | | | 479,371 | | |
| | 660 | | | Thermon Industries, Inc.,
LIBOR 1M + 3.750%(7) | | (B+, B2) | | 10/24/24 | | | 6.006 | | | | 665,328 | | |
| | | | 4,247,034 | | |
| Electronics (2.0%) | |
| | 1,176 | | | AI Ladder (Luxembourg) Subco Sarl,
LIBOR 3M + 4.500%(7) | | (B, B2) | | 07/09/25 | | | 7.020 | | | | 1,185,210 | | |
| | 495 | | | CPI International, Inc.,
LIBOR 1M + 3.500%(7) | | (B, B2) | | 07/26/24 | | | 5.802 | | | | 496,549 | | |
| | 500 | | | CPI International, Inc.,
LIBOR 1M + 7.250%(6),(7) | | (CCC+, Caa2) | | 07/26/25 | | | 9.552 | | | | 495,625 | | |
| | 556 | | | Lumentum Holdings(6),(7) | | (BB, Ba2) | | 08/07/25 | | | 2.500 | | | | 558,333 | | |
| | 792 | | | Microchip Technology, Inc.,
LIBOR 1M + 2.000%(7) | | (BB+, Baa3) | | 05/29/25 | | | 4.310 | | | | 790,517 | | |
| | 986 | | | Oberthur Technologies S.A.,
LIBOR 3M + 3.750%(7) | | (B-, B2) | | 01/10/24 | | | 5.992 | | | | 992,393 | | |
| | 313 | | | Seattle Spinco, Inc.,
LIBOR 1M + 2.500%(7) | | (BB-, B1) | | 06/21/24 | | | 4.802 | | | | 312,185 | | |
| | 435 | | | Tempo Acquisition LLC,
LIBOR 1M + 3.000%(7) | | (B, B1) | | 05/01/24 | | | 5.302 | | | | 436,185 | | |
| | | | 5,266,997 | | |
| Energy - Exploration & Production (0.2%) | |
| | 769 | | | PES Holdings LLC,
LIBOR 3M + 3.500%(6),(7) | | (B-, B2) | | 12/31/22 | | | 8.886 | | | | 642,247 | | |
| Food - Wholesale (0.4%) | |
| | 495 | | | AI Aqua Merger Sub, Inc.,
LIBOR 1M + 3.250%(7) | | (B, B2) | | 12/13/23 | | | 5.552 | | | | 493,918 | | |
| | 750 | | | United Natural Foods, Inc.,
LIBOR 1M + 4.250%(7) | | (B+, B2) | | 10/22/25 | | | 6.552 | | | | 705,938 | | |
| | | | 1,199,856 | | |
See Accompanying Notes to Financial Statements.
23
Credit Suisse Strategic Income Fund
Schedule of Investments (continued)
October 31, 2018
Par
(000) | |
| | Ratings†
(S&P/Moody's) | | Maturity | | Rate% | | Value | |
| BANK LOANS (continued) | | | |
| Gaming (0.7%) | |
$ | 990 | | | CBAC Borrower LLC,
LIBOR 1M + 4.000%(7) | | (B, B3) | | 07/05/24 | | | 6.302 | | | $ | 995,198 | | |
| | 791 | | | The Stars Group Holdings B.V.,
LIBOR 3M + 3.500%(7) | | (B+, B1) | | 07/10/25 | | | 5.886 | | | | 795,694 | | |
| | | | 1,790,892 | | |
| Gas Distribution (0.7%) | |
| | 715 | | | BCP Renaissance Parent LLC,
LIBOR 3M + 3.500%(7) | | (B+, B1) | | 10/31/24 | | | 6.027 | | | | 718,682 | | |
| | 398 | | | Messer Industries LLC(7) | | (BB-, B1) | | 10/01/25 | | | 2.500 | | | | 398,137 | | |
| | 778 | | | Traverse Midstream Partners LLC,
LIBOR 6M + 4.000%(7) | | (B+, B1) | | 09/27/24 | | | 6.600 | | | | 784,044 | | |
| | | | 1,900,863 | | |
| Health Facilities (1.1%) | |
| | 1,742 | | | Prospect Medical Holdings, Inc.,
LIBOR 1M + 5.500%(6),(7) | | (B, B1) | | 02/22/24 | | | 7.813 | | | | 1,757,222 | | |
| | 1,113 | | | Western Dental Services, Inc.,
LIBOR 1M + 4.500%(7) | | (B-, B3) | | 06/23/23 | | | 6.802 | | | | 1,120,055 | | |
| | | | 2,877,277 | | |
| Health Services (0.7%) | |
| | 1,000 | | | Auris Luxembourg III Sarl(7),(8) | | (B+, B2) | | 07/20/25 | | | 3.500 | | | | 1,008,545 | | |
| | 433 | | | Onex Carestream Finance LP,
LIBOR 1M + 4.000%(7) | | (B, B1) | | 06/07/19 | | | 6.302 | | | | 432,495 | | |
| | 389 | | | Valitas Health Services, Inc.,
LIBOR 3M + 5.000%(4),(5),(6),(7) | | (NR, NR) | | 04/14/22 | | | 9.195 | | | | 155,699 | | |
| | 130 | | | Valitas Health Services, Inc.,
LIBOR 3M + 12.000%(4),(5),(6),(7) | | (NR, NR) | | 12/31/19 | | | 14.346 | | | | 123,383 | | |
| | 156 | | | Valitas Health Services, Inc.,
LIBOR 3M + 12.000%(4),(5),(6),(7) | | (NR, NR) | | 12/31/19 | | | 14.445 | | | | 148,059 | | |
| | | | 1,868,181 | | |
| Insurance Brokerage (2.3%) | |
| | 500 | | | Achilles Acquisition LLC,
LIBOR 1M + 4.000%(6),(7) | | (B, B3) | | 10/03/25 | | | 6.313 | | | | 503,750 | | |
| | 1,070 | | | Acrisure LLC,
LIBOR 1M + 4.250%(7) | | (B, B2) | | 11/22/23 | | | 6.552 | | | | 1,074,629 | | |
| | 402 | | | Alera Group Holdings, Inc.,
LIBOR 1M + 4.500%(7) | | (B, B3) | | 07/25/25 | | | 6.802 | | | | 405,739 | | |
| | 1,443 | | | Alliant Holdings I, Inc.,
LIBOR 1M + 3.000%(7) | | (B, B2) | | 05/09/25 | | | 5.280 | | | | 1,444,033 | | |
| | 680 | | | AssuredPartners, Inc.,
LIBOR 1M + 3.250%(7) | | (B, B2) | | 10/22/24 | | | 5.552 | | | | 679,553 | | |
See Accompanying Notes to Financial Statements.
24
Credit Suisse Strategic Income Fund
Schedule of Investments (continued)
October 31, 2018
Par
(000) | |
| | Ratings†
(S&P/Moody's) | | Maturity | | Rate% | | Value | |
| BANK LOANS (continued) | | | |
Insurance Brokerage | |
$ | 1,225 | | | Hyperion Insurance Group Ltd.,
LIBOR 1M + 3.500%(7) | | (B, B2) | | 12/20/24 | | | 5.813 | | | $ | 1,231,579 | | |
| | 806 | | | NFP Corp.,
LIBOR 1M + 3.000%(7) | | (B, B2) | | 01/08/24 | | | 5.302 | | | | 804,917 | | |
| | | | 6,144,200 | | |
| Investments & Misc. Financial Services (1.6%) | |
| | 722 | | | Altisource Solutions Sarl,
LIBOR 3M + 4.000%(7) | | (B+, B3) | | 03/29/24 | | | 6.386 | | | | 723,213 | | |
| | 855 | | | Compass Group Diversified Holdings LLC,
LIBOR 1M + 2.500%(7) | | (BB, Ba3) | | 04/17/25 | | | 4.802 | | | | 857,819 | | |
| | 609 | | | Ditech Holding Corp.,
LIBOR 1M + 6.000%(7) | | (CCC+, Caa2) | | 06/30/22 | | | 8.302 | | | | 567,606 | | |
| | 434 | | | Focus Financial Partners LLC,
LIBOR 1M + 2.500%(7) | | (BB-, Ba3) | | 07/03/24 | | | 4.802 | | | | 435,396 | | |
| | 625 | | | Fortress Investment Group LLC,
LIBOR 1M + 2.000%(7) | | (BB, Baa3) | | 12/27/22 | | | 4.302 | | | | 625,963 | | |
| | 996 | | | Liquidnet Holdings, Inc.,
LIBOR 1M + 3.250%(6),(7) | | (B+, Ba3) | | 07/15/24 | | | 5.552 | | | | 1,002,319 | | |
| | | | 4,212,316 | | |
| Machinery (1.5%) | |
| | 933 | | | Cohu, Inc.,
LIBOR 3M + 3.000%(7) | | (BB-, B1) | | 09/20/25 | | | 5.396 | | | | 935,667 | | |
| | 495 | | | CPM Acquisition Corp.,
LIBOR 1M + 8.250%(7) | | (B-, Caa1) | | 04/10/23 | | | 10.552 | | | | 499,597 | | |
| | 294 | | | CPM Holdings, Inc.(7) | | (B, B2) | | 10/24/25 | | | 6.057 | | | | 295,593 | | |
| | 247 | | | CPM Holdings, Inc.(7) | | (B-, Caa2) | | 10/24/26 | | | 10.676 | | | | 248,053 | | |
| | 725 | | | CPM Holdings, Inc.,
LIBOR 1M + 3.500%(7) | | (B, B1) | | 04/11/22 | | | 5.802 | | | | 730,391 | | |
| | 411 | | | LTI Holdings, Inc.,
LIBOR 1M + 6.750%(7) | | (CCC+, Caa2) | | 09/06/26 | | | 9.052 | | | | 410,689 | | |
| | 230 | | | LTI Holdings, Inc.,
LIBOR 1M + 3.500%(7) | | (B-, B2) | | 09/06/25 | | | 5.802 | | | | 230,072 | | |
| | 741 | | | Penn Engineering & Manufacturing Corp.,
LIBOR 1M + 2.750%(7) | | (B+, B1) | | 06/27/24 | | | 5.045 | | | | 742,943 | | |
| | | | 4,093,005 | | |
| Media - Diversified (0.4%) | |
| | 750 | | | NEP/NCP Holdco, Inc.,
LIBOR 3M + 3.250%(7) | | (B+, B1) | | 10/20/25 | | | 5.474 | | | | 754,125 | | |
| | 250 | | | NEP/NCP Holdco, Inc.,
LIBOR 1M + 7.000%(7) | | (CCC+, Caa1) | | 10/19/26 | | | 9.302 | | | | 250,937 | | |
| | | | 1,005,062 | | |
See Accompanying Notes to Financial Statements.
25
Credit Suisse Strategic Income Fund
Schedule of Investments (continued)
October 31, 2018
Par
(000) | |
| | Ratings†
(S&P/Moody's) | | Maturity | | Rate% | | Value | |
| BANK LOANS (continued) | | | |
| Media Content (0.4%) | |
$ | 1,000 | | | DLG Acquisitions Ltd.,
EURIBOR 6M + 7.250%(7),(9) | | (CCC+, Caa2) | | 06/30/22 | | | 8.250 | | | $ | 1,141,723 | | |
| Medical Products (0.9%) | |
| | 1,073 | | | ABB Concise Optical Group LLC,
LIBOR 1M + 5.000%(7) | | (B-, B2) | | 06/15/23 | | | 7.280 | | | | 1,078,942 | | |
| | 993 | | | Avantor, Inc.,
LIBOR 1M + 4.000%(7) | | (B, B2) | | 11/21/24 | | | 6.302 | | | | 1,000,951 | | |
| | 224 | | | MedPlast Holdings, Inc.,
LIBOR 3M + 3.750%(7) | | (B, B1) | | 07/02/25 | | | 6.148 | | | | 225,366 | | |
| | | | 2,305,259 | | |
| Metals & Mining - Excluding Steel (0.5%) | |
| | 1,234 | | | GrafTech Finance, Inc.,
LIBOR 1M + 3.500%(7) | | (B+, B1) | | 02/12/25 | | | 5.802 | | | | 1,237,461 | | |
| | 221 | | | Noranda Aluminum Acquisition Corp.,
PRIME + 3.500%(3),(7) | | (NR, NR) | | 02/28/19 | | | 8.750 | | | | 968 | | |
| | | | 1,238,429 | | |
| Non - Electric Utilities (0.5%) | |
| | 741 | | | BCP Raptor LLC,
LIBOR 2M + 4.250%(7) | | (B, B3) | | 06/24/24 | | | 6.641 | | | | 732,822 | | |
| | 496 | | | Medallion Midland Acquisition LLC,
LIBOR 1M + 3.250%(7) | | (B+, B2) | | 10/30/24 | | | 5.552 | | | | 494,079 | | |
| | | | 1,226,901 | | |
| Oil Refining & Marketing (0.7%) | |
| | 500 | | | EG Finco Ltd.,
LIBOR 3M + 8.000%(7) | | (CCC+, Caa1) | | 04/20/26 | | | 10.386 | | | | 497,188 | | |
| | 1,388 | | | EG Finco Ltd.,
LIBOR 3M + 4.000%(7) | | (B, B2) | | 02/07/25 | | | 6.386 | | | | 1,391,669 | | |
| | | | 1,888,857 | | |
| Packaging (1.1%) | |
| | 722 | | | Flex Acquisition Co., Inc.,
LIBOR 3M + 3.000%(7) | | (B, B1) | | 12/29/23 | | | 5.256 | | | | 721,463 | | |
| | 832 | | | Proampac PG Borrower LLC,
LIBOR 3M + 3.500%(7) | | (B, B3) | | 11/18/23 | | | 5.841 | | | | 834,588 | | |
| | 250 | | | Proampac PG Borrower LLC,
LIBOR 3M + 8.500%(7) | | (CCC+, Caa2) | | 11/18/24 | | | 10.810 | | | | 252,084 | | |
| | 748 | | | Strategic Materials, Inc.,
LIBOR 3M + 3.750%(7) | | (B, B2) | | 10/25/24 | | | 6.094 | | | | 718,191 | | |
| | 500 | | | Strategic Materials, Inc.,
LIBOR 3M + 7.750%(6),(7) | | (CCC+, Caa2) | | 10/27/25 | | | 10.094 | | | | 462,500 | | |
| | | | 2,988,826 | | |
See Accompanying Notes to Financial Statements.
26
Credit Suisse Strategic Income Fund
Schedule of Investments (continued)
October 31, 2018
Par
(000) | |
| | Ratings†
(S&P/Moody's) | | Maturity | | Rate% | | Value | |
| BANK LOANS (continued) | | | |
| Personal & Household Products (1.3%) | |
$ | 500 | | | ABG Intermediate Holdings 2 LLC,
LIBOR 1M + 7.750%(7) | | (CCC+, Caa1) | | 09/29/25 | | | 10.045 | | | $ | 503,125 | | |
| | 741 | | | Comfort Holding LLC,
LIBOR 1M + 4.750%(7) | | (CCC+, Caa1) | | 02/05/24 | | | 7.052 | | | | 702,347 | | |
| | 634 | | | Comfort Holding LLC,
LIBOR 1M + 10.000%(7) | | (CCC-, Caa3) | | 02/03/25 | | | 12.302 | | | | 600,450 | | |
| | 739 | | | Serta Simmons Bedding LLC,
LIBOR 1M + 3.500%(7) | | (B-, B3) | | 11/08/23 | | | 5.770 | | | | 668,705 | | |
| | 250 | | | Serta Simmons Bedding LLC,
LIBOR 3M + 8.000%(7) | | (CCC, Caa2) | | 11/08/24 | | | 10.277 | | | | 195,820 | | |
| | 79 | | | TricorBraun Holdings, Inc.,
LIBOR 3M + 3.750%(7) | | (B, B2) | | 11/30/23 | | | 6.103 | | | | 79,706 | | |
| | 787 | | | TricorBraun Holdings, Inc.,
LIBOR 3M + 3.750%(7) | | (B, B2) | | 11/30/23 | | | 6.136 | | | | 791,019 | | |
| | | | 3,541,172 | | |
| Pharmaceuticals (1.0%) | |
| | 882 | | | Endo Luxembourg Finance Co. I Sarl,
LIBOR 1M + 4.250%(7) | | (BB-, Ba2) | | 04/29/24 | | | 6.563 | | | | 886,929 | | |
| | 980 | | | Explorer Holdings, Inc.,
LIBOR 3M + 3.750%(7) | | (B, B2) | | 05/02/23 | | | 6.136 | | | | 983,036 | | |
| | 744 | | | Valeant Pharmaceuticals International, Inc.,
LIBOR 1M + 3.000%(7) | | (BB-, Ba3) | | 06/01/25 | | | 5.274 | | | | 745,501 | | |
| | | | 2,615,466 | | |
| Real Estate Development & Management (0.4%) | |
| | 440 | | | Capital Automotive LP,
LIBOR 1M + 6.000%(7) | | (CCC+, B3) | | 03/24/25 | | | 8.310 | | | | 448,475 | | |
| | 526 | | | Forest City Enterprises, LP(7) | | (B+, B2) | | 10/24/25 | | | 4.000 | | | | 528,710 | | |
| | | | 977,185 | | |
| Recreation & Travel (1.0%) | |
| | 86 | | | Bulldog Purchaser, Inc.(7),(10) | | (CCC+, Caa2) | | 08/21/26 | | | 3.875 | | | | 85,633 | | |
| | 164 | | | Bulldog Purchaser, Inc.,
LIBOR 1M + 7.750%(7) | | (CCC+, Caa2) | | 09/04/26 | | | 10.052 | | | | 164,679 | | |
| | 352 | | | Bulldog Purchaser, Inc.(6),(7),(10) | | (B+, B2) | | 08/22/25 | | | 1.875 | | | | 349,738 | | |
| | 1,148 | | | Bulldog Purchaser, Inc.,
LIBOR 1M + 3.750%(7) | | (B+, B2) | | 08/22/25 | | | 6.052 | | | | 1,148,336 | | |
| | 551 | | | Hornblower Sub, LLC,
LIBOR 3M + 4.500%(6),(7) | | (B+, B2) | | 04/27/25 | | | 6.886 | | | | 553,435 | | |
| | 500 | | | Intrawest Resorts Holdings, Inc.,
LIBOR 1M + 3.000%(7) | | (B, B2) | | 07/31/24 | | | 5.302 | | | | 501,250 | | |
| | | | 2,803,071 | | |
See Accompanying Notes to Financial Statements.
27
Credit Suisse Strategic Income Fund
Schedule of Investments (continued)
October 31, 2018
Par
(000) | |
| | Ratings†
(S&P/Moody's) | | Maturity | | Rate% | | Value | |
| BANK LOANS (continued) | | | |
| Restaurants (1.2%) | |
$ | 785 | | | Flynn Restaurant Group LP,
LIBOR 1M + 3.500%(7) | | (B, B2) | | 06/27/25 | | | 5.802 | | | $ | 783,550 | | |
| | 1,467 | | | Golden Nugget, Inc.,
LIBOR 3M + 2.750%(7) | | (B+, Ba3) | | 10/04/23 | | | 5.230 | | | | 1,470,309 | | |
| | 296 | | | K-Mac Holdings Corp.,
LIBOR 1M + 6.750%(7) | | (CCC, Caa2) | | 03/16/26 | | | 9.030 | | | | 298,508 | | |
| | 750 | | | Miller's Ale House, Inc.,
LIBOR 1M + 4.750%(6),(7) | | (B-, B3) | | 05/26/25 | | | 7.006 | | | | 744,375 | | |
| | | | 3,296,742 | | |
| Software - Services (4.0%) | |
| | 1,070 | | | Air Newco LLC,
LIBOR 3M + 4.750%(7) | | (B-, B3) | | 05/31/24 | | | 7.027 | | | | 1,080,317 | | |
| | 990 | | | Cypress Intermediate Holdings III, Inc.,
LIBOR 1M + 3.000%(7) | | (B, B2) | | 04/26/24 | | | 5.310 | | | | 992,628 | | |
| | 977 | | | Epicor Software Corp.,
LIBOR 1M + 3.250%(7) | | (B-, B2) | | 06/01/22 | | | 5.560 | | | | 981,141 | | |
| | 550 | | | Evertec Group LLC,
LIBOR 1M + 2.500%(7) | | (B+, B2) | | 04/17/20 | | | 4.790 | | | | 549,778 | | |
| | 1,285 | | | Flexera Software LLC,
LIBOR 1M + 7.250%(7) | | (CCC+, Caa1) | | 02/26/26 | | | 9.560 | | | | 1,295,390 | | |
| | 744 | | | Hyland Software, Inc.,
LIBOR 1M + 7.000%(7) | | (CCC, Caa1) | | 07/07/25 | | | 9.302 | | | | 749,208 | | |
| | 492 | | | Infor (U.S.), Inc.,
LIBOR 3M + 2.750%(7) | | (B, B1) | | 02/01/22 | | | 5.136 | | | | 491,116 | | |
| | 493 | | | Kronos, Inc.,
LIBOR 3M + 3.000%(7) | | (B, B2) | | 11/01/23 | | | 5.343 | | | | 493,958 | | |
| | 750 | | | Kronos, Inc.,
LIBOR 3M + 8.250%(7) | | (CCC, Caa2) | | 11/01/24 | | | 10.593 | | | | 763,436 | | |
| | 730 | | | MA FinanceCo. LLC,
LIBOR 1M + 2.250%(7) | | (BB-, B1) | | 11/19/21 | | | 4.552 | | | | 725,814 | | |
| | 46 | | | MA FinanceCo. LLC,
LIBOR 1M + 2.500%(7) | | (BB-, B1) | | 06/21/24 | | | 4.802 | | | | 46,227 | | |
| | 388 | | | Newport Group, Inc.,
LIBOR 1M + 3.750%(6),(7) | | (B, B2) | | 09/13/25 | | | 6.030 | | | | 389,515 | | |
| | 700 | | | Project Ruby Ultimate Parent Corp.,
LIBOR 1M + 3.500%(7) | | (B-, B2) | | 02/09/24 | | | 5.802 | | | | 700,458 | | |
| | 271 | | | SS&C Technologies Holdings Europe Sarl,
LIBOR 1M + 2.250%(7) | | (BB, Ba3) | | 04/16/25 | | | 4.552 | | | | 269,672 | | |
| | 698 | | | SS&C Technologies, Inc.,
LIBOR 1M + 2.250%(7) | | (BB, Ba3) | | 04/16/25 | | | 4.552 | | | | 695,749 | | |
| | 500 | | | TigerLuxOne Sarl,
LIBOR 3M + 8.250%(7) | | (CCC+, Caa2) | | 02/16/25 | | | 10.636 | | | | 502,188 | | |
| | | | 10,726,595 | | |
See Accompanying Notes to Financial Statements.
28
Credit Suisse Strategic Income Fund
Schedule of Investments (continued)
October 31, 2018
Par
(000) | |
| | Ratings†
(S&P/Moody's) | | Maturity | | Rate% | | Value | |
| BANK LOANS (continued) | | | |
| Steel Producers/Products (1.0%) | |
$ | 1,289 | | | Atkore International, Inc.,
LIBOR 3M + 2.750%(7) | | (BB-, B2) | | 12/22/23 | | | 5.140 | | | $ | 1,291,696 | | |
| | 1,337 | | | Zekelman Industries, Inc.,
LIBOR 3M + 2.250%(7) | | (BB-, B1) | | 06/14/21 | | | 4.623 | | | | 1,336,743 | | |
| | | | 2,628,439 | | |
| Support - Services (3.2%) | |
| | 1,484 | | | Brand Energy & Infrastructure Services, Inc.,
LIBOR 3M + 4.250%(7) | | (B, B3) | | 06/21/24 | | | 6.732 | | | | 1,492,921 | | |
| | 1,466 | | | Change Healthcare Holdings LLC,
LIBOR 1M + 2.750%(7) | | (B+, Ba3) | | 03/01/24 | | | 5.052 | | | | 1,466,279 | | |
| | 710 | | | Long Term Care Group, Inc.,
LIBOR 1M + 5.000%(6),(7) | | (B, B3) | | 06/06/20 | | | 7.302 | | | | 706,095 | | |
| | 746 | | | PT Intermediate Holdings III LLC,
LIBOR 3M + 4.000%(7) | | (B-, B3) | | 12/07/24 | | | 6.386 | | | | 748,110 | | |
| | 990 | | | SAI Global Ltd.,
LIBOR 1M + 4.500%(7) | | (CCC+, B3) | | 12/20/23 | | | 5.500 | | | | 929,345 | | |
| | 908 | | | Sedgwick Claims Management Services, Inc.,
LIBOR 1M + 2.750%(7) | | (B, B2) | | 03/01/21 | | | 5.052 | | | | 908,778 | | |
| | 1,500 | | | Sedgwick Claims Management Services, Inc.,
LIBOR 3M + 5.750%(7) | | (CCC+, Caa2) | | 02/28/22 | | | 8.050 | | | | 1,504,222 | | |
| | 315 | | | Sprint Industrial Holdings LLC,
LIBOR 3M + 12.250%(4),(6),(7) | | (CC, Caa3) | | 11/14/19 | | | 13.500 | | | | 108,741 | | |
| | 248 | | | United Rentals, Inc.,
LIBOR 1M + 1.750%(7) | | (BBB-, Baa3) | | 10/31/25 | | | 4.052 | | | | 249,260 | | |
| | 327 | | | USS Ultimate Holdings, Inc.,
LIBOR 1M + 7.750%(7) | | (CCC+, Caa2) | | 08/25/25 | | | 10.052 | | | | 328,500 | | |
| | | | 8,442,251 | | |
| Telecom - Wireline Integrated & Services (1.4%) | |
| | 1,000 | | | Level 3 Financing, Inc.,
LIBOR 1M + 2.250%(7) | | (BBB-, Ba1) | | 02/22/24 | | | 4.530 | | | | 1,001,955 | | |
| | 1,494 | | | MTN Infrastructure TopCo, Inc.,
LIBOR 1M + 3.000%(7) | | (B, B2) | | 11/15/24 | | | 5.302 | | | | 1,497,481 | | |
| | 424 | | | Triton Solar U.S. Acquisition Co.,
LIBOR 2M + 6.000%(7) | | (B+, B2) | | 10/11/24 | | | 8.509 | | | | 400,424 | | |
| | 465 | | | TVC Albany, Inc.,
LIBOR 1M + 3.500%(7) | | (B-, B2) | | 07/23/25 | | | 5.800 | | | | 466,253 | | |
| | 438 | | | TVC Albany, Inc.,
LIBOR 1M + 7.500%(6),(7) | | (CCC, Caa2) | | 08/15/26 | | | 9.800 | | | | 435,313 | | |
| | | | 3,801,426 | | |
See Accompanying Notes to Financial Statements.
29
Credit Suisse Strategic Income Fund
Schedule of Investments (continued)
October 31, 2018
Par
(000) | |
| | Ratings†
(S&P/Moody's) | | Maturity | | Rate% | | Value | |
| BANK LOANS (continued) | | | |
| Theaters & Entertainment (1.0%) | |
$ | 1,204 | | | Metro-Goldwyn-Mayer, Inc.,
LIBOR 1M + 4.500%(7) | | (B-, B2) | | 07/03/26 | | | 6.810 | | | $ | 1,208,368 | | |
| | 1,497 | | | Technicolor S.A.,
LIBOR 3M + 2.750%(7) | | (B+, B1) | | 12/06/23 | | | 5.067 | | | | 1,426,338 | | |
| | | | 2,634,706 | | |
| Transport Infrastructure/Services (0.1%) | |
| | 250 | | | OSG Bulk Ships, Inc.,
LIBOR 3M + 4.250%(7) | | (B+, B2) | | 08/05/19 | | | 6.770 | | | | 248,385 | | |
| Trucking & Delivery (0.6%) | |
| | 592 | | | International Seaways, Inc.,
LIBOR 1M + 6.000%(6),(7) | | (B+, B3) | | 06/22/22 | | | 8.260 | | | | 593,457 | | |
| | 925 | | | Navios Maritime Partners LP,
LIBOR 3M + 5.000%(7) | | (BB-, B3) | | 09/14/20 | | | 7.340 | | | | 927,313 | | |
| | | | 1,520,770 | | |
| TOTAL BANK LOANS (Cost $106,818,405) | | | 106,045,644 | | |
| ASSET BACKED SECURITIES (5.1%) | | | |
| Collateralized Debt Obligations (5.1%) | | | |
| | 750 | | | BlueMountain Fuji U.S. Clo III Ltd.,
2017-3A, Rule 144A,
LIBOR 3M + 5.200%(1),(7) | | (BB-, NR) | | 01/15/30 | | | 7.539 | | | | 738,991 | | |
| | 750 | | | Carlyle Global Market Strategies CLO Ltd.,
2014-3RA, Rule 144A,
LIBOR 3M + 5.400%(1),(7) | | (BB-, NR) | | 07/27/31 | | | 7.488 | | | | 746,046 | | |
| | 500 | | | Carlyle Global Market Strategies CLO Ltd.,
2015-2A, Rule 144A,
LIBOR 3M + 6.150%(1),(7) | | (NR, B1) | | 04/27/27 | | | 8.659 | | | | 493,899 | | |
| | 500 | | | Carlyle U.S. CLO Ltd.,
2017-2A, Rule 144A(1),(4),(8),(11) | | (NR, NR) | | 07/20/31 | | | 0.000 | | | | 448,457 | | |
| | 750 | | | CIFC Funding Ltd., 2014-1A, Rule 144A,
LIBOR 3M + 5.850%(1),(7) | | (BB-, NR) | | 01/18/31 | | | 8.295 | | | | 738,879 | | |
| | 750 | | | Dryden 55 CLO Ltd., 2018-55A, Rule 144A,
LIBOR 3M + 2.850%(1),(7) | | (BBB-, NR) | | 04/15/31 | | | 5.286 | | | | 744,704 | | |
| | 750 | | | Goldentree Loan Opportunities XI Ltd.,
2015-11A, Rule 144A,
LIBOR 3M + 5.400%(1),(7) | | (NR, Ba3) | | 01/18/31 | | | 7.845 | | | | 742,575 | | |
| | 750 | | | Greywolf CLO V Ltd., 2015-1A, Rule 144A,
LIBOR 3M + 5.850%(1),(7) | | (BB-, NR) | | 01/27/31 | | | 8.340 | | | | 742,625 | | |
| | 750 | | | Greywolf CLO VI Ltd., 2018-1A, Rule 144A,
LIBOR 3M + 5.750%(1),(7) | | (BB-, NR) | | 04/26/31 | | | 8.258 | | | | 736,783 | | |
| | 500 | | | Halcyon Loan Advisors Funding Ltd.,
2015-2A, Rule 144A(1),(4),(8),(11) | | (NR, NR) | | 07/25/27 | | | 0.000 | | | | 300,390 | | |
| | 500 | | | JFIN CLO Ltd., 2013-1A, Rule 144A,
LIBOR 3M + 4.750%(1),(7) | | (BB, NR) | | 01/20/25 | | | 7.219 | | | | 499,524 | | |
See Accompanying Notes to Financial Statements.
30
Credit Suisse Strategic Income Fund
Schedule of Investments (continued)
October 31, 2018
Par
(000) | |
| | Ratings†
(S&P/Moody's) | | Maturity | | Rate% | | Value | |
| ASSET BACKED SECURITIES (continued) | | | |
Collateralized Debt Obligations | | | |
$ | 500 | | | KKR CLO Ltd., 20E, Rule 144A,
LIBOR 3M + 5.500%(1),(7) | | (NR, Ba3) | | 10/16/30 | | | 7.936 | | | $ | 492,725 | | |
| | 500 | | | KKR CLO Ltd.,13ER, Rule 144A,
LIBOR 3M + 4.950%(1),(7) | | (NR, Ba3) | | 01/16/28 | | | 7.386 | | | | 486,136 | | |
| | 750 | | | KKR Financial CLO Ltd., 2013-1A, Rule 144A,
LIBOR 3M + 6.080%(1),(7) | | (NR, Ba3) | | 04/15/29 | | | 8.516 | | | | 751,638 | | |
| | 500 | | | Shackleton CLO Ltd., 2014-6RA, Rule 144A,
LIBOR 3M + 2.970%(1),(7) | | (NR, Baa3) | | 07/17/28 | | | 5.306 | | | | 496,908 | | |
| | 500 | | | Symphony CLO XIV Ltd., 2014-14A, Rule 144A,
LIBOR 3M + 3.600%(1),(7) | | (NR, Baa2) | | 07/14/26 | | | 6.036 | | | | 502,070 | | |
| | 500 | | | Venture 35 CLO Ltd., 2018-35A, Rule 144A,
LIBOR 3M + 3.500%(1),(7),(11) | | (NR, Baa3) | | 10/22/31 | | | 0.000 | | | | 500,000 | | |
| | 750 | | | Venture XVII CLO Ltd., 2014-17A, Rule 144A,
LIBOR 3M + 2.820%(1),(7) | | (NR, Baa3) | | 04/15/27 | | | 5.256 | | | | 747,473 | | |
| | 500 | | | Venture XXVIII CLO Ltd., 2017-28A, Rule 144A,
LIBOR 3M + 6.150%(1),(7) | | (NR, Ba3) | | 07/20/30 | | | 8.619 | | | | 502,073 | | |
| | 500 | | | Vibrant CLO IV Ltd., 2016-4A, Rule 144A,
LIBOR 3M + 6.750%(1),(7) | | (NR, Ba3) | | 07/20/28 | | | 9.219 | | | | 503,100 | | |
| | 500 | | | Vibrant CLO V Ltd., 2016-5A, Rule 144A,
LIBOR 3M + 7.000%(1),(7) | | (NR, Ba3) | | 01/20/29 | | | 9.469 | | | | 508,816 | | |
| | 750 | | | Vibrant Clo VI Ltd., 2017-6A, Rule 144A,
LIBOR 3M + 5.750%(1),(7) | | (NR, Ba3) | | 06/20/29 | | | 8.088 | | | | 750,077 | | |
| | 500 | | | Voya CLO Ltd., 2014-4A, Rule 144A,
LIBOR 3M + 3.350%(1),(7) | | (BBB-, NR) | | 07/14/31 | | | 5.786 | | | | 502,187 | | |
| TOTAL ASSET BACKED SECURITIES (Cost $13,845,307) | | | 13,676,076 | | |
Number of
Shares | |
| |
| |
| |
| |
| |
| COMMON STOCKS (0.7%) | | | |
| Auto Parts & Equipment (0.2%) | |
| | 23,014 | | | UCI International, Inc.(4),(5),(6),(12) | | | | | | | | | | | | | | | 483,294 | | |
| Building & Construction (0.0%) | |
| | 2 | | | White Forest Resources, Inc.(4),(5),(6),(12) | | | | | | | | | | | | | | | 6 | | |
| Building Materials (0.1%) | |
| | 2,935 | | | Euramax International, Inc.(6) | | | | | | | | | | | | | | | 240,662 | | |
| Energy - Exploration & Production (0.2%) | |
| | 54,344 | | | Independence Contract Drilling, Inc.(6),(12) | | | | | | | | | | | | | | | 164,529 | | |
| | 37,190 | | | PES Energy, Inc.(6),(12) | | | | | | | | | | | | | | | 260,330 | | |
| | | | 424,859 | | |
| Health Services (0.0%) | |
| | 32,987 | | | Valitas Health Services, Inc.(5),(6) | | | | | | | | | | | | | | | 3,299 | | |
| Metals & Mining - Excluding Steel (0.2%) | |
| | 800,000 | | | Taseko Mines Ltd.(12) | | | | | | | | | | | | | | | 548,258 | | |
See Accompanying Notes to Financial Statements.
31
Credit Suisse Strategic Income Fund
Schedule of Investments (continued)
October 31, 2018
Number of
Shares | |
| |
| |
| |
| |
Value | |
| COMMON STOCKS (continued) | | | |
| Support - Services (0.0%) | |
| | 87 | | | Sprint Industrial Holdings LLC, Class G(5),(6),(12) | | | | | | | | | | | | | | $ | 1 | | |
| | 8 | | | Sprint Industrial Holdings LLC, Class H(5),(6),(12) | | | | | | | | | | | | | | | — | | |
| | 19 | | | Sprint Industrial Holdings LLC, Class I(5),(6),(12) | | | | | | | | | | | | | | | — | | |
| | | | 1 | | |
| TOTAL COMMON STOCKS (Cost $1,833,026) | | | 1,700,379 | | |
| TOTAL INVESTMENTS AT VALUE (94.3%) (Cost $257,296,557) | | | 251,373,086 | | |
| OTHER ASSETS IN EXCESS OF LIABILITIES (5.7%) | | | 15,330,780 | | |
| NET ASSETS (100.0%) | | $ | 266,703,866 | | |
† Credit ratings given by the Standard & Poor's Division of The McGraw-Hill Companies, Inc. ("S&P") and Moody's Investors Service, Inc. ("Moody's") are unaudited.
(1) Security exempt from registration under Rule 144A of the Securities Act of 1933, as amended. These securities may be resold in transactions exempt from registration, normally to qualified institutional buyers. At October 31, 2018, these securities amounted to a value of $120,689,464 or 45.3% of net assets.
(2) PIK: Payment-in-kind security for which part of the income earned may be paid as additional principal.
(3) Bond is currently in default.
(4) Illiquid security (unaudited).
(5) Not readily marketable security; security is valued at fair value as determined in good faith by, or under the direction of, the Board of Trustees.
(6) Security is valued using significant unobservable inputs.
(7) Variable rate obligation — The interest rate shown is the rate in effect as of October 31, 2018.
(8) The rates on certain variable rate securities are not based on a published reference rate and spread but are determined by the issuer or agent and are based on current market conditions. These securities do not indicate a reference rate and spread in their description above. The interest rate shown is the rate in effect as of October 31, 2018.
(9) This security is denominated in Euro.
(10) Unfunded loan commitment (See note 2-J).
(11) Zero-coupon security.
(12) Non-income producing security.
INVESTMENT ABBREVIATIONS
1M = 1 Month
2M = 2 Month
3M = 3 Month
6M = 6 Month
EURIBOR = Euro Interbank Offered Rate
LIBOR = London Interbank Offered Rate
NR = Not Rated
Sarl - société à responsabilité limitée
See Accompanying Notes to Financial Statements.
32
Credit Suisse Strategic Income Fund
Schedule of Investments (continued)
October 31, 2018
Forward Foreign Currency Contracts | |
Forward
Currency to be
Purchased (Local) | | Forward
Currency to be
Sold (Local) | | Expiration
Date | | Counterparty | | Value on
Settlement Date | | Current
Value/
Notional | | Net Unrealized
Appreciation
(Depreciation) | |
USD | 769,129 | | | CAD | 993,000 | | | 10/11/19 | | Morgan Stanley | | $ | (769,129 | ) | | $ | (760,148 | ) | | $ | 8,981 | | |
USD | 2,123,499 | | | EUR | 1,784,130 | | | 10/11/19 | | Morgan Stanley | | | (2,123,499 | ) | | | (2,086,645 | ) | | | 36,854 | | |
| | | $ | 45,835 | | |
Currency Abbreviations:
CAD = Canadian Dollar
EUR = Euro
USD = United States Dollar
See Accompanying Notes to Financial Statements.
33
Credit Suisse Strategic Income Fund
Statement of Assets and Liabilities
October 31, 2018
Assets | |
Investments at value (Cost $257,296,557) (Note 2) | | $ | 251,373,086 | | |
Cash | | | 14,429,947 | | |
Foreign currency at value (Cost $1,086,812) | | | 1,063,918 | | |
Receivable for investments sold | | | 4,904,287 | | |
Interest receivable | | | 2,965,835 | | |
Receivable for Fund shares sold | | | 1,365,432 | | |
Unrealized appreciation on forward foreign currency contracts (Note 2) | | | 45,835 | | |
Prepaid expenses and other assets | | | 43,596 | | |
Total assets | | | 276,191,936 | | |
Liabilities | |
Investment advisory fee payable (Note 3) | | | 114,407 | | |
Administrative services fee payable (Note 3) | | | 20,216 | | |
Shareholder servicing/Distribution fee payable (Note 3) | | | 49,010 | | |
Payable for investments purchased | | | 7,641,925 | | |
Payable for Fund shares redeemed | | | 972,448 | | |
Unfunded loan commitments (Note 2) | | | 433,528 | | |
Dividend payable | | | 56,935 | | |
Trustees' fees payable | | | 22,609 | | |
Accrued expenses | | | 176,992 | | |
Total liabilities | | | 9,488,070 | | |
Net Assets | |
Capital stock, $.001 par value (Note 6) | | | 26,778 | | |
Paid-in capital (Note 6) | | | 279,900,836 | | |
Total distributable earnings (loss) | | | (13,223,748 | ) | |
Net assets | | $ | 266,703,866 | | |
I Shares | |
Net assets | | $ | 175,188,737 | | |
Shares outstanding | | | 17,592,036 | | |
Net asset value, offering price and redemption price per share | | $ | 9.96 | | |
A Shares | |
Net assets | | $ | 44,929,608 | | |
Shares outstanding | | | 4,510,175 | | |
Net asset value and redemption price per share | | $ | 9.96 | | |
Maximum offering price per share (net asset value/(1-4.75%)) | | $ | 10.46 | | |
C Shares | |
Net assets | | $ | 46,585,521 | | |
Shares outstanding | | | 4,675,431 | | |
Net asset value and offering price per share | | $ | 9.96 | | |
See Accompanying Notes to Financial Statements.
34
Credit Suisse Strategic Income Fund
Statement of Operations
For the Year Ended October 31, 2018
Investment Income | |
Interest | | $ | 13,638,546 | | |
Dividends | | | 12,882 | | |
Total investment income | | | 13,651,428 | | |
Expenses | |
Investment advisory fees (Note 3) | | | 1,888,373 | | |
Administrative services fees (Note 3) | | | 77,239 | | |
Shareholder servicing/Distribution fees (Note 3) | |
Class A | | | 103,125 | | |
Class C | | | 416,262 | | |
Transfer agent fees (Note 3) | | | 226,547 | | |
Registration fees | | | 90,207 | | |
Trustees' fees | | | 65,159 | | |
Audit and tax fees | | | 57,920 | | |
Printing fees | | | 50,008 | | |
Legal fees | | | 47,581 | | |
Custodian fees | | | 43,538 | | |
Commitment fees (Note 4) | | | 42,807 | | |
Insurance expense | | | 3,414 | | |
Miscellaneous expense | | | 8,709 | | |
Total expenses | | | 3,120,889 | | |
Less: fees waived (Note 3) | | | (375,920 | ) | |
Net expenses | | | 2,744,969 | | |
Net investment income | | | 10,906,459 | | |
Net Realized and Unrealized Gain (Loss) from Investments,
Foreign Currency and Forward Foreign Currency Contracts | |
Net realized loss from investments | | | (998,470 | ) | |
Net realized gain from foreign currency transactions | | | 8,028 | | |
Net realized gain from forward foreign currency contracts | | | 14,609 | | |
Net change in unrealized appreciation (depreciation) from investments | | | (5,498,666 | ) | |
Net change in unrealized appreciation (depreciation) from foreign currency translations | | | 4,460 | | |
Net change in unrealized appreciation (depreciation) from forward foreign currency contracts | | | 12,466 | | |
Net realized and unrealized loss from investments, foreign currency and forward foreign
currency contracts | | | (6,457,573 | ) | |
Net increase in net assets resulting from operations | | $ | 4,448,886 | | |
See Accompanying Notes to Financial Statements.
35
Credit Suisse Strategic Income Fund
Statements of Changes in Net Assets
| | | For the Year
Ended
October 31, 2018 | | For the Year
Ended
October 31, 2017 | |
From Operations | |
Net investment income | | $ | 10,906,459 | | | $ | 6,526,623 | | |
Net realized loss from investments, foreign currency transactions and
forward foreign currency contracts | | | (975,833 | ) | | | (1,009,599 | ) | |
Net change in unrealized appreciation (depreciation) from investments,
foreign currency translations and forward foreign currency contracts | | | (5,481,740 | ) | | | 6,380,947 | | |
Net increase in net assets resulting from operations | | | 4,448,886 | | | | 11,897,971 | | |
From Distributions | |
From distributable earnings | |
Class I | | | (7,172,692 | ) | | | (4,332,237 | ) | |
Class A | | | (1,985,570 | ) | | | (1,293,742 | ) | |
Class C | | | (1,694,777 | ) | | | (663,736 | ) | |
Return of capital | |
Class I | | | (26,230 | ) | | | (163,178 | ) | |
Class A | | | (7,261 | ) | | | (48,730 | ) | |
Class C | | | (6,198 | ) | | | (25,000 | ) | |
Net decrease in net assets resulting from distributions and return of capital | | | (10,892,728 | ) | | | (6,526,623 | )1 | |
| From Capital Share Transactions (Note 6) | |
Proceeds from sale of shares | | | 188,618,647 | | | | 213,386,488 | | |
Reinvestment of dividends | | | 9,932,376 | | | | 5,843,341 | | |
Net asset value of shares redeemed | | | (108,380,424 | ) | | | (117,643,601 | ) | |
Net increase in net assets from capital share transactions | | | 90,170,599 | | | | 101,586,228 | | |
Net increase in net assets | | | 83,726,757 | | | | 106,957,576 | | |
Net Assets | |
Beginning of year | | | 182,977,109 | | | | 76,019,533 | | |
End of year | | $ | 266,703,866 | | | $ | 182,977,1092 | | |
1 Distributions include $(4,332,237), $(1,293,742) and $(663,736) from net investment income for Class I, Class A and Class C, respectively. Prior year amounts have been conformed to current year presentation.
2 Distributions in excess of net investment income as of October 31, 2017 were $(171,968).
See Accompanying Notes to Financial Statements.
36
Credit Suisse Strategic Income Fund
Financial Highlights
(For a Class I Share of the Fund Outstanding Throughout Each Year)
| | | For the Year Ended October 31, | |
| | | 2018 | | 2017 | | 2016 | | 2015 | | 2014 | |
Per share data | |
Net asset value, beginning of year | | $ | 10.24 | | | $ | 9.73 | | | $ | 9.78 | | | $ | 10.46 | | | $ | 10.65 | | |
INVESTMENT OPERATIONS | |
Net investment income1 | | | 0.51 | | | | 0.54 | | | | 0.71 | | | | 0.66 | | | | 0.64 | | |
Net gain (loss) from investments and foreign currency
related items (both realized and unrealized) | | | (0.27 | ) | | | 0.52 | | | | (0.04 | ) | | | (0.46 | ) | | | (0.06 | ) | |
Total from investment operations | | | 0.24 | | | | 1.06 | | | | 0.67 | | | | 0.20 | | | | 0.58 | | |
REDEMPTION FEES | | | — | | | | — | | | | — | | | | — | | | | 0.002 | | |
LESS DIVIDENDS AND DISTRIBUTIONS | |
Dividends from net investment income | | | (0.52 | ) | | | (0.53 | ) | | | (0.72 | ) | | | (0.60 | ) | | | (0.63 | ) | |
Distributions from net realized gains | | | — | | | | — | | | | — | | | | (0.22 | ) | | | (0.14 | ) | |
Return of capital | | | (0.00 | )2 | | | (0.02 | ) | | | — | | | | (0.06 | ) | | | — | | |
Total dividends and distributions | | | (0.52 | ) | | | (0.55 | ) | | | (0.72 | ) | | | (0.88 | ) | | | (0.77 | ) | |
Net asset value, end of year | | $ | 9.96 | | | $ | 10.24 | | | $ | 9.73 | | | $ | 9.78 | | | $ | 10.46 | | |
Total return3 | | | 2.34 | % | | | 11.11 | % | | | 7.40 | % | | | 2.05 | % | | | 5.57 | % | |
RATIOS AND SUPPLEMENTAL DATA | |
Net assets, end of year (000s omitted) | | $ | 175,189 | | | $ | 114,605 | | | $ | 60,899 | | | $ | 65,651 | | | $ | 81,868 | | |
Ratio of net expenses to average net assets | | | 0.99 | % | | | 0.99 | % | | | 1.00 | % | | | 1.00 | % | | | 1.00 | % | |
Ratio of expenses to average net assets
excluding interest expense | | | 0.99 | % | | | 0.99 | % | | | 0.99 | % | | | 0.99 | % | | | 0.99 | % | |
Ratio of net investment income to average net assets | | | 5.08 | % | | | 5.34 | % | | | 7.64 | % | | | 6.59 | % | | | 5.94 | % | |
Decrease reflected in above operating expense
ratios due to waivers/reimbursements | | | 0.17 | % | | | 0.26 | % | | | 0.29 | % | | | 0.16 | % | | | 0.18 | % | |
Portfolio turnover rate | | | 45 | % | | | 79 | % | | | 73 | % | | | 85 | % | | | 124 | % | |
1 Per share information is calculated using the average shares outstanding method.
2 This amount represents less than $0.01 or $(0.01) per share.
3 Total returns are historical and include change in share price and reinvestment of all dividends and distributions. Had certain expenses not been reduced during the periods shown, total returns would have been lower.
See Accompanying Notes to Financial Statements.
37
Credit Suisse Strategic Income Fund
Financial Highlights
(For a Class A Share of the Fund Outstanding Throughout Each Year)
| | | For the Year Ended October 31, | |
| | | 2018 | | 2017 | | 2016 | | 2015 | | 2014 | |
Per share data | |
Net asset value, beginning of year | | $ | 10.24 | | | $ | 9.74 | | | $ | 9.79 | | | $ | 10.47 | | | $ | 10.66 | | |
INVESTMENT OPERATIONS | |
Net investment income1 | | | 0.49 | | | | 0.51 | | | | 0.64 | | | | 0.55 | | | | 0.58 | | |
Net gain (loss) from investments and foreign
currency related items (both realized and unrealized) | | | (0.28 | ) | | | 0.51 | | | | 0.002 | | | | (0.38 | ) | | | (0.02 | ) | |
Total from investment operations | | | 0.21 | | | | 1.02 | | | | 0.64 | | | | 0.17 | | | | 0.56 | | |
REDEMPTION FEES | | | — | | | | — | | | | — | | | | — | | | | 0.002 | | |
LESS DIVIDENDS AND DISTRIBUTIONS | |
Dividends from net investment income | | | (0.49 | ) | | | (0.50 | ) | | | (0.69 | ) | | | (0.57 | ) | | | (0.61 | ) | |
Distributions from net realized gains | | | — | | | | — | | | | — | | | | (0.22 | ) | | | (0.14 | ) | |
Return of capital | | | (0.00 | )2 | | | (0.02 | ) | | | — | | | | (0.06 | ) | | | — | | |
Total dividends and distributions | | | (0.49 | ) | | | (0.52 | ) | | | (0.69 | ) | | | (0.85 | ) | | | (0.75 | ) | |
Net asset value, end of year | | $ | 9.96 | | | $ | 10.24 | | | $ | 9.74 | | | $ | 9.79 | | | $ | 10.47 | | |
Total return3 | | | 2.09 | % | | | 10.71 | % | | | 7.12 | % | | | 1.78 | % | | | 5.28 | % | |
RATIOS AND SUPPLEMENTAL DATA | |
Net assets, end of year (000s omitted) | | $ | 44,930 | | | $ | 36,961 | | | $ | 8,447 | | | $ | 66,244 | | | $ | 14,633 | | |
Ratio of net expenses to average net assets | | | 1.24 | % | | | 1.24 | % | | | 1.25 | % | | | 1.24 | % | | | 1.24 | % | |
Ratio of expenses to average net assets
excluding interest expense | | | 1.24 | % | | | 1.24 | % | | | 1.24 | % | | | 1.24 | % | | | 1.24 | % | |
Ratio of net investment income to average net assets | | | 4.84 | % | | | 4.99 | % | | | 6.73 | % | | | 5.45 | % | | | 5.44 | % | |
Decrease reflected in above operating expense
ratios due to waivers/reimbursements | | | 0.17 | % | | | 0.26 | % | | | 0.29 | % | | | 0.16 | % | | | 0.18 | % | |
Portfolio turnover rate | | | 45 | % | | | 79 | % | | | 73 | % | | | 85 | % | | | 124 | % | |
1 Per share information is calculated using the average shares outstanding method.
2 This amount represents less than $0.01 or $(0.01) per share.
3 Total returns are historical and include change in share price, reinvestment of all dividends and distributions and no sales charge. Had certain expenses not been reduced during the years shown, total returns would have been lower.
See Accompanying Notes to Financial Statements.
38
Credit Suisse Strategic Income Fund
Financial Highlights
(For a Class C Share of the Fund Outstanding Throughout Each Year)
| | | For the Year Ended October 31, | |
| | | 2018 | | 2017 | | 2016 | | 2015 | | 2014 | |
Per share data | |
Net asset value, beginning of year | | $ | 10.24 | | | $ | 9.74 | | | $ | 9.79 | | | $ | 10.471 | | | $ | 10.65 | | |
INVESTMENT OPERATIONS | |
Net investment income2 | | | 0.41 | | | | 0.43 | | | | 0.63 | | | | 0.55 | | | | 0.53 | | |
Net gain (loss) from investments and foreign
currency related items (both realized and unrealized) | | | (0.28 | ) | | | 0.52 | | | | (0.06 | ) | | | (0.45 | ) | | | (0.05 | ) | |
Total from investment operations | | | 0.13 | | | | 0.95 | | | | 0.57 | | | | 0.10 | | | | 0.48 | | |
REDEMPTION FEES | | | — | | | | — | | | | — | | | | — | | | | 0.003 | | |
LESS DIVIDENDS AND DISTRIBUTIONS | |
Dividends from net investment income | | | (0.41 | ) | | | (0.43 | ) | | | (0.62 | ) | | | (0.51 | ) | | | (0.52 | ) | |
Distributions from net realized gains | | | — | | | | — | | | | — | | | | (0.22 | ) | | | (0.14 | ) | |
Return of capital | | | (0.00 | )3 | | | (0.02 | ) | | | — | | | | (0.05 | ) | | | — | | |
Total dividends and distributions | | | (0.41 | ) | | | (0.45 | ) | | | (0.62 | ) | | | (0.78 | ) | | | (0.66 | ) | |
Net asset value, end of year | | $ | 9.961 | | | $ | 10.24 | | | $ | 9.74 | | | $ | 9.79 | | | $ | 10.471 | | |
Total return4 | | | 1.33 | % | | | 9.88 | % | | | 6.33 | % | | | 1.14 | % | | | 4.53 | % | |
RATIOS AND SUPPLEMENTAL DATA | |
Net assets, end of year (000s omitted) | | $ | 46,586 | | | $ | 31,411 | | | $ | 6,673 | | | $ | 3,022 | | | $ | 2,151 | | |
Ratio of net expenses to average net assets | | | 1.99 | % | | | 1.99 | % | | | 2.00 | % | | | 2.00 | % | | | 2.00 | % | |
Ratio of expenses to average net assets
excluding interest expense | | | 1.99 | % | | | 1.99 | % | | | 1.99 | % | | | 1.99 | % | | | 1.99 | % | |
Ratio of net investment income to average net assets | | | 4.09 | % | | | 4.25 | % | | | 6.70 | % | | | 5.52 | % | | | 4.97 | % | |
Decrease reflected in above operating expense
ratios due to waivers/reimbursements | | | 0.17 | % | | | 0.26 | % | | | 0.29 | % | | | 0.16 | % | | | 0.18 | % | |
Portfolio turnover rate | | | 45 | % | | | 79 | % | | | 73 | % | | | 85 | % | | | 124 | % | |
1 Includes adjustments in accordance with accounting principles generally accepted in the United States of America and as such, the net asset values for financial reporting purposes and the returns based upon net asset values may differ from the net asset values and returns for shareholder transactions.
2 Per share information is calculated using the average shares outstanding method.
3 This amount represents less than $0.01 or $(0.01) per share.
4 Total returns are historical and include change in share price, reinvestment of all dividends and distributions and no sales charge. Had certain expenses not been reduced during the years shown, total returns would have been lower.
See Accompanying Notes to Financial Statements.
39
Credit Suisse Strategic Income Fund
Notes to Financial Statements
October 31, 2018
Credit Suisse Strategic Income Fund (the "Fund"), a series of the Credit Suisse Opportunity Funds (the "Trust"), a Delaware statutory trust, is registered under the Investment Company Act of 1940, as amended (the "1940 Act"), as a non-diversified open-end management investment company that seeks total return. The Trust was organized under the laws of the State of Delaware as a business trust on May 31, 1995.
The Fund offers three classes of shares: Class I shares, Class A shares and Class C shares. Each class of shares represents an equal pro rata interest in the Fund, except the share classes bear different expenses. Class A shares are sold subject to a front-end sales charge of up to 4.75%. Class C shares are sold subject to a contingent deferred sales charge ("CDSC") of 1.00% if the shares are redeemed within the first year of purchase. Class I shares are sold without a sales charge.
Note 2. Significant Accounting Policies
The following is a summary of significant accounting policies followed by the Fund in the preparation of its financial statements. The policies are in accordance with generally accepted accounting principles in the United States of America ("GAAP"). The preparation of financial statements requires management to make estimates and assumptions that affect the reported amounts and disclosures in the financial statements. Actual results could differ from those estimates. The Fund is considered an investment company for financial reporting purposes under GAAP and follows the accounting and reporting guidance in Financial Accounting Standards Board's ("FASB") Accounting Standards Codification ("ASC") Topic 946 — Financial Services — Investment Companies.
A) SECURITY VALUATION — The Board of Trustees (the "Board") is responsible for the Fund's valuation process. The Board has delegated the supervision of the daily valuation process to Credit Suisse who has established a Pricing Committee which, pursuant to the policies adopted by the Board, is responsible for making fair valuation determinations and overseeing the Fund's pricing policies. The net asset value of the Fund is determined daily as of the close of regular trading on the New York Stock Exchange, Inc. (the "Exchange") on each day the Exchange is open for business. The valuations for fixed income securities (which may include, but are not limited to, corporate, government, municipal, mortgage-backed, collateralized mortgage obligations and asset-backed securities) and certain derivative instruments are typically the prices supplied by independent third party pricing services, which
40
Credit Suisse Strategic Income Fund
Notes to Financial Statements (continued)
October 31, 2018
Note 2. Significant Accounting Policies (continued)
may use market prices or broker/dealer quotations or a variety of valuation techniques and methodologies. The independent third party pricing services use inputs that are observable such as issuer details, interest rates, yield curves, prepayment speeds, credit risks/spreads, default rates and quoted prices for similar securities. These pricing services generally price fixed income securities assuming orderly transactions of an institutional "round lot" size, but some trades occur in smaller "odd lot" sizes which may be effected at lower prices than institutional round lot trades. Structured note agreements are valued in accordance with a dealer-supplied valuation based on changes in the value of the underlying index. Futures contracts are valued daily at the settlement price established by the board of trade or exchange on which they are traded. Forward contracts are valued at the London closing spot rates and the London closing forward point rates on a daily basis. The currency forward contract pricing model derives the differential in point rates to the expiration date of the forward and calculates its present value. Equity securities for which market quotations are available are valued at the last reported sales price or official closing price on the primary market or exchange on which they trade. The Fund may utilize a service provided by an independent third party which has been approved by the Board to fair value certain securities. When fair value pricing is employed, the prices of securities used by the Fund to calculate its net asset value may differ from quoted or published prices for the same securities. If independent third party pricing services are unable to supply prices for a portfolio investment, or if the prices supplied are deemed by the investment adviser to be unreliable, the market price may be determined by the investment adviser using quotations from one or more brokers/dealers or at the transaction price if the security has recently been purchased and no value has yet been obtained from a pricing service or pricing broker. When reliable prices are not readily available, such as when the value of a security has been significantly affected by events after the close of the exchange or market on which the security is principally traded, but before the Fund calculates its net asset value, these securities will be fair valued in good faith by the Pricing Committee, in accordance with procedures adopted by the Board.
The Fund uses valuation techniques to measure fair value that are consistent with the market approach and/or income approach, depending on the type of security and the particular circumstance. The market approach uses prices and other relevant information generated by market transactions involving identical or comparable securities. The income approach uses valuation techniques to discount estimated future cash flows to present value.
41
Credit Suisse Strategic Income Fund
Notes to Financial Statements (continued)
October 31, 2018
Note 2. Significant Accounting Policies (continued)
GAAP established a disclosure hierarchy that categorizes the inputs to valuation techniques used to value assets and liabilities at each measurement date. These inputs are summarized in the three broad levels listed below:
• Level 1 – quoted prices in active markets for identical investments
• Level 2 – other significant observable inputs (including quoted prices for similar investments, interest rates, prepayment speeds, credit risk, etc.)
• Level 3 – significant unobservable inputs (including the Fund's own assumptions in determining the fair value of investments)
The inputs or methodologies used to value securities are not necessarily an indication of the risk associated with investing in those securities.
The following is a summary of the inputs used as of October 31, 2018 in valuing the Fund's assets and liabilities carried at fair value:
Assets | | Level 1 | | Level 2 | | Level 3 | | Total | |
Investments in Securities | |
Corporate Bonds | | $ | — | | | $ | 129,562,275 | | | $ | 388,712 | (1) | | $ | 129,950,987 | (1) | |
Bank Loans | | | — | | | | 91,341,565 | | | | 14,704,079 | | | | 106,045,644 | | |
Asset Backed Securities | | | — | | | | 13,676,076 | | | | — | | | | 13,676,076 | | |
Common Stocks | | | 548,258 | | | | — | | | | 1,152,121 | (1) | | | 1,700,379 | (1) | |
| | | $ | 548,258 | | | $ | 234,579,916 | | | $ | 16,244,912 | (1) | | $ | 251,373,086 | (1) | |
Other Financial Instruments* | |
Forward Foreign Currency Contracts | | $ | — | | | $ | 45,835 | | | $ | — | | | $ | 45,835 | | |
* Other financial instruments include unrealized appreciation (depreciation) on forward foreign currency contracts.
(1) Includes zero valued securities.
The following is a reconciliation of investments as of October 31, 2018 for which significant unobservable inputs were used in determining fair value. All transfers, if any, are assumed to occur at the end of the reporting period.
| | | Corporate
Bonds | | Bank
Loans | | Asset
Backed
Securities | | Common
Stocks | | Total | |
Balance as of October 31, 2017 | | $ | 95,523 | | | $ | 17,191,487 | | | $ | 1,209,967 | | | $ | 1,008,713 | | | $ | 19,505,690 | | |
Accrued discounts (premiums) | | | 5,529 | | | | 57,311 | | | | 3,114 | | | | — | | | | 65,954 | | |
Purchases | | | 450,087 | | | | 10,829,855 | | | | 508,900 | | | | 334,710 | | | | 12,123,552 | | |
Sales | | | (154,861 | ) | | | (8,093,328 | ) | | | (768,750 | ) | | | (1,105,554 | ) | | | (10,122,493 | ) | |
Realized gain (loss) | | | (5,040 | ) | | | 21,074 | | | | 14,358 | | | | 656,315 | | | | 686,707 | | |
Change in unrealized appreciation
(depreciation) | | | (2,526 | ) | | | (627,893 | ) | | | (16,032 | ) | | | 93,408 | | | | (553,043 | ) | |
Transfers into Level 3 | | | — | | | | 108,742 | | | | — | | | | 164,529 | | | | 273,271 | | |
Transfers out of Level 3 | | | — | | | | (4,783,169 | ) | | | (951,557 | ) | | | — | | | | (5,734,726 | ) | |
Balance as of October 31, 2018 | | $ | 388,712 | (1) | | $ | 14,704,079 | | | $ | — | | | $ | 1,152,121 | (1) | | $ | 16,244,912 | (1) | |
42
Credit Suisse Strategic Income Fund
Notes to Financial Statements (continued)
October 31, 2018
Note 2. Significant Accounting Policies (continued)
| | | Corporate
Bonds | | Bank
Loans | | Asset
Backed
Securities | | Common
Stocks | | Total | |
Net change in unrealized appreciation
(depreciation) from investments still
held as of October 31, 2018 | | $ | (3,102 | ) | | $ | (493,485 | ) | | $ | — | | | $ | (29,292 | ) | | $ | (525,879 | ) | |
(1) Includes zero valued securities.
| | Quantitative Disclosure About Significant Unobservable Inputs | |
Asset Class | | Fair Value
At 10/31/2018 | | Valuation
Technique | | Unobservable
Input | | Range
(Weighted Average
per share) | |
Corporate
Bonds | | $ | 1,882
| | | Income Approach
| | Expected Remaining
Distribution | | $ | 0.00 – $0.04 | ($0.00) | |
| | $ | 386,830 | | | Vendor Pricing | | Single Broker Quote | | N/A | |
Bank Loans | | $ | 155,700 | | | Market Approach | | EBITDA Multiples | | N/A | |
| | $ | 271,442
| | | Market Approach
| | Discount for Illiquidity
and EBITDA Multiples | | N/A | |
| | $ | 14,276,937 | | | Vendor Pricing | | Single Broker Quote | | $ | 0.34 – $1.01 | ($0.95) | |
Common
Stocks | | $ | 240,663
| | | Market Approach/
Income Approach | | Comparable Bond Price,
Discounted Cash Flows | | $ | 0.01 – $82.00 | ($78.95) | |
| | $ | 164,529 | | | Market Approach | | Discount for Illiquidity | | N/A | |
| | $ | 6
| | | Market Approach
| | Discount for Illiquidity
and EBITDA Multiples | | N/A | |
| | $ | 3,299 | | | Market Approach | | Enterprise Value | | N/A | |
| | $ | 743,624 | | | Vendor Pricing | | Single Broker Quote | | $ | 7.00 – $21.00 | ($12.35) | |
Each fair value determination is based on a consideration of relevant factors, including both observable and unobservable inputs. Observable and unobservable inputs that Credit Suisse Asset Management, LLC, the Fund's investment adviser ("Credit Suisse" or the "Adviser") considers may include (i) the existence of any contractual restrictions on the disposition of securities; (ii) information obtained from the company, which may include an analysis of the company's financial statements, the company's products or intended markets or the company's technologies; (iii) the price of the same or similar security negotiated at arm's length in an issuer's completed subsequent round of financing; (iv) the price and extent of public trading in similar securities of the issuer or of comparable companies; or (v) a probability and time value adjusted analysis of contractual term. Where available and appropriate, multiple valuation methodologies are applied to confirm fair value. To the extent that valuation is based on models or inputs that are less observable or unobservable in the market, determining fair value requires more judgment. Because of the inherent uncertainty of valuation, those estimated values may be materially higher or lower than the values that would have been used had a ready market for the investments existed. Accordingly, the degree of judgment exercised by the Fund in determining fair value is greatest for
43
Credit Suisse Strategic Income Fund
Notes to Financial Statements (continued)
October 31, 2018
Note 2. Significant Accounting Policies (continued)
investments categorized in Level 3. In some circumstances, the inputs used to measure fair value might be categorized within different levels of the fair value hierarchy. In those instances, the fair value measurement is categorized in its entirety in the fair value hierarchy based on the least observable input that is significant to the fair value measurement. Additionally, changes in the market environment and other events that may occur over the life of the investments may cause the gains or losses ultimately realized on these investments to be different from the valuations used at the date of these financial statements.
For the year ended October 31, 2018, there were no transfers between Level 1 and Level 2, but there was $273,271 transferred from Level 2 to Level 3 due to a lack of a pricing source supported by observable inputs and $5,734,726 transferred from Level 3 to Level 2 as a result of the availability of a pricing source supported by observable inputs. All transfers, if any, are assumed to occur at the end of the reporting period.
B) DERIVATIVE INSTRUMENTS AND HEDGING ACTIVITIES — The Fund adopted amendments to authoritative guidance on disclosures about derivative instruments and hedging activities which require that a fund disclose (a) how and why an entity uses derivative instruments, (b) how derivative instruments and hedging activities are accounted for and (c) how derivative instruments and related hedging activities affect a fund's financial position, financial performance and cash flows. For the year ended October 31, 2018, the Fund's derivatives did not qualify for hedge accounting as they are held at fair value.
The following table presents the fair value and the location of derivatives within the Statement of Assets and Liabilities at October 31, 2018 and the effect of these derivatives on the Statement of Operations for the year ended October 31, 2018.
Primary Underlying Risk | | Derivative
Assets | | Derivative
Liabilities | | Realized
Gain (Loss) | | Change in Unrealized
Appreciation (Depreciation) | |
Foreign currency exchange rate | |
Forward contracts | | $ | 45,835 | | | $ | — | | | $ | 14,609 | | | $ | 12,466 | | |
For the year ended October 31, 2018, the Fund held an average monthly value on a net basis of $5,688,828 in forward foreign currency contracts.
The Fund is a party to International Swap and Derivatives Association, Inc. ("ISDA") Master Agreements ("Master Agreements") with certain counterparties that govern over-the-counter derivative (including Total Return, Credit Default and Interest Rate Swaps) and foreign exchange contracts entered into by the Fund. The Master Agreements may contain provisions regarding,
44
Credit Suisse Strategic Income Fund
Notes to Financial Statements (continued)
October 31, 2018
Note 2. Significant Accounting Policies (continued)
among other things, the parties' general obligations, representations, agreements, collateral requirements, events of default and early termination. Termination events applicable to the Fund may occur upon a decline in the Fund's net assets below a specified threshold over a certain period of time.
The following table presents by counterparty the Fund's derivative assets, net of related collateral held by the Fund, at October 31, 2018:
Counterparty | | Gross Amount of
Presented in
Statement of Assets
and Liabilities(a) | | Instruments
and Derivatives
Available for Offset | | Non-Cash
Collateral
Received | | Derivative Assets
Cash
Collateral
Received | | Financial
Net Amount
of Derivative
Assets | |
Morgan Stanley | | $ | 45,835 | | | $ | — | | | $ | — | | | $ | — | | | $ | 45,835 | | |
(a) Forward foreign currency contracts are included.
C) FOREIGN CURRENCY TRANSACTIONS — The books and records of the Fund are maintained in U.S. dollars. Transactions denominated in foreign currencies are recorded at the current prevailing exchange rates. All assets and liabilities denominated in foreign currencies, including purchases and sales of investments, and income and expenses, are translated into US dollar amounts on the date of those transactions.
Reported net realized gain (loss) from foreign currency transactions arises from sales of foreign currencies; currency gains or losses realized between the trade and settlement dates on securities transactions; and the difference between the amounts of dividends, interest, and foreign withholding taxes recorded on the Fund's books and the U.S. dollar equivalent of the amounts actually received or paid. Net change in unrealized gains and losses on translation of assets and liabilities denominated in foreign currencies arises from changes in the fair values of assets and liabilities, other than investments, at the end of the period, resulting from changes in exchange rates.
The Fund does not isolate that portion of the results of operations resulting from fluctuations in foreign exchange rates on investments from the fluctuations arising from changes in market prices of investments held. Such fluctuations are included with net realized and unrealized gain or loss from investments in the Statement of Operations.
D) SECURITY TRANSACTIONS AND INVESTMENT INCOME/EXPENSE — Security transactions are accounted for on a trade date basis. Interest income/expense is recorded on the accrual basis. The Fund amortizes premiums and accretes discounts using the effective interest method. Dividend income/expense is recorded on the ex-dividend date. Certain expenses are
45
Credit Suisse Strategic Income Fund
Notes to Financial Statements (continued)
October 31, 2018
Note 2. Significant Accounting Policies (continued)
class-specific expenses, vary by class and are charged only to that class. Income, expenses (excluding class-specific expenses) and realized/unrealized gains/losses are allocated proportionately to each class of shares based upon the relative net asset value of the outstanding shares of that class. The cost of investments sold is determined by use of the specific identification method for both financial reporting and income tax purposes. To the extent any issuer defaults or a credit event occurs that impacts the issuer, the Fund may halt any additional interest income accruals and consider the realizability of interest accrued up to the date of default or credit event.
E) DIVIDENDS AND DISTRIBUTIONS TO SHAREHOLDERS — Dividends from net investment income, if any, are declared daily and paid monthly. Distributions of net realized capital gains, if any, are declared and paid at least annually. However, to the extent that a net realized capital gain can be reduced by a capital loss carryforward, such gain will not be distributed. Dividends and distributions to shareholders of the Fund are recorded on the ex-dividend date and are determined in accordance with federal income tax regulations, which may differ from GAAP.
F) FEDERAL AND OTHER TAXES — No provision is made for federal taxes as it is the Fund's intention to continue to qualify as a regulated investment company ("RIC") under the Internal Revenue Code of 1986, as amended (the "Code"), and to make the requisite distributions to its shareholders, which will be sufficient to relieve it from federal income and excise taxes.
In order to qualify as a RIC under the Code, the Fund must meet certain requirements regarding the source of its income, the diversification of its assets and the distribution of its income. One of these requirements is that the Fund derive at least 90% of its gross income for each taxable year from dividends, interest, payments with respect to certain securities loans, gains from the sale or other disposition of stock, securities or foreign currencies, other income derived with respect to its business of investing in such stock, securities or currencies or net income derived from interests in certain publicly-traded partnerships ("Qualifying Income"). The Fund adopted the authoritative guidance for uncertainty in income taxes and recognizes a tax benefit or liability from an uncertain position only if it is more likely than not that the position is sustainable based solely on its technical merits and consideration of the relevant taxing authority's widely understood administrative practices and procedures. The Fund has reviewed its current tax positions and has determined that no provision for income tax is required in the Fund's financial statements. The Fund's federal and state income and federal excise tax returns for tax years for which the applicable statutes of limitations have not expired
46
Credit Suisse Strategic Income Fund
Notes to Financial Statements (continued)
October 31, 2018
Note 2. Significant Accounting Policies (continued)
are subject to examination by the Internal Revenue Service and state departments of revenue.
G) CASH — The Fund's uninvested cash balance is held in an interest bearing variable rate demand deposit account at State Street Bank and Trust Company ("SSB"), the Fund's custodian.
H) FUTURES — The Fund may enter into futures contracts to the extent permitted by its investment policies and objectives. The Fund may use futures contracts to gain exposure to or hedge against changes in interest rates, equity and market price movements and/or currency risks. Upon entering into a futures contract, the Fund is required to deposit cash and/or pledge U.S. Government securities as initial margin with a Futures Commission Merchant ("FCM"). Subsequent payments, which are dependent on the daily fluctuations in the value of the underlying instrument, are made or received by the Fund each day (daily variation margin) and are recorded as unrealized gains or losses until the contracts are closed. When the contracts are closed, the Fund records a realized gain or loss equal to the difference between the proceeds from (or cost of) the closing transaction and the Fund's basis in the contract. Risks of entering into futures contracts for hedging purposes include the possibility that a change in the value of the contract may not correlate with the changes in the value of the underlying instruments. Futures have minimal counterparty credit risk because futures are exchange traded and the exchange's clearinghouse, as counterparty to all exchange-traded futures, guarantees the futures against default. In addition, the purchase of a futures contract involves the risk that the Fund could lose more than the original margin deposit and subsequent payments may be required for a futures transaction. The Fund's open futures contracts are disclosed in the Schedule of Investments. At October 31, 2018, the Fund had no open futures contracts.
The Commodity Exchange Act requires an FCM to segregate all customer transactions and assets from the FCM's proprietary activities. A customer's cash and other equity deposited with an FCM are considered commingled with all other customer funds subject to the FCM's segregation requirements. In the event of an FCM's insolvency, recovery may be limited to the Fund's pro-rata share of segregated customer funds available. It is possible that the recovery amount could be less than the total of cash and other equity deposited.
I) FORWARD FOREIGN CURRENCY CONTRACTS — A forward foreign currency exchange contract ("forward currency contract") is a commitment to purchase or sell a foreign currency at the settlement date at a negotiated rate. The Fund will enter into forward currency contracts primarily for hedging
47
Credit Suisse Strategic Income Fund
Notes to Financial Statements (continued)
October 31, 2018
Note 2. Significant Accounting Policies (continued)
foreign currency risk. Forward currency contracts are valued at the prevailing forward exchange rate of the underlying currencies and unrealized gain/loss is recorded daily. On the settlement date of the forward currency contract, the Fund records a realized gain or loss equal to the difference between the value of the contract at the time it was opened and the value of the contract at the time it was closed. Certain risks may arise upon entering into forward currency contracts from the potential inability of counterparties to meet the terms of their contracts. The maximum counterparty credit risk to the Fund is measured by the unrealized gain on appreciated contracts. Additionally, when utilizing forward currency contracts to hedge, the Fund forgoes the opportunity to profit from favorable exchange rate movements during the term of the contract. The Fund's open forward currency contracts at October 31, 2018 are disclosed in the Schedule of Investments.
J) UNFUNDED LOAN COMMITMENTS — The Fund enters into certain agreements, all or a portion of which may be unfunded. The Fund is obligated to fund these loan commitments at the borrowers' discretion. Funded and unfunded portions of credit agreements are presented on the Statement of Investments. As of October 31, 2018, unfunded commitments were as follows:
| Borrower | | Maturity | | Rate | | Unfunded
Commitment | |
| Bulldog Purchaser, Inc. | | 08/22/25 | | | 1.875 | | | $ | 433,528 | | |
Unfunded loan commitments and funded portions of credit agreements are marked to market daily and any unrealized appreciation or depreciation is included in the Statement of Assets and Liabilities and the Statement of Operations.
K) SECURITIES LENDING — The initial collateral received by the Fund is required to have a value of at least 102% of the market value of domestic securities on loan (including any accrued interest thereon) and 105% of the market value of foreign securities on loan (including any accrued interest thereon). The collateral is maintained thereafter at a value equal to at least 102% of the current market value of the securities on loan. The market value of loaned securities is determined at the close of each business day of the Fund and any additional required collateral is delivered to the Fund, or excess collateral returned by the Fund, on the next business day. Cash collateral received by the Fund in connection with securities lending activity may be pooled together with cash collateral for other funds/portfolios advised by Credit Suisse and may be invested in a variety of investments, including funds advised by SSB, the Fund's securities lending agent, or money market instruments. However, in the event of default or bankruptcy by the other party
48
Credit Suisse Strategic Income Fund
Notes to Financial Statements (continued)
October 31, 2018
Note 2. Significant Accounting Policies (continued)
to the agreement, realization and/or retention of the collateral may be subject to legal proceedings.
SSB has been engaged by the Fund to act as the Fund's securities lending agent. The Fund's securities lending arrangement provides that the Fund and SSB will share the net income earned from securities lending activities. Securities lending income is accrued as earned. At October 31, 2018 and during the year ended October 31, 2018, there were no securities out on loan.
L) OTHER — The high yield, fixed income securities in which the Fund invests will primarily consist of senior secured floating rate loans ("Senior Loans") issued by non-investment grade companies. Senior Loans are typically secured by specific collateral of the issuer and hold the most senior position in the issuer's capital structure. The interest rate on Senior Loans is periodically adjusted to a recognized base rate, typically the London Interbank Offered Rate ("LIBOR"). While these characteristics may reduce interest rate risk and mitigate losses in the event of borrower default, the Senior Loans in which the Fund invests have below investment grade credit ratings and thereby are considered speculative because of the significant credit risk of their issuers.
Lower-rated debt securities (commonly known as "junk bonds") possess speculative characteristics and are subject to greater market fluctuations and risk of lost income and principal than higher-rated debt securities for a variety of reasons. Also, during an economic downturn or substantial period of rising interest rates, highly leveraged issuers may experience financial stress which would adversely affect their ability to service their principal and interest payment obligations, to meet projected business goals and to obtain additional financing.
In addition, periods of economic uncertainty and changes can be expected to result in increased volatility of market prices of lower-rated debt securities and the Fund's net asset value.
M) RECENT ACCOUNTING PRONOUNCEMENTS — In March 2017, the FASB issued Accounting Standards Update 2017-08, Receivables — Nonrefundable Fees and Other Costs (Subtopic 310-20): Premium Amortization On Purchased Callable Debt Securities ("ASU 2017-08"). The update shortens the amortization period for the premium on certain purchased callable debt securities to the earliest call date. ASU 2017-08 will be effective for annual periods beginning after December 15, 2018. Management is currently assessing the potential impact of these changes to future financial statements.
49
Credit Suisse Strategic Income Fund
Notes to Financial Statements (continued)
October 31, 2018
Note 2. Significant Accounting Policies (continued)
Also, in August 2018, the FASB issued Accounting Standards Update 2018-13, Fair Value Measurement (Topic 820): Disclosure Framework — Changes to the Disclosure Requirements for Fair Value Measurement ("ASU 2018-13"). The update provides guidance that eliminates, adds and modifies certain disclosure requirements for fair value measurements. ASU 2018-13 will be effective for annual periods beginning after December 15, 2019. Management is currently assessing the potential impact of these changes to future financial statements.
N) SUBSEQUENT EVENTS — In preparing the financial statements as of October 31, 2018, management considered the impact of subsequent events for potential recognition or disclosure in these financial statements through the date of release of this report. No such events requiring recognition or disclosure were identified through the date of the release of this report.
Note 3. Transactions with Affiliates and Related Parties
Credit Suisse serves as investment adviser and co-administrator for the Fund. For its investment advisory and administration services, Credit Suisse is entitled to receive a fee from the Fund at an annual rate of 0.84% of the Fund's average daily net assets. For the year ended October 31, 2018, investment advisory and administration fees earned and fees waived/expenses reimbursed by Credit Suisse were $1,888,373 and $375,920, respectively. The Fund is authorized to reimburse Credit Suisse for management fees previously limited and/or for expenses previously reimbursed by Credit Suisse through February 28, 2018, provided, however, that any reimbursements must be paid at a date not more than three years after the end of the fiscal year during which such fees were limited or expenses were reimbursed by Credit Suisse and the reimbursements do not cause the Fund to exceed the applicable expense limitation at the time the fees are recouped.
The amounts waived and reimbursed by Credit Suisse, which are available for potential future recoupment by Credit Suisse, and the expiration schedule at October 31, 2018 are as follows:
| | | Fee waivers/ expense
reimbursements
subject to
recoupment | | Expires
October 31,
2019 | | Expires
October 31,
2020 | | Expires
October 31,
2021 | |
Class I | | $ | 452,866 | | | $ | 175,395 | | | $ | 219,725 | | | $ | 57,746 | | |
Class A | | | 146,739 | | | | 57,872 | | | | 70,189 | | | | 18,678 | | |
Class C | | | 74,348 | | | | 14,172 | | | | 42,606 | | | | 17,570 | | |
Totals | | $ | 673,953 | | | $ | 247,439 | | | $ | 332,520 | | | $ | 93,994 | | |
50
Credit Suisse Strategic Income Fund
Notes to Financial Statements (continued)
October 31, 2018
Note 3. Transactions with Affiliates and Related Parties (continued)
Credit Suisse Asset Management Limited ("Credit Suisse U.K."), an affiliate of Credit Suisse, serves as sub-investment advisor to the Fund directly. Credit Suisse U.K.'s sub-investment advisor fees are paid by Credit Suisse.
For its co-administrative services, SSB receives a fee, exclusive of out-of-pocket expenses, calculated in total for all the Credit Suisse funds/portfolios co-administered by SSB and allocated based upon the relative average net assets of each fund/portfolio, subject to an annual minimum fee. For the year ended October 31, 2018, co-administrative services fees earned by SSB (including out-of-pocket expenses) with respect to the Fund were $77,239.
Credit Suisse Securities (USA) LLC ("CSSU"), an affiliate of Credit Suisse, serves as the distributor of the Fund's shares. Pursuant to a distribution plan adopted by the Fund pursuant to Rule 12b-1 under the 1940 Act, CSSU receives fees for its distribution services. These fees are calculated at an annual rate of 0.25% of the average daily net assets of the Class A shares. For the Class C shares, the fee is calculated at an annual rate of 1.00% of the average daily net assets. For the year ended October 31, 2018, the Fund paid Rule 12b-1 distribution fees of $103,125 for Class A shares and $416,262 for Class C shares. Class I shares are not subject to Rule 12b-1 distribution fees.
Certain brokers, dealers and financial representatives provide transfer agent-related services to the Fund and receive compensation from the Fund. For the year ended October 31, 2018, the Fund paid $63,383 which is included within transfer agent fees in the Statement of Operations.
For the year ended October 31, 2018, CSSU and its affiliates advised the Fund that they retained $30,109 from commissions earned on the sale of the Fund's Class A shares. There were no commissions earned on the sale of Class C shares.
The Fund from time to time purchases or sells loan investments in the secondary market through Credit Suisse or its affiliates acting in the capacity as broker-dealer. Credit Suisse or its affiliates may have acted in some type of agent capacity to the initial loan offering prior to such loan trading in the secondary market.
Note 4. Line of Credit
The Fund, together with other funds/portfolios advised by Credit Suisse (collectively, the "Participating Funds"), participates in a committed, unsecured line of credit facility ("Credit Facility"), with SSB in an aggregated amount of $250 million for temporary or emergency purposes under a first-come, first-served basis. Under the terms of the Credit Facility, the Participating Funds
51
Credit Suisse Strategic Income Fund
Notes to Financial Statements (continued)
October 31, 2018
Note 4. Line of Credit (continued)
pay an aggregate commitment fee on the average unused amount of the Credit Facility, which is allocated among the Participating Funds in such manner as is determined by the governing Boards of the Participating Funds. In addition, the Participating Funds pay interest on borrowings at either the Overnight Federal Funds rate or the Overnight LIBOR rate plus a spread. At October 31, 2018 and during the year ended October 31, 2018, the Fund had no borrowings outstanding under the Credit Facility. Additionally, the Fund is party to a joint uncommitted line of credit facility with SSB. For the year ended October 31, 2018, the line was not drawn upon and no fees were incurred.
Note 5. Purchases and Sales of Securities
For the year ended October 31, 2018, purchases and sales of investment securities (excluding short-term investments) were $183,484,953 and $95,137,400, respectively.
Note 6. Capital Share Transactions
The Fund is authorized to issue an unlimited number of full and fractional shares of beneficial interest, $.001 par value per share. The Fund offers Class I, Class A and Class C shares. Transactions in capital shares for each class of the Fund were as follows:
| | | Class I | |
| | | For the Year Ended
October 31, 2018 | | For the Year Ended
October 31, 2017 | |
| | | Shares | | Value | | Shares | | Value | |
Shares sold | | | 14,377,206 | | | $ | 145,493,006 | | | | 12,420,495 | | | $ | 125,853,292 | | |
Shares issued in reinvestment
of dividends | | | 661,315 | | | | 6,680,270 | | | | 405,783 | | | | 4,109,313 | | |
Shares redeemed | | | (8,640,791 | ) | | | (87,482,417 | ) | | | (7,888,320 | ) | | | (79,946,718 | ) | |
Net increase | | | 6,397,730 | | | $ | 64,690,859 | | | | 4,937,958 | | | $ | 50,015,887 | | |
| | | Class A | |
| | | For the Year Ended
October 31, 2018 | | For the Year Ended
October 31, 2017 | |
| | | Shares | | Value | | Shares | | Value | |
Shares sold | | | 2,132,305 | | | $ | 21,599,295 | | | | 6,093,233 | | | $ | 61,324,363 | | |
Shares issued in reinvestment
of dividends | | | 169,722 | | | | 1,715,488 | | | | 110,880 | | | | 1,125,565 | | |
Shares redeemed | | | (1,400,877 | ) | | | (14,184,386 | ) | | | (3,462,221 | ) | | | (35,072,341 | ) | |
Net increase | | | 901,150 | | | $ | 9,130,397 | | | | 2,741,892 | | | $ | 27,377,587 | | |
52
Credit Suisse Strategic Income Fund
Notes to Financial Statements (continued)
October 31, 2018
Note 6. Capital Share Transactions (continued)
| | | Class C | |
| | | For the Year Ended
October 31, 2018 | | For the Year Ended
October 31, 2017 | |
| | | Shares | | Value | | Shares | | Value | |
Shares sold | | | 2,121,083 | | | $ | 21,526,346 | | | | 2,582,010 | | | $ | 26,208,833 | | |
Shares issued in reinvestment
of dividends | | | 151,999 | | | | 1,536,618 | | | | 59,874 | | | | 608,463 | | |
Shares redeemed | | | (664,145 | ) | | | (6,713,621 | ) | | | (260,694 | ) | | | (2,624,542 | ) | |
Net increase | | | 1,608,937 | | | $ | 16,349,343 | | | | 2,381,190 | | | $ | 24,192,754 | | |
On October 31, 2018, the number of shareholders that held 5% or more of the outstanding shares of each class of the Fund was as follows:
| | | Number of
Shareholders | | Approximate Percentage
of Outstanding Shares | |
Class I | | | 3 | | | | 73 | % | |
Class A | | | 5 | | | | 68 | % | |
Class C | | | 3 | | | | 88 | % | |
The Fund's performance may be negatively impacted in the event one or more of the Fund's greater than 5% shareholders were to redeem at a given time. Some of the shareholders may be omnibus accounts, which hold shares on behalf of individual shareholders.
Note 7. Income Tax Information and Distributions to Shareholders
Income and capital gain distributions are determined in accordance with federal income tax regulations, which may differ from GAAP.
The tax character of dividends paid by the Fund during the years ended October 31, 2018 and 2017, respectively, was as follows:
| Ordinary Income | | Return of Capital | |
| 2018 | | 2017 | | 2018 | | 2017 | |
| $ | 10,853,039 | | | $ | 6,289,715 | | | $ | 39,689 | | | $ | 236,908 | | |
The tax basis components of distributable earnings differ from the amounts reflected in the Statement of Assets and Liabilities by temporary book/tax differences. These differences are primarily due to differing treatments of dividends payable, wash sales, forwards and deferred organizational expenses. At October 31, 2018, the components of distributable earnings on a tax basis were as follows:
Accumulated net realized loss | | $ | (7,184,535 | ) | |
Unrealized depreciation | | | (5,951,719 | ) | |
| | $ | (13,136,254 | ) | |
53
Credit Suisse Strategic Income Fund
Notes to Financial Statements (continued)
October 31, 2018
Note 7. Income Tax Information and Distributions to Shareholders (continued)
At October 31, 2018, the Fund had $1,312,974 of unlimited short-term capital loss carryforwards and $5,871,561 of unlimited long-term capital loss carryforwards available to offset possible future capital gains.
At October 31, 2018, the cost and net unrealized appreciation (depreciation) of investments and derivatives for income tax purposes were as follows:
Cost of Investments | | $ | 257,347,747 | | |
Unrealized appreciation | | $ | 1,694,481 | | |
Unrealized depreciation | | | (7,623,307 | ) | |
Net unrealized appreciation (depreciation) | | $ | (5,928,826 | ) | |
Note 8. Contingencies
In the normal course of business, the Fund may provide general indemnifications pursuant to certain contracts and organizational documents. The Fund's maximum exposure under these arrangements is dependent on future claims that may be made against the Fund and, therefore, cannot be estimated; however, based on experience, the risk of loss from such claims is considered remote.
54
Credit Suisse Strategic Income Fund
Report of Independent Registered Public Accounting Firm
To the Board of Trustees and Shareholders
Credit Suisse Strategic Income Fund:
Opinion on the Financial Statements
We have audited the accompanying statement of assets and liabilities of Credit Suisse Strategic Income Fund (the "Fund"), a series of the Credit Suisse Opportunity Funds, including the schedule of investments, as of October 31, 2018, and the related statement of operations for the year then ended, the statements of changes in net assets for each of the years in the two-year period then ended, and the related notes (collectively, the "financial statements") and the financial highlights for each of the years in the four-year period then ended. In our opinion, the financial statements and financial highlights present fairly, in all material respects, the financial position of Credit Suisse Strategic Income Fund as of October 31, 2018, the results of its operations for the year then ended, the changes in its net assets for each of the years in the two-year period then ended, and the financial highlights for each of the years in the four-year period then ended, in conformity with U.S. generally accepted accounting principles. The financial highlights for the year ended October 31, 2014 were audited by other independent registered public accountants whose report, dated December 29, 2014, expressed an unqualified opinion on those financial highlights.
Basis for Opinion
These financial statements and financial highlights are the responsibility of the Fund's management. Our responsibility is to express an opinion on these financial statements and financial highlights based on our audits. We are a public accounting firm registered with the Public Company Accounting Oversight Board (United States) (PCAOB) and are required to be independent with respect to the Fund in accordance with the U.S. federal securities laws and the applicable rules and regulations of the Securities and Exchange Commission and the PCAOB.
We conducted our audits in accordance with the standards of the PCAOB. Those standards require that we plan and perform the audit to obtain reasonable assurance about whether the financial statements and financial highlights are free of material misstatement, whether due to error or fraud. Our audits included performing procedures to assess the risks of material misstatement of the financial statements and financial highlights, whether due to error or fraud, and performing procedures that respond to those risks. Such procedures included examining, on a test basis, evidence regarding the amounts and disclosures in the financial statements and financial highlights. Such procedures also included confirmation of securities owned as of October 31, 2018, by correspondence with the custodian and brokers or by other appropriate auditing procedures. Our
55
Credit Suisse Strategic Income Fund
Report of Independent Registered Public Accounting Firm (continued)
audits also included evaluating the accounting principles used and significant estimates made by management, as well as evaluating the overall presentation of the financial statements and financial highlights. We believe that our audits provide a reasonable basis for our opinion.

We have served as the auditor of one or more Credit Suisse Asset Management, LLC investment companies since 2015.
New York, New York
December 28, 2018
56
Credit Suisse Strategic Income Fund
Information Concerning Trustees and Officers (unaudited)
Name, Address
(Year of Birth) | | Position(s)
Held with
Fund | | Term
of Office1
and
Length
of Time
Served | | Principal
Occupation(s) During
Past Five Years | | Number of
Portfolios
in Fund
Complex
Overseen
by Trustee | | Other
Trusteeships
Held by Trustee
During Past Five Years | |
Independent Trustees | | | | | | | | | | | |
Laura A. DeFelice
c/o Credit Suisse Asset
Management, LLC
Attn: General Counsel
Eleven Madison Avenue
New York, New York
10010
(1959) | | Trustee, Nominating and Audit Committee member | | Since 2017 | | Partner of Acacia Properties LLC (multi-family and commercial real estate ownership and operation) from 2008 to present; Stonegate Advisors LLC (renewable energy and energy efficiency) from 2007 to present. | | | 8 | | | None. | |
Jeffrey E. Garten
c/o Credit Suisse Asset Management, LLC Attn: General Counsel Eleven Madison Avenue New York, New York 10010
(1946) | | Trustee, Nominating and Audit Committee member | | Since Fund Inception | | Dean Emeritus of Yale School of Management from July 2015 to present; The Juan Trippe Professor in the Practice of International Trade, Finance and Business, from July 2005 to July 2015; Partner and Chairman of Garten Rothkopf (consulting firm) from October 2005 to June 2017. | | | 8 | | | Director of Aetna, Inc. (insurance company); Director of CarMax Group (used car dealers); Director of Miller Buckfire & Co., LLC (financial restructuring); Member of Standard & Poor's Board of Managers (credit rating agency) from December 2011 to November 2014. | |
1 Subject to the Trust's retirement policy, each Trustee may continue to serve as a Trustee until the last day of the calendar year in which the applicable Trustee attains age 75. Officer serves until his or her respective successor has been duly elected and qualified.
57
Credit Suisse Strategic Income Fund
Information Concerning Trustees and Officers (unaudited) (continued)
Name, Address
(Year of Birth) | | Position(s)
Held with
Fund | | Term
of Office1
and
Length
of Time
Served | | Principal
Occupation(s) During
Past Five Years | | Number of
Portfolios
in Fund
Complex
Overseen
by Trustee | | Other
Trusteeships
Held by Trustee
During Past Five Years | |
Independent Trustees | | | | | | | | | | | |
Mahendra R. Gupta
c/o Credit Suisse Asset
Management, LLC
Attn: General Counsel
Eleven Madison Avenue
New York, New York
10010
(1956) | | Trustee, Nominating Committee member and Audit Committee Chairman | | Since 2017 | | Professor, Washington University in St. Louis from July 1990 to present; Dean of Olin Business School at Washington University in St. Louis from July 2005 to July 2016; Partner, R.J. Mithaiwala (food manufacturing and retail, India) from March 1977 to present; Partner, F.F.B. Corporation (agriculture, India) from March 1977 to present; Partner, RPMG Research Corporation (benchmark research) from July 2001 to present. | | | 8 | | | Director of Caleres Inc. (footwear) from May 2012 to present; Director of Koch Development Corporation (real estate development) from November 2017 to present; Director of Supernova (fin-tech) from June 2014 to present. | |
1 Subject to the Trust's retirement policy, each Trustee may continue to serve as a Trustee until the last day of the calendar year in which the applicable Trustee attains age 75. Officer serves until his or her respective successor has been duly elected and qualified.
58
Credit Suisse Strategic Income Fund
Information Concerning Trustees and Officers (unaudited) (continued)
Name, Address
(Year of Birth) | | Position(s)
Held with
Fund | | Term
of Office1
and
Length
of Time
Served | | Principal
Occupation(s) During
Past Five Years | | Number of
Portfolios
in Fund
Complex
Overseen
by Trustee | | Other
Trusteeships
Held by Trustee
During Past Five Years | |
Independent Trustees | | | | | | | | | | | |
Steven N. Rappaport
Lehigh Court, LLC
555 Madison Avenue
29th Floor
New York, New York
10022
(1948) | | Chairman of the Board, Nominating Committee Chairman and Audit Committee member | | Trustee since Fund Inception and Chairman since 2005 | | Partner of Lehigh Court, LLC and RZ Capital (private investment firms) from July 2002 to present; Partner of Backstage Acquisition Holdings, LLC (publication job postings) from November 2013 to present. | | | 9 | | | Director of iCAD, Inc. (surgical and medical instruments and apparatus company); Director of Aberdeen Emerging Markets Equity Income Fund, Inc., (a closed-end investment company); Director of Aberdeen Funds (30 open-end portfolios); Director of Wood Resources, LLC (plywood manufacturing company) from 2003 to October 2013. | |
1 Subject to the Trust's retirement policy, each Trustee may continue to serve as a Trustee until the last day of the calendar year in which the applicable Trustee attains age 75. Officer serves until his or her respective successor has been duly elected and qualified.
59
Credit Suisse Strategic Income Fund
Information Concerning Trustees and Officers (unaudited) (continued)
Name, Address
(Year of Birth) | | Position(s)
Held with
Fund | | Term
of Office1
and
Length
of Time
Served | | Principal
Occupation(s) During
Past Five Years | | Number of
Portfolios
in Fund
Complex
Overseen
by Trustee | | Other
Trusteeships
Held by Trustee
During Past Five Years | |
Interested Trustee | | | | | | | | | | | |
John G. Popp2
Credit Suisse Asset
Management, LLC
Eleven Madison Avenue
New York, New York
10010
(1956) | | Trustee, Chief Executive Officer and President | | Trustee since 2017
Chief Executive Officer and President since 2010 | | Managing Director of Credit Suisse; Global Head and Chief Investment Officer of the Credit Investments Group; Associated with Credit Suisse or its predecessor since 1997; President and Chief Executive Officer of other Credit Suisse Funds. | | | 9 | | | None. | |
1 Subject to the Trust's retirement policy, each Trustee may continue to serve as a Trustee until the last day of the calendar year in which the applicable Trustee attains age 75. Officer serves until his or her respective successor has been duly elected and qualified.
2 Mr. Popp is an "interested person" of the Trust, as defined in the 1940 Act, by virtue of his current position as an officer of Credit Suisse.
60
Credit Suisse Strategic Income Fund
Information Concerning Trustees and Officers (unaudited) (continued)
Name, Address
(Year of Birth) | | Position(s)
Held with
Fund | | Term of
Office1
and
Length of
Time
Served | | Principal Occupation(s) During Past Five Years | |
Officers* | | | | | | | |
Emidio Morizio
Credit Suisse Asset
Management, LLC
Eleven Madison Avenue
New York, New York 10010
(1966) | | Chief Compliance Officer | | Since Fund Inception | | Managing Director and Global Head of Compliance of Credit Suisse since 2010; Associated with Credit Suisse since July 2000; Officer of other Credit Suisse Funds. | |
Lou Anne McInnis
Credit Suisse Asset Management, LLC
Eleven Madison Avenue
New York, New York 10010
(1959) | | Chief Legal Officer | | Since 2015 | | Director of Credit Suisse; Associated with Credit Suisse since April 2015; Counsel at DLA Piper US LLP from 2011 to April 2015; Associated with Morgan Stanley Investment Management from 1997 to 2010; Officer of other Credit Suisse Funds. | |
Laurie Pecha
Credit Suisse Asset
Management, LLC
Eleven Madison Avenue
New York, New York 10010
(1961) | | Chief Financial Officer and Treasurer | | Chief Financial Officer since 2016 and Treasurer since 2018 | | Director of Credit Suisse since August 2016; Senior Consultant of Spectra Professional Services, LLC from January 2012 to July 2016; Vice President of Legg Mason & Co. from March 2007 to December 2011; Officer of other Credit Suisse Funds. | |
Karen Regan
Credit Suisse Asset
Management, LLC
Eleven Madison Avenue
New York, New York 10010
(1963) | | Vice President and Secretary | | Since 2010 | | Vice President of Credit Suisse; Associated with Credit Suisse since December 2004; Officer of other Credit Suisse Funds. | |
1 Subject to the Trust's retirement policy, each Trustee may continue to serve as a Trustee until the last day of the calendar year in which the applicable Trustee attains age 75. Officer serves until his or her respective successor has been duly elected and qualified.
* The officers of the Fund shown are officers that make policy decisions.
The Statement of Additional Information includes additional information about the Trustees and is available, without charge, upon request, by calling 877-870-2874.
61
Credit Suisse Strategic Income Fund
Proxy Voting and Portfolio Holdings Information (unaudited)
Information regarding how the Fund voted proxies related to its portfolio securities during the 12-month period ended June 30 of each year, as well as the policies and procedures that the Fund uses to determine how to vote proxies relating to its portfolio securities are available:
• By calling 1-877-870-2874
• On the Fund's website, www.credit-suisse.com/us/funds
• On the website of the Securities and Exchange Commission, www.sec.gov
The Fund files a complete schedule of its portfolio holdings for the first and third quarters of its fiscal year with the SEC on Form N-Q. The Fund's Forms N-Q are available on the SEC's website at www.sec.gov and may be reviewed and copied at the SEC's Public Reference Room in Washington, DC. Information on the operation of the SEC's Public Reference Room may be obtained by calling 1-202-551-8090.
62

P.O. BOX 219916, KANSAS CITY, MO 64121-9916
877-870-2874 n www.credit-suisse.com/us/funds
CREDIT SUISSE SECURITIES (USA) LLC, DISTRIBUTOR. SIF-AR-1018
Item 2. Code of Ethics.
The registrant has adopted a code of ethics applicable to its Chief Executive Officer, President, Chief Financial Officer and Chief Accounting Officer, or persons performing similar functions. A copy of the code is filed as Exhibit 12(a)(1) to this Form. There were no amendments to the code during the fiscal year ended October 31, 2018. There were no waivers or implicit waivers from the code granted by the registrant during the fiscal year ended October 31, 2018.
Item 3. Audit Committee Financial Expert.
The registrant’s governing board has determined that it has two audit committee financial experts serving on its audit committee: Mahendra R. Gupta and Steven N. Rappaport. Each audit committee financial expert is “independent” for purposes of this item.
Item 4. Principal Accountant Fees and Services.
(a) through (d). The information in the table below is provided for services rendered to the registrant by its independent registered public accounting firm, KPMG LLP (“KPMG”), for its fiscal years ended October 31, 2017 and October 31, 2018.
| | 2017 | | 2018 | |
Audit Fees | | $ | 170,000 | | $ | 170,000 | |
Audit-Related Fees(1) | | $ | 24,600 | | $ | 28,913 | |
Tax Fees(2) | | $ | 13,680 | | $ | 13,680 | |
All Other Fees | | $ | 4,857 | | $ | 13,910 | |
Total | | $ | 213,137 | | $ | 226,503 | |
(1) Services include agreed-upon procedures in connection with the registrant’s semi-annual financial statements ($24,600 for 2017 and $28,913 for 2018).
(2) Tax services in connection with the registrant’s excise tax calculations and review of the registrant’s applicable tax returns.
The information in the table below is provided with respect to non-audit services that directly relate to the registrant’s operations and financial reporting and that were rendered by KPMG to the registrant’s investment adviser, Credit Suisse Asset Management, LLC (“Credit Suisse”), and any service provider to the registrant controlling, controlled by or under common control with Credit Suisse that
3
provided ongoing services to the registrant (“Covered Services Provider”), for the registrant’s fiscal years ended October 31, 2017 and October 31, 2018.
| | 2017 | | 2018 | |
Audit-Related Fees | | N/A | | N/A | |
Tax Fees | | N/A | | N/A | |
All Other Fees | | N/A | | N/A | |
Total | | N/A | | N/A | |
(e)(1) Pre-Approval Policies and Procedures. The Audit Committee (“Committee”) of the registrant is responsible for pre-approving (i) all audit and permissible non-audit services to be provided by the independent registered public accounting firm to the registrant and (ii) all permissible non-audit services to be provided by the independent registered public accounting firm to Credit Suisse and any Covered Services Provider if the engagement relates directly to the operations and financial reporting of the registrant. The Committee may delegate its responsibility to pre-approve any such audit and permissible non-audit services to the Chairperson of the Committee, and the Chairperson shall report to the Committee, at its next regularly scheduled meeting after the Chairperson’s pre-approval of such services, his or her decision(s). The Committee may also establish detailed pre-approval policies and procedures for pre-approval of such services in accordance with applicable laws, including the delegation of some or all of the Committee’s pre-approval responsibilities to other persons (other than Credit Suisse or the registrant’s officers). Pre-approval by the Committee of any permissible non-audit services shall not be required so long as: (i) the aggregate amount of all such permissible non-audit services provided to the registrant, Credit Suisse and any Covered Services Provider constitutes not more than 5% of the total amount of revenues paid by the registrant to its independent registered public accounting firm during the fiscal year in which the permissible non-audit services are provided; (ii) the permissible non-audit services were not recognized by the registrant at the time of the engagement to be non-audit services; and (iii) such services are promptly brought to the attention of the Committee and approved by the Committee (or its delegate(s)) prior to the completion of the audit.
(e)(2) The information in the table below sets forth the percentages of fees for services (other than audit, review or attest services) rendered by KPMG to the registrant for which the pre-approval requirement was waived pursuant to Rule 2-01(c)(7)(i)(C) of Regulation S-X:
4
| | 2017 | | 2018 | |
Audit-Related Fees | | N/A | | N/A | |
Tax Fees | | N/A | | N/A | |
All Other Fees | | N/A | | N/A | |
Total | | N/A | | N/A | |
The information in the table below sets forth the percentages of fees for services (other than audit, review or attest services) rendered by KPMG to Credit Suisse and any Covered Services Provider required to be approved pursuant to Rule 2-01(c)(7)(ii) of Regulation S-X, for the registrant’s fiscal years ended October 31, 2017 and October 31, 2018:
| | 2017 | | 2018 | |
Audit-Related Fees | | N/A | | N/A | |
Tax Fees | | N/A | | N/A | |
All Other Fees | | N/A | | N/A | |
Total | | N/A | | N/A | |
(f) Not Applicable.
(g) The aggregate fees billed by KPMG for non-audit services rendered to the registrant, Credit Suisse and Covered Service Providers for the fiscal years ended October 31, 2017 and October 31, 2018 were $0 and $0, respectively.
(h) Not Applicable.
Item 5. Audit Committee of Listed Registrants.
Form N-CSR disclosure requirement is not applicable to the registrant.
Item 6. Schedule of Investments.
Included as part of the report to shareholders filed under Item 1 of this Form.
Item 7. Disclosure of Proxy Voting Policies and Procedures for Closed-End Management Investment Companies.
Form N-CSR disclosure requirement is not applicable to the registrant.
5
Item 8. Portfolio Managers of Closed-End Management Investment Companies.
Form N-CSR disclosure requirement is not applicable to the registrant.
Item 9. Purchases of Equity Securities by Closed-End Management Investment Company and Affiliated Purchasers.
Form N-CSR disclosure requirement is not applicable to the registrant.
Item 10. Submission of Matters to a Vote of Security Holders.
None.
Item 11. Controls and Procedures.
(a) As of a date within 90 days from the filing date of this report, the principal executive officer and principal financial officer concluded that the registrant’s disclosure controls and procedures (as defined in Rule 30a-3(c) under the Investment Company Act of 1940 (the “Act”)) were effective based on their evaluation of the disclosure controls and procedures required by Rule 30a-3(b) under the Act and Rules 13a-15(b) or 15d-15(b) under the Securities Exchange Act of 1934.
(b) There were no changes in registrant’s internal control over financial reporting (as defined in Rule 30a-3(d) under the Act) that occurred during the second fiscal quarter of the period covered by this report that have materially affected, or are reasonably likely to materially affect, the registrant’s internal control over financial reporting.
Item 12. Disclosure of Securities Lending Activities for Closed-End Management Investment Companies.
Form N-CSR disclosure requirement is not applicable to the registrant.
Item 13. Exhibits.
(a)(1) Registrant’s Code of Ethics is an exhibit to this report.
(a)(2) The certifications of the registrant as required by Rule 30a-2(a) under the Act are exhibits to this report.
(a)(3) Not applicable.
6
(b) The certifications of the registrant as required by Rule 30a-2(b) under the Act are an exhibit to this report.
(other) Iran related activities disclosure requirement.
7
SIGNATURES
Pursuant to the requirements of the Securities Exchange Act of 1934 and the Investment Company Act of 1940, the registrant has duly caused this report to be signed on its behalf by the undersigned, thereunto duly authorized.
CREDIT SUISSE OPPORTUNITY FUNDS | |
| |
/s/ John G. Popp | |
Name: | John G. Popp | |
Title: | Chief Executive Officer and President | |
Date: | January 7, 2019 | |
Pursuant to the requirements of the Securities Exchange Act of 1934 and the Investment Company Act of 1940, this report has been signed below by the following persons on behalf of the registrant and in the capacities and on the dates indicated.
/s/ John G. Popp | |
Name: | John G. Popp | |
Title: | Chief Executive Officer and President | |
Date: | January 7, 2019 | |
| |
/s/ Laurie Pecha | |
Name: | Laurie Pecha | |
Title: | Chief Financial Officer and Treasurer | |
Date: | January 7, 2019 | |
8