UNITED STATES
SECURITIES AND EXCHANGE COMMISSION
Washington, D.C. 20549
FORM N-CSR
CERTIFIED SHAREHOLDER REPORT OF REGISTERED
MANAGEMENT INVESTMENT COMPANIES
Investment Company Act file number | 811-09054 |
|
CREDIT SUISSE OPPORTUNITY FUNDS |
(Exact name of registrant as specified in charter) |
|
One Madison Avenue, New York, New York | | 10010 |
(Address of principal executive offices) | | (Zip code) |
|
John G. Popp Credit Suisse Opportunity Funds One Madison Avenue New York, New York 10010 |
(Name and address of agent for service) |
|
Registrant’s telephone number, including area code: | (212) 325-2000 | |
|
Date of fiscal year end: | October 31st | |
|
Date of reporting period: | November 1, 2016 to October 31, 2017 | |
| | | | | | | | | |
Item 1. Reports to Stockholders.

CREDIT SUISSE FUNDS
Annual Report
October 31, 2017
n CREDIT SUISSE
FLOATING RATE HIGH INCOME FUND
The Fund's investment objectives, risks, charges and expenses (which should be considered carefully before investing), and more complete information about the Fund, are provided in the Prospectus, which should be read carefully before investing. You may obtain additional copies by calling 877-870-2874 or by visiting our website at www.credit-suisse.com/us/funds.
Credit Suisse Securities (USA) LLC, Distributor, is located at One Madison Avenue, New York, NY 10010. Credit Suisse Funds are advised by Credit Suisse Asset Management, LLC.
Investors in the Credit Suisse Funds should be aware that they may be eligible to purchase Class I shares (where offered) directly or through certain intermediaries. Such shares are not subject to a sales charge. Investors in the Credit Suisse Funds should also be aware that they may be eligible for a reduction or waiver of the sales charge with respect to Class A, B or C shares (where offered). For more information, please review the relevant prospectuses or consult your financial representative.
Fund shares are not deposits or other obligations of Credit Suisse Asset Management, LLC ("Credit Suisse") or any affiliate, are not FDIC-insured and are not guaranteed by Credit Suisse or any affiliate. Fund investments are subject to investment risks, including loss of your investment.
Credit Suisse Floating Rate High Income Fund
Annual Investment Adviser's Report
October 31, 2017 (unaudited)
November 24, 2017
Dear Shareholder:
We are pleased to present this Annual Report covering the activities of the Credit Suisse Floating Rate High Income Fund (the "Fund") for the 12-month period ended October 31, 2017.
Performance Summary
11/1/2016 – 10/31/2017
Fund & Benchmark | | Performance | |
Class I1 | | | 5.75 | % | |
Class A1,2 | | | 5.48 | % | |
Class B1,2 | | | 4.69 | % | |
Class C1,2 | | | 4.69 | % | |
Credit Suisse Leveraged Loan Index3 | | | 5.25 | % | |
Performance shown for the Fund's Class A, Class B and Class C Shares does not reflect sales charges, which are a maximum of 4.75%, 4.00% and 1.00%, respectively.2
Market Review: A positive period for senior loans
The twelve-month period ended October 31, 2017 was a positive one for the senior secured loan asset class, with the Credit Suisse Leveraged Loan Index (the "Benchmark"), the Fund's benchmark, returning 5.25% for the period. The discount margin for senior loans, using a three-year average life assumption, tightened 0.77% during the period to +417 basis points. Returns for the asset class have been largely driven by coupons.
Demand for leveraged loans has been robust as retail money flowed into loan funds, old Collateralized Loan Obligation ("CLO") structures reset, and new CLO's printed an average of almost $10 billion per month over the twelve-month period. Prime funds had net inflows of $30.7 billion versus a $15.7 billion outflow over the previous annual period (according to LCD — "Leveraged Commentary & Data"). Spread compression hasn't been isolated to loans, with CLO's pricing at tighter levels and existing vehicles being refinanced/reset at record pace. The period saw CLO issuance of $111.5 billion versus $67 billion in the previous period. Calendar year to date, more than $150 billion of existing CLO's have also been refinanced or reset (representing over 325 vehicles).
Over the period, borrowers have been enticed to tap the loan market, as a record $959 billion of institutional loans were issued during the period — 73% of which was used for the refinancing/repricing of existing debt. In the previous period, issuance was $407 billion, with nearly 60% used for refinancing/repricing, according to JPMorgan.
1
Credit Suisse Floating Rate High Income Fund
Annual Investment Adviser's Report (continued)
October 31, 2017 (unaudited)
Fundamentals in the senior secured loan market have been strong outside of energy and retail. The par-weighted default rate for loans ended the period at 1.37%. In fact, according to JPMorgan, 26 companies have defaulted in 2017 — putting it on pace for the lowest annual default total since 2013. While we expect an increase in defaults in some troubled industries going forward, overall fundamentals and cheap capital structures should broadly minimize defaults.
From a quality point of view, CCC/split CCC posted the highest returns for the period at 12.22%. Distressed (CC, C, and default) loans followed closely, returning 10.82%. Split BBB and BB rated loans underperformed with respective returns of 3.25% and 4.07%.
Strategic Review and Outlook: Expecting demand to remain positive
For the annual period ended October 31, 2017, the Fund's Class I and A shares outperformed the Benchmark. The Fund's outperformance was largely driven by positive security selection in the oil & gas sector. In addition, security selection and an underweight position to the retail sector were positive contributors to relative performance. From an asset class perspective, the Fund's weightings in high yield and asset-backed energy also contributed to performance.
Demand for the bank loan asset class continues to be solid, with steady issuer fundamentals, rate hike expectations (albeit at a measured pace), healthy institutional demand and elevated CLO formation levels. Additionally, outside of sectors like retail, default rates are expected to remain below long-term averages in the intermediate term.
Fundamental economic performance has remained stable and although there have been periods when international concerns and the domestic political climate have led to some volatility, the cautious investor sentiment was short lived. Barring a sudden increase in geopolitical risks, we would expect demand to remain positive thanks to economic performance that appears to be supportive of continued rate increases, as well as the attractiveness of the floating rate nature of the loan asset class.
The Credit Suisse Credit Investments Group Team
John G. Popp
Thomas J. Flannery
Louis I. Farano
Wing Chan
2
Credit Suisse Floating Rate High Income Fund
Annual Investment Adviser's Report (continued)
October 31, 2017 (unaudited)
Senior secured floating rate loans ("Senior Loans") typically hold the most senior position in the issuer's capital structure. Senior Loans are subject to the risk that a court could subordinate a Senior Loan to presently existing or future indebtedness or take other action detrimental to the holders of Senior Loans.
High yield bonds are lower-quality bonds that are also known as "junk bonds." Such bonds entail greater risks than those found in higher-rated securities.
Additional principal risk factors for the Fund include conflict of interest risk, credit risk, foreign securities risk, interest rate risk, liquidity risk, market risk, prepayment risk and valuation risk. Before you invest, please make sure you understand the risks that apply to the Fund. As with any mutual fund, you could lose money over any period of time.
Investments in the Fund are not bank deposits and are not insured or guaranteed by the Federal Deposit Insurance Corporation or any government agency. For a detailed discussion of these and other risks, please refer to the Fund's Prospectus, which should be read carefully before investing.
In addition to historical information, this report contains forward-looking statements, which may concern, among other things, domestic and foreign markets, industry and economic trends and developments and government regulation, and their potential impact on the Fund's investments. These statements are subject to risks and uncertainties and actual trends, developments and regulations in the future, and their impact on the Fund, could be materially different from those projected, anticipated or implied. The Fund has no obligation to update or revise forward-looking statements.
The views of the Fund's management are as of the date of this letter and the Fund holdings described in this document are as of October 31, 2017; these views and Fund holdings may have changed subsequent to these dates. Nothing in this document is a recommendation to purchase or sell securities.
3
Credit Suisse Floating Rate High Income Fund
Annual Investment Adviser's Report (continued)
October 31, 2017 (unaudited)
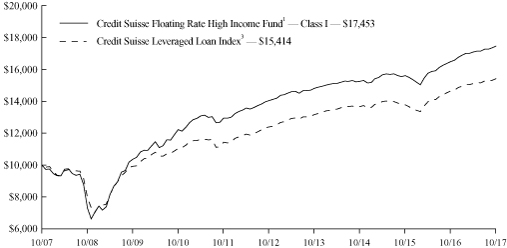
Comparison of Change in Value of $10,000 Investment in the
Credit Suisse Floating Rate High Income Fund1 Class I shares and the
Credit Suisse Leveraged Loan Index3 for Ten Years.
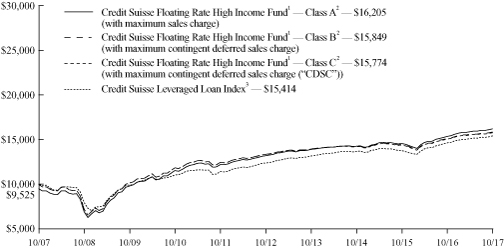
Comparison of Change in Value of $10,000 Investment in the
Credit Suisse Floating Rate High Income Fund1 Class A shares2,
Class B shares2, Class C shares2 and the Credit Suisse
Leveraged Loan Index3 for Ten Years.
1 Fee waivers and/or expense reimbursements reduce expenses for the Fund, without which performance would be lower. Voluntary waivers and/or expense reimbursements may be discontinued at any time.
4
Credit Suisse Floating Rate High Income Fund
Annual Investment Adviser's Report (continued)
October 31, 2017 (unaudited)
2 Total return for the Fund's Class A shares for the reporting period, based on offering price (including maximum sales charge of 4.75%), was 0.46%. Total return for the Fund's Class B shares for the reporting period, based on redemption value (including maximum CDSC of 4.00%), was 0.69%%. Total return for the Fund's Class C shares for the reporting period, based on redemption value (including maximum CDSC of 1.00%), was 3.69%.
3 Credit Suisse Leveraged Loan Index is an unmanaged index that is designed to mirror the investable universe of the U.S. dollar denominated institutional leveraged loan market. The index does not have transaction costs and investors cannot invest directly in the index.
Average Annual Returns as of October 31, 20171
| | | 1 Year | | 5 Years | | 10 Years | |
Class I | | | 5.75 | % | | | 4.45 | % | | | 5.73 | % | |
Class A Without Sales Charge | | | 5.48 | % | | | 4.18 | % | | | 5.45 | % | |
Class A With Maximum Sales Charge | | | 0.46 | % | | | 3.15 | % | | | 4.95 | % | |
Class B Without CDSC | | | 4.69 | % | | | 3.48 | % | | | 4.71 | % | |
Class B With CDSC | | | 0.69 | % | | | 3.48 | % | | | 4.71 | % | |
Class C Without CDSC | | | 4.69 | % | | | 3.39 | % | | | 4.66 | % | |
Class C With CDSC | | | 3.69 | % | | | 3.39 | % | | | 4.66 | % | |
Returns represent past performance and include change in share price and reinvestment of dividends and capital gain distributions, if any. Past performance cannot guarantee future results. The current performance of the Fund may be lower or higher than the figures shown. Returns and share price will fluctuate, and redemption value may be more or less than original cost. The performance results do not reflect the deduction of taxes that a shareholder would pay on Fund distributions or the redemption of Fund shares. Performance information current to the most recent month end is available at www.credit-suisse.com/us/funds.
The annual gross expense ratios are 0.77% for Class I shares, 1.02% for Class A shares, 1.77% for Class B shares and 1.77% for Class C shares. The annual net expense ratios after fee waivers and/or expense reimbursements are 0.70% for Class I shares, 0.95% for Class A shares, 1.70% for Class B shares and 1.70% for Class C shares.
1 Fee waivers and/or expense reimbursements reduce expenses for the Fund, without which performance would be lower. Voluntary waivers and/or reimbursements may be discontinued at any time.
5
Credit Suisse Floating Rate High Income Fund
Annual Investment Adviser's Report (continued)
October 31, 2017 (unaudited)
Information About Your Fund's Expenses
As an investor of the Fund, you incur two types of costs: ongoing expenses and transaction costs. Ongoing expenses include management fees, distribution and service (12b-1) fees and other Fund expenses. Examples of transaction costs include sales charges (loads), redemption fees and account maintenance fees, which are not shown in this section and which would result in higher total expenses. The following table is intended to help you understand your ongoing expenses of investing in the Fund and to help you compare these expenses with the ongoing expenses of investing in other mutual funds. The table is based on an investment of $1,000 made at the beginning of the six months ended October 31, 2017.
The table illustrates your Fund's expenses in two ways:
• Actual Fund Return. This helps you estimate the actual dollar amount of ongoing expenses paid on a $1,000 investment in the Fund using the Fund's actual return during the period. To estimate the expenses you paid over the period, simply divide your account value by $1,000 (for example, an $8,600 account value divided by $1,000 = 8.6), then multiply the result by the number in the "Expenses Paid per $1,000" line.
• Hypothetical 5% Fund Return. This helps you to compare the Fund's ongoing expenses with those of other mutual funds using the Fund's actual expense ratio and a hypothetical rate of return of 5% per year before expenses. Examples using a 5% hypothetical fund return may be found in the shareholder reports of other mutual funds. The hypothetical account values and expenses may not be used to estimate the actual ending account balance or expenses you paid for the period.
Please note that the expenses shown in these tables are meant to highlight your ongoing expenses only and do not reflect any transaction costs, such as sales charges (loads) or redemption fees. If these transaction costs had been included, your costs would have been higher. The "Expenses Paid per $1,000" line of the tables is useful in comparing ongoing expenses only and will not help you determine the relative total expenses of owning different funds.
6
Credit Suisse Floating Rate High Income Fund
Annual Investment Adviser's Report (continued)
October 31, 2017 (unaudited)
Expenses and Value for a $1,000 Investment
for the six-month period ended October 31, 2017
Actual Fund Return | | Class I | | Class A | | Class B | | Class C | |
Beginning Account Value 05/01/17 | | $ | 1,000.00 | | | $ | 1,000.00 | | | $ | 1,000.00 | | | $ | 1,000.00 | | |
Ending Account Value 10/31/17 | | $ | 1,021.90 | | | $ | 1,020.60 | | | $ | 1,016.80 | | | $ | 1,016.80 | | |
Expenses Paid per $1,000* | | $ | 3.57 | | | $ | 4.84 | | | $ | 8.64 | | | $ | 8.64 | | |
Hypothetical 5% Fund Return | |
Beginning Account Value 05/01/17 | | $ | 1,000.00 | | | $ | 1,000.00 | | | $ | 1,000.00 | | | $ | 1,000.00 | | |
Ending Account Value 10/31/17 | | $ | 1,021.68 | | | $ | 1,020.42 | | | $ | 1,016.64 | | | $ | 1,016.64 | | |
Expenses Paid per $1,000* | | $ | 3.57 | | | $ | 4.84 | | | $ | 8.64 | | | $ | 8.64 | | |
| | | Class I | | Class A | | Class B | | Class C | |
Annualized Expense Ratios* | | | 0.70 | % | | | 0.95 | % | | | 1.70 | % | | | 1.70 | % | |
* Expenses are equal to the Fund's annualized expense ratio for each share class, multiplied by the average account value over the period, multiplied by 184/365 to reflect the one-half year period.
The "Expenses Paid per $1,000" and the "Annualized Expense Ratios" in the tables are based on actual expenses paid by the Fund during the period, net of fee waivers and/or actual expense reimbursements, if applicable. If those fee waivers and/or expense reimbursements had not been in effect, the Fund's actual expenses would have been higher. Expenses do not reflect additional charges and expenses that are, or may be, imposed under the variable contracts or plans. Such charges and expenses are described in the prospectus of the insurance company separate account or in the plan documents or other informational materials supplied by plan sponsors. The Fund's expenses should be considered with these charges and expenses in evaluating the overall cost of investing in the separate account.
For more information, please refer to the Fund's Prospectus.
7
Credit Suisse Floating Rate High Income Fund
Annual Investment Adviser's Report (continued)
October 31, 2017 (unaudited)
Credit Quality Breakdown*
(% of Total Investments as of October 31, 2017)
S&P Ratings** | |
AA | | | 0.2 | % | |
A | | | 0.6 | | |
BBB | | | 8.4 | | |
BB | | | 33.1 | | |
B | | | 40.6 | | |
CCC | | | 5.0 | | |
CC1 | | | 0.0 | | |
NR | | | 3.9 | | |
Subtotal | | | 91.8 | | |
Equity and Other1 | | | 0.2 | | |
Short-Term Investments2 | | | 8.0 | | |
Total | | | 100.0 | % | |
* Expressed as a percentage of total investments (excluding securities lending collateral, if applicable) and may vary over time.
** Credit Quality is based on ratings provided by the Standard & Poor's Division of The McGraw-Hill Companies, Inc. ("S&P"). S&P is a main provider of ratings for Credit Asset Classes and is widely used amongst industry participants. The NR category consists of securities that have not been rated by S&P.
1 This amount represents less than 0.1%.
2 Primarily reflects cash invested in State Street Bank and Trust Co. Euro Time Deposit, for which the purchases of securities have been executed but not yet settled at October 31, 2017, if applicable.
8
Credit Suisse Floating Rate High Income Fund
Schedule of Investments
October 31, 2017
Par
(000) | |
| | Ratings†
(S&P/Moody's) | | Maturity | | Rate% | | Value | |
| BANK LOANS (82.6%) | | | |
| Advertising (0.2%) | | | |
$ | 5,980 | | | MH Sub I LLC, LIBOR 3M + 7.500%(1) | | (CCC+, Caa2) | | 09/15/25 | | | 8.820 | | | $ | 5,955,093 | | |
| Aerospace & Defense (1.1%) | | | |
| | 24,910 | | | Avolon TLB Borrower 1 (Luxembourg) Sarl,
LIBOR 1M + 2.250%(1) | | (BBB-, Ba1) | | 04/03/22 | | | 3.488 | | | | 25,132,983 | | |
| | 4,388 | | | Fly Funding II Sarl, LIBOR 3M + 2.250%(1) | | (BB+, Ba2) | | 02/09/23 | | | 3.560 | | | | 4,407,617 | | |
| | 8,843 | | | Sequa Mezzanine Holdings LLC,
LIBOR 3M + 5.500%(1) | | (B-, B3) | | 11/28/21 | | | 6.874 | | | | 8,932,931 | | |
| | | | 38,473,531 | | |
| Air Transportation (1.0%) | | | |
| | 9,441 | | | American Airlines, Inc., LIBOR 1M + 2.500%(1) | | (BB+, Ba1) | | 12/14/23 | | | 3.739 | | | | 9,480,078 | | |
| | 6,058 | | | American Airlines, Inc., LIBOR 1M + 2.000%(1) | | (BB+, Ba1) | | 10/12/21 | | | 3.238 | | | | 6,079,479 | | |
| | 19,132 | | | American Airlines, Inc., LIBOR 1M + 2.000%(1) | | (BB+, Ba1) | | 06/26/20 | | | 3.240 | | | | 19,212,035 | | |
| | | | 34,771,592 | | |
| Auto Parts & Equipment (1.3%) | | | |
| | 18,175 | | | American Axle & Manufacturing, Inc.,
LIBOR 3M + 2.250%(1) | | (BB, Ba2) | | 04/06/24 | | | 3.556 | | | | 18,237,396 | | |
| | 21,461 | | | CS Intermediate Holdco 2 LLC,
LIBOR 3M + 2.250%(1) | | (BBB-, Ba1) | | 11/02/23 | | | 3.583 | | | | 21,616,679 | | |
| | 8,313 | | | U.S. Farathane LLC, LIBOR 3M + 3.500%(1),(2) | | (B, B2) | | 12/23/21 | | | 4.833 | | | | 8,395,819 | | |
| | | | 48,249,894 | | |
| Automakers (0.6%) | | | |
| | 5,609 | | | FCA U.S. LLC, LIBOR 1M + 2.000%(1) | | (BBB-, Baa3) | | 12/31/18 | | | 3.240 | | | | 5,631,596 | | |
| | 7,350 | | | TI Group Automotive Systems LLC,
EURIBOR 3M + 3.000%(1),(3) | | (BB-, Ba3) | | 06/30/22 | | | 3.750 | | | | 8,645,865 | | |
| | 7,231 | | | TI Group Automotive Systems LLC,
LIBOR 1M + 2.750%(1) | | (BB-, Ba3) | | 06/30/22 | | | 3.992 | | | | 7,279,652 | | |
| | | | 21,557,113 | | |
| Banking (0.3%) | | | |
| | 11,657 | | | Citco Funding LLC, LIBOR 1M + 3.000%(1) | | (NR, Ba3) | | 03/31/22 | | | 4.242 | | | | 11,781,088 | | |
| Building & Construction (1.5%) | | | |
| | 7,027 | | | Beacon Roofing Supply, Inc.(4) | | (BB+, B1) | | 08/23/24 | | | 2.250 | | | | 7,082,580 | | |
| | 2,679 | | | Floor & Decor Outlets of America, Inc.,
LIBOR 1M + 3.000%(1),(2) | | (BB-, B2) | | 09/30/23 | | | 4.250 | | | | 2,688,817 | | |
| | 17,120 | | | Installed Building Products, Inc.,
LIBOR 1M + 3.000%(1),(2) | | (BB, B1) | | 04/15/24 | | | 4.242 | | | | 17,334,137 | | |
| | 14,184 | | | PGT, Inc., LIBOR 2M + 4.750%(1),(2) | | (BB-, B2) | | 02/16/22 | | | 6.026 | | | | 14,431,978 | | |
| | 9,000 | | | Triangle FM Services Holding GmbH,
LIBOR 3M + 5.000%(1),(5) | | (B, B2) | | 09/01/23 | | | 5.277 | | | | 12,100,951 | | |
| | | | 53,638,463 | | |
See Accompanying Notes to Financial Statements.
9
Credit Suisse Floating Rate High Income Fund
Schedule of Investments (continued)
October 31, 2017
Par
(000) | |
| | Ratings†
(S&P/Moody's) | | Maturity | | Rate% | | Value | |
| BANK LOANS (continued) | | | |
| Building Materials (3.1%) | | | |
$ | 20,098 | | | American Builders & Contractors
Supply Co., Inc., LIBOR 1M + 2.500%(1) | | (BB+, B1) | | 10/31/23 | | | 3.742 | | | $ | 20,249,777 | | |
| | 8,008 | | | C.H.I. Overhead Doors, Inc.,
LIBOR 3M + 3.250%(1) | | (B, B3) | | 07/29/22 | | | 4.583 | | | | 8,003,201 | | |
| | 2,595 | | | HD Supply, Inc., LIBOR 3M + 2.250%(1) | | (BB+, Ba3) | | 08/13/21 | | | 3.583 | | | | 2,622,627 | | |
| | 15,245 | | | HD Supply, Inc., LIBOR 3M + 2.500%(1) | | (BB+, Ba3) | | 10/17/23 | | | 3.833 | | | | 15,430,613 | | |
| | 7,275 | | | Morsco, Inc., LIBOR 1M + 7.000%(1) | | (B+, B3) | | 10/31/23 | | | 8.242 | | | | 7,361,427 | | |
| | 21,362 | | | Priso Acquisition Corp., LIBOR 1M + 3.000%(1) | | (B, B2) | | 05/08/22 | | | 4.242 | | | | 21,515,312 | | |
| | 7,655 | | | SRS Distribution, Inc., LIBOR 3M + 3.250%(1) | | (B, B2) | | 08/25/22 | | | 4.530 | | | | 7,736,632 | | |
| | 2,250 | | | SRS Distribution, Inc., LIBOR 3M + 8.750%(1) | | (CCC+, Caa1) | | 02/24/23 | | | 9.992 | | | | 2,314,688 | | |
| | 10,627 | | | Summit Materials Cos. I LLC,
LIBOR 1M + 2.750%(1) | | (BB+, Ba2) | | 07/17/22 | | | 3.992 | | | | 10,704,934 | | |
| | 18,607 | | | Wilsonart LLC, LIBOR 3M + 3.250%(1) | | (B+, B2) | | 12/19/23 | | | 4.590 | | | | 18,804,311 | | |
| | | | 114,743,522 | | |
| Cable & Satellite TV (3.8%) | | | |
| | 11,557 | | | Altice U.S. Finance I Corp.,
LIBOR 1M + 2.250%(1) | | (BB-, Ba3) | | 07/28/25 | | | 3.492 | | | | 11,564,414 | | |
| | 8,767 | | | Charter Communications Operating LLC,
LIBOR 1M + 2.000%(1) | | (BBB-, Ba1) | | 01/15/22 | | | 3.250 | | | | 8,816,812 | | |
| | 6,649 | | | Charter Communications Operating LLC,
LIBOR 1M + 2.250%(1) | | (BBB-, Ba1) | | 01/15/24 | | | 3.500 | | | | 6,704,533 | | |
| | 1,959 | | | Charter Communications Operating LLC,
LIBOR 1M + 2.000%(1) | | (BBB-, Ba1) | | 01/03/21 | | | 3.250 | | | | 1,969,619 | | |
| | 17,636 | | | CSC Holdings LLC, LIBOR 1M + 2.250%(1) | | (BB, Ba1) | | 07/17/25 | | | 3.489 | | | | 17,645,738 | | |
| | 13,566 | | | Telenet Financing USD LLC,
LIBOR 1M + 2.750%(1) | | (BB-, Ba3) | | 06/30/25 | | | 3.989 | | | | 13,639,433 | | |
| | 5,000 | | | Telenet International Finance Sarl,
EURIBOR 3M + 3.000%(1),(3) | | (BB-, Ba3) | | 03/31/26 | | | 3.000 | | | | 5,875,163 | | |
| | 5,000 | | | Unitymedia Finance LLC, LIBOR 1M + 2.250%(1) | | (BB-, Ba3) | | 09/30/25 | | | 3.489 | | | | 5,005,250 | | |
| | 25,000 | | | Unitymedia Finance LLC(4) | | (BB-, Ba3) | | 10/16/24 | | | 2.250 | | | | 24,984,375 | | |
| | 2,000 | | | Virgin Media Bristol LLC,
LIBOR 1M + 2.750%(1) | | (BB-, Ba3) | | 01/31/25 | | | 3.989 | | | | 2,010,250 | | |
| | 9,000 | | | Virgin Media Investment Holdings Ltd.,
LIBOR 1M + 3.500%(1),(5) | | (BB-, Ba3) | | 01/31/26 | | | 3.800 | | | | 12,014,003 | | |
| | 15,000 | | | Ziggo Secured Finance B.V.,
EURIBOR 6M + 3.000%(1),(3) | | (BB-, Ba3) | | 04/15/25 | | | 3.000 | | | | 17,547,553 | | |
| | 9,000 | | | Ziggo Secured Finance Partnership,
LIBOR 1M + 2.500%(1) | | (BB-, Ba3) | | 04/15/25 | | | 3.739 | | | | 9,030,690 | | |
| | | | 136,807,833 | | |
| Chemicals (6.2%) | | | |
| | 9,900 | | | Allnex (Luxembourg) & Cy S.C.A.,
EURIBOR 3M + 3.250%(1),(3) | | (B, B1) | | 09/13/23 | | | 3.250 | | | | 11,603,125 | | |
| | 1,135 | | | Allnex (Luxembourg) & Cy S.C.A.,
LIBOR 3M + 3.250%(1) | | (B, B1) | | 09/13/23 | | | 4.567 | | | | 1,144,137 | | |
See Accompanying Notes to Financial Statements.
10
Credit Suisse Floating Rate High Income Fund
Schedule of Investments (continued)
October 31, 2017
Par
(000) | |
| | Ratings†
(S&P/Moody's) | | Maturity | | Rate% | | Value | |
| BANK LOANS (continued) | | | |
Chemicals | | | |
$ | 855 | | | Allnex U.S.A., Inc., LIBOR 3M + 3.250%(1) | | (B, B1) | | 09/13/23 | | | 4.567 | | | $ | 861,981 | | |
| | 17,713 | | | Alpha 3 B.V., LIBOR 3M + 3.000%(1) | | (B+, B1) | | 01/31/24 | | | 4.333 | | | | 17,868,144 | | |
| | 15,351 | | | Ascend Performance Materials
Operations LLC, LIBOR 3M + 5.250%(1),(2) | | (B-, NR) | | 08/12/22 | | | 6.583 | | | | 15,504,329 | | |
| | 7,980 | | | Ashland, Inc., LIBOR 3M + 2.000%(1) | | (BB+, Ba1) | | 05/17/24 | | | 3.293 | | | | 8,038,852 | | |
| | 3,433 | | | ASP Chromaflo Dutch I B.V.,
LIBOR 1M + 4.000%(1) | | (B, B2) | | 11/18/23 | | | 5.242 | | | | 3,457,214 | | |
| | 4,063 | | | ASP Chromaflo Intermediate Holdings, Inc.,
LIBOR 1M + 8.000%(1) | | (CCC, Caa2) | | 11/14/24 | | | 9.242 | | | | 4,052,344 | | |
| | 2,640 | | | ASP Chromaflo Intermediate Holdings, Inc.,
LIBOR 1M + 4.000%(1) | | (B, B2) | | 11/18/23 | | | 5.242 | | | | 2,658,742 | | |
| | 18,170 | | | Axalta Coating Systems U.S. Holdings, Inc.,
LIBOR 3M + 2.000%(1) | | (BBB-, Ba1) | | 06/01/24 | | | 3.333 | | | | 18,289,784 | | |
| | 4,950 | | | Azelis Finance S.A., LIBOR 3M + 4.250%(1) | | (B+, B2) | | 12/15/22 | | | 5.583 | | | | 4,999,219 | | |
| | 1,715 | | | Colouroz Investment 2 LLC,
LIBOR 3M + 7.250%(1) | | (CCC+, Caa1) | | 09/06/22 | | | 8.615 | | | | 1,675,555 | | |
| | 1,965 | | | Flint Group GmbH, EURIBOR 3M + 3.000%(1),(3) | | (B, B2) | | 09/07/21 | | | 3.750 | | | | 2,247,213 | | |
| | 280 | | | Flint Group GmbH, LIBOR 3M + 3.000%(1) | | (B, B2) | | 09/07/21 | | | 4.300 | | | | 272,294 | | |
| | 1,697 | | | Flint Group U.S. LLC, LIBOR 3M + 3.000%(1) | | (B, B2) | | 09/07/21 | | | 4.365 | | | | 1,647,153 | | |
| | 12,974 | | | Gemini HDPE LLC, LIBOR 3M + 3.000%(1) | | (BB-, Ba3) | | 08/07/21 | | | 4.380 | | | | 13,079,081 | | |
| | 12,852 | | | H.B. Fuller Co., LIBOR 1M + 2.250%(1) | | (BB+, Ba2) | | 10/12/24 | | | 3.489 | | | | 12,939,883 | | |
| | 15,457 | | | Houghton International, Inc.,
LIBOR 3M + 3.250%(1) | | (B+, B1) | | 12/20/19 | | | 4.583 | | | | 15,520,109 | | |
| | 3,870 | | | Houghton International, Inc.,
LIBOR 3M + 8.500%(1),(2) | | (B-, Caa1) | | 12/20/20 | | | 9.833 | | | | 3,903,862 | | |
| | 1,691 | | | Huntsman International LLC,
LIBOR 1M + 3.000%(1) | | (BBB-, Ba2) | | 04/01/23 | | | 4.242 | | | | 1,702,587 | | |
| | 1,955 | | | Ineos Finance PLC,
EURIBOR 1M + 2.5000%(1),(3) | | (BB+, Ba1) | | 03/31/22 | | | 3.250 | | | | 2,284,616 | | |
| | 3,474 | | | Ineos U.S. Finance LLC,
LIBOR 3M + 2.750%(1) | | (BB+, Ba1) | | 04/01/24 | | | 3.941 | | | | 3,482,452 | | |
| | 3,261 | | | MacDermid, Inc., LIBOR 1M + 3.000%(1) | | (BB-, B2) | | 06/07/23 | | | 4.242 | | | | 3,284,407 | | |
| | 6,814 | | | Preferred Proppants LLC,
LIBOR 1W + 5.750%(1),(2),(6) | | (CCC, Caa2) | | 07/27/20 | | | 7.083 | | | | 6,371,438 | | |
| | 3,019 | | | Preferred Proppants LLC,
LIBOR 1M + 7.750%(1),(2),(6) | | (CCC, Caa2) | | 07/27/20 | | | 9.083 | | | | 2,837,605 | | |
| | 9,638 | | | Ravago Holdings America, Inc.,
LIBOR 2M + 3.250%(1) | | (BB-, B2) | | 06/30/23 | | | 4.070 | | | | 9,701,323 | | |
| | 8,744 | | | Solenis International LP,
LIBOR 3M + 6.750%(1) | | (B-, Caa1) | | 07/31/22 | | | 8.067 | | | | 8,667,835 | | |
| | 2,420 | | | Solenis International LP,
LIBOR 3M + 3.250%(1) | | (B, B2) | | 07/31/21 | | | 4.567 | | | | 2,434,698 | | |
| | 2,479 | | | Sonneborn LLC, LIBOR 1M + 3.750%(1),(2) | | (B+, B1) | | 12/10/20 | | | 4.992 | | | | 2,507,313 | | |
| | 438 | | | Sonneborn Refined Products B.V.,
LIBOR 1M + 3.750%(1),(2) | | (B+, B1) | | 12/10/20 | | | 4.992 | | | | 442,467 | | |
| | 8,903 | | | U.S. Silica Co., LIBOR 3M + 3.000%(1) | | (B+, B1) | | 07/23/20 | | | 4.375 | | | | 8,925,500 | | |
See Accompanying Notes to Financial Statements.
11
Credit Suisse Floating Rate High Income Fund
Schedule of Investments (continued)
October 31, 2017
Par
(000) | |
| | Ratings†
(S&P/Moody's) | | Maturity | | Rate% | | Value | |
| BANK LOANS (continued) | | | |
Chemicals | | | |
$ | 18,250 | | | Univar, Inc., LIBOR 1M + 2.750%(1) | | (BB, B1) | | 07/01/22 | | | 3.992 | | | $ | 18,370,389 | | |
| | 8,070 | | | UTEX Industries, Inc., LIBOR 1M + 4.000%(1) | | (CCC+, Caa1) | | 05/22/21 | | | 5.242 | | | | 7,663,403 | | |
| | 3,000 | | | Vantage Specialty Chemicals, Inc.(4) | | (B-, B3) | | 10/05/24 | | | 5.371 | | | | 3,033,120 | | |
| | 3,978 | | | Vantage Specialty Chemicals, Inc.,
LIBOR 3M + 8.250%(1) | | (CCC, Caa2) | | 10/05/25 | | | 9.621 | | | | 3,988,213 | | |
| | 2,250 | | | Zep, Inc., LIBOR 3M + 8.250%(1) | | (CCC, Caa2) | | 08/11/25 | | | 9.630 | | | | 2,233,125 | | |
| | | | 227,693,512 | | |
| Consumer/Commercial/Lease Financing (0.4%) | | | |
| | 14,776 | | | Infinity Acquisition LLC, LIBOR 3M + 3.000%(1) | | (B+, B1) | | 08/06/21 | | | 4.333 | | | | 14,794,645 | | |
| Department Stores (0.2%) | | | |
| | 7,650 | | | Dollar Tree, Inc.(4) | | (BBB-, Baa3) | | 07/06/22 | | | 4.250 | | | | 7,759,969 | | |
| Diversified Capital Goods (0.9%) | | | |
| | 5,184 | | | Compass Group Diversified Holdings LLC,
LIBOR 1M + 2.250%(1) | | (BB, Ba3) | | 06/04/21 | | | 3.492 | | | | 5,154,139 | | |
| | 15,609 | | | Cortes NP Acquisition Corp.,
LIBOR 1M + 4.000%(1) | | (B+, Ba3) | | 11/30/23 | | | 5.690 | | | | 15,755,601 | | |
| | 1,201 | | | Douglas Dynamics Holdings, Inc.,
LIBOR 1M + 3.000%(1) | | (BB-, B2) | | 12/31/21 | | | 4.250 | | | | 1,210,099 | | |
| | 3,491 | | | Dynacast International LLC, LIBOR 3M + 3.250%(1) | | (B, B1) | | 01/28/22 | | | 4.583 | | | | 3,527,059 | | |
| | 3,776 | | | Electrical Components International, Inc.,
LIBOR 3M + 4.750%(1) | | (B, B1) | | 05/28/21 | | | 6.085 | | | | 3,807,670 | | |
| | 1,674 | | | Horizon Global Corp., LIBOR 1M + 4.500%(1),(2) | | (B+, B1) | | 06/30/21 | | | 5.742 | | | | 1,688,725 | | |
| | | | 31,143,293 | | |
| Electronics (5.1%) | | | |
| | 14,819 | | | Brooks Automation, Inc., LIBOR 3M + 2.500%(1) | | (BB-, B1) | | 10/04/24 | | | 4.010 | | | | 14,902,418 | | |
| | 21,889 | | | Cavium, Inc., LIBOR 1M + 2.250%(1),(2) | | (BB, Ba3) | | 08/16/22 | | | 3.488 | | | | 22,025,357 | | |
| | 6,668 | | | Excelitas Technologies Corp.,
LIBOR 3M + 5.000%(1) | | (B-, B3) | | 10/31/20 | | | 6.340 | | | | 6,694,533 | | |
| | 26,416 | | | M/A-COM Technology Solutions Holdings, Inc.,
LIBOR 1M + 2.250%(1) | | (B+, Ba3) | | 05/17/24 | | | 3.489 | | | | 26,465,726 | | |
| | 19,638 | | | Microsemi Corp., LIBOR 1M + 2.250%(1) | | (BB, Ba2) | | 01/15/23 | | | 3.488 | | | | 19,745,821 | | |
| | 13,435 | | | Oberthur Technologies S.A.,
LIBOR 3M + 3.750%(1) | | (B-, B2) | | 01/10/24 | | | 5.083 | | | | 13,229,298 | | |
| | 7,000 | | | Oberthur Technologies S.A.,
EURIBOR 3M + 7.750%(1),(3) | | (B-, B2) | | 01/10/24 | | | 3.750 | | | | 8,071,390 | | |
| | 21,378 | | | ON Semiconductor Corp.,
LIBOR 1M + 2.250%(1) | | (BB, Ba1) | | 03/31/23 | | | 3.492 | | | | 21,500,630 | | |
| | 13,304 | | | Seattle Spinco, Inc., LIBOR 3M + 2.750%(1) | | (BB-, B1) | | 06/21/24 | | | 3.988 | | | | 13,370,619 | | |
| | 4,164 | | | Semiconductor Components Industries LLC,
LIBOR 3M + 1.750%(1) | | (NR, NR) | | 01/02/18 | | | 3.085 | | | | 4,170,457 | | |
| | 8,566 | | | Sophia LP, LIBOR 3M + 3.250%(1) | | (B, B2) | | 09/30/22 | | | 4.583 | | | | 8,566,291 | | |
| | 19,451 | | | Tempo Acquisition LLC, LIBOR 1M + 3.000%(1) | | (B, B1) | | 05/01/24 | | | 4.242 | | | | 19,542,476 | | |
See Accompanying Notes to Financial Statements.
12
Credit Suisse Floating Rate High Income Fund
Schedule of Investments (continued)
October 31, 2017
Par
(000) | |
| | Ratings†
(S&P/Moody's) | | Maturity | | Rate% | | Value | |
| BANK LOANS (continued) | | | |
Electronics | | | |
$ | 6,965 | | | Veritas Bermuda Ltd.,
EURIBOR 3M + 4.500%(1),(3) | | (B+, B2) | | 01/27/23 | | | 5.500 | | | $ | 8,218,992 | | |
| | | | 186,504,008 | | |
| Energy - Exploration & Production (0.6%) | | | |
| | 9,000 | | | Chief Exploration & Development LLC,
LIBOR 3M + 6.500%(1),(6) | | (NR, NR) | | 05/16/21 | | | 7.959 | | | | 8,835,030 | | |
| | 1,273 | | | Ocean Rig UDW, Inc.(4) | | (B, Caa1) | | 09/20/24 | | | 8.000 | | | | 1,291,942 | | |
| | 13,100 | | | W&T Offshore, Inc., LIBOR 6M + 9.000%(1),(6) | | (CCC, Caa2) | | 05/15/20 | | | 9.000 | | | | 12,477,750 | | |
| | | | 22,604,722 | | |
| Environmental (0.3%) | | | |
| | 10,058 | | | GFL Environmental, Inc., LIBOR 3M + 2.750%(1) | | (BB-, Ba2) | | 09/29/23 | | | 4.083 | | | | 10,108,229 | | |
| Food & Drug Retailers (0.5%) | | | |
| | 3,000 | | | Holland & Barrett International,
EURIBOR 3M + 4.250%(1),(3) | | (B, B2) | | 08/09/24 | | | 4.250 | | | | 3,430,300 | | |
| | 3,000 | | | Holland & Barrett International,
LIBOR 3M + 5.250%(1),(5) | | (B, B2) | | 08/04/24 | | | 5.579 | | | | 3,900,849 | | |
| | 5,130 | | | Rite Aid Corp., LIBOR 1M + 3.875%(1) | | (BB-, B2) | | 06/21/21 | | | 5.125 | | | | 5,153,521 | | |
| | 4,251 | | | Smart & Final Stores LLC,
LIBOR 3M + 3.500%(1) | | (B, B3) | | 11/15/22 | | | 4.833 | | | | 4,124,989 | | |
| | | | 16,609,659 | | |
| Food - Wholesale (1.8%) | | | |
| | 13,695 | | | Allflex Holdings III, Inc., LIBOR 6M + 3.250%(1) | | (B, B2) | | 07/20/20 | | | 4.706 | | | | 13,789,685 | | |
| | 1,000 | | | Allflex Holdings III, Inc., LIBOR 3M + 7.000%(1) | | (B-, B2) | | 07/19/21 | | | 8.363 | | | | 1,007,710 | | |
| | 2,000 | | | Charger OpCo B.V.,
EURIBOR 3M + 2.250%(1),(3) | | (BB, Ba2) | | 11/02/21 | | | 2.250 | | | | 2,343,879 | | |
| | 10,186 | | | Dole Food Co., Inc., LIBOR 3M + 2.750%(1) | | (B-, B1) | | 04/06/24 | | | 4.013 | | | | 10,246,849 | | |
| | 12,162 | | | JBS U.S.A. LLC, LIBOR 1M + 2.500%(1) | | (BB-, B1) | | 10/30/22 | | | 3.739 | | | | 11,933,741 | | |
| | 5,985 | | | Post Holdings, Inc., LIBOR 1M + 2.250%(1) | | (BB-, Ba2) | | 05/24/24 | | | 3.492 | | | | 6,022,945 | | |
| | 20,880 | | | U.S. Foods, Inc., LIBOR 1M + 2.750%(1) | | (BB, B1) | | 06/27/23 | | | 4.000 | | | | 21,078,195 | | |
| | | | 66,423,004 | | |
| Forestry & Paper (0.5%) | | | |
| | 4,959 | | | Pregis Corp., LIBOR 3M + 3.500%(1) | | (B, B3) | | 05/14/21 | | | 4.833 | | | | 4,980,277 | | |
| | 11,521 | | | Proampac PG Borrower LLC,
LIBOR 1M + 4.000%(1) | | (B, B2) | | 11/18/23 | | | 5.295 | | | | 11,648,552 | | |
| | 2,500 | | | Proampac PG Borrower LLC,
LIBOR 3M + 8.500%(1) | | (CCC+, Caa2) | | 11/18/24 | | | 9.816 | | | | 2,543,750 | | |
| | | | 19,172,579 | | |
| Gaming (2.8%) | | | |
| | 7,500 | | | Aristocrat Leisure Ltd., LIBOR 3M + 2.000%(1) | | (BB+, Ba1) | | 10/21/24 | | | 3.357 | | | | 7,548,750 | | |
| | 9,974 | | | Caesars Entertainment Resort Properties LLC,
LIBOR 1M + 3.500%(1) | | (BB, B1) | | 10/11/20 | | | 4.742 | | | | 9,993,693 | | |
| | 7,090 | | | CBAC Borrower LLC, LIBOR 1M + 4.000%(1) | | (B, B3) | | 06/28/24 | | | 5.242 | | | | 7,182,324 | | |
See Accompanying Notes to Financial Statements.
13
Credit Suisse Floating Rate High Income Fund
Schedule of Investments (continued)
October 31, 2017
Par
(000) | |
| | Ratings†
(S&P/Moody's) | | Maturity | | Rate% | | Value | |
| BANK LOANS (continued) | | | |
Gaming | | | |
$ | 17,265 | | | Eldorado Resorts LLC, LIBOR 3M + 2.250%(1) | | (BB, Ba2) | | 04/17/24 | | | 3.500 | | | $ | 17,322,838 | | |
| | 4,000 | | | GVC Holdings PLC, EURIBOR 1M + 3.250%(1),(3) | | (NR, NR) | | 02/28/23 | | | 3.250 | | | | 4,694,748 | | |
| | 11,940 | | | Las Vegas Sands LLC, LIBOR 1M + 2.000%(1) | | (BBB-, Ba1) | | 03/29/24 | | | 3.242 | | | | 12,023,309 | | |
| | 16,577 | | | MGM Growth Properties Operating
Partnership LP, LIBOR 1M + 2.250%(1) | | (BB+, Ba3) | | 04/25/23 | | | 3.492 | | | | 16,689,798 | | |
| | 7,000 | | | The Intertain Group Ltd.,
LIBOR 1M + 6.500%(1),(2),(5) | | (BB, B1) | | 04/08/22 | | | 7.500 | | | | 9,342,133 | | |
| | 7,000 | | | The Intertain Group Ltd.,
LIBOR 3M + 9.000%(1),(5),(6) | | (B, Caa1) | | 12/16/22 | | | 10.000 | | | | 9,644,242 | | |
| | 6,942 | | | The Intertain Group Ltd.,
LIBOR 1M + 6.500%(1) | | (BB, B1) | | 04/08/22 | | | 7.742 | | | | 7,002,831 | | |
| | | | 101,444,666 | | |
| Health Facilities (1.1%) | | | |
| | 15,147 | | | HCA, Inc., LIBOR 1M + 1.500%(1) | | (BBB-, Ba1) | | 06/10/20 | | | 2.742 | | | | 15,178,247 | | |
| | 3,132 | | | HCA, Inc., LIBOR 1M + 2.250%(1) | | (BBB-, Ba1) | | 02/15/24 | | | 3.492 | | | | 3,155,912 | | |
| | 5,431 | | | HCA, Inc., LIBOR 1M + 2.000%(1) | | (BBB-, Ba1) | | 03/17/23 | | | 3.242 | | | | 5,463,142 | | |
| | 6,582 | | | Surgery Center Holdings, Inc.,
LIBOR 1M + 3.250%(1) | | (B, B1) | | 09/02/24 | | | 4.500 | | | | 6,541,962 | | |
| | 11,231 | | | Western Dental Services, Inc.,
LIBOR 1M + 5.250%(1) | | (B-, B3) | | 06/23/23 | | | 6.492 | | | | 11,315,528 | | |
| | | | 41,654,791 | | |
| Health Services (1.5%) | | | |
| | 10,541 | | | Envision Healthcare Corp.,
LIBOR 1M + 3.000%(1) | | (BB-, Ba3) | | 12/01/23 | | | 4.250 | | | | 10,602,094 | | |
| | 3,687 | | | ExamWorks Group, Inc.,
LIBOR 1M + 3.250%(1) | | (B, B1) | | 07/27/23 | | | 4.492 | | | | 3,724,610 | | |
| | 3,713 | | | GHX Ultimate Parent Corp.,
LIBOR 3M + 3.250%(1),(2) | | (B, B2) | | 06/28/24 | | | 4.583 | | | | 3,750,510 | | |
| | 6,890 | | | Onex Carestream Finance LP,
LIBOR 3M + 4.000%(1) | | (B+, B1) | | 06/07/19 | | | 5.333 | | | | 6,914,020 | | |
| | 4,938 | | | Prospect Medical Holdings, Inc.,
LIBOR 6M + 6.000%(1),(2) | | (B, Ba3) | | 06/30/22 | | | 7.500 | | | | 4,993,047 | | |
| | 3,909 | | | Quintiles IMS, Inc., LIBOR 3M + 2.000%(1) | | (BBB-, Ba1) | | 03/07/24 | | | 3.333 | | | | 3,942,753 | | |
| | 18,905 | | | Team Health Holdings, Inc.,
LIBOR 1M + 2.750%(1) | | (B, B1) | | 02/06/24 | | | 3.992 | | | | 18,786,844 | | |
| | 2,999 | | | Valitas Health Services, Inc.,
LIBOR 3M + 3.646%(1),(2),(6) | | (NR, NR) | | 04/14/22 | | | 5.000 | | | | 1,499,653 | | |
| | 1,068 | | | Valitas Health Services, Inc.,
LIBOR 3M + 12.000%(1),(2),(6) | | (NR, NR) | | 12/31/19 | | | 13.312 | | | | 1,014,171 | | |
| | 1,281 | | | Valitas Health Services, Inc.,
LIBOR 3M + 12.000%(1),(2),(6) | | (NR, NR) | | 12/31/19 | | | 13.354 | | | | 1,217,005 | | |
| | | | 56,444,707 | | |
See Accompanying Notes to Financial Statements.
14
Credit Suisse Floating Rate High Income Fund
Schedule of Investments (continued)
October 31, 2017
Par
(000) | |
| | Ratings†
(S&P/Moody's) | | Maturity | | Rate% | | Value | |
| BANK LOANS (continued) | | | |
| Hotels (2.3%) | | | |
$ | 16,772 | | | Belmond Interfin Ltd., LIBOR 1M + 2.750%(1) | | (BB, B2) | | 07/03/24 | | | 3.992 | | | $ | 16,845,342 | | |
| | 1,985 | | | ESH Hospitality, Inc., LIBOR 1M + 2.500%(1) | | (BB+, Ba3) | | 08/30/23 | | | 3.742 | | | | 2,000,294 | | |
| | 17,430 | | | Hilton Worldwide Finance LLC,
LIBOR 1M + 2.000%(1) | | (BBB-, Ba1) | | 10/25/23 | | | 3.238 | | | | 17,567,792 | | |
| | 18,452 | | | La Quinta Intermediate Holdings LLC,
LIBOR 3M + 2.750%(1) | | (BB, B1) | | 04/14/21 | | | 4.109 | | | | 18,590,859 | | |
| | 27,432 | | | Playa Resorts Holding B.V.,
LIBOR 3M + 3.000%(1) | | (BB-, B2) | | 04/05/24 | | | 4.370 | | | | 27,544,492 | | |
| | | | 82,548,779 | | |
| Insurance Brokerage (3.7%) | | | |
| | 21,900 | | | Acrisure LLC, LIBOR 2M + 5.000%(1) | | (B, B2) | | 11/22/23 | | | 6.272 | | | | 22,036,533 | | |
| | 28,453 | | | Alliant Holdings I, Inc., LIBOR 1M + 3.250%(1) | | (B, B2) | | 08/12/22 | | | 4.490 | | | | 28,703,396 | | |
| | 1,000 | | | AmWINS Group, Inc., LIBOR 1M + 6.750%(1) | | (B-, Caa1) | | 01/25/25 | | | 7.992 | | | | 1,022,500 | | |
| | 15,666 | | | AmWINS Group, Inc., LIBOR 1M + 2.750%(1) | | (B+, B1) | | 01/25/24 | | | 3.990 | | | | 15,750,178 | | |
| | 7,487 | | | AssuredPartners, Inc., LIBOR 1M + 3.500%(1) | | (B, B2) | | 10/22/24 | | | 4.742 | | | | 7,584,241 | | |
| | 16,481 | | | Hub International Ltd., LIBOR 3M + 3.000%(1) | | (B, B1) | | 10/02/20 | | | 4.312 | | | | 16,629,681 | | |
| | 3,254 | | | Hyperion Insurance Group Ltd.,
LIBOR 1M + 4.000%(1) | | (B, B1) | | 04/29/22 | | | 5.250 | | | | 3,296,580 | | |
| | 23,085 | | | NFP Corp., LIBOR 1M + 3.500%(1) | | (B, B2) | | 01/08/24 | | | 4.742 | | | | 23,359,139 | | |
| | 15,949 | | | USI, Inc., LIBOR 3M + 3.000%(1) | | (B, B2) | | 05/16/24 | | | 4.314 | | | | 16,008,586 | | |
| | | | 134,390,834 | | |
| Investments & Misc. Financial Services (1.3%) | | | |
| | 15,123 | | | Altisource Solutions Sarl, LIBOR 1M + 3.500%(1) | | (B+, B3) | | 12/09/20 | | | 4.742 | | | | 14,480,206 | | |
| | 5,924 | | | Ocwen Financial Corp., LIBOR 3M + 5.000%(1) | | (B+, B3) | | 12/05/20 | | | 6.238 | | | | 5,946,266 | | |
| | 9,744 | | | VFH Parent LLC, LIBOR 3M + 3.750%(1) | | (B+, Ba2) | | 12/30/21 | | | 5.061 | | | | 9,855,440 | | |
| | 17,373 | | | Walter Investment Management Corp.,
LIBOR 1M + 3.750%(1) | | (CCC-, Caa2) | | 12/18/20 | | | 4.992 | | | | 16,454,024 | | |
| | | | 46,735,936 | | |
| Machinery (0.8%) | | | |
| | 3,483 | | | Clark Equipment Co., LIBOR 3M + 2.750%(1) | | (BB-, B1) | | 05/18/24 | | | 4.083 | | | | 3,513,843 | | |
| | 1,500 | | | CPM Acquisition Corp., LIBOR 1M + 8.250%(1),(2) | | (B-, Caa1) | | 04/10/23 | | | 9.492 | | | | 1,537,500 | | |
| | 4,766 | | | CPM Holdings, Inc., LIBOR 1M + 4.250%(1) | | (B, B1) | | 04/11/22 | | | 5.492 | | | | 4,833,508 | | |
| | 8,952 | | | Doncasters Finance U.S. LLC,
LIBOR 3M + 3.750%(1),(5) | | (B, B3) | | 04/09/20 | | | 4.750 | | | | 11,445,537 | | |
| | 8,762 | | | Welbilt, Inc., LIBOR 1M + 2.750%(1) | | (B+, B1) | | 03/03/23 | | | 3.992 | | | | 8,845,518 | | |
| | | | 30,175,906 | | |
See Accompanying Notes to Financial Statements.
15
Credit Suisse Floating Rate High Income Fund
Schedule of Investments (continued)
October 31, 2017
Par
(000) | |
| | Ratings†
(S&P/Moody's) | | Maturity | | Rate% | | Value | |
| BANK LOANS (continued) | | | |
| Managed Care (0.3%) | | | |
$ | 6,023 | | | Sedgwick Claims Management Services, Inc.,
LIBOR 1M + 2.750%(1) | | (B+, B1) | | 03/01/21 | | | 3.992 | | | $ | 6,062,083 | | |
| | 4,677 | | | Sedgwick Claims Management Services, Inc.,
LIBOR 3M + 3.250%(1) | | (B+, B1) | | 03/01/21 | | | 4.583 | | | | 4,719,925 | | |
| | | | 10,782,008 | | |
| Media Content (1.6%) | | | |
| | 5,000 | | | All3Media International,
LIBOR 6M + 4.250%(1),(5) | | (B, B2) | | 06/30/21 | | | 5.250 | | | | 6,642,974 | | |
| | 1,750 | | | DLG Acquisitions Ltd.,
EURIBOR 6M + 7.250%(1),(3) | | (CCC+, Caa2) | | 06/30/22 | | | 8.250 | | | | 2,055,226 | | |
| | 21,582 | | | EMI Music Publishing Ltd.,
LIBOR 1M + 2.500%(1) | | (BB-, Ba3) | | 08/21/23 | | | 3.738 | | | | 21,728,646 | | |
| | 2,635 | | | Inter Media Communication Srl,
EURIBOR 3M + 5.500%(1),(2),(3) | | (NR, NR) | | 05/28/19 | | | 5.500 | | | | 3,086,655 | | |
| | 208 | | | Marshall Broadcasting Group, Inc.,
LIBOR 1M + 2.000%(1),(2) | | (NR, Ba3) | | 06/28/18 | | | 3.235 | | | | 207,924 | | |
| | 2,417 | | | Mission Broadcasting, Inc.,
LIBOR 1M + 2.500%(1) | | (BB+, Ba3) | | 01/17/24 | | | 3.735 | | | | 2,434,642 | | |
| | 2,971 | | | Nexstar Broadcasting, Inc.,
LIBOR 1M + 2.000%(1),(2) | | (BB+, Ba3) | | 01/17/24 | | | 3.235 | | | | 2,975,081 | | |
| | 19,250 | | | Nexstar Broadcasting, Inc.,
LIBOR 1M + 2.500%(1) | | (BB+, Ba3) | | 01/17/24 | | | 3.735 | | | | 19,391,232 | | |
| | 100 | | | WXXA-TV LLC, LIBOR 1M + 2.000%(1),(2) | | (NR, Ba3) | | 07/19/22 | | | 3.235 | | | | 100,517 | | |
| | | | 58,622,897 | | |
| Medical Products (1.4%) | | | |
| | 15,356 | | | ABB Concise Optical Group LLC,
LIBOR 3M + 5.000%(1) | | (B-, B2) | | 06/15/23 | | | 6.320 | | | | 15,528,979 | | |
| | 12,500 | | | Avantor, Inc., LIBOR 3M + 4.000%(1) | | (B, B2) | | 09/07/24 | | | 5.240 | | | | 12,583,687 | | |
| | 4,444 | | | Convatec, Inc., LIBOR 3M + 2.000%(1) | | (BB, Ba3) | | 10/31/21 | | | 3.333 | | | | 4,452,082 | | |
| | 15,803 | | | VWR Funding, Inc., LIBOR 1M + 2.000%(1) | | (BB, Ba3) | | 09/28/20 | | | 3.242 | | | | 15,813,004 | | |
| | 990 | | | Zest Holdings LLC, LIBOR 1M + 4.250%(1) | | (B, B3) | | 08/16/23 | | | 5.500 | | | | 1,007,957 | | |
| | | | 49,385,709 | | |
| Metals & Mining - Excluding Steel (0.5%) | | | |
| | 1,429 | | | CeramTec Acquisition Corp.,
LIBOR 3M + 2.750%(1) | | (B, Ba3) | | 08/30/20 | | | 4.067 | | | | 1,430,801 | | |
| | 14,998 | | | Faenza Acquisition GmbH(1) | | (B, Ba3) | | 08/30/20 | | | 4.067 | | | | 15,012,262 | | |
| | 1,766 | | | Global Brass & Copper, Inc.,
LIBOR 1M + 3.250%(1),(2) | | (BB-, B2) | | 07/18/23 | | | 4.500 | | | | 1,788,551 | | |
| | 8,431 | | | Noranda Aluminum Acquisition Corp.,
Prime + 3.500%(1),(7) | | (NR, NR) | | 02/28/19 | | | 7.250 | | | | 316,171 | | |
| | | | 18,547,785 | | |
| Non - Electric Utilities (0.2%) | | | |
| | 5,753 | | | BCP Raptor LLC, LIBOR 1W + 4.250%(1) | | (B+, B3) | | 06/24/24 | | | 5.522 | | | | 5,829,135 | | |
See Accompanying Notes to Financial Statements.
16
Credit Suisse Floating Rate High Income Fund
Schedule of Investments (continued)
October 31, 2017
Par
(000) | |
| | Ratings†
(S&P/Moody's) | | Maturity | | Rate% | | Value | |
| BANK LOANS (continued) | | | |
| Oil Field Equipment & Services (0.2%) | | | |
$ | 13,808 | | | Pacific Drilling S.A., LIBOR 3M + 3.500%(1),(6) | | (NR, Caa3) | | 06/03/18 | | | 4.875 | | | $ | 4,606,050 | | |
| | 5,858 | | | Seadrill Partners Finco LLC,
LIBOR 3M + 3.000%(1) | | (CCC+, Caa2) | | 02/21/21 | | | 4.333 | | | | 4,478,780 | | |
| | | | 9,084,830 | | |
| Oil Refining & Marketing (0.4%) | | | |
| | 16,901 | | | Philadelphia Energy Solutions LLC,
LIBOR 3M + 5.000%(1),(6) | | (CCC-, B3) | | 04/04/18 | | | 6.333 | | | | 13,013,646 | | |
| Packaging (1.8%) | | | |
| | 8,681 | | | Berry Plastics Group, Inc.,
LIBOR 1M + 2.250%(1) | | (BB, Ba3) | | 02/08/20 | | | 3.488 | | | | 8,735,429 | | |
| | 12,069 | | | Berry Plastics Group, Inc.,
LIBOR 1M + 2.250%(1) | | (BB, Ba3) | | 01/06/21 | | | 3.488 | | | | 12,141,454 | | |
| | 22,095 | | | Flex Acquisition Co., Inc.,
LIBOR 3M + 3.000%(1) | | (B, B1) | | 12/29/23 | | | 4.335 | | | | 22,282,687 | | |
| | 6,840 | | | Reynolds Group Holdings, Inc.,
LIBOR 1M + 2.750%(1) | | (B+, B1) | | 02/05/23 | | | 3.992 | | | | 6,888,329 | | |
| | 17,163 | | | SIG Combibloc U.S. Acquisition, Inc.,
LIBOR 1M + 3.000%(1) | | (B+, B1) | | 03/13/22 | | | 4.242 | | | | 17,311,434 | | |
| | | | 67,359,333 | | |
| Personal & Household Products (2.2%) | | | |
| | 1,803 | | | Brickman Group Ltd. LLC,
LIBOR 1M + 6.500%(1) | | (CCC+, Caa1) | | 12/17/21 | | | 7.737 | | | | 1,815,111 | | |
| | 2,389 | | | Comfort Holding LLC,
LIBOR 1M + 10.000%(1) | | (CCC-, Caa2) | | 02/03/25 | | | 11.238 | | | | 1,946,713 | | |
| | 14,438 | | | Coty, Inc., LIBOR 1M + 1.750%(1),(2) | | (BB+, Ba1) | | 10/28/21 | | | 2.982 | | | | 14,365,312 | | |
| | 2,100 | | | Galleria Co., LIBOR 1M + 3.000%(1) | | (BB+, Ba1) | | 09/29/23 | | | 4.250 | | | | 2,100,000 | | |
| | 10,000 | | | Keter Group B.V., EURIBOR 3M + 4.250%(1),(3) | | (B, B2) | | 10/31/23 | | | 5.250 | | | | 11,730,580 | | |
| | 3,479 | | | Prestige Brands, Inc., LIBOR 1M + 2.750%(1) | | (BB-, B1) | | 01/26/24 | | | 3.992 | | | | 3,505,839 | | |
| | 17,375 | | | Serta Simmons Bedding LLC,
LIBOR 3M + 3.500%(1) | | (B, B1) | | 11/08/23 | | | 4.830 | | | | 17,163,255 | | |
| | 6,012 | | | Serta Simmons Bedding LLC,
LIBOR 3M + 8.000%(1) | | (CCC+, B3) | | 11/08/24 | | | 9.312 | | | | 5,740,381 | | |
| | 1,843 | | | TricorBraun Holdings, Inc.(4),(8) | | (B, B2) | | 11/30/23 | | | 3.750 | | | | 1,859,937 | | |
| | 18,291 | | | TricorBraun Holdings, Inc.,
LIBOR 3M + 3.750%(1) | | (B, B2) | | 10/30/23 | | | 5.083 | | | | 18,459,877 | | |
| | | | 78,687,005 | | |
| Pharmaceuticals (2.9%) | | | |
| | 3,464 | | | Alkermes, Inc., LIBOR 3M + 2.750%(1),(2) | | (BB, Ba3) | | 09/25/21 | | | 4.070 | | | | 3,496,012 | | |
| | 4,159 | | | Alvogen Pharma U.S., Inc.,
LIBOR 1M + 5.000%(1) | | (B, B3) | | 04/02/22 | | | 6.240 | | | | 4,129,276 | | |
| | 6,519 | | | Amneal Pharmaceuticals LLC,
LIBOR 3M + 3.500%(1) | | (BB-, B1) | | 11/01/19 | | | 4.833 | | | | 6,571,321 | | |
See Accompanying Notes to Financial Statements.
17
Credit Suisse Floating Rate High Income Fund
Schedule of Investments (continued)
October 31, 2017
Par
(000) | |
| | Ratings†
(S&P/Moody's) | | Maturity | | Rate% | | Value | |
| BANK LOANS (continued) | | | |
Pharmaceuticals | | | |
$ | 16,922 | | | Endo Luxembourg Finance Co. I Sarl,
LIBOR 1M + 4.250%(1) | | (BB-, Ba2) | | 04/29/24 | | | 5.500 | | | $ | 17,173,588 | | |
| | 25,634 | | | Grifols Worldwide Operations U.S.A., Inc.,
LIBOR 1W + 2.250%(1) | | (BB, Ba2) | | 01/31/25 | | | 3.452 | | | | 25,754,454 | | |
| | 15,000 | | | Parexel International Corp.,
LIBOR 1M + 3.000%(1) | | (B, B1) | | 09/27/24 | | | 4.242 | | | | 15,159,375 | | |
| | 15,662 | | | RPI Finance Trust, LIBOR 3M + 2.000%(1) | | (BBB-, Baa2) | | 03/27/23 | | | 3.333 | | | | 15,741,600 | | |
| | 17,706 | | | Valeant Pharmaceuticals International, Inc.,
LIBOR 1M + 4.750%(1) | | (BB-, Ba3) | | 04/01/22 | | | 5.990 | | | | 18,117,390 | | |
| | | | 106,143,016 | | |
| Real Estate Development & Management (0.8%) | | | |
| | 4,627 | | | Capital Automotive LP,
LIBOR 1M + 6.000%(1),(2) | | (CCC+, NR) | | 03/24/25 | | | 7.250 | | | | 4,765,892 | | |
| | 24,000 | | | Hanjin International Corp.,
LIBOR 3M + 2.500%(1),(2) | | (B+, Ba3) | | 09/20/20 | | | 3.854 | | | | 24,150,000 | | |
| | | | 28,915,892 | | |
| Real Estate Investment Trusts (2.0%) | | | |
| | 25,154 | | | DTZ U.S. Borrower LLC,
LIBOR 3M + 3.250%(1) | | (B+, B1) | | 11/04/21 | | | 4.586 | | | | 25,329,319 | | |
| | 8,706 | | | iStar, Inc., LIBOR 1M + 3.000%(1),(2) | | (BB-, Ba2) | | 10/01/21 | | | 4.238 | | | | 8,825,416 | | |
| | 13,912 | | | Quality Care Properties, Inc.,
LIBOR 1M + 5.250%(1) | | (B+, Caa1) | | 10/31/22 | | | 6.492 | | | | 14,042,911 | | |
| | 23,300 | | | VICI Properties 1 LLC,
LIBOR 1M + 3.500%(1) | | (NR, NR) | | 10/14/22 | | | 4.738 | | | | 23,362,328 | | |
| | | | 71,559,974 | | |
| Recreation & Travel (0.3%) | | | |
| | 6,000 | | | Legendary Pictures Funding LLC,
LIBOR 3M + 6.000%(1),(2),(6) | | (NR, NR) | | 04/22/20 | | | 7.333 | | | | 5,947,500 | | |
| | 4,250 | | | Richmond UK Bidco Ltd.,
LIBOR 1M + 4.250%(1),(5) | | (B+, B2) | | 03/03/24 | | | 4.654 | | | | 5,643,226 | | |
| | | | 11,590,726 | | |
| Restaurants (1.5%) | | | |
| | 35,014 | | | 1011778 B.C. Unlimited Liability Co.,
LIBOR 1M + 2.250%(1) | | (B+, Ba3) | | 02/16/24 | | | 3.528 | | | | 35,096,817 | | |
| | 7,526 | | | Golden Nugget, Inc., LIBOR 2M + 3.250%(1) | | (B+, Ba3) | | 10/04/23 | | | 4.526 | | | | 7,612,343 | | |
| | 11,773 | | | Pizza Hut Holdings LLC,
LIBOR 1M + 2.000%(1) | | (BBB-, Ba1) | | 06/16/23 | | | 3.237 | | | | 11,867,648 | | |
| | | | 54,576,808 | | |
| Software - Services (9.8%) | | | |
| | 18,320 | | | Almonde, Inc., LIBOR 3M + 3.500%(1) | | (B, B2) | | 06/13/24 | | | 4.817 | | | | 18,290,963 | | |
| | 6,078 | | | Almonde, Inc., LIBOR 3M + 7.250%(1) | | (CCC+, Caa2) | | 06/13/25 | | | 8.567 | | | | 6,055,130 | | |
| | 5,500 | | | Applied Systems, Inc., LIBOR 3M + 3.250%(1) | | (B, B1) | | 09/19/24 | | | 4.574 | | | | 5,578,293 | | |
See Accompanying Notes to Financial Statements.
18
Credit Suisse Floating Rate High Income Fund
Schedule of Investments (continued)
October 31, 2017
Par
(000) | |
| | Ratings†
(S&P/Moody's) | | Maturity | | Rate% | | Value | |
| BANK LOANS (continued) | | | |
Software - Services | | | |
$ | 10,288 | | | Aricent Technologies, LIBOR 1M + 4.500%(1) | | (B-, B2) | | 04/14/21 | | | 5.739 | | | $ | 10,350,718 | | |
| | 4,530 | | | Aricent Technologies, LIBOR 1M + 8.500%(1) | | (CCC, Caa2) | | 04/14/22 | | | 9.739 | | | | 4,562,571 | | |
| | 11,632 | | | Cypress Intermediate Holdings III, Inc.,
LIBOR 1M + 3.000%(1) | | (B, B2) | | 04/27/24 | | | 4.250 | | | | 11,696,654 | | |
| | 9,139 | | | Duff & Phelps Corp., LIBOR 3M + 3.250%(1) | | (B, B2) | | 10/06/24 | | | 4.607 | | | | 9,241,224 | | |
| | 6,115 | | | EagleView Technology Corp.,
LIBOR 3M + 4.250%(1) | | (B, B3) | | 07/22/22 | | | 5.580 | | | | 6,147,702 | | |
| | 13,339 | | | Epicor Software Corp., LIBOR 1M + 3.750%(1) | | (B-, B2) | | 06/01/22 | | | 5.000 | | | | 13,435,999 | | |
| | 9,927 | | | Evertec Group LLC, LIBOR 1M + 2.500%(1) | | (B+, B1) | | 04/17/20 | | | 3.736 | | | | 9,654,430 | | |
| | 977 | | | Evertec Group LLC, LIBOR 1M + 2.500%(1),(2) | | (B+, B1) | | 01/17/20 | | | 3.735 | | | | 952,387 | | |
| | 7,932 | | | Eze Castle Software, Inc.,
LIBOR 3M + 3.000%(1) | | (B, B1) | | 04/06/20 | | | 4.333 | | | | 7,986,843 | | |
| | 931 | | | Eze Castle Software, Inc.,
LIBOR 3M + 6.500%(1) | | (CCC+, Caa1) | | 04/05/21 | | | 7.833 | | | | 933,982 | | |
| | 2,250 | | | Flexera Software LLC,
LIBOR 3M + 3.500%(1) | | (B, B1) | | 04/02/20 | | | 4.830 | | | | 2,269,752 | | |
| | 3,000 | | | Flexera Software LLC,
LIBOR 3M + 7.000%(1),(2) | | (B-, Caa1) | | 04/02/21 | | | 8.330 | | | | 3,003,750 | | |
| | 1,810 | | | Global Payments, Inc., LIBOR 1M + 2.000%(1) | | (BBB-, Ba2) | | 04/21/23 | | | 3.242 | | | | 1,821,879 | | |
| | 19,196 | | | Go Daddy Operating Company LLC,
LIBOR 1M + 2.500%(1) | | (BB-, Ba3) | | 02/15/24 | | | 3.742 | | | | 19,322,506 | | |
| | 4,963 | | | Greeneden U.S. Holdings II LLC,
EURIBOR 3M + 7.750%(1),(3) | | (B, B2) | | 12/01/23 | | | 3.750 | | | | 5,855,800 | | |
| | 22,038 | | | Greeneden U.S. Holdings II LLC,
LIBOR 3M + 3.750%(1) | | (B, B2) | | 12/01/23 | | | 5.083 | | | | 22,213,853 | | |
| | 9,950 | | | Infor (U.S.), Inc., EURIBOR 3M + 7.750%(1),(3) | | (B, B1) | | 02/01/22 | | | 3.750 | | | | 11,679,635 | | |
| | 16,682 | | | Infor (U.S.), Inc., LIBOR 3M + 2.750%(1) | | (B, B1) | | 02/01/22 | | | 4.083 | | | | 16,726,768 | | |
| | 21,686 | | | Kronos, Inc., LIBOR 3M + 3.500%(1) | | (B, B2) | | 11/01/23 | | | 4.811 | | | | 21,865,419 | | |
| | 7,580 | | | Kronos, Inc., LIBOR 3M + 8.250%(1) | | (CCC, Caa2) | | 11/01/24 | | | 9.561 | | | | 7,831,793 | | |
| | 14,919 | | | MA FinanceCo. LLC, LIBOR 1M + 2.500%(1) | | (BB-, B1) | | 11/19/21 | | | 3.742 | | | | 14,983,871 | | |
| | 1,970 | | | MA FinanceCo. LLC, LIBOR 1M + 2.750%(1) | | (BB-, B1) | | 06/21/24 | | | 3.989 | | | | 1,979,880 | | |
| | 5,000 | | | Misys Europe S.A.,
EURIBOR 3M + 3.250%(1),(3) | | (B, B2) | | 06/13/24 | | | 4.250 | | | | 5,853,873 | | |
| | 11,762 | | | Omnitracs, Inc., LIBOR 3M + 3.750%(1) | | (B+, B1) | | 11/25/20 | | | 5.090 | | | | 11,910,776 | | |
| | 7,750 | | | Omnitracs, Inc., LIBOR 3M + 7.750%(1) | | (CCC+, Caa1) | | 05/25/21 | | | 9.090 | | | | 7,782,317 | | |
| | 10,611 | | | Pinnacle Holdco Sarl,
LIBOR 3M + 5.500%(1),(6) | | (CCC, Caa2) | | 07/30/19 | | | 6.840 | | | | 10,518,001 | | |
| | 13,969 | | | Project Alpha Intermediate Holding, Inc.,
LIBOR 3M + 3.500%(1) | | (B, B3) | | 04/26/24 | | | 5.040 | | | | 13,698,684 | | |
| | 6,419 | | | Sabre GLBL, Inc., LIBOR 1M + 2.250%(1) | | (BB-, Ba2) | | 02/22/24 | | | 3.492 | | | | 6,456,392 | | |
| | 10,325 | | | Solera LLC, LIBOR 1M + 3.250%(1) | | (B, Ba3) | | 03/03/23 | | | 4.492 | | | | 10,414,597 | | |
| | 13,497 | | | SS&C Technologies, Inc.,
LIBOR 1M + 2.250%(1) | | (BB+, Ba2) | | 07/08/22 | | | 3.492 | | | | 13,593,614 | | |
| | 619 | | | SS&C Technologies, Inc.,
LIBOR 1M + 2.250%(1) | | (BB+, Ba2) | | 07/08/22 | | | 3.492 | | | | 623,837 | | |
See Accompanying Notes to Financial Statements.
19
Credit Suisse Floating Rate High Income Fund
Schedule of Investments (continued)
October 31, 2017
Par
(000) | |
| | Ratings†
(S&P/Moody's) | | Maturity | | Rate% | | Value | |
| BANK LOANS (continued) | | | |
Software - Services | | | |
$ | 7,779 | | | Sungard Availability Services Capital, Inc.,
LIBOR 1M + 5.000%(1),(6) | | (B, B1) | | 03/31/19 | | | 6.242 | | | $ | 7,263,475 | | |
| | 2,418 | | | Symantec Corp., LIBOR 2M + 1.750%(1) | | (BB+, NR) | | 08/01/21 | | | 3.030 | | | | 2,415,149 | | |
| | 5,162 | | | Syniverse Holdings, Inc.,
LIBOR 3M + 3.000%(1) | | (B, B3) | | 04/23/19 | | | 4.333 | | | | 5,040,371 | | |
| | 6,090 | | | Syniverse Holdings, Inc.,
LIBOR 3M + 3.000%(1) | | (B, B3) | | 04/23/19 | | | 4.242 | | | | 5,945,956 | | |
| | 10,978 | | | Verint Systems, Inc., LIBOR 3M + 2.250%(1) | | (BBB-, Ba2) | | 06/29/24 | | | 3.561 | | | | 11,025,527 | | |
| | 3,195 | | | Wall Street Systems Delaware, Inc.,
LIBOR 3M + 3.500%(1) | | (B, B2) | | 08/26/23 | | | 4.833 | | | | 3,218,422 | | |
| | 4,200 | | | Wall Street Systems Delaware, Inc.,
EURIBOR 3M + 3.250%(1),(3) | | (B, B2) | | 08/26/23 | | | 4.250 | | | | 4,921,317 | | |
| | | | 355,124,110 | | |
| Specialty Retail (0.2%) | | | |
| | 4,987 | | | BJ's Wholesale Club, Inc.,
LIBOR 1M + 3.750%(1) | | (B-, B3) | | 02/03/24 | | | 4.988 | | | | 4,874,054 | | |
| | 3,430 | | | Sally Holdings, LLC, LIBOR 1M + 2.500%(1) | | (BBB-, Ba1) | | 07/05/24 | | | 3.750 | | | | 3,438,575 | | |
| | | | 8,312,629 | | |
| Steel Producers/Products (0.3%) | | | |
| | 12,504 | | | Zekelman Industries, Inc.,
LIBOR 3M + 2.750%(1) | | (BB-, B2) | | 06/14/21 | | | 4.073 | | | | 12,611,241 | | |
| Support - Services (4.5%) | | | |
| | 15,959 | | | Allied Universal Holdco LLC,
LIBOR 3M + 3.750%(1) | | (B+, B2) | | 07/28/22 | | | 5.083 | | | | 15,928,133 | | |
| | 19,921 | | | BakerCorp International, Inc.,
LIBOR 3M + 3.000%(1) | | (B-, B2) | | 02/07/20 | | | 4.380 | | | | 19,643,201 | | |
| | 30,174 | | | Brand Energy & Infrastructure Services, Inc.,
LIBOR 3M + 4.250%(1) | | (B, B3) | | 06/21/24 | | | 5.615 | | | | 30,400,683 | | |
| | 31,546 | | | Change Healthcare Holdings, Inc.,
LIBOR 1M + 2.750%(1) | | (B+, Ba3) | | 03/01/24 | | | 3.992 | | | | 31,762,581 | | |
| | 8,447 | | | SAI Global Ltd., LIBOR 3M + 4.500%(1),(2) | | (B+, Ba3) | | 12/20/23 | | | 5.833 | | | | 8,553,094 | | |
| | 1,279 | | | SGS Cayman LP, LIBOR 3M + 5.375%(1),(2) | | (BB-, Caa1) | | 04/23/21 | | | 6.708 | | | | 1,231,321 | | |
| | 1,949 | | | Sprint Industrial Holdings LLC,
LIBOR 3M + 5.750%(1),(6) | | (CCC+, Caa1) | | 05/14/19 | | | 7.083 | | | | 1,788,308 | | |
| | 2,485 | | | Sprint Industrial Holdings LLC,
LIBOR 3M + 12.250%(1),(6) | | (CC, Caa3) | | 11/14/19 | | | 13.500 | | | | 678,489 | | |
| | 13,840 | | | Sterigenics-Nordion Holdings LLC,
LIBOR 1M + 3.000%(1) | | (B, B1) | | 05/15/22 | | | 4.242 | | | | 13,870,760 | | |
| | 5,496 | | | Sutherland Global Services, Inc.,
LIBOR 3M + 5.375%(1),(2) | | (BB-, Caa1) | | 04/23/21 | | | 6.708 | | | | 5,289,694 | | |
| | 12,438 | | | The Geo Group, Inc., LIBOR 3M + 2.250%(1) | | (BB+, Ba3) | | 03/22/24 | | | 3.570 | | | | 12,463,370 | | |
| | 3,273 | | | USS Ultimate Holdings, Inc.,
LIBOR 3M + 7.750%(1) | | (CCC+, Caa2) | | 08/25/25 | | | 8.992 | | | | 3,304,096 | | |
See Accompanying Notes to Financial Statements.
20
Credit Suisse Floating Rate High Income Fund
Schedule of Investments (continued)
October 31, 2017
Par
(000) | |
| | Ratings†
(S&P/Moody's) | | Maturity | | Rate% | | Value | |
| BANK LOANS (continued) | | | |
Support - Services | | | |
$ | 10,364 | | | Xerox Business Services LLC,
LIBOR 1M + 2.250%(1),(2) | | (BB+, Ba2) | | 11/18/21 | | | 3.492 | | | $ | 10,390,020 | | |
| | 7,500 | | | Xerox Business Services LLC,
EURIBOR 3M + 2.250%(1),(3) | | (BB+, Ba2) | | 11/18/21 | | | 2.250 | | | | 8,731,664 | | |
| | | | 164,035,414 | | |
| Tech Hardware & Equipment (1.2%) | | | |
| | 3,157 | | | Avaya, Inc., LIBOR 1M + 7.500%(1) | | (BB-, NR) | | 01/24/18 | | | 8.741 | | | | 3,176,401 | | |
| | 14,946 | | | CommScope, Inc., LIBOR 3M + 2.000%(1) | | (BB+, Baa3) | | 12/29/22 | | | 3.366 | | | | 15,032,862 | | |
| | 15,967 | | | Dell, Inc., LIBOR 1M + 1.500%(1) | | (BBB-, Baa3) | | 12/31/18 | | | 2.750 | | | | 15,995,487 | | |
| | 10,888 | | | Western Digital Corp., LIBOR 1M + 2.750%(1) | | (BBB-, Ba1) | | 04/29/23 | | | 3.990 | | | | 10,948,968 | | |
| | | | 45,153,718 | | |
| Telecom - Wireless (1.3%) | | | |
| | 10,815 | | | SBA Senior Finance II LLC,
LIBOR 1M + 2.250%(1) | | (BB, B1) | | 06/10/22 | | | 3.500 | | | | 10,865,083 | | |
| | 35,232 | | | Sprint Communications, Inc.,
LIBOR 1M + 2.500%(1) | | (BB-, Ba2) | | 02/02/24 | | | 3.750 | | | | 35,404,908 | | |
| | | | 46,269,991 | | |
| Telecom - Wireline Integrated & Services (3.5%) | | | |
| | 19,975 | | | CenturyLink, Inc.(4) | | (BBB-, Ba3) | | 01/31/25 | | | 2.750 | | | | 19,756,573 | | |
| | 3,904 | | | Ciena Corp., LIBOR 1M + 2.500%(1) | | (BB+, Ba2) | | 01/28/22 | | | 3.739 | | | | 3,923,812 | | |
| | 10,952 | | | Equinix, Inc., EURIBOR 3M + 2.500%(1),(3) | | (BBB-, Ba2) | | 01/05/24 | | | 2.500 | | | | 12,845,982 | | |
| | 4,925 | | | Equinix, Inc., LIBOR 3M + 3.000%(1),(5) | | (BBB-, Ba2) | | 01/09/23 | | | 3.330 | | | | 6,564,683 | | |
| | 29,780 | | | Level 3 Financing, Inc.,
LIBOR 1M + 2.250%(1) | | (BBB-, Ba1) | | 02/22/24 | | | 3.489 | | | | 29,931,580 | | |
| | 18,443 | | | LTS Buyer LLC(4) | | (B, B1) | | 04/13/20 | | | 6.500 | | | | 18,512,620 | | |
| | 5,000 | | | Ufinet Telecom Holding S.L.U.,
EURIBOR 3M + 3.500%(1),(3) | | (B, B2) | | 06/30/23 | | | 3.500 | | | | 5,861,154 | | |
| | 29,568 | | | Zayo Group LLC, LIBOR 1M + 2.250%(1) | | (BB, Ba2) | | 01/19/24 | | | 3.489 | | | | 29,722,178 | | |
| | | | 127,118,582 | | |
| Theaters & Entertainment (1.7%) | | | |
| | 8,068 | | | Lions Gate Entertainment Corp.,
LIBOR 1M + 3.000%(1) | | (BB-, Ba2) | | 12/08/23 | | | 4.242 | | | | 8,138,691 | | |
| | 11,855 | | | Live Nation Entertainment, Inc.,
LIBOR 1M + 2.250%(1) | | (BB, Ba1) | | 10/31/23 | | | 3.500 | | | | 11,931,339 | | |
| | 327 | | | NEG Holdings LLC,
LIBOR 3M + 8.000%(1),(2),(6),(9) | | (NR, NR) | | 10/17/22 | | | 9.333 | | | | 283,390 | | |
| | 3,000 | | | Technicolor S.A.,
EURIBOR 3M + 3.000%(1),(3) | | (BB-, Ba3) | | 12/31/23 | | | 3.000 | | | | 3,505,334 | | |
| | 2,488 | | | Technicolor S.A., LIBOR 3M + 2.750%(1) | | (BB-, Ba3) | | 12/31/23 | | | 4.067 | | | | 2,497,612 | | |
| | 6,500 | | | Technicolor S.A., EURIBOR 3M + 3.500%(1),(3) | | (BB-, Ba3) | | 11/18/23 | | | 3.500 | | | | 7,606,249 | | |
| | 23,013 | | | William Morris Endeavor Entertainment LLC,
LIBOR 3M + 3.250%(1) | | (B+, B1) | | 05/06/21 | | | 4.640 | | | | 23,211,794 | | |
See Accompanying Notes to Financial Statements.
21
Credit Suisse Floating Rate High Income Fund
Schedule of Investments (continued)
October 31, 2017
Par
(000) | |
| | Ratings†
(S&P/Moody's) | | Maturity | | Rate% | | Value | |
| BANK LOANS (continued) | | | |
Theaters & Entertainment | | | |
$ | 3,800 | | | William Morris Endeavor Entertainment LLC,
LIBOR 3M + 7.250%(1),(2) | | (B-, Caa1) | | 05/06/22 | | | 8.630 | | | $ | 3,828,500 | | |
| | | | 61,002,909 | | |
| Transport Infrastructure/Services (0.4%) | | | |
| | 5,919 | | | AI Mistral Holdco Ltd., LIBOR 1M + 3.000%(1) | | (B, B1) | | 03/09/24 | | | 4.242 | | | | 5,893,445 | | |
| | 5,000 | | | MSX International, Inc.,
EURIBOR 3M + 5.500%(1),(3) | | (NR, NR) | | 01/06/24 | | | 5.500 | | | | 5,884,453 | | |
| | 3,622 | | | PODS LLC, LIBOR 1M + 3.250%(1),(6) | | (B+, B2) | | 02/02/22 | | | 4.485 | | | | 3,648,992 | | |
| | | | 15,426,890 | | |
| Trucking & Delivery (0.7%) | | | |
| | 11,700 | | | Navios Maritime Partners LP,
LIBOR 3M + 5.000%(1) | | (B+, B3) | | 09/14/20 | | | 6.320 | | | | 11,689,063 | | |
| | 13,722 | | | XPO Logistics, Inc., LIBOR 3M + 2.250%(1) | | (BB+, Ba1) | | 11/01/21 | | | 3.599 | | | | 13,819,238 | | |
| | | | 25,508,301 | | |
| TOTAL BANK LOANS (Cost $2,996,917,514) | | | 3,006,849,917 | | |
| CORPORATE BONDS (10.0%) | | | |
| Auto Parts & Equipment (0.2%) | | | |
| | 5,750 | | | Cooper-Standard Automotive, Inc.,
Rule 144A, Company Guaranteed Notes
(Callable 11/15/21 @ 102.81)(10) | | (B+, B2) | | 11/15/26 | | | 5.625 | | | | 5,980,000 | | |
| Automakers (0.0%) | | | |
| | 1,000 | | | Ford Motor Credit Co. LLC, Global Senior
Unsecured Notes, LIBOR 3M + 0.570%(1) | | (BBB, Baa2) | | 12/06/17 | | | 1.886 | | | | 1,000,364 | | |
| Banking (0.0%) | | | |
| | 1,600 | | | HSBC U.S.A., Inc., Senior Unsecured Notes,
LIBOR 3M + 0.340%(1) | | (A, A2) | | 11/13/17 | | | 1.649 | | | | 1,600,157 | | |
| Brokerage (0.3%) | | | |
| | 1,800 | | | Jefferies Finance LLC, Rule 144A,
Senior Unsecured Notes
(Callable 12/01/17 @ 105.16)(10) | | (B, B1) | | 04/15/22 | | | 6.875 | | | | 1,827,000 | | |
| | 5,000 | | | Jefferies Finance LLC, Rule 144A,
Senior Unsecured Notes
(Callable 12/01/17 @ 105.63)(10) | | (B, B1) | | 04/15/21 | | | 7.500 | | | | 5,237,500 | | |
| | 3,500 | | | LPL Holdings, Inc., Rule 144A,
Company Guaranteed Notes
(Callable 03/15/20 @ 104.31)(10) | | (B+, B2) | | 09/15/25 | | | 5.750 | | | | 3,648,750 | | |
| | | | 10,713,250 | | |
See Accompanying Notes to Financial Statements.
22
Credit Suisse Floating Rate High Income Fund
Schedule of Investments (continued)
October 31, 2017
Par
(000) | |
| | Ratings†
(S&P/Moody's) | | Maturity | | Rate% | | Value | |
| CORPORATE BONDS (continued) | | | |
| Building Materials (0.6%) | | | |
$ | 2,000 | | | American Builders & Contractors
Supply Co., Inc., Rule 144A,
Senior Unsecured Notes
(Callable 12/15/18 @ 104.31)(10) | | (B+, B3) | | 12/15/23 | | | 5.750 | | | $ | 2,130,000 | | |
| | 15,500 | | | Omnimax International, Inc., Rule 144A,
Senior Secured Notes
(Callable 02/15/18 @ 109.00)(10) | | (B-, Caa1) | | 08/15/20 | | | 12.000 | | | | 16,856,250 | | |
| | 3,000 | | | PriSo Acquisition Corp., Rule 144A,
Senior Unsecured Notes
(Callable 05/15/18 @ 104.50)(10) | | (CCC+, Caa1) | | 05/15/23 | | | 9.000 | | | | 3,172,500 | | |
| | 1,496 | | | U.S. Concrete, Inc.,
Global Company Guaranteed Notes
(Callable 06/01/19 @ 104.78) | | (BB-, B2) | | 06/01/24 | | | 6.375 | | | | 1,615,680 | | |
| | | | 23,774,430 | | |
| Cable & Satellite TV (0.9%) | | | |
| | 755 | | | Altice Financing S.A., Rule 144A,
Senior Secured Notes
(Callable 02/15/18 @ 104.97)(10) | | (BB-, B1) | | 02/15/23 | | | 6.625 | | | | 797,733 | | |
| | 4,000 | | | Altice Financing S.A., Rule 144A,
Senior Secured Notes
(Callable 05/15/21 @ 103.75)(10) | | (BB-, B1) | | 05/15/26 | | | 7.500 | | | | 4,395,000 | | |
| | 3,200 | | | Altice U.S. Finance I Corp., Rule 144A,
Senior Secured Notes
(Callable 05/15/21 @ 102.75)(10) | | (BB, Ba3) | | 05/15/26 | | | 5.500 | | | | 3,336,000 | | |
| | 3,900 | | | Block Communications, Inc.,
Rule 144A, Senior Unsecured Notes
(Callable 02/15/20 @ 103.44)(10) | | (BB-, Ba3) | | 02/15/25 | | | 6.875 | | | | 4,231,500 | | |
| | 1,000 | | | CSC Holdings LLC, Rule 144A,
Company Guaranteed Notes
(Callable 10/15/20 @ 103.31)(10) | | (BB, Ba1) | | 10/15/25 | | | 6.625 | | | | 1,098,500 | | |
| | 1,008 | | | CSC Holdings LLC, Rule 144A,
Senior Unsecured Notes
(Callable 10/15/20 @ 105.44)(10) | | (B, B2) | | 10/15/25 | | | 10.875 | | | | 1,237,320 | | |
| | 5,000 | | | SFR Group S.A., Rule 144A,
Senior Secured Notes
(Callable 05/01/21 @ 103.69)(10) | | (B+, B1) | | 05/01/26 | | | 7.375 | | | | 5,393,750 | | |
| | 9,000 | | | SFR Group S.A., Rule 144A,
Senior Secured Notes
(Callable 12/01/17 @ 104.50)(10) | | (B+, B1) | | 05/15/22 | | | 6.000 | | | | 9,393,750 | | |
| | 2,730 | | | Ziggo Secured Finance B.V.,
Rule 144A, Senior Secured Notes
(Callable 01/15/22 @ 102.75)(10) | | (BB-, Ba3) | | 01/15/27 | | | 5.500 | | | | 2,791,425 | | |
| | | | 32,674,978 | | |
See Accompanying Notes to Financial Statements.
23
Credit Suisse Floating Rate High Income Fund
Schedule of Investments (continued)
October 31, 2017
Par
(000) | |
| | Ratings†
(S&P/Moody's) | | Maturity | | Rate% | | Value | |
| CORPORATE BONDS (continued) | | | |
| Chemicals (0.2%) | | | |
$ | 2,500 | | | Kronos International, Inc., Reg S,
Senior Secured Notes
(Callable 09/15/20 @ 102.81)(3),(11) | | (B+, B2) | | 09/15/25 | | | 3.750 | | | $ | 3,048,304 | | |
| | 2,000 | | | Nufarm Australia Ltd., Rule 144A,
Company Guaranteed Notes
(Callable 12/01/17 @ 101.59)(10) | | (B+, B1) | | 10/15/19 | | | 6.375 | | | | 2,037,500 | | |
| | 3,839 | | | Westlake Chemical Corp.,
Global Company Guaranteed Notes
(Callable 05/15/18 @ 102.44) | | (BBB, Baa3) | | 05/15/23 | | | 4.875 | | | | 3,987,761 | | |
| | | | 9,073,565 | | |
| Consumer/Commercial/Lease Financing (0.2%) | | | |
| | 6,630 | | | Infinity Acquisition Finance Corp.,
Rule 144A, Senior Unsecured Notes
(Callable 11/16/17 @ 103.63)(10) | | (CCC+, Caa2) | | 08/01/22 | | | 7.250 | | | | 6,596,850 | | |
| Diversified Capital Goods (0.3%) | | | |
| | 9,525 | | | TriMas Corp., Rule 144A,
Company Guaranteed Notes
(Callable 10/15/20 @ 102.44)(10) | | (B+, B1) | | 10/15/25 | | | 4.875 | | | | 9,650,016 | | |
| Electronics (0.3%) | | | |
| | 10,000 | | | Intel Corp., Global Senior Unsecured Notes | | (A+, A1) | | 12/15/17 | | | 1.350 | | | | 10,000,325 | | |
| Energy - Exploration & Production (0.3%) | | | |
| | 6,000 | | | Chevron Corp., Global Senior Unsecured Notes,
LIBOR 3M + 0.360%(1) | | (AA-, Aa2) | | 11/09/17 | | | 1.671 | | | | 6,000,462 | | |
| | 3,800 | | | Oasis Petroleum, Inc.,
Company Guaranteed Notes
(Callable 12/01/17 @ 102.17)(12) | | (BB-, B3) | | 11/01/21 | | | 6.500 | | | | 3,885,500 | | |
| | | | 9,885,962 | | |
| Gas Distribution (0.1%) | | | |
| | 2,250 | | | Energy Transfer Equity LP, Senior
Secured Notes | | (BB-, Ba2) | | 10/15/20 | | | 7.500 | | | | 2,542,500 | | |
| | 750 | | | Genesis Energy Finance Corp.,
Global Company Guaranteed Notes
(Callable 12/01/17 @ 102.88) | | (BB-, B1) | | 02/15/21 | | | 5.750 | | | | 765,300 | | |
| | | | 3,307,800 | | |
| Health Services (0.3%) | | | |
| | 10,406 | | | AMN Healthcare, Inc., Rule 144A,
Company Guaranteed Notes
(Callable 10/01/19 @ 103.84)(10) | | (BB-, Ba2) | | 10/01/24 | | | 5.125 | | | | 10,770,210 | | |
See Accompanying Notes to Financial Statements.
24
Credit Suisse Floating Rate High Income Fund
Schedule of Investments (continued)
October 31, 2017
Par
(000) | |
| | Ratings†
(S&P/Moody's) | | Maturity | | Rate% | | Value | |
| CORPORATE BONDS (continued) | | | |
| Insurance Brokerage (0.5%) | | | |
$ | 1,000 | | | AssuredPartners, Inc., Rule 144A,
Senior Unsecured Notes
(Callable 08/15/20 @ 103.50)(10) | | (CCC+, Caa2) | | 08/15/25 | | | 7.000 | | | $ | 1,045,000 | | |
| | 18,900 | | | Hub Holdings Finance, Inc., 8.125%
Cash, 8.875% PIK, Rule 144A,
Senior Unsecured Notes
(Callable 12/01/17 @ 100.00)(10),(13) | | (CCC+, Caa2) | | 07/15/19 | | | 17.000 | | | | 18,970,875 | | |
| | | | 20,015,875 | | |
| Investments & Misc. Financial Services (0.1%) | | | |
| | 2,000 | | | Cabot Financial Luxembourg S.A., Rule 144A,
Senior Secured Notes
(Callable 11/30/17 @ 104.19)(5),(10) | | (B+, B2) | | 08/01/20 | | | 8.375 | | | | 2,787,201 | | |
| Media - Diversified (0.2%) | | | |
| | 4,609 | | | National CineMedia LLC,
Global Senior Secured Notes
(Callable 12/01/17 @ 103.00) | | (B+, Ba3) | | 04/15/22 | | | 6.000 | | | | 4,724,225 | | |
| | 2,500 | | | National CineMedia LLC,
Global Senior Unsecured Notes
(Callable 08/15/21 @ 102.88) | | (B-, B3) | | 08/15/26 | | | 5.750 | | | | 2,318,750 | | |
| | | | 7,042,975 | | |
| Media Content (0.1%) | | | |
| | 3,500 | | | EMI Music Publishing Group
North America Holdings, Inc.,
Rule 144A, Company Guaranteed Notes
(Callable 06/15/19 @ 105.72)(10) | | (B, B3) | | 06/15/24 | | | 7.625 | | | | 3,924,375 | | |
| Medical Products (0.0%) | | | |
| | 710 | | | Alere, Inc., Global Company Guaranteed Notes
(Callable 11/02/17 @ 100.00) | | (NR, B3) | | 07/01/18 | | | 7.250 | | | | 710,355 | | |
| Metals & Mining - Excluding Steel (0.4%) | | | |
| | 5,000 | | | Kaiser Aluminum Corp., Global Company
Guaranteed Notes
(Callable 05/15/19 @ 104.41) | | (BB+, Ba3) | | 05/15/24 | | | 5.875 | | | | 5,393,750 | | |
| | 2,100 | | | Noranda Aluminum Acquisition Corp.,
Global Company Guaranteed Notes
(Callable 12/01/17 @ 102.75)(6),(7) | | (NR, NR) | | 06/01/19 | | | 11.000 | | | | 126 | | |
| | 7,770 | | | Taseko Mines Ltd., Rule 144A,
Senior Secured Notes
(Callable 06/15/19 @ 104.38)(10),(12) | | (B-, B3) | | 06/15/22 | | | 8.750 | | | | 7,905,975 | | |
| | | | 13,299,851 | | |
See Accompanying Notes to Financial Statements.
25
Credit Suisse Floating Rate High Income Fund
Schedule of Investments (continued)
October 31, 2017
Par
(000) | |
| | Ratings†
(S&P/Moody's) | | Maturity | | Rate% | | Value | |
| CORPORATE BONDS (continued) | | | |
| Oil Field Equipment & Services (0.7%) | | | |
$ | 5,600 | | | FTS International, Inc., Global Senior Secured
Notes (Callable 12/01/17 @ 104.69) | | (CCC+, Caa2) | | 05/01/22 | | | 6.250 | | | $ | 5,460,000 | | |
| | 4,518 | | | Pacific Drilling V Ltd., Rule 144A, Senior
Secured Notes(10) | | (NR, Ca) | | 12/01/17 | | | 7.250 | | | | 2,010,510 | | |
| | 5,250 | | | Pioneer Energy Services Corp.,
Global Company Guaranteed Notes
(Callable 12/01/17 @ 104.59) | | (B-, Ca) | | 03/15/22 | | | 6.125 | | | | 4,488,750 | | |
| | 2,650 | | | Shelf Drilling Holdings Ltd., Rule 144A,
Secured Notes
(Callable 12/01/17 @ 100.00)(10) | | (B-, B2) | | 11/01/18 | | | 8.625 | | | | 2,659,937 | | |
| | 10,229 | | | Shelf Drilling Holdings Ltd., Rule 144A,
Secured Notes
(Callable 12/01/17 @ 104.31)(10) | | (B-, B2) | | 11/02/20 | | | 9.500 | | | | 10,433,264 | | |
| | | | 25,052,461 | | |
| Oil Refining & Marketing (0.2%) | | | |
| | 7,522 | | | Coffeyville Finance, Inc., Global Company
Guaranteed Notes
(Callable 12/01/17 @ 103.25) | | (BB-, B1) | | 11/01/22 | | | 6.500 | | | | 7,766,465 | | |
| Packaging (0.2%) | | | |
| | 3,500 | | | Ardagh Holdings U.S.A., Inc., Rule 144A,
Senior Secured Notes
(Callable 05/15/19 @ 102.31)(10) | | (BB, Ba3) | | 05/15/23 | | | 4.625 | | | | 3,609,375 | | |
| | 900 | | | Flex Acquisition Co., Inc., Rule 144A,
Senior Unsecured Notes
(Callable 01/15/20 @ 103.44)(10) | | (CCC+, Caa1) | | 01/15/25 | | | 6.875 | | | | 932,063 | | |
| | 2,200 | | | Owens-Brockway Glass Container, Inc.,
Rule 144A, Company Guaranteed Notes(10) | | (BB-, B1) | | 08/15/23 | | | 5.875 | | | | 2,418,625 | | |
| | | | 6,960,063 | | |
| Pharmaceuticals (0.2%) | | | |
| | 1,000 | | | Valeant Pharmaceuticals International, Inc.,
Rule 144A, Company Guaranteed Notes
(Callable 04/15/20 @ 103.06)(10) | | (B-, Caa1) | | 04/15/25 | | | 6.125 | | | | 843,750 | | |
| | 650 | | | Valeant Pharmaceuticals International, Inc.,
Rule 144A, Company Guaranteed Notes
(Callable 05/15/18 @ 102.94)(10) | | (B-, Caa1) | | 05/15/23 | | | 5.875 | | | | 550,875 | | |
| | 5,000 | | | Valeant Pharmaceuticals International, Inc.,
Rule 144A, Senior Secured Notes
(Callable 03/15/19 @ 103.25)(10) | | (BB-, Ba3) | | 03/15/22 | | | 6.500 | | | | 5,312,500 | | |
| | | | 6,707,125 | | |
See Accompanying Notes to Financial Statements.
26
Credit Suisse Floating Rate High Income Fund
Schedule of Investments (continued)
October 31, 2017
Par
(000) | |
| | Ratings†
(S&P/Moody's) | | Maturity | | Rate% | | Value | |
| CORPORATE BONDS (continued) | | | |
| Real Estate Investment Trusts (0.7%) | | | |
$ | 3,850 | | | iStar, Inc., Senior Unsecured Notes
(Callable 06/15/20 @ 100.00) | | (BB-, B1) | | 09/15/20 | | | 4.625 | | | $ | 3,941,438 | | |
| | 1,000 | | | iStar, Inc., Senior Unsecured Notes
(Callable 07/01/18 @ 103.25) | | (BB-, B1) | | 07/01/21 | | | 6.500 | | | | 1,048,750 | | |
| | 5,000 | | | iStar, Inc., Senior Unsecured Notes
(Callable 09/15/19 @ 102.63) | | (BB-, B1) | | 09/15/22 | | | 5.250 | | | | 5,137,500 | | |
| | 5,900 | | | iStar, Inc., Senior Unsecured Notes
(Callable 12/01/17 @ 101.25) | | (BB-, B1) | | 07/01/19 | | | 5.000 | | | | 5,962,687 | | |
| | 2,000 | | | Starwood Property Trust, Inc.,
Global Senior Unsecured Notes
(Callable 09/15/21 @ 100.00) | | (BB-, Ba3) | | 12/15/21 | | | 5.000 | | | | 2,100,000 | | |
| | 7,700 | | | VICI FC, Inc., Global Senior Secured Notes
(Callable 10/15/18 @ 103.00),
LIBOR 3M + 3.500%(1),(12) | | (NR, NR) | | 10/15/22 | | | 4.847 | | | | 7,777,000 | | |
| | | | 25,967,375 | | |
| Recreation & Travel (0.4%) | | | |
| | 4,000 | | | Six Flags Entertainment Corp., Rule 144A,
Company Guaranteed Notes
(Callable 04/15/22 @ 102.75)(10) | | (BB-, B2) | | 04/15/27 | | | 5.500 | | | | 4,185,000 | | |
| | 9,228 | | | Six Flags Entertainment Corp., Rule 144A,
Company Guaranteed Notes
(Callable 07/31/19 @ 103.66)(10) | | (BB-, B2) | | 07/31/24 | | | 4.875 | | | | 9,516,375 | | |
| | | | 13,701,375 | | |
| Software - Services (0.4%) | | | |
| | 7,270 | | | CDK Global, Inc., Rule 144A,
Senior Unsecured Notes
(Callable 06/01/22 @ 102.44)(10) | | (BB+, Ba1) | | 06/01/27 | | | 4.875 | | | | 7,597,150 | | |
| | 3,000 | | | Epicor Software Corp.(2) | | (CCC, Caa2) | | 06/01/23 | | | 9.585 | | | | 3,007,500 | | |
| | 5,500 | | | First Data Corp., Rule 144A, Secured Notes
(Callable 01/15/19 @ 102.88)(10) | | (B, B3) | | 01/15/24 | | | 5.750 | | | | 5,775,000 | | |
| | | | 16,379,650 | | |
| Specialty Retail (0.2%) | | | |
| | 1,000 | | | Penske Automotive Group, Inc.,
Company Guaranteed Notes
(Callable 12/01/19 @ 102.69) | | (B+, B1) | | 12/01/24 | | | 5.375 | | | | 1,030,000 | | |
| | 7,000 | | | Penske Automotive Group, Inc.,
Global Company Guaranteed Notes
(Callable 12/01/17 @ 102.88) | | (B+, B1) | | 10/01/22 | | | 5.750 | | | | 7,225,365 | | |
| | | | 8,255,365 | | |
See Accompanying Notes to Financial Statements.
27
Credit Suisse Floating Rate High Income Fund
Schedule of Investments (continued)
October 31, 2017
Par
(000) | |
| | Ratings†
(S&P/Moody's) | | Maturity | | Rate% | | Value | |
| CORPORATE BONDS (continued) | | | |
| Support - Services (0.3%) | | | |
$ | 5,200 | | | Avison Young Canada, Inc., Rule 144A,
Senior Secured Notes
(Callable 12/15/19 @ 104.75)(10) | | (B+, B3) | | 12/15/21 | | | 9.500 | | | $ | 5,302,700 | | |
| | 1,000 | | | Conduent Business Services LLC,
Rule 144A, Company Guaranteed Notes
(Callable 12/15/20 @ 105.25)(10) | | (B+, B2) | | 12/15/24 | | | 10.500 | | | | 1,180,000 | | |
| | 3,000 | | | URS Fox U.S. LP, Global Company Guaranteed
Notes (Callable 01/01/22 @ 100.00) | | (BB-, NR) | | 04/01/22 | | | 5.000 | | | | 3,131,250 | | |
| | | | 9,613,950 | | |
| Tech Hardware & Equipment (0.2%) | | | |
| | 3,000 | | | CommScope Technologies LLC, Rule 144A,
Company Guaranteed Notes
(Callable 03/15/22 @ 102.50)(10) | | (BB-, Ba3) | | 03/15/27 | | | 5.000 | | | | 2,928,261 | | |
| | 3,500 | | | CommScope, Inc., Rule 144A, Company
Guaranteed Notes
(Callable 12/01/17 @ 102.50)(10) | | (BB-, Ba3) | | 06/15/21 | | | 5.000 | | | | 3,583,125 | | |
| | | | 6,511,386 | | |
| Telecom - Wireless (1.1%) | | | |
| | 10,000 | | | Sprint Spectrum Co. II LLC, Rule 144A(10) | | (NR, Baa2) | | 09/20/21 | | | 3.360 | | | | 10,170,000 | | |
| | 2,000 | | | T-Mobile U.S.A., Inc., Company Guaranteed
Notes (Callable 04/15/19 @ 104.50) | | (BB, Ba3) | | 04/15/24 | | | 6.000 | | | | 2,145,000 | | |
| | 12,890 | | | Wind Acquisition Finance S.A., Rule 144A,
Secured Notes
(Callable 12/01/17 @ 103.69)(10) | | (B, B3) | | 04/23/21 | | | 7.375 | | | | 13,422,357 | | |
| | 14,585 | | | Wind Acquisition Finance S.A., Rule 144A,
Senior Secured Notes
(Callable 11/03/17 @ 101.19)(10) | | (BB, Ba3) | | 07/15/20 | | | 4.750 | | | | 14,760,793 | | |
| | | | 40,498,150 | | |
| Telecom - Wireline Integrated & Services (0.1%) | | | |
| | 4,500 | | | GTT Communications, Inc., Rule 144A,
Company Guaranteed Notes
(Callable 12/31/19 @ 105.91)(10) | | (CCC+, Caa1) | | 12/31/24 | | | 7.875 | | | | 4,809,375 | | |
| Theaters & Entertainment (0.1%) | | | |
| | 775 | | | AMC Entertainment Holdings, Inc.,
Global Company Guaranteed Notes
(Callable 05/15/22 @ 103.06)(12) | | (B+, B2) | | 05/15/27 | | | 6.125 | | | | 771,125 | | |
| | 1,000 | | | Carmike Cinemas, Inc., Rule 144A,
Secured Notes
(Callable 06/15/18 @ 104.50)(10) | | (BB, Ba1) | | 06/15/23 | | | 6.000 | | | | 1,065,000 | | |
| | | | 1,836,125 | | |
See Accompanying Notes to Financial Statements.
28
Credit Suisse Floating Rate High Income Fund
Schedule of Investments (continued)
October 31, 2017
Par
(000) | |
| | Ratings†
(S&P/Moody's) | | Maturity | | Rate% | | Value | |
| CORPORATE BONDS (continued) | | | |
| Wireless Telecommunication Services (0.2%) | | | |
$ | 3,000 | | | Wind Tre SpA, Reg S,
Senior Secured Notes
(Callable 05/03/18 @ 101.00),
EURIBOR 3M + 2.750%(1),(3),(11) | | (BB-, B1) | | 01/20/24 | | | 2.467 | | | $ | 3,515,819 | | |
| | 1,750 | | | Wind Tre SpA, Reg S, Senior Secured Notes
(Callable 11/03/19 @ 101.31)(3),(11) | | (BB-, B1) | | 01/20/23 | | | 2.625 | | | | 2,049,875 | | |
| | 400 | | | Wind Tre SpA, Reg S, Senior Secured Notes
(Callable 11/03/20 @ 101.56)(3),(11) | | (BB-, B1) | | 01/20/25 | | | 3.125 | | | | 467,669 | | |
| | | | 6,033,363 | | |
| TOTAL CORPORATE BONDS (Cost $356,669,638) | | | 362,900,767 | | |
| ASSET BACKED SECURITIES (2.5%) | | | |
| Collateralized Debt Obligations (2.5%) | | | |
| | 3,500 | | | ALM V Ltd., 2012-5A, Rule 144A,
LIBOR 3M + 5.250%(1),(10) | | (NR, Ba3) | | 10/18/27 | | | 6.639 | | | | 3,513,002 | | |
| | 3,500 | | | ALM XVI LLC, 2015-16A, Rule 144A,
LIBOR 3M + 3.200%(1),(10) | | (NR, Baa3) | | 07/15/27 | | | 4.559 | | | | 3,507,602 | | |
| | 2,000 | | | Apidos CLO XIX, 2014-19A, Rule 144A,
LIBOR 3M + 5.450%(1),(10) | | (NR, Ba3) | | 10/17/26 | | | 6.803 | | | | 2,004,525 | | |
| | 2,500 | | | BlueMountain CLO Ltd., 2015-4A, Rule 144A,
LIBOR 3M + 6.500%(1),(10) | | (BB, NR) | | 01/20/27 | | | 7.863 | | | | 2,529,571 | | |
| | 2,000 | | | Bowman Park CLO Ltd., 2014-1A, Rule 144A,
LIBOR 3M + 5.400%(1),(10) | | (BB-, NR) | | 11/23/25 | | | 6.714 | | | | 2,016,982 | | |
| | 3,234 | | | Capital Automotive LLC, 2017-1A,
Rule 144A(10) | | (A+, NR) | | 04/15/47 | | | 3.870 | | | | 3,233,127 | | |
| | 2,736 | | | Capital Automotive LLC, 2017-1A,
Rule 144A(10) | | (A+, NR) | | 04/15/47 | | | 4.180 | | | | 2,758,991 | | |
| | 750 | | | Carlyle Global Market Strategies CLO Ltd.,
2014-3A, Rule 144A,
LIBOR 3M + 5.750%(1),(10) | | (NR, Ba2) | | 07/27/26 | | | 7.124 | | | | 752,529 | | |
| | 1,000 | | | Carlyle Global Market Strategies CLO Ltd.,
2015-2A, Rule 144A,
LIBOR 3M + 6.200%(1),(10) | | (NR, B3) | | 04/27/27 | | | 7.574 | | | | 976,776 | | |
| | 2,750 | | | Carlyle Global Market Strategies CLO Ltd.,
2016-1A, Rule 144A,
LIBOR 3M + 4.900%(1),(10) | | (BBB-, NR) | | 04/20/27 | | | 6.263 | | | | 2,794,382 | | |
| | 2,000 | | | Carlyle U.S. CLO Ltd., 2017-2A,
Rule 144A(2),(4),(6),(10),(14) | | (NR, NR) | | 07/20/31 | | | 0.000 | | | | 1,791,302 | | |
| | 2,500 | | | CIFC Funding Ltd., 2013-3A, Rule 144A,
LIBOR 3M + 4.750%(1),(10) | | (BB, NR) | | 10/24/25 | | | 6.115 | | | | 2,509,333 | | |
| | 4,000 | | | CIFC Funding Ltd., 2013-4A, Rule 144A,
LIBOR 3M + 3.350%(1),(10) | | (NR, Baa2) | | 11/27/24 | | | 4.667 | | | | 4,007,977 | | |
| | 2,000 | | | Dryden Senior Loan Fund, 2012-24RA,
Rule 144A, LIBOR 3M + 5.950%(1),(10) | | (BB, NR) | | 11/15/23 | | | 7.265 | | | | 2,009,125 | | |
See Accompanying Notes to Financial Statements.
29
Credit Suisse Floating Rate High Income Fund
Schedule of Investments (continued)
October 31, 2017
Par
(000) | |
| | Ratings†
(S&P/Moody's) | | Maturity | | Rate% | | Value | |
| ASSET BACKED SECURITIES (continued) | | | |
Collateralized Debt Obligations | | | |
$ | 1,000 | | | Elevation CLO Ltd., 2014-2A, Rule 144A,
LIBOR 3M + 6.350%(1),(10) | | (NR, Ba3) | | 10/15/29 | | | 7.700 | | | $ | 953,653 | | |
| | 1,990 | | | FOCUS Brands Funding LLC, 2017-1A,
Rule 144A(10) | | (BBB, NR) | | 04/30/47 | | | 3.857 | | | | 2,032,790 | | |
| | 8,209 | | | FOCUS Brands Funding LLC, 2017-1A,
Rule 144A(10) | | (BBB, NR) | | 04/30/47 | | | 5.093 | | | | 8,564,459 | | |
| | 3,000 | | | Greywolf CLO III Ltd., 2014-1A, Rule 144A,
LIBOR 3M + 5.100%(1),(10) | | (BB, NR) | | 04/22/26 | | | 6.463 | | | | 3,020,472 | | |
| | 3,500 | | | Greywolf CLO IV Ltd., 2014-2A, Rule 144A,
LIBOR 3M + 2.350%(1),(10) | | (A, NR) | | 01/17/27 | | | 3.703 | | | | 3,529,389 | | |
| | 2,450 | | | Greywolf CLO IV Ltd., 2014-2A, Rule 144A,
LIBOR 3M + 5.600%(1),(10) | | (BB, NR) | | 01/17/27 | | | 6.953 | | | | 2,469,625 | | |
| | 1,500 | | | ICG U.S. CLO Ltd., 2014-2A, Rule 144A,
LIBOR 3M + 3.450%(1),(10) | | (NR, Baa3) | | 10/15/26 | | | 4.809 | | | | 1,501,466 | | |
| | 3,750 | | | ICG U.S. CLO Ltd., 2014-3A, Rule 144A,
LIBOR 3M + 3.600%(1),(10) | | (NR, Baa3) | | 01/25/27 | | | 4.967 | | | | 3,759,681 | | |
| | 2,500 | | | KKR CLO Ltd., 2014-14D, Rule 144A,
LIBOR 3M + 7.000%(1),(10) | | (NR, Ba3) | | 07/15/28 | | | 8.359 | | | | 2,559,714 | | |
| | 1,500 | | | LCM XVIII LP, 18A, Rule 144A,
LIBOR 3M + 3.800%(1),(10) | | (BBB, NR) | | 04/20/27 | | | 5.163 | | | | 1,521,390 | | |
| | 1,500 | | | Magnetite XIV Ltd., 2015-14A, Rule 144A,
LIBOR 3M + 6.500%(1),(10) | | (NR, B2) | | 07/18/28 | | | 7.854 | | | | 1,472,777 | | |
| | 4,000 | | | MP CLO VI Ltd., 2014-2A, Rule 144A,
LIBOR 3M + 2.250%(1),(10) | | (NR, A2) | | 01/15/27 | | | 3.609 | | | | 4,019,046 | | |
| | 1,500 | | | Ocean Trails CLO V, 2014-5A, Rule 144A,
LIBOR 3M + 3.600%(1),(10) | | (BBB, NR) | | 10/13/26 | | | 4.959 | | | | 1,503,656 | | |
| | 2,250 | | | Octagon Investment Partners 26 Ltd., 2016-1A,
Rule 144A, LIBOR 3M + 4.950%(1),(10) | | (NR, Baa3) | | 04/15/27 | | | 6.309 | | | | 2,284,160 | | |
| | 1,400 | | | Stewart Park CLO Ltd., 2015-1A,
Rule 144A(4),(6),(10),(14) | | (NR, NR) | | 04/15/26 | | | 0.000 | | | | 1,055,771 | | |
| | 2,470 | | | THL Credit Wind River CLO Ltd., 2014-2A,
Rule 144A, LIBOR 3M + 3.900%(1),(10) | | (NR, Baa3) | | 07/15/26 | | | 5.259 | | | | 2,482,923 | | |
| | 3,000 | | | VENTURE XIII CLO Ltd., 2013-13A,
Rule 144A, LIBOR 3M + 3.300%(1),(2),(10) | | (NR, Baa2) | | 09/10/29 | | | 4.617 | | | | 3,031,441 | | |
| | 2,500 | | | Vibrant CLO IV Ltd., 2016-4A, Rule 144A,
LIBOR 3M + 6.750%(1),(2),(10) | | (NR, Ba3) | | 07/20/28 | | | 8.113 | | | | 2,540,470 | | |
| | 1,650 | | | Vibrant CLO V Ltd., 2016-5A, Rule 144A,
LIBOR 3M + 7.000%(1),(10) | | (NR, Ba3) | | 01/20/29 | | | 8.363 | | | | 1,697,700 | | |
| | 1,500 | | | Vibrant CLO VI Ltd., 2017-6A, Rule 144A,
LIBOR 3M + 3.900%(1),(10) | | (NR, Baa3) | | 06/20/29 | | | 5.225 | | | | 1,526,684 | | |
| | 3,000 | | | Voya CLO Ltd., 2015-1A, Rule 144A,
LIBOR 3M + 3.400%(1),(10) | | (NR, Baa3) | | 04/18/27 | | | 4.754 | | | | 3,035,703 | | |
| | 3,000 | | | Voya CLO Ltd., 2017-1A, Rule 144A(4),(6),(10),(14) | | (NR, NR) | | 04/17/30 | | | 0.000 | | | | 2,591,271 | | |
| TOTAL ASSET BACKED SECURITIES (Cost $90,665,684) | | | 91,559,465 | | |
See Accompanying Notes to Financial Statements.
30
Credit Suisse Floating Rate High Income Fund
Schedule of Investments (continued)
October 31, 2017
Number of
Shares | |
| |
| |
| |
| | Value | |
| COMMON STOCKS (0.3%) | | | |
| Auto Parts & Equipment (0.1%) | | | |
| | 134,659 | | | UCI International, Inc.(2),(6),(9),(15) | | | | | | | | | | | | | | $ | 2,390,197 | | |
| Building & Construction (0.0%) | | | |
| | 6 | | | White Forest Resources, Inc.(2),(6),(9),(15) | | | | | | | | | | | | | | | 76 | | |
| Chemicals (0.0%) | | | |
| | 9,785 | | | Huntsman Corp.(6) | | | | | | | | | | | | | | | 313,316 | | |
| Energy Equipment & Services (0.2%) | | | |
| | 222,289 | | | Ocean Rig UDW, Inc.(15) | | | | | | | | | | | | | | | 5,952,899 | | |
| Health Services (0.0%) | | | |
| | 268,452 | | | Valitas Health Services, Inc.(2),(9) | | | | | | | | | | | | | | | 268,452 | | |
| Printing & Publishing (0.0%) | | | |
| | 708 | | | F & W Media, Inc.(2),(6) | | | | | | | | | | | | | | | 71 | | |
| Support - Services (0.0%) | | | |
| | 692 | | | Sprint Industrial Holdings LLC, Class G(2),(9),(15) | | | | | | | | | | | | | | | 7 | | |
| | 63 | | | Sprint Industrial Holdings LLC, Class H(2),(9),(15) | | | | | | | | | | | | | | | 1 | | |
| | 153 | | | Sprint Industrial Holdings LLC, Class I(2),(9),(15) | | | | | | | | | | | | | | | 1 | | |
| | | | 9 | | |
| Theaters & Entertainment (0.0%) | | | |
| | 40 | | | NEG Holdings LLC, Litigation Trust Units(2),(6),(9),(15) | | | | | | | | | | | | | | | 40 | | |
| TOTAL COMMON STOCKS (Cost $8,323,551) | | | 8,925,060 | | |
| SHORT-TERM INVESTMENTS (8.4%) | | | |
| | 7,049,810 | | | State Street Navigator Securities Lending
Government Money Market Portfolio,
1.00%(16) | | | | | | | | | | | | | | | 7,049,810 | | |
Par
(000) | |
| |
| | Maturity | | Rate% | | | |
$ | 6,550 | | | Molson Coors Brewing Co.(14) | | | | | | 11/10/17 | | | 0.000 | | | | 6,547,495 | | |
| | 280,601 | | | State Street Bank and Trust Co. Euro Time Deposit | | | | | | 11/01/17 | | | 0.120 | | | | 280,601,244 | | |
| | 13,000 | | | Tiffany & Co.(14) | | | | | | 11/14/17 | | | 0.000 | | | | 12,993,897 | | |
| TOTAL SHORT-TERM INVESTMENTS (Cost $307,192,446) | | | 307,192,446 | | |
| TOTAL INVESTMENTS AT VALUE (103.8%) (Cost $3,759,768,833) | | | 3,777,427,655 | | |
| LIABILITIES IN EXCESS OF OTHER ASSETS (-3.8%) | | | (137,001,703 | ) | |
| NET ASSETS (100.0%) | | $ | 3,640,425,952 | | |
† Credit ratings given by the Standard & Poor's Division of The McGraw-Hill Companies, Inc. ("S&P") and Moody's Investors Service, Inc. ("Moody's") are unaudited.
(1) Variable rate obligation — The interest rate shown is the rate in effect as of October 31, 2017.
(2) Security is valued using significant unobservable inputs.
See Accompanying Notes to Financial Statements.
31
Credit Suisse Floating Rate High Income Fund
Schedule of Investments (continued)
October 31, 2017
(3) This security is denominated in Euro.
(4) The rates on certain variable rate securities are not based on a published reference rate and spread but are determined by the issuer or agent and are based on current market conditions. These securities do not indicate a reference rate and spread in their description above. The interest rate shown is the rate in effect as of October 31, 2017.
(5) This security is denominated in British Pound.
(6) Illiquid security (unaudited).
(7) Bond is currently in default.
(8) A portion is an unfunded loan commitment (See note 2-I).
(9) Not readily marketable security; security is valued at fair value as determined in good faith by, or under the direction of, the Board of Trustees.
(10) Security exempt from registration under Rule 144A of the Securities Act of 1933, as amended. These securities may be resold in transactions exempt from registration, normally to qualified institutional buyers. At October 31, 2017, these securities amounted to a value of $339,840,480 or 9.3% of net assets.
(11) REG S: Securities sold under Regulation S may not be offered, sold or delivered within the United States or to, or for the account or benefit of, U.S. persons, except pursuant to an exemption from, or in a transaction not subject to, the registration requirements of the Securities Act of 1933.
(12) Security or portion thereof is out on loan (See note 2-J).
(13) PIK: Payment-in-kind security for which part of the income earned may be paid as additional principal.
(14) Zero-coupon security.
(15) Non-income producing security.
(16) Represents security purchased with cash collateral received for securities on loan. The rate shown is the annualized one-day yield at October 31, 2017.
INVESTMENT ABBREVIATIONS
1M = 1 Month
3M = 3 Month
6M = 6 Month
1W = 1 Week
ADR = American Depositary Receipt
EURIBOR = Euro Interbank Offered Rate
LIBOR = London Interbank Offered Rate
NR = Not Rated
See Accompanying Notes to Financial Statements.
32
Credit Suisse Floating Rate High Income Fund
Schedule of Investments (continued)
October 31, 2017
Forward Foreign Currency Contracts
Forward
Currency to be
Purchased (Local) | | Forward
Currency to be
Sold (Local) | | Expiration
Date | | Counterparty | | Value on
Settlement Date | | Current
Value/
Notional | | Net Unrealized
Appreciation
(Depreciation) | |
EUR | 1,850,000 | | | USD | 2,238,474 | | | 10/12/18 | | Morgan Stanley | | $ | 2,238,474 | | | $ | 2,202,354 | | | $ | (36,120 | ) | |
GBP | 1,450,000 | | | USD | 1,944,904 | | | 10/12/18 | | Morgan Stanley | | | 1,944,904 | | | | 1,946,400 | | | | 1,496 | | |
USD | 1,126,230 | | | EUR | 1,000,000 | | | 12/15/17 | | Morgan Stanley | | | (1,126,230 | ) | | | (1,167,761 | ) | | | (41,531 | ) | |
USD | 79,575,822 | | | EUR | 73,099,625 | | | 12/15/17 | | Morgan Stanley | | | (79,575,822 | ) | | | (85,362,911 | ) | | | (5,787,089 | ) | |
USD | 101,180,120 | | | EUR | 83,800,000 | | | 10/12/18 | | Morgan Stanley | | | (101,180,120 | ) | | | (99,760,705 | ) | | | 1,419,415 | | |
USD | 16,795,496 | | | GBP | 12,740,000 | | | 12/15/17 | | Morgan Stanley | | | (16,795,496 | ) | | | (16,940,145 | ) | | | (144,649 | ) | |
USD | 66,273,040 | | | GBP | 49,600,000 | | | 10/12/18 | | Morgan Stanley | | | (66,273,040 | ) | | | (66,580,289 | ) | | | (307,249 | ) | |
| | | $ | (4,895,727 | ) | |
Currency Abbreviations:
EUR = Euro
GBP = British Pound
USD = United States Dollar
See Accompanying Notes to Financial Statements.
33
Credit Suisse Floating Rate High Income Fund
Statement of Assets and Liabilities
October 31, 2017
Assets | |
Investments at value, including collateral for securities on loan of $7,049,810
(Cost $3,759,768,833) (Note 2) | | $ | 3,777,427,6551 | | |
Cash | | | 50,000 | | |
Foreign currency at value (Cost $11,584,168) | | | 11,421,128 | | |
Receivable for investments sold | | | 32,763,651 | | |
Interest receivable | | | 17,591,127 | | |
Receivable for Fund shares sold | | | 8,186,954 | | |
Unrealized appreciation on forward foreign currency contracts (Note 2) | | | 1,420,911 | | |
Prepaid expenses and other assets | | | 120,754 | | |
Total assets | | | 3,848,982,180 | | |
Liabilities | |
Investment advisory fee payable (Note 3) | | | 1,351,435 | | |
Administrative services fee payable (Note 3) | | | 171,475 | | |
Shareholder servicing/Distribution fee payable (Note 3) | | | 163,361 | | |
Payable for investments purchased | | | 182,787,261 | | |
Payable upon return of securities loaned (Note 2) | | | 7,049,810 | | |
Unrealized depreciation on forward foreign currency contracts (Note 2) | | | 6,316,638 | | |
Payable for Fund shares redeemed | | | 4,311,505 | | |
Dividend payable | | | 3,213,295 | | |
Unfunded loan commitments (Note 2) | | | 1,791,983 | | |
Trustees' fee payable | | | 15,156 | | |
Accrued expenses | | | 1,384,309 | | |
Total liabilities | | | 208,556,228 | | |
Net Assets | |
Capital stock, $.001 par value (Note 6) | | | 529,845 | | |
Paid-in capital (Note 6) | | | 3,641,290,925 | | |
Distributions in excess of net investment income | | | (3,346,513 | ) | |
Accumulated net realized loss from investments, foreign currency transactions
and forward foreign currency contracts | | | (10,711,584 | ) | |
Net unrealized appreciation from investments, foreign currency translations
and forward foreign currency contracts | | | 12,663,279 | | |
Net assets | | $ | 3,640,425,952 | | |
I Shares | |
Net assets | | $ | 3,236,360,312 | | |
Shares outstanding | | | 471,359,025 | | |
Net asset value, offering price and redemption price per share | | $ | 6.87 | | |
A Shares | |
Net assets | | $ | 284,455,931 | | |
Shares outstanding | | | 41,211,765 | | |
Net asset value and redemption price per share | | $ | 6.90 | | |
Maximum offering price per share (net asset value/(1-4.75%)) | | $ | 7.24 | | |
B Shares | |
Net assets | | $ | 956,108 | | |
Shares outstanding | | | 137,825 | | |
Net asset value and offering price per share | | $ | 6.94 | | |
C Shares | |
Net assets | | $ | 118,653,601 | | |
Shares outstanding | | | 17,136,636 | | |
Net asset value and offering price per share | | $ | 6.92 | | |
1 Includes $6,901,536 of securities on loan.
See Accompanying Notes to Financial Statements.
34
Credit Suisse Floating Rate High Income Fund
Statement of Operations
For the Year Ended October 31, 2017
Investment Income | |
Interest | | $ | 156,262,160 | | |
Dividends | | | 4,893 | | |
Securities lending (net of rebates) | | | 58,674 | | |
Total investment income | | | 156,325,727 | | |
Expenses | |
Investment advisory fees (Note 3) | | | 19,221,494 | | |
Administrative services fees (Note 3) | | | 586,392 | | |
Shareholder servicing/Distribution fees (Note 3) | |
Class A | | | 690,076 | | |
Class B | | | 15,299 | | |
Class C | | | 1,197,350 | | |
Transfer agent fees (Note 3) | | | 3,320,412 | | |
Custodian fees | | | 684,611 | | |
Commitment fees (Note 4) | | | 605,530 | | |
Registration fees | | | 215,437 | | |
Printing fees | | | 179,216 | | |
Insurance expense | | | 66,211 | | |
Audit and tax fees | | | 54,679 | | |
Legal fees | | | 54,130 | | |
Trustees' fees | | | 49,060 | | |
Miscellaneous expense | | | 57,075 | | |
Total expenses | | | 26,996,972 | | |
Less: fees waived (Note 3) | | | (2,404,609 | ) | |
Net expenses | | | 24,592,363 | | |
Net investment income | | | 131,733,364 | | |
Net Realized and Unrealized Gain (Loss) from Investments, Foreign Currency
and Forward Foreign Currency Contracts | |
Net realized loss from investments | | | (3,818,147 | ) | |
Net realized gain from foreign currency transactions | | | 2,189,108 | | |
Net realized loss from forward foreign currency contracts | | | (10,993,274 | ) | |
Net change in unrealized appreciation (depreciation) from investments | | | 61,145,892 | | |
Net change in unrealized appreciation (depreciation) from foreign currency translations | | | (102,005 | ) | |
Net change in unrealized appreciation (depreciation) from forward foreign currency contracts | | | (5,169,749 | ) | |
Net realized and unrealized gain from investments, foreign currency and forward foreign
currency contracts | | | 43,251,825 | | |
Net increase in net assets resulting from operations | | $ | 174,985,189 | | |
See Accompanying Notes to Financial Statements.
35
Credit Suisse Floating Rate High Income Fund
Statement of Changes in Net Assets
| | | For the Year
Ended
October 31, 2017 | | For the Year
Ended
October 31, 2016 | |
From Operations | |
Net investment income | | $ | 131,733,364 | | | $ | 122,223,478 | | |
Net realized loss from investments, foreign currency transactions
and forward foreign currency contracts | | | (12,622,313 | ) | | | (1,883,565 | ) | |
Net change in unrealized appreciation (depreciation) from investments,
foreign currency translations and forward foreign currency contracts | | | 55,874,138 | | | | 22,729,073 | | |
Net increase in net assets resulting from operations | | | 174,985,189 | | | | 143,068,986 | | |
From Dividends | |
Dividends from net investment income | |
Class I | | | (114,409,144 | ) | | | (104,574,110 | ) | |
Class A | | | (10,409,756 | ) | | | (11,144,809 | ) | |
Class B | | | (47,250 | ) | | | (71,524 | ) | |
Class C | | | (3,659,108 | ) | | | (4,588,704 | ) | |
Return of capital | |
Class I shares | | | (2,668,965 | ) | | | (1,757,990 | ) | |
Class A shares | | | (242,841 | ) | | | (197,458 | ) | |
Class B shares | | | (1,102 | ) | | | (1,512 | ) | |
Class C shares | | | (85,361 | ) | | | (97,164 | ) | |
Net decrease in net assets resulting from dividends | | | (131,523,527 | ) | | | (122,433,271 | ) | |
| From Capital Share Transactions (Note 6) | |
Proceeds from sale of shares | | | 1,622,987,334 | | | | 1,092,868,973 | | |
Reinvestment of dividends | | | 91,243,668 | | | | 80,494,692 | | |
Net asset value of shares redeemed | | | (898,835,466 | ) | | | (1,003,735,483 | ) | |
Net increase in net assets from capital share transactions | | | 815,395,536 | | | | 169,628,182 | | |
Net increase in net assets | | | 858,857,198 | | | | 190,263,897 | | |
Net Assets | |
Beginning of year | | | 2,781,568,754 | | | | 2,591,304,857 | | |
End of year | | $ | 3,640,425,952 | | | $ | 2,781,568,754 | | |
Distributions in excess of net investment income | | $ | (3,346,513 | ) | | $ | (4,054,371 | ) | |
See Accompanying Notes to Financial Statements.
36
Credit Suisse Floating Rate High Income Fund
Financial Highlights
(For a Class I Share of the Fund Outstanding Throughout Each Year)
| | | For the Year Ended October 31, | |
| | | 2017 | | 2016 | | 2015 | | 2014 | | 2013 | |
Per share data | |
Net asset value, beginning of year | | $ | 6.77 | | | $ | 6.72 | | | $ | 6.86 | | | $ | 6.94 | | | $ | 6.89 | | |
INVESTMENT OPERATIONS | |
Net investment income1 | | | 0.28 | | | | 0.32 | | | | 0.29 | | | | 0.28 | | | | 0.30 | | |
Net gain (loss) from investments, foreign currency
transactions and forward foreign currency
contracts (both realized and unrealized) | | | 0.10 | | | | 0.05 | | | | (0.14 | ) | | | (0.08 | ) | | | 0.07 | | |
Total from investment operations | | | 0.38 | | | | 0.37 | | | | 0.15 | | | | 0.20 | | | | 0.37 | | |
REDEMPTION FEES | | | — | | | | — | | | | — | | | | 0.002 | | | | 0.002 | | |
LESS DIVIDENDS AND DISTRIBUTIONS | |
Dividends from net investment income | | | (0.27 | ) | | | (0.31 | ) | | | (0.29 | ) | | | (0.28 | ) | | | (0.32 | ) | |
Distributions from net realized gains | | | — | | | | — | | | | (0.00 | )3 | | | — | | | | — | | |
Return of capital | | | (0.01 | ) | | | (0.01 | ) | | | (0.00 | )3 | | | — | | | | — | | |
Total dividends and distributions | | | (0.28 | ) | | | (0.32 | ) | | | (0.29 | ) | | | (0.28 | ) | | | (0.32 | ) | |
Net asset value, end of year | | $ | 6.87 | | | $ | 6.77 | | | $ | 6.72 | | | $ | 6.86 | | | $ | 6.94 | | |
Total return4 | | | 5.75 | % | | | 5.79 | % | | | 2.33 | % | | | 2.94 | % | | | 5.47 | % | |
RATIOS AND SUPPLEMENTAL DATA | |
Net assets, end of year (000s omitted) | | $ | 3,236,360 | | | $ | 2,438,027 | | | $ | 2,167,955 | | | $ | 1,343,741 | | | $ | 876,418 | | |
Ratio of net expenses to average net assets | | | 0.70 | % | | | 0.70 | % | | | 0.70 | % | | | 0.70 | % | | | 0.70 | % | |
Ratio of expenses to average net assets
excluding interest expense | | | 0.70 | % | | | 0.70 | % | | | 0.70 | % | | | 0.70 | %5 | | | 0.70 | %5 | |
Ratio of net investment income to average
net assets | | | 4.12 | % | | | 4.87 | % | | | 4.29 | % | | | 4.04 | % | | | 4.35 | % | |
Decrease reflected in above operating expense
ratios due to waivers/reimbursements | | | 0.07 | % | | | 0.11 | % | | | 0.07 | % | | | 0.07 | % | | | 0.07 | % | |
Portfolio turnover rate | | | 64 | % | | | 48 | % | | | 46 | % | | | 57 | % | | | 89 | % | |
1 Per share information is calculated using the average shares outstanding method.
2 This amount represents less than $0.01 per share.
3 This amount represents less than $(0.01) per share.
4 Total returns are historical and include change in share price and reinvestment of all dividends and distributions. Had certain expenses not been reduced during the years shown, total returns would have been lower.
5 Included to conform with current year presentation.
See Accompanying Notes to Financial Statements.
37
Credit Suisse Floating Rate High Income Fund
Financial Highlights
(For a Class A Share of the Fund Outstanding Throughout Each Year)
| | | For the Year Ended October 31, | |
| | | 2017 | | 2016 | | 2015 | | 2014 | | 2013 | |
Per share data | |
Net asset value, beginning of year | | $ | 6.80 | | | $ | 6.75 | | | $ | 6.89 | | | $ | 6.98 | | | $ | 6.92 | | |
INVESTMENT OPERATIONS | |
Net investment income1 | | | 0.27 | | | | 0.31 | | | | 0.28 | | | | 0.26 | | | | 0.29 | | |
Net gain (loss) from investments, foreign currency
transactions and forward foreign currency
contracts (both realized and unrealized) | | | 0.10 | | | | 0.05 | | | | (0.14 | ) | | | (0.09 | ) | | | 0.07 | | |
Total from investment operations | | | 0.37 | | | | 0.36 | | | | 0.14 | | | | 0.17 | | | | 0.36 | | |
REDEMPTION FEES | | | — | | | | — | | | | — | | | | 0.002 | | | | 0.002 | | |
LESS DIVIDENDS AND DISTRIBUTIONS | |
Dividends from net investment income | | | (0.26 | ) | | | (0.30 | ) | | | (0.28 | ) | | | (0.26 | ) | | | (0.30 | ) | |
Distributions from net realized gains | | | — | | | | — | | | | (0.00 | )3 | | | — | | | | — | | |
Return of capital | | | (0.01 | ) | | | (0.01 | ) | | | (0.00 | )3 | | | — | | | | — | | |
Total dividends and distributions | | | (0.27 | ) | | | (0.31 | ) | | | (0.28 | ) | | | (0.26 | ) | | | (0.30 | ) | |
Net asset value, end of year | | $ | 6.90 | | | $ | 6.80 | | | $ | 6.75 | | | $ | 6.89 | | | $ | 6.98 | | |
Total return4 | | | 5.48 | % | | | 5.52 | % | | | 2.09 | % | | | 2.53 | % | | | 5.33 | % | |
RATIOS AND SUPPLEMENTAL DATA | |
Net assets, end of year (000s omitted) | | $ | 284,456 | | | $ | 227,399 | | | $ | 286,805 | | | $ | 358,095 | | | $ | 456,550 | | |
Ratio of net expenses to average net assets | | | 0.95 | % | | | 0.95 | % | | | 0.95 | % | | | 0.95 | % | | | 0.95 | % | |
Ratio of expenses to average net assets
excluding interest expense | | | 0.95 | % | | | 0.95 | % | | | 0.95 | % | | | 0.95 | %5 | | | 0.95 | %5 | |
Ratio of net investment income to average
net assets | | | 3.87 | % | | | 4.63 | % | | | 4.06 | % | | | 3.79 | % | | | 4.13 | % | |
Decrease reflected in above operating expense
ratios due to waivers/reimbursements | | | 0.07 | % | | | 0.11 | % | | | 0.07 | % | | | 0.07 | % | | | 0.07 | % | |
Portfolio turnover rate | | | 64 | % | | | 48 | % | | | 46 | % | | | 57 | % | | | 89 | % | |
1 Per share information is calculated using the average shares outstanding method.
2 This amount represents less than $0.01 per share.
3 This amount represents less than $(0.01) per share.
4 Total returns are historical and include change in share price, reinvestment of all dividends and distributions and no sales charge. Had certain expenses not been reduced during the years shown, total returns would have been lower.
5 Included to conform with current year presentation.
See Accompanying Notes to Financial Statements.
38
Credit Suisse Floating Rate High Income Fund
Financial Highlights
(For a Class B Share of the Fund Outstanding Throughout Each Year)
| | | For the Year Ended October 31, | |
| | | 2017 | | 2016 | | 2015 | | 2014 | | 2013 | |
Per share data | |
Net asset value, beginning of year | | $ | 6.84 | | | $ | 6.79 | | | $ | 6.91 | | | $ | 7.00 | | | $ | 6.93 | | |
INVESTMENT OPERATIONS | |
Net investment income1 | | | 0.22 | | | | 0.26 | | | | 0.23 | | | | 0.21 | | | | 0.25 | | |
Net gain (loss) from investments, foreign currency
transactions and forward foreign currency
contracts (both realized and unrealized) | | | 0.10 | | | | 0.05 | | | | (0.12 | ) | | | (0.09 | ) | | | 0.07 | | |
Total from investment operations | | | 0.32 | | | | 0.31 | | | | 0.11 | | | | 0.12 | | | | 0.32 | | |
REDEMPTION FEES | | | — | | | | — | | | �� | — | | | | 0.002 | | | | 0.002 | | |
LESS DIVIDENDS AND DISTRIBUTIONS | |
Dividends from net investment income | | | (0.21 | ) | | | (0.25 | ) | | | (0.23 | ) | | | (0.21 | ) | | | (0.25 | ) | |
Distributions from net realized gains | | | — | | | | — | | | | (0.00 | )3 | | | — | | | | — | | |
Return of capital | | | (0.01 | ) | | | (0.01 | ) | | | (0.00 | )3 | | | — | | | | — | | |
Total dividends and distributions | | | (0.22 | ) | | | (0.26 | ) | | | (0.23 | ) | | | (0.21 | ) | | | (0.25 | ) | |
Net asset value, end of year | | $ | 6.94 | | | $ | 6.84 | | | $ | 6.79 | | | $ | 6.91 | | | $ | 7.00 | | |
Total return4 | | | 4.69 | % | | | 4.73 | % | | | 1.64 | % | | | 1.77 | % | | | 4.64 | % | |
RATIOS AND SUPPLEMENTAL DATA | |
Net assets, end of year (000s omitted) | | $ | 956 | | | $ | 1,800 | | | $ | 2,112 | | | $ | 3,638 | | | $ | 4,422 | | |
Ratio of net expenses to average net assets | | | 1.70 | % | | | 1.70 | % | | | 1.70 | % | | | 1.70 | % | | | 1.70 | % | |
Ratio of expenses to average net assets
excluding interest expense | | | 1.70 | % | | | 1.70 | % | | | 1.70 | % | | | 1.70 | %5 | | | 1.70 | %5 | |
Ratio of net investment income to average
net assets | | | 3.17 | % | | | 3.89 | % | | | 3.34 | % | | | 3.07 | % | | | 3.52 | % | |
Decrease reflected in above operating expense
ratios due to waivers/reimbursements | | | 0.07 | % | | | 0.11 | % | | | 0.07 | % | | | 0.07 | % | | | 0.07 | % | |
Portfolio turnover rate | | | 64 | % | | | 48 | % | | | 46 | % | | | 57 | % | | | 89 | % | |
1 Per share information is calculated using the average shares outstanding method.
2 This amount represents less than $0.01 per share.
3 This amount represents less than $(0.01) per share.
4 Total returns are historical and include change in share price, reinvestment of all dividends and distributions and no sales charge. Had certain expenses not been reduced during the years shown, total returns would have been lower.
5 Included to conform with current year presentation.
See Accompanying Notes to Financial Statements.
39
Credit Suisse Floating Rate High Income Fund
Financial Highlights
(For a Class C Share of the Fund Outstanding Throughout Each Year)
| | | For the Year Ended October 31, | |
| | | 2017 | | 2016 | | 2015 | | 2014 | | 2013 | |
Per share data | |
Net asset value, beginning of year | | $ | 6.82 | | | $ | 6.77 | | | $ | 6.91 | | | $ | 7.00 | | | $ | 6.94 | | |
INVESTMENT OPERATIONS | |
Net investment income1 | | | 0.22 | | | | 0.26 | | | | 0.23 | | | | 0.21 | | | | 0.24 | | |
Net gain (loss) from investments, foreign currency
transactions and forward foreign currency
contracts (both realized and unrealized) | | | 0.10 | | | | 0.05 | | | | (0.14 | ) | | | (0.09 | ) | | | 0.07 | | |
Total from investment operations | | | 0.32 | | | | 0.31 | | | | 0.09 | | | | 0.12 | | | | 0.31 | | |
REDEMPTION FEES | | | — | | | | — | | | | — | | | | 0.002 | | | | 0.002 | | |
LESS DIVIDENDS AND DISTRIBUTIONS | |
Dividends from net investment income | | | (0.21 | ) | | | (0.25 | ) | | | (0.23 | ) | | | (0.21 | ) | | | (0.25 | ) | |
Distributions from net realized gains | | | — | | | | — | | | | (0.00 | )3 | | | — | | | | — | | |
Return of capital | | | (0.01 | ) | | | (0.01 | ) | | | (0.00 | )3 | | | — | | | | — | | |
Total dividends and distributions | | | (0.22 | ) | | | (0.26 | ) | | | (0.23 | ) | | | (0.21 | ) | | | (0.25 | ) | |
Net asset value, end of year | | $ | 6.92 | | | $ | 6.82 | | | $ | 6.77 | | | $ | 6.91 | | | $ | 7.00 | | |
Total return4 | | | 4.69 | % | | | 4.73 | % | | | 1.33 | % | | | 1.77 | % | | | 4.47 | % | |
RATIOS AND SUPPLEMENTAL DATA | |
Net assets, end of year (000s omitted) | | $ | 118,654 | | | $ | 114,343 | | | $ | 134,433 | | | $ | 170,015 | | | $ | 167,653 | | |
Ratio of net expenses to average net assets | | | 1.70 | % | | | 1.70 | % | | | 1.70 | % | | | 1.70 | % | | | 1.70 | % | |
Ratio of expenses to average net assets
excluding interest expense | | | 1.70 | % | | | 1.70 | % | | | 1.70 | % | | | 1.70 | %5 | | | 1.70 | %5 | |
Ratio of net investment income to average
net assets | | | 3.13 | % | | | 3.89 | % | | | 3.32 | % | | | 3.04 | % | | | 3.40 | % | |
Decrease reflected in above operating expense
ratios due to waivers/reimbursements | | | 0.07 | % | | | 0.11 | % | | | 0.07 | % | | | 0.07 | % | | | 0.07 | % | |
Portfolio turnover rate | | | 64 | % | | | 48 | % | | | 46 | % | | | 57 | % | | | 89 | % | |
1 Per share information is calculated using the average shares outstanding method.
2 This amount represents less than $0.01 per share.
3 This amount represents less than $(0.01) per share.
4 Total returns are historical and include change in share price, reinvestment of all dividends and distributions and no sales charge. Had certain expenses not been reduced during the years shown, total returns would have been lower.
5 Included to conform with current year presentation.
See Accompanying Notes to Financial Statements.
40
Credit Suisse Floating Rate High Income Fund
Notes to Financial Statements
October 31, 2017
Credit Suisse Floating Rate High Income Fund (the "Fund"), a series of the Credit Suisse Opportunity Funds (the "Trust"), a Delaware statutory trust, is registered under the Investment Company Act of 1940, as amended (the "1940 Act"), as a diversified open-end management investment company that seeks to provide a high level of current income and, secondarily, capital appreciation. The Trust was organized under the laws of the State of Delaware as a business trust on May 31, 1995.
The Fund offers three classes of shares: Class I shares, Class A shares and Class C shares. Each class of shares represents an equal pro rata interest in the Fund, except the share classes bear different expenses, which reflect the differences in the range of services provided to them. Class A shares are sold subject to a front-end sales charge of up to 4.75%. Class C shares are sold subject to a CDSC of 1.00% if the shares are redeemed within the first year of purchase. Class I shares are sold without a sales charge. Effective February 29, 2012, Class B shares of the Fund are no longer being offered for sale. Existing shareholders may continue to purchase additional Class B shares of the Fund through the reinvestment of dividends and capital gain distributions paid by the Fund. Class B shares automatically convert to Class A shares after 8 years.
Note 2. Significant Accounting Policies
The following is a summary of significant accounting policies followed by the Fund in the preparation of its financial statements. The policies are in accordance with generally accepted accounting principles in the United States of America ("GAAP"). The preparation of financial statements requires management to make estimates and assumptions that affect the reported amounts and disclosures in the financial statements. Actual results could differ from those estimates. The Fund is considered an investment company for financial reporting purposes under GAAP and follows Accounting Standards Codification ("ASC") Topic 946 — Financial Services — Investment Companies.
A) SECURITY VALUATION — The net asset value of the Fund is determined daily as of the close of regular trading on the New York Stock Exchange, Inc. (the "Exchange") on each day the Exchange is open for business. The valuations for fixed income securities (which may include, but are not limited to, corporate, government, municipal, mortgage-backed, collateralized mortgage obligations and asset-backed securities) and certain derivative instruments are typically the prices supplied by independent third party pricing services, which may use market prices or broker/dealer quotations or
41
Credit Suisse Floating Rate High Income Fund
Notes to Financial Statements (continued)
October 31, 2017
Note 2. Significant Accounting Policies (continued)
a variety of valuation techniques and methodologies. The independent third party pricing services use inputs that are observable such as issuer details, interest rates, yield curves, prepayment speeds, credit risks/spreads, default rates and quoted prices for similar securities. These pricing services generally price fixed income securities assuming orderly transactions of an institutional "round lot" size, but some trades occur in smaller "odd lot" sizes which may be effected at lower prices than institutional round lot trades. Structured note agreements are valued in accordance with a dealer-supplied valuation based on changes in the value of the underlying index. Futures contracts are valued daily at the settlement price established by the board of trade or exchange on which they are traded. Forward contracts are valued at the London closing spot rates and the London closing forward point rates on a daily basis. The currency forward contract pricing model derives the differential in point rates to the expiration date of the forward and calculates its present value. Equity securities for which market quotations are available are valued at the last reported sales price or official closing price on the primary market or exchange on which they trade. The Fund may utilize a service provided by an independent third party which has been approved by the Board of Trustees (the "Board") to fair value certain securities. When fair value pricing is employed, the prices of securities used by the Fund to calculate its net asset value may differ from quoted or published prices for the same securities. If independent third party pricing services are unable to supply prices for a portfolio investment, or if the prices supplied are deemed by the investment adviser to be unreliable, the market price may be determined by the investment adviser using quotations from one or more brokers/dealers or at the transaction price if the security has recently been purchased and no value has yet been obtained from a pricing service or pricing broker. When reliable prices are not readily available, such as when the value of a security has been significantly affected by events after the close of the exchange or market on which the security is principally traded, but before the Fund calculates its net asset value, the Fund values these securities as determined in accordance with procedures approved and established by the Board.
The Fund uses valuation techniques to measure fair value that are consistent with the market approach and/or income approach, depending on the type of security and the particular circumstance. The market approach uses prices and other relevant information generated by market transactions involving identical or comparable securities. The income approach uses valuation techniques to discount estimated future cash flows to present value.
42
Credit Suisse Floating Rate High Income Fund
Notes to Financial Statements (continued)
October 31, 2017
Note 2. Significant Accounting Policies (continued)
GAAP established a disclosure hierarchy that categorizes the inputs to valuation techniques used to value assets and liabilities at each measurement date. These inputs are summarized in the three broad levels listed below:
• Level 1 – quoted prices in active markets for identical investments
• Level 2 – other significant observable inputs (including quoted prices for similar investments, interest rates, prepayment speeds, credit risk, etc.)
• Level 3 – significant unobservable inputs (including the Fund's own assumptions in determining the fair value of investments)
The inputs or methodologies used to value securities are not necessarily an indication of the risk associated with investing in those securities.
The following is a summary of the inputs used as of October 31, 2017 in valuing the Fund's assets and liabilities carried at fair value:
Assets | | Level 1 | | Level 2 | | Level 3 | | Total | |
Investments in Securities | |
Bank Loans | | $ | — | | | $ | 2,782,123,032 | | | $ | 224,726,885 | | | $ | 3,006,849,917 | | |
Corporate Bonds | | | — | | | | 359,893,267 | | | | 3,007,500 | | | | 362,900,767 | | |
Asset Backed Securities | | | — | | | | 84,196,252 | | | | 7,363,213 | | | | 91,559,465 | | |
Common Stocks | | | 6,266,215 | | | | — | | | | 2,658,845 | | | | 8,925,060 | | |
Short-term Investments | | | — | | | | 307,192,446 | | | | — | | | | 307,192,446 | | |
| | $ | 6,266,215 | | | $ | 3,533,404,997 | | | $ | 237,756,443 | | | $ | 3,777,427,655 | | |
Other Financial Instruments* | |
Forward Foreign Currency Contracts | | $ | — | | | $ | 1,420,911 | | | $ | — | | | $ | 1,420,911 | | |
Liabilities | | Level 1 | | Level 2 | | Level 3 | | Total | |
Other Financial Instruments* | |
Forward Foreign Currency Contracts | | $ | — | | | $ | 6,316,638 | | | $ | — | | | $ | 6,316,638 | | |
*Other financial instruments include unrealized appreciation (depreciation) on forward foreign currency contracts.
The following is a reconciliation of investments as of October 31, 2017 for which significant unobservable inputs were used in determining value. All transfers, if any, are assumed to occur at the end of the reporting period.
43
Credit Suisse Floating Rate High Income Fund
Notes to Financial Statements (continued)
October 31, 2017
Note 2. Significant Accounting Policies (continued)
| | Bank
Loans | | Corporate
Bonds | | Asset
Backed
Securities | | Common
Stocks | | Total | |
Balance as of October 31, 2016 | | $ | 223,042,749 | | | $ | 1,084,551 | | | $ | — | | | $ | 377,616 | | | $ | 224,504,916 | | |
Accrued discounts (premiums) | | | 755,104 | | | | 103,148 | | | | 4,763 | | | | — | | | | 863,015 | | |
Purchases | | | 155,083,661 | | | | 3,025,910 | | | | 7,313,625 | | | | 2,859,830 | | | | 168,283,026 | | |
Sales | | | (103,391,899 | ) | | | (1,042,605 | ) | | | — | | | | (287,500 | ) | | | (104,722,004 | ) | |
Realized gain (loss) | | | (152,486 | ) | | | 924,735 | | | | — | | | | (90,000 | ) | | | 682,249 | | |
Change in unrealized appreciation
(depreciation) | | | 2,385,218 | | | | (1,088,239 | ) | | | 44,825 | | | | (201,172 | ) | | | 1,140,632 | | |
Transfers into Level 3 | | | 58,560,781 | | | | — | | | | — | | | | 71 | | | | 58,560,852 | | |
Transfers out of Level 3 | | | (111,556,243 | ) | | | — | | | | — | | | | — | | | | (111,556,243 | ) | |
Balance as of October 31, 2017 | | $ | 224,726,885 | | | $ | 3,007,500 | | | $ | 7,363,213 | | | $ | 2,658,845 | | | $ | 237,756,443 | | |
Net change in unrealized
appreciation (depreciation)
from investments still held as of
October 31, 2017 | | $ | 2,687,755 | | | $ | (3,688 | ) | | $ | 44,825 | | | $ | (201,172 | ) | | $ | 2,527,720 | | |
| | Quantitative Disclosure About Significant Unobservable Inputs | |
| Asset Class | | Fair Value
At 10/31/2017 | | Valuation
Technique | | Unobservable
Input | | Range
(Weighted Average)
(per share) | |
Bank Loans | | $ | 283,390 | | | Market Approach | | Comparable Bond Price | | | N/A | | |
| | $ | 224,443,495 | | | Vendor Pricing | | Single Broker Quote | | $ | 0.50 – $1.33 | ($1.01) | |
Corporate Bonds | | $ | 3,007,500 | | | Vendor Pricing | | Single Broker Quote | | | N/A | | |
Asset Backed
Securities | | $ | 7,363,213 | | | Vendor Pricing | | Single Broker Quote | | $ | 0.90 – $1.02 | ($0.98) | |
| Common Stocks | | $ | 116
| | | Market Approach
| | Discount for Illiquidity
and EBITDA Multiples | | $ | 1.00 – $12.69 | ($2.53) | |
| | $ | 2,658,720 | | | Vendor Pricing | | Single Broker Quote | | $ | 0.10 – $17.75 | ($6.58) | |
| | | $ | 9
| | | Market/Income
Approach | | Comparable Bond Price
and Net Realizable Value | | | N/A | | |
Each fair value determination is based on a consideration of relevant factors, including both observable and unobservable inputs. Observable and unobservable inputs that Credit Suisse Asset Management, LLC, the Fund's investment adviser ("Credit Suisse" or the "Adviser") considers may include (i) the existence of any contractual restrictions on the disposition of securities; (ii) information obtained from the company, which may include an analysis of the company's financial statements, the company's products or intended markets or the company's technologies; (iii) the price of the same or similar security negotiated at arm's length in an issuer's completed subsequent round of financing; (iv) the price and extent of public trading in similar securities of the issuer or of comparable companies; or (v) a probability and time value adjusted analysis of contractual term. Where available and appropriate, multiple valuation methodologies are applied to confirm fair value. To the
44
Credit Suisse Floating Rate High Income Fund
Notes to Financial Statements (continued)
October 31, 2017
Note 2. Significant Accounting Policies (continued)
extent that valuation is based on models or inputs that are less observable or unobservable in the market, determining fair value requires more judgment. Because of the inherent uncertainty of valuation, those estimated values may be materially higher or lower than the values that would have been used had a ready market for the investments existed. Accordingly, the degree of judgment exercised by the Fund in determining fair value is greatest for investments categorized in Level 3. In some circumstances, the inputs used to measure fair value might be categorized within different levels of the fair value hierarchy. In those instances, the fair value measurement is categorized in its entirety in the fair value hierarchy based on the least observable input that is significant to the fair value measurement. Additionally, changes in the market environment and other events that may occur over the life of the investments may cause the gains or losses ultimately realized on these investments to be different from the valuations used at the date of these financial statements.
For the year ended October 31, 2017, there were no transfers between Level 1 and Level 2, but there was $58,560,852 transferred from Level 2 to Level 3 due to a lack of a pricing source supported by observable inputs and $111,556,243 transferred from Level 3 to Level 2 as a result of the availability of a pricing source supported by observable inputs. All transfers, if any, are assumed to occur at the end of the reporting period.
B) DERIVATIVE INSTRUMENTS AND HEDGING ACTIVITIES — The Fund adopted amendments to authoritative guidance on disclosures about derivative instruments and hedging activities which require that a fund disclose (a) how and why an entity uses derivative instruments, (b) how derivative instruments and hedging activities are accounted for and (c) how derivative instruments and related hedging activities affect a fund's financial position, financial performance and cash flows.
Fair Values of Derivative Instruments as of October 31, 2017
| | | Asset Derivatives | | Liability Derivatives | |
| | | Balance Sheet
Location | | Fair Value | | Balance Sheet
Location | | Fair Value | |
Currency Contracts
| | Unrealized appreciation
on forward foreign
currency contracts | | $ | 1,420,911 | | | Unrealized depreciation
on forward foreign
currency contracts | | $ | 6,316,638 | | |
45
Credit Suisse Floating Rate High Income Fund
Notes to Financial Statements (continued)
October 31, 2017
Note 2. Significant Accounting Policies (continued)
Effect of Derivative Instruments on the Statement of Operations
| | | Location | | Realized
Gain (Loss) | | Location | | Net Unrealized
Appreciation
(Depreciation) | |
Currency Contracts
| | Net realized loss from
forward foreign
currency contracts | | $ | (10,993,274 | ) | | Net change in unrealized
appreciation
(depreciation) from
forward foreign
currency contracts | | $ | (5,169,749 | ) | |
For the year ended October 31, 2017, the Fund held an average monthly value on a net basis of $186,631,527 in forward foreign currency contracts.
The Fund is a party to International Swap and Derivatives Association, Inc. ("ISDA") Master Agreements ("Master Agreements") with certain counterparties that govern over-the-counter derivative (including Total Return, Credit Default and Interest Rate Swaps) and foreign exchange contracts entered into by the Fund. The Master Agreements may contain provisions regarding, among other things, the parties' general obligations, representations, agreements, collateral requirements, events of default and early termination. Termination events applicable to the Fund may occur upon a decline in the Fund's net assets below a specified threshold over a certain period of time.
The following table presents by counterparty the Fund's derivative assets, net of related collateral held by the Fund, at October 31, 2017:
Counterparty | | Gross Amount of
Assets Presented in the
Statement of Assets
and Liabilities(a) | | Financial
Instruments
and Derivatives
Available for Offset | | Non-Cash
Collateral
Received | | Cash
Collateral
Received | | Net Amount
of Derivative
Assets | |
Morgan Stanley | | $ | 1,420,911 | | | $ | (1,420,911 | ) | | $ | — | | | $ | — | | | $ | — | | |
The following table presents by counterparty the Fund's derivative liabilities, net of related collateral pledged by the Fund, at October 31, 2017:
Counterparty | | Gross Amount of
Liabilities Presented in the
Statement of Assets
and Liabilities(a) | | Financial
Instruments
and Derivatives
Available for Offset | | Non-Cash
Collateral
Pledged | | Cash
Collateral
Pledged | | Net Amount
of Derivative
Liabilities | |
Morgan Stanley | | $ | 6,316,638 | | | $ | (1,420,911 | ) | | $ | — | | | $ | — | | | $ | 4,895,727 | | |
(a) Forward foreign currency contracts are included.
46
Credit Suisse Floating Rate High Income Fund
Notes to Financial Statements (continued)
October 31, 2017
Note 2. Significant Accounting Policies (continued)
C) FOREIGN CURRENCY TRANSACTIONS — The books and records of the Fund are maintained in U.S. dollars. Transactions denominated in foreign currencies are recorded at the current prevailing exchange rates. All assets and liabilities denominated in foreign currencies are translated into U.S. dollar amounts at the current exchange rate at the end of the period. Reported net realized gain (loss) from foreign currency transactions arises from sales of foreign currencies; currency gains or losses realized between the trade and settlement dates on securities transactions; and the difference between the amounts of dividends, interest, and foreign withholding taxes recorded on the Fund's books and the U.S. dollar equivalent of the amounts actually received or paid. Net change in unrealized gains and losses on translation of assets and liabilities denominated in foreign currencies arises from changes in the fair values of assets and liabilities, other than investments, at the end of the period, resulting from changes in exchange rates. The Fund does not isolate that portion of the results of operations resulting from fluctuations in foreign exchange rates on investments from the fluctuations arising from changes in market prices of investments held. Such fluctuations are included with net realized and unrealized gain or loss from investments in the Statement of Operations.
D) SECURITY TRANSACTIONS AND INVESTMENT INCOME/EXPENSE — Security transactions are accounted for on a trade date basis. Interest income/expense is recorded on the accrual basis. The Fund amortizes premiums and accretes discounts using the effective interest method. Dividend income/expense is recorded on the ex-dividend date. Certain expenses are class-specific expenses, vary by class and are charged only to that class. Income, expenses (excluding class-specific expenses) and realized/unrealized gains/losses are allocated proportionately to each class of shares based upon the relative net asset value of the outstanding shares of that class. The cost of investments sold is determined by use of the specific identification method for both financial reporting and income tax purposes. To the extent any issuer defaults or a credit event occurs that impacts the issuer, the Fund may halt any additional interest income accruals and consider the realizability of interest accrued up to the date of default or credit event.
E) DIVIDENDS AND DISTRIBUTIONS TO SHAREHOLDERS — Dividends from net investment income, if any, are declared daily and paid monthly. Distributions of net realized capital gains, if any, are declared and paid at least annually. However, to the extent that a net realized capital gain can be reduced by a capital loss carryforward, such gain will not be distributed. Dividends
47
Credit Suisse Floating Rate High Income Fund
Notes to Financial Statements (continued)
October 31, 2017
Note 2. Significant Accounting Policies (continued)
and distributions to shareholders of the Fund are recorded on the ex-dividend date and are determined in accordance with federal income tax regulations, which may differ from GAAP.
F) FEDERAL INCOME TAXES — No provision is made for federal taxes as it is the Fund's intention to continue to qualify as a regulated investment company ("RIC") under the Internal Revenue Code of 1986, as amended (the "Code"), and to make the requisite distributions to its shareholders, which will be sufficient to relieve it from federal income and excise taxes.
In order to qualify as a RIC under the Code, the Fund must meet certain requirements regarding the source of its income, the diversification of its assets and the distribution of its income. One of these requirements is that the Fund derive at least 90% of its gross income for each taxable year from dividends, interest, payments with respect to certain securities loans, gains from the sale or other disposition of stock, securities or foreign currencies, other income derived with respect to its business of investing in such stock, securities or currencies or net income derived from interests in certain publicly-traded partnerships ("Qualifying Income").
The Fund adopted the authoritative guidance for uncertainty in income taxes and recognizes a tax benefit or liability from an uncertain position only if it is more likely than not that the position is sustainable based solely on its technical merits and consideration of the relevant taxing authority's widely understood administrative practices and procedures. The Fund has reviewed its current tax positions and has determined that no provision for income tax is required in the Fund's financial statements. The Fund's federal and state income and federal excise tax returns for tax years for which the applicable statutes of limitations have not expired are subject to examination by the Internal Revenue Service and state departments of revenue.
G) SHORT-TERM INVESTMENTS — The Fund, together with other funds/portfolios advised by Credit Suisse, pools available cash into a short-term variable rate time deposit issued by State Street Bank and Trust Company ("SSB"), the Fund's custodian. The short-term time deposit issued by SSB is a variable rate account classified as a short-term investment.
H) FORWARD FOREIGN CURRENCY CONTRACTS — A forward foreign currency exchange contract ("forward currency contract") is a commitment to purchase or sell a foreign currency at the settlement date at a negotiated rate. The Fund will enter into forward currency contracts primarily for hedging foreign currency risk. Forward currency contracts are valued at the prevailing
48
Credit Suisse Floating Rate High Income Fund
Notes to Financial Statements (continued)
October 31, 2017
Note 2. Significant Accounting Policies (continued)
forward exchange rate of the underlying currencies and unrealized gain/loss is recorded daily. On the settlement date of the forward currency contract, the Fund records a realized gain or loss equal to the difference between the value of the contract at the time it was opened and the value of the contract at the time it was closed. Certain risks may arise upon entering into forward currency contracts from the potential inability of counterparties to meet the terms of their contracts. The maximum counterparty credit risk to the Fund is measured by the unrealized gain on appreciated contracts. Additionally, when utilizing forward currency contracts to hedge, the Fund forgoes the opportunity to profit from favorable exchange rate movements during the term of the contract. The Fund's open forward currency contracts at October 31, 2017 are disclosed in the Schedule of Investments.
I) UNFUNDED LOAN COMMITMENTS — The Fund enters into certain agreements, all or a portion of which may be unfunded. The Fund is obligated to fund these loan commitments at the borrowers' discretion. Funded and unfunded portions of credit agreements are presented in the Schedule of Investments. As of October 31, 2017, unfunded commitments were as follows:
Borrower | | Maturity | | Rate | | Unfunded Commitment | |
TricorBraun Holdings, Inc. | | 11/30/23 | | | 3.750 | | | $ | 1,791,983 | | |
Unfunded loan commitments and funded portions of credit agreements are marked to market daily and any unrealized appreciation or depreciation is included in the Statement of Assets and Liabilities and the Statement of Operations.
J) SECURITIES LENDING — The initial collateral received by the Fund is required to have a value of at least 102% of the market value of domestic securities on loan (including any accrued interest thereon) and 105% of the market value of foreign securities on loan (including any accrued interest thereon). The collateral is maintained thereafter at a value equal to at least 102% of the current market value of the securities on loan. The market value of loaned securities is determined at the close of each business day of the Fund and any additional required collateral is delivered to the Fund, or excess collateral returned by the Fund, on the next business day. Cash collateral received by the Fund in connection with securities lending activity may be pooled together with cash collateral for other funds/portfolios advised by Credit Suisse and may be invested in a variety of investments, including funds advised by SSB, the Fund's securities lending agent, or money market instruments. However, in the event of default or bankruptcy by the other party
49
Credit Suisse Floating Rate High Income Fund
Notes to Financial Statements (continued)
October 31, 2017
Note 2. Significant Accounting Policies (continued)
to the agreement, realization and/or retention of the collateral may be subject to legal proceedings.
SSB has been engaged by the Fund to act as the Fund's securities lending agent. As of October 31, 2017, the Fund had investment securities on loan with a fair value of $6,901,536. Collateral received for securities loaned and a related liability of $7,049,810 are presented gross in the Statement of Assets and Liabilities. The collateral for securities loaned is valued consistently to the other investments held by the Fund and is included in Level 2 of the fair value hierarchy. As of October 31, 2017, the value of the related collateral exceeded the value of the securities loaned.
The Fund's securities lending arrangement provides that the Fund and SSB will share the net income earned from securities lending activities. Securities lending income is accrued as earned. During the year ended October 31, 2017, total earnings from the Fund's investment in cash collateral received in connection with securities lending arrangements was $98,263, of which $20,036 was rebated to borrowers (brokers). The Fund retained $58,674 in income from the cash collateral investment, and SSB, as lending agent, was paid $19,553.
K) OTHER — The high yield, fixed income securities in which the Fund invests will primarily consist of senior secured floating rate loans ("Senior Loans") issued by non-investment grade companies. Senior Loans are typically secured by specific collateral of the issuer and hold the most senior position in the issuer's capital structure. The interest rate on Senior Loans is periodically adjusted to a recognized base rate, typically the London Interbank Offered Rate ("LIBOR"). While these characteristics may reduce interest rate risk and mitigate losses in the event of borrower default, the Senior Loans in which the Fund invests have below investment grade credit ratings and thereby are considered speculative because of the significant credit risk of their issuers.
Lower-rated debt securities (commonly known as "junk bonds") possess speculative characteristics and are subject to greater market fluctuations and risk of lost income and principal than higher-rated debt securities for a variety of reasons. Also, during an economic downturn or substantial period of rising interest rates, highly leveraged issuers may experience financial stress which would adversely affect their ability to service their principal and interest payment obligations, to meet projected business goals and to obtain additional financing.
In addition, periods of economic uncertainty and changes can be expected to result in increased volatility of market prices of lower-rated debt securities
50
Credit Suisse Floating Rate High Income Fund
Notes to Financial Statements (continued)
October 31, 2017
Note 2. Significant Accounting Policies (continued)
and the Fund's net asset value.
L) RECENT ACCOUNTING PRONOUNCEMENTS — On August 26, 2016, Financial Accounting Standards Board ("FASB") issued Accounting Standards Update No. 2016-15, "Statement of Cash Flows (Topic 230), a consensus of the FASB's Emerging Issues Task Force" ("ASU 2016-15"). ASU 2016-15 is intended to reduce diversity in practice in how certain transactions are classified in the statement of cash flows. The issues addressed in ASU 2016-15 are: debt prepayment or debt extinguishment costs, settlement of zero-coupon debt instruments, contingent consideration payments made after a business combination, proceeds from the settlement of insurance claims, proceeds from the settlement of corporate-owned life insurance policies, including bank-owned life insurance policies, distributions received from equity method investments, beneficial interests in securitization transactions; and, separately identifiable cash flows and application of the predominance principle. ASU 2016-15 is effective for interim and annual reporting periods beginning after December 15, 2017. Management is currently evaluating the impact, if any, of applying this provision.
In November 2016, FASB issued Accounting Standards Update No. 2016-18, "Statement of Cash Flows (Topic 230), Restricted Cash, a consensus of the FASB's Emerging Issues Task Force" ("ASU 2016-18"). ASU 2016-18 requires that a statement of cash flows explain the change during the period in the total of cash, cash equivalents, and amounts generally described as restricted cash or restricted cash equivalents. Therefore, amounts generally described as restricted cash and restricted cash equivalents should be included with cash and cash equivalents when reconciling the beginning-of-period and end-of-period total amounts shown on the statement of cash flows. The amendments in ASU 2016-18 do not provide a definition of restricted cash or restricted cash equivalents. ASU 2016-18 is effective for interim and annual reporting periods beginning after December 15, 2017. Management is currently evaluating the impact, if any, of applying this provision.
In October 2016, the U.S. Securities and Exchange Commission adopted new rules and amended existing rules (together, "final rules") intended to modernize the reporting and disclosure of information by registered investment companies. In part, the final rules amend Regulation S-X and require standardized, enhanced disclosure about derivatives in investment company financial statements, as well as other amendments. The compliance date for the amendments to Regulation S-X is August 1, 2017. The Fund has adopted the amendments to Regulation S-X and upon evaluation, has
51
Credit Suisse Floating Rate High Income Fund
Notes to Financial Statements (continued)
October 31, 2017
Note 2. Significant Accounting Policies (continued)
concluded that the amendments do not materially impact the financial statements. However, as required, additional or enhanced disclosure has been included.
M) SUBSEQUENT EVENTS — In preparing the financial statements as of October 31, 2017, management considered the impact of subsequent events for potential recognition or disclosure in these financial statements through the date of release of this report. No such events requiring recognition or disclosure were identified through the date of the release of this report.
Note 3. Transactions with Affiliates and Related Parties
Credit Suisse serves as investment adviser and co-administrator for the Fund. Effective November 15, 2016, for its investment advisory and administration services, Credit Suisse is entitled to receive a fee from the Fund at an annual rate of 0.79% of the Fund's average daily net assets less than or equal to $100 million and 0.59% of the Fund's average daily net assets greater than $100 million. Prior to November 15, 2016, the Fund paid Credit Suisse advisory fees at the annual rate of 0.70% of the Fund's average daily net assets less than or equal to $100 million and 0.50% of the Fund's average daily net assets greater than $100 million, and co-administration fees at an annual rate of 0.09% of the Fund's average daily net assets. On November 15, 2016, the Fund entered into an Investment Management Agreement with Credit Suisse which bundled the advisory and administration fees into a single fee. For the year ended October 31, 2017, investment advisory and administration fees earned and voluntarily waived by Credit Suisse were $19,324,122 and $2,404,609, respectively.
For its co-administrative services, SSB receives a fee, exclusive of out-of-pocket expenses, calculated in total for all the Credit Suisse funds/portfolios co-administered by SSB and allocated based upon the relative average net assets of each fund/portfolio, subject to an annual minimum fee. For the year ended October 31, 2017, co-administrative services fees earned by SSB (including out-of-pocket expenses) with respect to the Fund were $483,764.
Credit Suisse Securities (USA) LLC ("CSSU"), an affiliate of Credit Suisse, serves as the distributor of the Fund's shares. Pursuant to a distribution plan adopted by the Fund pursuant to Rule 12b-1 under the 1940 Act, CSSU receives fees for its distribution services. These fees are calculated at an annual rate of 0.25% of the average daily net assets of the Class A shares. For the Class B and Class C shares, the fee is calculated at an annual rate of 1.00% of the average
52
Credit Suisse Floating Rate High Income Fund
Notes to Financial Statements (continued)
October 31, 2017
Note 3. Transactions with Affiliates and Related Parties (continued)
daily net assets. For the year ended October 31, 2017, the Fund paid Rule 12b-1 distribution fees of $690,076 for Class A shares, $15,299 for Class B shares and $1,197,350 for Class C shares. Class I shares are not subject to Rule 12b-1 distribution fees.
Certain brokers, dealers and financial representatives provide transfer agent-related services to the Fund and receive compensation from the Fund. For the year ended October 31, 2017, the Fund paid $2,724,048, which is included within transfer agent fees in the Statement of Operations.
For the year ended October 31, 2017, CSSU and its affiliates advised the Fund that they retained $46,914 from commissions earned on the sale of the Fund's Class A shares. There were no commissions earned on the sale of Class C shares.
The Fund from time to time purchases or sells loan investments in the secondary market through Credit Suisse or its affiliates acting in the capacity as broker-dealer. Credit Suisse or its affiliates may have acted in some type of agent capacity to the initial loan offering prior to such loan trading in the secondary market.
Note 4. Line of Credit
The Fund, together with other funds/portfolios advised by Credit Suisse (collectively, the "Participating Funds"), participates in a committed, unsecured line of credit facility ("Credit Facility"), with SSB in an aggregated amount of $250 million for temporary or emergency purposes under a first-come, first-served basis. Under the terms of the Credit Facility, the Participating Funds pay an aggregate commitment fee on the average unused amount of the Credit Facility, which is allocated among the Participating Funds in such manner as is determined by the governing Boards of the Participating Funds. In addition, the Participating Funds pay interest on borrowings at either the Overnight Federal Funds rate or the Overnight LIBOR rate plus a spread. At October 31, 2017 and during the year ended October 31, 2017, the Fund had no borrowings outstanding under the Credit Facility.
53
Credit Suisse Floating Rate High Income Fund
Notes to Financial Statements (continued)
October 31, 2017
Note 5. Purchases and Sales of Securities
For the year ended October 31, 2017, purchases and sales of investment securities (excluding short-term investments) were $2,700,951,465 and $1,940,420,214, respectively.
Note 6. Capital Share Transactions
The Fund is authorized to issue an unlimited number of full and fractional shares of beneficial interest, $.001 par value per share. The Fund offers Class I, Class A, and Class C shares. Class B shares are shown but not offered. Effective December 15, 2017, all issued and outstanding Class B shares will be converted into Class A shares based on the aggregate net assets attributable to the Class B shares, and respective Class A net asset value per share immediately prior to the conversion. Transactions in capital shares for each class of the Fund were as follows:
| | | Class I | |
| | | For the Year Ended
October 31, 2017 | | For the Year Ended
October 31, 2016 | |
| | | Shares | | Value | | Shares | | Value | |
Shares sold | | | 211,638,545 | | | $ | 1,447,924,544 | | | | 149,356,768 | | | $ | 986,928,174 | | |
Shares issued in reinvestment
of dividends | | | 11,561,446 | | | | 79,147,727 | | | | 10,116,253 | | | | 66,947,489 | | |
Shares redeemed | | | (112,136,288 | ) | | | (766,942,041 | ) | | | (121,931,508 | ) | | | (804,238,116 | ) | |
Net increase | | | 111,063,703 | | | $ | 760,130,230 | | | | 37,541,513 | | | $ | 249,637,547 | | |
| | | Class A | |
| | | For the Year Ended
October 31, 2017 | | For the Year Ended
October 31, 2016 | |
| | | Shares | | Value | | Shares | | Value | |
Shares sold | | | 21,006,156 | | | $ | 144,468,807 | | | | 12,679,497 | | | $ | 84,108,918 | | |
Shares issued in reinvestment
of dividends | | | 1,324,811 | | | | 9,114,328 | | | | 1,493,495 | | | | 9,910,448 | | |
Shares redeemed | | | (14,547,205 | ) | | | (100,063,098 | ) | | | (23,217,202 | ) | | | (153,348,811 | ) | |
Net increase (decrease) | | | 7,783,762 | | | $ | 53,520,037 | | | | (9,044,210 | ) | | $ | (59,329,445 | ) | |
54
Credit Suisse Floating Rate High Income Fund
Notes to Financial Statements (continued)
October 31, 2017
Note 6. Capital Share Transactions (continued)
| | | Class B | |
| | | For the Year Ended
October 31, 2017 | | For the Year Ended
October 31, 2016 | |
| | | Shares | | Value | | Shares | | Value | |
Shares sold | | | 70 | | | $ | 483 | | | | 454 | | | $ | 3,155 | | |
Shares issued in reinvestment
of dividends | | | 4,360 | | | | 30,138 | | | | 6,631 | | | | 44,259 | | |
Shares redeemed | | | (129,977 | ) | | | (898,047 | ) | | | (54,950 | ) | | | (364,616 | ) | |
Net decrease | | | (125,547 | ) | | $ | (867,426 | ) | | | (47,865 | ) | | $ | (317,202 | ) | |
| | | Class C | |
| | | For the Year Ended
October 31, 2017 | | For the Year Ended
October 31, 2016 | |
| | | Shares | | Value | | Shares | | Value | |
Shares sold | | | 4,437,086 | | | $ | 30,593,500 | | | | 3,268,797 | | | $ | 21,828,726 | | |
Shares issued in reinvestment
of dividends | | | 427,766 | | | | 2,951,475 | | | | 539,495 | | | | 3,592,496 | | |
Shares redeemed | | | (4,485,008 | ) | | | (30,932,280 | ) | | | (6,898,846 | ) | | | (45,783,940 | ) | |
Net increase (decrease) | | | 379,844 | | | $ | 2,612,695 | | | | (3,090,554 | ) | | $ | (20,362,718 | ) | |
On October 31, 2017, the number of shareholders that held 5% or more of the outstanding shares of each class of the Fund was as follows:
| | | Number of
Shareholders | | Approximate Percentage
of Outstanding Shares | |
Class I | | | 4 | | | | 46 | % | |
Class A | | | 4 | | | | 66 | % | |
Class B | | | 4 | | | | 66 | % | |
Class C | | | 5 | | | | 74 | % | |
The Fund's performance may be negatively impacted in the event one or more of the Fund's greater than 5% shareholders were to redeem at a given time. Some of the shareholders are omnibus accounts, which hold shares on behalf of individual shareholders.
Note 7. Income Tax Information and Distributions to Shareholders
Income and capital gain distributions are determined in accordance with federal income tax regulations, which may differ from GAAP.
The tax character of dividends paid by the Fund during the fiscal years ended October 31, 2017 and 2016, respectively, was as follows:
| Ordinary Income | | Return of Capital | |
| 2017 | | 2016 | | 2017 | | 2016 | |
| $ | 128,525,258 | | | $ | 120,379,147 | | | $ | 2,998,269 | | | $ | 2,054,124 | | |
55
Credit Suisse Floating Rate High Income Fund
Notes to Financial Statements (continued)
October 31, 2017
Note 7. Income Tax Information and Distributions to Shareholders (continued)
The tax basis components of distributable earnings differ from the amounts reflected in the Statement of Assets and Liabilities by temporary book/tax differences. These differences are primarily due to differing treatments of dividends payable, wash sales, forward contracts marked to market and income from defaulted bonds. At October 31, 2017, the components of distributable earnings on a tax basis were as follows:
Accumulated net realized loss | | $ | (15,563,446 | ) | |
Unrealized appreciation | | | 17,381,923 | | |
| | $ | 1,818,477 | | |
At October 31, 2017, the Fund had $2,871,951 of unlimited short-term capital loss carryforwards and $12,691,495 of unlimited long-term capital loss carryforwards available to offset possible future capital gains.
At October 31, 2017, the cost and net unrealized appreciation (depreciation) of investments and derivatives for income tax purposes were as follows:
Cost of Investments | | $ | 3,755,050,189 | | |
Unrealized appreciation | | $ | 58,546,403 | | |
Unrealized depreciation | | | (41,064,664 | ) | |
Net unrealized appreciation (depreciation) | | $ | 17,481,739 | | |
To adjust for current period permanent book/tax differences which arose principally from differing book/tax treatment of foreign currency gain (loss) and defaulted bonds, paid-in capital was charged $73, distributions in excess of net investment income was charged $2,500,248 and accumulated net realized loss was credited $2,500,321. Net assets were not affected by this reclassification.
Note 8. Contingencies
In the normal course of business, the Fund may provide general indemnifications pursuant to certain contracts and organizational documents. The Fund's maximum exposure under these arrangements is dependent on future claims that may be made against the Fund and, therefore, cannot be estimated; however, based on experience, the risk of loss from such claims is considered remote.
56
Credit Suisse Floating Rate High Income Fund
Report of Independent Registered Public Accounting Firm
The Board of Trustees and Shareholders
Credit Suisse Floating Rate High Income Fund:
We have audited the accompanying statement of assets and liabilities of Credit Suisse Floating Rate High Income Fund (the "Fund"), a series of the Credit Suisse Opportunity Funds, including the schedule of investments, as of October 31, 2017, and the related statement of operations for the year then ended, the statements of changes in net assets for each of the years in the two-year period then ended, and the financial highlights for each of the years in the three-year period then ended. These financial statements and financial highlights are the responsibility of the Fund's management. Our responsibility is to express an opinion on these financial statements and financial highlights based on our audits. The accompanying financial highlights for each of the years in the two-year period ended October 31, 2014, were audited by other independent registered public accountants whose report thereon dated December 29, 2014, expressed an unqualified opinion on those financial highlights.
We conducted our audits in accordance with the standards of the Public Company Accounting Oversight Board (United States). Those standards require that we plan and perform the audits to obtain reasonable assurance about whether the financial statements and financial highlights are free of material misstatement. An audit includes examining, on a test basis, evidence supporting the amounts and disclosures in the financial statements. Our procedures included confirmation of securities owned as of October 31, 2017, by correspondence with the custodian and broker or by other appropriate auditing procedures. An audit also includes assessing the accounting principles used and significant estimates made by management, as well as evaluating the overall financial statement presentation. We believe that our audits provide a reasonable basis for our opinion.
In our opinion, the financial statements and financial highlights referred to above present fairly, in all material respects, the financial position of Credit Suisse Floating Rate High Income Fund as of October 31, 2017, the results of its operations for the year then ended, the changes in its net assets for each of the years in the two-year period then ended, and the financial highlights for each of the years in the three-year period then ended in conformity with U.S. generally accepted accounting principles.
New York, New York
December 28, 2017
57
Credit Suisse Floating Rate High Income Fund
Information Concerning Trustees and Officers (unaudited)
Name, Address
(Year of Birth) | | Position(s)
Held with
Fund | | Term
of Office1
and
Length
of Time
Served | | Principal
Occupation(s) During
Past Five Years | | Number of
Portfolios
in Fund
Complex
Overseen
by Trustee | | Other
Trusteeships
Held by Trustee
During Past Five Years | |
Independent Trustees | | | | | | | | | | | |
Laura A. DeFelice
c/o Credit Suisse Asset
Management, LLC
Attn: General Counsel
One Madison Avenue
New York, New York
10010
(1959) | | Trustee, Nominating and Audit Committee member | | Since 2017 | | Partner of Acacia Properties LLC (multi-family and commercial real estate ownership and operation) from 2008 to present; Stonegate Advisors LLC (renewable energy and energy efficiency) from 2007 to present. | | | 8 | | | None | |
Jeffrey E. Garten
c/o Credit Suisse Asset Management, LLC
Attn: General Counsel One Madison Avenue New York, New York 10010
(1946) | | Trustee, Nominating and Audit Committee member | | Since 2001 | | Dean Emeritus of Yale School of Management from July 2015 to present; The Juan Trippe Professor in the Practice of International Trade, Finance and Business, from July 2005 to July 2015; Partner and Chairman of Garten Rothkopf (consulting firm) from October 2005 to present. | | | 8 | | | Director of Aetna, Inc. (insurance company); Director of CarMax Group (used car dealers); Director of Miller Buckfire & Co., LLC (financial restructuring); Member of Standard & Poor's Board of Managers (credit rating agency) from December 2011 to November 2014. | |
1 Subject to the Trust's retirement policy, each Trustee may continue to serve as a Trustee until the last day of the calendar year in which the applicable Trustee attains age 75. Officer serves until his or her respective successor has been duly elected and qualified.
58
Credit Suisse Floating Rate High Income Fund
Information Concerning Trustees and Officers (unaudited) (continued)
Name, Address
(Year of Birth) | | Position(s)
Held with
Fund | | Term
of Office1
and
Length
of Time
Served | | Principal
Occupation(s) During
Past Five Years | | Number of
Portfolios
in Fund
Complex
Overseen
by Trustee | | Other
Trusteeships
Held by Trustee
During Past Five Years | |
Independent Trustees | | | | | | | | | | | |
Mahendra R. Gupta
c/o Credit Suisse Asset
Management, LLC
Attn: General Counsel
One Madison Avenue
New York, New York
10010
1956 | | Trustee, Nominating Committee member and Audit Committee Chairman | | Since 2017 | | Professor, Washington University in St. Louis from July 1990 to present; Dean of Olin Business School at Washington University in St. Louis from July 2005 to July 2016; Partner, R.J. Mithaiwala (food manufacturing and retail, India) from March 1977 to present; Partner, F.F.B. Corporation (agriculture, India) from March 1977 to present; Partner, RPMG Research Corporation (benchmark research) from July 2001 to present. | | | 8 | | | Director of Caleres Inc. (footwear) from May 2012 to present | |
1 Subject to the Trust's retirement policy, each Trustee may continue to serve as a Trustee until the last day of the calendar year in which the applicable Trustee attains age 75. Officer serves until his or her respective successor has been duly elected and qualified.
59
Credit Suisse Floating Rate High Income Fund
Information Concerning Trustees and Officers (unaudited) (continued)
Name, Address
(Year of Birth) | | Position(s)
Held with
Fund | | Term
of Office1
and
Length
of Time
Served | | Principal
Occupation(s) During
Past Five Years | | Number of
Portfolios
in Fund
Complex
Overseen
by Trustee | | Other
Trusteeships
Held by Trustee
During Past Five Years | |
Independent Trustees | | | | | | | | | | | |
Steven N. Rappaport
Lehigh Court, LLC
555 Madison Avenue
29th Floor
New York, New York
10022
(1948) | | Chairman of the Board, Nominating Committee Chairman and Audit Committee member | | Trustee since 2001 and Chairman since 2005 | | Partner of Lehigh Court, LLC and RZ Capital (private investment firms) from July 2002 to present; Partner of Backstage Acquisition Holdings, LLC (publication job postings) from November 2013 to present. | | | 10 | | | Director of iCAD, Inc. (surgical and medical instruments and apparatus company); Director of Aberdeen Chile Fund, Inc., Aberdeen Emerging Markets Smaller Company Opportunities Fund, Inc., Aberdeen Israel Fund, Inc., Aberdeen Indonesia Fund, Inc. and Aberdeen Latin America Equity Fund, Inc. (each a closed-end investment company); Director of Aberdeen Funds (23 open-end portfolios); Director of Presstek, Inc. (digital imaging technologies company) from 2003 to 2012; Director of Wood Resources, LLC (plywood manufacturing company) from 2003 to October 2013. | |
Interested Trustee | | | | | | | | | | | |
John G. Popp2
Credit Suisse Asset
Management, LLC
One Madison Avenue
New York, New York
10010
Year of Birth: 1956 | | Trustee, Chief Executive Officer and President | | Trustee since 2017
Chief Executive Officer and President since 2010 | | Managing Director of Credit Suisse; Global Head and Chief Investment Officer of the Credit Investments Group; Associated with Credit Suisse or its predecessor since 1997; President and Chief Executive Officer of other Credit Suisse Funds. | | | 10 | | | Trustee of Credit Suisse High Yield Bond Fund; Director of Credit Suisse Asset Management Income Fund, Inc. | |
1 Subject to the Trust's retirement policy, each Trustee may continue to serve as a Trustee until the last day of the calendar year in which the applicable Trustee attains age 75. Officer serves until his or her respective successor has been duly elected and qualified.
2 Mr. Popp is an "interested person" of the Trust, as defined in the 1940 Act, by virtue of his current position as an officer of Credit Suisse.
60
Credit Suisse Floating Rate High Income Fund
Information Concerning Trustees and Officers (unaudited) (continued)
Name, Address
(Year of Birth) | | Position(s)
Held with
Fund | | Term of
Office1
and
Length of
Time
Served | | Principal Occupation(s) During Past Five Years | |
Emidio Morizio
Credit Suisse Asset
Management, LLC
One Madison Avenue
New York, New York 10010
(1966) | | Chief Compliance Officer | | Since Fund Inception | | Managing Director and Global Head of Compliance of Credit Suisse since 2010; Associated with Credit Suisse since July 2000; Officer of other Credit Suisse Funds. | |
Lou Anne McInnis
Credit Suisse Asset Management, LLC
One Madison Avenue
New York, New York 10010
(1959) | | Chief Legal Officer | | Since 2015 | | Director of Credit Suisse; Associated with Credit Suisse since April 2015; Counsel at DLA Piper US LLP from 2011 to April 2015; Associated with Morgan Stanley Investment Management from 1997 to 2010; Officer of other Credit Suisse Funds. | |
Laurie Pecha
Credit Suisse Asset
Management, LLC
One Madison Avenue
New York, New York 10010
(1961) | | Chief Financial Officer | | Since 2016 | | Director of Credit Suisse since August 2016; Senior Consultant of Spectra Professional Services, LLC from January 2012 to July 2016; Vice President of Legg Mason & Co. from March 2007 to December 2011; Officer of other Credit Suisse Funds. | |
Esther Cheung
Credit Suisse Asset
Management, LLC
One Madison Avenue
New York, New York 10010
(1980) | | Treasurer | | Since 2016 | | Vice President of Credit Suisse since 2015; Associated with Reich & Tang Asset Management, LLC from June 2010 to August 2015; Officer of other Credit Suisse Funds. | |
Karen Regan
Credit Suisse Asset
Management, LLC
One Madison Avenue
New York, New York 10010
(1963) | | Vice President and Secretary | | Since Fund Inception | | Vice President of Credit Suisse; Associated with Credit Suisse since December 2004; Officer of other Credit Suisse Funds. | |
1 Subject to the Trust's retirement policy, each Trustee may continue to serve as a Trustee until the last day of the calendar year in which the applicable Trustee attains age 75. Officer serves until his or her respective successor has been duly elected and qualified.
* The officers of the Fund shown are officers that make policy decisions.
The Statement of Additional Information includes additional information about the Trustees and is available, without charge, upon request, by calling 877-870-2874.
61
Credit Suisse Floating Rate High Income Fund
Proxy Voting and Portfolio Holdings Information (unaudited)
Information regarding how the Fund voted proxies related to its portfolio securities during the 12-month period ended June 30 of each year, as well as the policies and procedures that the Fund uses to determine how to vote proxies relating to its portfolio securities are available:
• By calling 1-877-870-2874
• On the Fund's website, www.credit-suisse.com/us/funds
• On the website of the Securities and Exchange Commission, www.sec.gov
The Fund files a complete schedule of its portfolio holdings for the first and third quarters of its fiscal year with the SEC on Form N-Q. The Fund's Forms N-Q are available on the SEC's website at www.sec.gov and may be reviewed and copied at the SEC's Public Reference Room in Washington, DC. Information on the operation of the SEC's Public Reference Room may be obtained by calling 1-202-551-8090.
62
This page intentionally left blank
This page intentionally left blank
This page intentionally left blank
This page intentionally left blank
This page intentionally left blank
This page intentionally left blank

P.O. BOX 55030, BOSTON, MA 02205-5030
877-870-2874 n www.credit-suisse.com/us
CREDIT SUISSE SECURITIES (USA) LLC, DISTRIBUTOR. FLHI-AR-1017

CREDIT SUISSE FUNDS
Annual Report
October 31, 2017
n CREDIT SUISSE
MANAGED FUTURES STRATEGY FUND
The Fund's investment objectives, risks, charges and expenses (which should be considered carefully before investing), and more complete information about the Fund, are provided in the Prospectus, which should be read carefully before investing. You may obtain additional copies by calling 877-870-2874 or by visiting our website at www.credit-suisse.com/us/funds.
Credit Suisse Securities (USA) LLC, Distributor, is located at One Madison Avenue, New York, NY 10010. Credit Suisse Funds are advised by Credit Suisse Asset Management, LLC.
Investors in the Credit Suisse Funds should be aware that they may be eligible to purchase Class I shares (where offered) directly or through certain intermediaries. Such shares are not subject to a sales charge. Investors in the Credit Suisse Funds should also be aware that they may be eligible for a reduction or waiver of the sales charge with respect to Class A or C shares (where offered). For more information, please review the relevant prospectuses or consult your financial representative.
Fund shares are not deposits or other obligations of Credit Suisse Asset Management, LLC ("Credit Suisse") or any affiliate, are not FDIC-insured and are not guaranteed by Credit Suisse or any affiliate. Fund investments are subject to investment risks, including loss of your investment.
Credit Suisse Managed Futures Strategy Fund
Annual Investment Adviser's Report
October 31, 2017 (unaudited)
November 24, 2017
Dear Shareholder:
We are pleased to present this Annual Report covering the activities of the Credit Suisse Managed Futures Strategy Fund (the "Fund") for the 12-month period ended October 31, 2017.
Performance Summary
11/1/2016 – 10/31/2017
Fund & Benchmark | | Performance | |
| Class I1 | | | -1.60 | % | |
| Class A1,2 | | | -1.79 | % | |
| Class C1,2 | | | -2.52 | % | |
Credit Suisse Managed Futures Liquid Index3 | | | -2.19 | % | |
Performance shown for the Fund's Class A and Class C Shares does not reflect sales charges, which are a maximum of 5.25% and 1.00%, respectively.2
Market Review: A challenging period for managed futures
The twelve-month period ended October 31, 2017 was a tough one for managed futures strategies, with the Credit Suisse Managed Futures Hedge Fund Index returning 0.15% and the Credit Suisse Managed Futures Liquid Index, the Fund's benchmark, returning -2.19%.
Over the past year, as a number of underlying markets experienced medium to long-term reversals, the entire managed futures industry tended to struggle.
Portfolio Review and Outlook: Relative outperformance in a tough climate
The managed futures strategy is generally designed to profit from both upward and downward trending markets across several asset classes including commodities, bonds, equities, and currencies. For the 12-month period ended October 31, 2017, the Fund outperformed its benchmark, with a return of -1.60% (I shares), as compared to -2.19% for the Credit Suisse Managed Futures Liquid Index. Equity positions contributed positively to Fund performance, while fixed income, commodities and currencies detracted from performance.
Equity positions were the largest contributor to Fund performance due to persistent long positions in underlying contracts that generated profits from the sustained equity market rally that began following the U.S. presidential election last November. Earnings improvements, a synchronized global growth cycle, and heightened consumer confidence combined to push markets higher.
1
Credit Suisse Managed Futures Strategy Fund
Annual Investment Adviser's Report (continued)
October 31, 2017 (unaudited)
Fixed income positions were the largest detractors from performance, as conflicting inflation measures, central bank policy, and geopolitical risks increased the market's vulnerability to reversals and made it impossible to sustain market trends.
Commodities were the second largest detractor from performance over the period. Although persistent long positions in industrial metals delivered profits, they were offset by losses in energy, precious metals (which fluctuated due to the same challenges as fixed income), and agriculture.
Currencies also detracted from Fund performance. Long U.S. dollar positions initially profited following the election, but legislative setbacks caused a retreat at the beginning of the year that resulted in subsequent losses.
We continue to believe that the unique return profile of managed futures may appeal to investors searching for meaningful portfolio diversifiers that may help mitigate risk and provide uncorrelated returns.
The Quantitative Investment Strategies Group
Yung-Shin Kung
Sheel Dhande
The Fund is non-diversified, which means it may invest a greater proportion of its assets in the securities of a smaller number of issuers than a diversified mutual fund and may therefore be subject to greater volatility. The Fund's investment in alternative instruments may subject the Fund to greater volatility than investments in traditional securities, particularly in investments involving leverage.
The use of alternative assets and strategies entails substantial risks, including risk of loss of principal, commodity exposure risks, credit risk, currency risk, derivatives risk, equity exposure risk, exchange-traded notes risk, fixed income risk, foreign securities risk, forwards risk, futures contracts risk, interest rate risk, leveraging risk, market risk, options risk, portfolio turnover risk, repurchase agreements risk, short position risk, speculative exposure risk, structured note risk, subsidiary risk, swap agreements risk, tax risk and U.S. government securities risk. For a detailed discussion of these and other risks, please refer to the Fund's Prospectus, which should be read carefully before investing.
In addition to historical information, this report contains forward-looking statements, which may concern, among other things, domestic and foreign markets, industry and
2
Credit Suisse Managed Futures Strategy Fund
Annual Investment Adviser's Report (continued)
October 31, 2017 (unaudited)
economic trends and developments and government regulation, and their potential impact on the Fund's investments. These statements are subject to risks and uncertainties and actual trends, developments and regulations in the future, and their impact on the Fund, could be materially different from those projected, anticipated or implied. The Fund has no obligation to update or revise forward-looking statements.
The views of the Fund's management are as of the date of this letter and the Fund holdings described in this document are as of October 31, 2017; these views and Fund holdings may have changed subsequent to these dates. Nothing in this document is a recommendation to purchase or sell securities.
3
Credit Suisse Managed Futures Strategy Fund
Annual Investment Adviser's Report (continued)
October 31, 2017 (unaudited)
Comparison of Change in Value of $10,000 Investment in the
Credit Suisse Managed Futures Strategy Fund1 Class I Shares,
Class A Shares2, Class C Shares2 and Credit Suisse Managed Futures
Liquid Index3 from Inception (9/28/12).
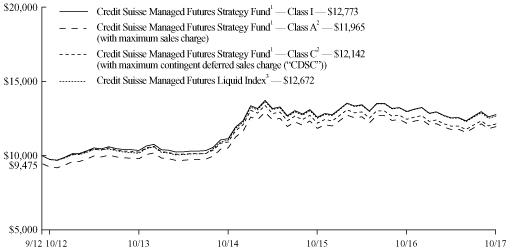
1 Fee waivers and/or expense reimbursements reduce expenses for the Fund, without which performance would be lower. The Fund entered into a written contract to limit expenses to 1.30% of the Fund's average daily net assets for Class I shares, 1.55% of the Fund's average daily net assets for Class A shares and 2.30% of the Fund's average daily net assets for Class C shares through at least February 28, 2019. This limit excludes certain expenses, as set forth in the Fund's Prospectus.
2 Total return for the Fund's Class A shares for the reporting period, based on offering price (including maximum sales charge of 5.25%), was (6.93)%. Total return for the Fund's Class C shares for the reporting period, based on redemption value including CDSC of 1.00%, was (3.47)%.
3 The Credit Suisse Managed Futures Liquid Index is a broadly diversified futures index currently composed of 14 futures contracts and 4 commodity indices which provide exposure to the asset classes. The Index uses a proprietary quantitative methodology to seek to identify price trends in each of the asset classes over a variety of time horizons. Components of the Index, which may change from time to time, are positioned either long or short based on the price trends within the asset classes determined using the Index's quantitative methodology. The Index does not have transaction costs and investors may not invest directly in the Index.
4
Credit Suisse Managed Futures Strategy Fund
Annual Investment Adviser's Report (continued)
October 31, 2017 (unaudited)
Average Annual Returns as of October 31, 20171
| | | 1 Year | | 5 Years | | Since
Inception2 | |
Class I | | | (1.60 | )% | | | 5.53 | % | | | 4.92 | % | |
Class A Without Sales Charge | | | (1.79 | )% | | | 5.28 | % | | | 4.68 | % | |
Class A With Maximum Sales Charge | | | (6.93 | )% | | | 4.15 | % | | | 3.59 | % | |
Class C Without CDSC | | | (2.52 | )% | | | 4.49 | % | | | 3.88 | % | |
Class C With CDSC | | | (3.47 | )% | | | 4.49 | % | | | 3.88 | % | |
Returns represent past performance and include change in share price and reinvestment of dividends and capital gain distributions, if any. Past performance cannot guarantee future results. The current performance of the Fund may be lower or higher than the figures shown. Returns and share price will fluctuate, and redemption value may be more or less than original cost. The performance results do not reflect the deduction of taxes that a shareholder would pay on Fund distributions or the redemption of Fund shares. Performance information current to the most recent month end is available at www.credit-suisse.com/us/funds.
The annual gross expense ratios are 1.39% for Class I shares, 1.64% for Class A shares and 2.39% for Class C shares. The annual net expense ratios after fee waivers and/or expense reimbursements are 1.30% for Class I shares, 1.55% for Class A shares and 2.30% for Class C shares.
1 Fee waivers and/or expense reimbursements reduce expenses for the Fund, without which performance would be lower. The Fund has entered into a written contract to limit expenses to 1.30% of the Fund's average daily net assets for Class I shares, 1.55% of the Fund's average daily net assets for Class A shares and 2.30% of the Fund's average daily net assets for Class C shares through at least February 28, 2019. This limit excludes certain expenses, as set forth in the Fund's Prospectus.
2 Inception Date September 28, 2012.
5
Credit Suisse Managed Futures Strategy Fund
Annual Investment Adviser's Report (continued)
October 31, 2017 (unaudited)
Information About Your Fund's Expenses
As an investor of the Fund, you incur two types of costs: ongoing expenses and transaction costs. Ongoing expenses include management fees, distribution and service (12b-1) fees and other Fund expenses. Examples of transaction costs include sales charges (loads), redemption fees and account maintenance fees, which are not shown in this section and which would result in higher total expenses. The following table is intended to help you understand your ongoing expenses of investing in the Fund and to help you compare these expenses with the ongoing expenses of investing in other mutual funds. The table is based on an investment of $1,000 made at the beginning of the six months ended October 31, 2017.
The table illustrates your Fund's expenses in two ways:
• Actual Fund Return. This helps you estimate the actual dollar amount of ongoing expenses paid on a $1,000 investment in the Fund using the Fund's actual return during the period. To estimate the expenses you paid over the period, simply divide your account value by $1,000 (for example, an $8,600 account value divided by $1,000 = 8.6), then multiply the result by the number in the "Expenses Paid per $1,000" line.
• Hypothetical 5% Fund Return. This helps you to compare the Fund's ongoing expenses with those of other mutual funds using the Fund's actual expense ratio and a hypothetical rate of return of 5% per year before expenses. Examples using a 5% hypothetical fund return may be found in the shareholder reports of other mutual funds. The hypothetical account values and expenses may not be used to estimate the actual ending account balance or expenses you paid for the period.
Please note that the expenses shown in these tables are meant to highlight your ongoing expenses only and do not reflect any transaction costs, such as sales charges (loads) or redemption fees. If these transaction costs had been included, your costs would have been higher. The "Expenses Paid per $1,000" line of the tables is useful in comparing ongoing expenses only and will not help you determine the relative total expenses of owning different funds.
6
Credit Suisse Managed Futures Strategy Fund
Annual Investment Adviser's Report (continued)
October 31, 2017 (unaudited)
Expenses and Value for a $1,000 Investment
for the six-month period ended October 31, 2017
Actual Fund Return | | Class I | | Class A | | Class C | |
Beginning Account Value 05/01/17 | | $ | 1,000.00 | | | $ | 1,000.00 | | | $ | 1,000.00 | | |
Ending Account Value 10/31/17 | | $ | 1,017.50 | | | $ | 1,016.60 | | | $ | 1,012.10 | | |
Expenses Paid per $1,000* | | $ | 6.61 | | | $ | 7.88 | | | $ | 11.66 | | |
Hypothetical 5% Fund Return | |
Beginning Account Value 05/01/17 | | $ | 1,000.00 | | | $ | 1,000.00 | | | $ | 1,000.00 | | |
Ending Account Value 10/31/17 | | $ | 1,018.65 | | | $ | 1,017.39 | | | $ | 1,013.61 | | |
Expenses Paid per $1,000* | | $ | 6.61 | | | $ | 7.88 | | | $ | 11.67 | | |
| | | Class I | | Class A | | Class C | |
Annualized Expense Ratios* | | | 1.30 | % | | | 1.55 | % | | | 2.30 | % | |
* Expenses are equal to the Fund's annualized expense ratio for each share class, multiplied by the average account value over the period, multiplied by 184/365 to reflect the one-half year period.
The "Expenses Paid per $1,000" and the "Annualized Expense Ratios" in the tables are based on actual expenses paid by the Fund during the period, net of fee waivers and/or actual expenses reimbursements, if applicable. If those fee waivers and/or expense reimbursements had not been in effect, the Fund's actual expenses would have been higher. Expenses do not reflect additional charges and expenses that are, or may be, imposed under the variable contracts or plans. Such charges and expenses are described in the prospectus of the insurance company separate account or in the plan documents or other informational materials supplied by plan sponsors. The Fund's expenses should be considered with these charges and expenses in evaluating the overall cost of investing in the separate account.
For more information, please refer to the Fund's Prospectus.
7
Credit Suisse Managed Futures Strategy Fund
Annual Investment Adviser's Report (continued)
October 31, 2017 (unaudited)
Portfolio Breakdown*
United States Treasury Obligations | | | 43.73 | % | |
Short-Term Investment1 | | | 56.27 | | |
Total | | | 100.00 | % | |
* Expressed as a percentage of total investments (excluding securities lending collateral, if applicable) and may vary over time.
1 Primarily reflects cash invested in State Street Bank and Trust Co. Euro Time Deposit, for which the purchases of securities have been executed but not yet settled at October 31, 2017, if applicable.
8
Credit Suisse Managed Futures Strategy Fund
Consolidated Schedule of Investments
October 31, 2017
Par
(000) | | | | Ratings†
(S&P/Moody's) | | Maturity | | Rate% | | Value | |
| UNITED STATES TREASURY OBLIGATIONS (39.4%) | | | |
$ | 20,000 | | | United States Treasury Bills | | (AA+, Aaa) | | 01/11/18 | | | 1.065 | | | $ | 19,959,077 | | |
| | 60,000 | | | United States Treasury Bills | | (AA+, Aaa) | | 02/01/18 | | | 1.093 | | | | 59,826,733 | | |
| | 20,000 | | | United States Treasury Bills | | (AA+, Aaa) | | 04/05/18 | | | 1.181 | | | | 19,895,698 | | |
| | 20,000 | | | United States Treasury Bills | | (AA+, Aaa) | | 05/24/18 | | | 1.244 | | | | 19,859,183 | | |
| TOTAL UNITED STATES TREASURY OBLIGATIONS (Cost $119,547,810) | | | 119,540,691 | | |
| SHORT-TERM INVESTMENTS (50.6%) | | | |
| 153,842
| | | State Street Bank and Trust Co. Euro Time Deposit
(Cost $153,841,748) | | | | | | |
11/01/17 | | | | 0.120 | | | | 153,841,748 | | |
| TOTAL INVESTMENTS AT VALUE (90.0%) (Cost $273,389,558) | | | 273,382,439 | | |
| OTHER ASSETS IN EXCESS OF LIABILITIES (10.0%) | | | 30,216,103 | | |
| NET ASSETS (100.0%) | | $ | 303,598,542 | | |
† Credit ratings given by the Standard & Poor's Division of the McGraw-Hill Companies, Inc. ("S&P") and Moody's Investors Service, Inc. (Moody's) are unaudited.
Futures Contracts
Contract Description | | Currency | | Expiration
Date | | Number of
Contracts | | Notional
Value | | Net Unrealized
Appreciation
(Depreciation) | |
Contracts to Purchase | |
Foreign Exchange Contracts | |
| AUD Currency Futures | | USD | | | | Dec 2017 | | | 419 | | | $ | 32,061,880 | | | $ | (1,233,094 | ) | |
| CAD Currency Futures | | USD | | | | Dec 2017 | | | 754 | | | | 58,491,550 | | | | (3,127,876 | ) | |
| EUR Currency Futures | | USD | | | | Dec 2017 | | | 379 | | | | 55,338,738 | | | | (1,146,099 | ) | |
| GBP Currency Futures | | USD | | | | Dec 2017 | | | 816 | | | | 67,835,100 | | | | 272,014 | | |
| | | $ | (5,235,055 | ) | |
Index Contracts | |
EURO Stoxx 50 Index Futures | | EUR | | | | Dec 2017 | | | 997 | | | | 42,718,317 | | | $ | 1,936,065 | | |
FTSE 100 Index Futures | | GBP | | | | Dec 2017 | | | 420 | | | | 41,649,182 | | | | 271,077 | | |
Hang Seng Index Futures | | HKD | | | | Nov 2017 | | | 234 | | | | 42,290,241 | | | | (119,313 | ) | |
Nikkei 225 Index Futures OSE | | JPY | | | | Dec 2017 | | | 235 | | | | 45,395,142 | | | | 3,674,591 | | |
S&P 500 E Mini Index Futures | | USD | | | | Dec 2017 | | | 346 | | | | 44,507,710 | | | | 1,427,467 | | |
| | | $ | 7,189,887 | | |
Interest Rate Contracts | |
10YR Japanese Bond Futures | | JPY | | | | Dec 2017 | | | 149 | | | | 197,307,313 | | | $ | 46,189 | | |
German EURO Bund Futures | | EUR | | | | Dec 2017 | | | 516 | | | | 97,831,329 | | | | 509,305 | | |
| | | $ | 555,494 | | |
Contracts to Sell | |
Foreign Exchange Contracts | |
| JPY Currency Futures | | USD | | | | Dec 2017 | | | (538 | ) | | | (59,274,150 | ) | | $ | 907,120 | | |
See Accompanying Notes to Consolidated Financial Statements.
9
Credit Suisse Managed Futures Strategy Fund
Consolidated Schedule of Investments (continued)
October 31, 2017
Futures Contracts (continued)
Contract Description | | Currency | | Expiration
Date | | Number of
Contracts | | Notional
Value | | Net Unrealized
Appreciation
(Depreciation) | |
Interest Rate Contracts | |
10YR U.S. Treasury Note Futures | | USD | | | | Dec 2017 | | | (1,230 | ) | | $ | (153,673,125 | ) | | $ | (244,371 | ) | |
Long Gilt Futures | | GBP | | | | Dec 2017 | | | (608 | ) | | | (100,383,300 | ) | | | (103,461 | ) | |
| | | $ | (347,832 | ) | |
Net unrealized appreciation (depreciation) | | $ | 3,069,614 | | |
Total Return Swap Contracts
Currency | | Notional
Amount | | Expiration
Date | | Counterparty | | Receive | | Pay | | Upfront
Premiums
Paid | | Upfront
Premiums
Received | | Net Unrealized
Appreciation
(Depreciation) | |
USD | | | | $ | 3,966,905 | | | 11/16/17 | | Goldman Sachs | | Bloomberg
Energy Index | | Fixed Rate | | $ | — | | | $ | — | | | $ | 9,032 | | |
USD | | | | | 11,262,781 | | | 11/16/17 | | Goldman Sachs | | Fixed Rate | | Bloomberg
Precious
Metals Index | | | — | | | | — | | | | 73,594 | | |
USD | | | | | 11,545,568 | | | 11/16/17 | | Goldman Sachs | | Fixed Rate | | Bloomberg
Precious
Metals Index | | | — | | | | — | | | | — | | |
USD | | | | | 30,673,770 | | | 11/16/17 | | Goldman Sachs | | Fixed Rate | | Bloomberg
Agriculture
Index | | | — | | | | — | | | | 187,840 | | |
USD | | | | | 42,378,525 | | | 11/16/17 | | Goldman Sachs | | Bloomberg
Industrial
Metals Index | | Fixed Rate | | | — | | | | — | | | | 190,314 | | |
USD | | | | | 1,955,239 | | | 11/16/17 | | Goldman Sachs | | Bloomberg
Energy Index | | Fixed Rate | | | — | | | | — | | | | 46,167 | | |
USD | | | | | 3,568,657 | | | 11/16/17 | | Goldman Sachs | | Bloomberg
Energy Index | | Fixed Rate | | | — | | | | — | | | | 111,004 | | |
USD | | | | | 7,349,997 | | | 11/16/17 | | Goldman Sachs | | Bloomberg
Energy Index | | Fixed Rate | | | — | | | | — | | | | 153,807 | | |
USD | | | | | 7,368,823 | | | 11/16/17 | | Goldman Sachs | | Bloomberg
Energy Index | | Fixed Rate | | | — | | | | — | | | | 151,716 | | |
USD | | | | | 3,734,767 | | | 11/16/17 | | Goldman Sachs | | Bloomberg
Energy Index | | Fixed Rate | | | — | | | | — | | | | 41,968 | | |
| | | $ | 965,442 | | |
Currency Abbreviations:
AUD = Australian Dollar
CAD = Canadian Dollar
EUR = Euro
GBP = British Pound
HKD = Hong Kong Dollar
JPY = Japanese Yen
USD = United States Dollar
See Accompanying Notes to Consolidated Financial Statements.
10
Credit Suisse Managed Futures Strategy Fund
Consolidated Statement of Assets and Liabilities
October 31, 2017
Assets | |
Investments at value (Cost $273,389,558) (Note 2) | | $ | 273,382,439 | | |
Cash | | | 100,000 | | |
Foreign currency at value (Cost $55) | | | 52 | | |
Cash segregated at brokers for futures contracts and swap contracts (Note 2) | | | 25,772,511 | | |
Receivable for Fund shares sold | | | 2,229,758 | | |
Variation margin receivable on futures contracts (Note 2) | | | 1,901,305 | | |
Unrealized appreciation on open swap contracts (Note 2) | | | 965,442 | | |
Interest receivable | | | 513 | | |
Prepaid expenses and other assets | | | 40,522 | | |
Total assets | | | 304,392,542 | | |
Liabilities | |
Investment advisory fee payable (Note 3) | | | 133,641 | | |
Administrative services fee payable (Note 3) | | | 12,228 | | |
Shareholder servicing/Distribution fee payable (Note 3) | | | 23,204 | | |
Payable for Fund shares redeemed | | | 203,912 | | |
Net payable for terminated total return swap contracts | | | 162,831 | | |
Trustees' fee payable | | | 15,157 | | |
Accrued expenses | | | 243,027 | | |
Total liabilities | | | 794,000 | | |
Net Assets | |
Capital stock, $.001 par value (Note 6) | | | 29,028 | | |
Paid-in capital (Note 6) | | | 299,112,705 | | |
Distributions in excess of net investment income | | | (35,543 | ) | |
Accumulated net realized gain from investments, futures contracts, swap contracts and foreign
currency transactions | | | 535,130 | | |
Net unrealized appreciation from investments, futures contracts, swap contracts and foreign
currency translations | | | 3,957,222 | | |
Net assets | | $ | 303,598,542 | | |
I Shares | |
Net assets | | $ | 201,477,659 | | |
Shares outstanding | | | 19,205,667 | | |
Net asset value, offering price and redemption price per share | | $ | 10.49 | | |
A Shares | |
Net assets | | $ | 98,756,087 | | |
Shares outstanding | | | 9,488,180 | | |
Net asset value and redemption price per share | | $ | 10.41 | | |
Maximum offering price per share (net asset value/(1-5.25%)) | | $ | 10.99 | | |
C Shares | |
Net assets | | $ | 3,364,796 | | |
Shares outstanding | | | 334,559 | | |
Net asset value and offering price per share | | $ | 10.06 | | |
See Accompanying Notes to Consolidated Financial Statements.
11
Credit Suisse Managed Futures Strategy Fund
Consolidated Statement of Operations
For the Year Ended October 31, 2017
Investment Income | |
Interest | | $ | 725,199 | | |
Foreign taxes withheld | | | (17 | ) | |
Total investment income | | | 725,182 | | |
Expenses | |
Investment advisory fees (Note 3) | | | 2,329,329 | | |
Administrative services fees (Note 3) | | | 37,543 | | |
Shareholder servicing/Distribution fees (Note 3) | |
Class A | | | 165,358 | | |
Class C | | | 36,118 | | |
Transfer agent fees (Note 3) | | | 329,046 | | |
Custodian fees | | | 111,273 | | |
Registration fees | | | 87,711 | | |
Printing fees | | | 58,957 | | |
Audit and tax fees | | | 54,679 | | |
Trustees' fees | | | 49,060 | | |
Legal fees | | | 46,164 | | |
Commitment fees (Note 4) | | | 9,014 | | |
Insurance expense | | | 4,136 | | |
Miscellaneous expense | | | 6,693 | | |
Total expenses | | | 3,325,081 | | |
Less: fees waived (Note 3) | | | (204,020 | ) | |
Net expenses | | | 3,121,061 | | |
Net investment loss | | | (2,395,879 | ) | |
Net Realized and Unrealized Gain (Loss) from Investments, Futures Contracts, Swap Contracts
and Foreign Currency Related Items | |
Net realized gain from futures contracts | | | 3,254,786 | | |
Net realized loss from swap contracts | | | (6,075,866 | ) | |
Net realized gain from foreign currency transactions | | | 152,425 | | |
Net change in unrealized appreciation (depreciation) from investments | | | (7,119 | ) | |
Net change in unrealized appreciation (depreciation) from futures contracts | | | 1,509,770 | | |
Net change in unrealized appreciation (depreciation) from swap contracts | | | 1,190,917 | | |
Net change in unrealized appreciation (depreciation) from foreign currency translations | | | (33,357 | ) | |
Net realized and unrealized loss from investments, futures contracts, swap contracts
and foreign currency related items | | | (8,444 | ) | |
Net decrease in net assets resulting from operations | | $ | (2,404,323 | ) | |
See Accompanying Notes to Consolidated Financial Statements.
12
Credit Suisse Managed Futures Strategy Fund
Consolidated Statement of Changes in Net Assets
| | | For the Year
Ended
October 31, 2017 | | For the Year
Ended
October 31, 2016 | |
From Operations | |
Net investment loss | | $ | (2,395,879 | ) | | $ | (1,809,916 | ) | |
Net realized gain (loss) from futures contracts, swap contracts and
foreign currency transactions | | | (2,668,655 | ) | | | 2,548,429 | | |
Net change in unrealized appreciation (depreciation) from investments,
futures contracts, swap contracts and foreign currency translations | | | 2,660,211 | | | | 1,372,660 | | |
Net increase (decrease) in net assets resulting from operations | | | (2,404,323 | ) | | | 2,111,173 | | |
From Dividends and Distributions | |
Dividends from net investment income | |
Class I | | | — | | | | (4,138,919 | ) | |
Class A | | | — | | | | (968,769 | ) | |
Class C | | | — | | | | (95,991 | ) | |
Distributions from net realized gains | |
Class I | | | (3,535,179 | ) | | | (2,575,914 | ) | |
Class A | | | (1,012,105 | ) | | | (769,312 | ) | |
Class C | | | (100,296 | ) | | | (89,902 | ) | |
Net decrease in net assets resulting from dividends and distributions | | | (4,647,580 | ) | | | (8,638,807 | ) | |
| From Capital Share Transactions (Note 6) | |
Proceeds from sale of shares | | | 290,761,733 | | | | 136,041,437 | | |
Reinvestment of dividends and distributions | | | 4,172,001 | | | | 7,665,777 | | |
Net asset value of shares redeemed | | | (153,607,206 | ) | | | (63,581,477 | ) | |
Net increase in net assets from capital share transactions | | | 141,326,528 | | | | 80,125,737 | | |
Net increase in net assets | | | 134,274,625 | | | | 73,598,103 | | |
Net Assets | |
Beginning of year | | | 169,323,917 | | | | 95,725,814 | | |
End of year | | $ | 303,598,542 | | | $ | 169,323,917 | | |
Distributions in excess of net investment income | | $ | (35,543 | ) | | $ | (39,097 | ) | |
See Accompanying Notes to Consolidated Financial Statements.
13
Credit Suisse Managed Futures Strategy Fund
Consolidated Financial Highlights
(For a Class I Share of the Fund Outstanding Throughout Each Year)
| | | For the Year Ended October 31, | |
| | | 2017 | | 2016 | | 2015 | | 2014 | | 2013 | |
Per share data | |
Net asset value, beginning of year | | $ | 10.94 | | | $ | 11.53 | | | $ | 10.851 | | | $ | 10.36 | | | $ | 9.76 | | |
INVESTMENT OPERATIONS | |
Net investment loss2 | | | (0.10 | ) | | | (0.15 | ) | | | (0.16 | ) | | | (0.17 | ) | | | (0.17 | ) | |
Net gain (loss) from investments, futures contracts,
swap contracts and foreign currency related items
(both realized and unrealized) | | | (0.06 | ) | | | 0.49 | | | | 1.51 | | | | 0.95 | | | | 0.77 | | |
Total from investment operations | | | (0.16 | ) | | | 0.34 | | | | 1.35 | | | | 0.78 | | | | 0.60 | | |
REDEMPTION FEES | | | — | | | | — | | | | — | | | | 0.003 | | | | 0.003 | | |
LESS DIVIDENDS AND DISTRIBUTIONS | |
Dividends from net investment income | | | — | | | | (0.52 | ) | | | (0.04 | ) | | | — | | | | — | | |
Distributions from net realized gains | | | (0.29 | ) | | | (0.41 | ) | | | (0.63 | ) | | | (0.29 | ) | | | — | | |
Total dividends and distributions | | | (0.29 | ) | | | (0.93 | ) | | | (0.67 | ) | | | (0.29 | ) | | | — | | |
Net asset value, end of year | | $ | 10.49 | | | $ | 10.94 | | | $ | 11.53 | | | $ | 10.851 | | | $ | 10.36 | | |
Total return4 | | | (1.60 | )% | | | 3.12 | % | | | 12.88 | % | | | 7.73 | % | | | 6.15 | % | |
RATIOS AND SUPPLEMENTAL DATA | |
Net assets, end of year (000s omitted) | | $ | 201,478 | | | $ | 127,597 | | | $ | 72,606 | | | $ | 69,190 | | | $ | 26,794 | | |
Ratio of net expenses to average net assets | | | 1.30 | % | | | 1.30 | % | | | 1.32 | % | | | 1.71 | % | | | 1.70 | % | |
Ratio of net investment loss to average net assets | | | (0.99 | )% | | | (1.29 | )% | | | (1.31 | )% | | | (1.68 | )% | | | (1.64 | )% | |
Decrease reflected in above operating expense
ratios due to waivers/reimbursements | | | 0.09 | % | | | 0.05 | % | | | 0.15 | % | | | 0.10 | % | | | 1.10 | % | |
Portfolio turnover rate | | | — | % | | | — | % | | | — | % | | | — | % | | | — | % | |
1 Includes adjustments in accordance with accounting principles generally accepted in the United States of America and as such, the net asset values for financial reporting purposes and the returns based upon net asset values may differ from the net asset values and returns for shareholder transactions.
2 Per share information is calculated using the average shares outstanding method.
3 This amount represents less than $0.01 per share.
4 Total returns are historical and include change in share price and reinvestment of all dividends and distributions. Had certain expenses not been reduced during the years shown, total returns would have been lower.
See Accompanying Notes to Consolidated Financial Statements.
14
Credit Suisse Managed Futures Strategy Fund
Consolidated Financial Highlights
(For a Class A Share of the Fund Outstanding Throughout Each Year)
| | | For the Year Ended October 31, | |
| | | 2017 | | 2016 | | 2015 | | 2014 | | 2013 | |
Per share data | |
Net asset value, beginning of year | | $ | 10.88 | | | $ | 11.47 | | | $ | 10.80 | | | $ | 10.35 | | | $ | 9.76 | | |
INVESTMENT OPERATIONS | |
Net investment loss1 | | | (0.12 | ) | | | (0.17 | ) | | | (0.19 | ) | | | (0.20 | ) | | | (0.20 | ) | |
Net gain (loss) from investments, futures contracts,
swap contracts and foreign currency related items
(both realized and unrealized) | | | (0.06 | ) | | | 0.48 | | | | 1.50 | | | | 0.94 | | | | 0.79 | | |
Total from investment operations | | | (0.18 | ) | | | 0.31 | | | | 1.31 | | | | 0.74 | | | | 0.59 | | |
REDEMPTION FEES | | | — | | | | — | | | | — | | | | 0.002 | | | | 0.002 | | |
LESS DIVIDENDS AND DISTRIBUTIONS | |
Dividends from net investment income | | | — | | | | (0.49 | ) | | | (0.01 | ) | | | — | | | | — | | |
Distributions from net realized gains | | | (0.29 | ) | | | (0.41 | ) | | | (0.63 | ) | | | (0.29 | ) | | | — | | |
Total dividends and distributions | | | (0.29 | ) | | | (0.90 | ) | | | (0.64 | ) | | | (0.29 | ) | | | — | | |
Net asset value, end of year | | $ | 10.41 | | | $ | 10.88 | | | $ | 11.47 | | | $ | 10.80 | | | $ | 10.35 | | |
Total return3 | | | (1.79 | )% | | | 2.87 | % | | | 12.47 | % | | | 7.35 | % | | | 6.05 | % | |
RATIOS AND SUPPLEMENTAL DATA | |
Net assets, end of year (000s omitted) | | $ | 98,756 | | | $ | 38,060 | | | $ | 20,200 | | | $ | 3,294 | | | $ | 5,824 | | |
Ratio of net expenses to average net assets | | | 1.55 | % | | | 1.55 | % | | | 1.56 | % | | | 1.96 | % | | | 1.95 | % | |
Ratio of net investment loss to average net assets | | | (1.20 | )% | | | (1.54 | )% | | | (1.55 | )% | | | (1.93 | )% | | | (1.90 | )% | |
Decrease reflected in above operating expense
ratios due to waivers/reimbursements | | | 0.09 | % | | | 0.05 | % | | | 0.15 | % | | | 0.10 | % | | | 1.10 | % | |
Portfolio turnover rate | | | — | % | | | — | % | | | — | % | | | — | % | | | — | % | |
1 Per share information is calculated using the average shares outstanding method.
2 This amount represents less than $0.01 per share.
3 Total returns are historical and include change in share price, reinvestment of all dividends and distributions and no sales charge. Had certain expenses not been reduced during the years shown, total returns would have been lower.
See Accompanying Notes to Consolidated Financial Statements.
15
Credit Suisse Managed Futures Strategy Fund
Consolidated Financial Highlights
(For a Class C Share of the Fund Outstanding Throughout Each Year)
| | | For the Year Ended October 31, | |
| | | 2017 | | 2016 | | 2015 | | 2014 | | 2013 | |
Per share data | |
Net asset value, beginning of year | | $ | 10.60 | | | $ | 11.19 | | | $ | 10.62 | | | $ | 10.25 | | | $ | 9.75 | | |
INVESTMENT OPERATIONS | |
Net investment loss1 | | | (0.20 | ) | | | (0.25 | ) | | | (0.27 | ) | | | (0.27 | ) | | | (0.27 | ) | |
Net gain (loss) from investments, futures contracts,
swap contracts and foreign currency related items
(both realized and unrealized) | | | (0.05 | ) | | | 0.48 | | | | 1.47 | | | | 0.93 | | | | 0.77 | | |
Total from investment operations | | | (0.25 | ) | | | 0.23 | | | | 1.20 | | | | 0.66 | | | | 0.50 | | |
REDEMPTION FEES | | | — | | | | — | | | | — | | | | 0.002 | | | | 0.002 | | |
LESS DIVIDENDS AND DISTRIBUTIONS | |
Dividends from net investment income | | | — | | | | (0.41 | ) | | | — | | | | — | | | | — | | |
Distributions from net realized gains | | | (0.29 | ) | | | (0.41 | ) | | | (0.63 | ) | | | (0.29 | ) | | | — | | |
Total dividends and distributions | | | (0.29 | ) | | | (0.82 | ) | | | (0.63 | ) | | | (0.29 | ) | | | — | | |
Net asset value, end of year | | $ | 10.06 | | | $ | 10.60 | | | $ | 11.19 | | | $ | 10.62 | | | $ | 10.25 | | |
Total return3 | | | (2.52 | )% | | | 2.13 | % | | | 11.60 | % | | | 6.62 | % | | | 5.13 | % | |
RATIOS AND SUPPLEMENTAL DATA | |
Net assets, end of year (000s omitted) | | $ | 3,365 | | | $ | 3,667 | | | $ | 2,920 | | | $ | 1,558 | | | $ | 800 | | |
Ratio of net expenses to average net assets | | | 2.30 | % | | | 2.30 | % | | | 2.32 | % | | | 2.71 | % | | | 2.70 | % | |
Ratio of net investment loss to average net assets | | | (2.01 | )% | | | (2.29 | )% | | | (2.31 | )% | | | (2.68 | )% | | | (2.64 | )% | |
Decrease reflected in above operating expense
ratios due to waivers/reimbursements | | | 0.09 | % | | | 0.05 | % | | | 0.15 | % | | | 0.10 | % | | | 1.10 | % | |
Portfolio turnover rate | | | — | % | | | — | % | | | — | % | | | — | % | | | — | % | |
1 Per share information is calculated using the average shares outstanding method.
2 This amount represents less than $0.01 per share.
3 Total returns are historical and include change in share price, reinvestment of all dividends and distributions and no sales charge. Had certain expenses not been reduced during the years shown, total returns would have been lower.
See Accompanying Notes to Consolidated Financial Statements.
16
Credit Suisse Managed Futures Strategy Fund
Notes to Consolidated Financial Statements
October 31, 2017
Credit Suisse Managed Futures Strategy Fund (the "Fund"), a series of the Credit Suisse Opportunity Funds (the "Trust"), a Delaware statutory trust, is registered under the Investment Company Act of 1940, as amended (the "1940 Act"), as a non-diversified open-end management investment company that seeks to achieve an investment result that corresponds generally to the risk and return patterns of managed futures funds. The Trust was organized under the laws of the State of Delaware as a business trust on May 31, 1995.
Credit Suisse Asset Management, LLC ("Credit Suisse"), the investment adviser to the Fund, is registered as a Commodity Pool Operator with the Commodity Futures Trading Commission. The Fund seeks to achieve its investment objective by investing directly and/or indirectly through the Credit Suisse Cayman Managed Futures Strategy Fund, Ltd. (the "Subsidiary"), a wholly-owned subsidiary of the Fund organized under the laws of the Cayman Islands, in a combination of securities and derivative instruments. The Subsidiary invests in commodity-linked derivative instruments, such as swaps and futures, as well as other types of futures, swaps and options. The Subsidiary may also invest in debt securities, some of which are intended to serve as margin or collateral for the Subsidiary's derivatives positions.
The Subsidiary is managed by the same portfolio managers that manage the Fund and the accompanying financial statements reflect the financial position of the Fund and the Subsidiary and the results of operations on a consolidated basis. The consolidated financial statements include portfolio holdings of the Fund and the Subsidiary and all intercompany transactions and balances have been eliminated. The Fund may invest up to 25% of its total assets in the Subsidiary. As of October 31, 2017, the Fund held $11,968,759 in the Subsidiary, representing 3.9% of the Fund's consolidated net assets. For the year ended October 31, 2017, the net realized loss on securities and other financial instruments held in the Subsidiary was $6,075,866.
Subsequent references to the Fund within the Notes to Consolidated Financial Statements collectively refer to the Fund and the Subsidiary.
The Fund offers three classes of shares: Class I shares, Class A shares and Class C shares. Each class of shares represents an equal pro rata interest in the Fund, except the share classes bear different expenses, which reflect the differences in the range of services provided to them. Class A shares are sold subject to a front-end sales charge of up to 5.25%. Class C shares are sold subject to a contingent deferred sales charge ("CDSC") of 1.00% if the shares are redeemed within the first year of purchase. Class I shares are sold without a sales charge.
17
Credit Suisse Managed Futures Strategy Fund
Notes to Consolidated Financial Statements (continued)
October 31, 2017
Note 2. Significant Accounting Policies
The following is a summary of significant accounting policies followed by the Fund in the preparation of its consolidated financial statements. The policies are in accordance with generally accepted accounting principles in the United States of America ("GAAP"). The preparation of consolidated financial statements requires management to make estimates and assumptions that affect the reported amounts and disclosures in the consolidated financial statements. Actual results could differ from those estimates. The Fund is considered an investment company for financial reporting purposes under GAAP and follows Accounting Standards Codification ("ASC") Topic 946 — Financial Services — Investment Companies.
A) SECURITY VALUATION — The net asset value of the Fund is determined daily as of the close of regular trading on the New York Stock Exchange, Inc. (the "Exchange") on each day the Exchange is open for business. The valuations for fixed income securities (which may include, but are not limited to, corporate, government, municipal, mortgage-backed, collateralized mortgage obligations and asset-backed securities) and certain derivative instruments are typically the prices supplied by independent third party pricing services, which may use market prices or broker/dealer quotations or a variety of valuation techniques and methodologies. The independent third party pricing services use inputs that are observable such as issuer details, interest rates, yield curves, prepayment speeds, credit risks/spreads, default rates and quoted prices for similar securities. These pricing services generally price fixed income securities assuming orderly transactions of an institutional "round lot" size, but some trades occur in smaller "odd lot" sizes which may be effected at lower prices than institutional round lot trades. Structured note agreements are valued in accordance with a dealer-supplied valuation based on changes in the value of the underlying index. Futures contracts are valued daily at the settlement price established by the board of trade or exchange on which they are traded. Forward contracts are valued at the London closing spot rates and the London closing forward point rates on a daily basis. The currency forward contract pricing model derives the differential in point rates to the expiration date of the forward and calculates its present value. Equity securities for which market quotations are available are valued at the last reported sales price or official closing price on the primary market or exchange on which they trade. The Fund may utilize a service provided by an independent third party which has been approved by the Board of Trustees (the "Board") to fair value certain securities. When fair value pricing is employed, the prices of securities used by the Fund to calculate its net asset value may differ from quoted or published prices for the same securities. If
18
Credit Suisse Managed Futures Strategy Fund
Notes to Consolidated Financial Statements (continued)
October 31, 2017
Note 2. Significant Accounting Policies (continued)
independent third party pricing services are unable to supply prices for a portfolio investment, or if the prices supplied are deemed by the investment adviser to be unreliable, the market price may be determined by the investment adviser using quotations from one or more brokers/dealers or at the transaction price if the security has recently been purchased and no value has yet been obtained from a pricing service or pricing broker. When reliable prices are not readily available, such as when the value of a security has been significantly affected by events after the close of the exchange or market on which the security is principally traded, but before the Fund calculates its net asset value, the Fund values these securities as determined in accordance with procedures approved and established by the Board.
The Fund uses valuation techniques to measure fair value that are consistent with the market approach and/or income approach, depending on the type of security and the particular circumstance. The market approach uses prices and other relevant information generated by market transactions involving identical or comparable securities. The income approach uses valuation techniques to discount estimated future cash flows to present value.
GAAP established a disclosure hierarchy that categorizes the inputs to valuation techniques used to value assets and liabilities at each measurement date. These inputs are summarized in the three broad levels listed below:
• Level 1 – quoted prices in active markets for identical investments
• Level 2 – other significant observable inputs (including quoted prices for similar investments, interest rates, prepayment speeds, credit risk, etc.)
• Level 3 – significant unobservable inputs (including the Fund's own assumptions in determining the fair value of investments)
The inputs or methodologies used to value securities are not necessarily an indication of the risk associated with investing in those securities.
The following is a summary of the inputs used as of October 31, 2017 in valuing the Fund's assets and liabilities carried at fair value:
Assets | | Level 1 | | Level 2 | | Level 3 | | Total | |
Investments in Securities | |
United States Treasury Obligations | | $ | — | | | $ | 119,540,691 | | | $ | — | | | $ | 119,540,691 | | |
Short-term Investments | | | — | | | | 153,841,748 | | | | — | | | | 153,841,748 | | |
| | | $ | — | | | $ | 273,382,439 | | | $ | — | | | $ | 273,382,439 | | |
Other Financial Instruments* | |
Futures Contracts | | $ | 9,043,828 | | | $ | — | | | $ | — | | | $ | 9,043,828 | | |
Swap Contracts | | | — | | | | 965,442 | | | | — | | | | 965,442 | | |
19
Credit Suisse Managed Futures Strategy Fund
Notes to Consolidated Financial Statements (continued)
October 31, 2017
Note 2. Significant Accounting Policies (continued)
Liabilities | | Level 1 | | Level 2 | | Level 3 | | Total | |
Other Financial Instruments* | |
Futures Contracts | | $ | 5,974,214 | | | $ | — | | | $ | — | | | $ | 5,974,214 | | |
* Other financial instruments include unrealized appreciation (depreciation) on futures and swap contracts.
For the year ended October 31, 2017, there were no transfers among Level 1, Level 2 and Level 3. All transfers, if any, are assumed to occur at the end of the reporting period.
B) DERIVATIVE INSTRUMENTS AND HEDGING ACTIVITIES — The Fund adopted amendments to authoritative guidance on disclosures about derivative instruments and hedging activities which require that a fund disclose (a) how and why an entity uses derivative instruments, (b) how derivative instruments and hedging activities are accounted for and (c) how derivative instruments and related hedging activities affect a fund's financial position, financial performance and cash flows. For the year ended October 31, 2017, the Fund's derivatives did not qualify for hedge accounting as they are held at fair value.
Fair Values of Derivative Instruments as of October 31, 2017
| | | Asset Derivatives | | Liability Derivatives | |
| | | Balance Sheet
Location | | Fair Value | | Balance Sheet
Location | | Fair Value | |
Foreign Exchange
Contracts | | Unrealized appreciation
on futures contracts | | $ | 1,179,134 | * | | Unrealized depreciation
on futures contracts | | $ | 5,507,069 | * | |
Index Contracts
| | Unrealized appreciation
on futures contracts | | | 7,309,200 | * | | Unrealized depreciation
on futures contracts | | | 119,313 | * | |
Interest Rate
Contracts | | Unrealized appreciation
on futures contracts | | | 555,494 | * | | Unrealized depreciation
on futures contracts | | | 347,832 | * | |
Commodity Index
Return Contracts | | Unrealized appreciation
on swap contracts | | | 965,442 | | | Unrealized depreciation
on swap contracts | | | — | | |
| | | | | | | $ | 10,009,270 | | | | | | | $ | 5,974,214 | | |
* Reflects cumulative appreciation (depreciation) on futures contracts as reported in the Consolidated Statement of Assets and Liabilities and Notes to Consolidated Financial Statements. Only unsettled variation margin receivable (payable) is reported in the Consolidated Statement of Assets and Liabilities.
20
Credit Suisse Managed Futures Strategy Fund
Notes to Consolidated Financial Statements (continued)
October 31, 2017
Note 2. Significant Accounting Policies (continued)
Effect of Derivative Instruments on the Consolidated Statement of Operations
| | | Location | | Realized
Gain (Loss) | | Location | | Unrealized
Appreciation
(Depreciation) | |
Foreign Exchange
Contracts | | Net realized gain from
futures contracts | | $ | 589,617 | | | Net change in unrealized
appreciation (depreciation)
from futures contracts | | $ | (5,868,226 | ) | |
Index Contracts | | Net realized gain from
futures contracts | | | 15,936,193 | | | Net change in unrealized
appreciation (depreciation)
from futures contracts | | | 6,985,401 | | |
Interest Rate
Contracts | | Net realized loss from
futures contracts | | | (13,271,024 | ) | | Net change in unrealized
appreciation (depreciation)
from futures contracts | | | 392,595 | | |
Commodity Index
Return Contracts | | Net realized loss from
swap contracts | | | (6,075,866 | ) | | Net change in unrealized
appreciation (depreciation)
from swap contracts | | | 1,190,917 | | |
| | | | | | | $ | (2,821,080 | ) | | | | | | $ | 2,700,687 | | |
The notional amount of futures contracts and swap contracts open at October 31, 2017 is reflected in the Consolidated Schedule of Investments. For the year ended October 31, 2017, the Fund held average monthly notional values on a net basis of $437,745,292, $220,158,433 and $82,099,557 in long futures contracts, short futures contracts and swap contracts, respectively.
The Fund is a party to International Swap and Derivatives Association, Inc. ("ISDA") Master Agreements ("Master Agreements") with certain counterparties that govern over-the-counter derivative (including Total Return, Credit Default and Interest Rate Swaps) and foreign exchange contracts entered into by the Fund. The Master Agreements may contain provisions regarding, among other things, the parties' general obligations, representations, agreements, collateral requirements, events of default and early termination. Termination events applicable to the Fund may occur upon a decline in the Fund's net assets below a specified threshold over a certain period of time.
The following table presents by counterparty the Fund's derivative assets, net of related collateral held by the Fund, at October 31, 2017:
Counterparty | | Gross Amount of
Assets Presented in
the Consolidated
Statement of Assets
and Liabilities(a) | | Financial
Instruments
and Derivatives
Available for Offset | | Non-Cash
Collateral
Received | | Cash
Collateral
Received | | Net Amount
of Derivative
Assets | |
Goldman Sachs | | $ | 965,442 | | | $ | — | | | $ | — | | | $ | — | | | $ | 965,442 | | |
(a) Swap contracts are included.
21
Credit Suisse Managed Futures Strategy Fund
Notes to Consolidated Financial Statements (continued)
October 31, 2017
Note 2. Significant Accounting Policies (continued)
C) SECURITY TRANSACTIONS AND INVESTMENT INCOME/EXPENSE — Security transactions are accounted for on a trade date basis. Interest income/expense is recorded on the accrual basis. The Fund amortizes premiums and accretes discounts using the effective interest method. Dividend income/expense is recorded on the ex-dividend date. Certain expenses are class-specific expenses, vary by class and are charged only to that class. Income, expenses (excluding class-specific expenses) and realized/unrealized gains/losses are allocated proportionately to each class of shares based upon the relative net asset value of the outstanding shares of that class. The cost of investments sold is determined by use of the specific identification method for both financial reporting and income tax purposes. To the extent any issuer defaults or a credit event occurs that impacts the issuer, the Fund may halt any additional interest income accruals and consider the realizability of interest accrued up to the date of default or credit event.
D) DIVIDENDS AND DISTRIBUTIONS TO SHAREHOLDERS — Dividends from net investment income, if any, are declared and paid quarterly. Distributions of net realized capital gains, if any, are declared and paid at least annually. However, to the extent that a net realized capital gain can be reduced by a capital loss carryforward, such gain will not be distributed. Dividends and distributions to shareholders of the Fund are recorded on the ex-dividend date and are determined in accordance with federal income tax regulations, which may differ from GAAP.
E) FEDERAL AND OTHER TAXES — No provision is made for federal taxes as it is the Fund's intention to continue to qualify as a regulated investment company ("RIC") under the Internal Revenue Code of 1986, as amended (the "Code"), and to make the requisite distributions to its shareholders, which will be sufficient to relieve it from federal income and excise taxes.
In order to qualify as a RIC under the Code, the Fund must meet certain requirements regarding the source of its income, the diversification of its assets and the distribution of its income. One of these requirements is that the Fund derive at least 90% of its gross income for each taxable year from dividends, interest, payments with respect to certain securities loans, gains from the sale or other disposition of stock, securities or foreign currencies, other income derived with respect to its business of investing in such stock, securities or currencies or net income derived from interests in certain publicly-traded partnerships ("Qualifying Income"). The Internal Revenue Service ("IRS") has issued a ruling that income realized from certain types of commodity-linked derivatives would not be Qualifying Income. As a result, the Fund's ability to
22
Credit Suisse Managed Futures Strategy Fund
Notes to Consolidated Financial Statements (continued)
October 31, 2017
Note 2. Significant Accounting Policies (continued)
realize income from investments in such commodity-linked derivatives as part of its investment strategy would be limited to a maximum of 10% of its gross income. The IRS has issued private letter rulings to registered investment companies concluding that income derived from their investment in a wholly-owned subsidiary would constitute Qualifying Income to the fund. The IRS has indicated that the granting of these types of private letter rulings is currently suspended.
If the Fund is unable to ensure continued qualification as a RIC, the Fund may be required to change its investment objective, policies or techniques, or may be liquidated. If the Fund fails to qualify as a RIC, the Fund will be subject to federal income tax on its net income and capital gains at regular corporate rates (without reduction for distributions to shareholders). If the Fund were to fail to qualify as a RIC and become subject to federal income tax, shareholders of the Fund would be subject to the risk of diminished returns.
The Fund adopted the authoritative guidance for uncertainty in income taxes and recognizes a tax benefit or liability from an uncertain position only if it is more likely than not that the position is sustainable based solely on its technical merits and consideration of the relevant taxing authority's widely understood administrative practices and procedures. The Fund has reviewed its current tax positions and has determined that no provision for income tax is required in the Fund's financial statements. The Fund's federal and state income and federal excise tax returns for tax years for which the applicable statutes of limitations have not expired are subject to examination by the Internal Revenue Service and state departments of revenue.
F) SHORT-TERM INVESTMENTS — The Fund, together with other funds/portfolios advised by Credit Suisse, pools available cash into a short-term variable rate time deposit issued by State Street Bank and Trust Company ("SSB"), the Fund's custodian. The short-term time deposit issued by SSB is a variable rate account classified as a short-term investment.
G) FUTURES — The Fund may enter into futures contracts to the extent permitted by its investment policies and objectives. The Fund may use futures contracts to gain exposure to or hedge against changes in interest rates, equity and market price movements and/or currency risks. Upon entering into a futures contract, the Fund is required to deposit cash and/or pledge U.S. Government securities as initial margin with a Futures Commission Merchant ("FCM"). Subsequent payments, which are dependent on the daily fluctuations in the value of the underlying instrument, are made or received by the Fund
23
Credit Suisse Managed Futures Strategy Fund
Notes to Consolidated Financial Statements (continued)
October 31, 2017
Note 2. Significant Accounting Policies (continued)
each day (daily variation margin) and are recorded as unrealized gains or losses in the Consolidated Statement of Operations until the contracts are closed. When the contracts are closed, the Fund records a realized gain or loss equal to the difference between the proceeds from (or cost of) the closing transaction and the Fund's basis in the contract. Risks of entering into futures contracts for hedging purposes include the possibility that a change in the value of the contract may not correlate with the changes in the value of the underlying instruments. Futures have minimal counterparty credit risk because futures are exchange traded and the exchange's clearinghouse, as counterparty to all exchange-traded futures, guarantees the futures against default. In addition, the purchase of a futures contract involves the risk that the Fund could lose more than the original margin deposit and subsequent payments may be required for a futures transaction. The Fund's open futures contracts are disclosed in the Consolidated Schedule of Investments. At October 31, 2017, the amount of restricted cash held at brokers related to open futures contracts was $20,972,511.
The Commodity Exchange Act requires an FCM to segregate all customer transactions and assets from the FCM's proprietary activities. A customer's cash and other equity deposited with an FCM are considered commingled with all other customer funds subject to the FCM's segregation requirements. In the event of an FCM's insolvency, recovery may be limited to the Fund's pro-rata share of segregated customer funds available. It is possible that the recovery amount could be less than the total of cash and other equity deposited.
H) SWAPS — The Fund may enter into swap contracts either for hedging purposes or to seek to increase total return. A swap contract is an agreement that obligates two parties to exchange a series of cash flows at specified intervals based upon or calculated by reference to changes in specified prices or rates for a specified amount of an underlying asset or notional principal amount. The Fund will enter into swap contracts only on a net basis, which means that the two payment streams are netted out, with the Fund receiving or paying, as the case may be, only the net amount of the two payments. Risks may arise as a result of the failure of the counterparty to the swap contract to comply with the terms of the swap contract. The extent of the Fund's exposure to credit and counterparty risks is the discounted net value of the cash flows to be received from the counterparty over the contract's remaining life, to the extent that the amount is positive. These risks are mitigated by having a master netting arrangement between the Fund and the counterparty and by the posting of collateral by the counterparty to the Fund to cover the Fund's
24
Credit Suisse Managed Futures Strategy Fund
Notes to Consolidated Financial Statements (continued)
October 31, 2017
Note 2. Significant Accounting Policies (continued)
exposure to the counterparty. Therefore, the Fund considers the creditworthiness of each counterparty as well as the amounts posted by the counterparty pursuant to the master netting agreement to a swap contract in evaluating potential credit risk. Additionally, risks may arise from unanticipated movements in interest rates or in the value of the underlying reference asset or index.
The Fund may enter into total return swap contracts, involving commitments to pay interest in exchange for a market-linked return, both based on notional amounts. The Fund may invest in total return swap contracts for hedging purposes or to seek to increase total return. To the extent the total return of the security or index underlying the transaction exceeds or falls short of the offsetting interest rate obligation, the Fund will receive a payment from or make a payment to the counterparty.
The Fund records unrealized gains or losses on a daily basis representing the value and the current net receivable or payable relating to open swap contracts. Net amounts received or paid on the swap contract are recorded as realized gains or losses. Fluctuations in the value of swap contracts are recorded for financial statement purposes as unrealized appreciation or depreciation from swap contracts. Realized gains and losses from terminated swaps are included in net realized gains/losses from swap contracts. The Fund's open swap contracts are disclosed in the Consolidated Schedule of Investments. At October 31, 2017, the amount of restricted cash held at brokers related to open swap contracts was $4,800,000.
I) SECURITIES LENDING — The initial collateral received by the Fund is required to have a value of at least 102% of the market value of domestic securities on loan (including any accrued interest thereon) and 105% of the market value of foreign securities on loan (including any accrued interest thereon). The collateral is maintained thereafter at a value equal to at least 102% of the current market value of the securities on loan. The market value of loaned securities is determined at the close of each business day of the Fund and any additional required collateral is delivered to the Fund, or excess collateral returned by the Fund, on the next business day. Cash collateral received by the Fund in connection with securities lending activity may be pooled together with cash collateral for other funds/portfolios advised by Credit Suisse and may be invested in a variety of investments, including funds advised by SSB, the Fund's securities lending agent, or money market instruments. However, in the event of default or bankruptcy by the other party
25
Credit Suisse Managed Futures Strategy Fund
Notes to Consolidated Financial Statements (continued)
October 31, 2017
Note 2. Significant Accounting Policies (continued)
to the agreement, realization and/or retention of the collateral may be subject to legal proceedings.
SSB has been engaged by the Fund to act as the Fund's securities lending agent. The Fund's securities lending arrangement provides that the Fund and SSB will share the net income earned from securities lending activities. Securities lending income is accrued as earned. At October 31, 2017 and during the year ended October 31, 2017, there were no securities out on loan.
J) OTHER — In the normal course of business the Fund trades financial instruments and enters into financial transactions for which risk of potential loss exists due to changes in the market (market risk) or failure of the other party to a transaction to perform (credit risk). Similar to credit risk, the Fund may be exposed to counterparty risk, including securities lending, or the risk that an institution or other entity with which the Fund has unsettled or open transactions will default. The potential loss could exceed the value of the financial assets recorded in the consolidated financial statements. Financial assets, which potentially expose the Fund to credit risk, consist principally of cash due from counterparties and investments. The extent of the Fund's exposure to credit and counterparty risks in respect to these financial assets approximates their carrying value as recorded in the Fund's Consolidated Statement of Assets and Liabilities.
K) RECENT ACCOUNTING PRONOUNCEMENTS — On August 26, 2016, Financial Accounting Standards Board ("FASB") issued Accounting Standards Update No. 2016-15, "Statement of Cash Flows (Topic 230), a consensus of the FASB's Emerging Issues Task Force" ("ASU 2016-15"). ASU 2016-15 is intended to reduce diversity in practice in how certain transactions are classified in the statement of cash flows. The issues addressed in ASU 2016-15 are: debt prepayment or debt extinguishment costs, settlement of zero-coupon debt instruments, contingent consideration payments made after a business combination, proceeds from the settlement of insurance claims, proceeds from the settlement of corporate-owned life insurance policies, including bank-owned life insurance policies, distributions received from equity method investments, beneficial interests in securitization transactions; and, separately identifiable cash flows and application of the predominance principle. ASU 2016-15 is effective for interim and annual reporting periods beginning after December 15, 2017. Management is currently evaluating the impact, if any, of applying this provision.
26
Credit Suisse Managed Futures Strategy Fund
Notes to Consolidated Financial Statements (continued)
October 31, 2017
Note 2. Significant Accounting Policies (continued)
In November 2016, FASB issued Accounting Standards Update No. 2016-18, "Statement of Cash Flows (Topic 230), Restricted Cash, a consensus of the FASB's Emerging Issues Task Force" ("ASU 2016-18"). ASU 2016-18 requires that a statement of cash flows explain the change during the period in the total of cash, cash equivalents, and amounts generally described as restricted cash or restricted cash equivalents. Therefore, amounts generally described as restricted cash and restricted cash equivalents should be included with cash and cash equivalents when reconciling the beginning-of-period and end-of-period total amounts shown on the statement of cash flows. The amendments in ASU 2016-18 do not provide a definition of restricted cash or restricted cash equivalents. ASU 2016-18 is effective for interim and annual reporting periods beginning after December 15, 2017. Management is currently evaluating the impact, if any, of applying this provision.
In October 2016, the U.S. Securities and Exchange Commission adopted new rules and amended existing rules (together, "final rules") intended to modernize the reporting and disclosure of information by registered investment companies. In part, the final rules amend Regulation S-X and require standardized, enhanced disclosure about derivatives in investment company financial statements, as well as other amendments. The compliance date for the amendments to Regulation S-X is August 1, 2017. The Fund has adopted the amendments to Regulation S-X and upon evaluation, has concluded that the amendments do not materially impact the financial statements. However, as required, additional or enhanced disclosure has been included.
L) SUBSEQUENT EVENTS — In preparing the financial statements as of October 31, 2017, management considered the impact of subsequent events for potential recognition or disclosure in these financial statements through the date of release of this report. No such events requiring recognition or disclosure were identified through the date of the release of this report.
Note 3. Transactions with Affiliates and Related Parties
Credit Suisse serves as investment adviser and co-administrator for the Fund. Effective November 15, 2016, for its investment advisory and administration services, Credit Suisse is entitled to receive a fee from the Fund at an annual rate of 1.04% of the Fund's average daily net assets. Prior to November 15, 2016, the Fund paid Credit Suisse advisory fees at the annual rate of 0.95% of the Fund's average daily net assets and co-administration fees at an annual rate of 0.09% of the Fund's average daily net assets. On November 15, 2016, the Fund entered into an Investment Management
27
Credit Suisse Managed Futures Strategy Fund
Notes to Consolidated Financial Statements (continued)
October 31, 2017
Note 3. Transactions with Affiliates and Related Parties (continued)
Agreement with Credit Suisse which bundled the advisory and administration fees into a single fee. For the year ended October 31, 2017, investment advisory and administration fees earned and fees waived/expenses reimbursed by Credit Suisse were $2,336,463 and $204,020, respectively. Credit Suisse has contractually agreed to limit expenses so that the Fund's annual operating expenses do not exceed 1.30% of the Fund's average daily net assets for Class I shares, 1.55% of the Fund's average daily net assets for Class A shares, and 2.30% of the Fund's average daily net assets for Class C shares. The Fund is authorized to reimburse Credit Suisse for management fees previously limited and/or for expenses previously reimbursed by Credit Suisse, provided, however, that any reimbursements must be paid at a date not more than three years after the end of the fiscal year during which such fees were limited or expenses were reimbursed by Credit Suisse and the reimbursements do not cause the Fund to exceed the applicable expense limitation in the contract at the time the fees are recouped. This contract may not be terminated before February 28, 2019.
The amounts waived and reimbursed by Credit Suisse, which are available for potential future recoupment by Credit Suisse, and the expiration schedule at October 31, 2017 are as follows:
| | | Fee waivers/
expense
reimbursements
subject to
recoupment* | | Expires
October 31,
2018 | | Expires
October 31,
2019 | | Expires
October 31,
2020 | |
Class I | | $ | 147,730 | | | $ | 60,735 | | | $ | 10,796 | | | $ | 76,199 | | |
Class A | | | 49,773 | | | | 13,830 | | | | 3,236 | | | | 32,707 | | |
Class C | | | 4,174 | | | | 2,053 | | | | 356 | | | | 1,765 | | |
Totals | | $ | 201,677 | | | $ | 76,618 | | | $ | 14,388 | | | $ | 110,671 | | |
* Subsidiary expenses are not eligible for recoupment.
For its co-administrative services, SSB receives a fee, exclusive of out-of-pocket expenses, calculated in total for all the Credit Suisse funds/portfolios co-administered by SSB and allocated based upon the relative average net assets of each fund/portfolio, subject to an annual minimum fee. For the year ended October 31, 2017, co-administrative services fees earned by SSB (including out-of-pocket expenses) with respect to the Fund were $30,409.
Credit Suisse Securities (USA) LLC ("CSSU"), an affiliate of Credit Suisse, serves as the distributor of the Fund's shares. Pursuant to a distribution plan adopted by the Fund pursuant to Rule 12b-1 under the 1940 Act, CSSU receives fees for its distribution services. These fees are calculated at an annual rate of
28
Credit Suisse Managed Futures Strategy Fund
Notes to Consolidated Financial Statements (continued)
October 31, 2017
Note 3. Transactions with Affiliates and Related Parties (continued)
0.25% of the average daily net assets of the Class A shares. For the Class C shares, the fee is calculated at an annual rate of 1.00% of the average daily net assets. For the year ended October 31, 2017, the Fund paid Rule 12b-1 distribution fees of $165,358 for Class A shares and $36,118 for Class C shares. Class I shares are not subject to Rule 12b-1 distribution fees.
Certain brokers, dealers and financial representatives provide transfer agent-related services to the Fund and receive compensation from the Fund. For the year ended October 31, 2017, the Fund paid $159,957, which is included within transfer agent fees in the Consolidated Statement of Operations.
For the year ended October 31, 2017, CSSU and its affiliates advised the Fund that they retained $371 from commissions earned on the sale of the Fund's Class A shares. There were no commissions earned on the sale of Class C shares.
Note 4. Line of Credit
The Fund, together with other funds/portfolios advised by Credit Suisse (collectively, the "Participating Funds"), participates in a committed, unsecured line of credit facility ("Credit Facility"), with SSB in an aggregated amount of $250 million for temporary or emergency purposes under a first-come, first-served basis. Under the terms of the Credit Facility, the Participating Funds pay an aggregate commitment fee on the average unused amount of the Credit Facility, which is allocated among the Participating Funds in such manner as is determined by the governing Boards of the Participating Funds. In addition, the Participating Funds pay interest on borrowings at either the Overnight Federal Funds rate or the Overnight LIBOR rate plus a spread. At October 31, 2017 and during the year ended October 31, 2017, the Fund had no borrowings outstanding under the Credit Facility.
Note 5. Purchases and Sales of Securities
For the year ended October 31, 2017, purchases and sales of investment securities (excluding short-term investments) and U.S. Government and Agency Obligations were as follows:
Investment Securities | | U.S. Government/
Agency Obligations | |
| Purchases | | Sales | | Purchases | | Sales | |
| $ | 0 | | | $ | 0 | | | $ | 0 | | | $ | 0 | | |
29
Credit Suisse Managed Futures Strategy Fund
Notes to Consolidated Financial Statements (continued)
October 31, 2017
Note 6. Capital Share Transactions
The Fund is authorized to issue an unlimited number of full and fractional shares of beneficial interest, $.001 par value per share. The Fund offers Class I, Class A and Class C shares. Transactions in capital shares for each class of the Fund were as follows:
| | | Class I | |
| | | For the Year Ended
October 31, 2017 | | For the Year Ended
October 31, 2016 | |
| | | Shares | | Value | | Shares | | Value | |
Shares sold | | | 18,009,249 | | | $ | 190,176,910 | | | | 9,390,795 | | | $ | 105,360,677 | | |
Shares issued in reinvestment
of dividends and distributions | | | 298,320 | | | | 3,263,624 | | | | 577,815 | | | | 6,339,853 | | |
Shares redeemed | | | (10,770,369 | ) | | | (113,846,649 | ) | | | (4,599,480 | ) | | | (51,998,010 | ) | |
Net increase | | | 7,537,200 | | | $ | 79,593,885 | | | | 5,369,130 | | | $ | 59,702,520 | | |
| | | Class A | |
| | | For the Year Ended
October 31, 2017 | | For the Year Ended
October 31, 2016 | |
| | | Shares | | Value | | Shares | | Value | |
Shares sold | | | 9,628,445 | | | $ | 99,722,720 | | | | 2,554,733 | | | $ | 28,671,167 | | |
Shares issued in reinvestment
of dividends and distributions | | | 74,667 | | | | 812,373 | | | | 104,757 | | | | 1,146,451 | | |
Shares redeemed | | | (3,714,041 | ) | | | (38,705,291 | ) | | | (921,553 | ) | | | (10,316,965 | ) | |
Net increase | | | 5,989,071 | | | $ | 61,829,802 | | | | 1,737,937 | | | $ | 19,500,653 | | |
| | | Class C | |
| | | For the Year Ended
October 31, 2017 | | For the Year Ended
October 31, 2016 | |
| | | Shares | | Value | | Shares | | Value | |
Shares sold | | | 84,093 | | | $ | 862,103 | | | | 183,521 | | | $ | 2,009,593 | | |
Shares issued in reinvestment
of dividends and distributions | | | 9,074 | | | | 96,004 | | | | 16,743 | | | | 179,473 | | |
Shares redeemed | | | (104,516 | ) | | | (1,055,266 | ) | | | (115,199 | ) | | | (1,266,502 | ) | |
Net increase (decrease) | | | (11,349 | ) | | $ | (97,159 | ) | | | 85,065 | | | $ | 922,564 | | |
On October 31, 2017, the number of shareholders that held 5% or more of the outstanding shares of each class of the Fund was as follows:
| | | Number of
Shareholders | | Approximate Percentage
of Outstanding Shares | |
Class I | | | 3 | | | | 77 | % | |
Class A | | | 1 | | | | 22 | % | |
Class C | | | 2 | | | | 27 | % | |
The Fund's performance may be negatively impacted in the event one or more of the Fund's greater than 5% shareholders were to redeem at a given time. Some of the shareholders may be omnibus accounts, which hold shares on behalf of individual shareholders.
30
Credit Suisse Managed Futures Strategy Fund
Notes to Consolidated Financial Statements (continued)
October 31, 2017
Note 7. Income Tax Information and Distributions to Shareholders
Income and capital gain distributions are determined in accordance with federal income tax regulations, which may differ from GAAP.
The tax character of distributions paid during the fiscal years ended October 31, 2017 and 2016, respectively, was as follows:
| Ordinary Income | | Long-Term Capital Gain | |
| 2017 | | 2016 | | 2017 | | 2016 | |
| $ | 2,100,180 | | | $ | 6,475,503 | | | $ | 2,547,400 | | | $ | 2,163,304 | | |
The tax basis components of distributable earnings differ from the amounts reflected in the Consolidated Statement of Assets and Liabilities by temporary book/tax differences. These differences are primarily due to differing treatments of futures contracts marked to market and offering expenses. At October 31, 2017, the components of distributable earnings on a tax basis were as follows:
Unrealized Appreciation | | $ | 4,492,352 | | |
At October 31, 2017, the cost and net unrealized appreciation (depreciation) of investments and derivatives for income tax purposes were as follows:
Cost of Investments | | $ | 272,854,428 | | |
Unrealized appreciation | | $ | 10,010,506 | | |
Unrealized depreciation | | | (5,447,439 | ) | |
Net unrealized appreciation (depreciation) | | $ | 4,563,067 | | |
To adjust for current period permanent book/tax differences which arose principally from differing book/tax treatment of foreign currency gain (loss) and Subsidiary accumulated income (loss), paid-in capital was charged $7,534,759, accumulated net realized gain was credited $5,135,326 and distributions in excess of net investment income was credited $2,399,433. Net assets were not affected by these reclassifications.
Note 8. Contingencies
In the normal course of business, the Fund may provide general indemnifications pursuant to certain contracts and organizational documents. The Fund's maximum exposure under these arrangements is dependent on future claims that may be made against the Fund and, therefore, cannot be estimated; however, based on experience, the risk of loss from such claims is considered remote.
31
Credit Suisse Managed Futures Strategy Fund
Report of Independent Registered Public Accounting Firm
The Board of Trustees and Shareholders
Credit Suisse Managed Futures Strategy Fund:
We have audited the accompanying consolidated statement of assets and liabilities of Credit Suisse Managed Futures Strategy Fund (the "Fund"), a series of the Credit Suisse Opportunity Funds, including the consolidated schedule of investments, as of October 31, 2017, and the related consolidated statement of operations for the year then ended, and the consolidated statements of changes in net assets for each of the years in the two-year period then ended, and the financial highlights for each of the years in the three-year period then ended. These consolidated financial statements and consolidated financial highlights are the responsibility of the Fund's management. Our responsibility is to express an opinion on these consolidated financial statements and consolidated financial highlights based on our audits. The accompanying consolidated financial highlights for the years in the two-year period ended October 31, 2014 were audited by other independent registered public accountants whose report thereon dated December 29, 2014, expressed an unqualified opinion on those consolidated financial highlights.
We conducted our audits in accordance with the standards of the Public Company Accounting Oversight Board (United States). Those standards require that we plan and perform the audits to obtain reasonable assurance about whether the consolidated financial statements and consolidated financial highlights are free of material misstatement. An audit includes examining, on a test basis, evidence supporting the amounts and disclosures in the consolidated financial statements. Our procedures included confirmation of securities owned as of October 31, 2017, by correspondence with the custodian and broker or by other appropriate auditing procedures. An audit also includes assessing the accounting principles used and significant estimates made by management, as well as evaluating the overall consolidated financial statement presentation. We believe that our audits provide a reasonable basis for our opinion.
In our opinion, the consolidated financial statements and consolidated financial highlights referred to above present fairly, in all material respects, the financial position of Credit Suisse Managed Futures Strategy Fund as of October 31, 2017, the results of its operations for the year then ended, the changes in its net assets for each of the years in the two-year period then ended, and the financial highlights for each of the years in the three-year period then ended in conformity with U.S. generally accepted accounting principles.

New York, New York
December 28, 2017
32
Credit Suisse Managed Futures Strategy Fund
Information Concerning Trustees and Officers (unaudited)
Name, Address
(Year of Birth) | | Position(s)
Held with
Fund | | Term
of Office1
and
Length
of Time
Served | | Principal
Occupation(s) During
Past Five Years | | Number of
Portfolios
in Fund
Complex
Overseen
by Trustee | | Other
Trusteeships
Held by Trustee
During Past Five Years | |
Independent Trustees | | | | | | | | | | | |
Laura A. DeFelice
c/o Credit Suisse Asset
Management, LLC
Attn: General Counsel
One Madison Avenue
New York, New York
10010
1959 | | Trustee, Nominating and Audit Committee member | | Since 2017 | | Partner of Acacia Properties LLC (multi-family and commercial real estate ownership and operation) from 2008 to present; Stonegate Advisors LLC (renewable energy and energy efficiency) from 2007 to present. | | | 8 | | | None | |
Jeffrey E. Garten
c/o Credit Suisse Asset Management, LLC
Attn: General Counsel One Madison Avenue New York, New York 10010
(1946) | | Trustee, Nominating and Audit Committee member | | Since Fund Inception | | Dean Emeritus of Yale School of Management from July 2015 to present; The Juan Trippe Professor in the Practice of International Trade, Finance and Business, from July 2005 to July 2015; Partner and Chairman of Garten Rothkopf (consulting firm) from October 2005 to present. | | | 8 | | | Director of Aetna, Inc. (insurance company); Director of CarMax Group (used car dealers); Director of Miller Buckfire & Co., LLC (financial restructuring); Member of Standard & Poor's Board of Managers (credit rating agency) from December 2011 to November 2014. | |
1 Subject to the Trust's retirement policy, each Trustee may continue to serve as a Trustee until the last day of the calendar year in which the applicable Trustee attains age 75. Officer serves until his or her respective successor has been duly elected and qualified.
33
Credit Suisse Managed Futures Strategy Fund
Information Concerning Trustees and Officers (unaudited) (continued)
Name, Address
(Year of Birth) | | Position(s)
Held with
Fund | | Term
of Office1
and
Length
of Time
Served | | Principal
Occupation(s) During
Past Five Years | | Number of
Portfolios
in Fund
Complex
Overseen
by Trustee | | Other
Trusteeships
Held by Trustee
During Past Five Years | |
Independent Trustees | | | | | | | | | | | |
Mahendra R. Gupta c/o Credit Suisse Asset Management, LLC Attn: General Counsel One Madison Avenue New York, New York 10010
1956 | | Trustee, Nominating Committee member and Audit Committee Chairman | | Since 2017 | | Professor, Washington University in St. Louis from July 1990 to present; Dean of Olin Business School at Washington University in St. Louis from July 2005 to July 2016; Partner, R.J. Mithaiwala (food manufacturing and retail, India) from March 1977 to present; Partner, F.F.B. Corporation (agriculture, India) from March 1977 to present; Partner, RPMG Research Corporation (benchmark research) from July 2001 to present. | | | 8 | | | Director of Caleres Inc. (footwear) from May 2012 to present | |
1 Subject to the Trust's retirement policy, each Trustee may continue to serve as a Trustee until the last day of the calendar year in which the applicable Trustee attains age 75. Officer serves until his or her respective successor has been duly elected and qualified.
34
Credit Suisse Managed Futures Strategy Fund
Information Concerning Trustees and Officers (unaudited) (continued)
Name, Address
(Year of Birth) | | Position(s)
Held with
Fund | | Term
of Office1
and
Length
of Time
Served | | Principal
Occupation(s) During
Past Five Years | | Number of
Portfolios
in Fund
Complex
Overseen
by Trustee | | Other
Trusteeships
Held by Trustee
During Past Five Years | |
Independent Trustees | | | | | | | | | | | |
Steven N. Rappaport
Lehigh Court, LLC
555 Madison Avenue
29th Floor
New York, New York
10022
(1948) | | Chairman of the Board, Nominating Committee Chairman and Audit Committee member | | Trustee since Fund Inception and Chairman since 2005 | | Partner of Lehigh Court, LLC and RZ Capital (private investment firms) from July 2002 to present; Partner of Backstage Acquisition Holdings, LLC (publication job postings) from November 2013 to present. | | | 10 | | | Director of iCAD, Inc. (surgical and medical instruments and apparatus company); Director of Aberdeen Chile Fund, Inc., Aberdeen Emerging Markets Smaller Company Opportunities Fund, Inc., Aberdeen Israel Fund, Inc., Aberdeen Indonesia Fund, Inc. and Aberdeen Latin America Equity Fund, Inc. (each a closed-end investment company); Director of Aberdeen Funds (23 open-end portfolios); Director of Presstek, Inc. (digital imaging technologies company) from 2003 to 2012; Director of Wood Resources, LLC (plywood manufacturing company) from 2003 to October 2013. | |
Interested Trustee | | | | | | | | | | | |
John G. Popp2
Credit Suisse Asset
Management, LLC
One Madison Avenue
New York, New York
10010
Year of Birth: 1956 | | Trustee, Chief Executive Officer and President | | Trustee since 2017
Chief Executive Officer and President since 2010 | | Managing Director of Credit Suisse; Global Head and Chief Investment Officer of the Credit Investments Group; Associated with Credit Suisse or its predecessor since 1997; President and Chief Executive Officer of other Credit Suisse Funds. | | | 10 | | | Trustee of Credit Suisse High Yield Bond Fund; Director of Credit Suisse Asset Management Income Fund, Inc. | |
1 Subject to the Trust's retirement policy, each Trustee may continue to serve as a Trustee until the last day of the calendar year in which the applicable Trustee attains age 75. Officer serves until his or her respective successor has been duly elected and qualified.
2 Mr. Popp is an "interested person" of the Trust, as defined in the 1940 Act, by virtue of his current position as an officer of Credit Suisse.
35
Credit Suisse Managed Futures Strategy Fund
Information Concerning Trustees and Officers (unaudited) (continued)
Name, Address
(Year of Birth) | | Position(s)
Held with
Fund | | Term of
Office1
and
Length of
Time
Served | | Principal Occupation(s) During Past Five Years | |
Officers* | | | | | | | |
Emidio Morizio
Credit Suisse Asset
Management, LLC
One Madison Avenue
New York, New York 10010
(1966) | | Chief Compliance Officer | | Since Fund Inception | | Managing Director and Global Head of Compliance of Credit Suisse since 2010; Associated with Credit Suisse since July 2000; Officer of other Credit Suisse Funds. | |
Lou Anne McInnis
Credit Suisse Asset Management, LLC
One Madison Avenue
New York, New York 10010
(1959) | | Chief Legal Officer | | Since 2015 | | Director of Credit Suisse; Associated with Credit Suisse since April 2015; Counsel at DLA Piper US LLP from 2011 to April 2015; Associated with Morgan Stanley Investment Management from 1997 to 2010; Officer of other Credit Suisse Funds. | |
Laurie Pecha
Credit Suisse Asset
Management, LLC
One Madison Avenue
New York, New York 10010
(1961) | | Chief Financial Officer | | Since 2016 | | Director of Credit Suisse since August 2016; Senior Consultant of Spectra Professional Services, LLC from January 2012 to July 2016; Vice President of Legg Mason & Co. from March 2007 to December 2011; Officer of other Credit Suisse Funds. | |
Esther Cheung
Credit Suisse Asset
Management, LLC
One Madison Avenue
New York, New York 10010
(1980) | | Treasurer | | Since 2016 | | Vice President of Credit Suisse since 2015; Associated with Reich & Tang Asset Management, LLC from June 2010 to August 2015; Officer of other Credit Suisse Funds. | |
Karen Regan
Credit Suisse Asset
Management, LLC
One Madison Avenue
New York, New York 10010
(1963) | | Vice President and Secretary | | Since Fund Inception | | Vice President of Credit Suisse; Associated with Credit Suisse since December 2004; Officer of other Credit Suisse Funds. | |
1 Subject to the Trust's retirement policy, each Trustee may continue to serve as a Trustee until the last day of the calendar year in which the applicable Trustee attains age 75. Officer serves until his or her respective successor has been duly elected and qualified.
* The officers of the Fund shown are officers that make policy decisions.
The Statement of Additional Information includes additional information about the Trustees and is available, without charge, upon request, by calling 877-870-2874.
36
Credit Suisse Managed Futures Strategy Fund
Proxy Voting and Portfolio Holdings Information (unaudited)
Information regarding how the Fund voted proxies related to its portfolio securities during the 12-month period ended June 30 of each year, as well as the policies and procedures that the Fund uses to determine how to vote proxies relating to its portfolio securities are available:
• By calling 1-877-870-2874
• On the Fund's website, www.credit-suisse.com/us/funds
• On the website of the Securities and Exchange Commission, www.sec.gov.
The Fund files a complete schedule of its portfolio holdings for the first and third quarters of its fiscal year with the SEC on Form N-Q. The Fund's Forms N-Q are available on the SEC's website at www.sec.gov and may be reviewed and copied at the SEC's Public Reference Room in Washington, DC. Information on the operation of the SEC's Public Reference Room may be obtained by calling 1-202-551-8090.
37

P.O. BOX 55030, BOSTON, MA 02205-5030
877-870-2874 n www.credit-suisse.com/us/funds
CREDIT SUISSE SECURITIES (USA) LLC, DISTRIBUTOR. MFS-AR-1017

CREDIT SUISSE FUNDS
Annual Report
October 31, 2017
n CREDIT SUISSE
MULTIALTERNATIVE STRATEGY FUND
The Fund's investment objectives, risks, charges and expenses (which should be considered carefully before investing), and more complete information about the Fund, are provided in the Prospectus, which should be read carefully before investing. You may obtain additional copies by calling 877-870-2874 or by visiting our website at www.credit-suisse.com/us/funds.
Credit Suisse Securities (USA) LLC, Distributor, is located at One Madison Avenue, New York, NY 10010. Credit Suisse Funds are advised by Credit Suisse Asset Management, LLC.
Investors in the Credit Suisse Funds should be aware that they may be eligible to purchase Class I shares (where offered) directly or through certain intermediaries. Such shares are not subject to a sales charge. Investors in the Credit Suisse Funds should also be aware that they may be eligible for a reduction or waiver of the sales charge with respect to Class A or C shares (where offered). For more information, please review the relevant prospectuses or consult your financial representative.
Fund shares are not deposits or other obligations of Credit Suisse Asset Management, LLC ("Credit Suisse") or any affiliate, are not FDIC-insured and are not guaranteed by Credit Suisse or any affiliate. Fund investments are subject to investment risks, including loss of your investment.
Credit Suisse Multialternative Strategy Fund
Annual Investment Adviser's Report
October 31, 2017 (unaudited)
November 24, 2017
Dear Shareholder:
We are pleased to present this Annual Report covering the activities of the Credit Suisse Multialternative Strategy Fund (the "Fund") for the 12-month period ended October 31, 2017.
Performance Summary
11/1/2016 – 10/31/2017
Fund & Benchmark | | Performance | |
Class I1 | | | 3.68 | % | |
Class A1,2 | | | 3.45 | % | |
Class C1,2 | | | 2.61 | % | |
Credit Suisse Hedge Fund Index3 | | | 7.46 | % | |
Credit Suisse Liquid Alternative Beta Index4 | | | 4.83 | % | |
Performance shown for the Fund's Class A and Class C Shares does not reflect sales charges, which are a maximum of 5.25% and 1.00%, respectively.2
Market Review: A strong period for alternative strategies
The annual period ended October 31, 2017 was a strong one for hedge funds, with the Credit Suisse Hedge Fund Index, the Fund's primary benchmark, returning 7.46%.
Within the hedge fund universe, long/short equity funds yielded the strongest performance — benefitting from the emerging synchronized global growth cycle that raised earnings expectations, resulting in a sustained equity market rally.
Despite suffering from a momentary rise in the U.S. dollar following the November 2016 U.S. presidential election, emerging market currency and credit related strategies ultimately benefitted from significant tailwinds due to the dollar's continual decline throughout 2017. Managed futures and macro funds were the worst performers over the period due to sharp reversals in markets in which persistent, exploitable trends were scarce. As a result of being on the wrong side of the larger reversals across markets, performance in these funds was mixed. Elements of the "Trump Trade" that performed well following the election incurred subsequent losses in early January — this was particularly pronounced in currency and rates markets.
Strategic Review: Performance across asset classes
The Fund follows a multi-strategy methodology and benefitted from exposure across different markets and asset classes. For the 12-month period ended
1
Credit Suisse Multialternative Strategy Fund
Annual Investment Adviser's Report (continued)
October 31, 2017 (unaudited)
October 31, 2017, however, the Fund underperformed its primary and secondary benchmarks, with a return of 3.68% (I shares) as compared to 7.46% for the Credit Suisse Hedge Fund Index and 4.83% for the Credit Suisse Liquid Alternative Beta Index.
From an asset class perspective, equity performance during the strong bull market was the biggest contributor to the Fund's return, followed by fixed income and volatility. Commodity and foreign exchange strategies both modestly detracted from Fund performance.
Within equities, value was the most profitable investment style due to broad long market exposures that took advantage of the persistent rally, complemented by select long and short positions in certain sectors. Tilts toward technology and small cap equities in developed markets were particularly profitable.
Fixed income value was the second largest contributing strategy, aided primarily by long high yield credit exposure that benefitted from tightening spreads (which approached multi-year lows).
Volatility liquidity/insurance strategies yielded the third largest gains over the period, as the equity market rally supported an increasingly low volatility environment favorable for these strategies. Despite decade-low volatility, a diverse set of strategies took advantage of implied-realized spreads and structural inefficiencies in volatility markets.
In commodities, losses were incurred due to value strategies based on the seasonality of certain markets and the relative positioning of market participants.
Multi-asset trend following was negative for the period, on continued reversal or sideways movements in fixed income, currency and commodity markets. Equity trend following posted positive performance based on broad-based upward trends across equity markets globally.
The Quantitative Investment Strategies Group
Yung-Shin Kung
Sheel Dhande
The Fund is non-diversified, which means it may invest a greater proportion of its assets in the securities of a smaller number of issuers than a diversified mutual fund and may therefore be subject to greater volatility. The Fund's investment in alternative instruments may subject the Fund to greater volatility than investments in traditional securities, particularly in investments involving leverage.
2
Credit Suisse Multialternative Strategy Fund
Annual Investment Adviser's Report (continued)
October 31, 2017 (unaudited)
The use of alternative assets and strategies entails substantial risks, including risk of loss of principal, arbitrage or fundamental risk, below investment grade securities risk, commodity exposure risks, concentration risk, credit risk, derivatives risk, exchange traded notes risk, fixed income risk, foreign securities risk, forwards risk, futures contracts risk, interest rate risk, leveraging risk, market risk, portfolio turnover risk, risks of investing in other funds, small- and mid- cap stock risk, speculative exposure risk, subsidiary risk, swap agreements risk and tax risk. For a detailed discussion of these and other risks, please refer to the Fund's Prospectus, which should be read carefully before investing.
In addition to historical information, this report contains forward-looking statements, which may concern, among other things, domestic and foreign markets, industry and economic trends and developments and government regulation, and their potential impact on the Fund's investments. These statements are subject to risks and uncertainties and actual trends, developments and regulations in the future, and their impact on the Fund, could be materially different from those projected, anticipated or implied. The Fund has no obligation to update or revise forward-looking statements.
The views of the Fund's management are as of the date of this letter and the Fund holdings described in this document are as of October 31, 2017; these views and Fund holdings may have changed subsequent to these dates. Nothing in this document is a recommendation to purchase or sell securities.
3
Credit Suisse Multialternative Strategy Fund
Annual Investment Adviser's Report (continued)
October 31, 2017 (unaudited)
Comparison of Change in Value of $10,000 Investment in the
Credit Suisse Multialternative Strategy Fund1 Class I shares,
Class A shares2, Class C shares2, the Credit Suisse
Hedge Fund Index3 and the Credit Suisse Liquid
Alternative Beta Index4 from Inception (03/30/12).

1 Fee waivers and/or expense reimbursements reduce expenses for the Fund, without which performance would be lower. The Fund entered into a written contract to limit expenses to 0.85% of the Fund's average daily net assets for Class I shares, 1.10% of the Fund's average daily net assets for Class A shares and 1.85% of the Fund's average daily net assets for Class C shares through at least February 28, 2019. This limit excludes certain expenses, as set forth in the Fund's prospectus.
2 Total return for the Fund's Class A shares for the reporting period, based on offering price (including maximum sales charge of 5.25%), was (1.97)%. Total return for the Fund's Class C shares for the reporting period, based on redemption value including maximum CDSC of 1.00%, was 1.61%.
3 The Credit Suisse Hedge Fund Index is compiled by Credit Suisse Asset Management, LLC. It is an asset-weighted hedge fund index and includes only hedge funds. It is rebalanced semiannually, is shown net of all performance fees and provides a rules-based and investable index, enabling investors to utilize the performance of a diversified market barometer for the hedge fund industry. It is the exclusive property of Credit Suisse Asset Management, LLC. The index does not have transaction costs and investors may not invest directly in the index.
4 The Credit Suisse Liquid Alternative Beta Index reflects the return of a dynamic basket of liquid, investable market factors selected and weighted in accordance with an algorithm that aims to approximate the aggregate returns of the universe of hedge fund managers as represented by the Credit Suisse Hedge Fund Index. The index does not have transaction costs and investors may not invest directly in the index.
4
Credit Suisse Multialternative Strategy Fund
Annual Investment Adviser's Report (continued)
October 31, 2017 (unaudited)
Average Annual Returns as of October 31, 20171
| | | 1 Year | | 5 Years | | Since
Inception2 | |
Class I | | | 3.68 | % | | | 3.00 | % | | | 2.59 | % | |
Class A Without Sales Charge | | | 3.45 | % | | | 2.78 | % | | | 2.35 | % | |
Class A With Maximum Sales Charge | | | (1.97 | )% | | | 1.68 | % | | | 1.38 | % | |
Class C Without CDSC | | | 2.61 | % | | | 1.99 | % | | | 1.57 | % | |
Class C With CDSC | | | 1.61 | % | | | 1.99 | % | | | 1.57 | % | |
Returns represent past performance and include change in share price and reinvestment of dividends and capital gain distributions, if any. Past performance cannot guarantee future results. The current performance of the Fund may be lower or higher than the figures shown. Returns and share price will fluctuate, and redemption value may be more or less than original cost. The performance results do not reflect the deduction of taxes that a shareholder would pay on Fund distributions or the redemption of Fund shares. Performance information current to the most recent month end is available at www.credit-suisse.com/us/funds.
The annual gross expense ratios are 1.68% for Class I shares, 1.94% for Class A shares and 2.65% for Class C shares. The annual net expense ratios after fee waivers and/or expense reimbursements and excluding securities sold short dividend expense are 0.85% for Class I shares, 1.10% for Class A shares and 1.85% for Class C shares.
1 Fee waivers and/or expense reimbursements reduce expenses for the Fund, without which performance would be lower. The Fund entered into a written contract to limit expenses to 0.85% of the Fund's average daily net assets for Class I shares, 1.10% of the Fund's average daily net assets for Class A shares and 1.85% of the Fund's average daily net assets for Class C shares through at least February 28, 2019. This limit excludes certain expenses, as set forth in the Fund's prospectus.
2 Inception Date March 30, 2012.
5
Credit Suisse Multialternative Strategy Fund
Annual Investment Adviser's Report (continued)
October 31, 2017 (unaudited)
Information About Your Fund's Expenses
As an investor of the Fund, you incur two types of costs: ongoing expenses and transaction costs. Ongoing expenses include management fees, distribution and service (12b-1) fees and other Fund expenses. Examples of transaction costs include sales charges (loads), redemption fees and account maintenance fees, which are not shown in this section and which would result in higher total expenses. The following table is intended to help you understand your ongoing expenses of investing in the Fund and to help you compare these expenses with the ongoing expenses of investing in other mutual funds. The table is based on an investment of $1,000 made at the beginning of the six months ended October 31, 2017.
The table illustrates your Fund's expenses in two ways:
• Actual Fund Return. This helps you estimate the actual dollar amount of ongoing expenses paid on a $1,000 investment in the Fund using the Fund's actual return during the period. To estimate the expenses you paid over the period, simply divide your account value by $1,000 (for example, an $8,600 account value divided by $1,000 = 8.6), then multiply the result by the number in the "Expenses Paid per $1,000" line.
• Hypothetical 5% Fund Return. This helps you to compare the Fund's ongoing expenses with those of other mutual funds using the Fund's actual expense ratio and a hypothetical rate of return of 5% per year before expenses. Examples using a 5% hypothetical fund return may be found in the shareholder reports of other mutual funds. The hypothetical account values and expenses may not be used to estimate the actual ending account balance or expenses you paid for the period.
Please note that the expenses shown in these tables are meant to highlight your ongoing expenses only and do not reflect any transaction costs, such as sales charges (loads) or redemption fees. If these transaction costs had been included, your costs would have been higher. The "Expenses Paid per $1,000" line of the tables is useful in comparing ongoing expenses only and will not help you determine the relative total expenses of owning different funds.
6
Credit Suisse Multialternative Strategy Fund
Annual Investment Adviser's Report (continued)
October 31, 2017 (unaudited)
Expenses and Value for a $1,000 Investment
for the six-month period ended October 31, 2017
Actual Fund Return | | Class I | | Class A | | Class C | |
Beginning Account Value 05/01/17 | | $ | 1,000.00 | | | $ | 1,000.00 | | | $ | 1,000.00 | | |
Ending Account Value 10/31/17 | | $ | 1,019.30 | | | $ | 1,018.50 | | | $ | 1,015.00 | | |
Expenses Paid per $1,000* | | $ | 5.70 | | | $ | 7.02 | | | $ | 10.77 | | |
Hypothetical 5% Fund Return | |
Beginning Account Value 05/01/17 | | $ | 1,000.00 | | | $ | 1,000.00 | | | $ | 1,000.00 | | |
Ending Account Value 10/31/17 | | $ | 1,019.56 | | | $ | 1,018.25 | | | $ | 1,014.52 | | |
Expenses Paid per $1,000* | | $ | 5.70 | | | $ | 7.02 | | | $ | 10.76 | | |
| | | Class I | | Class A | | Class C | |
Annualized Expense Ratios* | | | 1.12 | % | | | 1.38 | % | | | 2.12 | % | |
* Expenses are equal to the Fund's annualized expense ratio for each share class, multiplied by the average account value over the period, multiplied by 184/365 to reflect the one-half year period.
The "Expenses Paid per $1,000" and the "Annualized Expense Ratios" in the tables are based on actual expenses paid by the Fund during the period, net of fee waivers and/or actual expense reimbursements, if applicable. If those fee waivers and/or expense reimbursements had not been in effect, the Fund's actual expenses would have been higher. Expenses do not reflect additional charges and expenses that are, or may be, imposed under the variable contracts or plans. Such charges and expenses are described in the prospectus of the insurance company separate account or in the plan documents or other informational materials supplied by plan sponsors. The Fund's expenses should be considered with these charges and expenses in evaluating the overall cost of investing in the separate account.
For more information, please refer to the Fund's Prospectus.
7
Credit Suisse Multialternative Strategy Fund
Annual Investment Adviser's Report (continued)
October 31, 2017 (unaudited)
Investment Type Breakdown*
| | | Long | | Short | | Net | |
Common Stocks | | | 12.92 | % | | | (3.03 | )% | | | 9.89 | % | |
Rights | | | 0.01 | | | | 0.00 | | | | 0.01 | | |
United States Treasury Obligations | | | 56.76 | | | | 0.00 | | | | 56.76 | | |
Purchased Options | | | 0.05 | | | | 0.00 | | | | 0.05 | | |
Short-Term Investments1 | | | 33.29 | | | | 0.00 | | | | 33.29 | | |
Total | | | 103.03 | % | | | (3.03 | )% | | | 100.00 | % | |
* Expressed as a percentage of total long (short) investments (excluding securities lending collateral, if applicable) and may vary over time.
1 Primarily reflects cash invested in State Street Bank and Trust Co. Euro Time Deposit, for which the purchases of securities have been executed but not yet settled at October 31, 2017, if applicable.
8
Credit Suisse Multialternative Strategy Fund
Consolidated Schedule of Investments
October 31, 2017
| | | Number of
Shares | | Value | |
| LONG POSITIONS (87.2%) | |
| COMMON STOCKS (10.9%) | |
| BELGIUM (0.0%) | |
| Insurance (0.0%) | |
Ageas | | | 195 | | | $ | 9,457 | | |
| BERMUDA (0.1%) | |
| Insurance (0.1%) | |
Axis Capital Holdings Ltd. | | | 157 | | | | 8,539 | | |
XL Group Ltd. | | | 2,551 | | | | 103,239 | | |
| | | | 111,778 | | |
| CANADA (0.0%) | |
| Auto Components (0.0%) | |
Magna International, Inc. | | | 172 | | | | 9,391 | | |
| Multiline Retail (0.0%) | |
Canadian Tire Corp. Ltd., Class A(1) | | | 74 | | | | 9,087 | | |
Dollarama, Inc. | | | 84 | | | | 9,358 | | |
| | | | 18,445 | | |
| | | | 27,836 | | |
| DENMARK (0.8%) | |
| Banks (0.0%) | |
Danske Bank AS | | | 229 | | | | 8,740 | | |
| Chemicals (0.0%) | |
Novozymes AS, Class B | | | 179 | | | | 9,891 | | |
| Electrical Equipment (0.0%) | |
Vestas Wind Systems AS | | | 113 | | | | 9,977 | | |
| Healthcare Equipment & Supplies (0.1%) | |
William Demant Holding AS(2) | | | 347 | | | | 10,015 | | |
| Insurance (0.0%) | |
Tryg AS | | | 397 | | | | 9,458 | | |
| IT Services (0.7%) | |
Nets AS(2) | | | 27,290 | | | | 696,819 | | |
| Pharmaceuticals (0.0%) | |
Novo Nordisk AS, Class B | | | 192 | | | | 9,561 | | |
| Textiles, Apparel & Luxury Goods (0.0%) | |
Pandora AS(1) | | | 93 | | | | 8,783 | | |
| | | | 763,244 | | |
| FRANCE (0.7%) | |
| Aerospace & Defense (0.7%) | |
Dassault Aviation S.A. | | | 6 | | | | 9,356 | | |
Zodiac Aerospace | | | 22,935 | | | | 655,603 | | |
| | | | 664,959 | | |
See Accompanying Notes to Consolidated Financial Statements.
9
Credit Suisse Multialternative Strategy Fund
Consolidated Schedule of Investments (continued)
October 31, 2017
| | | Number of
Shares | | Value | |
| LONG POSITIONS (continued) | |
| COMMON STOCKS (continued) | |
FRANCE | |
| Diversified Financial Services (0.0%) | |
Eurazeo S.A. | | | 103 | | | $ | 9,577 | | |
| Hotels, Restaurants & Leisure (0.0%) | |
Sodexo S.A. | | | 74 | | | | 9,415 | | |
| IT Services (0.0%) | |
Capgemini SE | | | 78 | | | | 9,476 | | |
| Pharmaceuticals (0.0%) | |
Sanofi | | | 92 | | | | 8,712 | | |
| | | | 702,139 | | |
| GERMANY (0.0%) | |
| Insurance (0.0%) | |
Allianz SE, Reg S(3) | | | 53 | | | | 12,374 | | |
Muenchener Rueckversicherungs-Gesellschaft AG, Reg S(3) | | | 53 | | | | 11,900 | | |
| | | | 24,274 | | |
| IRELAND (0.0%) | |
| Trading Companies & Distributors (0.0%) | |
AerCap Holdings NV(2) | | | 179 | | | | 9,423 | | |
| ISRAEL (0.0%) | |
| Pharmaceuticals (0.0%) | |
Taro Pharmaceutical Industries Ltd.(2) | | | 81 | | | | 9,106 | | |
| ITALY (0.0%) | |
| Automobiles (0.0%) | |
Ferrari NV | | | 83 | | | | 9,939 | | |
| NETHERLANDS (0.0%) | |
| Media (0.0%) | |
Altice NV, Class B(2) | | | 462 | | | | 8,712 | | |
Wolters Kluwer NV | | | 198 | | | | 9,705 | | |
| | | | 18,417 | | |
| SPAIN (0.8%) | |
| Transportation Infrastructure (0.8%) | |
Abertis Infraestructuras S.A. | | | 38,022 | | | | 822,441 | | |
| SWEDEN (0.0%) | |
| Auto Components (0.0%) | |
Autoliv, Inc. | | | 74 | | | | 9,240 | | |
| Tobacco (0.0%) | |
Swedish Match AB | | | 262 | | | | 9,869 | | |
| | | | 19,109 | | |
See Accompanying Notes to Consolidated Financial Statements.
10
Credit Suisse Multialternative Strategy Fund
Consolidated Schedule of Investments (continued)
October 31, 2017
| | | Number of
Shares | | Value | |
| LONG POSITIONS (continued) | |
| COMMON STOCKS (continued) | |
| SWITZERLAND (0.0%) | |
| Electrical Equipment (0.0%) | |
ABB Ltd., Reg S(3) | | | 371 | | | $ | 9,697 | | |
| Insurance (0.0%) | |
Baloise Holding AG, Reg S(3) | | | 58 | | | | 9,152 | | |
Swiss Re AG | | | 101 | | | | 9,513 | | |
| | | | 18,665 | | |
| Professional Services (0.0%) | |
SGS S.A., Reg S(3) | | | 4 | | | | 9,887 | | |
| | | | 38,249 | | |
| UNITED KINGDOM (0.6%) | |
| Airlines (0.0%) | |
International Consolidated Airlines Group S.A. | | | 1,151 | | | | 9,716 | | |
| Auto Components (0.0%) | |
Delphi Automotive PLC | | | 93 | | | | 9,242 | | |
| Food Products (0.0%) | |
Unilever PLC | | | 158 | | | | 8,953 | | |
| Hotels, Restaurants & Leisure (0.0%) | |
Compass Group PLC | | | 432 | | | | 9,483 | | |
InterContinental Hotels Group PLC | | | 173 | | | | 9,583 | | |
| | | | 19,066 | | |
| Household Durables (0.0%) | |
Berkeley Group Holdings PLC | | | 184 | | | | 9,142 | | |
| Internet Software & Services (0.0%) | |
Auto Trader Group PLC | | | 1,741 | | | | 7,916 | | |
| Media (0.4%) | |
Liberty Global PLC, Class A(2) | | | 270 | | | | 8,330 | | |
Liberty Global PLC, Class C(2) | | | 280 | | | | 8,369 | | |
RELX NV | | | 431 | | | | 9,731 | | |
RELX PLC | | | 417 | | | | 9,594 | | |
Sky PLC(2) | | | 24,427 | | | | 305,884 | | |
| | | | 341,908 | | |
| Multi-Utilities (0.0%) | |
National Grid PLC | | | 739 | | | | 8,894 | | |
| Professional Services (0.0%) | |
Experian PLC | | | 456 | | | | 9,606 | | |
IHS Markit Ltd.(2) | | | 208 | | | | 8,863 | | |
| | | | 18,469 | | |
| Semiconductor Equipment & Products (0.2%) | |
Imagination Technologies Group PLC(2) | | | 63,263 | | | | 151,685 | | |
See Accompanying Notes to Consolidated Financial Statements.
11
Credit Suisse Multialternative Strategy Fund
Consolidated Schedule of Investments (continued)
October 31, 2017
| | | Number of
Shares | | Value | |
| LONG POSITIONS (continued) | |
| COMMON STOCKS (continued) | |
UNITED KINGDOM | |
| Specialty Retail (0.0%) | |
Kingfisher PLC | | | 2,519 | | | $ | 10,471 | | |
| Textiles, Apparel & Luxury Goods (0.0%) | |
Burberry Group PLC | | | 388 | | | | 9,798 | | |
Michael Kors Holdings Ltd.(2) | | | 192 | | | | 9,372 | | |
| | | | 19,170 | | |
| | | | 614,632 | | |
| UNITED STATES (7.9%) | |
| Aerospace & Defense (0.0%) | |
Lockheed Martin Corp. | | | 30 | | | | 9,245 | | |
The Boeing Co. | | | 36 | | | | 9,287 | | |
| | | | 18,532 | | |
| Airlines (0.5%) | |
American Airlines Group, Inc. | | | 208 | | | | 9,739 | | |
Delta Air Lines, Inc. | | | 4,801 | | | | 240,194 | | |
Southwest Airlines Co. | | | 4,571 | | | | 246,194 | | |
United Continental Holdings, Inc.(2) | | | 149 | | | | 8,713 | | |
| | | | 504,840 | | |
| Auto Components (0.0%) | |
Lear Corp. | | | 53 | | | | 9,306 | | |
| Automobiles (0.1%) | |
General Motors Co. | | | 227 | | | | 9,756 | | |
Harley-Davidson, Inc. | | | 1,675 | | | | 79,214 | | |
| | | | 88,970 | | |
| Banks (0.0%) | |
CIT Group, Inc. | | | 187 | | | | 8,718 | | |
Citigroup, Inc. | | | 126 | | | | 9,261 | | |
Regions Financial Corp. | | | 602 | | | | 9,319 | | |
| | | | 27,298 | | |
| Capital Markets (0.3%) | |
Ameriprise Financial, Inc. | | | 62 | | | | 9,706 | | |
Franklin Resources, Inc. | | | 5,662 | | | | 239,397 | | |
| | | | 249,103 | | |
| Chemicals (0.0%) | |
Celanese Corp., Series A | | | 88 | | | | 9,179 | | |
LyondellBasell Industries NV, Class A | | | 93 | | | | 9,629 | | |
| | | | 18,808 | | |
| Communications Equipment (0.6%) | |
Brocade Communications Systems, Inc. | | | 50,992 | | | | 594,057 | | |
See Accompanying Notes to Consolidated Financial Statements.
12
Credit Suisse Multialternative Strategy Fund
Consolidated Schedule of Investments (continued)
October 31, 2017
| | | Number of
Shares | | Value | |
| LONG POSITIONS (continued) | |
| COMMON STOCKS (continued) | |
UNITED STATES | |
| Consumer Finance (0.1%) | |
Ally Financial, Inc. | | | 378 | | | $ | 9,877 | | |
Capital One Financial Corp. | | | 108 | | | | 9,955 | | |
Discover Financial Services | | | 154 | | | | 10,246 | | |
Navient Corp. | | | 628 | | | | 7,825 | | |
Synchrony Financial | | | 295 | | | | 9,623 | | |
| | | | 47,526 | | |
| Diversified Financial Services (0.0%) | |
MSCI, Inc. | | | 78 | | | | 9,154 | | |
Voya Financial, Inc. | | | 230 | | | | 9,237 | | |
| | | | 18,391 | | |
| Electronic Equipment, Instruments & Components (0.0%) | |
CDW Corp. | | | 139 | | | | 9,730 | | |
Corning, Inc. | | | 306 | | | | 9,581 | | |
| | | | 19,311 | | |
| Food & Staples Retailing (0.1%) | |
CVS Health Corp. | | | 1,287 | | | | 88,198 | | |
Sysco Corp. | | | 170 | | | | 9,455 | | |
The Kroger Co. | | | 448 | | | | 9,274 | | |
| | | | 106,927 | | |
| Food Products (0.0%) | |
Conagra Brands, Inc. | | | 272 | | | | 9,291 | | |
| Gas Utilities (0.7%) | |
WGL Holdings, Inc. | | | 8,196 | | | | 702,397 | | |
| Healthcare Equipment & Supplies (0.6%) | |
Boston Scientific Corp.(2) | | | 8,393 | | | | 236,179 | | |
NxStage Medical, Inc.(2) | | | 14,166 | | | | 381,774 | | |
| | | | 617,953 | | |
| Healthcare Providers & Services (0.5%) | |
Aetna, Inc. | | | 58 | | | | 9,862 | | |
AmerisourceBergen Corp. | | | 111 | | | | 8,541 | | |
DaVita, Inc.(2) | | | 155 | | | | 9,415 | | |
Express Scripts Holding Co.(2) | | | 160 | | | | 9,806 | | |
HCA Healthcare, Inc.(2) | | | 985 | | | | 74,515 | | |
Henry Schein, Inc.(2) | | | 3,172 | | | | 249,525 | | |
McKesson Corp. | | | 64 | | | | 8,824 | | |
PharMerica Corp.(2) | | | 4,839 | | | | 141,783 | | |
| | | | 512,271 | | |
See Accompanying Notes to Consolidated Financial Statements.
13
Credit Suisse Multialternative Strategy Fund
Consolidated Schedule of Investments (continued)
October 31, 2017
| | | Number of
Shares | | Value | |
| LONG POSITIONS (continued) | |
| COMMON STOCKS (continued) | |
UNITED STATES | |
| Hotels, Restaurants & Leisure (0.0%) | |
McDonald's Corp. | | | 59 | | | $ | 9,848 | | |
Wyndham Worldwide Corp. | | | 87 | | | | 9,296 | | |
Yum! Brands, Inc. | | | 125 | | | | 9,306 | | |
| | | | 28,450 | | |
| Household Durables (0.0%) | |
PulteGroup, Inc. | | | 335 | | | | 10,127 | | |
| Independent Power Producers & Energy Traders (0.9%) | |
AES Corp. | | | 6,297 | | | | 66,937 | | |
Calpine Corp.(2) | | | 46,912 | | | | 700,866 | | |
TerraForm Global, Inc., Class A(2) | | | 27,134 | | | | 132,278 | | |
| | | | 900,081 | | |
| Insurance (0.4%) | |
American International Group, Inc. | | | 149 | | | | 9,627 | | |
Assurant, Inc. | | | 96 | | | | 9,662 | | |
Fidelity & Guaranty Life | | | 13,301 | | | | 413,661 | | |
Lincoln National Corp. | | | 125 | | | | 9,473 | | |
The Hartford Financial Services Group, Inc. | | | 165 | | | | 9,083 | | |
| | | | 451,506 | | |
| Internet & Catalog Retail (0.0%) | |
Liberty Interactive Corp. QVC Group, Class A(2) | | | 426 | | | | 9,679 | | |
TripAdvisor, Inc.(2) | | | 226 | | | | 8,475 | | |
| | | | 18,154 | | |
| Internet Software & Services (0.4%) | |
Bankrate, Inc.(2) | | | 30,197 | | | | 419,738 | | |
eBay, Inc.(2) | | | 238 | | | | 8,958 | | |
VeriSign, Inc.(2) | | | 86 | | | | 9,247 | | |
| | | | 437,943 | | |
| IT Services (0.1%) | |
Alliance Data Systems Corp. | | | 42 | | | | 9,397 | | |
MoneyGram International, Inc.(2) | | | 7,574 | | | | 117,776 | | |
The Western Union Co. | | | 477 | | | | 9,473 | | |
| | | | 136,646 | | |
| Media (0.2%) | |
CBS Corp., Class B | | | 152 | | | | 8,530 | | |
Charter Communications, Inc., Class A(2) | | | 25 | | | | 8,354 | | |
Discovery Communications, Inc., Class C(2) | | | 453 | | | | 8,068 | | |
Omnicom Group, Inc. | | | 574 | | | | 38,567 | | |
Sirius XM Holdings, Inc.(1) | | | 1,661 | | | | 9,036 | | |
Twenty-First Century Fox, Inc., Class A | | | 1,553 | | | | 40,611 | | |
Twenty-First Century Fox, Inc., Class B | | | 1,595 | | | | 40,593 | | |
| | | | 153,759 | | |
See Accompanying Notes to Consolidated Financial Statements.
14
Credit Suisse Multialternative Strategy Fund
Consolidated Schedule of Investments (continued)
October 31, 2017
| | | Number of
Shares | | Value | |
| LONG POSITIONS (continued) | |
| COMMON STOCKS (continued) | |
UNITED STATES | |
| Multi-Utilities (0.4%) | |
Avista Corp. | | | 8,684 | | | $ | 453,652 | | |
| Multiline Retail (0.0%) | |
Kohl's Corp. | | | 201 | | | | 8,394 | | |
Target Corp. | | | 155 | | | | 9,151 | | |
| | | | 17,545 | | |
| Pharmaceuticals (1.3%) | |
Akorn, Inc.(2) | | | 20,750 | | | | 675,828 | | |
Allergan PLC | | | 1,340 | | | | 237,488 | | |
Eli Lilly & Co. | | | 1,843 | | | | 151,015 | | |
Mallinckrodt PLC(2) | | | 237 | | | | 7,506 | | |
Zoetis, Inc. | | | 3,544 | | | | 226,178 | | |
| | | | 1,298,015 | | |
| Real Estate Investment Trusts (0.2%) | |
Federal Realty Investment Trust | | | 469 | | | | 56,524 | | |
GGP, Inc. | | | 1,971 | | | | 38,356 | | |
Simon Property Group, Inc. | | | 512 | | | | 79,438 | | |
| | | | 174,318 | | |
| Software (0.4%) | |
CA, Inc. | | | 7,723 | | | | 250,071 | | |
CDK Global, Inc. | | | 162 | | | | 10,297 | | |
Dell Technologies, Inc., Class V(2) | | | 119 | | | | 9,849 | | |
Silver Spring Networks, Inc.(2) | | | 8,774 | | | | 141,437 | | |
VMware, Inc., Class A(2) | | | 84 | | | | 10,054 | | |
| | | | 421,708 | | |
| Specialty Retail (0.1%) | |
Bed Bath & Beyond, Inc. | | | 391 | | | | 7,781 | | |
Best Buy Co., Inc. | | | 161 | | | | 9,013 | | |
CarMax, Inc.(2) | | | 121 | | | | 9,087 | | |
Foot Locker, Inc. | | | 260 | | | | 7,821 | | |
Lowe's Cos., Inc | | | 115 | | | | 9,194 | | |
O'Reilly Automotive, Inc.(2) | | | 43 | | | | 9,071 | | |
Signet Jewelers Ltd.(1) | | | 152 | | | | 9,966 | | |
Tractor Supply Co. | | | 145 | | | | 8,738 | | |
| | | | 70,671 | | |
| Textiles, Apparel & Luxury Goods (0.0%) | |
VF Corp. | | | 144 | | | | 10,030 | | |
| Trading Companies & Distributors (0.0%) | |
HD Supply Holdings, Inc.(2) | | | 254 | | | | 8,989 | | |
| | | | 8,136,575 | | |
| TOTAL COMMON STOCKS (Cost $11,231,692) | | | 11,316,619 | | |
See Accompanying Notes to Consolidated Financial Statements.
15
Credit Suisse Multialternative Strategy Fund
Consolidated Schedule of Investments (continued)
October 31, 2017
| | | Number of
Rights | | Value | |
| LONG POSITIONS (continued) | |
| RIGHT (0.0%) | |
| UNITED STATES (0.0%) | |
| Biotechnology (0.0%) | |
Shire Pharmaceuticals International(2),(4) (Cost $6,140) | | | 5,532 | | | $ | 6,140 | | |
Par
(000) | |
| | Ratings
(S&P/Moody's) | |
Maturity | |
Rate% | |
| |
| UNITED STATES TREASURY OBLIGATIONS (48.0%) | | | |
$ | 10,000 | | | United States Treasury Bills | | (AA+, Aaa) | | 01/11/18 | | | 1.065 | | | | 9,979,538 | | |
| | 20,000 | | | United States Treasury Bills | | (AA+, Aaa) | | 04/05/18 | | | 1.181 | | | | 19,895,698 | | |
| | 20,000 | | | United States Treasury Bills | | (AA+, Aaa) | | 05/24/18 | | | 1.244 | | | | 19,859,184 | | |
| TOTAL UNITED STATES TREASURY OBLIGATIONS (Cost $49,736,341) | | | 49,734,420 | | |
Number of
Contracts | |
| | | | | | | | | |
| PURCHASED OPTIONS (0.1%) | | | |
| Put Purchased Options (0.1%) | | | |
| | 124 | | | S&P 500 Index, Strike @ 2,480, expires 11/17/17 (Cost $65,850) | | | | | | | | | | | | | | | 42,160 | | |
| | | Number of
Shares | | | |
| SHORT-TERM INVESTMENTS (28.2%) | |
State Street Navigator Securities Lending Government Money Market Portfolio, 1.00%(5) | | | 37,455 | | | | 37,455 | | |
| | | Par
(000) | | | |
State Street Bank and Trust Co. Euro Time Deposit, 0.120% 11/01/2017
(Cost $29,165,637) | | $ | 29,166 | | | | 29,165,637 | | |
| TOTAL SHORT-TERM INVESTMENTS (Cost $29,203,092) | | | 29,203,092 | | |
| TOTAL INVESTMENTS AT VALUE/LONG POSITIONS (87.2%) (Cost $90,243,115) | | | 90,302,431 | | |
| TOTAL SECURITIES SOLD SHORT (-2.6%) (Proceeds $2,657,281) | | | (2,654,438 | ) | |
| OTHER ASSETS IN EXCESS OF LIABILITIES (15.4%) | | | 15,890,051 | | |
| NET ASSETS (100.0%) | | $ | 103,538,044 | | |
See Accompanying Notes to Consolidated Financial Statements.
16
Credit Suisse Multialternative Strategy Fund
Consolidated Schedule of Investments (continued)
October 31, 2017
| | | Number of
Shares | | Value | |
| SHORT POSITIONS (-2.6%) | |
| COMMON STOCKS (-2.6%) | |
| UNITED KINGDOM (-0.1%) | |
| Energy Equipment & Services (-0.1%) | |
TechnipFMC PLC(2) | | | (2,997 | ) | | $ | (81,693 | ) | |
| UNITED STATES (-2.5%) | |
| Auto Components (-0.1%) | |
BorgWarner, Inc. | | | (1,287 | ) | | | (67,851 | ) | |
| Communications Equipment (-0.2%) | |
F5 Networks, Inc.(2) | | | (1,987 | ) | | | (240,963 | ) | |
| Electronic Equipment, Instruments & Components (-0.2%) | |
FLIR Systems, Inc. | | | (4,793 | ) | | | (224,408 | ) | |
| Healthcare Equipment & Supplies (-0.1%) | |
Align Technology, Inc.(2) | | | (464 | ) | | | (111,368 | ) | |
| Healthcare Providers & Services (-0.9%) | |
Aetna, Inc. | | | (1,409 | ) | | | (239,572 | ) | |
Anthem, Inc. | | | (952 | ) | | | (199,168 | ) | |
DaVita, Inc.(2) | | | (3,817 | ) | | | (231,845 | ) | |
Express Scripts Holding Co.(2) | | | (3,704 | ) | | | (227,018 | ) | |
| | | | (897,603 | ) | |
| Internet Software & Services (-0.1%) | |
Akamai Technologies, Inc.(2) | | | (1,514 | ) | | | (79,125 | ) | |
| Oil, Gas & Consumable Fuels (-0.2%) | |
Cabot Oil & Gas Corp. | | | (2,994 | ) | | | (83,315 | ) | |
Marathon Petroleum Corp. | | | (1,370 | ) | | | (81,831 | ) | |
Newfield Exploration Co.(2) | | | (2,662 | ) | | | (81,779 | ) | |
| | | | (246,925 | ) | |
| Professional Services (-0.1%) | |
Robert Half International, Inc. | | | (2,616 | ) | | | (135,430 | ) | |
| Semiconductor Equipment & Products (-0.2%) | |
Broadcom Ltd. | | | (317 | ) | | | (83,638 | ) | |
Xilinx, Inc. | | | (1,102 | ) | | | (81,279 | ) | |
| | | | (164,917 | ) | |
| Software (-0.1%) | |
Activision Blizzard, Inc. | | | (1,250 | ) | | | (81,906 | ) | |
| Textiles, Apparel & Luxury Goods (-0.2%) | |
NIKE, Inc., Class B | | | (4,439 | ) | | | (244,101 | ) | |
See Accompanying Notes to Consolidated Financial Statements.
17
Credit Suisse Multialternative Strategy Fund
Consolidated Schedule of Investments (continued)
October 31, 2017
| | | Number of
Shares | | Value | |
| SHORT POSITIONS (continued) | |
| COMMON STOCKS (continued) | |
UNITED STATES | |
| Trading Companies & Distributors (-0.1%) | |
United Rentals, Inc.(2) | | | (549 | ) | | $ | (78,148 | ) | |
| | | | (2,572,745 | ) | |
| TOTAL SHORT POSITIONS (Proceeds $2,657,281) | | | (2,654,438 | ) | |
† Credit ratings given by the Standard & Poor's Division of The McGraw-Hill Companies, Inc. ("S&P") and Moody's Investors Service, Inc. ("Moody's") are unaudited.
(1) Security or portion thereof is out on loan (See note 2-L).
(2) Non-income producing security.
(3) REG S: Securities sold under Regulation S may not be offered, sold or delivered within the United States or to, or for the account or benefit of, U.S. persons, except pursuant to an exemption from, or in a transaction not subject to, the registration requirements of the Securities Act of 1933.
(4) Security is valued using significant unobservable inputs.
(5) Represents security purchased with cash collateral received for securities on loan. The rate shown is the annualized one-day yield at October 31, 2017.
Forward Foreign Currency Contracts
Forward
Currency to be
Purchased (Local) | | Forward
Currency to be
Sold (Local) | | Expiration
Date | | Counterparty | | Value on
Settlement Date | | Current
Value/
Notional | | Net Unrealized
Appreciation
(Depreciation) | |
AUD | 3,638,552 | | | USD | 2,848,550 | | | 11/20/17 | | Societe Generale | | $ | 2,848,550 | | | $ | 2,789,342 | | | $ | (59,208 | ) | |
CAD | 695,497 | | | USD | 561,960 | | | 12/20/17 | | Goldman Sachs | | | 561,960 | | | | 539,787 | | | | (22,173 | ) | |
CHF | 834,030 | | | USD | 858,760 | | | 12/20/17 | | Goldman Sachs | | | 858,760 | | | | 839,496 | | | | (19,264 | ) | |
NOK | 17,353,802 | | | USD | 2,183,802 | | | 11/20/17 | | Societe Generale | | | 2,183,802 | | | | 2,121,884 | | | | (61,918 | ) | |
NZD | 1,689,107 | | | USD | 1,208,556 | | | 11/20/17 | | Societe Generale | | | 1,208,556 | | | | 1,156,709 | | | | (51,847 | ) | |
USD | 837,595 | | | CAD | 1,052,991 | | | 11/17/17 | | Societe Generale | | | (837,595 | ) | | | (816,952 | ) | | | 20,643 | | |
USD | 3,040,977 | | | SEK | 24,767,234 | | | 11/20/17 | | Societe Generale | | | (3,040,977 | ) | | | (2,961,226 | ) | | | 79,751 | | |
USD | 2,059,629 | | | CHF | 2,014,688 | | | 11/20/17 | | Societe Generale | | | (2,059,629 | ) | | | (2,023,449 | ) | | | 36,180 | | |
USD | 1,888,492 | | | JPY | 211,883,130 | | | 11/20/17 | | Societe Generale | | | (1,888,492 | ) | | | (1,866,044 | ) | | | 22,448 | | |
USD | 1,518,702 | | | EUR | 1,290,239 | | | 11/20/17 | | Societe Generale | | | (1,518,702 | ) | | | (1,504,468 | ) | | | 14,234 | | |
USD | 1,158,358 | | | GBP | 878,762 | | | 11/20/17 | | Societe Generale | | | (1,158,358 | ) | | | (1,167,533 | ) | | | (9,175 | ) | |
USD | 2,064,180 | | | EUR | 1,720,891 | | | 12/20/17 | | JPMorgan Chase | | | (2,064,180 | ) | | | (2,010,273 | ) | | | 53,907 | | |
USD | 873,726 | | | CHF | 834,030 | | | 12/20/17 | | JPMorgan Chase | | | (873,726 | ) | | | (839,496 | ) | | | 34,230 | | |
USD | 570,286 | | | CAD | 695,497 | | | 12/20/17 | | JPMorgan Chase | | | (570,286 | ) | | | (539,787 | ) | | | 30,499 | | |
USD | 418,592 | | | GBP | 307,868 | | | 12/20/17 | | JPMorgan Chase | | | (418,592 | ) | | | (409,445 | ) | | | 9,147 | | |
USD | 765,460 | | | DKK | 4,826,758 | | | 12/20/17 | | Goldman Sachs | | | (765,460 | ) | | | (757,857 | ) | | | 7,603 | | |
USD | 27,746 | | | CAD | 34,594 | | | 12/20/17 | | Goldman Sachs | | | (27,746 | ) | | | (26,849 | ) | | | 897 | | |
USD | 37,336 | | | CHF | 36,231 | | | 12/20/17 | | Goldman Sachs | | | (37,336 | ) | | | (36,469 | ) | | | 867 | | |
USD | 9,320 | | | SEK | 75,194 | | | 12/20/17 | | Goldman Sachs | | | (9,320 | ) | | | (9,008 | ) | | | 312 | | |
USD | 92,700 | | | GBP | 69,780 | | | 12/20/17 | | Goldman Sachs | | | (92,700 | ) | | | (92,803 | ) | | | (103 | ) | |
| | | $ | 87,030 | | |
See Accompanying Notes to Consolidated Financial Statements.
18
Credit Suisse Multialternative Strategy Fund
Consolidated Schedule of Investments (continued)
October 31, 2017
Futures Contracts
Contract Description | | Currency | | Expiration
Date | | Number of
Contracts | | Notional
Value | | Net Unrealized
Appreciation
(Depreciation) | |
Contracts to Purchase | |
Agriculture | |
Coffee "C" Futures | | USD | | | | Mar 2018 | | | 13 | | | $ | 626,925 | | | $ | (1,196 | ) | |
Corn Futures | | USD | | | | Mar 2018 | | | 120 | | | | 2,157,000 | | | | (20,839 | ) | |
Cotton No. 2 Futures | | USD | | | | Mar 2018 | | | 12 | | | | 410,040 | | | | (372 | ) | |
Wheat Futures | | USD | | | | Mar 2018 | | | 61 | | | | 1,329,800 | | | | (30,029 | ) | |
| | | $ | (52,436 | ) | |
Energy | |
Brent Crude Oil Futures | | USD | | | | Mar 2018 | | | 41 | | | | 2,478,040 | | | $ | 47,643 | | |
Foreign Exchange Contracts | |
| AUD Currency Futures | | USD | | | | Dec 2017 | | | 25 | | | | 1,913,000 | | | $ | (75,955 | ) | |
| CAD Currency Futures | | USD | | | | Dec 2017 | | | 44 | | | | 3,413,300 | | | | (198,590 | ) | |
| EUR Currency Futures | | USD | | | | Dec 2017 | | | 23 | | | | 3,358,288 | | | | (72,819 | ) | |
| GBP Currency Futures | | USD | | | | Dec 2017 | | | 49 | | | | 4,073,431 | | | | 18,459 | | |
| | | $ | (328,905 | ) | |
Index Contracts | |
EURO Stoxx 50 Index Futures | | EUR | | | | Dec 2017 | | | 51 | | | | 2,185,190 | | | $ | 90,085 | | |
FTSE 100 Index Futures | | GBP | | | | Dec 2017 | | | 26 | | | | 2,578,283 | | | | 11,148 | | |
Hang Seng Index Futures | | HKD | | | | Nov 2017 | | | 14 | | | | 2,530,185 | | | | (7,132 | ) | |
Nikkei 225 Index Futures OSE | | JPY | | | | Dec 2017 | | | 13 | | | | 2,511,221 | | | | 205,829 | | |
S&P 500 E Mini Index Futures | | USD | | | | Dec 2017 | | | 14 | | | | 1,800,890 | | | | 3,537 | | |
| | | $ | 303,467 | | |
Industrial Metals | |
Copper Futures | | USD | | | | Mar 2018 | | | 36 | | | | 2,808,900 | | | $ | (30,007 | ) | |
LME Nickel Futures | | USD | | | | Nov 2017 | | | 25 | | | | 1,839,225 | | | | 255,071 | | |
LME Nickel Futures | | USD | | | | Jan 2018 | | | 12 | | | | 885,312 | | | | 131,448 | | |
LME Primary Aluminum Futures | | USD | | | | Nov 2017 | | | 65 | | | | 3,487,656 | | | | 187,735 | | |
LME Primary Aluminum Futures | | USD | | | | Jan 2018 | | | 31 | | | | 1,672,838 | | | | 19,855 | | |
LME Zinc Futures | | USD | | | | Nov 2017 | | | 25 | | | | 2,068,125 | | | | 174,713 | | |
LME Zinc Futures | | USD | | | | Jan 2018 | | | 12 | | | | 982,800 | | | | 44,648 | | |
| | | $ | 783,463 | | |
Interest Rate Contracts | |
10YR JGB Mini Futures | | JPY | | | | Dec 2017 | | | 88 | | | | 11,654,598 | | | $ | 4,146 | | |
German EURO Bund Futures | | EUR | | | | Dec 2017 | | | 31 | | | | 5,877,464 | | | | 24,818 | | |
| | | $ | 28,964 | | |
Livestock | |
Lean Hogs Futures | | USD | | | | Feb 2018 | | | 23 | | | | 671,600 | | | $ | 19,292 | | |
Live Cattle Futures | | USD | | | | Feb 2018 | | | 25 | | | | 1,295,500 | | | | 28,274 | | |
| | | $ | 47,566 | | |
See Accompanying Notes to Consolidated Financial Statements.
19
Credit Suisse Multialternative Strategy Fund
Consolidated Schedule of Investments (continued)
October 31, 2017
Futures Contracts (continued)
Contract Description | | Currency | | Expiration
Date | | Number of
Contracts | | Notional
Value | | Net Unrealized
Appreciation
(Depreciation) | |
Contracts to Purchase | |
Precious Metals | |
Gold 100 oz. Futures | | USD | | | | Feb 2018 | | | 29 | | | $ | 3,696,630 | | | $ | (9,676 | ) | |
Silver Futures | | USD | | | | Mar 2018 | | | 15 | | | | 1,259,250 | | | | (8,570 | ) | |
| | | $ | (18,246 | ) | |
Contracts to Sell | |
Agriculture | |
Coffee "C" Futures | | USD | | | | Dec 2017 | | | (13 | ) | | | (609,863 | ) | | $ | 699 | | |
Corn Futures | | USD | | | | Dec 2017 | | | (120 | ) | | | (2,074,500 | ) | | | 18,749 | | |
Cotton No. 2 Futures | | USD | | | | Dec 2017 | | | (12 | ) | | | (410,280 | ) | | | 713 | | |
Wheat Futures | | USD | | | | Dec 2017 | | | (61 | ) | | | (1,276,425 | ) | | | 27,583 | | |
| | | $ | 47,744 | | |
Energy | |
Brent Crude Oil Futures | | USD | | | | Jan 2018 | | | (41 | ) | | | (2,498,540 | ) | | $ | (48,167 | ) | |
Foreign Exchange Contracts | |
| JPY Currency Futures | | USD | | | | Dec 2017 | | | (32 | ) | | | (3,525,600 | ) | | $ | 51,651 | | |
Industrial Metals | |
Copper Futures | | USD | | | | Dec 2017 | | | (36 | ) | | | (2,790,900 | ) | | $ | 30,031 | | |
LME Nickel Futures | | USD | | | | Nov 2017 | | | (25 | ) | | | (1,839,225 | ) | | | (256,129 | ) | |
LME Nickel Futures | | USD | | | | Jan 2018 | | | (12 | ) | | | (885,312 | ) | | | (87,858 | ) | |
LME Primary Aluminum Futures | | USD | | | | Nov 2017 | | | (65 | ) | | | (3,487,656 | ) | | | (127,871 | ) | |
LME Primary Aluminum Futures | | USD | | | | Jan 2018 | | | (31 | ) | | | (1,672,838 | ) | | | (2,888 | ) | |
LME Zinc Futures | | USD | | | | Nov 2017 | | | (25 | ) | | | (2,068,125 | ) | | | (182,363 | ) | |
LME Zinc Futures | | USD | | | | Jan 2018 | | | (12 | ) | | | (982,800 | ) | | | (9,827 | ) | |
| | | $ | (636,905 | ) | |
Interest Rate Contracts | |
10YR U.S. Treasury Note Futures | | USD | | | | Dec 2017 | | | (72 | ) | | | (8,995,500 | ) | | $ | (14,361 | ) | |
Long Gilt Futures | | GBP | | | | Dec 2017 | | | (36 | ) | | | (5,943,748 | ) | | | (6,053 | ) | |
| | | $ | (20,414 | ) | |
Livestock | |
Lean Hogs Futures | | USD | | | | Dec 2017 | | | (23 | ) | | | (625,600 | ) | | $ | (23,468 | ) | |
Live Cattle Futures | | USD | | | | Dec 2017 | | | (25 | ) | | | (1,256,250 | ) | | | (36,854 | ) | |
| | | $ | (60,322 | ) | |
Precious Metals | |
Gold 100 oz. Futures | | USD | | | | Dec 2017 | | | (29 | ) | | | (3,684,450 | ) | | $ | 9,464 | | |
Silver Futures | | USD | | | | Dec 2017 | | | (15 | ) | | | (1,251,975 | ) | | | 8,416 | | |
| | | $ | 17,880 | | |
Net unrealized appreciation (depreciation) | | $ | 162,983 | | |
See Accompanying Notes to Consolidated Financial Statements.
20
Credit Suisse Multialternative Strategy Fund
Consolidated Schedule of Investments (continued)
October 31, 2017
Total Return Swap Contracts
Currency | | Notional
Amount | | Expiration
Date | | Counterparty | | Receive | | Pay | | Upfront
Premiums
Paid | | Upfront
Premiums
Received | | Net Unrealized
Appreciation
(Depreciation) | |
USD | | | | $ | 6,686,291 | | | 11/16/17 | | Barclays
Bank plc | | Barclays
Hedging
Insights Index | | Fixed Rate | | $ | — | | | $ | — | | | $ | (51,784 | ) | |
USD | | | | | 3,197,054 | | | 11/17/17 | | Barclays
Bank plc | | Barclays
U.S. Short
Variance
Index | | Fixed Rate | | | — | | | | — | | | | — | | |
USD | | | | | 5,177,863 | | | 06/21/18 | | BNP Paribas | | MSCI EAFE
Index | | Fee Plus
LIBOR | | | — | | | | — | | | | (4,123 | ) | |
USD | | | | | 2,872,050 | | | 09/28/18 | | BNP Paribas | | NASDAQ-100
Total Return | | Fee Plus
LIBOR | | | — | | | | — | | | | 63,434 | | |
USD | | | | | 2,015,362 | | | 10/22/17 | | BNP Paribas | | Russel 2000
Total Return
Index | | Fixed Rate | | | — | | | | — | | | | — | | |
USD | | | | | 1,891,392 | | | 11/16/17 | | Goldman Sachs | | Fixed Rate | | Bloomberg
Agriculture
Index | | | — | | | | — | | | | 11,582 | | |
USD | | | | | 2,613,131 | | | 11/16/17 | | Goldman Sachs | | Bloomberg
Industrial
Metals Index | | Fixed Rate | | | — | | | | — | | | | 11,735 | | |
USD | | | | | 3,169,129 | | | 11/21/17 | | Goldman Sachs | | Goldman Sachs
RP Equity
World Long
Short Series 53
Excess Return
Index(a) | | Fixed Rate | | | — | | | | — | | | | 19,923 | | |
USD | | | | | 787,986 | | | 11/16/17 | | Goldman Sachs | | Bloomberg
Energy Index | | Fixed Rate | | | — | | | | — | | | | 16,489 | | |
USD | | | | | 665,026 | | | 11/16/17 | | Goldman Sachs | | Bloomberg
Energy Index | | Fixed Rate | | | — | | | | — | | | | 7,473 | | |
USD | | | | | 662,617 | | | 11/16/17 | | Goldman Sachs | | Fixed Rate | | Bloomberg
Metals Index | | | — | | | | — | | | | 4,330 | | |
USD | | | | | 6,800,000 | | | 12/20/17 | | Goldman Sachs | | iBoxx $ Liquid
High Yield
Index | | Fee Plus
LIBOR | | | — | | | | — | | | | 120,897 | | |
GBP | | | | | 695,842 | | | 02/16/18 | | Goldman Sachs | | Fee Plus LIBOR | | Tesco PLC | | | — | | | | — | | | | 19,598 | | |
GBP | | | | | 892,633 | | | 02/16/18 | | Goldman Sachs | | Booker
Group PLC | | Fee Plus
LIBOR | | | — | | | | — | | | | (21,448 | ) | |
USD | | | | | 1,130,000 | | | 03/20/18 | | Goldman Sachs | | High Yield Index | | LIBOR | | | — | | | | — | | | | 5,538 | | |
USD | | | | | 689,000 | | | 03/20/18 | | Goldman Sachs | | iBoxx $ Liquid
High Yield Index | | Fee Plus
LIBOR | | | — | | | | — | | | | 6,129 | | |
USD | | | | | 7,040,000 | | | 03/20/18 | | Goldman Sachs | | iBoxx $ Liquid
High Yield Index | | Fee Plus
LIBOR | | | — | | | | — | | | | 8,232 | | |
USD | | | | | 285,618 | | | 05/01/18 | | Goldman Sachs | | Fee Plus LIBOR | | Becton,
Dickinson &
Co. | | | — | | | | — | | | | (16,536 | ) | |
See Accompanying Notes to Consolidated Financial Statements.
21
Credit Suisse Multialternative Strategy Fund
Consolidated Schedule of Investments (continued)
October 31, 2017
Total Return Swap Contracts (continued)
Currency | | Notional
Amount | | Expiration
Date | | Counterparty | | Receive | | Pay | | Upfront
Premiums
Paid | | Upfront
Premiums
Received | | Net Unrealized
Appreciation
(Depreciation) | |
USD | | | | $ | 915,378 | | | 05/01/18 | | Goldman Sachs | | C.R. Bard, Inc. | | Fee Plus
LIBOR | | $ | — | | | $ | — | | | $ | 17,426 | | |
USD | | | | | 1,200,000 | | | 06/20/18 | | Goldman Sachs | | Fee Plus LIBOR | | iBoxx $ Liquid
High Yield
Index | | | — | | | | — | | | | (23,546 | ) | |
USD | | | | | 972,237 | | | 06/26/18 | | Goldman Sachs | | Fee Plus LIBOR | | EQT Corp. | | | — | | | | — | | | | 37,514 | | |
USD | | | | | 1,154,836 | | | 06/26/18 | | Goldman Sachs | | Rice
Energy, Inc. | | Fee Plus
LIBOR | | | — | | | | — | | | | (9,694 | ) | |
USD | | | | | 725,019 | | | 08/21/18 | | Goldman Sachs | | Fee Plus LIBOR | | Invitation
Homes, Inc. | | | — | | | | — | | | | 5,103 | | |
USD | | | | | 720,954 | | | 08/21/18 | | Goldman Sachs | | Starwood
Waypoint
Homes | | Fee Plus
LIBOR | | | — | | | | — | | | | (3,360 | ) | |
CAD | | | | | 139,784 | | | 09/13/18 | | Goldman Sachs | | Richmont
Mines, Inc. | | Fee Plus
CDOR | | | — | | | | — | | | | (6,889 | ) | |
CAD | | | | | 141,070 | | | 09/13/18 | | Goldman Sachs | | Fee Plus CDOR | | Alamos
Gold, Inc. | | | — | | | | — | | | | 7,156 | | |
USD | | | | | 5,188,038 | | | 10/19/18 | | Goldman Sachs | | Fee Plus LIBOR | | S&P 500
Total Return
Index | | | — | | | | — | | | | (34,081 | ) | |
USD | | | | | 220,555 | | | 10/29/18 | | Goldman Sachs | | Deltic Timber
Corp. | | Fee Plus
LIBOR | | | — | | | | — | | | | 4,117 | | |
USD | | | | | 352,131 | | | 10/29/18 | | Goldman Sachs | | Fee Plus LIBOR | | Potlatch
Corp. | | | — | | | | — | | | | (8,138 | ) | |
USD | | | | | 90,554 | | | 10/29/18 | | Goldman Sachs | | Fee Plus LIBOR | | Potlatch
Corp. | | | — | | | | — | | | | 635 | | |
USD | | | | | 222,859 | | | 10/29/18 | | Goldman Sachs | | Deltic Timber
Corp. | | Fee Plus
LIBOR | | | — | | | | — | | | | 146 | | |
USD | | | | | 674,918 | | | 11/16/17 | | Goldman Sachs | | Fixed
Rate | | Bloomberg
Precious
Metals Index | | | — | | | | — | | | | — | | |
USD | | | | | 17,021,523 | | | 11/16/17 | | JPMorgan
Chase | | J.P. Morgan
Seasonal
Spreads
Portfolio
Commodity
Index | | Fixed Rate | | | — | | | | — | | | | (104,704 | ) | |
USD | | | | | 13,938,561 | | | 11/16/17 | | JPMorgan
Chase | | JPMorgan
Helix 2 Index | | Fixed Rate | | | — | | | | — | | | | 6,237 | | |
USD | | | | | 13,000,000 | | | 12/20/17 | | JPMorgan
Chase | | iBoxx $ Liquid
High Yield Index | | Fee Plus
LIBOR | | | — | | | | — | | | | 356,076 | | |
USD | | | | | 2,570,000 | | | 12/20/17 | | JPMorgan
Chase | | iBoxx $ Liquid
High Yield Index | | Fee Plus
LIBOR | | | — | | | | — | | | | 20,459 | | |
USD | | | | | 309,542 | | | 12/18/17 | | Morgan Stanley | | Russell 2000
Total Return
Index | | Fee Plus
LIBOR | | | — | | | | — | | | | 2,982 | | |
See Accompanying Notes to Consolidated Financial Statements.
22
Credit Suisse Multialternative Strategy Fund
Consolidated Schedule of Investments (continued)
October 31, 2017
Total Return Swap Contracts (continued)
Currency | | Notional
Amount | | Expiration
Date | | Counterparty | | Receive | | Pay | | Upfront
Premiums
Paid | | Upfront
Premiums
Received | | Net Unrealized
Appreciation
(Depreciation) | |
USD | | | | $ | 433,387 | | | 06/21/18 | | Societe
Generale | | Russell 2000
Total Return
Index | | Fee Plus
LIBOR | | $ | — | | | $ | — | | | $ | 1,607 | | |
USD | | | | | 3,833,949 | | | 08/21/18 | | Societe
Generale | | NASDAQ-100
Total Return | | Fee Plus
LIBOR | | | — | | | | — | | | | 134,260 | | |
USD | | | | | 2,247,737 | | | 08/21/18 | | Societe
Generale | | Russell 2000
Total Return
Index | | Fee Plus
LIBOR | | | — | | | | — | | | | 8,335 | | |
USD | | | | | 2,694,157 | | | 11/21/18 | | Societe
Generale | | Fee Plus LIBOR | | Industrial
Select
Sector Total
Return Index | | | — | | | | — | | | | 29,381 | | |
| | | $ | 642,491 | | |
Written Options
Number of
Contracts | | Counterparty | | Put Written Options | | Expiration
Date | | Notional
Amount | | Premiums
Received | | Current
Value | | Net Unrealized
Appreciation
(Depreciation) | |
| | 40 | | | JPMorgan Chase | | S&P 500 Index, Strike @ 2,560 | | 11/17/17 | | | 4,000 | | | $ | 58,718 | | | $ | (47,600 | ) | | $ | 11,118 | | |
| | 83 | | | Nomura Securities | | S&P 500 Index, Strike @ 2,545 | | 11/17/17 | | | 8,300 | | | | 96,535 | | | | (73,870 | ) | | | 22,665 | | |
Net Unrealized Appreciation (Depreciation) | | | | | | | | | | | | | | $ | 33,783 | | |
Currency Abbreviations:
AUD = Australian Dollar
CAD = Canadian Dollar
CHF = Swiss Franc
DKK = Danish Krone
EUR = Euro
GBP = British Pound
HKD = Hong Kong Dollar
JPY = Japanese Yen
NOK = Norwegian Krone
NZD = New Zealand Dollar
SEK = Swedish Krona
USD = United States Dollar
(a) The index intends to provide synthetic exposure to the performance of a basket comprising a 300% long position in the Goldman Sachs RP Equity World Long Short Series 37K Excess Return Strategy which, in turn, is in an index that provides exposure to a basket comprised of a short position in the USD Goldman Sachs Overnight Money Market Index, a short position in the MSCI Daily TR Gross World USD, and a long position in certain equity investments. The ticker symbols of the top 50 constituent investments held within the index are as follows, within North America: A UN Equity, ADM UN Equity, ALGN UW Equity, AMAT UW Equity, ANET UN Equity, BAX UN Equity, BBY UN Equity, BG UN Equity, BURL UN Equity, CHD UN Equity, CLX UN Equity, CM CT Equity, CNP UN Equity, CTAS UW Equity, DGX UN
See Accompanying Notes to Consolidated Financial Statements.
23
Credit Suisse Multialternative Strategy Fund
Consolidated Schedule of Investments (continued)
October 31, 2017
Equity, DTE GY Equity, DXC UN Equity, FL UN Equity, GLW UN Equity, GOOGL UW Equity, HII UN Equity, HSY UN Equity, ISRG UW Equity, JNJ UN Equity, LVLT UN Equity, MMC UN Equity, MTD UN Equity, OKE UN Equity, PAYX UW Equity, PKG UN Equity, RAI UN Equity, ROST UW Equity, RSG UN Equity, SNPS UW Equity, STI UN Equity, SYMC UW Equity, SYY UN Equity, TIF UN Equity, TRGP UN Equity, TWX UN Equity, ULTA UW Equity, VAL UN Equity, VMW UN Equity, WFM UW Equity, WMT UN Equity, ZTS UN Equity; within Europe: ATLN VX Equity, BATS LN Equity, DTE GY Equity, GLE FP Equity, SCMN VX Equity. The respective percentage weighting for each of the top 50 constituents ranges from 0.40% to 0.46% of the index.
See Accompanying Notes to Consolidated Financial Statements.
24
Credit Suisse Multialternative Strategy Fund
Consolidated Statement of Assets and Liabilities
October 31, 2017
Assets | |
Investments at value, including collateral for securities on loan of $37,455
(Cost $90,243,115) (Note 2) | | $ | 90,302,4311 | | |
Receivable from broker | | | 364,854 | | |
Foreign currency at value (Cost $676,072) | | | 671,105 | | |
Cash segregated held at brokers for futures contracts, swap contracts
and written options (Note 2) | | | 13,110,492 | | |
Receivable for investments sold | | | 4,648,071 | | |
Unrealized appreciation on open swap contracts (Note 2) | | | 926,794 | | |
Unrealized appreciation on forward foreign currency contracts (Note 2) | | | 310,718 | | |
Variation margin receivable on futures contracts (Note 2) | | | 942,777 | | |
Receivable for Fund shares sold | | | 51,155 | | |
Receivable from investment adviser (Note 3) | | | 38,000 | | |
Dividend and interest receivable | | | 22,066 | | |
Net receivable for open swap contracts | | | 7,924 | | |
Prepaid expenses and other assets | | | 18,598 | | |
Total assets | | | 111,414,985 | | |
Liabilities | |
Administrative services fee payable (Note 3) | | | 10,592 | | |
Due to custodian | | | 299,707 | | |
Shareholder servicing/Distribution fee payable (Note 3) | | | 295 | | |
Payable for investments purchased | | | 3,948,509 | | |
Securities sold short, at value (Proceeds $2,657,281) (Note 2) | | | 2,654,438 | | |
Unrealized depreciation on open swap contracts (Note 2) | | | 284,303 | | |
Unrealized depreciation on forward foreign currency contracts (Note 2) | | | 223,688 | | |
Outstanding written options, at value (Proceeds $155,253) (Note 2) | | | 121,470 | | |
Net payable for terminated total return swap contracts | | | 81,727 | | |
Payable upon return of securities loaned (Note 2) | | | 37,455 | | |
Trustees' fee payable | | | 15,157 | | |
Payable for Fund shares redeemed | | | 12,629 | | |
Accrued expenses | | | 186,971 | | |
Total liabilities | | | 7,876,941 | | |
Net Assets | |
Capital stock, $.001 par value (Note 6) | | | 9,821 | | |
Paid-in capital (Note 6) | | | 98,592,356 | | |
Distributions in excess of net investment income | | | (721,070 | ) | |
Accumulated net realized gain from investments, futures contracts, swap contracts,
written options, securities sold short, forward foreign currency contracts and
foreign currency transactions | | | 4,682,166 | | |
Net unrealized appreciation from investments, futures contracts, swap contracts,
written options, securities sold short, forward foreign currency contracts and
foreign currency translations | | | 974,771 | | |
Net assets | | $ | 103,538,044 | | |
I Shares | |
Net assets | | $ | 102,227,113 | | |
Shares outstanding | | | 9,695,955 | | |
Net asset value, offering price and redemption price per share | | $ | 10.54 | | |
A Shares | |
Net assets | | $ | 1,266,622 | | |
Shares outstanding | | | 121,013 | | |
Net asset value and redemption price per share | | $ | 10.47 | | |
Maximum offering price per share (net asset value/(1-5.25%)) | | $ | 11.05 | | |
C Shares | |
Net assets | | $ | 44,309 | | |
Shares outstanding | | | 4,366 | | |
Net asset value and offering price per share | | $ | 10.15 | | |
1 Includes $35,904 of securities on loan.
See Accompanying Notes to Consolidated Financial Statements.
25
Credit Suisse Multialternative Strategy Fund
Consolidated Statement of Operations
For the Year Ended October 31, 2017
Investment Income | |
Dividends (net of foreign withholding taxes of $5,222) | | $ | 413,230 | | |
Interest | | | 268,908 | | |
Securities lending (net of rebates) | | | 16,329 | | |
Total investment income | | | 698,467 | | |
Expenses | |
Investment advisory fees (Note 3) | | | 1,205,313 | | |
Administrative services fees (Note 3) | | | 34,358 | | |
Shareholder servicing/Distribution fees (Note 3) | |
Class A | | | 3,427 | | |
Class C | | | 586 | | |
Custodian fees | | | 193,164 | | |
Dividend expense for securities sold short | | | 170,153 | | |
Transfer agent fees (Note 3) | | | 71,938 | | |
Audit and tax fees | | | 56,879 | | |
Registration fees | | | 53,996 | | |
Legal fees | | | 49,226 | | |
Trustees' fees | | | 49,060 | | |
Printing fees | | | 35,095 | | |
Commitment fees (Note 4) | | | 11,255 | | |
Insurance expense | | | 2,384 | | |
Interest expense for securities sold short | | | 3,615 | | |
Miscellaneous expense | | | 6,680 | | |
Total expenses | | | 1,947,129 | | |
Less: fees waived (Note 3) | | | (784,338 | ) | |
Net expenses | | | 1,162,791 | | |
Net investment loss | | | (464,324 | ) | |
Net Realized and Unrealized Gain (Loss) from Investments, Futures Contracts, Swap Contracts,
Written Options, Securities Sold Short and Foreign Currency Related Items | |
Net realized gain from investments | | | 274,784 | | |
Net realized gain from futures contracts | | | 509,521 | | |
Net realized gain from swap contracts | | | 3,061,502 | | |
Net realized loss from purchased options | | | (459,841 | ) | |
Net realized gain from written options | | | 1,186,751 | | |
Net realized gain from securities sold short | | | 551,843 | | |
Net realized loss from foreign currency transactions | | | (137,379 | ) | |
Net realized loss from forward foreign currency contracts | | | (356,663 | ) | |
Net change in unrealized appreciation (depreciation) from investments | | | 122,203 | | |
Net change in unrealized appreciation (depreciation) from futures contracts | | | (43,559 | ) | |
Net change in unrealized appreciation (depreciation) from swap contracts | | | (362,188 | ) | |
Net change in unrealized appreciation (depreciation) from purchased options | | | (23,690 | ) | |
Net change in unrealized appreciation (depreciation) from written options | | | 43,464 | | |
Net change in unrealized appreciation (depreciation) from securities sold short | | | 5,006 | | |
Net change in unrealized appreciation (depreciation) from foreign currency translations | | | (13,769 | ) | |
Net change in unrealized appreciation (depreciation) from forward foreign currency contracts | | | 53,360 | | |
Net realized and unrealized gain from investments, futures contracts, swap contracts,
written options, securities sold short and foreign currency related items | | | 4,411,345 | | |
Net increase in net assets resulting from operations | | $ | 3,947,021 | | |
See Accompanying Notes to Consolidated Financial Statements.
26
Credit Suisse Multialternative Strategy Fund
Consolidated Statement of Changes in Net Assets
| | | For the Year
Ended
October 31, 2017 | | For the Year
Ended
October 31, 2016 | |
From Operations | |
Net investment loss | | $ | (464,324 | ) | | $ | (792,323 | ) | |
Net realized gain from investments, futures contracts, swap contracts,
written options, securities sold short, forward foreign currency contracts
and foreign currency transactions | | | 4,630,518 | | | | 1,535,008 | | |
Net change in unrealized appreciation (depreciation) from investments,
futures contracts, swap contracts, written options, securities sold short,
forward foreign currency contracts and foreign currency translations | | | (219,173 | ) | | | 1,069,871 | | |
Net increase in net assets resulting from operations | | | 3,947,021 | | | | 1,812,556 | | |
From Dividends and Distributions | |
Dividends from net investment income | |
Class I | | | (430,003 | ) | | | — | | |
Class A | | | (1,516 | ) | | | — | | |
Distributions from net realized gains | |
Class I | | | (2,021,820 | ) | | | (239,111 | ) | |
Class A | | | (23,670 | ) | | | (3,212 | ) | |
Class C | | | (1,733 | ) | | | (753 | ) | |
Net decrease in net assets resulting from dividends and distributions | | | (2,478,742 | ) | | | (243,076 | ) | |
| From Capital Share Transactions (Note 6) | |
Proceeds from sale of shares | | | 38,604,603 | | | | 121,506,721 | | |
Reinvestment of dividends and distributions | | | 2,464,559 | | | | 242,222 | | |
Net asset value of shares redeemed | | | (55,367,169 | ) | | | (20,664,750 | ) | |
Net increase (decrease) in net assets from capital share transactions | | | (14,298,007 | ) | | | 101,084,193 | | |
Net increase (decrease) in net assets | | | (12,829,728 | ) | | | 102,653,673 | | |
Net Assets | |
Beginning of year | | | 116,367,772 | | | | 13,714,099 | | |
End of year | | $ | 103,538,044 | | | $ | 116,367,772 | | |
Distributions in excess of net investment income | | $ | (721,070 | ) | | $ | (703,945 | ) | |
See Accompanying Notes to Consolidated Financial Statements.
27
Credit Suisse Multialternative Strategy Fund
Consolidated Financial Highlights
(For a Class I Share of the Fund Outstanding Throughout Each Year)
| | | For the Year Ended October 31, | |
| | | 2017 | | 2016 | | 2015 | | 2014 | | 2013 | |
Per share data | |
Net asset value, beginning of year | | $ | 10.391 | | | $ | 10.36 | | | $ | 10.42 | | | $ | 10.481 | | | $ | 9.95 | | |
INVESTMENT OPERATIONS | |
Net investment loss2 | | | (0.04 | ) | | | (0.08 | ) | | | (0.01 | ) | | | (0.15 | ) | | | (0.15 | ) | |
Net gain from investments, futures contracts,
swap contracts, written options, securities
sold short, forward foreign currency contracts
and foreign currency related items
(both realized and unrealized) | | | 0.41 | | | | 0.13 | | | | 0.25 | | | | 0.42 | | | | 0.75 | | |
Total from investment operations | | | 0.37 | | | | 0.05 | | | | 0.24 | | | | 0.27 | | | | 0.60 | | |
LESS DIVIDENDS AND DISTRIBUTIONS | |
Dividends from net investment income | | | (0.04 | ) | | | — | | | | (0.18 | ) | | | — | | | | (0.06 | ) | |
Distributions from net realized gains | | | (0.18 | ) | | | (0.02 | ) | | | (0.12 | ) | | | (0.33 | ) | | | (0.01 | ) | |
Total dividends and distributions | | | (0.22 | ) | | | (0.02 | ) | | | (0.30 | ) | | | (0.33 | ) | | | (0.07 | ) | |
Net asset value, end of year | | $ | 10.54 | | | $ | 10.391 | | | $ | 10.36 | | | $ | 10.42 | | | $ | 10.481 | | |
Total return3 | | | 3.68 | % | | | 0.53 | % | | | 2.33 | % | | | 2.64 | % | | | 6.11 | % | |
RATIOS AND SUPPLEMENTAL DATA | |
Net assets, end of year (000s omitted) | | $ | 102,227 | | | $ | 114,951 | | | $ | 13,015 | | | $ | 11,451 | | | $ | 5,409 | | |
Ratio of net expenses to average net assets | | | 1.00 | % | | | 0.91 | % | | | 1.56 | % | | | 1.85 | % | | | 1.78 | % | |
Ratio of expenses to average net assets
excluding securities sold short
dividend expense | | | 0.85 | % | | | 0.85 | % | | | 1.32 | % | | | 1.70 | % | | | 1.70 | % | |
Ratio of net investment loss to average net assets | | | (0.40 | )% | | | (0.79 | )% | | | (0.14 | )% | | | (1.47 | )% | | | (1.49 | )% | |
Decrease reflected in above operating expense
ratios due to waivers/reimbursements | | | 0.68 | % | | | 0.65 | % | | | 2.34 | % | | | 2.48 | % | | | 6.31 | % | |
Portfolio turnover rate | | | 586 | % | | | 1,021 | % | | | 292 | % | | | 431 | % | | | 284 | % | |
1 Includes adjustments in accordance with accounting principles generally accepted in the United States of America and as such, the net asset values for financial reporting purposes and the returns based upon net asset values may differ from the net asset values and returns for shareholder transactions.
2 Per share information is calculated using the average shares outstanding method.
3 Total returns are historical and include change in share price and reinvestment of all dividends and distributions. Had certain expenses not been reduced during the years shown, total returns would have been lower.
See Accompanying Notes to Consolidated Financial Statements.
28
Credit Suisse Multialternative Strategy Fund
Consolidated Financial Highlights
(For a Class A Share of the Fund Outstanding Throughout Each Year)
| | | For the Year Ended October 31, | |
| | | 2017 | | 2016 | | 2015 | | 2014 | | 2013 | |
Per share data | |
Net asset value, beginning of year | | $ | 10.31 | | | $ | 10.31 | | | $ | 10.37 | | | $ | 10.461 | | | $ | 9.93 | | |
INVESTMENT OPERATIONS | |
Net investment loss2 | | | (0.07 | ) | | | (0.10 | ) | | | (0.05 | ) | | | (0.18 | ) | | | (0.18 | ) | |
Net gain from investments, futures contracts,
swap contracts, written options, securities
sold short, forward foreign currency contracts
and foreign currency related items
(both realized and unrealized) | | | 0.42 | | | | 0.12 | | | | 0.26 | | | | 0.42 | | | | 0.76 | | |
Total from investment operations | | | 0.35 | | | | 0.02 | | | | 0.21 | | | | 0.24 | | | | 0.58 | | |
LESS DIVIDENDS AND DISTRIBUTIONS | |
Dividends from net investment income | | | (0.01 | ) | | | — | | | | (0.15 | ) | | | — | | | | (0.04 | ) | |
Distributions from net realized gains | | | (0.18 | ) | | | (0.02 | ) | | | (0.12 | ) | | | (0.33 | ) | | | (0.01 | ) | |
Total dividends and distributions | | | (0.19 | ) | | | (0.02 | ) | | | (0.27 | ) | | | (0.33 | ) | | | (0.05 | ) | |
Net asset value, end of year | | $ | 10.47 | | | $ | 10.31 | | | $ | 10.31 | | | $ | 10.37 | | | $ | 10.461 | | |
Total return3 | | | 3.45 | % | | | 0.24 | % | | | 2.08 | % | | | 2.35 | % | | | 5.96 | % | |
RATIOS AND SUPPLEMENTAL DATA | |
Net assets, end of year (000s omitted) | | $ | 1,267 | | | $ | 1,319 | | | $ | 320 | | | $ | 438 | | | $ | 324 | | |
Ratio of net expenses to average net assets | | | 1.26 | % | | | 1.17 | % | | | 1.82 | % | | | 2.10 | % | | | 2.03 | % | |
Ratio of expenses to average net assets
excluding securities sold short
dividend expense | | | 1.10 | % | | | 1.11 | % | | | 1.57 | % | | | 1.95 | % | | | 1.95 | % | |
Ratio of net investment loss to average net assets | | | (0.65 | )% | | | (0.98 | )% | | | (0.44 | )% | | | (1.73 | )% | | | (1.75 | )% | |
Decrease reflected in above operating expense
ratios due to waivers/reimbursements | | | 0.68 | % | | | 0.65 | % | | | 2.33 | % | | | 2.48 | % | | | 6.31 | % | |
Portfolio turnover rate | | | 586 | % | | | 1,021 | % | | | 292 | % | | | 431 | % | | | 284 | % | |
1 Includes adjustments in accordance with accounting principles generally accepted in the United States of America and as such, the net asset values for financial reporting purposes and the returns based upon net asset values may differ from the net asset values and returns for shareholder transactions.
2 Per share information is calculated using the average shares outstanding method.
3 Total returns are historical and include change in share price, reinvestment of all dividends and distributions and no sales charge. Had certain expenses not been reduced during the years shown, total returns would have been lower.
See Accompanying Notes to Consolidated Financial Statements.
29
Credit Suisse Multialternative Strategy Fund
Consolidated Financial Highlights
(For a Class C Share of the Fund Outstanding Throughout Each Year)
| | | For the Year Ended October 31, | |
| | | 2017 | | 2016 | | 2015 | | 2014 | | 2013 | |
Per share data | |
Net asset value, beginning of year | | $ | 10.07 | | | $ | 10.14 | | | $ | 10.21 | | | $ | 10.371 | | | $ | 9.89 | | |
INVESTMENT OPERATIONS | |
Net investment loss2 | | | (0.15 | ) | | | (0.10 | ) | | | (0.12 | ) | | | (0.25 | ) | | | (0.25 | ) | |
Net gain from investments, futures contracts,
swap contracts, written options, securities
sold short, forward foreign currency contracts
and foreign currency related items
(both realized and unrealized) | | | 0.41 | | | | 0.05 | | | | 0.24 | | | | 0.42 | | | | 0.74 | | |
Total from investment operations | | | 0.26 | | | | (0.05 | ) | | | 0.12 | | | | 0.17 | | | | 0.49 | | |
LESS DIVIDENDS AND DISTRIBUTIONS | |
Dividends from net investment income | | | — | | | | — | | | | (0.07 | ) | | | — | | | | — | | |
Distributions from net realized gains | | | (0.18 | ) | | | (0.02 | ) | | | (0.12 | ) | | | (0.33 | ) | | | (0.01 | ) | |
Total dividends and distributions | | | (0.18 | ) | | | (0.02 | ) | | | (0.19 | ) | | | (0.33 | ) | | | (0.01 | ) | |
Net asset value, end of year | | $ | 10.15 | | | $ | 10.07 | | | $ | 10.14 | | | $ | 10.21 | | | $ | 10.371 | | |
Total return3 | | | 2.61 | % | | | (0.45 | )% | | | 1.23 | % | | | 1.68 | % | | | 5.15 | % | |
RATIOS AND SUPPLEMENTAL DATA | |
Net assets, end of year (000s omitted) | | $ | 44 | | | $ | 97 | | | $ | 379 | | | $ | 1,344 | | | $ | 1,745 | | |
Ratio of net expenses to average net assets | | | 1.97 | % | | | 1.98 | % | | | 2.57 | % | | | 2.85 | % | | | 2.77 | % | |
Ratio of expenses to average net assets
excluding securities sold short
dividend expense | | | 1.85 | % | | | 1.91 | % | | | 2.32 | % | | | 2.70 | % | | | 2.70 | % | |
Ratio of net investment loss to average net assets | | | (1.45 | )% | | | (0.99 | )% | | | (1.20 | )% | | | (2.48 | )% | | | (2.49 | )% | |
Decrease reflected in above operating expense
ratios due to waivers/reimbursements | | | 0.68 | % | | | 0.81 | % | | | 2.33 | % | | | 2.48 | % | | | 6.31 | % | |
Portfolio turnover rate | | | 586 | % | | | 1,021 | % | | | 292 | % | | | 431 | % | | | 284 | % | |
1 Includes adjustments in accordance with accounting principles generally accepted in the United States of America and as such, the net asset values for financial reporting purposes and the returns based upon net asset values may differ from the net asset values and returns for shareholder transactions.
2 Per share information is calculated using the average shares outstanding method.
3 Total returns are historical and include change in share price, reinvestment of all dividends and distributions and no sales charge. Had certain expenses not been reduced during the years shown, total returns would have been lower.
See Accompanying Notes to Consolidated Financial Statements.
30
Credit Suisse Multialternative Strategy Fund
Notes to Consolidated Financial Statements
October 31, 2017
Credit Suisse Multialternative Strategy Fund (the "Fund"), a series of the Credit Suisse Opportunity Funds (the "Trust"), a Delaware statutory trust, is registered under the Investment Company Act of 1940, as amended (the "1940 Act"), as a non-diversified open-end management investment company that seeks to achieve total return consistent with the risk and return patterns of a diversified universe of hedge funds. The Trust was organized under the laws of the State of Delaware as a business trust on May 31, 1995.
Credit Suisse Asset Management, LLC ("Credit Suisse"), the investment adviser to the Fund, is registered as a Commodity Pool Operator with the Commodity Futures Trading Commission. The Fund intends to gain exposure to commodity derivatives through investing in a wholly-owned subsidiary, Credit Suisse Cayman Multialternative Strategy Fund, Ltd. (the "Subsidiary"), organized under the laws of the Cayman Islands. The Subsidiary invests in commodity-linked derivative instruments, such as swaps and futures. The Subsidiary may also invest in debt securities, some of which are intended to serve as margin or collateral for the Subsidiary's derivatives positions.
The Subsidiary is managed by the same portfolio managers that manage the Fund and the accompanying financial statements reflect the financial position of the Fund and the Subsidiary and the results of operations on a consolidated basis. The consolidated financial statements include portfolio holdings of the Fund and the Subsidiary and all intercompany transactions and balances have been eliminated. The Fund may invest up to 25% of its total assets in the Subsidiary. As of October 31, 2017, the Fund held $6,404,958 in the Subsidiary, representing 6.2% of the Fund's consolidated net assets. For the year ended October 31, 2017, the net realized loss on securities and other financial instruments held in the Subsidiary was $1,212,064.
Subsequent references to the Fund within the Notes to Consolidated Financial Statements collectively refer to the Fund and the Subsidiary.
The Fund offers three classes of shares: Class I shares, Class A shares and Class C shares. Each class of shares represents an equal pro rata interest in the Fund, except the share classes bear different expenses, which reflect the differences in the range of services provided to them. Class A shares are sold subject to a front-end sales charge of up to 5.25%. Class C shares are sold subject to a contingent deferred sales charge ("CDSC") of 1.00% if the shares are redeemed within the first year of purchase. Class I shares are sold without a sales charge.
31
Credit Suisse Multialternative Strategy Fund
Notes to Consolidated Financial Statements (continued)
October 31, 2017
Note 2. Significant Accounting Policies
The following is a summary of significant accounting policies followed by the Fund in the preparation of its consolidated financial statements. The policies are in accordance with generally accepted accounting principles in the United States of America ("GAAP"). The preparation of consolidated financial statements requires management to make estimates and assumptions that affect the reported amounts and disclosures in the consolidated financial statements. Actual results could differ from those estimates. The Fund is considered an investment company for financial reporting purposes under GAAP and follows Accounting Standards Codification ("ASC") Topic 946 — Financial Services — Investment Companies.
A) SECURITY VALUATION — The net asset value of the Fund is determined daily as of the close of regular trading on the New York Stock Exchange, Inc. (the "Exchange") on each day the Exchange is open for business. For certain international equity securities, in order to adjust for events which may occur between the close of the foreign exchanges and the close of the Exchange, a fair valuation model may be used. This fair valuation model takes into account comparisons to the valuation of American Depository Receipts (ADRs), exchange-traded funds, futures contracts and certain indices and these securities are categorized as Level 2. The valuations for fixed income securities (which may include, but are not limited to, corporate, government, municipal, mortgage-backed, collateralized mortgage obligations and asset-backed securities) and certain derivative instruments are typically the prices supplied by independent third party pricing services, which may use market prices or broker/dealer quotations or a variety of valuation techniques and methodologies. The independent third party pricing services use inputs that are observable such as issuer details, interest rates, yield curves, prepayment speeds, credit risks/spreads, default rates and quoted prices for similar securities. These pricing services generally price fixed income securities assuming orderly transactions of an institutional "round lot" size, but some trades occur in smaller "odd lot" sizes which may be effected at lower prices than institutional round lot trades. Structured note agreements are valued in accordance with a dealer-supplied valuation based on changes in the value of the underlying index. Option contracts on securities, currencies, indices, futures contracts, swaps and other instruments are valued at the mid-point between the last bid and ask quotations as of the close of trading on the exchange on which the option is traded. Futures contracts are valued daily at the settlement price established by the board of trade or exchange on which they are traded. Forward contracts are valued at the London closing spot rates and the London closing forward point rates on a daily basis. The currency forward contract
32
Credit Suisse Multialternative Strategy Fund
Notes to Consolidated Financial Statements (continued)
October 31, 2017
Note 2. Significant Accounting Policies (continued)
pricing model derives the differential in point rates to the expiration date of the forward and calculates its present value. Equity securities for which market quotations are available are valued at the last reported sales price or official closing price on the primary market or exchange on which they trade. The Fund may utilize a service provided by an independent third party which has been approved by the Board of Trustees (the "Board") to fair value certain securities. When fair value pricing is employed, the prices of securities used by the Fund to calculate its net asset value may differ from quoted or published prices for the same securities. If independent third party pricing services are unable to supply prices for a portfolio investment, or if the prices supplied are deemed by the investment adviser to be unreliable, the market price may be determined by the investment adviser using quotations from one or more brokers/dealers or at the transaction price if the security has recently been purchased and no value has yet been obtained from a pricing service or pricing broker. When reliable prices are not readily available, such as when the value of a security has been significantly affected by events after the close of the exchange or market on which the security is principally traded, but before the Fund calculates its net asset value, the Fund values these securities as determined in accordance with procedures approved and established by the Board.
The Fund uses valuation techniques to measure fair value that are consistent with the market approach and/or income approach, depending on the type of security and the particular circumstance. The market approach uses prices and other relevant information generated by market transactions involving identical or comparable securities. The income approach uses valuation techniques to discount estimated future cash flows to present value.
GAAP established a disclosure hierarchy that categorizes the inputs to valuation techniques used to value assets and liabilities at each measurement date. These inputs are summarized in the three broad levels listed below:
• Level 1 — quoted prices in active markets for identical investments
• Level 2 — other significant observable inputs (including quoted prices for similar investments, interest rates, prepayment speeds, credit risk, etc.)
• Level 3 — significant unobservable inputs (including the Fund's own assumptions in determining the fair value of investments)
The inputs or methodologies used to value securities are not necessarily an indication of the risk associated with investing in those securities.
33
Credit Suisse Multialternative Strategy Fund
Notes to Consolidated Financial Statements (continued)
October 31, 2017
Note 2. Significant Accounting Policies (continued)
The following is a summary of the inputs used as of October 31, 2017 in valuing the Fund's assets and liabilities carried at fair value:
Assets | | Level 1 | | Level 2 | | Level 3 | | Total | |
Investments in Securities | |
Common Stocks | | $ | 8,348,134 | | | $ | 2,968,485 | | | $ | — | | | $ | 11,316,619 | | |
Rights | | | — | | | | — | | | | 6,140 | | | | 6,140 | | |
United States Treasury Obligations | | | — | | | | 49,734,420 | | | | — | | | | 49,734,420 | | |
Purchased Options | | | 42,160 | | | | — | | | | — | | | | 42,160 | | |
Short-term Investments | | | — | | | | 29,203,092 | | | | — | | | | 29,203,092 | | |
| | | $ | 8,390,294 | | | $ | 81,905,997 | | | $ | 6,140 | | | $ | 90,302,431 | | |
Other Financial Instruments* | |
Forward Foreign Currency Contracts | | $ | — | | | $ | 310,718 | | | $ | — | | | $ | 310,718 | | |
Futures Contracts | | | 1,414,007 | | | | — | | | | — | | | | 1,414,007 | | |
Swap Contracts** | | | — | | | | 926,794 | | | | — | | | | 926,794 | | |
Liabilities | | Level 1 | | Level 2 | | Level 3 | | Total | |
Securities Sold Short | |
Common Stocks | | $ | 2,654,438 | | | $ | — | | | $ | — | | | $ | 2,654,438 | | |
Other Financial Instruments* | |
Forward Foreign Currency Contracts | | | — | | | | 223,688 | | | | — | | | | 223,688 | | |
Futures Contracts | | | 1,251,024 | | | | — | | | | — | | | | 1,251,024 | | |
Swap Contracts** | | | — | | | | 284,303 | | | | — | | | | 284,303 | | |
Written Options | | | 121,470 | | | | — | | | | — | | | | 121,470 | | |
* Other financial instruments include unrealized appreciation (depreciation) on forward foreign currency contracts, futures and swap contracts. Written options are reported at value.
** Value includes any premium paid or received with respect to swap contracts, if applicable.
As of October 31, 2017, the amount of Level 3 securities that were measured at fair value amounted to less than 0.01% of net assets. For the year ended October 31, 2017, there were no transfers among Level 1, Level 2 and Level 3. All transfers, if any, are assumed to occur at the end of the reporting period.
B) DERIVATIVE INSTRUMENTS AND HEDGING ACTIVITIES — The Fund adopted amendments to authoritative guidance on disclosures about derivative instruments and hedging activities which require that a fund disclose (a) how and why an entity uses derivative instruments, (b) how derivative instruments and hedging activities are accounted for and (c) how derivative instruments and related hedging activities affect a fund's financial position, financial performance and cash flows. For the year ended October 31, 2017, the Fund's derivatives did not qualify for hedge accounting as they are held at fair value.
34
Credit Suisse Multialternative Strategy Fund
Notes to Consolidated Financial Statements (continued)
October 31, 2017
Note 2. Significant Accounting Policies (continued)
The following table presents the fair value and the location of derivatives within the Consolidated Statement of Assets and Liabilities at October 31, 2017 and the effect of these derivatives on the Consolidated Statement of Operations for the year ended October 31, 2017.
| Primary Underlying Risk | | Derivative
Assets | | Derivative
Liabilities | | Realized
Gain (Loss) | | Unrealized
Appreciation
(Deprecition) | |
Foreign currency exchange rate | |
Forward contracts | | $ | 310,718 | | | $ | 223,688 | | | $ | (356,663 | ) | | $ | 53,360 | | |
Futures contracts | | | 70,110 | | | | 347,364 | | | | 170,230 | | | | (475,358 | ) | |
Interest rate | |
Futures contracts | | | 28,964 | | | | 20,414 | | | | (1,010,816 | ) | | | 25,955 | | |
Equity price | |
Futures contracts | | | 310,599 | | | | 7,132 | | | | 1,358,710 | | | | 277,624 | | |
Total return swap contracts | | | 926,794 | | | | 284,303 | | | | 3,061,502 | | | | (362,188 | ) | |
Purchased options | | | 42,160 | | | | — | | | | (459,841 | ) | | | (23,690 | ) | |
Written options | | | — | | | | 121,470 | | | | 1,186,751 | | | | 43,464 | | |
Commodity price | |
Futures contracts | | | 1,004,334 | | | | 876,114 | | | | (8,603 | ) | | | 128,220 | | |
Total | | $ | 2,693,679 | | | $ | 1,880,485 | | | $ | 3,941,270 | | | $ | (332,613 | ) | |
For the year ended October 31, 2017, the Fund held average monthly value on a net basis of $21,455,557 in forward foreign currency contracts and average monthly notional values on a net basis of $51,372,149, $35,626,715 and $106,311,567 in long futures contracts, short futures contracts and swap contracts, respectively. For the year ended October 31, 2017, the Fund received average monthly premiums of $237,044 from written options contracts.
The Fund is a party to International Swap and Derivatives Association, Inc. ("ISDA") Master Agreements ("Master Agreements") with certain counterparties that govern over-the-counter derivative (including Total Return, Credit Default and Interest Rate Swaps) and foreign exchange contracts entered into by the Fund. The Master Agreements may contain provisions regarding, among other things, the parties' general obligations, representations, agreements, collateral requirements, events of default and early termination. Termination events applicable to the Fund may occur upon a decline in the Fund's net assets below a specified threshold over a certain period of time.
35
Credit Suisse Multialternative Strategy Fund
Notes to Consolidated Financial Statements (continued)
October 31, 2017
Note 2. Significant Accounting Policies (continued)
The following table presents by counterparty the Fund's derivative assets, net of related collateral held by the Fund, at October 31, 2017:
Counterparty | | Gross Amount of
Assets Presented in
the Consolidated
Statement of Assets
and Liabilities(a) | | Financial
Instruments
and Derivatives
Available for Offset | | Non-Cash
Collateral
Received | | Cash
Collateral
Received(b) | | Net Amount
of Derivative
Assets | |
BNP Paribas | | $ | 63,434 | | | $ | (4,123 | ) | | $ | — | | | $ | — | | | $ | 59,311 | | |
Goldman Sachs | | | 313,702 | | | | (165,232 | ) | | | — | | | | — | | | | 148,470 | | |
JPMorgan Chase | | | 510,555 | | | | (152,304 | ) | | | — | | | | — | | | | 358,251 | | |
Morgan Stanley | | | 2,982 | | | | — | | | | — | | | | — | | | | 2,982 | | |
Societe Generale | | | 346,839 | | | | (182,148 | ) | | | — | | | | — | | | | 164,691 | | |
| | | $ | 1,237,512 | | | $ | (503,807 | ) | | $ | — | | | $ | — | | | $ | 733,705 | | |
The following table presents by counterparty the Fund's derivative liabilities, net of related collateral pledged by the Fund, at October 31, 2017:
Counterparty | | Gross Amount of
Liabilities Presented in
the Consolidated
Statement of Assets
and Liabilities(a) | | Financial
Instruments
and Derivatives
Available for Offset | | Non-Cash
Collateral
Pledged | | Cash
Collateral
Pledged(b) | | Net Amount
of Derivative
Liabilities | |
Barclays Bank plc | | $ | 51,784 | | | $ | — | | | $ | — | | | $ | (51,784 | ) | | $ | — | | |
BNP Paribas | | | 4,123 | | | | (4,123 | ) | | | — | | | | — | | | | — | | |
Goldman Sachs | | | 165,232 | | | | (165,232 | ) | | | — | | | | — | | | | — | | |
JPMorgan Chase | | | 152,304 | | | | (152,304 | ) | | | — | | | | — | | | | — | | |
Nomura Securities | | | 73,870 | | | | — | | | | | | — | | | | 73,870 | | |
Societe Generale | | | 182,148 | | | | (182,148 | ) | | | — | | | | — | | | | — | | |
| | | $ | 629,461 | | | $ | (503,807 | ) | | $ | — | | | $ | (51,784 | ) | | $ | 73,870 | | |
(a) Swap contracts, written options and forward foreign currency exchange contracts are included. Written options are reported at market value.
(b) The actual collateral pledged may be more than the amounts shown.
C) FOREIGN CURRENCY TRANSACTIONS — The books and records of the Fund are maintained in U.S. dollars. Transactions denominated in foreign currencies are recorded at the current prevailing exchange rates. All assets and liabilities denominated in foreign currencies are translated into U.S. dollar amounts at the current exchange rate at the end of the period. Reported net realized gain (loss) from foreign currency transactions arises from sales of foreign currencies; currency gains or losses realized between the trade and settlement dates on securities transactions; and the difference between the amounts of dividends, interest, and foreign withholding taxes recorded on the Fund's books and the U.S. dollar equivalent of the amounts actually received or paid. Net change in unrealized gains and losses on translation of assets and
36
Credit Suisse Multialternative Strategy Fund
Notes to Consolidated Financial Statements (continued)
October 31, 2017
Note 2. Significant Accounting Policies (continued)
liabilities denominated in foreign currencies arises from changes in the fair values of assets and liabilities, other than investments, at the end of the period, resulting from changes in exchange rates. The Fund does not isolate that portion of the results of operations resulting from fluctuations in foreign exchange rates on investments from the fluctuations arising from changes in market prices of investments held. Such fluctuations are included with net realized and unrealized gain or loss from investments in the Consolidated Statement of Operations.
D) SECURITY TRANSACTIONS AND INVESTMENT INCOME/EXPENSE — Security transactions are accounted for on a trade date basis. Interest income/expense is recorded on the accrual basis. The Fund amortizes premiums and accretes discounts using the effective interest method. Dividend income/expense is recorded on the ex-dividend date. Foreign dividend income is recorded on the ex-dividend date or as soon as practicable after the Fund determines the existence of a dividend declaration after exercising reasonable due diligence. Certain expenses are class-specific expenses, vary by class and are charged only to that class. Income, expenses (excluding class-specific expenses) and realized/unrealized gains/losses are allocated proportionately to each class of shares based upon the relative net asset value of the outstanding shares of that class. The cost of investments sold is determined by use of the specific identification method for both financial reporting and income tax purposes. To the extent any issuer defaults or a credit event occurs that impacts the issuer, the Fund may halt any additional interest income accruals and consider the realizability of interest accrued up to the date of default or credit event.
E) DIVIDENDS AND DISTRIBUTIONS TO SHAREHOLDERS — Dividends from net investment income, if any, are declared and paid quarterly. Distributions of net realized capital gains, if any, are declared and paid at least annually. However, to the extent that a net realized capital gain can be reduced by a capital loss carryforward, such gain will not be distributed. Dividends and distributions to shareholders of the Fund are recorded on the ex-dividend date and are determined in accordance with federal income tax regulations, which may differ from GAAP.
F) FEDERAL AND OTHER TAXES — No provision is made for federal taxes as it is the Fund's intention to continue to qualify as a regulated investment company ("RIC") under the Internal Revenue Code of 1986, as amended (the "Code"), and to make the requisite distributions to its shareholders, which will be sufficient to relieve it from federal income and excise taxes.
37
Credit Suisse Multialternative Strategy Fund
Notes to Consolidated Financial Statements (continued)
October 31, 2017
Note 2. Significant Accounting Policies (continued)
In order to qualify as a RIC under the Code, the Fund must meet certain requirements regarding the source of its income, the diversification of its assets and the distribution of its income. One of these requirements is that the Fund derive at least 90% of its gross income for each taxable year from dividends, interest, payments with respect to certain securities loans, gains from the sale or other disposition of stock, securities or foreign currencies, other income derived with respect to its business of investing in such stock, securities or currencies or net income derived from interests in certain publicly-traded partnerships ("Qualifying Income"). The Internal Revenue Service ("IRS") has issued a ruling that income realized from certain types of commodity-linked derivatives would not be Qualifying Income. As a result, the Fund's ability to realize income from investments in such commodity-linked derivatives as part of its investment strategy would be limited to a maximum of 10% of its gross income. The IRS has issued private letter rulings to registered investment companies concluding that income derived from their investment in a wholly-owned subsidiary would constitute Qualifying Income to the fund. The IRS has indicated that the granting of these types of private letter rulings is currently suspended.
If the Fund is unable to ensure continued qualification as a RIC, the Fund may be required to change its investment objective, policies or techniques, or may be liquidated. If the Fund fails to qualify as a RIC, the Fund will be subject to federal income tax on its net income and capital gains at regular corporate rates (without reduction for distributions to shareholders). If the Fund were to fail to qualify as a RIC and become subject to federal income tax, shareholders of the Fund would be subject to the risk of diminished returns. The Fund adopted the authoritative guidance for uncertainty in income taxes and recognizes a tax benefit or liability from an uncertain position only if it is more likely than not that the position is sustainable based solely on its technical merits and consideration of the relevant taxing authority's widely understood administrative practices and procedures. The Fund has reviewed its current tax positions and has determined that no provision for income tax is required in the Fund's financial statements. The Fund's federal and state income and federal excise tax returns for tax years for which the applicable statutes of limitations have not expired are subject to examination by the Internal Revenue Service and state departments of revenue.
G) SHORT-TERM INVESTMENTS — The Fund, together with other funds/portfolios advised by Credit Suisse, pools available cash into a short-term variable rate time deposit issued by State Street Bank and Trust Company
38
Credit Suisse Multialternative Strategy Fund
Notes to Consolidated Financial Statements (continued)
October 31, 2017
Note 2. Significant Accounting Policies (continued)
("SSB"), the Fund's custodian. The short-term time deposit issued by SSB is a variable rate account classified as a short-term investment.
H) SHORT SALES — When the Fund engages in a short sale, the collateral for the short position will be maintained by the Fund's custodian or qualified sub-custodian. While the short sale is open, the Fund will maintain in a segregated account an amount of liquid securities equal in value to its obligation to the securities sold short. The collateral amounts required are determined daily by reference to the market value of the short positions. Short sales expose the Fund to the risk that it will be required to cover its short position at a time when the securities have appreciated in value, thus resulting in a loss to the Fund. The Fund's loss on a short sale could theoretically be unlimited in a case where the Fund is unable, for whatever reason, to close out its short position. Short sales also involve transaction and other costs that will reduce potential gains and increase potential Fund losses. The use by the Fund of short sales in combination with long positions in the Fund in an attempt to improve performance may not be successful and may result in greater losses or lower positive returns than if the Fund held only long positions. It is possible that the Fund's long equity positions will decline in value at the same time that the value of the securities it has sold short increases, thereby increasing potential losses to the Fund. In addition, the Fund's short selling strategies may limit its ability to fully benefit from increases in the equity markets. Short selling also involves a form of financial leverage that may exaggerate any losses realized by the Fund. Also, there is the risk that the counterparty to a short sale may fail to honor its contractual terms, causing a loss to the Fund. At October 31, 2017, the amount of restricted cash held at brokers related to open short positions was $0.
I) FUTURES — The Fund may enter into futures contracts to the extent permitted by its investment policies and objectives. The Fund may use futures contracts to gain exposure to or hedge against changes in interest rates, equity and market price movements and/or currency risks. Upon entering into a futures contract, the Fund is required to deposit cash and/or pledge U.S. Government securities as initial margin with a Futures Commission Merchant ("FCM"). Subsequent payments, which are dependent on the daily fluctuations in the value of the underlying instrument, are made or received by the Fund each day (daily variation margin) and are recorded as unrealized gains or losses in the Consolidated Statement of Operations until the contracts are closed. When the contracts are closed, the Fund records a realized gain or loss equal to the difference between the proceeds from (or cost of) the closing transaction
39
Credit Suisse Multialternative Strategy Fund
Notes to Consolidated Financial Statements (continued)
October 31, 2017
Note 2. Significant Accounting Policies (continued)
and the Fund's basis in the contract. Risks of entering into futures contracts for hedging purposes include the possibility that a change in the value of the contract may not correlate with the changes in the value of the underlying instruments. Futures have minimal counterparty credit risk because futures are exchange traded and the exchange's clearinghouse, as counterparty to all exchange-traded futures, guarantees the futures against default. In addition, the purchase of a futures contract involves the risk that the Fund could lose more than the original margin deposit and subsequent payments may be required for a futures transaction. The Fund's open futures contracts are disclosed in the Consolidated Schedule of Investments. At October 31, 2017, the amount of restricted cash held at brokers related to open futures contracts was $1,230,484.
The Commodity Exchange Act requires an FCM to segregate all customer transactions and assets from the FCM's proprietary activities. A customer's cash and other equity deposited with an FCM are considered commingled with all other customer funds subject to the FCM's segregation requirements. In the event of an FCM's insolvency, recovery may be limited to the Fund's pro-rata share of segregated customer funds available. It is possible that the recovery amount could be less than the total of cash and other equity deposited.
J) FORWARD FOREIGN CURRENCY CONTRACTS — A forward foreign currency exchange contract ("forward currency contract") is a commitment to purchase or sell a foreign currency at the settlement date at a negotiated rate. The Fund will enter into forward currency contracts primarily for hedging foreign currency risk. Forward currency contracts are valued at the prevailing forward exchange rate of the underlying currencies and unrealized gain/loss is recorded daily. On the settlement date of the forward currency contract, the Fund records a realized gain or loss equal to the difference between the value of the contract at the time it was opened and the value of the contract at the time it was closed. Certain risks may arise upon entering into forward currency contracts from the potential inability of counterparties to meet the terms of their contracts. The maximum counterparty credit risk to the Fund is measured by the unrealized gain on appreciated contracts. Additionally, when utilizing forward currency contracts to hedge, the Fund forgoes the opportunity to profit from favorable exchange rate movements during the term of the contract. The Fund's open forward currency contracts at October 31, 2017 are disclosed in the Consolidated Schedule of Investments.
K) SWAPS — The Fund may enter into swaps either for hedging purposes or to seek to increase total return. A swap contract is an agreement that
40
Credit Suisse Multialternative Strategy Fund
Notes to Consolidated Financial Statements (continued)
October 31, 2017
Note 2. Significant Accounting Policies (continued)
obligates two parties to exchange a series of cash flows at specified intervals based upon or calculated by reference to changes in specified prices or rates for a specified amount of an underlying asset or notional principal amount. A centrally cleared swap is a transaction executed between the Fund and a counterparty, then cleared by a clearing member through a central clearinghouse. The central clearinghouse serves as the counterparty, with whom the Fund exchanges cash flows. The Fund will enter into swap contracts only on a net basis, which means that the two payment streams are netted out, with the Fund receiving or paying, as the case may be, only the net amount of the two payments. Risks may arise as a result of the failure of the counterparty to the swap contract to comply with the terms of the swap contract. The extent of the Fund's exposure to credit and counterparty risks is the discounted net value of the cash flows to be received from the counterparty over the contract's remaining life, to the extent that the amount is positive. These risks are mitigated by having a master netting arrangement between the Fund and the counterparty and by the posting of collateral by the counterparty to the Fund to cover the Fund's exposure to the counterparty. Therefore, the Fund considers the creditworthiness of each counterparty as well as the amounts posted by the counterparty pursuant to the master netting agreement to a swap contract in evaluating potential credit risk. Additionally, risks may arise from unanticipated movements in interest rates or in the value of the underlying reference asset or index.
The Fund may enter into total return swap contracts, involving commitments to pay interest in exchange for a market-linked return, both based on notional amounts. The Fund may invest in total return swap contracts for hedging purposes or to seek to increase total return. To the extent the total return of the security or index underlying the transaction exceeds or falls short of the offsetting interest rate obligation, the Fund will receive a payment from or make a payment to the counterparty.
The Fund may enter into credit default swap agreements either as a buyer or seller. The Fund may buy a credit default swap to attempt to mitigate the risk of default or credit quality deterioration in one or more individual holdings or in a segment of the fixed income securities market. The Fund may sell a credit default swap in an attempt to gain exposure to an underlying issuer's credit quality characteristics without investing directly in that issuer.
The Fund bears the risk of loss of the amount expected to be received under a credit default swap agreement in the event of the default or bankruptcy of the counterparty. The Fund will enter into swap agreements only with
41
Credit Suisse Multialternative Strategy Fund
Notes to Consolidated Financial Statements (continued)
October 31, 2017
Note 2. Significant Accounting Policies (continued)
counterparties that meet certain standards of creditworthiness (generally, such counterparties would have to be eligible counterparties under the terms of the Fund's repurchase agreement guidelines). Credit default swap agreements are generally valued at a price at which the counterparty to such agreement would terminate the agreement.
The Fund records unrealized gains or losses on a daily basis representing the value and the current net receivable or payable relating to open swap contracts. Net amounts received or paid on the swap contract are recorded as realized gains or losses. Fluctuations in the value of swap contracts are recorded for financial statement purposes as unrealized appreciation or depreciation from swap contracts. Realized gains and losses from terminated swaps are included in net realized gains/losses from swap contracts. Upon entering into a centrally cleared swap, the Fund is required to deposit with a financial intermediary cash or securities ("initial margin") in an amount equal to a certain percentage of the notional amount of the swap. Subsequent payments ("variation margin") are made or received by the Fund dependent upon the daily fluctuations in the value of the swap. In a cleared swap transaction, counterparty risk is minimized as the central clearinghouse acts as the counterparty. The Fund's open swap contracts are disclosed in the Consolidated Schedule of Investments. At October 31, 2017, the amounts of restricted cash held at brokers related to open swap contracts and centrally cleared swaps for the Fund were $10,698,248 and $0, respectively.
L) OPTION CONTRACTS — The Fund will enter into options contracts to gain exposure to risk volatility based assets. When the Fund purchases an option, it pays a premium and the option is subsequently marked to market to reflect current value. Premiums paid for purchasing options which expire are treated as realized losses. Premiums paid for purchasing options which are exercised or closed are added to the cost or deducted from the proceeds on the underlying instrument to determine the realized gain or loss. The risk associated with purchasing options is limited to the premium paid.
When the Fund writes an option, an amount equal to the net premium received (the premium less commission) is recorded as a liability and is subsequently adjusted to the current value. Net premiums received for written options which expire are treated as realized gains. Net premiums received for written options which are exercised or closed are deducted from the cost or added to the proceeds on the underlying instrument or closing purchase transaction to determine the realized gain or loss. The Fund, as writer of a
42
Credit Suisse Multialternative Strategy Fund
Notes to Consolidated Financial Statements (continued)
October 31, 2017
Note 2. Significant Accounting Policies (continued)
written option, bears the risk of an unfavorable change in the market value of the instrument underlying the written option.
Exchange-traded options have standardized contracts and are settled through a clearing house with fulfillment guaranteed by the credit of the exchange. Therefore, counterparty credit risks to the Fund are limited. Over-the-counter options are subject to the risk that the counterparty is unable or unwilling to meet its obligations under the option. The Fund's exchange-traded written options are disclosed in the Consolidated Schedule of Investments. At October 31, 2017, the amount of restricted cash held at brokers related to option contracts was $1,181,760.
M) SECURITIES LENDING — The initial collateral received by the Fund is required to have a value of at least 102% of the market value of domestic securities on loan (including any accrued interest thereon) and 105% of the market value of foreign securities on loan (including any accrued interest thereon). The collateral is maintained thereafter at a value equal to at least 102% of the current market value of the securities on loan. The market value of loaned securities is determined at the close of each business day of the Fund and any additional required collateral is delivered to the Fund, or excess collateral returned by the Fund, on the next business day. Cash collateral received by the Fund in connection with securities lending activity may be pooled together with cash collateral for other funds/portfolios advised by Credit Suisse and may be invested in a variety of investments, including funds advised by SSB, the Fund's securities lending agent, or money market instruments. However, in the event of default or bankruptcy by the other party to the agreement, realization and/or retention of the collateral may be subject to legal proceedings.
SSB has been engaged by the Fund to act as the Fund's securities lending agent. As of October 31, 2017, the Fund had investment securities on loan with a fair value of $35,904. Collateral received for securities loaned and a related liability of $37,455 are presented gross in the Consolidated Statement of Assets and Liabilities. The collateral for securities loaned is valued consistently to the other investments held by the Fund and is included in Level 2 of the fair value hierarchy. As of October 31, 2017, the value of the related collateral exceeded the value of the securities loaned.
During the year ended October 31, 2017, total earnings from the Fund's investment in cash collateral received in connection with securities lending
43
Credit Suisse Multialternative Strategy Fund
Notes to Consolidated Financial Statements (continued)
October 31, 2017
Note 2. Significant Accounting Policies (continued)
arrangements was $23,763, of which $1,990 was rebated to borrowers (brokers). The Fund retained $16,329 in income from the cash collateral investment, and SSB, as lending agent, was paid $5,444. Securities lending income is accrued as earned.
N) OTHER — In the normal course of business the Fund trades financial instruments and enters into financial transactions for which risk of potential loss exists due to changes in the market (market risk) or failure of the other party to a transaction to perform (credit risk). Similar to credit risk, the Fund may be exposed to counterparty risk, including securities lending, or the risk that an institution or other entity with which the Fund has unsettled or open transactions will default. The potential loss could exceed the value of the financial assets recorded in the consolidated financial statements. Financial assets, which potentially expose the Fund to credit risk, consist principally of cash due from counterparties and investments. The extent of the Fund's exposure to credit and counterparty risks in respect to these financial assets approximates their carrying value as recorded in the Fund's Consolidated Statement of Assets and Liabilities.
O) FOREIGN INVESTMENTS RISK — The Fund may have elements of risk not typically associated with investments in the U.S. due to concentrated investments in a limited number of countries or regions, which may vary throughout the year. Such concentrations may subject the Fund to additional risks resulting from political or economic conditions in such countries or regions and the possible imposition of adverse governmental laws or currency exchange restrictions could cause the securities and their markets to be less liquid and their prices to be more volatile than those of comparable U.S. securities.
Because the Fund may invest a significant portion of its assets in these markets, it is subject to greater risks of adverse events that occur in those markets and may experience greater volatility than a Fund that is more broadly diversified geographically.
P) RECENT ACCOUNTING PRONOUNCEMENTS — On August 26, 2016, Financial Accounting Standards Board ("FASB") issued Accounting Standards Update No. 2016-15, "Statement of Cash Flows (Topic 230), a consensus of the FASB's Emerging Issues Task Force" ("ASU 2016-15"). ASU 2016-15 is intended to reduce diversity in practice in how certain transactions are classified in the statement of cash flows. The issues addressed in ASU 2016-15 are: debt prepayment or debt extinguishment costs, settlement of zero-coupon debt
44
Credit Suisse Multialternative Strategy Fund
Notes to Consolidated Financial Statements (continued)
October 31, 2017
Note 2. Significant Accounting Policies (continued)
instruments, contingent consideration payments made after a business combination, proceeds from the settlement of insurance claims, proceeds from the settlement of corporate-owned life insurance policies, including bank-owned life insurance policies, distributions received from equity method investments, beneficial interests in securitization transactions; and, separately identifiable cash flows and application of the predominance principle. ASU 2016-15 is effective for interim and annual reporting periods beginning after December 15, 2017. Management is currently evaluating the impact, if any, of applying this provision.
In November 2016, FASB issued Accounting Standards Update No. 2016-18, "Statement of Cash Flows (Topic 230), Restricted Cash, a consensus of the FASB's Emerging Issues Task Force" ("ASU 2016-18"). ASU 2016-18 requires that a statement of cash flows explain the change during the period in the total of cash, cash equivalents, and amounts generally described as restricted cash or restricted cash equivalents. Therefore, amounts generally described as restricted cash and restricted cash equivalents should be included with cash and cash equivalents when reconciling the beginning-of-period and end-of-period total amounts shown on the statement of cash flows. The amendments in ASU 2016-18 do not provide a definition of restricted cash or restricted cash equivalents. ASU 2016-18 is effective for interim and annual reporting periods beginning after December 15, 2017. Management is currently evaluating the impact, if any, of applying this provision.
In October 2016, the U.S. Securities and Exchange Commission adopted new rules and amended existing rules (together, "final rules") intended to modernize the reporting and disclosure of information by registered investment companies. In part, the final rules amend Regulation S-X and require standardized, enhanced disclosure about derivatives in investment company financial statements, as well as other amendments. The compliance date for the amendments to Regulation S-X is August 1, 2017. The Fund has adopted the amendments to Regulation S-X and upon evaluation, has concluded that the amendments do not materially impact the financial statements. However, as required, additional or enhanced disclosure has been included.
Q) SUBSEQUENT EVENTS — In preparing the financial statements as of October 31, 2017, management considered the impact of subsequent events for potential recognition or disclosure in these financial statements through the date of release of this report. No such events requiring recognition or disclosure were identified through the date of the release of this report.
45
Credit Suisse Multialternative Strategy Fund
Notes to Consolidated Financial Statements (continued)
October 31, 2017
Note 3. Transactions with Affiliates and Related Parties
Credit Suisse serves as investment adviser and co-administrator for the Fund. Effective November 15, 2016, for its investment advisory and administration services, Credit Suisse is entitled to receive a fee from the Fund at an annual rate of 1.04% of the Fund's average daily net assets. Prior to November 15, 2016, the Fund paid Credit Suisse advisory fees at the annual rate of 0.95% of the Fund's average daily net assets and co-administration fees at an annual rate of 0.09% of the Fund's average daily net assets. On November 15, 2016, the Fund entered into an Investment Management Agreement with Credit Suisse which bundled the advisory and administration fees into a single fee. For the year ended October 31, 2017, investment advisory and administration fees earned and fees waived/expenses reimbursed by Credit Suisse were $1,211,312 and $784,338, respectively. Credit Suisse has contractually agreed to limit expenses so that the Fund's annual operating expenses do not exceed 0.85% of the Fund's average daily net assets for Class I shares, 1.10% of the Fund's average daily net assets for Class A shares, and 1.85% of the Fund's average daily net assets for Class C shares. The Fund is authorized to reimburse Credit Suisse for management fees previously limited and/or for expenses previously reimbursed by Credit Suisse, provided, however, that any reimbursements must be paid at a date not more than three years after the end of the fiscal year during which such fees were limited or expenses were reimbursed by Credit Suisse and the reimbursements do not cause the Fund to exceed the applicable expense limitation in the contract at the time the fees are recouped. This contract may not be terminated before February 28, 2019.
| | | Fee waivers/expense
reimbursements
subject to
recoupment* | | Expires
October 31,
2018 | | Expires
October 31,
2019 | | Expires
October 31,
2020 | |
Class I | | $ | 1,584,567 | | | $ | 276,384 | | | $ | 606,964 | | | $ | 701,219 | | |
Class A | | | 23,103 | | | | 8,041 | | | | 6,694 | | | | 8,368 | | |
Class C | | | 28,503 | | | | 27,045 | | | | 1,100 | | | | 358 | | |
Totals | | $ | 1,636,173 | | | $ | 311,470 | | | $ | 614,758 | | | $ | 709,945 | | |
* Subsidiary expenses are not eligible for recoupment.
For its co-administrative services, SSB receives a fee, exclusive of out-of-pocket expenses, calculated in total for all the Credit Suisse funds/portfolios co-administered by SSB and allocated based upon the relative average net assets of each fund/portfolio, subject to an annual minimum fee. For the year ended October 31, 2017, co-administrative services fees earned by SSB (including out-of-pocket expenses) with respect to the Fund were $28,359.
46
Credit Suisse Multialternative Strategy Fund
Notes to Consolidated Financial Statements (continued)
October 31, 2017
Note 3. Transactions with Affiliates and Related Parties (continued)
Credit Suisse Securities (USA) LLC ("CSSU"), an affiliate of Credit Suisse, serves as the distributor of the Fund's shares. Pursuant to a distribution plan adopted by the Fund pursuant to Rule 12b-1 under the 1940 Act, CSSU receives fees for its distribution services. These fees are calculated at an annual rate of 0.25% of the average daily net assets of the Class A shares. For the Class C shares, the fee is calculated at an annual rate of 1.00% of the average daily net assets. For the year ended October 31, 2017, the Fund paid Rule 12b-1 distribution fees of $3,427 for Class A shares and $586 for Class C shares. Class I shares are not subject to Rule 12b-1 distribution fees.
Certain brokers, dealers and financial representatives provide transfer agent-related services to the Fund and receive compensation from the Fund. For the year ended October 31, 2017, the Fund paid $67,801, which is included within transfer agent fees in the Consolidated Statement of Operations.
For the year ended October 31, 2017, CSSU and its affiliates advised the Fund that they retained $449 from commissions earned on the sale of the Fund's Class A shares. There were no commissions earned on the sale of Class C shares.
Note 4. Line of Credit
The Fund, together with other funds/portfolios advised by Credit Suisse (collectively, the "Participating Funds"), participates in a committed, unsecured line of credit facility ("Credit Facility"), with SSB in an aggregated amount of $250 million for temporary or emergency purposes under a first-come, first-served basis. Under the terms of the Credit Facility, the Participating Funds pay an aggregate commitment fee on the average unused amount of the Credit Facility, which is allocated among the Participating Funds in such manner as is determined by the governing Boards of the Participating Funds. In addition, the Participating Funds pay interest on borrowings at either the Overnight Federal Funds rate or the Overnight LIBOR rate plus a spread. At October 31, 2017 and during the year ended October 31, 2017, the Fund had no borrowings outstanding under the Credit Facility.
47
Credit Suisse Multialternative Strategy Fund
Notes to Consolidated Financial Statements (continued)
October 31, 2017
Note 5. Purchases and Sales of Securities
For the year ended October 31, 2017, purchases and sales of investment securities (excluding short-term investments) were as follows:
Investment Securities | |
| Purchases | | Sales | |
| $ | 120,893,617 | | | $ | 116,449,459 | | |
Note 6. Capital Share Transactions
The Fund is authorized to issue an unlimited number of full and fractional shares of beneficial interest, $.001 par value per share. The Fund offers Class I, Class A and Class C shares. Transactions in capital shares for each class of the Fund were as follows:
| | | Class I | |
| | | For the Year Ended
October 31, 2017 | | For the Year Ended
October 31, 2016 | |
| | | Shares | | Value | | Shares | | Value | |
Shares sold | | | 3,658,695 | | | $ | 37,970,122 | | | | 11,724,055 | | | $ | 119,800,085 | | |
Shares issued in reinvestment
of dividends and distributions | | | 236,955 | | | | 2,445,260 | | | | 23,730 | | | | 238,966 | | |
Shares redeemed | | | (5,265,549 | ) | | | (54,588,520 | ) | | | (1,938,432 | ) | | | (19,674,476 | ) | |
Net increase (decrease) | | | (1,369,899 | ) | | $ | (14,173,138 | ) | | | 9,809,353 | | | $ | 100,364,575 | | |
| | | Class A | |
| | | For the Year Ended
October 31, 2017 | | For the Year Ended
October 31, 2016 | |
| | | Shares | | Value | | Shares | | Value | |
Shares sold | | | 61,526 | | | $ | 634,481 | | | | 167,588 | | | $ | 1,706,636 | | |
Shares issued in reinvestment
of dividends and distributions | | | 1,789 | | | | 18,350 | | | | 260 | | | | 2,609 | | |
Shares redeemed | | | (70,220 | ) | | | (724,894 | ) | | | (70,992 | ) | | | (715,082 | ) | |
Net increase (decrease) | | | (6,905 | ) | | $ | (72,063 | ) | | | 96,856 | | | $ | 994,163 | | |
| | | Class C | |
| | | For the Year Ended
October 31, 2017 | | For the Year Ended
October 31, 2016 | |
| | | Shares | | Value | | Shares | | Value | |
Shares issued in reinvestment
of dividends and distributions | | | 95 | | | $ | 949 | | | | 66 | | | $ | 647 | | |
Shares redeemed | | | (5,375 | ) | | | (53,755 | ) | | | (27,774 | ) | | | (275,192 | ) | |
Net decrease | | | (5,280 | ) | | $ | (52,806 | ) | | | (27,708 | ) | | $ | (274,545 | ) | |
48
Credit Suisse Multialternative Strategy Fund
Notes to Consolidated Financial Statements (continued)
October 31, 2017
Note 6. Capital Share Transactions (continued)
On October 31, 2017, the number of shareholders that held 5% or more of the outstanding shares of each class of the Fund was as follows:
| | | Number of
Shareholders | | Approximate Percentage
of Outstanding Shares | |
Class I | | | 4 | | | | 97 | % | |
Class A | | | 3 | | | | 60 | % | |
Class C | | | 1 | | | | 100 | % | |
The Fund's performance may be negatively impacted in the event one or more of the Fund's greater than 5% shareholders were to redeem at a given time. Some of the shareholders may be omnibus accounts, which hold shares on behalf of individual shareholders.
Note 7. Income Tax Information and Distributions to Shareholders
Income and capital gain distributions are determined in accordance with federal income tax regulations, which may differ from GAAP.
The tax character of distributions paid by the Fund during the fiscal years ended October 31, 2017 and 2016, respectively, was as follows:
Ordinary Income | | Long-Term Capital Gain | |
| 2017 | | 2016 | | 2017 | | 2016 | |
| $ | 1,562,939 | | | $ | 170,434 | | | $ | 915,803 | | | $ | 72,642 | | |
The tax basis components of distributable earnings differ from the amounts reflected in the Consolidated Statement of Assets and Liabilities by temporary book/tax differences. These differences are primarily due to differing treatments of wash sales, marked to market of forward contracts, futures contracts, options contracts and deferred organizational expenses. At October 31, 2017, the components of distributable earnings on a tax basis were as follows:
Undistributed net investment income | | $ | 4,590,172 | | |
Accumulated net realized gain | | | 159,779 | | |
Unrealized appreciation | | | 206,235 | | |
| | | $ | 4,956,186 | | |
49
Credit Suisse Multialternative Strategy Fund
Notes to Consolidated Financial Statements (continued)
October 31, 2017
Note 7. Income Tax Information and Distributions to Shareholders (continued)
At October 31, 2017, the cost and net unrealized appreciation (depreciation) of investments, securities sold short and derivatives for income tax purposes were as follows:
Cost of Investments | | $ | 88,354,370 | | |
Unrealized appreciation | | $ | 2,957,360 | | |
Unrealized depreciation | | | (2,737,449 | ) | |
Net unrealized appreciation (depreciation) | | $ | 219,911 | | |
To adjust for current period permanent book/tax differences which arose principally from differing book/tax treatment of foreign currency gain (loss), ordinary loss netting to reduce short-term capital gains, swap gain (loss) and distribution re-designations, paid-in capital was charged $1,208,968, accumulated net realized gain was credited $330,250 and distributions in excess of net investment income was credited $878,718. Net assets were not affected by these reclassifications.
Note 8. Contingencies
In the normal course of business, the Fund may provide general indemnifications pursuant to certain contracts and organizational documents. The Fund's maximum exposure under these arrangements is dependent on future claims that may be made against the Fund and, therefore, cannot be estimated; however, based on experience, the risk of loss from such claims is considered remote.
50
Credit Suisse Multialternative Strategy Fund
Report of Independent Registered Public Accounting Firm
The Board of Trustees and Shareholders
Credit Suisse Multialternative Strategy Fund:
We have audited the accompanying consolidated statement of assets and liabilities of Credit Suisse Multialternative Strategy Fund (the "Fund"), a series of the Credit Suisse Opportunity Funds, including the consolidated schedule of investments, as of October 31, 2017, and the related consolidated statement of operations for the year then ended, the consolidated statements of changes in net assets for each of the years in the two-year period then ended, and the consolidated financial highlights for each of the years in the three-year period then ended. These consolidated financial statements and consolidated financial highlights are the responsibility of the Fund's management. Our responsibility is to express an opinion on these consolidated financial statements and consolidated financial highlights based on our audits. The accompanying consolidated financial highlights for each of the years in the two-year period ended October 31, 2014, were audited by other independent registered public accountants whose report thereon dated December 29, 2014, expressed an unqualified opinion on those consolidated financial highlights.
We conducted our audits in accordance with the standards of the Public Company Accounting Oversight Board (United States). Those standards require that we plan and perform the audits to obtain reasonable assurance about whether the consolidated financial statements and consolidated financial highlights are free of material misstatement. An audit includes examining, on a test basis, evidence supporting the amounts and disclosures in the consolidated financial statements. Our procedures included confirmation of securities owned as of October 31, 2017, by correspondence with the custodian and broker or by other appropriate auditing procedures. An audit also includes assessing the accounting principles used and significant estimates made by management, as well as evaluating the overall consolidated financial statement presentation. We believe that our audits provide a reasonable basis for our opinion.
In our opinion, the consolidated financial statements and consolidated financial highlights referred to above present fairly, in all material respects, the financial position of Credit Suisse Multialternative Strategy Fund as of October 31, 2017, the results of its operations for the year then ended, the changes in its net assets for each of years in the two-year period then ended, and the financial highlights for each of the years in the three-year period then ended, in conformity with U.S. generally accepted accounting principles.

New York, New York
December 28, 2017
51
Credit Suisse Multialternative Strategy Fund
Information Concerning Trustees and Officers (unaudited)
Name, Address
(Year of Birth) | | Position(s)
Held with
Fund | | Term
of Office1
and
Length
of Time
Served | | Principal
Occupation(s) During
Past Five Years | | Number of
Portfolios
in Fund
Complex
Overseen
by Trustee | | Other
Trusteeships
Held by Trustee
During Past Five Years | |
Independent Trustees | | | | | | | | | | | |
Laura A. DeFelice
c/o Credit Suisse Asset
Management, LLC
Attn: General Counsel
One Madison Avenue
New York, New York
10010
(1959) | | Trustee, Nominating and Audit Committee member | | Since 2017 | | Partner of Acacia Properties LLC (multi-family and commercial real estate ownership and operation) from 2008 to present; Stonegate Advisors LLC (renewable energy and energy efficiency) from 2007 to present. | | | 8 | | | None | |
Jeffrey E. Garten
c/o Credit Suisse Asset Management, LLC
Attn: General Counsel One Madison Avenue New York, New York 10010
(1946) | | Trustee, Nominating and Audit Committee member | | Since Fund Inception | | Dean Emeritus of Yale School of Management from July 2015 to present; The Juan Trippe Professor in the Practice of International Trade, Finance and Business, from July 2005 to July 2015; Partner and Chairman of Garten Rothkopf (consulting firm) from October 2005 to present. | | | 8 | | | Director of Aetna, Inc. (insurance company); Director of CarMax Group (used car dealers); Director of Miller Buckfire & Co., LLC (financial restructuring); Member of Standard & Poor's Board of Managers (credit rating agency) from December 2011 to November 2014. | |
1 Subject to the Trust's retirement policy, each Trustee may continue to serve as a Trustee until the last day of the calendar year in which the applicable Trustee attains age 75. Officer serves until his or her respective successor has been duly elected and qualified.
52
Credit Suisse Multialternative Strategy Fund
Information Concerning Trustees and Officers (unaudited) (continued)
Name, Address
(Year of Birth) | | Position(s)
Held with
Fund | | Term
of Office1
and
Length
of Time
Served | | Principal
Occupation(s) During
Past Five Years | | Number of
Portfolios
in Fund
Complex
Overseen
by Trustee | | Other
Trusteeships
Held by Trustee
During Past Five Years | |
Independent Trustees | | | | | | | | | | | |
Mahendra R. Gupta
c/o Credit Suisse Asset
Management, LLC
Attn: General Counsel
One Madison Avenue
New York, New York
10010
(1956) | | Trustee, Nominating Committee member and Audit Committee Chairman | | Since 2017 | | Professor, Washington University in St. Louis from July 1990 to present; Dean of Olin Business School at Washington University in St. Louis from July 2005 to July 2016; Partner, R.J. Mithaiwala (food manufacturing and retail, India) from March 1977 to present; Partner, F.F.B. Corporation (agriculture, India) from March 1977 to present; Partner, RPMG Research Corporation (benchmark research) from July 2001 to present. | | | 8 | | | Director of Caleres Inc. (footwear) from May 2012 to present | |
1 Subject to the Trust's retirement policy, each Trustee may continue to serve as a Trustee until the last day of the calendar year in which the applicable Trustee attains age 75. Officer serves until his or her respective successor has been duly elected and qualified.
53
Credit Suisse Multialternative Strategy Fund
Information Concerning Trustees and Officers (unaudited) (continued)
Name, Address
(Year of Birth) | | Position(s)
Held with
Fund | | Term
of Office1
and
Length
of Time
Served | | Principal
Occupation(s) During
Past Five Years | | Number of
Portfolios
in Fund
Complex
Overseen
by Trustee | | Other
Trusteeships
Held by Trustee
During Past Five Years | |
Independent Trustees | | | | | | | | | | | |
Steven N. Rappaport
Lehigh Court, LLC
555 Madison Avenue
29th Floor
New York, New York
10022
(1948) | | Chairman of the Board, Nominating Committee Chairman and Audit Committee member | | Trustee Since Fund Inception and Chairman Since 2005 | | Partner of Lehigh Court, LLC and RZ Capital (private investment firms) from July 2002 to present; Partner of Backstage Acquisition Holdings, LLC (publication job postings) from November 2013 to present. | | | 10 | | | Director of iCAD, Inc. (surgical and medical instruments and apparatus company); Director of Aberdeen Chile Fund, Inc., Aberdeen Emerging Markets Smaller Company Opportunities Fund, Inc., Aberdeen Israel Fund, Inc., Aberdeen Indonesia Fund, Inc. and Aberdeen Latin America Equity Fund, Inc. (each a closed-end investment company); Director of Aberdeen Funds (23 open end portfolios); Director of Presstek, Inc. (digital imaging technologies company) from 2003 to 2012; Director of Wood Resources, LLC (plywood manufacturing company) from 2003 to October 2013. | |
Interested Trustee | | | | | | | | | | | |
John G. Popp2
Credit Suisse Asset
Management, LLC
One Madison Avenue
New York, New York
10010
Year of Birth: 1956 | | Trustee, Chief Executive Officer and President | | Trustee since 2017
Chief Executive Officer and President since 2010 | | Managing Director of Credit Suisse; Global Head and Chief Investment Officer of the Credit Investments Group; Associated with Credit Suisse or its predecessor since 1997; President and Chief Executive Officer of other Credit Suisse Funds. | | | 10 | | | Trustee of Credit Suisse High Yield Bond Fund; Director of Credit Suisse Asset Management Income Fund, Inc. | |
1 Subject to the Trust's retirement policy, each Trustee may continue to serve as a Trustee until the last day of the calendar year in which the applicable Trustee attains age 75. Officer serves until his or her respective successor has been duly elected and qualified.
2 Mr. Popp is an "interested person" of the Trust, as defined in the 1940 Act, by virtue of his current position as an officer of Credit Suisse.
54
Credit Suisse Multialternative Strategy Fund
Information Concerning Trustees and Officers (unaudited) (continued)
Name, Address
(Year of Birth) | | Position(s)
Held with
Fund | | Term of
Office1
and
Length of
Time
Served | | Principal Occupation(s) During Past Five Years | |
Emidio Morizio
Credit Suisse Asset
Management, LLC
One Madison Avenue
New York, New York 10010
(1966) | | Chief Compliance Officer | | Since Fund Inception | | Managing Director and Global Head of Compliance of Credit Suisse since 2010; Associated with Credit Suisse since July 2000; Officer of other Credit Suisse Funds. | |
Lou Anne McInnis
Credit Suisse Asset Management, LLC
One Madison Avenue
New York, New York 10010
(1959) | | Chief Legal Officer | | Since 2015 | | Director of Credit Suisse; Associated with Credit Suisse since April 2015; Counsel at DLA Piper US LLP from 2011 to April 2015; Associated with Morgan Stanley Investment Management from 1997 to 2010; Officer of other Credit Suisse Funds. | |
Laurie Pecha
Credit Suisse Asset
Management, LLC
One Madison Avenue
New York, New York 10010
(1961) | | Chief Financial Officer | | Since 2016 | | Director of Credit Suisse since August 2016; Senior Consultant of Spectra Professional Services, LLC from January 2012 to July 2016; Vice President of Legg Mason & Co. from March 2007 to December 2011; Officer of other Credit Suisse Funds. | |
Esther Cheung
Credit Suisse Asset
Management, LLC
One Madison Avenue
New York, New York 10010
(1980) | | Treasurer | | Since 2016 | | Vice President of Credit Suisse since 2015; Associated with Reich & Tang Asset Management, LLC from June 2010 to August 2015; Officer of other Credit Suisse Funds. | |
Karen Regan
Credit Suisse Asset
Management, LLC
One Madison Avenue
New York, New York 10010
(1963) | | Vice President and Secretary | | Since Fund Inception | | Vice President of Credit Suisse; Associated with Credit Suisse since December 2004; Officer of other Credit Suisse Funds. | |
1 Subject to the Trust's retirement policy, each Trustee may continue to serve as a Trustee until the last day of the calendar year in which the applicable Trustee attains age 75. Officer serves until his or her respective successor has been duly elected and qualified.
* The officers of the Fund shown are officers that make policy decisions.
The Statement of Additional Information includes additional information about the Trustees and is available, without charge, upon request, by calling 877-870-2874.
55
Credit Suisse Multialternative Strategy Fund
Proxy Voting and Portfolio Holdings Information (unaudited)
Information regarding how the Fund voted proxies related to its portfolio securities during the 12-month period ended June 30 of each year, as well as the policies and procedures that the Fund uses to determine how to vote proxies relating to its portfolio securities are available:
• By calling 1-877-870-2874
• On the Fund's website, www.credit-suisse.com/us/funds
• On the website of the Securities and Exchange Commission, www.sec.gov.
The Fund files a complete schedule of its portfolio holdings for the first and third quarters of its fiscal year with the SEC on Form N-Q. The Fund's Forms N-Q are available on the SEC's website at www.sec.gov and may be reviewed and copied at the SEC's Public Reference Room in Washington, DC. Information on the operation of the SEC's Public Reference Room may be obtained by calling 1-202-551-8090.
56

P.O. BOX 55030, BOSTON, MA 02205-5030
877-870-2874 n www.credit-suisse.com/us/funds
CREDIT SUISSE SECURITIES (USA) LLC, DISTRIBUTOR. MSF-AR-1017

CREDIT SUISSE FUNDS
Annual Report
October 31, 2017
n CREDIT SUISSE
STRATEGIC INCOME FUND
The Fund's investment objectives, risks, charges and expenses (which should be considered carefully before investing), and more complete information about the Fund, are provided in the Prospectus, which should be read carefully before investing. You may obtain additional copies by calling 877-870-2874 or by visiting our website at www.credit-suisse.com/us/funds.
Credit Suisse Securities (USA) LLC, Distributor, is located at One Madison Avenue, New York, NY 10010. Credit Suisse Funds are advised by Credit Suisse Asset Management, LLC.
Investors in the Credit Suisse Funds should be aware that they may be eligible to purchase Class I shares (where offered) directly or through certain intermediaries. Such shares are not subject to a sales charge. Investors in the Credit Suisse Funds should also be aware that they may be eligible for a reduction or waiver of the sales charge with respect to Class A or C shares (where offered). For more information, please review the relevant prospectuses or consult your financial representative.
Fund shares are not deposits or other obligations of Credit Suisse Asset Management, LLC ("Credit Suisse") or any affiliate, are not FDIC-insured and are not guaranteed by Credit Suisse or any affiliate. Fund investments are subject to investment risks, including loss of your investment.
Credit Suisse Strategic Income Fund
Annual Investment Adviser's Report
October 31, 2017 (unaudited)
November 24, 2017
Dear Shareholder:
We are pleased to present this Annual Report covering the activities of the Credit Suisse Strategic Income Fund (the "Fund") for the 12-month period ended October 31, 2017.
Performance Summary
11/1/2016 – 10/31/2017
Fund & Benchmark | | Performance | |
| Class I1 | | | 11.11 | % | |
| Class A1,2 | | | 10.71 | % | |
| Class C1,2 | | | 9.88 | % | |
ICE BofAML 3-Month
US Treasury Bill Index3 | | | 0.72 | % | |
Performance shown for the Fund's Class A and Class C Shares does not reflect sales charges, which are a maximum of 4.75% and 1.00%, respectively.2
Market Review: A positive period
The annual period ended October 31, 2017 was a positive one for below investment grade credit asset classes, with the Credit Suisse Leveraged Loan Index and the ICE BofAML US High Yield Constrained Index returning 5.25% and 9.14%, respectively. In comparison, the ICE BofAML 3-Month US Treasury Bill Index (the "Benchmark"), the Fund's benchmark, returned 0.72% for the same time period.
The high yield asset class continued to produce positive returns in 2017 following a rally that began in 2016. Factors that contributed to positive sentiment included strength in global equity markets, higher oil prices, and enthusiasm surrounding U.S. tax reform. For the loan asset class, coupon clipping has driven much of the positive return and over 5% of the Credit Suisse Leveraged Loan Index's return can be attributed to interest return.
Demand for leveraged loans has been robust. Retail money flowed into loan funds, old Collateralized Loan Obligation ("CLO") structures reset, and new CLO's printed an average of almost $10 billion per month over the twelve-month period. Prime funds had net inflows of $30.7 billion versus a $15.7 billion outflow over the previous period (according to LCD —"Leveraged Commentary & Data"). The period saw CLO issuance of $111.5 billion versus $67 billion in the previous annual period. In contrast, high yield mutual fund flows have been
1
Credit Suisse Strategic Income Fund
Annual Investment Adviser's Report (continued)
October 31, 2017 (unaudited)
negative, with outflows of $9.8 billion year to date, as compared to $7.2 billion of inflows for the same period last year.
Fundamentals in the high yield and senior secured loan market have been stable outside of some notable sectors such as retail. Within high yield, default activity, as measured by JP Morgan, ended the period at 1.18% — down from the same twelve-month period last year and year-end 2016. The par-weighted default rate for loans ended the period at 1.37%. While it is expected that the market may experience an increase in defaults for some troubled industries going forward, overall fundamentals and cheap capital structures should broadly minimize defaults. Looking forward, JPMorgan is keeping its 2018 default rate forecast at 2.0% — which remains below long-term averages.
Strategic Review and Outlook: Expecting defaults to remain low
For the 12-month period ended October 31, 2017, the Fund outperformed the Benchmark. The Fund's outperformance can be attributed to positive performance from multiple asset classes. Positive returns in mining, steel, iron and non-precious metals, electronics and conglomerate service within the bank loan and high yield asset classes provided the most significant contributions to performance. CLOs also contributed positively to returns, as did all ratings classes.
The ongoing low rate environment has continued to be supportive of corporate balance sheets, with solid earnings and stable fundamentals supporting credit markets. Additionally, the United States economy continues to experience stable growth, while the labor market continues to show strength.
Economic performance does appear to be supportive of continued rate increases, although we expect the pace to be measured in the absence of a more material inflation upside surprise. Consequently, we currently maintain a shorter duration in the high yield asset class and are positively inclined toward the floating rate nature of the loan asset class.
Finally, we expect default rates for both high yield and loans to remain below long-term averages over the intermediate term — especially outside of certain sectors.
The Credit Suisse Credit Investments Group
John G. Popp
Andrew H. Marshak
Thomas J. Flannery
Louis I. Farano
Wing Chan
2
Credit Suisse Strategic Income Fund
Annual Investment Adviser's Report (continued)
October 31, 2017 (unaudited)
Senior secured floating rate loans ("Senior Loans") typically hold the most senior position in the issuer's capital structure. Senior Loans are subject to the risk that a court could subordinate a Senior Loan to presently existing or future indebtedness or take other action detrimental to the holders of Senior Loans.
High yield bonds are lower-quality bonds that are also known as "junk bonds." Such bonds entail greater risks than those found in higher-rated securities.
CLOs are subject to the risk of substantial losses due to actual defaults, decrease of market value due to collateral defaults and disappearance of subordinate tranches, market anticipation of defaults, and investor aversion to CLO securities as a class. The risks of CLOs depend largely on the type of the underlying loans and the tranche of CLOs in which the Fund invests. In addition, CLOs carry risks including interest rate risk and credit risk.
Additional principal risk factors for the Fund include conflict of interest risk, convertible securities risk, credit risk, derivatives risk, extension risk, foreign securities risk, futures contracts risk, hedged exposure risk, interest rate risk, liquidity risk, market risk, mortgage- and asset-backed securities risk, prepayment risk, short position risk, U.S. government securities risk and valuation risk. Before you invest, please make sure you understand the risks that apply to the Fund. As with any mutual fund, you could lose money over any period of time. Investments in the Fund are not bank deposits and are not insured or guaranteed by the Federal Deposit Insurance Corporation or any government agency. For a detailed discussion of these and other risks, please refer to the Fund's Prospectus, which should be read carefully before investing.
In addition to historical information, this report contains forward-looking statements, which may concern, among other things, domestic and foreign markets, industry and economic trends and developments and government regulation, and their potential impact on the Fund's investments. These statements are subject to risks and uncertainties and actual trends, developments and regulations in the future, and their impact on the Fund, could be materially different from those projected, anticipated or implied. The Fund has no obligation to update or revise forward-looking statements.
The views of the Fund's management are as of the date of this letter and the Fund holdings described in this document are as of October 31, 2017; these views and Fund holdings may have changed subsequent to these dates. Nothing in this document is a recommendation to purchase or sell securities.
3
Credit Suisse Strategic Income Fund
Annual Investment Adviser's Report (continued)
October 31, 2017 (unaudited)
Comparison of Change in Value of $10,000 Investment in the
Credit Suisse Strategic Income Fund1 Class I Shares,
Class A Shares2, Class C Shares2 and
ICE BofAML 3-Month US Treasury Bill Index3
from Inception (9/28/12).

1 Fee waivers and/or expense reimbursements reduce expenses for the Fund, without which performance would be lower. The Fund entered into a written contract to limit expenses to 0.99% of the Fund's average daily net assets for Class I shares, 1.24% of the Fund's average daily net assets for Class A shares and 1.99% of the Fund's average daily net assets for Class C shares through at least February 28, 2018. This limit excludes certain expenses, as set forth in the Fund's Prospectus.
2 Total return for the Fund's Class A shares for the reporting period, based on offering price (including maximum sales charge of 4.75%), was 5.41%. Total return for the Fund's Class C shares for the reporting period, based on redemption value (including maximum CDSC of 1.00%), was 8.88%.
3 Using only liquid securities, the ICE BofAML 3-Month US Treasury Bill Index seeks to replicate the return of the overall hedge fund industry, as represented by the Dow Jones Credit Suisse Hedge Fund Index. The index does not have transaction costs and investors may not invest directly in the index. The index was formerly known as The BofA Merrill Lynch 3-Month US Treasury Bill Index.
4
Credit Suisse Strategic Income Fund
Annual Investment Adviser's Report (continued)
October 31, 2017 (unaudited)
Average Annual Returns as of October 31, 20171
| | | 1 Year | | 5 Years | | Since
Inception2 | |
Class I | | | 11.11 | % | | | 7.62 | % | | | 7.61 | % | |
Class A Without Sales Charge | | | 10.71 | % | | | 7.30 | % | | | 7.32 | % | |
Class A With Maximum Sales Charge | | | 5.41 | % | | | 6.27 | % | | | 6.30 | % | |
Class C Without CDSC | | | 9.88 | % | | | 6.53 | % | | | 6.54 | % | |
Class C With CDSC | | | 8.88 | % | | | 6.53 | % | | | 6.54 | % | |
Returns represent past performance and include change in share price and reinvestment of dividends and capital gain distributions, if any. Past performance cannot guarantee future results. The current performance of the Fund may be lower or higher than the figures shown. Returns and share price will fluctuate, and redemption value may be more or less than original cost. The performance results do not reflect the deduction of taxes that a shareholder would pay on Fund distributions or the redemption of Fund shares. Performance information current to the most recent month end is available at www.credit-suisse.com/us/funds.
The annual gross expense ratios are 1.25% for Class I shares, 1.50% for Class A shares and 2.25% for Class C shares. The annual net expense ratios after fee waivers and/or expense reimbursements are 0.99% for Class I shares, 1.24% for Class A shares and 1.99% for Class C shares.
1 Fee waivers and/or expense reimbursements reduce expenses for the Fund, without which performance would be lower. The Fund entered into a written contract to limit expenses to 0.99% of the Fund's average daily net assets for Class I shares, 1.24% of the Fund's average daily net assets for Class A shares and 1.99% of the Fund's average daily net assets for Class C shares through at least February 28, 2018. This limit excludes certain expenses, as set forth in the Fund's Prospectus.
2 Inception Date September 28, 2012.
5
Credit Suisse Strategic Income Fund
Annual Investment Adviser's Report (continued)
October 31, 2017 (unaudited)
Information About Your Fund's Expenses
As an investor of the Fund, you incur two types of costs: ongoing expenses and transaction costs. Ongoing expenses include management fees, distribution and service (12b-1) fees and other Fund expenses. Examples of transaction costs include sales charges (loads), redemption fees and account maintenance fees, which are not shown in this section and which would result in higher total expenses. The following table is intended to help you understand your ongoing expenses of investing in the Fund and to help you compare these expenses with the ongoing expenses of investing in other mutual funds. The table is based on an investment of $1,000 made at the beginning of the six months ended October 31, 2017.
The table illustrates your Fund's expenses in two ways:
• Actual Fund Return. This helps you estimate the actual dollar amount of ongoing expenses paid on a $1,000 investment in the Fund using the Fund's actual return during the period. To estimate the expenses you paid over the period, simply divide your account value by $1,000 (for example, an $8,600 account value divided by $1,000 = 8.6), then multiply the result by the number in the "Expenses Paid per $1,000" line.
• Hypothetical 5% Fund Return. This helps you to compare the Fund's ongoing expenses with those of other mutual funds using the Fund's actual expense ratio and a hypothetical rate of return of 5% per year before expenses. Examples using a 5% hypothetical fund return may be found in the shareholder reports of other mutual funds. The hypothetical account values and expenses may not be used to estimate the actual ending account balance or expenses you paid for the period.
Please note that the expenses shown in these tables are meant to highlight your ongoing expenses only and do not reflect any transaction costs, such as sales charges (loads) or redemption fees. If these transaction costs had been included, your costs would have been higher. The "Expenses Paid per $1,000" line of the tables is useful in comparing ongoing expenses only and will not help you determine the relative total expenses of owning different funds.
6
Credit Suisse Strategic Income Fund
Annual Investment Adviser's Report (continued)
October 31, 2017 (unaudited)
Expenses and Value for a $1,000 Investment
for the six-month period ended October 31, 2017
Actual Fund Return | | Class I | | Class A | | Class C | |
Beginning Account Value 05/01/17 | | $ | 1,000.00 | | | $ | 1,000.00 | | | $ | 1,000.00 | | |
Ending Account Value 10/31/17 | | $ | 1,033.60 | | | $ | 982.10 | | | $ | 1,017.40 | | |
Expenses Paid per $1,000* | | $ | 5.07 | | | $ | 6.20 | | | $ | 10.12 | | |
Hypothetical 5% Fund Return | |
Beginning Account Value 05/01/17 | | $ | 1,000.00 | | | $ | 1,000.00 | | | $ | 1,000.00 | | |
Ending Account Value 10/31/17 | | $ | 1,020.21 | | | $ | 1,018.95 | | | $ | 1,015.17 | | |
Expenses Paid per $1,000* | | $ | 5.04 | | | $ | 6.31 | | | $ | 10.11 | | |
| | | Class I | | Class A | | Class C | |
Annualized Expense Ratios* | | | 0.99 | % | | | 1.24 | % | | | 1.99 | % | |
* Expenses are equal to the Fund's annualized expense ratio for each share class, multiplied by the average account value over the period, multiplied by 184/365 to reflect the one-half year period.
The "Expenses Paid per $1,000" and the "Annualized Expense Ratios" in the tables are based on actual expenses paid by the Fund during the period, net of fee waivers and/or actual expenses reimbursements, if applicable. If those fee waivers and/or expense reimbursements had not been in effect, the Fund's actual expenses would have been higher. Expenses do not reflect additional charges and expenses that are, or may be, imposed under the variable contracts or plans. Such charges and expenses are described in the prospectus of the insurance company separate account or in the plan documents or other informational materials supplied by plan sponsors. The Fund's expenses should be considered with these charges and expenses in evaluating the overall cost of investing in the separate account.
For more information, please refer to the Fund's Prospectus.
7
Credit Suisse Strategic Income Fund
Annual Investment Adviser's Report (continued)
October 31, 2017 (unaudited)
Credit Quality Breakdown*
(% of Total Investments as of October 31, 2017)
S&P Ratings** | |
BBB | | | 2.2 | % | |
BB | | | 24.5 | | |
B | | | 46.3 | | |
CCC | | | 13.2 | | |
CC1 | | | 0.0 | | |
NR | | | 3.5 | | |
Subtotal | | | 89.7 | | |
Equity and Other | | | 0.6 | | |
Short-Term Investments2 | | | 9.7 | | |
Total | | | 100.0 | % | |
* Expressed as a percentage of total investments (excluding securities lending collateral, if applicable) and may vary over time.
** Credit Quality is based on ratings provided by the Standard & Poor's Division of The McGraw-Hill Companies, Inc. ("S&P"). S&P is a main provider of ratings for Credit Asset Classes and is widely used amongst industry participants. The NR category consists of securities that have not been rated by S&P.
1 This amount represents less than 0.1%.
2 Primarily reflects cash invested in State Street Bank and Trust Co. Euro Time Deposit, for which the purchases of securities have been executed but not yet settled at October 31, 2017, if applicable.
8
Credit Suisse Strategic Income Fund
Schedule of Investments
October 31, 2017
Par
(000) | |
| | Ratings†
(S&P/Moody's) | | Maturity | | Rate% | | Value | |
| CORPORATE BONDS (42.3%) | |
| Advertising (0.6%) | |
$ | 1,000 | | | Southern Graphics, Inc., Rule 144A,
Company Guaranteed Notes
(Callable 12/01/17 @ 102.09)(1) | | (CCC+, Caa1) | | 10/15/20 | | | 8.375 | | | $ | 1,020,000 | | |
| Air Transportation (0.2%) | |
| | 300 | | | United Continental Holdings, Inc.,
Company Guaranteed Notes | | (BB-, Ba3) | | 02/01/24 | | | 5.000 | | | | 306,000 | | |
| Auto Parts & Equipment (0.6%) | |
| | 500 | | | Cooper-Standard Automotive, Inc., Rule 144A,
Company Guaranteed Notes
(Callable 11/15/21 @ 102.81)(1) | | (B+, B2) | | 11/15/26 | | | 5.625 | | | | 520,000 | | |
| | 650 | | | Delphi Technologies PLC, Rule 144A,
Senior Unsecured Notes(1) | | (BB, B1) | | 10/01/25 | | | 5.000 | | | | 656,500 | | |
| | | 1,176,500 | | |
| Brokerage (1.1%) | |
| | 1,850 | | | LPL Holdings, Inc., Rule 144A,
Company Guaranteed Notes
(Callable 03/15/20 @ 104.31)(1) | | (B+, B2) | | 09/15/25 | | | 5.750 | | | | 1,928,625 | | |
| Building & Construction (0.6%) | |
| | 1,000 | | | Beacon Escrow Corp., Rule 144A,
Senior Unsecured Notes
(Callable 11/01/20 @ 102.44)(1) | | (B+, B3) | | 11/01/25 | | | 4.875 | | | | 1,017,200 | | |
| Building Materials (3.4%) | |
| | 500 | | | Airxcel, Inc., Rule 144A,
Senior Secured Notes
(Callable 02/15/19 @ 104.25)(1) | | (B, B2) | | 02/15/22 | | | 8.500 | | | | 531,250 | | |
| | 350 | | | American Builders & Contractors Supply Co., Inc.,
Rule 144A, Senior Unsecured Notes
(Callable 12/15/18 @ 104.31)(1) | | (B+, B3) | | 12/15/23 | | | 5.750 | | | | 372,750 | | |
| | 414 | | | BMC East LLC, Rule 144A,
Senior Secured Notes
(Callable 10/01/19 @ 104.13)(1) | | (BB-, B2) | | 10/01/24 | | | 5.500 | | | | 434,700 | | |
| | 725 | | | Eagle Materials, Inc.,
Company Guaranteed Notes
(Callable 08/01/21 @ 102.25) | | (BBB, Baa3) | | 08/01/26 | | | 4.500 | | | | 759,437 | | |
| | 750 | | | FBM Finance, Inc., Rule 144A,
Senior Secured Notes
(Callable 08/15/18 @ 104.13)(1) | | (B+, B3) | | 08/15/21 | | | 8.250 | | | | 801,562 | | |
| | 200 | | | Masonite International Corp., Rule 144A,
Company Guaranteed Notes
(Callable 03/15/18 @ 104.22)(1) | | (BB, Ba3) | | 03/15/23 | | | 5.625 | | | | 210,750 | | |
| | 500 | | | NCI Building Systems, Inc., Rule 144A,
Company Guaranteed Notes
(Callable 01/15/18 @ 106.19)(1) | | (BB, B3) | | 01/15/23 | | | 8.250 | | | | 537,188 | | |
See Accompanying Notes to Financial Statements.
9
Credit Suisse Strategic Income Fund
Schedule of Investments (continued)
October 31, 2017
Par
(000) | |
| | Ratings†
(S&P/Moody's) | | Maturity | | Rate% | | Value | |
| CORPORATE BONDS (continued) | |
Building Materials | |
$ | 1,400 | | | Omnimax International, Inc., Rule 144A,
Senior Secured Notes
(Callable 02/15/18 @ 109.00)(1) | | (B-, Caa1) | | 08/15/20 | | | 12.000 | | | $ | 1,522,500 | | |
| | 50 | | | PriSo Acquisition Corp., Rule 144A,
Senior Unsecured Notes
(Callable 05/15/18 @ 104.50)(1) | | (CCC+, Caa1) | | 05/15/23 | | | 9.000 | | | | 52,875 | | |
| | 250 | | | Summit Materials Finance Corp., Rule 144A,
Company Guaranteed Notes
(Callable 06/01/20 @ 102.56)(1) | | (BB-, B3) | | 06/01/25 | | | 5.125 | | | | 253,750 | | |
| | 150 | | | U.S. Concrete, Inc.,
Global Company Guaranteed Notes
(Callable 06/01/19 @ 104.78) | | (BB-, B2) | | 06/01/24 | | | 6.375 | | | | 162,000 | | |
| | 500 | | | USG Corp., Rule 144A,
Company Guaranteed Notes
(Callable 06/01/22 @ 102.44)(1) | | (BB+, Ba2) | | 06/01/27 | | | 4.875 | | | | 520,000 | | |
| | | 6,158,762 | | |
| Cable & Satellite TV (3.4%) | |
| | 800 | | | Altice Financing S.A., Rule 144A,
Senior Secured Notes
(Callable 05/15/21 @ 103.75)(1) | | (BB-, B1) | | 05/15/26 | | | 7.500 | | | | 879,000 | | |
| | 400 | | | Altice U.S. Finance I Corp., Rule 144A,
Senior Secured Notes
(Callable 05/15/21 @ 102.75)(1) | | (BB, Ba3) | | 05/15/26 | | | 5.500 | | | | 417,000 | | |
| | 200 | | | Altice U.S. Finance I Corp., Rule 144A,
Senior Secured Notes
(Callable 07/15/18 @ 104.03)(1) | | (BB, Ba3) | | 07/15/23 | | | 5.375 | | | | 209,000 | | |
| | 500 | | | Block Communications, Inc., Rule 144A,
Senior Unsecured Notes
(Callable 02/15/20 @ 103.44)(1) | | (BB-, Ba3) | | 02/15/25 | | | 6.875 | | | | 542,500 | | |
| | 500 | | | Cable One, Inc., Rule 144A,
Company Guaranteed Notes
(Callable 06/15/18 @ 102.88)(1) | | (BB, B2) | | 06/15/22 | | | 5.750 | | | | 523,750 | | |
| | 300 | | | CSC Holdings LLC, Rule 144A,
Company Guaranteed Notes
(Callable 10/15/20 @ 103.31)(1) | | (BB, Ba1) | | 10/15/25 | | | 6.625 | | | | 329,550 | | |
| | 251 | | | CSC Holdings LLC, Rule 144A,
Senior Unsecured Notes
(Callable 10/15/20 @ 105.44)(1) | | (B, B2) | | 10/15/25 | | | 10.875 | | | | 308,103 | | |
| | 1,425 | | | Midcontinent Finance Corp., Rule 144A,
Company Guaranteed Notes
(Callable 08/15/18 @ 105.16)(1) | | (B, B3) | | 08/15/23 | | | 6.875 | | | | 1,535,437 | | |
| | 475 | | | SFR Group S.A., Rule 144A,
Senior Secured Notes
(Callable 05/01/21 @ 103.69)(1) | | (B+, B1) | | 05/01/26 | | | 7.375 | | | | 512,406 | | |
See Accompanying Notes to Financial Statements.
10
Credit Suisse Strategic Income Fund
Schedule of Investments (continued)
October 31, 2017
Par
(000) | |
| | Ratings†
(S&P/Moody's) | | Maturity | | Rate% | | Value | |
| CORPORATE BONDS (continued) | |
Cable & Satellite TV | |
$ | 461 | | | Virgin Media Secured Finance PLC, Rule 144A,
Senior Secured Notes
(Callable 08/15/21 @ 102.75)(1) | | (BB-, Ba3) | | 08/15/26 | | | 5.500 | | | $ | 483,474 | | |
| | 500 | | | Ziggo Secured Finance B.V., Rule 144A,
Senior Secured Notes
(Callable 01/15/22 @ 102.75)(1) | | (BB-, Ba3) | | 01/15/27 | | | 5.500 | | | | 511,250 | | |
| | | 6,251,470 | | |
| Chemicals (1.2%) | |
| | 525 | | | Alpha U.S. Bidco, Inc., Rule 144A,
Company Guaranteed Notes
(Callable 02/01/20 @ 103.13)(1) | | (CCC+, Caa1) | | 02/01/25 | | | 6.250 | | | | 540,750 | | |
| | 250 | | | PQ Corp., Rule 144A,
Senior Secured Notes
(Callable 05/15/19 @ 103.38)(1) | | (BB-, B2) | | 11/15/22 | | | 6.750 | | | | 271,250 | | |
| | 52 | | | Reichhold Industries, Inc., Rule 144A,
Senior Secured Notes
(Callable 12/01/17 @ 100.00)(1),(2),(3),(4),(5) | | (NR, NR) | | 05/01/18 | | | 9.000 | | | | 1,882 | | |
| | 1,000 | | | Trinseo Materials Finance, Inc., Rule 144A,
Company Guaranteed Notes
(Callable 09/01/20 @ 102.69)(1) | | (BB-, B3) | | 09/01/25 | | | 5.375 | | | | 1,055,000 | | |
| | 300 | | | Versum Materials, Inc., Rule 144A,
Company Guaranteed Notes
(Callable 09/30/21 @ 102.75)(1) | | (BB, Ba3) | | 09/30/24 | | | 5.500 | | | | 320,250 | | |
| | | 2,189,132 | | |
| Consumer/Commercial/Lease Financing (0.6%) | |
| | 1,050 | | | Infinity Acquisition Finance Corp., Rule 144A,
Senior Unsecured Notes
(Callable 11/16/17 @ 103.63)(1) | | (CCC+, Caa2) | | 08/01/22 | | | 7.250 | | | | 1,044,750 | | |
| Diversified Capital Goods (1.1%) | |
| | 372 | | | Belden, Inc., Rule 144A,
Company Guaranteed Notes
(Callable 07/15/19 @ 102.63)(1) | | (BB-, Ba3) | | 07/15/24 | | | 5.250 | | | | 388,740 | | |
| | 350 | | | EnerSys, Rule 144A,
Company Guaranteed Notes
(Callable 01/30/23 @ 100.00)(1) | | (BB+, Ba2) | | 04/30/23 | | | 5.000 | | | | 368,375 | | |
| | 1,200 | | | TriMas Corp., Rule 144A,
Company Guaranteed Notes
(Callable 10/15/20 @ 102.44)(1) | | (B+, B1) | | 10/15/25 | | | 4.875 | | | | 1,215,750 | | |
| | | 1,972,865 | | |
| Food & Drug Retailers (0.4%) | |
| | 750 | | | Valeant Pharmaceuticals International, Inc.,
Rule 144A, Senior Secured Notes
(Callable 11/01/20 @ 102.75)(1) | | (BB-, Ba3) | | 11/01/25 | | | 5.500 | | | | 768,750 | | |
See Accompanying Notes to Financial Statements.
11
Credit Suisse Strategic Income Fund
Schedule of Investments (continued)
October 31, 2017
Par
(000) | |
| | Ratings†
(S&P/Moody's) | | Maturity | | Rate% | | Value | |
| CORPORATE BONDS (continued) | |
| Food - Wholesale (0.7%) | |
$ | 400 | | | B&G Foods, Inc.,
Company Guaranteed Notes
(Callable 04/01/20 @ 103.94) | | (B+, B3) | | 04/01/25 | | | 5.250 | | | $ | 409,500 | | |
| | 400 | | | Clearwater Seafoods, Inc., Rule 144A,
Senior Unsecured Notes
(Callable 05/01/20 @ 105.16)(1) | | (B+, B3) | | 05/01/25 | | | 6.875 | | | | 424,000 | | |
| | 225 | | | Lamb Weston Holdings, Inc., Rule 144A,
Company Guaranteed Notes
(Callable 11/01/21 @ 102.31)(1) | | (BB, Ba3) | | 11/01/24 | | | 4.625 | | | | 236,250 | | |
| | 225 | | | Lamb Weston Holdings, Inc., Rule 144A,
Company Guaranteed Notes
(Callable 11/01/21 @ 102.44)(1) | | (BB, Ba3) | | 11/01/26 | | | 4.875 | | | | 237,094 | | |
| | | 1,306,844 | | |
| Gaming (1.2%) | |
| | 700 | | | Eldorado Resorts, Inc.,
Global Company Guaranteed Notes
(Callable 04/01/20 @ 104.50) | | (B, B3) | | 04/01/25 | | | 6.000 | | | | 742,000 | | |
| | 400 | | | Gateway Casinos & Entertainment Ltd.,
Rule 144A, Secured Notes
(Callable 03/01/20 @ 104.13)(1) | | (CCC+, Caa1) | | 03/01/24 | | | 8.250 | | | | 426,000 | | |
| | 450 | | | Jacobs Entertainment, Inc., Rule 144A,
Secured Notes
(Callable 02/01/20 @ 105.91)(1) | | (B, B2) | | 02/01/24 | | | 7.875 | | | | 487,125 | | |
| | 495 | | | Safari Holding Verwaltungs GmbH, Rule 144A,
Senior Secured Notes
(Callable 11/30/17 @ 104.13)(1),(6) | | (B, B2) | | 02/15/21 | | | 8.250 | | | | 601,267 | | |
| | | 2,256,392 | | |
| Gas Distribution (1.1%) | |
| | 750 | | | Genesis Energy Finance Corp.,
Company Guaranteed Notes
(Callable 10/01/20 @ 104.88) | | (BB-, B1) | | 10/01/25 | | | 6.500 | | | | 763,125 | | |
| | 500 | | | Genesis Energy Finance Corp.,
Global Company Guaranteed Notes
(Callable 12/01/17 @ 102.88) | | (BB-, B1) | | 02/15/21 | | | 5.750 | | | | 510,200 | | |
| | 650 | | | Holly Energy Finance Corp., Rule 144A,
Company Guaranteed Notes
(Callable 08/01/19 @ 104.50)(1) | | (BB, B2) | | 08/01/24 | | | 6.000 | | | | 684,125 | | |
| | | 1,957,450 | | |
| Health Facilities (1.5%) | |
| | 500 | | | MPT Finance Corp.,
Global Company Guaranteed Notes
(Callable 10/15/22 @ 102.50) | | (BBB-, Ba1) | | 10/15/27 | | | 5.000 | | | | 515,000 | | |
See Accompanying Notes to Financial Statements.
12
Credit Suisse Strategic Income Fund
Schedule of Investments (continued)
October 31, 2017
Par
(000) | |
| | Ratings†
(S&P/Moody's) | | Maturity | | Rate% | | Value | |
| CORPORATE BONDS (continued) | |
Health Facilities | |
$ | 250 | | | Sabra Health Care LP,
Global Company Guaranteed Notes
(Callable 05/15/26 @ 100.00) | | (BBB-, Ba1) | | 08/15/26 | | | 5.125 | | | $ | 256,240 | | |
| | 875 | | | SP Finco LLC, Rule 144A,
Company Guaranteed Notes
(Callable 07/01/20 @ 103.38)(1) | | (CCC+, Caa2) | | 07/01/25 | | | 6.750 | | | | 800,625 | | |
| | 500 | | | Tenet Healthcare Corp., Rule 144A,
Secured Notes
(Callable 05/01/20 @ 102.56)(1) | | (B-, Ba3) | | 05/01/25 | | | 5.125 | | | | 488,750 | | |
| | 700 | | | Tenet Healthcare Corp., Rule 144A,
Senior Secured Notes
(Callable 07/15/20 @ 102.31)(1) | | (BB-, Ba3) | | 07/15/24 | | | 4.625 | | | | 691,250 | | |
| | | 2,751,865 | | |
| Health Services (0.8%) | |
| | 500 | | | AMN Healthcare, Inc., Rule 144A,
Company Guaranteed Notes
(Callable 10/01/19 @ 103.84)(1) | | (BB-, Ba2) | | 10/01/24 | | | 5.125 | | | | 517,500 | | |
| | 900 | | | CareTrust Capital Corp.,
Company Guaranteed Notes
(Callable 06/01/20 @ 103.94) | | (BB-, Ba3) | | 06/01/25 | | | 5.250 | | | | 927,000 | | |
| | | 1,444,500 | | |
| Hotels (0.2%) | |
| | 400 | | | ESH Hospitality, Inc., Rule 144A,
Company Guaranteed Notes
(Callable 05/01/20 @ 102.63)(1) | | (BB-, B1) | | 05/01/25 | | | 5.250 | | | | 414,500 | | |
| Insurance Brokerage (1.8%) | |
| | 400 | | | Alliant Holdings Co-Issuer, Rule 144A,
Senior Unsecured Notes
(Callable 08/01/18 @ 104.13)(1) | | (CCC+, Caa2) | | 08/01/23 | | | 8.250 | | | | 427,000 | | |
| | 550 | | | AssuredPartners, Inc., Rule 144A,
Senior Unsecured Notes
(Callable 08/15/20 @ 103.50)(1) | | (CCC+, Caa2) | | 08/15/25 | | | 7.000 | | | | 574,750 | | |
| | 1,500 | | | Hub Holdings Finance, Inc.,
8.125% Cash, 8.875% PIK, Rule 144A,
Senior Unsecured Notes
(Callable 12/01/17 @ 100.00)(1),(7) | | (CCC+, Caa2) | | 07/15/19 | | | 17.000 | | | | 1,505,625 | | |
| | 675 | | | NFP Corp., Rule 144A,
Senior Unsecured Notes
(Callable 07/15/20 @ 103.44)(1) | | (CCC+, Caa2) | | 07/15/25 | | | 6.875 | | | | 703,687 | | |
| | | 3,211,062 | | |
See Accompanying Notes to Financial Statements.
13
Credit Suisse Strategic Income Fund
Schedule of Investments (continued)
October 31, 2017
Par
(000) | |
| | Ratings†
(S&P/Moody's) | | Maturity | | Rate% | | Value | |
| CORPORATE BONDS (continued) | |
| Investments & Misc. Financial Services (0.6%) | |
$ | 1,000 | | | Orchestra Co-Issuer, Inc., Rule 144A,
Secured Notes
(Callable 06/15/19 @ 103.38)(1) | | (B-, NR) | | 06/15/22 | | | 6.750 | | | $ | 1,042,300 | | |
| Machinery (0.5%) | |
| | 500 | | | Terex Corp., Rule 144A,
Company Guaranteed Notes
(Callable 02/01/20 @ 104.22)(1) | | (BB, B2) | | 02/01/25 | | | 5.625 | | | | 530,625 | | |
| | 350 | | | Vertiv Intermediate Holding Corp.,
12.000% Cash, 13.000% PIK, Rule 144A,
Senior Unsecured Notes
(Callable 02/15/19 @ 106.00)(1),(7) | | (B-, Caa1) | | 02/15/22 | | | 25.000 | | | | 383,688 | | |
| | | 914,313 | | |
| Media - Diversified (0.7%) | |
| | 715 | | | National CineMedia LLC,
Global Senior Secured Notes
(Callable 12/01/17 @ 103.00) | | (B+, Ba3) | | 04/15/22 | | | 6.000 | | | | 732,875 | | |
| | 500 | | | National CineMedia LLC,
Global Senior Unsecured Notes
(Callable 08/15/21 @ 102.88) | | (B-, B3) | | 08/15/26 | | | 5.750 | | | | 463,750 | | |
| | | 1,196,625 | | |
| Media Content (1.5%) | |
| | 500 | | | EMI Music Publishing Group
North America Holdings, Inc., Rule 144A,
Company Guaranteed Notes
(Callable 06/15/19 @ 105.72)(1) | | (B, B3) | | 06/15/24 | | | 7.625 | | | | 560,625 | | |
| | 500 | | | Netflix, Inc., Rule 144A,
Senior Unsecured Notes(1) | | (B+, B1) | | 04/15/28 | | | 4.875 | | | | 497,600 | | |
| | 925 | | | The EW Scripps Co., Rule 144A,
Company Guaranteed Notes
(Callable 05/15/20 @ 103.84)(1) | | (BB-, B1) | | 05/15/25 | | | 5.125 | | | | 952,750 | | |
| | 750 | | | WMG Acquisition Corp., Rule 144A,
Senior Secured Notes
(Callable 11/01/19 @ 103.66)(1) | | (B+, Ba3) | | 11/01/24 | | | 4.875 | | | | 776,250 | | |
| | | 2,787,225 | | |
| Metals & Mining - Excluding Steel (0.7%) | |
| | 2,975 | | | Noranda Aluminum Acquisition Corp.,
Global Company Guaranteed Notes
(Callable 12/01/17 @ 102.75)(2),(4) | | (NR, NR) | | 06/01/19 | | | 11.000 | | | | 179 | | |
| | 1,250 | | | Taseko Mines Ltd., Rule 144A,
Senior Secured Notes
(Callable 06/15/19 @ 104.38)(1) | | (B-, B3) | | 06/15/22 | | | 8.750 | | | | 1,271,875 | | |
| | | 1,272,054 | | |
See Accompanying Notes to Financial Statements.
14
Credit Suisse Strategic Income Fund
Schedule of Investments (continued)
October 31, 2017
Par
(000) | |
| | Ratings†
(S&P/Moody's) | | Maturity | | Rate% | | Value | |
| CORPORATE BONDS (continued) | |
| Oil Field Equipment & Services (2.1%) | |
$ | 500 | | | FTS International, Inc.,
Global Senior Secured Notes
(Callable 12/01/17 @ 104.69) | | (CCC+, Caa2) | | 05/01/22 | | | 6.250 | | | $ | 487,500 | | |
| | 400 | | | KCA Deutag UK Finance PLC, Rule 144A,
Senior Secured Notes
(Callable 04/01/20 @ 109.88)(1) | | (CCC+, Caa1) | | 04/01/22 | | | 9.875 | | | | 420,500 | | |
| | 597 | | | Nor Offshore SPV Ltd.,
PIK, Senior Secured Notes
(Callable 11/30/17 @ 100.00)(7) | | (NR, NR) | | 02/04/20 | | | 8.400 | | | | 230,890 | | |
| | 800 | | | Pacific Drilling V Ltd., Rule 144A,
Senior Secured Notes(1) | | (NR, Ca) | | 12/01/17 | | | 7.250 | | | | 356,000 | | |
| | 800 | | | Pioneer Energy Services Corp.,
Global Company Guaranteed Notes
(Callable 12/01/17 @ 104.59) | | (B-, Ca) | | 03/15/22 | | | 6.125 | | | | 684,000 | | |
| | 250 | | | Shelf Drilling Holdings Ltd., Rule 144A,
Secured Notes
(Callable 12/01/17 @ 100.00)(1) | | (B-, B2) | | 11/01/18 | | | 8.625 | | | | 250,937 | | |
| | 701 | | | Shelf Drilling Holdings Ltd., Rule 144A,
Secured Notes
(Callable 12/01/17 @ 104.31)(1) | | (B-, B2) | | 11/02/20 | | | 9.500 | | | | 714,849 | | |
| | 100 | | | Sidewinder Drilling, Inc.(3),(4),(5) | | (NR, NR) | | 02/14/20 | | | 12.000 | | | | 93,642 | | |
| | 325 | | | Transocean, Inc.,
Global Company Guaranteed Notes
(Callable 07/15/22 @ 100.00) | | (B, Caa1) | | 10/15/22 | | | 5.800 | | | | 319,312 | | |
| | 225 | | | Trinidad Drilling Ltd., Rule 144A,
Company Guaranteed Notes
(Callable 02/15/20 @ 104.97)(1) | | (BB-, Caa1) | | 02/15/25 | | | 6.625 | | | | 219,937 | | |
| | | 3,777,567 | | |
| Oil Refining & Marketing (0.2%) | |
| | 400 | | | Coffeyville Finance, Inc.,
Global Company Guaranteed Notes
(Callable 12/01/17 @ 103.25) | | (BB-, B1) | | 11/01/22 | | | 6.500 | | | | 413,000 | | |
| Packaging (1.1%) | |
| | 750 | | | Ardagh Holdings U.S.A., Inc., Rule 144A,
Senior Secured Notes
(Callable 05/15/19 @ 102.31)(1) | | (BB, Ba3) | | 05/15/23 | | | 4.625 | | | | 773,437 | | |
| | 500 | | | Flex Acquisition Co., Inc., Rule 144A,
Senior Unsecured Notes
(Callable 01/15/20 @ 103.44)(1) | | (CCC+, Caa1) | | 01/15/25 | | | 6.875 | | | | 517,813 | | |
| | 475 | | | Silgan Holdings, Inc., Rule 144A,
Senior Unsecured Notes
(Callable 03/15/20 @ 102.38)(1) | | (BB-, Ba3) | | 03/15/25 | | | 4.750 | | | | 490,438 | | |
See Accompanying Notes to Financial Statements.
15
Credit Suisse Strategic Income Fund
Schedule of Investments (continued)
October 31, 2017
Par
(000) | |
| | Ratings†
(S&P/Moody's) | | Maturity | | Rate% | | Value | |
| CORPORATE BONDS (continued) | |
Packaging | |
$ | 325 | | | Trident Merger Sub, Inc., Rule 144A,
Senior Unsecured Notes
(Callable 11/01/20 @ 103.31)(1) | | (CCC+, Caa2e) | | 11/01/25 | | | 6.625 | | | $ | 324,090 | | |
| | | 2,105,778 | | |
| Personal & Household Products (0.6%) | |
| | 450 | | | First Quality Finance Co., Inc., Rule 144A,
Company Guaranteed Notes
(Callable 07/01/20 @ 103.75)(1) | | (BB-, B1) | | 07/01/25 | | | 5.000 | | | | 463,811 | | |
| | 750 | | | High Ridge Brands Co., Rule 144A,
Company Guaranteed Notes
(Callable 03/15/20 @ 104.44)(1) | | (CCC+, Caa1) | | 03/15/25 | | | 8.875 | | | | 699,375 | | |
| | | 1,163,186 | | |
| Pharmaceuticals (0.3%) | |
| | 200 | | | Endo Finance LLC, Rule 144A,
Company Guaranteed Notes
(Callable 02/01/20 @ 103.00)(1) | | (CCC+, B3) | | 02/01/25 | | | 6.000 | | | | 160,000 | | |
| | 125 | | | Valeant Pharmaceuticals International, Inc.,
Rule 144A, Company Guaranteed Notes
(Callable 04/15/20 @ 103.06)(1) | | (B-, Caa1) | | 04/15/25 | | | 6.125 | | | | 105,469 | | |
| | 425 | | | Valeant Pharmaceuticals International, Inc.,
Rule 144A, Company Guaranteed Notes
(Callable 05/15/18 @ 102.94)(1) | | (B-, Caa1) | | 05/15/23 | | | 5.875 | | | | 360,187 | | |
| | | 625,656 | | |
| Real Estate Investment Trusts (2.0%) | |
| | 500 | | | CoreCivic, Inc.,
Company Guaranteed Notes
(Callable 07/15/27 @ 100.00) | | (BB, Ba1) | | 10/15/27 | | | 4.750 | | | | 502,500 | | |
| | 1,250 | | | iStar, Inc.,
Senior Unsecured Notes
(Callable 04/01/19 @ 103.00) | | (BB-, B1) | | 04/01/22 | | | 6.000 | | | | 1,303,125 | | |
| | 250 | | | iStar, Inc.,
Senior Unsecured Notes
(Callable 06/15/20 @ 100.00) | | (BB-, B1) | | 09/15/20 | | | 4.625 | | | | 255,938 | | |
| | 250 | | | iStar, Inc.,
Senior Unsecured Notes
(Callable 09/15/19 @ 102.63) | | (BB-, B1) | | 09/15/22 | | | 5.250 | | | | 256,875 | | |
| | 425 | | | QCP SNF West/Central/East/AL REIT LLC,
Rule 144A, Secured Notes
(Callable 11/01/19 @ 104.06)(1) | | (B, Caa2) | | 11/01/23 | | | 8.125 | | | | 443,062 | | |
| | 350 | | | QTS Finance Corp., Rule 144A,
Company Guaranteed Notes
(Callable 11/15/20 @ 103.56)(1) | | (BB, B1e) | | 11/15/25 | | | 4.750 | | | | 358,225 | | |
See Accompanying Notes to Financial Statements.
16
Credit Suisse Strategic Income Fund
Schedule of Investments (continued)
October 31, 2017
Par
(000) | |
| | Ratings†
(S&P/Moody's) | | Maturity | | Rate% | | Value | |
| CORPORATE BONDS (continued) | |
Real Estate Investment Trusts | |
$ | 500 | | | Starwood Property Trust, Inc.,
Global Senior Unsecured Notes
(Callable 09/15/21 @ 100.00) | | (BB-, Ba3) | | 12/15/21 | | | 5.000 | | | $ | 525,000 | | |
| | | 3,644,725 | | |
| Recreation & Travel (0.6%) | |
| | 250 | | | Canada's Wonderland Co., Rule 144A,
Company Guaranteed Notes
(Callable 04/15/22 @ 102.69)(1) | | (BB-, B1) | | 04/15/27 | | | 5.375 | | | | 264,688 | | |
| | 750 | | | Six Flags Entertainment Corp., Rule 144A,
Company Guaranteed Notes
(Callable 07/31/19 @ 103.66)(1) | | (BB-, B2) | | 07/31/24 | | | 4.875 | | | | 773,437 | | |
| | | 1,038,125 | | |
| Restaurants (1.6%) | |
| | 1,015 | | | Golden Nugget, Inc., Rule 144A,
Senior Unsecured Notes
(Callable 10/15/19 @ 103.38)(1) | | (CCC+, B3) | | 10/15/24 | | | 6.750 | | | | 1,035,300 | | |
| | 1,100 | | | New Red Finance, Inc., Rule 144A,
Secured Notes
(Callable 10/15/20 @ 102.50)(1) | | (B-, B3e) | | 10/15/25 | | | 5.000 | | | | 1,126,125 | | |
| | 750 | | | Pizza Hut Holdings LLC, Rule 144A,
Company Guaranteed Notes
(Callable 06/01/22 @ 102.38)(1) | | (BB, B1) | | 06/01/27 | | | 4.750 | | | | 771,562 | | |
| | | 2,932,987 | | |
| Software - Services (2.0%) | |
| | 1,125 | | | CDK Global, Inc., Rule 144A,
Senior Unsecured Notes
(Callable 06/01/22 @ 102.44)(1) | | (BB+, Ba1) | | 06/01/27 | | | 4.875 | | | | 1,175,625 | | |
| | 750 | | | First Data Corp., Rule 144A,
Secured Notes
(Callable 01/15/19 @ 102.88)(1) | | (B, B3) | | 01/15/24 | | | 5.750 | | | | 787,500 | | |
| | 475 | | | Infor Software Parent, Inc.,
7.125% Cash, 7.875% PIK, Rule 144A,
Company Guaranteed Notes
(Callable 12/01/17 @ 103.56)(1),(7) | | (CCC, Caa2) | | 05/01/21 | | | 15.000 | | | | 490,437 | | |
| | 300 | | | j2 Global Co-Obligor, Inc., Rule 144A,
Company Guaranteed Notes
(Callable 07/15/20 @ 104.50)(1) | | (BB, Ba3) | | 07/15/25 | | | 6.000 | | | | 317,250 | | |
| | 255 | | | Syniverse Foreign Holdings Corp., Rule 144A,
Company Guaranteed Notes
(Callable 01/15/19 @ 104.56)(1) | | (B, Caa3) | | 01/15/22 | | | 9.125 | | | | 261,375 | | |
| | 45 | | | Syniverse Holdings, Inc.,
Global Company Guaranteed Notes
(Callable 12/01/17 @ 100.00) | | (CCC+, Caa3) | | 01/15/19 | | | 9.125 | | | | 44,775 | | |
See Accompanying Notes to Financial Statements.
17
Credit Suisse Strategic Income Fund
Schedule of Investments (continued)
October 31, 2017
Par
(000) | |
| | Ratings†
(S&P/Moody's) | | Maturity | | Rate% | | Value | |
| CORPORATE BONDS (continued) | |
Software - Services | |
$ | 655 | | | WEX, Inc., Rule 144A,
Senior Secured Notes
(Callable 02/01/18 @ 102.38)(1) | | (BB-, Ba3) | | 02/01/23 | | | 4.750 | | | $ | 674,650 | | |
| | | 3,751,612 | | |
| Specialty Retail (0.3%) | |
| | 300 | | | Lithia Motors, Inc., Rule 144A,
Company Guaranteed Notes
(Callable 08/01/20 @ 103.94)(1) | | (BB, Ba2) | | 08/01/25 | | | 5.250 | | | | 315,375 | | |
| | 200 | | | Penske Automotive Group, Inc.,
Global Company Guaranteed Notes
(Callable 12/01/17 @ 102.88) | | (B+, B1) | | 10/01/22 | | | 5.750 | | | | 206,439 | | |
| | | 521,814 | | |
| Steel Producers/Products (0.6%) | |
| | 750 | | | Commercial Metals Co.,
Senior Unsecured Notes
(Callable 07/15/22 @ 102.69) | | (BB+, Ba2) | | 07/15/27 | | | 5.375 | | | | 776,250 | | |
| | 300 | | | Zekelman Industries, Inc., Rule 144A,
Senior Secured Notes
(Callable 06/15/19 @ 104.94)(1) | | (B, Caa1) | | 06/15/23 | | | 9.875 | | | | 339,750 | | |
| | | 1,116,000 | | |
| Support - Services (2.8%) | |
| | 548 | | | AECOM,
Global Company Guaranteed Notes
(Callable 12/15/26 @ 100.00) | | (BB, Ba3) | | 03/15/27 | | | 5.125 | | | | 565,125 | | |
| | 600 | | | Avison Young Canada, Inc., Rule 144A,
Senior Secured Notes
(Callable 12/15/19 @ 104.75)(1) | | (B+, B3) | | 12/15/21 | | | 9.500 | | | | 611,850 | | |
| | 425 | | | Conduent Business Services LLC, Rule 144A,
Company Guaranteed Notes
(Callable 12/15/20 @ 105.25)(1) | | (B+, B2) | | 12/15/24 | | | 10.500 | | | | 501,500 | | |
| | 775 | | | Gartner, Inc., Rule 144A,
Company Guaranteed Notes
(Callable 04/01/20 @ 103.84)(1) | | (BB-, B1) | | 04/01/25 | | | 5.125 | | | | 821,500 | | |
| | 1,041 | | | KAR Auction Services, Inc., Rule 144A,
Company Guaranteed Notes
(Callable 06/01/20 @ 103.84)(1) | | (B, B3) | | 06/01/25 | | | 5.125 | | | | 1,080,037 | | |
| | 750 | | | Tempo Acquisition Finance Corp., Rule 144A,
Senior Unsecured Notes
(Callable 06/01/20 @ 103.38)(1) | | (CCC+, Caa1) | | 06/01/25 | | | 6.750 | | | | 761,250 | | |
| | 850 | | | United Rentals North America, Inc.,
Company Guaranteed Notes
(Callable 10/15/20 @ 102.31) | | (BB-, Ba3) | | 10/15/25 | | | 4.625 | | | | 871,803 | | |
| | | 5,213,065 | | |
See Accompanying Notes to Financial Statements.
18
Credit Suisse Strategic Income Fund
Schedule of Investments (continued)
October 31, 2017
Par
(000) | |
| | Ratings†
(S&P/Moody's) | | Maturity | | Rate% | | Value | |
| CORPORATE BONDS (continued) | |
| Tech Hardware & Equipment (0.5%) | |
$ | 750 | | | CommScope Technologies LLC, Rule 144A,
Company Guaranteed Notes
(Callable 03/15/22 @ 102.50)(1) | | (BB-, Ba3) | | 03/15/27 | | | 5.000 | | | $ | 732,188 | | |
| | 250 | | | Western Digital Corp., Rule 144A,
Senior Secured Notes
(Callable 04/01/19 @ 103.69)(1) | | (BBB-, Ba1) | | 04/01/23 | | | 7.375 | | | | 274,375 | | |
| | | 1,006,563 | | |
| Telecom - Wireline Integrated & Services (1.5%) | |
| | 200 | | | Equinix, Inc.,
Senior Unsecured Notes
(Callable 05/15/22 @ 102.69) | | (BB+, B1) | | 05/15/27 | | | 5.375 | | | | 214,750 | | |
| | 1,125 | | | GTT Communications, Inc., Rule 144A,
Company Guaranteed Notes
(Callable 12/31/19 @ 105.91)(1) | | (CCC+, Caa1) | | 12/31/24 | | | 7.875 | | | | 1,202,344 | | |
| | 1,250 | | | Zayo Capital, Inc., Rule 144A,
Company Guaranteed Notes
(Callable 01/15/22 @ 102.88)(1) | | (B, B3) | | 01/15/27 | | | 5.750 | | | | 1,320,312 | | |
| | | 2,737,406 | | |
| Theaters & Entertainment (1.1%) | |
| | 750 | | | AMC Entertainment Holdings, Inc.,
Global Company Guaranteed Notes
(Callable 05/15/22 @ 103.06) | | (B+, B2) | | 05/15/27 | | | 6.125 | | | | 746,250 | | |
| | 750 | | | Carmike Cinemas, Inc., Rule 144A,
Secured Notes
(Callable 06/15/18 @ 104.50)(1) | | (BB, Ba1) | | 06/15/23 | | | 6.000 | | | | 798,750 | | |
| | 500 | | | Live Nation Entertainment, Inc., Rule 144A,
Company Guaranteed Notes
(Callable 11/01/19 @ 103.66)(1) | | (B+, B1) | | 11/01/24 | | | 4.875 | | | | 518,585 | | |
| | | 2,063,585 | | |
| Wireless Telecommunication Services (0.5%) | |
| | 900 | | | Wind Tre SpA, Rule 144A,
Company Guaranteed Notes
(Callable 11/03/20 @ 102.50)(1) | | (BB-, B1) | | 01/20/26 | | | 5.000 | | | | 906,970 | | |
| TOTAL CORPORATE BONDS (Cost $77,521,207) | | | 77,407,223 | | |
| BANK LOANS (47.4%) | |
| Aerospace & Defense (0.7%) | |
| | 925 | | | Avolon TLB Borrower 1 (Luxembourg) Sarl,
LIBOR 1M + 2.250%(8) | | (BBB-, Ba1) | | 04/03/22 | | | 3.488 | | | | 933,751 | | |
| | 354 | | | Sequa Mezzanine Holdings LLC,
LIBOR 3M + 5.500%(8) | | (B-, B3) | | 11/28/21 | | | 6.874 | | | | 357,317 | | |
| | | 1,291,068 | | |
See Accompanying Notes to Financial Statements.
19
Credit Suisse Strategic Income Fund
Schedule of Investments (continued)
October 31, 2017
Par
(000) | |
| | Ratings†
(S&P/Moody's) | | Maturity | | Rate% | | Value | |
| BANK LOANS (continued) | |
| Auto Parts & Equipment (1.1%) | |
$ | 998 | | | Dayco Products LLC, LIBOR 3M + 5.000%(5),(8) | | (B, B2) | | 05/19/23 | | | 6.317 | | | $ | 1,007,475 | | |
| | 997 | | | Superior Industries International, Inc.,
LIBOR 1M + 4.500%(8) | | (B, B1) | | 05/22/24 | | | 5.739 | | | | 1,004,914 | | |
| | | 2,012,389 | | |
| Banking (0.4%) | |
| | 744 | | | NXT Capital, Inc., LIBOR 1M + 4.500%(5),(8) | | (BB-, B1) | | 11/22/22 | | | 5.750 | | | | 755,541 | | |
| Building & Construction (0.3%) | |
| | 468 | | | Beacon Roofing Supply, Inc.(9) | | (BB+, B1) | | 08/23/24 | | | 2.250 | | | | 472,172 | | |
| Building Materials (1.0%) | |
| | 690 | | | Morsco, Inc., LIBOR 1M + 7.000%(8) | | (B+, B3) | | 10/31/23 | | | 8.242 | | | | 698,177 | | |
| | 1,039 | | | Priso Acquisition Corp., LIBOR 1M + 3.000%(8) | | (B, B2) | | 05/08/22 | | | 4.242 | | | | 1,045,973 | | |
| | | 1,744,150 | | |
| Cable & Satellite TV (0.7%) | |
| | 498 | | | Radiate Holdco LLC, LIBOR 1M + 3.000%(8) | | (B, B1) | | 02/01/24 | | | 4.242 | | | | 493,182 | | |
| | 750 | | | Telenet Financing USD LLC,
LIBOR 1M + 2.750%(8) | | (BB-, Ba3) | | 06/30/25 | | | 3.989 | | | | 754,061 | | |
| | | 1,247,243 | | |
| Chemicals (3.6%) | |
| | 423 | | | Allnex (Luxembourg) & Cy S.C.A.,
LIBOR 3M + 3.250%(8) | | (B, B1) | | 09/13/23 | | | 4.567 | | | | 426,906 | | |
| | 319 | | | Allnex U.S.A., Inc., LIBOR 3M + 3.250%(8) | | (B, B1) | | 09/13/23 | | | 4.567 | | | | 321,627 | | |
| | 429 | | | Colouroz Investment 2 LLC,
LIBOR 3M + 7.250%(8) | | (CCC+, Caa1) | | 09/06/22 | | | 8.615 | | | | 418,889 | | |
| | 1,000 | | | Minerals Technologies, Inc.(5),(9) | | (BB+, Ba2) | | 05/09/21 | | | 4.750 | | | | 1,013,750 | | |
| | 990 | | | Pinnacle Operating Corp., LIBOR 1M + 3.750%(8) | | (NR, Caa1) | | 11/15/18 | | | 4.992 | | | | 925,311 | | |
| | 1,006 | | | Preferred Proppants LLC,
LIBOR 1M + 7.750%(4),(5),(8) | | (CCC, Caa2) | | 07/27/20 | | | 9.083 | | | | 945,868 | | |
| | 594 | | | Solenis International LP, LIBOR 3M + 6.750%(8) | | (B-, Caa1) | | 07/31/22 | | | 8.067 | | | | 588,855 | | |
| | 750 | | | Vantage Specialty Chemicals, Inc.(9) | | (B-, B3) | | 10/05/24 | | | 4.000 | | | | 758,280 | | |
| | 205 | | | Vantage Specialty Chemicals, Inc.,
LIBOR 3M + 8.250%(8) | | (CCC, Caa2) | | 10/05/25 | | | 8.250 | | | | 205,578 | | |
| | 1,000 | | | Zep, Inc., LIBOR 3M + 4.000%(8) | | (B-, B2) | | 08/12/24 | | | 5.380 | | | | 1,012,190 | | |
| | | 6,617,254 | | |
| Diversified Capital Goods (3.1%) | |
| | 1,000 | | | Cortes NP Acquisition Corp.,
LIBOR 1M + 4.000%(8) | | (B+, Ba3) | | 11/30/23 | | | 5.689 | | | | 1,009,380 | | |
| | 667 | | | Douglas Dynamics Holdings, Inc.,
LIBOR 1M + 3.000%(8) | | (BB-, B2) | | 12/31/21 | | | 4.250 | | | | 671,547 | | |
| | 996 | | | Dynacast International LLC,
LIBOR 3M + 3.250%(8) | | (B, B1) | | 01/28/22 | | | 4.583 | | | | 1,006,446 | | |
| | 629 | | | Electrical Components International, Inc.,
LIBOR 3M + 4.750%(8) | | (B, B1) | | 05/28/21 | | | 6.085 | | | | 634,612 | | |
See Accompanying Notes to Financial Statements.
20
Credit Suisse Strategic Income Fund
Schedule of Investments (continued)
October 31, 2017
Par
(000) | |
| | Ratings†
(S&P/Moody's) | | Maturity | | Rate% | | Value | |
| BANK LOANS (continued) | |
Diversified Capital Goods | |
$ | 500 | | | Element Materials Technology Group
U.S. Holdings, Inc., LIBOR 3M + 3.500%(8) | | (B, B1) | | 06/28/24 | | | 4.833 | | | $ | 507,500 | | |
| | 1,000 | | | Hayward Industries, Inc., LIBOR 1M + 3.500%(8) | | (B, B3) | | 08/05/24 | | | 4.742 | | | | 1,010,625 | | |
| | 750 | | | Thermon Industries, Inc.,
LIBOR 6M + 6.500%(5),(8) | | (B+, B2) | | 10/24/24 | | | 3.750 | | | | 755,625 | | |
| | | 5,595,735 | | |
| Electronics (1.9%) | |
| | 500 | | | CPI International, Inc., LIBOR 1M + 3.500%(8) | | (B, B2) | | 07/26/24 | | | 4.742 | | | | 502,918 | | |
| | 500 | | | CPI International, Inc., LIBOR 1M + 7.250%(5),(8) | | (CCC+, Caa2) | | 07/26/25 | | | 8.492 | | | | 503,125 | | |
| | 748 | | | M/A-COM Technology Solutions Holdings, Inc.,
LIBOR 1M + 2.250%(8) | | (B+, Ba3) | | 05/17/24 | | | 3.489 | | | | 749,528 | | |
| | 996 | | | Oberthur Technologies S.A.,
LIBOR 3M + 3.750%(8) | | (B-, B2) | | 01/10/24 | | | 5.083 | | | | 980,380 | | |
| | 315 | | | Seattle Spinco, Inc., LIBOR 3M + 2.750%(8) | | (BB-, B1) | | 06/21/24 | | | 3.988 | | | | 316,464 | | |
| | 499 | | | Tempo Acquisition LLC, LIBOR 1M + 3.000%(8) | | (B, B1) | | 05/01/24 | | | 4.242 | | | | 501,089 | | |
| | | 3,553,504 | | |
| Energy - Exploration & Production (0.5%) | |
| | 1,000 | | | Chief Exploration & Development LLC,
LIBOR 3M + 6.500%(4),(8) | | (NR, NR) | | 05/16/21 | | | 7.959 | | | | 985,000 | | |
| Food - Wholesale (0.6%) | |
| | 500 | | | AI Aqua Merger Sub, Inc., LIBOR 1M + 3.500%(8) | | (B, B2) | | 12/13/23 | | | 4.742 | | | | 502,707 | | |
| | 500 | | | American Seafoods Group LLC,
LIBOR 3M + 3.250%(5),(8) | | (BB-, B1) | | 08/21/23 | | | 4.572 | | | | 506,875 | | |
| | | 1,009,582 | | |
| Forestry & Paper (0.6%) | |
| | 840 | | | Proampac PG Borrower LLC,
LIBOR 1M + 4.000%(8) | | (B, B2) | | 11/18/23 | | | 5.295 | | | | 849,418 | | |
| | 250 | | | Proampac PG Borrower LLC,
LIBOR 3M + 8.500%(8) | | (CCC+, Caa2) | | 11/18/24 | | | 9.816 | | | | 254,375 | | |
| | | 1,103,793 | | |
| Gaming (2.3%) | |
| | 748 | | | Caesars Entertainment Resort Properties LLC,
LIBOR 1M + 3.500%(8) | | (BB, B1) | | 10/11/20 | | | 4.742 | | | | 749,527 | | |
| | 1,000 | | | CBAC Borrower LLC, LIBOR 1M + 4.000%(8) | | (B, B3) | | 06/28/24 | | | 5.242 | | | | 1,012,970 | | |
| | 748 | | | Cyan Blue Holdco 3 Ltd., LIBOR 3M + 3.500%(8) | | (B, B2) | | 07/26/24 | | | 4.833 | | | | 754,361 | | |
| | 748 | | | Gateway Casinos & Entertainment Ltd.,
LIBOR 3M + 3.750%(8) | | (BB-, Ba3) | | 02/22/23 | | | 5.083 | | | | 760,398 | | |
| | 997 | | | MGM Growth Properties Operating Partnership LP,
LIBOR 1M + 2.250%(8) | | (BB+, Ba3) | | 04/25/23 | | | 3.492 | | | | 1,004,236 | | |
| | | 4,281,492 | | |
See Accompanying Notes to Financial Statements.
21
Credit Suisse Strategic Income Fund
Schedule of Investments (continued)
October 31, 2017
Par
(000) | |
| | Ratings†
(S&P/Moody's) | | Maturity | | Rate% | | Value | |
| BANK LOANS (continued) | |
| Gas Distribution (0.8%) | |
$ | 717 | | | BCP Renaissance Parent LLC,
LIBOR 3M + 4.000%(8) | | (B+, B1) | | 10/31/24 | | | 5.380 | | | $ | 726,308 | | |
| | 778 | | | Traverse Midstream Partners LLC,
LIBOR 3M + 4.000%(8) | | (B+, B1) | | 09/27/24 | | | 5.330 | | | | 789,609 | | |
| | | 1,515,917 | | |
| Health Facility (0.3%) | |
| | 625 | | | Western Dental Services, Inc.,
LIBOR 1M + 5.250%(8) | | (B-, B3) | | 06/23/23 | | | 6.492 | | | | 629,402 | | |
| Health Services (1.6%) | |
| | 433 | | | Onex Carestream Finance LP,
LIBOR 3M + 4.000%(8) | | (B+, B1) | | 06/07/19 | | | 5.333 | | | | 434,388 | | |
| | 996 | | | Prospect Medical Holdings, Inc.,
LIBOR 6M + 6.000%(5),(8) | | (B, Ba3) | | 06/30/22 | | | 7.500 | | | | 1,007,426 | | |
| | 996 | | | Team Health Holdings, Inc.,
LIBOR 1M + 2.750%(8) | | (B, B1) | | 02/06/24 | | | 3.992 | | | | 990,020 | | |
| | 369 | | | Valitas Health Services, Inc.,
LIBOR 3M + 3.646%(4),(5),(8) | | (NR, NR) | | 04/14/22 | | | 5.000 | | | | 184,273 | | |
| | 131 | | | Valitas Health Services, Inc.,
LIBOR 3M + 12.000%(4),(5),(8) | | (NR, NR) | | 12/31/19 | | | 13.312 | | | | 124,618 | | |
| | 157 | | | Valitas Health Services, Inc.,
LIBOR 3M + 12.000%(4),(5),(8) | | (NR, NR) | | 12/31/19 | | | 13.354 | | | | 149,542 | | |
| | | 2,890,267 | | |
| Insurance Brokerage (1.8%) | |
| | 1,081 | | | Acrisure LLC, LIBOR 2M + 5.000%(8) | | (B, B2) | | 11/22/23 | | | 6.272 | | | | 1,087,732 | | |
| | 746 | | | Alliant Holdings I, Inc., LIBOR 1M + 3.250%(8) | | (B, B2) | | 08/12/22 | | | 4.490 | | | | 752,756 | | |
| | 687 | | | AssuredPartners, Inc., LIBOR 1M + 3.500%(8) | | (B, B2) | | 10/22/24 | | | 4.742 | | | | 696,106 | | |
| | 815 | | | NFP Corp., LIBOR 1M + 3.500%(8) | | (B, B2) | | 01/08/24 | | | 4.742 | | | | 824,207 | | |
| | | 3,360,801 | | |
| Investments & Misc. Financial Services (1.6%) | |
| | 488 | | | Focus Financial Partners LLC,
LIBOR 3M + 3.250%(5),(8) | | (B+, Ba3) | | 07/03/24 | | | 4.574 | | | | 494,196 | | |
| | 741 | | | Freedom Mortgage Corp., LIBOR 6M + 5.500%(8) | | (B+, B1) | | 02/23/22 | | | 6.956 | | | | 754,512 | | |
| | 1,049 | | | Liquidnet Holdings, Inc., LIBOR 1M + 4.250%(5),(8) | | (B+, B1) | | 07/15/24 | | | 5.492 | | | | 1,055,776 | | |
| | 720 | | | Walter Investment Management Corp.,
LIBOR 1M + 3.750%(8) | | (CCC-, Caa2) | | 12/18/20 | | | 4.992 | | | | 681,559 | | |
| | | 2,986,043 | | |
| Machinery (1.5%) | |
| | 750 | | | Anvil International LLC, LIBOR 3M + 4.500%(8) | | (B, B2) | | 08/01/24 | | | 5.820 | | | | 757,031 | | |
| | 500 | | | CPM Acquisition Corp., LIBOR 1M + 8.250%(5),(8) | | (B-, Caa1) | | 04/10/23 | | | 9.492 | | | | 512,500 | | |
| | 735 | | | CPM Holdings, Inc., LIBOR 1M + 4.250%(8) | | (B, B1) | | 04/11/22 | | | 5.492 | | | | 745,301 | | |
| | 748 | | | Penn Engineering & Manufacturing Corp.,
LIBOR 1M + 2.750%(5),(8) | | (BB-, B1) | | 06/27/24 | | | 3.992 | | | | 754,204 | | |
| | | 2,769,036 | | |
See Accompanying Notes to Financial Statements.
22
Credit Suisse Strategic Income Fund
Schedule of Investments (continued)
October 31, 2017
Par
(000) | |
| | Ratings†
(S&P/Moody's) | | Maturity | | Rate% | | Value | |
| BANK LOANS (continued) | |
| Media - Diversified (0.6%) | |
$ | 1,000 | | | Cast & Crew Payroll LLC, LIBOR 3M + 3.000%(8) | | (B+, B2) | | 09/26/24 | | | 4.333 | | | $ | 1,007,815 | | |
| Media Content (0.6%) | |
| | 1,000 | | | DLG Acquisitions Ltd.,
EURIBOR 6M + 7.250%(6),(8) | | (CCC+, Caa2) | | 06/30/22 | | | 8.250 | | | | 1,174,415 | | |
| Medical Products (1.2%) | |
| | 1,084 | | | ABB Concise Optical Group LLC,
LIBOR 3M + 5.000%(8) | | (B-, B2) | | 06/15/23 | | | 6.320 | | | | 1,095,819 | | |
| | 1,000 | | | Avantor, Inc., LIBOR 3M + 4.000%(8) | | (B, B2) | | 09/07/24 | | | 5.240 | | | | 1,006,695 | | |
| | | 2,102,514 | | |
| Metals & Mining - Excluding Steel (0.0%) | |
| | 248 | | | Noranda Aluminum Acquisition Corp.,
Prime + 3.500%(2),(8) | | (NR, NR) | | 02/28/19 | | | 7.250 | | | | 9,291 | | |
| Non - Electric Utilities (0.4%) | |
| | 748 | | | BCP Raptor LLC, LIBOR 1W + 4.250%(8) | | (B+, B3) | | 06/24/24 | | | 5.522 | | | | 758,060 | | |
| Oil Refining & Marketing (0.4%) | |
| | 965 | | | Philadelphia Energy Solutions LLC,
LIBOR 3M + 5.000%(4),(8) | | (CCC-, B3) | | 04/04/18 | | | 6.333 | | | | 742,778 | | |
| Packaging (0.4%) | |
| | 729 | | | Flex Acquisition Co., Inc., LIBOR 3M + 3.000%(8) | | (B, B1) | | 12/29/23 | | | 4.335 | | | | 735,453 | | |
| Personal & Household Products (1.1%) | |
| | 500 | | | ABG Intermediate Holdings 2 LLC,
LIBOR 3M + 7.750%(8) | | (CCC+, Caa1) | | 09/29/25 | | | 9.083 | | | | 506,875 | | |
| | 498 | | | Comfort Holding LLC, LIBOR 1M + 4.750%(8) | | (CCC+, B3) | | 02/05/24 | | | 5.988 | | | | 454,591 | | |
| | 634 | | | Comfort Holding LLC, LIBOR 1M + 10.000%(8) | | (CCC-, Caa2) | | 02/03/25 | | | 11.238 | | | | 516,482 | | |
| | 497 | | | Serta Simmons Bedding LLC,
LIBOR 3M + 3.500%(8) | | (B, B1) | | 11/08/23 | | | 4.830 | | | | 491,432 | | |
| | | 1,969,380 | | |
| Pharmaceuticals (2.0%) | |
| | 426 | | | Alvogen Pharma U.S., Inc., LIBOR 1M + 5.000%(8) | | (B, B3) | | 04/02/22 | | | 6.240 | | | | 423,461 | | |
| | 891 | | | Endo Luxembourg Finance Co. I Sarl,
LIBOR 1M + 4.250%(8) | | (BB-, Ba2) | | 04/29/24 | | | 5.500 | | | | 903,873 | | |
| | 990 | | | Explorer Holdings, Inc., LIBOR 3M + 3.750%(8) | | (B, B1) | | 05/02/23 | | | 5.130 | | | | 1,000,304 | | |
| | 490 | | | PharMerica Corp.(9) | | (B, B1) | | 09/26/24 | | | 5.000 | | | | 493,879 | | |
| | 500 | | | PharMerica Corp.(9) | | (CCC+, Caa1) | | 09/26/25 | | | 9.240 | | | | 505,625 | | |
| | 379 | | | Valeant Pharmaceuticals International, Inc.,
LIBOR 1M + 4.750%(8) | | (BB-, Ba3) | | 04/01/22 | | | 5.990 | | | | 388,142 | | |
| | | 3,715,284 | | |
| Real Estate Development & Management (0.3%) | |
| | 463 | | | Capital Automotive LP, LIBOR 1M + 6.000%(5),(8) | | (CCC+, NR) | | 03/24/25 | | | 7.250 | | | | 477,208 | | |
See Accompanying Notes to Financial Statements.
23
Credit Suisse Strategic Income Fund
Schedule of Investments (continued)
October 31, 2017
Par
(000) | |
| | Ratings†
(S&P/Moody's) | | Maturity | | Rate% | | Value | |
| BANK LOANS (continued) | |
| Real Estate Investment Trusts (0.3%) | |
$ | 496 | | | Quality Care Properties, Inc.,
LIBOR 1M + 5.250%(8) | | (B+, Caa1) | | 10/31/22 | | | 6.492 | | | $ | 500,905 | | |
| Recreation & Travel (0.4%) | |
| | 746 | | | BC Equity Ventures LLC, LIBOR 1M + 6.500%(5),(8) | | (B, B3) | | 08/31/22 | | | 7.750 | | | | 757,415 | | |
| Restaurants (0.6%) | |
| | 997 | | | Golden Nugget, Inc., LIBOR 2M + 3.250%(8) | | (B+, Ba3) | | 10/04/23 | | | 4.526 | | | | 1,008,910 | | |
| Software - Services (8.1%) | |
| | 1,285 | | | Almonde, Inc., LIBOR 3M + 3.500%(8) | | (B, B2) | | 06/13/24 | | | 4.817 | | | | 1,282,963 | | |
| | 249 | | | Almonde, Inc., LIBOR 3M + 7.250%(8) | | (CCC+, Caa2) | | 06/13/25 | | | 8.567 | | | | 248,416 | | |
| | 396 | | | Aricent Technologies, LIBOR 1M + 4.500%(8) | | (B-, B2) | | 04/14/21 | | | 5.739 | | | | 398,328 | | |
| | 988 | | | Epicor Software Corp., LIBOR 1M + 3.750%(8) | | (B-, B2) | | 06/01/22 | | | 5.000 | | | | 994,704 | | |
| | 555 | | | Evertec Group LLC, LIBOR 1M + 2.500%(8) | | (B+, B1) | | 04/17/20 | | | 3.736 | | | | 540,078 | | |
| | 500 | | | Eze Castle Software, Inc., LIBOR 3M + 6.500%(8) | | (CCC+, Caa1) | | 04/05/21 | | | 7.833 | | | | 501,405 | | |
| | 1,000 | | | Flexera Software LLC, LIBOR 3M + 7.000%(5),(8) | | (B-, Caa1) | | 04/02/21 | | | 8.330 | | | | 1,001,250 | | |
| | 953 | | | Greeneden U.S. Holdings II LLC,
LIBOR 3M + 3.750%(8) | | (B, B2) | | 12/01/23 | | | 5.083 | | | | 960,612 | | |
| | 496 | | | Kronos, Inc., LIBOR 3M + 3.500%(8) | | (B, B2) | | 11/01/23 | | | 4.811 | | | | 500,353 | | |
| | 750 | | | Kronos, Inc., LIBOR 3M + 8.250%(8) | | (CCC, Caa2) | | 11/01/24 | | | 9.561 | | | | 774,960 | | |
| | 735 | | | MA FinanceCo. LLC, LIBOR 1M + 2.500%(8) | | (BB-, B1) | | 11/19/21 | | | 3.742 | | | | 738,341 | | |
| | 47 | | | MA FinanceCo. LLC, LIBOR 1M + 2.750%(8) | | (BB-, B1) | | 06/21/24 | | | 3.989 | | | | 46,861 | | |
| | 1,000 | | | Omnitracs, Inc., LIBOR 3M + 7.750%(8) | | (CCC+, Caa1) | | 05/25/21 | | | 9.090 | | | | 1,004,170 | | |
| | 743 | | | Pinnacle Holdco Sarl, LIBOR 3M + 5.500%(4),(8) | | (CCC, Caa2) | | 07/30/19 | | | 6.840 | | | | 736,337 | | |
| | 1,087 | | | Project Alpha Intermediate Holding, Inc.,
LIBOR 3M + 3.500%(8) | | (B, B3) | | 04/26/24 | | | 5.040 | | | | 1,065,586 | | |
| | 707 | | | Project Ruby Ultimate Parent Corp.,
LIBOR 1M + 3.750%(8) | | (B-, B2) | | 02/09/24 | | | 4.992 | | | | 712,413 | | |
| | 500 | | | QBS Holding Co., Inc., LIBOR 3M + 4.750%(4),(5),(8) | | (B, B3) | | 07/30/21 | | | 6.130 | | | | 496,250 | | |
| | 706 | | | Ramundsen Holdings LLC,
LIBOR 3M + 4.250%(5),(8) | | (B+, B2) | | 02/01/24 | | | 5.583 | | | | 711,334 | | |
| | 898 | | | Synchronoss Technologies, Inc.,
LIBOR 1M + 4.500%(8) | | (BB-, Ba3) | | 01/19/24 | | | 5.742 | | | | 898,494 | | |
| | 750 | | | Syniverse Holdings, Inc., LIBOR 3M + 3.000%(8) | | (B, B3) | | 04/23/19 | | | 4.333 | | | | 732,292 | | |
| | 500 | | | TigerLuxOne Sarl, LIBOR 3M + 8.250%(8) | | (CCC+, Caa2) | | 02/16/25 | | | 9.583 | | | | 497,500 | | |
| | | 14,842,647 | | |
| Specialty Retail (0.8%) | |
| | 495 | | | Mister Car Wash Holdings, Inc.,
LIBOR 3M + 3.750%(8) | | (B-, B1) | | 08/20/21 | | | 5.130 | | | | 497,780 | | |
| | 1,000 | | | Sally Holdings LLC(9) | | (BBB-, Ba1) | | 07/05/24 | | | 4.500 | | | | 1,000,615 | | |
| | | 1,498,395 | | |
| Steel Producers/Products (0.2%) | |
| | 348 | | | Zekelman Industries, Inc., LIBOR 3M + 2.750%(8) | | (BB-, B2) | | 06/14/21 | | | 4.073 | | | | 351,235 | | |
See Accompanying Notes to Financial Statements.
24
Credit Suisse Strategic Income Fund
Schedule of Investments (continued)
October 31, 2017
Par
(000) | |
| | Ratings†
(S&P/Moody's) | | Maturity | | Rate% | | Value | |
| BANK LOANS (continued) | |
| Support - Services (3.1%) | |
$ | 496 | | | BakerCorp International, Inc.,
LIBOR 3M + 3.000%(8) | | (B-, B2) | | 02/07/20 | | | 4.380 | | | $ | 489,198 | | |
| | 998 | | | Brand Energy & Infrastructure Services, Inc.,
LIBOR 3M + 4.250%(8) | | (B, B3) | | 06/21/24 | | | 5.615 | | | | 1,004,981 | | |
| | 995 | | | Change Healthcare Holdings, Inc.,
LIBOR 1M + 2.750%(8) | | (B+, Ba3) | | 03/01/24 | | | 3.992 | | | | 1,001,840 | | |
| | 710 | | | Long Term Care Group, Inc.,
LIBOR 1M + 5.000%(5),(8) | | (B, B3) | | 06/06/20 | | | 6.242 | | | | 706,095 | | |
| | 496 | | | SAI Global Ltd., LIBOR 3M + 4.500%(5),(8) | | (B+, Ba3) | | 12/20/23 | | | 5.833 | | | | 502,453 | | |
| | 93 | | | SGS Cayman LP, LIBOR 3M + 5.375%(5),(8) | | (BB-, Caa1) | | 04/23/21 | | | 6.708 | | | | 89,715 | | |
| | 276 | | | Sprint Industrial Holdings LLC,
LIBOR 3M + 12.250%(4),(8) | | (CC, Caa3) | | 11/14/19 | | | 13.500 | | | | 75,928 | | |
| | 400 | | | Sutherland Global Services, Inc.,
LIBOR 3M + 5.375%(5),(8) | | (BB-, Caa1) | | 04/23/21 | | | 6.708 | | | | 385,412 | | |
| | 718 | | | TriMark U.S.A. LLC, LIBOR 3M + 3.500%(8) | | (B, B3) | | 09/26/24 | | | 4.880 | | | | 726,654 | | |
| | 32 | | | TriMark U.S.A. LLC(9) | | (B, B3) | | 09/26/24 | | | 0.000 | | | | 32,440 | | |
| | 367 | | | USS Ultimate Holdings, Inc.,
LIBOR 3M + 3.750%(8) | | (B+, B2) | | 08/25/24 | | | 4.992 | | | | 371,527 | | |
| | 327 | | | USS Ultimate Holdings, Inc.,
LIBOR 3M + 7.750%(8) | | (CCC+, Caa2) | | 08/25/25 | | | 8.992 | | | | 330,410 | | |
| | | 5,716,653 | | |
| Tech Hardware & Equipment (0.3%) | |
| | 122 | | | Avaya, Inc., LIBOR 1M + 7.500%(8) | | (BB-, NR) | | 01/24/18 | | | 8.741 | | | | 122,789 | | |
| | 395 | | | Western Digital Corp., LIBOR 1M + 2.750%(8) | | (BBB-, Ba1) | | 04/29/23 | | | 3.990 | | | | 397,237 | | |
| | | 520,026 | | |
| Telecom - Wireline Integrated & Services (0.8%) | |
| | 505 | | | Lumos Networks Operating Co.(5),(9) | | (B, B2) | | 10/16/24 | | | 3.250 | | | | 508,366 | | |
| | 495 | | | Lumos Networks Operating Co.(5),(9) | | (B, B2) | | 10/16/24 | | | 3.250 | | | | 496,029 | | |
| | 500 | | | Zayo Group LLC, LIBOR 1M + 2.250%(8) | | (BB, Ba2) | | 01/19/24 | | | 3.489 | | | | 502,607 | | |
| | | 1,507,002 | | |
| Theaters & Entertainment (0.3%) | |
| | 533 | | | William Morris Endeavor Entertainment LLC,
LIBOR 3M + 7.250%(5),(8) | | (B-, Caa1) | | 05/06/22 | | | 8.630 | | | | 537,333 | | |
| Transport Infrastructure/Services (0.2%) | |
| | 300 | | | OSG Bulk Ships, Inc., LIBOR 3M + 4.250%(8) | | (BB-, B2) | | 08/05/19 | | | 5.570 | | | | 290,625 | | |
| Trucking & Delivery (0.9%) | |
| | 745 | | | International Seaways, Inc.,
LIBOR 1M + 5.500%(5),(8) | | (BB-, B3) | | 06/22/22 | | | 6.750 | | | | 751,834 | | |
| | 975 | | | Navios Maritime Partners LP,
LIBOR 3M + 5.000%(8) | | (B+, B3) | | 09/14/20 | | | 6.320 | | | | 974,089 | | |
| | | 1,725,923 | | |
| TOTAL BANK LOANS (Cost $86,766,037) | | | 86,769,656 | | |
See Accompanying Notes to Financial Statements.
25
Credit Suisse Strategic Income Fund
Schedule of Investments (continued)
October 31, 2017
Par
(000) | |
| | Ratings†
(S&P/Moody's) | | Maturity | | Rate% | | Value | |
| ASSET BACKED SECURITIES (2.2%) | | | |
| Collateralized Debt Obligations (2.2%) | |
$ | 500 | | | Apidos CLO XIX, 2014-19A, Rule 144A,
LIBOR 3M + 5.450%(1),(8) | | (NR, Ba3) | | 10/17/26 | | | 6.803 | | | $ | 501,131 | | |
| | 750 | | | Carlyle Global Market Strategies CLO Ltd.,
2014-3A, Rule 144A, LIBOR 3M + 5.750%(1),(8) | | (NR, Ba2) | | 07/27/26 | | | 7.124 | | | | 752,529 | | |
| | 500 | | | Carlyle U.S. CLO Ltd., 2017-2A,
Rule 144A(1),(4),(5),(9),(10) | | (NR, NR) | | 07/20/31 | | | 0.000 | | | | 447,826 | | |
| | 500 | | | Halcyon Loan Advisors Funding Ltd., 2015-2A,
Rule 144A(1),(4),(9),(10) | | (NR, NR) | | 07/25/27 | | | 0.000 | | | | 266,182 | | |
| | 500 | | | JFIN CLO Ltd., 2013-1A, Rule 144A,
LIBOR 3M + 4.750%(1),(8) | | (BB, NR) | | 01/20/25 | | | 6.113 | | | | 496,607 | | |
| | 400 | | | Stewart Park CLO Ltd., 2015-1A,
Rule 144A(1),(4),(9),(10) | | (NR, NR) | | 04/15/26 | | | 0.000 | | | | 301,649 | | |
| | 750 | | | Vibrant CLO IV Ltd., 2016-4A, Rule 144A,
LIBOR 3M + 6.750%(1),(5),(8) | | (NR, Ba3) | | 07/20/28 | | | 8.113 | | | | 762,141 | | |
| | 500 | | | Vibrant CLO V Ltd., 2016-5A, Rule 144A,
LIBOR 3M + 7.000%(1),(8) | | (NR, Ba3) | | 01/20/29 | | | 8.363 | | | | 514,455 | | |
| TOTAL ASSET BACKED SECURITIES (Cost $4,239,717) | | | 4,042,520 | | |
Number of
Shares | |
| |
| |
| |
| |
| |
| COMMON STOCKS (0.5%) | | | |
| Auto Parts & Equipment (0.2%) | |
| | 23,014 | | | UCI International, Inc.(3),(4),(5),(11) | | | | | | | | | | | | | | | 408,499 | | |
| Building & Construction (0.0%) | |
| | 2 | | | White Forest Resources, Inc.(3),(4),(5),(11) | | | | | | | | | | | | | | | 25 | | |
| Building Materials (0.1%) | |
| | 2,935 | | | Euramax International, Inc.(5),(11) | | | | | | | | | | | | | | | 234,792 | | |
| Consumer Products (0.2%) | |
| | 2,027 | | | Natural Products Group(4),(5),(11) | | | | | | | | | | | | | | | 293,930 | | |
| Health Services (0.0%) | |
| | 32,987 | | | Valitas Health Services, Inc.(3),(5) | | | | | | | | | | | | | | | 32,987 | | |
| Oil Field Equipment & Services (0.0%) | |
| | 2 | | | Sidewinder Drilling, Inc., Series A(3),(4),(5) | | | | | | | | | | | | | | | 38,479 | | |
| Support - Services (0.0%) | |
| | 87 | | | Sprint Industrial Holdings LLC, Class G(3),(5),(11) | | | | | | | | | | | | | | | 1 | | |
| | 8 | | | Sprint Industrial Holdings LLC, Class H(3),(5),(11) | | | | | | | | | | | | | | | — | | |
| | 19 | | | Sprint Industrial Holdings LLC, Class I(3),(5),(11) | | | | | | | | | | | | | | | — | | |
| | | 1 | | |
| TOTAL COMMON STOCKS (Cost $1,124,336) | | | 1,008,713 | | |
See Accompanying Notes to Financial Statements.
26
Credit Suisse Strategic Income Fund
Schedule of Investments (continued)
October 31, 2017
Number of
Shares | |
| |
| |
| |
| |
Value | |
MUTUAL FUNDS (0.1%) | | | |
| Commingled Funds (0.1%) | |
| | 4,623 | | | BlackRock Floating Rate Income Strategies Fund, Inc. | | | | | | | | | | | | | | $ | 66,155 | | |
| | 2,300 | | | Eaton Vance Floating-Rate Income Trust | | | | | | | | | | | | | | | 33,327 | | |
| TOTAL MUTUAL FUNDS (Cost $101,102) | | | 99,482 | | |
Par
(000) | |
| |
| | Maturity | | Rate% | | | |
| SHORT-TERM INVESTMENTS (10.0%) | | | |
$ | 18,303 | | | State Street Bank and Trust Co. Euro Time Deposit
(Cost $18,302,800) | | | | | | 11/01/17 | | | 0.120 | | | | 18,302,800 | | |
| TOTAL INVESTMENTS AT VALUE (102.5%) (Cost $188,055,199) | | | 187,630,394 | | |
| LIABILITIES IN EXCESS OF OTHER ASSETS (-2.5%) | | | (4,653,285 | ) | |
| NET ASSETS (100.0%) | | $ | 182,977,109 | | |
† Credit ratings given by the Standard & Poor's Division of The McGraw-Hill Companies, Inc. ("S&P") and Moody's Investors Service, Inc. ("Moody's") are unaudited.
(1) Security exempt from registration under Rule 144A of the Securities Act of 1933, as amended. These securities may be resold in transactions exempt from registration, normally to qualified institutional buyers. At October 31, 2017, these securities amounted to a value of $66,405,263 or 36.3% of net assets.
(2) Bond is currently in default.
(3) Not readily marketable security; security is valued at fair value as determined in good faith by, or under the direction of, the Board of Trustees.
(4) Illiquid security (unaudited).
(5) Security is valued using significant unobservable inputs.
(6) This security is denominated in Euro.
(7) PIK: Payment-in-kind security for which part of the income earned may be paid as additional principal.
(8) Variable rate obligation — The interest rate shown is the rate in effect as of October 31, 2017.
(9) The rates on certain variable rate securities are not based on a published reference rate and spread but are determined by the issuer or agent and are based on current market conditions. These securities do not indicate a reference rate and spread in their description above. The interest rate shown is the rate in effect as of October 31, 2017.
(10) Zero-coupon security.
(11) Non-income producing security.
INVESTMENT ABBREVIATIONS
3M = 3 Month
1M = 1 Month
1W = 1 Week
EURIBOR = Euro Interbank Offered Rate
LIBOR = London Interbank Offered Rate
NR = Not Rated
See Accompanying Notes to Financial Statements.
27
Credit Suisse Strategic Income Fund
Schedule of Investments (continued)
October 31, 2017
Forward Foreign Currency Contracts | |
Forward
Currency to be
Purchased (Local) | | Forward
Currency to be
Sold (Local) | | Expiration
Date | | Counterparty | | Value on
Settlement Date | | Current
Value/
Notional | | Net Unrealized
Appreciation
(Depreciation) | |
GBP | 400,000 | | | USD | 536,525 | | | 10/12/18 | | Morgan Stanley | | $ | 536,525 | | | $ | 536,938 | | | $ | 413 | | |
USD | 208,726 | | | EUR | 187,600 | | | 12/15/17 | | Morgan Stanley | | | (208,726 | ) | | | (219,073 | ) | | | (10,347 | ) | |
USD | 3,450,749 | | | EUR | 2,858,000 | | | 10/12/18 | | Morgan Stanley | | | (3,450,749 | ) | | | (3,402,340 | ) | | | 48,409 | | |
USD | 531,832 | | | GBP | 400,000 | | | 10/12/18 | | Morgan Stanley | | | (531,832 | ) | | | (536,938 | ) | | | (5,106 | ) | |
| | $ | 33,369 | | |
Currency Abbreviations:
EUR = Euro
GBP = British Pound
USD = United States Dollar
See Accompanying Notes to Financial Statements.
28
Credit Suisse Strategic Income Fund
Statement of Assets and Liabilities
October 31, 2017
Assets | |
Investments at value (Cost $188,055,199) (Note 2) | | $ | 187,630,394 | | |
Cash | | | 50,000 | | |
Foreign currency at value (Cost $1,805,773) | | | 1,778,581 | | |
Interest receivable | | | 1,656,640 | | |
Receivable for Fund shares sold | | | 1,374,520 | | |
Receivable for investments sold | | | 1,355,217 | | |
Unrealized appreciation on forward foreign currency contracts (Note 2) | | | 48,822 | | |
Prepaid expenses | | | 41,231 | | |
Total assets | | | 193,935,405 | | |
Liabilities | |
Investment advisory fee payable (Note 3) | | | 20,625 | | |
Administrative services fee payable (Note 3) | | | 19,835 | | |
Shareholder servicing/Distribution fee payable (Note 3) | | | 33,300 | | |
Payable for investments purchased | | | 10,380,536 | | |
Payable for Fund shares redeemed | | | 259,062 | | |
Dividend payable | | | 76,199 | | |
Unrealized depreciation on forward foreign currency contracts (Note 2) | | | 15,453 | | |
Trustees' fee payable | | | 15,157 | | |
Accrued expenses | | | 138,129 | | |
Total liabilities | | | 10,958,296 | | |
Net Assets | |
Capital stock, $.001 par value (Note 6) | | | 17,870 | | |
Paid-in capital (Note 6) | | | 189,778,834 | | |
Distributions in excess of net investment income | | | (171,968 | ) | |
Accumulated net realized loss from investments, foreign currency transactions and forward foreign
currency contracts | | | (6,228,837 | ) | |
Net unrealized depreciation from investments, foreign currency translations and forward foreign
currency contracts | | | (418,790 | ) | |
Net assets | | $ | 182,977,109 | | |
I Shares | |
Net assets | | $ | 114,604,510 | | |
Shares outstanding | | | 11,194,306 | | |
Net asset value, offering price and redemption price per share | | $ | 10.24 | | |
A Shares | |
Net assets | | $ | 36,961,127 | | |
Shares outstanding | | | 3,609,025 | | |
Net asset value and redemption price per share | | $ | 10.24 | | |
Maximum offering price per share (net asset value/(1-4.75%)) | | $ | 10.75 | | |
C Shares | |
Net assets | | $ | 31,411,472 | | |
Shares outstanding | | | 3,066,494 | | |
Net asset value and offering price per share | | $ | 10.24 | | |
See Accompanying Notes to Financial Statements.
29
Credit Suisse Strategic Income Fund
Statement of Operations
For the Year Ended October 31, 2017
Investment Income | |
Interest | | $ | 8,011,302 | | |
Dividends | | | 5,693 | | |
Total investment income | | | 8,016,995 | | |
Expenses | |
Investment advisory fees (Note 3) | | | 1,067,031 | | |
Administrative services fees (Note 3) | | | 53,551 | | |
Shareholder servicing/Distribution fees (Note 3) | |
Class A | | | 67,239 | | |
Class C | | | 162,250 | | |
Transfer agent fees (Note 3) | | | 126,174 | | |
Registration fees | | | 71,310 | | |
Audit and tax fees | | | 54,679 | | |
Legal fees | | | 51,780 | | |
Trustees' fees | | | 49,060 | | |
Printing fees | | | 42,718 | | |
Custodian fees | | | 34,073 | | |
Commitment fees (Note 4) | | | 23,476 | | |
Insurance expense | | | 2,739 | | |
Miscellaneous expense | | | 16,812 | | |
Total expenses | | | 1,822,892 | | |
Less: fees waived (Note 3) | | | (332,520 | ) | |
Net expenses | | | 1,490,372 | | |
Net investment income | | | 6,526,623 | | |
Net Realized and Unrealized Gain (Loss) from Investments
Foreign Currency and Forward Foreign Currency Related Items | |
Net realized loss from investments | | | (977,495 | ) | |
Net realized gain from foreign currency transactions | | | 136,803 | | |
Net realized loss from forward foreign currency contracts | | | (168,907 | ) | |
Net change in unrealized appreciation (depreciation) from investments | | | 6,397,488 | | |
Net change in unrealized appreciation (depreciation) from foreign currency translations | | | (27,192 | ) | |
Net change in unrealized appreciation (depreciation) from forward foreign currency contracts | | | 10,651 | | |
Net realized and unrealized gain from investments, foreign currency and forward
foreign currency contracts | | | 5,371,348 | | |
Net increase in net assets resulting from operations | | $ | 11,897,971 | | |
See Accompanying Notes to Financial Statements.
30
Credit Suisse Strategic Income Fund
Statement of Changes in Net Assets
| | | For the Year
Ended
October 31, 2017 | | For the Year
Ended
October 31, 2016 | |
From Operations | |
Net investment income | | $ | 6,526,623 | | | $ | 6,202,299 | | |
Net realized loss from investments, foreign currency transactions and
forward foreign currency contracts | | | (1,009,599 | ) | | | (5,523,982 | ) | |
Net change in unrealized appreciation (depreciation) from investments,
foreign currency translations and forward foreign currency contracts | | | 6,380,947 | | | | 1,224,257 | | |
Net increase in net assets resulting from operations | | | 11,897,971 | | | | 1,902,574 | | |
From Dividends | |
Dividends from net investment income | |
Class I | | | (4,332,237 | ) | | | (4,556,905 | ) | |
Class A | | | (1,293,742 | ) | | | (1,321,799 | ) | |
Class C | | | (663,736 | ) | | | (323,595 | ) | |
Return of capital | |
Class I | | | (163,178 | ) | | | — | | |
Class A | | | (48,730 | ) | | | — | | |
Class C | | | (25,000 | ) | | | — | | |
Net decrease in net assets resulting from dividends and distributions | | | (6,526,623 | ) | | | (6,202,299 | ) | |
| From Capital Share Transactions (Note 6) | |
Proceeds from sale of shares | | | 213,386,488 | | | | 52,419,402 | | |
Reinvestment of dividends | | | 5,843,341 | | | | 5,933,749 | | |
Net asset value of shares redeemed | | | (117,643,601 | ) | | | (112,950,455 | ) | |
Net increase (decrease) in net assets from capital share transactions | | | 101,586,228 | | | | (54,597,304 | ) | |
Net increase (decrease) in net assets | | | 106,957,576 | | | | (58,897,029 | ) | |
Net Assets | |
Beginning of year | | | 76,019,533 | | | | 134,916,562 | | |
End of year | | $ | 182,977,109 | | | $ | 76,019,533 | | |
Distributions in excess of net investment income | | $ | (171,968 | ) | | $ | (184,223 | ) | |
See Accompanying Notes to Financial Statements.
31
Credit Suisse Strategic Income Fund
Financial Highlights
(For a Class I Share of the Fund Outstanding Throughout Each Year)
| | | For the Year Ended October 31, | |
| | | 2017 | | 2016 | | 2015 | | 2014 | | 2013 | |
Per share data | |
Net asset value, beginning of year | | $ | 9.73 | | | $ | 9.78 | | | $ | 10.46 | | | $ | 10.65 | | | $ | 10.06 | | |
INVESTMENT OPERATIONS | |
Net investment income1 | | | 0.54 | | | | 0.71 | | | | 0.66 | | | | 0.64 | | | | 0.61 | | |
Net gain (loss) from investments, foreign currency
and forward foreign currency related items
(both realized and unrealized) | | | 0.52 | | | | (0.04 | ) | | | (0.46 | ) | | | (0.06 | ) | | | 0.60 | | |
Total from investment operations | | | 1.06 | | | | 0.67 | | | | 0.20 | | | | 0.58 | | | | 1.21 | | |
REDEMPTION FEES | | | — | | | | — | | | | — | | | | 0.002 | | | | 0.002 | | |
LESS DIVIDENDS AND DISTRIBUTIONS | |
Dividends from net investment income | | | (0.53 | ) | | | (0.72 | ) | | | (0.60 | ) | | | (0.63 | ) | | | (0.60 | ) | |
Distributions from net realized gains | | | — | | | | — | | | | (0.22 | ) | | | (0.14 | ) | | | (0.02 | ) | |
Return of capital | | | (0.02 | ) | | | — | | | | (0.06 | ) | | | — | | | | — | | |
Total dividends and distributions | | | (0.55 | ) | | | (0.72 | ) | | | (0.88 | ) | | | (0.77 | ) | | | (0.62 | ) | |
Net asset value, end of year | | $ | 10.24 | | | $ | 9.73 | | | $ | 9.78 | | | $ | 10.46 | | | $ | 10.65 | | |
Total return3 | | | 11.11 | % | | | 7.40 | % | | | 2.05 | % | | | 5.57 | % | | | 12.29 | % | |
RATIOS AND SUPPLEMENTAL DATA | |
Net assets, end of year (000s omitted) | | $ | 114,605 | | | $ | 60,899 | | | $ | 65,651 | | | $ | 81,868 | | | $ | 31,830 | | |
Ratio of net expenses to average net assets | | | 0.99 | % | | | 1.00 | % | | | 1.00 | % | | | 1.00 | % | | | 0.99 | % | |
Ratio of expenses to average net assets
excluding interest expense | | | 0.99 | % | | | 0.99 | % | | | 0.99 | % | | | 0.99 | % | | | 0.99 | % | |
Ratio of net investment income to average net assets | | | 5.34 | % | | | 7.64 | % | | | 6.59 | % | | | 5.94 | % | | | 5.77 | % | |
Decrease reflected in above operating expense
ratios due to waivers/reimbursements | | | 0.26 | % | | | 0.29 | % | | | 0.16 | % | | | 0.18 | % | | | 0.63 | % | |
Portfolio turnover rate | | | 79 | % | | | 73 | % | | | 85 | % | | | 124 | % | | | 159 | % | |
1 Per share information is calculated using the average shares outstanding method.
2 This amount represents less than $0.01 per share.
3 Total returns are historical and include change in share price and reinvestment of all dividends and distributions. Had certain expenses not been reduced during the years shown, total returns would have been lower.
See Accompanying Notes to Financial Statements.
32
Credit Suisse Strategic Income Fund
Financial Highlights
(For a Class A Share of the Fund Outstanding Throughout Each Year)
| | | For the Year Ended October 31, | |
| | | 2017 | | 2016 | | 2015 | | 2014 | | 2013 | |
Per share data | |
Net asset value, beginning of year | | $ | 9.74 | | | $ | 9.79 | | | $ | 10.47 | | | $ | 10.66 | | | $ | 10.07 | | |
INVESTMENT OPERATIONS | |
Net investment income1 | | | 0.51 | | | | 0.64 | | | | 0.55 | | | | 0.58 | | | | 0.45 | | |
Net gain (loss) from investments, foreign currency
and forward foreign currency related items
(both realized and unrealized) | | | 0.51 | | | | 0.002 | | | | (0.38 | ) | | | (0.02 | ) | | | 0.73 | | |
Total from investment operations | | | 1.02 | | | | 0.64 | | | | 0.17 | | | | 0.56 | | | | 1.18 | | |
REDEMPTION FEES | | | — | | | | — | | | | — | | | | 0.002 | | | | 0.002 | | |
LESS DIVIDENDS AND DISTRIBUTIONS | |
Dividends from net investment income | | | (0.50 | ) | | | (0.69 | ) | | | (0.57 | ) | | | (0.61 | ) | | | (0.57 | ) | |
Distributions from net realized gains | | | — | | | | — | | | | (0.22 | ) | | | (0.14 | ) | | | (0.02 | ) | |
Return of capital | | | (0.02 | ) | | | — | | | | (0.06 | ) | | | — | | | | — | | |
Total dividends and distributions | | | (0.52 | ) | | | (0.69 | ) | | | (0.85 | ) | | | (0.75 | ) | | | (0.59 | ) | |
Net asset value, end of year | | $ | 10.24 | | | $ | 9.74 | | | $ | 9.79 | | | $ | 10.47 | | | $ | 10.66 | | |
Total return3 | | | 10.71 | % | | | 7.12 | % | | | 1.78 | % | | | 5.28 | % | | | 11.94 | % | |
RATIOS AND SUPPLEMENTAL DATA | |
Net assets, end of year (000s omitted) | | $ | 36,961 | | | $ | 8,447 | | | $ | 66,244 | | | $ | 14,633 | | | $ | 46,573 | | |
Ratio of net expenses to average net assets | | | 1.24 | % | | | 1.25 | % | | | 1.24 | % | | | 1.24 | % | | | 1.24 | % | |
Ratio of expenses to average net assets
excluding interest expense | | | 1.24 | % | | | 1.24 | % | | | 1.24 | % | | | 1.24 | % | | | 1.24 | % | |
Ratio of net investment income to average net assets | | | 4.99 | % | | | 6.73 | % | | | 5.45 | % | | | 5.44 | % | | | 4.22 | % | |
Decrease reflected in above operating expense
ratios due to waivers/reimbursements | | | 0.26 | % | | | 0.29 | % | | | 0.16 | % | | | 0.18 | % | | | 0.63 | % | |
Portfolio turnover rate | | | 79 | % | | | 73 | % | | | 85 | % | | | 124 | % | | | 159 | % | |
1 Per share information is calculated using the average shares outstanding method.
2 This amount represents less than $0.01 per share.
3 Total returns are historical and include change in share price, reinvestment of all dividends and distributions and no sales charge. Had certain expenses not been reduced during the years shown, total returns would have been lower.
See Accompanying Notes to Financial Statements.
33
Credit Suisse Strategic Income Fund
Financial Highlights
(For a Class C Share of the Fund Outstanding Throughout Each Year)
| | | For the Year Ended October 31, | |
| | | 2017 | | 2016 | | 2015 | | 2014 | | 2013 | |
Per share data | |
Net asset value, beginning of year | | $ | 9.74 | | | $ | 9.79 | | | $ | 10.471 | | | $ | 10.65 | | | $ | 10.06 | | |
INVESTMENT OPERATIONS | |
Net investment income2 | | | 0.43 | | | | 0.63 | | | | 0.55 | | | | 0.53 | | | | 0.50 | | |
Net gain (loss) from investments, foreign currency
and forward foreign currency related items
(both realized and unrealized) | | | 0.52 | | | | (0.06 | ) | | | (0.45 | ) | | | (0.05 | ) | | | 0.61 | | |
Total from investment operations | | | 0.95 | | | | 0.57 | | | | 0.10 | | | | 0.48 | | | | 1.11 | | |
REDEMPTION FEES | | | — | | | | — | | | | — | | | | 0.003 | | | | 0.003 | | |
LESS DIVIDENDS AND DISTRIBUTIONS | |
Dividends from net investment income | | | (0.43 | ) | | | (0.62 | ) | | | (0.51 | ) | | | (0.52 | ) | | | (0.50 | ) | |
Distributions from net realized gains | | | — | | | | — | | | | (0.22 | ) | | | (0.14 | ) | | | (0.02 | ) | |
Return of capital | | | (0.02 | ) | | | — | | | | (0.05 | ) | | | — | | | | — | | |
Total dividends and distributions | | | (0.45 | ) | | | (0.62 | ) | | | (0.78 | ) | | | (0.66 | ) | | | (0.52 | ) | |
Net asset value, end of year | | $ | 10.24 | | | $ | 9.74 | | | $ | 9.79 | | | $ | 10.471 | | | $ | 10.65 | | |
Total return4 | | | 9.88 | % | | | 6.33 | % | | | 1.14 | % | | | 4.53 | % | | | 11.18 | % | |
RATIOS AND SUPPLEMENTAL DATA | |
Net assets, end of year (000s omitted) | | $ | 31,411 | | | $ | 6,673 | | | $ | 3,022 | | | $ | 2,151 | | | $ | 189 | | |
Ratio of net expenses to average net assets | | | 1.99 | % | | | 2.00 | % | | | 2.00 | % | | | 2.00 | % | | | 1.99 | % | |
Ratio of expenses to average net assets
excluding interest expense | | | 1.99 | % | | | 1.99 | % | | | 1.99 | % | | | 1.99 | % | | | 1.99 | % | |
Ratio of net investment income to average net assets | | | 4.25 | % | | | 6.70 | % | | | 5.52 | % | | | 4.97 | % | | | 4.77 | % | |
Decrease reflected in above operating expense
ratios due to waivers/reimbursements | | | 0.26 | % | | | 0.29 | % | | | 0.16 | % | | | 0.18 | % | | | 0.63 | % | |
Portfolio turnover rate | | | 79 | % | | | 73 | % | | | 85 | % | | | 124 | % | | | 159 | % | |
1 Includes adjustments in accordance with accounting principles generally accepted in the United States of America and as such, the net asset values for financial reporting purposes and the returns based upon net asset values may differ from the net asset values and returns for shareholder transactions.
2 Per share information is calculated using the average shares outstanding method.
3 This amount represents less than $0.01 per share.
4 Total returns are historical and include change in share price, reinvestment of all dividends and distributions and no sales charge. Had certain expenses not been reduced during the years shown, total returns would have been lower.
See Accompanying Notes to Financial Statements.
34
Credit Suisse Strategic Income Fund
Notes to Financial Statements
October 31, 2017
Credit Suisse Strategic Income Fund (the "Fund"), a series of the Credit Suisse Opportunity Funds (the "Trust"), a Delaware statutory trust, is registered under the Investment Company Act of 1940, as amended (the "1940 Act"), as a non-diversified open-end management investment company that seeks total return. The Trust was organized under the laws of the State of Delaware as a business trust on May 31, 1995.
The Fund offers three classes of shares: Class I shares, Class A shares and Class C shares. Each class of shares represents an equal pro rata interest in the Fund, except the share classes bear different expenses, which reflect the differences in the range of services provided to them. Class A shares are sold subject to a front-end sales charge of up to 4.75%. Class C shares are sold subject to a contingent deferred sales charge ("CDSC") of 1.00% if the shares are redeemed within the first year of purchase. Class I shares are sold without a sales charge.
Note 2. Significant Accounting Policies
The following is a summary of significant accounting policies followed by the Fund in the preparation of its financial statements. The policies are in accordance with generally accepted accounting principles in the United States of America ("GAAP"). The preparation of financial statements requires management to make estimates and assumptions that affect the reported amounts and disclosures in the financial statements. Actual results could differ from those estimates. The Fund is considered an investment company for financial reporting purposes under GAAP and follows Accounting Standards Codification ("ASC") Topic 946 — Financial Services — Investment Companies.
A) SECURITY VALUATION — The net asset value of the Fund is determined daily as of the close of regular trading on the New York Stock Exchange, Inc. (the "Exchange") on each day the Exchange is open for business. The valuations for fixed income securities (which may include, but are not limited to, corporate, government, municipal, mortgage-backed, collateralized mortgage obligations and asset-backed securities) and certain derivative instruments are typically the prices supplied by independent third party pricing services, which may use market prices or broker/dealer quotations or a variety of valuation techniques and methodologies. The independent third party pricing services use inputs that are observable such as issuer details, interest rates, yield curves, prepayment speeds, credit risks/spreads, default rates and quoted prices for similar securities. These pricing services generally price fixed income securities assuming orderly transactions of an institutional "round lot" size, but some
35
Credit Suisse Strategic Income Fund
Notes to Financial Statements (continued)
October 31, 2017
Note 2. Significant Accounting Policies (continued)
trades occur in smaller "odd lot" sizes which may be effected at lower prices than institutional round lot trades. Structured note agreements are valued in accordance with a dealer-supplied valuation based on changes in the value of the underlying index. Futures contracts are valued daily at the settlement price established by the board of trade or exchange on which they are traded. Forward contracts are valued at the London closing spot rates and the London closing forward point rates on a daily basis. The currency forward contract pricing model derives the differential in point rates to the expiration date of the forward and calculates its present value. Equity securities for which market quotations are available are valued at the last reported sales price or official closing price on the primary market or exchange on which they trade. The Fund may utilize a service provided by an independent third party which has been approved by the Board of Trustees (the "Board") to fair value certain securities. When fair value pricing is employed, the prices of securities used by the Fund to calculate its net asset value may differ from quoted or published prices for the same securities. If independent third party pricing services are unable to supply prices for a portfolio investment, or if the prices supplied are deemed by the investment adviser to be unreliable, the market price may be determined by the investment adviser using quotations from one or more brokers/dealers or at the transaction price if the security has recently been purchased and no value has yet been obtained from a pricing service or pricing broker. When reliable prices are not readily available, such as when the value of a security has been significantly affected by events after the close of the exchange or market on which the security is principally traded, but before the Fund calculates its net asset value, the Fund values these securities as determined in accordance with procedures approved and established by the Board.
The Fund uses valuation techniques to measure fair value that are consistent with the market approach and/or income approach, depending on the type of security and the particular circumstance. The market approach uses prices and other relevant information generated by market transactions involving identical or comparable securities. The income approach uses valuation techniques to discount estimated future cash flows to present value.
GAAP established a disclosure hierarchy that categorizes the inputs to valuation techniques used to value assets and liabilities at each measurement date. These inputs are summarized in the three broad levels listed below:
• Level 1 – quoted prices in active markets for identical investments
• Level 2 – other significant observable inputs (including quoted prices for similar investments, interest rates, prepayment speeds, credit risk, etc.)
36
Credit Suisse Strategic Income Fund
Notes to Financial Statements (continued)
October 31, 2017
Note 2. Significant Accounting Policies (continued)
• Level 3 – significant unobservable inputs (including the Fund's own assumptions in determining the fair value of investments)
The inputs or methodologies used to value securities are not necessarily an indication of the risk associated with investing in those securities.
The following is a summary of the inputs used as of October 31, 2017 in valuing the Fund's assets and liabilities carried at fair value:
Assets | | Level 1 | | Level 2 | | Level 3 | | Total | |
Investments in Securities | |
Corporate Bonds | | $ | — | | | $ | 77,311,700 | | | $ | 95,523 | | | $ | 77,407,223 | | |
Bank Loans | | | — | | | | 69,578,169 | | | | 17,191,487 | | | | 86,769,656 | | |
Asset Backed Securities | | | — | | | | 2,832,553 | | | | 1,209,967 | | | | 4,042,520 | | |
Common Stocks | | | — | | | | — | | | | 1,008,713 | | | | 1,008,713 | | |
Mutual Funds | | | 99,482 | | | | — | | | | — | | | | 99,482 | | |
Short-term Investment | | | — | | | | 18,302,800 | | | | — | | | | 18,302,800 | | |
| | | $ | 99,482 | | | $ | 168,025,222 | | | $ | 19,505,690 | | | $ | 187,630,394 | | |
Other Financial Instruments* | |
Forward Foreign Currency Contracts | | $ | — | | | $ | 48,822 | | | $ | — | | | $ | 48,822 | | |
Liabilities | | Level 1 | | Level 2 | | Level 3 | | Total | |
Other Financial Instruments* | |
Forward Foreign Currency Contracts | | $ | — | | | $ | 15,453 | | | $ | — | | | $ | 15,453 | | |
* Other financial instruments include unrealized appreciation (depreciation) on forward foreign currency contracts.
The following is a reconciliation of investments as of October 31, 2017 for which significant unobservable inputs were used in determining value. All transfers, if any, are assumed to occur at the end of the reporting period.
| | Corporate
Bonds | | Bank
Loans | | Asset
Backed
Securities | | Common
Stocks | | Total | |
Balance as of October 31, 2016 | | $ | 203,608 | | | $ | 6,277,025 | | | $ | — | | | $ | 434,411 | | | $ | 6,915,044 | | |
Accrued discounts (premiums) | | | (92 | ) | | | 15,585 | | | | 1,181 | | | | — | | | | 16,674 | | |
Purchases | | | 92,957 | | | | 14,472,643 | | | | 1,204,188 | | | | 736,567 | | | | 16,506,355 | | |
Sales | | | (249,639 | ) | | | (4,213,494 | ) | | | — | | | | — | | | | (4,463,133 | ) | |
Realized gain (loss) | | | (85,467 | ) | | | (409,364 | ) | | | — | | | | (8 | ) | | | (494,839 | ) | |
Change in unrealized appreciation
(depreciation) | | | 134,156 | | | | 829,377 | | | | 4,598 | | | | (162,257 | ) | | | 805,874 | | |
Transfers into Level 3 | | | — | | | | 2,013,711 | | | | — | | | | — | | | | 2,013,711 | | |
Transfers out of Level 3 | | | — | | | | (1,793,996 | ) | | | — | | | | — | | | | (1,793,996 | ) | |
Balance as of October 31, 2017 | | $ | 95,523 | | | $ | 17,191,487 | | | $ | 1,209,967 | | | $ | 1,008,713 | | | $ | 19,505,690 | | |
Net change in unrealized appreciation
(depreciation) from investments still
held as of October 31, 2017 | | $ | (1,192 | ) | | $ | 317,812 | | | $ | 4,598 | | | $ | (162,257 | ) | | $ | 158,961 | | |
37
Credit Suisse Strategic Income Fund
Notes to Financial Statements (continued)
October 31, 2017
Note 2. Significant Accounting Policies (continued)
| | Quantitative Disclosure About Significant Unobservable Inputs | |
| Asset Class | | Fair Value
At 10/31/2017 | | Valuation
Technique | | Unobservable
Input | | Range
(Weighted Average)
(per share) | |
Corporate Bonds | | $ | 1,882 | | | Income Approach | | Expected Remaining Distribution | | | N/A | | |
| | | $ | 93,641 | | | Market Approach | | Comparable Bond Price | | | N/A | | |
Bank Loans | | $ | 17,191,487 | | | Vendor Pricing | | Single Broker Quote | | $ | 0.50 – $1.03 | ($0.99) | |
Asset Backed
Securities | | $ | 1,209,967 | | |
Vendor Pricing | |
Single Broker Quote | | $ | 0.90 – $1.02 | ($0.97) | |
Common Stocks
| | $ | 25
| | | Market Approach
| | Discount for Illiquidity and
EBITDA Multiples | | | N/A | | |
| | | $ | 970,207 | | | Vendor Pricing | | Single Broker Quote | | $ | 1.00 – $145.00 | ($15.91) | |
| | $ | 38,481
| | | Market/Income
Approach | | Comparable Bond Price,
Discounted Cash Flows | | $ | 0.01 – $21,497 | ($333.63) | |
Each fair value determination is based on a consideration of relevant factors, including both observable and unobservable inputs. Observable and unobservable inputs that Credit Suisse Asset Management, LLC, the Fund's investment adviser ("Credit Suisse" or the "Adviser") considers may include (i) the existence of any contractual restrictions on the disposition of securities; (ii) information obtained from the company, which may include an analysis of the company's financial statements, the company's products or intended markets or the company's technologies; (iii) the price of the same or similar security negotiated at arm's length in an issuer's completed subsequent round of financing; (iv) the price and extent of public trading in similar securities of the issuer or of comparable companies; or (v) a probability and time value adjusted analysis of contractual term. Where available and appropriate, multiple valuation methodologies are applied to confirm fair value. To the extent that valuation is based on models or inputs that are less observable or unobservable in the market, determining fair value requires more judgment. Because of the inherent uncertainty of valuation, those estimated values may be materially higher or lower than the values that would have been used had a ready market for the investments existed. Accordingly, the degree of judgment exercised by the Fund in determining fair value is greatest for investments categorized in Level 3. In some circumstances, the inputs used to measure fair value might be categorized within different levels of the fair value hierarchy. In those instances, the fair value measurement is categorized in its entirety in the fair value hierarchy based on the least observable input that is significant to the fair value measurement. Additionally, changes in the market environment and other events that may occur over the life of the investments may cause the gains or losses ultimately realized on these investments to be different from the valuations used at the date of these financial statements.
38
Credit Suisse Strategic Income Fund
Notes to Financial Statements (continued)
October 31, 2017
Note 2. Significant Accounting Policies (continued)
For the year ended October 31, 2017, there were no transfers between Level 1 and Level 2, but there was $2,013,711 transferred from Level 2 to Level 3 due to a lack of a pricing source supported by observable inputs and $1,793,996 transferred from Level 3 to Level 2 as a result of the availability of a pricing source supported by observable inputs. All transfers, if any, are assumed to occur at the end of the reporting period.
B) DERIVATIVE INSTRUMENTS AND HEDGING ACTIVITIES — The Fund adopted amendments to authoritative guidance on disclosures about derivative instruments and hedging activities which require that a fund disclose (a) how and why an entity uses derivative instruments, (b) how derivative instruments and hedging activities are accounted for and (c) how derivative instruments and related hedging activities affect a fund's financial position, financial performance and cash flows. For the year ended October 31, 2017, the Fund's derivatives did not qualify for hedge accounting as they are held at fair value.
Fair Values of Derivative Instruments as of October 31, 2017
| | | Asset Derivatives | | Liability Derivatives | |
| | | Balance Sheet
Location | | Fair Value | | Balance Sheet
Location | | Fair Value | |
Currency Contracts
| | Unrealized appreciation
on forward foreign
currency contracts | | $ | 48,822 | | | Unrealized depreciation
on forward foreign
currency contracts | | $ | 15,453 | | |
Effect of Derivative Instruments on the Statement of Operations
| | | Location | | Realized
Gain (Loss) | | Location | | Net Unrealized
Appreciation
(Depreciation) | |
Currency
Contracts | | Net realized loss from
forward foreign
currency contracts | | $ | (168,907 | ) | | Net change in unrealized
appreciation (depreciation)
from forward foreign
currency contracts | | $ | 10,651 | | |
For the year ended October 31, 2017, the Fund held an average monthly value on a net basis of $4,838,796 in forward foreign currency contracts.
The Fund is a party to International Swap and Derivatives Association, Inc. ("ISDA") Master Agreements ("Master Agreements") with certain counterparties that govern over-the-counter derivative (including Total Return, Credit Default and Interest Rate Swaps) and foreign exchange contracts entered into by the Fund. The Master Agreements may contain provisions regarding, among other things, the parties' general obligations, representations, agreements, collateral requirements, events of default and early termination.
39
Credit Suisse Strategic Income Fund
Notes to Financial Statements (continued)
October 31, 2017
Note 2. Significant Accounting Policies (continued)
Termination events applicable to the Fund may occur upon a decline in the Fund's net assets below a specified threshold over a certain period of time.
The following table presents by counterparty the Fund's derivative assets, net of related collateral held by the Fund, at October 31, 2017:
Counterparty | | Gross Amount of
Assets Presented in
Statement of Assets
and Liabilities(a) | | Financial
Instruments
and Derivatives
Available for Offset | | Non-Cash
Collateral
Received | | Cash
Collateral
Received | | Net Amount
of Derivative
Assets | |
Morgan Stanley | | $ | 48,822 | | | $ | (15,453 | ) | | $ | — | | | $ | — | | | $ | 33,369 | | |
The following table presents by counterparty the Fund's derivative liabilities, net of related collateral pledged by the Fund, at October 31, 2017:
Counterparty | | Gross Amount of
Liabilities Presented in
Statement of Assets
and Liabilities(a) | | Financial
Instruments
and Derivatives
Available for Offset | | Non-Cash
Collateral
Pledged | | Cash
Collateral
Pledged | | Net Amount
of Derivative
Liabilities | |
Morgan Stanley | | $ | 15,453 | | | $ | (15,453 | ) | | $ | — | | | $ | — | | | $ | — | | |
(a) Forward foreign currency contracts are included.
C) FOREIGN CURRENCY TRANSACTIONS — The books and records of the Fund are maintained in U.S. dollars. Transactions denominated in foreign currencies are recorded at the current prevailing exchange rates. All assets and liabilities denominated in foreign currencies are translated into U.S. dollar amounts at the current exchange rate at the end of the period. Reported net realized gain (loss) from foreign currency transactions arises from sales of foreign currencies; currency gains or losses realized between the trade and settlement dates on securities transactions; and the difference between the amounts of dividends, interest, and foreign withholding taxes recorded on the Fund's books and the U.S. dollar equivalent of the amounts actually received or paid. Net change in unrealized gains and losses on translation of assets and liabilities denominated in foreign currencies arises from changes in the fair values of assets and liabilities, other than investments, at the end of the period, resulting from changes in exchange rates. The Fund does not isolate that portion of the results of operations resulting from fluctuations in foreign exchange rates on investments from the fluctuations arising from changes in market prices of investments held. Such fluctuations are included with net realized and unrealized gain or loss from investments in the Statement of Operations.
D) SECURITY TRANSACTIONS AND INVESTMENT INCOME/EXPENSE — Security transactions are accounted for on a trade date basis. Interest
40
Credit Suisse Strategic Income Fund
Notes to Financial Statements (continued)
October 31, 2017
Note 2. Significant Accounting Policies (continued)
income/expense is recorded on the accrual basis. The Fund amortizes premiums and accretes discounts using the effective interest method. Dividend income/expense is recorded on the ex-dividend date. Certain expenses are class-specific expenses, vary by class and are charged only to that class. Income, expenses (excluding class-specific expenses) and realized/unrealized gains/losses are allocated proportionately to each class of shares based upon the relative net asset value of the outstanding shares of that class. The cost of investments sold is determined by use of the specific identification method for both financial reporting and income tax purposes. To the extent any issuer defaults or a credit event occurs that impacts the issuer, the Fund may halt any additional interest income accruals and consider the realizability of interest accrued up to the date of default or credit event.
E) DIVIDENDS AND DISTRIBUTIONS TO SHAREHOLDERS — Dividends from net investment income, if any, are declared daily and paid monthly. Distributions of net realized capital gains, if any, are declared and paid at least annually. However, to the extent that a net realized capital gain can be reduced by a capital loss carryforward, such gain will not be distributed. Dividends and distributions to shareholders of the Fund are recorded on the ex-dividend date and are determined in accordance with federal income tax regulations, which may differ from GAAP.
F) FEDERAL AND OTHER TAXES — No provision is made for federal taxes as it is the Fund's intention to continue to qualify as a regulated investment company ("RIC") under the Internal Revenue Code of 1986, as amended (the "Code"), and to make the requisite distributions to its shareholders, which will be sufficient to relieve it from federal income and excise taxes.
In order to qualify as a RIC under the Code, the Fund must meet certain requirements regarding the source of its income, the diversification of its assets and the distribution of its income. One of these requirements is that the Fund derive at least 90% of its gross income for each taxable year from dividends, interest, payments with respect to certain securities loans, gains from the sale or other disposition of stock, securities or foreign currencies, other income derived with respect to its business of investing in such stock, securities or currencies or net income derived from interests in certain publicly-traded partnerships ("Qualifying Income"). The Fund adopted the authoritative guidance for uncertainty in income taxes and recognizes a tax benefit or liability from an uncertain position only if it is more likely than not that the position is sustainable based solely on its technical merits and consideration of the relevant taxing authority's widely understood administrative practices
41
Credit Suisse Strategic Income Fund
Notes to Financial Statements (continued)
October 31, 2017
Note 2. Significant Accounting Policies (continued)
and procedures. The Fund has reviewed its current tax positions and has determined that no provision for income tax is required in the Fund's financial statements. The Fund's federal and state income and federal excise tax returns for tax years for which the applicable statutes of limitations have not expired are subject to examination by the Internal Revenue Service and state departments of revenue.
G) SHORT-TERM INVESTMENTS — The Fund, together with other funds/portfolios advised by Credit Suisse, pools available cash into a short-term variable rate time deposit issued by State Street Bank and Trust Company ("SSB"), the Fund's custodian. The short-term time deposit issued by SSB is a variable rate account classified as a short-term investment.
H) FUTURES — The Fund may enter into futures contracts to the extent permitted by its investment policies and objectives. The Fund may use futures contracts to gain exposure to or hedge against changes in interest rates, equity and market price movements and/or currency risks. Upon entering into a futures contract, the Fund is required to deposit cash and/or pledge U.S. Government securities as initial margin with a Futures Commission Merchant ("FCM"). Subsequent payments, which are dependent on the daily fluctuations in the value of the underlying instrument, are made or received by the Fund each day (daily variation margin) and are recorded as unrealized gains or losses until the contracts are closed. When the contracts are closed, the Fund records a realized gain or loss equal to the difference between the proceeds from (or cost of) the closing transaction and the Fund's basis in the contract. Risks of entering into futures contracts for hedging purposes include the possibility that a change in the value of the contract may not correlate with the changes in the value of the underlying instruments. Futures have minimal counterparty credit risk because futures are exchange traded and the exchange's clearinghouse, as counterparty to all exchange-traded futures, guarantees the futures against default. In addition, the purchase of a futures contract involves the risk that the Fund could lose more than the original margin deposit and subsequent payments may be required for a futures transaction. The Fund's open futures contracts are disclosed in the Schedule of Investments. At October 31, 2017, the Fund had no open futures contracts.
The Commodity Exchange Act requires an FCM to segregate all customer transactions and assets from the FCM's proprietary activities. A customer's cash and other equity deposited with an FCM are considered commingled with all other customer funds subject to the FCM's segregation requirements. In the event of an FCM's insolvency, recovery may be limited to the Fund's pro-rata
42
Credit Suisse Strategic Income Fund
Notes to Financial Statements (continued)
October 31, 2017
Note 2. Significant Accounting Policies (continued)
share of segregated customer funds available. It is possible that the recovery amount could be less than the total of cash and other equity deposited.
I) FORWARD FOREIGN CURRENCY CONTRACTS — A forward foreign currency exchange contract ("forward currency contract") is a commitment to purchase or sell a foreign currency at the settlement date at a negotiated rate. The Fund will enter into forward currency contracts primarily for hedging foreign currency risk. Forward currency contracts are valued at the prevailing forward exchange rate of the underlying currencies and unrealized gain/loss is recorded daily. On the settlement date of the forward currency contract, the Fund records a realized gain or loss equal to the difference between the value of the contract at the time it was opened and the value of the contract at the time it was closed. Certain risks may arise upon entering into forward currency contracts from the potential inability of counterparties to meet the terms of their contracts. The maximum counterparty credit risk to the Fund is measured by the unrealized gain on appreciated contracts. Additionally, when utilizing forward currency contracts to hedge, the Fund forgoes the opportunity to profit from favorable exchange rate movements during the term of the contract. The Fund's open forward currency contracts at October 31, 2017 are disclosed in the Schedule of Investments.
J) UNFUNDED LOAN COMMITMENTS — The Fund enters into certain agreements, all or a portion of which may be unfunded. The Fund is obligated to fund these loan commitments at the borrowers' discretion. Funded and unfunded portions of credit agreements are presented on the Statement of Investments. There were no unfunded commitments as of October 31, 2017.
K) SECURITIES LENDING — The initial collateral received by the Fund is required to have a value of at least 102% of the market value of domestic securities on loan (including any accrued interest thereon) and 105% of the market value of foreign securities on loan (including any accrued interest thereon). The collateral is maintained thereafter at a value equal to at least 102% of the current market value of the securities on loan. The market value of loaned securities is determined at the close of each business day of the Fund and any additional required collateral is delivered to the Fund, or excess collateral returned by the Fund, on the next business day. Cash collateral received by the Fund in connection with securities lending activity may be pooled together with cash collateral for other funds/portfolios advised by Credit Suisse and may be invested in a variety of investments, including funds advised by SSB, the Fund's securities lending agent, or money market instruments. However, in the event of default or bankruptcy by the other party
43
Credit Suisse Strategic Income Fund
Notes to Financial Statements (continued)
October 31, 2017
Note 2. Significant Accounting Policies (continued)
to the agreement, realization and/or retention of the collateral may be subject to legal proceedings.
SSB has been engaged by the Fund to act as the Fund's securities lending agent. The Fund's securities lending arrangement provides that the Fund and SSB will share the net income earned from securities lending activities. Securities lending income is accrued as earned. At October 31, 2017 and during the year ended October 31, 2017, there were no securities out on loan.
L) OTHER — The high yield, fixed income securities in which the Fund invests will primarily consist of senior secured floating rate loans ("Senior Loans") issued by non-investment grade companies. Senior Loans are typically secured by specific collateral of the issuer and hold the most senior position in the issuer's capital structure. The interest rate on Senior Loans is periodically adjusted to a recognized base rate, typically the London Interbank Offered Rate ("LIBOR"). While these characteristics may reduce interest rate risk and mitigate losses in the event of borrower default, the Senior Loans in which the Fund invests have below investment grade credit ratings and thereby are considered speculative because of the significant credit risk of their issuers.
Lower-rated debt securities (commonly known as "junk bonds") possess speculative characteristics and are subject to greater market fluctuations and risk of lost income and principal than higher-rated debt securities for a variety of reasons. Also, during an economic downturn or substantial period of rising interest rates, highly leveraged issuers may experience financial stress which would adversely affect their ability to service their principal and interest payment obligations, to meet projected business goals and to obtain additional financing.
In addition, periods of economic uncertainty and changes can be expected to result in increased volatility of market prices of lower-rated debt securities and the Fund's net asset value.
M) RECENT ACCOUNTING PRONOUNCEMENTS — On August 26, 2016, Financial Accounting Standards Board ("FASB") issued Accounting Standards Update No. 2016-15, "Statement of Cash Flows (Topic 230), a consensus of the FASB's Emerging Issues Task Force" ("ASU 2016-15"). ASU 2016-15 is intended to reduce diversity in practice in how certain transactions are classified in the statement of cash flows. The issues addressed in ASU 2016-15 are: debt prepayment or debt extinguishment costs, settlement of zero-coupon debt instruments, contingent consideration payments made after a business combination, proceeds from the settlement of insurance claims, proceeds from
44
Credit Suisse Strategic Income Fund
Notes to Financial Statements (continued)
October 31, 2017
Note 2. Significant Accounting Policies (continued)
the settlement of corporate-owned life insurance policies, including bank-owned life insurance policies, distributions received from equity method investments, beneficial interests in securitization transactions; and, separately identifiable cash flows and application of the predominance principle. ASU 2016-15 is effective for interim and annual reporting periods beginning after December 15, 2017. Management is currently evaluating the impact, if any, of applying this provision.
In November 2016, FASB issued Accounting Standards Update No. 2016-18, "Statement of Cash Flows (Topic 230), Restricted Cash, a consensus of the FASB's Emerging Issues Task Force" ("ASU 2016-18"). ASU 2016-18 requires that a statement of cash flows explains the change during the period in the total of cash, cash equivalents, and amounts generally described as restricted cash or restricted cash equivalents. Therefore, amounts generally described as restricted cash and restricted cash equivalents should be included with cash and cash equivalents when reconciling the beginning-of-period and end-of-period total amounts shown on the statement of cash flows. The amendments in ASU 2016-18 do not provide a definition of restricted cash or restricted cash equivalents. ASU 2016-18 is effective for interim and annual reporting periods beginning after December 15, 2017. Management is currently evaluating the impact, if any, of applying this provision.
In October 2016, the U.S. Securities and Exchange Commission adopted new rules and amended existing rules (together, "final rules") intended to modernize the reporting and disclosure of information by registered investment companies. In part, the final rules amend Regulation S-X and require standardized, enhanced disclosure about derivatives in investment company financial statements, as well as other amendments. The compliance date for the amendments to Regulation S-X is August 1, 2017. The Fund has adopted the amendments to Regulation S-X and upon evaluation, has concluded that the amendments do not materially impact the financial statements. However, as required, additional or enhanced disclosure has been included.
N) SUBSEQUENT EVENTS — In preparing the financial statements as of October 31, 2017, management considered the impact of subsequent events for potential recognition or disclosure in these financial statements through the date of release of this report. No such events requiring recognition or disclosure were identified through the date of the release of this report.
45
Credit Suisse Strategic Income Fund
Notes to Financial Statements (continued)
October 31, 2017
Note 3. Transactions with Affiliates and Related Parties
Credit Suisse serves as investment adviser and co-administrator for the Fund. Effective November 15, 2016, for its investment advisory and administration services, Credit Suisse is entitled to receive a fee from the Fund at an annual rate of 0.84% of the Fund's average daily net assets. Prior to November 15, 2016, the Fund paid Credit Suisse advisory fees at the annual rate of 0.75% of the Fund's average daily net assets and co-administration fees at an annual rate of 0.09% of the Fund's average daily net assets. On November 15, 2016, the Fund entered into an Investment Management Agreement with Credit Suisse which bundled the advisory and administration fees into a single fee. For the year ended October 31, 2017, investment advisory and administration fees earned and fees waived/expenses reimbursed by Credit Suisse were $1,069,840 and $332,520, respectively. Credit Suisse has contractually agreed to limit expenses so that the Fund's annual operating expenses do not exceed 0.99% of the Fund's average daily net assets for Class I shares, 1.24% of the Fund's average daily net assets for Class A shares, and 1.99% of the Fund's average daily net assets for Class C shares. The Fund is authorized to reimburse Credit Suisse for management fees previously limited and/or for expenses previously reimbursed by Credit Suisse, provided, however, that any reimbursements must be paid at a date not more than three years after the end of the fiscal year during which such fees were limited or expenses were reimbursed by Credit Suisse and the reimbursements do not cause the Fund to exceed the applicable expense limitation in the contract at the time the fees are recouped. This contract may not be terminated before February 28, 2018.
The amounts waived and reimbursed by Credit Suisse, which are available for potential future recoupment by Credit Suisse, and the expiration schedule at October 31, 2017 are as follows:
| | | Fee waivers/
expense
reimbursements
subject to
recoupment | | Expires
October 31,
2018 | | Expires
October 31,
2019 | | Expires
October 31,
2020 | |
Class I | | $ | 497,515 | | | $ | 102,395 | | | $ | 175,395 | | | $ | 219,725 | | |
Class A | | | 179,036 | | | | 50,975 | | | | 57,872 | | | | 70,189 | | |
Class C | | | 60,847 | | | | 4,069 | | | | 14,172 | | | | 42,606 | | |
Totals | | $ | 737,398 | | | $ | 157,439 | | | $ | 247,439 | | | $ | 332,520 | | |
Credit Suisse Asset Management Limited ("Credit Suisse U.K."), an affiliate of Credit Suisse, serves as sub-investment advisor to the Fund directly. Credit Suisse U.K.'s sub-investment advisor fees are paid by Credit Suisse.
46
Credit Suisse Strategic Income Fund
Notes to Financial Statements (continued)
October 31, 2017
Note 3. Transactions with Affiliates and Related Parties (continued)
For its co-administrative services, SSB receives a fee, exclusive of out-of-pocket expenses, calculated in total for all the Credit Suisse funds/portfolios co-administered by SSB and allocated based upon the relative average net assets of each fund/portfolio, subject to an annual minimum fee. For the year ended October 31, 2017, co-administrative services fees earned by SSB (including out-of-pocket expenses) with respect to the Fund were $50,742.
Credit Suisse Securities (USA) LLC ("CSSU"), an affiliate of Credit Suisse, serves as the distributor of the Fund's shares. Pursuant to a distribution plan adopted by the Fund pursuant to Rule 12b-1 under the 1940 Act, CSSU receives fees for its distribution services. These fees are calculated at an annual rate of 0.25% of the average daily net assets of the Class A shares. For the Class C shares, the fee is calculated at an annual rate of 1.00% of the average daily net assets. For the year ended October 31, 2017, the Fund paid Rule 12b-1 distribution fees of $67,239 for Class A shares and $162,250 for Class C shares. Class I shares are not subject to Rule 12b-1 distribution fees.
Certain brokers, dealers and financial representatives provide transfer agent-related services to the Fund and receive compensation from the Fund. For the year ended October 31, 2017, the Fund paid $53,129, which is included within transfer agent fees in the Statement of Operations.
For the year ended October 31, 2017, CSSU and its affiliates advised the Fund that they retained $42,960 from commissions earned on the sale of the Fund's Class A shares. There were no commissions earned on the sale of Class C shares.
The Fund from time to time purchases or sells loan investments in the secondary market through Credit Suisse or its affiliates acting in the capacity as broker-dealer. Credit Suisse or its affiliates may have acted in some type of agent capacity to the initial loan offering prior to such loan trading in the secondary market.
Note 4. Line of Credit
The Fund, together with other funds/portfolios advised by Credit Suisse (collectively, the "Participating Funds"), participates in a committed, unsecured line of credit facility ("Credit Facility"), with SSB in an aggregated amount of $250 million for temporary or emergency purposes under a first-come, first-served basis. Under the terms of the Credit Facility, the Participating Funds pay an aggregate commitment fee on the average unused amount of the Credit
47
Credit Suisse Strategic Income Fund
Notes to Financial Statements (continued)
October 31, 2017
Note 4. Line of Credit (continued)
Facility, which is allocated among the Participating Funds in such manner as is determined by the governing Boards of the Participating Funds. In addition, the Participating Funds pay interest on borrowings at either the Overnight Federal Funds rate or the Overnight LIBOR rate plus a spread. At October 31, 2017 and during the year ended October 31, 2017, the Fund had no loans outstanding under the Credit Facility.
Note 5. Purchases and Sales of Securities
For the year ended October 31, 2017, purchases and sales of investment securities (excluding short-term investments) were $185,332,637 and $92,676,764, respectively.
Note 6. Capital Share Transactions
The Fund is authorized to issue an unlimited number of full and fractional shares of beneficial interest, $.001 par value per share. The Fund offers Class I, Class A and Class C shares. Transactions in capital shares for each class of the Fund were as follows:
| | | Class I | |
| | | For the Year Ended
October 31, 2017 | | For the Year Ended
October 31, 2016 | |
| | | Shares | | Value | | Shares | | Value | |
Shares sold | | | 12,420,495 | | | $ | 125,853,292 | | | | 2,699,746 | | | $ | 24,919,299 | | |
Shares issued in reinvestment
of dividends | | | 405,783 | | | | 4,109,313 | | | | 472,724 | | | | 4,405,459 | | |
Shares redeemed | | | (7,888,320 | ) | | | (79,946,718 | ) | | | (3,625,961 | ) | | | (33,177,588 | ) | |
Net increase (decrease) | | | 4,937,958 | | | $ | 50,015,887 | | | | (453,491 | ) | | $ | (3,852,830 | ) | |
| | | Class A | |
| | | For the Year Ended
October 31, 2017 | | For the Year Ended
October 31, 2016 | |
| | | Shares | | Value | | Shares | | Value | |
Shares sold | | | 6,093,233 | | | $ | 61,324,363 | | | | 2,388,476 | | | $ | 22,246,516 | | |
Shares issued in reinvestment
of dividends | | | 110,880 | | | | 1,125,565 | | | | 131,389 | | | | 1,232,816 | | |
Shares redeemed | | | (3,462,221 | ) | | | (35,072,341 | ) | | | (8,420,386 | ) | | | (77,803,490 | ) | |
Net increase (decrease) | | | 2,741,892 | | | $ | 27,377,587 | | | | (5,900,521 | ) | | $ | (54,324,158 | ) | |
48
Credit Suisse Strategic Income Fund
Notes to Financial Statements (continued)
October 31, 2017
Note 6. Capital Share Transactions (continued)
| | | Class C | |
| | | For the Year Ended
October 31, 2017 | | For the Year Ended
October 31, 2016 | |
| | | Shares | | Value | | Shares | | Value | |
Shares sold | | | 2,582,010 | | | $ | 26,208,833 | | | | 559,045 | | | $ | 5,253,587 | | |
Shares issued in reinvestment
of dividends | | | 59,874 | | | | 608,463 | | | | 31,617 | | | | 295,474 | | |
Shares redeemed | | | (260,694 | ) | | | (2,624,542 | ) | | | (214,013 | ) | | | (1,969,377 | ) | |
Net increase | | | 2,381,190 | | | $ | 24,192,754 | | | | 376,649 | | | $ | 3,579,684 | | |
On October 31, 2017, the number of shareholders that held 5% or more of the outstanding shares of each class of the Fund was as follows:
| | | Number of
Shareholders | | Approximate Percentage
of Outstanding Shares | |
Class I | | | 3 | | | | 53 | % | |
Class A | | | 5 | | | | 62 | % | |
Class C | | | 2 | | | | 59 | % | |
The Fund's performance may be negatively impacted in the event one or more of the Fund's greater than 5% shareholders were to redeem at a given time. Some of the shareholders are omnibus accounts, which hold shares on behalf of individual shareholders.
Note 7. Income Tax Information and Distributions to Shareholders
Income and capital gain distributions are determined in accordance with federal income tax regulations, which may differ from GAAP.
The tax character of dividends paid by the Fund during the years ended October 31, 2017 and 2016, respectively, was as follows:
| Ordinary Income | | Return of Capital | |
| 2017 | | 2016 | | 2017 | | 2016 | |
| $ | 6,289,715 | | | $ | 6,202,299 | | | $ | 236,908 | | | $ | — | | |
The tax basis components of distributable earnings differ from the amounts reflected in the Statement of Assets and Liabilities by temporary book/tax differences. These differences are primarily due to differing treatments of dividends payable, wash sales, forwards and futures contracts marked to
49
Credit Suisse Strategic Income Fund
Notes to Financial Statements (continued)
October 31, 2017
Note 7. Income Tax Information and Distributions to Shareholders (continued)
market and deferred organizational expenses. At October 31, 2017, the components of distributable earnings on a tax basis were as follows:
Accumulated net realized loss | | $ | (6,195,007 | ) | |
Unrealized depreciation | | | (514,433 | ) | |
| | | $ | (6,709,440 | ) | |
At October 31, 2017, the Fund had $1,481,306 of unlimited short-term capital loss carryforwards and $4,713,701 of unlimited long-term capital loss carryforwards available to offset possible future capital gains.
At October 31, 2017, the cost and net unrealized appreciation (depreciation) of investments and derivatives for income tax purposes were as follows:
Cost of Investments | | $ | 188,055,662 | | |
Unrealized appreciation | | $ | 3,852,489 | | |
Unrealized depreciation | | | (4,244,388 | ) | |
Net unrealized appreciation (depreciation) | | $ | (391,899 | ) | |
To adjust for current period permanent book/tax differences which arose principally from differing book/tax treatment of foreign currency gain (loss) and distribution re-designations, paid-in capital was charged $1,300, distributions in excess of net investment income was charged $224,653 and accumulated net realized loss was credited $225,953. Net assets were not affected by these reclassifications.
Note 8. Contingencies
In the normal course of business, the Fund may provide general indemnifications pursuant to certain contracts and organizational documents. The Fund's maximum exposure under these arrangements is dependent on future claims that may be made against the Fund and, therefore, cannot be estimated; however, based on experience, the risk of loss from such claims is considered remote.
50
Credit Suisse Strategic Income Fund
Report of Independent Registered Public Accounting Firm
The Board of Trustees and Shareholders
Credit Suisse Strategic Income Fund:
We have audited the accompanying statement of assets and liabilities of Credit Suisse Strategic Income Fund (the "Fund"), a series of the Credit Suisse Opportunity Funds, including the schedule of investments, as of October 31, 2017, and the related statement of operations for the year then ended, the statements of changes in net assets for each of the years in the two-year period then ended, and the financial highlights for each of the years in the three-year period then ended. These financial statements and financial highlights are the responsibility of the Fund's management. Our responsibility is to express an opinion on these financial statements and financial highlights based on our audits. The accompanying financial highlights of the Fund for each of the years in the two-year period ended October 31, 2014 were audited by other independent registered public accountants whose report thereon dated December 29, 2014, expressed an unqualified opinion on those financial highlights.
We conducted our audits in accordance with the standards of the Public Company Accounting Oversight Board (United States). Those standards require that we plan and perform the audits to obtain reasonable assurance about whether the financial statements and financial highlights are free of material misstatement. An audit includes examining, on a test basis, evidence supporting the amounts and disclosures in the financial statements. Our procedures included confirmation of securities owned as of October 31, 2017, by correspondence with the custodian and broker or by other appropriate auditing procedures. An audit also includes assessing the accounting principles used and significant estimates made by management, as well as evaluating the overall financial statement presentation. We believe that our audits provide a reasonable basis for our opinion.
In our opinion, the financial statements and financial highlights referred to above present fairly, in all material respects, the financial position of Credit Suisse Strategic Income Fund as of October 31, 2017, the results of its operations for the year then ended, the changes in its net assets for each of the years in the two-year period then ended, and the financial highlights for each of the years in the three-year period then ended in conformity with U.S. generally accepted accounting principles.

New York, New York
December 28, 2017
51
Credit Suisse Strategic Income Fund
Information Concerning Trustees and Officers (unaudited)
Name, Address
(Year of Birth) | | Position(s)
Held with
Fund | | Term
of Office1
and
Length
of Time
Served | | Principal
Occupation(s) During
Past Five Years | | Number of
Portfolios
in Fund
Complex
Overseen
by Trustee | | Other
Trusteeships
Held by Trustee
During Past Five Years | |
Independent Trustees | | | | | | | | | | | |
Laura A. DeFelice
c/o Credit Suisse Asset
Management, LLC
Attn: General Counsel
One Madison Avenue
New York, New York
10010
(1959) | | Trustee, Nominating and Audit Committee member | | Since 2017 | | Partner of Acacia Properties LLC (multi-family and commercial real estate ownership and operation) from 2008 to present; Stonegate Advisors LLC (renewable energy and energy efficiency) from 2007 to present. | | | 8 | | | None | |
Jeffrey E. Garten
c/o Credit Suisse Asset Management, LLC Attn: General Counsel One Madison Avenue New York, New York 10010
(1946) | | Trustee, Nominating and Audit Committee member | | Since Fund Inception | | Dean Emeritus of Yale School of Management from July 2015 to present; The Juan Trippe Professor in the Practice of International Trade, Finance and Business, from July 2005 to July 2015; Partner and Chairman of Garten Rothkopf (consulting firm) from October 2005 to present. | | | 8 | | | Director of Aetna, Inc. (insurance company); Director of CarMax Group (used car dealers); Director of Miller Buckfire & Co., LLC (financial restructuring); Member of Standard & Poor's Board of Managers (credit rating agency) from December 2011 to November 2014. | |
1 Subject to the Trust's retirement policy, each Trustee may continue to serve as a Trustee until the last day of the calendar year in which the applicable Trustee attains age 75. Officer serves until his or her respective successor has been duly elected and qualified.
52
Credit Suisse Strategic Income Fund
Information Concerning Trustees and Officers (unaudited) (continued)
Name, Address
(Year of Birth) | | Position(s)
Held with
Fund | | Term
of Office1
and
Length
of Time
Served | | Principal
Occupation(s) During
Past Five Years | | Number of
Portfolios
in Fund
Complex
Overseen
by Trustee | | Other
Trusteeships
Held by Trustee
During Past Five Years | |
Independent Trustees | | | | | | | | | | | |
Mahendra R. Gupta
c/o Credit Suisse Asset
Management, LLC
Attn: General Counsel
One Madison Avenue
New York, New York
10010
(1956) | | Trustee, Nominating Committee member and Audit Committee Chairman | | Since 2017 | | Professor, Washington University in St. Louis from July 1990 to present; Dean of Olin Business School at Washington University in St. Louis from July 2005 to July 2016; Partner, R.J. Mithaiwala (food manufacturing and retail, India) from March 1977 to present; Partner, F.F.B. Corporation (agriculture, India) from March 1977 to present; Partner, RPMG Research Corporation (benchmark research) from July 2001 to present. | | | 8 | | | Director of Caleres Inc. (footwear) from May 2012 to present | |
1 Subject to the Trust's retirement policy, each Trustee may continue to serve as a Trustee until the last day of the calendar year in which the applicable Trustee attains age 75. Officer serves until his or her respective successor has been duly elected and qualified.
53
Credit Suisse Strategic Income Fund
Information Concerning Trustees and Officers (unaudited) (continued)
Name, Address
(Year of Birth) | | Position(s)
Held with
Fund | | Term
of Office1
and
Length
of Time
Served | | Principal
Occupation(s) During
Past Five Years | | Number of
Portfolios
in Fund
Complex
Overseen
by Trustee | | Other
Trusteeships
Held by Trustee
During Past Five Years | |
Independent Trustees | | | | | | | | | | | |
Steven N. Rappaport
Lehigh Court, LLC
555 Madison Avenue
29th Floor
New York, New York
10022
(1948) | | Chairman of the Board, Nominating Committee Chairman and Audit Committee member | | Trustee since Fund Inception and Chairman since 2005 | | Partner of Lehigh Court, LLC and RZ Capital (private investment firms) from July 2002 to present; Partner of Backstage Acquisition Holdings, LLC (publication job postings) from November 2013 to present. | | | 10 | | | Director of iCAD, Inc. (surgical and medical instruments and apparatus company); Director of Aberdeen Chile Fund, Inc., Aberdeen Emerging Markets Smaller Company Opportunities Fund, Inc., Aberdeen Israel Fund, Inc., Aberdeen Indonesia Fund, Inc. and Aberdeen Latin America Equity Fund, Inc. (each a closed-end investment company); Director of Aberdeen Funds (23 open-end portfolios); Director of Presstek, Inc. (digital imaging technologies company) from 2003 to 2012; Director of Wood Resources, LLC (plywood manufacturing company) from 2003 to October 2013. | |
1 Subject to the Trust's retirement policy, each Trustee may continue to serve as a Trustee until the last day of the calendar year in which the applicable Trustee attains age 75. Officer serves until his or her respective successor has been duly elected and qualified.
54
Credit Suisse Strategic Income Fund
Information Concerning Trustees and Officers (unaudited) (continued)
Name, Address
(Year of Birth) | | Position(s)
Held with
Fund | | Term
of Office1
and
Length
of Time
Served | | Principal
Occupation(s) During
Past Five Years | | Number of
Portfolios
in Fund
Complex
Overseen
by Trustee | | Other
Trusteeships
Held by Trustee
During Past Five Years | |
Interested Trustee | | | | | | | | | | | |
John G. Popp2
Credit Suisse Asset
Management, LLC
One Madison Avenue
New York, New York
10010
Year of Birth: 1956 | | Trustee, Chief Executive Officer and President | | Trustee since 2017
Chief Executive Officer and President since 2010 | | Managing Director of Credit Suisse; Global Head and Chief Investment Officer of the Credit Investments Group; Associated with Credit Suisse or its predecessor since 1997; President and Chief Executive Officer of other Credit Suisse Funds. | | | 10 | | | Trustee of Credit Suisse High Yield Bond Fund; Director of Credit Suisse Asset Management Income Fund, Inc. | |
1 Subject to the Trust's retirement policy, each Trustee may continue to serve as a Trustee until the last day of the calendar year in which the applicable Trustee attains age 75. Officer serves until his or her respective successor has been duly elected and qualified.
2 Mr. Popp is an "interested person" of the Trust, as defined in the 1940 Act, by virtue of his current position as an officer of Credit Suisse.
55
Credit Suisse Strategic Income Fund
Information Concerning Trustees and Officers (unaudited) (continued)
Name, Address
(Year of Birth) | | Position(s)
Held with
Fund | | Term of
Office1
and
Length of
Time
Served | | Principal Occupation(s) During Past Five Years | |
Officers* | | | | | | | |
Emidio Morizio
Credit Suisse Asset
Management, LLC
One Madison Avenue
New York, New York 10010
(1966) | | Chief Compliance Officer | | Since Fund Inception | | Managing Director and Global Head of Compliance of Credit Suisse since 2010; Associated with Credit Suisse since July 2000; Officer of other Credit Suisse Funds. | |
Lou Anne McInnis
Credit Suisse Asset Management, LLC
One Madison Avenue
New York, New York 10010
(1959) | | Chief Legal Officer | | Since 2015 | | Director of Credit Suisse; Associated with Credit Suisse since April 2015; Counsel at DLA Piper US LLP from 2011 to April 2015; Associated with Morgan Stanley Investment Management from 1997 to 2010; Officer of other Credit Suisse Funds. | |
Laurie Pecha
Credit Suisse Asset
Management, LLC
One Madison Avenue
New York, New York 10010
(1961) | | Chief Financial Officer | | Since 2016 | | Director of Credit Suisse since August 2016; Senior Consultant of Spectra Professional Services, LLC from January 2012 to July 2016; Vice President of Legg Mason & Co. from March 2007 to December 2011; Officer of other Credit Suisse Funds. | |
Esther Cheung
Credit Suisse Asset
Management, LLC
One Madison Avenue
New York, New York 10010
(1980) | | Treasurer | | Since 2016 | | Vice President of Credit Suisse since 2015; Associated with Reich & Tang Asset Management, LLC from June 2010 to August 2015; Officer of other Credit Suisse Funds. | |
Karen Regan
Credit Suisse Asset
Management, LLC
One Madison Avenue
New York, New York 10010
(1963) | | Vice President and Secretary | | Since Fund Inception | | Vice President of Credit Suisse; Associated with Credit Suisse since December 2004; Officer of other Credit Suisse Funds. | |
1 Subject to the Trust's retirement policy, each Trustee may continue to serve as a Trustee until the last day of the calendar year in which the applicable Trustee attains age 75. Officer serves until his or her respective successor has been duly elected and qualified.
* The officers of the Fund shown are officers that make policy decisions.
The Statement of Additional Information includes additional information about the Trustees and is available, without charge, upon request, by calling 877-870-2874.
56
Credit Suisse Strategic Income Fund
Proxy Voting and Portfolio Holdings Information (unaudited)
Information regarding how the Fund voted proxies related to its portfolio securities during the 12-month period ended June 30 of each year, as well as the policies and procedures that the Fund uses to determine how to vote proxies relating to its portfolio securities are available:
• By calling 1-877-870-2874
• On the Fund's website, www.credit-suisse.com/us/funds
• On the website of the Securities and Exchange Commission, www.sec.gov
The Fund files a complete schedule of its portfolio holdings for the first and third quarters of its fiscal year with the SEC on Form N-Q. The Fund's Forms N-Q are available on the SEC's website at www.sec.gov and may be reviewed and copied at the SEC's Public Reference Room in Washington, DC. Information on the operation of the SEC's Public Reference Room may be obtained by calling 1-202-551-8090.
57

P.O. BOX 55030, BOSTON, MA 02205-5030
877-870-2874 n www.credit-suisse.com/us/funds
CREDIT SUISSE SECURITIES (USA) LLC, DISTRIBUTOR. SIF-AR-1017
Item 2. Code of Ethics.
The registrant has adopted a code of ethics applicable to its Chief Executive Officer, President, Chief Financial Officer and Chief Accounting Officer, or persons performing similar functions. A copy of the code is filed as Exhibit 12(a)(1) to this Form. There were no amendments to the code during the fiscal year ended October 31, 2017. There were no waivers or implicit waivers from the code granted by the registrant during the fiscal year ended October 31, 2017.
Item 3. Audit Committee Financial Expert.
The registrant’s governing board has determined that it has two audit committee financial experts serving on its audit committee: Mahendra R. Gupta and Steven N. Rappaport. Each audit committee financial expert is “independent” for purposes of this item.
Item 4. Principal Accountant Fees and Services.
(a) through (d). The information in the table below is provided for services rendered to the registrant by its independent registered public accounting firm, KPMG LLP (“KPMG”), for its fiscal years ended October 31, 2016 and October 31, 2017.
| | 2016 | | 2017 | |
Audit Fees | | $ | 217,350 | | $ | 170,000 | |
Audit-Related Fees(1) | | $ | 33,136 | | $ | 24,600 | |
Tax Fees(2) | | $ | 22,785 | | $ | 13,680 | |
All Other Fees | | $ | 8,500 | | $ | 4,857 | |
Total | | $ | 281,771 | | $ | 213,137 | |
(1) Services include agreed-upon procedures in connection with the registrant’s semi-annual financial statements ($33,136 for 2016 and $24,600 for 2017).
(2) Tax services in connection with the registrant’s excise tax calculations and review of the registrant’s applicable tax returns.
The information in the table below is provided with respect to non-audit services that directly relate to the registrant’s operations and financial reporting and that were rendered by KPMG to the registrant’s investment adviser, Credit Suisse Asset Management, LLC (“Credit Suisse”), and any service provider to the registrant controlling, controlled by or under common control with Credit Suisse that provided ongoing services to the registrant (“Covered Services Provider”), for the registrant’s fiscal years ended October 31, 2016 and October 31, 2017.
| | 2016 | | 2017 | |
Audit-Related Fees | | N/A | | N/A | |
Tax Fees | | N/A | | N/A | |
All Other Fees | | N/A | | N/A | |
Total | | N/A | | N/A | |
(e)(1) Pre-Approval Policies and Procedures. The Audit Committee (“Committee”) of the registrant is responsible for pre-approving (i) all audit and permissible non-audit services to be provided by the independent registered public accounting firm to the registrant and (ii) all permissible non-audit services to be provided by the independent registered public accounting firm to Credit Suisse and any Covered Services Provider if the engagement relates directly to the operations and financial reporting of the registrant. The Committee may delegate its responsibility to pre-approve any such audit and permissible non-audit services to the Chairperson of the Committee, and the Chairperson shall report to the Committee, at its next regularly scheduled meeting after the Chairperson’s pre-approval of such services, his or her decision(s). The Committee may also establish detailed pre-approval policies and procedures for pre-approval of such services in accordance with applicable laws, including the delegation of some or all of the Committee’s pre-approval responsibilities to other persons (other than Credit Suisse or the registrant’s officers). Pre-approval by the Committee of any permissible non-audit services shall not be required so long as: (i) the aggregate amount of all such permissible non-audit services provided to the registrant, Credit Suisse and any Covered Services Provider constitutes not more than 5% of the total amount of revenues paid by the registrant to its independent registered public accounting firm during the fiscal year in which the permissible non-audit services are provided; (ii) the permissible non-audit services were not recognized by the registrant at the time of the engagement to be non-audit services; and (iii) such services are promptly brought to the attention of the Committee and approved by the Committee (or its delegate(s)) prior to the completion of the audit.
(e)(2) The information in the table below sets forth the percentages of fees for services (other than audit, review or attest services) rendered by KPMG to the registrant for which the pre-approval requirement was waived pursuant to Rule 2-01(c)(7)(i)(C) of Regulation S-X:
| | 2016 | | 2017 | |
Audit-Related Fees | | N/A | | N/A | |
Tax Fees | | N/A | | N/A | |
All Other Fees | | N/A | | N/A | |
Total | | N/A | | N/A | |
The information in the table below sets forth the percentages of fees for services (other than audit, review or attest services) rendered by KPMG to Credit Suisse and any Covered Services Provider required to be approved pursuant to Rule 2-01(c)(7)(ii) of Regulation S-X, for the registrant’s fiscal years ended October 31, 2016 and October 31, 2017:
| | 2016 | | 2017 | |
Audit-Related Fees | | N/A | | N/A | |
Tax Fees | | N/A | | N/A | |
All Other Fees | | N/A | | N/A | |
Total | | N/A | | N/A | |
(f) Not Applicable.
(g) The aggregate fees billed by KPMG for non-audit services rendered to the registrant, Credit Suisse and Covered Service Providers for the fiscal years ended October 31, 2016 and October 31, 2017 were $0 and $0, respectively.
(h) Not Applicable.
Item 5. Audit Committee of Listed Registrants.
Form N-CSR disclosure requirement is not applicable to the registrant.
Item 6. Schedule of Investments.
Included as part of the report to shareholders filed under Item 1 of this Form.
Item 7. Disclosure of Proxy Voting Policies and Procedures for Closed-End Management Investment Companies.
Form N-CSR disclosure requirement is not applicable to the registrant.
Item 8. Portfolio Managers of Closed-End Management Investment Companies.
Form N-CSR disclosure requirement is not applicable to the registrant.
Item 9. Purchases of Equity Securities by Closed-End Management Investment Company and Affiliated Purchasers.
Form N-CSR disclosure requirement is not applicable to the registrant.
Item 10. Submission of Matters to a Vote of Security Holders.
None.
Item 11. Controls and Procedures.
(a) As of a date within 90 days from the filing date of this report, the principal executive officer and principal financial officer concluded that the registrant’s disclosure controls and procedures (as defined in Rule 30a-3(c) under the Investment Company Act of 1940 (the “Act”)) were effective based on their evaluation of the disclosure controls and procedures required by Rule 30a-3(b) under the Act and Rules 13a-15(b) or 15d-15(b) under the Securities Exchange Act of 1934.
(b) There were no changes in registrant’s internal control over financial reporting (as defined in Rule 30a-3(d) under the Act) that occurred during the second fiscal quarter of the period covered by this report that have materially affected, or are reasonably likely to materially affect, the registrant’s internal control over financial reporting.
Item 12. Disclosure of Securities Lending Activities for Closed-End Management Investment Companies
Not Applicable
Item 13. Exhibits.
(a)(1) Registrant’s Code of Ethics is an exhibit to this report.
(a)(2) The certifications of the registrant as required by Rule 30a-2(a) under the Act are exhibits to this report.
(a)(3) Not applicable.
(b) The certifications of the registrant as required by Rule 30a-2(b) under the Act are an exhibit to this report.
(other) Iran related activities disclosure requirement.
SIGNATURES
Pursuant to the requirements of the Securities Exchange Act of 1934 and the Investment Company Act of 1940, the registrant has duly caused this report to be signed on its behalf by the undersigned, thereunto duly authorized.
CREDIT SUISSE OPPORTUNITY FUNDS | |
| |
/s/ John G. Popp | |
Name: John G. Popp | |
Title: Chief Executive Officer and President | |
Date: January 3, 2018 | |
Pursuant to the requirements of the Securities Exchange Act of 1934 and the Investment Company Act of 1940, this report has been signed below by the following persons on behalf of the registrant and in the capacities and on the dates indicated.
/s/ John G. Popp | |
Name: John G. Popp | |
Title: Chief Executive Officer and President | |
Date: January 3, 2018 | |
| |
/s/ Laurie Pecha | |
Name: Laurie Pecha | |
Title: Chief Financial Officer | |
Date: January 3, 2018 | |