UNITED STATES
SECURITIES AND EXCHANGE COMMISSION
Washington, D.C. 20549
FORM N-CSR
CERTIFIED SHAREHOLDER REPORT OF REGISTERED
MANAGEMENT INVESTMENT COMPANIES
Investment Company Act file number | 811-09054 |
|
CREDIT SUISSE OPPORTUNITY FUNDS |
(Exact name of registrant as specified in charter) |
|
One Madison Avenue, New York, New York | | 10010 |
(Address of principal executive offices) | | (Zip code) |
|
John G. Popp Credit Suisse Opportunity Funds One Madison Avenue New York, New York 10010 |
(Name and address of agent for service) |
|
Registrant’s telephone number, including area code: | (212) 325-2000 | |
|
Date of fiscal year end: | October 31st | |
|
Date of reporting period: | November 1, 2013 to October 31, 2014 | |
| | | | | | | | | |
Item 1. Reports to Stockholders.

CREDIT SUISSE FUNDS
Annual Report
October 31, 2014
n CREDIT SUISSE
MANAGED FUTURES STRATEGY FUND
The Fund's investment objectives, risks, charges and expenses (which should be considered carefully before investing), and more complete information about the Fund, are provided in the Prospectus, which should be read carefully before investing. You may obtain additional copies by calling 877-870-2874 or by writing to Credit Suisse Funds, P.O. Box 55030, Boston, MA 02205-5030.
Credit Suisse Securities (USA) LLC, Distributor, is located at One Madison Avenue, New York, NY 10010. Credit Suisse Funds are advised by Credit Suisse Asset Management, LLC.
AFFIRMATION OF THE COMMODITY POOL OPERATOR
To the best of my knowledge and belief, the information contained in the attached financial statements for the year from November 1, 2013 to October 31, 2014, is accurate and complete.

Kenneth J. Lohsen, Managing Director
Credit Suisse Asset Management, LLC,
Commodity Pool Operator for the Credit Suisse Managed Futures Strategy Fund
Investors in the Credit Suisse Funds should be aware that they may be eligible to purchase Class I shares (where offered) directly or through certain intermediaries. Such shares are not subject to a sales charge. Investors in the Credit Suisse Funds should also be aware that they may be eligible for a reduction or waiver of the sales charge with respect to Class A or C shares (where offered). For more information, please review the relevant prospectuses or consult your financial representative.
Fund shares are not deposits or other obligations of Credit Suisse Asset Management, LLC ("Credit Suisse") or any affiliate, are not FDIC-insured and are not guaranteed by Credit Suisse or any affiliate. Fund investments are subject to investment risks, including loss of your investment.
Credit Suisse Managed Futures Strategy Fund
Annual Investment Adviser's Report
October 31, 2014 (unaudited)
December 22, 2014
Dear Shareholder:
We are pleased to present this Annual Report covering the activities of the Credit Suisse Managed Futures Strategy Fund (the "Fund") for the 12-months ended October 31, 2014.
Performance Summary
11/01/13 – 10/31/14
Fund & Benchmark | | Performance | |
| Class I1 | | | 7.63 | % | |
| Class A1,2 | | | 7.35 | % | |
| Class C1,2 | | | 6.62 | % | |
| Credit Suisse Managed Futures Liquid Index3 | | | 8.62 | % | |
Performance shown for the Fund's Class A and Class C Shares does not reflect sales charges, which are a maximum of 5.25% and 1.00%, respectively.2
Market Review: An interesting period for managed futures
The 12-months ended October 31, 2014 was a positive one for managed futures strategies. The Credit Suisse Managed Futures Liquid Index (the "Index"), the Fund's benchmark, had a positive return of 8.62% for the period.
Trend followers posted positive returns overall for the last two months of 2013, which resulted from trading equity indices where their long exposure benefitted from the post U.S. debt-ceiling resolution rally. However, range-bound trading in equity markets resulted in a difficult environment for trend-following strategies at the start of 2014.
In Q2 2014, trend following strategies generated profits from long fixed income positions as well as long equity exposure. Since then, they generated profits from long fixed income positions as well as short FX exposure. Commodities were a drag on performance in Q2, but turned positive in September as trend-followers caught up with bearish signals.
Strategic Review and Outlook: Anticipating continued interest in managed futures
For the 12-months ended October 31, 2014, the Fund underperformed the benchmark. Currencies contributed to performance, particularly due to profits from Euro and Japanese Yen positions. Fixed income also added to Fund performance, mainly due to the Euro-Bund futures. Long Gilt futures and Japanese 10-Year Bond futures also significantly contributed to performance. Additionally, commodities contributed positively overall to performance, despite the negative performance of industrial metals. In contrast, most equity positions detracted from overall Fund performance. Range-bound trading in Q1 2014 and
1
Credit Suisse Managed Futures Strategy Fund
Annual Investment Adviser's Report (continued)
October 31, 2014 (unaudited)
increased volatility in October 2014 were contributing causes to the negative equity performance.
In general, the managed futures strategy is designed to profit from both upward and downward trending markets across several asset classes including commodities, bonds, equities and currencies. We continue to believe that the unique return profile of managed futures may appeal to investors searching for meaningful portfolio diversifiers that may help mitigate risk and provide uncorrelated returns.
The Credit Suisse Liquid Alternative Beta Team
Dr. Sid Browne
Mark Nodelman
Jonathan Sheridan
Sheel Dhande
This Fund is non-diversified, which means it may invest a greater proportion of its assets in the securities of a smaller number of issuers than a diversified mutual fund and may therefore be subject to greater volatility. The Fund's investment in alternative instruments may subject the Fund to greater volatility than investment in traditional securities, particularly in investments involving leverage.
The use of alternative assets and strategies entails substantial risks, including risk of loss of principal, commodity exposure risks, credit risk, currency risk, derivatives risk, equity exposure risk, exchange-traded notes risk, fixed income risk, foreign securities risk, forwards risk, futures contracts risk, interest rate risk, leveraging risk, market risk, options risk, portfolio turnover risk, repurchase agreements risk, short position risk, structured note risk, swap agreement risk, tax risk and U.S. government securities risk. Gains and losses from speculative positions in derivatives may be much greater than the derivative's cost. For a detailed discussion of these and other risks, please refer to the Fund's Prospectus, which should be read carefully before investing.
In addition to historical information, this report contains forward-looking statements, which may concern, among other things, domestic and foreign market, industry and economic trends and developments and government regulation and their potential impact on the Fund's investments. These statements are subject to risks and uncertainties and actual trends, developments and regulations in the future, and their impact on the Fund could be materially different from those projected, anticipated or implied. The Fund has no obligation to update or revise forward-looking statements.
The views of the Fund's management are as of the date of the letter and the Fund holdings described in this document are as of October 31, 2014; these views and Fund holdings may have changed subsequent to these dates. Nothing in this document is a recommendation to purchase or sell securities.
2
Credit Suisse Managed Futures Strategy Fund
Annual Investment Adviser's Report (continued)
October 31, 2014 (unaudited)
Comparison of Change in Value of $10,000 Investment in the
Credit Suisse Managed Futures Strategy Fund1 Class I Shares,
Class A Shares2, Class C Shares2 and Credit Suisse Managed Futures Liquid Index3 from Inception (9/28/12).
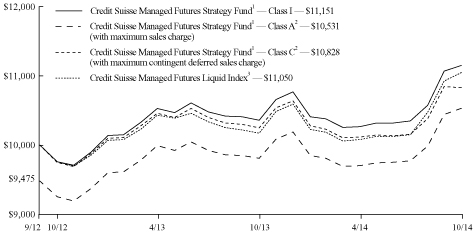
1 Fee waivers and/or expense reimbursements may reduce expenses for the Fund, without which performance would be lower. The Fund has entered into a written contract to limit expenses to 1.70% of the Fund's average daily net assets for Class I shares, 1.95% of the Fund's average daily net assets for Class A shares and 2.70% of the Fund's average daily net assets for Class C shares through at least February 28, 2015.
2 Total return for the Fund's Class A shares for the reporting period, based on offering price (including maximum sales charge of 5.25%), was 1.74%. Total return for the Fund's Class C shares for the reporting period, based on redemption value (including maximum contingent deferred sales charge of 1.00%), was 5.62%.
3 The Credit Suisse Managed Futures Liquid Index is currently composed of 14 futures contracts and 4 commodity indices which provide exposure to the asset classes. The Index uses a proprietary quantitative methodology to seek to identify price trends in each of the asset classes over a variety of time horizons. Components of the Index, which may change from time to time, are positioned either long or short based on the price trends within the asset classes determined using the Index's quantitative methodology. An index does not have transaction cost; investors cannot invest directly in an index.
3
Credit Suisse Managed Futures Strategy Fund
Annual Investment Adviser's Report (continued)
October 31, 2014 (unaudited)
Average Annual Returns as of October 31, 20141
| | | 1 Year | | Since
Inception2 | |
Class I | | | 7.63 | %3 | | | 5.34 | % | |
Class A Without Sales Charge | | | 7.35 | % | | | 5.16 | % | |
Class A With Maximum Sales Charge | | | 1.74 | % | | | 2.50 | % | |
Class C Without CDSC | | | 6.62 | % | | | 4.33 | % | |
Class C With CDSC | | | 5.62 | % | | | 3.87 | % | |
Returns represent past performance and include change in share price and reinvestment of dividends and capital gains. Past performance cannot guarantee future results. The current performance of the Fund may be lower or higher than the figures shown. Returns and share price will fluctuate, and redemption value may be more or less than original cost. The performance results do not reflect the deduction of taxes that a shareholder would pay on fund distributions or the redemption of fund shares. Performance information current to the most recent month-end is available at www.credit-suisse.com/us/funds.
The annual gross expense ratios are 1.81% for Class I shares, 2.06% for Class A shares and 2.81% for Class C shares. The annualized net expense ratios after fee waivers and/or expense reimbursements excluding interest expense are 1.70% for Class I shares, 1.95% for Class A shares and 2.70% for Class C shares.
1 Fee waivers and/or expense reimbursements may reduce expenses for the Fund, without which performance would be lower. The Fund has entered into a written contract to limit expenses to 1.70% of the Fund's average daily net assets for Class I shares, 1.95% of the Fund's average daily net assets for Class A shares and 2.70% of the Fund's average daily net assets for Class C shares through at least February 28, 2015.
2 Inception Date September 28, 2012.
3 The calculated total return shown does not reflect adjustments required under U.S. GAAP made to the Net Asset Value as of October 31, 2014. The total return for Class I shares based on the Net Asset Value adjusted for financial statement purposes is 7.73%.
4
Credit Suisse Managed Futures Strategy Fund
Annual Investment Adviser's Report (continued)
October 31, 2014 (unaudited)
Information About Your Fund's Expenses
As an investor of the Fund, you incur two types of costs: ongoing expenses and transaction costs. Ongoing expenses include management fees, distribution and service (12b-1) fees and other Fund expenses. Examples of transaction costs include sales charges (loads), redemption fees and account maintenance fees, which are not shown in this section and which would result in higher total expenses. The following table is intended to help you understand your ongoing expenses of investing in the Fund and to help you compare these expenses with the ongoing expenses of investing in other mutual funds. The table is based on an investment of $1,000 made at the beginning of the six-months ended October 31, 2014.
The table illustrates your Fund's expenses in two ways:
• Actual Fund Return. This helps you estimate the actual dollar amount of ongoing expenses paid on a $1,000 investment in the Fund using the Fund's actual return during the period. To estimate the expenses you paid over the period, simply divide your account value by $1,000 (for example, an $8,600 account value divided by $1,000 = 8.6), then multiply the result by the number in the "Expenses Paid per $1,000" line under the share class you hold.
• Hypothetical 5% Fund Return. This helps you to compare your Fund's ongoing expenses with those of other mutual funds using the Fund's actual expense ratio and a hypothetical rate of return of 5% per year before expenses. Examples using a 5% hypothetical fund return may be found in the shareholder reports of other mutual funds. The hypothetical account values and expenses may not be used to estimate the actual ending account balance or expenses you paid for the period.
Please note that the expenses shown in these tables are meant to highlight your ongoing expenses only and do not reflect any transaction costs, such as sales charges (loads) or redemption fees. If these transaction costs had been included, your costs would have been higher. The "Expenses Paid per $1,000" line of the tables is useful in comparing ongoing expenses only and will not help you determine the relative total expenses of owning different funds.
5
Credit Suisse Managed Futures Strategy Fund
Annual Investment Adviser's Report (continued)
October 31, 2014 (unaudited)
Expenses and Value for a $1,000 Investment
for the six month period ended October 31, 2014
Actual Fund Return | | Class I | | Class A | | Class C | |
Beginning Account Value 05/01/14 | | $ | 1,000.00 | | | $ | 1,000.00 | | | $ | 1,000.00 | | |
Ending Account Value 10/31/14 | | $ | 1,086.20 | | | $ | 1,085.40 | | | $ | 1,080.40 | | |
Expenses Paid per $1,000* | | $ | 8.99 | | | $ | 10.30 | | | $ | 14.21 | | |
Hypothetical 5% Fund Return | |
Beginning Account Value 05/01/14 | | $ | 1,000.00 | | | $ | 1,000.00 | | | $ | 1,000.00 | | |
Ending Account Value 10/31/14 | | $ | 1,016.59 | | | $ | 1,015.32 | | | $ | 1,011.54 | | |
Expenses Paid per $1,000* | | $ | 8.69 | | | $ | 9.96 | | | $ | 13.74 | | |
| | | Class I | | Class A | | Class C | |
Annualized Expense Ratios* | | | 1.71 | % | | | 1.96 | % | | | 2.71 | % | |
* Expenses are equal to the Fund's annualized expense ratio for each share class, multiplied by the average account value over the period, multiplied by the number of days in the most recent fiscal half year period, then divided by 365.
The "Expenses Paid per $1,000" and the "Annualized Expense Ratios" in the tables are based on actual expenses paid by the Fund during the period, net of fee waivers and/or expense reimbursements. If those fee waivers and/or expense reimbursements had not been in effect, the Fund's actual expenses would have been higher. Expenses do not reflect additional charges and expenses that are, or may be, imposed under the variable contracts or plans. Such charges and expenses are described in the prospectus of the insurance company separate account or in the plan documents or other informational materials supplied by plan sponsors. The Fund's expenses should be considered with these charges and expenses in evaluating the overall cost of investing in the separate account.
For more information, please refer to the Fund's prospectus.
Sector Breakdown*
United States Agency Obligations | | | 9.17 | % | |
Short-term Investment1 | | | 90.83 | | |
Total | | | 100.00 | % | |
* Expressed as a percentage of total investments (excluding securities lending collateral if applicable) and may vary over time.
1 Primarily reflects cash invested in State Street Bank and Trust Co. Euro Time Deposit, for which the purchases of securities have been executed but not yet settled at October 31, 2014, if applicable.
6
Credit Suisse Managed Futures Strategy Fund
Consolidated Schedule of Investments
October 31, 2014
Par
(000) | |
| | Ratings†
(S&P/Moody's) | | Maturity | | Rate% | | Value | |
| UNITED STATES AGENCY OBLIGATIONS (8.1%) | |
$ | 6,000 | | | Federal Farm Credit Banks# (Cost $5,999,809) | | (AA+, Aaa) | | 02/27/15 | | | 0.162 | | | $ | 6,002,250 | | |
SHORT-TERM INVESTMENT (80.3%) | |
| | 59,488 | | | State Street Bank and Trust Co. Euro
Time Deposit (Cost $59,488,000) | | | | | | 11/03/14 | | | 0.010 | | | | 59,488,000 | | |
| TOTAL INVESTMENTS AT VALUE (88.4%) (Cost $65,487,809) | | | 65,490,250 | | |
| OTHER ASSETS IN EXCESS OF LIABILITIES (11.6%) | | | 8,551,983 | | |
| NET ASSETS (100.0%) | | $ | 74,042,233 | | |
† Credit ratings given by the Standard & Poor's Division of The McGraw-Hill Companies, Inc. ("S&P") and Moody's Investors Service, Inc. ("Moody's") are unaudited.
# Variable rate obligations — The interest rate is the rate as of October 31, 2014.
Futures Contracts
Contract Description | | Currency | | Expiration
Date | | Number
of Contracts | | Notional
Value | | Net Unrealized
Appreciation
(Depreciation) | |
Contracts to Purchase | | | | | | | | | | | |
Index Contracts
Hang Seng Index Futures | | HKD | | | | Nov 2014 | | | 22 | | | $ | 3,396,083 | | | $ | 72,986 | | |
Nikkei 225 Index Futures OSE | | JPY | | | | Dec 2014 | | | 25 | | | | 3,677,356 | | | | 237,334 | | |
S&P 500 E Mini Index Futures | | USD | | | | Dec 2014 | | | 79 | | | | 7,945,030 | | | | 91,016 | | |
| | | $ | 401,336 | | |
Interest Rate Contracts
10YR JGB Mini Futures | | JPY | | | | Dec 2014 | | | 285 | | | | 37,284,778 | | | $ | 233,270 | | |
10YR U.S. Treasury Note Futures | | USD | | | | Dec 2014 | | | 89 | | | | 11,245,984 | | | | 88,791 | | |
German EURO Bund Futures | | EUR | | | | Dec 2014 | | | 129 | | | | 24,390,702 | | | | 320,044 | | |
Long Gilt Futures | | GBP | | | | Dec 2014 | | | 97 | | | | 17,861,834 | | | | 455,295 | | |
| | | $ | 1,097,400 | | |
Contracts to Sell | |
Foreign Exchange Contracts
AUD Currency Futures | | USD | | | | Dec 2014 | | | (215 | ) | | | (18,853,350 | ) | | $ | 331,021 | | |
| CAD Currency Futures | | USD | | | | Dec 2014 | | | (242 | ) | | | (21,441,200 | ) | | | 468,225 | | |
| EUR Currency Futures | | USD | | | | Dec 2014 | | | (159 | ) | | | (24,903,375 | ) | | | 790,600 | | |
| GBP Currency Futures | | USD | | | | Dec 2014 | | | (278 | ) | | | (27,773,938 | ) | | | 221,025 | | |
| JPY Currency Futures | | USD | | | | Dec 2014 | | | (167 | ) | | | (18,595,450 | ) | | | 1,053,742 | | |
| | | $ | 2,864,613 | | |
Index Contracts | |
EURO Stoxx 50 Index Futures | | EUR | | | | Dec 2014 | | | (132 | ) | | | (5,128,522 | ) | | $ | (284,957 | ) | |
FTSE 100 Index Futures | | GBP | | | | Dec 2014 | | | (131 | ) | | | (13,634,241 | ) | | | (89,720 | ) | |
| | | $ | (374,677 | ) | |
Net unrealized appreciation (depreciation) | | | | | | | | | | $ | 3,988,672 | | |
See Accompanying Notes to Consolidated Financial Statements.
7
Credit Suisse Managed Futures Strategy Fund
Consolidated Schedule of Investments (continued)
October 31, 2014
Currency Abbreviations:
AUD = Australian Dollar
CAD = Canadian Dollar
EUR = Euro
GBP = British Pound
HKD = Hong Kong Dollar
JPY = Japanese Yen
USD = United States Dollar
Total Return Swap Contracts | |
Currency | | Notional
Amount | | Expiration
Date | | Counterparty | | Receive | | Pay | | Net Unrealized
Appreciation
(Depreciation) | |
USD | $ | | | | 8,821,440 | | | 11/18/14 | | Goldman Sachs | | Fixed Rate | | Bloomberg Energy Index | | $ | 20,282 | | |
USD | $ | | | | 6,698,476 | | | 11/18/14 | | Goldman Sachs | | Fixed Rate | | Bloomberg Agriculture Index | | | (123,263 | ) | |
USD | $ | | | | 7,739,356 | | | 11/18/14 | | Goldman Sachs | | Fixed Rate | | Bloomberg Precious Metals Index | | | 471,401 | | |
USD | $ | | | | 4,405,562 | | | 11/18/14 | | Goldman Sachs | | Fixed Rate | | Bloomberg Industrial Metals Index | | | (173,668 | ) | |
USD | $ | | | | 3,240,572 | | | 11/18/14 | | Goldman Sachs | | Fixed Rate | | Bloomberg Industrial Metals Index | | | (73,344 | ) | |
USD | $ | | | | 1,083,409 | | | 11/18/14 | | Goldman Sachs | | Fixed Rate | | Bloomberg Industrial Metals Index | | | (32,612 | ) | |
| | | $ | 88,796 | | |
See Accompanying Notes to Consolidated Financial Statements.
8
Credit Suisse Managed Futures Strategy Fund
Consolidated Statement of Assets and Liabilities
October 31, 2014
Assets | |
Investments at value (Cost $65,487,809) (Note 2) | | $ | 65,490,250 | | |
Cash | | | 1,069 | | |
Cash segregated at brokers for futures contracts and swap contracts (Note 2) | | | 7,130,085 | | |
Variation margin receivable on futures contracts (Note 2) | | | 1,562,962 | | |
Unrealized appreciation on open swap contracts (Note 2) | | | 491,683 | | |
Receivable for fund shares sold | | | 31,933 | | |
Interest receivable | | | 146 | | |
Prepaid expenses and other assets | | | 32,337 | | |
Total assets | | | 74,740,465 | | |
Liabilities | |
Investment advisory fee payable (Note 3) | | | 96,305 | | |
Administrative services fee payable (Note 3) | | | 5,951 | | |
Shareholder servicing/Distribution fee payable (Note 3) | | | 1,993 | | |
Unrealized depreciation on open swap contracts (Note 2) | | | 402,887 | | |
Payable for fund shares redeemed | | | 60,837 | | |
Net payable for terminated total return swap contracts | | | 15,534 | | |
Trustees' fee payable | | | 10,440 | | |
Accrued expenses | | | 104,285 | | |
Total liabilities | | | 698,232 | | |
Net Assets | |
Capital stock, $.001 par value (Note 6) | �� | | 6,832 | | |
Paid-in capital (Note 6) | | | 68,397,909 | | |
Accumulated net investment income | | | 211,153 | | |
Accumulated net realized gain from investments, futures contracts, swap contracts
and foreign currency transactions | | | 1,349,613 | | |
Net unrealized appreciation from investments, futures contracts, swap contracts
and foreign currency translations | | | 4,076,726 | | |
Net assets | | $ | 74,042,233 | | |
I Shares | |
Net assets | | $ | 69,190,080 | | |
Shares outstanding | | | 6,379,873 | | |
Net asset value, offering price and redemption price per share | | $ | 10.85 | | |
A Shares | |
Net assets | | $ | 3,294,495 | | |
Shares outstanding | | | 305,107 | | |
Net asset value and redemption price per share | | $ | 10.80 | | |
Maximum offering price per share (net asset value/(1-5.25%)) | | $ | 11.40 | | |
C Shares | |
Net assets | | $ | 1,557,658 | | |
Shares outstanding | | | 146,693 | | |
Net asset value and offering price per share | | $ | 10.62 | | |
See Accompanying Notes to Consolidated Financial Statements.
9
Credit Suisse Managed Futures Strategy Fund
Consolidated Statement of Operations
For the Year Ended October 31, 2014
Investment Income | |
Interest | | $ | 15,908 | | |
Total investment income | | | 15,908 | | |
Expenses | |
Investment advisory fees (Note 3) | | | 688,720 | | |
Administrative services fees (Note 3) | | | 62,671 | | |
Shareholder servicing/Distribution fees (Note 3) | |
Class A | | | 11,821 | | |
Class C | | | 11,968 | | |
Custodian fees | | | 64,535 | | |
Audit and tax fees | | | 52,100 | | |
Registration fees | | | 51,274 | | |
Legal fees | | | 49,586 | | |
Trustees' fees | | | 44,139 | | |
Printing fees (Note 3) | | | 36,162 | | |
Transfer agent fees (Note 3) | | | 21,431 | | |
Interest expense (Note 4) | | | 4,701 | | |
Commitment fees (Note 4) | | | 2,924 | | |
Insurance expense | | | 1,466 | | |
Miscellaneous expense | | | 3,253 | | |
Total expenses | | | 1,106,751 | | |
Less: fees waived (Note 3) | | | (60,152 | ) | |
Net expenses | | | 1,046,599 | | |
Net investment loss | | | (1,030,691 | ) | |
Net Realized and Unrealized Gain (Loss) from Investments, Futures Contracts,
Swap Contracts and Foreign Currency Related Items | |
Net realized gain from investments | | | 1,116 | | |
Net realized gain from futures contracts | | | 2,569,586 | | |
Net realized gain from swap contracts | | | 639,685 | | |
Net realized loss from foreign currency transactions | | | (60,791 | ) | |
Net change in unrealized appreciation (depreciation) from investments | | | (5,897 | ) | |
Net change in unrealized appreciation (depreciation) from futures contracts | | | 3,139,289 | | |
Net change in unrealized appreciation (depreciation) from swap contracts | | | 7,772 | | |
Net change in unrealized appreciation (depreciation) from foreign currency translations | | | (10,917 | ) | |
Net realized and unrealized gain from investments, futures contracts, swap contracts
and foreign currency related items | | | 6,279,843 | | |
Net increase in net assets resulting from operations | | $ | 5,249,152 | | |
See Accompanying Notes to Consolidated Financial Statements.
10
Credit Suisse Managed Futures Strategy Fund
Consolidated Statement of Changes in Net Assets
| | | For the Year
Ended
October 31, 2014 | | For the Year
Ended
October 31, 2013 | |
From Operations | |
Net investment loss | | $ | (1,030,691 | ) | | $ | (448,412 | ) | |
Net realized gain from investments, futures contracts, swap contracts and
foreign currency transactions | | | 3,149,596 | | | | 708,236 | | |
Net change in unrealized appreciation (depreciation) from investments,
futures contracts, swap contracts and foreign currency translations | | | 3,130,247 | | | | 1,047,910 | | |
Net increase in net assets resulting from operations | | | 5,249,152 | | | | 1,307,734 | | |
From Dividends and Distributions
Distributions from net realized gains | |
Class I | | | (873,874 | ) | | | — | | |
Class A | | | (160,800 | ) | | | — | | |
Class C | | | (30,498 | ) | | | — | | |
Net decrease in net assets resulting from dividends and distributions | | | (1,065,172 | ) | | | — | | |
| From Capital Share Transactions (Note 6) | |
Proceeds from sale of shares | | | 42,426,721 | | | | 12,058,695 | | |
Reinvestment of dividends and distributions | | | 1,065,172 | | | | — | | |
Net asset value of shares redeemed | | | (7,050,750 | )1 | | | (1,912,635 | )2 | |
Net increase in net assets from capital share transactions | | | 36,441,143 | | | | 10,146,060 | | |
Net increase in net assets | | | 40,625,123 | | | | 11,453,794 | | |
Net Assets | |
Beginning of year | | | 33,417,110 | | | | 21,963,316 | | |
End of year | | $ | 74,042,233 | | | $ | 33,417,110 | | |
Undistributed (accumulated) net investment income (loss) | | $ | 211,153 | | | $ | (49,759 | ) | |
1 Net of $7 of redemption fees retained by the Fund.
2 Net of $524 of redemption fees retained by the Fund.
See Accompanying Notes to Consolidated Financial Statements.
11
Credit Suisse Managed Futures Strategy Fund
Consolidated Financial Highlights
(For a Class I Share of the Fund Outstanding Throughout Each Period)
| | | For the Year Ended October 31, | |
| | | 2014 | | 2013 | | 20121 | |
Per share data | |
Net asset value, beginning of year | | $ | 10.36 | | | $ | 9.76 | | | $ | 10.00 | | |
INVESTMENT OPERATIONS | |
Net investment loss2 | | | (0.17 | ) | | | (0.17 | ) | | | (0.01 | ) | |
Net gain (loss) on investments, futures contracts, swap contracts
and foreign currency related items (both realized and unrealized) | | | 0.95 | | | | 0.77 | | | | (0.23 | ) | |
Total from investment operations | | | 0.78 | | | | 0.60 | | | | (0.24 | ) | |
REDEMPTION FEES | | | 0.003 | | | | 0.003 | | | | 0.00 | | |
LESS DIVIDENDS AND DISTRIBUTIONS | |
Distributions from net realized gains | | | (0.29 | ) | | | — | | | | — | | |
Total dividends and distributions | | | (0.29 | ) | | | — | | | | — | | |
Net asset value, end of year | | $ | 10.854 | | | $ | 10.36 | | | $ | 9.76 | | |
Total return5 | | | 7.73 | % | | | 6.15 | % | | | (2.40 | )% | |
RATIOS AND SUPPLEMENTAL DATA | |
Net assets, end of year (000s omitted) | | $ | 69,190 | | | $ | 26,794 | | | $ | 21,768 | | |
Ratio of net expenses to average net assets | | | 1.71 | % | | | 1.70 | % | | | 1.70 | %6 | |
Ratio of expenses to average net assets excluding interest expense | | | 1.70 | % | | | 1.70 | % | | | 1.70 | %6 | |
Ratio of net investment loss to average net assets | | | (1.68 | )% | | | (1.64 | )% | | | (1.69 | )%6 | |
Decrease reflected in above operating expense ratios due to
waivers/reimbursements | | | 0.10 | % | | | 1.10 | % | | | 3.01 | %6 | |
Portfolio turnover rate | | | — | | | | — | | | | — | | |
1 For the period September 28, 2012 (commencement of operations) through October 31, 2012.
2 Per share information is calculated using the average shares outstanding method.
3 This amount represents less than $0.01 per share.
4 Includes adjustments in accordance with accounting principles generally accepted in the United States of America and as such, the net asset values for financial reporting purposes and the returns based upon net asset values may differ from the net asset values and returns for shareholder transactions.
5 Total returns are historical and assume changes in share price. Had certain expenses not been reduced during the years shown, total returns would have been lower. Total returns for periods less than one year are not annualized.
6 Annualized.
See Accompanying Notes to Consolidated Financial Statements.
12
Credit Suisse Managed Futures Strategy Fund
Consolidated Financial Highlights
(For a Class A Share of the Fund Outstanding Throughout Each Period)
| | | For the Year Ended October 31, | |
| | | 2014 | | 2013 | | 20121 | |
Per share data | |
Net asset value, beginning of year | | $ | 10.35 | | | $ | 9.76 | | | $ | 10.00 | | |
INVESTMENT OPERATIONS | |
Net investment loss2 | | | (0.20 | ) | | | (0.20 | ) | | | (0.02 | ) | |
Net gain (loss) on investments, futures contracts, swap contracts
and foreign currency related items (both realized and unrealized) | | | 0.94 | | | | 0.79 | | | | (0.22 | ) | |
Total from investment operations | | | 0.74 | | | | 0.59 | | | | (0.24 | ) | |
REDEMPTION FEES | | | 0.003 | | | | 0.003 | | | | 0.00 | | |
LESS DIVIDENDS AND DISTRIBUTIONS | |
Distributions from net realized gains | | | (0.29 | ) | | | — | | | | — | | |
Total dividends and distributions | | | (0.29 | ) | | | — | | | | — | | |
Net asset value, end of year | | $ | 10.80 | | | $ | 10.35 | | | $ | 9.76 | | |
Total return4 | | | 7.35 | % | | | 6.05 | % | | | (2.40 | )% | |
RATIOS AND SUPPLEMENTAL DATA | |
Net assets, end of year (000s omitted) | | $ | 3,294 | | | $ | 5,824 | | | $ | 98 | | |
Ratio of net expenses to average net assets | | | 1.96 | % | | | 1.95 | % | | | 1.95 | %5 | |
Ratio of expenses to average net assets excluding interest expense | | | 1.95 | % | | | 1.95 | % | | | 1.95 | %5 | |
Ratio of net investment loss to average net assets | | | (1.93 | )% | | | (1.90 | )% | | | (1.94 | )%5 | |
Decrease reflected in above operating expense ratios due to
waivers/reimbursements | | | 0.10 | % | | | 1.10 | % | | | 3.01 | %5 | |
Portfolio turnover rate | | | — | | | | — | | | | — | | |
1 For the period September 28, 2012 (commencement of operations) through October 31, 2012.
2 Per share information is calculated using the average shares outstanding method.
3 This amount represents less than $0.01 per share.
4 Total returns are historical and assume changes in share price and no sales charge. Had certain expenses not been reduced during the years shown, total returns would have been lower. Total returns for periods less than one year are not annualized.
5 Annualized.
See Accompanying Notes to Consolidated Financial Statements.
13
Credit Suisse Managed Futures Strategy Fund
Consolidated Financial Highlights
(For a Class C Share of the Fund Outstanding Throughout Each Period)
| | | For the Year Ended October 31, | |
| | | 2014 | | 2013 | | 20121 | |
Per share data | |
Net asset value, beginning of year | | $ | 10.25 | | | $ | 9.75 | | | $ | 10.00 | | |
INVESTMENT OPERATIONS | |
Net investment loss2 | | | (0.27 | ) | | | (0.27 | ) | | | (0.02 | ) | |
Net gain (loss) on investments, futures contracts, swap contracts
and foreign currency related items (both realized and unrealized) | | | 0.93 | | | | 0.77 | | | | (0.23 | ) | |
Total from investment operations | | | 0.66 | | | | 0.50 | | | | (0.25 | ) | |
REDEMPTION FEES | | | 0.003 | | | | 0.003 | | | | 0.00 | | |
LESS DIVIDENDS AND DISTRIBUTIONS | |
Distributions from net realized gains | | | (0.29 | ) | | | — | | | | — | | |
Total dividends and distributions | | | (0.29 | ) | | | — | | | | — | | |
Net asset value, end of year | | $ | 10.62 | | | $ | 10.25 | | | $ | 9.75 | | |
Total return4 | | | 6.62 | % | | | 5.13 | % | | | (2.50 | )% | |
RATIOS AND SUPPLEMENTAL DATA | |
Net assets, end of year (000s omitted) | | $ | 1,558 | | | $ | 800 | | | $ | 98 | | |
Ratio of net expenses to average net assets | | | 2.71 | % | | | 2.70 | % | | | 2.70 | %5 | |
Ratio of expenses to average net assets excluding interest expense | | | 2.70 | % | | | 2.70 | % | | | 2.70 | %5 | |
Ratio of net investment loss to average net assets | | | (2.68 | )% | | | (2.64 | )% | | | (2.70 | )%5 | |
Decrease reflected in above operating expense ratios due to
waivers/reimbursements | | | 0.10 | % | | | 1.10 | % | | | 3.01 | %5 | |
Portfolio turnover rate | | | — | | | | — | | | | — | | |
1 For the period September 28, 2012 (commencement of operations) through October 31, 2012.
2 Per share information is calculated using the average shares outstanding method.
3 This amount represents less than $0.01 per share.
4 Total returns are historical and assume changes in share price and no sales charge. Had certain expenses not been reduced during the years shown, total returns would have been lower. Total returns for periods less than one year are not annualized.
5 Annualized.
See Accompanying Notes to Consolidated Financial Statements.
14
Credit Suisse Managed Futures Strategy Fund
Notes to Consolidated Financial Statements
October 31, 2014
Credit Suisse Managed Futures Strategy Fund (the "Fund"), a series of the Credit Suisse Opportunity Funds (the "Trust"), a Delaware statutory trust, is registered under the Investment Company Act of 1940, as amended (the "1940 Act"), as a non-diversified open-end management investment company that seeks to achieve an investment result that corresponds generally to the risk and return patterns of managed futures funds. The Trust was organized under the laws of the State of Delaware as a business trust on May 31, 1995.
Credit Suisse Asset Management, LLC ("Credit Suisse"), the investment adviser to the Fund, is registered as a Commodity Pool Operator with the Commodity Futures Trading Commission. The Fund seeks to achieve its investment objective by investing directly and/or indirectly through the Credit Suisse Cayman Managed Futures Strategy Fund, Ltd. (the "Subsidiary"), a wholly-owned subsidiary of the Fund organized under the laws of the Cayman Islands, in a combination of securities and derivative instruments. The Subsidiary invests in commodity-linked derivative instruments, such as swaps and futures, as well as other types of futures, swaps and options. The Subsidiary may also invest in debt securities, some of which are intended to serve as margin or collateral for the Subsidiary's derivatives positions.
The Subsidiary is managed by the same portfolio managers that manage the Fund and the accompanying financial statements reflect the financial position of the Fund and its Subsidiary and the results of operations on a consolidated basis. The consolidated financial statements include portfolio holdings of the Fund and the Subsidiary and all intercompany transactions and balances have been eliminated. The Fund may invest up to 25% of its total net assets in the Subsidiary. As of October 31, 2014, the Fund held $8,134,686 in the Subsidiary, representing 11.0% of the Fund's consolidated net assets. See the Consolidated Schedule of Investments for securities held through the Subsidiary. For the year ended October 31, 2014, the net realized gain on securities held in the Subsidiary was $688,738.
Subsequent references to the Fund within the Notes to Consolidated Financial Statements collectively refer to the Fund and its Subsidiary.
The Fund offers three classes of shares: Class I shares, Class A shares and Class C shares. Each class of shares represents an equal pro rata interest in the Fund, except they bear different expenses, which reflect the differences in the range of services provided to them. Class A shares are sold subject to a front-end sales charge of up to 5.25%. Class C shares are sold subject to a contingent deferred sales charge of 1.00% if the shares are redeemed within the first year of purchase. Class I shares are sold without a sales charge.
15
Credit Suisse Managed Futures Strategy Fund
Notes to Consolidated Financial Statements (continued)
October 31, 2014
Note 2. Significant Accounting Policies
The following is a summary of significant accounting policies followed by the Fund in the preparation of its financial statements. The policies are in accordance with accounting principles generally accepted in the United States of America ("GAAP"). The preparation of financial statements requires management to make estimates and assumptions that affect the reported amounts and disclosures in the financial statements. Actual results could differ from those estimates.
A) SECURITY VALUATION — The net asset value of the Fund is determined daily as of the close of regular trading on the New York Stock Exchange, Inc. (the "Exchange") on each day the Exchange is open for business. The valuations for fixed income securities (which may include, but are not limited to, corporate, government, municipal, mortgage-backed, collateralized mortgage obligations and asset-backed securities) and certain derivative instruments are typically the prices supplied by independent third party pricing services, which may use market prices or broker/dealer quotations or a variety of valuation techniques and methodologies. The independent third party pricing services use inputs that are observable such as issuer details, interest rates, yield curves, prepayment speeds, credit risks/spreads, default rates and quoted prices for similar securities. Short-term fixed income securities that will mature in 60 days or less may be valued at amortized cost. Structured note agreements are valued in accordance with a dealer-supplied valuation based on changes in the value of the underlying index. Futures contracts are valued daily at the settlement price established by the board of trade or exchange on which they are traded. Forward contracts are valued at the London closing spot rates and the London closing forward point rates on a daily basis. The currency forward contract pricing model derives the differential in point rates to the expiration date of the forward and calculates its present value. Equity securities for which market quotations are available are valued at the last reported sales price or official closing price on the primary market or exchange on which they trade. The Fund may utilize a service provided by an independent third party which has been approved by the Board of Trustees (the "Board") to fair value certain securities. When fair value pricing is employed, the prices of securities used by the Fund to calculate its net asset value may differ from quoted or published prices for the same securities. If independent third party pricing services are unable to supply prices for a portfolio investment, or if the prices supplied are deemed by the investment adviser to be unreliable, the market price may be determined by the investment adviser using quotations from one or more broker/dealers or at the transaction price if the security has recently been purchased and no value has yet been
16
Credit Suisse Managed Futures Strategy Fund
Notes to Consolidated Financial Statements (continued)
October 31, 2014
Note 2. Significant Accounting Policies
obtained from a pricing service or pricing broker. When reliable prices are not readily available, such as when the value of a security has been significantly affected by events after the close of the exchange or market on which the security is principally traded, but before the Fund calculates its net asset value, the Fund values these securities as determined in accordance with procedures approved and established by the Fund's Board.
The Fund uses valuation techniques to measure fair value that are consistent with the market approach and/or income approach, depending on the type of security and the particular circumstance. The market approach uses prices and other relevant information generated by market transactions involving identical or comparable securities. The income approach uses valuation techniques to discount estimated future cash flows to present value.
GAAP established a disclosure hierarchy that categorizes the inputs to valuation techniques used to value assets and liabilities at each measurement date. These inputs are summarized in the three broad levels listed below:
• Level 1 — quoted prices in active markets for identical investments
• Level 2 — other significant observable inputs (including quoted prices for similar investments, interest rates, prepayment speeds, credit risk, etc.)
• Level 3 — significant unobservable inputs (including the Fund's own assumptions in determining the fair value of investments)
The inputs or methodologies used to value securities are not necessarily an indication of the risk associated with investing in those securities.
The following is a summary of the inputs used as of October 31, 2014 in valuing the Fund's assets and liabilities carried at fair value:
| | Level 1 | | Level 2 | | Level 3 | | Total | |
Investments in Securities | |
United States Agency Obligations | | $ | — | | | $ | 6,002,250 | | | $ | — | | | $ | 6,002,250 | | |
Short-term Investments | | | — | | | | 59,488,000 | | | | — | | | | 59,488,000 | | |
| | | — | | | | 65,490,250 | | | | — | | | | 65,490,250 | | |
Other Financial Instruments* | |
Futures Contracts | | $ | 3,988,672 | | | $ | — | | | $ | — | | | $ | 3,988,672 | | |
Swap Contracts | | | — | | | | 88,796 | | | | — | | | | 88,796 | | |
*Other financial instruments include unrealized appreciation (depreciation) on futures and swap contracts.
The Fund follows Financial Accounting Standards Board ("FASB") amendments to authoritative guidance which requires the Fund to disclose details of transfers in and out of Level 1 and Level 2 measurements and Level 2
17
Credit Suisse Managed Futures Strategy Fund
Notes to Consolidated Financial Statements (continued)
October 31, 2014
Note 2. Significant Accounting Policies
and Level 3 measurements and the reasons for the transfers. For the year ended October 31, 2014, there were no transfers in and out of Level 1, Level 2 and Level 3. All transfers are assumed to occur at the end of the reporting period.
B) DERIVATIVE INSTRUMENTS AND HEDGING ACTIVITIES — The Fund adopted amendments to authoritative guidance on disclosures about derivative instruments and hedging activities which require that a fund disclose (a) how and why an entity uses derivative instruments, (b) how derivative instruments and hedging activities are accounted for and (c) how derivative instruments and related hedging activities affect a fund's financial position, financial performance and cash flows. The Fund also invests indirectly in derivative instruments through the Subsidiary. For the year ended October 31, 2014, the consolidated Funds' derivatives did not qualify for hedge accounting as they are held at fair value.
Fair Values of Derivative Instruments as of October 31, 2014
| | | Asset Derivatives | | Liability Derivatives | |
| | | Balance Sheet
Location | | Fair Value | | Balance Sheet
Location | | Fair Value | |
Foreign Exchange
Contracts | | Unrealized appreciation
on futures contracts | | $ | 2,864,613 | * | | Unrealized depreciation
on futures contracts | | $ | — | | |
Index Contracts
| | Unrealized appreciation
on futures contracts | | | 401,336 | * | | Unrealized depreciation
on futures contracts | | | 374,677 | * | |
Interest Rate
Contracts | | Unrealized appreciation
on futures contracts | | | 1,097,400 | * | | Unrealized depreciation
on futures contracts | | | — | | |
Commodity Index
Return Contracts | | Unrealized appreciation
on open swap contracts | | | 491,683 | | | Unrealized depreciation
on open swap contracts | | | 402,887 | | |
| | | | | $ | 4,855,032 | | | | | $ | 777,564 | | |
*Includes cumulative appreciation (depreciation) of futures contracts as reported in the Consolidated Statement of Assets and Liabilities and Notes to Consolidated Financial Statements. Only the current day's variation margin is reported within the Consolidated Statement of Assets and Liabilities.
18
Credit Suisse Managed Futures Strategy Fund
Notes to Consolidated Financial Statements (continued)
October 31, 2014
Note 2. Significant Accounting Policies
Effect of Derivative Instruments on the Consolidated Statement of Operations
| | | Location | | Realized
Gain/Loss | | Location | | Unrealized
Appreciation/
Depreciation | |
Foreign Exchange
Contracts
| | Net realized gain
from futures
contracts | | $ | 2,194,531 | | | Net change in unrealized
appreciation (depreciation)
from futures contracts | | $ | 2,648,600 | | |
Index Contracts
| | Net realized loss
from futures
contracts | | | (2,457,997 | ) | | Net change in unrealized
appreciation (depreciation)
from futures contracts | | | (414,802 | ) | |
Interest Rate
Contracts
| | Net realized gain
from futures
contracts | | | 2,833,052 | | | Net change in unrealized
appreciation (depreciation)
from futures contracts | | | 905,491 | | |
Commodity Index
Return Contracts
| | Net realized gain
from swap
contracts | | | 639,685 | | | Net change in unrealized
appreciation (depreciation)
from swap contracts | | | 7,772 | | |
| | | | | | | | | $ | 3,209,271 | | | | | | | $ | 3,147,061 | | |
The notional amount of futures contracts and swap contracts at the year ended October 31, 2014 are reflected in the Consolidated Schedule of Investments. For the year ended October 31, 2014, the fund held average monthly notional values at net basis of $158,011,114 and $23,373,218 in futures and swap contracts, respectively.
The Fund is a party to International Swap and Derivatives Association, Inc. ("ISDA") Master Agreements ("Master Agreements") with certain counterparties that govern over-the-counter derivative (including Total Return, Credit Default and Interest Rate Swaps) and foreign exchange contracts entered into by the Fund. The Master Agreements may contain provisions regarding, among other things, the parties' general obligations, representations, agreements, collateral requirements, events of default and early termination. Termination events applicable to the Fund may occur upon a decline in the Fund's net assets below a specified threshold over a certain period of time.
19
Credit Suisse Managed Futures Strategy Fund
Notes to Consolidated Financial Statements (continued)
October 31, 2014
Note 2. Significant Accounting Policies
The following table presents by counterparty the Fund's derivative assets net of related collateral held by the Fund at October 31, 2014:
Counterparty | | Gross Amounts of
Assets Presented in
the Consolidated
Statement of Assets
and Liabilities(a) | | Financial
Instruments
and Derivatives
Available for Offset | | Non-Cash
Collateral
Received | | Cash
Collateral
Received(b) | | Net Amount
of Derivative
Assets | |
Goldman Sachs | | $ | 491,683 | | | $ | (402,887 | ) | | $ | — | | | $ | (88,796 | ) | | $ | — | | |
The following table presents by counterparty the Fund's derivative liabilities net of related collateral pledged by the Fund at October 31, 2014:
Counterparty | | Gross Amounts of
Liabilites Presented in
the Consolidated
Statement of Assets
and Liabilities(a) | | Financial
Instruments
and Derivatives
Available for Offset | | Non-Cash
Collateral
Pledged | | Cash
Collateral
Pledged | | Net Amount
of Derivative
Liabilities | |
Goldman Sachs | | $ | 402,887 | | | $ | (402,887 | ) | | $ | — | | | $ | — | | | $ | — | | |
(a) Swap contracts are included.
(b) The actual collateral received and/or pledged may be more than the amounts shown.
C) SECURITY TRANSACTIONS AND INVESTMENT INCOME/EXPENSE — Security transactions are accounted for on a trade date basis. Interest income/expense is recorded on the accrual basis. The Fund amortizes premiums and accretes discounts using the effective interest method. Dividend income/expense is recorded on the ex-dividend date. Certain expenses are class-specific expenses, vary by class and are charged only to that class. Income, expenses (excluding class-specific expenses) and realized/unrealized gains/losses are allocated proportionately to each class of shares based upon the relative net asset value of the outstanding shares of that class. The cost of investments sold is determined by use of the specific identification method for both financial reporting and income tax purposes.
D) DIVIDENDS AND DISTRIBUTIONS TO SHAREHOLDERS — Dividends from net investment income, if any, are declared and paid quarterly. Distributions of net realized capital gains, if any, are declared and paid at least annually. However, to the extent that a net realized capital gain can be reduced by a capital loss carryforward, such gain will not be distributed. Income and capital gain distributions are determined in accordance with federal income tax regulations, which may differ from GAAP.
20
Credit Suisse Managed Futures Strategy Fund
Notes to Consolidated Financial Statements (continued)
October 31, 2014
Note 2. Significant Accounting Policies
E) FEDERAL INCOME TAXES — No provision is made for federal taxes as it is the Fund's intention to continue to qualify for and elect the tax treatment applicable to regulated investment companies ("RIC") under the Internal Revenue Code of 1986, as amended (the "Code"), and to make the requisite distributions to its shareholders, which will be sufficient to relieve it from federal income and excise taxes.
In order to qualify as a RIC under the Code, the Fund must meet certain requirements regarding the source of its income, the diversification of its assets and the distribution of its income. One of these requirements is that the Fund derive at least 90% of its gross income for each taxable year from dividends, interest, payments with respect to certain securities loans, gains from the sale or other disposition of stock, securities or foreign currencies, other income derived with respect to its business of investing in such stock, securities or currencies or net income derived from interests in certain publicly traded partnerships ("Qualifying Income"). The IRS has issued a ruling that income realized from certain types of commodity-linked derivatives would not be Qualifying Income. As a result, the Fund's ability to realize income from investments in such commodity-linked derivatives as part of its investment strategy would be limited to a maximum of 10% of its gross income. The IRS has issued private letter rulings to registered investment companies concluding that income derived from their investment in a wholly-owned subsidiary would constitute Qualifying Income to the fund. The IRS has indicated that the granting of these types of private letter rulings is currently suspended, pending further internal discussion. As a result, there can be no assurance that the IRS will grant, such a private letter ruling to the Fund. If the Fund does not receive such a private letter ruling, there is a risk that the IRS could assert that the income derived from the Fund's investment in the Subsidiary will not be considered Qualifying Income for purposes of the fund remaining qualified as a RIC for U.S. federal income tax purposes. If the Fund is unable to ensure continued qualification as a RIC, the Fund may be required to change its investment objective, policies or techniques, or may be liquidated. If the Fund fails to qualify as a RIC, the Fund will be subject to federal income tax on its net income and capital gains at regular corporate rates (without reduction for distributions to shareholders). If the Fund were to fail to qualify as a RIC and become subject to federal income tax, shareholders of the Fund would be subject to the risk of diminished returns.
The Fund adopted the authoritative guidance for uncertainty in income taxes and recognizes a tax benefit or liability from an uncertain position only if it is
21
Credit Suisse Managed Futures Strategy Fund
Notes to Consolidated Financial Statements (continued)
October 31, 2014
Note 2. Significant Accounting Policies
more likely than not that the position is sustainable based solely on its technical merits and consideration of the relevant taxing authority's widely understood administrative practices and procedures. The Fund has reviewed its current tax positions and has determined that no provision for income tax is required in the Fund's financial statements. The Fund's federal tax returns for the prior two fiscal years remain subject to examination by the Internal Revenue Service.
F) SHORT-TERM INVESTMENTS — The Fund, together with other funds/portfolios advised by Credit Suisse, an indirect, wholly-owned subsidiary of Credit Suisse Group AG, pools available cash into a short-term variable rate time deposit issued by State Street Bank and Trust Company ("SSB"), the Fund's custodian. The short-term time deposit issued by SSB is a variable rate account classified as a short-term investment.
G) FUTURES — The Fund may enter into futures contracts to the extent permitted by its investment policies and objectives. The Fund may use futures contracts to gain exposure to or hedge against changes in interest rates, equity and market price movements and/or currency risks. Upon entering into a futures contract, the Fund is required to deposit cash and/or pledge U.S. Government securities as initial margin. Subsequent payments, which are dependent on the daily fluctuations in the value of the underlying instrument, are made or received by the Fund each day (daily variation margin) and are recorded as unrealized gains or losses until the contracts are closed. When the contracts are closed, the Fund records a realized gain or loss equal to the difference between the proceeds from (or cost of) the closing transactions and the Fund's basis in the contract. Risks of entering into futures contracts for hedging purposes include the possibility that a change in the value of the contract may not correlate with the changes in the value of the underlying instruments. With futures, there is minimal counterparty credit risk to the Fund since futures are exchange traded and the exchange's clearinghouse, as counterparty to all exchange traded futures, guarantees the futures against default. In addition, the purchase of a futures contract involves the risk that the Fund could lose more than the original margin deposit and subsequent payments may be required for a futures transaction. The Fund's open futures contracts at October 31, 2014 are disclosed in the consolidated Schedule of Investments. At October 31, 2014, the amount of restricted cash held at brokers for the Fund was $4,610,085.
H) SWAPS — The Fund may enter into swap contracts either for hedging purposes or to seek to increase total return. A swap contract is an agreement that obligates two parties to exchange a series of cash flows at specified
22
Credit Suisse Managed Futures Strategy Fund
Notes to Consolidated Financial Statements (continued)
October 31, 2014
Note 2. Significant Accounting Policies
intervals based upon or calculated by reference to changes in specified prices or rates for a specified amount of an underlying asset or notional principal amount. The Fund will enter into swap contracts only on a net basis, which means that the two payment streams are netted out, with the Fund receiving or paying, as the case may be, only the net amount of the two payments. Risks may arise as a result of the failure of the counterparty to the swap contract to comply with the terms of the swap contract. The extent of the Fund's exposure to credit and counterparty risks is the discounted net value of the cash flows to be received from the counterparty over the contract's remaining life, to the extent that the amount is positive. These risks are mitigated by having a master netting arrangement between the Fund and the counterparty and by the posting of collateral by the counterparty to the Fund to cover the Fund's exposure to the counterparty. Therefore, the Fund considers the creditworthiness of each counterparty as well as the amounts posted by the counterparty pursuant to the master netting agreement to a swap contract in evaluating potential credit risk. Additionally, risks may arise from unanticipated movements in interest rates or in the value of the underlying reference asset or index.
The Fund may enter into total return swap contracts, involving commitments to pay interest in exchange for a market-linked return, both based on notional amounts. To the extent the total return of the security or index underlying the transactions exceeds or falls short of the offsetting interest rate obligation, the Fund will receive a payment from or make a payment to the counterparty.
The Fund records unrealized gains or losses on a daily basis representing the value and the current net receivable or payable relating to open swap contracts. Net amounts received or paid on the swap contract are recorded as realized gains or losses. Fluctuations in the value of swap contracts are recorded for financial statement purposes as unrealized appreciation or depreciation on swap contracts. Realized gains and losses from terminated swaps are included in net realized gains/losses on swap contracts transactions. The Fund may invest in total return swap contracts for hedging purposes or to seek to increase total return. The Fund's open swap contracts at October 31, 2014 are disclosed in the consolidated Schedule of Investments. At October 31, 2014, the amount of restricted cash held at brokers for the Fund was $2,520,000.
I) SECURITIES LENDING — Loans of securities are required at all times to be secured by collateral at least equal to 102% of the market value of domestic securities on loan (including any accrued interest thereon) and 105% of the market value of foreign securities on loan (including any accrued interest
23
Credit Suisse Managed Futures Strategy Fund
Notes to Consolidated Financial Statements (continued)
October 31, 2014
Note 2. Significant Accounting Policies
thereon). Cash collateral received by the Fund in connection with securities lending activity may be pooled together with cash collateral for other funds/portfolios advised by Credit Suisse and may be invested in a variety of investments, including funds advised by SSB, the Fund's securities lending agent or money market instruments. However, in the event of default or bankruptcy by the other party to the agreement, realization and/or retention of the collateral may be subject to legal proceedings.
SSB has been engaged by the Fund to act as the Fund's securities lending agent. The Fund's securities lending arrangement provides that the Fund and SSB will share the net income earned from securities lending activities. During the year ended October 31, 2014, there were no securities out on loan. Securities lending income is accrued as earned.
J) OTHER — In the normal course of business the Fund trades financial instruments and enters into financial transactions where risk of potential loss exists due to changes in the market (market risk) or failure of the other party to a transaction to perform (credit risk). Similar to credit risk, the Fund may be exposed to counterparty risk, or the risk that an institution or other entity with which the Fund has unsettled or open transactions will default. The potential loss could exceed the value of the financial assets recorded in the financial statements. Financial assets, which potentially expose the Fund to credit risk, consist principally of cash due from counterparties and investments. The extent of the Fund's exposure to credit and counterparty risks in respect to these financial assets approximates their carrying value as recorded in the Fund's Consolidated Statement of Assets and Liabilities.
K) NEW ACCOUNTING PRONOUNCEMENTS — In June 2013, the FASB issued Accounting Standards Update (ASU) No. 2013-08, Investment Companies (Topic 946): Amendments to the Scope, Measurement, and Disclosure Requirements. The ASU modifies the criteria used in defining an investment company under GAAP and also sets forth certain measurement and disclosure requirements. Under the ASU, an entity that is registered under the 1940 Act automatically qualifies as an investment company. The ASU is effective for interim and annual reporting periods beginning after December 15, 2013. Management has reviewed the requirements and believes the adoption of this ASU will not have a material impact on the financial statements.
24
Credit Suisse Managed Futures Strategy Fund
Notes to Consolidated Financial Statements (continued)
October 31, 2014
Note 2. Significant Accounting Policies
In June 2014, FASB issued ASU No. 2014-11, Transfers and Servicing (Topic 860), Repurchase-to-Maturity Transactions, Repurchase Financings, and Disclosures. The ASU changes the accounting for certain repurchase agreements and expands disclosure requirements related to repurchase agreements, securities lending, repurchase-to-maturity and similar transactions. The ASU is effective for interim and annual reporting periods beginning after December 15, 2014. Management is currently evaluating the impact, if any, of applying this provision.
L) SUBSEQUENT EVENTS — In preparing the financial statements as of October 31, 2014, management considered the impact of subsequent events for potential recognition or disclosure in these financial statements through the date of release of this report. No such events requiring recognition or disclosure were identified through the date of the release of this report.
Note 3. Transactions with Affiliates and Related Parties
Credit Suisse serves as investment adviser for the Fund. For its investment advisory services, Credit Suisse is entitled to receive a fee from the Fund at an annual rate of 1.15% of the Fund's average daily net assets. For the year ended October 31, 2014, investment advisory fees earned and fees waived/expenses reimbursed were $688,720 and $60,152, respectively. The Fund is authorized to reimburse Credit Suisse for management fees previously limited and/or for expenses previously paid by Credit Suisse, provided, however, that any reimbursements must be paid at a date not more than three years after the end of the fiscal year during which such fees were limited or expenses were reimbursed by Credit Suisse and the reimbursements do not cause a class to exceed the applicable expense limitation in the contract at the time the fees were limited or expenses are paid. This contract may not be terminated before February 28, 2015. Credit Suisse contractually waives fees and reimburses expenses (excluding interest expense) so that the Fund's annual operating expenses will not exceed 1.70% of the Fund's average daily net assets for Class I shares, 1.95% of the Fund's average daily net assets for Class A shares, and 2.70% of the Fund's average daily net assets for Class C shares.
25
Credit Suisse Managed Futures Strategy Fund
Notes to Consolidated Financial Statements (continued)
October 31, 2014
Note 3. Transactions with Affiliates and Related Parties
For the period ended October 31, 2014, the amounts waived and reimbursed by the Advisor, as well as the amounts available for recoupment/potential future recoupment by the Advisor and the expiration schedule at Ocbober 31, 2014 are as follows:
| | Fee waivers/expense
reimbursements subject
to repayment* | | Expires October 31,
2015 | | Expires October 31,
2016 | |
Class I | | $ | 221,540 | | | $ | 26,573 | | | $ | 194,967 | | |
Class A | | | 13,993 | | | | — | | | | 13,993 | | |
Class C | | | 1,956 | | | | — | | | | 1,956 | | |
Totals | | $ | 237,489 | | | $ | 26,573 | | | $ | 210,915 | | |
*The Subsidiary is not eligible for recoupment.
Credit Suisse and SSB serve as co-administrators to the Fund. For its co-administrative services, Credit Suisse received a fee calculation at an annual rate of 0.09% of the Fund's average daily net assets. For the year ended October 31, 2014, co-administrative services fees earned by Credit Suisse were $53,900.
For its co-administrative services, SSB receives a fee, exclusive of out-of-pocket expenses, calculated in total for all the Credit Suisse funds/portfolios co-administered by SSB and allocated based upon the relative average net assets of each fund/portfolio, subject to an annual minimum fee. For the year ended October 31, 2014, co-administrative services fees earned by SSB (including out-of-pocket expenses) with respect to the Fund were $8,771.
Credit Suisse Securities (USA) LLC ("CSSU"), an affiliate of Credit Suisse, serves as the distributor of the Fund's shares. Pursuant to distribution plans adopted by the Fund pursuant to Rule 12b-1 under the 1940 Act, CSSU received fees for its distribution services. These fees were calculated at an annual rate of 0.25% of the average daily net assets of the Class A shares. For the Class C shares, the fee is calculated at an annual rate of 1.00% of the average daily net assets. For the year ended October 31, 2014, the Fund paid Rule 12b-1 distribution fees of $11,821 for Class A shares and $11,968 for Class C shares. Class I shares are not subject to Rule 12b-1 distribution fees.
Certain brokers, dealers and financial representatives provide transfer agent related services to the Fund and receive compensation from the Fund. Some of the fees are paid by Credit Suisse on behalf of the Fund. For the year ended October 31, 2014, the Fund reimbursed Credit Suisse $11,279, which is included in the Fund's transfer agent expense.
26
Credit Suisse Managed Futures Strategy Fund
Notes to Consolidated Financial Statements (continued)
October 31, 2014
Note 3. Transactions with Affiliates and Related Parties
For the year ended October 31, 2014, CSSU and its affiliates advised the Fund that they retained $77 from commissions earned on the sale of the Fund's Class A shares. There were no commissions earned on sale of Class C shares.
Merrill Corporation ("Merrill"), formerly an affiliate of Credit Suisse, has been engaged by the Fund to provide certain financial printing services. For the year ended October 31, 2014, Merrill was paid $31,575 for its services by the Fund. This amount was included in the printing fees presented on the Consolidated Statement of Operations. Effective July 23, 2014, Merrill was no longer considered an affiliate.
Note 4. Line of Credit
The Fund, together with other funds/portfolios advised by Credit Suisse (collectively, the "Participating Funds"), participates in a committed, unsecured line of credit facility ("Credit Facility"), in an aggregated amount of $200 million for temporary or emergency purposes with SSB under a first come first serve basis. Under the terms of the Credit Facility, the Participating Funds pay an aggregate commitment fee on the average unused amount of the Credit Facility, which is allocated among the Participating Funds in such manner as is determined by the governing Boards of the Participating Funds. In addition, the Participating Funds pay interest on borrowings at either the Overnight Federal Funds rate or the Overnight LIBOR rate plus a spread. At October 31, 2014 and during the year ended October 31, 2014, the Fund had no borrowings outstanding under the Credit Facility.
Note 5. Purchases and Sales of Securities
For the year ended October 31, 2014, purchases and sales of investment securities (excluding short-term investments) and U.S. Government and Agency Obligations were as follows:
Investment Securities | | U.S. Government/
Agency Obligations | |
| Purchases | | Sales | | Purchases | | Sales | |
| $ | — | | | $ | — | | | $ | 0 | | | $ | 1,001,070 | | |
Note 6. Capital Share Transactions
The Fund is authorized to issue an unlimited number of full and fractional shares of beneficial interest, $.001 par value per share. The Fund offers Class I,
27
Credit Suisse Managed Futures Strategy Fund
Notes to Consolidated Financial Statements (continued)
October 31, 2014
Note 6. Capital Share Transactions
Class A and Class C shares. Transactions in capital shares for each class of the Fund were as follows:
| | | Class I | |
| | | For the Year Ended
October 31, 2014 | | For the Year Ended
October 31, 2013 | |
| | | Shares | | Value | | Shares | | Value | |
Shares sold | | | 4,000,396 | | | $ | 40,478,168 | | | | 476,564 | | | $ | 4,927,737 | | |
Shares issued in reinvestment
of dividends and distributions | | | 85,842 | | | | 873,874 | | | | — | | | | — | | |
Shares redeemed | | | (291,874 | ) | | | (3,011,595 | ) | | | (121,055 | ) | | | (1,252,839 | ) | |
Net increase | | | 3,794,364 | | | $ | 38,340,447 | | | | 355,509 | | | $ | 3,674,898 | | |
| | Class A | |
| | | For the Year Ended
October 31, 2014 | | For the Year Ended
October 31, 2013 | |
| | | Shares | | Value | | Shares | | Value | |
Shares sold | | | 126,119 | | | $ | 1,285,230 | | | | 613,956 | | | $ | 6,405,758 | | |
Shares issued in reinvestment
of dividends and distributions | | | 15,827 | | | | 160,800 | | | | — | | | | — | | |
Shares redeemed | | | (399,745 | ) | | | (4,039,155 | ) | | | (61,050 | ) | | | (638,880 | ) | |
Net increase (decrease) | | | (257,799 | ) | | $ | (2,593,125 | ) | | | 552,906 | | | $ | 5,766,878 | | |
| | | Class C | |
| | | For the Year Ended
October 31, 2014 | | For the Year Ended
October 31, 2013 | |
| | | Shares | | Value | | Shares | | Value | |
Shares sold | | | 65,637 | | | $ | 663,323 | | | | 70,016 | | | $ | 725,200 | | |
Shares issued in reinvestment
of dividends and distributions | | | 3,032 | | | | 30,498 | | | | — | | | | — | | |
Shares redeemed | | | — | | | | — | | | | (1,992 | ) | | | (20,916 | ) | |
Net increase | | | 68,669 | | | $ | 693,821 | | | | 68,024 | | | $ | 704,284 | | |
Prior to February 1, 2014, the Fund imposed a redemption fee of 2% of the value of shares that were redeemed or exchanged within 30 days from the date of purchase. For the years ended October 31, 2014 and 2013, the redemption fees received by the Fund were $7 and $524, respectively. On February 1, 2014, the Fund eliminated the redemption fee.
28
Credit Suisse Managed Futures Strategy Fund
Notes to Consolidated Financial Statements (continued)
October 31, 2014
Note 6. Capital Share Transactions
On October 31, 2014, the number of shareholders that held 5% or more of the outstanding shares of each class of the Fund was as follows:
| | Number of
Shareholders | | Approximate Percentage
of Outstanding Shares | |
Class I | | | 3 | * | | | 92 | % | |
Class A | | | 2 | | | | 95 | % | |
Class C | | | 3 | * | | | 82 | % | |
*This includes the seed money from Merchant Holdings, Inc., an affiliate of Credit Suisse.
Some of the shareholders may be omnibus accounts, which hold shares on behalf of individual shareholders.
Note 7. Federal Income Taxes
Income and capital gain distributions are determined in accordance with federal income tax regulations, which may differ from GAAP.
The tax characteristics of dividends paid during the years ended October 31, 2014 and 2013, respectively, by the Fund were as follows:
| Ordinary Income | | Long-Term Capital Gain | |
| 2014 | | 2013 | | 2014 | | 2013 | |
| $ | 524,559 | | | $ | — | | | $ | 540,613 | | | $ | — | | |
The tax basis components of distributable earnings differ from the amounts reflected in the Consolidated Statement of Assets and Liabilities by temporary book/tax differences. These differences are primarily due to differing treatments of futures contracts marked to market and offering expenses. At October 31, 2014, the components of distributable earnings on a tax basis were as follows:
Undistributed net investment income | | $ | 1,026,068 | | |
Undistributed capital gain | | | 3,570,690 | | |
Unrealized appreciation | | | 1,086,939 | | |
| | $ | 5,683,697 | | |
Under the Regulated Investment Company Modernization Act of 2010, the Fund will be permitted to carry forward capital losses incurred in taxable years beginning after December 22, 2010 for an unlimited period. However, any losses incurred during those future taxable years will be required to be utilized prior to the losses incurred in pre-enactment taxable years. As a result of this ordering rule, pre-enactment capital loss carryforwards may be more likely to expire unused. Additionally, post-enactment capital losses that are carried forward will retain their character as either short-term or long-term capital
29
Credit Suisse Managed Futures Strategy Fund
Notes to Consolidated Financial Statements (continued)
October 31, 2014
Note 7. Federal Income Taxes
losses rather than being considered all short-term as under previous law. It is uncertain whether the Fund will be able to realize the full benefits of the capital loss carryforwards before they expire. The Fund has no pre-enactment capital loss carryforwards.
At October 31, 2014, the cost of investments (excluding foreign currency related transactions) and net unrealized appreciation (depreciation) for income tax purposes were as follows:
Cost of Investments | | $ | 65,487,809 | | |
Unrealized appreciation | | $ | 2,441 | �� | |
Unrealized depreciation | | | (— | ) | |
Net unrealized appreciation (depreciation) | | $ | 2,441 | | |
At October 31, 2014, the Fund reclassified $1,291,603 from accumulated net investment loss and $1,283,830 from accumulated net realized gain to paid in capital, to adjust for current period permanent book/tax differences which arose principally from differing book/tax treatment of foreign currency gain/(loss) and subsidiary cumulative income/loss. Net assets were not affected by these reclassifications.
Note 8. Contingencies
In the normal course of business, the Fund may provide general indemnifications pursuant to certain contracts and organizational documents. The Fund's maximum exposure under these arrangements is dependent on future claims that may be made against the Fund and, therefore, cannot be estimated; however, based on experience, the risk of loss from such claims is considered remote.
Note 9. Other Matters
On May 19, 2014, the U.S. Department of Justice (the "Department of Justice") filed a one-count criminal information (the "Information") in the District Court for the Eastern District of Virginia charging Credit Suisse AG ("CSAG") with conspiracy to commit tax fraud related to accounts CSAG established for cross-border clients. The Department of Justice and CSAG entered into a plea agreement (the "Plea Agreement") settling the action pursuant to which CSAG pleaded guilty to the charge set out in the Information.
30
Credit Suisse Managed Futures Strategy Fund
Notes to Consolidated Financial Statements (continued)
October 31, 2014
The Plea Agreement requires CSAG to pay over $1.8 billion to the U.S. government, including the U.S. Internal Revenue Service. The Plea Agreement also requires CSAG to lawfully undertake certain remedial actions to address the conduct described in the Plea Agreement.
CSAG has entered into other settlements relating to the conduct set out in the Plea Agreement. CSAG has entered into a Consent Order with the Federal Reserve Board (the "Federal Reserve") to resolve certain findings by the Federal Reserve, including that the activities of CSAG regarding opening of foreign accounts for U.S. taxpayers, provision of investment services to U.S. clients, and operation of CSAG's New York representative office prior to 2009 lacked adequate enterprise-wide risk management and compliance policies and procedures sufficient to ensure that all of its activities comply with U.S. laws and regulations. In addition, CSAG has entered into a Consent Order with the New York State Department of Financial Services (the "DFS") to resolve the DFS's investigation into the conduct described in the Plea Agreement. The settlement with the Federal Reserve requires CSAG to pay $100 million to the Federal Reserve, and the settlement with the DFS requires CSAG to pay $715 million to the DFS.
These settlements follow a settlement by Credit Suisse Group AG ("CS Group"), the parent company of CSAG, with the Securities and Exchange Commission (the "Commission") on February 21, 2014 to resolve an investigation by the Commission into solicitation and provision of broker-dealer and investment advisory services to certain U.S. cross-border clients by CS Group while not registered with the Commission as a broker-dealer or investment adviser. As part of the settlement, CS Group retained an independent consultant to evaluate its policies and procedures and examine its broker-dealer and investment adviser activities to fully verify that the business that was the subject of the Commission investigation has been completely exited. CS Group also agreed to pay $196,511,014, which includes $82,170,990 in disgorgement, $64,340,024 in interest and a $50,000,000 penalty.
CSAG is the indirect parent company of Credit Suisse and CSSU. Neither Credit Suisse, CSSU nor the Fund was named in the Plea Agreement (as defined below) or other settlements relating to the conduct set out in the Plea Agreement. The conduct set out in the Plea Agreement did not involve the Fund, Credit Suisse or CSSU with respect to its investment adviser and distribution activities relating to the Fund.
31
Credit Suisse Managed Futures Strategy Fund
Notes to Consolidated Financial Statements (continued)
October 31, 2014
Credit Suisse, CSSU and certain of their affiliates have received a permanent exemptive order from the Commission to permit them to continue serving as investment advisers and principal underwriters for U.S.-registered investment companies, such as the Fund. Due to a provision in the law governing the operation of U.S.-registered investment companies, they would otherwise have become ineligible to perform these activities as a result of the plea in the Plea Agreement. The permanent exemptive order permits Credit Suisse and CSSU to continue to provide services to the Fund, so long as, among other things, no current or former employee of CSAG or any affiliate of CSAG who previously has been or who subsequently may be identified by CSAG or any U.S. or non-U.S. regulatory or enforcement agencies as having been responsible for the conduct described in the Plea Agreement will be employed by Credit Suisse and certain of its affiliates. Credit Suisse and CSSU have informed the Fund that, Credit Suisse and CSSU believe the Settlements will not have any material impact on the Fund or on the ability of Credit Suisse or CSSU to perform services for the Fund.
On November 21, 2014, at the sentencing hearing, the court accepted and implemented the sentence as set out in the plea agreement. The court imposed no additional conditions beyond those contained in the agreement.
32
Credit Suisse Managed Futures Strategy Fund
Report of Independent Registered Public Accounting Firm
To the Board of Trustees and the Shareholders of
Credit Suisse Managed Futures Strategy Fund:
In our opinion, the accompanying consolidated statement of assets and liabilities, including the consolidated schedule of investments, and the related consolidated statements of operations and of changes in net assets and the financial highlights present fairly, in all material respects, the financial position of Credit Suisse Managed Futures Strategy Fund (a separate fund of Credit Suisse Opportunity Funds)(the "Fund") at October 31, 2014, the results of its operations for the year then ended, the changes in its net assets for each of the two years in the period then ended and the financial highlights for each of the periods presented, in conformity with accounting principles generally accepted in the United States of America. These financial statements and financial highlights (hereafter referred to as "financial statements") are the responsibility of the Fund's management. Our responsibility is to express an opinion on these financial statements based on our audits. We conducted our audits of these financial statements in accordance with the standards of the Public Company Accounting Oversight Board (United States). Those standards require that we plan and perform the audit to obtain reasonable assurance about whether the financial statements are free of material misstatement. An audit includes examining, on a test basis, evidence supporting the amounts and disclosures in the financial statements, assessing the accounting principles used and significant estimates made by management, and evaluating the overall financial statement presentation. We believe that our audits, which included confirmation of securities at October 31, 2014 by correspondence with the custodian and brokers, provide a reasonable basis for our opinion.
PricewaterhouseCoopers LLP
New York, New York
December 29, 2014
33
Credit Suisse Managed Futures Strategy Fund
Information Concerning Trustees and Officers (unaudited)
Name, Address
(Year of Birth) | | Position(s)
Held with
Fund | | Term
of Office1
and
Length
of Time
Served | | Principal
Occupation(s) During
Past Five Years | | Number of
Portfolios
in Fund
Complex
Overseen
by Trustee | | Other
Trusteeships
Held by Trustee | |
Independent Trustees | | | | | | | | | | | |
Enrique Arzac
c/o Credit Suisse Asset
Management, LLC
Attn: General Counsel
One Madison Avenue
New York, New York
10010
(1941) | | Trustee, Audit Committee Chairman and Nominating Committee Member | | Since Fund Inception | | Professor of Finance and Economics, Graduate School of Business, Columbia University since 1971. | | | 12 | | | Director of The Adams Express Company, Petroleum and Resources Corporation, Aberdeen Chile Fund, Inc., Aberdeen Emerging Markets Smaller Company Opportunities Fund, Inc., Aberdeen Israel Fund, Inc., Aberdeen Indonesia Fund, Inc. and Aberdeen Latin America Equity Fund, Inc. (each a closed-end investment company); Director of Aberdeen Asia-Pacific Income Investment Company Limited (a Canadian closed-end fund); Trustee of Mirae Asset Discovery Funds (6 open-end portfolios); Director of Starcomms PLC. (telecommunications company) from 2008 to 2011; Director of Epoch Holding Corporation (an investment management and investment advisory services company) from 2006 to March 2013 | |
1 Each Trustee and Officer serves until his or her respective successor has been duly elected and qualified.
34
Credit Suisse Managed Futures Strategy Fund
Information Concerning Trustees and Officers (unaudited) (continued)
Name, Address
(Year of Birth) | | Position(s)
Held with
Fund | | Term
of Office1
and
Length
of Time
Served | | Principal
Occupation(s) During
Past Five Years | | Number of
Portfolios
in Fund
Complex
Overseen
by Trustee | | Other
Trusteeships
Held by Trustee | |
Independent Trustees | | | | | | | | | | | |
Jeffrey E. Garten
c/o Credit Suisse Asset Management, LLC
Attn: General Counsel
One Madison Avenue
New York, New York 10010
(1946) | | Trustee, Audit and Nominating Committee Member | | Since Fund Inception | | The Juan Trippe Professor in the Practice of International Trade, Finance and Business, Yale School of Management, from July 2005 to present; Partner and Chairman of Garten Rothkopf (consulting firm) from October 2005 to present. | | | 9 | | | Director of Aetna, Inc. (insurance company); Director of CarMax Group (used car dealers); Director of Alcan (aluminum production) from February 2007 to November 2007; Member of Standard & Poor's Board of Managers (credit rating agency) from December 2011 to November 2014; Director of Miller Buckfire & Co., LLC (financial restructuring). | |
35
Credit Suisse Managed Futures Strategy Fund
Information Concerning Trustees and Officers (unaudited) (continued)
Name, Address
(Year of Birth) | | Position(s)
Held with
Fund | | Term
of Office1
and
Length
of Time
Served | | Principal
Occupation(s) During
Past Five Years | | Number of
Portfolios
in Fund
Complex
Overseen
by Trustee | | Other
Trusteeships
Held by Trustee | |
Steven N. Rappaport
Lehigh Court, LLC
555 Madison Avenue
29th Floor
New York, New York
10022
(1948) | | Chairman of the Board of Trustees, Audit Committee Member and Nominating Committee Chairman | | Since Fund Inception | | Partner of Lehigh Court, LLC and RZ Capital (private investment firms) from July 2002 to present. | | | 12 | | | Director of iCAD, Inc. (surgical and medical instruments and apparatus company); Director of Aberdeen Chile Fund, Inc., Aberdeen Emerging Markets Smaller Company Opportunities Fund, Inc., Aberdeen Israel Fund, Inc., Aberdeen Indonesia Fund, Inc. and Aberdeen Latin America Equity Fund, Inc. (each a closed-end investment company); Director of Presstek, Inc. (digital imaging technologies company) from 2003 to 2012; Director of Wood Resources, LLC. (plywood manufacturing company) from 2003 to October 2013; Partner Backstage Acquisition Holding, LLC (Publication Job Postings) from November 2013 to present. | |
36
Credit Suisse Managed Futures Strategy Fund
Information Concerning Trustees and Officers (unaudited) (continued)
Name, Address
(Year of Birth) | | Position(s)
Held with
Fund | | Term
of Office1
and
Length
of Time
Served | | Principal Occupation(s) During Past Five Years | |
Officers* | | | | | | | |
John G. Popp
Credit Suisse Asset
Management, LLC
One Madison Avenue
New York, New York 10010
(1956) | | Chief Executive Officer and President | | Since Fund Inception | | Managing Director of Credit Suisse; Global Head and Chief Investment Officer of the Credit Investment Group; Associated with Credit Suisse or its predecessor since 1997; Officer of other Credit Suisse Funds; Trustee of Credit Suisse High Yield Bond Fund; Director of Credit Suisse Asset Management Income Fund, Inc. | |
Bruce Rosenberg
Credit Suisse Asset
Management, LLC
One Madison Avenue
New York, New York 10010
(1961) | | Chief Financial Officer | | Since 2012 | | Director of Credit Suisse; Director of Liquid Accounting of Credit Suisse; Associated with Credit Suisse since 2008; Officer of other Credit Suisse Funds. | |
Emidio Morizio
Credit Suisse Asset
Management, LLC
One Madison Avenue
New York, New York 10010
(1966) | | Chief Compliance Officer | | Since Fund Inception | | Managing Director and Global Head of Compliance of Credit Suisse since 2010; Director and Global Head of Compliance of Credit Suisse from January 2005 to December 2009; Associated with Credit Suisse since July 2000; Officer of other Credit Suisse Funds. | |
Joanne Doldo
Credit Suisse Asset
Management, LLC
One Madison Avenue
New York, New York 10010
(1959) | | Chief Legal Officer | | Since 2013 | | Vice President of Credit Suisse; Associated with Credit Suisse since September 2011; Officer of other Credit Suisse Funds; Associated with Morgan Stanley Investment Management from 2002-2008. | |
Rocco DelGuercio
Credit Suisse Asset
Management, LLC
One Madison Avenue
New York, New York 10010
(1963) | | Treasurer | | Since 2013 | | Vice President of Credit Suisse since 2013; Independent Consultant from February 2012 to April 2013; Director of Legg Mason & Co., LLC from March 2004 to January 2012; Associated with Credit Suisse from June 1996 to March 2004; Officer of other Credit Suisse Funds. | |
Karen Regan
Credit Suisse Asset
Management, LLC
One Madison Avenue
New York, New York 10010
(1963) | | Senior Vice President and Secretary | | Since Fund Inception | | Vice President of Credit Suisse; Associated with Credit Suisse since December 2004; Officer of other Credit Suisse Funds. | |
* The officers of the Fund shown are officers that make policy decisions.
The Statement of Additional Information includes additional information about the Trustees and is available, without charge, upon request, by calling 877-870-2874.
37
Credit Suisse Managed Futures Strategy Fund
Proxy Voting and Portfolio Holdings Information (unaudited)
Information regarding how the Fund voted proxies related to its portfolio securities during the 12 month period ended June 30 of each year, as well as the policies and procedures that the Fund uses to determine how to vote proxies relating to its portfolio securities are available:
• By calling 1-877-870-2874
• On the Fund's website, www.credit-suisse.com/us/funds
• On the website of the Securities and Exchange Commission, www.sec.gov.
The Fund files a complete schedule of its portfolio holdings for the first and third quarters of its fiscal year with the SEC on Form N-Q. The Fund's Forms N-Q are available on the SEC's website at www.sec.gov and may be reviewed and copied at the SEC's Public Reference Room in Washington, DC. Information on the operation of the SEC's Public Reference Room may be obtained by calling 1-202-551-8090.
38
This page intentionally left blank
This page intentionally left blank

P.O. BOX 55030, BOSTON, MA 02205-5030
877-870-2874 n www.credit-suisse.com/us/funds
CREDIT SUISSE SECURITIES (USA) LLC, DISTRIBUTOR. MFS-AR-1014

CREDIT SUISSE FUNDS
Annual Report
October 31, 2014
n CREDIT SUISSE
MULTIALTERNATIVE STRATEGY FUND
The Fund's investment objectives, risks, charges and expenses (which should be considered carefully before investing), and more complete information about the Fund, are provided in the Prospectus, which should be read carefully before investing. You may obtain additional copies by calling 877-870-2874 or by writing to Credit Suisse Funds, P.O. Box 55030, Boston, MA 02205-5030.
Credit Suisse Securities (USA) LLC, Distributor, is located at One Madison Avenue, New York, NY 10010. Credit Suisse Funds are advised by Credit Suisse Asset Management, LLC.
AFFIRMATION OF THE COMMODITY POOL OPERATOR
To the best of my knowledge and belief, the information contained in the attached financial statements for the year from November 1, 2013 to October 31, 2014, is accurate and complete.

Kenneth J. Lohsen, Managing Director
Credit Suisse Asset Management, LLC,
Commodity Pool Operator for the Credit Suisse Multialternative
Strategy Fund
Investors in the Credit Suisse Funds should be aware that they may be eligible to purchase Class I shares (where offered) directly or through certain intermediaries. Such shares are not subject to a sales charge. Investors in the Credit Suisse Funds should also be aware that they may be eligible for a reduction or waiver of the sales charge with respect to Class A or C shares (where offered). For more information, please review the relevant prospectuses or consult your financial representative.
Fund shares are not deposits or other obligations of Credit Suisse Asset Management, LLC ("Credit Suisse") or any affiliate, are not FDIC-insured and are not guaranteed by Credit Suisse or any affiliate. Fund investments are subject to investment risks, including loss of your investment.
Credit Suisse Multialternative Strategy Fund
Annual Investment Adviser's Report
October 31, 2014 (unaudited)
December 22, 2014
Dear Shareholder:
We are pleased to present this Annual Report covering the activities of the Credit Suisse Multialternative Strategy Fund (the "Fund") for the 12-months ended October 31, 2014.
Performance Summary
11/01/13 – 10/31/14
Fund & Benchmark | | Performance | |
| Class I1 | | | 2.54 | % | |
| Class A1,2 | | | 2.25 | % | |
| Class C1,2 | | | 1.48 | % | |
| Credit Suisse Hedge Fund Index3 | | | 5.17 | % | |
| Credit Suisse Liquid Alternative Beta Index4 | | | 3.75 | % | |
Performance shown for the Fund's Class A and Class C Shares does not reflect sales charges, which are a maximum of 5.25% and 1.00%, respectively.2
Market Review: A positive period
The 12-months ended October 31, 2014 was a positive one for hedge funds with the Credit Suisse Hedge Fund Index (the "Index"), the Fund's primary benchmark, returning 5.17%.
Within the hedge fund universe, trend following strategies, such as managed futures, experienced gains despite periods of equity market volatility, as they are able to profit from both up and down trends in the markets.
Event driven managers generally benefitted from distressed credit, merger arbitrage, and special situations equity positions. However, event driven hedge fund managers generally struggled from a pull-back in special situations during Q3 2014, as well as catalyst-driven (e.g. corporate actions) equity and distressed credit names.
Despite equity market volatility in Q1 and October of 2014, directional equities performed positively overall during the period. When global equities exhibited weakness in Q3 2014, long/short equity managers generally succeeded in protecting capital due to their short positions — especially short positions in small- and mid-cap companies that were the hardest hit.
Strategic Review
For the 12-months ended October 31, 2014, the Fund underperformed the Index by 263 basis points on Class I, 292 basis points on Class A and 369 basis
1
Credit Suisse Multialternative Strategy Fund
Annual Investment Adviser's Report (continued)
October 31, 2014 (unaudited)
points on Class C. The Fund follows a multi-strategy methodology and benefitted from long exposure across different markets and exposure to some trading strategies. For example, the long/short equity sub-strategy benefitted primarily from Nasdaq 100 and S&P 500 positions, despite the equity market volatility in Q1 and October 2014. The event driven sub-strategy benefitted from the proprietary Illiquidity Premium and iBoxx High Yield Index positions. The existence of the Illiquidity Premium factor in the model this year may indicate that hedge fund managers held illiquid positions. Allocations to the global strategies sub-strategy also resulted in gains, primarily due to positions in managed futures and the S&P 500 Put Write. The lowest performers were merger arbitrage, which offset some of the upside from the event driven sub-strategy. Overall, tracking error to the primary benchmark was consistent with historical ranges.
The Credit Suisse Liquid Alternative Beta Team
Dr. Sid Browne
Mark Nodelman
Jonathan Sheridan
Sheel Dhande
The Fund is non-diversified, which means it may invest a greater proportion of its assets in the securities of a smaller number of issuers than a diversified mutual fund and may therefore be subject to greater volatility. The Fund's investment in alternative instruments may subject the Fund to greater volatility than investment in traditional securities, particularly in investments involving leverage.
The use of alternative assets and strategies entails substantial risks, including risk of loss principal, arbitrage or fundamental risk, below investment grade securities risk, commodity exposure risks, concentration risk, derivatives risk, risks of investing in other funds, exchange-traded notes risk, credit risk, foreign securities risk, interest rate risk, market risk, model and style risk, forwards risk, futures contracts risk, index/tracking error risk, portfolio turnover risk, leveraging risk, swap agreements risk, small-and mid-cap stock risk, speculative exposure risk and tax risk. For a detailed discussion of these and other risks, please refer to the Fund's Prospectus, which should be read carefully before investing.
2
Credit Suisse Multialternative Strategy Fund
Annual Investment Adviser's Report (continued)
October 31, 2014 (unaudited)
In addition to historical information, this report contains forward-looking statements, which may concern, among other things, domestic and foreign market, industry and economic trends and developments and government regulation and their potential impact on the Fund's investments. These statements are subject to risks and uncertainties and actual trends, developments and regulations in the future, and their impact on the Fund could be materially different from those projected, anticipated or implied. The Fund has no obligation to update or revise forward-looking statements.
The views of the Fund's management are as of the date of the letter and the Fund holdings described in this document are as of October 31, 2014; these views and Fund holdings may have changed subsequent to these dates. Nothing in this document is a recommendation to purchase or sell securities.
3
Credit Suisse Multialternative Strategy Fund
Annual Investment Adviser's Report (continued)
October 31, 2014 (unaudited)
Comparison of Change in Value of $10,000 Investment in the
Credit Suisse Multialternative Strategy Fund1 Class I shares,
Class A shares2, Class C shares2 and the Dow Jones Credit Suisse
Hedge Fund Index3 and the Credit Suisse Liquid
Alternative Beta Index4 from Inception (03/30/12).

1 Fee waivers and/or expense reimbursements may reduce expenses for the Fund, without which performance would be lower. The Fund has entered into a written contract to limit expenses to 1.70% of the Fund's average daily net assets for Class I shares, 1.95% of the Fund's average daily net assets for Class A shares and 2.70% of the Fund's average daily net assets for Class C shares through at least February 28, 2015.
2 Total return for the Fund's Class A shares for the 12 months ended October 31, 2014, based on offering price (including maximum sales charge of 5.25%), was (3.11)%. Total return for the Fund's Class C shares for the same period, based on redemption value (including maximum contingent deferred sales charge of 1.00%), was 0.50%.
3 Dow Jones Credit Suisse Hedge Fund Index is compiled by Credit Suisse Hedge Index LLC and CME Group Index Services LLC. It is an asset-weighted hedge fund index and includes only funds, as opposed to separate accounts. The Index uses the Credit Suisse database, which tracks over 9,000 funds, and consists only of funds with a minimum of US$50 million under management, a 12-month track record, and audited financial statements. It is calculated and rebalanced on a monthly basis, and shown net of all performance fees and expenses. An index does not have transaction costs; investors may not invest directly in an index.
4 Using only liquid securities, the Credit Suisse Liquid Alternative Beta Index seeks to replicate the return of the overall hedge fund industry, as represented by the Dow Jones Credit Suisse Hedge Fund Index. An index does not have transactions costs; investors may not invest directly in an index.
4
Credit Suisse Multialternative Strategy Fund
Annual Investment Adviser's Report (continued)
October 31, 2014 (unaudited)
Average Annual Returns as of October 31, 20141
| | | 1 Year | | Since
Inception2 | |
Class I | | | 2.54 | %3 | | | 3.11 | % | |
Class A Without Sales Charge | | | 2.25 | %3 | | | 2.86 | % | |
Class A With Maximum Sales Charge | | | (3.11 | )% | | | 0.76 | % | |
Class C Without CDSC | | | 1.48 | %3 | | | 2.10 | % | |
Class C With CDSC | | | 0.50 | % | | | 1.73 | % | |
Returns represent past performance and include change in share price and reinvestment of dividends and capital gains. Past performance cannot guarantee future results. The current performance of the Fund may be lower or higher than the figures shown. Returns and share price will fluctuate, and redemption value may be more or less than original cost. The performance results do not reflect the deduction of taxes that a shareholder would pay on fund distributions or the redemption of fund shares. Performance information current to the most recent month-end is available at www.credit-suisse.com/us/funds.
The annual gross expense ratios are 4.33% for Class I shares, 4.58% for Class A shares and 5.33% for Class C shares. The annualized net expense ratios after fee waivers and/or expense reimbursements excluding securities sold short dividend expense are 1.70% for Class I shares, 1.95% for Class A shares and 2.70% for Class C shares.
1 Fee waivers and/or expense reimbursements may reduce expenses for the Fund, without which performance would be lower. The Fund has entered into a written contract to limit expenses to 1.70% of the Fund's average daily net assets for Class I shares, 1.95% of the Fund's average daily net assets for Class A shares and 2.70% of the Fund's average daily net assets for Class C shares through at least February 28, 2015.
2 Inception Date March 30, 2012.
3 The calculated total return shown does not reflect adjustments required under U.S. GAAP made to the Net Asset Value as of October 31, 2014. The total return for Class I shares, Class A shares and Class C shares based on the Net Asset Value adjusted for financial statement purposes is 2.64%, 2.35% and 1.68%, respectively.
5
Credit Suisse Multialternative Strategy Fund
Annual Investment Adviser's Report (continued)
October 31, 2014 (unaudited)
Information About Your Fund's Expenses
As an investor of the Fund, you incur two types of costs: ongoing expenses and transaction costs. Ongoing expenses include management fees, distribution and service (12b-1) fees and other Fund expenses. Examples of transaction costs include sales charges (loads), redemption fees and account maintenance fees, which are not shown in this section and which would result in higher total expenses. The following table is intended to help you understand your ongoing expenses of investing in the Fund and to help you compare these expenses with the ongoing expenses of investing in other mutual funds. The table is based on an investment of $1,000 made at the beginning of the six-months ended October 31, 2014.
The table illustrates your Fund's expenses in two ways:
• Actual Fund Return. This helps you estimate the actual dollar amount of ongoing expenses paid on a $1,000 investment in the Fund using the Fund's actual return during the period. To estimate the expenses you paid over the period, simply divide your account value by $1,000 (for example, an $8,600 account value divided by $1,000 = 8.6), then multiply the result by the number in the "Expenses Paid per $1,000" line under the share class you hold.
• Hypothetical 5% Fund Return. This helps you to compare your Fund's ongoing expenses with those of other mutual funds using the Fund's actual expense ratio and a hypothetical rate of return of 5% per year before expenses. Examples using a 5% hypothetical fund return may be found in the shareholder reports of other mutual funds. The hypothetical account values and expenses may not be used to estimate the actual ending account balance or expenses you paid for the period.
Please note that the expenses shown in these tables are meant to highlight your ongoing expenses only and do not reflect any transaction costs, such as sales charges (loads) or redemption fees. If these transaction costs had been included, your costs would have been higher. The "Expenses Paid per $1,000" line of the tables is useful in comparing ongoing expenses only and will not help you determine the relative total expenses of owning different funds.
6
Credit Suisse Multialternative Strategy Fund
Annual Investment Adviser's Report (continued)
October 31, 2014 (unaudited)
Expenses and Value for a $1,000 Investment
for the six month period ended October 31, 2014
Actual Fund Return | | Class I | | Class A | | Class C | |
Beginning Account Value 05/01/14 | | $ | 1,000.00 | | | $ | 1,000.00 | | | $ | 1,000.00 | | |
Ending Account Value 10/31/14 | | $ | 1,009.70 | | | $ | 1,008.80 | | | $ | 1,004.90 | | |
Expenses Paid per $1,000* | | $ | 9.52 | | | $ | 10.73 | | | $ | 14.60 | | |
Hypothetical 5% Fund Return | |
Beginning Account Value 05/01/14 | | $ | 1,000.00 | | | $ | 1,000.00 | | | $ | 1,000.00 | | |
Ending Account Value 10/31/14 | | $ | 1,015.73 | | | $ | 1,014.52 | | | $ | 1,010.64 | | |
Expenses Paid per $1,000* | | $ | 9.55 | | | $ | 10.76 | | | $ | 14.65 | | |
| | | Class I | | Class A | | Class C | |
Annualized Expense Ratios* | | | 1.88 | % | | | 2.12 | % | | | 2.89 | % | |
* Expenses are equal to the Fund's annualized expense ratio for each share class, multiplied by the average account value over the period, multiplied by the number of days in the most recent fiscal half year period, then divided by 365.
The "Expenses Paid per $1,000" and the "Annualized Expense Ratios" in the tables are based on actual expenses paid by the Fund during the period, net of fee waivers and/or expense reimbursements. If those fee waivers and/or expense reimbursements had not been in effect, the Fund's actual expenses would have been higher. Expenses do not reflect additional charges and expenses that are, or may be, imposed under the variable contracts or plans. Such charges and expenses are described in the prospectus of the insurance company separate account or in the plan documents or other informational materials supplied by plan sponsors. The Fund's expenses should be considered with these charges and expenses in evaluating the overall cost of investing in the separate account.
For more information, please refer to the Fund's prospectus.
7
Credit Suisse Multialternative Strategy Fund
Annual Investment Adviser's Report (continued)
October 31, 2014 (unaudited)
Sector Breakdown*
| | | Long | | Short | | Net | |
Common Stocks | | | 24.07 | % | | | (8.74 | )% | | | 15.33 | % | |
Exchange Traded Funds | | | 5.70 | | | | (0.00 | ) | | | 5.70 | | |
Investment Company | | | 7.70 | | | | (0.00 | ) | | | 7.70 | | |
Rights2 | | | 0.00 | | | | (0.00 | ) | | | 0.00 | | |
United States Treasury Obligation | | | 12.15 | | | | (0.00 | ) | | | 12.15 | | |
Short-Term Investment1 | | | 59.12 | | | | (0.00 | ) | | | 59.12 | | |
Total | | | 108.74 | % | | | (8.74 | )% | | | 100.00 | % | |
* Expressed as a percentage of total long (short) investments, (excluding securities lending collateral if applicable) and may vary over time.
1 Primarily reflects cash invested in State Street Bank and Trust Co. Euro Time Deposit, for which the purchases of securities have been executed but not yet settled at October 31, 2014, if applicable.
2 This amount represents less than 0.01%.
8
Credit Suisse Multialternative Strategy Fund
Consolidated Schedule of Investments
October 31, 2014
| | | Number of
Shares | | Value | |
| LONG POSITIONS (46.3%) | |
| COMMON STOCKS (22.5%) | |
| FINLAND (0.2%) | |
| Building Products (0.2%) | |
Sanitec Corp.* | | | 2,053 | | | $ | 26,307 | | |
| FRANCE (1.0%) | |
| Construction Materials (0.9%) | |
Lafarge S.A. | | | 1,765 | | | | 122,467 | | |
| Hotels, Restaurants & Leisure (0.1%) | |
Club Mediterranee S.A.* | | | 323 | | | | 9,099 | | |
| | | | 131,566 | | |
| GERMANY (0.6%) | |
| Media (0.6%) | |
Sky Deutschland AG* | | | 9,860 | | | | 83,226 | | |
| IRELAND (1.3%) | |
| Healthcare Equipment & Supplies (1.3%) | |
Covidien PLC | | | 1,814 | | | | 167,686 | | |
| ITALY (0.4%) | |
| Household Durables (0.4%) | |
Indesit Co. SpA* | | | 4,366 | | | | 60,041 | | |
| NETHERLANDS (0.8%) | |
| Food Products (0.3%) | |
Nutreco N.V. | | | 801 | | | | 40,112 | | |
| Real Estate Investment Trusts (0.5%) | |
Corio N.V. | | | 1,332 | | | | 64,822 | | |
| | | | 104,934 | | |
| UNITED KINGDOM (1.2%) | |
| Diversified Telecommunication Services (0.4%) | |
Jazztel PLC* | | | 3,505 | | | | 56,025 | | |
| Healthcare Providers & Services (0.3%) | |
Synergy Health PLC | | | 1,092 | | | | 32,666 | | |
| Hotels, Restaurants & Leisure (0.2%) | |
Spirit Pub Co. PLC | | | 17,227 | | | | 29,283 | | |
| Semiconductor Equipment & Products (0.3%) | |
CSR PLC | | | 2,615 | | | | 35,147 | | |
| | | | 153,121 | | |
| UNITED STATES (17.0%) | |
| Auto Components (0.6%) | |
TRW Automotive Holdings Corp.* | | | 832 | | | | 84,323 | | |
See Accompanying Notes to Consolidated Financial Statements.
9
Credit Suisse Multialternative Strategy Fund
Consolidated Schedule of Investments (continued)
October 31, 2014
| | | Number of
Shares | | Value | |
LONG POSITIONS | |
COMMON STOCKS | |
UNITED STATES | |
| Banks (1.0%) | |
Hudson City Bancorp, Inc. | | | 13,331 | | | $ | 128,644 | | |
| Capital Markets (0.3%) | |
GFI Group, Inc. | | | 6,332 | | | | 34,826 | | |
| Chemicals (1.5%) | |
Rockwood Holdings, Inc. | | | 1,000 | | | | 76,910 | | |
Sigma-Aldrich Corp. | | | 567 | | | | 77,061 | | |
Taminco Corp.* | | | 1,870 | | | | 48,414 | | |
| | | | 202,385 | | |
| Diversified Telecommunication Services (0.8%) | |
tw telecom, Inc.* | | | 2,490 | | | | 106,522 | | |
| Electric Utilities (1.2%) | |
Cleco Corp. | | | 796 | | | | 42,793 | | |
Pepco Holdings, Inc. | | | 4,319 | | | | 118,081 | | |
| | | | 160,874 | | |
| Energy Equipment & Services (0.5%) | |
Dresser-Rand Group, Inc.* | | | 741 | | | | 60,540 | | |
| Food Products (0.2%) | |
Chiquita Brands International, Inc.* | | | 1,714 | | | | 24,733 | | |
| Healthcare Equipment & Supplies (1.0%) | |
Alere, Inc.* | | | 1,439 | | | | 57,517 | | |
CareFusion Corp.* | | | 1,170 | | | | 67,123 | | |
| | | | 124,640 | | |
| Healthcare Providers & Services (0.3%) | |
Gentiva Health Services, Inc.* | | | 2,001 | | | | 39,420 | | |
| Hotels, Restaurants & Leisure (0.7%) | |
Bally Technologies, Inc.* | | | 690 | | | | 55,476 | | |
Multimedia Games Holding Co., Inc.* | | | 1,150 | | | | 40,135 | | |
| | | | 95,611 | | |
| Insurance (0.9%) | |
Protective Life Corp. | | | 1,732 | | | | 120,686 | | |
| Internet Software & Services (0.4%) | |
Digital River, Inc.* | | | 926 | | | | 23,678 | | |
Move, Inc.* | | | 1,324 | | | | 27,738 | | |
| | | | 51,416 | | |
| Media (1.3%) | |
Time Warner Cable, Inc. | | | 1,194 | | | | 175,769 | | |
| Multi-utilities (0.6%) | |
Integrys Energy Group, Inc. | | | 1,161 | | | | 84,381 | | |
| Multiline Retail (0.7%) | |
Family Dollar Stores, Inc. | | | 1,181 | | | | 92,460 | | |
See Accompanying Notes to Consolidated Financial Statements.
10
Credit Suisse Multialternative Strategy Fund
Consolidated Schedule of Investments (continued)
October 31, 2014
| | | Number of
Shares | | Value | |
LONG POSITIONS | |
COMMON STOCKS | |
UNITED STATES | |
| Oil, Gas & Consumable Fuels (0.4%) | |
Athlon Energy, Inc.* | | | 924 | | | $ | 53,869 | | |
| Pharmaceuticals (0.3%) | |
Auxilium Pharmaceuticals, Inc.* | | | 1,071 | | | | 34,454 | | |
| Real Estate Investment Trust (0.3%) | |
Glimcher Realty Trust | | | 3,179 | | | | 43,648 | | |
| Semiconductor Equipment & Products (1.7%) | |
International Rectifier Corp.* | | | 1,422 | | | | 56,553 | | |
OmniVision Technologies, Inc.* | | | 1,871 | | | | 50,105 | | |
TriQuint Semiconductor, Inc.* | | | 5,187 | | | | 112,195 | | |
| | | | 218,853 | | |
| Software (1.3%) | |
Compuware Corp. | | | 5,354 | | | | 54,343 | | |
Concur Technologies, Inc.* | | | 504 | | | | 64,673 | | |
Covisint Corp.* | | | 750 | | | | 2,168 | | |
TIBCO Software, Inc.* | | | 2,026 | | | | 47,348 | | |
| | | | 168,532 | | |
| Tobacco (1.0%) | |
Lorillard, Inc. | | | 2,228 | | | | 137,022 | | |
| | | | 2,243,608 | | |
| TOTAL COMMON STOCKS (Cost $2,966,547) | | | 2,970,489 | | |
| EXCHANGE TRADED FUNDS (5.3%) | |
| UNITED STATES (5.3%) | |
| Diversified Financial Services (5.3%) | |
iShares iBoxx $ High Yield Corporate Bond ETF | | | 3,265 | | | | 302,111 | | |
Powershares QQQ Trust Series 1 | | | 3,951 | | | | 400,631 | | |
| TOTAL EXCHANGE TRADED FUNDS (Cost $693,068) | | | 702,742 | | |
| INVESTMENT COMPANY (7.2%) | |
| UNITED STATES (7.2%) | |
Credit Suisse Managed Futures Strategy Fund, I Shares (Cost $863,937)• | | | 87,674 | | | | 950,381 | | |
| | | Number of
Rights | | | |
| RIGHTS (0.0%) | |
| UNITED STATES (0.0%) | |
| Biotechnology (0.0%) | |
Trius Therapeutics, Inc. (Cost $0)*^ | | | 400 | | | | 52 | | |
| | | Par
(000) | | | |
| UNITED STATES TREASURY OBLIGATION (11.3%) | |
United States Treasury Bill, 0.00% 12/18/2014 (Cost $1,500,000)^^^2 | | $ | 1,500 | | | | 1,500,000 | | |
See Accompanying Notes to Consolidated Financial Statements.
11
Credit Suisse Multialternative Strategy Fund
Consolidated Schedule of Investments (continued)
October 31, 2014
| | | Par
(000) | | Value | |
| SHORT-TERM INVESTMENT (55.1%) | |
State Street Bank and Trust Co. Euro Time Deposit, 0.010% 11/03/2014
(Cost $7,296,000) | | $ | 7,296 | | | $ | 7,296,000 | | |
| TOTAL INVESTMENTS AT VALUE/LONG POSITIONS (101.4%) (Cost $13,319,552) | | | 13,419,664 | | |
| TOTAL SECURITIES SOLD SHORT (-8.1%) (Proceeds $1,059,147) | | | (1,078,416 | ) | |
| OTHER ASSETS IN EXCESS OF LIABILITIES (6.7%) | | | 891,411 | | |
| NET ASSETS (100.0%) | | $ | 13,232,659 | | |
| | | Number of
Shares | | | |
| SHORT POSITIONS (-8.1%) | |
| COMMON STOCKS (-8.1%) | |
| FRANCE (-0.5%) | |
| Real Estate Investment Trusts (-0.5%) | |
Klepierre | | | (1,518 | ) | | | (65,689 | ) | |
| IRELAND (-0.1%) | |
| Pharmaceuticals (-0.1%) | |
Endo International PLC* | | | (261 | ) | | | (17,466 | ) | |
| SWITZERLAND (-0.9%) | |
| Construction Materials (-0.9%) | |
Holcim Ltd., Reg S*1 | | | (1,765 | ) | | | (125,231 | ) | |
| UNITED KINGDOM (-0.2%) | |
| Hotels, Restaurants & Leisure (-0.2%) | |
Greene King PLC | | | (2,277 | ) | | | (29,277 | ) | |
| UNITED STATES (-6.4%) | |
| Banks (-1.0%) | |
M&T Bank Corp. | | | (1,120 | ) | | | (136,842 | ) | |
| Chemicals (-0.2%) | |
Albemarle Corp. | | | (480 | ) | | | (28,022 | ) | |
| Construction & Engineering (-0.1%) | |
AECOM Technology Corp.* | | | (478 | ) | | | (15,559 | ) | |
| Diversified Telecommunication Services (-0.6%) | |
Level 3 Communications, Inc.* | | | (1,743 | ) | | | (81,764 | ) | |
| Healthcare Equipment & Supplies (-1.2%) | |
Becton Dickinson and Co. | | | (91 | ) | | | (11,712 | ) | |
Medtronic, Inc. | | | (1,734 | ) | | | (118,189 | ) | |
STERIS Corp. | | | (471 | ) | | | (29,108 | ) | |
| | | | (159,009 | ) | |
| Media (-1.5%) | |
Comcast Corp., Class A | | | (3,432 | ) | | | (189,961 | ) | |
| Multi-utilities (-0.5%) | |
Wisconsin Energy Corp. | | | (1,302 | ) | | | (64,657 | ) | |
See Accompanying Notes to Consolidated Financial Statements.
12
Credit Suisse Multialternative Strategy Fund
Consolidated Schedule of Investments (continued)
October 31, 2014
| | | Number of
Shares | | Value | |
SHORT POSITIONS | |
COMMON STOCKS | |
UNITED STATES | |
| Real Estate Investment Trust (-0.1%) | |
Washington Prime Group, Inc. | | | (632 | ) | | $ | (11,142 | ) | |
| Semiconductor Equipment & Products (-0.9%) | |
RF Micro Devices, Inc.* | | | (8,688 | ) | | | (113,031 | ) | |
| Tobacco (-0.3%) | |
Reynolds American, Inc. | | | (648 | ) | | | (40,766 | ) | |
| | | | (840,753 | ) | |
| TOTAL SHORT POSITIONS (Proceeds $1,059,147) | | $ | (1,078,416 | ) | |
* Non-income producing security.
• Affiliated issuer. (See Note 3).
^ Not readily marketable security; security is valued at fair value as determined in good faith by, or under the direction of, the Board of Trustees.
^^^ At October 31, 2014, this security has been pledged, in whole or in part, as collateral for open written options.
1 REG S: Securities sold under Regulation S may not be offered, sold or delivered within the United States or to, or for the account or benefit of, U.S. persons, except pursuant to an exemption from, or in a transaction not subject to, the registration requirements of the Securities Act of 1933.
2 Zero-coupon security.
Forward Foreign Currency Contracts
Forward Foreign
Currency to be
Purchased (Local) | | Forward Foreign
Currency to be
Sold (Local) | | Expiration
Date | | Counterparty | | Value on
Settlement Date | | Current
Value/
Notional | | Net Unrealized
Appreciation
(Depreciation) | |
AUD | 108,284 | | | USD | 94,717 | | | 11/20/14 | | JPMorgan Chase | | $ | 94,717 | | | $ | 95,076 | | | $ | 359 | | |
NOK | 774,884 | | | USD | 117,567 | | | 11/20/14 | | JPMorgan Chase | | | 117,567 | | | | 114,718 | | | | (2,849 | ) | |
NZD | 167,397 | | | USD | 132,618 | | | 11/20/14 | | JPMorgan Chase | | | 132,618 | | | | 130,017 | | | | (2,601 | ) | |
USD | 52,245 | | | CAD | 58,985 | | | 11/19/14 | | JPMorgan Chase | | | (52,245 | ) | | | (52,297 | ) | | | (52 | ) | |
USD | 97,519 | | | JPY | 10,343,986 | | | 11/20/14 | | JPMorgan Chase | | | (97,519 | ) | | | (92,281 | ) | | | 5,238 | | |
USD | 135,154 | | | SEK | 970,184 | | | 11/20/14 | | JPMorgan Chase | | | (135,154 | ) | | | (131,106 | ) | | | 4,048 | | |
USD | 56,294 | | | CHF | 53,145 | | | 11/20/14 | | JPMorgan Chase | | | (56,294 | ) | | | (55,224 | ) | | | 1,070 | | |
USD | 47,384 | | | GBP | 29,586 | | | 11/20/14 | | JPMorgan Chase | | | (47,384 | ) | | | (47,327 | ) | | | 57 | | |
USD | 1,376 | | | EUR | 1,076 | | | 11/20/14 | | JPMorgan Chase | | | (1,376 | ) | | | (1,349 | ) | | | 27 | | |
| | | $ | 5,297 | | |
See Accompanying Notes to Consolidated Financial Statements.
13
Credit Suisse Multialternative Strategy Fund
Consolidated Schedule of Investments (continued)
October 31, 2014
Currency Abbreviations:
AUD = Australian Dollar
CAD = Canadian Dollar
CHF = Swiss Franc
EUR = Euro
GBP = British Pound
JPY = Japanese Yen
NOK = Norwegian Krone
NZD = New Zealand Dollar
SEK = Swedish Krona
USD = United States Dollar
Total Return Swap Contracts
Currency | | Notional
Amount | | Expiration
Date | | Counterparty | | Receive | | Pay | | Net Unrealized
Appreciation
(Depreciation) | |
USD | | | | $ | 508,214 | | | 10/16/15 | | Goldman Sachs | | Fee Plus LIBOR | | MSCI Daily TR
Emerging Markets Index | | $ | (24,662 | ) | |
USD | | | | $ | 448,000 | | | 03/20/15 | | Goldman Sachs | | iBoxx $ Liquid
High Yield Index | | Fee Plus LIBOR | | | 4,512 | | |
USD | | | | $ | 55,000 | | | 03/20/15 | | Goldman Sachs | | iBoxx $ Liquid
High Yield Index | | Fee Plus LIBOR | | | 23 | | |
USD | | | | $ | 412,000 | | | 03/20/15 | | Goldman Sachs | | iBoxx $ Liquid
High Yield Index | | Fee Plus LIBOR | | | 3,593 | | |
USD | | | | $ | 45,000 | | | 03/20/15 | | Goldman Sachs | | iBoxx $ Liquid
High Yield Index | | Fee Plus LIBOR | | | 381 | | |
USD | | | | $ | 56,643 | | | 08/18/15 | | Goldman Sachs | | Russell 2000 Total
Return Index | | Fee Plus LIBOR | | | 4,078 | | |
USD | | | | $ | 813,000 | | | 12/26/14 | | JPMorgan Chase | | Fee Plus LIBOR | | iBoxx $ Liquid
High Yield Index | | | 1,795 | | |
USD | | | | $ | 1,150,000 | | | 12/26/14 | | JPMorgan Chase | | Fee Plus LIBOR | | iBoxx $ Liquid
High Yield Index | | | (33,751 | ) | |
USD | | | | $ | 470,000 | | | 12/26/14 | | JPMorgan Chase | | iBoxx $ Liquid
High Yield Index | | Fee Plus LIBOR | | | (3,744 | ) | |
USD | | | | $ | 1,785,000 | | | 12/22/14 | | JPMorgan Chase | | iBoxx $ Liquid
High Yield Index | | Fee Plus LIBOR | | | (13,288 | ) | |
USD | | | | $ | 28,000 | | | 03/20/15 | | JPMorgan Chase | | iBoxx $ Liquid
High Yield Index | | Fee Plus LIBOR | | | (4 | ) | |
USD | | | | $ | 341,019 | | | 06/17/15 | | JPMorgan Chase | | Russell 2000 Total
Return Index | | Fee Plus LIBOR | | | 28,827 | | |
USD | | | | $ | 2,231,747 | | | 11/18/14 | | Societe Generale | | NASDAQ-100
Total Return | | Fee Plus LIBOR | | | 28,315 | | |
| | | $ | (3,925 | ) | |
See Accompanying Notes to Consolidated Financial Statements.
14
Credit Suisse Multialternative Strategy Fund
Consolidated Schedule of Investments (continued)
October 31, 2014
Credit Default Swap Contracts Bought
Currency | | Notional
Amount | | Expiration
Date | | Counterparty | | Referenced
Obligation | | Rate
Paid by
the Fund | |
USD |
| | | $ | 265,800
| | | 12/20/19
| | Societe Generale
| | CDX North America
High Yield Index | | | 5.0 | % | |
Credit
Received
at 10/31/2014 | | Market
Value | | Upfront
Premiums
Received | | Net Unrealized
Appreciation
(Depreciation) | |
| | — | | | $ | (18,566 | ) | | $ | 13,152 | | | $ | (5,414 | ) | |
Option Contracts
Number of
Contracts | | Call Written Options | | Expiration
Date | | Premiums
Received | | Current
Value/
Notional | | Net Unrealized
Appreciation
(Depreciation) | |
| | 34 | | | S&P 500 Index, Strike @ $2,025 | | 11/22/14 | | $ | 2,147 | | | $ | (57,970 | ) | | $ | (55,823 | ) | |
Number of
Contracts | | Put Written Options | | Expiration
Date | | Premiums
Received | | Current
Value/
Notional | | Net Unrealized
Appreciation
(Depreciation) | |
| | 34 | | | S&P 500 Index, Strike @ $1,850 | | 11/22/14 | | $ | 152,570 | | | $ | (5,440 | ) | | $ | 147,130 | | |
Net Unrealized Appreciation (Depreciation) | | | | | | | | | | $ | 91,307 | | |
See Accompanying Notes to Consolidated Financial Statements.
15
Credit Suisse Multialternative Strategy Fund
Consolidated Statement of Assets and Liabilities
October 31, 2014
Assets | |
Investments in unaffiliated issuers at value (Cost $12,455,615) (Note 2) | | $ | 12,469,283 | | |
Investment in affiliated issuer at value (Cost $863,937) (Note 3) | | | 950,381 | | |
Cash | | | 562 | | |
Cash segregated at brokers for swap contracts, written options and securities sold short (Note 2) | | | 1,076,525 | | |
Cash segregated at brokers for centrally cleared swaps (Note 2) | | | 34,844 | | |
Unrealized appreciation on open swap contracts (Note 2) | | | 71,524 | | |
Unrealized appreciation on forward currency contracts (Note 2) | | | 10,799 | | |
Receivable from investment adviser (Note 3) | | | 9,792 | | |
Dividend and interest receivable | | | 655 | | |
Prepaid expenses | | | 18,667 | | |
Total assets | | | 14,643,032 | | |
Liabilities | |
Administrative services fee payable (Note 3) | | | 2,492 | | |
Shareholder servicing/Distribution fee payable (Note 3) | | | 1,228 | | |
Securities sold short, at value (Proceeds $1,059,147) (Note 2) | | | 1,078,416 | | |
Unrealized depreciation on open swap contracts (Note 2) | | | 80,863 | | |
Outstanding written options, at value (Proceeds $154,717) (Note 2) | | | 63,410 | | |
Payable for investments purchased | | | 48,363 | | |
Trustees' fee payable | | | 10,440 | | |
Payable for fund shares redeemed | | | 6,736 | | |
Unrealized depreciation on forward currency contracts (Note 2) | | | 5,502 | | |
Due to custodian for foreign currency at value (cost $1,578) | | | 2,132 | | |
Interest payable for open swap contracts | | | 2,003 | | |
Dividend expense payable on securities sold short | | | 754 | | |
Upfront payments received on swap contracts (Note 2) | | | 13,290 | | |
Accrued expenses | | | 94,744 | | |
Total liabilities | | | 1,410,373 | | |
Net Assets | |
Capital stock, $.001 par value (Note 6) | | | 1,272 | | |
Paid-in capital (Note 6) | | | 12,889,739 | | |
Accumulated net investment income | | | 124,350 | | |
Accumulated net realized gain from investments, futures contracts, swap contracts,
written options, securities sold short and foreign currency transactions | | | 49,749 | | |
Net unrealized appreciation from investments, swap contracts, written options,
securities sold short and foreign currency translations | | | 167,549 | | |
Net assets | | $ | 13,232,659 | | |
I Shares | |
Net assets | | $ | 11,451,360 | | |
Shares outstanding | | | 1,098,635 | | |
Net asset value and offering price per share | | $ | 10.42 | | |
A Shares | |
Net assets | | $ | 437,774 | | |
Shares outstanding | | | 42,204 | | |
Net asset value and redemption price per share | | $ | 10.37 | | |
Maximum offering price per share (net asset value/(1-5.25%)) | | $ | 10.941 | | |
C Shares | |
Net assets | | $ | 1,343,525 | | |
Shares outstanding | | | 131,580 | | |
Net asset value, offering price and redemption price per share | | $ | 10.21 | | |
1 Per share amounts may not recalculate due to rounding of net assets and/or shares outstanding.
See Accompanying Notes to Consolidated Financial Statements.
16
Credit Suisse Multialternative Strategy Fund
Consolidated Statement of Operations
For the Year Ended October 31, 2014
Investment Income | |
Dividends | | $ | 40,525 | | |
Securities lending (net of rebates) | | | 935 | | |
Foreign taxes withheld | | | (1,408 | ) | |
Total investment income | | | 40,052 | | |
Expenses | |
Investment advisory fees (Note 3) | | | 120,297 | | |
Administrative services fees (Note 3) | | | 17,391 | | |
Shareholder servicing/Distribution fees (Note 3) | |
Class A | | | 956 | | |
Class C | | | 15,965 | | |
Custodian fees | | | 62,824 | | |
Audit and tax fees | | | 52,100 | | |
Registration fees | | | 49,317 | | |
Legal fees | | | 45,356 | | |
Printing fees (Note 3) | | | 29,902 | | |
Trustees' fees | | | 28,420 | | |
Dividend expense for securities sold short | | | 15,920 | | |
Transfer agent fees (Note 3) | | | 14,455 | | |
Commitment fees (Note 4) | | | 2,676 | | |
Insurance expense | | | 612 | | |
Miscellaneous expense | | | 13,485 | | |
Total expenses | | | 469,676 | | |
Less: fees waived and expenses reimbursed (Note 3) | | | (258,977 | ) | |
Net expenses | | | 210,699 | | |
Net investment loss | | | (170,647 | ) | |
Net Realized and Unrealized Gain (Loss) from Investments, Futures Contracts, Swap Contracts,
Written Options, Securities Sold Short and Foreign Currency Related Items | |
Net realized loss from investments | | | (89,570 | ) | |
Net realized gain from investment in affiliated issuer | | | 26,575 | | |
Net realized gain distribution from affiliated issuer | | | 27,371 | | |
Net realized loss from futures contracts | | | (217 | ) | |
Net realized gain from swap contracts | | | 432,336 | | |
Net realized gain from written options | | | 59,476 | | |
Net realized gain from securities sold short | | | 9,836 | | |
Net realized loss from foreign currency transactions | | | (72,533 | ) | |
Net change in unrealized appreciation (depreciation) from investments | | | (27,338 | ) | |
Net change in unrealized appreciation (depreciation) from investment in affiliated issuer | | | 53,762 | | |
Net change in unrealized appreciation (depreciation) from swap contracts | | | (74,778 | ) | |
Net change in unrealized appreciation (depreciation) from written options | | | 71,812 | | |
Net change in unrealized appreciation (depreciation) from securities sold short | | | (19,269 | ) | |
Net change in unrealized appreciation (depreciation) from foreign currency translations | | | 15,939 | | |
Net realized and unrealized gain from investments, futures contracts, swap contracts,
written options, securities sold short and foreign currency related items | | | 413,402 | | |
Net increase in net assets resulting from operations | | $ | 242,755 | | |
See Accompanying Notes to Consolidated Financial Statements.
17
Credit Suisse Multialternative Strategy Fund
Consolidated Statement of Changes in Net Assets
| | | For the Year
Ended
October 31, 2014 | | For the Year
Ended
October 31, 2013 | |
From Operations | |
Net investment loss | | $ | (170,647 | ) | | $ | (123,075 | ) | |
Net realized gain from investments, futures contracts, swap contracts,
written options, securities sold short and foreign currency transactions | | | 393,274 | | | | 326,825 | | |
Net change in unrealized appreciation (depreciation) from investments,
futures contracts, written options, securities sold short, swap contracts
and foreign currency translations | | | 20,128 | | | | 181,844 | | |
Net increase in net assets resulting from operations | | | 242,755 | | | | 385,594 | | |
From Dividends and Distributions | |
Dividends from net investment income | |
Class I | | | — | | | | (27,302 | ) | |
Class A | | | — | | | | (1,006 | ) | |
Distributions from net realized gains | |
Class I | | | (168,910 | ) | | | (4,398 | ) | |
Class A | | | (9,044 | ) | | | (220 | ) | |
Class C | | | (54,515 | ) | | | (1,132 | ) | |
Net decrease in net assets resulting from dividends and distributions | | | (232,469 | ) | | | (34,058 | ) | |
| From Capital Share Transactions (Note 6) | |
Proceeds from sale of shares | | | 6,259,249 | | | | 1,283,655 | | |
Reinvestment of dividends and distributions | | | 232,469 | | | | 34,058 | | |
Net asset value of shares redeemed | | | (746,929 | ) | | | (397,505 | ) | |
Net increase in net assets from capital share transactions | | | 5,744,789 | | | | 920,208 | | |
Net increase in net assets | | | 5,755,075 | | | | 1,271,744 | | |
Net Assets | |
Beginning of year | | | 7,477,584 | | | | 6,205,840 | | |
End of year | | $ | 13,232,659 | | | $ | 7,477,584 | | |
Undistributed (accumulated) net investment income (loss) | | $ | 124,350 | | | $ | (33,877 | ) | |
See Accompanying Notes to Consolidated Financial Statements.
18
Credit Suisse Multialternative Strategy Fund
Consolidated Financial Highlights
(For a Class I Share of the Fund Outstanding Throughout Each Period)
| | | For the Year Ended October 31, | |
| | | 2014 | | 2013 | | 20121 | |
Per share data | |
Net asset value, beginning of year | | $ | 10.482 | | | $ | 9.95 | | | $ | 10.00 | | |
INVESTMENT OPERATIONS | |
Net investment income (loss)3 | | | (0.15 | ) | | | (0.15 | ) | | | 0.01 | | |
Net gain (loss) on investments, futures contracts, swap contracts,
written options, securities sold short and foreign currency
related items (both realized and unrealized) | | | 0.42 | | | | 0.75 | | | | (0.06 | ) | |
Total from investment operations | | | 0.27 | | | | 0.60 | | | | (0.05 | ) | |
LESS DIVIDENDS AND DISTRIBUTIONS | |
Dividends from net investment income | | | — | | | | (0.06 | ) | | | — | | |
Distributions from net realized gains | | | (0.33 | ) | | | (0.01 | ) | | | — | | |
Total dividends and distributions | | | (0.33 | ) | | | (0.07 | ) | | | — | | |
Net asset value, end of year | | $ | 10.42 | | | $ | 10.482 | | | $ | 9.95 | | |
Total return4 | | | 2.64 | % | | | 6.11 | % | | | (0.50 | )% | |
RATIOS AND SUPPLEMENTAL DATA | |
Net assets, end of year (000s omitted) | | $ | 11,451 | | | $ | 5,409 | | | $ | 4,904 | | |
Ratio of net expenses to average net assets | | | 1.85 | % | | | 1.78 | % | | | 1.79 | %5 | |
Ratio of expenses to average net assets excluding securities
sold short dividend expense | | | 1.70 | % | | | 1.70 | % | | | 1.70 | %5 | |
Ratio of net investment income (loss) to average net assets | | | (1.47 | )% | | | (1.49 | )% | | | 0.21 | %5 | |
Decrease reflected in above operating expense ratios due to
waivers/reimbursements | | | 2.48 | % | | | 6.31 | % | | | 9.22 | %5 | |
Portfolio turnover rate | | | 431 | % | | | 284 | % | | | 228 | % | |
1 For the period March 30, 2012 (commencement of operations) through October 31, 2012.
2 Includes adjustments in accordance with accounting principles generally accepted in the United States of America and as such, the net asset values for financial reporting purposes and the returns based upon net asset values may differ from the net asset values and returns for shareholder transactions.
3 Per share information is calculated using the average shares outstanding method.
4 Total returns are historical and assume changes in share price and reinvestment of all dividends and distributions. Had certain expenses not been reduced during the years shown, total returns would have been lower. Total returns for periods less than one year are not annualized.
5 Annualized.
See Accompanying Notes to Consolidated Financial Statements.
19
Credit Suisse Multialternative Strategy Fund
Consolidated Financial Highlights
(For a Class A Share of the Fund Outstanding Throughout Each Period)
| | | For the Year Ended October 31, | |
| | | 2014 | | 2013 | | 20121 | |
Per share data | |
Net asset value, beginning of year | | $ | 10.462 | | | $ | 9.93 | | | $ | 10.00 | | |
INVESTMENT OPERATIONS | |
Net investment loss3 | | | (0.18 | ) | | | (0.18 | ) | | | (0.01 | ) | |
Net gain (loss) on investments, futures contracts, swap contracts,
written options, securities sold short and foreign currency
related items (both realized and unrealized) | | | 0.42 | | | | 0.76 | | | | (0.06 | ) | |
Total from investment operations | | | 0.24 | | | | 0.58 | | | | (0.07 | ) | |
LESS DIVIDENDS AND DISTRIBUTIONS | |
Dividends from net investment income | | | — | | | | (0.04 | ) | | | — | | |
Distributions from net realized gains | | | (0.33 | ) | | | (0.01 | ) | | | — | | |
Total dividends and distributions | | | (0.33 | ) | | | (0.05 | ) | | | — | | |
Net asset value, end of year | | $ | 10.37 | | | $ | 10.462 | | | $ | 9.93 | | |
Total return4 | | | 2.35 | % | | | 5.96 | % | | | (0.70 | )% | |
RATIOS AND SUPPLEMENTAL DATA | |
Net assets, end of year (000s omitted) | | $ | 438 | | | $ | 324 | | | $ | 228 | | |
Ratio of net expenses to average net assets | | | 2.10 | % | | | 2.03 | % | | | 2.04 | %5 | |
Ratio of expenses to average net assets excluding securities
sold short dividend expense | | | 1.95 | % | | | 1.95 | % | | | 1.95 | %5 | |
Ratio of net investment loss to average net assets | | | (1.73 | )% | | | (1.75 | )% | | | (0.18 | )%5 | |
Decrease reflected in above operating expense ratios due to
waivers/reimbursements | | | 2.48 | % | | | 6.31 | % | | | 9.22 | %5 | |
Portfolio turnover rate | | | 431 | % | | | 284 | % | | | 228 | % | |
1 For the period March 30, 2012 (commencement of operations) through October 31, 2012.
2 Includes adjustments in accordance with accounting principles generally accepted in the United States of America and as such, the net asset values for financial reporting purposes and the returns based upon net asset values may differ from the net asset values and returns for shareholder transactions.
3 Per share information is calculated using the average shares outstanding method.
4 Total returns are historical and assume changes in share price, reinvestment of all dividends and distributions and no sales charge. Had certain expenses not been reduced during the years shown, total returns would have been lower. Total returns for periods less than one year are not annualized.
5 Annualized.
See Accompanying Notes to Consolidated Financial Statements.
20
Credit Suisse Multialternative Strategy Fund
Consolidated Financial Highlights
(For a Class C Share of the Fund Outstanding Throughout Each Period)
| | | For the Year Ended October 31, | |
| | | 2014 | | 2013 | | 20121 | |
Per share data | |
Net asset value, beginning of year | | $ | 10.372 | | | $ | 9.89 | | | $ | 10.00 | | |
INVESTMENT OPERATIONS | |
Net investment loss3 | | | (0.25 | ) | | | (0.25 | ) | | | (0.06 | ) | |
Net gain (loss) on investments, futures contracts, swap contracts,
written options, securities sold short and foreign currency
related items (both realized and unrealized) | | | 0.42 | | | | 0.74 | | | | (0.05 | ) | |
Total from investment operations | | | 0.17 | | | | 0.49 | | | | (0.11 | ) | |
LESS DIVIDENDS AND DISTRIBUTIONS | |
Distributions from net realized gains | | | (0.33 | ) | | | (0.01 | ) | | | — | | |
Total dividends and distributions | | | (0.33 | ) | | | (0.01 | ) | | | — | | |
Net asset value, end of year | | $ | 10.21 | | | $ | 10.372 | | | $ | 9.89 | | |
Total return4 | | | 1.68 | % | | | 5.15 | % | | | (1.10 | )% | |
RATIOS AND SUPPLEMENTAL DATA | |
Net assets, end of year (000s omitted) | | $ | 1,344 | | | $ | 1,745 | | | $ | 1,074 | | |
Ratio of net expenses to average net assets | | | 2.85 | % | | | 2.77 | % | | | 2.79 | %5 | |
Ratio of expenses to average net assets excluding securities
sold short dividend expense | | | 2.70 | % | | | 2.70 | % | | | 2.70 | %5 | |
Ratio of net investment loss to average net assets | | | (2.48 | )% | | | (2.49 | )% | | | (1.00 | )%5 | |
Decrease reflected in above operating expense ratios due to
waivers/reimbursements | | | 2.48 | % | | | 6.31 | % | | | 9.22 | %5 | |
Portfolio turnover rate | | | 431 | % | | | 284 | % | | | 228 | % | |
1 For the period March 30, 2012 (commencement of operations) through October 31, 2012.
2 Includes adjustments in accordance with accounting principles generally accepted in the United States of America and as such, the net asset values for financial reporting purposes and the returns based upon net asset values may differ from the net asset values and returns for shareholder transactions.
3 Per share information is calculated using the average shares outstanding method.
4 Total returns are historical and assume changes in share price, reinvestment of all dividends and distributions and no sales charge. Had certain expenses not been reduced during the years shown, total returns would have been lower. Total returns for periods less than one year are not annualized.
5 Annualized.
See Accompanying Notes to Consolidated Financial Statements.
21
Credit Suisse Multialternative Strategy Fund
Notes to Consolidated Financial Statements
October 31, 2014
Credit Suisse Multialternative Strategy Fund (the "Fund"), a series of the Credit Suisse Opportunity Funds (the "Trust"), a Delaware statutory trust, is registered under the Investment Company Act of 1940, as amended (the "1940 Act"), as a non-diversified open-end management investment company that seeks to achieve total return consistent with the risk and return patterns of a diversified universe of hedge funds. The Trust was organized under the laws of the State of Delaware as a business trust on May 31, 1995.
Credit Suisse Asset Management, LLC ("Credit Suisse"), the investment adviser to the Fund, is registered as a Commodity Pool Operator with the Commodity Futures Trading Commission. The Fund intends to gain exposure to commodities derivatives through investing in a wholly-owned subsidiary, Credit Suisse Cayman Multialternative Strategy Fund, Ltd. (the "Subsidiary"), organized under the laws of the Cayman Islands. The Subsidiary invests in commodity-linked derivative instruments, such as swaps and futures. The Subsidiary may also invest in debt securities, some of which are intended to serve as margin or collateral for the Subsidiary's derivatives positions.
The Subsidiary is managed by the same portfolio managers that manage the Fund and the accompanying financial statements reflect the financial position of the Fund and its Subsidiary and the results of operations on a consolidated basis. The consolidated financial statements include portfolio holdings of the Fund and the Subsidiary and all intercompany transactions and balances have been eliminated. The Fund may invest up to 25% of its total net assets in the Subsidiary. As of October 31, 2014, the Fund held $36,096 in the Subsidiary, representing 0.3% of the Fund's consolidated net assets. See the Consolidated Schedule of Investments for securities held through the Subsidiary. For the year ended October 31, 2014, there was no realized gain (loss) on securities held in the Subsidiary.
Subsequent references to the Fund within the Notes to Consolidated Financial Statements collectively refer to the Fund and its Subsidiary.
The Fund offers three classes of shares: Class I shares, Class A shares and Class C shares. Each class of shares represents an equal pro rata interest in the Fund, except they bear different expenses, which reflect the differences in the range of services provided to them. Class A shares are sold subject to a front-end sales charge of up to 5.25%. Class C shares are sold subject to a contingent deferred sales charge of 1.00% if the shares are redeemed within the first year of purchase. Class I shares are sold without a sales charge.
22
Credit Suisse Multialternative Strategy Fund
Notes to Consolidated Financial Statements (continued)
October 31, 2014
Note 2. Significant Accounting Policies
The following is a summary of significant accounting policies followed by the Fund in the preparation of its financial statements. The policies are in accordance with accounting principles generally accepted in the United States of America ("GAAP"). The preparation of financial statements requires management to make estimates and assumptions that affect the reported amounts and disclosures in the financial statements. Actual results could differ from those estimates.
A) SECURITY VALUATION — The net asset value of the Fund is determined daily as of the close of regular trading on the New York Stock Exchange, Inc. (the "Exchange") on each day the Exchange is open for business. For certain international equity securities, in order to adjust for events which may occur between the close of the foreign exchanges and the close of the New York Stock Exchange, a fair valuation model may be used. This fair valuation model takes into account comparisons to the valuation of American Depository Receipts (ADRs), exchange?traded funds, futures contracts and certain indices and these securities are categorized as Level 2. The valuations for fixed income securities (which may include, but are not limited to, corporate, government, municipal, mortgage-backed, collateralized mortgage obligations and asset-backed securities) and certain derivative instruments are typically the prices supplied by independent third party pricing services, which may use market prices or broker/dealer quotations or a variety of valuation techniques and methodologies. The independent third party pricing services use inputs that are observable such as issuer details, interest rates, yield curves, prepayment speeds, credit risks/spreads, default rates and quoted prices for similar securities. Short-term fixed income securities that will mature in 60 days or less may be valued at amortized cost. Structured note agreements are valued in accordance with a dealer-supplied valuation based on changes in the value of the underlying index. Option contracts on securities, currencies, indices, futures contracts, swaps and other instruments are valued at the mid-point between the last bid and ask quotations as of the close of trading on the exchange which the option is traded. Futures contracts are valued daily at the settlement price established by the board of trade or exchange on which they are traded. Forward contracts are valued at the London closing spot rates and the London closing forward point rates on a daily basis. The currency forward contract pricing model derives the differential in point rates to the expiration date of the forward and calculates its present value. Equity securities for which market quotations are available are valued at the last reported sales price or official closing price on the primary market or exchange on which they trade. The Fund may utilize a service provided by an independent third party which
23
Credit Suisse Multialternative Strategy Fund
Notes to Consolidated Financial Statements (continued)
October 31, 2014
Note 2. Significant Accounting Policies
has been approved by the Board of Trustees (the "Board") to fair value certain securities. When fair value pricing is employed, the prices of securities used by the Fund to calculate its net asset value may differ from quoted or published prices for the same securities. If independent third party pricing services are unable to supply prices for a portfolio investment, or if the prices supplied are deemed by the investment adviser to be unreliable, the market price may be determined by the investment adviser using quotations from one or more broker/dealers or at the transaction price if the security has recently been purchased and no value has yet been obtained from a pricing service or pricing broker. When reliable prices are not readily available, such as when the value of a security has been significantly affected by events after the close of the exchange or market on which the security is principally traded, but before the Fund calculates its net asset value, the Fund values these securities as determined in accordance with procedures approved and established by the Fund's Board.
The Fund uses valuation techniques to measure fair value that are consistent with the market approach and/or income approach, depending on the type of security and the particular circumstance. The market approach uses prices and other relevant information generated by market transactions involving identical or comparable securities. The income approach uses valuation techniques to discount estimated future cash flows to present value.
GAAP established a disclosure hierarchy that categorizes the inputs to valuation techniques used to value assets and liabilities at each measurement date. These inputs are summarized in the three broad levels listed below:
• Level 1 – quoted prices in active markets for identical investments
• Level 2 – other significant observable inputs (including quoted prices for similar investments, interest rates, prepayment speeds, credit risk, etc.)
• Level 3 – significant unobservable inputs (including the Fund's own assumptions in determining the fair value of investments)
The inputs or methodologies used to value securities are not necessarily an indication of the risk associated with investing in those securities.
24
Credit Suisse Multialternative Strategy Fund
Notes to Consolidated Financial Statements (continued)
October 31, 2014
Note 2. Significant Accounting Policies
The following is a summary of the inputs used as of October 31, 2014 in valuing the Fund's assets and liabilities carried at fair value:
| | Level 1 | | Level 2 | | Level 3 | | Total | |
Investments in Securities | |
Common Stocks | | $ | 2,494,520 | | | $ | 475,969 | | | $ | — | | | $ | 2,970,489 | | |
Exchange Traded Funds | | | 702,742 | | | | — | | | | — | | | | 702,742 | | |
Investment Companies | | | 950,381 | | | | — | | | | — | | | | 950,381 | | |
Rights | | | — | | | | — | | | | 52 | | | | 52 | | |
United States Treasury Obligations | | | — | | | | 1,500,000 | | | | — | | | | 1,500,000 | | |
Short-term Investment | | | — | | | | 7,296,000 | | | | — | | | | 7,296,000 | | |
Securities Sold Short | |
Common Stocks | | | (858,219 | ) | | | (220,197 | ) | | | — | | | | (1,078,416 | ) | |
| | $ | 3,289,424 | | | $ | 9,051,772 | | | $ | 52 | | | $ | 12,341,248 | | |
Other Financial Instruments* | |
Forward Foreign Currency Contracts | | $ | — | | | $ | 5,297 | | | $ | — | | | $ | 5,297 | | |
Swap Contracts | | | — | | | | (9,339 | ) | | | — | | | | (9,339 | ) | |
Written Options | | | (63,410 | ) | | | — | | | | — | | | | (63,410 | ) | |
* Other financial instruments include unrealized appreciation(depreciation) on forwards, swaps, and written options, at value.
As of October 31, 2014, the amounts shown by the Fund as being Level 3 securities that were measured at fair value amounted to less than 0.01% of net assets.
The Fund follows Financial Accounting Standards Board ("FASB") amendments to authoritative guidance which requires the Fund to disclose details of transfers in and out of Level 1 and Level 2 measurements and Level 2 and Level 3 measurements and the reasons for the transfers. For the year ended October 31, 2014, there were no transfers in and out of Level 1, Level 2 and Level 3. All transfers are assumed to occur at the end of the reporting period.
B) DERIVATIVE INSTRUMENTS AND HEDGING ACTIVITIES — The Fund adopted amendments to authoritative guidance on disclosures about derivative instruments and hedging activities which require that a fund disclose (a) how and why an entity uses derivative instruments, (b) how derivative instruments and hedging activities are accounted for and (c) how derivative instruments and related hedging activities affect a fund's financial position, financial performance and cash flows. The Fund also invests indirectly in derivative instruments through the Subsidiary. For the year ended October 31, 2014, the consolidated Funds' derivatives did not qualify for hedge accounting as they are held at fair value.
25
Credit Suisse Multialternative Strategy Fund
Notes to Consolidated Financial Statements (continued)
October 31, 2014
Note 2. Significant Accounting Policies
Fair Values of Derivative Instruments as of October 31, 2014.
| | | Asset Derivatives | | Liability Derivatives | |
| | | Balance Sheet
Location | | Fair Value | | Balance Sheet
Location | | Fair Value | |
Currency Contracts
| | Unrealized appreciation
on forward currency
contracts | | $ | 10,799 | | | Unrealized depreciation
on forward currency
contracts | | $ | 5,502 | | |
Index Contracts
| | Unrealized appreciation
on open swap contracts | | | 71,524 | | | Unrealized depreciation
on open swap contracts | | | 80,863 | | |
Equity Contracts
| | Outstanding written
options, at value | | | — | | | Outstanding written
options, at value | | | 63,410 | * | |
| | | | | | | $ | 82,323 | | | | | | | $ | 149,775 | | |
*Written options are reported at market value.
Effect of Derivative Instruments on the consolidated Statement of Operations
| | | Location | | Realized
Gain/Loss | | Location | | Net Unrealized
Appreciation
(Depreciation) | |
Currency Contracts
| | Net realized loss
from foreign
currency | | $ | (72,533 | ) | | Net change in unrealized
appreciation (depreciation) from
foreign currency transactions | | $ | 15,939 | | |
Index Contracts
| | Net realized loss
from futures
contracts | | | (217 | ) | | Net change in unrealized
appreciation (depreciation) from
futures contracts | | | — | | |
Index Contracts
| | Net realized gain
from swap | | | | | | Net change in unrealized
appreciation (depreciation) from | | | | | |
| | | contracts | | | 432,336 | | | swap contracts | | | (74,778 | ) | |
Equity Contracts
| | Net realized gain
from written
options | | | 59,476 | | | Net change in unrealized
appreciation (depreciation) from
written options | | | 71,812 | | |
| | | | | $ | 419,062 | | | | | $ | 12,973 | | |
The notional amount of futures contracts, forward foreign currency contracts, swap contracts and written options at the year ended October 31, 2014 are reflected in the Consolidated Schedule of Investments. For the year ended October 31, 2014, the Fund held average monthly notional values on a net basis of $35,208, $5,721,528 and $1,755,286 in futures contracts, swap contracts and forward foreign currency contracts, respectively. For the year ended October 31, 2014, the Fund received average monthly premiums of $115,704 from written options contracts.
The Fund is a party to International Swap and Derivatives Association, Inc. ("ISDA") Master Agreements ("Master Agreements") with certain counterparties that govern over-the-counter derivative (including Total Return,
26
Credit Suisse Multialternative Strategy Fund
Notes to Consolidated Financial Statements (continued)
October 31, 2014
Note 2. Significant Accounting Policies
Credit Default and Interest Rate Swaps) and foreign exchange contracts entered into by the Fund. The Master Agreements may contain provisions regarding, among other things, the parties' general obligations, representations, agreements, collateral requirements, events of default and early termination. Termination events applicable to the Fund may occur upon a decline in the Fund's net assets below a specified threshold over a certain period of time.
The following table presents by counterparty the Fund's derivative assets net of related collateral held by the Fund at October 31, 2014:
Counterparty | | Gross Amounts of
Assets Presented in
the Consolidated
Statement of Assets
and Liabilities(a) | | Financial
Instruments
and Derivatives
Available for Offset | | Non-Cash
Collateral
Received | | Cash
Collateral
Received | | Net Amount
of Derivative
Assets | |
Goldman Sachs | | $ | 12,587 | | | $ | (12,587 | ) | | $ | — | | | $ | — | | | $ | — | | |
JPMorgan Chase | | | 41,421 | | | | (41,421 | ) | | | — | | | | — | | | | — | | |
Societe Generale | | | 28,315 | | | | — | | | | — | | | | — | | | | 28,315 | | |
| | | $ | 82,323 | | | $ | (54,008 | ) | | $ | — | | | $ | — | | | $ | 28,315 | | |
The following table presents by counterparty the Fund's derivative liabilities net of related collateral pledged by the Fund at October 31, 2014:
Counterparty | | Gross Amounts of
Liabilites Presented in
the Consolidated
Statement of Assets
and Liabilities(a) | | Financial
Instruments
and Derivatives
Available for Offset | | Non-Cash
Collateral
Pledged | | Cash
Collateral
Pledged(b) | | Net Amount
of Derivative
Liabilities | |
Goldman Sachs | | $ | 88,072 | | | $ | (12,587 | ) | | $ | — | | | $ | (75,485 | ) | | $ | — | | |
JPMorgan Chase | | | 56,289 | | | | (41,421 | ) | | | — | | | | — | | | | 14,868 | | |
| | | $ | 144,361 | | | $ | (54,008 | ) | | $ | — | | | $ | (75,485 | ) | | $ | 14,868 | | |
(a) Swap contracts, written options and Forward foreign currency exchange contracts are included. Written options are reported at market value.
(b) The actual collateral received and/or pledged may be more than the amounts shown.
C) SECURITY TRANSACTIONS AND INVESTMENT INCOME/EXPENSE — Security transactions are accounted for on a trade date basis. Interest income/expense is recorded on the accrual basis. The Fund amortizes premiums and accretes discounts using the effective interest method. Dividend income/expense is recorded on the ex-dividend date. Certain expenses are class-specific expenses, vary by class and are charged only to that class. Income, expenses (excluding class-specific expenses) and realized/unrealized gains/losses are allocated proportionately to each class of shares based upon the relative net asset value of the outstanding shares of that class. The cost of investments sold is
27
Credit Suisse Multialternative Strategy Fund
Notes to Consolidated Financial Statements (continued)
October 31, 2014
Note 2. Significant Accounting Policies
determined by use of the specific identification method for both financial reporting and income tax purposes.
D) DIVIDENDS AND DISTRIBUTIONS TO SHAREHOLDERS — Dividends from net investment income, if any, are declared and paid quarterly. Distributions of net realized capital gains, if any, are declared and paid at least annually. However, to the extent that a net realized capital gain can be reduced by a capital loss carryforward, such gain will not be distributed. Income and capital gain distributions are determined in accordance with federal income tax regulations, which may differ from GAAP.
E) FEDERAL INCOME TAXES — No provision is made for federal taxes as it is the Fund's intention to continue to qualify for and elect the tax treatment applicable to regulated investment companies ("RIC") under the Internal Revenue Code of 1986, as amended (the "Code"), and to make the requisite distributions to its shareholders, which will be sufficient to relieve it from federal income and excise taxes.
In order to qualify as a RIC under the Code, the Fund must meet certain requirements regarding the source of its income, the diversification of its assets and the distribution of its income. One of these requirements is that the Fund derive at least 90% of its gross income for each taxable year from dividends, interest, payments with respect to certain securities loans, gains from the sale or other disposition of stock, securities or foreign currencies, other income derived with respect to its business of investing in such stock, securities or currencies or net income derived from interests in certain publicly traded partnerships ("Qualifying Income"). The IRS has issued a ruling that income realized from certain types of commodity-linked derivatives would not be Qualifying Income. As a result, the Fund's ability to realize income from investments in such commodity-linked derivatives as part of its investment strategy would be limited to a maximum of 10% of its gross income. The IRS has issued private letter rulings to registered investment companies concluding that income derived from their investment in a wholly-owned subsidiary would constitute Qualifying Income to the fund. The IRS has indicated that the granting of these types of private letter rulings is currently suspended, pending further internal discussion. As a result, there can be no assurance that the IRS will grant, such a private letter ruling to the Fund. If the Fund does not request and receive such a private letter ruling, there is a risk that the IRS could assert that the income derived from the Fund's investment in the Subsidiary will not be considered Qualifying Income for purposes of the fund remaining qualified as a RIC for U.S. federal income tax purposes. If the Fund is unable
28
Credit Suisse Multialternative Strategy Fund
Notes to Consolidated Financial Statements (continued)
October 31, 2014
Note 2. Significant Accounting Policies
to ensure continued qualification as a RIC, the Fund may be required to change its investment objective, policies or techniques, or may be liquidated. If the Fund fails to qualify as a RIC, the Fund will be subject to federal income tax on its net income and capital gains at regular corporate rates (without reduction for distributions to shareholders). If the Fund were to fail to qualify as a RIC and become subject to federal income tax, shareholders of the Fund would be subject to the risk of diminished returns.
The Fund adopted the authoritative guidance for uncertainty in income taxes and recognizes a tax benefit or liability from an uncertain position only if it is more likely than not that the position is sustainable based solely on its technical merits and consideration of the relevant taxing authority's widely understood administrative practices and procedures. The Fund has reviewed its current tax positions and has determined that no provision for income tax is required in the Fund's financial statements. The Fund's federal tax returns for the prior two fiscal years remain subject to examination by the Internal Revenue Service.
F) SHORT-TERM INVESTMENTS — The Fund, together with other funds/portfolios advised by Credit Suisse, an indirect, wholly-owned subsidiary of Credit Suisse Group AG, pools available cash into a short-term variable rate time deposit issued by State Street Bank and Trust Company ("SSB"), the Fund's custodian. The short-term time deposit issued by SSB is a variable rate account classified as a short-term investment.
G) SHORT SALES — The Fund enters into short sales transactions collateralized by cash deposits received from brokers in connection with securities lending activities and securities. The collateral amounts required are determined daily by reference to the market value of the short positions. Short sales expose the Fund to the risk that it will be required to cover its short position at a time when the securities have appreciated in value, thus resulting in a loss to the Fund. The Fund's loss on a short sale could theoretically be unlimited in a case where the Fund is unable, for whatever reason, to close out its short position. Short sales also involve transaction and other costs that will reduce potential gains and increase potential Fund losses. The use by the Fund of short sales in combination with long positions in the Fund in an attempt to improve performance may not be successful and may result in greater losses or lower positive returns than if the Fund held only long positions. It is possible that the Fund's long equity positions will decline in value at the same time that the value of the securities it has sold short increases, thereby increasing potential losses to the Fund. In addition, the Fund's short selling strategies may limit its ability to fully benefit from increases in the equity markets. Short
29
Credit Suisse Multialternative Strategy Fund
Notes to Consolidated Financial Statements (continued)
October 31, 2014
Note 2. Significant Accounting Policies
selling also involves a form of financial leverage that may exaggerate any losses realized by the Fund. Also, there is the risk that the counterparty to a short sale may fail to honor its contractual terms, causing a loss to the Fund. At October 31, 2014, the amount of restricted cash held at brokers was $542,200.
H) FUTURES — The Fund may enter into futures contracts to the extent permitted by its investment policies and objectives. The Fund may use futures contracts to gain exposure to or hedge against changes in interest rates, equity and market price movements and/or currency risks. Upon entering into a futures contract, the Fund is required to deposit cash and/or pledge U.S. Government securities as initial margin. Subsequent payments, which are dependent on the daily fluctuations in the value of the underlying instrument, are made or received by the Fund each day (daily variation margin) and are recorded as unrealized gains or losses until the contracts are closed. When the contracts are closed, the Fund records a realized gain or loss equal to the difference between the proceeds from (or cost of) the closing transactions and the Fund's basis in the contract. Risks of entering into futures contracts for hedging purposes include the possibility that a change in the value of the contract may not correlate with the changes in the value of the underlying instruments. With futures, there is minimal counterparty credit risk to the Fund since futures are exchange traded and the exchange's clearinghouse, as counterparty to all exchange traded futures, guarantees the futures against default. In addition, the purchase of a futures contract involves the risk that the Fund could lose more than the original margin deposit and subsequent payments may be required for a futures transaction. At October 31, 2014, the Fund had no open futures contracts. At October 31, 2014, the amount of restricted cash held at brokers was $24,783.
I) FORWARD FOREIGN CURRENCY CONTRACTS — The Fund may enter into forward foreign currency contracts for the purchase or sale of a specific foreign currency at a fixed price on a future date as a hedge against currency fluctuations. Risks may arise upon entering into these contracts from the potential inability of counterparties to meet the terms of their contracts and from unanticipated movements in the value of a foreign currency. Forward foreign currency contracts are adjusted by the daily forward exchange rate of the underlying currency and any gains or losses are recorded for financial statement purposes as unrealized until the contract settlement date or an offsetting position is entered into. The Fund's open forward foreign currency contracts at October 31, 2014 are disclosed in the consolidated Schedule of Investments.
30
Credit Suisse Multialternative Strategy Fund
Notes to Consolidated Financial Statements (continued)
October 31, 2014
Note 2. Significant Accounting Policies
J) SWAPS — The Fund may enter into swaps either for hedging purposes or to seek to increase total return. A swap contract is an agreement that obligates two parties to exchange a series of cash flows at specified intervals based upon or calculated by reference to changes in specified prices or rates for a specified amount of an underlying asset or notional principal amount. A centrally cleared swap is a transaction executed between the Fund and a counterparty, then cleared by a clearing member through a central clearinghouse. The central clearinghouse serves as the counterparty, with whom the Fund exchanges cash flows. The Fund will enter into swap contracts only on a net basis, which means that the two payment streams are netted out, with the Fund receiving or paying, as the case may be, only the net amount of the two payments. Risks may arise as a result of the failure of the counterparty to the swap contract to comply with the terms of the swap contract. The extent of the Fund's exposure to credit and counterparty risks is the discounted net value of the cash flows to be received from the counterparty over the contract's remaining life, to the extent that the amount is positive. These risks are mitigated by having a master netting arrangement between the Fund and the counterparty and by the posting of collateral by the counterparty to the Fund to cover the Fund's exposure to the counterparty. Therefore, the Fund considers the creditworthiness of each counterparty as well as the amounts posted by the counterparty pursuant to the master netting agreement to a swap contract in evaluating potential credit risk. Additionally, risks may arise from unanticipated movements in interest rates or in the value of the underlying reference asset or index.
The Fund may enter into total return swap contracts, involving commitments to pay interest in exchange for a market-linked return, both based on notional amounts. The Fund may invest in total return swap contracts for hedging purposes or to seek to increase total return. To the extent the total return of the security or index underlying the transactions exceeds or falls short of the offsetting interest rate obligation, the Fund will receive a payment from or make a payment to the counterparty.
The Fund may enter into credit default swap agreements either as a buyer or seller. The Fund may buy a credit default swap to attempt to mitigate the risk of default or credit quality deterioration in one or more individual holdings or in a segment of the fixed income securities market. The Fund may sell a credit default swap in an attempt to gain exposure to an underlying issuer's credit quality characteristics without investing directly in that issuer.
31
Credit Suisse Multialternative Strategy Fund
Notes to Consolidated Financial Statements (continued)
October 31, 2014
Note 2. Significant Accounting Policies
The Fund bears the risk of loss of the amount expected to be received under a credit default swap agreement in the event of the default or bankruptcy of the counterparty. The Fund will enter into swap agreements only with counterparties that meet certain standards of creditworthiness (generally, such counterparties would have to be eligible counterparties under the terms of the Fund's repurchase agreement guidelines). Credit default swap agreements are generally valued at a price at which the counterparty to such agreement would terminate the agreement.
The Fund records unrealized gains or losses on a daily basis representing the value and the current net receivable or payable relating to open swap contracts. Net amounts received or paid on the swap contract are recorded as realized gains or losses. Fluctuations in the value of swap contracts are recorded for financial statement purposes as unrealized appreciation or depreciation on swap contracts. Realized gains and losses from terminated swaps are included in net realized gains/losses on swap contracts transactions. Upon entering into a centrally cleared swap, the Fund is required to deposit with a financial intermediary cash or securities ("initial margin") in an amount equal to a certain percentage of the notional amount of the swap. Subsequent payments ("variation margin") are made or received by the Fund dependent upon the daily fluctuations in the value of the swap. In a cleared swap transaction, counterparty risk is minimized as the central clearinghouse acts as the counterparty. The Fund's open swap contracts at October 31, 2014 are disclosed in the consolidated Schedule of Investments. At October 31, 2014, the amount of restricted cash held at brokers and centrally cleared swaps for the Fund were $260,000 and 34,844, respectively.
K) OPTION CONTRACTS — The Fund will enter into options contracts to gain exposure to risk volatility based assets. When the Fund purchases an option, it pays a premium and the option is subsequently marked to market to reflect current value. Premiums paid for purchasing options which expire are treated as realized losses. Premiums paid for purchasing options which are exercised or closed are added to the cost or deducted from the proceeds on the underlying instrument to determine the realized gain or loss. The risk associated with purchasing options is limited to the premium paid. The Fund did not invest in any purchased options at October 31, 2014.
When the Fund writes an option, an amount equal to the net premium received (the premium less commission) is recorded as a liability and is subsequently adjusted to the current value. Net premiums received for written options which expire are treated as realized gains. Net premiums received for
32
Credit Suisse Multialternative Strategy Fund
Notes to Consolidated Financial Statements (continued)
October 31, 2014
Note 2. Significant Accounting Policies
written options which are exercised or closed are deducted from the cost or added to the proceeds on the underlying instrument or closing purchase transaction to determine the realized gain or loss. The Fund, as writer of a written option, bears the risk of an unfavorable change in the market value of the instrument underlying the written option.
Exchange-traded options have standardized contracts and are settled through a clearing house with fulfillment guaranteed by the credit of the exchange. Therefore, counterparty credit risks to the Fund are limited. Over-the-counter options are subject to the risk that the counterparty is unable or unwilling to meet its obligations under the option. The Fund's exchange traded written options at October 31, 2014 are disclosed in the consolidated Schedule of Investments. At October 31, 2014, the amount of restricted cash held at brokers was $249,542.
For the year ended October 31, 2014, transactions for written options on securities, interest rate swaps and futures were as follows:
| | | Number of Contracts | | Premium
Received | |
Written Options, outstanding as of October 31, 2013 | | | 27 | | | $ | 30,835 | | |
Options written | | | 1,106 | | | | 2,552,662 | | |
Options closed | | | (936 | ) | | | (2,206,660 | ) | |
Options exercised | | | (28 | ) | | | (80,544 | ) | |
Options expired | | | (101 | ) | | | (141,576 | ) | |
Written Options, outstanding as of October 31, 2014 | | | 68 | | | $ | 154,717 | | |
L) SECURITIES LENDING — Loans of securities are required at all times to be secured by collateral at least equal to 102% of the market value of domestic securities on loan (including any accrued interest thereon) and 105% of the market value of foreign securities on loan (including any accrued interest thereon). Cash deposits are shown as collateral for securities on loan on the Consolidated Statement of Assets and Liabilities. Cash collateral received by the Fund in connection with securities lending activity may be pooled together with cash collateral for other funds/portfolios advised by Credit Suisse and may be invested in a variety of investments, including funds advised by SSB, the Fund's securities lending agent or money market instruments. However, in the event of default or bankruptcy by the other party to the agreement, realization and/or retention of the collateral may be subject to legal proceedings. For the year ended October 31, 2014, the fund had no securities on loan.
33
Credit Suisse Multialternative Strategy Fund
Notes to Consolidated Financial Statements (continued)
October 31, 2014
Note 2. Significant Accounting Policies
The Fund's securities lending arrangement provides that the Fund and SSB will share the net income earned from securities lending activities. During the year ended October 31, 2014, total earnings from the Fund's investment in cash collateral received in connection with securities lending arrangements was $1,102, of which $2 was rebated from borrowers (brokers). The Fund retained $935 in income from the cash collateral investment, and SSB, as lending agent, was paid $165. Securities lending income is accrued as earned.
M) OTHER — In the normal course of business the Fund trades financial instruments and enters into financial transactions where risk of potential loss exists due to changes in the market (market risk) or failure of the other party to a transaction to perform (credit risk). Similar to credit risk, the Fund may be exposed to counterparty risk, or the risk that an institution or other entity with which the Fund has unsettled or open transactions will default. The potential loss could exceed the value of the financial assets recorded in the financial statements. Financial assets, which potentially expose the Fund to credit risk, consist principally of cash due from counterparties and investments. The extent of the Fund's exposure to credit and counterparty risks in respect to these financial assets approximates their carrying value as recorded in the Fund's Consolidated Statement of Assets and Liabilities.
N) FOREIGN INVESTMENTS RISK — The Funds may have elements of risk not typically associated with investments in the United States of America due to concentrated investments in a limited number of countries or regions, which may vary throughout the year depending on the Fund. Such concentrations may subject the Funds to additional risks resulting from political or economic conditions in such countries or regions and the possible imposition of adverse governmental laws or currency exchange restrictions could cause the securities and their markets to be less liquid and their prices to be more volatile than those of comparable U.S. securities.
Because these Funds may invest a significant portion of their assets in these markets, they are subject to greater risks of adverse events that occur in those markets and may experience greater volatility than a Fund that is more broadly diversified geographically.
O) NEW ACCOUNTING PRONOUNCEMENTS — In June 2013, the FASB issued Accounting Standards Update (ASU) No. 2013-08, Investment Companies (Topic 946): Amendments to the Scope, Measurement, and Disclosure Requirements. The ASU modifies the criteria used in defining an investment company under GAAP and also sets forth certain measurement
34
Credit Suisse Multialternative Strategy Fund
Notes to Consolidated Financial Statements (continued)
October 31, 2014
Note 2. Significant Accounting Policies
and disclosure requirements. Under the ASU, an entity that is registered under the 1940 Act automatically qualifies as an investment company. The ASU is effective for interim and annual reporting periods beginning after December 15, 2013. Management has reviewed the requirements and believes the adoption of this ASU will not have a material impact on the financial statements.
In June 2014, FASB issued ASU No. 2014-11, Transfers and Servicing (Topic 860), Repurchase-to-Maturity Transactions, Repurchase Financings, and Disclosures. The ASU changes the accounting for certain repurchase agreements and expands disclosure requirements related to repurchase agreements, securities lending, repurchase-to-maturity and similar transactions. The ASU is effective for interim and annual reporting periods beginning after December 15, 2014. Management is currently evaluating the impact, if any, of applying this provision.
P) SUBSEQUENT EVENTS — In preparing the financial statements as of October 31, 2014, management considered the impact of subsequent events for potential recognition or disclosure in these financial statements through the date of release of this report. No such events requiring recognition or disclosure were identified through the date of the release of this report.
Note 3. Transactions with Affiliates and Related Parties
Credit Suisse serves as investment adviser for the Fund. For its investment advisory services, Credit Suisse is entitled to receive a fee from the Fund at an annual rate of 1.15% of the Fund's average daily net assets. For the year ended October 31, 2014, investment advisory fees earned and fees waived/expenses reimbursed were $120,297 and $258,977, respectively. The Fund is authorized to reimburse Credit Suisse for management fees previously limited and/or for expenses previously paid by Credit Suisse, provided, however, that any reimbursements must be paid at a date not more than three years after the end of the fiscal year during which such fees were limited or expenses were reimbursed by Credit Suisse and were limited or expenses are paid. This contract may not be terminated before February 28, 2015. Credit Suisse contractually waives fees and reimburses expenses (excluding Acquired Fund Fees and Expenses, dividend expense related to short sales, interest charges on Fund borrowings, taxes, brokerage commissions, dealer spreads and other transaction charges, expenditures that are capitalized in accordance with GAAP, extraordinary expenses, and any other expenses that may be approved by the governing Board of Trust) so that the Fund's annual operating expenses
35
Credit Suisse Multialternative Strategy Fund
Notes to Consolidated Financial Statements (continued)
October 31, 2014
Note 3. Transactions with Affiliates and Related Parties
will not exceed 1.70% of the Fund's average daily net assets for Class I shares, 1.95% of the Fund's average daily net assets for Class A shares, and 2.70% of the Fund's average daily net assets for Class C shares.
For the period ended October 31, 2014, the amounts waived and reimbursed by the Advisor, as well as the amounts available for recoupment/potential future recoupment by the Advisor and the expiration schedule at Ocbober 31, 2014 are as follows:
| | Fee waivers/
expense
reimbursements
subject to
repayment* | | Expires
October 31,
2015 | | Expires
October 31,
2016 | | Expires
October 31,
2017 | |
Class I | | $ | 763,833 | | | $ | 271,955 | | | $ | 290,327 | | | $ | 201,552 | | |
Class A | | | 32,249 | | | | 8,047 | | | | 15,111 | | | | 9,091 | | |
Class C | | | 160,421 | | | | 26,842 | | | | 95,562 | | | | 38,016 | | |
Totals | | $ | 956,503 | | | $ | 306,844 | | | $ | 401,000 | | | $ | 248,659 | | |
*The Subsidiary is not eligible for recoupment.
Credit Suisse and SSB serve as co-administrators to the Fund. For its co-administrative services, Credit Suisse received a fee calculation at an annual rate of 0.09% of the Fund's average daily net assets. For the year ended October 31, 2014, co-administrative services fees earned by Credit Suisse were $9,415.
For its co-administrative services, SSB receives a fee, exclusive of out-of-pocket expenses, calculated in total for all the Credit Suisse funds/portfolios co-administered by SSB and allocated based upon the relative average net assets of each fund/portfolio, subject to an annual minimum fee. For the year ended October 31, 2014, co-administrative services fees earned by SSB (including out-of-pocket expenses) with respect to the Fund were $7,976.
Credit Suisse Securities (USA) LLC ("CSSU"), an affiliate of Credit Suisse, serves as the distributor of the Fund's shares. Pursuant to distribution plans adopted by the Fund pursuant to Rule 12b-1 under the 1940 Act, CSSU received fees for its distribution services. These fees were calculated at an annual rate of 0.25% of the average daily net assets of the Class A shares. For the Class C shares, the fee is calculated at an annual rate of 1.00% of the average daily net assets. For the year ended October 31, 2014, the Fund paid Rule 12b-1 distribution fees of $956 for Class A shares and $15,965 for Class C shares. Class I shares were not subject to Rule 12b-1 distribution fees.
36
Credit Suisse Multialternative Strategy Fund
Notes to Consolidated Financial Statements (continued)
October 31, 2014
Note 3. Transactions with Affiliates and Related Parties
Certain brokers, dealers and financial representatives provide transfer agent related services to the Fund and receive compensation from the Fund. Some of the fees are paid by Credit Suisse on behalf of the Fund. For the year ended October 31, 2014, the Fund reimbursed Credit Suisse $11,638, which is included in the Fund's transfer agent expense.
For the year ended October 31, 2014, CSSU and its affiliates advised the Fund that they retained $31 from commissions earned on the sale of the Fund's Class A shares. There were no commissions earned on sale of Class C shares.
Merrill Corporation ("Merrill"), formerly an affiliate of Credit Suisse, has been engaged by the Fund to provide certain financial printing services. For the year ended October 31, 2014, Merrill was paid $31,961 for its services by the Fund. This amount was included in the printing fees presented on the Consolidated Statement of Operations. Effective July 23, 2014, Merrill was no longer considered an affiliate.
Affiliated Issuers — The Fund may invest in Underlying Credit Suisse Funds. The Underlying Credit Suisse Funds in which the Fund invests are considered to be affiliated investments. The Fund invested 7% of the Fund's net assets in affiliated issuers. Investments in affiliated funds are valued at the affiliated fund's net asset value per share ("NAV") as of the report date. A summary of the Fund's transactions with an affiliated Underlying Credit Suisse Fund during the year ended October 31, 2014 is as follows:
| Issuer | | Value
of Affiliate
at 10/31/2013 | | Purchases | | Sales | | Gain (loss) | | Net
realized gain
distribution | | Value
of Affiliate
at 10/31/2014 | |
Credit Suisse Managed
Futures Strategy Fund | | $ | 1,013,974 | | | $ | 1,051,371 | | | $ | 1,195,300 | | | $ | 26,575 | | | $ | 27,371 | | | $ | 950,381 | | |
Note 4. Line of Credit
The Fund, together with other funds/portfolios advised by Credit Suisse (collectively, the "Participating Funds"), participates in a committed, unsecured line of credit facility ("Credit Facility"), in an aggregated amount of $200 million for temporary or emergency purposes with SSB under a first come first serve basis. Under the terms of the Credit Facility, the Participating Funds pay an aggregate commitment fee on the average unused amount of the Credit Facility, which is allocated among the Participating Funds in such manner as is determined by the governing Boards of the Participating Funds. In addition, the Participating Funds pay interest on borrowings at either the Overnight Federal Funds rate or the Overnight LIBOR rate plus a spread. At October 31,
37
Credit Suisse Multialternative Strategy Fund
Notes to Consolidated Financial Statements (continued)
October 31, 2014
2014 and during the year ended October 31, 2014, the Fund had no borrowings outstanding under the Credit Facility.
Note 5. Purchases and Sales of Securities
For the year ended October 31, 2014, purchases and sales of investment securities (excluding short-term investments) and U.S. Government and Agency Obligations were as follows:
Investment Securities | |
| Purchases | | Sales | |
| $ | 12,051,349 | | | $ | 7,616,373 | | |
Securities sold short and purchases to cover securities sold short were as follows:
Investment Securities | |
| Purchases to Cover | | Securities Sold Short | |
| $ | 2,330,121 | | | $ | 2,306,469 | | |
Note 6. Capital Share Transactions
The Fund is authorized to issue an unlimited number of full and fractional shares of beneficial interest, $.001 par value per share. The Fund offers Class I, Class A and Class C shares. Transactions in capital shares for each class of the Fund were as follows:
| | | Class I | |
| | | For the Year Ended
October 31, 2014 | | For the Year Ended
October 31, 2013 | |
| | | Shares | | Value | | Shares | | Value | |
Shares sold | | | 577,382 | | | $ | 5,956,752 | | | | 19,951 | | | $ | 210,698 | | |
Shares issued in reinvestment of dividends
and distributions | | | 16,674 | | | | 168,910 | | | | 3,170 | | | | 31,699 | | |
Shares redeemed | | | (11,539 | ) | | | (119,905 | ) | | | — | | | | — | | |
Net increase | | | 582,517 | | | $ | 6,005,757 | | | | 23,121 | | | $ | 242,397 | | |
38
Credit Suisse Multialternative Strategy Fund
Notes to Consolidated Financial Statements (continued)
October 31, 2014
Note 6. Capital Share Transactions
| | | Class A | |
| | | For the Year Ended
October 31, 2014 | | For the Year Ended
October 31, 2013 | |
| | | Shares | | Value | | Shares | | Value | |
Shares sold | | | 23,801 | | | $ | 244,841 | | | | 15,142 | | | $ | 154,575 | | |
Shares issued in reinvestment of dividends
and distributions | | | 896 | | | | 9,044 | | | | 123 | | | | 1,226 | | |
Shares redeemed | | | (13,458 | ) | | | (139,274 | ) | | | (7,231 | ) | | | (73,284 | ) | |
Net increase | | | 11,239 | | | $ | 114,611 | | | | 8,034 | | | $ | 82,517 | | |
| | | Class C | |
| | | For the Year Ended
October 31, 2014 | | For the Year Ended
October 31, 2013 | |
| | | Shares | | Value | | Shares | | Value | |
Shares sold | | | 5,639 | | | $ | 57,656 | | | | 91,378 | | | $ | 918,382 | | |
Shares issued in reinvestment of dividends
and distributions | | | 5,446 | | | | 54,515 | | | | 114 | | | | 1,133 | | |
Shares redeemed | | | (47,716 | ) | | | (487,750 | ) | | | (31,887 | ) | | | (324,221 | ) | |
Net increase (decrease) | | | (36,631 | ) | | $ | (375,579 | ) | | | 59,605 | | | $ | 595,294 | | |
Prior to February 1, 2014, the Fund imposed a redemption fee of 2% of the value of shares that were redeemed or exchanged within 30 days from the date of purchase. For the years ended October 31, 2014 and 2013, the Fund did not receive any redemption fees. On February 1, 2014, the Fund eliminated the redemption fee.
On October 31, 2014, the number of shareholders that held 5% or more of the outstanding shares of each class of the Fund was as follows:
| | | Number of
Shareholders | | Approximate Percentage
of Outstanding Shares | |
Class I | | | 3 | * | | | 83 | % | |
Class A | | | 4 | * | | | 98 | % | |
Class C | | | 1 | | | | 93 | % | |
*This includes the seed money from Merchant Holdings, Inc., an affiliate of Credit Suisse.
Some of the shareholders may be omnibus accounts, which hold shares on behalf of individual shareholders.
Note 7. Federal Income Taxes
Income and capital gain distributions are determined in accordance with federal income tax regulations, which may differ from GAAP.
39
Credit Suisse Multialternative Strategy Fund
Notes to Consolidated Financial Statements (continued)
October 31, 2014
Note 7. Federal Income Taxes
The tax characteristics of dividends paid during the years ended October 31, 2014 and 2013, respectively, by the Fund were as follows:
| Ordinary Income | | Long-Term Capital Gain | |
| 2014 | | 2013 | | 2014 | | 2013 | |
| $ | 162,523 | | | $ | 32,710 | | | $ | 69,946 | | | $ | 1,348 | | |
The tax basis components of distributable earnings differ from the amounts reflected in the Consolidated Statement of Assets and Liabilities by temporary book/tax differences. These differences are primarily due to differing treatments of wash sales, forward contracts marked to market, options contracts marked to market, total return swaps marked to market, amortization of upfront payment for credit default swaps and deferred organizational expenses. At October 31, 2014, the components of distributable earnings on a tax basis were as follows:
Undistributed net investment income | | $ | 259,250 | | |
Undistributed capital gain | | | 78,835 | | |
Unrealized appreciation | | | 30,171 | | |
| | $ | 368,256 | | |
Under the Regulated Investment Company Modernization Act of 2010, the Fund will be permitted to carry forward capital losses incurred in taxable years beginning after December 22, 2010 for an unlimited period. However, any losses incurred during those future taxable years will be required to be utilized prior to the losses incurred in pre-enactment taxable years. As a result of this ordering rule, pre-enactment capital loss carryforwards may be more likely to expire unused. Additionally, post-enactment capital losses that are carried forward will retain their character as either short-term or long-term capital losses rather than being considered all short-term as under previous law. It is uncertain whether the Fund will be able to realize the full benefits of the capital loss carryforwards before they expire. The Fund has no pre-enactment capital loss carryforwards.
At October 31, 2014, the cost of investments (excluding foreign currency related transactions) and net unrealized appreciation (depreciation) for income tax purposes were as follows:
Cost of Investments | | $ | 13,320,960 | | |
Unrealized appreciation | | $ | 151,834 | | |
Unrealized depreciation | | | (53,130 | ) | |
Net unrealized appreciation (depreciation) | | $ | 98,704 | | |
40
Credit Suisse Multialternative Strategy Fund
Notes to Consolidated Financial Statements (continued)
October 31, 2014
Note 7. Federal Income Taxes
At October 31, 2014, the proceeds from securities sold short (excluding foreign currency related transactions) and net unrealized appreciation (depreciation) for income tax purposes were as follows:
Proceeds from investments | | $ | 1,059,147 | | |
Unrealized appreciation | | $ | 30,856 | | |
Unrealized depreciation | | | (50,125 | ) | |
Net unrealized appreciation (depreciation) | | $ | (19,269 | ) | |
At October 31, 2014, the Fund reclassified $328,874 from accumulated net investment loss and $328,874 from accumulated net realized gain to paid in capital, to adjust for current period permanent book/tax differences which arose principally from differing book/tax treatment of foreign currency gain (loss), swap gain (loss) re-classed to income, credit default swaps upfront payment sold and distribution re-designations. Net assets were not affected by these reclassifications.
Note 8. Contingencies
In the normal course of business, the Fund may provide general indemnifications pursuant to certain contracts and organizational documents. The Fund's maximum exposure under these arrangements is dependent on future claims that may be made against the Fund and, therefore, cannot be estimated; however, based on experience, the risk of loss from such claims is considered remote.
Note 9. Other Matters
On May 19, 2014, the U.S. Department of Justice (the "Department of Justice") filed a one-count criminal information (the "Information") in the District Court for the Eastern District of Virginia charging Credit Suisse AG ("CSAG") with conspiracy to commit tax fraud related to accounts CSAG established for cross-border clients. The Department of Justice and CSAG entered into a plea agreement (the "Plea Agreement") settling the action pursuant to which CSAG pleaded guilty to the charge set out in the Information.
The Plea Agreement requires CSAG to pay over $1.8 billion to the U.S. government, including the U.S. Internal Revenue Service. The Plea Agreement
41
Credit Suisse Multialternative Strategy Fund
Notes to Consolidated Financial Statements (continued)
October 31, 2014
also requires CSAG to lawfully undertake certain remedial actions to address the conduct described in the Plea Agreement.
CSAG has entered into other settlements relating to the conduct set out in the Plea Agreement. CSAG has entered into a Consent Order with the Federal Reserve Board (the "Federal Reserve") to resolve certain findings by the Federal Reserve, including that the activities of CSAG regarding opening of foreign accounts for U.S. taxpayers, provision of investment services to U.S. clients, and operation of CSAG's New York representative office prior to 2009 lacked adequate enterprise-wide risk management and compliance policies and procedures sufficient to ensure that all of its activities comply with U.S. laws and regulations. In addition, CSAG has entered into a Consent Order with the New York State Department of Financial Services (the "DFS") to resolve the DFS's investigation into the conduct described in the Plea Agreement. The settlement with the Federal Reserve requires CSAG to pay $100 million to the Federal Reserve, and the settlement with the DFS requires CSAG to pay $715 million to the DFS.
These settlements follow a settlement by Credit Suisse Group AG ("CS Group"), the parent company of CSAG, with the Securities and Exchange Commission (the "Commission") on February 21, 2014 to resolve an investigation by the Commission into solicitation and provision of broker-dealer and investment advisory services to certain U.S. cross-border clients by CS Group while not registered with the Commission as a broker-dealer or investment adviser. As part of the settlement, CS Group retained an independent consultant to evaluate its policies and procedures and examine its broker-dealer and investment adviser activities to fully verify that the business that was the subject of the Commission investigation has been completely exited. CS Group also agreed to pay $196,511,014, which includes $82,170,990 in disgorgement, $64,340,024 in interest and a $50,000,000 penalty.
CSAG is the indirect parent company of Credit Suisse and CSSU. Neither Credit Suisse, CSSU nor the Fund was named in the Plea Agreement (as defined below) or other settlements relating to the conduct set out in the Plea Agreement. The conduct set out in the Plea Agreement did not involve the Fund, Credit Suisse or CSSU with respect to its investment adviser and distribution activities relating to the Fund.
Credit Suisse, CSSU and certain of their affiliates have received a permanent exemptive order from the Commission to permit them to continue serving as investment advisers and principal underwriters for U.S.-registered investment
42
Credit Suisse Multialternative Strategy Fund
Notes to Consolidated Financial Statements (continued)
October 31, 2014
companies, such as the Fund. Due to a provision in the law governing the operation of U.S.-registered investment companies, they would otherwise have become ineligible to perform these activities as a result of the plea in the Plea Agreement. The permanent exemptive order permits Credit Suisse and CSSU to continue to provide services to the Fund, so long as, among other things, no current or former employee of CSAG or any affiliate of CSAG who previously has been or who subsequently may be identified by CSAG or any U.S. or non-U.S. regulatory or enforcement agencies as having been responsible for the conduct described in the Plea Agreement will be employed by Credit Suisse and certain of its affiliates. Credit Suisse and CSSU have informed the Fund that, Credit Suisse and CSSU believe the Settlements will not have any material impact on the Fund or on the ability of Credit Suisse or CSSU to perform services for the Fund.
On November 21, 2014, at the sentencing hearing, the court accepted and implemented the sentence as set out in the plea agreement. The court imposed no additional conditions beyond those contained in the agreement.
43
Credit Suisse Multialternative Strategy Fund
Report of Independent Registered Public Accounting Firm
To the Board of Trustees and the Shareholders of
Credit Suisse Multialternative Strategy Fund:
In our opinion, the accompanying consolidated statement of assets and liabilities, including the consolidated schedule of investments, and the related consolidated statements of operations and of changes in net assets and the financial highlights present fairly, in all material respects, the financial position of Credit Suisse Multialternative Strategy Fund (a separate fund of Credit Suisse Opportunity Funds)(the "Fund") at October 31, 2014, the results of its operations for the year then ended, the changes in its net assets for each of the two years in the period then ended and the financial highlights for each of the periods presented, in conformity with accounting principles generally accepted in the United States of America. These financial statements and financial highlights (hereafter referred to as "financial statements") are the responsibility of the Fund's management. Our responsibility is to express an opinion on these financial statements based on our audits. We conducted our audits of these financial statements in accordance with the standards of the Public Company Accounting Oversight Board (United States). Those standards require that we plan and perform the audit to obtain reasonable assurance about whether the financial statements are free of material misstatement. An audit includes examining, on a test basis, evidence supporting the amounts and disclosures in the financial statements, assessing the accounting principles used and significant estimates made by management, and evaluating the overall financial statement presentation. We believe that our audits, which included confirmation of securities at October 31, 2014 by correspondence with the transfer agent, custodian and brokers, provide a reasonable basis for our opinion.
PricewaterhouseCoopers LLP
New York, New York
December 29, 2014
44
Credit Suisse Multialternative Strategy Fund
Information Concerning Trustees and Officers (unaudited)
Name, Address
(Year of Birth) | | Position(s)
Held with
Fund | | Term
of Office1
and
Length
of Time
Served | | Principal
Occupation(s) During
Past Five Years | | Number of
Portfolios
in Fund
Complex
Overseen
by Trustee | | Other
Trusteeships
Held by Trustee | |
Independent Trustees | | | | | | | | | | | |
Enrique Arzac
c/o Credit Suisse Asset
Management, LLC
Attn: General Counsel
One Madison Avenue
New York, New York
10010
(1941) | | Trustee, Audit Committee Chairman and Nominating Committee Member | | Since Fund Inception | | Professor of Finance and Economics, Graduate School of Business, Columbia University since 1971. | | | 12 | | | Director of The Adams Express Company, Petroleum and Resources Corporation, Aberdeen Chile Fund, Inc., Aberdeen Emerging Markets Smaller Company Opportunities Fund, Inc., Aberdeen Israel Fund, Inc., Aberdeen Indonesia Fund, Inc. and Aberdeen Latin America Equity Fund, Inc. (each a closed-end investment company); Director of Aberdeen Asia-Pacific Income Investment Company Limited (a Canadian closed-end fund); Trustee of Mirae Asset Discovery Funds (6 open-end portfolios); Director of Starcomms PLC. (telecommunications company) from 2008 to 2011; Director of Epoch Holding Corporation (an investment management and investment advisory services company) from 2006 to March 2013. | |
45
Credit Suisse Multialternative Strategy Fund
Information Concerning Trustees and Officers (unaudited) (continued)
Name, Address
(Year of Birth) | | Position(s)
Held with
Fund | | Term
of Office1
and
Length
of Time
Served | | Principal
Occupation(s) During
Past Five Years | | Number of
Portfolios
in Fund
Complex
Overseen
by Trustee | | Other
Trusteeships
Held by Trustee | |
Independent Trustees | | | | | | | | | | | |
Jeffrey E. Garten
c/o Credit Suisse Asset
Management, LLC
Attn: General Counsel
One Madison Avenue
New York, New York
10010
(1946) | | Trustee, Audit and Nominating Committee Member | | Since Fund Inception | | The Juan Trippe Professor in the Practice of International Trade, Finance and Business, Yale School of Management, from July 2005 to present; Partner and Chairman of Garten Rothkopf (consulting firm) from October 2005 to present. | | | 10 | | | Director of Aetna, Inc. (insurance company); Director of CarMax Group (used car dealers); Director of Alcan (aluminum production) from February 2007 to November 2007; Member of Standard & Poor's Board of Managers (credit rating agency) from December 2011 to November 2014; Director of Miller Buckfire & Co., LLC (financial restructuring). | |
46
Credit Suisse Multialternative Strategy Fund
Information Concerning Trustees and Officers (unaudited) (continued)
Name, Address
(Year of Birth) | | Position(s)
Held with
Fund | | Term
of Office1
and
Length
of Time
Served | | Principal
Occupation(s) During
Past Five Years | | Number of
Portfolios
in Fund
Complex
Overseen
by Trustee | | Other
Trusteeships
Held by Trustee | |
Independent Trustees | | | | | | | | | | | |
Steven N. Rappaport
Lehigh Court, LLC
555 Madison Avenue
29th Floor
New York, New York
10022
(1948) | | Chairman of the Board of Trustees, Audit Committee Member and Nominating Committee Chairman | | Since Fund Inception | | Partner of Lehigh Court, LLC and RZ Capital (private investment firms) from July 2002 to present. | | | 12 | | | Director of iCAD, Inc. (surgical and medical instruments and apparatus company); Director of Aberdeen Chile Fund, Inc., Aberdeen Emerging Markets Smaller Company Opportunities Fund, Inc., Aberdeen Israel Fund, Inc., Aberdeen Indonesia Fund, Inc. and Aberdeen Latin America Equity Fund, Inc. (each a closed-end investment company); Director of Presstek, Inc. (digital imaging technologies company) from 2003 to 2012; Director of Wood Resources, LLC. (plywood manufacturing company) from 2003 to October 2013; Partner Backstage Acquisition Holding, LLC (Publication Job Postings) from November 2013 to present. | |
1 Each Trustee and Officer serves until his or her respective successor has been duly elected and qualified.
47
Credit Suisse Multialternative Strategy Fund
Information Concerning Trustees and Officers (unaudited) (continued)
Name, Address
(Year of Birth) | | Position(s)
Held with
Fund | | Term of
Office1
and
Length of
Time
Served | | PrincipalOccupation(s) During Past Five Years | |
Officers* | | | | | | | |
John G. Popp
Credit Suisse Asset
Management, LLC
One Madison Avenue
New York, New York 10010
(1956) | | Chief Executive Officer and President | | Since Fund Inception | | Managing Director of Credit Suisse; Global Head and Chief Investment Officer of the Credit Investment Group; Associated with Credit Suisse or its predecessor since 1997; Officer of other Credit Suisse Funds; Trustee of Credit Suisse High Yield Bond Fund; Director of Credit Suisse Asset Management Income Fund, Inc. | |
Bruce Rosenberg
Credit Suisse Asset
Management, LLC
One Madison Avenue
New York, New York 10010
(1961) | | Chief Financial Officer | | Since 2012 | | Director of Credit Suisse; Director of Liquid Accounting of Credit Suisse; Associated with Credit Suisse since 2008; Officer of other Credit Suisse Funds. | |
Emidio Morizio
Credit Suisse Asset
Management, LLC
One Madison Avenue
New York, New York 10010
(1966) | | Chief Compliance Officer | | Since Fund Inception | | Managing Director and Global Head of Compliance of Credit Suisse since 2010; Director and Global Head of Compliance of Credit Suisse from January 2005 to December 2009; Associated with Credit Suisse since July 2000; Officer of other Credit Suisse Funds. | |
Joanne Doldo
Credit Suisse Asset
Management, LLC
One Madison Avenue
New York, New York 10010
(1959) | | Chief Legal Officer | | Since 2013 | | Vice President of Credit Suisse; Associated with Credit Suisse since September 2011; Officer of other Credit Suisse Funds; Associated with Morgan Stanley Investment Management from 2002-2008. | |
Rocco DelGuercio
Credit Suisse Asset
Management, LLC
One Madison Avenue
New York, New York 10010
(1963) | | Treasurer | | Since 2013 | | Vice President of Credit Suisse since 2013; Independent Consultant from February 2012 to April 2013; Director of Legg Mason & Co., LLC from March 2004 to January 2012; Associated with Credit Suisse from June 1996 to March 2004; Officer of other Credit Suisse Funds. | |
Karen Regan
Credit Suisse Asset
Management, LLC
One Madison Avenue
New York, New York 10010
(1963) | | Senior Vice President and Secretary | | Since Fund Inception | | Vice President of Credit Suisse; Associated with Credit Suisse since December 2004; Officer of other Credit Suisse Funds. | |
* The officers of the Fund shown are officers that make policy decisions.
The Statement of Additional Information includes additional information about the Trustees and is available, without charge, upon request, by calling 877-870-2874.
48
Credit Suisse Multialternative Strategy Fund
Proxy Voting and Portfolio Holdings Information (unaudited)
Information regarding how the Fund voted proxies related to its portfolio securities during the 12 month period ended June 30 of each year, as well as the policies and procedures that the Fund uses to determine how to vote proxies relating to its portfolio securities are available:
• By calling 1-877-870-2874
• On the Fund's website, www.credit-suisse.com/us/funds
• On the website of the Securities and Exchange Commission, www.sec.gov.
The Fund files a complete schedule of its portfolio holdings for the first and third quarters of its fiscal year with the SEC on Form N-Q. The Fund's Forms N-Q are available on the SEC's website at www.sec.gov and may be reviewed and copied at the SEC's Public Reference Room in Washington, DC. Information on the operation of the SEC's Public Reference Room may be obtained by calling 1-202-551-8090.
49

P.O. BOX 55030, BOSTON, MA 02205-5030
877-870-2874 n www.credit-suisse.com/us/funds
CREDIT SUISSE SECURITIES (USA) LLC, DISTRIBUTOR. MSF-AR-1014

CREDIT SUISSE FUNDS
Annual Report
October 31, 2014
n CREDIT SUISSE
EMERGING MARKETS EQUITY
FUND
The Fund's investment objectives, risks, charges and expenses (which should be considered carefully before investing), and more complete information about the Fund, are provided in the Prospectus, which should be read carefully before investing. You may obtain additional copies by calling 877-870-2874 or by writing to Credit Suisse Funds, P.O. Box 55030, Boston, MA 02205-5030.
Credit Suisse Securities (USA) LLC, Distributor, is located at One Madison Avenue, New York, NY 10010. Credit Suisse Funds are advised by Credit Suisse Asset Management, LLC.
Investors in the Credit Suisse Funds should be aware that they may be eligible to purchase Class I shares (where offered) directly or through certain intermediaries. Such shares are not subject to a sales charge. Investors in the Credit Suisse Funds should also be aware that they may be eligible for a reduction or waiver of the sales charge with respect to Class A or C shares (where offered). For more information, please review the relevant prospectuses or consult your financial representative.
Fund shares are not deposits or other obligations of Credit Suisse Asset Management, LLC ("Credit Suisse") or any affiliate, are not FDIC-insured and are not guaranteed by Credit Suisse or any affiliate. Fund investments are subject to investment risks, including loss of your investment.
Credit Suisse Emerging Markets Equity Fund
Annual Investment Adviser's Report
October 31, 2014 (unaudited)
December 22, 2014
Dear Shareholder:
We are pleased to present this Annual Report covering the activities of the Credit Suisse Emerging Markets Equity Fund (the "Fund"), for the period from the Fund's inception on December 26, 2013 to October 31, 2014.
Performance Summary
12/26/13 – 10/31/14
Fund & Benchmark | | Performance | |
| Class I1 | | | 3.60 | % | |
| Class A1,2 | | | 3.40 | % | |
| Class C1,2 | | | 2.80 | % | |
| MSCI Emerging Markets USD Index NR3 | | | 4.63 | % | |
Performance shown for the Fund's Class A and Class C Shares does not reflect sales charges, which are a maximum of 5.25% and 1.00%, respectively.2
Market Review: A bumpy ride with a positive ending
The since inception period ended October 31, 2014 was a challenging one for emerging markets. The MSCI Emerging Markets Index "MSCI EM", the Fund's benchmark, was up 4.63% for the period.
Emerging market equities provided a bumpy ride for the start of 2014, ultimately finishing the first quarter down 0.43%. The Fund performed slightly ahead of the market, finishing down 0.20% for the quarter. The emerging markets were afflicted with a number of shocks during the first quarter. No sooner than interest rate hikes in the more fragile markets such as India, Turkey and Brazil had stabilized weak currencies, then Argentina devalued the peso by roughly 20%. This led to panic among investors that started an orderly but persistent wave of selling within the asset class. Subsequently, tensions in the Ukraine reached a boil as the President left the country and Russian troops entered Crimea, placing severe pressure on any equity that had Russian exposure, with the index there down close to 25% in mid-March.
During the second quarter, the MSCI EM gained 6.6%, outperforming developed markets, despite a military coup in Thailand and renewed violence in Iraq. India rallied more than 13% in response to the new leadership of Modi and several Indian positions contributed positively to Fund performance. Russia was the next best market performer, gaining over 10% — a rebound from the depths of fear in the first quarter. Some subsequently ill-timed selling in the Russian Growth and Financials stages detracted from performance as
1
Credit Suisse Emerging Markets Equity Fund
Annual Investment Adviser's Report (continued)
October 31, 2014 (unaudited)
momentum trends began to falter. More broadly, large caps outperformed small caps, and the Growth stage re-established its leadership. Amidst the initial euphoria, the opportunity to gain from a stock selection strategy was difficult, and the Fund trailed in the early May rally. As June matured, the Fund gained some traction and finished the quarter up 5.88% — 71 basis points behind the market.
The market's strong second quarter absolute returns continued through the end of August as improved Chinese industrial production and rising U.S. employment data bolstered investors' spirits. Toward the end of August, however, markets became angst ridden with renewed fears regarding the U.S. Fed's "tapering" and unexpected election polls in Brazil. The Brazilian incumbent candidate, Dilma Rousseff, had polled behind the more market friendly competitors. As polls began tilting back in her favor in September, the market dropped 19%. Further, although "tapering" fears are not new, many of the "fragile five" countries that were punished a year ago on tapering fears have made good progress shoring up their external accounts for the inevitable tighter liquidity scenarios to come. The panicked selling of September brought the benchmark to a 3.49% loss for the third quarter, with the Fund trailing by 56bps.
In October, the markets regained some stability although the feared outcome of a second term for Rousseff became reality. The MSCI EM rallied, gaining 1.18%, and the Fund gained back a portion of the underperformance from September, gaining 1.77%, 59 bps ahead of the market. Year to date, the MSCI EM has gained 3.63%, while the Fund has risen 3.18%.
Strategic Review and Outlook: Optimistic for outperformance going forward
During Q1, the performance of the Fund was influenced by several sub-currents. The Growth stage was the largest negative contributor during the quarter and appeared to be related to investors selling their strongest performers in the face of continued redemptions. The top positive contributor was the Cash Cow stage, whose stronger performers were mostly mid-sized companies, ranging from solar panel manufacturers in China, to Korean media players and South African retailers.
In the second quarter, the Fund began to benefit from valuation as the dominant alpha theme and positive stock selection in the mature Industrial Life Cycle (ILC) stages. Additionally, the inversion in momentum that took place at the end of the first quarter waned, causing a slightly higher than normal level of trading in the Growth stage. This led to trades out of areas
2
Credit Suisse Emerging Markets Equity Fund
Annual Investment Adviser's Report (continued)
October 31, 2014 (unaudited)
including Korean online games and South African drugs, while we traded into Asian factory automation and Korean cosmetics.
July and August saw strong relative returns driven by stock selection in most ILC stages, although Growth was the highlight. Price momentum and valuation reversed in the third quarter, resulting in price trends that drove Growth stage performance in Korean cosmetics and furniture names. The portfolio's Restructuring stage suffered in September when valuation as a factor faltered and stocks tied to Brazilian economic growth declined as Rousseff gained in the polls. This led to negative selection and caused the overall underperformance of the Fund in Q3.
In October, although Brazil gained only 0.52% as a market, the Brazil stocks in the Fund started to trade more in line with expectations, delivering more than 400bps of relative outperformance. Aside from the tailwinds of a rationalized Brazilian market, the Fund's overall performance was aided by several later stage telecom and construction stocks in Turkey. This offers a good example of what we would expect from the portfolio during fundamentally driven environments — diversified outperformance from stock selection.
At the end of Q3, the Fund's top country exposures were China/Hong Kong, Taiwan and Brazil, while the top sector exposures were financials, information technology, and consumer discretionary.
We believe fears will subside and much of the disorder dealt during Q3 will correct itself. 2014 has been an important year in Emerging Markets where over a billion people have voted across the globe in emerging markets countries. India and Brazil are the shining examples of opposite outcomes of exuberance and pessimism this year. There is now an interesting mix of new and old leadership looking to take these countries into the next cycle of development. As witnessed in October, with a gradual recovery in the developed world underway, hopefully the path has been set for an environment where our ILC stock selection will deliver more consistent outperformance.
Global Equity Investment Group
Alfred S. Bryant
Foreign investments involve significant risks including risk of loss of principal, currency risk, derivatives risk, emerging markets risk, equity exposure risk, foreign securities risk, information risk, political risk, access risk, operational risk, liquidity
3
Credit Suisse Emerging Markets Equity Fund
Annual Investment Adviser's Report (continued)
October 31, 2014 (unaudited)
risk, manager risk, market risk, and small- and mid-cap stock risk. For a detailed discussion of these and other risks, please refer to the Fund's Prospectus, which should be read carefully before investing.
In addition to historical information, this report contains forward-looking statements, which may concern, among other things, domestic and foreign market, industry and economic trends and developments and government regulation and their potential impact on the Fund's investments. These statements are subject to risks and uncertainties and actual trends, developments and regulations in the future, and their impact on the Fund could be materially different from those projected, anticipated or implied. The Fund has no obligation to update or revise forward-looking statements.
The views of the Fund's management are as of the date of the letter and the Fund holdings described in this document are as of October 31, 2014; these views and Fund holdings may have changed subsequent to these dates. Nothing in this document is a recommendation to purchase or sell securities.
4
Credit Suisse Emerging Markets Equity Fund
Annual Investment Adviser's Report (continued)
October 31, 2014 (unaudited)
Comparison of Change in Value of $10,000 Investment in the
Credit Suisse Emerging Markets Equity Fund1 Class I Shares, Class A Shares2, Class C Shares2 and MSCI Emerging Markets USD Index NR3 from Inception (12/26/13).

1 Fee waivers and/or expense reimbursements may reduce expenses for the Fund, without which performance would be lower. The Fund has entered into a written contract to limit expenses to 1.25% of the Fund's average daily net assets for Class I shares, 1.50% of the Fund's average daily net assets for Class A shares and 2.25% of the Fund's average daily net assets for Class C shares through at least February 28, 2015.
2 Total return for the Fund's Class A shares for the reporting period, based on offering price (including maximum sales charge of 5.25%), was (1.99)%. Total return for the Fund's Class C shares for the reporting period, based on redemption value (including maximum contingent deferred sales charge of 1.00%), was 1.80%.
3 Morgan Stanley Capital International (MSCI) Emerging Markets USD Index NR.
5
Credit Suisse Emerging Markets Equity Fund
Annual Investment Adviser's Report (continued)
October 31, 2014 (unaudited)
Average Annual Returns as of October 31, 20141
| | | Since
Inception2 | |
Class I | | | 3.60 | % | |
Class A Without Sales Charge | | | 3.40 | % | |
Class A With Maximum Sales Charge | | | (1.99 | )% | |
Class C Without CDSC | | | 2.80 | % | |
Class C With CDSC | | | 1.80 | % | |
Returns represent past performance and include change in share price and reinvestment of dividends and capital gains. Past performance cannot guarantee future results. The current performance of the Fund may be lower or higher than the figures shown. Returns and share price will fluctuate, and redemption value may be more or less than original cost. The performance results do not reflect the deduction of taxes that a shareholder would pay on fund distributions or the redemption of fund shares. Performance information current to the most recent month-end is available at www.credit-suisse.com/us/funds.
The annualized gross expense ratios are 2.63% for Class I shares, 2.88% for Class A shares and 3.63% for Class C shares. The annualized net expense ratios after fee waivers and/or expense reimbursements are 1.25% for Class I shares, 1.50% for Class A shares and 2.25% for Class C shares.
1 Fee waivers and/or expense reimbursements may reduce expenses for the Fund, without which performance would be lower. The Fund has entered into a written contract to limit expenses to 1.25% of the Fund's average daily net assets for Class I shares, 1.50% of the Fund's average daily net assets for Class A shares and 2.25% of the Fund's average daily net assets for Class C shares through at least February 28, 2015.
2 Inception Date December 26, 2013.
6
Credit Suisse Emerging Markets Equity Fund
Annual Investment Adviser's Report (continued)
October 31, 2014 (unaudited)
Information About Your Fund's Expenses
As an investor of the Fund, you incur two types of costs: ongoing expenses and transaction costs. Ongoing expenses include management fees, distribution and service (12b-1) fees and other Fund expenses. Examples of transaction costs include sales charges (loads), redemption fees and account maintenance fees, which are not shown in this section and which would result in higher total expenses. The following table is intended to help you understand your ongoing expenses of investing in the Fund and to help you compare these expenses with the ongoing expenses of investing in other mutual funds. The table is based on an investment of $1,000 made at the beginning of the six-months ended October 31, 2014.
The table illustrates your Fund's expenses in two ways:
• Actual Fund Return. This helps you estimate the actual dollar amount of ongoing expenses paid on a $1,000 investment in the Fund using the Fund's actual return during the period. To estimate the expenses you paid over the period, simply divide your account value by $1,000 (for example, an $8,600 account value divided by $1,000 = 8.6), then multiply the result by the number in the "Expenses Paid per $1,000" line under the share class you hold.
• Hypothetical 5% Fund Return. This helps you to compare your Fund's ongoing expenses with those of other mutual funds using the Fund's actual expense ratio and a hypothetical rate of return of 5% per year before expenses. Examples using a 5% hypothetical fund return may be found in the shareholder reports of other mutual funds. The hypothetical account values and expenses may not be used to estimate the actual ending account balance or expenses you paid for the period.
Please note that the expenses shown in these tables are meant to highlight your ongoing expenses only and do not reflect any transaction costs, such as sales charges (loads) or redemption fees. If these transaction costs had been included, your costs would have been higher. The "Expenses Paid per $1,000" line of the tables is useful in comparing ongoing expenses only and will not help you determine the relative total expenses of owning different funds.
7
Credit Suisse Emerging Markets Equity Fund
Annual Investment Adviser's Report (continued)
October 31, 2014 (unaudited)
Expenses and Value for a $1,000 Investment
for the six month period ended October 31, 2014
Actual Fund Return | | Class I | | Class A | | Class C | |
Beginning Account Value 05/01/14 | | $ | 1,000.00 | | | $ | 1,000.00 | | | $ | 1,000.00 | | |
Ending Account Value 10/31/14 | | $ | 1,036.00 | | | $ | 1,033.00 | | | $ | 1,030.10 | | |
Expenses Paid per $1,000* | | $ | 6.41 | | | $ | 7.69 | | | $ | 11.51 | | |
Hypothetical 5% Fund Return | |
Beginning Account Value 05/01/14 | | $ | 1,000.00 | | | $ | 1,000.00 | | | $ | 1,000.00 | | |
Ending Account Value 10/31/14 | | $ | 1,018.90 | | | $ | 1,017.64 | | | $ | 1,013.86 | | |
Expenses Paid per $1,000* | | $ | 6.36 | | | $ | 7.63 | | | $ | 11.42 | | |
| | | Class I | | Class A | | Class C | |
Annualized Expense Ratios* | | | 1.25 | % | | | 1.50 | % | | | 2.25 | % | |
* Expenses are equal to the Fund's annualized expense ratio for each share class, multiplied by the average account value over the period, multiplied by the number of days in the most recent fiscal half year period, then divided by 365.
The "Expenses Paid per $1,000" and the "Annualized Expense Ratios" in the tables are based on actual expenses paid by the Fund during the period, net of fee waivers and/or expense reimbursements. If those fee waivers and/or expense reimbursements had not been in effect, the Fund's actual expenses would have been higher. Expenses do not reflect additional charges and expenses that are, or may be, imposed under the variable contracts or plans. Such charges and expenses are described in the prospectus of the insurance company separate account or in the plan documents or other informational materials supplied by plan sponsors. The Fund's expenses should be considered with these charges and expenses in evaluating the overall cost of investing in the separate account.
For more information, please refer to the Fund's prospectus.
8
Credit Suisse Emerging Markets Equity Fund
Annual Investment Adviser's Report (continued)
October 31, 2014 (unaudited)
Sector Breakdown*
Financials | | | 19.8 | % | |
Information Technology | | | 19.5 | | |
Consumer Discretionary | | | 11.0 | | |
Energy | | | 9.5 | | |
Consumer Staples | | | 7.6 | | |
Industrials | | | 7.2 | | |
Commingled Fund | | | 6.8 | | |
Materials | | | 6.1 | | |
Utilities | | | 4.4 | | |
Telecommunication Services | | | 3.6 | | |
| Short-Term Investment1 | | | 2.6 | | |
Health Care | | | 1.9 | | |
Total | | | 100.0 | % | |
* Expressed as a percentage of total investments (excluding securities lending collateral if applicable) and may vary over time.
1 Primarily reflects cash invested in State Street Bank and Trust Co. Euro Time Deposit, for which the purchases of securities have been executed but not yet settled at October 31, 2014, if applicable.
9
Credit Suisse Emerging Markets Equity Fund
Schedule of Investments
October 31, 2014
| | | Number of
Shares | | Value | |
| COMMON STOCKS (89.2%) | |
| BRAZIL (8.5%) | |
| Commercial Banks (2.1%) | |
Banco do Brasil S.A. | | | 42,800 | | | $ | 483,745 | | |
| Diversified Consumer Services (2.2%) | |
Kroton Educacional S.A. | | | 73,600 | | | | 529,775 | | |
| Household Durables (1.4%) | |
Cyrela Brazil Realty S.A. | | | 24,700 | | | | 124,031 | | |
MRV Engenharia e Participacoes S.A. | | | 59,500 | | | | 198,758 | | |
| | | | 322,789 | | |
| Insurance (0.7%) | |
Porto Seguro S.A. | | | 13,900 | | | | 168,265 | | |
| IT Services (1.3%) | |
Cielo S.A. | | | 18,000 | | | | 298,296 | | |
| Metals & Mining (0.8%) | |
Vale S.A., ADR | | | 18,100 | | | | 182,629 | | |
| | | | 1,985,499 | | |
| CHILE (1.7%) | |
| Electric Utilities (1.7%) | |
Enersis S.A., ADR | | | 25,100 | | | | 396,329 | | |
| CHINA (14.8%) | |
| Commercial Banks (4.1%) | |
Agricultural Bank of China Ltd., Series H | | | 547,000 | | | | 254,186 | | |
Bank of China Ltd., Series H | | | 586,600 | | | | 280,775 | | |
China CITIC Bank Corp. Ltd., Series H | | | 423,700 | | | | 276,017 | | |
Chongqing Rural Commercial Bank Co. Ltd., Series H | | | 288,700 | | | | 138,939 | | |
| | | | 949,917 | | |
| Construction & Engineering (1.2%) | |
China Communications Construction Co. Ltd., Series H | | | 358,500 | | | | 275,213 | | |
| Construction Materials (1.0%) | |
China National Building Material Co. Ltd., Series H | | | 243,200 | | | | 225,485 | | |
| Independent Power Producers & Energy Traders (1.8%) | |
Huaneng Power International, Inc., Series H | | | 340,500 | | | | 418,182 | | |
| Internet Software & Services (2.7%) | |
Baidu, Inc., ADR* | | | 1,000 | | | | 238,770 | | |
Sohu.com, Inc.* | | | 2,500 | | | | 121,475 | | |
Tencent Holdings Ltd. | | | 17,500 | | | | 281,263 | | |
| | | | 641,508 | | |
| Life Sciences Tools & Services (0.6%) | |
WuXi PharmaTech Cayman, Inc., ADR* | | | 3,900 | | | | 147,030 | | |
| Metals & Mining (0.7%) | |
China Hongqiao Group Ltd. | | | 212,000 | | | | 163,132 | | |
See Accompanying Notes to Financial Statements.
10
Credit Suisse Emerging Markets Equity Fund
Schedule of Investments (continued)
October 31, 2014
| | | Number of
Shares | | Value | |
COMMON STOCKS | |
CHINA | |
| Oil, Gas & Consumable Fuels (1.7%) | |
China Petroleum & Chemical Corp., Series H | | | 274,900 | | | $ | 238,395 | | |
CNOOC Ltd. | | | 96,200 | | | | 150,390 | | |
| | | | 388,785 | | |
| Real Estate Management & Development (0.4%) | |
Country Garden Holdings Co. Ltd. | | | 220,000 | | | | 86,432 | | |
| Semiconductors & Semiconductor Equipment (0.6%) | |
JA Solar Holdings Co. Ltd., ADR* | | | 16,300 | | | | 136,431 | | |
| | | | 3,432,115 | | |
| COLOMBIA (1.6%) | |
| Oil, Gas & Consumable Fuels (1.6%) | |
Ecopetrol S.A., ADR | | | 13,600 | | | | 364,480 | | |
| HONG KONG (5.9%) | |
| Capital Markets (0.8%) | |
Sun Hung Kai & Co. Ltd. | | | 253,000 | | | | 188,063 | | |
| Chemicals (0.8%) | |
Huabao International Holdings Ltd. | | | 251,900 | | | | 180,121 | | |
| Communications Equipment (0.7%) | |
China Fiber Optic Network System Group Ltd. | | | 552,000 | | | | 167,452 | | |
| Construction & Engineering (0.8%) | |
China Singyes Solar Technologies Holdings Ltd.* | | | 101,800 | | | | 194,953 | | |
| Construction Materials (0.7%) | |
China Resources Cement Holdings Ltd. | | | 243,200 | | | | 164,747 | | |
| Industrial Conglomerates (1.5%) | |
Hutchison Whampoa Ltd. | | | 16,500 | | | | 209,653 | | |
Jardine Strategic Holdings Ltd. | | | 3,700 | | | | 131,893 | | |
| | | | 341,546 | | |
| Real Estate Management & Development (0.6%) | |
Shimao Property Holdings Ltd. | | | 66,100 | | | | 142,433 | | |
| | | | 1,379,315 | | |
| INDIA (2.4%) | |
| Automobiles (2.4%) | |
Tata Motors Ltd., ADR | | | 12,000 | | | | 565,200 | | |
| INDONESIA (0.9%) | |
| Food Products (0.9%) | |
Indofood Sukses Makmur Tbk PT | | | 368,500 | | | | 208,142 | | |
| ISRAEL (1.2%) | |
| Pharmaceuticals (1.2%) | |
Taro Pharmaceutical Industries Ltd.* | | | 1,800 | | | | 291,492 | | |
See Accompanying Notes to Financial Statements.
11
Credit Suisse Emerging Markets Equity Fund
Schedule of Investments (continued)
October 31, 2014
| | | Number of
Shares | | Value | |
COMMON STOCKS | |
| JAPAN (0.9%) | |
| Household Products (0.9%) | |
Pigeon Corp. | | | 3,200 | | | $ | 199,871 | | |
| MEXICO (2.2%) | |
| Food & Staples Retailing (1.5%) | |
Wal-Mart de Mexico S.A.B. de C.V., Series V | | | 150,200 | | | | 347,903 | | |
| Transportation Infrastructure (0.7%) | |
OHL Mexico S.A.B. de C.V.* | | | 56,200 | | | | 157,518 | | |
| | | | 505,421 | | |
| PANAMA (1.1%) | |
| Commercial Banks (1.1%) | |
Banco Latinoamericano de Comercio Exterior S.A., Series E | | | 7,500 | | | | 252,300 | | |
| RUSSIA (3.7%) | |
| Oil, Gas & Consumable Fuels (3.7%) | |
Gazprom OAO, ADR | | | 24,000 | | | | 158,352 | | |
Gazprom OAO, ADR | | | 3,800 | | | | 25,178 | | |
Lukoil OAO, ADR | | | 13,700 | | | | 671,985 | | |
| | | | 855,515 | | |
| SINGAPORE (2.7%) | |
| Commercial Banks (1.1%) | |
DBS Group Holdings Ltd. | | | 18,000 | | | | 258,776 | | |
| Industrial Conglomerates (1.6%) | |
Sembcorp Industries Ltd. | | | 95,200 | | | | 359,926 | | |
| | | | 618,702 | | |
| SOUTH AFRICA (4.5%) | |
| Food & Staples Retailing (1.4%) | |
The SPAR Group Ltd. | | | 28,177 | | | | 329,158 | | |
| Paper & Forest Products (0.6%) | |
Sappi Ltd.* | | | 35,500 | | | | 140,383 | | |
| Specialty Retail (1.3%) | |
The Foschini Group Ltd. | | | 26,900 | | | | 303,617 | | |
| Wireless Telecommunication Services (1.2%) | |
MTN Group Ltd. | | | 12,300 | | | | 271,934 | | |
| | | | 1,045,092 | | |
| SOUTH KOREA (10.7%) | |
| Automobiles (2.2%) | |
Hyundai Motor Co. | | | 1,300 | | | | 206,286 | | |
Kia Motors Corp. | | | 6,100 | | | | 296,292 | | |
| | | | 502,578 | | |
| Construction & Engineering (1.1%) | |
Daelim Industrial Co. Ltd. | | | 3,690 | | | | 244,426 | | |
See Accompanying Notes to Financial Statements.
12
Credit Suisse Emerging Markets Equity Fund
Schedule of Investments (continued)
October 31, 2014
| | | Number of
Shares | | Value | |
COMMON STOCKS | |
SOUTH KOREA | |
| Diversified Telecommunication Services (0.8%) | |
KT Corp. | | | 6,100 | | | $ | 187,938 | | |
| Electronic Equipment, Instruments & Components (1.5%) | |
LG Display Co. Ltd.* | | | 6,500 | | | | 191,354 | | |
LG Innotek Co. Ltd.* | | | 1,900 | | | | 149,811 | | |
| | | | 341,165 | | |
| Household Durables (0.8%) | |
Hanssem Co. Ltd. | | | 1,600 | | | | 190,714 | | |
| Insurance (0.8%) | |
Hyundai Marine & Fire Insurance Co. Ltd. | | | 7,300 | | | | 192,795 | | |
| Personal Products (1.4%) | |
Amorepacific Corp. | | | 155 | | | | 332,822 | | |
| Semiconductors & Semiconductor Equipment (1.2%) | |
Samsung Electronics Co. Ltd. | | | 230 | | | | 268,213 | | |
| Software (0.9%) | |
Com2uSCorp* | | | 1,200 | | | | 218,459 | | |
| | | | 2,479,110 | | |
| TAIWAN (13.8%) | |
| Commercial Banks (1.6%) | |
King's Town Bank Co. Ltd. | | | 159,000 | | | | 173,896 | | |
SinoPac Financial Holdings Co. Ltd. | | | 436,111 | | | | 189,349 | | |
| | | | 363,245 | | |
| Computers & Peripherals (3.4%) | |
Asustek Computer, Inc. | | | 30,900 | | | | 315,495 | | |
Catcher Technology Co. Ltd. | | | 38,100 | | | | 321,630 | | |
Pegatron Corp. | | | 79,300 | | | | 144,524 | | |
| | | | 781,649 | | |
| Electronic Equipment, Instruments & Components (3.4%) | |
Hon Hai Precision Industry Co. Ltd. | | | 205,960 | | | | 651,863 | | |
Largan Precision Co. Ltd. | | | 2,100 | | | | 147,523 | | |
| | | | 799,386 | | |
| Leisure Equipment & Products (0.8%) | |
Merida Industry Co. Ltd. | | | 27,700 | | | | 191,341 | | |
| Personal Products (0.5%) | |
Grape King Bio Ltd. | | | 29,600 | | | | 123,729 | | |
| Semiconductors & Semiconductor Equipment (4.1%) | |
Taiwan Semiconductor Manufacturing Co. Ltd. | | | 219,900 | | | | 953,238 | | |
| | | | 3,212,588 | | |
See Accompanying Notes to Financial Statements.
13
Credit Suisse Emerging Markets Equity Fund
Schedule of Investments (continued)
October 31, 2014
| | | Number of
Shares | | Value | |
COMMON STOCKS | |
| THAILAND (7.3%) | |
| Chemicals (1.6%) | |
PTT Global Chemical PCL | | | 196,900 | | | $ | 374,817 | | |
| Commercial Banks (3.0%) | |
Bangkok Bank PCL, NVDR | | | 57,400 | | | | 348,999 | | |
Krung Thai Bank PCL, NVDR | | | 504,000 | | | | 360,600 | | |
| | | | 709,599 | | |
| Food Products (1.1%) | |
Thai Union Frozen Products PCL | | | 112,500 | | | | 257,331 | | |
| Oil, Gas & Consumable Fuels (1.6%) | |
PTT PCL | | | 32,400 | | | | 366,079 | | |
| | | | 1,707,826 | | |
| TURKEY (4.3%) | |
| Construction & Engineering (0.6%) | |
Tekfen Holding AS* | | | 55,300 | | | | 139,203 | | |
| Diversified Telecommunication Services (1.6%) | |
Turk Telekomunikasyon AS | | | 132,100 | | | | 379,878 | | |
| Oil, Gas & Consumable Fuels (1.2%) | |
Tupras Turkiye Petrol Rafinerileri AS | | | 12,800 | | | | 277,926 | | |
| Real Estate Investment Trusts (0.9%) | |
Emlak Konut Gayrimenkul Yatirim Ortakligi AS | | | 188,600 | | | | 212,068 | | |
| | | | 1,009,075 | | |
| UNITED KINGDOM (1.0%) | |
| Insurance (1.0%) | |
Old Mutual PLC | | | 72,000 | | | | 223,622 | | |
| TOTAL COMMON STOCKS (Cost $20,242,224) | | | 20,731,694 | | |
| PREFERRED STOCKS (2.9%) | |
| BRAZIL (2.9%) | |
| Commercial Banks (1.9%) | |
Itau Unibanco Holding S.A. | | | 30,100 | | | | 451,128 | | |
| Electric Utilities (1.0%) | |
Cia Energetica de Minas Gerais | | | 38,800 | | | | 224,976 | | |
| TOTAL PREFERRED STOCKS (Cost $627,294) | | | 676,104 | | |
| EXCHANGE TRADED FUNDS (6.9%) | |
| FRANCE (3.2%) | |
Lyxor ETF MSCI India* | | | 43,250 | | | | 743,459 | | |
| LUXEMBOURG (3.0%) | |
db x-trackers CNX Nifty UCITS ETF* | | | 5,125 | | | | 708,634 | | |
| UNITED STATES (0.7%) | |
iShares MSCI Emerging Markets ETF | | | 3,700 | | | | 155,955 | | |
| TOTAL EXCHANGE TRADED FUNDS (Cost $1,310,821) | | | 1,608,048 | | |
See Accompanying Notes to Financial Statements.
14
Credit Suisse Emerging Markets Equity Fund
Schedule of Investments (continued)
October 31, 2014
| | | Par
(000) | | Value | |
| SHORT-TERM INVESTMENT (2.7%) | |
State Street Bank and Trust Co. Euro Time Deposit, 0.010% 11/03/2014 (Cost $621,000) | | $ | 621 | | | $ | 621,000 | | |
| TOTAL INVESTMENTS AT VALUE (101.7%) (Cost $22,801,339) | | | 23,636,846 | | |
| LIABILITIES IN EXCESS OF OTHER ASSETS (-1.7%) | | | (386,385 | ) | |
| NET ASSETS (100.0%) | | $ | 23,250,461 | | |
INVESTMENT ABBREVIATIONS
ADR = American Depositary Receipt
NVDR = Non-Voting Depository Receipt
* Non-income producing security.
See Accompanying Notes to Financial Statements.
15
Credit Suisse Emerging Markets Equity Fund
Statement of Assets and Liabilities
October 31, 2014
Assets | |
Investments at value (Cost $22,801,339) (Note 2) | | $ | 23,636,846 | | |
Cash | | | 443 | | |
Receivable for investments sold | | | 229,119 | | |
Dividend receivable | | | 15,728 | | |
Deferred offering costs (Note 3) | | | 10,256 | | |
Receivable for fund shares sold | | | 3,468 | | |
Prepaid expenses | | | 21,943 | | |
Total assets | | | 23,917,803 | | |
Liabilities | |
Investment advisory fee payable (Note 3) | | | 34,210 | | |
Administrative services fee payable (Note 3) | | | 26,107 | | |
Shareholder servicing/Distribution fee payable (Note 3) | | | 1,097 | | |
Due to custodian for foreign currency at value (cost $332,529) | | | 329,918 | | |
Payable for investments purchased | | | 183,228 | | |
Trustees' fee payable | | | 9,678 | | |
Offering costs (Note 3) | | | 1,173 | | |
Payable to adviser | | | 10,256 | | |
Accrued expenses | | | 71,675 | | |
Total liabilities | | | 667,342 | | |
Net Assets | |
Capital stock, $.001 par value (Note 6) | | | 2,244 | | |
Paid-in capital (Note 6) | | | 22,577,929 | | |
Undistributed net investment income | | | 336,253 | | |
Accumulated net realized loss on investments and foreign currency transactions | | | (503,994 | ) | |
Net unrealized appreciation from investments and foreign currency translations | | | 838,029 | | |
Net assets | | $ | 23,250,461 | | |
I Shares | |
Net assets | | $ | 21,040,402 | | |
Shares outstanding | | | 2,030,005 | | |
Net asset value, offering price and redemption price per share | | $ | 10.36 | | |
A Shares | |
Net assets | | $ | 1,182,308 | | |
Shares outstanding | | | 114,307 | | |
Net asset value and redemption price per share | | $ | 10.34 | | |
Maximum offering price per share (net asset value/(1-5.25%)) | | $ | 10.91 | | |
C Shares | |
Net assets | | $ | 1,027,751 | | |
Shares outstanding | | | 100,000 | | |
Net asset value, offering price and redemption price per share | | $ | 10.28 | | |
See Accompanying Notes to Financial Statements.
16
Credit Suisse Emerging Markets Equity Fund
Statement of Operations
For the Period Ended October 31, 20141
Investment Income | |
Dividends | | $ | 617,603 | | |
Foreign taxes withheld | | | (58,012 | ) | |
Total investment income | | | 559,591 | | |
Expenses | |
Investment advisory fees (Note 3) | | | 160,468 | | |
Administrative services fees (Note 3) | | | 91,701 | | |
Shareholder servicing/Distribution fees (Note 3) | |
Class A | | | 2,317 | | |
Class C | | | 8,633 | | |
Audit and tax fees | | | 57,100 | | |
Offering costs (Note 3) | | | 56,590 | | |
Trustees' fees | | | 25,778 | | |
Legal fees | | | 23,140 | | |
Printing fees (Note 3) | | | 21,640 | | |
Transfer agent fees (Note 3) | | | 11,693 | | |
Custodian fees | | | 10,685 | | |
Registration fees | | | 9,643 | | |
Commitment fees (Note 4) | | | 2,829 | | |
Insurance expense | | | 366 | | |
Miscellaneous expense | | | 5,180 | | |
Total expenses | | | 487,763 | | |
Less: fees waived and expenses reimbursed (Note 3) | | | (253,941 | ) | |
Net expenses | | | 233,822 | | |
Net investment income | | | 325,769 | | |
Net Realized and Unrealized Gain (Loss) from Investments and Foreign Currency Related Items | |
Net realized loss from investments | | | (483,236 | ) | |
Net realized loss from foreign currency transactions | | | (12,757 | ) | |
Net change in unrealized appreciation (depreciation) from investments | | | 835,507 | | |
Net change in unrealized appreciation (depreciation) from foreign currency translations | | | 2,522 | | |
Net realized and unrealized gain from investments and foreign currency related items | | | 342,036 | | |
Net increase in net assets resulting from operations | | $ | 667,805 | | |
1 For the period December 26, 2013 (commencement of operations) through October 31, 2014.
See Accompanying Notes to Financial Statements.
17
Credit Suisse Emerging Markets Equity Fund
Statement of Changes in Net Assets
| | | For the Period
Ended
October 31, 20141 | |
From Operations | |
Net investment income | | $ | 325,769 | | |
Net realized loss from investments and foreign currency transactions | | | (495,993 | ) | |
Net change in unrealized appreciation (depreciation) from investments and
foreign currency translations | | | 838,029 | | |
Net increase in net assets resulting from operations | | | 667,805 | | |
| From Capital Share Transactions (Note 6) | |
Proceeds from sale of shares | | | 22,618,171 | | |
Net asset value of shares redeemed | | | (35,515 | ) | |
Net increase in net assets from capital share transactions | | | 22,582,656 | | |
Net increase in net assets | | | 23,250,461 | | |
Net Assets | |
Beginning of period | | | — | | |
End of period | | $ | 23,250,461 | | |
Undistributed net investment income | | $ | 336,253 | | |
1 For the period December 26, 2013 (commencement of operations) through October 31, 2014.
See Accompanying Notes to Financial Statements.
18
Credit Suisse Emerging Markets Equity Fund
Financial Highlights
(For a Class I Share of the Fund Outstanding Throughout the Period)
| | | For the Period
Ended
October 31, 20141 | |
Per share data | |
Net asset value, beginning of period | | $ | 10.00 | | |
INVESTMENT OPERATIONS | |
Net investment income2 | | | 0.16 | | |
Net gain on investments and foreign currency related items (both realized and unrealized) | | | 0.20 | | |
Total from investment operations | | | 0.36 | | |
Net asset value, end of period | | $ | 10.36 | | |
Total return3 | | | 3.60 | % | |
RATIOS AND SUPPLEMENTAL DATA | |
Net assets, end of period (000s omitted) | | $ | 21,040 | | |
Ratio of net expenses to average net assets | | | 1.25 | %4 | |
Ratio of net investment income to average net assets | | | 1.88 | %4 | |
Decrease reflected in above operating expense ratios due to waivers/reimbursements | | | 1.38 | %4 | |
Portfolio turnover rate | | | 50 | % | |
1 For the period December 26, 2013 (commencement of operations) through October 31, 2014.
2 Per share information is calculated using the average shares outstanding method.
3 Total returns are historical and assume changes in share price. Had certain expenses not been reduced during the period shown, total returns would have been lower. Total returns for periods less than one year are not annualized.
4 Annualized. The non-recurring expenses of offering costs were not annualized.
See Accompanying Notes to Financial Statements.
19
Credit Suisse Emerging Markets Equity Fund
Financial Highlights
(For a Class A Share of the Fund Outstanding Throughout the Period)
| | | For the Period
Ended
October 31, 20141 | |
Per share data | |
Net asset value, beginning of period | | $ | 10.00 | | |
INVESTMENT OPERATIONS | |
Net investment income2 | | | 0.15 | | |
Net gain on investments and foreign currency related items (both realized and unrealized) | | | 0.19 | | |
Total from investment operations | | | 0.34 | | |
Net asset value, end of period | | $ | 10.34 | | |
Total return3 | | | 3.40 | % | |
RATIOS AND SUPPLEMENTAL DATA | |
Net assets, end of period (000s omitted) | | $ | 1,182 | | |
Ratio of net expenses to average net assets | | | 1.50 | %4 | |
Ratio of net investment income to average net assets | | | 1.72 | %4 | |
Decrease reflected in above operating expense ratios due to waivers/reimbursements | | | 1.38 | %4 | |
Portfolio turnover rate | | | 50 | % | |
1 For the period December 26, 2013 (commencement of operations) through October 31, 2014.
2 Per share information is calculated using the average shares outstanding method.
3 Total returns are historical and assume changes in share price and no sales charge. Had certain expenses not been reduced during the period shown, total returns would have been lower. Total returns for periods less than one year are not annualized.
4 Annualized. The non-recurring expenses of offering costs were not annualized.
See Accompanying Notes to Financial Statements.
20
Credit Suisse Emerging Markets Equity Fund
Financial Highlights
(For a Class C Share of the Fund Outstanding Throughout the Period)
| | | For the Period
Ended
October 31, 20141 | |
Per share data | |
Net asset value, beginning of period | | $ | 10.00 | | |
INVESTMENT OPERATIONS | |
Net investment income2 | | | 0.08 | | |
Net gain on investments and foreign currency related items (both realized and unrealized) | | | 0.20 | | |
Total from investment operations | | | 0.28 | | |
Net asset value, end of period | | $ | 10.28 | | |
Total return3 | | | 2.80 | % | |
RATIOS AND SUPPLEMENTAL DATA | |
Net assets, end of period (000s omitted) | | $ | 1,028 | | |
Ratio of net expenses to average net assets | | | 2.25 | %4 | |
Ratio of net investment income to average net assets | | | 0.91 | %4 | |
Decrease reflected in above operating expense ratios due to waivers/reimbursements | | | 1.38 | %4 | |
Portfolio turnover rate | | | 50 | % | |
1 For the period December 26, 2013 (commencement of operations) through October 31, 2014.
2 Per share information is calculated using the average shares outstanding method.
3 Total returns are historical and assume changes in share price and no sales charge. Had certain expenses not been reduced during the period shown, total returns would have been lower. Total returns for periods less than one year are not annualized.
4 Annualized. The non-recurring expenses of offering costs were not annualized.
See Accompanying Notes to Financial Statements.
21
Credit Suisse Emerging Markets Equity Fund
Notes to Financial Statements
October 31, 2014
Credit Suisse Emerging Markets Equity Fund (the "Fund"), a series of the Credit Suisse Opportunity Funds (the "Trust"), a Delaware statutory trust, is registered under the Investment Company Act of 1940, as amended (the "1940 Act"), as a diversified open-end management investment company that seeks capital appreciation. The Trust was organized under the laws of the State of Delaware as a business trust on May 31, 1995. The Fund commenced operations on December 26, 2013.
The Fund offers three classes of shares: Class I shares, Class A shares and Class C shares. Each class of shares represents an equal pro rata interest in the Fund, except they bear different expenses, which reflect the differences in the range of services provided to them. Class A shares are sold subject to a front-end sales charge of up to 5.25%. Class C shares are sold subject to a contingent deferred sales charge of 1.00% if the shares are redeemed within the first year of purchase. Class I shares are sold without a sales charge.
Note 2. Significant Accounting Policies
The following is a summary of significant accounting policies followed by the Fund in the preparation of its financial statements. The policies are in accordance with accounting principles generally accepted in the United States of America ("GAAP"). The preparation of financial statements requires management to make estimates and assumptions that affect the reported amounts and disclosures in the financial statements. Actual results could differ from those estimates.
A) SECURITY VALUATION — The net asset value of the Fund is determined daily as of the close of regular trading on the New York Stock Exchange, Inc. (the "Exchange") on each day the Exchange is open for business. For certain international equity securities, in order to adjust for events which may occur between the close of the foreign exchanges and the close of the New York Stock Exchange, a fair valuation model may be used. This fair valuation model takes into account comparisons to the valuation of American Depository Receipts (ADRs), exchange-traded funds, futures contracts and certain indices and these securities are categorized as Level 2. The valuations for fixed income securities (which may include, but are not limited to, corporate, government, municipal, mortgage-backed, collateralized mortgage obligations and asset-backed securities) and certain derivative instruments are typically the prices supplied by independent third party pricing services, which may use market prices or broker/dealer quotations or a variety of valuation techniques and
22
Credit Suisse Emerging Markets Equity Fund
Notes to Financial Statements (continued)
October 31, 2014
Note 2. Significant Accounting Policies
methodologies. The independent third party pricing services use inputs that are observable such as issuer details, interest rates, yield curves, prepayment speeds, credit risks/spreads, default rates and quoted prices for similar securities. Short-term fixed income securities that will mature in 60 days or less may be valued at amortized cost. Structured note agreements are valued in accordance with a dealer-supplied valuation based on changes in the value of the underlying index. Futures contracts are valued daily at the settlement price established by the board of trade or exchange on which they are traded. Forward contracts are valued at the London closing spot rates and the London closing forward point rates on a daily basis. The currency forward contract pricing model derives the differential in point rates to the expiration date of the forward and calculates its present value. Equity securities for which market quotations are available are valued at the last reported sales price or official closing price on the primary market or exchange on which they trade. The Fund may utilize a service provided by an independent third party which has been approved by the Board of Trustees (the "Board") to fair value certain securities. When fair value pricing is employed, the prices of securities used by the Fund to calculate its net asset value may differ from quoted or published prices for the same securities. If independent third party pricing services are unable to supply prices for a portfolio investment, or if the prices supplied are deemed by the investment adviser to be unreliable, the market price may be determined by the investment adviser using quotations from one or more broker/dealers or at the transaction price if the security has recently been purchased and no value has yet been obtained from a pricing service or pricing broker. When reliable prices are not readily available, such as when the value of a security has been significantly affected by events after the close of the exchange or market on which the security is principally traded, but before the Fund calculates its net asset value, the Fund values these securities as determined in accordance with procedures approved and established by the Fund's Board.
The Fund uses valuation techniques to measure fair value that are consistent with the market approach and/or income approach, depending on the type of security and the particular circumstance. The market approach uses prices and other relevant information generated by market transactions involving identical or comparable securities. The income approach uses valuation techniques to discount estimated future cash flows to present value.
23
Credit Suisse Emerging Markets Equity Fund
Notes to Financial Statements (continued)
October 31, 2014
Note 2. Significant Accounting Policies
GAAP established a disclosure hierarchy that categorizes the inputs to valuation techniques used to value assets and liabilities at each measurement date. These inputs are summarized in the three broad levels listed below:
• Level 1 – quoted prices in active markets for identical investments
• Level 2 – other significant observable inputs (including quoted prices for similar investments, interest rates, prepayment speeds, credit risk, etc.)
• Level 3 – significant unobservable inputs (including the Fund's own assumptions in determining the fair value of investments)
The inputs or methodologies used to value securities are not necessarily an indication of the risk associated with investing in those securities.
The following is a summary of the inputs used as of October 31, 2014 in valuing the Fund's assets and liabilities carried at fair value:
| | | Level 1 | | Level 2 | | Level 3 | | Total | |
Investments in Securities | |
Common Stocks | | $ | 5,030,121 | | | $ | 15,701,573 | * | | $ | — | | | $ | 20,731,694 | | |
Preferred Stocks | | | — | | | | 676,104 | | | | — | | | | 676,104 | | |
Exchange Traded Funds | | | 1,608,048 | | | | — | | | | — | | | | 1,608,048 | | |
Short-term Investment | | | — | | | | 621,000 | | | | — | | | | 621,000 | | |
| | | $ | 6,638,169 | | | $ | 16,998,677 | | | $ | — | | | $ | 23,636,846 | | |
*Fair value factor has been applied.
The Fund follows Financial Accounting Standards Board ("FASB") amendments to authoritative guidance which requires the Fund to disclose details of transfers in and out of Level 1 and Level 2 measurements and Level 2 and Level 3 measurements and the reasons for the transfers. For the period ended October 31, 2014, there were no transfers in and out of Level 1, Level 2 and Level 3. All transfers are assumed to occur at the end of the reporting period.
B) DERIVATIVE INSTRUMENTS AND HEDGING ACTIVITIES — The Fund adopted amendments to authoritative guidance on disclosures about derivative instruments and hedging activities which require that a fund disclose (a) how and why an entity uses derivative instruments, (b) how derivative instruments and hedging activities are accounted for and (c) how derivative instruments and related hedging activities affect a fund's financial position, financial performance and cash flows. The Fund has not entered into any derivative or hedging activities during the period covered by this report.
24
Credit Suisse Emerging Markets Equity Fund
Notes to Financial Statements (continued)
October 31, 2014
Note 2. Significant Accounting Policies
C) FOREIGN CURRENCY TRANSACTIONS — The books and records of the Fund are maintained in U.S. dollars. Transactions denominated in foreign currencies are recorded at the current prevailing exchange rates. All assets and liabilities denominated in foreign currencies are translated into U.S. dollar amounts at the current exchange rate at the end of the period. Translation gains or losses resulting from changes in the exchange rate during the reporting period and realized gains and losses on the settlement of foreign currency transactions are reported in the results of operations for the current period. The Fund does not isolate that portion of realized gains and losses on investments in equity securities which is due to changes in the foreign exchange rate from that which is due to changes in market prices of equity securities. The Fund isolates that portion of realized gains and losses on investments in debt securities which is due to changes in the foreign exchange rate from that which is due to changes in market prices of debt securities.
D) SECURITY TRANSACTIONS AND INVESTMENT INCOME/EXPENSE — Security transactions are accounted for on a trade date basis. Interest income/expense is recorded on the accrual basis. The Fund amortizes premiums and accretes discounts using the effective interest method. Dividend income/expense is recorded on the ex-dividend date. Certain expenses are class-specific expenses, vary by class and are charged only to that class. Income, expenses (excluding class-specific expenses) and realized/unrealized gains/losses are allocated proportionately to each class of shares based upon the relative net asset value of the outstanding shares of that class. The cost of investments sold is determined by use of the specific identification method for both financial reporting and income tax purposes.
E) DIVIDENDS AND DISTRIBUTIONS TO SHAREHOLDERS — Dividends from net investment income, if any, are declared and paid annually. Distributions of net realized capital gains, if any, are declared and paid at least annually. However, to the extent that a net realized capital gain can be reduced by a capital loss carryforward, such gain will not be distributed. Income and capital gain distributions are determined in accordance with federal income tax regulations, which may differ from GAAP.
F) FEDERAL INCOME TAXES — No provision is made for federal taxes as it is the Fund's intention to continue to qualify for and elect the tax treatment applicable to regulated investment companies ("RIC") under the Internal Revenue Code of 1986, as amended (the "Code"), and to make the requisite distributions to its shareholders, which will be sufficient to relieve it from federal income and excise taxes.
25
Credit Suisse Emerging Markets Equity Fund
Notes to Financial Statements (continued)
October 31, 2014
Note 2. Significant Accounting Policies
In order to qualify as a RIC under the Code, the Fund must meet certain requirements regarding the source of its income, the diversification of its assets and the distribution of its income. One of these requirements is that the Fund derive at least 90% of its gross income for each taxable year from dividends, interest, payments with respect to certain securities loans, gains from the sale or other disposition of stock, securities or foreign currencies, other income derived with respect to its business of investing in such stock, securities or currencies or net income derived from interests in certain publicly traded partnerships ("Qualifying Income").
The Fund adopted the authoritative guidance for uncertainty in income taxes and recognizes a tax benefit or liability from an uncertain position only if it is more likely than not that the position is sustainable based solely on its technical merits and consideration of the relevant taxing authority's widely understood administrative practices and procedures. The Fund has reviewed its current tax positions and has determined that no provision for income tax is required in the Fund's financial statements.
G) SHORT-TERM INVESTMENTS — The Fund, together with other funds/portfolios advised by Credit Suisse, an indirect, wholly-owned subsidiary of Credit Suisse Group AG, pools available cash into a short-term variable rate time deposit issued by State Street Bank and Trust Company ("SSB"), the Fund's custodian. The short-term time deposit issued by SSB is a variable rate account classified as a short-term investment.
H) OTHER — In the normal course of business the Fund trades financial instruments and enters into financial transactions where risk of potential loss exists due to changes in the market (market risk) or failure of the other party to a transaction to perform (credit risk). Similar to credit risk, the Fund may be exposed to counterparty risk, or the risk that an institution or other entity with which the Fund has unsettled or open transactions will default. The potential loss could exceed the value of the financial assets recorded in the financial statements. Financial assets, which potentially expose the Fund to credit risk, consist principally of cash due from counterparties and investments. The extent of the Fund's exposure to credit and counterparty risks in respect to these financial assets approximates their carrying value as recorded in the Fund's Statement of Assets and Liabilities.
I) FOREIGN INVESTMENTS RISK — The Funds may have elements of risk not typically associated with investments in the United States of America due to concentrated investments in a limited number of countries or regions, which may vary throughout the year depending on the Fund. Such concentrations
26
Credit Suisse Emerging Markets Equity Fund
Notes to Financial Statements (continued)
October 31, 2014
Note 2. Significant Accounting Policies
may subject the Funds to additional risks resulting from political or economic conditions in such countries or regions and the possible imposition of adverse governmental laws or currency exchange restrictions could cause the securities and their markets to be less liquid and their prices to be more volatile than those of comparable U.S. securities.
Because these Funds may invest a significant portion of their assets in these markets, they are subject to greater risks of adverse events that occur in those markets and may experience greater volatility than a Fund that is more broadly diversified geographically.
J) NEW ACCOUNTING PRONOUNCEMENTS — In June 2013, the FASB issued Accounting Standards Update (ASU) No. 2013-08, Investment Companies (Topic 946): Amendments to the Scope, Measurement, and Disclosure Requirements. The ASU modifies the criteria used in defining an investment company under GAAP and also sets forth certain measurement and disclosure requirements. Under the ASU, an entity that is registered under the 1940 Act automatically qualifies as an investment company. The ASU is effective for interim and annual reporting periods beginning after December 15, 2013. Management has reviewed the requirements and believes the adoption of this ASU will not have a material impact on the financial statements.
In June 2014, FASB issued ASU No. 2014-11, Transfers and Servicing (Topic 860), Repurchase-to-Maturity Transactions, Repurchase Financings, and Disclosures. The ASU changes the accounting for certain repurchase agreements and expands disclosure requirements related to repurchase agreements, securities lending, repurchase-to-maturity and similar transactions. The ASU is effective for interim and annual reporting periods beginning after December 15, 2014. Management is currently evaluating the impact, if any, of applying this provision.
K) SUBSEQUENT EVENTS — In preparing the financial statements as of October 31, 2014, management considered the impact of subsequent events for potential recognition or disclosure in these financial statements through the date of release of this report. No such events requiring recognition or disclosure were identified through the date of the release of this report.
Note 3. Transactions with Affiliates and Related Parties
Credit Suisse serves as investment adviser for the Fund. For its investment advisory services, Credit Suisse is entitled to receive a fee from the Fund at an
27
Credit Suisse Emerging Markets Equity Fund
Notes to Financial Statements (continued)
October 31, 2014
Note 3. Transactions with Affiliates and Related Parties
annual rate of 0.90% of the Fund's average daily net assets. For the period ended October 31, 2014, investment advisory fees earned and fees waived/expenses reimbursed were $160,468 and $253,941, respectively. The Fund is authorized to reimburse Credit Suisse for management fees previously limited and/or for expenses previously paid by Credit Suisse, provided, however, that any reimbursements must be paid at a date not more than three years after the end of the fiscal year during which such fees were limited or expenses were reimbursed by Credit Suisse and the reimbursements do not cause a class to exceed the applicable expense limitation in the contract at the time the fees were limited or expenses are paid. This contract may not be terminated before February 28, 2015. Credit Suisse contractually waives fees and reimburses expenses so that the Fund's annual operating expenses will not exceed 1.25% of the Fund's average daily net assets for Class I shares, 1.50% of the Fund's average daily net assets for Class A shares, and 2.25% of the Fund's average daily net assets for Class C shares.
For the period ended October 31, 2014, the amounts waived and reimbursed by the Advisor, as well as the amounts available for recoupment/potential future recoupment by the Advisor and the expiration schedule at Ocbober 31, 2014 are as follows:
| | Fee waivers/expense
reimbursements subject
to repayment | | Expires October 31,
2017 | |
Class I | | $ | 228,447 | | | $ | 228,447 | | |
Class A | | | 13,198 | | | | 13,198 | | |
Class C | | | 12,296 | | | | 12,296 | | |
Totals | | $ | 253,941 | | | $ | 253,941 | | |
Credit Suisse and SSB serve as co-administrators to the Fund. For its co-administrative services, Credit Suisse received a fee calculation at an annual rate of 0.09% of the Fund's average daily net assets. For the period ended October 31, 2014, co-administrative services fees earned by Credit Suisse were $16,047.
For its co-administrative services, SSB receives a fee, exclusive of out-of-pocket expenses, calculated in total for all the Credit Suisse funds/portfolios co-administered by SSB and allocated based upon the relative average net assets of each fund/portfolio, subject to an annual minimum fee. For the period ended October 31, 2014, co-administrative services fees earned by SSB (including out-of-pocket expenses) with respect to the Fund were $75,654.
28
Credit Suisse Emerging Markets Equity Fund
Notes to Financial Statements (continued)
October 31, 2014
Note 3. Transactions with Affiliates and Related Parties
Credit Suisse Securities (USA) LLC ("CSSU"), an affiliate of Credit Suisse, serves as the distributor of the Fund's shares. Pursuant to distribution plans adopted by the Fund pursuant to Rule 12b-1 under the 1940 Act, CSSU received fees for its distribution services. These fees were calculated at an annual rate of 0.25% of the average daily net assets of the Class A shares. For the Class C shares, the fee is calculated at an annual rate of 1.00% of the average daily net assets. For the period ended October 31, 2014, the Fund paid Rule 12b-1 distribution fees of $2,317 for Class A shares and $8,633 for Class C shares. Class I shares are not subject to Rule 12b-1 distribution fees.
Certain brokers, dealers and financial representatives provide transfer agent related services to the Fund and receive compensation from the Fund. Some of the fees are paid by Credit Suisse on behalf of the Fund. For the period ended October 31, 2014, the Fund reimbursed Credit Suisse $31, which is included in the Fund's transfer agent expense.
For the period ended October 31, 2014, CSSU and its affiliates advised the Fund that they retained $267 from commissions earned on the sale of the Fund's Class A shares. There were no commissions earned on sale of Class C shares.
Merrill Corporation ("Merrill"), formerly an affiliate of Credit Suisse, has been engaged by the Fund to provide certain financial printing services. For the period ended October 31, 2014, Merrill was paid $14,662 for its services by the Fund. This amount was included in the printing fees presented on the Statement of Operations. Effective July 23, 2014, Merrill was no longer considered an affiliate.
Offering costs, including initial registration cost, were deferred and will be charged to expenses over the Fund's first 12 months of operation. For the period ended October 31, 2014, $56,590 has been expensed to the Fund.
Note 4. Line of Credit
The Fund, together with other funds/portfolios advised by Credit Suisse (collectively, the "Participating Funds"), participates in a committed, unsecured line of credit facility ("Credit Facility"), in an aggregated amount of $200 million for temporary or emergency purposes with SSB under a first come first serve basis. Under the terms of the Credit Facility, the Participating Funds pay an aggregate commitment fee on the average unused amount of the Credit Facility, which is allocated among the Participating Funds in such manner as is determined by the governing Boards of the Participating Funds. In addition, the Participating Funds pay interest on borrowings at either the Overnight
29
Credit Suisse Emerging Markets Equity Fund
Notes to Financial Statements (continued)
October 31, 2014
Federal Funds rate or the Overnight LIBOR rate plus a spread. At October 31, 2014 and during the period ended October 31, 2014, the Fund had no borrowings outstanding under the Credit Facility.
Note 5. Purchases and Sales of Securities
For the period ended October 31, 2014, purchases and sales of investment securities (excluding short-term investments) were $32,507,724 and $10,327,889, respectively.
Note 6. Capital Share Transactions
The Fund is authorized to issue an unlimited number of full and fractional shares of beneficial interest, $.001 par value per share. The Fund offers Class I, Class A and Class C shares. Transactions in capital shares for each class of the Fund were as follows:
| | | Class I | |
| | | For the Period Ended
October 31, 20141 | |
| | | Shares | | Value | |
Shares sold | | | 2,033,391 | | | $ | 20,470,437 | | |
Shares redeemed | | | (3,386 | ) | | | (35,515 | ) | |
Net increase | | | 2,030,005 | | | $ | 20,434,922 | | |
| | | Class A | |
| | | For the Period Ended
October 31, 20141 | |
| | | Shares | | Value | |
Shares sold | | | 114,307 | | | $ | 1,147,734 | | |
Net increase | | | 114,307 | | | $ | 1,147,734 | | |
| | | Class C | |
| | | For the Period Ended
October 31, 20141 | |
| | | Shares | | Value | |
Shares sold | | | 100,000 | | | $ | 1,000,000 | | |
Net increase | | | 100,000 | | | $ | 1,000,000 | | |
1 For the period December 26, 2013 (commencement of operations) through October 31, 2014.
30
Credit Suisse Emerging Markets Equity Fund
Notes to Financial Statements (continued)
October 31, 2014
Note 6. Capital Share Transactions
On October 31, 2014, the number of shareholders that held 5% or more of the outstanding shares of each class of the Fund was as follows:
| | | Number of
Shareholders | | Approximate Percentage
of Outstanding Shares | |
Class I | | | 2 | * | | | 95 | % | |
Class A | | | 2 | * | | | 96 | % | |
Class C | | | 1 | * | | | 100 | % | |
*This includes the seed money from Merchant Holdings, Inc., an affiliate of Credit Suisse.
Some of the shareholders are omnibus accounts, which hold shares on behalf of individual shareholders.
Note 7. Federal Income Taxes
Income and capital gain distributions are determined in accordance with federal income tax regulations, which may differ from GAAP.
There were no dividends paid by the fund to shareholders during the period ended October 31, 2014.
The tax basis components of distributable earnings differ from the amounts reflected in the Statement of Assets and Liabilities by temporary book/tax differences. These differences are primarily due to passive foreign investment company un-reversed inclusions, wash sales and organizational expenses. At October 31, 2014, the components of distributable earnings on a tax basis were as follows:
Undistributed net investment income | | $ | 668,109 | | |
Accumulated realized loss | | | (496,626 | ) | |
Unrealized appreciation | | | 527,218 | | |
| | $ | 698,701 | | |
At October 31, 2014, the Fund had $485,770 of unlimited short-term and $10,856 of unlimited long-term capital loss carryforwards to offset possible future capital gains.
Under the Regulated Investment Company Modernization Act of 2010, the Fund will be permitted to carry forward capital losses incurred in taxable years beginning after December 22, 2010 for an unlimited period. However, any losses incurred during those future taxable years will be required to be utilized prior to the losses incurred in pre-enactment taxable years. As a result of this ordering rule, pre-enactment capital loss carryforwards may be more likely to expire unused. Additionally, post-enactment capital losses that are carried
31
Credit Suisse Emerging Markets Equity Fund
Notes to Financial Statements (continued)
October 31, 2014
Note 7. Federal Income Taxes
forward will retain their character as either short-term or long-term capital losses rather than being considered all short-term as under previous law. It is uncertain whether the Fund will be able to realize the full benefits of the capital loss carryforwards before they expire. The Fund has no pre-enactment capital loss carryforwards.
At October 31, 2014, the cost of investments (excluding foreign currency related transactions) and net unrealized appreciation (depreciation) for income tax purposes were as follows:
Cost of Investments | | $ | 23,112,150 | | |
Unrealized appreciation | | $ | 1,693,153 | | |
Unrealized depreciation | | | (1,168,457 | ) | |
Net unrealized appreciation (depreciation) | | $ | 524,696 | | |
At October 31, 2014, the Fund reclassified $10,484 to accumulated net investment income and $8,001 from accumulated net realized loss to paid in capital, to adjust for current period permanent book/tax differences. These permanent differences are due to differing book/tax treatment of foreign currency gain (loss) and non-deductible 12b-1 and blue sky expenses. Net assets were not affected by these reclassifications.
Note 8. Contingencies
In the normal course of business, the Fund may provide general indemnifications pursuant to certain contracts and organizational documents. The Fund's maximum exposure under these arrangements is dependent on future claims that may be made against the Fund and, therefore, cannot be estimated; however, based on experience, the risk of loss from such claims is considered remote.
Note 9. Other Matters
On May 19, 2014, the U.S. Department of Justice (the "Department of Justice") filed a one-count criminal information (the "Information") in the District Court for the Eastern District of Virginia charging Credit Suisse AG ("CSAG") with conspiracy to commit tax fraud related to accounts CSAG established for cross-border clients. The Department of Justice and CSAG entered into a plea agreement (the "Plea Agreement") settling the action pursuant to which CSAG pleaded guilty to the charge set out in the Information.
32
Credit Suisse Emerging Markets Equity Fund
Notes to Financial Statements (continued)
October 31, 2014
The Plea Agreement requires CSAG to pay over $1.8 billion to the U.S. government, including the U.S. Internal Revenue Service. The Plea Agreement also requires CSAG to lawfully undertake certain remedial actions to address the conduct described in the Plea Agreement.
CSAG has entered into other settlements relating to the conduct set out in the Plea Agreement. CSAG has entered into a Consent Order with the Federal Reserve Board (the "Federal Reserve") to resolve certain findings by the Federal Reserve, including that the activities of CSAG regarding opening of foreign accounts for U.S. taxpayers, provision of investment services to U.S. clients, and operation of CSAG's New York representative office prior to 2009 lacked adequate enterprise-wide risk management and compliance policies and procedures sufficient to ensure that all of its activities comply with U.S. laws and regulations. In addition, CSAG has entered into a Consent Order with the New York State Department of Financial Services (the "DFS") to resolve the DFS's investigation into the conduct described in the Plea Agreement. The settlement with the Federal Reserve requires CSAG to pay $100 million to the Federal Reserve, and the settlement with the DFS requires CSAG to pay $715 million to the DFS.
These settlements follow a settlement by Credit Suisse Group AG ("CS Group"), the parent company of CSAG, with the Securities and Exchange Commission (the "Commission") on February 21, 2014 to resolve an investigation by the Commission into solicitation and provision of broker-dealer and investment advisory services to certain U.S. cross-border clients by CS Group while not registered with the Commission as a broker-dealer or investment adviser. As part of the settlement, CS Group retained an independent consultant to evaluate its policies and procedures and examine its broker-dealer and investment adviser activities to fully verify that the business that was the subject of the Commission investigation has been completely exited. CS Group also agreed to pay $196,511,014, which includes $82,170,990 in disgorgement, $64,340,024 in interest and a $50,000,000 penalty.
CSAG is the indirect parent company of Credit Suisse and CSSU. Neither Credit Suisse, CSSU nor the Fund was named in the Plea Agreement (as defined below) or other settlements relating to the conduct set out in the Plea Agreement. The conduct set out in the Plea Agreement did not involve the Fund, Credit Suisse or CSSU with respect to its investment adviser and distribution activities relating to the Fund.
33
Credit Suisse Emerging Markets Equity Fund
Notes to Financial Statements (continued)
October 31, 2014
Credit Suisse, CSSU and certain of their affiliates have received a permanent exemptive order from the Commission to permit them to continue serving as investment advisers and principal underwriters for U.S.-registered investment companies, such as the Fund. Due to a provision in the law governing the operation of U.S.-registered investment companies, they would otherwise have become ineligible to perform these activities as a result of the plea in the Plea Agreement. The permanent exemptive order permits Credit Suisse and CSSU to continue to provide services to the Fund, so long as, among other things, no current or former employee of CSAG or any affiliate of CSAG who previously has been or who subsequently may be identified by CSAG or any U.S. or non-U.S. regulatory or enforcement agencies as having been responsible for the conduct described in the Plea Agreement will be employed by Credit Suisse and certain of its affiliates. Credit Suisse and CSSU have informed the Fund that, Credit Suisse and CSSU believe the Settlements will not have any material impact on the Fund or on the ability of Credit Suisse or CSSU to perform services for the Fund.
On November 21, 2014, at the sentencing hearing, the court accepted and implemented the sentence as set out in the plea agreement. The court imposed no additional conditions beyond those contained in the agreement.
34
Credit Suisse Emerging Markets Equity Fund
Report of Independent Registered Public Accounting Firm
To the Board of Trustees and the Shareholders of
Credit Suisse Emerging Markets Equity Fund:
In our opinion, the accompanying statement of assets and liabilities, including the schedule of investments, and the related statements of operations and of changes in net assets and the financial highlights present fairly, in all material respects, the financial position of Credit Suisse Emerging Markets Equity Fund(a separate fund of Credit Suisse Opportunity Funds) (the "Fund") at October 31, 2014, the results of its operations, the changes in its net assets and the financial highlights for the period December 26, 2013 (commencement of operations) through October 31, 2014, in conformity with accounting principles generally accepted in the United States of America. These financial statements and financial highlights (hereafter referred to as "financial statements") are the responsibility of the Fund's management. Our responsibility is to express an opinion on these financial statements based on our audit. We conducted our audit of these financial statements in accordance with the standards of the Public Company Accounting Oversight Board (United States). Those standards require that we plan and perform the audit to obtain reasonable assurance about whether the financial statements are free of material misstatement. An audit includes examining, on a test basis, evidence supporting the amounts and disclosures in the financial statements, assessing the accounting principles used and significant estimates made by management, and evaluating the overall financial statement presentation. We believe that our audit, which included confirmation of securities at October 31, 2014 by correspondence with the custodian and brokers, provides a reasonable basis for our opinion.
PricewaterhouseCoopers LLP
New York, New York
December 29, 2014
35
Credit Suisse Emerging Markets Equity Fund
Tax Information (unaudited)
Foreign Tax Credits
The Fund expects to make an election under Internal Revenue Code Section 853 to pass through foreign taxes paid by the Fund to its shareholders. For the year ended October 31, 2014, the total amount of foreign taxes that is expected to pass through to shareholders and foreign source income for information reporting purposes will be $58,012 and $627,700 respectively. Complete information regarding the Fund's foreign tax credit pass through to shareholders for 2014 will be reported in conjunction with Form 1099-DIV.
36
Credit Suisse Emerging Markets Equity Fund
Information Concerning Trustees and Officers (unaudited)
Name, Address
(Year of Birth) | | Position(s)
Held with
Fund | | Term
of Office1
and
Length
of Time
Served | | Principal
Occupation(s) During
Past Five Years | | Number of
Portfolios
in Fund
Complex
Overseen
by Trustee | | Other
Trusteeships
Held by Trustee | |
Independent Trustees | | | | | | | | | | | |
Enrique Arzac
c/o Credit Suisse Asset
Management, LLC
Attn: General Counsel
One Madison Avenue
New York, New York
10010
(1941) | | Trustee, Audit Committee Chairman and Nominating Committee Member | | Since Fund Inception | | Professor of Finance and Economics, Graduate School of Business, Columbia University since 1971. | | | 12 | | | Director of The Adams Express Company, Petroleum and Resources Corporation, Aberdeen Chile Fund, Inc., Aberdeen Emerging Markets Smaller Company Opportunities Fund, Inc., Aberdeen Israel Fund, Inc., Aberdeen Indonesia Fund, Inc. and Aberdeen Latin America Equity Fund, Inc. (each a closed-end investment company); Director of Aberdeen Asia-Pacific Income Investment Company Limited (a Canadian closed-end fund); Trustee of Mirae Asset Discovery Funds (6 open-end portfolios); Director of Starcomms PLC. (telecommunications company) from 2008 to 2011; Director of Epoch Holding Corporation (an investment management and investment advisory services company) from 2006 to March 2013. | |
37
Credit Suisse Emerging Markets Equity Fund
Information Concerning Trustees and Officers (unaudited) (continued)
Name, Address
(Year of Birth) | | Position(s)
Held with
Fund | | Term
of Office1
and
Length
of Time
Served | | Principal
Occupation(s) During
Past Five Years | | Number of
Portfolios
in Fund
Complex
Overseen
by Trustee | | Other
Trusteeships
Held by Trustee | |
Independent Trustees | | | | | | | | | | | |
Jeffrey E. Garten
c/o Credit Suisse Asset Management, LLC
Attn: General Counsel One Madison Avenue New York, New York 10010
(1946) | | Trustee, Audit and Nominating Committee Member | | Since Fund Inception | | The Juan Trippe Professor in the Practice of International Trade, Finance and Business, Yale School of Management, from July 2005 to present; Partner and Chairman of Garten Rothkopf (consulting firm) from October 2005 to present. | | | 10 | | | Director of Aetna, Inc. (insurance company); Director of CarMax Group (used car dealers); Director of Alcan (aluminum production) from February 2007 to November 2007; Member of Standard & Poor's Board of Managers (credit rating agency) from December 2011 to November 2014; Director of Miller Buckfire & Co., LLC (financial restructuring). | |
38
Credit Suisse Emerging Markets Equity Fund
Information Concerning Trustees and Officers (unaudited) (continued)
Name, Address
(Year of Birth) | | Position(s)
Held with
Fund | | Term
of Office1
and
Length
of Time
Served | | Principal
Occupation(s) During
Past Five Years | | Number of
Portfolios
in Fund
Complex
Overseen
by Trustee | | Other
Trusteeships
Held by Trustee | |
Independent Trustees | | | | | | | | | | | |
Steven N. Rappaport
Lehigh Court, LLC
555 Madison Avenue
29th Floor
New York, New York
10022
(1948) | | Chairman of the Board of Trustees, Audit Committee Member and Nominating Committee Chairman | | Since Fund Inception | | Partner of Lehigh Court, LLC and RZ Capital (private investment firms) from July 2002 to present. | | | 12 | | | Director of iCAD, Inc. (surgical and medical instruments and apparatus company); Director of Aberdeen Chile Fund, Inc., Aberdeen Emerging Markets Smaller Company Opportunities Fund, Inc., Aberdeen Israel Fund, Inc., Aberdeen Indonesia Fund, Inc. and Aberdeen Latin America Equity Fund, Inc. (each a closed-end investment company); Director of Presstek, Inc. (digital imaging technologies company) from 2003 to 2012; Director of Wood Resources, LLC. (plywood manufacturing company) from 2003 to October 2013; Partner Backstage Acquisition Holding, LLC (Publication Job Postings) from November 2013 to present. | |
1 Each Trustee and Officer serves until his or her respective successor has been duly elected and qualified.
39
Credit Suisse Emerging Markets Equity Fund
Information Concerning Trustees and Officers (unaudited) (continued)
Name, Address
(Year of Birth) | | Position(s)
Held with
Fund | | Term of
Office1
and
Length of
Time
Served | | Principal Occupation(s) During Past Five Years | |
Officers* | | | | | | | |
John G. Popp
Credit Suisse Asset
Management, LLC
One Madison Avenue
New York, New York 10010
(1956) | | Chief Executive Officer and President | | Since Fund Inception | | Managing Director of Credit Suisse; Global Head and Chief Investment Officer of the Credit Investment Group; Associated with Credit Suisse or its predecessor since 1997; Officer of other Credit Suisse Funds; Trustee of Credit Suisse High Yield Bond Fund; Director of Credit Suisse Asset Management Income Fund, Inc. | |
Bruce Rosenberg
Credit Suisse Asset
Management, LLC
One Madison Avenue
New York, New York 10010
(1961) | | Chief Financial Officer | | Since 2012 | | Director of Credit Suisse; Director of Liquid Accounting of Credit Suisse; Associated with Credit Suisse since 2008; Officer of other Credit Suisse Funds. | |
Emidio Morizio
Credit Suisse Asset
Management, LLC
One Madison Avenue
New York, New York 10010
(1966) | | Chief Compliance Officer | | Since Fund Inception | | Managing Director and Global Head of Compliance of Credit Suisse since 2010; Director and Global Head of Compliance of Credit Suisse from January 2005 to December 2009; Associated with Credit Suisse since July 2000; Officer of other Credit Suisse Funds. | |
Joanne Doldo
Credit Suisse Asset
Management, LLC
One Madison Avenue
New York, New York 10010
(1959) | | Chief Legal Officer | | Since 2013 | | Vice President of Credit Suisse; Associated with Credit Suisse since September 2011; Officer of other Credit Suisse Funds; Associated with Morgan Stanley Investment Management from 2002-2008. | |
Rocco DelGuercio
Credit Suisse Asset
Management, LLC
One Madison Avenue
New York, New York 10010
(1963) | | Treasurer | | Since 2013 | | Vice President of Credit Suisse since 2013; Independent Consultant from February 2012 to April 2013; Director of Legg Mason & Co., LLC from March 2004 to January 2012; Associated with Credit Suisse from June 1996 to March 2004; Officer of other Credit Suisse Funds. | |
Karen Regan
Credit Suisse Asset
Management, LLC
One Madison Avenue
New York, New York 10010
(1963) | | Senior Vice President and Secretary | | Since Fund Inception | | Vice President of Credit Suisse; Associated with Credit Suisse since December 2004; Officer of other Credit Suisse Funds. | |
* The officers of the Fund shown are officers that make policy decisions.
The Statement of Additional Information includes additional information about the Trustees and is available, without charge, upon request, by calling 877-870-2874.
40
Credit Suisse Emerging Markets Equity Fund
Proxy Voting and Portfolio Holdings Information (unaudited)
Information regarding how the Fund voted proxies related to its portfolio securities during the 12 month period ended June 30 of each year, as well as the policies and procedures that the Fund uses to determine how to vote proxies relating to its portfolio securities are available:
• By calling 1-877-870-2874
• On the Fund's website, www.credit-suisse.com/us/funds
• On the website of the Securities and Exchange Commission, www.sec.gov.
The Fund files a complete schedule of its portfolio holdings for the first and third quarters of its fiscal year with the SEC on Form N-Q. The Fund's Forms N-Q are available on the SEC's website at www.sec.gov and may be reviewed and copied at the SEC's Public Reference Room in Washington, DC. Information on the operation of the SEC's Public Reference Room may be obtained by calling 1-202-551-8090.
41

P.O. BOX 55030, BOSTON, MA 02205-5030
877-870-2874 n www.credit-suisse.com/us/funds
CREDIT SUISSE SECURITIES (USA) LLC, DISTRIBUTOR. EMF-AR-1014

CREDIT SUISSE FUNDS
Annual Report
October 31, 2014
n CREDIT SUISSE
FLOATING RATE HIGH INCOME FUND
The Fund's investment objectives, risks, charges and expenses (which should be considered carefully before investing), and more complete information about the Fund, are provided in the Prospectus, which should be read carefully before investing. You may obtain additional copies by calling 877-870-2874 or by writing to Credit Suisse Funds, P.O. Box 55030, Boston, MA 02205-5030.
Credit Suisse Securities (USA) LLC, Distributor, is located at One Madison Avenue, New York, NY 10010. Credit Suisse Funds are advised by Credit Suisse Asset Management, LLC.
Investors in the Credit Suisse Funds should be aware that they may be eligible to purchase Class I shares (where offered) directly or through certain intermediaries. Such shares are not subject to a sales charge. Investors in the Credit Suisse Funds should also be aware that they may be eligible for a reduction or waiver of the sales charge with respect to Class A, B or C shares (where offered). For more information, please review the relevant prospectuses or consult your financial representative.
Fund shares are not deposits or other obligations of Credit Suisse Asset Management, LLC ("Credit Suisse") or any affiliate, are not FDIC-insured and are not guaranteed by Credit Suisse or any affiliate. Fund investments are subject to investment risks, including loss of your investment.
Credit Suisse Floating Rate High Income Fund
Annual Investment Adviser's Report
October 31, 2014 (unaudited)
December 22, 2014
Dear Shareholder:
We are pleased to present this Annual Report covering the activities of the Credit Suisse Floating Rate High Income Fund (the "Fund"), for the 12-months ended October 31, 2014.
Performance Summary
11/01/13 – 10/31/14
Fund & Benchmark | | Performance | |
| Class I1 | | | 2.94 | % | |
| Class A1,2 | | | 2.53 | % | |
| Class B1,2 | | | 1.77 | % | |
| Class C1,2 | | | 1.77 | % | |
| Credit Suisse Leveraged Loan Index Total Return3 | | | 3.77 | % | |
Performance shown for the Fund's Class A, Class B and Class C Shares does not reflect sales charges, which are a maximum of 4.75%, 4.00% and 1.00%, respectively.2
Market Review: A positive period for senior secured loans
The 12-months ended October 31, 2014, was a positive one for the senior secured loan asset class. The Credit Suisse Leveraged Loan Index Total Return (the "Index"), returned 3.77% for the period. The discount margin for senior loans, using a three-year average life assumption, widened 0.17% during the period to +515 basis points. Returns represented mostly coupon clipping as the average price of the Index finished the period at 97.61, down by 0.61 points.
The last 12-months have presented an opportunity for corporations to refinance their balance sheets. According to JP Morgan, there was $553 billion in loan issuance, with re-financings/re-pricings representing 54% of that total and with leveraged buyout and dividend activity representing most of the remainder.
On the demand side, the loan mutual funds had enjoyed inflows for much of 2013 and the beginning of 2014. Flows reversed to negative in April, thus bringing the total flow for the last twelve months to -$8.4 billion, according to JPMorgan. Collateralized loan obligations ("CLOs"), however, have been issued at record pace, with $122.2 billion issued over the same period, more than offsetting any negative mutual fund flows.
Fundamentals in the senior secured loan market have been strong, with current and expected defaults continuing to contract. Default rates ended the period at 3.28%, elevated from the $19.5 billion Energy Futures ("TXU") default that occurred in 2014. Absent TXU, default rates are 0.24%. With few maturities
1
Credit Suisse Floating Rate High Income Fund
Annual Investment Adviser's Report (continued)
October 31, 2014 (unaudited)
looming, solid overall EBITDA growth among loan issuers, and expectations of economic growth in the intermediate term, default rates are anticipated to remain low.
From a quality point-of view, the lower rated portion of the Credit Suisse Leveraged Loan Index Total Return outperformed for the year. Distressed (CC, C, and Default) posted the highest returns, at 18.71%, followed by CCC/Split CCC loans which returned 7.30% during the period. Split BBB and BB rated loans underperformed with respective returns of 2.27% and 2.45%.
Strategic Review and Outlook: Anticipating a continued positive environment
For the 12-months ended October 31, 2014, the Fund underperformed the Index. Positive security selection in NR & Ba1 rated debt, oil and gas, and metals & mining contributed to returns. Conversely, allocations to utilities and printing/publishing detracted from performance.
Portfolio exposures remain underweight in the lower-rated, higher beta names in the Index that typically experience higher volatility during market corrections. Fundamentals within the loan space are relatively stable. Though we have seen increased leverage, interest coverage remains healthy as many companies have taken advantage of robust conditions over the past few years to re-finance their debt and extend maturities. However, potential exogenous shocks, such as oil price volatility, may contribute to elevated volatility in the near future. These factors, coupled with supply and demand dynamics between mutual fund flows, CLO creation and the new issue pipeline, will likely drive returns in the first half of 2015. Looking further out, most market participants expect the Fed to raise short-term interest rates in mid to late 2015. Given that loans typically have short interest rate exposure and coupons that are based on short-term rates, the asset class should benefit from a rising rate environment.
The Credit Suisse Credit Investments Group Team
John G. Popp
Thomas J. Flannery
Louis I. Farano
Wing Chan
Senior secured floating rate loans ("Senior Loans") are subject to risk that a court could subordinate a Senior Loan, which typically holds the most senior position in the
2
Credit Suisse Floating Rate High Income Fund
Annual Investment Adviser's Report (continued)
October 31, 2014 (unaudited)
issuer's capital structure, to presently existing or future indebtedness or take other action detrimental to the holders of Senior Loans.
High yield bonds are lower-quality bonds that are also known as "junk bonds." Such bonds entail greater risks than those found in higher-rated securities.
In addition to historical information, this report contains forward-looking statements, which may concern, among other things, domestic and foreign market, industry and economic trends and developments and government regulation and their potential impact on the Fund's investments. These statements are subject to risks and uncertainties and actual trends, developments and regulations in the future, and their impact on the Fund could be materially different from those projected, anticipated or implied. The Fund has no obligation to update or revise forward-looking statements.
The views of the Fund's management are as of the date of the letter and the Fund holdings described in this document are as of October 31, 2014; these views and Fund holdings may have changed subsequent to these dates. Nothing in this document is a recommendation to purchase or sell securities.
3
Credit Suisse Floating Rate High Income Fund
Annual Investment Adviser's Report (continued)
October 31, 2014 (unaudited)
Comparison of Change in Value of $10,000 Investment in the
Credit Suisse Floating Rate High Income Fund1 Class I shares and the
Credit Suisse Leveraged Loan Index3 for Ten Years.
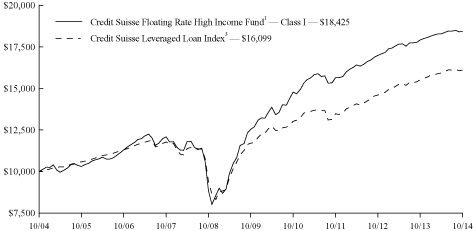
Comparison of Change in Value of $10,000 Investment in the
Credit Suisse Floating Rate High Income Fund1 Class A shares2,
Class B shares2, and Class C shares2 and the Credit Suisse
Leveraged Loan Index3 for Ten Years.
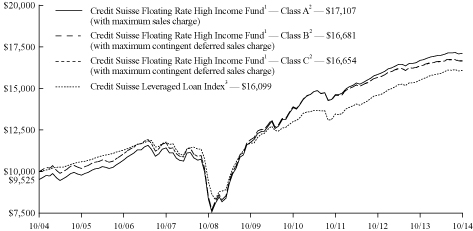
1 Fee waivers and/or expense reimbursements may reduce expenses for the Fund, without which performance would be lower. Voluntary waivers and/or reimbursements may be discontinued at any time.
4
Credit Suisse Floating Rate High Income Fund
Annual Investment Adviser's Report (continued)
October 31, 2014 (unaudited)
2 Total return for the Fund's Class A shares for the reporting period, based on offering price (including maximum sales charge of 4.75%), was (2.37)%. Total return for the Fund's Class B shares for the reporting period, based on redemption value (including maximum contingent deferred sales charge of 4.00%), was (2.18)%. Total return for the Fund's Class C shares for the reporting period, based on redemption value (including maximum contingent deferred sales charge of 1.00%), was 0.78%.
3 Credit Suisse Leveraged Loan Index is an unmanaged index that is designed to mirror the investable universe of the U.S. dollar denominated institutional leveraged loan market. An index does not have transaction costs, investors cannot invest directly in an index.
Average Annual Returns as of October 31, 20141
| | | 1 Year | | 5 Years | | 10 Years | | Since
Inception | |
Class I Class | | | 2.94 | % | | | 8.01 | % | | | 6.30 | % | | | 6.74 | % | |
Class A Without Sales Charge | | | 2.53 | % | | | 7.75 | % | | | 6.03 | % | | | 6.29 | % | |
Class A With Maximum
Sales Charge | | | (2.37 | )% | | | 6.71 | % | | | 5.52 | % | | | 5.96 | % | |
Class B Without CDSC | | | 1.77 | % | | | 6.95 | % | | | 5.25 | % | | | 5.48 | % | |
Class B With CDSC | | | (2.18 | )% | | | 6.95 | % | | | 5.25 | % | | | 5.48 | % | |
Class C Without CDSC | | | 1.77 | % | | | 6.91 | % | | | 5.23 | % | | | 5.55 | % | |
Class C With CDSC | | | 0.78 | % | | | 6.91 | % | | | 5.23 | % | | | 5.55 | % | |
Returns represent past performance and include change in share price and reinvestment of dividends and capital gains. Past performance cannot guarantee future results. The current performance of the Fund may be lower or higher than the figures shown. Returns and share price will fluctuate, and redemption value may be more or less than original cost. The performance results do not reflect the deduction of taxes that a shareholder would pay on fund distributions or the redemption of fund shares. Performance information current to the most recent month-end is available at www.credit-suisse.com/us/funds.
The annual gross expense ratios are 0.77% for Class I shares, 1.02% for Class A shares, 1.77% for Class B shares and 1.77% for Class C shares. The annual net expense ratios after fee waivers and/or expense reimbursements are 0.70% for Class I shares, 0.95% for Class A shares, 1.70% for Class B shares and 1.70% for Class C shares.
1 Fee waivers and/or expense reimbursements may reduce expenses for the Fund, without which performance would be lower. Voluntary waivers and/or reimbursements may be discontinued at any time.
5
Credit Suisse Floating Rate High Income Fund
Annual Investment Adviser's Report (continued)
October 31, 2014 (unaudited)
Information About Your Fund's Expenses
As an investor of the Fund, you incur two types of costs: ongoing expenses and transaction costs. Ongoing expenses include management fees, distribution and service (12b-1) fees and other Fund expenses. Examples of transaction costs include sales charges (loads), redemption fees and account maintenance fees, which are not shown in this section and which would result in higher total expenses. The following table is intended to help you understand your ongoing expenses of investing in the Fund and to help you compare these expenses with the ongoing expenses of investing in other mutual funds. The table is based on an investment of $1,000 made at the beginning of the six-months ended October 31, 2014.
The table illustrates your Fund's expenses in two ways:
• Actual Fund Return. This helps you estimate the actual dollar amount of ongoing expenses paid on a $1,000 investment in the Fund using the Fund's actual return during the period. To estimate the expenses you paid over the period, simply divide your account value by $1,000 (for example, an $8,600 account value divided by $1,000 = 8.6), then multiply the result by the number in the "Expenses Paid per $1,000" line under the share class you hold.
• Hypothetical 5% Fund Return. This helps you to compare your Fund's ongoing expenses with those of other mutual funds using the Fund's actual expense ratio and a hypothetical rate of return of 5% per year before expenses. Examples using a 5% hypothetical fund return may be found in the shareholder reports of other mutual funds. The hypothetical account values and expenses may not be used to estimate the actual ending account balance or expenses you paid for the period.
Please note that the expenses shown in these tables are meant to highlight your ongoing expenses only and do not reflect any transaction costs, such as sales charges (loads) or redemption fees. If these transaction costs had been included, your costs would have been higher. The "Expenses Paid per $1,000" line of the tables is useful in comparing ongoing expenses only and will not help you determine the relative total expenses of owning different funds.
6
Credit Suisse Floating Rate High Income Fund
Annual Investment Adviser's Report (continued)
October 31, 2014 (unaudited)
Expenses and Value for a $1,000 Investment
for the six month period ended October 31, 2014
Actual Fund Return | | Class I | | Class A | | Class B | | Class C | |
Beginning Account Value 05/01/14 | | $ | 1,000.00 | | | $ | 1,000.00 | | | $ | 1,000.00 | | | $ | 1,000.00 | | |
Ending Account Value 10/31/14 | | $ | 1,008.80 | | | $ | 1,006.10 | | | $ | 1,002.40 | | | $ | 1,002.40 | | |
Expenses Paid per $1,000* | | $ | 3.54 | | | $ | 4.80 | | | $ | 8.58 | | | $ | 8.58 | | |
Hypothetical 5% Fund Return | |
Beginning Account Value 05/01/14 | | $ | 1,000.00 | | | $ | 1,000.00 | | | $ | 1,000.00 | | | $ | 1,000.00 | | |
Ending Account Value 10/31/14 | | $ | 1,021.68 | | | $ | 1,020.42 | | | $ | 1,016.64 | | | $ | 1,016.64 | | |
Expenses Paid per $1,000* | | $ | 3.57 | | | $ | 4.84 | | | $ | 8.64 | | | $ | 8.64 | | |
| | | Class I | | Class A | | Class B | | Class C | |
Annualized Expense Ratios* | | | 0.70 | % | | | 0.95 | % | | | 1.70 | % | | | 1.70 | % | |
* Expenses are equal to the Fund's annualized expense ratio for each share class, multiplied by the average account value over the period, multiplied by the number of days in the most recent fiscal half year period, then divided by 365.
The "Expenses Paid per $1,000" and the "Annualized Expense Ratios" in the tables are based on actual expenses paid by the Fund during the period, net of fee waivers and/or expense reimbursements. If those fee waivers and/or expense reimbursements had not been in effect, the Fund's actual expenses would have been higher. Expenses do not reflect additional charges and expenses that are, or may be, imposed under the variable contracts or plans. Such charges and expenses are described in the prospectus of the insurance company separate account or in the plan documents or other informational materials supplied by plan sponsors. The Fund's expenses should be considered with these charges and expenses in evaluating the overall cost of investing in the separate account.
For more information, please refer to the Fund's prospectus.
7
Credit Suisse Floating Rate High Income Fund
Annual Investment Adviser's Report (continued)
October 31, 2014 (unaudited)
Credit Quality Breakdown*
(% of Total Investments as of October 31, 2014)
S&P Ratings | |
BBB | | | 3.3 | % | |
BB | | | 29.8 | | |
B | | | 58.4 | | |
CCC | | | 3.4 | | |
NR | | | 3.8 | | |
Subtotal | | | 98.7 | | |
Equity and Other | | | 0.0 | | |
| Short-Term Investment1 | | | 1.3 | | |
Total | | | 100.0 | % | |
* Expressed as a percentage of total investments (excluding securities lending collateral if applicable) and may vary over time.
1 Primarily reflects cash invested in State Street Bank and Trust Co. Euro Time Deposit, for which the purchases of securities have been executed but not yet settled at October 31, 2014, if applicable.
8
Credit Suisse Floating Rate High Income Fund
Schedule of Investments
October 31, 2014
Par
(000) | | | | Ratings†
(S&P/Moody's) | | Maturity | | Rate% | | Value | |
| BANK LOANS (83.7%) | |
| Aerospace & Defense (0.9%) | | | |
$ | 2,403 | | | Camp International Holding Co.# | | (B-, B2) | | 05/31/19 | | | 4.750 | | | $ | 2,405,877 | | |
| | 1,000 | | | Camp International Holding Co.# | | (CCC, Caa2) | | 11/30/19 | | | 8.250 | | | | 1,006,250 | | |
| | 12,057 | | | LM U.S. Corp. Acquisition, Inc.# | | (B-, B2) | | 10/25/19 | | | 4.750 | | | | 12,000,787 | | |
| | 1,400 | | | LM U.S. Corp. Acquisition, Inc.# | | (CCC, Caa2) | | 01/25/21 | | | 8.250 | | | | 1,382,500 | | |
| | | | 16,795,414 | | |
| Airlines (0.9%) | | | |
| | 6,907 | | | Delta Air Lines, Inc.# | | (BBB-, Ba1) | | 10/18/18 | | | 3.250 | | | | 6,774,390 | | |
| | 10,103 | | | United Airlines, Inc.# | | (BB-, Ba2) | | 04/01/19 | | | 3.500 | | | | 9,923,274 | | |
| | | | 16,697,664 | | |
| Auto Parts & Equipment (2.4%) | | | |
| | 2,000 | | | ABRA, Inc.# | | (CCC+, Caa1) | | 09/19/22 | | | 8.250 | | | | 2,000,000 | | |
| | 8,440 | | | Affinia Group Intermediate Holdings, Inc.# | | (B, B2) | | 04/27/20 | | | 4.750 | | | | 8,439,530 | | |
| | 5,724 | | | American Tire Distributors Holdings, Inc.# | | (CCC+, B2) | | 06/01/18 | | | 5.750 | | | | 5,734,714 | | |
| | 5,985 | | | CS Intermediate Holdco 2 LLC# | | (BB-, B1) | | 04/04/21 | | | 4.000 | | | | 5,932,631 | | |
| | 6,000 | | | Gates Global, Inc.# | | (B+, B2) | | 07/05/21 | | | 4.250 | | | | 5,942,670 | | |
| | 2,900 | | | MPG Holdco I, Inc.# | | (BB+, Ba3) | | 10/20/21 | | | 4.500 | | | | 2,906,046 | | |
| | 4,961 | | | UCI International, Inc.# | | (B, Ba3) | | 07/26/17 | | | 5.500 | | | | 4,962,903 | | |
| | 9,176 | | | Veyance Technologies, Inc.# | | (B, B2) | | 09/08/17 | | | 5.250 | | | | 9,162,997 | | |
| | | | 45,081,491 | | |
| Automakers (0.2%) | | | |
| | 2,873 | | | Chrysler Group LLC# | | (BB+, Ba1) | | 05/24/17 | | | 3.500 | | | | 2,862,075 | | |
| Banking (2.3%) | | | |
| | 7,387 | | | Citco Funding LLC# | | (NR, B1) | | 06/29/18 | | | 4.250 | | | | 7,344,164 | | |
| | 9,425 | | | Duff & Phelps Investment Management Co.# | | (B, B2) | | 04/23/20 | | | 4.500 | | | | 9,348,880 | | |
| | 9,405 | | | McJunkin Red Man Corp.# | | (BB-, B2) | | 11/08/19 | | | 5.000 | | | | 9,431,475 | | |
| | 11,857 | | | Ocwen Financial Corp.# | | (B, B2) | | 02/15/18 | | | 5.000 | | | | 11,471,857 | | |
| | 3,545 | | | Ship Luxco 3 Sarl#£ | | (B+, Ba3) | | 11/29/19 | | | 5.750 | | | | 5,689,407 | | |
| | | | 43,285,783 | | |
| Beverages (0.5%) | | | |
| | 7,940 | | | Del Monte Foods, Inc.# | | (B, B2) | | 02/18/21 | | | 4.253 | | | | 7,480,989 | | |
| | 1,500 | | | Del Monte Foods, Inc.# | | (CCC+, Caa1) | | 08/18/21 | | | 8.250 | | | | 1,350,000 | | |
| | | | 8,830,989 | | |
| Building Materials (1.5%) | | | |
| | 10,856 | | | ABC Supply Co., Inc.# | | (BB+, B1) | | 04/16/20 | | | 3.500 | | | | 10,643,680 | | |
| | 4,566 | | | Interline Brands, Inc.# | | (B, B2) | | 03/17/21 | | | 4.000 | | | | 4,479,333 | | |
| | 12,289 | | | Roofing Supply Group LLC# | | (B, B3) | | 05/31/19 | | | 5.000 | | | | 12,140,697 | | |
| | | | 27,263,710 | | |
| Chemicals (8.2%) | | | |
| | 2,600 | | | Allnex (Luxembourg) & Cy S.C.A.# | | (B+, Ba3) | | 10/03/19 | | | 4.500 | | | | 2,588,965 | | |
| | 3,949 | | | Allnex (Luxembourg) & Cy S.C.A.#€ | | (B+, Ba3) | | 10/04/19 | | | 4.750 | | | | 4,935,865 | | |
| | 1,349 | | | Allnex U.S.A., Inc.# | | (B+, Ba3) | | 10/03/19 | | | 4.500 | | | | 1,343,290 | | |
See Accompanying Notes to Financial Statements.
9
Credit Suisse Floating Rate High Income Fund
Schedule of Investments (continued)
October 31, 2014
Par
(000) | | | | Ratings†
(S&P/Moody's) | | Maturity | | Rate% | | Value | |
BANK LOANS | |
Chemicals | | | |
$ | 14,178 | | | Ascend Performance Materials LLC# | | (B, B2) | | 04/10/18 | | | 6.750 | | | $ | 13,788,510 | | |
| | 16,984 | | | Axalta Coating Systems U.S. Holding, Inc.# | | (B+, B1) | | 02/01/20 | | | 3.750 | | | | 16,746,559 | | |
| | 3,358 | | | AZ Chem U.S., Inc.# | | (BB-, Ba3) | | 06/12/21 | | | 4.500 | | | | 3,361,407 | | |
| | 13,734 | | | Chromaflo Technologies Corp.# | | (B, B2) | | 12/02/19 | | | 4.500 | | | | 13,690,820 | | |
| | 2,500 | | | Chromaflo Technologies Corp.# | | (B-, Caa2) | | 05/30/20 | | | 8.250 | | | | 2,506,250 | | |
| | 4,000 | | | Colouroz Investment 1 GmbH# | | (NR, Caa1) | | 09/06/22 | | | 8.250 | | | | 3,850,000 | | |
| | 9,975 | | | Gemini HDPE LLC# | | (B+, Ba2) | | 08/07/21 | | | 4.750 | | | | 9,933,478 | | |
| | 12,430 | | | Houghton International, Inc.# | | (B+, B1) | | 12/20/19 | | | 4.000 | | | | 12,305,489 | | |
| | 13,342 | | | Ineos U.S. Finance LLC# | | (BB-, Ba3) | | 05/04/18 | | | 3.750 | | | | 13,189,641 | | |
| | 5,126 | | | Kronos, Inc.# | | (B-, B1) | | 10/30/19 | | | 4.500 | | | | 5,112,952 | | |
| | 6,848 | | | Minerals Technologies, Inc.# | | (BB, Ba3) | | 05/09/21 | | | 4.000 | | | | 6,839,359 | | |
| | 8,285 | | | Nexeo Solutions LLC# | | (B+, B2) | | 09/08/17 | | | 5.000 | | | | 8,206,171 | | |
| | 623 | | | OEP Pearl Dutch Acquisition B.V.# | | (B, B1) | | 03/30/18 | | | 6.500 | | | | 624,551 | | |
| | 1,250 | | | Oxbow Carbon LLC# | | (B+, B3) | | 01/17/20 | | | 8.000 | | | | 1,225,000 | | |
| | 3,960 | | | OXEA Finance Sarl#€ | | (BB-, B1) | | 01/15/20 | | | 4.500 | | | | 4,884,409 | | |
| | 2,985 | | | OXEA Finance LLC# | | (BB-, B1) | | 01/15/20 | | | 4.250 | | | | 2,921,495 | | |
| | 3,982 | | | Polymer Group, Inc.# | | (B-, B2) | | 12/19/19 | | | 5.250 | | | | 3,997,414 | | |
| | 8,154 | | | Ravago Holdings America, Inc.# | | (BB-, B2) | | 12/20/20 | | | 5.500 | | | | 8,159,062 | | |
| | 4,059 | | | Royal Adhesives and Sealants LLC# | | (B, B1) | | 07/31/18 | | | 5.500 | | | | 4,083,927 | | |
| | 4,500 | | | Royal Adhesives and Sealants LLC# | | (CCC+, Caa2) | | 01/31/19 | | | 9.750 | | | | 4,550,625 | | |
| | 3,530 | | | Sonneborn LLC# | | (B, B1) | | 03/30/18 | | | 6.500 | | | | 3,539,122 | | |
| | 1,463 | | | Vantage Specialty Chemicals, Inc.# | | (B, B2) | | 02/10/19 | | | 5.000 | | | | 1,457,984 | | |
| | | | 153,842,345 | | |
| Computer Hardware (0.3%) | | | |
| | 4,838 | | | Dell, Inc.# | | (BB+, Ba2) | | 04/29/20 | | | 4.500 | | | | 4,852,383 | | |
| Consumer Products (0.6%) | | | |
| | 3,980 | | | ABG Intermediate Holdings 2 LLC# | | (B+, B1) | | 05/27/21 | | | 5.500 | | | | 3,965,075 | | |
| | 2,790 | | | Calceus Acquisition, Inc.# | | (B, B2) | | 01/31/20 | | | 5.000 | | | | 2,720,107 | | |
| | 4,801 | | | NBTY, Inc.# | | (B+, Ba3) | | 10/01/17 | | | 3.500 | | | | 4,708,233 | | |
| | | | 11,393,415 | | |
| Consumer/Commercial/Lease Financing (0.5%) | | | |
| | 10,378 | | | Home Loan Servicing Solutions Ltd.# | | (BB-, B2) | | 06/19/20 | | | 4.500 | | | | 9,780,906 | | |
| Diversified Capital Goods (2.0%) | | | |
| | 15,307 | | | Brand Energy & Infrastructure Services, Inc.# | | (B, B1) | | 11/26/20 | | | 4.750 | | | | 15,249,702 | | |
| | 3,990 | | | Compass Group Diversified Holdings LLC# | | (BB-, Ba3) | | 06/04/21 | | | 4.250 | | | | 3,962,569 | | |
| | 1,238 | | | Douglas Dynamics Holdings, Inc.# | | (BB, B1) | | 04/18/18 | | | 5.750 | | | | 1,238,053 | | |
| | 14,299 | | | Husky Injection Molding Systems Ltd.# | | (B, B1) | | 06/30/21 | | | 4.250 | | | | 14,099,747 | | |
| | 2,500 | | | Husky Injection Molding Systems Ltd.# | | (CCC+, Caa1) | | 06/30/22 | | | 7.250 | | | | 2,456,250 | | |
| | | | 37,006,321 | | |
| Electric - Distribution/Transportation (0.8%) | | | |
| | 5,000 | | | Gas Natural Fenosa Telecomunicaciones S.A.#€ | | (B, B2) | | 07/30/21 | | | 5.019 | | | | 6,229,265 | | |
| | 9,446 | | | Generac Power Systems, Inc.# | | (BB-, B1) | | 05/31/20 | | | 3.250 | | | | 9,274,404 | | |
| | | | 15,503,669 | | |
See Accompanying Notes to Financial Statements.
10
Credit Suisse Floating Rate High Income Fund
Schedule of Investments (continued)
October 31, 2014
Par
(000) | | | | Ratings���
(S&P/Moody's) | | Maturity | | Rate% | | Value | |
BANK LOANS | |
| Electronics (3.3%) | | | |
$ | 5,645 | | | Applied Systems, Inc.# | | (B+, B1) | | 01/25/21 | | | 4.250 | | | $ | 5,597,884 | | |
| | 11,471 | | | Avago Technologies Cayman Ltd.# | | (BBB-, Ba1) | | 05/06/21 | | | 3.750 | | | | 11,456,222 | | |
| | 13,450 | | | CCC Information Services, Inc.# | | (B+, B1) | | 12/20/19 | | | 4.000 | | | | 13,259,325 | | |
| | 10,131 | | | Freescale Semiconductor, Inc.# | | (B, B1) | | 02/28/20 | | | 4.250 | | | | 10,008,100 | | |
| | 4,914 | | | Presidio, Inc.# | | (B+, B1) | | 03/31/17 | | | 5.000 | | | | 4,913,617 | | |
| | 11,803 | | | TriZetto Corp.# | | (B-, B1) | | 05/02/18 | | | 4.750 | | | | 11,773,831 | | |
| | 1,000 | | | TriZetto Corp.# | | (CCC, Caa1) | | 03/28/19 | | | 8.500 | | | | 1,007,500 | | |
| | 4,150 | | | Zebra Technologies Corp.# | | (BB+, Ba2) | | 09/30/21 | | | 4.750 | | | | 4,185,877 | | |
| | | | 62,202,356 | | |
| Energy - Exploration & Production (0.8%) | | | |
| | 4,000 | | | Chief Exploration & Development LLC# | | (NR, NR) | | 05/12/21 | | | 7.500 | | | | 3,875,000 | | |
| | 3,500 | | | Energy Future Intermediate Holding Co. LLC# | | (BB, Ba3) | | 06/19/16 | | | 4.250 | | | | 3,498,687 | | |
| | 8,203 | | | EP Energy LLC# | | (B+, Ba3) | | 05/24/18 | | | 3.500 | | | | 8,022,163 | | |
| | | | 15,395,850 | | |
| Environmental (0.2%) | | | |
| | 3,428 | | | Waste Industries U.S.A., Inc.# | | (B+, B1) | | 03/17/17 | | | 4.000 | | | | 3,411,184 | | |
| Food - Wholesale (2.5%) | | | |
| | 11,656 | | | Allflex Holdings III, Inc.# | | (B, B2) | | 07/17/20 | | | 4.250 | | | | 11,442,350 | | |
| | 2,100 | | | Allflex Holdings III, Inc.# | | (B-, B2) | | 07/19/21 | | | 8.000 | | | | 2,078,128 | | |
| | 13,237 | | | Big Heart Pet Brands# | | (B+, B1) | | 03/08/20 | | | 3.500 | | | | 12,769,730 | | |
| | 5,626 | | | Dole Food Co., Inc.# | | (B-, B2) | | 11/01/18 | | | 4.501 | | | | 5,613,593 | | |
| | 1,985 | | | JBS U.S.A. Holdings, Inc.# | | (BB, Ba2) | | 09/18/20 | | | 3.750 | | | | 1,960,150 | | |
| | 12,557 | | | U.S. Foods, Inc.# | | (B-, B2) | | 03/31/19 | | | 4.500 | | | | 12,533,736 | | |
| | 1,761 | | | Weight Watchers International, Inc.# | | (B+, B1) | | 04/02/20 | | | 4.000 | | | | 1,354,199 | | |
| | | | 47,751,886 | | |
| Gaming (0.4%) | | | |
| | 5,000 | | | Aristocrat Leisure Ltd.# | | (BB, Ba2) | | 10/20/21 | | | 4.750 | | | | 4,976,575 | | |
| | 1,967 | | | MGM Resorts International# | | (BB, Ba2) | | 12/20/19 | | | 3.500 | | | | 1,947,375 | | |
| | | | 6,923,950 | | |
| Health Facilities (2.9%) | | | |
| | 4,489 | | | Curo Health Services LLC# | | (B, B2) | | 06/08/20 | | | 5.750 | | | | 4,410,197 | | |
| | 10,742 | | | Drumm Investors LLC# | | (B, B2) | | 05/04/18 | | | 6.750 | | | | 10,842,715 | | |
| | 12,899 | | | Heartland Dental Care, Inc.# | | (B, B1) | | 12/21/18 | | | 5.500 | | | | 12,914,955 | | |
| | 9,762 | | | Premier Dental Services, Inc.# | | (B, B3) | | 11/01/18 | | | 6.000 | | | | 9,627,357 | | |
| | 1,947 | | | Surgical Care Affiliates, Inc.# | | (B, B2) | | 12/29/17 | | | 4.233 | | | | 1,927,564 | | |
| | 11,382 | | | Surgical Care Affiliates, Inc.# | | (B, B2) | | 06/29/18 | | | 4.000 | | | | 11,292,177 | | |
| | 967 | | | United Surgical Partners International, Inc.# | | (B, B1) | | 04/19/17 | | | 4.250 | | | | 966,186 | | |
| | 2,463 | | | United Surgical Partners International, Inc.# | | (B, B1) | | 04/03/19 | | | 4.750 | | | | 2,467,117 | | |
| | | | 54,448,268 | | |
| Health Services (3.9%) | | | |
| | 13,923 | | | ABB Concise Optical Group LLC# | | (B, B2) | | 02/06/19 | | | 4.503 | | | | 13,844,701 | | |
| | 5,570 | | | Alvogen Pharma U.S., Inc.# | | (B-, B3) | | 05/23/18 | | | 7.000 | | | | 5,639,179 | | |
See Accompanying Notes to Financial Statements.
11
Credit Suisse Floating Rate High Income Fund
Schedule of Investments (continued)
October 31, 2014
Par
(000) | | | | Ratings†
(S&P/Moody's) | | Maturity | | Rate% | | Value | |
BANK LOANS | |
Health Services | | | |
$ | 11,203 | | | Ardent Medical Services, Inc.# | | (B+, B1) | | 07/02/18 | | | 6.750 | | | $ | 11,265,852 | | |
| | 362 | | | Catalent Pharma Solutions, Inc.# | | (BB-, B3) | | 12/29/17 | | | 6.500 | | | | 362,754 | | |
| | 1,590 | | | Faenza Acquisition GmbH# | | (B, Ba3) | | 08/28/20 | | | 4.250 | | | | 1,587,993 | | |
| | 5,282 | | | Faenza Acquisition GmbH# | | (B, Ba3) | | 08/31/20 | | | 4.250 | | | | 5,275,124 | | |
| | 1,883 | | | Ikaria, Inc.# | | (B-, B1) | | 02/12/21 | | | 5.000 | | | | 1,885,700 | | |
| | 3,000 | | | Ikaria, Inc.# | | (CCC, Caa1) | | 02/14/22 | | | 8.750 | | | | 3,022,500 | | |
| | 10,897 | | | INC Research, Inc.# | | (BB-, Ba2) | | 07/12/18 | | | 4.250 | | | | 10,837,582 | | |
| | 10,000 | | | Surgery Center Holdings, Inc.# | | (B, B1) | | 11/03/20 | | | 5.250 | | | | 10,000,050 | | |
| | 3,000 | | | Surgery Center Holdings, Inc.# | | (CCC+, Caa2) | | 11/03/21 | | | 8.500 | | | | 2,955,015 | | |
| | 6,138 | | | Valitas Health Services, Inc.# | | (B-, B3) | | 06/02/17 | | | 6.000 | | | | 5,984,777 | | |
| | | | 72,661,227 | | |
| Hotels (1.8%) | | | |
| | 7,425 | | | Four Seasons Holdings, Inc.# | | (BB-, B1) | | 06/27/20 | | | 3.500 | | | | 7,371,651 | | |
| | 18,296 | | | Hilton Worldwide Finance LLC# | | (BB+, Ba3) | | 10/26/20 | | | 3.500 | | | | 18,142,976 | | |
| | 8,315 | | | La Quinta Intermediate Holdings LLC# | | (BB-, B1) | | 04/14/21 | | | 4.000 | | | | 8,268,146 | | |
| | | | 33,782,773 | | |
| Household & Leisure Products (1.0%) | | | |
| | 12,665 | | | Serta Simmons Holdings LLC# | | (B+, B1) | | 10/01/19 | | | 4.250 | | | | 12,573,261 | | |
| | 6,660 | | | Tempur-Pedic International, Inc.# | | (BB, Ba3) | | 03/18/20 | | | 3.500 | | | | 6,588,869 | | |
| | | | 19,162,130 | | |
| Insured (0.6%) | | | |
| | 11,940 | | | Sedgwick, Inc.# | | (B, B1) | | 03/01/21 | | | 3.750 | | | | 11,629,560 | | |
| Investments & Misc. Financial Services (1.7%) | | | |
| | 11,011 | | | Altisource Solutions Sarl# | | (B+, B2) | | 12/09/20 | | | 4.500 | | | | 9,910,201 | | |
| | 2,000 | | | Ascensus, Inc.# | | (CCC+, Caa1) | | 12/02/20 | | | 9.000 | | | | 2,010,000 | | |
| | 4,988 | | | ION Trading Technologies Sarl#€ | | (B, B2) | | 06/10/21 | | | 4.500 | | | | 6,227,657 | | |
| | 2,068 | | | Liquidnet Holdings, Inc.# | | (B, B3) | | 05/22/19 | | | 7.750 | | | | 2,047,172 | | |
| | 4,900 | | | Transfirst Holdings, Inc.# | | (NR, Caa1) | | 06/27/18 | | | 8.000 | | | | 4,909,188 | | |
| | 485 | | | U.S. Security Holdings, Inc.# | | (B, B2) | | 07/28/17 | | | 6.000 | | | | 484,197 | | |
| | 6,948 | | | VFH Parent LLC# | | (NR, Ba3) | | 11/06/19 | | | 5.774 | | | | 6,964,869 | | |
| | | | 32,553,284 | | |
| Leisure (1.6%) | | | |
| | 8,561 | | | ClubCorp Club Operations, Inc.# | | (B+, B1) | | 07/24/20 | | | 4.500 | | | | 8,499,850 | | |
| | 8,145 | | | Great Wolf Resorts, Inc.# | | (BB-, B3) | | 08/06/20 | | | 4.250 | | | | 8,060,220 | | |
| | 8,500 | | | Metro-Goldwyn-Mayer, Inc.# | | (B+, Ba3) | | 06/26/20 | | | 5.125 | | | | 8,531,875 | | |
| | 4,988 | | | World Triathlon Corp.# | | (B, B2) | | 06/26/21 | | | 5.250 | | | | 4,956,328 | | |
| | | | 30,048,273 | | |
| Life Insurance (0.1%) | | | |
| | 1,080 | | | MSO of Puerto Rico, Inc.# | | (B+, B2) | | 12/12/17 | | | 9.750 | | | | 1,072,116 | | |
See Accompanying Notes to Financial Statements.
12
Credit Suisse Floating Rate High Income Fund
Schedule of Investments (continued)
October 31, 2014
Par
(000) | | | | Ratings†
(S&P/Moody's) | | Maturity | | Rate% | | Value | |
BANK LOANS | |
| Managed Care (0.3%) | | | |
$ | 477 | | | Onex York Acquisition Corp.#•u | | (B, B1) | | 10/01/21 | | | 0.000 | | | $ | 475,585 | | |
| | 4,413 | | | Onex York Acquisition Corp.# | | (B, B1) | | 10/01/21 | | | 4.750 | | | | 4,399,158 | | |
| | | | 4,874,743 | | |
| Media - Broadcast (3.5%) | | | |
| | 1,750 | | | All3Media International#€ | | (B, B3) | | 06/30/22 | | | 8.250 | | | | 2,167,909 | | |
| | 5,000 | | | All3Media International#£ | | (B, B2) | | 06/30/21 | | | 5.250 | | | | 7,898,414 | | |
| | 3,000 | | | Inter Media Communication Srl#€ | | (BB, NR) | | 06/05/19 | | | 5.650 | | | | 3,692,924 | | |
| | 7,697 | | | LIN Television Corp.# | | (BB+, Ba2) | | 12/21/18 | | | 4.000 | | | | 7,674,770 | | |
| | 5,105 | | | Mission Broadcasting, Inc.# | | (BB, Ba3) | | 10/01/20 | | | 3.750 | | | | 5,032,080 | | |
| | 5,790 | | | Nexstar Broadcasting, Inc.# | | (BB, Ba3) | | 10/01/20 | | | 3.750 | | | | 5,706,458 | | |
| | 14,475 | | | TWCC Holding Corp.# | | (B+, Ba3) | | 02/13/17 | | | 3.500 | | | | 14,292,394 | | |
| | 3,000 | | | UPC Financing Partnership#€ | | (BB, Ba3) | | 03/31/21 | | | 3.759 | | | | 3,761,520 | | |
| | 5,489 | | | William Morris Endeavor Entertainment LLC# | | (B, B1) | | 05/06/21 | | | 5.250 | | | | 5,414,652 | | |
| | 4,166 | | | Ziggo B.V.#u | | (BB-, Ba3) | | 01/15/22 | | | 2.750 | | | | 4,066,341 | | |
| | 2,533 | | | Ziggo B.V.#u | | (BB-, Ba3) | | 01/15/22 | | | 3.210 | | | | 2,472,476 | | |
| | 3,931 | | | Ziggo B.V.# | | (BB-, Ba3) | | 01/15/22 | | | 3.250 | | | | 3,836,754 | | |
| | | | 66,016,692 | | |
| Media - Cable (1.6%) | | | |
| | 7,000 | | | Block Communications, Inc.# | | (BB+, Ba1) | | 10/21/21 | | | 7.250 | | | | 6,997,830 | | |
| | 5,672 | | | Cequel Communications LLC# | | (BB, Ba2) | | 02/14/19 | | | 3.500 | | | | 5,624,718 | | |
| | 5,000 | | | Numericable Group S.A.#€ | | (B+, Ba3) | | 04/23/20 | | | 4.500 | | | | 6,283,766 | | |
| | 7,400 | | | Virgin Media Bristol LLC# | | (BB-, Ba3) | | 06/07/20 | | | 3.500 | | | | 7,311,089 | | |
| | 2,500 | | | Virgin Media Investment Holdings Ltd.#£ | | (BB-, Ba3) | | 06/30/23 | | | 4.250 | | | | 3,977,464 | | |
| | | | 30,194,867 | | |
| Media - Diversified (0.8%) | | | |
| | 15,676 | | | Tribune Co.# | | (BB+, Ba3) | | 12/27/20 | | | 4.000 | | | | 15,570,669 | | |
| Media - Services (0.5%) | | | |
| | 9,900 | | | WMG Acquisition Corp.# | | (B+, B1) | | 07/01/20 | | | 3.750 | | | | 9,609,188 | | |
| Medical Products (0.3%) | | | |
| | 2,473 | | | BSN Medical, Inc.# | | (BB-, Ba3) | | 08/28/19 | | | 4.000 | | | | 2,461,396 | | |
| | 3,980 | | | IMS Health, Inc.# | | (BB-, Ba3) | | 03/17/21 | | | 3.500 | | | | 3,938,787 | | |
| | | | 6,400,183 | | |
| Metals & Mining - Excluding Steel (2.5%) | | | |
| | 524 | | | CeramTec Acquisition Corp.# | | (B, Ba3) | | 08/28/20 | | | 4.250 | | | | 523,044 | | |
| | 14,938 | | | FMG Resources (August 2006) Pty. Ltd.# | | (BBB, Baa3) | | 06/30/19 | | | 3.750 | | | | 14,604,090 | | |
| | 2,000 | | | H.C. Starck GmbH#€ | | (NR, NR) | | 05/30/16 | | | 3.055 | | | | 2,478,137 | | |
| | 10,026 | | | Noranda Aluminum Acquisition Corp.# | | (B-, B2) | | 02/28/19 | | | 5.750 | | | | 9,775,503 | | |
| | 13,618 | | | Novelis, Inc.# | | (BB-, Ba2) | | 03/10/17 | | | 3.750 | | | | 13,502,720 | | |
| | 6,915 | | | U.S. Silica Co.# | | (BB, Ba3) | | 07/17/20 | | | 4.000 | | | | 6,867,434 | | |
| | | | 47,750,928 | | |
See Accompanying Notes to Financial Statements.
13
Credit Suisse Floating Rate High Income Fund
Schedule of Investments (continued)
October 31, 2014
Par
(000) | | | | Ratings†
(S&P/Moody's) | | Maturity | | Rate% | | Value | |
BANK LOANS | |
| Oil Field Equipment & Services (2.7%) | | | |
$ | 10,886 | | | BakerCorp International, Inc.# | | (B, B1) | | 02/14/20 | | | 4.250 | | | $ | 10,580,226 | | |
| | 5,000 | | | FTS International, Inc.# | | (B, B2) | | 04/16/21 | | | 5.750 | | | | 4,931,250 | | |
| | 10,381 | | | Pacific Drilling S.A.# | | (B+, B1) | | 06/03/18 | | | 4.500 | | | | 9,969,150 | | |
| | 12,388 | | | Philadelphia Energy Solutions LLC# | | (BB-, B1) | | 04/04/18 | | | 6.250 | | | | 11,784,298 | | |
| | 3,500 | | | Shelf Drilling Holdings Ltd.# | | (B+, B1) | | 10/08/18 | | | 10.000 | | | | 3,473,750 | | |
| | 9,543 | | | UTEX Industries, Inc.# | | (B, B2) | | 05/22/21 | | | 5.000 | | | | 9,450,568 | | |
| | | | 50,189,242 | | |
| Packaging (1.6%) | | | |
| | 5,000 | | | Anchor Glass Container Corp.# | | (BB-, B3) | | 06/30/21 | | | 4.250 | | | | 4,969,550 | | |
| | 15,322 | | | Berry Plastics Holding Corp.# | | (BB-, B1) | | 02/08/20 | | | 3.500 | | | | 15,034,786 | | |
| | 687 | | | Berry Plastics Holding Corp.# | | (BB-, B1) | | 01/06/21 | | | 3.750 | | | | 675,823 | | |
| | 3,990 | | | BWAY Holding Company, Inc.# | | (B-, B2) | | 08/14/20 | | | 5.500 | | | | 4,014,938 | | |
| | 5,947 | | | Clondalkin Acquisitions B.V.# | | (B, B2) | | 05/31/20 | | | 4.500 | | | | 5,873,044 | | |
| | | | 30,568,141 | | |
| Pharmaceuticals (3.0%) | | | |
| | 8,170 | | | Amneal Pharmaceuticals LLC# | | (B+, B2) | | 11/01/19 | | | 4.752 | | | | 8,108,731 | | |
| | 8,547 | | | Capsugel Holdings U.S., Inc.# | | (B+, Ba3) | | 08/01/18 | | | 3.500 | | | | 8,446,154 | | |
| | 10,394 | | | Delta Dutch Newco B.V.# | | (B, B2) | | 03/11/21 | | | 4.250 | | | | 10,155,773 | | |
| | 16,079 | | | Par Pharmaceutical Co., Inc.# | | (B, B1) | | 09/30/19 | | | 4.000 | | | | 15,865,009 | | |
| | 14,145 | | | Valeant Pharmaceuticals International, Inc.# | | (BB, Ba1) | | 12/11/19 | | | 3.500 | | | | 14,055,606 | | |
| | | | 56,631,273 | | |
| Printing & Publishing (0.7%) | | | |
| | 10,211 | | | Harland Clarke Holdings Corp.# | | (B+, B1) | | 06/30/17 | | | 5.483 | | | | 10,244,893 | | |
| | 2,422 | | | Harland Clarke Holdings Corp.# | | (B+, B1) | | 05/22/18 | | | 7.000 | | | | 2,452,149 | | |
| | 94 | | | Hibu Connect S.A., Sociedad Unipersonal#€K | | (CCC+, NR) | | 03/03/19 | | | 1.500 | | | | — | | |
| | 2,292 | | | YH Ltd.#• | | (CCC-, NR) | | 03/03/24 | | | 0.000 | | | | — | | |
| | 1,083 | | | YH Ltd.# | | (CCC+, NR) | | 03/03/19 | | | 5.233 | | | | 1,193,800 | | |
| | | | 13,890,842 | | |
| Real Estate Development & Management (0.8%) | | | |
| | 14,305 | | | Wilsonart LLC# | | (B+, B2) | | 10/31/19 | | | 4.000 | | | | 14,113,381 | | |
| Restaurants (0.3%) | | | |
| | 6,187 | | | Dunkin' Brands, Inc.# | | (B+, B2) | | 02/07/21 | | | 3.250 | | | | 6,090,677 | | |
| Software - Services (6.9%) | | | |
| | 10,845 | | | Deltek, Inc.# | | (B, B1) | | 10/10/18 | | | 4.500 | | | | 10,797,881 | | |
| | 6,055 | | | Eagle Parent, Inc.# | | (B+, Ba3) | | 05/16/18 | | | 4.000 | | | | 6,013,069 | | |
| | 10,238 | | | Evertec Group LLC# | | (BB-, B1) | | 04/17/20 | | | 3.500 | | | | 10,078,450 | | |
| | 4,190 | | | First Data Corp.# | | (BB-, B1) | | 03/24/21 | | | 4.153 | | | | 4,172,574 | | |
| | 7,939 | | | First Data Corp.# | | (BB-, B1) | | 03/23/18 | | | 3.653 | | | | 7,877,333 | | |
| | 3,000 | | | Flexera Software LLC# | | (CCC+, Caa1) | | 04/02/21 | | | 8.000 | | | | 2,932,500 | | |
| | 2,421 | | | Flexera Software LLC# | | (B, B1) | | 04/02/20 | | | 4.500 | | | | 2,400,100 | | |
| | 7,734 | | | Genesys Telecom Holdings U.S., Inc.# | | (B, B2) | | 02/07/20 | | | 4.000 | | | | 7,564,048 | | |
| | 7,692 | | | Genesys Telecom Holdings U.S., Inc.# | | (B, B2) | | 11/13/20 | | | 4.500 | | | | 7,638,993 | | |
See Accompanying Notes to Financial Statements.
14
Credit Suisse Floating Rate High Income Fund
Schedule of Investments (continued)
October 31, 2014
Par
(000) | | | | Ratings†
(S&P/Moody's) | | Maturity | | Rate% | | Value | |
BANK LOANS | |
Software - Services | | | |
$ | 10,661 | | | Infor (U.S.), Inc.# | | (B+, Ba3) | | 06/03/20 | | | 3.750 | | | $ | 10,535,853 | | |
| | 11,387 | | | Landslide Holdings, Inc.# | | (B, B1) | | 02/25/20 | | | 5.000 | | | | 11,304,662 | | |
| | 2,000 | | | Landslide Holdings, Inc.# | | (CCC+, Caa1) | | 02/25/21 | | | 8.250 | | | | 1,975,000 | | |
| | 2,000 | | | MSC.Software Corp.# | | (CCC, Caa1) | | 06/01/21 | | | 8.500 | | | | 1,970,000 | | |
| | 858 | | | MSC.Software Corp.# | | (B, B1) | | 05/29/20 | | | 5.000 | | | | 851,416 | | |
| | 11,067 | | | ON Assignment, Inc.# | | (BB+, Ba2) | | 05/15/20 | | | 3.500 | | | | 10,995,628 | | |
| | 10,808 | | | Pinnacle Holdco Sarl# | | (B+, B1) | | 07/30/19 | | | 4.750 | | | | 10,592,091 | | |
| | 8,228 | | | U.S. FT Holdco, Inc.# | | (B+, B1) | | 11/30/17 | | | 4.500 | | | | 8,213,084 | | |
| | 12,794 | | | Wall Street Systems Delaware, Inc.# | | (B, B3) | | 04/30/21 | | | 4.500 | | | | 12,746,108 | | |
| | | | 128,658,790 | | |
| Specialty Retail (4.5%) | | | |
| | 14,645 | | | Academy Ltd.# | | (B, B1) | | 08/03/18 | | | 4.500 | | | | 14,611,662 | | |
| | 16,810 | | | BJ's Wholesale Club, Inc.# | | (B-, B3) | | 09/26/19 | | | 4.500 | | | | 16,672,334 | | |
| | 2,500 | | | BJ's Wholesale Club, Inc.# | | (CCC, Caa2) | | 03/26/20 | | | 8.500 | | | | 2,507,300 | | |
| | 14,958 | | | General Nutrition Centers, Inc.# | | (BBB-, B1) | | 03/04/19 | | | 3.250 | | | | 14,633,859 | | |
| | 15,782 | | | Leslie's Poolmart, Inc.# | | (B, B2) | | 10/16/19 | | | 4.250 | | | | 15,545,064 | | |
| | 7,353 | | | Michaels Stores, Inc.# | | (B+, Ba3) | | 01/28/20 | | | 3.750 | | | | 7,236,528 | | |
| | 12,622 | | | Ollie's Bargain Outlet, Inc.# | | (B, B2) | | 09/27/19 | | | 4.750 | | | | 12,527,710 | | |
| | | | 83,734,457 | | |
| Steel Producers/Products (0.6%) | | | |
| | 10,506 | | | JMC Steel Group, Inc.# | | (BB-, B2) | | 04/01/17 | | | 4.750 | | | | 10,493,295 | | |
| Support - Services (2.8%) | | | |
| | 3,170 | | | Acosta Holdco, Inc.# | | (B, B1) | | 09/26/21 | | | 5.000 | | | | 3,179,114 | | |
| | 3,823 | | | Aramark Services, Inc.#£ | | (BBB-, B1) | | 02/24/21 | | | 3.250 | | | | 3,774,792 | | |
| | 7,373 | | | Emdeon Business Services LLC# | | (BB-, Ba3) | | 11/02/18 | | | 3.750 | | | | 7,319,269 | | |
| | 3,882 | | | Evergreen Tank Solutions, Inc.# | | (CCC+, Caa1) | | 09/28/18 | | | 9.500 | | | | 3,784,539 | | |
| | 2,500 | | | Intertrust Group Holding B.V.#€ | | (NR, NR) | | 04/16/21 | | | 4.299 | | | | 3,137,231 | | |
| | 1,486 | | | MMM Holdings, Inc.# | | (B+, B2) | | 12/12/17 | | | 9.750 | | | | 1,474,674 | | |
| | 2,981 | | | Redtop Acquisitions Ltd.# | | (B, Ba3) | | 12/03/20 | | | 4.500 | | | | 2,977,505 | | |
| | 3,938 | | | Redtop Acquisitions Ltd.# | | (CCC+, B3) | | 06/03/21 | | | 8.250 | | | | 3,957,395 | | |
| | 7,937 | | | Sabre, Inc.# | | (B+, Ba3) | | 02/19/19 | | | 4.000 | | | | 7,825,586 | | |
| | 10,465 | | | Sungard Availability Services Capital, Inc.# | | (BB-, Ba3) | | 03/31/19 | | | 6.000 | | | | 9,383,571 | | |
| | 5,404 | | | The Hertz Corp.# | | (BB, Ba1) | | 03/12/18 | | | 3.750 | | | | 5,351,955 | | |
| | | | 52,165,631 | | |
| Telecom - Integrated/Services (2.5%) | | | |
| | 5,003 | | | Eircom Finco Sarl#€ | | (B, B3) | | 09/30/19 | | | 4.589 | | | | 5,984,331 | | |
| | 5,218 | | | Intelsat Jackson Holdings S.A.# | | (BB, Ba3) | | 06/30/19 | | | 3.750 | | | | 5,183,924 | | |
| | 8,892 | | | LTS Buyer LLC# | | (B, B1) | | 04/13/20 | | | 4.000 | | | | 8,807,216 | | |
| | 1,940 | | | Windstream Corp.# | | (BB+, Ba2) | | 08/08/19 | | | 3.500 | | | | 1,928,546 | | |
| | 6,758 | | | XO Communications LLC# | | (BB-, B2) | | 03/17/21 | | | 4.250 | | | | 6,708,568 | | |
| | 19,257 | | | Zayo Group LLC# | | (B, B1) | | 07/02/19 | | | 4.000 | | | | 19,120,221 | | |
| | | | 47,732,806 | | |
See Accompanying Notes to Financial Statements.
15
Credit Suisse Floating Rate High Income Fund
Schedule of Investments (continued)
October 31, 2014
Par
(000) | | | | Ratings†
(S&P/Moody's) | | Maturity | | Rate% | | Value | |
BANK LOANS | |
| Telecom - Wireless (0.1%) | | | |
$ | 2,000 | | | Maritime Telecommunications Network, Inc.# | | (B+, NR) | | 03/03/16 | | | 7.500 | | | $ | 1,910,000 | | |
| Telecommunications Equipment (1.6%) | | | |
| | 9,786 | | | Avaya, Inc.# | | (B, B1) | | 10/26/17 | | | 4.652 | | | | 9,512,763 | | |
| | 5,812 | | | Avaya, Inc.# | | (B, B1) | | 03/30/18 | | | 6.500 | | | | 5,780,271 | | |
| | 14,143 | | | Omnitracs, Inc.# | | (B, B1) | | 11/25/20 | | | 4.750 | | | | 14,095,958 | | |
| | 750 | | | Omnitracs, Inc.# | | (CCC+, Caa1) | | 05/25/21 | | | 8.750 | | | | 743,752 | | |
| | | | 30,132,744 | | |
| Textiles & Apparel (0.8%) | | | |
| | 7,481 | | | Burlington Coat Factory Warehouse Corp.# | | (B, B1) | | 08/13/21 | | | 4.250 | | | | 7,449,455 | | |
| | 6,823 | | | Choo Luxury Holdings Ltd.# | | (NR, NR) | | 07/02/18 | | | 3.579 | | | | 6,797,411 | | |
| | | | 14,246,866 | | |
| Theaters & Entertainment (2.7%) | | | |
| | 4,880 | | | AMC Entertainment, Inc.# | | (BB-, Ba2) | | 04/30/20 | | | 3.500 | | | | 4,826,302 | | |
| | 2,000 | | | CKX, Inc.# | | (B+, B2) | | 06/21/17 | | | 9.000 | | | | 1,750,000 | | |
| | 10,406 | | | EMI Music Publishing Ltd.# | | (BB-, Ba3) | | 06/29/18 | | | 3.750 | | | | 10,319,823 | | |
| | 16,546 | | | Live Nation Entertainment, Inc.# | | (BB, Ba2) | | 08/17/20 | | | 3.500 | | | | 16,504,307 | | |
| | 16,364 | | | Tech Finance & Co. S.C.A.# | | (B+, B2) | | 07/10/20 | | | 5.500 | | | | 16,356,021 | | |
| | 1,773 | | | Village Roadshow Films (BVI) Ltd.# | | (NR, A2) | | 11/21/17 | | | 4.750 | | | | 1,763,805 | | |
| | | | 51,520,258 | | |
| Transportation - Excluding Air/Rail (0.7%) | | | |
| | 12,484 | | | Navios Partners Finance (U.S.), Inc.# | | (BB, Ba3) | | 06/27/18 | | | 5.250 | | | | 12,570,114 | | |
| TOTAL BANK LOANS (Cost $1,587,103,540) | | | 1,569,304,809 | | |
| CORPORATE BONDS (9.1%) | | | |
| Auto Parts & Equipment (0.2%) | | | |
| | 3,250 | | | UCI International, Inc., Global Company
Guaranteed Notes
(Callable 02/15/15 @ 104.31)§ | | (CCC, Caa1) | | 02/15/19 | | | 8.625 | | | | 3,136,250 | | |
| Banking (0.1%) | | | |
| | 2,500 | | | Infinity Acquisition Finance Corp., Rule 144A,
Senior Secured Notes
(Callable 08/01/17 @ 103.63)‡ | | (CCC+, Caa2) | | 08/01/22 | | | 7.250 | | | | 2,350,000 | | |
| Brokerage (0.4%) | | | |
| | 5,341 | | | Jefferies Finance LLC, Rule 144A,
Senior Unsecured Notes
(Callable 04/01/16 @ 105.53)‡ | | (B, B1) | | 04/01/20 | | | 7.375 | | | | 5,341,000 | | |
| | 1,800 | | | Jefferies Finance LLC, Rule 144A,
Senior Unsecured Notes
(Callable 04/15/17 @ 105.16)‡ | | (B, B1) | | 04/15/22 | | | 6.875 | | | | 1,750,500 | | |
| | | | 7,091,500 | | |
See Accompanying Notes to Financial Statements.
16
Credit Suisse Floating Rate High Income Fund
Schedule of Investments (continued)
October 31, 2014
Par
(000) | | | | Ratings†
(S&P/Moody's) | | Maturity | | Rate% | | Value | |
CORPORATE BONDS | |
| Building Materials (0.5%) | | | |
$ | 6,000 | | | Euramax International, Inc., Global
Senior Secured Notes
(Callable 12/01/14 @ 104.75)§ | | (B-, Caa2) | | 04/01/16 | | | 9.500 | | | $ | 5,895,000 | | |
| | 3,850 | | | Headwaters, Inc., Global Secured Notes
(Callable 04/01/15 @ 103.81) | | (B+, B2) | | 04/01/19 | | | 7.625 | | | | 4,042,500 | | |
| | | | 9,937,500 | | |
| Chemicals (0.1%) | | | |
| | 2,000 | | | Nufarm Australia Ltd., Rule 144A, Company
Guaranteed Notes
(Callable 10/15/15 @ 104.78)‡ | | (B+, B1) | | 10/15/19 | | | 6.375 | | | | 2,017,500 | | |
| Diversified Capital Goods (0.3%) | | | |
| | 5,250 | | | Anixter, Inc., Global Company Guaranteed Notes§ | | (BB, Ba3) | | 05/01/19 | | | 5.625 | | | | 5,565,000 | | |
| Energy - Exploration & Production (0.8%) | | | |
| | 2,750 | | | Dynegy Finance II, Inc., Rule 144A,
Senior Secured Notes
(Callable 05/01/17 @ 103.38)‡ | | (NR, B3) | | 11/01/19 | | | 6.750 | | | | 2,849,687 | | |
| | 4,500 | | | EPL Oil & Gas, Inc., Global Company
Guaranteed Notes
(Callable 02/15/15 @ 104.13) | | (B, B3) | | 02/15/18 | | | 8.250 | | | | 4,387,500 | | |
| | 5,000 | | | Oasis Petroleum, Inc., Company Guaranteed Notes
(Callable 11/01/16 @ 103.25)§ | | (B+, B2) | | 11/01/21 | | | 6.500 | | | | 5,150,000 | | |
| | 2,991 | | | Oasis Petroleum, Inc., Global Company
Guaranteed Notes
(Callable 09/15/17 @ 103.44)§ | | (B+, B2) | | 03/15/22 | | | 6.875 | | | | 3,125,595 | | |
| | | | 15,512,782 | | |
| Forestry & Paper (0.0%) | | | |
| | 200 | | | Stone & Webster, Inc.•K^ | | (NR, NR) | | 10/23/19 | | | 0.000 | | | | 750 | | |
| Gaming (0.0%) | | | |
| | 197 | | | Choctaw Resort Development Enterprise, Rule 144A,
Senior Unsecured Notes
(Callable 12/01/14 @ 100.00)‡ | | (B-, Caa1) | | 11/15/19 | | | 7.250 | | | | 196,508 | | |
| Gas Distribution (0.5%) | | | |
| | 2,250 | | | Energy Transfer Equity LP, Senior Secured Notes | | (BB, Ba2) | | 10/15/20 | | | 7.500 | | | | 2,598,750 | | |
| | 750 | | | Genesis Energy Finance Corp., Global Company
Guaranteed Notes
(Callable 02/15/17 @ 102.88) | | (B, B1) | | 02/15/21 | | | 5.750 | | | | 754,687 | | |
| | 6,250 | | | Holly Energy Finance Corp., Global Company
Guaranteed Notes
(Callable 03/01/16 @ 103.25) | | (BB-, B1) | | 03/01/20 | | | 6.500 | | | | 6,515,625 | | |
| | | | 9,869,062 | | |
See Accompanying Notes to Financial Statements.
17
Credit Suisse Floating Rate High Income Fund
Schedule of Investments (continued)
October 31, 2014
Par
(000) | | | | Ratings†
(S&P/Moody's) | | Maturity | | Rate% | | Value | |
CORPORATE BONDS | |
| Health Facilities (0.6%) | | | |
$ | 5,392 | | | MPT Finance Corp., Company Guaranteed Notes
(Callable 02/15/17 @ 103.19) | | (BB, Ba1) | | 02/15/22 | | | 6.375 | | | $ | 5,755,960 | | |
| | 4,977 | | | Symbion, Inc., Global Company Guaranteed Notes
(Callable 12/01/14 @ 100.00) | | (CCC+, Caa2) | | 08/23/15 | | | 11.000 | | | | 5,001,885 | | |
| | | | 10,757,845 | | |
| Health Services (0.0%) | | | |
| | 87 | | | inVentiv Health, Inc., 10.000% Cash,
12.000% PIK, Rule 144A, Company
Guaranteed Notes
(Callable 08/15/15 @ 105.00)‡1 | | (CCC, Caa2) | | 08/15/18 | | | 22.000 | | | | 78,735 | | |
| | 63 | | | inVentiv Health, Inc., Rule 144A, Company
Guaranteed Notes
(Callable 12/01/14 @ 105.00)‡ | | (CCC, Caa3) | | 08/15/18 | | | 10.000 | | | | 45,045 | | |
| | | | 123,780 | | |
| Hotels (0.3%) | | | |
| | 4,000 | | | Financiere Quick SAS, Rule 144A,
Senior Secured Notes
(Callable 04/15/15 @ 101.00)#€‡ | | (B-, B3) | | 04/15/19 | | | 4.832 | | | | 4,535,500 | | |
| | 1,500 | | | Financiere Quick SAS, Rule 144A, Unsecured Notes
(Callable 10/15/15 @ 102.00)#€‡ | | (CCC, Caa2) | | 10/15/19 | | | 7.582 | | | | 1,559,861 | | |
| | | | 6,095,361 | | |
| Insurance Brokerage (0.2%) | | | |
| | 3,000 | | | Towergate Finance PLC, Rule 144A,
Senior Secured Notes
(Callable 12/01/14 @ 101.00)#£‡ | | (NR, B1) | | 02/15/18 | | | 6.053 | | | | 4,031,619 | | |
| Investments & Misc. Financial Services (0.2%) | | | |
| | 2,000 | | | Cabot Financial Luxembourg S.A., Rule 144A,
Senior Secured Notes
(Callable 08/01/16 @ 106.28)£‡ | | (B+, B2) | | 08/01/20 | | | 8.375 | | | | 3,287,690 | | |
| | 500 | | | Cabot Financial Luxembourg S.A., Rule 144A,
Senior Secured Notes
(Callable 10/01/15 @ 107.78)£‡ | | (B+, B2) | | 10/01/19 | | | 10.375 | | | | 877,581 | | |
| | | | 4,165,271 | | |
| Media - Cable (0.4%) | | | |
| | 1,000 | | | Altice Financing S.A., Rule 144A,
Senior Secured Notes
(Callable 12/15/16 @ 104.88)‡ | | (BB-, B1) | | 01/15/22 | | | 6.500 | | | | 1,030,000 | | |
| | 6,430 | | | Block Communications, Inc., Rule 144A,
Senior Unsecured Notes
(Callable 02/01/16 @ 103.63)‡ | | (B+, B1) | | 02/01/20 | | | 7.250 | | | | 6,719,350 | | |
| | | | 7,749,350 | | |
See Accompanying Notes to Financial Statements.
18
Credit Suisse Floating Rate High Income Fund
Schedule of Investments (continued)
October 31, 2014
Par
(000) | | | | Ratings†
(S&P/Moody's) | | Maturity | | Rate% | | Value | |
CORPORATE BONDS | |
| Media - Diversified (0.3%) | | | |
$ | 4,000 | | | National CineMedia LLC, Global Senior
Secured Notes
(Callable 04/15/17 @ 103.00) | | (BB-, Ba2) | | 04/15/22 | | | 6.000 | | | $ | 4,070,000 | | |
| | 1,619 | | | National CineMedia LLC, Global Senior
Unsecured Notes
(Callable 07/15/16 @ 103.94)§ | | (B, B2) | | 07/15/21 | | | 7.875 | | | | 1,732,330 | | |
| | | | 5,802,330 | | |
| Media - Services (0.3%) | | | |
| | 575 | | | Clear Channel Worldwide Holdings, Inc.,
Global Company Guaranteed Notes
(Callable 11/15/17 @ 103.25) | | (B, B1) | | 11/15/22 | | | 6.500 | | | | 595,125 | | |
| | 1,400 | | | Clear Channel Worldwide Holdings, Inc., Series B,
Global Company Guaranteed Notes
(Callable 11/15/17 @ 103.25) | | (B, B1) | | 11/15/22 | | | 6.500 | | | | 1,456,000 | | |
| | 4,120 | | | WMG Acquisition Corp., Rule 144A,
Senior Secured Notes
(Callable 01/15/16 @ 104.50)§‡ | | (B+, B1) | | 01/15/21 | | | 6.000 | | | | 4,243,600 | | |
| | | | 6,294,725 | | |
| Metals & Mining - Excluding Steel (0.7%) | | | |
| | 3,000 | | | Global Brass & Copper, Inc., Global Senior
Secured Notes
(Callable 06/01/16 @ 104.75) | | (B, B3) | | 06/01/19 | | | 9.500 | | | | 3,307,500 | | |
| | 7,500 | | | KGHM International Ltd., Rule 144A, Company
Guaranteed Notes
(Callable 06/15/15 @ 103.88)‡ | | (BB-, B1) | | 06/15/19 | | | 7.750 | | | | 7,987,500 | | |
| | 2,000 | | | Xinergy Corp., Rule 144A, Senior Secured Notes
(Callable 05/15/15 @ 104.63)‡ | | (NR, NR) | | 05/15/19 | | | 9.250 | | | | 990,000 | | |
| | | | 12,285,000 | | |
| Oil Field Equipment & Services (0.7%) | | | |
| | 4,518 | | | Pacific Drilling V Ltd., Rule 144A,
Senior Secured Notes
(Callable 12/01/15 @ 103.63)‡ | | (B+, B2) | | 12/01/17 | | | 7.250 | | | | 4,501,058 | | |
| | 8,583 | | | Shelf Drilling Holdings Ltd., Rule 144A,
Secured Notes
(Callable 05/01/15 @ 104.31)§‡ | | (B+, Ba3) | | 11/01/18 | | | 8.625 | | | | 8,518,627 | | |
| | | | 13,019,685 | | |
| Oil Refining & Marketing (0.6%) | | | |
| | 6,522 | | | Coffeyville Finance, Inc., Global Secured
Notes (Callable 11/01/17 @ 103.25) | | (B+, B2) | | 11/01/22 | | | 6.500 | | | | 6,619,830 | | |
| | 4,000 | | | PBF Finance Corp., Global Senior Secured Notes
(Callable 02/15/16 @ 104.13) | | (BB+, Ba3) | | 02/15/20 | | | 8.250 | | | | 4,205,000 | | |
| | | | 10,824,830 | | |
See Accompanying Notes to Financial Statements.
19
Credit Suisse Floating Rate High Income Fund
Schedule of Investments (continued)
October 31, 2014
Par
(000) | | | | Ratings†
(S&P/Moody's) | | Maturity | | Rate% | | Value | |
CORPORATE BONDS | |
| Packaging (0.4%) | | | |
$ | 2,000 | | | Innovia Group Finance PLC, Rule 144A,
Senior Secured Notes
(Callable 03/15/15 @ 101.00) #€‡ | | (B, B2) | | 03/31/20 | | | 5.084 | | | $ | 2,480,743 | | |
| | 4,423 | | | Reynolds Group Issuer LLC, Global Senior
Secured Notes
(Callable 10/15/15 @ 104.31) | | (B+, B1) | | 10/15/20 | | | 5.750 | | | | 4,622,035 | | |
| | | | 7,102,778 | | |
| Restaurants (0.1%) | | | |
| | 375 | | | Punch Taverns Finance PLC, Reg S, Rule 144A,
Senior Secured Notes£‡2 | | (B+, Baa3) | | 10/15/26 | | | 7.274 | | | | 665,127 | | |
| | 1,125 | | | Punch Taverns Finance PLC, Series A,
Senior Secured Notes£ | | (NR, Baa2) | | 10/15/26 | | | 7.274 | | | | 1,997,812 | | |
| | | | 2,662,939 | | |
| Software - Services (0.2%) | | | |
| | 2,900 | | | Epicor Software Corp., Global Company
Guaranteed Notes
(Callable 05/01/15 @ 104.31) | | (CCC+, B3) | | 05/01/19 | | | 8.625 | | | | 3,099,375 | | |
| Specialty Retail (0.5%) | | | |
| | 2,250 | | | DFS Furniture Holdings PLC, Rule 144A,
Senior Secured Notes
(Callable 12/01/14 @ 101.00)#£‡ | | (B, B2) | | 08/15/18 | | | 6.563 | | | | 3,637,457 | | |
| | 1,765 | | | Express Finance Corp., Global Company
Guaranteed Notes
(Callable 12/01/14 @ 104.38)§ | | (BB, B1) | | 03/01/18 | | | 8.750 | | | | 1,835,600 | | |
| | 4,000 | | | Penske Automotive Group, Inc., Global Company
Guaranteed Notes
(Callable 10/01/17 @ 102.88) | | (B+, B1) | | 10/01/22 | | | 5.750 | | | | 4,180,000 | | |
| | | | 9,653,057 | | |
| Telecom - Integrated/Services (0.6%) | | | |
| | 100 | | | Hellas Telecommunications Luxembourg II S.C.A.,
Rule 144A, Subordinated Notes•K‡^Ø | | (NR, NR) | | 01/15/15 | | | 0.000 | | | | — | | |
| | 5,699 | | | Hughes Satellite Systems Corp.,
Global Senior Secured Notes | | (B+, Ba3) | | 06/15/19 | | | 6.500 | | | | 6,197,662 | | |
| | 2,000 | | | Numericable Group S.A., Rule 144A, Senior
Secured Notes (Callable 05/15/16 @ 103.66)‡ | | (B+, Ba3) | | 05/15/19 | | | 4.875 | | | | 2,002,500 | | |
| | 2,000 | | | Numericable Group S.A., Rule 144A, Senior
Secured Notes (Callable 05/15/17 @ 104.50)‡ | | (B+, Ba3) | | 05/15/22 | | | 6.000 | | | | 2,047,500 | | |
| | | | 10,247,662 | | |
See Accompanying Notes to Financial Statements.
20
Credit Suisse Floating Rate High Income Fund
Schedule of Investments (continued)
October 31, 2014
Par
(000) | | | | Ratings†
(S&P/Moody's) | | Maturity | | Rate% | | Value | |
CORPORATE BONDS | |
| Textiles & Apparel (0.1%) | | | |
$ | 275 | | | IT Holding Finance S.A., Company
Guaranteed Notes€KØ | | (NR, NR) | | 11/15/25 | | | 9.875 | | | $ | 3,394 | | |
| | 1,000 | | | Takko Luxembourg 2 S.C.A., Rule 144A,
Senior Secured Notes
(Callable 04/15/16 @ 104.94)€‡ | | (CCC+, B3) | | 04/15/19 | | | 9.875 | | | | 898,956 | | |
| | | | 902,350 | | |
| TOTAL CORPORATE BONDS (Cost $175,404,460) | | | 170,494,809 | | |
| ASSET BACKED SECURITIES (5.0%) | | | |
| Collateralized Debt Obligations (5.0%) | | | |
| | 3,400 | | | ACAS CLO Ltd., 2012-1A, Rule 144A#‡ | | (BB-, NR) | | 09/20/23 | | | 6.233 | | | | 3,335,975 | | |
| | 3,000 | | | ACAS CLO Ltd., 2013-2A, Rule 144A#‡ | | (BB, NR) | | 10/25/25 | | | 4.734 | | | | 2,559,816 | | |
| | 3,450 | | | ACIS CLO Ltd., 2014-4A, Rule 144A#‡ | | (BBB, NR) | | 05/01/26 | | | 3.327 | | | | 3,036,566 | | |
| | 1,000 | | | ALM V Ltd., 2012-5A, Rule 144A#‡ | | (NR, Ba2) | | 02/13/23 | | | 5.734 | | | | 962,386 | | |
| | 3,000 | | | ALM VII Ltd., 2012-7A, Rule 144A#‡ | | (BB, NR) | | 10/19/24 | | | 5.231 | | | | 2,793,159 | | |
| | 2,500 | | | ARES CLO Ltd., 2012-2A, Rule 144A#‡ | | (BB, NR) | | 10/12/23 | | | 6.031 | | | | 2,386,062 | | |
| | 1,875 | | | ARES XXV CLO Ltd., 2012-3A, Rule 144A#‡ | | (BBB, NR) | | 01/17/24 | | | 4.878 | | | | 1,875,774 | | |
| | 2,000 | | | Atlas Senior Loan Fund III Ltd., 2013-1A,
Rule 144A#‡ | | (BBB, NR) | | 08/18/25 | | | 3.731 | | | | 1,860,674 | | |
| | 3,000 | | | Atlas Senior Loan Fund V Ltd., 2014-1A,
Rule 144A#‡ | | (BB-, NR) | | 07/16/26 | | | 4.946 | | | | 2,571,855 | | |
| | 2,750 | | | Black Diamond CLO Ltd., 2012-1A, Rule 144A#‡ | | (BB, NR) | | 02/01/23 | | | 6.232 | | | | 2,639,150 | | |
| | 2,500 | | | BlueMountain CLO Ltd., 2013-2A, Rule 144A#‡ | | (BB, NR) | | 01/22/25 | | | 5.282 | | | | 2,280,465 | | |
| | 2,000 | | | Carlyle Global Market Strategies CLO Ltd., 2013-3A,
Rule 144A#‡ | | (BB, NR) | | 07/15/25 | | | 4.831 | | | | 1,789,882 | | |
| | 2,000 | | | Catamaran CLO Ltd., 2014-1A, Rule 144A#‡ | | (BB, NR) | | 04/20/26 | | | 4.731 | | | | 1,712,636 | | |
| | 1,000 | | | CIFC Funding Ltd., 2012-3A, Rule 144A#‡ | | (BB-, NR) | | 01/29/25 | | | 6.233 | | | | 963,055 | | |
| | 2,250 | | | CIFC Funding Ltd., 2012-3A, Rule 144A#‡ | | (B, NR) | | 01/29/25 | | | 7.133 | | | | 2,119,365 | | |
| | 1,500 | | | CIFC Funding Ltd., 2013-3A, Rule 144A#‡ | | (BB, NR) | | 10/24/25 | | | 5.006 | | | | 1,321,465 | | |
| | 2,000 | | | CIFC Funding Ltd., 2014-2A, Rule 144A#‡ | | (NR, Ba3) | | 05/24/26 | | | 4.845 | | | | 1,772,140 | | |
| | 3,000 | | | CIFC Funding Ltd., 2014-3A, Rule 144A#‡ | | (NR, Ba3) | | 07/22/26 | | | 4.902 | | | | 2,637,867 | | |
| | 4,000 | | | Galaxy XVII CLO Ltd., 2014-17A, Rule 144A#‡ | | (BB, NR) | | 07/15/26 | | | 4.997 | | | | 3,492,444 | | |
| | 3,000 | | | Greywolf CLO III Ltd., 2014-1A, Rule 144A#‡ | | (BB, NR) | | 04/22/26 | | | 5.326 | | | | 2,729,571 | | |
| | 1,419 | | | Halcyon Loan Advisors Funding Ltd., 2012-1A,
Rule 144A#‡ | | (BB, NR) | | 08/15/23 | | | 5.734 | | | | 1,327,194 | | |
| | 1,500 | | | Halcyon Loan Advisors Funding Ltd., 2012-2A,
Rule 144A#‡ | | (BB, NR) | | 12/20/24 | | | 5.633 | | | | 1,386,607 | | |
| | 1,000 | | | Hildene CLO II Ltd., 2014-2A, Rule 144A#‡ | | (NR, Ba3) | | 07/19/26 | | | 5.331 | | | | 903,446 | | |
| | 4,500 | | | Jamestown CLO III Ltd., 2013-3A, Rule 144A#‡ | | (BB-, NR) | | 01/15/26 | | | 4.831 | | | | 3,877,668 | | |
| | 1,850 | | | KVK CLO Ltd., 2012-1A, Rule 144A#‡ | | (BB, NR) | | 07/15/23 | | | 6.481 | | | | 1,800,685 | | |
| | 3,000 | | | KVK CLO Ltd., 2013-1A, Rule 144A#‡ | | (BB, NR) | | 04/14/25 | | | 5.730 | | | | 2,770,926 | | |
| | 1,250 | | | Neuberger Berman CLO XII Ltd., 2012-12AR,
Rule 144A#‡ | | (BB, NR) | | 07/25/23 | | | 6.484 | | | | 1,249,286 | | |
| | 1,000 | | | Ocean Trails CLO II, 2007-2X# | | (BBB-, Ba2) | | 06/27/22 | | | 2.580 | | | | 963,369 | | |
| | 1,750 | | | OCP CLO Ltd., 2014-6A, Rule 144A#‡ | | (B, NR) | | 07/17/26 | | | 5.855 | | | | 1,455,008 | | |
See Accompanying Notes to Financial Statements.
21
Credit Suisse Floating Rate High Income Fund
Schedule of Investments (continued)
October 31, 2014
Par
(000) | | | | Ratings†
(S&P/Moody's) | | Maturity | | Rate% | | Value | |
ASSET BACKED SECURITIES | |
Collateralized Debt Obligations | | | |
$ | 3,000 | | | Octagon Investment Partners XIV Ltd., 2012-1A,
Rule 144A#‡ | | (BB-, NR) | | 01/15/24 | | | 5.481 | | | $ | 2,775,441 | | |
| | 3,000 | | | Octagon Investment Partners XIV Ltd., 2012-1A,
Rule 144A#‡ | | (B, NR) | | 01/15/24 | | | 6.731 | | | | 2,733,618 | | |
| | 1,750 | | | Octagon Investment Partners XXI Ltd., 2014-1A,
Rule 144A#K‡^ | | (NR, Ba3) | | 11/14/26 | | | 6.834 | | | | 1,733,585 | | |
| | 2,000 | | | OZLM Funding V Ltd., 2013-5A, Rule 144A#‡ | | (BB, NR) | | 01/17/26 | | | 4.978 | | | | 1,747,896 | | |
| | 2,500 | | | Saratoga Investment Corp. CLO Ltd., 2013-1A,
Rule 144A#‡ | | (BBB, NR) | | 10/20/23 | | | 3.731 | | | | 2,358,532 | | |
| | 3,000 | | | Shackleton I CLO Ltd., 2012-1A, Rule 144A#‡ | | (BB, NR) | | 08/14/23 | | | 6.435 | | | | 2,869,899 | | |
| | 2,500 | | | Shackleton V CLO Ltd., 2014-5A, Rule 144A#‡ | | (BB-, NR) | | 05/07/26 | | | 4.587 | | | | 2,093,060 | | |
| | 2,000 | | | Sound Point CLO II Ltd., 2013-1A, Rule 144A#‡ | | (B, NR) | | 04/26/25 | | | 5.734 | | | | 1,695,752 | | |
| | 4,000 | | | Sound Point CLO IV Ltd., 2013-3A, Rule 144A#‡ | | (NR, Ba3) | | 01/21/26 | | | 4.731 | | | | 3,404,336 | | |
| | 3,250 | | | Sound Point CLO V Ltd., 2014-1A, Rule 144A#‡ | | (NR, Ba3) | | 04/18/26 | | | 4.481 | | | | 2,696,002 | | |
| | 1,500 | | | TICP CLO I Ltd., 2014-1A, Rule 144A#‡ | | (BB, NR) | | 04/26/26 | | | 4.734 | | | | 1,285,692 | | |
| | 2,000 | | | Trinitas CLO I Ltd., 2014-1A, Rule 144A#‡ | | (BB, NR) | | 04/15/26 | | | 4.981 | | | | 1,723,486 | | |
| | 1,666 | | | Venture X CLO Ltd., 2012-12A, Rule 144A#‡ | | (BB, NR) | | 02/28/24 | | | 5.538 | | | | 1,520,870 | | |
| | 2,000 | | | Voya CLO Ltd., 2014-3A, Rule 144A#‡ | | (NR, Ba3) | | 07/25/26 | | | 5.229 | | | | 1,767,070 | | |
| | 2,250 | | | WhiteHorse VII Ltd., 2013-1A, Rule 144A#‡ | | (BB-, NR) | | 11/24/25 | | | 5.035 | | | | 1,979,874 | | |
| TOTAL ASSET BACKED SECURITIES (Cost $96,033,763) | | | 92,959,609 | | |
Number of
Shares | |
| |
| |
| |
| |
| |
| COMMON STOCKS (0.0%) | | | |
| Building & Construction (0.0%) | | | |
| | 6,800 | | | Ashton Woods U.S.A. LLC, Class BK^* | | | | | | | | | | | | | | | 92,956 | | |
| Chemicals (0.0%) | | | |
| | 9,785 | | | Huntsman Corp.K | | | | | | | | | | | | | | | 238,754 | | |
| Gaming (0.0%) | | | |
| | 10,150 | | | Majestic Holdco LLCK^* | | | | | | | | | | | | | | | 7,105 | | |
| Health Services (0.0%) | | | |
| | 22 | | | Magellan Health, Inc.K* | | | | | | | | | | | | | | | 1,331 | | |
| Printing & Publishing (0.0%) | | | |
| | 708 | | | F & W Media, Inc.K* | | | | | | | | | | | | | | | 49,539 | | |
| | 884,979 | | | Hibu PLCK* | | | | | | | | | | | | | | | — | | |
| | | | 49,539 | | |
| TOTAL COMMON STOCKS (Cost $93,165) | | | 389,685 | | |
| SHORT-TERM INVESTMENTS (2.0%) | | | |
| | 13,436,710 | | | State Street Navigator Prime Portfolio, 0.16%§§ | | | | | | | | | | | | | | | 13,436,710 | | |
See Accompanying Notes to Financial Statements.
22
Credit Suisse Floating Rate High Income Fund
Schedule of Investments (continued)
October 31, 2014
Par
(000) | |
| |
| | Maturity | | Rate% | | Value | |
SHORT-TERM INVESTMENTS | |
$ | 24,815 | | | State Street Bank and Trust Co. Euro Time Deposit | | | | | | 11/03/14 | | | 0.010 | | | $ | 24,815,000 | | |
| TOTAL SHORT-TERM INVESTMENTS (Cost $38,251,710) | | | 38,251,710 | | |
| TOTAL INVESTMENTS AT VALUE (99.8%) (Cost $1,896,886,638) | | | 1,871,400,622 | | |
| OTHER ASSETS IN EXCESS OF LIABILITIES (0.2%) | | | 4,088,409 | | |
| NET ASSETS (100.0%) | | $ | 1,875,489,031 | | |
INVESTMENT ABBREVIATION
NR = Not Rated
† Credit ratings given by the Standard & Poor's Division of The McGraw-Hill Companies, Inc. ("S&P") and Moody's Investors Service, Inc. ("Moody's") are unaudited.
# Variable rate obligations — The interest rate is the rate as of October 31, 2014.
£ This security is denominated in British Pounds.
€ This security is denominated in Euros.
• Zero coupon security.
u (See Note 2I) regarding unfunded loan commitments.
K Illiquid security.
§ Security or portion thereof is out on loan (See note 2-J).
‡ Security exempt from registration under Rule 144A of the Securities Act of 1933. These securities may be resold in transactions exempt from registration, normally to qualified institutional buyers. At October 31, 2014, these securities amounted to a value of $166,639,884 or 8.9% of net assets.
^ Not readily marketable security; security is valued at fair value as determined in good faith by, or under the direction of, the Board of Trustees.
1 PIK: Payment-in-kind security for which part of the income earned may be paid as additional principal.
2 REG S: Securities sold under Regulation S may not be offered, sold or delivered within the United States or to, or for the account or benefit of, U.S. persons, except pursuant to an exemption from, or in a transaction not subject to, the registration requirements of the Securities Act of 1933.
Ø Bond is currently in default.
* Non-income producing security.
§§ Represents security purchased with cash collateral received for securities on loan. The rate shown is the annualized one-day yield at October 31, 2014.
Forward Foreign Currency Contracts | | | |
Forward Foreign
Currency to be
Purchased (Local) | | Forward Foreign
Currency to be
Sold (Local) | | Expiration
Date | | Counterparty | | Value on
Settlement Date | | Current
Value/
Notional | | Net Unrealized
Appreciation
(Depreciation) | |
EUR | 14,000,000 | | | USD | 17,551,800 | | | 01/15/15 | | Morgan Stanley | | $ | 17,551,800 | | | $ | 17,549,006 | | | $ | (2,794 | ) | |
USD | 87,808,954 | | | EUR | 69,490,000 | | | 01/15/15 | | Morgan Stanley | | | (87,808,954 | ) | | | (87,105,747 | ) | | | 703,207 | | |
USD | 43,868,014 | | | GBP | 27,340,000 | | | 01/15/15 | | Morgan Stanley | | | (43,868,014 | ) | | | (43,714,717 | ) | | | 153,297 | | |
| | | | | | | | | | | | | $ | 853,710 | | |
See Accompanying Notes to Financial Statements.
23
Credit Suisse Floating Rate High Income Fund
Schedule of Investments (continued)
October 31, 2014
EUR = Euro
GBP = British Pound
USD = United States Dollar
See Accompanying Notes to Financial Statements.
24
Credit Suisse Floating Rate High Income Fund
Statement of Assets and Liabilities
October 31, 2014
Assets | |
Investments at value, including collateral for securities on loan of $13,436,710
(Cost $1,896,886,638) (Note 2) | | $ | 1,871,400,6221 | | |
Cash | | | 432 | | |
Foreign currency at value (cost $19,063,405) | | | 18,734,402 | | |
Receivable for investments sold | | | 40,678,264 | | |
Dividend and interest receivable | | | 9,687,709 | | |
Receivable for fund shares sold | | | 1,461,153 | | |
Unrealized appreciation on forward currency contracts (Note 2) | | | 856,504 | | |
Prepaid expenses and other assets | | | 120,379 | | |
Total assets | | | 1,942,939,465 | | |
Liabilities | |
Administrative services fee payable (Note 3) | | | 564,989 | | |
Administrative services fee payable (Note 3) | | | 154,202 | | |
Shareholder servicing/Distribution fee payable (Note 3) | | | 227,461 | | |
Payable for investments purchased | | | 41,441,996 | | |
Payable upon return of securities loaned (Note 2) | | | 13,436,710 | | |
Payable for fund shares redeemed | | | 5,233,604 | | |
Unfunded loan commitments | | | 4,759,852 | | |
Dividend payable | | | 985,887 | | |
Trustees' fee payable | | | 10,440 | | |
Unrealized depreciation on forward currency contracts (Note 2) | | | 2,794 | | |
Accrued expenses | | | 632,499 | | |
Total liabilities | | | 67,450,434 | | |
Net Assets | |
Capital stock, $.001 par value (Note 6) | | | 273,085 | | |
Paid-in capital (Note 6) | | | 1,903,632,096 | | |
Accumulated net investment loss | | | (1,006,469 | ) | |
Accumulated net realized loss on investments and foreign currency transactions | | | (2,302,969 | ) | |
Net unrealized depreciation from investments and foreign currency translations | | | (25,106,712 | ) | |
Net assets | | $ | 1,875,489,031 | | |
I Shares | |
Net assets | | $ | 1,343,741,278 | | |
Shares outstanding | | | 195,989,654 | | |
Net asset value, offering price and redemption price per share | | $ | 6.86 | | |
A Shares | |
Net assets | | $ | 358,094,836 | | |
Shares outstanding | | | 51,966,941 | | |
Net asset value and redemption price per share | | $ | 6.89 | | |
Maximum offering price per share (net asset value/(1-4.75%)) | | $ | 7.23 | | |
B Shares | |
Net assets | | $ | 3,638,069 | | |
Shares outstanding | | | 526,354 | | |
Net asset value and offering price per share | | $ | 6.91 | | |
C Shares | |
Net assets | | $ | 170,014,848 | | |
Shares outstanding | | | 24,601,603 | | |
Net asset value and offering price per share | | $ | 6.91 | | |
1 Including $12,913,868 of securities on loan.
See Accompanying Notes to Financial Statements.
25
Credit Suisse Floating Rate High Income Fund
Statement of Operations
For the Year Ended October 31, 2014
Investment Income | |
Interest | | $ | 87,880,810 | | |
Dividends | | | 8,826 | | |
Securities lending (net of rebates) | | | 31,975 | | |
Total investment income | | | 87,921,611 | | |
Expenses | |
Investment advisory fees (Note 3) | | | 9,477,656 | | |
Administrative services fees (Note 3) | | | 1,964,387 | | |
Shareholder servicing/Distribution fees (Note 3) | |
Class A | | | 1,150,499 | | |
Class B | | | 40,704 | | |
Class C | | | 1,818,471 | | |
Transfer agent fees (Note 3) | | | 1,813,371 | | |
Custodian fees | | | 406,793 | | |
Registration fees | | | 198,365 | | |
Printing fees (Note 3) | | | 119,477 | | |
Commitment fees (Note 4) | | | 84,289 | | |
Audit and tax fees | | | 46,800 | | |
Insurance expense | | | 45,408 | | |
Legal fees | | | 44,700 | | |
Trustees' fees | | | 31,857 | | |
Miscellaneous expense | | | 15,454 | | |
Total expenses | | | 17,258,231 | | |
Less: fees waived (Note 3) | | | (1,259,839 | ) | |
Net expenses | | | 15,998,392 | | |
Net investment income | | | 71,923,219 | | |
Net Realized and Unrealized Gain (Loss) from Investments and Foreign Currency Related Items | |
Net realized gain from investments | | | 981,345 | | |
Net realized gain from foreign currency transactions | | | 6,253,274 | | |
Net change in unrealized appreciation (depreciation) from investments | | | (33,109,049 | ) | |
Net change in unrealized appreciation (depreciation) from foreign currency translations | | | 798,061 | | |
Net realized and unrealized loss from investments and foreign currency related items | | | (25,076,369 | ) | |
Net increase in net assets resulting from operations | | $ | 46,846,850 | | |
See Accompanying Notes to Financial Statements.
26
Credit Suisse Floating Rate High Income Fund
Statement of Changes in Net Assets
| | | For the Year
Ended
October 31, 2014 | | For the Year
Ended
October 31, 2013 | |
From Operations | |
Net investment income | | $ | 71,923,219 | | | $ | 37,124,544 | | |
Net realized gain from investments and foreign currency transactions | | | 7,234,619 | | | | 2,269,107 | | |
Net change in unrealized appreciation (depreciation)
from investments and foreign currency translations | | | (32,310,988 | ) | | | 2,025,993 | | |
Net increase in net assets resulting from operations | | | 46,846,850 | | | | 41,419,644 | | |
From Dividends | |
Dividends from net investment income | |
Class I | | | (49,008,403 | ) | | | (22,082,097 | ) | |
Class A | | | (17,437,438 | ) | | | (11,256,846 | ) | |
Class B | | | (124,263 | ) | | | (168,251 | ) | |
Class C | | | (5,533,291 | ) | | | (4,035,091 | ) | |
Net decrease in net assets resulting from dividends | | | (72,103,395 | ) | | | (37,542,285 | ) | |
| From Capital Share Transactions (Note 6) | |
Proceeds from sale of shares | | | 1,168,016,565 | | | | 1,358,631,102 | | |
Reinvestment of dividends | | | 60,653,794 | | | | 30,519,329 | | |
Net asset value of shares redeemed | | | (832,967,724 | )1 | | | (343,530,928 | )2 | |
Net increase in net assets from capital share transactions | | | 395,702,635 | | | | 1,045,619,503 | | |
Net increase in net assets | | | 370,446,090 | | | | 1,049,496,862 | | |
Net Assets | |
Beginning of year | | | 1,505,042,941 | | | | 455,546,079 | | |
End of year | | $ | 1,875,489,031 | | | $ | 1,505,042,941 | | |
Undistributed (accumulated) net investment income (loss) | | $ | (1,006,469 | ) | | $ | 144,579 | | |
1 Net of $8,404 of redemption fees retained by the Fund.
2 Net of $110,770 of redemption fees retained by the Fund.
See Accompanying Notes to Financial Statements.
27
Credit Suisse Floating Rate High Income Fund
Financial Highlights
(For a Class I Share of the Fund Outstanding Throughout Each Year)
| | | For the Year Ended October 31, | |
| | | 2014 | | 2013 | | 2012 | | 2011 | | 2010 | |
Per share data | |
Net asset value, beginning of year | | $ | 6.94 | | | $ | 6.89 | | | $ | 6.66 | | | $ | 6.72 | | | $ | 6.24 | | |
INVESTMENT OPERATIONS | |
Net investment income1 | | | 0.28 | | | | 0.30 | | | | 0.34 | | | | 0.43 | | | | 0.56 | | |
Net gain (loss) on investments and foreign currency
related items (both realized and unrealized) | | | (0.08 | ) | | | 0.07 | | | | 0.21 | | | | (0.04 | ) | | | 0.50 | | |
Total from investment operations | | | 0.20 | | | | 0.37 | | | | 0.55 | | | | 0.39 | | | | 1.06 | | |
REDEMPTION FEES2 | | | 0.00 | | | | 0.00 | | | | 0.00 | | | | 0.00 | | | | 0.00 | | |
LESS DIVIDENDS | |
Dividends from net investment income | | | (0.28 | ) | | | (0.32 | ) | | | (0.32 | ) | | | (0.45 | ) | | | (0.58 | ) | |
Total dividends | | | (0.28 | ) | | | (0.32 | ) | | | (0.32 | ) | | | (0.45 | ) | | | (0.58 | ) | |
Net asset value, end of year | | $ | 6.86 | | | $ | 6.94 | | | $ | 6.89 | | | $ | 6.66 | | | $ | 6.72 | | |
Total return3 | | | 2.94 | % | | | 5.47 | % | | | 8.51 | % | | | 5.85 | % | | | 17.87 | % | |
RATIOS AND SUPPLEMENTAL DATA | |
Net assets, end of year (000s omitted) | | $ | 1,343,741 | | | $ | 876,418 | | | $ | 226,027 | | | $ | 46,482 | | | $ | 31,374 | | |
Ratio of net expenses to average net assets | | | 0.70 | % | | | 0.70 | % | | | 0.70 | % | | | 0.70 | % | | | 0.72 | % | |
Ratio of net investment income to average net assets | | | 4.04 | % | | | 4.35 | % | | | 4.99 | % | | | 6.32 | % | | | 8.48 | % | |
Decrease reflected in above operating expense
ratios due to waivers/reimbursements | | | 0.07 | % | | | 0.07 | % | | | 0.20 | % | | | 0.68 | % | | | 0.65 | % | |
Portfolio turnover rate | | | 57 | % | | | 89 | % | | | 96 | % | | | 144 | % | | | 88 | % | |
1 Per share information is calculated using the average shares outstanding method.
2 This amount represents less than $0.01 per share.
3 Total returns are historical and assume changes in share price and reinvestment of all dividends and distributions. Had certain expenses not been reduced during the years shown, total returns would have been lower.
See Accompanying Notes to Financial Statements.
28
Credit Suisse Floating Rate High Income Fund
Financial Highlights
(For a Class A Share of the Fund Outstanding Throughout Each Year)
| | | For the Year Ended October 31, | |
| | | 2014 | | 2013 | | 2012 | | 2011 | | 2010 | |
Per share data | |
Net asset value, beginning of year | | $ | 6.98 | | | $ | 6.92 | | | $ | 6.69 | | | $ | 6.74 | | | $ | 6.26 | | |
INVESTMENT OPERATIONS | |
Net investment income1 | | | 0.26 | | | | 0.29 | | | | 0.32 | | | | 0.40 | | | | 0.52 | | |
Net gain (loss) on investments and foreign currency
related items (both realized and unrealized) | | | (0.09 | ) | | | 0.07 | | | | 0.22 | | | | (0.02 | ) | | | 0.53 | | |
Total from investment operations | | | 0.17 | | | | 0.36 | | | | 0.54 | | | | 0.38 | | | | 1.05 | | |
REDEMPTION FEES2 | | | 0.00 | | | | 0.00 | | | | 0.00 | | | | 0.00 | | | | 0.00 | | |
LESS DIVIDENDS | |
Dividends from net investment income | | | (0.26 | ) | | | (0.30 | ) | | | (0.31 | ) | | | (0.43 | ) | | | (0.57 | ) | |
Total dividends | | | (0.26 | ) | | | (0.30 | ) | | | (0.31 | ) | | | (0.43 | ) | | | (0.57 | ) | |
Net asset value, end of year | | $ | 6.89 | | | $ | 6.98 | | | $ | 6.92 | | | $ | 6.69 | | | $ | 6.74 | | |
Total return3 | | | 2.53 | % | | | 5.33 | % | | | 8.19 | % | | | 5.74 | % | | | 17.54 | % | |
RATIOS AND SUPPLEMENTAL DATA | |
Net assets, end of year (000s omitted) | | $ | 358,095 | | | $ | 456,550 | | | $ | 148,636 | | | $ | 49,439 | | | $ | 20,492 | | |
Ratio of net expenses to average net assets | | | 0.95 | % | | | 0.95 | % | | | 0.95 | % | | | 0.95 | % | | | 1.11 | % | |
Ratio of net investment income to average net assets | | | 3.79 | % | | | 4.13 | % | | | 4.65 | % | | | 5.97 | % | | | 8.00 | % | |
Decrease reflected in above operating expense
ratios due to waivers/reimbursements | | | 0.07 | % | | | 0.07 | % | | | 0.20 | % | | | 0.69 | % | | | 0.61 | % | |
Portfolio turnover rate | | | 57 | % | | | 89 | % | | | 96 | % | | | 144 | % | | | 88 | % | |
1 Per share information is calculated using the average shares outstanding method.
2 This amount represents less than $0.01 per share.
3 Total returns are historical and assume changes in share price, reinvestment of all dividends and distributions and no sales charge. Had certain expenses not been reduced during the years shown, total returns would have been lower.
See Accompanying Notes to Financial Statements.
29
Credit Suisse Floating Rate High Income Fund
Financial Highlights
(For a Class B Share of the Fund Outstanding Throughout Each Year)
| | | For the Year Ended October 31, | |
| | | 2014 | | 2013 | | 2012 | | 2011 | | 2010 | |
Per share data | |
Net asset value, beginning of year | | $ | 7.00 | | | $ | 6.93 | | | $ | 6.70 | | | $ | 6.74 | | | $ | 6.26 | | |
INVESTMENT OPERATIONS | |
Net investment income1 | | | 0.21 | | | | 0.25 | | | | 0.26 | | | | 0.39 | | | | 0.47 | | |
Net gain (loss) on investments and foreign currency
related items (both realized and unrealized) | | | (0.09 | ) | | | 0.07 | | | | 0.22 | | | | (0.06 | ) | | | 0.53 | | |
Total from investment operations | | | 0.12 | | | | 0.32 | | | | 0.48 | | | | 0.33 | | | | 1.00 | | |
REDEMPTION FEES2 | | | 0.00 | | | | 0.00 | | | | 0.00 | | | | 0.00 | | | | 0.00 | | |
LESS DIVIDENDS | |
Dividends from net investment income | | | (0.21 | ) | | | (0.25 | ) | | | (0.25 | ) | | | (0.37 | ) | | | (0.52 | ) | |
Total dividends | | | (0.21 | ) | | | (0.25 | ) | | | (0.25 | ) | | | (0.37 | ) | | | (0.52 | ) | |
Net asset value, end of year | | $ | 6.91 | | | $ | 7.00 | | | $ | 6.93 | | | $ | 6.70 | | | $ | 6.74 | | |
Total return3 | | | 1.77 | % | | | 4.64 | % | | | 7.30 | % | | | 5.03 | % | | | 16.58 | % | |
RATIOS AND SUPPLEMENTAL DATA | |
Net assets, end of year (000s omitted) | | $ | 3,638 | | | $ | 4,422 | | | $ | 5,185 | | | $ | 4,647 | | | $ | 7,283 | | |
Ratio of net expenses to average net assets | | | 1.70 | % | | | 1.70 | % | | | 1.70 | % | | | 1.70 | % | | | 1.86 | % | |
Ratio of net investment income to average net assets | | | 3.07 | % | | | 3.52 | % | | | 3.83 | % | | | 5.80 | % | | | 7.25 | % | |
Decrease reflected in above operating expense
ratios due to waivers/reimbursements | | | 0.07 | % | | | 0.07 | % | | | 0.20 | % | | | 0.68 | % | | | 0.61 | % | |
Portfolio turnover rate | | | 57 | % | | | 89 | % | | | 96 | % | | | 144 | % | | | 88 | % | |
1 Per share information is calculated using the average shares outstanding method.
2 This amount represents less than $0.01 per share.
3 Total returns are historical and assume changes in share price, reinvestment of all dividends and distributions and no sales charge. Had certain expenses not been reduced during the years shown, total returns would have been lower.
See Accompanying Notes to Financial Statements.
30
Credit Suisse Floating Rate High Income Fund
Financial Highlights
(For a Class C Share of the Fund Outstanding Throughout Each Year)
| | | For the Year Ended October 31, | |
| | | 2014 | | 2013 | | 2012 | | 2011 | | 2010 | |
Per share data | |
Net asset value, beginning of year | | $ | 7.00 | | | $ | 6.94 | | | $ | 6.71 | | | $ | 6.75 | | | $ | 6.27 | | |
INVESTMENT OPERATIONS | |
Net investment income1 | | | 0.21 | | | | 0.24 | | | | 0.27 | | | | 0.37 | | | | 0.47 | | |
Net gain (loss) on investments and foreign currency
related items (both realized and unrealized) | | | (0.09 | ) | | | 0.07 | | | | 0.21 | | | | (0.03 | ) | | | 0.53 | | |
Total from investment operations | | | 0.12 | | | | 0.31 | | | | 0.48 | | | | 0.34 | | | | 1.00 | | |
REDEMPTION FEES2 | | | 0.00 | | | | 0.00 | | | | 0.00 | | | | 0.00 | | | | 0.00 | | |
LESS DIVIDENDS | |
Dividends from net investment income | | | (0.21 | ) | | | (0.25 | ) | | | (0.25 | ) | | | (0.38 | ) | | | (0.52 | ) | |
Total dividends | | | (0.21 | ) | | | (0.25 | ) | | | (0.25 | ) | | | (0.38 | ) | | | (0.52 | ) | |
Net asset value, end of year | | $ | 6.91 | | | $ | 7.00 | | | $ | 6.94 | | | $ | 6.71 | | | $ | 6.75 | | |
Total return3 | | | 1.77 | % | | | 4.47 | % | | | 7.29 | % | | | 5.03 | % | | | 16.57 | % | |
RATIOS AND SUPPLEMENTAL DATA | |
Net assets, end of year (000s omitted) | | $ | 170,015 | | | $ | 167,653 | | | $ | 75,699 | | | $ | 23,905 | | | $ | 17,695 | | |
Ratio of net expenses to average net assets | | | 1.70 | % | | | 1.70 | % | | | 1.70 | % | | | 1.70 | % | | | 1.86 | % | |
Ratio of net investment income to average net assets | | | 3.04 | % | | | 3.40 | % | | | 3.93 | % | | | 5.39 | % | | | 7.25 | % | |
Decrease reflected in above operating expense
ratios due to waivers/reimbursements | | | 0.07 | % | | | 0.07 | % | | | 0.20 | % | | | 0.68 | % | | | 0.61 | % | |
Portfolio turnover rate | | | 57 | % | | | 89 | % | | | 96 | % | | | 144 | % | | | 88 | % | |
1 Per share information is calculated using the average shares outstanding method.
2 This amount represents less than $0.01 per share.
3 Total returns are historical and assume changes in share price, reinvestment of all dividends and distributions and no sales charge. Had certain expenses not been reduced during the years shown, total returns would have been lower.
See Accompanying Notes to Financial Statements.
31
Credit Suisse Floating Rate High Income Fund
Notes to Financial Statements
October 31, 2014
Credit Suisse Floating Rate High Income Fund (the "Fund"), a series of the Credit Suisse Opportunity Funds (the "Trust"), a Delaware statutory trust, is registered under the Investment Company Act of 1940, as amended (the "1940 Act"), as a diversified open-end management investment company that seeks to provide a high level of current income and, secondarily, capital appreciation. The Trust was organized under the laws of the State of Delaware as a business trust on May 31, 1995.
The Fund offers three classes of shares: Class I shares, Class A shares and Class C shares. Each class of shares represents an equal pro rata interest in the Fund, except they bear different expenses, which reflect the differences in the range of services provided to them. Class A shares are sold subject to a front-end sales charge of up to 4.75%. Class C shares are sold subject to a contingent deferred sales charge of 1.00% if the shares are redeemed within the first year of purchase. Class I shares are sold without a sales charge. Effective February 29, 2012, Class B shares of the Fund are no longer being offered for sale. Existing shareholders may continue to purchase additional Class B shares of the Fund through the reinvestment of dividends and capital gain distributions paid by the Fund. Class B shares automatically convert to Class A shares after 8 years.
Note 2. Significant Accounting Policies
The following is a summary of significant accounting policies followed by the Fund in the preparation of its financial statements. The policies are in accordance with accounting principles generally accepted in the United States of America ("GAAP"). The preparation of financial statements requires management to make estimates and assumptions that affect the reported amounts and disclosures in the financial statements. Actual results could differ from those estimates.
A) SECURITY VALUATION — The net asset value of the Fund is determined daily as of the close of regular trading on the New York Stock Exchange, Inc. (the "Exchange") on each day the Exchange is open for business. The valuations for fixed income securities (which may include, but are not limited to, corporate, government, municipal, mortgage-backed, collateralized mortgage obligations and asset-backed securities) and certain derivative instruments are typically the prices supplied by independent third party pricing services, which may use market prices or broker/dealer quotations or a variety of valuation techniques and methodologies. The independent third party pricing services use inputs that are observable such as issuer details,
32
Credit Suisse Floating Rate High Income Fund
Notes to Financial Statements (continued)
October 31, 2014
Note 2. Significant Accounting Policies
interest rates, yield curves, prepayment speeds, credit risks/spreads, default rates and quoted prices for similar securities. Short-term fixed income securities that will mature in 60 days or less may be valued at amortized cost. Structured note agreements are valued in accordance with a dealer-supplied valuation based on changes in the value of the underlying index. Futures contracts are valued daily at the settlement price established by the board of trade or exchange on which they are traded. Forward contracts are valued at the London closing spot rates and the London closing forward point rates on a daily basis. The currency forward contract pricing model derives the differential in point rates to the expiration date of the forward and calculates its present value. Equity securities for which market quotations are available are valued at the last reported sales price or official closing price on the primary market or exchange on which they trade. The Fund may utilize a service provided by an independent third party which has been approved by the Board of Trustees (the "Board") to fair value certain securities. When fair value pricing is employed, the prices of securities used by the Fund to calculate its net asset value may differ from quoted or published prices for the same securities. If independent third party pricing services are unable to supply prices for a portfolio investment, or if the prices supplied are deemed by the investment adviser to be unreliable, the market price may be determined by the investment adviser using quotations from one or more broker/dealers or at the transaction price if the security has recently been purchased and no value has yet been obtained from a pricing service or pricing broker. When reliable prices are not readily available, such as when the value of a security has been significantly affected by events after the close of the exchange or market on which the security is principally traded, but before the Fund calculates its net asset value, the Fund values these securities as determined in accordance with procedures approved and established by the Fund's Board.
The Fund uses valuation techniques to measure fair value that are consistent with the market approach and/or income approach, depending on the type of security and the particular circumstance. The market approach uses prices and other relevant information generated by market transactions involving identical or comparable securities. The income approach uses valuation techniques to discount estimated future cash flows to present value.
GAAP established a disclosure hierarchy that categorizes the inputs to valuation techniques used to value assets and liabilities at each measurement date. These inputs are summarized in the three broad levels listed below:
• Level 1 – quoted prices in active markets for identical investments
33
Credit Suisse Floating Rate High Income Fund
Notes to Financial Statements (continued)
October 31, 2014
Note 2. Significant Accounting Policies
• Level 2 – other significant observable inputs (including quoted prices for similar investments, interest rates, prepayment speeds, credit risk, etc.)
• Level 3 – significant unobservable inputs (including the Fund's own assumptions in determining the fair value of investments)
The inputs or methodologies used to value securities are not necessarily an indication of the risk associated with investing in those securities.
The following is a summary of the inputs used as of October 31, 2014 in valuing the Fund's assets and liabilities carried at fair value:
| | | Level 1 | | Level 2 | | Level 3 | | Total | |
Investments in Securities | |
Bank Loans | | $ | — | | | $ | 1,569,304,809 | | | $ | — | | | $ | 1,569,304,809 | | |
Corporate Bonds | | | — | | | | 170,494,059 | | | | 750 | | | | 170,494,809 | | |
Asset Backed Securities | | | — | | | | 91,226,024 | | | | 1,733,585 | | | | 92,959,609 | | |
Common Stocks | | | 240,085 | | | | 49,539 | | | | 100,061 | | | | 389,685 | | |
Short-term Investments | | | — | | | | 38,251,710 | | | | — | | | | 38,251,710 | | |
| | | | 240,085 | | | | 1,869,326,141 | | | | 1,834,396 | | | | 1,871,400,622 | | |
Other Financial Instruments* | |
Forward Foreign Currency Contracts | | $ | — | | | $ | 853,710 | | | $ | | | | $ | 853,710 | | |
*Other financial instruments include unrealized appreciation (depreciation) on forward foreign currency contracts.
The following is a reconciliation of investments as of October 31, 2014 in which significant unobservable inputs were used in determining value. Transfers in or out of Level 3 represent the end of the period value of any security or instrument where a change in the level has occurred from the beginning to the end of the period.
| | | Corporate
Bonds | | Asset Backed
Securities | | Common
Stocks | | Total | |
Balance as of October 31, 2013 | | $ | 40 | | | $ | — | | | $ | 101,388 | | | $ | 101,428 | | |
Accrued discounts (premiums) | | | — | | | | 7 | | | | — | | | | 7 | | |
Purchases | | | — | | | | 1,733,585 | | | | — | | | | 1,733,585 | | |
Sales | | | — | | | | — | | | | — | | | | — | | |
Realized gain (loss) | | | (407,141 | ) | | | — | | | | — | | | | (407,141 | ) | |
Change in unrealized appreciation (depreciation) | | | 407,101 | | | | (7 | ) | | | (8,432 | ) | | | 398,662 | | |
Transfers into Level 3 | | | 750 | | | | — | | | | 7,105 | | | | 7,855 | | |
Transfers out of Level 3 | | | — | | | | — | | | | — | | | | — | | |
Balance as of October 31, 2014 | | $ | 750 | | | $ | 1,733,585 | | | $ | 100,061 | | | $ | 1,834,396 | | |
Net change in unrealized appreciation (depreciation)
from investments still held as of October 31, 2014 | | $ | — | | | $ | (7 | ) | | $ | (8,432 | ) | | $ | (8,439 | ) | |
The Fund follows Financial Accounting Standards Board ("FASB") amendments to authoritative guidance which requires the Fund to disclose
34
Credit Suisse Floating Rate High Income Fund
Notes to Financial Statements (continued)
October 31, 2014
Note 2. Significant Accounting Policies
details of transfers in and out of Level 1 and Level 2 measurements and Level 2 and Level 3 measurements and the reasons for the transfers. For the year ended October 31, 2014 there were no significant transfers in and out of Level 1 and Level 2, but there were $7,855 transferred out from Level 2 to Level 3, due to lack of observable market data because of decrease in market activity. All transfers are assumed to occur at the end of the reporting period.
B) DERIVATIVE INSTRUMENTS AND HEDGING ACTIVITIES — The Fund adopted amendments to authoritative guidance on disclosures about derivative instruments and hedging activities which require that a fund disclose (a) how and why an entity uses derivative instruments, (b) how derivative instruments and hedging activities are accounted for and (c) how derivative instruments and related hedging activities affect a fund's financial position, financial performance and cash flows. For the year ended October 31, 2014, the Fund's derivatives did not qualify for hedge accounting as they are held at fair value.
Fair Values of Derivative Instruments as of October 31, 2014
| | | Asset Derivatives | | Liability Derivatives | |
| | | Balance Sheet
Location | | Fair Value | | Balance Sheet
Location | | Fair Value | |
Currency Contracts
| | Unrealized appreciation
on forward currency
contracts | | $ | 856,504 | | | Unrealized depreciation
on forward currency
contracts | | $ | 2,794 | | |
Effect of Derivative Instruments on the Statement of Operations
| | | Location | | Realized
Gain (Loss) | | Location | | Net Unrealized
Appreciation
(Depreciation) | |
Currency Contracts
| | Net realized gain from
foreign currency
transactions | | $ | 6,777,703 | | | Net change in unrealized
appreciation
(depreciation) from
foreign currency
translations | | $ | 1,275,343 | | |
The notional amount of forward foreign currency contracts at the year ended October 31, 2014 is reflected in the Schedule of Investments. For the year ended October 31, 2014, the Fund had an average monthly notional balance on a net basis of $120,882,436 in forward foreign currency contracts.
The Fund is a party to International Swap and Derivatives Association, Inc. ("ISDA") Master Agreements ("Master Agreements") with certain
35
Credit Suisse Floating Rate High Income Fund
Notes to Financial Statements (continued)
October 31, 2014
Note 2. Significant Accounting Policies
counterparties that govern over-the-counter derivative (including Total Return, Credit Default and Interest Rate Swaps) and foreign exchange contracts entered into by the Fund. The Master Agreements may contain provisions regarding, among other things, the parties' general obligations, representations, agreements, collateral requirements, events of default and early termination. Termination events applicable to the Fund may occur upon a decline in the Fund's net assets below a specified threshold over a certain period of time.
The following table presents by counterparty the Fund's derivative assets net of related collateral held by the Fund at October 31, 2014:
Counterparty | | Gross Amounts of
Assets Presented in
the Statement of Assets
and Liabilities(a) | | Financial
Instruments
and Derivatives
Available for Offset | | Non-Cash
Collateral
Received | | Cash
Collateral
Received | | Net Amount
of Derivative
Assets | |
Morgan Stanley | | $ | 856,504 | | | $ | (2,794 | ) | | $ | — | | | $ | — | | | $ | 853,710 | | |
The following table presents by counterparty the Fund's derivative liabilities net of related collateral pledged by the Fund at October 31, 2014:
Counterparty | | Gross Amounts of
Liabilities Presented in
the Statement of Assets
and Liabilities(a) | | Financial
Instruments
and Derivatives
Available for Offset | | Non-Cash
Collateral
Pledged | | Cash
Collateral
Pledged | | Net Amount
of Derivative
Liabilities | |
Morgan Stanley | | $ | 2,794 | | | $ | (2,794 | ) | | $ | — | | | $ | — | | | $ | — | | |
(a) Forward foreign currency exchange contracts are included.
C) FOREIGN CURRENCY TRANSACTIONS — The books and records of the Fund are maintained in U.S. dollars. Transactions denominated in foreign currencies are recorded at the current prevailing exchange rates. All assets and liabilities denominated in foreign currencies are translated into U.S. dollar amounts at the current exchange rate at the end of the period. Translation gains or losses resulting from changes in the exchange rate during the reporting period and realized gains and losses on the settlement of foreign currency transactions are reported in the results of operations for the current period. The Fund does not isolate that portion of realized gains and losses on investments in equity securities which is due to changes in the foreign exchange rate from that which is due to changes in market prices of equity securities. The Fund isolates that portion of realized gains and losses on investments in debt securities which is due to changes in the foreign exchange rate from that which is due to changes in market prices of debt securities.
36
Credit Suisse Floating Rate High Income Fund
Notes to Financial Statements (continued)
October 31, 2014
Note 2. Significant Accounting Policies
D) SECURITY TRANSACTIONS AND INVESTMENT INCOME/EXPENSE — Security transactions are accounted for on a trade date basis. Interest income/expense is recorded on the accrual basis. The Fund amortizes premiums and accretes discounts using the effective interest method. Dividend income/expense is recorded on the ex-dividend date. Certain expenses are class-specific expenses, vary by class and are charged only to that class. Income, expenses (excluding class-specific expenses) and realized/unrealized gains/losses are allocated proportionately to each class of shares based upon the relative net asset value of the outstanding shares of that class. The cost of investments sold is determined by use of the specific identification method for both financial reporting and income tax purposes.
E) DIVIDENDS AND DISTRIBUTIONS TO SHAREHOLDERS — Dividends from net investment income, if any, are declared daily and paid monthly. Distributions of net realized capital gains, if any, are declared and paid at least annually. However, to the extent that a net realized capital gain can be reduced by a capital loss carryforward, such gain will not be distributed. Income and capital gain distributions are determined in accordance with federal income tax regulations, which may differ from GAAP.
F) FEDERAL INCOME TAXES — No provision is made for federal taxes as it is the Fund's intention to continue to qualify for and elect the tax treatment applicable to regulated investment companies ("RIC") under the Internal Revenue Code of 1986, as amended (the "Code"), and to make the requisite distributions to its shareholders, which will be sufficient to relieve it from federal income and excise taxes.
In order to qualify as a RIC under the Code, the Fund must meet certain requirements regarding the source of its income, the diversification of its assets and the distribution of its income. One of these requirements is that the Fund derive at least 90% of its gross income for each taxable year from dividends, interest, payments with respect to certain securities loans, gains from the sale or other disposition of stock, securities or foreign currencies, other income derived with respect to its business of investing in such stock, securities or currencies or net income derived from interests in certain publicly traded partnerships ("Qualifying Income").
The Fund adopted the authoritative guidance for uncertainty in income taxes and recognizes a tax benefit or liability from an uncertain position only if it is more likely than not that the position is sustainable based solely on its technical merits and consideration of the relevant taxing authority's widely understood
37
Credit Suisse Floating Rate High Income Fund
Notes to Financial Statements (continued)
October 31, 2014
Note 2. Significant Accounting Policies
administrative practices and procedures. The Fund has reviewed its current tax positions and has determined that no provision for income tax is required in the Fund's financial statements. The Fund's federal tax returns for the prior three fiscal years remain subject to examination by the Internal Revenue Service.
G) SHORT-TERM INVESTMENTS — The Fund, together with other funds/portfolios advised by Credit Suisse, an indirect, wholly-owned subsidiary of Credit Suisse Group AG, pools available cash into a short-term variable rate time deposit issued by State Street Bank and Trust Company ("SSB"), the Fund's custodian. The short-term time deposit issued by SSB is a variable rate account classified as a short-term investment.
H) FORWARD FOREIGN CURRENCY CONTRACTS — The Fund may enter into forward foreign currency contracts for the purchase or sale of a specific foreign currency at a fixed price on a future date. Risks may arise upon entering into these contracts from the potential inability of counterparties to meet the terms of their contracts and from unanticipated movements in the value of a foreign currency. The Fund will enter into forward foreign currency contracts primarily for hedging foreign currency risk. Forward foreign currency contracts are adjusted by the daily forward exchange rate of the underlying currency and any gains or losses are recorded for financial statement purposes as unrealized until the contract settlement date or an offsetting position is entered into. The Fund's open forward foreign currency contracts at October 31, 2014 are disclosed in the Schedule of Investments.
I) UNFUNDED LOAN COMMITMENTS — The Fund enters into certain agreements, all or a portion of which may be unfunded. The Fund is obligated to fund these loan commitments at the borrowers' discretion. Funded portions of credit agreements are presented on the Statement of Investments. As of October 31, 2014, unfunded commitments were as follows:
Borrower | | Maturity | | Rate | | Unfunded Commitment | |
Onex York Acquisition Corp. | | 10/01/21 | | | 0.000 | | | $ | 390,244 | | |
Ziggo B.V. | | 01/15/22 | | | 2.750 | | | | 4,166,055 | | |
Ziggo B.V. | | 01/15/22 | | | 3.210 | | | | 203,553 | | |
Unfunded loan commitments and funded portions of credit agreements are marked to market daily and any unrealized appreciation or depreciation is included in the Statement of Assets and Liabilities and the Statement of Operations.
38
Credit Suisse Floating Rate High Income Fund
Notes to Financial Statements (continued)
October 31, 2014
Note 2. Significant Accounting Policies
J) SECURITIES LENDING — Loans of securities are required at all times to be secured by collateral at least equal to 102% of the market value of domestic securities on loan (including any accrued interest thereon) and 105% of the market value of foreign securities on loan (including any accrued interest thereon). Cash collateral received by the Fund in connection with securities lending activity may be pooled together with cash collateral for other funds/portfolios advised by Credit Suisse and may be invested in a variety of investments, including funds advised by SSB, the Fund's securities lending agent or money market instruments. However, in the event of default or bankruptcy by the other party to the agreement, realization and/or retention of the collateral may be subject to legal proceedings.
SSB has been engaged by the Fund to act as the Fund's securities lending agent. As of October 31, 2014, the Fund had investment securities on loan with a fair value of $12,913,868 and a related liability of $13,436,710 for collateral received on securities loaned, both of which are presented gross on the Statement of Assets and Liabilities. The collateral for securities loaned is valued consistently to the other investments held by the Fund and is included in level 2. For the year ended October 31, 2014, the value of the related collateral exceeded the value of the securities loaned.
The Fund's securities lending arrangement provides that the Fund and SSB will share the net income earned from securities lending activities. During the year ended October 31, 2014, total earnings from the Fund's investment in cash collateral received in connection with securities lending arrangements was $37,620, of which $0 was rebated from borrowers (brokers). The Fund retained $31,975 in income from the cash collateral investment, and SSB, as lending agent, was paid $5,645. Securities lending income is accrued as earned.
K) OTHER — The high yield, fixed income securities in which the fund invests will primarily consist of senior secured floating rate loans ("Senior Loans") issued by non-investment grade companies. Senior Loans are typically secured by specific collateral of the issuer and hold the most senior position in the issuer's capital structure. The interest rate on Senior Loans is periodically adjusted to a recognized base rate, typically the London Interbank Offered Rate ("LIBOR"). While these characteristics may reduce interest rate risk and mitigate losses in the event of borrower default, the Senior Loans in which the Fund invests have below investment grade credit ratings and thereby are considered speculative because of the significant credit risk of their issuers.
39
Credit Suisse Floating Rate High Income Fund
Notes to Financial Statements (continued)
October 31, 2014
Note 2. Significant Accounting Policies
Lower-rated debt securities (commonly known as "junk bonds") possess speculative characteristics and are subject to greater market fluctuations and risk of lost income and principal than higher-rated debt securities for a variety of reasons. Also, during an economic downturn or substantial period of rising interest rates, highly leveraged issuers may experience financial stress which would adversely affect their ability to service their principal and interest payment obligations, to meet projected business goals and to obtain additional financing.
In addition, periods of economic uncertainty and changes can be expected to result in increased volatility of market prices of lower-rated debt securities and the Fund's net asset value.
L) NEW ACCOUNTING PRONOUNCEMENTS — In June 2013, the FASB issued Accounting Standards Update (ASU) No. 2013-08, Investment Companies (Topic 946): Amendments to the Scope, Measurement, and Disclosure Requirements. The ASU modifies the criteria used in defining an investment company under GAAP and also sets forth certain measurement and disclosure requirements. Under the ASU, an entity that is registered under the 1940 Act automatically qualifies as an investment company. The ASU is effective for interim and annual reporting periods beginning after December 15, 2013. Management has reviewed the requirements and believes the adoption of this ASU will not have a material impact on the financial statements.
In June 2014, FASB issued ASU No. 2014-11, Transfers and Servicing (Topic 860), Repurchase-to-Maturity Transactions, Repurchase Financings, and Disclosures. The ASU changes the accounting for certain repurchase agreements and expands disclosure requirements related to repurchase agreements, securities lending, repurchase-to-maturity and similar transactions. The ASU is effective for interim and annual reporting periods beginning after December 15, 2014. Management is currently evaluating the impact, if any, of applying this provision.
M) SUBSEQUENT EVENTS — In preparing the financial statements as of October 31, 2014, management considered the impact of subsequent events for potential recognition or disclosure in these financial statements through the date of release of this report. No such events requiring recognition or disclosure were identified through the date of the release of this report.
40
Credit Suisse Floating Rate High Income Fund
Notes to Financial Statements (continued)
October 31, 2014
Note 3. Transactions with Affiliates and Related Parties
Credit Suisse serves as investment adviser for the Fund. For its investment advisory services, Credit Suisse is entitled to receive a fee from the Fund at an annual rate of 0.70% of the Fund's average daily net assets less than or equal to $100 million and 0.50% of the Fund's average daily net assets greater than $100 million. For the year ended October 31, 2014, investment advisory fees earned and voluntarily waived were $9,477,656 and $1,259,839, respectively. Fee waivers and expense reimbursements are voluntary and may be discontinued by Credit Suisse at any time.
Credit Suisse and SSB serve as co-administrators to the Fund. For its co-administrative services, Credit Suisse received a fee calculation at an annual rate of 0.09% of the Fund's average daily net assets. For the year ended October 31, 2014, co-administrative services fees earned by Credit Suisse were $1,669,978.
For its co-administrative services, SSB receives a fee, exclusive of out-of-pocket expenses, calculated in total for all the Credit Suisse funds/portfolios co-administered by SSB and allocated based upon the relative average net assets of each fund/portfolio, subject to an annual minimum fee. For the year ended October 31, 2014, co-administrative services fees earned by SSB (including out-of-pocket expenses) with respect to the Fund were $294,409.
Credit Suisse Securities (USA) LLC ("CSSU"), an affiliate of Credit Suisse, serves as the distributor of the Fund's shares. Pursuant to distribution plans adopted by the Fund pursuant to Rule 12b-1 under the 1940 Act, CSSU received fees for its distribution services. These fees were calculated at an annual rate of 0.25% of the average daily net assets of the Class A shares. For the Class B and Class C shares, the fee is calculated at an annual rate of 1.00% of the average daily net assets. For the year ended October 31, 2014, the Fund's paid Rule 12b-1 distribution fees of $1,150,499 for Class A shares, $40,704 for Class B Share and $1,818,471 for Class C shares. Class I shares are not subject to Rule 12b-1 distribution fees.
Certain brokers, dealers and financial representatives provide transfer agent related services to the Fund and receive compensation from the Fund. Some of the fees are paid by Credit Suisse on behalf of the Fund. For the year ended October 31, 2014, the Fund reimbursed Credit Suisse $866,696, which is included in the Fund's transfer agent expense.
For the year ended October 31, 2014, CSSU and its affiliates advised the Fund that they retained $37,549 from commissions earned on the sale of the Fund's Class A shares. There were no commissions earned on sale of Class C shares.
41
Credit Suisse Floating Rate High Income Fund
Notes to Financial Statements (continued)
October 31, 2014
Note 3. Transactions with Affiliates and Related Parties
Merrill Corporation ("Merrill"), formerly an affiliate of Credit Suisse, has been engaged by the Fund to provide certain financial printing services. For the year ended October 31, 2014, Merrill was paid $54,356 for its services by the Fund. This amount was included in the printing fees presented on the Statement of Operations. Effective July 23, 2014, Merrill was no longer considered an affiliate.
Note 4. Line of Credit
The Fund, together with other funds/portfolios advised by Credit Suisse (collectively, the "Participating Funds"), participates in a committed, unsecured line of credit facility ("Credit Facility"), in an aggregated amount of $200 million for temporary or emergency purposes with SSB under a first come first serve basis. Under the terms of the Credit Facility, the Participating Funds pay an aggregate commitment fee on the average unused amount of the Credit Facility, which is allocated among the Participating Funds in such manner as is determined by the governing Boards of the Participating Funds. In addition, the Participating Funds pay interest on borrowings at either the Overnight Federal Funds rate or the Overnight LIBOR rate plus a spread. At October 31, 2014 and during the year ended October 31, 2014, the Fund had no borrowings outstanding under the Credit Facility.
Note 5. Purchases and Sales of Securities
For the year ended October 31, 2014, purchases and sales of investment securities (excluding short-term investments) were $1,456,050,192 and $1,014,077,020, respectively.
Note 6. Capital Share Transactions
The Fund is authorized to issue an unlimited number of full and fractional shares of beneficial interest, $.001 par value per share. The Fund offers Class I,
42
Credit Suisse Floating Rate High Income Fund
Notes to Financial Statements (continued)
October 31, 2014
Note 6. Capital Share Transactions
Class A, and Class C shares. Class B shares are shown but not offered. Transactions in capital shares for each class of the Fund were as follows:
| | | Class I | |
| | | For the Year Ended
October 31, 2014 | | For the Year Ended
October 31, 2013 | |
| | | Shares | | Value | | Shares | | Value | |
Shares sold | | | 125,588,944 | | | $ | 872,476,682 | | | | 122,789,111 | | | $ | 851,983,662 | | |
Shares issued in reinvestment
of dividends | | | 5,958,795 | | | | 41,305,420 | | | | 2,561,784 | | | | 17,766,435 | | |
Shares redeemed net of
redemption fees | | | (61,807,152 | ) | | | (428,438,198 | ) | | | (31,903,094 | ) | | | (221,274,219 | ) | |
Net increase | | | 69,740,587 | | | $ | 485,343,904 | | | | 93,447,801 | | | $ | 648,475,878 | | |
| | | Class A | |
| | | For the Year Ended
October 31, 2014 | | For the Year Ended
October 31, 2013 | |
| | | Shares | | Value | | Shares | | Value | |
Shares sold | | | 34,647,617 | | | $ | 241,904,516 | | | | 57,399,112 | | | $ | 400,181,086 | | |
Shares issued in reinvestment
of dividends | | | 2,232,878 | | | | 15,565,228 | | | | 1,432,214 | | | | 9,982,858 | | |
Shares redeemed net of
redemption fees | | | (50,363,479 | ) | | | (350,986,465 | ) | | | (14,858,423 | ) | | | (103,535,867 | ) | |
Net increase (decrease) | | | (13,482,984 | ) | | $ | (93,516,721 | ) | | | 43,972,903 | | | $ | 306,628,077 | | |
| | | Class B | |
| | | For the Year Ended
October 31, 2014 | | For the Year Ended
October 31, 2013 | |
| | | Shares | | Value | | Shares | | Value | |
Shares sold | | | — | | | $ | — | | | | 6,144 | | | $ | 42,917 | | |
Shares issued in reinvestment
of dividends | | | 13,147 | | | | 92,023 | | | | 10,609 | | | | 74,101 | | |
Shares redeemed net of
redemption fees | | | (118,815 | ) | | | (830,010 | ) | | | (132,666 | ) | | | (922,622 | ) | |
Net decrease | | | (105,668 | ) | | $ | (737,987 | ) | | | (115,913 | ) | | $ | (805,604 | ) | |
| | | Class C | |
| | | For the Year Ended
October 31, 2014 | | For the Year Ended
October 31, 2013 | |
| | | Shares | | Value | | Shares | | Value | |
Shares sold | | | 7,657,514 | | | $ | 53,635,367 | | | | 15,215,739 | | | $ | 106,423,437 | | |
Shares issued in reinvestment
of dividends | | | 528,231 | | | | 3,691,123 | | | | 385,645 | | | | 2,695,935 | | |
Shares redeemed net of
redemption fees | | | (7,548,814 | ) | | | (52,713,051 | ) | | | (2,549,166 | ) | | | (17,798,220 | ) | |
Net increase | | | 636,931 | | | $ | 4,613,439 | | | | 13,052,218 | | | $ | 91,321,152 | | |
43
Credit Suisse Floating Rate High Income Fund
Notes to Financial Statements (continued)
October 31, 2014
Note 6. Capital Share Transactions
Prior to February 1, 2014, the Fund imposed a redemption fee of 2% of the value of shares that were redeemed or exchanged within 30 days from the date of purchase. For the years ended October 31, 2014 and 2013, the redemption fees received by the Fund were $8,404 and $110,770, respectively. On February 1, 2014, the Fund eliminated the redemption fee.
On October 31, 2014, the number of shareholders that held 5% or more of the outstanding shares of each class of the Fund was as follows:
| | | Number of
Shareholders | | Approximate Percentage
of Outstanding Shares | |
Class I | | | 4 | | | | 52 | % | |
Class A | | | 3 | | | | 64 | % | |
Class B | | | 4 | | | | 69 | % | |
Class C | | | 4 | | | | 69 | % | |
Some of the shareholders are omnibus accounts, which hold shares on behalf of individual shareholders.
Note 7. Federal Income Taxes
Income and capital gain distributions are determined in accordance with federal income tax regulations, which may differ from GAAP.
The tax characteristics of dividends paid during the years ended October 31, 2014 and 2013, respectively, by the Fund were as follows:
| Ordinary Income | | Long-Term Capital Gain | |
| 2014 | | 2013 | | 2014 | | 2013 | |
| $ | 71,286,758 | | | $ | 37,542,285 | | | $ | 816,637 | | | $ | — | | |
The tax basis components of distributable earnings differ from the amounts reflected in the Statement of Assets and Liabilities by temporary book/tax differences. These differences are primarily due to differing treatments of dividends payable, wash sales, forward contracts marked to market, partnership basis adjustments and income from defaulted bonds. At October 31, 2014, the components of distributable earnings on a tax basis were as follows:
Ordinary income distributions payable | | $ | (985,887 | ) | |
Undistributed Capital Gain | | | 921,341 | | |
Accumulated realized loss | | | (2,325,642 | ) | |
Unrealized depreciation | | | (26,025,962 | ) | |
| | $ | (28,416,150 | ) | |
44
Credit Suisse Floating Rate High Income Fund
Notes to Financial Statements (continued)
October 31, 2014
Note 7. Federal Income Taxes
At October 31, 2014, the Fund had $2,325,642 of short-term capital loss carryforwards available to offset possible future capital gains which will expire in 2016.
Included in the Fund's capital loss carryforward is $2,325,642, acquired in the Credit Suisse High Yield Fund merger, which is subject to IRS limitations. During the tax year ended October 31, 2014, the Fund utilized $8,565,283 of the capital loss carryforwards.
Under the Regulated Investment Company Modernization Act of 2010, the Fund will be permitted to carry forward capital losses incurred in taxable years beginning after December 22, 2010 for an unlimited period. However, any losses incurred during those future taxable years will be required to be utilized prior to the losses incurred in pre-enactment taxable years. As a result of this ordering rule, pre-enactment capital loss carryforwards may be more likely to expire unused. Additionally, post-enactment capital losses that are carried forward will retain their character as either short-term or long-term capital losses rather than being considered all short-term as under previous law. It is uncertain whether the Fund will be able to realize the full benefits of the capital loss carryforwards before they expire.
At October 31, 2014, the cost of investments (excluding foreign currency related transactions) and net unrealized appreciation (depreciation) for income tax purposes were as follows:
Cost of Investments | | $ | 1,896,952,179 | | |
Unrealized appreciation | | $ | 5,707,299 | | |
Unrealized depreciation | | | (31,258,855 | ) | |
Net unrealized appreciation (depreciation) | | $ | (25,551,556 | ) | |
At October 31, 2014, the Fund reclassified $970,872 from accumulated net investment income and $970,994 from accumulated net realized loss to paid in capital, to adjust for current period permanent book/tax differences which arose principally from differing book/tax treatment of foreign currency gain (loss), defaulted bonds and partnership basis adjustments. Net assets were not affected by these reclassifications.
45
Credit Suisse Floating Rate High Income Fund
Notes to Financial Statements (continued)
October 31, 2014
In the normal course of business, the Fund may provide general indemnifications pursuant to certain contracts and organizational documents. The Fund's maximum exposure under these arrangements is dependent on future claims that may be made against the Fund and, therefore, cannot be estimated; however, based on experience, the risk of loss from such claims is considered remote.
Note 9. Other Matters
On May 19, 2014, the U.S. Department of Justice (the "Department of Justice") filed a one-count criminal information (the "Information") in the District Court for the Eastern District of Virginia charging Credit Suisse AG ("CSAG") with conspiracy to commit tax fraud related to accounts CSAG established for cross-border clients. The Department of Justice and CSAG entered into a plea agreement (the "Plea Agreement") settling the action pursuant to which CSAG pleaded guilty to the charge set out in the Information.
The Plea Agreement requires CSAG to pay over $1.8 billion to the U.S. government, including the U.S. Internal Revenue Service. The Plea Agreement also requires CSAG to lawfully undertake certain remedial actions to address the conduct described in the Plea Agreement.
CSAG has entered into other settlements relating to the conduct set out in the Plea Agreement. CSAG has entered into a Consent Order with the Federal Reserve Board (the "Federal Reserve") to resolve certain findings by the Federal Reserve, including that the activities of CSAG regarding opening of foreign accounts for U.S. taxpayers, provision of investment services to U.S. clients, and operation of CSAG's New York representative office prior to 2009 lacked adequate enterprise-wide risk management and compliance policies and procedures sufficient to ensure that all of its activities comply with U.S. laws and regulations. In addition, CSAG has entered into a Consent Order with the New York State Department of Financial Services (the "DFS") to resolve the DFS's investigation into the conduct described in the Plea Agreement. The settlement with the Federal Reserve requires CSAG to pay $100 million to the Federal Reserve, and the settlement with the DFS requires CSAG to pay $715 million to the DFS.
These settlements follow a settlement by Credit Suisse Group AG ("CS Group"), the parent company of CSAG, with the Securities and Exchange Commission (the "Commission") on February 21, 2014 to resolve an
46
Credit Suisse Floating Rate High Income Fund
Notes to Financial Statements (continued)
October 31, 2014
investigation by the Commission into solicitation and provision of broker-dealer and investment advisory services to certain U.S. cross-border clients by CS Group while not registered with the Commission as a broker-dealer or investment adviser. As part of the settlement, CS Group retained an independent consultant to evaluate its policies and procedures and examine its broker-dealer and investment adviser activities to fully verify that the business that was the subject of the Commission investigation has been completely exited. CS Group also agreed to pay $196,511,014, which includes $82,170,990 in disgorgement, $64,340,024 in interest and a $50,000,000 penalty.
CSAG is the indirect parent company of Credit Suisse and CSSU. Neither Credit Suisse, CSSU nor the Fund was named in the Plea Agreement (as defined below) or other settlements relating to the conduct set out in the Plea Agreement. The conduct set out in the Plea Agreement did not involve the Fund, Credit Suisse or CSSU with respect to its investment adviser and distribution activities relating to the Fund.
Credit Suisse, CSSU and certain of their affiliates have received a permanent exemptive order from the Commission to permit them to continue serving as investment advisers and principal underwriters for U.S.-registered investment companies, such as the Fund. Due to a provision in the law governing the operation of U.S.-registered investment companies, they would otherwise have become ineligible to perform these activities as a result of the plea in the Plea Agreement. The permanent exemptive order permits Credit Suisse and CSSU to continue to provide services to the Fund, so long as, among other things, no current or former employee of CSAG or any affiliate of CSAG who previously has been or who subsequently may be identified by CSAG or any U.S. or non-U.S. regulatory or enforcement agencies as having been responsible for the conduct described in the Plea Agreement will be employed by Credit Suisse and certain of its affiliates. Credit Suisse and CSSU have informed the Fund that, Credit Suisse and CSSU believe the Settlements will not have any material impact on the Fund or on the ability of Credit Suisse or CSSU to perform services for the Fund.
On November 21, 2014, at the sentencing hearing, the court accepted and implemented the sentence as set out in the plea agreement. The court imposed no additional conditions beyond those contained in the agreement.
47
Credit Suisse Floating Rate High Income Fund
Report of Independent Registered Public Accounting Firm
To the Board of Trustees and the Shareholders of
Credit Suisse Floating Rate High Income Fund:
In our opinion, the accompanying statement of assets and liabilities, including the schedule of investments, and the related statements of operations and of changes in net assets and the financial highlights present fairly, in all material respects, the financial position of Credit Suisse Floating Rate High Income Fund (a separate fund of Credit Suisse Opportunity Funds)(the "Fund") at October 31, 2014, the results of its operations for the year then ended, the changes in its net assets for each of the two years in the period then ended and the financial highlights for each of the five years in the period then ended, in conformity with accounting principles generally accepted in the United States of America. These financial statements and financial highlights (hereafter referred to as "financial statements") are the responsibility of the Fund's management. Our responsibility is to express an opinion on these financial statements based on our audits. We conducted our audits of these financial statements in accordance with the standards of the Public Company Accounting Oversight Board (United States). Those standards require that we plan and perform the audit to obtain reasonable assurance about whether the financial statements are free of material misstatement. An audit includes examining, on a test basis, evidence supporting the amounts and disclosures in the financial statements, assessing the accounting principles used and significant estimates made by management, and evaluating the overall financial statement presentation. We believe that our audits, which included confirmation of securities at October 31, 2014 by correspondence with the custodian and brokers, provide a reasonable basis for our opinion.
PricewaterhouseCoopers LLP
New York, New York
December 29, 2014
48
Credit Suisse Floating Rate High Income Fund
Information Concerning Trustees and Officers (unaudited)
Name, Address
(Year of Birth) | | Position(s)
Held with
Fund | | Term
of Office1
and
Length
of Time
Served | | Principal
Occupation(s) During
Past Five Years | | Number of
Portfolios
in Fund
Complex
Overseen
by Trustee | | Other
Trusteeships
Held by Trustee | |
Independent Trustees | | | | | | | | | | | |
Enrique Arzac
c/o Credit Suisse Asset
Management, LLC
Attn: General Counsel
One Madison Avenue
New York, New York
10010
(1941) | | Trustee, Audit Committee Chairman and Nominating Committee Member | | Since 2005 | | Professor of Finance and Economics, Graduate School of Business, Columbia University since 1971. | | | 12 | | | Director of The Adams Express Company, Petroleum and Resources Corporation, Aberdeen Chile Fund, Inc., Aberdeen Emerging Markets Smaller Company Opportunities Fund, Inc., Aberdeen Israel Fund, Inc., Aberdeen Indonesia Fund, Inc. and Aberdeen Latin America Equity Fund, Inc. (each a closed-end investment company); Director of Aberdeen Asia-Pacific Income Investment Company Limited (a Canadian closed-end fund); Trustee of Mirae Asset Discovery Funds (6 open-end portfolios); Director of Starcomms PLC. (telecommunications company) from 2008 to 2011; Director of Epoch Holding Corporation (an investment management and investment advisory services company) from 2006 to March 2013 | |
1 Each Trustee and Officer serves until his or her respective successor has been duly elected and qualified.
49
Credit Suisse Floating Rate High Income Fund
Information Concerning Trustees and Officers (unaudited) (continued)
Name, Address
(Year of Birth) | | Position(s)
Held with
Fund | | Term
of Office1
and
Length
of Time
Served | | Principal
Occupation(s) During
Past Five Years | | Number of
Portfolios
in Fund
Complex
Overseen
by Trustee | | Other
Trusteeships
Held by Trustee | |
Independent Trustees | | | | | | | | | | | |
Jeffrey E. Garten
c/o Credit Suisse Asset
Management, LLC
Attn: General Counsel
One Madison Avenue
New York,
New York 10010
(1946) | | Trustee, Audit and Nominating Committee Member | | Since 2001 | | The Juan Trippe Professor in the Practice of International Trade, Finance and Business, Yale School of Management, from July 2005 to present; Partner and Chairman of Garten Rothkopf (consulting firm) from October 2005 to present. | | | 10 | | | Director of Aetna, Inc. (insurance company); Director of CarMax Group (used car dealers); Director of Alcan (aluminum production) from February 2007 to November 2007; Member of Standard & Poor's Board of Managers (credit rating agency) from December 2011 to November 2014; Director of Miller Buckfire & Co., LLC (financial restructuring). | |
1 Each Trustee and Officer serves until his or her respective successor has been duly elected and qualified.
50
Credit Suisse Floating Rate High Income Fund
Information Concerning Trustees and Officers (unaudited) (continued)
Name, Address
(Year of Birth) | | Position(s)
Held with
Fund | | Term
of Office1
and
Length
of Time
Served | | Principal
Occupation(s) During
Past Five Years | | Number of
Portfolios
in Fund
Complex
Overseen
by Trustee | | Other
Trusteeships
Held by Trustee | |
Independent Trustees | | | | | | | | | | | |
Steven N. Rappaport
Lehigh Court, LLC
555 Madison Avenue
29th Floor
New York, New York
10022
(1948) | | Chairman of the Board of Trustees, Audit Committee Member and Nominating Committee Chairman | | Trustee since 2001 and Chairman since 2005 | | Partner of Lehigh Court, LLC and RZ Capital (private investment firms) from July 2002 to present. | | | 12 | | | Director of iCAD, Inc. (surgical and medical instruments and apparatus company); Director of Aberdeen Chile Fund, Inc., Aberdeen Emerging Markets Smaller Company Opportunities Fund, Inc., Aberdeen Israel Fund, Inc., Aberdeen Indonesia Fund, Inc. and Aberdeen Latin America Equity Fund, Inc. (each a closed-end investment company); Director of Presstek, Inc. (digital imaging technologies company) from 2003 to 2012; Director of Wood Resources, LLC. (plywood manufacturing company) from 2003 to October 2013; Partner Backstage Acquisition Holding, LLC (Publication Job Postings) from November 2013 to present. | |
1 Each Trustee and Officer serves until his or her respective successor has been duly elected and qualified.
51
Credit Suisse Floating Rate High Income Fund
Information Concerning Trustees and Officers (unaudited) (continued)
Name, Address
(Year of Birth) | | Position(s)
Held with
Fund | | Term
of Office1
and
Length
of Time
Served | | Principal Occupation(s) During Past Five Years | |
Officers* | | | | | | | |
John G. Popp
Credit Suisse Asset
Management, LLC
One Madison Avenue
New York, New York 10010
(1956) | | Chief Executive Officer and President | | Since 2010 | | Managing Director of Credit Suisse; Global Head and Chief Investment Officer of the Credit Investment Group; Associated with Credit Suisse or its predecessor since 1997; Officer of other Credit Suisse Funds; Trustee of Credit Suisse High Yield Bond Fund; Director of Credit Suisse Asset Management Income Fund, Inc. | |
Bruce Rosenberg
Credit Suisse Asset
Management, LLC
One Madison Avenue
New York, New York 10010
(1961) | | Chief Financial Officer | | Since 2012 | | Director of Credit Suisse; Director of Liquid Accounting of Credit Suisse; Associated with Credit Suisse since 2008; Officer of other Credit Suisse Funds. | |
Emidio Morizio
Credit Suisse Asset
Management, LLC
One Madison Avenue
New York, New York 10010
(1966) | | Chief Compliance Officer | | Since 2004 | | Managing Director and Global Head of Compliance of Credit Suisse since 2010; Director and Global Head of Compliance of Credit Suisse from January 2005 to December 2009; Associated with Credit Suisse since July 2000; Officer of other Credit Suisse Funds. | |
Joanne Doldo
Credit Suisse Asset
Management, LLC
One Madison Avenue
New York, New York 10010
(1959) | | Chief Legal Officer | | Since 2013 | | Vice President of Credit Suisse; Associated with Credit Suisse since September 2011; Officer of other Credit Suisse Funds; Associated with Morgan Stanley Investment Management from 2002 – 2008. | |
Rocco DelGuercio
Credit Suisse Asset
Management, LLC
One Madison Avenue
New York, New York 10010
(1963) | | Treasurer | | Since 2013 | | Vice President of Credit Suisse since 2013; Independent Consultant from February 2012 to April 2013; Director of Legg Mason & Co., LLC from March 2004 to January 2012; Associated with Credit Suisse from June 1996 to March 2004; Officer of other Credit Suisse Funds. | |
Karen Regan
Credit Suisse Asset
Management, LLC
One Madison Avenue
New York, New York 10010
(1963) | | Senior Vice President and Secretary | | Since 2010 | | Vice President of Credit Suisse; Associated with Credit Suisse since December 2004; Officer of other Credit Suisse Funds. | |
* The officers of the Fund shown are officers that make policy decisions.
The Statement of Additional Information includes additional information about the Trustees and is available, without charge, upon request, by calling 877-870-2874.
52
Credit Suisse Floating Rate High Income Fund
Proxy Voting and Portfolio Holdings Information (unaudited)
Information regarding how the Fund voted proxies related to its portfolio securities during the 12 month period ended June 30 of each year, as well as the policies and procedures that the Fund uses to determine how to vote proxies relating to its portfolio securities are available:
• By calling 1-877-870-2874
• On the Fund's website, www.credit-suisse.com/us/funds
• On the website of the Securities and Exchange Commission, www.sec.gov.
The Fund files a complete schedule of its portfolio holdings for the first and third quarters of its fiscal year with the SEC on Form N-Q. The Fund's Forms N-Q are available on the SEC's website at www.sec.gov and may be reviewed and copied at the SEC's Public Reference Room in Washington, DC. Information on the operation of the SEC's Public Reference Room may be obtained by calling 1-202-551-8090.
53

P.O. BOX 55030, BOSTON, MA 02205-5030
877-870-2874 n www.credit-suisse.com/us/funds
CREDIT SUISSE SECURITIES (USA) INC, DISTRIBUTOR. FLHI-AR-1014

CREDIT SUISSE FUNDS
Annual Report
October 31, 2014
n CREDIT SUISSE
STRATEGIC INCOME FUND
The Fund's investment objectives, risks, charges and expenses (which should be considered carefully before investing), and more complete information about the Fund, are provided in the Prospectus, which should be read carefully before investing. You may obtain additional copies by calling 877-870-2874 or by writing to Credit Suisse Funds, P.O. Box 55030, Boston, MA 02205-5030.
Credit Suisse Securities (USA) LLC, Distributor, is located at One Madison Avenue, New York, NY 10010. Credit Suisse Funds are advised by Credit Suisse Asset Management, LLC.
Investors in the Credit Suisse Funds should be aware that they may be eligible to purchase Class I shares (where offered) directly or through certain intermediaries. Such shares are not subject to a sales charge. Investors in the Credit Suisse Funds should also be aware that they may be eligible for a reduction or waiver of the sales charge with respect to Class A or C shares (where offered). For more information, please review the relevant prospectuses or consult your financial representative.
Fund shares are not deposits or other obligations of Credit Suisse Asset Management, LLC ("Credit Suisse") or any affiliate, are not FDIC-insured and are not guaranteed by Credit Suisse or any affiliate. Fund investments are subject to investment risks, including loss of your investment.
Credit Suisse Strategic Income Fund
Annual Investment Adviser's Report
October 31, 2014 (unaudited)
December 22, 2014
Dear Shareholder:
We are pleased to present this Annual Report covering the activities of the Credit Suisse Strategic Income Fund (the "Fund"), for the 12-months ended October 31, 2014.
Performance Summary
11/01/13 – 10/31/14
Fund & Benchmark | | Performance | |
| Class I1 | | | 5.57 | % | |
| Class A1,2 | | | 5.28 | % | |
| Class C1,2 | | | 4.43 | % | |
| BofA Merrill Lynch 3-Month U.S. Treasury Bill Index3 | | | 0.06 | % | |
Performance shown for the Fund's Class A and Class C Shares does not reflect sales charges, which are a maximum of 4.75% and 1.00%, respectively.2
Market Review: A positive period for credit and fixed income
The 12-months ended October 31, 2014 was a positive one for fixed income. For much of the year, a bid for duration products caused a rally in the US Treasury market that led to positive returns across fixed income. The 10-year Treasury returned 5.20% for the period. In comparison, credit markets, such as investment grade corporates, represented by the BofA Merrill Lynch US Corporate Index4 , returned 6.49%, while high yield bonds, as represented by BofA Merrill Lynch High Yield Master II Constrained Index5, posted positive returns of 5.85%. The Credit Suisse Leveraged Loan Index6 registered a return of 3.77% for the same time period.
Default activity has remained low for the high yield universe with the par-weighted default rate, as reported by JPMorgan, reaching 1.86% in October for the senior loan market, par-weighted default rates were reported at 3.28%, according to S&P Leveraged Commentary and Data. There was a notable default this year — Energy Futures ("TXU"), a Texas based utility company. Absent TXU, default rates are 0.53% for high yield and 0.24% for senior loans.
High yield spreads were largely unchanged, narrowing by 1 basis point and ending the period at 444 basis points.
The yield-to-worst finished the period at 5.86%, compared to 5.66% in October of 2013. The discount margin for the senior loan asset class, using a three-year average life assumption, widened 17 basis points during the period
1
Credit Suisse Strategic Income Fund
Annual Investment Adviser's Report (continued)
October 31, 2014 (unaudited)
to +515 basis points, while the average Index price finished the period at 97.61, down by 0.61 points.
Strategic Review and Outlook: Anticipating a continuing positive environment
For the 12-months ended October 31, 2014, the Fund outperformed the benchmark. Given the positive interest rate and credit rate environments, returns in the high yield, leveraged loans and CLO asset classes all contributed to returns.
During the period, we favored the defensive nature of the senior loan asset class and we will continue to opportunistically take advantage of volatility within high yield bonds. In CLOs, we have been highly selective, buying a combination of well-subordinated, longer-duration mezzanine issues at big discounts from par, as well as sourcing earlier vintage, shorter-duration, higher coupon/higher priced bonds that exhibit less market price volatility.
Within the high yield market, trading has focused on areas where the manager perceived relative value. Depending on market conditions, this has fluctuated between compelling secondary opportunities and the new issues coming at concessions. As we head into the remainder of the year and into 2015, we will look to take advantage of market dislocations and selectively add in names that offer compelling risk-return.
Within the loan market, we expect price action will be driven primarily by supply and demand dynamics between mutual fund flows, collateralized loan obligation ("CLO") creation and the new issue pipeline. Looking forward, most market participants expect the Fed to raise short-term interest rates in mid to late 2015. Given that loans typically have short interest rate exposure and coupons that are based on short-term rates, the asset class should benefit from a rising rate environment.
For credit asset classes in general, fundamentals generally remain strong, supporting a sanguine outlook for default rates. However, as appetite for risk products has wavered in the past few months and oil prices have dropped, market volatility has increased. Thus, looking forward, we expect security selection to be an increasingly important contributor to returns in the future and continue to be selective in portfolio positioning.
2
Credit Suisse Strategic Income Fund
Annual Investment Adviser's Report (continued)
October 31, 2014 (unaudited)
The Credit Suisse Credit Investments Group
John G. Popp
Andrew H. Marshak
Thomas J. Flannery
Louis I. Farano
Wing Chan
Senior secured floating rate loans ("Senior Loans") are subject to the risk that a court could subordinate a Senior Loan, which typically holds the most senior position in the issuer's capital structure, to presently existing or future indebtedness or take other action detrimental to the holders of Senior Loans.
High yield bonds are lower-quality bonds that are also known as "junk bonds." Such bonds entail greater risks than those found in higher-rated securities.
Collateralized loan obligations ("CLOs") are subject to the risk of substantial losses due to actual defaults, decrease of market value due to collateral defaults and disappearance of subordinate tranches, market anticipation of defaults, and investor aversion to CLO securities as a class. The risks of CLOs depend largely on the type of the underlying loans and the tranche of CLOs in which the Fund invests. In addition, CLOs carry risks including interest rate risk and credit risk.
In addition to historical information, this report contains forward-looking statements, which may concern, among other things, domestic and foreign market, industry and economic trends and developments and government regulation and their potential impact on the Fund's investments. These statements are subject to risks and uncertainties and actual trends, developments and regulations in the future, and their impact on the Fund could be materially different from those projected, anticipated or implied. The Fund has no obligation to update or revise forward-looking statements.
The views of the Fund's management are as of the date of the letter and the Fund holdings described in this document are as of October 31, 2014; these views and Fund holdings may have changed subsequent to these dates. Nothing in this document is a recommendation to purchase or sell securities.
3
Credit Suisse Strategic Income Fund
Annual Investment Adviser's Report (continued)
October 31, 2014 (unaudited)
Comparison of Change in Value of $10,000 Investment in the
Credit Suisse Strategic Income Fund1 Class I Shares,
Class A Shares2, Class C Shares2 and the BofA
Merrill Lynch 3 Month U.S. Treasury Bill Index3
from Inception (09/28/12).

1 Fee waivers and/or expense reimbursements may reduce expenses for the Fund, without which performance would be lower. The Fund has entered into a written contract to limit expenses to 0.99% of the Fund's average daily net assets for Class I shares, 1.24% of the Fund's average daily net assets for Class A shares and 1.99% of the Fund's average daily net assets for Class C shares through at least February 28, 2015.
2 Total return for the Fund's Class A shares for the reporting period, based on offering price (including maximum sales charge of 4.75%), was 0.29%. Total return for the Fund's Class C shares for the reporting period, based on redemption value (including maximum contingent deferred sales charge of 1.00%), was 3.45%.
3 Using only liquid securities, the BofA Merrill Lynch 3 Month U.S. Treasury Bill Index seeks to replicate the return of the overall hedge fund industry, as represented by the Dow Jones Credit Suisse Hedge Fund Index. An index does not have transactions costs; investors may not invest directly in an index.
4 The Index is an unmanaged index comprised of U.S. dollar denominated investment grade corporate debt securities publicly issued in the U.S. domestic market with at least one year remaining term to final maturity.
5 The BofA Merrill Lynch US High Yield Master II Constrained Index is an unmanaged index that tracks the performance of below investment-grade U.S. dollar-denominated corporate bonds issued in the U.S. domestic market, where each issuer's allocation is limited to 2% of the index. An index does not have transaction costs; investors cannot invest directly in an index.
6 Credit Suisse Leveraged Loan Index is an unmanaged index that is designed to mirror the investable universe of the U.S dollar denominated institutional leveraged loan market. An index does not have transaction costs, investors cannot invest directly in an index.
4
Credit Suisse Strategic Income Fund
Annual Investment Adviser's Report (continued)
October 31, 2014 (unaudited)
Average Annual Returns as of October 31, 20141
| | | 1 Year | | Since
Inception2 | |
Class I | | | 5.57 | % | | | 8.81 | % | |
Class A Without Sales Charge | | | 5.28 | % | | | 8.55 | % | |
Class A With Maximum Sales Charge | | | 0.29 | % | | | 6.05 | % | |
Class C Without CDSC | | | 4.43 | %3 | | | 7.71 | % | |
Class C With CDSC | | | 3.45 | % | | | 7.71 | % | |
Returns represent past performance and include change in share price and reinvestment of dividends and capital gains. Past performance cannot guarantee future results. The current performance of the Fund may be lower or higher than the figures shown. Returns and share price will fluctuate, and redemption value may be more or less than original cost. The performance results do not reflect the deduction of taxes that a shareholder would pay on fund distributions or the redemption of fund shares. Performance information current to the most recent month-end is available at www.credit-suisse.com/us/funds.
The annual gross expense ratios are 1.18% for Class I shares, 1.42% for Class A shares and 2.18% for Class C shares. The annual net expense ratios after fee waivers and/or expense reimbursements are 0.99% for Class I shares, 1.24% for Class A shares and 1.99% for Class C shares.
1 Fee waivers and/or expense reimbursements may reduce expenses for the Fund, without which performance would be lower. The Fund has entered into a written contract to limit expenses to 0.99% of the Fund's average daily net assets for Class I shares, 1.24% of the Fund's average daily net assets for Class A shares and 1.99% of the Fund's average daily net assets for Class C shares through at least February 28, 2015.
2 Inception Date September 28, 2012.
3 The calculated total return shown does not reflect adjustments required under U.S. GAAP made to the Net Asset Value as of October 31, 2014. The total return for Class C shares based on the Net Asset Value adjusted for financial statement purposes is 4.53%.
5
Credit Suisse Strategic Income Fund
Annual Investment Adviser's Report (continued)
October 31, 2014 (unaudited)
Information About Your Fund's Expenses
As an investor of the Fund, you incur two types of costs: ongoing expenses and transaction costs. Ongoing expenses include management fees, distribution and service (12b-1) fees and other Fund expenses. Examples of transaction costs include sales charges (loads), redemption fees and account maintenance fees, which are not shown in this section and which would result in higher total expenses. The following table is intended to help you understand your ongoing expenses of investing in the Fund and to help you compare these expenses with the ongoing expenses of investing in other mutual funds. The table is based on an investment of $1,000 made at the beginning of the six-months ended October 31, 2014.
The table illustrates your Fund's expenses in two ways:
• Actual Fund Return. This helps you estimate the actual dollar amount of ongoing expenses paid on a $1,000 investment in the Fund using the Fund's actual return during the period. To estimate the expenses you paid over the period, simply divide your account value by $1,000 (for example, an $8,600 account value divided by $1,000 = 8.6), then multiply the result by the number in the "Expenses Paid per $1,000" line under the share class you hold.
• Hypothetical 5% Fund Return. This helps you to compare your Fund's ongoing expenses with those of other mutual funds using the Fund's actual expense ratio and a hypothetical rate of return of 5% per year before expenses. Examples using a 5% hypothetical fund return may be found in the shareholder reports of other mutual funds. The hypothetical account values and expenses may not be used to estimate the actual ending account balance or expenses you paid for the period.
Please note that the expenses shown in these tables are meant to highlight your ongoing expenses only and do not reflect any transaction costs, such as sales charges (loads) or redemption fees. If these transaction costs had been included, your costs would have been higher. The "Expenses Paid per $1,000" line of the tables is useful in comparing ongoing expenses only and will not help you determine the relative total expenses of owning different funds.
6
Credit Suisse Strategic Income Fund
Annual Investment Adviser's Report (continued)
October 31, 2014 (unaudited)
Expenses and Value for a $1,000 Investment
for the six month period ended October 31, 2014
Actual Fund Return | | Class I | | Class A | | Class C | |
Beginning Account Value 05/01/14 | | $ | 1,000.00 | | | $ | 1,000.00 | | | $ | 1,000.00 | | |
Ending Account Value 10/31/14 | | $ | 998.50 | | | $ | 997.30 | | | $ | 992.50 | | |
Expenses Paid per $1,000* | | $ | 4.99 | | | $ | 6.24 | | | $ | 9.99 | | |
Hypothetical 5% Fund Return | |
Beginning Account Value 05/01/14 | | $ | 1,000.00 | | | $ | 1,000.00 | | | $ | 1,000.00 | | |
Ending Account Value 10/31/14 | | $ | 1,020.21 | | | $ | 1,018.85 | | | $ | 1,015.17 | | |
Expenses Paid per $1,000* | | $ | 5.04 | | | $ | 6.31 | | | $ | 10.11 | | |
| | | Class I | | Class A | | Class C | |
Annualized Expense Ratios* | | | 0.99 | % | | | 1.24 | % | | | 1.99 | % | |
* Expenses are equal to the Fund's annualized expense ratio for each share class, multiplied by the average account value over the period, multiplied by the number of days in the most recent fiscal half year period, then divided by 365.
The "Expenses Paid per $1,000" and the "Annualized Expense Ratios" in the tables are based on actual expenses paid by the Fund during the period, net of fee waivers and/or expense reimbursements. If those fee waivers and/or expense reimbursements had not been in effect, the Fund's actual expenses would have been higher. Expenses do not reflect additional charges and expenses that are, or may be, imposed under the variable contracts or plans. Such charges and expenses are described in the prospectus of the insurance company separate account or in the plan documents or other informational materials supplied by plan sponsors. The Fund's expenses should be considered with these charges and expenses in evaluating the overall cost of investing in the separate account.
For more information, please refer to the Fund's prospectus.
7
Credit Suisse Strategic Income Fund
Annual Investment Adviser's Report (continued)
October 31, 2014 (unaudited)
Credit Quality Breakdown*
(% of Total Investments as of October 31, 2014)
S&P Ratings | |
BB | | | 18.8 | % | |
B | | | 44.8 | | |
CCC | | | 21.3 | | |
D | | | 0.0 | | |
NR | | | 12.5 | | |
Subtotal | | | 97.4 | | |
Equity and Other | | | 0.4 | | |
| Short-Term Investment1 | | | 2.2 | | |
Total | | | 100.0 | % | |
* Expressed as a percentage of total investments (excluding securities lending collateral if applicable) and may vary over time.
1 Primarily reflects cash invested in State Street Bank and Trust Co. Euro Time Deposit, for which the purchases of securities have been executed but not yet settled at October 31, 2014, if applicable.
8
Credit Suisse Strategic Income Fund
Schedule of Investments
October 31, 2014
Par
(000) | |
| | Ratings†
(S&P/Moody's) | | Maturity | | Rate% | | Value | |
| CORPORATE BONDS (33.0%) | | | |
| Auto Parts & Equipment (0.5%) | | | |
$ | 450 | | | MPG Holdco I, Inc., Rule 144A,
Company Guaranteed Notes
(Callable 10/15/17 @ 105.53)‡ | | (B+, B3) | | 10/15/22 | | | 7.375 | | | $ | 474,750 | | |
| Building & Construction (0.5%) | | | |
| | 500 | | | Rialto Corp., Rule 144A,
Company Guaranteed Notes
(Callable 12/01/15 @ 103.50)‡ | | (B, B2) | | 12/01/18 | | | 7.000 | | | | 512,188 | | |
| Building Materials (0.3%) | | | |
| | 250 | | | Interline Brands, Inc.,
10.000% Cash,10.750% PIK,
Global Senior Unsecured Notes
(Callable 12/01/14 @ 105.00)1 | | (CCC+, Caa2) | | 11/15/18 | | | 20.750 | | | | 261,875 | | |
| Chemicals (2.5%) | | | |
| | 800 | | | Nufarm Australia Ltd.,
Rule 144A, Company Guaranteed Notes
(Callable 10/15/15 @ 104.78)‡ | | (B+, B1) | | 10/15/19 | | | 6.375 | | | | 807,000 | | |
| | 1,000 | | | Polymer Group, Inc.,
Global Senior Secured Notes
(Callable 02/01/15 @ 103.88) | | (B-, B2) | | 02/01/19 | | | 7.750 | | | | 1,045,000 | | |
| | 600 | | | Polymer Group, Inc.,
Rule 144A, Company Guaranteed Notes
(Callable 12/01/15 @ 105.16)‡ | | (CCC+, Caa1) | | 06/01/19 | | | 6.875 | | | | 594,750 | | |
| | 52 | | | Reichhold Industries, Inc.,
9.000% Cash, 11.000% PIK,
Rule 144A, Senior Secured Notes
(Callable 12/01/14 @ 100.00)‡ 1 | | (D, NR) | | 05/08/17 | | | 20.000 | | | | 28,749 | | |
| | | | 2,475,499 | | |
| Diversified Capital Goods (0.9%) | | | |
| | 250 | | | Belden, Inc., Rule 144A,
Company Guaranteed Notes
(Callable 07/15/19 @ 102.63)‡ | | (B+, Ba2) | | 07/15/24 | | | 5.250 | | | | 246,875 | | |
| | 600 | | | Belden, Inc., Rule 144A,
Company Guaranteed Notes
(Callable 09/01/17 @ 102.75)‡ | | (B+, Ba2) | | 09/01/22 | | | 5.500 | | | | 613,500 | | |
| | | | 860,375 | | |
| Energy - Exploration & Production (4.6%) | | | |
| | 1,050 | | | Bonanza Creek Energy, Inc.,
Global Company Guaranteed Notes
(Callable 04/15/17 @ 103.38) | | (B-, B3) | | 04/15/21 | | | 6.750 | | | | 1,057,875 | | |
| | 500 | | | Dynegy Finance II, Inc., Rule 144A,
Senior Secured Notes
(Callable 05/01/17 @ 103.38)‡ | | (NR, B3) | | 11/01/19 | | | 6.750 | | | | 518,125 | | |
| | 500 | | | Harkand Finance, Inc.,
Reg S, Rule 144A, Senior Secured Notes
(Callable 03/28/16 @ 104.50)‡2 | | (NR, NR) | | 03/28/19 | | | 7.500 | | | | 482,500 | | |
See Accompanying Notes to Financial Statements.
9
Credit Suisse Strategic Income Fund
Schedule of Investments (continued)
October 31, 2014
Par
(000) | |
| | Ratings†
(S&P/Moody's) | | Maturity | | Rate% | | Value | |
CORPORATE BONDS | | | |
Energy - Exploration & Production | | | |
$ | 750 | | | Oasis Petroleum, Inc.,
Company Guaranteed Notes
(Callable 11/01/16 @ 103.25) | | (B+, B2) | | 11/01/21 | | | 6.500 | | | $ | 772,500 | | |
| | 750 | | | PDC Energy, Inc.,
Global Company Guaranteed Notes
(Callable 10/15/17 @ 103.88) | | (B-, B3) | | 10/15/22 | | | 7.750 | | | | 791,415 | | |
| | 1,000 | | | Stone Energy Corp.,
Global Company Guaranteed Notes
(Callable 11/15/17 @ 103.75) | | (B-, B3) | | 11/15/22 | | | 7.500 | | | | 937,500 | | |
| | | | 4,559,915 | | |
| Gaming (1.0%) | | | |
| | 750 | | | Safari Holding Verwaltungs GmbH, Rule 144A,
Senior Secured Notes
(Callable 02/15/17 @ 104.13)‡€ | | (B, B2) | | 02/15/21 | | | 8.250 | | | | 953,864 | | |
| Gas Distribution (2.3%) | | | |
| | 450 | | | Energy Transfer Equity LP,
Senior Secured Notes | | (BB, Ba2) | | 10/15/20 | | | 7.500 | | | | 519,750 | | |
| | 1,000 | | | Genesis Energy Finance Corp.,
Global Company Guaranteed Notes
(Callable 02/15/17 @ 102.88) | | (B, B1) | | 02/15/21 | | | 5.750 | | | | 1,006,250 | | |
| | 750 | | | Holly Energy Finance Corp.,
Global Company Guaranteed Notes
(Callable 03/01/16 @ 103.25) | | (BB-, B1) | | 03/01/20 | | | 6.500 | | | | 781,875 | | |
| | | | 2,307,875 | | |
| Health Facility (0.5%) | | | |
| | 500 | | | Aviv Healthcare Capital Corp.,
Global Company Guaranteed Notes
(Callable 10/15/17 @ 103.00) | | (BB, Ba3) | | 10/15/21 | | | 6.000 | | | | 516,875 | | |
| Health Services (1.3%) | | | |
| | 1,250 | | | Covenant Surgical Partners, Inc.,
Rule 144A, Senior Secured Notes
(Callable 08/01/16 @ 106.56)‡ | | (B-, B3) | | 08/01/19 | | | 8.750 | | | | 1,256,250 | | |
| Hotels (1.1%) | | | |
| | 1,000 | | | Financiere Quick SAS, Rule 144A,
Unsecured Notes
(Callable 10/15/15 @ 102.00)‡€# | | (CCC, Caa2) | | 10/15/19 | | | 7.582 | | | | 1,039,907 | | |
| Investments & Misc. Financial Services (0.9%) | | | |
| | 500 | | | Cabot Financial Luxembourg S.A.,
Rule 144A, Senior Secured Notes
(Callable 10/01/15 @ 107.78)࣠| | (B+, B2) | | 10/01/19 | | | 10.375 | | | | 877,581 | | |
See Accompanying Notes to Financial Statements.
10
Credit Suisse Strategic Income Fund
Schedule of Investments (continued)
October 31, 2014
Par
(000) | |
| | Ratings†
(S&P/Moody's) | | Maturity | | Rate% | | Value | |
CORPORATE BONDS | | | |
| Media - Cable (1.0%) | | | |
$ | 1,000 | | | Midcontinent Communications &
Midcontinent Finance Corp., Rule 144A,
Company Guaranteed Notes
(Callable 08/01/16 @ 104.69)‡ | | (B-, B3) | | 08/01/21 | | | 6.250 | | | $ | 1,027,500 | | |
| Media - Diversified (1.0%) | | | |
| | 965 | | | National CineMedia LLC,
Global Senior Secured Notes
(Callable 04/15/17 @ 103.00) | | (BB-, Ba2) | | 04/15/22 | | | 6.000 | | | | 981,888 | | |
| Media - Services (0.5%) | | | |
| | 500 | | | Clear Channel Worldwide Holdings, Inc.,
Series B, Global Company Guaranteed Notes
(Callable 11/15/17 @ 103.25) | | (B, B1) | | 11/15/22 | | | 6.500 | | | | 520,000 | | |
| Metals & Mining - Excluding Steel (4.2%) | | | |
| | 500 | | | Boart Longyear Management Pty. Ltd.,
Rule 144A, Company Guaranteed Notes
(Callable 04/01/16 @ 103.50)‡ | | (CCC, Caa2) | | 04/01/21 | | | 7.000 | | | | 406,250 | | |
| | 500 | | | Boart Longyear Management Pty. Ltd.,
Rule 144A, Senior Secured Notes‡ | | (B-, B3) | | 10/01/18 | | | 10.000 | | | | 537,500 | | |
| | 1,000 | | | KGHM International Ltd., Rule 144A,
Company Guaranteed Notes
(Callable 06/15/15 @ 103.88)‡ | | (BB-, B1) | | 06/15/19 | | | 7.750 | | | | 1,065,000 | | |
| | 2,000 | | | Taseko Mines Ltd., Company Guaranteed
Notes (Callable 04/15/15 @ 103.88) | | (B, B3) | | 04/15/19 | | | 7.750 | | | | 1,905,000 | | |
| | 500 | | | Xinergy Corp., Rule 144A, Senior Secured
Notes (Callable 05/15/15 @ 104.63)‡ | | (NR, NR) | | 05/15/19 | | | 9.250 | | | | 247,500 | | |
| | | | 4,161,250 | | |
| Oil Field Equipment & Services (2.3%) | | | |
| | 800 | | | Pacific Drilling V Ltd., Rule 144A,
Senior Secured Notes
(Callable 12/01/15 @ 103.63)‡ | | (B+, B2) | | 12/01/17 | | | 7.250 | | | | 797,000 | | |
| | 800 | | | Pioneer Energy Services Corp., Rule 144A,
Company Guaranteed Notes
(Callable 03/15/17 @ 104.59)‡ | | (B+, B2) | | 03/15/22 | | | 6.125 | | | | 746,000 | | |
| | 500 | | | Shelf Drilling Holdings Ltd., Rule 144A,
Secured Notes
(Callable 05/01/15 @ 104.31)‡ | | (B+, Ba3) | | 11/01/18 | | | 8.625 | | | | 496,250 | | |
| | 250 | | | Sidewinder Drilling, Inc., Rule 144A,
Senior Unsecured Notes
(Callable 11/15/16 @ 104.88)‡ | | (B-, B3) | | 11/15/19 | | | 9.750 | | | | 235,000 | | |
| | | | 2,274,250 | | |
See Accompanying Notes to Financial Statements.
11
Credit Suisse Strategic Income Fund
Schedule of Investments (continued)
October 31, 2014
Par
(000) | |
| | Ratings†
(S&P/Moody's) | | Maturity | | Rate% | | Value | |
CORPORATE BONDS | | | |
| Oil Refining & Marketing (2.6%) | | | |
$ | 1,000 | | | Coffeyville Finance, Inc.,
Global Secured Notes
(Callable 11/01/17 @ 103.25) | | (B+, B2) | | 11/01/22 | | | 6.500 | | | $ | 1,015,000 | | |
| | 1,250 | | | PBF Finance Corp., Global Senior
Secured Notes (Callable 02/15/16 @ 104.13) | | (BB+, Ba3) | | 02/15/20 | | | 8.250 | | | | 1,314,062 | | |
| | 250 | | | Western Refining, Inc., Global Company
Guaranteed Notes
(Callable 04/01/17 @ 103.13) | | (B+, B3) | | 04/01/21 | | | 6.250 | | | | 252,500 | | |
| | | | 2,581,562 | | |
| Real Estate Investment Trusts (2.1%) | | | |
| | 1,000 | | | CNL Lifestyle Properties, Inc.,
Global Company Guaranteed Notes
(Callable 04/15/15 @ 103.63) | | (B, Ba3) | | 04/15/19 | | | 7.250 | | | | 1,027,500 | | |
| | 500 | | | iStar Financial, Inc., Senior Unsecured
Notes (Callable 07/01/16 @ 102.50) | | (B+, B3) | | 07/01/19 | | | 5.000 | | | | 500,000 | | |
| | 500 | | | iStar Financial, Inc., Senior Unsecured
Notes (Callable 08/01/17 @ 100.00) | | (B+, B3) | | 11/01/17 | | | 4.000 | | | | 497,750 | | |
| | | | 2,025,250 | | |
| Software - Services (1.4%) | | | |
| | 1,000 | | | NeuStar, Inc., Global Company Guaranteed
Notes (Callable 01/15/18 @ 102.25) | | (BB-, B2) | | 01/15/23 | | | 4.500 | | | | 870,000 | | |
| | 500 | | | Sophia Holding Finance, Inc.,
PIK, Rule 144A, Company Guaranteed
Notes (Callable 12/01/14 @ 102.00)‡1 | | (CCC+, Caa2) | | 12/01/18 | | | 9.625 | | | | 511,250 | | |
| | | | 1,381,250 | | |
| Support - Services (0.8%) | | | |
| | 500 | | | H&E Equipment Services, Inc.,
Global Company Guaranteed Notes
(Callable 09/01/17 @ 103.50) | | (B+, B3) | | 09/01/22 | | | 7.000 | | | | 536,250 | | |
| | 250 | | | The Geo Group, Inc., Global Company
Guaranteed Notes
(Callable 02/15/16 @ 103.31) | | (BB-, Ba3) | | 02/15/21 | | | 6.625 | | | | 265,625 | | |
| | | | 801,875 | | |
| Telecom - Wireless (0.2%) | | | |
| | 183 | | | SBA Communications Corp.,
Rule 144A, Senior Unsecured Notes
(Callable 07/15/17 @ 103.66)‡ | | (B, B3) | | 07/15/22 | | | 4.875 | | | | 180,690 | | |
| Theaters & Entertainment (0.5%) | | | |
| | 500 | | | Regal Entertainment Group, Senior
Unsecured Notes
(Callable 06/15/18 @ 102.88) | | (B-, B3) | | 06/15/23 | | | 5.750 | | | | 482,500 | | |
| TOTAL CORPORATE BONDS (Cost $33,393,483) | | | 32,514,969 | | |
See Accompanying Notes to Financial Statements.
12
Credit Suisse Strategic Income Fund
Schedule of Investments (continued)
October 31, 2014
Par
(000) | |
| | Ratings†
(S&P/Moody's) | | Maturity | | Rate% | | Value | |
| BANK LOANS (43.8%) | | | |
| Aerospace & Defense (0.5%) | | | |
$ | 101 | | | Aveos Fleet Performance, Inc.#K | | (CCC+, B3) | | 03/12/15 | | | 12.750 | | | $ | 253 | | |
| | 500 | | | LM U.S. Corp. Acquisition, Inc.# | | (CCC, Caa2) | | 01/25/21 | | | 8.250 | | | | 493,750 | | |
| | | | 494,003 | | |
| Building Materials (1.5%) | | | |
| | 486 | | | Panolam Industries International, Inc.# | | (BB-, B2) | | 08/30/17 | | | 7.750 | | | | 486,301 | | |
| | 991 | | | Roofing Supply Group LLC# | | (B, B3) | | 05/31/19 | | | 5.000 | | | | 979,187 | | |
| | | | 1,465,488 | | |
| Chemicals (4.5%) | | | |
| | 1,000 | | | Albaugh LLC# | | (BB-, B1) | | 05/30/21 | | | 6.000 | | | | 986,250 | | |
| | 1,000 | | | Colouroz Investment 1 GmbH# | | (NR, Caa1) | | 09/06/22 | | | 8.250 | | | | 962,500 | | |
| | 995 | | | Peroxychem LLC# | | (B+, B2) | | 02/28/20 | | | 7.500 | | | | 999,975 | | |
| | 1,500 | | | Royal Adhesives and Sealants LLC# | | (CCC+, Caa2) | | 01/31/19 | | | 9.750 | | | | 1,516,875 | | |
| | | | 4,465,600 | | |
| Consumer Products (1.0%) | | | |
| | 995 | | | ABG Intermediate Holdings 2 LLC# | | (B+, B1) | | 05/27/21 | | | 5.500 | | | | 991,269 | | |
| Diversified Capital Goods (1.3%) | | | |
| | 750 | | | Husky Injection Molding Systems Ltd.# | | (CCC+, Caa1) | | 06/30/22 | | | 7.250 | | | | 736,875 | | |
| | 701 | | | Revere Industries LLC#K | | (CCC-, B3) | | 04/30/15 | | | 10.000 | | | | 595,807 | | |
| | | | 1,332,682 | | |
| Electric - Generation (0.4%) | | | |
| | 600 | | | Texas Competitive Electric Holdings Co. LLC# | | (CCC, NR) | | 10/10/17 | | | 4.647 | | | | 438,213 | | |
| Electronics (1.5%) | | | |
| | 975 | | | FIDJI Luxembourg (BC4) Sarl# | | (BB-, B1) | | 12/24/20 | | | 6.250 | | | | 977,442 | | |
| | 500 | | | TriZetto Corp.# | | (CCC, Caa1) | | 03/28/19 | | | 8.500 | | | | 503,750 | | |
| | | | 1,481,192 | | |
| Financial Services (1.0%) | | | |
| | 1,000 | | | Mergermarket U.S.A., Inc.# | | (CCC+, Caa2) | | 02/04/22 | | | 7.500 | | | | 960,000 | | |
| Food - Wholesale (2.4%) | | | |
| | 625 | | | Allflex Holdings III, Inc.# | | (B-, B2) | | 07/19/21 | | | 8.000 | | | | 618,491 | | |
| | 744 | | | Big Heart Pet Brands# | | (B+, B1) | | 03/08/20 | | | 3.500 | | | | 717,711 | | |
| | 1,000 | | | The Winebow Group, Inc.# | | (CCC+, Caa1) | | 12/31/21 | | | 8.500 | | | | 992,500 | | |
| | | | 2,328,702 | | |
| Gaming (0.7%) | | | |
| | 743 | | | ROC Finance LLC# | | (BB-, B2) | | 06/20/19 | | | 5.000 | | | | 713,264 | | |
| Health Facilities (2.5%) | | | |
| | 494 | | | Premier Dental Services, Inc.# | | (B, B3) | | 11/01/18 | | | 6.000 | | | | 486,968 | | |
| | 2,000 | | | Surgery Center Holdings, Inc.# | | (CCC+, Caa2) | | 07/09/21 | | | 8.500 | | | | 1,970,010 | | |
| | | | 2,456,978 | | |
| Health Services (1.0%) | | | |
| | 1,000 | | | Valitas Health Services, Inc.# | | (B-, B3) | | 06/02/17 | | | 6.000 | | | | 975,000 | | |
See Accompanying Notes to Financial Statements.
13
Credit Suisse Strategic Income Fund
Schedule of Investments (continued)
October 31, 2014
Par
(000) | |
| | Ratings†
(S&P/Moody's) | | Maturity | | Rate% | | Value | |
BANK LOANS | | | |
| Insurance Brokerage (1.0%) | | | |
$ | 1,000 | | | AssuredPartners Capital, Inc.# | | (CCC+, Caa2) | | 04/02/22 | | | 7.750 | | | $ | 983,125 | | |
| Investments & Misc. Financial Services (2.1%) | | | |
| | 494 | | | Liquidnet Holdings, Inc.# | | (B, B3) | | 05/22/19 | | | 7.750 | | | | 488,813 | | |
| | 1,000 | | | Transfirst Holdings, Inc.# | | (NR, Caa1) | | 06/27/18 | | | 8.000 | | | | 1,001,875 | | |
| | 605 | | | Walter Investment Management Corp.# | | (B+, B2) | | 12/11/20 | | | 4.750 | | | | 572,165 | | |
| | | | 2,062,853 | | |
| Leisure (1.0%) | | | |
| | 1,000 | | | New York Wheel Owner LLC#K^ | | (NR, NR) | | 06/05/20 | | | 9.250 | | | | 980,000 | | |
| Life Insurance (0.6%) | | | |
| | 356 | | | MMM Holdings, Inc.# | | (B+, B2) | | 12/12/17 | | | 9.750 | | | | 353,682 | | |
| | 259 | | | MSO of Puerto Rico, Inc.# | | (B+, B2) | | 12/12/17 | | | 9.750 | | | | 257,133 | | |
| | | | 610,815 | | |
| Machinery (1.9%) | | | |
| | 409 | | | Alliance Laundry Systems LLC# | | (CCC+, Caa2) | | 12/10/19 | | | 9.500 | | | | 411,903 | | |
| | 410 | | | Winoa S.A.€#K | | (NR, NR) | | 01/24/19 | | | 4.010 | | | | 509,974 | | |
| | 137 | | | Winoa S.A.€#^K | | (NR, NR) | | 01/30/19 | | | 4.010 | | | | 170,419 | | |
| | 785 | | | WTG Holdings III Corp.# | | (CCC+, NR) | | 01/15/22 | | | 8.500 | | | | 776,495 | | |
| | | | 1,868,791 | | |
| Media - Broadcast (1.2%) | | | |
| | 1,000 | | | All3Media International€# | | (B, B3) | | 06/30/22 | | | 8.250 | | | | 1,238,805 | | |
| Oil Field Equipment & Services (2.0%) | | | |
| | 995 | | | Philadelphia Energy Solutions LLC# | | (BB-, B1) | | 04/04/18 | | | 6.250 | | | | 946,446 | | |
| | 1,000 | | | Shelf Drilling Holdings Ltd.# | | (B+, B1) | | 10/08/18 | | | 10.000 | | | | 992,500 | | |
| | | | 1,938,946 | | |
| Packaging (0.5%) | | | |
| | 500 | | | Clondalkin Acquisitions B.V.# | | (CCC+, Caa2) | | 11/27/20 | | | 10.000 | | | | 502,500 | | |
| Pharmaceuticals (1.4%) | | | |
| | 937 | | | Auxilium Pharmaceuticals, Inc.# | | (B-, Ba3) | | 04/26/17 | | | 6.250 | | | | 943,492 | | |
| | 499 | | | Delta Dutch Newco B.V.# | | (B, B2) | | 03/11/21 | | | 4.250 | | | | 487,321 | | |
| | | | 1,430,813 | | |
| Printing & Publishing (0.7%) | | | |
| | 727 | | | Harland Clarke Holdings Corp.# | | (B+, B1) | | 05/22/18 | | | 7.000 | | | | 735,644 | | |
| Software - Services (4.5%) | | | |
| | 500 | | | AVG Technologies N.V.# | | (BB, B1) | | 10/15/20 | | | 5.750 | | | | 492,188 | | |
| | 1,000 | | | Flexera Software LLC# | | (CCC+, Caa1) | | 04/02/21 | | | 8.000 | | | | 977,500 | | |
| | 1,000 | | | Landslide Holdings, Inc.# | | (CCC+, Caa1) | | 02/25/21 | | | 8.250 | | | | 987,500 | | |
| | 995 | | | MRI Software LLC# | | (B+, B2) | | 01/29/21 | | | 5.250 | | | | 992,512 | | |
| | 1,000 | | | MSC.Software Corp.# | | (CCC, Caa1) | | 06/01/21 | | | 8.500 | | | | 985,000 | | |
| | | | 4,434,700 | | |
See Accompanying Notes to Financial Statements.
14
Credit Suisse Strategic Income Fund
Schedule of Investments (continued)
October 31, 2014
Par
(000) | |
| | Ratings†
(S&P/Moody's) | | Maturity | | Rate% | | Value | |
BANK LOANS | | | |
| Specialty Retail (1.0%) | | | |
$ | 980 | | | Ollie's Bargain Outlet, Inc.# | | (B, B2) | | 09/27/19 | | | 4.750 | | | $ | 972,230 | | |
| Support - Services (3.0%) | | | |
| | 961 | | | Evergreen Tank Solutions, Inc.# | | (CCC+, Caa1) | | 09/28/18 | | | 9.500 | | | | 936,513 | | |
| | 998 | | | Institutional Shareholder Services, Inc.# | | (B+, B2) | | 04/30/21 | | | 5.000 | | | | 987,525 | | |
| | 988 | | | Long Term Care Group, Inc.# | | (B, B3) | | 06/06/20 | | | 6.000 | | | | 994,906 | | |
| | | | 2,918,944 | | |
| Telecom - Wireless (1.0%) | | | |
| | 1,000 | | | Maritime Telecommunications Network, Inc.# | | (B+, NR) | | 03/03/16 | | | 7.500 | | | | 955,000 | | |
| Telecommunications Equipment (1.5%) | | | |
| | 497 | | | Avaya, Inc.# | | (B, B1) | | 03/30/18 | | | 6.500 | | | | 494,402 | | |
| | 1,000 | | | Omnitracs, Inc.# | | (CCC+, Caa1) | | 05/25/21 | | | 8.750 | | | | 991,670 | | |
| | | | 1,486,072 | | |
| Transportation - Excluding Air/Rail (2.1%) | | | |
| | 1,801 | | | Fraikin OPCO€#K^ | | (CCC+, B2) | | 03/31/17 | | | 11.182 | | | | 2,030,362 | | |
| TOTAL BANK LOANS (Cost $44,029,588) | | | 43,251,991 | | |
| ASSET BACKED SECURITIES (18.9%) | | | |
| Collateralized Debt Obligations (18.9%) | | | |
| | 900 | | | ARES CLO Ltd., 2012-2A, Rule 144A‡# | | (BB, NR) | | 10/12/23 | | | 6.031 | | | | 858,982 | | |
| | 1,000 | | | Atlas Senior Loan Fund V Ltd., 2014-1A,
Rule 144A‡# | | (BB-, NR) | | 07/16/26 | | | 4.946 | | | | 857,285 | | |
| | 750 | | | Carlyle Global Market Strategies CLO Ltd.,
2012-4A, Rule 144Aॠ| | (NR, NR) | | 01/20/25 | | | 0.000 | | | | 661,951 | | |
| | 750 | | | CIFC Funding Ltd., 2012-3A, Rule 144A‡# | | (B, NR) | | 01/29/25 | | | 7.133 | | | | 706,455 | | |
| | 1,250 | | | Galaxy XIV CLO Ltd., 2012-14A, Rule 144A‡# | | (BB, NR) | | 11/15/24 | | | 5.634 | | | | 1,172,985 | | |
| | 650 | | | Galaxy XVII CLO Ltd., 2014-17A, Rule 144A‡# | | (BB, NR) | | 07/15/26 | | | 4.997 | | | | 567,522 | | |
| | 800 | | | Halcyon Loan Advisors Funding Ltd.,
2012-2A, Rule 144A‡# | | (BB, NR) | | 12/20/24 | | | 5.633 | | | | 739,524 | | |
| | 1,000 | | | Hildene CLO II Ltd., 2014-2A, Rule 144A‡# | | (NR, Ba3) | | 07/19/26 | | | 5.331 | | | | 903,446 | | |
| | 1,000 | | | ING Investment Management CLO Ltd.,
2012-1RA, Rule 144A‡# | | (B, NR) | | 03/14/22 | | | 6.734 | | | | 990,325 | | |
| | 500 | | | JFIN CLO Ltd., 2013-1A, Rule 144A‡# | | (BB, NR) | | 01/20/25 | | | 4.981 | | | | 441,746 | | |
| | 1,300 | | | KVK CLO Ltd., 2013-1A, Rule 144A‡# | | (BB, NR) | | 04/14/25 | | | 5.730 | | | | 1,200,735 | | |
| | 1,000 | | | Ocean Trails CLO IV, 2013-4A, Rule 144A‡# | | (B, NR) | | 08/13/25 | | | 6.134 | | | | 873,078 | | |
| | 1,000 | | | OCP CLO Ltd., 2014-6A, Rule 144A‡# | | (B, NR) | | 07/17/26 | | | 5.855 | | | | 831,433 | | |
| | 1,000 | | | Saranac CLO III Ltd., 2014-3A, Rule 144A‡# | | (NR, Ba3) | | 06/22/25 | | | 5.459 | | | | 883,854 | | |
| | 1,000 | | | Shackleton V CLO Ltd., 2014-5A, Rule 144A‡# | | (BB-, NR) | | 05/07/26 | | | 4.587 | | | | 837,224 | | |
| | 750 | | | Sound Point CLO II Ltd., 2013-1A, Rule 144A‡# | | (B, NR) | | 04/26/25 | | | 5.734 | | | | 635,907 | | |
| | 1,000 | | | Sound Point CLO IV Ltd., 2013-3A, Rule 144A‡# | | (NR, Ba3) | | 01/21/26 | | | 4.731 | | | | 851,084 | | |
| | 750 | | | Sound Point CLO IV Ltd., 2013-3A, Rule 144A‡# | | (NR, B2) | | 01/21/26 | | | 5.181 | | | | 604,276 | | |
| | 750 | | | Sound Point CLO V Ltd., 2014-1A, Rule 144A‡# | | (NR, Ba3) | | 04/18/26 | | | 4.481 | | | | 622,154 | | |
See Accompanying Notes to Financial Statements.
15
Credit Suisse Strategic Income Fund
Schedule of Investments (continued)
October 31, 2014
Par
(000) | |
| | Ratings†
(S&P/Moody's) | | Maturity | | Rate% | | Value | |
ASSET BACKED SECURITIES | | | |
Collateralized Debt Obligations | | | |
$ | 750 | | | Trinitas CLO I Ltd., 2014-1A, Rule 144A‡# | | (BB, NR) | | 04/15/26 | | | 4.981 | | | $ | 646,307 | | |
| | 1,325 | | | Venture XVII CLO Ltd., 2014-17A, Rule 144A‡# | | (NR, Ba2) | | 07/15/26 | | | 5.231 | | | | 1,159,327 | | |
| | 800 | | | WhiteHorse IX Ltd., 2014-9A, Rule 144A‡# | | (NR, Ba3) | | 07/17/26 | | | 4.869 | | | | 699,141 | | |
| | 1,000 | | | WhiteHorse VIII Ltd., 2014-1A, Rule 144A‡# | | (NR, Ba3) | | 05/01/26 | | | 4.790 | | | | 870,109 | | |
| TOTAL ASSET BACKED SECURITIES (Cost $19,367,987) | | | 18,614,850 | | |
Number of
Shares | |
| |
| |
| |
| |
| |
| COMMON STOCK (0.3%) | | | |
| Consumer Products (0.3%) | | | |
| | 2,027 | | | Natural Products Group* (Cost $297,984) | | | | | | | | | | | | | | | 296,464 | | |
| MUTUAL FUNDS (0.1%) | | | |
| Commingled Funds (0.1%) | | | |
| | 4,600 | | | BlackRock Floating Rate Income Strategies Fund, Inc. | | | | | | | | | | | | | | | 63,204 | | |
| | 2,300 | | | Eaton Vance Floating-Rate Income Trust | | | | | | | | | | | | | | | 32,821 | | |
| TOTAL MUTUAL FUNDS (Cost $100,797) | | | 96,025 | | |
Par
(000) | | | | | | | | | | | |
| SHORT-TERM INVESTMENT (2.2%) | | | |
$ | 2,154 | | | State Street Bank and Trust Co. Euro Time Deposit
(Cost $2,154,000) | | | | | | 11/03/14 | | | 0.010 | | | | 2,154,000 | | |
| TOTAL INVESTMENTS AT VALUE (98.3%) (Cost $99,343,839) | | | 96,928,299 | | |
| OTHER ASSETS IN EXCESS OF LIABILITIES (1.7%) | | | 1,723,884 | | |
| NET ASSETS (100.0%) | | $ | 98,652,183 | | |
INVESTMENT ABBREVIATION
NR = Not Rated
† Credit ratings given by the Standard & Poor's Division of The McGraw-Hill Companies, Inc. ("S&P") and Moody's Investors Service, Inc. ("Moody's") are unaudited.
‡ Security exempt from registration under Rule 144A of the Securities Act of 1933. These securities may be resold in transactions exempt from registration, normally to qualified institutional buyers. At October 31, 2014, these securities amounted to a value of $33,270,829 or 33.7% of net assets.
1 PIK: Payment-in-kind security for which part of the income earned may be paid as additional principal.
2 REG S: Securities sold under Regulation S may not be offered, sold or delivered within the United States or to, or for the account or benefit of, U.S. persons, except pursuant to an exemption from, or in a transaction not subject to, the registration requirements of the Securities Act of 1933.
€ This security is denominated in Euros.
# Variable rate obligations — The interest rate is the rate as of October 31, 2014.
£ This security is denominated in British Pounds.
K Illiquid security.
See Accompanying Notes to Financial Statements.
16
Credit Suisse Strategic Income Fund
Schedule of Investments (continued)
October 31, 2014
^ Not readily marketable security; security is valued at fair value as determined in good faith by, or under the direction of, the Board of Directors/Trustees.
• Zero coupon security.
* Non-income producing security.
Forward Foreign Currency Contracts
Forward Foreign
Currency to be
Purchased (Local) | | Forward Foreign
Currency to be
Sold (Local) | | Expiration
Date | | Counterparty | | Value on
Settlement Date | | Current
Value | | Net Unrealized
Appreciation
(Depreciation) | |
GBP | 870,000 | | | USD | 1,405,876 | | | 01/15/15 | | Morgan Stanley | | $ | 1,405,876 | | | $ | 1,391,068 | | | $ | (14,808 | ) | |
USD | 6,267,555 | | | EUR | 4,960,000 | | | 01/15/15 | | Morgan Stanley | | | (6,267,555 | ) | | | (6,217,362 | ) | | | 50,193 | | |
USD | 2,435,685 | | | GBP | 1,518,000 | | | 01/15/15 | | Morgan Stanley | | | (2,435,685 | ) | | | (2,427,174 | ) | | | 8,511 | | |
| | | $ | 43,896 | | |
Currency Abbreviations:
EUR = Euro
GBP = British Pound
USD = United States Dollar
Futures Contracts
Contract Description | | Currency | | Expiration
Date | | Number
of Contracts | | Notional
Value | | Net Unrealized
Appreciation
(Depreciation) | |
Contracts to Sell | |
Interest Rate Contracts
10YR U.S. Treasury Note Futures | | USD | | | | Dec 2014 | | | (55 | ) | | $ | (6,949,766 | ) | | $ | (28,461 | ) | |
Net unrealized appreciation (depreciation) | | | | | | | | | | $ | (28,461 | ) | |
See Accompanying Notes to Financial Statements.
17
Credit Suisse Strategic Income Fund
Statement of Assets and Liabilities
October 31, 2014
Assets | |
Investments at value (Cost $99,343,839) (Note 2) | | $ | 96,928,299 | | |
Cash segregated at brokers for futures contracts (Note 2) | | | 72,600 | | |
Receivable for investments sold | | | 9,860,520 | | |
Interest receivable | | | 1,188,148 | | |
Unrealized appreciation on forward currency contracts (Note 2) | | | 58,704 | | |
Receivable for fund shares sold | | | 49,260 | | |
Variation margin receivable on futures contracts (Note 2) | | | 14,505 | | |
Prepaid expenses and other assets | | | 137,091 | | |
Total assets | | | 108,309,127 | | |
Liabilities | |
Advisory fee payable (Note 3) | | | 16,641 | | |
Administrative services fee payable (Note 3) | | | 5,566 | | |
Shareholder servicing/Distribution fee payable (Note 3) | | | 7,417 | | |
Payable for investments purchased | | | 5,692,984 | | |
Due to custodian | | | 2,076,814 | | |
Due to custodian for foreign currency at value (cost $1,271,697) | | | 1,270,208 | | |
Payable for fund shares redeemed | | | 222,107 | | |
Loan payable (Note 4) | | | 200,000 | | |
Unrealized depreciation on forward currency contracts (Note 2) | | | 14,808 | | |
Trustees' fee payable | | | 10,440 | | |
Dividend payable | | | 3,037 | | |
Accrued expenses | | | 136,922 | | |
Total liabilities | | | 9,656,944 | | |
Net Assets | |
Capital stock, $.001 par value (Note 6) | | | 9,426 | | |
Paid-in capital (Note 6) | | | 99,165,716 | | |
Accumulated net investment loss | | | (47,177 | ) | |
Accumulated net realized gain from investments, futures contracts and foreign currency transactions | | | 1,937,939 | | |
Net unrealized depreciation from investments, futures contracts and foreign currency translations | | | (2,413,721 | ) | |
Net asset | | $ | 98,652,183 | | |
I Shares | |
Net assets | | $ | 81,868,177 | | |
Shares outstanding | | | 7,823,166 | | |
Net asset value, offering price and redemption price per share | | $ | 10.46 | | |
A Shares | |
Net assets | | $ | 14,633,271 | | |
Shares outstanding | | | 1,397,115 | | |
Net asset value and redemption price per share | | $ | 10.47 | | |
Maximum offering price per share (net asset value/(1-4.75%)) | | $ | 10.99 | | |
C Shares | |
Net assets | | $ | 2,150,735 | | |
Shares outstanding | | | 205,441 | | |
Net asset value, offering price and redemption price per share | | $ | 10.47 | | |
See Accompanying Notes to Financial Statements.
18
Credit Suisse Strategic Income Fund
Statement of Operations
For the Year Ended October 31, 2014
Investment Income | |
Interest | | $ | 8,318,369 | | |
Dividends | | | 1,739 | | |
Total investment income | | | 8,320,108 | | |
Expenses | |
Investment advisory fees (Note 3) | | | 916,333 | | |
Administrative services fees (Note 3) | | | 156,793 | | |
Shareholder servicing/Distribution fees (Note 3) | |
Class A | | | 150,860 | | |
Class C | | | 12,522 | | |
Transfer agent fees (Note 3) | | | 100,418 | | |
Registration fees | | | 58,206 | | |
Audit and tax fees | | | 52,100 | | |
Trustees' fees | | | 44,139 | | |
Printing fees (Note 3) | | | 43,745 | | |
Custodian fees | | | 37,380 | | |
Legal fees | | | 9,749 | | |
Commitment fees (Note 4) | | | 6,956 | | |
Interest expense (Note 4) | | | 5,469 | | |
Insurance expense | | | 2,738 | | |
Miscellaneous expense | | | 3,810 | | |
Total expenses | | | 1,601,218 | | |
Less: fees waived (Note 3) | | | (222,808 | ) | |
Net expenses | | | 1,378,410 | | |
Net investment income | | | 6,941,698 | | |
Net Realized and Unrealized Gain (Loss) from Investments, Futures Contracts
and Foreign Currency Related Items | |
Net realized gain from investments | | | 1,506,377 | | |
Net realized loss from futures contracts | | | (80,303 | ) | |
Net realized gain from foreign currency transactions | | | 478,780 | | |
Payments by affiliates (See Note 9) | | | 15,617 | | |
Net change in unrealized appreciation (depreciation) from investments | | | (3,577,839 | ) | |
Net change in unrealized appreciation (depreciation) from futures contracts | | | (28,461 | ) | |
Net change in unrealized appreciation (depreciation) from foreign currency translations | | | 45,207 | | |
Net realized and unrealized loss from investments, futures contracts and
foreign currency related items | | | (1,640,622 | ) | |
Net increase in net assets resulting from operations | | $ | 5,301,076 | | |
See Accompanying Notes to Financial Statements.
19
Credit Suisse Strategic Income Fund
Statement of Changes in Net Assets
| | | For the Year
Ended
October 31, 2014 | | For the Year
Ended
October 31, 2013 | |
From Operations | |
Net investment income | | $ | 6,941,698 | | | $ | 2,183,342 | | |
Net realized gain from investments, futures contracts and
foreign currency transactions | | | 1,920,471 | | | | 1,183,257 | | |
Net change in unrealized appreciation (depreciation)
from investments, futures contracts and foreign currency translations | | | (3,561,093 | ) | | | 1,096,476 | | |
Net increase in net assets resulting from operations | | | 5,301,076 | | | | 4,463,075 | | |
From Dividends and Distributions | |
Dividends from net investment income | |
Class I | | | (3,618,640 | ) | | | (1,613,430 | ) | |
Class A | | | (3,298,831 | ) | | | (562,582 | ) | |
Class C | | | (62,248 | ) | | | (7,330 | ) | |
Distributions from net realized gains | |
Class I | | | (444,056 | ) | | | (31,458 | ) | |
Class A | | | (730,997 | ) | | | (153 | ) | |
Class C | | | (2,529 | ) | | | (208 | ) | |
Net decrease in net assets resulting from dividends and distributions | | | (8,157,301 | ) | | | (2,215,161 | ) | |
| From Capital Share Transactions (Note 6) | |
Proceeds from sale of shares | | | 112,200,097 | | | | 76,580,548 | | |
Reinvestment of dividends and distributions | | | 8,113,603 | | | | 2,201,120 | | |
Net asset value of shares redeemed | | | (97,397,159 | )1 | | | (23,349,446 | )2 | |
Net increase in net assets from capital share transactions | | | 22,916,541 | | | | 55,432,222 | | |
Net increase in net assets | | | 20,060,316 | | | | 57,680,136 | | |
Net Assets | |
Beginning of year | | | 78,591,867 | | | | 20,911,731 | | |
End of year | | $ | 98,652,183 | | | $ | 78,591,867 | | |
Accumulated net investment loss | | $ | (47,177 | ) | | $ | (8,933 | ) | |
1 Net of $193 of redemption fees retained by the Fund.
2 Net of $1,563 of redemption fees retained by the Fund.
See Accompanying Notes to Financial Statements.
20
Credit Suisse Strategic Income Fund
Financial Highlights
(For a Class I Share of the Fund Outstanding Throughout Each Period)
| | | For the Year Ended October 31, | |
| | | 2014 | | 2013 | | 20121 | |
Per share data | |
Net asset value, beginning of year | | $ | 10.65 | | | $ | 10.06 | | | $ | 10.00 | | |
INVESTMENT OPERATIONS | |
Net investment income2 | | | 0.64 | | | | 0.61 | | | | 0.01 | | |
Net gain (loss) on investments, futures contracts and foreign currency
related items (both realized and unrealized) | | | (0.06 | ) | | | 0.60 | | | | 0.06 | | |
Total from investment operations | | | 0.58 | | | | 1.21 | | | | 0.07 | | |
REDEMPTION FEES | | | 0.003 | | | | 0.003 | | | | — | | |
LESS DIVIDENDS AND DISTRIBUTIONS | |
Dividends from net investment income | | | (0.63 | ) | | | (0.60 | ) | | | (0.01 | ) | |
Distributions from net realized gains | | | (0.14 | ) | | | (0.02 | ) | | | — | | |
Total dividends and distributions | | | (0.77 | ) | | | (0.62 | ) | | | (0.01 | ) | |
Net asset value, end of year | | $ | 10.46 | | | $ | 10.65 | | | $ | 10.06 | | |
Total return4 | | | 5.57 | % | | | 12.29 | % | | | 0.67 | % | |
RATIOS AND SUPPLEMENTAL DATA | |
Net assets, end of year (000s omitted) | | $ | 81,868 | | | $ | 31,830 | | | $ | 20,710 | | |
Ratio of net expenses to average net assets | | | 1.00 | % | | | 0.99 | % | | | 0.99 | %5 | |
Ratio of expenses to average net assets excluding interest expense | | | 0.99 | % | | | 0.99 | % | | | 0.99 | % | |
Ratio of net investment income to average net assets | | | 5.94 | % | | | 5.77 | % | | | 0.87 | %5 | |
Decrease reflected in above operating expense ratios due to
waivers/reimbursements | | | 0.18 | % | | | 0.63 | % | | | 5.25 | %5 | |
Portfolio turnover rate | | | 124 | % | | | 159 | % | | | 31 | % | |
1 For the period September 28, 2012 (commencement of operations) through October 31, 2012.
2 Per share information is calculated using the average shares outstanding method.
3 This amount represents less than $0.01 per share.
4 Total returns are historical and assume changes in share price and reinvestment of all dividends and distributions. Had certain expenses not been reduced during the years shown, total returns would have been lower. Total returns for periods less than one year are not annualized.
5 Annualized.
See Accompanying Notes to Financial Statements.
21
Credit Suisse Strategic Income Fund
Financial Highlights
(For a Class A Share of the Fund Outstanding Throughout Each Period)
| | | For the Year Ended October 31, | |
| | | 2014 | | 2013 | | 20121 | |
Per share data | |
Net asset value, beginning of year | | $ | 10.66 | | | $ | 10.07 | | | $ | 10.00 | | |
INVESTMENT OPERATIONS | |
Net investment income2 | | | 0.58 | | | | 0.45 | | | | 0.003 | | |
Net gain (loss) on investments, futures contracts and foreign currency
related items (both realized and unrealized) | | | (0.02 | ) | | | 0.73 | | | | 0.08 | | |
Total from investment operations | | | 0.56 | | | | 1.18 | | | | 0.08 | | |
REDEMPTION FEES | | | 0.003 | | | | 0.003 | | | | — | | |
LESS DIVIDENDS AND DISTRIBUTIONS | |
Dividends from net investment income | | | (0.61 | ) | | | (0.57 | ) | | | (0.01 | ) | |
Distributions from net realized gains | | | (0.14 | ) | | | (0.02 | ) | | | — | | |
Total dividends and distributions | | | (0.75 | ) | | | (0.59 | ) | | | (0.01 | ) | |
Net asset value, end of year | | $ | 10.47 | | | $ | 10.66 | | | $ | 10.07 | | |
Total return4 | | | 5.28 | % | | | 11.94 | % | | | 0.76 | % | |
RATIOS AND SUPPLEMENTAL DATA | |
Net assets, end of year (000s omitted) | | $ | 14,633 | | | $ | 46,573 | | | $ | 101 | | |
Ratio of net expenses to average net assets | | | 1.24 | % | | | 1.24 | % | | | 1.24 | %5 | |
Ratio of expenses to average net assets excluding interest expense | | | 1.24 | % | | | 1.24 | % | | | 1.24 | % | |
Ratio of net investment income to average net assets | | | 5.44 | % | | | 4.22 | % | | | 0.42 | %5 | |
Decrease reflected in above operating expense ratios due to
waivers/reimbursements | | | 0.18 | % | | | 0.63 | % | | | 5.25 | %5 | |
Portfolio turnover rate | | | 124 | % | | | 159 | % | | | 31 | % | |
1 For the period September 28, 2012 (commencement of operations) through October 31, 2012.
2 Per share information is calculated using the average shares outstanding method.
3 This amount represents less than $0.01 per share.
4 Total returns are historical and assume changes in share price, reinvestment of all dividends and distributions and no sales charge. Had certain expenses not been reduced during the years shown, total returns would have been lower. Total returns for periods less than one year are not annualized.
5 Annualized.
See Accompanying Notes to Financial Statements.
22
Credit Suisse Strategic Income Fund
Financial Highlights
(For a Class C Share of the Fund Outstanding Throughout Each Period)
| | | For the Year Ended October 31, | |
| | | 2014 | | 2013 | | 20121 | |
Per share data | |
Net asset value, beginning of year | | $ | 10.65 | | | $ | 10.06 | | | $ | 10.00 | | |
INVESTMENT OPERATIONS | |
Net investment income (loss)2 | | | 0.53 | | | | 0.50 | | | | (0.00 | )3 | |
Net gain (loss) on investments, futures contracts and foreign currency
related items (both realized and unrealized) | | | (0.05 | ) | | | 0.61 | | | | 0.06 | | |
Total from investment operations | | | 0.48 | | | | 1.11 | | | | 0.06 | | |
REDEMPTION FEES | | | 0.003 | | | | 0.003 | | | | — | | |
LESS DIVIDENDS AND DISTRIBUTIONS | |
Dividends from net investment income | | | (0.52 | ) | | | (0.50 | ) | | | (0.00 | )3 | |
Distributions from net realized gains | | | (0.14 | ) | | | (0.02 | ) | | | — | | |
Total dividends and distributions | | | (0.66 | ) | | | (0.52 | ) | | | (0.00 | )3 | |
Net asset value, end of year | | $ | 10.474 | | | $ | 10.65 | | | $ | 10.06 | | |
Total return5 | | | 4.53 | % | | | 11.18 | % | | | 0.62 | % | |
RATIOS AND SUPPLEMENTAL DATA | |
Net assets, end of year (000s omitted) | | $ | 2,151 | | | $ | 189 | | | $ | 101 | | |
Ratio of net expenses to average net assets | | | 2.00 | % | | | 1.99 | % | | | 1.99 | %6 | |
Ratio of expenses to average net assets excluding interest expense | | | 1.99 | % | | | 1.99 | % | | | 1.99 | % | |
Ratio of net investment income (loss) to average net assets | | | 4.97 | % | | | 4.77 | % | | | (0.33 | )%6 | |
Decrease reflected in above operating expense ratios due to
waivers/reimbursements | | | 0.18 | % | | | 0.63 | % | | | 5.25 | %6 | |
Portfolio turnover rate | | | 124 | % | | | 159 | % | | | 31 | % | |
1 For the period September 28, 2012 (commencement of operations) through October 31, 2012.
2 Per share information is calculated using the average shares outstanding method.
3 This amount represents less than $0.01 per share.
4 Includes adjustments in accordance with accounting principles generally accepted in the United States of America and as such, the net asset values for financial reporting purposes and the returns based upon net asset values may differ from the net asset values and returns for shareholder transactions.
5 Total returns are historical and assume changes in share price, reinvestment of all dividends and distributions and no sales charge. Had certain expenses not been reduced during the years shown, total returns would have been lower. Total returns for periods less than one year are not annualized.
6 Annualized.
See Accompanying Notes to Financial Statements.
23
Credit Suisse Strategic Income Fund
Notes to Financial Statements
October 31, 2014
Credit Suisse Strategic Income Fund (the "Fund"), a series of the Credit Suisse Opportunity Funds (the "Trust"), a Delaware statutory trust, is registered under the Investment Company Act of 1940, as amended (the "1940 Act"), as a non-diversified open-end management investment company that seeks total return. The Trust was organized under the laws of the State of Delaware as a business trust on May 31, 1995.
The Fund offers three classes of shares: Class I shares, Class A shares and Class C shares. Each class of shares represents an equal pro rata interest in the Fund, except they bear different expenses, which reflect the differences in the range of services provided to them. Class A shares are sold subject to a front-end sales charge of up to 4.75%. Class C shares are sold subject to a contingent deferred sales charge of 1.00% if the shares are redeemed within the first year of purchase. Class I shares are sold without a sales charge.
Note 2. Significant Accounting Policies
The following is a summary of significant accounting policies followed by the Fund in the preparation of its financial statements. The policies are in accordance with accounting principles generally accepted in the United States of America ("GAAP"). The preparation of financial statements requires management to make estimates and assumptions that affect the reported amounts and disclosures in the financial statements. Actual results could differ from those estimates.
A) SECURITY VALUATION — The net asset value of the Fund is determined daily as of the close of regular trading on the New York Stock Exchange, Inc. (the "Exchange") on each day the Exchange is open for business. The valuations for fixed income securities (which may include, but are not limited to, corporate, government, municipal, mortgage-backed, collateralized mortgage obligations and asset-backed securities) and certain derivative instruments are typically the prices supplied by independent third party pricing services, which may use market prices or broker/dealer quotations or a variety of valuation techniques and methodologies. The independent third party pricing services use inputs that are observable such as issuer details, interest rates, yield curves, prepayment speeds, credit risks/spreads, default rates and quoted prices for similar securities. Short-term fixed income securities that will mature in 60 days or less may be valued at amortized cost. Structured note agreements are valued in accordance with a dealer-supplied valuation based on changes in the value of the underlying index. Futures contracts are
24
Credit Suisse Strategic Income Fund
Notes to Financial Statements (continued)
October 31, 2014
Note 2. Significant Accounting Policies
valued daily at the settlement price established by the board of trade or exchange on which they are traded. Forward contracts are valued at the London closing spot rates and the London closing forward point rates on a daily basis. The currency forward contract pricing model derives the differential in point rates to the expiration date of the forward and calculates its present value. Equity securities for which market quotations are available are valued at the last reported sales price or official closing price on the primary market or exchange on which they trade. The Fund may utilize a service provided by an independent third party which has been approved by the Board of Trustees (the "Board") to fair value certain securities. When fair value pricing is employed, the prices of securities used by the Fund to calculate its net asset value may differ from quoted or published prices for the same securities. If independent third party pricing services are unable to supply prices for a portfolio investment, or if the prices supplied are deemed by the investment adviser to be unreliable, the market price may be determined by the investment adviser using quotations from one or more broker/dealers or at the transaction price if the security has recently been purchased and no value has yet been obtained from a pricing service or pricing broker. When reliable prices are not readily available, such as when the value of a security has been significantly affected by events after the close of the exchange or market on which the security is principally traded, but before the Fund calculates its net asset value, the Fund values these securities as determined in accordance with procedures approved and established by the Fund's Board.
The Fund uses valuation techniques to measure fair value that are consistent with the market approach and/or income approach, depending on the type of security and the particular circumstance. The market approach uses prices and other relevant information generated by market transactions involving identical or comparable securities. The income approach uses valuation techniques to discount estimated future cash flows to present value.
GAAP established a disclosure hierarchy that categorizes the inputs to valuation techniques used to value assets and liabilities at each measurement date. These inputs are summarized in the three broad levels listed below:
• Level 1 – quoted prices in active markets for identical investments
• Level 2 – other significant observable inputs (including quoted prices for similar investments, interest rates, prepayment speeds, credit risk, etc.)
• Level 3 – significant unobservable inputs (including the Fund's own assumptions in determining the fair value of investments)
25
Credit Suisse Strategic Income Fund
Notes to Financial Statements (continued)
October 31, 2014
Note 2. Significant Accounting Policies
The inputs or methodologies used to value securities are not necessarily an indication of the risk associated with investing in those securities.
The following is a summary of the inputs used as of October 31, 2014 in valuing the Fund's assets and liabilities carried at fair value:
| | | Level 1 | | Level 2 | | Level 3 | | Total | |
Investments in Securities | |
Corporate Bonds | | $ | — | | | $ | 32,514,969 | | | $ | — | | | $ | 32,514,969 | | |
Bank Loans | | | — | | | | 38,965,429 | | | | 4,286,562 | | | | 43,251,991 | | |
Asset Backed Securities | | | — | | | | 18,614,850 | | | | — | | | | 18,614,850 | | |
Common Stocks | | | 296,464 | | | | — | | | | — | | | | 296,464 | | |
Mutual Funds | | | 96,025 | | | | — | | | | — | | | | 96,025 | | |
Short-term Investment | | | — | | | | 2,154,000 | | | | — | | | | 2,154,000 | | |
| | $ | 392,489 | | | $ | 92,249,248 | | | $ | 4,286,562 | | | $ | 96,928,299 | | |
Other Financial Instruments* | |
Forward Foreign Currency Contracts | | $ | — | | | $ | 43,896 | | | $ | — | | | $ | 43,896 | | |
Futures Contracts | | | (28,461 | ) | | | — | | | | — | | | | (28,461 | ) | |
*Other financial instruments include unrealized appreciation (depreciation) on forward foreign currency contracts and futures contracts.
The following is a reconciliation of investments as of October 31, 2014 in which significant unobservable inputs were used in determining value. Transfers in or out of Level 3 represent the end of the period value of any security or instrument where a change in the level has occurred from the beginning to the end of the period.
| | | Asset Backed
Securities | | Bank Loans | | Common
Stocks | | Total | |
Balance as of October 31, 2013 | | $ | 1,794,200 | | | $ | — | | | $ | 2,060,463 | | | $ | 3,854,663 | | |
Accrued discounts (premiums) | | | 8,674 | | | | 19,707 | | | | — | | | | 28,381 | | |
Purchases | | | — | | | | 4,050,414 | | | | — | | | | 4,050,414 | | |
Sales | | | (1,827,800 | ) | | | — | | | | (2,325,724 | ) | | | (4,153,524 | ) | |
Realized gain (loss) | | | 37,860 | | | | — | | | | 195,415 | | | | 233,275 | | |
Change in unrealized appreciation (depreciation) | | | (12,934 | ) | | | (379,366 | ) | | | 69,846 | | | | (322,454 | ) | |
Transfers into Level 3 | | | — | | | | 595,807 | | | | — | | | | 595,807 | | |
Transfers out of Level 3 | | | — | | | | — | | | | — | | | | — | | |
Balance as of October 31, 2014 | | $ | — | | | $ | 4,286,562 | | | $ | — | | | $ | 4,286,562 | | |
Net change in unrealized appreciation (depreciation)
from investments still held as of October 31, 2014 | | $ | — | | | $ | (379,366 | ) | | $ | — | | | $ | (379,366 | ) | |
| | | Quantitative Disclosure About Significant Unobservable Inputs | |
Asset Class | | Fair Value
at 10/31/2014 | | Valuation
Technique(s) | | Unobservable
Input | | Range | |
Bank Loans | | $ | 980,000 | | | Acquisition Value | | Acquisition Value | | | NA | | |
| | | $ | 3,306,562 | | | Third Party Vendor | | Single Broker Quote | | | NA | | |
26
Credit Suisse Strategic Income Fund
Notes to Financial Statements (continued)
October 31, 2014
Note 2. Significant Accounting Policies
Each fair value determination is based on a consideration of relevant factors, including both observable and unobservable inputs. Observable and unobservable inputs the Adviser considers may include (i) the existence of any contractual restrictions on the disposition of securities; (ii) information obtained from the company, which may include an analysis of the company's financial statements, the company's products or intended markets or the company's technologies; (iii) the price of the same or similar security negotiated at arm's length in an issuer's completed subsequent round of financing; (iv) the price and extent of public trading in similar securities of the issuer or of comparable companies; or (v) a probability and time value adjusted analysis of contractual term. Where available and appropriate, multiple valuation methodologies are applied to confirm fair value. Significant unobservable inputs identified by the Adviser are often used in the fair value determination. A significant change in any of these inputs may result in a significant change in the fair value measurement. Due to the uncertainty inherent in the valuation process, such estimates of fair value may differ significantly from the values that would have been used had a ready market for the investments existed, and differences could be material. Additionally, changes in the market environment and other events that may occur over the life of the investments may cause the gains or losses ultimately realized on these investments to be different from the valuations used at the date of these financial statements.
The Fund follows Financial Accounting Standards Board ("FASB") amendments to authoritative guidance which requires the Fund to disclose details of transfers in and out of Level 1 and Level 2 measurements and Level 2 and Level 3 measurements and the reasons for the transfers. For the year ended October 31, 2014, there were no transfers in and out of Level 1, Level 2 and Level 3. All transfers are assumed to occur at the end of the reporting period.
B) DERIVATIVE INSTRUMENTS AND HEDGING ACTIVITIES — The Fund adopted amendments to authoritative guidance on disclosures about derivative instruments and hedging activities which require that a fund disclose (a) how and why an entity uses derivative instruments, (b) how derivative instruments and hedging activities are accounted for and (c) how derivative instruments and related hedging activities affect a fund's financial position, financial performance and cash flows. For the year ended October 31, 2014, the Fund's derivatives did not qualify for hedge accounting as they are held at fair value.
27
Credit Suisse Strategic Income Fund
Notes to Financial Statements (continued)
October 31, 2014
Note 2. Significant Accounting Policies
Fair Values of Derivative Instruments as of October 31, 2014
| | | Asset Derivatives | | Liability Derivatives | |
| | | Balance Sheet
Location | | Fair Value | | Balance Sheet
Location | | Fair Value | |
Currency Contracts | | Unrealized appreciation
on forward currency
contracts | | $ | 58,704 | | | Unrealized depreciation
on forward currency
contracts | | $ | 14,808 | | |
Interest Rate Contracts | | Unrealized appreciation
on futures contracts | | | — | * | | Unrealized depreciation
on futures contracts | | | 28,461 | * | |
| | | | | $ | 58,704 | | | | | | | $ | 43,269 | | |
*Includes cumulative appreciation (depreciation) of futures contracts as reported in the Schedule of Investments. Only the current day's variation margin is reported within the Statement of Assets and Liabilities.
Effect of Derivative Instruments on the Statement of Operations
| | | Location | | Realized
Gain (Loss) | | Location | | Net Unrealized
Appreciation
(Depreciation) | |
Currency Contracts | | Net realized gain from
forward currency
transactions | | $ | 594,248 | | | Net change in unrealized
appreciation (depreciation)
from forward currency
transactions | | $ | 61,237 | | |
Interest Rate
Contracts | | Net realized loss from
futures contracts | | | (80,303 | ) | | Net change in unrealized
appreciation (depreciation)
from futures contracts | | | (28,461 | ) | |
| | | | | $ | 513,945 | | | | | | | $ | 32,776 | | |
The notional amounts of forward foreign currency contracts and futures contracts at the year ended October 31, 2014 are reflected in the Schedule of Investments. For the year ended October 31, 2014, the Fund held an average monthly value at net basis of $9,825,525 in forward foreign currency contracts and average monthly notional value at net basis of $2,169,411 in futures contracts.
The Fund is a party to International Swap and Derivatives Association, Inc. ("ISDA") Master Agreements ("Master Agreements") with certain counterparties that govern over-the-counter derivative (including Total Return, Credit Default and Interest Rate Swaps) and foreign exchange contracts entered into by the Fund. The Master Agreements may contain provisions regarding, among other things, the parties' general obligations, representations, agreements, collateral requirements, events of default and early termination. Termination events applicable to the Fund may occur upon a decline in the Fund's net assets below a specified threshold over a certain period of time.
28
Credit Suisse Strategic Income Fund
Notes to Financial Statements (continued)
October 31, 2014
Note 2. Significant Accounting Policies
The following table presents by counterparty the Fund's derivative assets net of related collateral held by the Fund at October 31, 2014:
Counterparty | | Gross Amounts of
Assets Presented in the
Statement of Assets
and Liabilities(a) | | Financial
Instruments
and Derivatives
Available for Offset | | Non-Cash
Collateral
Received | | Cash
Collateral
Received | | Net Amount
of Derivative
Assets | |
Morgan Stanley | | $ | 58,704 | | | $ | (14,808 | ) | | $ | — | | | $ | — | | | $ | 43,896 | | |
The following table presents by counterparty the Fund's derivative liabilities net of related collateral pledged by the Fund at October 31, 2014:
Counterparty | | Gross Amounts of
Liabilites Presented in
the Statement of Assets
and Liabilities(a) | | Financial
Instruments
and Derivatives
Available for Offset | | Non-Cash
Collateral
Pledged | | Cash
Collateral
Pledged | | Net Amount
of Derivative
Liabilities | |
Morgan Stanley | | $ | 14,808 | | | $ | (14,808 | ) | | $ | — | | | $ | — | | | $ | — | | |
(a) Forward foreign currency exchange contracts are included.
C) FOREIGN CURRENCY TRANSACTIONS — The books and records of the Fund are maintained in U.S. dollars. Transactions denominated in foreign currencies are recorded at the current prevailing exchange rates. All assets and liabilities denominated in foreign currencies are translated into U.S. dollar amounts at the current exchange rate at the end of the period. Translation gains or losses resulting from changes in the exchange rate during the reporting period and realized gains and losses on the settlement of foreign currency transactions are reported in the results of operations for the current period. The Fund does not isolate that portion of realized gains and losses on investments in equity securities which is due to changes in the foreign exchange rate from that which is due to changes in market prices of equity securities. The Fund isolates that portion of realized gains and losses on investments in debt securities which is due to changes in the foreign exchange rate from that which is due to changes in market prices of debt securities.
D) SECURITY TRANSACTIONS AND INVESTMENT INCOME/EXPENSE — Security transactions are accounted for on a trade date basis. Interest income/expense is recorded on the accrual basis. The Fund amortizes premiums and accretes discounts using the effective interest method. Dividend income/expense is recorded on the ex-dividend date. Certain expenses are class-specific expenses, vary by class and are charged only to that class. Income, expenses (excluding class-specific expenses) and realized/unrealized gains/losses are allocated proportionately to each class of shares based upon the relative net asset value of the outstanding shares of that class. The cost of
29
Credit Suisse Strategic Income Fund
Notes to Financial Statements (continued)
October 31, 2014
Note 2. Significant Accounting Policies
investments sold is determined by use of the specific identification method for both financial reporting and income tax purposes.
E) DIVIDENDS AND DISTRIBUTIONS TO SHAREHOLDERS — Dividends from net investment income, if any, are declared daily and paid monthly. Distributions of net realized capital gains, if any, are declared and paid at least annually. However, to the extent that a net realized capital gain can be reduced by a capital loss carryforward, such gain will not be distributed. Income and capital gain distributions are determined in accordance with federal income tax regulations, which may differ from GAAP.
F) FEDERAL INCOME TAXES — No provision is made for federal taxes as it is the Fund's intention to continue to qualify for and elect the tax treatment applicable to regulated investment companies ("RIC") under the Internal Revenue Code of 1986, as amended (the "Code"), and to make the requisite distributions to its shareholders, which will be sufficient to relieve it from federal income and excise taxes.
In order to qualify as a RIC under the Code, the Fund must meet certain requirements regarding the source of its income, the diversification of its assets and the distribution of its income. One of these requirements is that the Fund derive at least 90% of its gross income for each taxable year from dividends, interest, payments with respect to certain securities loans, gains from the sale or other disposition of stock, securities or foreign currencies, other income derived with respect to its business of investing in such stock, securities or currencies or net income derived from interests in certain publicly traded partnerships ("Qualifying Income").
The Fund adopted the authoritative guidance for uncertainty in income taxes and recognizes a tax benefit or liability from an uncertain position only if it is more likely than not that the position is sustainable based solely on its technical merits and consideration of the relevant taxing authority's widely understood administrative practices and procedures. The Fund has reviewed its current tax positions and has determined that no provision for income tax is required in the Fund's financial statements. The Fund's federal tax returns for the prior two fiscal years remain subject to examination by the Internal Revenue Service.
G) SHORT-TERM INVESTMENTS — The Fund, together with other funds/portfolios advised by Credit Suisse, an indirect, wholly-owned subsidiary of Credit Suisse Group AG, pools available cash into a short-term variable rate time deposit issued by State Street Bank and Trust Company
30
Credit Suisse Strategic Income Fund
Notes to Financial Statements (continued)
October 31, 2014
Note 2. Significant Accounting Policies
("SSB"), the Fund's custodian. The short-term time deposit issued by SSB is a variable rate account classified as a short-term investment.
H) FUTURES — The Fund may enter into futures contracts to the extent permitted by its investment policies and objectives. The Fund may use futures contracts to gain exposure to or hedge against changes in interest rates, equity and market price movements and/or currency risks. Upon entering into a futures contract, the Fund is required to deposit cash and/or pledge U.S. Government securities as initial margin. Subsequent payments, which are dependent on the daily fluctuations in the value of the underlying instrument, are made or received by the Fund each day (daily variation margin) and are recorded as unrealized gains or losses until the contracts are closed. When the contracts are closed, the Fund records a realized gain or loss equal to the difference between the proceeds from (or cost of) the closing transactions and the Fund's basis in the contract. Risks of entering into futures contracts for hedging purposes include the possibility that a change in the value of the contract may not correlate with the changes in the value of the underlying instruments. With futures, there is minimal counterparty credit risk to the Fund since futures are exchange traded and the exchange's clearinghouse, as counterparty to all exchange traded futures, guarantees the futures against default. In addition, the purchase of a futures contract involves the risk that the Fund could lose more than the original margin deposit and subsequent payments may be required for a futures transaction. The Fund's open futures contracts at October 31, 2014 are disclosed in the Schedule of Investments. At October 31, 2014, the amount of restricted cash held at brokers for the Fund was $72,600.
I) FORWARD FOREIGN CURRENCY CONTRACTS — The Fund may enter into forward foreign currency contracts for the purchase or sale of a specific foreign currency at a fixed price on a future date. Risks may arise upon entering into these contracts from the potential inability of counterparties to meet the terms of their contracts and from unanticipated movements in the value of a foreign currency. The Fund will enter into forward foreign currency contracts primarily for hedging foreign currency risk. Forward foreign currency contracts are adjusted by the daily forward exchange rate of the underlying currency and any gains or losses are recorded for financial statement purposes as unrealized until the contract settlement date or an offsetting position is entered into. The Fund's open forward foreign currency contracts at October 31, 2014 are disclosed in the Schedule of Investments.
31
Credit Suisse Strategic Income Fund
Notes to Financial Statements (continued)
October 31, 2014
Note 2. Significant Accounting Policies
J) SECURITIES LENDING — Loans of securities are required at all times to be secured by collateral at least equal to 102% of the market value of domestic securities on loan (including any accrued interest thereon) and 105% of the market value of foreign securities on loan (including any accrued interest thereon). Cash collateral received by the Fund in connection with securities lending activity may be pooled together with cash collateral for other funds/portfolios advised by Credit Suisse and may be invested in a variety of investments, including funds advised by SSB, the Fund's securities lending agent or money market instruments. However, in the event of default or bankruptcy by the other party to the agreement, realization and/or retention of the collateral may be subject to legal proceedings.
SSB has been engaged by the Fund to act as the Fund's securities lending agent. The Fund's securities lending arrangement provides that the Fund and SSB will share the net income earned from securities lending activities. During the year ended October 31, 2014, there were no securities out on loan. Securities lending income is accrued as earned.
K) OTHER — The high yield, fixed income securities in which the fund will invest will primarily consist of senior secured floating rate loans ("Senior Loans") issued by non-investment grade companies. Senior Loans are typically secured by specific collateral of the issuer and hold the most senior position in the issuer's capital structure. The interest rate on Senior Loans is periodically adjusted to a recognized base rate, typically the London Interbank Offered Rate ("LIBOR"). While these characteristics may reduce interest rate risk and mitigate losses in the event of borrower default, the Senior Loans in which the Fund invests have below investment grade credit ratings and thereby are considered speculative because of the significant credit risk of their issuers.
Lower-rated debt securities (commonly known as "junk bonds") possess speculative characteristics and are subject to greater market fluctuations and risk of lost income and principal than higher-rated debt securities for a variety of reasons. Also, during an economic downturn or substantial period of rising interest rates, highly leveraged issuers may experience financial stress which would adversely affect their ability to service their principal and interest payment obligations, to meet projected business goals and to obtain additional financing.
In addition, periods of economic uncertainty and changes can be expected to result in increased volatility of market prices of lower-rated debt securities and the Fund's net asset value.
32
Credit Suisse Strategic Income Fund
Notes to Financial Statements (continued)
October 31, 2014
Note 2. Significant Accounting Policies
L) NEW ACCOUNTING PRONOUNCEMENTS — In June 2013, the FASB issued Accounting Standards Update (ASU) No. 2013-08, Investment Companies (Topic 946): Amendments to the Scope, Measurement, and Disclosure Requirements. The ASU modifies the criteria used in defining an investment company under GAAP and also sets forth certain measurement and disclosure requirements. Under the ASU, an entity that is registered under the 1940 Act automatically qualifies as an investment company. The ASU is effective for interim and annual reporting periods beginning after December 15, 2013. Management has reviewed the requirements and believes the adoption of this ASU will not have a material impact on the financial statements.
In June 2014, FASB issued ASU No. 2014-11, Transfers and Servicing (Topic 860), Repurchase-to-Maturity Transactions, Repurchase Financings, and Disclosures. The ASU changes the accounting for certain repurchase agreements and expands disclosure requirements related to repurchase agreements, securities lending, repurchase-to-maturity and similar transactions. The ASU is effective for interim and annual reporting periods beginning after December 15, 2014. Management is currently evaluating the impact, if any, of applying this provision.
M) SUBSEQUENT EVENTS — In preparing the financial statements as of October 31, 2014, management considered the impact of subsequent events for potential recognition or disclosure in these financial statements through the date of release of this report. No such events requiring recognition or disclosure were identified through the date of the release of this report.
Note 3. Transactions with Affiliates and Related Parties
Credit Suisse serves as investment adviser for the Fund. For its investment advisory services, Credit Suisse is entitled to receive a fee from the Fund at an annual rate of 0.75% of the Fund's average daily net assets. For the year ended October 31, 2014, investment advisory fees earned and fees waived/expenses reimbursed were $916,333 and $222,808, respectively. The Fund is authorized to reimburse Credit Suisse for management fees previously limited and/or for expenses previously paid by Credit Suisse, provided, however, that any reimbursements must be paid at a date not more than three years after the end of the fiscal year during which such fees were limited or expenses were reimbursed by Credit Suisse and the reimbursements do not cause a class to exceed the applicable expense limitation in the contract at the time the fees were limited or expenses are paid. This contract may not be terminated before
33
Credit Suisse Strategic Income Fund
Notes to Financial Statements (continued)
October 31, 2014
Note 3. Transactions with Affiliates and Related Parties
February 28, 2015. Credit Suisse contractually waives fees and reimburses expenses so that the Fund's annual operating expenses (excluding interest expense) will not exceed 0.99% of the Fund's average daily net assets for Class I shares, 1.24% of the Fund's average daily net assets for Class A shares, and 1.99% of the Fund's average daily net assets for Class C shares.
For the period ended October 31, 2014, the amounts waived and reimbursed by the Advisor, as well as the amounts available for recoupment/potential future recoupment by the Advisor and the expiration schedule at Ocbober 31, 2014 are as follows:
| | Fee waivers/expense
reimbursements subject
to repayment | | Expires October 31,
2015 | | Expires October 31,
2016 | | Expires October 31,
2017 | |
Class I | | $ | 350,911 | | | $ | 65,936 | | | $ | 174,496 | | | $ | 110,479 | | |
Class A | | | 193,671 | | | | 514 | | | | 83,111 | | | | 110,046 | | |
Class C | | | 3,757 | | | | 514 | | | | 960 | | | | 2,283 | | |
Totals | | $ | 548,339 | | | $ | 66,964 | | | $ | 258,567 | | | $ | 222,808 | | |
Credit Suisse Asset Management Limited ("Credit Suisse U.K."), an affiliate of Credit Suisse, serves as sub-investment advisor to the Fund directly. Credit Suisse U.K.'s sub-investment advisor fees are paid by Credit Suisse.
Credit Suisse and SSB serve as co-administrators to the Fund. For its co-administrative services, Credit Suisse received a fee calculation at an annual rate of 0.09% of the Fund's average daily net assets. For the year ended October 31, 2014, co-administrative services fees earned by Credit Suisse were $109,960.
For its co-administrative services, SSB receives a fee, exclusive of out-of-pocket expenses, calculated in total for all the Credit Suisse funds/portfolios co-administered by SSB and allocated based upon the relative average net assets of each fund/portfolio, subject to an annual minimum fee. For the year ended October 31, 2014, co-administrative services fees earned by SSB (including out-of-pocket expenses) with respect to the Fund were $46,833.
Credit Suisse Securities (USA) LLC ("CSSU"), an affiliate of Credit Suisse, serves as the distributor of the Fund's shares. Pursuant to distribution plans adopted by the Fund pursuant to Rule 12b-1 under the 1940 Act, CSSU received fees for its distribution services. These fees were calculated at an annual rate of 0.25% of the average daily net assets of the Class A shares. For the Class C shares, the fee is calculated at an annual rate of 1.00% of the average daily net assets. For the year ended October 31, 2014, the Fund paid Rule 12b-1
34
Credit Suisse Strategic Income Fund
Notes to Financial Statements (continued)
October 31, 2014
Note 3. Transactions with Affiliates and Related Parties
distribution fees of $150,860 for Class A shares and $12,522 for Class C shares. Class I shares are not subject to Rule 12b-1 distribution fees.
Certain brokers, dealers and financial representatives provide transfer agent related services to the Fund and receive compensation from the Fund. Some of the fees are paid by Credit Suisse on behalf of the Fund. For the year ended October 31, 2014, the Fund reimbursed Credit Suisse $56,522, which is included in the Fund's transfer agent expense.
For the year ended October 31, 2014, CSSU and its affiliates advised the Fund that they retained $5,500 from commissions earned on the sale of the Fund's Class A shares. There were no commissions earned on sale of Class C shares.
Merrill Corporation ("Merrill"), formerly an affiliate of Credit Suisse, has been engaged by the Fund to provide certain financial printing services. For the year ended October 31, 2014, Merrill was paid $34,151 for its services by the Fund. This amount was included in the printing fees presented on the Statement of Operations. Effective July 23, 2014, Merrill was no longer considered an affiliate.
Note 4. Line of Credit
The Fund, together with other funds/portfolios advised by Credit Suisse (collectively, the "Participating Funds"), participates in a committed, unsecured line of credit facility ("Credit Facility"), in an aggregated amount of $200 million for temporary or emergency purposes with SSB under a first come first serve basis. Under the terms of the Credit Facility, the Participating Funds pay an aggregate commitment fee on the average unused amount of the Credit Facility, which is allocated among the Participating Funds in such manner as is determined by the governing Boards of the Participating Funds. In addition, the Participating Funds pay interest on borrowings at either the Overnight Federal Funds rate or the Overnight LIBOR rate plus a spread. At October 31, 2014, the Fund had loans outstanding under the Credit Facility of $200,000. At October 31, 2014, and during the year ended October 31, 2014, the Fund had borrowings under the Credit Facility as follows:
Average Daily
Loan Balance | | Weighted Average
Interest Rate % | | Maximum Daily
Loan Outstanding | | Interest Paid | |
| $ | 399,597 | | | | 1.350 | % | | $ | 14,595,000 | | | $ | 5,469 | | |
35
Credit Suisse Strategic Income Fund
Notes to Financial Statements (continued)
October 31, 2014
Note 5. Purchases and Sales of Securities
For the year ended October 31, 2014, purchases and sales of investment securities (excluding short-term investments) were $164,318,590 and $140,702,765, respectively.
Note 6. Capital Share Transactions
The Fund is authorized to issue an unlimited number of full and fractional shares of beneficial interest, $.001 par value per share. The Fund offers Class I, Class A and Class C shares. Transactions in capital shares for each class of the Fund were as follows:
| | | Class I | |
| | | For the Year Ended
October 31, 2014 | | For the Year Ended
October 31, 2013 | |
| | | Shares | | Value | | Shares | | Value | |
Shares sold | | | 5,577,837 | | | $ | 59,942,455 | | | | 1,096,985 | | | $ | 11,429,787 | | |
Shares issued in reinvestment of
dividends and distributions | | | 379,603 | | | | 4,049,153 | | | | 155,857 | | | | 1,638,107 | | |
Shares redeemed net of
redemption fees | | | (1,122,241 | ) | | | (11,944,176 | ) | | | (322,555 | ) | | | (3,422,530 | ) | |
Net increase | | | 4,835,199 | | | $ | 52,047,432 | | | | 930,287 | | | $ | 9,645,364 | | |
| | | Class A | |
| | | For the Year Ended
October 31, 2014 | | For the Year Ended
October 31, 2013 | |
| | | Shares | | Value | | Shares | | Value | |
Shares sold | | | 4,657,884 | | | $ | 50,152,817 | | | | 6,183,314 | | | $ | 65,076,457 | | |
Shares issued in reinvestment of
dividends and distributions | | | 374,142 | | | | 4,003,351 | | | | 52,394 | | | | 555,475 | | |
Shares redeemed net of
redemption fees | | | (8,003,989 | ) | | | (85,310,897 | ) | | | (1,876,636 | ) | | | (19,925,148 | ) | |
Net increase (decrease) | | | (2,971,963 | ) | | $ | (31,154,729 | ) | | | 4,359,072 | | | $ | 45,706,784 | | |
| | | Class C | |
| | | For the Year Ended
October 31, 2014 | | For the Year Ended
October 31, 2013 | |
| | | Shares | | Value | | Shares | | Value | |
Shares sold | | | 195,368 | | | $ | 2,104,825 | | | | 7,199 | | | $ | 74,304 | | |
Shares issued in reinvestment of
dividends and distributions | | | 5,727 | | | | 61,099 | | | | 718 | | | | 7,538 | | |
Shares redeemed net of
redemption fees | | | (13,405 | ) | | | (142,086 | ) | | | (168 | ) | | | (1,768 | ) | |
Net increase | | | 187,690 | | | $ | 2,023,838 | | | | 7,749 | | | $ | 80,074 | | |
36
Credit Suisse Strategic Income Fund
Notes to Financial Statements (continued)
October 31, 2014
Note 6. Capital Share Transactions
Prior to February 1, 2014, the Fund imposed a redemption fee of 2% of the value of shares that were redeemed or exchanged within 30 days from the date of purchase. For the years ended October 31, 2014 and 2013, the redemption fees received by the Fund were $193 and $1,563, respectively. On February 1, 2014, the Fund eliminated the redemption fee.
On October 31, 2014, the number of shareholders that held 5% or more of the outstanding shares of each class of the Fund was as follows:
| | | Number of
Shareholders | | Approximate Percentage
of Outstanding Shares | |
Class I | | | 5 | * | | | 93 | % | |
Class A | | | 4 | | | | 90 | % | |
Class C | | | 4 | * | | | 45 | % | |
*This includes the seed money from Merchant Holdings, Inc., an affiliate of Credit Suisse.
Some of the shareholders are omnibus accounts, which hold shares on behalf of individual shareholders.
Note 7. Federal Income Taxes
Income and capital gain distributions are determined in accordance with federal income tax regulations, which may differ from GAAP.
The tax characteristics of dividends paid during the years ended October 31, 2014 and 2013, respectively, by the Fund were as follows:
| Ordinary Income | | Long-Term Capital Gain | |
| 2014 | | 2013 | | 2014 | | 2013 | |
| $ | 8,077,239 | | | $ | 2,215,161 | | | $ | 80,062 | | | $ | — | | |
The tax basis components of distributable earnings differ from the amounts reflected in the Statement of Assets and Liabilities by temporary book/tax differences. These differences are primarily due to differing treatments of dividends payable, wash sales, forward contracts marked to market, futures contracts marked to market and organizational expenses. At October 31, 2014, the components of distributable earnings on a tax basis were as follows:
Undistributed net investment income | | $ | 1,242,795 | | |
Ordinary income distributions payable | | | (3,037 | ) | |
Undistributed capital gain | | | 717,404 | | |
Unrealized depreciation | | | (2,435,981 | ) | |
| | $ | (478,819 | ) | |
37
Credit Suisse Strategic Income Fund
Notes to Financial Statements (continued)
October 31, 2014
Note 7. Federal Income Taxes
Under the Regulated Investment Company Modernization Act of 2010, the Fund will be permitted to carry forward capital losses incurred in taxable years beginning after December 22, 2010 for an unlimited period. However, any losses incurred during those future taxable years will be required to be utilized prior to the losses incurred in pre-enactment taxable years. As a result of this ordering rule, pre-enactment capital loss carryforwards may be more likely to expire unused. Additionally, post-enactment capital losses that are carried forward will retain their character as either short-term or long-term capital losses rather than being considered all short-term as under previous law. It is uncertain whether the Fund will be able to realize the full benefits of the capital loss carryforwards before they expire. The Fund has no pre-enactment capital loss carryforwards.
At October 31, 2014, the cost of investments (excluding foreign currency related transactions) and net unrealized appreciation (depreciation) for income tax purposes were as follows:
Cost of Investments | | $ | 99,350,663 | | |
Unrealized appreciation | | $ | 493,670 | | |
Unrealized depreciation | | | (2,916,034 | ) | |
Net unrealized appreciation (depreciation) | | $ | (2,422,364 | ) | |
At October 31, 2014, the Fund reclassified $223 from accumulated net investment income and $233 from accumulated net realized loss to paid in capital, to adjust for current period permanent book/tax differences which arose principally from differing book/tax treatment of foreign currency gain/(loss), and distribution re-designations. Net assets were not affected by these reclassifications.
Note 8. Contingencies
In the normal course of business, the Fund may provide general indemnifications pursuant to certain contracts and organizational documents. The Fund's maximum exposure under these arrangements is dependent on future claims that may be made against the Fund and, therefore, cannot be estimated; however, based on experience, the risk of loss from such claims is considered remote.
38
Credit Suisse Strategic Income Fund
Notes to Financial Statements (continued)
October 31, 2014
Note 9. Payments by Affiliates
During the year ended October 31, 2014, the Advisor fully reimbursed the Fund $15,617 for a loss incurred on a trade executed incorrectly. The amount of the loss was less than 0.01% of the Fund's average net assets, thus having no impact on the Fund's total return. In addition, the per share effect to realized and unrealized gain (loss) was less than a penny per share.
Note 10. Other Matters
On May 19, 2014, the U.S. Department of Justice (the "Department of Justice") filed a one-count criminal information (the "Information") in the District Court for the Eastern District of Virginia charging Credit Suisse AG ("CSAG") with conspiracy to commit tax fraud related to accounts CSAG established for cross-border clients. The Department of Justice and CSAG entered into a plea agreement (the "Plea Agreement") settling the action pursuant to which CSAG pleaded guilty to the charge set out in the Information.
The Plea Agreement requires CSAG to pay over $1.8 billion to the U.S. government, including the U.S. Internal Revenue Service. The Plea Agreement also requires CSAG to lawfully undertake certain remedial actions to address the conduct described in the Plea Agreement.
CSAG has entered into other settlements relating to the conduct set out in the Plea Agreement. CSAG has entered into a Consent Order with the Federal Reserve Board (the "Federal Reserve") to resolve certain findings by the Federal Reserve, including that the activities of CSAG regarding opening of foreign accounts for U.S. taxpayers, provision of investment services to U.S. clients, and operation of CSAG's New York representative office prior to 2009 lacked adequate enterprise-wide risk management and compliance policies and procedures sufficient to ensure that all of its activities comply with U.S. laws and regulations. In addition, CSAG has entered into a Consent Order with the New York State Department of Financial Services (the "DFS") to resolve the DFS's investigation into the conduct described in the Plea Agreement. The settlement with the Federal Reserve requires CSAG to pay $100 million to the Federal Reserve, and the settlement with the DFS requires CSAG to pay $715 million to the DFS.
These settlements follow a settlement by Credit Suisse Group AG ("CS Group"), the parent company of CSAG, with the Securities and Exchange Commission (the "Commission") on February 21, 2014 to resolve an
39
Credit Suisse Strategic Income Fund
Notes to Financial Statements (continued)
October 31, 2014
investigation by the Commission into solicitation and provision of broker-dealer and investment advisory services to certain U.S. cross-border clients by CS Group while not registered with the Commission as a broker-dealer or investment adviser. As part of the settlement, CS Group retained an independent consultant to evaluate its policies and procedures and examine its broker-dealer and investment adviser activities to fully verify that the business that was the subject of the Commission investigation has been completely exited. CS Group also agreed to pay $196,511,014, which includes $82,170,990 in disgorgement, $64,340,024 in interest and a $50,000,000 penalty.
CSAG is the indirect parent company of Credit Suisse and CSSU. Neither Credit Suisse, CSSU nor the Fund was named in the Plea Agreement (as defined below) or other settlements relating to the conduct set out in the Plea Agreement. The conduct set out in the Plea Agreement did not involve the Fund, Credit Suisse or CSSU with respect to its investment adviser and distribution activities relating to the Fund.
Credit Suisse, CSSU and certain of their affiliates have received a permanent exemptive order from the Commission to permit them to continue serving as investment advisers and principal underwriters for U.S.-registered investment companies, such as the Fund. Due to a provision in the law governing the operation of U.S.-registered investment companies, they would otherwise have become ineligible to perform these activities as a result of the plea in the Plea Agreement. The permanent exemptive order permits Credit Suisse and CSSU to continue to provide services to the Fund, so long as, among other things, no current or former employee of CSAG or any affiliate of CSAG who previously has been or who subsequently may be identified by CSAG or any U.S. or non-U.S. regulatory or enforcement agencies as having been responsible for the conduct described in the Plea Agreement will be employed by Credit Suisse and certain of its affiliates. Credit Suisse and CSSU have informed the Fund that, Credit Suisse and CSSU believe the Settlements will not have any material impact on the Fund or on the ability of Credit Suisse or CSSU to perform services for the Fund.
On November 21, 2014, at the sentencing hearing, the court accepted and implemented the sentence as set out in the plea agreement. The court imposed no additional conditions beyond those contained in the agreement.
40
Credit Suisse Strategic Income Fund
Report of Independent Registered Public Accounting Firm
To the Board of Trustees and the Shareholders of
Credit Suisse Strategic Income Fund:
In our opinion, the accompanying statement of assets and liabilities, including the schedule of investments, and the related statements of operations and of changes in net assets and the financial highlights present fairly, in all material respects, the financial position of Credit Suisse Strategic Income Fund (a separate fund of Credit Suisse Opportunity Funds)(the "Fund") at October 31, 2014, the results of its operations for the year then ended, the changes in its net assets for each of the two years in the period then ended and the financial highlights for each of the periods presented, in conformity with accounting principles generally accepted in the United States of America. These financial statements and financial highlights (hereafter referred to as "financial statements") are the responsibility of the Fund's management. Our responsibility is to express an opinion on these financial statements based on our audits. We conducted our audits of these financial statements in accordance with the standards of the Public Company Accounting Oversight Board (United States). Those standards require that we plan and perform the audit to obtain reasonable assurance about whether the financial statements are free of material misstatement. An audit includes examining, on a test basis, evidence supporting the amounts and disclosures in the financial statements, assessing the accounting principles used and significant estimates made by management, and evaluating the overall financial statement presentation. We believe that our audits, which included confirmation of securities at October 31, 2014 by correspondence with the custodian and brokers, provide a reasonable basis for our opinion.
PricewaterhouseCoopers LLP
New York, New York
December 29, 2014
41
Credit Suisse Strategic Income Fund
Information Concerning Trustees and Officers (unaudited)
Name, Address
(Year of Birth) | | Position(s)
Held with
Fund | | Term
of Office1
and
Length
of Time
Served | | Principal
Occupation(s) During
Past Five Years | | Number of
Portfolios
in Fund
Complex
Overseen
by Trustee | | Other
Trusteeships
Held by Trustee | |
Independent Trustees | | | | | | | | | | | |
Enrique Arzac
c/o Credit Suisse Asset
Management, LLC
Attn: General Counsel
One Madison Avenue
New York, New York
10010
(1941) | | Trustee, Audit Committee Chairman and Nominating Committee Member | | Since Fund Inception | | Professor of Finance and Economics, Graduate School of Business, Columbia University since 1971. | | | 12 | | | Director of The Adams Express Company, Petroleum and Resources Corporation, Aberdeen Chile Fund, Inc., Aberdeen Emerging Markets Smaller Company Opportunities Fund, Inc., Aberdeen Israel Fund, Inc., Aberdeen Indonesia Fund, Inc. and Aberdeen Latin America Equity Fund, Inc. (each a closed-end investment company); Director of Aberdeen Asia-Pacific Income Investment Company Limited (a Canadian closed-end fund); Trustee of Mirae Asset Discovery Funds (6 open-end portfolios); Director of Starcomms PLC. (telecommunications company) from 2008 to 2011; Director of Epoch Holding Corporation (an investment management and investment advisory services company) from 2006 to March 2013. | |
1 Each Trustee and Officer serves until his or her respective successor has been duly elected and qualified.
42
Credit Suisse Strategic Income Fund
Information Concerning Trustees and Officers (unaudited) (continued)
Name, Address
(Year of Birth) | | Position(s)
Held with
Fund | | Term
of Office1
and
Length
of Time
Served | | Principal
Occupation(s) During
Past Five Years | | Number of
Portfolios
in Fund
Complex
Overseen
by Trustee | | Other
Trusteeships
Held by Trustee | |
Independent Trustees | | | | | | | | | | | |
Jeffrey E. Garten
c/o Credit Suisse Asset
Management, LLC
Attn: General Counsel
One Madison Avenue
New York, New York
10010
(1946) | | Trustee, Audit and Nominating Committee Member Since Fund Inception | | Since Fund Inception | | The Juan Trippe Professor in the Practice of International Trade, Finance and Business, Yale School of Management, from July 2005 to present; Partner and Chairman of Garten Rothkopf (consulting firm) from October 2005 to present. | | | 10 | | | Director of Aetna, Inc. (insurance company); Director of CarMax Group (used car dealers); Director of Alcan (aluminum production) from February 2007 to November 2007; Member of Standard & Poor's Board of Managers (credit rating agency) from December 2011 to November 2014; Director of Miller Buckfire & Co., LLC (financial restructuring). | |
43
Credit Suisse Strategic Income Fund
Information Concerning Trustees and Officers (unaudited) (continued)
Name, Address
(Year of Birth) | | Position(s)
Held with
Fund | | Term
of Office1
and
Length
of Time
Served | | Principal
Occupation(s) During
Past Five Years | | Number of
Portfolios
in Fund
Complex
Overseen
by Trustee | | Other
Trusteeships
Held by Trustee | |
Independent Trustees | | | | | | | | | | | |
Steven N. Rappaport
Lehigh Court, LLC
555 Madison Avenue
29th Floor
New York, New York
10022
(1948) | | Chairman of the Board of Trustees, Audit Committee Member and Nominating Committee Chairman | | Since Fund Inception | | Partner of Lehigh Court, LLC and RZ Capital (private investment firms) from July 2002 to present. | | | 12 | | | Director of iCAD, Inc. (surgical and medical instruments and apparatus company); Director of Aberdeen Chile Fund, Inc., Aberdeen Emerging Markets Smaller Company Opportunities Fund, Inc., Aberdeen Israel Fund, Inc., Aberdeen Indonesia Fund, Inc. and Aberdeen Latin America Equity Fund, Inc. (each a closed-end investment company); Director of Presstek, Inc. (digital imaging technologies company) from 2003 to 2012; Director of Wood Resources, LLC. (plywood manufacturing company) from 2003 to October 2013; Partner Backstage Acquisition Holding, LLC (Publication Job Postings) from November 2013 to present. | |
44
Credit Suisse Strategic Income Fund
Information Concerning Trustees and Officers (unaudited) (continued)
Name, Address
(Year of Birth) | | Position(s)
Held with
Fund | | Term
of Office1
and
Length
of Time
Served | | Principal Occupation(s) During Past Five Years | |
Officers* | | | | | | | |
John G. Popp
Credit Suisse Asset Management, LLC
One Madison Avenue
New York, New York 10010
(1956) | | Chief Executive Officer and President | | Since Fund Inception | | Managing Director of Credit Suisse; Global Head and Chief Investment Officer of the Credit Investment Group; Associated with Credit Suisse or its predecessor since 1997; Officer of other Credit Suisse Funds; Trustee of Credit Suisse High Yield Bond Fund; Director of Credit Suisse Asset Management Income Fund, Inc. | |
Bruce Rosenberg
Credit Suisse Asset Management, LLC
One Madison Avenue
New York, New York 10010
(1961) | | Chief Financial Officer | | Since 2012 | | Director of Credit Suisse; Director of Liquid Accounting of Credit Suisse; Associated with Credit Suisse since 2008; Officer of other Credit Suisse Funds. | |
Emidio Morizio
Credit Suisse Asset Management, LLC
One Madison Avenue
New York, New York 10010
(1966) | | Chief Compliance Officer | | Since Fund Inception | | Managing Director and Global Head of Compliance of Credit Suisse since 2010; Director and Global Head of Compliance of Credit Suisse from January 2005 to December 2009; Associated with Credit Suisse since July 2000; Officer of other Credit Suisse Funds. | |
Joanne Doldo
Credit Suisse Asset Management, LLC
One Madison Avenue
New York, New York 10010
(1959) | | Chief Legal Officer | | Since 2013 | | Vice President of Credit Suisse; Associated with Credit Suisse since September 2011; Officer of other Credit Suisse Funds; Associated with Morgan Stanley Investment Management from 2002-2008. | |
Rocco DelGuercio
Credit Suisse Asset Management, LLC
One Madison Avenue
New York, New York 10010
(1963) | | Treasurer | | Since 2013 | | Vice President of Credit Suisse since 2013; Independent Consultant from February 2012 to April 2013; Director of Legg Mason & Co., LLC from March 2004 to January 2012; Associated with Credit Suisse from June 1996 to March 2004; Officer of other Credit Suisse Funds. | |
Karen Regan
Credit Suisse Asset Management, LLC
One Madison Avenue
New York, New York 10010
(1963) | | Senior Vice President and Secretary | | Since Fund Inception | | Vice President of Credit Suisse; Associated with Credit Suisse since December 2004; Officer of other Credit Suisse Funds. | |
* The officers of the Fund shown are officers that make policy decisions.
The Statement of Additional Information includes additional information about the Trustees and is available, without charge, upon request, by calling 877-870-2874.
45
Credit Suisse Strategic Income Fund
Proxy Voting and Portfolio Holdings Information (unaudited)
Information regarding how the Fund voted proxies related to its portfolio securities during the 12 month period ended June 30 of each year, as well as the policies and procedures that the Fund uses to determine how to vote proxies relating to its portfolio securities are available:
• By calling 1-877-870-2874
• On the Fund's website, www.credit-suisse.com/us/funds
• On the website of the Securities and Exchange Commission, www.sec.gov.
The Fund files a complete schedule of its portfolio holdings for the first and third quarters of its fiscal year with the SEC on Form N-Q. The Fund's Forms N-Q are available on the SEC's website at www.sec.gov and may be reviewed and copied at the SEC's Public Reference Room in Washington, DC. Information on the operation of the SEC's Public Reference Room may be obtained by calling 1-202-551-8090.
46
This page intentionally left blank
This page intentionally left blank

P.O. BOX 55030, BOSTON, MA 02205-5030
877-870-2874 n www.credit-suisse.com/us/funds
CREDIT SUISSE SECURITIES (USA) LLC, DISTRIBUTOR. SlF-AR-1014

CREDIT SUISSE FUNDS
Annual Report
October 31, 2014
n CREDIT SUISSE
VOLARIS US STRATEGIES FUND
The Fund's investment objectives, risks, charges and expenses (which should be considered carefully before investing), and more complete information about the Fund, are provided in the Prospectus, which should be read carefully before investing. You may obtain additional copies by calling 877-870-2874 or by writing to Credit Suisse Funds, P.O. Box 55030, Boston, MA 02205-5030.
Credit Suisse Securities (USA) LLC, Distributor, is located at One Madison Avenue, New York, NY 10010. Credit Suisse Funds are advised by Credit Suisse Asset Management, LLC.
Investors in the Credit Suisse Funds should be aware that they may be eligible to purchase Class I shares (where offered) directly or through certain intermediaries. Such shares are not subject to a sales charge. Investors in the Credit Suisse Funds should also be aware that they may be eligible for a reduction or waiver of the sales charge with respect to Class A or C shares (where offered). For more information, please review the relevant prospectuses or consult your financial representative.
Fund shares are not deposits or other obligations of Credit Suisse Asset Management, LLC ("Credit Suisse") or any affiliate, are not FDIC-insured and are not guaranteed by Credit Suisse or any affiliate. Fund investments are subject to investment risks, including loss of your investment.
Credit Suisse Volaris US Strategies Fund
Annual Investment Adviser's Report
October 31, 2014 (unaudited)
December 22, 2014
Dear Shareholder:
We are pleased to present this Annual Report covering the activities of the Credit Suisse Volaris US Strategies Fund (the "Fund"), for the period from inception through October 31, 2014.
Performance Summary
03/31/14 – 10/31/14
Fund & Benchmark | | Performance | |
| Class I1 | | | 7.90 | % | |
| Class A1,2 | | | 7.70 | % | |
| Class C1,2 | | | 7.30 | % | |
| S&P 500 Total Return Index3 | | | 9.02 | % | |
Performance shown for the Fund's Class A and Class C Shares does not reflect sales charges, which are a maximum of 5.25% and 1.00%, respectively.2
Market and Strategic Review:
For the period from inception, March 31, 2014 through October 31, 2014 the S&P 500 Total Return Index, the Fund's benchmark, had a return of 9.02%.
The Fund underperformed the benchmark for the period. Market conditions were mixed for the option based return seeking strategy, which provided a small positive contribution to Fund performance. Due to the absence of extreme market moving events, the tail-risk hedging component had a relatively small negative contribution to the Fund's returns. The costs to maintain market exposure to the S&P 500 Index in addition to fund fees exceeded the yield on the short-dated fixed income investments and were the main driver of the underperformance of the benchmark.
Despite elevated geo-political tensions and concerns over slowing global growth early in 2014, the US economy continued to accelerate. Improvements in US employment, an increase in GDP, and a generally supportive Federal Reserve helped to buoy risk appetite for US large capitalization stocks throughout the year. These conditions were supportive of our yield seeking strategy as low levels of perceived market risk were met with even lower levels of market volatility. The Team was able to generate additional income in the option-based yield seeking strategy through the sale of option spreads throughout most of the first half of 2014.
1
Credit Suisse Volaris US Strategies Fund
Annual Investment Adviser's Report (continued)
October 31, 2014 (unaudited)
However, beginning in August 2014, global growth concerns came to the forefront once again as economic surveys in Europe and Asia came in below expectations. Economic activity in Germany, the European Union's largest economy, was slowing while data out of China also came in at weaker levels. These concerns culminated in a market correction in October as exposure to risky assets were reduced. A series of central bank actions by the Bank of China, the European Central Bank and the Bank of Japan helped to support markets. In conjunction with continued strong economic activity out of the US, the S&P 500 recovered to close at the highs for the fiscal year of the Fund. While the return of the S&P 500 from the end of August through the end of October was only+ 1%, the intra-period range was significant (10%) and volatile. This negatively impacted the yield seeking option-based strategy. Meanwhile, despite the sharp correction, the Tail Risk Hedging strategy was not a significant contributor to relative performance as the market subsequently recovered. The cost of implementing an extreme market hedging program was minimized.
Outlook
Going forward, equity market participants will continue to monitor the actions of central banks around the globe and continue to be sensitive to geo-political flare-ups. Currently, there is a contrast between the perceived paths of the world's major central banks, with the Federal Reserve appearing hawkish in comparison to the Bank of Japan and the European Central Bank, which continued to support the US Dollar. This trend may continue as Japan's economy unexpectedly entered into a recession despite its stimulus program while European growth remains weak, with deflation seemingly a bigger risk than inflation. This has many expecting the European Central Bank to implement additional easing measures.
Alternatively, in the US, significant improvements in the labor market supported the Federal Open Market Committee's decision to conclude its asset purchase program on October 29th. The growth picture in the US appears to be robust, while many central banks around the world appear willing to exert efforts to support a global economic recovery. This sentiment has been reflected in a rally in the US dollar versus other currencies around the world. However, the recent rapid decline in crude oil prices has also raised risk concerns. The impact of dramatically lower oil prices is unclear. While many expect that lower petroleum prices will boost global growth and favor oil consuming nations, geo-political tensions may increase in oil producing emerging economies. Even in the US, lower oil prices may curtail capital expenditures in the energy sector, which has been major contributor of recent economic activity.
2
Credit Suisse Volaris US Strategies Fund
Annual Investment Adviser's Report (continued)
October 31, 2014 (unaudited)
The Credit Suisse Volaris Investment Group
Vivek Kapoor
Timothy Knowles
The Fund is non-diversified, which means it may invest a greater proportion of its assets in the securities of a smaller number of issuers than a diversified mutual fund and may therefore be subject to greater volatility. The Fund's investment in alternative instruments may subject the Fund to greater volatility than investment in traditional securities, particularly in investments involving leverage.
The use of alternative assets and strategies entails substantial risks, including risk of loss principal, credit risk, derivatives risk, equity exposure risk, exchange traded funds risk, fixed income risk, futures contracts risk, hedged exposure risk, index/tracking error risk, interest rate risk, leveraging risk, market risk, options risk, short positions risk, strategy risk, speculative exposure risk and U.S. government securities risk. For a detailed discussion of these and other risks, please refer to the Fund's Prospectus, which should be read carefully before investing.
In addition to historical information, this report contains forward-looking statements, which may concern, among other things, domestic and foreign market, industry and economic trends and developments and government regulation and their potential impact on the Fund's investments. These statements are subject to risks and uncertainties and actual trends, developments and regulations in the future, and their impact on the Fund could be materially different from those projected, anticipated or implied. The Fund has no obligation to update or revise forward-looking statements.
The views of the Fund's management are as of the date of the letter and the Fund holdings described in this document are as of October 31, 2014; these views and Fund holdings may have changed subsequent to these dates. Nothing in this document is a recommendation to purchase or sell securities.
3
Credit Suisse Volaris US Strategies Fund
Annual Investment Adviser's Report (continued)
October 31, 2014 (unaudited)
Comparison of Change in Value of $10,000 Investment in the
Credit Suisse Volaris US Strategies Fund1 Class I Shares, Class A Shares2,
Class C Shares2 and S&P 500 Total Return Index3
from Inception (03/31/14).

1 Fee waivers and/or expense reimbursements may reduce expenses for the Fund, without which performance would be lower. The Fund has entered into a written contract to limit expenses to 1.30% of the Fund's average daily net assets for Class I shares, 1.55% of the Fund's average daily net assets for Class A shares and 2.30% of the Fund's average daily net assets for Class C shares through at least February 28, 2015.
2 Total return for the Fund's Class A shares from March 31, 2014 (Inception Date) through October 31, 2014, based on offering price (including maximum sales charge of 5.25%), was 2.09%. Total return for the Fund's Class C shares from March 31, 2014 (Inception Date) through October 31, 2014, based on redemption value (including maximum contingent deferred sales charge of 1.00%), was 6.30%.
3 The Standard & Poor's 500 Index is an unmanaged index (with no defined investment objective) of common stocks, includes reinvestment of dividends, and is a registered trademark of The McGraw-Hill Companies, Inc. Investors. An index does not have transaction costs; investors may not invest directly in an index.
4
Credit Suisse Volaris US Strategies Fund
Annual Investment Adviser's Report (continued)
October 31, 2014 (unaudited)
Average Annual Returns as of October 31, 20141
| | | Since
Inception2 | |
Class I | | | 7.90 | % | |
Class A Without Sales Charge | | | 7.70 | % | |
Class A With Maximum Sales Charge | | | 2.09 | % | |
Class C Without CDSC | | | 7.20 | % | |
Class C With CDSC | | | 6.30 | % | |
Returns represent past performance and include change in share price and reinvestment of dividends and capital gains. Past performance cannot guarantee future results. The current performance of the Fund may be lower or higher than the figures shown. Returns and share price will fluctuate, and redemption value may be more or less than original cost. The performance results do not reflect the deduction of taxes that a shareholder would pay on fund distributions or the redemption of fund shares. Performance information current to the most recent month-end is available at www.credit-suisse.com/us/funds.
The annualized gross expense ratios are 2.42% for Class I shares, 2.67% for Class A shares and 3.42% for Class C shares. The annualized net expense ratios after fee waivers and/or expense reimbursements are 1.30% for Class I shares, 1.55% for Class A shares and 2.30% for Class C shares.
1 Fee waivers and/or expense reimbursements may reduce expenses for the Fund, without which performance would be lower. The Fund has entered into a written contract to limit expenses to 1.30% of the Fund's average daily net assets for Class I shares, 1.55% of the Fund's average daily net assets for Class A shares and 2.30% of the Fund's average daily net assets for Class C shares through at least February 28, 2015.
2 Inception Date March 31, 2014.
5
Credit Suisse Volaris US Strategies Fund
Annual Investment Adviser's Report (continued)
October 31, 2014 (unaudited)
Information About Your Fund's Expenses
As an investor of the Fund, you incur two types of costs: ongoing expenses and transaction costs. Ongoing expenses include management fees, distribution and service (12b-1) fees and other Fund expenses. Examples of transaction costs include sales charges (loads), redemption fees and account maintenance fees, which are not shown in this section and which would result in higher total expenses. The following table is intended to help you understand your ongoing expenses of investing in the Fund and to help you compare these expenses with the ongoing expenses of investing in other mutual funds. The table is based on an investment of $1,000 made at the beginning of the six-months ended October 31, 2014.
The table illustrates your Fund's expenses in two ways:
• Actual Fund Return. This helps you estimate the actual dollar amount of ongoing expenses paid on a $1,000 investment in the Fund using the Fund's actual return during the period. To estimate the expenses you paid over the period, simply divide your account value by $1,000 (for example, an $8,600 account value divided by $1,000 = 8.6), then multiply the result by the number in the "Expenses Paid per $1,000" line under the share class you hold.
• Hypothetical 5% Fund Return. This helps you to compare your Fund's ongoing expenses with those of other mutual funds using the Fund's actual expense ratio and a hypothetical rate of return of 5% per year before expenses. Examples using a 5% hypothetical fund return may be found in the shareholder reports of other mutual funds. The hypothetical account values and expenses may not be used to estimate the actual ending account balance or expenses you paid for the period.
Please note that the expenses shown in these tables are meant to highlight your ongoing expenses only and do not reflect any transaction costs, such as sales charges (loads) or redemption fees. If these transaction costs had been included, your costs would have been higher. The "Expenses Paid per $1,000" line of the tables is useful in comparing ongoing expenses only and will not help you determine the relative total expenses of owning different funds.
6
Credit Suisse Volaris US Strategies Fund
Annual Investment Adviser's Report (continued)
October 31, 2014 (unaudited)
Expenses and Value for a $1,000 Investment
for the six month period ended October 31, 2014
Actual Fund Return | | Class I | | Class A | | Class C | |
Beginning Account Value 05/01/14 | | $ | 1,000.00 | | | $ | 1,000.00 | | | $ | 1,000.00 | | |
Ending Account Value 10/31/14 | | $ | 1,071.50 | | | $ | 1,070.60 | | | $ | 1,066.60 | | |
Expenses Paid per $1,000* | | $ | 6.79 | | | $ | 8.09 | | | $ | 11.98 | | |
Hypothetical 5% Fund Return | |
Beginning Account Value 05/01/14 | | $ | 1,000.00 | | | $ | 1,000.00 | | | $ | 1,000.00 | | |
Ending Account Value 10/31/14 | | $ | 1,018.65 | | | $ | 1,017.39 | | | $ | 1,013.61 | | |
Expenses Paid per $1,000* | | $ | 6.61 | | | $ | 7.88 | | | $ | 11.67 | | |
| | | Class I | | Class A | | Class C | |
Annualized Expense Ratios* | | | 1.30 | % | | | 1.55 | % | | | 2.30 | % | |
* Expenses are equal to the Fund's annualized expense ratio for each share class, multiplied by the average account value over the period, multiplied by the number of days in the most recent fiscal half year period, then divided by 365.
The "Expenses Paid per $1,000" and the "Annualized Expense Ratios" in the tables are based on actual expenses paid by the Fund during the period, net of fee waivers and/or expense reimbursements. If those fee waivers and/or expense reimbursements had not been in effect, the Fund's actual expenses would have been higher. Expenses do not reflect additional charges and expenses that are, or may be, imposed under the variable contracts or plans. Such charges and expenses are described in the prospectus of the insurance company separate account or in the plan documents or other informational materials supplied by plan sponsors. The Fund's expenses should be considered with these charges and expenses in evaluating the overall cost of investing in the separate account.
For more information, please refer to the Fund's prospectus.
7
Credit Suisse Volaris US Strategies Fund
Annual Investment Adviser's Report (continued)
October 31, 2014 (unaudited)
Sector Breakdown*
United States Agency Obligations | | | 72.98 | % | |
Options Purchased | | | 16.77 | | |
| Short-term Investment1 | | | 10.25 | | |
Total | | | 100.00 | % | |
* Expressed as a percentage of total investments (excluding securities lending collateral if applicable) and may vary over time.
1 Primarily reflects cash invested in State Street Bank and Trust Co. Euro Time Deposit, for which the purchases of securities have been executed but not yet settled at October 31, 2014, if applicable.
8
Credit Suisse Volaris US Strategies Fund
Schedule of Investments
October 31, 2014
Number of
Contracts | | | | | | | | | | Value | |
| OPTIONS PURCHASED (20.0%) | | | |
| Call Purchased Options (18.9%) | | | |
| | 13 | | | S&P 500 Index, Strike @ $1,820, expires 11/22/14 | | | | | | | | | | | | | | $ | 253,370 | | |
| | 2 | | | S&P 500 Index, Strike @ $1,840, expires 01/17/15 | | | | | | | | | | | | | | | 36,560 | | |
| | 26 | | | S&P 500 Index, Strike @ $1,850, expires 11/22/14 | | | | | | | | | | | | | | | 429,780 | | |
| | 1 | | | S&P 500 Index, Strike @ $1,855, expires 12/20/14 | | | | | | | | | | | | | | | 16,430 | | |
| | 135 | | | S&P 500 Index, Strike @ $1,860, expires 01/17/15 | | | | | | | | | | | | | | | 2,227,500 | | |
| | 59 | | | S&P 500 Index, Strike @ $1,910, expires 11/07/14 | | | | | | | | | | | | | | | 625,990 | | |
| | 8 | | | S&P 500 Index, Strike @ $1,925, expires 02/27/15 | | | | | | | | | | | | | | | 96,560 | | |
| | 6 | | | S&P 500 Index, Strike @ $1,930, expires 11/28/14 | | | | | | | | | | | | | | | 54,360 | | |
| | 5 | | | S&P 500 Index, Strike @ $1,935, expires 11/14/14 | | | | | | | | | | | | | | | 41,400 | | |
| | 4 | | | S&P 500 Index, Strike @ $1,935, expires 11/22/14 | | | | | | | | | | | | | | | 33,760 | | |
| | 6 | | | S&P 500 Index, Strike @ $1,940, expires 11/28/14 | | | | | | | | | | | | | | | 49,080 | | |
| | 28 | | | S&P 500 Index, Strike @ $1,945, expires 11/14/14 | | | | | | | | | | | | | | | 205,800 | | |
| | 3 | | | S&P 500 Index, Strike @ $1,945, expires 11/22/14 | | | | | | | | | | | | | | | 22,650 | | |
| | 4 | | | S&P 500 Index, Strike @ $1,950, expires 01/17/15 | | | | | | | | | | | | | | | 36,280 | | |
| | 7 | | | S&P 500 Index, Strike @ $1,960, expires 11/22/14 | | | | | | | | | | | | | | | 43,750 | | |
| | 7 | | | S&P 500 Index, Strike @ $1,970, expires 11/14/14 | | | | | | | | | | | | | | | 36,050 | | |
| | 19 | | | S&P 500 Index, Strike @ $1,970, expires 11/22/14 | | | | | | | | | | | | | | | 103,170 | | |
| | 6 | | | S&P 500 Index, Strike @ $1,970, expires 11/28/14 | | | | | | | | | | | | | | | 34,080 | | |
| | 13 | | | S&P 500 Index, Strike @ $1,970, expires 12/20/14 | | | | | | | | | | | | | | | 86,190 | | |
| | 4 | | | S&P 500 Index, Strike @ $1,980, expires 12/20/14 | | | | | | | | | | | | | | | 23,640 | | |
| | 144 | | | S&P 500 Index, Strike @ $1,990, expires 11/22/14 | | | | | | | | | | | | | | | 558,720 | | |
| | 102 | | | S&P 500 Index, Strike @ $2,025, expires 11/28/14 | | | | | | | | | | | | | | | 203,490 | | |
| | 198 | | | S&P 500 Index, Strike @ $2,065, expires 11/22/14 | | | | | | | | | | | | | | | 76,230 | | |
| | 98 | | | S&P 500 Index, Strike @ $2,080, expires 11/22/14 | | | | | | | | | | | | | | | 20,090 | | |
| | 127 | | | S&P 500 Index, Strike @ $2,125, expires 11/22/14 | | | | | | | | | | | | | | | 5,715 | | |
| | 130 | | | S&P 500 Index, Strike @ $2,150, expires 01/17/15 | | | | | | | | | | | | | | | 50,050 | | |
| | 130 | | | S&P 500 Index, Strike @ $2,175, expires 12/20/14 | | | | | | | | | | | | | | | 10,400 | | |
| | | | 5,381,095 | | |
| Put Purchased Options (1.1%) | | | |
| | 104 | | | S&P 500 Index, Strike @ $1,575, expires 11/22/14 | | | | | | | | | | | | | | | 1,560 | | |
| | 106 | | | S&P 500 Index, Strike @ $1,625, expires 01/17/15 | | | | | | | | | | | | | | | 31,270 | | |
| | 106 | | | S&P 500 Index, Strike @ $1,650, expires 12/20/14 | | | | | | | | | | | | | | | 16,430 | | |
| | 72 | | | S&P 500 Index, Strike @ $1,725, expires 11/28/14 | | | | | | | | | | | | | | | 6,120 | | |
| | 120 | | | S&P 500 Index, Strike @ $1,750, expires 11/22/14 | | | | | | | | | | | | | | | 7,200 | | |
| | 6 | | | S&P 500 Index, Strike @ $1,825, expires 11/22/14 | | | | | | | | | | | | | | | 750 | | |
| | 17 | | | S&P 500 Index, Strike @ $1,830, expires 11/14/14 | | | | | | | | | | | | | | | 1,020 | | |
| | 8 | | | S&P 500 Index, Strike @ $1,830, expires 01/17/15 | | | | | | | | | | | | | | | 9,800 | | |
| | 8 | | | S&P 500 Index, Strike @ $1,835, expires 11/14/14 | | | | | | | | | | | | | | | 520 | | |
| | 28 | | | S&P 500 Index, Strike @ $1,840, expires 11/22/14 | | | | | | | | | | | | | | | 4,060 | | |
| | 135 | | | S&P 500 Index, Strike @ $1,855, expires 11/22/14 | | | | | | | | | | | | | | | 22,950 | | |
| | 6 | | | S&P 500 Index, Strike @ $1,870, expires 11/22/14 | | | | | | | | | | | | | | | 1,260 | | |
| | 7 | | | S&P 500 Index, Strike @ $1,895, expires 11/22/14 | | | | | | | | | | | | | | | 2,065 | | |
| | 27 | | | S&P 500 Index, Strike @ $1,895, expires 11/28/14 | | | | | | | | | | | | | | | 12,555 | | |
| | 9 | | | S&P 500 Index, Strike @ $1,905, expires 11/07/14 | | | | | | | | | | | | | | | 495 | | |
| | 26 | | | S&P 500 Index, Strike @ $1,905, expires 11/22/14 | | | | | | | | | | | | | | | 8,970 | | |
| | 14 | | | S&P 500 Index, Strike @ $1,915, expires 12/20/14 | | | | | | | | | | | | | | | 19,880 | | |
| | 20 | | | S&P 500 Index, Strike @ $1,925, expires 11/14/14 | | | | | | | | | | | | | | | 5,100 | | |
See Accompanying Notes to Financial Statements.
9
Credit Suisse Volaris US Strategies Fund
Schedule of Investments (continued)
October 31, 2014
Number of
Contracts | | | | | | | | | | Value | |
OPTIONS PURCHASED | | | |
| | 13 | | | S&P 500 Index, Strike @ $1,930, expires 11/07/14 | | | | | | | | | | | | | | $ | 1,105 | | |
| | 3 | | | S&P 500 Index, Strike @ $1,940, expires 11/22/14 | | | | | | | | | | | | | | | 1,845 | | |
| | 3 | | | S&P 500 Index, Strike @ $1,945, expires 11/28/14 | | | | | | | | | | | | | | | 2,835 | | |
| | 11 | | | S&P 500 Index, Strike @ $1,950, expires 11/07/14 | | | | | | | | | | | | | | | 1,595 | | |
| | 22 | | | S&P 500 Index, Strike @ $1,965, expires 11/22/14 | | | | | | | | | | | | | | | 21,010 | | |
| | 22 | | | S&P 500 Index, Strike @ $1,975, expires 11/07/14 | | | | | | | | | | | | | | | 7,590 | | |
| | 15 | | | S&P 500 Index, Strike @ $1,975, expires 11/22/14 | | | | | | | | | | | | | | | 17,175 | | |
| | 3 | | | S&P 500 Index, Strike @ $1,975, expires 11/28/14 | | | | | | | | | | | | | | | 4,455 | | |
| | 4 | | | S&P 500 Index, Strike @ $1,980, expires 11/07/14 | | | | | | | | | | | | | | | 1,620 | | |
| | 5 | | | S&P 500 Index, Strike @ $1,985, expires 11/22/14 | | | | | | | | | | | | | | | 6,875 | | |
| | 8 | | | S&P 500 Index, Strike @ $1,990, expires 11/07/14 | | | | | | | | | | | | | | | 4,680 | | |
| | 1 | | | S&P 500 Index, Strike @ $1,995, expires 11/22/14 | | | | | | | | | | | | | | | 1,655 | | |
| | 15 | | | S&P 500 Index, Strike @ $2,000, expires 01/17/15 | | | | | | | | | | | | | | | 70,655 | | |
| | 8 | | | S&P 500 Index, Strike @ $2,005, expires 11/22/14 | | | | | | | | | | | | | | | 17,646 | | |
| | 6 | | | S&P 500 Index, Strike @ $2,010, expires 11/22/14 | | | | | | | | | | | | | | | 13,460 | | |
| | | | 326,206 | | |
| TOTAL OPTIONS PURCHASED (Cost $4,426,828) | | | 5,707,301 | | |
Par
(000) | |
| | Ratings†
(S&P/Moody's) | | Maturity | | Rate% | | | |
| UNITED STATES AGENCY OBLIGATIONS (87.2%) | | | |
$ | 5,829 | | | United States Treasury Bills | | (AA+, Aaa) | | 11/06/14 | | | 0.023 | | | | 5,828,981 | | |
| | 6,331 | | | United States Treasury Bills^^^ | | (AA+, Aaa) | | 11/28/14 | | | 0.032 | | | | 6,330,846 | | |
| | 6,361 | | | United States Treasury Bills^^^ | | (AA+, Aaa) | | 03/19/15 | | | 0.047 | | | | 6,359,842 | | |
| | 6,325 | | | United States Treasury Bills | | (AA+, Aaa) | | 04/02/15 | | | 0.037 | | | | 6,323,999 | | |
| TOTAL UNITED STATES AGENCY OBLIGATIONS (Cost $24,843,668) | | | 24,843,668 | | |
| SHORT-TERM INVESTMENT (12.3%) | | | |
| | 3,489 | | | State Street Bank and Trust Co. Euro Time Deposit
(Cost $3,489,000) | | | | | | 11/03/14 | | | 0.010 | | | | 3,489,000 | | |
| TOTAL INVESTMENTS AT VALUE (119.5%) (Cost $32,759,496) | | | 34,039,969 | | |
| LIABILITIES IN EXCESS OF OTHER ASSETS (-19.5%) | | | (5,552,461 | ) | |
| NET ASSETS (100.0%) | | $ | 28,487,508 | | |
† Credit ratings given by the Standard & Poor's Division of the McGraw-Hill Companies, Inc. ("S&P") and Moody's Investors Service, Inc. (Moody's) are unaudited.
^^^ At October 31, 2014, this security has been pledged, in whole or in part, as collateral for open written options.
See Accompanying Notes to Financial Statements.
10
Credit Suisse Volaris US Strategies Fund
Schedule of Investments (continued)
October 31, 2014
Written Option Contracts
Number of
Contracts | | Call Written Options | | Expiration
Date | | Premiums
Received | | Current
Value/
Notional | | Net Unrealized
Appreciation
(Depreciation) | |
| | 9 | | | S&P 500 Index, Strike @ $1,905 | | 11/07/14 | | $ | 34,013 | | | $ | (99,990 | ) | | $ | (65,977 | ) | |
| | 13 | | | S&P 500 Index, Strike @ $1,930 | | 11/07/14 | | | 45,555 | | | | (112,320 | ) | | | (66,765 | ) | |
| | 11 | | | S&P 500 Index, Strike @ $1,950 | | 11/07/14 | | | 35,939 | | | | (73,700 | ) | | | (37,761 | ) | |
| | 22 | | | S&P 500 Index, Strike @ $1,975 | | 11/07/14 | | | 71,817 | | | | (96,800 | ) | | | (24,983 | ) | |
| | 4 | | | S&P 500 Index, Strike @ $1,980 | | 11/07/14 | | | 7,993 | | | | (15,880 | ) | | | (7,887 | ) | |
| | 8 | | | S&P 500 Index, Strike @ $1,990 | | 11/07/14 | | | 26,490 | | | | (25,120 | ) | | | 1,370 | | |
| | 17 | | | S&P 500 Index, Strike @ $1,830 | | 11/14/14 | | | 87,826 | | | | (315,010 | ) | | | (227,184 | ) | |
| | 8 | | | S&P 500 Index, Strike @ $1,835 | | 11/14/14 | | | 43,418 | | | | (144,240 | ) | | | (100,822 | ) | |
| | 20 | | | S&P 500 Index, Strike @ $1,925 | | 11/14/14 | | | 75,547 | | | | (184,400 | ) | | | (108,853 | ) | |
| | 6 | | | S&P 500 Index, Strike @ $1,825 | | 11/22/14 | | | 34,069 | | | | (113,940 | ) | | | (79,871 | ) | |
| | 28 | | | S&P 500 Index, Strike @ $1,840 | | 11/22/14 | | | 147,074 | | | | (490,560 | ) | | | (343,486 | ) | |
| | 135 | | | S&P 500 Index, Strike @ $1,855 | | 11/22/14 | | | 706,905 | | | | (2,165,400 | ) | | | (1,458,495 | ) | |
| | 6 | | | S&P 500 Index, Strike @ $1,870 | | 11/22/14 | | | 30,025 | | | | (87,480 | ) | | | (57,455 | ) | |
| | 7 | | | S&P 500 Index, Strike @ $1,895 | | 11/22/14 | | | 31,669 | | | | (85,190 | ) | | | (53,521 | ) | |
| | 26 | | | S&P 500 Index, Strike @ $1,905 | | 11/22/14 | | | 119,049 | | | | (291,720 | ) | | | (172,671 | ) | |
| | 3 | | | S&P 500 Index, Strike @ $1,940 | | 11/22/14 | | | 13,510 | | | | (23,970 | ) | | | (10,460 | ) | |
| | 22 | | | S&P 500 Index, Strike @ $1,965 | | 11/22/14 | | | 92,048 | | | | (128,260 | ) | | | (36,212 | ) | |
| | 15 | | | S&P 500 Index, Strike @ $1,975 | | 11/22/14 | | | 40,003 | | | | (75,300 | ) | | | (35,297 | ) | |
| | 5 | | | S&P 500 Index, Strike @ $1,985 | | 11/22/14 | | | 14,111 | | | | (21,250 | ) | | | (7,139 | ) | |
| | 1 | | | S&P 500 Index, Strike @ $1,995 | | 11/22/14 | | | 2,335 | | | | (3,530 | ) | | | (1,195 | ) | |
| | 8 | | | S&P 500 Index, Strike @ $2,005 | | 11/22/14 | | | 21,374 | | | | (21,314 | ) | | | 60 | | |
| | 6 | | | S&P 500 Index, Strike @ $2,010 | | 11/22/14 | | | 15,058 | | | | (15,425 | ) | | | (367 | ) | |
| | 27 | | | S&P 500 Index, Strike @ $1,895 | | 11/28/14 | | | 132,068 | | | | (331,290 | ) | | | (199,222 | ) | |
| | 3 | | | S&P 500 Index, Strike @ $1,945 | | 11/28/14 | | | 10,708 | | | | (23,220 | ) | | | (12,512 | ) | |
| | 3 | | | S&P 500 Index, Strike @ $1,975 | | 11/28/14 | | | 8,926 | | | | (15,870 | ) | | | (6,944 | ) | |
| | 14 | | | S&P 500 Index, Strike @ $1,915 | | 12/20/14 | | | 83,005 | | | | (154,840 | ) | | | (71,835 | ) | |
| | 8 | | | S&P 500 Index, Strike @ $1,830 | | 01/17/15 | | | 63,474 | | | | (153,440 | ) | | | (89,966 | ) | |
| | 15 | | | S&P 500 Index, Strike @ $2,000 | | 01/17/15 | | | 83,404 | | | | (83,404 | ) | | | — | | |
| | | $ | (3,275,450 | ) | |
Number of
Contracts | | Put Written Options | | Expiration
Date | | Premiums
Received | | Current
Value/
Notional | | Net Unrealized
Appreciation
(Depreciation) | |
| | 59 | | | S&P 500 Index, Strike @ $1,910 | | 11/07/14 | | $ | 255,957 | | | $ | (3,245 | ) | | $ | 252,712 | | |
| | 5 | | | S&P 500 Index, Strike @ $1,935 | | 11/14/14 | | | 15,741 | | | | (1,575 | ) | | | 14,166 | | |
| | 28 | | | S&P 500 Index, Strike @ $1,945 | | 11/14/14 | | | 79,184 | | | | (10,780 | ) | | | 68,404 | | |
| | 7 | | | S&P 500 Index, Strike @ $1,970 | | 11/14/14 | | | 16,651 | | | | (4,725 | ) | | | 11,926 | | |
| | 13 | | | S&P 500 Index, Strike @ $1,820 | | 11/22/14 | | | 72,886 | | | | (1,495 | ) | | | 71,391 | | |
| | 26 | | | S&P 500 Index, Strike @ $1,850 | | 11/22/14 | | | 106,039 | | | | (4,160 | ) | | | 101,879 | | |
| | 4 | | | S&P 500 Index, Strike @ $1,935 | | 11/22/14 | | | 13,130 | | | | (2,260 | ) | | | 10,870 | | |
| | 3 | | | S&P 500 Index, Strike @ $1,945 | | 11/22/14 | | | 9,148 | | | | (2,025 | ) | | | 7,123 | | |
| | 7 | | | S&P 500 Index, Strike @ $1,960 | | 11/22/14 | | | 27,149 | | | | (6,125 | ) | | | 21,024 | | |
| | 19 | | | S&P 500 Index, Strike @ $1,970 | | 11/22/14 | | | 67,600 | | | | (19,855 | ) | | | 47,745 | | |
| | 144 | | | S&P 500 Index, Strike @ $1,990 | | 11/22/14 | | | 573,287 | | | | (216,720 | ) | | | 356,567 | | |
| | 6 | | | S&P 500 Index, Strike @ $1,930 | | 11/28/14 | | | 21,991 | | | | (4,560 | ) | | | 17,431 | | |
| | 6 | | | S&P 500 Index, Strike @ $1,940 | | 11/28/14 | | | 21,283 | | | | (5,250 | ) | | | 16,033 | | |
| | 6 | | | S&P 500 Index, Strike @ $1,970 | | 11/28/14 | | | 19,303 | | | | (8,250 | ) | | | 11,053 | | |
See Accompanying Notes to Financial Statements.
11
Credit Suisse Volaris US Strategies Fund
Schedule of Investments (continued)
October 31, 2014
Written Option Contracts
Number of
Contracts | | Put Written Options | | Expiration
Date | | Premiums
Received | | Current
Value/
Notional | | Net Unrealized
Appreciation
(Depreciation) | |
| | 1 | | | S&P 500 Index, Strike @ $1,855 | | 12/20/14 | | $ | 7,215 | | | $ | (795 | ) | | $ | 6,420 | | |
| | 13 | | | S&P 500 Index, Strike @ $1,970 | | 12/20/14 | | | 53,976 | | | | (32,500 | ) | | | 21,476 | | |
| | 4 | | | S&P 500 Index, Strike @ $1,980 | | 12/20/14 | | | 17,117 | | | | (11,120 | ) | | | 5,997 | | |
| | 2 | | | S&P 500 Index, Strike @ $1,840 | | 01/17/15 | | | 15,712 | | | | (2,650 | ) | | | 13,062 | | |
| | 135 | | | S&P 500 Index, Strike @ $1,860 | | 01/17/15 | | | 803,550 | | | | (207,225 | ) | | | 596,325 | | |
| | 4 | | | S&P 500 Index, Strike @ $1,950 | | 01/17/15 | | | 25,447 | | | | (12,400 | ) | | | 13,047 | | |
| | 8 | | | S&P 500 Index, Strike @ $1,925 | | 02/27/15 | | | 63,930 | | | | (32,400 | ) | | | 31,530 | | |
| | | $ | 1,696,181 | | |
Net Unrealized Appreciation (Depreciation) | | $ | (1,579,269 | ) | |
See Accompanying Notes to Financial Statements.
12
Credit Suisse Volaris US Strategies Fund
Statement of Assets and Liabilities
October 31, 2014
Assets | |
Investments at value (Cost $32,759,496) (Note 2) | | $ | 34,039,969 | | |
Cash | | | 144 | | |
Cash segregated at brokers for written options (Note 2) | | | 811,566 | | |
Receivable for investments sold | | | 564,400 | | |
Receivable for fund shares sold | | | 65,000 | | |
Deferred offering costs (Note 3) | | | 28,895 | | |
Receivable from investment adviser (Note 3) | | | 3,456 | | |
Prepaid expenses | | | 11,243 | | |
Total assets | | | 35,524,673 | | |
Liabilities | |
Administrative services fee payable (Note 3) | | | 16,616 | | |
Shareholder servicing/Distribution fee payable (Note 3) | | | 1,307 | | |
Outstanding written options, at value (Proceeds $4,363,709) (Note 2) | | | 5,942,978 | | |
Payable for investments purchased | | | 949,871 | | |
Trustees' fee payable | | | 9,685 | | |
Offering costs (Note 3) | | | 1,177 | | |
Payable to adviser | | | 28,895 | | |
Accrued expenses | | | 86,636 | | |
Total liabilities | | | 7,037,165 | | |
Net Assets | |
Capital stock, $.001 par value (Note 6) | | | 2,642 | | |
Paid-in capital (Note 6) | | | 26,499,364 | | |
Accumulated net investment loss | | | (27,976 | ) | |
Accumulated net realized gain from written options | | | 2,312,274 | | |
Net unrealized depreciation from investments and written options | | | (298,796 | ) | |
Net assets | | $ | 28,487,508 | | |
I Shares | |
Net assets | | $ | 25,318,574 | | |
Shares outstanding | | | 2,346,983 | | |
Net asset value, offering price and redemption price per share | | $ | 10.79 | | |
A Shares | |
Net assets | | $ | 2,092,181 | | |
Shares outstanding | | | 194,251 | | |
Net asset value and redemption price per share | | $ | 10.77 | | |
Maximum offering price per share (net asset value/(1-5.25%)) | | $ | 11.37 | | |
C Shares | |
Net assets | | $ | 1,076,753 | | |
Shares outstanding | | | 100,400 | | |
Net asset value, offering price and redemption price per share | | $ | 10.72 | | |
See Accompanying Notes to Financial Statements.
13
Credit Suisse Volaris US Strategies Fund
Statement of Operations
For the Period October 31, 20141
Investment Income | |
Interest | | $ | 2,903 | | |
Total investment income | | | 2,903 | | |
Expenses | |
Investment advisory fees (Note 3) | | | 155,353 | | |
Administrative services fees (Note 3) | | | 36,637 | | |
Shareholder servicing/Distribution fees (Note 3) | |
Class A | | | 2,043 | | |
Class C | | | 6,117 | | |
Audit and tax fees | | | 53,700 | | |
Offering costs (Note 3) | | | 40,949 | | |
Custodian fees | | | 30,792 | | |
Printing fees (Note 3) | | | 19,970 | | |
Legal fees | | | 18,556 | | |
Trustees' fees | | | 18,311 | | |
Transfer agent fees (Note 3) | | | 5,366 | | |
Registration fees | | | 5,302 | | |
Commitment fees (Note 4) | | | 2,894 | | |
Insurance expense | | | 483 | | |
Miscellaneous expense | | | 4,908 | | |
Total expenses | | | 401,381 | | |
Less: fees waived and expenses reimbursed (Note 3) | | | (191,262 | ) | |
Net expenses | | | 210,119 | | |
Net investment loss | | | (207,216 | ) | |
Net Realized and Unrealized Gain (Loss) from Investments and Written Options | |
Net realized gain from written options | | | 2,489,213 | | |
Net change in unrealized appreciation (depreciation) from investments | | | 1,280,473 | | |
Net change in unrealized appreciation (depreciation) from written options | | | (1,579,269 | ) | |
Net realized and unrealized gain from investments and written options | | | 2,190,417 | | |
Net increase in net assets resulting from operations | | $ | 1,983,201 | | |
1 For the period March 31, 2014 (commencement of operations) through October 31, 2014.
See Accompanying Notes to Financial Statements.
14
Credit Suisse Volaris US Strategies Fund
Statement of Changes in Net Assets
| | | For the Period
Ended
October 31, 20141 | |
From Operations | |
Net investment loss | | $ | (207,216 | ) | |
Net realized gain from written options | | | 2,489,213 | | |
Net change in unrealized appreciation (depreciation) from investments and written options | | | (298,796 | ) | |
Net increase in net assets resulting from operations | | | 1,983,201 | | |
| From Capital Share Transactions (Note 6) | |
Proceeds from sale of shares | | | 26,509,000 | | |
Net asset value of shares redeemed | | | (4,693 | ) | |
Net increase in net assets from capital share transactions | | | 26,504,307 | | |
Net increase in net assets | | | 28,487,508 | | |
Net Assets | |
Beginning of period | | | — | | |
End of period | | $ | 28,487,508 | | |
Accumulated net investment loss | | $ | (27,976 | ) | |
1 For the period March 31, 2014 (commencement of operations) through October 31, 2014.
See Accompanying Notes to Financial Statements.
15
Credit Suisse Volaris US Strategies Fund
Financial Highlights
(For a Class I Share of the Fund Outstanding Throughout the Period)
| | | For the Period
Ended
October 31, 20141 | |
Per share data | |
Net asset value, beginning of period | | $ | 10.00 | | |
INVESTMENT OPERATIONS | |
Net investment loss2 | | | (0.08 | ) | |
Net gain on investments and written options (both realized and unrealized) | | | 0.87 | | |
Total from investment operations | | | 0.79 | | |
Net asset value, end of period | | $ | 10.79 | | |
Total return3 | | | 7.90 | % | |
RATIOS AND SUPPLEMENTAL DATA | |
Net assets, end of period (000s omitted) | | $ | 25,319 | | |
Ratio of net expenses to average net assets | | | 1.30 | %4 | |
Ratio of net investment loss to average net assets | | | (1.28 | )%4 | |
Decrease reflected in above operating expense ratios due to waivers/reimbursements | | | 1.12 | %4 | |
Portfolio turnover rate | | | — | | |
1 For the period March 31, 2014 (commencement of operations) through October 31, 2014.
2 Per share information is calculated using the average shares outstanding method.
3 Total returns are historical and assume changes in share price. Had certain expenses not been reduced during the period shown, total returns would have been lower. Total returns for periods less than one year are not annualized.
4 Annualized. The non-recurring expenses of offering costs were not annualized.
See Accompanying Notes to Financial Statements.
16
Credit Suisse Volaris US Strategies Fund
Financial Highlights
(For a Class A Share of the Fund Outstanding Throughout the Period)
| | | For the Period
Ended
October 31, 20141 | |
Per share data | |
Net asset value, beginning of period | | $ | 10.00 | | |
INVESTMENT OPERATIONS | |
Net investment loss2 | | | (0.09 | ) | |
Net gain on investments and written options (both realized and unrealized) | | | 0.86 | | |
Total from investment operations | | | 0.77 | | |
Net asset value, end of period | | $ | 10.77 | | |
Total return3 | | | 7.70 | % | |
RATIOS AND SUPPLEMENTAL DATA | |
Net assets, end of period (000s omitted) | | $ | 2,092 | | |
Ratio of net expenses to average net assets | | | 1.55 | %4 | |
Ratio of net investment loss to average net assets | | | (1.53 | )%4 | |
Decrease reflected in above operating expense ratios due to waivers/reimbursements | | | 1.12 | %4 | |
Portfolio turnover rate | | | — | | |
1 For the period March 31, 2014 (commencement of operations) through October 31, 2014.
2 Per share information is calculated using the average shares outstanding method.
3 Total returns are historical and assume changes in share price and no sales charge. Had certain expenses not been reduced during the period shown, total returns would have been lower. Total returns for periods less than one year are not annualized.
4 Annualized. The non-recurring expenses of offering costs were not annualized.
See Accompanying Notes to Financial Statements.
17
Credit Suisse Volaris US Strategies Fund
Financial Highlights
(For a Class C Share of the Fund Outstanding Throughout the Period)
| | | For the Period
Ended
October 31, 20141 | |
Per share data | |
Net asset value, beginning of period | | $ | 10.00 | | |
INVESTMENT OPERATIONS | |
Net investment loss2 | | | (0.14 | ) | |
Net gain on investments and written options (both realized and unrealized) | | | 0.86 | | |
Total from investment operations | | | 0.72 | | |
Net asset value, end of period | | $ | 10.72 | | |
Total return3 | | | 7.20 | % | |
RATIOS AND SUPPLEMENTAL DATA | |
Net assets, end of period (000s omitted) | | $ | 1,077 | | |
Ratio of net expenses to average net assets | | | 2.30 | %4 | |
Ratio of net investment loss to average net assets | | | (2.28 | )%4 | |
Decrease reflected in above operating expense ratios due to waivers/reimbursements | | | 1.12 | %4 | |
Portfolio turnover rate | | | — | | |
1 For the period March 31, 2014 (commencement of operations) through October 31, 2014.
2 Per share information is calculated using the average shares outstanding method.
3 Total returns are historical and assume changes in share price and no sales charge. Had certain expenses not been reduced during the period shown, total returns would have been lower. Total returns for periods less than one year are not annualized.
4 Annualized. The non-recurring expenses of offering costs were not annualized.
See Accompanying Notes to Financial Statements.
18
Credit Suisse Volaris US Strategies Fund
Notes to Financial Statements
October 31, 2014
Credit Suisse Volaris US Strategies Fund (the "Fund"), a series of the Credit Suisse Opportunity Funds (the "Trust"), a Delaware statutory trust, is registered under the Investment Company Act of 1940, as amended (the "1940 Act"), as a non-diversified open-end management investment company that seeks total return. The Trust was organized under the laws of the State of Delaware as a business trust on May 31, 1995. The Fund commenced operations on March 31, 2014.
The Fund offers three classes of shares: Class I shares, Class A shares and Class C shares. Each class of shares represents an equal pro rata interest in the Fund, except they bear different expenses, which reflect the differences in the range of services provided to them. Class A shares are sold subject to a front-end sales charge of up to 5.25%. Class C shares are sold subject to a contingent deferred sales charge of 1.00% if the shares are redeemed within the first year of purchase. Class I shares are sold without a sales charge.
Note 2. Significant Accounting Policies
The following is a summary of significant accounting policies followed by the Fund in the preparation of its financial statements. The policies are in accordance with accounting principles generally accepted in the United States of America ("GAAP"). The preparation of financial statements requires management to make estimates and assumptions that affect the reported amounts and disclosures in the financial statements. Actual results could differ from those estimates.
A) SECURITY VALUATION — The net asset value of the Fund is determined daily as of the close of regular trading on the New York Stock Exchange, Inc. (the "Exchange") on each day the Exchange is open for business. The valuations for fixed income securities (which may include, but are not limited to, corporate, government, municipal, mortgage-backed, collateralized mortgage obligations and asset-backed securities) and certain derivative instruments are typically the prices supplied by independent third party pricing services, which may use market prices or broker/dealer quotations or a variety of valuation techniques and methodologies. The independent third party pricing services use inputs that are observable such as issuer details, interest rates, yield curves, prepayment speeds, credit risks/spreads, default rates and quoted prices for similar securities. Short-term fixed income securities that will mature in 60 days or less may be valued at amortized cost. Structured note agreements are valued in accordance with a dealer-supplied valuation based on changes in the
19
Credit Suisse Volaris US Strategies Fund
Notes to Financial Statements (continued)
October 31, 2014
Note 2. Significant Accounting Policies
value of the underlying index. Option contracts on securities, currencies, indices, futures contracts, swaps and other instruments are valued at the mid-point between the last bid and ask quotations as of the close of trading on the exchange which the option is traded. Futures contracts are valued daily at the settlement price established by the board of trade or exchange on which they are traded. Forward contracts are valued at the London closing spot rates and the London closing forward point rates on a daily basis. The currency forward contract pricing model derives the differential in point rates to the expiration date of the forward and calculates its present value. Equity securities for which market quotations are available are valued at the last reported sales price or official closing price on the primary market or exchange on which they trade. The Fund may utilize a service provided by an independent third party which has been approved by the Board of Trustees (the "Board") to fair value certain securities. When fair value pricing is employed, the prices of securities used by the Fund to calculate its net asset value may differ from quoted or published prices for the same securities. If independent third party pricing services are unable to supply prices for a portfolio investment, or if the prices supplied are deemed by the investment adviser to be unreliable, the market price may be determined by the investment adviser using quotations from one or more broker/dealers or at the transaction price if the security has recently been purchased and no value has yet been obtained from a pricing service or pricing broker. When reliable prices are not readily available, such as when the value of a security has been significantly affected by events after the close of the exchange or market on which the security is principally traded, but before the Fund calculates its net asset value, the Fund values these securities as determined in accordance with procedures approved and established by the Fund's Board.
The Fund uses valuation techniques to measure fair value that are consistent with the market approach and/or income approach, depending on the type of security and the particular circumstance. The market approach uses prices and other relevant information generated by market transactions involving identical or comparable securities. The income approach uses valuation techniques to discount estimated future cash flows to present value.
GAAP established a disclosure hierarchy that categorizes the inputs to valuation techniques used to value assets and liabilities at each measurement date. These inputs are summarized in the three broad levels listed below:
• Level 1 – quoted prices in active markets for identical investments
• Level 2 – other significant observable inputs (including quoted prices for similar investments, interest rates, prepayment speeds, credit risk, etc.)
20
Credit Suisse Volaris US Strategies Fund
Notes to Financial Statements (continued)
October 31, 2014
Note 2. Significant Accounting Policies
• Level 3 – significant unobservable inputs (including the Fund's own assumptions in determining the fair value of investments)
The inputs or methodologies used to value securities are not necessarily an indication of the risk associated with investing in those securities.
The following is a summary of the inputs used as of October 31, 2014 in valuing the Fund's assets and liabilities carried at fair value:
| | | Level 1 | | Level 2 | | Level 3 | | Total | |
Investments in Securities | |
Options Purchased | | $ | 5,707,301 | | | $ | — | | | $ | — | | | $ | 5,707,301 | | |
United States Agency Obligations | | | — | | | | 24,843,668 | | | | — | | | | 24,843,668 | | |
Short-term Investment | | | — | | | | 3,489,000 | | | | — | | | | 3,489,000 | | |
| | | | 5,707,301 | | | | 28,332,668 | | | | — | | | | 34,039,969 | | |
Other Financial Instruments* | |
Written Options | | $ | (5,942,978 | ) | | $ | — | | | $ | — | | | $ | (5,942,978 | ) | |
*Other financial instruments include written options, at value.
The Fund follows Financial Accounting Standards Board ("FASB") amendments to authoritative guidance which requires the Fund to disclose details of transfers in and out of Level 1 and Level 2 measurements and Level 2 and Level 3 measurements and the reasons for the transfers. For the period ended October 31, 2014, there were no transfers in and out of Level 1, Level 2 and Level 3. All transfers are assumed to occur at the end of the reporting period.
B) DERIVATIVE INSTRUMENTS AND HEDGING ACTIVITIES — The Fund adopted amendments to authoritative guidance on disclosures about derivative instruments and hedging activities which require that a fund disclose (a) how and why an entity uses derivative instruments, (b) how derivative instruments and hedging activities are accounted for and (c) how derivative instruments and related hedging activities affect a fund's financial position, financial performance and cash flows. For the period ended October 31, 2014, the Fund's derivatives did not qualify for hedge accounting as they are held at fair value.
Fair Values of Derivative Instruments as of October 31, 2014
| | | Asset Derivatives | | Liability Derivatives | |
| | | Balance Sheet
Location | | Fair Value | | Balance Sheet
Location | | Fair Value | |
Equity Contracts | | Purchased options,
at value | | $ | 5,707,301 | | | Outstanding written
options, at value | | $ | 5,942,978 | * | |
*Written options are reported at market value.
21
Credit Suisse Volaris US Strategies Fund
Notes to Financial Statements (continued)
October 31, 2014
Note 2. Significant Accounting Policies
Effect of Derivative Instruments on the Statement of Operations
| | | Location | | Realized
Gain/Loss | | Location | | Net Unrealized
Appreciation
(Depreciation) | |
Equity Contracts | | Net realized gain from
written options | | $ | 2,489,213 | | | Net change in unrealized
appreciation (depreciation)
from written options | | $ | (1,579,269 | ) | |
The notional amount of written options at the period ended October 31, 2014 is reflected in the Schedule of Investments. For the period ended October 31, 2014, the Fund received average monthly premiums of 1,456,615 from written option contracts.
The following table presents by counterparty the Fund's derivative assets net of related collateral held by the Fund at October 31, 2014:
Counterparty | | Gross Amounts of
Assets Presented in
the Statement of Assets
and Liabilities(a) | | Financial
Instruments
and Derivatives
Available for Offset | | Non-Cash
Collateral
Received | | Cash
Collateral
Received | | Net Amount
of Derivative
Assets | |
Goldman Sachs | | $ | 5,707,301 | | | $ | (5,707,301 | ) | | $ | — | | | $ | — | | | $ | — | | |
The following table presents by counterparty the Fund's derivative liabilities net of related collateral pledged by the Fund at October 31, 2014:
| Counterparty | | Gross Amounts of
Liabilities Presented in
the Statement of Assets
and Liabilities(a) | | Financial
Instruments
and Derivatives
Available for Offset | | Non-Cash
Collateral
Pledged | | Cash
Collateral
Pledged(b) | | Net Amount
of Derivative
Liabilities | |
Goldman Sachs | | $ | 5,942,978 | | | $ | (5,707,301 | ) | | $ | — | | | $ | (235,677 | ) | | $ | — | | |
(a) Investments, at value (includes purchased and written options).
(b) The actual collateral received and/or pledged may be more than the amounts shown.
C) SECURITY TRANSACTIONS AND INVESTMENT INCOME/EXPENSE — Security transactions are accounted for on a trade date basis. Interest income/expense is recorded on the accrual basis. The Fund amortizes premiums and accretes discounts using the effective interest method. Dividend income/expense is recorded on the ex-dividend date. Certain expenses are class-specific expenses, vary by class and are charged only to that class. Income, expenses (excluding class-specific expenses) and realized/unrealized gains/losses are allocated proportionately to each class of shares based upon the relative net asset value of the outstanding shares of that class. The cost of investments sold is determined by use of the specific identification method for both financial reporting and income tax purposes.
22
Credit Suisse Volaris US Strategies Fund
Notes to Financial Statements (continued)
October 31, 2014
Note 2. Significant Accounting Policies
D) DIVIDENDS AND DISTRIBUTIONS TO SHAREHOLDERS — Dividends from net investment income, if any, are declared and paid annually. Distributions of net realized capital gains, if any, are declared and paid at least annually. However, to the extent that a net realized capital gain can be reduced by a capital loss carryforward, such gain will not be distributed. Income and capital gain distributions are determined in accordance with federal income tax regulations, which may differ from GAAP.
E) FEDERAL INCOME TAXES — No provision is made for federal taxes as it is the Fund's intention to continue to qualify for and elect the tax treatment applicable to regulated investment companies ("RIC") under the Internal Revenue Code of 1986, as amended (the "Code"), and to make the requisite distributions to its shareholders, which will be sufficient to relieve it from federal income and excise taxes.
In order to qualify as a RIC under the Code, the Fund must meet certain requirements regarding the source of its income, the diversification of its assets and the distribution of its income. One of these requirements is that the Fund derive at least 90% of its gross income for each taxable year from dividends, interest, payments with respect to certain securities loans, gains from the sale or other disposition of stock, securities or foreign currencies, other income derived with respect to its business of investing in such stock, securities or currencies or net income derived from interests in certain publicly traded partnerships ("Qualifying Income").
The Fund adopted the authoritative guidance for uncertainty in income taxes and recognizes a tax benefit or liability from an uncertain position only if it is more likely than not that the position is sustainable based solely on its technical merits and consideration of the relevant taxing authority's widely understood administrative practices and procedures. The Fund has reviewed its current tax positions and has determined that no provision for income tax is required in the Fund's financial statements.
F) SHORT-TERM INVESTMENTS — The Fund, together with other funds/portfolios advised by Credit Suisse, an indirect, wholly-owned subsidiary of Credit Suisse Group AG, pools available cash into a short-term variable rate time deposit issued by State Street Bank and Trust Company ("SSB"), the Fund's custodian. The short-term time deposit issued by SSB is a variable rate account classified as a short-term investment.
G) OPTION CONTRACTS — The Fund will enter into options contracts to gain exposure to risk volatility based assets. When the Fund purchases an
23
Credit Suisse Volaris US Strategies Fund
Notes to Financial Statements (continued)
October 31, 2014
Note 2. Significant Accounting Policies
option, it pays a premium and the option is subsequently marked to market to reflect current value. Premiums paid for purchasing options which expire are treated as realized losses. Premiums paid for purchasing options which are exercised or closed are added to the cost or deducted from the proceeds on the underlying instrument to determine the realized gain or loss. The risk associated with purchasing options is limited to the premium paid.
When the Fund writes an option, an amount equal to the net premium received (the premium less commission) is recorded as a liability and is subsequently adjusted to the current value. Net premiums received for written options which expire are treated as realized gains. Net premiums received for written options which are exercised or closed are deducted from the cost or added to the proceeds on the underlying instrument or closing purchase transaction to determine the realized gain or loss. The Fund, as writer of a written option, bears the risk of an unfavorable change in the market value of the instrument underlying the written option.
Exchange-traded options have standardized contracts and are settled through a clearing house with fulfillment guaranteed by the credit of the exchange. Therefore, counterparty credit risks to the Fund are limited. Over-the-counter options are subject to the risk that the counterparty is unable or unwilling to meet its obligations under the option. The Fund's written options at October 31, 2014 are disclosed in the Schedule of Investments. At October 31, 2014, the amount of restricted cash held at brokers was $811,566.
For the period ended October 31, 2014, transactions for written options on securities, interest rate swaps and futures were as follows:
| | | Number of
Contracts | | Premium
Received | |
Written Options, outstanding as of October 31, 2013 | | | — | | | $ | — | | |
Options written | | | 8,616 | | | | 18,673,513 | | |
Options closed | | | (6,476 | ) | | | (11,130,251 | ) | |
Options exercised | | | — | | | | — | | |
Options expired | | | (1,190 | ) | | | (3,179,553 | ) | |
Written Options, outstanding as of October 31, 2014 | | | 950 | | | $ | 4,363,709 | | |
H) OTHER — In the normal course of business the Fund trades financial instruments and enters into financial transactions where risk of potential loss exists due to changes in the market (market risk) or failure of the other party to a transaction to perform (credit risk). Similar to credit risk, the Fund may be exposed to counterparty risk, or the risk that an institution or other entity with which the Fund has unsettled or open transactions will default. The potential
24
Credit Suisse Volaris US Strategies Fund
Notes to Financial Statements (continued)
October 31, 2014
Note 2. Significant Accounting Policies
loss could exceed the value of the financial assets recorded in the financial statements. Financial assets, which potentially expose the Fund to credit risk, consist principally of cash due from counterparties and investments. The extent of the Fund's exposure to credit and counterparty risks in respect to these financial assets approximates their carrying value as recorded in the Fund's Statement of Assets and Liabilities.
I) NEW ACCOUNTING PRONOUNCEMENTS — In June 2013, the FASB issued Accounting Standards Update (ASU) No. 2013-08, Investment Companies (Topic 946): Amendments to the Scope, Measurement, and Disclosure Requirements. The ASU modifies the criteria used in defining an investment company under GAAP and also sets forth certain measurement and disclosure requirements. Under the ASU, an entity that is registered under the 1940 Act automatically qualifies as an investment company. The ASU is effective for interim and annual reporting periods beginning after December 15, 2013. Management has reviewed the requirements and believes the adoption of this ASU will not have a material impact on the financial statements.
In June 2014, FASB issued ASU No. 2014-11, Transfers and Servicing (Topic 860), Repurchase-to-Maturity Transactions, Repurchase Financings, and Disclosures. The ASU changes the accounting for certain repurchase agreements and expands disclosure requirements related to repurchase agreements, securities lending, repurchase-to-maturity and similar transactions. The ASU is effective for interim and annual reporting periods beginning after December 15, 2014. Management is currently evaluating the impact, if any, of applying this provision.
J) SUBSEQUENT EVENTS — In preparing the financial statements as of October 31, 2014, management considered the impact of subsequent events for potential recognition or disclosure in these financial statements through the date of release of this report. No such events requiring recognition or disclosure were identified through the date of the release of this report.
Note 3. Transactions with Affiliates and Related Parties
Credit Suisse serves as investment adviser for the Fund. For its investment advisory services, Credit Suisse is entitled to receive a fee from the Fund at an annual rate of 1.00% of the Fund's average daily net assets. For the period ended October 31, 2014, investment advisory fees earned and fees waived/expenses reimbursed were $155,353 and $191,262, respectively. The Fund is authorized to reimburse Credit Suisse for management fees previously limited and/or for expenses previously paid by Credit Suisse, provided,
25
Credit Suisse Volaris US Strategies Fund
Notes to Financial Statements (continued)
October 31, 2014
Note 3. Transactions with Affiliates and Related Parties
however, that any reimbursements must be paid at a date not more than three years after the end of the fiscal year during which such fees were limited or expenses were reimbursed by Credit Suisse and the reimbursements do not cause a class to exceed the applicable expense limitation in the contract at the time the fees were limited or expenses are paid. This contract may not be terminated before February 28, 2015. Credit Suisse contractually waives fees and reimburses expenses so that the Fund's annual operating expenses will not exceed 1.30% of the Fund's average daily net assets for Class I shares, 1.55% of the Fund's average daily net assets for Class A shares, and 2.30% of the Fund's average daily net assets for Class C shares.
For the period ended October 31, 2014, the amounts waived and reimbursed by the Advisor, as well as the amounts available for recoupment/potential future recoupment by the Advisor and the expiration schedule at October 31, 2014 are as follows:
| | Fee waivers/
expense
reimbursements
subject to
repayment | | Expires
October 31,
2015 | | Expires
October 31,
2016 | | Expires
October 31,
2017 | |
Class I | | $ | 173,670 | | | $ | — | | | $ | — | | | $ | 173,670 | | |
Class A | | | 10,060 | | | | — | | | | — | | | | 10,060 | | |
Class C | | | 7,532 | | | | — | | | | — | | | | 7,532 | | |
Totals | | $ | 191,262 | | | $ | — | | | $ | — | | | $ | 191,262 | | |
Credit Suisse and SSB serve as co-administrators to the Fund. For its co-administrative services, Credit Suisse received a fee calculation at an annual rate of 0.09% of the Fund's average daily net assets. For the period ended October 31, 2014, co-administrative services fees earned by Credit Suisse were $13,982.
For its co-administrative services, SSB receives a fee, exclusive of out-of-pocket expenses, calculated in total for all the Credit Suisse funds/portfolios co-administered by SSB and allocated based upon the relative average net assets of each fund/portfolio, subject to an annual minimum fee. For the period ended October 31, 2014, co-administrative services fees earned by SSB (including out-of-pocket expenses) with respect to the Fund were $22,655.
Credit Suisse Securities (USA) LLC ("CSSU"), an affiliate of Credit Suisse, serves as the distributor of the Fund's shares. Pursuant to distribution plans adopted by the Fund pursuant to Rule 12b-1 under the 1940 Act, CSSU received fees for its distribution services. These fees were calculated at an annual rate of 0.25% of the average daily net assets of the Class A shares. For the Class C
26
Credit Suisse Volaris US Strategies Fund
Notes to Financial Statements (continued)
October 31, 2014
Note 3. Transactions with Affiliates and Related Parties
shares, the fee is calculated at an annual rate of 1.00% of the average daily net assets. For the period ended October 31, 2014, the Fund paid Rule 12b-1 distribution fees of $2,043 for Class A shares and $6,117 for Class C shares. Class I shares are not subject to Rule 12b-1 distribution fees.
Certain brokers, dealers and financial representatives provide transfer agent related services to the Fund and receive compensation from the Fund. Some of the fees are paid by Credit Suisse on behalf of the Fund. For the period ended October 31, 2014, the Fund had no reimbursement to Credit Suisse.
For the period ended October 31, 2014, CSSU and its affiliates advised the Fund that there were no commissions earned on the sale of the Fund's Class A shares and Class C shares.
Merrill Corporation ("Merrill"), formerly an affiliate of Credit Suisse, has been engaged by the Fund to provide certain financial printing services. For the period ended October 31, 2014, Merrill was paid $8,399 for its services by the Fund. This amount was included in the printing fees presented on the Statement of Operations. Effective July 23, 2014, Merrill was no longer considered an affiliate.
Offering costs, including initial registration cost, were deferred and will be charged to expenses over the Fund's first 12 months of operation. For the period ended October 31, 2014, $40,949 has been expensed to the Fund.
Note 4. Line of Credit
The Fund, together with other funds/portfolios advised by Credit Suisse (collectively, the "Participating Funds"), participates in a committed, unsecured line of credit facility ("Credit Facility"), in an aggregated amount of $200 million for temporary or emergency purposes with SSB under a first come first serve basis. Under the terms of the Credit Facility, the Participating Funds pay an aggregate commitment fee on the average unused amount of the Credit Facility, which is allocated among the Participating Funds in such manner as is determined by the governing Boards of the Participating Funds. In addition, the Participating Funds pay interest on borrowings at either the Overnight Federal Funds rate or the Overnight LIBOR rate plus a spread. At October 31, 2014 and during the period ended October 31, 2014, the Fund had no borrowings outstanding under the Credit Facility.
27
Credit Suisse Volaris US Strategies Fund
Notes to Financial Statements (continued)
October 31, 2014
Note 5. Purchases and Sales of Securities
For the period ended October 31, 2014, purchases and sales of investment securities (excluding short-term investments and purchased options) were $0 and $0, respectively.
Note 6. Capital Share Transactions
The Fund is authorized to issue an unlimited number of full and fractional shares of beneficial interest, $.001 par value per share. The Fund offers Class I, Class A and Class C shares. Transactions in capital shares for each class of the Fund were as follows:
| | | Class I | |
| | | For the Period Ended
October 31, 20141 | |
| | | Shares | | Value | |
Shares sold | | | 2,346,983 | | | $ | 23,500,000 | | |
Net increase | | | 2,346,983 | | | $ | 23,500,000 | | |
| | | Class A | |
| | | For the Period Ended
October 31, 20141 | |
| | | Shares | | Value | |
Shares sold | | | 194,716 | | | $ | 2,005,000 | | |
Shares redeemed | | | (465 | ) | | | (4,693 | ) | |
Net increase | | | 194,251 | | | $ | 2,000,307 | | |
| | | Class C | |
| | | For the Period Ended
October 31, 20141 | |
| | | Shares | | Value | |
Shares sold | | | 100,400 | | | $ | 1,004,000 | | |
Net increase | | | 100,400 | | | $ | 1,004,000 | | |
1 For the period March 31, 2014 (commencement of operations) through October 31, 2014.
On October 31, 2014, the number of shareholders that held 5% or more of the outstanding shares of each class of the Fund was as follows:
| | | Number of
Shareholders | | Approximate Percentage
of Outstanding Shares | |
Class I | | | 1 | * | | | 98 | % | |
Class A | | | 2 | * | | | 100 | % | |
Class C | | | 1 | * | | | 100 | % | |
*This includes the seed money from Merchant Holdings, Inc., an affiliate of Credit Suisse.
28
Credit Suisse Volaris US Strategies Fund
Notes to Financial Statements (continued)
October 31, 2014
Note 6. Capital Share Transactions
Some of the shareholders are omnibus accounts, which hold shares on behalf of individual shareholders.
Note 7. Federal Income Taxes
Income and capital gain distributions are determined in accordance with federal income tax regulations, which may differ from GAAP.
There were no dividends paid by the Fund to shareholders during the period ended October 31, 2014.
The tax basis components of distributable earnings differ from the amounts reflected in the Statement of Assets and Liabilities by temporary book/tax differences. This difference is primarily due to differing treatments of organizational expenses. At October 31, 2014, the components of distributable earnings on a tax basis were as follows:
Undistributed net investment income | | $ | 699,147 | | |
Undistributed capital gain | | | 1,314,331 | | |
| | | $ | 2,013,478 | | |
At October 31, 2014, the cost of investments (excluding foreign currency related transactions) and net unrealized appreciation (depreciation) for income tax purposes were as follows:
Cost of Investments | | $ | 32,759,496 | | |
Unrealized appreciation | | $ | 3,038,941 | | |
Unrealized depreciation | | | (1,758,468 | ) | |
Net unrealized appreciation (depreciation) | | $ | 1,280,473 | | |
At October 31, 2014, the Fund reclassified $179,240 from accumulated net investment loss and $176,939 from accumulated net realized gain to paid in capital, to adjust for current period permanent book/tax differences. These permanent differences are due to differing book/tax treatment of ordinary loss netting to reduce short term capital gains and non-deductible 12b-1 and blue sky expenses. Net assets were not affected by these reclassifications.
Note 8. Contingencies
In the normal course of business, the Fund may provide general indemnifications pursuant to certain contracts and organizational documents.
29
Credit Suisse Volaris US Strategies Fund
Notes to Financial Statements (continued)
October 31, 2014
The Fund's maximum exposure under these arrangements is dependent on future claims that may be made against the Fund and, therefore, cannot be estimated; however, based on experience, the risk of loss from such claims is considered remote.
Note 9. Other Matters
On May 19, 2014, the U.S. Department of Justice (the "Department of Justice") filed a one-count criminal information (the "Information") in the District Court for the Eastern District of Virginia charging Credit Suisse AG ("CSAG") with conspiracy to commit tax fraud related to accounts CSAG established for cross-border clients. The Department of Justice and CSAG entered into a plea agreement (the "Plea Agreement") settling the action pursuant to which CSAG pleaded guilty to the charge set out in the Information.
The Plea Agreement requires CSAG to pay over $1.8 billion to the U.S. government, including the U.S. Internal Revenue Service. The Plea Agreement also requires CSAG to lawfully undertake certain remedial actions to address the conduct described in the Plea Agreement.
CSAG has entered into other settlements relating to the conduct set out in the Plea Agreement. CSAG has entered into a Consent Order with the Federal Reserve Board (the "Federal Reserve") to resolve certain findings by the Federal Reserve, including that the activities of CSAG regarding opening of foreign accounts for U.S. taxpayers, provision of investment services to U.S. clients, and operation of CSAG's New York representative office prior to 2009 lacked adequate enterprise-wide risk management and compliance policies and procedures sufficient to ensure that all of its activities comply with U.S. laws and regulations. In addition, CSAG has entered into a Consent Order with the New York State Department of Financial Services (the "DFS") to resolve the DFS's investigation into the conduct described in the Plea Agreement. The settlement with the Federal Reserve requires CSAG to pay $100 million to the Federal Reserve, and the settlement with the DFS requires CSAG to pay $715 million to the DFS.
These settlements follow a settlement by Credit Suisse Group AG ("CS Group"), the parent company of CSAG, with the Securities and Exchange Commission (the "Commission") on February 21, 2014 to resolve an investigation by the Commission into solicitation and provision of broker-dealer and investment advisory services to certain U.S. cross-border clients by
30
Credit Suisse Volaris US Strategies Fund
Notes to Financial Statements (continued)
October 31, 2014
CS Group while not registered with the Commission as a broker-dealer or investment adviser. As part of the settlement, CS Group retained an independent consultant to evaluate its policies and procedures and examine its broker-dealer and investment adviser activities to fully verify that the business that was the subject of the Commission investigation has been completely exited. CS Group also agreed to pay $196,511,014, which includes $82,170,990 in disgorgement, $64,340,024 in interest and a $50,000,000 penalty.
CSAG is the indirect parent company of Credit Suisse and CSSU. Neither Credit Suisse, CSSU nor the Fund was named in the Plea Agreement (as defined below) or other settlements relating to the conduct set out in the Plea Agreement. The conduct set out in the Plea Agreement did not involve the Fund, Credit Suisse or CSSU with respect to its investment adviser and distribution activities relating to the Fund.
Credit Suisse, CSSU and certain of their affiliates have received a permanent exemptive order from the Commission to permit them to continue serving as investment advisers and principal underwriters for U.S.-registered investment companies, such as the Fund. Due to a provision in the law governing the operation of U.S.-registered investment companies, they would otherwise have become ineligible to perform these activities as a result of the plea in the Plea Agreement. The permanent exemptive order permits Credit Suisse and CSSU to continue to provide services to the Fund, so long as, among other things, no current or former employee of CSAG or any affiliate of CSAG who previously has been or who subsequently may be identified by CSAG or any U.S. or non-U.S. regulatory or enforcement agencies as having been responsible for the conduct described in the Plea Agreement will be employed by Credit Suisse and certain of its affiliates. Credit Suisse and CSSU have informed the Fund that, Credit Suisse and CSSU believe the Settlements will not have any material impact on the Fund or on the ability of Credit Suisse or CSSU to perform services for the Fund.
On November 21, 2014, at the sentencing hearing, the court accepted and implemented the sentence as set out in the plea agreement. The court imposed no additional conditions beyond those contained in the agreement.
31
Credit Suisse Volaris US Strategies Fund
Report of Independent Registered Public Accounting Firm
To the Board of Trustees and the Shareholders of
Credit Suisse Volaris US Strategies Fund:
In our opinion, the accompanying statement of assets and liabilities, including the schedule of investments, and the related statements of operations and of changes in net assets and the financial highlights present fairly, in all material respects, the financial position of Credit Suisse Volaris US Strategies Fund (a separate fund of Credit Suisse Opportunity Funds) (the "Fund") at October 31, 2014, the results of its operations, the changes in its net assets and the financial highlights for the period March 31, 2014 (commencement of operations) through October 31, 2014, in conformity with accounting principles generally accepted in the United States of America. These financial statements and financial highlights (hereafter referred to as "financial statements") are the responsibility of the Fund's management. Our responsibility is to express an opinion on these financial statements based on our audit. We conducted our audit of these financial statements in accordance with the standards of the Public Company Accounting Oversight Board (United States). Those standards require that we plan and perform the audit to obtain reasonable assurance about whether the financial statements are free of material misstatement. An audit includes examining, on a test basis, evidence supporting the amounts and disclosures in the financial statements, assessing the accounting principles used and significant estimates made by management, and evaluating the overall financial statement presentation. We believe that our audit, which included confirmation of securities at October 31, 2014 by correspondence with the custodian and brokers, provides a reasonable basis for our opinion.
PricewaterhouseCoopers LLP
New York, New York
December 29, 2014
32
Credit Suisse Volaris US Strategies Fund
Information Concerning Trustees and Officers (unaudited)
Name, Address
(Year of Birth) | | Position(s)
Held with
Fund | | Term
of Office1
and
Length
of Time
Served | | Principal
Occupation(s) During
Past Five Years | | Number of
Portfolios
in Fund
Complex
Overseen
by Trustee | | Other
Trusteeships
Held by Trustee | |
Independent Trustees | | | | | | | | | | | |
Enrique Arzac
c/o Credit Suisse Asset
Management, LLC
Attn: General Counsel
One Madison Avenue
New York, New York
10010
(1941) | | Trustee, Audit Committee Chairman and Nominating Committee Member | | Since Fund Inception | | Professor of Finance and Economics, Graduate School of Business, Columbia University since 1971. | | | 12 | | | Director of The Adams Express Company, Petroleum and Resources Corporation, Aberdeen Chile Fund, Inc., Aberdeen Emerging Markets Smaller Company Opportunities Fund, Inc., Aberdeen Israel Fund, Inc., Aberdeen Indonesia Fund, Inc. and Aberdeen Latin America Equity Fund, Inc. (each a closed-end investment company); Director of Aberdeen Asia-Pacific Income Investment Company Limited (a Canadian closed-end fund); Trustee of Mirae Asset Discovery Funds (6 open-end portfolios); Director of Starcomms PLC. (telecommunications company) from 2008 to 2011; Director of Epoch Holding Corporation (an investment management and investment advisory services company) from 2006 to March 2013. | |
33
Credit Suisse Volaris US Strategies Fund
Information Concerning Trustees and Officers (unaudited) (continued)
Name, Address
(Year of Birth) | | Position(s)
Held with
Fund | | Term
of Office1
and
Length
of Time
Served | | Principal
Occupation(s) During
Past Five Years | | Number of
Portfolios
in Fund
Complex
Overseen
by Trustee | | Other
Trusteeships
Held by Trustee | |
Independent Trustees | | | | | | | | | | | |
Jeffrey E. Garten
c/o Credit Suisse Asset
Management, LLC
Attn: General Counsel
One Madison Avenue
New York, New York 10010
(1946) | | Trustee, Audit and Nominating Committee Member | | Since Fund Inception | | The Juan Trippe Professor in the Practice of International Trade, Finance and Business, Yale School of Management, from July 2005 to present; Partner and Chairman of Garten Rothkopf (consulting firm) from October 2005 to present. | | | 10 | | | Director of Aetna, Inc. (insurance company); Director of CarMax Group (used car dealers); Director of Alcan (aluminum production) from February 2007 to November 2007; Member of Standard & Poor's Board of Managers (credit rating agency) from December 2011 to November 2014; Director of Miller Buckfire & Co., LLC (financial restructuring). | |
34
Credit Suisse Volaris US Strategies Fund
Information Concerning Trustees and Officers (unaudited) (continued)
Name, Address
(Year of Birth) | | Position(s)
Held with
Fund | | Term
of Office1
and
Length
of Time
Served | | Principal
Occupation(s) During
Past Five Years | | Number of
Portfolios
in Fund
Complex
Overseen
by Trustee | | Other
Trusteeships
Held by Trustee | |
Independent Trustees | | | | | | | | | | | |
Steven N. Rappaport
Lehigh Court, LLC
555 Madison Avenue
29th Floor
New York, New York
10022
(1948) | | Chairman of the Board of Trustees, Audit Committee Member and Nominating Committee Chairman | | Since Fund Inception | | Partner of Lehigh Court, LLC and RZ Capital (private investment firms) from July 2002 to present. | | | 12 | | | Director of iCAD, Inc. (surgical and medical instruments and apparatus company); Director of Aberdeen Chile Fund, Inc., Aberdeen Emerging Markets Smaller Company Opportunities Fund, Inc., Aberdeen Israel Fund, Inc., Aberdeen Indonesia Fund, Inc. and Aberdeen Latin America Equity Fund, Inc. (each a closed-end investment company); Director of Presstek, Inc. (digital imaging technologies company) from 2003 to 2012; Director of Wood Resources, LLC. (plywood manufacturing company) from 2003 to October 2013; Partner Backstage Acquisition Holding, LLC (Publication Job Postings) from November 2013 to present. | |
1 Each Trustee and Officer serves until his or her respective successor has been duly elected and qualified.
35
Credit Suisse Volaris US Strategies Fund
Information Concerning Trustees and Officers (unaudited) (continued)
Name, Address
(Year of Birth) | | Position(s)
Held with
Fund | | Term of
Office1
and
Length of
Time
Served | | Principal Occupation(s) During Past Five Years | |
Officers* | | | | | | | |
John G. Popp
Credit Suisse Asset
Management, LLC
One Madison Avenue
New York, New York 10010
(1956) | | Chief Executive Officer and President | | Since Fund Inception | | Managing Director of Credit Suisse; Global Head and Chief Investment Officer of the Credit Investment Group; Associated with Credit Suisse or its predecessor since 1997; Officer of other Credit Suisse Funds; Trustee of Credit Suisse High Yield Bond Fund; Director of Credit Suisse Asset Management Income Fund, Inc. | |
Bruce Rosenberg
Credit Suisse Asset
Management, LLC
One Madison Avenue
New York, New York 10010
(1961) | | Chief Financial Officer | | Since 2012 | | Director of Credit Suisse; Director of Liquid Accounting of Credit Suisse; Associated with Credit Suisse since 2008; Officer of other Credit Suisse Funds. | |
Emidio Morizio
Credit Suisse Asset
Management, LLC
One Madison Avenue
New York, New York 10010
(1966) | | Chief Compliance Officer | | Since Fund Inception | | Managing Director and Global Head of Compliance of Credit Suisse since 2010; Director and Global Head of Compliance of Credit Suisse from January 2005 to December 2009; Associated with Credit Suisse since July 2000; Officer of other Credit Suisse Funds. | |
Joanne Doldo
Credit Suisse Asset
Management, LLC
One Madison Avenue
New York, New York 10010
(1959) | | Chief Legal Officer | | Since 2013 | | Vice President of Credit Suisse; Associated with Credit Suisse since September 2011; Officer of other Credit Suisse Funds; Associated with Morgan Stanley Investment Management from 2002-2008. | |
Rocco DelGuercio
Credit Suisse Asset
Management, LLC
One Madison Avenue
New York, New York 10010
(1963) | | Treasurer | | Since 2013 | | Vice President of Credit Suisse since 2013; Independent Consultant from February 2012 to April 2013; Director of Legg Mason & Co., LLC from March 2004 to January 2012; Associated with Credit Suisse from June 1996 to March 2004; Officer of other Credit Suisse Funds. | |
Karen Regan
Credit Suisse Asset
Management, LLC
One Madison Avenue
New York, New York 10010
(1963) | | Senior Vice President and Secretary | | Since Fund Inception | | Vice President of Credit Suisse; Associated with Credit Suisse since December 2004; Officer of other Credit Suisse Funds. | |
* The officers of the Fund shown are officers that make policy decisions.
The Statement of Additional Information includes additional information about the Trustees and is available, without charge, upon request, by calling 877-870-2874.
36
Credit Suisse Volaris US Strategies Fund
Proxy Voting and Portfolio Holdings Information (unaudited)
Information regarding how the Fund voted proxies related to its portfolio securities during the 12 month period ended June 30 of each year, as well as the policies and procedures that the Fund uses to determine how to vote proxies relating to its portfolio securities are available:
• By calling 1-877-870-2874
• On the Fund's website, www.credit-suisse.com/us/funds
• On the website of the Securities and Exchange Commission, www.sec.gov.
The Fund files a complete schedule of its portfolio holdings for the first and third quarters of its fiscal year with the SEC on Form N-Q. The Fund's Forms N-Q are available on the SEC's website at www.sec.gov and may be reviewed and copied at the SEC's Public Reference Room in Washington, DC. Information on the operation of the SEC's Public Reference Room may be obtained by calling 1-202-551-8090.
37

P.O. BOX 55030, BOSTON, MA 02205-5030
877-870-2874 n www.credit-suisse.com/us/funds
CREDIT SUISSE SECURITIES (USA) LLC, DISTRIBUTOR. VAF-AR-1014
Item 2. Code of Ethics.
The registrant has adopted a code of ethics applicable to its Chief Executive Officer, President, Chief Financial Officer and Chief Accounting Officer, or persons performing similar functions. A copy of the code is filed as Exhibit 12(a)(1) to this Form. There were no amendments to the code during the fiscal year ended October 31, 2014. There were no waivers or implicit waivers from the code granted by the registrant during the fiscal year ended October 31, 2014.
Item 3. Audit Committee Financial Expert.
The registrant’s governing board has determined that it has two audit committee financial experts serving on its audit committee: Enrique R. Arzac and Steven N. Rappaport. Each audit committee financial expert is “independent” for purposes of this item.
Item 4. Principal Accountant Fees and Services.
(a) through (d). The information in the table below is provided for services rendered to the registrant by its independent registered public accounting firm, PricewaterhouseCoopers LLP (“PwC”), for its fiscal years ended October 31, 2013 and October 31, 2014.
| | 2013 | | 2014 | |
Audit Fees | | $ | 165,700 | | $ | 268,600 | |
Audit-Related Fees(1) | | $ | 14,400 | | $ | 15,500 | |
Tax Fees(2) | | $ | 12,000 | | $ | 27,200 | |
All Other Fees | | — | | — | |
Total | | $ | 192,100 | | $ | 311,300 | |
(1) Services include agreed-upon procedures in connection with the registrant’s semi-annual financial statements ($14,400 for 2013 and $15,500 for 2014).
(2) Tax services in connection with the registrant’s excise tax calculations and review of the registrant’s applicable tax returns.
The information in the table below is provided with respect to non-audit services that directly relate to the registrant’s operations and financial reporting and that were rendered by PwC to the registrant’s investment adviser, Credit Suisse Asset Management, LLC (“Credit Suisse”), and any service provider to the registrant controlling, controlled by or under common control with Credit Suisse that provided ongoing services to the registrant (“Covered Services Provider”), for the registrant’s fiscal years ended October 31, 2013 and October 31, 2014.
| | 2013 | | 2014 | |
Audit-Related Fees | | N/A | | N/A | |
Tax Fees | | N/A | | N/A | |
All Other Fees | | N/A | | N/A | |
Total | | N/A | | N/A | |
(e)(1) Pre-Approval Policies and Procedures. The Audit Committee (“Committee”) of the registrant is responsible for pre-approving (i) all audit and permissible non-audit services to be provided by the independent registered public accounting firm to the registrant and (ii) all permissible non-audit services to be provided by the independent registered public accounting firm to Credit Suisse and any Covered Services Provider if the engagement relates directly to the operations and financial reporting of the registrant. The Committee may delegate its responsibility to pre-approve any such audit and permissible non-audit services to the Chairperson of the Committee, and the Chairperson shall report to the Committee, at its next regularly scheduled meeting after the Chairperson’s pre-approval of such services, his or her decision(s). The Committee may also establish detailed pre-approval policies and procedures for pre-approval of such services in accordance with applicable laws, including the delegation of some or all of the Committee’s pre-approval responsibilities to other persons (other than Credit Suisse or the registrant’s officers). Pre-approval by the Committee of any permissible non-audit services shall not be required so long as: (i) the aggregate amount of all such permissible non-audit services provided to the registrant, Credit Suisse and any Covered Services Provider constitutes not more than 5% of the total amount of revenues paid by the registrant to its independent registered public accounting firm during the fiscal year in which the permissible non-audit services are provided; (ii) the permissible non-audit services were not recognized by the registrant at the time of the engagement to be non-audit services; and (iii) such services are promptly brought to the attention of the Committee and approved by the Committee (or its delegate(s)) prior to the completion of the audit.
(e)(2) The information in the table below sets forth the percentages of fees for services (other than audit, review or attest services) rendered by PwC to the registrant for which the pre-approval requirement was waived pursuant to Rule 2-01(c)(7)(i)(C) of Regulation S-X:
| | 2013 | | 2014 | |
Audit-Related Fees | | N/A | | N/A | |
Tax Fees | | N/A | | N/A | |
All Other Fees | | N/A | | N/A | |
Total | | N/A | | N/A | |
The information in the table below sets forth the percentages of fees for services (other than audit, review or attest services) rendered by PwC to Credit Suisse and any Covered Services Provider required to be approved pursuant to Rule 2-01(c)(7)(ii) of Regulation S-X, for the registrant’s fiscal years ended October 31, 2013 and October 31, 2014:
| | 2013 | | 2014 | |
Audit-Related Fees | | N/A | | N/A | |
Tax Fees | | N/A | | N/A | |
All Other Fees | | N/A | | N/A | |
Total | | N/A | | N/A | |
(f) Not Applicable.
(g) The aggregate fees billed by PwC for non-audit services rendered to the registrant, Credit Suisse and Covered Service Providers for the fiscal years ended October 31, 2013 and October 31, 2014 were $0 and $0, respectively.
(h) Not Applicable.
Item 5. Audit Committee of Listed Registrants.
Form N-CSR disclosure requirement is not applicable to the registrant.
Item 6. Schedule of Investments.
Included as part of the report to shareholders filed under Item 1 of this Form.
Item 7. Disclosure of Proxy Voting Policies and Procedures for Closed-End Management Investment Companies.
Form N-CSR disclosure requirement is not applicable to the registrant.
Item 8. Portfolio Managers of Closed-End Management Investment Companies.
Form N-CSR disclosure requirement is not applicable to the registrant.
Item 9. Purchases of Equity Securities by Closed-End Management Investment Company and Affiliated Purchasers.
Form N-CSR disclosure requirement is not applicable to the registrant.
Item 10. Submission of Matters to a Vote of Security Holders.
None.
Item 11. Controls and Procedures.
(a) As of a date within 90 days from the filing date of this report, the principal executive officer and principal financial officer concluded that the registrant’s disclosure controls and procedures (as defined in Rule 30a-3(c) under the Investment Company Act of 1940 (the “Act”)) were effective based on their evaluation of the disclosure controls and procedures required by Rule 30a-3(b) under the Act and Rules 13a-15(b) or 15d-15(b) under the Securities Exchange Act of 1934.
(b) There were no changes in registrant’s internal control over financial reporting (as defined in Rule 30a-3(d) under the Act) that occurred during the second fiscal quarter of the period covered by this report that have materially affected, or are reasonably likely to materially affect, the registrant’s internal control over financial reporting.
Item 12. Exhibits.
(a)(1) Registrant’s Code of Ethics is an exhibit to this report.
(a)(2) The certifications of the registrant as required by Rule 30a-2(a) under the Act are exhibits to this report.
(a)(3) Not applicable.
(b) The certifications of the registrant as required by Rule 30a-2(b) under the Act are an exhibit to this report.
(other) Iran related activities disclosure requirement.
SIGNATURES
Pursuant to the requirements of the Securities Exchange Act of 1934 and the Investment Company Act of 1940, the registrant has duly caused this report to be signed on its behalf by the undersigned, thereunto duly authorized.
CREDIT SUISSE OPPORTUNITY FUNDS | |
| |
/s/ John G. Popp | |
Name: John G. Popp | |
Title: Chief Executive Officer and President | |
Date: January 6, 2015 | |
Pursuant to the requirements of the Securities Exchange Act of 1934 and the Investment Company Act of 1940, this report has been signed below by the following persons on behalf of the registrant and in the capacities and on the dates indicated.
/s/ John G. Popp | |
Name: John G. Popp | |
Title: Chief Executive Officer and President | |
Date: January 6, 2015 | |
| |
/s/ Bruce S. Rosenberg | |
Name: Bruce S. Rosenberg | |
Title: Chief Financial Officer | |
Date: January 6, 2015 | |