UNITED STATES
SECURITIES AND EXCHANGE COMMISSION
Washington, D.C. 20549
FORM N-CSR
CERTIFIED SHAREHOLDER REPORT OF REGISTERED
MANAGEMENT INVESTMENT COMPANIES
Investment Company Act file number | 811-09054 |
|
CREDIT SUISSE OPPORTUNITY FUNDS |
(Exact name of registrant as specified in charter) |
|
One Madison Avenue, New York, New York | | 10010 |
(Address of principal executive offices) | | (Zip code) |
|
John G. Popp Credit Suisse Opportunity Funds One Madison Avenue New York, New York 10010 |
(Name and address of agent for service) |
|
Registrant’s telephone number, including area code: | (212) 325-2000 | |
|
Date of fiscal year end: | October 31st | |
|
Date of reporting period: | November 1, 2012 to October 31, 2013 | |
| | | | | | | | |
Item 1. Reports to Stockholders.

CREDIT SUISSE FUNDS
Annual Report
October 31, 2013
n CREDIT SUISSE
FLOATING RATE HIGH INCOME FUND
The Fund's investment objectives, risks, charges and expenses (which should be considered carefully before investing), and more complete information about the Fund, are provided in the Prospectus, which should be read carefully before investing. You may obtain additional copies by calling 877-870-2874 or by writing to Credit Suisse Funds, P.O. Box 55030, Boston, MA 02205-5030.
Credit Suisse Securities (USA) LLC, Distributor, is located at One Madison Avenue, New York, NY 10010. Credit Suisse Funds are advised by Credit Suisse Asset Management, LLC.
Investors in the Credit Suisse Funds should be aware that they may be eligible to purchase Class I shares (where offered) directly or through certain intermediaries. Such shares are not subject to a sales charge. Investors in the Credit Suisse Funds should also be aware that they may be eligible for a reduction or waiver of the sales charge with respect to Class A, B or C shares (where offered). For more information, please review the relevant prospectuses or consult your financial representative.
Fund shares are not deposits or other obligations of Credit Suisse Asset Management, LLC ("Credit Suisse") or any affiliate, are not FDIC-insured and are not guaranteed by Credit Suisse or any affiliate. Fund investments are subject to investment risks, including loss of your investment.
Credit Suisse Floating Rate High Income Fund
Annual Investment Adviser's Report
October 31, 2013 (unaudited)
December 24, 2013
Dear Shareholder:
We are pleased to present this Annual Report covering the activities of the Credit Suisse Floating Rate High Income Fund (the "Fund"), for the annual period ended October 31, 2013.
Performance Summary
11/01/12 – 10/31/13
Fund & Benchmark | | Performance | |
| Class I1 | | | 5.47 | % | |
| Class A1,2 | | | 5.33 | % | |
| Class B1,2 | | | 4.64 | % | |
| Class C1,2 | | | 4.47 | % | |
| Credit Suisse Leveraged Loan Index3 | | | 6.28 | % | |
Performance shown for the Fund's Class A and Class C Shares does not reflect sales charges, which are a maximum of 4.75% and 1.00%, respectively.2
Market Review: A positive period for senior loans
The annual period ended October 31, 2013, was a positive one for senior loans, with the Credit Suisse Leveraged Loan Index returning 6.28%. The Index saw positive returns in all but one month of the past year. The senior loan discount margin, assuming a three-year average life, tightened by 60 basis points to end the period at +498 basis points. The average Index price finished the year at 98.38, up 1.99 points.
From a quality point-of view, the lower rated portion of the Index outperformed for the year. Distressed (CC, C, and Default) loans had the highest returns, 21.75%, followed by Split B loans, which returned 10.32% during the period. Split BBB and BB rated loans underperformed, returning 3.30% and 4.50%, respectively. The Index was led by the food and drug and utility sectors, while retail and aerospace were the lowest performing sectors.
Senior loan default rates rose gradually through the period to finish October at 2.31%, according to S&P Leveraged Commentary & Data. At this level, the senior loan default rate is still below the historical average of 3.6%. Managers expect default rates to remain contained over the next 12-18 months, with the exception of the anticipated TXU default.
According to Credit Suisse, senior loan new issuance totaled $960 billion during the period, far outstripping the $450 billion of the prior year. New issue
1
Credit Suisse Floating Rate High Income Fund
Annual Investment Adviser's Report (continued)
October 31, 2013 (unaudited)
activity was greatest in the first and second quarter of 2013. Year-to-date new issuance as of October totaled $882.5 billion.
Senior loan mutual funds have seen record positive inflows so far in 2013, with total inflows of $60.5 billion during the past 12 months, as reported by Lipper FMI. The asset class saw positive inflows in each of the 12 months during the period, for an average monthly inflow of $5 billion. Year-to-date retail fund flows into the senior loan asset class totaled $56.5 billion as of October 2013, far surpassing the 2011 and 2012 totals. Additional demand for the asset class was driven by new collateralized loan obligation "CLO" issuance, which totals $68.6 billion year-to-date.
Strategic Review and Outlook: Cautiously optimistic about the future
For the annual period ended October 31, 2013, the Fund underperformed the benchmark.
Portfolio exposures continue to emphasize lower beta and B-rated loans with the best risk-return profiles. We have an underweight to the lower-rated and most levered components of the Index, as they typically exhibit the most volatility in a heightened macro risk environment — and we do not believe current valuations adequately compensate for tail risk.
The senior loan market continues to benefit from strong consumer sentiment that has been driven by retail inflows, allocations from institutional investors such as pensions, and new CLO issuance. As we head into year-end, we expect additional opportunistic deal flow, including re-pricings and refinancings, as issuers take advantage of strong demand.
Fundamentals have remained strong, as senior secured loan issuers have continued to focus on deleveraging in the past few years. This trend has in turn supported both below-average defaults for 2013 and continued below-average expectations leading into 2014. Therefore, we continue to believe that the loan market is well positioned in the near term, given a constructive credit landscape and continued demand for loans from retail and institutional investors.
The Credit Suisse Credit Investments Group Team
John G. Popp
Thomas J. Flannery
Wing Chan
2
Credit Suisse Floating Rate High Income Fund
Annual Investment Adviser's Report (continued)
October 31, 2013 (unaudited)
Senior secured floating rate loans ("Senior Loans") are subject to risk that a court could subordinate a Senior Loan, which typically holds the most senior position in the issuer's capital structure, to presently existing or future indebtedness or take other action detrimental to the holders of Senior Loans.
High yield bonds are lower-quality bonds that are also known as "junk bonds." Such bonds entail greater risks than those found in higher-rated securities.
In addition to historical information, this report contains forward-looking statements, which may concern, among other things, domestic and foreign market, industry and economic trends and developments and government regulation and their potential impact on the Fund's investments. These statements are subject to risks and uncertainties and actual trends, developments and regulations in the future, and their impact on the Fund could be materially different from those projected, anticipated or implied. The Fund has no obligation to update or revise forward-looking statements.
The views of the Fund's management are as of the date of the letter and the Fund holdings described in this document are as of October 31, 2013, these views and Fund holdings may have changed subsequent to these dates. Nothing in this document is a recommendation to purchase or sell securities.
3
Credit Suisse Floating Rate High Income Fund
Annual Investment Adviser's Report (continued)
October 31, 2013 (unaudited)
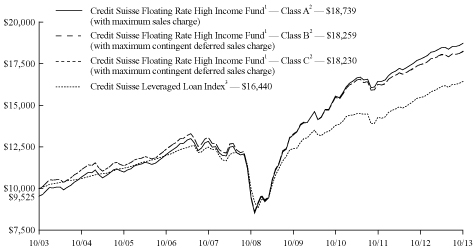
Comparison of Change in Value of $10,000 Investment in the
Credit Suisse Floating Rate High Income Fund1 Class I shares and the
Credit Suisse Leveraged Loan Index3 for Ten Years.

Comparison of Change in Value of $10,000 Investment in the
Credit Suisse Floating Rate High Income Fund1 Class A shares2,
Class B shares2, and Class C shares2 and the Credit Suisse
Leveraged Loan Index3 for Ten Years.
1 Fee waivers and/or expense reimbursements may reduce expenses for the Fund, without which performance would be lower. Waivers and/or reimbursements may be discontinued at any time.
4
Credit Suisse Floating Rate High Income Fund
Annual Investment Adviser's Report (continued)
October 31, 2013 (unaudited)
2 Total return for the Fund's Class A shares for the reporting period, based on offering price (including maximum sales charge of 4.75%), was 0.26%. Total return for the Fund's Class B shares for the reporting period, based on redemption value (including maximum contingent deferred sales charge of 4.00%), was 0.64%. Total return for the Fund's Class C shares for the reporting period, based on redemption value (including maximum contingent deferred sales charge of 1.00%), was 3.47%.
3 Credit Suisse Leveraged Loan Index is an unmanaged index that is designed to mirror the investable universe of the U.S dollar denominated institutional leveraged loan market. An index does not have transaction costs, investors cannot invest directly in an index.
Average Annual Returns as of October 31, 20131
| | | 1 Year | | 5 Years | | 10 Years | | Since
Inception | | Inception
Date | |
Class I | | | 5.47 | % | | | 15.16 | % | | | 7.25 | % | | | 7.03 | % | | 08/01/00 | |
Class A Without
Sales Charge | | | 5.33 | % | | | 14.89 | % | | | 7.00 | % | | | 6.55 | % | | 03/08/99 | |
Class A With Maximum
Sales Charge | | | 0.26 | % | | | 13.77 | % | | | 6.48 | % | | | 6.20 | % | | 03/08/99 | |
Class B Without CDSC | | | 4.64 | % | | | 14.08 | % | | | 6.21 | % | | | 5.74 | % | | 03/08/99 | |
Class B With CDSC | | | 0.64 | % | | | 14.08 | % | | | 6.21 | % | | | 5.74 | % | | 03/08/99 | |
Class C Without CDSC | | | 4.47 | % | | | 14.03 | % | | | 6.19 | % | | | 5.83 | % | | 02/28/00 | |
Class C With CDSC | | | 3.47 | % | | | 14.03 | % | | | 6.19 | % | | | 5.83 | % | | 02/28/00 | |
Returns represent past performance and include change in share price and reinvestment of dividends and capital gains. Past performance cannot guarantee future results. The current performance of the Fund may be lower or higher than the figures shown. Returns and share price will fluctuate, and redemption value may be more or less than original cost. The performance results do not reflect the deduction of taxes that a shareholder would pay on fund distributions or the redemption of fund shares. Performance information current to the most recent month-end is available at www.credit-suisse.com/us/funds.
The annualized gross expense ratios are 0.77% for Class I shares, 1.02% for Class A shares, 1.77% for Class B shares and 1.77% for Class C shares. The annualized net expense ratios after fee waivers and/or expense reimbursements are 0.70% for Class I shares, 0.95% for Class A shares, 1.70% for Class B shares and 1.70% for Class C shares.
1 Fee waivers and/or expense reimbursements may reduce expenses for the Fund, without which performance would be lower. Waivers and/or reimbursements may be discontinued at any time.
5
Credit Suisse Floating Rate High Income Fund
Annual Investment Adviser's Report (continued)
October 31, 2013 (unaudited)
Information About Your Fund's Expenses
As an investor of the Fund, you incur two types of costs: ongoing expenses and transaction costs. Ongoing expenses include management fees, distribution and service (12b-1) fees and other Fund expenses. Examples of transaction costs include sales charges (loads), redemption fees and account maintenance fees, which are not shown in this section and which would result in higher total expenses. The following table is intended to help you understand your ongoing expenses of investing in the Fund and to help you compare these expenses with the ongoing expenses of investing in other mutual funds. The table is based on an investment of $1,000 made at the beginning of the six month period ended October 31, 2013.
The table illustrates your Fund's expenses in two ways:
• Actual Fund Return. This helps you estimate the actual dollar amount of ongoing expenses paid on a $1,000 investment in the Fund using the Fund's actual return during the period. To estimate the expenses you paid over the period, simply divide your account value by $1,000 (for example, an $8,600 account value divided by $1,000 = 8.6), then multiply the result by the number in the "Expenses Paid per $1,000" line under the share class you hold.
• Hypothetical 5% Fund Return. This helps you to compare your Fund's ongoing expenses with those of other mutual funds using the Fund's actual expense ratio and a hypothetical rate of return of 5% per year before expenses. Examples using a 5% hypothetical fund return may be found in the shareholder reports of other mutual funds. The hypothetical account values and expenses may not be used to estimate the actual ending account balance or expenses you paid for the period.
Please note that the expenses shown in these tables are meant to highlight your ongoing expenses only and do not reflect any transaction costs, such as sales charges (loads) or redemption fees. If these transaction costs had been included, your costs would have been higher. The "Expenses Paid per $1,000" line of the tables is useful in comparing ongoing expenses only and will not help you determine the relative total expenses of owning different funds.
6
Credit Suisse Floating Rate High Income Fund
Annual Investment Adviser's Report (continued)
October 31, 2013 (unaudited)
Expenses and Value for a $1,000 Investment
for the six month period ended October 31, 2013
Actual Fund Return | | Class I | | Class A | | Class B | | Class C | |
Beginning Account Value 05/01/13 | | $ | 1,000.00 | | | $ | 1,000.00 | | | $ | 1,000.00 | | | $ | 1,000.00 | | |
Ending Account Value 10/31/13 | | $ | 1,014.20 | | | $ | 1,014.40 | | | $ | 1,010.60 | | | $ | 1,010.60 | | |
Expenses Paid per $1,000* | | $ | 3.55 | | | $ | 4.82 | | | $ | 8.62 | | | $ | 8.62 | | |
Hypothetical 5%
Fund Return | |
Beginning Account Value 05/01/13 | | $ | 1,000.00 | | | $ | 1,000.00 | | | $ | 1,000.00 | | | $ | 1,000.00 | | |
Ending Account Value 10/31/13 | | $ | 1,021.68 | | | $ | 1,020.42 | | | $ | 1,016.64 | | | $ | 1,016.64 | | |
Expenses Paid per $1,000* | | $ | 3.57 | | | $ | 4.84 | | | $ | 8.64 | | | $ | 8.64 | | |
| | | Class I | | Class A | | Class B | | Class C | |
Annualized Expense Ratios* | | | 0.70 | % | | | 0.95 | % | | | 1.70 | % | | | 1.70 | % | |
* Expenses are equal to the Fund's annualized expense ratio for each share class, multiplied by the average account value over the period, multiplied by the number of days in the most recent fiscal half year period, then divided by 365.
The "Expenses Paid per $1,000" and the "Annualized Expense Ratios" in the tables are based on actual expenses paid by the Fund during the period, net of fee waivers and/or expense reimbursements. If those fee waivers and/or expense reimbursements had not been in effect, the Fund's actual expenses would have been higher.
For more information, please refer to the Fund's prospectus.
7
Credit Suisse Floating Rate High Income Fund
Annual Investment Adviser's Report (continued)
October 31, 2013 (unaudited)
Credit Quality Breakdown*
(% of Total Investments as of October 31, 2013)
S&P Ratings
A | | | 0.3 | % | |
BBB | | | 3.1 | | |
BB | | | 35.0 | | |
B | | | 47.9 | | |
CCC | | | 1.6 | | |
NR | | | 3.1 | | |
Subtotal | | | 91.0 | | |
Equity and Other | | | 0.0 | | |
| Short-Term Investment1 | | | 9.0 | | |
Total | | | 100.0 | % | |
* Expressed as a percentage of total investments (excluding securities lending collateral if applicable) and may vary over time.
1 Primarily reflects cash invested in State Street Bank and Trust Co. Euro Time Deposit, for which the purchases of securities have been executed but not yet settled at October 31, 2013.
8
Credit Suisse Floating Rate High Income Fund
Schedule of Investments
October 31, 2013
Par
(000) | |
| | Ratings†
(S&P/Moody's) | | Maturity | | Rate% | | Value | |
| BANK LOANS (83.3%) | | | |
| Aerospace & Defense (1.2%) | | | |
$ | 2,421 | | | Camp International Holding Co.# | | (B, B1) | | 05/31/19 | | | 5.250 | | | $ | 2,443,363 | | |
| | 755 | | | Landmark Aviation FBO Canada, Inc.# | | (B-, B2) | | 10/25/19 | | | 5.750 | | | | 760,398 | | |
| | 8,906 | | | LM U.S. Corp. Acquisition, Inc.# | | (B-, B2) | | 10/25/19 | | | 5.750 | | | | 8,972,701 | | |
| | 5,434 | | | LMI Aerospace, Inc.# | | (B+, B1) | | 12/28/18 | | | 4.750 | | | | 5,429,302 | | |
| | | | 17,605,764 | | |
| Airlines (1.1%) | | | |
| | 2,337 | | | Delta Air Lines, Inc.# | | (BB, Ba1) | | 04/20/17 | | | 4.250 | | | | 2,354,620 | | |
| | 6,977 | | | Delta Air Lines, Inc.# | | (BB-, Ba1) | | 10/18/18 | | | 4.000 | | | | 7,017,184 | | |
| | 2,000 | | | U.S. Airways, Inc.# | | (BB-, B2) | | 05/21/19 | | | 4.250 | | | | 2,007,090 | | |
| | 4,692 | | | United Air Lines# | | (BB-, Ba2) | | 04/01/19 | | | 4.000 | | | | 4,728,291 | | |
| | | | 16,107,185 | | |
| Auto Parts & Equipment (2.0%) | | | |
| | 8,329 | | | Affinia Group, Inc.# | | (B, B2) | | 04/25/20 | | | 4.750 | | | | 8,423,116 | | |
| | 8,124 | | | ASP HHI Acquisition Co., Inc.# | | (B+, B2) | | 10/05/18 | | | 5.000 | | | | 8,198,813 | | |
| | 5,979 | | | Federal-Mogul# | | (B, B1) | | 12/29/14 | | | 2.108 | | | | 5,933,396 | | |
| | 3,280 | | | Federal-Mogul# | | (B, B1) | | 12/28/15 | | | 2.108 | | | | 3,254,447 | | |
| | 4,942 | | | Veyance Technologies, Inc.# | | (B, B2) | | 09/08/17 | | | 5.250 | | | | 4,923,948 | | |
| | | | 30,733,720 | | |
| Automakers (0.7%) | | | |
| | 10,726 | | | Chrysler Group LLC# | | (BB, Ba1) | | 05/24/17 | | | 4.250 | | | | 10,840,260 | | |
| Automotive (0.7%) | | | |
| | 7,500 | | | Schaeffler AG# | | (BB-, Ba2) | | 01/27/17 | | | 4.250 | | | | 7,553,100 | | |
| | 2,680 | | | The PEP Boys-Manny, Moe & Jack# | | (BB-, Ba2) | | 10/11/18 | | | 5.000 | | | | 2,698,187 | | |
| | | | 10,251,287 | | |
| Banking (2.6%) | | | |
| | 2,500 | | | Blackstone Perpetual Bidco B.V.#€ | | (NR, NR) | | 02/15/20 | | | 4.721 | | | | 3,425,666 | | |
| | 7,463 | | | Citco Funding LLC# | | (NR, B1) | | 06/29/18 | | | 4.250 | | | | 7,491,407 | | |
| | 7,538 | | | Duff & Phelps Corp.# | | (B, B2) | | 04/23/20 | | | 4.500 | | | | 7,554,851 | | |
| | 9,294 | | | McJunkin Red Man Corp.# | | (BB-, B2) | | 11/08/19 | | | 6.000 | | | | 9,369,447 | | |
| | 6,965 | | | Ocwen Financial Corp.# | | (B, B1) | | 02/15/18 | | | 5.000 | | | | 7,070,346 | | |
| | 3,000 | | | RBS Worldpay, Inc.#£ | | (B+, Ba3) | | 11/12/19 | | | 5.750 | | | | 4,861,206 | | |
| | | | 39,772,923 | | |
| Building Materials (0.9%) | | | |
| | 8,466 | | | American Builders & Contractors Supply Co., Inc.# | | (BB+, B1) | | 04/16/20 | | | 3.500 | | | | 8,488,678 | | |
| | 4,987 | | | Roofing Supply Group Holdings, Inc.# | | (B, B3) | | 05/31/19 | | | 5.000 | | | | 5,024,811 | | |
| | | | 13,513,489 | | |
| Chemicals (7.5%) | | | |
| | 2,627 | | | AIlnex (Luxembourg) & Cy S.C.A.# | | (B+, Ba3) | | 10/03/19 | | | 4.500 | | | | 2,648,342 | | |
| | 3,990 | | | AIlnex (Luxembourg) & Cy S.C.A.#€ | | (B+, Ba3) | | 10/03/19 | | | 4.750 | | | | 5,451,551 | | |
| | 1,363 | | | Allnex U.S.A., Inc.# | | (B+, Ba3) | | 10/03/19 | | | 4.500 | | | | 1,374,097 | | |
| | 8,460 | | | Ascend Performance Materials Operations LLC# | | (B+, B1) | | 04/10/18 | | | 6.750 | | | | 8,057,965 | | |
See Accompanying Notes to Financial Statements.
9
Credit Suisse Floating Rate High Income Fund
Schedule of Investments (continued)
October 31, 2013
Par
(000) | |
| | Ratings†
(S&P/Moody's) | | Maturity | | Rate% | | Value | |
BANK LOANS | | | |
Chemicals | | | |
$ | 8,189 | | | Axalta Coating Systems U.S. Holdings, Inc.# | | (B+, B1) | | 02/01/20 | | | 4.750 | | | $ | 8,287,380 | | |
| | 4,311 | | | AZ Chem U.S., Inc.# | | (BB-, Ba3) | | 12/22/17 | | | 5.250 | | | | 4,357,090 | | |
| | 755 | | | Cristal Inorganic Chemicals U.S.# | | (BB+, Ba3) | | 11/15/14 | | | 5.998 | | | | 758,907 | | |
| | 12,556 | | | Houghton International, Inc.# | | (B, B1) | | 12/20/19 | | | 4.000 | | | | 12,592,963 | | |
| | 9,467 | | | Ineos U.S. Finance LLC# | | (BB-, B1) | | 05/04/18 | | | 4.000 | | | | 9,512,950 | | |
| | 3,960 | | | Nexeo Solutions LLC# | | (B, B2) | | 09/08/17 | | | 5.000 | | | | 3,916,633 | | |
| | 654 | | | OEP Pearl Holdings LP# | | (B, B1) | | 03/30/18 | | | 6.500 | | | | 663,776 | | |
| | 7,268 | | | Oxbow Carbon & Minerals Holdings, Inc.# | | (BB+, Ba3) | | 07/18/19 | | | 4.250 | | | | 7,333,884 | | |
| | 1,500 | | | Oxbow Carbon & Minerals Holdings, Inc.# | | (BB-, B2) | | 01/18/20 | | | 8.000 | | | | 1,532,812 | | |
| | 4,000 | | | Oxea Finance & Cy S.C.A.#€ | | (B, B1) | | 01/15/20 | | | 4.500 | | | | 5,463,310 | | |
| | 185 | | | PQ Corp.# | | (B+, B2) | | 08/07/17 | | | 4.500 | | | | 186,895 | | |
| | 3,000 | | | Royal Adhesives and Sealants# | | (B, B1) | | 07/26/18 | | | 5.500 | | | | 3,033,750 | | |
| | 3,000 | | | Royal Adhesives and Sealants LLC# | | (CCC+, Caa2) | | 01/31/19 | | | 9.750 | | | | 3,015,000 | | |
| | 3,706 | | | Sonneborn LLC# | | (B, B1) | | 03/30/18 | | | 6.500 | | | | 3,761,396 | | |
| | 2,339 | | | Tronox Pigments (Netherlands) B.V.# | | (BBB-, Ba2) | | 03/19/20 | | | 4.500 | | | | 2,365,158 | | |
| | 6,985 | | | U.S. Silica Co.# | | (BB-, B1) | | 07/23/20 | | | 4.000 | | | | 7,011,194 | | |
| | 10,705 | | | Univar, Inc.# | | (B+, B2) | | 06/30/17 | | | 5.000 | | | | 10,562,546 | | |
| | 6,234 | | | Utex Industries, Inc.# | | (B, B2) | | 04/10/20 | | | 4.750 | | | | 6,275,927 | | |
| | 2,500 | | | Utex Industries, Inc.# | | (CCC+, Caa2) | | 04/10/21 | | | 8.750 | | | | 2,545,325 | | |
| | 1,478 | | | Vantage Specialties, Inc.# | | (B, B2) | | 02/10/19 | | | 5.000 | | | | 1,488,581 | | |
| | | | 112,197,432 | | |
| Computer Hardware (1.0%) | | | |
| | 13,950 | | | Dell, Inc.# | | (BB+, Ba2) | | 04/29/20 | | | 4.500 | | | | 13,888,969 | | |
| | 508 | | | Spansion LLC# | | (BB+, Ba3) | | 12/13/18 | | | 5.250 | | | | 511,696 | | |
| | | | 14,400,665 | | |
| Consumer Products (1.5%) | | | |
| | 6,838 | | | Calceus Acquisition, Inc.# | | (B, B2) | | 02/01/20 | | | 5.000 | | | | 6,889,420 | | |
| | 5,801 | | | NBTY, Inc.# | | (BB-, Ba3) | | 10/01/17 | | | 3.500 | | | | 5,845,686 | | |
| | 2,431 | | | Prestige Brands, Inc.# | | (BB-, Ba3) | | 01/31/19 | | | 3.750 | | | | 2,449,663 | | |
| | 4,724 | | | Ranpak Corp.# | | (B+, Ba3) | | 04/23/19 | | | 4.500 | | | | 4,730,285 | | |
| | 2,383 | | | Spectrum Brands# | | (BB, Ba3) | | 12/17/19 | | | 4.500 | | | | 2,396,641 | | |
| | | | 22,311,695 | | |
| Consumer/Commercial/Lease Financing (0.4%) | | | |
| | 5,985 | | | Home Loan Servicing Solutions Ltd.# | | (BB-, Ba3) | | 06/26/20 | | | 4.500 | | | | 6,037,369 | | |
| Department Stores (0.3%) | | | |
| | 5,000 | | | Sears Roebuck Acceptance Corp.# | | (B, Ba3) | | 06/30/18 | | | 5.500 | | | | 5,027,700 | | |
| Discount Stores (0.3%) | | | |
| | 4,943 | | | 99 Cents Only Stores# | | (B+, B2) | | 01/13/19 | | | 4.500 | | | | 4,987,484 | | |
| Diversified Capital Goods (0.7%) | | | |
| | 1,251 | | | Douglas Dynamics LLC# | | (BB, B1) | | 04/18/18 | | | 5.750 | | | | 1,257,145 | | |
| | 9,354 | | | Husky Injection Molding Systems Ltd.# | | (B, Ba3) | | 07/02/18 | | | 4.250 | | | | 9,432,210 | | |
| | | | 10,689,355 | | |
See Accompanying Notes to Financial Statements.
10
Credit Suisse Floating Rate High Income Fund
Schedule of Investments (continued)
October 31, 2013
Par
(000) | |
| | Ratings†
(S&P/Moody's) | | Maturity | | Rate% | | Value | |
BANK LOANS | | | |
| Electric - Generation (0.4%) | | | |
$ | 2,970 | | | Calpine Corp.# | | (BB-, B1) | | 10/09/19 | | | 4.000 | | | $ | 2,990,745 | | |
| | 1,200 | | | Calpine Corp.# | | (BB-, B1) | | 10/30/20 | | | 4.000 | | | | 1,207,500 | | |
| | 600 | | | Texas Competitive Electric Holdings Co. LLC# | | (CCC-, Caa3) | | 10/10/14 | | | 3.674 | | | | 405,627 | | |
| | 3,000 | | | Texas Competitive Electric Holdings Co. LLC# | | (CCC-, Caa3) | | 10/10/17 | | | 4.674 | | | | 2,006,250 | | |
| | | | 6,610,122 | | |
| Electric - Distribution/Transportation (0.4%) | | | |
| | 6,506 | | | Generac Power Systems, Inc.# | | (B+, B2) | | 05/31/20 | | | 3.500 | | | | 6,498,958 | | |
| Electronics (1.7%) | | | |
| | 4,000 | | | CCC Information Services Group, Inc.# | | (B+, B1) | | 12/20/19 | | | 4.000 | | | | 4,003,760 | | |
| | 8,000 | | | Freescale Semiconductor, Inc.# | | (B, B1) | | 01/15/21 | | | 5.000 | | | | 8,090,000 | | |
| | 2,978 | | | Hyland Software, Inc.# | | (B, B2) | | 10/25/19 | | | 5.500 | | | | 2,996,109 | | |
| | 5,630 | | | MicroSemi Corp.# | | (BB+, Ba2) | | 02/19/20 | | | 3.750 | | | | 5,661,100 | | |
| | 2,416 | | | Presidio, Inc.# | | (B+, Ba3) | | 03/31/17 | | | 5.750 | | | | 2,422,358 | | |
| | 1,975 | | | Shield Finance Co. Sarl# | | (B+, B2) | | 05/10/19 | | | 6.500 | | | | 1,975,000 | | |
| | 718 | | | Verint Systems, Inc.# | | (BB-, B1) | | 09/06/19 | | | 4.000 | | | | 722,146 | | |
| | | | 25,870,473 | | |
| Energy - Exploration & Production (0.4%) | | | |
| | 1,250 | | | Delek Benelux B.V.#€ | | (NR, NR) | | 02/08/17 | | | 5.254 | | | | 1,673,883 | | |
| | 4,667 | | | EP Energy# | | (B+, Ba3) | | 05/24/18 | | | 3.500 | | | | 4,680,084 | | |
| | | | 6,353,967 | | |
| Environmental (0.3%) | | | |
| | 766 | | | EnviroSolutions Real Property Holdings, Inc.# | | (NR, Caa1) | | 07/29/14 | | | 8.000 | | | | 767,290 | | |
| | 3,463 | | | Waste Industries U.S.A., Inc.# | | (B+, B1) | | 03/17/17 | | | 4.000 | | | | 3,476,207 | | |
| | | | 4,243,497 | | |
| Financial Services (0.9%) | | | |
| | 6,457 | | | Altisource Solutions Sarl# | | (B+, B1) | | 11/27/19 | | | 5.750 | | | | 6,509,828 | | |
| | 3,498 | | | Stoneriver Group LP# | | (B+, B1) | | 11/29/19 | | | 4.500 | | | | 3,492,970 | | |
| | 2,962 | | | Stoneriver Group LP# | | (CCC+, Caa1) | | 05/29/20 | | | 8.500 | | | | 2,999,225 | | |
| | | | 13,002,023 | | |
| Food & Drug Retailers (0.5%) | | | |
| | 2,084 | | | Holding Bercy Investissement S.C.A.#€ | | (BB-, B3) | | 03/29/19 | | | 5.543 | | | | 2,855,311 | | |
| | 3,980 | | | Rite Aid# | | (BB-, B1) | | 02/21/20 | | | 4.000 | | | | 4,007,999 | | |
| | | | 6,863,310 | | |
| Food - Wholesale (3.5%) | | | |
| | 15,798 | | | Del Monte Foods Co.# | | (B, B1) | | 03/08/18 | | | 4.000 | | | | 15,836,095 | | |
| | 8,000 | | | Dole Food Co., Inc.# | | (B-, B2) | | 10/25/18 | | | 4.500 | | | | 8,048,360 | | |
| | 8,962 | | | Dole Food Co., Inc.# | | (B+, Ba3) | | 04/01/20 | | | 3.750 | | | | 9,006,397 | | |
| | 3,655 | | | JBS U.S.A. LLC# | | (BB, Ba2) | | 05/25/18 | | | 3.750 | | | | 3,662,240 | | |
| | 2,475 | | | The Pantry, Inc.# | | (BB, B1) | | 08/03/19 | | | 4.750 | | | | 2,500,530 | | |
| | 10,417 | | | U.S. Foodservice, Inc.# | | (B-, B2) | | 03/31/19 | | | 4.500 | | | | 10,470,787 | | |
| | 3,980 | | | Weight Watchers International, Inc.# | | (BB, Ba2) | | 04/02/20 | | | 3.750 | | | | 3,672,804 | | |
| | | | 53,197,213 | | |
See Accompanying Notes to Financial Statements.
11
Credit Suisse Floating Rate High Income Fund
Schedule of Investments (continued)
October 31, 2013
Par
(000) | |
| | Ratings†
(S&P/Moody's) | | Maturity | | Rate% | | Value | |
BANK LOANS | | | |
| Forestry & Paper (0.2%) | | | |
$ | 2,993 | | | Clondalkin Acquisition B.V.# | | (B, B2) | | 05/31/20 | | | 5.750 | | | $ | 3,014,944 | | |
| Gaming (0.7%) | | | |
| | 6,500 | | | Activision Blizzard, Inc.# | | (BBB, Baa3) | | 10/11/20 | | | 3.250 | | | | 6,531,363 | | |
| | 2,397 | | | Affinity Gaming LLC# | | (BB, Ba2) | | 11/09/17 | | | 5.500 | | | | 2,434,605 | | |
| | 2,000 | | | CKX Entertainment, Inc.# | | (B+, B1) | | 06/21/17 | | | 9.000 | | | | 1,810,000 | | |
| | | | 10,775,968 | | |
| Health Facilities (0.8%) | | | |
| | 1,967 | | | Surgical Care Affiliates# | | (B, B1) | | 12/29/17 | | | 4.248 | | | | 1,967,213 | | |
| | 6,194 | | | Surgical Care Affiliates# | | (B, B1) | | 06/29/18 | | | 4.250 | | | | 6,190,603 | | |
| | 977 | | | United Surgical Partners International, Inc.# | | (B, B1) | | 04/19/17 | | | 4.250 | | | | 983,577 | | |
| | 2,488 | | | United Surgical Partners International, Inc.# | | (B, B1) | | 04/03/19 | | | 4.750 | | | | 2,502,724 | | |
| | | | 11,644,117 | | |
| Health Services (0.3%) | | | |
| | 4,960 | | | Aptalis Pharma, Inc.# | | (B+, B2) | | 10/02/20 | | | 6.000 | | | | 4,997,174 | | |
| Health Services (3.7%) | | | |
| | 5,899 | | | ABB Con-Cise Optical Group LLC# | | (B, B2) | | 02/06/19 | | | 4.500 | | | | 5,906,072 | | |
| | 5,398 | | | Ardent Medical Services, Inc.# | | (B+, B1) | | 07/02/18 | | | 6.750 | | | | 5,441,204 | | |
| | 6,279 | | | Capsugel Holdings U.S., Inc.# | | (B+, Ba3) | | 08/01/18 | | | 3.500 | | | | 6,274,006 | | |
| | 3,894 | | | Carestream Health Holdings, Inc.# | | (B+, B1) | | 06/07/19 | | | 5.000 | | | | 3,944,129 | | |
| | 3,990 | | | Catalent Pharma Solutions, Inc.# | | (BB-, Ba3) | | 09/15/16 | | | 3.668 | | | | 4,012,390 | | |
| | 983 | | | Catalent Pharma Solutions, Inc.# | | (BB-, Ba3) | | 09/15/17 | | | 4.250 | | | | 988,533 | | |
| | 3,000 | | | Catalent Pharma Solutions, Inc.# | | (B, Caa1) | | 12/31/17 | | | 6.500 | | | | 3,046,875 | | |
| | 2,410 | | | Convatec, Inc.# | | (B+, Ba3) | | 12/22/16 | | | 4.000 | | | | 2,427,295 | | |
| | 3,210 | | | Drumm Investors LLC# | | (B, B2) | | 05/04/18 | | | 5.000 | | | | 3,105,061 | | |
| | 4,975 | | | Heartland Dental Care LLC# | | (B+, Ba3) | | 12/20/18 | | | 6.250 | | | | 5,024,687 | | |
| | 2,973 | | | IMS Health, Inc.#€ | | (BB-, Ba3) | | 08/26/17 | | | 4.250 | | | | 4,079,596 | | |
| | 267 | | | inVentiv Health, Inc.# | | (B, B2) | | 05/15/18 | | | 7.750 | | | | 263,957 | | |
| | 3,500 | | | Mediq NV#€ | | (NR, NR) | | 02/13/20 | | | 5.227 | | | | 4,815,346 | | |
| | 6,860 | | | U.S. Renal Care, Inc.# | | (B, Ba3) | | 07/03/19 | | | 5.250 | | | | 6,962,900 | | |
| | | | 56,292,051 | | |
| Hotels (2.0%) | | | |
| | 7,500 | | | Four Seasons Hotels Ltd.# | | (BB-, B1) | | 06/29/20 | | | 4.250 | | | | 7,575,000 | | |
| | 6,983 | | | Great Wolf Resorts, Inc.# | | (BB-, B3) | | 08/06/20 | | | 4.500 | | | | 7,018,530 | | |
| | 10,000 | | | Hilton Worldwide Finance# | | (BB, Ba3) | | 10/26/20 | | | 4.000 | | | | 10,067,950 | | |
| | 4,963 | | | IntraWest ULC# | | (B+, NR) | | 12/04/17 | | | 7.000 | | | | 5,040,039 | | |
| | | | 29,701,519 | | |
| Household & Leisure Products (1.3%) | | | |
| | 10,264 | | | Serta Simmons Holdings LLC# | | (B+, B1) | | 10/01/19 | | | 5.000 | | | | 10,344,155 | | |
| | 9,488 | | | Tempur-Pedic International, Inc.# | | (BB, Ba3) | | 03/18/20 | | | 3.500 | | | | 9,500,207 | | |
| | | | 19,844,362 | | |
See Accompanying Notes to Financial Statements.
12
Credit Suisse Floating Rate High Income Fund
Schedule of Investments (continued)
October 31, 2013
Par
(000) | |
| | Ratings†
(S&P/Moody's) | | Maturity | | Rate% | | Value | |
BANK LOANS | | | |
| Insurance Brokerage (0.8%) | | | |
$ | 6,110 | | | Genex Services, Inc.# | | (B, B1) | | 07/25/18 | | | 5.250 | | | $ | 6,110,000 | | |
| | 6,000 | | | Hub International Holdings, Inc.# | | (B, B1) | | 09/17/20 | | | 4.750 | | | | 6,061,080 | | |
| | | | 12,171,080 | | |
| Investments & Misc. Financial Services (0.5%) | | | |
| | 7,377 | | | LPL Holdings, Inc.# | | (BB-, Ba2) | | 03/29/19 | | | 3.250 | | | | 7,379,266 | | |
| | 490 | | | U.S. Security Associates Holdings, Inc.# | | (B, B1) | | 07/28/17 | | | 6.000 | | | | 493,474 | | |
| | | | 7,872,740 | | |
| Leisure (2.3%) | | | |
| | 4,217 | | | Cedar Fair LP# | | (BB+, Ba1) | | 03/06/20 | | | 3.250 | | | | 4,234,516 | | |
| | 2,461 | | | ClubCorp Club Operations# | | (BB, Ba2) | | 07/23/20 | | | 4.000 | | | | 2,488,182 | | |
| | 2,938 | | | Deluxe Entertainment Services Group, Inc.# | | (CCC+, B2) | | 07/03/17 | | | 8.000 | | | | 2,890,248 | | |
| | 2,000 | | | Merlin Entertainments Group Luxembourg 2 Sarl#€ | | (BB-, NR) | | 07/03/19 | | | 3.869 | | | | 2,750,008 | | |
| | 6,995 | | | Seaworld Parks & Entertainment, Inc.# | | (BB-, Ba3) | | 05/14/20 | | | 3.000 | | | | 6,942,743 | | |
| | 8,888 | | | Tech Finance & Co S.C.A.# | | (B, B3) | | 07/10/20 | | | 7.250 | | | | 8,954,156 | | |
| | 1,219 | | | Technicolor S.A.# | | (CCC+, B3) | | 05/26/16 | | | 6.750 | | | | 1,217,883 | | |
| | 4,954 | | | Technicolor S.A.# | | (CCC+, B3) | | 05/26/17 | | | 7.750 | | | | 4,947,547 | | |
| | | | 34,425,283 | | |
| Life-Insurance (0.2%) | | | |
| | 1,680 | | | MMM Holdings, Inc.# | | (B+, B2) | | 12/12/17 | | | 9.750 | | | | 1,692,761 | | |
| | 1,222 | | | MSO of Puerto Rico, Inc.# | | (B+, B2) | | 12/12/17 | | | 9.750 | | | | 1,231,096 | | |
| | | | 2,923,857 | | |
| Media - Broadcast (4.2%) | | | |
| | 2,235 | | | Barrington Broadcasting Group LLC# | | (B+, B2) | | 06/14/17 | | | 7.500 | | | | 2,238,074 | | |
| | 6,496 | | | Cequel Communications LLC# | | (BB-, Ba2) | | 02/14/19 | | | 3.500 | | | | 6,513,295 | | |
| | 7,156 | | | Foxco Acquisition LLC# | | (B, B2) | | 07/14/17 | | | 5.500 | | | | 7,192,170 | | |
| | 1,488 | | | Gray Television, Inc.# | | (BB, Ba3) | | 10/14/19 | | | 4.750 | | | | 1,500,495 | | |
| | 979 | | | IMG Worldwide, Inc.# | | (B+, Ba2) | | 06/16/16 | | | 5.500 | | | | 981,774 | | |
| | 260 | | | Lavena Holding 3 GmbH#€ | | (NR, NR) | | 03/06/17 | | | 4.092 | | | | 355,363 | | |
| | 9,105 | | | Lin Television Corp.# | | (BB+, Ba2) | | 12/21/18 | | | 4.000 | | | | 9,186,754 | | |
| | 2,407 | | | Local TV Finance LLC# | | (B+, B1) | | 05/07/15 | | | 4.170 | | | | 2,410,336 | | |
| | 1,922 | | | Mission Broadcasting, Inc.# | | (BB, Ba3) | | 12/03/19 | | | 4.250 | | | | 1,931,861 | | |
| | 4,546 | | | Nexstar Broadcasting, Inc.# | | (BB, Ba3) | | 12/03/19 | | | 4.250 | | | | 4,569,594 | | |
| | 3,980 | | | Nine Entertainment Group Ltd.# | | (BB-, Ba2) | | 02/05/20 | | | 3.250 | | | | 3,970,050 | | |
| | 10,122 | | | TWCC Holding Corp.# | | (B+, Ba3) | | 02/13/17 | | | 3.500 | | | | 10,164,120 | | |
| | 5,000 | | | UPC Financing Partnership#€ | | (BB, Ba3) | | 03/31/21 | | | 3.879 | | | | 6,847,491 | | |
| | 4,500 | | | Virgin Media Investment Holding# | | (BB-, Ba3) | | 06/07/20 | | | 3.500 | | | | 4,505,625 | | |
| | | | 62,367,002 | | |
| Media - Cable (0.1%) | | | |
| | 1,970 | | | Bragg Communications, Inc.# | | (BB, NR) | | 02/27/18 | | | 3.500 | | | | 1,978,008 | | |
See Accompanying Notes to Financial Statements.
13
Credit Suisse Floating Rate High Income Fund
Schedule of Investments (continued)
October 31, 2013
Par
(000) | |
| | Ratings†
(S&P/Moody's) | | Maturity | | Rate% | | Value | |
BANK LOANS | | | |
| Media - Diversified (0.0%) | | | |
$ | 216 | | | Flint Group Holdings Sarl# | | (NR, NR) | | 06/30/18 | | | 7.396 | | | $ | 203,500 | | |
| | 299 | | | Flint Group Holdings Sarl# | | (NR, NR) | | 12/31/18 | | | 7.396 | | | | 261,202 | | |
| | | | 464,702 | | |
| Media - Services (1.3%) | | | |
| | 9,860 | | | Premier Dental Services, Inc.# | | (B, B3) | | 11/01/18 | | | 8.250 | | | | 9,934,123 | | |
| | 10,000 | | | WMG Acquisition Corp.# | | (BB-, Ba3) | | 07/01/20 | | | 3.750 | | | | 10,026,550 | | |
| | | | 19,960,673 | | |
| Medical Products (0.2%) | | | |
| | 2,500 | | | BSN Medical GmbH & Co.# | | (B+, Ba3) | | 08/28/19 | | | 4.000 | | | | 2,518,750 | | |
| Metals & Mining - Excluding Steel (1.6%) | | | |
| | 2,965 | | | Arch Coal, Inc.# | | (BB-, B1) | | 05/16/18 | | | 5.750 | | | | 2,882,841 | | |
| | 456 | | | CeramTec Acquisition Corp.# | | (B, Ba3) | | 08/30/20 | | | 4.250 | | | | 457,827 | | |
| | 6,044 | | | Faenza Acquisition GmbH# | | (B, Ba3) | | 08/30/20 | | | 4.250 | | | | 6,063,819 | | |
| | 14,822 | | | FMG Resources (August 2006) Pty Ltd.# | | (BB+, Ba1) | | 10/18/17 | | | 5.250 | | | | 14,877,177 | | |
| | | | 24,281,664 | | |
| Oil Field Equipment & Services (1.7%) | | | |
| | 5,957 | | | BakerCorp International, Inc.# | | (B, Ba3) | | 02/07/20 | | | 4.250 | | | | 5,935,153 | | |
| | 10,486 | | | Pacific Drilling S.A.# | | (B+, B1) | | 06/04/18 | | | 4.500 | | | | 10,549,587 | | |
| | 5,985 | | | Philadelphia Energy Solutions Refining and
Marketing LLC# | | (BB-, B1) | | 04/04/18 | | | 6.250 | | | | 5,416,391 | | |
| | 3,500 | | | Shelf Drilling Holdings Ltd.# | | (B+, B2) | | 10/08/18 | | | 10.000 | | | | 3,559,063 | | |
| | | | 25,460,194 | | |
| Packaging (1.6%) | | | |
| | 9,977 | | | Berry Plastics Holdings Corp.# | | (B+, B1) | | 02/08/20 | | | 3.500 | | | | 9,958,013 | | |
| | 5,955 | | | BWAY Holding Co.# | | (B, B1) | | 08/06/17 | | | 4.500 | | | | 6,001,508 | | |
| | 1,960 | | | Exopack LLC# | | (B, B2) | | 05/31/17 | | | 5.000 | | | | 1,990,536 | | |
| | 2,124 | | | Kleopatra Acquisition Corp.# | | (B, Ba3) | | 12/21/16 | | | 5.750 | | | | 2,139,852 | | |
| | 2,003 | | | Pertus Sechzehnte GmbH Mauser# | | (NR, NR) | | 12/14/16 | | | 4.543 | | | | 2,004,668 | | |
| | 1,997 | | | Pertus Sechzehnte GmbH Mauser# | | (NR, NR) | | 06/14/17 | | | 4.793 | | | | 1,999,332 | | |
| | | | 24,093,909 | | |
| Pharmaceuticals (2.5%) | | | |
| | 2,475 | | | Alkermes, Inc.# | | (BB+, Ba3) | | 09/25/19 | | | 3.500 | | | | 2,487,375 | | |
| | 7,250 | | | Amneal Pharmaceuticals LLC# | | (B, B2) | | 10/31/19 | | | 5.750 | | | | 7,177,500 | | |
| | 8,174 | | | Par Pharmaceutical Companies, Inc.# | | (B+, B1) | | 09/28/19 | | | 4.250 | | | | 8,217,495 | | |
| | 4,000 | | | Patheon, Inc.# | | (B+, B3) | | 12/14/18 | | | 7.250 | | | | 4,074,949 | | |
| | 5,163 | | | RPI Finance Trust# | | (BBB-, Baa2) | | 11/09/18 | | | 4.000 | | | | 5,182,417 | | |
| | 9,963 | | | Valeant Pharmaceuticals International, Inc.# | | (BB, Ba1) | | 12/11/19 | | | 3.750 | | | | 10,071,490 | | |
| | | | 37,211,226 | | |
See Accompanying Notes to Financial Statements.
14
Credit Suisse Floating Rate High Income Fund
Schedule of Investments (continued)
October 31, 2013
Par
(000) | |
| | Ratings†
(S&P/Moody's) | | Maturity | | Rate% | | Value | |
BANK LOANS | | | |
| Printing & Publishing (1.9%) | | | |
$ | 105 | | | F & W Media, Inc.# | | (CCC-, Caa3) | | 12/09/14 | | | 10.000 | | | $ | 90,330 | | |
| | 2,741 | | | Harland Clarke Holdings Corp.# | | (B+, B1) | | 06/30/17 | | | 5.418 | | | | 2,756,018 | | |
| | 2,484 | | | Harland Clarke Holdings Corp.# | | (B+, B1) | | 05/22/18 | | | 7.000 | | | | 2,499,592 | | |
| | 5,708 | | | hibu PLC# | | (NR, NR) | | 07/31/14 | | | 3.918 | | | | 1,314,367 | | |
| | 9,450 | | | MTL Publishing LLC# | | (BB-, Ba3) | | 06/29/18 | | | 4.250 | | | | 9,523,238 | | |
| | 12,929 | | | Tribune Co.# | | (BB+, Ba3) | | 12/31/19 | | | 4.000 | | | | 12,945,227 | | |
| | | | 29,128,772 | | |
| Real Estate Development & Management (0.3%) | | | |
| | 4,599 | | | Capital Automotive LP# | | (BB-, Ba2) | | 04/10/19 | | | 4.000 | | | | 4,635,729 | | |
| Real Estate Investment Trusts (0.6%) | | | |
| | 8,340 | | | iStar Financial, Inc.# | | (BB-, B1) | | 10/15/17 | | | 4.500 | | | | 8,402,785 | | |
| Restaurants (0.9%) | | | |
| | 3,957 | | | DineEquity, Inc.# | | (BB-, Ba2) | | 10/19/17 | | | 3.750 | | | | 3,998,075 | | |
| | 8,257 | | | Dunkin' Brands, Inc.# | | (B+, B2) | | 02/14/20 | | | 3.750 | | | | 8,294,357 | | |
| | 925 | | | Restaurant Holding Co. LLC# | | (B-, Caa2) | | 02/15/17 | | | 9.000 | | | | 901,875 | | |
| | | | 13,194,307 | | |
| Software/Services (8.6%) | | | |
| | 4,779 | | | Decision Insight Information Group U.S.# | | (B, B1) | | 01/04/17 | | | 7.000 | | | | 4,777,746 | | |
| | 10,956 | | | Deltek, Inc.# | | (B, B1) | | 10/10/18 | | | 5.000 | | | | 11,007,699 | | |
| | 4,784 | | | Eagle Parent, Inc.# | | (B+, Ba3) | | 05/16/18 | | | 4.500 | | | | 4,823,724 | | |
| | 5,736 | | | Evertec, Inc.# | | (BB-, B1) | | 04/17/20 | | | 3.500 | | | | 5,573,594 | | |
| | 3,198 | | | First Data Corp.# | | (B+, B1) | | 03/24/17 | | | 4.170 | | | | 3,207,328 | | |
| | 2,939 | | | First Data Corp.# | | (B+, B1) | | 03/23/18 | | | 4.170 | | | | 2,946,150 | | |
| | 6,146 | | | Flexera Software Inc.# | | (B+, B2) | | 03/13/19 | | | 5.000 | | | | 6,184,789 | | |
| | 2,831 | | | Genesys Telecom Holdings, U.S., Inc.# | | (B, B2) | | 02/08/20 | | | 4.000 | | | | 2,822,991 | | |
| | 5,917 | | | Infor (U.S.), Inc.# | | (B+, Ba3) | | 06/03/20 | | | 3.750 | | | | 5,913,663 | | |
| | 5,184 | | | Kronos, Inc.# | | (B, Ba3) | | 10/30/19 | | | 4.500 | | | | 5,217,635 | | |
| | 7,980 | | | Landslide Holdings, Inc.# | | (B+, B2) | | 08/09/19 | | | 5.250 | | | | 8,019,940 | | |
| | 11,651 | | | On Assignment# | | (BB-, Ba2) | | 05/15/20 | | | 3.500 | | | | 11,680,441 | | |
| | 5,960 | | | Pinnacle (U.S.) Acquisition Co. Ltd.# | | (B+, B1) | | 07/30/19 | | | 4.750 | | | | 5,958,165 | | |
| | 7,212 | | | Riverbed Technology, Inc.# | | (BBB-, Ba3) | | 12/18/19 | | | 4.000 | | | | 7,269,037 | | |
| | 526 | | | SafeNet, Inc.# | | (BB-, Ba2) | | 04/12/14 | | | 2.668 | | | | 525,995 | | |
| | 2,500 | | | SafeNet, Inc.# | | (B, B3) | | 04/12/15 | | | 6.236 | | | | 2,495,313 | | |
| | 1,000 | | | Serena Software, Inc.# | | (B+, B1) | | 03/10/16 | | | 5.000 | | | | 995,630 | | |
| | 698 | | | SS&C Technologies Holdings Europe Sarl# | | (BB, Ba3) | | 06/08/19 | | | 3.500 | | | | 702,257 | | |
| | 6,751 | | | SS&C Technologies, Inc.# | | (BB, Ba3) | | 06/08/19 | | | 3.500 | | | | 6,788,489 | | |
| | 6,087 | | | SumTotal Systems, Inc.# | | (B+, B1) | | 11/16/18 | | | 6.250 | | | | 6,026,067 | | |
| | 4,963 | | | SunGard Data Systems, Inc.# | | (BB, Ba3) | | 01/31/20 | | | 4.500 | | | | 5,001,555 | | |
| | 5,921 | | | The TriZetto Group, Inc.# | | (B-, B2) | | 05/02/18 | | | 4.750 | | | | 5,550,922 | | |
| | 1,000 | | | The TriZetto Group, Inc.# | | (CCC, Caa2) | | 03/28/19 | | | 8.500 | | | | 880,000 | | |
| | 6,623 | | | U.S. FT Holdco, Inc.# | | (B+, B1) | | 11/30/17 | | | 4.500 | | | | 6,652,198 | | |
| | 2,978 | | | Wall Street Systems Holdings, Inc.# | | (B, B2) | | 10/25/19 | | | 5.750 | | | | 2,998,908 | | |
| | 1,000 | | | Wall Street Systems Holdings, Inc.# | | (B-, Caa2) | | 10/25/20 | | | 9.250 | | | | 1,009,675 | | |
| | 3,856 | | | Web.com Group, Inc.# | | (B+, Ba3) | | 10/27/17 | | | 4.500 | | | | 3,901,370 | | |
| | | | 128,931,281 | | |
See Accompanying Notes to Financial Statements.
15
Credit Suisse Floating Rate High Income Fund
Schedule of Investments (continued)
October 31, 2013
Par
(000) | |
| | Ratings†
(S&P/Moody's) | | Maturity | | Rate% | | Value | |
BANK LOANS | | | |
| Specialty Retail (5.1%) | | | |
$ | 7,500 | | | AB Acquisitions French Holdco SAS#€ | | (B+, B1) | | 07/10/17 | | | 3.602 | | | $ | 10,196,244 | | |
| | 15,289 | | | Academy Ltd.# | | (B, B1) | | 08/03/18 | | | 4.500 | | | | 15,425,155 | | |
| | 12,927 | | | BJ's Wholesale Club, Inc.# | | (B-, Caa1) | | 09/26/19 | | | 4.250 | | | | 12,954,973 | | |
| | 2,996 | | | General Nutrition Centers, Inc.# | | (BB, Ba3) | | 03/04/19 | | | 3.750 | | | | 3,020,846 | | |
| | 7,905 | | | Leslie's Poolmart, Inc.# | | (B, B2) | | 10/16/19 | | | 5.250 | | | | 7,955,957 | | |
| | 8,458 | | | Michaels Stores, Inc.# | | (BB-, Ba3) | | 01/28/20 | | | 3.750 | | | | 8,504,016 | | |
| | 2,833 | | | National Vision, Inc.# | | (BB-, B1) | | 08/02/18 | | | 7.000 | | | | 2,847,347 | | |
| | 5,572 | | | Ollie's Holdings, Inc.# | | (B, B2) | | 09/28/19 | | | 5.250 | | | | 5,572,357 | | |
| | 4,974 | | | PETCO Animal Supplies Stores, Inc.# | | (B, Ba3) | | 11/24/17 | | | 4.000 | | | | 5,011,733 | | |
| | 1,199 | | | Pilot Travel Centers LLC# | | (BB, Ba2) | | 03/30/18 | | | 3.750 | | | | 1,200,910 | | |
| | 2,469 | | | Pilot Travel Centers LLC# | | (BB, Ba2) | | 08/07/19 | | | 4.250 | | | | 2,484,180 | | |
| | 2,073 | | | Select Service Partner Ltd.# | | (NR, NR) | | 06/15/16 | | | 2.676 | | | | 2,019,330 | | |
| | | | 77,193,048 | | |
| Steel Producers/Products (0.7%) | | | |
| | 10,615 | | | JMC Steel Group, Inc.# | | (BB-, B2) | | 04/01/17 | | | 4.750 | | | | 10,632,808 | | |
| Support-Services (2.8%) | | | |
| | 5,682 | | | Aramark Corp.# | | (BB-, B1) | | 07/26/16 | | | 3.668 | | | | 5,716,778 | | |
| | 7,700 | | | DigitalGlobe, Inc.# | | (BBB-, Ba2) | | 01/31/20 | | | 3.750 | | | | 7,754,131 | | |
| | 6,448 | | | Emdeon, Inc.# | | (BB-, Ba3) | | 11/02/18 | | | 3.750 | | | | 6,479,851 | | |
| | 3,759 | | | EnergySolutions, Inc.# | | (BB-, B1) | | 08/15/16 | | | 6.750 | | | | 3,800,359 | | |
| | 5,459 | | | Hertz Corp.# | | (BB, Ba1) | | 03/11/18 | | | 3.750 | | | | 5,497,152 | | |
| | 5,985 | | | ISS A/S# | | (BB-, Ba3) | | 04/30/18 | | | 3.750 | | | | 6,010,646 | | |
| | 3,750 | | | Sabre, Inc.# | | (B, B1) | | 02/19/19 | | | 4.500 | | | | 3,758,213 | | |
| | 3,270 | | | Sabre, Inc.# | | (B, B1) | | 02/19/19 | | | 5.250 | | | | 3,298,847 | | |
| | | | 42,315,977 | | |
| Telecom - Integrated/Services (2.4%) | | | |
| | 5,218 | | | Intelsat Jackson Holdings S.A.# | | (BB-, Ba3) | | 04/02/18 | | | 4.250 | | | | 5,256,426 | | |
| | 6,983 | | | LTS Buyer LLC# | | (B, B1) | | 04/13/20 | | | 4.500 | | | | 7,026,141 | | |
| | 5,360 | | | Securus Technologies, Inc.# | | (B, B2) | | 04/30/20 | | | 4.750 | | | | 5,295,251 | | |
| | 1,500 | | | Securus Technologies, Inc.# | | (CCC+, Caa2) | | 04/30/21 | | | 9.000 | | | | 1,490,002 | | |
| | 4,955 | | | Windstream Corp.# | | (BB+, Ba2) | | 08/08/19 | | | 4.000 | | | | 4,982,189 | | |
| | 11,428 | | | Zayo Group LLC# | | (B, B1) | | 07/02/19 | | | 4.500 | | | | 11,502,301 | | |
| | | | 35,552,310 | | |
| Telecom - Wireless (1.2%) | | | |
| | 6,952 | | | Cricket Communications, Inc.# | | (B+, Ba3) | | 10/10/19 | | | 4.750 | | | | 6,993,773 | | |
| | 10,962 | | | Crown Castle Operating Co.# | | (BB+, Ba2) | | 01/31/19 | | | 3.250 | | | | 10,967,193 | | |
| | | | 17,960,966 | | |
| Telecommunications Equipment (1.5%) | | | |
| | 4,455 | | | Avaya, Inc.# | | (B, B1) | | 10/26/17 | | | 4.762 | | | | 4,131,248 | | |
| | 3,373 | | | Avaya, Inc.# | | (B, B1) | | 03/31/18 | | | 8.000 | | | | 3,299,222 | | |
| | 11,973 | | | CommScope, Inc.# | | (BB+, Ba2) | | 01/14/18 | | | 3.750 | | | | 12,044,637 | | |
| | 3,474 | | | Mitel U.S. Holdings, Inc.# | | (B+, B1) | | 02/27/19 | | | 7.000 | | | | 3,473,750 | | |
| | | | 22,948,857 | | |
See Accompanying Notes to Financial Statements.
16
Credit Suisse Floating Rate High Income Fund
Schedule of Investments (continued)
October 31, 2013
Par
(000) | |
| | Ratings†
(S&P/Moody's) | | Maturity | | Rate% | | Value | |
BANK LOANS | | | |
| Textiles & Apparel (0.5%) | | | |
$ | 7,000 | | | Choo Luxury Holdings Ltd.# | | (NR, NR) | | 06/28/18 | | | 3.647 | | | $ | 6,871,655 | | |
| Theaters & Entertainment (1.4%) | | | |
| | 7,678 | | | AMC Entertainment, Inc.# | | (BB-, Ba2) | | 04/30/20 | | | 3.500 | | �� | | 7,688,315 | | |
| | 9,000 | | | Live Nation Worldwide, Inc.# | | (BB, Ba3) | | 08/14/20 | | | 3.500 | | | | 9,045,000 | | |
| | 4,000 | | | Village Roadshow Ltd.# | | (NR, A2) | | 11/21/17 | | | 4.750 | | | | 4,060,000 | | |
| | | | 20,793,315 | | |
| Transportation - Excluding Air/Rail (0.4%) | | | |
| | 5,200 | | | Navios Maritime Partners LP# | | (BB, Ba3) | | 06/27/18 | | | 5.250 | | | | 5,289,388 | | |
| TOTAL BANK LOANS (Cost $1,247,917,903) | | | 1,252,966,312 | | |
| CORPORATE BONDS (8.5%) | | | |
| Airlines (0.3%) | | | |
| | 4,050 | | | United Airlines, Inc., Rule 144A, Senior
Secured Notes (Callable 09/15/14 @ 100.00)‡ | | (BB-, Ba2) | | 09/15/15 | | | 6.750 | | | | 4,191,750 | | |
| Auto Parts & Equipment (0.3%) | | | |
| | 1,000 | | | Stoneridge, Inc., Rule 144A, Secured Notes
(Callable 10/15/14 @ 104.75)‡ | | (BB-, B2) | | 10/15/17 | | | 9.500 | | | | 1,090,000 | | |
| | 2,225 | | | Tomkins, Inc., Global Secured Notes
(Callable 10/01/14 @ 104.50)§ | | (BB-, B1) | | 10/01/18 | | | 9.000 | | | | 2,447,500 | | |
| | 1,000 | | | UCI International, Inc., Global Company
Guaranteed Notes (Callable 02/15/15 @ 104.31)§ | | (CCC, B3) | | 02/15/19 | | | 8.625 | | | | 1,035,000 | | |
| | | | 4,572,500 | | |
| Brokerage (0.1%) | | | |
| | 1,341 | | | Jefferies Finance LLC, Rule 144A,
Senior Unsecured Notes
(Callable 04/01/16 @ 105.53)ठ| | (B+, B1) | | 04/01/20 | | | 7.375 | | | | 1,384,583 | | |
| Building Materials (0.7%) | | | |
| | 3,500 | | | Building Materials Corp. of America, Rule 144A,
Senior Secured Notes
(Callable 02/15/15 @ 103.50)‡ | | (BB+, Baa3) | | 02/15/20 | | | 7.000 | | | | 3,780,000 | | |
| | 5,350 | | | Headwaters, Inc., Global Secured Notes
(Callable 04/01/15 @ 103.81)§ | | (B+, B2) | | 04/01/19 | | | 7.625 | | | | 5,724,500 | | |
| | 400 | | | Sanitec Corp., Rule 144A, Senior Secured Notes
(Callable 05/15/14 @ 101.00)#€‡ | | (B+, B1) | | 05/15/18 | | | 4.976 | | | | 553,996 | | |
| | | | 10,058,496 | | |
| Chemicals (0.6%) | | | |
| | 1,500 | | | Ineos Finance PLC, Rule 144A, Senior Secured
Notes (Callable 02/15/15 @ 102.00)#€‡ | | (BB-, B1) | | 02/15/19 | | | 7.250 | | | | 2,176,898 | | |
| | 500 | | | Ineos Finance PLC, Rule 144A, Senior Secured
Notes (Callable 05/01/15 @ 105.63)‡ | | (BB-, B1) | | 05/01/20 | | | 7.500 | | | | 548,750 | | |
| | 3,000 | | | Koppers, Inc., Global Company Guaranteed Notes
(Callable 12/01/14 @ 103.94) | | (B+, B1) | | 12/01/19 | | | 7.875 | | | | 3,270,000 | | |
See Accompanying Notes to Financial Statements.
17
Credit Suisse Floating Rate High Income Fund
Schedule of Investments (continued)
October 31, 2013
Par
(000) | |
| | Ratings†
(S&P/Moody's) | | Maturity | | Rate% | | Value | |
CORPORATE BONDS | | | |
Chemicals | | | |
$ | 2,000 | | | Nufarm Australia Ltd., Rule 144A, Company
Guaranteed Notes
(Callable 10/15/15 @ 104.78)‡ | | (BB-, Ba3) | | 10/15/19 | | | 6.375 | | | $ | 2,070,000 | | |
| | 1,500 | | | Taminco Global Chemical Corp., Rule 144A,
Secured Notes
(Callable 03/31/15 @ 107.31)‡ | | (B-, Caa1) | | 03/31/20 | | | 9.750 | | | | 1,710,000 | | |
| | | | 9,775,648 | | |
| Consumer Products (0.1%) | | | |
| | 1,000 | | | NBTY, Inc., Global Company Guaranteed Notes
(Callable 10/01/14 @ 104.50)§ | | (B, B3) | | 10/01/18 | | | 9.000 | | | | 1,102,500 | | |
| Consumer/Commercial/Lease Financing (0.1%) | | | |
| | 500 | | | Cabot Financial Luxembourg S.A., Rule 144A,
Senior Secured Notes
(Callable 10/01/15 @ 107.78)‡ | | (BB, B1) | | 10/01/19 | | | 10.375 | | | | 919,779 | | |
| | 1,000 | | | KION Finance S.A., Rule 144A, Senior Secured
Notes (Callable 02/15/14 @ 101.00)#€‡ | | (BB-, Ba3) | | 02/15/20 | | | 4.725 | | | | 1,385,792 | | |
| | | | 2,305,571 | | |
| Diversified Capital Goods (0.3%) | | | |
| | 3,350 | | | Anixter, Inc., Global Company Guaranteed Notes§ | | (BB, Ba3) | | 05/01/19 | | | 5.625 | | | | 3,534,250 | | |
| | 1,333 | | | Mueller Water Products, Inc., Global Company
Guaranteed Notes (Callable 09/01/15 @ 104.38) | | (BB-, B1) | | 09/01/20 | | | 8.750 | | | | 1,499,625 | | |
| | | | 5,033,875 | | |
| Energy - Exploration & Production (0.7%) | | | |
| | 6,815 | | | EPL Oil & Gas, Inc., Global Company Guaranteed
Notes (Callable 02/15/15 @ 104.13)§ | | (B-, Caa1) | | 02/15/18 | | | 8.250 | | | | 7,343,162 | | |
| | 325 | | | Oasis Petroleum, Inc., Global Company
Guaranteed Notes (Callable 02/01/15 @ 103.63)§ | | (B, B3) | | 02/01/19 | | | 7.250 | | | | 351,000 | | |
| | 2,000 | | | Shelf Drilling Holdings Ltd., Rule 144A, Senior
Secured Notes (Callable 05/01/15 @ 104.31)ठ| | (B+, B1) | | 11/01/18 | | | 8.625 | | | | 2,165,000 | | |
| | | | 9,859,162 | | |
| Forestry & Paper (0.0%) | | | |
| | 200 | | | Stone & Webster, Inc. | | (NR, NR) | | 10/23/19 | | | 0.000 | | | | 310 | | |
| Gaming (0.1%) | | | |
| | 197 | | | Choctaw Resort Development Enterprise,
Rule 144A, Senior Notes
(Callable 11/15/13 @ 101.21)‡ | | (B, Caa1) | | 11/15/19 | | | 7.250 | | | | 195,030 | | |
| | 850 | | | Greektown Superholdings, Inc., Series A,
Global Secured Notes
(Callable 01/01/14 @ 103.50) | | (NR, NR) | | 07/01/15 | | | 13.000 | | | | 889,313 | | |
| | 500 | | | Greektown Superholdings, Inc., Series B,
Global Secured Notes
(Callable 01/01/14 @ 103.50) | | (NR, NR) | | 07/01/15 | | | 13.000 | | | | 523,125 | | |
| | | | 1,607,468 | | |
See Accompanying Notes to Financial Statements.
18
Credit Suisse Floating Rate High Income Fund
Schedule of Investments (continued)
October 31, 2013
Par
(000) | |
| | Ratings†
(S&P/Moody's) | | Maturity | | Rate% | | Value | |
CORPORATE BONDS | | | |
| Gas Distribution (0.4%) | | | |
$ | 2,250 | | | Energy Transfer Equity LP, Senior Secured Notes | | (BB, Ba2) | | 10/15/20 | | | 7.500 | | | $ | 2,610,000 | | |
| | 1,000 | | | Genesis Energy LP, Global Company Guaranteed
Notes (Callable 02/15/17 @ 102.88)§ | | (B, B1) | | 02/15/21 | | | 5.750 | | | | 1,020,000 | | |
| | 1,000 | | | Genesis Energy LP, Global Company Guaranteed
Notes (Callable 12/15/14 @ 103.94)§ | | (B, B1) | | 12/15/18 | | | 7.875 | | | | 1,082,500 | | |
| | 2,000 | | | Holly Energy Finance Corp., Global Company
Guaranteed Notes (Callable 03/01/16 @ 103.25) | | (BB-, B1) | | 03/01/20 | | | 6.500 | | | | 2,105,000 | | |
| | | | 6,817,500 | | |
| Health Services (0.1%) | | | |
| | 150 | | | inVentiv Health, Inc., Rule 144A, Company
Guaranteed Notes
(Callable 08/15/14 @ 105.00)‡ | | (CCC, Caa2) | | 08/15/18 | | | 11.000 | | | | 130,500 | | |
| | 1,250 | | | STHI Holding Corp., Rule 144A, Secured
Notes (Callable 03/15/14 @ 106.00)‡ | | (B, B2) | | 03/15/18 | | | 8.000 | | | | 1,353,125 | | |
| | | | 1,483,625 | | |
| Insurance Brokerage (0.3%) | | | |
| | 3,000 | | | Towergate Finance PLC, Rule 144A,
Senior Secured Notes
(Callable 05/15/14 @ 101.00)#£‡ | | (NR, B1) | | 02/15/18 | | | 6.014 | | | | 4,819,804 | | |
| Leisure (0.2%) | | | |
| | 1,540 | | | Cedar Fair LP, Global Company Guaranteed
Notes (Callable 08/01/14 @ 104.56)§ | | (B, B1) | | 08/01/18 | | | 9.125 | | | | 1,694,000 | | |
| | 1,000 | | | Six Flags Entertainment Corp., Rule 144A,
Company Guaranteed Notes
(Callable 01/15/16 @ 103.94)‡ | | (BB-, B3) | | 01/15/21 | | | 5.250 | | | | 985,000 | | |
| | | | 2,679,000 | | |
| Media - Diversified (0.4%) | | | |
| | 1,565 | | | Block Communications, Inc., Rule 144A,
Senior Unsecured Notes
(Callable 02/01/16 @ 103.63)‡ | | (BB-, Ba3) | | 02/01/20 | | | 7.250 | | | | 1,662,813 | | |
| | 3,850 | | | National CineMedia LLC, Global Senior Secured
Notes (Callable 04/15/17 @ 103.00) | | (BB-, Ba2) | | 04/15/22 | | | 6.000 | | | | 4,023,250 | | |
| | 619 | | | National CineMedia LLC, Global Senior
Unsecured Notes
(Callable 07/15/16 @ 103.94)§ | | (B, B2) | | 07/15/21 | | | 7.875 | | | | 687,090 | | |
| | | | 6,373,153 | | |
| Media - Services (0.4%) | | | |
| | 3,000 | | | Cerved Group SpA, Rule 144A, Senior
Secured Notes (Callable 01/15/14 @ 101.00)#€‡ | | (B, B2) | | 01/15/19 | | | 5.602 | | | | 4,140,164 | | |
| | 575 | | | Clear Channel Worldwide Holdings, Inc.,
Series A, Global Company Guaranteed Notes
(Callable 11/15/17 @ 103.25)§ | | (B, B1) | | 11/15/22 | | | 6.500 | | | | 600,875 | | |
See Accompanying Notes to Financial Statements.
19
Credit Suisse Floating Rate High Income Fund
Schedule of Investments (continued)
October 31, 2013
Par
(000) | |
| | Ratings†
(S&P/Moody's) | | Maturity | | Rate% | | Value | |
CORPORATE BONDS | | | |
Media - Services | | | |
$ | 1,425 | | | Clear Channel Worldwide Holdings, Inc.,
Series B, Global Company Guaranteed Notes
(Callable 11/15/17 @ 103.25) | | (B, B1) | | 11/15/22 | | | 6.500 | | | $ | 1,503,375 | | |
| | | | 6,244,414 | | |
| Metals & Mining - Excluding Steel (0.9%) | | | |
| | 2,500 | | | Calcipar SA, Rule 144A, Senior Secured Notes
(Callable 05/01/15 @ 103.44)‡ | | (BB, Ba3) | | 05/01/18 | | | 6.875 | | | | 2,637,500 | | |
| | 3,000 | | | Global Brass & Copper, Inc., Global Senior
Secured Notes (Callable 06/01/16 @ 104.75)§ | | (B, B3) | | 06/01/19 | | | 9.500 | | | | 3,375,000 | | |
| | 2,000 | | | Kaiser Aluminum Corp., Global Company
Guaranteed Notes
(Callable 06/01/16 @ 104.13)§ | | (BB-, Ba3) | | 06/01/20 | | | 8.250 | | | | 2,275,000 | | |
| | 3,250 | | | KGHM International Ltd., Rule 144A,
Company Guaranteed Notes
(Callable 06/15/15 @ 103.88)ठ| | (BB-, B1) | | 06/15/19 | | | 7.750 | | | | 3,404,375 | | |
| | 150 | | | Old AII, Inc., Global Company
Guaranteed NotesØ^ | | (NR, NR) | | 12/15/14 | | | 9.000 | | | | 15 | | |
| | 250 | | | Old AII, Inc., Global Company Guaranteed
Notes (Callable 12/15/13 @ 101.67)Ø^ | | (NR, NR) | | 12/15/16 | | | 10.000 | | | | 25 | | |
| | 2,000 | | | Xinergy Corp., Rule 144A, Senior Secured
Notes (Callable 05/15/15 @ 104.63)‡ | | (NR, NR) | | 05/15/19 | | | 9.250 | | | | 1,470,000 | | |
| | | | 13,161,915 | | |
| Oil Field Equipment & Services (0.3%) | | | |
| | 3,850 | | | Parker Drilling Co., Global Company Guaranteed
Notes (Callable 04/01/14 @ 104.56) | | (B+, B1) | | 04/01/18 | | | 9.125 | | | | 4,138,750 | | |
| Oil Refining & Marketing (0.5%) | | | |
| | 4,000 | | | Coffeyville Finance, Inc., Global Secured
Notes (Callable 11/01/17 @ 103.25)§ | | (B+, B2) | | 11/01/22 | | | 6.500 | | | | 4,030,000 | | |
| | 3,000 | | | PBF Finance Corp., Global Senior Secured
Notes (Callable 02/15/16 @ 104.13)§ | | (BB+, Ba3) | | 02/15/20 | | | 8.250 | | | | 3,150,000 | | |
| | | | 7,180,000 | | |
| Packaging (0.2%) | | | |
| | 2,648 | | | Reynolds Group Issuer LLC, Global Senior
Secured Notes (Callable 10/15/15 @ 104.31) | | (B+, B1) | | 10/15/20 | | | 5.750 | | | | 2,747,300 | | |
| Restaurants (0.2%) | | | |
| | 1,500 | | | Punch Taverns Finance PLC,
Senior Secured Notes£ | | (BBB, Baa3) | | 04/15/22 | | | 7.274 | | | | 2,524,371 | | |
| Software/Services (0.1%) | | | |
| | 2,000 | | | Syniverse Holdings, Inc., Global Company
Guaranteed Notes
(Callable 01/15/15 @ 104.56) | | (B-, Caa1) | | 01/15/19 | | | 9.125 | | | | 2,175,000 | | |
See Accompanying Notes to Financial Statements.
20
Credit Suisse Floating Rate High Income Fund
Schedule of Investments (continued)
October 31, 2013
Par
(000) | |
| | Ratings†
(S&P/Moody's) | | Maturity | | Rate% | | Value | |
CORPORATE BONDS | | | |
| Specialty Retail (0.1%) | | | |
$ | 1,765 | | | Express Finance Corp., Global Company
Guaranteed Notes (Callable 03/01/14 @ 104.38) | | (BB, Ba3) | | 03/01/18 | | | 8.750 | | | $ | 1,881,931 | | |
| Support-Services (0.5%) | | | |
| | 2,500 | | | CoreLogic, Inc., Global Company Guaranteed
Notes (Callable 06/01/16 @ 103.63) | | (B+, B1) | | 06/01/21 | | | 7.250 | | | | 2,700,000 | | |
| | 4,500 | | | EnergySolutions LLC, Global Company
Guaranteed Notes
(Callable 08/15/14 @ 105.38) | | (B+, Caa2) | | 08/15/18 | | | 10.750 | | | | 4,876,875 | | |
| | | | 7,576,875 | | |
| Telecom - Integrated/Services (0.0%) | | | |
| | 100 | | | Hellas Telecommunications Luxembourg II S.C.A.,
Rule 144A, Subordinated Notes‡Ø^ | | (NR, NR) | | 01/15/15 | | | 0.000 | | | | — | | |
| Telecommunications Equipment (0.3%) | | | |
| | 2,600 | | | Brightstar Corp., Rule 144A, Company
Guaranteed Notes
(Callable 12/01/14 @ 104.75)‡ | | (B+, B1) | | 12/01/16 | | | 9.500 | | | | 2,873,000 | | |
| | 1,690 | | | Brightstar Corp., Rule 144A, Senior Unsecured
Notes (Callable 08/01/15 @ 105.44)‡ | | (B+, B1) | | 08/01/18 | | | 7.250 | | | | 1,825,200 | | |
| | | | 4,698,200 | | |
| Textiles & Apparel (0.1%) | | | |
| | 275 | | | IT Holding Finance SA, Rule 144A, Company
Guaranteed Notes€‡Ø | | (NR, NR) | | 11/15/25 | | | 9.875 | | | | 3,683 | | |
| | 1,000 | | | Takko Luxembourg 2 S.C.A., Rule 144A,
Senior Secured Notes
(Callable 04/15/16 @ 104.94)€‡ | | (B-, B3) | | 04/15/19 | | | 9.875 | | | | 1,369,695 | | |
| | | | 1,373,378 | | |
| Theaters & Entertainment (0.2%) | | | |
| | 1,500 | | | AMC Entertainment, Inc., Global Company
Guaranteed Notes
(Callable 06/01/14 @ 104.38) | | (B-, B2) | | 06/01/19 | | | 8.750 | | | | 1,621,875 | | |
| | 1,000 | | | AMC Entertainment, Inc., Global Company
Guaranteed Notes
(Callable 12/01/15 @ 104.88) | | (CCC+, Caa1) | | 12/01/20 | | | 9.750 | | | | 1,147,500 | | |
| | | | 2,769,375 | | |
| Transportation - Excluding Air/Rail (0.0%) | | | |
| | 150 | | | Navios Maritime Holdings Finance II U.S., Inc.,
Global Company Guaranteed Notes
(Callable 02/15/15 @ 104.06) | | (B+, Caa1) | | 02/15/19 | | | 8.125 | | | | 153,000 | | |
| TOTAL CORPORATE BONDS (Cost $126,805,779) | | | 128,689,454 | | |
See Accompanying Notes to Financial Statements.
21
Credit Suisse Floating Rate High Income Fund
Schedule of Investments (continued)
October 31, 2013
Par
(000) | |
| | Ratings†
(S&P/Moody's) | | Maturity | | Rate% | | Value | |
| ASSET BACKED SECURITIES (2.8%) | | | |
| Collateralized Debt Obligations (2.8%) | | | |
$ | 1,000 | | | ACAS CLO Ltd., 2012-1A, Rule 144A#‡ | | (BBB, NR) | | 09/20/23 | | | 5.102 | | | $ | 995,538 | | |
| | 3,000 | | | ACAS CLO Ltd., 2013-2A, Rule 144A#‡ | | (BB, NR) | | 10/25/25 | | | 4.759 | | | | 2,591,631 | | |
| | 1,875 | | | ARES XXV CLO Ltd., 2012-3A, Rule 144A#‡ | | (BBB, NR) | | 01/17/24 | | | 4.894 | | | | 1,881,837 | | |
| | 2,000 | | | Atlas Senior Loan Fund III Ltd., 2013-1A,
Rule 144A#‡ | | (BBB, NR) | | 08/18/25 | | | 3.770 | | | | 1,863,058 | | |
| | 1,000 | | | Avalon IV Capital Ltd., 2012-1A, Rule 144A#‡ | | (BBB, NR) | | 04/17/23 | | | 5.244 | | | | 1,002,916 | | |
| | 1,000 | | | BlueMountain CLO Ltd., 2013-2A, Rule 144A#‡ | | (BB, NR) | | 01/22/25 | | | 5.316 | | | | 923,732 | | |
| | 2,000 | | | Carlyle Global Market Strategies CLO Ltd.,
2013-3A, Rule 144A#‡ | | (BB, NR) | | 07/15/25 | | | 4.870 | | | | 1,828,766 | | |
| | 2,000 | | | Central Park CLO Ltd., 2011-1A, Rule 144A#‡ | | (BB, NR) | | 07/23/22 | | | 4.739 | | | | 1,874,154 | | |
| | 1,000 | | | CIFC Funding Ltd., 2012-3A, Rule 144A#‡ | | (BB-, NR) | | 01/29/25 | | | 6.237 | | | | 974,572 | | |
| | 2,000 | | | CIFC Funding Ltd., 2013-3A, Rule 144A#‡ | | (BB, NR) | | 10/24/25 | | | 5.006 | | | | 1,852,838 | | |
| | 1,000 | | | Emerson Park CLO Ltd., 2013-1A, Rule 144A#‡ | | (BB, NR) | | 07/15/25 | | | 5.113 | | | | 914,774 | | |
| | 1,500 | | | Halcyon Loan Advisors Funding Ltd., 2012-2A,
Rule 144A#‡ | | (BB, NR) | | 12/20/24 | | | 5.652 | | | | 1,387,901 | | |
| | 2,000 | | | Halcyon Structured Asset Management Long
Secured/Short Unsecured, 2007-2A,
Rule 144A#‡ | | (BBB, Ba1) | | 10/29/21 | | | 3.987 | | | | 2,017,392 | | |
| | 500 | | | Hewett's Island CDO Ltd., 2007-6A, Rule 144A#‡ | | (A, A2) | | 06/09/19 | | | 1.058 | | | | 471,576 | | |
| | 3,000 | | | ING Investment Management CLO Ltd.,
2011-1A, Rule 144A#‡ | | (BB, NR) | | 06/22/21 | | | 4.750 | | | | 2,705,019 | | |
| | 1,250 | | | KKR Financial CLO Corp., 2007-1A, Rule 144A#‡ | | (A, A3) | | 05/15/21 | | | 2.514 | | | | 1,199,847 | | |
| | 1,850 | | | KVK CLO Ltd., 2012-1A, Rule 144A#‡ | | (BB, NR) | | 07/15/23 | | | 6.494 | | | | 1,835,292 | | |
| | 2,000 | | | KVK CLO Ltd., 2013-1A, Rule 144A#‡ | | (BBB, NR) | | 04/14/25 | | | 4.594 | | | | 2,007,392 | | |
| | 3,000 | | | Marquette Park CLO Ltd., 2005-1A, Rule 144A#‡ | | (AA-, Aa3) | | 07/12/20 | | | 2.044 | | | | 2,920,244 | | |
| | 2,000 | | | Neuberger Berman CLO Ltd., 2012-12A,
Rule 144A#‡ | | (BB, NR) | | 07/25/23 | | | 7.238 | | | | 2,017,705 | | |
| | 1,000 | | | Ocean Trails CLO II, 2007-2X# | | (BBB-, Ba2) | | 06/27/22 | | | 2.594 | | | | 955,801 | | |
| | 2,000 | | | Riverside Park CLO Ltd., 2011-1X# | | (BBB, NR) | | 09/27/21 | | | 3.000 | | | | 1,951,824 | | |
| | 1,750 | | | Shackleton II CLO Ltd., 2012-2A, Rule 144A#‡ | | (BBB, NR) | | 10/20/23 | | | 4.292 | | | | 1,734,680 | | |
| | 2,750 | | | Symphony CLO VIII LP, 2012-8A, Rule 144A#‡ | | (BBB, NR) | | 01/09/23 | | | 4.843 | | | | 2,751,638 | | |
| | 2,250 | | | Whitehorse Ltd., 2013-1A, Rule 144A#‡ | | (BB-, NR) | | 11/24/25 | | | 5.106 | | | | 2,064,796 | | |
| TOTAL ASSET BACKED SECURITIES (Cost $42,287,639) | | | 42,724,923 | | |
Number of
Shares | |
| |
| |
| |
| |
| |
| COMMON STOCKS (0.0%) | | | |
| Automotive (0.0%) | | | |
| | 588 | | | Safelite Realty Corp.^* | | | | | | | | | | | | | | | — | | |
| Building & Construction (0.0%) | | | |
| | 6,800 | | | Ashton Woods U.S.A. LLC, Class B^* | | | | | | | | | | | | | | | 101,388 | | |
| | 303 | | | William Lyon Homes, Class A§* | | | | | | | | | | | | | | | 7,020 | | |
| | | | 108,408 | | |
| Chemicals (0.0%) | | | |
| | 9,785 | | | Huntsman Corp. | | | | | | | | | | | | | | | 227,208 | | |
See Accompanying Notes to Financial Statements.
22
Credit Suisse Floating Rate High Income Fund
Schedule of Investments (continued)
October 31, 2013
Number of
Shares | |
| |
| |
| |
| |
Value | |
COMMON STOCKS | | | |
| Forestry & Paper (0.0%) | | | |
| | 130 | | | Resolute Forest Products, Inc.* | | | | | | | | | | | | | | $ | 2,079 | | |
| Gaming (0.0%) | | | |
| | 10,150 | | | Majestic Holdco LLC* | | | | | | | | | | | | | | | 9,135 | | |
| Health Services (0.0%) | | | |
| | 22 | | | Magellan Health Services, Inc.§* | | | | | | | | | | | | | | | 1,291 | | |
| Printing & Publishing (0.0%) | | | |
| | 1,131 | | | F & W Media, Inc.* | | | | | | | | | | | | | | | 707 | | |
| TOTAL COMMON STOCKS (Cost $95,163) | | | 348,828 | | |
| WARRANT (0.0%) | | | |
| Printing & Publishing (0.0%) | | | |
| | 1,673 | | | The Readers Digest Association, Inc., strike price $0.00,
expires 02/19/14^* (Cost $—) | | | | | | | | | | | | | | | — | | |
| SHORT-TERM INVESTMENTS (10.3%) | | | |
| | 13,603,368 | | | State Street Navigator Prime Portfolio, 0.16%§§ | | | | | | | | | | | | | | | 13,603,368 | | |
Par
(000) | |
| |
| |
Maturity | |
Rate% | |
| |
$ | 140,796 | | | State Street Bank and Trust Co. Euro Time Deposit | | | | 11/01/13 | | | 0.010 | | | | 140,796,000 | | |
| TOTAL SHORT-TERM INVESTMENTS (Cost $154,399,368) | | | 154,399,368 | | |
| TOTAL INVESTMENTS AT VALUE (104.9%) (Cost $1,571,505,852) | | | 1,579,128,885 | | |
| LIABILITIES IN EXCESS OF OTHER ASSETS (-4.9%) | | | (74,085,944 | ) | |
| NET ASSETS (100.0%) | | $ | 1,505,042,941 | | |
INVESTMENT ABBREVIATIONS
NR = Not Rated
† Credit ratings given by the Standard & Poor's Division of The McGraw-Hill Companies, Inc. ("S&P") and Moody's Investors Service, Inc. ("Moody's") are unaudited.
# Variable rate obligations — The interest rate is the rate as of October 31, 2013.
€ This security is denominated in Euro.
£ This security is denominated in British Pound.
‡ Security exempt from registration under Rule 144A of the Securities Act of 1933. These securities may be resold in transactions exempt from registration, normally to qualified institutional buyers. At October 31, 2013, these securities amounted to a value of $88,663,735 or 5.9% of net assets.
§ Security or portion thereof is out on loan.
Ø Bond is currently in default.
^ Not readily marketable security; security is valued at fair value as determined in good faith by, or under the direction of, the Board of Trustees.
* Non-income producing security.
§§ Represents security purchased with cash collateral received for securities on loan. The rate shown is the annualized one-day yield at October 31, 2013.
See Accompanying Notes to Financial Statements.
23
Credit Suisse Floating Rate High Income Fund
Statement of Assets and Liabilities
October 31, 2013
Assets | |
Investments at value, including collateral for securities on loan of $13,603,368
(Cost $1,571,505,852) (Note 2) | | $ | 1,579,128,8851 | | |
Cash | | | 1,110 | | |
Foreign currency at value (cost $7,848,345) | | | 7,892,488 | | |
Receivable for investments sold | | | 42,378,762 | | |
Receivable for fund shares sold | | | 11,223,861 | | |
Dividend and interest receivable | | | 6,500,634 | | |
Prepaid expenses and other assets | | | 99,777 | | |
Total Assets | | | 1,647,225,517 | | |
Liabilities | |
Advisory fee payable (Note 3) | | | 488,719 | | |
Administrative services fee payable (Note 3) | | | 150,706 | | |
Shareholder servicing/Distribution fee payable (Note 3) | | | 231,515 | | |
Payable for investments purchased | | | 122,476,310 | | |
Payable upon return of securities loaned (Note 2) | | | 13,603,368 | | |
Payable for fund shares redeemed | | | 3,658,988 | | |
Dividend payable | | | 842,011 | | |
Unrealized depreciation on forward currency contracts (Note 2) | | | 421,633 | | |
Trustees' fee payable | | | 10,938 | | |
Accrued expenses | | | 298,388 | | |
Total Liabilities | | | 142,182,576 | | |
Net Assets | |
Capital stock, $.001 par value (Note 6) | | | 216,296 | | |
Paid-in capital (Note 6) | | | 1,507,986,372 | | |
Undistributed net investment income | | | 144,579 | | |
Accumulated net realized loss on investments and foreign currency transactions | | | (10,508,582 | ) | |
Net unrealized appreciation from investments and foreign currency translations | | | 7,204,276 | | |
Net Assets | | $ | 1,505,042,941 | | |
I Shares | |
Net assets | | $ | 876,417,727 | | |
Shares outstanding | | | 126,249,067 | | |
Net asset value, offering price and redemption price per share | | $ | 6.94 | | |
A Shares | |
Net assets | | $ | 456,550,331 | | |
Shares outstanding | | | 65,449,925 | | |
Net asset value and redemption price per share | | $ | 6.98 | | |
Maximum offering price per share (net asset value/(1-4.75%)) | | $ | 7.33 | | |
B Shares | |
Net assets | | $ | 4,421,879 | | |
Shares outstanding | | | 632,022 | | |
Net asset value and offering price per share | | $ | 7.00 | | |
C Shares | |
Net assets | | $ | 167,653,004 | | |
Shares outstanding | | | 23,964,672 | | |
Net asset value and offering price per share | | $ | 7.00 | | |
1 Including $13,338,398 of securities on loan.
See Accompanying Notes to Financial Statements.
24
Credit Suisse Floating Rate High Income Fund
Statement of Operations
For the Year Ended October 31, 2013
| Investment Income (Note 2) | |
Interest | | $ | 45,249,754 | | |
Dividends | | | 7,446 | | |
Securities lending (net of rebates) | | | 26,563 | | |
Total investment income | | | 45,283,763 | | |
Expenses | |
Investment advisory fees (Note 3) | | | 4,669,722 | | |
Administrative services fees (Note 3) | | | 968,900 | | |
Shareholder servicing/Distribution fees (Note 3) | |
Class A | | | 674,119 | | |
Class B | | | 47,409 | | |
Class C | | | 1,180,606 | | |
Transfer agent fees (Note 3) | | | 692,369 | | |
Registration fees | | | 151,149 | | |
Custodian fees | | | 126,505 | | |
Legal fees | | | 103,838 | | |
Printing fees (Note 3) | | | 93,018 | | |
Audit and tax fees | | | 40,300 | | |
Trustees' fees | | | 28,576 | | |
Insurance expense | | | 14,931 | | |
Commitment fees (Note 4) | | | 2,643 | | |
Miscellaneous expense | | | 8,230 | | |
Total expenses | | | 8,802,315 | | |
Less: fees waived (Note 3) | | | (643,096 | ) | |
Net expenses | | | 8,159,219 | | |
Net investment income | | | 37,124,544 | | |
Net Realized and Unrealized Gain (Loss) from Investments and Foreign Currency Related Items | |
Net realized gain from investments | | | 3,778,883 | | |
Net realized loss from foreign currency transactions | | | (1,509,776 | ) | |
Net change in unrealized appreciation (depreciation) from investments | | | 2,565,801 | | |
Net change in unrealized appreciation (depreciation) from foreign currency translations | | | (539,808 | ) | |
Net realized and unrealized gain from investments and foreign currency related items | | | 4,295,100 | | |
Net increase in net assets resulting from operations | | $ | 41,419,644 | | |
See Accompanying Notes to Financial Statements.
25
Credit Suisse Floating Rate High Income Fund
Statement of Changes in Net Assets
| | | For the Year
Ended
October 31, 2013 | | For the Year
Ended
October 31, 2012 | |
From Operations | |
Net investment income | | $ | 37,124,544 | | | $ | 13,469,970 | | |
Net realized gain from investments and foreign currency transactions | | | 2,269,107 | | | | 1,421,751 | | |
Net change in unrealized appreciation (depreciation)
from investments and foreign currency translations | | | 2,025,993 | | | | 7,635,646 | | |
Net increase in net assets resulting from operations | | | 41,419,644 | | | | 22,527,367 | | |
From Dividends | |
Dividends from net investment income | |
Class I | | | (22,082,097 | ) | | | (5,828,640 | ) | |
Class A | | | (11,256,846 | ) | | | (5,173,777 | ) | |
Class B | | | (168,251 | ) | | | (197,814 | ) | |
Class C | | | (4,035,091 | ) | | | (1,850,784 | ) | |
Net decrease in net assets resulting from dividends | | | (37,542,285 | ) | | | (13,051,015 | ) | |
| From Capital Share Transactions (Note 6) | |
Proceeds from sale of shares | | | 1,358,631,102 | | | | 420,906,171 | | |
Reinvestment of dividends | | | 30,519,329 | | | | 9,579,337 | | |
Net asset value of shares redeemed | | | (343,530,928 | )1 | | | (108,888,789 | )2 | |
Net increase in net assets from capital share transactions | | | 1,045,619,503 | | | | 321,596,719 | | |
Net increase in net assets | | | 1,049,496,862 | | | | 331,073,071 | | |
Net Assets | |
Beginning of year | | | 455,546,079 | | | | 124,473,008 | | |
End of year | | $ | 1,505,042,941 | | | $ | 455,546,079 | | |
Undistributed net investment income | | $ | 144,579 | | | $ | 355,380 | | |
1 Net of $110,770 of redemption fees retained by the Fund.
2 Net of $33,222 of redemption fees retained by the Fund.
See Accompanying Notes to Financial Statements.
26
Credit Suisse Floating Rate High Income Fund
Financial Highlights
(For a Class I Share of the Fund Outstanding Throughout Each Year)
| | | For the Year Ended October 31, | |
| | | 2013 | | 2012 | | 2011 | | 2010 | | 2009 | |
Per share data | |
Net asset value, beginning of year | | $ | 6.89 | | | $ | 6.66 | | | $ | 6.72 | | | $ | 6.24 | | | $ | 4.94 | | |
INVESTMENT OPERATIONS | |
Net investment income1 | | | 0.30 | | | | 0.34 | | | | 0.43 | | | | 0.56 | | | | 0.54 | | |
Net gain (loss) on investments and foreign currency
related items (both realized and unrealized) | | | 0.07 | | | | 0.21 | | | | (0.04 | ) | | | 0.50 | | | | 1.36 | | |
Total from investment operations | | | 0.37 | | | | 0.55 | | | | 0.39 | | | | 1.06 | | | | 1.90 | | |
REDEMPTION FEES | | | 0.002 | | | | 0.002 | | | | 0.002 | | | | 0.002 | | | | — | | |
LESS DIVIDENDS | |
Dividends from net investment income | | | (0.32 | ) | | | (0.32 | ) | | | (0.45 | ) | | | (0.58 | ) | | | (0.60 | ) | |
Total dividends | | | (0.32 | ) | | | (0.32 | ) | | | (0.45 | ) | | | (0.58 | ) | | | (0.60 | ) | |
Net asset value, end of year | | $ | 6.94 | | | $ | 6.89 | | | $ | 6.66 | | | $ | 6.72 | | | $ | 6.24 | | |
Total return3 | | | 5.47 | % | | | 8.51 | % | | | 5.85 | % | | | 17.87 | % | | | 41.87 | % | |
RATIOS AND SUPPLEMENTAL DATA | |
Net assets, end of year (000s omitted) | | $ | 876,418 | | | $ | 226,027 | | | $ | 46,482 | | | $ | 31,374 | | | $ | 383 | | |
Ratio of net expenses to average net assets | | | 0.70 | % | | | 0.70 | % | | | 0.70 | % | | | 0.72 | % | | | 0.85 | % | |
Ratio of net investment income to average net assets | | | 4.35 | % | | | 4.99 | % | | | 6.32 | % | | | 8.48 | % | | | 10.32 | % | |
Decrease reflected in above operating expense
ratios due to waivers/reimbursements | | | 0.07 | % | | | 0.20 | % | | | 0.68 | % | | | 0.65 | % | | | 0.58 | % | |
Portfolio turnover rate | | | 89 | % | | | 96 | % | | | 144 | % | | | 88 | % | | | 63 | % | |
1 Per share information is calculated using the average shares outstanding method.
2 This amount represents less than $0.01 per share.
3 Total returns are historical and assume changes in share price and reinvestment of all dividends and distributions. Had certain expenses not been reduced during the years shown, total returns would have been lower.
See Accompanying Notes to Financial Statements.
27
Credit Suisse Floating Rate High Income Fund
Financial Highlights
(For a Class A Share of the Fund Outstanding Throughout Each Year)
| | | For the Year Ended October 31, | |
| | | 2013 | | 2012 | | 2011 | | 2010 | | 2009 | |
Per share data | |
Net asset value, beginning of year | | $ | 6.92 | | | $ | 6.69 | | | $ | 6.74 | | | $ | 6.26 | | | $ | 4.96 | | |
INVESTMENT OPERATIONS | |
Net investment income1 | | | 0.29 | | | | 0.32 | | | | 0.40 | | | | 0.52 | | | | 0.53 | | |
Net gain (loss) on investments and foreign currency
related items (both realized and unrealized) | | | 0.07 | | | | 0.22 | | | | (0.02 | ) | | | 0.53 | | | | 1.36 | | |
Total from investment operations | | | 0.36 | | | | 0.54 | | | | 0.38 | | | | 1.05 | | | | 1.89 | | |
REDEMPTION FEES2 | | | 0.00 | | | | 0.00 | | | | 0.00 | | | | 0.00 | | | | 0.00 | | |
LESS DIVIDENDS | |
Dividends from net investment income | | | (0.30 | ) | | | (0.31 | ) | | | (0.43 | ) | | | (0.57 | ) | | | (0.59 | ) | |
Total dividends | | | (0.30 | ) | | | (0.31 | ) | | | (0.43 | ) | | | (0.57 | ) | | | (0.59 | ) | |
Net asset value, end of year | | $ | 6.98 | | | $ | 6.92 | | | $ | 6.69 | | | $ | 6.74 | | | $ | 6.26 | | |
Total return3 | | | 5.33 | % | | | 8.19 | % | | | 5.74 | % | | | 17.54 | % | | | 41.36 | % | |
RATIOS AND SUPPLEMENTAL DATA | |
Net assets, end of year (000s omitted) | | $ | 456,550 | | | $ | 148,636 | | | $ | 49,439 | | | $ | 20,492 | | | $ | 22,237 | | |
Ratio of net expenses to average net assets | | | 0.95 | % | | | 0.95 | % | | | 0.95 | % | | | 1.11 | % | | | 1.10 | % | |
Ratio of net investment income to average net assets | | | 4.13 | % | | | 4.65 | % | | | 5.97 | % | | | 8.00 | % | | | 10.07 | % | |
Decrease reflected in above operating expense
ratios due to waivers/reimbursements | | | 0.07 | % | | | 0.20 | % | | | 0.69 | % | | | 0.61 | % | | | 0.59 | % | |
Portfolio turnover rate | | | 89 | % | | | 96 | % | | | 144 | % | | | 88 | % | | | 63 | % | |
1 Per share information is calculated using the average shares outstanding method.
2 This amount represents less than $0.01 per share.
3 Total returns are historical and assume changes in share price, reinvestment of all dividends and distributions and no sales charge. Had certain expenses not been reduced during the years shown, total returns would have been lower.
See Accompanying Notes to Financial Statements.
28
Credit Suisse Floating Rate High Income Fund
Financial Highlights
(For a Class B Share of the Fund Outstanding Throughout Each Year)
| | | For the Year Ended October 31, | |
| | | 2013 | | 2012 | | 2011 | | 2010 | | 2009 | |
Per share data | |
Net asset value, beginning of year | | $ | 6.93 | | | $ | 6.70 | | | $ | 6.74 | | | $ | 6.26 | | | $ | 4.95 | | |
INVESTMENT OPERATIONS | |
Net investment income1 | | | 0.25 | | | | 0.26 | | | | 0.39 | | | | 0.47 | | | | 0.49 | | |
Net gain (loss) on investments and foreign currency
related items (both realized and unrealized) | | | 0.07 | | | | 0.22 | | | | (0.06 | ) | | | 0.53 | | | | 1.36 | | |
Total from investment operations | | | 0.32 | | | | 0.48 | | | | 0.33 | | | | 1.00 | | | | 1.85 | | |
REDEMPTION FEES2 | | | 0.00 | | | | 0.00 | | | | 0.00 | | | | 0.00 | | | | 0.00 | | |
LESS DIVIDENDS | |
Dividends from net investment income | | | (0.25 | ) | | | (0.25 | ) | | | (0.37 | ) | | | (0.52 | ) | | | (0.54 | ) | |
Total dividends | | | (0.25 | ) | | | (0.25 | ) | | | (0.37 | ) | | | (0.52 | ) | | | (0.54 | ) | |
Net asset value, end of year | | $ | 7.00 | | | $ | 6.93 | | | $ | 6.70 | | | $ | 6.74 | | | $ | 6.26 | | |
Total return3 | | | 4.64 | % | | | 7.30 | % | | | 5.03 | % | | | 16.58 | % | | | 40.55 | % | |
RATIOS AND SUPPLEMENTAL DATA | |
Net assets, end of year (000s omitted) | | $ | 4,422 | | | $ | 5,185 | | | $ | 4,647 | | | $ | 7,283 | | | $ | 7,280 | | |
Ratio of net expenses to average net assets | | | 1.70 | % | | | 1.70 | % | | | 1.70 | % | | | 1.86 | % | | | 1.85 | % | |
Ratio of net investment income to average net assets | | | 3.52 | % | | | 3.83 | % | | | 5.80 | % | | | 7.25 | % | | | 9.40 | % | |
Decrease reflected in above operating expense
ratios due to waivers/reimbursements | | | 0.07 | % | | | 0.20 | % | | | 0.68 | % | | | 0.61 | % | | | 0.59 | % | |
Portfolio turnover rate | | | 89 | % | | | 96 | % | | | 144 | % | | | 88 | % | | | 63 | % | |
1 Per share information is calculated using the average shares outstanding method.
2 This amount represents less than $0.01 per share.
3 Total returns are historical and assume changes in share price, reinvestment of all dividends and distributions and no sales charge. Had certain expenses not been reduced during the years shown, total returns would have been lower.
See Accompanying Notes to Financial Statements.
29
Credit Suisse Floating Rate High Income Fund
Financial Highlights
(For a Class C Share of the Fund Outstanding Throughout Each Year)
| | | For the Year Ended October 31, | |
| | | 2013 | | 2012 | | 2011 | | 2010 | | 2009 | |
Per share data | |
Net asset value, beginning of year | | $ | 6.94 | | | $ | 6.71 | | | $ | 6.75 | | | $ | 6.27 | | | $ | 4.96 | | |
INVESTMENT OPERATIONS | |
Net investment income1 | | | 0.24 | | | | 0.27 | | | | 0.37 | | | | 0.47 | | | | 0.49 | | |
Net gain (loss) on investments and foreign currency
related items (both realized and unrealized) | | | 0.07 | | | | 0.21 | | | | (0.03 | ) | | | 0.53 | | | | 1.36 | | |
Total from investment operations | | | 0.31 | | | | 0.48 | | | | 0.34 | | | | 1.00 | | | | 1.85 | | |
REDEMPTION FEES2 | | | 0.00 | | | | 0.00 | | | | 0.00 | | | | 0.00 | | | | 0.00 | | |
LESS DIVIDENDS | |
Dividends from net investment income | | | (0.25 | ) | | | (0.25 | ) | | | (0.38 | ) | | | (0.52 | ) | | | (0.54 | ) | |
Total dividends | | | (0.25 | ) | | | (0.25 | ) | | | (0.38 | ) | | | (0.52 | ) | | | (0.54 | ) | |
Net asset value, end of year | | $ | 7.00 | | | $ | 6.94 | | | $ | 6.71 | | | $ | 6.75 | | | $ | 6.27 | | |
Total return3 | | | 4.47 | % | | | 7.29 | % | | | 5.03 | % | | | 16.57 | % | | | 40.46 | % | |
RATIOS AND SUPPLEMENTAL DATA | |
Net assets, end of year (000s omitted) | | $ | 167,653 | | | $ | 75,699 | | | $ | 23,905 | | | $ | 17,695 | | | $ | 17,435 | | |
Ratio of net expenses to average net assets | | | 1.70 | % | | | 1.70 | % | | | 1.70 | % | | | 1.86 | % | | | 1.85 | % | |
Ratio of net investment income to average net assets | | | 3.40 | % | | | 3.93 | % | | | 5.39 | % | | | 7.25 | % | | | 9.33 | % | |
Decrease reflected in above operating expense
ratios due to waivers/reimbursements | | | 0.07 | % | | | 0.20 | % | | | 0.68 | % | | | 0.61 | % | | | 0.59 | % | |
Portfolio turnover rate | | | 89 | % | | | 96 | % | | | 144 | % | | | 88 | % | | | 63 | % | |
1 Per share information is calculated using the average shares outstanding method.
2 This amount represents less than $0.01 per share.
3 Total returns are historical and assume changes in share price, reinvestment of all dividends and distributions and no sales charge. Had certain expenses not been reduced during the years shown, total returns would have been lower.
See Accompanying Notes to Financial Statements.
30
Credit Suisse Floating Rate High Income Fund
Notes to Financial Statements
October 31, 2013
Credit Suisse Floating Rate High Income Fund (the "Fund"), a series of the Credit Suisse Opportunity Funds (the "Trust"), a Delaware statutory trust, is registered under the Investment Company Act of 1940, as amended (the "1940 Act"), as a diversified open-end management investment company that seeks to provide a high level of current income and, secondarily, capital appreciation. The Trust was organized under the laws of the State of Delaware as a business trust on May 31, 1995.
The Fund offers three classes of shares: Class I shares, Class A shares and Class C shares. Each class of shares represents an equal pro rata interest in the Fund, except they bear different expenses, which reflect the differences in the range of services provided to them. Class A shares are sold subject to a front-end sales charge of up to 4.75%. Class C shares are sold subject to a contingent deferred sales charge of 1.00% if the shares are redeemed within the first year of purchase. Effective February 29, 2012, Class B shares of the Fund are no longer being offered for sale. Existing shareholders may continue to purchase additional Class B shares of the Fund through the reinvestment of dividends and capital gain distributions paid by the Fund. Class B shares automatically convert to Class A shares after 8 years.
Note 2. Significant Accounting Policies
The following is a summary of significant accounting policies followed by the Funds in the preparation of their financial statements. The policies are in accordance with accounting principles generally accepted in the United States of America ("GAAP"). The preparation of financial statements requires management to make estimates and assumptions that affect the reported amounts and disclosures in the financial statements. Actual results could differ from those estimates.
A) SECURITY VALUATION — The net asset value of the Fund is determined daily as of the close of regular trading on the New York Stock Exchange, Inc. (the "Exchange") on each day the Exchange is open for business. The valuations for fixed income securities (which may include, but are not limited to, corporate, government, municipal, mortgage-backed, collateralized mortgage obligations and asset-backed securities) and certain derivative instruments are typically the prices supplied by independent third party pricing services, which may use market prices or broker/dealer quotations or a variety of valuation techniques and methodologies. The independent third party pricing services use inputs that are observable such as issuer details,
31
Credit Suisse Floating Rate High Income Fund
Notes to Financial Statements (continued)
October 31, 2013
Note 2. Significant Accounting Policies
interest rates, yield curves, prepayment speeds, credit risks/spreads, default rates and quoted prices for similar securities. Short-term fixed income securities that will mature in 60 days or less are valued at amortized cost unless it is determined that using this method would not reflect an investment's fair value. Structured note agreements are valued in accordance with a dealer-supplied valuation based on changes in the value of the underlying index. Futures contracts are valued daily at the settlement price established by the board of trade or exchange on which they are traded. Equity securities for which market quotations are available are valued at the last reported sales price or official closing price on the primary market or exchange on which they trade. The Fund may utilize a service provided by an independent third party which has been approved by the Board of Trustees to fair value certain securities. When fair value pricing is employed, the prices of securities used by the Fund to calculate its net asset value may differ from quoted or published prices for the same securities. If independent third party pricing services are unable to supply prices for a portfolio investment, or if the prices supplied are deemed by the investment adviser to be unreliable, the market price may be determined by the investment adviser using quotations from one or more broker/dealers or at the transaction price if the security has recently been purchased and no value has yet been obtained from a pricing service or pricing broker. When reliable prices are not readily available, such as when the value of a security has been significantly affected by events after the close of the exchange or market on which the security is principally traded, but before the Fund calculates its net asset value, the Fund values these securities as determined in accordance with procedures approved by the Fund's Board of Trustees.
The Fund uses valuation techniques to measure fair value that are consistent with the market approach and/or income approach, depending on the type of security and the particular circumstance. The market approach uses prices and other relevant information generated by market transactions involving identical or comparable securities. The income approach uses valuation techniques to discount estimated future cash flows to present value.
GAAP established a disclosure hierarchy that categorizes the inputs to valuation techniques used to value assets and liabilities at measurement date. These inputs are summarized in the three broad levels listed below:
• Level 1 – quoted prices in active markets for identical investments
• Level 2 – other significant observable inputs (including quoted prices for similar investments, interest rates, prepayment speeds, credit risk, etc.)
32
Credit Suisse Floating Rate High Income Fund
Notes to Financial Statements (continued)
October 31, 2013
Note 2. Significant Accounting Policies
• Level 3 – significant unobservable inputs (including the Fund's own assumptions in determining the fair value of investments)
The inputs or methodologies used to value securities are not necessarily an indication of the risk associated with investing in those securities.
The following is a summary of the inputs used as of October 31, 2013 in valuing the Fund's assets and liabilities carried at fair value:
| | | Level 1 | | Level 2 | | Level 3 | | Total | |
Investments in Securities | |
Bank Loans | | $ | — | | | $ | 1,252,966,312 | | | $ | — | | | $ | 1,252,966,312 | | |
Corporate Bonds | | | — | | | | 128,689,414 | | | | 40 | | | | 128,689,454 | | |
Asset Backed Securities | | | — | | | | 42,724,923 | | | | — | | | | 42,724,923 | | |
Common Stocks | | | 237,598 | | | | 9,842 | | | | 101,388 | | | | 348,828 | | |
Warrants | | | — | | | | — | | | | — | | | | — | | |
Short-Term Investments | | | — | | | | 154,399,368 | | | | — | | | | 154,399,368 | | |
Other Financial Instruments* | |
Forward Foreign Currency Contracts | | | — | | | | (421,633 | ) | | | — | | | | (421,633 | ) | |
| | | $ | 237,598 | | | $ | 1,578,368,226 | | | $ | 101,428 | | | $ | 1,578,707,252 | | |
*Other financial instruments include forward foreign currency contracts.
As of October 31, 2013, the amounts shown by the Fund as being Level 3 securities that were measured at fair value amounted to less than 0.01% of net assets.
The Fund adopted Financial Accounting Standards Board ("FASB") amendments to authoritative guidance which require the Fund to disclose details of transfers in and out of Level 1 and Level 2 measurements and Level 2 and Level 3 measurements and the reasons for the transfers. For the year ended October 31, 2013, there were no transfers in and out of Level 1, Level 2 and Level 3. All transfers are assumed to occur at the end of the reporting period.
B) DERIVATIVE INSTRUMENTS AND HEDGING ACTIVITIES — The Fund adopted amendments to authoritative guidance on disclosures about derivative instruments and hedging activities which require that the Fund disclose (a) how and why an entity uses derivative instruments, (b) how derivative instruments and hedging activities are accounted for, and (c) how derivative instruments and related hedging activities affect a fund's financial position, financial performance, and cash flows. For the year ended October 31, 2013, the Fund's derivatives did not qualify for hedge accounting as they are held at fair value.
33
Credit Suisse Floating Rate High Income Fund
Notes to Financial Statements (continued)
October 31, 2013
Note 2. Significant Accounting Policies
Fair Values of Derivative Instruments as of October 31, 2013
| | | Asset Derivatives | | Liability Derivatives | |
| | | Balance Sheet
Location | | Fair Value | | Balance Sheet
Location | | Fair Value | |
Currency Contracts
| | Unrealized appreciation
on forward currency
contracts | | $ | — | | | Unrealized depreciation
on forward currency
contracts | | $ | 421,633 | | |
Effect of Derivative Instruments on the Statement of Operations
| | | Location | | Realized
Gain/Loss | | Location | | Net Unrealized
Appreciation/
Depreciation | |
Currency Contracts
| | Net realized loss from
foreign currency
transactions | | $ | (1,421,096 | ) | | Net change in unrealized
appreciation (depreciation)
from foreign currency
translations | | $ | (560,783 | ) | |
The notional amount of forward foreign currency contracts at year ended October 31, 2013 are reflected in the Notes to Financial Statements. The notional amounts of forward foreign currency contracts at each month end throughout the reporting period averaged approximately 4.9% of net assets of the Fund.
C) FOREIGN CURRENCY TRANSACTIONS — The books and records of the Fund are maintained in U.S. dollars. Transactions denominated in foreign currencies are recorded at the current prevailing exchange rates. All assets and liabilities denominated in foreign currencies are translated into U.S. dollar amounts at the current exchange rate at the end of the period. Translation gains or losses resulting from changes in the exchange rate during the reporting period and realized gains and losses on the settlement of foreign currency transactions are reported in the results of operations for the current period. The Fund does not isolate that portion of realized gains and losses on investments in equity securities which is due to changes in the foreign exchange rate from that which is due to changes in market prices of equity securities. The Fund isolates that portion of realized gains and losses on investments in debt securities which is due to changes in the foreign exchange rate from that which is due to changes in market prices of debt securities.
D) SECURITY TRANSACTIONS AND INVESTMENT INCOME/EXPENSE — Security transactions are accounted for on a trade date basis. Interest income/expense is recorded on the accrual basis. The Fund amortizes premiums and accretes discounts using the effective interest method. Dividend income/expense is recorded on the ex-dividend date. Certain expenses are class-specific expenses, vary by class and are charged only to that class. Income,
34
Credit Suisse Floating Rate High Income Fund
Notes to Financial Statements (continued)
October 31, 2013
Note 2. Significant Accounting Policies
expenses (excluding class-specific expenses) and realized/unrealized gains/losses are allocated proportionately to each class of shares based upon the relative net asset value of the outstanding shares of that class. The cost of investments sold is determined by use of the specific identification method for both financial reporting and income tax purposes.
E) DIVIDENDS AND DISTRIBUTIONS TO SHAREHOLDERS — Dividends from net investment income, if any, are declared daily and paid monthly. Distributions of net realized capital gains, if any, are declared and paid at least annually. However, to the extent that a net realized capital gain can be reduced by a capital loss carryforward, such gain will not be distributed. Income and capital gain distributions are determined in accordance with federal income tax regulations, which may differ from GAAP.
F) FEDERAL INCOME TAXES — No provision is made for federal taxes as it is the Fund's intention to continue to qualify for and elect the tax treatment applicable to regulated investment companies ("RIC") under the Internal Revenue Code of 1986, as amended (the "Code"), and to make the requisite distributions to its shareholders, which will be sufficient to relieve it from federal income and excise taxes.
In order to qualify as a RIC under the Code, the Fund must meet certain requirements regarding the source of its income, the diversification of its assets and the distribution of its income. One of these requirements is that the Fund derive at least 90% of its gross income for each taxable year from dividends, interest, payments with respect to certain securities loans, gains from the sale or other disposition of stock, securities or foreign currencies, other income derived with respect to its business of investing in such stock, securities or currencies or net income derived from interests in certain publicly traded partnerships ("Qualifying Income").
The Fund adopted the authoritative guidance for uncertainty in income taxes and recognizes a tax benefit or liability from an uncertain position only if it is more likely than not that the position is sustainable based solely on its technical merits and consideration of the relevant taxing authority's widely understood administrative practices and procedures. The Fund has reviewed its current tax positions and has determined that no provision for income tax is required in the Fund's financial statements. The Fund's federal tax returns for the prior three fiscal years remain subject to examination by the Internal Revenue Service.
35
Credit Suisse Floating Rate High Income Fund
Notes to Financial Statements (continued)
October 31, 2013
Note 2. Significant Accounting Policies
G) SHORT-TERM INVESTMENTS — The Fund, together with other funds/portfolios advised by Credit Suisse Asset Management, LLC ("Credit Suisse"), an indirect, wholly-owned subsidiary of Credit Suisse Group AG, pools available cash into a short-term variable rate time deposit issued by State Street Bank and Trust Company ("SSB"), the Fund's custodian. The short-term time deposit issued by SSB is a variable rate account classified as a short-term investment.
H) FORWARD FOREIGN CURRENCY CONTRACTS — The Fund may enter into forward foreign currency contracts for the purchase or sale of a specific foreign currency at a fixed price on a future date. Risks may arise upon entering into these contracts from the potential inability of counterparties to meet the terms of their contracts and from unanticipated movements in the value of a foreign currency. The Fund will enter into forward foreign currency contracts primarily for hedging foreign currency risk. Forward foreign currency contracts are adjusted by the daily forward exchange rate of the underlying currency and any gains or losses are recorded for financial statement purposes as unrealized until the contract settlement date or an offsetting position is entered into. At October 31, 2013, the Fund had the following open forward foreign currency contracts:
Forward Foreign
Currency to be
Purchased (Local) | | Forward Foreign
Currency to be
Sold (Local) | | Expiration
Date | | Counterparty | | Value on
Settlement Date | | Current
Value | | Net Unrealized
Appreciation/
Depreciation | |
EUR | 1,750,000 | | | USD | 2,394,525 | | | 01/15/14 | | Morgan Stanley | | $ | (2,394,525 | ) | | $ | 2,379,371 | | | $ | (15,154 | ) | |
USD | 57,229,785 | | | EUR | 42,300,000 | | | 01/15/14 | | Morgan Stanley | | | (57,229,785 | ) | | | (57,512,809 | ) | | | (283,024 | ) | |
USD | 19,707,266 | | | GBP | 12,350,000 | | | 01/15/14 | | Morgan Stanley | | | (19,707,266 | ) | | | (19,830,721 | ) | | | (123,455 | ) | |
| | | | | | | | | | | | | | | $ | (421,633 | ) | |
Currency Abbreviations:
EUR = Euro
GBP = British Pound
USD = United States Dollar
I) SECURITIES LENDING — Loans of securities are required at all times to be secured by collateral at least equal to 102% of the market value of domestic securities on loan (including any accrued interest thereon) and 105% of the market value of foreign securities on loan (including any accrued interest thereon). Cash collateral received by the Fund in connection with securities lending activity may be pooled together with cash collateral for other funds/portfolios advised by Credit Suisse and may be invested in a variety of investments, including funds advised by SSB, the Fund's securities lending agent, or money market instruments. However, in the event of default or
36
Credit Suisse Floating Rate High Income Fund
Notes to Financial Statements (continued)
October 31, 2013
Note 2. Significant Accounting Policies
bankruptcy by the other party to the agreement, realization and/or retention of the collateral may be subject to legal proceedings.
SSB has been engaged by the Fund to act as the Fund's securities lending agent. As of October 31, 2013, the Fund had investment securities on loan with a fair value of $13,338,398 and a related liability of $13,603,368 for collateral received on securities loaned, both of which are presented gross on the Statement of Assets and Liabilities. The carrying value of the collateral for securities loaned approximates fair value which would have been considered level 2 under the fair value hierarchy if the collateral for securities loaned were carried at fair value.
The Fund's securities lending arrangement provides that the Fund and SSB will share the net income earned from securities lending activities. During the year ended October 31, 2013, total earnings from the Fund's investment in cash collateral received in connection with securities lending arrangements was $33,520, of which $2,275 was rebated to borrowers (brokers). The Fund retained $26,563 in income from the cash collateral investment, and SSB, as lending agent, was paid $4,682. Securities lending income is accrued as earned.
J) OTHER — The high yield, fixed income securities in which the fund will invest will primarily consist of senior secured floating rate loans ("Senior Loans") issued by non-investment grade companies. Senior Loans are typically secured by specific collateral of the issuer and hold the most senior position in the issuer's capital structure. The interest rate on Senior Loans is periodically adjusted to a recognized base rate, typically the London Interbank Offered Rate ("LIBOR"). While these characteristics may reduce interest rate risk and mitigate losses in the event of borrower default, the Senior Loans in which the Fund invests have below investment grade credit ratings and thereby are considered speculative because of the significant credit risk of their issuers.
Lower-rated debt securities (commonly known as "junk bonds") possess speculative characteristics and are subject to greater market fluctuations and risk of lost income and principal than higher-rated debt securities for a variety of reasons. Also, during an economic downturn or substantial period of rising interest rates, highly leveraged issuers may experience financial stress which would adversely affect their ability to service their principal and interest payment obligations, to meet projected business goals and to obtain additional financing.
37
Credit Suisse Floating Rate High Income Fund
Notes to Financial Statements (continued)
October 31, 2013
Note 2. Significant Accounting Policies
In addition, periods of economic uncertainty and changes can be expected to result in increased volatility of market prices of lower-rated debt securities and the Fund's net asset value.
K) NEW ACCOUNTING PRONOUNCEMENTS — In December 2011, the Financial Accounting Standards Board issued Accounting Standards Update ("ASU") No. 2013-1, Balance Sheet (Topic 210): Disclosures about Offsetting Assets and Liabilities. The amendments in the ASU enhance disclosures about the offsetting of financial assets and liabilities to enable investors to understand the effect of these arrangements on a fund's financial position. The ASU is effective for interim and annual reporting periods beginning on or after January 1, 2013. The Fund believes the adoption of this ASU will not have a material impact on its financial statements.
L) SUBSEQUENT EVENTS — In preparing the financial statements as of October 31, 2013, management considered the impact of subsequent events for potential recognition or disclosure in these financial statements through the date of release of this report. No such events requiring recognition or disclosure were identified through the date of the release of this report.
Note 3. Transactions with Affiliates and Related Parties
Credit Suisse serves as investment adviser for the Fund. For its investment advisory services, Credit Suisse is entitled to receive a fee from the Fund at an annual rate of 0.70% of the Fund's average daily net assets less than or equal to $100 million and 0.50% of the Fund's average daily net assets greater than $100 million. For the year ended October 31, 2013, investment advisory fees earned and voluntarily waived were $4,669,722 and $643,096, respectively. Fee waivers and expense reimbursements are voluntary and may be discontinued by Credit Suisse at any time.
Credit Suisse and SSB serve as co-administrators to the Fund. For its co-administrative services, Credit Suisse received a fee calculation at an annual rate of 0.09% of the Fund's average daily net assets. For the year ended October 31, 2013, co-administrative services fees earned by Credit Suisse were $804,550.
For its co-administrative services, SSB receives a fee, exclusive of out-of-pocket expenses, calculated in total for all the Credit Suisse funds/portfolios co-administered by SSB and allocated based upon the relative average net assets of each fund/portfolio, subject to an annual minimum fee. For the year ended
38
Credit Suisse Floating Rate High Income Fund
Notes to Financial Statements (continued)
October 31, 2013
Note 3. Transactions with Affiliates and Related Parties
October 31, 2013, co-administrative services fees earned by SSB (including out-of-pocket expenses) with respect to the Fund were $164,350.
Credit Suisse Securities (USA) LLC ("CSSU"), an affiliate of Credit Suisse, serves as distributor of the Fund's shares. Pursuant to distribution plans adopted by the Fund pursuant to Rule 12b-1 under the 1940 Act, CSSU received fees for its distribution services. These fees were calculated at an annual rate of 0.25% of the average daily net assets of the Class A shares. For the Class B and Class C shares, the fee is calculated at an annual rate of 1.00% of the average daily net assets. For the year ended October 31, 2013, the Fund's paid Rule 12b-1 distribution fees were $674,119 for Class A shares, $47,409 for Class B shares and $1,180,606 for Class C shares. Class I shares are not subject to distribution fees.
Certain brokers, dealers and financial representatives provide transfer agent related services to the Fund and receive compensation from Credit Suisse. Credit Suisse is then reimbursed by the Fund. For the year ended October 31, 2013, the Fund reimbursed Credit Suisse $590,909, which is included in the Fund's transfer agent expense.
For the year ended October 31, 2013, CSSU and its affiliates advised the Fund that it retained $52,061 from commissions earned on the sale of the Fund's Class A shares.
Merrill Corporation ("Merrill"), an affiliate of Credit Suisse, has been engaged by the Fund to provide certain financial printing services. For the year ended October 31, 2013, Merrill was paid $45,309 for its services by the Fund. This amount was included in the printing fees presented on the Statement of Operations.
Note 4. Line of Credit
The Fund, together with other funds/portfolios advised by Credit Suisse (collectively, the "Participating Funds"), participates in a committed, unsecured line of credit facility ("Credit Facility"), in an aggregated amount of $20 million for temporary or emergency purposes with SSB. Under the terms of the Credit Facility, the Participating Funds pay an aggregate commitment fee on the average unused amount of the Credit Facility, which is allocated among the Participating Funds in such manner as is determined by the governing Boards of the Participating Funds. In addition, the Participating Funds pay interest on borrowings at either the Overnight Federal Funds rate or the Overnight LIBOR rate plus a spread. At October 31, 2013, and during the year ended October 31, 2013, the Fund had no borrowings outstanding under the Credit Facility.
39
Credit Suisse Floating Rate High Income Fund
Notes to Financial Statements (continued)
October 31, 2013
Note 5. Purchases and Sales of Securities
For the year ended October 31, 2013, purchases and sales of investment securities (excluding short-term investments) were $1,719,415,882 and $748,966,157, respectively.
Note 6. Capital Share Transactions
The Fund is authorized to issue an unlimited number of full and fractional shares of beneficial interest, $.001 par value per share. The Fund offers Class I, Class A and Class C shares. Class B shares are shown but not offered. Transactions in capital shares for each class of the Fund were as follows:
| | | Class I | |
| | | For the Year Ended
October 31, 2013 | | For the Year Ended
October 31, 2012 | |
| | | Shares | | Value | | Shares | | Value | |
Shares sold | | | 122,789,111 | | | $ | 851,983,662 | | | | 29,259,713 | | | $ | 198,986,905 | | |
Shares issued in reinvestment
of dividends | | | 2,561,784 | | | | 17,766,435 | | | | 740,272 | | | | 5,041,974 | �� | |
Shares redeemed | | | (31,903,094 | ) | | | (221,274,219 | ) | | | (4,172,984 | ) | | | (28,368,005 | ) | |
Net increase | | | 93,447,801 | | | $ | 648,475,878 | | | | 25,827,001 | | | $ | 175,660,874 | | |
| | | Class A | |
| | | For the Year Ended
October 31, 2013 | | For the Year Ended
October 31, 2012 | |
| | | Shares | | Value | | Shares | | Value | |
Shares sold | | | 57,399,112 | | | $ | 400,181,086 | | | | 24,435,787 | | | $ | 166,120,736 | | |
Shares issued in reinvestment
of dividends | | | 1,432,214 | | | | 9,982,858 | | | | 496,186 | | | | 3,393,229 | | |
Shares redeemed | | | (14,858,423 | ) | | | (103,535,867 | ) | | | (10,841,008 | ) | | | (74,072,793 | ) | |
Net increase | | | 43,972,903 | | | $ | 306,628,077 | | | | 14,090,965 | | | $ | 95,441,172 | | |
| | | Class B | |
| | | For the Year Ended
October 31, 2013 | | For the Year Ended
October 31, 2012 | |
| | | Shares | | Value | | Shares | | Value | |
Shares sold | | | 6,144 | | | $ | 42,917 | | | | 232,114 | | | $ | 1,562,539 | | |
Shares issued in reinvestment
of dividends | | | 10,609 | | | | 74,101 | | | | 10,290 | | | | 70,301 | | |
Shares redeemed | | | (132,666 | ) | | | (922,622 | ) | | | (188,042 | ) | | | (1,279,905 | ) | |
Net increase (decrease) | | | (115,913 | ) | | $ | (805,604 | ) | | | 54,362 | | | $ | 352,935 | | |
40
Credit Suisse Floating Rate High Income Fund
Notes to Financial Statements (continued)
October 31, 2013
Note 6. Capital Share Transactions
| | | Class C | |
| | | For the Year Ended
October 31, 2013 | | For the Year Ended
October 31, 2012 | |
| | | Shares | | Value | | Shares | | Value | |
Shares sold | | | 15,215,739 | | | $ | 106,423,437 | | | | 7,947,779 | | | $ | 54,235,991 | | |
Shares issued in reinvestment
of dividends | | | 385,645 | | | | 2,695,935 | | | | 156,638 | | | | 1,073,833 | | |
Shares redeemed | | | (2,549,166 | ) | | | (17,798,220 | ) | | | (757,012 | ) | | | (5,168,086 | ) | |
Net increase | | | 13,052,218 | | | $ | 91,321,152 | | | | 7,347,405 | | | $ | 50,141,738 | | |
The Fund imposes a redemption fee of 2% of the value of all classes of shares currently being offered that are redeemed or exchanged within 30 days from the date of purchase. Reinvested dividends and distributions are not subject to the fee. The fee is charged based on the value of shares at redemption, is paid directly to the Fund and becomes part of the Fund's daily net asset value calculation. When shares are redeemed that are subject to the fee, reinvested dividends and distributions are redeemed first, followed by the shares held longest. During the years ended October 31, 2013 and 2012, respectively, the redemption fees received by the Fund were $110,770 and $33,222, respectively. On or about January 31, 2014, the redemption fee will be eliminated.
On October 31, 2013, the number of shareholders that held 5% or more of the outstanding shares of each class of the Fund was as follows:
| | | Number of
Shareholders | | Approximate Percentage
of Outstanding Shares | |
Class I | | | 5 | | | | 83 | % | |
Class A | | | 4 | | | | 70 | % | |
Class B | | | 4 | | | | 73 | % | |
Class C | | | 4 | | | | 70 | % | |
Some of the shareholders are omnibus accounts, which hold shares on behalf of individual shareholders.
Note 7. Federal Income Taxes
Income and capital gain distributions are determined in accordance with federal income tax regulations, which may differ from GAAP.
The tax characteristics of dividends paid during the years ended October 31, 2013 and 2012, respectively, by the Fund were as follows:
Ordinary Income | |
| 2013 | | 2012 | |
| $ | 37,542,285 | | | $ | 13,051,015 | | |
41
Credit Suisse Floating Rate High Income Fund
Notes to Financial Statements (continued)
October 31, 2013
Note 7. Federal Income Taxes
The tax basis components of distributable earnings differ from the amounts reflected in the Statement of Assets and Liabilities by temporary book/tax differences. These differences are primarily due to differing treatments of dividends payable, wash sales, forward contracts marked to market and income from defaulted bonds. At October 31, 2013, the components of distributable earnings on a tax basis were as follows:
Undistributed net investment income | | $ | 1,026,422 | | |
Ordinary income distribution payable | | | (842,011 | ) | |
Accumulated realized loss | | | (10,889,064 | ) | |
Unrealized appreciation | | | 7,544,926 | | |
| | $ | (3,159,727 | ) | |
At October 31, 2013, the Fund had capital loss carryforwards available to offset possible future capital gains as follows:
Expires October 31, | |
| 2015 | | 2016 | | 2017 | | 2018 | |
| $ | 883,720 | | | $ | 4,088,111 | | | $ | 5,676,396 | | | $ | 240,837 | | |
Included in the Fund's capital loss carryforward is $3,488,463, acquired in the Credit Suisse High Yield Fund merger, which is subject to IRS limitations. During the tax year ended October 31, 2013, the Fund utilized $1,526,840 of the capital loss carryforwards.
Under the Regulated Investment Company Modernization Act of 2010, the Fund will be permitted to carry forward capital losses incurred in taxable years beginning after December 22, 2010 for an unlimited period. However, any losses incurred during those future taxable years will be required to be utilized prior to the losses incurred in pre-enactment taxable years. As a result of this ordering rule, pre-enactment capital loss carryforwards may be more likely to expire unused. Additionally, post-enactment capital losses that are carried forward will retain their character as either short-term or long-term capital losses rather than being considered all short-term as under previous law. It is uncertain whether the Fund will be able to realize the full benefits of the capital loss carryforwards before they expire.
42
Credit Suisse Floating Rate High Income Fund
Notes to Financial Statements (continued)
October 31, 2013
Note 7. Federal Income Taxes
At October 31, 2013, the cost of investments (excluding foreign currency related transactions) and net unrealized appreciation (depreciation) for income tax purposes were as follows:
Cost of Investments | | $ | 1,571,586,835 | | |
Unrealized appreciation | | $ | 14,557,969 | | |
Unrealized depreciation | | | (7,015,919 | ) | |
Net unrealized appreciation (depreciation) | | $ | 7,542,050 | | |
At October 31, 2013, the Fund reclassified $206,940 from accumulated net investment loss and $206,827 from accumulated net realized gain to paid in capital, to adjust for current period permanent book/tax differences which arose principally from differing book/tax treatment of foreign currency gain (loss), defaulted bonds and partnership basis adjustments. Net assets were not affected by these reclassifications.
Note 8. Contingencies
In the normal course of business, the Fund may provide general indemnifications pursuant to certain contracts and organizational documents. The Fund's maximum exposure under these arrangements is dependent on future claims that may be made against the Fund and, therefore, cannot be estimated; however, based on experience, the risk of loss from such claims is considered remote.
43
Credit Suisse Floating Rate High Income Fund
Report of Independent Registered Public Accounting Firm
To the Board of Directors and Shareholders of Credit Suisse Floating Rate High Income Fund:
In our opinion, the accompanying statement of assets and liabilities, including the schedule of investments, and the related statements of operations and of changes in net assets and the financial highlights present fairly, in all material respects, the financial position of Credit Suisse Floating Rate High Income Fund (the "Fund") at October 31, 2013, the results of its operations for the year then ended, the changes in its net assets for each of the two years in the period then ended and the financial highlights for each of the five years in the period then ended, in conformity with accounting principles generally accepted in the United States of America. These financial statements and financial highlights (hereafter referred to as "financial statements") are the responsibility of the Fund's management; our responsibility is to express an opinion on these financial statements based on our audits. We conducted our audits of these financial statements in accordance with the standards of the Public Company Accounting Oversight Board (United States). Those standards require that we plan and perform the audit to obtain reasonable assurance about whether the financial statements are free of material misstatement. An audit includes examining, on a test basis, evidence supporting the amounts and disclosures in the financial statements, assessing the accounting principles used and significant estimates made by management, and evaluating the overall financial statement presentation. We believe that our audits, which included confirmation of securities at October 31, 2013 by correspondence with the custodian, agent banks and brokers, provide a reasonable basis for our opinion.
PricewaterhouseCoopers LLP
New York, New York
December 27, 2013
44
Credit Suisse Floating Rate High Income Fund
Information Concerning Trustees and Officers (unaudited)
Name, Address
(Year of Birth) | | Position(s)
Held with
Fund | | Term
of Office1
and
Length
of Time
Served | | Principal
Occupation(s) During
Past Five Years | | Number of
Portfolios
in Fund
Complex
Overseen
by Trustee | | Other
Directorships
Held by Trustee | |
Independent Trustees | | | | | | | | | | | |
Enrique Arzac
c/o Credit Suisse Asset
Management, LLC
Attn: General Counsel
Eleven Madison Avenue
New York, New York
10010
(1941) | | Trustee, Audit Committee Chairman and Nominating Committee Member | | Since 2005 | | Professor of Finance and Economics, Graduate School of Business, Columbia University since 1971. | | | 11 | | | Director of The Adams Express Company, Petroleum and Resources Corporation, Aberdeen Chile Fund, Inc., Aberdeen Emerging Markets Smaller Company Opportunities Fund, Inc., Aberdeen Israel Fund, Inc., Aberdeen Indonesia Fund, Inc. and Aberdeen Latin America Equity Fund, Inc. (each a closed-end investment company); Director of Aberdeen Asia-Pacific Income Investment Company Limited (a Canadian closed-end fund); Trustee of Mirae Asset Discovery Funds (6 open-end portfolios); Director of Starcomms PLC. (telecommunications company) from 2008 to 2011; Director of Epoch Holding Corporation (an investment management and investment advisory services company) from 2006 to March 2013 | |
1 Each Trustee and Officer serves until his or her respective successor has been duly elected and qualified.
45
Credit Suisse Floating Rate High Income Fund
Information Concerning Trustees and Officers (unaudited) (continued)
Name, Address
(Year of Birth) | | Position(s)
Held with
Fund | | Term
of Office1
and
Length
of Time
Served | | Principal
Occupation(s) During
Past Five Years | | Number of
Portfolios
in Fund
Complex
Overseen
by Trustee | | Other
Directorships
Held by Trustee | |
Independent Trustees | | | | | | | | | | | |
Jeffrey E. Garten
Box 208200
New Haven, Connecticut
06520-8200
(1946) | | Trustee, Audit and Nominating Committee Member | | Since 2001 | | The Juan Trippe Professor in the Practice of International Trade, Finance and Business, Yale School of Management, from July 2005 to present; Partner and Chairman of Garten Rothkopf (consulting firm) from October 2005 to present. | | | 9 | | | Director of Aetna, Inc. (insurance company); Director of CarMax Group (used car dealers); Director of Alcan (aluminum production) from February 2007 to November 2007; Member of Standard & Poor's Board of Managers (credit rating agency); Director of Miller Buckfire & Co., LLC (financial restructuring). | |
Steven N. Rappaport
Lehigh Court, LLC
555 Madison Avenue
29th Floor
New York, New York
10022
(1948) | | Chairman of the Board of Trustees, Audit Committee Member and Nominating Committee Chairman | | Trustee since 2001 and Chairman since 2005 | | Partner of Lehigh Court, LLC and RZ Capital (private investment firms) from July 2002 to present. | | | 11 | | | Director of iCAD, Inc. (surgical and medical instruments and apparatus company); Director of Wood Resources, LLC. (plywood manufacturing company); Director of Aberdeen Chile Fund, Inc., Aberdeen Emerging Markets Smaller Company Opportunities Fund, Inc., Aberdeen Israel Fund, Inc., Aberdeen Indonesia Fund, Inc. and Aberdeen Latin America Equity Fund, Inc. (each a closed-end investment company); Director of Presstek, Inc. (digital imaging technologies company) from 2003 to 2012. | |
1 Each Trustee and Officer serves until his or her respective successor has been duly elected and qualified.
46
Credit Suisse Floating Rate High Income Fund
Information Concerning Trustees and Officers (unaudited) (continued)
Name, Address
(Year of Birth) | | Position(s)
Held with
Fund | | Term
of Office1
and
Length
of Time
Served | | Principal Occupation(s) During Past Five Years | |
Officers* | | | | | | | |
John G. Popp
Credit Suisse Asset
Management, LLC
One Madison Avenue
New York, New York 10010
(1956) | | Chief Executive Officer and President | | Since 2010 | | Managing Director of Credit Suisse; Global Head and Chief Investment Officer of the Credit Investment Group; Associated with Credit Suisse or its predecessor since 1997; Officer of other Credit Suisse Funds; Trustee of Credit Suisse High Yield Bond Fund; Director of Credit Suisse Asset Management Income Fund, Inc. | |
Bruce Rosenberg
Credit Suisse Asset
Management, LLC
One Madison Avenue
New York, New York 10010
(1961) | | Chief Financial Officer | | Since 2012 | | Director of Credit Suisse; Director of Liquid Accounting of Credit Suisse; Associated with Credit Suisse since 2008; Officer of other Credit Suisse Funds. | |
Emidio Morizio
Credit Suisse Asset
Management, LLC
Eleven Madison Avenue
New York, New York 10010
(1966) | | Chief Compliance Officer | | Since 2004 | | Managing Director and Global Head of Compliance of Credit Suisse since 2010; Director and Global Head of Compliance of Credit Suisse from January 2005 to December 2009; Associated with Credit Suisse since July 2000; Officer of other Credit Suisse Funds. | |
Joanne Doldo
Credit Suisse Asset
Management, LLC
Eleven Madison Avenue
New York, New York 10010
(1959) | | Chief Legal Officer | | Since 2013 | | Vice President of Credit Suisse; Associated with Credit Suisse since September 2011; Officer of other Credit Suisse Funds; Associated with Morgan Stanley Investment Management from 2002 – 2008. | |
Rocco DelGuercio
Credit Suisse Asset
Management, LLC
One Madison Avenue
New York, New York 10010
(1963) | | Treasurer | | Since 2013 | | Vice President of Credit Suisse since 2013; Independent Consultant from February 2012 to April 2013; Director of Legg Mason & Co., LLC from March 2004 to January 2012; Associated with Credit Suisse from June 1996 to March 2004; Officer of other Credit Suisse Funds. | |
Karen Regan
Credit Suisse Asset
Management, LLC
Eleven Madison Avenue
New York, New York 10010
(1963) | | Senior Vice President and Secretary | | Since 2010 | | Vice President of Credit Suisse; Associated with Credit Suisse since December 2004; Officer of other Credit Suisse Funds. | |
* The officers of the Fund shown are officers that make policy decisions.
The Statement of Additional Information includes additional information about the Trustees and is available, without charge, upon request, by calling 877-870-2874.
47
Credit Suisse Floating Rate High Income Fund
Proxy Voting and Portfolio Holdings Information (unaudited)
Information regarding how the Fund voted proxies related to its portfolio securities during the 12 month period ended June 30 of each year, as well as the policies and procedures that the Fund uses to determine how to vote proxies relating to its portfolio securities are available:
• By calling 1-877-870-2874
• On the Fund's website, www.credit-suisse.com/us/funds
• On the website of the Securities and Exchange Commission, www.sec.gov.
The Fund files a complete schedule of its portfolio holdings for the first and third quarters of its fiscal year with the SEC on Form N-Q. The Fund's Forms N-Q are available on the SEC's website at www.sec.gov and may be reviewed and copied at the SEC's Public Reference Room in Washington, DC. Information on the operation of the SEC's Public Reference Room may be obtained by calling 1-202-551-8090.
48

P.O. BOX 55030, BOSTON, MA 02205-5030
877-870-2874 n www.credit-suisse.com/us/funds
CREDIT SUISSE SECURITIES (USA) INC, DISTRIBUTOR. FLHI-AR-1013

CREDIT SUISSE FUNDS
Annual Report
October 31, 2013
n CREDIT SUISSE
MULTIALTERNATIVE STRATEGY FUND
The Fund's investment objectives, risks, charges and expenses (which should be considered carefully before investing), and more complete information about the Fund, are provided in the Prospectus, which should be read carefully before investing. You may obtain additional copies by calling 877-870-2874 or by writing to Credit Suisse Funds, P.O. Box 55030, Boston, MA 02205-5030.
Credit Suisse Securities (USA) LLC, Distributor, is located at One Madison Avenue, New York, NY 10010. Credit Suisse Funds are advised by Credit Suisse Asset Management, LLC.
Investors in the Credit Suisse Funds should be aware that they may be eligible to purchase Class I shares (where offered) directly or through certain intermediaries. Such shares are not subject to a sales charge. Investors in the Credit Suisse Funds should also be aware that they may be eligible for a reduction or waiver of the sales charge with respect to Class A or C shares (where offered). For more information, please review the relevant prospectuses or consult your financial representative.
Fund shares are not deposits or other obligations of Credit Suisse Asset Management, LLC ("Credit Suisse") or any affiliate, are not FDIC-insured and are not guaranteed by Credit Suisse or any affiliate. Fund investments are subject to investment risks, including loss of your investment.
Credit Suisse Multialternative Strategy Fund
Annual Investment Adviser's Report
October 31, 2013 (unaudited)
December 24, 2013
Dear Shareholder:
We are pleased to present this Annual Report covering the activities of the Credit Suisse Multialternative Strategy Fund (the "Fund") for the annual period ended October 31, 2013.
Performance Summary
11/01/12 — 10/31/13
Fund & Benchmark | | Performance | |
| Class I1 | | 6.11% | |
| Class A1,2 | | 5.96% | |
| Class C1,2 | | 5.15% | |
Primary Benchmark —
Dow Jones Credit Suisse Hedge Fund Index3 | | 9.31% | |
Secondary Benchmark —
Credit Suisse Liquid Alternative Beta Index4 | | 6.95% | |
Performance shown for the Fund's Class A and Class C Shares does not reflect sales charges, which are a maximum of 5.25% and 1.00%, respectively.2
Market Review: A positive period for hedge fund strategies
The annual period ended October 31, 2013 was a positive one for hedge funds, with the Dow Jones Credit Suisse Hedge Fund Index, the Fund's primary benchmark, returning 9.31%. Despite a market sell-off in late May and the partial U.S. government shutdown in October, directional equities performed positively overall during the period, benefitting from a generally bullish equity market environment. Within the hedge fund universe, trend following strategies, such as managed futures, experienced solid gains as global equity markets rallied. Additionally, merger arbitrage activity began an upward trend in June and event driven hedge funds benefitted from completed deals.
Portfolio Review and Outlook: Cautiously optimistic going forward
For the annual period ended October 31, 2013, the Fund underperformed both the Credit Suisse Liquid Alternative Beta Index and the Dow Jones Credit Suisse Hedge Fund Index. The Fund follows a multi-strategy methodology and benefitted from exposure across different markets. The long/short equity sub-strategy benefitted from equity market rallies despite the sell-off in late May, profiting mostly from Russell 2000 and S&P 500 positions. The event driven sub-strategy benefitted from the high yield market rally, profiting mostly from the iBOXX High Yield position. Allocations to the Global Strategies sub-strategy also resulted in gains, primarily due to positions in the S&P 500 Put Write Index and
1
Credit Suisse Multialternative Strategy Fund
Annual Investment Adviser's Report (continued)
October 31, 2013 (unaudited)
managed futures. The managed futures strategy's ability to profit from both up and down trends in the markets allowed it to profit from short Japanese Yen and precious metals positions as fixed income and commodities were generally down in the past year. The lowest performers were consumer staples and technology positions that offset some of the upside from the long/short equity sub-strategy. Overall, tracking error to the benchmark was within historically expected ranges.
Long/short managers seem to remain cautious about market conditions and expected equity market performance. Overall, funds have maintained approximately 50% net exposure to equities. In the event driven space, cash on company balance sheets remains at all-time highs, which could increase merger arbitrage potential going forward. Additionally, despite the on going U.S. budget battle, equity markets have continued to rally — a trend that, if it continues, could benefit managed futures.
The Credit Suisse Liquid Alternative Team
Dr. Jordan Drachman
Sheel Dhande
The Fund is non-diversified, which means it may invest a greater proportion of its assets in the securities of a smaller number of issuers than a diversified mutual fund and may therefore be subject to greater volatility. The Fund's investment in alternative instruments may subject the Fund to greater volatility than investment in traditional securities, particularly in investments involving leverage.
The use of alternative assets and strategies entails substantial risks, including risk of loss principal, arbitrage or fundamental risk, below investment grade securities risk, commodity exposure risks, concentration risk, derivatives risk, risks of investing in other funds, exchange-traded notes risk, credit risk, foreign securities risk, interest rate risk, market risk, model and style risk, forwards risk, futures contracts risk, index/tracking error risk, portfolio turnover risk, leveraging risk, swap agreements risk, small-and mid-cap stock risk, speculative exposure risk and tax risk. For a detailed discussion of these and other risks, please refer to the Fund's Prospectus, which should be read carefully before investing.
In addition to historical information, this report contains forward-looking statements, which may concern, among other things, domestic and foreign market, industry and economic trends and developments and government regulation and their potential impact on the Fund's investments. These statements are subject to risks and uncertainties and actual trends, developments and regulations in the future, and their
2
Credit Suisse Multialternative Strategy Fund
Annual Investment Adviser's Report (continued)
October 31, 2013 (unaudited)
impact on the Fund could be materially different from those projected, anticipated or implied. The Fund has no obligation to update or revise forward-looking statements.
The views of the Fund's management are as of the date of the letter and the Fund holdings described in this document are as of October 31, 2013; these views and Fund holdings may have changed subsequent to these dates. Nothing in this document is a recommendation to purchase or sell securities.
3
Credit Suisse Multialternative Strategy Fund
Annual Investment Adviser's Report (continued)
October 31, 2013 (unaudited)
Comparison of Change in Value of $10,000 Investment in the
Credit Suisse Multialternative Strategy Fund1 Class I
shares, Class A shares2, Class C shares2 and the Dow Jones
Credit Suisse Hedge Fund Index3 and the Credit Suisse Liquid
Alternative Beta Index4 from Inception (03/30/12).
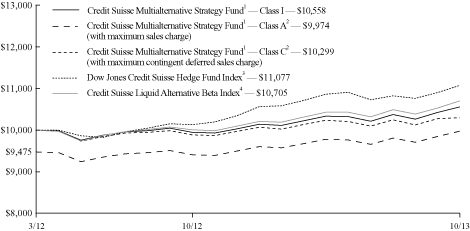
1 Fee waivers and/or expense reimbursements may reduce expenses for the Fund, without which performance would be lower.
2 Total return for the Fund's Class A shares for the reporting period, based on offering price (including maximum sales charge of 5.25%), was 0.40%. Total return for the Fund's Class C shares for the reporting period, based on redemption value (including maximum contingent deferred sales charge of 1.00%), was 4.15%.
3 Dow Jones Credit Suisse Hedge Fund Index is compiled by Credit Suisse Hedge Index LLC and CME Group Index Services LLC. It is an asset-weighted hedge fund index and includes only funds, as opposed to separate accounts. The Index uses the Credit Suisse database, which tracks over 9,000 funds, and consists only of funds with a minimum of US$50 million under management, a 12-month track record, and audited financial statements. It is calculated and rebalanced on a monthly basis, and shown net of all performance fees and expenses. An index does not have transaction costs; investors may not invest directly in an index.
4 Using only liquid securities, the Credit Suisse Liquid Alternative Beta Index seeks to replicate the return of the overall hedge fund industry, as represented by the Dow Jones Credit Suisse Hedge Fund Index. An index does not have transactions costs; investors may not invest directly in an index.
4
Credit Suisse Multialternative Strategy Fund
Annual Investment Adviser's Report (continued)
October 31, 2013 (unaudited)
Average Annual Returns as of October 31, 20131
| | | 1 Year | | Since
Inception2 | |
Class I | | | 6.11 | % | | | 3.47 | % | |
Class A Without Sales Charge | | | 5.96 | % | | | 3.25 | % | |
Class A With Maximum Sales Charge | | | 0.40 | % | | | (0.17 | )% | |
Class C Without CDSC | | | 5.15 | % | | | 2.49 | % | |
Class C With CDSC | | | 4.15 | % | | | 1.87 | % | |
Returns represent past performance and include change in share price and reinvestment of dividends and capital gains. Past performance cannot guarantee future results. The current performance of the Fund may be lower or higher than the figures shown. Returns and share price will fluctuate, and redemption value may be more or less than original cost. The performance results do not reflect the deduction of taxes that a shareholder would pay on fund distributions or the redemption of fund shares. Performance information current to the most recent month-end is available at www.credit-suisse.com/us/funds.
The annualized gross expense ratios are 8.09% for Class I shares, 8.34% for Class A shares and 9.08% for Class C shares. The annualized net expense ratios after fee waivers and/or expense reimbursements excluding securities sold short dividend expense are 1.70% for Class I shares, 1.95% for Class A shares and 2.70% for Class C shares.
1 Fee waivers and/or expense reimbursements may reduce expenses for the Fund, without which performance would be lower.
2 Inception date March 30, 2012.
5
Credit Suisse Multialternative Strategy Fund
Annual Investment Adviser's Report (continued)
October 31, 2013 (unaudited)
Information About Your Fund's Expenses
As an investor of the Fund, you incur two types of costs: ongoing expenses and transaction costs. Ongoing expenses include management fees, distribution and service (12b-1) fees and other Fund expenses. Examples of transaction costs include sales charges (loads), redemption fees and account maintenance fees, which are not shown in this section and which would result in higher total expenses. The following table is intended to help you understand your ongoing expenses of investing in the Fund and to help you compare these expenses with the ongoing expenses of investing in other mutual funds. The table is based on an investment of $1,000 made at the beginning of the six month period ended October 31, 2013.
The table illustrates your Fund's expenses in two ways:
• Actual Fund Return. This helps you estimate the actual dollar amount of ongoing expenses paid on a $1,000 investment in the Fund using the Fund's actual return during the period. To estimate the expenses you paid over the period, simply divide your account value by $1,000 (for example, an $8,600 account value divided by $1,000 = 8.6), then multiply the result by the number in the "Expenses Paid per $1,000" line under the share class you hold.
• Hypothetical 5% Fund Return. This helps you to compare your Fund's ongoing expenses with those of other mutual funds using the Fund's actual expense ratio and a hypothetical rate of return of 5% per year before expenses. Examples using a 5% hypothetical fund return may be found in the shareholder reports of other mutual funds. The hypothetical account values and expenses may not be used to estimate the actual ending account balance or expenses you paid for the period.
Please note that the expenses shown in these tables are meant to highlight your ongoing expenses only and do not reflect any transaction costs, such as sales charges (loads) or redemption fees. If these transaction costs had been included, your costs would have been higher. The "Expenses Paid per $1,000" line of the tables is useful in comparing ongoing expenses only and will not help you determine the relative total expenses of owning different funds.
6
Credit Suisse Multialternative Strategy Fund
Annual Investment Adviser's Report (continued)
October 31, 2013 (unaudited)
Expenses and Value for a $1,000 Investment
for the six month period ended October 31, 2013
Actual Fund Return | | Class I | | Class A | | Class C | |
Beginning Account Value 05/01/13 | | $ | 1,000.00 | | | $ | 1,000.00 | | | $ | 1,000.00 | | |
Ending Account Value 10/31/13 | | $ | 1,021.40 | | | $ | 1,019.50 | | | $ | 1,015.60 | | |
Expenses Paid per $1,000* | | $ | 8.81 | | | $ | 10.08 | | | $ | 13.87 | | |
Hypothetical 5% Fund Return | |
Beginning Account Value 05/01/13 | | $ | 1,000.00 | | | $ | 1,000.00 | | | $ | 1,000.00 | | |
Ending Account Value 10/31/13 | | $ | 1,016.48 | | | $ | 1,015.22 | | | $ | 1,011.44 | | |
Expenses Paid per $1,000* | | $ | 8.79 | | | $ | 10.06 | | | $ | 13.84 | | |
| | | Class I | | Class A | | Class C | |
Annualized Expense Ratios* | | | 1.73 | % | | | 1.98 | % | | | 2.73 | % | |
* Expenses are equal to the Fund's annualized expense ratio for each share class, multiplied by the average account value over the period, multiplied by the number of days in the most recent fiscal half year period, then divided by 365.
The "Expenses Paid per $1,000" and the "Annualized Expense Ratios" in the tables are based on actual expenses paid by the Fund during the period, net of fee waivers and/or expense reimbursements. If those fee waivers and/or expense reimbursements had not been in effect, the Fund's actual expenses would have been higher.
For more information, please refer to the Fund's prospectus.
Sector Breakdown*
Investment Company | | | 36.18 | % | |
Exchange Traded Funds | | | 15.40 | % | |
Rights | | | 0.00 | % | |
Short-Term Investment | | | 48.42 | % | |
Total | | | 100.00 | % | |
* Expressed as a percentage of total investments (excluding securities lending collateral if applicable) and may vary over time.
7
Credit Suisse Multialternative Strategy Fund
Consolidated Schedule of Investments
October 31, 2013
| | | Number of
Shares | | Value | |
| EXCHANGE TRADED FUNDS (5.8%) | |
| UNITED STATES (5.8%) | |
| Diversified Financial Services (5.8%) | |
iShares iBoxx $ High Yield Corporate Bond ETF | | | 1,734 | | | $ | 161,956 | | |
iShares Russell 2000 ETF§ | | | 2,008 | | | | 219,334 | | |
Vanguard FTSE Emerging Markets ETF | | | 1,206 | | | | 50,495 | | |
| TOTAL EXCHANGE TRADED FUNDS (Cost $390,831) | | | 431,785 | | |
| INVESTMENT COMPANY (13.6%) | |
| UNITED STATES (13.6%) | |
Credit Suisse Managed Futures Strategy Fund (Cost $981,292)*^ | | | 97,874 | | | | 1,013,974 | | |
| | | Number of
Rights | | | |
| RIGHTS (0.0%) | |
| UNITED STATES (0.0%) | |
| Biotechnology (0.0%) | |
Trius Therapeutics, Inc. (Cost $—)*• | | | 400 | | | | 52 | | |
| | | Number of
Shares | | | |
| SHORT-TERM INVESTMENTS (21.1%) | |
State Street Navigator Prime Portfolio, 0.16%§§ | | | 225,398 | | | | 225,398 | | |
| | | Par
(000) | | | |
State Street Bank and Trust Co. Euro Time Deposit, 0.010% 11/01/2013 | | $ | 1,357 | | | | 1,357,000 | | |
| TOTAL SHORT-TERM INVESTMENTS (Cost $1,582,398) | | | 1,582,398 | | |
| TOTAL INVESTMENTS AT VALUE (40.5%) (Cost $2,954,521) | | | 3,028,209 | | |
| OTHER ASSETS IN EXCESS OF LIABILITIES (59.5%) | | | 4,449,375 | | |
| NET ASSETS (100.0%) | | $ | 7,477,584 | | |
§ Security or portion thereof is out on loan.
* Non-income producing security.
^ Affiliated issuer. See Note 3.
• Not readily marketable security; security is valued at fair value as determined in good faith by, or under the direction of, the Board of Trustees.
§§ Represents security purchased with cash collateral received for securities on loan. The rate shown is the annualized one-day yield at October 31, 2013.
See Accompanying Notes to Consolidated Financial Statements.
8
Credit Suisse Multialternative Strategy Fund
Consolidated Statement of Assets and Liabilities
October 31, 2013
Assets | |
Investments in unaffiliated issuers at value, including collateral for securities
on loan of $225,398 (Cost $1,973,229) (Note 2) | | $ | 2,014,2351 | | |
Investment in affiliated issuer at value (Cost $981,292) (Note 2) | | | 1,013,974 | | |
Cash | | | 1,334 | | |
Foreign currency at value (cost $33,191) | | | 32,942 | | |
Cash segregated at brokers for swap contracts and written options | | | 4,627,501 | | |
Cash segregated at brokers for centrally cleared swaps | | | 11,100 | | |
Unrealized appreciation on open swap contracts (Note 2) | | | 78,390 | | |
Receivable from investment adviser (Note 3) | | | 46,979 | | |
Receivable for fund shares sold | | | 13,000 | | |
Unrealized appreciation on forward currency contracts (Note 2) | | | 2,676 | | |
Prepaid expenses and other assets | | | 11,980 | | |
Total Assets | | | 7,854,111 | | |
Liabilities | |
Administrative services fee payable (Note 3) | | | 1,910 | | |
Shareholder servicing/Distribution fee payable (Note 3) | | | 1,540 | | |
Payable upon return of securities loaned (Note 2) | | | 225,398 | | |
Trustees' fee payable | | | 14,375 | | |
Unrealized depreciation on forward currency contracts (Note 2) | | | 13,628 | | |
Outstanding written options, at value (Proceeds $30,835) (Note 2) | | | 11,340 | | |
Unrealized depreciation on open swap contracts (Note 2) | | | 9,314 | | |
Variation margin payable on centrally cleared swaps (Note 2) | | | 476 | | |
Accrued expenses | | | 98,546 | | |
Total Liabilities | | | 376,527 | | |
Net Assets | |
Capital stock, $.001 par value (Note 6) | | | 715 | | |
Paid-in capital (Note 6) | | | 7,145,507 | | |
Accumulated net investment loss | | | (33,877 | ) | |
Accumulated net realized gain from investments, futures contracts, written options,
securities sold short, swap contracts and foreign currency transactions | | | 217,818 | | |
Net unrealized appreciation from investments, written options, swap contracts and
foreign currency translations | | | 147,421 | | |
Net Assets | | $ | 7,477,584 | | |
I Shares | |
Net assets | | $ | 5,408,673 | | |
Shares outstanding | | | 516,118 | | |
Net asset value and offering price per share | | $ | 10.48 | | |
A Shares | |
Net assets | | $ | 323,787 | | |
Shares outstanding | | | 30,965 | | |
Net asset value and redemption price per share | | $ | 10.46 | | |
Maximum offering price per share (net asset value/(1-5.25%)) | | $ | 11.04 | | |
C Shares | |
Net assets | | $ | 1,745,124 | | |
Shares outstanding | | | 168,211 | | |
Net asset value, offering price and redemption price per share | | $ | 10.37 | | |
1 Including $219,254 of securities on loan.
See Accompanying Notes to Consolidated Financial Statements.
9
Credit Suisse Multialternative Strategy Fund
Consolidated Statement of Operations
For the Year Ended October 31, 2013
| Investment Income (Note 2) | |
Dividends | | $ | 16,949 | | |
Interest | | | 2,302 | | |
Securities lending | | | 1,184 | | |
Foreign taxes withheld | | | (21 | ) | |
Total investment income | | | 20,414 | | |
Expenses | |
Investment advisory fees (Note 3) | | | 81,426 | | |
Administrative services fees (Note 3) | | | 10,535 | | |
Shareholder servicing/Distribution fees (Note 3) | |
| Class A | | | 667 | | |
| Class C | | | 16,874 | | |
Legal fees | | | 180,440 | | |
Offering costs (Note 3) | | | 61,645 | | |
Custodian fees | | | 51,378 | | |
Audit and tax fees | | | 50,600 | | |
Printing fees (Note 3) | | | 45,162 | | |
Registration fees | | | 38,727 | | |
Trustees' fees | | | 33,193 | | |
Transfer agent fees (Note 3) | | | 8,601 | | |
Dividend expense for securities sold short | | | 5,811 | | |
Insurance expense | | | 312 | | |
Commitment fees (Note 4) | | | 23 | | |
Miscellaneous expense | | | 4,798 | | |
Total expenses | | | 590,192 | | |
Less: fees waived and expenses reimbursed (Note 3) | | | (446,703 | ) | |
Net expenses | | | 143,489 | | |
Net investment loss | | | (123,075 | ) | |
Net Realized and Unrealized Gain (Loss) from Investments, Futures Contracts, Written Options,
Securities Sold Short, Swap Contracts and Foreign Currency Related Items | |
Net realized gain from investments in unaffiliated issuers | | | 38,720 | | |
Net realized gain from investment in affiliated issuer | | | 13,742 | | |
Net realized gain from futures contracts | | | 46,852 | | |
Net realized gain from written options | | | 40,277 | | |
Net realized gain from securities sold short | | | 11,278 | | |
Net realized gain from swap contracts | | | 136,921 | | |
Net realized gain from foreign currency transactions | | | 39,035 | | |
Net change in unrealized appreciation (depreciation) from investments in unaffiliated issuers | | | 36,241 | | |
Net change in unrealized appreciation (depreciation) from investment in affiliated issuer | | | 32,682 | | |
Net change in unrealized appreciation (depreciation) from futures contracts | | | 21,941 | | |
Net change in unrealized appreciation (depreciation) from written options | | | 33,565 | | |
Net change in unrealized appreciation (depreciation) from swap contracts | | | 75,651 | | |
Net change in unrealized appreciation (depreciation) from foreign currency translations | | | (18,236 | ) | |
Net realized and unrealized gain from investments, futures contracts, written options,
securities sold short, swap contracts and foreign currency related items | | | 508,669 | | |
Net increase in net assets resulting from operations | | $ | 385,594 | | |
See Accompanying Notes to Consolidated Financial Statements.
10
Credit Suisse Multialternative Strategy Fund
Consolidated Statement of Changes in Net Assets
| | | For the Year
Ended
October 31, 2013 | | For the Period
Ended
October 31, 20121 | |
From Operations | |
Net investment income (loss) | | $ | (123,075 | ) | | $ | 2,391 | | |
Net realized gain (loss) from investments, futures contracts, written options,
securities sold short, swap contracts and foreign currency transactions | | | 326,825 | | | | (26,470 | ) | |
Net change in unrealized appreciation (depreciation) from investments,
futures contracts, written options, swap contracts and foreign
currency translations | | | 181,844 | | | | (34,423 | ) | |
Net increase (decrease) in net assets resulting from operations | | | 385,594 | | | | (58,502 | ) | |
From Dividends and Distributions | |
Dividends from net investment income | |
Class I | | | (27,302 | ) | | | — | | |
Class A | | | (1,006 | ) | | | — | | |
Distributions from net realized gains | |
Class I | | | (4,398 | ) | | | — | | |
Class A | | | (220 | ) | | | — | | |
Class C | | | (1,132 | ) | | | — | | |
Net decrease in net assets resulting from dividends and distributions | | | (34,058 | ) | | | — | | |
| From Capital Share Transactions (Note 6) | |
Proceeds from sale of shares | | | 1,283,655 | | | | 8,224,935 | | |
Reinvestment of dividends and distributions | | | 34,058 | | | | — | | |
Net asset value of shares redeemed | | | (397,505 | ) | | | (1,960,593 | ) | |
Net increase in net assets from capital share transactions | | | 920,208 | | | | 6,264,342 | | |
Net increase in net assets | | | 1,271,744 | | | | 6,205,840 | | |
Net Assets | |
Beginning of year | | | 6,205,840 | | | | — | | |
End of year | | $ | 7,477,584 | | | $ | 6,205,840 | | |
Undistributed (accumulated) net investment income (loss) | | $ | (33,877 | ) | | $ | 6,991 | | |
1 For the period March 30, 2012 (commencement of operations) through October 31, 2012.
See Accompanying Notes to Consolidated Financial Statements.
11
Credit Suisse Multialternative Strategy Fund
Consolidated Financial Highlights
(For a Class I Share of the Fund Outstanding Throughout Each Period)
| | | For the Year
Ended
October 31, 2013 | | For the Period
Ended
October 31, 20121 | |
Per share data | |
Net asset value, beginning of year | | $ | 9.95 | | | $ | 10.00 | | |
INVESTMENT OPERATIONS | |
Net investment income (loss)2 | | | (0.15 | ) | | | 0.01 | | |
Net gain (loss) on investments, futures contracts, written options,
securities sold short, swap contracts and foreign currency related
items (both realized and unrealized) | | | 0.75 | | | | (0.06 | ) | |
Total from investment operations | | | 0.60 | | | | (0.05 | ) | |
LESS DIVIDENDS AND DISTRIBUTIONS | |
Dividends from net investment income | | | (0.06 | ) | | | — | | |
Distributions from net realized gains | | | (0.01 | ) | | | — | | |
Total dividends and distributions | | | (0.07 | ) | | | — | | |
Net asset value, end of year | | $ | 10.483 | | | $ | 9.95 | | |
Total return4 | | | 6.11 | % | | | (0.50 | )% | |
RATIOS AND SUPPLEMENTAL DATA | |
Net assets, end of year (000s omitted) | | $ | 5,409 | | | $ | 4,904 | | |
Ratio of net expenses to average net assets | | | 1.78 | % | | | 1.79 | %5 | |
Ratio of expenses to average net assets excluding securities
sold short dividend expense | | | 1.70 | % | | | 1.70 | %5 | |
Ratio of net investment income (loss) to average net assets | | | (1.49 | )% | | | 0.21 | %5 | |
Decrease reflected in above operating expense ratios due to
waivers/reimbursements | | | 6.31 | % | | | 9.22 | %5 | |
Portfolio turnover rate | | | 284 | % | | | 228 | % | |
1 For the period March 30, 2012 (commencement of operations) through October 31, 2012.
2 Per share information is calculated using the average shares outstanding method.
3 Includes adjustments in accordance with accounting principles generally accepted in the United States of America and as such, the net asset values for financial reporting purposes and the returns based upon those net asset values may differ from the net asset values and returns for shareholder transactions.
4 Total returns are historical and assume changes in share price and reinvestment of all dividends and distributions. Had certain expenses not been reduced during the years shown, total returns would have been lower. Total returns for periods less than one year are not annualized.
5 Annualized.
See Accompanying Notes to Consolidated Financial Statements.
12
Credit Suisse Multialternative Strategy Fund
Consolidated Financial Highlights
(For a Class A Share of the Fund Outstanding Throughout Each Period)
| | | For the Year
Ended
October 31, 2013 | | For the Period
Ended
October 31, 20121 | |
Per share data | |
Net asset value, beginning of year | | $ | 9.93 | | | $ | 10.00 | | |
INVESTMENT OPERATIONS | |
Net investment loss2 | | | (0.18 | ) | | | (0.01 | ) | |
Net gain (loss) on investments, futures contracts, written options,
securities sold short, swap contracts and foreign currency related
items (both realized and unrealized) | | | 0.76 | | | | (0.06 | ) | |
Total from investment operations | | | 0.58 | | | | (0.07 | ) | |
LESS DIVIDENDS AND DISTRIBUTIONS | |
Dividends from net investment income | | | (0.04 | ) | | | — | | |
Distributions from net realized gains | | | (0.01 | ) | | | — | | |
Total dividends and distributions | | | (0.05 | ) | | | — | | |
Net asset value, end of year | | $ | 10.463 | | | $ | 9.93 | | |
Total return4 | | | 5.96 | % | | | (0.70 | )% | |
RATIOS AND SUPPLEMENTAL DATA | |
Net assets, end of year (000s omitted) | | $ | 324 | | | $ | 228 | | |
Ratio of net expenses to average net assets | | | 2.03 | % | | | 2.04 | %5 | |
Ratio of expenses to average net assets excluding securities
sold short dividend expense | | | 1.95 | % | | | 1.95 | %5 | |
Ratio of net investment loss to average net assets | | | (1.75 | )% | | | (0.18 | )%5 | |
Decrease reflected in above operating expense ratios due to
waivers/reimbursements | | | 6.31 | % | | | 9.22 | %5 | |
Portfolio turnover rate | | | 284 | % | | | 228 | % | |
1 For the period March 30, 2012 (commencement of operations) through October 31, 2012.
2 Per share information is calculated using the average shares outstanding method.
3 Includes adjustments in accordance with accounting principles generally accepted in the United States of America and as such, the net asset values for financial reporting purposes and the returns based upon those net asset values may differ from the net asset values and returns for shareholder transactions.
4 Total returns are historical and assume changes in share price, reinvestment of all dividends and distributions and no sales charge. Had certain expenses not been reduced during the years shown, total returns would have been lower. Total returns for periods less than one year are not annualized.
5 Annualized.
See Accompanying Notes to Consolidated Financial Statements.
13
Credit Suisse Multialternative Strategy Fund
Consolidated Financial Highlights
(For a Class C Share of the Fund Outstanding Throughout Each Period)
| | | For the Year
Ended
October 31, 2013 | | For the Period
Ended
October 31, 20121 | |
Per share data | |
Net asset value, beginning of year | | $ | 9.89 | | | $ | 10.00 | | |
INVESTMENT OPERATIONS | |
Net investment loss2 | | | (0.25 | ) | | | (0.06 | ) | |
Net gain (loss) on investments, futures contracts, written options,
securities sold short, swap contracts and foreign currency related
items (both realized and unrealized) | | | 0.74 | | | | (0.05 | ) | |
Total from investment operations | | | 0.49 | | | | (0.11 | ) | |
LESS DIVIDENDS AND DISTRIBUTIONS | |
Distributions from net realized gains | | | (0.01 | ) | | | — | | |
Total dividends and distributions | | | (0.01 | ) | | | — | | |
Net asset value, end of year | | $ | 10.37 | | | $ | 9.89 | | |
Total return3 | | | 5.15 | % | | | (1.10 | )% | |
RATIOS AND SUPPLEMENTAL DATA | |
Net assets, end of year (000s omitted) | | $ | 1,745 | | | $ | 1,074 | | |
Ratio of net expenses to average net assets | | | 2.77 | % | | | 2.79 | %4 | |
Ratio of expenses to average net assets excluding securities
sold short dividend expense | | | 2.70 | % | | | 2.70 | %4 | |
Ratio of net investment loss to average net assets | | | (2.49 | )% | | | (1.00 | )%4 | |
Decrease reflected in above operating expense ratios due to
waivers/reimbursements | | | 6.31 | % | | | 9.22 | %4 | |
Portfolio turnover rate | | | 284 | % | | | 228 | % | |
1 For the period March 30, 2012 (commencement of operations) through October 31, 2012.
2 Per share information is calculated using the average shares outstanding method.
3 Total returns are historical and assume changes in share price, reinvestment of all dividends and distributions and no sales charge. Had certain expenses not been reduced during the years shown, total returns would have been lower. Total returns for periods less than one year are not annualized.
4 Annualized.
See Accompanying Notes to Consolidated Financial Statements.
14
Credit Suisse Multialternative Strategy Fund
Notes to Consolidated Financial Statements
October 31, 2013
Credit Suisse Multialternative Strategy Fund (the "Fund"), a series of the Credit Suisse Opportunity Funds (the "Trust"), a Delaware statutory trust, is registered under the Investment Company Act of 1940, as amended (the "1940 Act"), as a non-diversified open-end management investment company that seeks to achieve investment results that correspond to the performance (before fees and expenses) of the Credit Suisse Liquid Alternative Beta Index. The Trust was organized under the laws of the State of Delaware as a business trust on May 31, 1995.
Fund is registered as a Commodity Pool Operator with the Commodity Futures Trading Commission. The Fund intends to gain exposure to commodities derivatives through investing in a wholly-owned subsidiary, Credit Suisse Cayman Multialternative Strategy Fund, Ltd., organized under the laws of the Cayman Islands (the "Subsidiary"). The Subsidiary invests in commodity-linked derivative instruments, such as swaps and futures. The Subsidiary may also invest in debt securities, some of which are intended to serve as margin or collateral for the Subsidiary's derivatives positions.
The Subsidiary is managed by the same portfolio managers that manage the Fund and the accompanying financial statements reflect the financial position of the Fund and its Subsidiary and the results of operations on a consolidated basis. The consolidated financial statements include portfolio holdings of the Fund and the Subsidiary and all intercompany transactions and balances have been eliminated. The Fund may invest up to 25% of its total net assets in the Subsidiary, as of October 31, 2013, the Fund held $36,095 in the Subsidiary, representing 0.5% of the Fund's net assets.
The Fund offers three classes of shares: Class I shares, Class A shares and Class C shares. Each class of shares represents an equal pro rata interest in the Fund, except they bear different expenses, which reflect the differences in the range of services provided to them. Class A shares are sold subject to a front-end sales charge of up to 5.25%. Class C shares are sold subject to a contingent deferred sales charge of 1.00% if the shares are redeemed within the first year of purchase.
Note 2. Significant Accounting Policies
The following is a summary of significant accounting policies followed by the Funds in the preparation of their financial statements. The policies are in accordance with accounting principles generally accepted in the United States of America ("GAAP"). The preparation of financial statements requires
15
Credit Suisse Multialternative Strategy Fund
Notes to Consolidated Financial Statements (continued)
October 31, 2013
Note 2. Significant Accounting Policies
management to make estimates and assumptions that affect the reported amounts and disclosures in the financial statements. Actual results could differ from those estimates.
A) SECURITY VALUATION — The net asset value of the Fund is determined daily as of the close of regular trading on the New York Stock Exchange, Inc. (the "Exchange") on each day the Exchange is open for business. The valuations for fixed income securities (which may include, but are not limited to, corporate, government, municipal, mortgage-backed, collateralized mortgage obligations and asset-backed securities) and certain derivative instruments are typically the prices supplied by independent third party pricing services, which may use market prices or broker/dealer quotations or a variety of valuation techniques and methodologies. The independent third party pricing services use inputs that are observable such as issuer details, interest rates, yield curves, prepayment speeds, credit risks/spreads, default rates and quoted prices for similar securities. Short-term fixed income securities that will mature in 60 days or less are valued at amortized cost unless it is determined that using this method would not reflect an investment's fair value. Structured note agreements are valued in accordance with a dealer-supplied valuation based on changes in the value of the underlying index. Futures contracts are valued daily at the settlement price established by the board of trade or exchange on which they are traded. Equity securities for which market quotations are available are valued at the last reported sales price or official closing price on the primary market or exchange on which they trade. The Fund may utilize a service provided by an independent third party which has been approved by the Board of Trustees to fair value certain securities. When fair value pricing is employed, the prices of securities used by the Fund to calculate its net asset value may differ from quoted or published prices for the same securities. If independent third party pricing services are unable to supply prices for a portfolio investment, or if the prices supplied are deemed by the investment adviser to be unreliable, the market price may be determined by the investment adviser using quotations from one or more broker/dealers or at the transaction price if the security has recently been purchased and no value has yet been obtained from a pricing service or pricing broker. When reliable prices are not readily available, such as when the value of a security has been significantly affected by events after the close of the exchange or market on which the security is principally traded, but before the Fund calculates its net asset value, the Fund values these securities as determined in accordance with procedures approved by the Fund's Board of Trustees.
16
Credit Suisse Multialternative Strategy Fund
Notes to Consolidated Financial Statements (continued)
October 31, 2013
Note 2. Significant Accounting Policies
The Fund uses valuation techniques to measure fair value that are consistent with the market approach and/or income approach, depending on the type of security and the particular circumstance. The market approach uses prices and other relevant information generated by market transactions involving identical or comparable securities. The income approach uses valuation techniques to discount estimated future cash flows to present value.
GAAP established a disclosure hierarchy that categorizes the inputs to valuation techniques used to value assets and liabilities at measurement date. These inputs are summarized in the three broad levels listed below:
• Level 1 – quoted prices in active markets for identical investments
• Level 2 – other significant observable inputs (including quoted prices for similar investments, interest rates, prepayment speeds, credit risk, etc.)
• Level 3 – significant unobservable inputs (including the Fund's own assumptions in determining the fair value of investments)
The inputs or methodologies used to value securities are not necessarily an indication of the risk associated with investing in those securities.
The following is a summary of the inputs used as of October 31, 2013 in valuing the Fund's assets and liabilities carried at fair value:
| | | Level 1 | | Level 2 | | Level 3 | | Total | |
Investments in Securities | |
Exchange Traded Funds | | $ | 431,785 | | | $ | — | | | $ | — | | | $ | 431,785 | | |
Investment Company | | | 1,013,974 | | | | — | | | | — | | | | 1,013,974 | | |
Rights | | | — | | | | — | | | | 52 | | | | 52 | | |
Short-term Investments | | | — | | | | 1,582,398 | | | | — | | | | 1,582,398 | | |
Other Financial Instruments* | |
Forward Foreign Currency Contracts | | | — | | | | (10,952 | ) | | | — | | | | (10,952 | ) | |
Swap Contracts | | | — | | | | 65,439 | | | | — | | | | 65,439 | | |
Written Options | | | (11,340 | ) | | | — | | | | — | | | | (11,340 | ) | |
| | | $ | 1,434,419 | | | $ | 1,636,885 | | | $ | 52 | | | $ | 3,071,356 | | |
*Other financial instruments include forwards, swaps, and written options.
As of October 31, 2013, the amounts shown by the Fund as being Level 3 securities that were measured at fair value amounted to less than 0.01% of net assets.
The Fund adopted Financial Accounting Standards Board ("FASB") amendments to authoritative guidance which require the Fund to disclose details of transfers in and out of Level 1 and Level 2 measurements and Level 2 and Level 3 measurements and the reasons for the transfers. For the year ended
17
Credit Suisse Multialternative Strategy Fund
Notes to Consolidated Financial Statements (continued)
October 31, 2013
Note 2. Significant Accounting Policies
October 31, 2013, there were no transfers in and out of Level 1, Level 2 and Level 3. All transfers are assumed to occur at the end of the reporting period.
B) DERIVATIVE INSTRUMENTS AND HEDGING ACTIVITIES — The Fund adopted amendments to authoritative guidance on disclosures about derivative instruments and hedging activities which require that the Fund disclose (a) how and why an entity uses derivative instruments, (b) how derivative instruments and hedging activities are accounted for, and (c) how derivative instruments and related hedging activities affect a fund's financial position, financial performance, and cash flows. For the year ended October 31, 2013, the Fund's derivatives did not qualify for hedge accounting as they are held at fair value.
Fair Values of Derivative Instruments as of October 31, 2013
| | | Asset Derivatives | | Liability Derivatives | |
| | | Balance Sheet
Location | | Fair Value | | Balance Sheet
Location | | Fair Value | |
Currency Contracts
| | Unrealized appreciation
on forward currency
contracts | | $ | 2,676 | | | Unrealized depreciation
on forward currency
contracts | | $ | 13,628 | | |
Interest Rate Contracts
| | Unrealized appreciation
on open swap contracts | | | 78,390 | | | Unrealized depreciation
on open swap contracts | | | 9,314 | | |
Credit Contracts
| | Unrealized appreciation
on open swap contracts | | | — | | | Unrealized depreciation
on open swap contracts | | | 3,637 | ^ | |
Equity Contracts
| | Outstanding written
options, at value | | | — | | | Outstanding written
options, at value | | | 11,340 | * | |
| | | | | $ | 81,066 | | | | | | | $ | 37,919 | | |
^Includes cumulative appreciation/depreciation of centrally cleared swap contracts as reported in the Consolidated Statement of Assets and Liabilities and Notes to Consolidated Financial Statements. Only the current day's variation margin is reported within the Consolidated Statement of Assets and Liabilities.
*Written options are reported at market value.
18
Credit Suisse Multialternative Strategy Fund
Notes to Consolidated Financial Statements (continued)
October 31, 2013
Note 2. Significant Accounting Policies
Effect of Derivative Instruments on the Consolidated Statement of Operations
| | | Location | | Realized
Gain/Loss | | Location | | Net Unrealized
Appreciation/
Depreciation | |
Currency Contracts
| | Net realized gain
from foreign
currency | | $ | 33,119 | | | Net change in unrealized
appreciation (depreciation) from
foreign currency transactions | | $ | (18,090 | ) | |
Index Contracts
| | Net realized gain
from futures
contracts | | | 46,852 | | | Net change in unrealized
appreciation (depreciation) from
futures contracts | | | 21,941 | | |
Interest Rate Contracts
| | Net realized gain
from swap
contracts | | | 145,601 | | | Net change in unrealized
appreciation (depreciation) from
swap contracts | | | 79,288 | | |
Credit Contracts
| | Net realized loss
from swap
contracts | | | (8,680 | ) | | Net change in unrealized
appreciation (depreciation) from
swap contracts | | | (3,637 | ) | |
Equity Contracts
| | Net realized gain
from written
options | | | 40,277 | | | Net change in unrealized
appreciation (depreciation) from
written options | | | 33,565 | | |
| | | | | | | $ | 257,169 | | | | | | | $ | 113,067 | | |
The notional amount of futures contracts, forward foreign currency contracts, swap contracts and written options at year ended October 31, 2013, are reflected in the Consolidated Notes to Financial Statements. The notional amounts of long and short open positions of futures contracts, forward foreign currency contracts, swap contracts and written options at each month end throughout the reporting period averaged approximately 7.4%, 2.8%, 28.7% and 0.2%, respectively of net assets of the Fund.
C) SECURITY TRANSACTIONS AND INVESTMENT INCOME/EXPENSE — Security transactions are accounted for on a trade date basis. Interest income/expense is recorded on the accrual basis. The Fund amortizes premiums and accretes discounts using the effective interest method. Dividend income/expense is recorded on the ex-dividend date. Certain expenses are class-specific expenses, vary by class and are charged only to that class. Income, expenses (excluding class-specific expenses) and realized/unrealized gains/losses are allocated proportionately to each class of shares based upon the relative net asset value of the outstanding shares of that class. The cost of investments sold is determined by use of the specific identification method for both financial reporting and income tax purposes.
D) DIVIDENDS AND DISTRIBUTIONS TO SHAREHOLDERS — Dividends from net investment income, if any, are declared and paid quarterly. Distributions of net realized capital gains, if any, are declared and paid at least
19
Credit Suisse Multialternative Strategy Fund
Notes to Consolidated Financial Statements (continued)
October 31, 2013
Note 2. Significant Accounting Policies
annually. However, to the extent that a net realized capital gain can be reduced by a capital loss carryforward, such gain will not be distributed. Income and capital gain distributions are determined in accordance with federal income tax regulations, which may differ from GAAP.
E) FEDERAL INCOME TAXES — No provision is made for federal taxes as it is the Fund's intention to continue to qualify for and elect the tax treatment applicable to regulated investment companies ("RIC") under the Internal Revenue Code of 1986, as amended (the "Code"), and to make the requisite distributions to its shareholders, which will be sufficient to relieve it from federal income and excise taxes.
In order to qualify as a RIC under the Code, the Fund must meet certain requirements regarding the source of its income, the diversification of its assets and the distribution of its income. One of these requirements is that the Fund derive at least 90% of its gross income for each taxable year from dividends, interest, payments with respect to certain securities loans, gains from the sale or other disposition of stock, securities or foreign currencies, other income derived with respect to its business of investing in such stock, securities or currencies or net income derived from interests in certain publicly traded partnerships ("Qualifying Income"). The IRS has issued a ruling that income realized from certain types of commodity-linked derivatives would not be Qualifying Income. As a result, the Fund's ability to realize income from investments in such commodity-linked derivatives as part of its investment strategy would be limited to a maximum of 10% of its gross income. The IRS has issued private letter rulings to registered investment companies concluding that income derived from their investment in a wholly-owned subsidiary would constitute Qualifying Income to the fund. The IRS has indicated that the granting of these types of private letter rulings is currently suspended, pending further internal discussion. As a result, the Fund has not received and there can be no assurance that the IRS will grant, such a private letter ruling to the Fund. If the Fund does not request and receive such a private letter ruling, there is a risk that the IRS could assert that the income derived from the Fund's investment in the Subsidiary will not be considered Qualifying Income for purposes of the fund remaining qualified as a RIC for U.S. federal income tax purposes. If the Fund is unable to ensure continued qualification as a RIC, the Fund may be required to change its investment objective, policies or techniques, or may be liquidated. If the Fund fails to qualify as a RIC, the Fund will be subject to federal income tax on its net income and capital gains at regular corporate rates (without reduction for distributions to shareholders).
20
Credit Suisse Multialternative Strategy Fund
Notes to Consolidated Financial Statements (continued)
October 31, 2013
Note 2. Significant Accounting Policies
If the Fund were to fail to qualify as a RIC and become subject to federal income tax, shareholders of the Fund would be subject to the risk of diminished returns.
The Fund adopted the authoritative guidance for uncertainty in income taxes and recognizes a tax benefit or liability from an uncertain position only if it is more likely than not that the position is sustainable based solely on its technical merits and consideration of the relevant taxing authority's widely understood administrative practices and procedures. The Fund has reviewed its current tax positions and has determined that no provision for income tax is required in the Fund's financial statements. The Fund's federal tax returns for the prior fiscal year remain subject to examination by the Internal Revenue Service.
F) SHORT-TERM INVESTMENTS — The Fund, together with other funds/portfolios advised by Credit Suisse Asset Management, LLC ("Credit Suisse"), an indirect, wholly-owned subsidiary of Credit Suisse Group AG, pools available cash into a short-term variable rate time deposit issued by State Street Bank and Trust Company ("SSB"), the Fund's custodian. The short-term time deposit issued by SSB is a variable rate account classified as a short-term investment.
G) SHORT SALES — The Fund enters into short sales transactions collateralized by cash deposits received from brokers in connection with securities lending activities and securities. Cash deposits are shown as collateral for securities on loan on the Consolidated Statement of Assets and Liabilities. The collateral amounts required are determined daily by reference to the market value of the short positions. Short sales expose the Fund to the risk that it will be required to cover its short position at a time when the securities have appreciated in value, thus resulting in a loss to the Fund. The Fund's loss on a short sale could theoretically be unlimited in a case where the Fund is unable, for whatever reason, to close out its short position. Short sales also involve transaction and other costs that will reduce potential gains and increase potential Fund losses. The use by the Fund of short sales in combination with long positions in the Fund in an attempt to improve performance may not be successful and may result in greater losses or lower positive returns than if the Fund held only long positions. It is possible that the Fund's long equity positions will decline in value at the same time that the value of the securities it has sold short increases, thereby increasing potential losses to the Fund. In addition, the Fund's short selling strategies may limit its ability to fully benefit from increases in the equity markets. Short selling also involves a form of financial leverage that may exaggerate any losses realized
21
Credit Suisse Multialternative Strategy Fund
Notes to Consolidated Financial Statements (continued)
October 31, 2013
Note 2. Significant Accounting Policies
by the Fund. Also, there is the risk that the counterparty to a short sale may fail to honor its contractual terms, causing a loss to the Fund. There were no securities held short at year-end.
H) FUTURES — The Fund may enter into futures contracts to the extent permitted by its investment policies and objectives. The Fund may use futures contracts to gain exposure to, or hedge against changes in interest rates, equity and market price movements and/or currency risks. Upon entering into a futures contract, the Fund is required to deposit cash and/or pledge U.S. Government securities as initial margin. Subsequent payments, which are dependent on the daily fluctuations in the value of the underlying instrument, are made or received by the Fund each day (daily variation margin) and are recorded as unrealized gains or losses until the contracts are closed. When the contracts are closed, the Fund records a realized gain or loss equal to the difference between the proceeds from (or cost of) the closing transactions and the Fund's basis in the contract. Risks of entering into futures contracts for hedging purposes include the possibility that a change in the value of the contract may not correlate with the changes in the value of the underlying instruments. With futures, there is minimal counterparty credit risk to the Fund since futures are exchange traded and the exchange's clearinghouse, as counterparty to all exchange traded futures, guarantees the futures against default. In addition, the purchase of a futures contract involves the risk that the Fund could lose more than the original margin deposit and subsequent payments may be required for a futures transaction. At October 31, 2013, the Fund had no open futures contracts.
I) FORWARD FOREIGN CURRENCY CONTRACTS — The Fund may enter into forward foreign currency contracts for the purchase or sale of a specific foreign currency at a fixed price on a future date. Risks may arise upon entering into these contracts from the potential inability of counterparties to meet the terms of their contracts and from unanticipated movements in the value of a foreign currency. Forward foreign currency contracts are adjusted by the daily forward exchange rate of the underlying currency and any gains or losses are recorded for financial statement purposes as unrealized until the contract
22
Credit Suisse Multialternative Strategy Fund
Notes to Consolidated Financial Statements (continued)
October 31, 2013
Note 2. Significant Accounting Policies
settlement date or an offsetting position is entered into. At October 31, 2013, the Fund had the following open forward foreign currency contracts:
Forward Foreign
Currency to be
Purchased (Local) | | Forward Foreign
Currency to be
Sold (Local) | | Expiration
Date | | Counterparty | | Value on
Settlement Date | | Current
Value | | Net Unrealized
Appreciation/
(Depreciation) | |
AUD | 283,432 | | | USD | 269,523 | | | 11/20/13 | | Goldman Sachs | | $ | 269,523 | | | $ | 268,115 | | | $ | (1,408 | ) | |
CAD | 243,577 | | | USD | 235,180 | | | 11/19/13 | | Goldman Sachs | | | 235,180 | | | | 233,463 | | | | (1,717 | ) | |
CHF | 100,199 | | | USD | 109,424 | | | 11/20/13 | | Goldman Sachs | | | 109,424 | | | | 110,664 | | | | 1,240 | | |
GBP | 52,962 | | | USD | 84,345 | | | 11/20/13 | | Goldman Sachs | | | 84,345 | | | | 85,079 | | | | 734 | | |
NZD | 141,527 | | | USD | 118,854 | | | 11/20/13 | | Goldman Sachs | | | 118,854 | | | | 117,022 | | | | (1,832 | ) | |
SEK | 792,994 | | | USD | 121,796 | | | 11/20/13 | | Goldman Sachs | | | 121,796 | | | | 122,498 | | | | 702 | | |
USD | 38,196 | | | NOK | 230,181 | | | 11/20/13 | | Goldman Sachs | | | (38,196 | ) | | | (38,678 | ) | | | (482 | ) | |
USD | 66,818 | | | JPY | 6,604,785 | | | 11/20/13 | | Goldman Sachs | | | (66,818 | ) | | | (67,325 | ) | | | (507 | ) | |
USD | 334,067 | | | EUR | 247,584 | | | 11/20/13 | | Goldman Sachs | | | (334,067 | ) | | | (336,602 | ) | | | (2,535 | ) | |
USD | 678,273 | | | EUR | 502,682 | | | 11/20/13 | | Goldman Sachs | | | (678,273 | ) | | | (683,420 | ) | | | (5,147 | ) | |
| | | | | | | | | | | | | | | | | | | | | | | | | $ | (10,952 | ) | |
Currency Abbreviations:
AUD = Australian Dollar
CAD = Canadian Dollar
CHF = Swiss Franc
EUR = Euro
GBP = British Pound
JPY = Japanese Yen
NOK = Norwegian Krone
NZD = New Zealand Dollar
SEK = Swedish Krona
USD = United States Dollar
J) SWAPS — The Fund may enter into swaps either for hedging purposes or to seek to increase total return. A swap contract is an agreement that obligates two parties to exchange a series of cash flows at specified intervals based upon or calculated by reference to changes in specified prices or rates for a specified amount of an underlying asset or notional principal amount. A centrally cleared swap is a transaction executed between the Fund and a counterparty, then cleared by a clearing member through a central clearinghouse. The central clearinghouse serves as the counterparty, with whom the Fund exchanges cash flows. The Fund will enter into Over-The-Counter ("OTC") swap contracts only on a net basis, which means that the two payment streams are netted out, with the Fund receiving or paying, as the case may be, only the net amount of the two payments. Risks may arise as a result of the failure of the counterparty to the swap contract to comply with the terms of the swap contract. The extent of the Fund's exposure to credit and counterparty risks is the discounted net value of the cash flows to be received from/paid to the counterparty over the contract's remaining life, to the extent that the amount is positive. These risks are mitigated by having a master netting arrangement between the Fund and
23
Credit Suisse Multialternative Strategy Fund
Notes to Consolidated Financial Statements (continued)
October 31, 2013
Note 2. Significant Accounting Policies
the counterparty and by the posting of collateral by the counterparty to the Fund to cover the Fund's exposure to the counterparty. Therefore, the Fund considers the creditworthiness of each counterparty to a swap contract in evaluating potential credit risk. Additionally, risks may arise from unanticipated movements in interest rates or in the value of the underlying reference asset or index.
The Fund may enter into total return swap contracts, involving commitments to pay interest in exchange for a market-linked return, both based on notional amounts. To the extent the total return of the security or index underlying the transactions exceeds or falls short of the offsetting interest rate obligation, the Fund will receive a payment from or make a payment to the counterparty.
The Fund may enter into credit default swap agreements either as a buyer or seller. The Fund may buy a credit default swap to attempt to mitigate the risk of default or credit quality deterioration in one or more individual holdings or in a segment of the fixed income securities market. The Fund may sell a credit default swap in an attempt to gain exposure to an underlying issuer's credit quality characteristics without investing directly in that issuer.
The Fund bears the risk of loss of the amount expected to be received under a credit default swap agreement in the event of the default or bankruptcy of the counterparty. The Fund will enter into swap agreements only with counterparties that meet certain standards of creditworthiness (generally, such counterparties would have to be eligible counterparties under the terms of the Fund's repurchase agreement guidelines). Credit default swap agreements are generally valued at a price at which the counterparty to such agreement would terminate the agreement.
The Fund records unrealized gains or losses on a daily basis representing the value and the current net receivable or payable relating to open swap contracts. Net amounts received or paid on the swap contract are recorded as realized gains or losses. Fluctuations in the value of swap contracts are recorded for financial statement purposes as unrealized appreciation or depreciation on swap contracts. Realized gains and losses from terminated swaps are included in net realized gains/losses on swap contracts transactions. Upon entering into a centrally cleared swap, the Fund is required to deposit with a financial intermediary cash or securities ("initial margin") in an amount equal to a certain percentage of the notional amount of the swap. Subsequent payments ("variation margin") are made or received by the Fund dependent upon the daily fluctuations in the value of the swap. In a cleared swap transaction, counterparty risk is minimized as the central clearhouse acts as
24
Credit Suisse Multialternative Strategy Fund
Notes to Consolidated Financial Statements (continued)
October 31, 2013
Note 2. Significant Accounting Policies
the counterparty. At October 31, 2013, the Fund had the following outstanding swap contracts and the amount of restricted cash held at brokers was $11,100:
Total Return Swap Contracts
Currency | | Notional
Amount | | Expiration
Date | | Counterparty | | Receive | | Pay | | Net Unrealized
Appreciation/
(Depreciation) | |
USD |
| | | $ | 160,001
| | | 09/17/14
| | Goldman Sachs
| | Fee Plus LIBOR
| | NASDAQ-100
Total Return | | $ | (3,731
| ) | |
USD |
| | | $ | 188,337
| | | 09/17/14
| | Goldman Sachs
| | MSCI Daily TR Net
Emerging Markets Index | | Fee Plus LIBOR
| | | 6,104
| | |
USD |
| | | $ | 162,000
| | | 12/20/13
| | JPMorgan Chase
| | iBoxx $ Liquid High
Yield Index | | Fee Plus LIBOR
| | | 2,158
| | |
USD |
| | | $ | 216,000
| | | 12/20/13
| | JPMorgan Chase
| | iBoxx $ Liquid High
Yield Index | | Fee Plus LIBOR
| | | 6,705
| | |
USD |
| | | $ | 350,000
| | | 12/20/13
| | JPMorgan Chase
| | iBoxx $ Liquid High
Yield Index | | Fee Plus LIBOR
| | | 10,614
| | |
USD |
| | | $ | 144,000
| | | 12/20/13
| | JPMorgan Chase
| | iBoxx $ Liquid High
Yield Index | | Fee Plus LIBOR
| | | 2,700
| | |
USD |
| | | $ | 144,000
| | | 03/20/14
| | JPMorgan Chase
| | iBoxx $ Liquid High
Yield Index | | Fee Plus LIBOR
| | | 2,534
| | |
USD |
| | | $ | 416,000
| | | 03/20/14
| | JPMorgan Chase
| | iBoxx $ Liquid High
Yield Index | | Fee Plus LIBOR
| | | 13,797
| | |
USD |
| | | $ | 490,000
| | | 03/20/14
| | JPMorgan Chase
| | iBoxx $ Liquid High
Yield Index | | Fee Plus LIBOR
| | | 16,953
| | |
USD |
| | | $ | 429,501
| | | 06/18/14
| | JPMorgan Chase
| | Russell 2000 Total
Return Index | | Fee Plus LIBOR
| | | (5,524
| ) | |
USD |
| | | $ | 268,846
| | | 11/19/13
| | Societe Generale
| | S&P 500 Consumer
Discretionary Sector Index | | Fee Plus LIBOR
| | | 7,469
| | |
USD |
| | | $ | 35,816
| | | 09/17/14
| | Societe Generale
| | Russell 2000 Total
Return Index | | Fee Plus LIBOR
| | | (59
| ) | |
USD | | | | $ | 693,260 | | | 09/17/14 | | Societe Generale | | S&P 500 Index | | Fee Plus LIBOR | | | 9,356 | | |
| | | | | | | | | | | | | | | | | | | | | | | | | $ | 69,076 | | |
Centrally Cleared Swap Contracts
Currency | | Notional
Amount | | Expiration
Date | | Counterparty | | Referenced
Obligation | | Rate
Received
(Paid) | | Credit
Received
at
10/31/2013 | | Net Unrealized
Appreciation/
(Depreciation) | |
USD | | | | $ | 182,000 | | | 12/20/18 | | CME | | CDX North America
High Yield Index | | | 5.0 | % | | | — | | | $ | (3,637 | ) | |
K) OPTION CONTRACTS — The Fund will enter into options contracts to gain exposure to risk volatility based assets. When the Fund purchases an option, it pays a premium and the option is subsequently marked to market to reflect current value. Premiums paid for purchasing options which expire are treated as realized losses. Premiums paid for purchasing options which are exercised or closed are added to the cost or deducted from the proceeds on the
25
Credit Suisse Multialternative Strategy Fund
Notes to Consolidated Financial Statements (continued)
October 31, 2013
Note 2. Significant Accounting Policies
underlying instrument to determine the realized gain or loss. The risk associated with purchasing options is limited to the premium paid.
When the Fund writes an option, an amount equal to the net premium received (the premium less commission) is recorded as a liability and is subsequently adjusted to the current value. Net premiums received for written options which expire are treated as realized gains. Net premiums received for written options which are exercised or closed are deducted from the cost or added to the proceeds on the underlying instrument or closing purchase transaction to determine the realized gain or loss. The Fund, as writer of a written option, bears the risk of an unfavorable change in the market value of the instrument underlying the written option.
Exchange-traded options have standardized contracts and are settled through a clearing house with fulfillment guaranteed by the credit of the exchange. Therefore, counterparty credit risks to the Fund are limited. Over-the-counter options are subject to the risk that the counterparty is unable or unwilling to meet its obligations under the option. At October 31, 2013, the Fund had the following written options and the amount of restricted cash held at brokers was $4,627,501:
Number of
Contracts | | Call Written Options | | Expiration
Date | | Premiums
Received | | Current
Value | | Net Unrealized
Appreciation/
(Depreciation) | |
| | 11 | | | S&P 500 Index, Strike @ $1,775 | | Nov 2013 | | $ | 9,328 | | | $ | (7,480 | ) | | $ | 1,848 | | |
Number of
Contracts | | Put Written Options | | Expiration
Date | | Premiums
Received | | Current
Value | | Net Unrealized
Appreciation/
(Depreciation) | |
| | 11 | | | S&P 500 Index, Strike @ $1,650 | | Nov 2013 | | $ | 8,667 | | | $ | (1,210 | ) | | $ | 7,457 | | |
| | 5 | | | S&P 500 Index, Strike @ $1,720 | | Nov 2013 | | | 12,840 | | | | (2,650 | ) | | | 10,190 | | |
| | | | | | | | | | | | | $ | 17,647 | | |
Net Unrealized Appreciation/(Depreciation) | | | | | | | | $ | 19,495 | | |
For the year ended October 31, 2013, transactions for written options on securities, interest rate swaps and futures were as follows:
| | | Number of Contracts | | Premium
Received | |
Written Options, outstanding as of October 31, 2012 | | | 5 | | | $ | 10,465 | | |
Options written | | | 209 | | | | 276,365 | | |
Options closed | | | (165 | ) | | | (241,160 | ) | |
Options exercised | | | — | | | | — | | |
Options expired | | | (22 | ) | | | (14,835 | ) | |
Written Options, outstanding as of October 31, 2013 | | | 27 | | | $ | 30,835 | | |
26
Credit Suisse Multialternative Strategy Fund
Notes to Consolidated Financial Statements (continued)
October 31, 2013
Note 2. Significant Accounting Policies
L) SECURITIES LENDING — Loans of securities are required at all times to be secured by collateral at least equal to 102% of the market value of domestic securities on loan (including any accrued interest thereon) and 105% of the market value of foreign securities on loan (including any accrued interest thereon). Cash collateral received by the Fund in connection with securities lending activity may be pooled together with cash collateral for other funds/portfolios advised by Credit Suisse and may be invested in a variety of investments, including funds advised by SSB, the Fund's securities lending agent, or money market instruments. However, in the event of default or bankruptcy by the other party to the agreement, realization and/or retention of the collateral may be subject to legal proceedings.
SSB has been engaged by the Fund to act as the Fund's securities lending agent. As of October 31, 2013, the Fund had investment securities on loan with a fair value of $219,254 and a related liability of $225,398 for collateral received on securities loaned, both of which are presented gross on the Consolidated Statement of Assets and Liabilities. The carrying value of the collateral for securities loaned approximates fair value which would have been considered level 2 under the fair value hierarchy if the collateral for securities loaned were carried at fair value.
The Fund's securities lending arrangement provides that the Fund and SSB will share the net income earned from securities lending activities. During the year ended October 31, 2013, total earnings from the Fund's investment in cash collateral received in connection with securities lending arrangements was $1,434, of which $42 was rebated to borrowers (brokers). The Fund retained $1,184 in income from the cash collateral investment, and SSB, as lending agent, was paid $208. Securities lending income is accrued as earned.
M) OTHER — In the normal course of business the Fund trades financial instruments and enters into financial transactions where risk of potential loss exists due to changes in the market (market risk) or failure of the other party to a transaction to perform (credit risk). Similar to credit risk, the Fund may be exposed to counterparty risk, or the risk that an institution or other entity with which the Fund has unsettled or open transactions will default. The potential loss could exceed the value of the financial assets recorded in the financial statements. Financial assets, which potentially expose the Fund to credit risk, consist principally of cash due from counterparties and investments. The extent of the Fund's exposure to credit and counterparty risks in respect to these financial assets approximates their carrying value as recorded in the Fund's Consolidated Statement of Assets and Liabilities.
27
Credit Suisse Multialternative Strategy Fund
Notes to Consolidated Financial Statements (continued)
October 31, 2013
Note 2. Significant Accounting Policies
N) NEW ACCOUNTING PRONOUNCEMENTS — In December 2011, the Financial Accounting Standards Board issued Accounting Standards Update ("ASU") No. 2013-1, Balance Sheet (Topic 210): Disclosures about Offsetting Assets and Liabilities. The amendments in the ASU enhance disclosures about offsetting of financial assets and liabilities to enable investors to understand the effect of these arrangements on a fund's financial position. The ASU is effective for interim and annual reporting periods beginning on or after January 1, 2013. The Fund believes the adoption of this ASU will not have a material impact on its financial statements.
O) SUBSEQUENT EVENTS — In preparing the financial statements as of October 31, 2013, management considered the impact of subsequent events for potential recognition or disclosure in these financial statements through the date of release of this report. No such events requiring recognition or disclosure were identified through the date of the release of this report.
Note 3. Transactions with Affiliates and Related Parties
Credit Suisse serves as investment adviser for the Fund. For its investment advisory services, Credit Suisse is entitled to receive a fee from the Fund at an annual rate of 1.15% of the Fund's average daily net assets. For the year ended October 31, 2013, investment advisory fees earned and fees waived/expenses reimbursed were $81,426 and $446,703, respectively. The Fund is authorized to reimburse Credit Suisse for management fees previously limited and/or for expenses previously paid by Credit Suisse, provided, however, that any reimbursements must be paid at a date not more than three years after the end of the fiscal year during which such fees were limited or expenses were reimbursed by Credit Suisse and the reimbursements do not cause a class to exceed the applicable expense limitation in the contract at the time the fees were limited or expenses are paid. This contract may not be terminated before February 28, 2014. Credit Suisse contractually waives fees and reimburses expenses (excluding Acquired Fund Fees and Expenses, dividend expense related to short sales, interest charges on Fund borrowings, taxes, brokerage commissions, dealers spreads and other transaction charges, expenditures that are capitalized in accordance with GAAP, extraordinary expenses, and any other expenses that may be approved by the governing Board of the Trust) so that the Fund's annual operating expenses will not exceed 1.70% of the Fund's average daily net assets for Class I shares, 1.95% of the Fund's average daily net assets for Class A shares, and 2.70% of the Fund's average daily net assets for Class C shares.
28
Credit Suisse Multialternative Strategy Fund
Notes to Consolidated Financial Statements (continued)
October 31, 2013
Note 3. Transactions with Affiliates and Related Parties
Credit Suisse and SSB serve as co-administrators to the Fund. For its co-administrative services, Credit Suisse received a fee calculation at an annual rate of 0.09% of the Fund's average daily net assets. For the year ended October 31, 2013, co-administrative services fees earned by Credit Suisse were $6,373.
For its co-administrative services, SSB receives a fee, exclusive of out-of-pocket expenses, calculated in total for all the Credit Suisse funds/portfolios co-administered by SSB and allocated based upon the relative average net assets of each fund/portfolio, subject to an annual minimum fee. For the year ended October 31, 2013, co-administrative services fees earned by SSB (including out-of-pocket expenses) with respect to the Fund were $4,162.
Credit Suisse Securities (USA) LLC ("CSSU"), an affiliate of Credit Suisse, serves as distributor of the Fund's shares. Pursuant to distribution plans adopted by the Fund pursuant to Rule 12b-1 under the 1940 Act, CSSU received fees for its distribution services. These fees were calculated at an annual rate of 0.25% of the average daily net assets of the Class A shares. For the Class C shares, the fee is calculated at an annual rate of 1.00% of the average daily net assets. For the year ended October 31, 2013, the Fund's paid Rule 12b-1 distribution fees were $667 for Class A shares and $16,874 for Class C shares. Class I shares are not subject to distribution fees.
Certain brokers, dealers and financial representatives provide transfer agent related services to the Fund and receive compensation from Credit Suisse. Credit Suisse is then reimbursed by the Fund. For the year ended October 31, 2013, the Fund reimbursed Credit Suisse $3,406, which is included in the Fund's transfer agent expense.
For the year ended October 31, 2013, CSSU and its affiliates advised the Fund that it retained $192 from commissions earned on the sale of the Fund's Class A shares.
Merrill Corporation ("Merrill"), an affiliate of Credit Suisse, has been engaged by the Fund to provide certain financial printing services. For the year ended October 31, 2013, Merrill was paid $34,055 for its services by the Fund. This amount was included in the printing fees presented on the Consolidated Statement of Operations.
Offering costs, including initial registration cost, were deferred and were charged to expenses over the first 12 months of Fund operations. For the year ended October 31, 2013, $61,645 has been expensed to the Fund.
Affiliated Issuers — The Fund may invest in Underlying Credit Suisse Funds. The Underlying Credit Suisse Funds in which the Fund invests are
29
Credit Suisse Multialternative Strategy Fund
Notes to Consolidated Financial Statements (continued)
October 31, 2013
Note 3. Transactions with Affiliates and Related Parties
considered to be affiliated investments. The Fund invested 13.6% of the Fund's net assets. Investments in affiliated funds are valued at the affiliated fund's net asset value per share ("NAV") as of the report date. As of October 31, 2013, 13.6% A summary of the Fund's transactions with an affiliated Underlying Credit Suisse Fund during the year ended October 31, 2013 is as follows:
Issuer | | Beginning
Shares | | Purchases | | Sales | | Ending
Shares | | Gain/Loss | | Dividend
Income | | Value
of Affiliate
at 10/31/2013 | |
Credit Suisse Managed
Futures Strategy Fund | | | — | | | | 144,786 | | | | 46,912 | | | | 97,874 | | | $ | 13,742 | | | $ | — | | | $ | 1,013,974 | | |
Note 4. Line of Credit
The Fund, together with other funds/portfolios advised by Credit Suisse (collectively, the "Participating Funds"), participates in a committed, unsecured line of credit facility ("Credit Facility"), in an aggregated amount of $20 million for temporary or emergency purposes with SSB. Under the terms of the Credit Facility, the Participating Funds pay an aggregate commitment fee on the average unused amount of the Credit Facility, which is allocated among the Participating Funds in such manner as is determined by the governing Boards of the Participating Funds. In addition, the Participating Funds pay interest on borrowings at either the Overnight Federal Funds rate or the Overnight LIBOR rate plus a spread. At October 31, 2013, and during the year ended October 31, 2013, the Fund had no borrowings outstanding under the Credit Facility.
Note 5. Purchases and Sales of Securities
For the year ended October 31, 2013, purchases and sales of investment securities (excluding short-term investments) and U.S. Government and Agency Obligations were as follows:
Investment Securities | | U.S. Government/
Agency Obligations | |
| Purchases | | Sales | | Purchases | | Sales | |
| $ | 3,997,545 | | | $ | 3,416,968 | | | $ | 1,999,561 | | | $ | 2,001,438 | | |
Securities sold short and purchases to cover securities sold short were as follows:
Investment Securities | |
| Securities Sold Short | | Purchases to Cover | |
| $ | 176,253 | | | $ | 159,981 | | |
30
Credit Suisse Multialternative Strategy Fund
Notes to Consolidated Financial Statements (continued)
October 31, 2013
Note 6. Capital Share Transactions
The Fund is authorized to issue an unlimited number of full and fractional shares of beneficial interest, $.001 par value per share. The Fund offers Class I, Class A and Class C shares. Transactions in capital shares for each class of the Fund were as follows:
| | | Class I | |
| | | For the Year Ended
October 31, 2013 | | For the Period Ended
October 31, 20121 | |
| | | Shares | | Value | | Shares | | Value | |
Shares sold | | | 19,951 | | | $ | 210,698 | | | | 693,465 | | | $ | 6,930,670 | | |
Shares issued in reinvestment of
dividends and distributions | | | 3,170 | | | | 31,699 | | | | — | | | | — | | |
Shares redeemed | | | — | | | | — | | | | (200,468 | ) | | | (1,960,593 | ) | |
Net increase | | | 23,121 | | | $ | 242,397 | | | | 492,997 | | | $ | 4,970,077 | | |
| | | Class A | |
| | | For the Year Ended
October 31, 2013 | | For the Period Ended
October 31, 20121 | |
| | | Shares | | Value | | Shares | | Value | |
Shares sold | | | 15,142 | | | $ | 154,575 | | | | 22,931 | | | $ | 225,975 | | |
Shares issued in reinvestment of
dividends and distributions | | | 123 | | | | 1,226 | | | | — | | | | — | | |
Shares redeemed | | | (7,231 | ) | | | (73,284 | ) | | | — | | | | — | | |
Net increase | | | 8,034 | | | $ | 82,517 | | | | 22,931 | | | $ | 225,975 | | |
| | | Class C | |
| | | For the Year Ended
October 31, 2013 | | For the Period Ended
October 31, 20121 | |
| | | Shares | | Value | | Shares | | Value | |
Shares sold | | | 91,378 | | | $ | 918,382 | | | | 108,606 | | | $ | 1,068,290 | | |
Shares issued in reinvestment of
dividends and distributions | | | 114 | | | | 1,133 | | | | — | | | | — | | |
Shares redeemed | | | (31,887 | ) | | | (324,221 | ) | | | — | | | | — | | |
Net increase | | | 59,605 | | | $ | 595,294 | | | | 108,606 | | | $ | 1,068,290 | | |
1 For the period March 30, 2012 (commencement of operations) through October 31, 2012.
The Fund imposes a redemption fee of 2% of the value of all classes of shares currently being offered that are redeemed or exchanged within 30 days from the date of purchase. Reinvested dividends and distributions are not subject to the fee. The fee is charged based on the value of shares at redemption, is paid directly to the Fund and becomes part of the Fund's daily net asset value calculation. When shares are redeemed that are subject to the fee, reinvested dividends and distributions are redeemed first, followed by the shares held longest. For the year ended October 31, 2013 and the period ended October 31,
31
Credit Suisse Multialternative Strategy Fund
Notes to Consolidated Financial Statements (continued)
October 31, 2013
Note 6. Capital Share Transactions
2012, the Fund did not receive any redemption fees. On or about January 31, 2014, the redemption fee will be eliminated.
On October 31, 2013, the number of shareholders that held 5% or more of the outstanding shares of each class of the Fund was as follows:
| | | Number of
Shareholders | | Approximate Percentage
of Outstanding Shares | |
Class I | | | 1 | * | | | 96 | % | |
Class A | | | 3 | * | | | 89 | % | |
Class C | | | 1 | | | | 97 | % | |
*This includes the seed money from Merchant Holdings, Inc., an affiliate of Credit Suisse.
Some of the shareholders may be omnibus accounts, which hold shares on behalf of individual shareholders.
Note 7. Federal Income Taxes
Income and capital gain distributions are determined in accordance with federal income tax regulations, which may differ from GAAP.
The tax characteristics of dividends paid during the years ended October 31, 2013 and the period ended October 31, 2012, respectively, by the Fund were as follows:
| Ordinary Income | | Long-Term Capital Gain | |
| 2013 | | 2012 | | 2013 | | 2012 | |
| $ | 32,710 | | | $ | — | | | $ | 1,348 | | | $ | — | | |
The tax basis components of distributable earnings differ from the amounts reflected in the Consolidated Statement of Assets and Liabilities by temporary book/tax differences. These differences are primarily due to differing treatments of wash sales, forward contracts marked to market, total return and credit default swaps marked to market and deferred organizational expenses. At October 31, 2013, the components of distributable earnings on a tax basis were as follows:
Undistributed net investment income | | $ | 157,262 | | |
Undistributed capital gain | | | 69,941 | | |
Unrealized appreciation | | | 132,862 | | |
| | $ | 360,065 | | |
Under the Regulated Investment Company Modernization Act of 2010, the Fund will be permitted to carry forward capital losses incurred in taxable years beginning after December 22, 2010 for an unlimited period. However, any losses incurred during those future taxable years will be required to be utilized prior to the losses incurred in pre-enactment taxable years. As a result of this
32
Credit Suisse Multialternative Strategy Fund
Notes to Consolidated Financial Statements (continued)
October 31, 2013
Note 7. Federal Income Taxes
ordering rule, pre-enactment capital loss carryforwards may be more likely to expire unused. Additionally, post-enactment capital losses that are carried forward will retain their character as either short-term or long-term capital losses rather than being considered all short-term as under previous law. It is uncertain whether the Fund will be able to realize the full benefits of the capital loss carryforwards before they expire. The Fund has no pre-enactment capital loss carryforwards.
At October 31, 2013, the cost of investments (excluding foreign currency related transactions) and net unrealized appreciation (depreciation) for income tax purposes were as follows:
Cost of Investments | | $ | 2,955,364 | | |
Unrealized appreciation | | $ | 73,311 | | |
Unrealized depreciation | | | (466 | ) | |
Net unrealized appreciation (depreciation) | | $ | 72,845 | | |
At October 31, 2013, the Fund reclassified $110,515 from accumulated net investment loss and $103,155 from accumulated net realized gain to paid in capital, to adjust for current period permanent book/tax differences which arose principally from differing book/tax treatment of foreign currency gain/(loss), swap income re-class, ordinary loss netting to reduce short term capital gains and distribution re-designations. Net assets were not affected by these reclassifications.
Note 8. Contingencies
In the normal course of business, the Fund may provide general indemnifications pursuant to certain contracts and organizational documents. The Fund's maximum exposure under these arrangements is dependent on future claims that may be made against the Fund and, therefore, cannot be estimated; however, based on experience, the risk of loss from such claims is considered remote.
33
Credit Suisse Multialternative Strategy Fund
Report of Independent Registered Public Accounting Firm
To the Board of Directors and Shareholders of Credit Suisse Multialternative Strategy Fund:
In our opinion, the accompanying consolidated statement of assets and liabilities, including the consolidated schedule of investments, and the related consolidated statements of operations and of changes in net assets and the financial highlights present fairly, in all material respects, the financial position of Credit Suisse Multialternative Strategy Fund and its subsidiary (the "Fund") at October 31, 2013, the results of their operations for the year then ended, the changes in their net assets for the year then ended and for the period September 28, 2012 (commencement of operations) through October 31, 2012, its cash flows for the year then ended and the financial highlights for the year then ended and for the period September 28, 2012 (commencement of operations) through October 31, 2012, in conformity with accounting principles generally accepted in the United States of America. These financial statements and financial highlights (hereafter referred to as "financial statements") are the responsibility of the Fund's management; our responsibility is to express an opinion on these financial statements based on our audits. We conducted our audits of these financial statements in accordance with the standards of the Public Company Accounting Oversight Board (United States). Those standards require that we plan and perform the audit to obtain reasonable assurance about whether the financial statements are free of material misstatement. An audit includes examining, on a test basis, evidence supporting the amounts and disclosures in the financial statements, assessing the accounting principles used and significant estimates made by management, and evaluating the overall financial statement presentation. We believe that our audits, which included confirmation of securities at October 31, 2013 by correspondence with the custodian and brokers, provide a reasonable basis for our opinion.
PricewaterhouseCoopers LLP
New York, New York
December 27, 2013
34
Credit Suisse Multialternative Strategy Fund
Information Concerning Trustees and Officers (unaudited)
Name, Address
(Year of Birth) | | Position(s)
Held with
Fund | | Term
of Office1
and
Length
of Time
Served | | Principal
Occupation(s) During
Past Five Years | | Number of
Portfolios
in Fund
Complex
Overseen
by Trustee | | Other
Directorships
Held by Trustee | |
Independent Trustees | | | | | | | | | | | |
Enrique Arzac
c/o Credit Suisse Asset
Management, LLC
Attn: General Counsel
Eleven Madison Avenue
New York, New York
10010
(1941) | | Trustee, Audit Committee Chairman and Nominating Committee Member | | Since Fund Inception | | Professor of Finance and Economics, Graduate School of Business, Columbia University since 1971. | | | 11 | | | Director of The Adams Express Company, Petroleum and Resources Corporation, Aberdeen Chile Fund, Inc., Aberdeen Emerging Markets Smaller Company Opportunities Fund, Inc., Aberdeen Israel Fund, Inc., Aberdeen Indonesia Fund, Inc. and Aberdeen Latin America Equity Fund, Inc. (each a closed-end investment company); Director of Aberdeen Asia-Pacific Income Investment Company Limited (a Canadian closed-end fund); Trustee of Mirae Asset Discovery Funds (6 open-end portfolios); Director of Starcomms PLC. (telecommunications company) from 2008 to 2011; Director of Epoch Holding Corporation (an investment management and investment advisory services company) from 2006 to March 2013. | |
35
Credit Suisse Multialternative Strategy Fund
Information Concerning Trustees and Officers (unaudited) (continued)
Name, Address
(Year of Birth) | | Position(s)
Held with
Fund | | Term
of Office1
and
Length
of Time
Served | | Principal
Occupation(s) During
Past Five Years | | Number of
Portfolios
in Fund
Complex
Overseen
by Trustee | | Other
Directorships
Held by Trustee | |
Independent Trustees | | | | | | | | | | | |
Jeffrey E. Garten
Box 208200
New Haven, Connecticut
06520-8200
(1946) | | Trustee, Audit and Nominating Committee Member | | Since Fund Inception | | The Juan Trippe Professor in the Practice of International Trade, Finance and Business, Yale School of Management, from July 2005 to present; Partner and Chairman of Garten Rothkopf (consulting firm) from October 2005 to present. | | | 9 | | | Director of Aetna, Inc. (insurance company); Director of CarMax Group (used car dealers); Director of Alcan (aluminum production) from February 2007 to November 2007; Member of Standard & Poor's Board of Managers (credit rating agency); Director of Miller Buckfire & Co., LLC (financial restructuring). | |
Steven N. Rappaport
Lehigh Court, LLC
555 Madison Avenue
29th Floor
New York, New York
10022
(1948) | | Chairman of the Board of Trustees, Audit Committee Member and Nominating Committee Chairman | | Since Fund Inception | | Partner of Lehigh Court, LLC and RZ Capital (private investment firms) from July 2002 to present. | | | 11 | | | Director of iCAD, Inc. (surgical and medical instruments and apparatus company); Director of Wood Resources, LLC. (plywood manufacturing company); Director of Aberdeen Chile Fund, Inc., Aberdeen Emerging Markets Smaller Company Opportunities Fund, Inc., Aberdeen Israel Fund, Inc., Aberdeen Indonesia Fund, Inc. and Aberdeen Latin America Equity Fund, Inc. (each a closed-end investment company); Director of Presstek, Inc. (digital imaging technologies company) from 2003 to 2012. | |
1 Each Trustee and Officer serves until his or her respective successor has been duly elected and qualified.
36
Credit Suisse Multialternative Strategy Fund
Information Concerning Trustees and Officers (unaudited) (continued)
Name, Address
(Year of Birth) | | Position(s)
Held with
Fund | | Term of
Office1
and
Length of
Time
Served | | PrincipalOccupation(s) During Past Five Years | |
Officers* | | | | | | | |
John G. Popp
Credit Suisse Asset
Management, LLC
One Madison Avenue
New York, New York 10010
(1956) | | Chief Executive Officer and President | | Since Fund Inception | | Managing Director of Credit Suisse; Global Head and Chief Investment Officer of the Credit Investment Group; Associated with Credit Suisse or its predecessor since 1997; Officer of other Credit Suisse Funds; Trustee of Credit Suisse High Yield Bond Fund; Director of Credit Suisse Asset Management Income Fund, Inc. | |
Bruce Rosenberg
Credit Suisse Asset
Management, LLC
One Madison Avenue
New York, New York 10010
(1961) | | Chief Financial Officer | | Since 2012 | | Director of Credit Suisse; Director of Liquid Accounting of Credit Suisse; Associated with Credit Suisse since 2008; Officer of other Credit Suisse Funds. | |
Emidio Morizio
Credit Suisse Asset
Management, LLC
Eleven Madison Avenue
New York, New York 10010
(1966) | | Chief Compliance Officer | | Since Fund Inception | | Managing Director and Global Head of Compliance of Credit Suisse since 2010; Director and Global Head of Compliance of Credit Suisse from January 2005 to December 2009; Associated with Credit Suisse since July 2000; Officer of other Credit Suisse Funds. | |
Joanne Doldo
Credit Suisse Asset
Management, LLC
Eleven Madison Avenue
New York, New York 10010
(1959) | | Chief Legal Officer | | Since 2013 | | Vice President of Credit Suisse; Associated with Credit Suisse since September 2011; Officer of other Credit Suisse Funds; Associated with Morgan Stanley Investment Management from 2002-2008. | |
Rocco DelGuercio
Credit Suisse Asset
Management, LLC
One Madison Avenue
New York, New York 10010
(1963) | | Treasurer | | Since 2013 | | Vice President of Credit Suisse since 2013; Independent Consultant from February 2012 to April 2013; Director of Legg Mason & Co., LLC from March 2004 to January 2012; Associated with Credit Suisse from June 1996 to March 2004; Officer of other Credit Suisse Funds. | |
Karen Regan
Credit Suisse Asset
Management, LLC
Eleven Madison Avenue
New York, New York 10010
(1963) | | Senior Vice President and Secretary | | Since Fund Inception | | Vice President of Credit Suisse; Associated with Credit Suisse since December 2004; Officer of other Credit Suisse Funds. | |
* The officers of the Fund shown are officers that make policy decisions.
The Statement of Additional Information includes additional information about the Trustees and is available, without charge, upon request, by calling 877-870-2874.
37
Credit Suisse Multialternative Strategy Fund
Proxy Voting and Portfolio Holdings Information (unaudited)
Information regarding how the Fund voted proxies related to its portfolio securities during the 12 month period ended June 30 of each year, as well as the policies and procedures that the Fund uses to determine how to vote proxies relating to its portfolio securities are available:
• By calling 1-877-870-2874
• On the Fund's website, www.credit-suisse.com/us/funds
• On the website of the Securities and Exchange Commission, www.sec.gov.
The Fund files a complete schedule of its portfolio holdings for the first and third quarters of its fiscal year with the SEC on Form N-Q. The Fund's Forms N-Q are available on the SEC's website at www.sec.gov and may be reviewed and copied at the SEC's Public Reference Room in Washington, DC. Information on the operation of the SEC's Public Reference Room may be obtained by calling 1-202-551-8090.
38
This page intentionally left blank
This page intentionally left blank

P.O. BOX 55030, BOSTON, MA 02205-5030
877-870-2874 n www.credit-suisse.com/us/funds
CREDIT SUISSE SECURITIES (USA) LLC, DISTRIBUTOR. LAF-AR-1013

CREDIT SUISSE FUNDS
Annual Report
October 31, 2013
n CREDIT SUISSE
STRATEGIC INCOME FUND
The Fund's investment objectives, risks, charges and expenses (which should be considered carefully before investing), and more complete information about the Fund, are provided in the Prospectus, which should be read carefully before investing. You may obtain additional copies by calling 877-870-2874 or by writing to Credit Suisse Funds, P.O. Box 55030, Boston, MA 02205-5030.
Credit Suisse Securities (USA) LLC, Distributor, is located at One Madison Avenue, New York, NY 10010. Credit Suisse Funds are advised by Credit Suisse Asset Management, LLC.
Investors in the Credit Suisse Funds should be aware that they may be eligible to purchase Class I shares (where offered) directly or through certain intermediaries. Such shares are not subject to a sales charge. Investors in the Credit Suisse Funds should also be aware that they may be eligible for a reduction or waiver of the sales charge with respect to Class A or C shares (where offered). For more information, please review the relevant prospectuses or consult your financial representative.
Fund shares are not deposits or other obligations of Credit Suisse Asset Management, LLC ("Credit Suisse") or any affiliate, are not FDIC-insured and are not guaranteed by Credit Suisse or any affiliate. Fund investments are subject to investment risks, including loss of your investment.
Credit Suisse Strategic Income Fund
Annual Investment Adviser's Report
October 31, 2013 (unaudited)
December 24, 2013
Dear Shareholder:
We are pleased to present this Annual Report covering the activities of the Credit Suisse Strategic Income Fund (the "Fund"), for the annual period ended October 31, 2013.
Performance Summary
11/01/12 – 10/31/13
Fund & Benchmark | | Performance | |
| Class I1 | | | 12.29 | % | |
| Class A1,2 | | | 11.94 | % | |
| Class C1,2 | | | 11.18 | % | |
| BofA Merrill Lynch 3-Month U.S. Treasury Bill Index3 | | | 0.09 | % | |
Performance shown for the Fund's Class A and Class C Shares does not reflect sales charges, which are a maximum of 4.75% and 1.00%, respectively.2
Market Review: A volatile, but positive period
The annual period ended October 31, 2013 was an unpredictable one. Markets experienced increased volatility as mounting rhetoric concerning the Fed's tapering of the quantitative easing program dominated movements in the rates market. While the 10-year Treasury dipped as low as 1.63% in May, rising yields followed, peaking at 3.00% in the second half of 2013. The BofA Merrill Lynch 3-Month U.S. Treasury Bill Index, the Fund's benchmark, returned 0.09% for the period. Credit markets — especially those that are less interest rate sensitive — posted positive returns, as the BofA Merrill Lynch High Yield Master II Constrained Index registered a return of 8.82%, while the Credit Suisse Leveraged Loan Index registered a return of 6.28% over the period.
Investors have demonstrated continued confidence in these asset classes and demand has driven retail mutual fund inflows as well as allocations from institutional investors. Additional demand for the Leveraged Loan market was driven by new collateralized loan obligation "CLO" issuance in 2013, as volumes topped $68.6 billion on a year-to-date basis.
Additionally, high yield default rates have decreased over the course of the year to finish the period at 1.11%, according to JP Morgan (compared to a rate of 1.77% at the end of October 2012). Senior loan default rates rose gradually through the period to finish October at 2.31%, according to S&P Leveraged Commentary and Data. At this level, the senior loan default rate still remains below the historical average of 3.6%. With the exception of the anticipated TXU
1
Credit Suisse Strategic Income Fund
Annual Investment Adviser's Report (continued)
October 31, 2013 (unaudited)
default, managers expect default rates to remain contained over the next 12-18 months.
Strategic Review and Outlook: Cautiously optimistic going forward
For the annual period ended October 31, 2013, the Fund outperformed the benchmark.
Fundamentals have remained strong so far in 2013, as balance sheet management remains a focus for corporate issuers. In turn, this has supported continued below-average default rates, which we expect to remain below average in the next year. High yield mutual fund flows have been mixed and we expect them to remain so given potential headline risk and Fed policy uncertainty. The senior loan market continues to benefit from strong consumer sentiment that has driven retail inflows, allocations from institutional investors such as pensions, and new CLO issuance. Against this backdrop, we have focused on pockets of opportunities within high yield, leveraged loans, and CLOs.
Compared to other fixed income investment opportunities, we believe these asset classes provide attractive relative value. However, we do remain cautious given potential headline risk in the coming months, both domestically and abroad. Therefore, we will favor the defensive nature of the senior loan asset class and will focus on shorter duration, lower beta securities within high yield.
The Credit Suisse Credit Investment Group Team
John G. Popp
Andrew H. Marshak
Thomas J. Flannery
Wing Chan
Senior secured floating rate loans ("Senior Loans") are subject to risk that a court could subordinate a Senior Loan, which typically holds the most senior position in the issuer's capital structure, to presently existing or future indebtedness or take other action detrimental to the holders of Senior Loans.
High yield bonds are lower-quality bonds that are also known as "junk bonds." Such bonds entail greater risks than those found in higher-rated securities.
2
Credit Suisse Strategic Income Fund
Annual Investment Adviser's Report (continued)
October 31, 2013 (unaudited)
The fund is non-diversified, which means it may invest a greater proportion of its assets in the securities of a smaller number of issuers than a diversified mutual fund and therefore may be subject to greater volatility.
In addition to historical information, this report contains forward-looking statements, which may concern, among other things, domestic and foreign market, industry and economic trends and developments and government regulation and their potential impact on the Fund's investments. These statements are subject to risks and uncertainties and actual trends, developments and regulations in the future, and their impact on the Fund could be materially different from those projected, anticipated or implied. The Fund has no obligation to update or revise forward-looking statements.
The views of the Fund's management are as of the date of the letter and the Fund holdings described in this document are as of October 31, 2013; these views and Fund holdings may have changed subsequent to these dates. Nothing in this document is a recommendation to purchase or sell securities.
3
Credit Suisse Strategic Income Fund
Annual Investment Adviser's Report (continued)
October 31, 2013 (unaudited)
Comparison of Change in Value of $10,000 Investment in the
Credit Suisse Strategic Income Fund1 Class I shares, Class A shares2,
Class C shares2 and the BofA Merrill Lynch 3 Month U.S. Treasury Bill
Index3 from Inception (9/28/12).

1 Fee waivers and/or expense reimbursements may reduce expenses for the Fund, without which performance would be lower. Voluntary waivers and/or reimbursements may be discontinued at any time.
2 Total return for the Fund's Class A shares for the reporting period, based on offering price (including maximum sales charge of 4.75%), was 6.65%. Total return for the Fund's Class C shares for the reporting period, based on redemption value (including maximum contingent deferred sales charge of 1.00%), was 10.18%.
3 Using only liquid securities, the BofA Merrill Lynch 3 Month U.S. Treasury Bill Index seeks to replicate the return of the overall hedge fund industry, as represented by the Dow Jones Credit Suisse Hedge Fund Index. An index does not have transactions costs; investors may not invest directly in an index.
4
Credit Suisse Strategic Income Fund
Annual Investment Adviser's Report (continued)
October 31, 2013 (unaudited)
Average Annual Returns as of October 31, 20131
| | | 1 Year | | Since
Inception2 | |
Class I | | | 12.29 | % | | | 11.87 | % | |
Class A Without Sales Charge | | | 11.94 | % | | | 11.64 | % | |
Class A With Maximum Sales Charge | | | 6.65 | % | | | 6.77 | % | |
Class C Without CDSC | | | 11.18 | % | | | 10.81 | % | |
Class C With CDSC | | | 10.18 | % | | | 10.81 | % | |
Returns represent past performance and include change in share price and reinvestment of dividends and capital gains. Past performance cannot guarantee future results. The current performance of the Fund may be lower or higher than the figures shown. Returns and share price will fluctuate, and redemption value may be more or less than original cost. The performance results do not reflect the deduction of taxes that a shareholder would pay on fund distributions or the redemption of fund shares. Performance information current to the most recent month-end is available at www.credit-suisse.com/us/funds.
The annualized gross expense ratios are 1.62% for Class I shares, 1.87% for Class A shares and 2.62% for Class C shares. The annualized net expense ratios after fee waivers and/or expense reimbursements excluding dividend expense from securities sold short are 0.99% for Class I shares, 1.24% for Class A shares and 1.99% for Class C shares.
1 Fee waivers and/or expense reimbursements may reduce expenses for the Fund, without which performance would be lower. Voluntary waivers and/or reimbursements may be discontinued at any time.
2 Inception date September 28, 2012.
5
Credit Suisse Strategic Income Fund
Annual Investment Adviser's Report (continued)
October 31, 2013 (unaudited)
Information About Your Fund's Expenses
As an investor of the Fund, you incur two types of costs: ongoing expenses and transaction costs. Ongoing expenses include management fees, distribution and service (12b-1) fees and other Fund expenses. Examples of transaction costs include sales charges (loads), redemption fees and account maintenance fees, which are not shown in this section and which would result in higher total expenses. The following table is intended to help you understand your ongoing expenses of investing in the Fund and to help you compare these expenses with the ongoing expenses of investing in other mutual funds. The table is based on an investment of $1,000 made at the beginning of the six months period ended October 31, 2013.
The table illustrates your Fund's expenses in two ways:
• Actual Fund Return. This helps you estimate the actual dollar amount of ongoing expenses paid on a $1,000 investment in the Fund using the Fund's actual return during the period. To estimate the expenses you paid over the period, simply divide your account value by $1,000 (for example, an $8,600 account value divided by $1,000 = 8.6), then multiply the result by the number in the "Expenses Paid per $1,000" line under the share class you hold.
• Hypothetical 5% Fund Return. This helps you to compare your Fund's ongoing expenses with those of other mutual funds using the Fund's actual expense ratio and a hypothetical rate of return of 5% per year before expenses. Examples using a 5% hypothetical fund return may be found in the shareholder reports of other mutual funds. The hypothetical account values and expenses may not be used to estimate the actual ending account balance or expenses you paid for the period.
Please note that the expenses shown in these tables are meant to highlight your ongoing expenses only and do not reflect any transaction costs, such as sales charges (loads) or redemption fees. If these transaction costs had been included, your costs would have been higher. The "Expenses Paid per $1,000" line of the tables is useful in comparing ongoing expenses only and will not help you determine the relative total expenses of owning different funds.
6
Credit Suisse Strategic Income Fund
Annual Investment Adviser's Report (continued)
October 31, 2013 (unaudited)
Expenses and Value for a $1,000 Investment
for the six month period ended October 31, 2013
Actual Fund Return | | Class I | | Class A | | Class C | |
Beginning Account Value 05/01/13 | | $ | 1,000.00 | | | $ | 1,000.00 | | | $ | 1,000.00 | | |
Ending Account Value 10/31/13 | | $ | 1,027.20 | | | $ | 1,025.90 | | | $ | 1,022.00 | | |
Expenses Paid per $1,000* | | $ | 5.06 | | | $ | 6.33 | | | $ | 10.14 | | |
Hypothetical 5% Fund Return | |
Beginning Account Value 05/01/13 | | $ | 1,000.00 | | | $ | 1,000.00 | | | $ | 1,000.00 | | |
Ending Account Value 10/31/13 | | $ | 1,020.21 | | | $ | 1,018.90 | | | $ | 1,015.17 | | |
Expenses Paid per $1,000* | | $ | 5.04 | | | $ | 6.31 | | | $ | 10.11 | | |
| | | Class I | | Class A | | Class C | |
Annualized Expense Ratios* | | | 0.99 | % | | | 1.24 | % | | | 1.99 | % | |
* Expenses are equal to the Fund's annualized expense ratio for each share class, multiplied by the average account value over the period, multiplied by the number of days in the most recent fiscal half year period, then divided by 365.
The "Expenses Paid per $1,000" and the "Annualized Expense Ratios" in the tables are based on actual expenses paid by the Fund during the period, net of fee waivers and/or expense reimbursements. If those fee waivers and/or expense reimbursements had not been in effect, the Fund's actual expenses would have been higher.
For more information, please refer to the Fund's prospectus.
7
Credit Suisse Strategic Income Fund
Annual Investment Adviser's Report (continued)
October 31, 2013 (unaudited)
Credit Quality Breakdown*
(% of Total Investments as of October 31, 2013)
S&P Ratings
BBB | | | 1.3 | % | |
BB | | | 28.8 | | |
B | | | 48.9 | | |
CCC | | | 14.9 | | |
NR | | | 3.3 | | |
Subtotal | | | 97.2 | | |
Equity | | | 2.7 | | |
Short-Term Investment1 | | | 0.1 | | |
Total | | | 100 | % | |
* Expressed as a percentage of total investments (excluding securities lending collateral if applicable) and may vary over time.
1 Primarily reflects cash invested in State Street Bank and Trust Co. Euro Time Deposit, for which the purchases of securities have been executed but not yet settled at October 31, 2013.
8
Credit Suisse Strategic Income Fund
Schedule of Investments
October 31, 2013
Par
(000) | |
| | Ratings†
(S&P/Moody's) | | Maturity | | Rate% | | Value | |
| CORPORATE BONDS (34.1%) | | | |
| Brokerage (0.7%) | | | |
$ | 500 | | | Jefferies Finance LLC, Rule 144A,
Senior Unsecured Notes
(Callable 04/01/16@ 105.53)‡ | | (B+, B1) | | 04/01/20 | | | 7.375 | | | $ | 516,250 | | |
| Building Materials (0.8%) | | | |
| | 400 | | | Euramax International, Inc.,
Global Senior Secured Notes
(Callable 04/01/14@ 104.75) | | (B-, Caa2) | | 04/01/16 | | | 9.500 | | | | 398,000 | | |
| | 250 | | | International Wire Group Holdings, Inc.,
Rule 144A, Senior Secured Notes
(Callable 10/15/15@ 104.25)‡ | | (B, B3) | | 10/15/17 | | | 8.500 | | | | 266,875 | | |
| | | | 664,875 | | |
| Chemicals (1.2%) | | | |
| | 317 | | | Reichhold Industries, Inc., PIK, Rule 144A,
Senior Secured Notes‡ | | (CCC+, NR) | | 05/08/17 | | | 11.000 | | | | 245,287 | | |
| | 500 | | | U.S. Coatings Acquisition, Inc., Reg S,
Senior Secured Notes
(Callable 02/01/16@ 104.31)€ | | (B+, B1) | | 02/01/21 | | | 5.750 | | | | 698,443 | | |
| | | | 943,730 | | |
| Consumer/Commercial/Lease Financing (1.2%) | | | |
| | 500 | | | Cabot Financial Luxembourg S.A.,
Rule 144A, Senior Secured Notes
(Callable 10/01/15@ 107.78)࣠| | (BB, B1) | | 10/01/19 | | | 10.375 | | | | 919,779 | | |
| Diversified Capital Goods (2.0%) | | | |
| | 750 | | | Anixter, Inc., Global Company Guaranteed Notes | | (BB, Ba3) | | 05/01/19 | | | 5.625 | | | | 791,250 | | |
| | 750 | | | Belden, Inc., Rule 144A, Company Guaranteed
Notes (Callable 09/01/17@ 102.75)‡ | | (B+, Ba2) | | 09/01/22 | | | 5.500 | | | | 753,750 | | |
| | | | 1,545,000 | | |
| Environmental (1.3%) | | | |
| | 700 | | | EnergySolutions LLC, Global
Company Guaranteed Notes
(Callable 08/15/14@ 105.38) | | (B+, Caa2) | | 08/15/18 | | | 10.750 | | | | 758,625 | | |
| | 250 | | | Nuverra Environmental Solutions, Inc.,
Global Company Guaranteed Notes
(Callable 04/15/15@ 104.94) | | (B, B3) | | 04/15/18 | | | 9.875 | | | | 255,625 | | |
| | | | 1,014,250 | | |
| Food - Wholesale (0.2%) | | | |
| | 150 | | | Wells Enterprises, Inc., Rule 144A,
Senior Secured Notes
(Callable 02/01/16@ 105.06)‡ | | (B+, B2) | | 02/01/20 | | | 6.750 | | | | 154,500 | | |
See Accompanying Notes to Financial Statements.
9
Credit Suisse Strategic Income Fund
Schedule of Investments (continued)
October 31, 2013
Par
(000) | |
| | Ratings†
(S&P/Moody's) | | Maturity | | Rate% | | Value | |
CORPORATE BONDS | | | |
| Gas Distribution (3.4%) | | | |
$ | 1,000 | | | Energy Transfer Equity LP,
Senior Secured Notes | | (BB, Ba2) | | 10/15/20 | | | 7.500 | | | $ | 1,160,000 | | |
| | 1,000 | | | Genesis Energy LP, Global Company
Guaranteed Notes
(Callable 02/15/17@ 102.88) | | (B, B1) | | 02/15/21 | | | 5.750 | | | | 1,020,000 | | |
| | 500 | | | Holly Energy Finance Corp.,
Global Company Guaranteed Notes
(Callable 03/01/16@ 103.25) | | (BB-, B1) | | 03/01/20 | | | 6.500 | | | | 526,250 | | |
| | | | 2,706,250 | | |
| Health Facilities (1.3%) | | | |
| | 500 | | | Aviv Healthcare Capital Corp., Rule 144A,
Company Guaranteed Notes
(Callable 10/15/17@ 103.00)‡ | | (BB, Ba3) | | 10/15/21 | | | 6.000 | | | | 515,000 | | |
| | 500 | | | MPT Finance Corp., Company Guaranteed
Notes (Callable 02/15/17@ 103.19) | | (BB, Ba1) | | 02/15/22 | | | 6.375 | | | | 518,750 | | |
| | | | 1,033,750 | | |
| Insurance Brokerage (0.3%) | | | |
| | 250 | | | A-S Merger Sub LLC, Rule 144A,
Senior Unsecured Notes
(Callable 12/15/15@ 103.94)‡ | | (CCC, Caa2) | | 12/15/20 | | | 7.875 | | | | 260,000 | | |
| Media - Cable (1.3%) | | | |
| | 500 | | | Midcontinent Communications &
Midcontinent Finance Corp.,
Rule 144A, Company Guaranteed Notes
(Callable 08/01/16@ 104.69)‡ | | (B-, B3) | | 08/01/21 | | | 6.250 | | | | 507,500 | | |
| | 250 | | | Virgin Media Finance PLC, Rule 144A,
Company Guaranteed Notes
(Callable 04/15/18@ 103.19)‡ | | (B, B2) | | 04/15/23 | | | 6.375 | | | | 257,500 | | |
| | 250 | | | Virgin Media Secured Finance PLC,
Rule 144A, Senior Secured Notes
(Callable 04/15/17@ 102.69)‡ | | (BB-, Ba3) | | 04/15/21 | | | 5.375 | | | | 252,500 | | |
| | | | 1,017,500 | | |
| Media - Diversified (0.1%) | | | |
| | 40 | | | Block Communications, Inc., Rule 144A,
Senior Unsecured Notes
(Callable 02/01/16@ 103.63)‡ | | (BB-, Ba3) | | 02/01/20 | | | 7.250 | | | | 42,500 | | |
| Medical Products (0.3%) | | | |
| | 250 | | | Polymer Group, Inc., Global Senior
Secured Notes (Callable 02/01/15@ 103.88) | | (B, B1) | | 02/01/19 | | | 7.750 | | | | 268,125 | | |
See Accompanying Notes to Financial Statements.
10
Credit Suisse Strategic Income Fund
Schedule of Investments (continued)
October 31, 2013
Par
(000) | |
| | Ratings†
(S&P/Moody's) | | Maturity | | Rate% | | Value | |
CORPORATE BONDS | | | |
| Metals & Mining - Excluding Steel (5.7%) | | | |
$ | 500 | | | Boart Longyear Management Pty Ltd.,
Rule 144A, Company Guaranteed Notes
(Callable 04/01/16@ 103.50)‡ | | (B, B3) | | 04/01/21 | | | 7.000 | | | $ | 376,250 | | |
| | 250 | | | Boart Longyear Management Pty Ltd.,
Rule 144A, Senior Secured Notes‡ | | (BB-, B1) | | 10/01/18 | | | 10.000 | | | | 258,750 | | |
| | 1,000 | | | Calcipar SA, Rule 144A, Senior Secured Notes
(Callable 05/01/15@ 103.44)‡ | | (BB, Ba3) | | 05/01/18 | | | 6.875 | | | | 1,055,000 | | |
| | 500 | | | Eldorado Gold Corp., Rule 144A,
Senior Unsecured Notes
(Callable 12/15/16@ 103.06)‡ | | (BB, Ba3) | | 12/15/20 | | | 6.125 | | | | 500,000 | | |
| | 250 | | | KGHM International Ltd., Rule 144A,
Company Guaranteed Notes
(Callable 06/15/15@ 103.88)‡ | | (BB-, B1) | | 06/15/19 | | | 7.750 | | | | 261,875 | | |
| | 750 | | | Noranda Aluminum Acquisition Corp.,
Rule 144A, Company Guaranteed Notes
(Callable 03/01/16@ 105.50)‡ | | (CCC+, Caa1) | | 06/01/19 | | | 11.000 | | | | 637,500 | | |
| | 1,000 | | | Taseko Mines Ltd., Company Guaranteed
Notes (Callable 04/15/15@ 103.88) | | (B, B3) | | 04/15/19 | | | 7.750 | | | | 1,002,500 | | |
| | 500 | | | Xinergy Corp., Rule 144A, Senior Secured
Notes (Callable 05/15/15@ 104.63)‡ | | (NR, NR) | | 05/15/19 | | | 9.250 | | | | 367,500 | | |
| | | | 4,459,375 | | |
| Oil Field Equipment & Services (2.3%) | | | |
| | 1,000 | | | Parker Drilling Co., Rule 144A,
Company Guaranteed Notes
(Callable 08/01/16@ 103.75)‡ | | (B+, B1) | | 08/01/20 | | | 7.500 | | | | 1,043,750 | | |
| | 500 | | | Shelf Drilling Holdings Ltd., Rule 144A,
Senior Secured Notes
(Callable 05/01/15@ 104.31)‡ | | (B+, B1) | | 11/01/18 | | | 8.625 | | | | 541,250 | | |
| | 250 | | | Sidewinder Drilling, Inc., Rule 144A,
Senior Unsecured Notes
(Callable 11/15/16@ 104.88)‡ | | (B-, B3) | | 11/15/19 | | | 9.750 | | | | 243,750 | | |
| | | | 1,828,750 | | |
| Oil Refining & Marketing (2.3%) | | | |
| | 750 | | | Coffeyville Finance, Inc., Global Secured
Notes (Callable 11/01/17@ 103.25) | | (B+, B2) | | 11/01/22 | | | 6.500 | | | | 755,625 | | |
| | 250 | | | Northern Tier Finance Corp., Senior Secured
Notes (Callable 11/15/2015@ 105.34) | | (BB-, B1) | | 11/15/20 | | | 7.125 | | | | 256,250 | | |
| | 500 | | | PBF Finance Corp., Global Senior Secured
Notes (Callable 02/15/16@ 104.13) | | (BB+, Ba3) | | 02/15/20 | | | 8.250 | | | | 525,000 | | |
| | 250 | | | Western Refining, Inc., Global
Company Guaranteed Notes
(Callable 04/01/17@ 103.13) | | (BB-, B2) | | 04/01/21 | | | 6.250 | | | | 251,875 | | |
| | | | 1,788,750 | | |
See Accompanying Notes to Financial Statements.
11
Credit Suisse Strategic Income Fund
Schedule of Investments (continued)
October 31, 2013
Par
(000) | |
| | Ratings†
(S&P/Moody's) | | Maturity | | Rate% | | Value | |
CORPORATE BONDS | | | |
| Packaging (0.7%) | | | |
$ | 500 | | | Reynolds Group Issuer LLC,
Global Senior Secured Notes
(Callable 10/15/15@ 104.31) | | (B+, B1) | | 10/15/20 | | | 5.750 | | | $ | 518,750 | | |
| Real Estate Development & Management (1.4%) | | | |
| | 533 | | | Annington Finance No. 5 PLC, PIK,
Rule 144A, Senior Secured Notes
(Callable 01/15/18@ 106.50)࣠| | (CCC+, Caa1) | | 01/15/23 | | | 13.000 | | | | 1,078,409 | | |
| Software/Services (0.9%) | | | |
| | 500 | | | NeuStar, Inc., Global Company Guaranteed
Notes (Callable 01/15/18@ 102.25) | | (BB-, Ba3) | | 01/15/23 | | | 4.500 | | | | 457,500 | | |
| | 250 | | | Syniverse Holdings, Inc., Global
Company Guaranteed Notes
(Callable 01/15/15@ 104.56) | | (B-, Caa1) | | 01/15/19 | | | 9.125 | | | | 271,875 | | |
| | | | 729,375 | | |
| Specialty Retail (1.1%) | | | |
| | 850 | | | Penske Automotive Group, Inc.,
Global Company Guaranteed Notes
(Callable 10/01/17@ 102.88) | | (B, B2) | | 10/01/22 | | | 5.750 | | | | 852,125 | | |
| Support-Services (3.6%) | | | |
| | 500 | | | CDL Acquisition Co., Inc., Rule 144A,
Senior Secured Notes
(Callable 04/15/16@ 106.19)‡ | | (B+, B2) | | 10/15/18 | | | 8.250 | | | | 512,500 | | |
| | 750 | | | CoreLogic, Inc., Global Company Guaranteed
Notes (Callable 06/01/16@ 103.63) | | (B+, B1) | | 06/01/21 | | | 7.250 | | | | 810,000 | | |
| | 250 | | | Iron Mountain, Inc., Company Guaranteed
Notes (Callable 08/15/18@ 103.00) | | (BB-, Ba1) | | 08/15/23 | | | 6.000 | | | | 255,625 | | |
| | 250 | | | The Geo Group, Inc., Global Company
Guaranteed Notes
(Callable 02/15/16@ 103.31) | | (B+, B1) | | 02/15/21 | | | 6.625 | | | | 265,937 | | |
| | 500 | | | The Geo Group, Inc., Global Company
Guaranteed Notes
(Callable 04/01/18@ 102.56) | | (B+, NR) | | 04/01/23 | | | 5.125 | | | | 471,250 | | |
| | 500 | | | TMS International Corp., Rule 144A,
Company Guaranteed Notes
(Callable 10/15/16@ 105.72)‡ | | (B-, B3) | | 10/15/21 | | | 7.625 | | | | 525,000 | | |
| | | | 2,840,312 | | |
| Telecom - Integrated/Services (1.0%) | | | |
| | 750 | | | Hughes Satellite Systems Corp.,
Global Senior Secured Notes | | (B+, Ba3) | | 06/15/19 | | | 6.500 | | | | 808,125 | | |
See Accompanying Notes to Financial Statements.
12
Credit Suisse Strategic Income Fund
Schedule of Investments (continued)
October 31, 2013
Par
(000) | |
| | Ratings†
(S&P/Moody's) | | Maturity | | Rate% | | Value | |
CORPORATE BONDS | | | |
| Theaters & Entertainment (1.0%) | | | |
$ | 250 | | | Carmike Cinemas, Inc.,
Global Secured Notes
(Callable 05/15/15@ 105.53) | | (B, B2) | | 05/15/19 | | | 7.375 | | | $ | 272,500 | | |
| | 500 | | | Regal Entertainment Group,
Senior Unsecured Notes
(Callable 06/15/18@ 102.88) | | (B-, B3) | | 06/15/23 | | | 5.750 | | | | 496,250 | | |
| | | | 768,750 | | |
| TOTAL CORPORATE BONDS (Cost $25,957,164) | | | 26,759,230 | | |
| BANK LOANS (47.7%) | | | |
| Aerospace & Defense (0.7%) | | | |
| | 163 | | | Aveos Fleet Performance, Inc.# | | (CCC+, NR) | | 03/12/15 | | | 12.750 | | | | 63,565 | | |
| | 500 | | | LM U.S. Corp. Acquisition, Inc.# | | (CCC, Caa2) | | 10/26/20 | | | 9.500 | | | | 505,000 | | |
| | | | 568,565 | | |
| Auto Parts & Equipment (0.6%) | | | |
| | 448 | | | ASP HHI Acquisition Co., Inc.# | | (B+, B2) | | 10/05/18 | | | 5.000 | | | | 452,229 | | |
| Banking (1.9%) | | | |
| | 499 | | | Citco Funding LLC# | | (NR, B1) | | 06/29/18 | | | 4.250 | | | | 500,597 | | |
| | 1,000 | | | McJunkin Red Man Corp.# | | (BB-, B2) | | 11/08/19 | | | 6.000 | | | | 1,008,120 | | |
| | | | 1,508,717 | | |
| Building Materials (0.6%) | | | |
| | 499 | | | Roofing Supply Group Holdings, Inc.# | | (B, B3) | | 05/31/19 | | | 5.000 | | | | 502,481 | | |
| Chemicals (2.6%) | | | |
| | 500 | | | Allnex U.S.A., Inc.# | | (B-, B3) | | 04/03/20 | | | 8.250 | | | | 515,625 | | |
| | 500 | | | Oxbow Carbon & Minerals Holdings, Inc.# | | (BB-, B2) | | 01/18/20 | | | 8.000 | | | | 510,937 | | |
| | 500 | | | Royal Adhesives and Sealants LLC# | | (CCC+, Caa2) | | 01/31/19 | | | 9.750 | | | | 502,500 | | |
| | 500 | | | Utex Industries, Inc.# | | (CCC+, Caa2) | | 04/10/21 | | | 8.750 | | | | 509,065 | | |
| | | | 2,038,127 | | |
| Consumer Products (0.7%) | | | |
| | 500 | | | Ranpak Corp.# | | (B-, Caa1) | | 04/23/20 | | | 8.500 | | | | 513,750 | | |
| Department Stores (1.3%) | | | |
| | 1,000 | | | Sears Roebuck Acceptance Corp.# | | (B, Ba3) | | 06/30/18 | | | 5.500 | | | | 1,005,540 | | |
| Diversified Capital Goods (2.4%) | | | |
| | 750 | | | Husky Injection Molding Systems Ltd.# | | (B, Ba3) | | 07/02/18 | | | 4.250 | | | | 756,281 | | |
| | 500 | | | Minimax GmbH & Co.# | | (B, B2) | | 08/14/20 | | | 4.500 | | | | 503,960 | | |
| | 701 | | | Revere Industries LLC# | | (CCC-, B3) | | 04/30/15 | | | 10.000 | | | | 595,808 | | |
| | | | 1,856,049 | | |
| Electric - Generation (0.5%) | | | |
| | 600 | | | Texas Competitive Electric Holdings Co. LLC# | | (CCC, Caa3) | | 10/10/17 | | | 4.674 | | | | 401,250 | | |
See Accompanying Notes to Financial Statements.
13
Credit Suisse Strategic Income Fund
Schedule of Investments (continued)
October 31, 2013
Par
(000) | |
| | Ratings†
(S&P/Moody's) | | Maturity | | Rate% | | Value | |
BANK LOANS | | | |
| Financial Services (2.8%) | | | |
$ | 758 | | | EZE Software Group LLC# | | (B+, B1) | | 04/06/20 | | | 4.750 | | | $ | 763,380 | | |
| | 658 | | | StoneRiver Group LP# | | (CCC+, Caa1) | | 05/29/20 | | | 8.500 | | | | 666,400 | | |
| | 740 | | | Walter Investment Management Corp.# | | (B+, B2) | | 11/28/17 | | | 5.750 | | | | 748,973 | | |
| | | | 2,178,753 | | |
| Food - Wholesale (1.1%) | | | |
| | 869 | | | Del Monte Foods Co.# | | (B, B1) | | 03/08/18 | | | 4.000 | | | | 871,018 | | |
| Forestry & Paper (0.6%) | | | |
| | 500 | | | Clondalkin Acquisition B.V.# | | (CCC+, Caa2) | | 11/30/20 | | | 10.000 | | | | 488,750 | | |
| Gaming (0.9%) | | | |
| | 750 | | | ROC Finance LLC# | | (BB-, B2) | | 06/20/19 | | | 5.000 | | | | 735,938 | | |
| Health Services (1.0%) | | | |
| | 798 | | | Alere, Inc.# | | (B+, Ba3) | | 06/30/17 | | | 4.250 | | | | 805,597 | | |
| Hotels (1.1%) | | | |
| | 836 | | | IntraWest ULC# | | (CCC, NR) | | 12/04/18 | | | 10.750 | | | | 863,384 | | |
| Household & Leisure Products (1.3%) | | | |
| | 1,000 | | | Steinway Musical Instruments# | | (B+, Caa1) | | 09/11/20 | | | 9.250 | | | | 1,025,000 | | |
| Insurance Brokerage (0.6%) | | | |
| | 500 | | | Genex Services, Inc.# | | (B, B1) | | 07/25/18 | | | 5.250 | | | | 500,000 | | |
| Life-Insurance (0.9%) | | | |
| | 403 | | | MMM Holdings, Inc.# | | (B+, B2) | | 12/12/17 | | | 9.750 | | | | 405,987 | | |
| | 293 | | | MSO of Puerto Rico, Inc.# | | (B+, B2) | | 12/12/17 | | | 9.750 | | | | 295,263 | | |
| | | | 701,250 | | |
| Machinery (0.5%) | | | |
| | 409 | | | Alliance Laundry Systems LLC# | | (CCC+, Caa2) | | 12/07/19 | | | 9.500 | | | | 414,462 | | |
| Media - Broadcast (0.6%) | | | |
| | 479 | | | Foxco Acquisition LLC# | | (B, B2) | | 07/14/17 | | | 5.500 | | | | 481,085 | | |
| Media - Services (0.6%) | | | |
| | 499 | | | Premier Dental Services, Inc.# | | (B, B3) | | 11/01/18 | | | 8.250 | | | | 502,485 | | |
| Metals & Mining - Excluding Steel (1.3%) | | | |
| | 997 | | | FMG Resources (August 2006) Pty Ltd.# | | (BB+, Ba1) | | 10/18/17 | | | 5.250 | | | | 1,001,172 | | |
| Oil Field Equipment & Services (1.3%) | | | |
| | 1,000 | | | Shelf Drilling Holdings Ltd.# | | (B+, B2) | | 10/08/18 | | | 10.000 | | | | 1,016,875 | | |
| Oil Refining & Marketing (1.0%) | | | |
| | 750 | | | Wildhorse Resources LLC# | | (B, B3) | | 12/13/18 | | | 7.500 | | | | 746,250 | | |
| Packaging (0.7%) | | | |
| | 500 | | | Berlin Packaging LLC# | | (CCC+, Caa1) | | 04/03/20 | | | 8.750 | | | | 506,250 | | |
| Pharmaceuticals (1.9%) | | | |
| | 988 | | | Auxilium Pharmaceuticals, Inc.# | | (B, Ba2) | | 04/26/17 | | | 6.250 | | | | 1,002,930 | | |
| | 499 | | | Patheon, Inc.# | | (B+, B3) | | 12/14/18 | | | 7.250 | | | | 508,092 | | |
| | | | 1,511,022 | | |
See Accompanying Notes to Financial Statements.
14
Credit Suisse Strategic Income Fund
Schedule of Investments (continued)
October 31, 2013
Par
(000) | |
| | Ratings†
(S&P/Moody's) | | Maturity | | Rate% | | Value | |
BANK LOANS | | | |
| Printing & Publishing (3.2%) | | | |
$ | 745 | | | Harland Clarke Holdings Corp.# | | (B+, B1) | | 05/22/18 | | | 7.000 | | | $ | 749,878 | | |
| | 748 | | | MTL Publishing LLC# | | (BB-, Ba3) | | 06/29/18 | | | 4.250 | | | | 753,915 | | |
| | 997 | | | Tribune Co.# | | (BB+, Ba3) | | 12/31/19 | | | 4.000 | | | | 998,734 | | |
| | | | 2,502,527 | | |
| Real Estate Investment Trusts (1.2%) | | | |
| | 927 | | | iStar Financial, Inc.# | | (BB-, B1) | | 10/15/17 | | | 4.500 | | | | 934,446 | | |
| Software/Services (5.0%) | | | |
| | 499 | | | Deltek, Inc.# | | (B, B1) | | 10/10/18 | | | 5.000 | | | | 501,113 | | |
| | 1,000 | | | Digital Insight Corp.# | | (CCC+, Caa2) | | 10/11/20 | | | 8.750 | | | | 1,008,330 | | |
| | 500 | | | SafeNet, Inc.# | | (B, B3) | | 04/12/15 | | | 6.236 | | | | 499,063 | | |
| | 1,000 | | | SumTotal Systems, Inc.# | | (CCC+, Caa1) | | 05/16/19 | | | 10.250 | | | | 987,500 | | |
| | 500 | | | The TriZetto Group, Inc.# | | (CCC, Caa2) | | 03/28/19 | | | 8.500 | | | | 440,000 | | |
| | 500 | | | Wall Street Systems Holdings, Inc.# | | (B-, Caa2) | | 10/25/20 | | | 9.250 | | | | 504,837 | | |
| | | | 3,940,843 | | |
| Specialty Retail (1.9%) | | | |
| | 492 | | | Academy Ltd.# | | (B, B1) | | 08/03/18 | | | 4.500 | | | | 496,848 | | |
| | 997 | | | BJ's Wholesale Club, Inc.# | | (B-, Caa1) | | 09/26/19 | | | 4.250 | | | | 999,612 | | |
| | | | 1,496,460 | | |
| Telecom - Integrated/Services (3.8%) | | | |
| | 998 | | | LTS Buyer LLC# | | (B, B1) | | 04/13/20 | | | 4.500 | | | | 1,003,734 | | |
| | 500 | | | LTS Buyer LLC# | | (CCC+, Caa1) | | 03/28/21 | | | 8.000 | | | | 508,750 | | |
| | 500 | | | Securus Technologies, Inc.# | | (CCC+, Caa2) | | 04/30/21 | | | 9.000 | | | | 496,668 | | |
| | 997 | | | Zayo Group LLC# | | (B, B1) | | 07/02/19 | | | 4.500 | | | | 1,003,918 | | |
| | | | 3,013,070 | | |
| Telecommunications Equipment (1.2%) | | | |
| | 997 | | | Avaya, Inc.# | | (B, B1) | | 10/26/17 | | | 4.762 | | | | 924,629 | | |
| Textiles & Apparel (0.6%) | | | |
| | 499 | | | Renfro Corp.# | | (B, B2) | | 01/30/19 | | | 5.750 | | | | 498,120 | | |
| Transportation - Excluding Air/Rail (1.3%) | | | |
| | 1,000 | | | Navios Maritime Partners LP# | | (BB, Ba3) | | 06/27/18 | | | 5.250 | | | | 1,017,190 | | |
| TOTAL BANK LOANS (Cost $37,203,390) | | | 37,523,284 | | |
See Accompanying Notes to Financial Statements.
15
Credit Suisse Strategic Income Fund
Schedule of Investments (continued)
October 31, 2013
Par
(000) | |
| | Ratings†
(S&P/Moody's) | | Maturity | | Rate% | | Value | |
| ASSET BACKED SECURITIES (11.0%) | | | |
| Collateralized Debt Obligations (11.0%) | | | |
$ | 750 | | | Carlyle Global Market Strategies
CLO Ltd., 2012-4A, Rule 144A‡ | | (NR, NR) | | 01/20/25 | | | 0.000 | | | $ | 712,044 | | |
| | 1,000 | | | CIFC Funding Ltd., 2013-3A^ | | (NR, NR) | | 11/27/24 | | | 4.992 | | | | 896,700 | | |
| | 500 | | | CIFC Funding Ltd., 2013-3A,
Rule 144A‡# | | (BB, NR) | | 10/24/25 | | | 5.006 | | | | 463,209 | | |
| | 500 | | | Emerson Park CLO Ltd., 2013-1A,
Rule 144A‡# | | (BB, NR) | | 07/15/25 | | | 5.113 | | | | 457,387 | | |
| | 500 | | | Gale Force 4 CLO Ltd., 2007-4A,
Rule 144A‡# | | (BBB, Ba1) | | 08/20/21 | | | 3.764 | | | | 488,002 | | |
| | 500 | | | Halcyon Loan Advisors Funding Ltd.,
2012-2A, Rule 144A‡# | | (BB, NR) | | 12/20/24 | | | 5.652 | | | | 462,634 | | |
| | 250 | | | Halcyon Loan Advisors Funding Ltd.,
2012-2X, Reg S# | | (BB, NR) | | 12/20/24 | | | 5.652 | | | | 231,317 | | |
| | 500 | | | JFIN CLO Ltd., 2013-1A, Rule 144A‡# | | (BB, NR) | | 01/20/25 | | | 4.992 | | | | 447,581 | | |
| | 550 | | | KVK CLO Ltd., 2013-1A, Rule 144A‡# | | (BB, NR) | | 04/14/25 | | | 5.744 | | | | 525,092 | | |
| | 500 | | | Neuberger Berman CLO Ltd., 2012-12A,
Rule 144A‡# | | (BB, NR) | | 07/25/23 | | | 7.238 | | | | 504,426 | | |
| | 1,000 | | | Neuberger Berman CLO Ltd., 2013-15A,
Rule 144A‡#^ | | (BB, NR) | | 10/15/25 | | | 4.852 | | | | 897,500 | | |
| | 500 | | | Ocean Trails CLO, 2013-4A, Rule 144A‡# | | (BBB, NR) | | 08/13/25 | | | 4.371 | | | | 484,891 | | |
| | 750 | | | Shackleton II CLO Ltd., 2012-2A,
Rule 144A‡# | | (BB, NR) | | 10/20/23 | | | 5.442 | | | | 694,975 | | |
| | 500 | | | Venture X CLO Ltd., 2012-12A,
Rule 144A‡# | | (BB, NR) | | 02/28/24 | | | 5.562 | | | | 463,493 | | |
| | 1,000 | | | Whitehorse Ltd., 2013-1A, Rule 144A‡# | | (BB-, NR) | | 11/24/25 | | | 5.106 | | | | 917,687 | | |
| TOTAL ASSET BACKED SECURITIES (Cost $8,536,753) | | | 8,646,938 | | |
Number of
Shares | |
| |
| |
| |
| |
| |
| COMMON STOCK (2.6%) | | | |
| Diversified Capital Goods (2.6%) | | | |
| | 698,462 | | | Electrical Components International, Inc.*^
(Cost $2,130,309) | | | | | | | | | | | | | | | 2,060,463 | | |
Par
(000) | |
| |
| | Maturity | | Rate% | |
| |
| SHORT-TERM INVESTMENT (0.1%) | | | |
$ | 48 | | | State Street Bank and Trust Co. Euro Time Deposit
(Cost $48,000) | | | | | | 11/01/13 | | | 0.010 | | | | 48,000 | | |
| TOTAL INVESTMENTS AT VALUE (95.5%) (Cost $73,875,616) | | | 75,037,915 | | |
| OTHER ASSETS IN EXCESS OF LIABILITIES (4.5%) | | | 3,553,952 | | |
| NET ASSETS (100.0%) | | $ | 78,591,867 | | |
See Accompanying Notes to Financial Statements.
16
Credit Suisse Strategic Income Fund
Schedule of Investments (continued)
October 31, 2013
INVESTMENT ABBREVIATIONS
NR = Not Rated
PIK = Payment in Kind
Reg S = Regulation S
† Credit ratings given by the Standard & Poor's Division of The McGraw-Hill Companies, Inc. ("S&P") and Moody's Investors Service, Inc. ("Moody's") are unaudited.
‡ Security exempt from registration under Rule 144A of the Securities Act of 1933. These securities may be resold in transactions exempt from registration, normally to qualified institutional buyers. At October 31, 2013, these securities amounted to a value of $19,611,896 or 25.0% of net assets.
€ This security is denominated in Euro.
£ This security is denominated in British Pound.
# Variable rate obligations — The interest rate is the rate as of October 31, 2013.
* Non-income producing security.
^ Not readily marketable security; security is valued at fair value as determined in good faith by, or under the direction of, the Board of Trustees.
See Accompanying Notes to Financial Statements.
17
Credit Suisse Strategic Income Fund
Statement of Assets and Liabilities
October 31, 2013
Assets | |
Investments at value (Cost $73,875,616) (Note 2) | | $ | 75,037,915 | | |
Cash | | | 457 | | |
Foreign currency at value (cost $265,878) | | | 267,508 | | |
Receivable for investments sold | | | 10,186,663 | | |
Due from custodian | | | 2,060,461 | | |
Dividend and interest receivable | | | 712,555 | | |
Receivable for fund shares sold | | | 29,013 | | |
Prepaid expenses | | | 25,098 | | |
Total Assets | | | 88,319,670 | | |
Liabilities | |
Advisory fee payable (Note 3) | | | 42,873 | | |
Administrative services fee payable (Note 3) | | | 9,770 | | |
Shareholder servicing/Distribution fee payable (Note 3) | | | 12,450 | | |
Payable for investments purchased | | | 9,146,812 | | |
Loan payable (Note 4) | | | 337,600 | | |
Payable for fund shares redeemed | | | 47,968 | | |
Unrealized depreciation on forward currency contracts (Note 2) | | | 17,341 | | |
Dividend payable | | | 1,181 | | |
Accrued expenses | | | 111,808 | | |
Total Liabilities | | | 9,727,803 | | |
Net Assets | |
Capital stock, $.001 par value (Note 6) | | | 7,375 | | |
Paid-in capital (Note 6) | | | 76,251,226 | | |
Accumulated net investment loss | | | (8,933 | ) | |
Accumulated net realized gain from investments and foreign currency transactions | | | 1,194,827 | | |
Net unrealized appreciation from investments and foreign currency translations | | | 1,147,372 | | |
Net Assets | | $ | 78,591,867 | | |
I Shares | |
Net assets | | $ | 31,830,284 | | |
Shares outstanding | | | 2,987,967 | | |
Net asset value, offering price and redemption price per share | | $ | 10.65 | | |
A Shares | |
Net assets | | $ | 46,572,511 | | |
Shares outstanding | | | 4,369,078 | | |
Net asset value and redemption price per share | | $ | 10.66 | | |
Maximum offering price per share (net asset value/(1-4.75%)) | | $ | 11.19 | | |
C Shares | |
Net assets | | $ | 189,072 | | |
Shares outstanding | | | 17,751 | | |
Net asset value, offering price and redemption price per share | | $ | 10.65 | | |
See Accompanying Notes to Financial Statements.
18
Credit Suisse Strategic Income Fund
Statement of Operations
For the Year Ended October 31, 2013
| Investment Income (Note 2) | |
Interest | | $ | 2,629,368 | | |
Foreign taxes withheld | | | (121 | ) | |
Total investment income | | | 2,629,247 | | |
Expenses | |
Investment advisory fees (Note 3) | | | 310,730 | | |
Administrative services fees (Note 3) | | | 59,485 | | |
Shareholder servicing/Distribution fees (Note 3) | |
Class A | | | 33,341 | | |
Class C | | | 1,537 | | |
Offering costs (Note 3) | | | 80,463 | | |
Legal fees | | | 77,526 | | |
Audit and tax fees | | | 50,600 | | |
Trustees' fees | | | 24,997 | | |
Registration fees | | | 18,078 | | |
Printing fees (Note 3) | | | 16,978 | | |
Custodian fees | | | 7,287 | | |
Transfer agent fees (Note 3) | | | 7,216 | | |
Insurance expense | | | 1,127 | | |
Interest expense (Note 4) | | | 864 | | |
Commitment fees (Note 4) | | | 18 | | |
Miscellaneous expense | | | 14,225 | | |
Total expenses | | | 704,472 | | |
Less: fees waived and expenses reimbursed (Note 3) | | | (258,567 | ) | |
Net expenses | | | 445,905 | | |
Net investment income | | | 2,183,342 | | |
Net Realized and Unrealized Gain (Loss) from Investments and Foreign Currency Related Items | |
Net realized gain from investments | | | 1,222,717 | | |
Net realized loss from foreign currency transactions | | | (39,460 | ) | |
Net change in unrealized appreciation (depreciation) from investments | | | 1,116,913 | | |
Net change in unrealized appreciation (depreciation) from foreign currency translations | | | (20,437 | ) | |
Net realized and unrealized gain from investments and foreign currency related items | | | 2,279,733 | | |
Net increase in net assets resulting from operations | | $ | 4,463,075 | | |
See Accompanying Notes to Financial Statements.
19
Credit Suisse Strategic Income Fund
Statement of Changes in Net Assets
| | | For the Year
Ended
October 31, 2013 | | For the Period
Ended
October 31, 20121 | |
From Operations | |
Net investment income | | $ | 2,183,342 | | | $ | 10,936 | | |
Net realized gain from investments and foreign currency transactions | | | 1,183,257 | | | | 33,592 | | |
Net change in unrealized appreciation (depreciation)
from investments and foreign currency translations | | | 1,096,476 | | | | 50,896 | | |
Net increase in net assets resulting from operations | | | 4,463,075 | | | | 95,424 | | |
From Dividends and Distributions | |
Dividends from net investment income | |
Class I | | | (1,613,430 | ) | | | (12,576 | ) | |
Class A | | | (562,582 | ) | | | (59 | ) | |
Class C | | | (7,330 | ) | | | (23 | ) | |
Distributions from net realized gains | |
Class I | | | (31,458 | ) | | | — | | |
Class A | | | (153 | ) | | | — | | |
Class C | | | (208 | ) | | | — | | |
Net decrease in net assets resulting from dividends and distributions | | | (2,215,161 | ) | | | (12,658 | ) | |
| From Capital Share Transactions (Note 6) | |
Proceeds from sale of shares | | | 76,580,548 | | | | 20,816,400 | | |
Reinvestment of dividends and distributions | | | 2,201,120 | | | | 12,612 | | |
Net asset value of shares redeemed | | | (23,349,446 | )2 | | | (47 | ) | |
Net increase in net assets from capital share transactions | | | 55,432,222 | | | | 20,828,965 | | |
Net increase in net assets | | | 57,680,136 | | | | 20,911,731 | | |
Net Assets | |
Beginning of year | | | 20,911,731 | | | | — | | |
End of year | | $ | 78,591,867 | | | $ | 20,911,731 | | |
Accumulated net investment loss | | $ | (8,933 | ) | | $ | (46 | ) | |
1 For the period September 28, 2012 (commencement of operations) through October 31, 2012.
2 Net of $1,563 of redemption fees retained by the Fund.
See Accompanying Notes to Financial Statements.
20
Credit Suisse Strategic Income Fund
Financial Highlights
(For a Class I Share of the Fund Outstanding Throughout Each Period)
| | | For the Year
Ended
October 31, 2013 | | For the Period
Ended
October 31, 20121 | |
Per share data | |
Net asset value, beginning of year | | $ | 10.06 | | | $ | 10.00 | | |
INVESTMENT OPERATIONS | |
Net investment income2 | | | 0.61 | | | | 0.01 | | |
Net gain on investments and foreign currency related items
(both realized and unrealized) | | | 0.60 | | | | 0.06 | | |
Total from investment operations | | | 1.21 | | | | 0.07 | | |
LESS DIVIDENDS AND DISTRIBUTIONS | |
Dividends from net investment income | | | (0.60 | ) | | | (0.01 | ) | |
Distributions from net realized gains | | | (0.02 | ) | | | — | | |
Total dividends and distributions | | | (0.62 | ) | | | (0.01 | ) | |
Net asset value, end of year | | $ | 10.65 | | | $ | 10.06 | | |
Total return3 | | | 12.29 | % | | | 0.67 | % | |
RATIOS AND SUPPLEMENTAL DATA | |
Net assets, end of year (000s omitted) | | $ | 31,830 | | | $ | 20,710 | | |
Ratio of net expenses to average net assets | | | 0.99 | % | | | 0.99 | %4 | |
Ratio of net investment income to average net assets | | | 5.77 | % | | | 0.87 | %4 | |
Decrease reflected in above operating expense ratios due to
waivers/reimbursements | | | 0.63 | % | | | 5.25 | %4 | |
Portfolio turnover rate | | | 159 | % | | | 31 | % | |
1 For the period September 28, 2012 (commencement of operations) through October 31, 2012.
2 Per share information is calculated using the average shares outstanding method.
3 Total returns are historical and assume changes in share price, reinvestment of all dividends and distributions. Had certain expenses not been reduced during the years shown, total returns would have been lower. Total returns for periods less than one year are not annualized.
4 Annualized.
See Accompanying Notes to Financial Statements.
21
Credit Suisse Strategic Income Fund
Financial Highlights
(For a Class A Share of the Fund Outstanding Throughout Each Period)
| | | For the Year
Ended
October 31, 2013 | | For the Period
Ended
October 31, 20121 | |
Per share data | |
Net asset value, beginning of year | | $ | 10.07 | | | $ | 10.00 | | |
INVESTMENT OPERATIONS | |
Net investment income2 | | | 0.45 | | | | 0.003 | | |
Net gain on investments and foreign currency related items
(both realized and unrealized) | | | 0.73 | | | | 0.08 | | |
Total from investment operations | | | 1.18 | | | | 0.08 | | |
REDEMPTION FEES | | | 0.003 | | | | — | | |
LESS DIVIDENDS AND DISTRIBUTIONS | |
Dividends from net investment income | | | (0.57 | ) | | | (0.01 | ) | |
Distributions from net realized gains | | | (0.02 | ) | | | — | | |
Total dividends and distributions | | | (0.59 | ) | | | (0.01 | ) | |
Net asset value, end of year | | $ | 10.66 | | | $ | 10.07 | | |
Total return4 | | | 11.94 | % | | | 0.76 | % | |
RATIOS AND SUPPLEMENTAL DATA | |
Net assets, end of year (000s omitted) | | $ | 46,573 | | | $ | 101 | | |
Ratio of net expenses to average net assets | | | 1.24 | % | | | 1.24 | %5 | |
Ratio of net investment income to average net assets | | | 4.22 | % | | | 0.42 | %5 | |
Decrease reflected in above operating expense ratios due to
waivers/reimbursements | | | 0.63 | % | | | 5.25 | %5 | |
Portfolio turnover rate | | | 159 | % | | | 31 | % | |
1 For the period September 28, 2012 (commencement of operations) through October 31, 2012.
2 Per share information is calculated using the average shares outstanding method.
3 This amount represents less than $0.01 per share.
4 Total returns are historical and assume changes in share price and reinvestment of all dividends and distributions and no sales charge. Had certain expenses not been reduced during the years shown, total returns would have been lower. Total returns for periods less than one year are not annualized.
5 Annualized.
See Accompanying Notes to Financial Statements.
22
Credit Suisse Strategic Income Fund
Financial Highlights
(For a Class C Share of the Fund Outstanding Throughout Each Period)
| | | For the Year
Ended
October 31, 2013 | | For the Period
Ended
October 31, 20121 | |
Per share data | |
Net asset value, beginning of year | | $ | 10.06 | | | $ | 10.00 | | |
INVESTMENT OPERATIONS | |
Net investment income (loss)2 | | | 0.50 | | | | (0.00 | )3 | |
Net gain on investments and foreign currency related items
(both realized and unrealized) | | | 0.61 | | | | 0.06 | | |
Total from investment operations | | | 1.11 | | | | 0.06 | | |
LESS DIVIDENDS AND DISTRIBUTIONS | |
Dividends from net investment income | | | (0.50 | ) | | | (0.00 | )3 | |
Distributions from net realized gains | | | (0.02 | ) | | | — | | |
Total dividends and distributions | | | (0.52 | ) | | | (0.00 | )3 | |
Net asset value, end of year | | $ | 10.65 | | | $ | 10.06 | | |
Total return4 | | | 11.18 | % | | | 0.62 | % | |
RATIOS AND SUPPLEMENTAL DATA | |
Net assets, end of year (000s omitted) | | $ | 189 | | | $ | 101 | | |
Ratio of net expenses to average net assets | | | 1.99 | % | | | 1.99 | %5 | |
Ratio of net investment income (loss) to average net assets | | | 4.77 | % | | | (0.33 | )%5 | |
Decrease reflected in above operating expense ratios due to
waivers/reimbursements | | | 0.63 | % | | | 5.25 | %5 | |
Portfolio turnover rate | | | 159 | % | | | 31 | % | |
1 For the period September 28, 2012 (commencement of operations) through October 31, 2012.
2 Per share information is calculated using the average shares outstanding method.
3 This amount represents less than $0.01 per share.
4 Total returns are historical and assume changes in share price, reinvestment of all dividends and distributions and no sales charge. Had certain expenses not been reduced during the years shown, total returns would have been lower. Total returns for periods less than one year are not annualized.
5 Annualized.
See Accompanying Notes to Financial Statements.
23
Credit Suisse Strategic Income Fund
Notes to Financial Statements
October 31, 2013
Credit Suisse Strategic Income Fund (the "Fund"), a series of the Credit Suisse Opportunity Funds (the "Trust"), a Delaware statutory trust, is registered under the Investment Company Act of 1940, as amended (the "1940 Act"), as a non-diversified open-end management investment company that seeks both current income and capital appreciation as elements of total return. The Trust was organized under the laws of the State of Delaware as a business trust on May 31, 1995.
The Fund offers three classes of shares: Class I shares, Class A shares and Class C shares. Each class of shares represents an equal pro rata interest in the Fund, except they bear different expenses, which reflect the differences in the range of services provided to them. Class A shares are sold subject to a front-end sales charge of up to 4.75%. Class C shares are sold subject to a contingent deferred sales charge of 1.00% if the shares are redeemed within the first year of purchase.
Note 2. Significant Accounting Policies
The following is a summary of significant accounting policies followed by the Funds in the preparation of their financial statements. The policies are in accordance with accounting principles generally accepted in the United States of America ("GAAP"). The preparation of financial statements requires management to make estimates and assumptions that affect the reported amounts and disclosures in the financial statements. Actual results could differ from those estimates.
A) SECURITY VALUATION — The net asset value of the Fund is determined daily as of the close of regular trading on the New York Stock Exchange, Inc. (the "Exchange") on each day the Exchange is open for business. The valuations for fixed income securities (which may include, but are not limited to, corporate, government, municipal, mortgage-backed, collateralized mortgage obligations and asset-backed securities) and certain derivative instruments are typically the prices supplied by independent third party pricing services, which may use market prices or broker/dealer quotations or a variety of valuation techniques and methodologies. The independent third party pricing services use inputs that are observable such as issuer details, interest rates, yield curves, prepayment speeds, credit risks/spreads, default rates and quoted prices for similar securities. Short-term fixed income securities that will mature in 60 days or less are valued at amortized cost unless it is determined that using this method would not reflect an investment's fair value.
24
Credit Suisse Strategic Income Fund
Notes to Financial Statements (continued)
October 31, 2013
Note 2. Significant Accounting Policies
Structured note agreements are valued in accordance with a dealer-supplied valuation based on changes in the value of the underlying index. Futures contracts are valued daily at the settlement price established by the board of trade or exchange on which they are traded. Equity securities for which market quotations are available are valued at the last reported sales price or official closing price on the primary market or exchange on which they trade. The Fund may utilize a service provided by an independent third party which has been approved by the Board of Trustees to fair value certain securities. When fair value pricing is employed, the prices of securities used by the Fund to calculate its net asset value may differ from quoted or published prices for the same securities. If independent third party pricing services are unable to supply prices for a portfolio investment, or if the prices supplied are deemed by the investment adviser to be unreliable, the market price may be determined by the investment adviser using quotations from one or more broker/dealers or at the transaction price if the security has recently been purchased and no value has yet been obtained from a pricing service or pricing broker. When reliable prices are not readily available, such as when the value of a security has been significantly affected by events after the close of the exchange or market on which the security is principally traded, but before the Fund calculates its net asset value, the Fund values these securities as determined in accordance with procedures approved by the Fund's Board of Trustees.
The Fund uses valuation techniques to measure fair value that are consistent with the market approach and/or income approach, depending on the type of security and the particular circumstance. The market approach uses prices and other relevant information generated by market transactions involving identical or comparable securities. The income approach uses valuation techniques to discount estimated future cash flows to present value.
GAAP established a disclosure hierarchy that categorizes the inputs to valuation techniques used to value assets and liabilities at measurement date. These inputs are summarized in the three broad levels listed below:
• Level 1 – quoted prices in active markets for identical investments
• Level 2 – other significant observable inputs (including quoted prices for similar investments, interest rates, prepayment speeds, credit risk, etc.)
• Level 3 – significant unobservable inputs (including the Fund's own assumptions in determining the fair value of investments)
25
Credit Suisse Strategic Income Fund
Notes to Financial Statements (continued)
October 31, 2013
Note 2. Significant Accounting Policies
The inputs or methodologies used to value securities are not necessarily an indication of the risk associated with investing in those securities.
The following is a summary of the inputs used as of October 31, 2013 in valuing the Fund's assets and liabilities carried at fair value:
| | | Level 1 | | Level 2 | | Level 3 | | Total | |
Investments in Securities | |
Corporate Bonds | | $ | — | | | $ | 26,759,230 | | | $ | — | | | $ | 26,759,230 | | |
Bank Loans | | | — | | | | 37,523,284 | | | | — | | | | 37,523,284 | | |
Asset Backed Securities | | | — | | | | 6,852,738 | | | | 1,794,200 | | | | 8,646,938 | | |
Common Stock | | | — | | | | — | | | | 2,060,463 | | | | 2,060,463 | | |
Short-term Investment | | | — | | | | 48,000 | | | | — | | | | 48,000 | | |
Other Financial Instruments* | |
Forward Foreign Currency Contracts | | | — | | | | (17,341 | ) | | | — | | | | (17,341 | ) | |
| | | $ | — | | | $ | 71,165,911 | | | $ | 3,854,663 | | | $ | 75,020,574 | | |
*Other financial instruments include forward foreign currency contracts.
The following is a reconciliation of investments as of October 31, 2013 in which significant unobservable inputs (Level 3) were used in determining value. Transfers in or out of Level 3 represent the end of the period value of any security or instrument where a change in the level has occurred from the beginning to the end of the period.
| | | Asset Backed
Securities | | Common
Stock | | Total | |
Balance as of October 31, 2012 | | $ | — | | | $ | — | | | $ | — | | |
Accrued discounts/premiums | | | 608 | | | | — | | | | 608 | | |
Purchases | | | 1,780,658 | | | | 2,130,309 | | | | 3,910,967 | | |
Sales | | | — | | | | — | | | | — | | |
Realized Gain (Loss) | | | — | | | | — | | | | — | | |
Change in Unrealized Appreciation (Depreciation) | | | 12,934 | | | | (69,846 | ) | | | (56,912 | ) | |
Transfers Into Level 3 | | | — | | | | — | | | | — | | |
Transfers Out of Level 3 | | | — | | | | — | | | | — | | |
Balance as of October 31, 2013 | | $ | 1,794,200 | | | $ | 2,060,463 | | | $ | 3,854,663 | | |
Net change in unrealized Appreciation (Depreciation)
from investments still held as of October 31, 2013 | | $ | 12,934 | | | $ | (69,846 | ) | | $ | (56,912 | ) | |
26
Credit Suisse Strategic Income Fund
Notes to Financial Statements (continued)
October 31, 2013
Note 2. Significant Accounting Policies
| | Quantitative Disclosure About Significant Unobservable Inputs | |
| Asset Class | | Fair Value
at 10/31/2013 | | Valuation
Technique(s) | | Unobservable
Input | | Range
(Weighted
Average) | |
Common Stocks | | | | | | | | | |
Diversified Capital
Goods | | $ | 2,060,463
| | | Market Approach
| | Single Broker Quote
| | $ | 2.95
per share | | |
Asset Backed Securities | | | | | | | | | |
Collateralized Debt
Obligations | | $ | 896,700
| | | Acquisition Value
| | Acquisition Value
| | $ | 89.67
per share | | |
| | $ | 897,500
| | | Market Approach
| | Single Broker Quote
| | $ | 89.75
per share | | |
Each fair value determination is based on a consideration of relevant factors, including both observable and unobservable inputs. Observable and unobservable inputs the Adviser considers may include (i) the existence of any contractual restrictions on the disposition of securities; (ii) information obtained from the company, which may include an analysis of the company's financial statements, the company's products or intended markets or the company's technologies; (iii) the price of the same or similar security negotiated at arm's length in an issuer's completed subsequent round of financing; (iv) the price and extent of public trading in similar securities of the issuer or of comparable companies; or (v) a probability and time value adjusted analysis of contractual term. Where available and appropriate, multiple valuation methodologies are applied to confirm fair value. Significant unobservable inputs identified by the Adviser are often used in the fair value determination. A significant change in any of these inputs may result in a significant change in the fair value measurement. Due to the uncertainty inherent in the valuation process, such estimates of fair value may differ significantly from the values that would have been used had a ready market for the investments existed, and differences could be material. Additionally, changes in the market environment and other events that may occur over the life of the investments may cause the gains or losses ultimately realized on these investments to be different from the valuations used at the date of these financial statements.
The Fund adopted Financial Accounting Standards Board ("FASB") amendments to authoritative guidance which require the Fund to disclose details of transfers in and out of Level 1 and Level 2 measurements and Level 2 and Level 3 measurements and the reasons for the transfers. For the year ended October 31, 2013, there were no transfers in and out of Level 1, Level 2 and Level 3. All transfers are assumed to occur at the end of the reporting period.
27
Credit Suisse Strategic Income Fund
Notes to Financial Statements (continued)
October 31, 2013
Note 2. Significant Accounting Policies
B) DERIVATIVE INSTRUMENTS AND HEDGING ACTIVITIES — The Fund adopted amendments to authoritative guidance on disclosures about derivative instruments and hedging activities which require that the Fund disclose (a) how and why an entity uses derivative instruments, (b) how derivative instruments and hedging activities are accounted for, and (c) how derivative instruments and related hedging activities affect a fund's financial position, financial performance, and cash flows. For the year ended October 31, 2013, the Fund's derivatives did not qualify for hedge accounting as they are held at fair value.
Fair Values of Derivative Instruments as of October 31, 2013
| | | Asset Derivatives | | Liability Derivatives | |
| | | Balance Sheet
Location | | Fair Value | | Balance Sheet
Location | | Fair Value | |
Currency Contracts
| | Unrealized appreciation
on forward currency
contracts | | $ | — | | | Unrealized depreciation
on forward currency
contracts | | $ | 17,341 | | |
Effect of Derivative Instruments on the Statement of Operations
| | | Location | | Realized
Gain/Loss | | Location | | Net Unrealized
Appreciation/
Depreciation | |
Currency Contracts
| |
Net realized loss from
foreign currency
transactions | | $ | (36,697 | ) | | Net change in unrealized
appreciation (depreciation)
from foreign currency
translations | | $ | (15,931 | ) | |
The notional amount of forward foreign currency contracts at year ended October 31, 2013 are reflected in the Notes to Financial Statements. The notional amounts of forward foreign currency contracts at each month end throughout the reporting period averaged approximately 3.9% of net assets of the Fund.
C) FOREIGN CURRENCY TRANSACTIONS — The books and records of the Fund are maintained in U.S. dollars. Transactions denominated in foreign currencies are recorded at the current prevailing exchange rates. All assets and liabilities denominated in foreign currencies are translated into U.S. dollar amounts at the current exchange rate at the end of the period. Translation gains or losses resulting from changes in the exchange rate during the reporting period and realized gains and losses on the settlement of foreign currency transactions are reported in the results of operations for the current period. The Fund does not isolate that portion of realized gains and losses on investments in equity securities which is due to changes in the foreign exchange rate from that which is due to changes in market prices of equity securities.
28
Credit Suisse Strategic Income Fund
Notes to Financial Statements (continued)
October 31, 2013
Note 2. Significant Accounting Policies
The Fund isolates that portion of realized gains and losses on investments in debt securities which is due to changes in the foreign exchange rate from that which is due to changes in market prices of debt securities.
D) SECURITY TRANSACTIONS AND INVESTMENT INCOME/EXPENSE — Security transactions are accounted for on a trade date basis. Interest income/expense is recorded on the accrual basis. The Fund amortizes premiums and accretes discounts using the effective interest method. Dividend income/expense is recorded on the ex-dividend date. Certain expenses are class-specific expenses, vary by class and are charged only to that class. Income, expenses (excluding class-specific expenses) and realized/unrealized gains/losses are allocated proportionately to each class of shares based upon the relative net asset value of the outstanding shares of that class. The cost of investments sold is determined by use of the specific identification method for both financial reporting and income tax purposes.
E) DIVIDENDS AND DISTRIBUTIONS TO SHAREHOLDERS — Dividends from net investment income, if any, are declared daily and paid monthly. Distributions of net realized capital gains, if any, are declared and paid at least annually. However, to the extent that a net realized capital gain can be reduced by a capital loss carryforward, such gain will not be distributed. Income and capital gain distributions are determined in accordance with federal income tax regulations, which may differ from GAAP.
F) FEDERAL INCOME TAXES — No provision is made for federal taxes as it is the Fund's intention to continue to qualify for and elect the tax treatment applicable to regulated investment companies ("RIC") under the Internal Revenue Code of 1986, as amended (the "Code"), and to make the requisite distributions to its shareholders, which will be sufficient to relieve it from federal income and excise taxes.
In order to qualify as a RIC under the Code, the Fund must meet certain requirements regarding the source of its income, the diversification of its assets and the distribution of its income. One of these requirements is that the Fund derive at least 90% of its gross income for each taxable year from dividends, interest, payments with respect to certain securities loans, gains from the sale or other disposition of stock, securities or foreign currencies, other income derived with respect to its business of investing in such stock, securities or currencies or net income derived from interests in certain publicly traded partnerships ("Qualifying Income").
29
Credit Suisse Strategic Income Fund
Notes to Financial Statements (continued)
October 31, 2013
Note 2. Significant Accounting Policies
The Fund adopted the authoritative guidance for uncertainty in income taxes and recognizes a tax benefit or liability from an uncertain position only if it is more likely than not that the position is sustainable based solely on its technical merits and consideration of the relevant taxing authority's widely understood administrative practices and procedures. The Fund has reviewed its current tax positions and has determined that no provision for income tax is required in the Fund's financial statements. The Fund's federal tax returns for the prior fiscal year remain subject to examination by the Internal Revenue Service.
G) SHORT-TERM INVESTMENTS — The Fund, together with other funds/portfolios advised by Credit Suisse Asset Management, LLC ("Credit Suisse"), an indirect, wholly-owned subsidiary of Credit Suisse Group AG, pools available cash into a short-term variable rate time deposit issued by State Street Bank and Trust Company ("SSB"), the Fund's custodian. The short-term time deposit issued by SSB is a variable rate account classified as a short-term investment.
H) FORWARD FOREIGN CURRENCY CONTRACTS — The Fund may enter into forward foreign currency contracts for the purchase or sale of a specific foreign currency at a fixed price on a future date. Risks may arise upon entering into these contracts from the potential inability of counterparties to meet the terms of their contracts and from unanticipated movements in the value of a foreign currency. The Fund will enter into forward foreign currency contracts primarily for hedging foreign currency risk. Forward foreign currency contracts are adjusted by the daily forward exchange rate of the underlying currency and any gains or losses are recorded for financial statement purposes as unrealized until the contract settlement date or an offsetting position is entered into. At October 31, 2013, the Fund had the following open forward foreign currency contracts:
Forward Foreign
Currency to be
Purchased (Local) | | Forward Foreign
Currency to be
Sold (Local) | | Expiration
Date | | Counterparty | | Value on
Settlement Date | | Current
Value | | Net Unrealized
Appreciation/
(Depreciation) | |
USD | 717,064 | | | EUR | 530,000 | | | 01/15/14 | | Morgan Stanley | | $ | (717,064 | ) | | $ | (720,610 | ) | | $ | (3,546 | ) | |
USD | 2,202,107 | | | GBP | 1,380,000 | | | 01/15/14 | | Morgan Stanley | | | (2,202,107 | ) | | | (2,215,902 | ) | | | (13,795 | ) | |
| | | | | | | | | | | | | | | | | | | | | | | $ | (17,341 | ) | |
Currency Abbreviations:
EUR = Euro
GBP = British Pound
USD = United States Dollar
30
Credit Suisse Strategic Income Fund
Notes to Financial Statements (continued)
October 31, 2013
Note 2. Significant Accounting Policies
I) SECURITIES LENDING — Loans of securities are required at all times to be secured by collateral at least equal to 102% of the market value of domestic securities on loan (including any accrued interest thereon) and 105% of the market value of foreign securities on loan (including any accrued interest thereon). Cash collateral received by the Fund in connection with securities lending activity may be pooled together with cash collateral for other funds/portfolios advised by Credit Suisse and may be invested in a variety of investments, including funds advised by SSB, the Fund's securities lending agent, or money market instruments. However, in the event of default or bankruptcy by the other party to the agreement, realization and/or retention of the collateral may be subject to legal proceedings.
SSB has been engaged by the Fund to act as the Fund's securities lending agent. The Fund's securities lending arrangement provides that the Fund and SSB will share the net income earned from securities lending activities. During the year ended October 31, 2013, there were no securities out on loan. Securities lending income is accrued as earned.
J) OTHER — The high yield, fixed income securities in which the fund will invest will primarily consist of senior secured floating rate loans ("Senior Loans") issued by non-investment grade companies. Senior Loans are typically secured by specific collateral of the issuer and hold the most senior position in the issuer's capital structure. The interest rate on Senior Loans is periodically adjusted to a recognized base rate, typically the London Interbank Offered Rate ("LIBOR"). While these characteristics may reduce interest rate risk and mitigate losses in the event of borrower default, the Senior Loans in which the Fund invests have below investment grade credit ratings and thereby are considered speculative because of the significant credit risk of their issuers.
Lower-rated debt securities (commonly known as "junk bonds") possess speculative characteristics and are subject to greater market fluctuations and risk of lost income and principal than higher-rated debt securities for a variety of reasons. Also, during an economic downturn or substantial period of rising interest rates, highly leveraged issuers may experience financial stress which would adversely affect their ability to service their principal and interest payment obligations, to meet projected business goals and to obtain additional financing.
In addition, periods of economic uncertainty and changes can be expected to result in increased volatility of market prices of lower-rated debt securities and the Fund's net asset value.
31
Credit Suisse Strategic Income Fund
Notes to Financial Statements (continued)
October 31, 2013
Note 2. Significant Accounting Policies
K) NEW ACCOUNTING PRONOUNCEMENTS — In December 2011, the Financial Accounting Standards Board issued Accounting Standards Update ("ASU") No. 2013-1, Balance Sheet (Topic 210): Disclosures about Offsetting Assets and Liabilities. The amendments in the ASU enhance disclosures about offsetting of financial assets and liabilities to enable investors to understand the effect of these arrangements on a fund's financial position. The ASU is effective for interim and annual reporting periods beginning on or after January 1, 2013. The Fund believes the adoption of this ASU will not have a material impact on its financial statements.
L) SUBSEQUENT EVENTS — In preparing the financial statements as of October 31, 2013, management considered the impact of subsequent events for potential recognition or disclosure in these financial statements through the date of release of this report. No such events requiring recognition or disclosure were identified through the date of the release of this report.
Note 3. Transactions with Affiliates and Related Parties
Credit Suisse serves as investment adviser for the Fund. For its investment advisory services, Credit Suisse is entitled to receive a fee from the Fund at an annual rate of 0.75% of the Fund's average daily net assets. For the year ended October 31, 2013, investment advisory fees earned and fees waived/expenses reimbursed were $310,730 and $258,567, respectively. The Fund is authorized to reimburse Credit Suisse for management fees previously limited and/or for expenses previously paid by Credit Suisse, provided, however, that any reimbursements must be paid at a date not more than three years after the end of the fiscal year during which such fees were limited or expenses were reimbursed by Credit Suisse and the reimbursements do not cause a class to exceed the applicable expense limitation in the contract at the time the fees were limited (or the current limitation whichever is lower) or expenses are paid. This contract may not be terminated before February 28, 2014. Credit Suisse contractually waives fees and reimburses expenses so that the Fund's annual operating expenses will not exceed 0.99% of the Fund's average daily net assets for Class I shares, 1.24% of the Fund's average daily net assets for Class A shares, and 1.99% of the Fund's average daily net assets for Class C shares.
Credit Suisse Asset Management Limited ("Credit Suisse U.K."), an affiliate of Credit Suisse, served as sub-investment advisor to the Fund. Credit Suisse
32
Credit Suisse Strategic Income Fund
Notes to Financial Statements (continued)
October 31, 2013
Note 3. Transactions with Affiliates and Related Parties
U.K.'s sub-investment advisor fees were paid by Credit Suisse out of Credit Suisse's net investment advisory fee and were not paid by the Fund.
Credit Suisse and SSB serve as co-administrators to the Fund. For its co-administrative services, Credit Suisse received a fee calculation at an annual rate of 0.09% of the Fund's average daily net assets. For the year ended October 31, 2013, co-administrative services fees earned by Credit Suisse were $37,288.
For its co-administrative services, SSB receives a fee, exclusive of out-of-pocket expenses, calculated in total for all the Credit Suisse funds/portfolios co-administered by SSB and allocated based upon the relative average net assets of each fund/portfolio, subject to an annual minimum fee. For the year ended October 31, 2013, co-administrative services fees earned by SSB (including out-of-pocket expenses) with respect to the Fund were $22,197.
Credit Suisse Securities (USA) LLC ("CSSU"), an affiliate of Credit Suisse, serves as distributor of the Fund's shares. Pursuant to distribution plans adopted by the Fund pursuant to Rule 12b-1 under the 1940 Act, CSSU received fees for its distribution services. These fees were paid at an annual rate of 0.25% of the average daily net assets of the Class A shares. For the Class C shares, the fee is calculated at an annual rate of 1.00% of the average daily net assets. For the year ended October 31, 2013, the Fund's distribution fees were $33,341 for Class A shares and $1,537 for Class C shares. Class I shares are not subject to distribution fees.
Certain brokers, dealers and financial representatives provide transfer agent related services to the Fund and receive compensation from Credit Suisse. Credit Suisse is then reimbursed by the Fund. For the year ended October 31, 2013, the Fund reimbursed Credit Suisse $11,973, which is included in the Fund's transfer agent expense.
Merrill Corporation ("Merrill"), an affiliate of Credit Suisse, has been engaged by the Fund to provide certain financial printing services. For the year ended October 31, 2013, Merrill was paid $19,308 for its services by the Fund. This amount was included in the printing fees presented on the Statement of Operations.
Offering costs, including initial registration costs, were deferred and were charged to expenses over the first 12 months of Fund operations. For the year ended October 31, 2013, $80,463 has been expensed to the Fund.
33
Credit Suisse Strategic Income Fund
Notes to Financial Statements (continued)
October 31, 2013
The Fund, together with other funds/portfolios advised by Credit Suisse (collectively, the "Participating Funds"), participates in a committed, unsecured line of credit facility ("Credit Facility"), in an aggregated amount of $20 million for temporary or emergency purposes with SSB. Under the terms of the Credit Facility, the Participating Funds pay an aggregate commitment fee on the average unused amount of the Credit Facility, which is allocated among the Participating Funds in such manner as is determined by the governing Boards of the Participating Funds. In addition, the Participating Funds pay interest on borrowings at either the Overnight Federal Funds rate or the Overnight LIBOR rate plus a spread. At October 31, 2013 and during the year ended October 31, 2013, the Fund had borrowings under the Credit Facility as follows:
Average Daily
Loan Balance | | Weighted Average
Interest Rate % | | Maximum Daily
Loan Outstanding | |
| $ | 62,973 | | | | 1.353 | % | | $ | 4,450,000 | | |
Note 5. Purchases and Sales of Securities
For the year ended October 31, 2013, purchases and sales of investment securities (excluding short-term investments) and U.S. Government and Agency Obligations were as follows:
Investment Securities | | U.S. Government/
Agency Obligations | |
| Purchases | | Sales | | Purchases | | Sales | |
| $ | 120,722,841 | | | $ | 57,071,705 | | | $ | 480,020 | | | $ | 470,703 | | |
Note 6. Capital Share Transactions
The Fund is authorized to issue an unlimited number of full and fractional shares of beneficial interest, $.001 par value per share. The Fund offers Class I, Class A and Class C shares. Transactions in capital shares for each class of the Fund were as follows:
| | | Class I | |
| | | For the Year Ended
October 31, 2013 | | For the Period Ended
October 31, 20121 | |
| | | Shares | | Value | | Shares | | Value | |
Shares sold | | | 1,096,985 | | | $ | 11,429,787 | | | | 2,056,439 | | | $ | 20,616,400 | | |
Shares issued in reinvestment
of dividends and distributions | | | 155,857 | | | | 1,638,107 | | | | 1,246 | | | | 12,530 | | |
Shares redeemed | | | (322,555 | ) | | | (3,422,530 | ) | | | (5 | ) | | | (47 | ) | |
Net increase | | | 930,287 | | | $ | 9,645,364 | | | | 2,057,680 | | | $ | 20,628,883 | | |
34
Credit Suisse Strategic Income Fund
Notes to Financial Statements (continued)
October 31, 2013
Note 6. Capital Share Transactions
| | | Class A | |
| | | For the Year Ended
October 31, 2013 | | For the Period Ended
October 31, 20121 | |
| | | Shares | | Value | | Shares | | Value | |
Shares sold | | | 6,183,314 | | | $ | 65,076,457 | | | | 10,000 | | | $ | 100,000 | | |
Shares issued in reinvestment
of dividends and distributions | | | 52,394 | | | | 555,475 | | | | 6 | | | | 59 | | |
Shares redeemed | | | (1,876,636 | ) | | | (19,925,148 | ) | | | — | | | | — | | |
Net increase | | | 4,359,072 | | | $ | 45,706,784 | | | | 10,006 | | | $ | 100,059 | | |
| | Class C | |
| | | For the Year Ended
October 31, 2013 | | For the Period Ended
October 31, 20121 | |
| | | Shares | | Value | | Shares | | Value | |
Shares sold | | | 7,199 | | | $ | 74,304 | | | | 10,000 | | | $ | 100,000 | | |
Shares issued in reinvestment
of dividends and distributions | | | 718 | | | | 7,538 | | | | 2 | | | | 23 | | |
Shares redeemed | | | (168 | ) | | | (1,768 | ) | | | — | | | | — | | |
Net increase | | | 7,749 | | | $ | 80,074 | | | | 10,002 | | | $ | 100,023 | | |
1For the period September 28, 2012 (commencement of operations) through October 31, 2012.
The Fund imposes a redemption fee of 2% of the value of all classes of shares currently being offered that are redeemed or exchanged within 30 days from the date of purchase. Reinvested dividends and distributions are not subject to the fee. The fee is charged based on the value of shares at redemption, is paid directly to the Fund and becomes part of the Fund's daily net asset value calculation. When shares are redeemed that are subject to the fee, reinvested dividends and distributions are redeemed first, followed by the shares held longest. During the year ended October 31, 2013 and the period ended October 31, 2012, the redemption fees received by the Fund were $1,563 and $0, respectively. On or about January 31, 2014, the redemption fee will be eliminated.
On October 31, 2013, the number of shareholders that held 5% or more of the outstanding shares of each class of the Fund was as follows:
| | | Number of
Shareholders | | Approximate Percentage
of Outstanding Shares | |
Class I | | | 2 | * | | | 94 | % | |
Class A | | | 2 | * | | | 97 | % | |
Class C | | | 3 | * | | | 98 | % | |
*This includes the seed money from Merchant Holdings, Inc., an affiliate of Credit Suisse.
Some of the shareholders are omnibus accounts, which hold shares on behalf of individual shareholders.
35
Credit Suisse Strategic Income Fund
Notes to Financial Statements (continued)
October 31, 2013
Note 7. Federal Income Taxes
Income and capital gain distributions are determined in accordance with federal income tax regulations, which may differ from GAAP.
The tax characteristics of dividends paid during the years ended October 31, 2013 and period ended October 31, 2012, respectively, by the Fund were as follows:
Ordinary Income | |
| 2013 | | 2012 | |
| $ | 2,215,161 | | | $ | 12,658 | | |
The tax basis components of distributable earnings differ from the amounts reflected in the Statement of Assets and Liabilities by temporary book/tax differences. These differences are primarily due to differing treatments of dividends payable, forward contracts marked to market and offering expenses. At October 31, 2013, the components of distributable earnings on a tax basis were as follows:
Undistributed net investment income | | $ | 1,137,219 | | |
Ordinary income distributions payable | | | (1,181 | ) | |
Undistributed capital gain | | | 80,050 | | |
Unrealized appreciation | | | 1,164,713 | | |
| | $ | 2,380,801 | | |
Under the Regulated Investment Company Modernization Act of 2010, the Fund will be permitted to carry forward capital losses incurred in taxable years beginning after December 22, 2010 for an unlimited period. However, any losses incurred during those future taxable years will be required to be utilized prior to the losses incurred in pre-enactment taxable years. As a result of this ordering rule, pre-enactment capital loss carryforwards may be more likely to expire unused. Additionally, post-enactment capital losses that are carried forward will retain their character as either short-term or long-term capital losses rather than being considered all short-term as under previous law. It is uncertain whether the Fund will be able to realize the full benefits of the capital loss carryforwards before they expire. The Fund has no pre-enactment capital loss carryforwards.
At October 31, 2013, the cost of investments (excluding foreign currency related transactions) and net unrealized appreciation (depreciation) for income tax purposes were as follows:
Cost of Investments | | $ | 73,875,616 | | |
Unrealized appreciation | | $ | 1,594,667 | | |
Unrealized depreciation | | | (432,368 | ) | |
Net unrealized appreciation (depreciation) | | $ | 1,162,299 | | |
36
Credit Suisse Strategic Income Fund
Notes to Financial Statements (continued)
October 31, 2013
Note 7. Federal Income Taxes
At October 31, 2013, the Fund reclassified $8,887 from accumulated net investment gain and $11,264 from accumulated net realized loss to paid in capital, to adjust for current period permanent book/tax differences which arose principally from differing book/tax treatment of foreign currency gain/(loss), and non-deductible 12b-1 and blue sky expenses. Net assets were not affected by these reclassifications.
Note 8. Contingencies
In the normal course of business, the Fund may provide general indemnifications pursuant to certain contracts and organizational documents. The Fund's maximum exposure under these arrangements is dependent on future claims that may be made against the Fund and, therefore, cannot be estimated; however, based on experience, the risk of loss from such claims is considered remote.
37
Credit Suisse Strategic Income Fund
Report of Independent Registered Public Accounting Firm
To the Board of Directors and Shareholders of Credit Suisse Strategic Income Fund:
In our opinion, the accompanying statement of assets and liabilities, including the schedule of investments, and the related statements of operations and of changes in net assets and the financial highlights present fairly, in all material respects, the financial position of Credit Suisse Strategic Income Fund (the "Fund") at October 31, 2013, the results of its operations for the year then ended, the changes in its net assets and the financial highlights for the year then ended and for the period September 28, 2012 (commencement of operations) through October 31, 2012, in conformity with accounting principles generally accepted in the United States of America. These financial statements and financial highlights (hereafter referred to as "financial statements") are the responsibility of the Fund's management; our responsibility is to express an opinion on these financial statements based on our audits. We conducted our audits of these financial statements in accordance with the standards of the Public Company Accounting Oversight Board (United States). Those standards require that we plan and perform the audit to obtain reasonable assurance about whether the financial statements are free of material misstatement. An audit includes examining, on a test basis, evidence supporting the amounts and disclosures in the financial statements, assessing the accounting principles used and significant estimates made by management, and evaluating the overall financial statement presentation. We believe that our audits, which included confirmation of securities at October 31, 2013 by correspondence with the custodian, agent banks and brokers, provide a reasonable basis for our opinion.
PricewaterhouseCoopers LLP
New York, New York
December 27, 2013
38
Credit Suisse Strategic Income Fund
Information Concerning Trustees and Officers (unaudited)
Name, Address
(Year of Birth) | | Position(s)
Held with
Fund | | Term
of Office1
and
Length
of Time
Served | | Principal
Occupation(s) During
Past Five Years | | Number of
Portfolios
in Fund
Complex
Overseen
by Trustee | | Other
Directorships
Held by Trustee | |
Independent Trustees | | | | | | | | | | | |
Enrique Arzac
c/o Credit Suisse Asset
Management, LLC
Attn: General Counsel
Eleven Madison Avenue
New York, New York
10010
(1941) | | Trustee, Audit Committee Chairman and Nominating Committee Member | | Since Fund Inception | | Professor of Finance and Economics, Graduate School of Business, Columbia University since 1971. | | | 11 | | | Director of The Adams Express Company, Petroleum and Resources Corporation, Aberdeen Chile Fund, Inc., Aberdeen Emerging Markets Smaller Company Opportunities Fund, Inc., Aberdeen Israel Fund, Inc., Aberdeen Indonesia Fund, Inc. and Aberdeen Latin America Equity Fund, Inc. (each a closed-end investment company); Director of Aberdeen Asia-Pacific Income Investment Company Limited (a Canadian closed-end fund); Trustee of Mirae Asset Discovery Funds (6 open-end portfolios); Director of Starcomms PLC. (telecommunications company) from 2008 to 2011; Director of Epoch Holding Corporation (an investment management and investment advisory services company) from 2006 to March 2013. | |
1 Each Trustee and Officer serves until his or her respective successor has been duly elected and qualified.
39
Credit Suisse Strategic Income Fund
Information Concerning Trustees and Officers (unaudited) (continued)
Name, Address
(Year of Birth) | | Position(s)
Held with
Fund | | Term
of Office1
and
Length
of Time
Served | | Principal
Occupation(s) During
Past Five Years | | Number of
Portfolios
in Fund
Complex
Overseen
by Trustee | | Other
Directorships
Held by Trustee | |
Independent Trustees | | | | | | | | | | | |
Jeffrey E. Garten
Box 208200
New Haven, Connecticut
06520-8200
(1946) | | Trustee, Audit and Nominating Committee Member Since Fund Inception | | Since Fund Inception | | The Juan Trippe Professor in the Practice of International Trade, Finance and Business, Yale School of Management, from July 2005 to present; Partner and Chairman of Garten Rothkopf (consulting firm) from October 2005 to present. | | | 9 | | | Director of Aetna, Inc. (insurance company); Director of CarMax Group (used car dealers); Director of Alcan (aluminum production) from February 2007 to November 2007; Member of Standard & Poor's Board of Managers (credit rating agency); Director of Miller Buckfire & Co., LLC (financial restructuring). | |
Steven N. Rappaport
Lehigh Court, LLC
555 Madison Avenue
29th Floor
New York, New York
10022
(1948) | | Chairman of the Board of Trustees, Audit Committee Member and Nominating Committee Chairman | | Since Fund Inception | | Partner of Lehigh Court, LLC and RZ Capital (private investment firms) from July 2002 to present. | | | 11 | | | Director of iCAD, Inc. (surgical and medical instruments and apparatus company); Director of Wood Resources, LLC. (plywood manufacturing company); Director of Aberdeen Chile Fund, Inc., Aberdeen Emerging Markets Smaller Company Opportunities Fund, Inc., Aberdeen Israel Fund, Inc., Aberdeen Indonesia Fund, Inc. and Aberdeen Latin America Equity Fund, Inc. (each a closed-end investment company); Director of Presstek, Inc. (digital imaging technologies company) from 2003 to 2012. | |
40
Credit Suisse Strategic Income Fund
Information Concerning Trustees and Officers (unaudited) (continued)
Name, Address
(Year of Birth) | | Position(s)
Held with
Fund | | Term
of Office1
and
Length
of Time
Served | | Principal Occupation(s) During Past Five Years | |
Officers* | | | | | | | |
John G. Popp
Credit Suisse Asset Management, LLC
One Madison Avenue
New York, New York 10010
(1956) | | Chief Executive Officer and President | | Since Fund Inception | | Managing Director of Credit Suisse; Global Head and Chief Investment Officer of the Credit Investment Group; Associated with Credit Suisse or its predecessor since 1997; Officer of other Credit Suisse Funds; Trustee of Credit Suisse High Yield Bond Fund; Director of Credit Suisse Asset Management Income Fund, Inc. | |
Bruce Rosenberg
Credit Suisse Asset Management, LLC
One Madison Avenue
New York, New York 10010
(1961) | | Chief Financial Officer | | Since 2012 | | Director of Credit Suisse; Director of Liquid Accounting of Credit Suisse; Associated with Credit Suisse since 2008; Officer of other Credit Suisse Funds. | |
Emidio Morizio
Credit Suisse Asset Management, LLC
Eleven Madison Avenue
New York, New York 10010
(1966) | | Chief Compliance Officer | | Since Fund Inception | | Managing Director and Global Head of Compliance of Credit Suisse since 2010; Director and Global Head of Compliance of Credit Suisse from January 2005 to December 2009; Associated with Credit Suisse since July 2000; Officer of other Credit Suisse Funds. | |
Joanne Doldo
Credit Suisse Asset Management, LLC
Eleven Madison Avenue
New York, New York 10010
(1959) | | Chief Legal Officer | | Since 2013 | | Vice President of Credit Suisse; Associated with Credit Suisse since September 2011; Officer of other Credit Suisse Funds; Associated with Morgan Stanley Investment Management from 2002-2008. | |
Rocco DelGuercio
Credit Suisse Asset Management, LLC
One Madison Avenue
New York, New York 10010
(1963) | | Treasurer | | Since 2013 | | Vice President of Credit Suisse since 2013; Independent Consultant from February 2012 to April 2013; Director of Legg Mason & Co., LLC from March 2004 to January 2012; Associated with Credit Suisse from June 1996 to March 2004; Officer of other Credit Suisse Funds. | |
Karen Regan
Credit Suisse Asset Management, LLC
Eleven Madison Avenue
New York, New York 10010
(1963) | | Senior Vice President and Secretary | | Since Fund Inception | | Vice President of Credit Suisse; Associated with Credit Suisse since December 2004; Officer of other Credit Suisse Funds. | |
* The officers of the Fund shown are officers that make policy decisions.
The Statement of Additional Information includes additional information about the Trustees and is available, without charge, upon request, by calling 877-870-2874.
41
Credit Suisse Strategic Income Fund
Proxy Voting and Portfolio Holdings Information (unaudited)
Information regarding how the Fund voted proxies related to its portfolio securities during the 12 month period ended June 30 of each year, as well as the policies and procedures that the Fund uses to determine how to vote proxies relating to its portfolio securities are available:
• By calling 1-877-870-2874
• On the Fund's website, www.credit-suisse.com/us/funds
• On the website of the Securities and Exchange Commission, www.sec.gov.
The Fund files a complete schedule of its portfolio holdings for the first and third quarters of its fiscal year with the SEC on Form N-Q. The Fund's Forms N-Q are available on the SEC's website at www.sec.gov and may be reviewed and copied at the SEC's Public Reference Room in Washington, DC. Information on the operation of the SEC's Public Reference Room may be obtained by calling 1-202-551-8090.
42
This page intentionally left blank
This page intentionally left blank

P.O. BOX 55030, BOSTON, MA 02205-5030
877-870-2874 n www.credit-suisse.com/us/funds
CREDIT SUISSE SECURITIES (USA) LLC, DISTRIBUTOR. SlF-AR-1013

CREDIT SUISSE FUNDS
Annual Report
October 31, 2013
n CREDIT SUISSE
MANAGED FUTURES STRATEGY FUND
The Fund's investment objectives, risks, charges and expenses (which should be considered carefully before investing), and more complete information about the Fund, are provided in the Prospectus, which should be read carefully before investing. You may obtain additional copies by calling 877-870-2874 or by writing to Credit Suisse Funds, P.O. Box 55030, Boston, MA 02205-5030.
Credit Suisse Securities (USA) LLC, Distributor, is located at One Madison Avenue, New York, NY 10010. Credit Suisse Funds are advised by Credit Suisse Asset Management, LLC.
Investors in the Credit Suisse Funds should be aware that they may be eligible to purchase Class I shares (where offered) directly or through certain intermediaries. Such shares are not subject to a sales charge. Investors in the Credit Suisse Funds should also be aware that they may be eligible for a reduction or waiver of the sales charge with respect to Class A or C shares (where offered). For more information, please review the relevant prospectuses or consult your financial representative.
Fund shares are not deposits or other obligations of Credit Suisse Asset Management, LLC ("Credit Suisse") or any affiliate, are not FDIC-insured and are not guaranteed by Credit Suisse or any affiliate. Fund investments are subject to investment risks, including loss of your investment.
Credit Suisse Managed Futures Strategy Fund
Annual Investment Adviser's Report
October 31, 2013 (unaudited)
December 24, 2013
Dear Shareholder:
We are pleased to present this Annual Report covering the activities of the Credit Suisse Managed Futures Strategy Fund (the "Fund") for the annual period ended October 31, 2013.
Performance Summary
11/01/12 – 10/31/13
Fund & Benchmark | | Performance | |
| Class I1 | | | 6.15 | % | |
| Class A1,2 | | | 6.05 | % | |
| Class C1,2 | | | 5.13 | % | |
| Credit Suisse Managed Futures Liquid Index3 | | | 4.25 | % | |
Performance shown for the Fund's Class A and Class C Shares does not reflect sales charges, which are a maximum of 5.25% and 1.00%, respectively.2
Market Review: A positive end to a mixed period
The annual period ended October 31, 2013 was a mixed one for managed futures strategies, with the Credit Suisse Managed Futures Liquid Index returning 4.25% for the period.
Trend followers experienced solid gains early in 2013 as U.S. equity markets continued to rally and Japanese equity markets maintained their positive momentum alongside aggressive monetary easing policy. However, in May and June, fears about global central bank tightening resulted in positive correlations between fixed income and equities and caused cross-asset correlation models to break down — managed futures trend followers struggled as result. In recent months, these strategies had difficulty navigating market reversals as concerns over U.S. Federal Reserve (the "Fed") decisions and geopolitical crises were mitigated by the abating of Middle East tensions and the Fed's decision not to "taper."
Portfolio Review and Outlook: A positive outlook for the future
For the annual period ended October 31, 2013, the Fund outperformed its benchmark. Long equity positions, most notably in Nikkei, mini S&P and Euro Stoxx futures were the Fund's top performers. Currencies were also positive overall, as profits from Japanese Yen and Australian Dollar positions exceeded losses from the euro, Pound and Canadian Dollar positions. Additionally, although commodities in general detracted from performance, a long energy index position was the largest drag on performance for the period. Fixed income was negative overall.
1
Credit Suisse Managed Futures Strategy Fund
Annual Investment Adviser's Report (continued)
October 31, 2013 (unaudited)
In general, managed futures strategies are designed to profit from both upward and downward trending markets across several asset classes including commodities, bonds, equities and currencies. We continue to believe that the unique return profile of managed futures strategies may appeal to investors searching for meaningful portfolio diversifiers that may help mitigate risk and provide uncorrelated returns.
The Credit Suisse Liquid Alternative Beta Team
Dr. Jordan Drachman
Sheel Dhande
This Fund is non-diversified, which means it may invest a greater proportion of its assets in the securities of a smaller number of issuers than a diversified mutual fund and may therefore be subject to greater volatility. The Fund's investment in alternative instruments may subject the Fund to greater volatility than investment in traditional securities, particularly in investments involving leverage.
The use of alternative assets and strategies entails substantial risks, including risk of loss principal, commodity exposure risks, currency risk, equity exposure risk, fixed income risk, derivatives risk, exchange-traded notes risk, credit risk, foreign securities risk, interest rate risk, market risk, forwards risk, futures contracts risk, index/tracking error risk, leverage risk, short position risk, swap agreement risk and tax risk. Gains and losses from speculative positions in derivatives may be much greater than the derivative's cost. For a detailed discussion of these and other risks, please refer to the Fund's Prospectus, which should be read carefully before investing.
In addition to historical information, this report contains forward-looking statements, which may concern, among other things, domestic and foreign market, industry and economic trends and developments and government regulation and their potential impact on the Fund's investments. These statements are subject to risks and uncertainties and actual trends, developments and regulations in the future, and their impact on the Fund could be materially different from those projected, anticipated or implied. The Fund has no obligation to update or revise forward-looking statements.
The views of the Fund's management are as of the date of the letter and the Fund holdings described in this document are as of October 31, 2013; these views and Fund holdings may have changed subsequent to these dates. Nothing in this document is a recommendation to purchase or sell securities.
2
Credit Suisse Managed Futures Strategy Fund
Annual Investment Adviser's Report (continued)
October 31, 2013 (unaudited)
Comparison of Change in Value of $10,000 Investment in the
Credit Suisse Managed Futures Strategy Fund1 Class I shares,
Class A shares2, Class C shares2 and the Credit Suisse Managed Futures
Liquid Index3 from Inception (9/28/12).
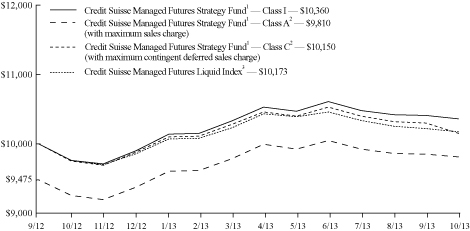
1 Fee waivers and/or expense reimbursements may reduce expenses for the Fund, without which performance would be lower. Voluntary waivers and/or reimbursements may be discontinued at any time.
2 Total return for the Fund's Class A shares for the reporting period, based on offering price (including maximum sales charge of 5.25%), was 0.49%. Total return for the Fund's Class C shares for the reporting period, based on redemption value (including maximum contingent deferred sales charge of 1.00%), was 4.13%.
3 The Credit Suisse Managed Futures Liquid Index is currently composed of 14 futures contracts and 4 commodity indices which provide exposure to the asset classes. The Index uses a proprietary quantitative methodology to seek to identify price trends in each of the asset classes over a variety of time horizons. Components of the Index, which may change from time to time, are positioned either long or short based on the price trends within the asset classes determined using the Index's quantitative methodology. An index does not have transaction cost; investors cannot invest directly in an index.
3
Credit Suisse Managed Futures Strategy Fund
Annual Investment Adviser's Report (continued)
October 31, 2013 (unaudited)
Average Annual Returns as of October 31, 20131
| | | 1 Year | | Since
Inception2 | |
Class I | | | 6.15 | % | | | 3.29 | % | |
Class A Without Sales Charge | | | 6.05 | % | | | 3.20 | % | |
Class A With Maximum Sales Charge | | | 0.49 | % | | | (1.74 | )% | |
Class C Without CDSC | | | 5.13 | % | | | 2.28 | % | |
Class C With CDSC | | | 4.13 | % | | | 1.37 | % | |
Returns represent past performance and include change in share price and reinvestment of dividends and capital gains. Past performance cannot guarantee future results. The current performance of the Fund may be lower or higher than the figures shown. Returns and share price will fluctuate, and redemption value may be more or less than original cost. The performance results do not reflect the deduction of taxes that a shareholder would pay on fund distributions or the redemption of fund shares. Performance information current to the most recent month-end is available at www.credit-suisse.com/us/funds.
The annualized gross expense ratios are 2.80% for Class I shares, 3.05% for Class A shares and 3.80% for Class C shares. The annualized net expense ratios after fee waivers and/or expense reimbursements excluding dividend expense from securities sold short are 1.70% for Class I shares, 1.95% for Class A shares and 2.70% for Class C shares.
1 Fee waivers and/or expense reimbursements may reduce expenses for the Fund, without which performance would be lower. Voluntary waivers and/or reimbursements may be discontinued at any time.
2 Inception date September 28, 2012.
4
Credit Suisse Managed Futures Strategy Fund
Annual Investment Adviser's Report (continued)
October 31, 2013 (unaudited)
Information About Your Fund's Expenses
As an investor of the Fund, you incur two types of costs: ongoing expenses and transaction costs. Ongoing expenses include management fees, distribution and service (12b-1) fees and other Fund expenses. Examples of transaction costs include sales charges (loads), redemption fees and account maintenance fees, which are not shown in this section and which would result in higher total expenses. The following table is intended to help you understand your ongoing expenses of investing in the Fund and to help you compare these expenses with the ongoing expenses of investing in other mutual funds. The table is based on an investment of $1,000 made at the beginning of the six month period ended October 31, 2013.
The table illustrates your Fund's expenses in two ways:
• Actual Fund Return. This helps you estimate the actual dollar amount of ongoing expenses paid on a $1,000 investment in the Fund using the Fund's actual return during the period. To estimate the expenses you paid over the period, simply divide your account value by $1,000 (for example, an $8,600 account value divided by $1,000 = 8.6), then multiply the result by the number in the "Expenses Paid per $1,000" line under the share class you hold.
• Hypothetical 5% Fund Return. This helps you to compare your Fund's ongoing expenses with those of other mutual funds using the Fund's actual expense ratio and a hypothetical rate of return of 5% per year before expenses. Examples using a 5% hypothetical fund return may be found in the shareholder reports of other mutual funds. The hypothetical account values and expenses may not be used to estimate the actual ending account balance or expenses you paid for the period.
Please note that the expenses shown in these tables are meant to highlight your ongoing expenses only and do not reflect any transaction costs, such as sales charges (loads) or redemption fees. If these transaction costs had been included, your costs would have been higher. The "Expenses Paid per $1,000" line of the tables is useful in comparing ongoing expenses only and will not help you determine the relative total expenses of owning different funds.
5
Credit Suisse Managed Futures Strategy Fund
Annual Investment Adviser's Report (continued)
October 31, 2013 (unaudited)
Expenses and Value for a $1,000 Investment
for the six month period ended October 31, 2013
Actual Fund Return | | Class I | | Class A | | Class C | |
Beginning Account Value 05/01/13 | | $ | 1,000.00 | | | $ | 1,000.00 | | | $ | 1,000.00 | | |
Ending Account Value 10/31/13 | | $ | 983.90 | | | $ | 982.00 | | | $ | 979.90 | | |
Expenses Paid per $1,000* | | $ | 8.50 | | | $ | 10.59 | | | $ | 13.47 | | |
Hypothetical 5% Fund Return | |
Beginning Account Value 05/01/13 | | $ | 1,000.00 | | | $ | 1,000.00 | | | $ | 1,000.00 | | |
Ending Account Value 10/31/13 | | $ | 1,016.64 | | | $ | 1,014.52 | | | $ | 1,011.59 | | |
Expenses Paid per $1,000* | | $ | 8.64 | | | $ | 10.76 | | | $ | 13.69 | | |
| | | Class I | | Class A | | Class C | |
Annualized Expense Ratios* | | | 1.70 | % | | | 1.95 | % | | | 2.70 | % | |
* Expenses are equal to the Fund's annualized expense ratio for each share class, multiplied by the average account value over the period, multiplied by the number of days in the most recent fiscal half year period, then divided by 365.
The "Expenses Paid per $1,000" and the "Annualized Expense Ratios" in the tables are based on actual expenses paid by the Fund during the period, net of fee waivers and/or expense reimbursements. If those fee waivers and/or expense reimbursements had not been in effect, the Fund's actual expenses would have been higher.
For more information, please refer to the Fund's prospectus.
Sector Breakdown*
United States Agency Obligations | | | 24.36 | % | |
Short-Term Investment | | | 75.64 | % | |
Total | | | 100.00 | % | |
* Expressed as a percentage of total investments (excluding securities lending collateral if applicable) and may vary over time.
6
Credit Suisse Managed Futures Strategy Fund
Consolidated Schedule of Investments
October 31, 2013
Par
(000) | |
| | Ratings†
(S&P/Moody's) | | Maturity | | Rate% | | Value | |
| UNITED STATES AGENCY OBLIGATIONS (21.0%) | | | |
$ | 1,000 | | | Federal Farm Credit Banks# | | (AA+, Aaa) | | 01/26/15 | | | 0.210 | | | $ | 1,001,709 | | |
| | 6,000 | | | Federal Farm Credit Banks# | | (AA+, Aaa) | | 02/27/15 | | | 0.181 | | | | 6,005,778 | | |
| TOTAL UNITED STATES AGENCY OBLIGATIONS (Cost $6,999,149) | | | 7,007,487 | | |
| SHORT-TERM INVESTMENT (65.1%) | | | |
| | 21,760 | | | State Street Bank and Trust Co.
Euro Time Deposit (Cost $21,760,000) | | | | | | 11/01/13 | | | 0.010 | | | | 21,760,000 | | |
| TOTAL INVESTMENTS AT VALUE (86.1%) (Cost $28,759,149) | | | 28,767,487 | | |
| OTHER ASSETS IN EXCESS OF LIABILITIES (13.9%) | | | 4,649,623 | | |
| NET ASSETS (100.0%) | | $ | 33,417,110 | | |
† Credit ratings given by the Standard & Poor's Division of the McGraw-Hill Companies, Inc. ("S&P") and Moody's Investors Service, Inc. (Moody's) are unaudited.
# Variable rate obligations — The interest rate is the rate as of October 31, 2013.
See Accompanying Notes to Consolidated Financial Statements.
7
Credit Suisse Managed Futures Strategy Fund
Consolidated Statement of Assets and Liabilities
October 31, 2013
Assets | |
Investments at value (Cost $28,759,149) (Note 2) | | $ | 28,767,487 | | |
Cash | | | 15,124 | | |
Cash segregated at brokers for futures contracts and swap contracts | | | 3,757,963 | | |
Variation margin receivable on futures contracts (Note 2) | | | 849,383 | | |
Unrealized appreciation on open swap contracts (Note 2) | | | 100,496 | | |
Receivable for fund shares sold | | | 33,909 | | |
Receivable from investment adviser (Note 3) | | | 8,154 | | |
Interest receivable | | | 193 | | |
Prepaid expenses | | | 20,834 | | |
Total Assets | | | 33,553,543 | | |
Liabilities | |
Administrative services fee payable (Note 3) | | | 8,782 | | |
Shareholder servicing/Distribution fee payable (Note 3) | | | 1,935 | | |
Unrealized depreciation on open swap contracts (Note 2) | | | 19,472 | | |
Net payable for terminated total return swap contracts | | | 14,306 | | |
Payable for fund shares redeemed | | | 309 | | |
Accrued expenses | | | 91,629 | | |
Total Liabilities | | | 136,433 | | |
Net Assets | |
Capital stock, $.001 par value (Note 6) | | | 3,226 | | |
Paid-in capital (Note 6) | | | 31,968,145 | | |
Accumulated net investment loss | | | (49,759 | ) | |
Accumulated net realized gain from investments, futures contracts, swap contracts and
foreign currency transactions | | | 549,019 | | |
Net unrealized appreciation from investments, futures contracts, swap contracts and foreign
currency translations | | | 946,479 | | |
Net Assets | | $ | 33,417,110 | | |
I Shares | |
Net assets | | $ | 26,793,565 | | |
Shares outstanding | | | 2,585,509 | | |
Net asset value, offering price and redemption price per share | | $ | 10.36 | | |
A Shares | |
Net assets | | $ | 5,823,604 | | |
Shares outstanding | | | 562,906 | | |
Net asset value and redemption price per share | | $ | 10.35 | | |
Maximum offering price per share (net asset value/(1-5.25%)) | | $ | 10.92 | | |
C Shares | |
Net assets | | $ | 799,941 | | |
Shares outstanding | | | 78,024 | | |
Net asset value and offering price per share | | $ | 10.25 | | |
See Accompanying Notes to Consolidated Financial Statements.
8
Credit Suisse Managed Futures Strategy Fund
Consolidated Statement of Operations
For the Year Ended October 31, 2013
| Investment Income (Note 2) | |
Interest | | $ | 15,909 | | |
Total investment income | | | 15,909 | | |
Expenses | |
Investment advisory fees (Note 3) | | | 308,627 | | |
Administrative services fees (Note 3) | | | 34,951 | | |
Shareholder servicing/Distribution fees (Note 3) | |
Class A | | | 5,131 | | |
Class C | | | 2,961 | | |
Custodian fees | | | 102,639 | | |
Offering costs (Note 3) | | | 87,212 | | |
Legal fees | | | 87,194 | | |
Audit and tax fees | | | 50,600 | | |
Trustees' fees | | | 24,997 | | |
Registration fees | | | 20,076 | | |
Printing fees (Note 3) | | | 15,979 | | |
Transfer agent fees (Note 3) | | | 6,483 | | |
Insurance expense | | | 1,132 | | |
Commitment fees (Note 4) | | | 9 | | |
Miscellaneous expense | | | 11,561 | | |
Total expenses | | | 759,552 | | |
Less: fees waived (Note 3) | | | (295,231 | ) | |
Net expenses | | | 464,321 | | |
Net investment loss | | | (448,412 | ) | |
Net Realized and Unrealized Gain (Loss) from Investments, Futures Contracts, Swap Contracts and
Foreign Currency Related Items | |
Net realized gain from investments | | | 9 | | |
Net realized gain from futures contracts | | | 1,115,146 | | |
Net realized loss from swap contracts | | | (419,253 | ) | |
Net realized gain from foreign currency transactions | | | 12,334 | | |
Net change in unrealized appreciation (depreciation) from investments | | | 8,207 | | |
Net change in unrealized appreciation (depreciation) from futures contracts | | | 923,130 | | |
Net change in unrealized appreciation (depreciation) from swap contracts | | | 109,154 | | |
Net change in unrealized appreciation (depreciation) from foreign currency translations | | | 7,419 | | |
Net realized and unrealized gain from investments, futures contracts, swap contracts and
foreign currency related items | | | 1,756,146 | | |
Net increase in net assets resulting from operations | | $ | 1,307,734 | | |
See Accompanying Notes to Consolidated Financial Statements.
9
Credit Suisse Managed Futures Strategy Fund
Consolidated Statement of Changes in Net Assets
| | | For the Year
Ended
October 31, 2013 | | For the Period
Ended
October 31, 20121 | |
From Operations | |
Net investment loss | | $ | (448,412 | ) | | $ | (31,959 | ) | |
Net realized gain (loss) from investments, futures contracts,
swap contracts and foreign currency transactions | | | 708,236 | | | | (403,294 | ) | |
Net change in unrealized appreciation (depreciation) from investments,
futures contracts, swap contracts and foreign currency translations | | | 1,047,910 | | | | (101,431 | ) | |
Net increase (decrease) in net assets resulting from operations | | | 1,307,734 | | | | (536,684 | ) | |
| From Capital Share Transactions (Note 6) | |
Proceeds from sale of shares | | | 12,058,695 | | | | 22,500,000 | | |
Net asset value of shares redeemed | | | (1,912,635 | )2 | | | — | | |
Net increase in net assets from capital share transactions | | | 10,146,060 | | | | 22,500,000 | | |
Net increase in net assets | | | 11,453,794 | | | | 21,963,316 | | |
Net Assets | |
Beginning of year | | | 21,963,316 | | | | — | | |
End of year | | $ | 33,417,110 | | | $ | 21,963,316 | | |
Accumulated net investment loss | | $ | (49,759 | ) | | $ | — | | |
1 For the period September 28, 2012 (commencement of operations) through October 31, 2012.
2 Net of $524 of redemption fees retained by the Fund.
See Accompanying Notes to Consolidated Financial Statements.
10
Credit Suisse Managed Futures Strategy Fund
Consolidated Financial Highlights
(For a Class I Share of the Fund Outstanding Throughout Each Period)
| | | For the Year
Ended
October 31, 2013 | | For the Period
Ended
October 31, 20121 | |
Per share data | |
Net asset value, beginning of year | | $ | 9.76 | | | $ | 10.00 | | |
INVESTMENT OPERATIONS | |
Net investment loss2 | | | (0.17 | ) | | | (0.01 | ) | |
Net gain (loss) on investments, futures contracts, swap contracts
and foreign currency related items (both realized and unrealized) | | | 0.77 | | | | (0.23 | ) | |
Total from investment operations | | | 0.60 | | | | (0.24 | ) | |
REDEMPTION FEES | | | 0.003 | | | | — | | |
Net asset value, end of year | | $ | 10.36 | | | $ | 9.76 | | |
Total return4 | | | 6.15 | % | | | (2.40 | )% | |
RATIOS AND SUPPLEMENTAL DATA | |
Net assets, end of year (000s omitted) | | $ | 26,794 | | | $ | 21,768 | | |
Ratio of net expenses to average net assets | | | 1.70 | % | | | 1.70 | %5 | |
Ratio of net investment loss to average net assets | | | (1.64 | )% | | | (1.69 | )%5 | |
Decrease reflected in above operating expense ratios due to
waivers/reimbursements | | | 1.10 | % | | | 3.01 | %5 | |
Portfolio turnover rate | | | — | % | | | — | % | |
1 For the period September 28, 2012 (commencement of operations) through October 31, 2012.
2 Per share information is calculated using the average shares outstanding method.
3 This amount represents less than $0.01 per share.
4 Total returns are historical and assume changes in share price. Had certain expenses not been reduced during the years shown, total returns would have been lower. Total returns for periods less than one year are not annualized.
5 Annualized.
See Accompanying Notes to Consolidated Financial Statements.
11
Credit Suisse Managed Futures Strategy Fund
Consolidated Financial Highlights
(For a Class A Share of the Fund Outstanding Throughout Each Period)
| | | For the Year
Ended
October 31, 2013 | | For the Period
Ended
October 31, 20121 | |
Per share data | |
Net asset value, beginning of year | | $ | 9.76 | | | $ | 10.00 | | |
INVESTMENT OPERATIONS | |
Net investment loss2 | | | (0.20 | ) | | | (0.02 | ) | |
Net gain (loss) on investments, futures contracts, swap contracts and
foreign currency related items (both realized and unrealized) | | | 0.79 | | | | (0.22 | ) | |
Total from investment operations | | | 0.59 | | | | (0.24 | ) | |
REDEMPTION FEES | | | 0.003 | | | | — | | |
Net asset value, end of year | | $ | 10.35 | | | $ | 9.76 | | |
Total return4 | | | 6.05 | % | | | (2.40 | )% | |
RATIOS AND SUPPLEMENTAL DATA | |
Net assets, end of year (000s omitted) | | $ | 5,824 | | | $ | 98 | | |
Ratio of net expenses to average net assets | | | 1.95 | % | | | 1.95 | %5 | |
Ratio of net investment loss to average net assets | | | (1.90 | )% | | | (1.94 | )%5 | |
Decrease reflected in above operating expense ratios due to
waivers/reimbursements | | | 1.10 | % | | | 3.01 | %5 | |
Portfolio turnover rate | | | — | % | | | — | % | |
1 For the period September 28, 2012 (commencement of operations) through October 31, 2012.
2 Per share information is calculated using the average shares outstanding method.
3 This amount represents less than $0.01 per share.
4 Total returns are historical and assume changes in share price and no sales charge. Had certain expenses not been reduced during the years shown, total returns would have been lower. Total returns for periods less than one year are not annualized.
5 Annualized.
See Accompanying Notes to Consolidated Financial Statements.
12
Credit Suisse Managed Futures Strategy Fund
Consolidated Financial Highlights
(For a Class C Share of the Fund Outstanding Throughout Each Period)
| | | For the Year
Ended
October 31, 2013 | | For the Period
Ended
October 31, 20121 | |
Per share data | |
Net asset value, beginning of year | | $ | 9.75 | | | $ | 10.00 | | |
INVESTMENT OPERATIONS | |
Net investment loss2 | | | (0.27 | ) | | | (0.02 | ) | |
Net gain (loss) on investments, futures contracts, swap contracts and
foreign currency related items (both realized and unrealized) | | | 0.77 | | | | (0.23 | ) | |
Total from investment operations | | | 0.50 | | | | (0.25 | ) | |
REDEMPTION FEES | | | 0.003 | | | | — | | |
Net asset value, end of year | | $ | 10.25 | | | $ | 9.75 | | |
Total return4 | | | 5.13 | % | | | (2.50 | )% | |
RATIOS AND SUPPLEMENTAL DATA | |
Net assets, end of year (000s omitted) | | $ | 800 | | | $ | 98 | | |
Ratio of net expenses to average net assets | | | 2.70 | % | | | 2.70 | %5 | |
Ratio of net investment loss to average net assets | | | (2.64 | )% | | | (2.70 | )%5 | |
Decrease reflected in above operating expense ratios due to
waivers/reimbursements | | | 1.10 | % | | | 3.01 | %5 | |
Portfolio turnover rate | | | — | % | | | — | % | |
1 For the period September 28, 2012 (commencement of operations) through October 31, 2012.
2 Per share information is calculated using the average shares outstanding method.
3 This amount represents less than $0.01 per share.
4 Total returns are historical and assume changes in share price and no sales charge. Had certain expenses not been reduced during the years shown, total returns would have been lower. Total returns for periods less than one year are not annualized.
5 Annualized.
See Accompanying Notes to Consolidated Financial Statements.
13
Credit Suisse Managed Futures Strategy Fund
Notes to Consolidated Financial Statements
October 31, 2013
Credit Suisse Managed Futures Strategy Fund (the "Fund"), a series of the Credit Suisse Opportunity Funds (the "Trust"), a Delaware statutory trust, is registered under the Investment Company Act of 1940, as amended (the "1940 Act"), as a non-diversified open-end management investment company that seeks to achieve investment results that correspond to the performance (before fees and expenses) of the Credit Suisse Managed Futures Liquid Index. The Trust was organized under the laws of the State of Delaware as a business trust on May 31, 1995.
Fund is registered as a Commodity Pool Operator with the Commodity Futures Trading Commission. The Fund seeks to achieve its investment objective by investing directly and/or indirectly through the Credit Suisse Cayman Managed Futures Strategy Fund, Ltd. (the "Subsidiary"), a wholly-owned subsidiary of the Fund organized under the laws of the Cayman Islands, in a combination of securities and derivative instruments. The Subsidiary may invest in commodity-linked derivative instruments, such as swaps and futures, as well as other types of futures, swaps and options. The Subsidiary may also invest in money market instruments, some of which are intended to serve as margin or collateral for the Subsidiary's derivatives positions.
The Subsidiary is managed by the same portfolio managers that manage the Fund and the accompanying financial statements reflect the financial position of the Fund and its Subsidiary and the results of operations on a consolidated basis. The consolidated financial statements include portfolio holdings of the Fund and the Subsidiary and all intercompany transactions and balances have been eliminated. The Fund may invest up to 25% of its total assets in the Subsidiary, as of October 31, 2013, the Fund held $5,486,817 in the Subsidiary, representing 16.4% of the Fund's net assets.
The Fund offers three classes of shares: Class I shares, Class A shares and Class C shares. Each class of shares represents an equal pro rata interest in the Fund, except they bear different expenses, which reflect the differences in the range of services provided to them. Class A shares are sold subject to a front-end sales charge of up to 5.25%. Class C shares are sold subject to a contingent deferred sales charge of 1.00% if the shares are redeemed within the first year of purchase.
Note 2. Significant Accounting Policies
The following is a summary of significant accounting policies followed by the Funds in the preparation of their financial statements. The policies are in accordance with accounting principles generally accepted in the United States
14
Credit Suisse Managed Futures Strategy Fund
Notes to Consolidated Financial Statements (continued)
October 31, 2013
Note 2. Significant Accounting Policies
of America ("GAAP"). The preparation of financial statements requires management to make estimates and assumptions that affect the reported amounts and disclosures in the financial statements. Actual results could differ from those estimates.
A) SECURITY VALUATION — The net asset value of the Fund is determined daily as of the close of regular trading on the New York Stock Exchange, Inc. (the "Exchange") on each day the Exchange is open for business. The valuations for fixed income securities (which may include, but are not limited to, corporate, government, municipal, mortgage-backed, collateralized mortgage obligations and asset-backed securities) and certain derivative instruments are typically the prices supplied by independent third party pricing services, which may use market prices or broker/dealer quotations or a variety of valuation techniques and methodologies. The independent third party pricing services use inputs that are observable such as issuer details, interest rates, yield curves, prepayment speeds, credit risks/spreads, default rates and quoted prices for similar securities. Short-term fixed income securities that will mature in 60 days or less are valued at amortized cost unless it is determined that using this method would not reflect an investment's fair value. Structured note agreements are valued in accordance with a dealer-supplied valuation based on changes in the value of the underlying index. Futures contracts are valued daily at the settlement price established by the board of trade or exchange on which they are traded. Equity securities for which market quotations are available are valued at the last reported sales price or official closing price on the primary market or exchange on which they trade. The Fund may utilize a service provided by an independent third party which has been approved by the Board of Trustees to fair value certain securities. When fair value pricing is employed, the prices of securities used by the Fund to calculate its net asset value may differ from quoted or published prices for the same securities. If independent third party pricing services are unable to supply prices for a portfolio investment, or if the prices supplied are deemed by the investment adviser to be unreliable, the market price may be determined by the investment adviser using quotations from one or more broker/dealers or at the transaction price if the security has recently been purchased and no value has yet been obtained from a pricing service or pricing broker. When reliable prices are not readily available, such as when the value of a security has been significantly affected by events after the close of the exchange or market on which the security is principally traded, but before the Fund calculates its net asset value, the Fund values these securities as determined in accordance with procedures approved by the Fund's Board of Trustees.
The Fund uses valuation techniques to measure fair value that are consistent with the market approach and/or income approach, depending on the type of
15
Credit Suisse Managed Futures Strategy Fund
Notes to Consolidated Financial Statements (continued)
October 31, 2013
Note 2. Significant Accounting Policies
security and the particular circumstance. The market approach uses prices and other relevant information generated by market transactions involving identical or comparable securities. The income approach uses valuation techniques to discount estimated future cash flows to present value.
GAAP established a disclosure hierarchy that categorizes the inputs to valuation techniques used to value assets and liabilities at measurement date. These inputs are summarized in the three broad levels listed below:
• Level 1 – quoted prices in active markets for identical investments
• Level 2 – other significant observable inputs (including quoted prices for similar investments, interest rates, prepayment speeds, credit risk, etc.)
• Level 3 – significant unobservable inputs (including the Fund's own assumptions in determining the fair value of investments)
The inputs or methodologies used to value securities are not necessarily an indication of the risk associated with investing in those securities.
The following is a summary of the inputs used as of October 31, 2013 in valuing the Fund's assets and liabilities carried at fair value:
| | | Level 1 | | Level 2 | | Level 3 | | Total | |
Investments in Securities | |
United States Agency Obligations | | $ | — | | | $ | 7,007,487 | | | $ | — | | | $ | 7,007,487 | | |
Short-term Investment | | | — | | | | 21,760,000 | | | | — | | | | 21,760,000 | | |
Other Financial Instruments* | |
Futures Contracts | | | 849,383 | | | | — | | | | — | | | | 849,383 | | |
Swap Contracts | | | — | | | | 81,024 | | | | — | | | | 81,024 | | |
| | | $ | 849,383 | | | $ | 28,848,511 | | | $ | — | | | $ | 29,697,894 | | |
* Other financial instruments include futures and swap contracts.
The Fund adopted Financial Accounting Standards Board ("FASB") amendments to authoritative guidance which require the Fund to disclose details of transfers in and out of Level 1 and Level 2 measurements and Level 2 and Level 3 measurements and the reasons for the transfers. For the year ended October 31, 2013, there were no transfers in and out of Level 1, Level 2 and Level 3. All transfers are assumed to occur at the end of the reporting period.
B) DERIVATIVE INSTRUMENTS AND HEDGING ACTIVITIES — The Fund adopted amendments to authoritative guidance on disclosures about derivative instruments and hedging activities which require that the Fund disclose (a) how and why an entity uses derivative instruments, (b) how derivative instruments and hedging activities are accounted for, and (c) how derivative instruments and related hedging activities affect a fund's financial
16
Credit Suisse Managed Futures Strategy Fund
Notes to Consolidated Financial Statements (continued)
October 31, 2013
Note 2. Significant Accounting Policies
position, financial performance, and cash flows. For the year ended October 31, 2013, the Fund's derivatives did not qualify for hedge accounting as they are held at fair value.
Fair Values of Derivative Instruments as of October 31, 2013
| | | Asset Derivatives | | Liability Derivatives | |
| | | Balance Sheet
Location | | Fair Value | | Balance Sheet
Location | | Fair Value | |
Foreign Exchange
Contracts | | Unrealized appreciation
on futures contracts | | $ | 255,104 | * | | Unrealized depreciation
on futures contracts | | $ | 39,091 | * | |
Equity Contracts | | Unrealized appreciation
on futures contracts | | | 441,461 | * | | Unrealized depreciation
on futures contracts | | | — | * | |
Interest Rate
Contracts | | Unrealized appreciation
on futures contracts | | | 269,959 | * | | Unrealized depreciation
on futures contracts | | | 78,050 | * | |
Commodity Index
Return Contracts | | Unrealized appreciation
on open swap contracts | | | 100,496 | | | Unrealized depreciation
on open swap contracts | | | 19,472 | | |
| | | | | $ | 1,067,020 | | | | | | | $ | 136,613 | | |
*Includes cumulative appreciation/depreciation of futures contracts as reported in the Consolidated Statement of Assets and Liabilities and Notes to Consolidated Financial Statements. Only the current day's variation margin is reported within the Consolidated Statement of Assets and Liabilities.
Effect of Derivative Instruments on the Consolidated Statement of Operations
| | | Location | | Realized
Gain/Loss | | Location | | Net Unrealized
Appreciation/
Depreciation | |
Foreign Exchange
Contracts
| | Net realized gain
from futures
contracts | | $ | 315,928 | | | Net change in unrealized
appreciation (depreciation)
from futures contracts | | $ | 272,085 | | |
Equity Contracts | | Net realized gain
from futures
contracts | | | 1,567,078 | | | Net change in unrealized
appreciation (depreciation)
from futures contracts | | | 446,274 | | |
Interest Rate
Contracts | | Net realized loss
from futures
contracts | | | (767,860 | ) | | Net change in unrealized
appreciation (depreciation)
from futures contracts | | | 204,771 | | |
Commodity Index
Return Contracts
| | Net realized loss
from swap
contracts | | | (419,253 | ) | | Net change in unrealized
appreciation (depreciation)
from swap contracts | | | 109,154 | | |
| | | | | $ | 695,893 | | | | | | | $ | 1,032,284 | | |
The notional amount of futures contracts and swap contracts at year ended October 31, 2013, are reflected in the Notes to Consolidated Financial Statements. The notional amounts of long and short open positions of futures contracts and swap contracts at each month ended throughout the reporting period averaged approximately 241.9% and 19.1%, respectively of net assets of the Fund.
17
Credit Suisse Managed Futures Strategy Fund
Notes to Consolidated Financial Statements (continued)
October 31, 2013
Note 2. Significant Accounting Policies
C) SECURITY TRANSACTIONS AND INVESTMENT INCOME/EXPENSE — Security transactions are accounted for on a trade date basis. Interest income/expense is recorded on the accrual basis. The Fund amortizes premiums and accretes discounts using the effective interest method. Dividend interest/expense is recorded on the ex-dividend date. Certain expenses are class-specific expenses, vary by class and are charged only to that class. Income, expenses (excluding class-specific expenses) and realized/unrealized gains/losses are allocated proportionately to each class of shares based upon the relative net asset value of the outstanding shares of that class. The cost of investments sold is determined by use of the specific identification method for both financial reporting and income tax purposes.
D) DIVIDENDS AND DISTRIBUTIONS TO SHAREHOLDERS — Dividends from net investment income, if any, are declared and paid quarterly. Distributions of net realized capital gains, if any, are declared and paid at least annually. However, to the extent that a net realized capital gain can be reduced by a capital loss carryforward, such gain will not be distributed. Income and capital gain distributions are determined in accordance with federal income tax regulations, which may differ from GAAP.
E) FEDERAL INCOME TAXES — No provision is made for federal taxes as it is the Fund's intention to continue to qualify for and elect the tax treatment applicable to regulated investment companies ("RIC") under the Internal Revenue Code of 1986, as amended (the "Code"), and to make the requisite distributions to its shareholders, which will be sufficient to relieve it from federal income and excise taxes.
In order to qualify as a RIC under the Code, the Fund must meet certain requirements regarding the source of its income, the diversification of its assets and the distribution of its income. One of these requirements is that the Fund derive at least 90% of its gross income for each taxable year from dividends, interest, payments with respect to certain securities loans, gains from the sale or other disposition of stock, securities or foreign currencies, other income derived with respect to its business of investing in such stock, securities or currencies or net income derived from interests in certain publicly traded partnerships ("Qualifying Income"). The IRS has issued a ruling that income realized from certain types of commodity-linked derivatives would not be Qualifying Income. As a result, the Fund's ability to realize income from investments in such commodity-linked derivatives as part of its investment strategy would be limited to a maximum of 10% of its gross income. The IRS has issued private letter rulings to registered investment companies concluding
18
Credit Suisse Managed Futures Strategy Fund
Notes to Consolidated Financial Statements (continued)
October 31, 2013
Note 2. Significant Accounting Policies
that income derived from their investment in a wholly-owned subsidiary would constitute Qualifying Income to the fund. The IRS has indicated that the granting of these types of private letter rulings is currently suspended, pending further internal discussion. As a result, the Fund has not received and there can be no assurance that the IRS will grant, such a private letter ruling to the Fund. If the Fund does not request and receive such a private letter ruling, there is a risk that the IRS could assert that the income derived from the Fund's investment in the Subsidiary will not be considered Qualifying Income for purposes of the fund remaining qualified as a RIC for U.S. federal income tax purposes. If the Fund is unable to ensure continued qualification as a RIC, the Fund may be required to change its investment objective, policies or techniques, or may be liquidated. If the Fund fails to qualify as a RIC, the Fund will be subject to federal income tax on its net income and capital gains at regular corporate rates (without reduction for distributions to shareholders). If the Fund were to fail to qualify as a RIC and become subject to federal income tax, shareholders of the Fund would be subject to the risk of diminished returns.
The Fund adopted the authoritative guidance for uncertainty in income taxes and recognizes a tax benefit or liability from an uncertain position only if it is more likely than not that the position is sustainable based solely on its technical merits and consideration of the relevant taxing authority's widely understood administrative practices and procedures. The Fund has reviewed its current tax positions and has determined that no provision for income tax is required in the Fund's financial statements. The Fund's federal tax returns for the prior fiscal year remain subject to examination by the Internal Revenue Service.
F) SHORT-TERM INVESTMENTS — The Fund, together with other funds/portfolios advised by Credit Suisse Asset Management, LLC ("Credit Suisse"), an indirect, wholly-owned subsidiary of Credit Suisse Group AG, pools available cash into a short-term variable rate time deposit issued by State Street Bank and Trust Company ("SSB"), the Fund's custodian. The short-term time deposit issued by SSB is a variable rate account classified as a short-term investment.
G) FUTURES — The Fund may enter into futures contracts to the extent permitted by its investment policies and objectives. The Fund may use futures contracts to gain exposure to, or hedge against changes in interest rates, equity and market price movements and/or currency risks. Upon entering into a futures contract, the Fund is required to deposit cash and/or pledge U.S. Government securities as initial margin. Subsequent payments, which are
19
Credit Suisse Managed Futures Strategy Fund
Notes to Consolidated Financial Statements (continued)
October 31, 2013
Note 2. Significant Accounting Policies
dependent on the daily fluctuations in the value of the underlying instrument, are made or received by the Fund each day (daily variation margin) and are recorded as unrealized gains or losses until the contracts are closed. When the contracts are closed, the Fund records a realized gain or loss equal to the difference between the proceeds from (or cost of) the closing transactions and the Fund's basis in the contract. Risks of entering into futures contracts for hedging purposes include the possibility that a change in the value of the contract may not correlate with the changes in the value of the underlying instruments. With futures, there is minimal counterparty credit risk to the Fund since futures are exchange traded and the exchange's clearinghouse, as counterparty to all exchange traded futures, guarantees the futures against default. In addition, the purchase of a futures contract involves the risk that the Fund could lose more than the original margin deposit and subsequent payments may be required for a futures transaction. At October 31, 2013, the Fund had the following open futures contracts and the amount of restricted cash held at brokers was $3,257,963:
Contract Description | | Currency | | Expiration
Date | | Notional
Value | | Net Unrealized
Appreciation/
(Depreciation) | |
Contracts to Purchase | |
Foreign Exchange Contracts | |
| EUR Currency Futures | | USD | | | | Dec 2013 | | $ | 6,965,900 | | | $ | 160,081 | | |
| GBP Currency Futures | | USD | | | | Dec 2013 | | | 6,218,600 | | | | 93,192 | | |
| | | | | | | | | $ | 253,273 | | |
Equity Contracts | |
Hang Seng Index Futures | | HKD | | | | Nov 2013 | | | 3,297,567 | | | $ | 82,041 | | |
EURO Stoxx 50 Index Futures | | EUR | | | | Dec 2013 | | | 2,911,095 | | | | 169,416 | | |
FTSE 100 Index Futures | | GBP | | | | Dec 2013 | | | 3,880,038 | | | | 75,924 | | |
Nikkei 225 Index Futures OSE | | JPY | | | | Dec 2013 | | | 2,779,024 | | | | 23,134 | | |
S&P 500 E Mini Index Futures | | USD | | | | Dec 2013 | | | 2,976,700 | | | | 90,946 | | |
| | | | | | | | | $ | 441,461 | | |
Interest Rate Contracts | |
10YR JGB Mini Futures | | JPY | | | | Dec 2013 | | | 16,407,318 | | | $ | 228,080 | | |
10YR U.S. Treasury Note Futures | | USD | | | | Dec 2013 | | | 891,516 | | | | (1,212 | ) | |
German EURO Bund Futures | | EUR | | | | Dec 2013 | | | 10,424,640 | | | | 41,879 | | |
| | | | | | | | | $ | 268,747 | | |
20
Credit Suisse Managed Futures Strategy Fund
Notes to Consolidated Financial Statements (continued)
October 31, 2013
Note 2. Significant Accounting Policies
Contract Description | | Currency | | Expiration
Date | | Notional
Value | | Net Unrealized
Appreciation/
(Depreciation) | |
Contracts to Sell | |
Foreign Exchange Contracts | |
| AUD Currency Futures | | USD | | | | Dec 2013 | | | (1,131,720 | ) | | $ | (7,249 | ) | |
| CAD Currency Futures | | USD | | | | Dec 2013 | | | (8,338,950 | ) | | | (31,842 | ) | |
| JPY Currency Futures | | USD | | | | Dec 2013 | | | (381,450 | ) | | | 1,831 | | |
| | | | | | | | | $ | (37,260 | ) | |
Interest Rate Contracts | |
Long Gilt Futures | | GBP | | | | Dec 2013 | | | (3,575,009 | ) | | $ | (76,838 | ) | |
Net unrealized appreciation (depreciation) | | | | | | | | $ | 849,383 | | |
Currency Abbreviations:
AUD = Australian Dollar
CAD = Canadian Dollar
EUR = Euro
GBP = British Pound
HKD = Hong Kong Dollar
JPY = Japanese Yen
USD = United States Dollar
H) SWAPS — The Fund may enter into swap contracts either for hedging purposes or to seek to increase total return. A swap contract is an agreement that obligates two parties to exchange a series of cash flows at specified intervals based upon or calculated by reference to changes in specified prices or rates for a specified amount of an underlying asset or notional principal amount. The Fund will enter into swap contracts only on a net basis, which means that the two payment streams are netted out, with the Fund receiving or paying, as the case may be, only the net amount of the two payments. Risks may arise as a result of the failure of the counterparty to the swap contract to comply with the terms of the swap contract. The extent of the Fund's exposure to credit and counterparty risks is the discounted net value of the cash flows to be received from/paid to the counterparty over the contract's remaining life, to the extent that the amount is positive. These risks are mitigated by having a master netting arrangement between the Fund and the counterparty and by the posting of collateral by the counterparty to the Fund to cover the Fund's exposure to the counterparty. Therefore, the Fund considers the creditworthiness of each counterparty to a swap contract in evaluating potential credit risk. Additionally, risks may arise from unanticipated movements in interest rates or in the value of the underlying reference asset or index.
21
Credit Suisse Managed Futures Strategy Fund
Notes to Consolidated Financial Statements (continued)
October 31, 2013
Note 2. Significant Accounting Policies
The Fund may enter into total return swap contracts, involving commitments to pay interest in exchange for a market-linked return, both based on notional amounts. To the extent the total return of the security or index underlying the transactions exceeds or falls short of the offsetting interest rate obligation, the Fund will receive a payment from or make a payment to the counterparty.
The Fund records unrealized gains or losses on a daily basis representing the value and the current net receivable or payable relating to open swap contracts. Net amounts received or paid on the swap contract are recorded as realized gains or losses. Fluctuations in the value of swap contracts are recorded for financial statement purposes as unrealized appreciation or depreciation on swap contracts. Realized gains and losses from terminated swaps are included in net realized gains/losses on swap contracts transactions. At October 31, 2013, the Fund had the following outstanding swap contracts and the amount of restricted cash held at brokers was $500,000:
Currency | | Notional
Amount | | Expiration
Date | | Counterparty | | Receive | | Pay | | Net Unrealized
Appreciation/
(Depreciation) | |
USD
| |
$1,575,988
| |
11/18/13
| |
Goldman Sachs
| |
Fixed Rate
| | Dow Jones – UBS
Agriculture Subindex | | $ | 43,266 | | |
USD
| |
$269,812
| |
11/18/13
| |
Goldman Sachs
| |
Fixed Rate
| | Dow Jones – UBS
Industrial
Metals Subindex | | | (1,230 | ) | |
USD
| |
$1,603,873
| |
11/18/13
| |
Goldman Sachs
| |
Fixed Rate
| | Dow Jones – UBS
Energy Subindex | | | 17,539 | | |
USD
| |
$2,018,557
| |
11/18/13
| |
Goldman Sachs
| |
Fixed Rate
| | Dow Jones – UBS
Energy Subindex | | | 22,566 | | |
USD
| |
$506,466
| |
11/18/13
| |
Goldman Sachs
| |
Fixed Rate
| | Dow Jones – UBS
Energy Subindex | | | 9,647 | | |
USD
| |
$974,765
| |
11/18/13
| |
Goldman Sachs
| |
Fixed Rate
| | Dow Jones – UBS
Agriculture Subindex | | | 7,478 | | |
USD
| |
$605,796
| |
11/18/13
| |
Goldman Sachs
| |
Fixed Rate
| | Dow Jones – UBS
Precious
Metals Subindex | | | (18,242 | ) | |
| | | | | $ | 81,024 | | |
I) SECURITIES LENDING — Loans of securities are required at all times to be secured by collateral at least equal to 102% of the market value of domestic securities on loan (including any accrued interest thereon) and 105% of the market value of foreign securities on loan (including any accrued interest thereon). Cash collateral received by the Fund in connection with securities lending activity may be pooled together with cash collateral for other
22
Credit Suisse Managed Futures Strategy Fund
Notes to Consolidated Financial Statements (continued)
October 31, 2013
Note 2. Significant Accounting Policies
funds/portfolios advised by Credit Suisse and may be invested in a variety of investments, including funds advised by SSB, the Fund's securities lending agent, or money market instruments. However, in the event of default or bankruptcy by the other party to the agreement, realization and/or retention of the collateral may be subject to legal proceedings.
SSB has been engaged by the Fund to act as the Fund's securities lending agent. The Fund's securities lending arrangement provides that the Fund and SSB will share the net income earned from securities lending activities. During the year ended October 31, 2013, there were no securities out on loan. Securities lending income is accrued as earned.
J) OTHER — In the normal course of business the Fund trades financial instruments and enters into financial transactions where risk of potential loss exists due to changes in the market (market risk) or failure of the other party to a transaction to perform (credit risk). Similar to credit risk, the Fund may be exposed to counterparty risk, or the risk that an institution or other entity with which the Fund has unsettled or open transactions will default. The potential loss could exceed the value of the financial assets recorded in the financial statements. Financial assets, which potentially expose the Fund to credit risk, consist principally of cash due from counterparties and investments. The extent of the Fund's exposure to credit and counterparty risks in respect to these financial assets approximates their carrying value as recorded in the Fund's Consolidated Statement of Assets and Liabilities.
K) NEW ACCOUNTING PRONOUNCEMENTS — In December 2011, the Financial Accounting Standards Board issued Accounting Standards Update ("ASU") No. 2013-1, Balance Sheet (Topic 210): Disclosures about Offsetting Assets and Liabilities. The amendments in the ASU enhance disclosures about offsetting of financial assets and liabilities to enable investors to understand the effect of these arrangements on a fund's financial position. The ASU is effective for interim and annual reporting periods beginning on or after January 1, 2013. The Fund believes the adoption of this ASU will not have a material impact on its financial statements.
L) SUBSEQUENT EVENTS — In preparing the financial statements as of October 31, 2013, management considered the impact of subsequent events for potential recognition or disclosure in these financial statements through the date of release of this report. No such events requiring recognition or disclosure were identified through the date of the release of this report.
23
Credit Suisse Managed Futures Strategy Fund
Notes to Consolidated Financial Statements (continued)
October 31, 2013
Note 3. Transactions with Affiliates and Related Parties
Credit Suisse serves as investment adviser for the Fund. For its investment advisory services, Credit Suisse is entitled to receive a fee from the Fund at an annual rate of 1.15% of the Fund's average daily net assets. For the year ended October 31, 2013, investment advisory fees earned and fees waived/expenses reimbursed were $308,627 and $295,231, respectively. The Fund is authorized to reimburse Credit Suisse for management fees previously limited and/or for expenses previously paid by Credit Suisse, provided, however, that any reimbursements must be paid at a date not more than three years after the end of the fiscal year during which such fees were limited or expenses were reimbursed by Credit Suisse and the reimbursements do not cause a class to exceed the applicable expense limitation in the contract at the time the fees were limited or expenses are paid. Credit Suisse contractually waives fees and reimburses expenses so that the Fund's annual operating expenses will not exceed 1.70% of the Fund's average daily net assets for Class I shares, 1.95% of the Fund's average daily net assets for Class A shares, and 2.70% of the Fund's average daily net assets for Class C shares.
Credit Suisse and SSB serve as co-administrators to the Fund. For its co-administrative services, Credit Suisse received a fee calculation at an annual rate of 0.09% of the Fund's average daily net assets. For the year ended October 31, 2013, co-administrative services fees earned by Credit Suisse were $24,153.
For its co-administrative services, SSB receives a fee, exclusive of out-of-pocket expenses, calculated in total for all the Credit Suisse funds/portfolios co-administered by SSB and allocated based upon the relative average net assets of each fund/portfolio, subject to an annual minimum fee. For the year ended October 31, 2013, co-administrative services fees earned by SSB (including out-of-pocket expenses) with respect to the Fund were $10,798.
Credit Suisse Securities (USA) LLC ("CSSU"), an affiliate of Credit Suisse, serves as distributor of the Fund's shares. Pursuant to distribution plans adopted by the Fund pursuant to Rule 12b-1 under the 1940 Act, CSSU received fees for its distribution services. These fees were calculated at an annual rate of 0.25% of the average daily net assets of the Class A shares. For the Class C shares, the fee is calculated at an annual rate of 1.00% of the average daily net assets. For the year ended October 31, 2013, the Fund's paid Rule 12b-1 distribution fees were $5,131 for Class A shares and $2,961 for Class C shares. Class I shares are not subject to distribution fees.
24
Credit Suisse Managed Futures Strategy Fund
Notes to Consolidated Financial Statements (continued)
October 31, 2013
Note 3. Transactions with Affiliates and Related Parties
Certain brokers, dealers and financial representatives provide transfer agent related services to the Fund and receive compensation from Credit Suisse. Credit Suisse is then reimbursed by the Fund. For the year ended October 31, 2013, the Fund reimbursed Credit Suisse $6,653, which is included in the Fund's transfer agent expense.
For the year ended October 31, 2013, CSSU and its affiliates advised the Fund that it retained $169 from commissions earned on the sale of the Fund's Class A shares.
Merrill Corporation ("Merrill"), an affiliate of Credit Suisse, has been engaged by the Fund to provide certain financial printing services. For the year ended October 31, 2013, Merrill was paid $18,543 for its services by the Fund. This amount was included in the printing fees presented on the Consolidated Statement of Operations.
Offering costs, including initial registration costs, were deferred and were charged to expenses over the first 12 months of Fund operations. For the year ended October 31, 2013, $87,212 has been expensed to the Fund.
Note 4. Line of Credit
The Fund, together with other funds/portfolios advised by Credit Suisse (collectively, the "Participating Funds"), participates in a committed, unsecured line of credit facility ("Credit Facility"), in an aggregated amount of $20 million for temporary or emergency purposes with SSB. Under the terms of the Credit Facility, the Participating Funds pay an aggregate commitment fee on the average unused amount of the Credit Facility, which is allocated among the Participating Funds in such manner as is determined by the governing Boards of the Participating Funds. In addition, the Participating Funds pay interest on borrowings at either the Overnight Federal Funds rate or the Overnight LIBOR rate plus a spread. At October 31, 2013, and during the year ended October 31, 2013, the Fund had no borrowings outstanding under the Credit Facility.
Note 5. Purchases and Sales of Securities
For the year ended October 31, 2013, purchases and sales of investment securities (excluding short-term investments) and U.S. Government and Agency Obligations were as follows:
Investment Securities | | U.S. Government/
Agency Obligations | |
| Purchases | | Sales | | Purchases | | Sales | |
| $ | — | | | $ | — | | | $ | 5,998,682 | | | $ | — | | |
25
Credit Suisse Managed Futures Strategy Fund
Notes to Consolidated Financial Statements (continued)
October 31, 2013
Note 6. Capital Share Transactions
The Fund is authorized to issue an unlimited number of full and fractional shares of beneficial interest, $.001 par value per share. The Fund offers Class I, Class A and Class C shares. Transactions in capital shares for each class of the Fund were as follows:
| | | Class I | |
| | | For the Year Ended
October 31, 2013 | | For the Period Ended
October 31, 20121 | |
| | | Shares | | Value | | Shares | | Value | |
Shares sold | | | 476,564 | | | $ | 4,927,737 | | | | 2,230,000 | | | $ | 22,300,000 | | |
Shares redeemed | | | (121,055 | ) | | | (1,252,839 | ) | | | — | | | | — | | |
Net increase | | | 355,509 | | | $ | 3,674,898 | | | | 2,230,000 | | | $ | 22,300,000 | | |
| | | Class A | |
| | | For the Year Ended
October 31, 2013 | | For the Period Ended
October 31, 20121 | |
| | | Shares | | Value | | Shares | | Value | |
Shares sold | | | 613,956 | | | $ | 6,405,758 | | | | 10,000 | | | $ | 100,000 | | |
Shares redeemed | | | (61,050 | ) | | | (638,880 | ) | | | — | | | | — | | |
Net increase | | | 552,906 | | | $ | 5,766,878 | | | | 10,000 | | | $ | 100,000 | | |
| | | Class C | |
| | | For the Year Ended
October 31, 2013 | | For the Period Ended
October 31, 20121 | |
| | | Shares | | Value | | Shares | | Value | |
Shares sold | | | 70,016 | | | $ | 725,200 | | | | 10,000 | | | $ | 100,000 | | |
Shares redeemed | | | (1,992 | ) | | | (20,916 | ) | | | — | | | | — | | |
Net increase | | | 68,024 | | | $ | 704,284 | | | | 10,000 | | | $ | 100,000 | | |
1 For the period September 28, 2012 (commencement of operations) through October 31, 2012.
The Fund imposes a redemption fee of 2% of the value of all classes of shares currently being offered that are redeemed or exchanged within 30 days from the date of purchase. Reinvested dividends and distributions are not subject to the fee. The fee is charged based on the value of shares at redemption, is paid directly to the Fund and becomes part of the Fund's daily net asset value calculation. When shares are redeemed that are subject to the fee, reinvested dividends and distributions are redeemed first, followed by the shares held longest. For the year ended October 31, 2013 and the period ended October 31, 2012, the redemption fees received by the Fund were $524 and $0, respectively. On or about January 31, 2014, the redemption fee will be eliminated.
26
Credit Suisse Managed Futures Strategy Fund
Notes to Consolidated Financial Statements (continued)
October 31, 2013
Note 6. Capital Share Transactions
On October 31, 2013, the number of shareholders that held 5% or more of the outstanding shares of each class of the Fund was as follows:
| | | Number of
Shareholders | | Approximate Percentage
of Outstanding Shares | |
Class I | | | 2 | * | | | 96 | % | |
Class A | | | 2 | | | | 98 | % | |
Class C | | | 2 | * | | | 100 | % | |
*This includes the seed money from Merchant Holdings, Inc., an affiliate of Credit Suisse.
Some of the shareholders may be omnibus accounts, which hold shares on behalf of individual shareholders.
Note 7. Federal Income Taxes
Income and capital gain distributions are determined in accordance with federal income tax regulations, which may differ from GAAP.
There were no dividends paid by the fund to shareholders during the year ended October 31, 2013 and the period ended October 31, 2012.
The tax basis components of distributable earnings differ from the amounts reflected in the Consolidated Statement of Assets and Liabilities by temporary book/tax differences. These differences are primarily due to differing treatments of futures contracts marked to market and offering expenses. At October 31, 2013, the components of distributable earnings on a tax basis were as follows:
Undistributed net investment income | | $ | 524,543 | | |
Undistributed capital gain | | | 540,603 | | |
Unrealized appreciation | | | 430,352 | | |
| | $ | 1,495,498 | | |
At October 31, 2013, the Fund had no capital loss carryforwards available to offset possible future capital gains.
During the tax year ended October 31, 2013, the Fund utilized $263,362 of capital loss carryforwards.
Under the Regulated Investment Company Modernization Act of 2010, the Fund will be permitted to carry forward capital losses incurred in taxable years beginning after December 22, 2010 for an unlimited period. However, any losses incurred during those future taxable years will be required to be utilized prior to the losses incurred in pre-enactment taxable years. As a result of this
27
Credit Suisse Managed Futures Strategy Fund
Notes to Consolidated Financial Statements (continued)
October 31, 2013
Note 7. Federal Income Taxes
ordering rule, pre-enactment capital loss carryforwards may be more likely to expire unused. Additionally, post-enactment capital losses that are carried forward will retain their character as either short-term or long-term capital losses rather than being considered all short-term as under previous law. It is uncertain whether the Fund will be able to realize the full benefits of the capital loss carryforwards before they expire. The Fund has no pre-enactment capital loss carryforwards.
At October 31, 2013, the cost of investments (excluding foreign currency related transactions) and net unrealized appreciation (depreciation) for income tax purposes were as follows:
Cost of Investments | | $ | 28,759,149 | | |
Unrealized appreciation | | $ | 8,338 | | |
Unrealized depreciation | | | — | | |
Net unrealized appreciation (depreciation) | | $ | 8,338 | | |
At October 31, 2013, the Fund reclassified $398,653 from accumulated net investment loss and $22,406 from accumulated net realized loss to paid in capital, to adjust for current period permanent book/tax differences which arose principally from differing book/tax treatment of foreign currency gain/(loss), ordinary loss netting to reduce short term capital gains, non-deductible 12b-1 and blue sky expenses and subsidiary cumulative income/loss. Net assets were not affected by these reclassifications.
Note 8. Contingencies
In the normal course of business, the Fund may provide general indemnifications pursuant to certain contracts and organizational documents. The Fund's maximum exposure under these arrangements is dependent on future claims that may be made against the Fund and, therefore, cannot be estimated; however, based on experience, the risk of loss from such claims is considered remote.
28
Credit Suisse Managed Futures Strategy Fund
Report of Independent Registered Public Accounting Firm
To the Board of Directors and Shareholders of Credit Suisse Managed Futures Strategy Fund:
In our opinion, the accompanying consolidated statement of assets and liabilities, including the consolidated schedule of investments, and the related consolidated statements of operations and of changes in net assets and the financial highlights present fairly, in all material respects, the financial position of Credit Suisse Managed Futures Strategy Fund and its subsidiary (the "Fund") at October 31, 2013, the results of their operations for the year then ended, the changes in their net assets and the financial highlights for the year then ended and for the period September 28, 2012 (commencement of operations) through October 31, 2012, in conformity with accounting principles generally accepted in the United States of America. These financial statements and financial highlights (hereafter referred to as "financial statements") are the responsibility of the Fund's management; our responsibility is to express an opinion on these financial statements based on our audits. We conducted our audits of these financial statements in accordance with the standards of the Public Company Accounting Oversight Board (United States). Those standards require that we plan and perform the audit to obtain reasonable assurance about whether the financial statements are free of material misstatement. An audit includes examining, on a test basis, evidence supporting the amounts and disclosures in the financial statements, assessing the accounting principles used and significant estimates made by management, and evaluating the overall financial statement presentation. We believe that our audits, which included confirmation of securities at October 31, 2013 by correspondence with the custodian and brokers, provide a reasonable basis for our opinion.
PricewaterhouseCoopers LLP
New York, NY
December 27, 2013
29
Credit Suisse Managed Futures Strategy Fund
Information Concerning Trustees and Officers (unaudited)
Name, Address
(Year of Birth) | | Position(s)
Held with
Fund | | Term
of Office1
and
Length
of Time
Served | | Principal
Occupation(s) During
Past Five Years | | Number of
Portfolios
in Fund
Complex
Overseen
by Trustee | | Other
Directorships
Held by Trustee | |
Independent Trustees | | | | | | | | | | | |
Enrique Arzac
c/o Credit Suisse Asset
Management, LLC
Attn: General Counsel
Eleven Madison Avenue
New York, New York
10010
(1941) | | Trustee, Audit Committee Chairman and Nominating Committee Member | | Since Fund Inception | | Professor of Finance and Economics, Graduate School of Business, Columbia University since 1971. | | | 11 | | | Director of The Adams Express Company, Petroleum and Resources Corporation, Aberdeen Chile Fund, Inc., Aberdeen Emerging Markets Smaller Company Opportunities Fund, Inc., Aberdeen Israel Fund, Inc., Aberdeen Indonesia Fund, Inc. and Aberdeen Latin America Equity Fund, Inc. (each a closed-end investment company); Director of Aberdeen Asia-Pacific Income Investment Company Limited (a Canadian closed-end fund); Trustee of Mirae Asset Discovery Funds (6 open-end portfolios); Director of Starcomms PLC. (telecommunications company) from 2008 to 2011; Director of Epoch Holding Corporation (an investment management and investment advisory services company) from 2006 to March 2013 | |
1 Each Trustee and Officer serves until his or her respective successor has been duly elected and qualified.
30
Credit Suisse Managed Futures Strategy Fund
Information Concerning Trustees and Officers (unaudited) (continued)
Name, Address
(Year of Birth) | | Position(s)
Held with
Fund | | Term
of Office1
and
Length
of Time
Served | | Principal
Occupation(s) During
Past Five Years | | Number of
Portfolios
in Fund
Complex
Overseen
by Trustee | | Other
Directorships
Held by Trustee | |
Independent Trustees | | | | | | | | | | | |
Jeffrey E. Garten
Box 208200
New Haven, Connecticut
06520-8200
(1946) | | Trustee, Audit and Nominating Committee Member | | Since Fund Inception | | The Juan Trippe Professor in the Practice of International Trade, Finance and Business, Yale School of Management, from July 2005 to present; Partner and Chairman of Garten Rothkopf (consulting firm) from October 2005 to present. | | | 9 | | | Director of Aetna, Inc. (insurance company); Director of CarMax Group (used car dealers); Director of Alcan (aluminum production) from February 2007 to November 2007; Member of Standard & Poor's Board of Managers (credit rating agency); Director of Miller Buckfire & Co., LLC (financial restructuring). | |
Steven N. Rappaport
Lehigh Court, LLC
555 Madison Avenue
29th Floor
New York, New York
10022
(1948) | | Chairman of the Board of Trustees, Audit Committee Member and Nominating Committee Chairman | | Since Fund Inception | | Partner of Lehigh Court, LLC and RZ Capital (private investment firms) from July 2002 to present. | | | 11 | | | Director of iCAD, Inc. (surgical and medical instruments and apparatus company); Director of Wood Resources, LLC. (plywood manufacturing company); Director of Aberdeen Chile Fund, Inc., Aberdeen Emerging Markets Smaller Company Opportunities Fund, Inc., Aberdeen Israel Fund, Inc., Aberdeen Indonesia Fund, Inc. and Aberdeen Latin America Equity Fund, Inc. (each a closed-end investment company); Director of Presstek, Inc. (digital imaging technologies company) from 2003 to 2012. | |
31
Credit Suisse Managed Futures Strategy Fund
Information Concerning Trustees and Officers (unaudited) (continued)
Name, Address
(Year of Birth) | | Position(s)
Held with
Fund | | Term
of Office1
and
Length
of Time
Served | | Principal Occupation(s) During Past Five Years | |
Officers* | | | | | | | |
John G. Popp
Credit Suisse Asset
Management, LLC
One Madison Avenue
New York, New York 10010
(1956) | | Chief Executive Officer and President | | Since Fund Inception | | Managing Director of Credit Suisse; Global Head and Chief Investment Officer of the Credit Investment Group; Associated with Credit Suisse or its predecessor since 1997; Officer of other Credit Suisse Funds; Trustee of Credit Suisse High Yield Bond Fund; Director of Credit Suisse Asset Management Income Fund, Inc. | |
Bruce Rosenberg
Credit Suisse Asset
Management, LLC
One Madison Avenue
New York, New York 10010
(1961) | | Chief Financial Officer | | Since 2012 | | Director of Credit Suisse; Director of Liquid Accounting of Credit Suisse; Associated with Credit Suisse since 2008; Officer of other Credit Suisse Funds. | |
Emidio Morizio
Credit Suisse Asset
Management, LLC
Eleven Madison Avenue
New York, New York 10010
(1966) | | Chief Compliance Officer | | Since Fund Inception | | Managing Director and Global Head of Compliance of Credit Suisse since 2010; Director and Global Head of Compliance of Credit Suisse from January 2005 to December 2009; Associated with Credit Suisse since July 2000; Officer of other Credit Suisse Funds. | |
Joanne Doldo
Credit Suisse Asset
Management, LLC
Eleven Madison Avenue
New York, New York 10010
(1959) | | Chief Legal Officer | | Since 2013 | | Vice President of Credit Suisse; Associated with Credit Suisse since September 2011; Officer of other Credit Suisse Funds; Associated with Morgan Stanley Investment Management from 2002-2008. | |
Rocco DelGuercio
Credit Suisse Asset
Management, LLC
One Madison Avenue
New York, New York 10010
(1963) | | Treasurer | | Since 2013 | | Vice President of Credit Suisse since 2013; Independent Consultant from February 2012 to April 2013; Director of Legg Mason & Co., LLC from March 2004 to January 2012; Associated with Credit Suisse from June 1996 to March 2004; Officer of other Credit Suisse Funds. | |
Karen Regan
Credit Suisse Asset
Management, LLC
Eleven Madison Avenue
New York, New York 10010
(1963) | | Senior Vice President and Secretary | | Since Fund Inception | | Vice President of Credit Suisse; Associated with Credit Suisse since December 2004; Officer of other Credit Suisse Funds. | |
* The officers of the Fund shown are officers that make policy decisions.
The Statement of Additional Information includes additional information about the Trustees and is available, without charge, upon request, by calling 877-870-2874.
32
Credit Suisse Managed Futures Strategy Fund
Proxy Voting and Portfolio Holdings Information (unaudited)
Information regarding how the Fund voted proxies related to its portfolio securities during the 12 month period ended June 30 of each year, as well as the policies and procedures that the Fund uses to determine how to vote proxies relating to its portfolio securities are available:
• By calling 1-877-870-2874
• On the Fund's website, www.credit-suisse.com/us/funds
• On the website of the Securities and Exchange Commission, www.sec.gov.
The Fund files a complete schedule of its portfolio holdings for the first and third quarters of its fiscal year with the SEC on Form N-Q. The Fund's Forms N-Q are available on the SEC's website at www.sec.gov and may be reviewed and copied at the SEC's Public Reference Room in Washington, DC. Information on the operation of the SEC's Public Reference Room may be obtained by calling 1-202-551-8090.
33

P.O. BOX 55030, BOSTON, MA 02205-5030
877-870-2874 n www.credit-suisse.com/us/funds
CREDIT SUISSE SECURITIES (USA) LLC, DISTRIBUTOR. MFS-AR-1013
Item 2. Code of Ethics.
The registrant has adopted a code of ethics applicable to its Chief Executive Officer, President, Chief Financial Officer and Chief Accounting Officer, or persons performing similar functions. A copy of the code is filed as Exhibit 12(a)(1) to this Form. There were no amendments to the code during the fiscal year ended October 31, 2013. There were no waivers or implicit waivers from the code granted by the registrant during the fiscal year ended October 31, 2013.
Item 3. Audit Committee Financial Expert.
The registrant’s governing board has determined that it has two audit committee financial experts serving on its audit committee: Enrique R. Arzac and Steven N. Rappaport. Each audit committee financial expert is “independent” for purposes of this item.
Item 4. Principal Accountant Fees and Services.
(a) through (d). The information in the table below is provided for services rendered to the registrant by its independent registered public accounting firm, PricewaterhouseCoopers LLP (“PwC”), for its fiscal years ended October 31, 2012 and October 31, 2013.
| | 2012 | | 2013 | |
Audit Fees | | $ | 101,700 | | $ | 165,700 | |
Audit-Related Fees(1) | | $ | 7,334 | | $ | 14,400 | |
Tax Fees(2) | | $ | 12,000 | | $ | 12,000 | |
All Other Fees | | — | | — | |
Total | | $ | 121,034 | | $ | 192,100 | |
(1) Services include agreed-upon procedures in connection with the registrant’s semi-annual financial statements ($7,334 for 2012 and $ 14,400 for 2013).
(2) Tax services in connection with the registrant’s excise tax calculations and review of the registrant’s applicable tax returns.
The information in the table below is provided with respect to non-audit services that directly relate to the registrant’s operations and financial reporting and that were rendered by PwC to the registrant’s investment adviser, Credit Suisse Asset Management, LLC (“Credit Suisse”), and any service provider to the registrant controlling, controlled by or under common control with Credit Suisse that provided ongoing services to the registrant (“Covered Services Provider”), for the registrant’s fiscal years ended October 31, 2012 and October 31, 2013.
| | 2012 | | 2013 | |
Audit-Related Fees | | N/A | | N/A | |
Tax Fees | | N/A | | N/A | |
All Other Fees | | N/A | | N/A | |
Total | | N/A | | N/A | |
(e)(1) Pre-Approval Policies and Procedures. The Audit Committee (“Committee”) of the registrant is responsible for pre-approving (i) all audit and permissible non-audit services to be provided by the independent registered public accounting firm to the registrant and (ii) all permissible non-audit services to be provided by the independent registered public accounting firm to Credit Suisse and any Covered Services Provider if the engagement relates directly to the operations and financial reporting of the registrant. The Committee may delegate its responsibility to pre-approve any such audit and permissible non-audit services to the Chairperson of the Committee, and the Chairperson shall report to the Committee, at its next regularly scheduled meeting after the Chairperson’s pre-approval of such services, his or her decision(s). The Committee may also establish detailed pre-approval policies and procedures for pre-approval of such services in accordance with applicable laws, including the delegation of some or all of the Committee’s pre-approval responsibilities to other persons (other than Credit Suisse or the registrant’s officers). Pre-approval by the Committee of any permissible non-audit services shall not be required so long as: (i) the aggregate amount of all such permissible non-audit services provided to the registrant, Credit Suisse and any Covered Services Provider constitutes not more than 5% of the total amount of revenues paid by the registrant to its independent registered public accounting firm during the fiscal year in which the permissible non-audit services are provided; (ii) the permissible non-audit services were not recognized by the registrant at the time of the engagement to be non-audit services; and (iii) such services are promptly brought to the attention of the Committee and approved by the Committee (or its delegate(s)) prior to the completion of the audit.
(e)(2) The information in the table below sets forth the percentages of fees for services (other than audit, review or attest services) rendered by PwC to the registrant for which the pre-approval requirement was waived pursuant to Rule 2-01(c)(7)(i)(C) of Regulation S-X:
| | 2012 | | 2013 | |
Audit-Related Fees | | N/A | | N/A | |
Tax Fees | | N/A | | N/A | |
All Other Fees | | N/A | | N/A | |
Total | | N/A | | N/A | |
The information in the table below sets forth the percentages of fees for services (other than audit, review or attest services) rendered by PwC to Credit Suisse and any Covered Services Provider required to be approved pursuant to Rule 2-01(c)(7)(ii) of Regulation S-X, for the registrant’s fiscal years ended October 31, 2012 and October 31, 2013:
| | 2012 | | 2013 | |
Audit-Related Fees | | N/A | | N/A | |
Tax Fees | | N/A | | N/A | |
All Other Fees | | N/A | | N/A | |
Total | | N/A | | N/A | |
(f) Not Applicable.
(g) The aggregate fees billed by PwC for non-audit services rendered to the registrant, Credit Suisse and Covered Service Providers for the fiscal years ended October 31, 2012 and October 31, 2013 were $0 and $0, respectively.
(h) Not Applicable.
Item 5. Audit Committee of Listed Registrants.
Form N-CSR disclosure requirement is not applicable to the registrant.
Item 6. Schedule of Investments.
Included as part of the report to shareholders filed under Item 1 of this Form.
Item 7. Disclosure of Proxy Voting Policies and Procedures for Closed-End Management Investment Companies.
Form N-CSR disclosure requirement is not applicable to the registrant.
Item 8. Portfolio Managers of Closed-End Management Investment Companies.
Form N-CSR disclosure requirement is not applicable to the registrant.
Item 9. Purchases of Equity Securities by Closed-End Management Investment Company and Affiliated Purchasers.
Form N-CSR disclosure requirement is not applicable to the registrant.
Item 10. Submission of Matters to a Vote of Security Holders.
None.
Item 11. Controls and Procedures.
(a) As of a date within 90 days from the filing date of this report, the principal executive officer and principal financial officer concluded that the registrant’s disclosure controls and procedures (as defined in Rule 30a-3(c) under the Investment Company Act of 1940 (the “Act”)) were effective based on their evaluation of the disclosure controls and procedures required by Rule 30a-3(b) under the Act and Rules 13a-15(b) or 15d-15(b) under the Securities Exchange Act of 1934.
(b) There were no changes in registrant’s internal control over financial reporting (as defined in Rule 30a-3(d) under the Act) that occurred during the second fiscal quarter of the period covered by this report that have materially affected, or are reasonably likely to materially affect, the registrant’s internal control over financial reporting.
Item 12. Exhibits.
(a)(1) Registrant’s Code of Ethics is an exhibit to this report.
(a)(2) The certifications of the registrant as required by Rule 30a-2(a) under the Act are exhibits to this report.
(a)(3) Not applicable.
(b) The certifications of the registrant as required by Rule 30a-2(b) under the Act are an exhibit to this report.
SIGNATURES
Pursuant to the requirements of the Securities Exchange Act of 1934 and the Investment Company Act of 1940, the registrant has duly caused this report to be signed on its behalf by the undersigned, thereunto duly authorized.
| CREDIT SUISSE OPPORTUNITY FUNDS | |
| /s/ John G. Popp | |
| Name: | John G. Popp | |
| Title: | Chief Executive Officer and President | |
| Date: | January 7, 2014 | |
Pursuant to the requirements of the Securities Exchange Act of 1934 and the Investment Company Act of 1940, this report has been signed below by the following persons on behalf of the registrant and in the capacities and on the dates indicated.
| /s/ John G. Popp | |
| Name: | John G. Popp | |
| Title: | Chief Executive Officer and President | |
| Date: | January 7, 2014 | |
| /s/ Bruce S. Rosenberg | |
| Name: | Bruce S. Rosenberg | |
| Title: | Chief Financial Officer | |
| Date: | January 7, 2014 | |