UNITED STATES
SECURITIES AND EXCHANGE COMMISSION
Washington, D.C. 20549
FORM N-CSR
CERTIFIED SHAREHOLDER REPORT OF REGISTERED
MANAGEMENT INVESTMENT COMPANIES
Investment Company Act file number | 811-09054 |
|
CREDIT SUISSE OPPORTUNITY FUNDS |
(Exact name of registrant as specified in charter) |
|
One Madison Avenue, New York, New York | | 10010 |
(Address of principal executive offices) | | (Zip code) |
|
John G. Popp Credit Suisse Opportunity Funds One Madison Avenue New York, New York 10010 |
(Name and address of agent for service) |
|
Registrant’s telephone number, including area code: | (212) 325-2000 | |
|
Date of fiscal year end: | October 31st | |
|
Date of reporting period: | November 1, 2011 to October 31, 2012 | |
| | | | | | | | | |
Item 1. Reports to Stockholders.
2

CREDIT SUISSE FUNDS
Annual Report
October 31, 2012
n CREDIT SUISSE
FLOATING RATE HIGH INCOME FUND
The Fund's investment objectives, risks, charges and expenses (which should be considered carefully before investing), and more complete information about the Fund, are provided in the Prospectus, which should be read carefully before investing. You may obtain additional copies by calling 877-870-2874 or by writing to Credit Suisse Funds, P.O. Box 55030, Boston, MA 02205-5030.
Credit Suisse Securities (USA) LLC, Distributor, is located at One Madison Avenue, New York, NY 10010. Credit Suisse Funds are advised by Credit Suisse Asset Management, LLC.
Investors in the Credit Suisse Funds should be aware that they may be eligible to purchase Class I shares (where offered) directly or through certain intermediaries. Such shares are not subject to a sales charge. Investors in the Credit Suisse Funds should also be aware that they may be eligible for a reduction or waiver of the sales charge with respect to Class A, B or C shares (where offered). For more information, please review the relevant prospectuses or consult your financial representative.
The views of the Fund's management are as of the date of the letter and the Fund holdings described in this document are as of October 31, 2012; these views and Fund holdings may have changed subsequent to these dates. Nothing in this document is a recommendation to purchase or sell securities.
Fund shares are not deposits or other obligations of Credit Suisse Asset Management, LLC ("Credit Suisse") or any affiliate, are not FDIC-insured and are not guaranteed by Credit Suisse or any affiliate. Fund investments are subject to investment risks, including loss of your investment.
Credit Suisse Floating Rate High Income Fund
Annual Investment Adviser's Report
October 31, 2012 (unaudited)
December 6, 2012
Dear Shareholder:
We are pleased to present this Annual Report covering the activities of the Credit Suisse Floating Rate High Income Fund for the 12-month period ended October 31, 2012.
Performance Summary
11/1/11 – 10/31/12
Fund & Benchmark | | Performance | |
| Class I1 | | | 8.51 | % | |
| Class A1,2 | | | 8.19 | % | |
| Class B1,2 | | | 7.30 | % | |
| Class C1,2 | | | 7.29 | % | |
| Credit Suisse Leveraged Loan Index Total Return3 | | | 8.34 | % | |
Performance shown for the Fund's Class A, Class B and Class C shares does not reflect sales charges, which are a maximum of 4.75%, 4.00% and 1.00%, respectively.2
Market Review: A Positive Period for Loans
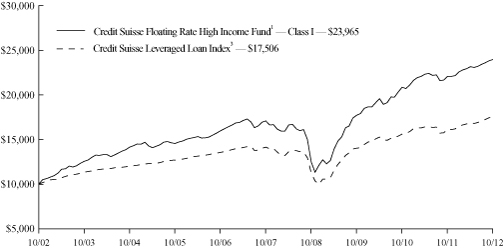
The annual period ended October 31, 2012, was a positive one for leveraged loans, with the Credit Suisse Leveraged Loan Index, the Fund's benchmark, registering a return of 8.34%. In fact, the Index saw positive returns in 10 of the 12 months during the period. Additionally, the senior loan discount margin, assuming a three-year average life, tightened by 91 basis points to finish the period at +557 basis points, while the average Index price ended the period at 96.23 (up by 3.78 points).
From a quality point-of-view, Distressed (CC, C, and Default) and CCC/Split CCC-rated loans posted the highest returns of 19.79% and 11.64% for the period, respectively. Split BBB- and BB-rated loans underperformed, delivering 4.87% and 6.35%, respectively. Housing, media/telecommunications and manufacturing were the best performing sectors during the period, while utility, aerospace and metals/minerals were the lowest performers.
After falling to historically low levels at the end of 2011, senior loan default rates increased slightly throughout 2012 to finish October at 1.06%, according to S&P Leveraged Commentary & Data. At this level, the senior loan default rate remains well below the historical average of 3.3% — although, according to S&P Leveraged Commentary & Data, it is expected to increase to 2.7% by the end of 2013.
According to Credit Suisse, senior loan new issuance totaled $449.7 billion during the 12-month period ending October 31, 2012. Over 47% of senior loan new issuance in 2012 was used to refinance existing debt.
1
Credit Suisse Floating Rate High Income Fund
Annual Investment Adviser's Report (continued)
October 31, 2012 (unaudited)
Senior loan mutual funds have seen positive inflows in 2012, with the largest inflows occurring in the third calendar quarter. According to Lipper FMI, year-to-date retail fund flows into the asset class totaled $8.7 billion as of October 31, 2012. This compares to a full year 2011 total of $13.9 billion. Additional demand for the asset class was driven by new CLO issuance, which totaled $40 billion for the year-to-date period ended October 31, 2012. This is the highest level of activity since 2007.
Strategy Review and Outlook: Anticipating Stable Market Conditions for the Near Term
For the 12-month period ended October 31, 2012, the Fund underperformed the Credit Suisse Leveraged Loan Index. Positive security selection in BB- and B-rated loans as well as in the leisure, retail stores and electronics sectors contributed positively to relative returns. In addition, the Fund's allocation to CLOs also added to returns. Conversely, positioning in the printing and publishing sector detracted from returns.
Portfolio exposures continue to emphasize BB- and B-rated loans with the best risk-return profiles. Additionally, the Fund has an underweight to the lower-rated and most levered components of the market, as they typically exhibit the most volatility in a heightened macro risk environment and we do not believe current valuations adequately compensate investors.
Overall, fundamentals have remained strong in 2012, as senior secured loan issuers have continued to focus on deleveraging. This trend has in turn supported below-average defaults for 2012 and continued below-average expectations leading into 2013. Investors have demonstrated continued confidence in loan markets and demand for the senior loan asset class has been driven by retail inflows, allocations from institutional investors such as pensions, and new CLO issuance. We continue to favor the defensive nature of the senior loan asset class and believe it provides attractive relative value compared to other fixed income investment opportunities. While we are cautious given potential headline risk in the coming months, we believe that loan market conditions will remain stable in the near term.
The Credit Suisse Credit Investments Group Team
John G. Popp
Thomas J. Flannery
Wing Chan
David H. Lerner
2
Credit Suisse Floating Rate High Income Fund
Annual Investment Adviser's Report (continued)
October 31, 2012 (unaudited)
Senior secured floating rate loans ("Senior Loans") are subject to risk that a court could subordinate a Senior Loan, which typically holds the most senior position in the issuer's capital structure, to presently existing or future indebtedness or take other action detrimental to the holders of Senior Loans.
High yield bonds are lower-quality bonds that are also known as "junk bonds." Such bonds entail greater risks than those found in higher-rated securities.
In addition to historical information, this report contains forward-looking statements, which may concern, among other things, domestic and foreign market, industry and economic trends and developments and government regulation and their potential impact on the Fund's investments. These statements are subject to risks and uncertainties and actual trends, developments and regulations in the future, and their impact on the Fund could be materially different from those projected, anticipated or implied. The Fund has no obligation to update or revise forward-looking statements.
The views of the Fund's management are as of the date of the letter and the Fund holdings described in this document are as of October 31, 2012, these views and Fund holdings may have changed subsequent to these dates. Nothing in this document is a recommendation to purchase or sell securities.
3
Credit Suisse Floating Rate High Income Fund
Annual Investment Adviser's Report (continued)
October 31, 2012 (unaudited)
Comparison of Change in Value of $10,000 Investment in the
Credit Suisse Floating Rate High Income Fund1 Class I shares and the
Credit Suisse Leveraged Loan Index3 for Ten Years.
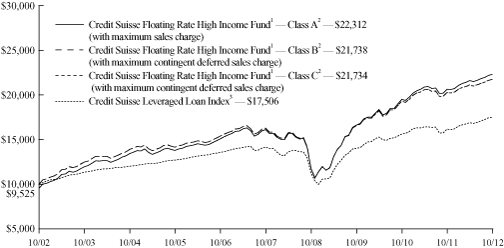
Comparison of Change in Value of $10,000 Investment in the
Credit Suisse Floating Rate High Income Fund1 Class A shares2, Class B
shares2, and Class C shares2 and the Credit Suisse Leveraged Loan Index3
for Ten Years.
4
Credit Suisse Floating Rate High Income Fund
Annual Investment Adviser's Report (continued)
October 31, 2012 (unaudited)
Average Annual Returns as of September 30, 20121
| | | 1 Year | | 5 Years | | 10 Years | | Since
Inception | |
Class I | | | 10.07 | % | | | 7.08 | % | | | 9.03 | % | | | 7.16 | % | |
Class A Without Sales Charge | | | 9.91 | % | | | 6.80 | % | | | 8.78 | % | | | 6.64 | % | |
Class A With Maximum
Sales Charge | | | 4.66 | % | | | 5.77 | % | | | 8.26 | % | | | 6.26 | % | |
Class B Without CDSC | | | 9.00 | % | | | 6.01 | % | | | 7.97 | % | | | 5.82 | % | |
Class B With CDSC | | | 5.00 | % | | | 6.01 | % | | | 7.97 | % | | | 5.82 | % | |
Class C Without CDSC | | | 8.99 | % | | | 6.01 | % | | | 7.97 | % | | | 5.94 | % | |
Class C With CDSC | | | 7.99 | % | | | 6.01 | % | | | 7.97 | % | | | 5.94 | % | |
Average Annual Returns as of October 31, 20121
| | | 1 Year | | 5 Years | | 10 Years | | Since
Inception | |
Class I | | | 8.51 | % | | | 7.03 | % | | | 9.13 | % | | | 7.16 | % | |
Class A Without Sales Charge | | | 8.19 | % | | | 6.75 | % | | | 8.89 | % | | | 6.64 | % | |
Class A With Maximum
Sales Charge | | | 3.11 | % | | | 5.72 | % | | | 8.36 | % | | | 6.26 | % | |
Class B Without CDSC | | | 7.30 | % | | | 5.96 | % | | | 8.07 | % | | | 5.82 | % | |
Class B With CDSC | | | 3.30 | % | | | 5.96 | % | | | 8.07 | % | | | 5.82 | % | |
Class C Without CDSC | | | 7.29 | % | | | 5.96 | % | | | 8.07 | % | | | 5.94 | % | |
Class C With CDSC | | | 6.29 | % | | | 5.96 | % | | | 8.07 | % | | | 5.94 | % | |
Returns represent past performance and include change in share price and reinvestment of dividends and capital gains. Past performance cannot guarantee future results. The current performance of the Fund may be lower or higher than the figures shown. Returns and share price will fluctuate, and redemption value may be more or less than original cost. The performance results do not reflect the deduction of taxes that a shareholder would pay on fund distributions or the redemption of fund shares. Performance information current to the most recent month-end is available at www.credit-suisse.com/us/funds.
The annualized gross expense ratios are 0.90% for Class I shares, 1.15% for Class A shares, 1.90% for Class B shares and 1.90% for Class C shares. The annualized net expense ratios after fee waivers and/or expense reimbursements are 0.70% for Class I shares, 0.95% for Class A shares, 1.70% for Class B shares and 1.70% for Class C shares.
1 Fee waivers and/or expense reimbursements may reduce expenses for the Fund, without which performance would be lower. Waivers and/or reimbursements may be discontinued at any time.
5
Credit Suisse Floating Rate High Income Fund
Annual Investment Adviser's Report (continued)
October 31, 2012 (unaudited)
2 Total return for the Fund's Class A shares for the reporting period, based on offering price (including maximum sales charge of 4.75%), was 3.11%. Total return for the Fund's Class B shares for the reporting period, based on redemption value (including maximum contingent deferred sales charge of 4.00%), was 3.30%. Total return for the Fund's Class C shares for the reporting period, based on redemption value (including maximum contingent deferred sales charge of 1.00%), was 6.29%.
3 The Fund changed its benchmark to the Credit Suisse Leveraged Loan Index effective June 3, 2011 in connection with changes to its principal investment strategies. Credit Suisse Leveraged Loan Index is an unmanaged index that is designed to mirror the investable universe of the U.S. dollar denominated institutional leveraged loan market. An index does not have transaction costs, investors cannot invest directly in an index.
6
Credit Suisse Floating Rate High Income Fund
Annual Investment Adviser's Report (continued)
October 31, 2012 (unaudited)
Information About Your Fund's Expenses
As an investor of the Fund, you incur two types of costs: ongoing expenses and transaction costs. Ongoing expenses include management fees, distribution and service (12b-1) fees and other Fund expenses. Examples of transaction costs include sales charges (loads), redemption fees and account maintenance fees, which are not shown in this section and which would result in higher total expenses. The following table is intended to help you understand your ongoing expenses of investing in the Fund and to help you compare these expenses with the ongoing expenses of investing in other mutual funds. The table is based on an investment of $1,000 made at the beginning of the six month period ended October 31, 2012.
The table illustrates your Fund's expenses in two ways:
• Actual Fund Return. This helps you estimate the actual dollar amount of ongoing expenses paid on a $1,000 investment in the Fund using the Fund's actual return during the period. To estimate the expenses you paid over the period, simply divide your account value by $1,000 (for example, an $8,600 account value divided by $1,000 = 8.6), then multiply the result by the number in the "Expenses Paid per $1,000" line under the share class you hold.
• Hypothetical 5% Fund Return. This helps you to compare your Fund's ongoing expenses with those of other mutual funds using the Fund's actual expense ratio and a hypothetical rate of return of 5% per year before expenses. Examples using a 5% hypothetical fund return may be found in the shareholder reports of other mutual funds. The hypothetical account values and expenses may not be used to estimate the actual ending account balance or expenses you paid for the period.
Please note that the expenses shown in these tables are meant to highlight your ongoing expenses only and do not reflect any transaction costs, such as sales charges (loads) or redemption fees. If these transaction costs had been included, your costs would have been higher. The "Expenses Paid per $1,000" line of the tables is useful in comparing ongoing expenses only and will not help you determine the relative total expenses of owning different funds.
7
Credit Suisse Floating Rate High Income Fund
Annual Investment Adviser's Report (continued)
October 31, 2012 (unaudited)
Expenses and Value for a $1,000 Investment
for the six month period ended October 31, 2012
Actual Fund Return | | Class I | | Class A | | Class B | | Class C | |
Beginning Account Value 5/1/12 | | $ | 1,000.00 | | | $ | 1,000.00 | | | $ | 1,000.00 | | | $ | 1,000.00 | | |
Ending Account Value 10/31/12 | | $ | 1,034.50 | | | $ | 1,033.10 | | | $ | 1,029.30 | | | $ | 1,030.70 | | |
Expenses Paid per $1,000* | | $ | 3.58 | | | $ | 4.85 | | | $ | 8.67 | | | $ | 8.68 | | |
Hypothetical 5% Fund Return | |
Beginning Account Value 5/1/12 | | $ | 1,000.00 | | | $ | 1,000.00 | | | $ | 1,000.00 | | | $ | 1,000.00 | | |
Ending Account Value 10/31/12 | | $ | 1,021.62 | | | $ | 1,020.36 | | | $ | 1,016.59 | | | $ | 1,016.59 | | |
Expenses Paid per $1,000* | | $ | 3.56 | | | $ | 4.82 | | | $ | 8.62 | | | $ | 8.62 | | |
| | | Class I | | Class A | | Class B | | Class C | |
Annualized Expense Ratios* | | | 0.70 | % | | | 0.95 | % | | | 1.70 | % | | | 1.70 | % | |
* Expenses are equal to the Fund's annualized expense ratio for each share class, multiplied by the average account value over the period, multiplied by the number of days in the most recent fiscal half year period, then divided by 366.
The "Expenses Paid per $1,000" and the "Annualized Expense Ratios" in the tables are based on actual expenses paid by the Fund during the period, net of fee waivers and/or expense reimbursements. If those fee waivers and/or expense reimbursements had not been in effect, the Fund's actual expenses would have been higher.
For more information, please refer to the Fund's prospectus.
8
Credit Suisse Floating Rate High Income Fund
Annual Investment Adviser's Report (continued)
October 31, 2012 (unaudited)
Credit Quality Breakdown*
(% of Total Investments as of October 31, 2012)
S&P Ratings | |
A | | | 0.4 | % | |
BBB | | | 5.0 | % | |
BB | | | 29.4 | % | |
B | | | 37.7 | % | |
CCC | | | 2.6 | % | |
CC | | | 0.0 | % | |
NR | | | 12.9 | % | |
Subtotal | | | 88.0 | % | |
Equity and Other | | | 0.1 | % | |
| Short-Term Investment1 | | | 11.9 | % | |
Total | | | 100.0 | % | |
* Expressed as a percentage of total investments (excluding securities lending collateral if applicable) and may vary over time.
1 Primarily reflects cash invested in State Street Bank and Trust Co. Euro Time Deposit, for which the purchases of securities have been executed but not yet settled at October 31, 2012.
9
Credit Suisse Floating Rate High Income Fund
Schedule of Investments
October 31, 2012
Par
(000) | |
| | Ratings†
(S&P/Moody's) | | Maturity | | Rate% | | Value | |
| BANK LOANS (80.7%) | | | |
| Aerospace & Defense (0.9%) | | | |
$ | 852 | | | AM General# | | (NR, NR) | | 09/30/13 | | | 3.196 | | | $ | 831,508 | | |
| | 1,458 | | | API Technologies Corp.# | | (B+, B2) | | 06/27/16 | | | 8.750 | | | | 1,450,236 | | |
| | 192 | | | Landmark Aviation FBO Canada, Inc.# | | (B, B2) | | 10/25/19 | | | 5.750 | | | | 193,269 | | |
| | 1,808 | | | LM US Member LLC# | | (B, B2) | | 10/25/19 | | | 5.750 | | | | 1,816,731 | | |
| | | | 4,291,744 | | |
| Airlines (1.4%) | | | |
| | 1,353 | | | Delta Air Lines, Inc.# | | (BB-, Ba2) | | 04/20/17 | | | 5.500 | | | | 1,356,700 | | |
| | 2,194 | | | United Air Lines, Inc.# | | (BB-, Ba3) | | 02/01/14 | | | 2.250 | | | | 2,176,666 | | |
| | 2,986 | | | US Airways Group, Inc.# | | (B+, B3) | | 03/21/14 | | | 2.711 | | | | 2,922,465 | | |
| | | | 6,455,831 | | |
| Auto Parts & Equipment (2.4%) | | | |
| | 1,000 | | | Delphi Corp.# | | (BBB, Baa2) | | 03/31/17 | | | 3.500 | | | | 1,005,310 | | |
| | 1,970 | | | Federal-Mogul Corp.# | | (B, B1) | | 12/29/14 | | | 2.148 | | | | 1,851,853 | | |
| | 754 | | | Federal-Mogul Corp.# | | (B, B1) | | 12/28/15 | | | 2.148 | | | | 708,693 | | |
| | 3,500 | | | HHI Holdings LLC# | | (NR, NR) | | 09/18/18 | | | 6.000 | | | | 3,498,530 | | |
| | 3,981 | | | Veyance Technologies, Inc.# | | (NR, NR) | | 07/31/14 | | | 2.470 | | | | 3,959,285 | | |
| | | | 11,023,671 | | |
| Automakers (0.5%) | | | |
| | 1,986 | | | Chrysler Group LLC# | | (BB, Ba2) | | 05/24/17 | | | 6.000 | | | | 2,033,087 | | |
| Automotive (1.3%) | | | |
| | 740 | | | KAR Auction Services, Inc.# | | (BB-, Ba3) | | 05/19/17 | | | 5.000 | | | | 745,708 | | |
| | 2,500 | | | Schaeffler AG# | | (B, B1) | | 01/27/17 | | | 6.000 | | | | 2,532,025 | | |
| | 2,700 | | | The PEP Boys-Manny, Moe & Jack# | | (BB-, Ba2) | | 10/11/18 | | | 5.000 | | | | 2,722,504 | | |
| | | | 6,000,237 | | |
| Banking (1.3%) | | | |
| | 990 | | | Citco III Ltd.# | | (NR, NR) | | 06/29/18 | | | 5.500 | | | | 997,816 | | |
| | 3,000 | | | GMACM Borrower LLC# | | (NR, NR) | | 11/18/13 | | | 5.000 | | | | 3,015,015 | | |
| | 1,749 | | | Ocwen Financial Corp.# | | (B, B1) | | 09/01/16 | | | 7.000 | | | | 1,761,564 | | |
| | | | 5,774,395 | | |
| Building & Construction (0.3%) | | | |
| | 1,529 | | | LNR Property LLC# | | (BB+, Ba2) | | 04/29/16 | | | 4.750 | | | | 1,531,195 | | |
| Chemicals (5.9%) | | | |
| | 1,990 | | | Ascend Performance Materials Operations LLC# | | (NR, NR) | | 04/10/18 | | | 6.750 | | | | 1,999,950 | | |
| | 787 | | | AZ Chem US, Inc.# | | (BB-, Ba3) | | 12/22/17 | | | 7.250 | | | | 799,082 | | |
| | 2,600 | | | Chemtura Corp.# | | (BB+, Ba1) | | 08/29/16 | | | 5.500 | | | | 2,643,069 | | |
| | 1,135 | | | Cristal Inorganic Chemicals US, Inc.# | | (B+, B1) | | 11/15/14 | | | 6.112 | | | | 1,136,107 | | |
| | 2,737 | | | Harko C.V.# | | (BB-, Ba2) | | 08/02/17 | | | 5.750 | | | | 2,759,704 | | |
| | 1,975 | | | Kronos Worldwide, Inc.# | | (BB-, Ba3) | | 06/13/18 | | | 5.750 | | | | 1,990,227 | | |
| | 2,430 | | | Momentive Performance Materials# | | (B-, B1) | | 05/05/15 | | | 3.750 | | | | 2,421,512 | | |
| | 3,250 | | | Nexeo Solutions LLC# | | (B, B1) | | 09/09/17 | | | 5.000 | | | | 3,197,187 | | |
| | 496 | | | Omnova Solutions, Inc.# | | (B+, Ba2) | | 05/31/17 | | | 5.500 | | | | 500,866 | | |
See Accompanying Notes to Financial Statements.
10
Credit Suisse Floating Rate High Income Fund
Schedule of Investments (continued)
October 31, 2012
Par
(000) | |
| | Ratings†
(S&P/Moody's) | | Maturity | | Rate% | | Value | |
BANK LOANS | | | |
Chemicals | | | |
$ | 993 | | | Polyone Corp.# | | (BB-, Ba1) | | 12/20/17 | | | 5.000 | | | $ | 1,000,192 | | |
| | 494 | | | Potters Holdings II LP# | | (B, Ba3) | | 05/06/17 | | | 6.000 | | | | 497,453 | | |
| | 1,001 | | | PQ Corp.# | | (B+, B3) | | 07/30/14 | | | 3.962 | | | | 1,000,170 | | |
| | 2,000 | | | PQ Corp.# | | (B-, Caa1) | | 07/30/15 | | | 0.000 | | | | 1,990,000 | | |
| | 445 | | | Trinseo Materials Operating S.C.A.# | | (B+, B1) | | 08/02/17 | | | 8.000 | | | | 425,823 | | |
| | 641 | | | Tronox Pigments BV# | | (NR, Ba2) | | 02/08/18 | | | 1.000 | | | | 645,970 | | |
| | 2,351 | | | Tronox Pigments BV# | | (BB+, NR) | | 02/08/18 | | | 4.250 | | | | 2,368,555 | | |
| | 1,493 | | | Vantage Specialties, Inc.# | | (B, B2) | | 02/10/18 | | | 7.000 | | | | 1,503,694 | | |
| | | | 26,879,561 | | |
| Computer Hardware (0.2%) | | | |
| | 1,098 | | | Spansion LLC# | | (BB+, Ba3) | | 02/09/15 | | | 4.750 | | | | 1,109,887 | | |
| Consumer Products (2.0%) | | | |
| | 1,488 | | | Huish Detergents, Inc.# | | (B, Ba3) | | 04/26/14 | | | 2.220 | | | | 1,424,970 | | |
| | 2,801 | | | NBTY, Inc.# | | (BB-, Ba3) | | 10/01/17 | | | 4.250 | | | | 2,820,731 | | |
| | 2,552 | | | Prestige Brands, Inc.# | | (BB-, Ba3) | | 01/31/19 | | | 5.250 | | | | 2,583,909 | | |
| | 2,288 | | | Ranpak Corp.# | | (BB-, Ba3) | | 04/20/17 | | | 4.750 | | | | 2,278,598 | | |
| | | | 9,108,208 | | |
| Consumer/Commercial/Lease Financing (0.4%) | | | |
| | 1,600 | | | Springleaf Financial Funding Co.# | | (CCC+, B3) | | 05/10/17 | | | 5.500 | | | | 1,582,000 | | |
| Discount Stores (0.6%) | | | |
| | 2,732 | | | 99 Cents Only Stores# | | (B+, B2) | | 01/11/19 | | | 5.250 | | | | 2,764,195 | | |
| Diversified Capital Goods (1.2%) | | | |
| | 455 | | | Douglas Dynamics LLC# | | (BB, B1) | | 04/18/18 | | | 5.750 | | | | 452,040 | | |
| | 2,319 | | | Electrical Components International, Inc.# | | (B+, B1) | | 02/04/17 | | | 6.750 | | | | 2,304,823 | | |
| | 2,424 | | | Husky Injection Molding Systems Ltd.# | | (B, Ba3) | | 07/02/18 | | | 5.750 | | | | 2,458,539 | | |
| | 438 | | | MX Mercury Beteilegungen GMBH# | | (B, B2) | | 06/28/13 | | | 3.185 | | | | 412,777 | | |
| | | | 5,628,179 | | |
| Electric - Generation (1.7%) | | | |
| | 3,000 | | | Calpine Corp.# | | (NR, B1) | | 10/09/19 | | | 4.500 | | | | 3,009,225 | | |
| | 1,990 | | | Covanta Energy Corp.# | | (BB+, Ba1) | | 03/28/19 | | | 4.000 | | | | 1,999,333 | | |
| | 463 | | | NexTag, Inc.# | | (BB-, B1) | | 01/28/16 | | | 7.000 | | | | 450,194 | | |
| | 600 | | | Texas Competitive Electric Holdings Co. LLC# | | (CCC, Caa1) | | 10/10/14 | | | 3.938 | | | | 409,749 | | |
| | 3,000 | | | Texas Competitive Electric Holdings Co. LLC# | | (CCC, Caa1) | | 10/10/17 | | | 4.938 | | | | 1,945,500 | | |
| | | | 7,814,001 | | |
| Electric - Distribution/Transportation (0.5%) | | | |
| | 1,995 | | | Generac Power Systems, Inc.# | | (B+, B2) | | 05/30/18 | | | 6.250 | | | | 2,042,381 | | |
| Electronics (2.4%) | | | |
| | 1,500 | | | Freescale Semiconductor, Inc.# | | (B, B1) | | 12/01/16 | | | 4.465 | | | | 1,457,250 | | |
| | 987 | | | Mitel Networks Corp.# | | (NR, B1) | | 08/16/14 | | | 3.672 | | | | 974,124 | | |
| | 1,990 | | | NXP Funding LLC# | | (B+, B3) | | 03/19/19 | | | 5.250 | | | | 2,017,363 | | |
| | 2,441 | | | Presidio, Inc.# | | (B+, NR) | | 03/31/17 | | | 5.750 | | | | 2,465,132 | | |
See Accompanying Notes to Financial Statements.
11
Credit Suisse Floating Rate High Income Fund
Schedule of Investments (continued)
October 31, 2012
Par
(000) | |
| | Ratings†
(S&P/Moody's) | | Maturity | | Rate% | | Value | |
BANK LOANS | | | |
Electronics | | | |
$ | 1,995 | | | Shield Finance Co. Sàrl# | | (B+, B2) | | 05/10/19 | | | 6.500 | | | $ | 2,004,975 | | |
| | 1,466 | | | TriZetto Group, Inc.# | | (B, B1) | | 05/02/18 | | | 4.750 | | | | 1,462,623 | | |
| | 742 | | | Verint Systems, Inc.# | | (B+, B1) | | 10/27/17 | | | 4.500 | | | | 747,589 | | |
| | | | 11,129,056 | | |
| Energy - Exploration & Production (1.7%) | | | |
| | 1,250 | | | Delek Benelux BV€# | | (NR, NR) | | 02/08/17 | | | 5.235 | | | | 1,445,323 | | |
| | 533 | | | Delphi Acquisition Holding I BV# | | (CCC-, B1) | | 07/11/16 | | | 4.712 | | | | 516,000 | | |
| | 267 | | | Delphi Acquisition Holding I BV# | | (NR, B1) | | 07/11/16 | | | 4.712 | | | | 258,000 | | |
| | 4,000 | | | Plains Exploration & Production, Inc.# | | (BB, Ba1) | | 10/15/19 | | | 0.000 | | | | 4,025,720 | | |
| | 1,601 | | | Varel Funding Corp.# | | (CCC+, NR) | | 11/05/14 | | | 6.317 | | | | 1,582,384 | | |
| | | | 7,827,427 | | |
| Environmental (0.7%) | | | |
| | 585 | | | EnviroSolutions Real Property Holdings, Inc.# | | (CCC-, Caa1) | | 07/29/14 | | | 8.000 | | | | 583,456 | | |
| | 1,983 | | | Safety-Kleen Systems, Inc.# | | (BB-, B1) | | 02/21/17 | | | 5.000 | | | | 1,987,677 | | |
| | 491 | | | Waste Industries USA, Inc.# | | (B+, B1) | | 03/17/17 | | | 4.750 | | | | 493,097 | | |
| | | | 3,064,230 | | |
| Food & Drug Retailers (1.5%) | | | |
| | 1,500 | | | Holding Bercy Investissement S.C.A.€# | | (NR, NR) | | 12/31/17 | | | 5.106 | | | | 1,914,545 | | |
| | 1,592 | | | Rite Aid Corp.# | | (B+, B2) | | 03/03/18 | | | 4.500 | | | | 1,591,919 | | |
| | 998 | | | Sprouts Farmers Markets Holdings LLC# | | (B+, B2) | | 04/18/18 | | | 6.000 | | | | 1,008,722 | | |
| | 2,250 | | | Supervalu, Inc.# | | (BB-, B1) | | 08/30/18 | | | 0.000 | | | | 2,270,925 | | |
| | | | 6,786,111 | | |
| Food - Wholesale (1.7%) | | | |
| | 2,189 | | | JBS USA LLC# | | (BB, Ba3) | | 05/25/18 | | | 4.250 | | | | 2,188,550 | | |
| | 2,500 | | | The Pantry, Inc.# | | (BB, B1) | | 08/03/19 | | | 5.750 | | | | 2,535,937 | | |
| | 1,483 | | | US Foods, Inc.# | | (B, B3) | | 03/31/17 | | | 5.750 | | | | 1,459,996 | | |
| | 1,492 | | | US Foods, Inc.# | | (B-, B3) | | 03/31/17 | | | 5.750 | | | | 1,474,396 | | |
| | | | 7,658,879 | | |
| Gaming (1.6%) | | | |
| | 2,488 | | | Affinity Gaming LLC# | | (BB, Ba3) | | 11/09/17 | | | 5.500 | | | | 2,518,594 | | |
| | 1,000 | | | CKX Entertainment, Inc.# | | (B+, B1) | | 06/21/17 | | | 9.000 | | | | 865,000 | | |
| | 2,000 | | | Penn National Gaming, Inc.# | | (BB-, Ba1) | | 07/16/18 | | | 3.750 | | | | 2,012,500 | | |
| | 1,990 | | | Pinnacle Entertainment, Inc.# | | (BB+, Ba1) | | 03/19/19 | | | 4.000 | | | | 2,004,925 | | |
| | | | 7,401,019 | | |
| Health Facilities (1.2%) | | | |
| | 2,489 | | | Iasis Healthcare LLC# | | (B, Ba3) | | 05/03/18 | | | 5.000 | | | | 2,498,749 | | |
| | 1,987 | | | Surgical Care Affiliates LLC# | | (B, Ba3) | | 12/29/17 | | | 4.362 | | | | 1,987,392 | | |
| | 987 | | | United Surgical Partners International, Inc.# | | (B, B1) | | 04/19/17 | | | 5.250 | | | | 995,053 | | |
| | | | 5,481,194 | | |
See Accompanying Notes to Financial Statements.
12
Credit Suisse Floating Rate High Income Fund
Schedule of Investments (continued)
October 31, 2012
Par
(000) | |
| | Ratings†
(S&P/Moody's) | | Maturity | | Rate% | | Value | |
BANK LOANS | | | |
| Health Services (3.2%) | | | |
$ | 1,990 | | | Aptalis Pharma, Inc.# | | (B+, B1) | | 02/10/17 | | | 5.500 | | | $ | 1,993,741 | | |
| | 2,197 | | | Ardent Medical Services, Inc.# | | (B, B1) | | 09/15/15 | | | 6.500 | | | | 2,210,491 | | |
| | 1,488 | | | Capsugel Holdings US, Inc.# | | (BB-, B1) | | 08/01/18 | | | 4.750 | | | | 1,500,681 | | |
| | 492 | | | Catalent Pharma Solutions, Inc.# | | (BB-, Ba3) | | 09/15/16 | | | 4.212 | | | | 495,077 | | |
| | 993 | | | Catalent Pharma Solutions, Inc.# | | (BB-, Ba3) | | 09/15/17 | | | 5.250 | | | | 1,002,855 | | |
| | 2,485 | | | ConvaTec, Inc.# | | (B+, Ba3) | | 12/22/16 | | | 5.000 | | | | 2,505,096 | | |
| | 2,242 | | | Drumm Investors LLC# | | (B+, B1) | | 05/04/18 | | | 5.000 | | | | 2,151,963 | | |
| | 494 | | | Inventiv Health, Inc.# | | (B+, B1) | | 05/15/18 | | | 6.750 | | | | 484,492 | | |
| | 744 | | | Kinetic Concepts, Inc.# | | (BB-, Ba2) | | 05/04/18 | | | 7.000 | | | | 755,210 | | |
| | 1,236 | | | Onex Carestream Finance LP# | | (BB-, B1) | | 02/25/17 | | | 5.000 | | | | 1,225,432 | | |
| | | | 14,325,038 | | |
| Insurance Brokerage (1.3%) | | | |
| | 979 | | | Alliant Holdings I, Inc.# | | (B, B2) | | 08/21/14 | | | 3.362 | | | | 977,363 | | |
| | 603 | | | Alliant Holdings I, Inc.# | | (B, B2) | | 08/21/14 | | | 6.750 | | | | 607,052 | | |
| | 3,029 | | | HUB International Ltd.# | | (B+, B1) | | 06/13/17 | | | 4.712 | | | | 3,049,799 | | |
| | 1,234 | | | USI Holdings Corp.# | | (B, B1) | | 05/05/14 | | | 2.720 | | | | 1,231,565 | | |
| | | | 5,865,779 | | |
| Investments & Misc. Financial Services (1.1%) | | | |
| | 1,995 | | | AlixPartners LLP# | | (B+, NR) | | 06/28/19 | | | 6.500 | | | | 2,023,918 | | |
| | 1,976 | | | BNY ConvergEX Group LLC# | | (B+, B2) | | 12/19/16 | | | 5.250 | | | | 1,928,222 | | |
| | 500 | | | BNY ConvergEX Group LLC# | | (B-, B3) | | 12/18/17 | | | 8.750 | | | | 466,460 | | |
| | 495 | | | U.S. Security Associates Holdings, Inc.# | | (B, Ba3) | | 07/28/17 | | | 6.000 | | | | 498,661 | | |
| | | | 4,917,261 | | |
| Leisure (3.5%) | | | |
| | 2,239 | | | Alpha Topco Ltd.# | | (B+, Ba3) | | 04/30/19 | | | 6.000 | | | | 2,261,753 | | |
| | 2,574 | | | ClubCorp Club Operations, Inc.# | | (BB, Ba2) | | 11/30/16 | | | 6.000 | | | | 2,592,571 | | |
| | 3,307 | | | Deluxe Entertainment Services Group, Inc.# | | (B, B2) | | 07/03/17 | | | 8.000 | | | | 3,276,960 | | |
| | 1,987 | | | Legendary Pictures Funding LLC# | | (NR, NR) | | 03/29/18 | | | 9.000 | | | | 1,946,933 | | |
| | 2,413 | | | Seaworld Parks & Entertainment, Inc.# | | (BB-, Ba3) | | 08/17/17 | | | 4.000 | | | | 2,429,323 | | |
| | 3,200 | | | Six Flags Theme Parks, Inc.# | | (BB+, B1) | | 12/20/18 | | | 4.250 | | | | 3,224,864 | | |
| | 110 | | | Technicolor SA# | | (B, B3) | | 05/26/16 | | | 7.000 | | | | 107,954 | | |
| | 296 | | | Technicolor SA# | | (B, B3) | | 05/26/17 | | | 8.000 | | | | 289,054 | | |
| | | | 16,129,412 | | |
| Life-Insurance (0.8%) | | | |
| | 726 | | | Aveta, Inc.# | | (B+, B1) | | 04/04/17 | | | 8.500 | | | | 732,263 | | |
| | 726 | | | Aveta, Inc.# | | (B+, NR) | | 04/04/17 | | | 8.500 | | | | 732,263 | | |
| | 2,000 | | | Aveta, Inc.# | | (B+, B2) | | 10/26/17 | | | 0.000 | | | | 2,000,000 | | |
| | | | 3,464,526 | | |
| Machinery (0.1%) | | | |
| | 489 | | | Pro Mach, Inc.# | | (B+, B2) | | 07/06/17 | | | 5.000 | | | | 490,413 | | |
See Accompanying Notes to Financial Statements.
13
Credit Suisse Floating Rate High Income Fund
Schedule of Investments (continued)
October 31, 2012
Par
(000) | |
| | Ratings†
(S&P/Moody's) | | Maturity | | Rate% | | Value | |
BANK LOANS | | | |
| Media - Broadcast (4.6%) | | | |
$ | 2,779 | | | Barrington Broadcasting Group LLC# | | (B, B2) | | 06/14/17 | | | 7.500 | | | $ | 2,806,708 | | |
| | 1,990 | | | Cequel Communications LLC# | | (BB-, Ba2) | | 02/14/19 | | | 4.000 | | | | 1,996,756 | | |
| | 3,500 | | | Gray Television, Inc.#µ | | (B+, B2) | | 10/12/19 | | | 4.750 | | | | 3,513,440 | | |
| | 989 | | | IMG Worldwide, Inc.# | | (B+, Ba2) | | 06/16/16 | | | 5.500 | | | | 991,827 | | |
| | 993 | | | LIN Television Corp.# | | (BB-, Ba2) | | 12/21/18 | | | 5.000 | | | | 1,002,425 | | |
| | 2,942 | | | Local TV Finance LLC# | | (B+, B1) | | 05/07/15 | | | 4.220 | | | | 2,959,922 | | |
| | 487 | | | Midcontinent Communications# | | (B+, B1) | | 12/31/16 | | | 5.250 | | | | 486,039 | | |
| | 1,990 | | | Rovi Guides, Inc.# | | (BB, Ba2) | | 03/29/19 | | | 4.000 | | | | 1,956,419 | | |
| | 2,747 | | | TWCC Holding Corp.# | | (BB-, Ba3) | | 02/13/17 | | | 4.250 | | | | 2,770,693 | | |
| | 2,000 | | | UPC Financing Partnership€ # | | (NR, Ba3) | | 12/31/16 | | | 3.865 | | | | 2,578,163 | | |
| | | | 21,062,392 | | |
| Media - Cable (0.6%) | | | |
| | 1,990 | | | Bragg Communications, Inc.# | | (BB, NR) | | 02/28/18 | | | 4.000 | | | | 2,002,437 | | |
| | 600 | | | CCO Holdings LLC# | | (BB+, Ba2) | | 09/06/14 | | | 2.712 | | | | 600,666 | | |
| | | | 2,603,103 | | |
| Media - Diversified (0.1%) | | | |
| | 215 | | | Flint Group Holdings Sarl# | | (B-, B2) | | 06/30/16 | | | 7.724 | | | | 182,010 | | |
| | 285 | | | Flint Group Holdings Sarl# | | (B-, B2) | | 12/31/16 | | | 7.224 | | | | 220,432 | | |
| | | | 402,442 | | |
| Medical Products (2.1%) | | | |
| | 1,995 | | | Bausch & Lomb, Inc.# | | (B+, B1) | | 05/17/19 | | | 5.250 | | | | 2,020,656 | | |
| | 2,500 | | | BSN Medical Luxembourg Holding Sarl# | | (B+, Ba3) | | 08/28/19 | | | 5.000 | | | | 2,514,062 | | |
| | 1,982 | | | Grifols, Inc.# | | (NR, Ba3) | | 06/01/17 | | | 4.500 | | | | 2,003,603 | | |
| | 2,993 | | | Hologic, Inc.# | | (BBB-, Ba2) | | 08/01/19 | | | 4.500 | | | | 3,031,777 | | |
| | | | 9,570,098 | | |
| Metals & Mining - Excluding Steel (0.7%) | | | |
| | 1,995 | | | Arch Coal, Inc.# | | (BB, Ba3) | | 05/16/18 | | | 5.750 | | | | 2,015,668 | | |
| | 990 | | | Novelis, Inc.# | | (BB-, Ba2) | | 03/10/17 | | | 4.000 | | | | 993,713 | | |
| | | | 3,009,381 | | |
| Oil Field Equipment & Services (0.7%) | | | |
| | 3,000 | | | MRC Global, Inc.# | | (B+, B2) | | 10/15/19 | | | 0.000 | | | | 3,007,500 | | |
| Packaging (3.1%) | | | |
| | 1,362 | | | Berry Plastics Holding Corp.# | | (B, B1) | | 04/03/15 | | | 2.212 | | | | 1,354,479 | | |
| | 4,000 | | | BWAY Holding Co.# | | (B, Ba3) | | 08/06/17 | | | 0.000 | | | | 4,025,000 | | |
| | 785 | | | BWAY Holding Co.# | | (B, Ba3) | | 02/23/18 | | | 5.250 | | | | 789,207 | | |
| | 1,980 | | | Exopack LLC# | | (B, B2) | | 05/31/17 | | | 6.500 | | | | 1,984,912 | | |
| | 2,494 | | | Kleopatra Acquisition Corp.# | | (B, Ba3) | | 12/21/16 | | | 6.750 | | | | 2,521,805 | | |
| | 2,439 | | | Sealed Air Corp.# | | (BB+, Ba1) | | 10/03/18 | | | 4.750 | | | | 2,453,931 | | |
| | 993 | | | Unifrax Holding Co.# | | (B+, B2) | | 11/28/18 | | | 6.500 | | | | 1,004,077 | | |
| | | | 14,133,411 | | |
See Accompanying Notes to Financial Statements.
14
Credit Suisse Floating Rate High Income Fund
Schedule of Investments (continued)
October 31, 2012
Par
(000) | |
| | Ratings†
(S&P/Moody's) | | Maturity | | Rate% | | Value | |
BANK LOANS | | | |
| Pharmaceuticals (3.5%) | | | |
$ | 2,500 | | | Alkermes, Inc# | | (BB, B1) | | 09/25/19 | | | 4.500 | | | $ | 2,521,875 | | |
| | 1,975 | | | Jazz Pharmaceuticals, Inc.# | | (BBB-, Ba3) | | 06/12/18 | | | 5.250 | | | | 1,995,579 | | |
| | 3,000 | | | Par Pharmaceutical Companies, Inc.# | | (B+, B1) | | 09/30/19 | | | 5.000 | | | | 2,996,565 | | |
| | 2,240 | | | RPI Finance Trust# | | (BBB-, Baa2) | | 11/09/18 | | | 4.000 | | | | 2,256,971 | | |
| | 3,000 | | | Valeant Pharmaceuticals International, Inc.# | | (BBB-, Ba1) | | 09/27/19 | | | 0.000 | | | | 3,012,300 | | |
| | 2,985 | | | Warner Chilcott Corp.# | | (BBB-, Ba3) | | 03/15/18 | | | 4.250 | | | | 2,999,787 | | |
| | | | 15,783,077 | | |
| Printing & Publishing (0.9%) | | | |
| | 313 | | | F & W Media, Inc.# | | (NR, NR) | | 06/09/14 | | | 7.750 | | | | 292,495 | | |
| | 188 | | | F & W Media, Inc.# | | (NR, NR) | | 12/09/14 | | | 15.000 | | | | 131,309 | | |
| | 1,036 | | | Harland Clarke Holdings Corp.# | | (B+, B1) | | 06/30/17 | | | 5.462 | | | | 953,126 | | |
| | 1,981 | | | Wenner Media LLC# | | (NR, NR) | | 10/02/13 | | | 1.962 | | | | 1,911,546 | | |
| | 5,435 | | | Yell Group PLC# | | (B-, B2) | | 07/31/14 | | | 4.459 | | | | 976,379 | | |
| | | | 4,264,855 | | |
| Real Estate Investment Trusts (0.6%) | | | |
| | 2,926 | | | iStar Financial, Inc.# | | (NR, NR) | | 10/15/17 | | | 5.750 | | | | 2,928,276 | | |
| Restaurants (2.0%) | | | |
| | 1,990 | | | Landry's, Inc.# | | (B+, B1) | | 04/24/18 | | | 6.500 | | | | 2,014,258 | | |
| | 3,000 | | | OSI Restaurant Partners LLC# | | (BB, B1) | | 10/28/19 | | | 0.000 | | | | 3,019,695 | | |
| | 944 | | | Restaurant Holding Co. LLC# | | (B-, B3) | | 02/17/17 | | | 9.000 | | | | 957,744 | | |
| | 3,000 | | | Wendy's International, Inc.# | | (BB-, B1) | | 05/15/19 | | | 4.750 | | | | 3,033,540 | | |
| | | | 9,025,237 | | |
| Software/Services (6.3%) | | | |
| | 2,085 | | | AVG Technologies N.V.# | | (B+, B1) | | 03/15/16 | | | 7.500 | | | | 2,087,551 | | |
| | 3,000 | | | Deltek, Inc.# | | (B+, B1) | | 10/10/18 | | | 6.000 | | | | 3,026,265 | | |
| | 1,198 | | | First Data Corp.# | | (B+, B1) | | 03/24/17 | | | 5.211 | | | | 1,181,974 | | |
| | 939 | | | First Data Corp.# | | (B+, B1) | | 03/23/18 | | | 4.211 | | | | 897,999 | | |
| | 490 | | | Flexera Software LLC# | | (B, B2) | | 09/30/17 | | | 7.500 | | | | 492,653 | | |
| | 750 | | | Flexera Software LLC# | | (CCC+, Caa2) | | 09/30/18 | | | 11.000 | | | | 765,000 | | |
| | 1,831 | | | On Assignment, Inc.# | | (BB-, Ba3) | | 05/15/19 | | | 5.000 | | | | 1,844,346 | | |
| | 992 | | | Open Solutions, Inc.# | | (B+, B1) | | 01/23/14 | | | 2.435 | | | | 959,055 | | |
| | 2,000 | | | Pinnacle Holdco Sàrl# | | (NR, NR) | | 07/30/19 | | | 6.500 | | | | 2,003,130 | | |
| | 1,936 | | | SafeNet, Inc.# | | (B+, B1) | | 04/12/14 | | | 2.712 | | | | 1,927,868 | | |
| | 1,500 | | | SafeNet, Inc.# | | (B-, Caa1) | | 04/12/15 | | | 6.212 | | | | 1,492,500 | | |
| | 1,000 | | | Serena Software, Inc.# | | (B+, B1) | | 03/10/16 | | | 5.000 | | | | 1,005,000 | | |
| | 209 | | | SS&C Technologies, Inc.# | | (BB-, Ba3) | | 06/07/19 | | | 5.000 | | | | 212,208 | | |
| | 2,021 | | | SS&C Technologies, Inc.# | | (BB-, Ba3) | | 06/07/19 | | | 5.000 | | | | 2,051,346 | | |
| | 743 | | | SSI Investments II Ltd.# | | (BB-, Ba3) | | 05/26/17 | | | 5.000 | | | | 750,853 | | |
| | 1,990 | | | US FT Holdco, Inc.# | | (B+, B1) | | 11/30/17 | | | 7.500 | | | | 2,004,912 | | |
| | 3,000 | | | Wall Street Systems Delaware, Inc.# | | (B, B2) | | 10/25/19 | | | 0.000 | | | | 2,998,125 | | |
| | 1,000 | | | Wall Street Systems Delaware, Inc.# | | (B-, Caa2) | | 10/25/20 | | | 0.000 | | | | 993,750 | | |
| | 2,012 | | | Web.com Group, Inc.# | | (B, Ba3) | | 10/27/17 | | | 7.000 | | | | 2,037,591 | | |
| | | | 28,732,126 | | |
See Accompanying Notes to Financial Statements.
15
Credit Suisse Floating Rate High Income Fund
Schedule of Investments (continued)
October 31, 2012
Par
(000) | |
| | Ratings†
(S&P/Moody's) | | Maturity | | Rate% | | Value | |
BANK LOANS | | | |
| Specialty Retail (3.5%) | | | |
$ | 2,000 | | | AB Acquisitions UK Topco 2 Ltd.£# | | (NR, NR) | | 07/09/15 | | | 3.491 | | | $ | 3,129,272 | | |
| | 3,525 | | | Academy Ltd.# | | (B, B2) | | 08/03/18 | | | 0.000 | | | | 3,532,438 | | |
| | 1,995 | | | National Vision, Inc.# | | (BB-, B1) | | 08/02/18 | | | 7.000 | | | | 2,019,938 | | |
| | 1,214 | | | Pilot Travel Centers LLC# | | (NR, NR) | | 03/30/18 | | | 3.750 | | | | 1,221,648 | | |
| | 2,500 | | | Pilot Travel Centers LLC# | | (BB, Ba2) | | 08/07/19 | | | 4.250 | | | | 2,518,225 | | |
| | 1,030 | | | SSP Financing Ltd.# | | (NR, NR) | | 06/15/16 | | | 0.002 | | | | 961,379 | | |
| | 1,043 | | | SSP Financing Ltd.# | | (NR, NR) | | 06/15/16 | | | 2.403 | | | | 974,176 | | |
| | 741 | | | Toys 'R' Us-Delaware, Inc.# | | (B+, B1) | | 09/01/16 | | | 6.000 | | | | 740,554 | | |
| | 923 | | | Toys 'R' Us-Delaware, Inc.# | | (B+, B1) | | 05/25/18 | | | 5.250 | | | | 908,231 | | |
| | | | 16,005,861 | | |
| Steel Producers/Products (0.5%) | | | |
| | 2,348 | | | JMC Steel Group, Inc.# | | (BB, B1) | | 04/01/17 | | | 4.750 | | | | 2,367,407 | | |
| Support-Services (2.2%) | | | |
| | 1,478 | | | Aramark Canada Ltd.# | | (BB, Ba3) | | 01/26/14 | | | 2.237 | | | | 1,477,775 | | |
| | 2,488 | | | Emdeon, Inc.# | | (BB-, Ba3) | | 11/02/18 | | | 5.000 | | | | 2,520,459 | | |
| | 2,470 | | | EnergySolutions LLC# | | (BB-, B2) | | 08/15/16 | | | 6.250 | | | | 2,365,052 | | |
| | 3,500 | | | Hertz Corp.# | | (NR, NR) | | 10/03/18 | | | 0.000 | | | | 3,496,885 | | |
| | 296 | | | Sabre, Inc.# | | (B, B1) | | 12/29/17 | | | 5.962 | | | | 295,918 | | |
| | | | 10,156,089 | | |
| Telecom - Integrated/Services (3.1%) | | | |
| | 3,117 | | | Cellular South, Inc.# | | (NR, NR) | | 07/27/17 | | | 5.750 | | | | 3,131,112 | | |
| | 2,434 | | | Intelsat Jackson Holdings SA# | | (BB-, B1) | | 04/02/18 | | | 4.500 | | | | 2,454,355 | | |
| | 2,343 | | | Neustar, Inc.# | | (BBB-, Ba2) | | 11/08/18 | | | 5.000 | | | | 2,365,145 | | |
| | 2,993 | | | Windstream Corp.# | | (BB+, Baa3) | | 08/08/19 | | | 4.000 | | | | 3,014,944 | | |
| | 2,993 | | | Zayo Group LLC# | | (B, B1) | | 07/02/19 | | | 5.250 | | | | 3,010,455 | | |
| | | | 13,976,011 | | |
| Telecom - Wireless (2.5%) | | | |
| | 3,000 | | | Cricket Communications, Inc.# | | (B+, Ba2) | | 10/10/19 | | | 4.750 | | | | 3,016,890 | | |
| | 1,737 | | | MetroPCS Wireless, Inc.# | | (BB, Ba1) | | 03/17/18 | | | 4.000 | | | | 1,742,731 | | |
| | 2,993 | | | Telesat Canada# | | (BB-, Ba3) | | 03/28/19 | | | 4.250 | | | | 3,023,682 | | |
| | 5 | | | WP Roaming III Sarl# | | (NR, NR) | | 05/05/14 | | | 3.750 | | | | 5,220 | | |
| | 1,902 | | | WP Roaming III Sarl# | | (NR, NR) | | 05/04/15 | | | 4.250 | | | | 1,814,352 | | |
| | 1,902 | | | WP Roaming III Sarl# | | (NR, NR) | | 05/03/16 | | | 4.750 | | | | 1,823,864 | | |
| | | | 11,426,739 | | |
| Telecommunications Equipment (0.6%) | | | |
| | 806 | | | Avaya, Inc.# | | (B, B1) | | 10/24/14 | | | 3.177 | | | | 785,801 | | |
| | 495 | | | Avaya, Inc.# | | (B, B1) | | 10/26/17 | | | 4.927 | | | | 443,151 | | |
| | 1,585 | | | Commscope, Inc.# | | (NR, NR) | | 01/14/18 | | | 4.250 | | | | 1,597,144 | | |
| | | | 2,826,096 | | |
| Textiles & Apparel (0.9%) | | | |
| | 1,500 | | | Choo Luxury Finance Ltd.# | | (NR, NR) | | 06/28/18 | | | 4.477 | | | | 1,436,250 | | |
| | 2,500 | | | Wolverine World Wide, Inc.# | | (BB, Ba2) | | 07/31/19 | | | 4.750 | | | | 2,521,875 | | |
| | | | 3,958,125 | | |
See Accompanying Notes to Financial Statements.
16
Credit Suisse Floating Rate High Income Fund
Schedule of Investments (continued)
October 31, 2012
Par
(000) | |
| | Ratings†
(S&P/Moody's) | | Maturity | | Rate% | | Value | |
BANK LOANS | | | |
| Theaters & Entertainment (0.8%) | | | |
$ | 1,990 | | | AMC Entertainment, Inc.# | | (BB-, Ba2) | | 02/22/18 | | | 4.750 | | | $ | 2,012,066 | | |
| | 1,812 | | | Live Nation Entertainment, Inc.# | | (BB-, Ba2) | | 11/07/16 | | | 4.500 | | | | 1,827,055 | | |
| | | | 3,839,121 | | |
| TOTAL BANK LOANS (Cost $361,825,533) | | | 367,656,264 | | |
| CORPORATE BONDS (10.9%) | | | |
| Airlines (0.5%) | | | |
| | 2,000 | | | Continental Airlines, Inc., Rule 144A, Senior
Secured Notes (Callable 12/03/12 @ 105.06)‡ | | (BB-, Ba2) | | 09/15/15 | | | 6.750 | | | | 2,102,500 | | |
| Auto Parts & Equipment (1.0%) | | | |
| | 2,450 | | | Affinia Group, Inc., Rule 144A, Senior Secured
Notes (Callable 12/03/12 @ 108.06)‡ | | (B+, B1) | | 08/15/16 | | | 10.750 | | | | 2,658,250 | | |
| | 1,000 | | | Stoneridge, Inc., Rule 144A, Senior Secured
Notes (Callable 10/15/14 @ 104.75)‡ | | (BB-, B2) | | 10/15/17 | | | 9.500 | | | | 1,083,750 | | |
| | 1,000 | | | UCI International, Inc., Global Company
Guaranteed Notes (Callable 02/15/15 @ 104.31) | | (CCC+, B3) | | 02/15/19 | | | 8.625 | | | | 996,250 | | |
| | | | 4,738,250 | | |
| Building & Construction (0.1%) | | | |
| | 211 | | | Ashton Woods Finance Co., Rule 144A,
Company Guaranteed Notes
(Callable 02/24/14 @ 105.50)‡+ | | (NR, NR) | | 06/30/15 | | | 11.000 | | | | 206,584 | | |
| | 91 | | | William Lyon Homes, Inc., Global Notes | | (NR, NR) | | 02/25/17 | | | 12.000 | | | | 90,846 | | |
| | | | 297,430 | | |
| Building Materials (1.2%) | | | |
| | 3,500 | | | Building Materials Corp. of America, Rule 144A,
Senior Secured Notes
(Callable 02/15/15 @ 103.50)‡ | | (BB+, Ba1) | | 02/15/20 | | | 7.000 | | | | 3,815,000 | | |
| | 1,750 | | | Headwaters, Inc., Global Secured Notes
(Callable 04/01/15 @ 103.81)§ | | (B+, B2) | | 04/01/19 | | | 7.625 | | | | 1,798,125 | | |
| | | | 5,613,125 | | |
| Chemicals (1.3%) | | | |
| | 1,500 | | | Ineos Finance PLC, Rule 144A, Senior Secured
Notes (Callable 02/15/15 @ 102.00)‡€# | | (B+, B1) | | 02/15/19 | | | 7.250 | | | | 1,987,433 | | |
| | 2,000 | | | Koppers, Inc., Global Company Guaranteed
Notes (Callable 12/01/14 @ 103.94) | | (B+, B1) | | 12/01/19 | | | 7.875 | | | | 2,205,000 | | |
| | 1,500 | | | Taminco Global Chemical Corp., Rule 144A,
Secured Notes (Callable 03/31/15 @ 107.31)‡ | | (B-, Caa1) | | 03/31/20 | | | 9.750 | | | | 1,635,000 | | |
| | | | 5,827,433 | | |
| Computer Hardware (0.2%) | | | |
| | 700 | | | Spansion LLC, Global Company Guaranteed
Notes (Callable 11/15/13 @ 103.94) | | (BB-, B3) | | 11/15/17 | | | 7.875 | | | | 703,500 | | |
See Accompanying Notes to Financial Statements.
17
Credit Suisse Floating Rate High Income Fund
Schedule of Investments (continued)
October 31, 2012
Par
(000) | |
| | Ratings†
(S&P/Moody's) | | Maturity | | Rate% | | Value | |
CORPORATE BONDS | | | |
| Diversified Capital Goods (0.4%) | | | |
$ | 1,500 | | | Mueller Water Products, Inc., Global Company
Guaranteed Notes (Callable 09/01/15 @ 104.38) | | (NR, B2) | | 09/01/20 | | | 8.750 | | | $ | 1,728,750 | | |
| Electronics (0.0%) | | | |
| | 250 | | | MEMC Electronic Materials, Inc., Global Company
Guaranteed Notes (Callable 04/01/14 @ 105.81) | | (B+, Caa1) | | 04/01/19 | | | 7.750 | | | | 187,813 | | |
| Energy - Exploration & Production (0.5%) | | | |
| | 525 | | | Energy Partners Ltd., Global Company Guaranteed
Notes (Callable 02/15/15 @ 104.13)§ | | (B-, Caa1) | | 02/15/18 | | | 8.250 | | | | 523,687 | | |
| | 500 | | | Linn Energy Finance Corp., Rule 144A, Company
Guaranteed Notes
(Callable 11/01/15 @ 103.13)ठ| | (B, B2) | | 11/01/19 | | | 6.250 | | | | 502,500 | | |
| | 700 | | | McMoRan Exploration Co., Company Guaranteed
Notes (Callable 11/15/12 @ 104.94)§ | | (B-, Caa1) | | 11/15/14 | | | 11.875 | | | | 736,750 | | |
| | 325 | | | Oasis Petroleum, Inc., Global Company
Guaranteed Notes (Callable 02/01/15 @ 103.63) | | (B, B3) | | 02/01/19 | | | 7.250 | | | | 349,375 | | |
| | | | 2,112,312 | | |
| Forestry & Paper (0.0%) | | | |
| | 200 | | | Stone & Webster, Inc.* | | (NR, NR) | | 07/02/13 | | | 0.000 | | | | 4,625 | | |
| Gaming (1.4%) | | | |
| | 197 | | | Choctaw Resort Development Enterprise,
Rule 144A, Senior Notes
(Callable 11/15/12 @ 102.42)‡ | | (B, Caa1) | | 11/15/19 | | | 7.250 | | | | 174,345 | | |
| | 210 | | | Fontainebleau Las Vegas Holdings LLC, Rule 144A,
Second Mortgage Notes
(Callable 12/03/12 @ 102.56)௠| | (NR, NR) | | 06/15/15 | | | 10.250 | | | | 394 | | |
| | 850 | | | Greektown Superholdings, Inc., Series A, Global
Secured Notes (Callable 01/01/13 @ 106.50) | | (NR, NR) | | 07/01/15 | | | 13.000 | | | | 916,938 | | |
| | 500 | | | Greektown Superholdings, Inc., Series B, Global
Secured Notes (Callable 01/01/13 @ 106.50) | | (NR, NR) | | 07/01/15 | | | 13.000 | | | | 539,375 | | |
| | 59 | | | Majestic Star Casino LLC, Rule 144A,
Senior Notes‡ | | (NR, NR) | | 12/01/16 | | | 12.500 | | | | 55,455 | | |
| | 200 | | | Peninsula Gaming LLC, Global Company
Guaranteed Notes (Callable 08/15/13 @ 105.38) | | (B, Caa1) | | 08/15/17 | | | 10.750 | | | | 226,250 | | |
| | 275 | | | Peninsula Gaming LLC, Global Secured Notes
(Callable 12/03/12 @ 104.19) | | (BB, Ba3) | | 08/15/15 | | | 8.375 | | | | 288,406 | | |
| | 3,975 | | | Seminole Hard Rock Entertainment, Inc.,
Rule 144A, Senior Secured Notes‡# | | (BB, B2) | | 03/15/14 | | | 2.889 | | | | 3,965,062 | | |
| | 175 | | | Tropicana Finance Corp., Global Senior
Subordinated Notes
(Callable 12/15/12 @ 100.00)^Ø | | (NR, NR) | | 12/15/14 | | | 9.625 | | | | 18 | | |
| | 300 | | | Tunica-Biloxi Gaming Authority, Rule 144A,
Senior Unsecured Notes
(Callable 11/15/12 @ 101.60)‡ | | (B+, B3) | | 11/15/15 | | | 9.000 | | | | 274,500 | | |
| | | | 6,440,743 | | |
See Accompanying Notes to Financial Statements.
18
Credit Suisse Floating Rate High Income Fund
Schedule of Investments (continued)
October 31, 2012
Par
(000) | |
| | Ratings†
(S&P/Moody's) | | Maturity | | Rate% | | Value | |
CORPORATE BONDS | | | |
| Gas Distribution (0.4%) | | | |
$ | 1,000 | | | Genesis Energy LP, Rule 144A, Senior Unsecured
Notes (Callable 12/15/14 @ 103.94)ठ| | (NR, B2) | | 12/15/18 | | | 7.875 | | | $ | 1,065,000 | | |
| | 500 | | | Holly Energy Finance Corp., Rule 144A, Company
Guaranteed Notes
(Callable 03/01/16 @ 103.25)‡ | | (BB-, B1) | | 03/01/20 | | | 6.500 | | | | 527,500 | | |
| | | | 1,592,500 | | |
| Health Services (0.0%) | | | |
| | 150 | | | inVentiv Health, Inc., Rule 144A, Company
Guaranteed Notes
(Callable 08/15/14 @ 105.00)‡ | | (CCC, Caa2) | | 08/15/18 | | | 10.000 | | | | 136,500 | | |
| Insurance Brokerage (0.2%) | | | |
| | 1,050 | | | USI Holdings Corp., Rule 144A, Company
Guaranteed Notes‡# | | (CCC, Caa1) | | 11/15/14 | | | 4.310 | | | | 1,023,750 | | |
| Media - Broadcast (0.1%) | | | |
| | 500 | | | Mission Broadcasting, Inc., Global Secured
Notes (Callable 04/15/14 @ 104.44)§ | | (B, B3) | | 04/15/17 | | | 8.875 | | | | 547,500 | | |
| Media - Diversified (0.1%) | | | |
| | 500 | | | National CineMedia LLC, Senior Unsecured Notes
(Callable 07/15/16 @ 103.94)§ | | (B, B2) | | 07/15/21 | | | 7.875 | | | | 548,750 | | |
| Media - Services (0.4%) | | | |
| | 1,500 | | | WMG Acquisition Corp., Global Senior Secured
Notes (Callable 06/15/13 @ 104.75)§ | | (BB-, Ba2) | | 06/15/16 | | | 9.500 | | | | 1,659,375 | | |
| Metals & Mining - Excluding Steel (0.9%) | | | |
| | 2,461 | | | Noranda Aluminium Acquisition Corp., Global
Company Guaranteed Notes# | | (CCC+, B3) | | 05/15/15 | | | 4.730 | | | | 2,338,265 | | |
| | 150 | | | Old AII, Inc., Global Company Guaranteed Notes
(Callable 12/15/12 @ 100.00)^Ø | | (NR, NR) | | 12/15/14 | | | 9.000 | | | | 15 | | |
| | 250 | | | Old AII, Inc., Global Company Guaranteed Notes
(Callable 12/15/12 @ 103.33)^Ø | | (NR, NR) | | 12/15/16 | | | 10.000 | | | | 25 | | |
| | 1,700 | | | Quadra FNX Mining Ltd., Rule 144A, Company
Guaranteed Notes
(Callable 06/15/15 @ 103.88)‡ | | (BB-, B1) | | 06/15/19 | | | 7.750 | | | | 1,763,750 | | |
| | | | 4,102,055 | | |
| Oil Field Equipment & Services (0.3%) | | | |
| | 575 | | | FTS International Bonds, Inc., Rule 144A,
Company Guaranteed Notes
(Callable 11/15/14 @ 103.56)‡ | | (BB-, Ba3) | | 11/15/18 | | | 8.125 | | | | 603,750 | | |
| | 275 | | | Parker Drilling Co., Global Company Guaranteed
Notes (Callable 04/01/14 @ 104.56) | | (B+, B1) | | 04/01/18 | | | 9.125 | | | | 295,625 | | |
| | 500 | | | Pioneer Energy Services Corp., Global Company
Guaranteed Notes (Callable 03/15/14 @ 104.94) | | (B+, B2) | | 03/15/18 | | | 9.875 | | | | 543,750 | | |
| | | | 1,443,125 | | |
See Accompanying Notes to Financial Statements.
19
Credit Suisse Floating Rate High Income Fund
Schedule of Investments (continued)
October 31, 2012
Par
(000) | |
| | Ratings†
(S&P/Moody's) | | Maturity | | Rate% | | Value | |
CORPORATE BONDS | | | |
| Oil Refining & Marketing (1.1%) | | | |
$ | 2,250 | | | Coffeyville Finance, Inc., Rule 144A, Secured Notes
(Callable 04/01/13 @ 108.16)ठ| | (B+, Ba3) | | 04/01/17 | | | 10.875 | | | $ | 2,497,500 | | |
| | 315 | | | Northern Tier Finance Corp., Global Senior Secured
Notes (Callable 12/01/13 @ 107.88) | | (BB-, B1) | | 12/01/17 | | | 10.500 | | | | 362,250 | | |
| | 2,000 | | | PBF Finance Corp., Rule 144A, Senior Secured
Notes (Callable 02/15/16 @ 104.13)ठ| | (BB+, Ba3) | | 02/15/20 | | | 8.250 | | | | 2,110,000 | | |
| | | | 4,969,750 | | |
| Packaging (0.2%) | | | |
| | 0 | | | BWAY Parent Co., Inc., Global Senior Unsecured
Notes (Callable 12/03/12 @ 105.00)1 | | (CCC+, Caa1) | | 11/01/15 | | | 10.125 | | | | 72 | | |
| | 1,050 | | | Clondalkin Acquisition BV, Rule 144A,
Secured Notes‡# | | (B, B2) | | 12/15/13 | | | 2.389 | | | | 1,002,750 | | |
| | | | 1,002,822 | | |
| Printing & Publishing (0.0%) | | | |
| | 242 | | | The Reader's Digest Association, Inc., Global
Senior Secured Notes
(Callable 02/15/13 @ 104.00)# | | (CC, Caa1) | | 02/15/17 | | | 9.500 | | | | 139,755 | | |
| Real Estate Investment Trusts (0.1%) | | | |
| | 500 | | | CNL Lifestyle Properties, Inc., Global Company
Guaranteed Notes
(Callable 04/15/15 @ 103.63)§ | | (B+, Ba3) | | 04/15/19 | | | 7.250 | | | | 476,250 | | |
| Support-Services (0.2%) | | | |
| | 500 | | | CoreLogic, Inc., Global Company Guaranteed
Notes (Callable 06/01/16 @ 103.63) | | (B+, Ba3) | | 06/01/21 | | | 7.250 | | | | 553,750 | | |
| | 400 | | | Sotheby's, Global Company Guaranteed Notes§ | | (BB, Ba3) | | 06/15/15 | | | 7.750 | | | | 440,000 | | |
| | | | 993,750 | | |
| Telecom - Integrated/Services (0.0%) | | | |
| | 100 | | | Hellas Telecommunications II SCA, Rule 144A,
Subordinated Notes‡^#Ø | | (NR, NR) | | 01/15/15 | | | 5.750 | | | | — | | |
| Textiles & Apparel (0.0%) | | | |
| | 275 | | | IT Holding Finance SA, Rule 144A, Company
Guaranteed Notes‡€Ø | | (NR, NR) | | 11/15/12 | | | 9.875 | | | | 3,653 | | |
| Theaters & Entertainment (0.3%) | | | |
| | 1,000 | | | AMC Entertainment, Inc., Global Company
Guaranteed Notes
(Callable 12/01/15 @ 104.88) | | (CCC+, Caa1) | | 12/01/20 | | | 9.750 | | | | 1,127,500 | | |
| Transportation - Excluding Air/Rail (0.0%) | | | |
| | 150 | | | Navios Maritime Holdings Finance II US, Inc.,
Global Company Guaranteed Notes
(Callable 02/15/15 @ 104.06) | | (B+, Caa1) | | 02/15/19 | | | 8.125 | | | | 133,500 | | |
| TOTAL CORPORATE BONDS (Cost $50,429,454) | | | 49,657,016 | | |
See Accompanying Notes to Financial Statements.
20
Credit Suisse Floating Rate High Income Fund
Schedule of Investments (continued)
October 31, 2012
Par
(000) | |
| | Ratings†
(S&P/Moody's) | | Maturity | | Rate% | | Value | |
| ASSET BACKED SECURITIES (2.4%) | | | |
| Collateralized Debt Obligations (2.4%) | | | |
$ | 2,000 | | | ACAs CLO Ltd.‡# | | (BBB, NR) | | 09/20/23 | | | 5.577 | | | $ | 1,969,602 | | |
| | 2,000 | | | Atlantis Funding Ltd.# | | (BBB+, A1) | | 11/20/15 | | | 4.684 | | | | 2,016,766 | | |
| | 2,000 | | | Copper River CLO Ltd.# | | (B+, Baa3) | | 01/20/21 | | | 1.819 | | | | 1,657,200 | | |
| | 750 | | | Gale Force CLO Ltd., Rule 144A‡# | | (BBB+, Baa2) | | 11/15/17 | | | 2.285 | | | | 667,552 | | |
| | 500 | | | Hewett's Island CDO Ltd., Rule 144A‡# | | (BBB+, Baa1) | | 06/09/19 | | | 1.208 | | | | 411,203 | | |
| | 2,000 | | | KKR Financial CLO 2007-1 Corp., Rule 144A‡# | | (A, A3) | | 05/15/21 | | | 2.685 | | | | 1,839,458 | | |
| | 2,000 | | | Riverside Park CLO Ltd.# | | (BBB, NR) | | 09/27/21 | | | 3.117 | | | | 1,775,250 | | |
| | 1,000 | | | WG Horizons CLO# | | (BBB-, Ba1) | | 05/24/19 | | | 2.127 | | | | 830,490 | | |
| TOTAL ASSET BACKED SECURITIES (Cost $10,824,445) | | | 11,167,521 | | |
Number of
Shares | |
| |
| |
| |
| |
| |
| COMMON STOCKS (0.1%) | | | |
| Automotive (0.0%) | | | |
| | 588 | | | Safelite Realty Corp.^* | | | | | | | | | | | | | | | — | | |
| Building & Construction (0.0%) | | | |
| | 53,871 | | | William Lyon Homes, Inc.* | | | | | | | | | | | | | | | 59,258 | | |
| Chemicals (0.1%) | | | |
| | 9,785 | | | Huntsman Corp. | | | | | | | | | | | | | | | 147,167 | | |
| Forestry & Paper (0.0%) | | | |
| | 3,000 | | | Resolute Forest Products*§ | | | | | | | | | | | | | | | 36,600 | | |
| Gaming (0.0%) | | | |
| | 10,150 | | | Majestic Holdco LLC | | | | | | | | | | | | | | | 20,300 | | |
| Health Services (0.0%) | | | |
| | 22 | | | Magellan Health Services, Inc.* | | | | | | | | | | | | | | | 1,103 | | |
| Printing & Publishing (0.0%) | | | |
| | 554 | | | Dex One Corp.*§ | | | | | | | | | | | | | | | 554 | | |
| | 1,131 | | | F & W Media, Inc.* | | | | | | | | | | | | | | | 707 | | |
| | 355 | | | SuperMedia, Inc.*§ | | | | | | | | | | | | | | | 905 | | |
| | | | 2,166 | | |
| TOTAL COMMON STOCKS (Cost $610,731) | | | 266,594 | | |
| WARRANT (0.0%) | | | |
| | 1,673 | | | The Readers Digest Association, Inc., strike price $0.00, expires 02/19/14 (Cost $0)^* | | | | | | | | | | | | | | | — | | |
| SHORT-TERM INVESTMENTS (14.0%) | | | |
| | 5,551,531 | | | State Street Navigator Prime Portfolio, 0.31%§§ | | | | | | | | | | | | | | | 5,551,531 | | |
Par
(000) | |
| |
| |
Maturity | |
Rate% | |
| |
$ | 58,072 | | | State Street Bank and Trust Co. Euro Time Deposit | | | | | | 11/01/12 | | | 0.010 | | | | 58,072,000 | | |
| TOTAL SHORT-TERM INVESTMENTS (Cost $63,623,531) | | | 63,623,531 | | |
| TOTAL INVESTMENTS AT VALUE (108.1%) (Cost $487,313,694) | | | 492,370,926 | | |
| LIABILITIES IN EXCESS OF OTHER ASSETS (-8.1%) | | | (36,824,847 | ) | |
| NET ASSETS (100.0%) | | $ | 455,546,079 | | |
See Accompanying Notes to Financial Statements.
21
Credit Suisse Floating Rate High Income Fund
Schedule of Investments (continued)
October 31, 2012
INVESTMENT ABBREVIATION
NR = Not Rated
† Credit ratings given by the Standard & Poor's Division of The McGraw-Hill Companies, Inc. ("S&P") and Moody's Investors Service, Inc. ("Moody's") are unaudited.
‡ Security exempt from registration under Rule 144A of the Securities Act of 1933. These securities may be resold in transactions exempt from registration, normally to qualified institutional buyers. At October 31, 2012, these securities amounted to a value of $34,082,741 or 7.5% of net assets.
€ This security is denominated in Euro.
£ This security is denominated in British Pound.
^ Not readily marketable security; security is valued at fair value as determined in good faith by, or under the direction of, the Board of Trustees.
1 Par value of security held is less than 1,000.
# Variable rate obligations — The interest rate is the rate as of October 31, 2012.
+ Step Bond — The interest rate is as of October 31, 2012 and will reset at a future date.
Ø Bond is currently in default.
µ See Note 2 regarding unfunded loan commitments.
* Non-income producing security.
§ Security or portion thereof is out on loan.
§§ Represents security purchased with cash collateral received for securities on loan. The rate shown is the annualized one-day yield at October 31, 2012.
See Accompanying Notes to Financial Statements.
22
Credit Suisse Floating Rate High Income Fund
Statement of Assets and Liabilities
October 31, 2012
Assets | |
Investments at value, including collateral for securities on loan of $5,551,531
(Cost $487,313,694) (Note 2) | | $ | 492,370,9261 | | |
Cash | | | 969,315 | | |
Foreign currency at value (cost $3,338,702) | | | 3,320,288 | | |
Receivable for investments sold | | | 13,784,586 | | |
Receivable for fund shares sold | | | 2,700,842 | | |
Interest receivable | | | 2,223,565 | | |
Unrealized appreciation on forward currency contracts (Note 2) | | | 139,150 | | |
Prepaid expenses and other assets | | | 57,546 | | |
Total Assets | | | 515,566,218 | | |
Liabilities | |
Advisory fee payable (Note 3) | | | 111,316 | | |
Administrative services fee payable (Note 3) | | | 57,426 | | |
Shareholder servicing/Distribution fee payable (Note 3) | | | 97,525 | | |
Payable for investments purchased | | | 53,002,626 | | |
Payable upon return of securities loaned (Note 2) | | | 5,551,531 | | |
Payable for fund shares redeemed | | | 639,759 | | |
Dividend payable | | | 429,667 | | |
Trustees' fee payable | | | 18,863 | | |
Other accrued expenses payable | | | 111,426 | | |
Total Liabilities | | | 60,020,139 | | |
Net Assets | |
Capital stock, $.001 par value (Note 6) | | | 65,939 | | |
Paid-in capital (Note 6) | | | 462,517,339 | | |
Undistributed net investment income | | | 355,380 | | |
Accumulated net realized loss on investments and foreign currency transactions | | | (12,570,862 | ) | |
Net unrealized appreciation from investments and foreign currency translations | | | 5,178,283 | | |
Net Assets | | $ | 455,546,079 | | |
I Shares | |
Net assets | | $ | 226,026,719 | | |
Shares outstanding | | | 32,801,266 | | |
Net asset value, offering price and redemption price per share | | $ | 6.89 | | |
A Shares | |
Net assets | | $ | 148,635,653 | | |
Shares outstanding | | | 21,477,022 | | |
Net asset value and redemption price per share | | $ | 6.92 | | |
Maximum offering price per share (net asset value/(1-4.75%)) | | $ | 7.27 | | |
B Shares | |
Net assets | | $ | 5,184,726 | | |
Shares outstanding | | | 747,935 | | |
Net asset value and offering price per share | | $ | 6.93 | | |
C Shares | |
Net assets | | $ | 75,698,981 | | |
Shares outstanding | | | 10,912,454 | | |
Net asset value and offering price per share | | $ | 6.94 | | |
1 Including $5,429,963 of securities on loan.
See Accompanying Notes to Financial Statements.
23
Credit Suisse Floating Rate High Income Fund
Statement of Operations
For the Year Ended October 31, 2012
| Investment Income (Note 2) | |
Interest | | $ | 16,310,213 | | |
Dividends | | | 6,557 | | |
Securities lending | | | 10,885 | | |
Total investment income | | | 16,327,655 | | |
Expenses | |
Investment advisory fees (Note 3) | | | 1,646,898 | | |
Administrative services fees (Note 3) | | | 341,016 | | |
Shareholder servicing/Distribution fees (Note 3) | |
Class A | | | 286,335 | | |
Class B | | | 53,549 | | |
Class C | | | 492,144 | | |
Legal fees | | | 127,168 | | |
Transfer agent fees | | | 118,788 | | |
Registration fees | | | 104,738 | | |
Trustees' fees | | | 83,684 | | |
Printing fees (Note 3) | | | 74,355 | | |
Custodian fees | | | 52,803 | | |
Audit and tax fees | | | 40,367 | | |
Insurance expense | | | 4,700 | | |
Commitment fees (Note 4) | | | 1,331 | | |
Miscellaneous expense | | | 10,572 | | |
Total expenses | | | 3,438,448 | | |
Less: fees waived (Note 3) | | | (580,763 | ) | |
Net expenses | | | 2,857,685 | | |
Net investment income | | | 13,469,970 | | |
Net Realized and Unrealized Gain (Loss) from Investments and Foreign Currency Related Items | |
Net realized gain from investments | | | 1,641,278 | | |
Net realized loss from foreign currency transactions | | | (219,527 | ) | |
Net change in unrealized appreciation (depreciation) from investments | | | 7,503,422 | | |
Net change in unrealized appreciation (depreciation) from foreign currency translations | | | 132,224 | | |
Net realized and unrealized gain from investments and foreign currency related items | | | 9,057,397 | | |
Net increase in net assets resulting from operations | | $ | 22,527,367 | | |
See Accompanying Notes to Financial Statements.
24
Credit Suisse Floating Rate High Income Fund
Statements of Changes in Net Assets
| | | For the Year
Ended
October 31, 2012 | | For the Year
Ended
October 31, 2011 | |
From Operations | |
Net investment income | | $ | 13,469,970 | | | $ | 4,876,444 | | |
Net realized gain from investments and foreign currency transactions | | | 1,421,751 | | | | 4,295,873 | | |
Net change in unrealized appreciation (depreciation)
from investments and foreign currency translations | | | 7,635,646 | | | | (4,415,241 | ) | |
Net increase in net assets resulting from operations | | | 22,527,367 | | | | 4,757,076 | | |
From Dividends | |
Dividends from net investment income | |
Class I shares | | | (5,828,640 | ) | | | (2,272,141 | ) | |
Class A shares | | | (5,173,777 | ) | | | (1,419,797 | ) | |
Class B shares | | | (197,814 | ) | | | (319,632 | ) | |
Class C shares | | | (1,850,784 | ) | | | (931,208 | ) | |
Net decrease in net assets resulting from dividends | | | (13,051,015 | ) | | | (4,942,778 | ) | |
| From Capital Share Transactions (Note 6) | |
Proceeds from sale of shares | | | 420,906,171 | | | | 73,834,993 | | |
Reinvestment of dividends | | | 9,579,337 | | | | 3,634,099 | | |
Net asset value of shares redeemed | | | (108,888,789 | )1 | | | (29,654,156 | )2 | |
Net increase in net assets from capital share transactions | | | 321,596,719 | | | | 47,814,936 | | |
Net increase in net assets | | | 331,073,071 | | | | 47,629,234 | | |
Net Assets | |
Beginning of year | | | 124,473,008 | | | | 76,843,774 | | |
End of year | | $ | 455,546,079 | | | $ | 124,473,008 | | |
Undistributed/Accumulated net investment income (loss) | | $ | 355,380 | | | $ | (130,428 | ) | |
1 Net of $33,222 of redemption fees retained by the Fund.
2 Net of $24,879 of redemption fees retained by the Fund.
See Accompanying Notes to Financial Statements.
25
Credit Suisse Floating Rate High Income Fund
Financial Highlights
(For a Class I Share of the Fund Outstanding Throughout Each Year)
| | | For the Year Ended October 31, | |
| | | 2012 | | 2011 | | 2010 | | 2009 | | 2008 | |
Per share data | |
Net asset value, beginning of year | | $ | 6.66 | | | $ | 6.72 | | | $ | 6.24 | | | $ | 4.94 | | | $ | 7.66 | | |
INVESTMENT OPERATIONS | |
Net investment income1 | | | 0.34 | | | | 0.43 | | | | 0.56 | | | | 0.54 | | | | 0.60 | | |
Net gain (loss) on investments, swap contracts and foreign
currency related items (both realized and unrealized) | | | 0.21 | | | | (0.04 | ) | | | 0.50 | | | | 1.36 | | | | (2.48 | ) | |
Total from investment operations | | | 0.55 | | | | 0.39 | | | | 1.06 | | | | 1.90 | | | | (1.88 | ) | |
REDEMPTION FEES | | | 0.002 | | | | 0.002 | | | | 0.002 | | | | — | | | | — | | |
LESS DIVIDENDS AND DISTRIBUTIONS | |
Dividends from net investment income | | | (0.32 | ) | | | (0.45 | ) | | | (0.58 | ) | | | (0.60 | ) | | | (0.60 | ) | |
Distributions from net realized gains | | | — | | | | — | | | | — | | | | — | | | | (0.24 | ) | |
Total dividends and distributions | | | (0.32 | ) | | | (0.45 | ) | | | (0.58 | ) | | | (0.60 | ) | | | (0.84 | ) | |
Net asset value, end of year | | $ | 6.89 | | | $ | 6.66 | | | $ | 6.72 | | | $ | 6.24 | | | $ | 4.94 | | |
Total return3 | | | 8.51 | % | | | 5.85 | % | | | 17.87 | % | | | 41.87 | % | | | (26.98 | )% | |
RATIOS AND SUPPLEMENTAL DATA | |
Net assets, end of year (000s omitted) | | $ | 226,027 | | | $ | 46,482 | | | $ | 31,374 | | | $ | 383 | | | $ | 310 | | |
Ratio of expenses to average net assets | | | 0.70 | % | | | 0.70 | % | | | 0.72 | % | | | 0.85 | % | | | 0.85 | % | |
Ratio of net investment income to average net assets | | | 4.99 | % | | | 6.32 | % | | | 8.48 | % | | | 10.32 | % | | | 8.98 | % | |
Decrease reflected in above operating expense ratios
due to waivers/reimbursements | | | 0.20 | % | | | 0.68 | % | | | 0.65 | % | | | 0.58 | % | | | 0.46 | % | |
Portfolio turnover rate | | | 96 | % | | | 144 | % | | | 88 | % | | | 63 | % | | | 28 | % | |
1 Per share information is calculated using the average shares outstanding method.
2 This amount represents less than $0.01 per share.
3 Total returns are historical and assume changes in share price and reinvestment of all dividends and distributions. Had certain expenses not been reduced during the years shown, total returns would have been lower.
See Accompanying Notes to Financial Statements.
26
Credit Suisse Floating Rate High Income Fund
Financial Highlights
(For a Class A Share of the Fund Outstanding Throughout Each Year)
| | | For the Year Ended October 31, | |
| | | 2012 | | 2011 | | 2010 | | 2009 | | 2008 | |
Per share data | |
Net asset value, beginning of year | | $ | 6.69 | | | $ | 6.74 | | | $ | 6.26 | | | $ | 4.96 | | | $ | 7.68 | | |
INVESTMENT OPERATIONS | |
Net investment income1 | | | 0.32 | | | | 0.40 | | | | 0.52 | | | | 0.53 | | | | 0.58 | | |
Net gain (loss) on investments, swap contracts, and foreign
currency related items (both realized and unrealized) | | | 0.22 | | | | (0.02 | ) | | | 0.53 | | | | 1.36 | | | | (2.47 | ) | |
Total from investment operations | | | 0.54 | | | | 0.38 | | | | 1.05 | | | | 1.89 | | | | (1.89 | ) | |
REDEMPTION FEES | | | 0.002 | | | | 0.002 | | | | 0.002 | | | | 0.002 | | | | 0.002 | | |
LESS DIVIDENDS AND DISTRIBUTIONS | |
Dividends from net investment income | | | (0.31 | ) | | | (0.43 | ) | | | (0.57 | ) | | | (0.59 | ) | | | (0.59 | ) | |
Distributions from net realized gains | | | — | | | | — | | | | — | | | | — | | | | (0.24 | ) | |
Total dividends and distributions | | | (0.31 | ) | | | (0.43 | ) | | | (0.57 | ) | | | (0.59 | ) | | | (0.83 | ) | |
Net asset value, end of year | | $ | 6.92 | | | $ | 6.69 | | | $ | 6.74 | | | $ | 6.26 | | | $ | 4.96 | | |
Total return3 | | | 8.19 | % | | | 5.74 | % | | | 17.54 | % | | | 41.36 | % | | | (27.08 | )% | |
RATIOS AND SUPPLEMENTAL DATA | |
Net assets, end of year (000s omitted) | | $ | 148,636 | | | $ | 49,439 | | | $ | 20,492 | | | $ | 22,237 | | | $ | 21,004 | | |
Ratio of expenses to average net assets | | | 0.95 | % | | | 0.95 | % | | | 1.11 | % | | | 1.10 | % | | | 1.10 | % | |
Ratio of net investment income to average net assets | | | 4.65 | % | | | 5.97 | % | | | 8.00 | % | | | 10.07 | % | | | 8.72 | % | |
Decrease reflected in above operating expense ratios
due to waivers/reimbursements | | | 0.20 | % | | | 0.69 | % | | | 0.61 | % | | | 0.59 | % | | | 0.47 | % | |
Portfolio turnover rate | | | 96 | % | | | 144 | % | | | 88 | % | | | 63 | % | | | 28 | % | |
1 Per share information is calculated using the average shares outstanding method.
2 This amount represents less than $0.01 per share.
3 Total returns are historical and assume changes in share price, reinvestment of all dividends and distributions and no sales charge. Had certain expenses not been reduced during the years shown, total returns would have been lower.
See Accompanying Notes to Financial Statements.
27
Credit Suisse Floating Rate High Income Fund
Financial Highlights
(For a Class B Share of the Fund Outstanding Throughout Each Year)
| | | For the Year Ended October 31, | |
| | | 2012 | | 2011 | | 2010 | | 2009 | | 2008 | |
Per share data | |
Net asset value, beginning of year | | $ | 6.70 | | | $ | 6.74 | | | $ | 6.26 | | | $ | 4.95 | | | $ | 7.68 | | |
INVESTMENT OPERATIONS | |
Net investment income1 | | | 0.26 | | | | 0.39 | | | | 0.47 | | | | 0.49 | | | | 0.54 | | |
Net gain (loss) on investments, swap contracts, and foreign
currency related items (both realized and unrealized) | | | 0.22 | | | | (0.06 | ) | | | 0.53 | | | | 1.36 | | | | (2.49 | ) | |
Total from investment operations | | | 0.48 | | | | 0.33 | | | | 1.00 | | | | 1.85 | | | | (1.95 | ) | |
REDEMPTION FEES | | | 0.002 | | | | 0.002 | | | | 0.002 | | | | 0.002 | | | | 0.002 | | |
LESS DIVIDENDS AND DISTRIBUTIONS | |
Dividends from net investment income | | | (0.25 | ) | | | (0.37 | ) | | | (0.52 | ) | | | (0.54 | ) | | | (0.54 | ) | |
Distributions from net realized gains | | | — | | | | — | | | | — | | | | — | | | | (0.24 | ) | |
Total dividends and distributions | | | (0.25 | ) | | | (0.37 | ) | | | (0.52 | ) | | | (0.54 | ) | | | (0.78 | ) | |
Net asset value, end of year | | $ | 6.93 | | | $ | 6.70 | | | $ | 6.74 | | | $ | 6.26 | | | $ | 4.95 | | |
Total return3 | | | 7.30 | % | | | 5.03 | % | | | 16.58 | % | | | 40.55 | % | | | (27.77 | )% | |
RATIOS AND SUPPLEMENTAL DATA | |
Net assets, end of year (000s omitted) | | $ | 5,185 | | | $ | 4,647 | | | $ | 7,283 | | | $ | 7,280 | | | $ | 6,901 | | |
Ratio of expenses to average net assets | | | 1.70 | % | | | 1.70 | % | | | 1.86 | % | | | 1.85 | % | | | 1.85 | % | |
Ratio of net investment income to average net assets | | | 3.83 | % | | | 5.80 | % | | | 7.25 | % | | | 9.40 | % | | | 7.96 | % | |
Decrease reflected in above operating expense ratios
due to waivers/reimbursements | | | 0.20 | % | | | 0.68 | % | | | 0.61 | % | | | 0.59 | % | | | 0.47 | % | |
Portfolio turnover rate | | | 96 | % | | | 144 | % | | | 88 | % | | | 63 | % | | | 28 | % | |
1 Per share information is calculated using the average shares outstanding method.
2 This amount represents less than $0.01 per share.
3 Total returns are historical and assume changes in share price, reinvestment of all dividends and distributions and no sales charge. Had certain expenses not been reduced during the years shown, total returns would have been lower.
See Accompanying Notes to Financial Statements.
28
Credit Suisse Floating Rate High Income Fund
Financial Highlights
(For a Class C Share of the Fund Outstanding Throughout Each Year)
| | | For the Year Ended October 31, | |
| | | 2012 | | 2011 | | 2010 | | 2009 | | 2008 | |
Per share data | |
Net asset value, beginning of year | | $ | 6.71 | | | $ | 6.75 | | | $ | 6.27 | | | $ | 4.96 | | | $ | 7.69 | | |
INVESTMENT OPERATIONS | |
Net investment income1 | | | 0.27 | | | | 0.37 | | | | 0.47 | | | | 0.49 | | | | 0.54 | | |
Net gain (loss) on investments, swap contracts, and foreign
currency related items (both realized and unrealized) | | | 0.21 | | | | (0.03 | ) | | | 0.53 | | | | 1.36 | | | | (2.49 | ) | |
Total from investment operations | | | 0.48 | | | | 0.34 | | | | 1.00 | | | | 1.85 | | | | (1.95 | ) | |
REDEMPTION FEES | | | 0.002 | | | | 0.002 | | | | 0.002 | | | | 0.002 | | | | 0.002 | | |
LESS DIVIDENDS AND DISTRIBUTIONS | |
Dividends from net investment income | | | (0.25 | ) | | | (0.38 | ) | | | (0.52 | ) | | | (0.54 | ) | | | (0.54 | ) | |
Distributions from net realized gains | | | — | | | | — | | | | — | | | | — | | | | (0.24 | ) | |
Total dividends and distributions | | | (0.25 | ) | | | (0.38 | ) | | | (0.52 | ) | | | (0.54 | ) | | | (0.78 | ) | |
Net asset value, end of year | | $ | 6.94 | | | $ | 6.71 | | | $ | 6.75 | | | $ | 6.27 | | | $ | 4.96 | | |
Total return3 | | | 7.29 | % | | | 5.03 | % | | | 16.57 | % | | | 40.46 | % | | | (27.72 | )% | |
RATIOS AND SUPPLEMENTAL DATA | |
Net assets, end of year (000s omitted) | | $ | 75,699 | | | $ | 23,905 | | | $ | 17,695 | | | $ | 17,435 | | | $ | 14,282 | | |
Ratio of expenses to average net assets | | | 1.70 | % | | | 1.70 | % | | | 1.86 | % | | | 1.85 | % | | | 1.85 | % | |
Ratio of net investment income to average net assets | | | 3.93 | % | | | 5.39 | % | | | 7.25 | % | | | 9.33 | % | | | 7.98 | % | |
Decrease reflected in above operating expense ratios
due to waivers/reimbursements | | | 0.20 | % | | | 0.68 | % | | | 0.61 | % | | | 0.59 | % | | | 0.46 | % | |
Portfolio turnover rate | | | 96 | % | | | 144 | % | | | 88 | % | | | 63 | % | | | 28 | % | |
1 Per share information is calculated using the average shares outstanding method.
2 This amount represents less than $0.01 per share.
3 Total returns are historical and assume changes in share price, reinvestment of all dividends and distributions and no sales charge. Had certain expenses not been reduced during the years shown, total returns would have been lower.
See Accompanying Notes to Financial Statements.
29
Credit Suisse Floating Rate High Income Fund
Notes to Financial Statements
October 31, 2012
Credit Suisse Floating Rate High Income Fund (the "Fund"), a series of the Credit Suisse Opportunity Funds (the "Trust"), a Delaware statutory trust, is registered under the Investment Company Act of 1940, as amended (the "1940 Act"), as a diversified open-end management investment company that seeks to provide a high level of current income and, secondarily, capital appreciation. The Trust was organized under the laws of the State of Delaware as a business trust on May 31, 1995.
The Fund offers three classes of shares: Class I shares, Class A shares and Class C shares. Each class of shares represents an equal pro rata interest in the Fund, except that they bear different expenses, which reflect the differences in the range of services provided to them. Class A shares are sold subject to a front-end sales charge of 4.75%. Class C shares are sold subject to a contingent deferred sales charge of 1.00% if the shares are redeemed within the first year of purchase. Effective February 29, 2012, Class B shares of the Fund are no longer being offered for sale. Existing shareholders may continue to purchase additional Class B shares of the Fund through the reinvestment of dividends and capital gain distributions paid by the Fund. Class B shares automatically convert to Class A shares after 8 years.
Note 2. Significant Accounting Policies
A) SECURITY VALUATION — The net asset value of the Fund is determined daily as of the close of regular trading on the New York Stock Exchange, Inc. (the "Exchange") on each day the Exchange is open for business. Debt securities with a remaining maturity greater than 60 days are valued in accordance with the price supplied by a pricing service, which may use a matrix, formula or other objective method that takes into consideration market indices, yield curves and other specific adjustments. Debt obligations that will mature in 60 days or less are valued on the basis of amortized cost, which approximates market value, unless it is determined that using this method would not represent fair value. Debt securities are generally categorized as Level 2. Equity investments are valued at market value, which is generally determined using the closing price on the exchange or market on which the security is primarily traded at the time of valuation (the "Valuation Time"). If no sales are reported, equity investments are generally valued at the most recent bid quotation as of the Valuation Time or at the lowest asked quotation in the case of a short sale of securities. Equity investments are generally categorized as Level 1. Investments in open-end investment companies are valued at their net asset value each business day and are generally categorized as Level 1. Forward
30
Credit Suisse Floating Rate High Income Fund
Notes to Financial Statements (continued)
October 31, 2012
Note 2. Significant Accounting Policies
currency contracts are valued at the prevailing forward exchange rate of the underlying currencies and are generally categorized as Level 2. Securities and other assets for which market quotations are not readily available, or whose values have been materially affected by events occurring before the Fund's Valuation Time but after the close of the securities' primary markets, are valued at fair value as determined in good faith by, or under the direction of, the Board of Trustees under procedures established by the Board of Trustees and are generally categorized as Level 3. The Fund may utilize a service provided by an independent third party which has been approved by the Board of Trustees to fair value certain securities. When fair value pricing is employed, the prices of securities used by the Fund to calculate its net asset value may differ from quoted or published prices for the same securities.
In accordance with the authoritative guidance on fair value measurements and disclosures under accounting principles generally accepted in the United States of America ("GAAP"), the Fund discloses the fair value of its investments in a hierarchy that prioritizes the inputs to valuation techniques used to measure the fair value. In accordance with GAAP, fair value is defined as the price that the Fund would receive upon selling an investment in a timely transaction to an independent buyer in the principal or most advantageous market of the investment. GAAP established a three-tier hierarchy to maximize the use of observable market data and minimize the use of unobservable inputs and to establish classification of fair value measurements for disclosure purposes. Inputs refer broadly to the assumptions that market participants would use in pricing the asset or liability, including assumptions about risk, for example, the risk inherent in a particular valuation technique used to measure fair value including such a pricing model and/or the risk inherent in the inputs to the valuation technique. Inputs may be observable or unobservable. Observable inputs are inputs that reflect the assumptions market participants would use in pricing the asset or liability developed based on market data obtained from sources independent of the reporting entity. Unobservable inputs are inputs that reflect the reporting entity's own assumptions about the assumptions market participants would use in pricing the asset or liability developed based on the best information available in the circumstances. In accordance with the Fund's valuation procedures, factors used in determining value may include, but are not limited to, the type of the security, the size of the holding, the initial cost of the security, the existence of any contractual restrictions on the security's disposition, the price and extent of public trading in similar securities of the issuer or of comparable companies, quotations or evaluated prices from broker-dealers and/or pricing services,
31
Credit Suisse Floating Rate High Income Fund
Notes to Financial Statements (continued)
October 31, 2012
Note 2. Significant Accounting Policies
information obtained from the issuer, analysts, and/or the appropriate stock exchange (for exchange-traded securities), an analysis of the company's or issuer's financial statements, an evaluation of the forces that influence the issuer and the market(s) in which the security is purchased and sold and with respect to debt securities, the maturity, coupon, creditworthiness, currency denomination, and the movement of the market in which the security is normally traded. The three-tier hierarchy of inputs is summarized in the three broad Levels listed below.
• Level 1 – quoted prices in active markets for identical investments
• Level 2 – other significant observable inputs (including quoted prices for similar investments, interest rates, prepayment speeds, credit risk, etc.)
• Level 3 – significant unobservable inputs (including the Fund's own assumptions in determining the fair value of investments)
The inputs or methodology used for valuing securities are not necessarily an indication of the risk associated with investing in those securities.
The following is a summary of the inputs used as of October 31, 2012 in valuing the Fund's investments carried at value:
| | | Level 1 | | Level 2 | | Level 3 | | Total | |
Investments in Securities | |
Bank Loans | | $ | — | | | $ | 367,656,264 | | | $ | — | | | $ | 367,656,264 | | |
Corporate Bonds | | | — | | | | 49,656,958 | | | | 58 | | | | 49,657,016 | | |
Asset Backed Securities | | | — | | | | 11,167,521 | | | | — | | | | 11,167,521 | | |
Common Stocks | | | 186,329 | | | | 80,265 | | | | — | | | | 266,594 | | |
Warrant | | | — | | | | — | | | | — | | | | — | | |
Short-Term Investments | | | 5,551,531 | | | | 58,072,000 | | | | — | | | | 63,623,531 | | |
Other Financial Instruments* | |
Forward Foreign Currency Contracts | | | — | | | | 139,150 | | | | — | | | | 139,150 | | |
| | | $ | 5,737,860 | | | $ | 486,772,158 | | | $ | 58 | | | $ | 492,510,076 | | |
*Other financial instruments include futures, forwards, and swap contracts.
As of October 31, 2012, the amounts shown by the Fund as being Level 3 securities that were measured at fair value amounted to less than 0.01% of net assets.
The Fund adopted FASB amendments to authoritative guidance which require the Fund to disclose details of transfers in and out of Level 1 and Level 2 measurements and Level 2 and Level 3 measurements and the reasons for the transfers. For the year ended October 31, 2012, there were no transfers in and out of Level 1, Level 2 and Level 3.
32
Credit Suisse Floating Rate High Income Fund
Notes to Financial Statements (continued)
October 31, 2012
Note 2. Significant Accounting Policies
B) DERIVATIVE INSTRUMENTS AND HEDGING ACTIVITIES — The Fund adopted amendments to authoritative guidance on disclosures about derivative instruments and hedging activities which require that the Fund disclose (a) how and why an entity uses derivative instruments, (b) how derivative instruments and hedging activities are accounted for, and (c) how derivative instruments and related hedging activities affect a fund's financial position, financial performance, and cash flows.
Fair Values of Derivative Instruments as of October 31, 2012
| | | Asset Derivatives | | Liability Derivatives | |
| | | Balance Sheet
Location | | Fair Value | | Balance Sheet
Location | | Fair Value | |
Currency Contracts
| | Unrealized appreciation/
depreciation on forward
currency contracts | | $ | 139,150 | * | | Unrealized appreciation/
depreciation on forward
currency contracts | | $ | — | | |
*Includes cumulative appreciation/depreciation of forward foreign currency contracts as reported in the Statement of Assets and Liabilities and Notes to Financial Statements.
Effect of Derivative Instruments on the Statement of Operations
| | Location | | Realized
Gain/Loss | | Location | | Unrealized
Appreciation/
Depreciation | |
| Currency Contracts | | Net realized loss from
foreign currency
transactions | | $ | (69,732 | ) | | Net change in unrealized
appreciation (depreciation)
from foreign currency
translations | | $ | 139,150 | | |
The notional amount of forward foreign currency contracts at year end are reflected in the Notes to Financial Statements. The notional amounts of forward foreign currency contracts at each month end throughout the reporting period averaged approximately 2.08% of net assets of the Fund.
C) FOREIGN CURRENCY TRANSACTIONS — The books and records of the Fund are maintained in U.S. dollars. Transactions denominated in foreign currencies are recorded at the current prevailing exchange rates. All assets and liabilities denominated in foreign currencies are translated into U.S. dollar amounts at the current exchange rate at the end of the period. Translation gains or losses resulting from changes in the exchange rate during the reporting period and realized gains and losses on the settlement of foreign currency transactions are reported in the results of operations for the current period. The Fund does not isolate that portion of realized gains and losses on investments in equity securities which is due to changes in the foreign exchange rate from that which is due to changes in market prices of equity securities.
33
Credit Suisse Floating Rate High Income Fund
Notes to Financial Statements (continued)
October 31, 2012
Note 2. Significant Accounting Policies
The Fund isolates that portion of realized gains and losses on investments in debt securities which is due to changes in the foreign exchange rate from that which is due to changes in market prices of debt securities.
D) SECURITY TRANSACTIONS AND INVESTMENT INCOME — Security transactions are accounted for on a trade date basis. Interest income is recorded on the accrual basis. The Fund amortizes premiums and accretes discounts using the effective interest method. Dividends are recorded on the ex-dividend date. Certain expenses are class-specific expenses and vary by class. Income, expenses (excluding class-specific expenses) and realized/unrealized gains/losses are allocated proportionately to each class of shares based upon the relative net asset value of the outstanding shares of that class. The cost of investments sold is determined by use of the specific identification method for both financial reporting and income tax purposes.
E) DIVIDENDS AND DISTRIBUTIONS TO SHAREHOLDERS — Dividends from net investment income, if any, are declared daily and paid monthly. Distributions of net realized capital gains, if any, are declared and paid at least annually. However, to the extent that a net realized capital gain can be reduced by a capital loss carryforward, such gain will not be distributed. Income and capital gain distributions are determined in accordance with federal income tax regulations, which may differ from GAAP.
F) FEDERAL INCOME TAXES — No provision is made for federal taxes as it is the Fund's intention to continue to qualify for and elect the tax treatment applicable to regulated investment companies ("RIC") under the Internal Revenue Code of 1986, as amended (the "Code"), and to make the requisite distributions to its shareholders, which will be sufficient to relieve it from federal income and excise taxes.
In order to qualify as a RIC under the Code, the Fund must meet certain requirements regarding the source of its income, the diversification of its assets and the distribution of its income. One of these requirements is that the Fund derive at least 90% of its gross income for each taxable year from dividends, interest, payments with respect to certain securities loans, gains from the sale or other disposition of stock, securities or foreign currencies, other income derived with respect to its business of investing in such stock, securities or currencies or net income derived from interests in certain publicly traded partnerships ("Qualifying Income").
The Fund adopted the authoritative guidance for uncertainty in income taxes and recognizes a tax benefit or liability from an uncertain position only if it is
34
Credit Suisse Floating Rate High Income Fund
Notes to Financial Statements (continued)
October 31, 2012
Note 2. Significant Accounting Policies
more likely than not that the position is sustainable based solely on its technical merits and consideration of the relevant taxing authority's widely understood administrative practices and procedures. The Fund has reviewed its current tax positions and has determined that no provision for income tax is required in the Fund's financial statements. The Fund's federal tax returns for the prior three fiscal years remain subject to examination by the Internal Revenue Service.
G) USE OF ESTIMATES — The preparation of financial statements in conformity with GAAP requires management to make estimates and assumptions that affect the reported amounts of assets and liabilities and disclosure of contingent assets and liabilities at the date of the financial statements and the reported amounts of income and expenses during the reporting period. Actual results could differ from these estimates.
H) SHORT-TERM INVESTMENTS — The Fund, together with other funds/portfolios advised by Credit Suisse Asset Management, LLC ("Credit Suisse"), an indirect, wholly-owned subsidiary of Credit Suisse Group AG, pools available cash into a short-term variable rate time deposit issued by State Street Bank and Trust Company ("SSB"), the Fund's custodian. The short-term time deposit issued by SSB is a variable rate account classified as a short-term investment.
I) FORWARD FOREIGN CURRENCY CONTRACTS — The Fund may enter into forward foreign currency contracts for the purchase or sale of a specific foreign currency at a fixed price on a future date. Risks may arise upon entering into these contracts from the potential inability of counterparties to meet the terms of their contracts and from unanticipated movements in the value of a foreign currency. The Fund will enter into forward foreign currency contracts primarily for hedging foreign currency risk. Forward foreign currency contracts are adjusted by the daily forward exchange rate of the underlying currency and any gains or losses are recorded for financial statement purposes as unrealized until the contract settlement date or an offsetting position is entered into. At October 31, 2012, the Fund had the following open forward foreign currency contracts:
Forward Foreign
Currency to be
Purchased (Local) | | Forward Foreign
Currency to be
Sold (Local) | | Expiration
Date | | Counterparties | | Value on
Settlement Date | | Current
Value | | Unrealized
Appreciation/
(Depreciation) | |
USD | 9,950,266 | | | EUR | 7,580,000 | | | 01/18/13 | | Morgan Stanley | | $ | (9,950,266 | ) | | $ | (9,829,889 | ) | | $ | 120,377 | | |
USD | 1,445,191 | | | EUR | 1,100,000 | | | 01/18/13 | | Morgan Stanley | | | (1,445,191 | ) | | | (1,426,501 | ) | | | 18,690 | | |
USD | 3,221,400 | | | GBP | 2,000,000 | | | 01/18/13 | | Morgan Stanley | | | (3,221,400 | ) | | | (3,221,317 | ) | | | 83 | | |
| | | | | | | | | | | | | | | | | | | | | | | $ | 139,150 | | |
Currency Abbreviations:
EUR = Euro
35
Credit Suisse Floating Rate High Income Fund
Notes to Financial Statements (continued)
October 31, 2012
Note 2. Significant Accounting Policies
GBP = British Pound
USD = United States Dollar
J) UNFUNDED LOAN COMMITMENTS — The Fund enters into certain credit agreements, all or a portion of which may be unfunded. The Fund is obligated to fund these loan commitments at the borrowers' discretion. Funded portions of credit agreements are presented on the Statement of Investments.
At October 31, 2012, unfunded commitments were as follows:
Borrower | | Maturity | | Rate | | Unfunded Commitment | |
Gray Television, Inc. | | 10/12/19 | | | 4.750 | | | $ | 851,351 | | |
Unfunded loan commitments and funded portions of credit agreements are marked to market daily and any unrealized appreciation or depreciation is included in the Statement of Assets and Liabilities and the Statement of Operations.
K) SECURITIES LENDING — Loans of securities are required at all times to be secured by collateral at least equal to 102% of the market value of domestic securities on loan (including any accrued interest thereon) and 105% of the market value of foreign securities on loan (including any accrued interest thereon). Cash collateral received by the Fund in connection with securities lending activity may be pooled together with cash collateral for other funds/portfolios advised by Credit Suisse and may be invested in a variety of investments, including funds advised by SSB, the Fund's securities lending agent, or money market instruments. However, in the event of default or bankruptcy by the other party to the agreement, realization and/or retention of the collateral may be subject to legal proceedings.
SSB has been engaged by the Fund to act as the Fund's securities lending agent. The Fund's securities lending arrangement provides that the Fund and SSB will share the net income earned from securities lending activities. During the year ended October 31, 2012, total earnings from the Fund's investment in cash collateral received in connection with securities lending arrangements was $14,550, of which $1,743 was rebated to borrowers (brokers). The Fund retained $10,885 in income from the cash collateral investment, and SSB, as lending agent, was paid $1,922. Securities lending income is accrued as earned.
L) OTHER — The high yield, fixed income securities in which the fund will invest will primarily consist of senior secured floating rate loans ("Senior Loans") issued by non-investment grade companies. Senior Loans are typically secured by specific collateral of the issuer and hold the most senior position in
36
Credit Suisse Floating Rate High Income Fund
Notes to Financial Statements (continued)
October 31, 2012
Note 2. Significant Accounting Policies
the issuer's capital structure. The interest rate on Senior Loans is periodically adjusted to a recognized base rate, typically the London Interbank Offered Rate ("LIBOR"). While these characteristics may reduce interest rate risk and mitigate losses in the event of borrower default, the Senior Loans in which the Fund invests have below investment grade credit ratings and thereby are considered speculative because of the significant credit risk of their issuers.
Lower-rated debt securities (commonly known as "junk bonds") possess speculative characteristics and are subject to greater market fluctuations and risk of lost income and principal than higher-rated debt securities for a variety of reasons. Also, during an economic downturn or substantial period of rising interest rates, highly leveraged issuers may experience financial stress which would adversely affect their ability to service their principal and interest payment obligations, to meet projected business goals and to obtain additional financing.
In addition, periods of economic uncertainty and changes can be expected to result in increased volatility of market prices of lower-rated debt securities and the Fund's net asset value.
M) SUBSEQUENT EVENTS — In preparing the financial statements as of October 31, 2012, management considered the impact of subsequent events for potential recognition or disclosure in these financial statements through the date of release of this report. No such events requiring recognition or disclosure were identified through the date of the release of this report.
Note 3. Transactions with Affiliates and Related Parties
Credit Suisse serves as investment adviser for the Fund. For its investment advisory services, Credit Suisse is entitled to receive a fee from the Fund at an annual rate of 0.70% of the Fund's average daily net assets less than or equal to $100 million and 0.50% of the Fund's average daily net assets greater than $100 million. For the year ended October 31, 2012, investment advisory fees earned and voluntarily waived were $1,646,898 and $580,763, respectively. Credit Suisse will not recapture from the Fund any fees it waived during the year ended October 31, 2012. Fee waivers and expense reimbursements are voluntary and may be discontinued by Credit Suisse at any time.
Through April 30, 2012, Credit Suisse Asset Management Securities, Inc. ("CSAMSI"), an affiliate of Credit Suisse, and SSB served as co-administrators to the Fund. Effective April 30, 2012, Credit Suisse replaced CSAMSI as co-administrator to the Fund. For their co-administrative services, CSAMSI and Credit Suisse received a fee calculated at an annual rate of 0.09% of the Fund's
37
Credit Suisse Floating Rate High Income Fund
Notes to Financial Statements (continued)
October 31, 2012
Note 3. Transactions with Affiliates and Related Parties
average daily net assets. For the year ended October 31, 2012, co-administrative services fees earned by CSAMSI and Credit Suisse were $260,441.
For its co-administrative services, SSB receives a fee, exclusive of out-of-pocket expenses, calculated in total for all the Credit Suisse funds/portfolios co-administered by SSB and allocated based upon the relative average net assets of each fund/portfolio, subject to an annual minimum fee. For the year ended October 31, 2012, co-administrative services fees earned by SSB (including out-of-pocket expenses) were $80,575.
In addition to serving as the Fund's co-administrator, through April 30, 2012, CSAMSI also served as distributor of the Fund's shares. Effective April 30, 2012, Credit Suisse Securities (USA) LLC ("CSSU"), an affiliate of Credit Suisse is the distributor of the Fund's shares. Pursuant to distribution plans adopted by the Fund pursuant to Rule 12b-1 under the 1940 Act, CSAMSI and CSSU received fees for their distribution services. The distributor is paid at the annual rate of 0.25% of the average daily net assets of the Class A shares. For the Class B and Class C shares, the fee is calculated at an annual rate of 1.00% of the average daily net assets. Class I shares are not subject to distribution fees.
For the year ended October 31, 2012, CSAMSI, CSSU and its affiliates advised the Fund that they retained $48,742 from commissions earned on the sale of the Fund's Class A shares.
Merrill Corporation ("Merrill"), an affiliate of Credit Suisse, has been engaged by the Fund to provide certain financial printing services. For the year ended October 31, 2012, Merrill was paid $59,296 for its services by the Fund.
Note 4. Line of Credit
The Fund, together with other funds/portfolios advised by Credit Suisse (collectively, the "Participating Funds"), participates in a committed, unsecured line of credit facility ("Credit Facility") for temporary or emergency purposes with SSB. Under the terms of the Credit Facility, the Participating Funds pay an aggregate commitment fee on the average unused amount of the Credit Facility, which is allocated among the Participating Funds in such manner as is determined by the governing Boards of the Participating Funds. In addition, the Participating Funds pay interest on borrowings at either the Overnight Federal Funds rate or the Overnight LIBOR rate plus a spread. At October 31, 2012, and during the year ended October 31, 2012, the Fund had no borrowings outstanding under the Credit Facility.
38
Credit Suisse Floating Rate High Income Fund
Notes to Financial Statements (continued)
October 31, 2012
Note 5. Purchases and Sales of Securities
For the year ended October 31, 2012, purchases and sales of investment securities (excluding short-term investments) were $573,296,353 and $255,100,281, respectively.
Note 6. Capital Share Transactions
The Fund is authorized to issue an unlimited number of full and fractional shares of beneficial interest, $.001 par value per share, of which an unlimited number of shares are classified as Class I shares, Class A shares, Class B shares and Class C shares. Transactions in capital shares for each class of the Fund were as follows:
| | | Class I | |
| | | For the Year Ended
October 31, 2012 | | For the Year Ended
October 31, 2011 | |
| | | Shares | | Value | | Shares | | Value | |
Shares sold | | | 29,259,713 | | | $ | 198,986,905 | | | | 2,756,694 | | | $ | 18,390,302 | | |
Shares issued in reinvestment
of dividends | | | 740,272 | | | | 5,041,974 | | | | 312,901 | | | | 2,113,807 | | |
Shares redeemed | | | (4,172,984 | ) | | | (28,368,005 | ) | | | (766,086 | ) | | | (5,132,969 | ) | |
Net increase | | | 25,827,001 | | | $ | 175,660,874 | | | | 2,303,509 | | | $ | 15,371,140 | | |
| | Class A | |
| | | For the Year Ended
October 31, 2012 | | For the Year Ended
October 31, 2011 | |
| | | Shares | | Value | | Shares | | Value | |
Shares sold | | | 24,435,787 | | | $ | 166,120,736 | | | | 6,377,908 | | | $ | 42,658,488 | | |
Shares issued in reinvestment
of dividends | | | 496,186 | | | | 3,393,229 | | | | 145,167 | | | | 983,762 | | |
Shares redeemed | | | (10,841,008 | ) | | | (74,072,793 | ) | | | (2,176,209 | ) | | | (14,784,134 | ) | |
Net increase | | | 14,090,965 | | | $ | 95,441,172 | | | | 4,346,866 | | | $ | 28,858,116 | | |
| | | Class B | |
| | | For the Year Ended
October 31, 2012 | | For the Year Ended
October 31, 2011 | |
| | | Shares | | Value | | Shares | | Value | |
Shares sold | | | 232,114 | | | $ | 1,562,539 | | | | 295,721 | | | $ | 1,998,761 | | |
Shares issued in reinvestment
of dividends | | | 10,290 | | | | 70,301 | | | | 20,990 | | | | 142,696 | | |
Shares redeemed | | | (188,042 | ) | | | (1,279,905 | ) | | | (702,886 | ) | | | (4,807,899 | ) | |
Net increase (decrease) | | | 54,362 | | | $ | 352,935 | | | | (386,175 | ) | | $ | (2,666,442 | ) | |
39
Credit Suisse Floating Rate High Income Fund
Notes to Financial Statements (continued)
October 31, 2012
Note 6. Capital Share Transactions
| | | Class C | |
| | | For the Year Ended
October 31, 2012 | | For the Year Ended
October 31, 2011 | |
| | | Shares | | Value | | Shares | | Value | |
Shares sold | | | 7,947,779 | | | $ | 54,235,991 | | | | 1,615,279 | | | $ | 10,787,442 | | |
Shares issued in reinvestment
of dividends | | | 156,638 | | | | 1,073,833 | | | | 57,968 | | | | 393,834 | | |
Shares redeemed | | | (757,012 | ) | | | (5,168,086 | ) | | | (728,120 | ) | | | (4,929,154 | ) | |
Net increase | | | 7,347,405 | | | $ | 50,141,738 | | | | 945,127 | | | $ | 6,252,122 | | |
The Fund imposes a redemption fee of 2% of the value of all classes of shares currently being offered that are redeemed or exchanged within 30 days from the date of purchase. Reinvested dividends and distributions are not subject to the fee. The fee is charged based on the value of shares at redemption, is paid directly to the Fund and becomes part of the Fund's daily net asset value calculation. When shares are redeemed that are subject to the fee, reinvested dividends and distributions are redeemed first, followed by the shares held longest.
On October 31, 2012, the number of shareholders that held 5% or more of the outstanding shares of each class of the Fund was as follows:
| | | Number of
Shareholders | | Approximate Percentage
of Outstanding Shares | |
Class I | | | 5 | | | | 76 | % | |
Class A | | | 5 | | | | 51 | % | |
Class B | | | 2 | | | | 52 | % | |
Class C | | | 2 | | | | 39 | % | |
Some of the shareholders are omnibus accounts, which hold shares on behalf of individual shareholders.
Note 7. Federal Income Taxes
Income and capital gain distributions are determined in accordance with federal income tax regulations, which may differ from GAAP.
The tax characteristics of dividends paid during the years ended October 31, 2012 and 2011, respectively, by the Fund were as follows:
Ordinary Income | |
| 2012 | | 2011 | |
| $ | 13,051,015 | | | $ | 4,942,778 | | |
40
Credit Suisse Floating Rate High Income Fund
Notes to Financial Statements (continued)
October 31, 2012
Note 7. Federal Income Taxes
The tax basis components of distributable earnings differ from the amounts reflected in the Statement of Assets and Liabilities by temporary book/tax differences. These differences are primarily due to dividends payable, wash sales, forward contracts mark to market and income from defaulted bonds. At October 31, 2012, the components of distributable earnings on a tax basis were as follows:
Undistributed net investment income | | $ | 919,665 | | |
Undistributed net investment loss — other | | | (429,667 | ) | |
Accumulated realized loss | | | (12,415,906 | ) | |
Unrealized appreciation | | | 4,888,710 | | |
| | $ | (7,037,198 | ) | |
At October 31, 2012, the Fund had capital loss carryforwards available to offset possible future capital gains as follows:
Expires October 31, | |
| 2015 | | 2016 | | 2017 | | 2018 | |
$ | 2,046,543 | | | $ | 4,452,130 | | | $ | 5,676,396 | | | $ | 240,837 | | |
Included in the Fund's capital loss carryforwards is $4,651,286, acquired in the Credit Suisse High Yield Fund merger, which is subject to IRS limitations. During the tax year ended October 31, 2012, the Fund utilized $1,505,636 of the capital loss carryforwards.
Under the Regulated Investment Company Modernization Act of 2010, the Fund will be permitted to carry forward capital losses incurred in taxable years beginning after December 22, 2010 for an unlimited period. However, any losses incurred during those future taxable years will be required to be utilized prior to the losses incurred in pre-enactment taxable years. As a result of this ordering rule, pre-enactment capital loss carryforwards may be more likely to expire unused. Additionally, post-enactment capital losses that are carried forward will retain their character as either short-term or long-term capital losses rather than being considered all short-term as under previous law. It is uncetain whether the Fund will be able to realize the full benefits of the capital loss carryforwards before they expire.
41
Credit Suisse Floating Rate High Income Fund
Notes to Financial Statements (continued)
October 31, 2012
Note 7. Federal Income Taxes
At October 31, 2012, the cost of investments (excluding foreign currency related transactions) and net unrealized appreciation (depreciation) for income tax purposes were as follows:
Cost of Investments | | $ | 487,464,117 | | |
Unrealized appreciation | | $ | 8,283,236 | | |
Unrealized depreciation | | | (3,376,427 | ) | |
Net unrealized appreciation (depreciation) | | $ | 4,906,809 | | |
At October 31, 2012, the Fund reclassified $66,782 to accumulated net realized gain and $71 to paid in capital from accumulated net investment loss, to adjust for current period permanent book/tax differences which arose principally from differing book/tax treatment of foreign currency gain/(loss), defaulted bonds and partnership basis adjustments. Net assets were not affected by these reclassifications.
Note 8. Contingencies
In the normal course of business, the Fund may provide general indemnifications pursuant to certain contracts and organizational documents. The Fund's maximum exposure under these arrangements is dependent on future claims that may be made against the Fund and, therefore, cannot be estimated; however, based on experience, the risk of loss from such claims is considered remote.
42
Credit Suisse Floating Rate High Income Fund
Report of Independent Registered Public Accounting Firm
To the Board of Trustees of Credit Suisse Opportunity Funds
and the Shareholders of Credit Suisse Floating Rate High Income Fund:
In our opinion, the accompanying statement of assets and liabilities, including the schedule of investments, and the related statements of operations and of changes in net assets and the financial highlights present fairly, in all material respects, the financial position of Credit Suisse Floating Rate High Income Fund (one of the Funds comprising Credit Suisse Opportunity Funds, hereafter referred to as the "Fund") at October 31, 2012, the results of its operations for the year then ended and the changes in its net assets and financial highlights for the periods presented, in conformity with accounting principles generally accepted in the United States of America. These financial statements and financial highlights (hereafter referred to as "financial statements") are the responsibility of the Fund's management. Our responsibility is to express an opinion on these financial statements based on our audits. We conducted our audits of these financial statements in accordance with the standards of the Public Company Accounting Oversight Board (United States). Those standards require that we plan and perform the audits to obtain reasonable assurance about whether the financial statements are free of material misstatement. An audit includes examining, on a test basis, evidence supporting the amounts and disclosures in the financial statements, assessing the accounting principles used and significant estimates made by management, and evaluating the overall financial statement presentation. We believe that our audit, which included confirmation of securities at October 31, 2012 by correspondence with the custodian, brokers, agent banks, and the application of alternative auditing procedures where securities purchased confirmations had not been received, provide a reasonable basis for our opinion.
PricewaterhouseCoopers LLP
Boston, Massachusetts
December 28, 2012
43
Credit Suisse Floating Rate High Income Fund
Information Concerning Trustees and Officers (unaudited)
Name, Address
(Year of Birth) | | Position(s)
Held with
Fund | | Term
of Office1
and
Length
of Time
Served | | Principal
Occupation(s) During
Past Five Years | | Number of
Portfolios
in Fund
Complex
Overseen
by Trustee | | Other
Directorships
Held by Trustee | |
Independent Trustees | | | | | | | | | | | |
Enrique Arzac
c/o Credit Suisse Asset
Management, LLC
Attn: General Counsel
One Madison Avenue
New York, New York
10010
(1941) | | Trustee, Audit Committee Chairman and Nominating Committee Member | | Since 2005 | | Professor of Finance and Economics, Graduate School of Business, Columbia University since 1971. | | | 9 | | | Director of Epoch Holding Corporation (an investment management and investment advisory services company); Director of The Adams Express Company, Director of Petroleum and Resources Corporation, Director of Aberdeen Asset Management-advised Funds (six closed-end investment companies); Director of Mirae Asset Discovery Funds (open-end investment companies). | |
Jeffrey E. Garten
Box 208200
New Haven, Connecticut
06520-8200
(1946) | | Trustee, Audit and Nominating Committee Member | | Since 2001 | | The Juan Trippe Professor in the Practice of International Trade, Finance and Business from July 2005 to present; Partner and Chairman of Garten Rothkopf (consulting firm) from October 2005 to present; Dean of Yale School of Management from November 1995 to June 2005. | | | 7 | | | Director of Aetna, Inc. (insurance company); Director of CarMax Group (used car dealers); Member of Standard & Poor's Board of Managers (credit rating agency). | |
1 Each Trustee and Officer serves until his or her respective successor has been duly elected and qualified.
44
Credit Suisse Floating Rate High Income Fund
Information Concerning Trustees and Officers (unaudited) (continued)
Name, Address
(Year of Birth) | | Position(s)
Held with
Fund | | Term
of Office1
and
Length
of Time
Served | | Principal
Occupation(s) During
Past Five Years | | Number of
Portfolios
in Fund
Complex
Overseen
by Trustee | | Other
Directorships
Held by Trustee | |
Independent Trustees | | | | | | | | | | | |
Peter F. Krogh
c/o Credit Suisse Asset
Management, LLC
Attn: General Counsel
One Madison Avenue
New York, New York
10010
(1937) | | Trustee, Audit and Nominating Committee Member | | Since 2000 | | Dean Emeritus and Distinguished Professor of International Affairs at the Edmund A. Walsh School of Foreign Service, Georgetown University from June 1995 to present. | | | 7 | | | None | |
Steven N. Rappaport
Lehigh Court, LLC
555 Madison Avenue
29th Floor
New York, New York
10022
(1948) | | Chairman of the Board of Trustees, Audit Committee Member and Nominating Committee Chairman | | Trustee since 2001 and Chairman since 2005 | | Partner of Lehigh Court, LLC and RZ Capital (private investment firms) from July 2002 to present. | | | 9 | | | Director of iCAD, Inc. (surgical and medical instruments and apparatus company); Director of Wood Resources, LLC. (plywood manufacturing company); Director of Aberdeen Asset Management-advised Funds (five closed-end investment companies). | |
45
Credit Suisse Floating Rate High Income Fund
Information Concerning Trustees and Officers (unaudited) (continued)
Name, Address
(Year of Birth) | | Position(s)
Held with
Fund | | Term
of Office1
and
Length
of Time
Served | | Principal Occupation(s) During Past Five Years | |
Officers** | | | | | | | |
John G. Popp
Credit Suisse Asset Management, LLC
One Madison Avenue
New York, New York 10010
(1956) | | Chief Executive Officer and President | | Since 2010 | | Managing Director of Credit Suisse; Group Manager and Senior Portfolio Manager for Performing Credit Strategies; Associated with Credit Suisse or its predecessor since 1997; Officer of other Credit Suisse Funds. | |
Bruce Rosenberg
Credit Suisse Asset Management, LLC
One Madison Avenue
New York, New York 10010
(1961) | | Chief Financial Officer | | Since 2012 | | Director and Director of Liquid Accounting of Credit Suisse; Associated with Credit Suisse since 2008; Associated with Bank of New York Mellon Alternative Investment Services from 2006 to 2008; Officer of other Credit Suisse Funds. | |
Emidio Morizio
Credit Suisse Asset Management, LLC
One Madison Avenue
New York, New York 10010
(1966) | | Chief Compliance Officer | | Since 2004 | | Managing Director and Global Head of Compliance of Credit Suisse; Associated with Credit Suisse since July 2000; Officer of other Credit Suisse Funds. | |
Roger Machlis
Credit Suisse Asset Management, LLC
One Madison Avenue
New York, New York 10010
(1961) | | Chief Legal Officer | | Since 2010 | | Managing Director and General Counsel for Credit Suisse; Associated with Credit Suisse Group AG since July 1997; Officer of other Credit Suisse Funds. | |
Cecilia Chau
Credit Suisse Asset Management, LLC
One Madison Avenue
New York, New York 10010
(1973) | | Treasurer | | Since 2008 | | Vice President of Credit Suisse since 2009; Assistant Vice President of Credit Suisse from June 2007 to December 2008; Associated with Alliance Bernstein L.P. from January 2007 to May 2007; Associated with Credit Suisse from August 2000 to December 2006; Officer of other Credit Suisse Funds. | |
Karen Regan
Credit Suisse Asset Management, LLC
One Madison Avenue
New York, New York 10010
(1963) | | Vice President and Secretary | | Since 2010 | | Vice President of Credit Suisse; Associated with Credit Suisse since December 2004; Officer of other Credit Suisse Funds. | |
** The officers of the Fund shown are officers that make policy decisions.
The Statement of Additional Information includes additional information about the Trustees and is available, without charge, upon request, by calling 877-870-2874.
46
Credit Suisse Floating Rate High Income Fund
Proxy Voting and Portfolio Holdings Information (unaudited)
Information regarding how the Fund voted proxies related to its portfolio securities during the 12 month period ended June 30 of each year, as well as the policies and procedures that the Fund uses to determine how to vote proxies relating to its portfolio securities are available:
• By calling 1-877-870-2874
• On the Fund's website, www.credit-suisse.com/us/funds
• On the website of the Securities and Exchange Commission, www.sec.gov.
The Fund files a complete schedule of its portfolio holdings for the first and third quarters of its fiscal year with the SEC on Form N-Q. The Fund's Forms N-Q are available on the SEC's website at www.sec.gov and may be reviewed and copied at the SEC's Public Reference Room in Washington, DC. Information on the operation of the SEC's Public Reference Room may be obtained by calling 1-202-551-8090.
47
This page intentionally left blank

P.O. BOX 55030, BOSTON, MA 02205-5030
877-870-2874 n www.credit-suisse.com/us/funds
CREDIT SUISSE SECURITIES (USA) INC, DISTRIBUTOR. FLHI-AR-1012

CREDIT SUISSE FUNDS
Annual Report
October 31, 2012
n CREDIT SUISSE
MULTIALTERNATIVE STRATEGY FUND
The Fund's investment objectives, risks, charges and expenses (which should be considered carefully before investing), and more complete information about the Fund, are provided in the Prospectus, which should be read carefully before investing. You may obtain additional copies by calling 877-870-2874 or by writing to Credit Suisse Funds, P.O. Box 55030, Boston, MA 02205-5030.
Credit Suisse Securities (USA) LLC, Distributor, is located at One Madison Avenue, New York, NY 10010. Credit Suisse Funds are advised by Credit Suisse Asset Management, LLC.
Investors in the Credit Suisse Funds should be aware that they may be eligible to purchase Class I shares (where offered) directly or through certain intermediaries. Such shares are not subject to a sales charge. Investors in the Credit Suisse Funds should also be aware that they may be eligible for a reduction or waiver of the sales charge with respect to Class A or C shares (where offered). For more information, please review the relevant prospectuses or consult your financial representative.
The views of the Fund's management are as of the date of the letter and the Fund holdings described in this document are as of October 31, 2012; these views and Fund holdings may have changed subsequent to these dates. Nothing in this document is a recommendation to purchase or sell securities.
Fund shares are not deposits or other obligations of Credit Suisse Asset Management, LLC ("Credit Suisse") or any affiliate, are not FDIC-insured and are not guaranteed by Credit Suisse or any affiliate. Fund investments are subject to investment risks, including loss of your investment.
Credit Suisse Multialternative Strategy Fund
Annual Investment Adviser's Report
October 31, 2012 (unaudited)
December 6, 2012
Dear Shareholder:
We are pleased to present this Annual Report covering the activities of the Credit Suisse Multialternative Strategy Fund (the "Fund"), formerly known as the Credit Suisse Liquid Alternative Fund, for the seven-month period ended October 31, 2012.
Performance Summary
04/01/12 – 10/31/12*
Fund & Benchmark | | Performance | |
Class I1 | | | -0.50 | % | |
Class A1,2 | | | -0.70 | % | |
Class C1,2 | | | -1.10 | % | |
Dow Jones Credit Suisse Hedge Fund Index3 | | | 1.33 | % | |
Credit Suisse Liquid Alternative Beta Index4 | | | 0.10 | % | |
Performance shown for the Fund's Class A and Class C Shares does not reflect sales charges, which are a maximum of 5.25% and 1.00%, respectively.2
Market Review:
The seven-month period ended October 31, 2012 was a mixed one for alternative investments with the Dow Jones Credit Suisse Hedge Fund Index, the Fund's benchmark, gaining 1.33%. The broader equity market, as represented by the MSCI World Index, returned 0.62% for the period.
Many financial markets this year appear to be primarily driven by government policy rather than fundamentals, causing systematic trading strategies to underperform.
Strategic Review and Outlook:
For the seven-month period ended October 31, 2012, the Fund underperformed its benchmark. The Fund also underperformed its target index, the Credit Suisse Liquid Alternative Beta Index. Managed futures were a persistent performance drag as markets were whipsawed and unable to establish a trend.
Throughout the time period, high yield bonds were the largest exposure for the Fund. While merger arbitrage began the period as the second largest exposure, it was removed in May as deal volume dried up and profit potential was reduced. Large cap technology stocks became the largest directional equity exposure and maintained that position for a majority of the time period.
1
Credit Suisse Multialternative Strategy Fund
Annual Investment Adviser's Report (continued)
October 31, 2012 (unaudited)
Going forward, the Liquid Alternative Beta replication models anticipate that merger arbitrage will continue to be an insignificant driver of hedge fund returns, as deal volumes will likely remain stagnant. Additionally, the dropping exposure to high yield bonds in recent months may be indicative of a pause in the high yield rally. Finally, despite poor recent performance, managed futures will likely remain a significant exposure for the Fund.
The Credit Suisse Liquid Alternative Fund became the Credit Suisse Multialternative Strategy Fund as of October 4, 2012. Additionally, during the period, Sheel Dhande and Alexander De Feo replaced Peter Little on the portfolio management team. The team is still led by Dr. Jordan Drachman.
The Credit Suisse Liquid Alternative Fund Team
Dr. Jordan Drachman
Sheel Dhande
Alexander De Feo
This Fund is non-diversified, which means it may invest a greater proportion of its assets in the securities of a smaller number of issuers than a diversified mutual fund and may therefore be subject to greater volatility. Exposure to commodity markets should only form a small part of a diversified portfolio. Investment in commodity markets may not be suitable for all investors. The Fund's investment in alternative instruments may subject the Fund to greater volatility than investment in traditional securities, particularly in investments involving leverage.
The use of alternative assets and strategies entails substantial risks, including risk of loss of principal, arbitrage or fundamental risk, below investment grade securities risk, commodity exposure risks, concentration risk, derivatives risk, exchange-traded funds risk, exchange-traded notes risk, credit risk, foreign securities risk, liquidity risk, interest rate risk, market risk, forwards risk, futures contracts risk, index/tracking error risk, leveraging risk, swap agreement risk, small-and mid-cap stock risk, speculative exposure risk, valuation risk and tax risk. Gains and losses from speculative positions in derivatives may be much greater than the derivative's cost. For a detailed discussion of these and other risks, please refer to the Fund's Prospectus, which should be read carefully before investing.
In addition to historical information, this report contains forward-looking statements, which may concern, among other things, domestic and foreign market, industry and economic trends and developments and government regulation and their potential impact on the Fund's investments. These statements are subject to risks and uncertainties and actual trends, developments and regulations in the future, and their impact on the Fund could be materially different from those projected, anticipated or implied. The Fund has no obligation to update or revise forward-looking statements.
2
Credit Suisse Multialternative Strategy Fund
Annual Investment Adviser's Report (continued)
October 31, 2012 (unaudited)
Comparison of Change in Value of $10,000 Investment in the
Credit Suisse Multialternative Strategy Fund1 Class I
shares, Class A shares2, Class C shares2, the Dow Jones
Credit Suisse Hedge Fund Index3 and the Credit Suisse
Liquid Alternative Beta Index4 from Inception (3/30/12).
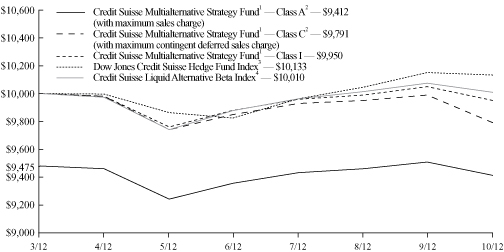
Average Annual Returns as of September 30, 20121
| | | Since
Inception | | Inception
Date | |
Class I | | | 0.50 | % | | 3/30/12 | |
Class A Without Sales Charge | | | 0.30 | % | | 3/30/12 | |
Class A With Maximum Sales Charge | | | (4.93 | )% | | 3/30/12 | |
Class C Without CDSC | | | (0.10 | )% | | 3/30/12 | |
Class C With CDSC | | | (1.10 | )% | | 3/30/12 | |
Average Annual Returns as of October 31, 20121
| | | Since
Inception | | Inception
Date | |
Class I | | | (0.50 | )% | | 3/30/12 | |
Class A Without Sales Charge | | | (0.70 | )% | | 3/30/12 | |
Class A With Maximum Sales Charge | | | (5.88 | )% | | 3/30/12 | |
Class C Without CDSC | | | (1.10 | )% | | 3/30/12 | |
Class C With CDSC | | | (2.09 | )% | | 3/30/12 | |
3
Credit Suisse Multialternative Strategy Fund
Annual Investment Adviser's Report (continued)
October 31, 2012 (unaudited)
Returns represent past performance and include change in share price and reinvestment of dividends and capital gains. Past performance cannot guarantee future results. The current performance of the Fund may be lower or higher than the figures shown. Returns and share price will fluctuate, and redemption value may be more or less than original cost. The performance results do not reflect the deduction of taxes that a shareholder would pay on fund distributions or the redemption of fund shares. Performance information current to the most recent month-end is available at www.credit-suisse.com/us/funds.
The annualized gross expense ratios are 11.01% for Class I shares, 11.26% for Class A shares and 12.01% for Class C shares. The annualized net expense ratios after fee waivers and/or expense reimbursements are 1.79% for Class I shares, 2.04% for Class A shares and 2.79% for Class C shares.
* The Fund commenced operations on March 30, 2012.
1 Fee waivers and/or expense reimbursements may reduce expenses for the Fund, without which performance would be lower.
2 Total return for the Fund's Class A shares for the reporting period, based on offering price (including maximum sales charge of 5.25%), was (5.88%). Total return for the Fund's Class C shares for the reporting period, based on redemption value (including maximum contingent deferred sales charge of 1.00%), was (2.09%).
3 Dow Jones Credit Suisse Hedge Fund Index is compiled by Credit Suisse Hedge Index LLC and CME Group Index Services LLC. It is an asset-weighted hedge fund index and includes only funds, as opposed to separate accounts. The Index uses the Credit Suisse database, which tracks over 9,000 funds, and consists only of funds with a minimum of US$50 million under management, a 12-month track record, and audited financial statements. It is calculated and rebalanced on a monthly basis, and shown net of all performance fees and expenses. An index does not have transaction costs; investors may not invest directly in an index.
4 Using only liquid securities, the Credit Suisse Liquid Alternative Beta Index seeks to replicate the return of the overall hedge fund industry, as represented by the Dow Jones Credit Suisse Hedge Fund Index. An index does not have transactions costs; investors may not invest directly in an index.
4
Credit Suisse Multialternative Strategy Fund
Annual Investment Adviser's Report (continued)
October 31, 2012 (unaudited)
Information About Your Fund's Expenses
As an investor of the Fund, you incur two types of costs: ongoing expenses and transaction costs. Ongoing expenses include management fees, distribution and service (12b-1) fees and other Fund expenses. Examples of transaction costs include sales charges (loads), redemption fees and account maintenance fees, which are not shown in this section and which would result in higher total expenses. The following table is intended to help you understand your ongoing expenses of investing in the Fund and to help you compare these expenses with the ongoing expenses of investing in other mutual funds. The table is based on an investment of $1,000 made at the beginning of the six month period ended October 31, 2012.
The table illustrates your Fund's expenses in two ways:
• Actual Fund Return. This helps you estimate the actual dollar amount of ongoing expenses paid on a $1,000 investment in the Fund using the Fund's actual return during the period. To estimate the expenses you paid over the period, simply divide your account value by $1,000 (for example, an $8,600 account value divided by $1,000 = 8.6), then multiply the result by the number in the "Expenses Paid per $1,000" line under the share class you hold.
• Hypothetical 5% Fund Return. This helps you to compare your Fund's ongoing expenses with those of other mutual funds using the Fund's actual expense ratio and a hypothetical rate of return of 5% per year before expenses. Examples using a 5% hypothetical fund return may be found in the shareholder reports of other mutual funds. The hypothetical account values and expenses may not be used to estimate the actual ending account balance or expenses you paid for the period.
Please note that the expenses shown in these tables are meant to highlight your ongoing expenses only and do not reflect any transaction costs, such as sales charges (loads) or redemption fees. If these transaction costs had been included, your costs would have been higher. The "Expenses Paid per $1,000" line of the tables is useful in comparing ongoing expenses only and will not help you determine the relative total expenses of owning different funds.
5
Credit Suisse Multialternative Strategy Fund
Annual Investment Adviser's Report (continued)
October 31, 2012 (unaudited)
Expenses and Value for a $1,000 Investment
for the six month period ended October 31, 2012
Actual Fund Return | | Class I | | Class A | | Class C | |
Beginning Account Value 5/1/12 | | $ | 1,000.00 | | | $ | 1,000.00 | | | $ | 1,000.00 | | |
Ending Account Value 10/31/12 | | $ | 997.00 | | | $ | 995.00 | | | $ | 991.00 | | |
Expenses Paid per $1,000* | | $ | 8.99 | | | $ | 10.23 | | | $ | 13.96 | | |
Hypothetical 5% Fund Return | |
Beginning Account Value 5/1/12 | | $ | 1,000.00 | | | $ | 1,000.00 | | | $ | 1,000.00 | | |
Ending Account Value 10/31/12 | | $ | 1,016.14 | | | $ | 1,014.88 | | | $ | 1,011.11 | | |
Expenses Paid per $1,000* | | $ | 9.07 | | | $ | 10.33 | | | $ | 14.10 | | |
| �� | | Class I | | Class A | | Class C | |
Annualized Expense Ratios* | | | 1.79 | % | | | 2.04 | % | | | 2.79 | % | |
* Expenses are equal to the Fund's annualized expense ratio for each share class, multiplied by the average account value over the period, multiplied by the number of days in the most recent period, then divided by 366.
The "Expenses Paid per $1,000" and the "Annualized Expense Ratios" in the tables are based on actual expenses paid by the Fund during the period, net of fee waivers and/or expense reimbursements. If those fee waivers and/or expense reimbursements had not been in effect, the Fund's actual expenses would have been higher.
For more information, please refer to the Fund's prospectus.
Sector Breakdown* | |
Exchange Traded Funds | | | 13.79 | % | |
Short-term Investments | | | 86.21 | % | |
Total | | | 100.00 | % | |
* Expressed as a percentage of total investments (excluding securities lending collateral if applicable) and may vary over time.
6
Credit Suisse Multialternative Strategy Fund
Consolidated Schedule of Investments
October 31, 2012
| | | Number of
Shares | | Value | |
| EXCHANGE TRADED FUNDS (12.1%) | |
| UNITED STATES (12.1%) | |
| Diversified Financial Services (12.1%) | |
iShares iBoxx $ High Yield Corporate Bond Fund | | | 3,186 | | | $ | 295,119 | | |
iShares Russell 2000 Index Fund§ | | | 1,328 | | | | 107,887 | | |
Powershares QQQ Trust Series 1§ | | | 4,608 | | | | 299,289 | | |
Vanguard MSCI Emerging Markets ETF | | | 1,165 | | | | 48,336 | | |
| TOTAL EXCHANGE TRADED FUNDS (Cost $745,866) | | | 750,631 | | |
| SHORT-TERM INVESTMENTS (82.3%) | |
State Street Navigator Prime Portfolio, 0.31%§§ | | | 417,808 | | | | 417,808 | | |
| | | Par
(000) | | | |
State Street Bank and Trust Co. Euro Time Deposit, 0.010%, 11/01/2012 | | $ | 4,691 | | | | 4,691,000 | | |
| TOTAL SHORT-TERM INVESTMENTS (Cost $5,108,808) | | | 5,108,808 | | |
| TOTAL INVESTMENTS AT VALUE (94.4%) (Cost $5,854,674) | | | 5,859,439 | | |
| OTHER ASSETS IN EXCESS OF LIABILITIES (5.6%) | | | 346,401 | | |
| NET ASSETS (100.0%) | | $ | 6,205,840 | | |
§ Security or portion thereof is out on loan.
§§ Represents security purchased with cash collateral received for securities on loan. The rate shown is the annualized one-day yield at October 31, 2012.
See Accompanying Notes to Financial Statements.
7
Credit Suisse Multialternative Strategy Fund
Consolidated Statement of Assets and Liabilities
October 31, 2012
Assets | |
Investments at value, including collateral for securities on loan of $417,808
(Cost $5,854,674) (Note 2) | | $ | 5,859,4391 | | |
Cash | | | 289 | | |
Foreign currency at value (cost $24,691) | | | 24,588 | | |
Cash segregated at brokers for futures contracts | | | 81,359 | | |
Cash segregated at brokers for written option | | | 725,000 | | |
Offering costs (Note 3) | | | 89,584 | | |
Unrealized appreciation on forward currency contracts (Note 2) | | | 7,138 | | |
Receivable for fund shares sold | | | 31 | | |
Prepaid expenses and other assets | | | 16,934 | | |
Total Assets | | | 6,804,362 | | |
Liabilities | |
Advisory fee payable (Note 3) | | | 15,520 | | |
Administrative services fee payable (Note 3) | | | 1,452 | | |
Shareholder servicing/Distribution fee payable (Note 3) | | | 929 | | |
Payable upon return of securities loaned (Note 2) | | | 417,808 | | |
Outstanding written options, at value (Proceeds $10,465) (Note 2) | | | 24,535 | | |
Unrealized loss on open futures contracts (Note 2) | | | 21,941 | | |
Trustees' fee payable | | | 14,960 | | |
Unrealized depreciation on open swap contracts (Note 2) | | | 10,212 | | |
Interest payable for open swap contracts | | | 413 | | |
Other accrued expenses payable | | | 90,752 | | |
Total Liabilities | | | 598,522 | | |
Net Assets | |
Capital stock, $.001 par value (Note 6) | | | 625 | | |
Paid-in capital (Note 6) | | | 6,232,749 | | |
Undistributed net investment income | | | 6,991 | | |
Accumulated net realized loss on investments, futures contracts, written options, short sales,
swap contracts and foreign currency transactions | | | (102 | ) | |
Net unrealized depreciation from investments, futures contracts, written options,
swap contracts and foreign currency translations | | | (34,423 | ) | |
Net Assets | | $ | 6,205,840 | | |
I Shares | |
Net assets | | $ | 4,904,046 | | |
Shares outstanding | | | 492,997 | | |
Net asset value and offering price per share | | $ | 9.95 | | |
A Shares | |
Net assets | | $ | 227,784 | | |
Shares outstanding | | | 22,931 | | |
Net asset value and redemption price per share | | $ | 9.93 | | |
Maximum offering price per share (net asset value/(1-5.25%)) | | $ | 10.48 | | |
C Shares | |
Net assets | | $ | 1,074,010 | | |
Shares outstanding | | | 108,606 | | |
Net asset value, offering price and redemption price per share | | $ | 9.89 | | |
1 Including $407,694 of securities on loan.
See Accompanying Notes to Financial Statements.
8
Credit Suisse Multialternative Strategy Fund
Consolidated Statement of Operations
For the Period Ended October 31, 20121
| Investment Income (Note 2) | |
Dividends | | $ | 64,772 | | |
Interest | | | 237 | | |
Securities lending | | | 1,862 | | |
Foreign taxes withheld | | | (212 | ) | |
Total investment income | | | 66,659 | | |
Expenses | |
Investment advisory fees (Note 3) | | | 38,844 | | |
Administrative services fees (Note 3) | | | 4,971 | | |
Shareholder servicing/Distribution fees (Note 3) | |
Class A | | | 244 | | |
Class C | | | 3,636 | | |
Offering costs (Note 3) | | | 125,417 | | |
Audit and tax fees | | | 50,667 | | |
Legal fees | | | 45,767 | | |
Trustees' fees | | | 30,433 | | |
Printing fees (Note 3) | | | 30,000 | | |
Organizational costs | | | 21,842 | | |
Transfer agent fees | | | 5,204 | | |
Registration fees | | | 4,619 | | |
Custodian fees | | | 4,198 | | |
Dividend expense for securities sold short | | | 2,964 | | |
Short sales expense | | | 352 | | |
Insurance expense | | | 41 | | |
Commitment fees (Note 4) | | | 15 | | |
Miscellaneous expense | | | 6,500 | | |
Total expenses | | | 375,714 | | |
Less: fees waived and expenses reimbursed (Note 3) | | | (311,446 | ) | |
Net expenses | | | 64,268 | | |
Net investment income | | | 2,391 | | |
Net Realized and Unrealized Gain (Loss) from Investments, Futures Contracts,
Written Options, Short Sales, Swap Contracts and Foreign Currency Related Items | |
Net realized gain from investments | | | 3,478 | | |
Net realized loss from short sales | | | (2,896 | ) | |
Net realized loss from futures contracts | | | (33,774 | ) | |
Net realized gain from written options | | | 21,139 | | |
Net realized gain from swap contracts | | | 858 | | |
Net realized loss from foreign currency transactions | | | (15,275 | ) | |
Net change in unrealized appreciation (depreciation) from investments | | | 4,765 | | |
Net change in unrealized appreciation (depreciation) from futures contracts | | | (21,941 | ) | |
Net change in unrealized appreciation (depreciation) from written options | | | (14,070 | ) | |
Net change in unrealized appreciation (depreciation) from swap contracts | | | (10,212 | ) | |
Net change in unrealized appreciation (depreciation) from foreign currency translations | | | 7,035 | | |
Net realized and unrealized loss from investments, futures contracts, written options,
swap contracts and foreign currency related items | | | (60,893 | ) | |
Net decrease in net assets resulting from operations | | $ | (58,502 | ) | |
1 For the period March 30, 2012 (commencement of operations) through October 31, 2012.
See Accompanying Notes to Financial Statements.
9
Credit Suisse Multialternative Strategy Fund
Consolidated Statement of Changes in Net Assets
| | | For the Period
Ended
October 31, 20121 | |
From Operations | |
Net investment income | | $ | 2,391 | | |
Net realized loss from investments, futures contracts, written options,
short sales, swap contracts and foreign currency transactions | | | (26,470 | ) | |
Net change in unrealized appreciation (depreciation) from investments,
futures contracts, written options, short sales, swap contracts and foreign
currency translations | | | (34,423 | ) | |
Net decrease in net assets resulting from operations | | | (58,502 | ) | |
| From Capital Share Transactions (Note 6) | |
Proceeds from sale of shares | | | 8,224,935 | | |
Net asset value of shares redeemed | | | (1,960,593 | ) | |
Net increase in net assets from capital share transactions | | | 6,264,342 | | |
Net increase in net assets | | | 6,205,840 | | |
Net Assets | |
Beginning of period | | | — | | |
End of period | | $ | 6,205,840 | | |
Undistributed net investment income | | $ | 6,991 | | |
1 For the period March 30, 2012 (commencement of operations) through October 31, 2012.
See Accompanying Notes to Financial Statements.
10
Credit Suisse Multialternative Strategy Fund
Consolidated Statement of Cash Flows
For the Year Ended October 31, 2012
Cash flows from operating activities | |
Investment income received | | $ | 66,659 | | | | | | |
Operating expenses paid | | | 42,793 | | | | | | |
Realized loss on futures contracts | | | (33,774 | ) | | | | | |
Realized gain on swap contracts | | | 858 | | | | | | |
Realized gain on written options | | | 21,139 | | | | | | |
Proceeds for written options | | | 10,465 | | | | | | |
Cash segragated at brokers for futures contracts | | | (806,359 | ) | | | | | |
Offering costs | | | (89,584 | ) | | | | | |
Purchases of investment securities | | | (5,254,210 | ) | | | | | |
Proceeds from disposition of investment securities | | | 4,508,926 | | | | | | |
Purchases of short-term securities, net | | | (4,691,000 | ) | | | | | |
| Net cash used in operating activities | | | | | | $ | (6,224,087 | ) | |
Cash flows from financing activities | |
Proceeds from sales of shares | | | 8,224,935 | | | | | | |
Net asset value of share redeemed | | | (1,960,593 | ) | | | | | |
Net cash provided by financing activities | | | | | | | 6,264,342 | | |
Effect of exchange rate on cash | | | | | | | (15,378 | ) | |
Net decrease in cash | | | | | | | 24,877 | | |
Cash — beginning of year | | | | | | | — | | |
| Cash — end of year | | | | | | $ | 24,877 | | |
RECONCILIATION OF NET INCREASE IN NET ASSETS FROM OPERATIONS TO
NET CASH USED IN OPERATING ACTIVITIES | |
Net increase in net assets resulting from operations | | | | $ | (58,502 | ) | |
Adjustments to Reconcile Net Increase in Net Assets from Operations to
Net Cash Used in Operating Activities | |
Change in accrued expenses | | $ | 108,093 | | | | | | |
Change in interest payable | | | 413 | | | | | | |
Change in prepaid expenses and other assets | | | (16,965 | ) | | | | | |
Change in advisory fees payable | | | 15,520 | | | | | | |
Change in offering costs | | | (89,584 | ) | | | | | |
Change in cash segragated at brokers | | | (806,359 | ) | | | | | |
Purchases of investment securities | | | (5,254,210 | ) | | | | | |
Proceeds from disposition of investment securities | | | 4,508,926 | | | | | | |
Proceeds for written options | | | 10,465 | | | | | | |
Purchases of short-term securities, net | | | (4,691,000 | ) | | | | | |
Net change in unrealized appreciation from investments | | | (4,765 | ) | | | | | |
Net change in unrealized appreciation from foreign currency translations | | | (7,035 | ) | | | | | |
Net change in unrealized appreciation from futures contracts | | | 21,941 | | | | | | |
Net change in unrealized appreciation from written options | | | 14,070 | | | | | | |
Net change in unrealized appreciation from swap contracts | | | 10,212 | | | | | | |
Net realized gain from investments | | | (3,478 | ) | | | | | |
Net realized loss on short sales | | | 2,896 | | | | | | |
Net realized loss on foreign currency transactions | | | 15,275 | | | | | | |
Total adjustments | | | | | | | (6,165,585 | ) | |
Net cash used in operating activities | | | | $ | (6,224,087 | ) | |
See Accompanying Notes to Financial Statements.
11
Credit Suisse Multialternative Strategy Fund
Financial Highlights
(For a Class I Share of the Fund Outstanding Throughout the Period)
| | | For the Period
Ended
October 31, 20121 | |
Per share data | |
Net asset value, beginning of period | | $ | 10.00 | | |
INVESTMENT OPERATIONS | |
Net investment income2 | | | 0.01 | | |
Net loss on investments, futures contracts, written options, short sales, swap contracts
and foreign currency related items (both realized and unrealized) | | | (0.06 | ) | |
Total from investment operations | | | (0.05 | ) | |
Net asset value, end of period | | $ | 9.95 | | |
Total return3 | | | (0.50 | )% | |
RATIOS AND SUPPLEMENTAL DATA | |
Net assets, end of period (000s omitted) | | $ | 4,904 | | |
Ratio of expenses to average net assets | | | 1.79 | %4 | |
Ratio of expenses to average net assets excluding short sales dividend expense | | | 1.70 | %4 | |
Ratio of net investment income to average net assets | | | 0.21 | %4 | |
Decrease reflected in above operating expense ratios due to waivers/reimbursements | | | 9.22 | %4 | |
Portfolio turnover rate | | | 228 | % | |
1 For the period March 30, 2012 (commencement of operations) through October 31, 2012.
2 Per share information is calculated using the average shares outstanding method.
3 Total returns are historical and assume changes in share price and reinvestment of all dividends and distributions. Had certain expenses not been reduced during the periods shown, total returns would have been lower. Total returns for periods less than one year are not annualized.
4 Annualized.
See Accompanying Notes to Financial Statements.
12
Credit Suisse Multialternative Strategy Fund
Financial Highlights
(For a Class A Share of the Fund Outstanding Throughout the Period)
| | | For the Period
Ended
October 31, 20121 | |
Per share data | |
Net asset value, beginning of period | | $ | 10.00 | | |
INVESTMENT OPERATIONS | |
Net investment loss2 | | | (0.01 | ) | |
Net loss on investments, futures contracts, written options, short sales, swap contracts
and foreign currency related items (both realized and unrealized) | | | (0.06 | ) | |
Total from investment operations | | | (0.07 | ) | |
Net asset value, end of period | | $ | 9.93 | | |
Total return3 | | | (0.70 | )% | |
RATIOS AND SUPPLEMENTAL DATA | |
Net assets, end of period (000s omitted) | | $ | 228 | | |
Ratio of expenses to average net assets | | | 2.04 | %4 | |
Ratio of expenses to average net assets excluding short sales dividend expense | | | 1.95 | %4 | |
Ratio of net investment loss to average net assets | | | (0.18 | )%4 | |
Decrease reflected in above operating expense ratios due to waivers/reimbursements | | | 9.22 | %4 | |
Portfolio turnover rate | | | 228 | % | |
1 For the period March 30, 2012 (commencement of operations) through October 31, 2012.
2 Per share information is calculated using the average shares outstanding method.
3 Total returns are historical and assume changes in share price, reinvestment of all dividends and distributions and no sales charge. Had certain expenses not been reduced during the periods shown, total returns would have been lower. Total returns for periods less than one year are not annualized.
4 Annualized.
See Accompanying Notes to Financial Statements.
13
Credit Suisse Multialternative Strategy Fund
Financial Highlights
(For a Class C Share of the Fund Outstanding Throughout the Period)
| | | For the Period
Ended
October 31, 20121 | |
Per share data | |
Net asset value, beginning of period | | $ | 10.00 | | |
INVESTMENT OPERATIONS | |
Net investment loss2 | | | (0.06 | ) | |
Net loss on investments, futures contracts, written options, short sales, swap contracts
and foreign currency related items (both realized and unrealized) | | | (0.05 | ) | |
Total from investment operations | | | (0.11 | ) | |
Net asset value, end of period | | $ | 9.89 | | |
Total return3 | | | (1.10 | )% | |
RATIOS AND SUPPLEMENTAL DATA | |
Net assets, end of period (000s omitted) | | $ | 1,074 | | |
Ratio of expenses to average net assets | | | 2.79 | %4 | |
Ratio of expenses to average net assets excluding short sales dividend expense | | | 2.70 | %4 | |
Ratio of net investment loss to average net assets | | | (1.00 | )%4 | |
Decrease reflected in above operating expense ratios due to waivers/reimbursements | | | 9.22 | %4 | |
Portfolio turnover rate | | | 228 | % | |
1 For the period March 30, 2012 (commencement of operations) through October 31, 2012.
2 Per share information is calculated using the average shares outstanding method.
3 Total returns are historical and assume changes in share price, reinvestment of all dividends and distributions and no sales charge. Had certain expenses not been reduced during the periods shown, total returns would have been lower. Total returns for periods less than one year are not annualized.
4 Annualized.
See Accompanying Notes to Financial Statements.
14
Credit Suisse Multialternative Strategy Fund
Notes to Consolidated Financial Statements
October 31, 2012
Credit Suisse Multialternative Strategy Fund (the "Fund"), a series of the Credit Suisse Opportunity Funds (the "Trust"), a Delaware statutory trust, is registered under the Investment Company Act of 1940, as amended (the "1940 Act"), as a non-diversified open-end management investment company that seeks to achieve investment results that correspond generally to the performance before fees and expenses of the Credit Suisse Liquid Alternative Beta Index. The Trust was organized under the laws of the State of Delaware as a business trust on May 31, 1995. The Fund commenced operations on March 30, 2012. Effective October 4, 2012, the name of the Fund was changed from Credit Suisse Liquid Alternative Fund. The Fund may gain exposure to commodities and commodity-linked derivatives through investments in a wholly-owned subsidiary, Credit Suisse Cayman Multialternative Strategy Fund, Ltd., organized under the laws of the Cayman Islands (the "Subsidiary"). Among other investments, the Subsidiary may invest in commodity-linked derivative instruments, such as swaps and futures. The Subsidiary may also invest in debt securities, some of which are intended to serve as margin or collateral for the Subsidiary's derivatives positions. The Subsidiary is managed by the same portfolio managers that manage the Fund. As of October 31, 2012, the Fund held $1,114,080 in the Subsidiary, representing 17.9% of the Fund's assets.
The Fund offers three classes of shares: Class I shares, Class A shares and Class C shares. Each class of shares represents an equal pro rata interest in the Fund, except that they bear different expenses, which reflect the differences in the range of services provided to them. Class A shares are sold subject to a front-end sales charge of 5.25%. Class C shares are sold subject to a contingent deferred sales charge of 1.00% if the shares are redeemed within the first year of purchase.
Note 2. Significant Accounting Policies
A) SECURITY VALUATION — The net asset value of the Fund is determined daily as of the close of regular trading on the New York Stock Exchange, Inc. (the "Exchange") on each day the Exchange is open for business. Equity investments are valued at market value, which is generally determined using the closing price on the exchange or market on which the security is primarily traded at the time of valuation (the "Valuation Time"). If no sales are reported, equity investments are generally valued at the most recent bid quotation as of the Valuation Time or at the lowest asked quotation in the case of a short sale of securities. Equity investments and exchange traded funds are generally categorized as Level 1. Investments in open-end investment companies are
15
Credit Suisse Multialternative Strategy Fund
Notes to Consolidated Financial Statements (continued)
October 31, 2012
Note 2. Significant Accounting Policies
valued at their net asset value each business day and are generally categorized as Level 1. Futures contracts are valued at the settlement prices established each day on the exchange on which they are traded and are generally categorized as Level 1. Option contracts are valued at market value, which is generally determined using the closing price on the exchange or market on which the security is primarily traded at the time of valuation and are generally categorized as Level 1. Debt securities with a remaining maturity greater than 60 days are valued in accordance with the price supplied by a pricing service, which may use a matrix, formula or other objective method that takes into consideration market indices, yield curves and other specific adjustments. Debt obligations that will mature in 60 days or less are valued on the basis of amortized cost, which approximates market value, unless it is determined that using this method would not represent fair value. Debt securities are generally categorized as Level 2. Forward currency contracts are valued at the prevailing forward exchange rate of the underlying currencies and are generally categorized as Level 2. Swap contracts are generally valued at a price at which the counterparty to such contract would repurchase the instrument or terminate the contract and are generally categorized as Level 2. Securities, options, swaps, futures contracts and other assets for which market quotations are not readily available, or whose values have been materially affected by events occurring before the Fund's Valuation Time but after the close of the securities' primary markets, are valued at fair value as determined in good faith by, or under the direction of, the Board of Trustees under procedures established by the Board of Trustees and are generally categorized as Level 3. The Fund may utilize a service provided by an independent third party which has been approved by the Board of Trustees to fair value certain securities. The Fund also may use fair value procedures if Credit Suisse determines that a significant event has occurred between the time at which a market price is determined and the time at which the Fund's net asset value is calculated. In particular, the value of foreign securities may be materially affected by events occurring after the close of the market on which they are valued, but before the Fund prices its shares. The Fund may utilize a fair value model developed by an independent third party pricing service to price foreign equity securities on days when there is a certain percentage change in the value of a domestic equity security index, as such percentage may be determined by Credit Suisse from time to time. The Subsidiary is subject to the same valuation policies as the Fund. When fair value pricing is employed, the prices of securities used by the Fund to calculate its net asset value may differ from quoted or published prices for the same securities.
In accordance with the authoritative guidance on fair value measurements and disclosures under accounting principles generally accepted in the United
16
Credit Suisse Multialternative Strategy Fund
Notes to Consolidated Financial Statements (continued)
October 31, 2012
Note 2. Significant Accounting Policies
States of America ("GAAP"), the Fund discloses the fair value of its investments in a hierarchy that prioritizes the inputs to valuation techniques used to measure the fair value. In accordance with GAAP, fair value is defined as the price that the Fund would receive upon selling an investment in a timely transaction to an independent buyer in the principal or most advantageous market of the investment. GAAP established a three-tier hierarchy to maximize the use of observable market data and minimize the use of unobservable inputs and to establish classification of fair value measurements for disclosure purposes. Inputs refer broadly to the assumptions that market participants would use in pricing the asset or liability, including assumptions about risk, for example, the risk inherent in a particular valuation technique used to measure fair value including such a pricing model and/or the risk inherent in the inputs to the valuation technique. Inputs may be observable or unobservable. Observable inputs are inputs that reflect the assumptions market participants would use in pricing the asset or liability developed based on market data obtained from sources independent of the reporting entity. Unobservable inputs are inputs that reflect the reporting entity's own assumptions about the assumptions market participants would use in pricing the asset or liability developed based on the best information available in the circumstances. In accordance with the Fund's valuation procedures, factors used in determining value may include, but are not limited to, the type of the security, the size of the holding, the initial cost of the security, the existence of any contractual restrictions on the security's disposition, the price and extent of public trading in similar securities of the issuer or of comparable companies, quotations or evaluated prices from broker-dealers and/or pricing services, information obtained from the issuer, analysts, and/or the appropriate stock exchange (for exchange-traded securities), an analysis of the company's or issuer's financial statements, an evaluation of the forces that influence the issuer and the market(s) in which the security is purchased and sold and with respect to debt securities, the maturity, coupon, creditworthiness, currency denomination, and the movement of the market in which the security is normally traded. The three-tier hierarchy of inputs is summarized in the three broad Levels listed below.
• Level 1 – quoted prices in active markets for identical investments
• Level 2 – other significant observable inputs (including quoted prices for similar investments, interest rates, prepayment speeds, credit risk, etc.)
• Level 3 – significant unobservable inputs (including the Fund's own assumptions in determining the fair value of investments)
The inputs or methodology used for valuing securities are not necessarily an indication of the risk associated with investing in those securities.
17
Credit Suisse Multialternative Strategy Fund
Notes to Consolidated Financial Statements (continued)
October 31, 2012
Note 2. Significant Accounting Policies
The following is a summary of the inputs used as of October 31, 2012 in valuing the Fund's investments carried at value:
| | | Level 1 | | Level 2 | | Level 3 | | Total | |
Investments in Securities | |
Exchange Traded Funds | | $ | 750,631 | | | $ | — | | | $ | — | | | $ | 750,631 | | |
Short-Term Investments | | | 417,808 | | | | 4,691,000 | | | | — | | | | 5,108,808 | | |
Other Financial Instruments* | |
Futures Contracts | | | (21,941 | ) | | | — | | | | — | | | | (21,941 | ) | |
Forward Foreign Currency Contracts | | | — | | | | 7,138 | | | | — | | | | 7,138 | | |
Swap Contracts | | | — | | | | (10,212 | ) | | | — | | | | (10,212 | ) | |
Written Options | | | (24,535 | ) | | | — | | | | — | | | | (24,535 | ) | |
| | | $ | 1,121,963 | | | $ | 4,687,926 | | | $ | — | | | $ | 5,809,889 | | |
*Other financial instruments include futures, forwards, swaps and written options.
The Fund adopted FASB amendments to authoritative guidance which require the Fund to disclose details of transfers in and out of Level 1 and Level 2 measurements and Level 2 and Level 3 measurements and the reasons for the transfers. For the period ended October 31, 2012, there were no transfers in and out of Level 1, Level 2 and Level 3.
B) DERIVATIVE INSTRUMENTS AND HEDGING ACTIVITIES — The Fund adopted amendments to authoritative guidance on disclosures about derivative instruments and hedging activities which require that the Fund disclose (a) how and why an entity uses derivative instruments, (b) how derivative instruments and hedging activities are accounted for, and (c) how derivative instruments and related hedging activities affect a fund's financial position, financial performance, and cash flows. The Fund has not entered into any derivative or hedging activities during the period covered by this report.
Fair Values of Derivative Instruments as of October 31, 2012
| | Asset Derivatives | | Liability Derivatives | |
| | Balance Sheet
Location | | Fair Value | | Balance Sheet
Location | | Fair Value | |
Foreign Exchange
Contracts
| | Unrealized appreciation/
depreciation on forward
currency contracts | | $ | 11,893 | * | | Unrealized appreciation/
depreciation on forward
currency contracts | | $ | 4,755 | * | |
| | Unrealized gain/loss on
open futures contracts | | | 912 | * | | Unrealized gain/loss on
open futures contracts | | | 4,675 | * | |
Index Contracts
| | Unrealized gain/loss on
open futures contracts | | | — | * | | Unrealized gain/loss on
open futures contracts | | | 18,541 | * | |
| | Unrealized appreciation/
depreciation on open
swap contracts | | | 7,390 | * | | Unrealized appreciation/
depreciation on open
swap contracts | | | 17,602 | * | |
| | Outstanding written
options at value | | | — | * | | Outstanding written
options at value | | | 24,535 | * | |
18
Credit Suisse Multialternative Strategy Fund
Notes to Consolidated Financial Statements (continued)
October 31, 2012
Note 2. Significant Accounting Policies
| | Asset Derivatives | | Liability Derivatives | |
| | Balance Sheet
Location | | Fair Value | | Balance Sheet
Location | | Fair Value | |
Interest Rate
Contracts | | Unrealized gain/loss on
open futures contracts | | $ | 363 | * | | Unrealized gain/loss on
open futures contracts | | $ | — | * | |
Total | | | | $ | 20,558 | | | | | $ | 70,108 | | |
*Includes cumulative appreciation/depreciation of forward currency contracts, futures contracts, and swap contracts as reported in the Statement of Assets and Liabilities and Notes to Financial Statements. For futures contracts only the unrealized loss is reported within the Statement of Assets and Liabilities. Written options are reported at market value.
Effect of Derivative Instruments on the Statement of Operations
| | Location | | Realized
Gain/Loss | | Location | | Unrealized
Appreciation/
Depreciation | |
Foreign Exchange
Contracts
| | Net realized loss
from foreign
currency contracts | | $ | (15,525 | ) | | Net change in unrealized
appreciation (depreciation) from
foreign currency contracts | | $ | 7,138 | | |
| | Net realized loss
from futures
contracts | | | (18,923 | ) | | Net change in unrealized
appreciation (depreciation) from
futures contracts | | | (3,763 | ) | |
Index Contracts
| | Net realized loss
from futures
contracts | | | (25,111 | ) | | Net change in unrealized
appreciation (depreciation) from
futures contracts | | | (18,541 | ) | |
| | Net realized gain
from written
options | | | 21,139 | | | Net change in unrealized
appreciation (depreciation) from
written options | | | (14,070 | ) | |
| | Net realized gain
from swap
contracts | | | 858 | | | Net change in unrealized
appreciation (depreciation) from
swap contracts | | | (10,212 | ) | |
Interest Rate
Contracts
| | Net realized loss
from futures
contracts | | | 10,260 | | | Net change in unrealized
appreciation (depreciation) from
futures contracts | | | 363 | | |
Total | | | | $ | (27,302 | ) | | | | $ | (39,085 | ) | |
The notional amount of futures contracts, forward foreign currency contracts, swap contracts and written options at period ended are reflected in the Notes to Financial Statements. The notional amounts of long and short open positions of futures contracts, forward foreign currency contracts, swap contracts and written options at each month end throughout the reporting period averaged approximately 27.1%, 5.4%, 8.6% and 0.1%, respectively of net assets of the Fund.
C) SECURITY TRANSACTIONS AND INVESTMENT INCOME — Security transactions are accounted for on a trade date basis. Interest income is recorded on the accrual basis. The Fund amortizes premiums and accretes discounts
19
Credit Suisse Multialternative Strategy Fund
Notes to Consolidated Financial Statements (continued)
October 31, 2012
Note 2. Significant Accounting Policies
using the effective interest method. Dividends are recorded on the ex-dividend date. Certain expenses are class-specific expenses and vary by class. Income, expenses (excluding class-specific expenses) and realized/unrealized gains/losses are allocated proportionately to each class of shares based upon the relative net asset value of the outstanding shares of that class. The cost of investments sold is determined by use of the specific identification method for both financial reporting and income tax purposes.
D) DIVIDENDS AND DISTRIBUTIONS TO SHAREHOLDERS — Dividends from net investment income, if any, are declared and paid quarterly and recorded on ex-dividend date. Distributions of net realized capital gains, if any, are declared and paid at least annually. However, to the extent that a net realized capital gain can be reduced by a capital loss carryforward, such gain will not be distributed. Income and capital gain distributions are determined in accordance with federal income tax regulations, which may differ from GAAP.
E) FEDERAL INCOME TAXES — No provision is made for federal taxes as it is the Fund's intention to continue to qualify for and elect the tax treatment applicable to regulated investment companies ("RIC") under the Internal Revenue Code of 1986, as amended (the "Code"), and to make the requisite distributions to its shareholders, which will be sufficient to relieve it from federal income and excise taxes.
In order to qualify as a RIC under the Code, the Fund must meet certain requirements regarding the source of its income, the diversification of its assets and the distribution of its income. One of these requirements is that the Fund derive at least 90% of its gross income for each taxable year from dividends, interest, payments with respect to certain securities loans, gains from the sale or other disposition of stock, securities or foreign currencies, other income derived with respect to its business of investing in such stock, securities or currencies or net income derived from interests in certain publicly traded partnerships ("Qualifying Income"). The IRS has issued a ruling that income realized from certain types of commodity-linked derivatives would not be Qualifying Income. As a result, the Fund's ability to realize income from investments in such commodity-linked derivatives as part of its investment strategy would be limited to a maximum of 10% of its gross income. The IRS has issued private letter rulings to registered investment companies concluding that income derived from their investment in a wholly-owned subsidiary would constitute Qualifying Income to the fund. The IRS has indicated that the granting of these types of private letter rulings is currently suspended, pending further internal discussion. As a result, the Fund has not received and
20
Credit Suisse Multialternative Strategy Fund
Notes to Consolidated Financial Statements (continued)
October 31, 2012
Note 2. Significant Accounting Policies
there can be no assurance that the IRS will grant, such a private letter ruling to the Fund. If the Fund does not request and receive such a private letter ruling, there is a risk that the IRS could assert that the income derived from the Fund's investment in the Subsidiary will not be considered Qualifying Income for purposes of the fund remaining qualified as a RIC for U.S. federal income tax purposes. If the Fund fails to qualify as a RIC, the Fund may be required to change its investment objective, policies or techniques, or may be liquidated. Further, if the Fund fails to qualify as a RIC, the Fund will be subject to federal income tax on its net income and capital gains at regular corporate rates (without reduction for distributions to shareholders). If the Fund were to fail to qualify as a RIC and become subject to federal income tax, shareholders of the Fund would be subject to the risk of diminished returns.
The Fund adopted the authoritative guidance for uncertainty in income taxes and recognizes a tax benefit or liability from an uncertain position only if it is more likely than not that the position is sustainable based solely on its technical merits and consideration of the relevant taxing authority's widely understood administrative practices and procedures. The Fund has reviewed its current tax positions and has determined that no provision for income tax is required in the Fund's financial statements. The Fund's federal tax returns for the prior three fiscal years remain subject to examination by the Internal Revenue Service.
F) USE OF ESTIMATES — The preparation of the consolidated financial statements in conformity with GAAP requires management to make estimates and assumptions that affect the reported amounts of assets and liabilities and disclosure of contingent assets and liabilities at the date of the financial statements and the reported amounts of income and expenses during the reporting period. Actual results could differ from these estimates. The consolidated financial statements include the accounts of the Fund and the Subsidiary. All inter-company transactions and balances have been eliminated.
G) SHORT-TERM INVESTMENTS — The Fund, together with other funds/portfolios advised by Credit Suisse, an indirect, wholly-owned subsidiary of Credit Suisse Group AG, pools available cash into a short-term variable rate time deposit issued by State Street Bank and Trust Company ("SSB"), the Fund's custodian. The short-term time deposit issued by SSB is a variable rate account classified as a short-term investment.
H) SHORT SALES — The Fund enters into short sales transactions collateralized by cash deposits received from brokers in connection with securities lending activities (see note N) and securities. Cash deposits are shown as cash segregated at brokers on the Statement of Assets and Liabilities.
21
Credit Suisse Multialternative Strategy Fund
Notes to Consolidated Financial Statements (continued)
October 31, 2012
Note 2. Significant Accounting Policies
The collateral amounts required are determined daily by reference to the market value of the short positions. Short sales expose the Fund to the risk that it will be required to cover its short position at a time when the securities have appreciated in value, thus resulting in a loss to the Fund. The Fund's loss on a short sale could theoretically be unlimited in a case where the Fund is unable, for whatever reason, to close out its short position. Short sales also involve transaction and other costs that will reduce potential gains and increase potential Fund losses. The use by the Fund of short sales in combination with long positions in the Fund in an attempt to improve performance may not be successful and may result in greater losses or lower positive returns than if the Fund held only long positions. It is possible that the Fund's long equity positions will decline in value at the same time that the value of the securities it has sold short increases, thereby increasing potential losses to the Fund. In addition, the Fund's short selling strategies may limit its ability to fully benefit from increases in the equity markets. Short selling also involves a form of financial leverage that may exaggerate any losses realized by the Fund. Also, there is the risk that the counterparty to a short sale may fail to honor its contractual terms, causing a loss to the Fund.
I) CHANGE IN ACCOUNTING POLICY — INVESTMENT IN CREDIT SUISSE CAYMAN MULTIALTERNATIVE STRATEGY FUND, LTD. — The accompanying financial statements reflect the financial position of the Fund and its Subsidiary and the results of operations on a consolidated basis. Prior to October 31, 2012, the financial statements for the Fund reflected its wholly owned Subsidiary as a single investment. As a result of the change in accounting policy the fund consolidates the assets and liabilities as well as its operations of the wholly owned Subsidiary within its financial statements. The change in policy was implemented to provide shareholders of the Fund with a more accurate and transparent portrayal of the Fund's investment strategy, financial position and the results of its operations and more fully reflects the fact that the sole purpose of the Subsidiary is to serve as a vehicle through which the Fund gains additional exposure to commodities. The result of the policy change did not have an impact on total net assets of the Fund. The Fund's investment portfolio has been consolidated and includes the accounts of the Fund and the Subsidiary. The consolidated financial statements include portfolio holdings of the Fund and the Subsidiary. All intercompany transactions and balances have been eliminated. The Fund may invest up to 25% of its total assets in the Subsidiary.
J) FUTURES — The Fund may enter into futures contracts to the extent permitted by its investment policies and objectives. The Fund may use futures contracts to gain exposure to, or hedge against changes in interest rates, equity and market price movements and/or currency risks. Upon entering into a futures contract, the Fund is required to deposit cash and/or pledge U.S. Government
22
Credit Suisse Multialternative Strategy Fund
Notes to Consolidated Financial Statements (continued)
October 31, 2012
Note 2. Significant Accounting Policies
securities as initial margin. Subsequent payments, which are dependent on the daily fluctuations in the value of the underlying instrument, are made or received by the Fund (variation margin) and are recorded as unrealized gains or losses until the contracts are closed. When the contracts are closed, the Fund records a realized gain or loss equal to the difference between the proceeds from (or cost of) the closing transactions and the Fund's basis in the contract. Risks of entering into futures contracts for hedging purposes include the possibility that a change in the value of the contract may not correlate with the changes in the value of the underlying instruments. With futures, there is minimal counterparty credit risk to the Fund since futures are exchange traded and the exchange's clearinghouse, as counterparty to all exchange traded futures, guarantees the futures against default. In addition, the purchase of a futures contract involves the risk that the Fund could lose more than the original margin deposit and subsequent payments may be required for a futures transaction. At October 31, 2012, the Fund had the following open futures contracts:
| Contract Description | | Currency | | Expiration
Date | | Notional
Value | | Unrealized
Appreciation
(Depreciation) | |
| Contracts to Purchase | |
Interest Rate Contracts | |
| 10 YR JGB Mini Futures | | JPY | | Dec 2012 | | $ | 541,224 | | | $ | 363 | | |
| | $ | 363 | | |
Index Contracts | |
| Hang Seng Index Futures | | HKD | | Nov 2012 | | | 139,831 | | | $ | (1,110 | ) | |
| EURO Stoxx 50 Index Futures | | EURO | | Dec 2012 | | | 64,894 | | | | (1,088 | ) | |
| FTSE 100 Index Futures | | GBP | | Dec 2012 | | | 92,861 | | | | (1,482 | ) | |
| NASDAQ 100 E-Mini Index | | USD | | Dec 2012 | | | 158,430 | | | | (12,363 | ) | |
| Nikkei 225 Index Futures OSE | | JPY | | Dec 2012 | | | 111,598 | | | | (125 | ) | |
| S&P 500 E Mini Index Futures | | USD | | Dec 2012 | | | 70,340 | | | | (2,373 | ) | |
| | $ | (18,541 | ) | |
Foreign Exchange Contracts | |
| AUD Currency Futures | | USD | | Dec 2012 | | | 103,400 | | | $ | (65 | ) | |
| CAD Currency Futures | | USD | | Dec 2012 | | | 199,760 | | | | (4,610 | ) | |
| GBP Currency Futures | | USD | | Dec 2012 | | | 201,588 | | | | 775 | | |
| | $ | (3,900 | ) | |
| Contracts to Sell | |
Foreign Exchange Contracts | |
| JPY Currency Futures | | USD | | Dec 2012 | | | (313,525 | ) | | $ | 137 | | |
Net unrealized appreciation (depreciation) | | | | | | | | | | | | | | $ | (21,941 | ) | |
K) FORWARD FOREIGN CURRENCY CONTRACTS — The Fund may enter into forward foreign currency contracts for the purchase or sale of a specific foreign currency at a fixed price on a future date. Risks may arise upon entering into these contracts from the potential inability of counterparties to meet the terms of their contracts and from unanticipated movements in the
23
Credit Suisse Multialternative Strategy Fund
Notes to Consolidated Financial Statements (continued)
October 31, 2012
Note 2. Significant Accounting Policies
value of a foreign currency. Forward foreign currency contracts are adjusted by the daily forward exchange rate of the underlying currency and any gains or losses are recorded for financial statement purposes as unrealized until the contract settlement date or an offsetting position is entered into. At October 31, 2012, the Fund had the following open forward foreign currency contracts:
Forward Foreign
Currency to be
Purchased (Local) | | Forward Foreign
Currency to be
Sold (Local) | | Expiration
Date | | Counterparties | | Value on
Settlement Date | | Current
Value | | Unrealized
Appreciation/
(Depreciation) | |
USD | 137,373 | | | GBP | 85,328 | | | 11/20/12 | | Barclays Bank PLC | | $ | (137,373 | ) | | $ | (137,460 | ) | | $ | (87 | ) | |
USD | 191,574 | | | CAD | 189,037 | | | 11/19/12 | | Barclays Bank PLC | | | (191,574 | ) | | | (189,064 | ) | | | 2,510 | | |
USD | 64,579 | | | JPY | 5,093,985 | | | 11/20/12 | | Barclays Bank PLC | | | (64,579 | ) | | | (63,740 | ) | | | 839 | | |
NZD | 125,385 | | | USD | 101,543 | | | 11/20/12 | | Barclays Bank PLC | | | 101,543 | | | | 102,960 | | | | 1,417 | | |
USD | 137,376 | | | SEK | 913,162 | | | 11/20/12 | | Barclays Bank PLC | | | (137,376 | ) | | | (137,547 | ) | | | (171 | ) | |
USD | 476,880 | | | CHF | 442,534 | | | 11/20/12 | | Barclays Bank PLC | | | (476,880 | ) | | | (475,357 | ) | | | 1,523 | | |
AUD | 408,129 | | | USD | 417,696 | | | 11/20/12 | | Barclays Bank PLC | | | 417,696 | | | | 422,624 | | | | 4,928 | | |
BRL | 69,506 | | | USD | 34,000 | | | 11/20/12 | | JPMorgan Chase Bank NA | | | 34,000 | | | | 34,166 | | | | 166 | | |
CZK | 648,736 | | | USD | 34,000 | | | 11/20/12 | | JPMorgan Chase Bank NA | | | 34,000 | | | | 33,483 | | | | (517 | ) | |
EUR | 69,311 | | | USD | 90,289 | | | 11/20/12 | | Barclays Bank PLC | | | 90,289 | | | | 89,827 | | | | (462 | ) | |
HUF | 7,288,570 | | | USD | 34,000 | | | 11/20/12 | | JPMorgan Chase Bank NA | | | 34,000 | | | | 33,274 | | | | (726 | ) | |
MXN | 436,359 | | | USD | 34,000 | | | 11/20/12 | | JPMorgan Chase Bank NA | | | 34,000 | | | | 33,289 | | | | (711 | ) | |
NOK | 1,625,121 | | | USD | 286,025 | | | 11/20/12 | | Barclays Bank PLC | | | 286,025 | | | | 284,459 | | | | (1,566 | ) | |
PLN | 107,171 | | | USD | 34,000 | | | 11/20/12 | | JPMorgan Chase Bank NA | | | 34,000 | | | | 33,485 | | | | (515 | ) | |
SGD | 41,505 | | | USD | 34,000 | | | 11/20/12 | | JPMorgan Chase Bank NA | | | 34,000 | | | | 34,018 | | | | 18 | | |
ZAR | 298,097 | | | USD | 34,000 | | | 11/20/12 | | JPMorgan Chase Bank NA | | | 34,000 | | | | 34,179 | | | | 179 | | |
TRY | 61,718 | | | USD | 34,000 | | | 11/19/12 | | JPMorgan Chase Bank NA | | | 34,000 | | | | 34,313 | | | | 313 | | |
| | | | | | | | | | | | | | | $ | 7,138 | | |
Currency Abbreviations:
AUD = Australian Dollar
BRL = Brazilian Real
CAD = Canadian Dollar
CHF = Swiss Franc
CZK = Crech Koruna
EUR = Euro
GBP = British Pound
HUF = Hungarian Forint
JPY = Japanese Yen
MXN = Mexican Peso
NOK = Norwegian Krone
NZD = New Zealand Dollar
PLN = Polish Zloty
SEK = Swedish Krona
SGD = Singapore Dollar
TRY = Turkish Lira
USD = United States Dollar
ZAR = South African Rand
L) SWAPS — The Fund may enter into swaps contracts either for hedging purposes or to seek to increase total return. A swap contract is an agreement that obligates two parties to exchange a series of cash flows at specified intervals based upon or calculated by reference to changes in specified prices or rates for
24
Credit Suisse Multialternative Strategy Fund
Notes to Consolidated Financial Statements (continued)
October 31, 2012
Note 2. Significant Accounting Policies
a specified amount of an underlying asset or notional principal amount. The Fund will enter into swap contracts only on a net basis, which means that the two payment streams are netted out, with the Fund receiving or paying, as the case may be, only the net amount of the two payments. Risks may arise as a result of the failure of the counterparty to the swap contract to comply with the terms of the swap contract. The extent of the Fund's exposure to credit and counterparty risks is the discounted net value of the cash flows to be received from/paid to the counterparty over the contract's remaining life, to the extent that the amount is positive. These risks are mitigated by having a master netting arrangement between the Fund and the counterparty and by the posting of collateral by the counterparty to the Fund to cover the Fund's exposure to the counterparty. Therefore, the Fund considers the creditworthiness of each counterparty to a swap contract in evaluating potential credit risk. Additionally, risks may arise from unanticipated movements in interest rates or in the value of the underlying reference asset or index.
The Fund may enter into total return swap contracts, involving commitments to pay interest in exchange for a market-linked return, both based on notional amounts. To the extent the total return of the security or index underlying the transactions exceeds or falls short of the offsetting interest rate obligation, the Fund will receive a payment from or make a payment to the counterparty.
The Fund records unrealized gains or losses on a daily basis representing the value and the current net receivable or payable relating to open swap contracts. Net amounts received or paid on the swap contract are recorded as realized gains or losses. Fluctuations in the value of swap contracts are recorded for financial statement purposes as unrealized appreciation or depreciation on swap contracts. Realized gains and losses from terminated swaps are included in net realized gains/losses on swap contracts transactions. At October 31, 2012, the Fund had the following outstanding swap contracts:
Currency | | Notional
Amount | | Expiration
Date | | Counterparty | | Receive | | Pay | | Unrealized
Appreciation/
(Depreciation) | |
USD | | | | $ | 251,056 | | | 12/28/2012 | | Societe Generale | | Fee plus LIBOR | | S&P 500 Health Care Sector
Index GICS Level 1 | | $ | 5,501 | | |
USD | | | | $ | 300,000 | | | 3/25/2013 | | JPMorgan Chase | | iBoxx $ Liquid
High Yield Index | | Fee plus LIBOR | | | (1,786 | ) | |
USD | | | | $ | 600,000 | | | 3/25/2013 | | JPMorgan Chase | | iBoxx $ Liquid
High Yield Index | | Fee plus LIBOR | | | (6,569 | ) | |
USD | | | | $ | 30,018 | | | 3/1/2013 | | Goldman Sachs | | MSCI Daily TR Net
Emerging Markets USD | | Fee plus LIBOR | | | (327 | ) | |
USD | | | | $ | 119,536 | | | 4/22/2013 | | Goldman Sachs | | Russell 2000 Total | | Fee plus LIBOR | | | (3,341 | ) | |
25
Credit Suisse Multialternative Strategy Fund
Notes to Consolidated Financial Statements (continued)
October 31, 2012
Note 2. Significant Accounting Policies
Currency | | Notional
Amount | | Expiration
Date | | Counterparty | | Receive | | Pay | | Unrealized
Appreciation/
(Depreciation) | |
| | | | | | | | | | | Return Index | | | | | |
USD | | | | $ | 40,024 | | | 4/1/2013 | | Goldman Sachs | | MSCI Daily TR Net
Emerging Markets USD | | Fee plus LIBOR | | $ | (436 | ) | |
USD | | | | $ | 138,085 | | | 5/21/2013 | | Goldman Sachs | | MSCI Daily TR Net
Emerging Markets USD | | Fee plus LIBOR | | | (1,504 | ) | |
USD | | | | $ | 44,835 | | | 11/16/2012 | | Goldman Sachs | | Dow Jones – UBS
Agriculture Subindex | | Fixed Rate | | | 425 | | |
USD | | | | $ | 23,943 | | | 11/16/2012 | | Goldman Sachs | | Dow Jones – UBS
Energy Subindex | | Fixed Rate | | | (1,023 | ) | |
USD | | | | $ | 96,517 | | | 11/16/2012 | | Goldman Sachs | | Dow Jones – UBS
Industrial Metals
Subindex | | Fixed Rate | | | (1,591 | ) | |
USD | | | | $ | 15,274 | | | 11/16/2012 | | Goldman Sachs | | Fixed Rate | | Dow Jones – UBS Industrial
Metals Subindex | | | 772 | | |
USD | | | | $ | 9,617 | | | 11/16/2012 | | Goldman Sachs | | Dow Jones – UBS
Energy Subindex | | Fixed Rate | | | (449 | ) | |
USD | | | | $ | 9,207 | | | 11/16/2012 | | Goldman Sachs | | Fixed Rate | | Dow Jones – UBS Industrial
Metals Subindex | | | 505 | | |
USD | | | | $ | 8,844 | | | 11/16/2012 | | Goldman Sachs | | Dow Jones – UBS
Agriculture Subindex | | Fixed Rate | | | (140 | ) | |
USD | | | | $ | 21,882 | | | 11/16/2012 | | Goldman Sachs | | Fixed Rate | | Dow Jones – UBS Industrial
Metals Subindex | | | 128 | | |
USD | | | | $ | 29,065 | | | 11/16/2012 | | Goldman Sachs | | Fixed Rate | | Dow Jones – UBS Industrial
Metals Subindex | | | 59 | | |
USD | | | | $ | 40,024 | | | 7/22/2013 | | Goldman Sachs | | MSCI Daily TR Net
Emerging Markets USD | | Fee plus LIBOR | | | (436 | ) | |
| | | | | | | | | | | | | | | $ | (10,212 | ) | |
M) OPTION CONTRACTS — The Fund may enter into options contracts. When the Fund purchases an option, it pays a premium and the option is subsequently marked to market to reflect current value. Premiums paid for purchasing options which expire are treated as realized losses. Premiums paid for purchasing options which are exercised or closed are added to the cost or deducted from the proceeds on the underlying instrument to determine the realized gain or loss. The risk associated with purchasing options is limited to the premium paid.
When the Fund writes an option, an amount equal to the net premium received (the premium less commission) is recorded as a liability and is subsequently adjusted to the current value. Net premiums received for written options which expire are treated as realized gains. Net premiums received for written options which are exercised or closed are deducted from the cost or added to the proceeds on the underlying instrument or closing purchase transaction to determine the realized gain or loss. The Fund, as writer of a
26
Credit Suisse Multialternative Strategy Fund
Notes to Consolidated Financial Statements (continued)
October 31, 2012
Note 2. Significant Accounting Policies
written option, bears the risk of an unfavorable change in the market value of the instrument underlying the written option.
Exchange-traded options have standardized contracts and are settled through a clearing house with fulfillment guaranteed by the credit of the exchange. Therefore, counterparty credit risks to the Fund are limited. Over-the-counter options are subject to the risk that the counterparty is unable or unwilling to meet its obligations under the option. At October 31, 2012, the Fund had the following written options:
Number of
Contracts | | Put Written Options | | Expiration
Date | | Premiums
Received | | Current
Value | | Unrealized
Appreciation
(Depreciation) | |
| | 5 | | | S&P 500 Index, strike @ $1,450 | | November 2012 | | $ | 10,465 | | | $ | (24,535 | ) | | $ | (14,070 | ) | |
N) SECURITIES LENDING — Loans of securities are required at all times to be secured by collateral at least equal to 102% of the market value of domestic securities on loan (including any accrued interest thereon) and 105% of the market value of foreign securities on loan (including any accrued interest thereon). Cash collateral received by the Fund in connection with securities lending activity may be pooled together with cash collateral for other funds/portfolios advised by Credit Suisse and may be invested in a variety of investments, including funds advised by SSB, the Fund's securities lending agent, or money market instruments. However, in the event of default or bankruptcy by the other party to the agreement, realization and/or retention of the collateral may be subject to legal proceedings.
SSB has been engaged by the Fund to act as the Fund's securities lending agent. The Fund's securities lending arrangement provides that the Fund and SSB will share the net income earned from securities lending activities. During the period ended October 31, 2012, total earnings from the Fund's investment in cash collateral received in connection with securities lending arrangements was $2,205, of which $14 was rebated to borrowers (brokers). The Fund retained $1,862 in income from the cash collateral investment, and SSB, as lending agent, was paid $329. Securities lending income is accrued as earned.
O) OTHER — In the normal course of business the Fund trades financial instruments and enters into financial transactions where risk of potential loss exists due to changes in the market (market risk) or failure of the other party to a transaction to perform (credit risk). Similar to credit risk, the Fund may be exposed to counterparty risk, or the risk that an institution or other entity with which the Fund has unsettled or open transactions will default. The potential loss could exceed the value of the financial assets recorded in the financial
27
Credit Suisse Multialternative Strategy Fund
Notes to Consolidated Financial Statements (continued)
October 31, 2012
Note 2. Significant Accounting Policies
statements. Financial assets, which potentially expose the Fund to credit risk, consist principally of cash due from counterparties and investments. The extent of the Fund's exposure to credit and counterparty risks in respect to these financial assets approximates their carrying value as recorded in the Fund's Statement of Assets and Liabilities.
P) SUBSEQUENT EVENTS — In preparing the financial statements as of October 31, 2012, management considered the impact of subsequent events for potential recognition or disclosure in these financial statements through the date of release of this report.
On February 8, 2012, the Commodity Futures Trading Commission (CFTC) adopted amendments to several of its rules relating to commodity pool operations, including Rule 4.5. The Funds currently rely on Rule 4.5's exclusion from CFTC regulation for regulated investment companies. Credit Suisse is currently evaluating the amendments and their impact, if any, on the Funds' financial statements.
Note 3. Transactions with Affiliates and Related Parties
Credit Suisse serves as investment adviser for the Fund. For its investment advisory services, Credit Suisse is entitled to receive a fee from the Fund at an annual rate of 1.15% of the Fund's average daily net assets. For the period ended October 31, 2012, investment advisory fees earned, fees waived and expenses reimbursed were $38,844, $38,844 and $272,602, respectively. The Fund is authorized to reimburse Credit Suisse for management fees previously limited and/or for expenses previously paid by Credit Suisse, provided, however, that any reimbursements must be paid at a date not more than three years after the end of the fund's first year of operations and the reimbursements do not cause a class to exceed the applicable expense limitation in the contract at the time the fees were limited or expenses are paid. This contract may not be terminated before the end of the fund's first year of operations. Credit Suisse waives fees and reimburses expenses so that the Fund's annual operating expenses will not exceed 1.70% of the Fund's average daily net assets for Class I shares, 1.95% of the Fund's average daily net assets for Class A shares, and 2.70% of the Fund's average daily net assets for Class C shares.
Through April 30, 2012, Credit Suisse Asset Management Securities, Inc. ("CSAMSI"), an affiliate of Credit Suisse, and SSB served as co-administrators to the Fund. Effective April 30, 2012, Credit Suisse replaced CSAMSI as co-administrator to the Fund. For their co-administrative services, CSAMSI and
28
Credit Suisse Multialternative Strategy Fund
Notes to Consolidated Financial Statements (continued)
October 31, 2012
Note 3. Transactions with Affiliates and Related Parties
Credit Suisse received a fee calculated at an annual rate of 0.09% of the Fund's average daily net assets. For the period ended October 31, 2012, co-administrative services fees earned by CSAMSI and Credit Suisse were $3,040.
For its co-administrative services, SSB receives a fee, exclusive of out-of-pocket expenses, calculated in total for all the Credit Suisse funds/portfolios co-administered by SSB and allocated based upon the relative average net assets of each fund/portfolio, subject to an annual minimum fee. For the period ended October 31, 2012, co-administrative services fees earned by SSB (including out-of-pocket expenses) were $1,931.
In addition to serving as the Fund's co-administrator, through April 30, 2012, CSAMSI also served as distributor of the Fund's shares. Effective April 30, 2012, Credit Suisse Securities (USA) LLC ("CSSU"), an affiliate of Credit Suisse, is the distributor of the Fund's shares. Pursuant to distribution plans adopted by the Fund pursuant to Rule 12b-1 under the 1940 Act, CSAMSI and CSSU received fees for its distribution services. The distributor is paid at the annual rate of 0.25% of the average daily net assets of the Class A shares. For the Class C shares, the fee is calculated at an annual rate of 1.00% of the average daily net assets. Class I shares are not subject to distribution fees.
Merrill Corporation ("Merrill"), an affiliate of Credit Suisse, has been engaged by the Fund to provide certain financial printing services. For the period ended October 31, 2012, Merrill was paid $22,264 for its services by the Fund.
Offering costs, including initial registration costs, were deferred and will be charged to expenses during the Fund's first year of operation. For the period ended October 31, 2012, $125,417 has been expensed to the Fund.
Note 4. Line of Credit
The Fund, together with other funds/portfolios advised by Credit Suisse (collectively, the "Participating Funds"), participates in a committed, unsecured line of credit facility ("Credit Facility") for temporary or emergency purposes with SSB. Under the terms of the Credit Facility, the Participating Funds pay an aggregate commitment fee on the average unused amount of the Credit Facility, which is allocated among the Participating Funds in such manner as is determined by the governing Boards of the Participating Funds. In addition, the Participating Funds pay interest on borrowings at either the Overnight Federal Funds rate or the Overnight LIBOR rate plus a spread. At October 31, 2012, and during the period ended October 31, 2012, the Fund had no borrowings outstanding under the Credit Facility.
29
Credit Suisse Multialternative Strategy Fund
Notes to Consolidated Financial Statements (continued)
October 31, 2012
Note 5. Purchases and Sales of Securities
For the period ended October 31, 2012, purchases and sales of investment securities (excluding short-term investments) were $4,876,225 and $4,008,627, respectively. Securities sold short and purchases to cover securities sold short were $335,691 and $340,335, respectively.
Note 6. Capital Share Transactions
The Fund is authorized to issue an unlimited number of full and fractional shares of beneficial interest, $.001 par value per share. The Fund offers Class I, Class A and Class C shares. Transactions in capital shares for each class of the Fund were as follows:
| | | Class I | |
| | | For the Period Ended
October 31, 20121 | |
| | | Shares | | Value | |
Shares sold | | | 693,465 | | | $ | 6,930,670 | | |
Shares redeemed | | | (200,468 | ) | | | (1,960,593 | ) | |
Net increase | | | 492,997 | | | $ | 4,970,077 | | |
| | | Class A | |
| | | For the Period Ended
October 31, 20121 | |
| | | Shares | | Value | |
Shares sold | | | 22,931 | | | $ | 225,975 | | |
Net increase | | | 22,931 | | | $ | 225,975 | | |
| | | Class C | |
| | | For the Period Ended
October 31, 20121 | |
| | | Shares | | Value | |
Shares sold | | | 108,606 | | | $ | 1,068,290 | | |
Net increase | | | 108,606 | | | $ | 1,068,290 | | |
1 For the period from March 30, 2012 (commencement of operations) through October 31, 2012.
The Fund imposes a redemption fee of 2% of the value of all classes of shares currently being offered that are redeemed or exchanged within 30 days from the date of purchase. Reinvested dividends and distributions are not subject to the fee. The fee is charged based on the value of shares at redemption, is paid directly to the Fund and becomes part of the Fund's daily net asset value calculation. When shares are redeemed that are subject to the fee, reinvested
30
Credit Suisse Multialternative Strategy Fund
Notes to Consolidated Financial Statements (continued)
October 31, 2012
Note 6. Capital Share Transactions
dividends and distributions are redeemed first, followed by the shares held longest.
On October 31, 2012, the number of shareholders that held 5% or more of the outstanding shares of each class of the Fund was as follows:
| | | Number of
Shareholders | | Approximate Percentage
of Outstanding Shares | |
Class I | | | 1 | * | | | 99 | % | |
Class A | | | 3 | | | | 95 | % | |
Class C | | | 1 | * | | | 95 | % | |
*This represents the seed money from Merchant Holding, Inc., an affiliate of Credit Suisse.
Some of the shareholders may be omnibus accounts, which hold shares on behalf of individual shareholders.
Note 7. Federal Income Taxes
Income and capital gain distributions are determined in accordance with federal income tax regulations, which may differ from GAAP.
No dividends were paid to shareholders during the period ended October 31, 2012.
The tax basis components of distributable earnings differ from the amounts reflected in the Statement of Assets and Liabilities by temporary book/tax differences. These differences are primarily due to differing treatments of wash sales, forward contracts mark to market, futures contracts mark to market, total return swap contracts mark to market and organizational expenses. At October 31, 2012, the components of distributable earnings on a tax basis were as follows:
Undistributed net investment income | | $ | 32,707 | | |
Undistributed capital gain | | | 1,344 | | |
Unrealized depreciation | | | (45,772 | ) | |
| | $ | (11,721 | ) | |
Under the Regulated Investment Company Modernization Act of 2010, the Fund will be permitted to carry forward capital losses incurred in taxable years beginning after December 22, 2010 for an unlimited period. However, any losses incurred during those future taxable years will be required to be utilized prior to the losses incurred in pre-enactment taxable years. As a result of this ordering rule, pre-enactment capital loss carryforwards may be more likely to expire unused. Additionally, post-enactment capital losses that are carried
31
Credit Suisse Multialternative Strategy Fund
Notes to Consolidated Financial Statements (continued)
October 31, 2012
Note 7. Federal Income Taxes
forward will retain their character as either short-term or long-term capital losses rather than being considered all short-term as under previous law. It is uncetain whether the Fund will be able to realize the full benefits of the capital loss carryforwards before they expire.
At October 31, 2012 the cost of investments (excluding foreign currency related transactions) and net unrealized appreciation (depreciation) for income tax purposes were as follows:
Cost of Investments | | $ | 5,872,156 | | |
Unrealized appreciation | | | 11,726 | | |
Unrealized depreciation | | | (24,443 | ) | |
Net unrealized appreciation (depreciation) | | $ | (12,717 | ) | |
At October 31, 2012, the Fund reclassified $4,600 to net investment loss and $26,368 to accumulated net realized loss from investments from paid in capital, to adjust for current period permanent book/tax differences which arose principally from differing book/tax treatment of foreign currency gain/(loss), swap income re-class, non-deductible 12b-1, and blue sky expenses. Net assets were not affected by these reclassifications.
Note 8. Contingencies
In the normal course of business, the Fund may provide general indemnifications pursuant to certain contracts and organizational documents. The Fund's maximum exposure under these arrangements is dependent on future claims that may be made against the Fund and, therefore, cannot be estimated; however, based on experience, the risk of loss from such claims is considered remote.
32
Credit Suisse Multialternative Strategy Fund
Report of Independent Registered Public Accounting Firm
To the Board of Trustees of Credit Suisse Opportunity Funds
and the Shareholders of Credit Suisse Multialternative Strategy Fund:
In our opinion, the accompanying consolidated statement of assets and liabilities, including the consolidated schedule of investments, and the related consolidated statements of operations and of changes in net assets and the financial highlights present fairly, in all material respects, the financial position of Credit Suisse Multialternative Strategy Fund (one of the Funds comprising Credit Suisse Opportunity Funds, hereafter referred to as the "Fund") at October 31, 2012, the results of their operations, the changes in their net assets and financial highlights for the period March 30, 2012 (commencement of operations) through October 31, 2012, in conformity with accounting principles generally accepted in the United States of America. These consolidated financial statements and financial highlights (hereafter referred to as "financial statements") are the responsibility of the Fund's management. Our responsibility is to express an opinion on these financial statements based on our audit. We conducted our audit of these financial statements in accordance with the standards of the Public Company Accounting Oversight Board (United States). Those standards require that we plan and perform the audit to obtain reasonable assurance about whether the financial statements are free of material misstatement. An audit includes examining, on a test basis, evidence supporting the amounts and disclosures in the financial statements, assessing the accounting principles used and significant estimates made by management, and evaluating the overall financial statement presentation. We believe that our audit, which included confirmation of securities at October 31, 2012 by correspondence with the custodian and brokers, provides a reasonable basis for our opinion.
PricewaterhouseCoopers LLP
Boston, Massachusetts
December 28, 2012
33
Credit Suisse Multialternative Strategy Fund
Information Concerning Trustees and Officers (unaudited)
Name, Address
(Year of Birth) | | Position(s)
Held with
Fund | | Term
of Office1
and
Length
of Time
Served | | Principal
Occupation(s) During
Past Five Years | | Number of
Portfolios
in Fund
Complex
Overseen
by Trustee | | Other
Directorships
Held by Trustee | |
Independent Trustees | | | | | | | | | | | |
Enrique Arzac
c/o Credit Suisse Asset
Management, LLC
Attn: General Counsel
One Madison Avenue
New York, New York
10010
(1941) | | Trustee, Audit Committee Chairman and Nominating Committee Member | | Since Fund Inception | | Professor of Finance and Economics, Graduate School of Business, Columbia University since 1971. | | | 9 | | | Director of Epoch Holding Corporation (an investment management and investment advisory services company); Director of The Adams Express Company, Director of Petroleum and Resources Corporation, Director of Aberdeen Asset Management-advised Funds (six closed-end investment companies); Director of Mirae Asset Discovery Funds (open-end investment companies). | |
Jeffrey E. Garten
Box 208200
New Haven, Connecticut
06520-8200
(1946) | | Trustee, Audit and Nominating Committee Member | | Since Fund Inception | | The Juan Trippe Professor in the Practice of International Trade, Finance and Business from July 2005 to present; Partner and Chairman of Garten Rothkopf (consulting firm) from October 2005 to present; Dean of Yale School of Management from November 1995 to June 2005. | | | 7 | | | Director of Aetna, Inc. (insurance company); Director of CarMax Group (used car dealers); Member of Standard & Poor's Board of Managers (credit rating agency). | |
Peter F. Krogh
c/o Credit Suisse Asset
Management, LLC
Attn: General Counsel
One Madison Avenue
New York, New York
10010
(1937) | | Trustee, Audit and Nominating Committee Member | | Since Fund Inception | | Dean Emeritus and Distinguished Professor of International Affairs at the Edmund A. Walsh School of Foreign Service, Georgetown University from June 1995 to present. | | | 7 | | | None | |
1 Each Trustee and Officer serves until his or her respective successor has been duly elected and qualified.
34
Credit Suisse Multialternative Strategy Fund
Information Concerning Trustees and Officers (unaudited) (continued)
Name, Address
(Year of Birth) | | Position(s)
Held with
Fund | | Term
of Office1
and
Length
of Time
Served | | Principal
Occupation(s) During
Past Five Years | | Number of
Portfolios
in Fund
Complex
Overseen
by Trustee | | Other
Directorships
Held by Trustee | |
Independent Trustees | | | | | | | | | | | |
Steven N. Rappaport
Lehigh Court, LLC
555 Madison Avenue
29th Floor
New York, New York
10022
(1948) | | Chairman of the Board of Trustees, Audit Committee Member and Nominating Committee Chairman | | Since Fund Inception | | Partner of Lehigh Court, LLC and RZ Capital (private investment firms) from July 2002 to present. | | | 9 | | | Director of iCAD, Inc. (surgical and medical instruments and apparatus company); Director of Wood Resources, LLC. (plywood manufacturing company); Director of Aberdeen Asset Management-advised Funds (five closed-end investment companies). | |
35
Credit Suisse Multialternative Strategy Fund
Information Concerning Trustees and Officers (unaudited) (continued)
Name, Address
(Year of Birth) | | Position(s)
Held with
Fund | | Term
of Office1
and
Length
of Time
Served | | Principal Occupation(s) During Past Five Years | |
Officers** | | | | | | | |
John G. Popp
Credit Suisse Asset
Management, LLC
One Madison Avenue
New York, New York 10010
(1956) | | Chief Executive Officer and President | | Since Fund Inception | | Managing Director of Credit Suisse; Group Manager and Senior Portfolio Manager for Performing Credit Strategies; Associated with Credit Suisse or its predecessor since 1997; Officer of other Credit Suisse Funds. | |
Bruce Rosenberg
Credit Suisse Asset
Management, LLC
One Madison Avenue
New York, New York 10010
(1961) | | Chief Financial Officer | | Since 2012 | | Director and Director of Liquid Accounting of Credit Suisse; Associated with Credit Suisse since 2008; Associated with Bank of New York Mellon Alternative Investment Services from 2006 to 2008; Officer of other Credit Suisse Funds. | |
Emidio Morizio
Credit Suisse Asset
Management, LLC
One Madison Avenue
New York, New York 10010
(1966) | | Chief Compliance Officer | | Since Fund Inception | | Managing Director and Global Head of Compliance of Credit Suisse; Associated with Credit Suisse since July 2000; Officer of other Credit Suisse Funds. | |
Roger Machlis
Credit Suisse Asset
Management, LLC
One Madison Avenue
New York, New York 10010
(1961) | | Chief Legal Officer | | Since Fund Inception | | Managing Director and General Counsel for Credit Suisse; Associated with Credit Suisse Group AG since July 1997; Officer of other Credit Suisse Funds. | |
Cecilia Chau
Credit Suisse Asset
Management, LLC
One Madison Avenue
New York, New York 10010
(1973) | | Treasurer | | Since Fund Inception | | Vice President of Credit Suisse since 2009; Assistant Vice President of Credit Suisse from June 2007 to December 2008; Associated with Alliance Bernstein L.P. from January 2007 to May 2007; Associated with Credit Suisse from August 2000 to December 2006; Officer of other Credit Suisse Funds. | |
Karen Regan
Credit Suisse Asset
Management, LLC
One Madison Avenue
New York, New York 10010
(1963) | | Vice President and Secretary | | Since Fund Inception | | Vice President of Credit Suisse; Associated with Credit Suisse since December 2004; Officer of other Credit Suisse Funds. | |
** The officers of the Fund shown are officers that make policy decisions.
The Statement of Additional Information includes additional information about the Trustees and is available, without charge, upon request, by calling 877-870-2874.
36
Credit Suisse Multialternative Strategy Fund
Proxy Voting and Portfolio Holdings Information (unaudited)
Information regarding how the Fund voted proxies related to its portfolio securities during the 12 month period ended June 30 of each year, as well as the policies and procedures that the Fund uses to determine how to vote proxies relating to its portfolio securities are available:
• By calling 1-877-870-2874
• On the Fund's website, www.credit-suisse.com/us/funds
• On the website of the Securities and Exchange Commission, www.sec.gov.
The Fund files a complete schedule of its portfolio holdings for the first and third quarters of its fiscal year with the SEC on Form N-Q. The Fund's Forms N-Q are available on the SEC's website at www.sec.gov and may be reviewed and copied at the SEC's Public Reference Room in Washington, DC. Information on the operation of the SEC's Public Reference Room may be obtained by calling 1-202-551-8090.
37
This page intentionally left blank
This page intentionally left blank
This page intentionally left blank

P.O. BOX 55030, BOSTON, MA 02205-5030
877-870-2874 n www.credit-suisse.com/us/funds
CREDIT SUISSE SECURITIES (USA) LLC, DISTRIBUTOR. LAF-AR-1012

CREDIT SUISSE FUNDS
Annual Report
October 31, 2012
n CREDIT SUISSE
STRATEGIC INCOME FUND
The Fund's investment objectives, risks, charges and expenses (which should be considered carefully before investing), and more complete information about the Fund, are provided in the Prospectus, which should be read carefully before investing. You may obtain additional copies by calling 877-870-2874 or by writing to Credit Suisse Funds, P.O. Box 55030, Boston, MA 02205-5030.
Credit Suisse Securities (USA) LLC, Distributor, is located at One Madison Avenue, New York, NY 10010. Credit Suisse Funds are advised by Credit Suisse Asset Management, LLC.
Investors in the Credit Suisse Funds should be aware that they may be eligible to purchase Class I shares (where offered) directly or through certain intermediaries. Such shares are not subject to a sales charge. Investors in the Credit Suisse Funds should also be aware that they may be eligible for a reduction or waiver of the sales charge with respect to Class A or C shares (where offered). For more information, please review the relevant prospectuses or consult your financial representative.
The views of the Fund's management are as of the date of the letter and the Fund holdings described in this document are as of October 31, 2012; these views and Fund holdings may have changed subsequent to these dates. Nothing in this document is a recommendation to purchase or sell securities.
Fund shares are not deposits or other obligations of Credit Suisse Asset Management, LLC ("Credit Suisse") or any affiliate, are not FDIC-insured and are not guaranteed by Credit Suisse or any affiliate. Fund investments are subject to investment risks, including loss of your investment.
Credit Suisse Strategic Income Fund
Annual Investment Adviser's Report
October 31, 2012 (unaudited)
December 11, 2012
Dear Shareholder:
We are pleased to present this Annual Report covering the activities of the Credit Suisse Strategic Income Fund (the "Fund") for the one-month period ended October 31, 2012.
Performance Summary
09/28/12 – 10/31/12*
Fund & Benchmark | | Performance | |
| Class I1 | | | 0.67 | % | |
| Class A1,2 | | | 0.76 | % | |
| Class C1,2 | | | 0.62 | % | |
| BofA ML 3-Month US Treasury Bill Index3 | | | 0.01 | % | |
Performance shown for the Fund's Class A and Class C Shares does not reflect sales charges, which are a maximum of 4.75% and 1.00%, respectively.2
Launched on September 28, 2012, the Credit Suisse Strategic Income Fund is an offering from Credit Suisse Asset Management that is designed to provide investors with both current income and capital appreciation as elements of total return.
The Fund may invest, among other things, in domestic and foreign corporate and government bonds, senior loans, mortgage- and asset-backed securities, collateralized loan obligations, convertible debt securities, U.S. Treasuries and other U.S. government or agency obligations.
The Fund may invest significantly in below investment grade debt securities and is authorized to invest without limit in these securities. The Fund may take short positions in securities or indices by using swaps or futures.
Additional information, including pricing and fund documents, can be found on www.credit-suisse.com/us/funds.
Market Review: A Positive Period for Fixed Income
The month of October was a positive one for fixed income strategies, with the BofA ML 3-Month US Treasury Bill Index, the Fund's benchmark, returning 0.01%, as monetary policies and encouraging economic data in the United States were supportive of market performance.
During October, the University of Michigan Consumer Confidence survey rose to its highest level since mid-2007, reaching 83. Economic activity also
1
Credit Suisse Strategic Income Fund
Annual Investment Adviser's Report (continued)
October 31, 2012 (unaudited)
displayed continued growth as demonstrated by the ISM nonmanufacturing survey reporting a level of 55, the 33rd consecutive month of expansion.
From an international perspective, economic growth in China is showing signs of stabilization. The Chinese property market, for example, saw a pick-up in construction activities and infrastructure investment. However, macroeconomic headline risk such as the U.S. fiscal cliff and debt ceiling, and concern about European growth prospects may continue to weigh on fixed income markets.
Rates have remained range bound for the month, with the 10-year U.S. Treasury trading between 1.60% and 1.85%, while the S&P declined -3.4%. Credit markets posted positive returns with Barclays US Credit Index, BofA Merrill Lynch US High Yield Master II Constrained Index and Credit Suisse Leveraged Loan Index returning 0.60%, 0.83% and 0.37%, respectively. Investors have demonstrated continued confidence in these asset classes with demand driven by retail mutual fund inflows and allocations from institutional investors.
In the leveraged loan market, CLO originations in 2012 have also provided an additional source of demand, as primary volumes topped $38.6 billion on a year-to-date basis.
Fundamentally, default rates for high yield bonds and leveraged loans remain below their historical averages, ending the period at 1.77% and 1.05%, respectively, according to JP Morgan and S&P LCD. This compares to historical averages of 4.2% for high yield bonds and 3.3% for the leveraged loans.
Strategic Review and Outlook: Attractive Relative Value
For the month of October, the Fund outperformed its benchmark. As October was the Fund's first full calendar month of operation, we were still building out positions and strategy.
Overall, corporate fundamentals have remained strong in 2012, as companies have focused on deleveraging and extending maturities since early 2009. In turn, this has supported below-average defaults for 2012 as well as below-average expectations leading into 2013. Investors have demonstrated continued confidence in credit markets with record year-to-date inflows into retail credit funds. Against this backdrop, we have focused on pockets of opportunities within the high yield, leveraged loan and CLO markets.
Compared to other fixed income investment opportunities, we believe these asset classes provide attractive relative value, although we do remain cautious given potential headline risk both domestically and abroad in the coming months. Therefore, we will continue to favor the defensive nature of the senior
2
Credit Suisse Strategic Income Fund
Annual Investment Adviser's Report (continued)
October 31, 2012 (unaudited)
loan asset class and will focus on shorter duration, lower beta securities within the high yield market.
The Credit Suisse Credit Investments Group Team
John G. Popp
Andrew H. Marshak
Thomas J. Flannery
David H. Lerner
Wing Chan
Senior secured floating rate loans ("Senior Loans") are subject to the risk that a court could subordinate a Senior Loan, which typically holds the most senior position in the issuer's capital structure, to presently existing or future indebtedness or take other action detrimental to the holders of Senior Loans.
High yield bonds are lower-quality bonds that are also known as "junk bonds." Such bonds entail greater risks than those found in higher-rated securities.
In addition to historical information, this report contains forward-looking statements, which may concern, among other things, domestic and foreign market, industry and economic trends and developments and government regulation and their potential impact on the Fund's investments. These statements are subject to risks and uncertainties and actual trends, developments and regulations in the future, and their impact on the Fund could be materially different from those projected, anticipated or implied. The Fund has no obligation to update or revise forward-looking statements.
3
Credit Suisse Strategic Income Fund
Annual Investment Adviser's Report (continued)
October 31, 2012 (unaudited)
Comparison of Change in Value of $10,000 Investment in the
Credit Suisse Strategic Income Fund1 Class I shares, Class A shares2,
Class C shares2 and the BofA Merrill Lynch 3 Month US Treasury Bill Index3 from Inception (9/28/12).
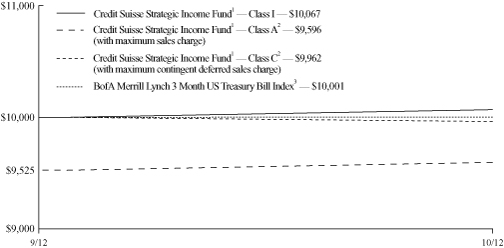
Average Annual Returns as of October 31, 20121
| | | Since
Inception | | Inception
Date | |
Class I | | | 0.67 | % | | 9/28/12 | |
Class A Without Sales Charge | | | 0.76 | % | | 9/28/12 | |
Class A With Maximum Sales Charge | | | (4.04 | )% | | 9/28/12 | |
Class C Without CDSC | | | 0.62 | % | | 9/28/12 | |
Class C With CDSC | | | (0.38 | )% | | 9/28/12 | |
Returns represent past performance and include change in share price and reinvestment of dividends and capital gains. Past performance cannot guarantee future results. The current performance of the Fund may be lower or higher than the figures shown. Returns and share price will fluctuate, and redemption value may be more or less than original cost. The performance results do not reflect the deduction of taxes that a shareholder would pay on fund distributions or the redemption of fund shares. Performance information current to the most recent month-end is available at www.credit-suisse.com/us/funds.
The annualized gross expense ratios are 6.24% for Class I shares, 6.49% for Class A shares and 7.24% for Class C shares. The annualized net expense ratios after fee waivers and/or expense reimbursements are 0.99% for Class I shares, 1.24% for Class A shares and 1.99% for Class C shares.
* Fund commenced operations on September 28, 2012.
4
Credit Suisse Strategic Income Fund
Annual Investment Adviser's Report (continued)
October 31, 2012 (unaudited)
1 Fee waivers and/or expense reimbursements may reduce expenses for the Fund, without which performance would be lower.
2 Total return for the Fund's Class A shares for the reporting period, based on offering price (including maximum sales charge of 4.75%), was (4.04%). Total return for the Fund's Class C shares for the reporting period, based on redemption value (including maximum contingent deferred sales charge of 1.00%), was (0.38%).
3 The BofA Merrill Lynch 3-Month U.S. Treasury Bill Index is comprised of a single issue purchased at the beginning of the month and held for a full month. Each month the index is rebalanced and the issue selected is the outstanding Treasury Bill that matures closest to, but not beyond 3 months from the rebalancing date. An index does not have transaction costs; investors may not invest directly in an index.
5
Credit Suisse Strategic Income Fund
Annual Investment Adviser's Report (continued)
October 31, 2012 (unaudited)
Information About Your Fund's Expenses
As an investor of the Fund, you incur two types of costs: ongoing expenses and transaction costs. Ongoing expenses include management fees, distribution and service (12b-1) fees and other Fund expenses. Examples of transaction costs include sales charges (loads), redemption fees and account maintenance fees, which are not shown in this section and which would result in higher total expenses. The following table is intended to help you understand your ongoing expenses of investing in the Fund and to help you compare these expenses with the ongoing expenses of investing in other mutual funds. The table is based on an investment of $1,000 made at the beginning of the period ended October 31, 2012.
The table illustrates your Fund's expenses in two ways:
• Actual Fund Return. This helps you estimate the actual dollar amount of ongoing expenses paid on a $1,000 investment in the Fund using the Fund's actual return during the period. To estimate the expenses you paid over the period, simply divide your account value by $1,000 (for example, an $8,600 account value divided by $1,000 = 8.6), then multiply the result by the number in the "Expenses Paid per $1,000" line under the share class you hold.
• Hypothetical 5% Fund Return. This helps you to compare your Fund's ongoing expenses with those of other mutual funds using the Fund's actual expense ratio and a hypothetical rate of return of 5% per year before expenses. Examples using a 5% hypothetical fund return may be found in the shareholder reports of other mutual funds. The hypothetical account values and expenses may not be used to estimate the actual ending account balance or expenses you paid for the period.
Please note that the expenses shown in these tables are meant to highlight your ongoing expenses only and do not reflect any transaction costs, such as sales charges (loads) or redemption fees. If these transaction costs had been included, your costs would have been higher. The "Expenses Paid per $1,000" line of the tables is useful in comparing ongoing expenses only and will not help you determine the relative total expenses of owning different funds.
6
Credit Suisse Strategic Income Fund
Annual Investment Adviser's Report (continued)
October 31, 2012 (unaudited)
Expenses and Value for a $1,000 Investment
for the period ended October 31, 2012
Actual Fund Return | | Class I | | Class A | | Class C | |
Beginning Account Value 9/28/12 | | $ | 1,000.00 | | | $ | 1,000.00 | | | $ | 1,000.00 | | |
Ending Account Value 10/31/12 | | $ | 1,006.70 | | | $ | 1,007.60 | | | $ | 1,006.20 | | |
Expenses Paid per $1,000* | | $ | 0.84 | | | $ | 1.05 | | | $ | 1.69 | | |
Hypothetical 5% Fund Return | |
Beginning Account Value 5/1/12 | | $ | 1,000.00 | | | $ | 1,000.00 | | | $ | 1,000.00 | | |
Ending Account Value 10/31/12 | | $ | 1,020.16 | | | $ | 1,018.90 | | | $ | 1,015.13 | | |
Expenses Paid per $1,000* | | $ | 5.03 | | | $ | 6.29 | | | $ | 10.08 | | |
| | | Class I | | Class A | | Class C | |
Annualized Expense Ratios* | | | 0.99 | % | | | 1.24 | % | | | 1.99 | % | |
* Expenses are equal to the Fund's annualized expense ratio for each share class, multiplied by the average account value over the period, multiplied by the number of days in the most recent period, then divided by 366.
The "Expenses Paid per $1,000" and the "Annualized Expense Ratios" in the tables are based on actual expenses paid by the Fund during the period, net of fee waivers and/or expense reimbursements. If those fee waivers and/or expense reimbursements had not been in effect, the Fund's actual expenses would have been higher.
For more information, please refer to the Fund's prospectus.
7
Credit Suisse Strategic Income Fund
Annual Investment Adviser's Report (continued)
October 31, 2012 (unaudited)
Credit Quality Breakdown*
(% of Total Investments as of October 31, 2012)
S&P Ratings | |
A | | | 1.7 | % | |
BBB | | | 3.4 | | |
BB | | | 7.5 | | |
B | | | 23.7 | | |
CCC | | | 5.1 | | |
NR | | | 10.8 | | |
Subtotal | | | 52.2 | | |
Short-Term Investment1 | | | 47.8 | | |
Total | | | 100.0 | % | |
* Expressed as a percentage of total investments (excluding securities lending collateral if applicable) and may vary over time.
1 Primarily reflects cash invested in State Street Bank and Trust Co. Euro Time Deposit, for which the purchases of securities have been executed but not yet settled at October 31, 2012.
8
Credit Suisse Strategic Income Fund
Schedule of Investments
October 31, 2012
Par
(000) | |
| | Ratings†
(S&P/Moody's) | | Maturity | | Rate% | | Value | |
| CORPORATE BONDS (34.0%) | | | |
| Auto Parts & Equipment (2.3%) | | | |
$ | 475 | | | Affinia Group, Inc., Global Company
Guaranteed Notes (Callable 11/30/12 @ 100.00) | | (CCC+, B3) | | 11/30/14 | | | 9.000 | | | $ | 478,567 | | |
| Building Materials (1.2%) | | | |
| | 250 | | | International Wire Group Holdings, Inc.,
Rule 144A, Senior Secured Notes
(Callable 10/15/15 @ 104.25)‡ | | (B, B3) | | 10/15/17 | | | 8.500 | | | | 253,750 | | |
| Chemicals (3.3%) | | | |
| | 250 | | | Nufarm Australia Ltd., Rule 144A, Company
Guaranteed Notes (Callable 10/15/15 @104.78)‡ | | (BB-, Ba3) | | 10/15/19 | | | 6.375 | | | | 257,500 | | |
| | 400 | | | Taminco Global Chemical Corp., Rule 144A,
Secured Notes (Callable 03/31/15 @ 107.31)‡ | | (B-, Caa1) | | 03/31/20 | | | 9.750 | | | | 436,000 | | |
| | | | 693,500 | | |
| Consumer Products (2.4%) | | | |
| | 500 | | | Alphabet Holding Co., Inc., Rule 144A,
Senior Unsecured Notes
(Callable 11/01/13 @ 103.00)‡ | | (B-, Caa1) | | 11/01/17 | | | 7.750 | | | | 505,625 | | |
| Diversified Capital Goods (1.3%) | | | |
| | 250 | | | Anixter, Inc., Global Company Guaranteed Notes | | (BB, Ba3) | | 05/01/19 | | | 5.625 | | | | 264,375 | | |
| Energy - Exploration & Production (4.3%) | | | |
| | 500 | | | Shelf Drilling Holdings Ltd., Rule 144A,
Senior Secured Notes
(Callable 05/01/15 @ 104.31)‡ | | (B, B1) | | 11/01/18 | | | 8.625 | | | | 505,000 | | |
| | 250 | | | Sidewinder Drilling, Inc., Rule 144A,
Senior Unsecured Notes
(Callable 11/15/16 @ 104.88)‡ | | (B-, B3) | | 11/15/19 | | | 9.750 | | | | 252,500 | | |
| | 150 | | | Stone Energy Corp., Global Company
Guaranteed Notes (Callable 11/15/17 @ 103.75) | | (B-, B3) | | 11/15/22 | | | 7.500 | | | | 148,875 | | |
| | | | 906,375 | | |
| Environmental (1.2%) | | | |
| | 250 | | | Rough Rider Escrow, Inc., Rule 144A,
Senior Notes (Callable 04/15/15 @ 104.94)‡ | | (B, B3) | | 04/15/18 | | | 9.875 | | | | 250,625 | | |
| Media - Broadcast (2.1%) | | | |
| | 400 | | | Mission Broadcasting, Inc., Global Secured Notes
(Callable 04/15/14 @ 104.44) | | (B, B3) | | 04/15/17 | | | 8.875 | | | | 438,000 | | |
| Oil Field Equipment & Services (5.7%) | | | |
| | 250 | | | Edgen Murray Corp., Rule 144A,
Senior Secured Notes
(Callable 11/01/15 @ 106.56)‡ | | (B+, Caa1) | | 11/01/20 | | | 8.750 | | | | 249,375 | | |
| | 400 | | | FTS International Bonds, Inc., Rule 144A,
Company Guaranteed Notes
(Callable 11/15/14 @ 103.56)‡ | | (BB-, Ba3) | | 11/15/18 | | | 8.125 | | | | 420,000 | | |
| | 480 | | | Pioneer Energy Services Corp., Global Company
Guaranteed Notes (Callable 03/15/14 @ 104.94) | | (B+, B2) | | 03/15/18 | | | 9.875 | | | | 522,000 | | |
| | | | 1,191,375 | | |
See Accompanying Notes to Financial Statements.
9
Credit Suisse Strategic Income Fund
Schedule of Investments (continued)
October 31, 2012
Par
(000) | |
| | Ratings†
(S&P/Moody's) | | Maturity | | Rate% | | Value | |
CORPORATE BONDS | | | |
| Oil Refining & Marketing (3.6%) | | | |
$ | 500 | | | Coffeyville Finance, Inc., Rule 144A,
Secured Notes (Callable 11/01/17 @ 103.25)‡ | | (B+, Ba3) | | 11/01/22 | | | 6.500 | | | $ | 491,250 | | |
| | 250 | | | PBF Finance Corp., Rule 144A,
Senior Secured Notes
(Callable 02/15/16 @ 104.13)‡ | | (BB+, Ba3) | | 02/15/20 | | | 8.250 | | | | 263,750 | | |
| | | | 755,000 | | |
| Software/Services (1.3%) | | | |
| | 250 | | | Syniverse Holdings, Inc., Global Company
Guaranteed Notes (Callable 01/15/15 @ 104.56) | | (B-, Caa1) | | 01/15/19 | | | 9.125 | | | | 267,500 | | |
| Telecom - Integrated/Services (3.2%) | | | |
| | 500 | | | Numericable Finance & Co. SCA, Rule 144A,
Senior Secured Notes
(Callable 02/15/16 @ 104.38)‡€ | | (B, B2) | | 02/15/19 | | | 8.750 | | | | 661,668 | | |
| Telecommunications Equipment (2.1%) | | | |
| | 400 | | | Brightstar Corp., Rule 144A, Company
Guaranteed Notes (Callable 12/01/14 @ 104.75)‡ | | (BB-, B1) | | 12/01/16 | | | 9.500 | | | | 430,000 | | |
| TOTAL CORPORATE BONDS (Cost $7,072,269) | | | 7,096,360 | | |
| ASSET BACKED SECURITIES (10.7%) | | | |
| Collateralized Debt Obligations (10.7%) | | | |
| | 500 | | | CIFC Funding Ltd.‡# | | (BB-, NR) | | 12/05/24 | | | 6.334 | | | | 460,000 | | |
| | 500 | | | Gale Force 4 CLO Ltd., Rule 144A‡# | | (BBB, Ba1) | | 08/20/21 | | | 3.934 | | | | 454,994 | | |
| | 400 | | | Genesis CLO 2007-1 Ltd.‡# | | (BB+, Caa1) | | 10/10/14 | | | 6.850 | | | | 402,583 | | |
| | 500 | | | KKR Financial CLO 2007-1 Corp., Rule 144A‡# | | (A, A3) | | 05/15/21 | | | 2.685 | | | | 459,865 | | |
| | 500 | | | OZLM Funding Ltd.# | | (BBB, NR) | | 10/30/23 | | | 4.867 | | | | 460,527 | | |
| TOTAL ASSET BACKED SECURITIES (Cost $2,224,628) | | | 2,237,969 | | |
| BANK LOANS (23.1%) | | | |
| Aerospace & Defense (2.4%) | | | |
| | 500 | | | LM US Member LLC# | | (CCC, Caa2) | | 10/26/20 | | | 9.500 | | | | 505,000 | | |
| Airlines (2.3%) | | | |
| | 500 | | | US Airways Group, Inc.# | | (B+, B3) | | 03/21/14 | | | 2.711 | | | | 489,375 | | |
| Auto Parts & Equipment (2.4%) | | | |
| | 500 | | | HHI Holdings LLC# | | (B+, B2) | | 09/18/18 | | | 6.000 | | | | 499,790 | | |
| Electric - Generation (1.9%) | | | |
| | 600 | | | Texas Competitive Electric Holdings Co. LLC# | | (CCC, Caa1) | | 10/10/17 | | | 4.938 | | | | 389,100 | | |
| Leisure (2.3%) | | | |
| | 500 | | | Legendary Pictures Funding LLC# | | (NR, NR) | | 03/29/18 | | | 9.000 | | | | 490,000 | | |
| Life-Insurance (2.4%) | | | |
| | 289 | | | MMM Holdings, Inc.# | | (B+, B2) | | 10/26/17 | | | 8.462 | | | | 289,474 | | |
| | 211 | | | MSO of Puerto Rico, Inc.# | | (B+, B2) | | 10/26/17 | | | 8.250 | | | | 210,526 | | |
| | | | 500,000 | | |
| Machinery (4.7%) | | | |
| | 1,000 | | | Amtrol, Inc.# | | (CCC-, B3) | | 06/05/14 | | | 5.000 | | | | 990,000 | | |
See Accompanying Notes to Financial Statements.
10
Credit Suisse Strategic Income Fund
Schedule of Investments (continued)
October 31, 2012
Par
(000) | |
| | Ratings†
(S&P/Moody's) | | Maturity | | Rate% | | Value | |
BANK LOANS | | | |
| Software/Services (2.4%) | | | |
$ | 500 | | | Wall Street Systems Delaware, Inc.# | | (B-, Caa2) | | 10/25/20 | | | 9.250 | | | $ | 496,875 | | |
| Specialty Retail (2.3%) | | | |
| | 475 | | | Academy Ltd.# | | (B, B2) | | 08/03/18 | | | 4.750 | | | | 476,002 | | |
| TOTAL BANK LOANS (Cost $4,828,188) | | | 4,836,142 | | |
| SHORT-TERM INVESTMENT (62.0%) | | | |
| | 12,963 | | | State Street Bank and Trust Co. Euro Time Deposit
(Cost $12,963,000) | | | | | | 11/01/12 | | | 0.010 | | | | 12,963,000 | | |
| TOTAL INVESTMENTS AT VALUE (129.8%) (Cost $27,088,085) | | | 27,133,471 | | |
| LIABILITIES IN EXCESS OF OTHER ASSETS (-29.8%) | | | (6,221,740 | ) | |
| NET ASSETS (100.0%) | | $ | 20,911,731 | | |
INVESTMENT ABBREVIATION
NR = Not Rated
† Credit ratings given by the Standard & Poor's Division of The McGraw-Hill Companies, Inc. ("S&P") and Moody's Investors Service, Inc. ("Moody's") are unaudited.
‡ Security exempt from registration under Rule 144A of the Securities Act of 1933. These securities may be resold in transactions exempt from registration, normally to qualified institutional buyers. At October 31, 2012, these securities amounted to a value of $6,754,485 or 32.3% of net assets.
€ This security is denominated in Euro.
# Variable rate obligations — The interest rate is the rate as of October 31, 2012.
See Accompanying Notes to Financial Statements.
11
Credit Suisse Strategic Income Fund
Statement of Assets and Liabilities
October 31, 2012
Assets | |
Investments at value (Cost $27,088,085) (Note 2) | | $ | 27,133,471 | | |
Cash | | | 902 | | |
Foreign currency at value (cost $646,575) | | | 647,900 | | |
Receivable for investments sold | | | 1,184,127 | | |
Dividend and interest receivable | | | 95,385 | | |
Receivable from investment adviser (Note 3) | | | 57,397 | | |
Offering costs (Note 3) | | | 137,260 | | |
Prepaid expenses | | | 680 | | |
Total Assets | | | 29,257,122 | | |
Liabilities | |
Administrative services fee payable (Note 3) | | | 1,148 | | |
Shareholder servicing/Distribution fee payable (Note 3) | | | 106 | | |
Payable for investments purchased | | | 8,211,120 | | |
Trustees' fee payable | | | 3,397 | | |
Unrealized depreciation on forward currency contracts (Note 2) | | | 1,410 | | |
Payable for fund shares redeemed | | | 47 | | |
Dividend payable | | | 46 | | |
Other accrued expenses payable | | | 128,117 | | |
Total Liabilities | | | 8,345,391 | | |
Net Assets | |
Capital stock, $.001 par value (Note 6) | | | 2,078 | | |
Paid-in capital (Note 6) | | | 20,826,678 | | |
Accumulated net investment loss | | | (46 | ) | |
Accumulated net realized gain from investments and foreign currency transactions | | | 32,125 | | |
Net unrealized appreciation from investments and foreign currency translations | | | 50,896 | | |
Net Assets | | $ | 20,911,731 | | |
I Shares | |
Net assets | | $ | 20,710,345 | | |
Shares outstanding | | | 2,057,680 | | |
Net asset value, offering price and redemption price per share | | $ | 10.06 | | |
A Shares | |
Net assets | | $ | 100,725 | | |
Shares outstanding | | | 10,006 | | |
Net asset value and redemption price per share | | $ | 10.07 | | |
Maximum offering price per share (net asset value/(1-4.75%)) | | $ | 10.57 | | |
C Shares | |
Net assets | | $ | 100,661 | | |
Shares outstanding | | | 10,002 | | |
Net asset value and offering price per share | | $ | 10.06 | | |
See Accompanying Notes to Financial Statements.
12
Credit Suisse Strategic Income Fund
Statement of Operations
For the Period Ended October 31, 20121
| Investment Income (Note 2) | |
Interest | | $ | 23,786 | | |
Foreign taxes withheld | | | (115 | ) | |
Total investment income | | | 23,671 | | |
Expenses | |
Investment advisory fees (Note 3) | | | 9,567 | | |
Administrative services fees (Note 3) | | | 1,531 | | |
Shareholder servicing/Distribution fees (Note 3) | |
Class A | | | 21 | | |
Class C | | | 85 | | |
Offering costs (Note 3) | | | 12,740 | | |
Printing fees (Note 3) | | | 15,038 | | |
Audit and tax fees | | | 15,000 | | |
Transfer agent fees | | | 7,644 | | |
Legal fees | | | 6,370 | | |
Custodian fees | | | 3,397 | | |
Trustees' fees | | | 3,397 | | |
Organizational costs | | | 2,774 | | |
Registration fees | | | 1,200 | | |
Commitment fees (Note 4) | | | 85 | | |
Miscellaneous expense | | | 850 | | |
Total expenses | | | 79,699 | | |
Less: fees waived and expenses reimbursed (Note 3) | | | (66,964 | ) | |
Net expenses | | | 12,735 | | |
Net investment income | | | 10,936 | | |
Net Realized and Unrealized Gain from Investments and Foreign Currency Related Items | |
Net realized gain from investments | | | 33,567 | | |
Net realized gain from foreign currency transactions | | | 25 | | |
Net change in unrealized appreciation (depreciation) from investments | | | 45,386 | | |
Net change in unrealized appreciation (depreciation) from foreign currency translations | | | 5,510 | | |
Net realized and unrealized gain from investments and foreign currency related items | | | 84,488 | | |
Net increase in net assets resulting from operations | | $ | 95,424 | | |
1 For the period September 28, 2012 (commencement of operations) through October 31, 2012.
See Accompanying Notes to Financial Statements.
13
Credit Suisse Strategic Income Fund
Statement of Changes in Net Assets
| | | For the Period
Ended
October 31, 20121 | |
From Operations | |
Net investment income | | $ | 10,936 | | |
Net realized gain from investments and foreign currency transactions | | | 33,592 | | |
Net change in unrealized appreciation (depreciation) from investments
and foreign currency translations | | | 50,896 | | |
Net increase in net assets resulting from operations | | | 95,424 | | |
From Dividends | |
Dividends from net investment income | |
Class I shares | | | (12,576 | ) | |
Class A shares | | | (59 | ) | |
Class C shares | | | (23 | ) | |
Net decrease in net assets resulting from dividends | | | (12,658 | ) | |
| From Capital Share Transactions (Note 6) | |
Proceeds from sale of shares | | | 20,816,400 | | |
Reinvestment of dividends | | | 12,612 | | |
Net asset value of shares redeemed | | | (47 | ) | |
Net increase in net assets from capital share transactions | | | 20,828,965 | | |
Net increase in net assets | | | 20,911,731 | | |
Net Assets | |
Beginning of period | | | — | | |
End of period | | $ | 20,911,731 | | |
Accumulated net investment loss | | $ | (46 | ) | |
1 For the period September 28, 2012 (commencement of operations) through October 31, 2012.
See Accompanying Notes to Financial Statements.
14
Credit Suisse Strategic Income Fund
Financial Highlights
(For a Class I Share of the Fund Outstanding Throughout the Period)
| | | For the Period
Ended
October 31, 20121 | |
Per share data | |
Net asset value, beginning of period | | $ | 10.00 | | |
INVESTMENT OPERATIONS | |
Net investment income2 | | | 0.01 | | |
Net gain on investments and foreign currency related items (both realized and unrealized) | | | 0.06 | | |
Total from investment operations | | | 0.07 | | |
LESS DIVIDENDS | |
Dividends from net investment income | | | (0.01 | ) | |
Total dividends | | | (0.01 | ) | |
Net asset value, end of period | | $ | 10.06 | | |
Total return3 | | | 0.67 | % | |
RATIOS AND SUPPLEMENTAL DATA | |
Net assets, end of period (000s omitted) | | $ | 20,710 | | |
Ratio of expenses to average net assets | | | 0.99 | %4 | |
Ratio of net investment income to average net assets | | | 0.87 | %4 | |
Decrease reflected in above operating expense ratios due to waivers/reimbursements | | | 5.25 | %4 | |
Portfolio turnover rate | | | 31 | % | |
1 For the period September 28, 2012 (commencement of operations) through October 31, 2012.
2 Per share information is calculated using the average shares outstanding method.
3 Total returns are historical and assume changes in share price and reinvestment of all dividends and distributions. Had certain expenses not been reduced during the period shown, total returns would have been lower. Total returns for periods less than one year are not annualized.
4 Annualized.
See Accompanying Notes to Financial Statements.
15
Credit Suisse Strategic Income Fund
Financial Highlights
(For a Class A Share of the Fund Outstanding Throughout the Period)
| | | For the Period
Ended
October 31, 20121 | |
Per share data | |
Net asset value, beginning of period | | $ | 10.00 | | |
INVESTMENT OPERATIONS | |
Net investment income2 | | | 0.003 | | |
Net gain on investments and foreign currency related items (both realized and unrealized) | | | 0.08 | | |
Total from investment operations | | | 0.08 | | |
LESS DIVIDENDS | |
Dividends from net investment income | | | (0.01 | ) | |
Total dividends | | | (0.01 | ) | |
Net asset value, end of period | | $ | 10.07 | | |
Total return4 | | | 0.76 | % | |
RATIOS AND SUPPLEMENTAL DATA | |
Net assets, end of period (000s omitted) | | $ | 101 | | |
Ratio of expenses to average net assets | | | 1.24 | %5 | |
Ratio of net investment income to average net assets | | | 0.42 | %5 | |
Decrease reflected in above operating expense ratios due to waivers/reimbursements | | | 5.25 | %5 | |
Portfolio turnover rate | | | 31 | % | |
1 For the period September 28, 2012 (commencement of operations) through October 31, 2012.
2 Per share information is calculated using the average shares outstanding method.
3 This amount represents less than $0.01 per share.
4 Total returns are historical and assume changes in share price, reinvestment of all dividends and distributions and no sales charge. Had certain expenses not been reduced during the period shown, total returns would have been lower. Total returns for periods less than one year are not annualized.
5 Annualized.
See Accompanying Notes to Financial Statements.
16
Credit Suisse Strategic Income Fund
Financial Highlights
(For a Class C Share of the Fund Outstanding Throughout the Period)
| | | For the Period
Ended
October 31, 20121 | |
Per share data | |
Net asset value, beginning of period | | $ | 10.00 | | |
INVESTMENT OPERATIONS | |
Net investment income2 | | | (0.00 | )3 | |
Net gain on investments and foreign currency related items (both realized and unrealized) | | | 0.06 | | |
Total from investment operations | | | 0.06 | | |
LESS DIVIDENDS | |
Dividends from net investment income | | | (0.00 | )3 | |
Total dividends | | | (0.00 | ) | |
Net asset value, end of period | | $ | 10.06 | | |
Total return4 | | | 0.62 | % | |
RATIOS AND SUPPLEMENTAL DATA | |
Net assets, end of period (000s omitted) | | $ | 101 | | |
Ratio of expenses to average net assets | | | 1.99 | %5 | |
Ratio of net investment loss to average net assets | | | (0.33 | )%5 | |
Decrease reflected in above operating expense ratios due to waivers/reimbursements | | | 5.25 | %5 | |
Portfolio turnover rate | | | 31 | % | |
1 For the period September 28, 2012 (commencement of operations) through October 31, 2012.
2 Per share information is calculated using the average shares outstanding method.
3 This amount represents less than $0.01 per share.
4 Total returns are historical and assume changes in share price, reinvestment of all dividends and distributions and no sales charge. Had certain expenses not been reduced during the period shown, total returns would have been lower. Total returns for periods less than one year are not annualized.
5 Annualized.
See Accompanying Notes to Financial Statements.
17
Credit Suisse Strategic Income Fund
Notes to Financial Statements
October 31, 2012
Credit Suisse Strategic Income Fund (the "Fund"), a series of Credit Suisse Opportunity Funds (the "Trust"), a Delaware statutory trust, is registered under the Investment Company Act of 1940, as amended (the "1940 Act"), as a diversified open-end management investment company that seeks both current income and capital appreciation as elements of total return. The Trust was organized under the laws of the State of Delaware as a business trust on May 31, 1995. The Fund commenced operations on September 28, 2012.
The Fund offers three classes of shares: Class I shares, Class A shares and Class C shares. Each class of shares represents an equal pro rata interest in the Fund, except that they bear different expenses, which reflect the differences in the range of services provided to them. Class A shares are sold subject to a front-end sales charge of 4.75%. Class C shares are sold subject to a contingent deferred sales charge of 1.00% if the shares are redeemed within the first year of purchase.
Note 2. Significant Accounting Policies
A) SECURITY VALUATION — The net asset value of the Fund is determined daily as of the close of regular trading on the New York Stock Exchange, Inc. (the "Exchange") on each day the Exchange is open for business. Equity investments are valued at market value, which is generally determined using the closing price on the exchange or market on which the security is primarily traded at the time of valuation (the "Valuation Time"). If no sales are reported, equity investments are generally valued at the most recent bid quotation as of the Valuation Time or at the lowest asked quotation in the case of a short sale of securities. Equity investments are generally categorized as Level 1. Investments in open-end investment companies are valued at their net asset value each business day and are generally categorized as Level 1. Debt securities with a remaining maturity greater than 60 days are valued in accordance with the price supplied by a pricing service, which may use a matrix, formula or other objective method that takes into consideration market indices, yield curves and other specific adjustments. Debt obligations that will mature in 60 days or less are valued on the basis of amortized cost, which approximates market value, unless it is determined that using this method would not represent fair value. Debt securities are generally categorized as Level 2. Forward currency contracts are valued at the prevailing forward exchange rate of the underlying currencies and are generally categorized as Level 2. Time Deposits are valued at cost and are generally categorized as Level 2. Securities, forward currency contracts and other assets for which
18
Credit Suisse Strategic Income Fund
Notes to Financial Statements (continued)
October 31, 2012
Note 2. Significant Accounting Policies
market quotations are not readily available, or whose values have been materially affected by events occurring before the Fund's Valuation Time but after the close of the securities' primary markets, are valued at fair value as determined in good faith by, or under the direction of, the Board of Trustees under procedures established by the Board of Trustees and are generally categorized as Level 3. The Fund may utilize a service provided by an independent third party which has been approved by the Board of Trustees to fair value certain securities. When fair value pricing is employed, the prices of securities used by the Fund to calculate its net asset value may differ from quoted or published prices for the same securities.
In accordance with the authoritative guidance on fair value measurements and disclosures under accounting principles generally accepted in the United States of America ("GAAP"), the Fund discloses the fair value of its investments in a hierarchy that prioritizes the inputs to valuation techniques used to measure the fair value. In accordance with GAAP, fair value is defined as the price that the Fund would receive upon selling an investment in a timely transaction to an independent buyer in the principal or most advantageous market of the investment. GAAP established a three-tier hierarchy to maximize the use of observable market data and minimize the use of unobservable inputs and to establish classification of fair value measurements for disclosure purposes. Inputs refer broadly to the assumptions that market participants would use in pricing the asset or liability, including assumptions about risk, for example, the risk inherent in a particular valuation technique used to measure fair value including such a pricing model and/or the risk inherent in the inputs to the valuation technique. Inputs may be observable or unobservable. Observable inputs are inputs that reflect the assumptions market participants would use in pricing the asset or liability developed based on market data obtained from sources independent of the reporting entity. Unobservable inputs are inputs that reflect the reporting entity's own assumptions about the assumptions market participants would use in pricing the asset or liability developed based on the best information available in the circumstances. In accordance with the Fund's valuation procedures, factors used in determining value may include, but are not limited to, the type of the security, the size of the holding, the initial cost of the security, the existence of any contractual restrictions on the security's disposition, the price and extent of public trading in similar securities of the issuer or of comparable companies, quotations or evaluated prices from broker-dealers and/or pricing services, information obtained from the issuer, analysts, and/or the appropriate stock exchange (for exchange-traded securities), an analysis of the company's or
19
Credit Suisse Strategic Income Fund
Notes to Financial Statements (continued)
October 31, 2012
Note 2. Significant Accounting Policies
issuer's financial statements, an evaluation of the forces that influence the issuer and the market(s) in which the security is purchased and sold and with respect to debt securities, the maturity, coupon, creditworthiness, currency denomination, and the movement of the market in which the security is normally traded. The three-tier hierarchy of inputs is summarized in the three broad Levels listed below.
• Level 1 – quoted prices in active markets for identical investments
• Level 2 – other significant observable inputs (including quoted prices for similar investments, interest rates, prepayment speeds, credit risk, etc.)
• Level 3 – significant unobservable inputs (including the Fund's own assumptions in determining the fair value of investments)
The inputs or methodology used for valuing securities are not necessarily an indication of the risk associated with investing in those securities.
The following is a summary of the inputs used as of October 31, 2012 in valuing the Fund's investments carried at value:
| | | Level 1 | | Level 2 | | Level 3 | | Total | |
Investments in Securities | |
Corporate Bonds | | $ | — | | | | 7,096,360 | | | $ | — | | | $ | 7,096,360 | | |
Asset Backed Securities | | | — | | | | 2,237,969 | | | | — | | | | 2,237,969 | | |
Bank Loans | | | — | | | | 4,836,142 | | | | — | | | | 4,836,142 | | |
Short-Term Investment | | | — | | | | 12,963,000 | | | | — | | | | 12,963,000 | | |
Other Financial Instruments* | |
Forward Foreign Currency Contracts | | | — | | | | (1,410 | ) | | | — | | | | (1,410 | ) | |
| | | $ | — | | | $ | 27,132,061 | | | $ | — | | | $ | 27,132,061 | | |
*Other financial instruments include forwards foreign currency contracts.
The Fund adopted FASB amendments to authoritative guidance which require the Fund to disclose details of transfers in and out of Level 1 and Level 2 measurements and Level 2 and Level 3 measurements and the reasons for the transfers. For the period ended October 31, 2012, there were no transfers in and out of Level 1, Level 2 and Level 3.
B) DERIVATIVE INSTRUMENTS AND HEDGING ACTIVITIES — The Fund adopted amendments to authoritative guidance on disclosures about derivative instruments and hedging activities which require that the Fund disclose (a) how and why an entity uses derivative instruments, (b) how derivative instruments and hedging activities are accounted for, and (c) how derivative instruments and related hedging activities affect a fund's financial position, financial performance, and cash flows.
20
Credit Suisse Strategic Income Fund
Notes to Financial Statements (continued)
October 31, 2012
Note 2. Significant Accounting Policies
Fair Values of Derivative Instruments as of October 31, 2012
| | Asset Derivatives | | Liability Derivatives | |
| | Balance Sheet
Location | | Fair Value | | Balance Sheet
Location | | Fair Value | |
| Currency Contracts | | Unrealized appreciation/
depreciation on forward
currency contracts | | $ | — | | | Unrealized appreciation/
depreciation on forward
currency contracts | | $ | 1,410 | * | |
*Includes cumulative appreciation/depreciation of forward foreign currency contracts as reported in the Statement of Assets and Liabilities and Notes to Financial Statements.
Effect of Derivative Instruments on the Statement of Operations
| | Location | | Realized
Gain/Loss | | Location | | Unrealized
Appreciation/
Depreciation | |
| Currency Contracts | |
Net realized loss from
foreign currency
transactions | | $ | — | | | Net change in unrealized
appreciation
(depreciation) from
foreign currency
translations | | $ | (1,410 | ) | |
The notional amount of forward foreign currency contracts at period end are reflected in the Notes to Financial Statements. The notional amounts of forward foreign currency contracts at each month end throughout the reporting period averaged approximately 3.09% of net assets of the Fund.
C) FOREIGN CURRENCY TRANSACTIONS — The books and records of the Fund are maintained in U.S. dollars. Transactions denominated in foreign currencies are recorded at the current prevailing exchange rates. All assets and liabilities denominated in foreign currencies are translated into U.S. dollar amounts at the current exchange rate at the end of the period. Translation gains or losses resulting from changes in the exchange rate during the reporting period and realized gains and losses on the settlement of foreign currency transactions are reported in the results of operations for the current period. The Fund does not isolate that portion of realized gains and losses on investments in equity securities which is due to changes in the foreign exchange rate from that which is due to changes in market prices of equity securities. The Fund isolates that portion of realized gains and losses on investments in debt securities which is due to changes in the foreign exchange rate from that which is due to changes in market prices of debt securities.
D) SECURITY TRANSACTIONS AND INVESTMENT INCOME — Security transactions are accounted for on a trade date basis. Interest income is recorded
21
Credit Suisse Strategic Income Fund
Notes to Financial Statements (continued)
October 31, 2012
Note 2. Significant Accounting Policies
on the accrual basis. The Fund amortizes premiums and accretes discounts using the effective interest method. Dividends are recorded on the ex-dividend date. Certain expenses are class-specific expenses and vary by class. Income, expenses (excluding class-specific expenses) and realized/unrealized gains/losses are allocated proportionately to each class of shares based upon the relative net asset value of the outstanding shares of that class. The cost of investments sold is determined by use of the specific identification method for both financial reporting and income tax purposes.
E) DIVIDENDS AND DISTRIBUTIONS TO SHAREHOLDERS — Dividends from net investment income, if any, are declared daily and paid monthly. Distributions of net realized capital gains, if any, are declared and paid at least annually. However, to the extent that a net realized capital gain can be reduced by a capital loss carryforward, such gain will not be distributed. Income and capital gain distributions are determined in accordance with federal income tax regulations, which may differ from GAAP.
F) FEDERAL INCOME TAXES — No provision is made for federal taxes as it is the Fund's intention to continue to qualify for and elect the tax treatment applicable to regulated investment companies ("RIC") under the Internal Revenue Code of 1986, as amended (the "Code"), and to make the requisite distributions to its shareholders, which will be sufficient to relieve it from federal income and excise taxes.
In order to qualify as a RIC under the Code, the Fund must meet certain requirements regarding the source of its income, the diversification of its assets and the distribution of its income. One of these requirements is that the Fund derive at least 90% of its gross income for each taxable year from dividends, interest, payments with respect to certain securities loans, gains from the sale or other disposition of stock, securities or foreign currencies, other income derived with respect to its business of investing in such stock, securities or currencies or net income derived from interests in certain publicly traded partnerships ("Qualifying Income").
The Fund adopted the authoritative guidance for uncertainty in income taxes and recognizes a tax benefit or liability from an uncertain position only if it is more likely than not that the position is sustainable based solely on its technical merits and consideration of the relevant taxing authority's widely understood administrative practices and procedures. The Fund has reviewed its current tax positions and has determined that no provision for income tax is required in the Fund's financial statements.
22
Credit Suisse Strategic Income Fund
Notes to Financial Statements (continued)
October 31, 2012
Note 2. Significant Accounting Policies
G) USE OF ESTIMATES — The preparation of financial statements in conformity with GAAP requires management to make estimates and assumptions that affect the reported amounts of assets and liabilities and disclosure of contingent assets and liabilities at the date of the financial statements and the reported amounts of income and expenses during the reporting period. Actual results could differ from these estimates.
H) SHORT-TERM INVESTMENTS — The Fund, together with other funds/portfolios advised by Credit Suisse Asset Management, LLC ("Credit Suisse"), an indirect, wholly-owned subsidiary of Credit Suisse Group AG, pools available cash into a short-term variable rate time deposit issued by State Street Bank and Trust Company ("SSB"), the Fund's custodian. The short-term time deposit issued by SSB is a variable rate account classified as a short-term investment.
I) FORWARD FOREIGN CURRENCY CONTRACTS — The Fund may enter into forward foreign currency contracts for the purchase or sale of a specific foreign currency at a fixed price on a future date. Risks may arise upon entering into these contracts from the potential inability of counterparties to meet the terms of their contracts and from unanticipated movements in the value of a foreign currency. The Fund will enter into forward foreign currency contracts primarily for hedging foreign currency risk. Forward foreign currency contracts are adjusted by the daily forward exchange rate of the underlying currency and any gains or losses are recorded for financial statement purposes as unrealized until the contract settlement date or an offsetting position is entered into. At October 31, 2012, the Fund had the following open forward foreign currency contracts:
Forward Foreign
Currency to be
Purchased (Local) | | Forward Foreign
Currency to be
Sold (Local) | | Expiration
Date | | Counterparties | | Value on
Settlement
Date | | Current
Value | | Unrealized
Appreciation/
(Depreciation) | |
USD | 647,000 | | | EUR | 500,000 | | | 1/18/13 | | Citigroup | | $ | (647,000 | ) | | $ | (648,410 | ) | | $ | (1,410 | ) | |
Currency Abbreviations:
EUR = Euro
USD = United States Dollar
J) SECURITIES LENDING — Loans of securities are required at all times to be secured by collateral at least equal to 102% of the market value of domestic securities on loan (including any accrued interest thereon) and 105% of the market value of foreign securities on loan (including any accrued interest thereon). Cash collateral received by the Fund in connection with securities lending activity may be pooled together with cash collateral for other
23
Credit Suisse Strategic Income Fund
Notes to Financial Statements (continued)
October 31, 2012
Note 2. Significant Accounting Policies
funds/portfolios advised by Credit Suisse and may be invested in a variety of investments, including funds advised by SSB, the Fund's securities lending agent, or money market instruments. However, in the event of default or bankruptcy by the other party to the agreement, realization and/or retention of the collateral may be subject to legal proceedings.
SSB has been engaged by the Fund to act as the Fund's securities lending agent. The Fund's securities lending arrangement provides that the Fund and SSB will share the net income earned from securities lending activities. During the period ended October 31, 2012, there were no securities out on loan. Securities lending income is accrued as earned.
K) OTHER — The high yield, fixed income securities in which the fund will invest will primarily consist of senior secured floating rate loans ("Senior Loans") issued by non-investment grade companies. Senior Loans are typically secured by specific collateral of the issuer and hold the most senior position in the issuer's capital structure. The interest rate on Senior Loans is periodically adjusted to a recognized base rate, typically the London Interbank Offered Rate ("LIBOR"). While these characteristics may reduce interest rate risk and mitigate losses in the event of borrower default, the Senior Loans in which the Fund invests have below investment grade credit ratings and thereby are considered speculative because of the significant credit risk of their issuers.
Lower-rated debt securities (commonly known as "junk bonds") possess speculative characteristics and are subject to greater market fluctuations and risk of lost income and principal than higher-rated debt securities for a variety of reasons. Also, during an economic downturn or substantial period of rising interest rates, highly leveraged issuers may experience financial stress which would adversely affect their ability to service their principal and interest payment obligations, to meet projected business goals and to obtain additional financing.
In addition, periods of economic uncertainty and changes can be expected to result in increased volatility of market prices of lower-rated debt securities and the Fund's net asset value.
L) SUBSEQUENT EVENTS — In preparing the financial statements as of October 31, 2012, management considered the impact of subsequent events for potential recognition or disclosure in these financial statements through the date of release of this report. No such events requiring recognition or disclosure were identified through the date of the release of this report.
24
Credit Suisse Strategic Income Fund
Notes to Financial Statements (continued)
October 31, 2012
Note 3. Transactions with Affiliates and Related Parties
Credit Suisse serves as investment adviser for the Fund. For its investment advisory services, Credit Suisse is entitled to receive a fee from the Fund at an annual rate of 0.75% of the Fund's average daily net assets. For the period ended October 31, 2012, investment advisory fees earned, voluntarily waived and reimbursed were $9,567, $9,567 and $57,397, respectively. The Fund is authorized to reimburse Credit Suisse for management fees previously limited and/or for expenses previously paid by Credit Suisse, provided, however, that any reimbursements must be paid at a date not more than three years after the end of the fund's first year of operations and the reimbursements do not cause a class to exceed the applicable expense limitation in the contract at the time the fees were limited or expenses are paid. This contract may not be terminated before the end of the fund's first year of operations. Credit Suisse waives fees and reimburses expenses so that the Fund's annual operating expenses will not exceed 0.99% of the Fund's average daily net assets for Class I shares, 1.24% of the Fund's average daily net assets for Class A shares, and 1.99% of the Fund's average daily net assets for Class C shares.
Credit Suisse Asset Management Limited ("Credit Suisse U.K."), an affiliate of Credit Suisse, served as sub-investment advisor to the Fund. Credit Suisse U.K.'s sub-investment advisor fees were paid by Credit Suisse out of Credit Suisse's net investment advisory fee and were not paid by the Fund.
Credit Suisse and SSB serve as co-administrators to the Fund. For its co-administrative services, Credit Suisse received a fee calculation at an annual rate of 0.09% of the Fund's average daily net assets. For the period ended October 31, 2012, co-administrative services fees earned by Credit Suisse were $1,148.
For its co-administrative services, SSB receives a fee, exclusive of out-of-pocket expenses, calculated in total for all the Credit Suisse funds/portfolios co-administered by SSB and allocated based upon the relative average net assets of each fund/portfolio, subject to an annual minimum fee. For the period ended October 31, 2012, co-administrative services fees earned by SSB (including out-of-pocket expenses) were $383.
Credit Suisse Securities (USA) LLC (CSSU), an affiliate of Credit Suisse, serves as distributor of the Fund's shares. Pursuant to distribution plans adopted by the Fund pursuant to Rule 12b-1 under the 1940 Act, CSSU received fees for its distribution services. The distributor is paid at the annual rate of 0.25% of the average daily net assets of the Class A shares. For the Class C
25
Credit Suisse Strategic Income Fund
Notes to Financial Statements (continued)
October 31, 2012
Note 3. Transactions with Affiliates and Related Parties
shares, the fee is calculated at an annual rate of 1.00% of the average daily net assets. Class I shares are not subject to distribution fees.
Merrill Corporation ("Merrill"), an affiliate of Credit Suisse, has been engaged by the Fund to provide certain financial printing services. For the year ended October 31, 2012, Merrill was paid $0 for its services by the Fund.
Offering costs, including initial registration costs, were deferred and will be charged to expenses during the Fund's first year of operation. For the period ended October 31, 2012, $12,740 has been expensed to the Fund.
Note 4. Line of Credit
The Fund, together with other funds/portfolios advised by Credit Suisse (collectively, the "Participating Funds"), participates in a committed, unsecured line of credit facility ("Credit Facility") for temporary or emergency purposes with SSB. Under the terms of the Credit Facility, the Participating Funds pay an aggregate commitment fee on the average unused amount of the Credit Facility, which is allocated among the Participating Funds in such manner as is determined by the governing Boards of the Participating Funds. In addition, the Participating Funds pay interest on borrowings at either the Overnight Federal Funds rate or the Overnight LIBOR rate plus a spread. At October 31, 2012, and during the period ended October 31, 2012, the Fund had no borrowings outstanding under the Credit Facility.
Note 5. Purchases and Sales of Securities
For the period ended October 31, 2012, purchases and sales of investment securities (excluding short-term investments) were $16,294,616 and $2,201,864, respectively.
26
Credit Suisse Strategic Income Fund
Notes to Financial Statements (continued)
October 31, 2012
Note 6. Capital Share Transactions
The Fund is authorized to issue an unlimited number of full and fractional shares of beneficial interest, $.001 par value per share. The Fund offers Class I, Class A and Class C shares. Transactions in capital shares for each class of the Fund were as follows:
| | | Class I | |
| | | For the Period
October 31, 20121 | |
| | | Shares | | Value | |
Shares sold | | | 2,056,439 | | | $ | 20,616,400 | | |
Shares issued in reinvestment of dividends | | | 1,246 | | | | 12,530 | | |
Shares redeemed | | | (5 | ) | | | (47 | ) | |
Net increase | | | 2,057,680 | | | $ | 20,628,883 | | |
| | | Class A | |
| | | For the Period
October 31, 20121 | |
| | | Shares | | Value | |
Shares sold | | | 10,000 | | | $ | 100,000 | | |
Shares issued in reinvestment of dividends | | | 6 | | | | 59 | | |
Net increase | | | 10,006 | | | $ | 100,059 | | |
| | | Class C | |
| | | For the Period
October 31, 20121 | |
| | | Shares | | Value | |
Shares sold | | | 10,000 | | | $ | 100,000 | | |
Shares issued in reinvestment of dividends | | | 2 | | | | 23 | | |
Net increase | | | 10,002 | | | $ | 100,023 | | |
1 For the period from September 28, 2012 (commencement of operations) through October 31, 2012.
The Fund imposes a redemption fee of 2% of the value of all classes of shares currently being offered that are redeemed or exchanged within 30 days from the date of purchase. Reinvested dividends and distributions are not subject to the fee. The fee is charged based on the value of shares at redemption, is paid directly to the Fund and becomes part of the Fund's daily net asset value calculation. When shares are redeemed that are subject to the fee, reinvested dividends and distributions are redeemed first, followed by the shares held longest.
27
Credit Suisse Strategic Income Fund
Notes to Financial Statements (continued)
October 31, 2012
Note 6. Capital Share Transactions
On October 31, 2012, the number of shareholders that held 5% or more of the outstanding shares of each class of the Fund was as follows:
| | | Number of
Shareholders | | Approximate Percentage
of Outstanding Shares | |
Class I | | | 1 | * | | | 96 | % | |
Class A | | | 1 | * | | | 100 | % | |
Class C | | | 1 | * | | | 100 | % | |
* This represents the seed money from Merchant Holding, Inc., an affiliate of Credit Suisse.
Note 7. Federal Income Taxes
Income and capital gain distributions are determined in accordance with federal income tax regulations, which may differ from GAAP.
The tax characteristics of dividends paid during the period ended October 31, 2012, by the Fund were as follows:
| | | Ordinary income | |
| | | 2012 | |
| | $ | 12,658 | | |
The tax basis components of distributable earnings differ from the amounts reflected in the Statement of Assets and Liabilities by temporary book/tax differences. These differences are primarily due to differing treatments of dividends payable and forward contracts mark to market. At October 31, 2012, the components of distributable earnings on a tax basis were as follows:
Undistributed ordinary income | | $ | 30,715 | | |
Ordinary income distributions payable | | | (46 | ) | |
Unrealized appreciation | | | 52,306 | | |
| | | $ | 82,975 | | |
Under the Regulated Investment Company Modernization Act of 2010, the Fund will be permitted to carry forward capital losses incurred in taxable years beginning after December 22, 2010 for an unlimited period. However, any losses incurred during those future taxable years will be required to be utilized prior to the losses incurred in pre-enactment taxable years. As a result of this ordering rule, pre-enactment capital loss carryforwards may be more likely to expire unused. Additionally, post-enactment capital losses that are carried forward will retain their character as either short-term or long-term capital losses rather than being considered all short-term as under previous law. It is
28
Credit Suisse Strategic Income Fund
Notes to Financial Statements (continued)
October 31, 2012
Note 7. Federal Income Taxes
uncetain whether the Fund will be able to realize the full benefits of the capital loss carryforwards before they expire.
At October 31, 2012, the cost of investments (excluding foreign currency related transactions) and net unrealized appreciation (depreciation) for income tax purposes were as follows:
Cost of Investments | | $ | 27,088,085 | | |
Unrealized appreciation | | $ | 94,235 | | |
Unrealized depreciation | | | (48,849 | ) | |
Net unrealized appreciation (depreciation) | | $ | 45,386 | | |
At October 31, 2012, the Fund reclassified $1,676 to accumulated net investment loss and $1,467 to accumulated net realized loss from investments from paid in capital, to adjust for current period permanent book/tax differences which arose principally from differing book/tax treatment of foreign currency gain/(loss) and distribution re-designations. Net assets were not affected by these reclassifications.
Note 8. Contingencies
In the normal course of business, the Fund may provide general indemnifications pursuant to certain contracts and organizational documents. The Fund's maximum exposure under these arrangements is dependent on future claims that may be made against the Fund and, therefore, cannot be estimated; however, based on experience, the risk of loss from such claims is considered remote.
29
Credit Suisse Strategic Income Fund
Report of Independent Registered Public Accounting Firm
To the Board of Trustees of Credit Suisse Opportunity Funds
and the Shareholders of Credit Suisse Strategic Income Fund:
In our opinion, the accompanying statement of assets and liabilities, including the schedule of investments, and the related statements of operations and of changes in net assets and the financial highlights present fairly, in all material respects, the financial position of Credit Suisse Strategic Income Fund (one of the Funds comprising Credit Suisse Opportunity Funds, hereafter referred to as the "Fund") at October 31, 2012, the results of its operations, the changes in its net assets and the financial highlights for the period September 28, 2012 (commencement of operations) through October 31, 2012, in conformity with accounting principles generally accepted in the United States of America. These financial statements and financial highlights (hereafter referred to as "financial statements") are the responsibility of the Fund's management. Our responsibility is to express an opinion on these financial statements based on our audit. We conducted our audit of these financial statements in accordance with the standards of the Public Company Accounting Oversight Board (United States). Those standards require that we plan and perform the audit to obtain reasonable assurance about whether the financial statements are free of material misstatement. An audit includes examining, on a test basis, evidence supporting the amounts and disclosures in the financial statements, assessing the accounting principles used and significant estimates made by management, and evaluating the overall financial statement presentation. We believe that our audit, which included confirmation of securities at October 31, 2012 by correspondence with the custodian, brokers, agent banks, and the application of alternative auditing procedures where securities purchased confirmations had not been received, provide a reasonable basis for our opinion.
PricewaterhouseCoopers LLP
Boston, Massachusetts
December 28, 2012
30
Credit Suisse Strategic Income Fund
Board Approval of Advisory Agreement
and Sub-Advisory Agreement (unaudited)
Credit Suisse Strategic Income Fund (the "Fund") is a new portfolio of Credit Suisse Opportunity Funds. In approving the Fund's Amended and Restated Investment Advisory Agreement (the "Advisory Agreement") and Sub-Advisory Agreement, the Board of Trustees (the "Board") of the Credit Suisse Opportunity Funds, including a majority of the Trustees who are not "interested persons" of the Fund as defined in the Investment Company Act of 1940 (the "Independent Trustees"), at a meeting held on August 14, 2012, considered the following factors:
Investment Advisory Fee Rates and Expenses
The Board reviewed and considered the proposed contractual advisory fee rate of 0.75% of the Fund's average daily net assets ("Gross Advisory Fee") for the Fund in light of the extent and quality of the proposed advisory services that would be provided by Credit Suisse Asset Management, LLC ("Credit Suisse") or Credit Suisse Asset Management Limited (the "Sub-Adviser"). The Board noted that the compensation paid to the Sub-Adviser does not increase the fees or expenses otherwise incurred by the Fund. The Board also considered that Credit Suisse would enter into an expense limitation agreement ("Expense Limitation Agreement") limiting the Fund's total net expenses to 1.24%, 1.99% and 0.99% of the average daily net assets of Class A, Class C and Class I, respectively, for at least the first year of Fund operations.
Additionally, the Board received and considered information used to compare the Fund's proposed Gross Advisory Fee and the Fund's net total expenses with those of funds in the relevant expense group ("Expense Group One") provided by an independent provider of investment company data and Credit Suisse ("Expense Group Two"). The Board was provided with a description of the methodology used to arrive at the funds included in Expense Group One and Expense Group Two.
Nature, Extent and Quality of the Services under the Advisory Agreement
The Board received and considered information about the Fund's proposed objective, principal strategies, principal risks and Credit Suisse's distribution strategy for the Fund. The Board received and considered information regarding the nature, extent and quality of services that would be provided to the Fund by Credit Suisse under the proposed Advisory Agreement and by the Sub-Adviser under the Sub-Advisory Agreement. The Board also noted information received at regular meetings throughout the year related to the services rendered by Credit Suisse to other funds. The Board reviewed
31
Credit Suisse Strategic Income Fund
Board Approval of Advisory Agreement
and Sub-Advisory Agreement (unaudited) (continued)
background information about Credit Suisse and the Sub-Adviser. The Board considered the background and experience of Credit Suisse's senior management and the expertise of, and the amount of attention that was expected to be given to the Fund by, senior personnel of Credit Suisse. In addition, the Board reviewed the qualifications, backgrounds and responsibilities of the portfolio management team that would be primarily responsible for the day-to-day portfolio management of the Fund and the extent of the resources devoted to research and analysis of actual and potential investments. The Board evaluated the ability of Credit Suisse and the Sub-Adviser, based on their resources, reputation and other attributes, to attract and retain qualified investment professionals including research, advisory, and supervisory personnel.
In approving the Sub-Advisory Agreement, the Board considered the benefits of retaining Credit Suisse's affiliate as the Fund's Sub-Adviser and the Sub-Adviser's investment style.
Fund Performance
There was no performance information since the Fund was new.
Credit Suisse Profitability
There was no profitability analysis since the Fund was new. However, the Board considered a profitability analysis of Credit Suisse based on the fees payable under advisory agreements for other Credit Suisse funds advised by Credit Suisse annually. The Board considered that the profitability with respect to the Fund would be similar to that analysis.
Economies of Scale
The Board considered information regarding whether there could be economies of scale with respect to the management of the Fund and whether the Fund could appropriately benefit from any economies of scale. Accordingly, the Board considered whether breakpoints in the Fund's proposed advisory fee structure would be appropriate or reasonable taking into consideration economies of scale or other efficiencies that might accrue from increases in the Fund's asset levels.
32
Credit Suisse Strategic Income Fund
Board Approval of Advisory Agreement
and Sub-Advisory Agreement (unaudited) (continued)
Other Benefits to Credit Suisse
The Board considered other benefits received by Credit Suisse, the Sub-Adviser and their affiliates as a result of their relationship with the Fund. Such benefits include, among others, benefits potentially derived from an increase in Credit Suisse's and the Sub-Adviser's businesses as a result of its relationship with the Fund (such as the ability to market to shareholders other financial products offered by Credit Suisse and its affiliates) and the fees paid to affiliates of Credit Suisse for co-administration and distribution services.
The Board considered the standards Credit Suisse and the Sub-Adviser would apply in seeking best execution for the Fund and considered Credit Suisse's method for allocating portfolio investment opportunities among its advisory clients.
Other Factors and Broader Review
The Board reviews and assesses the quality of the services that Credit Suisse provides to other Credit Suisse funds throughout the year. In this regard, the Board reviews reports of Credit Suisse at least quarterly, which include, among other things, detailed portfolio and market reviews, detailed fund performance reports, and Credit Suisse's compliance procedures for other Credit Suisse funds. The Board would receive similar reports with respect to the Fund.
Conclusions
In selecting Credit Suisse and the Sub-Adviser, and approving the Advisory Agreement and the investment advisory fee under such agreement and the Sub-Advisory Agreement, the Board concluded that:
• The estimated net total expenses were above the median of Expense Group One while the proposed Gross Advisory Fee was near the higher end of Expense Group One. The estimated net total expenses and proposed Gross Advisory Fee were below the average of Expense Group Two. The Board also considered the demands, complexity and quality of the investment management of the Fund and the Expense Limitation Agreement. The Board determined the fees to be reasonable.
• The Board was satisfied with the proposed nature, extent and quality of the investment advisory services that would be provided to the Fund by Credit Suisse and the Sub-Adviser and that, based on dialogue with management and counsel, the services that would be provided by Credit
33
Credit Suisse Strategic Income Fund
Board Approval of Advisory Agreement
and Sub-Advisory Agreement (unaudited) (continued)
Suisse under the Advisory Agreement and Sub-Adviser under the Sub-Advisory Agreement are typical of, and consistent with, those provided to similar mutual funds by other investment advisers.
• In light of the information, the Fund's proposed fee structure was considered reasonable.
No single factor reviewed by the Board was identified by the Board as the principal factor in determining whether to approve the Advisory Agreement and Sub-Advisory Agreement. The Independent Trustees were advised by separate independent legal counsel throughout the process.
34
Credit Suisse Strategic Income Fund
Information Concerning Trustees and Officers (unaudited)
Name, Address
(Year of Birth) | | Position(s)
Held with
Fund | | Term
of Office1
and
Length
of Time
Served | | Principal
Occupation(s) During
Past Five Years | | Number of
Portfolios
in Fund
Complex
Overseen
by Trustee | | Other
Directorships
Held by Trustee | |
Independent Trustees | | | | | | | | | | | |
Enrique Arzac
c/o Credit Suisse Asset
Management, LLC
Attn: General Counsel
One Madison Avenue
New York, New York
10010
(1941) | | Trustee, Audit Committee Chairman and Nominating Committee Member | | Since Fund Inception | | Professor of Finance and Economics, Graduate School of Business, Columbia University since 1971. | | | 9 | | | Director of Epoch Holding Corporation (an investment management and investment advisory services company); Director of The Adams Express Company, Director of Petroleum and Resources Corporation, Director of Aberdeen Asset Management-advised Funds (six closed-end investment companies); Director of Mirae Asset Discovery Funds (open-end investment companies). | |
Jeffrey E. Garten
Box 208200
New Haven, Connecticut
06520-8200
(1946) | | Trustee, Audit and Nominating Committee Member | | Since Fund Inception | | The Juan Trippe Professor in the Practice of International Trade, Finance and Business from July 2005 to present; Partner and Chairman of Garten Rothkopf (consulting firm) from October 2005 to present; Dean of Yale School of Management from November 1995 to June 2005. | | | 7 | | | Director of Aetna, Inc. (insurance company); Director of CarMax Group (used car dealers); Member of Standard & Poor's Board of Managers (credit rating agency). | |
1 Each Trustee and Officer serves until his or her respective successor has been duly elected and qualified.
35
Credit Suisse Strategic Income Fund
Information Concerning Trustees and Officers (unaudited) (continued)
Name, Address
(Year of Birth) | | Position(s)
Held with
Fund | | Term
of Office1
and
Length
of Time
Served | | Principal
Occupation(s) During
Past Five Years | | Number of
Portfolios
in Fund
Complex
Overseen
by Trustee | | Other
Directorships
Held by Trustee | |
Independent Trustees | | | | | | | | | | | |
Peter F. Krogh
c/o Credit Suisse Asset
Management, LLC
Attn: General Counsel
One Madison Avenue
New York, New York
10010
(1937) | | Trustee, Audit and Nominating Committee Member | | Since Fund Inception | | Dean Emeritus and Distinguished Professor of International Affairs at the Edmund A. Walsh School of Foreign Service, Georgetown University from June 1995 to present. | | | 7 | | | None | |
Steven N. Rappaport
Lehigh Court, LLC
555 Madison Avenue
29th Floor
New York, New York
10022
(1948) | | Chairman of the Board of Trustees, Audit Committee Member and Nominating Committee Chairman | | Since Fund Inception | | Partner of Lehigh Court, LLC and RZ Capital (private investment firms) from July 2002 to present. | | | 9 | | | Director of iCAD, Inc. (surgical and medical instruments and apparatus company); Director of Wood Resources, LLC. (plywood manufacturing company); Director of Aberdeen Asset Management-advised Funds (five closed-end investment companies). | |
36
Credit Suisse Strategic Income Fund
Information Concerning Trustees and Officers (unaudited) (continued)
Name, Address
(Year of Birth) | | Position(s)
Held with
Fund | | Term
of Office1
and
Length
of Time
Served | | Principal Occupation(s) During Past Five Years | |
Officers** | | | | | | | |
John G. Popp
Credit Suisse Asset Management, LLC
One Madison Avenue
New York, New York 10010
(1956) | | Chief Executive Officer and President | | Since Fund Inception | | Managing Director of Credit Suisse; Group Manager and Senior Portfolio Manager for Performing Credit Strategies; Associated with Credit Suisse or its predecessor since 1997; Officer of other Credit Suisse Funds. | |
Bruce Rosenberg
Credit Suisse Asset
Management, LLC
One Madison Avenue
New York, New York 10010
(1961) | | Chief Financial Officer | | Since 2012 | | Director and Director of Liquid Accounting of Credit Suisse; Associated with Credit Suisse since 2008; Associated with Bank of New York Mellon Alternative Investment Services from 2006 to 2008; Officer of other Credit Suisse Funds. | |
Emidio Morizio
Credit Suisse Asset Management, LLC
One Madison Avenue
New York, New York 10010
(1966) | | Chief Compliance Officer | | Since Fund Inception | | Managing Director and Global Head of Compliance of Credit Suisse; Associated with Credit Suisse since July 2000; Officer of other Credit Suisse Funds. | |
Roger Machlis
Credit Suisse Asset Management, LLC
One Madison Avenue
New York, New York 10010
(1961) | | Chief Legal Officer | | Since Fund Inception | | Managing Director and General Counsel for Credit Suisse; Associated with Credit Suisse Group AG since July 1997; Officer of other Credit Suisse Funds. | |
Cecilia Chau
Credit Suisse Asset Management, LLC
One Madison Avenue
New York, New York 10010
(1973) | | Treasurer | | Since Fund Inception | | Vice President of Credit Suisse since 2009; Assistant Vice President of Credit Suisse from June 2007 to December 2008; Associated with Alliance Bernstein L.P. from January 2007 to May 2007; Associated with Credit Suisse from August 2000 to December 2006; Officer of other Credit Suisse Funds. | |
Karen Regan
Credit Suisse Asset Management, LLC
One Madison Avenue
New York, New York 10010
(1963) | | Vice President and Secretary | | Since Fund Inception | | Vice President of Credit Suisse; Associated with Credit Suisse since December 2004; Officer of other Credit Suisse Funds. | |
** The officers of the Fund shown are officers that make policy decisions.
The Statement of Additional Information includes additional information about the Trustees and is available, without charge, upon request, by calling 877-870-2874.
37
Credit Suisse Strategic Income Fund
Proxy Voting and Portfolio Holdings Information (unaudited)
Information regarding how the Fund voted proxies related to its portfolio securities during the 12 month period ended June 30 of each year, as well as the policies and procedures that the Fund uses to determine how to vote proxies relating to its portfolio securities are available:
• By calling 1-877-870-2874
• On the Fund's website, www.credit-suisse.com/us/funds
• On the website of the Securities and Exchange Commission, www.sec.gov.
The Fund files a complete schedule of its portfolio holdings for the first and third quarters of its fiscal year with the SEC on Form N-Q. The Fund's Forms N-Q are available on the SEC's website at www.sec.gov and may be reviewed and copied at the SEC's Public Reference Room in Washington, DC. Information on the operation of the SEC's Public Reference Room may be obtained by calling 1-202-551-8090.
38
This page intentionally left blank
This page intentionally left blank

P.O. BOX 55030, BOSTON, MA 02205-5030
877-870-2874 n www.credit-suisse.com/us/funds
CREDIT SUISSE SECURITIES (USA) LLC, DISTRIBUTOR. SIF-AR-1012

CREDIT SUISSE FUNDS
Annual Report
October 31, 2012
n CREDIT SUISSE
MANAGED FUTURES STRATEGY FUND
The Fund's investment objectives, risks, charges and expenses (which should be considered carefully before investing), and more complete information about the Fund, are provided in the Prospectus, which should be read carefully before investing. You may obtain additional copies by calling 877-870-2874 or by writing to Credit Suisse Funds, P.O. Box 55030, Boston, MA 02205-5030.
Credit Suisse Securities (USA) LLC, Distributor, is located at One Madison Avenue, New York, NY 10010. Credit Suisse Funds are advised by Credit Suisse Asset Management, LLC.
Investors in the Credit Suisse Funds should be aware that they may be eligible to purchase Class I shares (where offered) directly or through certain intermediaries. Such shares are not subject to a sales charge. Investors in the Credit Suisse Funds should also be aware that they may be eligible for a reduction or waiver of the sales charge with respect to Class A or C shares (where offered). For more information, please review the relevant prospectuses or consult your financial representative.
The views of the Fund's management are as of the date of the letter and the Fund holdings described in this document are as of October 31, 2012; these views and Fund holdings may have changed subsequent to these dates. Nothing in this document is a recommendation to purchase or sell securities.
Fund shares are not deposits or other obligations of Credit Suisse Asset Management, LLC ("Credit Suisse") or any affiliate, are not FDIC-insured and are not guaranteed by Credit Suisse or any affiliate. Fund investments are subject to investment risks, including loss of your investment.
Credit Suisse Managed Futures Strategy Fund
Annual Investment Adviser's Report
October 31, 2012 (unaudited)
December 11, 2012
Dear Shareholder:
We are pleased to present this Annual Report covering the activities of the Credit Suisse Managed Futures Strategy Fund (the "Fund") for the one-month period ended October 31, 2012.
Performance Summary
09/28/12 – 10/31/12*
Fund & Benchmark | | Performance | |
| Class I1 | | | -2.40 | % | |
| Class A1,2 | | | -2.40 | % | |
| Class C1,2 | | | -2.50 | % | |
| Credit Suisse Managed Futures Liquid Index3 | | | -2.41 | % | |
Performance shown for the Fund's Class A and Class C Shares does not reflect sales charges, which are a maximum of 5.25% and 1.00%, respectively.2
Market Review:
The month of October was a bit challenging for managed futures strategies, with the Credit Suisse Managed Futures Liquid Index ("Index"), the Fund's benchmark, losing 2.41%.
For the latter part of the year, many markets have been range-trading and unable to develop trends — a circumstance that hurts managed futures strategies. As markets currently appear to be driven primarily by policies, rather than fundamentals, traditional trading patterns have broken down.
Strategic Review and Outlook:
The Fund seeks to achieve investment results that correspond generally to the performance, before fees and expenses, of the Index. The Index is designed to provide exposure to both up and down price trends in four broad asset classes: equities, fixed income, commodities and currencies. The Index is currently composed of 14 futures contracts and 4 commodity indices that provide exposure to the asset classes. The Index uses a proprietary quantitative methodology to seek to identify price trends in each of the asset classes over a variety of time horizons. Components of the Index, which may change from time to time, are positioned either long or short based on the price trends within the asset classes determined using the Index's quantitative methodology.
For the month, the Fund performed in line with its benchmark, returning -2.40% versus the Index's -2.41%. The Fund was primarily long for the
1
Credit Suisse Managed Futures Strategy Fund
Annual Investment Adviser's Report (continued)
October 31, 2012 (unaudited)
entire time period. We switched positions in industrial metals and Japanese Yen futures from long to short as upward trends ended and downward trends began. Additionally, Nikkei 225 futures were changed from long to short and then back to long as that market continued to range-trade.
Due to the continuing uncertainty in the markets caused by the European crisis and the US budget negotiations, we believe that markets are not likely to establish trends in the near term, thus causing managed futures strategies to underperform. A rapid resolution of these issues, however, could prove profitable to the strategy.
The Credit Suisse Liquid Alternative Beta Team
Dr. Jordan Drachman
Sheel Dhande
Alexander De Feo
This Fund is non-diversified, which means it may invest a greater proportion of its assets in the securities of a smaller number of issuers than a diversified mutual fund and may therefore be subject to greater volatility. The Fund's investment in alternative instruments may subject the Fund to greater volatility than investment in traditional securities, particularly in investments involving leverage.
The use of alternative assets and strategies entails substantial risks, including risk of loss principal, commodity exposure risks, currency risk, equity risk, fixed income risk, derivatives risk, exchange-traded notes risk, credit risk, foreign securities risk, interest rate risk, market risk, forwards risk, futures contracts risk, index/tracking error risk, leveraging risk, short position risk, swap agreement risk, valuation risk and tax risk. Gains and losses from speculative positions in derivatives may be much greater than the derivative's cost. For a detailed discussion of these and other risks, please refer to the Fund's Prospectus, which should be read carefully before investing.
In addition to historical information, this report contains forward-looking statements, which may concern, among other things, domestic and foreign market, industry and economic trends and developments and government regulation and their potential impact on the Fund's investments. These statements are subject to risks and uncertainties and actual trends, developments and regulations in the future, and their impact on the Fund could be materially different from those projected, anticipated or implied. The Fund has no obligation to update or revise forward-looking statements.
2
Credit Suisse Managed Futures Strategy Fund
Annual Investment Adviser's Report (continued)
October 31, 2012 (unaudited)
Comparison of Change in Value of $10,000 Investment in the
Credit Suisse Managed Futures Strategy Fund1 Class I shares,
Class A shares2, Class C shares2 and the Credit Suisse Managed Futures
Liquid Index3 from Inception (9/28/12).
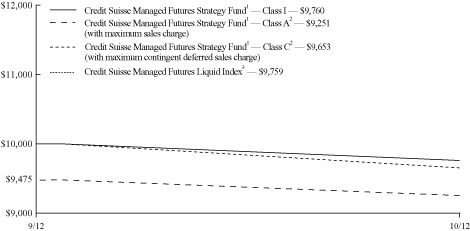
Average Annual Returns as of October 31, 20121
| | | Since
Inception | | Inception
Date | |
Class I | | | (2.40 | )% | | 9/28/12 | |
Class A Without Sales Charge | | | (2.40 | )% | | 9/28/12 | |
Class A With Maximum Sales Charge | | | (7.49 | )% | | 9/28/12 | |
Class C Without CDSC | | | (2.50 | )% | | 9/28/12 | |
Class C With CDSC | | | (3.48 | )% | | 9/28/12 | |
Returns represent past performance and include change in share price and reinvestment of dividends and capital gains. Past performance cannot guarantee future results. The current performance of the Fund may be lower or higher than the figures shown. Returns and share price will fluctuate, and redemption value may be more or less than original cost. The performance results do not reflect the deduction of taxes that a shareholder would pay on fund distributions or the redemption of fund shares. Performance information current to the most recent month-end is available at www.credit-suisse.com/us/funds.
3
Credit Suisse Managed Futures Strategy Fund
Annual Investment Adviser's Report (continued)
October 31, 2012 (unaudited)
The annualized gross expense ratios are 4.71% for Class I shares, 4.96% for Class A shares and 5.71% for Class C shares. The annualized net expense ratios after fee waivers and/or expense reimbursements are 1.70% for Class I shares, 1.95% for Class A shares and 2.70% for Class C shares.
* Fund commenced operations on September 28, 2012.
1 Fee waivers and/or expense reimbursements may reduce expenses for the Fund, without which performance would be lower.
2 Total return for the Fund's Class A shares for the reporting period, based on offering price (including maximum sales charge of 5.25%), was (7.49%). Total return for the Fund's Class C shares for the reporting period, based on redemption value (including maximum contingent deferred sales charge of 1.00%), was (3.48%).
3 The Credit Suisse Managed Futures Liquid Index is currently composed of 14 futures contracts and 4 commodity indices which provide exposure to the asset classes. The Index uses a proprietary quantitative methodology to seek to identify price trends in each of the asset classes over a variety of time horizons. Components of the Index, which may change from time to time, are positioned either long or short based on the price trends within the asset classes determined using the Index's quantitative methodology. An index does not have transaction cost; investors cannot invest directly in an index.
4
Credit Suisse Managed Futures Strategy Fund
Annual Investment Adviser's Report (continued)
October 31, 2012 (unaudited)
Information About Your Fund's Expenses
As an investor of the Fund, you incur two types of costs: ongoing expenses and transaction costs. Ongoing expenses include management fees, distribution and service (12b-1) fees and other Fund expenses. Examples of transaction costs include sales charges (loads), redemption fees and account maintenance fees, which are not shown in this section and which would result in higher total expenses. The following table is intended to help you understand your ongoing expenses of investing in the Fund and to help you compare these expenses with the ongoing expenses of investing in other mutual funds. The table is based on an investment of $1,000 made at the beginning of the period ended October 31, 2012.
The table illustrates your Fund's expenses in two ways:
• Actual Fund Return. This helps you estimate the actual dollar amount of ongoing expenses paid on a $1,000 investment in the Fund using the Fund's actual return during the period. To estimate the expenses you paid over the period, simply divide your account value by $1,000 (for example, an $8,600 account value divided by $1,000 = 8.6), then multiply the result by the number in the "Expenses Paid per $1,000" line under the share class you hold.
• Hypothetical 5% Fund Return. This helps you to compare your Fund's ongoing expenses with those of other mutual funds using the Fund's actual expense ratio and a hypothetical rate of return of 5% per year before expenses. Examples using a 5% hypothetical fund return may be found in the shareholder reports of other mutual funds. The hypothetical account values and expenses may not be used to estimate the actual ending account balance or expenses you paid for the period.
Please note that the expenses shown in these tables are meant to highlight your ongoing expenses only and do not reflect any transaction costs, such as sales charges (loads) or redemption fees. If these transaction costs had been included, your costs would have been higher. The "Expenses Paid per $1,000" line of the tables is useful in comparing ongoing expenses only and will not help you determine the relative total expenses of owning different funds.
5
Credit Suisse Managed Futures Strategy Fund
Annual Investment Adviser's Report (continued)
October 31, 2012 (unaudited)
Expenses and Value for a $1,000 Investment
for the period ended October 31, 2012
Actual Fund Return | | Class I | | Class A | | Class C | |
Beginning Account Value 9/28/12 | | $ | 1,000.00 | | | $ | 1,000.00 | | | $ | 1,000.00 | | |
Ending Account Value 10/31/12 | | $ | 976.00 | | | $ | 976.00 | | | $ | 975.00 | | |
Expenses Paid per $1,000* | | $ | 1.42 | | | $ | 1.64 | | | $ | 2.26 | | |
Hypothetical 5% Fund Return | |
Beginning Account Value 5/1/12 | | $ | 1,000.00 | | | $ | 1,000.00 | | | $ | 1,000.00 | | |
Ending Account Value 10/31/12 | | $ | 1,016.59 | | | $ | 1,015.33 | | | $ | 1,011.56 | | |
Expenses Paid per $1,000* | | $ | 8.62 | | | $ | 9.88 | | | $ | 13.65 | | |
| | | Class I | | Class A | | Class C | |
Annualized Expense Ratios* | | | 1.70 | % | | | 1.95 | % | | | 2.70 | % | |
* Expenses are equal to the Fund's annualized expense ratio for each share class, multiplied by the average account value over the period, multiplied by the number of days in the most recent period, then divided by 366.
The "Expenses Paid per $1,000" and the "Annualized Expense Ratios" in the tables are based on actual expenses paid by the Fund during the period, net of fee waivers and/or expense reimbursements. If those fee waivers and/or expense reimbursements had not been in effect, the Fund's actual expenses would have been higher.
For more information, please refer to the Fund's prospectus.
Sector Breakdown*
United States Agency Obligation | | | 5.14 | % | |
Short-Term Investment | | | 94.86 | | |
Total | | | 100.00 | % | |
* Expressed as a percentage of total investments (excluding securities lending collateral if applicable) and may vary over time.
6
Credit Suisse Managed Futures Strategy Fund
Consolidated Schedule of Investments
October 31, 2012
| | | Par
(000) | | Value | |
| UNITED STATES AGENCY OBLIGATION (4.6%) | |
Federal Farm Credit Banks, 0.290% 01/26/2015 (Cost $999,887)# | | $ | 1,000 | | | $ | 1,000,018 | | |
| SHORT-TERM INVESTMENT (84.0%) | |
State Street Bank and Trust Co. Euro Time Deposit, 0.010%, 11/1/2012 (Cost $18,460,000) | | | 18,460 | | | | 18,460,000 | | |
| TOTAL INVESTMENTS AT VALUE (88.6%) (Cost $19,459,887) | | | 19,460,018 | | |
| OTHER ASSETS IN EXCESS OF LIABILITIES (11.4%) | | | 2,503,298 | | |
| NET ASSETS (100.0%) | | $ | 21,963,316 | | |
# Variable rate obligations — The interest rate is the rate as of October 31, 2012.
See Accompanying Notes to Financial Statements.
7
Credit Suisse Managed Futures Strategy Fund
Consolidated Statement of Assets and Liabilities
October 31, 2012
Assets | |
Investments at value (Cost $19,459,887) (Note 2) | | $ | 19,460,018 | | |
Cash | | | 1,419 | | |
Cash segregated at brokers for futures contracts and swap contracts (Cost $2,562,748) | | | 2,563,063 | | |
Offering costs (Note 3) | | | 137,261 | | |
Receivable from investment adviser (Note 3) | | | 34,998 | | |
Interest receivable | | | 55 | | |
Prepaid expenses | | | 3,411 | | |
Total Assets | | | 22,200,225 | | |
Liabilities | |
Administrative services fee payable (Note 3) | | | 2,363 | | |
Shareholder servicing/Distribution fee payable (Note 3) | | | 105 | | |
Unrealized depreciation on futures contracts (Note 2) | | | 73,747 | | |
Unrealized depreciation on open swap contracts | | | 28,130 | | |
Trustees' fee payable | | | 3,397 | | |
Interest payable for open swap contracts | | | 325 | | |
Other accrued expenses payable | | | 128,842 | | |
Total Liabilities | | | 236,909 | | |
Net Assets | |
Capital stock, $.001 par value (Note 6) | | | 2,250 | | |
Paid-in capital (Note 6) | | | 22,244,120 | | |
Accumulated net realized loss on futures contracts, swap contracts and foreign currency transactions | | | (181,623 | ) | |
Net unrealized depreciation from investments, futures contracts, swap contracts and foreign
currency translations | | | (101,431 | ) | |
Net Assets | | $ | 21,963,316 | | |
I Shares | |
Net assets | | $ | 21,768,190 | | |
Shares outstanding | | | 2,230,000 | | |
Net asset value and offering price and redemption price per share | | $ | 9.76 | | |
A Shares | |
Net assets | | $ | 97,594 | | |
Shares outstanding | | | 10,000 | | |
Net asset value and redemption price per share | | $ | 9.76 | | |
Maximum offering price per share (net asset value/(1-5.25%)) | | $ | 10.30 | | |
C Shares | |
Net assets | | $ | 97,532 | | |
Shares outstanding | | | 10,000 | | |
Net asset value and offering price per share | | $ | 9.75 | | |
See Accompanying Notes to Financial Statements.
8
Credit Suisse Managed Futures Strategy Fund
Consolidated Statement of Operations
For the Period Ended October 31, 20121
| Investment Income (Note 2) | |
Interest | | $ | 212 | | |
Total investment income | | | 212 | | |
Expenses | |
Investment advisory fees (Note 3) | | | 21,691 | | |
Administrative services fees (Note 3) | | | 2,362 | | |
Shareholder servicing/Distribution fees (Note 3) | |
Class A | | | 21 | | |
Class C | | | 84 | | |
Offering costs (Note 3) | | | 12,740 | | |
Printing fees (Note 3) | | | 15,038 | | |
Audit and tax fees | | | 15,000 | | |
Transfer agent fees | | | 7,644 | | |
Legal fees | | | 6,370 | | |
Trustees' fees | | | 3,397 | | |
Custodian fees | | | 2,208 | | |
Registration fees | | | 1,200 | | |
Insurance expense | | | 170 | | |
Commitment fees (Note 4) | | | 85 | | |
Miscellaneous expense | | | 850 | | |
Total expenses | | | 88,860 | | |
Less: fees waived and expenses reimbursed (Note 3) | | | (56,689 | ) | |
Net expenses | | | 32,171 | | |
Net investment loss | | | (31,959 | ) | |
Net Realized and Unrealized Gain (Loss) from Investments, Futures Contracts, Swap Contracts and
Foreign Currency Related Items | |
Net realized loss from futures contracts | | | (202,927 | ) | |
Net realized loss from swap contracts | | | (200,458 | ) | |
Net realized gain from foreign currency transactions | | | 91 | | |
Net change in unrealized appreciation (depreciation) from investments | | | 131 | | |
Net change in unrealized appreciation (depreciation) from futures contracts | | | (73,747 | ) | |
Net change in unrealized appreciation (depreciation) from swap contracts | | | (28,130 | ) | |
Net change in unrealized appreciation (depreciation) from foreign currency translations | | | 315 | | |
Net realized and unrealized loss from investments, futures contracts, swap contracts and
foreign currency related items | | | (504,725 | ) | |
Net decrease in net assets resulting from operations | | $ | (536,684 | ) | |
1 For the period September 28, 2012 (commencement of operations) through October 31, 2012.
See Accompanying Notes to Financial Statements.
9
Credit Suisse Managed Futures Strategy Fund
Consolidated Statement of Changes in Net Assets
| | | For the Period
Ended
October 31, 20121 | |
From Operations | |
Net investment loss | | $ | (31,959 | ) | |
Net realized loss from investments, futures contracts, swap contracts and
foreign currency transactions | | | (403,294 | ) | |
Net change in unrealized appreciation (depreciation) from investments, futures contracts,
swap contracts and foreign currency translations | | | (101,431 | ) | |
Net decrease in net assets resulting from operations | | | (536,684 | ) | |
| From Capital Share Transactions (Note 6) | |
Proceeds from sale of shares | | | 22,500,000 | | |
Net increase in net assets from capital share transactions | | | 22,500,000 | | |
Net increase in net assets | | | 21,963,316 | | |
Net Assets | |
Beginning of period | | | — | | |
End of period | | $ | 21,963,316 | | |
1 For the period September 28,2012 (commencement of operations) through October 31, 2012.
See Accompanying Notes to Financial Statements.
10
Credit Suisse Managed Futures Strategy Fund
Financial Highlights
(For a Class I Share of the Fund Outstanding Throughout the Period)
| | | For the Period
Ended
October 31, 20121 | |
Per share data | |
Net asset value, beginning of period | | $ | 10.00 | | |
INVESTMENT OPERATIONS | |
Net investment loss2 | | | (0.01 | ) | |
Net loss on investments, futures contracts, swap contracts and
foreign currency related items (both realized and unrealized) | | | (0.23 | ) | |
Total from investment operations | | | (0.24 | ) | |
Net asset value, end of period | | $ | 9.76 | | |
Total return3 | | | (2.40 | )% | |
RATIOS AND SUPPLEMENTAL DATA | |
Net assets, end of period (000s omitted) | | $ | 21,768 | | |
Ratio of expenses to average net assets | | | 1.70 | %4 | |
Ratio of net investment loss to average net assets | | | (1.69 | )%4 | |
Decrease reflected in above operating expense ratios due to waivers/reimbursements | | | 3.01 | %4 | |
Portfolio turnover rate | | | — | % | |
1 For the period September 28, 2012 (commencement of operations) through October 31, 2012.
2 Per share information is calculated using the average shares outstanding method.
3 Total returns are historical and assume changes in share price. Had certain expenses not been reduced during the periods shown, total returns would have been lower. Total returns for periods less than one year are not annualized.
4 Annualized.
See Accompanying Notes to Financial Statements.
11
Credit Suisse Managed Futures Strategy Fund
Financial Highlights
(For a Class A Share of the Fund Outstanding Throughout the Period)
| | | For the Period
Ended
October 31, 20121 | |
Per share data | |
Net asset value, beginning of period | | $ | 10.00 | | |
INVESTMENT OPERATIONS | |
Net investment loss2 | | | (0.02 | ) | |
Net loss on investments, futures contracts, swap contracts and
foreign currency related items (both realized and unrealized) | | | (0.22 | ) | |
Total from investment operations | | | (0.24 | ) | |
Net asset value, end of period | | $ | 9.76 | | |
Total return3 | | | (2.40 | )% | |
RATIOS AND SUPPLEMENTAL DATA | |
Net assets, end of period (000s omitted) | | $ | 98 | | |
Ratio of expenses to average net assets | | | 1.95 | %4 | |
Ratio of net investment loss to average net assets | | | (1.94 | )%4 | |
Decrease reflected in above operating expense ratios due to waivers/reimbursements | | | 3.01 | %4 | |
Portfolio turnover rate | | | — | % | |
1 For the period September 28, 2012 (commencement of operations) through October 31, 2012.
2 Per share information is calculated using the average shares outstanding method.
3 Total returns are historical and assume changes in share price and no sales charge. Had certain expenses not been reduced during the periods shown, total returns would have been lower. Total returns for periods less than one year are not annualized.
4 Annualized.
See Accompanying Notes to Financial Statements.
12
Credit Suisse Managed Futures Strategy Fund
Financial Highlights
(For a Class C Share of the Fund Outstanding Throughout the Period)
| | | For the Period
Ended
October 31, 20121 | |
Per share data | |
Net asset value, beginning of period | | $ | 10.00 | | |
INVESTMENT OPERATIONS | |
Net investment loss2 | | | (0.02 | ) | |
Net loss on investments, futures contracts, swap contracts and
foreign currency related items (both realized and unrealized) | | | (0.23 | ) | |
Total from investment operations | | | (0.25 | ) | |
Net asset value, end of period | | $ | 9.75 | | |
Total return3 | | | (2.50 | )% | |
RATIOS AND SUPPLEMENTAL DATA | |
Net assets, end of period (000s omitted) | | $ | 98 | | |
Ratio of expenses to average net assets | | | 2.70 | %4 | |
Ratio of net investment loss to average net assets | | | (2.70 | )%4 | |
Decrease reflected in above operating expense ratios due to waivers/reimbursements | | | 3.01 | %4 | |
Portfolio turnover rate | | | — | % | |
1 For the period September 28, 2012 (commencement of operations) through October 31, 2012.
2 Per share information is calculated using the average shares outstanding method.
3 Total returns are historical and assume changes in share price and no sales charge. Had certain expenses not been reduced during the periods shown, total returns would have been lower. Total returns for periods less than one year are not annualized.
4 Annualized.
See Accompanying Notes to Financial Statements.
13
Credit Suisse Managed Futures Strategy Fund
Notes to Consolidated Financial Statements
October 31, 2012
Credit Suisse Managed Futures Strategy Fund (the "Fund"), a series of Credit Suisse Opportunity Funds (the "Trust"), a Delaware statutory trust, is registered under the Investment Company Act of 1940, as amended (the "1940 Act"), as a non-diversified open-end management investment company that seeks to achieve investment results that correspond generally to the performance, before fees and expenses, of the Credit Suisse Managed Futures Liquid Index. The Trust was organized under the laws of State of Delaware as a business trust on May 31, 1995. The Fund commenced operations on September 28, 2012.
The Fund seeks to achieve its investment objective by investing directly and/or indirectly through the Credit Suisse Cayman Managed Futures Strategy Fund, Ltd. (the "Subsidiary"), a wholly-owned subsidiary of the Fund organized under the laws of the Cayman Islands, in a combination of securities and derivative instruments. The Fund may invest up to 25% of its total assets in the Subsidiary.
The Fund offers three classes of shares: Class I shares, Class A shares and Class C shares. Each class of shares represents an equal pro rata interest in the Fund, except that they bear different expenses, which reflect the differences in the range of services provided to them. Class A shares are sold subject to a front-end sales charge of 5.25%. Class C shares are sold subject to a contingent deferred sales charge of 1.00% if the shares are redeemed within the first year of purchase.
Note 2. Significant Accounting Policies
A) SECURITY VALUATION — The net asset value of the Fund is determined daily as of the close of regular trading on the New York Stock Exchange, Inc. (the "Exchange") on each day the Exchange is open for business. Equity investments are valued at market value, which is generally determined using the closing price on the exchange or market on which the security is primarily traded at the time of valuation (the "Valuation Time"). If no sales are reported, equity investments are generally valued at the most recent bid quotation as of the Valuation Time or at the lowest asked quotation in the case of a short sale of securities. Equity investments are generally categorized as Level 1. Investments in open-end investment companies are valued at their net asset value each business day and are generally categorized as Level 1. Futures contracts are valued at the settlement prices established each day on the exchange on which they are traded and are generally categorized as Level 1. Debt securities with a remaining maturity greater than 60 days are valued in accordance with the price supplied by a pricing service,
14
Credit Suisse Managed Futures Strategy Fund
Notes to Consolidated Financial Statements (continued)
October 31, 2012
Note 2. Significant Accounting Policies
which may use a matrix, formula or other objective method that takes into consideration market indices, yield curves and other specific adjustments. Debt obligations that will mature in 60 days or less are valued on the basis of amortized cost, which approximates market value, unless it is determined that using this method would not represent fair value. Debt securities are generally categorized as Level 2. Forward currency contracts are valued at the prevailing forward exchange rate of the underlying currencies and are generally categorized as Level 2. Swap contracts are generally valued at a price at which the counterparty to such contract would repurchase the instrument or terminate the contract and are generally categorized as Level 2. Time Deposits are valued at cost and are generally categorized as Level 2. Securities, swaps, futures contracts and other assets for which market quotations are not readily available, or whose values have been materially affected by events occurring before the Fund's Valuation Time but after the close of the securities' primary markets, are valued at fair value as determined in good faith by, or under the direction of, the Board of Trustees under procedures established by the Board of Trustees and are generally categorized as Level 3. The Fund may utilize a service provided by an independent third party which has been approved by the Board of Trustees to fair value certain securities. The Fund also may use fair value procedures if Credit Suisse determines that a significant event has occurred between the time at which a market price is determined and the time at which the Fund's net asset value is calculated. In particular, the value of foreign securities may be materially affected by events occurring after the close of the market on which they are valued, but before the Fund prices its shares. The Fund may utilize a fair value model developed by an independent third party pricing service to price foreign equity securities on days when there is a certain percentage change in the value of a domestic equity security index, as such percentage may be determined by Credit Suisse from time to time. When fair value pricing is employed, the prices of securities used by the Fund to calculate its net asset value may differ from quoted or published prices for the same securities.
In accordance with the authoritative guidance on fair value measurements and disclosures under accounting principles generally accepted in the United States of America ("GAAP"), the Fund discloses the fair value of its investments in a hierarchy that prioritizes the inputs to valuation techniques used to measure the fair value. In accordance with GAAP, fair value is defined as the price that the Fund would receive upon selling an investment in a timely transaction to an independent buyer in the principal or most advantageous market of the investment. GAAP established a three-tier hierarchy to maximize the use of observable market data and minimize the use of unobservable inputs and to
15
Credit Suisse Managed Futures Strategy Fund
Notes to Consolidated Financial Statements (continued)
October 31, 2012
Note 2. Significant Accounting Policies
establish classification of fair value measurements for disclosure purposes. Inputs refer broadly to the assumptions that market participants would use in pricing the asset or liability, including assumptions about risk, for example, the risk inherent in a particular valuation technique used to measure fair value including such a pricing model and/or the risk inherent in the inputs to the valuation technique. Inputs may be observable or unobservable. Observable inputs are inputs that reflect the assumptions market participants would use in pricing the asset or liability developed based on market data obtained from sources independent of the reporting entity. Unobservable inputs are inputs that reflect the reporting entity's own assumptions about the assumptions market participants would use in pricing the asset or liability developed based on the best information available in the circumstances. In accordance with the Fund's valuation procedures, factors used in determining value may include, but are not limited to, the type of the security, the size of the holding, the initial cost of the security, the existence of any contractual restrictions on the security's disposition, the price and extent of public trading in similar securities of the issuer or of comparable companies, quotations or evaluated prices from broker-dealers and/or pricing services, information obtained from the issuer, analysts, and/or the appropriate stock exchange (for exchange-traded securities), an analysis of the company's or issuer's financial statements, an evaluation of the forces that influence the issuer and the market(s) in which the security is purchased and sold and with respect to debt securities, the maturity, coupon, creditworthiness, currency denomination, and the movement of the market in which the security is normally traded. The three-tier hierarchy of inputs is summarized in the three broad Levels listed below.
• Level 1 – quoted prices in active markets for identical investments
• Level 2 – other significant observable inputs (including quoted prices for similar investments, interest rates, prepayment speeds, credit risk, etc.)
• Level 3 – significant unobservable inputs (including the Fund's own assumptions in determining the fair value of investments)
The inputs or methodology used for valuing securities are not necessarily an indication of the risk associated with investing in those securities.
16
Credit Suisse Managed Futures Strategy Fund
Notes to Consolidated Financial Statements (continued)
October 31, 2012
Note 2. Significant Accounting Policies
The following is a summary of the inputs used as of October 31, 2012 in valuing the Fund's investments carried at value:
| | | Level 1 | | Level 2 | | Level 3 | | Total | |
Investments in Securities | |
United States Agency Obligations | | $ | — | | | $ | 1,000,018 | | | $ | — | | | $ | 1,000,018 | | |
Short-Term Investment | | | — | | | | 18,460,000 | | | | — | | | | 18,460,000 | | |
Other Financial Instruments* | |
Futures Contracts | | | (73,747 | ) | | | — | | | | — | | | | (73,747 | ) | |
Swap Contracts | | | — | | | | (28,130 | ) | | | — | | | | (28,130 | ) | |
| | | $ | (73,747 | ) | | $ | 19,431,888 | | | $ | — | | | $ | 19,358,141 | | |
*Other financial instruments include futures contracts and swap constracts.
The Fund adopted FASB amendments to authoritative guidance which require the Fund to disclose details of transfers in and out of Level 1 and Level 2 measurements and Level 2 and Level 3 measurements and the reasons for the transfers. For the period ended October 31, 2012, there were no transfers in and out of Level 1, Level 2 and Level 3.
B) DERIVATIVE INSTRUMENTS AND HEDGING ACTIVITIES — The Fund adopted amendments to authoritative guidance on disclosures about derivative instruments and hedging activities which require that the Fund disclose (a) how and why an entity uses derivative instruments, (b) how derivative instruments and hedging activities are accounted for, and (c) how derivative instruments and related hedging activities affect a fund's financial position, financial performance, and cash flows.
| | Asset Derivatives | | Liability Derivatives | |
| | Balance Sheet
Location | | Fair Value | | Balance Sheet
Location | | Fair Value | |
Commodity Index
Return Contracts | | Unrealized appreciation/
depreciation on swap
contracts | | $ | 43,165 | | | Unrealized appreciation/
depreciation on swap
contracts | | $ | 71,295 | | |
Foreign Exchange
Contracts | | Unrealized appreciation/
depreciation on futures
contracts | | | 21,270 | * | | Unrealized appreciation/
depreciation on futures
contracts | | | 77,342 | * | |
| Index Contracts | | Unrealized appreciation/
depreciation on futures
contracts | | | 54,220 | * | | Unrealized appreciation/
depreciation on futures
contracts | | | 59,033 | * | |
Interest Rate
Contracts | | Unrealized appreciation/
depreciation on futures
contracts | | | 2,602 | * | | Unrealized appreciation/
depreciation on futures
contracts | | | 15,464 | * | |
Total | | | | $ | 121,257 | | | | | $ | 223,134 | | |
*Includes cumulative appreciation/depreciation of futures contracts as reported in the Statement of Assets and Liabilities and Notes to Financial Statements.
17
Credit Suisse Managed Futures Strategy Fund
Notes to Consolidated Financial Statements (continued)
October 31, 2012
Note 2. Significant Accounting Policies
Effect of Derivative Instruments on the Statement of Operations
| | | Location | | Realized
Gain/Loss | | Location | | Unrealized
Appreciation/
Depreciation | |
Commodity Index
Return Contracts | | Net Realized Loss
from Swap
Contracts | | $ | (200,458 | ) | | Net Change in Unrealized
Appreciation (Depreciation)
from Swap Contracts | | $ | (28,130 | ) | |
Foreign Exchange
Contracts | | Net Realized Loss
from Futures
Contracts | | | (92,674 | ) | | Net Change in Unrealized
Appreciation (Depreciation)
from Futures Contracts | | | (56,072 | ) | |
| Index Contracts | | Net Realized Loss
from Futures
Contracts | | | 516 | | | Net Change in Unrealized
Appreciation (Depreciation)
from Futures Contracts | | | (4,813 | ) | |
Interest Rate
Contracts | | Net Realized Loss
from Futures
Contracts | | | (110,769 | ) | | Net Change in Unrealized
Appreciation (Depreciation)
from Futures Contracts | | | (12,862 | ) | |
Total | | | | $ | (403,385 | ) | | | | $ | (101,877 | ) | |
The notional amount of futures contracts and swap contracts at period ended are reflected in the Notes to Financial Statements. The notional amounts of long and short open positions of futures contracts and swap contracts at each month end throughout the reporting period averaged approximately 198.8% and 26.7%, respectively of net assets of the Fund.
C) SECURITY TRANSACTIONS AND INVESTMENT INCOME — Security transactions are accounted for on a trade date basis. Interest income is recorded on the accrual basis. The Fund amortizes premiums and accretes discounts using the effective interest method. Dividends are recorded on the ex-dividend date. Certain expenses are class-specific expenses and vary by class. Income, expenses (excluding class-specific expenses) and realized/unrealized gains/losses are allocated proportionately to each class of shares based upon the relative net asset value of the outstanding shares of that class. The cost of investments sold is determined by use of the specific identification method for both financial reporting and income tax purposes.
D) DIVIDENDS AND DISTRIBUTIONS TO SHAREHOLDERS — Dividends from net investment income, if any, are declared and paid quarterly. Distributions of net realized capital gains, if any, are declared and paid at least annually. However, to the extent that a net realized capital gain can be reduced by a capital loss carryforward, such gain will not be distributed. Income and capital gain distributions are determined in accordance with federal income tax regulations, which may differ from GAAP.
18
Credit Suisse Managed Futures Strategy Fund
Notes to Consolidated Financial Statements (continued)
October 31, 2012
Note 2. Significant Accounting Policies
E) FEDERAL INCOME TAXES — No provision is made for federal taxes as it is the Fund's intention to continue to qualify for and elect the tax treatment applicable to regulated investment companies ("RIC") under the Internal Revenue Code of 1986, as amended (the "Code"), and to make the requisite distributions to its shareholders, which will be sufficient to relieve it from federal income and excise taxes.
In order to qualify as a RIC under the Code, the Fund must meet certain requirements regarding the source of its income, the diversification of its assets and the distribution of its income. One of these requirements is that the Fund derive at least 90% of its gross income for each taxable year from dividends, interest, payments with respect to certain securities loans, gains from the sale or other disposition of stock, securities or foreign currencies, other income derived with respect to its business of investing in such stock, securities or currencies or net income derived from interests in certain publicly traded partnerships ("Qualifying Income"). The IRS has issued a ruling that income realized from certain types of commodity-linked derivatives would not be Qualifying Income. As a result, the Fund's ability to realize income from investments in such commodity-linked derivatives as part of its investment strategy would be limited to a maximum of 10% of its gross income. The IRS has issued private letter rulings to registered investment companies concluding that income derived from their investment in a wholly-owned subsidiary would constitute Qualifying Income to the fund. The IRS has indicated that the granting of these types of private letter rulings is currently suspended, pending further internal discussion. As a result, the Fund has not received and there can be no assurance that the IRS will grant, such a private letter ruling to the Fund. If the Fund does not request and receive such a private letter ruling, there is a risk that the IRS could assert that the income derived from the Fund's investment in the Subsidiary will not be considered Qualifying Income for purposes of the fund remaining qualified as a RIC for U.S. federal income tax purposes. If the Fund is fails to qualify as a RIC, the Fund may be required to change its investment objective, policies or techniques, or may be liquidated. Further, if the Fund fails to qualify as a RIC, the Fund will be subject to federal income tax on its net income and capital gains at regular corporate rates (without reduction for distributions to shareholders). If the Fund were to fail to qualify as a RIC and become subject to federal income tax, shareholders of the Fund would be subject to the risk of diminished returns.
The Fund adopted the authoritative guidance for uncertainty in income taxes and recognizes a tax benefit or liability from an uncertain position only if it is
19
Credit Suisse Managed Futures Strategy Fund
Notes to Consolidated Financial Statements (continued)
October 31, 2012
Note 2. Significant Accounting Policies
more likely than not that the position is sustainable based solely on its technical merits and consideration of the relevant taxing authority's widely understood administrative practices and procedures. The Fund has reviewed its current tax positions and has determined that no provision for income tax is required in the Fund's financial statements.
F) USE OF ESTIMATES — The preparation of financial statements in conformity with GAAP requires management to make estimates and assumptions that affect the reported amounts of assets and liabilities and disclosure of contingent assets and liabilities at the date of the financial statements and the reported amounts of income and expenses during the reporting period. Actual results could differ from these estimates.
G) SHORT-TERM INVESTMENTS — The Fund, together with other funds/portfolios advised by Credit Suisse, an indirect, wholly-owned subsidiary of Credit Suisse Group AG, pools available cash into a short-term variable rate time deposit issued by State Street Bank and Trust Company ("SSB"), the Fund's custodian. The short-term time deposit issued by SSB is a variable rate account classified as a short-term investment.
H) INVESTMENT IN CREDIT SUISSE CAYMAN MANAGED FUTURES STRATEGY FUND, LTD. — The accompanying financial statements reflect the financial position of the Fund and its Subsidiary and the results of operations on a consolidated basis. The Fund's investment portfolio has been consolidated and includes the accounts of the Fund and the Subsidiary. The consolidated financial statements include portfolio holdings of the Fund and the Subsidiary. All intercompany transactions and balances have been eliminated.
The Fund wholly owns and controls the Subsidiary, and the Fund and the Subsidiary are both managed by Credit Suisse. The Fund may invest up to 25% of its total net assets in the Subsidiary. As of October 31, 2012, the Fund held $3,771,441 in the Subsidiary, representing 17% of the Fund's net assets.
I) FUTURES — The Fund may enter into futures contracts to the extent permitted by its investment policies and objectives. The Fund may use futures contracts to gain exposure to, or hedge against changes in interest rates, equity and market price movements and/or currency risks. Upon entering into a futures contract, the Fund is required to deposit cash and/or pledge U.S. Government securities as initial margin. Subsequent payments, which are dependent on the daily fluctuations in the value of the underlying instrument, are made or received by the Fund (variation margin) and are recorded as unrealized gains or losses until the contracts are closed. When the contracts
20
Credit Suisse Managed Futures Strategy Fund
Notes to Consolidated Financial Statements (continued)
October 31, 2012
Note 2. Significant Accounting Policies
are closed, the Fund records a realized gain or loss equal to the difference between the proceeds from (or cost of) the closing transactions and the Fund's basis in the contract. Risks of entering into futures contracts for hedging purposes include the possibility that a change in the value of the contract may not correlate with the changes in the value of the underlying instruments. With futures, there is minimal counterparty credit risk to the Fund since futures are exchange traded and the exchange's clearinghouse, as counterparty to all exchange traded futures, guarantees the futures against default. In addition, the purchase of a futures contract involves the risk that the Fund could lose more than the original margin deposit and subsequent payments may be required for a futures transaction. At October 31, 2012, the Fund had the following open futures contracts:
Contract Description | | Currency | | Expiration
Date | | Notional
Value | | Unrealized
Appreciation
(Depreciation) | |
Contracts to Purchase | |
Interest Rate Contracts | | | | | | | | | | | | | | | | | |
German EURO Bund Futures | | EURO | | Dec 2012 | | | 183,589 | | | $ | 1,101 | | |
UK Long Gilt Bond Futures | | GBP | | Dec 2012 | | | 1,151,643 | | | | (11,648 | ) | |
10YR Japan Govt Bond FTRS TSE | | JPY | | Dec 2012 | | | 3,609,408 | | | | 1,501 | | |
10YR JGB Mini Futures SGX | | JPY | | Dec 2012 | | | 9,020,393 | | | | (2,878 | ) | |
10YR US Treasury Note Futures | | USD | | Dec 2012 | | | 266,063 | | | | (938 | ) | |
| | | | | | | | | | | | | | (12,862 | ) | |
Index Contracts | | | | | | | | | | | | | | | | | |
Hang Seng Index Futures | | HKD | | Nov 2012 | | | 2,097,470 | | | | (12,726 | ) | |
EURO Stoxx 50 Index Futures | | EURO | | Dec 2012 | | | 1,654,788 | | | | 36,348 | | |
FTSE 100 Index Futures | | GBP | | Dec 2012 | | | 2,042,941 | | | | 17,872 | | |
Nikkei 225 Index Futures OSE | | JPY | | Dec 2012 | | | 2,008,758 | | | | (15,889 | ) | |
S&P 500 E Mini Index Futures | | USD | | Dec 2012 | | | 1,617,820 | | | | (30,418 | ) | |
| | | | | | | | | | | | | | (4,813 | ) | |
Foreign Exchange Contracts | | | | | | | | | | | | | | | |
| EUR Currency Futures | | USD | | Dec 2012 | | | 1,458,788 | | | | (7,825 | ) | |
| AUD Currency Futures | | USD | | Dec 2012 | | | 3,205,400 | | | | 21,270 | | |
| CAD Currency Futures | | USD | | Dec 2012 | | | 3,895,320 | | | | (63,168 | ) | |
| GBP Currency Futures | | USD | | Dec 2012 | | | 5,342,068 | | | | (2,159 | ) | |
| | | | | | | | | | | | | | | | (51,882 | ) | |
Contracts to Sell | |
Foreign Exchange Contracts | | | | | | | | | | | | | | | | | |
| JPY Currency Futures | | USD | | Dec 2012 | | | (6,113,738 | ) | | $ | (4,190 | ) | |
Net unrealized appreciation (depreciation) | | | | | | | | | | | | | | $ | (73,747 | ) | |
21
Credit Suisse Managed Futures Strategy Fund
Notes to Consolidated Financial Statements (continued)
October 31, 2012
Note 2. Significant Accounting Policies
J) SWAPS — The Fund may enter into swap contracts either for hedging purposes or to seek to increase total return. A swap contract is an agreement that obligates two parties to exchange a series of cash flows at specified intervals based upon or calculated by reference to changes in specified prices or rates for a specified amount of an underlying asset or notional principal amount. The Fund will enter into swap contracts only on a net basis, which means that the two payment streams are netted out, with the Fund receiving or paying, as the case may be, only the net amount of the two payments. Risks may arise as a result of the failure of the counterparty to the swap contract to comply with the terms of the swap contract. The extent of the Fund's exposure to credit and counterparty risks is the discounted net value of the cash flows to be received from/paid to the counterparty over the contract's remaining life, to the extent that the amount is positive. These risks are mitigated by having a master netting arrangement between the Fund and the counterparty and by the posting of collateral by the counterparty to the Fund to cover the Fund's exposure to the counterparty. Therefore, the Fund considers the creditworthiness of each counterparty to a swap contract in evaluating potential credit risk. Additionally, risks may arise from unanticipated movements in interest rates or in the value of the underlying reference asset or index.
The Fund may enter into total return swap contracts, involving commitments to pay interest in exchange for a market-linked return, both based on notional amounts. To the extent the total return of the security or index underlying the transactions exceeds or falls short of the offsetting interest rate obligation, the Fund will receive a payment from or make a payment to the counterparty.
The Fund records unrealized gains or losses on a daily basis representing the value and the current net receivable or payable relating to open swap contracts. Net amounts received or paid on the swap contract are recorded as realized gains or losses. Fluctuations in the value of swap contracts are recorded for financial statement purposes as unrealized appreciation or depreciation on swap contracts. Realized gains and losses from terminated swaps are included in net realized gains/losses on swap contracts
22
Credit Suisse Managed Futures Strategy Fund
Notes to Consolidated Financial Statements (continued)
October 31, 2012
Note 2. Significant Accounting Policies
transactions. At October 31, 2012, the Fund had the following outstanding swap contracts:
Currency | | Notional
Amount | | Expiration
Date | | Counterparty | | Receive | | Pay | | Unrealized
Appreciation/
(Depreciation) | |
USD | |
$965,675 | |
11/16/2012 | |
Goldman Sachs | |
Fixed Rate | | Commodity
Index Return1 | | $ | 9,164 | | |
USD | |
$584,220 | |
11/16/2012 | |
Goldman Sachs | |
Fixed Rate | | Commodity
Index Return1 | | | (24,966 | ) | |
USD | |
$2,171,640 | |
11/16/2012 | |
Goldman Sachs | |
Fixed Rate | | Commodity
Index Return1 | | | (35,800 | ) | |
USD | |
$144,260 | |
11/16/2012 | |
Goldman Sachs | |
Fixed Rate | | Commodity
Index Return1 | | | (6,738 | ) | |
USD | |
$305,487 | |
11/16/2012 | |
Goldman Sachs | | Commodity
Index Return1 | |
Fixed Rate | | | 15,432 | | |
USD | |
$260,852 | |
11/16/2012 | |
Goldman Sachs | | Commodity
Index Return1 | |
Fixed Rate | | | 14,306 | | |
USD | |
$238,797 | |
11/16/2012 | |
Goldman Sachs | |
Fixed Rate | | Commodity
Index Return1 | | | (3,791 | ) | |
USD | |
$481,396 | |
11/16/2012 | |
Goldman Sachs | | Commodity
Index Return1 | |
Fixed Rate | | | 2,806 | | |
USD | |
$712,090 | |
11/16/2012 | |
Goldman Sachs | | Commodity
Index Return1 | |
Fixed Rate | | | 1,457 | | |
| | | Total | | $ | (28,130 | ) | |
1 The Commodity Index Return is comprised of futures contracts on physical commodities.
K) SECURITIES LENDING — Loans of securities are required at all times to be secured by collateral at least equal to 102% of the market value of domestic securities on loan (including any accrued interest thereon) and 105% of the market value of foreign securities on loan (including any accrued interest thereon). Cash collateral received by the Fund in connection with securities lending activity may be pooled together with cash collateral for other funds/portfolios advised by Credit Suisse and may be invested in a variety of investments, including funds advised by SSB, the Fund's securities lending agent, or money market instruments. However, in the event of default or bankruptcy by the other party to the agreement, realization and/or retention of the collateral may be subject to legal proceedings.
SSB has been engaged by the Fund to act as the Fund's securities lending agent. The Fund's securities lending arrangement provides that the Fund and SSB will share the net income earned from securities lending activities. During the period ended October 31, 2012, there were no securities on loan. Securities lending income is accrued as earned.
23
Credit Suisse Managed Futures Strategy Fund
Notes to Consolidated Financial Statements (continued)
October 31, 2012
Note 2. Significant Accounting Policies
L) OTHER — In the normal course of business the Fund trades financial instruments and enters into financial transactions where risk of potential loss exists due to changes in the market (market risk) or failure of the other party to a transaction to perform (credit risk). Similar to credit risk, the Fund may be exposed to counterparty risk, or the risk that an institution or other entity with which the Fund has unsettled or open transactions will default. The potential loss could exceed the value of the financial assets recorded in the financial statements. Financial assets, which potentially expose the Fund to credit risk, consist principally of cash due from counterparties and investments. The extent of the Fund's exposure to credit and counterparty risks in respect to these financial assets approximates their carrying value as recorded in the Fund's Statement of Assets and Liabilities.
M) SUBSEQUENT EVENTS — In preparing the financial statements as of October 31, 2012, management considered the impact of subsequent events for potential recognition or disclosure in these financial statements through the date of release of this report.
On February 8, 2012, the Commodity Futures Trading Commission (CFTC) adopted amendments to several of its rules relating to commodity pool operations, including Rule 4.5. The Funds currently rely on Rule 4.5's exclusion from CFTC regulation for regulated investment companies. Credit Suisse is currently evaluating the amendments and their impact, if any, on the Funds' financial statements.
Note 3. Transactions with Affiliates and Related Parties
Credit Suisse serves as investment adviser for the Fund. For its investment advisory services, Credit Suisse is entitled to receive a fee from the Fund at an annual rate of 1.15% of the Fund's average daily net assets. For the period ended October 31, 2012, investment advisory fees earned, fees waived and expenses reimbursed were $21,691, $21,691 and $34,998, respectively. The Fund is authorized to reimburse Credit Suisse for management fees previously limited and/or for expenses previously paid by Credit Suisse, provided, however, that any reimbursements must be paid at a date not more than three years after the end of the fund's first year of operations and the reimbursements do not cause a class to exceed the applicable expense limitation in the contract at the time the fees were limited or expenses are paid. This contract may not be terminated before the end of the fund's first year of operations. Credit Suisse waives fees and reimburses expenses so that the Fund's annual operating
24
Credit Suisse Managed Futures Strategy Fund
Notes to Consolidated Financial Statements (continued)
October 31, 2012
Note 3. Transactions with Affiliates and Related Parties
expenses will not exceed 1.70% of the Fund's average daily net assets for Class I shares, 1.95% of the Fund's average daily net assets for Class A shares, and 2.70% of the Fund's average daily net assets for Class C shares.
Credit Suisse and SSB serve as co-administrators to the Fund. For its co-administrative services, Credit Suisse received a fee calculation at an annual rate of 0.09% of the Fund's average daily net assets. For the period ended October 31, 2012, co-administrative services fees earned by Credit Suisse were $1,698.
For its co-administrative services, SSB receives a fee, exclusive of out-of-pocket expenses, calculated in total for all the Credit Suisse funds/portfolios co-administered by SSB and allocated based upon the relative average net assets of each fund/portfolio, subject to an annual minimum fee. For the period ended October 31, 2012, co-administrative services fees earned by SSB (including out-of-pocket expenses) were $664.
Credit Suisse Securities (USA) LLC ("CSSU"), an affiliate of Credit Suisse, serves as distributor of the Fund's shares. Pursuant to distribution plans adopted by the Fund pursuant to Rule 12b-1 under the 1940 Act, CSSU received fees for its distribution services. The distributor is paid at the annual rate of 0.25% of the average daily net assets of the Class A shares. For the Class C shares, the fee is calculated at an annual rate of 1.00% of the average daily net assets. Class I shares are not subject to distribution fees.
Merrill Corporation ("Merrill"), an affiliate of Credit Suisse, has been engaged by the Fund to provide certain financial printing services. For the year ended October 31, 2012, Merrill was paid $0 for its services by the Fund.
Offering costs, including initial registration costs, were deferred and will be charged to expenses during the Fund's first year of operation. For the period ended October 31, 2012, $12,740 has been expensed to the Fund.
Note 4. Line of Credit
The Fund, together with other funds/portfolios advised by Credit Suisse (collectively, the "Participating Funds"), participates in a committed, unsecured line of credit facility ("Credit Facility") for temporary or emergency purposes with SSB. Under the terms of the Credit Facility, the Participating Funds pay an aggregate commitment fee on the average unused amount of the Credit Facility, which is allocated among the Participating Funds in such manner as is determined by the governing Boards of the Participating Funds. In addition, the Participating Funds pay interest on borrowings at either the Overnight
25
Credit Suisse Managed Futures Strategy Fund
Notes to Consolidated Financial Statements (continued)
October 31, 2012
Federal Funds rate or the Overnight LIBOR rate plus a spread. At October 31, 2012, and during the period ended October 31, 2012, the Fund had no borrowings outstanding under the Credit Facility.
Note 5. Purchases and Sales of Securities
For the period ended October 31, 2012, purchases and sales of investment securities (excluding short-term investments) and U.S. Government & Agency Obligations were as follows:
Investment Securities | | U.S. Government/
Agency Obligations | |
| Purchases | | Sales | | Purchases | | Sales | |
| $ | — | | | $ | — | | | $ | 999,886 | | | $ | — | | |
Note 6. Capital Share Transactions
The Fund is authorized to issue an unlimited number of full and fractional shares of beneficial interest, $.001 par value per share. The Fund offers Class I, Class A and Class C shares. Transactions in capital shares for each class of the Fund were as follows:
| | | Class I | |
| | | For the Period Ended
October 31, 20121 | |
| | | Shares | | Value | |
Shares sold | | | 2,230,000 | | | $ | 22,300,000 | | |
Net increase | | | 2,230,000 | | | $ | 22,300,000 | | |
| | | Class A | |
| | | For the Period Ended
October 31, 20121 | |
| | | Shares | | Value | |
Shares sold | | | 10,000 | | | $ | 100,000 | | |
Net increase | | | 10,000 | | | $ | 100,000 | | |
| | | Class C | |
| | | For the Period Ended
October 31, 20121 | |
| | | Shares | | Value | |
Shares sold | | | 10,000 | | | $ | 100,000 | | |
Net increase | | | 10,000 | | | $ | 100,000 | | |
1 For the period from September 28, 2012 (commencement of operations) through October 31, 2012.
26
Credit Suisse Managed Futures Strategy Fund
Notes to Consolidated Financial Statements (continued)
October 31, 2012
Note 6. Capital Share Transactions
The Fund imposes a redemption fee of 2% of the value of all classes of shares currently being offered that are redeemed or exchanged within 30 days from the date of purchase. Reinvested dividends and distributions are not subject to the fee. The fee is charged based on the value of shares at redemption, is paid directly to the Fund and becomes part of the Fund's daily net asset value calculation. When shares are redeemed that are subject to the fee, reinvested dividends and distributions are redeemed first, followed by the shares held longest.
On October 31, 2012, the number of shareholders that held 5% or more of the outstanding shares of each class of the Fund was as follows:
| | | Number of
Shareholders | | Approximate Percentage
of Outstanding Shares | |
Class I | | | 1 | * | | | 100 | % | |
Class A | | | 1 | * | | | 100 | % | |
Class C | | | 1 | * | | | 100 | % | |
*This represents the seed money from Merchant Holding, Inc., an affiliate of Credit Suisse.
Note 7. Federal Income Taxes
Income and capital gain distributions are determined in accordance with federal income tax regulations, which may differ from GAAP.
There were no dividends paid by the fund to shareholders during the period ended October 31, 2012.
The tax basis components of distributable earnings differ from the amounts reflected in the Statement of Assets and Liabilities by temporary book/tax differences. These differences are primarily due to differing treatments of futures contracts. At October 31, 2012, the components of distributable earnings on a tax basis were as follows:
Accumulated realized loss | | $ | (263,362 | ) | |
Unrealized depreciation | | | (19,692 | ) | |
| | $ | (283,054 | ) | |
For federal income tax purposes, the fund has $102,351 of unlimited Short-Term Capital losses and $161,011 of unlimited Long-Term capital losses as of October 31, 2012, which are available to offset future capital gains, if any.
Under the Regulated Investment Company Modernization Act of 2010, the Fund will be permitted to carry forward capital losses incurred in taxable years beginning after December 22, 2010 for an unlimited period. However, any
27
Credit Suisse Managed Futures Strategy Fund
Notes to Consolidated Financial Statements (continued)
October 31, 2012
Note 7. Federal Income Taxes
losses incurred during those future taxable years will be required to be utilized prior to the losses incurred in pre-enactment taxable years. As a result of this ordering rule, pre-enactment capital loss carryforwards may be more likely to expire unused. Additionally, post-enactment capital losses that are carried forward will retain their character as either short-term or long-term capital losses rather than being considered all short-term as under previous law. It is uncetain whether the Fund will be able to realize the full benefits of the capital loss carryforwards before they expire.
At October 31, 2012, the cost of investments (excluding foreign currency related transactions) and net unrealized appreciation (depreciation) for income tax purposes were as follows:
Cost of Investments | | $ | 19,459,887 | | |
Unrealized appreciation | | | 131 | | |
Unrealized depreciation | | | — | | |
Net unrealized appreciation (depreciation) | | $ | 131 | | |
At October 31, 2012, the Fund reclassified $31,959 to accumulated net investment loss and $221,671 to accumulated net realized loss from paid in capital, to adjust for current period permanent book/tax differences. These permanent differences are due to differing book/tax treatment of foreign currency gain/loss, net operating losses, adjustments from subsidiary fund, and non-deductible 12b-1 and blue sky expenses. Net assets were not affected by these reclassifications.
Note 8. Contingencies
In the normal course of business, the Fund may provide general indemnifications pursuant to certain contracts and organizational documents. The Fund's maximum exposure under these arrangements is dependent on future claims that may be made against the Fund and, therefore, cannot be estimated; however, based on experience, the risk of loss from such claims is considered remote.
28
Credit Suisse Managed Futures Strategy Fund
Report of Independent Registered Public Accounting Firm
To the Board of Trustees of Credit Suisse Opportunity Funds
and the Shareholders of Credit Suisse Managed Futures Strategy Fund:
In our opinion, the accompanying consolidated statement of assets and liabilities, including the consolidated schedule of investments, and the related consolidated statements of operations and of changes in net assets and the financial highlights present fairly, in all material respects, the financial position of Credit Suisse Managed Futures Strategy Fund and its Subsidiary (one of the Funds comprising Credit Suisse Opportunity Funds, hereafter referred to as the "Fund") at October 31, 2012, the results of their operations, the changes in their net assets and financial highlights for the period September 28, 2012 (commencement of operations) through October 31, 2012, in conformity with accounting principles generally accepted in the United States of America. These consolidated financial statements and financial highlights (hereafter referred to as "financial statements") are the responsibility of the Fund's management. Our responsibility is to express an opinion on these financial statements based on our audit. We conducted our audit of these financial statements in accordance with the standards of the Public Company Accounting Oversight Board (United States). Those standards require that we plan and perform the audit to obtain reasonable assurance about whether the financial statements are free of material misstatement. An audit includes examining, on a test basis, evidence supporting the amounts and disclosures in the financial statements, assessing the accounting principles used and significant estimates made by management, and evaluating the overall financial statement presentation. We believe that our audit, which included confirmation of securities at October 31, 2012 by correspondence with the custodian and brokers, provides a reasonable basis for our opinion.
PricewaterhouseCoopers LLP
Boston, Massachusetts
December 28, 2012
29
Credit Suisse Managed Futures Strategy Fund
Board Approval of Advisory Agreement
Credit Suisse Managed Futures Strategy Fund (the "Fund") is a new portfolio of Credit Suisse Opportunity Funds. In approving the Fund's Amended and Restated Investment Advisory Agreement (the "Advisory Agreement"), the Board of Trustees (the "Board") of Credit Suisse Opportunity Funds, including a majority of the Trustees who are not "interested persons" of the Fund as defined in the Investment Company Act of 1940 (the "Independent Trustees"), at a meeting held on August 14, 2012, considered the following factors:
Investment Advisory Fee Rates and Expenses
The Board reviewed and considered the proposed contractual advisory fee rate of 1.15% of the Fund's average daily net assets ("Gross Advisory Fee") for the Fund in light of the extent and quality of the proposed advisory services that would be provided by Credit Suisse Asset Management, LLC ("Credit Suisse"). The Board also considered that Credit Suisse would enter into an expense limitation agreement ("Expense Limitation Agreement") limiting the Fund's total net expenses to 1.95%, 2.70% and 1.70% of the average daily net assets of Class A, Class C and Class I, respectively, for at least the first year of Fund operations.
Additionally, the Board received and considered information used to compare the Fund's proposed Gross Advisory Fee and the Fund's net total expenses with those of funds in the relevant expense group ("Expense Group One") provided by an independent provider of investment company data and Credit Suisse ("Expense Group Two"). The Board was provided with a description of the methodology used to arrive at the funds included in Expense Group One and Expense Group Two.
Nature, Extent and Quality of the Services under the Advisory Agreement
The Board received and considered information about the Fund's proposed objective, principal strategies, principal risks and Credit Suisse's distribution strategy for the Fund. The Board received and considered information regarding the nature, extent and quality of services that would be provided to the Fund by Credit Suisse under the proposed Advisory Agreement. The Board also noted information received at regular meetings throughout the year related to the services rendered by Credit Suisse to other funds. The Board reviewed background information about Credit Suisse. The Board considered the background and experience of Credit Suisse's senior management and the expertise of, and the amount of attention that was expected to be given to the Fund by, senior personnel of Credit Suisse. In addition, the Board reviewed the qualifications, backgrounds and responsibilities of the portfolio
30
Credit Suisse Managed Futures Strategy Fund
Board Approval of Advisory Agreement (continued)
management team that would be primarily responsible for the day-to-day portfolio management of the Fund and the extent of the resources devoted to research and analysis of actual and potential investments. The Board evaluated the ability of Credit Suisse, based on its resources, reputation and other attributes, to attract and retain qualified investment professionals including research, advisory, and supervisory personnel.
Fund Performance
There was no performance information since the Fund was new.
Credit Suisse Profitability
There was no profitability analysis since the Fund was new. However, the Board considered a profitability analysis of Credit Suisse based on the fees payable under advisory agreements for other Credit Suisse funds advised by Credit Suisse annually. The Board considered that the profitability with respect to the Fund would be similar to that analysis.
Economies of Scale
The Board considered information regarding whether there could be economies of scale with respect to the management of the Fund and whether the Fund could appropriately benefit from any economies of scale. Accordingly, the Board considered whether breakpoints in the Fund's proposed advisory fee structure would be appropriate or reasonable taking into consideration economies of scale or other efficiencies that might accrue from increases in the Fund's asset levels.
Other Benefits to Credit Suisse
The Board considered other benefits received by Credit Suisse and its affiliates as a result of their relationship with the Fund. Such benefits include, among others, benefits potentially derived from an increase in Credit Suisse's businesses as a result of its relationship with the Fund (such as the ability to market to shareholders other financial products offered by Credit Suisse and its affiliates) and the fees paid to affiliates of Credit Suisse for co-administration and distribution services.
The Board considered the standards Credit Suisse would apply in seeking best execution for the Fund and reviewed Credit Suisse's method for allocating portfolio investment opportunities among its advisory clients.
31
Credit Suisse Managed Futures Strategy Fund
Board Approval of Advisory Agreement (continued)
Other Factors and Broader Review
The Board reviews and assesses the quality of the services that Credit Suisse provides to other Credit Suisse funds throughout the year. In this regard, the Board reviews reports of Credit Suisse at least quarterly, which include, among other things, detailed portfolio and market reviews, detailed fund performance reports, and Credit Suisse's compliance procedures for other Credit Suisse funds. The Board would receive similar reports with respect to the Fund.
Conclusions
In selecting Credit Suisse, and approving the Advisory Agreement and the investment advisory fee under such agreement, the Board concluded that:
• The estimated net total expenses were the same as the median of Expense Group One while the proposed Gross Advisory Fee was near the lower end of Expense Group One. The estimated net total expenses and proposed Gross Advisory Fee were below the average of Expense Group Two. The Board also considered the demands, complexity and quality of the investment management of the Fund and the Expense Limitation Agreement. The Board determined the fees to be reasonable.
• The Board was satisfied with the proposed nature, extent and quality of the investment advisory services that would be provided to the Fund by Credit Suisse and that, based on dialogue with management and counsel, the services that would be provided by Credit Suisse under the Advisory Agreement are typical of, and consistent with, those provided to similar mutual funds by other investment advisers.
• In light of the information, the Fund's proposed fee structure was considered reasonable.
No single factor reviewed by the Board was identified by the Board as the principal factor in determining whether to approve the Advisory Agreement. The Independent Trustees were advised by separate independent legal counsel throughout the process.
32
Credit Suisse Managed Futures Strategy Fund
Information Concerning Trustees and Officers (unaudited)
Name, Address
(Year of Birth) | | Position(s)
Held with
Fund | | Term
of Office1
and
Length
of Time
Served | | Principal
Occupation(s) During
Past Five Years | | Number of
Portfolios
in Fund
Complex
Overseen
by Trustee | | Other
Directorships
Held by Trustee | |
Independent Trustees | | | | | | | | | | | |
Enrique Arzac
c/o Credit Suisse Asset
Management, LLC
Attn: General Counsel
One Madison Avenue
New York, New York
10010
(1941) | | Trustee, Audit Committee Chairman and Nominating Committee Member | | Since Fund Inception | | Professor of Finance and Economics, Graduate School of Business, Columbia University since 1971. | | | 9 | | | Director of Epoch Holding Corporation (an investment management and investment advisory services company); Director of The Adams Express Company, Director of Petroleum and Resources Corporation, Director of Aberdeen Asset Management-advised Funds (six closed-end investment companies); Director of Mirae Asset Discovery Funds (open-end investment companies). | |
Jeffrey E. Garten
Box 208200
New Haven, Connecticut
06520-8200
(1946) | | Trustee, Audit and Nominating Committee Member | | Since Fund Inception | | The Juan Trippe Professor in the Practice of International Trade, Finance and Business from July 2005 to present; Partner and Chairman of Garten Rothkopf (consulting firm) from October 2005 to present; Dean of Yale School of Management from November 1995 to June 2005. | | | 7 | | | Director of Aetna, Inc. (insurance company); Director of CarMax Group (used car dealers); Member of Standard & Poor's Board of Managers (credit rating agency). | |
Peter F. Krogh
c/o Credit Suisse Asset
Management, LLC
Attn: General Counsel
One Madison Avenue
New York, New York
10010
(1937) | | Trustee, Audit and Nominating Committee Member | | Since Fund Inception | | Dean Emeritus and Distinguished Professor of International Affairs at the Edmund A. Walsh School of Foreign Service, Georgetown University from June 1995 to present. | | | 7 | | | None | |
1 Each Trustee and Officer serves until his or her respective successor has been duly elected and qualified.
33
Credit Suisse Managed Futures Strategy Fund
Information Concerning Trustees and Officers (unaudited) (continued)
Name, Address
(Year of Birth) | | Position(s)
Held with
Fund | | Term
of Office1
and
Length
of Time
Served | | Principal
Occupation(s) During
Past Five Years | | Number of
Portfolios
in Fund
Complex
Overseen
by Trustee | | Other
Directorships
Held by Trustee | |
Independent Trustees | | | | | | | | | | | |
Steven N. Rappaport
Lehigh Court, LLC
555 Madison Avenue
29th Floor
New York, New York
10022
(1948) | | Chairman of the Board of Trustees, Audit Committee Member and Nominating Committee Chairman | | Since Fund Inception | | Partner of Lehigh Court, LLC and RZ Capital (private investment firms) from July 2002 to present. | | | 9 | | | Director of iCAD, Inc. (surgical and medical instruments and apparatus company); Director of Wood Resources, LLC. (plywood manufacturing company); Director of Aberdeen Asset Management-advised Funds (five closed-end investment companies). | |
34
Credit Suisse Managed Futures Strategy Fund
Information Concerning Trustees and Officers (unaudited) (continued)
Name, Address
(Year of Birth) | | Position(s)
Held with
Fund | | Term
of Office1
and
Length
of Time
Served | | Principal Occupation(s) During Past Five Years | |
Officers** | | | | | | | |
John G. Popp
Credit Suisse Asset
Management, LLC
One Madison Avenue
New York, New York 10010
(1956) | | Chief Executive Officer and President | | Since Fund Inception | | Managing Director of Credit Suisse; Group Manager and Senior Portfolio Manager for Performing Credit Strategies; Associated with Credit Suisse or its predecessor since 1997; Officer of other Credit Suisse Funds. | |
Bruce Rosenberg
Credit Suisse Asset
Management, LLC
One Madison Avenue
New York, New York 10010
(1961) | | Chief Financial Officer | | Since 2012 | | Director and Director of Liquid Accounting of Credit Suisse; Associated with Credit Suisse since 2008; Associated with Bank of New York Mellon Alternative Investment Services from 2006 to 2008; Officer of other Credit Suisse Funds. | |
Emidio Morizio
Credit Suisse Asset
Management, LLC
One Madison Avenue
New York, New York 10010
(1966) | | Chief Compliance Officer | | Since Fund Inception | | Managing Director and Global Head of Compliance of Credit Suisse; Associated with Credit Suisse since July 2000; Officer of other Credit Suisse Funds. | |
Roger Machlis
Credit Suisse Asset
Management, LLC
One Madison Avenue
New York, New York 10010
(1961) | | Chief Legal Officer | | Since Fund Inception | | Managing Director and General Counsel for Credit Suisse; Associated with Credit Suisse Group AG since July 1997; Officer of other Credit Suisse Funds. | |
Karen Regan
Credit Suisse Asset
Management, LLC
One Madison Avenue
New York, New York 10010
(1963) | | Vice President and Secretary | | Since Fund Inception | | Vice President of Credit Suisse; Associated with Credit Suisse since December 2004; Officer of other Credit Suisse Funds. | |
Cecilia Chau
Credit Suisse Asset
Management, LLC
One Madison Avenue
New York, New York 10010
(1973) | | Treasurer | | Since Fund Inception | | Vice President of Credit Suisse since 2009; Assistant Vice President of Credit Suisse from June 2007 to December 2008; Associated with Alliance Bernstein L.P. from January 2007 to May 2007; Associated with Credit Suisse from August 2000 to December 2006; Officer of other Credit Suisse Funds. | |
** The officers of the Fund shown are officers that make policy decisions.
The Statement of Additional Information includes additional information about the Trustees and is available, without charge, upon request, by calling 877-870-2874.
35
Credit Suisse Managed Futures Strategy Fund
Proxy Voting and Portfolio Holdings Information (unaudited)
Information regarding how the Fund voted proxies related to its portfolio securities during the 12 month period ended June 30 of each year, as well as the policies and procedures that the Fund uses to determine how to vote proxies relating to its portfolio securities are available:
• By calling 1-877-870-2874
• On the Fund's website, www.credit-suisse.com/us/funds
• On the website of the Securities and Exchange Commission, www.sec.gov.
The Fund files a complete schedule of its portfolio holdings for the first and third quarters of its fiscal year with the SEC on Form N-Q. The Fund's Forms N-Q are available on the SEC's website at www.sec.gov and may be reviewed and copied at the SEC's Public Reference Room in Washington, DC. Information on the operation of the SEC's Public Reference Room may be obtained by calling 1-202-551-8090.
36

P.O. BOX 55030, BOSTON, MA 02205-5030
877-870-2874 n www.credit-suisse.com/us/funds
CREDIT SUISSE SECURITIES (USA) LLC, DISTRIBUTOR. MFS-AR-1012
Item 2. Code of Ethics.
The registrant has adopted a code of ethics applicable to its Chief Executive Officer, President, Chief Financial Officer and Chief Accounting Officer, or persons performing similar functions. A copy of the code is filed as Exhibit 12(a)(1) to this Form. There were no amendments to the code during the fiscal year ended October 31, 2012. There were no waivers or implicit waivers from the code granted by the registrant during the fiscal year ended October 31, 2012.
Item 3. Audit Committee Financial Expert.
The registrant’s governing board has determined that it has two audit committee financial experts serving on its audit committee: Enrique R. Arzac and Steven N. Rappaport. Each audit committee financial expert is “independent” for purposes of this item.
Item 4. Principal Accountant Fees and Services.
(a) through (d). The information in the table below is provided for services rendered to the registrant by its independent registered public accounting firm, PricewaterhouseCoopers LLP (“PwC”), for its fiscal years ended October 31, 2011 and October 31, 2012.
| | 2011 | | 2012 | |
Audit Fees | | $ | 33,150 | | $ | 101,700 | |
Audit-Related Fees(1) | | $ | 3,500 | | $ | 7,334 | |
Tax Fees(2) | | $ | 2,900 | | $ | 12,000 | |
All Other Fees | | — | | — | |
Total | | $ | 39,550 | | $ | 121,034 | |
(1) Services include agreed-upon procedures in connection with the registrant’s semi-annual financial statements ($3,500 for 2011 and $7,334 for 2012).
(2) Tax services in connection with the registrant’s excise tax calculations and review of the registrant’s applicable tax returns.
The information in the table below is provided with respect to non-audit services that directly relate to the registrant’s operations and financial reporting and that were rendered by PwC to the registrant’s investment adviser, Credit Suisse Asset Management, LLC (“Credit Suisse”), and any service provider to the registrant controlling, controlled by or under common control with Credit Suisse that
3
provided ongoing services to the registrant (“Covered Services Provider”), for the registrant’s fiscal years ended October 31, 2011 and October 31, 2012.
| | 2011 | | 2012 | |
Audit-Related Fees | | N/A | | N/A | |
Tax Fees | | N/A | | N/A | |
All Other Fees | | N/A | | N/A | |
Total | | N/A | | N/A | |
(e)(1) Pre-Approval Policies and Procedures. The Audit Committee (“Committee”) of the registrant is responsible for pre-approving (i) all audit and permissible non-audit services to be provided by the independent registered public accounting firm to the registrant and (ii) all permissible non-audit services to be provided by the independent registered public accounting firm to Credit Suisse and any Covered Services Provider if the engagement relates directly to the operations and financial reporting of the registrant. The Committee may delegate its responsibility to pre-approve any such audit and permissible non-audit services to the Chairperson of the Committee, and the Chairperson shall report to the Committee, at its next regularly scheduled meeting after the Chairperson’s pre-approval of such services, his or her decision(s). The Committee may also establish detailed pre-approval policies and procedures for pre-approval of such services in accordance with applicable laws, including the delegation of some or all of the Committee’s pre-approval responsibilities to other persons (other than Credit Suisse or the registrant’s officers). Pre-approval by the Committee of any permissible non-audit services shall not be required so long as: (i) the aggregate amount of all such permissible non-audit services provided to the registrant, Credit Suisse and any Covered Services Provider constitutes not more than 5% of the total amount of revenues paid by the registrant to its independent registered public accounting firm during the fiscal year in which the permissible non-audit services are provided; (ii) the permissible non-audit services were not recognized by the registrant at the time of the engagement to be non-audit services; and (iii) such services are promptly brought to the attention of the Committee and approved by the Committee (or its delegate(s)) prior to the completion of the audit.
(e)(2) The information in the table below sets forth the percentages of fees for services (other than audit, review or attest services) rendered by PwC to the registrant for which the pre-approval requirement was waived pursuant to Rule 2-01(c)(7)(i)(C) of Regulation S-X:
4
| | 2011 | | 2012 | |
Audit-Related Fees | | N/A | | N/A | |
Tax Fees | | N/A | | N/A | |
All Other Fees | | N/A | | N/A | |
Total | | N/A | | N/A | |
The information in the table below sets forth the percentages of fees for services (other than audit, review or attest services) rendered by PwC to Credit Suisse and any Covered Services Provider required to be approved pursuant to Rule 2-01(c)(7)(ii) of Regulation S-X, for the registrant’s fiscal years ended October 31, 2011 and October 31, 2012:
| | 2011 | | 2012 | |
Audit-Related Fees | | N/A | | N/A | |
Tax Fees | | N/A | | N/A | |
All Other Fees | | N/A | | N/A | |
Total | | N/A | | N/A | |
(f) Not Applicable.
(g) The aggregate fees billed by PwC for non-audit services rendered to the registrant, Credit Suisse and Covered Service Providers for the fiscal years ended October 31, 2011 and October 31, 2012 were $6,400 and $19,334, respectively.
(h) Not Applicable.
Item 5. Audit Committee of Listed Registrants.
Form N-CSR disclosure requirement is not applicable to the registrant.
Item 6. Schedule of Investments.
Included as part of the report to shareholders filed under Item 1 of this Form.
5
Item 7. Disclosure of Proxy Voting Policies and Procedures for Closed-End Management Investment Companies.
Form N-CSR disclosure requirement is not applicable to the registrant.
Item 8. Portfolio Managers of Closed-End Management Investment Companies.
Form N-CSR disclosure requirement is not applicable to the registrant.
Item 9. Purchases of Equity Securities by Closed-End Management Investment Company and Affiliated Purchasers.
Form N-CSR disclosure requirement is not applicable to the registrant.
Item 10. Submission of Matters to a Vote of Security Holders.
None.
Item 11. Controls and Procedures.
(a) As of a date within 90 days from the filing date of this report, the principal executive officer and principal financial officer concluded that the registrant’s disclosure controls and procedures (as defined in Rule 30a-3(c) under the Investment Company Act of 1940 (the “Act”)) were effective based on their evaluation of the disclosure controls and procedures required by Rule 30a-3(b) under the Act and Rules 13a-15(b) or 15d-15(b) under the Securities Exchange Act of 1934.
(b) There were no changes in registrant’s internal control over financial reporting (as defined in Rule 30a-3(d) under the Act) that occurred during the second fiscal quarter of the period covered by this report that have materially affected, or are reasonably likely to materially affect, the registrant’s internal control over financial reporting.
Item 12. Exhibits.
(a)(1) Registrant’s Code of Ethics is an exhibit to this report.
(a)(2) The certifications of the registrant as required by Rule 30a-2(a) under the Act are exhibits to this report.
(a)(3) Not applicable.
(b) The certifications of the registrant as required by Rule 30a-2(b) under the Act are an exhibit to this report.
6
SIGNATURES
Pursuant to the requirements of the Securities Exchange Act of 1934 and the Investment Company Act of 1940, the registrant has duly caused this report to be signed on its behalf by the undersigned, thereunto duly authorized.
CREDIT SUISSE OPPORTUNITY FUNDS | |
| |
/s/ John G. Popp | |
Name: | John G. Popp | |
Title: | Chief Executive Officer | |
Date: | January 4, 2013 | |
Pursuant to the requirements of the Securities Exchange Act of 1934 and the Investment Company Act of 1940, this report has been signed below by the following persons on behalf of the registrant and in the capacities and on the dates indicated.
/s/ John G. Popp | |
Name: | John G. Popp | |
Title: | Chief Executive Officer | |
Date: | January 4, 2013 | |
| |
/s/ Bruce S. Rosenberg | |
Name: | Bruce S. Rosenberg | |
Title: | Chief Financial Officer | |
Date: | January 4, 2013 | |
7