UNITED STATES
SECURITIES AND EXCHANGE COMMISSION
Washington, D.C. 20549
FORM N-CSR
CERTIFIED SHAREHOLDER REPORT OF REGISTERED
MANAGEMENT INVESTMENT COMPANIES
Investment Company Act file number | 811-09054 |
|
CREDIT SUISSE OPPORTUNITY FUNDS |
(Exact name of registrant as specified in charter) |
|
Eleven Madison Avenue, New York, New York | | 10010 |
(Address of principal executive offices) | | (Zip code) |
|
John G. Popp Credit Suisse Opportunity Funds Eleven Madison Avenue New York, New York 10010 |
(Name and address of agent for service) |
|
Registrant’s telephone number, including area code: | (212) 325-2000 | |
|
Date of fiscal year end: | October 31st | |
|
Date of reporting period: | November 1, 2010 to October 31, 2011 | |
| | | | | | | | |
Item 1. Reports to Stockholders.

CREDIT SUISSE FUNDS
Annual Report
October 31, 2011
n CREDIT SUISSE
FLOATING RATE HIGH INCOME FUND
The Fund's investment objectives, risks, charges and expenses (which should be considered carefully before investing), and more complete information about the Fund, are provided in the Prospectus, which should be read carefully before investing. You may obtain additional copies by calling 877-870-2874 or by writing to Credit Suisse Funds, P.O. Box 55030, Boston, MA 02205-5030.
Credit Suisse Asset Management Securities, Inc., Distributor, is located at Eleven Madison Avenue, New York, NY 10010. Credit Suisse Funds are advised by Credit Suisse Asset Management, LLC.
Investors in the Credit Suisse Funds should be aware that they may be eligible to purchase Class I shares (where offered) directly or through certain intermediaries. Such shares are not subject to a sales charge. Investors in the Credit Suisse Funds should also be aware that they may be eligible for a reduction or waiver of the sales charge with respect to Class A, B or C shares (where offered). For more information, please review the relevant prospectuses or consult your financial representative.
The views of the Fund's management are as of the date of the letter and the Fund holdings described in this document are as of October 31, 2011; these views and Fund holdings may have changed subsequent to these dates. Nothing in this document is a recommendation to purchase or sell securities.
Fund shares are not deposits or other obligations of Credit Suisse Asset Management, LLC ("Credit Suisse") or any affiliate, are not FDIC-insured and are not guaranteed by Credit Suisse or any affiliate. Fund investments are subject to investment risks, including loss of your investment.
Credit Suisse Floating Rate High Income Fund
Annual Investment Adviser's Report
October 31, 2011 (unaudited)
December 1, 2011
We are pleased to present this Annual Report which covers the activities of the Credit Suisse Floating Rate High Income Fund for the year ended October 31, 2011.
Dear Shareholder:
Performance Summary
11/1/10 – 10/31/11
| Fund & Benchmark | | Performance | |
| Class I1 | | | 5.85 | % | |
| Class A1,2 | | | 5.74 | % | |
| Class B1,2 | | | 5.03 | % | |
| Class C1,2 | | | 5.03 | % | |
| Credit Suisse Leveraged Loan Index3 | | | 3.54 | % | |
BofA Merrill Lynch US High
Yield Master II Constrained Index4 | | | 4.82 | % | |
Performance shown for the Fund's Class A, Class B and Class C shares does not reflect sales charges, which are a maximum of 4.75%, 4.00% and 1.00%, respectively.2
On June 3, 2011, the Credit Suisse High Income Fund changed its name to the "Credit Suisse Floating Rate High Income Fund." While the Fund's strategy continues to focus on generating income from investing in the debt of non-investment grade companies, the portfolio emphasizes the senior secured loan asset class rather than high yield bonds. For further information regarding this change, please refer to the Supplement to the Prospectus filed with the SEC on April 4, 2011.
Market Review: Lowest default rates since 2008
The year ended October 31, 2011 was a volatile one for the leveraged loan and high yield markets. The Fund's benchmark, the Credit Suisse Leveraged Loan Index (the "Index") returned 3.54% for the year. In addition, the BofA Merrill Lynch US High Yield Master II Constrained Index returned 4.82% for the same time period. Although there was optimism in the first half of the year, it was tempered by escalating concerns over systemic risks in Europe and the United States during the third quarter. The senior loan discount margin, assuming a three-year average, widened by 62 basis points to end the year at +654 basis points. The average index price, which reached a high of 95.92 in April, finished the year unchanged at 92.44.
1
Credit Suisse Floating Rate High Income Fund
Annual Investment Adviser's Report (continued)
October 31, 2011 (unaudited)
From a quality point-of view, split BB and B-rated loans posted the highest returns during the period: 4.44% and 3.55% respectively. Split B and CCC/Split CCC-rated securities underperformed with respective returns of -0.16% and 1.53% respectively. The top performers in the Index were the consumer durables, metals/mineral and gaming/leisure sectors. Conversely, utility, media/telecom and food/tobacco were the biggest detractors to performance during the period.
High yield default rates have fallen to their lowest levels since early 2008 with the trailing 12-month issuer-weighted global default rate, as measured by Moody's, declining steadily from 3.8% in October 2010 to 1.9% in October 2011. This rate is well below the historical average of 4.45% and is forecasted to increase to 2.25% over the next 12 months. According to Credit Suisse, senior loan new issuance topped $468 billion during the period, with the greatest activity during the second quarter with more than $142 billion in volume. High yield issue volume for the period, according to JP Morgan, was more than $274 billion — generally in line with last year's figure of nearly $284 billion. New issue activity was greatest during the second quarter of 2011, with over $92 billion in new issues. There was a considerable decrease in activity in the third quarter as issuance dropped to less than $26 billion.
Senior loan mutual funds experienced a 9-month streak of positive flows during the year only to see it broken by 3 months of consecutive outflows from August through October. Net inflows for the year, as reported by Lipper FMI, totaled more than $22 billion. Additionally, Lipper reported that high-yield mutual funds saw eight months of positive flows during the year for a total net inflow of more than $9 billion for the year.
Strategic Review and Outlook: Cautiously optimistic going forward
For the 12-month period ended October 31, 2011, the Fund outperformed its benchmarks. For the period between November 2010 and May 2011, when the Fund had been focused on the high yield bond asset class, it benefitted from superior security selection in the gaming and leisure sectors. Since the Fund's transition to focusing on the non-investment grade senior secured loans asset class in June of this year, strong performance in broadcast and oil sectors contributed to performance. In contrast, security selection in the restaurant sector hurt relative returns.
We believe recent dislocations in credit markets have presented opportunities to selectively add leverage loan exposure at attractive yields. Our portfolio positioning remains defensive, with an emphasis on senior secured loans. In addition, we continue to maintain an overweight to B-rated loans with the best risk-return profiles, while underweighting the most aggressive CC-rated
2
Credit Suisse Floating Rate High Income Fund
Annual Investment Adviser's Report (continued)
October 31, 2011 (unaudited)
components of the Index. From a sector perspective, we have a positive view on energy, technology and media. We continue to remain cautious with respect to consumer-driven industries where asset quality is low.
The broad macroeconomic data, such as inconsistent U.S. economic trends and Eurozone concerns, cause us to remain cautious for the near-term. However, on a fundamental basis, non-investment grade companies have focused on deleveraging and extending maturities since early 2009 — despite the volatility and negative sentiment that has dominated the landscape. These improved fundamentals continue to support the expectations that defaults will be lower than historical averages for 2012 and 2013.
The Credit Suisse Credit Investments Group Team
John G. Popp
Thomas J. Flannery
Wing Chan
David H. Lerner
Senior secured floating rate loans ("Senior Loans") are subject to the risk that a court could subordinate a Senior Loan, which typically holds the most senior position in the issuer's capital structure, to presently existing or future indebtedness or take other action detrimental to the holders of Senior Loans.
High yield bonds are lower-quality bonds that are also known as "junk bonds." Such bonds entail greater risks than those found in higher-rated securities.
In addition to historical information, this report contains forward-looking statements, which may concern, among other things, domestic and foreign market, industry and economic trends and developments and government regulation and their potential impact on the Fund's investments. These statements are subject to risks and uncertainties and actual trends, developments and regulations in the future, and their impact on the Fund could be materially different from those projected, anticipated or implied. The Fund has no obligation to update or revise forward-looking statements.
3
Credit Suisse Floating Rate High Income Fund
Annual Investment Adviser's Report (continued)
October 31, 2011 (unaudited)
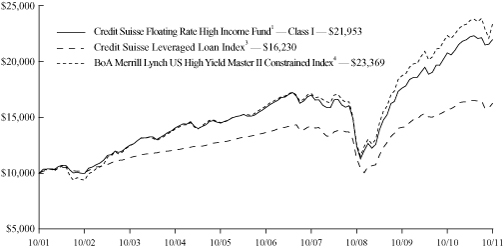
Comparison of Change in Value of $10,000 Investment in the
Credit Suisse Floating Rate High Income Fund1 Class I shares, the Credit
Suisse Leveraged Loan Index3 and the BofA Merrill Lynch US High Yield
Master II Constrained Index4 for Ten Years.
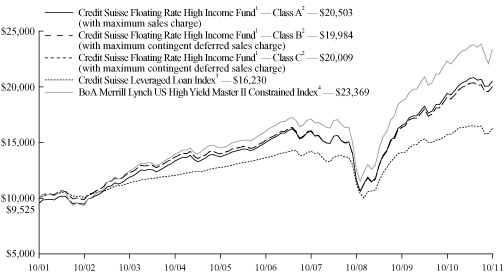
Comparison of Change in Value of $10,000 Investment in the
Credit Suisse Floating Rate High Income Fund1 Class A shares2, Class B
shares2, and Class C shares2, the Credit Suisse Leveraged Loan Index3 and
the BofA Merrill Lynch US High Yield Master II Constrained Index4 for
Ten Years.
4
Credit Suisse Floating Rate High Income Fund
Annual Investment Adviser's Report (continued)
October 31, 2011 (unaudited)
Average Annual Returns as of September 30, 20111
| | | 1 Year | | 5 Years | | 10 Years | | Since
Inception | |
| Class I | | | 6.51 | % | | | 6.61 | % | | | 8.36 | % | | | 6.91 | % | |
| Class A Without Sales Charge | | | 6.24 | % | | | 6.33 | % | | | 8.14 | % | | | 6.39 | % | |
Class A With Maximum
Sales Charge | | | 1.19 | % | | | 5.30 | % | | | 7.61 | % | | | 5.97 | % | |
| Class B Without CDSC | | | 5.53 | % | | | 5.55 | % | | | 7.34 | % | | | 5.57 | % | |
| Class B With CDSC | | | 1.55 | % | | | 5.55 | % | | | 7.34 | % | | | 5.57 | % | |
| Class C Without CDSC | | | 5.53 | % | | | 5.55 | % | | | 7.34 | % | | | 5.68 | % | |
| Class C With CDSC | | | 4.54 | % | | | 5.55 | % | | | 7.34 | % | | | 5.68 | % | |
Average Annual Returns as of October 31, 20111
| | | 1 Year | | 5 Years | | 10 Years | | Since
Inception | |
| Class I | | | 5.85 | % | | | 6.70 | % | | | 8.18 | % | | | 7.04 | % | |
| Class A Without Sales Charge | | | 5.74 | % | | | 6.46 | % | | | 7.97 | % | | | 6.52 | % | |
Class A With Maximum
Sales Charge | | | 0.66 | % | | | 5.43 | % | | | 7.44 | % | | | 6.11 | % | |
| Class B Without CDSC | | | 5.03 | % | | | 5.67 | % | | | 7.17 | % | | | 5.70 | % | |
| Class B With CDSC | | | 1.05 | % | | | 5.67 | % | | | 7.17 | % | | | 5.70 | % | |
| Class C Without CDSC | | | 5.03 | % | | | 5.67 | % | | | 7.18 | % | | | 5.83 | % | |
| Class C With CDSC | | | 4.04 | % | | | 5.67 | % | | | 7.18 | % | | | 5.83 | % | |
Returns represent past performance and include change in share price and reinvestment of dividends and capital gains. Past performance cannot guarantee future results. The current performance of the Fund may be lower or higher than the figures shown. Returns and share price will fluctuate, and redemption value may be more or less than original cost. The performance results do not reflect the deduction of taxes that a shareholder would pay on fund distributions or the redemption of fund shares. Performance information current to the most recent month-end is available at www.credit-suisse.com/us.
The annualized gross expense ratios are 1.38% for Class I shares, 1.64% for Class A shares, 2.38% for Class B shares and 2.38% for Class C shares. The annualized net expense ratios after fee waivers and/or expense reimbursements are 0.70% for Class I shares, 0.95% for Class A shares, 1.70% for Class B shares and 1.70% for Class C shares.
1 Fee waivers and/or expense reimbursements may reduce expenses for the Fund, without which performance would be lower. Waivers and/or reimbursements may be discontinued at any time.
5
Credit Suisse Floating Rate High Income Fund
Annual Investment Adviser's Report (continued)
October 31, 2011 (unaudited)
2 Total return for the Fund's Class A shares for the reporting period, based on offering price (including maximum sales charge of 4.75%), was 0.66%. Total return for the Fund's Class B shares for the reporting period, based on redemption value (including maximum contingent deferred sales charge of 4.00%), was 1.05%. Total return for the Fund's Class C shares for the reporting period, based on redemption value (including maximum contingent deferred sales charge of 1.00%), was 4.04%.
3 The Credit Suisse Leveraged Loan Index is an unmanaged index that is designed to mirror the investable universe of the U.S. dollar denominated institutional leveraged loan market. An index does not have transaction costs; investors cannot invest directly in an index.
4 The BofA Merrill Lynch US High Yield Master II Constrained Index is an unmanaged index that tracks the performance of below investment-grade U.S. dollar-denominated corporate bonds issued in the U.S. domestic market, where each issuer's allocation is limited to 2% of the index. An index does not have transaction costs; investors cannot invest directly in an index.
6
Credit Suisse Floating Rate High Income Fund
Annual Investment Adviser's Report (continued)
October 31, 2011 (unaudited)
Information About Your Fund's Expenses
As an investor in the Fund, you incur two types of costs: ongoing expenses and transaction costs. Ongoing expenses include management fees, distribution and service (12b-1) fees and other Fund expenses. Examples of transaction costs include sales charges (loads), redemption fees and account maintenance fees, which are not shown in this section and which would result in higher total expenses. The following table is intended to help you understand your ongoing expenses of investing in the Fund and to help you compare these expenses with the ongoing expenses of investing in other mutual funds. The table is based on an investment of $1,000 made at the beginning of the six month period ended October 31, 2011.
The table illustrates your Fund's expenses in two ways:
• Actual Fund Return. This helps you estimate the actual dollar amount of ongoing expenses paid on a $1,000 investment in the Fund using the Fund's actual return during the period. To estimate the expenses you paid over the period, simply divide your account value by $1,000 (for example, an $8,600 account value divided by $1,000 = 8.6), then multiply the result by the number in the "Expenses Paid per $1,000" line under the share class you hold.
• Hypothetical 5% Fund Return. This helps you to compare your Fund's ongoing expenses with those of other mutual funds using the Fund's actual expense ratio and a hypothetical rate of return of 5% per year before expenses. Examples using a 5% hypothetical fund return may be found in the shareholder reports of other mutual funds. The hypothetical account values and expenses may not be used to estimate the actual ending account balance or expenses you paid for the period.
Please note that the expenses shown in these tables are meant to highlight your ongoing expenses only and do not reflect any transaction costs, such as sales charges (loads) or redemption fees. If these transaction costs had been included, your costs would have been higher. The "Expenses Paid per $1,000" line of the tables is useful in comparing ongoing expenses only and will not help you determine the relative total expenses of owning different funds.
7
Credit Suisse Floating Rate High Income Fund
Annual Investment Adviser's Report (continued)
October 31, 2011 (unaudited)
Expenses and Value for a $1,000 Investment
for the six month period ended October 31, 2011
| Actual Fund Return | | Class I | | Class A | | Class B | | Class C | |
| Beginning Account Value 5/1/11 | | $ | 1,000.00 | | | $ | 1,000.00 | | | $ | 1,000.00 | | | $ | 1,000.00 | | |
| Ending Account Value 10/31/11 | | $ | 989.00 | | | $ | 988.00 | | | $ | 984.20 | | | $ | 984.30 | | |
| Expenses Paid per $1,000* | | $ | 3.51 | | | $ | 4.76 | | | $ | 8.50 | | | $ | 8.50 | | |
| Hypothetical 5% Fund Return | |
| Beginning Account Value 5/1/11 | | $ | 1,000.00 | | | $ | 1,000.00 | | | $ | 1,000.00 | | | $ | 1,000.00 | | |
| Ending Account Value 10/31/11 | | $ | 1,021.68 | | | $ | 1,020.42 | | | $ | 1,016.64 | | | $ | 1,016.64 | | |
| Expenses Paid per $1,000* | | $ | 3.57 | | | $ | 4.84 | | | $ | 8.64 | | | $ | 8.64 | | |
| | | Class I | | Class A | | Class B | | Class C | |
| Annualized Expense Ratios* | | | 0.70 | % | | | 0.95 | % | | | 1.70 | % | | | 1.70 | % | |
* Expenses are equal to the Fund's annualized expense ratio for each share class, multiplied by the average account value over the period, multiplied by the number of days in the most recent fiscal half year period, then divided by 365.
The "Expenses Paid per $1,000" and the "Annualized Expense Ratios" in the tables are based on actual expenses paid by the Fund during the period, net of fee waivers and/or expense reimbursements. If those fee waivers and/or expense reimbursements had not been in effect, the Fund's actual expenses would have been higher.
For more information, please refer to the Fund's prospectus.
8
Credit Suisse Floating Rate High Income Fund
Annual Investment Adviser's Report (continued)
October 31, 2011 (unaudited)
Credit Quality Breakdown*
Ratings
S&P | |
| BBB | | | 1.3 | % | |
| BB | | | 30.9 | % | |
| B | | | 34.7 | % | |
| CCC | | | 3.4 | % | |
| D | | | 0.5 | % | |
| NR | | | 1.9 | % | |
| Subtotal | | | 72.7 | % | |
| Equity and Other | | | 0.1 | % | |
| Short-Term Investment | | | 27.2 | % | |
| Total | | | 100.0 | % | |
* Expressed as a percentage of total investments (excluding securities lending collateral if applicable) and may vary over time.
9
Credit Suisse Floating Rate High Income Fund
Schedule of Investments
October 31, 2011
Par
(000) | |
| | Ratings†
(S&P/Moody's) | | Maturity | | Rate% | | Value | |
| BANK LOANS (65.8%) | | | |
| Aerospace & Defense (1.7%) | | | |
| $ | 499 | | | API Technologies Corp.# | | (B+, B2) | | 06/27/16 | | | 7.750 | | | $ | 479,835 | | |
| | 500 | | | Bombardier Recreational Products, Inc.# | | (B, B2) | | 06/28/13 | | | 2.890 | | | | 480,000 | | |
| | 499 | | | Ducommun, Inc.# | | (BB-, Ba2) | | 06/28/17 | | | 5.500 | | | | 493,762 | | |
| | 750 | | | Sequa Corp.# | | (B-, B1) | | 12/03/14 | | | 3.630 | | | | 726,330 | | |
| | | | 2,179,927 | | |
| Airlines (0.5%) | | | |
| | 597 | | | Delta Air Lines, Inc.# | | (BB-, Ba2) | | 03/07/16 | | | 4.250 | | | | 569,389 | | |
| Auto Loans (0.4%) | | | |
| | 488 | | | Capital Automotive LP# | | (B+, Ba3) | | 03/11/17 | | | 5.000 | | | | 480,564 | | |
| Auto Parts & Equipment (1.7%) | | | |
| | 994 | | | Federal-Mogul Corp.# | | (B+, Ba3) | | 12/29/14 | | | 2.178 | | | | 941,236 | | |
| | 253 | | | Federal-Mogul Corp.# | | (B+, Ba3) | | 12/28/15 | | | 2.178 | | | | 239,816 | | |
| | 494 | | | Milacron LLC# | | (B, B1) | | 05/15/17 | | | 7.500 | | | | 490,047 | | |
| | 437 | | | Veyance Technologies, Inc.# | | (NR, NR) | | 07/31/14 | | | 2.750 | | | | 395,028 | | |
| | 63 | | | Veyance Technologies, Inc.# | | (NR, NR) | | 07/31/14 | | | 2.750 | | | | 56,579 | | |
| | | | 2,122,706 | | |
| Automotive (1.0%) | | | |
| | 499 | | | Chrysler Group LLC# | | (BB, Ba2) | | 05/24/17 | | | 6.000 | | | | 470,072 | | |
| | 748 | | | Kar Auction Services, Inc.# | | (BB-, Ba3) | | 05/19/17 | | | 5.000 | | | | 746,950 | | |
| | | | 1,217,022 | | |
| Banks (1.2%) | | | |
| | 999 | | | Fifth Third Processing Solutions LLC# | | (BB-, Ba3) | | 11/03/16 | | | 4.500 | | | | 998,332 | | |
| | 488 | | | Ocwen Financial Corp.# | | (B, B1) | | 09/01/16 | | | 7.000 | | | | 487,500 | | |
| | | | 1,485,832 | | |
| Building & Construction (0.4%) | | | |
| | 488 | | | LNR Property Corp.# | | (BB+, Ba2) | | 04/29/16 | | | 4.750 | | | | 483,844 | | |
| Building Materials (0.5%) | | | |
| | 598 | | | Nortek, Inc.# | | (BB-, B1) | | 04/26/17 | | | 5.250 | | | | 590,515 | | |
| Chemicals (6.0%) | | | |
| | 750 | | | AZ Chem US, Inc.# | | (BB, B1) | | 11/21/16 | | | 4.745 | | | | 751,935 | | |
| | 600 | | | Chemtura Corp.# | | (BB+, Ba1) | | 08/29/16 | | | 5.500 | | | | 600,750 | | |
| | 750 | | | Harko C.V.# | | (BB-, Ba2) | | 08/02/17 | | | 5.750 | | | | 746,250 | | |
| | 650 | | | Huntsman International LLC# | | (BB, Ba2) | | 04/19/17 | | | 2.800 | | | | 628,605 | | |
| | 1,000 | | | Ineos US Finance LLC# | | (B, Ba3) | | 12/16/13 | | | 7.500 – 8.000 | | | | 1,024,165 | | |
| | 346 | | | Matrix Acquisition Corp.# | | (BB-, Ba3) | | 04/12/14 | | | 2.246 | | | | 338,699 | | |
| | 996 | | | Momentive Performance Materials, Inc.# | | (B, Ba3) | | 05/05/15 | | | 3.750 | | | | 941,296 | | |
| | 500 | | | Norit Holding B.V.# | | (BB-, B1) | | 07/10/17 | | | 6.750 | | | | 496,250 | | |
| | 499 | | | Potters Holdings II LP# | | (B, Ba3) | | 05/06/17 | | | 6.000 | | | | 491,269 | | |
| | 1,001 | | | PQ Corp.# | | (B+, B3) | | 07/30/14 | | | 3.680 | | | | 950,083 | | |
| | 499 | | | Styron Sarl# | | (B+, B1) | | 08/02/17 | | | 6.000 | | | | 457,722 | | |
| | | | 7,427,024 | | |
See Accompanying Notes to Financial Statements.
10
Credit Suisse Floating Rate High Income Fund
Schedule of Investments (continued)
October 31, 2011
Par
(000) | |
| | Ratings†
(S&P/Moody's) | | Maturity | | Rate% | | Value | |
| BANK LOANS | | | |
| Consumer Products (1.5%) | | | |
| $ | 499 | | | NBTY, Inc.# | | (BB-, Ba3) | | 10/01/17 | | | 4.250 | | | $ | 498,432 | | |
| | 459 | | | Ranpak Corp.# | | (BB-, Ba3) | | 04/20/17 | | | 4.750 | | | | 445,368 | | |
| | 511 | | | Spectrum Brands, Inc.# | | (B, B1) | | 06/17/16 | | | 5.000 | | | | 511,735 | | |
| | 481 | | | Targus Information Corp.# | | (BB-, B1) | | 12/29/16 | | | 7.500 | | | | 464,361 | | |
| | | | 1,919,896 | | |
| Consumer/Commercial/Lease Financing (0.4%) | | | |
| | 600 | | | Springleaf Financial Funding Co.# | | (B+, B2) | | 05/10/17 | | | 5.500 | | | | 551,895 | | |
| Diversified Capital Goods (2.7%) | | | |
| | 500 | | | Douglas Dynamics LLC# | | (BB, B1) | | 04/18/18 | | | 5.750 | | | | 485,000 | | |
| | 598 | | | Electrical Components International, Inc.# | | (B+, B1) | | 02/04/17 | | | 6.750 | | | | 564,079 | | |
| | 499 | | | Husky Injection Molding Systems Ltd.# | | (B, Ba3) | | 06/29/18 | | | 6.500 | | | | 498,022 | | |
| | 876 | | | MX Mercury Beteilegungen GMBH# | | (B, B2) | | 06/28/13 | | | 2.245 | | | | 823,364 | | |
| | 499 | | | Sensata Technology Finance Co. LLC# | | (BB+, Ba3) | | 05/12/18 | | | 4.000 | | | | 497,815 | | |
| | 499 | | | TriMas Corp.# | | (BB, Ba2) | | 06/21/17 | | | 4.250 | | | | 491,892 | | |
| | | | 3,360,172 | | |
| Electric - Generation (0.4%) | | | |
| | 600 | | | Texas Competitive Electric Holdings Co. LLC# | | (CCC, B2) | | 10/10/14 | | | 3.808 | | | | 449,166 | | |
| Electric - Integrated (0.2%) | | | |
| | 238 | | | The AES Corp.# | | (BB+, Ba1) | | 06/01/18 | | | 4.250 | | | | 237,610 | | |
| Electronics (2.6%) | | | |
| | 731 | | | Infor Enterprise Solutions Holdings, Inc.# | | (B+, B1) | | 07/28/15 | | | 6.000 | | | | 703,126 | | |
| | 750 | | | Microsemi Corp.# | | (BB+, Ba2) | | 02/02/18 | | | 5.750 | | | | 752,970 | | |
| | 499 | | | Shield Finance Co. Sarl# | | (B+, B2) | | 06/15/16 | | | 7.625 | | | | 492,516 | | |
| | 499 | | | The TriZetto Group, Inc.# | | (B, B1) | | 05/02/18 | | | 4.750 | | | | 488,338 | | |
| | 750 | | | Verint Systems, Inc.# | | (B+, B1) | | 10/27/17 | | | 4.500 | | | | 744,844 | | |
| | | | 3,181,794 | | |
| Energy - Exploration & Production (0.9%) | | | |
| | 800 | | | Delphi Acquisition Holding I BV# | | (CCC-, B1) | | 07/11/16 | | | 4.814 – 4.869 | | | | 696,000 | | |
| | 475 | | | Varel Funding Corp.# | | (CCC+, NR) | | 11/05/14 | | | 6.316 | | | | 462,712 | | |
| | | | 1,158,712 | | |
| Environmental (1.0%) | | | |
| | 780 | | | EnviroSolutions Real Property Holdings, Inc.# | | (CCC-, Caa1) | | 07/29/14 | | | 8.000 | | | | 759,744 | | |
| | 499 | | | Waste Industries USA, Inc.# | | (B+, B1) | | 03/17/17 | | | 4.750 | | | | 487,525 | | |
| | | | 1,247,269 | | |
| Food & Drug Retailers (1.5%) | | | |
| | 1,300 | | | BJ's Wholesale Club, Inc.# | | (B+, B1) | | 09/28/18 | | | 7.000 | | | | 1,299,675 | | |
| | 600 | | | Rite Aid Corp.# | | (B+, B3) | | 03/03/18 | | | 4.500 | | | | 571,500 | | |
| | | | 1,871,175 | | |
| Food - Wholesale (2.8%) | | | |
| | 748 | | | Del Monte Foods Co.# | | (B, Ba3) | | 03/08/18 | | | 4.500 | | | | 728,797 | | |
See Accompanying Notes to Financial Statements.
11
Credit Suisse Floating Rate High Income Fund
Schedule of Investments (continued)
October 31, 2011
Par
(000) | |
| | Ratings†
(S&P/Moody's) | | Maturity | | Rate% | | Value | |
| BANK LOANS | | | |
| Food - Wholesale | | | |
| $ | 174 | | | Dole Food Co., Inc.# | | (BB-, Ba2) | | 07/08/18 | | | 6.000 | | | $ | 174,429 | | |
| | 599 | | | JBS USA LLC# | | (BB, Ba3) | | 05/25/18 | | | 4.250 | | | | 589,523 | | |
| | 499 | | | Michael Foods Group, Inc.# | | (BB-, B1) | | 02/25/18 | | | 4.250 | | | | 493,917 | | |
| | 599 | | | Pinnacle Foods Finance LLC# | | (B+, Ba3) | | 04/02/14 | | | 2.739 | | | | 590,870 | | |
| | 324 | | | Solvest, Ltd.# | | (BB-, Ba2) | | 07/08/18 | | | 6.000 | | | | 323,939 | | |
| | 597 | | | U.S. Foodservice, Inc.# | | (B, B3) | | 07/03/14 | | | 2.740 | | | | 555,349 | | |
| | | | 3,456,824 | | |
| Forestry & Paper (0.1%) | | | |
| | 188 | | | ICL Industrial Containers# | | (B, Ba3) | | 02/23/18 | | | 4.500 | | | | 187,021 | | |
| Gaming (1.2%) | | | |
| | 481 | | | CCM Merger, Inc.# | | (B+, B3) | | 03/01/17 | | | 7.000 | | | | 478,030 | | |
| | 363 | | | VML US Finance LLC# | | (BB, Ba3) | | 05/25/12 | | | 4.750 | | | | 362,069 | | |
| | 628 | | | VML US Finance LLC# | | (BB, Ba3) | | 05/27/13 | | | 4.750 | | | | 626,835 | | |
| | | | 1,466,934 | | |
| Health Facilities (0.4%) | | | |
| | 93 | | | United Surgical Partners International, Inc.# | | (B, Ba3) | | 04/21/14 | | | 2.250 | | | | 88,872 | | |
| | 405 | | | United Surgical Partners International, Inc.# | | (B, Ba3) | | 04/21/14 | | | 2.250 | | | | 388,885 | | |
| | | | 477,757 | | |
| Health Services (4.9%) | | | |
| | 500 | | | Ardent Medical Services, Inc.# | | (B, B1) | | 09/15/15 | | | 6.500 | | | | 488,125 | | |
| | 500 | | | Capsugel Holdings US, Inc.# | | (BB-, B1) | | 08/01/18 | | | 5.250 | | | | 501,252 | | |
| | 497 | | | Catalent Pharma Solutions, Inc.# | | (BB-, Ba3) | | 04/10/14 | | | 2.496 | | | | 475,952 | | |
| | 497 | | | ConvaTec, Inc.# | | (B+, Ba3) | | 12/22/16 | | | 5.750 | | | | 488,788 | | |
| | 249 | | | Drummers Investors LLC# | | (B+, B1) | | 05/04/18 | | | 5.000 | | | | 227,666 | | |
| | 750 | | | Emdeon, Inc.# | | (BB-, Ba3) | | 11/02/18 | | | 6.750 | | | | 754,012 | | |
| | 499 | | | Inventiv Health, Inc.# | | (BB-, B1) | | 05/15/18 | | | 6.750 | | | | 495,009 | | |
| | 750 | | | Kinetic Concepts, Inc.# | | (BB-, Ba1) | | 05/04/18 | | | 7.000 | | | | 754,031 | | |
| | 497 | | | Onex Carestream Finance LP# | | (BB-, B1) | | 02/25/17 | | | 5.000 | | | | 449,489 | | |
| | 498 | | | Surgery Center Holdings, Inc.# | | (B+, Ba3) | | 02/06/17 | | | 6.500 | | | | 477,600 | | |
| | 313 | | | Warner Chilcott Corp.# | | (BBB-, Ba3) | | 03/15/18 | | | 4.250 | | | | 311,710 | | |
| | 228 | | | Warner Chilcott Corp.# | | (BBB-, Ba3) | | 03/15/18 | | | 4.250 | | | | 226,698 | | |
| | 456 | | | Warner Chilcott Corp.# | | (BBB-, Ba3) | | 03/15/18 | | | 4.250 | | | | 453,396 | | |
| | | | 6,103,728 | | |
| Investments & Misc. Financial Services (1.2%) | | | |
| | 350 | | | BNY ConvergEX Group LLC# | | (B+, B1) | | 12/19/16 | | | 5.250 | | | | 349,277 | | |
| | 147 | | | BNY ConvergEX Group LLC# | | (NR, B1) | | 12/19/16 | | | 5.250 | | | | 146,558 | | |
| | 500 | | | BNY ConvergEX Group LLC# | | (B-, B2) | | 12/18/17 | | | 8.750 | | | | 498,332 | | |
| | 82 | | | U.S. Security Associates Holdings, Inc.# | | (B, Ba3) | | 07/28/17 | | | 1.500 | | | | 81,296 | | |
| | 419 | | | U.S. Security Associates Holdings, Inc.# | | (B, Ba3) | | 07/28/17 | | | 6.000 | | | | 417,454 | | |
| | | | 1,492,917 | | |
| Leisure (2.0%) | | | |
| | 491 | | | Cedar Fair LP# | | (BB-, Ba2) | | 12/15/17 | | | 4.000 | | | | 491,815 | | |
| | 651 | | | ClubCorp Club Operations, Inc.# | | (BB, Ba2) | | 11/30/16 | | | 6.000 | | | | 647,425 | | |
See Accompanying Notes to Financial Statements.
12
Credit Suisse Floating Rate High Income Fund
Schedule of Investments (continued)
October 31, 2011
Par
(000) | |
| | Ratings†
(S&P/Moody's) | | Maturity | | Rate% | | Value | |
| BANK LOANS | | | |
| Leisure | | | |
| $ | 499 | | | Seaworld Parks & Entertainment, Inc.# | | (BB+, Ba2) | | 08/17/17 | | | 4.000 | | | $ | 497,273 | | |
| | 500 | | | Six Flags Theme Parks, Inc.# | | (BB, NR) | | 06/30/16 | | | 5.250 | | | | 502,767 | | |
| | 150 | | | Technicolor SA# | | (B-, B3) | | 05/26/16 | | | 7.000 | | | | 123,284 | | |
| | 343 | | | Technicolor SA# | | (B-, B3) | | 05/26/17 | | | 8.000 | | | | 282,946 | | |
| | | | 2,545,510 | | |
| Machinery (0.4%) | | | |
| | 499 | | | Pro Mach, Inc.# | | (B+, B2) | | 07/06/17 | | | 6.250 | | | | 491,269 | | |
| Media - Broadcast (4.3%) | | | |
| | 600 | | | CCO Holdings LLC# | | (BB+, Ba3) | | 09/06/14 | | | 2.746 | | | | 584,127 | | |
| | 750 | | | FoxCo Acquisition Sub, LLC# | | (B+, B1) | | 07/14/15 | | | 4.750 | | | | 729,847 | | |
| | 499 | | | IMG Worldwide, Inc.# | | (B+, Ba2) | | 06/16/16 | | | 5.500 | | | | 488,775 | | |
| | 942 | | | Local TV Finance LLC# | | (B+, B2) | | 05/07/13 | | | 2.250 | | | | 895,402 | | |
| | 499 | | | Midcontinent Communications# | | (B+, B1) | | 12/31/16 | | | 4.000 | | | | 489,392 | | |
| | 750 | | | Raycom TV Broadcasting, LLC# | | (CCC-, NR) | | 05/31/17 | | | 4.500 | | | | 713,749 | | |
| | 1,000 | | | Rovi Solutions Corporation/ Rovi Guides, Inc.# | | (BB+, Ba1) | | 02/07/18 | | | 4.000 | | | | 1,004,375 | | |
| | 473 | | | TWCC Holding Corp.# | | (BB-, Ba3) | | 02/11/17 | | | 4.250 | | | | 475,172 | | |
| | | | 5,380,839 | | |
| Media - Cable (1.8%) | | | |
| | 499 | | | Bresnan Broadband Holdings LLC# | | (BB+, Ba3) | | 12/14/17 | | | 4.500 | | | | 495,213 | | |
| | 1,298 | | | Cequel Communications LLC# | | (BB-, Ba2) | | 11/05/13 | | | 2.241 | | | | 1,277,788 | | |
| | 499 | | | CSC Holdings LLC# | | (BBB-, Baa3) | | 03/29/16 | | | 1.250 | | | | 494,744 | | |
| | | | 2,267,745 | | |
| Media - Diversified (0.3%) | | | |
| | 272 | | | Flint Group Holdings Sarl# | | (B-, B2) | | 12/31/14 | | | 6.926 | | | | 213,564 | | |
| | 215 | | | Flint Group Holdings Sarl# | | (B-, B2) | | 06/30/16 | | | 6.926 | | | | 175,769 | | |
| | | | 389,333 | | |
| Medical Products (0.9%) | | | |
| | 1,100 | | | Grifols, Inc.# | | (BB, Ba3) | | 06/01/16 | | | 5.500 | | | | 1,100,000 | | |
| Metals & Mining - Excluding Steel (2.1%) | | | |
| | 398 | | | American Rock Salt Co. LLC# | | (B+, B3) | | 04/25/17 | | | 5.500 | | | | 391,035 | | |
| | 494 | | | Bourland & Leverich Supply Co. LLC# | | (B+, Caa1) | | 08/19/15 | | | 11.000 | | | | 493,507 | | |
| | 500 | | | Novelis, Inc.# | | (BB-, Ba2) | | 03/10/17 | | | 3.750 | | | | 497,500 | | |
| | 748 | | | SunCoke Energy, Inc.# | | (BB+, Ba1) | | 07/26/18 | | | 4.000 | | | | 749,060 | | |
| | 487 | | | Walter Energy, Inc.# | | (BB-, B1) | | 04/02/18 | | | 4.000 | | | | 486,739 | | |
| | | | 2,617,841 | | |
| Packaging (2.0%) | | | |
| | 597 | | | Berry Plastics Holding Corp.# | | (B, B1) | | 04/03/15 | | | 2.243 | | | | 570,866 | | |
| | 132 | | | BWAY Holding Co.# | | (B, Ba3) | | 02/23/18 | | | 4.500 | | | | 131,437 | | |
| | 998 | | | Exopack Holding Corp.# | | (B, B1) | | 05/31/17 | | | 6.500 | | | | 987,525 | | |
| | 748 | | | Sealed Air Corp.# | | (BB+, Ba1) | | 10/03/18 | | | 4.750 | | | | 755,531 | | |
| | | | 2,445,359 | | |
See Accompanying Notes to Financial Statements.
13
Credit Suisse Floating Rate High Income Fund
Schedule of Investments (continued)
October 31, 2011
Par
(000) | |
| | Ratings†
(S&P/Moody's) | | Maturity | | Rate% | | Value | |
| BANK LOANS | | | |
| Printing & Publishing (1.2%) | | | |
| $ | 335 | | | F & W Media, Inc.# | | (NR, NR) | | 06/09/14 | | | 12.750 | | | $ | 271,350 | | |
| | 165 | | | F & W Media, Inc.# | | (NR, NR) | | 12/09/14 | | | 15.000 | | | | 74,250 | | |
| | 997 | | | Harland Clarke Holdings Corp.# | | (B+, B1) | | 06/30/14 | | | 2.869 | | | | 846,006 | | |
| | 1,000 | | | Yell Group PLC# | | (B-, B2) | | 07/31/14 | | | 3.996 | | | | 294,690 | | |
| | | | 1,486,296 | | |
| Real Estate Investment Trusts (0.6%) | | | |
| | 750 | | | iStar Financial, Inc.# | | (BB-, B2) | | 06/30/14 | | | 7.000 | | | | 732,345 | | |
| Restaurants (2.4%) | | | |
| | 994 | | | Burger King Holdings, Inc.# | | (BB-, Ba3) | | 10/19/16 | | | 4.500 | | | | 989,148 | | |
| | 500 | | | DineEquity, Inc.# | | (BB-, Ba2) | | 10/19/17 | | | 4.250 | | | | 499,152 | | |
| | 1,000 | | | NPC International, Inc.# | | (B+, Ba3) | | 05/03/13 | | | 2.050 | | | | 980,000 | | |
| | 20 | | | OSI Restaurant Partners, Inc.# | | (B+, B3) | | 06/14/13 | | | 2.750 | | | | 19,427 | | |
| | 576 | | | OSI Restaurant Partners, Inc.# | | (B+, B3) | | 06/14/14 | | | 2.563 | | | | 552,044 | | |
| | | | 3,039,771 | | |
| Software/Services (4.5%) | | | |
| | 500 | | | AVG Technologies N.V.# | | (B+, B1) | | 03/15/16 | | | 7.500 | | | | 470,000 | | |
| | 496 | | | Bentley Systems, Inc.# | | (BB+, Ba3) | | 02/10/17 | | | 5.750 | | | | 486,325 | | |
| | 500 | | | Blackboard, Inc.# | | (B+, B1) | | 10/04/18 | | | 7.500 | | | | 484,532 | | |
| | 499 | | | Eagle Parent, Inc.# | | (NR, Ba3) | | 05/16/18 | | | 5.000 | | | | 486,127 | | |
| | 600 | | | First Data Corp.# | | (B+, B1) | | 09/24/14 | | | 2.995 | | | | 557,169 | | |
| | 500 | | | Flexera Software, Inc.# | | (B, B2) | | 09/30/17 | | | 7.500 | | | | 484,690 | | |
| | 500 | | | Go Daddy Operating Co. LLC# | | (B, Ba3) | | 09/17/18 | | | 7.000 | | | | 501,095 | | |
| | 500 | | | Open Link Financial, Inc.# | | (NR, NR) | | 04/27/18 | | | 4.000 | | | | 500,000 | | |
| | 500 | | | SSI Investments II Ltd.# | | (BB-, Ba3) | | 05/26/17 | | | 6.500 | | | | 495,315 | | |
| | 500 | | | SunGard Data Systems, Inc.# | | (BB, Ba3) | | 02/28/14 | | | 3.742 | | | | 498,750 | | |
| | 750 | | | Web.com Group, Inc.# | | (B, Ba3) | | 10/27/17 | | | 7.000 | | | | 673,125 | | |
| | | | 5,637,128 | | |
| Specialty Retail (3.3%) | | | |
| | 500 | | | Academy, Ltd.# | | (B, B2) | | 08/03/18 | | | 6.000 | | | | 495,625 | | |
| | 600 | | | Claire's Stores, Inc.# | | (B, B3) | | 05/29/14 | | | 3.178 | | | | 531,378 | | |
| | 600 | | | General Nutrition Centers, Inc.# | | (B+, B1) | | 03/02/18 | | | 4.250 | | | | 598,500 | | |
| | 500 | | | Nebraska Book Co., Inc.# | | (D, Caa2) | | 06/29/12 | | | 7.250 | | | | 494,375 | | |
| | 1,217 | | | Pilot Travel Centers LLC# | | (BB+, Ba2) | | 03/30/18 | | | 4.250 | | | | 1,215,914 | | |
| | 748 | | | Toys 'R' Us, Inc.# | | (BB-, B1) | | 09/01/16 | | | 6.000 | | | | 739,231 | | |
| | | | 4,075,023 | | |
| Steel Producers/Products (0.5%) | | | |
| | 598 | | | JMC Steel Group, Inc.# | | (BB-, B1) | | 04/01/17 | | | 4.750 | | | | 597,996 | | |
| Support - Services (0.6%) | | | |
| | 750 | | | Avis Budget Car Rental LLC# | | (BB, Ba1) | | 09/22/18 | | | 6.250 | | | | 755,625 | | |
See Accompanying Notes to Financial Statements.
14
Credit Suisse Floating Rate High Income Fund
Schedule of Investments (continued)
October 31, 2011
Par
(000) | |
| | Ratings†
(S&P/Moody's) | | Maturity | | Rate% | | Value | |
| BANK LOANS | | | |
| Telecom - Integrated/Services (1.0%) | | | |
| $ | 499 | | | Cellular South, Inc.# | | (CCC-, Ba3) | | 07/27/17 | | | 4.500 | | | $ | 491,019 | | |
| | 746 | | | Intelsat Jackson Holdings SA# | | (BB-, B1) | | 04/02/18 | | | 5.250 | | | | 743,295 | | |
| | | | 1,234,314 | | |
| Telecom - Wireless (0.7%) | | | |
| | 385 | | | Ntelos, Inc.# | | (BB-, Ba3) | | 08/07/15 | | | 4.000 | | | | 381,546 | | |
| | 499 | | | SBA Senior Finance II LLC# | | (BB, Ba2) | | 06/30/18 | | | 3.750 | | | | 496,880 | | |
| | | | 878,426 | | |
| Telecommunications Equipment (1.6%) | | | |
| | 497 | | | Avaya, Inc.# | | (B, B1) | | 10/24/14 | | | 3.064 | | | | 475,944 | | |
| | 500 | | | Avaya, Inc.# | | (B, B1) | | 10/26/17 | | | 5.006 | | | | 458,125 | | |
| | 598 | | | Commscope, Inc.# | | (BB, Ba3) | | 01/14/18 | | | 5.000 | | | | 596,066 | | |
| | 459 | | | Telesat Canada# | | (BB-, B1) | | 10/31/14 | | | 3.250 | | | | 451,793 | | |
| | 39 | | | Telesat Canada# | | (BB-, B1) | | 10/31/14 | | | 3.250 | | | | 38,809 | | |
| | | | 2,020,737 | | |
| Theaters & Entertainment (0.4%) | | | |
| | 500 | | | Miramax Film NY, LLC# | | (BB-, Ba2) | | 06/22/16 | | | 7.750 | | | | 500,313 | | |
| TOTAL BANK LOANS (Cost $82,085,525) | | | 81,915,563 | | |
| ASSET BACKED SECURITY (0.3%) | | | |
| Collateralized Debt Obligation (0.3%) | | | |
| | 500 | | | Hewett's Island CDO, Ltd., Rule 144A#‡
(Cost $368,285) | | (BBB+, Baa1) | | 06/09/19 | | | 1.137 | | | | 322,006 | | |
| CORPORATE BONDS (13.4%) | | | |
| Auto Parts & Equipment (0.2%) | | | |
| | 275 | | | Stoneridge, Inc., Rule 144A, Senior Secured
Notes (Callable 10/15/14 @ $104.75)‡ | | (BB-, B3) | | 10/15/17 | | | 9.500 | | | | 283,938 | | |
| Automotive (0.4%) | | | |
| | 500 | | | Delphi Corp., Rule 144A, Company
Guaranteed Notes
(Callable 05/15/14 @ $104.41)ठ| | (BB, Ba3) | | 05/15/19 | | | 5.875 | | | | 510,000 | | |
| Building & Construction (0.2%) | | | |
| | 221 | | | Ashton Woods Finance Co., Rule 144A,
Company Guaranteed Notes
(Callable 02/24/14 @ $105.50)*+‡ | | (NR, NR) | | 06/30/15 | | | 0.000 | | | | 158,015 | | |
| | 75 | | | William Lyon Homes, Inc., Global
Company Guaranteed Notesø | | (C, C) | | 12/15/12 | | | 7.625 | | | | 13,875 | | |
| | 275 | | | William Lyon Homes, Inc., Global Company
Guaranteed Notes
(Callable 02/15/12 @ $100.00)ø | | (C, C) | | 02/15/14 | | | 7.500 | | | | 50,875 | | |
| | | | 222,765 | | |
See Accompanying Notes to Financial Statements.
15
Credit Suisse Floating Rate High Income Fund
Schedule of Investments (continued)
October 31, 2011
Par
(000) | |
| | Ratings†
(S&P/Moody's) | | Maturity | | Rate% | | Value | |
| CORPORATE BONDS | | | |
| Building Materials (0.3%) | | | |
| $ | 175 | | | Associated Materials LLC, Global Senior
Secured Notes
(Callable 11/01/13 @ $106.84)§ | | (B, B3) | | 11/01/17 | | | 9.125 | | | $ | 160,125 | | |
| | 300 | | | Headwaters, Inc., Global Secured Notes
(Callable 04/01/15 @ $103.81) | | (B+, B2) | | 04/01/19 | | | 7.625 | | | | 262,500 | | |
| | | | 422,625 | | |
| Chemicals (0.2%) | | | |
| | 350 | | | Omnova Solutions, Inc., Global Company
Guaranteed Notes
(Callable 11/01/14 @ $103.94)§ | | (B-, B2) | | 11/01/18 | | | 7.875 | | | | 303,625 | | |
| Computer Hardware (0.6%) | | | |
| | 700 | | | Spansion LLC, Rule 144A, Company
Guaranteed Notes
(Callable 11/15/13 @ $103.94)‡ | | (BB-, B3) | | 11/15/17 | | | 7.875 | | | | 714,000 | | |
| Diversified Capital Goods (0.6%) | | | |
| | 200 | | | Belden, Inc., Global Company Guaranteed
Notes (Callable 03/15/12 @ $103.50) | | (B+, Ba2) | | 03/15/17 | | | 7.000 | | | | 202,000 | | |
| | 225 | | | Belden, Inc., Global Company Guaranteed
Notes (Callable 06/15/14 @ $104.63)§ | | (B+, Ba2) | | 06/15/19 | | | 9.250 | | | | 241,875 | | |
| | 250 | | | Mueller Water Products, Inc., Global
Company Guaranteed Notes
(Callable 09/01/15 @ $104.38)§ | | (B+, B2) | | 09/01/20 | | | 8.750 | | | | 267,500 | | |
| | | | 711,375 | | |
| Electronics (0.2%) | | | |
| | 250 | | | MEMC Electronic Materials, Inc., Global
Company Guaranteed Notes
(Callable 04/01/14 @ 105.81) | | (BB, B1) | | 04/01/19 | | | 7.750 | | | | 215,625 | | |
| Energy - Exploration & Production (1.3%) | | | |
| | 525 | | | Energy Partners Ltd., Global Company
Guaranteed Notes
(Callable 02/15/15 @ $104.13) | | (B-, Caa1) | | 02/15/18 | | | 8.250 | | | | 496,125 | | |
| | 700 | | | McMoRan Exploration Co., Company
Guaranteed Notes
(Callable 11/15/11 @ $105.94) | | (B, Caa1) | | 11/15/14 | | | 11.875 | | | | 745,500 | | |
| | 325 | | | Oasis Petroleum, Inc., Rule 144A, Senior
Notes (Callable 02/01/15 @ $103.63)‡ | | (B-, Caa1) | | 02/01/19 | | | 7.250 | | | | 344,500 | | |
| | | | 1,586,125 | | |
| Food - Wholesale (0.4%) | | | |
| | 525 | | | Southern States Cooperative, Inc., Rule 144A,
Senior Notes (Callable 05/15/13 @ $105.63)‡ | | (B+, B3) | | 05/15/15 | | | 11.250 | | | | 551,250 | | |
| Forestry & Paper (0.0%) | | | |
| | 200 | | | Stone & Webster, Inc.* | | (NR, NR) | | 07/01/12 | | | 0.000 | | | | 5,500 | | |
See Accompanying Notes to Financial Statements.
16
Credit Suisse Floating Rate High Income Fund
Schedule of Investments (continued)
October 31, 2011
Par
(000) | |
| | Ratings†
(S&P/Moody's) | | Maturity | | Rate% | | Value | |
| CORPORATE BONDS | | | |
| Gaming (2.4%) | | | |
| $ | 325 | | | Buffalo Thunder Development Authority,
Rule 144A, Senior Secured Notes
(Callable 12/15/11 @ $102.34)ø‡ | | (NR, NR) | | 12/15/14 | | | 9.375 | | | $ | 115,375 | | |
| | 197 | | | Choctaw Resort Development Enterprise,
Rule 144A, Senior Notes
(Callable 11/15/11 @ $103.63)‡ | | (CCC+, Caa2) | | 11/15/19 | | | 7.250 | | | | 124,110 | | |
| | 210 | | | Fontainebleau Las Vegas Holdings LLC,
Rule 144A, Second Mortgage Notes
(Callable 06/15/12 @ $105.13)ø‡ | | (NR, NR) | | 06/15/15 | | | 10.250 | | | | 263 | | |
| | 475 | | | Great Canadian Gaming Corp., Rule 144A,
Company Guaranteed Notes
(Callable 02/15/12 @ $101.81)ठ| | (BB-, B2) | | 02/15/15 | | | 7.250 | | | | 477,375 | | |
| | 500 | | | Greektown Superholdings, Inc., Series B,
Global Senior Secured Notes
(Callable 01/01/13 @ $106.50) | | (NR, NR) | | 07/01/15 | | | 13.000 | | | | 516,250 | | |
| | 450 | | | Jacobs Entertainment, Inc., Global Company
Guaranteed Notes
(Callable 06/15/12 @ $100.00) | | (B-, Caa1) | | 06/15/14 | | | 9.750 | | | | 438,750 | | |
| | 175 | | | Majestic Star Casino Capital Corp., Senior
Secured Notesø | | (NR, NR) | | 10/15/10 | | | 9.500 | | | | 69,125 | | |
| | 200 | | | Peninsula Gaming LLC, Global Company
Guaranteed Notes
(Callable 08/15/13 @ $105.38) | | (B, Caa1) | | 08/15/17 | | | 10.750 | | | | 207,000 | | |
| | 275 | | | Peninsula Gaming LLC, Global Senior Secured
Notes (Callable 08/15/12 @ $104.19)§ | | (BB, Ba3) | | 08/15/15 | | | 8.375 | | | | 283,937 | | |
| | 475 | | | Seminole Hard Rock Entertainment, Inc.,
Rule 144A, Senior Secured Notes#‡ | | (BB, B2) | | 03/15/14 | | | 2.847 | | | | 445,312 | | |
| | 175 | | | Tropicana Finance Corp., Global Senior
Subordinated Notes
(Callable 12/15/11 @ $102.41)ø^ | | (NR, NR) | | 12/15/14 | | | 9.625 | | | | 18 | | |
| | 300 | | | Tunica-Biloxi Gaming Authority, Rule 144A,
Senior Unsecured Notes
(Callable 11/15/11 @ $103.00)‡ | | (B+, B2) | | 11/15/15 | | | 9.000 | | | | 300,000 | | |
| | | | 2,977,515 | | |
| Health Services (0.1%) | | | |
| | 150 | | | inVentiv Health, Inc., Rule 144A, Company
Guaranteed Notes
(Callable 08/15/14 @ $105.00)‡ | | (CCC+, Caa2) | | 08/15/18 | | | 10.000 | | | | 144,750 | | |
| Machinery (0.2%) | | | |
| | 175 | | | CPM Holdings, Inc., Global Senior Secured
Notes (Callable 09/01/12 @ 105.31)§ | | (B+, B2) | | 09/01/14 | | | 10.625 | | | | 187,250 | | |
See Accompanying Notes to Financial Statements.
17
Credit Suisse Floating Rate High Income Fund
Schedule of Investments (continued)
October 31, 2011
Par
(000) | |
| | Ratings†
(S&P/Moody's) | | Maturity | | Rate% | | Value | |
| CORPORATE BONDS | | | |
| Media - Broadcast (0.6%) | | | |
| $ | 210 | | | Barrington Broadcasting Capital Corp., Global
Company Guaranteed Notes
(Callable 08/15/12 @ $100.00) | | (CCC+, Caa1) | | 08/15/14 | | | 10.500 | | | $ | 194,250 | | |
| | 500 | | | Mission Broadcasting, Inc., Global Senior
Secured Notes
(Callable 04/15/14 @ $104.44)§ | | (B, B3) | | 04/15/17 | | | 8.875 | | | | 510,000 | | |
| | | | 704,250 | | |
| Media - Cable (0.6%) | | | |
| | 475 | | | Insight Communications Co., Inc., Rule 144A,
Senior Notes (Callable 07/15/13 @ $107.03)‡ | | (B-, B3) | | 07/15/18 | | | 9.375 | | | | 541,500 | | |
| | 150 | | | Kabel Baden-Wurttemberg GmbH & Co. KG,
Rule 144A, Senior Secured Notes
(Callable 03/15/15 @ $103.75)ठ| | (B+, B1) | | 03/15/19 | | | 7.500 | | | | 156,750 | | |
| | | | 698,250 | | |
| Media - Diversified (0.6%) | | | |
| | 750 | | | Block Communications, Inc., Rule 144A,
Senior Notes (Callable 12/15/11 @ $102.75)‡ | | (B, B1) | | 12/15/15 | | | 8.250 | | | | 761,250 | | |
| Metals & Mining - Excluding Steel (0.3%) | | | |
| | 381 | | | Noranda Aluminium Acquisition Corp., Global
Company Guaranteed Notes# | | (B, B2) | | 05/15/15 | | | 4.417 | | | | 354,022 | | |
| | 150 | | | Old AII, Inc., Global Company Guaranteed
Notes (Callable 12/15/11 @ $102.25)ø | | (NR, NR) | | 12/15/14 | | | 9.000 | | | | 15 | | |
| | 250 | | | Old AII, Inc., Global Company Guaranteed
Notes (Callable 12/15/11 @ $105.00)ø | | (NR, NR) | | 12/15/16 | | | 10.000 | | | | 25 | | |
| | | | 354,062 | | |
| Oil Field Equipment & Services (1.0%) | | | |
| | 575 | | | Frac Tech Finance, Inc., Rule 144A, Company
Guaranteed Notes
(Callable 11/15/14 @ $103.56)‡ | | (BB, Ba3) | | 11/15/18 | | | 7.625 | | | | 603,750 | | |
| | 275 | | | Parker Drilling Co., Global Company
Guaranteed Notes
(Callable 04/01/14 @ $104.56) | | (B+, B1) | | 04/01/18 | | | 9.125 | | | | 289,437 | | |
| | 340 | | | Pioneer Drilling Co., Global Company
Guaranteed Notes
(Callable 03/15/14 @ $104.94) | | (B, NR) | | 03/15/18 | | | 9.875 | | | | 355,300 | | |
| | | | 1,248,487 | | |
| Oil Refining & Marketing (0.5%) | | | |
| | 175 | | | Coffeyville Finance, Inc., Rule 144A, Senior
Secured Notes
(Callable 04/01/13 @ $108.16)ठ| | (BB-, B3) | | 04/01/17 | | | 10.875 | | | | 199,063 | | |
See Accompanying Notes to Financial Statements.
18
Credit Suisse Floating Rate High Income Fund
Schedule of Investments (continued)
October 31, 2011
Par
(000) | |
| | Ratings†
(S&P/Moody's) | | Maturity | | Rate% | | Value | |
| CORPORATE BONDS | | | |
| Oil Refining & Marketing | | | |
| $ | 350 | | | Northern Tier Finance Corp., Rule 144A,
Senior Secured Notes
(Callable 12/01/13 @ $107.88)‡ | | (BB-, B1) | | 12/01/17 | | | 10.500 | | | $ | 385,875 | | |
| | | | 584,938 | | |
| Packaging (0.2%) | | | |
| | 0 | | | BWAY Parent Co., Inc., Global Senior
Unsecured Notes
(Callable 11/01/12 @ $105.00)1 | | (CCC+, Caa1) | | 11/01/15 | | | 10.875 | | | | 57 | | |
| | 300 | | | Clondalkin Acquisition BV, Rule 144A,
Senior Secured Notes#‡ | | (B, B1) | | 12/15/13 | | | 2.347 | | | | 282,000 | | |
| | | | 282,057 | | |
| Printing & Publishing (0.2%) | | | |
| | 275 | | | The Reader's Digest Association, Inc., Global
Senior Secured Notes
(Callable 02/15/13 @ $104.00)# | | (CCC, B3) | | 02/15/17 | | | 9.500 | | | | 221,375 | | |
| Real Estate Development & Management (0.3%) | | | |
| | 425 | | | Icahn Enterprises LP, Rule 144A, Senior
Unsecured Notes#‡ | | (NR, NR) | | 08/15/13 | | | 4.000 | | | | 399,500 | | |
| Real Estate Investment Trusts (0.6%) | | | |
| | 500 | | | CNL Lifestyle Properties, Inc., Global
Company Guaranteed Notes
(Callable 04/15/15 @ $103.63) | | (BB-, Ba3) | | 04/15/19 | | | 7.250 | | | | 452,500 | | |
| | 325 | | | Sabra Capital Corp., Global Company
Guaranteed Notes
(Callable 11/01/14 @ $104.06)§ | | (BB-, B2) | | 11/01/18 | | | 8.125 | | | | 321,750 | | |
| | | | 774,250 | | |
| Restaurants (0.1%) | | | |
| | 350 | | | Real Mex Restaurants, Inc., Global Senior
Secured Notes
(Callable 07/01/12 @ $100.00)ø | | (D, NR) | | 01/01/13 | | | 14.000 | | | | 168,000 | | |
| Support - Services (0.6%) | | | |
| | 500 | | | CoreLogic, Inc., Rule 144A, Company
Guaranteed Notes
(Callable 06/01/16 @ $103.63)‡ | | (B+, Ba3) | | 06/01/21 | | | 7.250 | | | | 477,500 | | |
| | 325 | | | Maxim Crane Works LP, Rule 144A, Senior
Secured Notes
(Callable 04/15/12 @ $109.19)‡ | | (B, Caa1) | | 04/15/15 | | | 12.250 | | | | 297,375 | | |
| | | | 774,875 | | |
| Telecom - Integrated/Services (0.0%) | | | |
| | 100 | | | Hellas Telecommunications II SCA,
Rule 144A, Subordinated Notesø^#‡ | | (NR, NR) | | 01/15/15 | | | 6.034 | | | | 0 | | |
See Accompanying Notes to Financial Statements.
19
Credit Suisse Floating Rate High Income Fund
Schedule of Investments (continued)
October 31, 2011
Par
(000) | |
| | Ratings†
(S&P/Moody's) | | Maturity | | Rate% | | Value | |
| CORPORATE BONDS | | | |
| Textiles & Apparel (0.0%) | | | |
| $ | 275 | | | IT Holding Finance SA, Rule 144A, Company
Guaranteed Notesø‡ | | (NR, NR) | | 11/15/12 | | | 9.875 | | | $ | 19,178 | | |
| Theaters & Entertainment (0.6%) | | | |
| | 200 | | | AMC Entertainment Holdings, Inc., Global
Company Guaranteed Notes
(Callable 12/01/15 @ $104.88)§ | | (CCC+, Caa1) | | 12/01/20 | | | 9.750 | | | | 195,000 | | |
| | 500 | | | National CineMedia LLC, Senior Unsecured
Notes (Callable 07/15/16 @ $103.94) | | (B, B2) | | 07/15/21 | | | 7.875 | | | | 507,500 | | |
| | | | 702,500 | | |
| Transportation - Excluding Air/Rail (0.1%) | | | |
| | 150 | | | Navios Maritime Holdings Finance II US, Inc.,
Global Company Guaranteed Notes
(Callable 02/15/15 @ $104.06) | | (B+, B3) | | 02/15/19 | | | 8.125 | | | | 118,875 | | |
| TOTAL CORPORATE BONDS (Cost $18,586,690) | | | 16,648,190 | | |
Number of
Shares | |
| |
| |
| |
| |
| |
| COMMON STOCKS (0.1%) | | | |
| Automotive (0.0%) | | | |
| | 588 | | | Safelite Realty Corp.*^ | | | | | | | | | | | | | | | 0 | | |
| Chemicals (0.1%) | | | |
| | 9,785 | | | Huntsman Corp. | | | | | | | | | | | | | | | 114,876 | | |
| Forestry & Paper (0.0%) | | | |
| | 3,000 | | | AbitibiBowater, Inc.*§ | | | | | | | | | | | | | | | 51,000 | | |
| Printing & Publishing (0.0%) | | | |
| | 554 | | | Dex One Corp.*§ | | | | | | | | | | | | | | | 345 | | |
| | 1,131 | | | F & W Media, Inc.*^ | | | | | | | | | | | | | | | 0 | | |
| | 355 | | | SuperMedia, Inc.*§ | | | | | | | | | | | | | | | 614 | | |
| | | | 959 | | |
| TOTAL COMMON STOCKS (Cost $543,273) | | | 166,835 | | |
| PREFERRED STOCK (0.1%) | | | |
| Banks (0.1%) | | | |
| | 151 | | | Ally Financial, Inc., Rule 144A (Callable 12/31/11 @ $1,000) (Cost $27,633)ठ| | | | | | | | | | | | | | | 112,622 | | |
| WARRANT (0.0%) | | | |
| Printing & Publishing (0.0%) | | | |
| | 1,673 | | | The Readers Digest Association, Inc., strike price $0.00, expires 02/19/14 (Cost $0)* | | | | | | | | | | | | | | | 0 | | |
See Accompanying Notes to Financial Statements.
20
Credit Suisse Floating Rate High Income Fund
Schedule of Investments (continued)
October 31, 2011
Number of
Shares | |
| |
| | Maturity | | Rate% | | Value | |
| SHORT-TERM INVESTMENTS (32.8%) | |
| | 3,820,266 | | | State Street Navigator Prime Portfolio, 0.23%§§ | | | | | | | | | | | | | | $ | 3,820,266 | | |
Par
(000) | |
| |
| |
| |
| |
| |
| $ | 36,986 | | | State Street Bank and Trust Co. Euro Time Deposit | | | | | | 11/01/11 | | | 0.010 | | | | 36,986,000 | | |
| TOTAL SHORT-TERM INVESTMENTS (Cost $40,806,266) | | | 40,806,266 | | |
| TOTAL INVESTMENTS AT VALUE (112.5%) (Cost $142,417,672) | | | 139,971,482 | | |
| LIABILITIES IN EXCESS OF OTHER ASSETS (-12.5%) | | | (15,498,474 | ) | |
| NET ASSETS (100.0%) | | $ | 124,473,008 | | |
INVESTMENT ABBREVIATION
NR = NOT RATED
† Credit ratings given by the Standard & Poor's Division of The McGraw-Hill Companies, Inc. ("S&P") and Moody's Investors Service, Inc. ("Moody's") are unaudited.
‡ Security exempt from registration under Rule 144A of the Securities Act of 1933. These securities may be resold in transactions exempt from registration, normally to qualified institutional buyers. At October 31, 2011, these securities amounted to a value of $8,727,257 or 7.0% of net assets.
^ Not readily marketable security; security is valued at fair value as determined in good faith by, or under the direction of, the Board of Trustees.
1 Par value of security held is less than 1,000.
# Variable rate obligations — The interest rate is the rate as of October 31, 2011.
+ Step Bond — The interest rate is as of October 31, 2011 and will reset at a future date.
ø Bond is currently in default.
* Non-income producing security.
§ Security or portion thereof is out on loan.
§§ Represents security purchased with cash collateral received for securities on loan. The rate shown is the annualized one-day yield at October 31, 2011.
See Accompanying Notes to Financial Statements.
21
Credit Suisse Floating Rate High Income Fund
Statement of Assets and Liabilities
October 31, 2011
| Assets | |
Investments at value, including collateral for securities on loan of $3,820,266
(Cost $142,417,672) (Note 2) | | $ | 139,971,4821 | | |
| Cash | | | 836,719 | | |
| Foreign currency at value (cost $1,104,322) | | | 1,093,149 | | |
| Receivable for fund shares sold | | | 3,219,894 | | |
| Receivable for investments sold | | | 946,912 | | |
| Interest receivable | | | 614,731 | | |
| Receivable from investment adviser (Note 3) | | | 22,607 | | |
| Prepaid expenses and other assets | | | 45,567 | | |
| Total Assets | | | 146,751,061 | | |
| Liabilities | |
| Administrative services fee payable (Note 3) | | | 20,956 | | |
| Shareholder servicing/Distribution fee payable (Note 3) | | | 29,506 | | |
| Payable for investments purchased | | | 18,093,931 | | |
| Payable upon return of securities loaned (Note 2) | | | 3,820,266 | | |
| Payable for fund shares redeemed | | | 136,872 | | |
| Dividend payable | | | 89,689 | | |
| Trustees' fee payable | | | 18,287 | | |
| Other accrued expenses payable | | | 68,546 | | |
| Total Liabilities | | | 22,278,053 | | |
| Net Assets | |
| Capital stock, $.001 par value (Note 6) | | | 18,619 | | |
| Paid-in capital (Note 6) | | | 140,968,011 | | |
| Accumulated net investment loss | | | (130,428 | ) | |
| Accumulated net realized loss on investments and foreign currency transactions | | | (13,925,831 | ) | |
| Net unrealized depreciation from investments and foreign currency translations | | | (2,457,363 | ) | |
| Net Assets | | $ | 124,473,008 | | |
| I Shares | |
| Net assets | | $ | 46,481,465 | | |
| Shares outstanding | | | 6,974,265 | | |
| Net asset value, offering price and redemption price per share | | $ | 6.66 | | |
| A Shares | |
| Net assets | | $ | 49,438,878 | | |
| Shares outstanding | | | 7,386,057 | | |
| Net asset value and redemption price per share | | $ | 6.69 | | |
| Maximum offering price per share (net asset value/(1-4.75%)) | | $ | 7.02 | | |
| B Shares | |
| Net assets | | $ | 4,647,282 | | |
| Shares outstanding | | | 693,573 | | |
| Net asset value and offering price per share | | $ | 6.70 | | |
| C Shares | |
| Net assets | | $ | 23,905,383 | | |
| Shares outstanding | | | 3,565,049 | | |
| Net asset value and offering price per share | | $ | 6.71 | | |
1 Including $3,743,466 of securities on loan.
See Accompanying Notes to Financial Statements.
22
Credit Suisse Floating Rate High Income Fund
Statement of Operations
For the Year Ended October 31, 2011
| Investment Income (Note 2) | |
| Interest | | $ | 5,678,738 | | |
| Dividends | | | 15,808 | | |
| Securities lending | | | 36,700 | | |
| Total investment income | | | 5,731,246 | | |
| Expenses | |
| Investment advisory fees (Note 3) | | | 570,052 | | |
| Administrative services fees (Note 3) | | | 143,940 | | |
| Shareholder servicing/Distribution fees (Note 3) | |
| Class A | | | 58,685 | | |
| Class B | | | 54,395 | | |
| Class C | | | 171,656 | | |
| Legal fees | | | 98,639 | | |
| Registration fees | | | 85,281 | | |
| Transfer agent fees | | | 70,086 | | |
| Printing fees (Note 3) | | | 49,493 | | |
| Trustees' fees | | | 47,075 | | |
| Audit and tax fees | | | 44,550 | | |
| Custodian fees | | | 5,767 | | |
| Insurance expense | | | 2,638 | | |
| Commitment fees (Note 4) | | | 395 | | |
| Interest expense (Note 4) | | | 15 | | |
| Miscellaneous expense | | | 6,458 | | |
| Total expenses | | | 1,409,125 | | |
| Less: fees waived (Note 3) | | | (554,323 | ) | |
| Net expenses | | | 854,802 | | |
| Net investment income | | | 4,876,444 | | |
| Net Realized and Unrealized Gain (Loss) from Investments and Foreign Currency Related Items | |
| Net realized gain from investments | | | 4,327,145 | | |
| Net realized loss from foreign currency transactions | | | (31,272 | ) | |
| Net change in unrealized appreciation (depreciation) from investments | | | (4,391,078 | ) | |
| Net change in unrealized appreciation (depreciation) from foreign currency translations | | | (24,163 | ) | |
| Net realized and unrealized loss from investments and foreign currency related items | | | (119,368 | ) | |
| Net increase in net assets resulting from operations | | $ | 4,757,076 | | |
See Accompanying Notes to Financial Statements.
23
Credit Suisse Floating Rate High Income Fund
Statements of Changes in Net Assets
| | | For the Year
Ended
October 31, 2011 | | For the Year
Ended
October 31, 2010 | |
| From Operations | |
| Net investment income | | $ | 4,876,444 | | | $ | 4,086,587 | | |
| Net realized gain from investments and foreign currency transactions | | | 4,295,873 | | | | 8,950 | | |
Net change in unrealized appreciation (depreciation)
from investments and foreign currency translations | | | (4,415,241 | ) | | | 5,098,721 | | |
| Net increase in net assets resulting from operations | | | 4,757,076 | | | | 9,194,258 | | |
| From Dividends | |
| Dividends from net investment income | |
| Class I shares | | | (2,272,141 | ) | | | (464,552 | ) | |
| Class A shares | | | (1,419,797 | ) | | | (2,048,684 | ) | |
| Class B shares | | | (319,632 | ) | | | (555,873 | ) | |
| Class C shares | | | (931,208 | ) | | | (1,393,826 | ) | |
| Net decrease in net assets resulting from dividends | | | (4,942,778 | ) | | | (4,462,935 | ) | |
| From Capital Share Transactions (Note 6) | |
| Proceeds from sale of shares | | | 73,834,993 | | | | 6,764,782 | | |
| Exchange value of shares due to merger (Note 8) | | | — | | | | 28,998,037 | | |
| Reinvestment of dividends | | | 3,634,099 | | | | 2,060,829 | | |
| Net asset value of shares redeemed | | | (29,654,156 | )1 | | | (13,045,834 | )2 | |
| Net increase in net assets from capital share transactions | | | 47,814,936 | | | | 24,777,814 | | |
| Net increase in net assets | | | 47,629,234 | | | | 29,509,137 | | |
| Net Assets | |
| Beginning of year | | | 76,843,774 | | | | 47,334,637 | | |
| End of year | | $ | 124,473,008 | | | $ | 76,843,774 | | |
| Accumulated net investment loss | | $ | (130,428 | ) | | $ | (227,489 | ) | |
1 Net of $24,879 of redemption fees retained by the Fund.
2 Net of $3,586 of redemption fees retained by the Fund.
See Accompanying Notes to Financial Statements.
24
Credit Suisse Floating Rate High Income Fund
Financial Highlights
(For a Class I Share of the Fund Outstanding Throughout Each Year)
| | | For the Year Ended October 31, | |
| | | 2011 | | 2010 | | 2009 | | 2008 | | 2007 | |
| Per share data | |
| Net asset value, beginning of year | | $ | 6.72 | | | $ | 6.24 | | | $ | 4.94 | | | $ | 7.66 | | | $ | 7.82 | | |
| INVESTMENT OPERATIONS | |
| Net investment income1 | | | 0.43 | | | | 0.56 | | | | 0.54 | | | | 0.60 | | | | 0.63 | | |
Net gain (loss) on investments, swap contracts and foreign
currency related items (both realized and unrealized) | | | (0.04 | ) | | | 0.50 | | | | 1.36 | | | | (2.48 | ) | | | (0.09 | ) | |
| Total from investment operations | | | 0.39 | | | | 1.06 | | | | 1.90 | | | | (1.88 | ) | | | 0.54 | | |
| REDEMPTION FEES | | | 0.002 | | | | 0.002 | | | | — | | | | — | | | | — | | |
| LESS DIVIDENDS AND DISTRIBUTIONS | |
| Dividends from net investment income | | | (0.45 | ) | | | (0.58 | ) | | | (0.60 | ) | | | (0.60 | ) | | | (0.66 | ) | |
| Distributions from net realized gains | | | — | | | | — | | | | — | | | | (0.24 | ) | | | (0.04 | ) | |
| Total dividends and distributions | | | (0.45 | ) | | | (0.58 | ) | | | (0.60 | ) | | | (0.84 | ) | | | (0.70 | ) | |
| Net asset value, end of year | | $ | 6.66 | | | $ | 6.72 | | | $ | 6.24 | | | $ | 4.94 | | | $ | 7.66 | | |
| Total return3 | | | 5.85 | % | | | 17.87 | % | | | 41.87 | % | | | (26.98 | )% | | | 7.02 | % | |
| RATIOS AND SUPPLEMENTAL DATA | |
| Net assets, end of year (000s omitted) | | $ | 46,482 | | | $ | 31,374 | | | $ | 383 | | | $ | 310 | | | $ | 484 | | |
| Ratio of expenses to average net assets | | | 0.70 | % | | | 0.72 | % | | | 0.85 | % | | | 0.85 | % | | | 0.85 | % | |
| Ratio of net investment income to average net assets | | | 6.32 | % | | | 8.48 | % | | | 10.32 | % | | | 8.98 | % | | | 8.02 | % | |
Decrease reflected in above operating expense ratios
due to waivers/reimbursements | | | 0.68 | % | | | 0.65 | % | | | 0.58 | % | | | 0.46 | % | | | 0.32 | % | |
| Portfolio turnover rate | | | 144 | % | | | 88 | % | | | 63 | % | | | 28 | % | | | 49 | % | |
1 Per share information is calculated using the average shares outstanding method.
2 This amount represents less than $0.01 per share.
3 Total returns are historical and assume changes in share price and reinvestment of all dividends and distributions. Had certain expenses not been reduced during the years shown, total returns would have been lower.
See Accompanying Notes to Financial Statements.
25
Credit Suisse Floating Rate High Income Fund
Financial Highlights
(For a Class A Share of the Fund Outstanding Throughout Each Year)
| | | For the Year Ended October 31, | |
| | | 2011 | | 2010 | | 2009 | | 2008 | | 2007 | |
| Per share data | |
| Net asset value, beginning of year | | $ | 6.74 | | | $ | 6.26 | | | $ | 4.96 | | | $ | 7.68 | | | $ | 7.84 | | |
| INVESTMENT OPERATIONS | |
| Net investment income1 | | | 0.40 | | | | 0.52 | | | | 0.53 | | | | 0.58 | | | | 0.61 | | |
Net gain (loss) on investments, swap contracts and foreign
currency related items (both realized and unrealized) | | | (0.02 | ) | | | 0.53 | | | | 1.36 | | | | (2.47 | ) | | | (0.09 | ) | |
| Total from investment operations | | | 0.38 | | | | 1.05 | | | | 1.89 | | | | (1.89 | ) | | | 0.52 | | |
| REDEMPTION FEES | | | 0.002 | | | | 0.002 | | | | 0.002 | | | | 0.002 | | | | — | | |
| LESS DIVIDENDS AND DISTRIBUTIONS | |
| Dividends from net investment income | | | (0.43 | ) | | | (0.57 | ) | | | (0.59 | ) | | | (0.59 | ) | | | (0.64 | ) | |
| Distributions from net realized gains | | | — | | | | — | | | | — | | | | (0.24 | ) | | | (0.04 | ) | |
| Total dividends and distributions | | | (0.43 | ) | | | (0.57 | ) | | | (0.59 | ) | | | (0.83 | ) | | | (0.68 | ) | |
| Net asset value, end of year | | $ | 6.69 | | | $ | 6.74 | | | $ | 6.26 | | | $ | 4.96 | | | $ | 7.68 | | |
| Total return3 | | | 5.74 | % | | | 17.54 | % | | | 41.36 | % | | | (27.08 | )% | | | 6.74 | % | |
| RATIOS AND SUPPLEMENTAL DATA | |
| Net assets, end of year (000s omitted) | | $ | 49,439 | | | $ | 20,492 | | | $ | 22,237 | | | $ | 21,004 | | | $ | 40,822 | | |
| Ratio of expenses to average net assets | | | 0.95 | % | | | 1.11 | % | | | 1.10 | % | | | 1.10 | % | | | 1.10 | % | |
| Ratio of net investment income to average net assets | | | 5.97 | % | | | 8.00 | % | | | 10.07 | % | | | 8.72 | % | | | 7.75 | % | |
Decrease reflected in above operating expense ratios
due to waivers/reimbursements | | | 0.69 | % | | | 0.61 | % | | | 0.59 | % | | | 0.47 | % | | | 0.31 | % | |
| Portfolio turnover rate | | | 144 | % | | | 88 | % | | | 63 | % | | | 28 | % | | | 49 | % | |
1 Per share information is calculated using the average shares outstanding method.
2 This amount represents less than $0.01 per share.
3 Total returns are historical and assume changes in share price, reinvestment of all dividends and distributions and no sales charge. Had certain expenses not been reduced during the years shown, total returns would have been lower.
See Accompanying Notes to Financial Statements.
26
Credit Suisse Floating Rate High Income Fund
Financial Highlights
(For a Class B Share of the Fund Outstanding Throughout Each Year)
| | | For the Year Ended October 31, | |
| | | 2011 | | 2010 | | 2009 | | 2008 | | 2007 | |
| Per share data | |
| Net asset value, beginning of year | | $ | 6.74 | | | $ | 6.26 | | | $ | 4.95 | | | $ | 7.68 | | | $ | 7.83 | | |
| INVESTMENT OPERATIONS | |
| Net investment income1 | | | 0.39 | | | | 0.47 | | | | 0.49 | | | | 0.54 | | | | 0.55 | | |
Net gain (loss) on investments, swap contracts and foreign
currency related items (both realized and unrealized) | | | (0.06 | ) | | | 0.53 | | | | 1.36 | | | | (2.49 | ) | | | (0.09 | ) | |
| Total from investment operations | | | 0.33 | | | | 1.00 | | | | 1.85 | | | | (1.95 | ) | | | 0.46 | | |
| REDEMPTION FEES | | | 0.002 | | | | 0.002 | | | | 0.002 | | | | 0.002 | | | | — | | |
| LESS DIVIDENDS AND DISTRIBUTIONS | |
| Dividends from net investment income | | | (0.37 | ) | | | (0.52 | ) | | | (0.54 | ) | | | (0.54 | ) | | | (0.57 | ) | |
| Distributions from net realized gains | | | — | | | | — | | | | — | | | | (0.24 | ) | | | (0.04 | ) | |
| Total dividends and distributions | | | (0.37 | ) | | | (0.52 | ) | | | (0.54 | ) | | | (0.78 | ) | | | (0.61 | ) | |
| Net asset value, end of year | | $ | 6.70 | | | $ | 6.74 | | | $ | 6.26 | | | $ | 4.95 | | | $ | 7.68 | | |
| Total return3 | | | 5.03 | % | | | 16.58 | % | | | 40.55 | % | | | (27.77 | )% | | | 6.01 | % | |
| RATIOS AND SUPPLEMENTAL DATA | |
| Net assets, end of year (000s omitted) | | $ | 4,647 | | | $ | 7,283 | | | $ | 7,280 | | | $ | 6,901 | | | $ | 15,019 | | |
| Ratio of expenses to average net assets | | | 1.70 | % | | | 1.86 | % | | | 1.85 | % | | | 1.85 | % | | | 1.85 | % | |
| Ratio of net investment income to average net assets | | | 5.80 | % | | | 7.25 | % | | | 9.40 | % | | | 7.96 | % | | | 7.01 | % | |
Decrease reflected in above operating expense ratios
due to waivers/reimbursements | | | 0.68 | % | | | 0.61 | % | | | 0.59 | % | | | 0.47 | % | | | 0.30 | % | |
| Portfolio turnover rate | | | 144 | % | | | 88 | % | | | 63 | % | | | 28 | % | | | 49 | % | |
1 Per share information is calculated using the average shares outstanding method.
2 This amount represents less than $0.01 per share.
3 Total returns are historical and assume changes in share price, reinvestment of all dividends and distributions and no sales charge. Had certain expenses not been reduced during the years shown, total returns would have been lower.
See Accompanying Notes to Financial Statements.
27
Credit Suisse Floating Rate High Income Fund
Financial Highlights
(For a Class C Share of the Fund Outstanding Throughout Each Year)
| | | For the Year Ended October 31, | |
| | | 2011 | | 2010 | | 2009 | | 2008 | | 2007 | |
| Per share data | |
| Net asset value, beginning of year | | $ | 6.75 | | | $ | 6.27 | | | $ | 4.96 | | | $ | 7.69 | | | $ | 7.84 | | |
| INVESTMENT OPERATIONS | |
| Net investment income1 | | | 0.37 | | | | 0.47 | | | | 0.49 | | | | 0.54 | | | | 0.55 | | |
Net gain (loss) on investments, swap contracts and foreign
currency related items (both realized and unrealized) | | | (0.03 | ) | | | 0.53 | | | | 1.36 | | | | (2.49 | ) | | | (0.09 | ) | |
| Total from investment operations | | | 0.34 | | | | 1.00 | | | | 1.85 | | | | (1.95 | ) | | | 0.46 | | |
| REDEMPTION FEES | | | 0.002 | | | | 0.002 | | | | 0.002 | | | | 0.002 | | | | — | | |
| LESS DIVIDENDS AND DISTRIBUTIONS | |
| Dividends from net investment income | | | (0.38 | ) | | | (0.52 | ) | | | (0.54 | ) | | | (0.54 | ) | | | (0.57 | ) | |
| Distributions from net realized gains | | | — | | | | — | | | | — | | | | (0.24 | ) | | | (0.04 | ) | |
| Total dividends and distributions | | | (0.38 | ) | | | (0.52 | ) | | | (0.54 | ) | | | (0.78 | ) | | | (0.61 | ) | |
| Net asset value, end of year | | $ | 6.71 | | | $ | 6.75 | | | $ | 6.27 | | | $ | 4.96 | | | $ | 7.69 | | |
| Total return3 | | | 5.03 | % | | | 16.57 | % | | | 40.46 | % | | | (27.72 | )% | | | 6.02 | % | |
| RATIOS AND SUPPLEMENTAL DATA | |
| Net assets, end of year (000s omitted) | | $ | 23,905 | | | $ | 17,695 | | | $ | 17,435 | | | $ | 14,282 | | | $ | 27,459 | | |
| Ratio of expenses to average net assets | | | 1.70 | % | | | 1.86 | % | | | 1.85 | % | | | 1.85 | % | | | 1.85 | % | |
| Ratio of net investment income to average net assets | | | 5.39 | % | | | 7.25 | % | | | 9.33 | % | | | 7.98 | % | | | 7.01 | % | |
Decrease reflected in above operating expense ratios
due to waivers/reimbursements | | | 0.68 | % | | | 0.61 | % | | | 0.59 | % | | | 0.46 | % | | | 0.31 | % | |
| Portfolio turnover rate | | | 144 | % | | | 88 | % | | | 63 | % | | | 28 | % | | | 49 | % | |
1 Per share information is calculated using the average shares outstanding method.
2 This amount represents less than $0.01 per share.
3 Total returns are historical and assume changes in share price, reinvestment of all dividends and distributions and no sales charge. Had certain expenses not been reduced during the years shown, total returns would have been lower.
See Accompanying Notes to Financial Statements.
28
Credit Suisse Floating Rate High Income Fund
Notes to Financial Statements
October 31, 2011
Note 1. Organization
Credit Suisse Floating Rate High Income Fund (the "Fund"), a portfolio of the Credit Suisse Opportunity Funds (the "Trust"), a Delaware business trust, is registered under the Investment Company Act of 1940, as amended (the "1940 Act"), as a diversified open-end management investment company that seeks to provide a high level of current income and, secondarily, capital appreciation. The Fund was organized under the laws of the State of Delaware as a business trust on May 31, 1995. Effective June 3, 2011, the name of the Fund was changed from Credit Suisse High Income Fund.
The Fund offers four classes of shares: Class I shares, Class A shares, Class B shares and Class C shares. On September 1, 2011, Common Class shares were renamed Class I shares. Each class of shares represents an equal pro rata interest in the Fund, except that they bear different expenses, which reflect the differences in the range of services provided to them. Class A shares are sold subject to a front-end sales charge of 4.75%. Class B shares are sold subject to a contingent deferred sales charge which declines from 4.00% to zero depending on the period of time the shares are held. Class B shares automatically convert to Class A shares after 8 years. Class C shares are sold subject to a contingent deferred sales charge of 1.00% if the shares are redeemed within the first year of purchase.
Note 2. Significant Accounting Policies
A) SECURITY VALUATION — The net asset value of the Fund is determined daily as of the close of regular trading on the New York Stock Exchange, Inc. (the "Exchange") on each day the Exchange is open for business. Equity investments are valued at market value, which is generally determined using the closing price on the exchange or market on which the security is primarily traded at the time of valuation (the "Valuation Time"). If no sales are reported, equity investments are generally valued at the most recent bid quotation as of the Valuation Time or at the lowest asked quotation in the case of a short sale of securities. Equity investments are generally categorized as Level 1. Investments in open-end investment companies are valued at their net asset value each business day and are generally categorized as Level 1. Debt securities with a remaining maturity greater than 60 days are valued in accordance with the price supplied by a pricing service, which may use a matrix, formula or other objective method that takes into consideration market indices, yield curves and other specific adjustments. Debt obligations that will mature in 60 days or less are valued on the basis of amortized cost, which approximates market value, unless it is determined that using this method
29
Credit Suisse Floating Rate High Income Fund
Notes to Financial Statements (continued)
October 31, 2011
Note 2. Significant Accounting Policies
would not represent fair value. Debt securities are generally categorized as Level 2. Forward currency contracts are valued at the prevailing forward exchange rate of the underlying currencies and are generally categorized as Level 2. Securities and other assets for which market quotations are not readily available, or whose values have been materially affected by events occurring before the Fund's Valuation Time but after the close of the securities' primary markets, are valued at fair value as determined in good faith by, or under the direction of, the Board of Trustees under procedures established by the Board of Trustees and are generally categorized as Level 3. The Fund may utilize a service provided by an independent third party which has been approved by the Board of Trustees to fair value certain securities. When fair value pricing is employed, the prices of securities used by a fund to calculate its net asset value may differ from quoted or published prices for the same securities.
In accordance with the authoritative guidance on fair value measurements and disclosures under accounting principles generally accepted in the United States of America ("GAAP"), the Fund discloses the fair value of its investments in a hierarchy that prioritizes the inputs to valuation techniques used to measure the fair value. In accordance with GAAP, fair value is defined as the price that the Fund would receive upon selling an investment in a timely transaction to an independent buyer in the principal or most advantageous market of the investment. GAAP established a three-tier hierarchy to maximize the use of observable market data and minimize the use of unobservable inputs and to establish classification of fair value measurements for disclosure purposes. Inputs refer broadly to the assumptions that market participants would use in pricing the asset or liability, including assumptions about risk, for example, the risk inherent in a particular valuation technique used to measure fair value including such a pricing model and/or the risk inherent in the inputs to the valuation technique. Inputs may be observable or unobservable. Observable inputs are inputs that reflect the assumptions market participants would use in pricing the asset or liability developed based on market data obtained from sources independent of the reporting entity. Unobservable inputs are inputs that reflect the reporting entity's own assumptions about the assumptions market participants would use in pricing the asset or liability developed based on the best information available in the circumstances. In accordance with the Fund's valuation procedures, factors used in determining value may include, but are not limited to, the type of the security, the size of the holding, the initial cost of the security, the existence of any contractual restrictions on the security's disposition, the price and extent of public trading in similar securities of the issuer or of comparable companies,
30
Credit Suisse Floating Rate High Income Fund
Notes to Financial Statements (continued)
October 31, 2011
Note 2. Significant Accounting Policies
quotations or evaluated prices from broker-dealers and/or pricing services, information obtained from the issuer, analysts, and/or the appropriate stock exchange (for exchange-traded securities), an analysis of the company's or issuer's financial statements, an evaluation of the forces that influence the issuer and the market(s) in which the security is purchased and sold and with respect to debt securities, the maturity, coupon, creditworthiness, currency denomination, and the movement of the market in which the security is normally traded. The three-tier hierarchy of inputs is summarized in the three broad Levels listed below.
• Level 1 – quoted prices in active markets for identical investments
• Level 2 – other significant observable inputs (including quoted prices for similar investments, interest rates, prepayment speeds, credit risk, etc.)
• Level 3 – significant unobservable inputs (including the Fund's own assumptions in determining the fair value of investments)
The inputs or methodology used for valuing securities are not necessarily an indication of the risk associated with investing in those securities.
The following is a summary of the inputs used as of October 31, 2011 in valuing the Fund's investments carried at value:
| | | Level 1 | | Level 2 | | Level 3 | | Total | |
| Investments in Securities | |
| Bank Loans | | $ | — | | | $ | 81,915,563 | | | $ | — | | | $ | 81,915,563 | | |
| Asset Backed Security | | | — | | | | 322,006 | | | | — | | | | 322,006 | | |
| Corporate Bonds | | | — | | | | 16,648,172 | | | | 18 | | | | 16,648,190 | | |
| Common Stocks | | | 166,835 | | | | — | | | | — | | | | 166,835 | | |
| Preferred Stock | | | 112,622 | | | | — | | | | — | | | | 112,622 | | |
| Warrant | | | — | | | | — | | | | — | | | | — | | |
| Short-Term Investments | | | 3,820,266 | | | | 36,986,000 | | | | — | | | | 40,806,266 | | |
| Other Financial Instruments* | |
| | | $ | 4,099,723 | | | $ | 135,871,741 | | | $ | 18 | | | $ | 139,971,482 | | |
*Other financial instruments include futures, forwards and swap contracts.
As of October 31, 2011, the amounts shown by the Fund as being Level 3 securities that were measured at fair value amounted to less than 0.01% of net assets.
The Fund adopted FASB amendments to authoritative guidance which require the Fund to disclose details of significant transfers in and out of Level 1 and Level 2 measurements and Level 2 and Level 3 measurements and the
31
Credit Suisse Floating Rate High Income Fund
Notes to Financial Statements (continued)
October 31, 2011
Note 2. Significant Accounting Policies
reasons for the transfers. For the year ended October 31, 2011, there were no significant transfers in and out of Level 1 and Level 2 and no significant transfers in and out of Level 2 and Level 3.
B) DERIVATIVE INSTRUMENTS AND HEDGING ACTIVITIES — The Fund adopted amendments to authoritative guidance on disclosures about derivative instruments and hedging activities which require that the Fund disclose (a) how and why an entity uses derivative instruments, (b) how derivative instruments and hedging activities are accounted for, and (c) how derivative instruments and related hedging activities affect a fund's financial position, financial performance, and cash flows.
Effect of Derivative Instruments on the Statement of Operations
Amount of Realized Gain (Loss) on Derivatives Recognized
Forward Foreign Currency Contracts | | $ | (19,615 | ) | |
Change in Unrealized Appreciation (Depreciation) on Derivatives Recognized
Forward Foreign Currency Contracts | | $ | (12,929 | ) | |
From the beginning of the fiscal year through June 30, 2011, the notional amount of forward foreign currency contracts averaged 1.6% of net assets of the Fund. For the remainder of the year, the Fund did not invest in forward foreign currency contracts.
C) FOREIGN CURRENCY TRANSACTIONS — The books and records of the Fund are maintained in U.S. dollars. Transactions denominated in foreign currencies are recorded at the current prevailing exchange rates. All assets and liabilities denominated in foreign currencies are translated into U.S. dollar amounts at the current exchange rate at the end of the period. Translation gains or losses resulting from changes in the exchange rate during the reporting period and realized gains and losses on the settlement of foreign currency transactions are reported in the results of operations for the current period. The Fund does not isolate that portion of realized gains and losses on investments in equity securities which is due to changes in the foreign exchange rate from that which is due to changes in market prices of equity securities. The Fund isolates that portion of realized gains and losses on investments in debt securities which is due to changes in the foreign exchange rate from that which is due to changes in market prices of debt securities.
D) SECURITY TRANSACTIONS AND INVESTMENT INCOME — Security transactions are accounted for on a trade date basis. Interest income is recorded on the accrual basis. The Fund amortizes premiums and accretes discounts using
32
Credit Suisse Floating Rate High Income Fund
Notes to Financial Statements (continued)
October 31, 2011
Note 2. Significant Accounting Policies
the effective interest method. Dividends are recorded on the ex-dividend date. Certain expenses are class-specific expenses and vary by class. Income, expenses (excluding class-specific expenses) and realized/unrealized gains/losses are allocated proportionately to each class of shares based upon the relative net asset value of the outstanding shares of that class. The cost of investments sold is determined by use of the specific identification method for both financial reporting and income tax purposes.
E) DIVIDENDS AND DISTRIBUTIONS TO SHAREHOLDERS — Dividends from net investment income are declared daily and paid monthly. Distributions of net realized capital gains, if any, are declared and paid at least annually. However, to the extent that a net realized capital gain can be reduced by a capital loss carryforward, such gain will not be distributed. Income and capital gain distributions are determined in accordance with federal income tax regulations, which may differ from GAAP.
F) FEDERAL INCOME TAXES — No provision is made for federal taxes as it is the Fund's intention to continue to qualify for and elect the tax treatment applicable to regulated investment companies under the Internal Revenue Code of 1986, as amended, and to make the requisite distributions to its shareholders, which will be sufficient to relieve it from federal income and excise taxes.
The Fund adopted the authoritative guidance for uncertainty in income taxes and recognizes a tax benefit or liability from an uncertain position only if it is more likely than not that the position is sustainable based solely on its technical merits and consideration of the relevant taxing authority's widely understood administrative practices and procedures. The Fund has reviewed its current tax positions and has determined that no provision for income tax is required in the Fund's financial statements. The Fund's federal tax returns for the prior three fiscal years remain subject to examination by the Internal Revenue Service.
G) USE OF ESTIMATES — The preparation of financial statements in conformity with GAAP requires management to make estimates and assumptions that affect the reported amounts of assets and liabilities and disclosure of contingent assets and liabilities at the date of the financial statements and the reported amounts of income and expenses during the reporting period. Actual results could differ from these estimates.
H) SHORT-TERM INVESTMENTS — The Fund, together with other funds/portfolios advised by Credit Suisse Asset Management, LLC ("Credit
33
Credit Suisse Floating Rate High Income Fund
Notes to Financial Statements (continued)
October 31, 2011
Note 2. Significant Accounting Policies
Suisse"), an indirect, wholly-owned subsidiary of Credit Suisse Group AG, pools available cash into a short-term variable rate time deposit issued by State Street Bank and Trust Company ("SSB"), the Fund's custodian. The short-term time deposit issued by SSB is a variable rate account classified as a short-term investment.
I) FORWARD FOREIGN CURRENCY CONTRACTS — The Fund may enter into forward foreign currency contracts for the purchase or sale of a specific foreign currency at a fixed price on a future date. Risks may arise upon entering into these contracts from the potential inability of counterparties to meet the terms of their contracts and from unanticipated movements in the value of a foreign currency. The Fund will enter into forward foreign currency contracts primarily for hedging foreign currency risk. Forward foreign currency contracts are adjusted by the daily forward exchange rate of the underlying currency and any gains or losses are recorded for financial statement purposes as unrealized until the contract settlement date or an offsetting position is entered into. At October 31, 2011, the Fund had no open forward foreign currency contracts.
J) SECURITIES LENDING — Loans of securities are required at all times to be secured by collateral at least equal to 102% of the market value of domestic securities on loan (including any accrued interest thereon) and 105% of the market value of foreign securities on loan (including any accrued interest thereon). Cash collateral received by the Fund in connection with securities lending activity may be pooled together with cash collateral for other funds/portfolios advised by Credit Suisse and may be invested in a variety of investments, including funds advised by SSB, the Fund's securities lending agent, or money market instruments. However, in the event of default or bankruptcy by the other party to the agreement, realization and/or retention of the collateral may be subject to legal proceedings.
SSB has been engaged by the Fund to act as the Fund's securities lending agent. The Fund's securities lending arrangement provides that the Fund and SSB will share the net income earned from securities lending activities. During the year ended October 31, 2011, total earnings from the Fund's investment in cash collateral received in connection with securities lending arrangements was $51,594, of which $6,357 was rebated to borrowers (brokers). The Fund retained $36,700 in income from the cash collateral investment, and SSB, as lending agent, was paid $8,537. Securities lending income is accrued as earned.
34
Credit Suisse Floating Rate High Income Fund
Notes to Financial Statements (continued)
October 31, 2011
Note 2. Significant Accounting Policies
K) OTHER — The high yield, fixed income securities in which the fund will invest will primarily consist of senior secured floating rate loans ("Senior Loans") issued by non-investment grade companies. Senior Loans are typically secured by specific collateral of the issuer and hold the most senior position in the issuer's capital structure. The interest rate on Senior Loans is periodically adjusted to a recognized base rate, typically the London Interbank Offered Rate (LIBOR). While these characteristics may reduce interest rate risk and mitigate losses in the event of borrower default, the Senior Loans in which the Fund invests have below investment grade credit ratings and thereby are considered speculative because of the significant credit risk of their issuers.
Lower-rated debt securities (commonly known as "junk bonds") possess speculative characteristics and are subject to greater market fluctuations and risk of lost income and principal than higher-rated debt securities for a variety of reasons. Also, during an economic downturn or substantial period of rising interest rates, highly leveraged issuers may experience financial stress which would adversely affect their ability to service their principal and interest payment obligations, to meet projected business goals and to obtain additional financing.
In addition, periods of economic uncertainty and changes can be expected to result in increased volatility of market prices of lower-rated debt securities and the Fund's net asset value.
L) SUBSEQUENT EVENTS — In preparing the financial statements as of October 31, 2011, management considered the impact of subsequent events for potential recognition or disclosure in these financial statements through the date of release of this report.
Note 3. Transactions with Affiliates and Related Parties
Credit Suisse serves as investment adviser for the Fund. For its investment advisory services, Credit Suisse is entitled to receive a fee from the Fund at an annual rate of 0.70% of the Fund's average daily net assets less than or equal to $100 million and 0.50% of the Fund's average daily net assets greater than $100 million. For the year ended October 31, 2011, investment advisory fees earned and voluntarily waived were $570,052 and $554,323, respectively. Credit Suisse will not recapture from the Fund any fees it waived during the year ended October 31, 2011. Fee waivers and expense reimbursements are voluntary and may be discontinued by Credit Suisse at any time.
35
Credit Suisse Floating Rate High Income Fund
Notes to Financial Statements (continued)
October 31, 2011
Note 3. Transactions with Affiliates and Related Parties
Credit Suisse Asset Management Securities, Inc. ("CSAMSI"), an affiliate of Credit Suisse, and SSB serve as co-administrators to the Fund. For its co-administrative services, CSAMSI currently receives a fee calculated at an annual rate of 0.09% of the Fund's average daily net assets. For the year ended October 31, 2011, co-administrative services fees earned by CSAMSI were $73,292.
For its co-administrative services, SSB receives a fee, exclusive of out-of-pocket expenses, calculated in total for all the Credit Suisse funds/portfolios co-administered by SSB and allocated based upon the relative average net assets of each fund/portfolio, subject to an annual minimum fee. For the year ended October 31, 2011, co-administrative services fees earned by SSB (including out-of-pocket expenses) were $70,648.
In addition to serving as the Fund's co-administrator, CSAMSI currently serves as distributor of the Fund's shares. Pursuant to distribution plans adopted by the Fund pursuant to Rule 12b-1 under the 1940 Act, CSAMSI receives fees for its distribution services. CSAMSI is currently paid at the annual rate of 0.25% of the average daily net assets of the Class A shares. For the Class B and Class C shares, the fee is calculated at an annual rate of 1.00% of the average daily net assets. Class I shares of the Fund are not subject to distribution fees.
For the year ended October 31, 2011, CSAMSI and its affiliates advised the Fund that it retained $20,342 from commissions earned on the sale of the Fund's Class A shares.
Merrill Corporation ("Merrill"), an affiliate of Credit Suisse, has been engaged by the Fund to provide certain financial printing services. For the year ended October 31, 2011, Merrill was paid $41,961 for its services by the Fund.
Note 4. Line of Credit
The Fund, together with other funds/portfolios advised by Credit Suisse (collectively, the "Participating Funds"), participates in a committed, unsecured line of credit facility ("Credit Facility") for temporary or emergency purposes with SSB. Under the terms of the Credit Facility, the Participating Funds pay an aggregate commitment fee on the average unused amount of the Credit Facility, which is allocated among the Participating Funds in such manner as is determined by the governing Boards of the Participating Funds. In addition, the Participating Funds pay interest on borrowings at either the
36
Credit Suisse Floating Rate High Income Fund
Notes to Financial Statements (continued)
October 31, 2011
Note 4. Line of Credit
Overnight Federal Funds rate or the Overnight LIBOR rate plus a spread. At October 31, 2011, the Fund had no borrowings under the Credit Facility. During the year ended October 31, 2011, the Fund had borrowings under the Credit Facility as follows:
Average Daily
Loan Balance | | Weighted Average
Interest Rate % | | Maximum Daily
Loan Outstanding | |
| $ | 181,000 | | | | 1.500 | % | | $ | 181,000 | | |
Note 5. Purchases and Sales of Securities
For the year ended October 31, 2011, purchases and sales of investment securities (excluding short-term investments) were $132,241,523 and $109,319,168, respectively.
Note 6. Capital Share Transactions
The Fund is authorized to issue an unlimited number of full and fractional shares of beneficial interest, $.001 par value per share, of which an unlimited number of shares are classified as Class I shares, Class A shares, Class B shares and Class C shares. Transactions in capital shares for each class of the Fund were as follows:
| | | Class I | |
| | | For the Year Ended
October 31, 2011 | | For the Year Ended
October 31, 2010 | |
| | | Shares | | Value | | Shares | | Value | |
| Shares sold | | | 2,756,694 | | | $ | 18,390,302 | | | | 115,214 | | | $ | 762,027 | | |
| Shares exchanged due to merger | | | — | | | | — | | | | 4,493,884 | | | | 28,998,037 | | |
Shares issued in reinvestment
of dividends | | | 312,901 | | | | 2,113,807 | | | | 61,415 | | | | 408,089 | | |
| Shares redeemed | | | (766,086 | ) | | | (5,132,969 | ) | | | (61,178 | ) | | | (402,347 | ) | |
| Net increase | | | 2,303,509 | | | $ | 15,371,140 | | | | 4,609,335 | | | $ | 29,765,806 | | |
| | | Class A | |
| | | For the Year Ended
October 31, 2011 | | For the Year Ended
October 31, 2010 | |
| | | Shares | | Value | | Shares | | Value | |
| Shares sold | | | 6,377,908 | | | $ | 42,658,488 | | | | 514,531 | | | $ | 3,309,743 | | |
Shares issued in reinvestment
of dividends | | | 145,167 | | | | 983,762 | | | | 150,728 | | | | 973,600 | | |
| Shares redeemed | | | (2,176,209 | ) | | | (14,784,134 | ) | | | (1,176,878 | ) | | | (7,725,044 | ) | |
| Net increase (decrease) | | | 4,346,866 | | | $ | 28,858,116 | | | | (511,619 | ) | | $ | (3,441,701 | ) | |
37
Credit Suisse Floating Rate High Income Fund
Notes to Financial Statements (continued)
October 31, 2011
Note 6. Capital Share Transactions
| | | Class B | |
| | | For the Year Ended
October 31, 2011 | | For the Year Ended
October 31, 2010 | |
| | | Shares | | Value | | Shares | | Value | |
| Shares sold | | | 295,721 | | | $ | 1,998,761 | | | | 152,868 | | | $ | 998,424 | | |
Shares issued in reinvestment
of dividends | | | 20,990 | | | | 142,696 | | | | 34,801 | | | | 224,987 | | |
| Shares redeemed | | | (702,886 | ) | | | (4,807,899 | ) | | | (270,694 | ) | | | (1,743,417 | ) | |
| Net decrease | | | (386,175 | ) | | $ | (2,666,442 | ) | | | (83,025 | ) | | $ | (520,006 | ) | |
| | | Class C | |
| | | For the Year Ended
October 31, 2011 | | For the Year Ended
October 31, 2010 | |
| | | Shares | | Value | | Shares | | Value | |
| Shares sold | | | 1,615,279 | | | $ | 10,787,442 | | | | 260,273 | | | $ | 1,694,588 | | |
Shares issued in reinvestment
of dividends | | | 57,968 | | | | 393,834 | | | | 70,200 | | | | 454,153 | | |
| Shares redeemed | | | (728,120 | ) | | | (4,929,154 | ) | | | (491,557 | ) | | | (3,175,026 | ) | |
| Net increase (decrease) | | | 945,127 | | | $ | 6,252,122 | | | | (161,084 | ) | | $ | (1,026,285 | ) | |
The Fund imposes a redemption fee of 2% of the value of all classes of shares currently being offered that are redeemed or exchanged within 30 days from the date of purchase. Reinvested dividends and distributions are not subject to the fee. The fee is charged based on the value of shares at redemption, is paid directly to the Fund and becomes part of the Fund's daily net asset value calculation. When shares are redeemed that are subject to the fee, reinvested dividends and distributions are redeemed first, followed by the shares held longest.
On October 31, 2011, the number of shareholders that held 5% or more of the outstanding shares of each class of the Fund was as follows:
| | | Number of
Shareholders | | Approximate Percentage
of Outstanding Shares | |
| Class I | | | 1 | | | | 87 | % | |
| Class A | | | 3 | | | | 50 | % | |
| Class B | | | 3 | | | | 63 | % | |
| Class C | | | 3 | | | | 64 | % | |
Some of the shareholders are omnibus accounts, which hold shares on behalf of individual shareholders.
38
Credit Suisse Floating Rate High Income Fund
Notes to Financial Statements (continued)
October 31, 2011
Note 7. Federal Income Taxes
Income and capital gain distributions are determined in accordance with federal income tax regulations, which may differ from GAAP.
The tax characteristics of dividends paid during the years ended October 31, 2011 and 2010, respectively, by the Fund were as follows:
| | Ordinary Income | |
| | 2011 | | 2010 | |
| | | | | $ | 4,942,778 | | | $ | 4,462,935 | | |
The tax basis components of distributable earnings differ from the amounts reflected in the Statement of Assets and Liabilities by temporary book/tax differences. These differences are primarily due to differing treatments of dividends payable, wash sales and income from defaulted bonds. At October 31, 2011, the components of distributable earnings on a tax basis were as follows:
| Undistributed net investment income | | $ | 246,050 | | |
| Undistributed net investment loss — other | | | (89,689 | ) | |
| Accumulated realized loss | | | (13,921,542 | ) | |
| Unrealized depreciation | | | (2,748,441 | ) | |
| | | $ | (16,513,622 | ) | |
At October 31, 2011, the Fund had capital loss carryforwards available to offset possible future capital gains as follows:
| Expires October 31, | |
| 2013 | | 2014 | | 2015 | | 2016 | | 2017 | | 2018 | |
| $ | 190,454 | | | $ | 297,542 | | | $ | 2,721,368 | | | $ | 4,794,945 | | | $ | 5,676,396 | | | $ | 240,837 | | |
Included in the Fund's capital loss carryforwards is $5,814,107, acquired in the Credit Suisse High Yield Fund merger, which is subject to IRS limitations. During the year ended October 31, 2011, the Fund utilized $4,121,004 of capital loss carryforwards.
Under the Regulated Investment Company Modernization Act of 2010, the Fund will be permitted to carry forward capital losses incurred in taxable years beginning after December 22, 2010 for an unlimited period. However, any losses incurred during those future taxable years will be required to be utilized prior to the losses incurred in pre-enactment taxable years. As a result of this ordering rule, pre-enactment capital loss carryforwards may be more likely to expire unused. Additionally, post-enactment capital losses that are carried forward will retain their character as either short-term or long-term capital
39
Credit Suisse Floating Rate High Income Fund
Notes to Financial Statements (continued)
October 31, 2011
Note 7. Federal Income Taxes
losses rather than being considered all short-term as under previous law. It is uncertain whether the Fund will be able to realize the full benefits of the capital loss carryforwards before they expire.
At October 31, 2011, the identified cost for federal income tax purposes, as well as the gross unrealized appreciation from investments for those securities having an excess of value over cost, gross unrealized depreciation from investments for those securities having an excess of cost over value and the net unrealized depreciation from investments were $142,708,749, $1,441,533, $(4,178,800) and $(2,737,267), respectively.
At October 31, 2011, the Fund reclassified $163,395 to accumulated net investment loss and $4 to paid in capital from accumulated net realized loss from investments, to adjust for current period permanent book/tax differences which arose principally from differing book/tax treatments of foreign currency gain/(loss) and defaulted bonds. Net assets were not affected by these reclassifications.
Note 8. Acquisition of Credit Suisse High Yield Fund
On August 27, 2010, Credit Suisse Floating Rate High Income Fund acquired all of the net assets of Credit Suisse High Yield Fund, an open-end investment company, pursuant to a plan of reorganization approved by the Board of Trustees on May 3, 2010. The purpose of the transaction was to combine two funds managed by Credit Suisse with comparable investment objectives and strategies. The acquisition was accomplished by a tax-free exchange of 4,493,884 Common shares of Credit Suisse Floating Rate High Income Fund for 3,321,931 Class I shares of Credit Suisse High Yield Fund valued at $28,998,037. The investment portfolio of Credit Suisse High Yield Fund had a fair value at August 27, 2010 of $28,423,765 and identified cost of $28,896,540, which were the principal assets acquired by Credit Suisse Floating Rate High Income Fund. For financial reporting purposes, assets received and shares issued by Credit Suisse Floating Rate High Income Fund were recorded at fair value; however the cost basis of the investments received from Credit Suisse High Yield Fund were carried forward to align ongoing reporting of Credit Suisse Floating Rate High Income Fund's realized and unrealized gains and losses with amounts distributable to shareholders for tax purposes. Immediately prior to the merger, the net assets of Credit Suisse Floating Rate High Income Fund were $47,219,734.
40
Credit Suisse Floating Rate High Income Fund
Notes to Financial Statements (continued)
October 31, 2011
Note 8. Acquisition of Credit Suisse High Yield Fund
Credit Suisse Floating Rate High Income Fund pro forma results of operations for the year ended October 31, 2010 are as follows:
| Net investment income | | $ | 5,779,0751 | | |
| Net gain from investments and foreign currency related item | | | 5,531,5552 | | |
| Net increase in net assets resulting from operations | | $ | 11,310,630 | | |
Because the combined investment portfolios have been managed as a single integrated portfolio since the acquisition was completed, it is not practicable to separate the amounts of net investment income and net gain on investments of Credit Suisse High Yield Fund that have been included in Credit Suisse Floating Rate High Income Fund's statement of operations since August 27, 2010.
1 $4,086,587 as reported, plus $1,598,188 for Credit Suisse High Yield Fund, premerger, plus $94,300 of pro-forma gross expenses eliminated.
2 $5,107,671 as reported, plus $423,884 for Credit Suisse High Yield Fund, respectively, premerger.
Note 9. Contingencies
In the normal course of business, the Fund may provide general indemnifications pursuant to certain contracts and organizational documents. The Fund's maximum exposure under these arrangements is dependent on future claims that may be made against the Fund and, therefore, cannot be estimated; however, based on experience, the risk of loss from such claims is considered remote.
41
Credit Suisse Floating Rate High Income Fund
Report of Independent Registered Public Accounting Firm
To the Board of Trustees and Shareholders of
Credit Suisse Floating Rate High Income Fund:
In our opinion, the accompanying statement of assets and liabilities, including the schedule of investments, and the related statements of operations and of changes in net assets and the financial highlights present fairly, in all material respects, the financial position of Credit Suisse Floating Rate High Income Fund (the "Fund", formerly Credit Suisse High Income Fund) at October 31, 2011, the results of its operations for the year then ended and the changes in its net assets and financial highlights for the periods presented, in conformity with accounting principles generally accepted in the United States of America. These financial statements and financial highlights (hereafter referred to as "financial statements") are the responsibility of the Fund's management. Our responsibility is to express an opinion on these financial statements based on our audit. We conducted our audit of these financial statements in accordance with the standards of the Public Company Accounting Oversight Board (United States). Those standards require that we plan and perform the audit to obtain reasonable assurance about whether the financial statements are free of material misstatement. An audit includes examining, on a test basis, evidence supporting the amounts and disclosures in the financial statements, assessing the accounting principles used and significant estimates made by management, and evaluating the overall financial statement presentation. We believe that our audit, which included confirmation of securities at October 31, 2011 by correspondence with the custodian, brokers, agent banks and the application of alternative auditing procedures where confirmations had not been received, provides a reasonable basis for our opinion.
Boston, Massachusetts
December 21, 2011
42
Credit Suisse Floating Rate High Income Fund
Information Concerning Trustees and Officers (unaudited)
Name, Address
(Year of Birth) | | Position(s)
Held with
Fund | | Term
of Office1
and
Length
of Time
Served | | Principal
Occupation(s) During
Past Five Years | | Number of
Portfolios
in Fund
Complex
Overseen
by Trustee | | Other
Directorships
Held by Trustee | |
| Independent Trustees | | | | | | | | | | | |
|
Enrique Arzac
c/o Credit Suisse Asset
Management, LLC
Attn: General Counsel
Eleven Madison Avenue
New York, New York
10010
(1941) | | Trustee, Audit
Committee
Chairman and
Nominating
Committee
Member | | Since
2005 | | Professor of Finance and Economics, Graduate School of Business, Columbia University since 1971. | | | 6 | | | Director of Epoch Holding Corporation (an investment management and investment advisory services company); Director of The Adams Express Company, Director of Petroleum and Resources Corporation, Director of Aberdeen Asset Management-advised Funds (six closed-end investment companies); Director of Mirae Asset Discovery Funds (open-end investment companies). | |
|
Jeffrey E. Garten
Box 208200
New Haven, Connecticut
06520-8200
(1946) | | Trustee, Audit and Nominating Committee Member | | Since
2001 | | The Juan Trippe Professor in the Practice of International Trade, Finance and Business from July 2005 to present; Partner and Chairman of Garten Rothkopf (consulting firm) from October 2005 to present; Dean of Yale School of Management from November 1995 to June 2005. | | | 4 | | | Director of Aetna, Inc. (insurance company); Director of CarMax Group (used car dealers); Member of Standard & Poor's Board of Managers (credit rating agency). | |
|
1 Each Trustee and Officer serves until his or her respective successor has been duly elected and qualified.
43
Credit Suisse Floating Rate High Income Fund
Information Concerning Trustees and Officers (unaudited) (continued)
Name, Address
(Year of Birth) | | Position(s)
Held with
Fund | | Term
of Office1
and
Length
of Time
Served | | Principal
Occupation(s) During
Past Five Years | | Number of
Portfolios
in Fund
Complex
Overseen
by Trustee | | Other
Directorships
Held by Trustee | |
| Independent Trustees | | | | | | | | | | | |
|
Peter F. Krogh
c/o Credit Suisse Asset
Management, LLC
Attn: General Counsel
Eleven Madison Avenue
New York, New York
10010
(1937) | | Trustee, Audit and Nominating Committee Member | | Since 2000 | | Dean Emeritus and Distinguished Professor of International Affairs at the Edmund A. Walsh School of Foreign Service, Georgetown University from June 1995 to present. | | | 4 | | | None | |
|
Steven N. Rappaport
Lehigh Court, LLC
555 Madison Avenue
29th Floor
New York, New York
10022
(1948) | | Chairman of the Board of Trustees, Audit Committee Member and Nominating Committee Chairman | | Trustee since 2001 and Chairman since 2005 | | Partner of Lehigh Court, LLC and RZ Capital (private investment firms) from July 2002 to present. | | | 6 | | | Director of iCAD, Inc. (surgical and medical instruments and apparatus company); Director of Presstek, Inc. (digital imaging technologies company); Director of Wood Resources, LLC. (plywood manufacturing company); Director of Aberdeen Asset Management-advised Funds (five closed-end investment companies). | |
|
44
Credit Suisse Floating Rate High Income Fund
Information Concerning Trustees and Officers (unaudited) (continued)
Name, Address
(Year of Birth) | | Position(s)
Held with
Fund | | Term
of Office1
and
Length
of Time
Served | | Principal Occupation(s) During Past Five Years | |
| Officers** | | | | | | | |
|
John G. Popp
Credit Suisse Asset
Management, LLC
Eleven Madison Avenue
New York, New York 10010
(1956) | | Chief Executive Officer and President | | Since 2010 | | Managing Director of Credit Suisse; Group Manager and Senior Portfolio Manager for Performing Credit Strategies; Associated with Credit Suisse or its predecessor since 1997; Officer of other Credit Suisse Funds. | |
|
Michael A. Pignataro
Credit Suisse Asset
Management, LLC
Eleven Madison Avenue
New York, New York 10010
(1959) | | Chief Financial Officer | | Since 2001 | | Director and Director of Fund Administration of Credit Suisse; Associated with Credit Suisse or its predecessor since 1984; Officer of other Credit Suisse Funds. | |
|
Emidio Morizio
Credit Suisse Asset
Management, LLC
One Madison Avenue
New York, New York 10010
(1966) | | Chief Compliance Officer | | Since 2004 | | Managing Director and Global Head of Compliance of Credit Suisse; Associated with Credit Suisse since July 2000; Officer of other Credit Suisse Funds. | |
|
Roger Machlis
Credit Suisse Asset
Management, LLC
One Madison Avenue
New York, New York 10010
(1961) | | Chief Legal Officer | | Since 2010 | | Managing Director and General Counsel for Credit Suisse; Associated with Credit Suisse Group AG since July 1997; Officer of other Credit Suisse Funds. | |
|
Cecilia Chau
Credit Suisse Asset
Management, LLC
Eleven Madison Avenue
New York, New York 10010
(1973) | | Treasurer | | Since 2008 | | Vice President of Credit Suisse since 2009; Assistant Vice President of Credit Suisse from June 2007 to December 2008; Associated with Alliance Bernstein L.P. from January 2007 to May 2007; Associated with Credit Suisse from August 2000 to December 2006; Officer of other Credit Suisse Funds. | |
|
Karen Regan
Credit Suisse Asset Management, LLC
Eleven Madison Avenue New York, New York 10010
(1963) | | Vice President and Secretary | | Since 2010 | | Vice President of Credit Suisse; Associated with Credit Suisse since December 2004; Officer of other Credit Suisse Funds. | |
|
** The officers of the Fund shown are officers that make policy decisions.
The Statement of Additional Information includes additional information about the Trustees and is available, without charge, upon request, by calling 877-870-2874.
45
Credit Suisse Floating Rate High Income Fund
Proxy Voting and Portfolio Holdings Information (unaudited)
Information regarding how the Fund voted proxies related to its portfolio securities during the 12 month period ended June 30 of each year, as well as the policies and procedures that the Fund uses to determine how to vote proxies relating to its portfolio securities are available:
• By calling 1-877-870-2874
• On the Fund's website, www.credit-suisse.com/us
• On the website of the Securities and Exchange Commission, www.sec.gov.
The Fund files a complete schedule of its portfolio holdings for the first and third quarters of its fiscal year with the SEC on Form N-Q. The Fund's Forms N-Q are available on the SEC's website at www.sec.gov and may be reviewed and copied at the SEC's Public Reference Room in Washington, DC. Information on the operation of the SEC's Public Reference Room may be obtained by calling 1-202-551-8090.
46
This page intentionally left blank
This page intentionally left blank

P.O. BOX 55030, BOSTON, MA 02205-5030
877-870-2874 n www.credit-suisse.com/us
CREDIT SUISSE ASSET MANAGEMENT SECURITIES, INC., DISTRIBUTOR. FLHI-AR-1011
Item 2. Code of Ethics.
The registrant has adopted a code of ethics applicable to its Chief Executive Officer, President, Chief Financial Officer and Chief Accounting Officer, or persons performing similar functions. A copy of the code is filed as Exhibit 12(a)(1) to this Form. There were no amendments to the code during the fiscal year ended October 31, 2011. There were no waivers or implicit waivers from the code granted by the registrant during the fiscal year ended October 31, 2011.
Item 3. Audit Committee Financial Expert.
The registrant’s governing board has determined that it has two audit committee financial experts serving on its audit committee: Enrique R. Arzac and Steven N. Rappaport. Each audit committee financial expert is “independent” for purposes of this item.
Item 4. Principal Accountant Fees and Services.
(a) through (d). The information in the table below is provided for services rendered to the registrant by its independent registered public accounting firm, PricewaterhouseCoopers LLP (“PwC”), for its fiscal years ended October 31, 2010 and October 31, 2011.
| | 2010 | | 2011 | |
Audit Fees | | $ | 32,500 | | $ | 33,150 | |
Audit-Related Fees(1) | | $ | 3,400 | | $ | 3,500 | |
Tax Fees(2) | | $ | 2,800 | | $ | 2,900 | |
All Other Fees | | — | | — | |
Total | | $ | 38,700 | | $ | 39,550 | |
(1) Services include agreed-upon procedures in connection with the registrant’s semi-annual financial statements ($3,400 for 2010 and $3,500 for 2011).
(2) Tax services in connection with the registrant’s excise tax calculations and review of the registrant’s applicable tax returns.
The information in the table below is provided with respect to non-audit services that directly relate to the registrant’s operations and financial reporting and that were rendered by PwC to the registrant’s investment adviser, Credit Suisse Asset Management, LLC (“Credit Suisse”), and any service provider to the registrant controlling, controlled by or under common control with Credit Suisse that provided ongoing services to the registrant (“Covered Services Provider”), for the registrant’s fiscal years ended October 31, 2010 and October 31, 2011.
2
| | 2010 | | 2011 | |
Audit-Related Fees | | N/A | | N/A | |
Tax Fees | | N/A | | N/A | |
All Other Fees | | N/A | | N/A | |
Total | | N/A | | N/A | |
(e)(1) Pre-Approval Policies and Procedures. The Audit Committee (“Committee”) of the registrant is responsible for pre-approving (i) all audit and permissible non-audit services to be provided by the independent registered public accounting firm to the registrant and (ii) all permissible non-audit services to be provided by the independent registered public accounting firm to Credit Suisse and any Covered Services Provider if the engagement relates directly to the operations and financial reporting of the registrant. The Committee may delegate its responsibility to pre-approve any such audit and permissible non-audit services to the Chairperson of the Committee, and the Chairperson shall report to the Committee, at its next regularly scheduled meeting after the Chairperson’s pre-approval of such services, his or her decision(s). The Committee may also establish detailed pre-approval policies and procedures for pre-approval of such services in accordance with applicable laws, including the delegation of some or all of the Committee’s pre-approval responsibilities to other persons (other than Credit Suisse or the registrant’s officers). Pre-approval by the Committee of any permissible non-audit services shall not be required so long as: (i) the aggregate amount of all such permissible non-audit services provided to the registrant, Credit Suisse and any Covered Services Provider constitutes not more than 5% of the total amount of revenues paid by the registrant to its independent registered public accounting firm during the fiscal year in which the permissible non-audit services are provided; (ii) the permissible non-audit services were not recognized by the registrant at the time of the engagement to be non-audit services; and (iii) such services are promptly brought to the attention of the Committee and approved by the Committee (or its delegate(s)) prior to the completion of the audit.
(e)(2) The information in the table below sets forth the percentages of fees for services (other than audit, review or attest services) rendered by PwC to the registrant for which the pre-approval requirement was waived pursuant to Rule 2-01(c)(7)(i)(C) of Regulation S-X:
| | 2010 | | 2011 | |
Audit-Related Fees | | N/A | | N/A | |
Tax Fees | | N/A | | N/A | |
All Other Fees | | N/A | | N/A | |
Total | | N/A | | N/A | |
3
The information in the table below sets forth the percentages of fees for services (other than audit, review or attest services) rendered by PwC to Credit Suisse and any Covered Services Provider required to be approved pursuant to Rule 2-01(c)(7)(ii) of Regulation S-X, for the registrant’s fiscal years ended October 31, 2010 and October 31, 2011:
| | 2010 | | 2011 | |
Audit-Related Fees | | N/A | | N/A | |
Tax Fees | | N/A | | N/A | |
All Other Fees | | N/A | | N/A | |
Total | | N/A | | N/A | |
(f) Not Applicable.
(g) The aggregate fees billed by PwC for non-audit services rendered to the registrant, Credit Suisse and Covered Service Providers for the fiscal years ended October 31, 2010 and October 31, 2011 were $6,200 and $6,400, respectively.
(h) Not Applicable.
Item 5. Audit Committee of Listed Registrants.
Form N-CSR disclosure requirement is not applicable to the registrant.
Item 6. Schedule of Investments.
Included as part of the report to shareholders filed under Item 1 of this Form.
Item 7. Disclosure of Proxy Voting Policies and Procedures for Closed-End Management Investment Companies.
Form N-CSR disclosure requirement is not applicable to the registrant.
Item 8. Portfolio Managers of Closed-End Management Investment Companies.
Form N-CSR disclosure requirement is not applicable to the registrant.
4
Item 9. Purchases of Equity Securities by Closed-End Management Investment Company and Affiliated Purchasers.
Form N-CSR disclosure requirement is not applicable to the registrant.
Item 10. Submission of Matters to a Vote of Security Holders.
None.
Item 11. Controls and Procedures.
(a) As of a date within 90 days from the filing date of this report, the principal executive officer and principal financial officer concluded that the registrant’s disclosure controls and procedures (as defined in Rule 30a-3(c) under the Investment Company Act of 1940 (the “Act”)) were effective based on their evaluation of the disclosure controls and procedures required by Rule 30a-3(b) under the Act and Rules 13a-15(b) or 15d-15(b) under the Securities Exchange Act of 1934.
(b) There were no changes in registrant’s internal control over financial reporting (as defined in Rule 30a-3(d) under the Act) that occurred during the second fiscal quarter of the period covered by this report that have materially affected, or are reasonably likely to materially affect, the registrant’s internal control over financial reporting.
Item 12. Exhibits.
(a)(1) Registrant’s Code of Ethics is an exhibit to this report.
(a)(2) The certifications of the registrant as required by Rule 30a-2(a) under the Act are exhibits to this report.
(a)(3) Not applicable.
(b) The certifications of the registrant as required by Rule 30a-2(b) under the Act are an exhibit to this report.
5
SIGNATURES
Pursuant to the requirements of the Securities Exchange Act of 1934 and the Investment Company Act of 1940, the registrant has duly caused this report to be signed on its behalf by the undersigned, thereunto duly authorized.
CREDIT SUISSE OPPORTUNITY FUNDS | |
| |
/s/ John G. Popp | |
Name: | John G. Popp | |
Title: | Chief Executive Officer | |
Date: | January 4, 2012 | |
Pursuant to the requirements of the Securities Exchange Act of 1934 and the Investment Company Act of 1940, this report has been signed below by the following persons on behalf of the registrant and in the capacities and on the dates indicated.
/s/ John G. Popp | |
Name: | John G. Popp | |
Title: | Chief Executive Officer | |
Date: | January 4, 2012 | |
| |
/s/ Michael A. Pignataro | |
Name: | Michael A. Pignataro | |
Title: | Chief Financial Officer | |
Date: | January 4, 2012 | |
6