UNITED STATES
SECURITIES AND EXCHANGE COMMISSION
Washington, D.C. 20549
FORM N-CSR
CERTIFIED SHAREHOLDER REPORT OF REGISTERED
MANAGEMENT INVESTMENT COMPANIES
Investment Company Act file number | 811-09054 |
|
CREDIT SUISSE OPPORTUNITY FUNDS |
(Exact name of registrant as specified in charter) |
|
One Madison Avenue, New York, New York | | 10010 |
(Address of principal executive offices) | | (Zip code) |
|
John G. Popp Credit Suisse Opportunity Funds One Madison Avenue New York, New York 10010 |
(Name and address of agent for service) |
|
Registrant’s telephone number, including area code: | (212) 325-2000 | |
|
Date of fiscal year end: | October 31st | |
|
Date of reporting period: | November 1, 2014 to October 31, 2015 | |
| | | | | | | | | |
Item 1. Reports to Stockholders.

CREDIT SUISSE FUNDS
Annual Report
October 31, 2015
n CREDIT SUISSE
MULTIALTERNATIVE STRATEGY FUND
The Fund's investment objectives, risks, charges and expenses (which should be considered carefully before investing), and more complete information about the Fund, are provided in the Prospectus, which should be read carefully before investing. You may obtain additional copies by calling 877-870-2874 or by visiting our website at www.credit-suisse.com/us/funds.
Credit Suisse Securities (USA) LLC, Distributor, is located at One Madison Avenue, New York, NY 10010. Credit Suisse Funds are advised by Credit Suisse Asset Management, LLC.
Investors in the Credit Suisse Funds should be aware that they may be eligible to purchase Class I shares (where offered) directly or through certain intermediaries. Such shares are not subject to a sales charge. Investors in the Credit Suisse Funds should also be aware that they may be eligible for a reduction or waiver of the sales charge with respect to Class A or C shares (where offered). For more information, please review the relevant prospectuses or consult your financial representative.
Fund shares are not deposits or other obligations of Credit Suisse Asset Management, LLC ("Credit Suisse") or any affiliate, are not FDIC-insured and are not guaranteed by Credit Suisse or any affiliate. Fund investments are subject to investment risks, including loss of your investment.
Credit Suisse Multialternative Strategy Fund
Annual Investment Adviser's Report
October 31, 2015 (unaudited)
December 21, 2015
Dear Shareholder:
We are pleased to present this Annual Report covering the activities of the Credit Suisse Multialternative Strategy Fund (the "Fund") for the 12 months ended October 31, 2015.
Performance Summary
11/01/14 – 10/31/15
Fund & Benchmark | | Performance | |
Class I1 | | | 2.33 | % | |
Class A1,2 | | | 2.08 | % | |
Class C1,2 | | | 1.23 | % | |
Credit Suisse Hedge Fund Index3 | | | 1.45 | % | |
Credit Suisse Liquid Alternative Beta Index4 | | | 2.46 | % | |
Performance shown for the Fund's Class A and Class C Shares does not reflect sales charges, which are a maximum of 5.25% and 1.00%, respectively. 2
Market Review: A volatile period
The Fund's multi-alternative strategy seeks to approximate the aggregate returns of the universe of hedge funds, as represented by the Credit Suisse Hedge Fund Index, using liquid investments.
The 12 months ended October 31, 2015 was a volatile one for hedge funds, with the Credit Suisse Hedge Fund Index, the Fund's primary benchmark, returning 1.45%.
Within the hedge fund universe, trend-following strategies, such as managed futures, experienced gains due to trends in fixed income, commodities (most notably oil), and a strengthening U.S. dollar versus several G10 currencies. Managed futures strategies did experience periods of equity market volatility and several trend reversals, particularly in the second and third quarters of 2015.
Event-driven strategies were generally able to benefit from opportunities in distressed corporate credit and increased corporate activity early in the period. They suffered losses as credit spreads widened in Q3, but ended the period on a positive note as yield spreads tightened in October.
In long/short equity strategies, capital protection helped performance during the volatile end to 2014. In Q1, strategies with currency hedged exposures performed particularly well. In Q2, strategies that began the quarter with long exposure to Asia and short exposure to Europe and ended the period short
1
Credit Suisse Multialternative Strategy Fund
Annual Investment Adviser's Report (continued)
October 31, 2015 (unaudited)
performed well, as European equities experienced selling pressure due to uncertainty over Greece. In Q3, performance was negative due to increased equity volatility driven by policy actions in China and lower commodity prices that raised concerns. Long/short equity strategies posted gains in October as equities began recovering.
Strategic Review and Outlook: Cautious going forward
For the 12 months ended October 31, 2015, the Fund (Class I shares) returned 2.33% versus a return of 2.46% for the Credit Suisse Liquid Alternative Beta Index and 1.45% for the Credit Suisse Hedge Fund Index. The Fund follows a multi-strategy methodology and benefitted from exposure across different markets.
The long/short equity sub-strategy benefitted mostly from short emerging markets exposure and long technology exposure (which were also the greatest positive contributors to overall Fund performance). The MSCI EAFE position was the greatest detractor from the long/short equity sub-strategy. The global strategies sub-strategy contributed positively to Fund performance, due primarily to underlying long/short equity exposure, as well as the managed futures strategy exposure. The currency carry position was the main detractor from the sub-strategy and overall Fund performance. The event driven sub-strategy was primarily hurt by long high yield exposure over the period. The long merger arbitrage strategy and illiquidity premium positions were the biggest contributors to this sub-strategy (illiquidity premium factor being in the model this year possibly indicates that hedge fund managers had illiquid positions). Overall, funds maintained approximately 35% net exposure — and tracking error to the benchmark was within historically expected ranges.
Although October was a positive month overall for long/short equity managers, they remain cautious about market conditions and the expected equity market performance.
The Quantitative Investment Strategies Group
Yung-Shin Kung
Sheel Dhande
The Fund is non-diversified, which means it may invest a greater proportion of its assets in the securities of a smaller number of issuers than a diversified mutual fund and may therefore be subject to greater volatility. The Fund's investment in alternative
2
Credit Suisse Multialternative Strategy Fund
Annual Investment Adviser's Report (continued)
October 31, 2015 (unaudited)
instruments may subject the Fund to greater volatility than investing in traditional securities, particularly in investments involving leverage.
The use of alternative assets and strategies entails substantial risks, including risk of loss of principal, arbitrage or fundamental risk, below investment grade securities risk, commodity exposure risks, concentration risk, derivatives risk, risks of investing in other funds, exchange-traded notes risk, fixed income risk, credit risk, foreign securities risk, interest rate risk, market risk, non-diversified status, forwards risk, futures contracts risk, portfolio turnover risk, leveraging risk, swap agreements risk, small- and mid-cap stock risk, speculative exposure risk, subsidiary risk, and tax risk. For a detailed discussion of these and other risks, please refer to the Fund's Prospectus, which should be read carefully before investing.
In addition to historical information, this report contains forward-looking statements, which may concern, among other things, domestic and foreign markets, industry and economic trends and developments and government regulation and their potential impact on the Fund's investments. These statements are subject to risks and uncertainties and actual trends, developments and regulations in the future, and their impact on the Fund could be materially different from those projected, anticipated or implied. The Fund has no obligation to update or revise forward-looking statements.
The views of the Fund's management are as of the date of the letter and the Fund holdings described in this document are as of October 31, 2015; these views and Fund holdings may have changed subsequent to these dates. Nothing in this document is a recommendation to purchase or sell securities.
3
Credit Suisse Multialternative Strategy Fund
Annual Investment Adviser's Report (continued)
October 31, 2015 (unaudited)
Comparison of Change in Value of $10,000 Investment in the
Credit Suisse Multialternative Strategy Fund1 Class I shares,
Class A shares2, Class C shares2 and the Dow Jones Credit Suisse
Hedge Fund Index3 and the Credit Suisse Liquid
Alternative Beta Index4 from Inception (03/30/12).
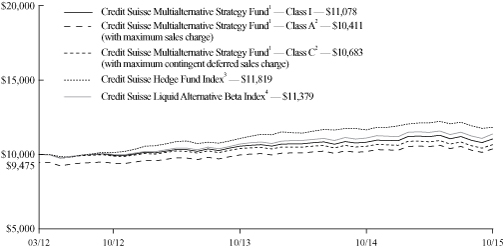
1 Fee waivers and/or expense reimbursements may reduce expenses for the Fund, without which performance would be lower. The Fund entered into a written contract to limit expenses to 1.30% of the Fund's average daily net assets for Class I shares, 1.55% of the Fund's average daily net assets for Class A shares and 2.30% of the Fund's average daily net assets for Class C shares. Effective November 18, 2015, the contractual expense limitation with respect to the Fund is lowered to 1.10% of the Fund's average daily net assets for Class A shares, 1.85% of the Fund's average daily net assets for Class C shares and 0.85% of the Fund's average daily net assets for Class I shares through at least February 28, 2017.
2 Total return for the Fund's Class A shares for the reporting period, based on offering price (including maximum sales charge of 5.25%), was (3.24)%. Total return for the Fund's Class C shares for the reporting period, based on redemption value (including maximum contingent deferred sales charge of 1.00%), was 0.23%.
3 Credit Suisse Hedge Fund Index is compiled by Credit Suisse Asset Management, LLC. It is an asset-weighted hedge fund index and includes only helge funds. It is rebalanced semiannually, is shown net of all performance fees and provides a rules-based and investableindex, enabling investors to utilize the performance of a diversified market barometer for the barometer for the hedge fund industry. It is the exclusive property of Credit Suisse Asset Management, LLC.
4 The Credit Suisse Liquid Alternative Beta Index reflects the return of a dynamic basket of liquid, investable market factors selected and weighted in accordance with an algorithm that aims to approximate the aggregate returns of the universe of hedge fund managers as represented by the Credit Suisse Hedge Fund Index. The index does not have transaction costs and investors may not invest directly in the index.
4
Credit Suisse Multialternative Strategy Fund
Annual Investment Adviser's Report (continued)
October 31, 2015 (unaudited)
Average Annual Returns as of October 31, 20151
| | | 1 Year | | Since
Inception2 | |
Class I | | | 2.33 | % | | | 2.89 | % | |
Class A Without Sales Charge | | | 2.08 | % | | | 2.65 | % | |
Class A With Maximum Sales Charge | | | (3.24 | )% | | | 1.13 | % | |
Class C Without CDSC | | | 1.23 | % | | | 1.86 | % | |
Class C With CDSC | | | 0.23 | % | | | 1.86 | % | |
Returns represent past performance and include change in share price and reinvestment of dividends and capital gains. Past performance cannot guarantee future results. The current performance of the Fund may be lower or higher than the figures shown. Returns and share price will fluctuate, and redemption value may be more or less than original cost. The performance results do not reflect the deduction of taxes that a shareholder would pay on fund distributions or the redemption of fund shares. Performance information current to the most recent month-end is available at www.credit-suisse.com/us/funds.
The annual gross expense ratios are 3.89% for Class I shares, 4.15% for Class A shares and 4.90% for Class C shares. The annual net expense ratios after fee waivers and/or expense reimbursements excluding securities sold short dividend expense are 1.32% for Class I shares, 1.57% for Class A shares and 2.32% for Class C shares.
1 Fee waivers and/or expense reimbursements may reduce expenses for the Fund, without which performance would be lower. The Fund entered into a written contract to limit expenses to 1.30% of the Fund's average daily net assets for Class I shares, 1.55% of the Fund's average daily net assets for Class A shares and 2.30% of the Fund's average daily net assets for Class C shares. Effective November 18, 2015, the contractual expense limitation with respect to the Fund is lowered to 1.10% of the Fund's average daily net assets for Class A shares, 1.85% of the Fund's average daily net assets for Class C shares and 0.85% of the Fund's average daily net assets for Class I shares through at least February 28, 2017.
2 Inception Date March 30, 2012.
5
Credit Suisse Multialternative Strategy Fund
Annual Investment Adviser's Report (continued)
October 31, 2015 (unaudited)
Information About Your Fund's Expenses
As an investor of the Fund, you incur two types of costs: ongoing expenses and transaction costs. Ongoing expenses include management fees, distribution and service (12b-1) fees and other Fund expenses. Examples of transaction costs include sales charges (loads), redemption fees and account maintenance fees, which are not shown in this section and which would result in higher total expenses. The following table is intended to help you understand your ongoing expenses of investing in the Fund and to help you compare these expenses with the ongoing expenses of investing in other mutual funds. The table is based on an investment of $1,000 made at the beginning of the six-months ended October 31, 2015.
The table illustrates your Fund's expenses in two ways:
• Actual Fund Return. This helps you estimate the actual dollar amount of ongoing expenses paid on a $1,000 investment in the Fund using the Fund's actual return during the period. To estimate the expenses you paid over the period, simply divide your account value by $1,000 (for example, an $8,600 account value divided by $1,000 = 8.6), then multiply the result by the number in the "Expenses Paid per $1,000" line under the share class you hold.
• Hypothetical 5% Fund Return. This helps you to compare your Fund's ongoing expenses with those of other mutual funds using the Fund's actual expense ratio and a hypothetical rate of return of 5% per year before expenses. Examples using a 5% hypothetical fund return may be found in the shareholder reports of other mutual funds. The hypothetical account values and expenses may not be used to estimate the actual ending account balance or expenses you paid for the period.
Please note that the expenses shown in these tables are meant to highlight your ongoing expenses only and do not reflect any transaction costs, such as sales charges (loads) or redemption fees. If these transaction costs had been included, your costs would have been higher. The "Expenses Paid per $1,000" line of the tables is useful in comparing ongoing expenses only and will not help you determine the relative total expenses of owning different funds.
6
Credit Suisse Multialternative Strategy Fund
Annual Investment Adviser's Report (continued)
October 31, 2015 (unaudited)
Expenses and Value for a $1,000 Investment
for the six month period ended October 31, 2015
Actual Fund Return | | Class I | | Class A | | Class C | |
Beginning Account Value 05/01/15 | | $ | 1,000.00 | | | $ | 1,000.00 | | | $ | 1,000.00 | | |
Ending Account Value 10/31/15 | | $ | 989.50 | | | $ | 988.50 | | | $ | 984.50 | | |
Expenses Paid per $1,000* | | $ | 7.57 | | | $ | 8.82 | | | $ | 12.61 | | |
Hypothetical 5% Fund Return | |
Beginning Account Value 05/01/15 | | $ | 1,000.00 | | | $ | 1,000.00 | | | $ | 1,000.00 | | |
Ending Account Value 10/31/15 | | $ | 1,017.59 | | | $ | 1,016.33 | | | $ | 1,012.50 | | |
Expenses Paid per $1,000* | | $ | 7.68 | | | $ | 8.94 | | | $ | 12.78 | | |
| | | Class I | | Class A | | Class C | |
Annualized Expense Ratios* | | | 1.51 | % | | | 1.76 | % | | | 2.52 | % | |
* Expenses are equal to the Fund's annualized expense ratio for each share class, multiplied by the average account value over the period, multiplied by 184/365 to reflect the one-half year period.
The "Expenses Paid per $1,000" and the "Annualized Expense Ratios" in the tables are based on actual expenses paid by the Fund during the period, net of fee waivers and/or expense reimbursements. If those fee waivers and/or expense reimbursements had not been in effect, the Fund's actual expenses would have been higher. Expenses do not reflect additional charges and expenses that are, or may be, imposed under the variable contracts or plans. Such charges and expenses are described in the prospectus of the insurance company separate account or in the plan documents or other informational materials supplied by plan sponsors. The Fund's expenses should be considered with these charges and expenses in evaluating the overall cost of investing in the separate account.
For more information, please refer to the Fund's prospectus.
7
Credit Suisse Multialternative Strategy Fund
Annual Investment Adviser's Report (continued)
October 31, 2015 (unaudited)
Investment Type Breakdown*
| | | Long | | Short | | Net | |
Exchange Traded Funds | | | 46.28 | % | | | (9.28 | )% | | | 37.00 | % | |
Common Stocks | | | 27.47 | | | | 0.00 | | | | 27.47 | | |
Investment Company | | | 9.49 | | | | 0.00 | | | | 9.49 | | |
Rights1 | | | 0.00 | | | | 0.00 | | | | 0.00 | | |
Short-term Investment2 | | | 26.04 | | | | 0.00 | | | | 26.04 | | |
Total | | | 109.28 | % | | | (9.28 | )% | | | 100.00 | % | |
* Expressed as a percentage of total long (short) investments, (excluding securities lending collateral if applicable) and may vary over time.
1 This amount represents less than 0.01%.
2 Primarily reflects cash invested in State Street Bank and Trust Co. Euro Time Deposit, for which the purchases of securities have been executed but not yet settled at October 31, 2015, if applicable.
8
Credit Suisse Multialternative Strategy Fund
Consolidated Schedule of Investments
October 31, 2015
| | | Number of
Shares | | Value | |
| LONG POSITIONS (75.4%) | |
| COMMON STOCKS (24.8%) | |
| BAHAMAS (0.2%) | |
| Diversified Consumer Services (0.2%) | |
Steiner Leisure, Ltd.1 | | | 511 | | | $ | 32,377 | | |
BELGIUM (0.7%)
| Food & Staples Retailing (0.7%) | |
Delhaize Group | | | 1,038 | | | | 96,753 | | |
CANADA (0.4%)
| Oil, Gas & Consumable Fuels (0.4%) | |
Canadian Oil Sands, Ltd. | | | 7,275 | | | | 54,881 | | |
FRANCE (0.5%)
| Auto Components (0.1%) | |
Montupet | | | 183 | | | | 14,411 | | |
| Communications Equipment (0.4%) | |
Alcatel-Lucent1 | | | 11,947 | | | | 48,718 | | |
| | | 63,129 | | |
IRELAND (0.3%)
| Trading Companies & Distributors (0.3%) | |
Avolon Holdings, Ltd.1,2 | | | 1,500 | | | | 45,765 | | |
NETHERLANDS (0.5%)
| Air Freight & Logistics (0.2%) | |
TNT Express N.V. | | | 3,767 | | | | 31,798 | | |
| Chemicals (0.3%) | |
Koninklijke Ten Cate N.V. | | | 1,191 | | | | 32,364 | | |
| | | 64,162 | | |
UNITED KINGDOM (2.8%)
| Beverages (1.1%) | |
SABMiller PLC | | | 2,593 | | | | 159,560 | | |
| Communications Equipment (0.1%) | |
Pace PLC1 | | | 1,675 | | | | 9,616 | | |
| Electrical Equipment (0.3%) | |
HellermannTyton Group PLC | | | 5,073 | | | | 37,129 | | |
| Healthcare Providers & Services (0.5%) | |
Synergy Health PLC | | | 1,904 | | | | 68,367 | | |
| Insurance (0.4%) | |
Amlin PLC | | | 5,118 | | | | 52,027 | | |
| Oil, Gas & Consumable Fuels (0.4%) | |
BG Group PLC | | | 4,069 | | | | 64,401 | | |
| | | 391,100 | | |
See Accompanying Notes to Consolidated Financial Statements.
9
Credit Suisse Multialternative Strategy Fund
Consolidated Schedule of Investments (continued)
October 31, 2015
| | | Number of
Shares | | Value | |
| LONG POSITIONS (continued) | |
| COMMON STOCKS (continued) | |
| UNITED STATES (19.4%) | |
| Aerospace & Defense (0.8%) | |
Precision Castparts Corp. | | | 453 | | | $ | 104,557 | | |
| Air Freight & Logistics (0.2%) | |
UTi Worldwide, Inc.1,2 | | | 3,795 | | | | 27,058 | | |
| Auto Components (0.2%) | |
Remy International, Inc. | | | 1,128 | | | | 33,265 | | |
| Banks (0.4%) | |
City National Corp. | | | 640 | | | | 57,344 | | |
| Capital Markets (0.4%) | |
GFI Group, Inc. | | | 10,101 | | | | 60,808 | | |
| Chemicals (1.4%) | |
Cytec Industries, Inc. | | | 786 | | | | 58,494 | | |
Sigma-Aldrich Corp. | | | 910 | | | | 127,145 | | |
| | | 185,639 | | |
| Diversified Telecommunication Services (0.2%) | |
Premiere Global Services, Inc.1,2 | | | 2,400 | | | | 32,832 | | |
| Electric Utilities (1.5%) | |
Cleco Corp. | | | 1,341 | | | | 71,073 | | |
Pepco Holdings, Inc. | | | 5,166 | | | | 137,571 | | |
| | | 208,644 | | |
| Energy Equipment & Services (0.9%) | |
Baker Hughes, Inc. | | | 1,030 | | | | 54,260 | | |
Cameron International Corp.1 | | | 1,068 | | | | 72,635 | | |
| | | 126,895 | | |
| Gas Utilities (0.5%) | |
AGL Resources, Inc. | | | 1,079 | | | | 67,437 | | |
| Healthcare Equipment & Supplies (0.6%) | |
Sirona Dental Systems, Inc.1 | | | 716 | | | | 78,137 | | |
| Healthcare Providers & Services (2.4%) | |
Cigna Corp. | | | 846 | | | | 113,398 | | |
Health Net, Inc.1,2 | | | 1,079 | | | | 69,337 | | |
Humana, Inc. | | | 654 | | | | 116,824 | | |
IPC Healthcare, Inc.1,2 | | | 451 | | | | 35,403 | | |
| | | 334,962 | | |
| Insurance (1.7%) | |
StanCorp Financial Group, Inc. | | | 471 | | | | 54,033 | | |
Symetra Financial Corp. | | | 1,683 | | | | 53,402 | | |
The Chubb Corp. | | | 990 | | | | 128,056 | | |
| | | 235,491 | | |
See Accompanying Notes to Consolidated Financial Statements.
10
Credit Suisse Multialternative Strategy Fund
Consolidated Schedule of Investments (continued)
October 31, 2015
| | | Number of
Shares | | Value | |
| LONG POSITIONS (continued) | |
| COMMON STOCKS (continued) | |
UNITED STATES | |
| Internet Software & Services (0.3%) | |
Xoom Corp.1,2 | | | 1,608 | | | $ | 40,104 | | |
| Media (1.2%) | |
Cablevision Systems Corp., Class A | | | 2,300 | | | | 74,957 | | |
Media General, Inc.1,2 | | | 3,334 | | | | 49,543 | | |
Rentrak Corp.1 | | | 621 | | | | 34,267 | | |
| | | 158,767 | | |
| Multi-Utilities (0.4%) | |
TECO Energy, Inc. | | | 2,200 | | | | 59,400 | | |
| Pharmaceuticals (0.2%) | |
Depomed, Inc.1,2 | | | 1,500 | | | | 26,250 | | |
| Real Estate Investment Trusts (1.2%) | |
BioMed Realty Trust, Inc.2 | | | 2,623 | | | | 61,405 | | |
Gramercy Property Trust, Inc. | | | 2,056 | | | | 46,630 | | |
Strategic Hotels & Resorts, Inc.1 | | | 3,600 | | | | 50,760 | | |
| | | 158,795 | | |
| Semiconductor Equipment & Products (2.4%) | |
Altera Corp. | | | 1,038 | | | | 54,547 | | |
Freescale Semiconductor, Ltd.1,2 | | | 1,473 | | | | 49,331 | | |
Integrated Silicon Solution, Inc. | | | 893 | | | | 20,075 | | |
KLA-Tencor Corp. | | | 1,131 | | | | 75,913 | | |
OmniVision Technologies, Inc.1,2 | | | 3,003 | | | | 86,696 | | |
PMC-Sierra, Inc.1,2 | | | 4,088 | | | | 48,729 | | |
| | | 335,291 | | |
| Software (0.9%) | |
SolarWinds, Inc.1 | | | 979 | | | | 56,811 | | |
Solera Holdings, Inc. | | | 1,100 | | | | 60,126 | | |
| | | 116,937 | | |
| Specialty Retail (0.4%) | |
Office Depot, Inc.1,2 | | | 6,478 | | | | 49,362 | | |
| Thrifts & Mortgage Finance (1.2%) | |
Hudson City Bancorp, Inc. | | | 15,948 | | | | 161,394 | | |
| | | 2,659,369 | | |
| TOTAL COMMON STOCKS (Cost $3,409,729) | | | 3,407,536 | | |
See Accompanying Notes to Consolidated Financial Statements.
11
Credit Suisse Multialternative Strategy Fund
Consolidated Schedule of Investments (continued)
October 31, 2015
Number of
Shares | | Value | |
| LONG POSITIONS (continued) | |
EXCHANGE TRADED FUNDS (41.9%)
| UNITED STATES (41.9%) | |
| Diversified Financial Services (41.9%) | |
Health Care Select Sector SPDR Fund | | | 4,463 | | | $ | 318,390 | | |
iShares iBoxx $ High Yield Corporate Bond ETF | | | 52,063 | | | | 4,455,031 | | |
Powershares QQQ Trust Series 12 | | | 8,535 | | | | 967,272 | | |
| TOTAL EXCHANGE TRADED FUNDS (Cost $5,846,481) | | | 5,740,693 | | |
INVESTMENT COMPANY (8.6%)
| UNITED STATES (8.6%) | |
Credit Suisse Managed Futures Strategy Fund, I Shares (Cost $1,027,399)3 | | | 102,044 | | | | 1,176,562 | | |
| | Number of
Rights | | | |
RIGHT (0.0%)
| UNITED STATES (0.0%) | |
| BIOTECHNOLOGY (0.0%) | |
Trius Therapeutics, Inc. (Cost $0)1 | | | 400 | | | | 52 | | |
SHORT-TERM INVESTMENTS (33.2%)
| | Number of
Shares | | | |
State Street Navigator Prime Portfolio, 0.22%4 | | | 1,321,803 | | | | 1,321,803 | | |
| | Par
(000) | | | |
State Street Bank and Trust Co. Euro Time Deposit, 0.010% 11/02/2015 (Cost $3,229,911) | | $ | 3,230 | | | | 3,229,911 | | |
| TOTAL SHORT-TERM INVESTMENTS (Cost $4,551,714) | | | 4,551,714 | | |
| TOTAL INVESTMENTS AT VALUE/LONG POSITIONS (108.5%) (Cost $14,835,323) | | | 14,876,557 | | |
| TOTAL SECURITIES SOLD SHORT (-8.4%) (Proceeds $1,197,664) | | | (1,151,547 | ) | |
| LIABILITIES IN EXCESS OF OTHER ASSETS (-0.1%) | | | (10,911 | ) | |
| NET ASSETS (100.0%) | | $ | 13,714,099 | | |
| | Number of
Shares | | | |
| SHORT POSITIONS (-8.4%) | |
| COMMON STOCKS (-8.4%) | |
| CANADA (-0.6%) | |
| BANKS (-0.2%) | |
Royal Bank of Canada | | | (479 | ) | | | (27,374 | ) | |
| Oil, Gas & Consumable Fuels (-0.4%) | |
Suncor Energy, Inc. | | | (1,819 | ) | | | (54,096 | ) | |
| | | (81,470 | ) | |
See Accompanying Notes to Consolidated Financial Statements.
12
Credit Suisse Multialternative Strategy Fund
Consolidated Schedule of Investments (continued)
October 31, 2015
| | | Number of
Shares | | Value | |
| SHORT POSITIONS (continued) | |
| COMMON STOCKS (continued) | |
| FINLAND (-0.4%) | |
| Computers & Peripherals (-0.4%) | |
Nokia Oyj | | | (6,571 | ) | | $ | (49,103 | ) | |
NETHERLANDS (-1.0%)
| Food & Staples Retailing (-0.7%) | |
Koninklijke Ahold N.V. | | | (4,931 | ) | | | (100,766 | ) | |
| Semiconductor Equipment & Products (-0.3%) | |
NXP Semiconductors N.V.1 | | | (519 | ) | | | (40,664 | ) | |
| | | (141,430 | ) | |
| SWITZERLAND (-0.5%) | |
| Construction Materials (0.0%) | |
LafargeHolcim, Ltd., Reg S1,5 | | | (2 | ) | | | (113 | ) | |
| Insurance (-0.5%) | |
ACE, Ltd. | | | (596 | ) | | | (67,670 | ) | |
| | | (67,783 | ) | |
| UNITED KINGDOM (-0.3%) | |
| Healthcare Equipment & Supplies (0.0%) | |
LivaNova PLC1 | | | (1 | ) | | | (66 | ) | |
| Oil, Gas & Consumable Fuels (-0.3%) | |
Royal Dutch Shell PLC, A Shares | | | (1,825 | ) | | | (47,733 | ) | |
| | | (47,799 | ) | |
| UNITED STATES (-5.6%) | |
| Banks (-1.2%) | |
M&T Bank Corp. | | | (1,340 | ) | | | (160,599 | ) | |
| Communications Equipment (-0.1%) | |
ARRIS Group, Inc.1 | | | (244 | ) | | | (6,895 | ) | |
| Energy Equipment & Services (-0.8%) | |
Halliburton Co. | | | (1,153 | ) | | | (44,252 | ) | |
Schlumberger, Ltd. | | | (765 | ) | | | (59,792 | ) | |
| | | (104,044 | ) | |
| Healthcare Equipment & Supplies (-1.0%) | |
DENTSPLY International, Inc. | | | (1,316 | ) | | | (80,079 | ) | |
STERIS Corp. | | | (820 | ) | | | (61,459 | ) | |
| | | (141,538 | ) | |
| Healthcare Providers & Services (-1.2%) | |
Aetna, Inc. | | | (547 | ) | | | (62,785 | ) | |
Anthem, Inc. | | | (436 | ) | | | (60,669 | ) | |
Centene Corp.1 | | | (671 | ) | | | (39,911 | ) | |
| | | (163,365 | ) | |
See Accompanying Notes to Consolidated Financial Statements.
13
Credit Suisse Multialternative Strategy Fund
Consolidated Schedule of Investments (continued)
October 31, 2015
| | | Number of
Shares | | Value | |
| SHORT POSITIONS (continued) | |
| UNITED STATES (continued) | |
| Internet Software & Services (-0.2%) | |
comScore, Inc.1 | | | (715 | ) | | | (30,588 | ) | |
| Media (-0.1%) | |
Nexstar Broadcasting Group, Inc., Class A | | | (299 | ) | | | (15,916 | ) | |
| Metals & Mining (0.0%) | |
Alcoa, Inc. | | | (1 | ) | | | (9 | ) | |
| Oil, Gas & Consumable Fuels (0.0%) | |
Noble Energy, Inc. | | | (1 | ) | | | (36 | ) | |
| Pharmaceuticals (-0.2%) | |
Horizon Pharma PLC1 | | | (1,400 | ) | | | (22,008 | ) | |
| Real Estate Investment Trusts (-0.3%) | |
Chambers Street Properties | | | (6,560 | ) | | | (46,445 | ) | |
| Semiconductor Equipment & Products (-0.4%) | |
Lam Research Corp. | | | (565 | ) | | | (43,273 | ) | |
Microsemi Corp.1 | | | (301 | ) | | | (10,839 | ) | |
| | | (54,112 | ) | |
| Specialty Retail (-0.1%) | |
| Staples, Inc.(1,417) | | | (18,407 | ) | |
| | | (763,962 | ) | |
| TOTAL SHORT POSITIONS (Proceeds $1,197,664) | | $ | (1,151,547 | ) | |
1 Non-income producing security.
2 Security or portion thereof is out on loan (See note 2-L).
3 Affiliated issuer. (See Note 3.)
4 Represents security purchased with cash collateral received for securities on loan. The rate shown is the annualized one-day yield at October 31, 2015.
5 REG S: Securities sold under Regulation S may not be offered, sold or delivered within the United States or to, or for the account or benefit of, U.S. persons, except pursuant to an exemption from, or in a transaction not subject to, the registration requirements of the Securities Act of 1933.
Forward Foreign Currency Contracts
Forward Foreign
Currency to be
Purchased (Local) | | Forward Foreign
Currency to be
Sold (Local) | | Expiration
Date | | Counterparty | | Value on
Settlement Date | | Current
Value/
Notional | | Net Unrealized
Appreciation
(Depreciation) | |
AUD | 120,309 | | | USD | 87,295 | | | 11/19/15 | | Societe Generale | | $ | 87,295 | | | $ | 85,763 | | | $ | (1,532 | ) | |
EUR | 167,736 | | | USD | 190,915 | | | 11/19/15 | | Societe Generale | | | 190,915 | | | | 185,326 | | | | (5,589 | ) | |
JPY | 13,914,942 | | | USD | 116,789 | | | 11/19/15 | | Societe Generale | | | 116,789 | | | | 115,323 | | | | (1,466 | ) | |
NOK | 392,504 | | | USD | 48,477 | | | 11/19/15 | | Societe Generale | | | 48,477 | | | | 46,373 | | | | (2,104 | ) | |
NZD | 180,865 | | | USD | 122,762 | | | 11/19/15 | | Societe Generale | | | 122,762 | | | | 122,227 | | | | (535 | ) | |
USD | 115,629 | | | CAD | 149,401 | | | 11/18/15 | | Societe Generale | | | (115,629 | ) | | | (114,178 | ) | | | 1,451 | | |
See Accompanying Notes to Consolidated Financial Statements.
14
Credit Suisse Multialternative Strategy Fund
Consolidated Schedule of Investments (continued)
October 31, 2015
Forward Foreign Currency Contracts (continued)
Forward Foreign
Currency to be
Purchased (Local) | | Forward Foreign
Currency to be
Sold (Local) | | Expiration
Date | | Counterparty | | Value on
Settlement Date | | Current
Value/
Notional | | Net Unrealized
Appreciation
(Depreciation) | |
USD | 264,088 | | | CHF | 251,004 | | | 11/19/15 | | Societe Generale | | $ | (264,088 | ) | | $ | (254,755 | ) | | $ | 9,333 | | |
USD | 971,701 | | | EUR | 853,725 | | | 11/19/15 | | Societe Generale | | | (971,701 | ) | | | (943,254 | ) | | | 28,447 | | |
USD | 32,610 | | | GBP | 21,119 | | | 11/19/15 | | Societe Generale | | | (32,610 | ) | | | (32,614 | ) | | | (4 | ) | |
USD | 166,944 | | | SEK | 1,370,670 | | | 11/19/15 | | Societe Generale | | | (166,944 | ) | | | (161,481 | ) | | | 5,463 | | |
| | | | | | | | | | | | | | | $ | 33,464 | | |
Currency Abbreviations:
AUD = Australian Dollar
CAD = Canadian Dollar
CHF = Swiss Franc
EUR = Euro
GBP = British Pound
JPY = Japanese Yen
NOK = Norwegian Krone
NZD = New Zealand Dollar
SEK = Swedish Krona
USD = United States Dollar
Total Return Swap Contracts
| Currency | | Notional
Amount | | Expiration
Date | | Counterparty | | Receive | | Pay | | Net Unrealized
Appreciation
(Depreciation) | |
USD | $ | | | | 312,000 | | |
12/21/15 | |
Goldman Sachs | | iBoxx $ Liquid High
Yield Index | |
Fee Plus LIBOR | | $ | (9,082 | ) | |
USD | $ | | | | 155,000 | | |
12/21/15 | |
Goldman Sachs | | iBoxx $ Liquid High
Yield Index | |
Fee Plus LIBOR | | | (3,995 | ) | |
USD | $ | | | | 186,089 | | |
10/17/16 | |
Goldman Sachs | |
Fee Plus LIBOR | | Goldman Sachs Credit
Suisse Custom
Short Basket Index | | | 2,818 | | |
USD | $ | | | | 189,273 | | |
10/17/16 | |
Goldman Sachs | | Goldman Sachs Credit
Suisse Custom
Long Basket Index | |
Fee Plus LIBOR | | | 2,963 | | |
USD | $ | | | | 88,779 | | | 02/18/16 | | Goldman Sachs | | Russell 2000 Total
Return Index | | Fee Plus LIBOR | | | (161 | ) | |
USD | $ | | | | 305,178 | | | 08/18/16 | | Goldman Sachs | | Russell 2000 Total
Return Index | | Fee Plus LIBOR | | | (553 | ) | |
USD | $ | | | | 271,419 | | | 09/16/16 | | Goldman Sachs | | Russell 2000 Total
Return Index | | Fee Plus LIBOR | | | (26 | ) | |
USD | $ | | | | 221,956 | | | 11/18/15 | | Societe Generale | | Russell 2000 Total
Return Index | | Fee Plus LIBOR | | | (411 | ) | |
| | $ | (8,447 | ) | |
See Accompanying Notes to Consolidated Financial Statements.
15
Credit Suisse Multialternative Strategy Fund
Consolidated Schedule of Investments (continued)
October 31, 2015
Credit Default Swap Contracts Bought
| Currency | | Notional
Amount | | Expiration
Date | | Counterparty | | Referenced
Obligation | | Rate
Paid
by the
Fund | | Credit
Received
at
10/31/2015 | | Market
Value | | Upfront
Premiums
Received | | Net Unrealized
Appreciation
(Depreciation) | |
USD | | | | $ | 332,500 | | |
12/20/20 | |
JPMorgan
Chase | | CDX North
America
High Yield
Index | | | 5.0 | % | | | — | | | $ | 10,463 | | | $ | 1,230 | | | $ | 11,693 | | |
See Accompanying Notes to Consolidated Financial Statements.
16
Credit Suisse Multialternative Strategy Fund
Consolidated Statement of Assets and Liabilities
October 31, 2015
Assets | |
Investments in unaffiliated issuers at value, including collateral for securities on loan of $1,321,803
(Cost $13,807,924) (Note 2) | | $ | 13,699,9951 | | |
Investment in affiliated issuer at value (Cost $1,027,399) (Note 3) | | | 1,176,562 | | |
Cash | | | 84,299 | | |
Foreign currency at value (cost $97) | | | 87 | | |
Cash segregated held at brokers for futures contracts, swap contracts, written options and
securities sold short (Note 2) | | | 1,251,233 | | |
Cash segregated held at brokers for centrally cleared swaps (Note 2) | | | 46,274 | | |
Receivable for investments sold | | | 145,066 | | |
Unrealized appreciation on forward currency contracts (Note 2) | | | 44,694 | | |
Receivable from investment adviser (Note 3) | | | 19,895 | | |
Unrealized appreciation on open swap contracts (Note 2) | | | 17,474 | | |
Interest receivable for open swap contracts | | | 1,745 | | |
Interest receivable | | | 2 | | |
Prepaid expenses and other assets | | | 13,729 | | |
Total assets | | | 16,501,055 | | |
Liabilities | |
Administrative services fee payable (Note 3) | | | 2,507 | | |
Shareholder servicing/Distribution fee payable (Note 3) | | | 404 | | |
Payable upon return of securities loaned (Note 2) | | | 1,321,803 | | |
Securities sold short, at value (Proceeds $1,197,664) (Note 2) | | | 1,151,547 | | |
Payable for investments purchased | | | 190,744 | | |
Unrealized depreciation on open swap contracts (Note 2) | | | 14,228 | | |
Unrealized depreciation on forward currency contracts (Note 2) | | | 11,230 | | |
Trustees' fee payable | | | 7,332 | | |
Dividend expense payable on securities sold short | | | 1,712 | | |
Upfront payments received on swap contracts (Note 2) | | | 1,230 | | |
Accrued expenses | | | 84,219 | | |
Total liabilities | | | 2,786,956 | | |
Net Assets | |
Capital stock, $.001 par value (Note 6) | | | 1,325 | | |
Paid-in capital (Note 6) | | | 13,469,472 | | |
Accumulated net investment loss | | | (36,205 | ) | |
Accumulated net realized gain from investments, swap contracts, written options,
securities sold short and foreign currency transactions | | | 155,434 | | |
Net unrealized appreciation from investments, swap contracts, securities sold short and
foreign currency translations | | | 124,073 | | |
Net assets | | $ | 13,714,099 | | |
I Shares | |
Net assets | | $ | 13,014,886 | | |
Shares outstanding | | | 1,256,501 | | |
Net asset value and offering price per share | | $ | 10.36 | | |
A Shares | |
Net assets | | $ | 320,300 | | |
Shares outstanding | | | 31,062 | | |
Net asset value and redemption price per share | | $ | 10.31 | | |
Maximum offering price per share (net asset value/(1-5.25%)) | | $ | 10.88 | | |
C Shares | |
Net assets | | $ | 378,913 | | |
Shares outstanding | | | 37,354 | | |
Net asset value, offering price and redemption price per share | | $ | 10.14 | | |
1 Including $1,289,700 of securities on loan.
See Accompanying Notes to Consolidated Financial Statements.
17
Credit Suisse Multialternative Strategy Fund
Consolidated Statement of Operations
For the Year Ended October 31, 2015
Investment Income | |
Dividends | | $ | 179,494 | | |
Dividend from affiliated issuer | | | 3,775 | | |
Securities lending (net of rebates) (Note 2) | | | 11,073 | | |
Foreign taxes withheld | | | (892 | ) | |
Total investment income | | | 193,450 | | |
Expenses | |
Investment advisory fees (Note 3) | | | 131,703 | | |
Administrative services fees (Note 3) | | | 21,493 | | |
Shareholder servicing/Distribution fees (Note 3) | |
Class A | | | 887 | | |
Class C | | | 11,934 | | |
Custodian fees | | | 71,292 | | |
Legal fees | | | 66,903 | | |
Audit and tax fees | | | 54,717 | | |
Registration fees | | | 48,047 | | |
Printing fees | | | 36,875 | | |
Dividend expense for securities sold short | | | 32,880 | | |
Trustees' fees | | | 28,000 | | |
Transfer agent fees (Note 3) | | | 14,899 | | |
Commitment fees (Note 4) | | | 8,258 | | |
Insurance expense | | | 289 | | |
Miscellaneous expense | | | 19,406 | | |
Total expenses | | | 547,583 | | |
Less: fees waived and expenses reimbursed (Note 3) | | | (320,832 | ) | |
Net expenses | | | 226,751 | | |
Net investment loss | | | (33,301 | ) | |
Net Realized and Unrealized Gain (Loss) from Investments, Swap Contracts, Written Options,
Securities Sold Short and Foreign Currency Related Items | |
Net realized loss from investments | | | (147,259 | ) | |
Net realized loss from investment in affiliated issuer | | | (9,305 | ) | |
Net realized gain distribution from affiliated issuer | | | 64,792 | | |
Net realized gain from swap contracts | | | 327,572 | | |
Net realized gain from written options | | | 145,348 | | |
Net realized gain from securities sold short | | | 55,343 | | |
Net realized loss from foreign currency transactions | | | (94,660 | ) | |
Net change in unrealized appreciation (depreciation) from investments | | | (121,597 | ) | |
Net change in unrealized appreciation (depreciation) from investment in affiliated issuer | | | 62,719 | | |
Net change in unrealized appreciation (depreciation) from swap contracts | | | 12,585 | | |
Net change in unrealized appreciation (depreciation) from written options | | | (91,307 | ) | |
Net change in unrealized appreciation (depreciation) from securities sold short | | | 65,386 | | |
Net change in unrealized appreciation (depreciation) from foreign currency translations | | | 28,738 | | |
Net realized and unrealized gain from investments, swap contracts, written options,
securities sold short and foreign currency related items | | | 298,355 | | |
Net increase in net assets resulting from operations | | $ | 265,054 | | |
See Accompanying Notes to Consolidated Financial Statements.
18
Credit Suisse Multialternative Strategy Fund
Consolidated Statement of Changes in Net Assets
| | | For the Year
Ended
October 31, 2015 | | For the Year
Ended
October 31, 2014 | |
From Operations | |
Net investment loss | | $ | (33,301 | ) | | $ | (170,647 | ) | |
Net realized gain from investments, swap contracts, written options,
securities sold short and foreign currency transactions | | | 341,831 | | | | 393,274 | | |
Net change in unrealized appreciation (depreciation) from investments,
swap contracts, written options, securities sold short and
foreign currency translations | | | (43,476 | ) | | | 20,128 | | |
Net increase in net assets resulting from operations | | | 265,054 | | | | 242,755 | | |
From Dividends and Distributions | |
Dividends from net investment income | |
Class I | | | (199,923 | ) | | | — | | |
Class A | | | (6,054 | ) | | | — | | |
Class C | | | (9,655 | ) | | | — | | |
Distributions from net realized gains | |
Class I | | | (128,472 | ) | | | (168,910 | ) | |
Class A | | | (4,564 | ) | | | (9,044 | ) | |
Class C | | | (14,732 | ) | | | (54,515 | ) | |
Net decrease in net assets resulting from dividends and distributions | | | (363,400 | ) | | | (232,469 | ) | |
| From Capital Share Transactions (Note 6) | |
Proceeds from sale of shares | | | 2,470,503 | | | | 6,259,249 | | |
Reinvestment of dividends and distributions | | | 360,777 | | | | 232,469 | | |
Net asset value of shares redeemed | | | (2,251,494 | ) | | | (746,929 | ) | |
Net increase in net assets from capital share transactions | | | 579,786 | | | | 5,744,789 | | |
Net increase in net assets | | | 481,440 | | | | 5,755,075 | | |
Net Assets | |
Beginning of year | | | 13,232,659 | | | | 7,477,584 | | |
End of year | | $ | 13,714,099 | | | $ | 13,232,659 | | |
Undistributed (accumulated) net investment income (loss) | | $ | (36,205 | ) | | $ | 124,350 | | |
See Accompanying Notes to Consolidated Financial Statements.
19
Credit Suisse Multialternative Strategy Fund
Consolidated Financial Highlights
(For a Class I Share of the Fund Outstanding Throughout Each Period)
| | | For the Year Ended October 31, | |
| | | 2015 | | 2014 | | 2013 | | 20121 | |
Per share data | |
Net asset value, beginning of period | | $ | 10.42 | | | $ | 10.482 | | | $ | 9.95 | | | $ | 10.00 | | |
INVESTMENT OPERATIONS | |
Net investment income (loss)3 | | | (0.01 | ) | | | (0.15 | ) | | | (0.15 | ) | | | 0.01 | | |
Net gain (loss) on investments, swap contracts, written options,
securities sold short and foreign currency related items
(both realized and unrealized) | | | 0.25 | | | | 0.42 | | | | 0.75 | | | | (0.06 | ) | |
Total from investment operations | | | 0.24 | | | | 0.27 | | | | 0.60 | | | | (0.05 | ) | |
LESS DIVIDENDS AND DISTRIBUTIONS | |
Dividends from net investment income | | | (0.18 | ) | | | — | | | | (0.06 | ) | | | — | | |
Distributions from net realized gains | | | (0.12 | ) | | | (0.33 | ) | | | (0.01 | ) | | | — | | |
Total dividends and distributions | | | (0.30 | ) | | | (0.33 | ) | | | (0.07 | ) | | | — | | |
Net asset value, end of period | | $ | 10.36 | | | $ | 10.42 | | | $ | 10.482 | | | $ | 9.95 | | |
Total return4 | | | 2.33 | % | | | 2.64 | % | | | 6.11 | % | | | (0.50 | )% | |
RATIOS AND SUPPLEMENTAL DATA | |
Net assets, end of period (000s omitted) | | $ | 13,015 | | | $ | 11,451 | | | $ | 5,409 | | | $ | 4,904 | | |
Ratio of net expenses to average net assets | | | 1.56 | % | | | 1.85 | % | | | 1.78 | % | | | 1.79 | %5 | |
Ratio of expenses to average net assets excluding securities
sold short dividend expense | | | 1.32 | % | | | 1.70 | % | | | 1.70 | % | | | 1.70 | %5 | |
Ratio of net investment income (loss) to average net assets | | | (0.14 | )% | | | (1.47 | )% | | | (1.49 | )% | | | 0.21 | %5 | |
Decrease reflected in above operating expense ratios due to
waivers/reimbursements | | | 2.33 | % | | | 2.48 | % | | | 6.31 | % | | | 9.22 | %5 | |
Portfolio turnover rate | | | 292 | % | | | 431 | % | | | 284 | % | | | 228 | % | |
1 For the period March 30, 2012 (inception date) through October 31, 2012.
2 Includes adjustments in accordance with accounting principles generally accepted in the United States of America and as such, the net asset values for financial reporting purposes and the returns based upon net asset values may differ from the net asset values and returns for shareholder transactions.
3 Per share information is calculated using the average shares outstanding method.
4 Total returns are historical and assume changes in share price and reinvestment of all dividends and distributions. Had certain expenses not been reduced during the periods shown, total returns would have been lower. Total returns for periods less than one year are not annualized.
5 Annualized.
See Accompanying Notes to Consolidated Financial Statements.
20
Credit Suisse Multialternative Strategy Fund
Consolidated Financial Highlights
(For a Class A Share of the Fund Outstanding Throughout Each Period)
| | | For the Year Ended October 31, | |
| | | 2015 | | 2014 | | 2013 | | 20121 | |
Per share data | |
Net asset value, beginning of period | | $ | 10.37 | | | $ | 10.462 | | | $ | 9.93 | | | $ | 10.00 | | |
INVESTMENT OPERATIONS | |
Net investment loss3 | | | (0.05 | ) | | | (0.18 | ) | | | (0.18 | ) | | | (0.01 | ) | |
Net gain (loss) on investments, swap contracts, written options,
securities sold short and foreign currency related items
(both realized and unrealized) | | | 0.26 | | | | 0.42 | | | | 0.76 | | | | (0.06 | ) | |
Total from investment operations | | | 0.21 | | | | 0.24 | | | | 0.58 | | | | (0.07 | ) | |
LESS DIVIDENDS AND DISTRIBUTIONS | |
Dividends from net investment income | | | (0.15 | ) | | | — | | | | (0.04 | ) | | | — | | |
Distributions from net realized gains | | | (0.12 | ) | | | (0.33 | ) | | | (0.01 | ) | | | — | | |
Total dividends and distributions | | | (0.27 | ) | | | (0.33 | ) | | | (0.05 | ) | | | — | | |
Net asset value, end of period | | $ | 10.31 | | | $ | 10.37 | | | $ | 10.462 | | | $ | 9.93 | | |
Total return4 | | | 2.08 | % | | | 2.35 | % | | | 5.96 | % | | | (0.70 | )% | |
RATIOS AND SUPPLEMENTAL DATA | |
Net assets, end of period (000s omitted) | | $ | 320 | | | $ | 438 | | | $ | 324 | | | $ | 228 | | |
Ratio of net expenses to average net assets | | | 1.82 | % | | | 2.10 | % | | | 2.03 | % | | | 2.04 | %5 | |
Ratio of expenses to average net assets excluding securities
sold short dividend expense | | | 1.57 | % | | | 1.95 | % | | | 1.95 | % | | | 1.95 | %5 | |
Ratio of net investment loss to average net assets | | | (0.44 | )% | | | (1.73 | )% | | | (1.75 | )% | | | (0.18 | )%5 | |
Decrease reflected in above operating expense ratios due to
waivers/reimbursements | | | 2.33 | % | | | 2.48 | % | | | 6.31 | % | | | 9.22 | %5 | |
Portfolio turnover rate | | | 292 | % | | | 431 | % | | | 284 | % | | | 228 | % | |
1 For the period March 30, 2012 (inception date) through October 31, 2012.
2 Includes adjustments in accordance with accounting principles generally accepted in the United States of America and as such, the net asset values for financial reporting purposes and the returns based upon net asset values may differ from the net asset values and returns for shareholder transactions.
3 Per share information is calculated using the average shares outstanding method.
4 Total returns are historical and assume changes in share price, reinvestment of all dividends and distributions and no sales charge. Had certain expenses not been reduced during the periods shown, total returns would have been lower. Total returns for periods less than one year are not annualized.
5 Annualized.
See Accompanying Notes to Consolidated Financial Statements.
21
Credit Suisse Multialternative Strategy Fund
Consolidated Financial Highlights
(For a Class C Share of the Fund Outstanding Throughout Each Period)
| | | For the Year Ended October 31, | |
| | | 2015 | | 2014 | | 2013 | | 20121 | |
Per share data | |
Net asset value, beginning of period | | $ | 10.21 | | | $ | 10.372 | | | $ | 9.89 | | | $ | 10.00 | | |
INVESTMENT OPERATIONS | |
Net investment loss3 | | | (0.12 | ) | | | (0.25 | ) | | | (0.25 | ) | | | (0.06 | ) | |
Net gain (loss) on investments, swap contracts, written options,
securities sold short and foreign currency related items
(both realized and unrealized) | | | 0.24 | | | | 0.42 | | | | 0.74 | | | | (0.05 | ) | |
Total from investment operations | | | 0.12 | | | | 0.17 | | | | 0.49 | | | | (0.11 | ) | |
LESS DIVIDENDS AND DISTRIBUTIONS | |
Dividends from net investment income | | | (0.07 | ) | | | — | | | | — | | | | — | | |
Distributions from net realized gains | | | (0.12 | ) | | | (0.33 | ) | | | (0.01 | ) | | | — | | |
Total dividends and distributions | | | (0.19 | ) | | | (0.33 | ) | | | (0.01 | ) | | | — | | |
Net asset value, end of period | | $ | 10.14 | | | $ | 10.21 | | | $ | 10.372 | | | $ | 9.89 | | |
Total return4 | | | 1.23 | % | | | 1.68 | % | | | 5.15 | % | | | (1.10 | )% | |
RATIOS AND SUPPLEMENTAL DATA | |
Net assets, end of period (000s omitted) | | $ | 379 | | | $ | 1,344 | | | $ | 1,745 | | | $ | 1,074 | | |
Ratio of net expenses to average net assets | | | 2.57 | % | | | 2.85 | % | | | 2.77 | % | | | 2.79 | %5 | |
Ratio of expenses to average net assets excluding securities
sold short dividend expense | | | 2.32 | % | | | 2.70 | % | | | 2.70 | % | | | 2.70 | %5 | |
Ratio of net investment loss to average net assets | | | (1.20 | )% | | | (2.48 | )% | | | (2.49 | )% | | | (1.00 | )%5 | |
Decrease reflected in above operating expense ratios due to
waivers/reimbursements | | | 2.33 | % | | | 2.48 | % | | | 6.31 | % | | | 9.22 | %5 | |
Portfolio turnover rate | | | 292 | % | | | 431 | % | | | 284 | % | | | 228 | % | |
1 For the period March 30, 2012 (inception date) through October 31, 2012.
2 Includes adjustments in accordance with accounting principles generally accepted in the United States of America and as such, the net asset values for financial reporting purposes and the returns based upon net asset values may differ from the net asset values and returns for shareholder transactions.
3 Per share information is calculated using the average shares outstanding method.
4 Total returns are historical and assume changes in share price, reinvestment of all dividends and distributions and no sales charge. Had certain expenses not been reduced during the periods shown, total returns would have been lower. Total returns for periods less than one year are not annualized.
5 Annualized.
See Accompanying Notes to Consolidated Financial Statements.
22
Credit Suisse Multialternative Strategy Fund
Notes to Consolidated Financial Statements
October 31, 2015
Credit Suisse Multialternative Strategy Fund (the "Fund"), a series of the Credit Suisse Opportunity Funds (the "Trust"), a Delaware statutory trust, is registered under the Investment Company Act of 1940, as amended (the "1940 Act"), as a non-diversified open-end management investment company that seeks to achieve total return consistent with the risk and return patterns of a diversified universe of hedge funds. The Trust was organized under the laws of the State of Delaware as a business trust on May 31, 1995.
Credit Suisse Asset Management, LLC ("Credit Suisse"), the investment adviser to the Fund, is registered as a Commodity Pool Operator with the Commodity Futures Trading Commission. The Fund intends to gain exposure to commodities derivatives through investing in a wholly-owned subsidiary, Credit Suisse Cayman Multialternative Strategy Fund, Ltd. (the "Subsidiary"), organized under the laws of the Cayman Islands. The Subsidiary invests in commodity-linked derivative instruments, such as swaps and futures. The Subsidiary may also invest in debt securities, some of which are intended to serve as margin or collateral for the Subsidiary's derivatives positions.
The Subsidiary is managed by the same portfolio managers that manage the Fund and the accompanying financial statements reflect the financial position of the Fund and its Subsidiary and the results of operations on a consolidated basis. The consolidated financial statements include portfolio holdings of the Fund and the Subsidiary and all intercompany transactions and balances have been eliminated. The Fund may invest up to 25% of its total net assets in the Subsidiary. As of October 31, 2015, the Fund held $36,092 in the Subsidiary, representing 0.3% of the Fund's consolidated net assets. For the year ended October 31, 2015, there was no realized gain (loss) on securities held in the Subsidiary.
Subsequent references to the Fund within the Notes to Consolidated Financial Statements collectively refer to the Fund and its Subsidiary.
The Fund offers three classes of shares: Class I shares, Class A shares and Class C shares. Each class of shares represents an equal pro rata interest in the Fund, except they bear different expenses, which reflect the differences in the range of services provided to them. Class A shares are sold subject to a front-end sales charge of up to 5.25%. Class C shares are sold subject to a contingent deferred sales charge of 1.00% if the shares are redeemed within the first year of purchase. Class I shares are sold without a sales charge.
23
Credit Suisse Multialternative Strategy Fund
Notes to Consolidated Financial Statements (continued)
October 31, 2015
Note 2. Significant Accounting Policies
The following is a summary of significant accounting policies followed by the Fund in the preparation of its consolidated financial statements. The policies are in accordance with accounting principles generally accepted in the United States of America ("GAAP"). The preparation of consolidated financial statements requires management to make estimates and assumptions that affect the reported amounts and disclosures in the consolidated financial statements. Actual results could differ from those estimates. The Fund is considered an investment company for financial reporting purposes under GAAP and follows Accounting Standard Codification ("ASC") Topic 946 — Financial Services — Investment Companies.
A) SECURITY VALUATION — The net asset value of the Fund is determined daily as of the close of regular trading on the New York Stock Exchange, Inc. (the "Exchange") on each day the Exchange is open for business. For certain international equity securities, in order to adjust for events which may occur between the close of the foreign exchanges and the close of the New York Stock Exchange, a fair valuation model may be used. This fair valuation model takes into account comparisons to the valuation of American Depository Receipts (ADRs), exchange-traded funds, futures contracts and certain indices and these securities are categorized as Level 2. The valuations for fixed income securities (which may include, but are not limited to, corporate, government, municipal, mortgage-backed, collateralized mortgage obligations and asset-backed securities) and certain derivative instruments are typically the prices supplied by independent third party pricing services, which may use market prices or broker/dealer quotations or a variety of valuation techniques and methodologies. The independent third party pricing services use inputs that are observable such as issuer details, interest rates, yield curves, prepayment speeds, credit risks/spreads, default rates and quoted prices for similar securities. These pricing services generally price fixed income securities assuming orderly transactions of an institutional "round lot" size, but some trades occur in smaller "odd lot" sizes which may be effected at lower prices than institutional round lot trades. Structured note agreements are valued in accordance with a dealer-supplied valuation based on changes in the value of the underlying index. Option contracts on securities, currencies, indices, futures contracts, swaps and other instruments are valued at the mid-point between the last bid and ask quotations as of the close of trading on the exchange which the option is traded. Futures contracts are valued daily at the settlement price established by the board of trade or exchange on which they are traded. Forward contracts are valued at the London closing spot rates and the London closing forward point rates on a daily basis. The currency forward contract
24
Credit Suisse Multialternative Strategy Fund
Notes to Consolidated Financial Statements (continued)
October 31, 2015
Note 2. Significant Accounting Policies (continued)
pricing model derives the differential in point rates to the expiration date of the forward and calculates its present value. Equity securities for which market quotations are available are valued at the last reported sales price or official closing price on the primary market or exchange on which they trade. The Fund may utilize a service provided by an independent third party which has been approved by the Board of Trustees (the "Board") to fair value certain securities. When fair value pricing is employed, the prices of securities used by the Fund to calculate its net asset value may differ from quoted or published prices for the same securities. If independent third party pricing services are unable to supply prices for a portfolio investment, or if the prices supplied are deemed by the investment adviser to be unreliable, the market price may be determined by the investment adviser using quotations from one or more broker/dealers or at the transaction price if the security has recently been purchased and no value has yet been obtained from a pricing service or pricing broker. When reliable prices are not readily available, such as when the value of a security has been significantly affected by events after the close of the exchange or market on which the security is principally traded, but before the Fund calculates its net asset value, the Fund values these securities as determined in accordance with procedures approved and established by the Board.
The Fund uses valuation techniques to measure fair value that are consistent with the market approach and/or income approach, depending on the type of security and the particular circumstance. The market approach uses prices and other relevant information generated by market transactions involving identical or comparable securities. The income approach uses valuation techniques to discount estimated future cash flows to present value.
GAAP established a disclosure hierarchy that categorizes the inputs to valuation techniques used to value assets and liabilities at each measurement date. These inputs are summarized in the three broad levels listed below:
• Level 1 – quoted prices in active markets for identical investments
• Level 2 – other significant observable inputs (including quoted prices for similar investments, interest rates, prepayment speeds, credit risk, etc.)
• Level 3 – significant unobservable inputs (including the Fund's own assumptions in determining the fair value of investments)
The inputs or methodologies used to value securities are not necessarily an indication of the risk associated with investing in those securities.
25
Credit Suisse Multialternative Strategy Fund
Notes to Consolidated Financial Statements (continued)
October 31, 2015
Note 2. Significant Accounting Policies (continued)
The following is a summary of the inputs used as of October 31, 2015 in valuing the Fund's assets and liabilities carried at fair value:
Assets | | Level 1 | | Level 2 | | Level 3 | | Total | |
Investments in Securities | |
Common Stocks | | $ | 2,860,759 | | | $ | 546,777 | | | $ | — | | | $ | 3,407,536 | | |
Exchange Traded Funds | | | 5,740,693 | | | | — | | | | — | | | | 5,740,693 | | |
Investment Companies | | | 1,176,562 | | | | — | | | | — | | | | 1,176,562 | | |
Right | | | — | | | | — | | | | 52 | | | | 52 | | |
Short-term Investments | | | — | | | | 4,551,714 | | | | — | | | | 4,551,714 | | |
| | $ | 9,778,014 | | | $ | 5,098,491 | | | $ | 52 | | | $ | 14,876,557 | | |
Other Financial Instruments* | |
Forward Foreign Currency Contracts | | $ | — | | | $ | 44,694 | | | $ | — | | | $ | 44,694 | | |
Swap Contracts | | | — | | | | 17,474 | | | | — | | | | 17,474 | | |
Liabilities | | Level 1 | | Level 2 | | Level 3 | | Total | |
Securities Sold Short | |
Common Stocks | | $ | 953,832 | | | $ | 197,715 | | | $ | — | | | $ | 1,151,547 | | |
Other Financial Instruments* | |
Forward Foreign Currency Contracts | | | — | | | | 11,230 | | | | — | | | | 11,230 | | |
Swap Contracts | | | — | | | | 14,228 | | | | — | | | | 14,228 | | |
*Other financial instruments include unrealized appreciation (depreciation) on forwards and swap contracts.
As of October 31, 2015, the Fund holds Level 3 securities that were measured at fair value that amounted to less than 0.01% of consolidated net assets.
For the year ended October 31, 2015, there were no transfers in and out of Level 2 and Level 3, but but there were $68,367 transferred out from Level 2 to Level 1, as a result of the availability of a pricing source supported by observable inputs. All transfers, if any, are assumed to occur at the end of the reporting period.
B) DERIVATIVE INSTRUMENTS AND HEDGING ACTIVITIES — The Fund adopted amendments to authoritative guidance on disclosures about derivative instruments and hedging activities which require that a fund disclose (a) how and why an entity uses derivative instruments, (b) how derivative instruments and hedging activities are accounted for and (c) how derivative instruments and related hedging activities affect a fund's financial position, financial performance and cash flows. For the year ended October 31, 2015, the Fund's derivatives did not qualify for hedge accounting as they are held at fair value.
26
Credit Suisse Multialternative Strategy Fund
Notes to Consolidated Financial Statements (continued)
October 31, 2015
Note 2. Significant Accounting Policies (continued)
Fair Values of Derivative Instruments as of October 31, 2015
| | Asset Derivatives | | Liability Derivatives | |
| | Balance Sheet
Location | | Fair Value | | Balance Sheet
Location | | Fair Value | |
Currency Contracts
| | Unrealized appreciation
on forward currency
contracts | | $ | 44,694 | | | Unrealized depreciation
on forward currency
contracts | | $ | 11,230 | | |
Index Contracts
| | Unrealized appreciation
on open swap
contracts | | | 17,474 | | | Unrealized depreciation
on open swap contracts | | | 14,228 | | |
| | | | | | $ | 62,168 | | | $ | 25,458 | | |
Effect of Derivative Instruments on the consolidated Statement of Operations
| | Location | | Realized
Gain (Loss) | | Location | | Net Unrealized
Appreciation
(Depreciation) | |
Currency Contracts
| | Net realized loss
from foreign | | | | | | Net change in unrealized | | | | | |
| | currency
transactions* | | $ | (113,539 | ) | | appreciation (depreciation) from
foreign currency transactions* | | $ | 28,167 | | |
Index Contracts
| | Net realized gain
from swap | | | | | | Net change in unrealized
appreciation (depreciation) from | | | | | |
| | | contracts | | | 327,572 | | | swap contracts | | | 12,585 | | |
Equity Contracts
| | Net realized gain
from written | | | | | | Net change in unrealized
appreciation (depreciation) from | | | | | |
| | | options | | | 145,348 | | | written options | | | (91,307 | ) | |
| | | | $ | 359,381 | | | | | $ | (50,555 | ) | |
*Statement of Operations includes both forward currency contracts and foreign currency transactions/translations.
The value amount of forward foreign currency contracts, the notional amount of swap contracts and the value amount of written options at the year ended October 31, 2015 is reflected in the Consolidated Schedule of Investments. For the year ended October 31, 2015, the Fund held an average monthly value on a net basis of $1,968,526 in forward foreign currency contracts and average monthly notional value on a net basis of $6,390,676 in swap contracts, respectively. For the year ended October 31, 2015, the Fund received average monthly premiums of $29,842 from written options contracts.
The Fund is a party to International Swap and Derivatives Association, Inc. ("ISDA") Master Agreements ("Master Agreements") with certain counterparties that govern over-the-counter derivative (including Total Return, Credit Default and Interest Rate Swaps) and foreign exchange contracts entered into by the Fund. The Master Agreements may contain provisions regarding, among other things, the parties' general obligations, representations,
27
Credit Suisse Multialternative Strategy Fund
Notes to Consolidated Financial Statements (continued)
October 31, 2015
Note 2. Significant Accounting Policies (continued)
agreements, collateral requirements, events of default and early termination. Termination events applicable to the Fund may occur upon a decline in the Fund's net assets below a specified threshold over a certain period of time.
The following table presents by counterparty the Fund's derivative assets net of related collateral held by the Fund at October 31, 2015:
| Counterparty | | Gross Amounts of
Assets Presented in
the Consolidated
Statement of Assets
and Liabilities(a) | | Financial
Instruments
and Derivatives
Available for Offset | | Non-Cash
Collateral
Received | | Cash
Collateral
Received | | Net Amount
of Derivative
Assets | |
Goldman Sachs | | $ | 5,781 | | | $ | (5,781 | ) | | $ | — | | | $ | — | | | $ | — | | |
Societe Generale | | | 44,694 | | | | (11,641 | ) | | | — | | | | — | | | | 33,053 | | |
| | $ | 50,475 | | | $ | (17,422 | ) | | $ | — | | | $ | — | | | $ | 33,053 | | |
The following table presents by counterparty the Fund's derivative liabilities net of related collateral pledged by the Fund at October 31, 2015:
| Counterparty | | Gross Amounts of
Liabilities Presented in
the Consolidated
Statement of Assets
and Liabilities(a) | | Financial
Instruments
and Derivatives
Available for Offset | | Non-Cash
Collateral
Pledged | | Cash
Collateral
Pledged(b) | | Net Amount
of Derivative
Liabilities | |
Goldman Sachs | | $ | 13,817 | | | $ | (5,781 | ) | | $ | — | | | $ | (8,036 | ) | | $ | — | | |
Societe Generale | | | 11,641 | | | | (11,641 | ) | | | — | | | | — | | | | — | | |
| | | $ | 25,458 | | | $ | (17,422 | ) | | $ | — | | | $ | (8,036 | ) | | $ | — | | |
(a) Swap and Forward foreign currency exchange contracts are included.
(b) The actual collateral received and/or pledged may be more than the amounts shown.
C) FOREIGN CURRENCY TRANSACTIONS — The books and records of the Fund are maintained in U.S. dollars. Transactions denominated in foreign currencies are recorded at the current prevailing exchange rates. All assets and liabilities denominated in foreign currencies are translated into U.S. dollar amounts at the current exchange rate at the end of the period. Translation gains or losses resulting from changes in the exchange rate during the reporting period and realized gains and losses on the settlement of foreign currency transactions are reported in the results of operations for the current period. The Fund isolates that portion of realized gains and losses on investments which is due to changes in the foreign exchange rate from that which is due to changes in market prices.
D) SECURITY TRANSACTIONS AND INVESTMENT INCOME/EXPENSE — Security transactions are accounted for on a trade date basis. Interest
28
Credit Suisse Multialternative Strategy Fund
Notes to Consolidated Financial Statements (continued)
October 31, 2015
Note 2. Significant Accounting Policies (continued)
income/expense is recorded on the accrual basis. The Fund amortizes premiums and accretes discounts using the effective interest method. Dividend income/expense is recorded on the ex-dividend date. Certain expenses are class-specific expenses, vary by class and are charged only to that class. Income, expenses (excluding class-specific expenses) and realized/unrealized gains/losses are allocated proportionately to each class of shares based upon the relative net asset value of the outstanding shares of that class. The cost of investments sold is determined by use of the specific identification method for both financial reporting and income tax purposes.
E) DIVIDENDS AND DISTRIBUTIONS TO SHAREHOLDERS — Dividends from net investment income, if any, are declared and paid quarterly. Distributions of net realized capital gains, if any, are declared and paid at least annually. However, to the extent that a net realized capital gain can be reduced by a capital loss carryforward, such gain will not be distributed. Income and capital gain distributions are determined in accordance with federal income tax regulations, which may differ from GAAP.
F) FEDERAL INCOME TAXES — No provision is made for federal taxes as it is the Fund's intention to continue to qualify as a regulated investment company ("RIC") under the Internal Revenue Code of 1986, as amended (the "Code"), and to make the requisite distributions to its shareholders, which will be sufficient to relieve it from federal income and excise taxes.
In order to qualify as a RIC under the Code, the Fund must meet certain requirements regarding the source of its income, the diversification of its assets and the distribution of its income. One of these requirements is that the Fund derive at least 90% of its gross income for each taxable year from dividends, interest, payments with respect to certain securities loans, gains from the sale or other disposition of stock, securities or foreign currencies, other income derived with respect to its business of investing in such stock, securities or currencies or net income derived from interests in certain publicly traded partnerships ("Qualifying Income"). The Internal Revenue Service ("IRS") has issued a ruling that income realized from certain types of commodity-linked derivatives would not be Qualifying Income. As a result, the Fund's ability to realize income from investments in such commodity-linked derivatives as part of its investment strategy would be limited to a maximum of 10% of its gross income. The IRS has issued private letter rulings to registered investment companies concluding that income derived from their investment in a wholly-owned subsidiary would constitute Qualifying Income to the fund. The IRS has indicated that the granting of these types of private letter rulings is
29
Credit Suisse Multialternative Strategy Fund
Notes to Consolidated Financial Statements (continued)
October 31, 2015
Note 2. Significant Accounting Policies (continued)
currently suspended, pending further internal discussion. As a result, there can be no assurance that the IRS will grant, such a private letter ruling to the Fund. If the Fund does not receive such a private letter ruling, there is a risk that the IRS could assert that the income derived from the Fund's investment in the Subsidiary will not be considered Qualifying Income for purposes of the fund remaining qualified as a RIC for U.S. federal income tax purposes. If the Fund is unable to ensure continued qualification as a RIC, the Fund may be required to change its investment objective, policies or techniques, or may be liquidated. If the Fund fails to qualify as a RIC, the Fund will be subject to federal income tax on its net income and capital gains at regular corporate rates (without reduction for distributions to shareholders). If the Fund were to fail to qualify as a RIC and become subject to federal income tax, shareholders of the Fund would be subject to the risk of diminished returns.
The Fund adopted the authoritative guidance for uncertainty in income taxes and recognizes a tax benefit or liability from an uncertain position only if it is more likely than not that the position is sustainable based solely on its technical merits and consideration of the relevant taxing authority's widely understood administrative practices and procedures. The Fund has reviewed its current tax positions and has determined that no provision for income tax is required in the Fund's financial statements. The Fund's federal tax returns for the prior three fiscal years remain subject to examination by the IRS.
G) SHORT-TERM INVESTMENTS — The Fund, together with other funds/portfolios advised by Credit Suisse, pools available cash into a short-term variable rate time deposit issued by State Street Bank and Trust Company ("SSB"), the Fund's custodian. The short-term time deposit issued by SSB is a variable rate account classified as a short-term investment.
H) SHORT SALES — The Fund enters into short sales transactions collateralized by cash deposits received from brokers in connection with securities lending activities and securities. The collateral amounts required are determined daily by reference to the market value of the short positions. Short sales expose the Fund to the risk that it will be required to cover its short position at a time when the securities have appreciated in value, thus resulting in a loss to the Fund. The Fund's loss on a short sale could theoretically be unlimited in a case where the Fund is unable, for whatever reason, to close out its short position. Short sales also involve transaction and other costs that will reduce potential gains and increase potential Fund losses. The use by the Fund of short sales in combination with long positions in the Fund in an attempt to improve performance may not be successful and may result in greater losses
30
Credit Suisse Multialternative Strategy Fund
Notes to Consolidated Financial Statements (continued)
October 31, 2015
Note 2. Significant Accounting Policies (continued)
or lower positive returns than if the Fund held only long positions. It is possible that the Fund's long equity positions will decline in value at the same time that the value of the securities it has sold short increases, thereby increasing potential losses to the Fund. In addition, the Fund's short selling strategies may limit its ability to fully benefit from increases in the equity markets. Short selling also involves a form of financial leverage that may exaggerate any losses realized by the Fund. Also, there is the risk that the counterparty to a short sale may fail to honor its contractual terms, causing a loss to the Fund. At October 31, 2015, the amount of restricted cash held at brokers was $186,279.
I) FUTURES — The Fund may enter into futures contracts to the extent permitted by its investment policies and objectives. The Fund may use futures contracts to gain exposure to or hedge against changes in interest rates, equity and market price movements and/or currency risks. Upon entering into a futures contract, the Fund is required to deposit cash and/or pledge U.S. Government securities as initial margin. Subsequent payments, which are dependent on the daily fluctuations in the value of the underlying instrument, are made or received by the Fund each day (daily variation margin) and are recorded as unrealized gains or losses until the contracts are closed. When the contracts are closed, the Fund records a realized gain or loss equal to the difference between the proceeds from (or cost of) the closing transactions and the Fund's basis in the contract. Risks of entering into futures contracts for hedging purposes include the possibility that a change in the value of the contract may not correlate with the changes in the value of the underlying instruments. With futures, there is minimal counterparty credit risk to the Fund since futures are exchange traded and the exchange's clearinghouse, as counterparty to all exchange traded futures, guarantees the futures against default. In addition, the purchase of a futures contract involves the risk that the Fund could lose more than the original margin deposit and subsequent payments may be required for a futures transaction. The Fund's open futures contracts are disclosed in the Consolidated Schedule of Investments. At October 31, 2015, the amount of restricted cash held at brokers was $24,781.
J) FORWARD FOREIGN CURRENCY CONTRACTS — A forward foreign currency exchange contract ("forward currency contract") is a commitment to purchase or sell a foreign currency at the settlement date at a negotiated rate. The Fund will enter into forward foreign currency contracts primarily for hedging foreign currency risk. Forward currency contracts are valued at the prevailing forward exchange rate of the underlying currencies and unrealized gain (loss) is recorded daily. On the settlement date of the forward currency
31
Credit Suisse Multialternative Strategy Fund
Notes to Consolidated Financial Statements (continued)
October 31, 2015
Note 2. Significant Accounting Policies (continued)
contract, the Fund records a realized gain or loss equal to the difference between the value of the contract at the time it was opened and the value of the contract at the time it was closed. Certain risks may arise upon entering into forward currency contracts from the potential inability of counterparties to meet the terms of their contracts. The maximum counterparty credit risk to the Fund is measured by the unrealized gain on appreciated contracts. Additionally, when utilizing forward currency contracts to hedge, the Fund gives up the opportunity to profit from favorable exchange rate movements during the term of the contract. The Fund's open forward foreign currency contracts at October 31, 2015 are disclosed in the Consolidated Schedule of Investments.
K) SWAPS — The Fund may enter into swaps either for hedging purposes or to seek to increase total return. A swap contract is an agreement that obligates two parties to exchange a series of cash flows at specified intervals based upon or calculated by reference to changes in specified prices or rates for a specified amount of an underlying asset or notional principal amount. A centrally cleared swap is a transaction executed between the Fund and a counterparty, then cleared by a clearing member through a central clearinghouse. The central clearinghouse serves as the counterparty, with whom the Fund exchanges cash flows. The Fund will enter into swap contracts only on a net basis, which means that the two payment streams are netted out, with the Fund receiving or paying, as the case may be, only the net amount of the two payments. Risks may arise as a result of the failure of the counterparty to the swap contract to comply with the terms of the swap contract. The extent of the Fund's exposure to credit and counterparty risks is the discounted net value of the cash flows to be received from the counterparty over the contract's remaining life, to the extent that the amount is positive. These risks are mitigated by having a master netting arrangement between the Fund and the counterparty and by the posting of collateral by the counterparty to the Fund to cover the Fund's exposure to the counterparty. Therefore, the Fund considers the creditworthiness of each counterparty as well as the amounts posted by the counterparty pursuant to the master netting agreement to a swap contract in evaluating potential credit risk. Additionally, risks may arise from unanticipated movements in interest rates or in the value of the underlying reference asset or index.
The Fund may enter into total return swap contracts, involving commitments to pay interest in exchange for a market-linked return, both based on notional amounts. The Fund may invest in total return swap contracts for hedging
32
Credit Suisse Multialternative Strategy Fund
Notes to Consolidated Financial Statements (continued)
October 31, 2015
Note 2. Significant Accounting Policies (continued)
purposes or to seek to increase total return. To the extent the total return of the security or index underlying the transactions exceeds or falls short of the offsetting interest rate obligation, the Fund will receive a payment from or make a payment to the counterparty.
The Fund may enter into credit default swap agreements either as a buyer or seller. The Fund may buy a credit default swap to attempt to mitigate the risk of default or credit quality deterioration in one or more individual holdings or in a segment of the fixed income securities market. The Fund may sell a credit default swap in an attempt to gain exposure to an underlying issuer's credit quality characteristics without investing directly in that issuer.
The Fund bears the risk of loss of the amount expected to be received under a credit default swap agreement in the event of the default or bankruptcy of the counterparty. The Fund will enter into swap agreements only with counterparties that meet certain standards of creditworthiness (generally, such counterparties would have to be eligible counterparties under the terms of the Fund's repurchase agreement guidelines). Credit default swap agreements are generally valued at a price at which the counterparty to such agreement would terminate the agreement.
The Fund records unrealized gains or losses on a daily basis representing the value and the current net receivable or payable relating to open swap contracts. Net amounts received or paid on the swap contract are recorded as realized gains or losses. Fluctuations in the value of swap contracts are recorded for financial statement purposes as unrealized appreciation or depreciation on swap contracts. Realized gains and losses from terminated swaps are included in net realized gains/losses on swap contracts transactions. Upon entering into a centrally cleared swap, the Fund is required to deposit with a financial intermediary cash or securities ("initial margin") in an amount equal to a certain percentage of the notional amount of the swap. Subsequent payments ("variation margin") are made or received by the Fund dependent upon the daily fluctuations in the value of the swap. In a cleared swap transaction, counterparty risk is minimized as the central clearinghouse acts as the counterparty. The Fund's open swap contracts are disclosed in the Consolidated Schedule of Investments. At October 31, 2015, the amount of restricted cash held at brokers and centrally cleared swaps for the Fund were $300,000 and $46,274, respectively.
L) OPTION CONTRACTS — The Fund will enter into options contracts to gain exposure to risk volatility based assets. When the Fund purchases an option, it pays a premium and the option is subsequently marked to market to
33
Credit Suisse Multialternative Strategy Fund
Notes to Consolidated Financial Statements (continued)
October 31, 2015
Note 2. Significant Accounting Policies (continued)
reflect current value. Premiums paid for purchasing options which expire are treated as realized losses. Premiums paid for purchasing options which are exercised or closed are added to the cost or deducted from the proceeds on the underlying instrument to determine the realized gain or loss. The risk associated with purchasing options is limited to the premium paid.
When the Fund writes an option, an amount equal to the net premium received (the premium less commission) is recorded as a liability and is subsequently adjusted to the current value. Net premiums received for written options which expire are treated as realized gains. Net premiums received for written options which are exercised or closed are deducted from the cost or added to the proceeds on the underlying instrument or closing purchase transaction to determine the realized gain or loss. The Fund, as writer of a written option, bears the risk of an unfavorable change in the market value of the instrument underlying the written option.
Exchange-traded options have standardized contracts and are settled through a clearing house with fulfillment guaranteed by the credit of the exchange. Therefore, counterparty credit risks to the Fund are limited. Over-the-counter options are subject to the risk that the counterparty is unable or unwilling to meet its obligations under the option. The Fund's exchanged traded written options are disclosed in the Consolidated Schedule of Investments. At October 31, 2015, the amount of restricted cash held at brokers was $740,173.
For the year ended October 31, 2015, transactions for written options on securities, interest rate swaps and futures were as follows:
| | | Number of
Contracts | | Premium
Received | |
Written Options, outstanding as of October 31, 2014 | | | 68 | | | $ | 154,717 | | |
Options written | | | 124 | | | | 220,485 | | |
Options closed | | | (178 | ) | | | (339,059 | ) | |
Options exercised | | | — | | | | — | | |
Options expired | | | (14 | ) | | | (36,143 | ) | |
Written Options, outstanding as of October 31, 2015 | | | — | | | $ | — | | |
M) SECURITIES LENDING — Loans of securities are required at all times to be secured by collateral at least equal to 102% of the market value of domestic securities on loan (including any accrued interest thereon) and 105% of the market value of foreign securities on loan (including any accrued interest thereon). Cash collateral received by the Fund in connection with securities lending activity may be pooled together with cash collateral for other
34
Credit Suisse Multialternative Strategy Fund
Notes to Consolidated Financial Statements (continued)
October 31, 2015
Note 2. Significant Accounting Policies (continued)
funds/portfolios advised by Credit Suisse and may be invested in a variety of investments, including funds advised by SSB, the Fund's securities lending agent or money market instruments. However, in the event of default or bankruptcy by the other party to the agreement, realization and/or retention of the collateral may be subject to legal proceedings.
SSB has been engaged by the Fund to act as the Fund's securities lending agent. As of October 31, 2015, the Fund had investment securities on loan with a fair value of $1,289,700 and a related liability of $1,321,803 for collateral received on securities loaned, both of which are presented gross on the Consolidated Statement of Assets and Liabilities. The collateral for securities loaned is valued consistently to the other investments held by the Fund and is included in level 2 of the fair value hierarchy. For the year ended October 31, 2015, the value of the related collateral exceeded the value of the securities loaned.
The Fund's securities lending arrangement provides that the Fund and SSB will share the net income earned from securities lending activities. During the year ended October 31, 2015, total earnings from the Fund's investment in cash collateral received in connection with securities lending arrangements was $13,050, of which $20 was rebated to borrowers (brokers). The Fund retained $11,073 in income from the cash collateral investment, and SSB, as lending agent, was paid $1,957. Securities lending income is accrued as earned.
N) OTHER — In the normal course of business the Fund trades financial instruments and enters into financial transactions where risk of potential loss exists due to changes in the market (market risk) or failure of the other party to a transaction to perform (credit risk). Similar to credit risk, the Fund may be exposed to counterparty risk, or the risk that an institution or other entity with which the Fund has unsettled or open transactions will default. The potential loss could exceed the value of the financial assets recorded in the consolidated financial statements. Financial assets, which potentially expose the Fund to credit risk, consist principally of cash due from counterparties and investments. The extent of the Fund's exposure to credit and counterparty risks in respect to these financial assets approximates their carrying value as recorded in the Fund's Consolidated Statement of Assets and Liabilities.
O) FOREIGN INVESTMENTS RISK — The Fund may have elements of risk not typically associated with investments in the United States of America due to concentrated investments in a limited number of countries or regions, which may vary throughout the year. Such concentrations may subject the Fund to additional risks resulting from political or economic conditions in such
35
Credit Suisse Multialternative Strategy Fund
Notes to Consolidated Financial Statements (continued)
October 31, 2015
Note 2. Significant Accounting Policies (continued)
countries or regions and the possible imposition of adverse governmental laws or currency exchange restrictions could cause the securities and their markets to be less liquid and their prices to be more volatile than those of comparable U.S. securities.
Because the Fund may invest a significant portion of its assets in these markets, it is subject to greater risks of adverse events that occur in those markets and may experience greater volatility than a fund that is more broadly diversified geographically.
P) NEW ACCOUNTING PRONOUNCEMENTS — In June 2014, Financial Accounting Standards Board ("FASB") issued ASU No. 2014-11, Transfers and Servicing (Topic 860), Repurchase-to-Maturity Transactions, Repurchase Financings, and Disclosures. The ASU changes the accounting for certain repurchase agreements and expands disclosure requirements related to repurchase agreements, securities lending, repurchase-to-maturity and similar transactions. The ASU is effective for interim and annual reporting periods beginning after December 15, 2014. Management has reviewed the requirements and believes the adoption of this ASU will not have a material impact on the financial statements.
On April 7, 2015, the Financial Accounting Standards Board (FASB) issued a new Accounting Standards Update (ASU) No. 2015-03, "Simplifying the Presentation of Debt Issuance Costs". The ASU requires debt issuance costs to be presented on the balance sheet as a direct deduction from the debt liability. The ASU is effective for interim and annual reporting periods beginning after December 15, 2015. Management has reviewed the requirements and believes the adoption of this ASU will not have a material impact on the financial statements.
In May 2015, the FASB issued ASU No. 2015-07, "Disclosures for Investments in Certain Entities that Calculate Net Asset Value per Share (or its Equivalent)". The guidance removes the requirement to categorize within the fair value hierachy all investments for which fair value is measured using the NAV per share practical expedient. Sufficient information must be provided to permit reconciliation of the fair value of assets categorized within the fair value hierachy to the amounts presented in the Consolidated Statements of Assets and Liabilities. The guidance is required to be presented for annual periods beginning after December 15, 2015, and for interim periods within those fiscal years. Management is currently reviewing the requirements and believes the adoption of this ASU will not have a material impact on its financial statements.
36
Credit Suisse Multialternative Strategy Fund
Notes to Consolidated Financial Statements (continued)
October 31, 2015
Note 2. Significant Accounting Policies (continued)
Q) SUBSEQUENT EVENTS — In preparing the financial statements as of October 31, 2015, management considered the impact of subsequent events for potential recognition or disclosure in these financial statements through the date of release of this report. No such events requiring recognition or disclosure were identified through the date of the release of this report.
Note 3. Transactions with Affiliates and Related Parties
Credit Suisse serves as investment adviser for the Fund. For its investment advisory services, Credit Suisse is entitled to receive a fee from the Fund at an annual rate of 0.95% of the Fund's average daily net assets. For the year ended October 31, 2015, investment advisory fees earned and fees waived/expenses reimbursed were $131,703 and $320,832, respectively. The Fund is authorized to reimburse Credit Suisse for management fees previously limited and/or for expenses previously paid by Credit Suisse, provided, however, that any reimbursements must be paid at a date not more than three years after the end of the fiscal year during which such fees were limited or expenses were reimbursed by Credit Suisse and the reimbursements do not cause a class to exceed the applicable expense limitation in the contract at the time the fees were limited or expenses are paid. Currently, Credit Suisse contractually waives fees and reimburses expenses so that the Fund's annual operating expenses will not exceed 1.30% of the Fund's average daily net assets for Class I shares, 1.55% of the Fund's average daily net assets for Class A shares, and 2.30% of the Fund's average daily net assets for Class C shares. Effective November 18, 2015, the contractual expense limitation with respect to the Fund will be lowered to 1.10% of the Fund's average daily net assets for Class A shares, 1.85% of the Fund's average daily net assets for Class C shares and 0.85% of the Fund's average daily net assets for Class I shares. This contract may not be terminated before February 28, 2017.
For the year ended October 31, 2015, the amounts waived and reimbursed by Credit Suisse, as well as the amounts available for recoupment/potential
37
Credit Suisse Multialternative Strategy Fund
Notes to Consolidated Financial Statements (continued)
October 31, 2015
Note 3. Transactions with Affiliates and Related Parties (continued)
future recoupment by Credit Suisse and the expiration schedule at October 31, 2015 are as follows:
| | | Fee waivers/
expense
reimbursements
subject to
repayment* | | Expires
October 31,
2016 | | Expires
October 31,
2017 | | Expires
October 31,
2018 | |
Class I | | $ | 768,263 | | | $ | 290,327 | | | $ | 201,552 | | | $ | 276,384 | | |
Class A | | | 32,243 | | | | 15,111 | | | | 9,091 | | | | 8,041 | | |
Class C | | | 160,623 | | | | 95,562 | | | | 38,016 | | | | 27,045 | | |
Totals | | $ | 961,129 | | | $ | 401,000 | | | $ | 248,659 | | | $ | 311,470 | | |
*The Subsidiary is not eligible for recoupment.
Fee waivers/expense reimbursements subject to potential recoupment in the amount of $306,844 expired on October 31, 2015.
Credit Suisse and SSB serve as co-administrators to the Fund. For its co-administrative services, Credit Suisse received a fee calculation at an annual rate of 0.09% of the Fund's average daily net assets. For the year ended October 31, 2015, co-administrative services fees earned by Credit Suisse were $12,354.
For its co-administrative services, SSB receives a fee, exclusive of out-of-pocket expenses, calculated in total for all the Credit Suisse funds/portfolios co-administered by SSB and allocated based upon the relative average net assets of each fund/portfolio, subject to an annual minimum fee. For the year ended October 31, 2015, co-administrative services fees earned by SSB (including out-of-pocket expenses) with respect to the Fund were $9,139.
Credit Suisse Securities (USA) LLC ("CSSU"), an affiliate of Credit Suisse, serves as the distributor of the Fund's shares. Pursuant to distribution plans adopted by the Fund pursuant to Rule 12b-1 under the 1940 Act, CSSU received fees for its distribution services. These fees were calculated at an annual rate of 0.25% of the average daily net assets of the Class A shares. For the Class C shares, the fee is calculated at an annual rate of 1.00% of the average daily net assets. For the year ended October 31, 2015, the Fund paid Rule 12b-1 distribution fees of $887 for Class A shares and $11,934 for Class C shares. Class I shares are not subject to Rule 12b-1 distribution fees.
Certain brokers, dealers and financial representatives provide transfer agent related services to the Fund and receive compensation from the Fund. For the year ended October 31, 2015, the Fund paid $12,380, which is included within transfer agent fees on the Consolidated Statement of Operations.
38
Credit Suisse Multialternative Strategy Fund
Notes to Consolidated Financial Statements (continued)
October 31, 2015
Note 3. Transactions with Affiliates and Related Parties (continued)
For the year ended October 31, 2015, CSSU and its affiliates advised the Fund that they retained $19 from commissions earned on the sale of the Fund's Class A shares. There were no commissions earned on sale of Class C shares.
Affiliated Issuers — The Fund may invest in other Credit Suisse Funds ("Underlying Credit Suisse Funds"). The Underlying Credit Suisse Funds in which the Fund invests are considered to be affiliated investments. The Fund invested 8.6% of the Fund's consolidated net assets in Underlying Credit Suisse Funds. Investments in Underlying Credit Suisse Funds are valued at the Underlying Credit Suisse Fund's net asset value per share ("NAV") as of the report date. A summary of the Fund's transactions with an affiliated Underlying Credit Suisse Fund during the year ended October 31, 2015 is as follows:
Issuer | | Value
of Affiliate
at 10/31/2014 | | Purchases | | Sales | | Gain (loss) | | Dividend
income | | Net
realized gain
distribution | | Value
of Affiliate
at 10/31/2015 | |
Credit Suisse
Managed Futures
Strategy Fund | | $ | 950,381 | | | $ | 532,667 | | | $ | 359,900 | | | $ | (9,305 | ) | | $ | 3,775 | | | $ | 64,792 | | | $ | 1,176.562 | | |
Note 4. Line of Credit
The Fund, together with other funds/portfolios advised by Credit Suisse (collectively, the "Participating Funds"), participates in a committed, unsecured line of credit facility ("Credit Facility"), in an aggregated amount of $200 million for temporary or emergency purposes with SSB under a first-come, first-served basis. Under the terms of the Credit Facility, the Participating Funds pay an aggregate commitment fee on the average unused amount of the Credit Facility, which is allocated among the Participating Funds in such manner as is determined by the governing Boards of the Participating Funds. In addition, the Participating Funds pay interest on borrowings at either the Overnight Federal Funds rate or the Overnight LIBOR rate plus a spread. At October 31, 2015 and during the year ended October 31, 2015, the Fund had no borrowings outstanding under the Credit Facility.
39
Credit Suisse Multialternative Strategy Fund
Notes to Consolidated Financial Statements (continued)
October 31, 2015
Note 5. Purchases and Sales of Securities
For the year ended October 31, 2015, purchases and sales of investment securities (excluding short-term investments) and U.S. Government and Agency Obligations were as follows:
Investment Securities | |
| Purchases | | Sales | |
| $ | 22,393,149 | | | $ | 15,352,611 | | |
Securities sold short and purchases to cover securities sold short were as follows:
Investment Securities | |
| Purchases to Cover | | Securities Sold Short | |
| $ | 2,570,791 | | | $ | 2,782,418 | | |
Note 6. Capital Share Transactions
The Fund is authorized to issue an unlimited number of full and fractional shares of beneficial interest, $.001 par value per share. The Fund offers Class I, Class A and Class C shares. Transactions in capital shares for each class of the Fund were as follows:
| | | Class I | |
| | | For the Year Ended
October 31, 2015 | | For the Year Ended
October 31, 2014 | |
| | | Shares | | Value | | Shares | | Value | |
Shares sold | | | 232,051 | | | $ | 2,428,772 | | | | 577,382 | | | $ | 5,956,752 | | |
Shares issued in reinvestment
of dividends and distributions | | | 31,896 | | | | 326,614 | | | | 16,674 | | | | 168,910 | | |
Shares redeemed | | | (106,081 | ) | | | (1,112,983 | ) | | | (11,539 | ) | | | (119,905 | ) | |
Net increase | | | 157,866 | | | $ | 1,642,403 | | | | 582,517 | | | $ | 6,005,757 | | |
| | | Class A | |
| | | For the Year Ended
October 31, 2015 | | For the Year Ended
October 31, 2014 | |
| | | Shares | | Value | | Shares | | Value | |
Shares sold | | | 3,384 | | | $ | 35,067 | | | | 23,801 | | | $ | 244,841 | | |
Shares issued in reinvestment
of dividends and distributions | | | 1,040 | | | | 10,618 | | | | 896 | | | | 9,044 | | |
Shares redeemed | | | (15,566 | ) | | | (158,806 | ) | | | (13,458 | ) | | | (139,274 | ) | |
Net increase (decrease) | | | (11,142 | ) | | $ | (113,121 | ) | | | 11,239 | | | $ | 114,611 | | |
40
Credit Suisse Multialternative Strategy Fund
Notes to Consolidated Financial Statements (continued)
October 31, 2015
Note 6. Capital Share Transactions (continued)
| | | Class C | |
| | | For the Year Ended
October 31, 2015 | | For the Year Ended
October 31, 2014 | |
| | | Shares | | Value | | Shares | | Value | |
Shares sold | | | 634 | | | $ | 6,664 | | | | 5,639 | | | $ | 57,656 | | |
Shares issued in reinvestment
of dividends and distributions | | | 2,342 | | | | 23,545 | | | | 5,446 | | | | 54,515 | | |
Shares redeemed | | | (97,202 | ) | | | (979,705 | ) | | | (47,716 | ) | | | (487,750 | ) | |
Net decrease | | | (94,226 | ) | | $ | (949,496 | ) | | | (36,631 | ) | | $ | (375,579 | ) | |
On October 31, 2015, the number of shareholders that held 5% or more of the outstanding shares of each class of the Fund was as follows:
| | | Number of
Shareholders | | Approximate Percentage
of Outstanding Shares | |
Class I | | | 5 | * | | | 78 | % | |
Class A | | | 3 | * | | | 96 | % | |
Class C | | | 3 | * | | | 100 | % | |
*This includes the seed money from Merchant Holding, Inc., an affiliate of Credit Suisse.
Some of the shareholders may be omnibus accounts, which hold shares on behalf of individual shareholders.
Note 7. Federal Income Taxes
Income and capital gain distributions are determined in accordance with federal income tax regulations, which may differ from GAAP.
The tax characteristics of dividends paid during the years ended October 31, 2015 and 2014, respectively, by the Fund were as follows:
Ordinary Income | | Long-Term Capital Gain | |
| 2015 | | 2014 | | 2015 | | 2014 | |
| $ | 284,564 | | | $ | 162,523 | | | $ | 78,836 | | | $ | 69,946 | | |
The tax basis components of distributable earnings differ from the amounts reflected in the Consolidated Statement of Assets and Liabilities by temporary book/tax differences. These differences are primarily due to differing treatments of wash sales, swap marked to market and deferred organizational
41
Credit Suisse Multialternative Strategy Fund
Notes to Consolidated Financial Statements (continued)
October 31, 2015
Note 7. Federal Income Taxes (continued)
expenses. At October 31, 2015, the components of distributable earnings on a tax basis were as follows:
Undistributed net investment income | | $ | 170,373 | | |
Undistributed capital gain | | | 72,586 | | |
Unrealized appreciation | | | 24,855 | | |
| | $ | 267,814 | | |
At October 31, 2015, the cost of investments (excluding foreign currency related transactions) and net unrealized appreciation (depreciation) for income tax purposes were as follows:
Cost of Investments | | $ | 14,889,384 | | |
Unrealized appreciation | | $ | 308,471 | | |
Unrealized depreciation | | | (321,298 | ) | |
Net unrealized appreciation (depreciation) | | $ | (12,827 | ) | |
At October 31, 2015, the proceeds from securities sold short (excluding foreign currency related transactions) and net unrealized appreciation (depreciation) for income tax purposes were as follows:
Proceeds from investments | | $ | 1,197,664 | | |
Unrealized appreciation | | $ | 91,915 | | |
Unrealized depreciation | | | (45,798 | ) | |
Net unrealized appreciation (depreciation) | | $ | 46,117 | | |
At October 31, 2015, the Fund reclassified $88,378 from accumulated net investment loss and $88,378 from accumulated net realized gain to paid in capital, to adjust for current period permanent book/tax differences which arose principally from differing book/tax treatment of foreign currency gain (loss), ordinary loss netting to reduce short term capital gains, swap gain (loss) passive foreign investment companies (PFIC) and distribution re-designations. Net assets were not affected by these reclassifications.
42
Credit Suisse Multialternative Strategy Fund
Notes to Consolidated Financial Statements (continued)
October 31, 2015
In the normal course of business, the Fund may provide general indemnifications pursuant to certain contracts and organizational documents. The Fund's maximum exposure under these arrangements is dependent on future claims that may be made against the Fund and, therefore, cannot be estimated; however, based on experience, the risk of loss from such claims is considered remote.
Note 9. Other Matters
On May 19, 2014, the U.S. Department of Justice (the "Department of Justice") filed a one-count criminal information (the "Information") in the District Court for the Eastern District of Virginia (the "District Court") charging Credit Suisse AG ("CSAG") with conspiracy to commit tax fraud related to accounts CSAG established for cross-border clients. The Department of Justice and CSAG entered into a plea agreement (the "Plea Agreement") settling the action pursuant to which CSAG pleaded guilty to the charge set out in the Information.
The Plea Agreement requires CSAG to pay over $1.8 billion to the U.S. government, including the U.S. Internal Revenue Service. The Plea Agreement also requires CSAG to lawfully undertake certain remedial actions to address the conduct described in the Plea Agreement.
CSAG has entered into other settlements relating to the conduct set out in the Plea Agreement. CSAG has entered into a Consent Order with the Federal Reserve Board (the "Federal Reserve") to resolve certain findings by the Federal Reserve, including that the activities of CSAG regarding opening of foreign accounts for U.S. taxpayers, provision of investment services to U.S. clients, and operation of CSAG's New York representative office prior to 2009 lacked adequate enterprise-wide risk management and compliance policies and procedures sufficient to ensure that all of its activities comply with U.S. laws and regulations. In addition, CSAG has entered into a Consent Order with the New York State Department of Financial Services (the "DFS") to resolve the DFS's investigation into the conduct described in the Plea Agreement. The settlement with the Federal Reserve requires CSAG to pay $100 million to the Federal Reserve, and the settlement with the DFS requires CSAG to pay $715 million to the DFS.
These settlements follow a settlement by Credit Suisse Group AG ("CS Group"), the parent company of CSAG, with the Securities and Exchange Commission (the "Commission") on February 21, 2014 to resolve an
43
Credit Suisse Multialternative Strategy Fund
Notes to Consolidated Financial Statements (continued)
October 31, 2015
Note 9. Other Matters (continued)
investigation by the Commission into solicitation and provision of broker-dealer and investment advisory services to certain U.S. cross-border clients by CS Group while not registered with the Commission as a broker-dealer or investment adviser. As part of the settlement, CS Group retained an independent consultant to evaluate its policies and procedures and examine its broker-dealer and investment adviser activities to fully verify that the business that was the subject of the Commission investigation has been completely exited. CS Group also agreed to pay $196,511,014, which includes $82,170,990 in disgorgement, $64,340,024 in interest and a $50,000,000 penalty.
CSAG is the indirect parent company of Credit Suisse and CSSU. Neither Credit Suisse, CSSU nor the Fund was named in the Plea Agreement (as defined above) or other settlements relating to the conduct set out in the Plea Agreement. The conduct set out in the Plea Agreement did not involve the Fund, Credit Suisse or CSSU with respect to its investment adviser and distribution activities relating to the Fund.
Credit Suisse, CSSU and certain of their affiliates have received a permanent exemptive order from the Commission to permit them to continue serving as investment advisers and principal underwriters for U.S.-registered investment companies, such as the Fund. Due to a provision in the law governing the operation of U.S.-registered investment companies, they would otherwise have become ineligible to perform these activities as a result of the plea in the Plea Agreement. The permanent exemptive order permits Credit Suisse and CSSU to continue to provide services to the Fund, so long as, among other things, no current or former employee of CSAG or any affiliate of CSAG who previously has been or who subsequently may be identified by CSAG or any U.S. or non-U.S. regulatory or enforcement agencies as having been responsible for the conduct described in the Plea Agreement will be employed by Credit Suisse and certain of its affiliates. Credit Suisse and CSSU have informed the Fund that, Credit Suisse and CSSU believe the Settlements will not have any material impact on the Fund or on the ability of Credit Suisse or CSSU to perform services for the Fund.
On November 21, 2014, at the sentencing hearing, the District Court accepted and implemented the sentence as set out in the Plea Agreement. The District Court imposed no additional conditions beyond those contained in the Plea Agreement.
44
Credit Suisse Multialternative Strategy Fund
Report of Independent Registered Public Accounting Firm
The Board of Trustees and Shareholders
Credit Suisse Multialternative Strategy Fund:
We have audited the accompanying consolidated statement of assets and liabilities of Credit Suisse Multialternative Strategy Fund (the "Fund"), a series of the Credit Suisse Opportunity Funds, including the consolidated schedule of investments, as of October 31, 2015, and the related consolidated statements of operations, changes in net assets and financial highlights for the year then ended. These consolidated financial statements and consolidated financial highlights are the responsibility of the Fund's management. Our responsibility is to express an opinion on these consolidated financial statements and consolidated financial highlights based on our audit. The accompanying consolidated statement of net assets of the Fund for the year ended October 31, 2014 and the consolidated financial highlights for each of the years or period in the three-year period ended October 31, 2014, were audited by other independent registered public accountants whose report thereon dated December 29, 2014, expressed an unqualified opinion on that consolidated financial statement and those consolidated financial highlights.
We conducted our audit in accordance with the standards of the Public Company Accounting Oversight Board (United States). Those standards require that we plan and perform the audit to obtain reasonable assurance about whether the consolidated financial statements and consolidated financial highlights are free of material misstatement. An audit includes examining, on a test basis, evidence supporting the amounts and disclosures in the financial statements. Our procedures included confirmation of securities owned as of October 31, 2015, by correspondence with the custodian and broker or by other appropriate auditing procedures. An audit also includes assessing the accounting principles used and significant estimates made by management, as well as evaluating the overall financial statement presentation. We believe that our audit provides a reasonable basis for our opinion.
In our opinion, the 2015 consolidated financial statements and consolidated financial highlights referred to above present fairly, in all material respects, the financial position of Credit Suisse Multialternative Strategy Fund as of October 31, 2015, the results of its operations, changes in its net assets and the consolidated financial highlights for the year then ended, in conformity with U.S. generally accepted accounting principles.

New York, New York
December 30, 2015
45
Credit Suisse Multialternative Strategy Fund
Information Concerning Trustees and Officers (unaudited)
Name, Address
(Year of Birth) | | Position(s)
Held with
Fund | | Term
of Office1
and
Length
of Time
Served | | Principal
Occupation(s) During
Past Five Years | | Number of
Portfolios
in Fund
Complex
Overseen
by Trustee | | Other
Trusteeships
Held by Trustee | |
Independent Trustees | | | | | | | | | | | |
Enrique Arzac
c/o Credit Suisse Asset
Management, LLC
Attn: General Counsel
One Madison Avenue
New York, New York
10010
(1941) | | Trustee, Audit Committee Chairman and Nominating Committee Member | | Since Fund Inception | | Professor of Finance and Economics, Graduate School of Business, Columbia University since 1971. | | | 14 | | | Director of Adams Diversified Equity Fund, Inc., Adams Natural Resources Fund, Inc., Aberdeen Chile Fund, Inc., Aberdeen Emerging Markets Smaller Company Opportunities Fund, Inc., Aberdeen Israel Fund, Inc., Aberdeen Indonesia Fund, Inc. and Aberdeen Latin America Equity Fund, Inc. (each a closed-end investment company); Director of Aberdeen Asia-Pacific Income Investment Company Limited (a Canadian closed-end fund); Trustee of Mirae Asset Discovery Funds (7 open-end portfolios); Director of Starcomms PLC (telecommunications company) from 2008 to 2011; Director of Epoch Holding Corporation (an investment management and investment advisory services company) from 2006 to March 2013. | |
1 Each Trustee and Officer serves until his or her respective successor has been duly elected and qualified.
46
Credit Suisse Multialternative Strategy Fund
Information Concerning Trustees and Officers (unaudited) (continued)
Name, Address
(Year of Birth) | | Position(s)
Held with
Fund | | Term
of Office1
and
Length
of Time
Served | | Principal
Occupation(s) During
Past Five Years | | Number of
Portfolios
in Fund
Complex
Overseen
by Trustee | | Other
Trusteeships
Held by Trustee | |
Independent Trustees | | | | | | | | | | | |
Jeffrey E. Garten
c/o Credit Suisse Asset
Management, LLC
Attn: General Counsel
One Madison Avenue
New York, New York
10010
(1946) | | Trustee, Audit and Nominating Committee Member | | Since Fund Inception | | Dean Emeritus of Yale School of Management from July 2015 to present; The Juan Trippe Professor in the Practice of International Trade, Finance and Business from July 2005 to July 2015; Partner and Chairman of Garten Rothkopf (consulting firm) from October 2005 to present. | | | 11 | | | Director of Aetna, Inc. (insurance company); Director of CarMax Group (used car dealers); Director of Miller Buckfire & Co., LLC (financial restructuring); Member of Standard & Poor's Board of Managers (credit rating agency) from December 2011 to November 2014. | |
Steven N. Rappaport
Lehigh Court, LLC
555 Madison Avenue
29th Floor
New York, New York
10022
(1948) | | Chairman of the Board of Trustees, Audit Committee Member and Nominating Committee Chairman | | Since Fund Inception | | Partner of Lehigh Court, LLC and RZ Capital (private investment firms) from July 2002 to present; Partner of Backstage Acquisition Holding, LLC (Publication Job Postings) from November 2013 to present. | | | 14 | | | Director of iCAD, Inc. (surgical and medical instruments and apparatus company); Director of Aberdeen Chile Fund, Inc., Aberdeen Emerging Markets Smaller Company Opportunities Fund, Inc., Aberdeen Israel Fund, Inc., Aberdeen Indonesia Fund, Inc. and Aberdeen Latin America Equity Fund, Inc. (each a closed-end investment company); Director of Presstek, Inc. (digital imaging technologies company) from 2003 to 2012; Director of Wood Resources, LLC (plywood manufacturing company) from 2003 to October 2013. | |
1 Each Trustee and Officer serves until his or her respective successor has been duly elected and qualified.
47
Credit Suisse Multialternative Strategy Fund
Information Concerning Trustees and Officers (unaudited) (continued)
Name, Address
(Year of Birth) | | Position(s)
Held with
Fund | | Term of
Office1
and
Length of
Time
Served | | PrincipalOccupation(s) During Past Five Years | |
Officers* | | | | | | | |
John G. Popp
Credit Suisse Asset
Management, LLC
One Madison Avenue
New York, New York 10010
(1956) | | Chief Executive Officer and President | | Since Fund Inception | | Managing Director of Credit Suisse; Global Head and Chief Investment Officer of the Credit Investment Group; Associated with Credit Suisse or its predecessor since 1997; Officer of other Credit Suisse Funds; Trustee of Credit Suisse High Yield Bond Fund; Director of Credit Suisse Asset Management Income Fund, Inc; Director of Credit Suisse Park View BDC, Inc. | |
Emidio Morizio
Credit Suisse Asset
Management, LLC
One Madison Avenue
New York, New York 10010
(1966) | | Chief Compliance Officer | | Since Fund Inception | | Managing Director and Global Head of Compliance of Credit Suisse since 2010; Associated with Credit Suisse since July 2000; Officer of other Credit Suisse Funds. | |
Lou Anne McInnis
Credit Suisse Asset
Management, LLC
One Madison Avenue
New York, New York 10010
(1959) | | Chief Legal Officer | | Since 2015 | | Director of Credit Suisse; Associated with Credit Suisse since April 2015; Counsel at DLA Piper US LLP from 2011 to April 2015; Associated with Morgan Stanley Investment Management from 1997 to 2010: Officer of other Credit Suisse Funds. | |
Rocco DelGuercio
Credit Suisse Asset
Management, LLC
One Madison Avenue
New York, New York 10010
(1963) | | Chief Financial Officer and Treasurer | | Chief Financial Officer since 2015; Treasurer since 2013 | | Vice President of Credit Suisse since 2013; Independent Consultant from February 2012 to April 2013; Director of Legg Mason & Co., LLC from March 2004 to January 2012; Associated with Credit Suisse from June 1996 to March 2004; Officer of other Credit Suisse Funds. | |
Karen Regan
Credit Suisse Asset
Management, LLC
One Madison Avenue
New York, New York 10010
(1963) | | Vice President and Secretary | | Since Fund Inception | | Vice President of Credit Suisse; Associated with Credit Suisse since December 2004; Officer of other Credit Suisse Funds. | |
1 Each Trustee and Officer serves until his or her respective successor has been duly elected and qualified.
* The officers of the Fund shown are officers that make policy decisions.
The Statement of Additional Information includes additional information about the Trustees and is available, without charge, upon request, by calling 877-870-2874.
48
Credit Suisse Multialternative Strategy Fund
Proxy Voting and Portfolio Holdings Information (unaudited)
Information regarding how the Fund voted proxies related to its portfolio securities during the 12-month period ended June 30 of each year, as well as the policies and procedures that the Fund uses to determine how to vote proxies relating to its portfolio securities are available:
• By calling 1-877-870-2874
• On the Fund's website, www.credit-suisse.com/us/funds
• On the website of the Securities and Exchange Commission, www.sec.gov.
The Fund files a complete schedule of its portfolio holdings for the first and third quarters of its fiscal year with the SEC on Form N-Q. The Fund's Forms N-Q are available on the SEC's website at www.sec.gov and may be reviewed and copied at the SEC's Public Reference Room in Washington, DC. Information on the operation of the SEC's Public Reference Room may be obtained by calling 1-202-551-8090.
49

P.O. BOX 55030, BOSTON, MA 02205-5030
877-870-2874 n www.credit-suisse.com/us/funds
CREDIT SUISSE SECURITIES (USA) LLC, DISTRIBUTOR. MSF-AR-1015

CREDIT SUISSE FUNDS
Annual Report
October 31, 2015
n CREDIT SUISSE
MANAGED FUTURES STRATEGY FUND
The Fund's investment objectives, risks, charges and expenses (which should be considered carefully before investing), and more complete information about the Fund, are provided in the Prospectus, which should be read carefully before investing. You may obtain additional copies by calling 877-870-2874 or by writing to Credit Suisse Funds, P.O. Box 55030, Boston, MA 02205-5030.
Credit Suisse Securities (USA) LLC, Distributor, is located at One Madison Avenue, New York, NY 10010. Credit Suisse Funds are advised by Credit Suisse Asset Management, LLC.
Investors in the Credit Suisse Funds should be aware that they may be eligible to purchase Class I shares (where offered) directly or through certain intermediaries. Such shares are not subject to a sales charge. Investors in the Credit Suisse Funds should also be aware that they may be eligible for a reduction or waiver of the sales charge with respect to Class A or C shares (where offered). For more information, please review the relevant prospectuses or consult your financial representative.
Fund shares are not deposits or other obligations of Credit Suisse Asset Management, LLC ("Credit Suisse") or any affiliate, are not FDIC-insured and are not guaranteed by Credit Suisse or any affiliate. Fund investments are subject to investment risks, including loss of your investment.
Credit Suisse Managed Futures Strategy Fund
Annual Investment Adviser's Report
October 31, 2015 (unaudited)
December 21, 2015
Dear Shareholder:
We are pleased to present this Annual Report covering the activities of the Credit Suisse Managed Futures Fund (the "Fund") for the 12 months ended October 31, 2015.
Performance Summary
11/1/2014 – 10/31/2015
Fund & Benchmark | | Performance | |
| Class I1 | | | 12.47 | % | |
| Class A1,2 | | | 11.60 | % | |
| Class C1,2 | | | 12.88 | % | |
| Credit Suisse Managed Futures Liquid Index3 | | | 13.36 | % | |
Performance shown for the Fund's Class A and Class C Shares does not reflect sales charges, which are a maximum of 5.25% and 1.00%, respectively.2
Market Review: A positive period overall
The 12 months ended October 31, 2015 was a positive one for managed futures strategies, with the Credit Suisse Managed Futures Liquid Index (the "Index"), the Fund's benchmark, returning 13.36% for the period.
At the end of 2014, many trend-followers benefitted from strong trends in fixed income and commodities (most notably oil), as well as a strengthening U.S. dollar versus several G10 currencies. In Q1 2015, the continued strengthening of the U.S. dollar helped trend-followers as well. Q2, however, was a difficult period as a number of trends reversed.
In Q3, trend-followers were affected by several market reversals, though they generally benefitted from short exposure to commodities (as there was a sell-off in oil), long exposure to the U.S. dollar, and long fixed income exposure. Trend-followers were hurt by equities overall, but were able to benefit from the sell-off in equities toward the end of the quarter by reversing positions. In October, managed futures funds were mainly hurt by currency positions and the trend reversal in equities.
Strategic Review and Outlook: Continued optimism for the future
For the 12 months ended October 31, 2015, the Fund (Class I shares) returned 12.88% versus a return of 13.36% for the Index. Currencies were the most significant contributor to performance, particularly due to profits from Australian Dollar, Canadian Dollar and Euro positions. Commodities also contributed
1
Credit Suisse Managed Futures Strategy Fund
Annual Investment Adviser's Report (continued)
October 31, 2015 (unaudited)
positively to performance, with energy and industrial metals performing well (and offsetting a negatively performing precious metals position). Fixed income also added to Fund performance, mainly due to the U.K. (Long Gilt) and German (Euro-Bund) futures (although all positions performed positively).
On the other hand, equity positions largely detracted from overall Fund performance. The European equities (FTSE 100 and Euro Stoxx 50) position detracted the most, although U.S. large-cap equities were also a drag on Fund performance. The Asian equities Hang Seng and Nikkei 225 positions added to performance but not enough to offset losses of the other positions.
In general, the managed futures strategy is designed to profit from both upward and downward trending markets across several asset classes, including commodities, bonds, equities and currencies. We continue to believe that the unique return profile of managed futures may appeal to investors searching for meaningful portfolio diversifiers that may help mitigate risk and provide uncorrelated returns.
The Quantitative Investment Strategies Group
Yung-Shin Kung
Sheel Dhande
The Fund is non-diversified, which means it may invest a greater proportion of its assets in the securities of a smaller number of issuers than a diversified mutual fund and may therefore be subject to greater volatility. The Fund's investment in alternative instruments may subject the Fund to greater volatility than investment in traditional securities, particularly in investments involving leverage.
The use of alternative assets and strategies entails substantial risks, including risk of loss of principal, , commodity exposure risks, credit risk, currency risk, derivatives risk, equity exposure risk, exchange-traded notes risk, fixed income risk, foreign securities risk, forwards risk, futures contracts risk, interest rate risk, leveraging risk, market risk, non-diversified status, options risk, portfolio turnover risk, repurchase agreements risk, short position risk, speculative exposure risk, structured notes risk, subsidiary risk, swap agreements risk, tax risk, and U.S. government securities risk. For a detailed discussion of these and other risks, please refer to the Fund's Prospectus, which should be read carefully before investing.
2
Credit Suisse Managed Futures Strategy Fund
Annual Investment Adviser's Report (continued)
October 31, 2015 (unaudited)
In addition to historical information, this report contains forward-looking statements, which may concern, among other things, domestic and foreign market, industry and economic trends and developments and government regulation and their potential impact on the Fund's investments. These statements are subject to risks and uncertainties and actual trends, developments and regulations in the future, and their impact on the Fund could be materially different from those projected, anticipated or implied. The Fund has no obligation to update or revise forward-looking statements.
The views of the Fund's management are as of the date of the letter and the Fund holdings described in this document are as of October 31, 2015; these views and Fund holdings may have changed subsequent to these dates. Nothing in this document is a recommendation to purchase or sell securities.
3
Credit Suisse Managed Futures Strategy Fund
Annual Investment Adviser's Report (continued)
October 31, 2015 (unaudited)
Comparison of Change in Value of $10,000 Investment in the
Credit Suisse Managed Futures Strategy Fund1 Class I Shares,
Class A Shares2, Class C Shares2 and Credit Suisse Managed Future
Liquid Index3 from Inception (9/28/12).
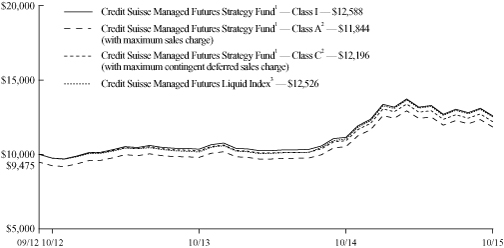
1 Fee waivers and/or expense reimbursements may reduce expenses for the Fund, without which performance would be lower. The Fund entered into a written contract to limit expenses to 1.30% of the Fund's average daily net assets for Class I shares, 1.55% of the Fund's average daily net assets for Class A shares and 2.30% of the Fund's average daily net assets for Class C shares through at least February 28, 2017.
2 Total return for the Fund's Class A shares for the reporting period, based on offering price (including maximum sales charge of 5.25%), was 6.55%. Total return for the Fund's Class C shares for the reporting period, based on redemption value (including maximum contingent deferred sales charge of 1.00%), was 10.60%.
3 The Credit Suisse Managed Futures Liquid Index is currently composed of 14 futures contracts and 4 commodity indices which provide exposure to the asset classes. The Index uses a proprietary quantitative methodology to seek to identify price trends in each of the asset classes over a variety of time horizons. Components of the Index, which may change from time to time, are positioned either long or short based on the price trends within the asset classes determined using the Index's quantitative methodology. The index does not have transaction cost and investors cannot invest directly in the index.
4
Credit Suisse Managed Futures Strategy Fund
Annual Investment Adviser's Report (continued)
October 31, 2015 (unaudited)
Average Annual Returns as of October 31, 20151
| | | 1 Year | | Since
Inception2 | |
Class I | | | 12.88 | % | | | 7.72 | % | |
Class A Without Sales Charge | | | 12.47 | % | | | 7.47 | % | |
Class A With Maximum Sales Charge | | | 6.55 | % | | | 5.62 | % | |
Class C Without CDSC | | | 11.60 | % | | | 6.63 | % | |
Class C With CDSC | | | 10.60 | % | | | 6.63 | % | |
Returns represent past performance and include change in share price and reinvestment of dividends and capital gains. Past performance cannot guarantee future results. The current performance of the Fund may be lower or higher than the figures shown. Returns and share price will fluctuate, and redemption value may be more or less than original cost. The performance results do not reflect the deduction of taxes that a shareholder would pay on fund distributions or the redemption of fund shares. Performance information current to the most recent month-end is available at www.credit-suisse.com/us/funds.
The annual gross expense ratios are 1.47% for Class I shares, 1.71% for Class A shares and 2.47% for Class C shares. The annualized net expense ratios after fee waivers and/or expense reimbursements are 1.32% for Class I shares, 1.56% for Class A shares and 2.32% for Class C shares.
1 Fee waivers and/or expense reimbursements may reduce expenses for the Fund, without which performance would be lower. The Fund entered into a written contract to limit expenses to 1.30% of the Fund's average daily net assets for Class I shares, 1.55% of the Fund's average daily net assets for Class A shares and 2.30% of the Fund's average daily net assets for Class C shares through at least February 28, 2017.
2 Inception Date September 28, 2012.
5
Credit Suisse Managed Futures Strategy Fund
Annual Investment Adviser's Report (continued)
October 31, 2015 (unaudited)
Information About Your Fund's Expenses
As an investor of the Fund, you incur two types of costs: ongoing expenses and transaction costs. Ongoing expenses include management fees, distribution and service (12b-1) fees and other Fund expenses. Examples of transaction costs include sales charges (loads), redemption fees and account maintenance fees, which are not shown in this section and which would result in higher total expenses. The following table is intended to help you understand your ongoing expenses of investing in the Fund and to help you compare these expenses with the ongoing expenses of investing in other mutual funds. The table is based on an investment of $1,000 made at the beginning of the six-months ended October 31, 2015.
The table illustrates your Fund's expenses in two ways:
• Actual Fund Return. This helps you estimate the actual dollar amount of ongoing expenses paid on a $1,000 investment in the Fund using the Fund's actual return during the period. To estimate the expenses you paid over the period, simply divide your account value by $1,000 (for example, an $8,600 account value divided by $1,000 = 8.6), then multiply the result by the number in the "Expenses Paid per $1,000" line under the share class you hold.
• Hypothetical 5% Fund Return. This helps you to compare your Fund's ongoing expenses with those of other mutual funds using the Fund's actual expense ratio and a hypothetical rate of return of 5% per year before expenses. Examples using a 5% hypothetical fund return may be found in the shareholder reports of other mutual funds. The hypothetical account values and expenses may not be used to estimate the actual ending account balance or expenses you paid for the period.
Please note that the expenses shown in these tables are meant to highlight your ongoing expenses only and do not reflect any transaction costs, such as sales charges (loads) or redemption fees. If these transaction costs had been included, your costs would have been higher. The "Expenses Paid per $1,000" line of the tables is useful in comparing ongoing expenses only and will not help you determine the relative total expenses of owning different funds.
6
Credit Suisse Managed Futures Strategy Fund
Annual Investment Adviser's Report (continued)
October 31, 2015 (unaudited)
Expenses and Value for a $1,000 Investment
for the six month period ended October 31, 2015
Actual Fund Return | | Class I | | Class A | | Class C | |
Beginning Account Value 05/01/15 | | $ | 1,000.00 | | | $ | 1,000.00 | | | $ | 1,000.00 | | |
Ending Account Value 10/31/15 | | $ | 955.30 | | | $ | 953.40 | | | $ | 949.90 | | |
Expenses Paid per $1,000* | | $ | 6.46 | | | $ | 7.68 | | | $ | 11.35 | | |
Hypothetical 5% Fund Return | |
Beginning Account Value 05/01/15 | | $ | 1,000.00 | | | $ | 1,000.00 | | | $ | 1,000.00 | | |
Ending Account Value 10/31/15 | | $ | 1,018.60 | | | $ | 1,017.34 | | | $ | 1,013.56 | | |
Expenses Paid per $1,000* | | $ | 6.67 | | | $ | 7.93 | | | $ | 11.72 | | |
| | | Class I | | Class A | | Class C | |
Annualized Expense Ratios* | | | 1.31 | % | | | 1.56 | % | | | 2.31 | % | |
* Expenses are equal to the Fund's annualized expense ratio for each share class, multiplied by the average account value over the period, multiplied by 184/365 to reflect the one-half year period.
The "Expenses Paid per $1,000" and the "Annualized Expense Ratios" in the tables are based on actual expenses paid by the Fund during the period, net of fee waivers and/or expense reimbursements. If those fee waivers and/or expense reimbursements had not been in effect, the Fund's actual expenses would have been higher. Expenses do not reflect additional charges and expenses that are, or may be, imposed under the variable contracts or plans. Such charges and expenses are described in the prospectus of the insurance company separate account or in the plan documents or other informational materials supplied by plan sponsors. The Fund's expenses should be considered with these charges and expenses in evaluating the overall cost of investing in the separate account.
For more information, please refer to the Fund's prospectus.
Sector Breakdown*
Short-term Investment1 | | | 100.00 | % | |
Total | | | 100.00 | % | |
* Expressed as a percentage of total investments (excluding securities lending collateral if applicable) and may vary over time.
1 Primarily reflects cash invested in State Street Bank and Trust Co. Euro Time Deposit, for which the purchases of securities have been executed but not yet settled at October 31, 2015, if applicable.
7
Credit Suisse Managed Futures Strategy Fund
Consolidated Schedule of Investments
October 31, 2015
Par
(000) | |
| | Maturity | | Rate% | | Value | |
| SHORT-TERM INVESTMENT (88.7%) | |
$ | 84,921 | | | State Street Bank and Trust Co. Euro Time Deposit
(Cost $84,921,063) | | 11/02/15 | | | 0.010 | | | $ | 84,921,063 | | |
| TOTAL INVESTMENTS AT VALUE (88.7%) (Cost $84,921,063) | | | | | | 84,921,063 | |
| OTHER ASSETS IN EXCESS OF LIABILITIES (11.3%) | | | | | | 10,804,751 | |
| NET ASSETS (100.0%) | | | | | | $95,725,814 | |
Futures Contracts
Contract Description | | Currency | | Expiration
Date | | Number of
Contracts | | Notional
Value | | Net Unrealized
Appreciation
(Depreciation) | |
Contracts to Purchase | | | | | | | | | | | |
Index Contracts
EURO Stoxx 50 Index Futures | | EUR | | | | Dec 2015 | | | 79 | | | $ | 2,969,708 | | | $ | (3,216 | ) | |
S&P 500 E Mini Index Futures | | USD | | | | Dec 2015 | | | 73 | | | | 7,569,005 | | | | (19,740 | ) | |
| | | $ | (22,956 | ) | |
Interest Rate Contracts
10YR JGB Mini Futures | | JPY | | | | Dec 2015 | | | 235 | | | | 28,926,373 | | | $ | 143,513 | | |
10YR U.S. Treasury Note Futures | | USD | | | | Dec 2015 | | | 151 | | | | 19,280,813 | | | | 24,384 | | |
German EURO Bund Futures | | EUR | | | | Dec 2015 | | | 115 | | | | 19,971,135 | | | | 248,544 | | |
Long Gilt Futures | | GBP | | | | Dec 2015 | | | 125 | | | | 22,731,625 | | | | (160,377 | ) | |
| | | $ | 256,064 | | |
Contracts to Sell | | | | | | | | | | | |
Foreign Exchange Contracts
AUD Currency Futures | | USD | | | | Dec 2015 | | | (129 | ) | | | (9,180,930 | ) | | $ | (131,475 | ) | |
| CAD Currency Futures | | USD | | | | Dec 2015 | | | (180 | ) | | | (13,761,000 | ) | | | (150,929 | ) | |
| EUR Currency Futures | | USD | | | | Dec 2015 | | | (114 | ) | | | (15,687,825 | ) | | | (49,697 | ) | |
| GBP Currency Futures | | USD | | | | Dec 2015 | | | (183 | ) | | | (17,638,913 | ) | | | (63,131 | ) | |
| JPY Currency Futures | | USD | | | | Dec 2015 | | | (24 | ) | | | (2,486,400 | ) | | | (2,467 | ) | |
| | | $ | (397,699 | ) | |
Index Contracts | | | | | | | | | | | |
Hang Seng Index Futures | | HKD | | | | Nov 2015 | | | (18 | ) | | | (2,634,237 | ) | | $ | 49,020 | | |
FTSE 100 Index Futures | | GBP | | | | Dec 2015 | | | (90 | ) | | | (8,784,542 | ) | | | (278,830 | ) | |
| | | $ | (229,810 | ) | |
Net unrealized appreciation (depreciation) | | | | | | | | | | $ | (394,401 | ) | |
See Accompanying Notes to Consolidated Financial Statements.
8
Credit Suisse Managed Futures Strategy Fund
Consolidated Schedule of Investments (continued)
October 31, 2015
Currency Abbreviations:
AUD = Australian Dollar
CAD = Canadian Dollar
EUR = Euro
GBP = British Pound
HKD = Hong Kong Dollar
JPY = Japanese Yen
USD = United States Dollar
Total Return Swap Contracts | |
Currency | | Notional
Amount | | Expiration
Date | | Counterparty | | Receive | | Pay | | Net Unrealized
Appreciation
(Depreciation) | |
USD | | | | $ | 4,221,347 | | | 11/17/15 | | Goldman Sachs | | Fixed Rate | | Bloomberg Industrial
Metals Index | | $ | 197,461 | | |
USD | | | | $ | 3,449,010 | | | 11/17/15 | | Goldman Sachs | | Fixed Rate | | Bloomberg Energy
Index | | | 136,310 | | |
USD | | | | $ | 4,356,301 | | | 11/17/15 | | Goldman Sachs | | Fixed Rate | | Bloomberg
Agriculture Index | | | (17,141 | ) | |
USD | | | | $ | 687,780 | | | 11/17/15 | | Goldman Sachs | | Bloomberg Precious
Metals Index | | Fixed Rate | | | (12,823 | ) | |
USD | | | | $ | 868,038 | | | 11/17/15 | | Goldman Sachs | | Fixed Rate | | Bloomberg Industrial
Metals Index | | | 15,976 | | |
USD | | | | $ | 1,266,634 | | | 11/17/15 | | Goldman Sachs | | Bloomberg Precious
Metals Index | | Fixed Rate | | | 0 | | |
| | | $ | 319,783 | | |
See Accompanying Notes to Consolidated Financial Statements.
9
Credit Suisse Managed Futures Strategy Fund
Consolidated Statement of Assets and Liabilities
October 31, 2015
Assets | |
Investments at value (Cost $84,921,063) (Note 2) | | $ | 84,921,063 | | |
Cash | | | 100,000 | | |
Cash segregated at brokers for swap contracts (Note 2) | | | 700,000 | | |
Variation margin receivable on futures contracts (Note 2) | | | 9,616,225 | | |
Unrealized appreciation on open swap contracts (Note 2) | | | 349,747 | | |
Receivable for fund shares sold | | | 251,959 | | |
Interest receivable | | | 47 | | |
Prepaid expenses and other assets | | | 29,465 | | |
Total assets | | | 95,968,506 | | |
Liabilities | |
Investment advisory fee payable (Note 3) | | | 48,458 | | |
Administrative services fee payable (Note 3) | | | 10,052 | | |
Shareholder servicing/Distribution fee payable (Note 3) | | | 6,664 | | |
Unrealized depreciation on open swap contracts (Note 2) | | | 29,964 | | |
Net payable for terminated total return swap contracts | | | 25,487 | | |
Payable for fund shares redeemed | | | 15,921 | | |
Trustees' fee payable | | | 7,332 | | |
Due to custodian for foreign currency at value (cost $421) | | | 422 | | |
Accrued expenses | | | 98,392 | | |
Total liabilities | | | 242,692 | | |
Net Assets | |
Capital stock, $.001 par value (Note 6) | | | 8,321 | | |
Paid-in capital (Note 6) | | | 86,770,535 | | |
Undistributed net investment income | | | 5,161,004 | | |
Accumulated net realized gain from futures contracts, swap contracts and
foreign currency transactions | | | 3,861,603 | | |
Net unrealized depreciation from futures contracts, swap contracts and foreign currency translations | | | (75,649 | ) | |
Net assets | | $ | 95,725,814 | | |
I Shares | |
Net assets | | $ | 72,606,134 | | |
Shares outstanding | | | 6,299,337 | | |
Net asset value, offering price and redemption price per share | | $ | 11.53 | | |
A Shares | |
Net assets | | $ | 20,199,804 | | |
Shares outstanding | | | 1,761,172 | | |
Net asset value and redemption price per share | | $ | 11.47 | | |
Maximum offering price per share (net asset value/(1-5.25%)) | | $ | 12.11 | | |
C Shares | |
Net assets | | $ | 2,919,876 | | |
Shares outstanding | | | 260,843 | | |
Net asset value and offering price per share | | $ | 11.19 | | |
See Accompanying Notes to Consolidated Financial Statements.
10
Credit Suisse Managed Futures Strategy Fund
Consolidated Statement of Operations
For the Year Ended October 31, 2015
Investment Income | |
Interest | | $ | 7,927 | | |
Total investment income | | | 7,927 | | |
Expenses | |
Investment advisory fees (Note 3) | | | 914,754 | | |
Administrative services fees (Note 3) | | | 97,905 | | |
Shareholder servicing/Distribution fees (Note 3) | |
Class A | | | 41,798 | | |
Class C | | | 25,062 | | |
Custodian fees | | | 76,292 | | |
Registration fees | | | 58,644 | | |
Transfer agent fees (Note 3) | | | 57,088 | | |
Audit and tax fees | | | 53,217 | | |
Legal fees | | | 48,758 | | |
Printing fees | | | 44,264 | | |
Trustees' fees | | | 28,000 | | |
Commitment fees (Note 4) | | | 7,801 | | |
Insurance expense | | | 1,658 | | |
Miscellaneous expense | | | 10,254 | | |
Total expenses | | | 1,465,495 | | |
Less: fees waived (Note 3) | | | (137,633 | ) | |
Net expenses | | | 1,327,862 | | |
Net investment loss | | | (1,319,935 | ) | |
Net Realized and Unrealized Gain (Loss) from Investments, Futures Contracts, Swap Contracts
and Foreign Currency Related Items | |
Net realized gain from futures contracts | | | 7,459,884 | | |
Net realized gain from swap contracts | | | 5,611,305 | | |
Net realized gain from foreign currency transactions | | | 76,457 | | |
Net change in unrealized appreciation (depreciation) from investments | | | (2,441 | ) | |
Net change in unrealized appreciation (depreciation) from futures contracts | | | (4,383,073 | ) | |
Net change in unrealized appreciation (depreciation) from swap contracts | | | 230,987 | | |
Net change in unrealized appreciation (depreciation) from foreign currency translations | | | 2,152 | | |
Net realized and unrealized gain from investments, futures contracts, swap contracts and
foreign currency related items | | | 8,995,271 | | |
Net increase in net assets resulting from operations | | $ | 7,675,336 | | |
See Accompanying Notes to Consolidated Financial Statements.
11
Credit Suisse Managed Futures Strategy Fund
Consolidated Statement of Changes in Net Assets
| | | For the Year
Ended
October 31, 2015 | | For the Year
Ended
October 31, 2014 | |
From Operations | |
Net investment loss | | $ | (1,319,935 | ) | | $ | (1,030,691 | ) | |
Net realized gain from investments, futures contracts, swap contracts and
foreign currency transactions | | | 13,147,646 | | | | 3,149,596 | | |
Net change in unrealized appreciation (depreciation) from investments,
futures contracts, swap contracts and foreign currency translations | | | (4,152,375 | ) | | | 3,130,247 | | |
Net increase in net assets resulting from operations | | | 7,675,336 | | | | 5,249,152 | | |
From Dividends and Distributions | |
Dividends from net investment income | |
Class I | | | (255,480 | ) | | | — | | |
Class A | | | (1,885 | ) | | | — | | |
Distributions from net realized gains | |
Class I | | | (4,063,363 | ) | | | (873,874 | ) | |
Class A | | | (196,884 | ) | | | (160,800 | ) | |
Class C | | | (79,245 | ) | | | (30,498 | ) | |
Net decrease in net assets resulting from dividends and distributions | | | (4,596,857 | ) | | | (1,065,172 | ) | |
| From Capital Share Transactions (Note 6) | |
Proceeds from sale of shares | | | 59,613,706 | | | | 42,426,721 | | |
Reinvestment of dividends and distributions | | | 4,589,750 | | | | 1,065,172 | | |
Net asset value of shares redeemed | | | (45,598,354 | ) | | | (7,050,750 | )1 | |
Net increase in net assets from capital share transactions | | | 18,605,102 | | | | 36,441,143 | | |
Net increase in net assets | | | 21,683,581 | | | | 40,625,123 | | |
Net Assets | |
Beginning of year | | | 74,042,233 | | | | 33,417,110 | | |
End of year | | $ | 95,725,814 | | | $ | 74,042,233 | | |
Undistributed net investment income | | $ | 5,161,004 | | | $ | 211,153 | | |
1 Net of $7 of redemption fees retained by the Fund.
See Accompanying Notes to Consolidated Financial Statements.
12
Credit Suisse Managed Futures Strategy Fund
Consolidated Financial Highlights
(For a Class I Share of the Fund Outstanding Throughout Each Period)
| | | For the Year Ended October 31, | |
| | | 2015 | | 2014 | | 2013 | | 20121 | |
Per share data | |
Net asset value, beginning of period | | $ | 10.852 | | | $ | 10.36 | | | $ | 9.76 | | | $ | 10.00 | | |
INVESTMENT OPERATIONS | |
Net investment loss3 | | | (0.16 | ) | | | (0.17 | ) | | | (0.17 | ) | | | (0.01 | ) | |
Net gain (loss) on investments, futures contracts, swap
contracts and foreign currency related items
(both realized and unrealized) | | | 1.51 | | | | 0.95 | | | | 0.77 | | | | (0.23 | ) | |
Total from investment operations | | | 1.35 | | | | 0.78 | | | | 0.60 | | | | (0.24 | ) | |
REDEMPTION FEES | | | — | | | | 0.004 | | | | 0.004 | | | | — | | |
LESS DIVIDENDS AND DISTRIBUTIONS | |
Dividends from net investment income | | | (0.04 | ) | | | — | | | | — | | | | — | | |
Distributions from net realized gains | | | (0.63 | ) | | | (0.29 | ) | | | — | | | | — | | |
Total dividends and distributions | | | (0.67 | ) | | | (0.29 | ) | | | — | | | | — | | |
Net asset value, end of period | | $ | 11.53 | | | $ | 10.852 | | | $ | 10.36 | | | $ | 9.76 | | |
Total return5 | | | 12.88 | % | | | 7.73 | % | | | 6.15 | % | | | (2.40 | )% | |
RATIOS AND SUPPLEMENTAL DATA | |
Net assets, end of period (000s omitted) | | $ | 72,606 | | | $ | 69,190 | | | $ | 26,794 | | | $ | 21,768 | | |
Ratio of net expenses to average net assets | | | 1.32 | % | | | 1.71 | % | | | 1.70 | % | | | 1.70 | %6 | |
Ratio of net investment loss to average net assets | | | (1.31 | )% | | | (1.68 | )% | | | (1.64 | )% | | | (1.69 | )%6 | |
Decrease reflected in above operating expense ratios due to
waivers/reimbursements | | | 0.15 | % | | | 0.10 | % | | | 1.10 | % | | | 3.01 | %6 | |
Portfolio turnover rate | | | — | | | | — | | | | — | | | | — | | |
1 For the period September 28, 2012 (inception date) through October 31, 2012.
2 Includes adjustments in accordance with accounting principles generally accepted in the United States of America and as such, the net asset values for financial reporting purposes and the returns based upon net asset values may differ from the net asset values and returns for shareholder transactions.
3 Per share information is calculated using the average shares outstanding method.
4 This amount represents less than $0.01 per share.
5 Total returns are historical and assume changes in share price and reinvestment of all dividends and distributions. Had certain expenses not been reduced during the periods shown, total returns would have been lower. Total returns for periods less than one year are not annualized.
6 Annualized.
See Accompanying Notes to Consolidated Financial Statements.
13
Credit Suisse Managed Futures Strategy Fund
Consolidated Financial Highlights
(For a Class A Share of the Fund Outstanding Throughout Each Period)
| | | For the Year Ended October 31, | |
| | | 2015 | | 2014 | | 2013 | | 20121 | |
Per share data | |
Net asset value, beginning of period | | $ | 10.80 | | | $ | 10.35 | | | $ | 9.76 | | | $ | 10.00 | | |
INVESTMENT OPERATIONS | |
Net investment loss2 | | | (0.19 | ) | | | (0.20 | ) | | | (0.20 | ) | | | (0.02 | ) | |
Net gain (loss) on investments, futures contracts, swap
contracts and foreign currency related items
(both realized and unrealized) | | | 1.50 | | | | 0.94 | | | | 0.79 | | | | (0.22 | ) | |
Total from investment operations | | | 1.31 | | | | 0.74 | | | | 0.59 | | | | (0.24 | ) | |
REDEMPTION FEES | | | — | | | | 0.003 | | | | 0.003 | | | | — | | |
LESS DIVIDENDS AND DISTRIBUTIONS | |
Dividends from net investment income | | | (0.01 | ) | | | — | | | | — | | | | — | | |
Distributions from net realized gains | | | (0.63 | ) | | | (0.29 | ) | | | — | | | | — | | |
Total dividends and distributions | | | (0.64 | ) | | | (0.29 | ) | | | — | | | | — | | |
Net asset value, end of period | | $ | 11.47 | | | $ | 10.80 | | | $ | 10.35 | | | $ | 9.76 | | |
Total return4 | | | 12.47 | % | | | 7.35 | % | | | 6.05 | % | | | (2.40 | )% | |
RATIOS AND SUPPLEMENTAL DATA | |
Net assets, end of period (000s omitted) | | $ | 20,200 | | | $ | 3,294 | | | $ | 5,824 | | | $ | 98 | | |
Ratio of net expenses to average net assets | | | 1.56 | % | | | 1.96 | % | | | 1.95 | % | | | 1.95 | %5 | |
Ratio of net investment loss to average net assets | | | (1.55 | )% | | | (1.93 | )% | | | (1.90 | )% | | | (1.94 | )%5 | |
Decrease reflected in above operating expense ratios due to
waivers/reimbursements | | | 0.15 | % | | | 0.10 | % | | | 1.10 | % | | | 3.01 | %5 | |
Portfolio turnover rate | | | — | | | | — | | | | — | | | | — | | |
1 For the period September 28, 2012 (inception date) through October 31, 2012.
2 Per share information is calculated using the average shares outstanding method.
3 This amount represents less than $0.01 per share.
4 Total returns are historical and assume changes in share price, reinvestment of all dividends and distributions and no sales charge. Had certain expenses not been reduced during the periods shown, total returns would have been lower. Total returns for periods less than one year are not annualized.
5 Annualized.
See Accompanying Notes to Consolidated Financial Statements.
14
Credit Suisse Managed Futures Strategy Fund
Consolidated Financial Highlights
(For a Class C Share of the Fund Outstanding Throughout Each Period)
| | | For the Year Ended October 31, | |
| | | 2015 | | 2014 | | 2013 | | 20121 | |
Per share data | |
Net asset value, beginning of period | | $ | 10.62 | | | $ | 10.25 | | | $ | 9.75 | | | $ | 10.00 | | |
INVESTMENT OPERATIONS | |
Net investment loss2 | | | (0.27 | ) | | | (0.27 | ) | | | (0.27 | ) | | | (0.02 | ) | |
Net gain (loss) on investments, futures contracts, swap
contracts and foreign currency related items
(both realized and unrealized) | | | 1.47 | | | | 0.93 | | | | 0.77 | | | | (0.23 | ) | |
Total from investment operations | | | 1.20 | | | | 0.66 | | | | 0.50 | | | | (0.25 | ) | |
REDEMPTION FEES | | | — | | | | 0.003 | | | | 0.003 | | | | — | | |
LESS DIVIDENDS AND DISTRIBUTIONS | |
Distributions from net realized gains | | | (0.63 | ) | | | (0.29 | ) | | | — | | | | — | | |
Total dividends and distributions | | | (0.63 | ) | | | (0.29 | ) | | | — | | | | — | | |
Net asset value, end of period | | $ | 11.19 | | | $ | 10.62 | | | $ | 10.25 | | | $ | 9.75 | | |
Total return4 | | | 11.60 | % | | | 6.62 | % | | | 5.13 | % | | | (2.50 | )% | |
RATIOS AND SUPPLEMENTAL DATA | |
Net assets, end of period (000s omitted) | | $ | 2,920 | | | $ | 1,558 | | | $ | 800 | | | $ | 98 | | |
Ratio of net expenses to average net assets | | | 2.32 | % | | | 2.71 | % | | | 2.70 | % | | | 2.70 | %5 | |
Ratio of net investment loss to average net assets | | | (2.31 | )% | | | (2.68 | )% | | | (2.64 | )% | | | (2.70 | )%5 | |
Decrease reflected in above operating expense ratios due to
waivers/reimbursements | | | 0.15 | % | | | 0.10 | % | | | 1.10 | % | | | 3.01 | %5 | |
Portfolio turnover rate | | | — | | | | — | | | | — | | | | — | | |
1 For the period September 28, 2012 (inception date) through October 31, 2012.
2 Per share information is calculated using the average shares outstanding method.
3 This amount represents less than $0.01 per share.
4 Total returns are historical and assume changes in share price, reinvestment of all dividends and distributions and no sales charge. Had certain expenses not been reduced during the periods shown, total returns would have been lower. Total returns for periods less than one year are not annualized.
5 Annualized.
See Accompanying Notes to Consolidated Financial Statements.
15
Credit Suisse Managed Futures Strategy Fund
Notes to Consolidated Financial Statements
October 31, 2015
Credit Suisse Managed Futures Strategy Fund (the "Fund"), a series of the Credit Suisse Opportunity Funds (the "Trust"), a Delaware statutory trust, is registered under the Investment Company Act of 1940, as amended (the "1940 Act"), as a non-diversified open-end management investment company that seeks to achieve an investment result that corresponds generally to the risk and return patterns of managed futures funds. The Trust was organized under the laws of the State of Delaware as a business trust on May 31, 1995.
Credit Suisse Asset Management, LLC ("Credit Suisse"), the investment adviser to the Fund, is registered as a Commodity Pool Operator with the Commodity Futures Trading Commission. The Fund seeks to achieve its investment objective by investing directly and/or indirectly through the Credit Suisse Cayman Managed Futures Strategy Fund, Ltd. (the "Subsidiary"), a wholly-owned subsidiary of the Fund organized under the laws of the Cayman Islands, in a combination of securities and derivative instruments. The Subsidiary invests in commodity-linked derivative instruments, such as swaps and futures, as well as other types of futures, swaps and options. The Subsidiary may also invest in debt securities, some of which are intended to serve as margin or collateral for the Subsidiary's derivatives positions.
The Subsidiary is managed by the same portfolio managers that manage the Fund and the accompanying financial statements reflect the financial position of the Fund and its Subsidiary and the results of operations on a consolidated basis. The consolidated financial statements include portfolio holdings of the Fund and the Subsidiary and all intercompany transactions and balances have been eliminated. The Fund may invest up to 25% of its total net assets in the Subsidiary. As of October 31, 2015, the Fund held $13,449,306 in the Subsidiary, representing 14.0% of the Fund's consolidated net assets. For the year ended October 31, 2015, the net realized gain on securities held in the Subsidiary was $5,082,694.
Subsequent references to the Fund within the Notes to Consolidated Financial Statements collectively refer to the Fund and its Subsidiary.
The Fund offers three classes of shares: Class I shares, Class A shares and Class C shares. Each class of shares represents an equal pro rata interest in the Fund, except they bear different expenses, which reflect the differences in the range of services provided to them. Class A shares are sold subject to a front-end sales charge of up to 5.25%. Class C shares are sold subject to a contingent deferred sales charge of 1.00% if the shares are redeemed within the first year of purchase. Class I shares are sold without a sales charge.
16
Credit Suisse Managed Futures Strategy Fund
Notes to Consolidated Financial Statements (continued)
October 31, 2015
Note 2. Significant Accounting Policies
The following is a summary of significant accounting policies followed by the Fund in the preparation of its consolidated financial statements. The policies are in accordance with accounting principles generally accepted in the United States of America ("GAAP"). The preparation of consolidated financial statements requires management to make estimates and assumptions that affect the reported amounts and disclosures in the consolidated financial statements. Actual results could differ from those estimates. The Fund is considered an investment company for financial reporting purposes under GAAP and follows Accounting Standard Codification ("ASC") Topic 946 — Financial Services — Investment Companies.
A) SECURITY VALUATION — The net asset value of the Fund is determined daily as of the close of regular trading on the New York Stock Exchange, Inc. (the "Exchange") on each day the Exchange is open for business. The valuations for fixed income securities (which may include, but are not limited to, corporate, government, municipal, mortgage-backed, collateralized mortgage obligations and asset-backed securities) and certain derivative instruments are typically the prices supplied by independent third party pricing services, which may use market prices or broker/dealer quotations or a variety of valuation techniques and methodologies. The independent third party pricing services use inputs that are observable such as issuer details, interest rates, yield curves, prepayment speeds, credit risks/spreads, default rates and quoted prices for similar securities. These pricing services generally price fixed income securities assuming orderly transactions of an institutional "round lot" size, but some trades occur in smaller "odd lot" sizes which may be effected at lower prices than institutional round lot trades. Structured note agreements are valued in accordance with a dealer-supplied valuation based on changes in the value of the underlying index. Futures contracts are valued daily at the settlement price established by the board of trade or exchange on which they are traded. Forward contracts are valued at the London closing spot rates and the London closing forward point rates on a daily basis. The currency forward contract pricing model derives the differential in point rates to the expiration date of the forward and calculates its present value. Equity securities for which market quotations are available are valued at the last reported sales price or official closing price on the primary market or exchange on which they trade. The Fund may utilize a service provided by an independent third party which has been approved by the Board of Trustees (the "Board") to fair value certain securities. When fair value pricing is employed, the prices of securities used by the Fund to calculate its net asset value may differ from quoted or published prices for the same securities. If
17
Credit Suisse Managed Futures Strategy Fund
Notes to Consolidated Financial Statements (continued)
October 31, 2015
Note 2. Significant Accounting Policies (continued)
independent third party pricing services are unable to supply prices for a portfolio investment, or if the prices supplied are deemed by the investment adviser to be unreliable, the market price may be determined by the investment adviser using quotations from one or more broker/dealers or at the transaction price if the security has recently been purchased and no value has yet been obtained from a pricing service or pricing broker. When reliable prices are not readily available, such as when the value of a security has been significantly affected by events after the close of the exchange or market on which the security is principally traded, but before the Fund calculates its net asset value, the Fund values these securities as determined in accordance with procedures approved and established by the Board.
The Fund uses valuation techniques to measure fair value that are consistent with the market approach and/or income approach, depending on the type of security and the particular circumstance. The market approach uses prices and other relevant information generated by market transactions involving identical or comparable securities. The income approach uses valuation techniques to discount estimated future cash flows to present value.
GAAP established a disclosure hierarchy that categorizes the inputs to valuation techniques used to value assets and liabilities at each measurement date. These inputs are summarized in the three broad levels listed below:
• Level 1 – quoted prices in active markets for identical investments
• Level 2 – other significant observable inputs (including quoted prices for similar investments, interest rates, prepayment speeds, credit risk, etc.)
• Level 3 – significant unobservable inputs (including the Fund's own assumptions in determining the fair value of investments)
The inputs or methodologies used to value securities are not necessarily an indication of the risk associated with investing in those securities.
The following is a summary of the inputs used as of October 31, 2015 in valuing the Fund's assets and liabilities carried at fair value:
Assets | | Level 1 | | Level 2 | | Level 3 | | Total | |
Investments in Securities | |
Short-term Investment | | $ | — | | | $ | 84,921,063 | | | $ | — | | | $ | 84,921,063 | | |
| | | $ | — | | | $ | 84,921,063 | | | $ | — | | | $ | 84,921,063 | | |
Other Financial Instruments* | |
Futures Contracts | | $ | 465,461 | | | $ | — | | | $ | — | | | $ | 465,461 | | |
Swap Contracts | | | — | | | | 349,747 | | | | — | | | | 349,747 | | |
18
Credit Suisse Managed Futures Strategy Fund
Notes to Consolidated Financial Statements (continued)
October 31, 2015
Note 2. Significant Accounting Policies (continued)
Liabilities | | Level 1 | | Level 2 | | Level 3 | | Total | |
Other Financial Instruments* | |
Futures Contracts | | $ | 859,862 | | | $ | — | | | $ | — | | | $ | 859,862 | | |
Swap Contracts | | | — | | | | 29,964 | | | | — | | | | 29,964 | | |
*Other financial instruments include unrealized appreciation (depreciation) on futures and swap contracts.
For the year ended October 31, 2015, there were no transfers in and out of Level 1, Level 2 and Level 3. All transfers, if any, are assumed to occur at the end of the reporting period.
B) DERIVATIVE INSTRUMENTS AND HEDGING ACTIVITIES — The Fund adopted amendments to authoritative guidance on disclosures about derivative instruments and hedging activities which require that a fund disclose (a) how and why an entity uses derivative instruments, (b) how derivative instruments and hedging activities are accounted for and (c) how derivative instruments and related hedging activities affect a fund's financial position, financial performance and cash flows. For the year ended October 31, 2015, the Fund's derivatives did not qualify for hedge accounting as they are held at fair value.
Fair Values of Derivative Instruments as of October 31, 2015
| | | Asset Derivatives | | Liability Derivatives | |
| | | Balance Sheet
Location | | Fair Value | | Balance Sheet
Location | | Fair Value | |
Foreign Exchange
Contracts | | Unrealized appreciation
on futures contracts | | $ | — | | | Unrealized depreciation
on futures contracts | | $ | 397,699 | * | |
Index Contracts | | Unrealized appreciation
on futures contracts | | | 49,020 | * | | Unrealized depreciation
on futures contracts | | | 301,786 | * | |
Interest Rate
Contracts | | Unrealized appreciation
on futures contracts | | | 416,441 | * | | Unrealized depreciation
on futures contracts | | | 160,377 | * | |
Commodity Index
Return Contracts | | Unrealized appreciation
on open swap contracts | | | 349,747 | | | Unrealized depreciation
on open swap contracts | | | 29,964 | | |
| | | | | | | $ | 815,208 | | | | | | | $ | 889,826 | | |
*Reflects cumulative appreciation (depreciation) of futures contracts as reported in the Consolidated Statement of Assets and Liabilities and Notes to Consolidated Financial Statements. The current day's variation margin reported within the Consolidated Statement of Assets and Liabilities includes the cumulative appreciation (depreciation) of futures contracts.
19
Credit Suisse Managed Futures Strategy Fund
Notes to Consolidated Financial Statements (continued)
October 31, 2015
Note 2. Significant Accounting Policies (continued)
Effect of Derivative Instruments on the Consolidated Statement of Operations
| | | Location | | Realized
Gain(Loss) | | Location | | Unrealized
Appreciation/
Depreciation | |
Foreign Exchange
Contracts | | |
Net realized gain from
futures contracts | | | $ | 10,843,575 | | | Net change in unrealized
appreciation (depreciation)
from futures contracts | | $ | (3,262,312 | ) | |
Index Contracts | | |
Net realized loss from
futures contracts | | | | (4,385,323 | ) | | Net change in unrealized
appreciation (depreciation)
from futures contracts | | | (279,425 | ) | |
Interest Rate
Contracts | | |
Net realized gain from
futures contracts | | | | 1,001,632 | | | Net change in unrealized
appreciation (depreciation)
from futures contracts | | | (841,336 | ) | |
Commodity Index
Return Contracts | | |
Net realized gain from
swap contracts | | | | 5,611,305 | | | Net change in unrealized
appreciation (depreciation)
from swap contracts | | | 230,987 | | |
| | | | | $ | 13,071,189 | | | | | $ | (4,152,086 | ) | |
The notional amount of futures contracts and swap contracts for the year ended October 31, 2015 is reflected in the Consolidated Schedule of Investments. For the year ended October 31, 2015, the Fund held average monthly notional values on a net basis of $109,230,441, $95,495,329 and $33,148,913 in long futures contracts, short futures contracts and swap contracts, respectively.
The Fund is a party to International Swap and Derivatives Association, Inc. ("ISDA") Master Agreements ("Master Agreements") with certain counterparties that govern over-the-counter derivative (including Total Return, Credit Default and Interest Rate Swaps) and foreign exchange contracts entered into by the Fund. The Master Agreements may contain provisions regarding, among other things, the parties' general obligations, representations, agreements, collateral requirements, events of default and early termination. Termination events applicable to the Fund may occur upon a decline in the Fund's net assets below a specified threshold over a certain period of time.
The following table presents by counterparty the Fund's derivative assets net of related collateral held by the Fund at October 31, 2015:
Counterparty | | Gross Amounts of
Assets Presented in
the Consolidated
Statement of Assets
and Liabilities(a) | | Financial
Instruments
and Derivatives
Available for Offset | | Non-Cash
Collateral
Received | | Cash
Collateral
Received(b) | | Net Amount
of Derivative
Assets | |
Goldman Sachs | | $ | 349,747 | | | $ | (29,964 | ) | | $ | — | | | $ | (319,783 | ) | | $ | — | | |
20
Credit Suisse Managed Futures Strategy Fund
Notes to Consolidated Financial Statements (continued)
October 31, 2015
Note 2. Significant Accounting Policies (continued)
The following table presents by counterparty the Fund's derivative liabilities net of related collateral pledged by the Fund at October 31, 2015:
Counterparty | | Gross Amounts of
Liabilities Presented in
the Consolidated
Statement of Assets
and Liabilities(a) | | Financial
Instruments
and Derivatives
Available for Offset | | Non-Cash
Collateral
Pledged | | Cash
Collateral
Pledged | | Net Amount
of Derivative
Liabilities | |
Goldman Sachs | | $ | 29,964 | | | $ | (29,964 | ) | | $ | — | | | $ | — | | | $ | — | | |
(a) Swap contracts are included.
(b) The actual collateral received and/or pledged may be more than the amounts shown.
C) SECURITY TRANSACTIONS AND INVESTMENT INCOME/EXPENSE — Security transactions are accounted for on a trade date basis. Interest income/expense is recorded on the accrual basis. The Fund amortizes premiums and accretes discounts using the effective interest method. Dividend income/expense is recorded on the ex-dividend date. Certain expenses are class-specific expenses, vary by class and are charged only to that class. Income, expenses (excluding class-specific expenses) and realized/unrealized gains/losses are allocated proportionately to each class of shares based upon the relative net asset value of the outstanding shares of that class. The cost of investments sold is determined by use of the specific identification method for both financial reporting and income tax purposes.
D) DIVIDENDS AND DISTRIBUTIONS TO SHAREHOLDERS — Dividends from net investment income, if any, are declared and paid quarterly. Distributions of net realized capital gains, if any, are declared and paid at least annually. However, to the extent that a net realized capital gain can be reduced by a capital loss carryforward, such gain will not be distributed. Income and capital gain distributions are determined in accordance with federal income tax regulations, which may differ from GAAP.
E) FEDERAL INCOME TAXES — No provision is made for federal taxes as it is the Fund's intention to continue to qualify as a regulated investment company ("RIC") under the Internal Revenue Code of 1986, as amended (the "Code"), and to make the requisite distributions to its shareholders, which will be sufficient to relieve it from federal income and excise taxes.
In order to qualify as a RIC under the Code, the Fund must meet certain requirements regarding the source of its income, the diversification of its assets and the distribution of its income. One of these requirements is that the Fund derive at least 90% of its gross income for each taxable year from dividends,
21
Credit Suisse Managed Futures Strategy Fund
Notes to Consolidated Financial Statements (continued)
October 31, 2015
Note 2. Significant Accounting Policies (continued)
interest, payments with respect to certain securities loans, gains from the sale or other disposition of stock, securities or foreign currencies, other income derived with respect to its business of investing in such stock, securities or currencies or net income derived from interests in certain publicly traded partnerships ("Qualifying Income"). The Internal Revenue Service ("IRS") has issued a ruling that income realized from certain types of commodity-linked derivatives would not be Qualifying Income. As a result, the Fund's ability to realize income from investments in such commodity-linked derivatives as part of its investment strategy would be limited to a maximum of 10% of its gross income. The IRS has issued private letter rulings to registered investment companies concluding that income derived from their investment in a wholly-owned subsidiary would constitute Qualifying Income to the fund. The IRS has indicated that the granting of these types of private letter rulings is currently suspended, pending further internal discussion. As a result, there can be no assurance that the IRS will grant, such a private letter ruling to the Fund. If the Fund does not receive such a private letter ruling, there is a risk that the IRS could assert that the income derived from the Fund's investment in the Subsidiary will not be considered Qualifying Income for purposes of the fund remaining qualified as a RIC for U.S. federal income tax purposes. If the Fund is unable to ensure continued qualification as a RIC, the Fund may be required to change its investment objective, policies or techniques, or may be liquidated. If the Fund fails to qualify as a RIC, the Fund will be subject to federal income tax on its net income and capital gains at regular corporate rates (without reduction for distributions to shareholders). If the Fund were to fail to qualify as a RIC and become subject to federal income tax, shareholders of the Fund would be subject to the risk of diminished returns.
The Fund adopted the authoritative guidance for uncertainty in income taxes and recognizes a tax benefit or liability from an uncertain position only if it is more likely than not that the position is sustainable based solely on its technical merits and consideration of the relevant taxing authority's widely understood administrative practices and procedures. The Fund has reviewed its current tax positions and has determined that no provision for income tax is required in the Fund's financial statements. The Fund's federal tax returns for the prior three fiscal years remain subject to examination by the IRS.
F) SHORT-TERM INVESTMENTS — The Fund, together with other funds/portfolios advised by Credit Suisse, pools available cash into a short-term variable rate time deposit issued by State Street Bank and Trust Company ("SSB"), the Fund's custodian. The short-term time deposit issued by SSB is a variable rate account classified as a short-term investment.
22
Credit Suisse Managed Futures Strategy Fund
Notes to Consolidated Financial Statements (continued)
October 31, 2015
Note 2. Significant Accounting Policies (continued)
G) FUTURES — The Fund may enter into futures contracts to the extent permitted by its investment policies and objectives. The Fund may use futures contracts to gain exposure to or hedge against changes in interest rates, equity and market price movements and/or currency risks. Upon entering into a futures contract, the Fund is required to deposit cash and/or pledge U.S. Government securities as initial margin. Subsequent payments, which are dependent on the daily fluctuations in the value of the underlying instrument, are made or received by the Fund each day (daily variation margin) and are recorded as unrealized gains or losses until the contracts are closed. When the contracts are closed, the Fund records a realized gain or loss equal to the difference between the proceeds from (or cost of) the closing transactions and the Fund's basis in the contract. Risks of entering into futures contracts for hedging purposes include the possibility that a change in the value of the contract may not correlate with the changes in the value of the underlying instruments. With futures, there is minimal counterparty credit risk to the Fund since futures are exchange traded and the exchange's clearinghouse, as counterparty to all exchange traded futures, guarantees the futures against default. In addition, the purchase of a futures contract involves the risk that the Fund could lose more than the original margin deposit and subsequent payments may be required for a futures transaction. The Fund's open futures contracts are disclosed in the Consolidated Schedule of Investments. At October 31, 2015, the amount of restricted cash held at brokers was $0.
H) SWAPS — The Fund may enter into swap contracts either for hedging purposes or to seek to increase total return. A swap contract is an agreement that obligates two parties to exchange a series of cash flows at specified intervals based upon or calculated by reference to changes in specified prices or rates for a specified amount of an underlying asset or notional principal amount. The Fund will enter into swap contracts only on a net basis, which means that the two payment streams are netted out, with the Fund receiving or paying, as the case may be, only the net amount of the two payments. Risks may arise as a result of the failure of the counterparty to the swap contract to comply with the terms of the swap contract. The extent of the Fund's exposure to credit and counterparty risks is the discounted net value of the cash flows to be received from the counterparty over the contract's remaining life, to the extent that the amount is positive. These risks are mitigated by having a master netting arrangement between the Fund and the counterparty and by the posting of collateral by the counterparty to the Fund to cover the Fund's exposure to the counterparty. Therefore, the Fund considers the creditworthiness of each counterparty as well as the amounts posted by the
23
Credit Suisse Managed Futures Strategy Fund
Notes to Consolidated Financial Statements (continued)
October 31, 2015
Note 2. Significant Accounting Policies (continued)
counterparty pursuant to the master netting agreement to a swap contract in evaluating potential credit risk. Additionally, risks may arise from unanticipated movements in interest rates or in the value of the underlying reference asset or index.
The Fund may enter into total return swap contracts, involving commitments to pay interest in exchange for a market-linked return, both based on notional amounts. The Fund may invest in total return swap contracts for hedging purposes or to seek to increase total return. To the extent the total return of the security or index underlying the transactions exceeds or falls short of the offsetting interest rate obligation, the Fund will receive a payment from or make a payment to the counterparty.
The Fund records unrealized gains or losses on a daily basis representing the value and the current net receivable or payable relating to open swap contracts. Net amounts received or paid on the swap contract are recorded as realized gains or losses. Fluctuations in the value of swap contracts are recorded for financial statement purposes as unrealized appreciation or depreciation on swap contracts. Realized gains and losses from terminated swaps are included in net realized gains/losses on swap contracts transactions. The Fund's open swap contracts are disclosed in the Consolidated Schedule of Investments. At October 31, 2015, the amount of restricted cash held at brokers for the Fund was $700,000.
I) SECURITIES LENDING — Loans of securities are required at all times to be secured by collateral at least equal to 102% of the market value of domestic securities on loan (including any accrued interest thereon) and 105% of the market value of foreign securities on loan (including any accrued interest thereon). Cash collateral received by the Fund in connection with securities lending activity may be pooled together with cash collateral for other funds/portfolios advised by Credit Suisse and may be invested in a variety of investments, including funds advised by SSB, the Fund's securities lending agent or money market instruments. However, in the event of default or bankruptcy by the other party to the agreement, realization and/or retention of the collateral may be subject to legal proceedings.
SSB has been engaged by the Fund to act as the Fund's securities lending agent. The Fund's securities lending arrangement provides that the Fund and SSB will share the net income earned from securities lending activities. During the year ended October 31, 2015, there were no securities out on loan. Securities lending income is accrued as earned.
24
Credit Suisse Managed Futures Strategy Fund
Notes to Consolidated Financial Statements (continued)
October 31, 2015
Note 2. Significant Accounting Policies (continued)
J) OTHER — In the normal course of business the Fund trades financial instruments and enters into financial transactions where risk of potential loss exists due to changes in the market (market risk) or failure of the other party to a transaction to perform (credit risk). Similar to credit risk, the Fund may be exposed to counterparty risk, or the risk that an institution or other entity with which the Fund has unsettled or open transactions will default. The potential loss could exceed the value of the financial assets recorded in the financial statements. Financial assets, which potentially expose the Fund to credit risk, consist principally of cash due from counterparties and investments. The extent of the Fund's exposure to credit and counterparty risks in respect to these financial assets approximates their carrying value as recorded in the Fund's Consolidated Statement of Assets and Liabilities.
K) NEW ACCOUNTING PRONOUNCEMENTS — In June 2014, Financial Accounting Standards Board ("FASB") issued ASU No. 2014-11, Transfers and Servicing (Topic 860), Repurchase-to-Maturity Transactions, Repurchase Financings, and Disclosures. The ASU changes the accounting for certain repurchase agreements and expands disclosure requirements related to repurchase agreements, securities lending, repurchase-to-maturity and similar transactions. The ASU is effective for interim and annual reporting periods beginning after December 15, 2014. Management has reviewed the requirements and believes the adoption of this ASU will not have a material impact on the financial statements.
On April 7, 2015, the Financial Accounting Standards Board (FASB) issued a new Accounting Standards Update (ASU) No. 2015-03, "Simplifying the Presentation of Debt Issuance Costs". The ASU requires debt issuance costs to be presented on the balance sheet as a direct deduction from the debt liability. The ASU is effective for interim and annual reporting periods beginning after December 15, 2015. Management has reviewed the requirements and believes the adoption of this ASU will not have a material impact on the financial statements.
In May 2015, the FASB issued ASU No. 2015-07, "Disclosures for Investments in Certain Entities that Calculate Net Asset Value per Share (or its Equivalent)". The guidance removes the requirement to categorize within the fair value hierachy all investments for which fair value is measured using the NAV per share practical expedient. Sufficient information must be provided to permit reconciliation of the fair value of assets categorized within the fair value hierachy to the amounts presented in the Consolidated Statements of Assets and Liabilities. The guidance is required to be presented for annual periods
25
Credit Suisse Managed Futures Strategy Fund
Notes to Consolidated Financial Statements (continued)
October 31, 2015
Note 2. Significant Accounting Policies (continued)
beginning after December 15, 2015, and for interim periods within those fiscal years. Management is currently reviewing the requirements and believes the adoption of this ASU will not have a material impact on its financial statements.
L) SUBSEQUENT EVENTS — In preparing the financial statements as of October 31, 2015, management considered the impact of subsequent events for potential recognition or disclosure in these financial statements through the date of release of this report. No such events requiring recognition or disclosure were identified through the date of the release of this report.
Note 3. Transactions with Affiliates and Related Parties
Credit Suisse serves as investment adviser for the Fund. For its investment advisory services, Credit Suisse is entitled to receive a fee from the Fund at an annual rate of 0.95% of the Fund's average daily net assets. For the year ended October 31, 2015, investment advisory fees earned and fees waived/expenses reimbursed were $914,754 and $137,633, respectively. The Fund is authorized to reimburse Credit Suisse for management fees previously limited and/or for expenses previously paid by Credit Suisse, provided, however, that any reimbursements must be paid at a date not more than three years after the end of the fiscal year during which such fees were limited or expenses were reimbursed by Credit Suisse and the reimbursements do not cause a class to exceed the applicable expense limitation in the contract at the time the fees were limited or expenses are paid. This contract may not be terminated before February 28, 2017. Currently, Credit Suisse contractually waives fees and reimburses expenses so that the Fund's annual operating expenses will not exceed 1.30% of the Fund's average daily net assets for Class I shares, 1.55% of the Fund's average daily net assets for Class A shares, and 2.30% of the Fund's average daily net assets for Class C shares.
For the year ended October 31, 2015, the amounts waived and reimbursed by Credit Suisse, as well as the amounts available for recoupment/potential future recoupment by Credit Suisse and the expiration schedule at October 31, 2015 are as follows:
| | | Fee waivers/ expense
reimbursements subject
to repayment* | | Expires October 31,
2016 | | Expires October 31,
2018 | |
Class I | | $ | 252,015 | | | $ | 191,280 | | | $ | 60,735 | | |
Class A | | | 27,650 | | | | 13,820 | | | | 13,830 | | |
Class C | | | 3,926 | | | | 1,873 | | | | 2,053 | | |
Totals | | $ | 283,591 | | | $ | 206,973 | | | $ | 76,618 | | |
*The subsidiary is not eligible for recoupment.
26
Credit Suisse Managed Futures Strategy Fund
Notes to Consolidated Financial Statements (continued)
October 31, 2015
Note 3. Transactions with Affiliates and Related Parties (continued)
Fee waivers/expense reimbursements subject to potential recoupment in the amount of $22,886 expired on October 31, 2015.
Credit Suisse and SSB serve as co-administrators to the Fund. For its co-administrative services, Credit Suisse received a fee calculation at an annual rate of 0.09% of the Fund's average daily net assets. For the year ended October 31, 2015, co-administrative services fees earned by Credit Suisse were $85,958.
For its co-administrative services, SSB receives a fee, exclusive of out-of-pocket expenses, calculated in total for all the Credit Suisse funds/portfolios co-administered by SSB and allocated based upon the relative average net assets of each fund/portfolio, subject to an annual minimum fee. For the year ended October 31, 2015, co-administrative services fees earned by SSB (including out-of-pocket expenses) with respect to the Fund were $11,947.
Credit Suisse Securities (USA) LLC ("CSSU"), an affiliate of Credit Suisse, serves as the distributor of the Fund's shares. Pursuant to distribution plans adopted by the Fund pursuant to Rule 12b-1 under the 1940 Act, CSSU received fees for its distribution services. These fees were calculated at an annual rate of 0.25% of the average daily net assets of the Class A shares. For the Class C shares, the fee is calculated at an annual rate of 1.00% of the average daily net assets. For the year ended October 31, 2015, the Fund paid Rule 12b-1 distribution fees of $41,798 for Class A shares and $25,062 for Class C shares. Class I shares are not subject to Rule 12b-1 distribution fees.
Certain brokers, dealers and financial representatives provide transfer agent related services to the Fund and receive compensation from the Fund. For the year ended October 31, 2015, the Fund paid $32,915, which is included within transfer agent fees on the Consolidated Statement of Operations.
For the year ended October 31, 2015, CSSU and its affiliates advised the Fund that they retained $99 from commissions earned on the sale of the Fund's Class A shares. There were no commissions earned on sale of Class C shares.
Note 4. Line of Credit
The Fund, together with other funds/portfolios advised by Credit Suisse (collectively, the "Participating Funds"), participates in a committed, unsecured line of credit facility ("Credit Facility"), in an aggregated amount of $200 million for temporary or emergency purposes with SSB under a first-come, first-served basis. Under the terms of the Credit Facility, the
27
Credit Suisse Managed Futures Strategy Fund
Notes to Consolidated Financial Statements (continued)
October 31, 2015
Note 4. Line of Credit (continued)
Participating Funds pay an aggregate commitment fee on the average unused amount of the Credit Facility, which is allocated among the Participating Funds in such manner as is determined by the governing Boards of the Participating Funds. In addition, the Participating Funds pay interest on borrowings at either the Overnight Federal Funds rate or the Overnight LIBOR rate plus a spread. At October 31, 2015 and during the year ended October 31, 2015, the Fund had no borrowings outstanding under the Credit Facility.
Note 5. Purchases and Sales of Securities
For the year ended October 31, 2015, purchases and sales of investment securities (excluding short-term investments) and U.S. Government and Agency Obligations were as follows:
Investment Securities | | U.S. Government/
Agency Obligations | |
| Purchases | | Sales | | Purchases | | Sales | |
| $ | — | | | $ | — | | | $ | — | | | $ | — | | |
Note 6. Capital Share Transactions
The Fund is authorized to issue an unlimited number of full and fractional shares of beneficial interest, $.001 par value per share. The Fund offers Class I, Class A and Class C shares. Transactions in capital shares for each class of the Fund were as follows:
| | | Class I | |
| | | For the Year Ended
October 31, 2015 | | For the Year Ended
October 31, 2014 | |
| | | Shares | | Value | | Shares | | Value | |
Shares sold | | | 1,298,671 | | | $ | 15,605,770 | | | | 4,000,396 | | | $ | 40,478,168 | | |
Shares issued in reinvestment
of dividends and distributions | | | 392,240 | | | | 4,318,168 | | | | 85,842 | | | | 873,874 | | |
Shares redeemed | | | (1,771,447 | ) | | | (21,358,396 | ) | | | (291,874 | ) | | | (3,011,595 | ) | |
Net increase (decrease) | | | (80,536 | ) | | $ | (1,434,458 | ) | | | 3,794,364 | | | $ | 38,340,447 | | |
| | | Class A | |
| | | For the Year Ended
October 31, 2015 | | For the Year Ended
October 31, 2014 | |
| | | Shares | | Value | | Shares | | Value | |
Shares sold | | | 3,449,303 | | | $ | 42,162,996 | | | | 126,119 | | | $ | 1,285,230 | | |
Shares issued in reinvestment
of dividends and distributions | | | 18,180 | | | | 198,770 | | | | 15,827 | | | | 160,800 | | |
Shares redeemed | | | (2,011,418 | ) | | | (23,654,995 | ) | | | (399,745 | ) | | | (4,039,155 | ) | |
Net increase (decrease) | | | 1,456,065 | | | $ | 18,706,771 | | | | (257,799 | ) | | $ | (2,593,125 | ) | |
28
Credit Suisse Managed Futures Strategy Fund
Notes to Consolidated Financial Statements (continued)
October 31, 2015
Note 6. Capital Share Transactions (continued)
| | | Class C | |
| | | For the Year Ended
October 31, 2015 | | For the Year Ended
October 31, 2014 | |
| | | Shares | | Value | | Shares | | Value | |
Shares sold | | | 157,431 | | | $ | 1,844,940 | | | | 65,637 | | | $ | 663,323 | | |
Shares issued in reinvestment
of dividends and distributions | | | 6,786 | | | | 72,812 | | | | 3,032 | | | | 30,498 | | |
Shares redeemed | | | (50,067 | ) | | | (584,963 | ) | | | — | | | | — | | |
Net increase | | | 114,150 | | | $ | 1,332,789 | | | | 68,669 | | | $ | 693,821 | | |
On October 31, 2015, the number of shareholders that held 5% or more of the outstanding shares of each class of the Fund was as follows:
| | | Number of
Shareholders | | Approximate Percentage
of Outstanding Shares | |
Class I | | | 2 | * | | | 85 | % | |
Class A | | | 3 | | | | 33 | % | |
Class C | | | 1 | | | | 59 | % | |
*This includes the seed money from Merchant Holding, Inc., an affiliate of Credit Suisse.
Some of the shareholders may be omnibus accounts, which hold shares on behalf of individual shareholders.
Note 7. Federal Income Taxes
Income and capital gain distributions are determined in accordance with federal income tax regulations, which may differ from GAAP.
The tax characteristics of dividends paid during the years ended October 31, 2015 and 2014, respectively, by the Fund were as follows:
Ordinary Income | | Long-Term Capital Gain | |
| 2015 | | 2014 | | 2015 | | 2014 | |
| $ | 1,026,134 | | | $ | 524,559 | | | $ | 3,570,723 | | | $ | 540,613 | | |
The tax basis components of distributable earnings differ from the amounts reflected in the Consolidated Statement of Assets and Liabilities by temporary book/tax differences. These differences are primarily due to differing treatments of futures contracts marked to market and offering expenses. At
29
Credit Suisse Managed Futures Strategy Fund
Notes to Consolidated Financial Statements (continued)
October 31, 2015
Note 7. Federal Income Taxes (continued)
October 31, 2015, the components of distributable earnings on a tax basis were as follows:
Undistributed net investment income | | $ | 6,475,405 | | |
Undistributed capital gain | | | 2,163,296 | | |
Unrealized appreciation | | | 350,908 | | |
| | | $ | 8,989,609 | | |
At October 31, 2015, the cost of investments (excluding foreign currency related transactions) and net unrealized appreciation (depreciation) for income tax purposes were as follows:
Cost of Investments | | $ | 84,921,063 | | |
Unrealized appreciation | | $ | — | | |
Unrealized depreciation | | | (— | ) | |
Net unrealized appreciation (depreciation) | | $ | — | | |
At October 31, 2015, the Fund reclassified $6,527,151 from accumulated net investment loss and $6,296,164 from accumulated net realized gain to paid in capital, to adjust for current period permanent book/tax differences which arose principally from differing book/tax treatment of foreign currency gain (loss) and subsidiary accumulative income (loss). Net assets were not affected by these reclassifications.
Note 8. Contingencies
In the normal course of business, the Fund may provide general indemnifications pursuant to certain contracts and organizational documents. The Fund's maximum exposure under these arrangements is dependent on future claims that may be made against the Fund and, therefore, cannot be estimated; however, based on experience, the risk of loss from such claims is considered remote.
Note 9. Other Matters
On May 19, 2014, the U.S. Department of Justice (the "Department of Justice") filed a one-count criminal information (the "Information") in the District Court for the Eastern District of Virginia (the "District Court") charging Credit Suisse AG ("CSAG") with conspiracy to commit tax fraud related to accounts CSAG established for cross-border clients. The Department of Justice
30
Credit Suisse Managed Futures Strategy Fund
Notes to Consolidated Financial Statements (continued)
October 31, 2015
Note 9. Other Matters (continued)
and CSAG entered into a plea agreement (the "Plea Agreement") settling the action pursuant to which CSAG pleaded guilty to the charge set out in the Information.
The Plea Agreement requires CSAG to pay over $1.8 billion to the U.S. government, including the U.S. Internal Revenue Service. The Plea Agreement also requires CSAG to lawfully undertake certain remedial actions to address the conduct described in the Plea Agreement.
CSAG has entered into other settlements relating to the conduct set out in the Plea Agreement. CSAG has entered into a Consent Order with the Federal Reserve Board (the "Federal Reserve") to resolve certain findings by the Federal Reserve, including that the activities of CSAG regarding opening of foreign accounts for U.S. taxpayers, provision of investment services to U.S. clients, and operation of CSAG's New York representative office prior to 2009 lacked adequate enterprise-wide risk management and compliance policies and procedures sufficient to ensure that all of its activities comply with U.S. laws and regulations. In addition, CSAG has entered into a Consent Order with the New York State Department of Financial Services (the "DFS") to resolve the DFS's investigation into the conduct described in the Plea Agreement. The settlement with the Federal Reserve requires CSAG to pay $100 million to the Federal Reserve, and the settlement with the DFS requires CSAG to pay $715 million to the DFS.
These settlements follow a settlement by Credit Suisse Group AG ("CS Group"), the parent company of CSAG, with the Securities and Exchange Commission (the "Commission") on February 21, 2014 to resolve an investigation by the Commission into solicitation and provision of broker-dealer and investment advisory services to certain U.S. cross-border clients by CS Group while not registered with the Commission as a broker-dealer or investment adviser. As part of the settlement, CS Group retained an independent consultant to evaluate its policies and procedures and examine its broker-dealer and investment adviser activities to fully verify that the business that was the subject of the Commission investigation has been completely exited. CS Group also agreed to pay $196,511,014, which includes $82,170,990 in disgorgement, $64,340,024 in interest and a $50,000,000 penalty.
CSAG is the indirect parent company of Credit Suisse and CSSU. Neither Credit Suisse, CSSU nor the Fund was named in the Plea Agreement (as defined above) or other settlements relating to the conduct set out in the Plea Agreement. The conduct set out in the Plea Agreement did not involve the
31
Credit Suisse Managed Futures Strategy Fund
Notes to Consolidated Financial Statements (continued)
October 31, 2015
Note 9. Other Matters (continued)
Fund, Credit Suisse or CSSU with respect to its investment adviser and distribution activities relating to the Fund.
Credit Suisse, CSSU and certain of their affiliates have received a permanent exemptive order from the Commission to permit them to continue serving as investment advisers and principal underwriters for U.S.-registered investment companies, such as the Fund. Due to a provision in the law governing the operation of U.S.-registered investment companies, they would otherwise have become ineligible to perform these activities as a result of the plea in the Plea Agreement. The permanent exemptive order permits Credit Suisse and CSSU to continue to provide services to the Fund, so long as, among other things, no current or former employee of CSAG or any affiliate of CSAG who previously has been or who subsequently may be identified by CSAG or any U.S. or non-U.S. regulatory or enforcement agencies as having been responsible for the conduct described in the Plea Agreement will be employed by Credit Suisse and certain of its affiliates. Credit Suisse and CSSU have informed the Fund that, Credit Suisse and CSSU believe the Settlements will not have any material impact on the Fund or on the ability of Credit Suisse or CSSU to perform services for the Fund.
On November 21, 2014, at the sentencing hearing, the District Court accepted and implemented the sentence as set out in the Plea Agreement. The District Court imposed no additional conditions beyond those contained in the Plea Agreement.
32
Credit Suisse Managed Futures Strategy Fund
Report of Independent Registered Public Accounting Firm
The Board of Trustees and Shareholders
Credit Suisse Managed Futures Strategy Fund:
We have audited the accompanying consolidated statement of assets and liabilities of Credit Suisse Managed Futures Strategy Fund (the "Fund"), a series of the Credit Suisse Opportunity Funds, including the consolidated schedule of investments, as of October 31, 2015, and the related consolidated statements of operations, changes in net assets and financial highlights for the year then ended. These consolidated financial statements and consolidated financial highlights are the responsibility of the Fund's management. Our responsibility is to express an opinion on these consolidated financial statements and consolidated financial highlights based on our audit. The accompanying consolidated statement of changes in net assets of the Fund for the year ended October 31, 2014 and the consolidated financial highlights for the years or period in the three-year period ended October 31, 2014 were audited by other independent registered public accountants whose report thereon dated December 29, 2014, expressed an unqualified opinion on that consolidated financial statement and those consolidated financial highlights.
We conducted our audit in accordance with the standards of the Public Company Accounting Oversight Board (United States). Those standards require that we plan and perform the audit to obtain reasonable assurance about whether the consolidated financial statements and consolidated financial highlights are free of material misstatement. An audit includes examining, on a test basis, evidence supporting the amounts and disclosures in the financial statements. Our procedures included confirmation of securities owned as of October 31, 2015, by correspondence with the custodian and broker or by other appropriate auditing procedures. An audit also includes assessing the accounting principles used and significant estimates made by management, as well as evaluating the overall financial statement presentation. We believe that our audit provides a reasonable basis for our opinion.
In our opinion, the 2015 consolidated financial statements and consolidated financial highlights referred to above present fairly, in all material respects, the financial position of Credit Suisse Managed Futures Strategy Fund as of October 31, 2015, the results of its operations, changes in its net assets and the consolidated financial highlights for the year then ended, in conformity with U.S. generally accepted accounting principles.

New York, New York
December 30, 2015
33
Credit Suisse Managed Futures Strategy Fund
Information Concerning Trustees and Officers (unaudited)
Name, Address
(Year of Birth) | | Position(s)
Held with
Fund | | Term
of Office1
and
Length
of Time
Served | | Principal
Occupation(s) During
Past Five Years | | Number of
Portfolios
in Fund
Complex
Overseen
by Trustee | | Other
Trusteeships
Held by Trustee | |
Independent Trustees | | | | | | | | | | | |
Enrique Arzac
c/o Credit Suisse Asset
Management, LLC
Attn: General Counsel
One Madison Avenue
New York, New York
10010
(1941) | | Trustee, Audit Committee Chairman and Nominating Committee Member | | Since Fund Inception | | Professor of Finance and Economics, Graduate School of Business, Columbia University since 1971. | | | 14 | | | Director of Adams Diversified Equity Fund, Inc., Adams Natural Resources Fund, Inc., Aberdeen Chile Fund, Inc., Aberdeen Emerging Markets Smaller Company Opportunities Fund, Inc., Aberdeen Israel Fund, Inc., Aberdeen Indonesia Fund, Inc. and Aberdeen Latin America Equity Fund, Inc. (each a closed-end investment company); Director of Aberdeen Asia-Pacific Income Investment Company Limited (a Canadian closed-end fund); Trustee of Mirae Asset Discovery Funds (7 open-end portfolios); Director of Starcomms PLC (telecommunications company) from 2008 to 2011; Director of Epoch Holding Corporation (an investment management and investment advisory services company) from 2006 to March 2013 | |
1 Each Trustee and Officer serves until his or her respective successor has been duly elected and qualified.
34
Credit Suisse Managed Futures Strategy Fund
Information Concerning Trustees and Officers (unaudited) (continued)
Name, Address
(Year of Birth) | | Position(s)
Held with
Fund | | Term
of Office1
and
Length
of Time
Served | | Principal
Occupation(s) During
Past Five Years | | Number of
Portfolios
in Fund
Complex
Overseen
by Trustee | | Other
Trusteeships
Held by Trustee | |
Independent Trustees | | | | | | | | | | | |
Jeffrey E. Garten
c/o Credit Suisse Asset Management, LLC
Attn: General Counsel
One Madison Avenue
New York, New York 10010
(1946) | | Trustee, Audit and Nominating Committee Member | | Since Fund Inception | | Dean Emeritus of Yale School of Management from July 2015 to present; The Juan Trippe Professor in the Practice of International Trade, Finance and Business from July 2005 to July 2015; Partner and Chairman of Garten Rothkopf (consulting firm) from October 2005 to present. | | | 11 | | | Director of Aetna, Inc. (insurance company); Director of CarMax Group (used car dealers); Director of Miller Buckfire & Co., LLC (financial restructuring); Member of Standard & Poor's Board of Managers (credit rating agency) from December 2011 to November 2014. | |
1 Each Trustee and Officer serves until his or her respective successor has been duly elected and qualified.
35
Credit Suisse Managed Futures Strategy Fund
Information Concerning Trustees and Officers (unaudited) (continued)
Name, Address
(Year of Birth) | | Position(s)
Held with
Fund | | Term
of Office1
and
Length
of Time
Served | | Principal
Occupation(s) During
Past Five Years | | Number of
Portfolios
in Fund
Complex
Overseen
by Trustee | | Other
Trusteeships
Held by Trustee | |
Independent Trustees | | | | | | | | | | | |
Steven N. Rappaport
Lehigh Court, LLC
555 Madison Avenue
29th Floor
New York, New York
10022
(1948) | | Chairman of the Board of Trustees, Audit Committee Member and Nominating Committee Chairman | | Since Fund Inception | | Partner of Lehigh Court, LLC and RZ Capital (private investment firms) from July 2002 to present; Partner of Backstage Acquisition Holding, LLC (Publication Job Postings) from November 2013 to present. | | | 14 | | | Director of iCAD, Inc. (surgical and medical instruments and apparatus company); Director of Aberdeen Chile Fund, Inc., Aberdeen Emerging Markets Smaller Company Opportunities Fund, Inc., Aberdeen Israel Fund, Inc., Aberdeen Indonesia Fund, Inc. and Aberdeen Latin America Equity Fund, Inc. (each a closed-end investment company); Director of Presstek, Inc. (digital imaging technologies company) from 2003 to 2012; Director of Wood Resources, LLC (plywood manufacturing company) from 2003 to October 2013. | |
1 Each Trustee and Officer serves until his or her respective successor has been duly elected and qualified.
36
Credit Suisse Managed Futures Strategy Fund
Information Concerning Trustees and Officers (unaudited) (continued)
Name, Address
(Year of Birth) | | Position(s)
Held with
Fund | | Term
of Office1
and
Length
of Time
Served | | Principal Occupation(s) During Past Five Years | |
Officers* | | | | | | | |
John G. Popp
Credit Suisse Asset
Management, LLC
One Madison Avenue
New York, New York 10010
(1956) | | Chief Executive Officer and President | | Since Fund Inception | | Managing Director of Credit Suisse; Global Head and Chief Investment Officer of the Credit Investment Group; Associated with Credit Suisse or its predecessor since 1997; Officer of other Credit Suisse Funds; Trustee of Credit Suisse High Yield Bond Fund; Director of Credit Suisse Asset Management Income Fund, Inc.; Director of Credit Suisse Park View BDC, Inc. | |
Emidio Morizio
Credit Suisse Asset
Management, LLC
One Madison Avenue
New York, New York 10010
(1966) | | Chief Compliance Officer | | Since Fund Inception | | Managing Director and Global Head of Compliance of Credit Suisse since 2010; Associated with Credit Suisse since July 2000; Officer of other Credit Suisse Funds. | |
Lou Anne McInnis
Credit Suisse Asset
Management, LLC
One Madison Avenue
New York, New York 10010
(1959) | | Chief Legal Officer | | Since 2015 | | Director of Credit Suisse; Associated with Credit Suisse since April 2015; Counsel at DLA Piper US LLP from 2011 to April 2015; Associated with Morgan Stanley Investment Management from 1997 to 2010; Officer of other Credit Suisse Funds. | |
Rocco DelGuercio
Credit Suisse Asset
Management, LLC
One Madison Avenue
New York, New York 10010
(1963) | | Chief Financial Officer and Treasurer | | Chief Financial Officer since 2015; Treasurer since 2013 | | Vice President of Credit Suisse since 2013; Independent Consultant from February 2012 to April 2013; Director of Legg Mason & Co., LLC from March 2004 to January 2012; Associated with Credit Suisse from June 1996 to March 2004; Officer of other Credit Suisse Funds. | |
Karen Regan
Credit Suisse Asset
Management, LLC
One Madison Avenue
New York, New York 10010
(1963) | | Vice President and Secretary | | Since Fund Inception | | Vice President of Credit Suisse; Associated with Credit Suisse since December 2004; Officer of other Credit Suisse Funds. | |
1 Each Trustee and Officer serves until his or her respective successor has been duly elected and qualified.
* The officers of the Fund shown are officers that make policy decisions.
The Statement of Additional Information includes additional information about the Trustees and is available, without charge, upon request, by calling 877-870-2874.
37
Credit Suisse Managed Futures Strategy Fund
Proxy Voting and Portfolio Holdings Information (unaudited)
Information regarding how the Fund voted proxies related to its portfolio securities during the 12-month period ended June 30 of each year, as well as the policies and procedures that the Fund uses to determine how to vote proxies relating to its portfolio securities are available:
• By calling 1-877-870-2874
• On the Fund's website, www.credit-suisse.com/us/funds
• On the website of the Securities and Exchange Commission, www.sec.gov.
The Fund files a complete schedule of its portfolio holdings for the first and third quarters of its fiscal year with the SEC on Form N-Q. The Fund's Forms N-Q are available on the SEC's website at www.sec.gov and may be reviewed and copied at the SEC's Public Reference Room in Washington, DC. Information on the operation of the SEC's Public Reference Room may be obtained by calling 1-202-551-8090.
38
This page intentionally left blank
This page intentionally left blank

P.O. BOX 55030, BOSTON, MA 02205-5030
877-870-2874 n www.credit-suisse.com/us/funds
CREDIT SUISSE SECURITIES (USA) LLC, DISTRIBUTOR. MFS-AR-1015

CREDIT SUISSE FUNDS
Annual Report
October 31, 2015
n CREDIT SUISSE
GLOBAL SUSTAINABLE DIVIDEND EQUITY FUND
The Fund's investment objectives, risks, charges and expenses (which should be considered carefully before investing), and more complete information about the Fund, are provided in the Prospectus, which should be read carefully before investing. You may obtain additional copies by calling 877-870-2874 or by visiting our website at www.credit-suisse.com/us/funds.
Credit Suisse Securities (USA) LLC, Distributor, is located at One Madison Avenue, New York, NY 10010. Credit Suisse Funds are advised by Credit Suisse Asset Management, LLC.
Investors in the Credit Suisse Funds should be aware that they may be eligible to purchase Class I shares (where offered) directly or through certain intermediaries. Such shares are not subject to a sales charge. Investors in the Credit Suisse Funds should also be aware that they may be eligible for a reduction or waiver of the sales charge with respect to Class A or C shares (where offered). For more information, please review the relevant prospectuses or consult your financial representative.
Fund shares are not deposits or other obligations of Credit Suisse Asset Management, LLC ("Credit Suisse") or any affiliate, are not FDIC-insured and are not guaranteed by Credit Suisse or any affiliate. Fund investments are subject to investment risks, including loss of your investment.
Credit Suisse Global Sustainable Dividend Equity Fund
Annual Investment Adviser's Report
October 31, 2015 (unaudited)
December 21, 2015
Dear Shareholder:
We are pleased to present this Annual Report covering the activities of the Credit Suisse Global Sustainable Dividend Equity Fund (the "Fund"), for the eight-month period ended October 31, 2015.
Performance Summary
03/1/2015 – 10/31/2015
Fund & Benchmark | | Performance | |
| Class I1 | | | -0.86 | % | |
| Class A1,2 | | | -1.00 | % | |
| Class C1,2 | | | -1.50 | % | |
Morgan Stanley Capital International
All Country World Index3 | | | -3.52 | % | |
Performance shown for the Fund's Class A and Class C Shares does not reflect sales charges, which are a maximum of 5.25% and 1.00%, respectively.2
Market Review: A challenging period for global equities
The fiscal period ended October 31, 2015 was a challenging one for the global market, with the Morgan Stanley Capital International All Country World Index, (the "Index") losing 3.52%. Although the first half of 2015 ended in positive territory, the third quarter put the majority of global markets squarely in the red. Markets rallied in October, leaving the Index just slightly positive year to date, but not offsetting the losses for the fiscal year.
The U.S. economy has proven to be the strongest, but everything is relative. With continued U.S. rate uncertainty, China woes, weak commodity prices, and U.S. dollar strength vs. global currencies, equity performance continues to be driven by macro headlines.
Strategic Review and Outlook: Cautiously optimistic going forward
For the 8-month period ended October 31, 2015, the Fund outperformed the Index. The beginning of the period saw relative underperformance for the Fund, driven by the financials, information technology, and consumer discretionary sectors. This underperformance was the result of a combination of stock selection and the Fund's underweight versus the Index in both financials and consumer discretionary.
Strong relative performance in Q3, however, made up for the initial lag, causing the Fund to end the period noticeably up versus the Index. The
1
Credit Suisse Global Sustainable Dividend Equity Fund
Annual Investment Adviser's Report (continued)
October 31, 2015 (unaudited)
outperformance in Q3 was driven by the financials energy and industrials sectors. The Fund was 50% underweight in financials, but had positive performance due to allocation and stock selection. In energy, the Fund's significant underweight led to outperformance (and as of the end of the quarter, there was no allocation to the energy sector). The industrials sector was also underweight, but outperformance was driven by stock selection.
From a regional perspective, the Fund remains overweight in European and U.S. equities, and underweight in Asia Pacific equities. From a stock specific perspective, U.S. equities with sustainable dividend yields and wide, defensive moats around their businesses have become increasingly expensive. The management team is focused on finding opportunities for dividend growth as opposed to absolute dividend yield.
From a sector perspective, the Fund is overweight staples, health care and materials, and underweight financials, energy, industrials and telecom. Since the Fund's inception on February 27, 2015, the management team reduced the weight in both utilities and energy, as yield and valuation currently are not adequately compensating the increased volatility. The management team added positions in companies with defensive characteristics and defensible business models within cyclical sectors (materials, industrials and discretionary) and increased exposure to financials.
The Fund does not deviate from focusing on strong companies with sustainable cash flows. The sector exposure shifted this year as macro and company level risks led us away from energy and U.S. utilities. What has not changed is the commitment to dividend sustainability, quality, and value. As the portfolio has stayed true to these core tenets, it has avoided dividend cuts and has consistently provided downside protection in difficult market environments. The management team remains confident that the portfolio is well positioned to weather market volatility and provide clients with a combination of current income and the potential for capital appreciation.
The Credit Suisse Capital Discipline Group
Adam Steffanus
Michael Valentinas
All investments involve some level of risk. Simply defined, risk is the possibility that you will lose money or not make money. Principal risk factors for the Fund include currency risk, derivatives risk, equity exposure risk, foreign securities risk, futures contract risk, liquidity risk, manager risk, market risk, small- and mid-cap stock risk
2
Credit Suisse Global Sustainable Dividend Equity Fund
Annual Investment Adviser's Report (continued)
October 31, 2015 (unaudited)
and swap agreements risk. Before you invest, please make sure you understand the risks that apply to the Fund. As with any mutual fund, you could lose money over any period of time. Investments in the Fund are not bank deposits and are not insured or guaranteed by the Federal Deposit Insurance Corporation or any other government agency. For a detailed discussion of these and other risks, please refer to the Fund's Prospectus, which should be read carefully before investing.
In addition to historical information, this report contains forward-looking statements, which may concern, among other things, domestic and foreign market, industry and economic trends and developments and government regulation and their potential impact on the Fund's investments. These statements are subject to risks and uncertainties and actual trends, developments and regulations in the future, and their impact on the Fund could be materially different from those projected, anticipated or implied. The Fund has no obligation to update or revise forward-looking statements.
The views of the Fund's management are as of the date of the letter and the Fund holdings described in this document are as of October 31, 2015; these views and Fund holdings may have changed subsequent to these dates. Nothing in this document is a recommendation to purchase or sell securities.
3
Credit Suisse Global Sustainable Dividend Equity Fund
Annual Investment Adviser's Report (continued)
October 31, 2015 (unaudited)
Comparison of Change in Value of $10,000 Investment in the
Credit Suisse Global Sustainable Dividend Equity Fund1 Class I Shares,
Class A Shares2, Class C Shares2 and MSCI All Country World Index3
from Inception (02/27/15).
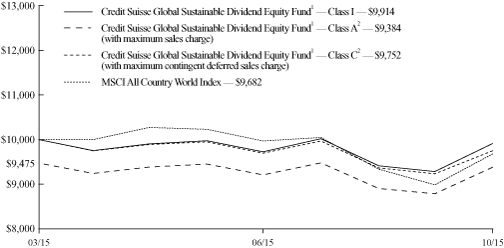
1 Fee waivers and/or expense reimbursements may reduce expenses for the Fund, without which performance would be lower. The Fund entered into a written contract to limit expenses to 0.70% of the Fund's average daily net assets for Class I shares, 0.95% of the Fund's average daily net assets for Class A shares and 1.70% of the Fund's average daily net assets for Class C shares through at least February 28, 2017.
2 Total return for the Fund's Class A shares for the reporting period, based on offering price (including maximum sales charge of 5.25%), was (6.16)%. Total return for the Fund's Class C shares for the reporting period, based on redemption value (including maximum contingent deferred sales charge of 1.00%), was (2.48)%.
3 Morgan Stanley Capital International (MSCI) All Country World Index is a free float weighted equity index that captures large and mid cap representation across developed market countries. It covers approximately 85% of free float-adjusted market capitalization in each country. The index does not have transaction costs and investors cannot invest directly in the index.
4
Credit Suisse Global Sustainable Dividend Equity Fund
Annual Investment Adviser's Report (continued)
October 31, 2015 (unaudited)
Average Returns as of October 31, 20151
| | | Since
Inception2 | |
Class I | | | (0.86 | )% | |
Class A Without Sales Charge | | | (1.00 | )% | |
Class A With Maximum Sales Charge | | | (6.16 | )% | |
Class C Without CDSC | | | (1.50 | )% | |
Class C With CDSC | | | (2.48 | )% | |
Returns represent past performance and include change in share price and reinvestment of dividends and capital gains. Past performance cannot guarantee future results. The current performance of the Fund may be lower or higher than the figures shown. Returns and share price will fluctuate, and redemption value may be more or less than original cost. The performance results do not reflect the deduction of taxes that a shareholder would pay on fund distributions or the redemption of fund shares. Performance information current to the most recent month-end is available at www.credit-suisse.com/us/funds.
The annualized gross expense ratios are 2.17% for Class I shares, 2.42% for Class A shares and 3.17% for Class C shares. The annualized net expense ratios after fee waivers and/or expense reimbursements are 0.70% for Class I shares, 0.95% for Class A shares and 1.70% for Class C shares.
1 Fee waivers and/or expense reimbursements may reduce expenses for the Fund, without which performance would be lower. The Fund entered into a written contract to limit expenses to 0.70% of the Fund's average daily net assets for Class I shares, 0.95% of the Fund's average daily net assets for Class A shares and 1.70% of the Fund's average daily net assets for Class C shares through at least February 28, 2017.
2 Inception Date February 27, 2015.
5
Credit Suisse Global Sustainable Dividend Equity Fund
Annual Investment Adviser's Report (continued)
October 31, 2015 (unaudited)
Information About Your Fund's Expenses
As an investor of the Fund, you incur two types of costs: ongoing expenses and transaction costs. Ongoing expenses include management fees, distribution and service (12b-1) fees and other Fund expenses. Examples of transaction costs include sales charges (loads), redemption fees and account maintenance fees, which are not shown in this section and which would result in higher total expenses. The following table is intended to help you understand your ongoing expenses of investing in the Fund and to help you compare these expenses with the ongoing expenses of investing in other mutual funds. The table is based on an investment of $1,000 made at the beginning of the six months ended October 31, 2015.
The table illustrates your Fund's expenses in two ways:
• Actual Fund Return. This helps you estimate the actual dollar amount of ongoing expenses paid on a $1,000 investment in the Fund using the Fund's actual return during the period. To estimate the expenses you paid over the period, simply divide your account value by $1,000 (for example, an $8,600 account value divided by $1,000 = 8.6), then multiply the result by the number in the "Expenses Paid per $1,000" line under the share class you hold.
• Hypothetical 5% Fund Return. This helps you to compare your Fund's ongoing expenses with those of other mutual funds using the Fund's actual expense ratio and a hypothetical rate of return of 5% per year before expenses. Examples using a 5% hypothetical fund return may be found in the shareholder reports of other mutual funds. The hypothetical account values and expenses may not be used to estimate the actual ending account balance or expenses you paid for the period.
Please note that the expenses shown in these tables are meant to highlight your ongoing expenses only and do not reflect any transaction costs, such as sales charges (loads) or redemption fees. If these transaction costs had been included, your costs would have been higher. The "Expenses Paid per $1,000" line of the tables is useful in comparing ongoing expenses only and will not help you determine the relative total expenses of owning different funds.
6
Credit Suisse Global Sustainable Dividend Equity Fund
Annual Investment Adviser's Report (continued)
October 31, 2015 (unaudited)
Expenses and Value for a $1,000 Investment
for the six month period ended October 31, 2015
Actual Fund Return | | Class I | | Class A | | Class C | |
Beginning Account Value 05/01/15 | | $ | 1,000.00 | | | $ | 1,000.00 | | | $ | 1,000.00 | | |
Ending Account Value 10/31/15 | | $ | 1,000.90 | | | $ | 999.70 | | | $ | 995.90 | | |
Expenses Paid per $1,000* | | $ | 3.53 | | | $ | 4.79 | | | $ | 8.55 | | |
Hypothetical 5% Fund Return | |
Beginning Account Value 05/01/15 | | $ | 1,000.00 | | | $ | 1,000.00 | | | $ | 1,000.00 | | |
Ending Account Value 10/31/15 | | $ | 1,021.68 | | | $ | 1,020.42 | | | $ | 1,016.64 | | |
Expenses Paid per $1,000* | | $ | 3.57 | | | $ | 4.84 | | | $ | 8.64 | | |
| | | Class I | | Class A | | Class C | |
Annualized Expense Ratios* | | | 0.70 | % | | | 0.95 | % | | | 1.70 | % | |
* Expenses are equal to the Fund's annualized expense ratio for each share class, multiplied by the average account value over the period, multiplied by 184/365 to reflect the one-half year period.
The "Expenses Paid per $1,000" and the "Annualized Expense Ratios" in the tables are based on actual expenses paid by the Fund during the period, net of fee waivers and/or expense reimbursements. If those fee waivers and/or expense reimbursements had not been in effect, the Fund's actual expenses would have been higher. Expenses do not reflect additional charges and expenses that are, or may be, imposed under the variable contracts or plans. Such charges and expenses are described in the prospectus of the insurance company separate account or in the plan documents or other informational materials supplied by plan sponsors. The Fund's expenses should be considered with these charges and expenses in evaluating the overall cost of investing in the separate account.
For more information, please refer to the Fund's prospectus.
7
Credit Suisse Global Sustainable Dividend Equity Fund
Annual Investment Adviser's Report (continued)
October 31, 2015 (unaudited)
Sector Breakdown*
Health Care | | | 20.9 | % | |
Consumer Staples | | | 19.1 | | |
Information Technology | | | 13.7 | | |
Consumer Discretionary | | | 12.4 | | |
Financials | | | 10.1 | | |
Materials | | | 8.3 | | |
Industrials | | | 8.0 | | |
| Short-Term Investment1 | | | 4.0 | | |
Utilities | | | 2.5 | | |
Telecommunication Services | | | 1.0 | | |
Total | | | 100.0 | % | |
* Expressed as a percentage of total investments (excluding securities lending collateral if applicable) and may vary over time
1 Primarily reflects cash invested in State Street Bank and Trust Co. Euro Time Deposit, for which the purchases of securities have been executed but not yet settled at October 31, 2015, if applicable.
8
Credit Suisse Global Sustainable Dividend Equity Fund
Schedule of Investments
October 31, 2015
| | | Number of
Shares | | Value | |
| COMMON STOCKS (95.8%) | |
| FRANCE (12.3%) | |
| Aerospace & Defense (1.6%) | |
Safran S.A. | | | 4,800 | | | $ | 366,237 | | |
| Insurance (3.2%) | |
AXA S.A. | | | 27,000 | | | | 723,855 | | |
| Media (0.8%) | |
Eutelsat Communications S.A. | | | 5,100 | | | | 168,858 | | |
| Personal Products (2.1%) | |
L'Oreal S.A. | | | 2,500 | | | | 457,834 | | |
| Pharmaceuticals (3.8%) | |
Sanofi, ADR | | | 16,800 | | | | 845,712 | | |
| Textiles, Apparel & Luxury Goods (0.8%) | |
LVMH Moet Hennessy Louis Vuitton SE | | | 900 | | | | 168,314 | | |
| | | | | | 2,730,810 | | |
| GERMANY (6.8%) | |
| Chemicals (2.2%) | |
BASF SE, ADR | | | 6,000 | | | | 491,220 | | |
| Industrial Conglomerates (0.8%) | |
Siemens AG, ADR | | | 1,700 | | | | 170,969 | | |
| Insurance (3.8%) | |
Allianz SE, Reg S1 | | | 4,800 | | | | 844,146 | | |
| | | | | | 1,506,335 | | |
| IRELAND (4.9%) | |
| IT Services (4.9%) | |
Accenture PLC, Class A | | | 10,100 | | | | 1,082,720 | | |
| MEXICO (1.1%) | |
| Food & Staples Retailing (1.1%) | |
Wal-Mart de Mexico S.A.B. de C.V. | | | 89,800 | | | | 237,692 | | |
| SOUTH AFRICA (1.0%) | |
| Wireless Telecommunication Services (1.0%) | |
MTN Group Ltd. | | | 19,600 | | | | 223,661 | | |
| SPAIN (2.4%) | |
| Electric Utilities (2.4%) | |
Red Electrica Corp. S.A.2 | | | 6,200 | | | | 548,298 | | |
| SWEDEN (2.1%) | |
| Communications Equipment (2.1%) | |
Telefonaktiebolaget LM Ericsson, ADR | | | 47,600 | | | | 463,624 | | |
See Accompanying Notes to Financial Statements.
9
Credit Suisse Global Sustainable Dividend Equity Fund
Schedule of Investments (continued)
October 31, 2015
| | | Number of
Shares | | Value | |
| COMMON STOCKS (continued) | |
| SWITZERLAND (8.1%) | |
| Pharmaceuticals (8.1%) | |
Novartis AG, ADR | | | 9,800 | | | $ | 886,214 | | |
Roche Holding AG, ADR | | | 27,400 | | | | 929,134 | | |
| | | | | | 1,815,348 | | |
| UNITED KINGDOM (13.1%) | |
| Chemicals (0.7%) | |
Johnson Matthey PLC | | | 4,100 | | | | 163,370 | | |
| Food Products (5.6%) | |
Unilever PLC, ADR | | | 27,900 | | | | 1,240,155 | | |
| Hotels, Restaurants & Leisure (1.6%) | |
Compass Group PLC | | | 20,800 | | | | 358,220 | | |
| Media (2.0%) | |
Sky PLC | | | 26,300 | | | | 444,638 | | |
| Textiles, Apparel & Luxury Goods (0.7%) | |
Burberry Group PLC | | | 8,000 | | | | 163,706 | | |
| Tobacco (2.5%) | |
British American Tobacco PLC, ADR | | | 4,600 | | | | 543,260 | | |
| | | | | | 2,913,349 | | |
| UNITED STATES (44.0%) | |
| Beverages (1.8%) | |
Dr. Pepper Snapple Group, Inc. | | | 4,600 | | | | 411,102 | | |
| Chemicals (1.8%) | |
Airgas, Inc. | | | 4,200 | | | | 403,872 | | |
| Commercial Banks (1.3%) | |
JPMorgan Chase & Co. | | | 4,500 | | | | 289,125 | | |
| Communications Equipment (5.3%) | |
Cisco Systems, Inc. | | | 15,300 | | | | 441,405 | | |
Harris Corp. | | | 2,700 | | | | 213,651 | | |
QUALCOMM, Inc. | | | 8,700 | | | | 516,954 | | |
| | | | | | 1,172,010 | | |
| Containers & Packaging (3.6%) | |
Avery Dennison Corp. | | | 2,900 | | | | 188,413 | | |
Bemis Co., Inc. | | | 6,500 | | | | 297,570 | | |
Sonoco Products Co. | | | 7,200 | | | | 307,368 | | |
| | | | | | 793,351 | | |
| Food & Staples Retailing (2.1%) | |
Sysco Corp. | | | 11,100 | | | | 457,875 | | |
| Food Products (1.6%) | |
The Hershey Co. | | | 4,000 | | | | 354,760 | | |
See Accompanying Notes to Financial Statements.
10
Credit Suisse Global Sustainable Dividend Equity Fund
Schedule of Investments (continued)
October 31, 2015
| | | Number of
Shares | | Value | |
| COMMON STOCKS (continued) | |
UNITED STATES | |
| Industrial Conglomerates (5.5%) | |
General Electric Co. | | | 42,500 | | | $ | 1,229,100 | | |
| Insurance (1.7%) | |
The Travelers Cos., Inc. | | | 3,400 | | | | 383,826 | | |
| Leisure Equipment & Products (2.1%) | |
Hasbro, Inc. | | | 6,200 | | | | 476,346 | | |
| Multiline Retail (4.4%) | |
Kohl's Corp. | | | 7,100 | | | | 327,452 | | |
Target Corp. | | | 8,400 | | | | 648,312 | | |
| | | | | | 975,764 | | |
| Pharmaceuticals (8.9%) | |
AbbVie, Inc. | | | 6,400 | | | | 381,120 | | |
Eli Lilly & Co. | | | 6,300 | | | | 513,891 | | |
Johnson & Johnson | | | 10,800 | | | | 1,091,124 | | |
| | | | | | 1,986,135 | | |
| Software (1.5%) | |
Microsoft Corp. | | | 6,200 | | | | 326,368 | | |
| Tobacco (2.4%) | |
Altria Group, Inc. | | | 8,800 | | | | 532,136 | | |
| | | | | | 9,791,770 | | |
| TOTAL COMMON STOCKS (Cost $21,535,703) | | | 21,313,607 | | |
| | | Par
(000) | | | |
| SHORT-TERM INVESTMENT (3.9%) | |
State Street Bank and Trust Co. Euro Time Deposit, 0.010% 11/02/2015 (Cost $875,785) | | $ | 876 | | | | 875,785 | | |
| TOTAL INVESTMENTS AT VALUE (99.7%) (Cost $22,411,488) | | | 22,189,392 | | |
| OTHER ASSETS IN EXCESS OF LIABILITIES (0.3%) | | | 67,552 | | |
| NET ASSETS (100.0%) | | $ | 22,256,944 | | |
1 REG S: Securities sold under Regulation S may not be offered, sold or delivered within the United States or to, or for the account or benefit of, U.S. persons, except pursuant to an exemption from, or in a transaction not subject to, the registration requirements of the Securities Act of 1933.
2 Non-income producing security.
INVESTMENT ABBREVIATION
ADR = American Depositary Receipt
See Accompanying Notes to Financial Statements.
11
Credit Suisse Global Sustainable Dividend Equity Fund
Statement of Assets and Liabilities
October 31, 2015
Assets | |
Investments at value (Cost $22,411,488) (Note 2) | | $ | 22,189,392 | | |
Cash | | | 50,000 | | |
Dividend receivable | | | 49,137 | | |
Deferred offering costs (Note 3) | | | 35,096 | | |
Receivable from investment adviser (Note 3) | | | 15,045 | | |
Receivable for fund shares sold | | | 585 | | |
Prepaid expenses | | | 3,311 | | |
Total Assets | | | 22,342,566 | | |
Liabilities | |
Administrative services fee payable (Note 3) | | | 17,786 | | |
Shareholder servicing/Distribution fee payable (Note 3) | | | 1,141 | | |
Offering costs (Note 3) | | | 10,402 | | |
Trustees' fee payable | | | 7,332 | | |
Due to custodian for foreign currency at value (cost $62) | | | 60 | | |
Accrued expenses | | | 48,901 | | |
Total Liabilities | | | 85,622 | | |
Net Assets | |
Capital stock, $.001 par value (Note 6) | | | 2,268 | | |
Paid-in capital (Note 6) | | | 22,655,402 | | |
Undistributed net investment income | | | 117,467 | | |
Accumulated net realized loss on investments and foreign currency transactions | | | (296,021 | ) | |
Net unrealized depreciation from investments and foreign currency translations | | | (222,172 | ) | |
Net Assets | | $ | 22,256,944 | | |
I Shares | |
Net assets | | $ | 20,043,984 | | |
Shares outstanding | | | 2,042,706 | | |
Net asset value, offering price and redemption price per share | | $ | 9.81 | | |
A Shares | |
Net assets | | $ | 1,120,485 | | |
Shares outstanding | | | 114,214 | | |
Net asset value and redemption price per share | | $ | 9.81 | | |
Maximum offering price per share (net asset value/(1-5.25%)) | | $ | 10.35 | | |
C Shares | |
Net assets | | $ | 1,092,475 | | |
Shares outstanding | | | 111,468 | | |
Net asset value, offering price and redemption price per share | | $ | 9.80 | | |
See Accompanying Notes to Financial Statements.
12
Credit Suisse Global Sustainable Dividend Equity Fund
Statement of Operations
For the Period Ended October 31, 20151
Investment Income | |
Dividends | | $ | 451,502 | | |
Foreign taxes withheld | | | (26,176 | ) | |
Total investment income | | | 425,326 | | |
Expenses | |
Investment advisory fees (Note 3) | | | 86,993 | | |
Administrative services fees (Note 3) | | | 52,038 | | |
Shareholder servicing/Distribution fees (Note 3) | |
Class A | | | 1,815 | | |
Class C | | | 7,189 | | |
Offering costs (Note 3) | | | 69,904 | | |
Audit and tax fees | | | 33,600 | | |
Trustees' fees | | | 18,905 | | |
Printing fees | | | 16,358 | | |
Legal fees | | | 10,167 | | |
Registration fees | | | 6,437 | | |
Transfer agent fees (Note 3) | | | 5,652 | | |
Commitment fees (Note 4) | | | 4,451 | | |
Custodian fees | | | 3,602 | | |
Insurance expense | | | 141 | | |
Miscellaneous expense | | | 5,714 | | |
Total expenses | | | 322,966 | | |
Less: fees waived and expenses reimbursed (Note 3) | | | (212,469 | ) | |
Net expenses | | | 110,497 | | |
Net investment income | | | 314,829 | | |
Net Realized and Unrealized Gain (Loss) from Investments and Foreign Currency Related Items | |
Net realized loss from investments | | | (296,021 | ) | |
Net realized gain from foreign currency transactions | | | 18,340 | | |
Net change in unrealized appreciation (depreciation) from investments | | | (222,096 | ) | |
Net change in unrealized appreciation (depreciation) from foreign currency translations | | | (76 | ) | |
Net realized and unrealized loss from investments and foreign currency related items | | | (499,853 | ) | |
Net decrease in net assets resulting from operations | | $ | (185,024 | ) | |
1 For the period February 27, 2015 (inception date) through October 31, 2015.
See Accompanying Notes to Financial Statements.
13
Credit Suisse Global Sustainable Dividend Equity Fund
Statement of Changes in Net Assets
| | | For the Period
Ended
October 31, 20151 | |
From Operations | |
Net investment income | | $ | 314,829 | | |
Net realized loss from investments and foreign currency transactions | | | (277,681 | ) | |
Net change in unrealized appreciation (depreciation)
from investments and foreign currency translations | | | (222,172 | ) | |
Net decrease in net assets resulting from operations | | | (185,024 | ) | |
From Dividends | |
Dividends from net investment income | |
Class I | | | (202,432 | ) | |
Class A | | | (9,840 | ) | |
Class C | | | (5,363 | ) | |
Net decrease in net assets resulting from dividends | | | (217,635 | ) | |
| From Capital Share Transactions (Note 6) | |
Proceeds from sale of shares | | | 22,603,497 | | |
Reinvestment of dividends | | | 217,635 | | |
Net asset value of shares redeemed | | | (161,529 | ) | |
Net increase in net assets from capital share transactions | | | 22,659,603 | | |
Net increase in net assets | | | 22,256,944 | | |
Net Assets | |
Beginning of period | | | — | | |
End of period | | $ | 22,256,944 | | |
Undistributed net investment income | | $ | 117,467 | | |
1 For the period February 27, 2015 (inception date) through October 31, 2015.
See Accompanying Notes to Financial Statements.
14
Credit Suisse Global Sustainable Dividend Equity Fund
Financial Highlights
(For a Class I Share of the Fund Outstanding Throughout the Period)
| | | For the Period
Ended
October 31, 20151 | |
Per share data | |
Net asset value, beginning of period | | $ | 10.00 | | |
INVESTMENT OPERATIONS | |
Net investment income2 | | | 0.15 | | |
Net loss on investments and foreign currency related items (both realized and unrealized) | | | (0.24 | ) | |
Total from investment operations | | | (0.09 | ) | |
LESS DIVIDENDS | |
Dividends from net investment income | | | (0.10 | ) | |
Total dividends | | | (0.10 | ) | |
Net asset value, end of period | | $ | 9.81 | | |
Total return3 | | | (0.86 | )% | |
RATIOS AND SUPPLEMENTAL DATA | |
Net assets, end of period (000s omitted) | | $ | 20,044 | | |
Ratio of net expenses to average net assets | | | 0.70 | %4 | |
Ratio of net investment income to average net assets | | | 2.23 | %4 | |
Decrease reflected in above operating expense ratios due to waivers/reimbursements | | | 1.47 | %4 | |
Portfolio turnover rate | | | 37 | % | |
1 For the period February 27, 2015 (inception date) through October 31, 2015.
2 Per share information is calculated using the average shares outstanding method.
3 Total returns are historical and assume changes in share price and reinvestment of all dividends. Had certain expenses not been reduced during the period shown, total returns would have been lower. Total returns for periods less than one year are not annualized.
4 Annualized.
See Accompanying Notes to Financial Statements.
15
Credit Suisse Global Sustainable Dividend Equity Fund
Financial Highlights
(For a Class A Share of the Fund Outstanding Throughout the Period)
| | | For the Period
Ended
October 31, 20151 | |
Per share data | |
Net asset value, beginning of period | | $ | 10.00 | | |
INVESTMENT OPERATIONS | |
Net investment income2 | | | 0.13 | | |
Net loss on investments and foreign currency related items (both realized and unrealized) | | | (0.23 | ) | |
Total from investment operations | | | (0.10 | ) | |
LESS DIVIDENDS | |
Dividends from net investment income | | | (0.09 | ) | |
Total dividends | | | (0.09 | ) | |
Net asset value, end of period | | $ | 9.81 | | |
Total return3 | | | (1.00 | )% | |
RATIOS AND SUPPLEMENTAL DATA | |
Net assets, end of period (000s omitted) | | $ | 1,120 | | |
Ratio of net expenses to average net assets | | | 0.95 | %4 | |
Ratio of net investment income to average net assets | | | 1.96 | %4 | |
Decrease reflected in above operating expense ratios due to waivers/reimbursements | | | 1.47 | %4 | |
Portfolio turnover rate | | | 37 | % | |
1 For the period February 27, 2015 (inception date) through October 31, 2015.
2 Per share information is calculated using the average shares outstanding method.
3 Total returns are historical and assume changes in share price, reinvestment of all dividends and no sales charge. Had certain expenses not been reduced during the period shown, total returns would have been lower. Total returns for periods less than one period are not annualized.
4 Annualized.
See Accompanying Notes to Financial Statements.
16
Credit Suisse Global Sustainable Dividend Equity Fund
Financial Highlights
(For a Class C Share of the Fund Outstanding Throughout the Period)
| | | For the Period
Ended
October 31, 20151 | |
Per share data | |
Net asset value, beginning of period | | $ | 10.00 | | |
INVESTMENT OPERATIONS | |
Net investment income2 | | | 0.08 | | |
Net loss on investments and foreign currency related items (both realized and unrealized) | | | (0.23 | ) | |
Total from investment operations | | | (0.15 | ) | |
LESS DIVIDENDS | |
Dividends from net investment income | | | (0.05 | ) | |
Total dividends | | | (0.05 | ) | |
Net asset value, end of period | | $ | 9.80 | | |
Total return3 | | | (1.50 | )% | |
RATIOS AND SUPPLEMENTAL DATA | |
Net assets, end of period (000s omitted) | | $ | 1,092 | | |
Ratio of net expenses to average net assets | | | 1.70 | %4 | |
Ratio of net investment income to average net assets | | | 1.23 | %4 | |
Decrease reflected in above operating expense ratios due to waivers/reimbursements | | | 1.47 | %4 | |
Portfolio turnover rate | | | 37 | % | |
1 For the period February 27, 2015 (inception date) through October 31, 2015.
2 Per share information is calculated using the average shares outstanding method.
3 Total returns are historical and assume changes in share price, reinvestment of all dividends and no sales charge. Had certain expenses not been reduced during the period shown, total returns would have been lower. Total returns for periods less than one period are not annualized.
4 Annualized.
See Accompanying Notes to Financial Statements.
17
Credit Suisse Global Sustainable Dividend Equity Fund
Notes to Financial Statements
October 31, 2015
Credit Suisse Global Sustainable Dividend Equity Fund (the "Fund"), a series of the Credit Suisse Opportunity Funds (the "Trust"), a Delaware statutory trust, is registered under the Investment Company Act of 1940, as amended (the "1940 Act"), as a diversified open-end management investment company that seeks current income and capital appreciation. The Trust was organized under the laws of the State of Delaware as a business trust on May 31, 1995.
The Fund offers three classes of shares: Class I shares, Class A shares and Class C shares. Each class of shares represents an equal pro rata interest in the Fund, except they bear different expenses, which reflect the differences in the range of services provided to them. Class A shares are sold subject to a front-end sales charge of up to 5.25%. Class C shares are sold subject to a contingent deferred sales charge of 1.00% if the shares are redeemed within the first year of purchase. Class I shares are sold without a sales charge.
Note 2. Significant Accounting Policies
The following is a summary of significant accounting policies followed by the Fund in the preparation of its financial statements. The policies are in accordance with accounting principles generally accepted in the United States of America ("GAAP"). The preparation of financial statements requires management to make estimates and assumptions that affect the reported amounts and disclosures in the financial statements. Actual results could differ from those estimates. The Fund is considered an investment company for financial reporting purposes under GAAP and follows Accounting Standard Codification ("ASC") Topic 946 — Financial Services-Investment Companies.
A) SECURITY VALUATION — The net asset value of the Fund is determined daily as of the close of regular trading on the New York Stock Exchange, Inc. (the "Exchange") on each day the Exchange is open for business. For certain international equity securities, in order to adjust for events which may occur between the close of the foreign exchanges and the close of the New York Stock Exchange, a fair valuation model may be used. This fair valuation model takes into account comparisons to the valuation of American Depository Receipts (ADRs), exchange-traded funds, futures contracts and certain indices and these securities are categorized as Level 2. The valuations for fixed income securities (which may include, but are not limited to, corporate, government, municipal, mortgage-backed, collateralized mortgage obligations and asset-backed securities) and certain derivative instruments are typically the prices supplied by independent third party pricing services, which may use market prices or broker/dealer quotations or a variety of valuation techniques and
18
Credit Suisse Global Sustainable Dividend Equity Fund
Notes to Financial Statements (continued)
October 31, 2015
Note 2. Significant Accounting Policies (continued)
methodologies. The independent third party pricing services use inputs that are observable such as issuer details, interest rates, yield curves, prepayment speeds, credit risks/spreads, default rates and quoted prices for similar securities. These pricing services generally price fixed income securities assuming orderly transactions of an institutional "round lot" size, but some trades occur in smaller "odd lot" sizes which may be effected at lower prices than institutional round lot trades. Structured note agreements are valued in accordance with a dealer-supplied valuation based on changes in the value of the underlying index. Futures contracts are valued daily at the settlement price established by the board of trade or exchange on which they are traded. Forward contracts are valued at the London closing spot rates and the London closing forward point rates on a daily basis. The currency forward contract pricing model derives the differential in point rates to the expiration date of the forward and calculates its present value. Equity securities for which market quotations are available are valued at the last reported sales price or official closing price on the primary market or exchange on which they trade. The Fund may utilize a service provided by an independent third party which has been approved by the Board of Trustees (the "Board") to fair value certain securities. When fair value pricing is employed, the prices of securities used by the Fund to calculate its net asset value may differ from quoted or published prices for the same securities. If independent third party pricing services are unable to supply prices for a portfolio investment, or if the prices supplied are deemed by the investment adviser to be unreliable, the market price may be determined by the investment adviser using quotations from one or more broker/dealers or at the transaction price if the security has recently been purchased and no value has yet been obtained from a pricing service or pricing broker. When reliable prices are not readily available, such as when the value of a security has been significantly affected by events after the close of the exchange or market on which the security is principally traded, but before the Fund calculates its net asset value, the Fund values these securities as determined in accordance with procedures approved and established by the Board.
The Fund uses valuation techniques to measure fair value that are consistent with the market approach and/or income approach, depending on the type of security and the particular circumstance. The market approach uses prices and other relevant information generated by market transactions involving identical or comparable securities. The income approach uses valuation techniques to discount estimated future cash flows to present value.
19
Credit Suisse Global Sustainable Dividend Equity Fund
Notes to Financial Statements (continued)
October 31, 2015
Note 2. Significant Accounting Policies (continued)
GAAP established a disclosure hierarchy that categorizes the inputs to valuation techniques used to value assets and liabilities at each measurement date. These inputs are summarized in the three broad levels listed below:
• Level 1 – quoted prices in active markets for identical investments
• Level 2 – other significant observable inputs (including quoted prices for similar investments, interest rates, prepayment speeds, credit risk, etc.)
• Level 3 – significant unobservable inputs (including the Fund's own assumptions in determining the fair value of investments)
The inputs or methodologies used to value securities are not necessarily an indication of the risk associated with investing in those securities.
The following is a summary of the inputs used as of October 31, 2015 in valuing the Fund's assets and liabilities carried at fair value:
Assets | | Level 1 | | Level 2 | | Level 3 | | Total | |
Investments in Securities | |
Common Stocks | | $ | 16,682,470 | | | $ | 4,631,137 | | | $ | — | | | $ | 21,313,607 | | |
Short-term Investment | | | — | | | | 875,785 | | | | — | | | | 875,785 | | |
| | | $ | 16,682,470 | | | $ | 5,506,922 | | | $ | — | | | $ | 22,189,392 | | |
For the period ended October 31, 2015, there were no transfers in and out of Level 1, Level 2 and Level 3. All transfers, if any, are assumed to occur at the end of the reporting period.
B) DERIVATIVE INSTRUMENTS AND HEDGING ACTIVITIES — The Fund adopted amendments to authoritative guidance on disclosures about derivative instruments and hedging activities which require that a fund disclose (a) how and why an entity uses derivative instruments, (b) how derivative instruments and hedging activities are accounted for and (c) how derivative instruments and related hedging activities affect a fund's financial position, financial performance and cash flows. The Fund has not entered into any derivative or hedging activities during the period covered by this report.
C) FOREIGN CURRENCY TRANSACTIONS — The books and records of the Fund are maintained in U.S. dollars. Transactions denominated in foreign currencies are recorded at the current prevailing exchange rates. All assets and liabilities denominated in foreign currencies are translated into U.S. dollar amounts at the current exchange rate at the end of the period. Translation gains or losses resulting from changes in the exchange rate during the reporting period and realized gains and losses on the settlement of foreign currency
20
Credit Suisse Global Sustainable Dividend Equity Fund
Notes to Financial Statements (continued)
October 31, 2015
Note 2. Significant Accounting Policies (continued)
transactions are reported in the results of operations for the current period. The Fund isolates that portion of realized gains and losses on investments which is due to changes in the foreign exchange rate from that which is due to changes in market prices.
D) SECURITY TRANSACTIONS AND INVESTMENT INCOME/EXPENSE — Security transactions are accounted for on a trade date basis. Interest income/expense is recorded on the accrual basis. The Fund amortizes premiums and accretes discounts using the effective interest method. Dividend income/expense is recorded on the ex-dividend date. Certain expenses are class-specific expenses, vary by class and are charged only to that class. Income, expenses (excluding class-specific expenses) and realized/unrealized gains/losses are allocated proportionately to each class of shares based upon the relative net asset value of the outstanding shares of that class. The cost of investments sold is determined by use of the specific identification method for both financial reporting and income tax purposes.
E) DIVIDENDS AND DISTRIBUTIONS TO SHAREHOLDERS — Dividends from net investment income, if any, are declared and paid quarterly. Distributions of net realized capital gains, if any, are declared and paid at least annually. However, to the extent that a net realized capital gain can be reduced by a capital loss carryforward, such gain will not be distributed. Income and capital gain distributions are determined in accordance with federal income tax regulations, which may differ from GAAP.
F) FEDERAL INCOME TAXES — No provision is made for federal taxes as it is the Fund's intention to continue to qualify as a regulated investment company ("RIC") under the Internal Revenue Code of 1986, as amended (the "Code"), and to make the requisite distributions to its shareholders, which will be sufficient to relieve it from federal income and excise taxes.
In order to qualify as a RIC under the Code, the Fund must meet certain requirements regarding the source of its income, the diversification of its assets and the distribution of its income. One of these requirements is that the Fund derive at least 90% of its gross income for each taxable year from dividends, interest, payments with respect to certain securities loans, gains from the sale or other disposition of stock, securities or foreign currencies, other income derived with respect to its business of investing in such stock, securities or currencies or net income derived from interests in certain publicly traded partnerships ("Qualifying Income").
21
Credit Suisse Global Sustainable Dividend Equity Fund
Notes to Financial Statements (continued)
October 31, 2015
Note 2. Significant Accounting Policies (continued)
The Fund adopted the authoritative guidance for uncertainty in income taxes and recognizes a tax benefit or liability from an uncertain position only if it is more likely than not that the position is sustainable based solely on its technical merits and consideration of the relevant taxing authority's widely understood administrative practices and procedures. The Fund has reviewed its current tax positions and has determined that no provision for income tax is required in the Fund's financial statements.
G) SHORT-TERM INVESTMENTS — The Fund, together with other funds/portfolios advised by Credit Suisse, pools available cash into a short-term variable rate time deposit issued by State Street Bank and Trust Company ("SSB"), the Fund's custodian. The short-term time deposit issued by SSB is a variable rate account classified as a short-term investment.
H) OTHER — In the normal course of business the Fund trades financial instruments and enters into financial transactions where risk of potential loss exists due to changes in the market (market risk) or failure of the other party to a transaction to perform (credit risk). Similar to credit risk, the Fund may be exposed to counterparty risk, or the risk that an institution or other entity with which the Fund has unsettled or open transactions will default. The potential loss could exceed the value of the financial assets recorded in the financial statements. Financial assets, which potentially expose the Fund to credit risk, consist principally of cash due from counterparties and investments. The extent of the Fund's exposure to credit and counterparty risks in respect to these financial assets approximates their carrying value as recorded in the Fund's Statement of Assets and Liabilities.
I) FOREIGN INVESTMENTS RISK — The Fund may have elements of risk not typically associated with investments in the United States of America due to concentrated investments in a limited number of countries or regions, which may vary throughout the year. Such concentrations may subject the Fund to additional risks resulting from political or economic conditions in such countries or regions and the possible imposition of adverse governmental laws or currency exchange restrictions could cause the securities and their markets to be less liquid and their prices to be more volatile than those of comparable U.S. securities.
Because the Fund may invest a significant portion of its assets in these markets, it is subject to greater risks of adverse events that occur in those markets and may experience greater volatility than a fund that is more broadly diversified geographically.
22
Credit Suisse Global Sustainable Dividend Equity Fund
Notes to Financial Statements (continued)
October 31, 2015
Note 2. Significant Accounting Policies (continued)
J) NEW ACCOUNTING PRONOUNCEMENTS — In June 2014, Financial Accounting Standards Board ("FASB") issued ASU No. 2014-11, Transfers and Servicing (Topic 860), Repurchase-to-Maturity Transactions, Repurchase Financings, and Disclosures. The ASU changes the accounting for certain repurchase agreements and expands disclosure requirements related to repurchase agreements, securities lending, repurchase-to-maturity and similar transactions. The ASU is effective for interim and annual reporting periods beginning after December 15, 2014. Management has reviewed the requirements and believes the adoption of this ASU will not have a material impact on the financial statements.
On April 7, 2015, the Financial Accounting Standards Board (FASB) issued a new Accounting Standards Update (ASU) No. 2015-03, "Simplifying the Presentation of Debt Issuance Costs". The ASU requires debt issuance costs to be presented on the balance sheet as a direct deduction from the debt liability. The ASU is effective for interim and annual reporting periods beginning after December 15, 2015. Management has reviewed the requirements and believes the adoption of this ASU will not have a material impact on the financial statements.
In May 2015, the FASB issued ASU No. 2015-07, "Disclosures for Investments in Certain Entities that Calculate Net Asset Value per Share (or its Equivalent)". The guidance removes the requirement to categorize within the fair value hierachy all investments for which fair value is measured using the NAV per share practical expedient. Sufficient information must be provided to permit reconciliation of the fair value of assets categorized within the fair value hierachy to the amounts presented in the Statements of Assets and Liabilities. The guidance is required to be presented for annual periods beginning after December 15, 2015, and for interim periods within those fiscal years. Management is currently reviewing the requirements and believes the adoption of this ASU will not have a material impact on its financial statements.
K) SUBSEQUENT EVENTS — In preparing the financial statements as of October 31, 2015, management considered the impact of subsequent events for potential recognition or disclosure in these financial statements through the date of release of this report. No such events requiring recognition or disclosure were identified through the date of the release of this report.
23
Credit Suisse Global Sustainable Dividend Equity Fund
Notes to Financial Statements (continued)
October 31, 2015
Note 3. Transactions with Affiliates and Related Parties
Credit Suisse serves as investment adviser for the Fund. For its investment advisory services, Credit Suisse is entitled to receive a fee from the Fund at an annual rate of 0.60% of the Fund's average daily net assets. For the period ended October 31, 2015, investment advisory fees earned and fees waived/expenses reimbursed were $86,993 and $212,469, respectively. The Fund is authorized to reimburse Credit Suisse for management fees previously limited and/or for expenses previously paid by Credit Suisse, provided, however, that any reimbursements must be paid at a date not more than three years after the end of the fiscal year during which such fees were limited or expenses were reimbursed by Credit Suisse and the reimbursements do not cause a class to exceed the applicable expense limitation in the contract at the time the fees were limited or expenses are paid. This contract may not be terminated before February 28, 2017. Currently, Credit Suisse contractually waives fees and reimburses expenses so that the Fund's annual operating expenses will not exceed 0.70% of the Fund's average daily net assets for Class I shares, 0.95% of the Fund's average daily net assets for Class A shares, and 1.70% of the Fund's average daily net assets for Class C shares.
For the period ended October 31, 2015, the amounts waived and reimbursed by Credit Suisse, as well as the amounts available for recoupment/potential future recoupment by Credit Suisse and the expiration schedule at October 31, 2015 are as follows:
| | | Fee waivers/
expense
reimbursements
subject to
repayment | |
Expires
October 31,
2018 | |
Class I | | $ | 191,261 | | | $ | 191,261 | | |
Class A | | | 10,666 | | | | 10,666 | | |
Class C | | | 10,542 | | | | 10,542 | | |
Totals | | $ | 212,469 | | | $ | 212,469 | | |
Credit Suisse and SSB serve as co-administrators to the Fund. For its co-administrative services, Credit Suisse received a fee calculation at an annual rate of 0.09% of the Fund's average daily net assets. For the period ended October 31, 2015, co-administrative services fees earned by Credit Suisse were $13,049.
For its co-administrative services, SSB receives a fee, exclusive of out-of-pocket expenses, calculated in total for all the Credit Suisse funds/portfolios co-administered by SSB and allocated based upon the relative average net assets of each fund/portfolio, subject to an annual minimum fee. For the period ended
24
Credit Suisse Global Sustainable Dividend Equity Fund
Notes to Financial Statements (continued)
October 31, 2015
Note 3. Transactions with Affiliates and Related Parties (continued)
October 31, 2015, co-administrative services fees earned by SSB (including out-of-pocket expenses) with respect to the Fund were $38,989.
Credit Suisse Securities (USA) LLC ("CSSU"), an affiliate of Credit Suisse, serves as the distributor of the Fund's shares. Pursuant to distribution plans adopted by the Fund pursuant to Rule 12b-1 under the 1940 Act, CSSU received fees for its distribution services. These fees were calculated at an annual rate of 0.25% of the average daily net assets of the Class A shares. For the Class C shares, the fee is calculated at an annual rate of 1.00% of the average daily net assets. For the period ended October 31, 2015, the Fund paid Rule 12b-1 distribution fees of $1,815 for Class A shares and $7,189 for Class C shares. Class I shares are not subject to Rule 12b-1 distribution fees.
Certain brokers, dealers and financial representatives provide transfer agent related services to the Fund and receive compensation from the Fund. For the period ended October 31, 2015, the Fund paid $181, which is included within transfer agent fees on the Statement of Operations.
For the period ended October 31, 2015, CSSU and its affiliates advised the Fund that they retained $455 from commissions earned on the sale of the Fund's Class A shares. There were no commissions earned on sale of Class C shares.
Offering costs, including initial registration cost, were deferred and will be charged to expenses over the Fund's first 12 months of operation. For the period ended October 31, 2015, $69,904 has been expensed by the Fund.
Note 4. Line of Credit
The Fund, together with other funds/portfolios advised by Credit Suisse (collectively, the "Participating Funds"), participates in a committed, unsecured line of credit facility ("Credit Facility"), in an aggregated amount of $200 million for temporary or emergency purposes with SSB under a first-come, first-served basis. Under the terms of the Credit Facility, the Participating Funds pay an aggregate commitment fee on the average unused amount of the Credit Facility, which is allocated among the Participating Funds in such manner as is determined by the governing Boards of the Participating Funds. In addition, the Participating Funds pay interest on borrowings at either the Overnight Federal Funds rate or the Overnight LIBOR rate plus a spread. At October 31, 2015 and during the period ended October 31, 2015, the Fund had no borrowings outstanding under the Credit Facility.
25
Credit Suisse Global Sustainable Dividend Equity Fund
Notes to Financial Statements (continued)
October 31, 2015
Note 5. Purchases and Sales of Securities
For the period ended October 31, 2015, purchases and sales of investment securities (excluding short-term investments) were $29,362,249 and $7,530,525, respectively.
Note 6. Capital Share Transactions
The Fund is authorized to issue an unlimited number of full and fractional shares of beneficial interest, $.001 par value per share. The Fund offers Class I, Class A and Class C shares. Transactions in capital shares for each class of the Fund were as follows:
| | | Class I | |
| | | For the Period Ended
October 31, 20151 | |
| | | Shares | | Value | |
Shares sold | | | 2,037,710 | | | $ | 20,368,418 | | |
Shares issued in reinvestment of dividends | | | 21,302 | | | | 202,432 | | |
Shares redeemed | | | (16,306 | ) | | | (161,529 | ) | |
Net increase | | | 2,042,706 | | | $ | 20,409,321 | | |
| | | Class A | |
| | | For the Period Ended
October 31, 20151 | |
| | | Shares | | Value | |
Shares sold | | | 113,179 | | | $ | 1,130,079 | | |
Shares issued in reinvestment of dividends | | | 1,035 | | | | 9,840 | | |
Net increase | | | 114,214 | | | $ | 1,139,919 | | |
| | | Class C | |
| | | For the Period Ended
October 31, 20151 | |
| | | Shares | | Value | |
Shares sold | | | 110,907 | | | $ | 1,105,000 | | |
Shares issued in reinvestment of dividends | | | 561 | | | | 5,363 | | |
Net increase | | | 111,468 | | | $ | 1,110,363 | | |
1 For the period February 27, 2015 (inception date) through October 31, 2015.
26
Credit Suisse Global Sustainable Dividend Equity Fund
Notes to Financial Statements (continued)
October 31, 2015
Note 6. Capital Share Transactions (continued)
On October 31, 2015, the number of shareholders that held 5% or more of the outstanding shares of each class of the Fund was as follows:
| | | Number of
Sharesholder | | Approximate Percentage
of Outstanding Shares | |
Class I | | | 1 | * | | | 89 | % | |
Class A | | | 2 | * | | | 96 | % | |
Class C | | | 2 | * | | | 100 | % | |
*This includes the seed money from Merchant Holdings, Inc., an affiliate of Credit Suisse.
Some of the shareholders may be omnibus accounts, which hold shares on behalf of individual shareholders.
Note 7. Federal Income Taxes
Income and capital gain distributions are determined in accordance with federal income tax regulations, which may differ from GAAP.
The tax characteristics of dividends paid during the year ended October 31, 2015, by the Fund was as follows:
| Ordinary Income | |
| 2015 | |
| $ | 217,635 | | |
The tax basis components of distributable earnings differ from the amounts reflected in the Statement of Assets and Liabilities by temporary book/tax differences. These differences are primarily due to differing treatments of wash sales and offering expenses. At October 31, 2015, the components of distributable earnings on a tax basis were as follows:
Undistributed net investment income | | $ | 138,837 | | |
Capital loss carryover | | | (293,152 | ) | |
Unrealized depreciation | | | (225,041 | ) | |
| | | $ | (379,356 | ) | |
At October 31, 2015, the Fund had $293,152 of unlimited short-term capital loss carryforwards available to offset possible future capital gains.
27
Credit Suisse Global Sustainable Dividend Equity Fund
Notes to Financial Statements (continued)
October 31, 2015
Note 7. Federal Income Taxes (continued)
At October 31, 2015, the cost of investments (excluding foreign currency related transactions) and net unrealized appreciation (depreciation) for income tax purposes were as follows:
Cost of Investments | | $ | 22,414,357 | | |
Unrealized appreciation | | $ | 723,742 | | |
Unrealized depreciation | | | (948,707 | ) | |
Net unrealized appreciation (depreciation) | | $ | (224,965 | ) | |
At October 31, 2015, the Fund reclassified $20,273 from accumulated net investment loss and $18,340 from accumulated net realized gain to paid in capital, to adjust for current period permanent book/tax differences. These permanent are due to differeing book/tax treatment of foreign currency gain (loss) and non-deductible 12b-1 and blue sky expenses. Net assets were not affected by these reclassifications.
Note 8. Contingencies
In the normal course of business, the Fund may provide general indemnifications pursuant to certain contracts and organizational documents. The Fund's maximum exposure under these arrangements is dependent on future claims that may be made against the Fund and, therefore, cannot be estimated; however, based on experience, the risk of loss from such claims is considered remote.
Note 9. Other Matters
On May 19, 2014, the U.S. Department of Justice (the "Department of Justice") filed a one-count criminal information (the "Information") in the District Court for the Eastern District of Virginia (the "District Court") charging Credit Suisse AG ("CSAG") with conspiracy to commit tax fraud related to accounts CSAG established for cross-border clients. The Department of Justice and CSAG entered into a plea agreement (the "Plea Agreement") settling the action pursuant to which CSAG pleaded guilty to the charge set out in the Information.
The Plea Agreement requires CSAG to pay over $1.8 billion to the U.S. government, including the U.S. Internal Revenue Service. The Plea Agreement also requires CSAG to lawfully undertake certain remedial actions to address the conduct described in the Plea Agreement.
28
Credit Suisse Global Sustainable Dividend Equity Fund
Notes to Financial Statements (continued)
October 31, 2015
Note 9. Other Matters (continued)
CSAG has entered into other settlements relating to the conduct set out in the Plea Agreement. CSAG has entered into a Consent Order with the Federal Reserve Board (the "Federal Reserve") to resolve certain findings by the Federal Reserve, including that the activities of CSAG regarding opening of foreign accounts for U.S. taxpayers, provision of investment services to U.S. clients, and operation of CSAG's New York representative office prior to 2009 lacked adequate enterprise-wide risk management and compliance policies and procedures sufficient to ensure that all of its activities comply with U.S. laws and regulations. In addition, CSAG has entered into a Consent Order with the New York State Department of Financial Services (the "DFS") to resolve the DFS's investigation into the conduct described in the Plea Agreement. The settlement with the Federal Reserve requires CSAG to pay $100 million to the Federal Reserve, and the settlement with the DFS requires CSAG to pay $715 million to the DFS.
These settlements follow a settlement by Credit Suisse Group AG ("CS Group"), the parent company of CSAG, with the Securities and Exchange Commission (the "Commission") on February 21, 2014 to resolve an investigation by the Commission into solicitation and provision of broker-dealer and investment advisory services to certain U.S. cross-border clients by CS Group while not registered with the Commission as a broker-dealer or investment adviser. As part of the settlement, CS Group retained an independent consultant to evaluate its policies and procedures and examine its broker-dealer and investment adviser activities to fully verify that the business that was the subject of the Commission investigation has been completely exited. CS Group also agreed to pay $196,511,014, which includes $82,170,990 in disgorgement, $64,340,024 in interest and a $50,000,000 penalty.
CSAG is the indirect parent company of Credit Suisse and CSSU. Neither Credit Suisse, CSSU nor the Fund was named in the Plea Agreement (as defined above) or other settlements relating to the conduct set out in the Plea Agreement. The conduct set out in the Plea Agreement did not involve the Fund, Credit Suisse or CSSU with respect to its investment adviser and distribution activities relating to the Fund.
Credit Suisse, CSSU and certain of their affiliates have received a permanent exemptive order from the Commission to permit them to continue serving as investment advisers and principal underwriters for U.S.-registered investment companies, such as the Fund. Due to a provision in the law governing the operation of U.S.-registered investment companies, they would otherwise have become ineligible to perform these activities as a result of the plea in the Plea
29
Credit Suisse Global Sustainable Dividend Equity Fund
Notes to Financial Statements (continued)
October 31, 2015
Note 9. Other Matters (continued)
Agreement. The permanent exemptive order permits Credit Suisse and CSSU to continue to provide services to the Fund, so long as, among other things, no current or former employee of CSAG or any affiliate of CSAG who previously has been or who subsequently may be identified by CSAG or any U.S. or non-U.S. regulatory or enforcement agencies as having been responsible for the conduct described in the Plea Agreement will be employed by Credit Suisse and certain of its affiliates. Credit Suisse and CSSU have informed the Fund that, Credit Suisse and CSSU believe the Settlements will not have any material impact on the Fund or on the ability of Credit Suisse or CSSU to perform services for the Fund.
On November 21, 2014, at the sentencing hearing, the District Court accepted and implemented the sentence as set out in the Plea Agreement. The District Court imposed no additional conditions beyond those contained in the Plea Agreement.
30
Credit Suisse Global Sustainable Dividend Equity Fund
Report of Independent Registered Public Accounting Firm
The Board of Trustees and Shareholders
Credit Suisse Global Sustainable Dividend Equity Fund:
We have audited the accompanying statement of assets and liabilities of Credit Suisse Global Sustainable Dividend Equity Fund (the "Fund"), a series of the Credit Suisse Opportunity Funds, including the schedule of investments, as of October 31, 2015, and the related statements of operations, changes in net assets and financial highlights for the period from February 27, 2015 (commencement of operations) to October 31, 2015. These financial statements and financial highlights are the responsibility of the Fund's management. Our responsibility is to express an opinion on these financial statements and financial highlights based on our audit.
We conducted our audit in accordance with the standards of the Public Company Accounting Oversight Board (United States). Those standards require that we plan and perform the audit to obtain reasonable assurance about whether the financial statements and financial highlights are free of material misstatement. An audit includes examining, on a test basis, evidence supporting the amounts and disclosures in the financial statements. Our procedures included confirmation of securities owned as of October 31, 2015, by correspondence with the custodian and broker or by other appropriate auditing procedures. An audit also includes assessing the accounting principles used and significant estimates made by management, as well as evaluating the overall financial statement presentation. We believe that our audit provides a reasonable basis for our opinion.
In our opinion, the financial statements and financial highlights referred to above present fairly, in all material respects, the financial position of Credit Suisse Global Sustainable Dividend Equity Fund as of October 31, 2015, the results of its operations, the changes in its net assets, and the financial highlights for the period February 27, 2015 (commencement of operations) to October 31, 2015, in conformity with U.S. generally accepted accounting principles.

New York, New York
December 30, 2015
31
Credit Suisse Global Sustainable Dividend Equity Fund
Information Concerning Trustees and Officers (unaudited)
Name, Address
(Year of Birth) | | Position(s)
Held with
Fund | | Term
of Office1
and
Length
of Time
Served | | Principal
Occupation(s) During
Past Five Years | | Number of
Portfolios
in Fund
Complex
Overseen
by Trustee | | Other
Trusteeships
Held by Trustee | |
Independent Trustees | | | | | | | | | | | |
Enrique Arzac
c/o Credit Suisse Asset
Management, LLC
Attn: General Counsel
One Madison Avenue
New York, New York
10010
(1941) | | Trustee, Audit Committee Chairman and Nominating Committee Member | | Since Fund Inception | | Professor of Finance and Economics, Graduate School of Business, Columbia University since 1971. | | | 14 | | | Director of Adams Diversified Equity Fund, Inc., Adams Natural Resources Fund, Inc., Aberdeen Chile Fund, Inc., Aberdeen Emerging Markets Smaller Company Opportunities Fund, Inc., Aberdeen Israel Fund, Inc., Aberdeen Indonesia Fund, Inc. and Aberdeen Latin America Equity Fund, Inc. (each a closed-end investment company); Director of Aberdeen Asia-Pacific Income Investment Company Limited (a Canadian closed-end fund); Trustee of Mirae Asset Discovery Funds (7 open-end portfolios); Director of Starcomms PLC (telecommunications company) from 2008 to 2011; Director of Epoch Holding Corporation (an investment management and investment advisory services company) from 2006 to March 2013 | |
1 Each Trustee and Officer serves until his or her respective successor has been duly elected and qualified.
32
Credit Suisse Global Sustainable Dividend Equity Fund
Information Concerning Trustees and Officers (unaudited) (continued)
Name, Address
(Year of Birth) | | Position(s)
Held with
Fund | | Term
of Office1
and
Length
of Time
Served | | Principal
Occupation(s) During
Past Five Years | | Number of
Portfolios
in Fund
Complex
Overseen
by Trustee | | Other
Trusteeships
Held by Trustee | |
Independent Trustees | | | | | | | | | | | |
Jeffrey E. Garten
c/o Credit Suisse Asset Management, LLC
Attn: General Counsel
One Madison Avenue
New York, New York 10010
(1946) | | Trustee, Audit and Nominating Committee Member | | Since Fund Inception | | Dean Emeritus of Yale School of Management from July 2015 to present; The Juan Trippe Professor in the Practice of International Trade, Finance and Business from July 2005 to July 2015; Partner and Chairman of Garten Rothkopf (consulting firm) from October 2005 to present. | | | 11 | | | Director of Aetna, Inc. (insurance company); Director of CarMax Group (used car dealers); Director of Miller Buckfire & Co., LLC (financial restructuring); Member of Standard & Poor's Board of Managers (credit rating agency) from December 2011 to November 2014 | |
1 Each Trustee and Officer serves until his or her respective successor has been duly elected and qualified.
33
Credit Suisse Global Sustainable Dividend Equity Fund
Information Concerning Trustees and Officers (unaudited) (continued)
Name, Address
(Year of Birth) | | Position(s)
Held with
Fund | | Term
of Office1
and
Length
of Time
Served | | Principal
Occupation(s) During
Past Five Years | | Number of
Portfolios
in Fund
Complex
Overseen
by Trustee | | Other
Trusteeships
Held by Trustee | |
Independent Trustees | | | | | | | | | | | |
Steven N. Rappaport
Lehigh Court, LLC
555 Madison Avenue
29th Floor
New York, New York
10022
(1948) | | Chairman of the Board of Trustees, Audit Committee Member and Nominating Committee Chairman | | Since Fund Inception | | Partner of Lehigh Court, LLC and RZ Capital (private investment firms) from July 2002 to present; Partner of Backstage Acquisition Holding, LLC (Publication Job Postings) from November 2013 to present. | | | 14 | | | Director of iCAD, Inc. (surgical and medical instruments and apparatus company); Director of Aberdeen Chile Fund, Inc., Aberdeen Emerging Markets Smaller Company Opportunities Fund, Inc., Aberdeen Israel Fund, Inc., Aberdeen Indonesia Fund, Inc. and Aberdeen Latin America Equity Fund, Inc. (each a closed-end investment company); Director of Presstek, Inc. (digital imaging technologies company) from 2003 to 2012; Director of Wood Resources, LLC (plywood manufacturing company) from 2003 to October 2013. | |
1 Each Trustee and Officer serves until his or her respective successor has been duly elected and qualified.
34
Credit Suisse Global Sustainable Dividend Equity Fund
Information Concerning Trustees and Officers (unaudited) (continued)
Name, Address
(Year of Birth) | | Position(s)
Held with
Fund | | Term
of Office1
and
Length
of Time
Served | | Principal Occupation(s) During Past Five Years | |
Officers* | | | | | | | |
John G. Popp
Credit Suisse Asset
Management, LLC
One Madison Avenue
New York, New York 10010
(1956) | | Chief Executive Officer and President | | Since Fund Inception | | Managing Director of Credit Suisse; Global Head and Chief Investment Officer of the Credit Investment Group; Associated with Credit Suisse or its predecessor since 1997; Officer of other Credit Suisse Funds; Trustee of Credit Suisse High Yield Bond Fund; Director of Credit Suisse Asset Management Income Fund, Inc.; Director of Credit Suisse Park View BDC, Inc. | |
Emidio Morizio
Credit Suisse Asset
Management, LLC
One Madison Avenue
New York, New York 10010
(1966) | | Chief Compliance Officer | | Since Fund Inception | | Managing Director and Global Head of Compliance of Credit Suisse since 2010; Associated with Credit Suisse since July 2000; Officer of other Credit Suisse Funds. | |
Lou Anne McInnis
Credit Suisse Asset
Management, LLC
One Madison Avenue
New York, New York 10010
(1959) | | Chief Legal Officer | | Since 2015 | | Director of Credit Suisse; Associated with Credit Suisse since April 2015; Counsel at DLA Piper US LLP from 2011 to April 2015; Associated with Morgan Stanley Investment Management from 1997 to 2010; Officer of other Credit Suisse Funds. | |
Rocco DelGuercio
Credit Suisse Asset
Management, LLC
One Madison Avenue
New York, New York 10010
(1963) | | Chief Financial Officer since 2015; Treasurer since 2013 | | Since 2013 | | Vice President of Credit Suisse since 2013; Independent Consultant from February 2012 to April 2013; Director of Legg Mason & Co., LLC from March 2004 to January 2012; Associated with Credit Suisse from June 1996 to March 2004; Officer of other Credit Suisse Funds. | |
Karen Regan
Credit Suisse Asset
Management, LLC
One Madison Avenue
New York, New York 10010
(1963) | | Vice President and Secretary | | Since Fund Inception | | Vice President of Credit Suisse; Associated with Credit Suisse since December 2004; Officer of other Credit Suisse Funds. | |
1 Each Trustee and Officer serves until his or her respective successor has been duly elected and qualified.
* The officers of the Fund shown are officers that make policy decisions.
The Statement of Additional Information includes additional information about the Trustees and is available, without charge, upon request, by calling 877-870-2874.
35
Credit Suisse Global Sustainable Dividend Equity Fund
Proxy Voting and Portfolio Holdings Information (unaudited)
Information regarding how the Fund voted proxies related to its portfolio securities during the 12-month period ended June 30 of each year, as well as the policies and procedures that the Fund uses to determine how to vote proxies relating to its portfolio securities are available:
• By calling 1-877-870-2874
• On the Fund's website, www.credit-suisse.com/us/funds
• On the website of the Securities and Exchange Commission, www.sec.gov.
The Fund files a complete schedule of its portfolio holdings for the first and third quarters of its fiscal year with the SEC on Form N-Q. The Fund's Forms N-Q are available on the SEC's website at www.sec.gov and may be reviewed and copied at the SEC's Public Reference Room in Washington, DC. Information on the operation of the SEC's Public Reference Room may be obtained by calling 1-202-551-8090.
36

P.O. BOX 55030, BOSTON, MA 02205-5030
877-870-2874 n www.credit-suisse.com/us/funds
CREDIT SUISSE SECURITIES (USA) LLC, DISTRIBUTOR. GSDE-AR-1015

CREDIT SUISSE FUNDS
Annual Report
October 31, 2015
n CREDIT SUISSE
EMERGING MARKETS EQUITY
FUND
The Fund's investment objectives, risks, charges and expenses (which should be considered carefully before investing), and more complete information about the Fund, are provided in the Prospectus, which should be read carefully before investing. You may obtain additional copies by calling 877-870-2874 or by visiting our website at www.credit-suisse.com/us/funds.
Credit Suisse Securities (USA) LLC, Distributor, is located at One Madison Avenue, New York, NY 10010. Credit Suisse Funds are advised by Credit Suisse Asset Management, LLC.
Investors in the Credit Suisse Funds should be aware that they may be eligible to purchase Class I shares (where offered) directly or through certain intermediaries. Such shares are not subject to a sales charge. Investors in the Credit Suisse Funds should also be aware that they may be eligible for a reduction or waiver of the sales charge with respect to Class A or C shares (where offered). For more information, please review the relevant prospectuses or consult your financial representative.
Fund shares are not deposits or other obligations of Credit Suisse Asset Management, LLC ("Credit Suisse") or any affiliate, are not FDIC-insured and are not guaranteed by Credit Suisse or any affiliate. Fund investments are subject to investment risks, including loss of your investment.
Credit Suisse Emerging Markets Equity Fund
Annual Investment Adviser's Report
October 31, 2015 (unaudited)
December 21, 2015
Dear Shareholder:
We are pleased to present this Annual Report covering the activities of the Credit Suisse Emerging Markets Equity Fund (the "Fund"), for the 12 months ended October 31, 2015.
Performance Summary
11/1/2014 – 10/31/2015
Fund & Benchmark | | Performance | |
Class I1 | | | -16.68 | % | |
Class A1,2 | | | -16.74 | % | |
Class C1,2 | | | -17.48 | % | |
MSCI Emerging Markets Index3 | | | -14.53 | % | |
Performance shown for the Fund's Class A and Class C Shares does not reflect sales charges, which are a maximum of 5.25% and 1.00%, respectively.2
Market Review: A challenging period for emerging markets
The 12 months ended October 31, 2015 was a challenging one for emerging markets, with the MSCI Emerging Markets Index, the Fund's benchmark, returning -14.53%.
Lower oil prices late in 2014 were a gift that carried into the beginning of 2015. For the first half of the year, emerging markets saw positive returns, as the initiation of European quantitative easing and Chinese monetary easing continued to heighten global market volatility.
Global markets experienced a significant correction in the third quarter, driven by a perceived deceleration in China, devaluation of the Chinese currency, political and fiscal strife in Brazil, and the Fed's anxiously awaited decision regarding interest rates. After steep declines where emerging markets neared -20%, lows not seen since 2009, they staged a low quality rally of 7% in October, fueled by the view that loose monetary policy in the U.S. would be extended due to global weakness. A short delay in the Fed's interest rate hike plans led to a reflation of many of the low quality assets that had been beaten down in the months prior due to fears over their ability to survive a return to normalized interest rates.
Portfolio Review and Outlook: Cautiously optimistic going forward
For the 12 months ended October 31, 2015, the Fund underperformed the benchmark, losing 16.68% versus the benchmark loss of 14.53%. The end result,
1
Credit Suisse Emerging Markets Equity Fund
Annual Investment Adviser's Report (continued)
October 31, 2015 (unaudited)
however, masks what was a back and forth period of relative performance. For example, late 2014 saw outperformance driven by energy-intensive positions in China and Turkey, and strong gains in the Chinese banking space. In addition, although the initial 2015 rally in China left many of the portfolio's positions lagging, the Fund regained much of this underperformance in April as the main tenets of our valuation approach found renewed vigor. The Fund underperformed in Q3, however, driven by negative stock selection, predominantly from late stage industrial positions in China and financials in Brazil. This underperformance accelerated in October as a result of stock selection across most Industrial Life Cycle "ILC" stages and sectors. Stock selection in consumer staples, telecommunications, and utilities contributed positively to performance. Conversely, stock selection in consumer discretionary, materials, and information technology detracted from returns.
The Fed's decision to delay the interest rate hike was somewhat validated in October of 2015 when the U.S. released a less than vigorous jobs report. Additionally, the global economy is intertwined, and weakness in one corner, such as China or Europe, will eventually trickle through to the U.S., either in the form of lower earnings for multinational companies or through imported price deflation. This is the main concern of the Fed — and markets are now tasked with determining the probabilities between low interest rates for a more extended period of time versus a gradual increase to more normal levels. The vacillation between higher and lower rate outcomes has encased emerging market equities into a trading range that is likely to remain intact until consensus moves beyond a split weight between the two scenarios. In the meantime, the delay in rate rises is likely to reinvigorate the latter life cycles — along with the reawakening of valuation — as an effective alpha factor in the fourth quarter.
Going forward, we expect that the ILC process will make up for the initial deficit seen in October in one of two manners. Either the catalyst for the low quality rally will reverse itself (in this case if the Fed reverses course and raises rates) or the rally will mature as leadership broadens out to include the more sustainable types of names that pass the ILC screening and due diligence process.
HOLT Active Equity Group
Alfred S. Bryant
Foreign investments involve significant risks including risk of loss of principal, currency risk, derivatives risk, emerging markets risk, equity exposure risk, foreign securities risk, information risk, political risk, access risk, operational risk, liquidity
2
Credit Suisse Emerging Markets Equity Fund
Annual Investment Adviser's Report (continued)
October 31, 2015 (unaudited)
risk, manager risk, market risk, and small- and mid-cap stock risk. For a detailed discussion of these and other risks, please refer to the Fund's Prospectus, which should be read carefully before investing.
In addition to historical information, this report contains forward-looking statements, which may concern, among other things, domestic and foreign market, industry and economic trends and developments and government regulation and their potential impact on the Fund's investments. These statements are subject to risks and uncertainties and actual trends, developments and regulations in the future, and their impact on the Fund could be materially different from those projected, anticipated or implied. The Fund has no obligation to update or revise forward-looking statements.
The views of the Fund's management are as of the date of the letter and the Fund holdings described in this document are as of October 31, 2015; these views and Fund holdings may have changed subsequent to these dates. Nothing in this document is a recommendation to purchase or sell securities.
3
Credit Suisse Emerging Markets Equity Fund
Annual Investment Adviser's Report (continued)
October 31, 2015 (unaudited)
Comparison of Change in Value of $10,000 Investment in the
Credit Suisse Emerging Market Equity Fund1 Class I Shares, Class A
Shares2, Class C Shares2 and MSCI Emerging Markets USD Index NR3
from Inception (12/26/13).
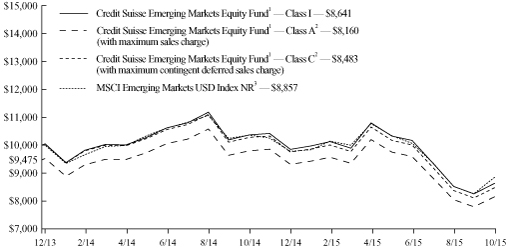
1 Fee waivers and/or expense reimbursements may reduce expenses for the Fund, without which performance would be lower. The Fund entered into a written contract to limit expenses to 1.25% of the Fund's average daily net assets for Class I shares, 1.50% of the Fund's average daily net assets for Class A shares and 2.25% of the Fund's average daily net assets for Class C shares through at least February 28, 2017.
2 Total return for the Fund's Class A shares for the reporting period, based on offering price (including maximum sales charge of 5.25%), was (21.09)%. Total return for the Fund's Class C shares for the reporting period, based on redemption value (including maximum contingent deferred sales charge of 1.00%), was (18.29)%.
3 Morgan Stanley Capital International (MSCI) Emerging Markets USD Index NR is a free float-adjusted market capitalization index that is designed to measure equity market performance in the global emerging markets. The index does not have transaction costs and investors can not invest directly in the index.
4
Credit Suisse Emerging Markets Equity Fund
Annual Investment Adviser's Report (continued)
October 31, 2015 (unaudited)
Average Annual Returns as of October 31, 20151
| | | 1 Year | | Since
Inception2 | |
Class I | | | (16.68 | )% | | | (7.60 | )% | |
Class A Without Sales Charge | | | (16.74 | )% | | | (7.78 | )% | |
Class A With Maximum Sales Charge | | | (21.09 | )% | | | (10.41 | )% | |
Class C Without CDSC | | | (17.48 | )% | | | (8.51 | )% | |
Class C With CDSC | | | (18.29 | )% | | | (8.51 | )% | |
Returns represent past performance and include change in share price and reinvestment of dividends and capital gains. Past performance cannot guarantee future results. The current performance of the Fund may be lower or higher than the figures shown. Returns and share price will fluctuate, and redemption value may be more or less than original cost. The performance results do not reflect the deduction of taxes that a shareholder would pay on fund distributions or the redemption of fund shares. Performance information current to the most recent month-end is available at www.credit-suisse.com/us/funds.
The annual gross expense ratios are 2.42% for Class I shares, 2.67% for Class A shares and 3.42% for Class C shares. The annual net expense ratios after fee waivers and/or expense reimbursements are 1.25% for Class I shares, 1.50% for Class A shares and 2.25% for Class C shares.
1 Fee waivers and/or expense reimbursements may reduce expenses for the Fund, without which performance would be lower. The Fund entered into a written contract to limit expenses to 1.25% of the Fund's average daily net assets for Class I shares, 1.50% of the Fund's average daily net assets for Class A shares and 2.25% of the Fund's average daily net assets for Class C shares through at least February 28, 2017.
2 Inception Date December 26, 2013.
5
Credit Suisse Emerging Markets Equity Fund
Annual Investment Adviser's Report (continued)
October 31, 2015 (unaudited)
Information About Your Fund's Expenses
As an investor of the Fund, you incur two types of costs: ongoing expenses and transaction costs. Ongoing expenses include management fees, distribution and service (12b-1) fees and other Fund expenses. Examples of transaction costs include sales charges (loads), redemption fees and account maintenance fees, which are not shown in this section and which would result in higher total expenses. The following table is intended to help you understand your ongoing expenses of investing in the Fund and to help you compare these expenses with the ongoing expenses of investing in other mutual funds. The table is based on an investment of $1,000 made at the beginning of the six months ended October 31, 2015.
The table illustrates your Fund's expenses in two ways:
• Actual Fund Return. This helps you estimate the actual dollar amount of ongoing expenses paid on a $1,000 investment in the Fund using the Fund's actual return during the period. To estimate the expenses you paid over the period, simply divide your account value by $1,000 (for example, an $8,600 account value divided by $1,000 = 8.6), then multiply the result by the number in the "Expenses Paid per $1,000" line under the share class you hold.
• Hypothetical 5% Fund Return. This helps you to compare your Fund's ongoing expenses with those of other mutual funds using the Fund's actual expense ratio and a hypothetical rate of return of 5% per year before expenses. Examples using a 5% hypothetical fund return may be found in the shareholder reports of other mutual funds. The hypothetical account values and expenses may not be used to estimate the actual ending account balance or expenses you paid for the period.
Please note that the expenses shown in these tables are meant to highlight your ongoing expenses only and do not reflect any transaction costs, such as sales charges (loads) or redemption fees. If these transaction costs had been included, your costs would have been higher. The "Expenses Paid per $1,000" line of the tables is useful in comparing ongoing expenses only and will not help you determine the relative total expenses of owning different funds.
6
Credit Suisse Emerging Markets Equity Fund
Annual Investment Adviser's Report (continued)
October 31, 2015 (unaudited)
Expenses and Value for a $1,000 Investment
for the six month period ended October 31, 2015
Actual Fund Return | | Class I | | Class A | | Class C | |
Beginning Account Value 05/01/15 | | $ | 1,000.00 | | | $ | 1,000.00 | | | $ | 1,000.00 | | |
Ending Account Value 10/31/15 | | $ | 800.20 | | | $ | 800.00 | | | $ | 796.60 | | |
Expenses Paid per $1,000* | | $ | 5.67 | | | $ | 6.81 | | | $ | 10.19 | | |
Hypothetical 5% Fund Return | |
Beginning Account Value 05/01/15 | | $ | 1,000.00 | | | $ | 1,000.00 | | | $ | 1,000.00 | | |
Ending Account Value 10/31/15 | | $ | 1,018.90 | | | $ | 1,017.64 | | | $ | 1,013.86 | | |
Expenses Paid per $1,000* | | $ | 6.36 | | | $ | 7.63 | | | $ | 11.42 | | |
| | | Class I | | Class A | | Class C | |
Annualized Expense Ratios* | | | 1.25 | % | | | 1.50 | % | | | 2.25 | % | |
* Expenses are equal to the Fund's annualized expense ratio for each share class, multiplied by the average account value over the period, multiplied by 184/365 to reflect the one-half year period.
The "Expenses Paid per $1,000" and the "Annualized Expense Ratios" in the tables are based on actual expenses paid by the Fund during the period, net of fee waivers and/or expense reimbursements. If those fee waivers and/or expense reimbursements had not been in effect, the Fund's actual expenses would have been higher. Expenses do not reflect additional charges and expenses that are, or may be, imposed under the variable contracts or plans. Such charges and expenses are described in the prospectus of the insurance company separate account or in the plan documents or other informational materials supplied by plan sponsors. The Fund's expenses should be considered with these charges and expenses in evaluating the overall cost of investing in the separate account.
For more information, please refer to the Fund's prospectus.
7
Credit Suisse Emerging Markets Equity Fund
Annual Investment Adviser's Report (continued)
October 31, 2015 (unaudited)
Sector Breakdown*
Financials | | | 24.3 | % | |
Information Technology | | | 19.8 | | |
Consumer Discretionary | | | 13.6 | | |
Consumer Staples | | | 8.2 | | |
Energy | | | 6.4 | | |
Commingled Funds | | | 5.2 | | |
Telecommunication Services | | | 4.9 | | |
Materials | | | 4.7 | | |
Health Care | | | 4.4 | | |
Industrials | | | 3.6 | | |
Utilities | | | 3.1 | | |
Short-Term Investment1 | | | 1.8 | | |
Total | | | 100.0 | % | |
* Expressed as a percentage of total investments (excluding securities lending collateral if applicable) and may vary over time.
1 Primarily reflects cash invested in State Street Bank and Trust Co. Euro Time Deposit, for which the purchases of securities have been executed but not yet settled at October 31, 2015, if applicable.
8
Credit Suisse Emerging Markets Equity Fund
Schedule of Investments
October 31, 2015
| | | Number of
Shares | | Value | |
| COMMON STOCKS (90.4%) | |
| BRAZIL (6.9%) | |
| Commercial Banks (1.5%) | |
Banco do Brasil S.A. | | | 87,000 | | | $ | 361,752 | | |
| Electric Utilities (0.9%) | |
Transmissora Alianca de Energia Eletrica S.A. | | | 40,100 | | | | 207,503 | | |
| Food Products (0.9%) | |
Marfrig Global Foods S.A.1 | | | 133,900 | | | | 221,918 | | |
| Household Durables (1.1%) | |
Cyrela Brazil Realty S.A. | | | 62,700 | | | | 146,113 | | |
MRV Engenharia e Participacoes S.A. | | | 67,500 | | | | 130,261 | | |
| | | | 276,374 | | |
| Insurance (1.4%) | |
Porto Seguro S.A. | | | 39,000 | | | | 327,959 | | |
| Metals & Mining (0.5%) | |
Vale S.A., ADR | | | 25,500 | | | | 111,180 | | |
| Multiline Retail (0.6%) | |
Lojas Renner S.A. | | | 30,100 | | | | 144,890 | | |
| | | | 1,651,576 | | |
| CHILE (1.4%) | |
| Electric Utilities (1.4%) | |
Enersis S.A., ADR | | | 25,500 | | | | 337,875 | | |
| CHINA (16.4%) | |
| Building Products (0.6%) | |
China Lesso Group Holdings Ltd. | | | 186,000 | | | | 150,393 | | |
| Commercial Banks (6.0%) | |
Agricultural Bank of China Ltd., Series H | | | 742,200 | | | | 304,467 | | |
Bank of China Ltd., Series H | | | 903,600 | | | | 426,130 | | |
China CITIC Bank Corp. Ltd., Series H1 | | | 640,600 | | | | 415,110 | | |
Chongqing Rural Commercial Bank Co. Ltd., Series H | | | 471,400 | | | | 293,649 | | |
| | | | 1,439,356 | | |
| Construction & Engineering (1.7%) | |
Sinopec Engineering Group Co. Ltd., Series H | | | 479,000 | | | | 412,390 | | |
| Construction Materials (0.9%) | |
China National Building Material Co. Ltd., Series H | | | 344,900 | | | | 213,423 | | |
| Electrical Equipment (0.7%) | |
Zhuzhou CSR Times Electric Co. Ltd., Series H | | | 23,372 | | | | 151,606 | | |
| Independent Power Producers & Energy Traders (0.7%) | |
Huaneng Power International, Inc., Series H | | | 161,450 | | | | 174,596 | | |
| Insurance (0.7%) | |
New China Life Insurance Co. Ltd., Series H | | | 37,800 | | | | 165,973 | | |
See Accompanying Notes to Financial Statements.
9
Credit Suisse Emerging Markets Equity Fund
Schedule of Investments (continued)
October 31, 2015
| | | Number of
Shares | | Value | |
| COMMON STOCKS (continued) | |
CHINA | |
| Internet Software & Services (0.8%) | |
Tencent Holdings Ltd. | | | 10,300 | | | $ | 193,631 | | |
| Metals & Mining (0.8%) | |
China Hongqiao Group Ltd. | | | 382,900 | | | | 198,889 | | |
| Oil, Gas & Consumable Fuels (1.4%) | |
CNOOC Ltd. | | | 291,200 | | | | 328,178 | | |
| Semiconductors & Semiconductor Equipment (1.3%) | |
JA Solar Holdings Co. Ltd., ADR1 | | | 35,100 | | | | 299,052 | | |
| Specialty Retail (0.8%) | |
Belle International Holdings Ltd. | | | 191,000 | | | | 185,404 | | |
| | | | 3,912,891 | | |
| COLOMBIA (0.7%) | |
| Oil, Gas & Consumable Fuels (0.7%) | |
Ecopetrol S.A., ADR | | | 17,000 | | | | 158,440 | | |
| HONG KONG (4.7%) | |
| Capital Markets (1.0%) | |
Sun Hung Kai & Co. Ltd. | | | 348,400 | | | | 234,491 | | |
| Chemicals (0.5%) | |
Yingde Gases Group Co. Ltd. | | | 250,500 | | | | 111,323 | | |
| Construction Materials (0.5%) | |
China Resources Cement Holdings Ltd. | | | 278,200 | | | | 112,272 | | |
| Industrial Conglomerates (0.6%) | |
Jardine Strategic Holdings Ltd. | | | 4,700 | | | | 141,473 | | |
| Pharmaceuticals (0.6%) | |
China Traditional Chinese Medicine Co. Ltd.1 | | | 191,600 | | | | 144,916 | | |
| Specialty Retail (0.6%) | |
Luk Fook Holdings International Ltd. | | | 58,000 | | | | 149,257 | | |
| Wireless Telecommunication Services (0.9%) | |
China Mobile Ltd. | | | 18,600 | | | | 222,906 | | |
| | | | 1,116,638 | | |
| HUNGARY (0.8%) | |
| Pharmaceuticals (0.8%) | |
Richter Gedeon Nyrt | | | 11,100 | | | | 185,878 | | |
| INDIA (4.6%) | |
| Automobiles (1.4%) | |
Tata Motors Ltd., ADR1 | | | 11,600 | | | | 343,012 | | |
| Pharmaceuticals (1.8%) | |
Dr Reddy's Laboratories Ltd., ADR | | | 6,600 | | | | 427,614 | | |
See Accompanying Notes to Financial Statements.
10
Credit Suisse Emerging Markets Equity Fund
Schedule of Investments (continued)
October 31, 2015
| | | Number of
Shares | | Value | |
| COMMON STOCKS (continued) | |
INDIA | |
| Thrifts & Mortgage Finance (1.4%) | |
Indiabulls Housing Finance Ltd., GDR | | | 30,500 | | | $ | 336,873 | | |
| | | | 1,107,499 | | |
| INDONESIA (0.6%) | |
| Food Products (0.6%) | |
Indofood Sukses Makmur Tbk PT | | | 323,500 | | | | 130,050 | | |
| JAPAN (0.6%) | |
| Household Products (0.6%) | |
Pigeon Corp. | | | 5,000 | | | | 140,089 | | |
| LUXEMBOURG (0.6%) | |
| Metals & Mining (0.6%) | |
Ternium S.A., ADR | | | 10,500 | | | | 150,885 | | |
| MALAYSIA (0.9%) | |
| IT Services (0.9%) | |
My EG Services Bhd | | | 311,500 | | | | 213,899 | | |
| MEXICO (0.5%) | |
| Pharmaceuticals (0.5%) | |
Genomma Lab Internacional S.A.B. de C.V., Series B1 | | | 161,200 | | | | 118,203 | | |
| PANAMA (1.0%) | |
| Commercial Banks (1.0%) | |
Banco Latinoamericano de Comercio Exterior S.A., Series E | | | 9,200 | | | | 248,676 | | |
| RUSSIA (3.6%) | |
| Diversified Financial Services (0.8%) | |
Moscow Exchange MICEX-RTS PJSC1 | | | 139,800 | | | | 197,070 | | |
| Oil, Gas & Consumable Fuels (2.8%) | |
Gazprom PAO, ADR | | | 61,850 | | | | 258,533 | | |
Lukoil PJSC, ADR | | | 11,300 | | | | 409,625 | | |
| | | | 668,158 | | |
| | | | 865,228 | | |
| SINGAPORE (0.7%) | |
| Commercial Banks (0.7%) | |
DBS Group Holdings Ltd. | | | 13,300 | | | | 163,571 | | |
| SOUTH AFRICA (5.3%) | |
| Food & Staples Retailing (2.2%) | |
The SPAR Group Ltd. | | | 35,700 | | | | 513,652 | | |
| Food Products (0.6%) | |
AVI Ltd. | | | 23,300 | | | | 148,574 | | |
| Real Estate Investment Trusts (1.3%) | |
Growthpoint Properties Ltd. | | | 175,300 | | | | 321,900 | | |
See Accompanying Notes to Financial Statements.
11
Credit Suisse Emerging Markets Equity Fund
Schedule of Investments (continued)
October 31, 2015
| | | Number of
Shares | | Value | |
| COMMON STOCKS (continued) | |
SOUTH AFRICA | |
| Specialty Retail (1.2%) | |
Truworths International Ltd. | | | 41,500 | | | $ | 281,439 | | |
| | | | 1,265,565 | | |
| SOUTH KOREA (18.9%) | |
| Automobiles (2.7%) | |
Hyundai Motor Co. | | | 1,400 | | | | 191,233 | | |
Kia Motors Corp. | | | 9,100 | | | | 444,190 | | |
| | | | 635,423 | | |
| Biotechnology (0.7%) | |
Medy-Tox, Inc. | | | 400 | | | | 169,870 | | |
| Commercial Banks (2.1%) | |
Woori Bank | | | 56,300 | | | | 488,377 | | |
| Diversified Telecommunication Services (2.2%) | |
KT Corp.1 | | | 20,500 | | | | 531,066 | | |
| Electronic Equipment, Instruments & Components (1.6%) | |
LG Display Co. Ltd. | | | 12,700 | | | | 241,263 | | |
LG Innotek Co. Ltd. | | | 1,800 | | | | 145,546 | | |
| | | | 386,809 | | |
| Hotels, Restaurants & Leisure (0.5%) | |
Hana Tour Service, Inc. | | | 1,100 | | | | 121,189 | | |
| Household Durables (1.0%) | |
Hanssem Co. Ltd. | | | 1,200 | | | | 245,226 | | |
| Insurance (0.9%) | |
Hyundai Marine & Fire Insurance Co. Ltd. | | | 7,300 | | | | 217,376 | | |
| Media (1.1%) | |
KT Skylife Co. Ltd. | | | 15,200 | | | | 248,776 | | |
| Personal Products (1.0%) | |
Amorepacific Corp. | | | 740 | | | | 244,270 | | |
| Semiconductors & Semiconductor Equipment (3.9%) | |
Samsung Electronics Co. Ltd. | | | 780 | | | | 935,552 | | |
| Tobacco (1.2%) | |
KT&G Corp. | | | 2,800 | | | | 279,767 | | |
| | | | 4,503,701 | | |
| TAIWAN (14.0%) | |
| Computers & Peripherals (3.6%) | |
Asustek Computer, Inc. | | | 20,900 | | | | 187,043 | | |
Catcher Technology Co. Ltd. | | | 12,500 | | | | 122,675 | | |
Compal Electronics, Inc. | | | 444,000 | | | | 276,137 | | |
Pegatron Corp. | | | 112,300 | | | | 274,423 | | |
| | | | 860,278 | | |
See Accompanying Notes to Financial Statements.
12
Credit Suisse Emerging Markets Equity Fund
Schedule of Investments (continued)
October 31, 2015
| | | Number of
Shares | | Value | |
| COMMON STOCKS (continued) | |
TAIWAN | |
| Electronic Equipment, Instruments & Components (3.0%) | |
Hon Hai Precision Industry Co. Ltd. | | | 211,453 | | | $ | 562,055 | | |
Largan Precision Co. Ltd. | | | 2,100 | | | | 163,188 | | |
| | | | 725,243 | | |
| Internet Software & Services (0.6%) | |
PChome Online, Inc. | | | 13,155 | | | | 147,426 | | |
| Personal Products (0.5%) | |
Grape King Bio Ltd. | | | 21,900 | | | | 120,387 | | |
| Semiconductors & Semiconductor Equipment (3.8%) | |
Taiwan Semiconductor Manufacturing Co. Ltd. | | | 213,600 | | | | 900,039 | | |
| Textiles, Apparel & Luxury Goods (2.5%) | |
Eclat Textile Co. Ltd. | | | 24,000 | | | | 352,990 | | |
Makalot Industrial Co. Ltd. | | | 30,842 | | | | 234,820 | | |
| | | | 587,810 | | |
| | | | 3,341,183 | | |
| THAILAND (3.8%) | |
| Chemicals (0.8%) | |
PTT Global Chemical PCL | | | 132,500 | | | | 207,686 | | |
| Commercial Banks (1.7%) | |
Bangkok Bank PCL, NVDR | | | 54,400 | | | | 255,619 | | |
Krung Thai Bank PCL, NVDR | | | 319,700 | | | | 153,405 | | |
| | | | 409,024 | | |
| Food Products (0.6%) | |
Thai Union Group PCL, Series F | | | 277,700 | | | | 138,196 | | |
| Oil, Gas & Consumable Fuels (0.7%) | |
PTT PCL | | | 20,800 | | | | 160,821 | | |
| | | | 915,727 | | |
| TURKEY (2.6%) | |
| Diversified Telecommunication Services (1.7%) | |
Turk Telekomunikasyon AS | | | 189,100 | | | | 408,424 | | |
| Oil, Gas & Consumable Fuels (0.9%) | |
Tupras Turkiye Petrol Rafinerileri AS1 | | | 7,500 | | | | 198,168 | | |
| | | | 606,592 | | |
| UNITED ARAB EMIRATES (0.7%) | |
| Commercial Banks (0.7%) | |
Abu Dhabi Commercial Bank PJSC | | | 79,000 | | | | 160,379 | | |
See Accompanying Notes to Financial Statements.
13
Credit Suisse Emerging Markets Equity Fund
Schedule of Investments (continued)
October 31, 2015
| | | Number of
Shares | | Value | |
| COMMON STOCKS (continued) | |
| UNITED KINGDOM (1.1%) | |
| Insurance (1.1%) | |
Old Mutual PLC | | | 82,000 | | | $ | 268,496 | | |
| TOTAL COMMON STOCKS (Cost $24,093,826) | | | 21,563,041 | | |
| PREFERRED STOCKS (1.7%) | |
| BRAZIL (1.7%) | |
| Commercial Banks (1.7%) | |
Banco Bradesco S.A. | | | 16,080 | | | | 87,895 | | |
Itau Unibanco Holding S.A. | | | 44,550 | | | | 306,997 | | |
| TOTAL PREFERRED STOCKS (Cost $710,508) | | | 394,892 | | |
| EXCHANGE TRADED FUNDS (5.1%) | |
| FRANCE (2.5%) | |
Lyxor ETF MSCI India1 | | | 38,450 | | | | 593,359 | | |
| LUXEMBOURG (2.6%) | |
db x-trackers CNX Nifty UCITS ETF1 | | | 4,925 | | | | 623,089 | | |
| TOTAL EXCHANGE TRADED FUNDS (Cost $1,040,617) | | | 1,216,448 | | |
| | | Par
(000) | | | |
| SHORT-TERM INVESTMENT (1.7%) | |
State Street Bank and Trust Co. Euro Time Deposit, 0.010% 11/02/2015 (Cost $413,660) | | $ | 414 | | | | 413,660 | | |
| TOTAL INVESTMENTS AT VALUE (98.9%) (Cost $26,258,611) | | | 23,588,041 | | |
| OTHER ASSETS IN EXCESS OF LIABILITIES (1.1%) | | | 268,486 | | |
| NET ASSETS (100.0%) | | $ | 23,856,527 | | |
1 Non-income producing security.
INVESTMENT ABBREVIATIONS
ADR = American Depositary Receipt
GDR = Global Depositary Receipt
NVDR = Non-Voting Depository Receipt
See Accompanying Notes to Financial Statements.
14
Credit Suisse Emerging Markets Equity Fund
Statement of Assets and Liabilities
October 31, 2015
Assets | |
Investments at value (Cost $26,258,611) (Note 2) | | $ | 23,588,041 | | |
Cash | | | 50,000 | | |
Foreign currency at value (cost $275,316) | | | 277,316 | | |
Dividend receivable | | | 13,379 | | |
Receivable from investment adviser (Note 3) | | | 13,201 | | |
Receivable for fund shares sold | | | 6,597 | | |
Prepaid expenses | | | 6,681 | | |
Total assets | | | 23,955,215 | | |
Liabilities | |
Administrative services fee payable (Note 3) | | | 27,445 | | |
Shareholder servicing/Distribution fee payable (Note 3) | | | 1,568 | | |
Trustees' fee payable | | | 7,438 | | |
Accrued expenses | | | 62,237 | | |
Total liabilities | | | 98,688 | | |
Net Assets | |
Capital stock, $.001 par value (Note 6) | | | 2,837 | | |
Paid-in capital (Note 6) | | | 28,446,334 | | |
Accumulated net investment loss | | | (14,029 | ) | |
Accumulated net realized loss on investments and foreign currency transactions | | | (1,910,170 | ) | |
Net unrealized depreciation from investments and foreign currency translations | | | (2,668,445 | ) | |
Net assets | | $ | 23,856,527 | | |
I Shares | |
Net assets | | $ | 21,050,890 | | |
Shares outstanding | | | 2,501,604 | | |
Net asset value, offering price and redemption price per share | | $ | 8.41 | | |
A Shares | |
Net assets | | $ | 1,287,571 | | |
Shares outstanding | | | 153,335 | | |
Net asset value and redemption price per share | | $ | 8.40 | | |
Maximum offering price per share (net asset value/(1-5.25%)) | | $ | 8.87 | | |
C Shares | |
Net assets | | $ | 1,518,066 | | |
Shares outstanding | | | 181,951 | | |
Net asset value, offering price and redemption price per share | | $ | 8.34 | | |
See Accompanying Notes to Financial Statements.
15
Credit Suisse Emerging Markets Equity Fund
Statement of Operations
For the Year Ended October 31, 2015
Investment Income | |
Dividends | | $ | 747,298 | | |
Foreign taxes withheld | | | (74,459 | ) | |
Total investment income | | | 672,839 | | |
Expenses | |
Investment advisory fees (Note 3) | | | 230,315 | | |
Administrative services fees (Note 3) | | | 178,795 | | |
Shareholder servicing/Distribution fees (Note 3) | |
Class A | | | 3,425 | | |
Class C | | | 13,990 | | |
Registration fees | | | 46,845 | | |
Trustees' fees | | | 28,867 | | |
Legal fees | | | 28,069 | | |
Audit and tax fees | | | 25,913 | | |
Printing fees | | | 24,322 | | |
Custodian fees | | | 24,135 | | |
Transfer agent fees (Note 3) | | | 9,660 | | |
Offering costs (Note 3) | | | 9,083 | | |
Commitment fees (Note 4) | | | 8,779 | | |
Insurance expense | | | 636 | | |
Miscellaneous expense | | | 4,676 | | |
Total expenses | | | 637,510 | | |
Less: fees waived and expenses reimbursed (Note 3) | | | (300,236 | ) | |
Net expenses | | | 337,274 | | |
Net investment income | | | 335,565 | | |
Net Realized and Unrealized Gain (Loss) from Investments and Foreign Currency Related Items | |
Net realized loss from investments | | | (1,399,953 | ) | |
Net realized loss from foreign currency transactions | | | (23,950 | ) | |
Net change in unrealized appreciation (depreciation) from investments | | | (3,506,077 | ) | |
Net change in unrealized appreciation (depreciation) from foreign currency translations | | | (397 | ) | |
Net realized and unrealized loss from investments and foreign currency related items | | | (4,930,377 | ) | |
Net decrease in net assets resulting from operations | | $ | (4,594,812 | ) | |
See Accompanying Notes to Financial Statements.
16
Credit Suisse Emerging Markets Equity Fund
Statement of Changes in Net Assets
| | | For the Year
Ended
October 31, 2015 | | For the Period
Ended
October 31, 20141 | |
From Operations | |
Net investment income | | $ | 335,565 | | | $ | 325,769 | | |
Net realized loss from investments and foreign currency transactions | | | (1,423,903 | ) | | | (495,993 | ) | |
Net change in unrealized appreciation (depreciation)
from investments and foreign currency translations | | | (3,506,474 | ) | | | 838,029 | | |
Net increase (decrease) in net assets resulting from operations | | | (4,594,812 | ) | | | 667,805 | | |
From Dividends | |
Dividends from net investment income | |
Class I | | | (620,068 | ) | | | — | | |
Class A | | | (31,587 | ) | | | — | | |
Class C | | | (16,465 | ) | | | — | | |
Net decrease in net assets resulting from dividends | | | (668,120 | ) | | | — | | |
| From Capital Share Transactions (Note 6) | |
Proceeds from sale of shares | | | 6,646,901 | | | | 22,618,171 | | |
Reinvestment of dividends | | | 665,629 | | | | — | | |
Net asset value of shares redeemed | | | (1,443,532 | ) | | | (35,515 | ) | |
Net increase in net assets from capital share transactions | | | 5,868,998 | | | | 22,582,656 | | |
Net increase in net assets | | | 606,066 | | | | 23,250,461 | | |
Net Assets | |
Beginning of period | | | 23,250,461 | | | | — | | |
End of period | | $ | 23,856,527 | | | $ | 23,250,461 | | |
Undistributed (accumulated) net investment income (loss) | | $ | (14,029 | ) | | $ | 336,253 | | |
1 For the period December 26, 2013 (Inception Date) through October 31, 2014.
See Accompanying Notes to Financial Statements.
17
Credit Suisse Emerging Markets Equity Fund
Financial Highlights
(For a Class I Share of the Fund Outstanding Throughout Each Period)
| | | For the Year
Ended
October 31, 2015 | | For the Period
Ended
October 31, 20141 | |
Per share data | |
Net asset value, beginning of Period | | $ | 10.36 | | | $ | 10.00 | | |
INVESTMENT OPERATIONS | |
Net investment income2 | | | 0.13 | | | | 0.16 | | |
Net gain (loss) on investments and foreign currency related items
(both realized and unrealized) | | | (1.82 | ) | | | 0.20 | | |
Total from investment operations | | | (1.69 | ) | | | 0.36 | | |
LESS DIVIDENDS | |
Dividends from net investment income | | | (0.26 | ) | | | — | | |
Total dividends | | | (0.26 | ) | | | — | | |
Net asset value, end of Period | | $ | 8.41 | | | $ | 10.36 | | |
Total return3 | | | (16.68 | )% | | | 3.60 | % | |
RATIOS AND SUPPLEMENTAL DATA | |
Net assets, end of period (000s omitted) | | $ | 21,051 | | | $ | 21,040 | | |
Ratio of net expenses to average net assets | | | 1.25 | % | | | 1.25 | %4 | |
Ratio of net investment income to average net assets | | | 1.36 | % | | | 1.88 | %4 | |
Decrease reflected in above operating expense ratios due to
waivers/reimbursements | | | 1.17 | % | | | 1.38 | %4 | |
Portfolio turnover rate | | | 62 | % | | | 50 | % | |
1 For the period December 26, 2013 (Inception Date) through October 31, 2014.
2 Per share information is calculated using the average shares outstanding method.
3 Total returns are historical and assume changes in share price and reinvestment of all dividends. Had certain expenses not been reduced during the period shown, total returns would have been lower. Total returns for periods less than one year are not annualized.
4 Annualized.
See Accompanying Notes to Financial Statements.
18
Credit Suisse Emerging Markets Equity Fund
Financial Highlights
(For a Class A Share of the Fund Outstanding Throughout Each Period)
| | | For the Year
Ended
October 31, 2015 | | For the Period
Ended
October 31, 20141 | |
Per share data | |
Net asset value, beginning of period | | $ | 10.34 | | | $ | 10.00 | | |
INVESTMENT OPERATIONS | |
Net investment income2 | | | 0.11 | | | | 0.15 | | |
Net gain (loss) on investments and foreign currency related items
(both realized and unrealized) | | | (1.81 | ) | | | 0.19 | | |
Total from investment operations | | | (1.70 | ) | | | 0.34 | | |
LESS DIVIDENDS | |
Dividends from net investment income | | | (0.24 | ) | | | — | | |
Total dividends | | | (0.24 | ) | | | — | | |
Net asset value, end of period | | $ | 8.40 | | | $ | 10.34 | | |
Total return3 | | | (16.74 | )% | | | 3.40 | % | |
RATIOS AND SUPPLEMENTAL DATA | |
Net assets, end of period (000s omitted) | | $ | 1,288 | | | $ | 1,182 | | |
Ratio of net expenses to average net assets | | | 1.50 | % | | | 1.50 | %4 | |
Ratio of net investment income to average net assets | | | 1.18 | % | | | 1.72 | %4 | |
Decrease reflected in above operating expense ratios due to
waivers/reimbursements | | | 1.17 | % | | | 1.38 | %4 | |
Portfolio turnover rate | | | 62 | % | | | 50 | % | |
1 For the period December 26, 2013 (Inception Date) through October 31, 2014.
2 Per share information is calculated using the average shares outstanding method.
3 Total returns are historical and assume changes in share price, reinvestment of all dividends and no sales charge. Had certain expenses not been reduced during the period shown, total returns would have been lower. Total returns for periods less than one period are not annualized
4 Annualized.
See Accompanying Notes to Financial Statements.
19
Credit Suisse Emerging Markets Equity Fund
Financial Highlights
(For a Class C Share of the Fund Outstanding Throughout Each Period)
| | | For the Year
Ended
October 31, 2015 | | For the Period
Ended
October 31, 20141 | |
Per share data | |
Net asset value, beginning of period | | $ | 10.28 | | | $ | 10.00 | | |
INVESTMENT OPERATIONS | |
Net investment income2 | | | 0.06 | | | | 0.08 | | |
Net gain (loss) on investments and foreign currency related items
(both realized and unrealized) | | | (1.84 | ) | | | 0.20 | | |
Total from investment operations | | | (1.78 | ) | | | 0.28 | | |
LESS DIVIDENDS | |
Dividends from net investment income | | | (0.16 | ) | | | — | | |
Total dividends | | | (0.16 | ) | | | — | | |
Net asset value, end of period | | $ | 8.34 | | | $ | 10.28 | | |
Total return3 | | | (17.48 | )% | | | 2.80 | % | |
RATIOS AND SUPPLEMENTAL DATA | |
Net assets, end of period (000s omitted) | | $ | 1,518 | | | $ | 1,028 | | |
Ratio of net expenses to average net assets | | | 2.25 | % | | | 2.25 | %4 | |
Ratio of net investment income to average net assets | | | 0.62 | % | | | 0.91 | %4 | |
Decrease reflected in above operating expense ratios due to
waivers/reimbursements | | | 1.17 | % | | | 1.38 | %4 | |
Portfolio turnover rate | | | 62 | % | | | 50 | % | |
1 For the period December 26, 2013 (Inception Date) through October 31, 2014.
2 Per share information is calculated using the average shares outstanding method.
3 Total returns are historical and assume changes in share price, reinvestment of all dividends and no sales charge. Had certain expenses not been reduced during the period shown, total returns would have been lower. Total returns for periods less than one period are not annualized.
4 Annualized.
See Accompanying Notes to Financial Statements.
20
Credit Suisse Emerging Markets Equity Fund
Notes to Financial Statements
October 31, 2015
Credit Suisse Emerging Markets Equity Fund (the "Fund"), a series of the Credit Suisse Opportunity Funds (the "Trust"), a Delaware statutory trust, is registered under the Investment Company Act of 1940, as amended (the "1940 Act"), as a diversified open-end management investment company that seeks capital appreciation. The Trust was organized under the laws of the State of Delaware as a business trust on May 31, 1995.
The Fund offers three classes of shares: Class I shares, Class A shares and Class C shares. Each class of shares represents an equal pro rata interest in the Fund, except they bear different expenses, which reflect the differences in the range of services provided to them. Class A shares are sold subject to a front-end sales charge of up to 5.25%. Class C shares are sold subject to a contingent deferred sales charge of 1.00% if the shares are redeemed within the first year of purchase. Class I shares are sold without a sales charge.
Note 2. Significant Accounting Policies
The following is a summary of significant accounting policies followed by the Fund in the preparation of its financial statements. The policies are in accordance with accounting principles generally accepted in the United States of America ("GAAP"). The preparation of financial statements requires management to make estimates and assumptions that affect the reported amounts and disclosures in the financial statements. Actual results could differ from those estimates. The Fund is considered an investment company for financial reporting purposes under GAAP and follows Accounting Standard Codification ("ASC") Topic 946 — Financial Services — Investment Companies.
A) SECURITY VALUATION — The net asset value of the Fund is determined daily as of the close of regular trading on the New York Stock Exchange, Inc. (the "Exchange") on each day the Exchange is open for business. For certain international equity securities, in order to adjust for events which may occur between the close of the foreign exchanges and the close of the New York Stock Exchange, a fair valuation model may be used. This fair valuation model takes into account comparisons to the valuation of American Depository Receipts (ADRs), exchange-traded funds, futures contracts and certain indices and these securities are categorized as Level 2. The valuations for fixed income securities (which may include, but are not limited to, corporate, government, municipal, mortgage-backed, collateralized mortgage obligations and asset-backed securities) and certain derivative instruments are typically the prices supplied
21
Credit Suisse Emerging Markets Equity Fund
Notes to Financial Statements (continued)
October 31, 2015
Note 2. Significant Accounting Policies (continued)
by independent third party pricing services, which may use market prices or broker/dealer quotations or a variety of valuation techniques and methodologies. The independent third party pricing services use inputs that are observable such as issuer details, interest rates, yield curves, prepayment speeds, credit risks/spreads, default rates and quoted prices for similar securities. These pricing services generally price fixed income securities assuming orderly transactions of an institutional "round lot" size, but some trades occur in smaller "odd lot" sizes which may be effected at lower prices than institutional round lot trades. Structured note agreements are valued in accordance with a dealer-supplied valuation based on changes in the value of the underlying index. Futures contracts are valued daily at the settlement price established by the board of trade or exchange on which they are traded. Forward contracts are valued at the London closing spot rates and the London closing forward point rates on a daily basis. The currency forward contract pricing model derives the differential in point rates to the expiration date of the forward and calculates its present value. Equity securities for which market quotations are available are valued at the last reported sales price or official closing price on the primary market or exchange on which they trade. The Fund may utilize a service provided by an independent third party which has been approved by the Board of Trustees (the "Board") to fair value certain securities. When fair value pricing is employed, the prices of securities used by the Fund to calculate its net asset value may differ from quoted or published prices for the same securities. If independent third party pricing services are unable to supply prices for a portfolio investment, or if the prices supplied are deemed by the investment adviser to be unreliable, the market price may be determined by the investment adviser using quotations from one or more broker/dealers or at the transaction price if the security has recently been purchased and no value has yet been obtained from a pricing service or pricing broker. When reliable prices are not readily available, such as when the value of a security has been significantly affected by events after the close of the exchange or market on which the security is principally traded, but before the Fund calculates its net asset value, the Fund values these securities as determined in accordance with procedures approved and established by the Board.
The Fund uses valuation techniques to measure fair value that are consistent with the market approach and/or income approach, depending on the type of security and the particular circumstance. The market approach uses prices and other relevant information generated by market transactions involving
22
Credit Suisse Emerging Markets Equity Fund
Notes to Financial Statements (continued)
October 31, 2015
Note 2. Significant Accounting Policies (continued)
identical or comparable securities. The income approach uses valuation techniques to discount estimated future cash flows to present value.
GAAP established a disclosure hierarchy that categorizes the inputs to valuation techniques used to value assets and liabilities at each measurement date. These inputs are summarized in the three broad levels listed below:
• Level 1 – quoted prices in active markets for identical investments
• Level 2 – other significant observable inputs (including quoted prices for similar investments, interest rates, prepayment speeds, credit risk, etc.)
• Level 3 – significant unobservable inputs (including the Fund's own assumptions in determining the fair value of investments)
The inputs or methodologies used to value securities are not necessarily an indication of the risk associated with investing in those securities.
The following is a summary of the inputs used as of October 31, 2015 in valuing the Fund's assets and liabilities carried at fair value:
Assets | | Level 1 | | Level 2 | | Level 3 | | Total | |
Investments in Securities | |
Common Stocks | | $ | 3,903,741 | | | $ | 17,659,300 | | | $ | — | | | $ | 21,563,041 | | |
Preferred Stocks | | | — | | | | 394,892 | | | | — | | | | 394,892 | | |
Exchange Traded Funds | | | 1,216,448 | | | | — | | | | — | | | | 1,216,448 | | |
Short-term Investment | | | — | | | | 413,660 | | | | — | | | | 413,660 | | |
| | $ | 5,120,189 | | | $ | 18,467,852 | | | $ | — | | | $ | 23,588,041 | | |
For the year ended October 31, 2015, there were no transfers in and out of Level 1, Level 2 and Level 3. All transfers, if any, are assumed to occur at the end of the reporting period.
B) DERIVATIVE INSTRUMENTS AND HEDGING ACTIVITIES — The Fund adopted amendments to authoritative guidance on disclosures about derivative instruments and hedging activities which require that a fund disclose (a) how and why an entity uses derivative instruments, (b) how derivative instruments and hedging activities are accounted for and (c) how derivative instruments and related hedging activities affect a fund's financial position, financial performance and cash flows. The Fund has not entered into any derivative or hedging activities during the period covered by this report.
C) FOREIGN CURRENCY TRANSACTIONS — The books and records of the Fund are maintained in U.S. dollars. Transactions denominated in foreign currencies are recorded at the current prevailing exchange rates. All assets and
23
Credit Suisse Emerging Markets Equity Fund
Notes to Financial Statements (continued)
October 31, 2015
Note 2. Significant Accounting Policies (continued)
liabilities denominated in foreign currencies are translated into U.S. dollar amounts at the current exchange rate at the end of the period. Translation gains or losses resulting from changes in the exchange rate during the reporting period and realized gains and losses on the settlement of foreign currency transactions are reported in the results of operations for the current period. The Fund isolates that portion of realized gains and losses on investments which is due to changes in the foreign exchange rate from that which is due to changes in market prices.
D) SECURITY TRANSACTIONS AND INVESTMENT INCOME/EXPENSE — Security transactions are accounted for on a trade date basis. Interest income/expense is recorded on the accrual basis. The Fund amortizes premiums and accretes discounts using the effective interest method. Dividend income/expense is recorded on the ex-dividend date. Certain expenses are class-specific expenses, vary by class and are charged only to that class. Income, expenses (excluding class-specific expenses) and realized/unrealized gains/losses are allocated proportionately to each class of shares based upon the relative net asset value of the outstanding shares of that class. The cost of investments sold is determined by use of the specific identification method for both financial reporting and income tax purposes.
E) DIVIDENDS AND DISTRIBUTIONS TO SHAREHOLDERS — Dividends from net investment income, if any, are declared and paid annually. Distributions of net realized capital gains, if any, are declared and paid at least annually. However, to the extent that a net realized capital gain can be reduced by a capital loss carryforward, such gain will not be distributed. Income and capital gain distributions are determined in accordance with federal income tax regulations, which may differ from GAAP.
F) FEDERAL INCOME TAXES — No provision is made for federal taxes as it is the Fund's intention to continue to qualify as a regulated investment company ("RIC") under the Internal Revenue Code of 1986, as amended (the "Code"), and to make the requisite distributions to its shareholders, which will be sufficient to relieve it from federal income and excise taxes.
In order to qualify as a RIC under the Code, the Fund must meet certain requirements regarding the source of its income, the diversification of its assets and the distribution of its income. One of these requirements is that the Fund derive at least 90% of its gross income for each taxable year from dividends, interest, payments with respect to certain securities loans, gains from the sale or other disposition of stock, securities or foreign currencies, other income
24
Credit Suisse Emerging Markets Equity Fund
Notes to Financial Statements (continued)
October 31, 2015
Note 2. Significant Accounting Policies (continued)
derived with respect to its business of investing in such stock, securities or currencies or net income derived from interests in certain publicly traded partnerships ("Qualifying Income").
The Fund adopted the authoritative guidance for uncertainty in income taxes and recognizes a tax benefit or liability from an uncertain position only if it is more likely than not that the position is sustainable based solely on its technical merits and consideration of the relevant taxing authority's widely understood administrative practices and procedures. The Fund has reviewed its current tax positions and has determined that no provision for income tax is required in the Fund's financial statements. The Fund's federal tax returns for the prior two fiscal years remain subject to examination by the Internal Revenue Service.
G) SHORT-TERM INVESTMENTS — The Fund, together with other funds/portfolios advised by Credit Suisse, pools available cash into a short-term variable rate time deposit issued by State Street Bank and Trust Company ("SSB"), the Fund's custodian. The short-term time deposit issued by SSB is a variable rate account classified as a short-term investment.
H) OTHER — In the normal course of business the Fund trades financial instruments and enters into financial transactions where risk of potential loss exists due to changes in the market (market risk) or failure of the other party to a transaction to perform (credit risk). Similar to credit risk, the Fund may be exposed to counterparty risk, or the risk that an institution or other entity with which the Fund has unsettled or open transactions will default. The potential loss could exceed the value of the financial assets recorded in the financial statements. Financial assets, which potentially expose the Fund to credit risk, consist principally of cash due from counterparties and investments. The extent of the Fund's exposure to credit and counterparty risks in respect to these financial assets approximates their carrying value as recorded in the Fund's Statement of Assets and Liabilities.
I) FOREIGN INVESTMENTS RISK — The Fund may have elements of risk not typically associated with investments in the United States of America due to concentrated investments in a limited number of countries or regions, which may vary throughout the year. Such concentrations may subject the Fund to additional risks resulting from political or economic conditions in such countries or regions and the possible imposition of adverse governmental laws or currency exchange restrictions could cause the securities and their markets to be less liquid and their prices to be more volatile than those of comparable U.S. securities.
25
Credit Suisse Emerging Markets Equity Fund
Notes to Financial Statements (continued)
October 31, 2015
Note 2. Significant Accounting Policies (continued)
Because the Fund may invest a significant portion of its assets in these markets, it is subject to greater risks of adverse events that occur in those markets and may experience greater volatility than a fund that is more broadly diversified geographically.
J) NEW ACCOUNTING PRONOUNCEMENTS — In June 2014, Financial Accounting Standards Board ("FASB") issued ASU No. 2014-11, Transfers and Servicing (Topic 860), Repurchase-to-Maturity Transactions, Repurchase Financings, and Disclosures. The ASU changes the accounting for certain repurchase agreements and expands disclosure requirements related to repurchase agreements, securities lending, repurchase-to-maturity and similar transactions. The ASU is effective for interim and annual reporting periods beginning after December 15, 2014. Management has reviewed the requirements and believes the adoption of this ASU will not have a material impact on the financial statements.
On April 7, 2015, the FASB issued a new ASU No. 2015-03, "Simplifying the Presentation of Debt Issuance Costs". The ASU requires debt issuance costs to be presented on the balance sheet as a direct deduction from the debt liability. The ASU is effective for interim and annual reporting periods beginning after December 15, 2015. Management has reviewed the requirements and believes the adoption of this ASU will not have a material impact on the financial statements.
In May 2015, the FASB issued ASU No. 2015-07, "Disclosures for Investments in Certain Entities that Calculate Net Asset Value per Share (or its Equivalent)". The guidance removes the requirement to categorize within the fair value hierarchy all investments for which fair value is measured using the NAV per share practical expedient. Sufficient information must be provided to permit reconciliation of the fair value of assets categorized within the fair value hierarchy to the amounts presented in the Statement of Assets and Liabilities. The guidance is required to be presented for annual periods beginning after December 15, 2015, and for interim periods within those fiscal years. Management is currently viewing the requirements and believes the adoption of this ASU will not have a material impact on its financial statements.
K) SUBSEQUENT EVENTS — In preparing the financial statements as of October 31, 2015, management considered the impact of subsequent events for potential recognition or disclosure in these financial statements through the date of release of this report. No such events requiring recognition or disclosure were identified through the date of the release of this report.
26
Credit Suisse Emerging Markets Equity Fund
Notes to Financial Statements (continued)
October 31, 2015
Note 3. Transactions with Affiliates and Related Parties
Credit Suisse serves as investment adviser for the Fund. For its investment advisory services, Credit Suisse is entitled to receive a fee from the Fund at an annual rate of 0.90% of the Fund's average daily net assets. For the year ended October 31, 2015, investment advisory fees earned and fees waived/expenses reimbursed were $230,315 and $300,236, respectively. The Fund is authorized to reimburse Credit Suisse for management fees previously limited and/or for expenses previously paid by Credit Suisse, provided, however, that any reimbursements must be paid at a date not more than three years after the end of the fiscal year during which such fees were limited or expenses were reimbursed by Credit Suisse and the reimbursements do not cause a class to exceed the applicable expense limitation in the contract at the time the fees were limited or expenses are paid. This contract may not be terminated before February 28, 2017. Currently, Credit Suisse contractually waives fees and reimburses expenses so that the Fund's annual operating expenses will not exceed 1.25% of the Fund's average daily net assets for Class I shares, 1.50% of the Fund's average daily net assets for Class A shares, and 2.25% of the Fund's average daily net assets for Class C shares.
For the year ended October 31, 2015, the amounts waived and reimbursed by Credit Suisse, as well as the amounts available for recoupment/potential future recoupment by Credit Suisse and the expiration schedule at October 31, 2015 are as follows:
| | | Fee waivers/expense
reimbursements subject
to repayment | | Expires October 31,
2017 | | Expires October 31,
2018 | |
Class I | | $ | 496,199 | | | $ | 228,447 | | | $ | 267,752 | | |
Class A | | | 29,286 | | | | 13,198 | | | | 16,088 | | |
Class C | | | 28,692 | | | | 12,296 | | | | 16,396 | | |
Totals | | $ | 554,177 | | | $ | 253,941 | | | $ | 300,236 | | |
Credit Suisse and SSB serve as co-administrators to the Fund. For its co-administrative services, Credit Suisse received a fee calculation at an annual rate of 0.09% of the Fund's average daily net assets. For the year ended October 31, 2015, co-administrative services fees earned by Credit Suisse were $23,032.
For its co-administrative services, SSB receives a fee, exclusive of out-of-pocket expenses, calculated in total for all the Credit Suisse funds/portfolios co-administered by SSB and allocated based upon the relative average net assets of each fund/portfolio, subject to an annual minimum fee. For the year ended
27
Credit Suisse Emerging Markets Equity Fund
Notes to Financial Statements (continued)
October 31, 2015
Note 3. Transactions with Affiliates and Related Parties (continued)
October 31, 2015, co-administrative services fees earned by SSB (including out-of-pocket expenses) with respect to the Fund were $155,763.
Credit Suisse Securities (USA) LLC ("CSSU"), an affiliate of Credit Suisse, serves as the distributor of the Fund's shares. Pursuant to distribution plans adopted by the Fund pursuant to Rule 12b-1 under the 1940 Act, CSSU received fees for its distribution services. These fees were calculated at an annual rate of 0.25% of the average daily net assets of the Class A shares. For the Class C shares, the fee is calculated at an annual rate of 1.00% of the average daily net assets. For the year ended October 31, 2015, the Fund paid Rule 12b-1 distribution fees of $3,425 for Class A shares and $13,990 for Class C shares. Class I shares are not subject to Rule 12b-1 distribution fees.
Certain brokers, dealers and financial representatives provide transfer agent related services to the Fund and receive compensation from the Fund. For the year ended October 31, 2015, the Fund paid $7,474, which is included within transfer agent fees on the Statement of Operations.
For the year ended October 31, 2015, CSSU and its affiliates advised the Fund that there was no commissions earned on the sale of the Fund's Class A and Class C shares.
Offering costs, including initial registration cost, were deferred and were expensed over the Fund's first 12 months of operation. For the year ended October 31, 2015, $9,083 has been expensed by the Fund and $0 remains deferred.
Note 4. Line of Credit
The Fund, together with other funds/portfolios advised by Credit Suisse (collectively, the "Participating Funds"), participates in a committed, unsecured line of credit facility ("Credit Facility"), in an aggregated amount of $200 million for temporary or emergency purposes with SSB under a first-come, first-served basis. Under the terms of the Credit Facility, the Participating Funds pay an aggregate commitment fee on the average unused amount of the Credit Facility, which is allocated among the Participating Funds in such manner as is determined by the governing Boards of the Participating Funds. In addition, the Participating Funds pay interest on borrowings at either the Overnight Federal Funds rate or the Overnight LIBOR rate plus a spread. At October 31, 2015 and during the year ended October 31, 2015, the Fund had no borrowings outstanding under the Credit Facility.
28
Credit Suisse Emerging Markets Equity Fund
Notes to Financial Statements (continued)
October 31, 2015
Note 5. Purchases and Sales of Securities
For the year ended October 31, 2015, purchases and sales of investment securities (excluding short-term investments) were $19,451,806 and $15,355,986, respectively.
Note 6. Capital Share Transactions
The Fund is authorized to issue an unlimited number of full and fractional shares of beneficial interest, $.001 par value per share. The Fund offers Class I, Class A and Class C shares. Transactions in capital shares for each class of the Fund were as follows:
| | | Class I | |
| | | For the Year Ended
October 31, 2015 | | For the Period Ended
October 31, 20141 | |
| | | Shares | | Value | | Shares | | Value | |
Shares sold | | | 559,159 | | | $ | 5,526,914 | | | | 2,033,391 | | | $ | 20,470,437 | | |
Shares issued in reinvestment
of dividends | | | 64,398 | | | | 617,577 | | | | — | | | | — | | |
Shares redeemed | | | (151,958 | ) | | | (1,443,532 | ) | | | (3,386 | ) | | | (35,515 | ) | |
Net increase | | | 471,599 | | | $ | 4,700,959 | | | | 2,030,005 | | | $ | 20,434,922 | | |
| | | Class A | |
| | | For the Year Ended
October 31, 2015 | | For the Period Ended
October 31, 20141 | |
| | | Shares | | Value | | Shares | | Value | |
Shares sold | | | 35,734 | | | $ | 355,000 | | | | 114,307 | | | $ | 1,147,734 | | |
Shares issued in reinvestment
of dividends | | | 3,294 | | | | 31,587 | | | | — | | | | — | | |
Net increase | | | 39,028 | | | $ | 386,587 | | | | 114,307 | | | $ | 1,147,734 | | |
| | | Class C | |
| | | For the Year Ended
October 31, 2015 | | For the Period Ended
October 31, 20141 | |
| | | Shares | | Value | | Shares | | Value | |
Shares sold | | | 80,234 | | | $ | 764,987 | | | | 100,000 | | | $ | 1,000,000 | | |
Shares issued in reinvestment
of dividends | | | 1,717 | | | | 16,465 | | | | — | | | | — | | |
Net increase | | | 81,951 | | | $ | 781,452 | | | | 100,000 | | | $ | 1,000,000 | | |
1 For the period December 26, 2013 (Inception Date) through October 31, 2014.
29
Credit Suisse Emerging Markets Equity Fund
Notes to Financial Statements (continued)
October 31, 2015
Note 6. Capital Share Transactions (continued)
On October 31, 2015, the number of shareholders that held 5% or more of the outstanding shares of each class of the Fund was as follows:
| | | Number of
Shareholders | | Approximate Percentage
of Outstanding Shares | |
Class I | | | 2 | * | | | 97 | % | |
Class A | | | 3 | * | | | 98 | % | |
Class C | | | 2 | * | | | 96 | % | |
*This includes the seed money from Merchant Holding, Inc., an affiliate of Credit Suisse.
Some of the shareholders are omnibus accounts, which hold shares on behalf of individual shareholders.
Note 7. Federal Income Taxes
Income and capital gain distributions are determined in accordance with federal income tax regulations, which may differ from GAAP.
The tax characteristics of dividends paid during the years ended October 31, 2015 and 2014, respectively, by the Fund were as follows:
| | Ordinary Income | |
| | 2015 | | 2014 | |
| | | | | $ | 668,120 | | | $ | — | | |
The tax basis components of distributable earnings differ from the amounts reflected in the Statement of Assets and Liabilities by temporary book/tax differences. These differences are primarily due to adjustments for sales of shares in passive foreign investment company, wash sales and organizational expenses. At October 31, 2015, the components of distributable earnings on a tax basis were as follows:
Undistributed net investment income | | $ | 301,642 | | |
Capital loss carryover | | | (1,892,256 | ) | |
Unrealized depreciation | | | (2,970,720 | ) | |
| | $ | (4,561,334 | ) | |
At October 31, 2015, the Fund had $1,439,436 of unlimited short-term and $452,820 of unlimited long-term capital loss carryforwards available to offset possible future capital gains.
30
Credit Suisse Emerging Markets Equity Fund
Notes to Financial Statements (continued)
October 31, 2015
Note 7. Federal Income Taxes (continued)
At October 31, 2015, the cost of investments (excluding foreign currency related transactions) and net unrealized appreciation (depreciation) for income tax purposes were as follows:
Cost of Investments | | $ | 26,560,886 | | |
Unrealized appreciation | | $ | 1,272,275 | | |
Unrealized depreciation | | | (4,245,120 | ) | |
Net unrealized appreciation (depreciation) | | $ | (2,972,845 | ) | |
At October 31, 2015, the Fund reclassified $17,727 from accumulated net investment income and $17,727 from accumulated net realized loss to paid in capital, to adjust for current period permanent book/tax differences which arose principally from differing book/tax treatment of foreign currency gain (loss) and passive foreign investment company gains and losses. Net assets were not affected by these reclassifications.
Note 8. Contingencies
In the normal course of business, the Fund may provide general indemnifications pursuant to certain contracts and organizational documents. The Fund's maximum exposure under these arrangements is dependent on future claims that may be made against the Fund and, therefore, cannot be estimated; however, based on experience, the risk of loss from such claims is considered remote.
Note 9. Other Matters
On May 19, 2014, the U.S. Department of Justice (the "Department of Justice") filed a one-count criminal information (the "Information") in the District Court for the Eastern District of Virginia (the "District Court") charging Credit Suisse AG ("CSAG") with conspiracy to commit tax fraud related to accounts CSAG established for cross-border clients. The Department of Justice and CSAG entered into a plea agreement (the "Plea Agreement") settling the action pursuant to which CSAG pleaded guilty to the charge set out in the Information.
The Plea Agreement requires CSAG to pay over $1.8 billion to the U.S. government, including the U.S. Internal Revenue Service. The Plea Agreement also requires CSAG to lawfully undertake certain remedial actions to address the conduct described in the Plea Agreement.
31
Credit Suisse Emerging Markets Equity Fund
Notes to Financial Statements (continued)
October 31, 2015
Note 9. Other Matters (continued)
CSAG has entered into other settlements relating to the conduct set out in the Plea Agreement. CSAG has entered into a Consent Order with the Federal Reserve Board (the "Federal Reserve") to resolve certain findings by the Federal Reserve, including that the activities of CSAG regarding opening of foreign accounts for U.S. taxpayers, provision of investment services to U.S. clients, and operation of CSAG's New York representative office prior to 2009 lacked adequate enterprise-wide risk management and compliance policies and procedures sufficient to ensure that all of its activities comply with U.S. laws and regulations. In addition, CSAG has entered into a Consent Order with the New York State Department of Financial Services (the "DFS") to resolve the DFS's investigation into the conduct described in the Plea Agreement. The settlement with the Federal Reserve requires CSAG to pay $100 million to the Federal Reserve, and the settlement with the DFS requires CSAG to pay $715 million to the DFS.
These settlements follow a settlement by Credit Suisse Group AG ("CS Group"), the parent company of CSAG, with the Securities and Exchange Commission (the "Commission") on February 21, 2014 to resolve an investigation by the Commission into solicitation and provision of broker-dealer and investment advisory services to certain U.S. cross-border clients by CS Group while not registered with the Commission as a broker-dealer or investment adviser. As part of the settlement, CS Group retained an independent consultant to evaluate its policies and procedures and examine its broker-dealer and investment adviser activities to fully verify that the business that was the subject of the Commission investigation has been completely exited. CS Group also agreed to pay $196,511,014, which includes $82,170,990 in disgorgement, $64,340,024 in interest and a $50,000,000 penalty.
CSAG is the indirect parent company of Credit Suisse and CSSU. Neither Credit Suisse, CSSU nor the Fund was named in the Plea Agreement (as defined above) or other settlements relating to the conduct set out in the Plea Agreement. The conduct set out in the Plea Agreement did not involve the Fund, Credit Suisse or CSSU with respect to its investment adviser and distribution activities relating to the Fund.
Credit Suisse, CSSU and certain of their affiliates have received a permanent exemptive order from the Commission to permit them to continue serving as investment advisers and principal underwriters for U.S.-registered investment companies, such as the Fund. Due to a provision in the law governing the operation of U.S.-registered investment companies, they would otherwise have become ineligible to perform these activities as a result of the plea in the Plea
32
Credit Suisse Emerging Markets Equity Fund
Notes to Financial Statements (continued)
October 31, 2015
Note 9. Other Matters (continued)
Agreement. The permanent exemptive order permits Credit Suisse and CSSU to continue to provide services to the Fund, so long as, among other things, no current or former employee of CSAG or any affiliate of CSAG who previously has been or who subsequently may be identified by CSAG or any U.S. or non-U.S. regulatory or enforcement agencies as having been responsible for the conduct described in the Plea Agreement will be employed by Credit Suisse and certain of its affiliates. Credit Suisse and CSSU have informed the Fund that, Credit Suisse and CSSU believe the Settlements will not have any material impact on the Fund or on the ability of Credit Suisse or CSSU to perform services for the Fund.
On November 21, 2014, at the sentencing hearing, the District Court accepted and implemented the sentence as set out in the Plea Agreement. The District Court imposed no additional conditions beyond those contained in the Plea Agreement.
33
Credit Suisse Emerging Markets Equity Fund
Report of Independent Registered Public Accounting Firm
The Board of Trustees and Shareholders
Credit Suisse Emerging Markets Equity Fund:
We have audited the accompanying statement of assets and liabilities of Credit Suisse Emerging Markets Equity Fund (the "Fund"), a series of the Credit Suisse Opportunity Funds, including the schedule of investments, as of October 31, 2015, and the related statements of operations, changes in net assets and financial highlights for the year then ended. These financial statements and financial highlights are the responsibility of the Fund's management. Our responsibility is to express an opinion on these financial statements and financial highlights based on our audit. The accompanying statement of changes in net assets and financial highlights of the Fund for the period December 26, 2013 to October 31, 2014 were audited by other independent registered public accountants whose report thereon dated December 29, 2014, expressed an unqualified opinion on that financial statement and those financial highlights.
We conducted our audit in accordance with the standards of the Public Company Accounting Oversight Board (United States). Those standards require that we plan and perform the audit to obtain reasonable assurance about whether the financial statements and financial highlights are free of material misstatement. An audit includes examining, on a test basis, evidence supporting the amounts and disclosures in the financial statements. Our procedures included confirmation of securities owned as of October 31, 2015, by correspondence with the custodian and broker or by other appropriate auditing procedures. An audit also includes assessing the accounting principles used and significant estimates made by management, as well as evaluating the overall financial statement presentation. We believe that our audit provides a reasonable basis for our opinion.
In our opinion, the 2015 financial statements and financial highlights referred to above present fairly, in all material respects, the financial position of Credit Suisse Emerging Markets Equity Fund as of October 31, 2015, the results of its operations, changes in its net assets and the financial highlights for the year then ended, in conformity with U.S. generally accepted accounting principles.

New York, New York
December 30, 2015
34
Credit Suisse Emerging Markets Equity Fund
Information Concerning Trustees and Officers (unaudited)
Name, Address
(Year of Birth) | | Position(s)
Held with
Fund | | Term
of Office1
and
Length
of Time
Served | | Principal
Occupation(s) During
Past Five Years | | Number of
Portfolios
in Fund
Complex
Overseen
by Trustee | | Other
Trusteeships
Held by Trustee | |
Independent Trustees | | | | | | | | | | | |
Enrique Arzac
c/o Credit Suisse Asset
Management, LLC
Attn: General Counsel
One Madison Avenue
New York, New York
10010
(1941) | | Trustee, Audit Committee Chairman and Nominating Committee Member | | Since Fund Inception | | Professor of Finance and Economics, Graduate School of Business, Columbia University since 1971. | | | 14 | | | Director of Adams Diversified Equity Fund, Inc., Adams Natural Resources Fund, Inc., Aberdeen Chile Fund, Inc., Aberdeen Emerging Markets Smaller Company Opportunities Fund, Inc., Aberdeen Israel Fund, Inc., Aberdeen Indonesia Fund, Inc. and Aberdeen Latin America Equity Fund, Inc. (each a closed-end investment company); Director of Aberdeen Asia-Pacific Income Investment Company Limited (a Canadian closed-end fund); Trustee of Mirae Asset Discovery Funds (7 open-end portfolios); Director of Starcomms PLC (telecommunications company) from 2008 to 2011; Director of Epoch Holding Corporation (an investment management and investment advisory services company) from 2006 to March 2013. | |
1 Each Trustee and Officer serves until his or her respective successor has been duly elected and qualified.
35
Credit Suisse Emerging Markets Equity Fund
Information Concerning Trustees and Officers (unaudited) (continued)
Name, Address
(Year of Birth) | | Position(s)
Held with
Fund | | Term
of Office1
and
Length
of Time
Served | | Principal
Occupation(s) During
Past Five Years | | Number of
Portfolios
in Fund
Complex
Overseen
by Trustee | | Other
Trusteeships
Held by Trustee | |
Independent Trustees | | | | | | | | | | | |
Jeffrey E. Garten
c/o Credit Suisse Asset Management, LLC
Attn: General Counsel One Madison Avenue New York, New York 10010
(1946) | | Trustee, Audit and Nominating Committee Member | | Since Fund Inception | | Dean Emeritus of Yale School of Management from July 2015 to present; The Juan Trippe Professor in the Practice of International Trade, Finance and Business from July 2005 to July 2015; Partner and Chairman of Garten Rothkopf (consulting firm) from October 2005 to present. | | | 11 | | | Director of Aetna, Inc. (insurance company); Director of CarMax Group (used car dealers); Director of Miller Buckfire & Co., LLC (financial restructuring); Member of Standard & Poor's Board of Managers (credit rating agency) from December 2011 to November 2014. | |
1 Each Trustee and Officer serves until his or her respective successor has been duly elected and qualified.
36
Credit Suisse Emerging Markets Equity Fund
Information Concerning Trustees and Officers (unaudited) (continued)
Name, Address
(Year of Birth) | | Position(s)
Held with
Fund | | Term
of Office1
and
Length
of Time
Served | | Principal
Occupation(s) During
Past Five Years | | Number of
Portfolios
in Fund
Complex
Overseen
by Trustee | | Other
Trusteeships
Held by Trustee | |
Independent Trustees | | | | | | | | | | | |
Steven N. Rappaport
Lehigh Court, LLC
555 Madison Avenue
29th Floor
New York, New York
10022
(1948) | | Chairman of the Board of Trustees, Audit Committee Member and Nominating Committee Chairman | | Since Fund Inception | | Partner of Lehigh Court, LLC and RZ Capital (private investment firms) from July 2002 to present; Partner of Backstage Acquisition Holding, LLC (Publication Job Postings) from November 2013 to present. | | | 14 | | | Director of iCAD, Inc. (surgical and medical instruments and apparatus company); Director of Aberdeen Chile Fund, Inc., Aberdeen Emerging Markets Smaller Company Opportunities Fund, Inc., Aberdeen Israel Fund, Inc., Aberdeen Indonesia Fund, Inc. and Aberdeen Latin America Equity Fund, Inc. (each a closed-end investment company); Director of Presstek, Inc. (digital imaging technologies company) from 2003 to 2012; Director of Wood Resources, LLC (plywood manufacturing company) from 2003 to October 2013. | |
1 Each Trustee and Officer serves until his or her respective successor has been duly elected and qualified.
37
Credit Suisse Emerging Markets Equity Fund
Information Concerning Trustees and Officers (unaudited) (continued)
Name, Address
(Year of Birth) | | Position(s)
Held with
Fund | | Term of
Office1
and
Length of
Time
Served | | Principal Occupation(s) During Past Five Years | |
Officers* | | | | | | | |
John G. Popp
Credit Suisse Asset
Management, LLC
One Madison Avenue
New York, New York 10010
(1956) | | Chief Executive Officer and President | | Since Fund Inception | | Managing Director of Credit Suisse; Global Head and Chief Investment Officer of the Credit Investment Group; Associated with Credit Suisse or its predecessor since 1997; Officer of other Credit Suisse Funds; Trustee of Credit Suisse High Yield Bond Fund; Director of Credit Suisse Asset Management Income Fund, Inc.; Director of Credit Suisse Park View BDC, inc. | |
Emidio Morizio
Credit Suisse Asset
Management, LLC
One Madison Avenue
New York, New York 10010
(1966) | | Chief Compliance Officer | | Since Fund Inception | | Managing Director and Global Head of Compliance of Credit Suisse since 2010; Associated with Credit Suisse since July 2000; Officer of other Credit Suisse Funds. | |
Lou Anne McInnis
Credit Suisse Asset Management, LLC
One Madison Avenue
New York, New York 10010
(1959) | | Chief Legal Officer | | Since 2015 | | Director of Credit Suisse; Associated with Credit Suisse since April 2015; Counsel at DLA Piper US LLP from 2011 to April 2015; Associated with Morgan Stanley Investment Management from 1997 to 2010; Officer of other Credit Suisse Funds. | |
Rocco DelGuercio
Credit Suisse Asset
Management, LLC
One Madison Avenue
New York, New York 10010
(1963) | | Chief Financial Officer and Treasurer | | Chief Financial Officer since 2015; Treasurer since 2013 | | Vice President of Credit Suisse since 2013; Independent Consultant from February 2012 to April 2013; Director of Legg Mason & Co., LLC from March 2004 to January 2012; Associated with Credit Suisse from June 1996 to March 2004; Officer of other Credit Suisse Funds. | |
Karen Regan
Credit Suisse Asset
Management, LLC
One Madison Avenue
New York, New York 10010
(1963) | | Vice President and Secretary | | Since Fund Inception | | Vice President of Credit Suisse; Associated with Credit Suisse since December 2004; Officer of other Credit Suisse Funds. | |
1 Each Trustee and Officer serves until his or her respective successor has been duly elected and qualified.
* The officers of the Fund shown are officers that make policy decisions.
The Statement of Additional Information includes additional information about the Trustees and is available, without charge, upon request, by calling 877-870-2874.
38
Credit Suisse Emerging Markets Equity Fund
Proxy Voting and Portfolio Holdings Information (unaudited)
Information regarding how the Fund voted proxies related to its portfolio securities during the 12-month period ended June 30 of each year, as well as the policies and procedures that the Fund uses to determine how to vote proxies relating to its portfolio securities are available:
• By calling 1-877-870-2874
• On the Fund's website, www.credit-suisse.com/us/funds
• On the website of the Securities and Exchange Commission, www.sec.gov.
The Fund files a complete schedule of its portfolio holdings for the first and third quarters of its fiscal year with the SEC on Form N-Q. The Fund's Forms N-Q are available on the SEC's website at www.sec.gov and may be reviewed and copied at the SEC's Public Reference Room in Washington, DC. Information on the operation of the SEC's Public Reference Room may be obtained by calling 1-202-551-8090.
39
This page intentionally left blank

P.O. BOX 55030, BOSTON, MA 02205-5030
877-870-2874 n www.credit-suisse.com/us/funds
CREDIT SUISSE SECURITIES (USA) LLC, DISTRIBUTOR. EMF-AR-2015

CREDIT SUISSE FUNDS
Annual Report
October 31, 2015
n CREDIT SUISSE
STRATEGIC INCOME FUND
The Fund's investment objectives, risks, charges and expenses (which should be considered carefully before investing), and more complete information about the Fund, are provided in the Prospectus, which should be read carefully before investing. You may obtain additional copies by calling 877-870-2874 or by visiting our website at
www.credit-suisse.com/us/funds.
Credit Suisse Securities (USA) LLC, Distributor, is located at One Madison Avenue, New York, NY 10010. Credit Suisse Funds are advised by Credit Suisse Asset Management, LLC.
Investors in the Credit Suisse Funds should be aware that they may be eligible to purchase Class I shares (where offered) directly or through certain intermediaries. Such shares are not subject to a sales charge. Investors in the Credit Suisse Funds should also be aware that they may be eligible for a reduction or waiver of the sales charge with respect to Class A or C shares (where offered). For more information, please review the relevant prospectuses or consult your financial representative.
Fund shares are not deposits or other obligations of Credit Suisse Asset Management, LLC ("Credit Suisse") or any affiliate, are not FDIC-insured and are not guaranteed by Credit Suisse or any affiliate. Fund investments are subject to investment risks, including loss of your investment.
Credit Suisse Strategic Income Fund
Annual Investment Adviser's Report
October 31, 2015 (unaudited)
December 21, 2015
Dear Shareholder:
We are pleased to present this Annual Report covering the activities of the Credit Suisse Strategic Income Fund (the "Fund"), for the 12 month period ended October 31, 2015.
Performance Summary
11/01/14 – 10/31/15
Fund & Benchmark | | Performance | |
Class I1 | | | 2.05 | % | |
Class A1,2 | | | 1.78 | % | |
Class C1,2 | | | 1.14 | % | |
BofA Merrill Lynch 3-Month U.S. Treasury Bill Index3 | | | 0.05 | % | |
Performance shown for the Fund's Class A and Class C Shares does not reflect sales charges, which are a maximum of 4.75% and 1.00%, respectively. 2
Market Review: A mixed period for fixed income
The 12 month period ended October 31, 2015 was a mixed one for fixed income, with the BofA Merrill Lynch 3-Month U.S. Treasury Bill Index (the "Index"), the Fund's benchmark, returning 0.05%. The period started in a positive tone for many fixed income asset classes, however, a mixed technical environment, questions regarding the timing of a potential interest rate hike by the Federal Reserve, and continued weakness in the price of oil, led to elevated volatility as the period ended. The U.S. 10-year Treasury returned 3.57%, while the investment grade asset class, represented by BofA Merrill Lynch U.S. Corporate Index, returned 0.96%. In addition, the high yield market, represented by BofA Merrill Lynch U.S. High Yield Constrained Index, returned -2.03% and the senior loan market, represented by Credit Suisse Leveraged Loan Index, returned 0.81%.
Default rates within both the senior loan market and high yield asset class increased to 1.32% and 2.21%, respectively. Though both figures remain below historical averages, we believe the default rates will see an incremental increase in 2016, with much of the increase comprised of distressed oil and commodity issuers.
Market sentiment has been fickle as equity and credit asset classes experienced weakness at the end of the fiscal year. Within the senior loan market, collateralized loan obligation ("CLO") issuance has been robust but retail funds have continued to experienced outflows. Within the high yield market, mutual
1
Credit Suisse Strategic Income Fund
Annual Investment Adviser's Report (continued)
October 31, 2015 (unaudited)
fund inflows have been inconsistent and market returns have wavered throughout the year.
Strategic review and outlook: Ever mindful of changing risks
For the 12 months ended October 31, 2015, the Fund outperformed the Index. From an asset class perspective, an allocation to senior loans was the largest contributor to overall returns. Industry contribution was most positive in the electronics and diversified manufacturing sectors, while metals and mining detracted from absolute return. From a ratings perspective, the Fund's exposure to BB and CCC rated investments contributed the most to returns.
Portfolio exposures remain focused on B-rated names in the Index that we believe exhibit the best risk-return characteristics. In addition, we remain mindful of potential external risks such as the heightened probability of future interest rate hike from the Federal Reserve and weaker growth from China. Further, given existing market conditions, we expect that any potential headline risks may also contribute additional volatility.
The Credit Suisse Credit Investments Group
John G. Popp
Andrew H. Marshak
Thomas J. Flannery
Louis I. Farano
Wing Chan
Senior secured floating rate loans ("Senior Loans") are subject to the risk that a court could subordinate a Senior Loan, which typically holds the most senior position in the issuer's capital structure, to presently existing or future indebtedness or take other action detrimental to the holders of Senior Loans.
High yield bonds are lower-quality bonds that are also known as "junk bonds." Such bonds entail greater risks than those found in higher-rated securities.
CLOs are subject to the risk of substantial losses due to actual defaults, decrease of market value due to collateral defaults and disappearance of subordinate tranches, market anticipation of defaults, and investor aversion to CLO securities as a class. The risks of CLOs depend largely on the type of the underlying loans and the tranche of CLOs in which the Fund invests. In addition, CLOs carry risks including interest rate risk and credit risk.
2
Credit Suisse Strategic Income Fund
Annual Investment Adviser's Report (continued)
October 31, 2015 (unaudited)
Additional principal risk factors for the Fund include conflict of interest risk, convertible securities risk, credit risk, derivatives risk, extension risk, foreign securities risk, futures contracts risk, hedged exposure risk, interest rate risk, liquidity risk, market risk, mortgage- and asset-backed securities risk, prepayment risk, short position risk, U.S. government securities risk and valuation risk . Before you invest, please make sure you understand the risks that apply to the Fund. As with any mutual fund, you could lose money over any period of time. Investments in the Fund are not bank deposits and are not insured or guaranteed by the Federal Deposit Insurance Corporation or any government agency. For a detailed discussion of these and other risks, please refer to the Fund's Prospectus, which should be read carefully before investing.
In addition to historical information, this report contains forward-looking statements, which may concern, among other things, domestic and foreign market, industry and economic trends and developments and government regulation and their potential impact on the Fund's investments. These statements are subject to risks and uncertainties and actual trends, developments and regulations in the future, and their impact on the Fund could be materially different from those projected, anticipated or implied. The Fund has no obligation to update or revise forward-looking statements.
The views of the Fund's management are as of the date of the letter and the Fund holdings described in this document are as of October 31, 2015; these views and Fund holdings may have changed subsequent to these dates. Nothing in this document is a recommendation to purchase or sell securities.
3
Credit Suisse Strategic Income Fund
Annual Investment Adviser's Report (continued)
October 31, 2015 (unaudited)
Comparison of Change in Value of $10,000 Investment in the
Credit Suisse Strategic Income Fund1 Class I Shares,
Class A Shares2, Class C Shares2 and the BofA
Merrill Lynch 3-Month U.S. Treasury Bill Index3
from Inception (09/28/12).
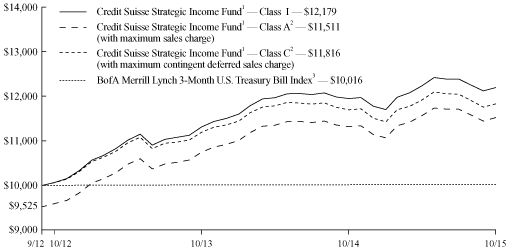
1 Fee waivers and/or expense reimbursements may reduce expenses for the Fund, without which performance would be lower. The Fund entered into a written contract to limit expenses to 0.99% of the Fund's average daily net assets for Class I shares, 1.24% of the Fund's average daily net assets for Class A shares and 1.99% of the Fund's average daily net assets for Class C shares through at least February 28, 2017.
2 Total return for the Fund's Class A shares for the reporting period, based on offering price (including maximum sales charge of 4.75%), was (3.03)%. Total return for the Fund's Class C shares for the reporting period, based on redemption value (including maximum contingent deferred sales charge of 1.00%), was 0.20%.
3 Using only liquid securities, the BofA Merrill Lynch 3-Month U.S. Treasury Bill Index seeks to replicate the return of the overall hedge fund industry, as represented by the Dow Jones Credit Suisse Hedge Fund Index. The index does not have transaction costs and investors may not invest directly in the index.
4
Credit Suisse Strategic Income Fund
Annual Investment Adviser's Report (continued)
October 31, 2015 (unaudited)
Average Annual Returns as of October 31, 20151
| | | 1 Year | | Since
Inception2 | |
Class I | | | 2.05 | % | | | 6.58 | % | |
Class A Without Sales Charge | | | 1.78 | % | | | 6.32 | % | |
Class A With Maximum Sales Charge | | | (3.03 | )% | | | 4.65 | % | |
Class C Without CDSC | | | 1.14 | % | | | 5.54 | % | |
Class C With CDSC | | | 0.20 | % | | | 5.54 | % | |
Returns represent past performance and include change in share price and reinvestment of dividends and capital gains. Past performance cannot guarantee future results. The current performance of the Fund may be lower or higher than the figures shown. Returns and share price will fluctuate, and redemption value may be more or less than original cost. The performance results do not reflect the deduction of taxes that a shareholder would pay on fund distributions or the redemption of fund shares. Performance information current to the most recent month-end is available at www.credit-suisse.com/us/funds.
The annual gross expense ratios are 1.16% for Class I shares, 1.40% for Class A shares and 2.16% for Class C shares. The annual net expense ratios after fee waivers and/or expense reimbursements are 0.99% for Class I shares, 1.24% for Class A shares and 1.99% for Class C shares.
1 Fee waivers and/or expense reimbursements may reduce expenses for the Fund, withoutwhich performance would be lower. The Fund entered into a written contract to limit expenses to 0.99% of the Fund's average daily net assets for Class I shares, 1.24% of the Fund's average daily net assets for Class A shares and 1.99% of the Fund's average daily net assets for Class C shares through at least February 28, 2017.
2 Inception Date September 28, 2012.
5
Credit Suisse Strategic Income Fund
Annual Investment Adviser's Report (continued)
October 31, 2015 (unaudited)
Information About Your Fund's Expenses
As an investor of the Fund, you incur two types of costs: ongoing expenses and transaction costs. Ongoing expenses include management fees, distribution and service (12b-1) fees and other Fund expenses. Examples of transaction costs include sales charges (loads), redemption fees and account maintenance fees, which are not shown in this section and which would result in higher total expenses. The following table is intended to help you understand your ongoing expenses of investing in the Fund and to help you compare these expenses with the ongoing expenses of investing in other mutual funds. The table is based on an investment of $1,000 made at the beginning of the six months ended October 31, 2015.
The table illustrates your Fund's expenses in two ways:
• Actual Fund Return. This helps you estimate the actual dollar amount of ongoing expenses paid on a $1,000 investment in the Fund using the Fund's actual return during the period. To estimate the expenses you paid over the period, simply divide your account value by $1,000 (for example, an $8,600 account value divided by $1,000 = 8.6), then multiply the result by the number in the "Expenses Paid per $1,000" line under the share class you hold.
• Hypothetical 5% Fund Return. This helps you to compare your Fund's ongoing expenses with those of other mutual funds using the Fund's actual expense ratio and a hypothetical rate of return of 5% per year before expenses. Examples using a 5% hypothetical fund return may be found in the shareholder reports of other mutual funds. The hypothetical account values and expenses may not be used to estimate the actual ending account balance or expenses you paid for the period.
Please note that the expenses shown in these tables are meant to highlight your ongoing expenses only and do not reflect any transaction costs, such as sales charges (loads) or redemption fees. If these transaction costs had been included, your costs would have been higher. The "Expenses Paid per $1,000" line of the tables is useful in comparing ongoing expenses only and will not help you determine the relative total expenses of owning different funds.
6
Credit Suisse Strategic Income Fund
Annual Investment Adviser's Report (continued)
October 31, 2015 (unaudited)
Expenses and Value for a $1,000 Investment
for the six month period ended October 31, 2015
Actual Fund Return | | Class I | | Class A | | Class C | |
Beginning Account Value 05/01/15 | | $ | 1,000.00 | | | $ | 1,000.00 | | | $ | 1,000.00 | | |
Ending Account Value 10/31/15 | | $ | 997.10 | | | $ | 996.60 | | | $ | 993.00 | | |
Expenses Paid per $1,000* | | $ | 4.98 | | | $ | 6.24 | | | $ | 10.00 | | |
Hypothetical 5% Fund Return | |
Beginning Account Value 05/01/15 | | $ | 1,000.00 | | | $ | 1,000.00 | | | $ | 1,000.00 | | |
Ending Account Value 10/31/15 | | $ | 1,020.21 | | | $ | 1,018.95 | | | $ | 1,015.17 | | |
Expenses Paid per $1,000* | | $ | 5.04 | | | $ | 6.31 | | | $ | 10.11 | | |
| | | Class I | | Class A | | Class C | |
Annualized Expense Ratios* | | | 0.99 | % | | | 1.24 | % | | | 1.99 | % | |
* Expenses are equal to the Fund's annualized expense ratio for each share class, multiplied by the average account value over the period, multiplied by 184/365 to reflect the one-half year period.
The "Expenses Paid per $1,000" and the "Annualized Expense Ratios" in the tables are based on actual expenses paid by the Fund during the period, net of fee waivers and/or expense reimbursements. If those fee waivers and/or expense reimbursements had not been in effect, the Fund's actual expenses would have been higher. Expenses do not reflect additional charges and expenses that are, or may be, imposed under the variable contracts or plans. Such charges and expenses are described in the prospectus of the insurance company separate account or in the plan documents or other informational materials supplied by plan sponsors. The Fund's expenses should be considered with these charges and expenses in evaluating the overall cost of investing in the separate account.
For more information, please refer to the Fund's prospectus.
7
Credit Suisse Strategic Income Fund
Annual Investment Adviser's Report (continued)
October 31, 2015 (unaudited)
Credit Quality Breakdown*
% of Total Investments as of October 31, 2015
S&P Ratings** | |
BBB | | | 2.4 | % | |
BB | | | 24.6 | | |
B | | | 47.4 | | |
CCC | | | 11.7 | | |
D | | | 0.3 | | |
NR | | | 6.1 | | |
Subtotal | | | 92.5 | | |
Equity and Other | | | 0.5 | | |
| Short Term Investment1 | | | 7.0 | | |
Total | | | 100.0 | % | |
* Expressed as a percentage of total investments (excluding securities lending collateral if applicable) and may vary over time.
** Credit Quality is based on S&P Ratings. S&P is a main provider of ratings for Credit Assets Classes and is widely used amongst industry participants. The NR category consists of securities that have not been rated by S&P Ratings.
1 Primarily reflects cash invested in State Street Bank and Trust Co. Euro Time Deposit, for which the purchases of securities have been executed but not yet settled at October 31, 2015, if applicable.
8
Credit Suisse Strategic Income Fund
Schedule of Investments
October 31, 2015
Par
(000) | |
| | Ratings†
(S&P/Moody's) | | Maturity | | Rate% | | Value | |
| CORPORATE BONDS (31.9%) | | | |
| Auto Parts & Equipment (0.3%) | | | |
$ | 350 | | | EnerSys, Rule 144A, Company
Guaranteed Notes
(Callable 01/30/23 @ 100.00)1 | | (BB+, Ba2) | | 04/30/23 | | | 5.000 | | | $ | 357,000 | | |
| Banking (0.7%) | | | |
| | 925 | | | CCRE Finance Corp., Rule 144A,
Company Guaranteed Notes
(Callable 11/30/15 @ 105.81)1 | | (B+, B1) | | 02/15/18 | | | 7.750 | | | | 968,937 | | |
| Building & Construction (0.9%) | | | |
| | 750 | | | AV Homes, Inc., Global Company
Guaranteed Notes
(Callable 07/01/16 @ 106.38) | | (B-, Caa1) | | 07/01/19 | | | 8.500 | | | | 753,750 | | |
| | 500 | | | NCI Building Systems, Inc.,
Rule 144A, Company Guaranteed
Notes (Callable 01/15/18 @ 106.19)1 | | (B+, B3) | | 01/15/23 | | | 8.250 | | | | 532,500 | | |
| | | | 1,286,250 | | |
| Building Materials (1.5%) | | | |
| | 1,000 | | | Euramax International, Inc., Rule 144A,
Senior Secured Notes
(Callable 02/15/18 @ 109.00)1 | | (B-, Caa2) | | 08/15/20 | | | 12.000 | | | | 975,000 | | |
| | 500 | | | Headwaters, Inc., Global Company
Guaranteed Notes
(Callable 01/15/16 @ 103.63) | | (B-, Caa1) | | 01/15/19 | | | 7.250 | | | | 520,000 | | |
| | 500 | | | Summit Materials Finance Corp.,
Global Company Guaranteed Notes
(Callable 07/15/18 @ 103.06) | | (B, Caa2) | | 07/15/23 | | | 6.125 | | | | 500,000 | | |
| | | | 1,995,000 | | |
| Cable & Satellite TV (3.5%) | | | |
| | 400 | | | Altice Financing S.A., Rule 144A,
Senior Secured Notes
(Callable 02/15/18 @ 104.97)1 | | (BB-, B1) | | 02/15/23 | | | 6.625 | | | | 402,000 | | |
| | 750 | | | Block Communications, Inc., Rule 144A,
Senior Unsecured Notes
(Callable 02/01/16 @ 103.63)1 | | (B+, B1) | | 02/01/20 | | | 7.250 | | | | 757,500 | | |
| | 600 | | | Cable One, Inc., Rule 144A, Company
Guaranteed Notes
(Callable 06/15/18 @ 102.88)1 | | (BB, B1) | | 06/15/22 | | | 5.750 | | | | 616,500 | | |
| | 525 | | | CCO Safari II LLC, Rule 144A,
Senior Secured Notes
(Callable 04/23/25 @ 100.00)1 | | (BBB-, Ba1) | | 07/23/25 | | | 4.908 | | | | 534,458 | | |
| | 750 | | | CCO Safari II LLC, Rule 144A,
Senior Secured Notes
(Callable 05/23/22 @ 100.00)1 | | (BBB-, Ba1) | | 07/23/22 | | | 4.464 | | | | 761,732 | | |
| | 500 | | | Cequel Capital Corp., Rule 144A,
Senior Unsecured Notes
(Callable 11/30/15 @ 104.78)1 | | (B-, B3) | | 09/15/20 | | | 6.375 | | | | 502,500 | | |
See Accompanying Notes to Financial Statements.
9
Credit Suisse Strategic Income Fund
Schedule of Investments (continued)
October 31, 2015
Par
(000) | |
| | Ratings†
(S&P/Moody's) | | Maturity | | Rate% | | Value | |
| CORPORATE BONDS (continued) | | | |
Cable & Satellite TV | | | |
$ | 500 | | | Midcontinent Communications &
Midcontinent Finance Corp., Rule 144A,
Company Guaranteed Notes
(Callable 08/01/16 @ 104.69)1 | | (B, B3) | | 08/01/21 | | | 6.250 | | | $ | 520,000 | | |
| | 300 | | | Neptune Finco Corp., Rule 144A,
Senior Unsecured Notes
(Callable 10/15/20 @ 103.31)1 | | (BB-, Ba1) | | 10/15/25 | | | 6.625 | | | | 316,500 | | |
| | 300 | | | Neptune Finco Corp., Rule 144A,
Senior Unsecured Notes
(Callable 10/15/20 @ 105.44)1 | | (B-, B2) | | 10/15/25 | | | 10.875 | | | | 321,000 | | |
| | | | 4,732,190 | | |
| Chemicals (1.9%) | | | |
| | 500 | | | A Schulman, Inc., Rule 144A,
Company Guaranteed Notes
(Callable 06/01/18 @ 105.16)1 | | (B+, B3) | | 06/01/23 | | | 6.875 | | | | 498,750 | | |
| | 500 | | | Axiall Corp., Global Company
Guaranteed Notes
(Callable 05/15/18 @ 102.44) | | (BB, Ba3) | | 05/15/23 | | | 4.875 | | | | 477,187 | | |
| | 525 | | | Blue Cube Spinco, Inc., Rule 144A,
Company Guaranteed Notes
(Callable 10/15/20 @ 102.44)1 | | (BB+, Ba1) | | 10/15/23 | | | 9.750 | | | | 568,312 | | |
| | 52 | | | Reichhold Industries, Inc., Rule 144A,
Senior Secured Notes
(Callable 11/30/15 @ 100.00)1,2,3 | | (NR, NR) | | 05/08/17 | | | 9.000 | | | | 21,954 | | |
| | 850 | | | Tronox Finance LLC, Global Company
Guaranteed Notes
(Callable 11/30/15 @ 104.78) | | (B+, B3) | | 08/15/20 | | | 6.375 | | | | 609,620 | | |
| | 375 | | | Univar U.S.A., Inc., Rule 144A,
Company Guaranteed Notes
(Callable 07/15/18 @ 103.38)1 | | (B, Caa1) | | 07/15/23 | | | 6.750 | | | | 372,188 | | |
| | | | 2,548,011 | | |
| Consumer/Commercial/Lease Financing (0.5%) | | | |
| | 700 | | | Infinity Acquisition Finance Corp.,
Rule 144A, Senior Secured Notes
(Callable 08/01/17 @ 103.63)1 | | (CCC+, Caa2) | | 08/01/22 | | | 7.250 | | | | 630,000 | | |
| Electric - Generation (0.4%) | | | |
| | 500 | | | Dynegy, Inc., Global Company
Guaranteed Notes
(Callable 05/01/17 @ 103.38) | | (B+, B3) | | 11/01/19 | | | 6.750 | | | | 501,250 | | |
See Accompanying Notes to Financial Statements.
10
Credit Suisse Strategic Income Fund
Schedule of Investments (continued)
October 31, 2015
Par
(000) | |
| | Ratings†
(S&P/Moody's) | | Maturity | | Rate% | | Value | |
| CORPORATE BONDS (continued) | | | |
| Energy - Exploration & Production (1.7%) | | | |
$ | 1,050 | | | Bonanza Creek Energy, Inc.,
Global Company Guaranteed Notes
(Callable 04/15/17 @ 103.38) | | (CCC+, B3) | | 04/15/21 | | | 6.750 | | | $ | 761,250 | | |
| | 500 | | | Det Norske Oljeselskap ASA, Rule 144A,
Subordinated Notes
(Callable 05/27/19 @ 105.13)1 | | (NR, NR) | | 05/27/22 | | | 10.250 | | | | 456,250 | | |
| | 479 | | | Harkand Finance, Inc., 7.800% Cash,
0.600% PIK, Reg S, Rule 144A,
Senior Secured Notes
(Callable 03/28/16 @ 104.50)1,4,5 | | (NR, NR) | | 03/28/19 | | | 8.400 | | | | 299,316 | | |
| | 750 | | | PDC Energy, Inc., Global Company
Guaranteed Notes
(Callable 10/15/17 @ 103.88) | | (B+, B2) | | 10/15/22 | | | 7.750 | | | | 757,500 | | |
| | | | 2,274,316 | | |
| Gaming (0.6%) | | | |
| | 750 | | | Safari Holding Verwaltungs GmbH,
Rule 144A, Senior Secured Notes
(Callable 02/15/17 @ 104.13)1,6 | | (B, B2) | | 02/15/21 | | | 8.250 | | | | 865,852 | | |
| Gas Distribution (1.2%) | | | |
| | 1,000 | | | Genesis Energy Finance Corp., Global
Company Guaranteed Notes
(Callable 02/15/17 @ 102.88) | | (B+, B1) | | 02/15/21 | | | 5.750 | | | | 940,000 | | |
| | 750 | | | Holly Energy Finance Corp., Global
Company Guaranteed Notes
(Callable 03/01/16 @ 103.25) | | (BB, B1) | | 03/01/20 | | | 6.500 | | | | 750,000 | | |
| | | | 1,690,000 | | |
| Health Facilities (0.7%) | | | |
| | 500 | | | Covenant Surgical Partners, Inc.,
Rule 144A, Senior Secured Notes
(Callable 08/01/16 @ 106.56)1 | | (B-, B3) | | 08/01/19 | | | 8.750 | | | | 500,000 | | |
| | 500 | | | Tenet Healthcare Corp., Global
Senior Unsecured Notes | | (CCC+, B3) | | 06/15/23 | | | 6.750 | | | | 498,750 | | |
| | | | 998,750 | | |
| Health Services (0.6%) | | | |
| | 500 | | | Emdeon, Inc., Rule 144A, Company
Guaranteed Notes
(Callable 08/15/17 @ 104.50)1 | | (CCC+, Caa1) | | 02/15/21 | | | 6.000 | | | | 491,875 | | |
| | 350 | | | ExamWorks Group, Inc., Company
Guaranteed Notes
(Callable 04/15/18 @ 104.22) | | (B-, B3) | | 04/15/23 | | | 5.625 | | | | 365,312 | | |
| | | | 857,187 | | |
See Accompanying Notes to Financial Statements.
11
Credit Suisse Strategic Income Fund
Schedule of Investments (continued)
October 31, 2015
Par
(000) | |
| | Ratings†
(S&P/Moody's) | | Maturity | | Rate% | | Value | |
| CORPORATE BONDS (continued) | | | |
| Insurance Brokerage (0.4%) | | | |
$ | 500 | | | National Financial Partners Corp.,
Rule 144A, Senior Unsecured Notes
(Callable 07/15/16 @ 106.75)1 | | (CCC+, Caa2) | | 07/15/21 | | | 9.000 | | | $ | 491,875 | | |
| Investments & Misc. Financial Services (0.6%) | | | |
| | 500 | | | Cabot Financial Luxembourg S.A.,
Rule 144A, Senior Secured Notes
(Callable 11/30/15 @ 107.78)1,7 | | (B+, B2) | | 10/01/19 | | | 10.375 | | | | 834,342 | | |
| Metals & Mining - Excluding Steel (1.8%) | | | |
| | 500 | | | Boart Longyear Management Pty. Ltd.,
Rule 144A, Company Guaranteed Notes
(Callable 04/01/16 @ 103.50)1 | | (CCC+, Caa2) | | 04/01/21 | | | 7.000 | | | | 203,750 | | |
| | 164 | | | Boart Longyear Management Pty. Ltd.,
Rule 144A, Senior Secured Notes1 | | (B, B3) | | 10/01/18 | | | 10.000 | | | | 141,040 | | |
| | 2,975 | | | Noranda Aluminum Acquisition Corp.,
Global Company Guaranteed Notes
(Callable 03/01/16 @ 105.50) | | (CCC, Caa3) | | 06/01/19 | | | 11.000 | | | | 684,250 | | |
| | 2,500 | | | Taseko Mines Ltd., Company
Guaranteed Notes
(Callable 11/30/15 @ 103.88) | | (B-, B3) | | 04/15/19 | | | 7.750 | | | | 1,312,500 | | |
| | 500 | | | Xinergy Corp., Rule 144A,
Senior Secured Notes
(Callable 11/30/15 @ 104.63)1,8 | | (NR, NR) | | 05/15/19 | | | 9.250 | | | | 102,500 | | |
| | | | 2,444,040 | | |
| Oil Field Equipment & Services (1.2%) | | | |
| | 500 | | | FTS International, Inc., Global
Senior Secured Notes
(Callable 05/01/17 @ 104.69) | | (CCC+, Caa2) | | 05/01/22 | | | 6.250 | | | | 117,500 | | |
| | 800 | | | Pacific Drilling V Ltd., Rule 144A,
Senior Secured Notes
(Callable 12/01/15 @ 103.63)1 | | (B+, Caa3) | | 12/01/17 | | | 7.250 | | | | 548,000 | | |
| | 800 | | | Pioneer Energy Services Corp.,
Global Company Guaranteed Notes
(Callable 03/15/17 @ 104.59) | | (B+, B3) | | 03/15/22 | | | 6.125 | | | | 464,000 | | |
| | 500 | | | Shelf Drilling Holdings Ltd.,
Rule 144A, Secured Notes
(Callable 11/30/15 @ 104.31)1 | | (B+, B1) | | 11/01/18 | | | 8.625 | | | | 386,250 | | |
| | 250 | | | Sidewinder Drilling, Inc., Rule 144A,
Senior Unsecured Notes
(Callable 11/15/16 @ 104.88)1 | | (CCC+, Ca) | | 11/15/19 | | | 9.750 | | | | 142,500 | | |
| | | | 1,658,250 | | |
See Accompanying Notes to Financial Statements.
12
Credit Suisse Strategic Income Fund
Schedule of Investments (continued)
October 31, 2015
Par
(000) | |
| | Ratings†
(S&P/Moody's) | | Maturity | | Rate% | | Value | |
| CORPORATE BONDS (continued) | | | |
| Oil Refining & Marketing (1.3%) | | | |
$ | 1,000 | | | Coffeyville Finance, Inc., Global
Company Guaranteed Notes
(Callable 11/01/17 @ 103.25) | | (BB-, B1) | | 11/01/22 | | | 6.500 | | | $ | 987,500 | | |
| | 500 | | | PBF Finance Corp., Global
Senior Secured Notes
(Callable 02/15/16 @ 104.13) | | (BB+, Ba3) | | 02/15/20 | | | 8.250 | | | | 527,500 | | |
| | 250 | | | Western Refining, Inc., Global
Company Guaranteed Notes
(Callable 04/01/17 @ 103.13) | | (B+, B3) | | 04/01/21 | | | 6.250 | | | | 250,000 | | |
| | | | 1,765,000 | | |
| Packaging (0.4%) | | | |
| | 500 | | | Owens-Brockway Glass Container, Inc.,
Rule 144A, Company Guaranteed Notes1 | | (BB-, B1) | | 08/15/23 | | | 5.875 | | | | 531,563 | | |
| Pharmaceuticals (1.1%) | | | |
| | 500 | | | AMAG Pharmaceuticals, Inc.,
Rule 144A, Company
Guaranteed Notes
(Callable 09/01/18 @ 105.91)1 | | (B+, B3) | | 09/01/23 | | | 7.875 | | | | 468,750 | | |
| | 1,000 | | | Endo Ltd., Rule 144A, Company
Guaranteed Notes
(Callable 07/15/18 @ 104.50)1 | | (B, B1) | | 07/15/23 | | | 6.000 | | | | 1,005,000 | | |
| | | | 1,473,750 | | |
| Printing & Publishing (0.6%) | | | |
| | 819 | | | Harland Clarke Holdings Corp.,
Rule 144A, Senior Secured Notes
(Callable 11/30/15 @ 104.88)1 | | (B+, B1) | | 08/01/18 | | | 9.750 | | | | 838,451 | | |
| Property & Casualty Insurance (0.3%) | | | |
| | 400 | | | York Risk Services Holding Corp.,
Rule 144A, Company
Guaranteed Notes
(Callable 10/01/17 @ 106.38)1 | | (CCC+, Caa2) | | 10/01/22 | | | 8.500 | | | | 353,500 | | |
| Real Estate Development & Management (0.4%) | | | |
| | 500 | | | DuPont Fabros Technology LP,
Company Guaranteed Notes
(Callable 06/15/18 @ 104.22) | | (BB, Ba1) | | 06/15/23 | | | 5.625 | | | | 515,000 | | |
| Real Estate Investment Trusts (0.4%) | | | |
| | 500 | | | iStar, Inc., Senior Unsecured Notes
(Callable 07/01/16 @ 102.44) | | (B+, B2) | | 07/01/18 | | | 4.875 | | | | 494,375 | | |
| Restaurants (0.7%) | | | |
| | 1,000 | | | Financiere Quick SAS, Rule 144A,
Unsecured Notes
(Callable 11/30/15 @ 102.00)1,6,9 | | (CCC, Caa2) | | 10/15/19 | | | 7.451 | | | | 916,860 | | |
See Accompanying Notes to Financial Statements.
13
Credit Suisse Strategic Income Fund
Schedule of Investments (continued)
October 31, 2015
Par
(000) | |
| | Ratings†
(S&P/Moody's) | | Maturity | | Rate% | | Value | |
| CORPORATE BONDS (continued) | | | |
| Software - Services (2.8%) | | | |
$ | 1,250 | | | Audatex North America, Inc., Rule 144A,
Company Guaranteed Notes
(Callable 11/01/18 @ 103.06)1 | | (BB-, B1) | | 11/01/23 | | | 6.125 | | | $ | 1,262,500 | | |
| | 600 | | | NeuStar, Inc., Global Company
Guaranteed Notes
(Callable 01/15/18 @ 102.25) | | (B+, B2) | | 01/15/23 | | | 4.500 | | | | 519,000 | | |
| | 500 | | | Optimas OE Solutions, Inc.,
Rule 144A, Senior Secured Notes
(Callable 06/01/18 @ 104.31)1 | | (B-, B3) | | 06/01/21 | | | 8.625 | | | | 477,500 | | |
| | 500 | | | Riverbed Technology Inc., Rule 144A,
Senior Unsecured Notes
(Callable 03/01/18 @ 104.44)1 | | (CCC+, Caa1) | | 03/01/23 | | | 8.875 | | | | 466,875 | | |
| | 750 | | | SS&C Technologies Holdings, Inc.,
Rule 144A, Company Guaranteed Notes
(Callable 07/15/18 @ 104.41)1 | | (B+, B3) | | 07/15/23 | | | 5.875 | | | | 789,375 | | |
| | 500 | | | Sungard Availability Services Capital, Inc.,
Rule 144A, Company Guaranteed Notes
(Callable 04/01/19 @ 104.38)1 | | (CCC+, Caa1) | | 04/01/22 | | | 8.750 | | | | 315,000 | | |
| | | | 3,830,250 | | |
| Specialty Retail (0.9%) | | | |
| | 500 | | | Beverages & More, Inc., Rule 144A,
Senior Secured Notes
(Callable 11/30/15 @ 105.00)1 | | (B-, Caa1) | | 11/15/18 | | | 10.000 | | | | 486,875 | | |
| | 750 | | | Caleres, Inc., Rule 144A,
Company Guaranteed Notes
(Callable 08/15/18 @ 104.69)1 | | (BB, B1) | | 08/15/23 | | | 6.250 | | | | 761,250 | | |
| | | | 1,248,125 | | |
| Steel Producers/Products (0.3%) | | | |
| | 500 | | | JMC Steel Group, Inc.,144A,
Senior Unsecured Notes
(Callable 11/30/15 @ $104.13)1 | | (B-, Caa1) | | 03/15/18 | | | 8.250 | | | | 342,500 | | |
| Support - Services (1.1%) | | | |
| | 250 | | | Brand Energy & Infrastructure Services, Inc.,
Rule 144A, Company Guaranteed Notes
(Callable 12/01/16 @ 106.38)1 | | (CCC+, Caa1) | | 12/01/21 | | | 8.500 | | | | 227,500 | | |
| | 700 | | | CEB, Inc., Rule 144A, Company
Guaranteed Notes
(Callable 06/15/18 @ 104.22)1 | | (BB-, Ba3) | | 06/15/23 | | | 5.625 | | | | 713,125 | | |
| | 500 | | | H&E Equipment Services, Inc., Global
Company Guaranteed Notes
(Callable 09/01/17 @ 103.50) | | (BB-, B3) | | 09/01/22 | | | 7.000 | | | | 510,000 | | |
| | | | 1,450,625 | | |
See Accompanying Notes to Financial Statements.
14
Credit Suisse Strategic Income Fund
Schedule of Investments (continued)
October 31, 2015
Par
(000) | |
| | Ratings†
(S&P/Moody's) | | Maturity | | Rate% | | Value | |
| CORPORATE BONDS (continued) | | | |
| Tech Hardware & Equipment (0.9%) | | | |
$ | 500 | | | Avaya, Inc., Rule 144A,
Senior Secured Notes
(Callable 11/30/15 @ 104.50)1 | | (B, B1) | | 04/01/19 | | | 9.000 | | | $ | 410,000 | | |
| | 740 | | | CommScope Technologies
Finance LLC, Rule 144A,
Senior Secured Notes
(Callable 06/15/20 @ 103.00)1 | | (B, B2) | | 06/15/25 | | | 6.000 | | | | 752,950 | | |
| | | | 1,162,950 | | |
| Telecom - Satellite (0.2%) | | | |
| | 250 | | | Hughes Satellite Systems Corp.,
Global Company Guaranteed Notes | | (BB-, B3) | | 06/15/21 | | | 7.625 | | | | 273,438 | | |
| Telecom - Wireless (0.5%) | | | |
| | 750 | | | Sprint Corp., Global Company
Guaranteed Notes | | (B+, Caa1) | | 09/15/23 | | | 7.875 | | | | 695,625 | | |
| Telecom - Wireline Integrated & Services (0.3%) | | | |
| | 375 | | | Frontier Communications Corp.,
Rule 144A, Senior Unsecured Notes
(Callable 06/15/25 @ 100.00)1 | | (BB-, Ba3) | | 09/15/25 | | | 11.000 | | | | 393,983 | | |
| Theaters & Entertainment (1.2%) | | | |
| | 385 | | | Activision Blizzard, Inc., Rule 144A,
Company Guaranteed Notes
(Callable 09/15/16 @ 104.22)1 | | (BB+, Ba2) | | 09/15/21 | | | 5.625 | | | | 408,177 | | |
| | 715 | | | National CineMedia LLC, Global
Senior Secured Notes
(Callable 04/15/17 @ 103.00) | | (BB-, Ba2) | | 04/15/22 | | | 6.000 | | | | 748,033 | | |
| | 500 | | | Regal Entertainment Group,
Senior Unsecured Notes
(Callable 06/15/18 @ 102.88) | | (B-, B3) | | 06/15/23 | | | 5.750 | | | | 502,500 | | |
| | | | 1,658,710 | | |
| TOTAL CORPORATE BONDS (Cost $47,305,824) | | | 43,077,955 | | |
| BANK LOANS (49.2%) | | | |
| Aerospace & Defense (0.6%) | | | |
| | 101 | | | Aveos Fleet Performance, Inc.2,3,9 | | (CCC+, B3) | | 03/12/16 | | | 12.750 | | | | 1,009 | | |
| | 415 | | | LM U.S. Corp. Acquisition, Inc.9 | | (CCC, Caa2) | | 01/25/21 | | | 8.250 | | | | 414,388 | | |
| | 499 | | | Sequa Corp.9 | | (CCC+, Caa1) | | 06/19/17 | | | 5.250 | | | | 411,442 | | |
| | | | 826,839 | | |
| Auto Parts & Equipment (1.1%) | | | |
| | 995 | | | Federal-Mogul Holdings Corp.9 | | (B-, B1) | | 04/15/21 | | | 4.750 | | | | 910,570 | | |
| | 578 | | | U.S. Farathane LLC9 | | (B+, B2) | | 12/23/21 | | | 6.750 | | | | 582,195 | | |
| | | | 1,492,765 | | |
See Accompanying Notes to Financial Statements.
15
Credit Suisse Strategic Income Fund
Schedule of Investments (continued)
October 31, 2015
Par
(000) | |
| | Ratings†
(S&P/Moody's) | | Maturity | | Rate% | | Value | |
| BANK LOANS (continued) | | | |
| Automakers (0.7%) | | | |
$ | 1,000 | | | TI Group Automotive Systems LLC9 | | (BB, Ba3) | | 06/30/22 | | | 4.500 | | | $ | 991,665 | | |
| Building Materials (1.1%) | | | |
| | 459 | | | Panolam Industries International, Inc.9 | | (BB-, B2) | | 08/23/17 | | | 7.750 | | | | 460,051 | | |
| | 998 | | | Summit Materials Cos. I LLC9 | | (BB, B1) | | 07/17/22 | | | 4.250 | | | | 995,630 | | |
| | | | 1,455,681 | | |
| Cable & Satellite TV (1.2%) | | | |
| | 637 | | | Onex Wizard U.S. Acquisition, Inc.9 | | (B+, B1) | | 03/13/22 | | | 4.250 | | | | 638,220 | | |
| | 995 | | | TWCC Holding Corp.9 | | (B+, B1) | | 02/11/20 | | | 5.750 | | | | 997,090 | | |
| | | | 1,635,310 | | |
| Chemicals (3.0%) | | | |
| | 949 | | | Albaugh LLC9 | | (BB, B1) | | 05/31/21 | | | 6.000 | | | | 951,740 | | |
| | 657 | | | Chemstralia Pty Ltd.9 | | (BB-, B1) | | 02/28/22 | | | 7.250 | | | | 651,775 | | |
| | 728 | | | Colouroz Investment 2 LLC9 | | (B-, Caa1) | | 09/06/22 | | | 8.250 | | | | 719,357 | | |
| | 728 | | | Houghton International, Inc.9 | | (B-, Caa1) | | 12/20/20 | | | 9.750 | | | | 722,232 | | |
| | 1,000 | | | Minerals Technologies, Inc.9 | | (BB, Ba2) | | 05/09/21 | | | 4.750 | | | | 1,003,750 | | |
| | | | 4,048,854 | | |
| Department Stores (1.1%) | | | |
| | 800 | | | Dollar Tree, Inc.9 | | (BB+, Ba1) | | 07/06/22 | | | 4.250 | | | | 801,900 | | |
| | 750 | | | Hudson's Bay Co.9 | | (BB, B1) | | 09/30/22 | | | 4.750 | | | | 752,227 | | |
| | | | 1,554,127 | | |
| Discount Stores (1.0%) | | | |
| | 796 | | | 99 Cents Only Stores9 | | (B, B3) | | 01/11/19 | | | 4.500 | | | | 636,751 | | |
| | 671 | | | Ollie's Bargain Outlet, Inc.9 | | (B+, Ba3) | | 09/27/19 | | | 4.750 | | | | 667,874 | | |
| | | | 1,304,625 | | |
| Diversified Capital Goods (1.3%) | | | |
| | 537 | | | Dynacast International LLC9 | | (B, Ba3) | | 01/28/22 | | | 4.500 | | | | 530,584 | | |
| | 494 | | | Horizon Global Corp.9 | | (B, B2) | | 05/11/22 | | | 7.000 | | | | 490,047 | | |
| | 748 | | | Infiltrator Systems, Inc.9 | | (B+, B1) | | 05/27/22 | | | 5.250 | | | | 748,873 | | |
| | | | 1,769,504 | | |
| Electric - Generation (0.1%) | | | |
| | 600 | | | Texas Competitive Electric Holdings Co. LLC9 | | (CCC, NR) | | 10/10/17 | | | 4.677 | | | | 204,750 | | |
| Electronics (2.0%) | | | |
| | 997 | | | Avago Technologies Cayman Ltd.9 | | (BBB-, Ba1) | | 05/06/21 | | | 3.750 | | | | 998,273 | | |
| | 698 | | | FIDJI Luxembourg (BC4) Sarl9 | | (BB-, B1) | | 12/24/20 | | | 6.250 | | | | 696,628 | | |
| | 995 | | | Freescale Semiconductor, Inc.9 | | (B, B1) | | 02/28/20 | | | 4.250 | | | | 995,335 | | |
| | | | 2,690,236 | | |
| Food & Drug Retailers (0.9%) | | | |
| | 731 | | | Albertson's LLC9 | | (BB-, Ba3) | | 08/25/19 | | | 5.000 | | | | 731,831 | | |
| | 500 | | | Albertson's LLC9 | | (BB-, Ba3) | | 08/25/21 | | | 5.500 | | | | 500,653 | | |
| | | | 1,232,484 | | |
See Accompanying Notes to Financial Statements.
16
Credit Suisse Strategic Income Fund
Schedule of Investments (continued)
October 31, 2015
Par
(000) | |
| | Ratings†
(S&P/Moody's) | | Maturity | | Rate% | | Value | |
| BANK LOANS (continued) | | | |
| Food - Wholesale (0.5%) | | | |
$ | 625 | | | Allflex Holdings III, Inc.9 | | (B-, B2) | | 07/19/21 | | | 8.000 | | | $ | 617,187 | | |
| Gaming (0.6%) | | | |
| | 125 | | | CBAC Borrower LLC9 | | (B-, B3) | | 07/02/20 | | | 8.250 | | | | 118,438 | | |
| | 735 | | | ROC Finance LLC9 | | (B+, B2) | | 06/20/19 | | | 5.000 | | | | 695,725 | | |
| | | | 814,163 | | |
| Gas Distribution (0.7%) | | | |
| | 1,000 | | | Energy Transfer Equity LP9 | | (BB, Ba2) | | 12/02/19 | | | 4.000 | | | | 971,785 | | |
| Health Facilities (1.6%) | | | |
| | 1,244 | | | Drumm Investors LLC9 | | (B, B2) | | 05/04/18 | | | 6.750 | | | | 1,251,892 | | |
| | 448 | | | Premier Dental Services, Inc.9 | | (CCC+, Caa1) | | 11/01/18 | | | 6.000 | | | | 392,830 | | |
| | 503 | | | Surgery Center Holdings, Inc.9 | | (CCC+, Caa2) | | 11/03/21 | | | 8.500 | | | | 499,288 | | |
| | | | 2,144,010 | | |
| Health Services (1.6%) | | | |
| | 325 | | | MMM Holdings, Inc.9 | | (D, Caa1) | | 12/12/17 | | | 9.750 | | | | 243,169 | | |
| | 236 | | | MSO of Puerto Rico, Inc.9 | | (D, Caa1) | | 12/12/17 | | | 9.750 | | | | 176,783 | | |
| | 973 | | | Onex Carestream Finance LP9 | | (B+, B1) | | 06/07/19 | | | 5.000 | | | | 927,484 | | |
| | 978 | | | Valitas Health Services, Inc.9 | | (CCC, Caa2) | | 06/02/17 | | | 6.000 | | | | 771,239 | | |
| | | | 2,118,675 | | |
| Hotels (0.7%) | | | |
| | 957 | | | La Quinta Intermediate Holdings LLC9 | | (BB, B1) | | 04/14/21 | | | 3.750 | | | | 949,682 | | |
| Insurance Brokerage (1.0%) | | | |
| | 599 | | | Acrisure LLC9 | | (B, B2) | | 05/19/22 | | | 5.250 | | | | 580,545 | | |
| | 750 | | | Hub International Ltd.9 | | (B, B1) | | 10/02/20 | | | 4.000 | | | | 732,187 | | |
| | | | 1,312,732 | | |
| Investments & Misc. Financial Services (3.5%) | | | |
| | 497 | | | Altisource Solutions Sarl9 | | (B+, B3) | | 12/09/20 | | | 4.500 | | | | 444,538 | | |
| | 990 | | | American Capital Ltd.9 | | (BB, B2) | | 08/22/17 | | | 3.500 | | | | 988,662 | | |
| | 469 | | | Liquidnet Holdings, Inc.9 | | (B, B3) | | 05/22/19 | | | 7.750 | | | | 454,688 | | |
| | 1,000 | | | Mergermarket U.S.A., Inc.9 | | (CCC+, Caa2) | | 02/04/22 | | | 7.500 | | | | 917,500 | | |
| | 428 | | | Ocwen Financial Corp.9 | | (B+, B2) | | 02/15/18 | | | 5.500 | | | | 429,022 | | |
| | 400 | | | TransFirst, Inc.9 | | (CCC+, Caa2) | | 11/12/22 | | | 9.000 | | | | 401,166 | | |
| | 517 | | | TransFirst, Inc.9 | | (B, B2) | | 11/12/21 | | | 4.750 | | | | 517,277 | | |
| | 579 | | | Walter Investment Management Corp.9 | | (BB-, B2) | | 12/19/20 | | | 4.750 | | | | 529,813 | | |
| | | | 4,682,666 | | |
| Machinery (1.4%) | | | |
| | 748 | | | CPM Holdings, Inc.9 | | (B+, B1) | | 04/11/22 | | | 6.000 | | | | 749,685 | | |
| | 382 | | | Winoa S.A.3,6,9 | | (NR, NR) | | 01/24/19 | | | 3.881 | | | | 422,480 | | |
| | 785 | | | WTG Holdings III Corp.9 | | (CCC+, Caa1) | | 01/15/22 | | | 8.500 | | | | 775,188 | | |
| | | | 1,947,353 | | |
See Accompanying Notes to Financial Statements.
17
Credit Suisse Strategic Income Fund
Schedule of Investments (continued)
October 31, 2015
Par
(000) | |
| | Ratings†
(S&P/Moody's) | | Maturity | | Rate% | | Value | |
| BANK LOANS (continued) | | | |
| Media Content (0.8%) | | | |
$ | 1,000 | | | DLG Acquisitions Ltd.6,9 | | (B-, Caa2) | | 06/30/22 | | | 8.250 | | | $ | 1,075,653 | | |
| Metals & Mining - Excluding Steel (0.2%) | | | |
| | 496 | | | Noranda Aluminum Acquisition Corp.9 | | (B-, Caa1) | | 02/28/19 | | | 5.750 | | | | 321,256 | | |
| Oil Field Equipment & Services (0.5%) | | | |
| | 1,000 | | | Shelf Drilling Holdings Ltd.9 | | (B+, B2) | | 10/08/18 | | | 10.000 | | | | 625,000 | | |
| Oil Refining & Marketing (0.7%) | | | |
| | 985 | | | Philadelphia Energy Solutions LLC9 | | (BB-, B1) | | 04/04/18 | | | 6.250 | | | | 970,076 | | |
| Packaging (0.7%) | | | |
| | 995 | | | BWAY Holding Company, Inc.9 | | (B-, B2) | | 08/14/20 | | | 5.500 | | | | 998,693 | | |
| Personal & Household Products (0.5%) | | | |
| | 500 | | | ABG Intermediate Holdings 2 LLC9 | | (B+, B1) | | 05/27/21 | | | 5.500 | | | | 497,877 | | |
| | 168 | | | ABG Intermediate Holdings 2 LLC9,10 | | (B+, B1) | | 05/27/21 | | | 4.500 | | | | 166,802 | | |
| | | | 664,679 | | |
| Pharmaceuticals (1.8%) | | | |
| | 500 | | | Albany Molecular Research, Inc.9 | | (B+, B1) | | 07/16/21 | | | 5.750 | | | | 500,625 | | |
| | 731 | | | Alvogen Pharma U.S., Inc.9 | | (B, B3) | | 04/02/22 | | | 6.000 | | | | 720,288 | | |
| | 1,245 | | | Valeant Pharmaceuticals International, Inc.9 | | (BB, Ba1) | | 04/01/22 | | | 4.000 | | | | 1,161,355 | | |
| | | | 2,382,268 | | |
| Restaurants (0.6%) | | | |
| | 746 | | | B.C. Unlimited Liability Co.9 | | (B+, Ba3) | | 12/12/21 | | | 3.750 | | | | 748,061 | | |
| Software - Services (8.0%) | | | |
| | 995 | | | Camp International Holding Co.9 | | (B-, B2) | | 05/31/19 | | | 4.750 | | | | 983,298 | | |
| | 995 | | | Dell International LLC9 | | (BBB, Ba1) | | 04/29/20 | | | 4.000 | | | | 996,448 | | |
| | 1,000 | | | Deltek, Inc.9 | | (CCC+, Caa2) | | 06/17/23 | | | 9.500 | | | | 1,000,000 | | |
| | 998 | | | Epicor RSG U.S., Inc.9 | | (B, B3) | | 06/23/22 | | | 6.000 | | | | 995,006 | | |
| | 998 | | | Epicor Software Corp.9 | | (B, B2) | | 06/01/22 | | | 4.750 | | | | 993,635 | | |
| | 1,000 | | | Flexera Software LLC9 | | (CCC+, Caa1) | | 04/02/21 | | | 8.000 | | | | 976,250 | | |
| | 746 | | | Infor (U.S.), Inc.9 | | (B+, B1) | | 06/03/20 | | | 3.750 | | | | 727,715 | | |
| | 1,000 | | | Landslide Holdings, Inc.9 | | (CCC+, Caa1) | | 02/25/21 | | | 8.250 | | | | 955,000 | | |
| | 746 | | | MA FinanceCo. LLC9 | | (BB-, B1) | | 11/19/21 | | | 5.250 | | | | 745,657 | | |
| | 820 | | | MRI Software LLC9 | | (CCC+, Caa2) | | 06/17/22 | | | 9.000 | | | | 824,100 | | |
| | 749 | | | Pinnacle Holdco Sarl9 | | (B+, B1) | | 07/30/19 | | | 4.750 | | | | 685,082 | | |
| | 995 | | | SkillSoft Corp.9 | | (B-, B2) | | 04/28/21 | | | 5.750 | | | | 850,693 | | |
| | | | 10,732,884 | | |
| Specialty Retail (1.3%) | | | |
| | 747 | | | BJ's Wholesale Club, Inc.9 | | (B-, B3) | | 09/26/19 | | | 4.500 | | | | 741,595 | | |
| | 995 | | | Leslie's Poolmart, Inc.9 | | (B, B1) | | 10/16/19 | | | 4.250 | | | | 981,940 | | |
| | | | 1,723,535 | | |
| Steel Producers/Products (0.5%) | | | |
| | 748 | | | Atkore International, Inc.9 | | (B, B3) | | 04/09/21 | | | 4.500 | | | | 705,090 | | |
See Accompanying Notes to Financial Statements.
18
Credit Suisse Strategic Income Fund
Schedule of Investments (continued)
October 31, 2015
Par
(000) | |
| | Ratings†
(S&P/Moody's) | | Maturity | | Rate% | | Value | |
| BANK LOANS (continued) | | | |
| Support - Services (2.1%) | | | |
$ | 746 | | | Acosta Holdco, Inc.9 | | (B, B1) | | 09/26/21 | | | 4.250 | | | $ | 730,206 | | |
| | 497 | | | Capstone Logistics LLC9 | | (B-, B1) | | 10/07/21 | | | 5.500 | | | | 495,311 | | |
| | 988 | | | Institutional Shareholder Services, Inc.9 | | (B+, B2) | | 04/30/21 | | | 5.000 | | | | 972,687 | | |
| | 710 | | | Long Term Care Group, Inc.9 | | (B, B3) | | 06/06/20 | | | 6.000 | | | | 656,420 | | |
| | | | 2,854,624 | | |
| Tech Hardware & Equipment (2.1%) | | | |
| | 479 | | | Avaya, Inc.9 | | (B, B1) | | 03/30/18 | | | 6.500 | | | | 402,975 | | |
| | 780 | | | CommScope, Inc.9 | | (BB, Ba2) | | 12/29/22 | | | 3.750 | | | | 780,733 | | |
| | 750 | | | Mitel U.S. Holdings, Inc.9 | | (B+, Ba3) | | 04/29/22 | | | 5.500 | | | | 729,375 | | |
| | 1,000 | | | Omnitracs, Inc.9 | | (CCC+, Caa1) | | 05/25/21 | | | 8.750 | | | | 973,750 | | |
| | | | 2,886,833 | | |
| Telecom - Wireline Integrated & Services (2.1%) | | | |
| | 796 | | | AF Borrower LLC9 | | (B, B2) | | 01/28/22 | | | 6.250 | | | | 794,507 | | |
| | 1,000 | | | LTS Buyer LLC9 | | (B, B1) | | 04/13/20 | | | 4.000 | | | | 987,875 | | |
| | 995 | | | Zayo Group LLC9 | | (BB-, NR) | | 05/06/21 | | | 3.750 | | | | 995,080 | | |
| | | | 2,777,462 | | |
| Theaters & Entertainment (1.3%) | | | |
| | 975 | | | Tech Finance & Co. S.C.A.9 | | (B+, B1) | | 07/10/20 | | | 5.000 | | | | 974,395 | | |
| | 800 | | | William Morris Endeavor Entertainment LLC9 | | (B-, Caa1) | | 05/01/22 | | | 8.250 | | | | 766,000 | | |
| | | | 1,740,395 | | |
| Transport Infrastructure/Services (0.3%) | | | |
| | 468 | | | PODS LLC9 | | (B+, B1) | | 02/02/22 | | | 4.500 | | | | 467,066 | | |
| TOTAL BANK LOANS (Cost $68,988,829) | | | 66,438,668 | | |
| ASSET BACKED SECURITIES (11.8%) | | | |
| Collateralized Debt Obligations (11.8%) | | | |
| | 750 | | | ACAS CLO Ltd., 2013-2A, Rule 144A1,9 | | (BB, NR) | | 10/25/25 | | | 4.820 | | | | 617,291 | | |
| | 1,000 | | | Atlas Senior Loan Fund V Ltd., 2014-1A,
Rule 144A1,9 | | (BB-, NR) | | 07/16/26 | | | 5.017 | | | | 840,980 | | |
| | 750 | | | Babson CLO Ltd., 2015-2A, Rule 144A1,9 | | (NR, Ba3) | | 07/20/27 | | | 5.844 | | | | 685,136 | | |
| | 500 | | | Blue Hill CLO Ltd., 2013-1A, Rule 144A1,9 | | (BB-, NR) | | 01/15/26 | | | 4.921 | | | | 414,679 | | |
| | 500 | | | BNPP IP CLO Ltd., 2014-2A, Rule 144A1,9 | | (BB, NR) | | 10/30/25 | | | 5.572 | | | | 425,154 | | |
| | 750 | | | Carlyle Global Market Strategies CLO Ltd.,
2012-4A, Rule 144A1,9 | | (NR, NR) | | 01/20/25 | | | 0.000 | | | | 576,675 | | |
| | 500 | | | CIFC Funding Ltd., 2012-2A, Rule 144A1,9 | | (BB-, NR) | | 12/05/24 | | | 6.082 | | | | 499,880 | | |
| | 750 | | | CIFC Funding Ltd., 2012-3A, Rule 144A1,9 | | (B, NR) | | 01/29/25 | | | 7.194 | | | | 659,267 | | |
| | 750 | | | CIFC Funding Ltd., 2014-1A, Rule 144A1,9 | | (NR, Ba3) | | 04/18/25 | | | 4.815 | | | | 616,724 | | |
| | 750 | | | Eaton Vance CLO Ltd., 2014-1A, Rule 144A1,9 | | (NR, Ba3) | | 07/15/26 | | | 5.351 | | | | 654,331 | | |
| | 400 | | | Halcyon Loan Advisors Funding Ltd.,
2012-2A, Rule 144A1,9 | | (BB, NR) | | 12/20/24 | | | 5.745 | | | | 353,415 | | |
| | 500 | | | Halcyon Loan Advisors Funding Ltd.,
2015-2A, Rule 144A1,9 | | (NR, NR) | | 07/25/27 | | | 0.000 | | | | 397,833 | | |
See Accompanying Notes to Financial Statements.
19
Credit Suisse Strategic Income Fund
Schedule of Investments (continued)
October 31, 2015
Par
(000) | |
| | Ratings†
(S&P/Moody's) | | Maturity | | Rate% | | Value | |
| ASSET BACKED SECURITIES (continued) | | | |
Collateralized Debt Obligations | | | |
$ | 500 | | | Halcyon Loan Advisors Funding Ltd.,
2015-2A, Rule 144A1,9 | | (NR, Ba3) | | 07/25/27 | | | 6.037 | | | $ | 452,607 | | |
| | 500 | | | Highbridge Loan Management Ltd.,
2012-1A, Rule 144A1,9 | | (B, NR) | | 09/20/22 | | | 7.069 | | | | 490,898 | | |
| | 500 | | | Highbridge Loan Management Ltd.,
2012-1AR, Rule 144A1,9 | | (BB, NR) | | 09/20/22 | | | 6.031 | | | | 488,148 | | |
| | 500 | | | JFIN CLO Ltd., 2013-1A, Rule 144A1,9 | | (BB, NR) | | 01/20/25 | | | 5.067 | | | | 424,335 | | |
| | 1,000 | | | Ocean Trails CLO IV, 2013-4A, Rule 144A1,9 | | (B, NR) | | 08/13/25 | | | 6.214 | | | | 819,130 | | |
| | 1,000 | | | OCP CLO Ltd., 2014-6A, Rule 144A1,9 | | (B, NR) | | 07/17/26 | | | 5.915 | | | | 761,155 | | |
| | 1,000 | | | Shackleton V CLO Ltd., 2014-5A, Rule 144A1,9 | | (BB-, NR) | | 05/07/26 | | | 4.661 | | | | 820,673 | | |
| | 750 | | | Sound Point CLO II Ltd., 2013-1A, Rule 144A1,9 | | (B, NR) | | 04/26/25 | | | 5.820 | | | | 594,552 | | |
| | 750 | | | Sound Point CLO IV Ltd., 2013-3A, Rule 144A1,9 | | (NR, B2) | | 01/21/26 | | | 5.242 | | | | 560,367 | | |
| | 400 | | | Stewart Park CLO Ltd., 2015-1A, Rule 144A1,9 | | (NR, NR) | | 04/15/26 | | | 8.010 | | | | 347,532 | | |
| | 1,325 | | | Venture XVII CLO Ltd., 2014-17A, Rule 144A1,9 | | (NR, Ba2) | | 07/15/26 | | | 5.321 | | | | 1,150,033 | | |
| | 750 | | | Vibrant CLO Ltd., 2012-1A, Rule 144A1,9 | | (BB, NR) | | 07/17/24 | | | 6.615 | | | | 735,507 | | |
| | 800 | | | WhiteHorse IX Ltd., 2014-9A, Rule 144A1,9 | | (NR, Ba3) | | 07/17/26 | | | 4.965 | | | | 651,754 | | |
| | 1,000 | | | WhiteHorse VIII Ltd., 2014-1A, Rule 144A1,9 | | (NR, Ba3) | | 05/01/26 | | | 4.739 | | | | 815,309 | | |
| TOTAL ASSET BACKED SECURITIES (Cost $17,225,996) | | | 15,853,365 | | |
Number of
Shares | |
| |
| |
| |
| |
| |
| COMMON STOCKS (0.4%) | | | |
| Banks (0.1%) | | | |
| | 20,000 | | | Neff Corp.12 | | | | | | | | | | | | | | | 117,200 | | |
| Building Materials (0.1%) | | | |
| | 935 | | | Euramax International, Inc.2,12 | | | | | | | | | | | | | | | 74,800 | | |
| Consumer Products (0.2%) | | | |
| | 2,027 | | | Natural Products Group12 | | | | | | | | | | | | | | | 354,742 | | |
| TOTAL COMMON STOCKS (Cost $489,156) | | | 546,742 | | |
| MUTUAL FUNDS (0.1%) | | | |
| Commingled Funds (0.1%) | | | |
| | 4,623 | | | BlackRock Floating Rate Income Strategies Fund, Inc. | | | | | | | | | | | | | | | 60,238 | | |
| | 2,300 | | | Eaton Vance Floating-Rate Income Trust | | | | | | | | | | | | | | | 30,314 | | |
| TOTAL MUTUAL FUNDS (Cost $101,102) | | | 90,552 | | |
Par
(000) | | | | | | | | | | | |
| SHORT-TERM INVESTMENT (7.1%) | | | |
$ | 9,537 | | | State Street Bank and Trust Co. Euro Time Deposit
(Cost $9,536,592) | | | | | | 11/02/15 | | | 0.010 | | | | 9,536,592 | | |
| TOTAL INVESTMENTS AT VALUE (100.5%) (Cost $143,647,499) | | | 135,543,874 | | |
| LIABILITIES IN EXCESS OF OTHER ASSETS (-0.5%) | | | (627,312 | ) | |
| NET ASSETS (100.0%) | | $ | 134,916,562 | | |
See Accompanying Notes to Financial Statements.
20
Credit Suisse Strategic Income Fund
Schedule of Investments (continued)
October 31, 2015
† Credit ratings given by the Standard & Poor's Division of The McGraw-Hill Companies, Inc. ("S&P") and Moody's Investors Service, Inc. ("Moody's") are unaudited.
1 Security exempt from registration under Rule 144A of the Securities Act of 1933. These securities may be resold in transactions exempt from registration, normally to qualified institutional buyers. At October 31, 2015, these securities amounted to a value of $42,895,480 or 31.8% of net assets.
2 Not readily marketable security; security is valued at fair value as determined in good faith by, or under the direction of, the Board of Trustees.
3 Illiquid security (unaudited).
4 PIK: Payment-in-kind security for which part of the income earned may be paid as additional principal.
5 REG S: Securities sold under Regulation S may not be offered, sold or delivered within the United States or to, or for the account or benefit of, U.S. persons, except pursuant to an exemption from, or in a transaction not subject to, the registration requirements of the Securities Act of 1933.
6 This security is denominated in Euro.
7 This security is denominated in British Pound.
8 Bond is currently in default.
9 Variable rate obligations — The interest rate is the rate as of October 31, 2015.
10 Represents unfunded loan commitments (See Note 2-J).
11 Zero-coupon security.
12 Non-income producing security.
INVESTMENT ABBREVIATIONS:
NR = Not Rated (unaudited)
Forward Foreign Currency Contracts
Forward Foreign
Currency to be
Purchased (Local) | | Forward Foreign
Currency to be
Sold (Local) | | Expiration
Date | | Counterparty | | Value on
Settlement Date | | Current
Value/
Notional | | Net Unrealized
Appreciation
(Depreciation) | |
USD | 3,580,735 | | | EUR | 3,147,000 | | | 01/15/16 | | Morgan Stanley | | $ | (3,580,735 | ) | | $ | (3,481,087 | ) | | $ | 99,648 | | |
USD | 850,176 | | | GBP | 554,500 | | | 01/15/16 | | Morgan Stanley | | | (850,176 | ) | | | (856,150 | ) | | | (5,974 | ) | |
| | | $ | 93,674 | | |
Currency Abbreviations:
EUR = Euro
GBP = British Pound
USD = United States Dollar
Futures Contracts
Contract Description | | Currency | | Expiration
Date | | Number
of Contracts | | Notional
Value | | Net Unrealized
Appreciation
(Depreciation) | |
Contracts to Sell | |
Interest Rate Contracts
10YR U.S. Treasury Note Futures | | USDDec 2015 | | (30) | | $(3,830,625) | | $(8,962) | |
Net unrealized appreciation (depreciation) | | | | | | | | | | $ | (8,962 | ) | |
See Accompanying Notes to Financial Statements.
21
Credit Suisse Strategic Income Fund
Statement of Assets and Liabilities
October 31, 2015
Assets | |
Investments at value (Cost $143,647,499) (Note 2) | | $ | 135,543,874 | | |
Cash | | | 57,088 | | |
Foreign currency at value (cost $188,450) | | | 183,618 | | |
Interest receivable | | | 1,383,201 | | |
Receivable for investments sold | | | 801,746 | | |
Receivable for fund shares sold | | | 417,871 | | |
Unrealized appreciation on forward currency contracts (Note 2) | | | 99,648 | | |
Variation margin receivable on futures contracts (Note 2) | | | 42,107 | | |
Prepaid expenses | | | 39,444 | | |
Total assets | | | 138,568,597 | | |
Liabilities | |
Investment advisory fee payable (Note 3) | | | 67,141 | | |
Administrative services fee payable (Note 3) | | | 17,613 | | |
Shareholder servicing/Distribution fee payable (Note 3) | | | 16,196 | | |
Payable for investments purchased | | | 3,216,050 | | |
Unfunded loan commitments (Note 2-J) | | | 167,500 | | |
Payable for fund shares redeemed | | | 59,444 | | |
Dividend payable | | | 11,457 | | |
Trustees' fee payable | | | 7,332 | | |
Unrealized depreciation on forward currency contracts (Note 2) | | | 5,974 | | |
Accrued expenses | | | 83,328 | | |
Total liabilities | | | 3,652,035 | | |
Net Assets | |
Capital stock, $.001 par value (Note 6) | | | 13,786 | | |
Paid-in capital (Note 6) | | | 143,063,722 | | |
Accumulated net investment loss | | | (52,202 | ) | |
Accumulated net realized loss on investments, futures contracts and foreign currency transactions | | | (84,750 | ) | |
Net unrealized depreciation from investments, futures contracts and foreign currency translations | | | (8,023,994 | ) | |
Net assets | | $ | 134,916,562 | | |
I Shares | |
Net assets | | $ | 65,650,946 | | |
Shares outstanding | | | 6,709,839 | | |
Net asset value, offering price and redemption price per share | | $ | 9.78 | | |
A Shares | |
Net assets | | $ | 66,244,084 | | |
Shares outstanding | | | 6,767,654 | | |
Net asset value and redemption price per share | | $ | 9.79 | | |
Maximum offering price per share (net asset value/(1-4.75%)) | | $ | 10.28 | | |
C Shares | |
Net assets | | $ | 3,021,532 | | |
Shares outstanding | | | 308,655 | | |
Net asset value, offering price and redemption price per share | | $ | 9.79 | | |
See Accompanying Notes to Financial Statements.
22
Credit Suisse Strategic Income Fund
Statement of Operations
For the Year Ended October 31, 2015
Investment Income | |
Interest | | $ | 7,085,939 | | |
Dividends | | | 150,133 | | |
Total investment income | | | 7,236,072 | | |
Expenses | |
Investment advisory fees (Note 3) | | | 743,359 | | |
Administrative services fees (Note 3) | | | 111,781 | | |
Shareholder servicing/Distribution fees (Note 3) | |
Class A | | | 79,453 | | |
Class C | | | 25,418 | | |
Registration fees | | | 64,589 | | |
Audit and tax fees | | | 44,906 | | |
Legal fees | | | 34,420 | | |
Transfer agent fees (Note 3) | | | 30,800 | | |
Custodian fees | | | 28,128 | | |
Trustees' fees | | | 28,000 | | |
Printing fees | | | 21,984 | | |
Commitment fees (Note 4) | | | 16,385 | | |
Interest expense (Note 4) | | | 6,415 | | |
Insurance expense | | | 3,355 | | |
Miscellaneous expense | | | 10,966 | | |
Total expenses | | | 1,249,959 | | |
Less: fees waived (Note 3) | | | (157,439 | ) | |
Net expenses | | | 1,092,520 | | |
Net investment income | | | 6,143,552 | | |
Net Realized and Unrealized Gain (Loss) from Investments, Futures Contracts
and Foreign Currency Related Items | |
Net realized loss from investments | | | (1,183,886 | ) | |
Net realized loss from futures contracts | | | (178,201 | ) | |
Net realized gain from foreign currency transactions | | | 725,924 | | |
Net change in unrealized appreciation (depreciation) from investments | | | (5,688,085 | ) | |
Net change in unrealized appreciation (depreciation) from futures contracts | | | 19,499 | | |
Net change in unrealized appreciation (depreciation) from foreign currency translations | | | 58,313 | | |
Net realized and unrealized loss from investments, futures contracts and
foreign currency related items | | | (6,246,436 | ) | |
Net decrease in net assets resulting from operations | | $ | (102,884 | ) | |
See Accompanying Notes to Financial Statements.
23
Credit Suisse Strategic Income Fund
Statement of Changes in Net Assets
| | | For the Year
Ended
October 31, 2015 | | For the Year
Ended
October 31, 2014 | |
From Operations | |
Net investment income | | $ | 6,143,552 | | | $ | 6,941,698 | | |
Net realized gain (loss) from investments, futures contracts and
foreign currency transactions | | | (636,163 | ) | | | 1,920,471 | | |
Net change in unrealized appreciation (depreciation)
from investments, futures contracts and foreign currency translations | | | (5,610,273 | ) | | | (3,561,093 | ) | |
Net increase (decrease) in net assets resulting from operations | | | (102,884 | ) | | | 5,301,076 | | |
From Dividends and Distributions | |
Dividends from net investment income | |
Class I | | | (3,876,591 | ) | | | (3,618,640 | ) | |
Class A | | | (1,570,893 | ) | | | (3,298,831 | ) | |
Class C | | | (127,369 | ) | | | (62,248 | ) | |
Distributions from net realized gains | |
Class I | | | (1,613,222 | ) | | | (444,056 | ) | |
Class A | | | (305,637 | ) | | | (730,997 | ) | |
Class C | | | (41,391 | ) | | | (2,529 | ) | |
Return of Capital | |
Class I | | | (395,457 | ) | | | — | | |
Class A | | | (160,249 | ) | | | — | | |
Class C | | | (12,993 | ) | | | — | | |
Net decrease in net assets resulting from dividends and distributions | | | (8,103,802 | ) | | | (8,157,301 | ) | |
| From Capital Share Transactions (Note 6) | |
Proceeds from sale of shares | | | 94,917,773 | | | | 112,200,097 | | |
Reinvestment of dividends and distributions | | | 8,029,841 | | | | 8,113,603 | | |
Net asset value of shares redeemed | | | (58,476,549 | ) | | | (97,397,159 | )1 | |
Net increase in net assets from capital share transactions | | | 44,471,065 | | | | 22,916,541 | | |
Net increase in net assets | | | 36,264,379 | | | | 20,060,316 | | |
Net Assets | |
Beginning of year | | | 98,652,183 | | | | 78,591,867 | | |
End of year | | $ | 134,916,562 | | | $ | 98,652,183 | | |
Accumulated net investment loss | | $ | (52,202 | ) | | $ | (47,177 | ) | |
1 Net of $193 of redemption fees retained by the Fund.
See Accompanying Notes to Financial Statements.
24
Credit Suisse Strategic Income Fund
Statement of Cash Flows
October 31, 2015
RECONCILIATION OF NET INCREASE IN NET ASSETS FROM OPERATIONS TO
NET CASH PROVIDED BY OPERATING ACTIVITIES | |
Net decrease in net assets resulting from operations | | | | $ | (102,884 | ) | |
Adjustments to Reconcile Net Increase in Net Assets from Operations to
Net Cash Provided by (Used in) Operating Activities | |
Increase in interest receivable | | $ | (195,053 | ) | | | | | |
Decrease in accrued expenses | | | (35,876 | ) | | | | | |
Decrease in prepaid expenses and other assets | | | 97,647 | | | | | | |
Increase in advisory fees payable | | | 50,500 | | | | | | |
Net amortization of discount on investments | | | (369,424 | ) | | | | | |
Decrease in cash segregated at brokers | | | 72,600 | | | | | | |
Decrease in due to custodian | | | (2,076,814 | ) | | | | | |
Decrease in due to custodian for foreign currencies | | | (1,270,208 | ) | | | | | |
Purchases of long-term securities | | | (121,768,285 | ) | | | | | |
Proceeds from sales of long-term securities | | | 90,604,211 | | | | | | |
Sales of short-term securities, net | | | (7,382,592 | ) | | | | | |
Net change in unrealized (appreciation) depreciation from investments and
foreign currency translations | | | 5,638,307 | | | | | | |
Net change in unrealized (appreciation) depreciation from futures contracts | | | (19,499 | ) | | | | | |
Net realized loss from investments | | | 1,183,886 | | | | | | |
Net realized loss from futures | | | 178,201 | | | | | | |
Total adjustments | | | | | (35,292,399 | ) | |
Net cash provided by (used in) operating activities1 | | | | $ | (35,395,283 | ) | |
Cash Flows From Financing Activities | |
Borrowings on revolving credit facility | | | 19,376,500 | | | | | | |
Repayments of credit facility | | | (19,576,500 | ) | | | | | |
Proceeds from the sale of shares | | | 94,549,162 | | | | | | |
Net asset value of shares redeemed | | | (58,639,212 | ) | | | | | |
Cash dividends paid | | | (73,961 | ) | | | | | |
Net cash provided by (used in) financing activities | | | | | | | 35,635,989 | | |
Net increase in cash | | | | | | | 240,706 | | |
Cash — beginning of year | | | | | | | 0 | | |
Cash — end of year | | | | | | $ | 240,706 | | |
Non-Cash Activity: | |
Issuance of shares through dividend reinvestments | | | | $ | 8,029,841 | | |
1 Included in operating expenses is cash of $6,415 paid for interest on borrowings.
See Accompanying Notes to Financial Statements.
25
Credit Suisse Strategic Income Fund
Financial Highlights
(For a Class I Share of the Fund Outstanding Throughout Each Period)
| | | For the Year Ended October 31, | |
| | | 2015 | | 2014 | | 2013 | | 20121 | |
Per share data | |
Net asset value, beginning of period | | $ | 10.46 | | | $ | 10.65 | | | $ | 10.06 | | | $ | 10.00 | | |
INVESTMENT OPERATIONS | |
Net investment income2 | | | 0.66 | | | | 0.64 | | | | 0.61 | | | | 0.01 | | |
Net gain (loss) on investments, futures contracts
and foreign currency related items
(both realized and unrealized) | | | (0.46 | ) | | | (0.06 | ) | | | 0.60 | | | | 0.06 | | |
Total from investment operations | | | 0.20 | | | | 0.58 | | | | 1.21 | | | | 0.07 | | |
REDEMPTION FEES | | | — | | | | 0.003 | | | | 0.003 | | | | — | | |
LESS DIVIDENDS AND DISTRIBUTIONS | |
Dividends from net investment income | | | (0.60 | ) | | | (0.63 | ) | | | (0.60 | ) | | | (0.01 | ) | |
Distributions from net realized gains | | | (0.22 | ) | | | (0.14 | ) | | | (0.02 | ) | | | — | | |
Return of capital | | | (0.06 | ) | | | — | | | | — | | | | — | | |
Total dividends and distributions | | | (0.88 | ) | | | (0.77 | ) | | | (0.62 | ) | | | (0.01 | ) | |
Net asset value, end of period | | $ | 9.78 | | | $ | 10.46 | | | $ | 10.65 | | | $ | 10.06 | | |
Total return4 | | | 2.05 | % | | | 5.57 | % | | | 12.29 | % | | | 0.67 | % | |
RATIOS AND SUPPLEMENTAL DATA | |
Net assets, end of period (000s omitted) | | $ | 65,651 | | | $ | 81,868 | | | $ | 31,830 | | | $ | 20,710 | | |
Ratio of net expenses to average net assets | | | 1.00 | % | | | 1.00 | % | | | 0.99 | % | | | 0.99 | %5 | |
Ratio of expenses to average net assets
excluding interest expense | | | 0.99 | % | | | 0.99 | % | | | 0.99 | % | | | 0.99 | % | |
Ratio of net investment income to
average net assets | | | 6.59 | % | | | 5.94 | % | | | 5.77 | % | | | 0.87 | %5 | |
Decrease reflected in above operating expense
ratios due to waivers/reimbursements | | | 0.16 | % | | | 0.18 | % | | | 0.63 | % | | | 5.25 | %5 | |
Portfolio turnover rate | | | 85 | % | | | 124 | % | | | 159 | % | | | 31 | % | |
1 For the period September 28, 2012 (Inception Date) through October 31, 2012.
2 Per share information is calculated using the average shares outstanding method.
3 This amount represents less than $0.01 per share.
4 Total returns are historical and assume changes in share price and reinvestment of all dividends and distributions. Had certain expenses not been reduced during the periods shown, total returns would have been lower. Total returns for periods less than one year are not annualized.
5 Annualized.
See Accompanying Notes to Financial Statements.
26
Credit Suisse Strategic Income Fund
Financial Highlights
(For a Class A Share of the Fund Outstanding Throughout Each Period)
| | | For the Year Ended October 31, | |
| | | 2015 | | 2014 | | 2013 | | 20121 | |
Per share data | |
Net asset value, beginning of period | | $ | 10.47 | | | $ | 10.66 | | | $ | 10.07 | | | $ | 10.00 | | |
INVESTMENT OPERATIONS | |
Net investment income2 | | | 0.55 | | | | 0.58 | | | | 0.45 | | | | 0.003 | | |
Net gain (loss) on investments, futures contracts
and foreign currency related items
(both realized and unrealized) | | | (0.38 | ) | | | (0.02 | ) | | | 0.73 | | | | 0.08 | | |
Total from investment operations | | | 0.17 | | | | 0.56 | | | | 1.18 | | | | 0.08 | | |
REDEMPTION FEES | | | — | | | | 0.003 | | | | 0.003 | | | | — | | |
LESS DIVIDENDS AND DISTRIBUTIONS | |
Dividends from net investment income | | | (0.57 | ) | | | (0.61 | ) | | | (0.57 | ) | | | (0.01 | ) | |
Distributions from net realized gains | | | (0.22 | ) | | | (0.14 | ) | | | (0.02 | ) | | | — | | |
Return of capital | | | (0.06 | ) | | | — | | | | — | | | | — | | |
Total dividends and distributions | | | (0.85 | ) | | | (0.75 | ) | | | (0.59 | ) | | | (0.01 | ) | |
Net asset value, end of period | | $ | 9.79 | | | $ | 10.47 | | | $ | 10.66 | | | $ | 10.07 | | |
Total return4 | | | 1.78 | % | | | 5.28 | % | | | 11.94 | % | | | 0.76 | % | |
RATIOS AND SUPPLEMENTAL DATA | |
Net assets, end of period (000s omitted) | | $ | 66,244 | | | $ | 14,633 | | | $ | 46,573 | | | $ | 101 | | |
Ratio of net expenses to average net assets | | | 1.24 | % | | | 1.24 | % | | | 1.24 | % | | | 1.24 | %5 | |
Ratio of expenses to average net assets
excluding interest expense | | | 1.24 | % | | | 1.24 | % | | | 1.24 | % | | | 1.24 | % | |
Ratio of net investment income to
average net assets | | | 5.45 | % | | | 5.44 | % | | | 4.22 | % | | | 0.42 | %5 | |
Decrease reflected in above operating expense
ratios due to waivers/reimbursements | | | 0.16 | % | | | 0.18 | % | | | 0.63 | % | | | 5.25 | %5 | |
Portfolio turnover rate | | | 85 | % | | | 124 | % | | | 159 | % | | | 31 | % | |
1 For the period September 28, 2012 (Inception Date) through October 31, 2012.
2 Per share information is calculated using the average shares outstanding method.
3 This amount represents less than $0.01 per share.
4 Total returns are historical and assume changes in share price, reinvestment of all dividends and distributions and no sales charge. Had certain expenses not been reduced during the periods shown, total returns would have been lower. Total returns for periods less than one year are not annualized.
5 Annualized.
See Accompanying Notes to Financial Statements.
27
Credit Suisse Strategic Income Fund
Financial Highlights
(For a Class C Share of the Fund Outstanding Throughout Each Period)
| | | For the Year Ended October 31, | |
| | | 2015 | | 2014 | | 2013 | | 20121 | |
Per share data | |
Net asset value, beginning of period | | $ | 10.474 | | | $ | 10.65 | | | $ | 10.06 | | | $ | 10.00 | | |
INVESTMENT OPERATIONS | |
Net investment income (loss)2 | | | 0.55 | | | | 0.53 | | | | 0.50 | | | | (0.00 | )3 | |
Net gain (loss) on investments, futures contracts
and foreign currency related items
(both realized and unrealized) | | | (0.45 | ) | | | (0.05 | ) | | | 0.61 | | | | 0.06 | | |
Total from investment operations | | | 0.10 | | | | 0.48 | | | | 1.11 | | | | 0.06 | | |
REDEMPTION FEES | | | — | | | | 0.003 | | | | 0.003 | | | | — | | |
LESS DIVIDENDS AND DISTRIBUTIONS | |
Dividends from net investment income | | | (0.51 | ) | | | (0.52 | ) | | | (0.50 | ) | | | (0.00 | )3 | |
Distributions from net realized gains | | | (0.22 | ) | | | (0.14 | ) | | | (0.02 | ) | | | — | | |
Return of capital | | | (0.05 | ) | | | — | | | | — | | | | — | | |
Total dividends and distributions | | | (0.78 | ) | | | (0.66 | ) | | | (0.52 | ) | | | (0.00 | )3 | |
Net asset value, end of period | | $ | 9.79 | | | $ | 10.474 | | | $ | 10.65 | | | $ | 10.06 | | |
Total return5 | | | 1.14 | % | | | 4.53 | % | | | 11.18 | % | | | 0.62 | % | |
RATIOS AND SUPPLEMENTAL DATA | |
Net assets, end of period (000s omitted) | | $ | 3,022 | | | $ | 2,151 | | | $ | 189 | | | $ | 101 | | |
Ratio of net expenses to average net assets | | | 2.00 | % | | | 2.00 | % | | | 1.99 | % | | | 1.99 | %6 | |
Ratio of expenses to average net assets
excluding interest expense | | | 1.99 | % | | | 1.99 | % | | | 1.99 | % | | | 1.99 | % | |
Ratio of net investment income (loss) to
average net assets | | | 5.52 | % | | | 4.97 | % | | | 4.77 | % | | | (0.33 | )%6 | |
Decrease reflected in above operating expense
ratios due to waivers/reimbursements | | | 0.16 | % | | | 0.18 | % | | | 0.63 | % | | | 5.25 | %6 | |
Portfolio turnover rate | | | 85 | % | | | 124 | % | | | 159 | % | | | 31 | % | |
1 For the period September 28, 2012 (Inception Date) through October 31, 2012.
2 Per share information is calculated using the average shares outstanding method.
3 This amount represents less than $0.01 per share.
4 Includes adjustments in accordance with accounting principles generally accepted in the United States of America and as such, the net asset values for financial reporting purposes and the returns based upon net asset values may differ from the net asset values and returns for shareholder transactions.
5 Total returns are historical and assume changes in share price, reinvestment of all dividends and distributions and no sales charge. Had certain expenses not been reduced during the periods shown, total returns would have been lower. Total returns for periods less than one year are not annualized.
6 Annualized.
See Accompanying Notes to Financial Statements.
28
Credit Suisse Strategic Income Fund
Notes to Financial Statements
October 31, 2015
Credit Suisse Strategic Income Fund (the "Fund"), a series of the Credit Suisse Opportunity Funds (the "Trust"), a Delaware statutory trust, is registered under the Investment Company Act of 1940, as amended (the "1940 Act"), as a non-diversified open-end management investment company that seeks total return. The Trust was organized under the laws of the State of Delaware as a business trust on May 31, 1995.
The Fund offers three classes of shares: Class I shares, Class A shares and Class C shares. Each class of shares represents an equal pro rata interest in the Fund, except they bear different expenses, which reflect the differences in the range of services provided to them. Class A shares are sold subject to a front-end sales charge of up to 4.75%. Class C shares are sold subject to a contingent deferred sales charge of 1.00% if the shares are redeemed within the first year of purchase. Class I shares are sold without a sales charge.
Note 2. Significant Accounting Policies
The following is a summary of significant accounting policies followed by the Fund in the preparation of its financial statements. The policies are in accordance with accounting principles generally accepted in the United States of America ("GAAP"). The preparation of financial statements requires management to make estimates and assumptions that affect the reported amounts and disclosures in the financial statements. Actual results could differ from those estimates. The Fund is considered an investment company for financial reporting purposes under GAAP and follows Accounting Standard Codification ("ASC") Topic 946 — Financial Services — Investment Companies.
A) SECURITY VALUATION — The net asset value of the Fund is determined daily as of the close of regular trading on the New York Stock Exchange, Inc. (the "Exchange") on each day the Exchange is open for business. The valuations for fixed income securities (which may include, but are not limited to, corporate, government, municipal, mortgage-backed, collateralized mortgage obligations and asset-backed securities) and certain derivative instruments are typically the prices supplied by independent third party pricing services, which may use market prices or broker/dealer quotations or a variety of valuation techniques and methodologies. The independent third party pricing services use inputs that are observable such as issuer details, interest rates, yield curves, prepayment speeds, credit risks/spreads, default rates and quoted prices for similar securities. These pricing services generally price fixed income securities assuming orderly transactions of an institutional "round lot" size, but some trades occur in smaller
29
Credit Suisse Strategic Income Fund
Notes to Financial Statements (continued)
October 31, 2015
Note 2. Significant Accounting Policies (continued)
"odd lot" sizes which may be effected at lower prices than institutional round lot trades. Structured note agreements are valued in accordance with a dealer-supplied valuation based on changes in the value of the underlying index. Futures contracts are valued daily at the settlement price established by the board of trade or exchange on which they are traded. Forward contracts are valued at the London closing spot rates and the London closing forward point rates on a daily basis. The currency forward contract pricing model derives the differential in point rates to the expiration date of the forward and calculates its present value. Equity securities for which market quotations are available are valued at the last reported sales price or official closing price on the primary market or exchange on which they trade. The Fund may utilize a service provided by an independent third party which has been approved by the Board of Trustees (the "Board") to fair value certain securities. When fair value pricing is employed, the prices of securities used by the Fund to calculate its net asset value may differ from quoted or published prices for the same securities. If independent third party pricing services are unable to supply prices for a portfolio investment, or if the prices supplied are deemed by the investment adviser to be unreliable, the market price may be determined by the investment adviser using quotations from one or more broker/dealers or at the transaction price if the security has recently been purchased and no value has yet been obtained from a pricing service or pricing broker. When reliable prices are not readily available, such as when the value of a security has been significantly affected by events after the close of the exchange or market on which the security is principally traded, but before the Fund calculates its net asset value, the Fund values these securities as determined in accordance with procedures approved and established by the Board.
The Fund uses valuation techniques to measure fair value that are consistent with the market approach and/or income approach, depending on the type of security and the particular circumstance. The market approach uses prices and other relevant information generated by market transactions involving identical or comparable securities. The income approach uses valuation techniques to discount estimated future cash flows to present value.
GAAP established a disclosure hierarchy that categorizes the inputs to valuation techniques used to value assets and liabilities at each measurement date. These inputs are summarized in the three broad levels listed below:
• Level 1 – quoted prices in active markets for identical investments
• Level 2 – other significant observable inputs (including quoted prices for similar investments, interest rates, prepayment speeds, credit risk, etc.)
30
Credit Suisse Strategic Income Fund
Notes to Financial Statements (continued)
October 31, 2015
Note 2. Significant Accounting Policies (continued)
• Level 3 – significant unobservable inputs (including the Fund's own assumptions in determining the fair value of investments)
The inputs or methodologies used to value securities are not necessarily an indication of the risk associated with investing in those securities.
The following is a summary of the inputs used as of October 31, 2015 in valuing the Fund's assets and liabilities carried at fair value:
Assets | | Level 1 | | Level 2 | | Level 3 | | Total | |
Investments in Securities | |
Corporate Bonds | | $ | — | | | $ | 43,056,001 | | | $ | 21,954 | | | $ | 43,077,955 | | |
Bank Loans | | | — | | | | 53,053,894 | | | | 13,384,774 | | | | 66,438,668 | | |
Asset Backed Securities | | | — | | | | 15,853,365 | | | | — | | | | 15,853,365 | | |
Common Stocks | | | 117,200 | | | | 354,742 | | | | 74,800 | | | | 546,742 | | |
Mutual Funds | | | 90,552 | | | | — | | | | — | | | | 90,552 | | |
Short-term Investment | | | — | | | | 9,536,592 | | | | — | | | | 9,536,592 | | |
| | | $ | 207,752 | | | $ | 121,854,594 | | | $ | 13,481,528 | | | $ | 135,543,874 | | |
Other Financial Instruments* | |
Forward Foreign Currency Contracts | | $ | — | | | $ | 99,648 | | | $ | — | | | $ | 99,648 | | |
Liabilities | | Level 1 | | Level 2 | | Level 3 | | Total | |
Other Financial Instruments* | |
Forward Foreign Currency Contracts | | $ | — | | | $ | 5,974 | | | $ | — | | | $ | 5,974 | | |
Futures Contracts | | | 8,962 | | | | — | | | | — | | | | 8,962 | | |
*Other financial instruments include unrealized appreciation (depreciation) on forward foreign currency and futures contracts.
The following is a reconciliation of investments as of October 31, 2015 in which significant unobservable inputs were used in determining value. Transfers in or out of Level 3 represent the end of the period value of any security or instrument where a change in the level has occurred from the beginning to the end of the period.
| | | Bank Loans | | Corporate
Bonds | | Common
Stock | | Total | |
Balance as of October 31, 2014 | | $ | 4,286,562 | | | $ | — | | | $ | — | | | $ | 4,286,562 | | |
Accrued discounts (premiums) | | | (115,277 | ) | | | — | | | | — | | | | (115,277 | ) | |
Purchases | | | 6,831,164 | | | | — | | | | 74,800 | | | | 6,905,964 | | |
Sales | | | (2,872,275 | ) | | | — | | | | — | | | | (2,872,275 | ) | |
Realized gain (loss) | | | (597,353 | ) | | | — | | | | — | | | | (597,353 | ) | |
Change in unrealized appreciation (depreciation) | | | 111,105 | | | | — | | | | — | | | | 111,105 | | |
Transfers into Level 3 | | | 5,740,848 | | | | 21,954 | | | | — | | | | 5,762,802 | | |
Transfers out of Level 3 | | | — | | | | — | | | | — | | | | — | | |
Balance as of October 31, 2015 | | $ | 13,384,774 | | | $ | 21,954 | | | $ | 74,800 | | | $ | 13,481,528 | | |
Net change in unrealized appreciation (depreciation)
from investments still held as of October 31, 2015 | | $ | (250,437 | ) | | $ | — | | | $ | — | | | $ | (250,437 | ) | |
31
Credit Suisse Strategic Income Fund
Notes to Financial Statements (continued)
October 31, 2015
Note 2. Significant Accounting Policies (continued)
| | | Quantitative Disclosure About Significant Unobservable Inputs | |
Asset Class | | Fair Value
at 10/31/2015 | | Valuation
Techniques | | Unobservable
Input | | Range (Weighted Average)
(per share) | |
Corporate Bond | | $ | 21,954 | | | Vendor Pricing | | Single Broker Quote | | | NA | | |
Bank Loans | | $ | 13,383,765 | | | Vendor Pricing | | Single Broker Quote | | $ | 0.63 – $1.10 | ($0.95) | |
| | $ | 1,009 | | | Income Approach | | Expected Remaining
Distribution | | | NA | | |
Common Stock | | $ | 74,800 | | | Market Approach | | Discount For Illiquidity | | | NA | | |
Each fair value determination is based on a consideration of relevant factors, including both observable and unobservable inputs. Observable and unobservable inputs Credit Suisse Asset Managment LLC, the Fund's investment adviser ("Credit Suisse" or the "Adviser") considers may include (i) the existence of any contractual restrictions on the disposition of securities; (ii) information obtained from the company, which may include an analysis of the company's financial statements, the company's products or intended markets or the company's technologies; (iii) the price of the same or similar security negotiated at arm's length in an issuer's completed subsequent round of financing; (iv) the price and extent of public trading in similar securities of the issuer or of comparable companies; or (v) a probability and time value adjusted analysis of contractual term. Where available and appropriate, multiple valuation methodologies are applied to confirm fair value. Significant unobservable inputs identified by the Adviser are often used in the fair value determination. A significant change in any of these inputs may result in a significant change in the fair value measurement. Due to the uncertainty inherent in the valuation process, such estimates of fair value may differ significantly from the values that would have been used had a ready market for the investments existed, and differences could be material. Additionally, changes in the market environment and other events that may occur over the life of the investments may cause the gains or losses ultimately realized on these investments to be different from the valuations used at the date of these financial statements.
For the year ended October 31, 2015, there were $354,742 transferred out from Level 1 to Level 2 and $5,762,802 transferred out from Level 2 to Level 3 due to lack of pricing source supported by observable inputs. All transfers, if any, are assumed to occur at the end of the reporting period.
B) DERIVATIVE INSTRUMENTS AND HEDGING ACTIVITIES — The Fund adopted amendments to authoritative guidance on disclosures about derivative instruments and hedging activities which require that a fund disclose (a) how and why an entity uses derivative instruments, (b) how derivative instruments
32
Credit Suisse Strategic Income Fund
Notes to Financial Statements (continued)
October 31, 2015
Note 2. Significant Accounting Policies (continued)
and hedging activities are accounted for and (c) how derivative instruments and related hedging activities affect a fund's financial position, financial performance and cash flows. For the year ended October 31, 2015, the Fund's derivatives did not qualify for hedge accounting as they are held at fair value.
Fair Values of Derivative Instruments as of October 31, 2015
| | | Asset Derivatives | | Liability Derivatives | |
| | | Balance Sheet
Location | | Fair Value | | Balance Sheet
Location | | Fair Value | |
Currency Contracts | | Unrealized appreciation
on forward currency
contracts | | $ | 99,648 | | | Unrealized depreciation
on forward currency
contracts | | $ | 5,974 | | |
Interest Rate Contracts | | Unrealized appreciation
on futures contracts | | | — | | | Unrealized depreciation
on futures contracts | | | 8,962 | * | |
| | | | | | | $ | 99,648 | | | | | | | $ | 14,936 | | |
*Reflects cumulative appreciation (depreciation) of futures contracts as reported in the Statement of Assets and Liabilities and Notes to Financial Statements. The current day's variation margin reported within the Statement of Assets and Liabilities includes the cumulative appreciation (depreciation) of futures contracts.
Effect of Derivative Instruments on the Statement of Operations
| | | Location | | Realized
Gain(Loss) | | Location | | Net Unrealized
Appreciation
(Depreciation) | |
Currency Contracts | | |
Net realized gain from
forward currency
transactions* | | | $ | 836,134 | | | Net change in unrealized
appreciation (depreciation)
transactions* | | |
from forward currency
$49,778 | | |
Interest Rate
Contracts | | Net realized loss from
futures contracts | | | (178,201 | ) | | Net change in unrealized
appreciation (depreciation)
from futures contracts | | | 19,499 | | |
| | | | | $ | 657,933 | | | | | $ | 69,277 | | |
*Statement of Operations includes both forward currency contracts and foreign currency transactions/translations.
The value amount of forward foreign currency contracts and the notional amount of futures contracts at the year ended October 31, 2015 is reflected in the Schedule of Investments. For the year ended October 31, 2015, the Fund held an average monthly value on a net basis of $7,769,661 in forward foreign currency contracts and average monthly notional value on a net basis of $0 and $5,069,537 in long futures contracts and short future contracts, respectively.
The Fund is a party to International Swap and Derivatives Association, Inc. ("ISDA") Master Agreements ("Master Agreements") with certain counterparties that govern over-the-counter derivative (including Total Return, Credit Default and Interest Rate Swaps) and foreign exchange contracts entered
33
Credit Suisse Strategic Income Fund
Notes to Financial Statements (continued)
October 31, 2015
Note 2. Significant Accounting Policies (continued)
into by the Fund. The Master Agreements may contain provisions regarding, among other things, the parties' general obligations, representations, agreements, collateral requirements, events of default and early termination. Termination events applicable to the Fund may occur upon a decline in the Fund's net assets below a specified threshold over a certain period of time.
The following table presents by counterparty the Fund's derivative assets net of related collateral held by the Fund at October 31, 2015:
Counterparty | | Gross Amounts of
Assets Presented in
Statement of Assets
and Liabilities(a) | | Financial
Instruments
and Derivatives
Available for Offset | | Non-Cash
Collateral
Received | | Cash
Collateral
Received | | Net Amount
of Derivative
Assets | |
Morgan Stanley | | $ | 99,648 | | | $ | (5,974 | ) | | $ | — | | | $ | — | | | $ | 93,674 | | |
The following table presents by counterparty the Fund's derivative liabilities net of related collateral pledged by the Fund at October 31, 2015:
Counterparty | | Gross Amounts of
Liabilities Presented in
Statement of Assets
and Liabilities(a) | | Financial
Instruments
and Derivatives
Available for Offset | | Non-Cash
Collateral
Pledged | | Cash
Collateral
Pledged | | Net Amount
of Derivative
Liabilities | |
Morgan Stanley | | $ | 5,974 | | | $ | (5,974 | ) | | $ | — | | | $ | — | | | $ | — | | |
(a) Forward foreign currency exchange contracts are included.
C) FOREIGN CURRENCY TRANSACTIONS — The books and records of the Fund are maintained in U.S. dollars. Transactions denominated in foreign currencies are recorded at the current prevailing exchange rates. All assets and liabilities denominated in foreign currencies are translated into U.S. dollar amounts at the current exchange rate at the end of the period. Translation gains or losses resulting from changes in the exchange rate during the reporting period and realized gains and losses on the settlement of foreign currency transactions are reported in the results of operations for the current period. The Fund isolates that portion of realized gains and losses on investments which is due to changes in the foreign exchange rate from that which is due to changes in market prices.
D) SECURITY TRANSACTIONS AND INVESTMENT INCOME/EXPENSE — Security transactions are accounted for on a trade date basis. Interest income/expense is recorded on the accrual basis. The Fund amortizes premiums and accretes discounts using the effective interest method. Dividend income/expense is recorded on the ex-dividend date. Certain expenses are class-specific expenses, vary by class and are charged only to that class. Income,
34
Credit Suisse Strategic Income Fund
Notes to Financial Statements (continued)
October 31, 2015
Note 2. Significant Accounting Policies (continued)
expenses (excluding class-specific expenses) and realized/unrealized gains/losses are allocated proportionately to each class of shares based upon the relative net asset value of the outstanding shares of that class. The cost of investments sold is determined by use of the specific identification method for both financial reporting and income tax purposes.
E) DIVIDENDS AND DISTRIBUTIONS TO SHAREHOLDERS — Dividends from net investment income, if any, are declared daily and paid monthly. Distributions of net realized capital gains, if any, are declared and paid at least annually. However, to the extent that a net realized capital gain can be reduced by a capital loss carryforward, such gain will not be distributed. Income and capital gain distributions are determined in accordance with federal income tax regulations, which may differ from GAAP.
F) FEDERAL INCOME TAXES — No provision is made for federal taxes as it is the Fund's intention to continue to qualify as a regulated investment company ("RIC") under the Internal Revenue Code of 1986, as amended (the "Code"), and to make the requisite distributions to its shareholders, which will be sufficient to relieve it from federal income and excise taxes.
In order to qualify as a RIC under the Code, the Fund must meet certain requirements regarding the source of its income, the diversification of its assets and the distribution of its income. One of these requirements is that the Fund derive at least 90% of its gross income for each taxable year from dividends, interest, payments with respect to certain securities loans, gains from the sale or other disposition of stock, securities or foreign currencies, other income derived with respect to its business of investing in such stock, securities or currencies or net income derived from interests in certain publicly traded partnerships ("Qualifying Income"). The Fund adopted the authoritative guidance for uncertainty in income taxes and recognizes a tax benefit or liability from an uncertain position only if it is more likely than not that the position is sustainable based solely on its technical merits and consideration of the relevant taxing authority's widely understood administrative practices and procedures. The Fund has reviewed its current tax positions and has determined that no provision for income tax is required in the Fund's financial statements. The Fund's federal tax returns for the prior three fiscal years remain subject to examination by the Internal Revenue Service.
G) SHORT-TERM INVESTMENTS — The Fund, together with other funds/portfolios advised by Credit Suisse, pools available cash into a short-term variable rate time deposit issued by State Street Bank and Trust Company
35
Credit Suisse Strategic Income Fund
Notes to Financial Statements (continued)
October 31, 2015
Note 2. Significant Accounting Policies (continued)
("SSB"), the Fund's custodian. The short-term time deposit issued by SSB is a variable rate account classified as a short-term investment.
H) FUTURES — The Fund may enter into futures contracts to the extent permitted by its investment policies and objectives. The Fund may use futures contracts to gain exposure to or hedge against changes in interest rates, equity and market price movements and/or currency risks. Upon entering into a futures contract, the Fund is required to deposit cash and/or pledge U.S. Government securities as initial margin. Subsequent payments, which are dependent on the daily fluctuations in the value of the underlying instrument, are made or received by the Fund each day (daily variation margin) and are recorded as unrealized gains or losses until the contracts are closed. When the contracts are closed, the Fund records a realized gain or loss equal to the difference between the proceeds from (or cost of) the closing transactions and the Fund's basis in the contract. Risks of entering into futures contracts for hedging purposes include the possibility that a change in the value of the contract may not correlate with the changes in the value of the underlying instruments. With futures, there is minimal counterparty credit risk to the Fund since futures are exchange traded and the exchange's clearinghouse, as counterparty to all exchange traded futures, guarantees the futures against default. In addition, the purchase of a futures contract involves the risk that the Fund could lose more than the original margin deposit and subsequent payments may be required for a futures transaction. The Fund's open futures contracts are disclosed in the Schedule of Investments. At October 31, 2015, the amount of restricted cash held at brokers was $0.
I) FORWARD FOREIGN CURRENCY CONTRACTS — A forward foreign currency exchange contract ("forward currency contract") is a commitment to purchase or sell a foreign currency at the settlement date at a negotiated rate. The Fund will enter into forward foreign currency contracts primarily for hedging foreign currency risk. Forward currency contracts are valued at the prevailing forward exchange rate of the underlying currencies and unrealized gain (loss) is recorded daily. On the settlement date of the forward currency contract, the Fund records a realized gain or loss equal to the difference between the value of the contract at the time it was opened and the value of the contract at the time it was closed. Certain risks may arise upon entering into forward currency contracts from the potential inability of counterparties to meet the terms of their contracts. The maximum counterparty credit risk to the Fund is measured by the unrealized gain on appreciated contracts. Additionally, when utilizing forward currency contracts to hedge, the Fund
36
Credit Suisse Strategic Income Fund
Notes to Financial Statements (continued)
October 31, 2015
Note 2. Significant Accounting Policies (continued)
gives up the opportunity to profit from favorable exchange rate movements during the term of the contract. The Fund's open forward foreign currency contracts at October 31, 2015 are disclosed in the Schedule of Investments. The Fund's open forward foreign currency contracts at October 31, 2015 are disclosed in the Schedule of Investments.
J) UNFUNDED LOAN COMMITMENTS — The Fund enters into certain agreements, all or a portion of which may be unfunded. The Fund is obligated to fund these loan commitments at the borrowers' discretion. Funded portions of credit agreements are presented on the Schedule of Investments. As of October 31, 2015, unfunded commitments were as follows:
Borrower | | Maturity | | Rate | | Unfunded Commitment | |
ABG Intermediate Holdings 2 LLC | | 05/27/21 | | | 4.500 | | | $ | 167,500 | | |
Unfunded loan commitments and funded portions of credit agreements are marked to market daily and any unrealized appreciation or depreciation is included in the Statement of Assets and Liabilities and the Statement of Operations.
K) SECURITIES LENDING — Loans of securities are required at all times to be secured by collateral at least equal to 102% of the market value of domestic securities on loan (including any accrued interest thereon) and 105% of the market value of foreign securities on loan (including any accrued interest thereon). Cash collateral received by the Fund in connection with securities lending activity may be pooled together with cash collateral for other funds/portfolios advised by Credit Suisse and may be invested in a variety of investments, including funds advised by SSB, the Fund's securities lending agent or money market instruments. However, in the event of default or bankruptcy by the other party to the agreement, realization and/or retention of the collateral may be subject to legal proceedings.
SSB has been engaged by the Fund to act as the Fund's securities lending agent. The Fund's securities lending arrangement provides that the Fund and SSB will share the net income earned from securities lending activities. During the year ended October 31, 2015, there were no securities out on loan. Securities lending income is accrued as earned.
L) OTHER — The high yield, fixed income securities in which the Fund invests will primarily consist of senior secured floating rate loans ("Senior Loans") issued by non-investment grade companies. Senior Loans are typically secured by specific collateral of the issuer and hold the most senior position in
37
Credit Suisse Strategic Income Fund
Notes to Financial Statements (continued)
October 31, 2015
Note 2. Significant Accounting Policies (continued)
the issuer's capital structure. The interest rate on Senior Loans is periodically adjusted to a recognized base rate, typically the London Interbank Offered Rate ("LIBOR"). While these characteristics may reduce interest rate risk and mitigate losses in the event of borrower default, the Senior Loans in which the Fund invests have below investment grade credit ratings and thereby are considered speculative because of the significant credit risk of their issuers.
Lower-rated debt securities (commonly known as "junk bonds") possess speculative characteristics and are subject to greater market fluctuations and risk of lost income and principal than higher-rated debt securities for a variety of reasons. Also, during an economic downturn or substantial period of rising interest rates, highly leveraged issuers may experience financial stress which would adversely affect their ability to service their principal and interest payment obligations, to meet projected business goals and to obtain additional financing.
In addition, periods of economic uncertainty and changes can be expected to result in increased volatility of market prices of lower-rated debt securities and the Fund's net asset value.
M) NEW ACCOUNTING PRONOUNCEMENTS — In June 2014, Financial Accounting Standards Board ("FASB") issued ASU No. 2014-11, Transfers and Servicing (Topic 860), Repurchase-to-Maturity Transactions, Repurchase Financings, and Disclosures. The ASU changes the accounting for certain repurchase agreements and expands disclosure requirements related to repurchase agreements, securities lending, repurchase-to-maturity and similar transactions. The ASU is effective for interim and annual reporting periods beginning after December 15, 2014. Management has reviewed the requirements and believes the adoption of this ASU will not have a material impact on the financial statements.
On April 7, 2015, the FASB issued a new ASU No. 2015-03, "Simplifying the Presentation of Debt Issuance Costs". The ASU requires debt issuance costs to be presented on the balance sheet as a direct deduction from the debt liability. The ASU is effective for interim and annual reporting periods beginning after December 15, 2015. Management has reviewed the requirements and believes the adoption of this ASU will not have a material impact on the financial statements.
In May 2015, the FASB issued ASU No. 2015-07, "Disclosures for Investments in Certain Entities that Calculate Net Asset Value per Share (or its Equivalent)". The guidance removes the requirement to categorize within the fair value hierarchy all investments for which fair value is measured using the NAV per
38
Credit Suisse Strategic Income Fund
Notes to Financial Statements (continued)
October 31, 2015
Note 2. Significant Accounting Policies (continued)
share practical expedient. Sufficient information must be provided to permit reconciliation of the fair value of assets categorized within the fair value hierarchy to the amounts presented in the Statement of Assets and Liabilities. The guidance is required to be presented for annual periods beginning after December 15, 2015, and for interim periods within those fiscal years. Management is currently viewing the requirements and believes the adoption of this ASU will not have a material impact on its financial statements.
N) SUBSEQUENT EVENTS — In preparing the financial statements as of October 31, 2015, management considered the impact of subsequent events for potential recognition or disclosure in these financial statements through the date of release of this report. No such events requiring recognition or disclosure were identified through the date of the release of this report.
Note 3. Transactions with Affiliates and Related Parties
Credit Suisse serves as investment adviser for the Fund. For its investment advisory services, Credit Suisse is entitled to receive a fee from the Fund at an annual rate of 0.75% of the Fund's average daily net assets. For the year ended October 31, 2015, investment advisory fees earned and fees waived/expenses reimbursed were $743,359 and $157,439, respectively. The Fund is authorized to reimburse Credit Suisse for management fees previously limited and/or for expenses previously paid by Credit Suisse, provided, however, that any reimbursements must be paid at a date not more than three years after the end of the fiscal year during which such fees were limited or expenses were reimbursed by Credit Suisse and the reimbursements do not cause a class to exceed the applicable expense limitation in the contract at the time the fees were limited or expenses are paid. This contract may not be terminated before February 28, 2017. Currently, Credit Suisse contractually waives fees and reimburses expenses so that the Fund's annual operating expenses (excluding interest expense) will not exceed 0.99% of the Fund's average daily net assets for Class I shares, 1.24% of the Fund's average daily net assets for Class A shares, and 1.99% of the Fund's average daily net assets for Class C shares.
39
Credit Suisse Strategic Income Fund
Notes to Financial Statements (continued)
October 31, 2015
Note 3. Transactions with Affiliates and Related Parties (continued)
For the year ended October 31, 2015, the amounts waived and reimbursed by Credit Suisse, as well as the amounts available for recoupment/potential future recoupment by Credit Suisse and the expiration schedule at October 31, 2015 are as follows:
| | | Fee waivers/expense
reimbursements subject
to repayment | | Expires October 31,
2016 | | Expires October 31,
2017 | | Expires October 31,
2018 | |
Class I | | $ | 387,370 | | | $ | 174,496 | | | $ | 110,479 | | | $ | 102,395 | | |
Class A | | | 244,132 | | | | 83,111 | | | | 110,046 | | | | 50,975 | | |
Class C | | | 7,312 | | | | 960 | | | | 2,283 | | | | 4,069 | | |
Totals | | $ | 638,814 | | | $ | 258,567 | | | $ | 222,808 | | | $ | 157,439 | | |
Fee waivers/expense reimbursements subject to potential recoupment in the amount of $66,964 expired on October 31, 2015.
Credit Suisse Asset Management Limited ("Credit Suisse U.K."), an affiliate of Credit Suisse, serves as sub-investment advisor to the Fund. Credit Suisse U.K.'s sub-investment advisor fees are paid by Credit Suisse.
Credit Suisse and SSB serve as co-administrators to the Fund. For its co-administrative services, Credit Suisse received a fee calculation at an annual rate of 0.09% of the Fund's average daily net assets. For the year ended October 31, 2015, co-administrative services fees earned by Credit Suisse were $89,203.
For its co-administrative services, SSB receives a fee, exclusive of out-of-pocket expenses, calculated in total for all the Credit Suisse funds/portfolios co-administered by SSB and allocated based upon the relative average net assets of each fund/portfolio, subject to an annual minimum fee. For the year ended October 31, 2015, co-administrative services fees earned by SSB (including out-of-pocket expenses) with respect to the Fund were $22,578.
Credit Suisse Securities (USA) LLC ("CSSU"), an affiliate of Credit Suisse, serves as the distributor of the Fund's shares. Pursuant to distribution plans adopted by the Fund pursuant to Rule 12b-1 under the 1940 Act, CSSU received fees for its distribution services. These fees were calculated at an annual rate of 0.25% of the average daily net assets of the Class A shares. For the Class C shares, the fee is calculated at an annual rate of 1.00% of the average daily net assets. For the year ended October 31, 2015, the Fund paid Rule 12b-1 distribution fees of $79,453 for Class A shares and $25,418 for Class C shares. Class I shares are not subject to Rule 12b-1 distribution fees.
40
Credit Suisse Strategic Income Fund
Notes to Financial Statements (continued)
October 31, 2015
Note 3. Transactions with Affiliates and Related Parties (continued)
Certain brokers, dealers and financial representatives provide transfer agent related services to the Fund and receive compensation from the Fund. For the year ended October 31, 2015, the Fund paid $36,194, which is included within transfer agent fees on the Statement of Operations.
For the year ended October 31, 2015, CSSU and its affiliates advised the Fund that they retained $2,059 from commissions earned on the sale of the Fund's Class A shares. There were no commissions earned on sale of Class C shares.
Note 4. Line of Credit
The Fund, together with other funds/portfolios advised by Credit Suisse (collectively, the "Participating Funds"), participates in a committed, unsecured line of credit facility ("Credit Facility"), in an aggregated amount of $200 million for temporary or emergency purposes with SSB under a first-come, first-served basis. Under the terms of the Credit Facility, the Participating Funds pay an aggregate commitment fee on the average unused amount of the Credit Facility, which is allocated among the Participating Funds in such manner as is determined by the governing Boards of the Participating Funds. In addition, the Participating Funds pay interest on borrowings at either the Overnight Federal Funds rate or the Overnight LIBOR rate plus a spread. At October 31, 2015, the Fund had loans outstanding under the Credit Facility of $0. At October 31, 2015, and during the year ended October 31, 2015, the Fund had borrowings under the Credit Facility as follows:
Average Daily
Loan Balance | | Weighted Average
Interest Rate % | | Maximum Daily
Loan Outstanding | | Interest
Expense | |
| $ | 458,085 | | | | 1.381 | % | | $ | 10,632,000 | | | $ | 6,415 | | |
Note 5. Purchases and Sales of Securities
For the year ended October 31, 2015, purchases and sales of investment securities (excluding short-term investments) were $119,291,922 and $81,545,437, respectively.
41
Credit Suisse Strategic Income Fund
Notes to Financial Statements (continued)
October 31, 2015
Note 6. Capital Share Transactions (continued)
The Fund is authorized to issue an unlimited number of full and fractional shares of beneficial interest, $.001 par value per share. The Fund offers Class I, Class A and Class C shares. Transactions in capital shares for each class of the Fund were as follows:
| | | Class I | |
| | | For the Year Ended
October 31, 2015 | | For the Year Ended
October 31, 2014 | |
| | | Shares | | Value | | Shares | | Value | |
Shares sold | | | 2,163,780 | | | $ | 21,626,181 | | | | 5,577,837 | | | $ | 59,942,455 | | |
Shares issued in reinvestment of
dividends and distributions | | | 584,614 | | | | 5,854,342 | | | | 379,603 | | | | 4,049,153 | | |
Shares redeemed | | | (3,861,721 | ) | | | (38,745,731 | ) | | | (1,122,241 | ) | | | (11,944,176 | ) | |
Net increase (decrease) | | | (1,113,327 | ) | | $ | (11,265,208 | ) | | | 4,835,199 | | | $ | 52,047,432 | | |
| | | Class A | |
| | | For the Year Ended
October 31, 2015 | | For the Year Ended
October 31, 2014 | |
| | | Shares | | Value | | Shares | | Value | |
Shares sold | | | 7,083,713 | | | $ | 71,922,814 | | | | 4,657,884 | | | $ | 50,152,817 | | |
Shares issued in reinvestment of
dividends and distributions | | | 201,047 | | | | 2,002,854 | | | | 374,142 | | | | 4,003,351 | | |
Shares redeemed net of
redemption fees | | | (1,914,221 | ) | | | (19,207,088 | ) | | | (8,003,989 | ) | | | (85,310,897 | ) | |
Net increase (decrease) | | | 5,370,539 | | | $ | 54,718,580 | | | | (2,971,963 | ) | | $ | (31,154,729 | ) | |
| | | Class C | |
| | | For the Year Ended
October 31, 2015 | | For the Year Ended
October 31, 2014 | |
| | | Shares | | Value | | Shares | | Value | |
Shares sold | | | 137,898 | | | $ | 1,368,778 | | | | 195,368 | | | $ | 2,104,825 | | |
Shares issued in reinvestment of
dividends and distributions | | | 17,251 | | | | 172,645 | | | | 5,727 | | | | 61,099 | | |
Shares redeemed net of
redemption fees | | | (51,935 | ) | | | (523,730 | ) | | | (13,405 | ) | | | (142,086 | ) | |
Net increase | | | 103,214 | | | $ | 1,017,693 | | | | 187,690 | | | $ | 2,023,838 | | |
On October 31, 2015, the number of shareholders that held 5% or more of the outstanding shares of each class of the Fund was as follows:
| | | Number of
Shareholders | | Approximate Percentage
of Outstanding Shares | |
Class I | | | 4 | * | | | 78 | % | |
Class A | | | 3 | | | | 89 | % | |
Class C | | | 2 | | | | 45 | % | |
*This includes the seed money from Merchant Holding, Inc., an affiliate of Credit Suisse.
42
Credit Suisse Strategic Income Fund
Notes to Financial Statements (continued)
October 31, 2015
Note 6. Capital Share Transactions (continued)
Some of the shareholders are omnibus accounts, which hold shares on behalf of individual shareholders.
Note 7. Federal Income Taxes
Income and capital gain distributions are determined in accordance with federal income tax regulations, which may differ from GAAP.
The tax characteristics of dividends paid during the years ended October 31, 2015 and 2014, respectively, by the Fund were as follows:
Ordinary Income | | Long-Term Capital Gain | | Return of Capital | |
| 2015 | | 2014 | | 2015 | | 2014 | | 2015 | | 2014 | |
| $ | 6,780,225 | | | $ | 8,077,239 | | | $ | 754,878 | | | $ | 80,062 | | | $ | 568,699 | | | $ | — | | |
The tax basis components of distributable earnings differ from the amounts reflected in the Statement of Assets and Liabilities by temporary book/tax differences. These differences are primarily due to differing treatments of dividends payable, wash sales, forwards and futures contracts marked to market and deferred organizational expenses. At October 31, 2015, the components of distributable earnings on a tax basis were as follows:
Unrealized depreciation | | $ | (8,108,742 | ) | |
At October 31, 2015, the cost of investments (excluding foreign currency related transactions) and net unrealized appreciation (depreciation) for income tax purposes were as follows:
Cost of Investments | | $ | 143,647,537 | | |
Unrealized appreciation | | $ | 783,895 | | |
Unrealized depreciation | | | (8,887,558 | ) | |
Net unrealized appreciation (depreciation) | | $ | (8,103,663 | ) | |
At October 31, 2015, the Fund reclassified $(573,724) from accumulated net investment income and $573,724 from accumulated net realized loss to paid in capital, to adjust for current period permanent book/tax differences which arose principally from differing book/tax treatment of foreign currency gain (loss), and distribution re-designations. Net assets were not affected by these reclassifications.
Note 8. Contingencies
In the normal course of business, the Fund may provide general indemnifications pursuant to certain contracts and organizational documents.
43
Credit Suisse Strategic Income Fund
Notes to Financial Statements (continued)
October 31, 2015
Note 8. Contingencies (continued)
The Fund's maximum exposure under these arrangements is dependent on future claims that may be made against the Fund and, therefore, cannot be estimated; however, based on experience, the risk of loss from such claims is considered remote.
Note 9. Other Matters
On May 19, 2014, the U.S. Department of Justice (the "Department of Justice") filed a one-count criminal information (the "Information") in the District Court for the Eastern District of Virginia (the "District Court") charging Credit Suisse AG ("CSAG") with conspiracy to commit tax fraud related to accounts CSAG established for cross-border clients. The Department of Justice and CSAG entered into a plea agreement (the "Plea Agreement") settling the action pursuant to which CSAG pleaded guilty to the charge set out in the Information.
The Plea Agreement requires CSAG to pay over $1.8 billion to the U.S. government, including the U.S. Internal Revenue Service. The Plea Agreement also requires CSAG to lawfully undertake certain remedial actions to address the conduct described in the Plea Agreement.
CSAG has entered into other settlements relating to the conduct set out in the Plea Agreement. CSAG has entered into a Consent Order with the Federal Reserve Board (the "Federal Reserve") to resolve certain findings by the Federal Reserve, including that the activities of CSAG regarding opening of foreign accounts for U.S. taxpayers, provision of investment services to U.S. clients, and operation of CSAG's New York representative office prior to 2009 lacked adequate enterprise-wide risk management and compliance policies and procedures sufficient to ensure that all of its activities comply with U.S. laws and regulations. In addition, CSAG has entered into a Consent Order with the New York State Department of Financial Services (the "DFS") to resolve the DFS's investigation into the conduct described in the Plea Agreement. The settlement with the Federal Reserve requires CSAG to pay $100 million to the Federal Reserve, and the settlement with the DFS requires CSAG to pay $715 million to the DFS.
These settlements follow a settlement by Credit Suisse Group AG ("CS Group"), the parent company of CSAG, with the Securities and Exchange Commission (the "Commission") on February 21, 2014 to resolve an investigation by the Commission into solicitation and provision of broker-dealer and investment advisory services to certain U.S. cross-border clients by CS Group while not registered with the Commission as a broker-dealer or investment adviser. As part of the settlement, CS Group retained an
44
Credit Suisse Strategic Income Fund
Notes to Financial Statements (continued)
October 31, 2015
Note 9. Other Matters (continued)
independent consultant to evaluate its policies and procedures and examine its broker-dealer and investment adviser activities to fully verify that the business that was the subject of the Commission investigation has been completely exited. CS Group also agreed to pay $196,511,014, which includes $82,170,990 in disgorgement, $64,340,024 in interest and a $50,000,000 penalty.
CSAG is the indirect parent company of Credit Suisse and CSSU. Neither Credit Suisse, CSSU nor the Fund was named in the Plea Agreement (as defined above) or other settlements relating to the conduct set out in the Plea Agreement. The conduct set out in the Plea Agreement did not involve the Fund, Credit Suisse or CSSU with respect to its investment adviser and distribution activities relating to the Fund.
Credit Suisse, CSSU and certain of their affiliates have received a permanent exemptive order from the Commission to permit them to continue serving as investment advisers and principal underwriters for U.S.-registered investment companies, such as the Fund. Due to a provision in the law governing the operation of U.S.-registered investment companies, they would otherwise have become ineligible to perform these activities as a result of the plea in the Plea Agreement. The permanent exemptive order permits Credit Suisse and CSSU to continue to provide services to the Fund, so long as, among other things, no current or former employee of CSAG or any affiliate of CSAG who previously has been or who subsequently may be identified by CSAG or any U.S. or non-U.S. regulatory or enforcement agencies as having been responsible for the conduct described in the Plea Agreement will be employed by Credit Suisse and certain of its affiliates. Credit Suisse and CSSU have informed the Fund that, Credit Suisse and CSSU believe the Settlements will not have any material impact on the Fund or on the ability of Credit Suisse or CSSU to perform services for the Fund.
On November 21, 2014, at the sentencing hearing, the District Court accepted and implemented the sentence as set out in the Plea Agreement. The District Court imposed no additional conditions beyond those contained in the Plea Agreement.
45
Credit Suisse Strategic Income Fund
Report of Independent Registered Public Accounting Firm
The Board of Trustees and Shareholders
Credit Suisse Strategic Income Fund:
We have audited the accompanying statement of assets and liabilities of Credit Suisse Strategic Income Fund (the "Fund"), a series of the Credit Suisse Opportunity Funds, including the schedule of investments, as of October 31, 2015, and the related statements of operations, changes in net assets, cash flows and financial highlights for the year then ended. These financial statements and financial highlights are the responsibility of the Fund's management. Our responsibility is to express an opinion on these financial statements and financial highlights based on our audit. The accompanying statement of changes in net assets of the Fund for the year ended October 31, 2014, and the financial highlights for each of the years or period in the three-year period ended October 31, 2014 were audited by other independent registered public accountants whose report thereon dated December 29, 2014, expressed an unqualified opinion on that financial statement and those financial highlights.
We conducted our audit in accordance with the standards of the Public Company Accounting Oversight Board (United States). Those standards require that we plan and perform the audit to obtain reasonable assurance about whether the financial statements and financial highlights are free of material misstatement. An audit includes examining, on a test basis, evidence supporting the amounts and disclosures in the financial statements. Our procedures included confirmation of securities owned as of October 31, 2015, by correspondence with the custodian and broker or by other appropriate auditing procedures. An audit also includes assessing the accounting principles used and significant estimates made by management, as well as evaluating the overall financial statement presentation. We believe that our audit provides a reasonable basis for our opinion.
In our opinion, the 2015 financial statements and financial highlights referred to above present fairly, in all material respects, the financial position of Credit Suisse Strategic Income Fund as of October 31, 2015, the results of its operations, changes in its net assets, cash flows and the financial highlights for the year then ended, in conformity with U.S. generally accepted accounting principles.
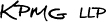
New York, New York
December 30, 2015
46
Credit Suisse Strategic Income Fund
Information Concerning Trustees and Officers (unaudited)
Name, Address
(Year of Birth) | | Position(s)
Held with
Fund | | Term
of Office1
and
Length
of Time
Served | | Principal
Occupation(s) During
Past Five Years | | Number of
Portfolios
in Fund
Complex
Overseen
by Trustee | | Other
Trusteeships
Held by Trustee | |
Independent Trustees | | | | | | | | | | | |
Enrique Arzac
c/o Credit Suisse Asset
Management, LLC
Attn: General Counsel
One Madison Avenue
New York, New York
10010
(1941) | | Trustee, Audit Committee Chairman and Nominating Committee Member | | Since Fund Inception | | Professor of Finance and Economics, Graduate School of Business, Columbia University since 1971. | | | 14 | | | Director of Adams Diversified Equity Fund, Inc., Adams Natural Resources Fund, Inc., Aberdeen Chile Fund, Inc., Aberdeen Emerging Markets Smaller Company Opportunities Fund, Inc., Aberdeen Israel Fund, Inc., Aberdeen Indonesia Fund, Inc. and Aberdeen Latin America Equity Fund, Inc. (each a closed-end investment company); Director of Aberdeen Asia-Pacific Income Investment Company Limited (a Canadian closed-end fund); Trustee of Mirae Asset Discovery Funds (7 open-end portfolios); Director of Starcomms PLC (telecommunications company) from 2008 to 2011; Director of Epoch Holding Corporation (an investment management and investment advisory services company) from 2006 to March 2013. | |
1 Each Trustee and Officer serves until his or her respective successor has been duly elected and qualified.
47
Credit Suisse Strategic Income Fund
Information Concerning Trustees and Officers (unaudited) (continued)
Name, Address
(Year of Birth) | | Position(s)
Held with
Fund | | Term
of Office1
and
Length
of Time
Served | | Principal
Occupation(s) During
Past Five Years | | Number of
Portfolios
in Fund
Complex
Overseen
by Trustee | | Other
Trusteeships
Held by Trustee | |
Independent Trustees | | | | | | | | | | | |
Jeffrey E. Garten
c/o Credit Suisse Asset
Management, LLC
Attn: General Counsel
One Madison Avenue
New York, New York
10010
(1946) | | Trustee, Audit and Nominating Committee Member Since Fund Inception | | Since Fund Inception | | Dean Emeritus of Yale School of Management from July 2015 to present; The Juan Trippe Professor in the Practice of International Trade, Finance and Business from July 2005 to July 2015; Partner and Chairman of Garten Rothkopf (consulting firm) from October 2005 to present. | | | 11 | | | Director of Aetna, Inc. (insurance company); Director of CarMax Group (used car dealers); Director of Miller Buckfire & Co., LLC (financial restructuring); Member of Standard & Poor's Board of Managers (credit rating agency) from December 2011 to November 2014. | |
Steven N. Rappaport
Lehigh Court, LLC
555 Madison Avenue
29th Floor
New York, New York
10022
(1948) | | Chairman of the Board of Trustees, Audit Committee Member and Nominating Committee Chairman | | Since Fund Inception | | Partner of Lehigh Court, LLC and RZ Capital (private investment firms) from July 2002 to present; Partner of Backstage Acquisition Holding, LLC (Publication Job Postings) from November 2013 to present. | | | 14 | | | Director of iCAD, Inc. (surgical and medical instruments and apparatus company); Director of Aberdeen Chile Fund, Inc., Aberdeen Emerging Markets Smaller Company Opportunities Fund, Inc., Aberdeen Israel Fund, Inc., Aberdeen Indonesia Fund, Inc. and Aberdeen Latin America Equity Fund, Inc. (each a closed-end investment company); Director of Presstek, Inc. (digital imaging technologies company) from 2003 to 2012; Director of Wood Resources, LLC (plywood manufacturing company) from 2003 to October 2013. | |
1 Each Trustee and Officer serves until his or her respective successor has been duly elected and qualified.
48
Credit Suisse Strategic Income Fund
Information Concerning Trustees and Officers (unaudited) (continued)
Name, Address
(Year of Birth) | | Position(s)
Held with
Fund | | Term
of Office1
and
Length
of Time
Served | | Principal Occupation(s) During Past Five Years | |
Officers* | | | | | | | |
John G. Popp
Credit Suisse Asset Management, LLC
One Madison Avenue
New York, New York 10010
(1956) | | Chief Executive Officer and President | | Since Fund Inception | | Managing Director of Credit Suisse; Global Head and Chief Investment Officer of the Credit Investment Group; Associated with Credit Suisse or its predecessor since 1997; Officer of other Credit Suisse Funds; Trustee of Credit Suisse High Yield Bond Fund; Director of Credit Suisse Asset Management Income Fund, Inc; Director of Credit Suisse Park View BDC, Inc. | |
Emidio Morizio
Credit Suisse Asset Management, LLC
One Madison Avenue
New York, New York 10010
(1966) | | Chief Compliance Officer | | Since Fund Inception | | Managing Director and Global Head of Compliance of Credit Suisse since 2010; Associated with Credit Suisse since July 2000; Officer of other Credit Suisse Funds. | |
Lou Anne McInnis
Credit Suisse Asset Management, LLC
One Madison Avenue
New York, New York 10010
(1959) | | Chief Legal Officer | | Since 2015 | | Director of Credit Suisse; Associated with Credit Suisse since April 2015; Counsel at DLA Piper US LLP from 2011 to April 2015; Associated with Morgan Stanley Investment Management from 1997 to 2010; Officer of other Credit Suisse Funds. | |
Rocco DelGuercio
Credit Suisse Asset Management, LLC
One Madison Avenue
New York, New York 10010
(1963) | | Chief Financial Officer and Treasurer | | Chief Financial Officer since 2015; Treasurer since 2013 | | Vice President of Credit Suisse since 2013; Independent Consultant from February 2012 to April 2013; Director of Legg Mason & Co., LLC from March 2004 to January 2012; Associated with Credit Suisse from June 1996 to March 2004; Officer of other Credit Suisse Funds. | |
Karen Regan
Credit Suisse Asset Management, LLC
One Madison Avenue
New York, New York 10010
(1963) | | Vice President and Secretary | | Since Fund Inception | | Vice President of Credit Suisse; Associated with Credit Suisse since December 2004; Officer of other Credit Suisse Funds. | |
1 Each Trustee and Officer serves until his or her respective successor has been duly elected and qualified.
* The officers of the Fund shown are officers that make policy decisions.
The Statement of Additional Information includes additional information about the Trustees and is available, without charge, upon request, by calling 877-870-2874.
49
Credit Suisse Strategic Income Fund
Proxy Voting and Portfolio Holdings Information (unaudited)
Information regarding how the Fund voted proxies related to its portfolio securities during the 12-month period ended June 30 of each year, as well as the policies and procedures that the Fund uses to determine how to vote proxies relating to its portfolio securities are available:
• By calling 1-877-870-2874
• On the Fund's website, www.credit-suisse.com/us/funds
• On the website of the Securities and Exchange Commission, www.sec.gov.
The Fund files a complete schedule of its portfolio holdings for the first and third quarters of its fiscal year with the SEC on Form N-Q. The Fund's Forms N-Q are available on the SEC's website at www.sec.gov and may be reviewed and copied at the SEC's Public Reference Room in Washington, DC. Information on the operation of the SEC's Public Reference Room may be obtained by calling 1-202-551-8090.
50

P.O. BOX 55030, BOSTON, MA 02205-5030
877-870-2874 n www.credit-suisse.com/us/funds
CREDIT SUISSE SECURITIES (USA) LLC, DISTRIBUTOR. SlF-AR-2015

CREDIT SUISSE FUNDS
Annual Report
October 31, 2015
n CREDIT SUISSE
VOLARIS US STRATEGIES FUND
The Fund's investment objectives, risks, charges and expenses (which should be considered carefully before investing), and more complete information about the Fund, are provided in the Prospectus, which should be read carefully before investing. You may obtain additional copies by calling 877-870-2874 or by visiting our website at www.credit-suisse.com/us/funds.
Credit Suisse Securities (USA) LLC, Distributor, is located at One Madison Avenue, New York, NY 10010. Credit Suisse Funds are advised by Credit Suisse Asset Management, LLC.
Investors in the Credit Suisse Funds should be aware that they may be eligible to purchase Class I shares (where offered) directly or through certain intermediaries. Such shares are not subject to a sales charge. Investors in the Credit Suisse Funds should also be aware that they may be eligible for a reduction or waiver of the sales charge with respect to Class A or C shares (where offered). For more information, please review the relevant prospectuses or consult your financial representative.
Fund shares are not deposits or other obligations of Credit Suisse Asset Management, LLC ("Credit Suisse") or any affiliate, are not FDIC-insured and are not guaranteed by Credit Suisse or any affiliate. Fund investments are subject to investment risks, including loss of your investment.
Credit Suisse Volaris US Strategies Fund
Annual Investment Adviser's Report
October 31, 2015 (unaudited)
December 21, 2015
Dear Shareholder:
We are pleased to present this Annual Report covering the activities of the Credit Suisse Volaris US Strategies Fund (the "Fund"), for the 12 months ended October 31, 2015.
Performance Summary
11/1/14 – 10/31/15
Fund & Benchmark | | Performance | |
| Class I1 | | | -4.75 | % | |
| Class A1,2 | | | -4.96 | % | |
| Class C1,2 | | | -5.68 | % | |
| S&P 500 Total Return Index3 | | | 5.20 | % | |
Performance shown for the Fund's Class A and Class C Shares does not reflect sales charges, which are a maximum of 5.25% and 1.00%, respectively.2
Market and Strategic Review:
The Fund was down 4.75% over the reporting year whereas the S&P 500 Total Return Index was up 5.2%.
The Fund's underperformance is driven from three sources: the costs to maintain a market exposure to the S&P 500 Index and Fund fees exceeded the yield on the short-dated fixed income investments held by the Fund, the sharp market reversals, discussed below, resulted in higher hedging costs for the options strategies in the absence of a tail-risk-event and the stocks picked on the "valuation" criterion — as a part of the market directional exposure — underperformed the S&P 500 Index.
This reporting period was characterized by multiple sharp-reversals for the US equity markets that underwent a rapid correction and reversal in August 2015. The movements in emerging markets and commodity prices were of a considerable greater magnitude than those experienced in the US large-cap universe and reflected global economic growth slow-down concerns. These concerns were also aided by the Federal Reserve's (the "Fed's") stated goal to raise interest rates. The rate uncertainty was repeatedly built-up and dissipated in-between the meetings, reflecting mixed economic data, and a sequence of hawkish and dovish inferences of the Fed's meeting minutes.
The Fund transitioned to employing the Industrial Life Cycle ("ILC")/HOLT approach for obtaining market exposure on August month end. ILC seeks capital appreciation by investing in stocks of companies based in the US. The focus is
1
Credit Suisse Volaris US Strategies Fund
Annual Investment Adviser's Report (continued)
October 31, 2015 (unaudited)
on a bottom-up stock selection as the main driver of potential outperformance. The ILC investment process is an innovative approach to universe creation and stock selection based around the corporate life cycle.
The ILC investment process incorporates a strict risk management regimen, which is designed to limit outsized country, sector or style positioning relative to the benchmark. This serves to potentially buffer the portfolio from macro-driven volatility. While aware of macro themes, we refrain from making top-down allocations. Instead, we continue to focus on our disciplined process of identifying good company-specific opportunities across all life cycle stages.
Outlook:
Financial markets have been conditioned to rely on monetary authorities around the world to buffer volatility of asset prices. Yet, higher rates are necessary for the markets to return to a more normalized environment where fundamentals drive economic returns. It remains to be seen whether global growth is strong enough to absorb a Fed rate increase. Volatility is likely to remain elevated as investors' perspectives continue to shift. Often, these types of markets yield compelling investment ideas that we harvest through our disciplined investment approach.
The Credit Suisse Volaris Investment Group
Christian Strauss
Vivek Kapoor
Timothy Knowles
The Fund is non-diversified, which means it may invest a greater proportion of its assets in the securities of a smaller number of issuers than a diversified mutual Fund and may therefore be subject to greater volatility. The Fund's investment in alternative instruments may subject the Fund to greater volatility than investment in traditional securities, particularly in investments involving leverage.
The use of alternative assets and strategies entails substantial risks, including risk of loss principal, credit risk, derivatives risk, equity exposure risk, exchange traded Funds risk, fixed income risk, futures contracts risk, hedged exposure risk, interest rate risk, leveraging risk, manager risk, market risk, options risk, short positions risk, strategy risk, speculative exposure risk and U.S. government securities risk. For a detailed discussion of these and other risks, please refer to the Fund's Prospectus, which should be read carefully before investing.
2
Credit Suisse Volaris US Strategies Fund
Annual Investment Adviser's Report (continued)
October 31, 2015 (unaudited)
In addition to historical information, this report contains forward-looking statements, which may concern, among other things, domestic and foreign market, industry and economic trends and developments and government regulation and their potential impact on the Fund's investments. These statements are subject to risks and uncertainties and actual trends, developments and regulations in the future, and their impact on the Fund could be materially different from those projected, anticipated or implied. The Fund has no obligation to update or revise forward-looking statements.
The views of the Fund's management are as of the date of the letter and the Fund holdings described in this document are as of October 31, 2015; these views and Fund holdings may have changed subsequent to these dates. Nothing in this document is a recommendation to purchase or sell securities.
3
Credit Suisse Volaris US Strategies Fund
Annual Investment Adviser's Report (continued)
October 31, 2015 (unaudited)
Comparison of Change in Value of $10,000 Investment in the
Credit Suisse Volaris US Strategies Fund1 Class I Shares, Class A Shares2,
Class C Shares2 and S&P 500 Total Return Index3
from Inception (03/31/14).
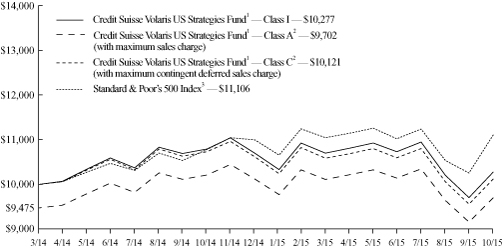
1 Fee waivers and/or expense reimbursements may reduce expenses for the Fund, without which performance would be lower. The Fund entered into a written contract to limit expenses to 1.30% of the Fund's average daily net assets for Class I shares, 1.55% of the Fund's average daily net assets for Class A shares and 2.30% of the Fund's average daily net assets for Class C shares through at least February 28, 2017.
2 Total return for the Fund's Class A shares for the reporting period, based on offering price (including maximum sales charge of 5.25%), was (9.98)%. Total return for the Fund's Class C shares for the reporting period, based on redemption value (including maximum contingent deferred sales charge of 1.00%), was (6.55)%.
3 The Standard & Poor's 500 Index is an unmanaged index (with no defined investment objective) of common stocks, includes reinvestment of dividends, and is a registered trademark of The McGraw-Hill Companies, Inc. Investors. The index does not have transaction costs and investors may not invest directly in the index.
4
Credit Suisse Volaris US Strategies Fund
Annual Investment Adviser's Report (continued)
October 31, 2015 (unaudited)
Average Annual Returns as of October 31, 20151
| | | 1 Year | | Since
Inception2 | |
Class I | | | (4.75 | )% | | | 1.73 | % | |
Class A Without Sales Charge | | | (4.96 | )% | | | 1.48 | % | |
Class A With Maximum Sales Charge | | | (9.98 | )% | | | (1.89 | )% | |
Class C Without CDSC | | | (5.68 | )% | | | 0.76 | % | |
Class C With CDSC | | | (6.55 | )% | | | 0.76 | % | |
Returns represent past performance and include change in share price and reinvestment of dividends and capital gains. Past performance cannot guarantee future results. The current performance of the Fund may be lower or higher than the figures shown. Returns and share price will fluctuate, and redemption value may be more or less than original cost. The performance results do not reflect the deduction of taxes that a shareholder would pay on fund distributions or the redemption of fund shares. Performance information current to the most recent month-end is available at www.credit-suisse.com/us/funds.
The annual gross expense ratios are 2.22% for Class I shares, 2.47% for Class A shares and 3.22% for Class C shares. The annual net expense ratios after fee waivers and/or expense reimbursements are 1.30% for Class I shares, 1.55% for Class A shares and 2.30% for Class C shares.
1 Fee waivers and/or expense reimbursements may reduce expenses for the Fund, without which performance would be lower. The Fund entered into a written contract to limit expenses to 1.30% of the Fund's average daily net assets for Class I shares, 1.55% of the Fund's average daily net assets for Class A shares and 2.30% of the Fund's average daily net assets for Class C shares through at least February 28, 2017.
2 Inception Date March 31, 2014.
5
Credit Suisse Volaris US Strategies Fund
Annual Investment Adviser's Report (continued)
October 31, 2015 (unaudited)
Information About Your Fund's Expenses
As an investor of the Fund, you incur two types of costs: ongoing expenses and transaction costs. Ongoing expenses include management fees, distribution and service (12b-1) fees and other Fund expenses. Examples of transaction costs include sales charges (loads), redemption fees and account maintenance fees, which are not shown in this section and which would result in higher total expenses. The following table is intended to help you understand your ongoing expenses of investing in the Fund and to help you compare these expenses with the ongoing expenses of investing in other mutual funds. The table is based on an investment of $1,000 made at the beginning of the six months ended October 31, 2015.
The table illustrates your Fund's expenses in two ways:
• Actual Fund Return. This helps you estimate the actual dollar amount of ongoing expenses paid on a $1,000 investment in the Fund using the Fund's actual return during the period. To estimate the expenses you paid over the period, simply divide your account value by $1,000 (for example, an $8,600 account value divided by $1,000 = 8.6), then multiply the result by the number in the "Expenses Paid per $1,000" line under the share class you hold.
• Hypothetical 5% Fund Return. This helps you to compare your Fund's ongoing expenses with those of other mutual funds using the Fund's actual expense ratio and a hypothetical rate of return of 5% per year before expenses. Examples using a 5% hypothetical fund return may be found in the shareholder reports of other mutual funds. The hypothetical account values and expenses may not be used to estimate the actual ending account balance or expenses you paid for the period.
Please note that the expenses shown in these tables are meant to highlight your ongoing expenses only and do not reflect any transaction costs, such as sales charges (loads) or redemption fees. If these transaction costs had been included, your costs would have been higher. The "Expenses Paid per $1,000" line of the tables is useful in comparing ongoing expenses only and will not help you determine the relative total expenses of owning different funds.
6
Credit Suisse Volaris US Strategies Fund
Annual Investment Adviser's Report (continued)
October 31, 2015 (unaudited)
Expenses and Value for a $1,000 Investment
for the six month period ended October 31, 2015
Actual Fund Return | | Class I | | Class A | | Class C | |
Beginning Account Value 05/01/15 | | $ | 1,000.00 | | | $ | 1,000.00 | | | $ | 1,000.00 | | |
Ending Account Value 10/31/15 | | $ | 951.10 | | | $ | 949.90 | | | $ | 947.50 | | |
Expenses Paid per $1,000* | | $ | 6.39 | | | $ | 7.62 | | | $ | 11.29 | | |
Hypothetical 5% Fund Return | |
Beginning Account Value 05/01/15 | | $ | 1,000.00 | | | $ | 1,000.00 | | | $ | 1,000.00 | | |
Ending Account Value 10/31/15 | | $ | 1,018.65 | | | $ | 1,017.39 | | | $ | 1,013.61 | | |
Expenses Paid per $1,000* | | $ | 6.61 | | | $ | 7.88 | | | $ | 11.67 | | |
| | | Class I | | Class A | | Class C | |
Annualized Expense Ratios* | | | 1.30 | % | | | 1.55 | % | | | 2.30 | % | |
* Expenses are equal to the Fund's annualized expense ratio for each share class, multiplied by the average account value over the period, multiplied by 184/365 to reflect the one-half year period.
The "Expenses Paid per $1,000" and the "Annualized Expense Ratios" in the tables are based on actual expenses paid by the Fund during the period, net of fee waivers and/or expense reimbursements. If those fee waivers and/or expense reimbursements had not been in effect, the Fund's actual expenses would have been higher. Expenses do not reflect additional charges and expenses that are, or may be, imposed under the variable contracts or plans. Such charges and expenses are described in the prospectus of the insurance company separate account or in the plan documents or other informational materials supplied by plan sponsors. The Fund's expenses should be considered with these charges and expenses in evaluating the overall cost of investing in the separate account.
For more information, please refer to the Fund's prospectus.
Investment Type Breakdown*
Common Stocks | | | 80.65 | % | |
Options Purchased | | | 13.53 | | |
Short-term Investment1 | | | 5.82 | | |
Total | | | 100.00 | % | |
* Expressed as a percentage of total investments (excluding securities lending collateral if applicable) and may vary over time.
1 Primarily reflects cash invested in State Street Bank and Trust Co. Euro Time Deposit, for which the purchases of securities have been executed but not yet settled at October 31, 2015, if applicable.
7
Credit Suisse Volaris US Strategies Fund
Schedule of Investments
October 31, 2015
| | | Number of
Shares | | Value | |
| COMMON STOCKS (88.6%) | |
| UNITED STATES (88.6%) | |
| Aerospace & Defense (4.1%) | |
General Dynamics Corp. | | | 5,100 | | | $ | 757,758 | | |
Teledyne Technologies, Inc.1 | | | 5,000 | | | | 446,150 | | |
| | | | 1,203,908 | | |
| Auto Components (0.5%) | |
Gentex Corp. | | | 8,200 | | | | 134,398 | | |
| Automobiles (3.5%) | |
Ford Motor Co. | | | 42,300 | | | | 626,463 | | |
Thor Industries, Inc. | | | 7,500 | | | | 405,600 | | |
| | | | 1,032,063 | | |
| Beverages (0.5%) | |
Monster Beverage Corp.1 | | | 1,000 | | | | 136,320 | | |
| Biotechnology (0.5%) | |
Gilead Sciences, Inc. | | | 1,400 | | | | 151,382 | | |
| Capital Markets (4.9%) | |
Apollo Investment Corp. | | | 69,700 | | | | 372,198 | | |
Stifel Financial Corp.1 | | | 7,900 | | | | 350,997 | | |
The Goldman Sachs Group, Inc. | | | 3,900 | | | | 731,250 | | |
| | | | 1,454,445 | | |
| Chemicals (1.1%) | |
The Mosaic Co. | | | 9,200 | | | | 310,868 | | |
| Commercial Banks (3.2%) | |
Citigroup, Inc. | | | 4,800 | | | | 255,216 | | |
JPMorgan Chase & Co. | | | 10,900 | | | | 700,325 | | |
| | | | 955,541 | | |
| Commercial Services & Supplies (1.0%) | |
Rollins, Inc. | | | 11,500 | | | | 308,430 | | |
| Communications Equipment (1.5%) | |
QUALCOMM, Inc. | | | 7,600 | | | | 451,592 | | |
| Computers & Peripherals (5.4%) | |
Apple, Inc. | | | 10,300 | | | | 1,230,850 | | |
NetApp, Inc. | | | 10,200 | | | | 346,800 | | |
| | | | 1,577,650 | | |
| Consumer Finance (1.0%) | |
Capital One Financial Corp. | | | 3,800 | | | | 299,820 | | |
| Diversified Consumer Services (0.9%) | |
Hillenbrand, Inc. | | | 8,900 | | | | 264,063 | | |
| Diversified Telecommunication Services (2.3%) | |
CenturyLink, Inc. | | | 9,400 | | | | 265,174 | | |
Verizon Communications, Inc. | | | 8,500 | | | | 398,480 | | |
| | | | 663,654 | | |
See Accompanying Notes to Financial Statements.
8
Credit Suisse Volaris US Strategies Fund
Schedule of Investments (continued)
October 31, 2015
| | | Number of
Shares | | Value | |
| COMMON STOCKS (continued) | |
UNITED STATES | |
| Electric Utilities (1.5%) | |
Entergy Corp. | | | 3,600 | | | $ | 245,376 | | |
Pinnacle West Capital Corp. | | | 3,100 | | | | 196,881 | | |
| | | | 442,257 | | |
| Electrical Equipment (0.8%) | |
Regal Beloit Corp. | | | 3,800 | | | | 242,402 | | |
| Food & Staples Retailing (4.3%) | |
Casey's General Stores, Inc. | | | 2,500 | | | | 265,550 | | |
CVS Health Corp. | | | 5,900 | | | | 582,802 | | |
Wal-Mart Stores, Inc. | | | 7,200 | | | | 412,128 | | |
| | | | 1,260,480 | | |
| Food Products (1.3%) | |
Tyson Foods, Inc., Class A | | | 8,700 | | | | 385,932 | | |
| Health Care Providers & Services (3.0%) | |
Aetna, Inc. | | | 6,700 | | | | 769,026 | | |
McKesson Corp. | | | 700 | | | | 125,160 | | |
| | | | 894,186 | | |
| Insurance (2.0%) | |
Greenlight Capital Re Ltd., Class A1 | | | 5,300 | | | | 116,388 | | |
MetLife, Inc. | | | 9,200 | | | | 463,496 | | |
| | | | 579,884 | | |
| Internet & Catalog Retail (2.2%) | |
Amazon.com, Inc.1 | | | 700 | | | | 438,130 | | |
Liberty Interactive Corp., Class A1 | | | 7,400 | | | | 202,538 | | |
| | | | 640,668 | | |
| Internet Software & Services (3.3%) | |
Facebook, Inc., Class A1 | | | 9,500 | | | | 968,715 | | |
| IT Services (2.2%) | |
Alliance Data Systems Corp.1 | | | 1,500 | | | | 445,965 | | |
Vantiv, Inc., Class A1 | | | 4,300 | | | | 215,645 | | |
| | | | 661,610 | | |
| Life Sciences Tools & Services (1.6%) | |
ICON PLC1 | | | 7,600 | | | | 485,412 | | |
| Media (2.3%) | |
Comcast Corp., Class A | | | 6,100 | | | | 381,982 | | |
Viacom, Inc., Class B | | | 5,700 | | | | 281,067 | | |
| | | | 663,049 | | |
| Multi-Utilities (2.1%) | |
Public Service Enterprise Group, Inc. | | | 14,900 | | | | 615,221 | | |
See Accompanying Notes to Financial Statements.
9
Credit Suisse Volaris US Strategies Fund
Schedule of Investments (continued)
October 31, 2015
| | | Number of
Shares | | Value | |
| COMMON STOCKS (continued) | |
UNITED STATES | |
| Multiline Retail (2.0%) | |
Kohl's Corp. | | | 12,800 | | | $ | 590,336 | | |
| Oil, Gas & Consumable Fuels (7.9%) | |
Chevron Corp. | | | 8,700 | | | | 790,656 | | |
Valero Energy Corp. | | | 15,600 | | | | 1,028,352 | | |
World Fuel Services Corp. | | | 11,400 | | | | 506,844 | | |
| | | | 2,325,852 | | |
| Pharmaceuticals (4.5%) | |
Johnson & Johnson | | | 8,000 | | | | 808,240 | | |
Merck & Co., Inc. | | | 9,500 | | | | 519,270 | | |
| | | | 1,327,510 | | |
| Professional Services (1.4%) | |
Verisk Analytics, Inc.1 | | | 5,800 | | | | 415,338 | | |
| Real Estate Investment Trusts (2.4%) | |
Starwood Property Trust, Inc. | | | 12,100 | | | | 243,089 | | |
Two Harbors Investment Corp. | | | 54,100 | | | | 457,686 | | |
| | | | 700,775 | | |
| Semiconductors & Semiconductor Equipment (4.2%) | |
Intel Corp. | | | 23,800 | | | | 805,868 | | |
Lam Research Corp. | | | 5,600 | | | | 428,904 | | |
| | | | 1,234,772 | | |
| Software (3.9%) | |
Mentor Graphics Corp. | | | 9,600 | | | | 261,120 | | |
Microsoft Corp. | | | 11,700 | | | | 615,888 | | |
Synopsys, Inc.1 | | | 5,600 | | | | 279,888 | | |
| | | | 1,156,896 | | |
| Specialty Retail (2.6%) | |
Bed Bath & Beyond, Inc.1 | | | 4,400 | | | | 262,372 | | |
Foot Locker, Inc. | | | 7,600 | | | | 514,900 | | |
| | | | 777,272 | | |
| Textiles, Apparel & Luxury Goods (0.8%) | |
Deckers Outdoor Corp.1 | | | 4,200 | | | | 233,772 | | |
| Thrifts & Mortgage Finance (0.7%) | |
Flagstar Bancorp, Inc.1 | | | 9,100 | | | | 202,384 | | |
| Trading Companies & Distributors (1.2%) | |
MSC Industrial Direct Co., Class A | | | 5,600 | | | | 351,512 | | |
| TOTAL COMMON STOCKS (Cost $25,540,257) | | | 26,100,369 | | |
See Accompanying Notes to Financial Statements.
10
Credit Suisse Volaris US Strategies Fund
Schedule of Investments (continued)
October 31, 2015
Number of
Contracts | | | | | | | | | | Value | |
| OPTIONS PURCHASED (14.9%) | | | |
| Call Options Purchased (10.8%) | | | |
| | 1 | | | S&P 500 Index, Strike @ $1,870, expires 12/19/15 | | | | | | | | | | | | | | $ | 21,060 | | |
| | 3 | | | S&P 500 Index, Strike @ $1,875, expires 11/20/15 | | | | | | | | | | | | | | | 60,840 | | |
| | 16 | | | S&P 500 Index, Strike @ $1,905, expires 11/20/15 | | | | | | | | | | | | | | | 277,600 | | |
| | 3 | | | S&P 500 Index, Strike @ $1,915, expires 11/20/15 | | | | | | | | | | | | | | | 49,140 | | |
| | 6 | | | S&P 500 Index, Strike @ $1,915, expires 12/19/15 | | | | | | | | | | | | | | | 101,340 | | |
| | 38 | | | S&P 500 Index, Strike @ $1,920, expires 11/20/15 | | | | | | | | | | | | | | | 603,820 | | |
| | 2 | | | S&P 500 Index, Strike @ $1,930, expires 11/20/15 | | | | | | | | | | | | | | | 29,860 | | |
| | 6 | | | S&P 500 Index, Strike @ $1,940, expires 11/20/15 | | | | | | | | | | | | | | | 83,820 | | |
| | 1 | | | S&P 500 Index, Strike @ $1,940, expires 12/19/15 | | | | | | | | | | | | | | | 14,630 | | |
| | 1 | | | S&P 500 Index, Strike @ $1,955, expires 12/19/15 | | | | | | | | | | | | | | | 13,310 | | |
| | 2 | | | S&P 500 Index, Strike @ $1,955, expires 01/15/16 | | | | | | | | | | | | | | | 28,340 | | |
| | 13 | | | S&P 500 Index, Strike @ $1,960, expires 11/20/15 | | | | | | | | | | | | | | | 157,040 | | |
| | 1 | | | S&P 500 Index, Strike @ $1,965, expires 11/20/15 | | | | | | | | | | | | | | | 11,610 | | |
| | 11 | | | S&P 500 Index, Strike @ $1,965, expires 01/15/16 | | | | | | | | | | | | | | | 146,740 | | |
| | 5 | | | S&P 500 Index, Strike @ $1,970, expires 12/19/15 | | | | | | | | | | | | | | | 60,050 | | |
| | 10 | | | S&P 500 Index, Strike @ $1,975, expires 11/20/15 | | | | | | | | | | | | | | | 106,800 | | |
| | 1 | | | S&P 500 Index, Strike @ $1,985, expires 11/20/15 | | | | | | | | | | | | | | | 9,770 | | |
| | 11 | | | S&P 500 Index, Strike @ $1,990, expires 11/20/15 | | | | | | | | | | | | | | | 102,520 | | |
| | 2 | | | S&P 500 Index, Strike @ $1,995, expires 11/20/15 | | | | | | | | | | | | | | | 17,740 | | |
| | 11 | | | S&P 500 Index, Strike @ $2,005, expires 11/20/15 | | | | | | | | | | | | | | | 87,890 | | |
| | 10 | | | S&P 500 Index, Strike @ $2,010, expires 12/19/15 | | | | | | | | | | | | | | | 87,200 | | |
| | 7 | | | S&P 500 Index, Strike @ $2,010, expires 01/15/16 | | | | | | | | | | | | | | | 68,320 | | |
| | 23 | | | S&P 500 Index, Strike @ $2,015, expires 11/20/15 | | | | | | | | | | | | | | | 163,990 | | |
| | 2 | | | S&P 500 Index, Strike @ $2,020, expires 11/20/15 | | | | | | | | | | | | | | | 13,420 | | |
| | 2 | | | S&P 500 Index, Strike @ $2,020, expires 12/19/15 | | | | | | | | | | | | | | | 15,880 | | |
| | 9 | | | S&P 500 Index, Strike @ $2,025, expires 11/20/15 | | | | | | | | | | | | | | | 56,700 | | |
| | 5 | | | S&P 500 Index, Strike @ $2,025, expires 01/15/16 | | | | | | | | | | | | | | | 43,200 | | |
| | 20 | | | S&P 500 Index, Strike @ $2,030, expires 11/20/15 | | | | | | | | | | | | | | | 117,800 | | |
| | 18 | | | S&P 500 Index, Strike @ $2,040, expires 12/19/15 | | | | | | | | | | | | | | | 116,100 | | |
| | 21 | | | S&P 500 Index, Strike @ $2,055, expires 11/20/15 | | | | | | | | | | | | | | | 83,580 | | |
| | 34 | | | S&P 500 Index, Strike @ $2,065, expires 12/19/15 | | | | | | | | | | | | | | | 161,160 | | |
| | 3 | | | S&P 500 Index, Strike @ $2,065, expires 01/15/16 | | | | | | | | | | | | | | | 17,640 | | |
| | 27 | | | S&P 500 Index, Strike @ $2,070, expires 11/20/15 | | | | | | | | | | | | | | | 79,920 | | |
| | 6 | | | S&P 500 Index, Strike @ $2,070, expires 12/19/15 | | | | | | | | | | | | | | | 26,520 | | |
| | 1 | | | S&P 500 Index, Strike @ $2,075, expires 11/20/15 | | | | | | | | | | | | | | | 2,640 | | |
| | 3 | | | S&P 500 Index, Strike @ $2,080, expires 01/15/16 | | | | | | | | | | | | | | | 15,192 | | |
| | 8 | | | S&P 500 Index, Strike @ $2,085, expires 11/20/15 | | | | | | | | | | | | | | | 16,560 | | |
| | 3 | | | S&P 500 Index, Strike @ $2,085, expires 01/15/16 | | | | | | | | | | | | | | | 13,920 | | |
| | 8 | | | S&P 500 Index, Strike @ $2,105, expires 11/13/15 | | | | | | | | | | | | | | | 8,710 | | |
| | 8 | | | S&P 500 Index, Strike @ $2,110, expires 11/20/15 | | | | | | | | | | | | | | | 9,886 | | |
| | 8 | | | S&P 500 Index, Strike @ $2,180, expires 12/04/15 | | | | | | | | | | | | | | | 1,486 | | |
| | 109 | | | S&P 500 Index, Strike @ $2,195, expires 12/19/15 | | | | | | | | | | | | | | | 21,255 | | |
| | 101 | | | S&P 500 Index, Strike @ $2,200, expires 12/19/15 | | | | | | | | | | | | | | | 17,928 | | |
| | 45 | | | S&P 500 Index, Strike @ $2,230, expires 01/15/16 | | | | | | | | | | | | | | | 10,013 | | |
| | 80 | | | S&P 500 Index, Strike @ $2,240, expires 01/15/16 | | | | | | | | | | | | | | | 15,572 | | |
| | 44 | | | S&P 500 Index, Strike @ $2,250, expires 01/15/16 | | | | | | | | | | | | | | | 6,050 | | |
See Accompanying Notes to Financial Statements.
11
Credit Suisse Volaris US Strategies Fund
Schedule of Investments (continued)
October 31, 2015
Number of
Contracts | | | | | | | | | | Value | |
| OPTIONS PURCHASED (continued) | | | |
Call Options Purchased | | | |
| | 98 | | | S&P 500 Index, Strike @ $2,260, expires 11/20/15 | | | | | | | | | | | | | | $ | 1,225 | | |
| | 44 | | | S&P 500 Index, Strike @ $2,275, expires 02/19/16 | | | | | | | | | | | | | | | 8,250 | | |
| | | | 3,184,037 | | |
| Put Options Purchased (4.1%) | | | |
| | 120 | | | S&P 500 Index, Strike @ $1,565, expires 11/20/15 | | | | | | | | | | | | | | | 2,100 | | |
| | 99 | | | S&P 500 Index, Strike @ $1,720, expires 02/19/16 | | | | | | | | | | | | | | | 108,405 | | |
| | 133 | | | S&P 500 Index, Strike @ $1,725, expires 01/15/16 | | | | | | | | | | | | | | | 75,145 | | |
| | 193 | | | S&P 500 Index, Strike @ $1,740, expires 01/15/16 | | | | | | | | | | | | | | | 120,625 | | |
| | 101 | | | S&P 500 Index, Strike @ $1,765, expires 12/19/15 | | | | | | | | | | | | | | | 30,805 | | |
| | 4 | | | S&P 500 Index, Strike @ $1,775, expires 12/19/15 | | | | | | | | | | | | | | | 1,103 | | |
| | 4 | | | S&P 500 Index, Strike @ $1,780, expires 11/20/15 | | | | | | | | | | | | | | | 223 | | |
| | 101 | | | S&P 500 Index, Strike @ $1,780, expires 12/19/15 | | | | | | | | | | | | | | | 34,845 | | |
| | 4 | | | S&P 500 Index, Strike @ $1,790, expires 11/13/15 | | | | | | | | | | | | | | | 107 | | |
| | 110 | | | S&P 500 Index, Strike @ $1,800, expires 01/15/16 | | | | | | | | | | | | | | | 99,550 | | |
| | 4 | | | S&P 500 Index, Strike @ $1,835, expires 12/04/15 | | | | | | | | | | | | | | | 883 | | |
| | 32 | | | S&P 500 Index, Strike @ $1,870, expires 11/20/15 | | | | | | | | | | | | | | | 4,640 | | |
| | 4 | | | S&P 500 Index, Strike @ $1,880, expires 11/20/15 | | | | | | | | | | | | | | | 610 | | |
| | 15 | | | S&P 500 Index, Strike @ $1,890, expires 11/20/15 | | | | | | | | | | | | | | | 2,588 | | |
| | 7 | | | S&P 500 Index, Strike @ $1,900, expires 11/20/15 | | | | | | | | | | | | | | | 1,383 | | |
| | 8 | | | S&P 500 Index, Strike @ $1,900, expires 01/15/16 | | | | | | | | | | | | | | | 13,480 | | |
| | 6 | | | S&P 500 Index, Strike @ $1,910, expires 11/20/15 | | | | | | | | | | | | | | | 1,335 | | |
| | 4 | | | S&P 500 Index, Strike @ $1,925, expires 11/20/15 | | | | | | | | | | | | | | | 1,090 | | |
| | 7 | | | S&P 500 Index, Strike @ $1,930, expires 12/19/15 | | | | | | | | | | | | | | | 8,155 | | |
| | 15 | | | S&P 500 Index, Strike @ $1,935, expires 11/20/15 | | | | | | | | | | | | | | | 4,612 | | |
| | 15 | | | S&P 500 Index, Strike @ $1,935, expires 12/19/15 | | | | | | | | | | | | | | | 18,225 | | |
| | 4 | | | S&P 500 Index, Strike @ $1,945, expires 11/20/15 | | | | | | | | | | | | | | | 1,420 | | |
| | 1 | | | S&P 500 Index, Strike @ $1,945, expires 01/15/16 | | | | | | | | | | | | | | | 2,270 | | |
| | 3 | | | S&P 500 Index, Strike @ $1,950, expires 11/20/15 | | | | | | | | | | | | | | | 1,155 | | |
| | 20 | | | S&P 500 Index, Strike @ $1,955, expires 11/20/15 | | | | | | | | | | | | | | | 8,100 | | |
| | 1 | | | S&P 500 Index, Strike @ $1,960, expires 12/19/15 | | | | | | | | | | | | | | | 1,505 | | |
| | 1 | | | S&P 500 Index, Strike @ $1,960, expires 01/15/16 | | | | | | | | | | | | | | | 2,510 | | |
| | 1 | | | S&P 500 Index, Strike @ $1,965, expires 12/19/15 | | | | | | | | | | | | | | | 1,575 | | |
| | 20 | | | S&P 500 Index, Strike @ $1,970, expires 11/20/15 | | | | | | | | | | | | | | | 10,100 | | |
| | 10 | | | S&P 500 Index, Strike @ $1,970, expires 01/15/16 | | | | | | | | | | | | | | | 26,900 | | |
| | 25 | | | S&P 500 Index, Strike @ $1,975, expires 12/19/15 | | | | | | | | | | | | | | | 42,875 | | |
| | 27 | | | S&P 500 Index, Strike @ $1,980, expires 11/20/15 | | | | | | | | | | | | | | | 15,795 | | |
| | 1 | | | S&P 500 Index, Strike @ $1,980, expires 12/19/15 | | | | | | | | | | | | | | | 1,795 | | |
| | 2 | | | S&P 500 Index, Strike @ $1,990, expires 12/19/15 | | | | | | | | | | | | | | | 3,930 | | |
| | 23 | | | S&P 500 Index, Strike @ $2,000, expires 12/19/15 | | | | | | | | | | | | | | | 49,450 | | |
| | 6 | | | S&P 500 Index, Strike @ $2,005, expires 01/15/16 | | | | | | | | | | | | | | | 20,400 | | |
| | 12 | | | S&P 500 Index, Strike @ $2,010, expires 11/20/15 | | | | | | | | | | | | | | | 10,980 | | |
| | 11 | | | S&P 500 Index, Strike @ $2,020, expires 01/15/16 | | | | | | | | | | | | | | | 41,360 | | |
| | 1 | | | S&P 500 Index, Strike @ $2,025, expires 12/19/15 | | | | | | | | | | | | | | | 2,690 | | |
| | 2 | | | S&P 500 Index, Strike @ $2,035, expires 11/20/15 | | | | | | | | | | | | | | | 2,690 | | |
| | 2 | | | S&P 500 Index, Strike @ $2,035, expires 12/19/15 | | | | | | | | | | | | | | | 5,880 | | |
See Accompanying Notes to Financial Statements.
12
Credit Suisse Volaris US Strategies Fund
Schedule of Investments (continued)
October 31, 2015
Number of
Contracts | | | | | | | | | | Value | |
| OPTIONS PURCHASED (continued) | | | |
Put Options Purchased | | | |
| | 8 | | | S&P 500 Index, Strike @ $2,040, expires 11/20/15 | | | | | | | | | | | | | | $ | 11,640 | | |
| | 3 | | | S&P 500 Index, Strike @ $2,045, expires 11/20/15 | | | | | | | | | | | | | | | 4,695 | | |
| | 1 | | | S&P 500 Index, Strike @ $2,045, expires 12/19/15 | | | | | | | | | | | | | | | 3,220 | | |
| | 13 | | | S&P 500 Index, Strike @ $2,050, expires 11/20/15 | | | | | | | | | | | | | | | 22,035 | | |
| | 20 | | | S&P 500 Index, Strike @ $2,050, expires 12/19/15 | | | | | | | | | | | | | | | 67,400 | | |
| | 7 | | | S&P 500 Index, Strike @ $2,050, expires 02/19/16 | | | | | | | | | | | | | | | 42,840 | | |
| | 6 | | | S&P 500 Index, Strike @ $2,060, expires 11/20/15 | | | | | | | | | | | | | | | 11,910 | | |
| | 20 | | | S&P 500 Index, Strike @ $2,060, expires 12/19/15 | | | | | | | | | | | | | | | 73,800 | | |
| | 1 | | | S&P 500 Index, Strike @ $2,060, expires 01/15/16 | | | | | | | | | | | | | | | 4,950 | | |
| | 9 | | | S&P 500 Index, Strike @ $2,065, expires 11/20/15 | | | | | | | | | | | | | | | 19,350 | | |
| | 27 | | | S&P 500 Index, Strike @ $2,075, expires 01/15/16 | | | | | | | | | | | | | | | 148,230 | | |
| | 1 | | | S&P 500 Index, Strike @ $2,080, expires 11/20/15 | | | | | | | | | | | | | | | 2,700 | | |
| | | | 1,196,059 | | |
| TOTAL OPTIONS PURCHASED (Cost $4,833,837) | | | 4,380,096 | | |
Par
(000) | | | | | | Maturity | | Rate% | | | |
| SHORT-TERM INVESTMENT (6.4%) | | | |
| | 1,884 | | | State Street Bank and Trust Co. Euro Time Deposit
(Cost $1,884,098) | | | | | | 11/02/15 | | | 0.010 | | | | 1,884,098 | | |
| TOTAL INVESTMENTS AT VALUE (109.9%) (Cost $32,258,192) | | | 32,364,563 | | |
| LIABILITIES IN EXCESS OF OTHER ASSETS (-9.9%) | | | (2,923,653 | ) | |
| NET ASSETS (100.0%) | | $ | 29,440,910 | | |
1 Non-income producing security.
Options Written | | | |
Number of
Contracts | | Call Options Written | | Expiration
Date | | Premiums
Received | | Current
Value | | Net Unrealized
Appreciation
(Depreciation) | |
| | 4 | | | S&P 500 Index, Strike @ $2,060 | | 11/13/15 | | $ | 15,345 | | | $ | (15,345 | ) | | $ | — | | |
| | 32 | | | S&P 500 Index, Strike @ $1,870 | | 11/20/15 | | | 221,478 | | | | (664,960 | ) | | | (443,482 | ) | |
| | 4 | | | S&P 500 Index, Strike @ $1,880 | | 11/20/15 | | | 33,509 | | | | (79,160 | ) | | | (45,651 | ) | |
| | 15 | | | S&P 500 Index, Strike @ $1,890 | | 11/20/15 | | | 131,073 | | | | (282,150 | ) | | | (151,077 | ) | |
| | 7 | | | S&P 500 Index, Strike @ $1,900 | | 11/20/15 | | | 63,583 | | | | (124,880 | ) | | | (61,297 | ) | |
| | 6 | | | S&P 500 Index, Strike @ $1,910 | | 11/20/15 | | | 57,555 | | | | (101,160 | ) | | | (43,605 | ) | |
| | 4 | | | S&P 500 Index, Strike @ $1,925 | | 11/20/15 | | | 24,566 | | | | (61,640 | ) | | | (37,074 | ) | |
| | 15 | | | S&P 500 Index, Strike @ $1,935 | | 11/20/15 | | | 107,016 | | | | (216,750 | ) | | | (109,734 | ) | |
| | 4 | | | S&P 500 Index, Strike @ $1,945 | | 11/20/15 | | | 29,559 | | | | (54,000 | ) | | | (24,441 | ) | |
| | 3 | | | S&P 500 Index, Strike @ $1,950 | | 11/20/15 | | | 22,303 | | | | (39,060 | ) | | | (16,757 | ) | |
| | 20 | | | S&P 500 Index, Strike @ $1,955 | | 11/20/15 | | | 128,816 | | | | (251,000 | ) | | | (122,184 | ) | |
| | 20 | | | S&P 500 Index, Strike @ $1,970 | | 11/20/15 | | | 105,336 | | | | (222,800 | ) | | | (117,464 | ) | |
| | 27 | | | S&P 500 Index, Strike @ $1,980 | | 11/20/15 | | | 178,489 | | | | (275,940 | ) | | | (97,451 | ) | |
| | 12 | | | S&P 500 Index, Strike @ $2,010 | | 11/20/15 | | | 46,454 | | | | (90,720 | ) | | | (44,266 | ) | |
See Accompanying Notes to Financial Statements.
13
Credit Suisse Volaris US Strategies Fund
Schedule of Investments (continued)
October 31, 2015
| OPTIONS WRITTEN (continued) | | | |
Number of
Contracts | | Call Options Written | | Expiration
Date | | Premiums
Received | | Current
Value | | Net Unrealized
Appreciation
(Depreciation) | |
| | 2 | | | S&P 500 Index, Strike @ $2,035 | | 11/20/15 | | $ | 6,458 | | | $ | (10,980 | ) | | $ | (4,522 | ) | |
| | 8 | | | S&P 500 Index, Strike @ $2,040 | | 11/20/15 | | | 42,754 | | | | (40,720 | ) | | | 2,034 | | |
| | 3 | | | S&P 500 Index, Strike @ $2,045 | | 11/20/15 | | | 9,634 | | | | (14,130 | ) | | | (4,496 | ) | |
| | 13 | | | S&P 500 Index, Strike @ $2,050 | | 11/20/15 | | | 95,836 | | | | (56,420 | ) | | | 39,416 | | |
| | 6 | | | S&P 500 Index, Strike @ $2,060 | | 11/20/15 | | | 38,339 | | | | (21,720 | ) | | | 16,619 | | |
| | 13 | | | S&P 500 Index, Strike @ $2,065 | | 11/20/15 | | | 41,072 | | | | (42,770 | ) | | | (1,698 | ) | |
| | 1 | | | S&P 500 Index, Strike @ $2,080 | | 11/20/15 | | | 7,060 | | | | (2,340 | ) | | | 4,720 | | |
| | 4 | | | S&P 500 Index, Strike @ $2,120 | | 12/04/15 | | | 5,797 | | | | (5,797 | ) | | | — | | |
| | 7 | | | S&P 500 Index, Strike @ $1,930 | | 12/19/15 | | | 58,195 | | | | (108,710 | ) | | | (50,514 | ) | |
| | 15 | | | S&P 500 Index, Strike @ $1,935 | | 12/19/15 | | | 132,822 | | | | (226,200 | ) | | | (93,378 | ) | |
| | 1 | | | S&P 500 Index, Strike @ $1,945 | | 12/19/15 | | | 8,817 | | | | (14,190 | ) | | | (5,373 | ) | |
| | 1 | | | S&P 500 Index, Strike @ $1,960 | | 12/19/15 | | | 8,464 | | | | (12,870 | ) | | | (4,406 | ) | |
| | 1 | | | S&P 500 Index, Strike @ $1,965 | | 12/19/15 | | | 7,799 | | | | (12,440 | ) | | | (4,641 | ) | |
| | 25 | | | S&P 500 Index, Strike @ $1,975 | | 12/19/15 | | | 162,659 | | | | (289,750 | ) | | | (127,091 | ) | |
| | 1 | | | S&P 500 Index, Strike @ $1,980 | | 12/19/15 | | | 7,446 | | | | (11,170 | ) | | | (3,724 | ) | |
| | 2 | | | S&P 500 Index, Strike @ $1,990 | | 12/19/15 | | | 14,308 | | | | (20,660 | ) | | | (6,352 | ) | |
| | 23 | | | S&P 500 Index, Strike @ $2,000 | | 12/19/15 | | | 126,303 | | | | (218,960 | ) | | | (92,657 | ) | |
| | 1 | | | S&P 500 Index, Strike @ $2,025 | | 12/19/15 | | | 4,654 | | | | (7,560 | ) | | | (2,906 | ) | |
| | 2 | | | S&P 500 Index, Strike @ $2,035 | | 12/19/15 | | | 9,528 | | | | (13,640 | ) | | | (4,112 | ) | |
| | 1 | | | S&P 500 Index, Strike @ $2,045 | | 12/19/15 | | | 4,504 | | | | (6,100 | ) | | | (1,596 | ) | |
| | 20 | | | S&P 500 Index, Strike @ $2,050 | | 12/19/15 | | | 95,424 | | | | (115,000 | ) | | | (19,576 | ) | |
| | 20 | | | S&P 500 Index, Strike @ $2.060 | | 12/19/15 | | | 92,050 | | | | (101,400 | ) | | | (9,350 | ) | |
| | 8 | | | S&P 500 Index, Strike @ $1,900 | | 01/15/16 | | | 70,698 | | | | (151,360 | ) | | | (80,662 | ) | |
| | 1 | | | S&P 500 Index, Strike @ $1,945 | | 01/15/16 | | | 8,789 | | | | (15,010 | ) | | | (6,221 | ) | |
| | 1 | | | S&P 500 Index, Strike @ $1,960 | | 01/15/16 | | | 7,529 | | | | (13,750 | ) | | | (6,221 | ) | |
| | 10 | | | S&P 500 Index, Strike @ $1,970 | | 01/15/16 | | | 85,330 | | | | (129,300 | ) | | | (43,970 | ) | |
| | 6 | | | S&P 500 Index, Strike @ $2,005 | | 01/15/16 | | | 39,085 | | | | (60,900 | ) | | | (21,815 | ) | |
| | 11 | | | S&P 500 Index, Strike @ $2,020 | | 01/15/16 | | | 66,469 | | | | (99,110 | ) | | | (32,641 | ) | |
| | 1 | | | S&P 500 Index, Strike @ $2,060 | | 01/15/16 | | | 5,704 | | | | (6,200 | ) | | | (496 | ) | |
| | 27 | | | S&P 500 Index, Strike @ $2,075 | | 01/15/16 | | | 150,255 | | | | (141,480 | ) | | | 8,775 | | |
| | 7 | | | S&P 500 Index, Strike @ $2,050 | | 02/19/16 | | | 52,575 | | | | (55,930 | ) | | | (3,355 | ) | |
| | 4 | | | S&P 500 Index, Strike @ $2,125 | | 12/19/15 | | | 7,637 | | | | (7,637 | ) | | | — | | |
| | | $ | (1,874,692 | ) | |
OPTIONS WRITTEN | | | |
Number of
Contracts | | Put Options Written | | Expiration
Date | | Premiums
Received | | Current
Value | | Net Unrealized
Appreciation
(Depreciation) | |
| | 4 | | | S&P 500 Index, Strike @ $1,920 | | 11/13/15 | | $ | 377 | | | $ | (377 | ) | | $ | — | | |
| | 3 | | | S&P 500 Index, Strike @ $1,875 | | 11/20/15 | | | 29,804 | | | | (442 | ) | | | 29,362 | | |
| | 16 | | | S&P 500 Index, Strike @ $1,905 | | 11/20/15 | | | 132,451 | | | | (3,400 | ) | | | 129,051 | | |
| | 3 | | | S&P 500 Index, Strike @ $1,915 | | 11/20/15 | | | 19,066 | | | | (712 | ) | | | 18,353 | | |
| | 42 | | | S&P 500 Index, Strike @ $1,920 | | 11/20/15 | | | 53,113 | | | | (10,605 | ) | | | 42,508 | | |
| | 2 | | | S&P 500 Index, Strike @ $1,930 | | 11/20/15 | | | 17,416 | | | | (575 | ) | | | 16,841 | | |
| | 6 | | | S&P 500 Index, Strike @ $1,940 | | 11/20/15 | | | 32,579 | | | | (2,010 | ) | | | 30,569 | | |
| | 13 | | | S&P 500 Index, Strike @ $1,960 | | 11/20/15 | | | 100,202 | | | | (5,655 | ) | | | 94,547 | | |
| | 1 | | | S&P 500 Index, Strike @ $1,965 | | 11/20/15 | | | 6,599 | | | | (465 | ) | | | 6,134 | | |
See Accompanying Notes to Financial Statements.
14
Credit Suisse Volaris US Strategies Fund
Schedule of Investments (continued)
October 31, 2015
| OPTIONS WRITTEN (continued) | | | |
Number of
Contracts | | Put Options Written | | Expiration
Date | | Premiums
Received | | Current
Value | | Net Unrealized
Appreciation
(Depreciation) | |
| | 10 | | | S&P 500 Index, Strike @ $1,975 | | 11/20/15 | | $ | 74,024 | | | $ | (5,450 | ) | | $ | 68,574 | | |
| | 1 | | | S&P 500 Index, Strike @ $1,985 | | 11/20/15 | | | 5,038 | | | | (625 | ) | | | 4,413 | | |
| | 11 | | | S&P 500 Index, Strike @ $1,990 | | 11/20/15 | | | 55,428 | | | | (7,425 | ) | | | 48,003 | | |
| | 2 | | | S&P 500 Index, Strike @ $1,995 | | 11/20/15 | | | 11,918 | | | | (1,470 | ) | | | 10,448 | | |
| | 11 | | | S&P 500 Index, Strike @ $2,005 | | 11/20/15 | | | 45,498 | | | | (9,405 | ) | | | 36,093 | | |
| | 23 | | | S&P 500 Index, Strike @ $2,015 | | 11/20/15 | | | 89,353 | | | | (22,655 | ) | | | 66,698 | | |
| | 2 | | | S&P 500 Index, Strike @ $2,020 | | 11/20/15 | | | 7,419 | | | | (2,130 | ) | | | 5,289 | | |
| | 9 | | | S&P 500 Index, Strike @ $2,025 | | 11/20/15 | | | 29,423 | | | | (10,395 | ) | | | 19,028 | | |
| | 20 | | | S&P 500 Index, Strike @ $2,030 | | 11/20/15 | | | 63,011 | | | | (24,900 | ) | | | 38,111 | | |
| | 21 | | | S&P 500 Index, Strike @ $2,055 | | 11/20/15 | | | 66,704 | | | | (38,535 | ) | | | 28,169 | | |
| | 27 | | | S&P 500 Index, Strike @ $2,070 | | 11/20/15 | | | 79,477 | | | | (62,640 | ) | | | 16,837 | | |
| | 1 | | | S&P 500 Index, Strike @ $2,075 | | 11/20/15 | | | 2,689 | | | | (2,500 | ) | | | 189 | | |
| | 8 | | | S&P 500 Index, Strike @ $2,085 | | 11/20/15 | | | 24,113 | | | | (23,360 | ) | | | 753 | | |
| | 4 | | | S&P 500 Index, Strike @ $1,975 | | 12/04/15 | | | 3,717 | | | | (3,717 | ) | | | — | | |
| | 1 | | | S&P 500 Index, Strike @ $1,870 | | 12/19/15 | | | 2,007 | | | | (695 | ) | | | 1,311 | | |
| | 6 | | | S&P 500 Index, Strike @ $1,915 | | 12/19/15 | | | 57,163 | | | | (6,150 | ) | | | 51,013 | | |
| | 102 | | | S&P 500 Index, Strike @ $1,940 | | 12/19/15 | | | 179,823 | | | | (129,030 | ) | | | 50,793 | | |
| | 3 | | | S&P 500 Index, Strike @ $1,945 | | 12/19/15 | | | 3,387 | | | | (3,387 | ) | | | — | | |
| | 101 | | | S&P 500 Index, Strike @ $1,950 | | 12/19/15 | | | 165,578 | | | | (138,875 | ) | | | 26,703 | | |
| | 1 | | | S&P 500 Index, Strike @ $1,955 | | 12/19/15 | | | 8,784 | | | | (1,435 | ) | | | 7,349 | | |
| | 5 | | | S&P 500 Index, Strike @ $1,970 | | 12/19/15 | | | 44,996 | | | | (8,225 | ) | | | 36,771 | | |
| | 10 | | | S&P 500 Index, Strike @ $2,010 | | 12/19/15 | | | 66,482 | | | | (23,500 | ) | | | 42,982 | | |
| | 2 | | | S&P 500 Index, Strike @ $2,020 | | 12/19/15 | | | 10,108 | | | | (5,140 | ) | | | 4,968 | | |
| | 18 | | | S&P 500 Index, Strike @ $2,040 | | 12/19/15 | | | 84,318 | | | | (55,440 | ) | | | 28,878 | | |
| | 34 | | | S&P 500 Index, Strike @ $2,065 | | 12/19/15 | | | 150,110 | | | | (131,240 | ) | | | 18,870 | | |
| | 6 | | | S&P 500 Index, Strike @ $2,070 | | 12/19/15 | | | 25,801 | | | | (24,240 | ) | | | 1,561 | | |
| | 80 | | | S&P 500 Index, Strike @ $1,940 | | 01/15/16 | | | 166,709 | | | | (166,709 | ) | | | — | | |
| | 2 | | | S&P 500 Index, Strike @ $1,955 | | 01/15/16 | | | 17,168 | | | | (4,860 | ) | | | 12,309 | | |
| | 11 | | | S&P 500 Index, Strike @ $1,965 | | 01/15/16 | | | 84,174 | | | | (28,600 | ) | | | 55,574 | | |
| | 45 | | | S&P 500 Index, Strike @ $1,985 | | 01/15/16 | | | 196,478 | | | | (133,650 | ) | | | 62,828 | | |
| | 7 | | | S&P 500 Index, Strike @ $2,010 | | 01/15/16 | | | 49,716 | | | | (24,640 | ) | | | 25,076 | | |
| | 5 | | | S&P 500 Index, Strike @ $2,025 | | 01/15/16 | | | 29,931 | | | | (19,450 | ) | | | 10,481 | | |
| | 44 | | | S&P 500 Index, Strike @ $2,045 | | 01/15/16 | | | 192,472 | | | | (196,680 | ) | | | (4,208 | ) | |
| | 3 | | | S&P 500 Index, Strike @ $2,065 | | 01/15/16 | | | 17,051 | | | | (15,360 | ) | | | 1,691 | | |
| | 3 | | | S&P 500 Index, Strike @ $2,080 | | 01/15/16 | | | 16,792 | | | | (16,792 | ) | | | — | | |
| | 3 | | | S&P 500 Index, Strike @ $2,085 | | 01/15/16 | | | 16,901 | | | | (17,670 | ) | | | (769 | ) | |
| | 44 | | | S&P 500 Index, Strike @ $1,975 | | 02/19/16 | | | 191,069 | | | | (179,520 | ) | | | 11,549 | | |
| | | $ | 1,155,700 | | |
Net Unrealized Appreciation (Depreciation) | | $ | (718,992 | ) | |
See Accompanying Notes to Financial Statements.
15
Credit Suisse Volaris US Strategies Fund
Statement of Assets and Liabilities
October 31, 2015
Assets | |
Investments at value (Cost $32,258,192) (Note 2) | | $ | 32,364,563 | | |
Cash | | | 50,000 | | |
Cash segregated at brokers for written options (Note 2) | | | 3,016,075 | | |
Receivable for investments sold | | | 319,882 | | |
Dividend and interest receivable | | | 24,256 | | |
Receivable from investment adviser (Note 3) | | | 7,524 | | |
Prepaid expenses | | | 12,134 | | |
Total assets | | | 35,794,434 | | |
Liabilities | |
Administrative services fee payable (Note 3) | | | 15,494 | | |
Shareholder servicing/Distribution fee payable (Note 3) | | | 1,483 | | |
Outstanding written options, at value (Proceeds $5,365,513) (Note 2) | | | 6,084,505 | | |
Payable for investments purchased | | | 181,476 | | |
Trustees' fee payable | | | 7,499 | | |
Accrued expenses | | | 63,067 | | |
Total liabilities | | | 6,353,524 | | |
Net Assets | |
Capital stock, $.001 par value (Note 6) | | | 3,091 | | |
Paid-in capital (Note 6) | | | 30,845,887 | | |
Accumulated net investment loss | | | (260,503 | ) | |
Accumulated net realized loss on investments and written options | | | (534,944 | ) | |
Net unrealized depreciation from investments and written options | | | (612,621 | ) | |
Net assets | | $ | 29,440,910 | | |
I Shares | |
Net assets | | $ | 25,353,421 | | |
Shares outstanding | | | 2,659,151 | | |
Net asset value, offering price and redemption price per share | | $ | 9.53 | | |
A Shares | |
Net assets | | $ | 3,068,057 | | |
Shares outstanding | | | 323,130 | | |
Net asset value and redemption price per share | | $ | 9.49 | | |
Maximum offering price per share (net asset value/(1-5.25%)) | | $ | 10.02 | | |
C Shares | |
Net assets | | $ | 1,019,432 | | |
Shares outstanding | | | 108,690 | | |
Net asset value, offering price and redemption price per share | | $ | 9.38 | | |
See Accompanying Notes to Financial Statements.
16
Credit Suisse Volaris US Strategies Fund
Statement of Operations
For the Year Ended October 31, 2015
Investment Income | |
Dividends | | $ | 96,761 | | |
Interest | | | 14,733 | | |
Total investment income | | | 111,494 | | |
Expenses | |
Investment advisory fees (Note 3) | | | 299,919 | | |
Administrative services fees (Note 3) | | | 161,771 | | |
Shareholder servicing/Distribution fees (Note 3) | |
Class A | | | 7,604 | | |
Class C | | | 10,631 | | |
Legal fees | | | 48,190 | | |
Registration fees | | | 41,112 | | |
Offering costs (Note 3) | | | 28,895 | | |
Trustees' fees | | | 27,921 | | |
Printing fees | | | 22,241 | | |
Audit and tax fees | | | 17,044 | | |
Commitment fees (Note 4) | | | 8,912 | | |
Transfer agent fees (Note 3) | | | 2,540 | | |
Custodian fees | | | 950 | | |
Insurance expense | | | 820 | | |
Miscellaneous expense | | | 4,407 | | |
Total expenses | | | 682,957 | | |
Less: fees waived (Note 3) | | | (274,825 | ) | |
Net expenses | | | 408,132 | | |
Net investment loss | | | (296,638 | ) | |
Net Realized and Unrealized Gain (Loss) from Investments and Written Options | |
Net realized loss from investments | | | (67,301 | ) | |
Net realized loss from written options | | | (766,439 | ) | |
Net change in unrealized appreciation (depreciation) from investments | | | (1,174,102 | ) | |
Net change in unrealized appreciation (depreciation) from written options | | | 860,277 | | |
Net realized and unrealized loss from investments and written options | | | (1,147,565 | ) | |
Net decrease in net assets resulting from operations | | $ | (1,444,203 | ) | |
See Accompanying Notes to Financial Statements.
17
Credit Suisse Volaris US Strategies Fund
Statement of Changes in Net Assets
| | | For the Year
Ended
October 31, 2015 | | For the Period
Ended
October 31, 20141 | |
From Operations | |
Net investment loss | | $ | (296,638 | ) | | $ | (207,216 | ) | |
Net realized gain (loss) from investments and written options | | | (833,740 | ) | | | 2,489,213 | | |
Net change in unrealized appreciation (depreciation)
from investments and written options | | | (313,825 | ) | | | (298,796 | ) | |
Net increase (decrease) in net assets resulting from operations | | | (1,444,203 | ) | | | 1,983,201 | | |
From Distributions | |
Distributions from net realized gains | |
Class I | | | (1,782,651 | ) | | | — | | |
Class A | | | (154,602 | ) | | | — | | |
Class C | | | (76,259 | ) | | | — | | |
Net decrease in net assets resulting from distributions | | | (2,013,512 | ) | | | — | | |
| From Capital Share Transactions (Note 6) | |
Proceeds from sale of shares | | | 2,476,794 | | | | 26,509,000 | | |
Reinvestment of dividends and distributions | | | 2,013,208 | | | | — | | |
Net asset value of shares redeemed | | | (78,885 | ) | | | (4,693 | ) | |
Net increase in net assets from capital share transactions | | | 4,411,117 | | | | 26,504,307 | | |
Net increase in net assets | | | 953,402 | | | | 28,487,508 | | |
Net Assets | |
Beginning of period | | | 28,487,508 | | | | — | | |
End of period | | $ | 29,440,910 | | | $ | 28,487,508 | | |
Accumulated net investment loss | | $ | (260,503 | ) | | $ | (27,976 | ) | |
1 For the period March 31, 2014 (Inception Date) through October 31, 2014.
See Accompanying Notes to Financial Statements.
18
Credit Suisse Volaris US Strategies Fund
Financial Highlights
(For a Class I Share of the Fund Outstanding Throughout Each Period)
| | | For the Year
Ended
October 31,
2015 | | For the Period
Ended
October 31,
20141 | |
Per share data | |
Net asset value, beginning of period | | $ | 10.79 | | | $ | 10.00 | | |
INVESTMENT OPERATIONS | |
Net investment loss2 | | | (0.09 | ) | | | (0.08 | ) | |
Net gain (loss) on investments and written options
(both realized and unrealized) | | | (0.41 | ) | | | 0.87 | | |
Total from investment operations | | | (0.50 | ) | | | 0.79 | | |
LESS DISTRIBUTIONS | |
Distributions from net realized gains | | | (0.76 | ) | | | — | | |
Total distributions | | | (0.76 | ) | | | — | | |
Net asset value, end of period | | $ | 9.53 | | | $ | 10.79 | | |
Total return3 | | | (4.75 | )% | | | 7.90 | % | |
RATIOS AND SUPPLEMENTAL DATA | |
Net assets, end of period (000s omitted) | | $ | 25,353 | | | $ | 25,319 | | |
Ratio of net expenses to average net assets | | | 1.30 | % | | | 1.30 | %4 | |
Ratio of net investment loss to average net assets | | | (0.93 | )% | | | (1.28 | )%4 | |
Decrease reflected in above operating expense ratios
due to waivers/reimbursements | | | 0.92 | % | | | 1.12 | %4 | |
Portfolio turnover rate | | | 45 | % | | | — | | |
1 For the period March 31, 2014 (Inception Date) through October 31, 2014.
2 Per share information is calculated using the average shares outstanding method.
3 Total returns are historical and assume changes in share price and reinvestment of all distributions. Had certain expenses not been reduced during the periods shown, total returns would have been lower. Total returns for periods less than one year are not annualized.
4 Annualized. The non-recurring expenses of offering costs were not annualized.
See Accompanying Notes to Financial Statements.
19
Credit Suisse Volaris US Strategies Fund
Financial Highlights
(For a Class A Share of the Fund Outstanding Throughout Each Period)
| | | For the Year
Ended
October 31,
2015 | | For the Period
Ended
October 31,
20141 | |
Per share data | |
Net asset value, beginning of period | | $ | 10.77 | | | $ | 10.00 | | |
INVESTMENT OPERATIONS | |
Net investment loss2 | | | (0.12 | ) | | | (0.09 | ) | |
Net gain (loss) on investments and written options
(both realized and unrealized) | | | (0.40 | ) | | | 0.86 | | |
Total from investment operations | | | (0.52 | ) | | | 0.77 | | |
LESS DISTRIBUTIONS | |
Distributions from net realized gains | | | (0.76 | ) | | | — | | |
Total distributions | | | (0.76 | ) | | | — | | |
Net asset value, end of period | | $ | 9.49 | | | $ | 10.77 | | |
Total return3 | | | (4.96 | )% | | | 7.70 | % | |
RATIOS AND SUPPLEMENTAL DATA | |
Net assets, end of period (000s omitted) | | $ | 3,068 | | | $ | 2,092 | | |
Ratio of net expenses to average net assets | | | 1.55 | % | | | 1.55 | %4 | |
Ratio of net investment loss to average net assets | | | (1.17 | )% | | | (1.53 | )%4 | |
Decrease reflected in above operating expense ratios
due to waivers/reimbursements | | | 0.92 | % | | | 1.12 | %4 | |
Portfolio turnover rate | | | 45 | % | | | — | | |
1 For the period March 31, 2014 (Inception Date) through October 31, 2014.
2 Per share information is calculated using the average shares outstanding method.
3 Total returns are historical and assume changes in share price, reinvestment of all distributions and no sales charge. Had certain expenses not been reduced during the periods shown, total returns would have been lower. Total returns for periods less than one year are not annualized.
4 Annualized. The non-recurring expenses of offering costs were not annualized.
See Accompanying Notes to Financial Statements.
20
Credit Suisse Volaris US Strategies Fund
Financial Highlights
(For a Class C Share of the Fund Outstanding Throughout Each Period)
| | | For the Year
Ended
October 31,
2015 | | For the Period
Ended
October 31,
20141 | |
Per share data | |
Net asset value, beginning of period | | $ | 10.72 | | | $ | 10.00 | | |
INVESTMENT OPERATIONS | |
Net investment loss2 | | | (0.19 | ) | | | (0.14 | ) | |
Net gain (loss) on investments and written options
(both realized and unrealized) | | | (0.39 | ) | | | 0.86 | | |
Total from investment operations | | | (0.58 | ) | | | 0.72 | | |
LESS DISTRIBUTIONS | |
Distributions from net realized gains | | | (0.76 | ) | | | — | | |
Total distributions | | | (0.76 | ) | | | — | | |
Net asset value, end of period | | $ | 9.38 | | | $ | 10.72 | | |
Total return3 | | | (5.68 | )% | | | 7.20 | % | |
RATIOS AND SUPPLEMENTAL DATA | |
Net assets, end of period (000s omitted) | | $ | 1,019 | | | $ | 1,077 | | |
Ratio of net expenses to average net assets | | | 2.30 | % | | | 2.30 | %4 | |
Ratio of net investment loss to average net assets | | | (1.94 | )% | | | (2.28 | )%4 | |
Decrease reflected in above operating expense ratios
due to waivers/reimbursements | | | 0.92 | % | | | 1.12 | %4 | |
Portfolio turnover rate | | | 45 | % | | | — | | |
1 For the period March 31, 2014 (Inception Date) through October 31, 2014.
2 Per share information is calculated using the average shares outstanding method.
3 Total returns are historical and assume changes in share price and reinvestment of all distributions. Had certain expenses not been reduced during the periods shown, total returns would have been lower. Total returns for periods less than one year are not annualized.
4 Annualized. The non-recurring expenses of offering costs were not annualized.
See Accompanying Notes to Financial Statements.
21
Credit Suisse Volaris US Strategies Fund
Notes to Financial Statements
October 31, 2015
Credit Suisse Volaris US Strategies Fund (the "Fund"), a series of the Credit Suisse Opportunity Funds (the "Trust"), a Delaware statutory trust, is registered under the Investment Company Act of 1940, as amended (the "1940 Act"), as a non-diversified open-end management investment company that seeks total return. The Trust was organized under the laws of the State of Delaware as a business trust on May 31, 1995.
The Fund offers three classes of shares: Class I shares, Class A shares and Class C shares. Each class of shares represents an equal pro rata interest in the Fund, except they bear different expenses, which reflect the differences in the range of services provided to them. Class A shares are sold subject to a front-end sales charge of up to 5.25%. Class C shares are sold subject to a contingent deferred sales charge of 1.00% if the shares are redeemed within the first year of purchase. Class I shares are sold without a sales charge.
Note 2. Significant Accounting Policies
The following is a summary of significant accounting policies followed by the Fund in the preparation of its financial statements. The policies are in accordance with accounting principles generally accepted in the United States of America ("GAAP"). The preparation of financial statements requires management to make estimates and assumptions that affect the reported amounts and disclosures in the financial statements. Actual results could differ from those estimates. The Fund is considered an investment company for financial reporting purposes under GAAP and follows Accounting Standard Codification ("ASC") Topic 946—Financial Services—Investment Companies.
A) SECURITY VALUATION — The net asset value of the Fund is determined daily as of the close of regular trading on the New York Stock Exchange, Inc. (the "Exchange") on each day the Exchange is open for business. The valuations for fixed income securities (which may include, but are not limited to, corporate, government, municipal, mortgage-backed, collateralized mortgage obligations and asset-backed securities) and certain derivative instruments are typically the prices supplied by independent third party pricing services, which may use market prices or broker/dealer quotations or a variety of valuation techniques and methodologies. The independent third party pricing services use inputs that are observable such as issuer details, interest rates, yield curves, prepayment speeds, credit risks/spreads, default rates and quoted prices for similar securities. These pricing services generally price fixed income securities assuming orderly transactions of an institutional
22
Credit Suisse Volaris US Strategies Fund
Notes to Financial Statements (continued)
October 31, 2015
Note 2. Significant Accounting Policies (continued)
"round lot" size, but some trades occur in smaller "odd lot" sizes which may be effected at lower prices than institutional round lot trades. Structured note agreements are valued in accordance with a dealer-supplied valuation based on changes in the value of the underlying index. Option contracts on securities, currencies, indices, futures contracts, swaps and other instruments are valued at the mid-point between the last bid and ask quotations as of the close of trading on the exchange which the option is traded. Futures contracts are valued daily at the settlement price established by the board of trade or exchange on which they are traded. Forward contracts are valued at the London closing spot rates and the London closing forward point rates on a daily basis. The currency forward contract pricing model derives the differential in point rates to the expiration date of the forward and calculates its present value. Equity securities for which market quotations are available are valued at the last reported sales price or official closing price on the primary market or exchange on which they trade. The Fund may utilize a service provided by an independent third party which has been approved by the Board of Trustees (the "Board") to fair value certain securities. When fair value pricing is employed, the prices of securities used by the Fund to calculate its net asset value may differ from quoted or published prices for the same securities. If independent third party pricing services are unable to supply prices for a portfolio investment, or if the prices supplied are deemed by the investment adviser to be unreliable, the market price may be determined by the investment adviser using quotations from one or more broker/dealers or at the transaction price if the security has recently been purchased and no value has yet been obtained from a pricing service or pricing broker. When reliable prices are not readily available, such as when the value of a security has been significantly affected by events after the close of the exchange or market on which the security is principally traded, but before the Fund calculates its net asset value, the Fund values these securities as determined in accordance with procedures approved and established by the Board.
The Fund uses valuation techniques to measure fair value that are consistent with the market approach and/or income approach, depending on the type of security and the particular circumstance. The market approach uses prices and other relevant information generated by market transactions involving identical or comparable securities. The income approach uses valuation techniques to discount estimated future cash flows to present value.
23
Credit Suisse Volaris US Strategies Fund
Notes to Financial Statements (continued)
October 31, 2015
Note 2. Significant Accounting Policies (continued)
GAAP established a disclosure hierarchy that categorizes the inputs to valuation techniques used to value assets and liabilities at each measurement date. These inputs are summarized in the three broad levels listed below:
• Level 1 – quoted prices in active markets for identical investments
• Level 2 – other significant observable inputs (including quoted prices for similar investments, interest rates, prepayment speeds, credit risk, etc.)
• Level 3 – significant unobservable inputs (including the Fund's own assumptions in determining the fair value of investments)
The inputs or methodologies used to value securities are not necessarily an indication of the risk associated with investing in those securities.
The following is a summary of the inputs used as of October 31, 2015 in valuing the Fund's assets and liabilities carried at fair value:
Assets | | Level 1 | | Level 2 | | Level 3 | | Total | |
Investments in Securities | |
Common Stocks | | $ | 26,100,369 | | | $ | — | | | $ | — | | | $ | 26,100,369 | | |
Options Purchased | | | 4,380,096 | | | | — | | | | — | | | | 4,380,096 | | |
Short-term Investments | | | — | | | | 1,884,098 | | | | — | | | | 1,884,098 | | |
| | | $ | 30,480,465 | | | $ | 1,884,098 | | | $ | — | | | $ | 32,364,563 | | |
Liabilities | | Level 1 | | Level 2 | | Level 3 | | Total | |
Other Financial Instruments* | |
Written Options | | $ | 6,084,505 | | | $ | — | | | $ | — | | | $ | 6,084,505 | | |
*Other financial instruments include written options, at value.
For the year ended October 31, 2015, there were no transfers in and out of Level 1, Level 2 and Level 3. All transfers, if any, are assumed to occur at the end of the reporting period.
B) DERIVATIVE INSTRUMENTS AND HEDGING ACTIVITIES — The Fund adopted amendments to authoritative guidance on disclosures about derivative instruments and hedging activities which require that a fund disclose (a) how and why an entity uses derivative instruments, (b) how derivative instruments and hedging activities are accounted for and (c) how derivative instruments and related hedging activities affect a fund's financial position, financial performance and cash flows. For the year ended October 31, 2015, the Fund's derivatives did not qualify for hedge accounting as they are held at fair value.
24
Credit Suisse Volaris US Strategies Fund
Notes to Financial Statements (continued)
October 31, 2015
Note 2. Significant Accounting Policies (continued)
Fair Values of Derivative Instruments as of October, 31 2015.
| | | Asset Derivatives | | Liability Derivatives | |
| | | Balance Sheet
Location | | Fair Value | | Balance Sheet
Location | | Fair Value | |
Equity Contracts | | Purchased options,
at value* | | $ | 4,380,096 | | | Outstanding written
options, at value | | $ | 6,084,505 | | |
*Market value of purchased options is reported in investments at value in the Statement of Assets and Liabilities.
Effect of Derivative Instruments on the Statement of Operations
| | | Location | | Realized
Gain(Loss) | | Location | | Net Unrealized
Appreciation
(Depreciation) | |
Equity Contracts | | Net realized loss from
written options | | $ | (766,439 | ) | | Net change in unrealized
appreciation (depreciation)
from written options | | $ | 860,277 | | |
The value amount of written options at the year ended October 31, 2015 is reflected in the Schedule of Investments. For the year ended October 31, 2015, the Fund received average monthly premiums of $4,436,066 from written option contracts.
The following table presents by counterparty the Fund's derivative assets net of related collateral held by the Fund at October 31, 2015:
Counterparty | | Gross Amounts of
Assets Presented in
the Statement of Assets
and Liabilities(a) | | Financial
Instruments
and Derivatives
Available for Offset | | Non-Cash
Collateral
Received | | Cash
Collateral
Received | | Net Amount
of Derivative
Assets | |
Goldman Sachs | | $ | 4,380,096 | | | $ | (4,380,096 | ) | | $ | — | | | $ | — | | | $ | — | | |
The following table presents by counterparty the Fund's derivative liabilities net of related collateral pledged by the Fund at October 31, 2015:
Counterparty | | Gross Amounts of
Liabilities Presented in
the Statement of Assets
and Liabilities(a) | | Financial
Instruments
and Derivatives
Available for Offset | | Non-Cash
Collateral
Pledged | | Cash
Collateral
Pledged(b) | | Net Amount
of Derivative
Liabilities | |
Goldman Sachs | | $ | 6,084,505 | | | $ | (4,380,096 | ) | | $ | — | | | $ | (1,704,409 | ) | | $ | — | | |
(a) Investments, at value (includes purchased and outstanding written options).
(b) The actual collateral received and/or pledged may be more than the amounts shown.
25
Credit Suisse Volaris US Strategies Fund
Notes to Financial Statements (continued)
October 31, 2015
Note 2. Significant Accounting Policies (continued)
C) SECURITY TRANSACTIONS AND INVESTMENT INCOME/EXPENSE — Security transactions are accounted for on a trade date basis. Interest income/expense is recorded on the accrual basis. The Fund amortizes premiums and accretes discounts using the effective interest method. Dividend income/expense is recorded on the ex-dividend date. Certain expenses are class-specific expenses, vary by class and are charged only to that class. Income, expenses (excluding class-specific expenses) and realized/unrealized gains/losses are allocated proportionately to each class of shares based upon the relative net asset value of the outstanding shares of that class. The cost of investments sold is determined by use of the specific identification method for both financial reporting and income tax purposes.
D) DIVIDENDS AND DISTRIBUTIONS TO SHAREHOLDERS — Dividends from net investment income, if any, are declared and paid annually. Distributions of net realized capital gains, if any, are declared and paid at least annually. However, to the extent that a net realized capital gain can be reduced by a capital loss carryforward, such gain will not be distributed. Income and capital gain distributions are determined in accordance with federal income tax regulations, which may differ from GAAP.
E) FEDERAL INCOME TAXES — No provision is made for federal taxes as it is the Fund's intention to continue to qualify as a regulated investment company ("RIC") under the Internal Revenue Code of 1986, as amended (the "Code"), and to make the requisite distributions to its shareholders, which will be sufficient to relieve it from federal income and excise taxes.
In order to qualify as a RIC under the Code, the Fund must meet certain requirements regarding the source of its income, the diversification of its assets and the distribution of its income. One of these requirements is that the Fund derive at least 90% of its gross income for each taxable year from dividends, interest, payments with respect to certain securities loans, gains from the sale or other disposition of stock, securities or foreign currencies, other income derived with respect to its business of investing in such stock, securities or currencies or net income derived from interests in certain publicly traded partnerships ("Qualifying Income"). The Fund adopted the authoritative guidance for uncertainty in income taxes and recognizes a tax benefit or liability from an uncertain position only if it is more likely than not that the position is sustainable based solely on its technical merits and consideration of the relevant taxing authority's widely understood administrative practices and procedures. The Fund has reviewed its current tax positions and has determined that no provision for income tax is required in the Fund's financial
26
Credit Suisse Volaris US Strategies Fund
Notes to Financial Statements (continued)
October 31, 2015
Note 2. Significant Accounting Policies (continued)
statements. The Fund's federal tax returns for the prior two fiscal years remain subject to examination by the Internal Revenue Service.
F) SHORT-TERM INVESTMENTS — The Fund, together with other funds/portfolios advised by Credit Suisse, pools available cash into a short-term variable rate time deposit issued by State Street Bank and Trust Company ("SSB"), the Fund's custodian. The short-term time deposit issued by SSB is a variable rate account classified as a short-term investment.
G) OPTION CONTRACTS — The Fund will enter into options contracts to gain exposure to risk volatility based assets. When the Fund purchases an option, it pays a premium and the option is subsequently marked to market to reflect current value. Premiums paid for purchasing options which expire are treated as realized losses. Premiums paid for purchasing options which are exercised or closed are added to the cost or deducted from the proceeds on the underlying instrument to determine the realized gain or loss. The risk associated with purchasing options is limited to the premium paid.
When the Fund writes an option, an amount equal to the net premium received (the premium less commission) is recorded as a liability and is subsequently adjusted to the current value. Net premiums received for written options which expire are treated as realized gains. Net premiums received for written options which are exercised or closed are deducted from the cost or added to the proceeds on the underlying instrument or closing purchase transaction to determine the realized gain or loss. The Fund, as writer of a written option, bears the risk of an unfavorable change in the market value of the instrument underlying the written option.
Exchange-traded options have standardized contracts and are settled through a clearing house with fulfillment guaranteed by the credit of the exchange. Therefore, counterparty credit risks to the Fund are limited. Over-the-counter options are subject to the risk that the counterparty is unable or unwilling to meet its obligations under the option. The Fund's exchanged traded written options are disclosed in the Schedule of Investments. At October 31, 2015, the amount of restricted cash held at brokers was $3,016,075.
27
Credit Suisse Volaris US Strategies Fund
Notes to Financial Statements (continued)
October 31, 2015
Note 2. Significant Accounting Policies (continued)
For the year ended October 31, 2015, transactions for written options on securities, interest rate swaps and futures were as follows:
| | | Number of
Contracts | | Premium
Received | |
Written Options, outstanding as of October 31, 2014 | | | 950 | | | $ | 4,363,709 | | |
Options written | | | 14,098 | | | | 43,229,299 | | |
Options closed | | | (10,857 | ) | | | (29,848,441 | ) | |
Options exercised | | | — | | | | — | | |
Options expired | | | (2,996 | ) | | | (12,379,054 | ) | |
Written Options, outstanding as of October 31, 2015 | | | 1,195 | | | $ | 5,365,513 | | |
H) OTHER — In the normal course of business the Fund trades financial instruments and enters into financial transactions where risk of potential loss exists due to changes in the market (market risk) or failure of the other party to a transaction to perform (credit risk). Similar to credit risk, the Fund may be exposed to counterparty risk, or the risk that an institution or other entity with which the Fund has unsettled or open transactions will default. The potential loss could exceed the value of the financial assets recorded in the financial statements. Financial assets, which potentially expose the Fund to credit risk, consist principally of cash due from counterparties and investments. The extent of the Fund's exposure to credit and counterparty risks in respect to these financial assets approximates their carrying value as recorded in the Fund's Statement of Assets and Liabilities.
I) NEW ACCOUNTING PRONOUNCEMENTS — In June 2014, Financial Accounting Standards Board ("FASB") issued ASU No. 2014-11, Transfers and Servicing (Topic 860), Repurchase-to-Maturity Transactions, Repurchase Financings, and Disclosures. The ASU changes the accounting for certain repurchase agreements and expands disclosure requirements related to repurchase agreements, securities lending, repurchase-to-maturity and similar transactions. The ASU is effective for interim and annual reporting periods beginning after December 15, 2014. Management has reviewed the requirements and believes the adoption of this ASU will not have a material impact on the financial statements.
On April 7, 2015, the FASB issued a new ASU No. 2015-03, "Simplifying the Presentation of Debt Issuance Costs". The ASU requires debt issuance costs to be presented on the balance sheet as a direct deduction from the debt liability. The ASU is effective for interim and annual reporting periods beginning after December 15, 2015. Management has reviewed the requirements and believes
28
Credit Suisse Volaris US Strategies Fund
Notes to Financial Statements (continued)
October 31, 2015
Note 2. Significant Accounting Policies (continued)
the adoption of this ASU will not have a material impact on the financial statements.
In May 2015, the FASB issued ASU No. 2015-07, "Disclosures for Investments in Certain Entities that Calculate Net Asset Value per Share (or its Equivalent)". The guidance removes the requirement to categorize within the fair value hierarchy all investments for which fair value is measured using the NAV per share practical expedient. Sufficient information must be provided to permit reconciliation of the fair value of assets categorized within the fair value hierarchy to the amounts presented in the Statement of Assets and Liabilities. The guidance is required to be presented for annual periods beginning after December 15, 2015, and for interim periods within those fiscal years. Management is currently viewing the requirements and believes the adoption of this ASU will not have a material impact on its financial statements.
J) SUBSEQUENT EVENTS — In preparing the financial statements as of October 31, 2015, management considered the impact of subsequent events for potential recognition or disclosure in these financial statements through the date of release of this report. No such events requiring recognition or disclosure were identified through the date of the release of this report.
Note 3. Transactions with Affiliates and Related Parties
Credit Suisse serves as investment adviser for the Fund. For its investment advisory services, Credit Suisse is entitled to receive a fee from the Fund at an annual rate of 1.00% of the Fund's average daily net assets. For the year ended October 31, 2015, investment advisory fees earned and fees waived/expenses reimbursed were $299,919 and $274,825, respectively. The Fund is authorized to reimburse Credit Suisse for management fees previously limited and/or for expenses previously paid by Credit Suisse, provided, however, that any reimbursements must be paid at a date not more than three years after the end of the fiscal year during which such fees were limited or expenses were reimbursed by Credit Suisse and the reimbursements do not cause a class to exceed the applicable expense limitation in the contract at the time the fees were limited or expenses are paid. This contract may not be terminated before February 28, 2017. Currently, Credit Suisse contractually waives fees and reimburses expenses so that the Fund's annual operating expenses will not exceed 1.30% of the Fund's average daily net assets for Class I shares, 1.55% of the Fund's average daily net assets for Class A shares, and 2.30% of the Fund's average daily net assets for Class C shares.
29
Credit Suisse Volaris US Strategies Fund
Notes to Financial Statements (continued)
October 31, 2015
Note 3. Transactions with Affiliates and Related Parties (continued)
For the year ended October 31, 2015, the amounts waived and reimbursed by Credit Suisse, as well as the amounts available for recoupment/potential future recoupment by Credit Suisse and the expiration schedule at October 31, 2015 are as follows:
| | | Fee waivers/
expense
reimbursements
subject to
repayment | | Expires
October 31,
2017 | | Expires
October 31,
2018 | |
Class I | | $ | 410,878 | | | $ | 173,670 | | | $ | 237,208 | | |
Class A | | | 37,935 | | | | 10,060 | | | | 27,875 | | |
Class C | | | 17,274 | | | | 7,532 | | | | 9,742 | | |
Totals | | $ | 466,087 | | | $ | 191,262 | | | $ | 274,825 | | |
Credit Suisse and SSB serve as co-administrators to the Fund. For its co-administrative services, Credit Suisse received a fee calculation at an annual rate of 0.09% of the Fund's average daily net assets. For the year ended October 31, 2015, co-administrative services fees earned by Credit Suisse were $26,993.
For its co-administrative services, SSB receives a fee, exclusive of out-of-pocket expenses, calculated in total for all the Credit Suisse funds/portfolios co-administered by SSB and allocated based upon the relative average net assets of each fund/portfolio, subject to an annual minimum fee. For the year ended October 31, 2015, co-administrative services fees earned by SSB (including out-of-pocket expenses) with respect to the Fund were $134,778.
Credit Suisse Securities (USA) LLC ("CSSU"), an affiliate of Credit Suisse, serves as the distributor of the Fund's shares. Pursuant to distribution plans adopted by the Fund pursuant to Rule 12b-1 under the 1940 Act, CSSU received fees for its distribution services. These fees were calculated at an annual rate of 0.25% of the average daily net assets of the Class A shares. For the Class C shares, the fee is calculated at an annual rate of 1.00% of the average daily net assets. For the year ended October 31, 2015, the Fund paid Rule 12b-1 distribution fees of $7,604 for Class A shares and $10,631 for Class C shares. Class I shares are not subject to Rule 12b-1 distribution fees.
Certain brokers, dealers and financial representatives provide transfer agent related services to the Fund and receive compensation from the Fund. For the year ended October 31, 2015, the Fund paid $429, which is included within transfer agent fees on the Statement of Operations.
30
Credit Suisse Volaris US Strategies Fund
Notes to Financial Statements (continued)
October 31, 2015
Note 3. Transactions with Affiliates and Related Parties (continued)
For the year ended October 31, 2015, CSSU and its affiliates advised the Fund that they retained $0 from commissions earned on the sale of the Fund's Class A shares. There were no commissions earned on sale of Class C shares.
Offering costs, including initial registration cost, were deferred and were expensed over the Fund's first 12 months of operation. For the year ended October 31, 2015, $28,895 has been expensed by the Fund.
Note 4. Line of Credit
The Fund, together with other funds/portfolios advised by Credit Suisse (collectively, the "Participating Funds"), participates in a committed, unsecured line of credit facility ("Credit Facility"), in an aggregated amount of $200 million for temporary or emergency purposes with SSB under a first-come, first-served basis. Under the terms of the Credit Facility, the Participating Funds pay an aggregate commitment fee on the average unused amount of the Credit Facility, which is allocated among the Participating Funds in such manner as is determined by the governing Boards of the Participating Funds. In addition, the Participating Funds pay interest on borrowings at either the Overnight Federal Funds rate or the Overnight LIBOR rate plus a spread. At October 31, 2015 and during the year ended October 31, 2015, the Fund had no borrowings outstanding under the Credit Facility.
Note 5. Purchases and Sales of Securities
For the year ended October 31, 2015, purchases and sales of investment securities (excluding short-term investments and purchased options) were $27,372,665 and $1,762,493, respectively.
31
Credit Suisse Volaris US Strategies Fund
Notes to Financial Statements (continued)
October 31, 2015
Note 6. Capital Share Transactions
The Fund is authorized to issue an unlimited number of full and fractional shares of beneficial interest, $.001 par value per share. The Fund offers Class I, Class A and Class C shares. Transactions in capital shares for each class of the Fund were as follows:
| | | Class I | |
| | | For the Year Ended
October 31, 2015 | | For the Period Ended
October 31, 20141 | |
| | | Shares | | Value | | Shares | | Value | |
Shares sold | | | 128,953 | | | $ | 1,312,352 | | | | 2,346,983 | | | $ | 23,500,000 | | |
Shares issued in reinvestment
of distributions | | | 183,968 | | | | 1,782,651 | | | | — | | | | — | | |
Shares redeemed | | | (753 | ) | | | (7,297 | ) | | | — | | | | — | | |
Net increase | | | 312,168 | | | $ | 3,087,706 | | | | 2,346,983 | | | $ | 23,500,000 | | |
| | | Class A | |
| | | For the Year Ended
October 31, 2015 | | For the Period Ended
October 31, 20141 | |
| | | Shares | | Value | | Shares | | Value | |
Shares sold | | | 120,295 | | | $ | 1,160,500 | | | | 194,716 | | | $ | 2,005,000 | | |
Shares issued in reinvestment
of distributions | | | 15,987 | | | | 154,602 | | | | — | | | | — | | |
Shares redeemed | | | (7,403 | ) | | | (71,588 | ) | | | (465 | ) | | | (4,693 | ) | |
Net increase | | | 128,879 | | | $ | 1,243,514 | | | | 194,251 | | | $ | 2,000,307 | | |
| | | Class C | |
| | | For the Year Ended
October 31, 2015 | | For the Period Ended
October 31, 20141 | |
| | | Shares | | Value | | Shares | | Value | |
Shares sold | | | 394 | | | $ | 3,942 | | | | 100,400 | | | $ | 1,004,000 | | |
Shares issued in reinvestment
of distributions | | | 7,896 | | | | 75,955 | | | | — | | | | — | | |
Net increase | | | 8,290 | | | $ | 79,897 | | | | 100,400 | | | $ | 1,004,000 | | |
1 For the period March 31, 2014 (Inception Date) through October 31, 2014.
On October 31, 2015, the number of shareholders that held 5% or more of the outstanding shares of each class of the Fund was as follows:
| | | Number of
Shareholders | | Approximate Percentage
of Outstanding Shares | |
Class I | | | 1 | * | | | 93 | % | |
Class A | | | 2 | * | | | 100 | % | |
Class C | | | 1 | * | | | 99 | % | |
*This includes the seed money from Merchant Holding, Inc., an affiliate of Credit Suisse.
32
Credit Suisse Volaris US Strategies Fund
Notes to Financial Statements (continued)
October 31, 2015
Note 6. Capital Share Transactions (continued)
Some of the shareholders are omnibus accounts, which hold shares on behalf of individual shareholders.
Note 7. Federal Income Taxes
Income and capital gain distributions are determined in accordance with federal income tax regulations, which may differ from GAAP.
The tax characteristics of dividends paid during the years ended October 31, 2015 and 2014, respectively, by the Fund were as follows:
| Ordinary Income | | Long-Term Capital Gain | |
| 2015 | | 2014 | | 2015 | | 2014 | |
| $ | 699,156 | | | $ | — | | | $ | 1,314,356 | | | $ | — | | |
The tax basis components of distributable earnings differ from the amounts reflected in the Statement of Assets and Liabilities by temporary book/tax differences. These differences are primarily due to differing treatments of option contracts marked to market and organizational expenses. At October 31, 2015, the components of distributable earnings on a tax basis were as follows:
Capital loss carryover | | $ | (1,707,677 | ) | |
Late year ordinary capital loss deferral | | | (218,351 | ) | |
Unrealized Appreciation | | | 560,112 | | |
| | $ | (1,365,916 | ) | |
During the tax year ended October 31, 2015, the Fund elected to defer Late-Year ordinary losses $218,351. These losses are deemed to arise on the first day of the Fund's next taxable year.
At October 31, 2015, the Fund had $723,452 of unlimited short-term and $984,225 of unlimited long-term capital loss carryforwards available to offset possible future capital gains.
At October 31, 2015, the cost of investments (excluding foreign currency related transactions) and net unrealized appreciation (depreciation) for income tax purposes were as follows:
Cost of Investments | | $ | 32,258,192 | | |
Unrealized appreciation | | $ | 2,547,643 | | |
Unrealized depreciation | | | (2,441,272 | ) | |
Net unrealized appreciation (depreciation) | | $ | 106,371 | | |
33
Credit Suisse Volaris US Strategies Fund
Notes to Financial Statements (continued)
October 31, 2015
Note 7. Federal Income Taxes (continued)
At October 31, 2015, the Fund reclassified $64,111 from accumulated net investment loss and $34 from accumulated net realized loss to paid in capital, to adjust for current period permanent book/tax differences which arose principally from differing book/tax treatment of net operating losses and distributions in excess of current earnings. Net assets were not affected by these reclassifications.
Note 8. Contingencies
In the normal course of business, the Fund may provide general indemnifications pursuant to certain contracts and organizational documents. The Fund's maximum exposure under these arrangements is dependent on future claims that may be made against the Fund and, therefore, cannot be estimated; however, based on experience, the risk of loss from such claims is considered remote.
Note 9. Other Matters
On May 19, 2014, the U.S. Department of Justice (the "Department of Justice") filed a one-count criminal information (the "Information") in the District Court for the Eastern District of Virginia (the "District Court") charging Credit Suisse AG ("CSAG") with conspiracy to commit tax fraud related to accounts CSAG established for cross-border clients. The Department of Justice and CSAG entered into a plea agreement (the "Plea Agreement") settling the action pursuant to which CSAG pleaded guilty to the charge set out in the Information.
The Plea Agreement requires CSAG to pay over $1.8 billion to the U.S. government, including the U.S. Internal Revenue Service. The Plea Agreement also requires CSAG to lawfully undertake certain remedial actions to address the conduct described in the Plea Agreement.
CSAG has entered into other settlements relating to the conduct set out in the Plea Agreement. CSAG has entered into a Consent Order with the Federal Reserve Board (the "Federal Reserve") to resolve certain findings by the Federal Reserve, including that the activities of CSAG regarding opening of foreign accounts for U.S. taxpayers, provision of investment services to U.S. clients, and operation of CSAG's New York representative office prior to 2009 lacked adequate enterprise-wide risk management and compliance policies and procedures sufficient to ensure that all of its activities comply with U.S. laws
34
Credit Suisse Volaris US Strategies Fund
Notes to Financial Statements (continued)
October 31, 2015
Note 9. Other Matters (continued)
and regulations. In addition, CSAG has entered into a Consent Order with the New York State Department of Financial Services (the "DFS") to resolve the DFS's investigation into the conduct described in the Plea Agreement. The settlement with the Federal Reserve requires CSAG to pay $100 million to the Federal Reserve, and the settlement with the DFS requires CSAG to pay $715 million to the DFS.
These settlements follow a settlement by Credit Suisse Group AG ("CS Group"), the parent company of CSAG, with the Securities and Exchange Commission (the "Commission") on February 21, 2014 to resolve an investigation by the Commission into solicitation and provision of broker-dealer and investment advisory services to certain U.S. cross-border clients by CS Group while not registered with the Commission as a broker-dealer or investment adviser. As part of the settlement, CS Group retained an independent consultant to evaluate its policies and procedures and examine its broker-dealer and investment adviser activities to fully verify that the business that was the subject of the Commission investigation has been completely exited. CS Group also agreed to pay $196,511,014, which includes $82,170,990 in disgorgement, $64,340,024 in interest and a $50,000,000 penalty.
CSAG is the indirect parent company of Credit Suisse and CSSU. Neither Credit Suisse, CSSU nor the Fund was named in the Plea Agreement (as defined above) or other settlements relating to the conduct set out in the Plea Agreement. The conduct set out in the Plea Agreement did not involve the Fund, Credit Suisse or CSSU with respect to its investment adviser and distribution activities relating to the Fund.
Credit Suisse, CSSU and certain of their affiliates have received a permanent exemptive order from the Commission to permit them to continue serving as investment advisers and principal underwriters for U.S.-registered investment companies, such as the Fund. Due to a provision in the law governing the operation of U.S.-registered investment companies, they would otherwise have become ineligible to perform these activities as a result of the plea in the Plea Agreement. The permanent exemptive order permits Credit Suisse and CSSU to continue to provide services to the Fund, so long as, among other things, no current or former employee of CSAG or any affiliate of CSAG who previously has been or who subsequently may be identified by CSAG or any U.S. or non-U.S. regulatory or enforcement agencies as having been responsible for the conduct described in the Plea Agreement will be employed by Credit Suisse and certain of its affiliates. Credit Suisse and CSSU have informed the Fund that, Credit Suisse and CSSU believe the Settlements will not have any material
35
Credit Suisse Volaris US Strategies Fund
Notes to Financial Statements (continued)
October 31, 2015
Note 9. Other Matters (continued)
impact on the Fund or on the ability of Credit Suisse or CSSU to perform services for the Fund.
On November 21, 2014, at the sentencing hearing, the District Court accepted and implemented the sentence as set out in the Plea Agreement. The District Court imposed no additional conditions beyond those contained in the Plea Agreement.
36
Credit Suisse Volaris US Strategies Fund
Report of Independent Registered Public Accounting Firm
The Board of Trustees and Shareholders
Credit Suisse Volaris US Strategies Fund:
We have audited the accompanying statement of assets and liabilities of Credit Suisse Volaris US Strategies Fund (the "Fund"), a series of the Credit Suisse Opportunity Funds, including the schedule of investments, as of October 31, 2015, and the related statements of operations, changes in net assets and financial highlights for the year then ended. These financial statements and financial highlights are the responsibility of the Fund's management. Our responsibility is to express an opinion on these financial statements and financial highlights based on our audit. The accompanying statement of changes in net assets and financial highlights of the Fund for the period March 31, 2014 (commencement of operations) to October 31, 2014, were audited by other independent registered public accountants whose report thereon dated December 29, 2014, expressed an unqualified opinion on that financial statement and those financial highlights.
We conducted our audit in accordance with the standards of the Public Company Accounting Oversight Board (United States). Those standards require that we plan and perform the audit to obtain reasonable assurance about whether the financial statements and financial highlights are free of material misstatement. An audit includes examining, on a test basis, evidence supporting the amounts and disclosures in the financial statements. Our procedures included confirmation of securities owned as of October 31, 2015, by correspondence with the custodian and broker or by other appropriate auditing procedures. An audit also includes assessing the accounting principles used and significant estimates made by management, as well as evaluating the overall financial statement presentation. We believe that our audit provides a reasonable basis for our opinion.
In our opinion, the 2015 financial statements and financial highlights referred to above present fairly, in all material respects, the financial position of Credit Suisse Volaris US Strategies Fund as of October 31, 2015, the results of its operations, changes in its net assets and the financial highlights for the year then ended, in conformity with U.S. generally accepted accounting principles.

New York, New York
December 30, 2015
37
Credit Suisse Volaris US Strategies Fund
Information Concerning Trustees and Officers (unaudited)
Name, Address
(Year of Birth) | | Position(s)
Held with
Fund | | Term
of Office1
and
Length
of Time
Served | | Principal
Occupation(s) During
Past Five Years | | Number of
Portfolios
in Fund
Complex
Overseen
by Trustee | | Other
Trusteeships
Held by Trustee | |
Independent Trustees | | | | | | | | | | | |
Enrique Arzac
c/o Credit Suisse Asset
Management, LLC
Attn: General Counsel
One Madison Avenue
New York, New York
10010
(1941) | | Trustee, Audit Committee Chairman and Nominating Committee Member | | Since Fund Inception | | Professor of Finance and Economics, Graduate School of Business, Columbia University since 1971. | | | 14 | | | Director of Adam Diversified Equity Fund, Inc., Adams Natural Resources Fund, Inc., Aberdeen Chile Fund, Inc., Aberdeen Emerging Markets Smaller Company Opportunities Fund, Inc., Aberdeen Israel Fund, Inc., Aberdeen Indonesia Fund, Inc. and Aberdeen Latin America Equity Fund, Inc. (each a closed-end investment company); Director of Aberdeen Asia-Pacific Income Investment Company Limited (a Canadian closed-end fund); Trustee of Mirae Asset Discovery Funds (7 open-end portfolios); Director of Starcomms PLC (telecommunications company) from 2008 to 2011; Director of Epoch Holding Corporation (an investment management and investment advisory services company) from 2006 to March 2013. | |
1 Each Trustee and Officer serves until his or her respective successor has been duly elected and qualified.
38
Credit Suisse Volaris US Strategies Fund
Information Concerning Trustees and Officers (unaudited) (continued)
Name, Address
(Year of Birth) | | Position(s)
Held with
Fund | | Term
of Office1
and
Length
of Time
Served | | Principal
Occupation(s) During
Past Five Years | | Number of
Portfolios
in Fund
Complex
Overseen
by Trustee | | Other
Trusteeships
Held by Trustee | |
Independent Trustees | | | | | | | | | | | |
Jeffrey E. Garten
c/o Credit Suisse Asset
Management, LLC
Attn: General Counsel
One Madison Avenue
New York, New York 10010
(1946) | | Trustee, Audit and Nominating Committee Member | | Since Fund Inception | | Dean Emeritus of Yale School of Management from July 2015 to present; The Juan Trippe Professor in the Practice of International Trade, Finance and Business from July 2005 to July 2015; Partner and Chairman of Garten Rothkopf (consulting firm) from October 2005 to present. | | | 11 | | | Director of Aetna, Inc. (insurance company); Director of CarMax Group (used car dealers); Director of Miller Buckfire & Co., LLC (financial restructuring); Member of Standard & Poor's Board of Managers (credit rating agency) from December 2011 to November 2014. | |
Steven N. Rappaport
Lehigh Court, LLC
555 Madison Avenue
29th Floor
New York, New York
10022
(1948) | | Chairman of the Board of Trustees, Audit Committee Member and Nominating Committee Chairman | | Since Fund Inception | | Partner of Lehigh Court, LLC and RZ Capital (private investment firms) from July 2002 to present; Partner of Backstage Acquisition Holding, LLC (Publication Job Postings) from November 2013 to present. | | | 14 | | | Director of iCAD, Inc. (surgical and medical instruments and apparatus company); Director of Aberdeen Chile Fund, Inc., Aberdeen Emerging Markets Smaller Company Opportunities Fund, Inc., Aberdeen Israel Fund, Inc., Aberdeen Indonesia Fund, Inc. and Aberdeen Latin America Equity Fund, Inc. (each a closed-end investment company); Director of Presstek, Inc. (digital imaging technologies company) from 2003 to 2012; Director of Wood Resources, LLC (plywood manufacturing company) from 2003 to October 2013. | |
1 Each Trustee and Officer serves until his or her respective successor has been duly elected and qualified.
39
Credit Suisse Volaris US Strategies Fund
Information Concerning Trustees and Officers (unaudited) (continued)
Name, Address
(Year of Birth) | | Position(s)
Held with
Fund | | Term of
Office1
and
Length of
Time
Served | | Principal Occupation(s) During Past Five Years | |
Officers* | | | | | | | |
John G. Popp
Credit Suisse Asset
Management, LLC
One Madison Avenue
New York, New York 10010
(1956) | | Chief Executive Officer and President | | Since Fund Inception | | Managing Director of Credit Suisse; Global Head and Chief Investment Officer of the Credit Investment Group; Associated with Credit Suisse or its predecessor since 1997; Officer of other Credit Suisse Funds; Trustee of Credit Suisse High Yield Bond Fund; Director of Credit Suisse Asset Management Income Fund, Inc; Director of Credit Suisse Park View BDC, Inc. | |
Emidio Morizio
Credit Suisse Asset
Management, LLC
One Madison Avenue
New York, New York 10010
(1966) | | Chief Compliance Officer | | Since Fund Inception | | Managing Director and Global Head of Compliance of Credit Suisse since 2010; Associated with Credit Suisse since July 2000; Officer of other Credit Suisse Funds. | |
Lou Anne McInnis
Credit Suisse Asset
Management, LLC
One Madison Avenue
New York, New York 10010
(1959) | | Chief Legal Officer | | Since 2015 | | Director of Credit Suisse; Associated with Credit Suisse since April 2015; Counsel at DLA Piper US LLP from 2011 to April 2015; Associated with Morgan Stanley Investment Management from 1997 to 2010; Officer of other Credit Suisse Funds. | |
Rocco DelGuercio
Credit Suisse Asset
Management, LLC
One Madison Avenue
New York, New York 10010
(1963) | | Chief Financial Officer and Treasurer | | Chief Financial Officer since 2015; Treasurer since 2013 | | Vice President of Credit Suisse since 2013; Independent Consultant from February 2012 to April 2013; Director of Legg Mason & Co., LLC from March 2004 to January 2012; Associated with Credit Suisse from June 1996 to March 2004; Officer of other Credit Suisse Funds. | |
Karen Regan
Credit Suisse Asset
Management, LLC
One Madison Avenue
New York, New York 10010
(1963) | | Vice President and Secretary | | Since Fund Inception | | Vice President of Credit Suisse; Associated with Credit Suisse since December 2004; Officer of other Credit Suisse Funds. | |
1 Each Trustee and Officer serves until his or her respective successor has been duly elected and qualified.
* The officers of the Fund shown are officers that make policy decisions.
The Statement of Additional Information includes additional information about the Trustees and is available, without charge, upon request, by calling 877-870-2874.
40
Credit Suisse Volaris US Strategies Fund
Proxy Voting and Portfolio Holdings Information (unaudited)
Information regarding how the Fund voted proxies related to its portfolio securities during the 12-month period ended June 30 of each year, as well as the policies and procedures that the Fund uses to determine how to vote proxies relating to its portfolio securities are available:
• By calling 1-877-870-2874
• On the Fund's website, www.credit-suisse.com/us/funds
• On the website of the Securities and Exchange Commission, www.sec.gov.
The Fund files a complete schedule of its portfolio holdings for the first and third quarters of its fiscal year with the SEC on Form N-Q. The Fund's Forms N-Q are available on the SEC's website at www.sec.gov and may be reviewed and copied at the SEC's Public Reference Room in Washington, DC. Information on the operation of the SEC's Public Reference Room may be obtained by calling 1-202-551-8090.
41
This page intentionally left blank
This page intentionally left blank
This page intentionally left blank

P.O. BOX 55030, BOSTON, MA 02205-5030
877-870-2874 n www.credit-suisse.com/us/funds
CREDIT SUISSE SECURITIES (USA) LLC, DISTRIBUTOR. VUS-AR-2015

CREDIT SUISSE FUNDS
Annual Report
October 31, 2015
n CREDIT SUISSE
FLOATING RATE HIGH INCOME FUND
The Fund's investment objectives, risks, charges and expenses (which should be considered carefully before investing), and more complete information about the Fund, are provided in the Prospectus, which should be read carefully before investing. You may obtain additional copies by calling 877-870-2874 or by visiting our website at www.credit-suisse.com/us/funds.
Credit Suisse Securities (USA) LLC, Distributor, is located at One Madison Avenue, New York, NY 10010. Credit Suisse Funds are advised by Credit Suisse Asset Management, LLC.
Investors in the Credit Suisse Funds should be aware that they may be eligible to purchase Class I shares (where offered) directly or through certain intermediaries. Such shares are not subject to a sales charge. Investors in the Credit Suisse Funds should also be aware that they may be eligible for a reduction or waiver of the sales charge with respect to Class A, B or C shares (where offered). For more information, please review the relevant prospectuses or consult your financial representative.
Fund shares are not deposits or other obligations of Credit Suisse Asset Management, LLC ("Credit Suisse") or any affiliate, are not FDIC-insured and are not guaranteed by Credit Suisse or any affiliate. Fund investments are subject to investment risks, including loss of your investment.
Credit Suisse Floating Rate High Income Fund
Annual Investment Adviser's Report
October 31, 2015 (unaudited)
December 21, 2015
Dear Shareholder:
We are pleased to present this Annual Report covering the activities of the Credit Suisse Floating Rate High Income Fund (the "Fund"), for the 12 months ended October 31, 2015.
Performance Summary
11/1/2014 – 10/31/2015
Fund & Benchmark | | Performance | |
Class I1 | | | 2.33 | % | |
Class A1,2 | | | 2.09 | % | |
Class B1,2 | | | 1.64 | % | |
Class C1,2 | | | 1.33 | % | |
Credit Suisse Leveraged Loan Index3 | | | 0.81 | % | |
Performance shown for the Fund's Class A, Class B and Class C Shares does not reflect sales charges, which are a maximum of 4.75, 4.00% and 1.00%, respectively.2
Market Review: A muted period for senior loans
The 12 months ended October 31, 2015 was a muted one for the senior secured loan asset class, with the Credit Suisse Leveraged Loan Index (the "Index"), the Fund's benchmark, returning 0.81% for the period. The discount margin for senior loans, using a three-year average life assumption, widened 0.81% during the period to +596 basis points. Returns represented mostly coupon clipping, as the average price of the Index finished the period at 93.82, which was a decrease of 3.79 basis points.
According to S&P data, loan issuance was $433 billion over the last 12 months — 23% lower than 2014. With a large repricing wave in the previous period, it's no surprise that JPMorgan data showed an uptick of leveraged buyout/dividend activity and a decrease in refinancing/repricing as a percentage of overall issuance.
On the demand side, the loan mutual fund flows were -$22.4 billion according to JPMorgan, with only two positive months over the last 12 months. This compared to -$8.4 billion over the previous year. Collateralized loan obligations ("CLOs"), however, have almost kept pace with last year's record issuance. In fact, with $105.16 billion of CLO creation over the 12 months period, it more than offset the outflow experienced in loan mutual funds.
Fundamentals in the senior secured loan market have been strong, but have begun to show cracks recently. Default rates ended the period at 1.32%, but are
1
Credit Suisse Floating Rate High Income Fund
Annual Investment Adviser's Report (continued)
October 31, 2015 (unaudited)
expected to float toward 2% with the recent volatility in certain sectors (energy, mining, and retail).
From a quality point of view, the lower rated portion of the Index underperformed for the year. Distressed loans (CC, C, and Default) posted the lowest returns, at -40.79%, followed by CCC/Split CCC loans which returned -2.11% during the period. Split BBB and BB rated loans outperformed with returns of 3.27% and 3.12%, respectively. These results were the polar opposite of the previous year, where the lower rated and defaulted names outperformed the Index and the higher rated ones lagged.
Strategic Review and Outlook: Positioned well for the future
For the 12 months ended October 31, 2015, the Fund outperformed the benchmark. The Fund's underweight position in utilities and security selection in oil and gas contributed to relative returns. In addition, the Fund's exposure to B-rated investments in conjunction with the avoidance of lower rated CC and NR loans also contributed to relative returns.
Market sentiment has been fickle, as returns in equity and credit asset classes experienced weakness at the end of 2Q 2015. Though CLO issuance has been robust, retail funds have continued to experienced outflows. Given these factors, coupled with a heightened probability of future rate hike from the Federal Reserve (the "Fed") and robust growth out of China, we continue to expect increased volatility.
Portfolio exposures remain focused on B-rated names in the Index that we believe exhibit the best risk-return characteristics. As the Fed continues to evaluate raising short-term interest rates, the Fund's focus on short duration floating rate loans should position the Fund well in the expected rising rate environment.
The Credit Suisse Credit Investments Group Team
John G. Popp
Thomas J. Flannery
Louis I. Farano
Wing Chan
Senior secured floating rate loans ("Senior Loans") are subject to risk that a court could subordinate a Senior Loan, which typically holds the most senior position in the issuer's capital structure, to presently existing or future indebtedness or take other action detrimental to the holders of Senior Loans.
2
Credit Suisse Floating Rate High Income Fund
Annual Investment Adviser's Report (continued)
October 31, 2015 (unaudited)
High yield bonds are lower-quality bonds that are also known as "junk bonds." Such bonds entail greater risks than those found in higher-rated securities.
Additional principal risk factors for the Fund include conflict of interest risk, credit risk, foreign securities risk, interest rate risk, liquidity risk, market risk, prepayment risk and valuation risk. Before you invest, please make sure you understand the risks that apply to the Fund. As with any mutual fund, you could lose money over any period of time. Investments in the Fund are not bank deposits and are not insured or guaranteed by the Federal Deposit Insurance Corporation or any government agency. For a detailed discussion of these and other risks, please refer to the Fund's Prospectus, which should be read carefully before investing.
In addition to historical information, this report contains forward-looking statements, which may concern, among other things, domestic and foreign market, industry and economic trends and developments and government regulation and their potential impact on the Fund's investments. These statements are subject to risks and uncertainties and actual trends, developments and regulations in the future, and their impact on the Fund could be materially different from those projected, anticipated or implied. The Fund has no obligation to update or revise forward-looking statements.
The views of the Fund's management are as of the date of the letter and the Fund holdings described in this document are as of October 31, 2015; these views and Fund holdings may have changed subsequent to these dates. Nothing in this document is a recommendation to purchase or sell securities.
3
Credit Suisse Floating Rate High Income Fund
Annual Investment Adviser's Report (continued)
October 31, 2015 (unaudited)
Comparison of Change in Value of $10,000 Investment in the
Credit Suisse Floating Rate High Income Fund1 Class I shares and the
Credit Suisse Leveraged Loan Index3 for Ten Years.
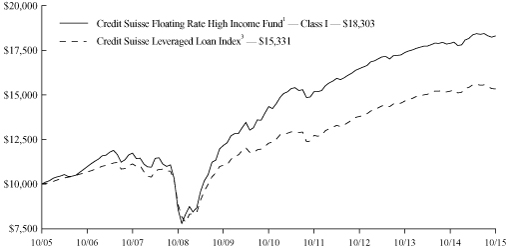
Comparison of Change in Value of $10,000 Investment in the
Credit Suisse Floating Rate High Income Fund1 Class A shares2,
Class B shares2, and Class C shares2 and the Credit Suisse
Leveraged Loan Index3 for Ten Years.
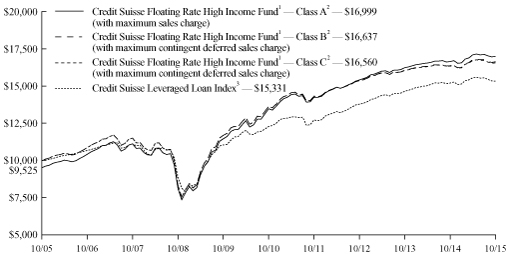
1 Fee waivers and/or expense reimbursements may reduce expenses for the Fund, without which performance would be lower. Voluntary waivers and/or reimbursements may be discontinued at any time.
4
Credit Suisse Floating Rate High Income Fund
Annual Investment Adviser's Report (continued)
October 31, 2015 (unaudited)
2 Total return for the Fund's Class A shares for the reporting period, based on offering price (including maximum sales charge of 4.75%), was (2.71)%. Total return for the Fund's Class B shares for the reporting period, based on redemption value (including maximum contingent deferred sales charge of 4.00%), was (2.29)%. Total return for the Fund's Class C shares for the reporting period, based on redemption value (including maximum contingent deferred sales charge of 1.00%), was 0.35%.
3 Credit Suisse Leveraged Loan Index is an unmanaged index that is designed to mirror the investable universe of the U.S. dollar-denominated institutional leveraged loan market. The index does not have transaction costs and investors cannot invest directly in the index.
Average Annual Returns as of October 31, 20151
| | | 1 Year | | 5 Years | | 10 Years | |
Class I Class | | | 2.33 | % | | | 5.00 | % | | | 6.23 | % | |
Class A Without Sales Charge | | | 2.09 | % | | | 4.75 | % | | | 5.97 | % | |
Class A With Maximum Sales Charge | | | (2.71 | )% | | | 3.73 | % | | | 5.45 | % | |
Class B Without CDSC | | | 1.64 | % | | | 4.05 | % | | | 5.22 | % | |
Class B With CDSC | | | (2.29 | )% | | | 4.05 | % | | | 5.22 | % | |
Class C Without CDSC | | | 1.33 | % | | | 3.96 | % | | | 5.17 | % | |
Class C With CDSC | | | 0.35 | % | | | 3.96 | % | | | 5.17 | % | |
Returns represent past performance and include change in share price and reinvestment of dividends and capital gains. Past performance cannot guarantee future results. The current performance of the Fund may be lower or higher than the figures shown. Returns and share price will fluctuate, and redemption value may be more or less than original cost. The performance results do not reflect the deduction of taxes that a shareholder would pay on fund distributions or the redemption of fund shares. Performance information current to the most recent month-end is available at www.credit-suisse.com/us/funds.
The annual gross expense ratios are 0.77% for Class I shares, 1.02% for Class A shares, 1.77% for Class B shares and 1.77% for Class C shares. The annual net expense ratios after fee waivers and/or expense reimbursements are 0.70% for Class I shares, 0.95% for Class A shares, 1.70% for Class B shares and 1.70% for Class C shares.
1 Fee waivers and/or expense reimbursements may reduce expenses for the Fund, without which performance would be lower. Voluntary waivers and/or reimbursements may be discontinued at any time.
5
Credit Suisse Floating Rate High Income Fund
Annual Investment Adviser's Report (continued)
October 31, 2015 (unaudited)
Information About Your Fund's Expenses
As an investor of the Fund, you incur two types of costs: ongoing expenses and transaction costs. Ongoing expenses include management fees, distribution and service (12b-1) fees and other Fund expenses. Examples of transaction costs include sales charges (loads), redemption fees and account maintenance fees, which are not shown in this section and which would result in higher total expenses. The following table is intended to help you understand your ongoing expenses of investing in the Fund and to help you compare these expenses with the ongoing expenses of investing in other mutual funds. The table is based on an investment of $1,000 made at the beginning of the six months ended October 31, 2015.
The table illustrates your Fund's expenses in two ways:
• Actual Fund Return. This helps you estimate the actual dollar amount of ongoing expenses paid on a $1,000 investment in the Fund using the Fund's actual return during the period. To estimate the expenses you paid over the period, simply divide your account value by $1,000 (for example, an $8,600 account value divided by $1,000 = 8.6), then multiply the result by the number in the "Expenses Paid per $1,000" line under the share class you hold.
• Hypothetical 5% Fund Return. This helps you to compare your Fund's ongoing expenses with those of other mutual funds using the Fund's actual expense ratio and a hypothetical rate of return of 5% per year before expenses. Examples using a 5% hypothetical fund return may be found in the shareholder reports of other mutual funds. The hypothetical account values and expenses may not be used to estimate the actual ending account balance or expenses you paid for the period.
Please note that the expenses shown in these tables are meant to highlight your ongoing expenses only and do not reflect any transaction costs, such as sales charges (loads) or redemption fees. If these transaction costs had been included, your costs would have been higher. The "Expenses Paid per $1,000" line of the tables is useful in comparing ongoing expenses only and will not help you determine the relative total expenses of owning different funds.
6
Credit Suisse Floating Rate High Income Fund
Annual Investment Adviser's Report (continued)
October 31, 2015 (unaudited)
Expenses and Value for a $1,000 Investment
for the six month period ended October 31, 2015
Actual Fund Return | | Class I | | Class A | | Class B | | Class C | |
Beginning Account Value 05/01/15 | | $ | 1,000.00 | | | $ | 1,000.00 | | | $ | 1,000.00 | | | $ | 1,000.00 | | |
Ending Account Value 10/31/15 | | $ | 996.70 | | | $ | 994.10 | | | $ | 992.00 | | | $ | 990.50 | | |
Expenses Paid per $1,000* | | $ | 3.52 | | | $ | 4.77 | | | $ | 8.54 | | | $ | 8.53 | | |
Hypothetical 5% Fund Return | |
Beginning Account Value 05/01/15 | | $ | 1,000.00 | | | $ | 1,000.00 | | | $ | 1,000.00 | | | $ | 1,000.00 | | |
Ending Account Value 10/31/15 | | $ | 1,021.68 | | | $ | 1,020.42 | | | $ | 1,016.64 | | | $ | 1,016.64 | | |
Expenses Paid per $1,000* | | $ | 3.57 | | | $ | 4.84 | | | $ | 8.64 | | | $ | 8.64 | | |
| | | Class I | | Class A | | Class B | | Class C | |
Annualized Expense Ratios* | | | 0.70 | % | | | 0.95 | % | | | 1.70 | % | | | 1.70 | % | |
* Expenses are equal to the Fund's annualized expense ratio for each share class, multiplied by the average account value over the period, multiplied by 184/365 to reflect the one-half year period.
The "Expenses Paid per $1,000" and the "Annualized Expense Ratios" in the tables are based on actual expenses paid by the Fund during the period, net of fee waivers and/or expense reimbursements. If those fee waivers and/or expense reimbursements had not been in effect, the Fund's actual expenses would have been higher. Expenses do not reflect additional charges and expenses that are, or may be, imposed under the variable contracts or plans. Such charges and expenses are described in the prospectus of the insurance company separate account or in the plan documents or other informational materials supplied by plan sponsors. The Fund's expenses should be considered with these charges and expenses in evaluating the overall cost of investing in the separate account.
For more information, please refer to the Fund's prospectus.
7
Credit Suisse Floating Rate High Income Fund
Annual Investment Adviser's Report (continued)
October 31, 2015 (unaudited)
Credit Quality Breakdown*
(% of Total Investments as of October 31, 2015)
S&P Ratings** | |
BBB | | | 2.6 | % | |
BB | | | 29.3 | | |
B | | | 47.1 | | |
CCC | | | 4.1 | | |
NR | | | 1.9 | | |
Subtotal | | | 85.0 | | |
Equity and Other1 | | | 0.0 | | |
Short-Term Investments2 | | | 15.0 | | |
Total | | | 100.0 | % | |
* Expressed as a percentage of total investments (excluding securities lending collateral if applicable) and may vary over time.
** Credit Quality is based on S&P Ratings. S&P is a main provider of ratings for Credit Asset Classes and is widely used amongst industry participants. The NR category consists of securities that have not been rated by S&P Ratings.
1 This amount represents less than 0.1%.
2 Primarily reflects cash invested in State Street Bank and Trust Co. Euro Time Deposit, for which the purchases of securities have been executed but not yet settled at October 31, 2015, if applicable.
8
Credit Suisse Floating Rate High Income Fund
Schedule of Investments
October 31, 2015
Par
(000) | | | | Ratings†
(S&P/Moody's) | | Maturity | | Rate% | | Value | |
| BANK LOANS (77.8%) | |
| Advertising (0.8%) | | | |
$ | 5,531 | | | MH Sub I LLC1 | | (B, B1) | | 07/08/21 | | | 4.750 | | | $ | 5,489,821 | | |
| | 4,980 | | | MH Sub I LLC1 | | (CCC+, Caa1) | | 07/08/22 | | | 8.500 | | | | 4,889,737 | | |
| | 9,810 | | | WMG Acquisition Corp.1 | | (B, B1) | | 07/01/20 | | | 3.750 | | | | 9,573,630 | | |
| | | 19,953,188 | | |
| Aerospace & Defense (1.1%) | | | |
| | 11,936 | | | LM U.S. Corp. Acquisition, Inc.1 | | (B-, B2) | | 10/25/19 | | | 4.750 | | | | 11,927,934 | | |
| | 5,108 | | | LM U.S. Corp. Acquisition, Inc.1 | | (CCC, Caa2) | | 01/25/21 | | | 8.250 | | | | 5,096,978 | | |
| | 15,203 | | | Sequa Corp.1 | | (CCC+, Caa1) | | 06/19/17 | | | 5.250 | | | | 12,542,676 | | |
| | | 29,567,588 | | |
| Air Transportation (0.4%) | | | |
| | 10,001 | | | United Airlines, Inc.1 | | (BB+, Ba1) | | 04/01/19 | | | 3.250 | | | | 9,978,790 | | |
| Auto Parts & Equipment (1.4%) | | | |
| | 6,896 | | | Affinia Group Intermediate Holdings, Inc.1 | | (B, B2) | | 04/27/20 | | | 4.750 | | | | 6,912,986 | | |
| | 3,033 | | | American Tire Distributors Holdings, Inc.1 | | (B-, B2) | | 09/01/21 | | | 5.250 | | | | 3,051,020 | | |
| | 11,063 | | | CS Intermediate Holdco 2 LLC1 | | (BB-, B1) | | 04/04/21 | | | 4.000 | | | | 11,005,726 | | |
| | 7,503 | | | Gates Global, Inc.1 | | (B+, B2) | | 07/05/21 | | | 4.250 | | | | 7,064,002 | | |
| | 4,644 | | | Remy International, Inc.1 | | (BB-, B1) | | 03/05/20 | | | 3.250 | | | | 4,641,297 | | |
| | 3,500 | | | Wand Intermediate I LP1 | | (CCC+, Caa1) | | 09/19/22 | | | 8.250 | | | | 3,403,750 | | |
| | | 36,078,781 | | |
| Automakers (0.8%) | | | |
| | 8,874 | | | Chrysler Group LLC1 | | (BB+, Ba1) | | 05/24/17 | | | 3.500 | | | | 8,877,196 | | |
| | 7,500 | | | TI Group Automotive Systems LLC1,2 | | (BB, Ba3) | | 06/30/22 | | | 4.500 | | | | 8,167,479 | | |
| | 4,000 | | | TI Group Automotive Systems LLC1 | | (BB, Ba3) | | 06/30/22 | | | 4.500 | | | | 3,966,660 | | |
| | | 21,011,335 | | |
| Banking (0.3%) | | | |
| | 7,311 | | | Citco Funding LLC1 | | (NR, Ba3) | | 06/29/18 | | | 4.250 | | | | 7,332,392 | | |
| Building & Construction (0.3%) | | | |
| | 4,945 | | | PGT, Inc.1 | | (BB-, B2) | | 09/22/21 | | | 5.250 | | | | 4,959,477 | | |
| | 3,000 | | | Priso Acquisition Corp.1 | | (B+, B2) | | 05/08/22 | | | 4.500 | | | | 2,955,000 | | |
| | | 7,914,477 | | |
| Building Materials (1.6%) | | | |
| | 11,736 | | | ABC Supply Co., Inc.1 | | (BB+, B1) | | 04/16/20 | | | 3.500 | | | | 11,683,319 | | |
| | 10,953 | | | Headwaters, Inc.1 | | (BB-, B1) | | 03/24/22 | | | 4.500 | | | | 11,007,313 | | |
| | 3,850 | | | Jeld-Wen, Inc.1 | | (B, B1) | | 06/18/22 | | | 5.000 | | | | 3,862,051 | | |
| | 4,823 | | | Mannington Mills, Inc.1 | | (BB-, B1) | | 10/01/21 | | | 4.750 | | | | 4,827,163 | | |
| | 10,905 | | | Wilsonart LLC1 | | (B+, B2) | | 10/31/19 | | | 4.000 | | | | 10,850,817 | | |
| | | 42,230,663 | | |
| Cable & Satellite TV (3.3%) | | | |
| | 5,486 | | | Altice Financing S.A.1 | | (BB-, B1) | | 07/02/19 | | | 5.500 | | | | 5,501,127 | | |
| | 2,095 | | | Altice Financing S.A.1 | | (BB-, B1) | | 02/04/22 | | | 5.250 | | | | 2,090,560 | | |
| | 5,483 | | | Cequel Communications LLC1 | | (BB, Ba2) | | 02/14/19 | | | 3.500 | | | | 5,423,746 | | |
| | 3,000 | | | Cequel Communications LLC1 | | (BB-, Ba2) | | 12/14/22 | | | 4.250 | | | | 2,949,375 | | |
See Accompanying Notes to Financial Statements.
9
Credit Suisse Floating Rate High Income Fund
Schedule of Investments (continued)
October 31, 2015
Par
(000) | | | | Ratings†
(S&P/Moody's) | | Maturity | | Rate% | | Value | |
| BANK LOANS (continued) | |
Cable & Satellite TV | | | |
$ | 2,000 | | | Charter Communications Operating LLC1 | | (BB+, Baa3) | | 01/04/21 | | | 3.000 | | | $ | 1,983,340 | | |
| | 6,750 | | | Charter Communications Operating LLC1 | | (BBB-, Ba1) | | 01/24/23 | | | 3.500 | | | | 6,754,219 | | |
| | 11,680 | | | Neptune Finco Corp.1 | | (BB-, Ba1) | | 10/09/22 | | | 5.000 | | | | 11,739,451 | | |
| | 1,950 | | | Numericable Group S.A.1 | | (B+, B1) | | 07/31/22 | | | 4.000 | | | | 1,925,957 | | |
| | 6,723 | | | Onex Wizard U.S. Acquisition, Inc.1 | | (B+, B1) | | 03/13/22 | | | 4.250 | | | | 6,738,125 | | |
| | 13,121 | | | TWCC Holding Corp.1 | | (B+, B1) | | 02/11/20 | | | 5.750 | | | | 13,148,127 | | |
| | 2,500 | | | Virgin Media Investment Holdings Ltd.1,3 | | (BB-, Ba3) | | 06/30/23 | | | 4.250 | | | | 3,817,176 | | |
| | 9,250 | | | WideOpenWest Finance LLC1 | | (B, Ba3) | | 04/01/19 | | | 4.500 | | | | 9,112,499 | | |
| | 14,000 | | | Ziggo Financing Partnership1 | | (BB-, Ba3) | | 01/15/22 | | | 3.500 | | | | 13,806,520 | | |
| | | 84,990,222 | | |
| Chemicals (7.5%) | | | |
| | 3,553 | | | Allnex (Luxembourg) & Cy S.C.A.1 | | (B+, B1) | | 10/03/19 | | | 4.500 | | | | 3,559,950 | | |
| | 1,844 | | | Allnex U.S.A., Inc.1 | | (B+, B1) | | 10/03/19 | | | 4.500 | | | | 1,847,083 | | |
| | 15,770 | | | Ascend Performance Materials Operations LLC1 | | (B, B2) | | 04/10/18 | | | 6.750 | | | | 14,303,410 | | |
| | 12,697 | | | Axalta Coating Systems U.S. Holdings, Inc.1 | | (BB-, Ba3) | | 02/01/20 | | | 3.750 | | | | 12,696,741 | | |
| | 9,666 | | | AZ Chem U.S., Inc.1 | | (BB-, Ba3) | | 06/12/21 | | | 4.500 | | | | 9,668,191 | | |
| | 4,378 | | | Chemstralia Pty Ltd.1 | | (BB-, B1) | | 02/28/22 | | | 7.250 | | | | 4,345,165 | | |
| | 13,590 | | | Chromaflo Technologies Corp.1 | | (B-, B2) | | 12/02/19 | | | 4.500 | | | | 13,114,306 | | |
| | 2,500 | | | Chromaflo Technologies Corp.1 | | (CCC+, Caa2) | | 06/02/20 | | | 8.250 | | | | 2,378,034 | | |
| | 2,911 | | | Colouroz Investment 2 LLC1 | | (B-, Caa1) | | 09/06/22 | | | 8.250 | | | | 2,877,430 | | |
| | 9,875 | | | Gemini HDPE LLC1 | | (B+, Ba2) | | 08/07/21 | | | 4.750 | | | | 9,875,119 | | |
| | 12,303 | | | Houghton International, Inc.1 | | (B+, B1) | | 12/20/19 | | | 4.250 | | | | 12,280,268 | | |
| | 2,000 | | | Houghton International, Inc.1 | | (B-, Caa1) | | 12/20/20 | | | 9.750 | | | | 1,985,000 | | |
| | 1,995 | | | Ineos Group Holdings S.A.1,2 | | (BB-, Ba3) | | 12/15/20 | | | 4.000 | | | | 2,152,496 | | |
| | 12,611 | | | Ineos U.S. Finance LLC1 | | (BB-, Ba3) | | 05/04/18 | | | 3.750 | | | | 12,492,517 | | |
| | 333 | | | Ineos U.S. Finance LLC1 | | (BB-, Ba3) | | 03/31/22 | | | 4.250 | | | | 329,476 | | |
| | 4,546 | | | Minerals Technologies, Inc.1 | | (BB, Ba2) | | 05/09/21 | | | 3.750 | | | | 4,539,831 | | |
| | 8,201 | | | Nexeo Solutions LLC1 | | (B, B3) | | 09/08/17 | | | 5.000 | | | | 7,728,822 | | |
| | 6,000 | | | Osmose Holdings, Inc.1 | | (B, B2) | | 07/29/22 | | | 4.750 | | | | 5,981,250 | | |
| | 3,920 | | | OXEA Finance & Cy S.C.A.1,2 | | (B+, B2) | | 01/15/20 | | | 4.500 | | | | 4,193,545 | | |
| | 8,330 | | | OXEA Finance LLC1 | | (B+, B2) | | 01/15/20 | | | 4.250 | | | | 8,011,001 | | |
| | 4,708 | | | PQ Corp.1 | | (B+, B2) | | 08/07/17 | | | 4.000 | | | | 4,701,165 | | |
| | 2,500 | | | Quality Distribution, Inc.1 | | (CCC, Caa1) | | 07/20/23 | | | 9.500 | | | | 2,387,500 | | |
| | 6,092 | | | Ravago Holdings America, Inc.1 | | (BB-, B2) | | 12/20/20 | | | 5.500 | | | | 6,102,220 | | |
| | 2,479 | | | Solenis International LP1 | | (B, B2) | | 07/31/21 | | | 4.250 | | | | 2,444,348 | | |
| | 4,499 | | | Solenis International LP1 | | (B-, Caa1) | | 07/31/22 | | | 7.750 | | | | 4,240,594 | | |
| | 2,683 | | | Sonneborn LLC1 | | (B, B1) | | 12/10/20 | | | 4.750 | | | | 2,683,841 | | |
| | 473 | | | Sonneborn Refined Products B.V.1 | | (B, B1) | | 12/10/20 | | | 4.750 | | | | 473,619 | | |
| | 2,993 | | | The Chemours Co.1 | | (BBB-, Ba1) | | 05/12/22 | | | 3.750 | | | | 2,750,108 | | |
| | 11,130 | | | Tronox Pigments (Netherlands) B.V.1 | | (BB+, Ba3) | | 03/19/20 | | | 4.250 | | | | 10,259,263 | | |
| | 9,089 | | | U.S. Silica Co.1 | | (BB-, Ba3) | | 07/23/20 | | | 4.000 | | | | 8,528,678 | | |
| | 6,750 | | | Univar, Inc.1 | | (BB-, B2) | | 07/01/22 | | | 4.250 | | | | 6,671,059 | | |
| | 9,447 | | | UTEX Industries, Inc.1 | | (B-, B2) | | 05/22/21 | | | 5.000 | | | | 8,101,079 | | |
| | 1,438 | | | Vantage Specialty Chemicals, Inc.1 | | (B-, B2) | | 02/10/19 | | | 5.000 | | | | 1,416,285 | | |
| | | 195,119,394 | | |
See Accompanying Notes to Financial Statements.
10
Credit Suisse Floating Rate High Income Fund
Schedule of Investments (continued)
October 31, 2015
Par
(000) | | | | Ratings†
(S&P/Moody's) | | Maturity | | Rate% | | Value | |
| BANK LOANS (continued) | |
| Consumer/Commercial/Lease Financing (0.2%) | | | |
$ | 5,000 | | | Infinity Acquisition LLC1 | | (B+, B1) | | 08/06/21 | | | 4.000 | | | $ | 4,904,150 | | |
| Department Stores (0.7%) | | | |
| | 8,400 | | | Dollar Tree, Inc.1 | | (BB+, Ba1) | | 07/06/22 | | | 4.250 | | | | 8,419,950 | | |
| | 10,000 | | | Hudson's Bay Co.1 | | (BB, B1) | | 09/30/22 | | | 4.750 | | | | 10,029,700 | | |
| | | 18,449,650 | | |
| Discount Stores (0.5%) | | | |
| | 6,964 | | | 99 Cents Only Stores1 | | (B, B3) | | 01/11/19 | | | 4.500 | | | | 5,571,573 | | |
| | 7,642 | | | Ollie's Bargain Outlet, Inc.1 | | (B+, Ba3) | | 09/27/19 | | | 4.750 | | | | 7,603,502 | | |
| | | 13,175,075 | | |
| Diversified Capital Goods (0.8%) | | | |
| | 1,226 | | | Douglas Dynamics Holdings, Inc.1 | | (BB-, B1) | | 12/31/21 | | | 5.250 | | | | 1,227,114 | | |
| | 3,950 | | | Horizon Global Corp.1 | | (B, B2) | | 05/11/22 | | | 7.000 | | | | 3,920,375 | | |
| | 12,785 | | | Husky Injection Molding Systems Ltd.1 | | (B, B1) | | 06/30/21 | | | 4.250 | | | | 12,567,169 | | |
| | 3,990 | | | Infiltrator Systems, Inc.1 | | (B+, B1) | | 05/27/22 | | | 5.250 | | | | 3,993,990 | | |
| | | 21,708,648 | | |
| Electric - Generation (0.2%) | | | |
| | 4,747 | | | Calpine Corp.1 | | (BB, Ba3) | | 05/27/22 | | | 3.500 | | | | 4,702,924 | | |
| Electric - Distribution/Transportation (0.1%) | | | |
| | 3,500 | | | Energy Future Intermediate Holding Co. LLC1 | | (BB, Ba3) | | 06/19/16 | | | 4.250 | | | | 3,503,833 | | |
| Electronics (1.6%) | | | |
| | 10,592 | | | Avago Technologies Cayman Ltd.1 | | (BBB-, Ba1) | | 05/06/21 | | | 3.750 | | | | 10,604,733 | | |
| | 4,987 | | | Excelitas Technologies Corp.1 | | (B-, B2) | | 10/31/20 | | | 6.000 | | | | 4,823,096 | | |
| | 4,987 | | | Freescale Semiconductor, Inc.1 | | (B, B1) | | 01/15/21 | | | 5.000 | | | | 5,010,643 | | |
| | 10,775 | | | Freescale Semiconductor, Inc.1 | | (B, B1) | | 02/28/20 | | | 4.250 | | | | 10,779,527 | | |
| | 11,000 | | | Sophia LP1 | | (B, B2) | | 09/30/22 | | | 4.750 | | | | 11,000,000 | | |
| | | 42,217,999 | | |
| Energy - Exploration & Production (0.3%) | | | |
| | 4,000 | | | Chief Exploration & Development LLC1 | | (NR, NR) | | 05/12/21 | | | 7.500 | | | | 3,228,000 | | |
| | 3,900 | | | W&T Offshore, Inc.1 | | (B+, B2) | | 05/01/20 | | | 9.000 | | | | 3,441,750 | | |
| | | 6,669,750 | | |
| Environmental (0.1%) | | | |
| | 2,973 | | | PSC Industrial Holdings Corp.1 | | (B+, B1) | | 12/05/20 | | | 5.750 | | | | 2,940,333 | | |
| Food & Drug Retailers (1.1%) | | | |
| | 2,978 | | | Albertson's LLC1 | | (BB-, Ba3) | | 03/21/19 | | | 5.375 | | | | 2,979,565 | | |
| | 731 | | | Albertson's LLC1 | | (BB-, Ba3) | | 08/25/19 | | | 5.000 | | | | 731,831 | | |
| | 9,452 | | | Albertson's LLC1 | | (BB-, Ba3) | | 08/25/21 | | | 5.500 | | | | 9,464,806 | | |
| | 11,734 | | | New Albertson's, Inc.1 | | (B+, Ba3) | | 06/27/21 | | | 4.750 | | | | 11,695,272 | | |
| | 2,250 | | | Smart & Final Stores LLC1 | | (B+, B3) | | 11/15/19 | | | 4.000 | | | | 2,243,441 | | |
| | | 27,114,915 | | |
See Accompanying Notes to Financial Statements.
11
Credit Suisse Floating Rate High Income Fund
Schedule of Investments (continued)
October 31, 2015
Par
(000) | | | | Ratings†
(S&P/Moody's) | | Maturity | | Rate% | | Value | |
| BANK LOANS (continued) | |
| Food - Wholesale (0.8%) | | | |
$ | 11,538 | | | Allflex Holdings III, Inc.1 | | (B, B2) | | 07/17/20 | | | 4.250 | | | $ | 11,398,885 | | |
| | 2,350 | | | Allflex Holdings III, Inc.1 | | (B-, B2) | | 07/19/21 | | | 8.000 | | | | 2,320,625 | | |
| | 1,650 | | | CSM Bakery Solutions LLC1 | | (CCC+, B3) | | 07/03/21 | | | 8.750 | | | | 1,575,750 | | |
| | 1,500 | | | Del Monte Foods, Inc.1 | | (CCC+, Caa1) | | 08/18/21 | | | 8.250 | | | | 1,370,160 | | |
| | 2,111 | | | Dole Food Co., Inc.1 | | (B-, B1) | | 11/01/18 | | | 4.500 | | | | 2,112,885 | | |
| | 2,200 | | | JBS U.S.A., LLC1 | | (BB+, Ba1) | | 10/30/22 | | | 4.000 | | | | 2,206,171 | | |
| | | 20,984,476 | | |
| Forestry & Paper (0.2%) | | | |
| | 2,359 | | | Prolampac Intermediate, Inc.1 | | (B, B1) | | 08/18/22 | | | 5.000 | | | | 2,348,545 | | |
| | 1,750 | | | Prolampac Intermediate, Inc.1 | | (CCC+, Caa1) | | 08/18/23 | | | 9.250 | | | | 1,706,250 | | |
| | | 4,054,795 | | |
| Gaming (0.9%) | | | |
| | 5,000 | | | CBAC Borrower LLC1 | | (B-, B3) | | 07/02/20 | | | 8.250 | | | | 4,737,500 | | |
| | 2,985 | | | Las Vegas Sands LLC1 | | (BBB-, Ba2) | | 12/19/20 | | | 3.250 | | | | 2,950,395 | | |
| | 8,990 | | | ROC Finance LLC1 | | (B+, B2) | | 06/20/19 | | | 5.000 | | | | 8,509,451 | | |
| | 6,630 | | | The Intertain Group Ltd.1 | | (BB, B2) | | 04/08/22 | | | 7.500 | | | | 6,663,150 | | |
| | | 22,860,496 | | |
| Gas Distribution (0.3%) | | | |
| | 3,718 | | | Energy Transfer Equity LP1 | | (BB, Ba2) | | 12/02/19 | | | 4.000 | | | | 3,612,754 | | |
| | 3,000 | | | Energy Transfer Equity LP1 | | (BB, Ba2) | | 12/02/19 | | | 3.250 | | | | 2,884,230 | | |
| | | 6,496,984 | | |
| Health Facilities (2.2%) | | | |
| | 4,988 | | | Community Health Systems, Inc.1 | | (BB, Ba2) | | 12/31/19 | | | 3.750 | | | | 4,975,430 | | |
| | 4,418 | | | Community Health Systems, Inc.1 | | (BB, Ba2) | | 01/27/21 | | | 4.000 | | | | 4,411,514 | | |
| | 14,359 | | | Drumm Investors LLC1 | | (B, B2) | | 05/04/18 | | | 6.750 | | | | 14,453,384 | | |
| | 10,790 | | | Heartland Dental LLC1 | | (B, B1) | | 12/21/18 | | | 5.500 | | | | 10,674,986 | | |
| | 6,984 | | | Iasis Healthcare LLC1 | | (B, Ba3) | | 05/03/18 | | | 4.500 | | | | 7,005,427 | | |
| | 8,850 | | | Premier Dental Services, Inc.1 | | (CCC+, Caa1) | | 11/01/18 | | | 6.000 | | | | 7,766,250 | | |
| | 7,463 | | | Surgical Care Affiliates, Inc.1 | | (B+, B1) | | 03/17/22 | | | 4.250 | | | | 7,467,201 | | |
| | | 56,754,192 | | |
| Health Services (3.4%) | | | |
| | 13,816 | | | ABB Concise Optical Group LLC1 | | (B+, B3) | | 02/06/19 | | | 4.500 | | | | 13,758,665 | | |
| | 9,287 | | | DPx Holdings B.V.1 | | (B, B1) | | 03/11/21 | | | 4.250 | | | | 9,126,237 | | |
| | 15,058 | | | Emdeon Business Services LLC1 | | (B+, Ba3) | | 11/02/18 | | | 3.750 | | | | 14,941,099 | | |
| | 10,972 | | | Kinetic Concepts, Inc.1 | | (BB-, Ba3) | | 05/04/18 | | | 4.500 | | | | 10,983,876 | | |
| | 347 | | | Kinetic Concepts, Inc.1 | | (BB-, Ba3) | | 11/04/16 | | | 4.000 | | | | 347,067 | | |
| | 985 | | | MSO of Puerto Rico, Inc.1 | | (D, Caa1) | | 12/12/17 | | | 9.750 | | | | 737,095 | | |
| | 15,481 | | | Onex Carestream Finance LP1 | | (B+, B1) | | 06/07/19 | | | 5.000 | | | | 14,762,454 | | |
| | 3,500 | | | Phillips-Medisize Corp.1 | | (CCC+, Caa2) | | 06/16/22 | | | 8.250 | | | | 3,395,000 | | |
| | 11,920 | | | Surgery Center Holdings, Inc.1 | | (B, B2) | | 11/03/20 | | | 5.250 | | | | 11,880,281 | | |
| | 1,509 | | | Surgery Center Holdings, Inc.1 | | (CCC+, Caa2) | | 11/03/21 | | | 8.500 | | | | 1,497,865 | | |
| | 7,962 | | | Valitas Health Services, Inc.1 | | (CCC, Caa2) | | 06/02/17 | | | 6.000 | | | | 6,276,522 | | |
| | | 87,706,161 | | |
See Accompanying Notes to Financial Statements.
12
Credit Suisse Floating Rate High Income Fund
Schedule of Investments (continued)
October 31, 2015
Par
(000) | | | | Ratings†
(S&P/Moody's) | | Maturity | | Rate% | | Value | |
| BANK LOANS (continued) | |
| Hotels (1.3%) | | | |
$ | 4,250 | | | Compass Holdco 2 Ltd.1,3 | | (B+, B1) | | 10/31/22 | | | 5.250 | | | $ | 6,518,571 | | |
| | 10,140 | | | Hilton Worldwide Finance LLC1 | | (BBB-, Ba2) | | 10/26/20 | | | 3.500 | | | | 10,172,671 | | |
| | 13,830 | | | La Quinta Intermediate Holdings LLC1 | | (BB, B1) | | 04/14/21 | | | 3.750 | | | | 13,726,756 | | |
| | 3,000 | | | Playa Resorts Holding B.V.1 | | (BB-, B2) | | 08/09/19 | | | 4.000 | | | | 2,964,375 | | |
| | | 33,382,373 | | |
| Household & Leisure Products (0.0%) | | | |
| | 1,050 | | | Coty, Inc.1 | | (BBB-, Ba1) | | 09/24/22 | | | 5.250 | | | | 1,055,581 | | |
| Insurance Brokerage (1.3%) | | | |
| | 8,903 | | | Acrisure LLC1,4 | | (B, B2) | | 05/19/22 | | | 5.250 | | | | 8,635,791 | | |
| | 2,341 | | | Acrisure LLC | | (B, B2) | | 05/19/22 | | | 5.250 | | | | 2,271,017 | | |
| | 6,488 | | | Alliant Holdings I, Inc.1 | | (B, B2) | | 08/12/22 | | | 4.500 | | | | 6,428,010 | | |
| | 9,762 | | | Hub International Ltd.1 | | (B, B1) | | 10/02/20 | | | 4.000 | | | | 9,529,732 | | |
| | 4,589 | | | Hyperion Insurance Group Ltd.1 | | (B, B1) | | 04/29/22 | | | 5.500 | | | | 4,600,294 | | |
| | 2,992 | | | National Financial Partners Corp.1 | | (B, B1) | | 07/01/20 | | | 4.500 | | | | 2,957,392 | | |
| | | 34,422,236 | | |
| Investments & Misc. Financial Services (2.4%) | | | |
| | 4,833 | | | AlixPartners LLP1 | | (B+, B2) | | 07/28/22 | | | 4.500 | | | | 4,839,375 | | |
| | 14,498 | | | Altisource Solutions Sarl1 | | (B+, B3) | | 12/09/20 | | | 4.500 | | | | 12,957,615 | | |
| | 2,000 | | | First American Payment Systems, LP1 | | (CCC+, Caa1) | | 04/11/19 | | | 10.750 | | | | 1,990,000 | | |
| | 4,230 | | | Hamilton Lane Advisors LLC1 | | (BB+, Ba3) | | 07/09/22 | | | 4.250 | | | | 4,233,976 | | |
| | 1,963 | | | Liquidnet Holdings, Inc.1 | | (B, B3) | | 05/22/19 | | | 7.750 | | | | 1,904,255 | | |
| | 6,829 | | | Ocwen Financial Corp.1 | | (B+, B2) | | 02/15/18 | | | 5.500 | | | | 6,849,363 | | |
| | 2,000 | | | TransFirst, Inc.1 | | (CCC+, Caa2) | | 11/12/22 | | | 9.000 | | | | 2,005,830 | | |
| | 3,990 | | | TransFirst, Inc.1 | | (B, B2) | | 11/12/21 | | | 4.750 | | | | 3,994,962 | | |
| | 12,767 | | | USI, Inc.1 | | (B, B1) | | 12/27/19 | | | 4.250 | | | | 12,651,693 | | |
| | 6,925 | | | VFH Parent LLC1 | | (NR, Ba3) | | 11/06/19 | | | 5.250 | | | | 6,942,164 | | |
| | 5,000 | | | Walter Investment Management Corp.1 | | (BB-, B2) | | 12/19/20 | | | 4.750 | | | | 4,575,000 | | |
| | | 62,944,233 | | |
| Machinery (0.6%) | | | |
| | 1,500 | | | CPM Holdings, Inc.1 | | (B, Caa1) | | 04/10/23 | | | 10.250 | | | | 1,507,500 | | |
| | 2,993 | | | CPM Holdings, Inc.1 | | (B+, B1) | | 04/11/22 | | | 6.000 | | | | 2,998,739 | | |
| | 11,895 | | | Rexnord LLC1 | | (BB-, B2) | | 08/21/20 | | | 4.000 | | | | 11,776,143 | | |
| | | 16,282,382 | | |
| Managed Care (0.6%) | | | |
| | 6,962 | | | GENEX Holdings, Inc.1 | | (B, B1) | | 05/30/21 | | | 5.250 | | | | 6,932,020 | | |
| | 9,825 | | | Sedgwick Claims Management Services, Inc.1 | | (B, B1) | | 03/01/21 | | | 3.750 | | | | 9,674,237 | | |
| | | 16,606,257 | | |
| Media - Cable (0.2%) | | | |
| | 4,963 | | | Numericable Group S.A.1,2 | | (B+, B1) | | 05/21/20 | | | 4.500 | | | | 5,428,378 | | |
| Media - Diversified (0.3%) | | | |
| | 5,000 | | | All3Media International1,3 | | (B+, B2) | | 06/30/21 | | | 5.250 | | | | 7,454,390 | | |
See Accompanying Notes to Financial Statements.
13
Credit Suisse Floating Rate High Income Fund
Schedule of Investments (continued)
October 31, 2015
Par
(000) | | | | Ratings†
(S&P/Moody's) | | Maturity | | Rate% | | Value | |
| BANK LOANS (continued) | |
| Media Content (0.6%) | | | |
$ | 1,750 | | | DLG Acquisitions Ltd.1,2 | | (B-, Caa2) | | 06/30/22 | | | 8.250 | | | $ | 1,882,393 | | |
| | 2,948 | | | Inter Media Communication Srl1,2 | | (B, NR) | | 05/28/19 | | | 5.500 | | | | 2,995,811 | | |
| | 5,065 | | | Mission Broadcasting, Inc.1 | | (BB, Ba2) | | 10/01/20 | | | 3.750 | | | | 5,052,132 | | |
| | 5,744 | | | Nexstar Broadcasting, Inc.1 | | (BB, Ba2) | | 10/01/20 | | | 3.750 | | | | 5,729,198 | | |
| | | 15,659,534 | | |
| Medical Products (0.5%) | | | |
| | 8,000 | | | Alere, Inc.1 | | (B+, Ba3) | | 06/18/22 | | | 4.250 | | | | 8,017,280 | | |
| | 6,000 | | | Sterigenics-Nordion Holdings LLC1 | | (B, B1) | | 05/15/22 | | | 4.250 | | | | 5,955,000 | | |
| | | 13,972,280 | | |
| Metals & Mining - Excluding Steel (2.3%) | | | |
| | 1,313 | | | CeramTec Acquisition Corp.1 | | (B, Ba3) | | 08/30/20 | | | 4.250 | | | | 1,316,572 | | |
| | 16,636 | | | Faenza Acquisition GmbH1 | | (B, Ba3) | | 08/30/20 | | | 4.250 | | | | 16,683,645 | | |
| | 16,783 | | | FMG Resources (August 2006) Pty. Ltd.1 | | (BB+, Ba1) | | 06/30/19 | | | 4.250 | | | | 14,256,151 | | |
| | 2,000 | | | H.C. Starck GmbH1,2 | | (B-, NR) | | 05/30/16 | | | 2.800 | | | | 2,000,334 | | |
| | 16,884 | | | Noranda Aluminum Acquisition Corp.1 | | (B-, Caa1) | | 02/28/19 | | | 5.750 | | | | 10,932,171 | | |
| | 13,513 | | | Novelis, Inc.1 | | (BB, Ba2) | | 06/02/22 | | | 4.000 | | | | 13,286,757 | | |
| | | 58,475,630 | | |
| Oil Field Equipment & Services (1.0%) | | | |
| | 11,976 | | | BakerCorp International, Inc.1 | | (B, B2) | | 02/14/20 | | | 4.250 | | | | 11,287,786 | | |
| | 6,317 | | | McJunkin Red Man Corp.1 | | (B+, B2) | | 11/08/19 | | | 4.750 | | | | 6,174,800 | | |
| | 10,276 | | | Pacific Drilling S.A.1 | | (B+, Caa2) | | 06/03/18 | | | 4.500 | | | | 5,617,529 | | |
| | 3,500 | | | Shelf Drilling Holdings Ltd.1 | | (B+, B2) | | 10/08/18 | | | 10.000 | | | | 2,187,500 | | |
| | | 25,267,615 | | |
| Oil Refining & Marketing (0.7%) | | | |
| | 17,255 | | | Philadelphia Energy Solutions LLC1 | | (BB-, B1) | | 04/04/18 | | | 6.250 | | | | 16,995,961 | | |
| | 3,980 | | | Seadrill Partners Finco LLC1 | | (BB-, B2) | | 02/21/21 | | | 4.000 | | | | 2,336,868 | | |
| | | 19,332,829 | | |
| Packaging (1.9%) | | | |
| | 13,054 | | | Anchor Glass Container Corp.1 | | (BB-, B3) | | 07/01/22 | | | 4.500 | | | | 13,070,077 | | |
| | 3,242 | | | Ardagh Holdings U.S.A., Inc.1 | | (B+, Ba3) | | 12/17/19 | | | 4.000 | | | | 3,243,296 | | |
| | 15,166 | | | Berry Plastics Holding Corp.1 | | (BB-, Ba3) | | 02/08/20 | | | 3.500 | | | | 15,058,990 | | |
| | 2,875 | | | Berry Plastics Holding Corp.1 | | (BB-, Ba3) | | 01/06/21 | | | 3.750 | | | | 2,876,812 | | |
| | 3,950 | | | BWAY Holding Company, Inc.1 | | (B-, B2) | | 08/14/20 | | | 5.500 | | | | 3,964,813 | | |
| | 5,917 | | | Clondalkin Group Ltd.1 | | (B, B2) | | 05/31/20 | | | 4.750 | | | | 5,887,687 | | |
| | 2,000 | | | Hilex Poly Co. LLC1 | | (CCC+, Caa1) | | 05/22/22 | | | 9.750 | | | | 1,990,000 | | |
| | 3,722 | | | Hilex Poly Co. LLC1 | | (B, B1) | | 12/05/21 | | | 6.000 | | | | 3,731,961 | | |
| | | 49,823,636 | | |
| Personal & Household Products (1.3%) | | | |
| | 2,340 | | | Calceus Acquisition, Inc.1 | | (B, B2) | | 01/31/20 | | | 5.000 | | | | 2,215,300 | | |
| | 2,100 | | | Galleria Co.1 | | (BBB-, Ba1) | | 09/22/22 | | | 3.750 | | | | 2,105,586 | | |
| | 10,801 | | | NBTY, Inc.1 | | (B+, Ba3) | | 10/01/17 | | | 3.500 | | | | 10,740,062 | | |
| | 2,992 | | | Revlon Consumer Products Corp.1 | | (B+, Ba2) | | 10/08/19 | | | 4.000 | | | | 2,994,884 | | |
See Accompanying Notes to Financial Statements.
14
Credit Suisse Floating Rate High Income Fund
Schedule of Investments (continued)
October 31, 2015
Par
(000) | | | | Ratings†
(S&P/Moody's) | | Maturity | | Rate% | | Value | |
| BANK LOANS (continued) | |
Personal & Household Products | | | |
$ | 16,158 | | | Serta Simmons Holdings LLC1 | | (B+, B1) | | 10/01/19 | | | 4.250 | | | $ | 16,187,762 | | |
| | | 34,243,594 | | |
| Pharmaceuticals (2.2%) | | | |
| | 6,000 | | | Albany Molecular Research, Inc.1 | | (B+, B1) | | 07/16/21 | | | 5.750 | | | | 6,007,500 | | |
| | 8,845 | | | Alvogen Pharma U.S., Inc.1 | | (B, B3) | | 04/02/22 | | | 6.000 | | | | 8,712,626 | | |
| | 6,000 | | | AMAG Pharmaceuticals, Inc.1 | | (BB, Ba2) | | 08/13/21 | | | 4.750 | | | | 5,910,000 | | |
| | 6,653 | | | Amneal Pharmaceuticals LLC1 | | (BB-, B1) | | 11/01/19 | | | 4.500 | | | | 6,601,531 | | |
| | 6,187 | | | Capsugel Holdings U.S., Inc.1 | | (B+, Ba3) | | 08/01/18 | | | 3.500 | | | | 6,174,992 | | |
| | 3,691 | | | eResearchTechnology, Inc.1 | | (B, B2) | | 05/08/22 | | | 5.500 | | | | 3,663,069 | | |
| | 11,645 | | | Valeant Pharmaceuticals International, Inc.1 | | (BB, Ba1) | | 12/11/19 | | | 3.750 | | | | 10,911,908 | | |
| | 3,000 | | | Valeant Pharmaceuticals International, Inc.1 | | (BB, Ba1) | | 08/05/20 | | | 3.750 | | | | 2,797,080 | | |
| | 7,463 | | | Valeant Pharmaceuticals International, Inc.1 | | (BB, Ba1) | | 04/01/22 | | | 4.000 | | | | 6,961,132 | | |
| | | 57,739,838 | | |
| Printing & Publishing (0.6%) | | | |
| | 9,028 | | | Harland Clarke Holdings Corp.1 | | (B+, B1) | | 06/30/17 | | | 5.577 | | | | 8,999,737 | | |
| | 5,340 | | | Harland Clarke Holdings Corp.1 | | (B+, B1) | | 05/22/18 | | | 7.000 | | | | 5,331,629 | | |
| | 1,484 | | | Harland Clarke Holdings Corp.1 | | (B+, B1) | | 08/04/19 | | | 6.000 | | | | 1,478,979 | | |
| | | 15,810,345 | | |
| Property & Casualty Insurance (0.1%) | | | |
| | 2,401 | | | York Risk Services Holding Corp.1 | | (B, B1) | | 10/01/21 | | | 4.750 | | | | 2,316,401 | | |
| Real Estate Development & Management (0.3%) | | | |
| | 6,875 | | | SRS Distribution, Inc.1 | | (B, B2) | | 08/12/22 | | | 5.250 | | | | 6,883,552 | | |
| Real Estate Investment Trusts (0.2%) | | | |
| | 5,586 | | | DTZ U.S. Borrower LLC1 | | (B+, B1) | | 11/04/21 | | | 4.250 | | | | 5,538,882 | | |
| Recreation & Travel (1.3%) | | | |
| | 9,561 | | | ClubCorp Club Operations, Inc.1 | | (B+, B1) | | 07/24/20 | | | 4.250 | | | | 9,573,934 | | |
| | 12,967 | | | Intrawest Operations Group LLC1 | | (B+, B2) | | 12/09/20 | | | 4.750 | | | | 13,010,185 | | |
| | 6,000 | | | Legendary Pictures Funding LLC1,5 | | (B, NR) | | 04/17/20 | | | 7.000 | | | | 5,970,000 | | |
| | 4,938 | | | World Triathlon Corp.1 | | (B, B2) | | 06/26/21 | | | 5.250 | | | | 4,915,898 | | |
| | | 33,470,017 | | |
| Restaurants (0.7%) | | | |
| | 17,695 | | | B.C. Unlimited Liability Co.1 | | (B+, Ba3) | | 12/12/21 | | | 3.750 | | | | 17,752,627 | | |
| Revenue - Transportation (0.4%) | | | |
| | 10,000 | | | XPO Logistics, Inc.1 | | (BB-, Ba1) | | 10/15/22 | | | 5.500 | | | | 9,925,000 | | |
| Software - Services (10.1%) | | | |
| | 7,583 | | | Applied Systems, Inc.1 | | (B+, B1) | | 01/25/21 | | | 4.250 | | | | 7,541,153 | | |
| | 8,952 | | | Aricent Technologies1 | | (B, B1) | | 04/14/21 | | | 5.500 | | | | 8,834,769 | | |
| | 4,530 | | | Aricent Technologies1 | | (CCC+, Caa1) | | 04/14/22 | | | 9.500 | | | | 4,397,882 | | |
| | 1,000 | | | Camp International Holding Co.1 | | (CCC, Caa2) | | 11/30/19 | | | 8.250 | | | | 985,830 | | |
| | 12,204 | | | Camp International Holding Co.1 | | (B-, B2) | | 05/31/19 | | | 4.750 | | | | 12,061,782 | | |
| | 17,721 | | | CCC Information Services, Inc.1 | | (B+, B1) | | 12/20/19 | | | 4.000 | | | | 17,565,458 | | |
See Accompanying Notes to Financial Statements.
15
Credit Suisse Floating Rate High Income Fund
Schedule of Investments (continued)
October 31, 2015
Par
(000) | | | | Ratings†
(S&P/Moody's) | | Maturity | | Rate% | | Value | |
| BANK LOANS (continued) | |
Software - Services | | | |
$ | 13,757 | | | Dell International LLC1 | | (BBB, Ba1) | | 04/29/20 | | | 4.000 | | | $ | 13,776,851 | | |
| | 3,027 | | | Dell, Inc.1 | | (BBB, Ba1) | | 10/29/18 | | | 3.750 | | | | 3,029,964 | | |
| | 13,665 | | | Deltek, Inc.1 | | (B, B1) | | 06/25/22 | | | 5.000 | | | | 13,670,847 | | |
| | 9,330 | | | Duff & Phelps Investment Management Co.1 | | (B, B2) | | 04/23/20 | | | 4.750 | | | | 9,260,106 | | |
| | 6,240 | | | EagleView Technology Corp.1 | | (B, B2) | | 07/22/22 | | | 5.250 | | | | 6,156,821 | | |
| | 4,988 | | | Epicor RSG U.S., Inc.1 | | (B, B3) | | 06/23/22 | | | 6.000 | | | | 4,975,031 | | |
| | 11,970 | | | Epicor Software Corp.1 | | (B, B2) | | 06/01/22 | | | 4.750 | | | | 11,923,616 | | |
| | 10,135 | | | Evertec Group LLC1 | | (BB-, B1) | | 04/17/20 | | | 3.250 | | | | 9,862,423 | | |
| | 1,109 | | | Evertec Group LLC1 | | (BB-, B1) | | 04/17/18 | | | 2.446 | | | | 1,069,723 | | |
| | 4,190 | | | First Data Corp.1 | | (BB, B1) | | 03/24/21 | | | 4.197 | | | | 4,199,413 | | |
| | 14,939 | | | First Data Corp.1 | | (BB, B1) | | 03/24/18 | | | 3.697 | | | | 14,846,518 | | |
| | 2,288 | | | Flexera Software LLC1 | | (B, B1) | | 04/02/20 | | | 4.500 | | | | 2,269,306 | | |
| | 3,000 | | | Flexera Software LLC1 | | (CCC+, Caa1) | | 04/02/21 | | | 8.000 | | | | 2,928,750 | | |
| | 10,916 | | | Genesys Telecom Holdings U.S., Inc.1 | | (B, B2) | | 02/08/20 | | | 4.000 | | | | 10,849,486 | | |
| | 7,614 | | | Genesys Telecom Holdings U.S., Inc.1 | | (B, B2) | | 11/13/20 | | | 4.500 | | | | 7,604,857 | | |
| | 7,000 | | | Global Healthcare Exchange LLC1 | | (B, B2) | | 08/15/22 | | | 5.500 | | | | 6,997,830 | | |
| | 2,000 | | | Hyland Software, Inc.1 | | (B, B2) | | 07/01/22 | | | 4.750 | | | | 1,981,250 | | |
| | 9,698 | | | Infor (U.S.), Inc.1 | | (B+, B1) | | 06/03/20 | | | 3.750 | | | | 9,453,964 | | |
| | 8,300 | | | Infor (U.S.), Inc.1 | | (B+, B1) | | 06/03/20 | | | 3.750 | | | | 8,094,861 | | |
| | 11,272 | | | Landslide Holdings, Inc.1 | | (B, B1) | | 02/25/20 | | | 5.000 | | | | 11,215,733 | | |
| | 2,000 | | | Landslide Holdings, Inc.1 | | (CCC+, Caa1) | | 02/25/21 | | | 8.250 | | | | 1,910,000 | | |
| | 5,239 | | | MA FinanceCo. LLC1 | | (BB-, B1) | | 11/19/21 | | | 5.250 | | | | 5,238,456 | | |
| | 5,700 | | | MA FinanceCo. LLC1 | | (BB-, B1) | | 11/20/19 | | | 4.500 | | | | 5,697,036 | | |
| | 10,705 | | | Pinnacle Holdco Sarl1 | | (B+, B1) | | 07/30/19 | | | 4.750 | | | | 9,785,867 | | |
| | 12,044 | | | Riverbed Technology, Inc.1 | | (B, B1) | | 04/24/22 | | | 6.000 | | | | 12,072,744 | | |
| | 5,486 | | | SkillSoft Corp.1 | | (B-, B2) | | 04/28/21 | | | 5.750 | | | | 4,690,625 | | |
| | 2,155 | | | SunGard Data Systems, Inc.1 | | (BB, Ba3) | | 02/28/17 | | | 3.945 | | | | 2,156,930 | | |
| | 3,006 | | | Sybil Software LLC1 | | (BB-, Ba3) | | 03/20/20 | | | 4.250 | | | | 3,007,455 | | |
| | 11,223 | | | Wall Street Systems Delaware, Inc.1 | | (B, B2) | | 04/30/21 | | | 4.500 | | | | 11,213,399 | | |
| | | 261,326,736 | | |
| Specialty Retail (2.9%) | | | |
| | 4,250 | | | BJ's Wholesale Club, Inc.1 | | (CCC, Caa2) | | 03/26/20 | | | 8.500 | | | | 4,155,905 | | |
| | 16,655 | | | BJ's Wholesale Club, Inc.1 | | (B-, B3) | | 09/26/19 | | | 4.500 | | | | 16,538,310 | | |
| | 20,469 | | | Choo Luxury Holdings Ltd.1 | | (NR, NR) | | 06/28/18 | | | 3.470 | | | | 20,161,956 | | |
| | 8,082 | | | General Nutrition Centers, Inc.1 | | (BBB-, Ba2) | | 03/04/19 | | | 3.250 | | | | 7,837,423 | | |
| | 11,621 | | | Leslie's Poolmart, Inc.1 | | (B, B1) | | 10/16/19 | | | 4.250 | | | | 11,469,695 | | |
| | 7,278 | | | Michaels Stores, Inc.1 | | (BB-, Ba2) | | 01/28/20 | | | 3.750 | | | | 7,286,458 | | |
| | 9,975 | | | Payless, Inc.1 | | (B, B1) | | 03/11/21 | | | 5.000 | | | | 7,281,519 | | |
| | | 74,731,266 | | |
| Steel Producers/Products (0.8%) | | | |
| | 5,293 | | | Atkore International, Inc.1 | | (B, B3) | | 04/09/21 | | | 4.500 | | | | 4,988,871 | | |
| | 6,500 | | | Atkore International, Inc.1 | | (CCC+, Caa2) | | 10/09/21 | | | 7.750 | | | | 5,736,250 | | |
| | 10,398 | | | JMC Steel Group, Inc.1 | | (BB-, B2) | | 04/01/17 | | | 4.750 | | | | 10,137,779 | | |
| | | 20,862,900 | | |
See Accompanying Notes to Financial Statements.
16
Credit Suisse Floating Rate High Income Fund
Schedule of Investments (continued)
October 31, 2015
Par
(000) | | | | Ratings†
(S&P/Moody's) | | Maturity | | Rate% | | Value | |
| BANK LOANS (continued) | |
| Support - Services (4.2%) | | | |
$ | 4,980 | | | Acosta Holdco, Inc.1 | | (B, B1) | | 09/26/21 | | | 4.250 | | | $ | 4,872,918 | | |
| | 8,400 | | | Advantage Sales & Marketing, Inc.1 | | (B, B1) | | 07/23/21 | | | 4.250 | | | | 8,234,353 | | |
| | 2,500 | | | Allied Security Holdings LLC1 | | (CCC+, Caa2) | | 08/13/21 | | | 8.000 | | | | 2,375,000 | | |
| | 9,975 | | | Amaya Holdings B.V.1 | | (BB, B1) | | 08/01/21 | | | 5.000 | | | | 9,777,296 | | |
| | 16,898 | | | Brand Energy & Infrastructure Services, Inc.1 | | (B, B1) | | 11/26/20 | | | 4.750 | | | | 15,720,797 | | |
| | 1,355 | | | MMM Holdings, Inc.1 | | (D, Caa1) | | 12/12/17 | | | 9.750 | | | | 1,013,894 | | |
| | 3,000 | | | Neff Rental LLC1 | | (B-, Caa1) | | 06/09/21 | | | 7.250 | | | | 2,752,500 | | |
| | 4,749 | | | ON Assignment, Inc.1 | | (BB, Ba2) | | 06/05/22 | | | 3.750 | | | | 4,760,417 | | |
| | 2,951 | | | RedTop Luxembourg Sarl1 | | (B, Ba3) | | 12/03/20 | | | 4.500 | | | | 2,962,261 | | |
| | 4,396 | | | RedTop Luxembourg Sarl1 | | (CCC+, B3) | | 06/03/21 | | | 8.250 | | | | 4,382,665 | | |
| | 7,857 | | | Sabre, Inc.1 | | (BB-, Ba3) | | 02/19/19 | | | 4.000 | | | | 7,866,830 | | |
| | 942 | | | SGS Cayman LP1 | | (BB-, B2) | | 04/23/21 | | | 6.000 | | | | 943,312 | | |
| | 1,253 | | | Spin Holdco, Inc.1 | | (B, B2) | | 11/14/19 | | | 4.250 | | | | 1,241,882 | | |
| | 1,990 | | | Sprint Industrial Holdings LLC1 | | (B+, B3) | | 05/14/19 | | | 7.000 | | | | 1,741,094 | | |
| | 2,000 | | | Sprint Industrial Holdings LLC1 | | (CCC+, Caa3) | | 11/14/19 | | | 11.250 | | | | 1,570,000 | | |
| | 9,728 | | | Sungard Availability Services Capital, Inc.1 | | (B+, Ba3) | | 03/31/19 | | | 6.000 | | | | 8,577,189 | | |
| | 4,046 | | | Sutherland Global Services, Inc.1 | | (BB-, B2) | | 04/23/21 | | | 6.000 | | | | 4,052,422 | | |
| | 5,349 | | | The Hertz Corp.1 | | (BB, Ba1) | | 03/11/18 | | | 3.750 | | | | 5,353,751 | | |
| | 19,042 | | | U.S. Foods, Inc.1 | | (B-, B2) | | 03/31/19 | | | 4.500 | | | | 19,070,236 | | |
| | 851 | | | WASH Multifamily Laundry Systems LLC1 | | (CCC+, Caa2) | | 05/14/23 | | | 8.000 | | | | 825,430 | | |
| | 149 | | | WASH Multifamily Laundry Systems LLC1 | | (CCC+, Caa2) | | 05/12/23 | | | 8.000 | | | | 144,570 | | |
| | | 108,238,817 | | |
| Tech Hardware & Equipment (1.5%) | | | |
| | 12,379 | | | Avaya, Inc.1 | | (B, B1) | | 03/30/18 | | | 6.500 | | | | 10,424,454 | | |
| | 8,500 | | | CommScope, Inc.1 | | (BB, Ba2) | | 12/29/22 | | | 3.750 | | | | 8,507,990 | | |
| | 3,750 | | | Mitel U.S. Holdings, Inc.1 | | (B+, Ba3) | | 04/29/22 | | | 5.500 | | | | 3,646,875 | | |
| | 12,006 | | | Omnitracs, Inc.1 | | (B, B1) | | 11/25/20 | | | 4.750 | | | | 11,970,245 | | |
| | 4,750 | | | Omnitracs, Inc.1 | | (CCC+, Caa1) | | 05/25/21 | | | 8.750 | | | | 4,625,313 | | |
| | | 39,174,877 | | |
| Telecom - Satellite (0.5%) | | | |
| | 12,218 | | | Intelsat Jackson Holdings S.A.1 | | (BB-, Ba3) | | 06/30/19 | | | 3.750 | | | | 11,865,478 | | |
| Telecom - Wireline Integrated & Services (2.4%) | | | |
| | 5,003 | | | Eircom Finco Sarl1,2 | | (B, B3) | | 05/31/22 | | | 4.500 | | | | 5,439,552 | | |
| | 5,000 | | | Gas Natural Fenosa Telecomunicaciones S.A.1 | | (B, B2) | | 06/28/21 | | | 4.717 | | | | 5,540,511 | | |
| | 8,250 | | | Level 3 Financing, Inc.1 | | (BB, Ba1) | | 01/15/20 | | | 4.000 | | | | 8,278,875 | | |
| | 3,000 | | | LTS Buyer LLC1 | | (CCC+, Caa1) | | 04/12/21 | | | 8.000 | | | | 2,940,000 | | |
| | 13,790 | | | LTS Buyer LLC1 | | (B, B1) | | 04/13/20 | | | 4.000 | | | | 13,622,445 | | |
| | 7,687 | | | XO Communications LLC1 | | (BB-, B2) | | 03/17/21 | | | 4.250 | | | | 7,658,589 | | |
| | 18,567 | | | Zayo Group LLC1 | | (BB-, NR) | | 05/06/21 | | | 3.750 | | | | 18,568,182 | | |
| | | 62,048,154 | | |
| Theaters & Entertainment (2.9%) | | | |
| | 4,830 | | | AMC Entertainment, Inc.1 | | (BB, Ba1) | | 04/30/20 | | | 3.500 | | | | 4,830,922 | | |
| | 2,000 | | | CKX, Inc.1,5 | | (CCC-, Caa2) | | 06/21/17 | | | 11.000 | | | | 885,000 | | |
| | 15,900 | | | EMI Music Publishing Ltd.1 | | (BB-, Ba3) | | 07/03/22 | | | 4.000 | | | | 15,906,010 | | |
See Accompanying Notes to Financial Statements.
17
Credit Suisse Floating Rate High Income Fund
Schedule of Investments (continued)
October 31, 2015
Par
(000) | | | | Ratings†
(S&P/Moody's) | | Maturity | | Rate% | | Value | |
| BANK LOANS (continued) | |
Theaters & Entertainment | | | |
$ | 16,379 | | | Live Nation Entertainment, Inc.1 | | (BB, Ba2) | | 08/16/20 | | | 3.500 | | | $ | 16,419,490 | | |
| | 9,500 | | | Metro-Goldwyn-Mayer, Inc.1 | | (BB, Ba3) | | 06/26/20 | | | 5.125 | | | | 9,523,750 | | |
| | 15,904 | | | Tech Finance & Co. S.C.A.1 | | (B+, B1) | | 07/10/20 | | | 5.000 | | | | 15,894,044 | | |
| | 7,512 | | | William Morris Endeavor Entertainment LLC1 | | (B, B1) | | 05/06/21 | | | 5.250 | | | | 7,514,779 | | |
| | 4,200 | | | William Morris Endeavor Entertainment LLC1 | | (B-, Caa1) | | 05/01/22 | | | 8.250 | | | | 4,021,500 | | |
| | | 74,995,495 | | |
| Transport Infrastructure/Services (0.7%) | | | |
| | 11,818 | | | Navios Partners Finance (U.S.), Inc.1 | | (BB+, Ba3) | | 06/27/18 | | | 5.250 | | | | 11,740,247 | | |
| | 4,468 | | | PODS LLC1 | | (B+, B1) | | 02/02/22 | | | 4.500 | | | | 4,462,017 | | |
| | 1,800 | | | PODS LLC1 | | (CCC+, Caa1) | | 02/02/23 | | | 9.250 | | | | 1,773,000 | | |
| | | 17,975,264 | | |
| Transportation Infrastructure/Services (0.1%) | | | |
| | 2,801 | | | OSG International, Inc.1 | | (BB-, B1) | | 08/05/19 | | | 5.750 | | | | 2,787,233 | | |
| TOTAL BANK LOANS (Cost $2,062,020,469) | | | 2,016,215,041 | | |
| CORPORATE BONDS (7.8%) | | | |
| Advertising (0.2%) | | | |
| | 575 | | | Clear Channel Worldwide Holdings, Inc.,
Global Company Guaranteed Notes
(Callable 11/15/17 @ 103.25) | | (B, B1) | | 11/15/22 | | | 6.500 | | | | 594,406 | | |
| | 1,400 | | | Clear Channel Worldwide Holdings, Inc.,
Series B, Global Company Guaranteed Notes
(Callable 11/15/17 @ 103.25) | | (B, B1) | | 11/15/22 | | | 6.500 | | | | 1,464,750 | | |
| | 4,120 | | | WMG Acquisition Corp., Rule 144A,
Senior Secured Notes
(Callable 01/15/16 @ 104.50)6 | | (B, B1) | | 01/15/21 | | | 6.000 | | | | 4,264,200 | | |
| | | 6,323,356 | | |
| Auto Parts & Equipment (0.1%) | | | |
| | 3,250 | | | UCI International, Inc.,
Global Company Guaranteed Notes
(Callable 11/30/15 @ 104.31) | | (CCC, Caa2) | | 02/15/19 | | | 8.625 | | | | 2,323,750 | | |
| Banking (0.3%) | | | |
| | 6,500 | | | CCRE Finance Corp., Rule 144A,
Company Guaranteed Notes
(Callable 11/30/15 @ 105.81)6 | | (B+, B1) | | 02/15/18 | | | 7.750 | | | | 6,808,750 | | |
| Building & Construction (0.1%) | | | |
| | 2,000 | | | AV Homes, Inc.,
Global Company Guaranteed Notes
(Callable 07/01/16 @ 106.38) | | (B-, Caa1) | | 07/01/19 | | | 8.500 | | | | 2,010,000 | | |
| Building Materials (0.3%) | | | |
| | 7,000 | | | Euramax International, Inc., Rule 144A,
Senior Secured Notes
(Callable 02/15/18 @ 109.00)6 | | (B-, Caa2) | | 08/15/20 | | | 12.000 | | | | 6,825,000 | | |
See Accompanying Notes to Financial Statements.
18
Credit Suisse Floating Rate High Income Fund
Schedule of Investments (continued)
October 31, 2015
Par
(000) | | | | Ratings†
(S&P/Moody's) | | Maturity | | Rate% | | Value | |
| CORPORATE BONDS (continued) | |
Building Materials | | | |
$ | 2,000 | | | Headwaters, Inc.,
Global Company Guaranteed Notes
(Callable 01/15/16 @ 103.63) | | (B-, Caa1) | | 01/15/19 | | | 7.250 | | | $ | 2,080,000 | | |
| | | 8,905,000 | | |
| Cable & Satellite TV (0.8%) | | | |
| | 1,200 | | | Altice Financing S.A., Rule 144A,
Senior Secured Notes
(Callable 02/15/18 @ 104.97)6 | | (BB-, B1) | | 02/15/23 | | | 6.625 | | | | 1,206,000 | | |
| | 1,000 | | | Altice Financing S.A., Rule 144A,
Senior Secured Notes
(Callable 12/15/16 @ 104.88)6,7 | | (BB-, B1) | | 01/15/22 | | | 6.500 | | | | 1,015,000 | | |
| | 7,855 | | | Block Communications, Inc., Rule 144A,
Senior Unsecured Notes
(Callable 02/01/16 @ 103.63)6,7 | | (B+, B1) | | 02/01/20 | | | 7.250 | | | | 7,933,550 | | |
| | 3,000 | | | Harron Finance Corp., Rule 144A,
Senior Unsecured Notes
(Callable 04/01/16 @ 104.56)6 | | (BB-, B3) | | 04/01/20 | | | 9.125 | | | | 3,213,750 | | |
| | 1,100 | | | Neptune Finco Corp., Rule 144A,
Senior Unsecured Notes
(Callable 10/15/20 @ 103.31)6 | | (BB-, Ba1) | | 10/15/25 | | | 6.625 | | | | 1,160,500 | | |
| | 1,200 | | | Neptune Finco Corp., Rule 144A,
Senior Unsecured Notes
(Callable 10/15/20 @ 105.44)6 | | (B-, B2) | | 10/15/25 | | | 10.875 | | | | 1,284,000 | | |
| | 4,500 | | | Numericable-SFR SAS, Rule 144A,
Senior Secured Notes
(Callable 05/15/17 @ 104.50)6 | | (B+, B1) | | 05/15/22 | | | 6.000 | | | | 4,522,500 | | |
| | | 20,335,300 | | |
| Chemicals (0.3%) | | | |
| | 5,000 | | | Axiall Corp.,
Global Company Guaranteed Notes
(Callable 05/15/18 @ 102.44) | | (BB, Ba3) | | 05/15/23 | | | 4.875 | | | | 4,771,875 | | |
| | 2,000 | | | Nufarm Australia Ltd., Rule 144A,
Company Guaranteed Notes
(Callable 11/30/15 @ 104.78)6 | | (B+, B1) | | 10/15/19 | | | 6.375 | | | | 1,997,500 | | |
| | | 6,769,375 | | |
| Consumer/Commercial/Lease Financing (0.2%) | | | |
| | 5,645 | | | Infinity Acquisition Finance Corp.,
Rule 144A, Senior Secured Notes
(Callable 08/01/17 @ 103.63)6 | | (CCC+, Caa2) | | 08/01/22 | | | 7.250 | | | | 5,080,500 | | |
| Electric - Generation (0.1%) | | | |
| | 2,750 | | | Dynegy, Inc.,
Global Company Guaranteed Notes
(Callable 05/01/17 @ 103.38) | | (B+, B3) | | 11/01/19 | | | 6.750 | | | | 2,756,875 | | |
See Accompanying Notes to Financial Statements.
19
Credit Suisse Floating Rate High Income Fund
Schedule of Investments (continued)
October 31, 2015
Par
(000) | | | | Ratings†
(S&P/Moody's) | | Maturity | | Rate% | | Value | |
| CORPORATE BONDS (continued) | |
| Energy - Exploration & Production (0.3%) | | | |
$ | 5,000 | | | Oasis Petroleum, Inc.,
Company Guaranteed Notes
(Callable 11/01/16 @ 103.25) | | (B+, B2) | | 11/01/21 | | | 6.500 | | | $ | 4,287,500 | | |
| | 2,991 | | | Oasis Petroleum, Inc.,
Global Company Guaranteed Notes
(Callable 09/15/17 @ 103.44)7 | | (B+, B2) | | 03/15/22 | | | 6.875 | | | | 2,564,783 | | |
| | | 6,852,283 | | |
| Forestry & Paper (0.0%) | | | |
| | 200 | | | Stone & Webster, Inc.5,8,9 | | (NR, NR) | | 10/23/19 | | | 0.000 | | | | 400 | | |
| Gaming (0.0%) | | | |
| | 1,158 | | | Choctaw Resort Development Enterprise,
Rule 144A, Senior Unsecured Notes
(Callable 11/30/15 @ 100.00)6 | | (B-, Caa1) | | 11/15/19 | | | 7.250 | | | | 1,140,630 | | |
| Gas Distribution (0.4%) | | | |
| | 2,250 | | | Energy Transfer Equity LP, Senior Secured Notes | | (BB, Ba2) | | 10/15/20 | | | 7.500 | | | | 2,430,450 | | |
| | 750 | | | Genesis Energy Finance Corp.,
Global Company Guaranteed Notes
(Callable 02/15/17 @ 102.88) | | (B+, B1) | | 02/15/21 | | | 5.750 | | | | 705,000 | | |
| | 6,250 | | | Holly Energy Finance Corp.,
Global Company Guaranteed Notes
(Callable 03/01/16 @ 103.25) | | (BB, B1) | | 03/01/20 | | | 6.500 | | | | 6,250,000 | | |
| | | 9,385,450 | | |
| Health Facility (0.4%) | | | |
| | 11,000 | | | Tenet Healthcare Corp., Rule 144A,
Senior Secured Notes
(Callable 06/15/16 @ 102.00)1,6 | | (BB-, Ba2) | | 06/15/20 | | | 3.837 | | | | 10,972,500 | | |
| Investments & Misc. Financial Services (0.4%) | | | |
| | 2,000 | | | Cabot Financial Luxembourg S.A.,
Rule 144A, Senior Secured Notes
(Callable 08/01/16 @ 106.28)3,6 | | (B+, B2) | | 08/01/20 | | | 8.375 | | | | 3,204,011 | | |
| | 500 | | | Cabot Financial Luxembourg S.A.,
Rule 144A, Senior Secured Notes
(Callable 11/30/15 @ 107.78)3,6 | | (B+, B2) | | 10/01/19 | | | 10.375 | | | | 834,342 | | |
| | 1,800 | | | Jefferies Finance LLC, Rule 144A,
Senior Unsecured Notes
(Callable 04/15/17 @ 105.16)6 | | (B, B1) | | 04/15/22 | | | 6.875 | | | | 1,701,000 | | |
| | 5,000 | | | Jefferies Finance LLC, Rule 144A,
Senior Unsecured Notes
(Callable 10/15/17 @ 105.63)6 | | (B, B1) | | 04/15/21 | | | 7.500 | | | | 4,862,500 | | |
| | | 10,601,853 | | |
See Accompanying Notes to Financial Statements.
20
Credit Suisse Floating Rate High Income Fund
Schedule of Investments (continued)
October 31, 2015
Par
(000) | | | | Ratings†
(S&P/Moody's) | | Maturity | | Rate% | | Value | |
| CORPORATE BONDS (continued) | |
| Metals & Mining - Excluding Steel (0.3%) | | | |
| | 3,000 | | | Global Brass & Copper, Inc.,
Global Senior Secured Notes
(Callable 06/01/16 @ 104.75) | | (B+, B3) | | 06/01/19 | | | 9.500 | | | | 3,232,500 | | |
| | 2,100 | | | Noranda Aluminum Acquisition Corp.,
Global Company Guaranteed Notes
(Callable 03/01/16 @ 105.50) | | (CCC, Caa3) | | 06/01/19 | | | 11.000 | | | | 483,000 | | |
| | 6,000 | | | Taseko Mines Ltd.,
Company Guaranteed Notes
(Callable 11/30/15 @ 103.88) | | (B-, B3) | | 04/15/19 | | | 7.750 | | | | 3,150,000 | | |
| | 2,000 | | | Xinergy Corp., Rule 144A,
Senior Secured Notes
(Callable 11/30/15 @ 104.63)6,10 | | (NR, NR) | | 05/15/19 | | | 9.250 | | | | 410,000 | | |
| | | 7,275,500 | | |
| Oil Field Equipment & Services (0.6%) | | | |
| | 5,600 | | | FTS International, Inc.,
Global Senior Secured Notes
(Callable 05/01/17 @ 104.69) | | (CCC+, Caa2) | | 05/01/22 | | | 6.250 | | | | 1,316,000 | | |
| | 4,518 | | | Pacific Drilling V Ltd., Rule 144A,
Senior Secured Notes
(Callable 12/01/15 @ 103.63)6,7 | | (B+, Caa3) | | 12/01/17 | | | 7.250 | | | | 3,094,830 | | |
| | 5,250 | | | Pioneer Energy Services Corp.,
Global Company Guaranteed Notes
(Callable 03/15/17 @ 104.59) | | (B+, B3) | | 03/15/22 | | | 6.125 | | | | 3,045,000 | | |
| | 9,333 | | | Shelf Drilling Holdings Ltd.,
Rule 144A, Secured Notes
(Callable 11/30/15 @ 104.31)6,7 | | (B+, B1) | | 11/01/18 | | | 8.625 | | | | 7,209,742 | | |
| | | 14,665,572 | | |
| Oil Refining & Marketing (0.6%) | | | |
| | 6,522 | | | Coffeyville Finance, Inc.,
Global Company Guaranteed Notes
(Callable 11/01/17 @ 103.25) | | (BB-, B1) | | 11/01/22 | | | 6.500 | | | | 6,440,475 | | |
| | 8,284 | | | PBF Finance Corp.,
Global Senior Secured Notes
(Callable 02/15/16 @ 104.13)7 | | (BB+, Ba3) | | 02/15/20 | | | 8.250 | | | | 8,739,620 | | |
| | | 15,180,095 | | |
| Packaging (0.3%) | | | |
| | 2,000 | | | Innovia Group Finance PLC,
Rule 144A, Senior Secured Notes
(Callable 11/30/15 @ 101.00)1,2,6 | | (B, B2) | | 03/31/20 | | | 4.962 | | | | 2,163,678 | | |
| | 2,500 | | | Owens-Brockway Glass Container, Inc.,
Rule 144A, Company Guaranteed Notes6,7 | | (BB-, B1) | | 08/15/23 | | | 5.875 | | | | 2,657,812 | | |
See Accompanying Notes to Financial Statements.
21
Credit Suisse Floating Rate High Income Fund
Schedule of Investments (continued)
October 31, 2015
Par
(000) | | | | Ratings†
(S&P/Moody's) | | Maturity | | Rate% | | Value | |
| CORPORATE BONDS (continued) | |
Packaging | | | |
$ | 2,123 | | | Reynolds Group Issuer LLC,
Global Senior Secured Notes
(Callable 11/30/15 @ 104.31) | | (B+, B1) | | 10/15/20 | | | 5.750 | | | $ | 2,213,228 | | |
| | | 7,034,718 | | |
| Pharmaceuticals (0.0%) | | | |
| | 98 | | | inVentiv Health, Inc., 10.000% Cash,
12.000% PIK, Rule 144A, Secured Notes
(Callable 11/30/15 @ 105.00)6,11 | | (CCC, Caa2) | | 08/15/18 | | | 22.000 | | | | 97,264 | | |
| | 63 | | | inVentiv Health, Inc.,
Global Company Guaranteed Notes
(Callable 11/30/15 @ 102.50) | | (CCC, Caa3) | | 08/15/18 | | | 10.000 | | | | 61,425 | | |
| | | 158,689 | | |
| Printing & Publishing (0.1%) | | | |
| | 3,000 | | | Harland Clarke Holdings Corp.,
Rule 144A, Senior Secured Notes
(Callable 11/30/15 @ 104.88)6 | | (B+, B1) | | 08/01/18 | | | 9.750 | | | | 3,071,250 | | |
| Real Estate Investment Trusts (0.4%) | | | |
| | 7,668 | | | iStar, Inc., Senior Unsecured Notes
(Callable 07/01/16 @ 102.44)7 | | (B+, B2) | | 07/01/18 | | | 4.875 | | | | 7,581,735 | | |
| | 1,875 | | | iStar, Inc., Senior Unsecured Notes
(Callable 07/01/16 @ 102.50) | | (B+, B2) | | 07/01/19 | | | 5.000 | | | | 1,842,188 | | |
| | 2,000 | | | iStar, Inc., Senior Unsecured Notes
(Callable 08/01/17 @ 100.00) | | (B+, B2) | | 11/01/17 | | | 4.000 | | | | 1,960,000 | | |
| | | 11,383,923 | | |
| Restaurants (0.3%) | | | |
| | 4,000 | | | Financiere Quick SAS, Rule 144A,
Senior Secured Notes
(Callable 11/30/15 @ 101.00)1,2,6 | | (B-, B3) | | 04/15/19 | | | 4.701 | | | | 3,989,444 | | |
| | 1,500 | | | Financiere Quick SAS,
Rule 144A, Unsecured Notes
(Callable 11/30/15 @ 102.00)1,2,6 | | (CCC, Caa2) | | 10/15/19 | | | 7.451 | | | | 1,375,289 | | |
| | 375 | | | Punch Taverns Finance PLC, Reg S,
Rule 144A, Secured Notes3,6,12 | | (B+, Baa3) | | 10/15/26 | | | 7.274 | | | | 635,617 | | |
| | 1,071 | | | Punch Taverns Finance PLC, Secured Notes3 | | (NR, Baa2) | | 10/15/26 | | | 7.274 | | | | 1,815,322 | | |
| | | 7,815,672 | | |
| Software - Services (0.5%) | | | |
| | 7,000 | | | Audatex North America, Inc., Rule 144A,
Company Guaranteed Notes
(Callable 06/15/17 @ 103.00)6 | | (BB-, B1) | | 06/15/21 | | | 6.000 | | | | 7,075,320 | | |
| | 3,000 | | | Audatex North America, Inc., Rule 144A,
Company Guaranteed Notes
(Callable 11/01/18 @ 103.06)6 | | (BB-, B1) | | 11/01/23 | | | 6.125 | | | | 3,030,000 | | |
See Accompanying Notes to Financial Statements.
22
Credit Suisse Floating Rate High Income Fund
Schedule of Investments (continued)
October 31, 2015
Par
(000) | | | | Ratings†
(S&P/Moody's) | | Maturity | | Rate% | | Value | |
| CORPORATE BONDS (continued) | |
Software - Services | | | |
$ | 3,125 | | | Sungard Availability Services Capital, Inc.,
Rule 144A, Company Guaranteed Notes
(Callable 04/01/19 @ 104.38)6,7 | | (CCC+, Caa1) | | 04/01/22 | | | 8.750 | | | $ | 1,968,750 | | |
| | | 12,074,070 | | |
| Specialty Retail (0.2%) | | | |
| | 5,000 | | | Penske Automotive Group, Inc.,
Global Company Guaranteed Notes
(Callable 10/01/17 @ 102.88) | | (B+, B1) | | 10/01/22 | | | 5.750 | | | | 5,187,500 | | |
| | 700 | | | Takko Luxembourg 2 S.C.A.,
Rule 144A, Senior Secured Notes
(Callable 04/15/16 @ 104.94)2,6 | | (CCC+, Caa1) | | 04/15/19 | | | 9.875 | | | | 510,348 | | |
| | | 5,697,848 | | |
| Tech Hardware & Equipment (0.3%) | | | |
| | 5,000 | | | Anixter, Inc., Global Company Guaranteed Notes | | (BB, Ba3) | | 05/01/19 | | | 5.625 | | | | 5,306,250 | | |
| | 3,500 | | | CommScope, Inc., Rule 144A,
Company Guaranteed Notes
(Callable 06/15/17 @ 102.50)6 | | (B, B2) | | 06/15/21 | | | 5.000 | | | | 3,535,000 | | |
| | | 8,841,250 | | |
| Telecom - Wireline Integrated & Services (0.1%) | | | |
| | 100 | | | Hellas Telecommunications
Luxembourg II S.C.A., Rule 144A,
Subordinated Notes5,6,8,9,10 | | (NR, NR) | | 01/15/15 | | | 0.000 | | | | — | | |
| | 3,000 | | | NeuStar, Inc.,
Global Company Guaranteed Notes
(Callable 01/15/18 @ 102.25)7 | | (B+, B2) | | 01/15/23 | | | 4.500 | | | | 2,595,000 | | |
| | | 2,595,000 | | |
| Theaters & Entertainment (0.2%) | | | |
| | 4,609 | | | National CineMedia LLC,
Global Senior Secured Notes
(Callable 04/15/17 @ 103.00) | | (BB-, Ba2) | | 04/15/22 | | | 6.000 | | | | 4,821,936 | | |
| | 1,619 | | | National CineMedia LLC,
Global Senior Unsecured Notes
(Callable 07/15/16 @ 103.94) | | (B, B2) | | 07/15/21 | | | 7.875 | | | | 1,716,140 | | |
| | | 6,538,076 | | |
| TOTAL CORPORATE BONDS (Cost $218,628,740) | | | 202,597,685 | | |
| ASSET BACKED SECURITIES (3.9%) | | | |
| Collateralized Debt Obligations (3.9%) | | | |
| | 3,400 | | | ACAS CLO Ltd., 2012-1A, Rule 144A1,6 | | (BB-, NR) | | 09/20/23 | | | 6.345 | | | | 3,398,990 | | |
| | 3,450 | | | ACIS CLO Ltd., 2014-4A, Rule 144A1,6 | | (BBB, NR) | | 05/01/26 | | | 3.400 | | | | 2,975,112 | | |
| | 3,000 | | | ALM VII Ltd., 2012-7A, Rule 144A1,6 | | (BB, NR) | | 10/19/24 | | | 5.315 | | | | 2,761,091 | | |
| | 3,250 | | | Atlas Senior Loan Fund V Ltd.,
2014-1A, Rule 144A1,6 | | (BB-, NR) | | 07/16/26 | | | 5.017 | | | | 2,733,184 | | |
See Accompanying Notes to Financial Statements.
23
Credit Suisse Floating Rate High Income Fund
Schedule of Investments (continued)
October 31, 2015
Par
(000) | | | | Ratings†
(S&P/Moody's) | | Maturity | | Rate% | | Value | |
| ASSET BACKED SECURITIES (continued) | |
Collateralized Debt Obligations | | | |
$ | 3,000 | | | Benefit Street Partners CLO Ltd.,
2012-IA, Rule 144A1,6 | | (BB, NR) | | 10/15/25 | | | 7.233 | | | $ | 2,912,026 | | |
| | 2,750 | | | Black Diamond CLO Ltd., 2012-1A, Rule 144A1,6 | | (BB, NR) | | 02/01/23 | | | 6.300 | | | | 2,574,175 | | |
| | 3,000 | | | Blue Hill CLO Ltd., 2013-1A, Rule 144A1,6 | | (BB-, NR) | | 01/15/26 | | | 4.921 | | | | 2,488,076 | | |
| | 2,500 | | | BlueMountain CLO Ltd., 2013-2A, Rule 144A1,6 | | (BB, NR) | | 01/22/25 | | | 5.370 | | | | 2,261,762 | | |
| | 2,000 | | | BlueMountain CLO Ltd., 2014-3A, Rule 144A1,6 | | (B, NR) | | 10/15/26 | | | 5.971 | | | | 1,624,191 | | |
| | 2,500 | | | BNPP IP CLO Ltd., 2014-2A, Rule 144A1,6 | | (BB, NR) | | 10/30/25 | | | 5.572 | | | | 2,125,770 | | |
| | 2,000 | | | Carlyle Global Market Strategies CLO Ltd.,
2012-3A, Rule 144A1,6 | | (BB, NR) | | 10/04/24 | | | 5.821 | | | | 1,870,799 | | |
| | 2,000 | | | Carlyle Global Market Strategies CLO Ltd.,
2013-3A, Rule 144A1,6 | | (BB, NR) | | 07/15/25 | | | 4.921 | | | | 1,743,381 | | |
| | 2,000 | | | Catamaran CLO Ltd., 2014-1A, Rule 144A1,6 | | (BB, NR) | | 04/20/26 | | | 4.817 | | | | 1,662,998 | | |
| | 2,000 | | | Cent CLO 16 LP, 2014-16XR, Reg S1,12 | | (BB, NR) | | 08/01/24 | | | 6.290 | | | | 1,955,384 | | |
| | 5,000 | | | Cent CLO LP, 2014-21X, Reg S12 | | (BB, NR) | | 07/27/26 | | | 5.323 | | | | 4,142,060 | | |
| | 1,000 | | | CIFC Funding Ltd., 2012-3A, Rule 144A1,6 | | (BB-, NR) | | 01/29/25 | | | 6.294 | | | | 935,190 | | |
| | 2,250 | | | CIFC Funding Ltd., 2012-3A, Rule 144A1,6 | | (B, NR) | | 01/29/25 | | | 7.194 | | | | 1,977,800 | | |
| | 1,500 | | | CIFC Funding Ltd., 2013-3A, Rule 144A1,6 | | (BB, NR) | | 10/24/25 | | | 5.044 | | | | 1,291,145 | | |
| | 2,000 | | | Dryden Senior Loan Fund,
2012-24RA, Rule 144A1,6 | | (BB, NR) | | 11/15/23 | | | 6.271 | | | | 1,908,091 | | |
| | 1,500 | | | Dryden Senior Loan Fund,
2012-24RA, Rule 144A1,6 | | (B, NR) | | 11/15/23 | | | 8.221 | | | | 1,440,634 | | |
| | 1,000 | | | Eaton Vance CLO Ltd., 2014-1A, Rule 144A1,6 | | (NR, Ba3) | | 07/15/26 | | | 5.351 | | | | 872,441 | | |
| | 3,000 | | | Greywolf CLO III Ltd., 2014-1A, Rule 144A1,6 | | (BB, NR) | | 04/22/26 | | | 5.420 | | | | 2,636,906 | | |
| | 1,419 | | | Halcyon Loan Advisors Funding Ltd.,
2012-1A, Rule 144A1,6 | | (BB, NR) | | 08/15/23 | | | 5.821 | | | | 1,254,382 | | |
| | 1,500 | | | Halcyon Loan Advisors Funding Ltd.,
2015-2A, Rule 144A1,6 | | (NR, Ba3) | | 07/25/27 | | | 6.037 | | | | 1,357,820 | | |
| | 3,000 | | | Highbridge Loan Management Ltd.,
2012-1A, Rule 144A1,6 | | (B, NR) | | 09/20/22 | | | 7.069 | | | | 2,945,390 | | |
| | 3,000 | | | Highbridge Loan Management Ltd.,
2012-1AR, Rule 144A1,6 | | (BB, NR) | | 09/20/22 | | | 6.031 | | | | 2,928,889 | | |
| | 1,140 | | | Jamestown CLO I Ltd., 2012-1X, Reg S1,12 | | (BB, NR) | | 11/05/24 | | | 5.804 | | | | 1,058,082 | | |
| | 4,500 | | | Jamestown CLO III Ltd., 2013-3A, Rule 144A1,6 | | (BB-, NR) | | 01/15/26 | | | 4.921 | | | | 3,573,771 | | |
| | 1,850 | | | KVK CLO Ltd., 2012-1A, Rule 144A1,6 | | (BB+, NR) | | 07/15/23 | | | 6.571 | | | | 1,771,154 | | |
| | 2,300 | | | KVK CLO Ltd., 2013-1A, Rule 144A1,6 | | (BB, NR) | | 04/14/25 | | | 5.821 | | | | 1,991,897 | | |
| | 1,750 | | | Neuberger Berman CLO XII Ltd.,
2012-12AR, Rule 144A1,6 | | (BB, NR) | | 07/25/23 | | | 6.545 | | | | 1,669,183 | | |
| | 1,000 | | | Ocean Trails CLO II, 2007-2X, Reg S1,12 | | (BBB-, Ba1) | | 06/27/22 | | | 2.671 | | | | 963,012 | | |
| | 3,000 | | | Ocean Trails CLO V, 2014-5A, Rule 144A1,6 | | (BBB, NR) | | 10/13/26 | | | 4.246 | | | | 2,778,696 | | |
| | 1,750 | | | OCP CLO Ltd., 2014-6A, Rule 144A1,6 | | (B, NR) | | 07/17/26 | | | 5.915 | | | | 1,332,022 | | |
| | 3,000 | | | Octagon Investment Partners XIV Ltd.,
2012-1A, Rule 144A1,6 | | (BB-, NR) | | 01/15/24 | | | 5.571 | | | | 2,750,595 | | |
| | 4,000 | | | Octagon Investment Partners XIV Ltd.,
2012-1A, Rule 144A1,6 | | (B, NR) | | 01/15/24 | | | 6.821 | | | | 3,400,180 | | |
| | 1,750 | | | Octagon Investment Partners XXI Ltd.,
2014-1A, Rule 144A1,6 | | (NR, Ba3) | | 11/14/26 | | | 6.875 | | | | 1,644,509 | | |
See Accompanying Notes to Financial Statements.
24
Credit Suisse Floating Rate High Income Fund
Schedule of Investments (continued)
October 31, 2015
Par
(000) | | | | Ratings†
(S&P/Moody's) | | Maturity | | Rate% | | Value | |
| ASSET BACKED SECURITIES (continued) | |
Collateralized Debt Obligations | | | |
$ | 2,000 | | | OZLM Ltd., 2014-9A | | (NR, Ba3) | | 01/20/27 | | | 5.437 | | | $ | 1,743,977 | | |
| | 2,000 | | | Race Point V CLO Ltd., 2011-5AR, Rule 144A1,6 | | (BB, NR) | | 12/15/22 | | | 6.337 | | | | 1,949,683 | | |
| | 2,500 | | | Saratoga Investment Corp. CLO Ltd.,
2013-1A, Rule 144A1,6 | | (BBB, NR) | | 10/20/23 | | | 3.817 | | | | 2,353,761 | | |
| | 2,500 | | | Shackleton V CLO Ltd., 2014-5A, Rule 144A1,6 | | (BB-, NR) | | 05/07/26 | | | 4.661 | | | | 2,051,683 | | |
| | 2,000 | | | Sound Point CLO II Ltd., 2013-1A, Rule 144A1,6 | | (B, NR) | | 04/26/25 | | | 5.820 | | | | 1,585,471 | | |
| | 2,000 | | | Sound Point CLO IV Ltd., 2013-3A, Rule 144A1,6 | | (NR, Ba3) | | 01/21/26 | | | 4.792 | | | | 1,700,815 | | |
| | 1,400 | | | Stewart Park CLO Ltd., 2015-1A, Rule 144A1,6,9 | | (NR, NR) | | 04/15/26 | | | 8.010 | | | | 1,216,363 | | |
| | 1,500 | | | TICP CLO I Ltd., 2014-1A, Rule 144A1,6 | | (BB, NR) | | 04/26/26 | | | 4.820 | | | | 1,226,733 | | |
| | 1,666 | | | Venture XII CLO Ltd., 2012-12A, Rule 144A1,6 | | (BB, NR) | | 02/28/24 | | | 5.625 | | | | 1,494,722 | | |
| | 3,000 | | | Vibrant CLO Ltd., 2012-1A, Rule 144A1,6 | | (BB, NR) | | 07/17/24 | | | 6.615 | | | | 2,942,027 | | |
| | 750 | | | Voya CLO Ltd., 2014-3A, Rule 144A1,6 | | (NR, Ba3) | | 07/25/26 | | | 5.320 | | | | 651,342 | | |
| | 2,250 | | | WhiteHorse VII Ltd., 2013-1A, Rule 144A1,6 | | (BB-, NR) | | 11/24/25 | | | 5.082 | | | | 1,896,195 | | |
| TOTAL ASSET BACKED SECURITIES (Cost $105,804,972) | | | 100,523,560 | | |
Number of
Shares | |
| |
| |
| |
| |
| |
| COMMON STOCKS (0.0%) | | | |
| Chemicals (0.0%) | | | |
| | 9,785 | | | Huntsman Corp.5 | | | | | | | | | | | | | | | 128,868 | | |
| Gaming (0.0%) | | | |
| | 10,150 | | | Majestic Holdco LLC5,13 | | | | | | | | | | | | | | | 2,411 | | |
| Printing & Publishing (0.0%) | | | |
| | 708 | | | F & W Media, Inc.5,13 | | | | | | | | | | | | | | | 60,155 | | |
| TOTAL COMMON STOCKS (Cost $93,165) | | | 191,434 | | |
| SHORT-TERM INVESTMENTS (16.8%) | | | |
| | 26,231,225 | | | State Street Navigator Prime Portfolio, 0.22%14 | | | | | | | | | | | | | | | 26,231,225 | | |
Par
(000) | |
| |
| |
| |
| |
| |
$ | 408,388 | | | State Street Bank and Trust Co.
Euro Time Deposit | | | | | | 11/02/15 | | | 0.010 | | | | 408,387,711 | | |
| TOTAL SHORT-TERM INVESTMENTS (Cost $434,618,936) | | | 434,618,936 | | |
| TOTAL INVESTMENTS AT VALUE (106.3%) (Cost $2,821,166,282) | | | 2,754,146,656 | | |
| LIABILITIES IN EXCESS OF OTHER ASSETS (-6.3%) | | | (162,841,799 | ) | |
| NET ASSETS (100.0%) | | $ | 2,591,304,857 | | |
† Credit ratings given by the Standard & Poor's Division of The McGraw-Hill Companies, Inc. ("S&P") and Moody's Investors Service, Inc. ("Moody's") are unaudited.
1 Variable rate obligations — The interest rate is the rate as of October 31, 2015.
2 This security is denominated in Euro.
3 This security is denominated in British Pound.
4 Represents unfunded loan commitments (See Note 2-I)
See Accompanying Notes to Financial Statements.
25
Credit Suisse Floating Rate High Income Fund
Schedule of Investments (continued)
October 31, 2015
5 Illiquid security (unaudited).
6 Security exempt from registration under Rule 144A of the Securities Act of 1933. These securities may be resold in transactions exempt from registration, normally to qualified institutional buyers. At October 31, 2015, these securities amounted to a value of $199,511,622 or 7.7% of net assets.
7 Security or portion thereof is out on loan (See note 2-J).
8 Not readily marketable security; security is valued at fair value as determined in good faith by, or under the direction of, the Board of Trustees.
9 Zero-coupon security.
10 Bond is currently in default.
11 PIK: Payment-in-kind security for which part of the income earned may be paid as additional principal.
12 REG S: Securities sold under Regulation S may not be offered, sold or delivered within the United States or to, or for the account or benefit of, U.S. persons, except pursuant to an exemption from, or in a transaction not subject to, the registration requirements of the Securities Act of 1933.
13 Non-income producing security.
14 Represents security purchased with cash collateral received for securities on loan. The rate shown is the annualized one-day yield at October 31, 2015.
INVESTMENT ABBREVIATION
NR = Not Rated (unaudited)
Forward Foreign Currency Contracts | |
Forward Foreign
Currency to be
Purchased (Local) | | Forward Foreign
Currency to be
Sold (Local) | | Expiration
Date | | Counterparty | | Value on
Settlement Date | | Current
Value/
Notional | | Net Unrealized
Appreciation
(Depreciation) | |
USD | 51,765,917 | | | EUR | 45,495,500 | | | 01/15/16 | | Morgan Stanley | | $ | (51,765,917 | ) | | $ | (50,325,318 | ) | | $ | 1,440,599 | | |
USD | 26,176,993 | | | GBP | 17,064,000 | | | 01/15/16 | | Morgan Stanley | | | (26,176,993 | ) | | | (26,346,887 | ) | | | (169,894 | ) | |
| | | | | | | | | | | | $ | 1,270,705 | | |
Currency Abbreviations: | |
EUR = Euro
GBP = British Pound
USD = United States Dollar
See Accompanying Notes to Financial Statements.
26
Credit Suisse Floating Rate High Income Fund
Statement of Assets and Liabilities
October 31, 2015
Assets | |
Investments at value, including collateral for securities on loan of $26,231,225
(Cost $2,821,166,282) (Note 2) | | $ | 2,754,146,6561 | | |
Cash | | | 85,438 | | |
Foreign currency at value (cost $12,740,599) | | | 12,607,098 | | |
Receivable for investments sold | | | 22,791,550 | | |
Interest receivable | | | 13,035,363 | | |
Receivable for fund shares sold | | | 5,565,657 | | |
Unrealized appreciation on forward currency contracts (Note 2) | | | 1,440,599 | | |
Prepaid expenses and other assets | | | 104,826 | | |
Total assets | | | 2,809,777,187 | | |
Liabilities | |
Investment advisory fee payable (Note 3) | | | 705,903 | | |
Administrative services fee payable (Note 3) | | | 242,743 | | |
Shareholder servicing/Distribution fee payable (Note 3) | | | 176,800 | | |
Payable for investments purchased | | | 181,793,831 | | |
Payable upon return of securities loaned (Note 2) | | | 26,231,225 | | |
Dividend payable | | | 3,077,785 | | |
Unfunded loan commitments (Note 2-I) | | | 2,877,698 | | |
Payable for fund shares redeemed | | | 2,500,727 | | |
Unrealized depreciation on forward currency contracts (Note 2) | | | 169,894 | | |
Trustees' fee payable | | | 7,332 | | |
Accrued expenses | | | 688,392 | | |
Total liabilities | | | 218,472,330 | | |
Net Assets | |
Capital stock, $.001 par value (Note 6) | | | 385,385 | | |
Paid-in capital (Note 6) | | | 2,662,627,036 | | |
Accumulated net investment loss | | | (3,153,489 | ) | |
Accumulated net realized loss on investments and foreign currency transactions | | | (2,614,143 | ) | |
Net unrealized depreciation from investments and foreign currency translations | | | (65,939,932 | ) | |
Net assets | | $ | 2,591,304,857 | | |
I Shares | |
Net assets | | $ | 2,167,954,772 | | |
Shares outstanding | | | 322,753,809 | | |
Net asset value, offering price and redemption price per share | | $ | 6.72 | | |
A Shares | |
Net assets | | $ | 286,805,212 | | |
Shares outstanding | | | 42,472,213 | | |
Net asset value and redemption price per share | | $ | 6.75 | | |
Maximum offering price per share (net asset value/(1-4.75%)) | | $ | 7.09 | | |
B Shares | |
Net assets | | $ | 2,111,825 | | |
Shares outstanding | | | 311,237 | | |
Net asset value and offering price per share | | $ | 6.79 | | |
C Shares | |
Net assets | | $ | 134,433,048 | | |
Shares outstanding | | | 19,847,346 | | |
Net asset value and offering price per share | | $ | 6.77 | | |
1 Including $25,732,030 of securities on loan.
See Accompanying Notes to Financial Statements.
27
Credit Suisse Floating Rate High Income Fund
Statement of Operations
For the Year Ended October 31, 2015
Investment Income | |
Interest | | $ | 97,787,755 | | |
Dividends | | | 4,893 | | |
Securities lending (net of rebates) (Note 2) | | | 162,489 | | |
Total investment income | | | 97,955,137 | | |
Expenses | |
Investment advisory fees (Note 3) | | | 9,996,207 | | |
Administrative services fees (Note 3) | | | 2,061,808 | | |
Shareholder servicing/Distribution fees (Note 3) | |
Class A | | | 811,648 | | |
Class B | | | 26,254 | | |
Class C | | | 1,491,370 | | |
Transfer agent fees (Note 3) | | | 1,957,329 | | |
Custodian fees | | | 342,936 | | |
Commitment fees (Note 4) | | | 237,579 | | |
Registration fees | | | 167,048 | | |
Printing fees | | | 69,624 | | |
Insurance expense | | | 57,638 | | |
Audit and tax fees | | | 52,806 | | |
Legal fees | | | 37,598 | | |
Trustees' fees | | | 28,000 | | |
Interest expense (Note 4) | | | 3,154 | | |
Miscellaneous expense | | | 46,346 | | |
Total expenses | | | 17,387,345 | | |
Less: fees waived (Note 3) | | | (1,340,229 | ) | |
Net expenses | | | 16,047,116 | | |
Net investment income | | | 81,908,021 | | |
Net Realized and Unrealized Gain (Loss) from Investments and Foreign Currency Related Items | |
Net realized loss from investments | | | (9,867,608 | ) | |
Net realized gain from foreign currency transactions | | | 6,670,489 | | |
Net change in unrealized appreciation (depreciation) from investments | | | (41,533,610 | ) | |
Net change in unrealized appreciation (depreciation) from foreign currency translations | | | 700,390 | | |
Net realized and unrealized loss from investments and foreign currency related items | | | (44,030,339 | ) | |
Net increase in net assets resulting from operations | | $ | 37,877,682 | | |
See Accompanying Notes to Financial Statements.
28
Credit Suisse Floating Rate High Income Fund
Statement of Changes in Net Assets
| | | For the Year
Ended
October 31, 2015 | | For the Year
Ended
October 31, 2014 | |
From Operations | |
Net investment income | | $ | 81,908,021 | | | $ | 71,923,219 | | |
Net realized gain (loss) from investments and foreign currency transactions | | | (3,197,119 | ) | | | 7,234,619 | | |
Net change in unrealized appreciation (depreciation)
from investments and foreign currency translations | | | (40,833,220 | ) | | | (32,310,988 | ) | |
Net increase in net assets resulting from operations | | | 37,877,682 | | | | 46,846,850 | | |
From Dividends and Distributions | |
Dividends from net investment income | |
Class I | | | (63,287,729 | ) | | | (49,008,403 | ) | |
Class A | | | (13,110,404 | ) | | | (17,437,438 | ) | |
Class B | | | (87,197 | ) | | | (124,263 | ) | |
Class C | | | (4,925,319 | ) | | | (5,533,291 | ) | |
Distributions from net realized gains | |
Class I | | | (669,301 | ) | | | — | | |
Class A | | | (166,856 | ) | | | — | | |
Class B | | | (1,659 | ) | | | — | | |
Class C | | | (83,525 | ) | | | — | | |
Return of capital | |
Class I | | | (386,468 | ) | | | — | | |
Class A | | | (80,059 | ) | | | — | | |
Class B | | | (532 | ) | | | — | | |
Class C | | | (30,077 | ) | | | — | | |
Net decrease in net assets resulting from dividends and distributions | | | (82,829,126 | ) | | | (72,103,395 | ) | |
| From Capital Share Transactions (Note 6) | |
Proceeds from sale of shares | | | 1,560,226,456 | | | | 1,168,016,565 | | |
Reinvestment of dividends and distributions | | | 67,438,964 | | | | 60,653,794 | | |
Net asset value of shares redeemed | | | (866,898,150 | ) | | | (832,967,724 | )1 | |
Net increase in net assets from capital share transactions | | | 760,767,270 | | | | 395,702,635 | | |
Net increase in net assets | | | 715,815,826 | | | | 370,446,090 | | |
Net Assets | |
Beginning of year | | | 1,875,489,031 | | | | 1,505,042,941 | | |
End of year | | $ | 2,591,304,857 | | | $ | 1,875,489,031 | | |
Accumulated net investment loss | | $ | (3,153,489 | ) | | $ | (1,006,469 | ) | |
1 Net of $8,404 of redemption fees retained by the Fund.
See Accompanying Notes to Financial Statements.
29
Credit Suisse Floating Rate High Income Fund
Financial Highlights
(For a Class I Share of the Fund Outstanding Throughout Each Year)
| | | For the Year Ended October 31, | |
| | | 2015 | | 2014 | | 2013 | | 2012 | | 2011 | |
Per share data | |
Net asset value, beginning of year | | $ | 6.86 | | | $ | 6.94 | | | $ | 6.89 | | | $ | 6.66 | | | $ | 6.72 | | |
INVESTMENT OPERATIONS | |
Net investment income1 | | | 0.29 | | | | 0.28 | | | | 0.30 | | | | 0.34 | | | | 0.43 | | |
Net gain (loss) on investments and foreign currency
related items (both realized and unrealized) | | | (0.14 | ) | | | (0.08 | ) | | | 0.07 | | | | 0.21 | | | | (0.04 | ) | |
Total from investment operations | | | 0.15 | | | | 0.20 | | | | 0.37 | | | | 0.55 | | | | 0.39 | | |
REDEMPTION FEES | | | — | | | | 0.002 | | | | 0.002 | | | | 0.002 | | | | 0.002 | | |
LESS DIVIDENDS AND DISTRIBUTIONS | |
Dividends from net investment income | | | (0.29 | ) | | | (0.28 | ) | | | (0.32 | ) | | | (0.32 | ) | | | (0.45 | ) | |
Distributions from net realized gains | | | (0.00 | )3 | | | — | | | | — | | | | — | | | | — | | |
Return of capital | | | (0.00 | )3 | | | — | | | | — | | | | — | | | | — | | |
Total dividends and distributions | | | (0.29 | ) | | | (0.28 | ) | | | (0.32 | ) | | | (0.32 | ) | | | (0.45 | ) | |
Net asset value, end of year | | $ | 6.72 | | | $ | 6.86 | | | $ | 6.94 | | | $ | 6.89 | | | $ | 6.66 | | |
Total return4 | | | 2.33 | % | | | 2.94 | % | | | 5.47 | % | | | 8.51 | % | | | 5.85 | % | |
RATIOS AND SUPPLEMENTAL DATA | |
Net assets, end of year (000s omitted) | | $ | 2,167,955 | | | $ | 1,343,741 | | | $ | 876,418 | | | $ | 226,027 | | | $ | 46,482 | | |
Ratio of net expenses to average net assets | | | 0.70 | % | | | 0.70 | % | | | 0.70 | % | | | 0.70 | % | | | 0.70 | % | |
Ratio of expenses to average net assets
excluding interest expense | | | 0.70 | % | | | — | | | | — | | | | — | | | | — | | |
Ratio of net investment income to average
net assets | | | 4.29 | % | | | 4.04 | % | | | 4.35 | % | | | 4.99 | % | | | 6.32 | % | |
Decrease reflected in above operating expense
ratios due to waivers/reimbursements | | | 0.07 | % | | | 0.07 | % | | | 0.07 | % | | | 0.20 | % | | | 0.68 | % | |
Portfolio turnover rate | | | 46 | % | | | 57 | % | | | 89 | % | | | 96 | % | | | 144 | % | |
1 Per share information is calculated using the average shares outstanding method.
2 This amount represents less than $0.01 per share.
3 This amount represents less than $(0.01) per share.
4 Total returns are historical and assume changes in share price and reinvestment of all dividends and distributions. Had certain expenses not been reduced during the years shown, total returns would have been lower.
See Accompanying Notes to Financial Statements.
30
Credit Suisse Floating Rate High Income Fund
Financial Highlights
(For a Class A Share of the Fund Outstanding Throughout Each Year)
| | | For the Year Ended October 31, | |
| | | 2015 | | 2014 | | 2013 | | 2012 | | 2011 | |
Per share data | |
Net asset value, beginning of year | | $ | 6.89 | | | $ | 6.98 | | | $ | 6.92 | | | $ | 6.69 | | | $ | 6.74 | | |
INVESTMENT OPERATIONS | |
Net investment income1 | | | 0.28 | | | | 0.26 | | | | 0.29 | | | | 0.32 | | | | 0.40 | | |
Net gain (loss) on investments and foreign currency
related items (both realized and unrealized) | | | (0.14 | ) | | | (0.09 | ) | | | 0.07 | | | | 0.22 | | | | (0.02 | ) | |
Total from investment operations | | | 0.14 | | | | 0.17 | | | | 0.36 | | | | 0.54 | | | | 0.38 | | |
REDEMPTION FEES | | | — | | | | 0.002 | | | | 0.002 | | | | 0.002 | | | | 0.002 | | |
LESS DIVIDENDS AND DISTRIBUTIONS | |
Dividends from net investment income | | | (0.28 | ) | | | (0.26 | ) | | | (0.30 | ) | | | (0.31 | ) | | | (0.43 | ) | |
Distributions from net realized gains | | | (0.00 | )3 | | | — | | | | — | | | | — | | | | — | | |
Return of capital | | | (0.00 | )3 | | | — | | | | — | | | | — | | | | — | | |
Total dividends and distributions | | | (0.28 | ) | | | (0.26 | ) | | | (0.30 | ) | | | (0.31 | ) | | | (0.43 | ) | |
Net asset value, end of year | | $ | 6.75 | | | $ | 6.89 | | | $ | 6.98 | | | $ | 6.92 | | | $ | 6.69 | | |
Total return4 | | | 2.09 | % | | | 2.53 | % | | | 5.33 | % | | | 8.19 | % | | | 5.74 | % | |
RATIOS AND SUPPLEMENTAL DATA | |
Net assets, end of year (000s omitted) | | $ | 286,805 | | | $ | 358,095 | | | $ | 456,550 | | | $ | 148,636 | | | $ | 49,439 | | |
Ratio of net expenses to average net assets | | | 0.95 | % | | | 0.95 | % | | | 0.95 | % | | | 0.95 | % | | | 0.95 | % | |
Ratio of expenses to average net assets
excluding interest expense | | | 0.95 | % | | | — | | | | — | | | | — | | | | — | | |
Ratio of net investment income to average
net assets | | | 4.06 | % | | | 3.79 | % | | | 4.13 | % | | | 4.65 | % | | | 5.97 | % | |
Decrease reflected in above operating expense
ratios due to waivers/reimbursements | | | 0.07 | % | | | 0.07 | % | | | 0.07 | % | | | 0.20 | % | | | 0.69 | % | |
Portfolio turnover rate | | | 46 | % | | | 57 | % | | | 89 | % | | | 96 | % | | | 144 | % | |
1 Per share information is calculated using the average shares outstanding method.
2 This amount represents less than $0.01 per share.
3 This amount represents less than $(0.01) per share.
4 Total returns are historical and assume changes in share price, reinvestment of all dividends and distributions and no sales charge. Had certain expenses not been reduced during the years shown, total returns would have been lower.
See Accompanying Notes to Financial Statements.
31
Credit Suisse Floating Rate High Income Fund
Financial Highlights
(For a Class B Share of the Fund Outstanding Throughout Each Year)
| | | For the Year Ended October 31, | |
| | | 2015 | | 2014 | | 2013 | | 2012 | | 2011 | |
Per share data | |
Net asset value, beginning of year | | $ | 6.91 | | | $ | 7.00 | | | $ | 6.93 | | | $ | 6.70 | | | $ | 6.74 | | |
INVESTMENT OPERATIONS | |
Net investment income1 | | | 0.23 | | | | 0.21 | | | | 0.25 | | | | 0.26 | | | | 0.39 | | |
Net gain (loss) on investments and foreign currency
related items (both realized and unrealized) | | | (0.12 | ) | | | (0.09 | ) | | | 0.07 | | | | 0.22 | | | | (0.06 | ) | |
Total from investment operations | | | 0.11 | | | | 0.12 | | | | 0.32 | | | | 0.48 | | | | 0.33 | | |
REDEMPTION FEES | | | — | | | | 0.002 | | | | 0.002 | | | | 0.002 | | | | 0.002 | | |
LESS DIVIDENDS AND DISTRIBUTIONS | |
Dividends from net investment income | | | (0.23 | ) | | | (0.21 | ) | | | (0.25 | ) | | | (0.25 | ) | | | (0.37 | ) | |
Distributions from net realized gains | | | (0.00 | )3 | | | — | | | | — | | | | — | | | | — | | |
Return of capital | | | (0.00 | )3 | | | — | | | | — | | | | — | | | | — | | |
Total dividends and distributions | | | (0.23 | ) | | | (0.21 | ) | | | (0.25 | ) | | | (0.25 | ) | | | (0.37 | ) | |
Net asset value, end of year | | $ | 6.79 | | | $ | 6.91 | | | $ | 7.00 | | | $ | 6.93 | | | $ | 6.70 | | |
Total return4 | | | 1.64 | % | | | 1.77 | % | | | 4.64 | % | | | 7.30 | % | | | 5.03 | % | |
RATIOS AND SUPPLEMENTAL DATA | |
Net assets, end of year (000s omitted) | | $ | 2,112 | | | $ | 3,638 | | | $ | 4,422 | | | $ | 5,185 | | | $ | 4,647 | | |
Ratio of net expenses to average net assets | | | 1.70 | % | | | 1.70 | % | | | 1.70 | % | | | 1.70 | % | | | 1.70 | % | |
Ratio of expenses to average net assets
excluding interest expense | | | 1.70 | % | | | — | | | | — | | | | — | | | | — | | |
Ratio of net investment income to average
net assets | | | 3.34 | % | | | 3.07 | % | | | 3.52 | % | | | 3.83 | % | | | 5.80 | % | |
Decrease reflected in above operating expense
ratios due to waivers/reimbursements | | | 0.07 | % | | | 0.07 | % | | | 0.07 | % | | | 0.20 | % | | | 0.68 | % | |
Portfolio turnover rate | | | 46 | % | | | 57 | % | | | 89 | % | | | 96 | % | | | 144 | % | |
1 Per share information is calculated using the average shares outstanding method.
2 This amount represents less than $0.01 per share.
3 This amount represents less than $(0.01) per share.
4 Total returns are historical and assume changes in share price, reinvestment of all dividends and distributions and no sales charge. Had certain expenses not been reduced during the years shown, total returns would have been lower.
See Accompanying Notes to Financial Statements.
32
Credit Suisse Floating Rate High Income Fund
Financial Highlights
(For a Class C Share of the Fund Outstanding Throughout Each Year)
| | | For the Year Ended October 31, | |
| | | 2015 | | 2014 | | 2013 | | 2012 | | 2011 | |
Per share data | |
Net asset value, beginning of year | | $ | 6.91 | | | $ | 7.00 | | | $ | 6.94 | | | $ | 6.71 | | | $ | 6.75 | | |
INVESTMENT OPERATIONS | |
Net investment income1 | | | 0.23 | | | | 0.21 | | | | 0.24 | | | | 0.27 | | | | 0.37 | | |
Net gain (loss) on investments and foreign currency
related items (both realized and unrealized) | | | (0.14 | ) | | | (0.09 | ) | | | 0.07 | | | | 0.21 | | | | (0.03 | ) | |
Total from investment operations | | | 0.09 | | | | 0.12 | | | | 0.31 | | | | 0.48 | | | | 0.34 | | |
REDEMPTION FEES | | | — | | | | 0.002 | | | | 0.002 | | | | 0.002 | | | | 0.002 | | |
LESS DIVIDENDS AND DISTRIBUTIONS | |
Dividends from net investment income | | | (0.23 | ) | | | (0.21 | ) | | | (0.25 | ) | | | (0.25 | ) | | | (0.38 | ) | |
Distributions from net realized gains | | | (0.00 | )3 | | | — | | | | — | | | | — | | | | — | | |
Return of capital | | | (0.00 | )3 | | | — | | | | — | | | | — | | | | — | | |
Total dividends and distributions | | | (0.23 | ) | | | (0.21 | ) | | | (0.25 | ) | | | (0.25 | ) | | | (0.38 | ) | |
Net asset value, end of year | | $ | 6.77 | | | $ | 6.91 | | | $ | 7.00 | | | $ | 6.94 | | | $ | 6.71 | | |
Total return4 | | | 1.33 | % | | | 1.77 | % | | | 4.47 | % | | | 7.29 | % | | | 5.03 | % | |
RATIOS AND SUPPLEMENTAL DATA | |
Net assets, end of year (000s omitted) | | $ | 134,433 | | | $ | 170,015 | | | $ | 167,653 | | | $ | 75,699 | | | $ | 23,905 | | |
Ratio of net expenses to average net assets | | | 1.70 | % | | | 1.70 | % | | | 1.70 | % | | | 1.70 | % | | | 1.70 | % | |
Ratio of expenses to average net assets
excluding interest expense | | | 1.70 | % | | | — | | | | — | | | | — | | | | — | | |
Ratio of net investment income to average
net assets | | | 3.32 | % | | | 3.04 | % | | | 3.40 | % | | | 3.93 | % | | | 5.39 | % | |
Decrease reflected in above operating expense
ratios due to waivers/reimbursements | | | 0.07 | % | | | 0.07 | % | | | 0.07 | % | | | 0.20 | % | | | 0.68 | % | |
Portfolio turnover rate | | | 46 | % | | | 57 | % | | | 89 | % | | | 96 | % | | | 144 | % | |
1 Per share information is calculated using the average shares outstanding method.
2 This amount represents less than $0.01 per share.
3 This amount represents less than $(0.01) per share.
4 Total returns are historical and assume changes in share price, reinvestment of all dividends and distributions and no sales charge. Had certain expenses not been reduced during the years shown, total returns would have been lower.
See Accompanying Notes to Financial Statements.
33
Credit Suisse Floating Rate High Income Fund
Notes to Financial Statements
October 31, 2015
Credit Suisse Floating Rate High Income Fund (the "Fund"), a series of the Credit Suisse Opportunity Funds (the "Trust"), a Delaware statutory trust, is registered under the Investment Company Act of 1940, as amended (the "1940 Act"), as a diversified open-end management investment company that seeks to provide a high current income and, secondarily, capital appreciation. The Trust was organized under the laws of the State of Delaware as a business trust on May 31, 1995.
The Fund offers three classes of shares: Class I shares, Class A shares and Class C shares. Each class of shares represents an equal pro rata interest in the Fund, except they bear different expenses, which reflect the differences in the range of services provided to them. Class A shares are sold subject to a front-end sales charge of up to 4.75%. Class C shares are sold subject to a contingent deferred sales charge of 1.00% if the shares are redeemed within the first year of purchase. Class I shares are sold without a sales charge. Effective February 29, 2012, Class B shares of the Fund are no longer being offered for sale. Existing shareholders may continue to purchase additional Class B shares of the Fund through the reinvestment of dividends and capital gain distributions paid by the Fund. Class B shares automatically convert to Class A shares after 8 years.
Note 2. Significant Accounting Policies
The following is a summary of significant accounting policies followed by the Fund in the preparation of its financial statements. The policies are in accordance with accounting principles generally accepted in the United States of America ("GAAP"). The preparation of financial statements requires management to make estimates and assumptions that affect the reported amounts and disclosures in the financial statements. Actual results could differ from those estimates. The Fund is considered an investment company for financial reporting purposes under GAAP and follows Accounting Standard Codification ("ASC") Topic 946 — Financial Services — Investment Companies.
A) SECURITY VALUATION — The net asset value of the Fund is determined daily as of the close of regular trading on the New York Stock Exchange, Inc. (the "Exchange") on each day the Exchange is open for business. The valuations for fixed income securities (which may include, but are not limited to, corporate, government, municipal, mortgage-backed, collateralized mortgage obligations and asset-backed securities) and certain derivative instruments are typically the prices supplied by independent third party pricing services, which may use market prices or broker/dealer quotations or
34
Credit Suisse Floating Rate High Income Fund
Notes to Financial Statements (continued)
October 31, 2015
Note 2. Significant Accounting Policies (continued)
a variety of valuation techniques and methodologies. The independent third party pricing services use inputs that are observable such as issuer details, interest rates, yield curves, prepayment speeds, credit risks/spreads, default rates and quoted prices for similar securities. These pricing services generally price fixed income securities assuming orderly transactions of an institutional "round lot" size, but some trades occur in smaller "odd lot" sizes which may be effected at lower prices than institutional round lot trades. Structured note agreements are valued in accordance with a dealer-supplied valuation based on changes in the value of the underlying index. Futures contracts are valued daily at the settlement price established by the board of trade or exchange on which they are traded. Forward contracts are valued at the London closing spot rates and the London closing forward point rates on a daily basis. The currency forward contract pricing model derives the differential in point rates to the expiration date of the forward and calculates its present value. Equity securities for which market quotations are available are valued at the last reported sales price or official closing price on the primary market or exchange on which they trade. The Fund may utilize a service provided by an independent third party which has been approved by the Board of Trustees (the "Board") to fair value certain securities. When fair value pricing is employed, the prices of securities used by the Fund to calculate its net asset value may differ from quoted or published prices for the same securities. If independent third party pricing services are unable to supply prices for a portfolio investment, or if the prices supplied are deemed by the investment adviser to be unreliable, the market price may be determined by the investment adviser using quotations from one or more broker/dealers or at the transaction price if the security has recently been purchased and no value has yet been obtained from a pricing service or pricing broker. When reliable prices are not readily available, such as when the value of a security has been significantly affected by events after the close of the exchange or market on which the security is principally traded, but before the Fund calculates its net asset value, the Fund values these securities as determined in accordance with procedures approved and established by the Board.
The Fund uses valuation techniques to measure fair value that are consistent with the market approach and/or income approach, depending on the type of security and the particular circumstance. The market approach uses prices and other relevant information generated by market transactions involving identical or comparable securities. The income approach uses valuation techniques to discount estimated future cash flows to present value.
35
Credit Suisse Floating Rate High Income Fund
Notes to Financial Statements (continued)
October 31, 2015
Note 2. Significant Accounting Policies (continued)
GAAP established a disclosure hierarchy that categorizes the inputs to valuation techniques used to value assets and liabilities at each measurement date. These inputs are summarized in the three broad levels listed below:
• Level 1 – quoted prices in active markets for identical investments
• Level 2 – other significant observable inputs (including quoted prices for similar investments, interest rates, prepayment speeds, credit risk, etc.)
• Level 3 – significant unobservable inputs (including the Fund's own assumptions in determining the fair value of investments)
The inputs or methodologies used to value securities are not necessarily an indication of the risk associated with investing in those securities.
The following is a summary of the inputs used as of October 31, 2015 in valuing the Fund's assets and liabilities carried at fair value:
Assets | | Level 1 | | Level 2 | | Level 3 | | Total | |
Investments in Securities | |
Bank Loans | | $ | — | | | $ | 1,802,886,479 | | | $ | 213,328,562 | | | $ | 2,016,215,041 | | |
Corporate Bonds | | | — | | | | 202,597,285 | | | | 400 | | | | 202,597,685 | | |
Asset Backed Securities | | | — | | | | 100,523,560 | | | | — | | | | 100,523,560 | | |
Common Stocks | | | 128,868 | | | | 62,566 | | | | — | | | | 191,434 | | |
Short-term Investments | | | — | | | | 434,618,936 | | | | — | | | | 434,618,936 | | |
| | | $ | 128,868 | | | $ | 2,540,688,826 | | | $ | 213,328,962 | | | $ | 2,754,146,656 | | |
Other Financial Instruments* | |
Forward Foreign Currency Contracts | | $ | — | | | $ | 1,440,599 | | | $ | — | | | $ | 1,440,599 | | |
Liabilities | | Level 1 | | Level 2 | | Level 3 | | Total | |
Other Financial Instruments* | |
Forward Foreign Currency Contracts | | $ | — | | | $ | 169,894 | | | $ | — | | | $ | 169,894 | | |
*Other financial instruments include unrealized appreciation (depreciation) on forward foreign currency contracts.
36
Credit Suisse Floating Rate High Income Fund
Notes to Financial Statements (continued)
October 31, 2015
Note 2. Significant Accounting Policies (continued)
The following is a reconciliation of investments as of October 31, 2015 in which significant unobservable inputs were used in determining value. Transfers in or out of Level 3 represent the end of the period value of any security or instrument where a change in the level has occurred from the beginning to the end of the period.
| | | Bank
Loans | | Corporate
Bonds | | Asset
Backed
Securities | | Common
Stocks | | Total | |
Balance as of October 31, 2014 | | $ | — | | | $ | 750 | | | $ | 1,733,585 | | | $ | 100,061 | | | $ | 1,834,396 | | |
Accrued discounts (premiums) | | | 151,314 | | | | — | | | | 1,362 | | | | — | | | | 152,676 | | |
Purchases | | | 131,504,510 | | | | — | | | | — | | | | — | | | | 131,504,510 | | |
Sales | | | (369,389 | ) | | | — | | | | — | | | | (133,000 | ) | | | (502,389 | ) | |
Realized gain (loss) | | | 10,135 | | | | — | | | | — | | | | 133,000 | | | | 143,135 | | |
Change in unrealized
appreciation (depreciation) | | | (1,008,514 | ) | | | (350 | ) | | | (90,438 | ) | | | (97,650 | ) | | | (1,196,952 | ) | |
Transfers into Level 3 | | | 83,040,506 | | | | — | | | | — | | | | — | | | | 83,040,506 | | |
Transfers out of Level 3 | | | — | | | | — | | | | (1,644,509 | ) | | | (2,411 | ) | | | (1,646,920 | ) | |
Balance as of October 31, 2015 | | $ | 213,328,562 | | | | 400 | | | | — | | | $ | — | | | $ | 213,328,962 | | |
Net change in unrealized
appreciation (depreciation)
from investments still held
as of October 31, 2015 | | $ | (1,008,514 | ) | | $ | (350 | ) | | $ | — | | | $ | — | | | $ | (1,008,864 | ) | |
| | | Quantitative Disclosure About Significant Unobservable Inputs | |
Asset Class | | Fair Value
at 10/31/2015 | | Valuation
Technique(s) | | Unobservable
Input | | Range
(Weighted
Average)
(per share) | |
Corporate Bond | | $ | 400 | | | Vendor pricing | | Single Broker Quote | | | NA | | |
Bank Loans | | $ | 213,328,562 | | | Vendor pricing | | Single Broker Quote | | $ | 0.63 – $1.02 | | |
| | | | | | | | | ($0.96) | | |
Each fair value determination is based on a consideration of relevant factors, including both observable and unobservable inputs. Observable and unobservable inputs Credit Suisse Asset Managment LLC, the Fund's investment adviser ("Credit Suisse" or the "Adviser") considers may include (i) the existence of any contractual restrictions on the disposition of securities; (ii) information obtained from the company, which may include an analysis of the company's financial statements, the company's products or intended markets or the company's technologies; (iii) the price of the same or similar security negotiated at arm's length in an issuer's completed subsequent round of financing; (iv) the price and extent of public trading in similar securities of the issuer or of comparable companies; or (v) a probability and time value adjusted analysis of contractual term. Where available and appropriate, multiple valuation methodologies are applied to confirm fair value. Significant unobservable inputs identified by the Adviser are often used in the fair value
37
Credit Suisse Floating Rate High Income Fund
Notes to Financial Statements (continued)
October 31, 2015
Note 2. Significant Accounting Policies (continued)
determination. A significant change in any of these inputs may result in a significant change in the fair value measurement. Due to the uncertainty inherent in the valuation process, such estimates of fair value may differ significantly from the values that would have been used had a ready market for the investments existed, and differences could be material. Additionally, changes in the market environment and other events that may occur over the life of the investments may cause the gains or losses ultimately realized on these investments to be different from the valuations used at the date of these financial statements.
For the year ended October 31, 2015, there were no transfers in and out of Level 1 and Level 2, but there were $83,040,506 transferred out from Level 2 to Level 3 due to lack of pricing source supported by observable inputs. $1,646,920 transferred out from Level 3 to Level 2 as a result of the availability of a pricing source supported by observable inputs. All transfers, if any, are assumed to occur at the end of the reporting period.
B) DERIVATIVE INSTRUMENTS AND HEDGING ACTIVITIES — The Fund adopted amendments to authoritative guidance on disclosures about derivative instruments and hedging activities which require that a fund disclose (a) how and why an entity uses derivative instruments, (b) how derivative instruments and hedging activities are accounted for and (c) how derivative instruments and related hedging activities affect a fund's financial position, financial performance and cash flows. For the year ended October 31, 2015, the Fund's derivatives did not qualify for hedge accounting as they are held at fair value.
Fair Values of Derivative Instruments as of October 31, 2015
| | | Asset Derivatives | | Liability Derivatives | |
| | | Balance Sheet
Location | | Fair Value | | Balance Sheet
Location | | Fair Value | |
Currency Contracts
| | Unrealized appreciation
on forward currency
contracts | | $ | 1,440,599 | | | Unrealized depreciation
on forward currency
contracts | | $ | 169,894 | | |
38
Credit Suisse Floating Rate High Income Fund
Notes to Financial Statements (continued)
October 31, 2015
Note 2. Significant Accounting Policies (continued)
Effect of Derivative Instruments on the Statement of Operations
| | | Location | | Realized
Gain (Loss) | | Location | | Net Unrealized
Appreciation
(Depreciation) | |
Currency Contracts
| | Net realized gain from
foreign currency
transactions* | | $ | 8,174,565 | | | Net change in unrealized
appreciation
(depreciation) from
foreign currency
translations | | $ | 416,995 | | |
*Statement of Operations includes both forward currency contracts and foreign currency transactions/translations.
The value amount of forward foreign currency contracts at the year ended October 31, 2015 is reflected in the Schedule of Investments. For the year ended October 31, 2015, the Fund held an average monthly value on a net basis of $99,494,405 in forward foreign currency contracts.
The Fund is a party to International Swap and Derivatives Association, Inc. ("ISDA") Master Agreements ("Master Agreements") with certain counterparties that govern over-the-counter derivative (including Total Return, Credit Default and Interest Rate Swaps) and foreign exchange contracts entered into by the Fund. The Master Agreements may contain provisions regarding, among other things, the parties' general obligations, representations, agreements, collateral requirements, events of default and early termination. Termination events applicable to the Fund may occur upon a decline in the Fund's net assets below a specified threshold over a certain period of time.
The following table presents by counterparty the Fund's derivative assets net of related collateral held by the Fund at October 31, 2015:
Counterparty | | Gross Amounts of
Assets Presented in
Statement of Assets
and Liabilities(a) | | Financial
Instruments
and Derivatives
Available for Offset | | Non-Cash
Collateral
Received | | Cash
Collateral
Received | | Net Amount
of Derivative
Assets | |
Morgan Stanley | | $ | 1,440,599 | | | $ | (169,894 | ) | | $ | — | | | $ | — | | | $ | 1,270,705 | | |
The following table presents by counterparty the Fund's derivative liabilities net of related collateral pledged by the Fund at October 31, 2015:
Counterparty | | Gross Amounts of
Assets Presented in
Statement of Assets
and Liabilities(a) | | Financial
Instruments
and Derivatives
Available for Offset | | Non-Cash
Collateral
Pledged | | Cash
Collateral
Pledged | | Net Amount
of Derivative
Liabilities | |
Morgan Stanley | | $ | 169,894 | | | $ | (169,894 | ) | | $ | — | | | $ | — | | | $ | — | | |
(a) Forward foreign currency exchange contracts are included.
39
Credit Suisse Floating Rate High Income Fund
Notes to Financial Statements (continued)
October 31, 2015
Note 2. Significant Accounting Policies (continued)
C) FOREIGN CURRENCY TRANSACTIONS — The books and records of the Fund are maintained in U.S. dollars. Transactions denominated in foreign currencies are recorded at the current prevailing exchange rates. All assets and liabilities denominated in foreign currencies are translated into U.S. dollar amounts at the current exchange rate at the end of the period. Translation gains or losses resulting from changes in the exchange rate during the reporting period and realized gains and losses on the settlement of foreign currency transactions are reported in the results of operations for the current period. The Fund isolates that portion of realized gains and losses on investments which is due to changes in the foreign exchange rate from that which is due to changes in market prices.
D) SECURITY TRANSACTIONS AND INVESTMENT INCOME/EXPENSE — Security transactions are accounted for on a trade date basis. Interest income/expense is recorded on the accrual basis. The Fund amortizes premiums and accretes discounts using the effective interest method. Dividend income/expense is recorded on the ex-dividend date. Certain expenses are class-specific expenses, vary by class and are charged only to that class. Income, expenses (excluding class-specific expenses) and realized/unrealized gains/losses are allocated proportionately to each class of shares based upon the relative net asset value of the outstanding shares of that class. The cost of investments sold is determined by use of the specific identification method for both financial reporting and income tax purposes.
E) DIVIDENDS AND DISTRIBUTIONS TO SHAREHOLDERS — Dividends from net investment income, if any, are declared daily and paid monthly. Distributions of net realized capital gains, if any, are declared and paid at least annually. However, to the extent that a net realized capital gain can be reduced by a capital loss carryforward, such gain will not be distributed. Income and capital gain distributions are determined in accordance with federal income tax regulations, which may differ from GAAP.
F) FEDERAL INCOME TAXES — No provision is made for federal taxes as it is the Fund's intention to continue to qualify as a regulated investment company ("RIC") under the Internal Revenue Code of 1986, as amended (the "Code"), and to make the requisite distributions to its shareholders, which will be sufficient to relieve it from federal income and excise taxes.
In order to qualify as a RIC under the Code, the Fund must meet certain requirements regarding the source of its income, the diversification of its assets and the distribution of its income. One of these requirements is that the Fund
40
Credit Suisse Floating Rate High Income Fund
Notes to Financial Statements (continued)
October 31, 2015
Note 2. Significant Accounting Policies (continued)
derive at least 90% of its gross income for each taxable year from dividends, interest, payments with respect to certain securities loans, gains from the sale or other disposition of stock, securities or foreign currencies, other income derived with respect to its business of investing in such stock, securities or currencies or net income derived from interests in certain publicly traded partnerships ("Qualifying Income").
The Fund adopted the authoritative guidance for uncertainty in income taxes and recognizes a tax benefit or liability from an uncertain position only if it is more likely than not that the position is sustainable based solely on its technical merits and consideration of the relevant taxing authority's widely understood administrative practices and procedures. The Fund has reviewed its current tax positions and has determined that no provision for income tax is required in the Fund's financial statements. The Fund's federal tax returns for the prior three fiscal years remain subject to examination by the Internal Revenue Service.
G) SHORT-TERM INVESTMENTS — The Fund, together with other funds/portfolios advised by Credit Suisse, pools available cash into a short-term variable rate time deposit issued by State Street Bank and Trust Company ("SSB"), the Fund's custodian. The short-term time deposit issued by SSB is a variable rate account classified as a short-term investment.
H) FORWARD FOREIGN CURRENCY CONTRACTS — A forward foreign currency exchange contract ("forward currency contract") is a commitment to purchase or sell a foreign currency at the settlement date at a negotiated rate. The Fund will enter into forward foreign currency contracts primarily for hedging foreign currency risk. Forward currency contracts are valued at the prevailing forward exchange rate of the underlying currencies and unrealized gain (loss) is recorded daily. On the settlement date of the forward currency contract, the Fund records a realized gain or loss equal to the difference between the value of the contract at the time it was opened and the value of the contract at the time it was closed. Certain risks may arise upon entering into forward currency contracts from the potential inability of counterparties to meet the terms of their contracts. The maximum counterparty credit risk to the Fund is measured by the unrealized gain on appreciated contracts. Additionally, when utilizing forward currency contracts to hedge, the Fund gives up the opportunity to profit from favorable exchange rate movements during the term of the contract. The Fund's open forward foreign currency contracts at October 31, 2015 are disclosed in the Schedule of Investments.
41
Credit Suisse Floating Rate High Income Fund
Notes to Financial Statements (continued)
October 31, 2015
Note 2. Significant Accounting Policies (continued)
I) UNFUNDED LOAN COMMITMENTS — The Fund enters into certain agreements, all or a portion of which may be unfunded. The Fund is obligated to fund these loan commitments at the borrowers' discretion. Funded portions of credit agreements are presented on the Schedule of Investments. As of October 31, 2015, unfunded commitments were as follows:
Borrower | | Maturity | | Rate | | Unfunded Commitment | |
Acrisure LL | | 05/19/22 | | | 5.250 | | | $ | 8,635,791 | | |
Unfunded loan commitments and funded portions of credit agreements are marked to market daily and any unrealized appreciation or depreciation is included in the Statement of Assets and Liabilities and the Statement of Operations.
J) SECURITIES LENDING — Loans of securities are required at all times to be secured by collateral at least equal to 102% of the market value of domestic securities on loan (including any accrued interest thereon) and 105% of the market value of foreign securities on loan (including any accrued interest thereon). Cash collateral received by the Fund in connection with securities lending activity may be pooled together with cash collateral for other funds/portfolios advised by Credit Suisse and may be invested in a variety of investments, including funds advised by SSB, the Fund's securities lending agent or money market instruments. However, in the event of default or bankruptcy by the other party to the agreement, realization and/or retention of the collateral may be subject to legal proceedings.
SSB has been engaged by the Fund to act as the Fund's securities lending agent. As of October 31, 2015, the Fund had investment securities on loan with a fair value of $25,732,030 and a related liability of $26,231,225 for collateral received on securities loaned, both of which are presented gross on the Statement of Assets and Liabilities. The collateral for securities loaned is valued consistently to the other investments held by the Fund and is included in level 2 of the fair value hierarchy. For the year ended October 31, 2015, the value of the related collateral exceeded the value of the securities loaned.
The Fund's securities lending arrangement provides that the Fund and SSB will share the net income earned from securities lending activities. During the year ended October 31, 2015, total earnings from the Fund's investment in cash collateral received in connection with securities lending arrangements was $192,673, of which $1,364 was rebated to borrowers (brokers). The Fund retained $162,489 in income from the cash collateral investment, and SSB, as
42
Credit Suisse Floating Rate High Income Fund
Notes to Financial Statements (continued)
October 31, 2015
Note 2. Significant Accounting Policies (continued)
lending agent, was paid $28,820. Securities lending income is accrued as earned.
K) OTHER — The high yield, fixed income securities in which the fund invests will primarily consist of senior secured floating rate loans ("Senior Loans") issued by non-investment grade companies. Senior Loans are typically secured by specific collateral of the issuer and hold the most senior position in the issuer's capital structure. The interest rate on Senior Loans is periodically adjusted to a recognized base rate, typically the London Interbank Offered Rate ("LIBOR"). While these characteristics may reduce interest rate risk and mitigate losses in the event of borrower default, the Senior Loans in which the Fund invests have below investment grade credit ratings and thereby are considered speculative because of the significant credit risk of their issuers.
Lower-rated debt securities (commonly known as "junk bonds") possess speculative characteristics and are subject to greater market fluctuations and risk of lost income and principal than higher-rated debt securities for a variety of reasons. Also, during an economic downturn or substantial period of rising interest rates, highly leveraged issuers may experience financial stress which would adversely affect their ability to service their principal and interest payment obligations, to meet projected business goals and to obtain additional financing.
In addition, periods of economic uncertainty and changes can be expected to result in increased volatility of market prices of lower-rated debt securities and the Fund's net asset value.
L) NEW ACCOUNTING PRONOUNCEMENTS — In June 2014, Financial Accounting Standards Board ("FASB") issued ASU No. 2014-11, Transfers and Servicing (Topic 860), Repurchase-to-Maturity Transactions, Repurchase Financings, and Disclosures. The ASU changes the accounting for certain repurchase agreements and expands disclosure requirements related to repurchase agreements, securities lending, repurchase-to-maturity and similar transactions. The ASU is effective for interim and annual reporting periods beginning after December 15, 2014. Management has reviewed the requirements and believes the adoption of this ASU will not have a material impact on the financial statements.
On April 7, 2015, the FASB issued a new ASU No. 2015-03, "Simplifying the Presentation of Debt Issuance Costs". The ASU requires debt issuance costs to be presented on the balance sheet as a direct deduction from the debt liability. The ASU is effective for interim and annual reporting periods beginning after
43
Credit Suisse Floating Rate High Income Fund
Notes to Financial Statements (continued)
October 31, 2015
Note 2. Significant Accounting Policies (continued)
December 15, 2015. Management has reviewed the requirements and believes the adoption of this ASU will not have a material impact on the financial statements.
In May 2015, the FASB issued ASU No. 2015-07, "Disclosures for Investments in Certain Entities that Calculate Net Asset Value per Share (or its Equivalent)". The guidance removes the requirement to categorize within the fair value hierarchy all investments for which fair value is measured using the NAV per share practical expedient. Sufficient information must be provided to permit reconciliation of the fair value of assets categorized within the fair value hierarchy to the amounts presented in the Statement of Assets and Liabilities. The guidance is required to be presented for annual periods beginning after December 15, 2015, and for interim periods within those fiscal years. Management is currently viewing the requirements and believes the adoption of this ASU will not have a material impact on its financial statements.
M) SUBSEQUENT EVENTS — In preparing the financial statements as of October 31, 2015, management considered the impact of subsequent events for potential recognition or disclosure in these financial statements through the date of release of this report. No such events requiring recognition or disclosure were identified through the date of the release of this report.
Note 3. Transactions with Affiliates and Related Parties
Credit Suisse serves as investment adviser for the Fund. For its investment advisory services, Credit Suisse is entitled to receive a fee from the Fund at an annual rate of 0.70% of the Fund's average daily net assets less than or equal to $100 million and 0.50% of the Fund's average daily net assets greater than $100 million. For the year ended October 31, 2015, investment advisory fees earned and voluntarily waived were $9,996,207 and $1,340,229, respectively. Fee waivers and expense reimbursements are voluntary and may be discontinued by Credit Suisse at any time.
Credit Suisse and SSB serve as co-administrators to the Fund. For its co-administrative services, Credit Suisse received a fee calculation at an annual rate of 0.09% of the Fund's average daily net assets. For the year ended October 31, 2015, co-administrative services fees earned by Credit Suisse were $1,763,317.
For its co-administrative services, SSB receives a fee, exclusive of out-of-pocket expenses, calculated in total for all the Credit Suisse funds/portfolios co-administered by SSB and allocated based upon the relative average net
44
Credit Suisse Floating Rate High Income Fund
Notes to Financial Statements (continued)
October 31, 2015
Note 3. Transactions with Affiliates and Related Parties (continued)
assets of each fund/portfolio, subject to an annual minimum fee. For the year ended October 31, 2015, co-administrative services fees earned by SSB (including out-of-pocket expenses) with respect to the Fund were $298,491.
Credit Suisse Securities (USA) LLC ("CSSU"), an affiliate of Credit Suisse, serves as the distributor of the Fund's shares. Pursuant to distribution plans adopted by the Fund pursuant to Rule 12b-1 under the 1940 Act, CSSU received fees for its distribution services. These fees were calculated at an annual rate of 0.25% of the average daily net assets of the Class A shares. For the Class B and Class C shares, the fee is calculated at an annual rate of 1.00% of the average daily net assets. For the year ended October 31, 2015, the Fund's paid Rule 12b-1 distribution fees of $811,648 for Class A shares, $26,254 for Class B Share and $1,491,370 for Class C shares. Class I shares are not subject to Rule 12b-1 distribution fees.
Certain brokers, dealers and financial representatives provide transfer agent related services to the Fund and receive compensation from the Fund. For the year ended October 31, 2015, the Fund paid $1,633,668, which is included within transfer agent fees on the Statement of Operations.
For the year ended October 31, 2015, CSSU and its affiliates advised the Fund that they retained $17,938 from commissions earned on the sale of the Fund's Class A shares. There were no commissions earned on sale of Class C shares.
Note 4. Line of Credit
The Fund, together with other funds/portfolios advised by Credit Suisse (collectively, the "Participating Funds"), participates in a committed, unsecured line of credit facility ("Credit Facility"), in an aggregated amount of $200 million for temporary or emergency purposes with SSB under a first-come, first-served basis. Under the terms of the Credit Facility, the Participating Funds pay an aggregate commitment fee on the average unused amount of the Credit Facility, which is allocated among the Participating Funds in such manner as is determined by the governing Boards of the Participating Funds. In addition, the Participating Funds pay interest on borrowings at either the Overnight Federal Funds rate or the Overnight LIBOR rate plus a spread. At October 31, 2015, the Fund had loans outstanding under the Credit Facility of $0. At
45
Credit Suisse Floating Rate High Income Fund
Notes to Financial Statements (continued)
October 31, 2015
Note 4. Line of Credit (continued)
October 31, 2015, and during the year ended October 31, 2015, the Fund had borrowings under the Credit Facility as follows:
Average Daily
Loan Balance | | Weighted Average
Interest Rate % | | Maximum Daily
Loan Outstanding | | Interest Expense | |
| $ | 225,745 | | | | 1.378 | % | | $ | 17,500,000 | | | $ | 3,154 | | |
Note 5. Purchases and Sales of Securities
For the year ended October 31, 2015, purchases and sales of investment securities (excluding short-term investments) were $1,408,400,435 and $872,384,210, respectively.
Note 6. Capital Share Transactions
The Fund is authorized to issue an unlimited number of full and fractional shares of beneficial interest, $.001 par value per share. The Fund offers Class I, Class A, and Class C shares. Class B shares are shown but not offered. Transactions in capital shares for each class of the Fund were as follows:
| | | Class I | |
| | | For the Year Ended
October 31, 2015 | | For the Year Ended
October 31, 2014 | |
| | | Shares | | Value | | Shares | | Value | |
Shares sold | | | 198,305,828 | | | $ | 1,347,449,562 | | | | 125,588,944 | | | $ | 872,476,682 | | |
Shares issued in reinvestment
of dividends and distributions | | | 7,651,192 | | | | 52,100,200 | | | | 5,958,795 | | | | 41,305,420 | | |
Shares redeemed | | | (79,192,865 | ) | | | (538,755,284 | ) | | | (61,807,152 | ) | | | (428,438,198 | ) | |
Net increase | | | 126,764,155 | | | $ | 860,794,478 | | | | 69,740,587 | | | $ | 485,343,904 | | |
| | | Class A | |
| | | For the Year Ended
October 31, 2015 | | For the Year Ended
October 31, 2014 | |
| | | Shares | | Value | | Shares | | Value | |
Shares sold | | | 27,898,729 | | | $ | 190,531,045 | | | | 34,647,617 | | | $ | 241,904,516 | | |
Shares issued in reinvestment
of dividends and distributions | | | 1,728,623 | | | | 11,837,787 | | | | 2,232,878 | | | | 15,565,228 | | |
Shares redeemed net of
redemption fees | | | (39,122,080 | ) | | | (268,403,501 | ) | | | (50,363,479 | ) | | | (350,986,465 | ) | |
Net decrease | | | (9,494,728 | ) | | $ | (66,034,669 | ) | | | (13,482,984 | ) | | $ | (93,516,721 | ) | |
46
Credit Suisse Floating Rate High Income Fund
Notes to Financial Statements (continued)
October 31, 2015
Note 6. Capital Share Transactions (continued)
| | | Class B | |
| | | For the Year Ended
October 31, 2015 | | For the Year Ended
October 31, 2014 | |
| | | Shares | | Value | | Shares | | Value | |
Shares sold | | | 1,381 | | | $ | 14,452 | | | | — | | | $ | — | | |
Shares issued in reinvestment
of dividends and distributions | | | 6,275 | | | | 43,099 | | | | 13,147 | | | | 92,023 | | |
Shares redeemed net of
redemption fees | | | (222,773 | ) | | | (1,531,386 | ) | | | (118,815 | ) | | | (830,010 | ) | |
Net decrease | | | (215,117 | ) | | $ | (1,473,835 | ) | | | (105,668 | ) | | $ | (737,987 | ) | |
| | | Class C | |
| | | For the Year Ended
October 31, 2015 | | For the Year Ended
October 31, 2014 | |
| | | Shares | | Value | | Shares | | Value | |
Shares sold | | | 3,224,432 | | | $ | 22,231,397 | | | | 7,657,514 | | | $ | 53,635,367 | | |
Shares issued in reinvestment
of dividends and distributions | | | 503,755 | | | | 3,457,878 | | | | 528,231 | | | | 3,691,123 | | |
Shares redeemed net of
redemption fees | | | (8,482,444 | ) | | | (58,207,979 | ) | | | (7,548,814 | ) | | | (52,713,051 | ) | |
Net increase (decrease) | | | (4,754,257 | ) | | $ | (32,518,704 | ) | | | 636,931 | | | $ | 4,613,439 | | |
On October 31, 2015, the number of shareholders that held 5% or more of the outstanding shares of each class of the Fund was as follows:
| | | Number of
Shareholders | | Approximate Percentage
of Outstanding Shares | |
Class I | | | 3 | | | | 35 | % | |
Class A | | | 4 | | | | 64 | % | |
Class B | | | 3 | | | | 56 | % | |
Class C | | | 4 | | | | 64 | % | |
Some of the shareholders are omnibus accounts, which hold shares on behalf of individual shareholders.
Note 7. Federal Income Taxes
Income and capital gain distributions are determined in accordance with federal income tax regulations, which may differ from GAAP.
The tax characteristics of dividends paid during the years ended October 31, 2015 and 2014, respectively, by the Fund were as follows:
| Ordinary Income | | Long-Term Capital Gain | | Return of Captial Gain | |
| 2015 | | 2014 | | 2015 | | 2014 | | 2015 | | 2014 | |
| $ | 81,410,649 | | | $ | 71,286,758 | | | $ | 921,341 | | | $ | 816,637 | | | $ | 497,136 | | | $ | — | | |
47
Credit Suisse Floating Rate High Income Fund
Notes to Financial Statements (continued)
October 31, 2015
Note 7. Federal Income Taxes (continued)
The tax basis components of distributable earnings differ from the amounts reflected in the Statement of Assets and Liabilities by temporary book/tax differences. These differences are primarily due to differing treatments of dividends payable, wash sales, forward contracts marked to market, partnership basis adjustments and income from defaulted bonds. At October 31, 2015, the components of distributable earnings on a tax basis were as follows:
Ordinary income distributions payable | | $ | (3,077,785 | ) | |
Accumulated realized loss | | | (1,162,821 | ) | |
Unrealized depreciation | | | (67,466,958 | ) | |
| | $ | (71,707,564 | ) | |
At October 31, 2015, the Fund had $1,162,821 of short-term capital loss carryforwards available to offset possible future capital gains, which will expire in 2016.
Included in the Fund's capital loss carryforward is $1,162,821, acquired in the Credit Suisse High Yield Fund merger, which is subject to IRS limitations. During the tax year ended October 31, 2015 the Fund utilized $1,162,821 of the capital loss carryforwards.
At October 31, 2015, the cost of investments (excluding foreign currency related transactions) and net unrealized appreciation (depreciation) for income tax purposes were as follows:
Cost of Investments | | $ | 2,821,422,603 | | |
Unrealized appreciation | | | 6,809,770 | | |
Unrealized depreciation | | | (74,085,717 | ) | |
Net unrealized appreciation (depreciation) | | $ | (67,275,947 | ) | |
At October 31, 2015, the Fund reclassified $(2,644,425) from accumulated net investment income and $3,807,319 from accumulated net realized loss to paid in capital, to adjust for current period permanent book/tax differences which arose principally from differing book/tax treatment of foreign currency gain (loss), defaulted bonds and partnership basis adjustments. Net assets were not affected by these reclassifications.
Note 8. Contingencies
In the normal course of business, the Fund may provide general indemnifications pursuant to certain contracts and organizational documents.
48
Credit Suisse Floating Rate High Income Fund
Notes to Financial Statements (continued)
October 31, 2015
Note 8. Contingencies (continued)
The Fund's maximum exposure under these arrangements is dependent on future claims that may be made against the Fund and, therefore, cannot be estimated; however, based on experience, the risk of loss from such claims is considered remote.
Note 9. Other Matters
On May 19, 2014, the U.S. Department of Justice (the "Department of Justice") filed a one-count criminal information (the "Information") in the District Court for the Eastern District of Virginia (the "District Court") charging Credit Suisse AG ("CSAG") with conspiracy to commit tax fraud related to accounts CSAG established for cross-border clients. The Department of Justice and CSAG entered into a plea agreement (the "Plea Agreement") settling the action pursuant to which CSAG pleaded guilty to the charge set out in the Information.
The Plea Agreement requires CSAG to pay over $1.8 billion to the U.S. government, including the U.S. Internal Revenue Service. The Plea Agreement also requires CSAG to lawfully undertake certain remedial actions to address the conduct described in the Plea Agreement.
CSAG has entered into other settlements relating to the conduct set out in the Plea Agreement. CSAG has entered into a Consent Order with the Federal Reserve Board (the "Federal Reserve") to resolve certain findings by the Federal Reserve, including that the activities of CSAG regarding opening of foreign accounts for U.S. taxpayers, provision of investment services to U.S. clients, and operation of CSAG's New York representative office prior to 2009 lacked adequate enterprise-wide risk management and compliance policies and procedures sufficient to ensure that all of its activities comply with U.S. laws and regulations. In addition, CSAG has entered into a Consent Order with the New York State Department of Financial Services (the "DFS") to resolve the DFS's investigation into the conduct described in the Plea Agreement. The settlement with the Federal Reserve requires CSAG to pay $100 million to the Federal Reserve, and the settlement with the DFS requires CSAG to pay $715 million to the DFS.
These settlements follow a settlement by Credit Suisse Group AG ("CS Group"), the parent company of CSAG, with the Securities and Exchange Commission (the "Commission") on February 21, 2014 to resolve an investigation by the Commission into solicitation and provision of broker-dealer and investment advisory services to certain U.S. cross-border clients by
49
Credit Suisse Floating Rate High Income Fund
Notes to Financial Statements (continued)
October 31, 2015
Note 9. Other Matters (continued)
CS Group while not registered with the Commission as a broker-dealer or investment adviser. As part of the settlement, CS Group retained an independent consultant to evaluate its policies and procedures and examine its broker-dealer and investment adviser activities to fully verify that the business that was the subject of the Commission investigation has been completely exited. CS Group also agreed to pay $196,511,014, which includes $82,170,990 in disgorgement, $64,340,024 in interest and a $50,000,000 penalty.
CSAG is the indirect parent company of Credit Suisse and CSSU. Neither Credit Suisse, CSSU nor the Fund was named in the Plea Agreement (as defined above) or other settlements relating to the conduct set out in the Plea Agreement. The conduct set out in the Plea Agreement did not involve the Fund, Credit Suisse or CSSU with respect to its investment adviser and distribution activities relating to the Fund.
Credit Suisse, CSSU and certain of their affiliates have received a permanent exemptive order from the Commission to permit them to continue serving as investment advisers and principal underwriters for U.S.-registered investment companies, such as the Fund. Due to a provision in the law governing the operation of U.S.-registered investment companies, they would otherwise have become ineligible to perform these activities as a result of the plea in the Plea Agreement. The permanent exemptive order permits Credit Suisse and CSSU to continue to provide services to the Fund, so long as, among other things, no current or former employee of CSAG or any affiliate of CSAG who previously has been or who subsequently may be identified by CSAG or any U.S. or non-U.S. regulatory or enforcement agencies as having been responsible for the conduct described in the Plea Agreement will be employed by Credit Suisse and certain of its affiliates. Credit Suisse and CSSU have informed the Fund that, Credit Suisse and CSSU believe the Settlements will not have any material impact on the Fund or on the ability of Credit Suisse or CSSU to perform services for the Fund.
On November 21, 2014, at the sentencing hearing, the District Court accepted and implemented the sentence as set out in the Plea Agreement. The District Court imposed no additional conditions beyond those contained in the Plea Agreement.
50
Credit Suisse Floating Rate High Income Fund
Report of Independent Registered Public Accounting Firm
The Board of Trustees and Shareholders
Credit Suisse Floating Rate High Income Fund:
We have audited the accompanying statement of assets and liabilities of Credit Suisse Floating Rate High Income Fund (the "Fund"), a series of the Credit Suisse Opportunity Funds, including the schedule of investments, as of October 31, 2015, and the related statements of operations, changes in net assets and financial highlights for the year then ended. These financial statements and financial highlights are the responsibility of the Fund's management. Our responsibility is to express an opinion on these financial statements and financial highlights based on our audit. The accompanying statement of changes in net assets of the Fund for the year ended October 31, 2014 and the financial highlights for each of the years in the four-year period ended October 31, 2014, were audited by other independent registered public accountants whose report thereon dated December 29, 2014, expressed an unqualified opinion on that financial statement and those financial highlights.
We conducted our audit in accordance with the standards of the Public Company Accounting Oversight Board (United States). Those standards require that we plan and perform the audit to obtain reasonable assurance about whether the financial statements and financial highlights are free of material misstatement. An audit includes examining, on a test basis, evidence supporting the amounts and disclosures in the financial statements. Our procedures included confirmation of securities owned as of October 31, 2015, by correspondence with the custodian and broker or by other appropriate auditing procedures. An audit also includes assessing the accounting principles used and significant estimates made by management, as well as evaluating the overall financial statement presentation. We believe that our audit provides a reasonable basis for our opinion.
In our opinion, the 2015 financial statements and financial highlights referred to above present fairly, in all material respects, the financial position of Credit Suisse Floating Rate High Income Fund as of October 31, 2015, the results of its operations, changes in its net assets and the financial highlights for the year then ended, in conformity with U.S. generally accepted accounting principles.

New York, New York
December 30, 2015
51
Credit Suisse Floating Rate High Income Fund
Information Concerning Trustees and Officers (unaudited)
Name, Address
(Year of Birth) | | Position(s)
Held with
Fund | | Term
of Office1
and
Length
of Time
Served | | Principal
Occupation(s) During
Past Five Years | | Number of
Portfolios
in Fund
Complex
Overseen
by Trustee | | Other
Trusteeships
Held by Trustee | |
Independent Trustees | | | | | | | | | | | |
Enrique Arzac
c/o Credit Suisse Asset
Management, LLC
Attn: General Counsel
One Madison Avenue
New York, New York
10010
(1941) | | Trustee, Audit Committee Chairman and Nominating Committee Member | | Since 2005 | | Professor of Finance and Economics, Graduate School of Business, Columbia University since 1971. | | | 14 | | | Director of Adams Diversified Equity Fund, Inc., Adams Natural Resources Fund, Inc., Aberdeen Chile Fund, Inc., Aberdeen Emerging Markets Smaller Company Opportunities Fund, Inc., Aberdeen Israel Fund, Inc., Aberdeen Indonesia Fund, Inc. and Aberdeen Latin America Equity Fund, Inc. (each a closed-end investment company); Director of Aberdeen Asia-Pacific Income Investment Company Limited (a Canadian closed-end fund); Trustee of Mirae Asset Discovery Funds (7 open-end portfolios); Director of Starcomms PLC (telecommunications company) from 2008 to 2011; Director of Epoch Holding Corporation (an investment management and investment advisory services company) from 2006 to March 2013 | |
1 Each Trustee and Officer serves until his or her respective successor has been duly elected and qualified.
52
Credit Suisse Floating Rate High Income Fund
Information Concerning Trustees and Officers (unaudited) (continued)
Name, Address
(Year of Birth) | | Position(s)
Held with
Fund | | Term
of Office1
and
Length
of Time
Served | | Principal
Occupation(s) During
Past Five Years | | Number of
Portfolios
in Fund
Complex
Overseen
by Trustee | | Other
Trusteeships
Held by Trustee | |
Independent Trustees | | | | | | | | | | | |
Jeffrey E. Garten
c/o Credit Suisse Asset
Management, LLC
Attn: General Counsel
One Madison Avenue
New York,
New York 10010
(1946) | | Trustee, Audit and Nominating Committee Member | | Since 2001 | | Dean Emeritus of Yale School of Management from July 2015 to present; The Juan Trippe Professor in the Practice of International Trade, Finance and Business from July 2005 to July 2015; Partner and Chairman of Garten Rothkopf (consulting firm) from October 2005 to present. | | | 11 | | | Director of Aetna, Inc. (insurance company); Director of CarMax Group (used car dealers); Director of Miller Buckfire & Co., LLC (financial restructuring); Member of Standard & Poor's Board of Managers (credit rating agency) from December 2011 to November 2014. | |
1 Each Trustee and Officer serves until his or her respective successor has been duly elected and qualified.
53
Credit Suisse Floating Rate High Income Fund
Information Concerning Trustees and Officers (unaudited) (continued)
Name, Address
(Year of Birth) | | Position(s)
Held with
Fund | | Term
of Office1
and
Length
of Time
Served | | Principal
Occupation(s) During
Past Five Years | | Number of
Portfolios
in Fund
Complex
Overseen
by Trustee | | Other
Trusteeships
Held by Trustee | |
Independent Trustees | | | | | | | | | | | |
Steven N. Rappaport
Lehigh Court, LLC
555 Madison Avenue
29th Floor
New York, New York
10022
(1948) | | Chairman of the Board of Trustees, Audit Committee Member and Nominating Committee Chairman | | Trustee since 2001 and Chairman since 2005 | | Partner of Lehigh Court, LLC and RZ Capital (private investment firms) from July 2002 to present; Partner of Backstage Acquisition Holding, LLC (Publication Job Postings) from November 2013 to present. | | | 14 | | | Director of iCAD, Inc. (surgical and medical instruments and apparatus company); Director of Aberdeen Chile Fund, Inc., Aberdeen Emerging Markets Smaller Company Opportunities Fund, Inc., Aberdeen Israel Fund, Inc., Aberdeen Indonesia Fund, Inc. and Aberdeen Latin America Equity Fund, Inc. (each a closed-end investment company); Director of Presstek, Inc. (digital imaging technologies company) from 2003 to 2012; Director of Wood Resources, LLC (plywood manufacturing company) from 2003 to October 2013. | |
1 Each Trustee and Officer serves until his or her respective successor has been duly elected and qualified.
54
Credit Suisse Floating Rate High Income Fund
Information Concerning Trustees and Officers (unaudited) (continued)
Name, Address
(Year of Birth) | | Position(s)
Held with
Fund | | Term
of Office1
and
Length
of Time
Served | | Principal Occupation(s) During Past Five Years | |
Officers* | | | | | | | |
John G. Popp
Credit Suisse Asset
Management, LLC
One Madison Avenue
New York, New York 10010
(1956) | | Chief Executive Officer and President | | Since 2010 | | Managing Director of Credit Suisse; Global Head and Chief Investment Officer of the Credit Investment Group; Associated with Credit Suisse or its predecessor since 1997; Officer of other Credit Suisse Funds; Trustee of Credit Suisse High Yield Bond Fund; Director of Credit Suisse Asset Management Income Fund, Inc.; Director of Credit Suisse Park View BDC, Inc. | |
Emidio Morizio
Credit Suisse Asset
Management, LLC
One Madison Avenue
New York, New York 10010
(1966) | | Chief Compliance Officer | | Since 2004 | | Managing Director and Global Head of Compliance of Credit Suisse since 2010; Associated with Credit Suisse since July 2000; Officer of other Credit Suisse Funds. | |
Lou Anne McInnis
Credit Suisse Asset Management, LLC
One Madison Avenue
New York, New York 10010
(1959) | | Chief Legal Officer | | Since 2015 | | Director of Credit Suisse; Associated with Credit Suisse since April 2015; Counsel at DLA Piper US LLP from 2011 to April 2015; Associated with Morgan Stanley Investment Management from 1997 to 2010; Officer of other Credit Suisse Funds. | |
Rocco DelGuercio
Credit Suisse Asset
Management, LLC
One Madison Avenue
New York, New York 10010
(1963) | | Chief Financial Officer and Treasurer | | Chief Financial Officer since 2015; Treasurer since 2013 | | Vice President of Credit Suisse since 2013; Independent Consultant from February 2012 to April 2013; Director of Legg Mason & Co., LLC from March 2004 to January 2012; Associated with Credit Suisse from June 1996 to March 2004; Officer of other Credit Suisse Funds. | |
Karen Regan
Credit Suisse Asset
Management, LLC
One Madison Avenue
New York, New York 10010
(1963) | | Vice President and Secretary | | Since 2010 | | Vice President of Credit Suisse; Associated with Credit Suisse since December 2004; Officer of other Credit Suisse Funds. | |
1 Each Trustee and Officer serves until his or her respective successor has been duly elected and qualified.
* The officers of the Fund shown are officers that make policy decisions.
The Statement of Additional Information includes additional information about the Trustees and is available, without charge, upon request, by calling 877-870-2874.
55
Credit Suisse Floating Rate High Income Fund
Proxy Voting and Portfolio Holdings Information (unaudited)
Information regarding how the Fund voted proxies related to its portfolio securities during the 12-month period ended June 30 of each year, as well as the policies and procedures that the Fund uses to determine how to vote proxies relating to its portfolio securities are available:
• By calling 1-877-870-2874
• On the Fund's website, www.credit-suisse.com/us/funds
• On the website of the Securities and Exchange Commission, www.sec.gov.
The Fund files a complete schedule of its portfolio holdings for the first and third quarters of its fiscal year with the SEC on Form N-Q. The Fund's Forms N-Q are available on the SEC's website at www.sec.gov and may be reviewed and copied at the SEC's Public Reference Room in Washington, DC. Information on the operation of the SEC's Public Reference Room may be obtained by calling 1-202-551-8090.
56

P.O. BOX 55030, BOSTON, MA 02205-5030
877-870-2874 n www.credit-suisse.com/us/funds
CREDIT SUISSE SECURITIES (USA) INC, DISTRIBUTOR. FLHI-AR-1015
Item 2. Code of Ethics.
The registrant has adopted a code of ethics applicable to its Chief Executive Officer, President, Chief Financial Officer and Chief Accounting Officer, or persons performing similar functions. A copy of the code is filed as Exhibit 12(a)(1) to this Form. There were no amendments to the code during the fiscal year ended October 31, 2015. There were no waivers or implicit waivers from the code granted by the registrant during the fiscal year ended October 31, 2015.
Item 3. Audit Committee Financial Expert.
The registrant’s governing board has determined that it has two audit committee financial experts serving on its audit committee: Enrique R. Arzac and Steven N. Rappaport. Each audit committee financial expert is “independent” for purposes of this item.
Item 4. Principal Accountant Fees and Services.
a) through (d). The information in the table below is provided for services rendered to the registrant showing the amount of fees billed to the registrant during the registrant’s last two fiscal years by KPMG LLP (“KPMG”), the registrant’s current independent registered public accounting firm, and PricewaterhouseCoopers LLP (“PwC”), the registrant’s former independent registered public accounting firm. The audit fees billed to the registrant for the fiscal year 2015 are the only fees that have been billed to the registrant by KPMG. All other fees listed in the tables below were billed to the registrant by PwC. For engagements with KPMG and PwC the Audit Committee approved in advance all audit services and non-audit services that KPMG and PwC provided to the registrant for its fiscal years ended October 31, 2014 and October 31, 2015.
| | 2014 | | 2015 | |
Audit Fees | | $ | 268,600 | | $ | 238,500 | |
Audit-Related Fees(1) | | $ | 15,500 | | $ | 28,000 | |
Tax Fees(2) | | $ | 27,200 | | $ | 28,550 | |
All Other Fees | | — | | — | |
Total | | $ | 311,300 | | $ | 295,050 | |
(1) Services include agreed-upon procedures in connection with the registrant’s semi-annual financial statements ($15,500 for 2014 and $28,000 for 2015).
(2) Tax services in connection with the registrant’s excise tax calculations and review of the registrant’s applicable tax returns.
The information in the table below is provided with respect to non-audit services that directly relate to the registrant’s operations and financial reporting and that were rendered by PwC for the fiscal year ended October 31, 2014 and by KPMG for the fiscal year ended October 31, 2015 to the registrant’s investment adviser, Credit Suisse Asset Management, LLC (“Credit Suisse”), and any service provider to the registrant controlling, controlled by or under common control with Credit Suisse that
2
provided ongoing services to the registrant (“Covered Services Provider”), for the registrant’s fiscal years ended October 31, 2014 and October 31, 2015.
| | 2014 | | 2015 | |
Audit-Related Fees | | N/A | | N/A | |
Tax Fees | | N/A | | N/A | |
All Other Fees | | N/A | | N/A | |
Total | | N/A | | N/A | |
(e)(1) Pre-Approval Policies and Procedures. The Audit Committee (“Committee”) of the registrant is responsible for pre-approving (i) all audit and permissible non-audit services to be provided by the independent registered public accounting firm to the registrant and (ii) all permissible non-audit services to be provided by the independent registered public accounting firm to Credit Suisse and any Covered Services Provider if the engagement relates directly to the operations and financial reporting of the registrant. The Committee may delegate its responsibility to pre-approve any such audit and permissible non-audit services to the Chairperson of the Committee, and the Chairperson shall report to the Committee, at its next regularly scheduled meeting after the Chairperson’s pre-approval of such services, his or her decision(s). The Committee may also establish detailed pre-approval policies and procedures for pre-approval of such services in accordance with applicable laws, including the delegation of some or all of the Committee’s pre-approval responsibilities to other persons (other than Credit Suisse or the registrant’s officers). Pre-approval by the Committee of any permissible non-audit services shall not be required so long as: (i) the aggregate amount of all such permissible non-audit services provided to the registrant, Credit Suisse and any Covered Services Provider constitutes not more than 5% of the total amount of revenues paid by the registrant to its independent registered public accounting firm during the fiscal year in which the permissible non-audit services are provided; (ii) the permissible non-audit services were not recognized by the registrant at the time of the engagement to be non-audit services; and (iii) such services are promptly brought to the attention of the Committee and approved by the Committee (or its delegate(s)) prior to the completion of the audit.
(e)(2) The information in the table below sets forth the percentages of fees for services (other than audit, review or attest services) rendered by PwC for the fiscal year ended October 31, 2014 and by KPMG for the fiscal year ended October 31, 2015 to the registrant for which the pre-approval requirement was waived pursuant to Rule 2-01(c)(7)(i)(C) of Regulation S-X:
| | 2014 | | 2015 | |
Audit-Related Fees | | N/A | | N/A | |
Tax Fees | | N/A | | N/A | |
All Other Fees | | N/A | | N/A | |
Total | | N/A | | N/A | |
3
The information in the table below sets forth the percentages of fees for services (other than audit, review or attest services) rendered by PwC for the fiscal year ended October 31, 2014 and by KPMG for the fiscal year ended October 31, 2015 to Credit Suisse and any Covered Services Provider required to be approved pursuant to Rule 2-01(c)(7)(ii) of Regulation S-X, for the registrant’s fiscal years ended October 31, 2014 and October 31, 2015:
| | 2014 | | 2015 | |
Audit-Related Fees | | N/A | | N/A | |
Tax Fees | | N/A | | N/A | |
All Other Fees | | N/A | | N/A | |
Total | | N/A | | N/A | |
(f) Not Applicable.
(g) The aggregate fees billed by PwC for the fiscal year ended October 31, 2014 and by KPMG for the fiscal year ended October 31, 2015 for non-audit services rendered to the registrant, Credit Suisse and Covered Service Providers for the fiscal years ended October 31, 2014 and October 31, 2015 were $0 and $0, respectively.
(h) Not Applicable.
Item 5. Audit Committee of Listed Registrants.
Form N-CSR disclosure requirement is not applicable to the registrant.
Item 6. Schedule of Investments.
Included as part of the report to shareholders filed under Item 1 of this Form.
4
Item 7. Disclosure of Proxy Voting Policies and Procedures for Closed-End Management Investment Companies.
Form N-CSR disclosure requirement is not applicable to the registrant.
Item 8. Portfolio Managers of Closed-End Management Investment Companies.
Form N-CSR disclosure requirement is not applicable to the registrant.
Item 9. Purchases of Equity Securities by Closed-End Management Investment Company and Affiliated Purchasers.
Form N-CSR disclosure requirement is not applicable to the registrant.
Item 10. Submission of Matters to a Vote of Security Holders.
None.
Item 11. Controls and Procedures.
(a) As of a date within 90 days from the filing date of this report, the principal executive officer and principal financial officer concluded that the registrant’s disclosure controls and procedures (as defined in Rule 30a-3(c) under the Investment Company Act of 1940 (the “Act”)) were effective based on their evaluation of the disclosure controls and procedures required by Rule 30a-3(b) under the Act and Rules 13a-15(b) or 15d-15(b) under the Securities Exchange Act of 1934.
(b) There were no changes in registrant’s internal control over financial reporting (as defined in Rule 30a-3(d) under the Act) that occurred during the second fiscal quarter of the period covered by this report that have materially affected, or are reasonably likely to materially affect, the registrant’s internal control over financial reporting.
Item 12. Exhibits.
(a)(1) Registrant’s Code of Ethics is an exhibit to this report.
(a)(2) The certifications of the registrant as required by Rule 30a-2(a) under the Act are exhibits to this report.
(a)(3) Not applicable.
(b) The certifications of the registrant as required by Rule 30a-2(b) under the Act are an exhibit to this report.
5
(other) Iran related activities disclosure requirement.
6
SIGNATURES
Pursuant to the requirements of the Securities Exchange Act of 1934 and the Investment Company Act of 1940, the registrant has duly caused this report to be signed on its behalf by the undersigned, thereunto duly authorized.
CREDIT SUISSE OPPORTUNITY FUNDS | |
| |
/s/ John G. Popp | |
Name: | John G. Popp | |
Title: | Chief Executive Officer and President | |
Date: | January 6, 2016 | |
Pursuant to the requirements of the Securities Exchange Act of 1934 and the Investment Company Act of 1940, this report has been signed below by the following persons on behalf of the registrant and in the capacities and on the dates indicated.
/s/ John G. Popp | |
Name: | John G. Popp | |
Title: | Chief Executive Officer and President | |
Date: | January 6, 2016 | |
| |
/s/ Rocco DelGuercio | |
Name: | Rocco DelGuercio | |
Title: | Chief Financial Officer and Treasurer | |
Date: | January 6, 2016 | |
7