UNITED STATES
SECURITIES AND EXCHANGE COMMISSION
Washington, D.C. 20549
FORM N-CSR
CERTIFIED SHAREHOLDER REPORT OF REGISTERED
MANAGEMENT INVESTMENT COMPANIES
Investment Company Act file number | 811-09054 |
|
CREDIT SUISSE OPPORTUNITY FUNDS |
(Exact name of registrant as specified in charter) |
|
One Madison Avenue, New York, New York | | 10010 |
(Address of principal executive offices) | | (Zip code) |
|
John G. Popp Credit Suisse Opportunity Funds One Madison Avenue New York, New York 10010 |
(Name and address of agent for service) |
|
Registrant’s telephone number, including area code: | (212) 325-2000 | |
|
Date of fiscal year end: | October 31st | |
|
Date of reporting period: | November 1, 2015 to October 31, 2016 | |
| | | | | | | | | |
Item 1. Reports to Stockholders.

CREDIT SUISSE FUNDS
Annual Report
October 31, 2016
n CREDIT SUISSE
MANAGED FUTURES STRATEGY FUND
The Fund's investment objectives, risks, charges and expenses (which should be considered carefully before investing), and more complete information about the Fund, are provided in the Prospectus, which should be read carefully before investing. You may obtain additional copies by calling 877-870-2874 or visiting our website at www.credit-suisse.com/us/funds.
Credit Suisse Securities (USA) LLC, Distributor, is located at One Madison Avenue, New York, NY 10010. Credit Suisse Funds are advised by Credit Suisse Asset Management, LLC.
Investors in the Credit Suisse Funds should be aware that they may be eligible to purchase Class I shares (where offered) directly or through certain intermediaries. Such shares are not subject to a sales charge. Investors in the Credit Suisse Funds should also be aware that they may be eligible for a reduction or waiver of the sales charge with respect to Class A or C shares (where offered). For more information, please review the relevant prospectuses or consult your financial representative.
Fund shares are not deposits or other obligations of Credit Suisse Asset Management, LLC ("Credit Suisse") or any affiliate, are not FDIC-insured and are not guaranteed by Credit Suisse or any affiliate. Fund investments are subject to investment risks, including loss of your investment.
Credit Suisse Managed Futures Strategy Fund
Annual Investment Adviser's Report
October 31, 2016 (unaudited)
November 25, 2016
Dear Shareholder:
We are pleased to present this Annual Report covering the activities of the Credit Suisse Managed Futures Fund (the "Fund") for the twelve months ended October 31, 2016.
Performance Summary
11/1/2015 – 10/31/16
Fund & Benchmark | | Performance | |
| Class I1 | | | 3.12 | % | |
| Class A1,2 | | | 2.87 | % | |
| Class C1,2 | | | 2.13 | % | |
| Credit Suisse Managed Futures Liquid Index3 | | | 3.43 | % | |
Performance shown for the Fund's Class A and Class C Shares does not reflect sales charges, which are a maximum of 5.25% and 1.00%, respectively.2
Market Review: A challenging period
The annual period ended October 31, 2016 was a challenging one for managed futures, with the asset class generally providing negative returns. The Credit Suisse Managed Futures Hedge Fund Index, for example, was down 4.00% for the period. However, the Credit Suisse Managed Futures Liquid Index, the Fund's benchmark, delivered a positive return of 3.43%, as it was able to perform positively despite market reversals.
Within the hedge fund universe, trend-following strategies, such as managed futures, experienced losses overall, as they were generally hurt by trend reversals in several markets, including commodities, fixed income and currencies.
Strategic Review: Continued diversification benefits
For the twelve-month period ended October 31, 2016, the Fund (Class I shares) underperformed the benchmark. Fixed income contributed the most to performance — particularly due to 10-year UK and 10-year German Bonds. Currencies also contributed positively to performance, mainly due to profits from the Japanese Yen and British Pound versus U.S. Dollar positions. Equity positions added to Fund performance as well, with Asian equity gains offsetting the losses from U.S. large-cap equities. Commodities, however, detracted from performance.
In general, the managed futures strategy is designed to profit from both upward and downward trending markets across several asset classes, including commodities, bonds, equities and currencies.
1
Credit Suisse Managed Futures Strategy Fund
Annual Investment Adviser's Report (continued)
October 31, 2016 (unaudited)
We continue to believe that the unique return profile of managed futures may appeal to investors searching for meaningful portfolio diversifiers that can help mitigate risk and provide uncorrelated returns.
The Quantitative Investment Strategies Group
Yung-Shin Kung
Sheel Dhande
The Fund is non-diversified, which means it may invest a greater proportion of its assets in the securities of a smaller number of issuers than a diversified mutual fund and may therefore be subject to greater volatility. The Fund's investment in alternative instruments may subject the Fund to greater volatility than investment in traditional securities, particularly in investments involving leverage.
The use of alternative assets and strategies entails substantial risks, including risk of loss of principal, commodity exposure risks, credit risk, currency risk, derivatives risk, equity exposure risk, exchange-traded notes risk, fixed income risk, foreign securities risk, forwards risk, futures contracts risk, interest rate risk, leveraging risk, market risk, non-diversified status, options risk, portfolio turnover risk, repurchase agreements risk, short position risk, speculative exposure risk, structured note risk, subsidiary risk, swap agreements risk, tax risk and U.S. government securities risk. For a detailed discussion of these and other risks, please refer to the Fund's Prospectus, which should be read carefully before investing.
In addition to historical information, this report contains forward-looking statements, which may concern, among other things, domestic and foreign markets, industry and economic trends and developments and government regulation and their potential impact on the Fund's investments. These statements are subject to risks and uncertainties and actual trends, developments and regulations in the future, and their impact on the Fund, could be materially different from those projected, anticipated or implied. The Fund has no obligation to update or revise forward-looking statements.
The views of the Fund's management are as of the date of this letter and the Fund holdings described in this document are as of October 31, 2016; these views and Fund holdings may have changed subsequent to these dates. Nothing in this document is a recommendation to purchase or sell securities.
2
Credit Suisse Managed Futures Strategy Fund
Annual Investment Adviser's Report (continued)
October 31, 2016 (unaudited)
Comparison of Change in Value of $10,000 Investment in the
Credit Suisse Managed Futures Strategy Fund1 Class I Shares,
Class A Shares2, Class C Shares2 and Credit Suisse Managed Futures
Liquid Index3 from Inception (9/28/12)

1 Fee waivers and/or expense reimbursements may reduce expenses for the Fund, without which performance would be lower. The Fund entered into a written contract to limit expenses to 1.30% of the Fund's average daily net assets for Class I shares, 1.55% of the Fund's average daily net assets for Class A shares and 2.30% of the Fund's average daily net assets for Class C shares through at least February 28, 2018. This limit excludes certain expenses, as set forth in the Fund's Prospectus.
2 Total return for the Fund's Class A shares for the reporting period, based on offering price (including maximum sales charge of 5.25%), was (2.57)%. Total return for the Fund's Class C shares for the reporting period, based on redemption value (including maximum CDSC of 1.00%), was 1.18%.
3 The Credit Suisse Managed Futures Liquid Index (the "Index") is currently composed of 14 futures contracts and 4 commodity indices which provide exposure to the asset classes. The Index uses a proprietary quantitative methodology to seek to identify price trends in each of the asset classes over a variety of time horizons. Components of the Index, which may change from time to time, are positioned either long or short based on the price trends within the asset classes determined using the Index's quantitative methodology. The Index does not have transaction costs and investors may not invest directly in the Index.
3
Credit Suisse Managed Futures Strategy Fund
Annual Investment Adviser's Report (continued)
October 31, 2016 (unaudited)
Average Annual Returns as of October 31, 20161
| | | 1 Year | | Since
Inception2 | |
Class I | | | 3.12 | % | | | 6.58 | % | |
Class A Without Sales Charge | | | 2.87 | % | | | 6.33 | % | |
Class A With Maximum Sales Charge | | | (2.57 | )% | | | 4.94 | % | |
Class C Without CDSC | | | 2.13 | % | | | 5.51 | % | |
Class C With CDSC | | | 1.18 | % | | | 5.51 | % | |
Returns represent past performance and include change in share price and reinvestment of dividends and capital gain distributions. Past performance cannot guarantee future results. The current performance of the Fund may be lower or higher than the figures shown. Returns and share price will fluctuate, and redemption value may be more or less than original cost. The performance results do not reflect the deduction of taxes that a shareholder would pay on Fund distributions or the redemption of Fund shares. Performance information current to the most recent month end is available at www.credit-suisse.com/us/funds.
The annual gross expense ratios are 1.35% for Class I shares, 1.60% for Class A shares and 2.35% for Class C shares. The annualized net expense ratios after fee waivers and/or expense reimbursements excluding interest expense are 1.30% for Class I shares, 1.55% for Class A shares and 2.30% for Class C shares.
1 Fee waivers and/or expense reimbursements may reduce expenses for the Fund, without which performance would be lower. The Fund has entered into a written contract to limit expenses to 1.30% of the Fund's average daily net assets for Class I shares, 1.55% of the Fund's average daily net assets for Class A shares and 2.30% of the Fund's average daily net assets for Class C shares through at least February 28, 2018. This limit excludes certain expenses, as set forth in the Fund's Prospectus.
2 Inception Date September 28, 2012.
4
Credit Suisse Managed Futures Strategy Fund
Annual Investment Adviser's Report (continued)
October 31, 2016 (unaudited)
Information About Your Fund's Expenses
As an investor of the Fund, you incur two types of costs: ongoing expenses and transaction costs. Ongoing expenses include management fees, distribution and service (12b-1) fees and other Fund expenses. Examples of transaction costs include sales charges (loads), redemption fees and account maintenance fees, which are not shown in this section and which would result in higher total expenses. The following table is intended to help you understand your ongoing expenses of investing in the Fund and to help you compare these expenses with the ongoing expenses of investing in other mutual funds. The table is based on an investment of $1,000 made at the beginning of the six months ended October 31, 2016.
The table illustrates your Fund's expenses in two ways:
• Actual Fund Return. This helps you estimate the actual dollar amount of ongoing expenses paid on a $1,000 investment in the Fund using the Fund's actual return during the period. To estimate the expenses you paid over the period, simply divide your account value by $1,000 (for example, an $8,600 account value divided by $1,000 = 8.6), then multiply the result by the number in the "Expenses Paid per $1,000" line.
• Hypothetical 5% Fund Return. This helps you to compare the Fund's ongoing expenses with those of other mutual funds using the Fund's actual expense ratio and a hypothetical rate of return of 5% per year before expenses. Examples using a 5% hypothetical fund return may be found in the shareholder reports of other mutual funds. The hypothetical account values and expenses may not be used to estimate the actual ending account balance or expenses you paid for the period.
Please note that the expenses shown in these tables are meant to highlight your ongoing expenses only and do not reflect any transaction costs, such as sales charges (loads) or redemption fees. If these transaction costs had been included, your costs would have been higher. The "Expenses Paid per $1,000" line of the tables is useful in comparing ongoing expenses only and will not help you determine the relative total expenses of owning different funds.
5
Credit Suisse Managed Futures Strategy Fund
Annual Investment Adviser's Report (continued)
October 31, 2016 (unaudited)
Expenses and Value for a $1,000 Investment
for the six-month period ended October 31, 2016
Actual Fund Return | | Class I | | Class A | | Class C | |
Beginning Account Value 05/01/16 | | $ | 1,000.00 | | | $ | 1,000.00 | | | $ | 1,000.00 | | |
Ending Account Value 10/31/16 | | $ | 966.40 | | | $ | 965.40 | | | $ | 961.90 | | |
Expenses Paid per $1,000* | | $ | 6.43 | | | $ | 7.66 | | | $ | 11.34 | | |
Hypothetical 5% Fund Return | |
Beginning Account Value 05/01/16 | | $ | 1,000.00 | | | $ | 1,000.00 | | | $ | 1,000.00 | | |
Ending Account Value 10/31/16 | | $ | 1,018.60 | | | $ | 1,017.34 | | | $ | 1,013.57 | | |
Expenses Paid per $1,000* | | $ | 6.60 | | | $ | 7.86 | | | $ | 11.64 | | |
| | | Class I | | Class A | | Class C | |
Annualized Expense Ratios* | | | 1.30 | % | | | 1.55 | % | | | 2.30 | % | |
* Expenses are equal to the Fund's annualized expense ratio for each share class, multiplied by the average account value over the period, multiplied by 184/366 to reflect the one-half year period.
The "Expenses Paid per $1,000" and the "Annualized Expense Ratios" in the tables are based on actual expenses paid by the Fund during the period, net of fee waivers and/or actual expense reimbursements, if applicable. If those fee waivers and/or expense reimbursements had not been in effect, the Fund's actual expenses would have been higher. Expenses do not reflect additional charges and expenses that are, or may be, imposed under the variable contracts or plans. Such charges and expenses are described in the prospectus of the insurance company separate account or in the plan documents or other informational materials supplied by plan sponsors. The Fund's expenses should be considered with these charges and expenses in evaluating the overall cost of investing in the separate account.
For more information, please refer to the Fund's Prospectus.
Portfolio Breakdown*
Short-term Investment1 | | | 100.00 | % | |
Total | | | 100.00 | % | |
* Expressed as a percentage of total investments (excluding securities lending collateral, if applicable) and may vary over time.
1 Primarily reflects cash invested in State Street Bank and Trust Co. Euro Time Deposit, for which the purchases of securities have been executed but not yet settled at October 31, 2016, if applicable.
6
Credit Suisse Managed Futures Strategy Fund
Consolidated Schedule of Investments
October 31, 2016
Par
(000) | | | | | | Maturity | | Rate% | | Value | |
| SHORT-TERM INVESTMENT (87.3%) | |
$ | 147,846 | | | State Street Bank and Trust Co. Euro Time Deposit
(Cost $147,845,751) | | | | 11/01/16 | | | 0.010 | | | $ | 147,845,751 | | |
| TOTAL INVESTMENTS AT VALUE (87.3%) (Cost $147,845,751) | | | 147,845,751 | | |
| OTHER ASSETS IN EXCESS OF LIABILITIES (12.7%) | | | 21,478,166 | | |
| NET ASSETS (100.0%) | | $ | 169,323,917 | | |
Futures Contracts
Contract Description | | Currency | | Expiration
Date | | Number of
Contracts | | Notional
Value | | Net Unrealized
Appreciation
(Depreciation) | |
Contracts to Purchase | |
Foreign Exchange Contracts | |
| AUD Currency Futures | | USD | | | | Dec 2016 | | | 316 | | | $ | 23,990,720 | | | $ | 234,328 | | |
| JPY Currency Futures | | USD | | | | Dec 2016 | | | 85 | | | | 10,142,094 | | | | (239,731 | ) | |
| | | $ | (5,403 | ) | |
Index Contracts | |
EURO Stoxx 50 Index Futures | | EUR | | | | Dec 2016 | | | 463 | | | | 15,495,219 | | | $ | 58,891 | | |
FTSE 100 Index Futures | | GBP | | | | Dec 2016 | | | 196 | | | | 16,580,846 | | | | 679,126 | | |
Hang Seng Index Futures | | HKD | | | | Nov 2016 | | | 118 | | | | 17,426,449 | | | | (524,859 | ) | |
Nikkei 225 Index Futures OSE | | JPY | | | | Dec 2016 | | | 65 | | | | 10,787,458 | | | | 140,678 | | |
S&P 500 E Mini Index Futures | | USD | | | | Dec 2016 | | | 106 | | | | 11,236,530 | | | | (149,350 | ) | |
| | | $ | 204,486 | | |
Interest Rate Contracts | |
German EURO Bund Futures | | EUR | | | | Dec 2016 | | | 12 | | | | 2,133,249 | | | $ | (52,535 | ) | |
Long Gilt Futures | | GBP | | | | Dec 2016 | | | 20 | | | | 3,060,552 | | | | (143,430 | ) | |
| | | $ | (195,965 | ) | |
Contracts to Sell | |
Foreign Exchange Contracts | |
| CAD Currency Futures | | USD | | | | Dec 2016 | | | (451 | ) | | | (33,610,775 | ) | | $ | 133,897 | | |
| EUR Currency Futures | | USD | | | | Dec 2016 | | | (326 | ) | | | (44,772,025 | ) | | | 337,538 | | |
| GBP Currency Futures | | USD | | | | Dec 2016 | | | (195 | ) | | | (14,934,562 | ) | | | 1,074,259 | | |
| | | $ | 1,545,694 | | |
Interest Rate Contracts | |
10YR JGB Mini Futures | | JPY | | | | Dec 2016 | | | (102 | ) | | | (14,723,681 | ) | | $ | 12,693 | | |
10YR U.S. Treasury Note Futures | | USD | | | | Dec 2016 | | | (90 | ) | | | (11,666,250 | ) | | | (1,661 | ) | |
| | | $ | 11,032 | | |
Net unrealized appreciation (depreciation) | | $ | 1,559,844 | | |
See Accompanying Notes to Consolidated Financial Statements.
7
Credit Suisse Managed Futures Strategy Fund
Consolidated Schedule of Investments (continued)
October 31, 2016
Total Return Swap Contracts
Currency | | Notional
Amount | | Expiration
Date | | Counterparty | | Receive | | Pay | | Net Unrealized
Appreciation
(Depreciation) | |
USD | | | | $ | 3,168,544 | | |
11/16/16 | |
Goldman Sachs | | Bloomberg Agriculture
Index | |
Fixed Rate | | $ | 485 | | |
USD | | | | | 6,205,666 | | | 11/16/16 | | Goldman Sachs | | Bloomberg Industrial
Metals Index | | Fixed Rate | | | 0 | | |
USD | | | | | 8,073,133 | | | 11/16/16 | | Goldman Sachs | | Bloomberg Energy
Index | | Fixed Rate | | | (667,762 | ) | |
USD | | | | | 9,688,139 | | | 11/16/16 | | Goldman Sachs | | Bloomberg Industrial
Metals Index | | Fixed Rate | | | 479,165 | | |
USD | | | | | 1,051,815 | | | 11/16/16 | | Goldman Sachs | | Bloomberg Precious
Metals Index | | Fixed Rate | | | (8,762 | ) | |
USD | | | | | 4,478,765 | | | 11/16/16 | | Goldman Sachs | | Bloomberg Agriculture
Index | | Fixed Rate | | | (21,928 | ) | |
USD | | | | | 2,480,888 | | | 11/16/16 | | Goldman Sachs | | Bloomberg Agriculture
Index | | Fixed Rate | | | 9,883 | | |
USD | | | | | 2,170,469 | | | 11/16/16 | | Goldman Sachs | | Bloomberg Agriculture
Index | | Fixed Rate | | | 1,774 | | |
USD | | | | | 2,110,191 | | | 11/16/16 | | Goldman Sachs | | Bloomberg Agriculture
Index | | Fixed Rate | | | (2,903 | ) | |
USD | | | | | 2,742,324 | | | 11/16/16 | | Goldman Sachs | | Bloomberg Agriculture
Index | | Fixed Rate | | | (15,427 | ) | |
USD | | | | | 2,308,520 | | | 11/16/16 | | Goldman Sachs | | Bloomberg Agriculture
Index | | Fixed Rate | | | 0 | | |
| | | $ | (225,475 | ) | |
Currency Abbreviations:
AUD = Australian Dollar
CAD = Canadian Dollar
EUR = Euro
GBP = British Pound
HKD = Hong Kong Dollar
JPY = Japanese Yen
USD = United States Dollar
See Accompanying Notes to Consolidated Financial Statements.
8
Credit Suisse Managed Futures Strategy Fund
Consolidated Statement of Assets and Liabilities
October 31, 2016
Assets | |
Investments at value (Cost $147,845,751) (Note 2) | | $ | 147,845,751 | | |
Cash | | | 100,000 | | |
Foreign currency at value (Cost $91) | | | 89 | | |
Cash segregated at brokers for futures and swap contracts (Note 2) | | | 9,373,357 | | |
Variation margin receivable on futures contracts (Note 2) | | | 7,914,234 | | |
Receivable for Fund shares sold | | | 4,713,775 | | |
Unrealized appreciation on open swap contracts (Note 2) | | | 491,307 | | |
Interest receivable | | | 41 | | |
Prepaid expenses and other assets | | | 38,027 | | |
Total assets | | | 170,476,581 | | |
Liabilities | |
Investment advisory fee payable (Note 3) | | | 124,908 | | |
Administrative services fee payable (Note 3) | | | 18,249 | | |
Shareholder servicing/Distribution fee payable (Note 3) | | | 11,156 | | |
Unrealized depreciation on open swap contracts (Note 2) | | | 716,782 | | |
Net payable for terminated total return swap contracts | | | 100,633 | | |
Payable for Fund shares redeemed | | | 82,125 | | |
Trustees' fee payable | | | 8,299 | | |
Accrued expenses | | | 90,512 | | |
Total liabilities | | | 1,152,664 | | |
Net Assets | |
Capital stock, $.001 par value (Note 6) | | | 15,513 | | |
Paid-in capital (Note 6) | | | 165,334,451 | | |
Distributions in excess of net investment income | | | (39,097 | ) | |
Accumulated net realized gain from futures contracts, swap contracts and foreign
currency transactions | | | 2,716,039 | | |
Net unrealized appreciation from futures contracts, swap contracts and foreign
currency translations | | | 1,297,011 | | |
Net assets | | $ | 169,323,917 | | |
I Shares | |
Net assets | | $ | 127,597,084 | | |
Shares outstanding | | | 11,668,467 | | |
Net asset value, offering price and redemption price per share | | $ | 10.94 | | |
A Shares | |
Net assets | | $ | 38,060,299 | | |
Shares outstanding | | | 3,499,109 | | |
Net asset value and redemption price per share | | $ | 10.88 | | |
Maximum offering price per share (net asset value/(1-5.25%)) | | $ | 11.48 | | |
C Shares | |
Net assets | | $ | 3,666,534 | | |
Shares outstanding | | | 345,908 | | |
Net asset value and offering price per share | | $ | 10.60 | | |
See Accompanying Notes to Consolidated Financial Statements.
9
Credit Suisse Managed Futures Strategy Fund
Consolidated Statement of Operations
For the Year Ended October 31, 2016
Investment Income | |
Interest | | $ | 10,249 | | |
Total investment income | | | 10,249 | | |
Expenses | |
Investment advisory fees (Note 3) | | | 1,250,467 | | |
Administrative services fees (Note 3) | | | 138,627 | | |
Shareholder servicing/Distribution fees (Note 3) | |
Class A | | | 77,706 | | |
Class C | | | 30,265 | | |
Transfer agent fees (Note 3) | | | 102,599 | | |
Registration fees | | | 66,237 | | |
Custodian fees | | | 58,721 | | |
Audit and tax fees | | | 51,369 | | |
Trustees' fees | | | 30,430 | | |
Legal fees | | | 28,649 | | |
Printing fees | | | 25,200 | | |
Commitment fees (Note 4) | | | 11,966 | | |
Insurance expense | | | 2,464 | | |
Miscellaneous expense | | | 6,896 | | |
Total expenses | | | 1,881,596 | | |
Less: fees waived (Note 3) | | | (61,431 | ) | |
Net expenses | | | 1,820,165 | | |
Net investment loss | | | (1,809,916 | ) | |
Net Realized and Unrealized Gain (Loss) from Futures Contracts, Swap Contracts and Foreign
Currency Related Items | |
Net realized gain from futures contracts | | | 4,040,693 | | |
Net realized loss from swap contracts | | | (1,555,829 | ) | |
Net realized gain from foreign currency transactions | | | 63,565 | | |
Net change in unrealized appreciation (depreciation) from futures contracts | | | 1,954,245 | | |
Net change in unrealized appreciation (depreciation) from swap contracts | | | (545,258 | ) | |
Net change in unrealized appreciation (depreciation) from foreign currency translations | | | (36,327 | ) | |
Net realized and unrealized gain from futures contracts, swap contracts and foreign
currency related items | | | 3,921,089 | | |
Net increase in net assets resulting from operations | | $ | 2,111,173 | | |
See Accompanying Notes to Consolidated Financial Statements.
10
Credit Suisse Managed Futures Strategy Fund
Consolidated Statement of Changes in Net Assets
| | | For the Year
Ended
October 31, 2016 | | For the Year
Ended
October 31, 2015 | |
From Operations | |
Net investment loss | | $ | (1,809,916 | ) | | $ | (1,319,935 | ) | |
Net realized gain from futures contracts, swap contracts and foreign currency
transactions | | | 2,548,429 | | | | 13,147,646 | | |
Net change in unrealized appreciation (depreciation) from futures contracts,
swap contracts and foreign currency translations | | | 1,372,660 | | | | (4,152,375 | ) | |
Net increase in net assets resulting from operations | | | 2,111,173 | | | | 7,675,336 | | |
From Dividends and Distributions | |
Dividends from net investment income | |
Class I | | | (4,138,919 | ) | | | (255,480 | ) | |
Class A | | | (968,769 | ) | | | (1,885 | ) | |
Class C | | | (95,991 | ) | | | — | | |
Distributions from net realized gains | |
Class I | | | (2,575,914 | ) | | | (4,063,363 | ) | |
Class A | | | (769,312 | ) | | | (196,884 | ) | |
Class C | | | (89,902 | ) | | | (79,245 | ) | |
Net decrease in net assets resulting from dividends and distributions | | | (8,638,807 | ) | | | (4,596,857 | ) | |
| From Capital Share Transactions (Note 6) | |
Proceeds from sale of shares | | | 136,041,437 | | | | 59,613,706 | | |
Reinvestment of dividends and distributions | | | 7,665,777 | | | | 4,589,750 | | |
Net asset value of shares redeemed | | | (63,581,477 | ) | | | (45,598,354 | ) | |
Net increase in net assets from capital share transactions | | | 80,125,737 | | | | 18,605,102 | | |
Net increase in net assets | | | 73,598,103 | | | | 21,683,581 | | |
Net Assets | |
Beginning of year | | | 95,725,814 | | | | 74,042,233 | | |
End of year | | $ | 169,323,917 | | | $ | 95,725,814 | | |
Distributions in excess of net investment income and Undistributed net
investment income | | $ | (39,097 | ) | | $ | 5,161,004 | | |
See Accompanying Notes to Consolidated Financial Statements.
11
Credit Suisse Managed Futures Strategy Fund
Consolidated Financial Highlights
(For a Class I Share of the Fund Outstanding Throughout Each Period)
| | | For the Year Ended October 31, | |
| | | 2016 | | 2015 | | 2014 | | 2013 | | 20121 | |
Per share data | |
Net asset value, beginning of period | | $ | 11.53 | | | $ | 10.852 | | | $ | 10.36 | | | $ | 9.76 | | | $ | 10.00 | | |
INVESTMENT OPERATIONS | |
Net investment loss3 | | | (0.15 | ) | | | (0.16 | ) | | | (0.17 | ) | | | (0.17 | ) | | | (0.01 | ) | |
Net gain (loss) from futures contracts, swap contracts
and foreign currency related items (both realized
and unrealized) | | | 0.49 | | | | 1.51 | | | | 0.95 | | | | 0.77 | | | | (0.23 | ) | |
Total from investment operations | | | 0.34 | | | | 1.35 | | | | 0.78 | | | | 0.60 | | | | (0.24 | ) | |
REDEMPTION FEES | | | — | | | | — | | | | 0.004 | | | | 0.004 | | | | — | | |
LESS DIVIDENDS AND DISTRIBUTIONS | |
Dividends from net investment income | | | (0.52 | ) | | | (0.04 | ) | | | — | | | | — | | | | — | | |
Distributions from net realized gains | | | (0.41 | ) | | | (0.63 | ) | | | (0.29 | ) | | | — | | | | — | | |
Total dividends and distributions | | | (0.93 | ) | | | (0.67 | ) | | | (0.29 | ) | | | — | | | | — | | |
Net asset value, end of period | | $ | 10.94 | | | $ | 11.53 | | | $ | 10.852 | | | $ | 10.36 | | | $ | 9.76 | | |
Total return5 | | | 3.12 | % | | | 12.88 | % | | | 7.73 | % | | | 6.15 | % | | | (2.40 | )% | |
RATIOS AND SUPPLEMENTAL DATA | |
Net assets, end of period (000s omitted) | | $ | 127,597 | | | $ | 72,606 | | | $ | 69,190 | | | $ | 26,794 | | | $ | 21,768 | | |
Ratio of net expenses to average net assets | | | 1.30 | % | | | 1.32 | % | | | 1.71 | % | | | 1.70 | % | | | 1.70 | %6 | |
Ratio of net investment loss to average net assets | | | (1.29 | )% | | | (1.31 | )% | | | (1.68 | )% | | | (1.64 | )% | | | (1.69 | )%6 | |
Decrease reflected in above operating expense
ratios due to waivers/reimbursements | | | 0.05 | % | | | 0.15 | % | | | 0.10 | % | | | 1.10 | % | | | 3.01 | %6 | |
Portfolio turnover rate | | | — | | | | — | | | | — | | | | — | | | | — | | |
1 For the period September 28, 2012 (Inception Date) through October 31, 2012.
2 Includes adjustments in accordance with accounting principles generally accepted in the United States of America and as such, the net asset values for financial reporting purposes and the returns based upon net asset values may differ from the net asset values and returns for shareholder transactions.
3 Per share information is calculated using the average shares outstanding method.
4 This amount represents less than $0.01 per share.
5 Total returns are historical and include change in share price and reinvestment of all dividends and distributions. Had certain expenses not been reduced during the periods shown, total returns would have been lower. Total returns for periods less than one year are not annualized.
6 Annualized.
See Accompanying Notes to Consolidated Financial Statements.
12
Credit Suisse Managed Futures Strategy Fund
Consolidated Financial Highlights
(For a Class A Share of the Fund Outstanding Throughout Each Period)
| | | For the Year Ended October 31, | |
| | | 2016 | | 2015 | | 2014 | | 2013 | | 20121 | |
Per share data | |
Net asset value, beginning of period | | $ | 11.47 | | | $ | 10.80 | | | $ | 10.35 | | | $ | 9.76 | | | $ | 10.00 | | |
INVESTMENT OPERATIONS | |
Net investment loss2 | | | (0.17 | ) | | | (0.19 | ) | | | (0.20 | ) | | | (0.20 | ) | | | (0.02 | ) | |
Net gain (loss) from futures contracts, swap contracts
and foreign currency related items (both realized
and unrealized) | | | 0.48 | | | | 1.50 | | | | 0.94 | | | | 0.79 | | | | (0.22 | ) | |
Total from investment operations | | | 0.31 | | | | 1.31 | | | | 0.74 | | | | 0.59 | | | | (0.24 | ) | |
REDEMPTION FEES | | | — | | | | — | | | | 0.003 | | | | 0.003 | | | | — | | |
LESS DIVIDENDS AND DISTRIBUTIONS | |
Dividends from net investment income | | | (0.49 | ) | | | (0.01 | ) | | | — | | | | — | | | | — | | |
Distributions from net realized gains | | | (0.41 | ) | | | (0.63 | ) | | | (0.29 | ) | | | — | | | | — | | |
Total dividends and distributions | | | (0.90 | ) | | | (0.64 | ) | | | (0.29 | ) | | | — | | | | — | | |
Net asset value, end of period | | $ | 10.88 | | | $ | 11.47 | | | $ | 10.80 | | | $ | 10.35 | | | $ | 9.76 | | |
Total return4 | | | 2.87 | % | | | 12.47 | % | | | 7.35 | % | | | 6.05 | % | | | (2.40 | )% | |
RATIOS AND SUPPLEMENTAL DATA | |
Net assets, end of period (000s omitted) | | $ | 38,060 | | | $ | 20,200 | | | $ | 3,294 | | | $ | 5,824 | | | $ | 98 | | |
Ratio of net expenses to average net assets | | | 1.55 | % | | | 1.56 | % | | | 1.96 | % | | | 1.95 | % | | | 1.95 | %5 | |
Ratio of net investment loss to average net assets | | | (1.54 | )% | | | (1.55 | )% | | | (1.93 | )% | | | (1.90 | )% | | | (1.94 | )%5 | |
Decrease reflected in above operating expense
ratios due to waivers/reimbursements | | | 0.05 | % | | | 0.15 | % | | | 0.10 | % | | | 1.10 | % | | | 3.01 | %5 | |
Portfolio turnover rate | | | — | | | | — | | | | — | | | | — | | | | — | | |
1 For the period September 28, 2012 (Inception Date) through October 31, 2012.
2 Per share information is calculated using the average shares outstanding method.
3 This amount represents less than $0.01 per share.
4 Total returns are historical and include change in share price, reinvestment of all dividends and distributions and no sales charge. Had certain expenses not been reduced during the periods shown, total returns would have been lower. Total returns for periods less than one year are not annualized.
5 Annualized.
See Accompanying Notes to Consolidated Financial Statements.
13
Credit Suisse Managed Futures Strategy Fund
Consolidated Financial Highlights
(For a Class C Share of the Fund Outstanding Throughout Each Period)
| | | For the Year Ended October 31, | |
| | | 2016 | | 2015 | | 2014 | | 2013 | | 20121 | |
Per share data | |
Net asset value, beginning of period | | $ | 11.19 | | | $ | 10.62 | | | $ | 10.25 | | | $ | 9.75 | | | $ | 10.00 | | |
INVESTMENT OPERATIONS | |
Net investment loss2 | | | (0.25 | ) | | | (0.27 | ) | | | (0.27 | ) | | | (0.27 | ) | | | (0.02 | ) | |
Net gain (loss) from futures contracts, swap contracts
and foreign currency related items (both realized
and unrealized) | | | 0.48 | | | | 1.47 | | | | 0.93 | | | | 0.77 | | | | (0.23 | ) | |
Total from investment operations | | | 0.23 | | | | 1.20 | | | | 0.66 | | | | 0.50 | | | | (0.25 | ) | |
REDEMPTION FEES | | | — | | | | — | | | | 0.003 | | | | 0.003 | | | | — | | |
LESS DIVIDENDS AND DISTRIBUTIONS | |
Dividends from net investment income | | | (0.41 | ) | | | — | | | | — | | | | — | | | | — | | |
Distributions from net realized gains | | | (0.41 | ) | | | (0.63 | ) | | | (0.29 | ) | | | — | | | | — | | |
Total dividends and distributions | | | (0.82 | ) | | | (0.63 | ) | | | (0.29 | ) | | | — | | | | — | | |
Net asset value, end of period | | $ | 10.60 | | | $ | 11.19 | | | $ | 10.62 | | | $ | 10.25 | | | $ | 9.75 | | |
Total return4 | | | 2.13 | % | | | 11.60 | % | | | 6.62 | % | | | 5.13 | % | | | (2.50 | )% | |
RATIOS AND SUPPLEMENTAL DATA | |
Net assets, end of period (000s omitted) | | $ | 3,667 | | | $ | 2,920 | | | $ | 1,558 | | | $ | 800 | | | $ | 98 | | |
Ratio of net expenses to average net assets | | | 2.30 | % | | | 2.32 | % | | | 2.71 | % | | | 2.70 | % | | | 2.70 | %5 | |
Ratio of net investment loss to average net assets | | | (2.29 | )% | | | (2.31 | )% | | | (2.68 | )% | | | (2.64 | )% | | | (2.70 | )%5 | |
Decrease reflected in above operating expense
ratios due to waivers/reimbursements | | | 0.05 | % | | | 0.15 | % | | | 0.10 | % | | | 1.10 | % | | | 3.01 | %5 | |
Portfolio turnover rate | | | — | | | | — | | | | — | | | | — | | | | — | | |
1 For the period September 28, 2012 (Inception Date) through October 31, 2012.
2 Per share information is calculated using the average shares outstanding method.
3 This amount represents less than $0.01 per share.
4 Total returns are historical and include change in share price, reinvestment of all dividends and distributions and no sales charge. Had certain expenses not been reduced during the periods shown, total returns would have been lower. Total returns for periods less than one year are not annualized.
5 Annualized.
See Accompanying Notes to Consolidated Financial Statements.
14
Credit Suisse Managed Futures Strategy Fund
Notes to Consolidated Financial Statements
October 31, 2016
Credit Suisse Managed Futures Strategy Fund (the "Fund"), a series of the Credit Suisse Opportunity Funds (the "Trust"), a Delaware statutory trust, is registered under the Investment Company Act of 1940, as amended (the "1940 Act"), as a non-diversified open-end management investment company that seeks to achieve an investment result that corresponds generally to the risk and return patterns of managed futures funds. The Trust was organized under the laws of the State of Delaware as a business trust on May 31, 1995.
Credit Suisse Asset Management, LLC ("Credit Suisse"), the investment adviser to the Fund, is registered as a Commodity Pool Operator with the Commodity Futures Trading Commission. The Fund seeks to achieve its investment objective by investing directly and/or indirectly through the Credit Suisse Cayman Managed Futures Strategy Fund, Ltd. (the "Subsidiary"), a wholly-owned subsidiary of the Fund organized under the laws of the Cayman Islands, in a combination of securities and derivative instruments. The Subsidiary invests in commodity-linked derivative instruments, such as swaps and futures, as well as other types of futures, swaps and options. The Subsidiary may also invest in debt securities, some of which are intended to serve as margin or collateral for the Subsidiary's derivatives positions.
The Subsidiary is managed by the same portfolio managers that manage the Fund and the accompanying financial statements reflect the financial position of the Fund and its Subsidiary and the results of operations on a consolidated basis. The consolidated financial statements include portfolio holdings of the Fund and the Subsidiary and all intercompany transactions and balances have been eliminated. The Fund may invest up to 25% of its total assets in the Subsidiary. As of October 31, 2016, the Fund held $11,350,448 in the Subsidiary, representing 6.7% of the Fund's consolidated net assets. For the year ended October 31, 2016, the net realized loss on securities and other financial instruments held in the Subsidiary was $1,555,829.
Subsequent references to the Fund within the Notes to Consolidated Financial Statements collectively refer to the Fund and the Subsidiary.
The Fund offers three classes of shares: Class I shares, Class A shares and Class C shares. Each class of shares represents an equal pro rata interest in the Fund, except the share classes bear different expenses, which reflect the differences in the range of services provided to them. Class A shares are sold subject to a front-end sales charge of up to 5.25%. Class C shares are sold subject to a CDSC of 1.00% if the shares are redeemed within the first year of purchase. Class I shares are sold without a sales charge.
15
Credit Suisse Managed Futures Strategy Fund
Notes to Consolidated Financial Statements (continued)
October 31, 2016
Note 2. Significant Accounting Policies
The following is a summary of significant accounting policies followed by the Fund in the preparation of its consolidated financial statements. The policies are in accordance with accounting principles generally accepted in the United States of America ("GAAP"). The preparation of consolidated financial statements requires management to make estimates and assumptions that affect the reported amounts and disclosures in the consolidated financial statements. Actual results could differ from those estimates. The Fund is considered an investment company for financial reporting purposes under GAAP and follows Accounting Standard Codification ("ASC") Topic 946 — Financial Services — Investment Companies.
A) SECURITY VALUATION — The net asset value of the Fund is determined daily as of the close of regular trading on the New York Stock Exchange, Inc. (the "Exchange") on each day the Exchange is open for business. The valuations for fixed income securities (which may include, but are not limited to, corporate, government, municipal, mortgage-backed, collateralized mortgage obligations and asset-backed securities) and certain derivative instruments are typically the prices supplied by independent third party pricing services, which may use market prices or broker/dealer quotations or a variety of valuation techniques and methodologies. The independent third party pricing services use inputs that are observable such as issuer details, interest rates, yield curves, prepayment speeds, credit risks/spreads, default rates and quoted prices for similar securities. These pricing services generally price fixed income securities assuming orderly transactions of an institutional "round lot" size, but some trades occur in smaller "odd lot" sizes which may be effected at lower prices than institutional round lot trades. Structured note agreements are valued in accordance with a dealer-supplied valuation based on changes in the value of the underlying index. Futures contracts are valued daily at the settlement price established by the board of trade or exchange on which they are traded. Forward contracts are valued at the London closing spot rates and the London closing forward point rates on a daily basis. The currency forward contract pricing model derives the differential in point rates to the expiration date of the forward and calculates its present value. Equity securities for which market quotations are available are valued at the last reported sales price or official closing price on the primary market or exchange on which they trade. The Fund may utilize a service provided by an independent third party which has been approved by the Board of Trustees (the "Board") to fair value certain securities. When fair value pricing is employed, the prices of securities used by the Fund to calculate its net asset value may differ from quoted or published prices for the same securities. If
16
Credit Suisse Managed Futures Strategy Fund
Notes to Consolidated Financial Statements (continued)
October 31, 2016
Note 2. Significant Accounting Policies (continued)
independent third party pricing services are unable to supply prices for a portfolio investment, or if the prices supplied are deemed by the investment adviser to be unreliable, the market price may be determined by the investment adviser using quotations from one or more brokers/dealers or at the transaction price if the security has recently been purchased and no value has yet been obtained from a pricing service or pricing broker. When reliable prices are not readily available, such as when the value of a security has been significantly affected by events after the close of the exchange or market on which the security is principally traded, but before the Fund calculates its net asset value, the Fund values these securities as determined in accordance with procedures approved and established by the Board.
The Fund uses valuation techniques to measure fair value that are consistent with the market approach and/or income approach, depending on the type of security and the particular circumstance. The market approach uses prices and other relevant information generated by market transactions involving identical or comparable securities. The income approach uses valuation techniques to discount estimated future cash flows to present value.
GAAP established a disclosure hierarchy that categorizes the inputs to valuation techniques used to value assets and liabilities at each measurement date. These inputs are summarized in the three broad levels listed below:
• Level 1 – quoted prices in active markets for identical investments
• Level 2 – other significant observable inputs (including quoted prices for similar investments, interest rates, prepayment speeds, credit risk, etc.)
• Level 3 – significant unobservable inputs (including the Fund's own assumptions in determining the fair value of investments)
The inputs or methodologies used to value securities are not necessarily an indication of the risk associated with investing in those securities.
The following is a summary of the inputs used as of October 31, 2016 in valuing the Fund's assets and liabilities carried at fair value:
Assets | | Level 1 | | Level 2 | | Level 3 | | Total | |
Investments in Securities | |
Short-term Investment | | $ | — | | | $ | 147,845,751 | | | $ | — | | | $ | 147,845,751 | | |
| | | $ | — | | | $ | 147,845,751 | | | $ | — | | | $ | 147,845,751 | | |
Other Financial Instruments* | |
Futures Contracts | | $ | 2,671,410 | | | $ | — | | | $ | — | | | $ | 2,671,410 | | |
Swap Contracts** | | | — | | | | 491,307 | | | | — | | | | 491,307 | | |
17
Credit Suisse Managed Futures Strategy Fund
Notes to Consolidated Financial Statements (continued)
October 31, 2016
Note 2. Significant Accounting Policies (continued)
Liabilities | | Level 1 | | Level 2 | | Level 3 | | Total | |
Other Financial Instruments* | |
Futures Contracts | | $ | 1,111,566 | | | $ | — | | | $ | — | | | $ | 1,111,566 | | |
Swap Contracts** | | | — | | | | 716,782 | | | | — | | | | 716,782 | | |
* Other financial instruments include unrealized appreciation (depreciation) on futures and swap contracts.
** Value includes any premium paid or received with respect to swap contracts, if applicable.
For the year ended October 31, 2016, there were no transfers among Level 1, Level 2 and Level 3. All transfers, if any, are assumed to occur at the end of the reporting period.
B) DERIVATIVE INSTRUMENTS AND HEDGING ACTIVITIES — The Fund adopted amendments to authoritative guidance on disclosures about derivative instruments and hedging activities which require that a fund disclose (a) how and why an entity uses derivative instruments, (b) how derivative instruments and hedging activities are accounted for and (c) how derivative instruments and related hedging activities affect a fund's financial position, financial performance and cash flows. For the year ended October 31, 2016, the Fund's derivatives did not qualify for hedge accounting as they are held at fair value.
Fair Value of Derivative Instruments as of October 31, 2016
| | | Asset Derivatives | | Liability Derivatives | |
| | | Balance Sheet
Location | | Fair Value | | Balance Sheet
Location | | Fair Value | |
Foreign Exchange
Contracts | | Unrealized appreciation
on futures contracts | | $ | 1,780,022 | * | | Unrealized depreciation
on futures contracts | | $ | 239,731 | * | |
Index Contracts | | Unrealized appreciation
on futures contracts | | | 878,695 | * | | Unrealized depreciation
on futures contracts | | | 674,209 | * | |
Interest Rate
Contracts | | Unrealized appreciation
on futures contracts | | | 12,693 | * | | Unrealized depreciation
on futures contracts | | | 197,626 | * | |
Commodity Index
Return Contracts | | Unrealized appreciation
on open swap contracts | | | 491,307 | | | Unrealized depreciation
on open swap contracts | | | 716,782 | | |
| | | | | | | $ | 3,162,717 | | | | | | | $ | 1,828,348 | | |
*Reflects cumulative appreciation (depreciation) of futures contracts as reported in the Consolidated Statement of Assets and Liabilities and Notes to Consolidated Financial Statements. Only unsettled variation margin receivable (payable) is reported in the Consolidated Statement of Assets and Liabilities.
18
Credit Suisse Managed Futures Strategy Fund
Notes to Consolidated Financial Statements (continued)
October 31, 2016
Note 2. Significant Accounting Policies (continued)
Effect of Derivative Instruments on the Consolidated Statement of Operations
| | | Location | | Realized
Gain (Loss) | | Location | | Unrealized
Appreciation
(Depreciation) | |
Foreign Exchange
Contracts | | Net realized loss from
futures contracts | | $ | (954,674 | ) | | Net change in unrealized
appreciation (depreciation)
from futures contracts | | $ | 1,937,990 | | |
Index Contracts | | Net realized gain from
futures contracts | | | 820,259 | | | Net change in unrealized
appreciation (depreciation)
from futures contracts | | | 457,252 | | |
Interest Rate
Contracts | | Net realized gain from
futures contracts | | | 4,175,108 | | | Net change in unrealized
appreciation (depreciation)
from futures contracts | | | (440,997 | ) | |
Commodity Index
Return Contracts | | Net realized loss from
swap contracts | | | (1,555,829 | ) | | Net change in unrealized
appreciation (depreciation)
from open swap contracts | | | (545,258 | ) | |
| | | | | | | $ | 2,484,864 | | | | | | | $ | 1,408,987 | | |
For the year ended October 31, 2016, the Fund held average monthly notional values on a net basis of $155,980,903, $59,906,770 and $29,716,065 in long futures contracts, short futures contracts and swap contracts, respectively.
The Fund is a party to International Swap and Derivatives Association, Inc. ("ISDA") Master Agreements ("Master Agreements") with certain counterparties that govern over-the-counter derivative (including Total Return, Credit Default and Interest Rate Swaps) and foreign exchange contracts entered into by the Fund. The Master Agreements may contain provisions regarding, among other things, the parties' general obligations, representations, agreements, collateral requirements, events of default and early termination. Termination events applicable to the Fund may occur upon a decline in the Fund's net assets below a specified threshold over a certain period of time.
The following table presents by counterparty the Fund's derivative assets, net of related collateral held by the Fund, at October 31, 2016:
Counterparty | | Gross Amount of
Assets Presented in
the Consolidated
Statement of Assets
and Liabilities(a) | | Financial
Instruments
and Derivatives
Available for Offset | | Non-Cash
Collateral
Received | | Cash
Collateral
Received | | Net Amount
of Derivative
Assets | |
Goldman Sachs | | $ | 491,307 | | | $ | (491,307 | ) | | $ | — | | | $ | — | | | $ | — | | |
19
Credit Suisse Managed Futures Strategy Fund
Notes to Consolidated Financial Statements (continued)
October 31, 2016
Note 2. Significant Accounting Policies (continued)
The following table presents by counterparty the Fund's derivative liabilities, net of related collateral pledged by the Fund, at October 31, 2016:
Counterparty | | Gross Amount of
Liabilities Presented in
the Consolidated
Statement of Assets
and Liabilities(a) | | Financial
Instruments
and Derivatives
Available for Offset | | Non-Cash
Collateral
Pledged | | Cash
Collateral
Pledged(b) | | Net Amount
of Derivative
Liabilities | |
Goldman Sachs | | $ | 716,782 | | | $ | (491,307 | ) | | $ | — | | | $ | (225,475 | ) | | $ | — | | |
(a) Swap contracts are included.
(b) The actual collateral pledged may be more than the amounts shown.
C) SECURITY TRANSACTIONS AND INVESTMENT INCOME/EXPENSE — Security transactions are accounted for on a trade date basis. Interest income/expense is recorded on the accrual basis. The Fund amortizes premiums and accretes discounts using the effective interest method. Dividend income/expense is recorded on the ex-dividend date. Certain expenses are class-specific expenses, vary by class and are charged only to that class. Income, expenses (excluding class-specific expenses) and realized/unrealized gains/losses are allocated proportionately to each class of shares based upon the relative net asset value of the outstanding shares of that class. The cost of investments sold is determined by use of the specific identification method for both financial reporting and income tax purposes. To the extent any issuer defaults or a credit event occurs that impacts the issuer, the Fund may halt any additional interest income accruals and consider the realizability of interest accrued up to the date of default or credit event.
D) DIVIDENDS AND DISTRIBUTIONS TO SHAREHOLDERS — Dividends from net investment income, if any, are declared and paid quarterly. Distributions of net realized capital gains, if any, are declared and paid at least annually. However, to the extent that a net realized capital gain can be reduced by a capital loss carryforward, such gain will not be distributed. Dividends and distributions to shareholders of the Fund are recorded on the ex-dividend date and are determined in accordance with federal income tax regulations, which may differ from GAAP.
E) FEDERAL INCOME TAXES — No provision is made for federal taxes as it is the Fund's intention to continue to qualify as a regulated investment company ("RIC") under the Internal Revenue Code of 1986, as amended (the "Code"), and to make the requisite distributions to its shareholders, which will be sufficient to relieve it from federal income and excise taxes.
20
Credit Suisse Managed Futures Strategy Fund
Notes to Consolidated Financial Statements (continued)
October 31, 2016
Note 2. Significant Accounting Policies (continued)
In order to qualify as a RIC under the Code, the Fund must meet certain requirements regarding the source of its income, the diversification of its assets and the distribution of its income. One of these requirements is that the Fund derive at least 90% of its gross income for each taxable year from dividends, interest, payments with respect to certain securities loans, gains from the sale or other disposition of stock, securities or foreign currencies, other income derived with respect to its business of investing in such stock, securities or currencies or net income derived from interests in certain publicly-traded partnerships ("Qualifying Income"). The Internal Revenue Service ("IRS") has issued a ruling that income realized from certain types of commodity-linked derivatives would not be Qualifying Income. As a result, the Fund's ability to realize income from investments in such commodity-linked derivatives as part of its investment strategy would be limited to a maximum of 10% of its gross income. The IRS has issued private letter rulings to registered investment companies concluding that income derived from their investment in a wholly-owned subsidiary would constitute Qualifying Income to the fund. The IRS has indicated that the granting of these types of private letter rulings is currently suspended, pending further internal discussion. As a result, there can be no assurance that the IRS will grant such a private letter ruling to the Fund. If the Fund does not receive such a private letter ruling, there is a risk that the IRS could assert that the income derived from the Fund's investment in the Subsidiary will not be considered Qualifying Income for purposes of the Fund remaining qualified as a RIC for U.S. federal income tax purposes. If the Fund is unable to ensure continued qualification as a RIC, the Fund may be required to change its investment objective, policies or techniques, or may be liquidated. If the Fund fails to qualify as a RIC, the Fund will be subject to federal income tax on its net income and capital gains at regular corporate rates (without reduction for distributions to shareholders). If the Fund were to fail to qualify as a RIC and become subject to federal income tax, shareholders of the Fund would be subject to the risk of diminished returns.
The Fund adopted the authoritative guidance for uncertainty in income taxes and recognizes a tax benefit or liability from an uncertain position only if it is more likely than not that the position is sustainable based solely on its technical merits and consideration of the relevant taxing authority's widely understood administrative practices and procedures. The Fund has reviewed its current tax positions and has determined that no provision for income tax is required in the Fund's financial statements. The Fund's federal and state income and federal excise tax returns for tax years for which the applicable statutes of limitations have not expired are subject to examination by the IRS and state departments of revenue.
21
Credit Suisse Managed Futures Strategy Fund
Notes to Consolidated Financial Statements (continued)
October 31, 2016
Note 2. Significant Accounting Policies (continued)
F) SHORT-TERM INVESTMENTS — The Fund, together with other funds/portfolios advised by Credit Suisse, pools available cash into a short-term variable rate time deposit issued by State Street Bank and Trust Company ("SSB"), the Fund's custodian. The short-term time deposit issued by SSB is a variable rate account classified as a short-term investment.
G) FUTURES — The Fund may enter into futures contracts to the extent permitted by its investment policies and objectives. The Fund may use futures contracts to gain exposure to or hedge against changes in interest rates, equity and market price movements and/or currency risks. Upon entering into a futures contract, the Fund is required to deposit cash and/or pledge U.S. Government securities as initial margin with a Futures Commission Merchant ("FCM"). Subsequent payments, which are dependent on the daily fluctuations in the value of the underlying instrument, are made or received by the Fund each day (daily variation margin) and are recorded as unrealized gains or losses until the contracts are closed. When the contracts are closed, the Fund records a realized gain or loss equal to the difference between the proceeds from (or cost of) the closing transaction and the Fund's basis in the contract. Risks of entering into futures contracts for hedging purposes include the possibility that a change in the value of the contract may not correlate with the changes in the value of the underlying instruments. Futures have minimal counterparty risk because futures are exchange traded and the exchange's clearinghouse, as counterparty to all exchange-traded futures, guarantees the futures against default. In addition, the purchase of a futures contract involves the risk that the Fund could lose more than the original margin deposit and subsequent payments may be required for a futures transaction. The Fund's open futures contracts are disclosed in the Consolidated Schedule of Investments. At October 31, 2016, the amount of restricted cash held at brokers related to futures contracts was $7,723,357.
The Commodity Exchange Act requires an FCM to segregate all customer transactions and assets from the FCM's proprietary activities. A customer's cash and other equity deposited with an FCM are considered commingled with all other customer funds subject to the FCM's segregation requirements. In the event of an FCM's insolvency, recovery may be limited to the Fund's pro rata share of segregated customer funds available. It is possible that the recovery amount could be less than the total of cash and other equity deposited.
H) SWAPS — The Fund may enter into swap contracts either for hedging purposes or to seek to increase total return. A swap contract is an agreement that obligates two parties to exchange a series of cash flows at specified
22
Credit Suisse Managed Futures Strategy Fund
Notes to Consolidated Financial Statements (continued)
October 31, 2016
Note 2. Significant Accounting Policies (continued)
intervals based upon or calculated by reference to changes in specified prices or rates for a specified amount of an underlying asset or notional principal amount. The Fund will enter into swap contracts only on a net basis, which means that the two payment streams are netted out, with the Fund receiving or paying, as the case may be, only the net amount of the two payments. Risks may arise as a result of the failure of the counterparty to the swap contract to comply with the terms of the swap contract. The extent of the Fund's exposure to credit and counterparty risks is the discounted net value of the cash flows to be received from the counterparty over the contract's remaining life, to the extent that the amount is positive. These risks are mitigated by having a master netting arrangement between the Fund and the counterparty and by the posting of collateral by the counterparty to the Fund to cover the Fund's exposure to the counterparty. Therefore, the Fund considers the creditworthiness of each counterparty as well as the amounts posted by the counterparty pursuant to the master netting agreement to a swap contract in evaluating potential credit risk. Additionally, risks may arise from unanticipated movements in interest rates or in the value of the underlying reference asset or index.
The Fund may enter into total return swap contracts, involving commitments to pay interest in exchange for a market-linked return, both based on notional amounts. The Fund may invest in total return swap contracts for hedging purposes or to seek to increase total return. To the extent the total return of the security or index underlying the transaction exceeds or falls short of the offsetting interest rate obligation, the Fund will receive a payment from or make a payment to the counterparty.
The Fund records unrealized gains or losses on a daily basis representing the value and the current net receivable or payable relating to open swap contracts. Net amounts received or paid on the swap contract are recorded as realized gains or losses. Fluctuations in the value of swap contracts are recorded for financial statement purposes as unrealized appreciation or depreciation from swap contracts. Realized gains and losses from terminated swaps are included in net realized gains/losses from swap contracts. The Fund's open swap contracts are disclosed in the Consolidated Schedule of Investments. At October 31, 2016, the amount of restricted cash held at brokers related to swap contracts was $1,650,000.
I) SECURITIES LENDING — The initial collateral received by the Fund is required to have a value of at least 102% of the market value of domestic securities on loan (including any accrued interest thereon) and 105% of the market value of foreign securities on loan (including any accrued interest
23
Credit Suisse Managed Futures Strategy Fund
Notes to Consolidated Financial Statements (continued)
October 31, 2016
Note 2. Significant Accounting Policies (continued)
thereon). The collateral is maintained thereafter at a value equal to at least 102% of the current market value of the securities on loan. The market value of loaned securities is determined at the close of each business day of the Fund and any additional required collateral is delivered to the Fund, or excess collateral returned by the Fund, on the next business day. Cash collateral received by the Fund in connection with securities lending activity may be pooled together with cash collateral for other funds/portfolios advised by Credit Suisse and may be invested in a variety of investments, including funds advised by SSB, the Fund's securities lending agent, or money market instruments. However, in the event of default or bankruptcy by the other party to the agreement, realization and/or retention of the collateral may be subject to legal proceedings. Securities lending income is accrued as earned.
SSB has been engaged by the Fund to act as the Fund's securities lending agent. The Fund's securities lending arrangement provides that the Fund and SSB will share the net income earned from securities lending activities. Securities lending income is accrued as earned. At October 31, 2016, and during the year ended October 31, 2016, there were no securities out on loan.
J) OTHER — In the normal course of business the Fund trades financial instruments and enters into financial transactions for which risk of potential loss exists due to changes in the market (market risk) or failure of the other party to a transaction to perform (credit risk). Similar to credit risk, the Fund may be exposed to counterparty risk, or the risk that an institution or other entity with which the Fund has unsettled or open transactions will default. The potential loss could exceed the value of the financial assets recorded in the consolidated financial statements. Financial assets, which potentially expose the Fund to credit risk, consist principally of cash due from counterparties and investments. The extent of the Fund's exposure to credit and counterparty risks in respect to these financial assets approximates their carrying value as recorded in the Fund's Consolidated Statement of Assets and Liabilities.
K) NEW ACCOUNTING PRONOUNCEMENTS — On August 26, 2016, Financial Accounting Standards Board ("FASB") issued a new Accounting Standards Update No. 2016-15, "Statement of Cash Flows (Topic 230), a consensus of the FASB's Emerging Issues Task Force" ("ASU 2016-15"). ASU 2016-15 is intended to reduce diversity in practice in how certain transactions are classified in the statement of cash flows. The issues addressed in ASU 2016-15 are: debt prepayment or debt extinguishment costs, settlement of zero-coupon debt instruments, contingent consideration payments made after a business
24
Credit Suisse Managed Futures Strategy Fund
Notes to Consolidated Financial Statements (continued)
October 31, 2016
Note 2. Significant Accounting Policies (continued)
combination, proceeds from the settlement of insurance claims, proceeds from the settlement of corporate-owned life insurance policies, including bank-owned life insurance policies, distributions received from equity method investments, beneficial interests in securitization transactions; and, separately identifiable cash flows and application of the predominance principle. ASU 2016-15 is effective for interim and annual reporting periods beginning after December 15, 2017. Management is currently evaluating the impact, if any, of applying this provision.
In November 2016, FASB issued a new Accounting Standards Update No. 2016-18, "Statement of Cash Flows (Topic 230), Restricted Cash, a consensus of the FASB's Emerging Issues Task Force" ("ASU 2016-18"). ASU 2016-18 requires that a statement of cash flows explain the change during the period in the total of cash, cash equivalents, and amounts generally described as restricted cash or restricted cash equivalents. Therefore, amounts generally described as restricted cash and restricted cash equivalents should be included with cash and cash equivalents when reconciling the beginning-of-period and end-of-period total amounts shown on the statement of cash flows. The amendments in ASU 2016-18 do not provide a definition of restricted cash or restricted cash equivalents. ASU 2016-18 is effective for interim and annual reporting periods beginning after December 15, 2017. Management is currently evaluating the impact, if any, of applying this provision.
In October 2016, the U.S. Securities and Exchange Commission adopted new rules and amended existing rules (together, "final rules") intended to modernize the reporting and disclosure of information by registered investment companies. In part, the final rules amend Regulation S-X and require standardized, enhanced disclosure about derivatives in investment company financial statements, as well as other amendments. The compliance date for the amendments to Regulation S-X is August 1, 2017. Management is currently evaluating the impact that the adoption of the amendments to Regulation S-X will have on the Fund's financial statements and related disclosures.
L) SUBSEQUENT EVENTS — In preparing the financial statements as of October 31, 2016, management considered the impact of subsequent events for potential recognition or disclosure in these financial statements through the date of release of this report. No such events requiring recognition or disclosure were identified through the date of the release of this report.
25
Credit Suisse Managed Futures Strategy Fund
Notes to Consolidated Financial Statements (continued)
October 31, 2016
Note 3. Transactions with Affiliates and Related Parties
Credit Suisse serves as investment adviser for the Fund. For its investment advisory services, Credit Suisse is entitled to receive a fee from the Fund at an annual rate of 0.95% of the Fund's average daily net assets. Credit Suisse has contractually waived fees and reimbursed expenses so that the Fund's annual operating expenses would not exceed 1.30% of the Fund's average daily net assets for Class I shares, 1.55% of the Fund's average daily net assets for Class A shares, and 2.30% of the Fund's average daily net assets for Class C shares. For the year ended October 31, 2016, investment advisory fees earned and fees waived/expenses reimbursed were $1,250,467 and $61,431, respectively. The Fund is authorized to reimburse Credit Suisse for management fees previously limited and/or for expenses previously reimbursed by Credit Suisse, provided, however, that any reimbursements must be paid at a date not more than three years after the end of the fiscal year during which such fees were limited or expenses were reimbursed by Credit Suisse and the reimbursements do not cause the Fund to exceed the applicable expense limitation in the contract at the time the fees are recouped. This contract may not be terminated before February 28, 2018.
The amounts waived and reimbursed by Credit Suisse, which are available for potential future recoupment by Credit Suisse, and the expiration schedule at October 31, 2016 are as follows:
| | | Fee waivers/ expense
reimbursements
subject to
recoupment* | | Expires
October 31,
2018 | | Expires
October 31,
2019 | |
Class I | | $ | 71,531 | | | $ | 60,735 | | | $ | 10,796 | | |
Class A | | | 17,066 | | | | 13,830 | | | | 3,236 | | |
Class C | | | 2,409 | | | | 2,053 | | | | 356 | | |
Totals | | $ | 91,006 | | | $ | 76,618 | | | $ | 14,388 | | |
*The Subsidiary is not eligible for recoupment.
Credit Suisse and SSB serve as co-administrators to the Fund. For its co-administrative services, Credit Suisse receives a fee calculated at an annual rate of 0.09% of the Fund's average daily net assets. For the year ended October 31, 2016, co-administrative services fees earned by Credit Suisse were $118,465.
For its co-administrative services, SSB receives a fee, exclusive of out-of-pocket expenses, calculated in total for all the Credit Suisse funds/portfolios co-administered by SSB and allocated based upon the relative average net assets of each fund/portfolio, subject to an annual minimum fee. For the year
26
Credit Suisse Managed Futures Strategy Fund
Notes to Consolidated Financial Statements (continued)
October 31, 2016
Note 3. Transactions with Affiliates and Related Parties (continued)
ended October 31, 2016, co-administrative services fees earned by SSB (including out-of-pocket expenses) with respect to the Fund were $20,162.
Credit Suisse Securities (USA) LLC ("CSSU"), an affiliate of Credit Suisse, serves as the distributor of the Fund's shares. Pursuant to a distribution plan adopted by the Fund pursuant to Rule 12b-1 under the 1940 Act, CSSU receives fees for its distribution services. These fees are calculated at an annual rate of 0.25% of the average daily net assets of the Class A shares. For the Class C shares, the fee is calculated at an annual rate of 1.00% of the average daily net assets. For the year ended October 31, 2016, the Fund paid Rule 12b-1 distribution fees of $77,706 for Class A shares and $30,265 for Class C shares. Class I shares are not subject to Rule 12b-1 distribution fees.
Certain brokers, dealers and financial representatives provide transfer agent-related services to the Fund and receive compensation from the Fund. For the year ended October 31, 2016, the Fund paid $63,669, which is included within transfer agent fees in the Consolidated Statement of Operations.
For the year ended October 31, 2016, CSSU and its affiliates advised the Fund that they retained $2,643 from commissions earned on the sale of the Fund's Class A shares. There were no commissions earned on sale of Class C shares.
Note 4. Line of Credit
The Fund, together with other funds/portfolios advised by Credit Suisse (collectively, the "Participating Funds"), participates in a committed, unsecured line of credit facility ("Credit Facility"), with SSB in an aggregated amount of $250 million for temporary or emergency purposes under a first-come, first-served basis. Under the terms of the Credit Facility, the Participating Funds pay an aggregate commitment fee on the average unused amount of the Credit Facility, which is allocated among the Participating Funds in such manner as is determined by the governing Boards of the Participating Funds. In addition, the Participating Funds pay interest on borrowings at either the Overnight Federal Funds rate or the Overnight LIBOR rate plus a spread. At October 31, 2016 and during the year ended October 31, 2016, the Fund had no borrowings outstanding under the Credit Facility.
27
Credit Suisse Managed Futures Strategy Fund
Notes to Consolidated Financial Statements (continued)
October 31, 2016
Note 5. Purchases and Sales of Securities
For the year ended October 31, 2016, purchases and sales of investment securities (excluding short-term investments) and U.S. Government and Agency Obligations were as follows:
Investment Securities | | U.S. Government/
Agency Obligations | |
| Purchases | | Sales | | Purchases | | Sales | |
| $ | 0 | | | $ | 0 | | | $ | 0 | | | $ | 0 | | |
Note 6. Capital Share Transactions
The Fund is authorized to issue an unlimited number of full and fractional shares of beneficial interest, $.001 par value per share. The Fund offers Class I, Class A and Class C shares. Transactions in capital shares for each class of the Fund were as follows:
| | | Class I | |
| | | For the Year Ended
October 31, 2016 | | For the Year Ended
October 31, 2015 | |
| | | Shares | | Value | | Shares | | Value | |
Shares sold | | | 9,390,795 | | | $ | 105,360,677 | | | | 1,298,671 | | | $ | 15,605,770 | | |
Shares issued in reinvestment
of dividends and distributions | | | 577,815 | | | | 6,339,853 | | | | 392,240 | | | | 4,318,168 | | |
Shares redeemed | | | (4,599,480 | ) | | | (51,998,010 | ) | | | (1,771,447 | ) | | | (21,358,396 | ) | |
Net increase (decrease) | | | 5,369,130 | | | $ | 59,702,520 | | | | (80,536 | ) | | $ | (1,434,458 | ) | |
| | | Class A | |
| | | For the Year Ended
October 31, 2016 | | For the Year Ended
October 31, 2015 | |
| | | Shares | | Value | | Shares | | Value | |
Shares sold | | | 2,554,733 | | | $ | 28,671,167 | | | | 3,449,303 | | | $ | 42,162,996 | | |
Shares issued in reinvestment
of dividends and distributions | | | 104,757 | | | | 1,146,451 | | | | 18,180 | | | | 198,770 | | |
Shares redeemed | | | (921,553 | ) | | | (10,316,965 | ) | | | (2,011,418 | ) | | | (23,654,995 | ) | |
Net increase | | | 1,737,937 | | | $ | 19,500,653 | | | | 1,456,065 | | | $ | 18,706,771 | | |
| | | Class C | |
| | | For the Year Ended
October 31, 2016 | | For the Year Ended
October 31, 2015 | |
| | | Shares | | Value | | Shares | | Value | |
Shares sold | | | 183,521 | | | $ | 2,009,593 | | | | 157,431 | | | $ | 1,844,940 | | |
Shares issued in reinvestment
of dividends and distributions | | | 16,743 | | | | 179,473 | | | | 6,786 | | | | 72,812 | | |
Shares redeemed | | | (115,199 | ) | | | (1,266,502 | ) | | | (50,067 | ) | | | (584,963 | ) | |
Net increase | | | 85,065 | | | $ | 922,564 | | | | 114,150 | | | $ | 1,332,789 | | |
28
Credit Suisse Managed Futures Strategy Fund
Notes to Consolidated Financial Statements (continued)
October 31, 2016
Note 6. Capital Share Transactions (continued)
On October 31, 2016, the number of shareholders that held 5% or more of the outstanding shares of each class of the Fund was as follows:
| | | Number of
Shareholders | | Approximate Percentage
of Outstanding Shares | |
Class I | | | 4 | * | | | 86 | % | |
Class A | | | 3 | | | | 47 | % | |
Class C | | | 3 | | | | 29 | % | |
*This includes the seed money from Merchant Holding, Inc., an affiliate of Credit Suisse.
Some of the shareholders may be omnibus accounts, which hold shares on behalf of individual shareholders.
Note 7. Federal Income Taxes
Income and capital gain distributions are determined in accordance with federal income tax regulations, which may differ from GAAP.
The tax characteristics of distributions paid by the Fund during the years ended October 31, 2016 and 2015, respectively, were as follows:
| Ordinary Income | | Long-Term Capital Gain | |
| 2016 | | 2015 | | 2016 | | 2015 | |
| $ | 6,475,503 | | | $ | 1,026,134 | | | $ | 2,163,304 | | | $ | 3,570,723 | | |
The tax basis components of distributable earnings differ from the amounts reflected in the Consolidated Statement of Assets and Liabilities by temporary book/tax differences. These differences are primarily due to differing treatments of futures contracts marked to market and offering expenses. At October 31, 2016, the components of distributable earnings on a tax basis were as follows:
Undistributed net investment income | | $ | 2,100,050 | | |
| Accumulated net realized gain | | | 2,547,321 | | |
Unrealized depreciation | | | (634,321 | ) | |
| | | $ | 4,013,050 | | |
29
Credit Suisse Managed Futures Strategy Fund
Notes to Consolidated Financial Statements (continued)
October 31, 2016
Note 7. Federal Income Taxes (continued)
At October 31, 2016, the cost of investments (excluding foreign currency related transactions) and the net unrealized appreciation (depreciation) for income tax purposes were as follows:
Cost of Investments | | $ | 147,845,751 | | |
Unrealized appreciation | | $ | — | | |
Unrealized depreciation | | | (— | ) | |
Net unrealized appreciation (depreciation) | | $ | — | | |
To adjust for current period permanent book/tax differences which arose principally from differing book/tax treatment of foreign currency gain (loss) and subsidiary accumulative income (loss), paid-in capital was charged $1,554,629, accumulated net realized gain was charged $258,865 and distributions in excess of net investment income was credited $1,813,494. Net assets were not affected by these reclassifications.
Note 8. Contingencies
In the normal course of business, the Fund may provide general indemnifications pursuant to certain contracts and organizational documents. The Fund's maximum exposure under these arrangements is dependent on future claims that may be made against the Fund and, therefore, cannot be estimated; however, based on experience, the risk of loss from such claims is considered remote.
30
Credit Suisse Managed Futures Strategy Fund
Report of Independent Registered Public Accounting Firm
The Board of Trustees and Shareholders
Credit Suisse Managed Futures Strategy Fund:
We have audited the accompanying consolidated statement of assets and liabilities of Credit Suisse Managed Futures Strategy Fund (the "Fund"), a series of the Credit Suisse Opportunity Funds, including the consolidated schedule of investments, as of October 31, 2016, and the related consolidated statement of operations for the year then ended, and the consolidated statements of changes in net assets and financial highlights for each of the years in the two-year period then ended. These consolidated financial statements and consolidated financial highlights are the responsibility of the Fund's management. Our responsibility is to express an opinion on these consolidated financial statements and consolidated financial highlights based on our audits. The accompanying consolidated financial highlights for each of the years in the three-year period ended October 31, 2014 were audited by other independent registered public accountants whose report thereon dated December 29, 2014, expressed an unqualified opinion on those consolidated financial highlights.
We conducted our audits in accordance with the standards of the Public Company Accounting Oversight Board (United States). Those standards require that we plan and perform the audits to obtain reasonable assurance about whether the consolidated financial statements and consolidated financial highlights are free of material misstatement. An audit includes examining, on a test basis, evidence supporting the amounts and disclosures in the consolidated financial statements. Our procedures included confirmation of securities owned as of October 31, 2016, by correspondence with the custodian and broker or by other appropriate auditing procedures. An audit also includes assessing the accounting principles used and significant estimates made by management, as well as evaluating the overall consolidated financial statement presentation. We believe that our audits provide a reasonable basis for our opinion.
In our opinion, the consolidated financial statements and consolidated financial highlights referred to above present fairly, in all material respects, the financial position of Credit Suisse Managed Futures Strategy Fund as of October 31, 2016, the results of its operations for the year then ended and the changes in its net assets and financial highlights for each of the years in the two-year period then ended, in conformity with U.S. generally accepted accounting principles.
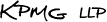
New York, New York
December 28, 2016
31
Credit Suisse Managed Futures Strategy Fund
Information Concerning Trustees and Officers (unaudited)
Name, Address
(Year of Birth) | | Position(s)
Held with
Fund | | Term
of Office1
and
Length
of Time
Served | | Principal
Occupation(s) During
Past Five Years | | Number of
Portfolios
in Fund
Complex
Overseen
by Trustee | | Other
Trusteeships
Held by Trustee | |
Independent Trustees | | | | | | | | | | | |
Enrique R. Arzac
c/o Credit Suisse Asset
Management, LLC
Attn: General Counsel
One Madison Avenue
New York, New York
10010
(1941) | | Trustee, Audit Committee Chairman and Nominating Committee Member | | Since Fund Inception | | Professor Emeritus of Finance and Economics from July 2015 to present; Professor of Finance and Economics, Graduate School of Business, Columbia University from 1971 to July 2015. | | | 12 | | | Director of Adams Diversified Equity Fund, Inc., Adams Natural Resources Fund, Inc., Aberdeen Chile Fund, Inc., Aberdeen Emerging Markets Smaller Company Opportunities Fund, Inc., Aberdeen Israel Fund, Inc., Aberdeen Indonesia Fund, Inc. and Aberdeen Latin America Equity Fund, Inc. (each a closed-end investment company); Director of Aberdeen Asia-Pacific Income Investment Company Limited (a Canadian closed-end fund); Trustee of Mirae Asset Discovery Funds (7 open-end portfolios); Director of Epoch Holding Corporation (an investment management and investment advisory services company) from August 2006 to March 2013 | |
1 Subject to the Trust's retirement policy, each Trustee may continue to serve as a Trustee until the last day of the calendar year in which the applicable Trustee attains age 75. Officer serves until his or her respective successor has been duly elected and qualified.
32
Credit Suisse Managed Futures Strategy Fund
Information Concerning Trustees and Officers (unaudited) (continued)
Name, Address
(Year of Birth) | | Position(s)
Held with
Fund | | Term
of Office1
and
Length
of Time
Served | | Principal
Occupation(s) During
Past Five Years | | Number of
Portfolios
in Fund
Complex
Overseen
by Trustee | | Other
Trusteeships
Held by Trustee | |
Independent Trustees | | | | | | | | | | | |
Jeffrey E. Garten
c/o Credit Suisse Asset Management, LLC
Attn: General Counsel
One Madison Avenue
New York, New York 10010
(1946) | | Trustee, Audit and Nominating Committee Member | | Since Fund Inception | | Dean Emeritus of Yale School of Management from July 2015 to present; The Juan Trippe Professor in the Practice of International Trade, Finance and Business, Yale School of Management, from July 2005 to July 2015; Partner and Chairman of Garten Rothkopf (consulting firm) from October 2005 to present. | | | 10 | | | Director of Aetna, Inc. (insurance company); Director of CarMax Group (used car dealers); Director of Miller Buckfire & Co., LLC (financial restructuring); Member of Standard & Poor's Board of Managers (credit rating agency) from December 2011 to November 2014. | |
1 Subject to the Trust's retirement policy, each Trustee may continue to serve as a Trustee until the last day of the calendar year in which the applicable Trustee attains age 75. Officer serves until his or her respective successor has been duly elected and qualified.
33
Credit Suisse Managed Futures Strategy Fund
Information Concerning Trustees and Officers (unaudited) (continued)
Name, Address
(Year of Birth) | | Position(s)
Held with
Fund | | Term
of Office1
and
Length
of Time
Served | | Principal
Occupation(s) During
Past Five Years | | Number of
Portfolios
in Fund
Complex
Overseen
by Trustee | | Other
Trusteeships
Held by Trustee | |
Independent Trustees | | | | | | | | | | | |
Steven N. Rappaport
Lehigh Court, LLC
555 Madison Avenue
29th Floor
New York, New York
10022
(1948) | | Chairman of the Board of Trustees, Audit Committee Member and Nominating Committee Chairman | | Trustee since Fund Inception and Chairman since 2005 | | Partner of Lehigh Court, LLC and RZ Capital (private investment firms) from July 2002 to present; Partner of Backstage Acquisition Holdings, LLC (publication job postings) from November 2013 to present. | | | 12 | | | Director of iCAD, Inc. (surgical and medical instruments and apparatus company); Director of Aberdeen Chile Fund, Inc., Aberdeen Emerging Markets Smaller Company Opportunities Fund, Inc., Aberdeen Israel Fund, Inc., Aberdeen Indonesia Fund, Inc. and Aberdeen Latin America Equity Fund, Inc. (each a closed-end investment company); Director of Aberdeen Funds (25 open end portfolios); Director of Presstek, Inc. (digital imaging technologies company) from 2003 to 2012; Director of Wood Resources, LLC (plywood manufacturing company) from 2003 to October 2013. | |
1 Subject to the Trust's retirement policy, each Trustee may continue to serve as a Trustee until the last day of the calendar year in which the applicable Trustee attains age 75. Officer serves until his or her respective successor has been duly elected and qualified.
34
Credit Suisse Managed Futures Strategy Fund
Information Concerning Trustees and Officers (unaudited) (continued)
Name, Address
(Year of Birth) | | Position(s)
Held with
Fund | | Term
of Office1
and
Length
of Time
Served | | Principal Occupation(s) During Past Five Years | |
John G. Popp
Credit Suisse Asset
Management, LLC
One Madison Avenue
New York, New York 10010
(1956) | | Chief Executive Officer and President | | Since Fund Inception | | Managing Director of Credit Suisse; Global Head and Chief Investment Officer of the Credit Investment Group; Associated with Credit Suisse or its predecessor since 1997; Officer of other Credit Suisse Funds; Trustee of Credit Suisse High Yield Bond Fund; Director of Credit Suisse Asset Management Income Fund, Inc. | |
Emidio Morizio
Credit Suisse Asset
Management, LLC
One Madison Avenue
New York, New York 10010
(1966) | | Chief Compliance Officer | | Since Fund Inception | | Managing Director and Global Head of Compliance of Credit Suisse since 2010; Associated with Credit Suisse since July 2000; Officer of other Credit Suisse Funds. | |
Lou Anne McInnis
Credit Suisse Asset
Management, LLC
One Madison Avenue
New York, New York 10010
(1959) | | Chief Legal Officer | | Since 2015 | | Director of Credit Suisse; Associated with Credit Suisse since April 2015; Counsel at DLA Piper US LLP from 2011 to April 2015; Associated with Morgan Stanley Investment Management from 1997 to 2010; Officer of other Credit Suisse Funds. | |
Laurie Pecha
Credit Suisse Asset
Management, LLC
One Madison Avenue
New York, New York 10010
(1961) | | Chief Financial Officer | | Since 2016 | | Director of Credit Suisse since August 2016; Senior Consultant of Spectra Professional Services, LLC from January 2012 to July 2016; Vice President of Legg Mason & Co. from March 2007 to December 2011; Officer of other Credit Suisse Funds. | |
Esther Cheung
Credit Suisse Asset
Management, LLC
One Madison Avenue
New York, New York 10010
(1980) | | Treasurer | | Since 2016 | | Vice President of Credit Suisse since 2015; Associated with Reich & Tang Asset Management, LLC from June 2010 to August 2015; Officer of other Credit Suisse Funds. | |
Karen Regan
Credit Suisse Asset
Management, LLC
One Madison Avenue
New York, New York 10010
(1963) | | Vice President and Secretary | | Since Fund Inception | | Vice President of Credit Suisse; Associated with Credit Suisse since December 2004; Officer of other Credit Suisse Funds. | |
1 Subject to the Trust's retirement policy, each Trustee may continue to serve as a Trustee until the last day of the calendar year in which the applicable Trustee attains age 75. Officer serves until his or her respective successor has been duly elected and qualified.
* The officers of the Fund shown are officers that make policy decisions.
The Statement of Additional Information includes additional information about the Trustees and is available, without charge, upon request, by calling 877-870-2874.
35
Credit Suisse Managed Futures Strategy Fund
Proxy Voting and Portfolio Holdings Information (unaudited)
Information regarding how the Fund voted proxies related to its portfolio securities during the 12-month period ended June 30 of each year, as well as the policies and procedures that the Fund uses to determine how to vote proxies relating to its portfolio securities are available:
• By calling 1-877-870-2874
• On the Fund's website, www.credit-suisse.com/us/funds
• On the website of the Securities and Exchange Commission, www.sec.gov.
The Fund files a complete schedule of its portfolio holdings for the first and third quarters of its fiscal year with the SEC on Form N-Q. The Fund's Forms N-Q are available on the SEC's website at www.sec.gov and may be reviewed and copied at the SEC's Public Reference Room in Washington, DC. Information on the operation of the SEC's Public Reference Room may be obtained by calling 1-202-551-8090.
36

P.O. BOX 55030, BOSTON, MA 02205-5030
877-870-2874 n www.credit-suisse.com/us/funds
CREDIT SUISSE SECURITIES (USA) LLC, DISTRIBUTOR. MFS-AR-1016

CREDIT SUISSE FUNDS
Annual Report
October 31, 2016
n CREDIT SUISSE
MULTIALTERNATIVE STRATEGY FUND
The Fund's investment objectives, risks, charges and expenses (which should be considered carefully before investing), and more complete information about the Fund, are provided in the Prospectus, which should be read carefully before investing. You may obtain additional copies by calling 877-870-2874 or by visiting our website at www.credit-suisse.com/us/funds.
Credit Suisse Securities (USA) LLC, Distributor, is located at One Madison Avenue, New York, NY 10010. Credit Suisse Funds are advised by Credit Suisse Asset Management, LLC.
Investors in the Credit Suisse Funds should be aware that they may be eligible to purchase Class I shares (where offered) directly or through certain intermediaries. Such shares are not subject to a sales charge. Investors in the Credit Suisse Funds should also be aware that they may be eligible for a reduction or waiver of the sales charge with respect to Class A or C shares (where offered). For more information, please review the relevant prospectuses or consult your financial representative.
Fund shares are not deposits or other obligations of Credit Suisse Asset Management, LLC ("Credit Suisse") or any affiliate, are not FDIC-insured and are not guaranteed by Credit Suisse or any affiliate. Fund investments are subject to investment risks, including loss of your investment.
Credit Suisse Multialternative Strategy Fund
Annual Investment Adviser's Report
October 31, 2016 (unaudited)
November 25, 2016
Dear Shareholder:
We are pleased to present this Annual Report covering the activities of the Credit Suisse Multialternative Strategy Fund (the "Fund") for the twelve months ended October 31, 2016.
Performance Summary
11/1/2015 – 10/31/16
Fund & Benchmark | | Performance | |
Class I1 | | | 0.53 | % | |
Class A1, 2 | | | 0.24 | % | |
Class C1, 2 | | | -0.45 | % | |
Credit Suisse Hedge Fund Index3 | | | -0.73 | % | |
Credit Suisse Liquid Alternative Beta Index4 | | | 1.53 | % | |
Performance shown for the Fund's Class A and Class C Shares does not reflect sales charges, which are a maximum of 5.25% and 1.00%, respectively. 2
Market Review: A negative period for hedge funds
The annual period ended October 31, 2016 was a negative one for hedge funds with the Credit Suisse Hedge Fund Index, the Fund's primary benchmark, returning -0.73%.
Within the hedge fund universe, trend-following strategies, such as managed futures, experienced losses overall, as they were generally hurt by trend reversals in several markets, including commodities, fixed income and currencies.
Event-driven funds performed negatively overall, largely due to multi-strategy sub-strategies, while distressed and merger arbitrage contributed positively during the period. Long/short equity funds experienced negative performance as increased equity volatility in early 2016 challenged managers, reversing some of their 2015 gains.
Strategic Review: Outperformance in a negative period
For the annual period ended October 31, 2016, the Fund outperformed its primary benchmark and underperformed its secondary benchmark. All of the Fund's asset classes added to performance, with the exception of equities, as long/short performed negatively for the period. Fixed income was the highest contributing asset class, largely due to long high yield credit exposure. Currency-related strategies also contributed to performance.
1
Credit Suisse Multialternative Strategy Fund
Annual Investment Adviser's Report (continued)
October 31, 2016 (unaudited)
The Credit Suisse Multialternative Strategy Fund follows a multi-strategy methodology and benefitted from exposure across different markets.
The Quantitative Investment Strategies Group
Yung-Shin Kung
Sheel Dhande
The Fund is non-diversified, which means it may invest a greater proportion of its assets in the securities of a smaller number of issuers than a diversified mutual fund and may therefore be subject to greater volatility. The Fund's investment in alternative instruments may subject the Fund to greater volatility than investment in traditional securities, particularly in investments involving leverage.
The use of alternative assets and strategies entails substantial risks, including risk of loss of principal, arbitrage or fundamental risk, below investment grade securities risk, commodity exposure risks, concentration risk, credit risk, derivatives risk, exchange-traded notes risk, fixed income risk, foreign securities risk, forwards risk, futures contracts risk, interest rate risk, leveraging risk, market risk, non-diversified status, portfolio turnover risk, risks of investing in other funds, small- and mid- cap stock risk, speculative exposure risk, subsidiary risk, swap agreements risk and tax risk. For a detailed discussion of these and other risks, please refer to the Fund's Prospectus, which should be read carefully before investing.
In addition to historical information, this report contains forward-looking statements, which may concern, among other things, domestic and foreign markets, industry and economic trends and developments and government regulation and their potential impact on the Fund's investments. These statements are subject to risks and uncertainties and actual trends, developments and regulations in the future, and their impact on the Fund, could be materially different from those projected, anticipated or implied. The Fund has no obligation to update or revise forward-looking statements.
The views of the Fund's management are as of the date of this letter and the Fund holdings described in this document are as of October 31, 2016; these views and Fund holdings may have changed subsequent to these dates. Nothing in this document is a recommendation to purchase or sell securities.
2
Credit Suisse Multialternative Strategy Fund
Annual Investment Adviser's Report (continued)
October 31, 2016 (unaudited)
Comparison of Change in Value of $10,000 Investment in the
Credit Suisse Multialternative Strategy Fund1 Class I shares,
Class A shares2, Class C shares2 and the Credit Suisse
Hedge Fund Index3 and the Credit Suisse Liquid
Alternative Beta Index4 from Inception (03/30/12)
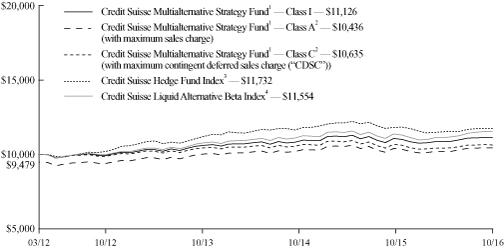
1 Fee waivers and/or expense reimbursements may reduce expenses for the Fund, without which performance would be lower. Effective November 18, 2015, the Fund entered into a written contract to limit expenses to 0.85% of the Fund's average daily net assets for Class I shares, 1.10% of the Fund's average daily net assets for Class A shares and 1.85% of the Fund's average daily net assets for Class C shares through at least February 28, 2018. This limit excludes certain expenses, as set forth in the Fund's prospectus. Prior to November 18, 2015, the limit on expenses was 1.30% of the Fund's average daily net assets for Class I shares, 1.55% of the Fund's average daily net assets for Class A shares and 2.30% of the Fund's average daily net assets for Class C shares.
2 Total return for the Fund's Class A shares for the reporting period, based on offering price (including maximum sales charge of 5.25%), was (5.01)%. Total return for the Fund's Class C shares for the reporting period, based on redemption value (including maximum CDSC of 1.00%), was (1.44)%.
3 The Credit Suisse Hedge Fund Index is compiled by Credit Suisse Asset Management, LLC. It is an asset-weighted hedge fund index and includes only hedge funds. It is rebalanced semiannually, is shown net of all performance fees and provides a rules-based and investable index, enabling investors to utilize the performance of a diversified market barometer for the hedge fund industry. It is the exclusive property of Credit Suisse Asset Management, LLC. The index does not have transaction costs and investors may not invest directly in the index.
4 The Credit Suisse Liquid Alternative Beta Index reflects the return of a dynamic basket of liquid, investable market factors selected and weighted in accordance with an algorithm that aims to approximate the aggregate returns of the universe of hedge fund managers as represented by the Credit Suisse Hedge Fund Index. The index does not have transaction costs and investors may not invest directly in the index.
3
Credit Suisse Multialternative Strategy Fund
Annual Investment Adviser's Report (continued)
October 31, 2016 (unaudited)
Average Annual Returns as of October 31, 20161
| | | 1 Year | | Since
Inception2 | |
Class I | | | 0.53 | % | | | 2.37 | % | |
Class A Without Sales Charge | | | 0.24 | % | | | 2.12 | % | |
Class A With Maximum Sales Charge | | | (5.01 | )% | | | 0.93 | % | |
Class C Without CDSC | | | (0.45 | )% | | | 1.35 | % | |
Class C With CDSC | | | (1.44 | )% | | | 1.35 | % | |
Returns represent past performance and include change in share price and reinvestment of dividends and capital gain distributions. Past performance cannot guarantee future results. The current performance of the Fund may be lower or higher than the figures shown. Returns and share price will fluctuate, and redemption value may be more or less than original cost. The performance results do not reflect the deduction of taxes that a shareholder would pay on Fund distributions or the redemption of Fund shares. Performance information current to the most recent month end is available at www.credit-suisse.com/us/funds.
The annual gross expense ratios are 1.56% for Class I shares, 1.82% for Class A shares and 2.79% for Class C shares. The annual net expense ratios after fee waivers and/or expense reimbursements are 0.91% for Class I shares, 1.17% for Class A shares and 1.98% for Class C shares.
1 Fee waivers and/or expense reimbursements may reduce expenses for the Fund, without which performance would be lower. Effective November 18, 2015, the Fund entered into a written contract to limit expenses to 0.85% of the Fund's average daily net assets for Class I shares, 1.10% of the Fund's average daily net assets for Class A shares and 1.85% of the Fund's average daily net assets for Class C shares through at least February 28, 2018. This limit excludes certain expenses, as set forth in the Fund's Prospectus. Prior to November 18, 2015, the limit on expenses was 1.30% of the Fund's average daily net assets for Class I shares, 1.55% of the Fund's average daily net assets for Class A shares and 2.30% of the Fund's average daily net assets for Class C shares.
2 Inception Date March 30, 2012.
4
Credit Suisse Multialternative Strategy Fund
Annual Investment Adviser's Report (continued)
October 31, 2016 (unaudited)
Information About Your Fund's Expenses
As an investor of the Fund, you incur two types of costs: ongoing expenses and transaction costs. Ongoing expenses include management fees, distribution and service (12b-1) fees and other Fund expenses. Examples of transaction costs include sales charges (loads), redemption fees and account maintenance fees, which are not shown in this section and which would result in higher total expenses. The following table is intended to help you understand your ongoing expenses of investing in the Fund and to help you compare these expenses with the ongoing expenses of investing in other mutual funds. The table is based on an investment of $1,000 made at the beginning of the six months ended October 31, 2016.
The table illustrates your Fund's expenses in two ways:
• Actual Fund Return. This helps you estimate the actual dollar amount of ongoing expenses paid on a $1,000 investment in the Fund using the Fund's actual return during the period. To estimate the expenses you paid over the period, simply divide your account value by $1,000 (for example, an $8,600 account value divided by $1,000 = 8.6), then multiply the result by the number in the "Expenses Paid per $1,000" line.
• Hypothetical 5% Fund Return. This helps you to compare the Fund's ongoing expenses with those of other mutual funds using the Fund's actual expense ratio and a hypothetical rate of return of 5% per year before expenses. Examples using a 5% hypothetical fund return may be found in the shareholder reports of other mutual funds. The hypothetical account values and expenses may not be used to estimate the actual ending account balance or expenses you paid for the period.
Please note that the expenses shown in these tables are meant to highlight your ongoing expenses only and do not reflect any transaction costs, such as sales charges (loads) or redemption fees. If these transaction costs had been included, your costs would have been higher. The "Expenses Paid per $1,000" line of the tables is useful in comparing ongoing expenses only and will not help you determine the relative total expenses of owning different funds.
5
Credit Suisse Multialternative Strategy Fund
Annual Investment Adviser's Report (continued)
October 31, 2016 (unaudited)
Expenses and Value for a $1,000 Investment
for the six-month period ended October 31, 2016
Actual Fund Return | | Class I | | Class A | | Class C | |
Beginning Account Value 05/01/16 | | $ | 1,000.00 | | | $ | 1,000.00 | | | $ | 1,000.00 | | |
Ending Account Value 10/31/16 | | $ | 1,025.70 | | | $ | 1,023.80 | | | $ | 1,020.30 | | |
Expenses Paid per $1,000* | | $ | 4.48 | | | $ | 5.75 | | | $ | 9.55 | | |
Hypothetical 5% Fund Return | |
Beginning Account Value 05/01/16 | | $ | 1,000.00 | | | $ | 1,000.00 | | | $ | 1,000.00 | | |
Ending Account Value 10/31/16 | | $ | 1,020.71 | | | $ | 1,019.46 | | | $ | 1,015.69 | | |
Expenses Paid per $1,000* | | $ | 4.47 | | | $ | 5.74 | | | $ | 9.53 | | |
| | | Class I | | Class A | | Class C | |
Annualized Expense Ratios* | | | 0.88 | % | | | 1.13 | % | | | 1.88 | % | |
* Expenses are equal to the Fund's annualized expense ratio for each share class, multiplied by the average account value over the period, multiplied by 184/366 to reflect the one-half year period.
The "Expenses Paid per $1,000" and the "Annualized Expense Ratios" in the tables are based on actual expenses paid by the Fund during the period, net of fee waivers and/or actual expense reimbursements, if applicable. If those fee waivers and/or expense reimbursements had not been in effect, the Fund's actual expenses would have been higher. Expenses do not reflect additional charges and expenses that are, or may be, imposed under the variable contracts or plans. Such charges and expenses are described in the prospectus of the insurance company separate account or in the plan documents or other informational materials supplied by plan sponsors. The Fund's expenses should be considered with these charges and expenses in evaluating the overall cost of investing in the separate account.
For more information, please refer to the Fund's Prospectus.
6
Credit Suisse Multialternative Strategy Fund
Annual Investment Adviser's Report (continued)
October 31, 2016 (unaudited)
Investment Type Breakdown*
| | | Long | | Short | | Net | |
Common Stocks | | | 2.54 | % | | | (0.61 | )% | | | 1.93 | % | |
Exchange Traded Fund | | | 3.10 | | | | 0.00 | | | | 3.10 | | |
Rights | | | 0.01 | | | | 0.00 | | | | 0.01 | | |
Short-term Investment1 | | | 94.96 | | | | 0.00 | | | | 94.96 | | |
Total | | | 100.61 | % | | | (0.61 | )% | | | 100.00 | % | |
* Expressed as a percentage of total long (short) investments, (excluding securities lending collateral, if applicable) and may vary over time.
1 Primarily reflects cash invested in State Street Bank and Trust Co. Euro Time Deposit, for which the purchases of securities have been executed but not yet settled at October 31, 2016, if applicable.
7
Credit Suisse Multialternative Strategy Fund
Consolidated Schedule of Investments
October 31, 2016
| | | Number of
Shares | | Value | |
| LONG POSITIONS (5.2%) | |
| COMMON STOCKS (2.3%) | |
| BERMUDA (0.1%) | |
| Insurance (0.1%) | |
Endurance Specialty Holdings, Ltd. | | | 746 | | | $ | 68,595 | | |
| FRANCE (0.1%) | |
| Energy Equipment & Services (0.1%) | |
Technip S.A. | | | 1,281 | | | | 84,900 | | |
| Oil, Gas & Consumable Fuels (0.0%) | |
Etablissements Maurel et Prom(1) | | | 6,513 | | | | 28,629 | | |
| | | | 113,529 | | |
| GERMANY (0.1%) | |
| Machinery (0.1%) | |
SLM Solutions Group AG(1),(2) | | | 1,376 | | | | 45,402 | | |
| Semiconductor Equipment & Products (0.0%) | |
AIXTRON SE(1) | | | 4,090 | | | | 19,427 | | |
| | | | 64,829 | | |
| IRELAND (0.0%) | |
| Software (0.0%) | |
Fleetmatics Group PLC(1) | | | 730 | | | | 43,727 | | |
| NETHERLANDS (0.0%) | |
| Insurance (0.0%) | |
Delta Lloyd N.V. | | | 8,147 | | | | 49,149 | | |
| SWEDEN (0.0%) | |
| Machinery (0.0%) | |
Haldex AB | | | 3,361 | | | | 43,402 | | |
| UNITED KINGDOM (0.1%) | |
| Capital Markets (0.0%) | |
| SVG Capital PLC(1) | | | 964 | | | | 8,264 | | |
| Diversified Financial Services (0.1%) | |
London Stock Exchange Group PLC | | | 4,010 | | | | 137,388 | | |
| | | | 145,652 | | |
| UNITED STATES (1.9%) | |
| Airlines (0.0%) | |
Virgin America, Inc.(1) | | | 773 | | | | 42,013 | | |
| Auto Components (0.0%) | |
Federal-Mogul Holdings Corp.(1) | | | 992 | | | | 9,186 | | |
| Biotechnology (0.0%) | |
Cepheid (1) | | | 919 | | | | 48,615 | | |
See Accompanying Notes to Consolidated Financial Statements.
8
Credit Suisse Multialternative Strategy Fund
Consolidated Schedule of Investments (continued)
October 31, 2016
| | | Number of
Shares | | Value | |
| LONG POSITIONS (continued) | |
| COMMON STOCKS (continued) | |
UNITED STATES | |
| Chemicals (0.3%) | |
Chemtura Corp.(1) | | | 1,315 | | | $ | 43,132 | | |
E.I. Du Pont de Nemours & Co. | | | 1,733 | | | | 119,213 | | |
Monsanto Co. | | | 1,255 | | | | 126,466 | | |
The Valspar Corp. | | | 646 | | | | 64,342 | | |
| | | | 353,153 | | |
| Commercial Services & Supplies (0.0%) | |
G&K Services, Inc., Class A | | | 426 | | | | 40,342 | | |
| Computers & Peripherals (0.1%) | |
Lexmark International, Inc., Class A | | | 1,374 | | | | 54,534 | | |
| Diversified Consumer Services (0.1%) | |
Apollo Education Group, Inc.(1) | | | 5,821 | | | | 51,167 | | |
| Diversified Telecommunication Services (0.0%) | |
inContact, Inc.(1) | | | 2,284 | | | | 31,770 | | |
| Electric Utilities (0.0%) | |
The Empire District Electric Co. | | | 1,099 | | | | 37,619 | | |
| Electronic Equipment, Instruments & Components (0.1%) | |
DTS, Inc. | | | 700 | | | | 29,645 | | |
Ingram Micro, Inc., Class A | | | 1,613 | | | | 60,004 | | |
Rofin-Sinar Technologies, Inc.(1) | | | 770 | | | | 25,063 | | |
| | | | 114,712 | | |
| Food & Staples Retailing (0.1%) | |
Rite Aid Corp.(1) | | | 8,304 | | | | 55,720 | | |
| Food Products (0.1%) | |
The WhiteWave Foods Co.(1) | | | 1,347 | | | | 73,398 | | |
| Healthcare Equipment & Supplies (0.1%) | |
Alere, Inc.(1) | | | 933 | | | | 41,686 | | |
St. Jude Medical, Inc. | | | 1,313 | | | | 102,204 | | |
| | | | 143,890 | | |
| Healthcare Providers & Services (0.2%) | |
Cigna Corp. | | | 866 | | | | 102,907 | | |
Humana, Inc. | | | 622 | | | | 106,691 | | |
| | | | 209,598 | | |
| Independent Power Producers & Energy Traders (0.0%) | |
Talen Energy Corp.(1) | | | 2,962 | | | | 41,261 | | |
| Insurance (0.1%) | |
Genworth Financial, Inc., Class A(1) | | | 12,462 | | | | 51,593 | | |
See Accompanying Notes to Consolidated Financial Statements.
9
Credit Suisse Multialternative Strategy Fund
Consolidated Schedule of Investments (continued)
October 31, 2016
| | | Number of
Shares | | Value | |
| LONG POSITIONS (continued) | |
| COMMON STOCKS (continued) | |
UNITED STATES | |
| Internet Software & Services (0.2%) | |
Cvent, Inc.(1) | | | 1,112 | | | $ | 34,717 | | |
LinkedIn Corp., Class A(1) | | | 461 | | | | 87,405 | | |
Rackspace Hosting, Inc.(1) | | | 1,745 | | | | 55,735 | | |
| | | | 177,857 | | |
| Machinery (0.0%) | |
Joy Global, Inc. | | | 1,758 | | | | 48,925 | | |
| Media (0.0%) | |
Carmike Cinemas, Inc.(1),(2) | | | 1,021 | | | | 33,336 | | |
| Mortgage Real Estate Investment Trusts (0.0%) | |
Colony Capital, Inc., Class A | | | 2,460 | | | | 46,765 | | |
| Real Estate Investment Trusts (0.1%) | |
NorthStar Realty Finance Corp. | | | 3,432 | | | | 49,833 | | |
| Semiconductor Equipment & Products (0.1%) | |
Intersil Corp., Class A | | | 2,234 | | | | 49,327 | | |
Linear Technology Corp. | | | 1,410 | | | | 84,684 | | |
| | | | 134,011 | | |
| Software (0.1%) | |
Infoblox, Inc.(1) | | | 1,480 | | | | 39,220 | | |
Interactive Intelligence Group, Inc.(1) | | | 659 | | | | 39,836 | | |
NetSuite, Inc.(1) | | | 655 | | | | 60,994 | | |
| | | | 140,050 | | |
| Specialty Retail (0.1%) | |
Cabela's, Inc.(1) | | | 945 | | | | 58,222 | | |
CST Brands, Inc. | | | 1,111 | | | | 53,350 | | |
| | | | 111,572 | | |
| Thrifts & Mortgage Finance (0.1%) | |
Astoria Financial Corp. | | | 2,607 | | | | 38,140 | | |
EverBank Financial Corp. | | | 2,339 | | | | 45,166 | | |
| | | | 83,306 | | |
| | | | 2,184,226 | | |
| TOTAL COMMON STOCKS (Cost $2,743,723) | | | 2,713,109 | | |
| EXCHANGE TRADED FUND (2.9%) | |
| UNITED STATES (2.9%) | |
| Diversified Financial Services (2.9%) | |
Powershares QQQ Trust Series 1 | | | 28,312 | | | | 3,312,221 | | |
| TOTAL EXCHANGE TRADED FUND (Cost $3,320,856) | | | 3,312,221 | | |
See Accompanying Notes to Consolidated Financial Statements.
10
Credit Suisse Multialternative Strategy Fund
Consolidated Schedule of Investments (continued)
October 31, 2016
| | | Number of
Rights | | Value | |
| LONG POSITIONS (continued) | |
| RIGHTS (0.0%) | |
| UNITED STATES (0.0%) | |
| Biotechnology (0.0%) | |
Trius Therapeutics, Inc.(1) | | | 400 | | | $ | 52 | | |
Shire Pharmaceuticals International(1) | | | 5,532 | | | | 6,141 | | |
| TOTAL RIGHTS (Cost $6,141) | | | 6,193 | | |
| SHORT-TERM INVESTMENTS (87.3%) | |
| | | Number of
Shares | | | |
State Street Navigator Securities Lending Government Money Market Portfolio, 0.27%(3) | | | 124,917 | | | | 124,917 | | |
| | | Par
(000) | | | |
State Street Bank and Trust Co. Euro Time Deposit, 0.010% 11/01/2016
(Cost $101,499,612) | | $ | 101,500 | | | | 101,499,612 | | |
| TOTAL SHORT-TERM INVESTMENTS (Cost $101,624,529) | | | 101,624,529 | | |
| TOTAL INVESTMENTS AT VALUE/LONG POSITIONS (92.5%) (Cost $107,695,249) | | | 107,656,052 | | |
| TOTAL SECURITIES SOLD SHORT (-0.6%) (Proceeds $647,145) | | | (649,308 | ) | |
| OTHER ASSETS IN EXCESS OF LIABILITIES (8.1%) | | | 9,361,028 | | |
| NET ASSETS (100.0%) | | $ | 116,367,772 | | |
| | | Number of
Shares | | | |
| SHORT POSITIONS (-0.6%) | |
| COMMON STOCKS (-0.6%) | |
| GERMANY (-0.1%) | |
| Diversified Financial Services (-0.1%) | |
Deutsche Boerse AG | | | (1,773 | ) | | | (132,387 | ) | |
| UNITED STATES (-0.5%) | |
| Capital Markets (-0.1%) | |
NorthStar Asset Management Group, Inc. | | | (7,381 | ) | | | (101,120 | ) | |
| Chemicals (-0.1%) | |
The Dow Chemical Co. | | | (2,222 | ) | | | (119,566 | ) | |
| Energy Equipment & Services (-0.1%) | |
FMC Technologies, Inc.(1) | | | (2,563 | ) | | | (82,708 | ) | |
| Healthcare Equipment & Supplies (-0.1%) | |
Abbott Laboratories | | | (1,143 | ) | | | (44,851 | ) | |
| Healthcare Providers & Services (-0.1%) | |
Aetna, Inc. | | | (521 | ) | | | (55,929 | ) | |
Anthem, Inc. | | | (446 | ) | | | (54,350 | ) | |
| | | | (110,279 | ) | |
| Semiconductor Equipment & Products (0.0%) | |
Analog Devices, Inc. | | | (327 | ) | | | (20,961 | ) | |
See Accompanying Notes to Consolidated Financial Statements.
11
Credit Suisse Multialternative Strategy Fund
Consolidated Schedule of Investments (continued)
October 31, 2016
| | | Number of
Shares | | Value | |
| SHORT POSITIONS (continued) | |
| COMMON STOCKS (continued) | |
UNITED STATES | |
| Thrifts & Mortgage Finance (0.0%) | |
New York Community Bancorp, Inc. | | | (2,607 | ) | | $ | (37,436 | ) | |
| | | | (516,921 | ) | |
| TOTAL SHORT POSITIONS (Proceeds $647,145) | | $ | (649,308 | ) | |
(1) Non-income producing security.
(2) Security or portion thereof is out on loan (See note 2-M).
(3) Represents security purchased with cash collateral received for securities on loan. The rate shown is the annualized one-day yield at October 31, 2016.
Forward Foreign Currency Contracts
Forward Foreign
Currency to be
Purchased (Local) | | Forward Foreign
Currency to be
Sold (Local) | | Expiration
Date | | Counterparty | | Value on
Settlement Date | | Current
Value/
Notional | | Net Unrealized
Appreciation
(Depreciation) | |
NOK | 22,922,379 | | | USD | 2,806,226 | | | 11/18/16 | | Societe Generale | | $ | 2,806,226 | | | $ | 2,778,032 | | | $ | (28,194 | ) | |
NZD | 4,041,006 | | | USD | 2,906,736 | | | 11/18/16 | | Societe Generale | | | 2,906,736 | | | | 2,889,082 | | | | (17,654 | ) | |
USD | 860,060 | | | CAD | 1,129,491 | | | 11/17/16 | | Societe Generale | | | (860,060 | ) | | | (842,837 | ) | | | 17,223 | | |
USD | 2,094,032 | | | SEK | 18,469,364 | | | 11/18/16 | | Societe Generale | | | (2,094,032 | ) | | | (2,048,713 | ) | | | 45,319 | | |
USD | 6,848,734 | | | EUR | 6,233,602 | | | 11/18/16 | | Societe Generale | | | (6,848,734 | ) | | | (6,837,596 | ) | | | 11,138 | | |
USD | 595,940 | | | JPY | 61,886,631 | | | 11/18/16 | | Societe Generale | | | (595,940 | ) | | | (589,227 | ) | | | 6,713 | | |
USD | 289,481 | | | AUD | 378,179 | | | 11/18/16 | | Societe Generale | | | (289,481 | ) | | | (287,652 | ) | | | 1,829 | | |
USD | 198,457 | | | GBP | 161,216 | | | 11/18/16 | | Societe Generale | | | (198,457 | ) | | | (196,889 | ) | | | 1,568 | | |
USD | 2,619,275 | | | CHF | 2,592,375 | | | 11/18/16 | | Societe Generale | | | (2,619,275 | ) | | | (2,623,547 | ) | | | (4,272 | ) | |
| | | $ | 33,670 | | |
Futures Contracts
Contract Description | | Currency | | Expiration
Date | | Number of
Contracts | | Notional
Value | | Net Unrealized
Appreciation
(Depreciation) | |
Contracts to Purchase | |
Foreign Exchange Contracts | | | | | | | | | | | |
| AUD Currency Futures | | USD | | | | Dec 2016 | | | 30 | | | $ | 2,277,600 | | | $ | 46,998 | | |
| JPY Currency Futures | | USD | | | | Dec 2016 | | | 10 | | | | 1,193,188 | | | | (29,116 | ) | |
| | | $ | 17,882 | | |
Index Contracts | |
EURO Stoxx 50 Index Futures | | EUR | | | | Dec 2016 | | | 54 | | | | 1,807,218 | | | $ | 6,992 | | |
FTSE 100 Index Futures | | GBP | | | | Dec 2016 | | | 23 | | | | 1,945,711 | | | | 85,883 | | |
Hang Seng Index Futures | | HKD | | | | Nov 2016 | | | 14 | | | | 2,067,545 | | | | (62,269 | ) | |
Nikkei 225 Index Futures OSE | | JPY | | | | Dec 2016 | | | 8 | | | | 1,327,687 | | | | 12,815 | | |
S&P 500 E Mini Index Futures | | USD | | | | Dec 2016 | | | 11 | | | | 1,166,055 | | | | (17,578 | ) | |
| | | $ | 25,843 | | |
See Accompanying Notes to Consolidated Financial Statements.
12
Credit Suisse Multialternative Strategy Fund
Consolidated Schedule of Investments (continued)
October 31, 2016
Futures Contracts (continued)
Contract Description | | Currency | | Expiration
Date | | Number of
Contracts | | Notional
Value | | Net Unrealized
Appreciation
(Depreciation) | |
Interest Rate Contracts | |
German EURO Bund Futures | | EUR | | | | Dec 2016 | | | 1 | | | $ | 177,771 | | | $ | (4,374 | ) | |
Long Gilt Futures | | GBP | | | | Dec 2016 | | | 2 | | | | 306,055 | | | | (14,336 | ) | |
| | | $ | (18,710 | ) | |
Contracts to Sell | |
Foreign Exchange Contracts | |
| CAD Currency Futures | | USD | | | | Dec 2016 | | | (52 | ) | | | (3,875,300 | ) | | $ | 23,838 | | |
| EUR Currency Futures | | USD | | | | Dec 2016 | | | (37 | ) | | | (5,081,488 | ) | | | 36,598 | | |
| GBP Currency Futures | | USD | | | | Dec 2016 | | | (23 | ) | | | (1,761,512 | ) | | | 119,786 | | |
| | | $ | 180,222 | | |
Interest Rate Contracts | |
10YR JGB Mini Futures | | JPY | | | | Dec 2016 | | | (12 | ) | | | (1,732,198 | ) | | $ | 1,481 | | |
10YR U.S. Treasury Note Futures | | USD | | | | Dec 2016 | | | (10 | ) | | | (1,296,250 | ) | | | (176 | ) | |
| | | $ | 1,305 | | |
Net unrealized appreciation (depreciation) | | $ | 206,542 | | |
Total Return Swap Contracts
Currency | | Notional
Amount | | Expiration
Date | | Counterparty | | Receive | | Pay | | Net Unrealized
Appreciation
(Depreciation) | |
USD | | | | $ | 3,451,397 | | |
11/16/16 | |
Barclays Bank plc | | Barclays Hedging
Insights Index | |
Fixed Rate | | $ | 88,683 | | |
USD | | | | | 2,118,685 | | |
10/18/17 | |
BNP Paribas | |
Fee Plus LIBOR | | Health Care Select
Sector Index | | | 85,247 | | |
USD | | | | | 1,608,053 | | |
10/18/17 | |
BNP Paribas | | Russell 2000 Total
Return Index | |
Fee Plus LIBOR | | | (33,817 | ) | |
USD | | | | | 669,972 | | |
11/16/16 | |
Goldman Sachs | | Bloomberg
Agriculture Index | |
Fixed Rate | | | 103 | | |
USD | | | | | 1,083,457 | | |
11/16/16 | |
Goldman Sachs | | Bloomberg
Energy Index | |
Fixed Rate | | | (89,617 | ) | |
USD | | | | | 1,435,550 | | |
11/16/16 | |
Goldman Sachs | | Bloomberg Industrial
Metals Index | |
Fixed Rate | | | 71,001 | | |
USD | | | | | 388,384 | | |
11/16/16 | |
Goldman Sachs | |
Fixed Rate | | Bloomberg Precious
Metals Index | | | (3,236 | ) | |
USD | | | | | 3,441,187 | | |
11/16/16 | |
Goldman Sachs | | Goldman Sachs RP
Equity World Long
Short Series 53
Excess Return Index | |
Fixed Rate | | | (34,070 | ) | |
USD | | | | | 787,302 | | |
11/16/16 | |
Goldman Sachs | | Bloomberg
Agriculture Index | |
Fixed Rate | | | 3,136 | | |
USD | | | | | 1,920,000 | | |
12/20/16 | |
Goldman Sachs | | iBoxx $ Liquid
High Yield Index | |
Fee Plus LIBOR | | | 205,026 | | |
See Accompanying Notes to Consolidated Financial Statements.
13
Credit Suisse Multialternative Strategy Fund
Consolidated Schedule of Investments (continued)
October 31, 2016
Total Return Swap Contracts (continued)
Currency | | Notional
Amount | | Expiration
Date | | Counterparty | | Receive | | Pay | | Net Unrealized
Appreciation
(Depreciation) | |
iBoxx $ Liquid
USD | | $ | 4,295,681 | | | 12/20/16 | | Goldman Sachs | | High Yield Index | | Fee Plus LIBOR | | $ | 299,209 | | |
USD | | | | | 1,129,135 | | | 06/16/17 | | Goldman Sachs | | MSCI EAFE Index | | Fee Plus LIBOR | | | 6,533 | | |
USD | | | | | 923,402 | | | 09/18/17 | | Goldman Sachs | | MSCI EAFE Index | | Fee Plus LIBOR | | | 5,343 | | |
USD | | | | | 2,778,570 | | |
10/18/17 | |
Goldman Sachs | |
Fee Plus LIBOR | | MSCI Daily TR
Emerging
Markets Index | | | 10,025 | | |
USD | | | | | 8,673,238 | | |
11/16/16 | |
JPMorgan Chase | | J.P. Morgan Seasonal
Spreads Portfolio
Commodity Index | |
Fixed Rate | | | (2,202 | ) | |
USD | | | | | 6,943,466 | | |
11/16/16 | |
JPMorgan Chase | | JPMorgan
Helix 2 Index | |
Fixed Rate | | | 6,904 | | |
USD | | | | | 999,479 | | |
12/20/16 | |
JPMorgan Chase | | iBoxx $ Liquid
High Yield Index | |
Fee Plus LIBOR | | | 20,255 | | |
USD | | | | | 7,300,000 | | |
12/20/16 | |
JPMorgan Chase | | iBoxx $ Liquid
High Yield Index | |
Fee Plus LIBOR | | | 125,100 | | |
USD | | | | | 2,995,204 | | |
12/20/16 | |
JPMorgan Chase | | iBoxx $ Liquid
High Yield Index | |
Fee Plus LIBOR | | | 40,742 | | |
USD | | | | | 3,500,000 | | |
03/20/17 | |
JPMorgan Chase | | iBoxx $ Liquid
High Yield Index | |
Fee Plus LIBOR | | | 58,529 | | |
USD | | | | | 1,387,882 | | |
03/20/17 | |
JPMorgan Chase | | iBoxx $ Liquid
High Yield Index | |
Fee Plus LIBOR | | | 87,573 | | |
USD | | | | | 4,000,000 | | |
06/20/17 | |
JPMorgan Chase | |
Fee Plus LIBOR | | iBoxx $ Liquid
High Yield Index | | | 20,252 | | |
USD | | | | | 1,957,590 | | |
04/26/17 | |
Morgan Stanley | | NASDAQ-100
Total Return | |
Fee Plus LIBOR | | | (23,834 | ) | |
USD | | | | | 1,287,022 | | |
05/17/17 | |
Morgan Stanley | |
MSCI EAFE Index | |
Fee Plus LIBOR | | | 7,446 | | |
USD | | | | | 5,394,375 | | |
06/20/17 | |
Societe Generale | | iBoxx $ Liquid
High Yield Index | |
Fee Plus LIBOR | | | 50,348 | | |
| | | $ | 1,004,679 | | |
Written Options
Number of
Contracts | | Put Written Options | | Expiration
Date | | Premiums
Received | | Current
Value | | Net Unrealized
Appreciation
(Depreciation) | |
| | 22 | | | S&P 500 Index, Strike @ $2,140 | | 11/18/16 | | $ | 75,569 | | | $ | (85,250 | ) | | $ | (9,681 | ) | |
See Accompanying Notes to Consolidated Financial Statements.
14
Credit Suisse Multialternative Strategy Fund
Consolidated Schedule of Investments (continued)
October 31, 2016
Currency Abbreviations:
AUD = Australian Dollar
CAD = Canadian Dollar
CHF = Swiss Franc
EUR = Euro
GBP = British Pound
HKD = Hong Kong Dollar
JPY = Japanese Yen
NOK = Norwegian Krone
NZD = New Zealand Dollar
SEK = Swedish Krona
USD = United States Dollar
See Accompanying Notes to Consolidated Financial Statements.
15
Credit Suisse Multialternative Strategy Fund
Consolidated Statement of Assets and Liabilities
October 31, 2016
Assets | |
Investments at value, including collateral for securities on loan of $124,917
(Cost $107,695,249) (Note 2) | | $ | 107,656,0521 | | |
Cash | | | 98,808 | | |
Foreign currency at value (Cost $575,480) | | | 574,767 | | |
Cash segregated held at brokers for futures contracts, swap contracts,
written options and securities sold short (Note 2) | | | 7,461,135 | | |
Unrealized appreciation on open swap contracts (Note 2) | | | 1,191,455 | | |
Variation margin receivable on futures contracts (Note 2) | | | 764,685 | | |
Receivable for investments sold | | | 136,913 | | |
Unrealized appreciation on forward currency contracts (Note 2) | | | 83,790 | | |
Receivable for Fund shares sold | | | 34,670 | | |
Net receivable for open swap contracts | | | 3,346 | | |
Interest receivable | | | 28 | | |
Prepaid expenses and other assets | | | 14,632 | | |
Total assets | | | 118,020,281 | | |
Liabilities | |
Investment advisory fee payable (Note 3) | | | 84,917 | | |
Administrative services fee payable (Note 3) | | | 13,421 | | |
Shareholder servicing/Distribution fee payable (Note 3) | | | 361 | | |
Securities sold short, at value (Proceeds $647,145) (Note 2) | | | 649,308 | | |
Payable for Fund shares redeemed | | | 244,440 | | |
Unrealized depreciation on open swap contracts (Note 2) | | | 186,776 | | |
Payable upon return of securities loaned (Note 2) | | | 124,917 | | |
Outstanding written options, at value (Proceeds $75,569) (Note 2) | | | 85,250 | | |
Payable for investments purchased | | | 52,016 | | |
Unrealized depreciation on forward currency contracts (Note 2) | | | 50,120 | | |
Net payable for terminated total return swap contracts | | | 30,094 | | |
Trustees' fee payable | | | 8,299 | | |
Dividend expense payable on securities sold short | | | 645 | | |
Upfront payments received on swap contracts (Note 2) | | | 17,379 | | |
Accrued expenses | | | 104,566 | | |
Total liabilities | | | 1,652,509 | | |
Net Assets | |
Capital stock, $.001 par value (Note 6) | | | 11,203 | | |
Paid-in capital (Note 6) | | | 114,097,949 | | |
Distributions in excess of net investment income | | | (703,945 | ) | |
Accumulated net realized gain from investments, futures contracts, swap contracts,
written options, securities sold short and foreign currency transactions | | | 1,768,621 | | |
Net unrealized appreciation from investments, futures contracts, swap contracts,
written options, securities sold short and foreign currency translations | | | 1,193,944 | | |
Net assets | | $ | 116,367,772 | | |
I Shares | |
Net assets | | $ | 114,951,302 | | |
Shares outstanding | | | 11,065,854 | | |
Net asset value and offering price per share | | $ | 10.39 | | |
A Shares | |
Net assets | | $ | 1,319,323 | | |
Shares outstanding | | | 127,918 | | |
Net asset value and redemption price per share | | $ | 10.31 | | |
Maximum offering price per share (net asset value/(1-5.25%)) | | $ | 10.88 | | |
C Shares | |
Net assets | | $ | 97,147 | | |
Shares outstanding | | | 9,646 | | |
Net asset value, offering price and redemption price per share | | $ | 10.07 | | |
1 Including $78,738 of securities on loan.
See Accompanying Notes to Consolidated Financial Statements.
16
Credit Suisse Multialternative Strategy Fund
Consolidated Statement of Operations
For the Year Ended October 31, 2016
Investment Income | |
Dividends | | $ | 123,976 | | |
Securities lending (net of rebates) | | | 5,193 | | |
Foreign taxes withheld | | | (79 | ) | |
Total investment income | | | 129,090 | | |
Expenses | |
Investment advisory fees (Note 3) | | | 954,320 | | |
Administrative services fees (Note 3) | | | 109,535 | | |
Shareholder servicing/Distribution fees (Note 3) | |
Class A | | | 2,686 | | |
Class C | | | 1,412 | | |
Custodian fees | | | 119,315 | | |
Transfer agent fees (Note 3) | | | 75,399 | | |
Dividend expense for securities sold short | | | 60,217 | | |
Registration fees | | | 57,010 | | |
Audit and tax fees | | | 52,119 | | |
Legal fees | | | 39,110 | | |
Trustees' fees | | | 30,430 | | |
Printing fees | | | 28,652 | | |
Commitment fees (Note 4) | | | 13,600 | | |
Insurance expense | | | 456 | | |
Miscellaneous expense | | | 22,587 | | |
Total expenses | | | 1,566,848 | | |
Less: fees waived (Note 3) | | | (645,435 | ) | |
Net expenses | | | 921,413 | | |
Net investment loss | | | (792,323 | ) | |
Net Realized and Unrealized Gain (Loss) from Investments, Futures Contracts, Swap Contracts,
Written Options, Securities Sold Short and Foreign Currency Related Items | |
Net realized loss from investments in unaffiliated issuers | | | (894,998 | ) | |
Net realized gain from investment in affiliated issuer | | | 166,510 | | |
Net realized gain from futures contracts | | | 431,523 | | |
Net realized gain from swap contracts | | | 809,069 | | |
Net realized gain from written options | | | 143,477 | | |
Net realized gain from securities sold short | | | 210,415 | | |
Net realized gain from foreign currency transactions | | | 669,012 | | |
Net change in unrealized appreciation (depreciation) from investments | | | 68,732 | | |
Net change in unrealized appreciation (depreciation) from investments in affiliated issuer | | | (149,163 | ) | |
Net change in unrealized appreciation (depreciation) from futures contracts | | | 206,542 | | |
Net change in unrealized appreciation (depreciation) from swap contracts | | | 1,001,433 | | |
Net change in unrealized appreciation (depreciation) from written options | | | (9,681 | ) | |
Net change in unrealized appreciation (depreciation) from securities sold short | | | (48,280 | ) | |
Net change in unrealized appreciation (depreciation) from foreign currency translations | | | 288 | | |
Net realized and unrealized gain from investments, futures contracts, swap contracts,
written options, securities sold short and foreign currency related items | | | 2,604,879 | | |
Net increase in net assets resulting from operations | | $ | 1,812,556 | | |
See Accompanying Notes to Consolidated Financial Statements.
17
Credit Suisse Multialternative Strategy Fund
Consolidated Statement of Changes in Net Assets
| | | For the Year
Ended
October 31, 2016 | | For the Year
Ended
October 31, 2015 | |
From Operations | |
Net investment loss | | $ | (792,323 | ) | | $ | (33,301 | ) | |
Net realized gain from investments, futures contracts, swap contracts,
written options, securities sold short and foreign currency transactions | | | 1,535,008 | | | | 341,831 | | |
Net change in unrealized appreciation (depreciation) from investments,
futures contracts, swap contracts, written options, securities sold short
and foreign currency translations | | | 1,069,871 | | | | (43,476 | ) | |
Net increase in net assets resulting from operations | | | 1,812,556 | | | | 265,054 | | |
From Dividends and Distributions | |
Dividends from net investment income | |
Class I | | | — | | | | (199,923 | ) | |
Class A | | | — | | | | (6,054 | ) | |
Class C | | | — | | | | (9,655 | ) | |
Distributions from net realized gains | |
Class I | | | (239,111 | ) | | | (128,472 | ) | |
Class A | | | (3,212 | ) | | | (4,564 | ) | |
Class C | | | (753 | ) | | | (14,732 | ) | |
Net decrease in net assets resulting from dividends and distributions | | | (243,076 | ) | | | (363,400 | ) | |
| From Capital Share Transactions (Note 6) | |
Proceeds from sale of shares | | | 121,506,721 | | | | 2,470,503 | | |
Reinvestment of dividends and distributions | | | 242,222 | | | | 360,777 | | |
Net asset value of shares redeemed | | | (20,664,750 | ) | | | (2,251,494 | ) | |
Net increase in net assets from capital share transactions | | | 101,084,193 | | | | 579,786 | | |
Net increase in net assets | | | 102,653,673 | | | | 481,440 | | |
Net Assets | |
Beginning of year | | | 13,714,099 | | | | 13,232,659 | | |
End of year | | $ | 116,367,772 | | | $ | 13,714,099 | | |
Distributions in excess of net investment income | | $ | (703,945 | ) | | $ | (36,205 | ) | |
See Accompanying Notes to Consolidated Financial Statements.
18
Credit Suisse Multialternative Strategy Fund
Consolidated Financial Highlights
(For a Class I Share of the Fund Outstanding Throughout Each Period)
| | | For the Year Ended October 31, | |
| | | 2016 | | 2015 | | 2014 | | 2013 | | 20121 | |
Per share data | |
Net asset value, beginning of period | | $ | 10.36 | | | $ | 10.42 | | | $ | 10.482 | | | $ | 9.95 | | | $ | 10.00 | | |
INVESTMENT OPERATIONS | |
Net investment income (loss)3 | | | (0.08 | ) | | | (0.01 | ) | | | (0.15 | ) | | | (0.15 | ) | | | 0.01 | | |
Net gain (loss) from investments, futures contracts,
swap contracts, written options, securities sold
short and foreign currency related items
(both realized and unrealized) | | | 0.13 | | | | 0.25 | | | | 0.42 | | | | 0.75 | | | | (0.06 | ) | |
Total from investment operations | | | 0.05 | | | | 0.24 | | | | 0.27 | | | | 0.60 | | | | (0.05 | ) | |
LESS DIVIDENDS AND DISTRIBUTIONS | |
Dividends from net investment income | | | — | | | | (0.18 | ) | | | — | | | | (0.06 | ) | | | — | | |
Distributions from net realized gains | | | (0.02 | ) | | | (0.12 | ) | | | (0.33 | ) | | | (0.01 | ) | | | — | | |
Total dividends and distributions | | | (0.02 | ) | | | (0.30 | ) | | | (0.33 | ) | | | (0.07 | ) | | | — | | |
Net asset value, end of period | | $ | 10.392 | | | $ | 10.36 | | | $ | 10.42 | | | $ | 10.482 | | | $ | 9.95 | | |
Total return4 | | | 0.53 | %2 | | | 2.33 | % | | | 2.64 | % | | | 6.11 | % | | | (0.50 | )% | |
RATIOS AND SUPPLEMENTAL DATA | |
Net assets, end of period (000s omitted) | | $ | 114,951 | | | $ | 13,015 | | | $ | 11,451 | | | $ | 5,409 | | | $ | 4,904 | | |
Ratio of net expenses to average net assets | | | 0.91 | % | | | 1.56 | % | | | 1.85 | % | | | 1.78 | % | | | 1.79 | %5 | |
Ratio of expenses to average net assets
excluding securities sold short dividend
expense | | | 0.85 | % | | | 1.32 | % | | | 1.70 | % | | | 1.70 | % | | | 1.70 | %5 | |
Ratio of net investment income (loss) to
average net assets | | | (0.79 | )% | | | (0.14 | )% | | | (1.47 | )% | | | (1.49 | )% | | | 0.21 | %5 | |
Decrease reflected in above operating expense
ratios due to waivers/reimbursements | | | 0.65 | % | | | 2.34 | % | | | 2.48 | % | | | 6.31 | % | | | 9.22 | %5 | |
Portfolio turnover rate | | | 1,021 | % | | | 292 | % | | | 431 | % | | | 284 | % | | | 228 | % | |
1 For the period March 30, 2012 (inception date) through October 31, 2012.
2 Includes adjustments in accordance with accounting principles generally accepted in the United States of America and as such, the net asset values for financial reporting purposes and the returns based upon net asset values may differ from the net asset values and returns for shareholder transactions.
3 Per share information is calculated using the average shares outstanding method.
4 Total returns are historical and include change in share price and reinvestment of all dividends and distributions. Had certain expenses not been reduced during the periods shown, total returns would have been lower. Total returns for periods less than one year are not annualized.
5 Annualized.
See Accompanying Notes to Consolidated Financial Statements.
19
Credit Suisse Multialternative Strategy Fund
Consolidated Financial Highlights
(For a Class A Share of the Fund Outstanding Throughout Each Period)
| | | For the Year Ended October 31, | |
| | | 2016 | | 2015 | | 2014 | | 2013 | | 20121 | |
Per share data | |
Net asset value, beginning of period | | $ | 10.31 | | | $ | 10.37 | | | $ | 10.462 | | | $ | 9.93 | | | $ | 10.00 | | |
INVESTMENT OPERATIONS | |
Net investment loss3 | | | (0.10 | ) | | | (0.05 | ) | | | (0.18 | ) | | | (0.18 | ) | | | (0.01 | ) | |
Net gain (loss) from investments, futures contracts,
swap contracts, written options, securities sold
short and foreign currency related items
(both realized and unrealized) | | | 0.12 | | | | 0.26 | | | | 0.42 | | | | 0.76 | | | | (0.06 | ) | |
Total from investment operations | | | 0.02 | | | | 0.21 | | | | 0.24 | | | | 0.58 | | | | (0.07 | ) | |
LESS DIVIDENDS AND DISTRIBUTIONS | |
Dividends from net investment income | | | — | | | | (0.15 | ) | | | — | | | | (0.04 | ) | | | — | | |
Distributions from net realized gains | | | (0.02 | ) | | | (0.12 | ) | | | (0.33 | ) | | | (0.01 | ) | | | — | | |
Total dividends and distributions | | | (0.02 | ) | | | (0.27 | ) | | | (0.33 | ) | | | (0.05 | ) | | | — | | |
Net asset value, end of period | | $ | 10.31 | | | $ | 10.31 | | | $ | 10.37 | | | $ | 10.462 | | | $ | 9.93 | | |
Total return4 | | | 0.24 | % | | | 2.08 | % | | | 2.35 | % | | | 5.96 | % | | | (0.70 | )% | |
RATIOS AND SUPPLEMENTAL DATA | |
Net assets, end of period (000s omitted) | | $ | 1,319 | | | $ | 320 | | | $ | 438 | | | $ | 324 | | | $ | 228 | | |
Ratio of net expenses to average net assets | | | 1.17 | % | | | 1.82 | % | | | 2.10 | % | | | 2.03 | % | | | 2.04 | %5 | |
Ratio of expenses to average net assets excluding
securities sold short dividend expense | | | 1.11 | % | | | 1.57 | % | | | 1.95 | % | | | 1.95 | % | | | 1.95 | %5 | |
Ratio of net investment loss to average net assets | | | (0.98 | )% | | | (0.44 | )% | | | (1.73 | )% | | | (1.75 | )% | | | (0.18 | )%5 | |
Decrease reflected in above operating expense
ratios due to waivers/reimbursements | | | 0.65 | % | | | 2.33 | % | | | 2.48 | % | | | 6.31 | % | | | 9.22 | %5 | |
Portfolio turnover rate | | | 1,021 | % | | | 292 | % | | | 431 | % | | | 284 | % | | | 228 | % | |
1 For the period March 30, 2012 (inception date) through October 31, 2012.
2 Includes adjustments in accordance with accounting principles generally accepted in the United States of America and as such, the net asset values for financial reporting purposes and the returns based upon net asset values may differ from the net asset values and returns for shareholder transactions.
3 Per share information is calculated using the average shares outstanding method.
4 Total returns are historical and include change in share price, reinvestment of all dividends and distributions and no sales charge. Had certain expenses not been reduced during the periods shown, total returns would have been lower. Total returns for periods less than one year are not annualized.
5 Annualized.
See Accompanying Notes to Consolidated Financial Statements.
20
Credit Suisse Multialternative Strategy Fund
Consolidated Financial Highlights
(For a Class C Share of the Fund Outstanding Throughout Each Period)
| | | For the Year Ended October 31, | |
| | | 2016 | | 2015 | | 2014 | | 2013 | | 20121 | |
Per share data | |
Net asset value, beginning of period | | $ | 10.14 | | | $ | 10.21 | | | $ | 10.372 | | | $ | 9.89 | | | $ | 10.00 | | |
INVESTMENT OPERATIONS | |
Net investment loss3 | | | (0.10 | ) | | | (0.12 | ) | | | (0.25 | ) | | | (0.25 | ) | | | (0.06 | ) | |
Net gain (loss) from investments, futures contracts,
swap contracts, written options, securities sold
short and foreign currency related items (both
realized and unrealized) | | | 0.05 | | | | 0.24 | | | | 0.42 | | | | 0.74 | | | | (0.05 | ) | |
Total from investment operations | | | (0.05 | ) | | | 0.12 | | | | 0.17 | | | | 0.49 | | | | (0.11 | ) | |
LESS DIVIDENDS AND DISTRIBUTIONS | |
Dividends from net investment income | | | — | | | | (0.07 | ) | | | — | | | | — | | | | — | | |
Distributions from net realized gains | | | (0.02 | ) | | | (0.12 | ) | | | (0.33 | ) | | | (0.01 | ) | | | — | | |
Total dividends and distributions | | | (0.02 | ) | | | (0.19 | ) | | | (0.33 | ) | | | (0.01 | ) | | | — | | |
Net asset value, end of period | | $ | 10.07 | | | $ | 10.14 | | | $ | 10.21 | | | $ | 10.372 | | | $ | 9.89 | | |
Total return4 | | | (0.45 | )% | | | 1.23 | % | | | 1.68 | % | | | 5.15 | % | | | (1.10 | )% | |
RATIOS AND SUPPLEMENTAL DATA | |
Net assets, end of period (000s omitted) | | $ | 97 | | | $ | 379 | | | $ | 1,344 | | | $ | 1,745 | | | $ | 1,074 | | |
Ratio of net expenses to average net assets | | | 1.98 | % | | | 2.57 | % | | | 2.85 | % | | | 2.77 | % | | | 2.79 | %5 | |
Ratio of expenses to average net assets
excluding securities sold short dividend expense | | | 1.91 | % | | | 2.32 | % | | | 2.70 | % | | | 2.70 | % | | | 2.70 | %5 | |
Ratio of net investment loss to average net assets | | | (0.99 | )% | | | (1.20 | )% | | | (2.48 | )% | | | (2.49 | )% | | | (1.00 | )%5 | |
Decrease reflected in above operating expense
ratios due to waivers/reimbursements | | | 0.81 | % | | | 2.33 | % | | | 2.48 | % | | | 6.31 | % | | | 9.22 | %5 | |
Portfolio turnover rate | | | 1,021 | % | | | 292 | % | | | 431 | % | | | 284 | % | | | 228 | % | |
1 For the period March 30, 2012 (inception date) through October 31, 2012.
2 Includes adjustments in accordance with accounting principles generally accepted in the United States of America and as such, the net asset values for financial reporting purposes and the returns based upon net asset values may differ from the net asset values and returns for shareholder transactions.
3 Per share information is calculated using the average shares outstanding method.
4 Total returns are historical and include change in share price, reinvestment of all dividends and distributions and no sales charge. Had certain expenses not been reduced during the periods shown, total returns would have been lower. Total returns for periods less than one year are not annualized.
5 Annualized.
See Accompanying Notes to Consolidated Financial Statements.
21
Credit Suisse Multialternative Strategy Fund
Notes to Consolidated Financial Statements
October 31, 2016
Credit Suisse Multialternative Strategy Fund (the "Fund"), a series of the Credit Suisse Opportunity Funds (the "Trust"), a Delaware statutory trust, is registered under the Investment Company Act of 1940, as amended (the "1940 Act"), as a non-diversified open-end management investment company that seeks to achieve total return consistent with the risk and return patterns of a diversified universe of hedge funds. The Trust was organized under the laws of the State of Delaware as a business trust on May 31, 1995.
Credit Suisse Asset Management, LLC ("Credit Suisse"), the investment adviser to the Fund, is registered as a Commodity Pool Operator with the Commodity Futures Trading Commission. The Fund intends to gain exposure to commodity derivatives through investing in a wholly-owned subsidiary, Credit Suisse Cayman Multialternative Strategy Fund, Ltd. (the "Subsidiary"), organized under the laws of the Cayman Islands. The Subsidiary invests in commodity-linked derivative instruments, such as swaps and futures. The Subsidiary may also invest in debt securities, some of which are intended to serve as margin or collateral for the Subsidiary's derivatives positions.
The Subsidiary is managed by the same portfolio managers that manage the Fund and the accompanying financial statements reflect the financial position of the Fund and the Subsidiary and the results of operations on a consolidated basis. The consolidated financial statements include portfolio holdings of the Fund and the Subsidiary and all intercompany transactions and balances have been eliminated. The Fund may invest up to 25% of its total assets in the Subsidiary. As of October 31, 2016, the Fund held $7,658,124 in the Subsidiary, representing 6.6% of the Fund's consolidated net assets. For the year ended October 31, 2016, the net realized loss on securities held in the Subsidiary was $446,437.
Subsequent references to the Fund within the Notes to Consolidated Financial Statements collectively refer to the Fund and the Subsidiary.
The Fund offers three classes of shares: Class I shares, Class A shares and Class C shares. Each class of shares represents an equal pro rata interest in the Fund, except the share classes bear different expenses, which reflect the differences in the range of services provided to them. Class A shares are sold subject to a front-end sales charge of up to 5.25%. Class C shares are sold subject to a CDSC of 1.00% if the shares are redeemed within the first year of purchase. Class I shares are sold without a sales charge.
22
Credit Suisse Multialternative Strategy Fund
Notes to Consolidated Financial Statements (continued)
October 31, 2016
Note 2. Significant Accounting Policies
The following is a summary of significant accounting policies followed by the Fund in the preparation of its consolidated financial statements. The policies are in accordance with accounting principles generally accepted in the United States of America ("GAAP"). The preparation of consolidated financial statements requires management to make estimates and assumptions that affect the reported amounts and disclosures in the consolidated financial statements. Actual results could differ from those estimates. The Fund is considered an investment company for financial reporting purposes under GAAP and follows Accounting Standard Codification ("ASC") Topic 946 — Financial Services — Investment Companies.
A) SECURITY VALUATION — The net asset value of the Fund is determined daily as of the close of regular trading on the New York Stock Exchange, Inc. (the "Exchange") on each day the Exchange is open for business. For certain international equity securities, in order to adjust for events which may occur between the close of the foreign exchanges and the close of the New York Stock Exchange, a fair valuation model may be used. This fair valuation model takes into account comparisons to the valuation of American Depository Receipts ("ADRs"), exchange-traded funds, futures contracts and certain indices, and these securities are categorized as Level 2. The valuations for fixed income securities (which may include, but are not limited to, corporate, government, municipal, mortgage-backed, collateralized mortgage obligations and asset-backed securities) and certain derivative instruments are typically the prices supplied by independent third party pricing services, which may use market prices or broker/dealer quotations or a variety of valuation techniques and methodologies. The independent third party pricing services use inputs that are observable such as issuer details, interest rates, yield curves, prepayment speeds, credit risks/spreads, default rates and quoted prices for similar securities. These pricing services generally price fixed income securities assuming orderly transactions of an institutional "round lot" size, but some trades occur in smaller "odd lot" sizes which may be effected at lower prices than institutional round lot trades. Structured note agreements are valued in accordance with a dealer-supplied valuation based on changes in the value of the underlying index. Option contracts on securities, currencies, indices, futures contracts, swaps and other instruments are valued at the mid-point between the last bid and ask quotations as of the close of trading on the exchange on which the option is traded. Futures contracts are valued daily at the settlement price established by the board of trade or exchange on which they are traded. Forward contracts are valued at the London closing spot rates and the London closing forward point rates on a daily basis. The currency forward contract
23
Credit Suisse Multialternative Strategy Fund
Notes to Consolidated Financial Statements (continued)
October 31, 2016
Note 2. Significant Accounting Policies (continued)
pricing model derives the differential in point rates to the expiration date of the forward and calculates its present value. Equity securities for which market quotations are available are valued at the last reported sales price or official closing price on the primary market or exchange on which they trade. The Fund may utilize a service provided by an independent third party which has been approved by the Board of Trustees (the "Board") to fair value certain securities. When fair value pricing is employed, the prices of securities used by the Fund to calculate its net asset value may differ from quoted or published prices for the same securities. If independent third party pricing services are unable to supply prices for a portfolio investment, or if the prices supplied are deemed by the investment adviser to be unreliable, the market price may be determined by the investment adviser using quotations from one or more brokers/dealers or at the transaction price if the security has recently been purchased and no value has yet been obtained from a pricing service or pricing broker. When reliable prices are not readily available, such as when the value of a security has been significantly affected by events after the close of the exchange or market on which the security is principally traded, but before the Fund calculates its net asset value, the Fund values these securities as determined in accordance with procedures approved and established by the Board.
The Fund uses valuation techniques to measure fair value that are consistent with the market approach and/or income approach, depending on the type of security and the particular circumstance. The market approach uses prices and other relevant information generated by market transactions involving identical or comparable securities. The income approach uses valuation techniques to discount estimated future cash flows to present value.
GAAP established a disclosure hierarchy that categorizes the inputs to valuation techniques used to value assets and liabilities at each measurement date. These inputs are summarized in the three broad levels listed below:
• Level 1 – quoted prices in active markets for identical investments
• Level 2 – other significant observable inputs (including quoted prices for similar investments, interest rates, prepayment speeds, credit risk, etc.)
• Level 3 – significant unobservable inputs (including the Fund's own assumptions in determining the fair value of investments)
The inputs or methodologies used to value securities are not necessarily an indication of the risk associated with investing in those securities.
24
Credit Suisse Multialternative Strategy Fund
Notes to Consolidated Financial Statements (continued)
October 31, 2016
Note 2. Significant Accounting Policies (continued)
The following is a summary of the inputs used as of October 31, 2016 in valuing the Fund's assets and liabilities carried at fair value:
Assets | | Level 1 | | Level 2 | | Level 3 | | Total | |
Investments in Securities | |
Common Stocks | | $ | 2,404,779 | | | $ | 308,330 | | | $ | — | | | $ | 2,713,109 | | |
Exchange Traded Funds | | | 3,312,221 | | | | — | | | | — | | | | 3,312,221 | | |
Rights | | | — | | | | — | | | | 6,193 | | | | 6,193 | | |
Short-term Investments | | | — | | | | 101,624,529 | | | | — | | | | 101,624,529 | | |
| | | $ | 5,717,000 | | | $ | 101,932,859 | | | $ | 6,193 | | | $ | 107,656,052 | | |
Other Financial Instruments* | |
Forward Foreign Currency Contracts | | $ | — | | | $ | 83,790 | | | $ | — | | | $ | 83,790 | | |
Futures Contracts | | | 334,391 | | | | — | | | | — | | | | 334,391 | | |
Swap Contracts** | | | — | | | | 1,191,455 | | | | — | | | | 1,191,455 | | |
Liabilities | | Level 1 | | Level 2 | | Level 3 | | Total | |
Securities Sold Short | |
Common Stocks | | $ | 516,921 | | | $ | 132,387 | | | $ | — | | | $ | 649,308 | | |
Other Financial Instruments* | |
Forward Foreign Currency Contracts | | | — | | | | 50,120 | | | | — | | | | 50,120 | | |
Futures Contracts | | | 127,849 | | | | — | | | | — | | | | 127,849 | | |
Swap Contracts** | | | — | | | | 186,776 | | | | — | | | | 186,776 | | |
Written Options | | | 85,250 | | | | — | | | | — | | | | 85,250 | | |
* Other financial instruments include unrealized appreciation (depreciation) on forwards, futures and swap contracts. Written options is reported at value.
** Value includes any premium paid or received with respect to swap contracts, if applicable.
As of October 31, 2016, the amounts shown by the Fund as being Level 3 securities that were measured at fair value amounted to less than 0.01% of net assets. For the year ended October 31, 2016, there were no transfers among Level 1, Level 2 and Level 3. All transfers, if any, are assumed to occur at the end of the reporting period.
B) DERIVATIVE INSTRUMENTS AND HEDGING ACTIVITIES — The Fund adopted amendments to authoritative guidance on disclosures about derivative instruments and hedging activities which require that a fund disclose (a) how and why an entity uses derivative instruments, (b) how derivative instruments and hedging activities are accounted for and (c) how derivative instruments and related hedging activities affect a fund's financial position, financial performance and cash flows. For the year ended October 31, 2016, the Fund's derivatives did not qualify for hedge accounting as they are held at fair value.
25
Credit Suisse Multialternative Strategy Fund
Notes to Consolidated Financial Statements (continued)
October 31, 2016
Note 2. Significant Accounting Policies (continued)
Fair Value of Derivative Instruments as of October 31, 2016
| | | Asset Derivatives | | Liability Derivatives | |
| | | Balance Sheet
Location | | Fair Value | | Balance Sheet
Location | | Fair Value | |
Currency Contracts | | Unrealized appreciation on
forward foreign currency
contracts | | $ | 83,790 | | | Unrealized depreciation on
forward foreign currency
contracts | | $ | 50,120 | | |
Foreign Exchange
Contracts | | Unrealized appreciation on
futures contracts | | | 227,220 | * | | Unrealized depreciation on
futures contracts | | | 29,116 | * | |
Index Contracts | | Unrealized appreciation on
futures contracts | | | 105,690 | * | | Unrealized depreciation on
futures contracts | | | 79,847 | * | |
Interest Rate
Contracts | | Unrealized appreciation on
futures contracts | | | 1,481 | * | | Unrealized depreciation on
futures contracts | | | 18,886 | * | |
Index Contracts | | Unrealized appreciation on
open swap contracts | | | 1,191,455 | | | Unrealized depreciation on
open swap contracts | | | 186,776 | | |
Equity Contracts | | Unrealized appreciation on
written options | | | — | | | Unrealized depreciation on
written options | | | 9,681 | | |
| | | | | | | $ | 1,609,636 | | | | | | | $ | 374,426 | | |
*Reflects cumulative appreciation (depreciation) of futures contracts as reported in the Consolidated Statement of Assets and Liabilities and Notes to Consolidated Financial Statements. Only unsettled variation margin receivable (payable) is reported in the Consolidated Statement of Assets and Liabilities.
Effect of Derivative Instruments on the Consolidated Statement of Operations
| | | Location | | Realized
Gain (Loss) | | Location | | Unrealized
Appreciation
(Depreciation) | |
Currency Contracts | | Net realized gain
from forward
foreign currency
transactions* | | $ | 593,648 | | | Net change in unrealized appreciation
(depreciation) from forward
foreign currency translations* | | $ | 206 | | |
Foreign Exchange
Contracts | | Net realized
loss from
futures
contracts | | | (91,846 | ) | | Net change in unrealized
appreciation (depreciation) from
futures contracts | | | 198,104 | | |
Index Contracts | | Net realized gain
from futures
contracts | | | 44,242 | | | Net change in unrealized
appreciation (depreciation) from
futures contracts | | | 25,843 | | |
Interest Rate
Contracts | | Net realized gain
from futures
contracts | | | 479,127 | | | Net change in unrealized
appreciation (depreciation) from
futures contracts | | | (17,405 | ) | |
Index Contract | | Net realized gain
from swap
contracts | | | 809,069 | | | Net change in unrealized
appreciation (depreciation) from
open swap contracts | | | 1,001,433 | | |
Equity Contracts | | Net realized gain
from written
options | | | 143,477 | | | Net change in unrealized
appreciation (depreciation) from
written options | | | (9,681 | ) | |
| | | | | | | $ | 1,977,717 | | | | | | | $ | 1,198,500 | | |
*Consolidated Statement of Operations includes both forward foreign currency contracts and foreign currency transactions/translations.
26
Credit Suisse Multialternative Strategy Fund
Notes to Consolidated Financial Statements (continued)
October 31, 2016
Note 2. Significant Accounting Policies (continued)
For the year ended October 31, 2016, the Fund held average monthly value on a net basis of $15,741,791 in forward foreign currency contracts and average monthly notional value on a net basis of $20,512,236 and $6,775,123 in long futures contracts and short futures contracts and $67,364,426 in swap contracts, respectively. For the year ended October 31, 2016, the Fund received average monthly premiums of $82,965 from written options contracts.
The Fund is a party to International Swap and Derivatives Association, Inc. ("ISDA") Master Agreements ("Master Agreements") with certain counterparties that govern over-the-counter derivative (including Total Return, Credit Default and Interest Rate Swaps) and foreign exchange contracts entered into by the Fund. The Master Agreements may contain provisions regarding, among other things, the parties' general obligations, representations, agreements, collateral requirements, events of default and early termination. Termination events applicable to the Fund may occur upon a decline in the Fund's net assets below a specified threshold over a certain period of time.
The following table presents by counterparty the Fund's derivative assets, net of related collateral held by the Fund, at October 31, 2016:
Counterparty | | Gross Amount of
Assets Presented in
the Consolidated
Statement of Assets
and Liabilities(a) | | Financial
Instruments
and Derivatives
Available for Offset | | Non-Cash
Collateral
Received(c) | | Cash
Collateral
Received | | Net Amount
of Derivative
Assets(b) | |
Barclays Bank plc | | $ | 88,683 | | | $ | — | | | $ | — | | | $ | — | | | $ | 88,683 | | |
BNP Paribas | | | 85,247 | | | | (33,817 | ) | | | — | | | | — | | | | 51,430 | | |
Goldman Sachs | | | 600,376 | | | | (212,173 | ) | | | (388,203 | ) | | | — | | | | — | | |
Morgan Stanley | | | 7,446 | | | | (7,446 | ) | | | — | | | | — | | | | — | | |
JPMorgan Chase | | | 359,355 | | | | (2,202 | ) | | | — | | | | — | | | | 357,153 | | |
Societe Generale | | | 134,138 | | | | (50,120 | ) | | | — | | | | — | | | | 84,018 | | |
| | | $ | 1,275,245 | | | $ | (305,758 | ) | | $ | (388,203 | ) | | $ | — | | | $ | 581,284 | | |
27
Credit Suisse Multialternative Strategy Fund
Notes to Consolidated Financial Statements (continued)
October 31, 2016
Note 2. Significant Accounting Policies (continued)
The following table presents by counterparty the Fund's derivative liabilities, net of related collateral pledged by the Fund, at October 31, 2016:
Counterparty | | Gross Amount of
Liabilities Presented in
the Consolidated
Statement of Assets
and Liabilities(a) | | Financial
Instruments
and Derivatives
Available for Offset | | Non-Cash
Collateral
Pledged | | Cash
Collateral
Pledged(c) | | Net Amount
of Derivative
Liabilities | |
BNP Paribas | | $ | 33,817 | | | $ | (33,817 | ) | | $ | — | | | $ | — | | | $ | — | | |
Goldman Sachs | | | 212,173 | | | | (212,173 | ) | | | — | | | | — | | | | — | | |
JPMorgan Chase | | | 2,202 | | | | (2,202 | ) | | | — | | | | — | | | | — | | |
Morgan Stanley | | | 23,834 | | | | (7,446 | ) | | | — | | | | (16,388 | ) | | | — | | |
Societe Generale | | | 50,120 | | | | (50,120 | ) | | | — | | | | — | | | | — | | |
| | | $ | 322,146 | | | $ | (305,758 | ) | | $ | — | | | $ | (16,388 | ) | | $ | — | | |
(a) Swap contracts, written options and forward foreign currency exchange contracts are included. Written options is reported at market value.
(b) In lieu of receiving cash collateral for its net exposure to the counterparty, the Fund's unrealized gains are used to satisfy the Independent amount of collateral required by the counterparty for open contracts.
(c) The actual collateral pledged received may be more than the amounts shown.
C) FOREIGN CURRENCY TRANSACTIONS — The books and records of the Fund are maintained in U.S. dollars. Transactions denominated in foreign currencies are recorded at the current prevailing exchange rates. All assets and liabilities denominated in foreign currencies are translated into U.S. dollar amounts at the current exchange rate at the end of the period. Reported net realized gain (loss) from foreign currency transactions arises from sales of foreign currencies; currency gains or losses realized between the trade and settlement dates on securities transactions; and the difference between the amounts of dividends, interest, and foreign withholding taxes recorded on the Fund's books and the U.S. dollar equivalent of the amounts actually received or paid. Net change in unrealized gains and losses on translation of assets and liabilities denominated in foreign currencies arises from changes in the fair values of assets and liabilities, other than investments at the end of the period, resulting from changes in exchange rates. The Fund does not isolate that portion of the results of operations resulting from fluctuations in foreign exchange rates on investments from the fluctuations arising from changes in market prices of investments held. Such fluctuations are included with net realized and unrealized gain or loss from investments in the Consolidated Statement of Operations.
D) SECURITY TRANSACTIONS AND INVESTMENT INCOME/EXPENSE — Security transactions are accounted for on a trade date basis. Interest income/expense is recorded on the accrual basis. The Fund amortizes
28
Credit Suisse Multialternative Strategy Fund
Notes to Consolidated Financial Statements (continued)
October 31, 2016
Note 2. Significant Accounting Policies (continued)
premiums and accretes discounts using the effective interest method. Dividend income/expense is recorded on the ex-dividend date. Certain expenses are class-specific expenses, vary by class and are charged only to that class. Income, expenses (excluding class-specific expenses) and realized/unrealized gains/losses are allocated proportionately to each class of shares based upon the relative net asset value of the outstanding shares of that class. The cost of investments sold is determined by use of the specific identification method for both financial reporting and income tax purposes. To the extent any issuer defaults or a credit event occurs that impacts the issuer, the Fund may halt any additional interest income accruals and consider the realizability of interest accrued up to the date of default or credit event.
E) DIVIDENDS AND DISTRIBUTIONS TO SHAREHOLDERS — Dividends from net investment income, if any, are declared and paid quarterly. Distributions of net realized capital gains, if any, are declared and paid at least annually. However, to the extent that a net realized capital gain can be reduced by a capital loss carryforward, such gain will not be distributed. Dividends and distributions to shareholders of the Fund are recorded on the ex-dividend date and are determined in accordance with federal income tax regulations, which may differ from GAAP.
F) FEDERAL INCOME TAXES — No provision is made for federal taxes as it is the Fund's intention to continue to qualify as a regulated investment company ("RIC") under the Internal Revenue Code of 1986, as amended (the "Code"), and to make the requisite distributions to its shareholders, which will be sufficient to relieve it from federal income and excise taxes.
In order to qualify as a RIC under the Code, the Fund must meet certain requirements regarding the source of its income, the diversification of its assets and the distribution of its income. One of these requirements is that the Fund derive at least 90% of its gross income for each taxable year from dividends, interest, payments with respect to certain securities loans, gains from the sale or other disposition of stock, securities or foreign currencies, other income derived with respect to its business of investing in such stock, securities or currencies or net income derived from interests in certain publicly-traded partnerships ("Qualifying Income"). The Internal Revenue Service ("IRS") has issued a ruling that income realized from certain types of commodity-linked derivatives would not be Qualifying Income. As a result, the Fund's ability to realize income from investments in such commodity-linked derivatives as part of its investment strategy would be limited to a maximum of 10% of its gross income. The IRS has issued private letter rulings to registered investment
29
Credit Suisse Multialternative Strategy Fund
Notes to Consolidated Financial Statements (continued)
October 31, 2016
Note 2. Significant Accounting Policies (continued)
companies concluding that income derived from their investment in a wholly-owned subsidiary would constitute Qualifying Income to the fund. The IRS has indicated that the granting of these types of private letter rulings is currently suspended, pending further internal discussion. As a result, there can be no assurance that the IRS will grant such a private letter ruling to the Fund. If the Fund does not receive such a private letter ruling, there is a risk that the IRS could assert that the income derived from the Fund's investment in the Subsidiary will not be considered Qualifying Income for purposes of the Fund remaining qualified as a RIC for U.S. federal income tax purposes. If the Fund is unable to ensure continued qualification as a RIC, the Fund may be required to change its investment objective, policies or techniques, or may be liquidated. If the Fund fails to qualify as a RIC, the Fund will be subject to federal income tax on its net income and capital gains at regular corporate rates (without reduction for distributions to shareholders). If the Fund were to fail to qualify as a RIC and become subject to federal income tax, shareholders of the Fund would be subject to the risk of diminished returns. The Fund adopted the authoritative guidance for uncertainty in income taxes and recognizes a tax benefit or liability from an uncertain position only if it is more likely than not that the position is sustainable based solely on its technical merits and consideration of the relevant taxing authority's widely understood administrative practices and procedures. The Fund has reviewed its current tax positions and has determined that no provision for income tax is required in the Fund's financial statements. The Fund's federal and state income and federal excise tax returns for tax years for which the applicable statutes of limitations have not expired are subject to examination by the IRS and state departments of revenue.
G) SHORT-TERM INVESTMENTS — The Fund, together with other funds/portfolios advised by Credit Suisse, pools available cash into a short-term variable rate time deposit issued by State Street Bank and Trust Company ("SSB"), the Fund's custodian. The short-term time deposit issued by SSB is a variable rate account classified as a short-term investment.
H) SHORT SALES — The Fund enters into short sales transactions collateralized by cash deposits received from brokers in connection with securities lending activities and securities. The collateral amounts required are determined daily by reference to the market value of the short positions. Short sales expose the Fund to the risk that it will be required to cover its short position at a time when the securities have appreciated in value, thus resulting in a loss to the Fund. The Fund's loss on a short sale could theoretically be
30
Credit Suisse Multialternative Strategy Fund
Notes to Consolidated Financial Statements (continued)
October 31, 2016
Note 2. Significant Accounting Policies (continued)
unlimited in a case where the Fund is unable, for whatever reason, to close out its short position. Short sales also involve transaction and other costs that will reduce potential gains and increase potential Fund losses. The use by the Fund of short sales in combination with long positions in the Fund in an attempt to improve performance may not be successful and may result in greater losses or lower positive returns than if the Fund held only long positions. It is possible that the Fund's long equity positions will decline in value at the same time that the value of the securities it has sold short increases, thereby increasing potential losses to the Fund. In addition, the Fund's short selling strategies may limit its ability to fully benefit from increases in the equity markets. Short selling also involves a form of financial leverage that may exaggerate any losses realized by the Fund. Also, there is the risk that the counterparty to a short sale may fail to honor its contractual terms, causing a loss to the Fund. At October 31, 2016, the amount of restricted cash held at brokers related to open short positions was $344,034.
I) FUTURES — The Fund may enter into futures contracts to the extent permitted by its investment policies and objectives. The Fund may use futures contracts to gain exposure to or hedge against changes in interest rates, equity and market price movements and/or currency risks. Upon entering into a futures contract, the Fund is required to deposit cash and/or pledge U.S. Government securities as initial margin with a Futures Commission Merchant ("FCM"). Subsequent payments, which are dependent on the daily fluctuations in the value of the underlying instrument, are made or received by the Fund each day (daily variation margin) and are recorded as unrealized gains or losses until the contracts are closed. When the contracts are closed, the Fund records a realized gain or loss equal to the difference between the proceeds from (or cost of) the closing transaction and the Fund's basis in the contract. Risks of entering into futures contracts for hedging purposes include the possibility that a change in the value of the contract may not correlate with the changes in the value of the underlying instruments. Futures have minimal counterparty risk because futures are exchange traded and the exchange's clearinghouse, as counterparty to all exchange-traded futures, guarantees the futures against default. In addition, the purchase of a futures contract involves the risk that the Fund could lose more than the original margin deposit and subsequent payments may be required for a futures transaction. The Fund's open futures contracts are disclosed in the Consolidated Schedule of Investments. At October 31, 2016, the amount of restricted cash held at brokers related to futures contracts was $892,675.
31
Credit Suisse Multialternative Strategy Fund
Notes to Consolidated Financial Statements (continued)
October 31, 2016
Note 2. Significant Accounting Policies (continued)
The Commodity Exchange Act requires an FCM to segregate all customer transactions and assets from the FCM's proprietary activities. A customer's cash and other equity deposited with an FCM are considered commingled with all other customer funds subject to the FCM's segregation requirements. In the event of an FCM's insolvency, recovery may be limited to the Fund's pro rata share of segregated customer funds available. It is possible that the recovery amount could be less than the total of cash and other equity deposited.
J) FORWARD FOREIGN CURRENCY CONTRACTS — A forward foreign currency exchange contract ("forward currency contract") is a commitment to purchase or sell a foreign currency at the settlement date at a negotiated rate. The Fund will enter into forward currency contracts primarily for hedging foreign currency risk. Forward currency contracts are valued at the prevailing forward exchange rate of the underlying currencies and unrealized gain (loss) is recorded daily. On the settlement date of the forward currency contract, the Fund records a realized gain or loss equal to the difference between the value of the contract at the time it was opened and the value of the contract at the time it was closed. Certain risks may arise upon entering into forward currency contracts from the potential inability of counterparties to meet the terms of their contracts. The maximum counterparty credit risk to the Fund is measured by the unrealized gain on appreciated contracts. Additionally, when utilizing forward currency contracts to hedge, the Fund gives up the opportunity to profit from favorable exchange rate movements during the term of the contract. The Fund's open forward currency contracts at October 31, 2016 are disclosed in the Consolidated Schedule of Investments.
K) SWAPS — The Fund may enter into swaps either for hedging purposes or to seek to increase total return. A swap contract is an agreement that obligates two parties to exchange a series of cash flows at specified intervals based upon or calculated by reference to changes in specified prices or rates for a specified amount of an underlying asset or notional principal amount. A centrally cleared swap is a transaction executed between the Fund and a counterparty, then cleared by a clearing member through a central clearinghouse. The central clearinghouse serves as the counterparty, with whom the Fund exchanges cash flows. The Fund will enter into swap contracts only on a net basis, which means that the two payment streams are netted out, with the Fund receiving or paying, as the case may be, only the net amount of the two payments. Risks may arise as a result of the failure of the counterparty to the swap contract to comply with the terms of the swap contract. The extent of the Fund's exposure to credit and counterparty risks is the discounted net value of the cash flows to be received from the counterparty over the contract's
32
Credit Suisse Multialternative Strategy Fund
Notes to Consolidated Financial Statements (continued)
October 31, 2016
Note 2. Significant Accounting Policies (continued)
remaining life, to the extent that the amount is positive. These risks are mitigated by having a master netting arrangement between the Fund and the counterparty and by the posting of collateral by the counterparty to the Fund to cover the Fund's exposure to the counterparty. Therefore, the Fund considers the creditworthiness of each counterparty as well as the amounts posted by the counterparty pursuant to the master netting agreement to a swap contract in evaluating potential credit risk. Additionally, risks may arise from unanticipated movements in interest rates or in the value of the underlying reference asset or index.
The Fund may enter into total return swap contracts, involving commitments to pay interest in exchange for a market-linked return, both based on notional amounts. The Fund may invest in total return swap contracts for hedging purposes or to seek to increase total return. To the extent the total return of the security or index underlying the transaction exceeds or falls short of the offsetting interest rate obligation, the Fund will receive a payment from or make a payment to the counterparty.
The Fund may enter into credit default swap agreements either as a buyer or seller. The Fund may buy a credit default swap to attempt to mitigate the risk of default or credit quality deterioration in one or more individual holdings or in a segment of the fixed income securities market. The Fund may sell a credit default swap in an attempt to gain exposure to an underlying issuer's credit quality characteristics without investing directly in that issuer.
The Fund bears the risk of loss of the amount expected to be received under a credit default swap agreement in the event of the default or bankruptcy of the counterparty. The Fund will enter into swap agreements only with counterparties that meet certain standards of creditworthiness (generally, such counterparties would have to be eligible counterparties under the terms of the Fund's repurchase agreement guidelines). Credit default swap agreements are generally valued at a price at which the counterparty to such agreement would terminate the agreement.
The Fund records unrealized gains or losses on a daily basis representing the value and the current net receivable or payable relating to open swap contracts. Net amounts received or paid on the swap contract are recorded as realized gains or losses. Fluctuations in the value of swap contracts are recorded for financial statement purposes as unrealized appreciation or depreciation from swap contracts. Realized gains and losses from terminated swaps are included in net realized gains/losses from swap contracts. Upon entering into a centrally cleared swap, the Fund is required to deposit with a
33
Credit Suisse Multialternative Strategy Fund
Notes to Consolidated Financial Statements (continued)
October 31, 2016
Note 2. Significant Accounting Policies (continued)
financial intermediary cash or securities ("initial margin") in an amount equal to a certain percentage of the notional amount of the swap. Subsequent payments ("variation margin") are made or received by the Fund dependent upon the daily fluctuations in the value of the swap. In a cleared swap transaction, counterparty risk is minimized as the central clearinghouse acts as the counterparty. The Fund's open swap contracts are disclosed in the Consolidated Schedule of Investments. At October 31, 2016, the amounts of restricted cash held at brokers related to open swap contracts and centrally cleared swaps for the Fund were $3,940,000 and $0, respectively.
L) OPTION CONTRACTS — The Fund will enter into options contracts to gain exposure to risk volatility based assets. When the Fund purchases an option, it pays a premium and the option is subsequently marked to market to reflect current value. Premiums paid for purchasing options which expire are treated as realized losses. Premiums paid for purchasing options which are exercised or closed are added to the cost or deducted from the proceeds on the underlying instrument to determine the realized gain or loss. The risk associated with purchasing options is limited to the premium paid.
When the Fund writes an option, an amount equal to the net premium received (the premium less commission) is recorded as a liability and is subsequently adjusted to the current value. Net premiums received for written options which expire are treated as realized gains. Net premiums received for written options which are exercised or closed are deducted from the cost or added to the proceeds on the underlying instrument or closing purchase transaction to determine the realized gain or loss. The Fund, as writer of a written option, bears the risk of an unfavorable change in the market value of the instrument underlying the written option.
Exchange-traded options have standardized contracts and are settled through a clearing house with fulfillment guaranteed by the credit of the exchange. Therefore, counterparty credit risks to the Fund are limited. Over-the-counter options are subject to the risk that the counterparty is unable or unwilling to meet its obligations under the option. The Fund's exchanged traded written options are disclosed in the Consolidated Schedule of Investments. At October 31, 2016, the amount of restricted cash held at brokers related to option contracts was $2,284,426.
34
Credit Suisse Multialternative Strategy Fund
Notes to Consolidated Financial Statements (continued)
October 31, 2016
Note 2. Significant Accounting Policies (continued)
For the year ended October 31, 2016, transactions for written options on securities, interest rate swaps and futures were as follows:
| | | Number of
Contracts | | Premium
Received | |
Written Options, outstanding as of October 31, 2015 | | | — | | | $ | — | | |
Options written | | | 209 | | | | 663,716 | | |
Options bought back | | | (112 | ) | | | (351,261 | ) | |
Options exercised | | | (32 | ) | | | (80,927 | ) | |
Options expired | | | (43 | ) | | | (155,959 | ) | |
Written Options, outstanding as of October 31, 2016 | | | 22 | | | $ | 75,569 | | |
M) SECURITIES LENDING — The initial collateral received by the Fund is required to have a value of at least 102% of the market value of domestic securities on loan (including any accrued interest thereon) and 105% of the market value of foreign securities on loan (including any accrued interest thereon). The collateral is maintained thereafter at a value equal to at least 102% of the current market value of the securities on loan. The market value of loaned securities is determined at the close of each business day of the Fund and any additional required collateral is delivered to the Fund, or excess collateral returned by the Fund, on the next business day. Cash collateral received by the Fund in connection with securities lending activity may be pooled together with cash collateral for other funds/portfolios advised by Credit Suisse and may be invested in a variety of investments, including funds advised by SSB, the Fund's securities lending agent, or money market instruments. However, in the event of default or bankruptcy by the other party to the agreement, realization and/or retention of the collateral may be subject to legal proceedings.
SSB has been engaged by the Fund to act as the Fund's securities lending agent. As of October 31, 2016, the Fund had investment securities on loan with a fair value of $78,738. Collateral received for securities loaned and a related liability of $124,917 are presented gross in the Consolidated Statement of Assets and Liabilities. The collateral for securities loaned is valued consistently to the other investments held by the Fund and is included in Level 2 of the fair value hierarchy. For the year ended October 31, 2016, the value of the related collateral exceeded the value of the securities loaned.
The Fund's securities lending arrangement provides that the Fund and SSB will share the net income earned from securities lending activities. Securities lending income is accrued as earned. During the year ended October 31, 2016, total earnings from the Fund's investment in cash collateral received in
35
Credit Suisse Multialternative Strategy Fund
Notes to Consolidated Financial Statements (continued)
October 31, 2016
Note 2. Significant Accounting Policies (continued)
connection with securities lending arrangements was $6,907, of which $654 was rebated to borrowers (brokers). The Fund retained $5,193 in income from the cash collateral investment, and SSB, as lending agent, was paid $1,060.
N) OTHER — In the normal course of business the Fund trades financial instruments and enters into financial transactions for which risk of potential loss exists due to changes in the market (market risk) or failure of the other party to a transaction to perform (credit risk). Similar to credit risk, the Fund may be exposed to counterparty risk, or the risk that an institution or other entity with which the Fund has unsettled or open transactions will default. The potential loss could exceed the value of the financial assets recorded in the consolidated financial statements. Financial assets, which potentially expose the Fund to credit risk, consist principally of cash due from counterparties and investments. The extent of the Fund's exposure to credit and counterparty risks in respect to these financial assets approximates their carrying value as recorded in the Fund's Consolidated Statement of Assets and Liabilities.
O) FOREIGN INVESTMENTS RISK — The Fund may have elements of risk not typically associated with investments in the U.S. due to concentrated investments in a limited number of countries or regions, which may vary throughout the year. Such concentrations may subject the Fund to additional risks resulting from political or economic conditions in such countries or regions and the possible imposition of adverse governmental laws or currency exchange restrictions could cause the securities and their markets to be less liquid and their prices to be more volatile than those of comparable U.S. securities.
Because the Fund may invest a significant portion of its assets in these markets, it is subject to greater risks of adverse events that occur in those markets and may experience greater volatility than a Fund that is more broadly diversified geographically.
P) NEW ACCOUNTING PRONOUNCEMENTS — On August 26, 2016, Financial Accounting Standards Board ("FASB") issued a new Accounting Standards Update No. 2016-15, "Statement of Cash Flows (Topic 230), a consensus of the FASB's Emerging Issues Task Force" ("ASU 2016-15"). ASU 2016-15 is intended to reduce diversity in practice in how certain transactions are classified in the statement of cash flows. The issues addressed in ASU 2016-15 are: debt prepayment or debt extinguishment costs, settlement of zero-coupon debt instruments, contingent consideration payments made after a business combination, proceeds from the settlement of insurance claims, proceeds from
36
Credit Suisse Multialternative Strategy Fund
Notes to Consolidated Financial Statements (continued)
October 31, 2016
Note 2. Significant Accounting Policies (continued)
the settlement of corporate-owned life insurance policies, including bank-owned life insurance policies, distributions received from equity method investments, beneficial interests in securitization transactions; and, separately identifiable cash flows and application of the predominance principle. ASU 2016-15 is effective for interim and annual reporting periods beginning after December 15, 2017. Management is currently evaluating the impact, if any, of applying this provision.
In November 2016, FASB issued a new Accounting Standards Update No. 2016-18, "Statement of Cash Flows (Topic 230), Restricted Cash, a consensus of the FASB's Emerging Issues Task Force" ("ASU 2016-18"). ASU 2016-18 requires that a statement of cash flows explain the change during the period in the total of cash, cash equivalents, and amounts generally described as restricted cash or restricted cash equivalents. Therefore, amounts generally described as restricted cash and restricted cash equivalents should be included with cash and cash equivalents when reconciling the beginning-of-period and end-of-period total amounts shown on the statement of cash flows. The amendments in ASU 2016-18 do not provide a definition of restricted cash or restricted cash equivalents. ASU 2016-18 is effective for interim and annual reporting periods beginning after December 15, 2017. Management is currently evaluating the impact, if any, of applying this provision.
In October 2016, the U.S. Securities and Exchange Commission adopted new rules and amended existing rules (together, "final rules") intended to modernize the reporting and disclosure of information by registered investment companies. In part, the final rules amend Regulation S-X and require standardized, enhanced disclosure about derivatives in investment company financial statements, as well as other amendments. The compliance date for the amendments to Regulation S-X is August 1, 2017. Management is currently evaluating the impact that the adoption of the amendments to Regulation S-X will have on the Fund's financial statements and related disclosures.
Q) SUBSEQUENT EVENTS — In preparing the financial statements as of October 31, 2016, management considered the impact of subsequent events for potential recognition or disclosure in these financial statements through the date of release of this report. No such events requiring recognition or disclosure were identified through the date of the release of this report.
37
Credit Suisse Multialternative Strategy Fund
Notes to Consolidated Financial Statements (continued)
October 31, 2016
Note 3. Transactions with Affiliates and Related Parties
Credit Suisse serves as investment adviser for the Fund. For its investment advisory services, Credit Suisse is entitled to receive a fee from the Fund at an annual rate of 0.95% of the Fund's average daily net assets. For the year ended October 31, 2016, investment advisory fees earned and fees waived/expenses reimbursed were $954,320 and $645,435, respectively. The Fund is authorized to reimburse Credit Suisse for management fees previously limited and/or for expenses previously reimbursed by Credit Suisse, provided, however, that any reimbursements must be paid at a date not more than three years after the end of the fiscal year during which such fees were limited or expenses were reimbursed by Credit Suisse and the reimbursements do not cause the Fund to exceed the applicable expense limitation in the contract at the time the fees are recouped.
The Fund entered into a written contract effective November 18, 2015 to limit expenses to 0.85% of the Fund's average daily net assets for Class I shares, 1.10% of the Fund's average daily net assets for Class A shares and 1.85% of the Fund's average daily net assets for Class C shares through at least February 28, 2018. Prior to November 18, 2015, the limit on expenses was 1.30% of the Fund's average daily net assets for Class I shares, 1.55% of the Fund's average daily net assets for Class A shares, and 2.30% of the Fund's average daily net assets for Class C shares. Credit Suisse voluntarily waived fees and reimbursed expenses so that the Fund's annual operating expenses did not exceed these amounts.
The amounts waived and reimbursed by Credit Suisse, which are available for potential future recoupment by Credit Suisse, and the expiration schedule at October 31, 2016 are as follows:
| | | Fee waivers/
expense
reimbursements
subject to
recoupment* | | Expires
October 31,
2017 | | Expires
October 31,
2018 | | Expires
October 31,
2019 | |
Class I | | $ | 1,084,900 | | | $ | 201,552 | | | $ | 276,384 | | | $ | 606,964 | | |
Class A | | | 23,826 | | | | 9,091 | | | | 8,041 | | | | 6,694 | | |
Class C | | | 66,161 | | | | 38,016 | | | | 27,045 | | | | 1,100 | | |
Totals | | $ | 1,174,887 | | | $ | 248,659 | | | $ | 311,470 | | | $ | 614,758 | | |
*The Subsidiary is not eligible for recoupment.
Credit Suisse and SSB serve as co-administrators to the Fund. For its co-administrative services, Credit Suisse receives a fee calculated at an annual rate of 0.09% of the Fund's average daily net assets. For the year ended
38
Credit Suisse Multialternative Strategy Fund
Notes to Consolidated Financial Statements (continued)
October 31, 2016
Note 3. Transactions with Affiliates and Related Parties (continued)
October 31, 2016, co-administrative services fees earned by Credit Suisse were $90,409.
For its co-administrative services, SSB receives a fee, exclusive of out-of-pocket expenses, calculated in total for all the Credit Suisse funds/portfolios co-administered by SSB and allocated based upon the relative average net assets of each fund/portfolio, subject to an annual minimum fee. For the year ended October 31, 2016, co-administrative services fees earned by SSB (including out-of-pocket expenses) with respect to the Fund were $19,126.
Credit Suisse Securities (USA) LLC ("CSSU"), an affiliate of Credit Suisse, serves as the distributor of the Fund's shares. Pursuant to a distribution plan adopted by the Fund pursuant to Rule 12b-1 under the 1940 Act, CSSU receives fees for its distribution services. These fees are calculated at an annual rate of 0.25% of the average daily net assets of the Class A shares. For the Class C shares, the fee is calculated at an annual rate of 1.00% of the average daily net assets. For the year ended October 31, 2016, the Fund paid Rule 12b-1 distribution fees of $2,686 for Class A shares and $1,412 for Class C shares. Class I shares are not subject to Rule 12b-1 distribution fees.
Certain brokers, dealers and financial representatives provide transfer agent-related services to the Fund and receive compensation from the Fund. For the year ended October 31, 2016, the Fund paid $56,060, which is included within transfer agent fees in the Consolidated Statement of Operations.
For the year ended October 31, 2016, CSSU and its affiliates advised the Fund that they retained $235 from commissions earned on the sale of the Fund's Class A shares. There were no commissions earned on sale of Class C shares.
Affiliated Issuers — The Fund may invest in other Credit Suisse Funds ("Underlying Credit Suisse Funds"). The Underlying Credit Suisse Funds in which the Fund invests are considered to be affiliated investments. The Fund did not have any investments in Underlying Credit Suisse Funds at October 31, 2016. Investments in Underlying Credit Suisse Funds are valued at the Underlying Credit Suisse Fund's net asset value per share ("NAV") as of the report date, if applicable. A summary of the Fund's transactions with an affiliated Underlying Credit Suisse Fund during the year ended October 31, 2016 is as follows:
Issuer | | Value
of Affiliate
at 10/31/2015 | | Purchases | | Sales | | Gain (loss) | | Dividend
income | | Net
realized gain
distribution | | Value
of Affiliate
at 10/31/2016 | |
Credit Suisse
Managed Futures
Strategy Fund | | $ | 1,176,562 | | | $ | — | | | $ | 1,193,910 | | | $ | 166,510 | | | $ | — | | | $ | — | | | $ | — | | |
39
Credit Suisse Multialternative Strategy Fund
Notes to Consolidated Financial Statements (continued)
October 31, 2016
The Fund, together with other funds/portfolios advised by Credit Suisse (collectively, the "Participating Funds"), participates in a committed, unsecured line of credit facility ("Credit Facility"), with SSB in an aggregated amount of $250 million for temporary or emergency purposes under a first-come, first-served basis. Under the terms of the Credit Facility, the Participating Funds pay an aggregate commitment fee on the average unused amount of the Credit Facility, which is allocated among the Participating Funds in such manner as is determined by the governing Boards of the Participating Funds. In addition, the Participating Funds pay interest on borrowings at either the Overnight Federal Funds rate or the Overnight LIBOR rate plus a spread. At October 31, 2016 and during the year ended October 31, 2016, the Fund had no borrowings outstanding under the Credit Facility.
Note 5. Purchases and Sales of Securities
For the year ended October 31, 2016, purchases and sales of investment securities (excluding short-term investments) were as follows:
Investment Securities | |
| Purchases | | Sales | |
| $ | 39,723,768 | | | $ | 41,700,453 | | |
Securities sold short and purchases to cover securities sold short were as follows:
Investment Securities | |
| Purchases to Cover | | Securities Sold Short | |
| $ | 11,185,592 | | | $ | 10,353,406 | | |
Note 6. Capital Share Transactions
The Fund is authorized to issue an unlimited number of full and fractional shares of beneficial interest, $.001 par value per share. The Fund offers Class I,
40
Credit Suisse Multialternative Strategy Fund
Notes to Consolidated Financial Statements (continued)
October 31, 2016
Note 6. Capital Share Transactions (continued)
Class A and Class C shares. Transactions in capital shares for each class of the Fund were as follows:
| | | Class I | |
| | | For the Year Ended
October 31, 2016 | | For the Year Ended
October 31, 2015 | |
| | | Shares | | Value | | Shares | | Value | |
Shares sold | | | 11,724,055 | | | $ | 119,800,085 | | | | 232,051 | | | $ | 2,428,772 | | |
Shares issued in reinvestment
of dividends and distributions | | | 23,730 | | | | 238,966 | | | | 31,896 | | | | 326,614 | | |
Shares redeemed | | | (1,938,432 | ) | | | (19,674,476 | ) | | | (106,081 | ) | | | (1,112,983 | ) | |
Net increase | | | 9,809,353 | | | $ | 100,364,575 | | | | 157,866 | | | $ | 1,642,403 | | |
| | | Class A | |
| | | For the Year Ended
October 31, 2016 | | For the Year Ended
October 31, 2015 | |
| | | Shares | | Value | | Shares | | Value | |
Shares sold | | | 167,588 | | | $ | 1,706,636 | | | | 3,384 | | | $ | 35,067 | | |
Shares issued in reinvestment
of dividends and distributions | | | 260 | | | | 2,609 | | | | 1,040 | | | | 10,618 | | |
Shares redeemed | | | (70,992 | ) | | | (715,082 | ) | | | (15,566 | ) | | | (158,806 | ) | |
Net increase (decrease) | | | 96,856 | | | $ | 994,163 | | | | (11,142 | ) | | $ | (113,121 | ) | |
| | | Class C | |
| | | For the Year Ended
October 31, 2016 | | For the Year Ended
October 31, 2015 | |
| | | Shares | | Value | | Shares | | Value | |
Shares sold | | | — | | | $ | — | | | | 634 | | | $ | 6,664 | | |
Shares issued in reinvestment
of dividends and distributions | | | 66 | | | | 647 | | | | 2,342 | | | | 23,545 | | |
Shares redeemed | | | (27,774 | ) | | | (275,192 | ) | | | (97,202 | ) | | | (979,705 | ) | |
Net decrease | | | (27,708 | ) | | $ | (274,545 | ) | | | (94,226 | ) | | $ | (949,496 | ) | |
On October 31, 2016, the number of shareholders that held 5% or more of the outstanding shares of each class of the Fund was as follows:
| | | Number of
Shareholders | | Approximate Percentage
of Outstanding Shares | |
Class I | | | 3 | | | | 91 | % | |
Class A | | | 3 | | | | 70 | % | |
Class C | | | 2 | * | | | 100 | % | |
*This includes the seed money from Merchant Holding, Inc., an affiliate of Credit Suisse.
Some of the shareholders may be omnibus accounts, which hold shares on behalf of individual shareholders.
41
Credit Suisse Multialternative Strategy Fund
Notes to Consolidated Financial Statements (continued)
October 31, 2016
Note 7. Federal Income Taxes
Income and capital gain distributions are determined in accordance with federal income tax regulations, which may differ from GAAP.
The tax characteristics of distributions paid by the Fund during the years ended October 31, 2016 and 2015, respectively, were as follows:
| Ordinary Income | | Long-Term Capital Gain | |
| 2016 | | 2015 | | 2016 | | 2015 | |
| $ | 170,434 | | | $ | 284,564 | | | $ | 72,642 | | | $ | 78,836 | | |
The tax basis components of distributable earnings differ from the amounts reflected in the Consolidated Statement of Assets and Liabilities by temporary book/tax differences. These differences are primarily due to differing treatments of wash sales, marked to market of forward contracts, futures contracts, options contracts and deferred organizational expenses. At October 31, 2016, the components of distributable earnings on a tax basis were as follows:
Undistributed net investment income | | $ | 1,373,110 | | |
Accumulated net realized gain | | | 915,723 | | |
Unrealized depreciation | | | (7,797 | ) | |
| | $ | 2,281,036 | | |
At October 31, 2016, the cost of investments (excluding foreign currency related transactions) and net unrealized appreciation (depreciation) for income tax purposes were as follows:
Cost of Investments | | $ | 107,656,251 | | |
Unrealized appreciation | | $ | 1,108,017 | | |
Unrealized depreciation | | | (1,108,216 | ) | |
Net unrealized depreciation | | $ | (199 | ) | |
At October 31, 2016, the proceeds from securities sold short (excluding foreign currency related transactions) and net unrealized appreciation (depreciation) for income tax purposes were as follows:
Proceeds from investments | | $ | 647,145 | | |
Unrealized appreciation | | $ | 24,707 | | |
Unrealized depreciation | | | (26,870 | ) | |
Net unrealized depreciation | | $ | (2,163 | ) | |
To adjust for current period permanent book/tax differences which arose principally from differing book/tax treatment of foreign currency gain (loss),
42
Credit Suisse Multialternative Strategy Fund
Notes to Consolidated Financial Statements (continued)
October 31, 2016
Note 7. Federal Income Taxes (continued)
ordinary loss netting to reduce short-term capital gains, swap gain (loss), passive foreign investment companies (PFIC) and distribution re-designations, paid-in capital was charged $445,838, accumulated net realized gain was credited $321,255 and distributions in excess of net investment income was credited $124,583. Net assets were not affected by these reclassifications.
Note 8. Contingencies
In the normal course of business, the Fund may provide general indemnifications pursuant to certain contracts and organizational documents. The Fund's maximum exposure under these arrangements is dependent on future claims that may be made against the Fund and, therefore, cannot be estimated; however, based on experience, the risk of loss from such claims is considered remote.
43
Credit Suisse Multialternative Strategy Fund
Report of Independent Registered Public Accounting Firm
The Board of Trustees and Shareholders
Credit Suisse Multialternative Strategy Fund:
We have audited the accompanying consolidated statement of assets and liabilities of Credit Suisse Multialternative Strategy Fund (the "Fund"), a series of the Credit Suisse Opportunity Funds, including the consolidated schedule of investments, as of October 31, 2016, and the related consolidated statement of operations for the year ended and the consolidated statements of changes in net assets and financial highlights for each of the years in the two-year period then ended. These consolidated financial statements and consolidated financial highlights are the responsibility of the Fund's management. Our responsibility is to express an opinion on these consolidated financial statements and consolidated financial highlights based on our audits. The accompanying consolidated financial highlights for each of the years in the three-year period ended October 31, 2014, were audited by other independent registered public accountants whose report thereon dated December 29, 2014, expressed an unqualified opinion on those consolidated financial highlights.
We conducted our audits in accordance with the standards of the Public Company Accounting Oversight Board (United States). Those standards require that we plan and perform the audits to obtain reasonable assurance about whether the consolidated financial statements and consolidated financial highlights are free of material misstatement. An audit includes examining, on a test basis, evidence supporting the amounts and disclosures in the consolidated financial statements. Our procedures included confirmation of securities owned as of October 31, 2016, by correspondence with the custodian and broker or by other appropriate auditing procedures. An audit also includes assessing the accounting principles used and significant estimates made by management, as well as evaluating the overall consolidated financial statement presentation. We believe that our audits provide a reasonable basis for our opinion.
In our opinion, the consolidated financial statements and consolidated financial highlights referred to above present fairly, in all material respects, the financial position of Credit Suisse Multialternative Strategy Fund as of October 31, 2016, the results of its operations for the year then ended and the changes in its net assets and financial highlights for each of years in the two-year period then ended, in conformity with U.S. generally accepted accounting principles.

New York, New York
December 28, 2016
44
Credit Suisse Multialternative Strategy Fund
Information Concerning Trustees and Officers (unaudited)
Name, Address
(Year of Birth) | | Position(s)
Held with
Fund | | Term
of Office1
and
Length
of Time
Served | | Principal
Occupation(s) During
Past Five Years | | Number of
Portfolios
in Fund
Complex
Overseen
by Trustee | | Other
Trusteeships
Held by Trustee | |
Independent Trustees | | | | | | | | | | | |
Enrique R. Arzac
c/o Credit Suisse Asset
Management, LLC
Attn: General Counsel
One Madison Avenue
New York, New York
10010
(1941) | | Trustee, Audit Committee Chairman and Nominating Committee Member | | Since Fund Inception | | Professor Emeritus of Finance and Economics from July 2015 to present; Professor of Finance and Economics, Graduate School of Business, Columbia University from 1971 to July 2015. | | | 12 | | | Director of Adams Diversified Equity Fund, Inc., Adams Natural Resources Fund, Inc., Aberdeen Chile Fund, Inc., Aberdeen Emerging Markets Smaller Company Opportunities Fund, Inc., Aberdeen Israel Fund, Inc., Aberdeen Indonesia Fund, Inc. and Aberdeen Latin America Equity Fund, Inc. (each a closed-end investment company); Director of Aberdeen Asia-Pacific Income Investment Company Limited (a Canadian closed-end fund); Trustee of Mirae Asset Discovery Funds (7 open-end portfolios); Director of Epoch Holding Corporation (an investment management and investment advisory services company) from August 2006 to March 2013. | |
1 Subject to the Trust's retirement policy, each Trustee may continue to serve as a Trustee until the last day of the calendar year in which the applicable Trustee attains age 75. Officer serves until his or her respective successor has been duly elected and qualified.
45
Credit Suisse Multialternative Strategy Fund
Information Concerning Trustees and Officers (unaudited) (continued)
Name, Address
(Year of Birth) | | Position(s)
Held with
Fund | | Term
of Office1
and
Length
of Time
Served | | Principal
Occupation(s) During
Past Five Years | | Number of
Portfolios
in Fund
Complex
Overseen
by Trustee | | Other
Trusteeships
Held by Trustee | |
Independent Trustees | | | | | | | | | | | |
Jeffrey E. Garten
c/o Credit Suisse Asset
Management, LLC
Attn: General Counsel
One Madison Avenue
New York, New York
10010
(1946) | | Trustee, Audit and Nominating Committee Member | | Since Fund Inception | | Dean Emeritus of Yale School of Management from July 2015 to present; The Juan Trippe Professor in the Practice of International Trade, Finance and Business, Yale School of Management, from July 2005 to July 2015; Partner and Chairman of Garten Rothkopf (consulting firm) from October 2005 to present. | | | 10 | | | Director of Aetna, Inc. (insurance company); Director of CarMax Group (used car dealers); Director of Miller Buckfire & Co., LLC (financial restructuring); Member of Standard & Poor's Board of Managers (credit rating agency) from December 2011 to November 2014. | |
Steven N. Rappaport
Lehigh Court, LLC
555 Madison Avenue
29th Floor
New York, New York
10022
(1948) | | Chairman of the Board of Trustees, Audit Committee Member and Nominating Committee Chairman | | Trustee since Fund Inception and Chairman since 2005 | | Partner of Lehigh Court, LLC and RZ Capital (private investment firms) from July 2002 to present; Partner of Backstage Acquisition Holdings, LLC (publication job postings) from November 2013 to present. | | | 12 | | | Director of iCAD, Inc. (surgical and medical instruments and apparatus company); Director of Aberdeen Chile Fund, Inc., Aberdeen Emerging Markets Smaller Company Opportunities Fund, Inc., Aberdeen Israel Fund, Inc., Aberdeen Indonesia Fund, Inc. and Aberdeen Latin America Equity Fund, Inc. (each a closed-end investment company); Director of Aberdeen Funds (25 open portfolios); Director of Presstek, Inc. (digital imaging technologies company) from 2003 to 2012; Director of Wood Resources, LLC (plywood manufacturing company) from 2003 to October 2013. | |
1 Subject to the Trust's retirement policy, each Trustee may continue to serve as a Trustee until the last day of the calendar year in which the applicable Trustee attains age 75. Officer serves until his or her respective successor has been duly elected and qualified.
46
Credit Suisse Multialternative Strategy Fund
Information Concerning Trustees and Officers (unaudited) (continued)
Name, Address
(Year of Birth) | | Position(s)
Held with
Fund | | Term of
Office1
and
Length of
Time
Served | | Principal Occupation(s) During Past Five Years | |
Officers* | | | | | | | |
John G. Popp
Credit Suisse Asset
Management, LLC
One Madison Avenue
New York, New York 10010
(1956) | | Chief Executive Officer and President | | Since Fund Inception | | Managing Director of Credit Suisse; Global Head and Chief Investment Officer of the Credit Investment Group; Associated with Credit Suisse or its predecessor since 1997; Officer of other Credit Suisse Funds; Trustee of Credit Suisse High Yield Bond Fund; Director of Credit Suisse Asset Management Income Fund, Inc. | |
Emidio Morizio
Credit Suisse Asset
Management, LLC
One Madison Avenue
New York, New York 10010
(1966) | | Chief Compliance Officer | | Since Fund Inception | | Managing Director and Global Head of Compliance of Credit Suisse since 2010; Associated with Credit Suisse since July 2000; Officer of other Credit Suisse Funds. | |
Lou Anne McInnis
Credit Suisse Asset
Management, LLC
One Madison Avenue
New York, New York 10010
(1959) | | Chief Legal Officer | | Since 2015 | | Director of Credit Suisse; Associated with Credit Suisse since April 2015; Counsel at DLA Piper US LLP from 2011 to April 2015; Associated with Morgan Stanley Investment Management from 1997 to 2010: Officer of other Credit Suisse Funds. | |
Laurie Pecha
Credit Suisse Asset
Management, LLC
One Madison Avenue
New York, New York 10010
(1961) | | Chief Financial Officer | | Since 2016 | | Director of Credit Suisse since August 2016; Senior Consultant of Spectra Professional Services, LLC from January 2012 to July 2016; Vice President of Legg Mason & Co. from March 2007 to December 2011; Officer of other Credit Suisse Funds. | |
Esther Cheung
Credit Suisse Asset
Management, LLC
One Madison Avenue
New York, New York 10010
(1980) | | Treasurer | | Since 2016 | | Vice President of Credit Suisse since 2015; Associated with Reich & Tang Asset Management, LLC from June 2010 to August 2015; Officer of other Credit Suisse Funds. | |
Karen Regan
Credit Suisse Asset
Management, LLC
One Madison Avenue
New York, New York 10010
(1963) | | Vice President and Secretary | | Since Fund Inception | | Vice President of Credit Suisse; Associated with Credit Suisse since December 2004; Officer of other Credit Suisse Funds. | |
1 Subject to the Trust's retirement policy, each Trustee may continue to serve as a Trustee until the last day of the calendar year in which the applicable Trustee attains age 75. Officer serves until his or her respective successor has been duly elected and qualified.
* The officers of the Fund shown are officers that make policy decisions.
The Statement of Additional Information includes additional information about the Trustees and is available, without charge, upon request, by calling 877-870-2874.
47
Credit Suisse Multialternative Strategy Fund
Proxy Voting and Portfolio Holdings Information (unaudited)
Information regarding how the Fund voted proxies related to its portfolio securities during the 12-month period ended June 30 of each year, as well as the policies and procedures that the Fund uses to determine how to vote proxies relating to its portfolio securities are available:
• By calling 1-877-870-2874
• On the Fund's website, www.credit-suisse.com/us/funds
• On the website of the Securities and Exchange Commission, www.sec.gov.
The Fund files a complete schedule of its portfolio holdings for the first and third quarters of its fiscal year with the SEC on Form N-Q. The Fund's Forms N-Q are available on the SEC's website at www.sec.gov and may be reviewed and copied at the SEC's Public Reference Room in Washington, DC. Information on the operation of the SEC's Public Reference Room may be obtained by calling 1-202-551-8090.
48

P.O. BOX 55030, BOSTON, MA 02205-5030
877-870-2874 n www.credit-suisse.com/us/funds
CREDIT SUISSE SECURITIES (USA) LLC, DISTRIBUTOR. MSF-AR-1016

CREDIT SUISSE FUNDS
Annual Report
October 31, 2016
n CREDIT SUISSE
GLOBAL SUSTAINABLE DIVIDEND EQUITY FUND
The Fund's investment objectives, risks, charges and expenses (which should be considered carefully before investing), and more complete information about the Fund, are provided in the Prospectus, which should be read carefully before investing. You may obtain additional copies by calling 877-870-2874 or by visiting our website at www.credit-suisse.com/us/funds.
Credit Suisse Securities (USA) LLC, Distributor, is located at One Madison Avenue, New York, NY 10010. Credit Suisse Funds are advised by Credit Suisse Asset Management, LLC.
Investors in the Credit Suisse Funds should be aware that they may be eligible to purchase Class I shares (where offered) directly or through certain intermediaries. Such shares are not subject to a sales charge. Investors in the Credit Suisse Funds should also be aware that they may be eligible for a reduction or waiver of the sales charge with respect to Class A or C shares (where offered). For more information, please review the relevant prospectuses or consult your financial representative.
Fund shares are not deposits or other obligations of Credit Suisse Asset Management, LLC ("Credit Suisse") or any affiliate, are not FDIC-insured and are not guaranteed by Credit Suisse or any affiliate. Fund investments are subject to investment risks, including loss of your investment.
Credit Suisse Global Sustainable Dividend Equity Fund
Annual Investment Adviser's Report
October 31, 2016 (unaudited)
November 25, 2016
Dear Shareholder:
We are pleased to present this Annual Report covering the activities of the Credit Suisse Global Sustainable Dividend Equity Fund (the "Fund") for the twelve months ended October 31, 2016.
Performance Summary
11/1/2015 – 10/31/2016
Fund & Benchmark | | Performance | |
Class I1 | | | (0.04 | )% | |
Class A1, 2 | | | (0.29 | )% | |
Class C1, 2 | | | (1.04 | )% | |
MSCI All Country World Index3 | | | 2.05 | % | |
Performance shown for the Fund's Class A and Class C Shares does not reflect sales charges, which are a maximum of 5.25% and 1.00%, respectively. 2
Market Review: A challenging period for global dividend equities
The twelve month period ended October 31, 2016 was a challenging one for global markets, with the MSCI All Country World Index (the "Index"), the Fund's benchmark, delivering 2.05%. Global investors have been forced to grapple with a number of macroeconomic events and a large degree of political turmoil during the period.
Although global markets were volatile, they ended in positive territory. Oil prices potentially put in a bottom, the UK voted to leave the European Union, U.S. rates remained unchanged, and the presidential race in the United States polarized voters. After several years of weak performance, emerging markets outpaced developed markets. Recession fears in the first six weeks of 2016 appeared to be unfounded, though confidence in economic recovery remains lackluster. Even as unemployment numbers have continued to fall and wages have started to rise in the U.S., the U.S. Federal Reserve (the "Fed") has not yet raised interest rates.
In general, value outperformed growth and dividend-paying stocks outperformed non-dividend paying stocks across global markets. Within the dividend universe, "bond-like" stocks led, creating lofty valuations across these stocks (specifically consumer staples, utilities, and telecom).
1
Credit Suisse Global Sustainable Dividend Equity Fund
Annual Investment Adviser's Report (continued)
October 31, 2016 (unaudited)
Strategic Review:
Over the past year, the Fund underperformed the Index. Although the Fund successfully navigated the volatility from early 2016 through the end of the second quarter, it underperformed the Index post-Brexit, as global equities accelerated at a faster-than-anticipated pace. From a sector perspective, healthcare, consumer discretionary, and energy had the largest negative relative contributions to performance. Healthcare faced headwinds from drug pricing and the potential regulatory impact of a new U.S. administration. Additionally, the Fund was more heavily weighted toward European pharmaceuticals, which weighed on it from a regional perspective. Stock selection within discretionary also had a negative impact on performance. A zero allocation to energy negatively affected performance, as oil prices began rising from February lows. Conversely, an overweight in consumer staples and strong stock selection in materials and technology positively contributed to performance.
From a regional perspective, the Fund was underweight emerging markets — the strongest performing region globally. During the year, the team actively added to emerging markets exposure with an emphasis on high quality, cash generative companies, like Brazilian beverage company Ambev.
The Fund is focused on high quality, dividend growth names with reasonable valuations. The portfolio management team has found value in some of the more cyclical sectors. During the year, the team added to industrials and financials with an eye toward companies with the ability to raise dividends and perform well in a rising interest rate environment.
Looking ahead, we expect to see range-bound oil prices, higher U.S. interest rates, and a return to fundamentals in the equity markets. We believe 2017 will bring volatility, but are confident that a focus on high quality, reasonably valued, dividend growth names remains a sound long-term strategy, rather than simply an investment theme.
ON NOVEMBER 15, 2016, THE BOARD OF TRUSTEES OF THE FUND APPROVED A PLAN OF LIQUIDATION, DISSOLUTION AND TERMINATION (THE "PLAN") FOR THE FUND WHEREBY ALL OF THE FUND'S ASSETS WILL BE LIQUIDATED AND THE FUND WILL SUBSEQUENTLY BE DISSOLVED. IN LIGHT OF THE BOARD'S DECISION, SHARES OF THE FUND ARE CLOSED TO NEW INVESTORS.
AS A RESULT OF THE FUND'S LIQUIDATION, EACH SHAREHOLDER OF THE FUND WILL RECEIVE A DISTRIBUTION IN AN AMOUNT EQUAL TO THE NET ASSET VALUE OF HIS/HER SHARES AS OF DECEMBER 16, 2016. EACH SHAREHOLDER MAY ALSO RECEIVE UNPAID DIVIDENDS AND
2
Credit Suisse Global Sustainable Dividend Equity Fund
Annual Investment Adviser's Report (continued)
October 31, 2016 (unaudited)
DISTRIBUTIONS WITH RESPECT TO EACH OF THE SHAREHOLDER'S SHARES OF THE FUND. A NOTICE DESCRIBING THE PLAN AND THE LIQUIDATION OF THE FUND HAS BEEN MAILED TO SHAREHOLDERS OF THE FUND.
ON DECEMBER 16, 2016, THE FUND STOPPED CHARGING DISTRIBUTION AND SERVICE (12b-1) FEES ON ALL CLASSES OF SHARES.
The Credit Suisse Capital Discipline Group
Heather Kidde
Christian Stauss
All investments involve some level of risk. Simply defined, risk is the possibility that you will lose money or not make money. Principal risk factors for the Fund include currency risk, derivatives risk, equity exposure risk, foreign securities risk, futures contracts risk, liquidity risk, manager risk, market risk, small- and mid-cap stock risk and swap agreements risk. Before you invest, please make sure you understand the risks that apply to the Fund. As with any mutual fund, you could lose money over any period of time. Investments in the Fund are not bank deposits and are not insured or guaranteed by the Federal Deposit Insurance Corporation or any other government agency. For a detailed discussion of these and other risks, please refer to the Fund's Prospectus, which should be read carefully before investing.
In addition to historical information, this report contains forward-looking statements which may concern, among other things, domestic and foreign markets, industry and economic trends and developments and government regulation and their potential impact on the Fund's investments. These statements are subject to risks and uncertainties and actual trends, developments and regulations in the future, and their impact on the Fund could be materially different from those projected, anticipated or implied. The Fund has no obligation to update or revise forward-looking statements.
The views of the Fund's management are as of the date of this letter and the Fund holdings described in this document are as of October 31, 2016; these views and Fund holdings may have changed subsequent to these dates. Nothing in this document is a recommendation to purchase or sell securities.
3
Credit Suisse Global Sustainable Dividend Equity Fund
Annual Investment Adviser's Report (continued)
October 31, 2016 (unaudited)
Comparison of Change in Value of $10,000 Investment in the
Credit Suisse Global Sustainable Dividend Equity Fund1 Class I Shares,
Class A Shares2, Class C Shares2 and MSCI All Country World Index3 from Inception (02/27/15)
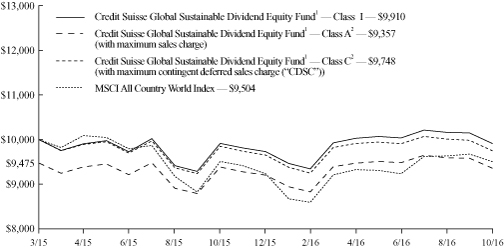
1 Fee waivers and/or expense reimbursements may reduce expenses for the Fund, without which performance would be lower. The Fund entered into a written contract to limit expenses to 0.70% of the Fund's average daily net assets for Class I shares, 0.95% of the Fund's average daily net assets for Class A shares and 1.70% of the Fund's average daily net assets for Class C shares through at least February 28, 2017. This limit excludes certain expenses, as set forth in the Fund's Prospectus.
2 Total return for the Fund's Class A shares for the reporting period, based on offering price (including maximum sales charge of 5.25%), was (5.49)%. Total return for the Fund's Class C shares for the reporting period, based on redemption value (including maximum CDSC of 1.00%), was (2.01)%.
3 Morgan Stanley Capital International (MSCI) All Country World Index is a free float weighted equity index that captures large and mid cap representation across developed market countries. It covers approximately 85% of free float-adjusted market capitalization in each country. The index does not have transaction costs and investors may not invest directly in the index.
4
Credit Suisse Global Sustainable Dividend Equity Fund
Annual Investment Adviser's Report (continued)
October 31, 2016 (unaudited)
Average Annual Returns as of October 31, 20161
| | | 1 Year | | Since
Inception2 | |
Class I | | | (0.04 | )% | | | (0.54 | )% | |
Class A Without Sales Charge | | | (0.29 | )% | | | (0.77 | )% | |
Class A With Maximum Sales Charge | | | (5.49 | )% | | | (3.91 | )% | |
Class C Without CDSC | | | (1.04 | )% | | | (1.52 | )% | |
Class C With CDSC | | | (2.01 | )% | | | (1.52 | )% | |
Returns represent past performance and include change in share price and reinvestment of dividends and capital gain distributions. Past performance cannot guarantee future results. The current performance of the Fund may be lower or higher than the figures shown. Returns and share price will fluctuate, and redemption value may be more or less than original cost. The performance results do not reflect the deduction of taxes that a shareholder would pay on Fund distributions or the redemption of Fund shares. Performance information current to the most recent month end is available at www.credit-suisse.com/us/funds.
The annual gross expense ratios are 2.25% for Class I shares, 2.50% for Class A shares and 3.25% for Class C shares. The annual net expense ratios after fee waivers and/or expense reimbursements are 0.70% for Class I shares, 0.95% for Class A shares and 1.70% for Class C shares.
1 Fee waivers and/or expense reimbursements may reduce expenses for the Fund, without which performance would be lower. The Fund entered into a written contract to limit expenses to 0.70% of the Fund's average daily net assets for Class I shares, 0.95% of the Fund's average daily net assets for Class A shares and 1.70% of the Fund's average daily net assets for Class C shares through at least February 28, 2017. This limit excludes certain expenses, as set forth in the Fund Prospectus.
2 Inception Date February 27, 2015.
5
Credit Suisse Global Sustainable Dividend Equity Fund
Annual Investment Adviser's Report (continued)
October 31, 2016 (unaudited)
Information About Your Fund's Expenses
As an investor of the Fund, you incur two types of costs: ongoing expenses and transaction costs. Ongoing expenses include management fees, distribution and service (12b-1) fees and other Fund expenses. Examples of transaction costs include sales charges (loads), redemption fees and account maintenance fees, which are not shown in this section and which would result in higher total expenses. The following table is intended to help you understand your ongoing expenses of investing in the Fund and to help you compare these expenses with the ongoing expenses of investing in other mutual funds. The table is based on an investment of $1,000 made at the beginning of the six months ended October 31, 2016.
The table illustrates your Fund's expenses in two ways:
• Actual Fund Return. This helps you estimate the actual dollar amount of ongoing expenses paid on a $1,000 investment in the Fund using the Fund's actual return during the period. To estimate the expenses you paid over the period, simply divide your account value by $1,000 (for example, an $8,600 account value divided by $1,000 = 8.6), then multiply the result by the number in the "Expenses Paid per $1,000" line.
• Hypothetical 5% Fund Return. This helps you to compare the Fund's ongoing expenses with those of other mutual funds using the Fund's actual expense ratio and a hypothetical rate of return of 5% per year before expenses. Examples using a 5% hypothetical fund return may be found in the shareholder reports of other mutual funds. The hypothetical account values and expenses may not be used to estimate the actual ending account balance or expenses you paid for the period.
Please note that the expenses shown in these tables are meant to highlight your ongoing expenses only and do not reflect any transaction costs, such as sales charges (loads) or redemption fees. If these transaction costs had been included, your costs would have been higher. The "Expenses Paid per $1,000" line of the tables is useful in comparing ongoing expenses only and will not help you determine the relative total expenses of owning different funds.
6
Credit Suisse Global Sustainable Dividend Equity Fund
Annual Investment Adviser's Report (continued)
October 31, 2016 (unaudited)
Expenses and Value for a $1,000 Investment
for the six-month period ended October 31, 2016
Actual Fund Return | | Class I | | Class A | | Class C | |
Beginning Account Value 05/01/16 | | $ | 1,000.00 | | | $ | 1,000.00 | | | $ | 1,000.00 | | |
Ending Account Value 10/31/16 | | $ | 988.20 | | | $ | 988.00 | | | $ | 983.30 | | |
Expenses Paid per $1,000* | | $ | 3.50 | | | $ | 4.75 | | | $ | 8.48 | | |
Hypothetical 5% Fund Return | |
Beginning Account Value 05/01/16 | | $ | 1,000.00 | | | $ | 1,000.00 | | | $ | 1,000.00 | | |
Ending Account Value 10/31/16 | | $ | 1,021.62 | | | $ | 1,020.36 | | | $ | 1,016.59 | | |
Expenses Paid per $1,000* | | $ | 3.56 | | | $ | 4.82 | | | $ | 8.62 | | |
| | | Class I | | Class A | | Class C | |
Annualized Expense Ratios* | | | 0.70 | % | | | 0.95 | % | | | 1.70 | % | |
* Expenses are equal to the Fund's annualized expense ratio for each share class, multiplied by the average account value over the period, multiplied by 184/366 to reflect the one-half year period.
The "Expenses Paid per $1,000" and the "Annualized Expense Ratios" in the tables are based on actual expenses paid by the Fund during the period, net of fee waivers and/or actual expense reimbursements, if applicable. If those fee waivers and/or expense reimbursements had not been in effect, the Fund's actual expenses would have been higher. Expenses do not reflect additional charges and expenses that are, or may be, imposed under the variable contracts or plans. Such charges and expenses are described in the prospectus of the insurance company separate account or in the plan documents or other informational materials supplied by plan sponsors. The Fund's expenses should be considered with these charges and expenses in evaluating the overall cost of investing in the separate account.
For more information, please refer to the Fund's Prospectus.
7
Credit Suisse Global Sustainable Dividend Equity Fund
Annual Investment Adviser's Report (continued)
October 31, 2016 (unaudited)
Sector Breakdown*
Health Care | | | 18.8 | % | |
Industrials | | | 15.9 | | |
Consumer Staples | | | 15.8 | | |
Information Technology | | | 12.8 | | |
Financials | | | 12.4 | | |
Consumer Discretionary | | | 9.8 | | |
| Short-Term Investment1 | | | 6.4 | | |
Telecommunication Services | | | 3.0 | | |
Materials | | | 2.6 | | |
Utilities | | | 2.5 | | |
| | | | 100.0 | % | |
* Expressed as a percentage of total investments (excluding securities lending collateral, if applicable) and may vary over time.
1 Primarily reflects cash invested in State Street Bank and Trust Co. Euro Time Deposit, for which the purchases of securities have been executed but not yet settled at October 31, 2016, if applicable.
8
Credit Suisse Global Sustainable Dividend Equity Fund
Schedule of Investments
October 31, 2016
| | | Number of
Shares | | Value | |
| COMMON STOCKS (93.5%) | |
| BRAZIL (3.7%) | |
| Beverages (3.7%) | |
Ambev S.A., ADR | | | 146,100 | | | $ | 861,990 | | |
| FRANCE (6.8%) | |
| Food Products (1.0%) | |
Danone S.A. | | | 3,500 | | | | 242,412 | | |
| Insurance (2.3%) | |
AXA S.A. | | | 23,900 | | | | 538,478 | | |
| Pharmaceuticals (1.9%) | |
Sanofi, ADR | | | 11,500 | | | | 447,235 | | |
| Textiles, Apparel & Luxury Goods (1.6%) | |
LVMH Moet Hennessy Louis Vuitton SE | | | 2,000 | | | | 363,608 | | |
| | | | 1,591,733 | | |
| GERMANY (4.6%) | |
| Industrial Conglomerates (2.3%) | |
Siemens AG, ADR | | | 4,700 | | | | 534,155 | | |
| Insurance (2.3%) | |
Allianz SE, Reg S(1) | | | 3,500 | | | | 545,593 | | |
| | | | 1,079,748 | | |
| HONG KONG (1.5%) | |
| Wireless Telecommunication Services (1.5%) | |
China Mobile Ltd. | | | 30,000 | | | | 343,723 | | |
| IRELAND (3.7%) | |
| Electrical Equipment (1.1%) | |
Eaton Corp. PLC | | | 4,000 | | | | 255,080 | | |
| IT Services (2.6%) | |
Accenture PLC, Class A | | | 5,300 | | | | 616,072 | | |
| | | | 871,152 | | |
| MEXICO (3.1%) | |
| Food & Staples Retailing (3.1%) | |
Wal-Mart de Mexico S.A.B. de C.V. | | | 347,300 | | | | 738,272 | | |
| SPAIN (2.5%) | |
| Electric Utilities (2.5%) | |
Red Electrica Corp. S.A. | | | 27,800 | | | | 578,325 | | |
| SWITZERLAND (6.8%) | |
| Pharmaceuticals (6.8%) | |
Novartis AG, ADR | | | 10,600 | | | | 752,812 | | |
Roche Holding AG, ADR | | | 29,700 | | | | 851,647 | | |
| | | | 1,604,459 | | |
See Accompanying Notes to Financial Statements.
9
Credit Suisse Global Sustainable Dividend Equity Fund
Schedule of Investments (continued)
October 31, 2016
| | | Number of
Shares | | Value | |
| COMMON STOCKS (continued) | |
| TAIWAN (5.0%) | |
| Diversified Telecommunication Services (1.5%) | |
Chunghwa Telecom Co. Ltd., ADR | | | 10,600 | | | $ | 361,990 | | |
| Semiconductors & Semiconductor Equipment (3.5%) | |
Taiwan Semiconductor Manufacturing Co. Ltd., ADR | | | 26,000 | | | | 808,600 | | |
| | | | 1,170,590 | | |
| UNITED KINGDOM (6.0%) | |
| Media (1.0%) | |
WPP PLC | | | 10,400 | | | | 225,244 | | |
| Personal Products (3.2%) | |
Unilever PLC, ADR | | | 18,300 | | | | 762,561 | | |
| Tobacco (1.8%) | |
British American Tobacco PLC, ADR | | | 3,600 | | | | 413,604 | | |
| | | | 1,401,409 | | |
| UNITED STATES (49.8%) | |
| Aerospace & Defense (7.8%) | |
General Dynamics Corp. | | | 2,400 | | | | 361,776 | | |
Honeywell International, Inc. | | | 9,100 | | | | 998,088 | | |
Raytheon Co. | | | 3,500 | | | | 478,135 | | |
| | | | 1,837,999 | | |
| Biotechnology (0.9%) | |
AbbVie, Inc. | | | 3,800 | | | | 211,964 | | |
| Commercial Banks (6.2%) | |
JPMorgan Chase & Co. | | | 15,800 | | | | 1,094,308 | | |
Wells Fargo & Co. | | | 7,600 | | | | 349,676 | | |
| | | | 1,443,984 | | |
| Communications Equipment (2.2%) | |
Cisco Systems, Inc. | | | 16,600 | | | | 509,288 | | |
| Containers & Packaging (2.6%) | |
Bemis Co., Inc. | | | 4,400 | | | | 214,368 | | |
Sonoco Products Co. | | | 7,700 | | | | 387,233 | | |
| | | | 601,601 | | |
| Food & Staples Retailing (2.9%) | |
Sysco Corp. | | | 14,300 | | | | 688,116 | | |
| Health Care Providers & Services (2.5%) | |
Anthem, Inc. | | | 3,200 | | | | 389,952 | | |
Cardinal Health, Inc. | | | 2,800 | | | | 192,332 | | |
| | | | 582,284 | | |
| Industrial Conglomerates (4.7%) | |
General Electric Co. | | | 37,600 | | | | 1,094,160 | | |
See Accompanying Notes to Financial Statements.
10
Credit Suisse Global Sustainable Dividend Equity Fund
Schedule of Investments (continued)
October 31, 2016
| | | Number of
Shares | | Value | |
| COMMON STOCKS (continued) | |
UNITED STATES | |
| Insurance (1.6%) | |
The Travelers Cos., Inc. | | | 3,600 | | | $ | 389,448 | | |
| Leisure Equipment & Products (4.0%) | |
Hasbro, Inc. | | | 11,200 | | | | 934,192 | | |
| Multiline Retail (3.3%) | |
Target Corp. | | | 11,200 | | | | 769,776 | | |
| Pharmaceuticals (6.6%) | |
Bristol-Myers Squibb Co. | | | 4,200 | | | | 213,822 | | |
Johnson & Johnson | | | 11,500 | | | | 1,333,885 | | |
| | | | 1,547,707 | | |
| Semiconductors & Semiconductor Equipment (2.8%) | |
QUALCOMM, Inc. | | | 9,500 | | | | 652,840 | | |
| Software (1.7%) | |
Microsoft Corp. | | | 6,700 | | | | 401,464 | | |
| | | | 11,664,823 | | |
| TOTAL COMMON STOCKS (Cost $21,662,382) | | | 21,906,224 | | |
| | | Par
(000) | | | |
| SHORT-TERM INVESTMENT (6.4%) | |
State Street Bank and Trust Co. Euro Time Deposit, 0.010% 11/01/2016 (Cost $1,497,954) | | $ | 1,498 | | | | 1,497,954 | | |
| TOTAL INVESTMENTS AT VALUE (99.9%) (Cost $23,160,336) | | | 23,404,178 | | |
| OTHER ASSETS IN EXCESS OF LIABILITIES (0.1%) | | | 29,266 | | |
| NET ASSETS (100.0%) | | $ | 23,433,444 | | |
(1) REG S: Securities sold under Regulation S may not be offered, sold or delivered within the United States or to, or for the account or benefit of, U.S. persons, except pursuant to an exemption from, or in a transaction not subject to, the registration requirements of the Securities Act of 1933.
INVESTMENT ABBREVIATION
ADR = American Depositary Receipt
See Accompanying Notes to Financial Statements.
11
Credit Suisse Global Sustainable Dividend Equity Fund
Statement of Assets and Liabilities
October 31, 2016
Assets | |
Investments at value (Cost $23,160,336) (Note 2) | | $ | 23,404,178 | | |
Cash | | | 50,000 | | |
Dividend receivable | | | 44,860 | | |
Receivable from investment adviser (Note 3) | | | 16,292 | | |
Prepaid expenses | | | 10,200 | | |
Total assets | | | 23,525,530 | | |
Liabilities | |
Administrative services fee payable (Note 3) | | | 39,568 | | |
Shareholder servicing/Distribution fee payable (Note 3) | | | 1,183 | | |
Trustees' fee payable | | | 8,299 | | |
Due to custodian for foreign currency at value (cost $3,323) | | | 3,310 | | |
Accrued expenses | | | 39,726 | | |
Total liabilities | | | 92,086 | | |
Net Assets | |
Capital stock, $.001 par value (Note 6) | | | 2,450 | | |
Paid-in capital (Note 6) | | | 24,407,862 | | |
Accumulated undistributed net investment income | | | 7,741 | | |
Accumulated net realized loss on investments and foreign currency transactions | | | (1,228,160 | ) | |
Net unrealized appreciation from investments and foreign currency translations | | | 243,551 | | |
Net assets | | $ | 23,433,444 | | |
I Shares | |
Net assets | | $ | 21,019,900 | | |
Shares outstanding | | | 2,197,849 | | |
Net asset value, offering price and redemption price per share | | $ | 9.56 | | |
A Shares | |
Net assets | | $ | 1,332,153 | | |
Shares outstanding | | | 139,306 | | |
Net asset value and redemption price per share | | $ | 9.56 | | |
Maximum offering price per share (net asset value/(1-5.25%)) | | $ | 10.09 | | |
C Shares | |
Net assets | | $ | 1,081,391 | | |
Shares outstanding | | | 113,202 | | |
Net asset value, offering price and redemption price per share | | $ | 9.55 | | |
See Accompanying Notes to Financial Statements.
12
Credit Suisse Global Sustainable Dividend Equity Fund
Statement of Operations
For the Year Ended October 31, 2016
Investment Income | |
Dividends | | $ | 705,465 | | |
Foreign taxes withheld | | | (41,940 | ) | |
Total investment income | | | 663,525 | | |
Expenses | |
Investment advisory fees (Note 3) | | | 142,216 | | |
Administrative services fees (Note 3) | | | 167,536 | | |
Shareholder servicing/Distribution fees (Note 3) | |
Class A | | | 2,695 | | |
Class C | | | 12,063 | | |
Registration fees | | | 40,255 | | |
Audit and tax fees | | | 38,105 | | |
Trustees' fees | | | 30,429 | | |
Legal fees | | | 25,866 | | |
Offering costs (Note 3) | | | 24,695 | | |
Printing fees | | | 23,475 | | |
Transfer agent fees (Note 3) | | | 16,452 | | |
Commitment fees (Note 4) | | | 13,854 | | |
Custodian fees | | | 3,399 | | |
Insurance expense | | | 540 | | |
Miscellaneous expense | | | 6,735 | | |
Total expenses | | | 548,315 | | |
Less: fees waived and expenses reimbursed (Note 3) | | | (367,638 | ) | |
Net expenses | | | 180,677 | | |
Net investment income | | | 482,848 | | |
Net Realized and Unrealized Gain (Loss) from Investments and Foreign Currency Related Items | |
Net realized loss from investments | | | (932,060 | ) | |
Net realized loss from foreign currency transactions | | | (3,654 | ) | |
Net change in unrealized appreciation (depreciation) from investments | | | 465,938 | | |
Net change in unrealized appreciation (depreciation) from foreign currency translations | | | (215 | ) | |
Net realized and unrealized loss from investments and foreign currency related items | | | (469,991 | ) | |
Net increase in net assets resulting from operations | | $ | 12,857 | | |
See Accompanying Notes to Financial Statements.
13
Credit Suisse Global Sustainable Dividend Equity Fund
Statement of Changes in Net Assets
| | | For the Year
Ended
October 31, 2016 | | For the Period
Ended
October 31, 20151 | |
From Operations | |
Net investment income | | $ | 482,848 | | | $ | 314,829 | | |
Net realized loss from investments and foreign currency transactions | | | (935,714 | ) | | | (277,681 | ) | |
Net change in unrealized appreciation (depreciation)
from investments and foreign currency translations | | | 465,723 | | | | (222,172 | ) | |
Net increase (decrease) in net assets resulting from operations | | | 12,857 | | | | (185,024 | ) | |
From Dividends | |
Dividends from net investment income | |
Class I | | | (544,534 | ) | | | (202,432 | ) | |
Class A | | | (24,689 | ) | | | (9,840 | ) | |
Class C | | | (19,776 | ) | | | (5,363 | ) | |
Net decrease in net assets resulting from dividends | | | (588,999 | ) | | | (217,635 | ) | |
| From Capital Share Transactions (Note 6) | |
Proceeds from sale of shares | | | 4,490,563 | | | | 22,603,497 | | |
Reinvestment of dividends | | | 588,866 | | | | 217,635 | | |
Net asset value of shares redeemed | | | (3,326,787 | ) | | | (161,529 | ) | |
Net increase in net assets from capital share transactions | | | 1,752,642 | | | | 22,659,603 | | |
Net increase in net assets | | | 1,176,500 | | | | 22,256,944 | | |
Net Assets | |
Beginning of period | | | 22,256,944 | | | | — | | |
End of period | | $ | 23,433,444 | | | $ | 22,256,944 | | |
Accumulated undistributed net investment income | | $ | 7,741 | | | $ | 117,467 | | |
1 For the period February 27, 2015 (Inception Date) through October 31, 2015.
See Accompanying Notes to Financial Statements.
14
Credit Suisse Global Sustainable Dividend Equity Fund
Financial Highlights
(For a Class I Share of the Fund Outstanding Throughout Each Period)
| | | For the Year
Ended
October 31, 2016 | | For the Period
Ended
October 31, 20151 | |
Per share data | |
Net asset value, beginning of period | | $ | 9.81 | | | $ | 10.00 | | |
INVESTMENT OPERATIONS | |
Net investment income2 | | | 0.20 | | | | 0.15 | | |
Net loss from investments and foreign currency related items
(both realized and unrealized) | | | (0.20 | ) | | | (0.24 | ) | |
Total from investment operations | | | (0.00 | ) | | | (0.09 | ) | |
LESS DIVIDENDS | |
Dividends from net investment income | | | (0.25 | ) | | | (0.10 | ) | |
Total dividends | | | (0.25 | ) | | | (0.10 | ) | |
Net asset value, end of period | | $ | 9.56 | | | $ | 9.81 | | |
Total return3 | | | (0.04 | )% | | | (0.86 | )% | |
RATIOS AND SUPPLEMENTAL DATA | |
Net assets, end of period (000s omitted) | | $ | 21,020 | | | $ | 20,044 | | |
Ratio of net expenses to average net assets | | | 0.70 | % | | | 0.70 | %4 | |
Ratio of net investment income to average net assets | | | 2.10 | % | | | 2.23 | %4 | |
Decrease reflected in above operating expense ratios due to
waivers/reimbursements | | | 1.55 | % | | | 1.47 | %4 | |
Portfolio turnover rate | | | 57 | % | | | 37 | % | |
1 For the period February 27, 2015 (Inception Date) through October 31, 2015.
2 Per share information is calculated using the average shares outstanding method.
3 Total returns are historical and include change in share price and reinvestment of all distributions. Had certain expenses not been reduced during the periods shown, total returns would have been lower.
4 Annualized.
See Accompanying Notes to Financial Statements.
15
Credit Suisse Global Sustainable Dividend Equity Fund
Financial Highlights
(For a Class A Share of the Fund Outstanding Throughout Each Period)
| | | For the Year
Ended
October 31, 2016 | | For the Period
Ended
October 31, 20151 | |
Per share data | |
Net asset value, beginning of period | | $ | 9.81 | | | $ | 10.00 | | |
INVESTMENT OPERATIONS | |
Net investment income2 | | | 0.17 | | | | 0.13 | | |
Net loss on investments and foreign currency related items
(both realized and unrealized) | | | (0.20 | ) | | | (0.23 | ) | |
Total from investment operations | | | (0.03 | ) | | | (0.10 | ) | |
LESS DIVIDENDS | |
Dividends from net investment income | | | (0.22 | ) | | | (0.09 | ) | |
Total dividends | | | (0.22 | ) | | | (0.09 | ) | |
Net asset value, end of period | | $ | 9.56 | | | $ | 9.81 | | |
Total return3 | | | (0.29 | )% | | | (1.00 | )% | |
RATIOS AND SUPPLEMENTAL DATA | |
Net assets, end of period (000s omitted) | | $ | 1,332 | | | $ | 1,120 | | |
Ratio of net expenses to average net assets | | | 0.95 | % | | | 0.95 | %4 | |
Ratio of net investment income to average net assets | | | 1.81 | % | | | 1.96 | %4 | |
Decrease reflected in above operating expense ratios due to
waivers/reimbursements | | | 1.55 | % | | | 1.47 | %4 | |
Portfolio turnover rate | | | 57 | % | | | 37 | % | |
1 For the period February 27, 2015 (Inception Date) through October 31, 2015.
2 Per share information is calculated using the average shares outstanding method.
3 Total returns are historical and include change in share price, reinvestment of all dividends and no sales charge. Had certain expenses not been reduced during the periods shown, total returns would have been lower.
4 Annualized.
See Accompanying Notes to Financial Statements.
16
Credit Suisse Global Sustainable Dividend Equity Fund
Financial Highlights
(For a Class C Share of the Fund Outstanding Throughout Each Period)
| | | For the Year
Ended
October 31, 2016 | | For the Period
Ended
October 31, 20151 | |
Per share data | |
Net asset value, beginning of period | | $ | 9.80 | | | $ | 10.00 | | |
INVESTMENT OPERATIONS | |
Net investment income2 | | | 0.11 | | | | 0.08 | | |
Net loss from investments and foreign currency related items
(both realized and unrealized) | | | (0.21 | ) | | | (0.23 | ) | |
Total from investment operations | | | (0.10 | ) | | | (0.15 | ) | |
LESS DIVIDENDS | |
Dividends from net investment income | | | (0.15 | ) | | | (0.05 | ) | |
Total dividends | | | (0.15 | ) | | | (0.05 | ) | |
Net asset value, end of period | | $ | 9.55 | | | $ | 9.80 | | |
Total return3 | | | (1.04 | )% | | | (1.50 | )% | |
RATIOS AND SUPPLEMENTAL DATA | |
Net assets, end of period (000s omitted) | | $ | 1,081 | | | $ | 1,092 | | |
Ratio of net expenses to average net assets | | | 1.70 | % | | | 1.70 | %4 | |
Ratio of net investment income to average net assets | | | 1.16 | % | | | 1.23 | %4 | |
Decrease reflected in above operating expense ratios due to
waivers/reimbursements | | | 1.55 | % | | | 1.47 | %4 | |
Portfolio turnover rate | | | 57 | % | | | 37 | % | |
1 For the period February 27, 2015 (Inception Date) through October 31, 2015.
2 Per share information is calculated using the average shares outstanding method.
3 Total returns are historical and include change in share price, reinvestment of all dividends and no sales charge. Had certain expenses not been reduced during the periods shown, total returns would have been lower.
4 Annualized.
See Accompanying Notes to Financial Statements.
17
Credit Suisse Global Sustainable Dividend Equity Fund
Notes to Financial Statements
October 31, 2016
Credit Suisse Global Sustainable Dividend Equity Fund (the "Fund"), a series of the Credit Suisse Opportunity Funds (the "Trust"), a Delaware statutory trust, is registered under the Investment Company Act of 1940, as amended (the "1940 Act"), as a diversified open-end management investment company that seeks current income and capital appreciation. The Trust was organized under the laws of the State of Delaware as a business trust on May 31, 1995.
The Fund offers three classes of shares: Class I shares, Class A shares and Class C shares. Each class of shares represents an equal pro rata interest in the Fund, except the share classes bear different expenses, which reflect the differences in the range of services provided to them. Class A shares are sold subject to a front-end sales charge of up to 5.25%. Class C shares are sold subject to a contingent deferred sales charge of 1.00% if the shares are redeemed within the first year of purchase. Class I shares are sold without a sales charge.
Note 2. Significant Accounting Policies
The following is a summary of significant accounting policies followed by the Fund in the preparation of its financial statements. The policies are in accordance with accounting principles generally accepted in the United States of America ("GAAP"). The preparation of financial statements requires management to make estimates and assumptions that affect the reported amounts and disclosures in the financial statements. Actual results could differ from those estimates. The Fund is considered an investment company for financial reporting purposes under GAAP and follows Accounting Standard Codification ("ASC") Topic 946 — Financial Services — Investment Companies.
A) SECURITY VALUATION — The net asset value of the Fund is determined daily as of the close of regular trading on the New York Stock Exchange, Inc. (the "Exchange") on each day the Exchange is open for business. For certain international equity securities, in order to adjust for events which may occur between the close of the foreign exchanges and the close of the New York Stock Exchange, a fair valuation model may be used. This fair valuation model takes into account comparisons to the valuation of American Depository Receipts ("ADRs"), exchange-traded funds, futures contracts and certain indices, and these securities are categorized as Level 2. The valuations for fixed income securities (which may include, but are not limited to, corporate, government, municipal, mortgage-backed, collateralized mortgage obligations and asset-backed securities) and certain derivative instruments are typically the prices supplied by independent third party pricing services, which may use market
18
Credit Suisse Global Sustainable Dividend Equity Fund
Notes to Financial Statements (continued)
October 31, 2016
Note 2. Significant Accounting Policies (continued)
prices or broker/dealer quotations or a variety of valuation techniques and methodologies. The independent third party pricing services use inputs that are observable such as issuer details, interest rates, yield curves, prepayment speeds, credit risks/spreads, default rates and quoted prices for similar securities. These pricing services generally price fixed income securities assuming orderly transactions of an institutional "round lot" size, but some trades occur in smaller "odd lot" sizes which may be effected at lower prices than institutional round lot trades. Structured note agreements are valued in accordance with a dealer-supplied valuation based on changes in the value of the underlying index. Futures contracts are valued daily at the settlement price established by the board of trade or exchange on which they are traded. Forward contracts are valued at the London closing spot rates and the London closing forward point rates on a daily basis. The currency forward contract pricing model derives the differential in point rates to the expiration date of the forward and calculates its present value. Equity securities for which market quotations are available are valued at the last reported sales price or official closing price on the primary market or exchange on which they trade. The Fund may utilize a service provided by an independent third party which has been approved by the Board of Trustees (the "Board") to fair value certain securities. When fair value pricing is employed, the prices of securities used by the Fund to calculate its net asset value may differ from quoted or published prices for the same securities. If independent third party pricing services are unable to supply prices for a portfolio investment, or if the prices supplied are deemed by the investment adviser to be unreliable, the market price may be determined by the investment adviser using quotations from one or more brokers/dealers or at the transaction price if the security has recently been purchased and no value has yet been obtained from a pricing service or pricing broker. When reliable prices are not readily available, such as when the value of a security has been significantly affected by events after the close of the exchange or market on which the security is principally traded, but before the Fund calculates its net asset value, the Fund values these securities as determined in accordance with procedures approved and established by the Board.
The Fund uses valuation techniques to measure fair value that are consistent with the market approach and/or income approach, depending on the type of security and the particular circumstance. The market approach uses prices and other relevant information generated by market transactions involving identical or comparable securities. The income approach uses valuation techniques to discount estimated future cash flows to present value.
19
Credit Suisse Global Sustainable Dividend Equity Fund
Notes to Financial Statements (continued)
October 31, 2016
Note 2. Significant Accounting Policies (continued)
GAAP established a disclosure hierarchy that categorizes the inputs to valuation techniques used to value assets and liabilities at each measurement date. These inputs are summarized in the three broad levels listed below:
• Level 1 – quoted prices in active markets for identical investments
• Level 2 – other significant observable inputs (including quoted prices for similar investments, interest rates, prepayment speeds, credit risk, etc.)
• Level 3 – significant unobservable inputs (including the Fund's own assumptions in determining the fair value of investments)
The inputs or methodologies used to value securities are not necessarily an indication of the risk associated with investing in those securities.
The following is a summary of the inputs used as of October 31, 2016 in valuing the Fund's assets and liabilities carried at fair value:
Assets | | Level 1 | | Level 2 | | Level 3 | | Total | |
Investments in Securities | |
Common Stocks | | $ | 19,068,841 | | | $ | 2,837,383 | | | $ | — | | | $ | 21,906,224 | | |
Short-term Investment | | | — | | | | 1,497,954 | | | | — | | | | 1,497,954 | | |
| | | $ | 19,068,841 | | | $ | 4,335,337 | | | $ | — | | | $ | 23,404,178 | | |
For the year ended October 31, 2016, there were no transfers among Level 1, Level 2 and Level 3. All transfers, if any, are assumed to occur at the end of the reporting period.
B) DERIVATIVE INSTRUMENTS AND HEDGING ACTIVITIES — The Fund adopted amendments to authoritative guidance on disclosures about derivative instruments and hedging activities which require that a fund disclose (a) how and why an entity uses derivative instruments, (b) how derivative instruments and hedging activities are accounted for and (c) how derivative instruments and related hedging activities affect a fund's financial position, financial performance and cash flows. The Fund has not entered into any derivative or hedging activities during the period covered by this report.
C) FOREIGN CURRENCY TRANSACTIONS — The books and records of the Fund are maintained in U.S. dollars. Transactions denominated in foreign currencies are recorded at the current prevailing exchange rates. All assets and liabilities denominated in foreign currencies are translated into U.S. dollar amounts at the current exchange rate at the end of the period. Reported net realized gain (loss) from foreign currency transactions arises from sales of foreign currencies; currency gains or losses realized between the trade and
20
Credit Suisse Global Sustainable Dividend Equity Fund
Notes to Financial Statements (continued)
October 31, 2016
Note 2. Significant Accounting Policies (continued)
settlement dates on securities transactions; and the difference between the amounts of dividends, interest, and foreign withholding taxes recorded on the Fund's books and the U.S. dollar equivalent of the amounts actually received or paid. Net change in unrealized gains and losses on translation of assets and liabilities denominated in foreign currencies arises from changes in the fair values of assets and liabilities, other than investments at the end of the period, resulting from changes in exchange rates. The Fund does not isolate that portion of the results of operations resulting from fluctuations in foreign exchange rates on investments from the fluctuations arising from changes in market prices of investments held. Such fluctuations are included with net realized and unrealized gain or loss from investments in the Statement of Operations.
D) SECURITY TRANSACTIONS AND INVESTMENT INCOME/EXPENSE — Security transactions are accounted for on a trade date basis. Interest income/expense is recorded on the accrual basis. The Fund amortizes premiums and accretes discounts using the effective interest method. Dividend income/expense is recorded on the ex-dividend date. Certain expenses are class-specific expenses, vary by class and are charged only to that class. Income, expenses (excluding class-specific expenses) and realized/unrealized gains/losses are allocated proportionately to each class of shares based upon the relative net asset value of the outstanding shares of that class. The cost of investments sold is determined by use of the specific identification method for both financial reporting and income tax purposes. To the extent any issuer defaults or a credit event occurs that impacts the issuer, the Fund may halt any additional interest income accruals and consider the realizability of interest accrued up to the date of default or credit event.
E) DIVIDENDS AND DISTRIBUTIONS TO SHAREHOLDERS — Dividends from net investment income, if any, are declared and paid quarterly. Distributions of net realized capital gains, if any, are declared and paid at least annually. However, to the extent that a net realized capital gain can be reduced by a capital loss carryforward, such gain will not be distributed. Dividends and distributions to shareholders of the Fund are recorded on the ex-dividend date and are determined in accordance with federal income tax regulations, which may differ from GAAP.
F) FEDERAL INCOME TAXES — No provision is made for federal taxes as it is the Fund's intention to continue to qualify as a regulated investment company ("RIC") under the Internal Revenue Code of 1986, as amended (the "Code"), and to make the requisite distributions to its shareholders, which will be sufficient to relieve it from federal income and excise taxes.
21
Credit Suisse Global Sustainable Dividend Equity Fund
Notes to Financial Statements (continued)
October 31, 2016
Note 2. Significant Accounting Policies (continued)
In order to qualify as a RIC under the Code, the Fund must meet certain requirements regarding the source of its income, the diversification of its assets and the distribution of its income. One of these requirements is that the Fund derive at least 90% of its gross income for each taxable year from dividends, interest, payments with respect to certain securities loans, gains from the sale or other disposition of stock, securities or foreign currencies, other income derived with respect to its business of investing in such stock, securities or currencies or net income derived from interests in certain publicly-traded partnerships ("Qualifying Income").
The Fund adopted the authoritative guidance for uncertainty in income taxes and recognizes a tax benefit or liability from an uncertain position only if it is more likely than not that the position is sustainable based solely on its technical merits and consideration of the relevant taxing authority's widely understood administrative practices and procedures. The Fund has reviewed its current tax positions and has determined that no provision for income tax is required in the Fund's financial statements. The Fund's federal and state income and federal excise tax returns for tax years for which the applicable statutes of limitations have not expired are subject to examination by the Internal Revenue Service and state departments of revenue.
G) SHORT-TERM INVESTMENTS — The Fund, together with other funds/portfolios advised by Credit Suisse, pools available cash into a short-term variable rate time deposit issued by State Street Bank and Trust Company ("SSB"), the Fund's custodian. The short-term time deposit issued by SSB is a variable rate account classified as a short-term investment.
H) OTHER — In the normal course of business the Fund trades financial instruments and enters into financial transactions for which risk of potential loss exists due to changes in the market (market risk) or failure of the other party to a transaction to perform (credit risk). Similar to credit risk, the Fund may be exposed to counterparty risk, or the risk that an institution or other entity with which the Fund has unsettled or open transactions will default. The potential loss could exceed the value of the financial assets recorded in the financial statements. Financial assets, which potentially expose the Fund to credit risk, consist principally of cash due from counterparties and investments. The extent of the Fund's exposure to credit and counterparty risks in respect to these financial assets approximates their carrying value as recorded in the Fund's Statement of Assets and Liabilities.
22
Credit Suisse Global Sustainable Dividend Equity Fund
Notes to Financial Statements (continued)
October 31, 2016
Note 2. Significant Accounting Policies (continued)
I) FOREIGN INVESTMENTS RISK — The Fund may have elements of risk not typically associated with investments in the U.S. due to concentrated investments in a limited number of countries or regions, which may vary throughout the year. Such concentrations may subject the Fund to additional risks resulting from political or economic conditions in such countries or regions, and the possible imposition of adverse governmental laws or currency exchange restrictions could cause the securities and their markets to be less liquid and their prices to be more volatile than those of comparable U.S. securities.
Because the Fund may invest a significant portion of its assets in these markets, it is subject to greater risks of adverse events that occur in those markets and may experience greater volatility than a Fund that is more broadly diversified geographically.
J) RECENT ACCOUNTING PRONOUNCEMENTS — On August 26, 2016, Financial Accounting Standards Board ("FASB") issued a new Accounting Standards Update No. 2016-15, "Statement of Cash Flows (Topic 230), a consensus of the FASB's Emerging Issues Task Force" ("ASU 2016-15"). ASU 2016-15 is intended to reduce diversity in practice in how certain transactions are classified in the statement of cash flows. The issues addressed in ASU 2016-15 are: debt prepayment or debt extinguishment costs, settlement of zero-coupon debt instruments, contingent consideration payments made after a business combination, proceeds from the settlement of insurance claims, proceeds from the settlement of corporate-owned life insurance policies, including bank-owned life insurance policies, distributions received from equity method investments, beneficial interests in securitization transactions; and, separately identifiable cash flows and application of the predominance principle. ASU 2016-15 is effective for interim and annual reporting periods beginning after December 15, 2017. Management is currently evaluating the impact, if any, of applying this provision.
In November 2016, FASB issued a new Accounting Standards Update No. 2016-18, "Statement of Cash Flows (Topic 230), Restricted Cash, a consensus of the FASB's Emerging Issues Task Force" ("ASU 2016-18"). ASU 2016-18 requires that a statement of cash flows explain the change during the period in the total of cash, cash equivalents, and amounts generally described as restricted cash or restricted cash equivalents. Therefore, amounts generally described as restricted cash and restricted cash equivalents should be included with cash and cash equivalents when reconciling the beginning-of-period and end-of-period total amounts shown on the statement of cash flows. The
23
Credit Suisse Global Sustainable Dividend Equity Fund
Notes to Financial Statements (continued)
October 31, 2016
Note 2. Significant Accounting Policies (continued)
amendments in ASU 2016-18 do not provide a definition of restricted cash or restricted cash equivalents. ASU 2016-18 is effective for interim and annual reporting periods beginning after December 15, 2017. Management is currently evaluating the impact, if any, of applying this provision.
In October 2016, the U.S. Securities and Exchange Commission adopted new rules and amended existing rules (together, "final rules") intended to modernize the reporting and disclosure of information by registered investment companies. In part, the final rules amend Regulation S-X and require standardized, enhanced disclosure about derivatives in investment company financial statements, as well as other amendments. The compliance date for the amendments to Regulation S-X is August 1, 2017. Management is currently evaluating the impact that the adoption of the amendments to Regulation S-X will have on the Fund's financial statements and related disclosures.
K) SUBSEQUENT EVENTS — On November 15, 2016, the Board of Trustees of the Fund approved a plan of liquidation, dissolution and termination for the Fund whereby all of the Fund's assets were to be liquidated and the Fund subsequently dissolved. Upon approval of the plan of liquidation, the Fund was closed to new investors. A final distribution to shareholders of the Fund, based on the Fund's December 16, 2016 net asset value, was made on December 19, 2016.
Note 3. Transactions with Affiliates and Related Parties
Credit Suisse serves as investment adviser for the Fund. For its investment advisory services, Credit Suisse is entitled to receive a fee from the Fund at an annual rate of 0.60% of the Fund's average daily net assets. Credit Suisse has contractually waived fees and reimbursed expenses so that the Fund's annual operating expenses would not exceed 0.70% of the Fund's average daily net assets for Class I shares, 0.95% of the Fund's average daily net assets for Class A shares, and 1.70% of the Fund's average daily net assets for Class C shares. For the year ended October 31, 2016, investment advisory fees earned and fees waived/expenses reimbursed were $142,216 and $367,638, respectively. The Fund is authorized to reimburse Credit Suisse for management fees previously limited and/or for expenses previously reimbursed by Credit Suisse, provided, however, that any reimbursements must be paid at a date not more than three years after the end of the fiscal year during which such fees were limited or expenses were reimbursed by Credit Suisse and the reimbursements do not
24
Credit Suisse Global Sustainable Dividend Equity Fund
Notes to Financial Statements (continued)
October 31, 2016
Note 3. Transactions with Affiliates and Related Parties (continued)
cause the Fund to exceed the applicable expense limitation in the contract at the time the fees are recouped. This contract may not be terminated before February 28, 2017.
The amounts waived and reimbursed by Credit Suisse, which are available for potential future recoupment by Credit Suisse, and the expiration schedule at October 31, 2016 are as follows:
| | | Fee waivers/
expense
reimbursements
subject to
recoupment | | Expires
October 31,
2018 | | Expires
October 31,
2019 | |
Class I | | $ | 523,467 | | | $ | 191,261 | | | $ | 332,206 | | |
Class A | | | 27,386 | | | | 10,666 | | | | 16,720 | | |
Class C | | | 29,254 | | | | 10,542 | | | | 18,712 | | |
Totals | | $ | 580,107 | | | $ | 212,469 | | | $ | 367,638 | | |
Credit Suisse and SSB serve as co-administrators to the Fund. For its co-administrative services, Credit Suisse receives a fee calculated at an annual rate of 0.09% of the Fund's average daily net assets. For the year ended October 31, 2016, co-administrative services fees earned by Credit Suisse were $21,332.
For its co-administrative services, SSB receives a fee, exclusive of out-of-pocket expenses, calculated in total for all the Credit Suisse funds/portfolios co-administered by SSB and allocated based upon the relative average net assets of each fund/portfolio, subject to an annual minimum fee. For the year ended October 31, 2016, co-administrative services fees earned by SSB (including out-of-pocket expenses) with respect to the Fund were $146,204.
Credit Suisse Securities (USA) LLC ("CSSU"), an affiliate of Credit Suisse, serves as the distributor of the Fund's shares. Pursuant to a distribution plan adopted by the Fund pursuant to Rule 12b-1 under the 1940 Act, CSSU receives fees for its distribution services. These fees are calculated at an annual rate of 0.25% of the average daily net assets of the Class A shares. For the Class C shares, the fee is calculated at an annual rate of 1.00% of the average daily net assets. For the year ended October 31, 2016, the Fund paid Rule 12b-1 distribution fees of $2,695 for Class A shares and $12,063 for Class C shares. Class I shares are not subject to Rule 12b-1 distribution fees.
Certain brokers, dealers and financial representatives provide transfer agent-related services to the Fund and receive compensation from the Fund. For the
25
Credit Suisse Global Sustainable Dividend Equity Fund
Notes to Financial Statements (continued)
October 31, 2016
Note 3. Transactions with Affiliates and Related Parties (continued)
year ended October 31, 2016, the Fund paid $9,786, which is included within transfer agent fees in the Statement of Operations.
For the year ended October 31, 2016, CSSU and its affiliates advised the Fund that they retained $0 from commissions earned on the sale of the Fund's Class A shares. There were no commissions earned on sale of Class C shares.
Offering costs, including initial registration cost, were deferred and were charged over the Fund's first twelve months of operation. For the year ended October 31, 2016, $24,695 was expensed by the Fund.
Note 4. Line of Credit
The Fund, together with other funds/portfolios advised by Credit Suisse (collectively, the "Participating Funds"), participates in a committed, unsecured line of credit facility ("Credit Facility"), with SSB in an aggregated amount of $250 million for temporary or emergency purposes under a first-come, first-served basis. Under the terms of the Credit Facility, the Participating Funds pay an aggregate commitment fee on the average unused amount of the Credit Facility, which is allocated among the Participating Funds in such manner as is determined by the governing Boards of the Participating Funds. In addition, the Participating Funds pay interest on borrowings at either the Overnight Federal Funds rate or the Overnight LIBOR rate plus a spread. At October 31, 2016 and during the year ended October 31, 2016, the Fund had no borrowings outstanding under the Credit Facility.
Note 5. Purchases and Sales of Securities
For the year ended October 31, 2016, purchases and sales of investment securities (excluding short-term investments) were $13,944,307 and $12,885,567, respectively.
Note 6. Capital Share Transactions
The Fund is authorized to issue an unlimited number of full and fractional shares of beneficial interest, $.001 par value per share. The Fund offers Class I,
26
Credit Suisse Global Sustainable Dividend Equity Fund
Notes to Financial Statements (continued)
October 31, 2016
Note 6. Capital Share Transactions (continued)
Class A and Class C shares. Transactions in capital shares for each class of the Fund were as follows:
| | | Class I | |
| | | For the Year Ended
October 31, 2016 | | For the Period Ended
October 31, 20151 | |
| | | Shares | | Value | | Shares | | Value | |
Shares sold | | | 406,318 | | | $ | 3,932,273 | | | | 2,037,710 | | | $ | 20,368,418 | | |
Shares issued in reinvestment
of dividends | | | 56,269 | | | | 544,402 | | | | 21,302 | | | | 202,432 | | |
Shares redeemed | | | (307,444 | ) | | | (2,978,328 | ) | | | (16,306 | ) | | | (161,529 | ) | |
Net increase | | | 155,143 | | | $ | 1,498,347 | | | | 2,042,706 | | | $ | 20,409,321 | | |
| | | Class A | |
| | | For the Year Ended
October 31, 2016 | | For the Period Ended
October 31, 20151 | |
| | | Shares | | Value | | Shares | | Value | |
Shares sold | | | 32,182 | | | $ | 308,824 | | | | 113,179 | | | $ | 1,130,079 | | |
Shares issued in reinvestment
of dividends | | | 2,554 | | | | 24,688 | | | | 1,035 | | | | 9,840 | | |
Shares redeemed | | | (9,644 | ) | | | (91,793 | ) | | | — | | | | — | | |
Net increase | | | 25,092 | | | $ | 241,719 | | | | 114,214 | | | $ | 1,139,919 | | |
| | | Class C | |
| | | For the Year Ended
October 31, 2016 | | For the Period Ended
October 31, 20151 | |
| | | Shares | | Value | | Shares | | Value | |
Shares sold | | | 25,796 | | | $ | 249,466 | | | | 110,907 | | | $ | 1,105,000 | | |
Shares issued in reinvestment
of dividends | | | 2,048 | | | | 19,776 | | | | 561 | | | | 5,363 | | |
Shares redeemed | | | (26,110 | ) | | | (256,666 | ) | | | — | | | | — | | |
Net increase | | | 1,734 | | | $ | 12,576 | | | | 111,468 | | | $ | 1,110,363 | | |
1For the period February 27, 2015 (Inception Date) through October 31, 2015.
On October 31, 2016, the number of shareholders that held 5% or more of the outstanding shares of each class of the Fund was as follows:
| | | Number of
Shareholders | | Approximate Percentage
of Outstanding Shares | |
Class I | | | 1 | * | | | 85 | % | |
Class A | | | 2 | * | | | 96 | % | |
Class C | | | 2 | * | | | 100 | % | |
*This includes the seed money from Merchant Holding, Inc., an affiliate of Credit Suisse.
27
Credit Suisse Global Sustainable Dividend Equity Fund
Notes to Financial Statements (continued)
October 31, 2016
Note 7. Federal Income Taxes
Income and capital gain distributions are determined in accordance with federal income tax regulations, which may differ from GAAP.
The tax characteristics of distributions paid by the Fund during the years ended October 31, 2016 and 2015, respectively, were as follows:
| | Ordinary Income | |
| | 2016 | | 2015 | |
| | | | | $ | 588,999 | | | $ | 217,635 | | |
The tax basis components of distributable earnings differ from the amounts reflected in the Statement of Assets and Liabilities by temporary book/tax differences. These differences are primarily due to differing treatments of wash sales and offering expenses. At October 31, 2016, the components of distributable earnings on a tax basis were as follows:
Undistributed net investment income | | $ | 27,620 | | |
Accumulated net realized loss | | | (1,188,075 | ) | |
Unrealized appreciation | | | 203,466 | | |
| | $ | (956,989 | ) | |
At October 31, 2016, the Fund had $744,482 of unlimited short-term capital loss carryforwards and $443,593 of unlimited long-term capital loss carryforwards available to offset possible future capital gains.
At October 31, 2016, the cost of investments (excluding foreign currency related transactions) and the net unrealized appreciation (depreciation) for income tax purposes were as follows:
Cost of Investments | | $ | 23,200,421 | | |
Unrealized appreciation | | $ | 1,305,183 | | |
Unrealized depreciation | | | (1,101,426 | ) | |
Net unrealized appreciation | | $ | 203,757 | | |
To adjust for current period permanent book/tax differences which arose principally from differing book/tax treatment of foreign currency gain (loss), accumulated net realized loss was credited $3,575 and accumulated undistributed net investment income was charged $3,575. Net assets were not affected by these reclassifications.
28
Credit Suisse Global Sustainable Dividend Equity Fund
Notes to Financial Statements (continued)
October 31, 2016
In the normal course of business, the Fund may provide general indemnifications pursuant to certain contracts and organizational documents. The Fund's maximum exposure under these arrangements is dependent on future claims that may be made against the Fund and, therefore, cannot be estimated; however, based on experience, the risk of loss from such claims is considered remote.
29
Credit Suisse Global Sustainable Dividend Equity Fund
Report of Independent Registered Public Accounting Firm
The Board of Trustees and Shareholders
Credit Suisse Global Sustainable Dividend Equity Fund:
We have audited the accompanying statement of assets and liabilities of Credit Suisse Global Sustainable Dividend Equity Fund (the "Fund"), a series of the Credit Suisse Opportunity Funds, including the schedule of investments, as of October 31, 2016, and the related statement of operations for the year then ended, the statements of changes in net assets and financial highlights for the year then ended and for the period from February 27, 2015 (inception date) through October 31, 2015. These financial statements and financial highlights are the responsibility of the Fund's management. Our responsibility is to express an opinion on these financial statements and financial highlights based on our audits.
We conducted our audits in accordance with the standards of the Public Company Accounting Oversight Board (United States). Those standards require that we plan and perform the audits to obtain reasonable assurance about whether the financial statements and financial highlights are free of material misstatement. An audit includes examining, on a test basis, evidence supporting the amounts and disclosures in the financial statements. Our procedures included confirmation of securities owned as of October 31, 2016, by correspondence with the custodian and broker or by other appropriate auditing procedures. An audit also includes assessing the accounting principles used and significant estimates made by management, as well as evaluating the overall financial statement presentation. We believe that our audits provide a reasonable basis for our opinion.
In our opinion, the financial statements and financial highlights referred to above present fairly, in all material respects, the financial position of Credit Suisse Global Sustainable Dividend Equity Fund as of October 31, 2016, the results of its operations for the year then ended, the changes in its net assets and the financial highlights for the year then ended and for the period from February 27, 2015 (inception date) through October 31, 2015, in conformity with U.S. generally accepted accounting principles.
As discussed in Note 2 to the financial statements, the Fund's Board of Trustees approved a plan of liquidation, dissolution and termination for the Fund subsequent to the date of the statement of assets and liabilities. Our opinion is not modified with respect to this matter.

New York, New York
December 28, 2016
30
Credit Suisse Global Sustainable Dividend Equity Fund
Information Concerning Trustees and Officers (unaudited)
Name, Address
(Year of Birth) | | Position(s)
Held with
Fund | | Term
of Office1
and
Length
of Time
Served | | Principal
Occupation(s) During
Past Five Years | | Number of
Portfolios
in Fund
Complex
Overseen
by Trustee | | Other
Trusteeships
Held by Trustee | |
Independent Trustees | | | | | | | | | | | |
Enrique R. Arzac
c/o Credit Suisse Asset
Management, LLC
Attn: General Counsel
One Madison Avenue
New York, New York
10010
(1941) | | Trustee, Audit Committee Chairman and Nominating Committee Member | | Since Fund Inception | | Professor Emeritus of Finance and Economics from July 2015 to present; Professor of Finance and Economics, Graduate School of Business, Columbia University from 1971 to July 2015. | | | 12 | | | Director of Adams Diversified Equity Fund, Inc., Adams Natural Resources Fund, Inc., Aberdeen Chile Fund, Inc., Aberdeen Emerging Markets Smaller Company Opportunities Fund, Inc., Aberdeen Israel Fund, Inc., Aberdeen Indonesia Fund, Inc. and Aberdeen Latin America Equity Fund, Inc. (each a closed-end investment company); Director of Aberdeen Asia-Pacific Income Investment Company Limited (a Canadian closed-end fund); Trustee of Mirae Asset Discovery Funds (7 open-end portfolios); Director of Epoch Holding Corporation (an investment management and investment advisory services company) from August 2006 to March 2013. | |
1 Subject to the Trust's retirement policy, each Trustee may continue to serve as a Trustee until the last day of the calendar year in which the applicable Trustee attains age 75. Officer serves until his or her respective successor has been duly elected and qualified.
31
Credit Suisse Global Sustainable Dividend Equity Fund
Information Concerning Trustees and Officers (unaudited) (continued)
Name, Address
(Year of Birth) | | Position(s)
Held with
Fund | | Term
of Office1
and
Length
of Time
Served | | Principal
Occupation(s) During
Past Five Years | | Number of
Portfolios
in Fund
Complex
Overseen
by Trustee | | Other
Trusteeships
Held by Trustee | |
Independent Trustees | | | | | | | | | | | |
Jeffrey E. Garten
c/o Credit Suisse Asset Management, LLC
Attn: General Counsel
One Madison Avenue
New York, New York
10010
(1946) | | Trustee, Audit and Nominating Committee Member | | Since Fund Inception | | Dean Emeritus of Yale School of Management from July 2015 to present; The Juan Trippe Professor in the Practice of International Trade, Finance and Business, Yale School of Management, from July 2005 to July 2015; Partner and Chairman of Garten Rothkopf (consulting firm) from October 2005 to present. | | | 10 | | | Director of Aetna, Inc. (insurance company); Director of CarMax Group (used car dealers); Director of Miller Buckfire & Co., LLC (financial restructuring); Member of Standard & Poor's Board of Managers (credit rating agency) from December 2011 to November 2014. | |
Steven N. Rappaport
Lehigh Court, LLC
555 Madison Avenue
29th Floor
New York, New York
10022
(1948) | | Chairman of the Board of Trustees, Audit Committee Member and Nominating Committee Chairman | | Trustee since Fund Inception and Chairman since 2005 | | Partner of Lehigh Court, LLC and RZ Capital (private investment firms) from July 2002 to present; Partner of Backstage Acquisition Holdings, LLC (publication job postings) from November 2013 to present. | | | 12 | | | Director of iCAD, Inc. (surgical and medical instruments and apparatus company); Director of Aberdeen Chile Fund, Inc., Aberdeen Emerging Markets Smaller Company Opportunities Fund, Inc., Aberdeen Israel Fund, Inc., Aberdeen Indonesia Fund, Inc. and Aberdeen Latin America Equity Fund, Inc. (each a closed-end investment company); Director of Aberdeen Funds (25 open portfolios); Director of Presstek, Inc. (digital imaging technologies company) from 2003 to 2012; Director of Wood Resources, LLC (plywood manufacturing company) from 2003 to October 2013. | |
1 Subject to the Trust's retirement policy, each Trustee may continue to serve as a Trustee until the last day of the calendar year in which the applicable Trustee attains age 75. Officer serves until his or her respective successor has been duly elected and qualified.
32
Credit Suisse Global Sustainable Dividend Equity Fund
Information Concerning Trustees and Officers (unaudited) (continued)
Name, Address
(Year of Birth) | | Position(s)
Held with
Fund | | Term of
Office1
and
Length of
Time
Served | | Principal Occupation(s) During Past Five Years | |
Officers* | | | | | | | |
John G. Popp
Credit Suisse Asset
Management, LLC
One Madison Avenue
New York, New York 10010
(1956) | | Chief Executive Officer and President | | Since Fund Inception | | Managing Director of Credit Suisse; Global Head and Chief Investment Officer of the Credit Investment Group; Associated with Credit Suisse or its predecessor since 1997; Officer of other Credit Suisse Funds; Trustee of Credit Suisse High Yield Bond Fund; Director of Credit Suisse Asset Management Income Fund, Inc. | |
Emidio Morizio
Credit Suisse Asset
Management, LLC
One Madison Avenue
New York, New York 10010
(1966) | | Chief Compliance Officer | | Since Fund Inception | | Managing Director and Global Head of Compliance of Credit Suisse since 2010; Associated with Credit Suisse since July 2000; Officer of other Credit Suisse Funds. | |
Lou Anne McInnis
Credit Suisse Asset Management, LLC
One Madison Avenue
New York, New York 10010
(1959) | | Chief Legal Officer | | Since 2015 | | Director of Credit Suisse; Associated with Credit Suisse since April 2015; Counsel at DLA Piper US LLP from 2011 to April 2015; Associated with Morgan Stanley Investment Management from 1997 to 2010; Officer of other Credit Suisse Funds. | |
Laurie Pecha
Credit Suisse Asset
Management, LLC
One Madison Avenue
New York, New York 10010
(1961) | | Chief Financial Officer | | Since 2016 | | Director of Credit Suisse since August 2016; Senior Consultant of Spectra Professional Services, LLC from January 2012 to July 2016; Vice President of Legg Mason & Co. from March 2007 to December 2011; Officer of other Credit Suisse Funds. | |
Esther Cheung
Credit Suisse Asset
Management, LLC
One Madison Avenue
New York, New York 10010
(1980) | | Treasurer | | Since 2016 | | Vice President of Credit Suisse since 2015; Associated with Reich & Tang Asset Management, LLC from June 2010 to August 2015; Officer of other Credit Suisse Funds. | |
Karen Regan
Credit Suisse Asset
Management, LLC
One Madison Avenue
New York, New York 10010
(1963) | | Vice President and Secretary | | Since Fund Inception | | Vice President of Credit Suisse; Associated with Credit Suisse since December 2004; Officer of other Credit Suisse Funds. | |
1 Subject to the Trust's retirement policy, each Trustee may continue to serve as a Trustee until the last day of the calendar year in which the applicable Trustee attains age 75. Officer serves until his or her respective successor has been duly elected and qualified.
* The officers of the Fund shown are officers that make policy decisions.
The Statement of Additional Information includes additional information about the Trustees and is available, without charge, upon request, by calling 877-870-2874.
33
Credit Suisse Global Sustainable Dividend Equity Fund
Proxy Voting and Portfolio Holdings Information (unaudited)
Information regarding how the Fund voted proxies related to its portfolio securities during the 12-month period ended June 30 of each year, as well as the policies and procedures that the Fund uses to determine how to vote proxies relating to its portfolio securities are available:
• By calling 1-877-870-2874
• On the Fund's website, www.credit-suisse.com/us/funds
• On the website of the Securities and Exchange Commission, www.sec.gov.
The Fund files a complete schedule of its portfolio holdings for the first and third quarters of its fiscal year with the SEC on Form N-Q. The Fund's Forms N-Q are available on the SEC's website at www.sec.gov and may be reviewed and copied at the SEC's Public Reference Room in Washington, DC. Information on the operation of the SEC's Public Reference Room may be obtained by calling 1-202-551-8090.
34
This page intentionally left blank
This page intentionally left blank

P.O. BOX 55030, BOSTON, MA 02205-5030
877-870-2874 n www.credit-suisse.com/us/funds
CREDIT SUISSE SECURITIES (USA) LLC, DISTRIBUTOR. GSDE-AR-1016

CREDIT SUISSE FUNDS
Annual Report
October 31, 2016
n CREDIT SUISSE
EMERGING MARKETS EQUITY
FUND
The Fund's investment objectives, risks, charges and expenses (which should be considered carefully before investing), and more complete information about the Fund, are provided in the Prospectus, which should be read carefully before investing. You may obtain additional copies by calling 877-870-2874 or by visiting our website at www.credit-suisse.com/us/funds.
Credit Suisse Securities (USA) LLC, Distributor, is located at One Madison Avenue, New York, NY 10010. Credit Suisse Funds are advised by Credit Suisse Asset Management, LLC.
Investors in the Credit Suisse Funds should be aware that they may be eligible to purchase Class I shares (where offered) directly or through certain intermediaries. Such shares are not subject to a sales charge. Investors in the Credit Suisse Funds should also be aware that they may be eligible for a reduction or waiver of the sales charge with respect to Class A or C shares (where offered). For more information, please review the relevant prospectuses or consult your financial representative.
Fund shares are not deposits or other obligations of Credit Suisse Asset Management, LLC ("Credit Suisse") or any affiliate, are not FDIC-insured and are not guaranteed by Credit Suisse or any affiliate. Fund investments are subject to investment risks, including loss of your investment.
Credit Suisse Emerging Markets Equity Fund
Annual Investment Adviser's Report
October 31, 2016 (unaudited)
November 25, 2016
Dear Shareholder:
We are pleased to present this Annual Report covering the activities of the Credit Suisse Emerging Markets Equity Fund (the "Fund") for the twelve months ended October 31, 2016.
Performance Summary
11/1/2015 – 10/31/16
Fund & Benchmark | | Performance | |
Class I1 | | | 10.46 | % | |
Class A1, 2 | | | 10.08 | % | |
Class C1, 2 | | | 9.31 | % | |
MSCI Emerging Markets USD Index NR3 | | | 9.27 | % | |
Performance shown for the Fund's Class A and Class C Shares does not reflect sales charges, which are a maximum of 5.25% and 1.00%, respectively. 2
Market Review: A strong period despite market shocks
The twelve-month period ended October 31, 2016 brought considerable gains for emerging market equities. The MSCI Emerging Markets USD Index NR (the "Index"), the Fund's benchmark, returned 9.27%. A more dovish U.S. Federal Reserve (the "Fed"), recovering global growth, and a rise in commodities all helped to provide lift to the asset class.
The year initially began with declines at the end of 2015. The main concerns at the time centered on the path the Fed would take on interest rates. Retrospectively, these concerns were overdone, as the only hike of the year took place at the end of 2015. Although the markets were dealt a few shocks from the Brazilian impeachment proceedings, the Brexit vote, and the U.S. presidential campaigns, the attractive growth, valuation, and yield emanating from emerging markets were able to stave off concerns.
Strategic Review: Anticipating continued positive performance for Emerging Markets
For the annual period ended October 31, 2016, the Fund outperformed its benchmark, gaining 10.46% net of fees (Class I shares) as compared to 9.27% for the Index. The Fund initially underperformed in late 2015, but has more than made up for those losses in 2016, with outperformance entirely generated from stock selection. The portfolio's recent strength has come from the more valuation-sensitive stages of Cash Cow and Financials.
1
Credit Suisse Emerging Markets Equity Fund
Annual Investment Adviser's Report (continued)
October 31, 2016 (unaudited)
The last few uncertain years have made stock selection in the Cash Cow stage difficult, as investors flocked to these typically stable companies with little regard to their multiples. Recently, however, this "quality at any price" mindset has taken a turn — for example, in the third quarter of 2015 there were global growth and political concerns in emerging markets like China and Brazil. In that time, the cheapest Cash Cow names — ILC's preferred profile — underperformed the most expensive by more than 600bps. Against 2016's calmer backdrop, however, valuation has regained relevance as investors anticipate smoother global growth and normalizing interest rates. More rationally priced Cash Cows are now beating their richer peers by approximately 300bps, offering a tailwind for the portfolio.
Looking ahead, we expect the implications of the recent U.S. presidential election and Fed interest rate decisions will be the focal point for investors as 2016 comes to a close. The increased probability of a late 2016 interest rate hike in the United States has lent recent momentum back to the Growth stage. In short order, the year-to-date return spread between the lagging Growth and leading Restructuring stages narrowed from 9% to 3%. During the past four years, the Growth stage has returned 24% while the Restructuring stage lost 18%. If the relative global stability persists, the performance gap between the stages is likely to continue narrowing and the valuation-sensitive alpha portions of the portfolio should be well positioned for additional gains.
HOLT Active Equity Group
Alfred S. Bryant
Foreign investments involve significant risks including risk of loss of principal, currency risk, derivatives risk, emerging markets risk, equity exposure risk, foreign securities risk, information risk, political risk, access risk, operational risk, liquidity risk, manager risk, market risk, and small- and mid-cap stock risk. In addition, the Fund is subject to options risk and participation notes risk. For a detailed discussion of these and other risks, please refer to the Fund's Prospectus, which should be read carefully before investing.
In addition to historical information, this report contains forward-looking statements, which may concern, among other things, domestic and foreign markets, industry and economic trends and developments and government regulation and their potential impact on the Fund's investments. These statements are subject to risks and uncertainties and actual trends, developments and regulations in the future, and their
2
Credit Suisse Emerging Markets Equity Fund
Annual Investment Adviser's Report (continued)
October 31, 2016 (unaudited)
impact on the Fund, could be materially different from those projected, anticipated or implied. The Fund has no obligation to update or revise forward-looking statements.
The views of the Fund's management are as of the date of this letter and the Fund holdings described in this document are as of October 31, 2016; these views and Fund holdings may have changed subsequent to these dates. Nothing in this document is a recommendation to purchase or sell securities.
3
Credit Suisse Emerging Markets Equity Fund
Annual Investment Adviser's Report (continued)
October 31, 2016 (unaudited)
Comparison of Change in Value of $10,000 Investment in the
Credit Suisse Emerging Market Equity Fund1 Class I Shares,
Class A Shares2, Class C Shares2 and MSCI Emerging
Markets USD Index NR3 from Inception (12/26/13)

1 Fee waivers and/or expense reimbursements may reduce expenses for the Fund, without which performance would be lower. The Fund entered into a written contract to limit expenses to 1.25% of the Fund's average daily net assets for Class I shares, 1.50% of the Fund's average daily net assets for Class A shares and 2.25% of the Fund's average daily net assets for Class C shares through at least February 28, 2018. This limit excludes certain expenses, as set forth in the Fund's Prospectus.
2 Total return for the Fund's Class A shares for the reporting period, based on offering price (including maximum sales charge of 5.25%), was 4.24%. Total return for the Fund's Class C shares for the reporting period, based on redemption value (including maximum CDSC of 1.00%), was 8.31%.
3 Morgan Stanley Capital International (MSCI) Emerging Markets USD Index NR is a free float-adjusted market capitalization index that is designed to measure equity market performance in the global emerging markets. The index does not have transaction costs and investors can not invest directly in the index.
4
Credit Suisse Emerging Markets Equity Fund
Annual Investment Adviser's Report (continued)
October 31, 2016 (unaudited)
Average Annual Returns as of October 31, 20161
| | | 1 Year | | Since
Inception2 | |
Class I | | | 10.46 | % | | | (1.62 | )% | |
Class A Without Sales Charge | | | 10.08 | % | | | (1.87 | )% | |
Class A With Maximum Sales Charge | | | 4.24 | % | | | (3.70 | )% | |
Class C Without CDSC | | | 9.31 | % | | | (2.61 | )% | |
Class C With CDSC | | | 8.31 | % | | | (2.61 | )% | |
Returns represent past performance and include change in share price and reinvestment of dividends and capital gain distributions. Past performance cannot guarantee future results. The current performance of the Fund may be lower or higher than the figures shown. Returns and share price will fluctuate, and redemption value may be more or less than original cost. The performance results do not reflect the deduction of taxes that a shareholder would pay on Fund distributions or the redemption of Fund shares. Performance information current to the most recent month end is available at www.credit-suisse.com/us/funds.
The annual gross expense ratios are 2.60% for Class I shares, 2.85% for Class A shares and 3.60% for Class C shares. The annual net expense ratios after fee waivers and/or expense reimbursements are 1.25% for Class I shares, 1.50% for Class A shares and 2.25% for Class C shares.
1 Fee waivers and/or expense reimbursements may reduce expenses for the Fund, without which performance would be lower. The Fund entered into a written contract to limit expenses to 1.25% of the Fund's average daily net assets for Class I shares, 1.50% of the Fund's average daily net assets for Class A shares and 2.25% of the Fund's average daily net assets for Class C shares through at least February 28, 2018. This limit excludes certain expenses, as set forth in the Fund's Prospectus.
2 Inception Date December 26, 2013.
5
Credit Suisse Emerging Markets Equity Fund
Annual Investment Adviser's Report (continued)
October 31, 2016 (unaudited)
Information About Your Fund's Expenses
As an investor of the Fund, you incur two types of costs: ongoing expenses and transaction costs. Ongoing expenses include management fees, distribution and service (12b-1) fees and other Fund expenses. Examples of transaction costs include sales charges (loads), redemption fees and account maintenance fees, which are not shown in this section and which would result in higher total expenses. The following table is intended to help you understand your ongoing expenses of investing in the Fund and to help you compare these expenses with the ongoing expenses of investing in other mutual funds. The table is based on an investment of $1,000 made at the beginning of the six months ended October 31, 2016.
The table illustrates your Fund's expenses in two ways:
• Actual Fund Return. This helps you estimate the actual dollar amount of ongoing expenses paid on a $1,000 investment in the Fund using the Fund's actual return during the period. To estimate the expenses you paid over the period, simply divide your account value by $1,000 (for example, an $8,600 account value divided by $1,000 = 8.6), then multiply the result by the number in the "Expenses Paid per $1,000" line.
• Hypothetical 5% Fund Return. This helps you to compare the Fund's ongoing expenses with those of other mutual funds using the Fund's actual expense ratio and a hypothetical rate of return of 5% per year before expenses. Examples using a 5% hypothetical fund return may be found in the shareholder reports of other mutual funds. The hypothetical account values and expenses may not be used to estimate the actual ending account balance or expenses you paid for the period.
Please note that the expenses shown in these tables are meant to highlight your ongoing expenses only and do not reflect any transaction costs, such as sales charges (loads) or redemption fees. If these transaction costs had been included, your costs would have been higher. The "Expenses Paid per $1,000" line of the tables is useful in comparing ongoing expenses only and will not help you determine the relative total expenses of owning different funds.
6
Credit Suisse Emerging Markets Equity Fund
Annual Investment Adviser's Report (continued)
October 31, 2016 (unaudited)
Expenses and Value for a $1,000 Investment
for the six-month period ended October 31, 2016
Actual Fund Return | | Class I | | Class A | | Class C | |
Beginning Account Value 05/01/16 | | $ | 1,000.00 | | | $ | 1,000.00 | | | $ | 1,000.00 | | |
Ending Account Value 10/31/16 | | $ | 1,093.40 | | | $ | 1,092.30 | | | $ | 1,087.70 | | |
Expenses Paid per $1,000* | | $ | 6.58 | | | $ | 7.89 | | | $ | 11.81 | | |
Hypothetical 5% Fund Return | |
Beginning Account Value 05/01/16 | | $ | 1,000.00 | | | $ | 1,000.00 | | | $ | 1,000.00 | | |
Ending Account Value 10/31/16 | | $ | 1,018.85 | | | $ | 1,017.60 | | | $ | 1,013.83 | | |
Expenses Paid per $1,000* | | $ | 6.34 | | | $ | 7.61 | | | $ | 11.39 | | |
| | | Class I | | Class A | | Class C | |
Annualized Expense Ratios* | | | 1.25 | % | | | 1.50 | % | | | 2.25 | % | |
* Expenses are equal to the Fund's annualized expense ratio for each share class, multiplied by the average account value over the period, multiplied by 184/366 to reflect the one-half year period.
The "Expenses Paid per $1,000" and the "Annualized Expense Ratios" in the tables are based on actual expenses paid by the Fund during the period, net of fee waivers and/or actual expense reimbursements, if applicable. If those fee waivers and/or expense reimbursements had not been in effect, the Fund's actual expenses would have been higher. Expenses do not reflect additional charges and expenses that are, or may be, imposed under the variable contracts or plans. Such charges and expenses are described in the prospectus of the insurance company separate account or in the plan documents or other informational materials supplied by plan sponsors. The Fund's expenses should be considered with these charges and expenses in evaluating the overall cost of investing in the separate account.
For more information, please refer to the Fund's Prospectus.
7
Credit Suisse Emerging Markets Equity Fund
Annual Investment Adviser's Report (continued)
October 31, 2016 (unaudited)
Sector Breakdown*
Financials | | | 28.1 | % | |
Information Technology | | | 25.9 | | |
Consumer Discretionary | | | 11.8 | | |
Consumer Staples | | | 6.7 | | |
Energy | | | 6.1 | | |
Telecommunication Services | | | 4.5 | | |
Industrials | | | 4.3 | | |
Materials | | | 4.0 | | |
Utilities | | | 3.0 | | |
Health Care | | | 2.4 | | |
| Short-Term Investment1 | | | 2.3 | | |
Commingled Funds | | | 0.9 | | |
Total | | | 100.0 | % | |
* Expressed as a percentage of total investments (excluding securities lending collateral, if applicable) and may vary over time.
1 Primarily reflects cash invested in State Street Bank and Trust Co. Euro Time Deposit, for which the purchases of securities have been executed but not yet settled at October 31, 2016, if applicable.
8
Credit Suisse Emerging Markets Equity Fund
Schedule of Investments
October 31, 2016
| | | Number of
Shares | | Value | |
| COMMON STOCKS (95.3%) | |
| BRAZIL (7.1%) | |
| Commercial Banks (1.8%) | |
Banco do Brasil S.A. | | | 50,500 | | | $ | 467,219 | | |
| Electric Utilities (1.0%) | |
Transmissora Alianca de Energia Eletrica S.A. | | | 40,100 | | | | 262,828 | | |
| Food Products (1.3%) | |
Marfrig Global Foods S.A.(1) | | | 191,700 | | | | 344,543 | | |
| Household Durables (1.3%) | |
Cyrela Brazil Realty S.A. | | | 42,900 | | | | 145,672 | | |
MRV Engenharia e Participacoes S.A. | | | 50,200 | | | | 195,989 | | |
| | | | 341,661 | | |
| Insurance (1.7%) | |
Porto Seguro S.A. | | | 45,700 | | | | 436,957 | | |
| | | | 1,853,208 | | |
| CHILE (1.5%) | |
| Commercial Banks (0.7%) | |
Banco de Credito e Inversiones | | | 3,457 | | | | 176,496 | | |
| Electric Utilities (0.8%) | |
Enersis Americas S.A., ADR | | | 25,500 | | | | 221,085 | | |
| | | | 397,581 | | |
| CHINA (20.5%) | |
| Biotechnology (0.9%) | |
China Biologic Products, Inc.(1) | | | 1,900 | | | | 224,409 | | |
| Building Products (0.7%) | |
China Lesso Group Holdings Ltd. | | | 241,000 | | | | 176,439 | | |
| Commercial Banks (7.5%) | |
Agricultural Bank of China Ltd., Series H | | | 943,400 | | | | 396,897 | | |
Bank of China Ltd., Series H | | | 1,740,700 | | | | 780,111 | | |
China CITIC Bank Corp. Ltd., Series H | | | 792,100 | | | | 510,896 | | |
Chongqing Rural Commercial Bank Co. Ltd., Series H | | | 476,400 | | | | 285,133 | | |
| | | | 1,973,037 | | |
| Diversified Consumer Services (1.1%) | |
TAL Education Group, ADR(1) | | | 3,400 | | | | 276,896 | | |
| Electronic Equipment, Instruments & Components (0.7%) | |
AAC Technologies Holdings, Inc. | | | 19,200 | | | | 182,953 | | |
| Gas Utilities (0.5%) | |
ENN Energy Holdings Ltd. | | | 28,700 | | | | 134,940 | | |
| Insurance (0.6%) | |
PICC Property & Casualty Co. Ltd., Series H | | | 104,500 | | | | 168,689 | | |
See Accompanying Notes to Financial Statements.
9
Credit Suisse Emerging Markets Equity Fund
Schedule of Investments (continued)
October 31, 2016
| | | Number of
Shares | | Value | |
| COMMON STOCKS (continued) | |
CHINA | |
| Internet Software & Services (6.1%) | |
NetEase, Inc., ADR | | | 1,700 | | | $ | 436,883 | | |
Tencent Holdings Ltd. | | | 44,100 | | | | 1,168,858 | | |
| | | | 1,605,741 | | |
| Machinery (0.6%) | |
Fujian Longking Co. Ltd., Series A | | | 82,492 | | | | 157,045 | | |
| Metals & Mining (0.8%) | |
China Hongqiao Group Ltd. | | | 240,400 | | | | 214,838 | | |
| Pharmaceuticals (1.0%) | |
China Medical System Holdings Ltd. | | | 82,000 | | | | 128,063 | | |
Humanwell Healthcare Group Co. Ltd., Series A | | | 47,200 | | | | 142,838 | | |
| | | | 270,901 | | |
| | | | 5,385,888 | | |
| HONG KONG (8.7%) | |
| Auto Components (1.6%) | |
Xinyi Glass Holdings Ltd. | | | 493,900 | | | | 424,712 | | |
| Electronic Equipment, Instruments & Components (0.6%) | |
PAX Global Technology Ltd. | | | 265,500 | | | | 166,808 | | |
| Food Products (1.9%) | |
WH Group Ltd. | | | 617,600 | | | | 500,237 | | |
| Household Durables (1.2%) | |
Haier Electronics Group Co. Ltd. | | | 197,700 | | | | 318,668 | | |
| Industrial Conglomerates (1.3%) | |
Jardine Strategic Holdings Ltd. | | | 9,400 | | | | 329,821 | | |
| Real Estate Management & Development (1.3%) | |
Kerry Properties Ltd. | | | 106,000 | | | | 335,669 | | |
| Wireless Telecommunication Services (0.8%) | |
China Mobile Ltd. | | | 19,100 | | | | 218,837 | | |
| | | | 2,294,752 | | |
| INDIA (4.3%) | |
| Automobiles (2.5%) | |
Hero MotoCorp Ltd. | | | 10,300 | | | | 516,978 | | |
Tata Motors Ltd., ADR | | | 3,300 | | | | 130,053 | | |
| | | | 647,031 | | |
| Diversified Financial Services (0.7%) | |
Rural Electrification Corp. Ltd. | | | 89,200 | | | | 180,239 | | |
| Media (0.5%) | |
Zee Entertainment Enterprises Ltd. | | | 19,100 | | | | 148,141 | | |
See Accompanying Notes to Financial Statements.
10
Credit Suisse Emerging Markets Equity Fund
Schedule of Investments (continued)
October 31, 2016
| | | Number of
Shares | | Value | |
| COMMON STOCKS (continued) | |
INDIA | |
| Thrifts & Mortgage Finance (0.6%) | |
Indiabulls Housing Finance Ltd., GDR | | | 12,700 | | | $ | 161,163 | | |
| | | | 1,136,574 | | |
| INDONESIA (0.6%) | |
| Gas Utilities (0.6%) | |
PT Perusahaan Gas Negara Persero Tbk | | | 861,500 | | | | 169,025 | | |
| LUXEMBOURG (1.3%) | |
| Metals & Mining (1.3%) | |
Ternium S.A., ADR | | | 14,400 | | | | 344,304 | | |
MEXICO (2.7%) | |
| Hotels, Restaurants & Leisure (1.0%) | |
Alsea S.A.B. de C.V. | | | 67,600 | | | | 253,471 | | |
| Industrial Conglomerates (1.7%) | |
Alfa S.A.B. de C.V., Class A | | | 303,100 | | | | 462,204 | | |
| | | | 715,675 | | |
| PANAMA (1.2%) | |
| Commercial Banks (1.2%) | |
Banco Latinoamericano de Comercio Exterior S.A., Series E | | | 11,200 | | | | 302,064 | | |
| RUSSIA (5.2%) | |
| Diversified Financial Services (1.8%) | |
Moscow Exchange MICEX-RTS PJSC | | | 253,200 | | | | 469,279 | | |
| Oil, Gas & Consumable Fuels (3.4%) | |
Gazprom PAO, ADR | | | 77,650 | | | | 336,224 | | |
Lukoil PJSC, ADR | | | 11,500 | | | | 559,015 | | |
| | | | 895,239 | | |
| | | | 1,364,518 | | |
| SINGAPORE (1.1%) | |
| Commercial Banks (0.4%) | |
DBS Group Holdings Ltd. | | | 9,700 | | | | 104,505 | | |
| Software (0.7%) | |
IGG, Inc. | | | 235,300 | | | | 171,531 | | |
| | | | 276,036 | | |
| SOUTH AFRICA (2.4%) | |
| Commercial Banks (0.6%) | |
Nedbank Group Ltd. | | | 9,500 | | | | 155,520 | | |
| Insurance (0.5%) | |
Liberty Holdings Ltd. | | | 15,800 | | | | 136,045 | | |
See Accompanying Notes to Financial Statements.
11
Credit Suisse Emerging Markets Equity Fund
Schedule of Investments (continued)
October 31, 2016
| | | Number of
Shares | | Value | |
| COMMON STOCKS (continued) | |
SOUTH AFRICA | |
| Real Estate Investment Trusts (1.3%) | |
Growthpoint Properties Ltd. | | | 177,200 | | | $ | 330,464 | | |
| | | | 622,029 | | |
| SOUTH KOREA (17.1%) | |
| Automobiles (1.2%) | |
Hyundai Motor Co. | | | 1,400 | | | | 170,925 | | |
Kia Motors Corp. | | | 4,200 | | | | 149,137 | | |
| | | | 320,062 | | |
| Biotechnology (0.5%) | |
Medy-Tox, Inc. | | | 400 | | | | 141,919 | | |
| Chemicals (1.0%) | |
Soulbrain Co. Ltd. | | | 4,700 | | | | 256,133 | | |
| Commercial Banks (3.4%) | |
Woori Bank | | | 82,000 | | | | 893,647 | | |
| Computers & Peripherals (4.8%) | |
Samsung Electronics Co. Ltd. | | | 880 | | | | 1,258,689 | | |
| Diversified Telecommunication Services (2.3%) | |
KT Corp. | | | 21,000 | | | | 592,403 | | |
| Household Products (1.0%) | |
LG Household & Health Care Ltd. | | | 350 | | | | 250,368 | | |
| Internet Software & Services (1.1%) | |
NAVER Corp. | | | 400 | | | | 299,266 | | |
| Tobacco (1.8%) | |
KT&G Corp. | | | 4,900 | | | | 483,288 | | |
| | | | 4,495,775 | | |
| TAIWAN (13.3%) | |
| Computers & Peripherals (5.0%) | |
Asustek Computer, Inc. | | | 34,500 | | | | 302,022 | | |
Compal Electronics, Inc. | | | 1,094,000 | | | | 650,511 | | |
Pegatron Corp. | | | 132,300 | | | | 356,254 | | |
| | | | 1,308,787 | | |
| Electronic Equipment, Instruments & Components (2.7%) | |
E Ink Holdings, Inc. | | | 337,000 | | | | 285,626 | | |
Hon Hai Precision Industry Co. Ltd. | | | 156,498 | | | | 422,726 | | |
| | | | 708,352 | | |
| Household Durables (0.7%) | |
Nien Made Enterprise Co. Ltd. | | | 14,900 | | | | 172,583 | | |
| Personal Products (0.7%) | |
Grape King Bio Ltd. | | | 21,900 | | | | 183,883 | | |
See Accompanying Notes to Financial Statements.
12
Credit Suisse Emerging Markets Equity Fund
Schedule of Investments (continued)
October 31, 2016
| | | Number of
Shares | | Value | |
| COMMON STOCKS (continued) | |
TAIWAN | |
| Semiconductors & Semiconductor Equipment (4.2%) | |
Taiwan Semiconductor Manufacturing Co. Ltd. | | | 183,700 | | | $ | 1,102,448 | | |
| | | | 3,476,053 | | |
| THAILAND (6.3%) | |
| Chemicals (0.9%) | |
PTT Global Chemical PCL | | | 132,500 | | | | 227,159 | | |
| Commercial Banks (2.0%) | |
Bangkok Bank PCL, NVDR | | | 54,400 | | | | 247,870 | | |
Krung Thai Bank PCL, NVDR | | | 573,500 | | | | 281,659 | | |
| | | | 529,529 | | |
| Oil, Gas & Consumable Fuels (2.6%) | |
PTT PCL | | | 70,200 | | | | 694,027 | | |
| Specialty Retail (0.8%) | |
Home Product Center PCL, NVDR | | | 701,200 | | | | 201,915 | | |
| | | | 1,652,630 | | |
| TURKEY (1.4%) | |
| Diversified Telecommunication Services (1.4%) | |
Turk Telekomunikasyon AS | | | 192,100 | | | | 355,157 | | |
| UNITED ARAB EMIRATES (0.6%) | |
| Real Estate Management & Development (0.6%) | |
Aldar Properties PJSC | | | 217,400 | | | | 155,623 | | |
| TOTAL COMMON STOCKS (Cost $23,363,839) | | | 24,996,892 | | |
| PREFERRED STOCKS (1.5%) | |
| BRAZIL (0.7%) | |
| Commercial Banks (0.7%) | |
Banco Bradesco S.A. | | | 17,688 | | | | 186,834 | | |
| COLOMBIA (0.8%) | |
| Commercial Banks (0.8%) | |
Banco Davivienda S.A. | | | 19,100 | | | | 195,073 | | |
| TOTAL PREFERED STOCKS (Cost $363,815) | | | 381,907 | | |
| EXCHANGE TRADED FUNDS (1.0%) | |
| FRANCE (0.4%) | |
Lyxor ETF MSCI India(1) | | | 6,350 | | | | 100,130 | | |
| LUXEMBOURG (0.6%) | |
db x-trackers NIFTY 50 UCITS ETF(1) | | | 1,125 | | | | 148,147 | | |
| TOTAL EXCHANGE TRADED FUNDS (Cost $201,734) | | | 248,277 | | |
See Accompanying Notes to Financial Statements.
13
Credit Suisse Emerging Markets Equity Fund
Schedule of Investments (continued)
October 31, 2016
| | | Par
(000) | | Value | |
| SHORT-TERM INVESTMENT (2.3%) | |
State Street Bank and Trust Co. Euro Time Deposit, 0.010% 11/01/2016 (Cost $611,880) | | $ | 612 | | | $ | 611,880 | | |
| TOTAL INVESTMENTS AT VALUE (100.1%) (Cost $24,541,268) | | | 26,238,956 | | |
| LIABILITIES IN EXCESS OF OTHER ASSETS (-0.1%) | | | (13,118 | ) | |
| NET ASSETS (100.0%) | | $ | 26,225,838 | | |
(1) Non-income producing security.
INVESTMENT ABBREVIATIONS
ADR = American Depositary Receipt
GDR = Global Depositary Receipt
NVDR = Non-Voting Depository Receipt
See Accompanying Notes to Financial Statements.
14
Credit Suisse Emerging Markets Equity Fund
Statement of Assets and Liabilities
October 31, 2016
Assets | |
Investments at value (Cost $24,541,268) (Note 2) | | $ | 26,238,956 | | |
Cash | | | 50,000 | | |
Foreign currency at value (Cost $7,977) | | | 7,949 | | |
Dividend receivable | | | 21,411 | | |
Receivable for Fund shares sold | | | 12,065 | | |
Receivable from investment adviser (Note 3) | | | 2,093 | | |
Prepaid expenses | | | 7,463 | | |
Total assets | | | 26,339,937 | | |
Liabilities | |
Administrative services fee payable (Note 3) | | | 40,522 | | |
Shareholder servicing/Distribution fee payable (Note 3) | | | 1,671 | | |
Trustees' fee payable | | | 8,031 | | |
Accrued expenses | | | 63,875 | | |
Total liabilities | | | 114,099 | | |
Net Assets | |
Capital stock, $.001 par value (Note 6) | | | 2,874 | | |
Paid-in capital (Note 6) | | | 28,714,050 | | |
Accumulated undistributed net investment income | | | 219,519 | | |
Accumulated net realized loss on investments and foreign currency transactions | | | (4,401,011 | ) | |
Net unrealized appreciation from investments and foreign currency translations | | | 1,690,406 | | |
Net assets | | $ | 26,225,838 | | |
I Shares | |
Net assets | | $ | 23,328,970 | | |
Shares outstanding | | | 2,555,135 | | |
Net asset value, offering price and redemption price per share | | $ | 9.13 | | |
A Shares | |
Net assets | | $ | 1,245,564 | | |
Shares outstanding | | | 136,713 | | |
Net asset value and redemption price per share | | $ | 9.11 | | |
Maximum offering price per share (net asset value/(1-5.25%)) | | $ | 9.61 | | |
C Shares | |
Net assets | | $ | 1,651,304 | | |
Shares outstanding | | | 182,410 | | |
Net asset value, offering price and redemption price per share | | $ | 9.05 | | |
See Accompanying Notes to Financial Statements.
15
Credit Suisse Emerging Markets Equity Fund
Statement of Operations
For the Year Ended October 31, 2016
Investment Income | |
Dividends | | $ | 856,591 | | |
Foreign taxes withheld | | | (100,336 | ) | |
Total investment income | | | 756,255 | | |
Expenses | |
Investment advisory fees (Note 3) | | | 213,668 | | |
Administrative services fees (Note 3) | | | 177,285 | | |
Shareholder servicing/Distribution fees (Note 3) | |
Class A | | | 2,988 | | |
Class C | | | 15,017 | | |
Registration fees | | | 47,084 | | |
Audit and tax fees | | | 44,205 | | |
Legal fees | | | 30,865 | | |
Trustees' fees | | | 30,387 | | |
Custodian fees | | | 18,874 | | |
Printing fees | | | 18,774 | | |
Transfer agent fees (Note 3) | | | 16,229 | | |
Commitment fees (Note 4) | | | 14,026 | | |
Insurance expense | | | 616 | | |
Miscellaneous expense | | | 6,229 | | |
Total expenses | | | 636,247 | | |
Less: fees waived and expenses reimbursed (Note 3) | | | (321,480 | ) | |
Net expenses | | | 314,767 | | |
Net investment income | | | 441,488 | | |
Net Realized and Unrealized Gain (Loss) from Investments and Foreign Currency Related Items | |
Net realized loss from investments | | | (2,311,326 | ) | |
Net realized loss from foreign currency transactions | | | (22,383 | ) | |
Net change in unrealized appreciation (depreciation) from investments | | | 4,368,258 | | |
Net change in unrealized appreciation (depreciation) from foreign currency translations | | | (9,407 | ) | |
Net realized and unrealized gain from investments and foreign currency related items | | | 2,025,142 | | |
Net increase in net assets resulting from operations | | $ | 2,466,630 | | |
See Accompanying Notes to Financial Statements.
16
Credit Suisse Emerging Markets Equity Fund
Statement of Changes in Net Assets
| | | For the Year
Ended
October 31, 2016 | | For the Year
Ended
October 31, 2015 | |
From Operations | |
Net investment income | | $ | 441,488 | | | $ | 335,565 | | |
Net realized loss from investments and foreign currency transactions | | | (2,333,709 | ) | | | (1,423,903 | ) | |
Net change in unrealized appreciation (depreciation)
from investments and foreign currency translations | | | 4,358,851 | | | | (3,506,474 | ) | |
Net increase (decrease) in net assets resulting from operations | | | 2,466,630 | | | | (4,594,812 | ) | |
From Dividends | |
Dividends from net investment income | |
Class I | | | (337,426 | ) | | | (620,068 | ) | |
Class A | | | (17,340 | ) | | | (31,587 | ) | |
Class C | | | (10,307 | ) | | | (16,465 | ) | |
Net decrease in net assets resulting from dividends | | | (365,073 | ) | | | (668,120 | ) | |
| From Capital Share Transactions (Note 6) | |
Proceeds from sale of shares | | | 1,643,676 | | | | 6,646,901 | | |
Reinvestment of dividends | | | 365,074 | | | | 665,629 | | |
Net asset value of shares redeemed | | | (1,740,996 | ) | | | (1,443,532 | ) | |
Net increase in net assets from capital share transactions | | | 267,754 | | | | 5,868,998 | | |
Net increase in net assets | | | 2,369,311 | | | | 606,066 | | |
Net Assets | |
Beginning of year | | | 23,856,527 | | | | 23,250,461 | | |
End of year | | $ | 26,225,838 | | | $ | 23,856,527 | | |
Accumulated undistributed (overdistributed) net investment income | | $ | 219,519 | | | $ | (14,029 | ) | |
See Accompanying Notes to Financial Statements.
17
Credit Suisse Emerging Markets Equity Fund
Financial Highlights
(For a Class I Share of the Fund Outstanding Throughout Each Period)
| | | For the Year Ended October 31, | |
| | | 2016 | | 2015 | | 20141 | |
Per share data | |
Net asset value, beginning of period | | $ | 8.41 | | | $ | 10.36 | | | $ | 10.00 | | |
INVESTMENT OPERATIONS | |
Net investment income2 | | | 0.16 | | | | 0.13 | | | | 0.16 | | |
Net gain (loss) from investments and foreign currency related items
(both realized and unrealized) | | | 0.69 | | | | (1.82 | ) | | | 0.20 | | |
Total from investment operations | | | 0.85 | | | | (1.69 | ) | | | 0.36 | | |
LESS DIVIDENDS | |
Dividends from net investment income | | | (0.13 | ) | | | (0.26 | ) | | | — | | |
Total dividends | | | (0.13 | ) | | | (0.26 | ) | | | — | | |
Net asset value, end of period | | $ | 9.13 | | | $ | 8.41 | | | $ | 10.36 | | |
Total return3 | | | 10.46 | % | | | (16.68 | )% | | | 3.60 | % | |
RATIOS AND SUPPLEMENTAL DATA | |
Net assets, end of period (000s omitted) | | $ | 23,329 | | | $ | 21,051 | | | $ | 21,040 | | |
Ratio of net expenses to average net assets | | | 1.25 | % | | | 1.25 | % | | | 1.25 | %4 | |
Ratio of net investment income to average net assets | | | 1.94 | % | | | 1.36 | % | | | 1.88 | %4 | |
Decrease reflected in above operating expense ratios due to
waivers/reimbursements | | | 1.35 | % | | | 1.17 | % | | | 1.38 | %4 | |
Portfolio turnover rate | | | 61 | % | | | 62 | % | | | 50 | % | |
1 For the period December 26, 2013 (Inception Date) through October 31, 2014.
2 Per share information is calculated using the average shares outstanding method.
3 Total returns are historical and include change in share price and reinvestment of all dividends and distributions. Had certain expenses not been reduced during the periods shown, total returns would have been lower. Total returns for periods less than one year are not annualized.
4 Annualized.
See Accompanying Notes to Financial Statements.
18
Credit Suisse Emerging Markets Equity Fund
Financial Highlights
(For a Class A Share of the Fund Outstanding Throughout Each Period)
| | | For the Year Ended October 31, | |
| | | 2016 | | 2015 | | 20141 | |
Per share data | |
Net asset value, beginning of period | | $ | 8.40 | | | $ | 10.34 | | | $ | 10.00 | | |
INVESTMENT OPERATIONS | |
Net investment income2 | | | 0.13 | | | | 0.11 | | | | 0.15 | | |
Net gain (loss) from investments and foreign currency related items
(both realized and unrealized) | | | 0.70 | | | | (1.81 | ) | | | 0.19 | | |
Total from investment operations | | | 0.83 | | | | (1.70 | ) | | | 0.34 | | |
LESS DIVIDENDS | |
Dividends from net investment income | | | (0.12 | ) | | | (0.24 | ) | | | — | | |
Total dividends | | | (0.12 | ) | | | (0.24 | ) | | | — | | |
Net asset value, end of period | | $ | 9.11 | | | $ | 8.40 | | | $ | 10.34 | | |
Total return3 | | | 10.08 | % | | | (16.74 | )% | | | 3.40 | % | |
RATIOS AND SUPPLEMENTAL DATA | |
Net assets, end of period (000s omitted) | | $ | 1,246 | | | $ | 1,288 | | | $ | 1,182 | | |
Ratio of net expenses to average net assets | | | 1.50 | % | | | 1.50 | % | | | 1.50 | %4 | |
Ratio of net investment income to average net assets | | | 1.64 | % | | | 1.18 | % | | | 1.72 | %4 | |
Decrease reflected in above operating expense ratios due to
waivers/reimbursements | | | 1.35 | % | | | 1.17 | % | | | 1.38 | %4 | |
Portfolio turnover rate | | | 61 | % | | | 62 | % | | | 50 | % | |
1 For the period December 26, 2013 (Inception Date) through October 31, 2014.
2 Per share information is calculated using the average shares outstanding method.
3 Total returns are historical and include change in share price, reinvestment of all dividends and distributions and no sales charge. Had certain expenses not been reduced during the periods shown, total returns would have been lower. Total returns for periods less than one year are not annualized.
4 Annualized.
See Accompanying Notes to Financial Statements.
19
Credit Suisse Emerging Markets Equity Fund
Financial Highlights
(For a Class C Share of the Fund Outstanding Throughout Each Period)
| | | For the Year Ended October 31, | |
| | | 2016 | | 2015 | | 20141 | |
Per share data | |
Net asset value, beginning of period | | $ | 8.34 | | | $ | 10.28 | | | $ | 10.00 | | |
INVESTMENT OPERATIONS | |
Net investment income2 | | | 0.08 | | | | 0.06 | | | | 0.08 | | |
Net gain (loss) from investments and foreign currency related items
(both realized and unrealized) | | | 0.69 | | | | (1.84 | ) | | | 0.20 | | |
Total from investment operations | | | 0.77 | | | | (1.78 | ) | | | 0.28 | | |
LESS DIVIDENDS | |
Dividends from net investment income | | | (0.06 | ) | | | (0.16 | ) | | | — | | |
Total dividends | | | (0.06 | ) | | | (0.16 | ) | | | — | | |
Net asset value, end of period | | $ | 9.05 | | | $ | 8.34 | | | $ | 10.28 | | |
Total return3 | | | 9.31 | % | | | (17.48 | )% | | | 2.80 | % | |
RATIOS AND SUPPLEMENTAL DATA | |
Net assets, end of period (000s omitted) | | $ | 1,651 | | | $ | 1,518 | | | $ | 1,028 | | |
Ratio of net expenses to average net assets | | | 2.25 | % | | | 2.25 | % | | | 2.25 | %4 | |
Ratio of net investment income to average net assets | | | 0.93 | % | | | 0.62 | % | | | 0.91 | %4 | |
Decrease reflected in above operating expense ratios due to
waivers/reimbursements | | | 1.35 | % | | | 1.17 | % | | | 1.38 | %4 | |
Portfolio turnover rate | | | 61 | % | | | 62 | % | | | 50 | % | |
1 For the period December 26, 2013 (Inception Date) through October 31, 2014.
2 Per share information is calculated using the average shares outstanding method.
3 Total returns are historical and include change in share price, reinvestment of all dividends and distributions and no sales charge. Had certain expenses not been reduced during the periods shown, total returns would have been lower. Total returns for periods less than one year are not annualized.
4 Annualized.
See Accompanying Notes to Financial Statements.
20
Credit Suisse Emerging Markets Equity Fund
Notes to Financial Statements
October 31, 2016
Credit Suisse Emerging Markets Equity Fund (the "Fund"), a series of the Credit Suisse Opportunity Funds (the "Trust"), a Delaware statutory trust, is registered under the Investment Company Act of 1940, as amended (the "1940 Act"), as a diversified open-end management investment company that seeks capital appreciation. The Trust was organized under the laws of the State of Delaware as a business trust on May 31, 1995.
The Fund offers three classes of shares: Class I shares, Class A shares and Class C shares. Each class of shares represents an equal pro rata interest in the Fund, except the share classes bear different expenses, which reflect the differences in the range of services provided to them. Class A shares are sold subject to a front-end sales charge of up to 5.25%. Class C shares are sold subject to a CDSC of 1.00% if the shares are redeemed within the first year of purchase. Class I shares are sold without a sales charge.
Note 2. Significant Accounting Policies
The following is a summary of significant accounting policies followed by the Fund in the preparation of its financial statements. The policies are in accordance with accounting principles generally accepted in the United States of America ("GAAP"). The preparation of financial statements requires management to make estimates and assumptions that affect the reported amounts and disclosures in the financial statements. Actual results could differ from those estimates. The Fund is considered an investment company for financial reporting purposes under GAAP and follows Accounting Standard Codification ("ASC") Topic 946 — Financial Services — Investment Companies.
A) SECURITY VALUATION — The net asset value of the Fund is determined daily as of the close of regular trading on the New York Stock Exchange, Inc. (the "Exchange") on each day the Exchange is open for business. For certain international equity securities, in order to adjust for events which may occur between the close of the foreign exchanges and the close of the New York Stock Exchange, a fair valuation model may be used. This fair valuation model takes into account comparisons to the valuation of American Depository Receipts ("ADRs"), exchange-traded funds, futures contracts and certain indices, and these securities are categorized as Level 2. The valuations for fixed income securities (which may include, but are not limited to, corporate, government, municipal, mortgage-backed, collateralized mortgage obligations and asset-backed securities) and certain derivative instruments are typically the prices supplied by independent third party pricing services, which may use market
21
Credit Suisse Emerging Markets Equity Fund
Notes to Financial Statements (continued)
October 31, 2016
Note 2. Significant Accounting Policies (continued)
prices or broker/dealer quotations or a variety of valuation techniques and methodologies. The independent third party pricing services use inputs that are observable such as issuer details, interest rates, yield curves, prepayment speeds, credit risks/spreads, default rates and quoted prices for similar securities. These pricing services generally price fixed income securities assuming orderly transactions of an institutional "round lot" size, but some trades occur in smaller "odd lot" sizes which may be effected at lower prices than institutional round lot trades. Structured note agreements are valued in accordance with a dealer-supplied valuation based on changes in the value of the underlying index. Futures contracts are valued daily at the settlement price established by the board of trade or exchange on which they are traded. Forward contracts are valued at the London closing spot rates and the London closing forward point rates on a daily basis. The currency forward contract pricing model derives the differential in point rates to the expiration date of the forward and calculates its present value. Equity securities for which market quotations are available are valued at the last reported sales price or official closing price on the primary market or exchange on which they trade. The Fund may utilize a service provided by an independent third party which has been approved by the Board of Trustees (the "Board") to fair value certain securities. When fair value pricing is employed, the prices of securities used by the Fund to calculate its net asset value may differ from quoted or published prices for the same securities. If independent third party pricing services are unable to supply prices for a portfolio investment, or if the prices supplied are deemed by the investment adviser to be unreliable, the market price may be determined by the investment adviser using quotations from one or more brokers/dealers or at the transaction price if the security has recently been purchased and no value has yet been obtained from a pricing service or pricing broker. When reliable prices are not readily available, such as when the value of a security has been significantly affected by events after the close of the exchange or market on which the security is principally traded, but before the Fund calculates its net asset value, the Fund values these securities as determined in accordance with procedures approved and established by the Board.
The Fund uses valuation techniques to measure fair value that are consistent with the market approach and/or income approach, depending on the type of security and the particular circumstance. The market approach uses prices and other relevant information generated by market transactions involving identical or comparable securities. The income approach uses valuation techniques to discount estimated future cash flows to present value.
22
Credit Suisse Emerging Markets Equity Fund
Notes to Financial Statements (continued)
October 31, 2016
Note 2. Significant Accounting Policies (continued)
GAAP established a disclosure hierarchy that categorizes the inputs to valuation techniques used to value assets and liabilities at each measurement date. These inputs are summarized in the three broad levels listed below:
• Level 1 – quoted prices in active markets for identical investments
• Level 2 – other significant observable inputs (including quoted prices for similar investments, interest rates, prepayment speeds, credit risk, etc.)
• Level 3 – significant unobservable inputs (including the Fund's own assumptions in determining the fair value of investments)
The inputs or methodologies used to value securities are not necessarily an indication of the risk associated with investing in those securities.
The following is a summary of the inputs used as of October 31, 2016 in valuing the Fund's assets and liabilities carried at fair value:
Assets | | Level 1 | | Level 2 | | Level 3 | | Total | |
Investments in Securities | |
Common Stocks | | $ | 8,442,206 | | | $ | 16,554,686 | | | $ | — | | | $ | 24,996,892 | | |
Preferred Stocks | | | 381,907 | | | | — | | | | — | | | | 381,907 | | |
Exchange Traded Funds | | | — | | | | 248,277 | | | | — | | | | 248,277 | | |
Short-term Investment | | | — | | | | 611,880 | | | | — | | | | 611,880 | | |
| | | $ | 8,824,113 | | | $ | 17,414,843 | | | $ | — | | | $ | 26,238,956 | | |
For the year ended October 31, 2016, there were no transfers between Level 2 and Level 3, but there was $248,277 transferred out from Level 1 to Level 2 due to lack of market data because of a decrease in market activity and $2,040,042 transferred out from Level 2 to Level 1 as a result of the availability of a pricing source supported by observable inputs. All transfers, if any, are assumed to occur at the end of the reporting period.
B) DERIVATIVE INSTRUMENTS AND HEDGING ACTIVITIES — The Fund adopted amendments to authoritative guidance on disclosures about derivative instruments and hedging activities which require that a fund disclose (a) how and why an entity uses derivative instruments, (b) how derivative instruments and hedging activities are accounted for and (c) how derivative instruments and related hedging activities affect a fund's financial position, financial performance and cash flows. The Fund has not entered into any derivative or hedging activities during the period covered by this report.
C) FOREIGN CURRENCY TRANSACTIONS — The books and records of the Fund are maintained in U.S. dollars. Transactions denominated in foreign
23
Credit Suisse Emerging Markets Equity Fund
Notes to Financial Statements (continued)
October 31, 2016
Note 2. Significant Accounting Policies (continued)
currencies are recorded at the current prevailing exchange rates. All assets and liabilities denominated in foreign currencies are translated into U.S. dollar amounts at the current exchange rate at the end of the period. Reported net realized gain (loss) from foreign currency transactions arises from sales of foreign currencies; currency gains or losses realized between the trade and settlement dates on securities transactions; and the difference between the amounts of dividends, interest, and foreign withholding taxes recorded on the Fund's books and the U.S. dollar equivalent of the amounts actually received or paid. Net change in unrealized gains and losses on translation of assets and liabilities denominated in foreign currencies arises from changes in the fair values of assets and liabilities, other than investments at the end of the period, resulting from changes in exchange rates. The Fund does not isolate that portion of the results of operations resulting from fluctuations in foreign exchange rates on investments from the fluctuations arising from changes in market prices of investments held. Such fluctuations are included with net realized and unrealized gain or loss from investments in the Statement of Operations.
D) SECURITY TRANSACTIONS AND INVESTMENT INCOME/EXPENSE — Security transactions are accounted for on a trade date basis. Interest income/expense is recorded on the accrual basis. The Fund amortizes premiums and accretes discounts using the effective interest method. Dividend income/expense is recorded on the ex-dividend date. Certain expenses are class-specific expenses, vary by class and are charged only to that class. Income, expenses (excluding class-specific expenses) and realized/unrealized gains/losses are allocated proportionately to each class of shares based upon the relative net asset value of the outstanding shares of that class. The cost of investments sold is determined by use of the specific identification method for both financial reporting and income tax purposes. To the extent any issuer defaults or a credit event occurs that impacts the issuer, the Fund may halt any additional interest income accruals and consider the realizability of interest accrued up to the date of default or credit event.
E) DIVIDENDS AND DISTRIBUTIONS TO SHAREHOLDERS — Dividends from net investment income, if any, are declared and paid annually. Distributions of net realized capital gains, if any, are declared and paid at least annually. However, to the extent that a net realized capital gain can be reduced by a capital loss carryforward, such gain will not be distributed. Dividends and distributions to shareholders of the Fund are recorded on the ex-dividend date and are determined in accordance with federal income tax regulations, which may differ from GAAP.
24
Credit Suisse Emerging Markets Equity Fund
Notes to Financial Statements (continued)
October 31, 2016
Note 2. Significant Accounting Policies (continued)
F) FEDERAL INCOME TAXES — No provision is made for federal taxes as it is the Fund's intention to continue to qualify as a regulated investment company ("RIC") under the Internal Revenue Code of 1986, as amended (the "Code"), and to make the requisite distributions to its shareholders, which will be sufficient to relieve it from federal income and excise taxes.
In order to qualify as a RIC under the Code, the Fund must meet certain requirements regarding the source of its income, the diversification of its assets and the distribution of its income. One of these requirements is that the Fund derive at least 90% of its gross income for each taxable year from dividends, interest, payments with respect to certain securities loans, gains from the sale or other disposition of stock, securities or foreign currencies, other income derived with respect to its business of investing in such stock, securities or currencies or net income derived from interests in certain publicly-traded partnerships ("Qualifying Income").
The Fund adopted the authoritative guidance for uncertainty in income taxes and recognizes a tax benefit or liability from an uncertain position only if it is more likely than not that the position is sustainable based solely on its technical merits and consideration of the relevant taxing authority's widely understood administrative practices and procedures. The Fund has reviewed its current tax positions and has determined that no provision for income tax is required in the Fund's financial statements. The Fund's federal and state income and federal excise tax returns for tax years for which the applicable statutes of limitations have not expired are subject to examination by the Internal Revenue Service and state departments of revenue.
G) SHORT-TERM INVESTMENTS — The Fund, together with other funds/portfolios advised by Credit Suisse, pools available cash into a short-term variable rate time deposit issued by State Street Bank and Trust Company ("SSB"), the Fund's custodian. The short-term time deposit issued by SSB is a variable rate account classified as a short-term investment.
H) OTHER — In the normal course of business the Fund trades financial instruments and enters into financial transactions for which risk of potential loss exists due to changes in the market (market risk) or failure of the other party to a transaction to perform (credit risk). Similar to credit risk, the Fund may be exposed to counterparty risk, or the risk that an institution or other entity with which the Fund has unsettled or open transactions will default. The potential loss could exceed the value of the financial assets recorded in the financial statements. Financial assets, which potentially expose the Fund to credit risk, consist principally of cash due from counterparties and investments. The extent
25
Credit Suisse Emerging Markets Equity Fund
Notes to Financial Statements (continued)
October 31, 2016
Note 2. Significant Accounting Policies (continued)
of the Fund's exposure to credit and counterparty risks in respect to these financial assets approximates their carrying value as recorded in the Fund's Statement of Assets and Liabilities.
I) FOREIGN INVESTMENTS RISK — The Fund may have elements of risk not typically associated with investments in the U.S. due to concentrated investments in a limited number of countries or regions, which may vary throughout the year. Such concentrations may subject the Fund to additional risks resulting from political or economic conditions in such countries or regions, and the possible imposition of adverse governmental laws or currency exchange restrictions could cause the securities and their markets to be less liquid and their prices to be more volatile than those of comparable U.S. securities.
Because the Fund may invest a significant portion of its assets in these markets, it is subject to greater risks of adverse events that occur in those markets and may experience greater volatility than a Fund that is more broadly diversified geographically.
J) NEW ACCOUNTING PRONOUNCEMENTS — On August 26, 2016, Financial Accounting Standards Board ("FASB") issued a new Accounting Standards Update No. 2016-15, "Statement of Cash Flows (Topic 230), a consensus of the FASB's Emerging Issues Task Force" ("ASU 2016-15"). ASU 2016-15 is intended to reduce diversity in practice in how certain transactions are classified in the statement of cash flows. The issues addressed in ASU 2016-15 are: debt prepayment or debt extinguishment costs, settlement of zero-coupon debt instruments, contingent consideration payments made after a business combination, proceeds from the settlement of insurance claims, proceeds from the settlement of corporate-owned life insurance policies, including bank-owned life insurance policies, distributions received from equity method investments, beneficial interests in securitization transactions; and, separately identifiable cash flows and application of the predominance principle. ASU 2016-15 is effective for interim and annual reporting periods beginning after December 15, 2017. Management is currently evaluating the impact, if any, of applying this provision.
In November 2016, FASB issued a new Accounting Standards Update No. 2016-18, "Statement of Cash Flows (Topic 230), Restricted Cash, a consensus of the FASB's Emerging Issues Task Force" ("ASU 2016-18"). ASU 2016-18 requires that a statement of cash flows explain the change during the period in the total of cash, cash equivalents, and amounts generally described as restricted cash or restricted cash equivalents. Therefore, amounts generally
26
Credit Suisse Emerging Markets Equity Fund
Notes to Financial Statements (continued)
October 31, 2016
Note 2. Significant Accounting Policies (continued)
described as restricted cash and restricted cash equivalents should be included with cash and cash equivalents when reconciling the beginning-of-period and end-of-period total amounts shown on the statement of cash flows. The amendments in ASU 2016-18 do not provide a definition of restricted cash or restricted cash equivalents. ASU 2016-18 is effective for interim and annual reporting periods beginning after December 15, 2017. Management is currently evaluating the impact, if any, of applying this provision.
In October 2016, the U.S. Securities and Exchange Commission adopted new rules and amended existing rules (together, "final rules") intended to modernize the reporting and disclosure of information by registered investment companies. In part, the final rules amend Regulation S-X and require standardized, enhanced disclosure about derivatives in investment company financial statements, as well as other amendments. The compliance date for the amendments to Regulation S-X is August 1, 2017. Management is currently evaluating the impact that the adoption of the amendments to Regulation S-X will have on the Fund's financial statements and related disclosures.
K) SUBSEQUENT EVENTS — In preparing the financial statements as of October 31, 2016, management considered the impact of subsequent events for potential recognition or disclosure in these financial statements through the date of release of this report. No such events requiring recognition or disclosure were identified through the date of the release of this report.
Note 3. Transactions with Affiliates and Related Parties
Credit Suisse serves as investment adviser for the Fund. For its investment advisory services, Credit Suisse is entitled to receive a fee from the Fund at an annual rate of 0.90% of the Fund's average daily net assets. Credit Suisse has contractually waived fees and reimbursed expenses so that the Fund's annual operating expenses would not exceed 1.25% of the Fund's average daily net assets for Class I shares, 1.50% of the Fund's average daily net assets for Class A shares, and 2.25% of the Fund's average daily net assets for Class C shares. For the year ended October 31, 2016, investment advisory fees earned and fees waived/expenses reimbursed were $213,668 and $321,480, respectively. The Fund is authorized to reimburse Credit Suisse for management fees previously limited and/or for expenses previously reimbursed by Credit Suisse, provided, however, that any reimbursements must be paid at a date not more than three years after the end of the fiscal year during which such fees were limited or expenses were reimbursed by Credit Suisse and the reimbursements do not
27
Credit Suisse Emerging Markets Equity Fund
Notes to Financial Statements (continued)
October 31, 2016
Note 3. Transactions with Affiliates and Related Parties (continued)
cause the Fund to exceed the applicable expense limitation in the contract at the time the fees are recouped. This contract may not be terminated before February 28, 2018.
The amounts waived and reimbursed by Credit Suisse, which are available for potential future recoupment by Credit Suisse, and the expiration schedule at October 31, 2016 are as follows:
| | | Fee waivers/
expense
reimbursements
subject to
recoupment | | Expires
October 31,
2017 | | Expires
October 31,
2018 | | Expires
October 31,
2019 | |
Class I | | $ | 781,160 | | | $ | 228,447 | | | $ | 267,752 | | | $ | 284,961 | | |
Class A | | | 45,471 | | | | 13,198 | | | | 16,088 | | | | 16,185 | | |
Class C | | | 49,026 | | | | 12,296 | | | | 16,396 | | | | 20,334 | | |
Totals | | $ | 875,657 | | | $ | 253,941 | | | $ | 300,236 | | | $ | 321,480 | | |
Credit Suisse and SSB serve as co-administrators to the Fund. For its co-administrative services, Credit Suisse receives a fee calculated at an annual rate of 0.09% of the Fund's average daily net assets. For the year ended October 31, 2016, co-administrative services fees earned by Credit Suisse were $21,367.
For its co-administrative services, SSB receives a fee, exclusive of out-of-pocket expenses, calculated in total for all the Credit Suisse funds/portfolios co-administered by SSB and allocated based upon the relative average net assets of each fund/portfolio, subject to an annual minimum fee. For the year ended October 31, 2016, co-administrative services fees earned by SSB (including out-of-pocket expenses) with respect to the Fund were $155,918.
Credit Suisse Securities (USA) LLC ("CSSU"), an affiliate of Credit Suisse, serves as the distributor of the Fund's shares. Pursuant to a distribution plan adopted by the Fund pursuant to Rule 12b-1 under the 1940 Act, CSSU receives fees for its distribution services. These fees are calculated at an annual rate of 0.25% of the average daily net assets of the Class A shares. For the Class C shares, the fee is calculated at an annual rate of 1.00% of the average daily net assets. For the year ended October 31, 2016, the Fund paid Rule 12b-1 distribution fees of $2,988 for Class A shares and $15,017 for Class C shares. Class I shares are not subject to Rule 12b-1 distribution fees.
Certain brokers, dealers and financial representatives provide transfer agent-related services to the Fund and receive compensation from the Fund. For the year ended October 31, 2016, the Fund paid $13,058, which is included within transfer agent fees in the Statement of Operations.
28
Credit Suisse Emerging Markets Equity Fund
Notes to Financial Statements (continued)
October 31, 2016
Note 3. Transactions with Affiliates and Related Parties (continued)
For the year ended October 31, 2016, CSSU and its affiliates advised the Fund that there were no commissions earned on the sale of the Fund's Class A and Class C shares.
Note 4. Line of Credit
The Fund, together with other funds/portfolios advised by Credit Suisse (collectively, the "Participating Funds"), participates in a committed, unsecured line of credit facility ("Credit Facility"), with SSB in an aggregated amount of $250 million for temporary or emergency purposes under a first-come, first-served basis. Under the terms of the Credit Facility, the Participating Funds pay an aggregate commitment fee on the average unused amount of the Credit Facility, which is allocated among the Participating Funds in such manner as is determined by the governing Boards of the Participating Funds. In addition, the Participating Funds pay interest on borrowings at either the Overnight Federal Funds rate or the Overnight LIBOR rate plus a spread. At October 31, 2016 and during the year ended October 31, 2016, the Fund had no borrowings outstanding under the Credit Facility.
Note 5. Purchases and Sales of Securities
For the year ended October 31, 2016, purchases and sales of investment securities (excluding short-term investments) were $14,640,354 and $14,245,323, respectively.
Note 6. Capital Share Transactions
The Fund is authorized to issue an unlimited number of full and fractional shares of beneficial interest, $.001 par value per share. The Fund offers Class I, Class A and Class C shares. Transactions in capital shares for each class of the Fund were as follows:
| | | Class I | |
| | | For the Year Ended
October 31, 2016 | | For the Year Ended
October 31, 2015 | |
| | | Shares | | Value | | Shares | | Value | |
Shares sold | | | 193,469 | | | $ | 1,580,312 | | | | 559,159 | | | $ | 5,526,914 | | |
Shares issued in reinvestment of dividends | | | 43,765 | | | | 337,426 | | | | 64,398 | | | | 617,577 | | |
Shares redeemed | | | (183,703 | ) | | | (1,510,760 | ) | | | (151,958 | ) | | | (1,443,532 | ) | |
Net increase | | | 53,531 | | | $ | 406,978 | | | | 471,599 | | | $ | 4,700,959 | | |
29
Credit Suisse Emerging Markets Equity Fund
Notes to Financial Statements (continued)
October 31, 2016
Note 6. Capital Share Transactions (continued)
| | | Class A | |
| | | For the Year Ended
October 31, 2016 | | For the Year Ended
October 31, 2015 | |
| | | Shares | | Value | | Shares | | Value | |
Shares sold | | | 6,626 | | | $ | 48,650 | | | | 35,734 | | | $ | 355,000 | | |
Shares issued in reinvestment of dividends | | | 2,249 | | | | 17,340 | | | | 3,294 | | | | 31,587 | | |
Shares redeemed | | | (25,497 | ) | | | (206,889 | ) | | | — | | | | — | | |
Net increase (decrease) | | | (16,622 | ) | | $ | (140,899 | ) | | | 39,028 | | | $ | 386,587 | | |
| | | Class C | |
| | | For the Year Ended
October 31, 2016 | | For the Year Ended
October 31, 2015 | |
| | | Shares | | Value | | Shares | | Value | |
Shares sold | | | 1,699 | | | $ | 14,714 | | | | 80,234 | | | $ | 764,987 | | |
Shares issued in reinvestment of dividends | | | 1,337 | | | | 10,308 | | | | 1,717 | | | | 16,465 | | |
Shares redeemed | | | (2,577 | ) | | | (23,347 | ) | | | — | | | | — | | |
Net increase | | | 459 | | | $ | 1,675 | | | | 81,951 | | | $ | 781,452 | | |
On October 31, 2016, the number of shareholders that held 5% or more of the outstanding shares of each class of the Fund was as follows:
| | | Number of
Shareholders | | Approximate Percentage
of Outstanding Shares | |
Class I | | | 2 | * | | | 97 | % | |
Class A | | | 3 | * | | | 95 | % | |
Class C | | | 2 | * | | | 100 | % | |
*This includes the seed money from Merchant Holding, Inc., an affiliate of Credit Suisse.
Some of the shareholders are omnibus accounts, which hold shares on behalf of individual shareholders.
Note 7. Federal Income Taxes
Income and capital gain distributions are determined in accordance with federal income tax regulations, which may differ from GAAP.
The tax characteristics of distributions paid by the Fund during the years ended October 31, 2016 and 2015, respectively, were as follows:
| | Ordinary Income | |
| | 2016 | | 2015 | |
| | | | | $ | 365,073 | | | $ | 668,120 | | |
The tax basis components of distributable earnings differ from the amounts reflected in the Statement of Assets and Liabilities by temporary book/tax
30
Credit Suisse Emerging Markets Equity Fund
Notes to Financial Statements (continued)
October 31, 2016
Note 7. Federal Income Taxes (continued)
differences. These differences are primarily due to adjustments for sales of shares in passive foreign investment companies, wash sales and organizational expenses. At October 31, 2016, the components of distributable earnings on a tax basis were as follows:
Undistributed net investment income | | $ | 468,856 | | |
Accumulated net realized loss | | | (4,384,405 | ) | |
Unrealized appreciation | | | 1,453,417 | | |
| | $ | (2,462,132 | ) | |
At October 31, 2016, the Fund had $2,656,193 of unlimited short-term and $1,728,212 of unlimited long-term capital loss carryforwards available to offset possible future capital gains.
At October 31, 2016, the cost of investments (excluding foreign currency related transactions) and the net unrealized appreciation (depreciation) for income tax purposes were as follows:
Cost of Investments | | $ | 24,778,257 | | |
Unrealized appreciation | | $ | 2,733,603 | | |
Unrealized depreciation | | | (1,272,904 | ) | |
Net unrealized appreciation | | $ | 1,460,699 | | |
To adjust for current period permanent book/tax differences which arose principally from differing book/tax treatment of foreign currency gain (loss) and passive foreign investment company gain (loss), paid-in capital was charged $1, accumulated net realized loss was charged $157,132 and accumulated undistributed net investment income was credited $157,133. Net assets were not affected by these reclassifications.
Note 8. Contingencies
In the normal course of business, the Fund may provide general indemnifications pursuant to certain contracts and organizational documents. The Fund's maximum exposure under these arrangements is dependent on future claims that may be made against the Fund and, therefore, cannot be estimated; however, based on experience, the risk of loss from such claims is considered remote.
31
Credit Suisse Emerging Markets Equity Fund
Report of Independent Registered Public Accounting Firm
The Board of Trustees and Shareholders
Credit Suisse Emerging Markets Equity Fund:
We have audited the accompanying statement of assets and liabilities of Credit Suisse Emerging Markets Equity Fund (the "Fund"), a series of the Credit Suisse Opportunity Funds, including the schedule of investments, as of October 31, 2016, and the related statement of operations for the year then ended, the statements of changes in net assets and the financial highlights for each of the years in the two-year period then ended. These financial statements and financial highlights are the responsibility of the Fund's management. Our responsibility is to express an opinion on these financial statements and financial highlights based on our audits. The accompanying financial highlights for the period from December 26, 2013 to October 31, 2014 was audited by other independent registered public accountants whose report thereon dated December 29, 2014, expressed an unqualified opinion on those financial highlights.
We conducted our audits in accordance with the standards of the Public Company Accounting Oversight Board (United States). Those standards require that we plan and perform the audits to obtain reasonable assurance about whether the financial statements and financial highlights are free of material misstatement. An audit includes examining, on a test basis, evidence supporting the amounts and disclosures in the financial statements. Our procedures included confirmation of securities owned as of October 31, 2016, by correspondence with the custodian and broker or by other appropriate auditing procedures. An audit also includes assessing the accounting principles used and significant estimates made by management, as well as evaluating the overall financial statement presentation. We believe that our audits provide a reasonable basis for our opinion.
In our opinion, the financial statements and financial highlights referred to above present fairly, in all material respects, the financial position of Credit Suisse Emerging Markets Equity Fund as of October 31, 2016, the results of its operations for the year then ended, and the changes in its net assets and the financial highlights for each of the years in the two-year period then ended, in conformity with U.S. generally accepted accounting principles.

New York, New York
December 28, 2016
32
Credit Suisse Emerging Markets Equity Fund
Information Concerning Trustees and Officers (unaudited)
Name, Address
(Year of Birth) | | Position(s)
Held with
Fund | | Term
of Office1
and
Length
of Time
Served | | Principal
Occupation(s) During
Past Five Years | | Number of
Portfolios
in Fund
Complex
Overseen
by Trustee | | Other
Trusteeships
Held by Trustee | |
Independent Trustees | | | | | | | | | | | |
Enrique R. Arzac
c/o Credit Suisse Asset
Management, LLC
Attn: General Counsel
One Madison Avenue
New York, New York
10010
(1941) | | Trustee, Audit Committee Chairman and Nominating Committee Member | | Since Fund Inception | | Professor Emeritus of Finance and Economics from July 2015 to present; Professor of Finance and Economics, Graduate School of Business, Columbia University from 1971 to July 2015. | | | 12 | | | Director of Adams Diversified Equity Fund, Inc., Adams Natural Resources Fund, Inc., Aberdeen Chile Fund, Inc., Aberdeen Emerging Markets Smaller Company Opportunities Fund, Inc., Aberdeen Israel Fund, Inc., Aberdeen Indonesia Fund, Inc. and Aberdeen Latin America Equity Fund, Inc. (each a closed-end investment company); Director of Aberdeen Asia-Pacific Income Investment Company Limited (a Canadian closed-end fund); Trustee of Mirae Asset Discovery Funds (7 open-end portfolios); Director of Epoch Holding Corporation (an investment management and investment advisory services company) from August 2006 to March 2013. | |
1 Subject to the Trust's retirement policy, each Trustee may continue to serve as a Trustee until the last day of the calendar year in which the applicable Trustee attains age 75. Officer serves until his or her respective successor has been duly elected and qualified.
33
Credit Suisse Emerging Markets Equity Fund
Information Concerning Trustees and Officers (unaudited) (continued)
Name, Address
(Year of Birth) | | Position(s)
Held with
Fund | | Term
of Office1
and
Length
of Time
Served | | Principal
Occupation(s) During
Past Five Years | | Number of
Portfolios
in Fund
Complex
Overseen
by Trustee | | Other
Trusteeships
Held by Trustee | |
Independent Trustees | | | | | | | | | | | |
Jeffrey E. Garten
c/o Credit Suisse Asset Management, LLC
Attn: General Counsel
One Madison Avenue
New York, New York
10010
(1946) | | Trustee, Audit and Nominating Committee Member | | Since Fund Inception | | Dean Emeritus of Yale School of Management from July 2015 to present; The Juan Trippe Professor in the Practice of International Trade, Finance and Business, Yale School of Management, from July 2005 to July 2015; Partner and Chairman of Garten Rothkopf (consulting firm) from October 2005 to present. | | | 10 | | | Director of Aetna, Inc. (insurance company); Director of CarMax Group (used car dealers); Director of Miller Buckfire & Co., LLC (financial restructuring); Member of Standard & Poor's Board of Managers (credit rating agency) from December 2011 to November 2014. | |
Steven N. Rappaport
Lehigh Court, LLC
555 Madison Avenue
29th Floor
New York, New York
10022
(1948) | | Chairman of the Board of Trustees, Audit Committee Member and Nominating Committee Chairman | | Trustee since Fund Inception and Chairman since 2005 | | Partner of Lehigh Court, LLC and RZ Capital (private investment firms) from July 2002 to present; Partner of Backstage Acquisition Holdings, LLC (publication job postings) from November 2013 to present. | | | 12 | | | Director of iCAD, Inc. (surgical and medical instruments and apparatus company); Director of Aberdeen Chile Fund, Inc., Aberdeen Emerging Markets Smaller Company Opportunities Fund, Inc., Aberdeen Israel Fund, Inc., Aberdeen Indonesia Fund, Inc. and Aberdeen Latin America Equity Fund, Inc. (each a closed-end investment company); Director of Aberdeen Funds (25 open portfolios); Director of Presstek, Inc. (digital imaging technologies company) from 2003 to 2012; Director of Wood Resources, LLC (plywood manufacturing company) from 2003 to October 2013. | |
1 Subject to the Trust's retirement policy, each Trustee may continue to serve as a Trustee until the last day of the calendar year in which the applicable Trustee attains age 75. Officer serves until his or her respective successor has been duly elected and qualified.
34
Credit Suisse Emerging Markets Equity Fund
Information Concerning Trustees and Officers (unaudited) (continued)
Name, Address
(Year of Birth) | | Position(s)
Held with
Fund | | Term of
Office1
and
Length of
Time
Served | | Principal Occupation(s) During Past Five Years | |
Officers* | | | | | | | |
John G. Popp
Credit Suisse Asset
Management, LLC
One Madison Avenue
New York, New York 10010
(1956) | | Chief Executive Officer and President | | Since Fund Inception | | Managing Director of Credit Suisse; Global Head and Chief Investment Officer of the Credit Investment Group; Associated with Credit Suisse or its predecessor since 1997; Officer of other Credit Suisse Funds; Trustee of Credit Suisse High Yield Bond Fund; Director of Credit Suisse Asset Management Income Fund, Inc. | |
Emidio Morizio
Credit Suisse Asset
Management, LLC
One Madison Avenue
New York, New York 10010
(1966) | | Chief Compliance Officer | | Since Fund Inception | | Managing Director and Global Head of Compliance of Credit Suisse since 2010; Associated with Credit Suisse since July 2000; Officer of other Credit Suisse Funds. | |
Lou Anne McInnis
Credit Suisse Asset Management, LLC
One Madison Avenue
New York, New York 10010
(1959) | | Chief Legal Officer | | Since 2015 | | Director of Credit Suisse; Associated with Credit Suisse since April 2015; Counsel at DLA Piper US LLP from 2011 to April 2015; Associated with Morgan Stanley Investment Management from 1997 to 2010; Officer of other Credit Suisse Funds. | |
Laurie Pecha
Credit Suisse Asset
Management, LLC
One Madison Avenue
New York, New York 10010
(1961) | | Chief Financial Officer | | Since 2016 | | Director of Credit Suisse since August 2016; Senior Consultant of Spectra Professional Services, LLC from January 2012 to July 2016; Vice President of Legg Mason & Co. from March 2007 to December 2011; Officer of other Credit Suisse Funds. | |
Esther Cheung
Credit Suisse Asset
Management, LLC
One Madison Avenue
New York, New York 10010
(1980) | | Treasurer | | Since 2016 | | Vice President of Credit Suisse since 2015; Associated with Reich & Tang Asset Management, LLC from June 2010 to August 2015; Officer of other Credit Suisse Funds. | |
Karen Regan
Credit Suisse Asset
Management, LLC
One Madison Avenue
New York, New York 10010
(1963) | | Vice President and Secretary | | Since Fund Inception | | Vice President of Credit Suisse; Associated with Credit Suisse since December 2004; Officer of other Credit Suisse Funds. | |
1 Subject to the Trust's retirement policy, each Trustee may continue to serve as a Trustee until the last day of the calendar year in which the applicable Trustee attains age 75. Officer serves until his or her respective successor has been duly elected and qualified.
* The officers of the Fund shown are officers that make policy decisions.
The Statement of Additional Information includes additional information about the Trustees and is available, without charge, upon request, by calling 877-870-2874.
35
Credit Suisse Emerging Markets Equity Fund
Proxy Voting and Portfolio Holdings Information (unaudited)
Information regarding how the Fund voted proxies related to its portfolio securities during the 12-month period ended June 30 of each year, as well as the policies and procedures that the Fund uses to determine how to vote proxies relating to its portfolio securities are available:
• By calling 1-877-870-2874
• On the Fund's website, www.credit-suisse.com/us/funds
• On the website of the Securities and Exchange Commission, www.sec.gov.
The Fund files a complete schedule of its portfolio holdings for the first and third quarters of its fiscal year with the SEC on Form N-Q. The Fund's Forms N-Q are available on the SEC's website at www.sec.gov and may be reviewed and copied at the SEC's Public Reference Room in Washington, DC. Information on the operation of the SEC's Public Reference Room may be obtained by calling 1-202-551-8090.
36

P.O. BOX 55030, BOSTON, MA 02205-5030
877-870-2874 n www.credit-suisse.com/us/funds
CREDIT SUISSE SECURITIES (USA) LLC, DISTRIBUTOR. EMF-AR-1016

CREDIT SUISSE FUNDS
Annual Report
October 31, 2016
n CREDIT SUISSE
STRATEGIC INCOME FUND
The Fund's investment objectives, risks, charges and expenses (which should be considered carefully before investing), and more complete information about the Fund, are provided in the Prospectus, which should be read carefully before investing. You may obtain additional copies by calling 877-870-2874 or by visiting our website at www.credit-suisse.com/us/funds.
Credit Suisse Securities (USA) LLC, Distributor, is located at One Madison Avenue, New York, NY 10010. Credit Suisse Funds are advised by Credit Suisse Asset Management, LLC.
Investors in the Credit Suisse Funds should be aware that they may be eligible to purchase Class I shares (where offered) directly or through certain intermediaries. Such shares are not subject to a sales charge. Investors in the Credit Suisse Funds should also be aware that they may be eligible for a reduction or waiver of the sales charge with respect to Class A or C shares (where offered). For more information, please review the relevant prospectuses or consult your financial representative.
Fund shares are not deposits or other obligations of Credit Suisse Asset Management, LLC ("Credit Suisse") or any affiliate, are not FDIC-insured and are not guaranteed by Credit Suisse or any affiliate. Fund investments are subject to investment risks, including loss of your investment.
Credit Suisse Strategic Income Fund
Annual Investment Adviser's Report
October 31, 2016 (unaudited)
November 25, 2016
Dear Shareholder:
We are pleased to present this Annual Report covering the activities of the Credit Suisse Strategic Income Fund (the "Fund") for the twelve months ended October 31, 2016.
Performance Summary
11/1/2015 – 10/31/2016
Fund & Benchmark | | Performance | |
Class I1 | | | 7.40 | % | |
Class A1,2 | | | 7.12 | % | |
Class C1,2 | | | 6.33 | % | |
BofA Merrill Lynch 3-Month U.S. Treasury Bill Index3 | | | 0.33 | % | |
Performance shown for the Fund's Class A and Class C Shares does not reflect sales charges, which are a maximum of 4.75% and 1.00%, respectively.2
Market Review: A volatile, yet positive period
The twelve-month period ended October 31, 2016 was a volatile one for the credit markets, with the BofA Merrill Lynch 3-Month U.S. Treasury Bill Index, the Fund's benchmark, returning 0.33%.
For the first four months of the period, uncertainty around oil and commodity prices, vagueness around U.S. Federal Reserve ("Fed") rate increases, retail outflows, the United Kingdom's vote to withdraw from the European Union, speculation about U.S. election results, and global economic concerns created market volatility. The tone of the market, however, changed in late February and led to a rally in numerous asset classes. In particular, both the high yield and leveraged loan markets ended the twelve-month period on a positive note, returning 10.18% and 6.30%, respectively.
It's worth noting that technicals in both the high yield and leveraged loan markets have been positive for much of this period. In fact, high yield bond mutual funds have reported positive inflows of $11.1 billion on a calendar year-to-date basis compared to a $1.1 billion outflow during the same period last year. With respect to leveraged loans, however, mutual fund flows have had net outflows of $15.7 billion reported for the twelve-month period ended October 31, 2016. Positive collateralized loan obligation ("CLO") issuance, however, has more than outweighed outflows, as $67 billion of new CLOs were issued in the last twelve months.
Default activity for high yield, as measured by JP Morgan, increased to 4.84% for the period, though if commodities are excluded, it was only 0.46%. Similarly,
1
Credit Suisse Strategic Income Fund
Annual Investment Adviser's Report (continued)
October 31, 2016 (unaudited)
loan default rates ended the period at 1.95% — and of the $25 billion of defaults in 2016, $16.5 billion were borrowers in the oil & gas or metals & mining sectors. While there is high likelihood of elevated defaults for these troubled industries going forward, overall stable fundamentals should minimize defaults broadly. In fact, default activity, outside of commodities and oil, is expected to remain low in 2017.
Strategic Review and Outlook: Well positioned going forward
For the annual period ended October 31, 2016, the Fund outperformed its benchmark. The high yield and loan asset classes were the greatest contributors to performance, as each asset class returned more than 9%. CLOs also provided positive contribution to returns. However, because exposure to the asset class is limited, its contribution was not as impactful as the below investment grade-asset classes.
After a weak start to 2016, credit markets have experienced substantial positive returns in the second and third quarters — largely driven by improved commodity and oil outlooks, as well as dissipating global macroeconomic concerns. Coupled with the continued pursuit of yield in a low global rate environment, technicals were decidedly strong for credit asset classes.
We expect that the recent U.S. election results may bring slightly elevated volatility in both the loan market and high yield asset class in the near term. However, we do not believe there are sufficient factors to support prolonged instability, as we do not expect any fundamental shift in credit outlook or supply and demand. We are mindful of rate volatility in the near term as we continue to believe in the heightened likelihood of tightening from the Fed in December. In addition, the long end of the treasury curve could witness additional weakening in the face of increased inflation expectations. Within bonds, we will continue to maintain a shorter duration in the portfolio and focus on B-rated bonds. Additionally, because a large portion of the Fund is focused on short duration, floating rate loan products, we believe it should be positioned well in a rising rate environment. Lastly, we believe the improved commodity backdrop will lead to a stabilization and potential decline in overall default activity.
The Credit Suisse Credit Investments Group
John G. Popp
Andrew H. Marshak
Thomas J. Flannery
Louis I. Farano
Wing Chan
2
Credit Suisse Strategic Income Fund
Annual Investment Adviser's Report (continued)
October 31, 2016 (unaudited)
Senior secured floating rate loans ("Senior Loans") are subject to the risk that a court could subordinate a Senior Loan, which typically holds the most senior position in the issuer's capital structure, to presently existing or future indebtedness or take other action detrimental to the holders of Senior Loans.
High yield bonds are lower-quality bonds that are also known as "junk bonds." Such bonds entail greater risks than those found in higher-rated securities.
CLOs are subject to the risk of substantial losses due to actual defaults, decrease of market value due to collateral defaults and disappearance of subordinate tranches, market anticipation of defaults, and investor aversion to CLO securities as a class. The risks of CLOs depend largely on the type of the underlying loans and the tranche of CLOs in which the Fund invests. In addition, CLOs carry risks including interest rate risk and credit risk.
Additional principal risk factors for the Fund include conflict of interest risk, convertible securities risk, credit risk, derivatives risk, extension risk, foreign securities risk, futures contracts risk, hedged exposure risk, interest rate risk, liquidity risk, market risk, mortgage- and asset-backed securities risk, prepayment risk, short position risk, U.S. government securities risk and valuation risk. Before you invest, please make sure you understand the risks that apply to the Fund. As with any mutual fund, you could lose money over any period of time. Investments in the Fund are not bank deposits and are not insured or guaranteed by the Federal Deposit Insurance Corporation or any government agency. For a detailed discussion of these and other risks, please refer to the Fund's Prospectus, which should be read carefully before investing.
In addition to historical information, this report contains forward-looking statements, which may concern, among other things, domestic and foreign markets, industry and economic trends and developments and government regulation and their potential impact on the Fund's investments. These statements are subject to risks and uncertainties and actual trends, developments and regulations in the future, and their impact on the Fund could be materially different from those projected, anticipated or implied. The Fund has no obligation to update or revise forward-looking statements.
The views of the Fund's management are as of the date of this letter and the Fund holdings described in this document are as of October 31, 2016; these views and Fund holdings may have changed subsequent to these dates. Nothing in this document is a recommendation to purchase or sell securities.
3
Credit Suisse Strategic Income Fund
Annual Investment Adviser's Report (continued)
October 31, 2016 (unaudited)
Comparison of Change in Value of $10,000 Investment in the
Credit Suisse Strategic Income Fund1 Class I Shares,
Class A Shares2, Class C Shares2 and the BofA
Merrill Lynch 3-Month U.S. Treasury Bill Index3
from Inception (9/28/12)

1 Fee waivers and/or expense reimbursements may reduce expenses for the Fund, without which performance would be lower. The Fund entered into a written contract to limit expenses to 0.99% of the Fund's average daily net assets for Class I shares, 1.24% of the Fund's average daily net assets for Class A shares and 1.99% of the Fund's average daily net assets for Class C shares through at least February 28, 2018. This limit excludes certain expenses, as set forth in the Fund's Prospectus.
2 Total return for the Fund's Class A shares for the reporting period, based on offering price (including maximum sales charge of 4.75%), was 2.01%. Total return for the Fund's Class C shares for the reporting period, based on redemption value (including maximum CDSC of 1.00%), was 5.33%.
3 Using only liquid securities, the BofA Merrill Lynch 3-Month U.S. Treasury Bill Index seeks to replicate the return of the overall hedge fund industry, as represented by the Dow Jones Credit Suisse Hedge Fund Index. The Index does not have transaction costs and investors may not invest directly in the Index.
4
Credit Suisse Strategic Income Fund
Annual Investment Adviser's Report (continued)
October 31, 2016 (unaudited)
Average Annual Returns as of October 31, 20161
| | | 1 Year | | Since
Inception2 | |
Class I | | | 7.40 | % | | | 6.78 | % | |
Class A Without Sales Charge | | | 7.12 | % | | | 6.51 | % | |
Class A With Maximum Sales Charge | | | 2.01 | % | | | 5.25 | % | |
Class C Without CDSC | | | 6.33 | % | | | 5.74 | % | |
Class C With CDSC | | | 5.33 | % | | | 5.74 | % | |
Returns represent past performance and include change in share price and reinvestment of dividends and capital gain distributions. Past performance cannot guarantee future results. The current performance of the Fund may be lower or higher than the figures shown. Returns and share price will fluctuate, and redemption value may be more or less than original cost. The performance results do not reflect the deduction of taxes that a shareholder would pay on Fund distributions or the redemption of Fund shares. Performance information current to the most recent month end is available at www.credit-suisse.com/us/funds.
The annual gross expense ratios are 1.29% for Class I shares, 1.54% for Class A shares and 2.29% for Class C shares. The annual net expense ratios after fee waivers and/or expense reimbursements are 0.99% for Class I shares, 1.24% for Class A shares and 1.99% for Class C shares.
1 Fee waivers and/or expense reimbursements may reduce expenses for the Fund, without which performance would be lower. The Fund entered into a written contract to limit expenses to 0.99% of the Fund's average daily net assets for Class I shares, 1.24% of the Fund's average daily net assets for Class A shares and 1.99% of the Fund's average daily net assets for Class C shares through at least February 28, 2018. This limit excludes certain expenses, as set forth in the Fund's Prospectus.
2 Inception Date September 28, 2012.
5
Credit Suisse Strategic Income Fund
Annual Investment Adviser's Report (continued)
October 31, 2016 (unaudited)
Information About Your Fund's Expenses
As an investor of the Fund, you incur two types of costs: ongoing expenses and transaction costs. Ongoing expenses include management fees, distribution and service (12b-1) fees and other Fund expenses. Examples of transaction costs include sales charges (loads), redemption fees and account maintenance fees, which are not shown in this section and which would result in higher total expenses. The following table is intended to help you understand your ongoing expenses of investing in the Fund and to help you compare these expenses with the ongoing expenses of investing in other mutual funds. The table is based on an investment of $1,000 made at the beginning of the six months ended October 31, 2016.
The table illustrates your Fund's expenses in two ways:
• Actual Fund Return. This helps you estimate the actual dollar amount of ongoing expenses paid on a $1,000 investment in the Fund using the Fund's actual return during the period. To estimate the expenses you paid over the period, simply divide your account value by $1,000 (for example, an $8,600 account value divided by $1,000 = 8.6), then multiply the result by the number in the "Expenses Paid per $1,000" line.
• Hypothetical 5% Fund Return. This helps you to compare the Fund's ongoing expenses with those of other mutual funds using the Fund's actual expense ratio and a hypothetical rate of return of 5% per year before expenses. Examples using a 5% hypothetical fund return may be found in the shareholder reports of other mutual funds. The hypothetical account values and expenses may not be used to estimate the actual ending account balance or expenses you paid for the period.
Please note that the expenses shown in these tables are meant to highlight your ongoing expenses only and do not reflect any transaction costs, such as sales charges (loads) or redemption fees. If these transaction costs had been included, your costs would have been higher. The "Expenses Paid per $1,000" line of the tables is useful in comparing ongoing expenses only and will not help you determine the relative total expenses of owning different funds.
6
Credit Suisse Strategic Income Fund
Annual Investment Adviser's Report (continued)
October 31, 2016 (unaudited)
Expenses and Value for a $1,000 Investment
for the six-month period ended October 31, 2016
Actual Fund Return | | Class I | | Class A | | Class C | |
Beginning Account Value 05/01/16 | | $ | 1,000.00 | | | $ | 1,000.00 | | | $ | 1,000.00 | | |
Ending Account Value 10/31/16 | | $ | 1,100.80 | | | $ | 1,099.30 | | | $ | 1,095.20 | | |
Expenses Paid per $1,000* | | $ | 5.23 | | | $ | 6.54 | | | $ | 10.48 | | |
Hypothetical 5% Fund Return | |
Beginning Account Value 05/01/16 | | $ | 1,000.00 | | | $ | 1,000.00 | | | $ | 1,000.00 | | |
Ending Account Value 10/31/16 | | $ | 1,020.16 | | | $ | 1,018.90 | | | $ | 1,015.13 | | |
Expenses Paid per $1,000* | | $ | 5.03 | | | $ | 6.29 | | | $ | 10.08 | | |
| | | Class I | | Class A | | Class C | |
Annualized Expense Ratios* | | | 0.99 | % | | | 1.24 | % | | | 1.99 | % | |
* Expenses are equal to the Fund's annualized expense ratio for each share class, multiplied by the average account value over the period, multiplied by 184/366 to reflect the one-half year period.
The "Expenses Paid per $1,000" and the "Annualized Expense Ratios" in the tables are based on actual expenses paid by the Fund during the period, net of fee waivers and/or actual expense reimbursements, if applicable. If those fee waivers and/or expense reimbursements had not been in effect, the Fund's actual expenses would have been higher. Expenses do not reflect additional charges and expenses that are, or may be, imposed under the variable contracts or plans. Such charges and expenses are described in the prospectus of the insurance company separate account or in the plan documents or other informational materials supplied by plan sponsors. The Fund's expenses should be considered with these charges and expenses in evaluating the overall cost of investing in the separate account.
For more information, please refer to the Fund's Prospectus.
7
Credit Suisse Strategic Income Fund
Annual Investment Adviser's Report (continued)
October 31, 2016 (unaudited)
Credit Quality Breakdown*
(% of Total Investments as of October 31, 2016)
S&P Ratings** | |
BBB | | | 5.1 | % | |
BB | | | 20.2 | | |
B | | | 43.2 | | |
CCC | | | 15.8 | | |
C | | | 0.9 | | |
D | | | 0.8 | | |
NR | | | 6.5 | | |
Subtotal | | | 92.5 | | |
Equity and Other | | | 0.7 | | |
| Short-Term Investment1 | | | 6.8 | | |
Total | | | 100.0 | % | |
* Expressed as a percentage of total investments (excluding securities lending collateral, if applicable) and may vary over time.
** Credit Quality is based on ratings provided by Standard & Poor's Division of The McGraw-Hill Companies, Inc. ("S&P"). S&P is a main provider of ratings for Credit Assets Classes and is widely used amongst industry participants. The NR category consists of securities that have not been rated by S&P.
1 Primarily reflects cash invested in State Street Bank and Trust Co. Euro Time Deposit, for which the purchases of securities have been executed but not yet settled at October 31, 2016, if applicable.
8
Credit Suisse Strategic Income Fund
Schedule of Investments
October 31, 2016
Par
(000) | |
| | Ratings†
(S&P/Moody's) | | Maturity | | Rate% | | Value | |
| CORPORATE BONDS (42.5%) | |
| Advertising (1.0%) | |
$ | 250 | | | WMG Acquisition Corp., Rule 144A,
Senior Secured Notes
(Callable 11/01/19 @ 103.66)(1) | | (B, Ba3) | | 11/01/24 | | | 4.875 | | | $ | 250,625 | | |
| | 500 | | | WMG Acquisition Corp., Rule 144A,
Senior Secured Notes
(Callable 12/01/16 @ 104.50)(1) | | (B, Ba3) | | 01/15/21 | | | 6.000 | | | | 518,750 | | |
| | | | 769,375 | | |
| Auto Parts & Equipment (1.4%) | |
| | 450 | | | Cooper-Standard Automotive, Inc.,
Rule 144A, Senior Unsecured Notes
(Callable 11/15/21 @ 102.81)(1) | | (B, B2) | | 11/15/26 | | | 5.625 | | | | 453,375 | | |
| | 500 | | | Optimas OE Solutions, Inc., Rule 144A,
Senior Secured Notes
(Callable 06/01/18 @ 104.31)(1) | | (CCC+, Caa2) | | 06/01/21 | | | 8.625 | | | | 387,500 | | |
| | 1,049 | | | UCI International LLC,
Global Company Guaranteed Notes
(Callable 12/01/16 @ 102.16)(2) | | (NR, NR) | | 02/15/19 | | | 8.625 | | | | 230,780 | | |
| | | | 1,071,655 | | |
| Brokerage (1.2%) | |
| | 925 | | | CCRE Finance Corp., Rule 144A,
Company Guaranteed Notes
(Callable 12/01/16 @ 102.91)(1) | | (B+, B1) | | 02/15/18 | | | 7.750 | | | | 929,625 | | |
| Building & Construction (1.1%) | |
| | 500 | | | AV Homes, Inc.,
Global Company Guaranteed Notes
(Callable 12/01/16 @ 106.38) | | (B, Caa1) | | 07/01/19 | | | 8.500 | | | | 522,500 | | |
| | 325 | | | U.S. Concrete, Inc.,
Global Company Guaranteed Notes
(Callable 06/01/19 @ 104.78) | | (BB-, B3) | | 06/01/24 | | | 6.375 | | | | 338,812 | | |
| | | | 861,312 | | |
| Building Materials (2.4%) | |
| | 1,000 | | | Euramax International, Inc., Rule 144A,
Senior Secured Notes
(Callable 02/15/18 @ 109.00)(1) | | (B-, Caa2) | | 08/15/20 | | | 12.000 | | | | 1,045,000 | | |
| | 200 | | | FBM Finance, Inc., Rule 144A,
Senior Secured Notes
(Callable 08/15/18 @ 104.13)(1) | | (B+, Caa1) | | 08/15/21 | | | 8.250 | | | | 210,000 | | |
| | 500 | | | NCI Building Systems, Inc., Rule 144A,
Company Guaranteed Notes
(Callable 01/15/18 @ 106.19)(1) | | (BB-, B3) | | 01/15/23 | | | 8.250 | | | | 549,375 | | |
| | | | 1,804,375 | | |
See Accompanying Notes to Financial Statements.
9
Credit Suisse Strategic Income Fund
Schedule of Investments (continued)
October 31, 2016
Par
(000) | |
| | Ratings†
(S&P/Moody's) | | Maturity | | Rate% | | Value | |
| CORPORATE BONDS (continued) | |
| Cable & Satellite TV (4.8%) | |
$ | 800 | | | Altice Financing S.A., Rule 144A,
Senior Secured Notes
(Callable 05/15/21 @ 103.75)(1) | | (BB-, B1) | | 05/15/26 | | | 7.500 | | | $ | 826,000 | | |
| | 400 | | | Altice U.S. Finance I Corp., Rule 144A,
Senior Secured Notes
(Callable 05/15/21 @ 102.75)(1) | | (BB-, Ba3) | | 05/15/26 | | | 5.500 | | | | 409,000 | | |
| | 450 | | | Cable One, Inc., Rule 144A,
Company Guaranteed Notes
(Callable 06/15/18 @ 102.88)(1) | | (BB, B1) | | 06/15/22 | | | 5.750 | | | | 475,875 | | |
| | 300 | | | CSC Holdings LLC, Rule 144A,
Company Guaranteed Notes
(Callable 10/15/20 @ 103.31)(1) | | (BB-, Ba1) | | 10/15/25 | | | 6.625 | | | | 325,875 | | |
| | 300 | | | CSC Holdings LLC, Rule 144A,
Senior Unsecured Notes
(Callable 10/15/20 @ 105.44)(1) | | (B-, B2) | | 10/15/25 | | | 10.875 | | | | 345,750 | | |
| | 250 | | | Midcontinent Finance Corp., Rule 144A,
Company Guaranteed Notes
(Callable 12/01/16 @ 104.69)(1) | | (B, B3) | | 08/01/21 | | | 6.250 | | | | 263,125 | | |
| | 475 | | | SFR Group S.A., Rule 144A,
Senior Secured Notes
(Callable 05/01/21 @ 103.69)(1) | | (B+, B1) | | 05/01/26 | | | 7.375 | | | | 480,344 | | |
| | 200 | | | Virgin Media Secured Finance PLC, Rule 144A,
Senior Secured Notes
(Callable 08/15/21 @ 102.75)(1) | | (BB-, Ba3) | | 08/15/26 | | | 5.500 | | | | 202,250 | | |
| | 350 | | | Ziggo Secured Finance B.V., Rule 144A,
Senior Secured Notes
(Callable 01/15/22 @ 102.75)(1) | | (BB-, Ba3) | | 01/15/27 | | | 5.500 | | | | 346,500 | | |
| | | | 3,674,719 | | |
| Chemicals (3.3%) | |
| | 525 | | | Blue Cube Spinco, Inc.,
Global Company Guaranteed Notes
(Callable 10/15/20 @ 102.44) | | (BB, Ba1) | | 10/15/23 | | | 9.750 | | | | 619,500 | | |
| | 250 | | | PQ Corp., Rule 144A,
Senior Secured Notes
(Callable 05/15/19 @ 103.38)(1) | | (B+, B2) | | 11/15/22 | | | 6.750 | | | | 270,312 | | |
| | 52 | | | Reichhold Industries, Inc., Rule 144A,
Senior Secured Notes
(Callable 12/01/16 @ 100.00)(1),(2),(3),(4) | | (NR, NR) | | 05/08/17 | | | 9.000 | | | | 2,091 | | |
| | 850 | | | Tronox Finance LLC,
Global Company Guaranteed Notes
(Callable 12/01/16 @ 103.19) | | (B, Caa1) | | 08/15/20 | | | 6.375 | | | | 767,125 | | |
| | 300 | | | Versum Materials, Inc., Rule 144A,
Company Guaranteed Notes
(Callable 09/30/21 @ 102.75)(1) | | (BB-, Ba3) | | 09/30/24 | | | 5.500 | | | | 307,500 | | |
See Accompanying Notes to Financial Statements.
10
Credit Suisse Strategic Income Fund
Schedule of Investments (continued)
October 31, 2016
Par
(000) | |
| | Ratings†
(S&P/Moody's) | | Maturity | | Rate% | | Value | |
| CORPORATE BONDS (continued) | |
Chemicals | |
$ | 500 | | | Westlake Chemical Corp., Rule 144A,
Company Guaranteed Notes
(Callable 05/15/18 @ 102.44)(1) | | (BBB, NR) | | 05/15/23 | | | 4.875 | | | $ | 521,250 | | |
| | | | 2,487,778 | | |
| Consumer/Commercial/Lease Financing (1.5%) | |
| | 700 | | | Infinity Acquisition Finance Corp., Rule 144A,
Senior Unsecured Notes
(Callable 08/01/17 @ 103.63)(1) | | (CCC+, Caa2) | | 08/01/22 | | | 7.250 | | | | 609,000 | | |
| | 500 | | | NFP Corp., Rule 144A,
Senior Unsecured Notes
(Callable 12/01/16 @ 106.75)(1) | | (CCC+, Caa2) | | 07/15/21 | | | 9.000 | | | | 511,875 | | |
| | | | 1,120,875 | | |
| Diversified Capital Goods (0.5%) | |
| | 350 | | | EnerSys, Rule 144A,
Company Guaranteed Notes
(Callable 01/30/23 @ 100.00)(1) | | (BB+, Ba2) | | 04/30/23 | | | 5.000 | | | | 360,500 | | |
| Energy - Exploration & Production (1.6%) | |
| | 500 | | | Aker BP ASA, Rule 144A,
Subordinated Notes
(Callable 05/27/19 @ 105.13)(1) | | (NR, NR) | | 05/27/22 | | | 10.250 | | | | 556,875 | | |
| | 1,050 | | | Bonanza Creek Energy, Inc.,
Global Company Guaranteed Notes
(Callable 04/15/17 @ 103.38) | | (D, Ca) | | 04/15/21 | | | 6.750 | | | | 643,125 | | |
| | | | 1,200,000 | | |
| Gaming (1.1%) | |
| | 750 | | | Safari Holding Verwaltungs GmbH, Rule 144A,
Senior Secured Notes
(Callable 02/15/17 @ 104.13)(1),(5) | | (B, B2) | | 02/15/21 | | | 8.250 | | | | 869,424 | | |
| Gas Distribution (2.0%) | |
| | 1,000 | | | Genesis Energy Finance Corp.,
Global Company Guaranteed Notes
(Callable 02/15/17 @ 102.88) | | (B+, B1) | | 02/15/21 | | | 5.750 | | | | 1,002,500 | | |
| | 500 | | | Holly Energy Finance Corp.,
Global Company Guaranteed Notes
(Callable 12/01/16 @ 103.25) | | (BB, B1) | | 03/01/20 | | | 6.500 | | | | 516,250 | | |
| | | | 1,518,750 | | |
| Health Facilities (1.2%) | |
| | 250 | | | Care Capital Properties LP, Rule 144A,
Company Guaranteed Notes
(Callable 05/15/26 @ 100.00)(1) | | (BBB-, Baa3) | | 08/15/26 | | | 5.125 | | | | 248,376 | | |
See Accompanying Notes to Financial Statements.
11
Credit Suisse Strategic Income Fund
Schedule of Investments (continued)
October 31, 2016
Par
(000) | |
| | Ratings†
(S&P/Moody's) | | Maturity | | Rate% | | Value | |
| CORPORATE BONDS (continued) | |
Health Facilities | |
$ | 250 | | | Covenant Surgical Partners, Inc., Rule 144A,
Senior Secured Notes
(Callable 12/01/16 @ 106.56)(1) | | (B-, B3) | | 08/01/19 | | | 8.750 | | | $ | 245,000 | | |
| | 400 | | | MPT Finance Corp.,
Company Guaranteed Notes
(Callable 02/15/17 @ 103.19) | | (BBB-, Ba1) | | 02/15/22 | | | 6.375 | | | | 415,500 | | |
| | | | 908,876 | | |
| Media - Diversified (1.2%) | |
| | 715 | | | National CineMedia LLC,
Global Senior Secured Notes
(Callable 04/15/17 @ 103.00) | | (BB-, Ba2) | | 04/15/22 | | | 6.000 | | | | 747,175 | | |
| | 150 | | | National CineMedia LLC, Rule 144A,
Senior Unsecured Notes
(Callable 08/15/21 @ 102.88)(1) | | (B, B2) | | 08/15/26 | | | 5.750 | | | | 154,875 | | |
| | | | 902,050 | | |
| Media Content (0.7%) | |
| | 500 | | | EMI Music Publishing Group
North America Holdings, Inc., Rule 144A,
Company Guaranteed Notes
(Callable 06/15/19 @ 105.72)(1) | | (B, B3) | | 06/15/24 | | | 7.625 | | | | 542,500 | | |
| Metals & Mining - Excluding Steel (2.2%) | |
| | 16 | | | New Day Aluminum LLC(4) | | (NR, NR) | | 10/28/20 | | | 4.000 | | | | 14,177 | | |
| | 2,975 | | | Noranda Aluminum Acquisition Corp.,
Global Company Guaranteed Notes
(Callable 12/01/16 @ 105.50)(2) | | (NR, NR) | | 06/01/19 | | | 11.000 | | | | 1,785 | | |
| | 2,500 | | | Taseko Mines Ltd.,
Company Guaranteed Notes
(Callable 12/01/16 @ 101.94) | | (CCC, Caa2) | | 04/15/19 | | | 7.750 | | | | 1,625,000 | | |
| | | | 1,640,962 | | |
| Oil Field Equipment & Services (3.0%) | |
| | 500 | | | FTS International, Inc.,
Global Senior Secured Notes
(Callable 05/01/17 @ 104.69) | | (CCC, Ca) | | 05/01/22 | | | 6.250 | | | | 285,000 | | |
| | 549 | | | Nor Offshore SPV Ltd., PIK,
Senior Secured Notes
(Callable 11/30/16 @ 100.00)(6) | | (NR, NR) | | 02/04/20 | | | 8.400 | | | | 200,752 | | |
| | 800 | | | Pacific Drilling V Ltd., Rule 144A,
Senior Secured Notes
(Callable 12/01/16 @ 100.00)(1) | | (B-, Ca) | | 12/01/17 | | | 7.250 | | | | 320,000 | | |
| | 800 | | | Pioneer Energy Services Corp.,
Global Company Guaranteed Notes
(Callable 03/15/17 @ 104.59) | | (B-, Ca) | | 03/15/22 | | | 6.125 | | | | 592,000 | | |
See Accompanying Notes to Financial Statements.
12
Credit Suisse Strategic Income Fund
Schedule of Investments (continued)
October 31, 2016
Par
(000) | |
| | Ratings†
(S&P/Moody's) | | Maturity | | Rate% | | Value | |
| CORPORATE BONDS (continued) | |
Oil Field Equipment & Services | |
$ | 500 | | | Shelf Drilling Holdings Ltd., Rule 144A,
Secured Notes
(Callable 12/01/16 @ 102.16)(1) | | (CCC, B2) | | 11/01/18 | | | 8.625 | | | $ | 402,500 | | |
| | 216 | | | Sidewinder Drilling, Inc.(3),(4) | | (NR, NR) | | 11/15/19 | | | 9.750 | | | | 107,836 | | |
| | 88 | | | Sidewinder Drilling, Inc.(3),(4) | | (NR, NR) | | 11/15/19 | | | 12.000 | | | | 79,504 | | |
| | 325 | | | Transocean, Inc.,
Global Company Guaranteed Notes
(Callable 07/15/22 @ 100.00) | | (BB-, Caa1) | | 10/15/22 | | | 5.550 | | | | 279,500 | | |
| | | | 2,267,092 | | |
| Oil Refining & Marketing (1.5%) | |
| | 400 | | | Coffeyville Finance, Inc.,
Global Company Guaranteed Notes
(Callable 11/01/17 @ 103.25) | | (BB-, B1) | | 11/01/22 | | | 6.500 | | | | 372,000 | | |
| | 500 | | | PBF Finance Corp.,
Global Senior Secured Notes
(Callable 12/01/16 @ 104.13) | | (BBB-, B1) | | 02/15/20 | | | 8.250 | | | | 512,500 | | |
| | 250 | | | Western Refining, Inc.,
Global Company Guaranteed Notes
(Callable 04/01/17 @ 103.13) | | (B, B3) | | 04/01/21 | | | 6.250 | | | | 253,125 | | |
| | | | 1,137,625 | | |
| Pharmaceuticals (0.2%) | |
| | 200 | | | Endo Finco, Inc., Rule 144A,
Company Guaranteed Notes
(Callable 02/01/20 @ 103.00)(1) | | (B, B3) | | 02/01/25 | | | 6.500 | | | | 169,500 | | |
| Real Estate Investment Trusts (1.0%) | |
| | 500 | | | iStar, Inc.,
Senior Unsecured Notes
(Callable 12/01/16 @ 102.44) | | (B+, B2) | | 07/01/18 | | | 4.875 | | | | 501,875 | | |
| | 275 | | | QCP SNF West/Central/East/AL REIT LLC,
Rule 144A, Secured Notes
(Callable 11/01/19 @ 104.06)(1) | | (BB-, B3) | | 11/01/23 | | | 8.125 | | | | 278,094 | | |
| | | | 779,969 | | |
| Recreation & Travel (1.4%) | |
| | 500 | | | ClubCorp Club Operations, Inc., Rule 144A,
Company Guaranteed Notes
(Callable 12/15/18 @ 106.19)(1) | | (B-, B3) | | 12/15/23 | | | 8.250 | | | | 535,000 | | |
| | 400 | | | Six Flags Entertainment Corp., Rule 144A,
Company Guaranteed Notes
(Callable 07/31/19 @ 103.66)(1) | | (BB-, B3) | | 07/31/24 | | | 4.875 | | | | 402,000 | | |
| | 100 | | | Six Flags Entertainment Corp., Rule 144A,
Company Guaranteed Notes
(Callable 12/01/16 @ 103.94)(1) | | (BB-, B3) | | 01/15/21 | | | 5.250 | | | | 103,025 | | |
| | | | 1,040,025 | | |
See Accompanying Notes to Financial Statements.
13
Credit Suisse Strategic Income Fund
Schedule of Investments (continued)
October 31, 2016
Par
(000) | |
| | Ratings†
(S&P/Moody's) | | Maturity | | Rate% | | Value | |
| CORPORATE BONDS (continued) | |
| Restaurants (1.4%) | |
$ | 935 | | | Financiere Quick SAS, Rule 144A,
Unsecured Notes
(Callable 11/30/16 @ 101.00)(1),(5),(7) | | (CCC, Caa2) | | 10/15/19 | | | 7.189 | | | $ | 762,699 | | |
| | 300 | | | Landry's, Inc., Rule 144A,
Senior Unsecured Notes
(Callable 10/15/19 @ 103.38)(1) | | (CCC+, Caa1) | | 10/15/24 | | | 6.750 | | | | 306,750 | | |
| | | | 1,069,449 | | |
| Software - Services (1.8%) | |
| | 300 | | | NeuStar, Inc.,
Global Company Guaranteed Notes
(Callable 01/15/18 @ 102.25) | | (B+, B2) | | 01/15/23 | | | 4.500 | | | | 280,125 | | |
| | 500 | | | Sungard Availability Services Capital, Inc.,
Rule 144A, Company Guaranteed Notes
(Callable 04/01/19 @ 104.38)(1) | | (CCC, Caa2) | | 04/01/22 | | | 8.750 | | | | 347,500 | | |
| | 300 | | | Syniverse Holdings, Inc.,
Global Company Guaranteed Notes
(Callable 12/01/16 @ 102.28) | | (CCC+, Caa2) | | 01/15/19 | | | 9.125 | | | | 241,500 | | |
| | 500 | | | WEX, Inc., Rule 144A,
Company Guaranteed Notes
(Callable 02/01/18 @ 102.38)(1) | | (BB-, Ba3) | | 02/01/23 | | | 4.750 | | | | 500,000 | | |
| | | | 1,369,125 | | |
| Steel Producers/Products (0.4%) | |
| | 300 | | | Zekelman Industries, Inc., Rule 144A,
Senior Secured Notes
(Callable 06/15/19 @ 104.94)(1) | | (B, Caa2) | | 06/15/23 | | | 9.875 | | | | 316,500 | | |
| Support - Services (1.6%) | |
| | 600 | | | Avis Budget Finance, Inc., Rule 144A,
Company Guaranteed Notes
(Callable 04/01/19 @ 104.78)(1) | | (B+, B1) | | 04/01/24 | | | 6.375 | | | | 606,000 | | |
| | 200 | | | The GEO Group, Inc.,
Global Company Guaranteed Notes
(Callable 04/15/21 @ 103.00) | | (B+, B1) | | 04/15/26 | | | 6.000 | | | | 173,500 | | |
| | 500 | | | York Risk Services Holding Corp., Rule 144A,
Company Guaranteed Notes
(Callable 10/01/17 @ 106.38)(1) | | (CCC, Caa3) | | 10/01/22 | | | 8.500 | | | | 397,500 | | |
| | | | 1,177,000 | | |
| Tech Hardware & Equipment (1.6%) | |
| | 500 | | | Avaya, Inc., Rule 144A,
Senior Secured Notes
(Callable 12/01/16 @ 102.25)(1) | | (CCC+, B2) | | 04/01/19 | | | 9.000 | | | | 417,500 | | |
See Accompanying Notes to Financial Statements.
14
Credit Suisse Strategic Income Fund
Schedule of Investments (continued)
October 31, 2016
Par
(000) | |
| | Ratings†
(S&P/Moody's) | | Maturity | | Rate% | | Value | |
| CORPORATE BONDS (continued) | |
Tech Hardware & Equipment | |
$ | 500 | | | Riverbed Technology, Inc., Rule 144A,
Company Guaranteed Notes
(Callable 03/01/18 @ 104.44)(1) | | (CCC+, Caa1) | | 03/01/23 | | | 8.875 | | | $ | 535,000 | | |
| | 250 | | | Western Digital Corp., Rule 144A,
Senior Secured Notes
(Callable 04/01/19 @ 103.69)(1) | | (BBB-, Ba1) | | 04/01/23 | | | 7.375 | | | | 274,062 | | |
| | | | 1,226,562 | | |
| Telecom - Satellite (0.4%) | |
| | 330 | | | Telesat LLC, Rule 144A,
Company Guaranteed Notes
(Callable 12/01/16 @ 100.00)(1) | | (B, B3) | | 05/15/17 | | | 6.000 | | | | 331,238 | | |
Telecom - Wireless (1.0%) | |
| | 750 | | | Sprint Corp.,
Global Company Guaranteed Notes | | (B, Caa1) | | 09/15/23 | | | 7.875 | | | | 744,375 | | |
| TOTAL CORPORATE BONDS (Cost $36,466,430) | | | 32,291,236 | | |
| BANK LOANS (42.1%) | |
| Aerospace & Defense (0.6%) | |
| | 101 | | | Aveos Fleet Performance, Inc.(2),(3),(4),(7) | | (CCC+, B3) | | 03/12/17 | | | 12.750 | | | | — | | |
| | 494 | | | Sequa Corp.(7) | | (CCC-, Caa3) | | 06/19/17 | | | 5.250 | | | | 456,057 | | |
| | | | 456,057 | | |
| Building Materials (1.6%) | |
| | 450 | | | Morsco, Inc.(7) | | (B, B3) | | 10/19/23 | | | 8.000 | | | | 443,250 | | |
| | 748 | | | Priso Acquisition Corp.(7) | | (B, B2) | | 05/08/22 | | | 4.500 | | | | 751,149 | | |
| | | | 1,194,399 | | |
| Chemicals (3.4%) | |
| | 728 | | | Colouroz Investment 2 LLC(7) | | (CCC+, Caa1) | | 09/06/22 | | | 8.250 | | | | 701,016 | | |
| | 331 | | | INEOS Styrolution Group GmbH(7) | | (BB-, B1) | | 09/14/21 | | | 4.750 | | | | 334,541 | | |
| | 1,000 | | | Minerals Technologies, Inc.(7) | | (BB+, Ba2) | | 05/09/21 | | | 4.750 | | | | 1,013,750 | | |
| | 499 | | | Univar, Inc.(7) | | (BB-, B2) | | 07/01/22 | | | 4.250 | | | | 500,194 | | |
| | | | 2,549,501 | | |
| Diversified Capital Goods (0.9%) | |
| | 673 | | | Douglas Dynamics Holdings, Inc.(7) | | (BB-, B2) | | 12/31/21 | | | 5.250 | | | | 677,074 | | |
| Electronics (1.9%) | |
| | 778 | | | Avago Technologies Cayman Ltd.(7) | | (BBB, Ba1) | | 02/01/23 | | | 3.535 | | | | 787,289 | | |
| | 642 | | | MKS Instruments, Inc.(7) | | (BB, Ba2) | | 05/01/23 | | | 4.250 | | | | 648,766 | | |
| | | | 1,436,055 | | |
| Forestry & Paper (0.7%) | |
| | 499 | | | Prolampac Intermediate, Inc.(7) | | (B, B3) | | 08/18/22 | | | 5.750 | | | | 500,535 | | |
See Accompanying Notes to Financial Statements.
15
Credit Suisse Strategic Income Fund
Schedule of Investments (continued)
October 31, 2016
Par
(000) | |
| | Ratings†
(S&P/Moody's) | | Maturity | | Rate% | | Value | |
| BANK LOANS (continued) | |
| Health Facilities (1.5%) | |
$ | 724 | | | Drumm Investors LLC(7) | | (B, Caa1) | | 05/04/18 | | | 9.500 | | | $ | 723,922 | | |
| | 448 | | | Premier Dental Services, Inc.(7) | | (B-, Caa1) | | 11/01/18 | | | 7.500 | | | | 445,991 | | |
| | | | 1,169,913 | | |
| Health Services (1.7%) | |
| | 918 | | | Onex Carestream Finance LP(7) | | (B+, B1) | | 06/07/19 | | | 5.000 | | | | 855,283 | | |
| | 926 | | | Valitas Health Services, Inc.(3),(7) | | (NR, Caa2) | | 06/02/17 | | | 10.000 | | | | 428,408 | | |
| | | | 1,283,691 | | |
| Health Services (1.3%) | |
| | 450 | | | ABB Concise Optical Group LLC(7) | | (B, B1) | | 06/15/23 | | | 6.000 | | | | 452,250 | | |
| | 500 | | | Surgery Center Holdings, Inc.(7) | | (B, B2) | | 11/03/20 | | | 4.750 | | | | 502,813 | | |
| | | | 955,063 | | |
| Insurance Brokerage (1.6%) | |
| | 593 | | | Acrisure LLC(7) | | (B, B2) | | 05/19/22 | | | 6.500 | | | | 594,730 | | |
| | 588 | | | Alliant Holdings I, Inc.(7) | | (B, B2) | | 08/12/22 | | | 5.253 | | | | 592,348 | | |
| | | | 1,187,078 | | |
| Investments & Misc. Financial Services (4.2%) | |
| | 444 | | | Liquidnet Holdings, Inc.(7) | | (B, B2) | | 05/22/19 | | | 7.750 | | | | 440,422 | | |
| | 1,000 | | | Mergermarket U.S.A., Inc.(3),(7) | | (CCC+, Caa2) | | 02/04/22 | | | 7.500 | | | | 967,500 | | |
| | 748 | | | NorthStar Asset Management Group, Inc.(7) | | (BBB-, Ba2) | | 01/29/23 | | | 4.762 | | | | 749,366 | | |
| | 500 | | | VFH Parent LLC(7) | | (B, Ba3) | | 10/21/22 | | | 4.250 | | | | 502,032 | | |
| | 579 | | | Walter Investment Management Corp.(7) | | (B+, B3) | | 12/19/20 | | | 4.750 | | | | 543,687 | | |
| | | | 3,203,007 | | |
| Machinery (1.6%) | |
| | 741 | | | CPM Holdings, Inc.(7) | | (B+, B1) | | 04/11/22 | | | 6.000 | | | | 745,254 | | |
| | 408 | | | Winoa S.A.(5),(7) | | (NR, NR) | | 01/30/19 | | | 3.628 | | | | 443,731 | | |
| | | | 1,188,985 | | |
| Managed Care (0.3%) | |
| | 258 | | | Sedgwick Claims Management Services, Inc.(7) | | (B, B1) | | 03/01/21 | | | 4.250 | | | | 258,361 | | |
| Media Content (1.4%) | |
| | 1,000 | | | DLG Acquisitions Ltd.(5),(7) | | (B-, Caa2) | | 06/30/22 | | | 8.250 | | | | 1,071,536 | | |
| Metals & Mining - Excluding Steel (0.0%) | |
| | 266 | | | Noranda Aluminum Acquisition Corp.(2),(7) | | (NR, NR) | | 02/28/19 | | | 7.000 | | | | 29,258 | | |
| Oil Field Equipment & Services (0.9%) | |
| | 1,000 | | | Shelf Drilling Holdings Ltd.(7) | | (C, B3) | | 10/08/18 | | | 10.000 | | | | 710,000 | | |
| Oil Refining & Marketing (1.1%) | |
| | 975 | | | Philadelphia Energy Solutions LLC(7) | | (BB-, B1) | | 04/04/18 | | | 6.250 | | | | 850,467 | | |
| Packaging (0.6%) | |
| | 418 | | | Hilex Poly Co. LLC(7) | | (B, B1) | | 12/05/21 | | | 6.000 | | | | 422,489 | | |
| Personal & Household Products (0.5%) | |
| | 384 | | | Serta Simmons Holdings LLC(7) | | (B, B1) | | 10/20/23 | | | 4.500 | | | | 384,336 | | |
See Accompanying Notes to Financial Statements.
16
Credit Suisse Strategic Income Fund
Schedule of Investments (continued)
October 31, 2016
Par
(000) | |
| | Ratings†
(S&P/Moody's) | | Maturity | | Rate% | | Value | |
| BANK LOANS (continued) | |
| Pharmaceuticals (1.9%) | |
$ | 694 | | | Alvogen Pharma U.S., Inc.(7) | | (B, B3) | | 04/02/22 | | | 6.000 | | | $ | 695,286 | | |
| | 750 | | | Valeant Pharmaceuticals International, Inc.(7) | | (BB-, Ba2) | | 08/05/20 | | | 5.250 | | | | 748,436 | | |
| | | | 1,443,722 | | |
| Real Estate Development & Management (0.7%) | |
| | 499 | | | SRS Distribution, Inc.(7) | | (B, B2) | | 08/25/22 | | | 5.250 | | | | 504,247 | | |
| Software - Services (5.7%) | |
| | 988 | | | Epicor Software Corp.(7) | | (B-, B2) | | 06/01/22 | | | 4.750 | | | | 978,548 | | |
| | 1,000 | | | Flexera Software LLC(7) | | (CCC+, Caa1) | | 04/02/21 | | | 8.000 | | | | 989,580 | | |
| | 250 | | | Landslide Holdings, Inc.(7) | | (B, B1) | | 09/27/22 | | | 5.500 | | | | 252,423 | | |
| | 737 | | | MA FinanceCo. LLC(7) | | (BB-, B1) | | 11/20/21 | | | 4.500 | | | | 740,844 | | |
| | 820 | | | MRI Software LLC(3),(7) | | (CCC+, Caa2) | | 06/23/22 | | | 9.000 | | | | 795,400 | | |
| | 745 | | | Pinnacle Holdco Sarl(3),(7) | | (B, B3) | | 07/30/19 | | | 4.750 | | | | 604,647 | | |
| | | | 4,361,442 | | |
| Steel Producers/Products (0.5%) | |
| | 352 | | | Zekelman Industries, Inc.(7) | | (BB-, B2) | | 06/14/21 | | | 6.000 | | | | 355,418 | | |
| Support - Services (2.5%) | |
| | 748 | | | Explorer Holdings, Inc.(7) | | (B, B1) | | 05/02/23 | | | 6.000 | | | | 757,634 | | |
| | 710 | | | Long Term Care Group, Inc.(3),(7) | | (B, B3) | | 06/06/20 | | | 6.000 | | | | 670,612 | | |
| | 94 | | | SGS Cayman LP(7) | | (BB-, B2) | | 04/23/21 | | | 6.000 | | | | 93,504 | | |
| | 405 | | | Sutherland Global Services, Inc.(7) | | (BB-, B2) | | 04/23/21 | | | 6.000 | | | | 401,690 | | |
| | | | 1,923,440 | | |
| Tech Hardware & Equipment (2.3%) | |
| | 479 | | | Avaya, Inc.(7) | | (CCC+, B2) | | 03/30/18 | | | 6.500 | | | | 410,301 | | |
| | 1,000 | | | Omnitracs, Inc.(7) | | (CCC+, Caa1) | | 05/25/21 | | | 8.750 | | | | 950,415 | | |
| | 399 | | | Western Digital Corp.(7) | | (BBB-, Ba1) | | 04/29/23 | | | 4.500 | | | | 404,021 | | |
| | | | 1,764,737 | | |
| Telecom - Wireline Integrated & Services (1.0%) | |
| | 788 | | | AF Borrower LLC(7) | | (B, B2) | | 01/28/22 | | | 6.250 | | | | 791,692 | | |
| Theaters & Entertainment (1.7%) | |
| | 499 | | | William Morris Endeavor Entertainment LLC(7) | | (B, B1) | | 05/06/21 | | | 5.250 | | | | 502,340 | | |
| | 800 | | | William Morris Endeavor Entertainment LLC(7) | | (B-, Caa1) | | 05/06/22 | | | 8.250 | | | | 801,668 | | |
| | | | 1,304,008 | | |
| TOTAL BANK LOANS (Cost $33,796,225) | | | 31,976,511 | | |
| ASSET BACKED SECURITIES (8.7%) | |
| Collateralized Debt Obligations (8.7%) | |
| | 750 | | | CIFC Funding Ltd., 2012-3A, Rule 144A(1),(7) | | (B, NR) | | 01/29/25 | | | 7.652 | | | | 661,202 | | |
| | 500 | | | Galaxy XXI CLO Ltd., 2015-21A, Rule 144A(1),(7) | | (NR, Ba3) | | 01/20/28 | | | 6.481 | | | | 461,902 | | |
| | 500 | | | Halcyon Loan Advisors Funding Ltd., 2015-2A,
Rule 144A(1),(3),(8) | | (NR, NR) | | 07/25/27 | | | 0.000 | | | | 330,303 | | |
| | 500 | | | Highbridge Loan Management Ltd., 2012-1A,
Rule 144A(1),(7) | | (B, NR) | | 09/20/22 | | | 7.607 | | | | 458,191 | | |
See Accompanying Notes to Financial Statements.
17
Credit Suisse Strategic Income Fund
Schedule of Investments (continued)
October 31, 2016
Par
(000) | |
| | Ratings†
(S&P/Moody's) | | Maturity | | Rate% | | Value | |
| ASSET BACKED SECURITIES (continued) | |
Collateralized Debt Obligations | |
$ | 500 | | | JFIN CLO Ltd., 2013-1A, Rule 144A(1),(7) | | (BB, NR) | | 01/20/25 | | | 5.631 | | | $ | 383,383 | | |
| | 1,000 | | | Ocean Trails CLO IV, 2013-4A, Rule 144A(1),(7) | | (B, NR) | | 08/13/25 | | | 6.717 | | | | 792,199 | | |
| | 1,000 | | | OCP CLO Ltd., 2014-6A, Rule 144A(1),(7) | | (B, NR) | | 07/17/26 | | | 6.480 | | | | 718,347 | | |
| | 400 | | | Stewart Park CLO Ltd., 2015-1A,
Rule 144A(1),(3),(8) | | (NR, NR) | | 04/15/26 | | | 0.000 | | | | 365,660 | | |
| | 1,325 | | | Venture XVII CLO Ltd., 2014-17A, Rule 144A(1),(7) | | (NR, Ba2) | | 07/15/26 | | | 5.880 | | | | 1,138,247 | | |
| | 750 | | | Vibrant CLO Ltd., 2012-1A, Rule 144A(1),(7) | | (BB, NR) | | 07/17/24 | | | 7.180 | | | | 741,940 | | |
| | 800 | | | WhiteHorse IX Ltd., 2014-9A, Rule 144A(1),(7) | | (NR, Ba3) | | 07/17/26 | | | 5.530 | | | | 561,111 | | |
| TOTAL ASSET BACKED SECURITIES (Cost $7,482,273) | | | 6,612,485 | | |
Number of
Shares | |
| |
| |
| |
| |
| |
| COMMON STOCKS (0.6%) | |
| Building & Construction (0.0%) | |
| | 2 | | | White Forest Resources, Inc.(3),(4),(9) | | | | | | | | | | | | | | | 29 | | |
| Building Materials (0.1%) | |
| | 935 | | | Euramax International, Inc.(9) | | | | | | | | | | | | | | | 65,450 | | |
| Consumer Products (0.5%) | |
| | 2,027 | | | Natural Products Group(3),(9) | | | | | | | | | | | | | | | 368,932 | | |
| TOTAL COMMON STOCKS (Cost $387,777) | | | 434,411 | | |
| MUTUAL FUNDS (0.1%) | |
| Commingled Funds (0.1%) | |
| | 4,623 | | | BlackRock Floating Rate Income Strategies Fund, Inc. | | | | | | | | | | | | | | | 63,705 | | |
| | 2,300 | | | Eaton Vance Floating-Rate Income Trust | | | | | | | | | | | | | | | 33,166 | | |
| TOTAL MUTUAL FUNDS (Cost $101,102) | | | 96,871 | | |
Par
(000) | |
| |
| | Maturity | | Rate% | | | |
| SHORT-TERM INVESTMENT (6.8%) | |
$ | 5,208 | | | State Street Bank and Trust Co. Euro Time Deposit
(Cost $5,207,946) | | | | | | 11/01/16 | | | 0.010 | | | | 5,207,946 | | |
| TOTAL INVESTMENTS AT VALUE (100.8%) (Cost $83,441,753) | | | 76,619,460 | | |
| LIABILITIES IN EXCESS OF OTHER ASSETS (-0.8%) | | | (599,927 | ) | |
| NET ASSETS (100.0%) | | $ | 76,019,533 | | |
† Credit ratings given by the Standard & Poor's Division of The McGraw-Hill Companies, Inc. ("S&P") and Moody's Investors Service, Inc. ("Moody's") are unaudited.
(1) Security exempt from registration under Rule 144A of the Securities Act of 1933. These securities may be resold in transactions exempt from registration, normally to qualified institutional buyers. At October 31, 2016, these securities amounted to a value of $26,835,900 or 35.3% of net assets.
(2) Bond is currently in default.
See Accompanying Notes to Financial Statements.
18
Credit Suisse Strategic Income Fund
Schedule of Investments (continued)
October 31, 2016
(3) Illiquid security (unaudited).
(4) Not readily marketable security; security is valued at fair value as determined in good faith by, or under the direction of, the Board of Trustees.
(5) This security is denominated in Euro.
(6) PIK: Payment-in-kind security for which part of the income earned may be paid as additional principal.
(7) Variable rate obligation — The interest rate shown is the rate as of October 31, 2016.
(8) Zero-coupon security.
(9) Non-income producing security.
INVESTMENT ABBREVIATION
NR = Not Rated
Forward Foreign Currency Contracts | |
Forward Foreign
Currency to be
Purchased (Local) | | Forward Foreign
Currency to be
Sold (Local) | | Expiration
Date | | Counterparty | | Value on
Settlement
Date | | Current
Value/
Notional | | Net Unrealized
Appreciation
(Depreciation) | |
USD | 22,209 | | | EUR | 19,750 | | | 12/15/16 | | Morgan Stanley | | $ | (22,209 | ) | | $ | (21,692 | ) | | $ | 517 | | |
USD | 3,233,577 | | | EUR | 2,878,000 | | | 10/13/17 | | Morgan Stanley | | | (3,233,577 | ) | | | (3,206,193 | ) | | | 27,384 | | |
USD | 678,964 | | | GBP | 556,250 | | | 10/13/17 | | Morgan Stanley | | | (678,964 | ) | | | (684,147 | ) | | | (5,183 | ) | |
| | | $ | 22,718 | | |
Currency Abbreviations: | |
EUR = Euro
GBP = British Pound
USD = United States Dollar
See Accompanying Notes to Financial Statements.
19
Credit Suisse Strategic Income Fund
Statement of Assets and Liabilities
October 31, 2016
Assets | |
Investments at value (Cost $83,441,753) (Note 2) | | $ | 76,619,460 | | |
Cash | | | 64,984 | | |
Foreign currency at value (Cost $743,190) | | | 743,279 | | |
Interest receivable | | | 864,675 | | |
Receivable for investments sold | | | 549,243 | | |
Receivable for fund shares sold | | | 367,258 | | |
Unrealized appreciation on forward foreign currency contracts (Note 2) | | | 27,901 | | |
Prepaid expenses | | | 29,039 | | |
Total assets | | | 79,265,839 | | |
Liabilities | |
Investment advisory fee payable (Note 3) | | | 28,879 | | |
Administrative services fee payable (Note 3) | | | 13,206 | | |
Shareholder servicing/Distribution fee payable (Note 3) | | | 7,148 | | |
Payable for investments purchased | | | 2,971,432 | | |
Payable for fund shares redeemed | | | 113,917 | | |
Dividend payable | | | 28,671 | | |
Trustees' fee payable | | | 8,299 | | |
Unrealized depreciation on forward foreign currency contracts (Note 2) | | | 5,183 | | |
Accrued expenses | | | 69,571 | | |
Total liabilities | | | 3,246,306 | | |
Net Assets | |
Capital stock, $.001 par value (Note 6) | | | 7,809 | | |
Paid-in capital (Note 6) | | | 88,440,875 | | |
Distributions in excess of net investment income | | | (184,223 | ) | |
Accumulated net realized loss on investments, futures contracts and foreign currency transactions | | | (5,445,191 | ) | |
Net unrealized depreciation from investments and foreign currency translations | | | (6,799,737 | ) | |
Net assets | | $ | 76,019,533 | | |
I Shares | |
Net assets | | $ | 60,899,475 | | |
Shares outstanding | | | 6,256,348 | | |
Net asset value, offering price and redemption price per share | | $ | 9.73 | | |
A Shares | |
Net assets | | $ | 8,446,562 | | |
Shares outstanding | | | 867,133 | | |
Net asset value and redemption price per share | | $ | 9.74 | | |
Maximum offering price per share (net asset value/(1-4.75%)) | | $ | 10.23 | | |
C Shares | |
Net assets | | $ | 6,673,496 | | |
Shares outstanding | | | 685,304 | | |
Net asset value, offering price and redemption price per share | | $ | 9.74 | | |
See Accompanying Notes to Financial Statements.
20
Credit Suisse Strategic Income Fund
Statement of Operations
For the Year Ended October 31, 2016
Investment Income | |
Interest | | $ | 7,133,044 | | |
Dividends | | | 5,524 | | |
Total investment income | | | 7,138,568 | | |
Expenses | |
Investment advisory fees (Note 3) | | | 630,649 | | |
Administrative services fees (Note 3) | | | 108,904 | | |
Shareholder servicing/Distribution fees (Note 3) | |
Class A | | | 49,122 | | |
Class C | | | 48,274 | | |
Transfer agent fees (Note 3) | | | 64,679 | | |
Registration fees | | | 64,106 | | |
Audit and tax fees | | | 51,369 | | |
Printing fees | | | 36,739 | | |
Commitment fees (Note 4) | | | 31,957 | | |
Trustees' fees | | | 30,430 | | |
Legal fees | | | 26,650 | | |
Custodian fees | | | 23,269 | | |
Interest expense (Note 4) | | | 6,415 | | |
Insurance expense | | | 3,120 | | |
Miscellaneous expense | | | 8,025 | | |
Total expenses | | | 1,183,708 | | |
Less: fees waived (Note 3) | | | (247,439 | ) | |
Net expenses | | | 936,269 | | |
Net investment income | | | 6,202,299 | | |
Net Realized and Unrealized Gain (Loss) from Investments,
Futures Contracts and Foreign Currency Related Items | |
Net realized loss from investments | | | (5,686,019 | ) | |
Net realized loss from futures contracts | | | (94,985 | ) | |
Net realized gain from foreign currency transactions | | | 257,022 | | |
Net change in unrealized appreciation (depreciation) from investments | | | 1,281,332 | | |
Net change in unrealized appreciation (depreciation) from futures contracts | | | 8,962 | | |
Net change in unrealized appreciation (depreciation) from foreign currency translations | | | (66,037 | ) | |
Net realized and unrealized loss from investments, futures contracts and
foreign currency related items | | | (4,299,725 | ) | |
Net increase in net assets resulting from operations | | $ | 1,902,574 | | |
See Accompanying Notes to Financial Statements.
21
Credit Suisse Strategic Income Fund
Statement of Changes in Net Assets
| | | For the Year
Ended
October 31, 2016 | | For the Year
Ended
October 31, 2015 | |
From Operations | |
Net investment income | | $ | 6,202,299 | | | $ | 6,143,552 | | |
Net realized loss from investments, futures contracts and
foreign currency transactions | | | (5,523,982 | ) | | | (636,163 | ) | |
Net change in unrealized appreciation (depreciation) from investments,
futures contracts and foreign currency translations | | | 1,224,257 | | | | (5,610,273 | ) | |
Net increase (decrease) in net assets resulting from operations | | | 1,902,574 | | | | (102,884 | ) | |
From Dividends and Distributions | |
Dividends from net investment income | |
Class I | | | (4,556,905 | ) | | | (3,876,591 | ) | |
Class A | | | (1,321,799 | ) | | | (1,570,893 | ) | |
Class C | | | (323,595 | ) | | | (127,369 | ) | |
Distributions from net realized gains | |
Class I | | | — | | | | (1,613,222 | ) | |
Class A | | | — | | | | (305,637 | ) | |
Class C | | | — | | | | (41,391 | ) | |
Return of Capital | |
Class I shares | | | — | | | | (395,457 | ) | |
Class A shares | | | — | | | | (160,249 | ) | |
Class C shares | | | — | | | | (12,993 | ) | |
Net decrease in net assets resulting from dividends and distributions | | | (6,202,299 | ) | | | (8,103,802 | ) | |
| From Capital Share Transactions (Note 6) | |
Proceeds from sale of shares | | | 52,419,402 | | | | 94,917,773 | | |
Reinvestment of dividends and distributions | | | 5,933,749 | | | | 8,029,841 | | |
Net asset value of shares redeemed | | | (112,950,455 | ) | | | (58,476,549 | ) | |
Net increase (decrease) in net assets from capital share transactions | | | (54,597,304 | ) | | | 44,471,065 | | |
Net increase (decrease) in net assets | | | (58,897,029 | ) | | | 36,264,379 | | |
Net Assets | |
Beginning of year | | | 134,916,562 | | | | 98,652,183 | | |
End of year | | $ | 76,019,533 | | | $ | 134,916,562 | | |
Distributions in excess of net investment income | | $ | (184,223 | ) | | $ | (52,202 | ) | |
See Accompanying Notes to Financial Statements.
22
Credit Suisse Strategic Income Fund
Financial Highlights
(For a Class I Share of the Fund Outstanding Throughout Each Period)
| | | For the Year Ended October 31, | |
| | | 2016 | | 2015 | | 2014 | | 2013 | | 20121 | |
Per share data | |
Net asset value, beginning of period | | $ | 9.78 | | | $ | 10.46 | | | $ | 10.65 | | | $ | 10.06 | | | $ | 10.00 | | |
INVESTMENT OPERATIONS | |
Net investment income2 | | | 0.71 | | | | 0.66 | | | | 0.64 | | | | 0.61 | | | | 0.01 | | |
Net gain (loss) from investments, futures
contracts and foreign currency related items
(both realized and unrealized) | | | (0.04 | ) | | | (0.46 | ) | | | (0.06 | ) | | | 0.60 | | | | 0.06 | | |
Total from investment operations | | | 0.67 | | | | 0.20 | | | | 0.58 | | | | 1.21 | | | | 0.07 | | |
REDEMPTION FEES | | | — | | | | — | | | | 0.003 | | | | 0.003 | | | | — | | |
LESS DIVIDENDS AND DISTRIBUTIONS | |
Dividends from net investment income | | | (0.72 | ) | | | (0.60 | ) | | | (0.63 | ) | | | (0.60 | ) | | | (0.01 | ) | |
Distributions from net realized gains | | | — | | | | (0.22 | ) | | | (0.14 | ) | | | (0.02 | ) | | | — | | |
Return of capital | | | — | | | | (0.06 | ) | | | — | | | | — | | | | — | | |
Total dividends and distributions | | | (0.72 | ) | | | (0.88 | ) | | | (0.77 | ) | | | (0.62 | ) | | | (0.01 | ) | |
Net asset value, end of period | | $ | 9.73 | | | $ | 9.78 | | | $ | 10.46 | | | $ | 10.65 | | | $ | 10.06 | | |
Total return4 | | | 7.40 | % | | | 2.05 | % | | | 5.57 | % | | | 12.29 | % | | | 0.67 | % | |
RATIOS AND SUPPLEMENTAL DATA | |
Net assets, end of period (000s omitted) | | $ | 60,899 | | | $ | 65,651 | | | $ | 81,868 | | | $ | 31,830 | | | $ | 20,710 | | |
Ratio of net expenses to average net assets | | | 1.00 | % | | | 1.00 | % | | | 1.00 | % | | | 0.99 | % | | | 0.99 | %5 | |
Ratio of expenses to average net assets
excluding interest expense | | | 0.99 | % | | | 0.99 | % | | | 0.99 | % | | | 0.99 | % | | | 0.99 | %5 | |
Ratio of net investment income to
average net assets | | | 7.64 | % | | | 6.59 | % | | | 5.94 | % | | | 5.77 | % | | | 0.87 | %5 | |
Decrease reflected in above operating expense
ratios due to waivers/reimbursements | | | 0.29 | % | | | 0.16 | % | | | 0.18 | % | | | 0.63 | % | | | 5.25 | %5 | |
Portfolio turnover rate | | | 73 | % | | | 85 | % | | | 124 | % | | | 159 | % | | | 31 | % | |
1 For the period September 28, 2012 (Inception Date) through October 31, 2012.
2 Per share information is calculated using the average shares outstanding method.
3 This amount represents less than $0.01 per share.
4 Total returns are historical and include change in share price and reinvestment of all dividends and distributions. Had certain expenses not been reduced during the periods shown, total returns would have been lower. Total returns for periods less than one year are not annualized.
5 Annualized.
See Accompanying Notes to Financial Statements.
23
Credit Suisse Strategic Income Fund
Financial Highlights
(For a Class A Share of the Fund Outstanding Throughout Each Period)
| | | For the Year Ended October 31, | |
| | | 2016 | | 2015 | | 2014 | | 2013 | | 20121 | |
Per share data | |
Net asset value, beginning of period | | $ | 9.79 | | | $ | 10.47 | | | $ | 10.66 | | | $ | 10.07 | | | $ | 10.00 | | |
INVESTMENT OPERATIONS | |
Net investment income2 | | | 0.64 | | | | 0.55 | | | | 0.58 | | | | 0.45 | | | | 0.003 | | |
Net gain (loss) from investments, futures
contracts and foreign currency related items
(both realized and unrealized) | | | 0.003 | | | | (0.38 | ) | | | (0.02 | ) | | | 0.73 | | | | 0.08 | | |
Total from investment operations | | | 0.64 | | | | 0.17 | | | | 0.56 | | | | 1.18 | | | | 0.08 | | |
REDEMPTION FEES | | | — | | | | — | | | | 0.003 | | | | 0.003 | | | | — | | |
LESS DIVIDENDS AND DISTRIBUTIONS | |
Dividends from net investment income | | | (0.69 | ) | | | (0.57 | ) | | | (0.61 | ) | | | (0.57 | ) | | | (0.01 | ) | |
Distributions from net realized gains | | | — | | | | (0.22 | ) | | | (0.14 | ) | | | (0.02 | ) | | | — | | |
Return of capital | | | — | | | | (0.06 | ) | | | — | | | | — | | | | — | | |
Total dividends and distributions | | | (0.69 | ) | | | (0.85 | ) | | | (0.75 | ) | | | (0.59 | ) | | | (0.01 | ) | |
Net asset value, end of period | | $ | 9.74 | | | $ | 9.79 | | | $ | 10.47 | | | $ | 10.66 | | | $ | 10.07 | | |
Total return4 | | | 7.12 | % | | | 1.78 | % | | | 5.28 | % | | | 11.94 | % | | | 0.76 | % | |
RATIOS AND SUPPLEMENTAL DATA | |
Net assets, end of period (000s omitted) | | $ | 8,447 | | | $ | 66,244 | | | $ | 14,633 | | | $ | 46,573 | | | $ | 101 | | |
Ratio of net expenses to average net assets | | | 1.25 | % | | | 1.24 | % | | | 1.24 | % | | | 1.24 | % | | | 1.24 | %5 | |
Ratio of expenses to average net assets
excluding interest expense | | | 1.24 | % | | | 1.24 | % | | | 1.24 | % | | | 1.24 | % | | | 1.24 | %5 | |
Ratio of net investment income to
average net assets | | | 6.73 | % | | | 5.45 | % | | | 5.44 | % | | | 4.22 | % | | | 0.42 | %5 | |
Decrease reflected in above operating expense
ratios due to waivers/reimbursements | | | 0.29 | % | | | 0.16 | % | | | 0.18 | % | | | 0.63 | % | | | 5.25 | %5 | |
Portfolio turnover rate | | | 73 | % | | | 85 | % | | | 124 | % | | | 159 | % | | | 31 | % | |
1 For the period September 28, 2012 (Inception Date) through October 31, 2012.
2 Per share information is calculated using the average shares outstanding method.
3 This amount represents less than $0.01 per share.
4 Total returns are historical and include change in share price, reinvestment of all dividends and distributions and no sales charge. Had certain expenses not been reduced during the periods shown, total returns would have been lower. Total returns for periods less than one year are not annualized.
5 Annualized.
See Accompanying Notes to Financial Statements.
24
Credit Suisse Strategic Income Fund
Financial Highlights
(For a Class C Share of the Fund Outstanding Throughout Each Period)
| | | For the Year Ended October 31, | |
| | | 2016 | | 2015 | | 2014 | | 2013 | | 20121 | |
Per share data | |
Net asset value, beginning of period | | $ | 9.79 | | | $ | 10.472 | | | $ | 10.65 | | | $ | 10.06 | | | $ | 10.00 | | |
INVESTMENT OPERATIONS | |
Net investment income (loss)3 | | | 0.63 | | | | 0.55 | | | | 0.53 | | | | 0.50 | | | | (0.00 | )4 | |
Net gain (loss) from investments, futures
contracts and foreign currency related items
(both realized and unrealized) | | | (0.06 | ) | | | (0.45 | ) | | | (0.05 | ) | | | 0.61 | | | | 0.06 | | |
Total from investment operations | | | 0.57 | | | | 0.10 | | | | 0.48 | | | | 1.11 | | | | 0.06 | | |
REDEMPTION FEES | | | — | | | | — | | | | 0.004 | | | | 0.004 | | | | — | | |
LESS DIVIDENDS AND DISTRIBUTIONS | |
Dividends from net investment income | | | (0.62 | ) | | | (0.51 | ) | | | (0.52 | ) | | | (0.50 | ) | | | (0.00 | )4 | |
Distributions from net realized gains | | | — | | | | (0.22 | ) | | | (0.14 | ) | | | (0.02 | ) | | | — | | |
Return of capital | | | — | | | | (0.05 | ) | | | — | | | | — | | | | — | | |
Total dividends and distributions | | | (0.62 | ) | | | (0.78 | ) | | | (0.66 | ) | | | (0.52 | ) | | | (0.00 | )4 | |
Net asset value, end of period | | $ | 9.74 | | | $ | 9.79 | | | $ | 10.472 | | | $ | 10.65 | | | $ | 10.06 | | |
Total return5 | | | 6.33 | % | | | 1.14 | % | | | 4.53 | % | | | 11.18 | % | | | 0.62 | % | |
RATIOS AND SUPPLEMENTAL DATA | |
Net assets, end of period (000s omitted) | | $ | 6,673 | | | $ | 3,022 | | | $ | 2,151 | | | $ | 189 | | | $ | 101 | | |
Ratio of net expenses to average net assets | | | 2.00 | % | | | 2.00 | % | | | 2.00 | % | | | 1.99 | % | | | 1.99 | %6 | |
Ratio of expenses to average net assets
excluding interest expense | | | 1.99 | % | | | 1.99 | % | | | 1.99 | % | | | 1.99 | % | | | 1.99 | %6 | |
Ratio of net investment income (loss) to
average net assets | | | 6.70 | % | | | 5.52 | % | | | 4.97 | % | | | 4.77 | % | | | (0.33 | )%6 | |
Decrease reflected in above operating expense
ratios due to waivers/reimbursements | | | 0.29 | % | | | 0.16 | % | | | 0.18 | % | | | 0.63 | % | | | 5.25 | %6 | |
Portfolio turnover rate | | | 73 | % | | | 85 | % | | | 124 | % | | | 159 | % | | | 31 | % | |
1 For the period September 28, 2012 (Inception Date) through October 31, 2012.
2 Includes adjustments in accordance with accounting principles generally accepted in the United States of America and as such, the net asset values for financial reporting purposes and the returns based upon net asset values may differ from the net asset values and returns for shareholder transactions.
3 Per share information is calculated using the average shares outstanding method.
4 This amount represents less than $0.01 per share.
5 Total returns are historical and include change in share price, reinvestment of all dividends and distributions and no sales charge. Had certain expenses not been reduced during the periods shown, total returns would have been lower. Total returns for periods less than one year are not annualized.
6 Annualized.
See Accompanying Notes to Financial Statements.
25
Credit Suisse Strategic Income Fund
Notes to Financial Statements
October 31, 2016
Credit Suisse Strategic Income Fund (the "Fund"), a series of the Credit Suisse Opportunity Funds (the "Trust"), a Delaware statutory trust, is registered under the Investment Company Act of 1940, as amended (the "1940 Act"), as a non-diversified open-end management investment company that seeks total return. The Trust was organized under the laws of the State of Delaware as a business trust on May 31, 1995.
The Fund offers three classes of shares: Class I shares, Class A shares and Class C shares. Each class of shares represents an equal pro rata interest in the Fund, except the share classes bear different expenses, which reflect the differences in the range of services provided to them. Class A shares are sold subject to a front-end sales charge of up to 4.75%. Class C shares are sold subject to a CDSC of 1.00% if the shares are redeemed within the first year of purchase. Class I shares are sold without a sales charge.
Note 2. Significant Accounting Policies
The following is a summary of significant accounting policies followed by the Fund in the preparation of its financial statements. The policies are in accordance with accounting principles generally accepted in the United States of America ("GAAP"). The preparation of financial statements requires management to make estimates and assumptions that affect the reported amounts and disclosures in the financial statements. Actual results could differ from those estimates. The Fund is considered an investment company for financial reporting purposes under GAAP and follows Accounting Standard Codification ("ASC") Topic 946 — Financial Services — Investment Companies.
A) SECURITY VALUATION — The net asset value of the Fund is determined daily as of the close of regular trading on the New York Stock Exchange, Inc. (the "Exchange") on each day the Exchange is open for business. The valuations for fixed income securities (which may include, but are not limited to, corporate, government, municipal, mortgage-backed, collateralized mortgage obligations and asset-backed securities) and certain derivative instruments are typically the prices supplied by independent third party pricing services, which may use market prices or broker/dealer quotations or a variety of valuation techniques and methodologies. The independent third party pricing services use inputs that are observable such as issuer details, interest rates, yield curves, prepayment speeds, credit risks/spreads, default rates and quoted prices for similar securities. These pricing services generally price fixed income securities assuming orderly transactions of an institutional "round lot" size, but some trades occur in smaller "odd lot" sizes which may be effected at lower prices than institutional round lot
26
Credit Suisse Strategic Income Fund
Notes to Financial Statements (continued)
October 31, 2016
Note 2. Significant Accounting Policies (continued)
trades. Structured note agreements are valued in accordance with a dealer-supplied valuation based on changes in the value of the underlying index. Futures contracts are valued daily at the settlement price established by the board of trade or exchange on which they are traded. Forward contracts are valued at the London closing spot rates and the London closing forward point rates on a daily basis. The currency forward contract pricing model derives the differential in point rates to the expiration date of the forward and calculates its present value. Equity securities for which market quotations are available are valued at the last reported sales price or official closing price on the primary market or exchange on which they trade. The Fund may utilize a service provided by an independent third party which has been approved by the Board of Trustees (the "Board") to fair value certain securities. When fair value pricing is employed, the prices of securities used by the Fund to calculate its net asset value may differ from quoted or published prices for the same securities. If independent third party pricing services are unable to supply prices for a portfolio investment, or if the prices supplied are deemed by the investment adviser to be unreliable, the market price may be determined by the investment adviser using quotations from one or more brokers/dealers or at the transaction price if the security has recently been purchased and no value has yet been obtained from a pricing service or pricing broker. When reliable prices are not readily available, such as when the value of a security has been significantly affected by events after the close of the exchange or market on which the security is principally traded, but before the Fund calculates its net asset value, the Fund values these securities as determined in accordance with procedures approved and established by the Board.
The Fund uses valuation techniques to measure fair value that are consistent with the market approach and/or income approach, depending on the type of security and the particular circumstance. The market approach uses prices and other relevant information generated by market transactions involving identical or comparable securities. The income approach uses valuation techniques to discount estimated future cash flows to present value.
GAAP established a disclosure hierarchy that categorizes the inputs to valuation techniques used to value assets and liabilities at each measurement date. These inputs are summarized in the three broad levels listed below:
• Level 1 – quoted prices in active markets for identical investments
• Level 2 – other significant observable inputs (including quoted prices for similar investments, interest rates, prepayment speeds, credit risk, etc.)
27
Credit Suisse Strategic Income Fund
Notes to Financial Statements (continued)
October 31, 2016
Note 2. Significant Accounting Policies (continued)
• Level 3 – significant unobservable inputs (including the Fund's own assumptions in determining the fair value of investments)
The inputs or methodologies used to value securities are not necessarily an indication of the risk associated with investing in those securities.
The following is a summary of the inputs used as of October 31, 2016 in valuing the Fund's assets and liabilities carried at fair value:
Assets | | Level 1 | | Level 2 | | Level 3 | | Total | |
Investments in Securities | |
Corporate Bonds | | $ | — | | | $ | 32,087,628 | | | $ | 203,608 | | | $ | 32,291,236 | | |
Bank Loans | | | — | | | | 25,699,486 | | | | 6,277,025 | | | | 31,976,511 | | |
Asset Backed Securities | | | — | | | | 6,612,485 | | | | — | | | | 6,612,485 | | |
Common Stocks | | | — | | | | — | | | | 434,411 | | | | 434,411 | | |
Mutual Funds | | | 96,871 | | | | — | | | | — | | | | 96,871 | | |
Short-term Investment | | | — | | | | 5,207,946 | | | | — | | | | 5,207,946 | | |
| | | $ | 96,871 | | | $ | 69,607,545 | | | $ | 6,915,044 | | | $ | 76,619,460 | | |
Other Financial Instrument* | |
Forward Foreign Currency Contracts | | $ | — | | | $ | 27,901 | | | $ | — | | | $ | 27,901 | | |
Liabilities | | Level 1 | | Level 2 | | Level 3 | | Total | |
Other Financial Instrument* | |
Forward Foreign Currency Contracts | | $ | — | | | $ | 5,183 | | | $ | — | | | $ | 5,183 | | |
*Other financial instruments include unrealized appreciation (depreciation) on forward foreign currency contracts.
The following is a reconciliation of investments as of October 31, 2016 for which significant unobservable inputs were used in determining value. All transfers, if any, are assumed to occur at the end of the reporting period.
| | | Corporate
Bonds | | Bank
Loans | | Common
Stocks | | Total | |
Balance as of October 31, 2015 | | $ | 21,954 | | | $ | 13,384,774 | | | $ | 74,800 | | | $ | 13,481,528 | | |
Accrued discounts (premiums) | | | (3,575 | ) | | | 46,226 | | | | — | | | | 42,651 | | |
Purchases | | | 344,227 | | | | 1,246,850 | | | | 14,993 | | | | 1,606,070 | | |
Sales | | | — | | | | (7,123,457 | ) | | | — | | | | (7,123,457 | ) | |
Realized gain (loss) | | | — | | | | (117,660 | ) | | | — | | | | (117,660 | ) | |
Change in unrealized appreciation (depreciation) | | | (158,998 | ) | | | 114,088 | | | | (24,314 | ) | | | (69,224 | ) | |
Transfers into Level 3 | | | — | | | | 1,413,491 | | | | 368,932 | | | | 1,782,423 | | |
Transfers out of Level 3 | | | — | | | | (2,687,287 | ) | | | — | | | | (2,687,287 | ) | |
Balance as of October 31, 2016 | | $ | 203,608 | | | $ | 6,277,025 | | | $ | 434,411 | | | $ | 6,915,044 | | |
Net change in unrealized appreciation (depreciation)
from investments still held as of October 31, 2016 | | $ | (158,998 | ) | | $ | 78,391 | | | $ | (24,314 | ) | | $ | (104,921 | ) | |
28
Credit Suisse Strategic Income Fund
Notes to Financial Statements (continued)
October 31, 2016
Note 2. Significant Accounting Policies (continued)
| | | Quantitative Disclosure About Significant Unobservable Inputs | |
Asset Class | | Fair Value
At 10/31/2016 | | Valuation
Techniques | | Unobservable
Input | | Range
(Weighted Average)
(per share) | |
Corporate Bonds | | $ | 187,340 | | | Market Approach | | Discount for Illiquidity | | $0.50 – $0.90 ($0.62) | |
| | $ | 16,268
| | | Income Approach
| | Expected Remaining
Distribution | | $0.04 – $0.90 ($0.24) | |
Bank Loans | | $ | 6,277,025 | | | Vendor Pricing | | Single Broker Quote | | $0.71 – $1.09 ($0.95) | |
| | | $ | 0
| | | Income Approach
| | Expected remaining
distribution | | NA | |
Common Stocks | | $ | 29 | | | Market Approach | | Discount for Illiquidity | | NA | |
| | $ | 434,382 | | | Vendor Pricing | | Single Broker Quote | | $70 – $182 ($147) | |
Each fair value determination is based on a consideration of relevant factors, including both observable and unobservable inputs. Observable and unobservable inputs that Credit Suisse Asset Management LLC, the Fund's investment adviser ("Credit Suisse" or the "Adviser") considers may include (i) the existence of any contractual restrictions on the disposition of securities; (ii) information obtained from the company, which may include an analysis of the company's financial statements, the company's products or intended markets or the company's technologies; (iii) the price of the same or similar security negotiated at arm's length in an issuer's completed subsequent round of financing; (iv) the price and extent of public trading in similar securities of the issuer or of comparable companies; or (v) a probability and time value adjusted analysis of contractual term. Where available and appropriate, multiple valuation methodologies are applied to confirm fair value. To the extent that valuation is based on models or inputs that are less observable or unobservable in the market, determining fair value requires more judgment. Because of the inherent uncertainty of valuation, those estimated values may be materially higher or lower than the values that would have been used had a ready market for the investments existed. Accordingly, the degree of judgment exercised by the Fund in determining fair value is greatest for investments categorized in Level 3. In some circumstances, the inputs used to measure fair value might be categorized within different levels of the fair value hierarchy. In those instances, the fair value measurement is categorized in its entirety in the fair value hierarchy based on the least observable input that is significant to the fair value measurement. Additionally, changes in the market environment and other events that may occur over the life of the investments may cause the gains or losses ultimately realized on these investments to be different from the valuations used at the date of these financial statements.
For the year ended October 31, 2016, there were no transfers between Level 1 and Level 2, but there was $1,782,423 transferred out from Level 2 to Level 3
29
Credit Suisse Strategic Income Fund
Notes to Financial Statements (continued)
October 31, 2016
Note 2. Significant Accounting Policies (continued)
due to a lack of pricing source supported by observable inputs and $2,687,287 transferred out from Level 3 to Level 2 as a result of the availability of a pricing source supported by observable inputs. All transfers, if any, are assumed to occur at the end of the reporting period.
B) DERIVATIVE INSTRUMENTS AND HEDGING ACTIVITIES — The Fund adopted amendments to authoritative guidance on disclosures about derivative instruments and hedging activities which require that a fund disclose (a) how and why an entity uses derivative instruments, (b) how derivative instruments and hedging activities are accounted for and (c) how derivative instruments and related hedging activities affect a fund's financial position, financial performance and cash flows. For the year ended October 31, 2016, the Fund's derivatives did not qualify for hedge accounting as they are held at fair value.
Fair Value of Derivative Instruments as of October 31, 2016
| | | Asset Derivatives | | Liability Derivatives | |
| | | Balance Sheet
Location | | Fair Value | | Balance Sheet
Location | | Fair Value | |
Currency Contracts
| | Unrealized appreciation
on forward foreign
currency contracts | | $ | 27,901 | | | Unrealized depreciation
on forward foreign
currency contracts | | $ | 5,183 | | |
Effect of Derivative Instruments on the Statement of Operations
| | | Location | | Realized
Gain(Loss) | | Location | | Net Unrealized
Appreciation
(Depreciation) | |
Currency
Contracts | | Net realized gain from
forward foreign
currency transactions* | | $ | 307,833 | | | Net change in unrealized
appreciation (depreciation)
from forward foreign
currency transactions* | | $ | (70,956 | ) | |
Interest Rate
Contracts | | Net realized loss from
futures contracts | | | (94,985 | ) | | Net change in unrealized
appreciation (depreciation)
from futures contracts | | | 8,962 | | |
| | | | | $ | 212,848 | | | | | $ | (61,994 | ) | |
*Statement of Operations includes both forward foreign currency contracts and foreign currency transactions/translations.
For the year ended October 31, 2016, the Fund held an average monthly value on a net basis of $4,495,369 in forward foreign currency contracts and an average monthly notional value on a net basis of $0 and $3,861,295 in long futures and short futures contracts, respectively.
The Fund is a party to International Swap and Derivatives Association, Inc. ("ISDA") Master Agreements ("Master Agreements") with certain
30
Credit Suisse Strategic Income Fund
Notes to Financial Statements (continued)
October 31, 2016
Note 2. Significant Accounting Policies (continued)
counterparties that govern over-the-counter derivative (including Total Return, Credit Default and Interest Rate Swaps) and foreign exchange contracts entered into by the Fund. The Master Agreements may contain provisions regarding, among other things, the parties' general obligations, representations, agreements, collateral requirements, events of default and early termination. Termination events applicable to the Fund may occur upon a decline in the Fund's net assets below a specified threshold over a certain period of time.
The following table presents by counterparty the Fund's derivative assets, net of related collateral held by the Fund, at October 31, 2016:
Counterparty | | Gross Amount of
Assets Presented in
Statement of Assets
and Liabilities(a) | | Financial
Instruments
and Derivatives
Available for Offset | | Non-Cash
Collateral
Received | | Cash
Collateral
Received | | Net Amount
of Derivative
Assets | |
Morgan Stanley | | $ | 27,901 | | | $ | (5,183 | ) | | $ | — | | | $ | — | | | $ | 22,718 | | |
The following table presents by counterparty the Fund's derivative liabilities, net of related collateral pledged by the Fund, at October 31, 2016:
Counterparty | | Gross Amount of
Liabilities Presented in
Statement of Assets
and Liabilities(a) | | Financial
Instruments
and Derivatives
Available for Offset | | Non-Cash
Collateral
Pledged | | Cash
Collateral
Pledged | | Net Amount
of Derivative
Liabilities | |
Morgan Stanley | | $ | 5,183 | | | $ | (5,183 | ) | | $ | — | | | $ | — | | | $ | — | | |
(a) Forward foreign currency exchange contracts are included.
C) FOREIGN CURRENCY TRANSACTIONS — The books and records of the Fund are maintained in U.S. dollars. Transactions denominated in foreign currencies are recorded at the current prevailing exchange rates. All assets and liabilities denominated in foreign currencies are translated into U.S. dollar amounts at the current exchange rate at the end of the period. Reported net realized gain (loss) from foreign currency transactions arises from sales of foreign currencies; currency gains or losses realized between the trade and settlement dates on securities transactions; and the difference between the amounts of dividends, interest, and foreign withholding taxes recorded on the Fund's books and the U.S. dollar equivalent of the amounts actually received or paid. Net change in unrealized gains and losses on translation of assets and liabilities denominated in foreign currencies arises from changes in the fair values of assets and liabilities, other than investments at the end of the period, resulting from changes in exchange rates. The Fund does not isolate that portion of the results of operations resulting from fluctuations in foreign exchange rates on investments from the fluctuations arising from changes in market prices of
31
Credit Suisse Strategic Income Fund
Notes to Financial Statements (continued)
October 31, 2016
Note 2. Significant Accounting Policies (continued)
investments held. Such fluctuations are included with net realized and unrealized gain or loss from investments in the Statement of Operations.
D) SECURITY TRANSACTIONS AND INVESTMENT INCOME/EXPENSE — Security transactions are accounted for on a trade date basis. Interest income/expense is recorded on the accrual basis. The Fund amortizes premiums and accretes discounts using the effective interest method. Dividend income/expense is recorded on the ex-dividend date. Certain expenses are class-specific expenses, vary by class and are charged only to that class. Income, expenses (excluding class-specific expenses) and realized/unrealized gains/losses are allocated proportionately to each class of shares based upon the relative net asset value of the outstanding shares of that class. The cost of investments sold is determined by use of the specific identification method for both financial reporting and income tax purposes. To the extent any issuer defaults or a credit event occurs that impacts the issuer, the Fund may halt any additional interest income accruals and consider the realizability of interest accrued up to the date of default or credit event.
E) DIVIDENDS AND DISTRIBUTIONS TO SHAREHOLDERS — Dividends from net investment income, if any, are declared daily and paid monthly. Distributions of net realized capital gains, if any, are declared and paid at least annually. However, to the extent that a net realized capital gain can be reduced by a capital loss carryforward, such gain will not be distributed. Dividends and distributions to shareholders of the Fund are recorded on the ex-dividend date and are determined in accordance with federal income tax regulations, which may differ from GAAP.
F) FEDERAL INCOME TAXES — No provision is made for federal taxes as it is the Fund's intention to continue to qualify as a regulated investment company ("RIC") under the Internal Revenue Code of 1986, as amended (the "Code"), and to make the requisite distributions to its shareholders, which will be sufficient to relieve it from federal income and excise taxes.
In order to qualify as a RIC under the Code, the Fund must meet certain requirements regarding the source of its income, the diversification of its assets and the distribution of its income. One of these requirements is that the Fund derive at least 90% of its gross income for each taxable year from dividends, interest, payments with respect to certain securities loans, gains from the sale or other disposition of stock, securities or foreign currencies, other income derived with respect to its business of investing in such stock, securities or currencies or net income derived from interests in certain publicly-traded partnerships ("Qualifying Income").
32
Credit Suisse Strategic Income Fund
Notes to Financial Statements (continued)
October 31, 2016
Note 2. Significant Accounting Policies (continued)
The Fund adopted the authoritative guidance for uncertainty in income taxes and recognizes a tax benefit or liability from an uncertain position only if it is more likely than not that the position is sustainable based solely on its technical merits and consideration of the relevant taxing authority's widely understood administrative practices and procedures. The Fund has reviewed its current tax positions and has determined that no provision for income tax is required in the Fund's financial statements. The Fund's federal and state income and federal excise tax returns for tax years for which the applicable statutes of limitations have not expired are subject to examination by the Internal Revenue Service and state departments of revenue.
G) SHORT-TERM INVESTMENTS — The Fund, together with other funds/portfolios advised by Credit Suisse, pools available cash into a short-term variable rate time deposit issued by State Street Bank and Trust Company ("SSB"), the Fund's custodian. The short-term time deposit issued by SSB is a variable rate account classified as a short-term investment.
H) FUTURES — The Fund may enter into futures contracts to the extent permitted by its investment policies and objectives. The Fund may use futures contracts to gain exposure to or hedge against changes in interest rates, equity and market price movements and/or currency risks. Upon entering into a futures contract, the Fund is required to deposit cash and/or pledge U.S. Government securities as initial margin with a Futures Commission Merchant (FCM). Subsequent payments, which are dependent on the daily fluctuations in the value of the underlying instrument, are made or received by the Fund each day (daily variation margin) and are recorded as unrealized gains or losses until the contracts are closed. When the contracts are closed, the Fund records a realized gain or loss equal to the difference between the proceeds from (or cost of) the closing transaction and the Fund's basis in the contract. Risks of entering into futures contracts for hedging purposes include the possibility that a change in the value of the contract may not correlate with the changes in the value of the underlying instruments. Futures have minimal counterparty risk because futures are exchange traded and the exchange's clearinghouse, as counterparty to all exchange-traded futures, guarantees the futures against default. In addition, the purchase of a futures contract involves the risk that the Fund could lose more than the original margin deposit and subsequent payments may be required for a futures transaction. The Fund's open futures contracts are disclosed in the Schedule of Investments. At October 31, 2016, the Fund had no open futures contracts.
33
Credit Suisse Strategic Income Fund
Notes to Financial Statements (continued)
October 31, 2016
Note 2. Significant Accounting Policies (continued)
The Commodity Exchange Act requires an FCM to segregate all customer transactions and assets from the FCM's proprietary activities. A customer's cash and other equity deposited with an FCM are considered commingled with all other customer funds subject to the FCM's segregation requirements. In the event of an FCM's insolvency, recovery may be limited to the Fund's pro rata share of segregated customer funds available. It is possible that the recovery amount could be less than the total of cash and other equity deposited.
I) FORWARD FOREIGN CURRENCY CONTRACTS — A forward foreign currency exchange contract ("forward currency contract") is a commitment to purchase or sell a foreign currency at the settlement date at a negotiated rate. The Fund will enter into forward currency contracts primarily for hedging foreign currency risk. Forward currency contracts are valued at the prevailing forward exchange rate of the underlying currencies and unrealized gain (loss) is recorded daily. On the settlement date of the forward currency contract, the Fund records a realized gain or loss equal to the difference between the value of the contract at the time it was opened and the value of the contract at the time it was closed. Certain risks may arise upon entering into forward currency contracts from the potential inability of counterparties to meet the terms of their contracts. The maximum counterparty credit risk to the Fund is measured by the unrealized gain on appreciated contracts. Additionally, when utilizing forward currency contracts to hedge, the Fund forgoes the opportunity to profit from favorable exchange rate movements during the term of the contract. The Fund's open forward currency contracts at October 31, 2016 are disclosed in the Schedule of Investments.
J) SECURITIES LENDING — The initial collateral received by the Fund is required to have a value of at least 102% of the market value of domestic securities on loan (including any accrued interest thereon) and 105% of the market value of foreign securities on loan (including any accrued interest thereon). The collateral is maintained thereafter at a value equal to at least 102% of the current market value of the securities on loan. The market value of loaned securities is determined at the close of each business day of the Fund and any additional required collateral is delivered to the Fund, or excess collateral returned by the Fund, on the next business day. Cash collateral received by the Fund in connection with securities lending activity may be pooled together with cash collateral for other funds/portfolios advised by Credit Suisse and may be invested in a variety of investments, including funds advised by SSB, the Fund's securities lending agent, or money market instruments. However, in the event of default or bankruptcy by the other party
34
Credit Suisse Strategic Income Fund
Notes to Financial Statements (continued)
October 31, 2016
Note 2. Significant Accounting Policies (continued)
to the agreement, realization and/or retention of the collateral may be subject to legal proceedings.
SSB has been engaged by the Fund to act as the Fund's securities lending agent. The Fund's securities lending arrangement provides that the Fund and SSB will share the net income earned from securities lending activities. Securities lending income is accrued as earned. At October 31, 2016, and for the year ended October 31, 2016, there were no securities out on loan.
K) OTHER — The high yield, fixed income securities in which the Fund invests will primarily consist of senior secured floating rate loans ("Senior Loans") issued by non-investment grade companies. Senior Loans are typically secured by specific collateral of the issuer and hold the most senior position in the issuer's capital structure. The interest rate on Senior Loans is periodically adjusted to a recognized base rate, typically the London Interbank Offered Rate ("LIBOR"). While these characteristics may reduce interest rate risk and mitigate losses in the event of borrower default, the Senior Loans in which the Fund invests have below investment grade credit ratings and thereby are considered speculative because of the significant credit risk of their issuers.
Lower-rated debt securities (commonly known as "junk bonds") possess speculative characteristics and are subject to greater market fluctuations and risk of lost income and principal than higher-rated debt securities for a variety of reasons. Also, during an economic downturn or substantial period of rising interest rates, highly leveraged issuers may experience financial stress which would adversely affect their ability to service their principal and interest payment obligations, to meet projected business goals and to obtain additional financing.
In addition, periods of economic uncertainty and changes can be expected to result in increased volatility of market prices of lower-rated debt securities and the Fund's net asset value.
L) NEW ACCOUNTING PRONOUNCEMENTS — On August 26, 2016, Financial Accounting Standards Board ("FASB") issued a new Accounting Standards Update No. 2016-15, "Statement of Cash Flows (Topic 230), a consensus of the FASB's Emerging Issues Task Force" ("ASU 2016-15"). ASU 2016-15 is intended to reduce diversity in practice in how certain transactions are classified in the statement of cash flows. The issues addressed in ASU 2016-15 are: debt prepayment or debt extinguishment costs, settlement of zero-coupon debt instruments, contingent consideration payments made after a business combination, proceeds from the settlement of insurance claims, proceeds from
35
Credit Suisse Strategic Income Fund
Notes to Financial Statements (continued)
October 31, 2016
Note 2. Significant Accounting Policies (continued)
the settlement of corporate-owned life insurance policies, including bank-owned life insurance policies, distributions received from equity method investments, beneficial interests in securitization transactions; and, separately identifiable cash flows and application of the predominance principle. ASU 2016-15 is effective for interim and annual reporting periods beginning after December 15, 2017. Management is currently evaluating the impact, if any, of applying this provision.
In November 2016, FASB issued a new Accounting Standards Update No. 2016-18, "Statement of Cash Flows (Topic 230), Restricted Cash, a consensus of the FASB's Emerging Issues Task Force" ("ASU 2016-18"). ASU 2016-18 requires that a statement of cash flows explain the change during the period in the total of cash, cash equivalents, and amounts generally described as restricted cash or restricted cash equivalents. Therefore, amounts generally described as restricted cash and restricted cash equivalents should be included with cash and cash equivalents when reconciling the beginning-of-period and end-of-period total amounts shown on the statement of cash flows. The amendments in ASU 2016-18 do not provide a definition of restricted cash or restricted cash equivalents. ASU 2016-18 is effective for interim and annual reporting periods beginning after December 15, 2017. Management is currently evaluating the impact, if any, of applying this provision.
In October 2016, the U.S. Securities and Exchange Commission adopted new rules and amended existing rules (together, "final rules") intended to modernize the reporting and disclosure of information by registered investment companies. In part, the final rules amend Regulation S-X and require standardized, enhanced disclosure about derivatives in investment company financial statements, as well as other amendments. The compliance date for the amendments to Regulation S-X is August 1, 2017. Management is currently evaluating the impact that the adoption of the amendments to Regulation S-X will have on the Fund's financial statements and related disclosures.
M) SUBSEQUENT EVENTS — In preparing the financial statements as of October 31, 2016, management considered the impact of subsequent events for potential recognition or disclosure in these financial statements through the date of release of this report. No such events requiring recognition or disclosure were identified through the date of the release of this report.
36
Credit Suisse Strategic Income Fund
Notes to Financial Statements (continued)
October 31, 2016
Note 3. Transactions with Affiliates and Related Parties
Credit Suisse serves as investment adviser for the Fund. For its investment advisory services, Credit Suisse is entitled to receive a fee from the Fund at an annual rate of 0.75% of the Fund's average daily net assets. Credit Suisse has contractually waived fees and reimbursed expenses so that the Fund's annual operating expenses (excluding interest expense) would not exceed 0.99% of the Fund's average daily net assets for Class I shares, 1.24% of the Fund's average daily net assets for Class A shares, and 1.99% of the Fund's average daily net assets for Class C shares. For the year ended October 31, 2016, investment advisory fees earned and fees waived/expenses reimbursed were $630,649 and $247,439, respectively. The Fund is authorized to reimburse Credit Suisse for management fees previously limited and/or for expenses previously reimbursed by Credit Suisse, provided, however, that any reimbursements must be paid at a date not more than three years after the end of the fiscal year during which such fees were limited or expenses were reimbursed by Credit Suisse and the reimbursements do not cause the Fund to exceed the applicable expense limitation in the contract at the time the fees are recouped. This contract may not be terminated before February 28, 2018.
The amounts waived and reimbursed by Credit Suisse, which are available for potential future recoupment by Credit Suisse, and the expiration schedule at October 31, 2016 are as follows:
| | Fee waivers/
expense
reimbursements
subject to
recoupment | | Expires
October 31,
2017 | | Expires
October 31,
2018 | | Expires
October 31,
2019 | |
Class I | | $ | 388,269 | | | $ | 110,479 | | | $ | 102,395 | | | $ | 175,395 | | |
Class A | | | 218,893 | | | | 110,046 | | | | 50,975 | | | | 57,872 | | |
Class C | | | 20,524 | | | | 2,283 | | | | 4,069 | | | | 14,172 | | |
Totals | | $ | 627,686 | | | $ | 222,808 | | | $ | 157,439 | | | $ | 247,439 | | |
Credit Suisse Asset Management Limited ("Credit Suisse U.K."), an affiliate of Credit Suisse, serves as sub-investment advisor to the Fund directly. Credit Suisse U.K.'s sub-investment advisor fees are paid by Credit Suisse.
Credit Suisse and SSB serve as co-administrators to the Fund. For its co-administrative services, Credit Suisse receives a fee calculated at an annual rate of 0.09% of the Fund's average daily net assets. For the year ended October 31, 2016, co-administrative services fees earned by Credit Suisse were $75,678.
For its co-administrative services, SSB receives a fee, exclusive of out-of-pocket expenses, calculated in total for all the Credit Suisse funds/portfolios
37
Credit Suisse Strategic Income Fund
Notes to Financial Statements (continued)
October 31, 2016
Note 3. Transactions with Affiliates and Related Parties (continued)
co-administered by SSB and allocated based upon the relative average net assets of each fund/portfolio, subject to an annual minimum fee. For the year ended October 31, 2016, co-administrative services fees earned by SSB (including out-of-pocket expenses) with respect to the Fund were $33,226.
Credit Suisse Securities (USA) LLC ("CSSU"), an affiliate of Credit Suisse, serves as the distributor of the Fund's shares. Pursuant to a distribution plan adopted by the Fund pursuant to Rule 12b-1 under the 1940 Act, CSSU receives fees for its distribution services. These fees are calculated at an annual rate of 0.25% of the average daily net assets of the Class A shares. For the Class C shares, the fee is calculated at an annual rate of 1.00% of the average daily net assets. For the year ended October 31, 2016, the Fund paid Rule 12b-1 distribution fees of $49,122 for Class A shares and $48,274 for Class C shares. Class I shares are not subject to Rule 12b-1 distribution fees.
Certain brokers, dealers and financial representatives provide transfer agent-related services to the Fund and receive compensation from the Fund. For the year ended October 31, 2016, the Fund paid $54,539, which is included within transfer agent fees in the Statement of Operations.
For the year ended October 31, 2016, CSSU and its affiliates advised the Fund that they retained $4,362 from commissions earned on the sale of the Fund's Class A shares. There were no commissions earned on sale of Class C shares.
The Fund from time to time purchases or sells loan investments in the secondary market through Credit Suisse or its affiliates acting in the capacity as broker-dealer. Credit Suisse or its affiliates may have acted in some type of agent capacity to the initial loan offering prior to such loan trading in the secondary market.
Note 4. Line of Credit
The Fund, together with other funds/portfolios advised by Credit Suisse (collectively, the "Participating Funds"), participates in a committed, unsecured line of credit facility ("Credit Facility"), with SSB in an aggregated amount of $250 million for temporary or emergency purposes under a first-come, first-served basis. Under the terms of the Credit Facility, the Participating Funds pay an aggregate commitment fee on the average unused amount of the Credit Facility, which is allocated among the Participating Funds in such manner as is determined by the governing Boards of the Participating Funds. In addition, the Participating Funds pay interest on borrowings at either the Overnight Federal Funds rate or the Overnight LIBOR rate plus a spread. At October 31,
38
Credit Suisse Strategic Income Fund
Notes to Financial Statements (continued)
October 31, 2016
Note 4. Line of Credit (continued)
2016, the Fund had loans outstanding under the Credit Facility of $0. During the year ended October 31, 2016, the Fund had borrowings under the Credit Facility as follows:
Average Daily
Loan Balance | | Weighted Average
Interest Rate % | | Maximum Daily
Loan Outstanding | | Interest Expense | |
$ | 388,880 | | | | 1.623 | % | | $ | 18,450,000 | | | $ | 6,415 | | |
Note 5. Purchases and Sales of Securities
For the year ended October 31, 2016, purchases and sales of investment securities (excluding short-term investments) were $58,550,157 and $109,780,771, respectively.
Note 6. Capital Share Transactions
The Fund is authorized to issue an unlimited number of full and fractional shares of beneficial interest, $.001 par value per share. The Fund offers Class I, Class A and Class C shares. Transactions in capital shares for each class of the Fund were as follows:
| | | Class I | |
| | | For the Year Ended
October 31, 2016 | | For the Year Ended
October 31, 2015 | |
| | | Shares | | Value | | Shares | | Value | |
Shares sold | | | 2,699,746 | | | $ | 24,919,299 | | | | 2,163,780 | | | $ | 21,626,181 | | |
Shares issued in reinvestment
of dividends and distributions | | | 472,724 | | | | 4,405,459 | | | | 584,614 | | | | 5,854,342 | | |
Shares redeemed | | | (3,625,961 | ) | | | (33,177,588 | ) | | | (3,861,721 | ) | | | (38,745,731 | ) | |
Net decrease | | | (453,491 | ) | | $ | (3,852,830 | ) | | | (1,113,327 | ) | | $ | (11,265,208 | ) | |
| | | Class A | |
| | | For the Year Ended
October 31, 2016 | | For the Year Ended
October 31, 2015 | |
| | | Shares | | Value | | Shares | | Value | |
Shares sold | | | 2,388,476 | | | $ | 22,246,516 | | | | 7,083,713 | | | $ | 71,922,814 | | |
Shares issued in reinvestment
of dividends and distributions | | | 131,389 | | | | 1,232,816 | | | | 201,047 | | | | 2,002,854 | | |
Shares redeemed net of
redemption fees | | | (8,420,386 | ) | | | (77,803,490 | ) | | | (1,914,221 | ) | | | (19,207,088 | ) | |
Net increase (decrease) | | | (5,900,521 | ) | | $ | (54,324,158 | ) | | | 5,370,539 | | | $ | 54,718,580 | | |
39
Credit Suisse Strategic Income Fund
Notes to Financial Statements (continued)
October 31, 2016
Note 6. Capital Share Transactions (continued)
| | | Class C | |
| | | For the Year Ended
October 31, 2016 | | For the Year Ended
October 31, 2015 | |
| | | Shares | | Value | | Shares | | Value | |
Shares sold | | | 559,045 | | | $ | 5,253,587 | | | | 137,898 | | | $ | 1,368,778 | | |
Shares issued in reinvestment
of dividends and distributions | | | 31,617 | | | | 295,474 | | | | 17,251 | | | | 172,645 | | |
Shares redeemed net of
redemption fees | | | (214,013 | ) | | | (1,969,377 | ) | | | (51,935 | ) | | | (523,730 | ) | |
Net increase | | | 376,649 | | | $ | 3,579,684 | | | | 103,214 | | | $ | 1,017,693 | | |
On October 31, 2016, the number of shareholders that held 5% or more of the outstanding shares of each class of the Fund was as follows:
| | | Number of
Shareholders | | Approximate Percentage
of Outstanding Shares | |
Class I | | | 3 | * | | | 64 | % | |
Class A | | | 5 | | | | 66 | % | |
Class C | | | 3 | | | | 55 | % | |
*This includes the seed money from Merchant Holding, Inc., an affiliate of Credit Suisse.
Some of the shareholders are omnibus accounts, which hold shares on behalf of individual shareholders.
Note 7. Federal Income Taxes
Income and capital gain distributions are determined in accordance with federal income tax regulations, which may differ from GAAP.
The tax characteristics of distributions paid by the Fund during the years ended October 31, 2016 and 2015, respectively, were as follows:
Ordinary Income | | Long-Term Capital Gain | | Return of Capital | |
| 2016 | | 2015 | | 2016 | | 2015 | | 2016 | | 2015 | |
| $ | 6,202,299 | | | $ | 6,780,225 | | | $ | — | | | $ | 754,878 | | | $ | — | | | $ | 568,699 | | |
The tax basis components of distributable earnings differ from the amounts reflected in the Statement of Assets and Liabilities by temporary book/tax differences. These differences are primarily due to differing treatments of dividends payable, wash sales, forwards and futures contracts marked to
40
Credit Suisse Strategic Income Fund
Notes to Financial Statements (continued)
October 31, 2016
Note 7. Federal Income Taxes (continued)
market and deferred organizational expenses. At October 31, 2016, the components of distributable earnings on a tax basis were as follows:
Undistributed net investment income | | $ | 27,245 | | |
Accumulated net realized loss | | | (5,422,437 | ) | |
Unrealized depreciation | | | (6,999,560 | ) | |
| | $ | (12,394,752 | ) | |
At October 31, 2016, the Fund had $1,987,833 of unlimited short-term capital loss carryforwards and $3,434,604 of unlimited long-term capital loss carryforwards available to offset possible future capital gains.
At October 31, 2016, the cost of investments (excluding foreign currency related transactions) and the net unrealized appreciation (depreciation) for income tax purposes were as follows:
Cost of Investments | | $ | 83,441,789 | | |
Unrealized appreciation | | $ | 1,219,330 | | |
Unrealized depreciation | | | (8,041,659 | ) | |
Net unrealized depreciation | | $ | (6,822,329 | ) | |
To adjust for current period permanent book/tax differences which arose principally from differing book/tax treatment of foreign currency gain (loss) and distribution re-designations, paid-in capital was charged $31,520, distributions in excess of net investment income was charged $132,021 and accumulated net realized loss was credited $163,541. Net assets were not affected by these reclassifications.
Note 8. Contingencies
In the normal course of business, the Fund may provide general indemnifications pursuant to certain contracts and organizational documents. The Fund's maximum exposure under these arrangements is dependent on future claims that may be made against the Fund and, therefore, cannot be estimated; however, based on experience, the risk of loss from such claims is considered remote.
41
Credit Suisse Strategic Income Fund
Report of Independent Registered Public Accounting Firm
The Board of Trustees and Shareholders
Credit Suisse Strategic Income Fund:
We have audited the accompanying statement of assets and liabilities of Credit Suisse Strategic Income Fund (the "Fund"), a series of the Credit Suisse Opportunity Funds, including the schedule of investments, as of October 31, 2016, and the related statement of operations for the year then ended, the statements of changes in net assets and the financial highlights for each of the years in the two-year period then ended. These financial statements and financial highlights are the responsibility of the Fund's management. Our responsibility is to express an opinion on these financial statements and financial highlights based on our audits. The accompanying financial highlights of the Fund for each of the years in the two-year period ended October 31, 2014 and for the period from September 28, 2012 (Inception Date) through October 31, 2012 were audited by other independent registered public accountants whose report thereon dated December 29, 2014, expressed an unqualified opinion on those financial highlights.
We conducted our audits in accordance with the standards of the Public Company Accounting Oversight Board (United States). Those standards require that we plan and perform the audits to obtain reasonable assurance about whether the financial statements and financial highlights are free of material misstatement. An audit includes examining, on a test basis, evidence supporting the amounts and disclosures in the financial statements. Our procedures included confirmation of securities owned as of October 31, 2016, by correspondence with the custodian and broker or by other appropriate auditing procedures. An audit also includes assessing the accounting principles used and significant estimates made by management, as well as evaluating the overall financial statement presentation. We believe that our audits provide a reasonable basis for our opinion.
In our opinion, the financial statements and financial highlights referred to above present fairly, in all material respects, the financial position of Credit Suisse Strategic Income Fund as of October 31, 2016, the results of its operations for the year then ended and the changes in its net assets and the financial highlights for each of the years in the two-year period then ended, in conformity with U.S. generally accepted accounting principles.

New York, New York
December 28, 2016
42
Credit Suisse Strategic Income Fund
Information Concerning Trustees and Officers (unaudited)
Name, Address
(Year of Birth) | | Position(s)
Held with
Fund | | Term
of Office1
and
Length
of Time
Served | | Principal
Occupation(s) During
Past Five Years | | Number of
Portfolios
in Fund
Complex
Overseen
by Trustee | | Other
Trusteeships
Held by Trustee | |
Independent Trustees | | | | | | | | | | | |
Enrique R. Arzac
c/o Credit Suisse Asset
Management, LLC
Attn: General Counsel
One Madison Avenue
New York, New York
10010
(1941) | | Trustee, Audit Committee Chairman and Nominating Committee Member | | Since Fund Inception | | Professor Emeritus of Finance and Economics from July 2015 to present; Professor of Finance and Economics, Graduate School of Business, Columbia University from 1971 to July 2015. | | | 12 | | | Director of Adams Diversified Equity Fund, Inc., Adams Natural Resources Fund, Inc., Aberdeen Chile Fund, Inc., Aberdeen Emerging Markets Smaller Company Opportunities Fund, Inc., Aberdeen Israel Fund, Inc., Aberdeen Indonesia Fund, Inc. and Aberdeen Latin America Equity Fund, Inc. (each a closed-end investment company); Director of Aberdeen Asia-Pacific Income Investment Company Limited (a Canadian closed-end fund); Trustee of Mirae Asset Discovery Funds (7 open-end portfolios); Director of Epoch Holding Corporation (an investment management and investment advisory services company) from August 2006 to March 2013. | |
1 Subject to the Trust's retirement policy, each Trustee may continue to serve as a Trustee until the last day of the calendar year in which the applicable Trustee attains age 75. Officer serves until his or her respective successor has been duly elected and qualified.
43
Credit Suisse Strategic Income Fund
Information Concerning Trustees and Officers (unaudited) (continued)
Name, Address
(Year of Birth) | | Position(s)
Held with
Fund | | Term
of Office1
and
Length
of Time
Served | | Principal
Occupation(s) During
Past Five Years | | Number of
Portfolios
in Fund
Complex
Overseen
by Trustee | | Other
Trusteeships
Held by Trustee | |
Independent Trustees | | | | | | | | | | | |
Jeffrey E. Garten
c/o Credit Suisse Asset Management, LLC Attn: General Counsel One Madison Avenue New York, New York 10010
(1946) | | Trustee, Audit and Nominating Committee Member | | Since Fund Inception | | Dean Emeritus of Yale School of Management from July 2015 to present; The Juan Trippe Professor in the Practice of International Trade, Finance and Business, Yale School of Management, from July 2005 to July 2015; Partner and Chairman of Garten Rothkopf (consulting firm) from October 2005 to present. | | | 10 | | | Director of Aetna, Inc. (insurance company); Director of CarMax Group (used car dealers); Director of Miller Buckfire & Co., LLC (financial restructuring); Member of Standard & Poor's Board of Managers (credit rating agency) from December 2011 to November 2014. | |
Steven N. Rappaport
Lehigh Court, LLC
555 Madison Avenue
29th Floor
New York, New York
10022
(1948) | | Chairman of the Board of Trustees, Audit Committee Member and Nominating Committee Chairman | | Trustee since Fund Inception and Chairman since 2005 | | Partner of Lehigh Court, LLC and RZ Capital (private investment firms) from July 2002 to present; Partner of Backstage Acquisition Holdings, LLC (publication job postings) from November 2013 to present. | | | 12 | | | Director of iCAD, Inc. (surgical and medical instruments and apparatus company); Director of Aberdeen Chile Fund, Inc., Aberdeen Emerging Markets Smaller Company Opportunities Fund, Inc., Aberdeen Israel Fund, Inc., Aberdeen Indonesia Fund, Inc. and Aberdeen Latin America Equity Fund, Inc. (each a closed-end investment company); Director of Aberdeen Funds (25 open end portfolios); Director of Presstek, Inc. (digital imaging technologies company) from 2003 to 2012; Director of Wood Resources, LLC (plywood manufacturing company) from 2003 to October 2013. | |
1 Subject to the Trust's retirement policy, each Trustee may continue to serve as a Trustee until the last day of the calendar year in which the applicable Trustee attains age 75. Officer serves until his or her respective successor has been duly elected and qualified.
44
Credit Suisse Strategic Income Fund
Information Concerning Trustees and Officers (unaudited) (continued)
Name, Address
(Year of Birth) | | Position(s)
Held with
Fund | | Term of
Office1
and
Length of
Time
Served | | Principal Occupation(s) During Past Five Years | |
Officers* | | | | | | | |
John G. Popp
Credit Suisse Asset
Management, LLC
One Madison Avenue
New York, New York 10010
(1956) | | Chief Executive Officer and President | | Since Fund Inception | | Managing Director of Credit Suisse; Global Head and Chief Investment Officer of the Credit Investment Group; Associated with Credit Suisse or its predecessor since 1997; Officer of other Credit Suisse Funds; Trustee of Credit Suisse High Yield Bond Fund; Director of Credit Suisse Asset Management Income Fund, Inc. | |
Emidio Morizio
Credit Suisse Asset
Management, LLC
One Madison Avenue
New York, New York 10010
(1966) | | Chief Compliance Officer | | Since Fund Inception | | Managing Director and Global Head of Compliance of Credit Suisse since 2010; Associated with Credit Suisse since July 2000; Officer of other Credit Suisse Funds. | |
Lou Anne McInnis
Credit Suisse Asset Management, LLC
One Madison Avenue
New York, New York 10010
(1959) | | Chief Legal Officer | | Since 2015 | | Director of Credit Suisse; Associated with Credit Suisse since April 2015; Counsel at DLA Piper US LLP from 2011 to April 2015; Associated with Morgan Stanley Investment Management from 1997 to 2010; Officer of other Credit Suisse Funds. | |
Laurie Pecha
Credit Suisse Asset
Management, LLC
One Madison Avenue
New York, New York 10010
(1961) | | Chief Financial Officer | | Since 2016 | | Director of Credit Suisse since August 2016; Senior Consultant of Spectra Professional Services, LLC from January 2012 to July 2016; Vice President of Legg Mason & Co. from March 2007 to December 2011; Officer of other Credit Suisse Funds. | |
Esther Cheung
Credit Suisse Asset
Management, LLC
One Madison Avenue
New York, New York 10010
(1980) | | Treasurer | | Since 2016 | | Vice President of Credit Suisse since 2015; Associated with Reich & Tang Asset Management, LLC from June 2010 to August 2015; Officer of other Credit Suisse Funds. | |
Karen Regan
Credit Suisse Asset
Management, LLC
One Madison Avenue
New York, New York 10010
(1963) | | Vice President and Secretary | | Since Fund Inception | | Vice President of Credit Suisse; Associated with Credit Suisse since December 2004; Officer of other Credit Suisse Funds. | |
1 Subject to the Trust's retirement policy, each Trustee may continue to serve as a Trustee until the last day of the calendar year in which the applicable Trustee attains age 75. Officer serves until his or her respective successor has been duly elected and qualified.
* The officers of the Fund shown are officers that make policy decisions.
The Statement of Additional Information includes additional information about the Trustees and is available, without charge, upon request, by calling 877-870-2874.
45
Credit Suisse Strategic Income Fund
Proxy Voting and Portfolio Holdings Information (unaudited)
Information regarding how the Fund voted proxies related to its portfolio securities during the 12-month period ended June 30 of each year, as well as the policies and procedures that the Fund uses to determine how to vote proxies relating to its portfolio securities are available:
• By calling 1-877-870-2874
• On the Fund's website, www.credit-suisse.com/us/funds
• On the website of the Securities and Exchange Commission, www.sec.gov.
The Fund files a complete schedule of its portfolio holdings for the first and third quarters of its fiscal year with the SEC on Form N-Q. The Fund's Forms N-Q are available on the SEC's website at www.sec.gov and may be reviewed and copied at the SEC's Public Reference Room in Washington, DC. Information on the operation of the SEC's Public Reference Room may be obtained by calling 1-202-551-8090.
46
This page intentionally left blank
This page intentionally left blank

P.O. BOX 55030, BOSTON, MA 02205-5030
877-870-2874 n www.credit-suisse.com/us/funds
CREDIT SUISSE SECURITIES (USA) LLC, DISTRIBUTOR. SIF-AR-1016

CREDIT SUISSE FUNDS
Annual Report
October 31, 2016
n CREDIT SUISSE
FLOATING RATE HIGH INCOME FUND
The Fund's investment objectives, risks, charges and expenses (which should be considered carefully before investing), and more complete information about the Fund, are provided in the Prospectus, which should be read carefully before investing. You may obtain additional copies by calling 877-870-2874 or by visiting our website at www.credit-suisse.com/us/funds.
Credit Suisse Securities (USA) LLC, Distributor, is located at One Madison Avenue, New York, NY 10010. Credit Suisse Funds are advised by Credit Suisse Asset Management, LLC.
Investors in the Credit Suisse Funds should be aware that they may be eligible to purchase Class I shares (where offered) directly or through certain intermediaries. Such shares are not subject to a sales charge. Investors in the Credit Suisse Funds should also be aware that they may be eligible for a reduction or waiver of the sales charge with respect to Class A, B or C shares (where offered). For more information, please review the relevant prospectuses or consult your financial representative.
Fund shares are not deposits or other obligations of Credit Suisse Asset Management, LLC ("Credit Suisse") or any affiliate, are not FDIC-insured and are not guaranteed by Credit Suisse or any affiliate. Fund investments are subject to investment risks, including loss of your investment.
Credit Suisse Floating Rate High Income Fund
Annual Investment Adviser's Report
October 31, 2016 (unaudited)
November 25, 2016
Dear Shareholder:
We are pleased to present this Annual Report covering the activities of the Credit Suisse Floating Rate High Income Fund (the "Fund") for the twelve months ended October 31, 2016.
Performance Summary
11/1/2015 – 10/31/2016
Fund & Benchmark | | Performance | |
Class I1 | | | 5.79 | % | |
Class A1,2 | | | 5.52 | % | |
Class B1,2 | | | 4.73 | % | |
Class C1,2 | | | 4.73 | % | |
Credit Suisse Leveraged Loan Index3 | | | 6.30 | % | |
Performance shown for the Fund's Class A, Class B and Class C Shares does not reflect sales charges, which are a maximum of 4.75%, 4.00% and 1.00%, respectively. 2
Market Review: Volatility followed by Positive Returns
The annual period ended October 31, 2016 was a positive, yet volatile one for the senior secured loan asset class. The Credit Suisse Leveraged Loan Index (the "Index"), the Fund's benchmark, returned 6.30% for the period. The discount margin for senior loans, using a three-year average life assumption, tightened 1.02% during the period to +494 basis points. Principal appreciation was a large contributor to returns, as the price of the Index increased 1.30 points to finish the period at 95.12.
In general, after a tough start to 2016, credit markets experienced positive returns in the second and third quarters on the back of improved commodity prices and fading global macroeconomic concerns. Specifically, general volatility in oil and commodities prices forced a general sell off through February. But as the volatility subsided, the subsequent rally enticed borrowers to tap the loan market, and $407 billion of institutional loans priced during the period — almost 60% of which was used for the refinancing/repricing of existing debt. In comparison, $320 billion was issued in the previous period, with only 43% used for refinancing/repricing, according to JPMorgan.
Additionally, collateralized loan obligation ("CLO") issuance has been more robust than expected. Heading into 2016, underwriters had dampened their expectations for CLO issuance due to both volatility in the underlying loan market and concerns over risk retention. However, many managers were able
1
Credit Suisse Floating Rate High Income Fund
Annual Investment Adviser's Report (continued)
October 31, 2016 (unaudited)
to work through risk retention, and an 8-month rally in loans pushed CLO issuance far above expectations. Although expectations were only for $40-50 billion, the 12-month period ended October 31, 2016 saw issuance of $67 billion. Positive CLO issuance more than offset the $15.7 billion in net Prime Fund outflows (according to LCD — "Legal Commentary & Data") for the period. These factors helped propel a rally in loans, which returned 9.68% from March through October.
Outside of oil & gas and metals & mining, fundamentals in the senior secured loan market have been strong. Default rates ended the period at 1.95%. Of the $25 billion in 2016 defaults, $16.5 billion were borrowers in the oil & gas or metals & mining sectors. While we expect elevated defaults for these troubled industries going forward, overall fundamentals and cheap capital structures should minimize defaults broadly.
From a quality point of view, the lower rated portion of the Index outperformed for the year. CCC/Split CCC posted the highest returns, at 14.18%, followed by distressed (CC, C, and Default) loans, which returned 9.85% during the period. Split BBB and BB- rated loans underperformed with returns of 4.44% and 5.11%, respectively.
Strategy Review and Outlook: Anticipating Rising Rates
For the 12-month period ended October 31, 2016, the Fund underperformed the Index. Security selection in the bank loan (particularly in healthcare and chemicals) asset class contributed positively to relative returns. An underweight to utilities also contributed positively to relative returns. However, security selection in electronics and finance (though these securities had positive returns on an absolute basis) detracted from relative performance, as their returns were lower than those of the Index's components. Additionally, exposure to B-rated investments added to performance, while exposure to lower rated CCC, CCC- and CC positions detracted from relative returns due to negative security selection.
The Fund has been underweight utilities, as we believe renewable energy substitutes and recent construction of highly efficient gas plants have continued to cause pressure for the industry, and the Fund currently has zero exposure to the sector. The portfolio maintains overweight positions in chemicals, financial services and information technology (software) based on our view of favorable fundamentals and strong relative value in those sectors. Additionally, the portfolio is underweight healthcare, as we believe investors are not being adequately compensated for certain names. Finally, we are maintaining the Fund's overweight exposure to B-rated issues.
2
Credit Suisse Floating Rate High Income Fund
Annual Investment Adviser's Report (continued)
October 31, 2016 (unaudited)
Looking forward, we expect the recent U.S. election results may bring slightly elevated volatility in the loan market over the near term. As was the case with Brexit, we do not believe that there are sufficient factors to support a significant sell off. This is in part because the portion of the market with the most flight risk, retail ownership, has been materially reduced over the past few years, and the continued growth in demand for loans has been largely institutional. In addition, there is currently a strong technical underpinning from the CLO market which is seeing a flurry of transactions trying to ramp and price in advance of the December 24, 2016 Risk Retention requirement. As a result, we do not expect any fundamental shift in credit outlook or supply and demand for loans. We continue to believe that a December U.S. Federal Reserve hike is likely. With the increased likelihood of tightening in short-term interest rates, the nature of the Fund's focus on short duration floating rate products should position it well in the expected rising rate environment.
The Credit Suisse Credit Investments Group Team
John G. Popp
Thomas J. Flannery
Louis I. Farano
Wing Chan
Senior secured floating rate loans ("Senior Loans") are subject to risk that a court could subordinate a Senior Loan, which typically holds the most senior position in the issuer's capital structure, to presently existing or future indebtedness or take other action detrimental to the holders of Senior Loans.
High yield bonds are lower-quality bonds that are also known as "junk bonds." Such bonds entail greater risks than those found in higher-rated securities.
Additional principal risk factors for the Fund include conflict of interest risk, credit risk, foreign securities risk, interest rate risk, liquidity risk, market risk, prepayment risk and valuation risk. Before you invest, please make sure you understand the risks that apply to the Fund. As with any mutual fund, you could lose money over any period of time.
Investments in the Fund are not bank deposits and are not insured or guaranteed by the Federal Deposit Insurance Corporation or any government agency. For a detailed
3
Credit Suisse Floating Rate High Income Fund
Annual Investment Adviser's Report (continued)
October 31, 2016 (unaudited)
discussion of these and other risks, please refer to the Fund's Prospectus, which should be read carefully before investing.
In addition to historical information, this report contains forward-looking statements, which may concern, among other things, domestic and foreign markets, industry and economic trends and developments and government regulation and their potential impact on the Fund's investments. These statements are subject to risks and uncertainties and actual trends, developments and regulations in the future, and their impact on the Fund could be materially different from those projected, anticipated or implied. The Fund has no obligation to update or revise forward-looking statements.
The views of the Fund's management are as of the date of this letter and the Fund holdings described in this document are as of October 31, 2016; these views and Fund holdings may have changed subsequent to these dates. Nothing in this document is a recommendation to purchase or sell securities.
4
Credit Suisse Floating Rate High Income Fund
Annual Investment Adviser's Report (continued)
October 31, 2016 (unaudited)
Comparison of Change in Value of $10,000 Investment in the
Credit Suisse Floating Rate High Income Fund1 Class I shares and the
Credit Suisse Leveraged Loan Index3 for Ten Years
Comparison of Change in Value of $10,000 Investment in the
Credit Suisse Floating Rate High Income Fund1 Class A shares2,
Class B shares2, and Class C shares2 and the Credit Suisse
Leveraged Loan Index3 for Ten Years
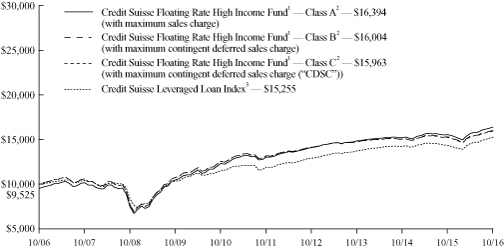
1 Fee waivers and/or expense reimbursements may reduce expenses for the Fund, without which performance would be lower. Voluntary waivers and/or reimbursements may be discontinued at any time.
5
Credit Suisse Floating Rate High Income Fund
Annual Investment Adviser's Report (continued)
October 31, 2016 (unaudited)
2 Total return for the Fund's Class A shares for the reporting period, based on offering price (including maximum sales charge of 4.75%), was 0.46%. Total return for the Fund's Class B shares for the reporting period, based on redemption value (including maximum CDSC of 4.00%), was 0.73%. Total return for the Fund's Class C shares for the reporting period, based on redemption value (including maximum CDSC of 1.00%), was 3.73%.
3 Credit Suisse Leveraged Loan Index is an unmanaged index that is designed to mirror the investable universe of the U.S. dollar denominated institutional leveraged loan market. The index does not have transaction costs and investors cannot invest directly in the index.
Average Annual Returns as of October 31, 20161
| | | 1 Year | | 5 Years | | 10 Years | |
Class I | | | 5.79 | % | | | 4.98 | % | | | 5.84 | % | |
Class A Without Sales Charge | | | 5.52 | % | | | 4.71 | % | | | 5.58 | % | |
Class A With Maximum Sales Charge | | | 0.46 | % | | | 3.70 | % | | | 5.07 | % | |
Class B Without CDSC | | | 4.73 | % | | | 3.99 | % | | | 4.83 | % | |
Class B With CDSC | | | 0.73 | % | | | 3.99 | % | | | 4.83 | % | |
Class C Without CDSC | | | 4.73 | % | | | 3.90 | % | | | 4.78 | % | |
Class C With CDSC | | | 3.73 | % | | | 3.90 | % | | | 4.78 | % | |
Returns represent past performance and include change in share price and reinvestment of dividends and capital gain distributions. Past performance cannot guarantee future results. The current performance of the Fund may be lower or higher than the figures shown. Returns and share price will fluctuate, and redemption value may be more or less than original cost. The performance results do not reflect the deduction of taxes that a shareholder would pay on Fund distributions or the redemption of Fund shares. Performance information current to the most recent month end is available at www.credit-suisse.com/us/funds.
The annual gross expense ratios are 0.81% for Class I shares, 1.06% for Class A shares, 1.81% for Class B shares and 1.81% for Class C shares. The annual net expense ratios after fee waivers and/or expense reimbursements are 0.70% for Class I shares, 0.95% for Class A shares, 1.70% for Class B shares and 1.70% for Class C shares.
1 Fee waivers and/or expense reimbursements may reduce expenses for the Fund, without which performance would be lower. Voluntary waivers and/or reimbursements may be discontinued at any time.
6
Credit Suisse Floating Rate High Income Fund
Annual Investment Adviser's Report (continued)
October 31, 2016 (unaudited)
Information About Your Fund's Expenses
As an investor of the Fund, you incur two types of costs: ongoing expenses and transaction costs. Ongoing expenses include management fees, distribution and service (12b-1) fees and other Fund expenses. Examples of transaction costs include sales charges (loads), redemption fees and account maintenance fees, which are not shown in this section and which would result in higher total expenses. The following table is intended to help you understand your ongoing expenses of investing in the Fund and to help you compare these expenses with the ongoing expenses of investing in other mutual funds. The table is based on an investment of $1,000 made at the beginning of the six months ended October 31, 2016.
The table illustrates your Fund's expenses in two ways:
• Actual Fund Return. This helps you estimate the actual dollar amount of ongoing expenses paid on a $1,000 investment in the Fund using the Fund's actual return during the period. To estimate the expenses you paid over the period, simply divide your account value by $1,000 (for example, an $8,600 account value divided by $1,000 = 8.6), then multiply the result by the number in the "Expenses Paid per $1,000" line.
• Hypothetical 5% Fund Return. This helps you to compare the Fund's ongoing expenses with those of other mutual funds using the Fund's actual expense ratio and a hypothetical rate of return of 5% per year before expenses. Examples using a 5% hypothetical fund return may be found in the shareholder reports of other mutual funds. The hypothetical account values and expenses may not be used to estimate the actual ending account balance or expenses you paid for the period.
Please note that the expenses shown in these tables are meant to highlight your ongoing expenses only and do not reflect any transaction costs, such as sales charges (loads) or redemption fees. If these transaction costs had been included, your costs would have been higher. The "Expenses Paid per $1,000" line of the tables is useful in comparing ongoing expenses only and will not help you determine the relative total expenses of owning different funds.
7
Credit Suisse Floating Rate High Income Fund
Annual Investment Adviser's Report (continued)
October 31, 2016 (unaudited)
Expenses and Value for a $1,000 Investment
for the six-month period ended October 31, 2016
Actual Fund Return | | Class I | | Class A | | Class B | | Class C | |
Beginning Account Value 05/01/16 | | $ | 1,000.00 | | | $ | 1,000.00 | | | $ | 1,000.00 | | | $ | 1,000.00 | | |
Ending Account Value 10/31/16 | | $ | 1,047.90 | | | $ | 1,046.50 | | | $ | 1,042.40 | | | $ | 1,042.50 | | |
Expenses Paid per $1,000* | | $ | 3.60 | | | $ | 4.89 | | | $ | 8.73 | | | $ | 8.73 | | |
Hypothetical 5% Fund Return | |
Beginning Account Value 05/01/16 | | $ | 1,000.00 | | | $ | 1,000.00 | | | $ | 1,000.00 | | | $ | 1,000.00 | | |
Ending Account Value 10/31/16 | | $ | 1,021.62 | | | $ | 1,020.36 | | | $ | 1,016.59 | | | $ | 1,016.59 | | |
Expenses Paid per $1,000* | | $ | 3.56 | | | $ | 4.82 | | | $ | 8.62 | | | $ | 8.62 | | |
| | | Class I | | Class A | | Class B | | Class C | |
Annualized Expense Ratios* | | | 0.70 | % | | | 0.95 | % | | | 1.70 | % | | | 1.70 | % | |
* Expenses are equal to the Fund's annualized expense ratio for each share class, multiplied by the average account value over the period, multiplied by 184/366 to reflect the one-half year period.
The "Expenses Paid per $1,000" and the "Annualized Expense Ratios" in the tables are based on actual expenses paid by the Fund during the period, net of fee waivers and/or actual expense reimbursements, if applicable. If those fee waivers and/or expense reimbursements had not been in effect, the Fund's actual expenses would have been higher. Expenses do not reflect additional charges and expenses that are, or may be, imposed under the variable contracts or plans. Such charges and expenses are described in the prospectus of the insurance company separate account or in the plan documents or other informational materials supplied by plan sponsors. The Fund's expenses should be considered with these charges and expenses in evaluating the overall cost of investing in the separate account.
For more information, please refer to the Fund's Prospectus.
8
Credit Suisse Floating Rate High Income Fund
Annual Investment Adviser's Report (continued)
October 31, 2016 (unaudited)
Credit Quality Breakdown*
(% of Total Investments as of October 31, 2016)
S&P Ratings** | |
AAA | | | 0.4 | % | |
AA | | | 0.5 | | |
A | | | 0.9 | | |
BBB | | | 6.7 | | |
BB | | | 29.5 | | |
B | | | 46.0 | | |
CCC | | | 5.3 | | |
CC | | | 0.01 | | |
C | | | 0.1 | | |
NR | | | 2.6 | | |
Subtotal | | | 92.0 | | |
Equity and Other | | | 0.01 | | |
Short-Term Investments2 | | | 8.0 | | |
Total | | | 100.0 | % | |
* Expressed as a percentage of total investments (excluding securities lending collateral, if applicable) and may vary over time.
** Credit Quality is based on ratings given by the Standard & Poor's division of The McGraw-Hill Companies, Inc., ("S&P"). S&P is a main provider of ratings for Credit Asset Classes and is widely used amongst industry participants. The NR category consists of securities that have not been rated by S&P.
1 This amount represents less than 0.1%.
2 Primarily reflects cash invested in State Street Bank and Trust Co. Euro Time Deposit, for which the purchases of securities have been executed but not yet settled at October 31, 2016, if applicable.
9
Credit Suisse Floating Rate High Income Fund
Schedule of Investments
October 31, 2016
Par
(000)
| | Ratings†
(S&P/Moody's) | | Maturity | | Rate% | | Value | |
| BANK LOANS (84.1%) | | | |
| Advertising (0.7%) | | | |
$ | 5,478 | | | MH Sub I LLC(1) | | (B, B1) | | 07/08/21 | | | 4.750 | | | $ | 5,501,324 | | |
| | 4,980 | | | MH Sub I LLC(1) | | (CCC+, Caa1) | | 07/08/22 | | | 8.500 | | | | 4,948,875 | | |
| | 9,764 | | | WMG Acquisition Corp.(1) | | (B, Ba3) | | 07/01/20 | | | 3.750 | | | | 9,767,919 | | |
| | | | 20,218,118 | | |
| Aerospace & Defense (0.5%) | | | |
| | 16,042 | | | Sequa Corp.(1) | | (CCC-, Caa3) | | 06/19/17 | | | 5.250 | | | | 14,821,931 | | |
| Air Transportation (0.7%) | | | |
| | 15,429 | | | American Airlines, Inc.(1) | | (BB+, Ba1) | | 06/27/20 | | | 3.250 | | | | 15,468,846 | | |
| | 2,965 | | | United Airlines, Inc.(1) | | (BB+, Ba1) | | 04/01/19 | | | 3.250 | | | | 2,980,208 | | |
| | | | 18,449,054 | | |
| Auto Parts & Equipment (0.7%) | | | |
| | 11,984 | | | CS Intermediate Holdco 2 LLC(1) | | (BB-, Ba3) | | 04/04/21 | | | 4.000 | | | | 12,024,824 | | |
| | 8,637 | | | U.S. Farathane LLC(1) | | (B, B2) | | 12/23/21 | | | 5.750 | | | | 8,679,746 | | |
| | | | 20,704,570 | | |
| Automakers (0.7%) | | | |
| | 2,914 | | | FCA U.S. LLC(1) | | (BBB-, Baa3) | | 05/24/17 | | | 3.500 | | | | 2,920,539 | | |
| | 5,609 | | | FCA U.S. LLC(1) | | (BBB-, Baa3) | | 12/31/18 | | | 3.250 | | | | 5,621,640 | | |
| | 7,425 | | | TI Group Automotive Systems LLC(1),(2) | | (BB, Ba3) | | 06/30/22 | | | 4.500 | | | | 8,215,634 | | |
| | 3,960 | | | TI Group Automotive Systems LLC(1) | | (BB, Ba3) | | 06/30/22 | | | 4.500 | | | | 3,970,712 | | |
| | | | 20,728,525 | | |
| Banking (0.3%) | | | |
| | 7,235 | | | Citco Funding LLC(1) | | (NR, Ba3) | | 06/29/18 | | | 4.250 | | | | 7,257,465 | | |
| Building & Construction (1.4%) | | | |
| | 6,148 | | | Floor and Decor Outlets of America, Inc.(1) | | (B, B2) | | 09/30/23 | | | 5.250 | | | | 6,171,055 | | |
| | 13,849 | | | HD Supply, Inc.(1) | | (BB, B1) | | 10/17/23 | | | 3.630 | | | | 13,874,679 | | |
| | 2,115 | | | HD Supply, Inc.(1) | | (BB, B1) | | 08/13/21 | | | 3.588 | | | | 2,118,862 | | |
| | 15,346 | | | PGT, Inc.(1) | | (B+, B2) | | 02/16/22 | | | 6.750 | | | | 15,321,547 | | |
| | | | 37,486,143 | | |
| Building Materials (2.5%) | | | |
| | 8,076 | | | American Builders & Contractors Supply Co.(1) | | (BB+, B1) | | 10/31/23 | | | 3.500 | | | | 8,119,322 | | |
| | 17,825 | | | Headwaters, Inc.(1) | | (BB-, B1) | | 03/24/22 | | | 4.000 | | | | 17,944,858 | | |
| | 3,812 | | | Jeld-Wen, Inc.(1) | | (B, B1) | | 07/01/22 | | | 4.750 | | | | 3,840,868 | | |
| | 6,930 | | | LBM Borrower LLC(1) | | (B+, B3) | | 08/20/22 | | | 6.250 | | | | 6,945,177 | | |
| | 2,418 | | | Mannington Mills, Inc.(1) | | (BB-, B1) | | 10/01/21 | | | 4.750 | | | | 2,427,627 | | |
| | 15,113 | | | Priso Acquisition Corp.(1) | | (B, B2) | | 05/08/22 | | | 4.500 | | | | 15,174,458 | | |
| | 5,235 | | | Summit Materials Cos. I LLC(1) | | (BB, Ba3) | | 07/17/22 | | | 4.000 | | | | 5,276,466 | | |
| | 10,793 | | | Wilsonart LLC(1) | | (B+, B2) | | 10/31/19 | | | 4.000 | | | | 10,821,868 | | |
| | | | 70,550,644 | | |
See Accompanying Notes to Financial Statements.
10
Credit Suisse Floating Rate High Income Fund
Schedule of Investments (continued)
October 31, 2016
Par
(000)
| | Ratings†
(S&P/Moody's) | | Maturity | | Rate% | | Value | |
| BANK LOANS (continued) | | | |
| Cable & Satellite TV (1.8%) | | | |
$ | 10,245 | | | Altice U.S. Finance I Corp.(1) | | (BB-, Ba3) | | 01/15/25 | | | 3.882 | | | $ | 10,295,887 | | |
| | 6,716 | | | Charter Communications Operating LLC(1) | | (BBB, Ba1) | | 01/24/23 | | | 3.500 | | | | 6,765,682 | | |
| | 1,980 | | | Charter Communications Operating LLC(1) | | (BBB, Ba1) | | 01/04/21 | | | 3.000 | | | | 1,985,112 | | |
| | 8,715 | | | CSC Holdings LLC(1) | | (BB-, Ba1) | | 10/11/24 | | | 3.876 | | | | 8,762,318 | | |
| | 3,487 | | | Numericable U.S. LLC(1) | | (B+, B1) | | 02/10/23 | | | 4.750 | | | | 3,497,727 | | |
| | 2,913 | | | Telenet International Finance Sarl(1) | | (B+, B1) | | 06/30/24 | | | 4.357 | | | | 2,924,158 | | |
| | 2,500 | | | Virgin Media Investment Holdings Ltd.(1),(3) | | (BB-, Ba3) | | 06/30/23 | | | 4.250 | | | | 3,065,191 | | |
| | 11,484 | | | Ziggo Financing Partnership(1) | | (BB-, Ba3) | | 01/15/22 | | | 3.500 | | | | 11,499,817 | | |
| | 1,328 | | | Ziggo Financing Partnership(1) | | (BB-, Ba3) | | 01/15/22 | | | 3.701 | | | | 1,329,664 | | |
| | | | 50,125,556 | | |
| Chemicals (8.6%) | | | |
| | 10,000 | | | Allnex (Luxembourg) & Cy S.C.A.(1),(2) | | (B+, B1) | | 09/13/23 | | | 5.000 | | | | 11,157,292 | | |
| | 15,506 | | | Ascend Performance Materials Operations LLC(1) | | (B, B2) | | 08/12/22 | | | 6.500 | | | | 15,522,399 | | |
| | 5,000 | | | Azelis Finance S.A.(1) | | (B+, B2) | | 12/15/22 | | | 6.500 | | | | 5,058,065 | | |
| | 13,452 | | | Chromaflo Technologies Corp.(1) | | (B-, B2) | | 12/02/19 | | | 4.500 | | | | 13,468,395 | | |
| | 4,127 | | | Chromaflo Technologies Corp.(1) | | (CCC+, Caa2) | | 06/02/20 | | | 8.250 | | | | 4,148,041 | | |
| | 2,911 | | | Colouroz Investment 2 LLC(1) | | (CCC+, Caa1) | | 09/06/22 | | | 8.250 | | | | 2,804,062 | | |
| | 1,985 | | | Flint Group GmbH(1),(2) | | (B, NR) | | 09/07/21 | | | 4.250 | | | | 2,201,123 | | |
| | 15,715 | | | Gemini HDPE LLC(1) | | (B+, Ba2) | | 08/07/21 | | | 4.750 | | | | 15,891,302 | | |
| | 2,500 | | | Gruden Acquisition, Inc.(1),(4) | | (CCC, Caa2) | | 08/18/23 | | | 9.500 | | | | 1,935,163 | | |
| | 14,176 | | | Houghton International, Inc.(1) | | (B+, B1) | | 12/20/19 | | | 4.250 | | | | 14,211,246 | | |
| | 3,870 | | | Houghton International, Inc.(1) | | (B-, Caa1) | | 12/20/20 | | | 9.750 | | | | 3,831,300 | | |
| | 3,253 | | | Huntsman International LLC(1) | | (BB, Ba2) | | 10/01/21 | | | 3.750 | | | | 3,273,977 | | |
| | 7,214 | | | Huntsman International LLC(1) | | (BB, Ba2) | | 04/01/23 | | | 4.250 | | | | 7,278,385 | | |
| | 1,975 | | | Ineos Group Holdings S.A.(1),(2) | | (BB-, Ba3) | | 12/15/20 | | | 4.000 | | | | 2,190,973 | | |
| | 12,482 | | | Ineos U.S. Finance LLC(1) | | (BB-, Ba3) | | 05/04/18 | | | 3.750 | | | | 12,522,757 | | |
| | 330 | | | Ineos U.S. Finance LLC(1) | | (BB-, Ba3) | | 03/31/22 | | | 4.250 | | | | 332,371 | | |
| | 13,724 | | | Ineos U.S. Finance LLC(1) | | (BB-, Ba3) | | 12/31/16 | | | 3.034 | | | | 13,736,629 | | |
| | 15,000 | | | Kronos, Inc.(1) | | (B-, B2) | | 10/04/23 | | | 5.000 | | | | 15,084,375 | | |
| | 3,580 | | | Kronos, Inc.(1) | | (CCC, Caa2) | | 10/04/24 | | | 9.250 | | | | 3,699,603 | | |
| | 3,760 | | | Minerals Technologies, Inc.(1) | | (BB+, Ba2) | | 05/09/21 | | | 3.750 | | | | 3,800,228 | | |
| | 5,940 | | | Osmose Holdings, Inc.(1) | | (B, B2) | | 08/21/22 | | | 4.750 | | | | 5,962,275 | | |
| | 3,880 | | | OXEA Finance & Cy S.C.A.(1),(2) | | (B+, B3) | | 01/15/20 | | | 4.500 | | | | 4,123,533 | | |
| | 8,245 | | | OXEA Finance LLC(1) | | (B+, B3) | | 01/15/20 | | | 4.250 | | | | 7,906,870 | | |
| | 7,731 | | | Ravago Holdings America, Inc.(1) | | (BB, B2) | | 06/30/23 | | | 5.000 | | | | 7,807,931 | | |
| | 2,454 | | | Solenis International LP(1) | | (B, B2) | | 07/31/21 | | | 4.250 | | | | 2,455,887 | | |
| | 5,499 | | | Solenis International LP(1) | | (B-, Caa1) | | 07/31/22 | | | 7.750 | | | | 5,397,567 | | |
| | 2,505 | | | Sonneborn LLC(1) | | (B, B1) | | 12/10/20 | | | 4.750 | | | | 2,512,754 | | |
| | 442 | | | Sonneborn Refined Products B.V.(1) | | (B, B1) | | 12/10/20 | | | 4.750 | | | | 443,427 | | |
| | 4,264 | | | The Chemours Co.(1) | | (BB+, Ba1) | | 05/12/22 | | | 3.750 | | | | 4,221,589 | | |
| | 18,016 | | | Tronox Pigments (Netherlands) B.V.(1) | | (BB, B1) | | 03/19/20 | | | 4.500 | | | | 17,954,842 | | |
| | 8,996 | | | U.S. Silica Co.(1) | | (B, B2) | | 07/23/20 | | | 4.000 | | | | 8,816,301 | | |
| | 11,114 | | | Univar, Inc.(1) | | (BB-, B2) | | 07/01/22 | | | 4.250 | | | | 11,146,823 | | |
| | 8,154 | | | UTEX Industries, Inc.(1) | | (CCC+, Caa1) | | 05/22/21 | | | 5.000 | | | | 6,998,584 | | |
| | 1,423 | | | Vantage Specialty Chemicals, Inc.(1) | | (B-, B2) | | 02/05/21 | | | 5.500 | | | | 1,423,959 | | |
| | | | 239,320,028 | | |
See Accompanying Notes to Financial Statements.
11
Credit Suisse Floating Rate High Income Fund
Schedule of Investments (continued)
October 31, 2016
Par
(000)
| | Ratings†
(S&P/Moody's) | | Maturity | | Rate% | | Value | |
| BANK LOANS (continued) | | | |
| Consumer/Commercial/Lease Financing (1.2%) | | | |
$ | 12,817 | | | Infinity Acquisition LLC(1) | | (B+, B1) | | 08/06/21 | | | 4.250 | | | $ | 12,378,706 | | |
| | 19,853 | | | National Financial Partners Corp.(1) | | (B, B1) | | 07/01/20 | | | 4.500 | | | | 19,930,626 | | |
| | | | 32,309,332 | | |
| Department Stores (0.3%) | | | |
| | 8,400 | | | Dollar Tree, Inc.(1) | | (BBB, Ba1) | | 07/06/22 | | | 4.250 | | | | 8,536,500 | | |
| Diversified Capital Goods (0.7%) | | | |
| | 5,237 | | | Compass Group Diversified Holdings LLC(1) | | (BB-, Ba3) | | 06/04/21 | | | 4.250 | | | | 5,279,451 | | |
| | 1,213 | | | Douglas Dynamics Holdings, Inc.(1) | | (BB-, B2) | | 12/31/21 | | | 5.250 | | | | 1,220,058 | | |
| | 3,750 | | | Horizon Global Corp.(1) | | (B, B2) | | 06/30/21 | | | 7.000 | | | | 3,773,437 | | |
| | 7,710 | | | Husky Injection Molding Systems Ltd.(1) | | (B, B2) | | 06/30/21 | | | 4.250 | | | | 7,717,134 | | |
| | | | 17,990,080 | | |
| Electronics (2.6%) | | | |
| | 22,436 | | | Avago Technologies Cayman Ltd.(1) | | (BBB, Ba1) | | 02/01/23 | | | 3.535 | | | | 22,694,876 | | |
| | 4,500 | | | Cavium, Inc.(1) | | (BB-, Ba3) | | 08/16/22 | | | 3.750 | | | | 4,519,687 | | |
| | 1,990 | | | CPI International, Inc.(1) | | (B, B1) | | 11/17/17 | | | 4.250 | | | | 1,986,065 | | |
| | 6,744 | | | Excelitas Technologies Corp.(1) | | (CCC+, B3) | | 10/31/20 | | | 6.000 | | | | 6,541,582 | | |
| | 7,032 | | | Microsemi Corp.(1) | | (BB, Ba2) | | 01/15/23 | | | 3.750 | | | | 7,103,890 | | |
| | 6,211 | | | MKS Instruments, Inc.(1) | | (BB, Ba2) | | 05/01/23 | | | 4.250 | | | | 6,271,403 | | |
| | 4,500 | | | NXP B.V.(1) | | (BBB-, Baa2) | | 03/04/17 | | | 2.750 | | | | 4,511,250 | | |
| | 13,417 | | | ON Semiconductor Corp.(1) | | (BB, Ba1) | | 03/31/23 | | | 3.777 | | | | 13,519,296 | | |
| | 5,179 | | | Sophia LP(1) | | (B-, B2) | | 09/30/22 | | | 4.750 | | | | 5,193,629 | | |
| | | | 72,341,678 | | |
| Energy - Exploration & Production (0.4%) | | | |
| | 4,000 | | | Chief Exploration & Development LLC(1) | | (NR, NR) | | 05/16/21 | | | 7.753 | | | | 3,846,260 | | |
| | 9,100 | | | W&T Offshore, Inc.(1) | | (CCC, Caa2) | | 05/15/20 | | | 9.000 | | | | 6,256,250 | | |
| | | | 10,102,510 | | |
| Environmental (0.5%) | | | |
| | 10,160 | | | GFL Environmental, Inc.(1) | | (BB-, Ba2) | | 09/23/23 | | | 3.750 | | | | 10,184,934 | | |
| | 2,943 | | | PSC Industrial Holdings Corp.(1),(4) | | (B+, B2) | | 12/05/20 | | | 5.750 | | | | 2,846,941 | | |
| | | | 13,031,875 | | |
| Food & Drug Retailers (0.3%) | | | |
| | 5,130 | | | Rite Aid Corp.(1) | | (B+, B2) | | 06/21/21 | | | 4.875 | | | | 5,154,598 | | |
| | 4,251 | | | Smart & Final Stores LLC(1) | | (B+, B3) | | 11/15/22 | | | 4.305 | | | | 4,247,211 | | |
| | | | 9,401,809 | | |
| Food - Wholesale (1.4%) | | | |
| | 12,413 | | | Allflex Holdings III, Inc.(1) | | (B, B2) | | 07/20/20 | | | 4.250 | | | | 12,482,679 | | |
| | 1,650 | | | CSM Bakery Solutions LLC(1),(4) | | (CCC+, B3) | | 07/03/21 | | | 8.750 | | | | 1,489,125 | | |
| | 4,665 | | | JBS U.S.A. LLC(1) | | (BBB-, Ba1) | | 10/30/22 | | | 4.000 | | | | 4,667,666 | | |
| | 21,092 | | | U.S. Foods, Inc.(1) | | (B+, B1) | | 06/27/23 | | | 4.000 | | | | 21,249,884 | | |
| | | | 39,889,354 | | |
See Accompanying Notes to Financial Statements.
12
Credit Suisse Floating Rate High Income Fund
Schedule of Investments (continued)
October 31, 2016
Par
(000)
| | Ratings†
(S&P/Moody's) | | Maturity | | Rate% | | Value | |
| BANK LOANS (continued) | | | |
| Forestry & Paper (0.3%) | | | |
$ | 5,315 | | | Prolampac Intermediate, Inc.(1) | | (B, B3) | | 08/18/22 | | | 5.750 | | | $ | 5,334,353 | | |
| | 2,750 | | | Prolampac Intermediate, Inc.(1) | | (CCC+, Caa2) | | 08/18/23 | | | 9.250 | | | | 2,722,500 | | |
| | | | 8,056,853 | | |
| Gaming (1.6%) | | | |
| | 9,135 | | | Amaya Holdings B.V.(1) | | (BB-, B1) | | 08/01/21 | | | 5.000 | | | | 9,146,519 | | |
| | 7,000 | | | BC Equity Ventures LLC(1) | | (BB-, Ba3) | | 08/31/17 | | | 7.500 | | | | 6,965,000 | | |
| | 4,963 | | | CBAC Borrower LLC(1) | | (B-, Caa1) | | 07/02/20 | | | 8.250 | | | | 4,900,469 | | |
| | 4,988 | | | MGM Growth Prop. Operating Partnership LP(1) | | (BB+, B1) | | 04/25/23 | | | 4.000 | | | | 5,007,515 | | |
| | 10,700 | | | ROC Finance LLC(1) | | (B+, B2) | | 06/20/19 | | | 5.000 | | | | 10,709,113 | | |
| | 7,831 | | | The Intertain Group Ltd.(1) | | (BB, B2) | | 04/08/22 | | | 7.500 | | | | 7,831,413 | | |
| | | | 44,560,029 | | |
| Gas Distribution (0.1%) | | | |
| | 3,000 | | | Energy Transfer Equity LP(1) | | (BB, Ba2) | | 12/02/19 | | | 3.292 | | | | 2,983,125 | | |
| Health Facilities (3.0%) | | | |
| | 4,938 | | | Community Health Systems, Inc.(1) | | (BB-, Ba3) | | 12/31/19 | | | 3.750 | | | | 4,685,243 | | |
| | 3,376 | | | Community Health Systems, Inc.(1) | | (BB-, Ba3) | | 01/27/21 | | | 4.000 | | | | 3,199,350 | | |
| | 17,562 | | | Drumm Investors LLC(1) | | (B, Caa1) | | 05/04/18 | | | 9.500 | | | | 17,562,320 | | |
| | 5,472 | | | HCA, Inc.(1) | | (BBB-, Ba1) | | 03/17/23 | | | 3.784 | | | | 5,535,781 | | |
| | 3,156 | | | HCA, Inc.(1) | | (BBB-, Ba1) | | 02/15/24 | | | 3.588 | | | | 3,187,987 | | |
| | 13,676 | | | Heartland Dental LLC(1) | | (B-, B1) | | 12/21/18 | | | 5.500 | | | | 13,722,814 | | |
| | 6,912 | | | Iasis Healthcare LLC(1) | | (B, Ba3) | | 05/03/18 | | | 4.500 | | | | 6,884,145 | | |
| | 13,442 | | | Premier Dental Services, Inc.(1) | | (B-, Caa1) | | 11/01/18 | | | 7.500 | | | | 13,391,369 | | |
| | 15,388 | | | Surgical Care Affiliates, Inc.(1) | | (B+, Ba3) | | 03/17/22 | | | 3.750 | | | | 15,464,438 | | |
| | | | 83,633,447 | | |
| Health Services (3.7%) | | | |
| | 14,000 | | | ABB Concise Optical Group LLC(1) | | (B, B1) | | 06/15/23 | | | 6.004 | | | | 14,070,000 | | |
| | 17,691 | | | DPx Holdings B.V.(1) | | (B, B2) | | 03/11/21 | | | 4.250 | | | | 17,720,269 | | |
| | 8,181 | | | Envision Healthcare Corp.(1) | | (BB-, B1) | | 10/28/22 | | | 4.500 | | | | 8,223,648 | | |
| | 3,724 | | | ExamWorks Group, Inc.(1) | | (B, B1) | | 07/27/23 | | | 4.750 | | | | 3,755,160 | | |
| | 9,974 | | | IMS Health, Inc.(1) | | (BBB-, Ba1) | | 03/17/21 | | | 3.500 | | | | 10,046,141 | | |
| | 13,576 | | | Kinetic Concepts, Inc.(1) | | (NR, Ba3) | | 11/04/20 | | | 5.000 | | | | 13,701,605 | | |
| | 14,608 | | | Onex Carestream Finance LP(1) | | (B+, B1) | | 06/07/19 | | | 5.000 | | | | 13,613,252 | | |
| | 4,988 | | | Prospect Medical Holdings, Inc.(1) | | (B, Ba3) | | 06/30/22 | | | 7.000 | | | | 4,971,914 | | |
| | 13,701 | | | Surgery Center Holdings, Inc.(1) | | (B, B2) | | 11/03/20 | | | 4.750 | | | | 13,777,685 | | |
| | 7,538 | | | Valitas Health Services, Inc.(1),(4) | | (NR, Caa2) | | 06/02/17 | | | 10.000 | | | | 3,486,485 | | |
| | | | 103,366,159 | | |
| Hotels (1.7%) | | | |
| | 1,600 | | | Hilton Worldwide Finance LLC(1) | | (BBB, Ba1) | | 10/26/20 | | | 3.500 | | | | 1,608,858 | | |
| | 16,359 | | | Hilton Worldwide Finance LLC(1) | | (BBB, Ba1) | | 10/25/23 | | | 3.034 | | | | 16,464,772 | | |
| | 16,677 | | | La Quinta Intermediate Holdings LLC(1) | | (BB, B1) | | 04/14/21 | | | 3.750 | | | | 16,679,388 | | |
| | 12,402 | | | Playa Resorts Holding B.V.(1) | | (BB-, B2) | | 08/09/19 | | | 4.000 | | | | 12,402,346 | | |
| | | | 47,155,364 | | |
See Accompanying Notes to Financial Statements.
13
Credit Suisse Floating Rate High Income Fund
Schedule of Investments (continued)
October 31, 2016
Par
(000)
| | Ratings†
(S&P/Moody's) | | Maturity | | Rate% | | Value | |
| BANK LOANS (continued) | | | |
| Insurance Brokerage (2.0%) | | | |
$ | 103 | | | Acrisure LLC(1),(5) | | (B, B2) | | 05/19/22 | | | 6.500 | | | $ | 103,697 | | |
| | 14,831 | | | Acrisure LLC(1) | | (B, B2) | | 05/19/22 | | | 6.500 | | | | 14,887,026 | | |
| | 19,883 | | | Alliant Holdings I, Inc.(1) | | (B, B2) | | 08/12/22 | | | 4.753 | | | | 19,915,649 | | |
| | 2,331 | | | Alliant Holdings I, Inc.(1) | | (B, B2) | | 08/12/22 | | | 5.253 | | | | 2,348,296 | | |
| | 14,392 | | | Hub International Ltd.(1) | | (B+, Ba3) | | 10/02/20 | | | 4.000 | | | | 14,407,367 | | |
| | 3,498 | | | Hyperion Insurance Group Ltd.(1) | | (B, B1) | | 04/29/22 | | | 5.500 | | | | 3,448,991 | | |
| | | | 55,111,026 | | |
| Investments & Misc. Financial Services (3.1%) | | | |
| | 15,321 | | | Altisource Solutions Sarl(1) | | (BB-, B3) | | 12/09/20 | | | 4.500 | | | | 14,860,899 | | |
| | 3,183 | | | BATS Global Markets, Inc.(1) | | (BB-, Ba3) | | 06/14/23 | | | 4.034 | | | | 3,197,574 | | |
| | 2,000 | | | First American Payment Systems LP(1) | | (CCC+, Caa1) | | 04/11/19 | | | 10.750 | | | | 1,935,000 | | |
| | 4,025 | | | Hamilton Lane Advisors LLC(1) | | (BB+, Ba3) | | 07/09/22 | | | 4.250 | | | | 4,050,989 | | |
| | 1,858 | | | Liquidnet Holdings, Inc.(1) | | (B, B2) | | 05/22/19 | | | 7.750 | | | | 1,844,510 | | |
| | 3,264 | | | LPL Holdings, Inc.(1) | | (BB-, Ba3) | | 03/29/19 | | | 3.250 | | | | 3,270,716 | | |
| | 995 | | | LPL Holdings, Inc.(1) | | (BB-, Ba3) | | 03/29/21 | | | 4.250 | | | | 1,001,206 | | |
| | 4,169 | | | LPL Holdings, Inc.(1) | | (BB-, Ba3) | | 11/20/22 | | | 4.750 | | | | 4,212,790 | | |
| | 16,441 | | | NorthStar Asset Management Group, Inc.(1) | | (BBB-, Ba2) | | 01/29/23 | | | 4.762 | | | | 16,468,565 | | |
| | 18,667 | | | USI, Inc.(1) | | (B, B1) | | 12/27/19 | | | 4.250 | | | | 18,701,945 | | |
| | 11,854 | | | VFH Parent LLC(1) | | (B, Ba3) | | 10/21/22 | | | 4.250 | | | | 11,902,558 | | |
| | 5,000 | | | Walter Investment Management Corp.(1) | | (B+, B3) | | 12/19/20 | | | 4.750 | | | | 4,694,800 | | |
| | | | 86,141,552 | | |
| Machinery (0.9%) | | | |
| | 4,239 | | | Blount International, Inc.(1) | | (B+, B1) | | 04/12/23 | | | 7.250 | | | | 4,295,017 | | |
| | 1,500 | | | CPM Holdings, Inc.(1),(4) | | (B, Caa1) | | 04/10/23 | | | 10.250 | | | | 1,425,000 | | |
| | 4,803 | | | CPM Holdings, Inc.(1) | | (B+, B1) | | 04/11/22 | | | 6.000 | | | | 4,833,200 | | |
| | 4,085 | | | Manitowoc Foodservice, Inc.(1) | | (B+, B1) | | 03/03/23 | | | 5.750 | | | | 4,152,277 | | |
| | 11,213 | | | Rexnord LLC(1) | | (BB-, B2) | | 08/21/20 | | | 4.000 | | | | 11,258,981 | | |
| | | | 25,964,475 | | |
| Managed Care (0.5%) | | | |
| | 6,892 | | | GENEX Holdings, Inc.(1) | | (B, B2) | | 05/30/21 | | | 5.250 | | | | 6,846,006 | | |
| | 3,500 | | | Sedgwick Claims Management Services, Inc.(1) | | (B, B1) | | 03/01/21 | | | 3.750 | | | | 3,481,415 | | |
| | 4,122 | | | Sedgwick Claims Management Services, Inc.(1) | | (B, B1) | | 03/01/21 | | | 4.250 | | | | 4,133,779 | | |
| | | | 14,461,200 | | |
| Media Content (1.2%) | | | |
| | 5,000 | | | All3Media International(1),(3) | | (B+, B2) | | 06/30/21 | | | 5.250 | | | | 6,046,171 | | |
| | 1,750 | | | DLG Acquisitions Ltd.(1),(2) | | (B-, Caa2) | | 06/30/22 | | | 8.250 | | | | 1,875,188 | | |
| | 2,791 | | | Inter Media Communication Srl(1),(2) | | (B, NR) | | 05/28/19 | | | 5.500 | | | | 3,044,529 | | |
| | 5,016 | | | Mission Broadcasting, Inc.(1) | | (BB+, Ba2) | | 10/01/20 | | | 3.750 | | | | 5,037,787 | | |
| | 1,002 | | | Mission Broadcasting, Inc.(1) | | (BB+, Ba3) | | 09/26/23 | | | 3.000 | | | | 1,007,600 | | |
| | 5,688 | | | Nexstar Broadcasting, Inc.(1) | | (BB+, Ba2) | | 10/01/20 | | | 3.750 | | | | 5,712,930 | | |
| | 11,248 | | | Nexstar Broadcasting, Inc.(1) | | (BB+, Ba3) | | 09/21/23 | | | 3.000 | | | | 11,307,509 | | |
| | | | 34,031,714 | | |
See Accompanying Notes to Financial Statements.
14
Credit Suisse Floating Rate High Income Fund
Schedule of Investments (continued)
October 31, 2016
Par
(000)
| | Ratings†
(S&P/Moody's) | | Maturity | | Rate% | | Value | |
| BANK LOANS (continued) | | | |
| Medical Products (1.1%) | | | |
$ | 9,410 | | | Alere, Inc.(1) | | (B+, Ba3) | | 06/18/22 | | | 4.250 | | | $ | 9,394,626 | | |
| | 5,000 | | | BSN Medical, Inc.(1) | | (B+, B1) | | 08/28/19 | | | 4.000 | | | | 5,002,075 | | |
| | 5,940 | | | Sterigenics-Nordion Holdings LLC(1) | | (B, B1) | | 05/15/22 | | | 4.250 | | | | 5,925,150 | | |
| | 11,209 | | | VWR Funding, Inc.(1) | | (BB, Ba3) | | 09/28/20 | | | 2.534 | | | | 11,096,772 | | |
| | | | 31,418,623 | | |
| Metals & Mining - Excluding Steel (1.7%) | | | |
| | 1,444 | | | CeramTec Acquisition Corp.(1) | | (B, Ba3) | | 08/30/20 | | | 4.250 | | | | 1,453,935 | | |
| | 17,013 | | | Faenza Acquisition GmbH(1) | | (B, Ba3) | | 08/30/20 | | | 4.250 | | | | 17,126,381 | | |
| | 10,297 | | | FMG Resources (August 2006) Pty. Ltd.(1) | | (BB+, Ba1) | | 06/30/19 | | | 3.750 | | | | 10,303,061 | | |
| | 1,784 | | | Global Brass & Copper, Inc.(1) | | (BB-, B2) | | 07/18/23 | | | 5.250 | | | | 1,805,502 | | |
| | 2,087 | | | H.C. Starck GmbH(1),(2),(4) | | (NR, Caa1) | | 05/30/20 | | | 8.000 | | | | 1,945,745 | | |
| | 741 | | | New Day Aluminum LLC(1),(4),(6) | | (NR, NR) | | 10/21/17 | | | 8.000 | | | | 740,507 | | |
| | 9,051 | | | Noranda Aluminum Acquisition Corp.(1),(7) | | (NR, NR) | | 02/28/19 | | | 7.000 | | | | 995,651 | | |
| | 12,363 | | | Novelis, Inc.(1) | | (BB, Ba2) | | 06/02/22 | | | 4.000 | | | | 12,413,274 | | |
| | | | 46,784,056 | | |
| Oil Field Equipment & Services (0.8%) | | | |
| | 9,898 | | | Drillships Financing Holding, Inc.(1) | | (CCC-, Caa2) | | 03/31/21 | | | 6.000 | | | | 5,122,059 | | |
| | 6,222 | | | McJunkin Red Man Corp.(1) | | (B+, B3) | | 11/08/19 | | | 5.000 | | | | 6,183,044 | | |
| | 13,953 | | | Pacific Drilling S.A.(1) | | (B-, Caa3) | | 06/03/18 | | | 4.500 | | | | 4,011,360 | | |
| | 5,919 | | | Seadrill Partners Finco LLC(1) | | (CCC+, Caa2) | | 02/21/21 | | | 4.000 | | | | 3,329,402 | | |
| | 3,500 | | | Shelf Drilling Holdings Ltd.(1) | | (C, B3) | | 10/08/18 | | | 10.000 | | | | 2,485,000 | | |
| | | | 21,130,865 | | |
| Oil Refining & Marketing (1.1%) | | | |
| | 17,078 | | | Philadelphia Energy Solutions LLC(1) | | (BB-, B1) | | 04/04/18 | | | 6.250 | | | | 14,900,390 | | |
| | 6,929 | | | Western Refining, Inc.(1) | | (B+, B1) | | 11/12/20 | | | 5.250 | | | | 6,924,423 | | |
| | 9,476 | | | Western Refining, Inc.(1) | | (B+, B1) | | 06/23/23 | | | 5.500 | | | | 9,479,235 | | |
| | | | 31,304,048 | | |
| Packaging (1.9%) | | | |
| | 4,567 | | | Anchor Glass Container Corp.(1) | | (BB-, B2) | | 07/01/22 | | | 4.750 | | | | 4,619,494 | | |
| | 2,560 | | | Ardagh Holdings U.S.A., Inc.(1) | | (B+, Ba3) | | 12/17/21 | | | 4.000 | | | | 2,589,330 | | |
| | 13,031 | | | Berry Plastics Holding Corp.(1) | | (BB, Ba3) | | 02/08/20 | | | 3.500 | | | | 13,065,155 | | |
| | 2,000 | | | Berry Plastics Holding Corp.(1) | | (BB, Ba3) | | 01/06/21 | | | 3.500 | | | | 2,004,170 | | |
| | 5,858 | | | Clondalkin Group Ltd.(1) | | (B, B2) | | 05/31/20 | | | 4.750 | | | | 5,828,660 | | |
| | 6,470 | | | Hilex Poly Co. LLC(1) | | (B, B1) | | 12/05/21 | | | 6.000 | | | | 6,541,661 | | |
| | 17,862 | | | SIG Combibloc U.S. Acquisition, Inc.(1) | | (B+, B1) | | 03/13/22 | | | 4.000 | | | | 17,907,103 | | |
| | | | 52,555,573 | | |
| Personal & Household Products (1.5%) | | | |
| | 5,000 | | | Brickman Group Ltd. LLC(1) | | (CCC+, Caa1) | | 12/17/21 | | | 7.500 | | | | 5,004,675 | | |
| | 2,000 | | | Charger OpCo B.V.(1),(2) | | (BB, NR) | | 10/14/21 | | | 2.250 | | | | 2,175,958 | | |
| | 2,100 | | | Galleria Co.(1) | | (BBB-, Ba1) | | 01/26/23 | | | 3.750 | | | | 2,118,364 | | |
| | 15,000 | | | Serta Simmons Holdings LLC(1) | | (B, B1) | | 10/20/23 | | | 4.500 | | | | 15,021,375 | | |
| | 6,333 | | | Serta Simmons Holdings LLC(1) | | (CCC+, B3) | | 10/20/24 | | | 9.000 | | | | 6,394,703 | | |
| | 11,829 | | | Serta Simmons Holdings LLC(1) | | (BB-, Ba3) | | 10/01/19 | | | 4.250 | | | | 11,815,035 | | |
| | | | 42,530,110 | | |
See Accompanying Notes to Financial Statements.
15
Credit Suisse Floating Rate High Income Fund
Schedule of Investments (continued)
October 31, 2016
Par
(000)
| | Ratings†
(S&P/Moody's) | | Maturity | | Rate% | | Value | |
| BANK LOANS (continued) | | | |
| Pharmaceuticals (2.5%) | | | |
$ | 10,927 | | | Albany Molecular Research, Inc.(1) | | (B, B1) | | 07/16/21 | | | 5.750 | | | $ | 10,982,043 | | |
| | 3,500 | | | Alkermes, Inc.(1) | | (BB, Ba3) | | 09/25/19 | | | 3.590 | | | | 3,504,375 | | |
| | 8,392 | | | Alvogen Pharma U.S., Inc.(1) | | (B, B3) | | 04/02/22 | | | 6.000 | | | | 8,410,197 | | |
| | 7,600 | | | AMAG Pharmaceuticals, Inc.(1) | | (BB, Ba2) | | 08/13/21 | | | 4.750 | | | | 7,619,000 | | |
| | 6,586 | | | Amneal Pharmaceuticals LLC(1) | | (BB-, B1) | | 11/01/19 | | | 4.501 | | | | 6,636,677 | | |
| | 3,818 | | | Capsugel Holdings U.S., Inc.(1) | | (B+, B1) | | 07/31/21 | | | 4.000 | | | | 3,841,316 | | |
| | 11,294 | | | Valeant Pharmaceuticals International, Inc.(1) | | (BB-, Ba2) | | 12/11/19 | | | 5.250 | | | | 11,294,518 | | |
| | 2,909 | | | Valeant Pharmaceuticals International, Inc.(1) | | (BB-, Ba2) | | 08/05/20 | | | 5.250 | | | | 2,903,344 | | |
| | 3,971 | | | Valeant Pharmaceuticals International, Inc.(1) | | (BB-, Ba2) | | 04/01/20 | | | 4.280 | | | | 3,943,290 | | |
| | 9,016 | | | Valeant Pharmaceuticals International, Inc.(1) | | (BB-, Ba2) | | 04/01/22 | | | 5.500 | | | | 9,007,474 | | |
| | | | 68,142,234 | | |
| Printing & Publishing (0.0%) | | | |
| | 1,155 | | | Harland Clarke Holdings Corp.(1) | | (BB-, B1) | | 08/04/19 | | | 6.993 | | | | 1,149,399 | | |
| Real Estate Development & Management (0.4%) | | | |
| | 7,733 | | | SRS Distribution, Inc.(1) | | (B, B2) | | 08/25/22 | | | 5.250 | | | | 7,818,787 | | |
| | 2,250 | | | SRS Distribution, Inc.(1) | | (CCC+, Caa1) | | 02/24/23 | | | 9.750 | | | | 2,283,750 | | |
| | | | 10,102,537 | | |
| Real Estate Investment Trusts (1.0%) | | | |
| | 17,374 | | | DTZ U.S. Borrower LLC(1) | | (B+, B1) | | 11/04/21 | | | 4.250 | | | | 17,364,509 | | |
| | 11,570 | | | Istar Financial, Inc.(1) | | (B+, Ba3) | | 07/01/20 | | | 5.500 | | | | 11,709,651 | | |
| | | | 29,074,160 | | |
| Recreation & Travel (1.3%) | | | |
| | 9,516 | | | ClubCorp Club Operations, Inc.(1) | | (BB-, Ba3) | | 12/15/22 | | | 4.000 | | | | 9,581,052 | | |
| | 16,484 | | | Intrawest Operations Group LLC(1) | | (B+, B2) | | 12/09/20 | | | 4.500 | | | | 16,640,615 | | |
| | 6,000 | | | Legendary Pictures Funding LLC(1),(4) | | (B, NR) | | 04/22/20 | | | 7.000 | | | | 6,015,000 | | |
| | 4,250 | | | Parkdean Resorts Holdco Ltd.(1),(3),(4) | | (B+, B1) | | 11/10/22 | | | 5.637 | | | | 5,223,849 | | |
| | | | 37,460,516 | | |
| Restaurants (1.6%) | | | |
| | 27,667 | | | B.C. Unlimited Liability Co.(1) | | (B+, Ba3) | | 12/10/21 | | | 3.750 | | | | 27,831,573 | | |
| | 5,543 | | | Landry's, Inc.(1) | | (B+, Ba3) | | 10/04/23 | | | 4.000 | | | | 5,583,918 | | |
| | 9,726 | | | Yum! Brands, Inc.(1) | | (BBB-, Ba1) | | 06/16/23 | | | 3.286 | | | | 9,841,117 | | |
| | | | 43,256,608 | | |
| Software - Services (10.0%) | | | |
| | 3,882 | | | Applied Systems, Inc.(1) | | (B+, B1) | | 01/25/21 | | | 4.000 | | | | 3,895,657 | | |
| | 7,000 | | | Applied Systems, Inc.(1) | | (B+, B1) | | 01/23/21 | | | 4.250 | | | | 7,025,375 | | |
| | 10,394 | | | Aricent Technologies(1) | | (B-, B2) | | 04/14/21 | | | 5.500 | | | | 9,746,399 | | |
| | 4,530 | | | Aricent Technologies(1),(4) | | (CCC, Caa2) | | 04/14/22 | | | 9.500 | | | | 3,780,285 | | |
| | 8,000 | | | Avast Software B.V.(1) | | (BB-, Ba3) | | 09/30/22 | | | 5.000 | | | | 8,092,000 | | |
| | 7,730 | | | Camelot UK Holdco Ltd.(1) | | (BB-, B2) | | 10/03/23 | | | 4.750 | | | | 7,751,721 | | |
| | 6,235 | | | Camp International Holding Co.(1) | | (B-, B2) | | 08/11/23 | | | 4.750 | | | | 6,248,655 | | |
| | 17,538 | | | CCC Information Services, Inc.(1) | | (B+, B1) | | 12/20/19 | | | 4.000 | | | | 17,576,618 | | |
| | 15,291 | | | Deltek, Inc.(1) | | (B, Ba3) | | 06/25/22 | | | 5.000 | | | | 15,403,504 | | |
See Accompanying Notes to Financial Statements.
16
Credit Suisse Floating Rate High Income Fund
Schedule of Investments (continued)
October 31, 2016
Par
(000)
| | Ratings†
(S&P/Moody's) | | Maturity | | Rate% | | Value | |
| BANK LOANS (continued) | | | |
Software - Services | | | |
$ | 9,235 | | | Duff & Phelps Investment Management Co.(1) | | (NR, B2) | | 04/23/20 | | | 4.750 | | | $ | 9,269,331 | | |
| | 3,075 | | | Duff & Phelps Investment Management Co.(1) | | (CCC+, Caa1) | | 04/23/21 | | | 9.500 | | | | 3,059,625 | | |
| | 6,178 | | | EagleView Technology Corp.(1) | | (B, B2) | | 07/22/22 | | | 5.250 | | | | 6,198,202 | | |
| | 13,339 | | | Epicor Software Corp.(1) | | (B-, B2) | | 06/01/22 | | | 4.750 | | | | 13,217,778 | | |
| | 10,031 | | | Evertec Group LLC(1) | | (BB-, B1) | | 04/17/20 | | | 3.250 | | | | 9,978,853 | | |
| | 1,039 | | | Evertec Group LLC(1) | | (BB-, B1) | | 04/17/18 | | | 2.775 | | | | 1,031,363 | | |
| | 3,984 | | | Eze Castle Software, Inc.(1) | | (B+, B1) | | 04/06/20 | | | 4.000 | | | | 3,981,230 | | |
| | 4,190 | | | First Data Corp.(1) | | (BB, Ba3) | | 07/08/22 | | | 4.274 | | | | 4,225,266 | | |
| | 2,266 | | | Flexera Software LLC(1) | | (B, B1) | | 04/02/20 | | | 4.500 | | | | 2,275,931 | | |
| | 3,000 | | | Flexera Software LLC(1) | | (CCC+, Caa1) | | 04/02/21 | | | 8.000 | | | | 2,968,740 | | |
| | 13,773 | | | Genesys Telecom Holdings U.S., Inc.(1) | | (B, B2) | | 02/08/20 | | | 4.000 | | | | 13,768,952 | | |
| | 7,537 | | | Genesys Telecom Holdings U.S., Inc.(1) | | (B, B2) | | 11/13/20 | | | 4.500 | | | | 7,547,804 | | |
| | 6,930 | | | Global Healthcare Exchange LLC(1) | | (B, B1) | | 08/15/22 | | | 5.250 | | | | 6,987,982 | | |
| | 8,116 | | | Global Payments, Inc.(1) | | (NR, NR) | | 10/25/21 | | | 2.706 | | | | 8,186,957 | | |
| | 1,829 | | | Global Payments, Inc.(1) | | (BBB-, Ba2) | | 04/22/23 | | | 3.034 | | | | 1,820,055 | | |
| | 2,295 | | | Hyland Software, Inc.(1) | | (CCC+, Caa2) | | 07/01/23 | | | 8.250 | | | | 2,315,081 | | |
| | 2,453 | | | Infor (U.S.), Inc.(1) | | (B+, B1) | | 06/03/20 | | | 3.750 | | | | 2,453,164 | | |
| | 18,055 | | | Infor (U.S.), Inc.(1) | | (B+, B1) | | 06/03/20 | | | 3.750 | | | | 18,041,903 | | |
| | 2,500 | | | Landslide Holdings, Inc.(1) | | (B, B1) | | 09/27/22 | | | 5.500 | | | | 2,524,225 | | |
| | 13,264 | | | MA FinanceCo. LLC(1) | | (BB-, B1) | | 11/20/21 | | | 4.500 | | | | 13,328,407 | | |
| | 2,541 | | | MA FinanceCo. LLC(1) | | (BB-, B1) | | 11/20/19 | | | 4.500 | | | | 2,554,048 | | |
| | 4,385 | | | MRI Software LLC(1),(4) | | (B+, B2) | | 06/23/21 | | | 5.250 | | | | 4,375,794 | | |
| | 10,641 | | | Pinnacle Holdco Sarl(1),(4) | | (B, B3) | | 07/30/19 | | | 4.750 | | | | 8,636,904 | | |
| | 9,382 | | | SS&C Technologies, Inc.(1) | | (BB, Ba3) | | 07/08/22 | | | 4.000 | | | | 9,471,101 | | |
| | 1,142 | | | SS&C Technologies, Inc.(1) | | (BB, Ba3) | | 07/08/22 | | | 4.000 | | | | 1,152,630 | | |
| | 12,387 | | | Sungard Availability Services Capital, Inc.(1) | | (B, B1) | | 03/31/19 | | | 6.000 | | | | 11,783,132 | | |
| | 6,097 | | | Syniverse Holdings, Inc.(1) | | (B+, B2) | | 04/23/19 | | | 4.000 | | | | 5,647,466 | | |
| | 5,169 | | | Syniverse Holdings, Inc.(1) | | (B+, B2) | | 04/23/19 | | | 4.000 | | | | 4,780,908 | | |
| | 11,935 | | | Wall Street Systems Delaware, Inc.(1) | | (B, B2) | | 08/23/23 | | | 4.750 | | | | 11,980,074 | | |
| | 3,574 | | | WEX, Inc.(1) | | (BB-, Ba3) | | 07/01/23 | | | 4.250 | | | | 3,620,234 | | |
| | | | 276,703,354 | | |
| Specialty Retail (1.3%) | | | |
| | 2,888 | | | BJ's Wholesale Club, Inc.(1) | | (CCC, Caa2) | | 03/26/20 | | | 8.500 | | | | 2,907,463 | | |
| | 16,118 | | | BJ's Wholesale Club, Inc.(1) | | (B-, B3) | | 09/26/19 | | | 4.500 | | | | 16,162,366 | | |
| | 9,500 | | | Leslie's Poolmart, Inc.(1) | | (B, B1) | | 08/16/23 | | | 5.250 | | | | 9,581,130 | | |
| | 11,655 | | | Payless, Inc.(1) | | (B, B2) | | 03/11/21 | | | 5.000 | | | | 7,452,007 | | |
| | | | 36,102,966 | | |
| Steel Producers/Products (1.1%) | | | |
| | 11,267 | | | Atkore International, Inc.(1) | | (B, B2) | | 04/09/21 | | | 4.500 | | | | 11,321,423 | | |
| | 7,500 | | | Atkore International, Inc.(1) | | (CCC+, Caa1) | | 10/09/21 | | | 7.750 | | | | 7,537,500 | | |
| | 12,630 | | | Zekelman Industries, Inc.(1) | | (BB-, B2) | | 06/14/21 | | | 6.000 | | | | 12,761,453 | | |
| | | | 31,620,376 | | |
See Accompanying Notes to Financial Statements.
17
Credit Suisse Floating Rate High Income Fund
Schedule of Investments (continued)
October 31, 2016
Par
(000)
| | Ratings†
(S&P/Moody's) | | Maturity | | Rate% | | Value | |
| BANK LOANS (continued) | | | |
| Support - Services (2.9%) | | | |
$ | 15,116 | | | BakerCorp International, Inc.(1) | | (B-, B2) | | 02/07/20 | | | 4.250 | | | $ | 13,264,199 | | |
| | 13,910 | | | Brand Energy & Infrastructure Services, Inc.(1) | | (B, B2) | | 11/26/20 | | | 4.750 | | | | 13,763,417 | | |
| | 15,397 | | | Change Healthcare Holdings Inc.(1) | | (B+, Ba3) | | 11/02/18 | | | 3.750 | | | | 15,449,930 | | |
| | 2,543 | | | Explorer Holdings, Inc.(1) | | (B, B1) | | 05/02/23 | | | 6.000 | | | | 2,575,620 | | |
| | 2,985 | | | GCA Services Group, Inc.(1) | | (B, B1) | | 03/01/23 | | | 5.872 | | | | 3,015,313 | | |
| | 4,469 | | | Neff Rental LLC(1) | | (B-, B3) | | 06/09/21 | | | 7.250 | | | | 4,371,731 | | |
| | 4,290 | | | ON Assignment, Inc.(1) | | (BB, Ba2) | | 06/03/22 | | | 3.500 | | | | 4,319,335 | | |
| | 6,468 | | | Sabre, Inc.(1) | | (BB-, Ba2) | | 02/19/19 | | | 4.500 | | | | 6,505,519 | | |
| | 3,000 | | | Safway Group Holding LLC(1) | | (B+, B3) | | 08/19/23 | | | 5.750 | | | | 3,006,255 | | |
| | 1,292 | | | SGS Cayman LP(1) | | (BB-, B2) | | 04/23/21 | | | 6.000 | | | | 1,283,326 | | |
| | 1,969 | | | Sprint Industrial Holdings LLC(1),(4) | | (CCC+, Caa1) | | 05/14/19 | | | 7.000 | | | | 1,447,557 | | |
| | 2,000 | | | Sprint Industrial Holdings LLC(1),(4) | | (CC, Caa3) | | 11/14/19 | | | 11.250 | | | | 1,190,000 | | |
| | 5,552 | | | Sutherland Global Services, Inc.(1) | | (BB-, B2) | | 04/23/21 | | | 6.000 | | | | 5,513,104 | | |
| | 6,305 | | | York Risk Services Holding Corp.(1) | | (B-, B3) | | 10/01/21 | | | 4.750 | | | | 5,875,387 | | |
| | | | 81,580,693 | | |
| Tech Hardware & Equipment (3.2%) | | | |
| | 12,379 | | | Avaya, Inc.(1) | | (CCC+, B2) | | 03/30/18 | | | 6.500 | | | | 10,613,981 | | |
| | 13,398 | | | CommScope, Inc.(1) | | (BB, Ba1) | | 12/29/22 | | | 3.250 | | | | 13,479,477 | | |
| | 15,000 | | | Dell, Inc.(1) | | (BBB, Baa3) | | 12/31/18 | | | 2.540 | | | | 14,992,200 | | |
| | 20,000 | | | Dell, Inc.(1) | | (BBB-, Baa3) | | 09/07/21 | | | 2.790 | | | | 19,858,000 | | |
| | 11,884 | | | Omnitracs, Inc.(1) | | (B, B1) | | 11/25/20 | | | 4.750 | | | | 11,857,921 | | |
| | 4,750 | | | Omnitracs, Inc.(1) | | (CCC+, Caa1) | | 05/25/21 | | | 8.750 | | | | 4,514,471 | | |
| | 6,213 | | | Riverbed Technology, Inc.(1) | | (B, B1) | | 04/24/22 | | | 5.000 | | | | 6,272,181 | | |
| | 5,985 | | | Western Digital Corp.(1) | | (BBB-, Ba1) | | 04/29/23 | | | 4.500 | | | | 6,060,321 | | |
| | | | 87,648,552 | | |
| Telecom - Wireless (0.4%) | | | |
| | 10,925 | | | SBA Senior Finance II LLC(1) | | (BB, B1) | | 06/10/22 | | | 3.340 | | | | 10,943,622 | | |
| Telecom - Wireline Integrated & Services (3.2%) | | | |
| | 7,483 | | | AF Borrower LLC(1) | | (B, B2) | | 01/28/22 | | | 6.250 | | | | 7,518,250 | | |
| | 4,850 | | | Ciena Corp.(1) | | (BB, Ba2) | | 04/25/21 | | | 4.250 | | | | 4,858,723 | | |
| | 4,332 | | | Eircom Finco Sarl(1),(2) | | (NR, B2) | | 05/31/22 | | | 4.000 | | | | 4,796,613 | | |
| | 4,975 | | | Equinix, Inc.(1),(3) | | (BBB, Ba2) | | 01/08/23 | | | 4.500 | | | | 6,144,830 | | |
| | 5,000 | | | Gas Natural Fenosa Telecomunicaciones S.A.(1),(2) | | (B, B2) | | 06/28/21 | | | 4.078 | | | | 5,551,789 | | |
| | 3,552 | | | LTS Buyer LLC(1) | | (CCC+, Caa1) | | 04/12/21 | | | 8.000 | | | | 3,570,192 | | |
| | 16,123 | | | LTS Buyer LLC(1) | | (B, B1) | | 04/13/20 | | | 4.088 | | | | 16,203,614 | | |
| | 2,432 | | | NeuStar, Inc.(1) | | (BB+, Ba2) | | 01/22/19 | | | 3.784 | | | | 2,433,950 | | |
| | 13,489 | | | XO Communications LLC(1) | | (BB-, B2) | | 03/17/21 | | | 4.250 | | | | 13,528,456 | | |
| | 23,041 | | | Zayo Group LLC(1) | | (BB-, Ba2) | | 05/06/21 | | | 3.750 | | | | 23,195,475 | | |
| | | | 87,801,892 | | |
| Theaters & Entertainment (3.0%) | | | |
| | 16,595 | | | EMI Music Publishing Ltd.(1) | | (BB-, Ba3) | | 08/19/22 | | | 4.000 | | | | 16,640,331 | | |
| | 12,000 | | | Lions Gate Entertainment Corp.(1) | | (BB-, Ba2) | | 10/12/23 | | | 3.750 | | | | 12,000,000 | | |
| | 16,211 | | | Live Nation Entertainment, Inc.(1) | | (BB, Ba2) | | 10/26/23 | | | 3.340 | | | | 16,253,938 | | |
See Accompanying Notes to Financial Statements.
18
Credit Suisse Floating Rate High Income Fund
Schedule of Investments (continued)
October 31, 2016
Par
(000)
| | Ratings†
(S&P/Moody's) | | Maturity | | Rate% | | Value | |
| BANK LOANS (continued) | | | |
Theaters & Entertainment | | | |
$ | 300 | | | NEG Holdings LLC(1),(6) | | (NR, NR) | | 10/17/22 | | | 7.000 | | | $ | 300,000 | | |
| | 17,498 | | | Tech Finance & Co. S.C.A.(1) | | (BB-, Ba3) | | 07/11/20 | | | 5.000 | | | | 17,601,882 | | |
| | 14,714 | | | William Morris Endeavor Entertainment LLC(1) | | (B, B1) | | 05/06/21 | | | 5.250 | | | | 14,820,344 | | |
| | 6,450 | | | William Morris Endeavor Entertainment LLC(1) | | (B-, Caa1) | | 05/06/22 | | | 8.250 | | | | 6,463,448 | | |
| | | | 84,079,943 | | |
| Transport Infrastructure/Services (0.7%) | | | |
| | 11,099 | | | Navios Partners Finance (U.S.), Inc.(1) | | (B, B3) | | 06/27/18 | | | 5.250 | | | | 10,183,735 | | |
| | 4,018 | | | OSG International, Inc.(1) | | (BB-, B1) | | 08/05/19 | | | 5.750 | | | | 4,008,296 | | |
| | 4,708 | | | PODS LLC(1) | | (B, B2) | | 02/02/22 | | | 4.500 | | | | 4,741,093 | | |
| | | | 18,933,124 | | |
| TOTAL BANK LOANS (Cost $2,368,241,679) | | | 2,339,053,367 | | |
| CORPORATE BONDS (11.1%) | | | |
| Advertising (0.1%) | | | |
| | 500 | | | WMG Acquisition Corp., Rule 144A,
Senior Secured Notes
(Callable 11/01/19 @ 103.66)(8) | | (B, Ba3) | | 11/01/24 | | | 4.875 | | | | 501,250 | | |
| | 3,475 | | | WMG Acquisition Corp., Rule 144A,
Senior Secured Notes
(Callable 12/01/16 @ 104.50)(8) | | (B, Ba3) | | 01/15/21 | | | 6.000 | | | | 3,605,313 | | |
| | | | 4,106,563 | | |
| Auto Parts & Equipment (0.2%) | | | |
| | 3,500 | | | Cooper-Standard Automotive, Inc., Rule 144A,
Senior Unsecured Notes
(Callable 11/15/21 @ 102.81)(8) | | (B, B2) | | 11/15/26 | | | 5.625 | | | | 3,526,250 | | |
| | 6,138 | | | UCI International LLC,
Global Company Guaranteed Notes
(Callable 12/01/16 @ 102.16)(7) | | (NR, NR) | | 02/15/19 | | | 8.625 | | | | 1,350,360 | | |
| | | | 4,876,610 | | |
| Automakers (0.3%) | | | |
| | 7,000 | | | Volkswagen Group of America Finance LLC,
Rule 144A, Company Guaranteed Notes(1),(8) | | (BBB+, A3) | | 11/22/16 | | | 1.091 | | | | 7,000,994 | | |
| Banking (0.3%) | | | |
| | 5,000 | | | Bank of America NA, Senior Unsecured Notes | | (A, A1) | | 11/14/16 | | | 1.125 | | | | 5,000,340 | | |
| | 2,100 | | | Bank of America NA, Senior Unsecured Notes(1) | | (A, A1) | | 11/14/16 | | | 1.287 | | | | 2,099,891 | | |
| | | | 7,100,231 | | |
| Brokerage (0.5%) | | | |
| | 6,500 | | | CCRE Finance Corp., Rule 144A,
Company Guaranteed Notes
(Callable 12/01/16 @ 102.91)(8) | | (B+, B1) | | 02/15/18 | | | 7.750 | | | | 6,532,500 | | |
See Accompanying Notes to Financial Statements.
19
Credit Suisse Floating Rate High Income Fund
Schedule of Investments (continued)
October 31, 2016
Par
(000)
| | Ratings†
(S&P/Moody's) | | Maturity | | Rate% | | Value | |
| CORPORATE BONDS (continued) | | | |
Brokerage | | | |
$ | 1,800 | | | Jefferies Finance LLC, Rule 144A,
Senior Unsecured Notes
(Callable 04/15/17 @ 105.16)(8) | | (B, B1) | | 04/15/22 | | | 6.875 | | | $ | 1,710,000 | | |
| | 5,000 | | | Jefferies Finance LLC, Rule 144A,
Senior Unsecured Notes
(Callable 10/15/17 @ 105.63)(8) | | (B, B1) | | 04/15/21 | | | 7.500 | | | | 4,906,250 | | |
| | | | 13,148,750 | | |
| Building & Construction (0.3%) | | | |
| | 2,000 | | | AV Homes, Inc.,
Global Company Guaranteed Notes
(Callable 12/01/16 @ 106.38) | | (B, Caa1) | | 07/01/19 | | | 8.500 | | | | 2,090,000 | | |
| | 3,500 | | | Beazer Homes U.S.A., Inc.,
Global Company Guaranteed Notes
(Callable 11/15/16 @ 100.00) | | (B-, B3) | | 05/15/19 | | | 9.125 | | | | 3,508,750 | | |
| | 2,000 | | | U.S. Concrete, Inc.,
Global Company Guaranteed Notes
(Callable 06/01/19 @ 104.78) | | (BB-, B3) | | 06/01/24 | | | 6.375 | | | | 2,085,000 | | |
| | | | 7,683,750 | | |
| Building Materials (0.4%) | | | |
| | 9,000 | | | Euramax International, Inc., Rule 144A,
Senior Secured Notes
(Callable 02/15/18 @ 109.00)(8) | | (B-, Caa2) | | 08/15/20 | | | 12.000 | | | | 9,405,000 | | |
| | 3,000 | | | PriSo Acquisition Corp., Rule 144A,
Senior Unsecured Notes
(Callable 05/15/18 @ 104.50)(8) | | (CCC+, Caa1) | | 05/15/23 | | | 9.000 | | | | 2,932,500 | | |
| | | | 12,337,500 | | |
| Cable & Satellite TV (1.4%) | | | |
| | 755 | | | Altice Financing S.A., Rule 144A,
Senior Secured Notes
(Callable 02/15/18 @ 104.97)(8) | | (BB-, B1) | | 02/15/23 | | | 6.625 | | | | 779,538 | | |
| | 4,000 | | | Altice Financing S.A., Rule 144A,
Senior Secured Notes
(Callable 05/15/21 @ 103.75)(8) | | (BB-, B1) | | 05/15/26 | | | 7.500 | | | | 4,130,000 | | |
| | 800 | | | Altice Financing S.A., Rule 144A,
Senior Secured Notes
(Callable 12/15/16 @ 104.88)(8) | | (BB-, B1) | | 01/15/22 | | | 6.500 | | | | 838,200 | | |
| | 3,500 | | | Altice U.S. Finance I Corp., Rule 144A,
Senior Secured Notes
(Callable 05/15/21 @ 102.75)(8) | | (BB-, Ba3) | | 05/15/26 | | | 5.500 | | | | 3,578,750 | | |
| | 9,405 | | | Block Communications, Inc., Rule 144A,
Senior Unsecured Notes
(Callable 12/01/16 @ 103.63)(8) | | (B, B1) | | 02/01/20 | | | 7.250 | | | | 9,663,637 | | |
See Accompanying Notes to Financial Statements.
20
Credit Suisse Floating Rate High Income Fund
Schedule of Investments (continued)
October 31, 2016
Par
(000)
| | Ratings†
(S&P/Moody's) | | Maturity | | Rate% | | Value | |
| CORPORATE BONDS (continued) | | | |
Cable & Satellite TV | | | |
$ | 1,000 | | | CSC Holdings LLC, Rule 144A,
Company Guaranteed Notes
(Callable 04/15/22 @ 102.75)(8) | | (BB-, Ba1) | | 04/15/27 | | | 5.500 | | | $ | 1,016,875 | | |
| | 1,000 | | | CSC Holdings LLC, Rule 144A,
Company Guaranteed Notes
(Callable 10/15/20 @ 103.31)(8) | | (BB-, Ba1) | | 10/15/25 | | | 6.625 | | | | 1,086,250 | | |
| | 1,200 | | | CSC Holdings LLC, Rule 144A,
Senior Unsecured Notes
(Callable 10/15/20 @ 105.44)(8) | | (B-, B2) | | 10/15/25 | | | 10.875 | | | | 1,383,000 | | |
| | 5,000 | | | SFR Group S.A., Rule 144A,
Senior Secured Notes
(Callable 05/01/21 @ 103.69)(8) | | (B+, B1) | | 05/01/26 | | | 7.375 | | | | 5,056,250 | | |
| | 9,000 | | | SFR Group S.A., Rule 144A,
Senior Secured Notes
(Callable 05/15/17 @ 104.50)(8) | | (B+, B1) | | 05/15/22 | | | 6.000 | | | | 9,261,630 | | |
| | 2,325 | | | Ziggo Secured Finance B.V., Rule 144A,
Senior Secured Notes
(Callable 01/15/22 @ 102.75)(8) | | (BB-, Ba3) | | 01/15/27 | | | 5.500 | | | | 2,301,750 | | |
| | | | 39,095,880 | | |
| Chemicals (0.3%) | | | |
| | 2,000 | | | Nufarm Australia Ltd., Rule 144A,
Company Guaranteed Notes
(Callable 12/01/16 @ 103.19)(8) | | (B+, B1) | | 10/15/19 | | | 6.375 | | | | 2,047,500 | | |
| | 5,000 | | | Westlake Chemical Corp., Rule 144A,
Company Guaranteed Notes
(Callable 05/15/18 @ 102.44)(8) | | (BBB, NR) | | 05/15/23 | | | 4.875 | | | | 5,212,500 | | |
| | | | 7,260,000 | | |
| Consumer/Commercial/Lease Financing (0.2%) | | | |
| | 6,645 | | | Infinity Acquisition Finance Corp., Rule 144A,
Senior Unsecured Notes
(Callable 08/01/17 @ 103.63)(8) | | (CCC+, Caa2) | | 08/01/22 | | | 7.250 | | | | 5,781,150 | | |
| Diversified Capital Goods (0.1%) | | | |
| | 2,500 | | | Anixter, Inc.,
Global Company Guaranteed Notes | | (BB, Ba3) | | 05/01/19 | | | 5.625 | | | | 2,659,375 | | |
| Energy - Exploration & Production (1.2%) | | | |
| | 6,500 | | | BP Capital Markets PLC,
Company Guaranteed Notes | | (A-, A2) | | 11/01/16 | | | 2.248 | | | | 6,500,000 | | |
| | 4,100 | | | BP Capital Markets PLC,
Global Company Guaranteed Notes(1) | | (A-, A2) | | 11/07/16 | | | 1.208 | | | | 4,100,332 | | |
| | 10,750 | | | Chevron Corp.,
Global Senior Unsecured Notes(1) | | (AA-, Aa2) | | 11/09/16 | | | 0.892 | | | | 10,750,763 | | |
See Accompanying Notes to Financial Statements.
21
Credit Suisse Floating Rate High Income Fund
Schedule of Investments (continued)
October 31, 2016
Par
(000)
| | Ratings†
(S&P/Moody's) | | Maturity | | Rate% | | Value | |
| CORPORATE BONDS (continued) | | | |
Energy - Exploration & Production | | | |
$ | 3,800 | | | Oasis Petroleum, Inc.,
Company Guaranteed Notes
(Callable 12/01/16 @ 103.25)(9) | | (B+, B3) | | 11/01/21 | | | 6.500 | | | $ | 3,795,250 | | |
| | 796 | | | Oasis Petroleum, Inc.,
Global Company Guaranteed Notes
(Callable 09/15/17 @ 103.44)(9) | | (B+, B3) | | 03/15/22 | | | 6.875 | | | | 792,020 | | |
| | 6,000 | | | Shell International Finance B.V.,
Global Company Guaranteed Notes(1) | | (A, Aa2) | | 11/15/16 | | | 1.027 | | | | 6,001,260 | | |
| | | | 31,939,625 | | |
| Forestry & Paper (0.0%) | | | |
| | 200 | | | Stone & Webster, Inc.(4),(7),(10) | | (NR, NR) | | 10/23/19 | | | 0.000 | | | | 433 | | |
| Gas Distribution (0.3%) | | | |
| | 2,250 | | | Energy Transfer Equity LP,
Senior Secured Notes | | (BB, Ba2) | | 10/15/20 | | | 7.500 | | | | 2,463,750 | | |
| | 750 | | | Genesis Energy Finance Corp.,
Global Company Guaranteed Notes
(Callable 02/15/17 @ 102.88) | | (B+, B1) | | 02/15/21 | | | 5.750 | | | | 751,875 | | |
| | 6,250 | | | Holly Energy Finance Corp.,
Global Company Guaranteed Notes
(Callable 12/01/16 @ 103.25) | | (BB, B1) | | 03/01/20 | | | 6.500 | | | | 6,453,125 | | |
| | | | 9,668,750 | | |
| Health Facilities (0.4%) | | | |
| | 850 | | | MPT Finance Corp.,
Company Guaranteed Notes
(Callable 02/15/17 @ 103.19) | | (BBB-, Ba1) | | 02/15/22 | | | 6.375 | | | | 882,937 | | |
| | 11,000 | | | Tenet Healthcare Corp.,
Global Senior Secured Notes
(Callable 12/01/16 @ 102.00)(1) | | (BB-, Ba3) | | 06/15/20 | | | 4.350 | | | | 11,137,500 | | |
| | | | 12,020,437 | | |
| Investments & Misc. Financial Services (0.1%) | | | |
| | 2,000 | | | Cabot Financial Luxembourg S.A.,
Rule 144A, Senior Secured Notes
(Callable 11/30/16 @ 106.28)(3),(8) | | (B+, B2) | | 08/01/20 | | | 8.375 | | | | 2,551,680 | | |
| | 1,535 | | | JPMorgan Chase & Co.,
Senior Unsecured Notes(1) | | (A-, A3) | | 11/18/16 | | | 1.251 | | | | 1,535,470 | | |
| | | | 4,087,150 | | |
| Media - Diversified (0.2%) | | | |
| | 4,609 | | | National CineMedia LLC,
Global Senior Secured Notes
(Callable 04/15/17 @ 103.00) | | (BB-, Ba2) | | 04/15/22 | | | 6.000 | | | | 4,816,405 | | |
See Accompanying Notes to Financial Statements.
22
Credit Suisse Floating Rate High Income Fund
Schedule of Investments (continued)
October 31, 2016
Par
(000)
| | Ratings†
(S&P/Moody's) | | Maturity | | Rate% | | Value | |
| CORPORATE BONDS (continued) | | | |
| Media Content (0.1%) | | | |
$ | 3,500 | | | EMI Music Publishing Group
North America Holdings, Inc.,
Rule 144A, Company Guaranteed Notes
(Callable 06/15/19 @ 105.72)(8) | | (B, B3) | | 06/15/24 | | | 7.625 | | | $ | 3,797,500 | | |
| Medical Products (0.5%) | | | |
| | 12,477 | | | Johnson & Johnson,
Global Senior Unsecured Notes(1) | | (AAA, Aaa) | | 11/28/16 | | | 0.899 | | | | 12,480,980 | | |
| Metals & Mining - Excluding Steel (0.2%) | | | |
| | 1,396 | | | New Day Aluminum LLC(6) | | (NR, NR) | | 10/28/20 | | | 4.000 | | | | 1,084,551 | | |
| | 2,100 | | | Noranda Aluminum Acquisition Corp.,
Global Company Guaranteed Notes
(Callable 12/01/16 @ 105.50)(7) | | (NR, NR) | | 06/01/19 | | | 11.000 | | | | 1,260 | | |
| | 7,540 | | | Taseko Mines Ltd.,
Company Guaranteed Notes
(Callable 12/01/16 @ 101.94) | | (CCC, Caa2) | | 04/15/19 | | | 7.750 | | | | 4,901,000 | | |
| | | | 5,986,811 | | |
| Oil Field Equipment & Services (0.6%) | | | |
| | 5,600 | | | FTS International, Inc.,
Global Senior Secured Notes
(Callable 05/01/17 @ 104.69) | | (CCC, Ca) | | 05/01/22 | | | 6.250 | | | | 3,192,000 | | |
| | 4,518 | | | Pacific Drilling V Ltd., Rule 144A,
Senior Secured Notes
(Callable 12/01/16 @ 103.63)(8) | | (B-, Ca) | | 12/01/17 | | | 7.250 | | | | 1,807,200 | | |
| | 5,250 | | | Pioneer Energy Services Corp.,
Global Company Guaranteed Notes
(Callable 03/15/17 @ 104.59) | | (B-, Ca) | | 03/15/22 | | | 6.125 | | | | 3,885,000 | | |
| | 10,333 | | | Shelf Drilling Holdings Ltd., Rule 144A,
Secured Notes (Callable 12/01/16 @ 102.16)(8) | | (CCC, B2) | | 11/01/18 | | | 8.625 | | | | 8,318,065 | | |
| | | | 17,202,265 | | |
| Oil Refining & Marketing (0.6%) | | | |
| | 7,522 | | | Coffeyville Finance, Inc.,
Global Company Guaranteed Notes
(Callable 11/01/17 @ 103.25) | | (BB-, B1) | | 11/01/22 | | | 6.500 | | | | 6,995,460 | | |
| | 8,284 | | | PBF Finance Corp.,
Global Senior Secured Notes
(Callable 12/01/16 @ 104.13) | | (BBB-, B1) | | 02/15/20 | | | 8.250 | | | | 8,491,100 | | |
| | | | 15,486,560 | | |
| Packaging (0.3%) | | | |
| | 1,556 | | | Innovia Group Finance PLC, Rule 144A,
Senior Secured Notes
(Callable 11/30/16 @ 100.00)(1),(2),(8) | | (B, B2) | | 03/31/20 | | | 4.698 | | | | 1,717,342 | | |
See Accompanying Notes to Financial Statements.
23
Credit Suisse Floating Rate High Income Fund
Schedule of Investments (continued)
October 31, 2016
Par
(000)
| | Ratings†
(S&P/Moody's) | | Maturity | | Rate% | | Value | |
| CORPORATE BONDS (continued) | | | |
Packaging | | | |
$ | 2,225 | | | Owens-Brockway Glass Container, Inc.,
Rule 144A, Company Guaranteed Notes(8),(9) | | (BB-, B1) | | 08/15/23 | | | 5.875 | | | $ | 2,375,188 | | |
| | 3,000 | | | Reynolds Group Issuer LLC,
Global Company Guaranteed Notes
(Callable 11/06/16 @ 102.47) | | (B-, Caa2) | | 08/15/19 | | | 9.875 | | | | 3,078,750 | | |
| | | | 7,171,280 | | |
| Personal & Household Products (0.2%) | | | |
| | 5,000 | | | The Procter & Gamble Co.,
Global Senior Unsecured Notes(9) | | (AA-, Aa3) | | 11/04/16 | | | 0.750 | | | | 4,999,985 | | |
| Real Estate Investment Trusts (0.4%) | | | |
| | 1,000 | | | iStar, Inc., Senior Unsecured Notes
(Callable 07/01/18 @ 103.25) | | (B+, B2) | | 07/01/21 | | | 6.500 | | | | 1,010,000 | | |
| | 575 | | | iStar, Inc., Senior Unsecured Notes
(Callable 08/01/17 @ 100.00) | | (B+, B2) | | 11/01/17 | | | 4.000 | | | | 577,156 | | |
| | 8,293 | | | iStar, Inc., Senior Unsecured Notes
(Callable 12/01/16 @ 102.44) | | (B+, B2) | | 07/01/18 | | | 4.875 | | | | 8,324,099 | | |
| | 1,875 | | | iStar, Inc., Senior Unsecured Notes
(Callable 12/01/16 @ 102.50) | | (B+, B2) | | 07/01/19 | | | 5.000 | | | | 1,875,244 | | |
| | | | 11,786,499 | | |
| Recreation & Travel (0.3%) | | | |
| | 4,000 | | | ClubCorp Club Operations, Inc., Rule 144A,
Company Guaranteed Notes
(Callable 12/15/18 @ 106.19)(8) | | (B-, B3) | | 12/15/23 | | | 8.250 | | | | 4,280,000 | | |
| | 3,850 | | | Six Flags Entertainment Corp., Rule 144A,
Company Guaranteed Notes
(Callable 07/31/19 @ 103.66)(8) | | (BB-, B3) | | 07/31/24 | | | 4.875 | | | | 3,869,250 | | |
| | | | 8,149,250 | | |
| Restaurants (0.2%) | | | |
| | 3,273 | | | Financiere Quick SAS, Rule 144A,
Senior Secured Notes
(Callable 11/30/16 @ 100.00)(1),(2),(8) | | (B-, B3) | | 04/15/19 | | | 4.439 | | | | 3,083,584 | | |
| | 1,403 | | | Financiere Quick SAS, Rule 144A,
Unsecured Notes
(Callable 11/30/16 @ 101.00)(1),(2),(8) | | (CCC, Caa2) | | 10/15/19 | | | 7.189 | | | | 1,144,048 | | |
| | 375 | | | Punch Taverns Finance PLC, Reg S,
Rule 144A, Secured Notes(3),(8),(11) | | (B, Baa3) | | 10/15/26 | | | 7.274 | | | | 522,429 | | |
| | 1,600 | | | Starbucks Corp.,
Global Senior Unsecured Notes | | (A-, A2) | | 12/05/16 | | | 0.875 | | | | 1,600,355 | | |
| | | | 6,350,416 | | |
See Accompanying Notes to Financial Statements.
24
Credit Suisse Floating Rate High Income Fund
Schedule of Investments (continued)
October 31, 2016
Par
(000)
| | Ratings†
(S&P/Moody's) | | Maturity | | Rate% | | Value | |
| CORPORATE BONDS (continued) | | | |
| Software - Services (0.1%) | | | |
$ | 3,125 | | | Sungard Availability Services Capital, Inc.,
Rule 144A, Company Guaranteed Notes
(Callable 04/01/19 @ 104.38)(8) | | (CCC, Caa2) | | 04/01/22 | | | 8.750 | | | $ | 2,171,875 | | |
| Specialty Retail (0.3%) | | | |
| | 1,000 | | | Penske Automotive Group, Inc.,
Company Guaranteed Notes
(Callable 12/01/19 @ 102.69)(9) | | (B+, B1) | | 12/01/24 | | | 5.375 | | | | 1,010,000 | | |
| | 7,000 | | | Penske Automotive Group, Inc.,
Global Company Guaranteed Notes
(Callable 10/01/17 @ 102.88) | | (B+, B1) | | 10/01/22 | | | 5.750 | | | | 7,288,750 | | |
| | 700 | | | Takko Luxembourg 2 S.C.A., Rule 144A,
Senior Secured Notes
(Callable 11/10/16 @ 104.94)(2),(8) | | (CCC+, Caa1) | | 04/15/19 | | | 9.875 | | | | 494,543 | | |
| | | | 8,793,293 | | |
| Support - Services (0.0%) | | | |
| | 1,000 | | | York Risk Services Holding Corp.,
Rule 144A, Company Guaranteed Notes
(Callable 10/01/17 @ 106.38)(8) | | (CCC, Caa3) | | 10/01/22 | | | 8.500 | | | | 795,000 | | |
| Tech Hardware & Equipment (0.2%) | | | |
| | 3,500 | | | CommScope, Inc., Rule 144A,
Company Guaranteed Notes
(Callable 06/15/17 @ 102.50)(8) | | (B, B1) | | 06/15/21 | | | 5.000 | | | | 3,591,875 | | |
| | 3,000 | | | Riverbed Technology, Inc., Rule 144A,
Company Guaranteed Notes
(Callable 03/01/18 @ 104.44)(8) | | (CCC+, Caa1) | | 03/01/23 | | | 8.875 | | | | 3,210,000 | | |
| | | | 6,801,875 | | |
| Telecom - Wireless (0.7%) | | | |
| | 10,000 | | | Sprint Spectrum Co. II LLC, Rule 144A,
Senior Secured Notes(8) | | (NR, Baa2) | | 09/20/21 | | | 3.360 | | | | 10,062,500 | | |
| | 2,000 | | | T-Mobile U.S.A., Inc.,
Company Guaranteed Notes
(Callable 04/15/19 @ 104.50) | | (BB, Ba3) | | 04/15/24 | | | 6.000 | | | | 2,132,500 | | |
| | 8,500 | | | Telesat LLC, Rule 144A,
Company Guaranteed Notes
(Callable 12/01/16 @ 100.00)(8) | | (B, B3) | | 05/15/17 | | | 6.000 | | | | 8,531,875 | | |
| | | | 20,726,875 | | |
| Telecom - Wireline Integrated & Services (0.1%) | | | |
| | 2,200 | | | NeuStar, Inc.,
Global Company Guaranteed Notes
(Callable 01/15/18 @ 102.25) | | (B+, B2) | | 01/15/23 | | | 4.500 | | | | 2,054,250 | | |
| TOTAL CORPORATE BONDS (Cost $319,711,294) | | | 308,338,317 | | |
See Accompanying Notes to Financial Statements.
25
Credit Suisse Floating Rate High Income Fund
Schedule of Investments (continued)
October 31, 2016
Par
(000)
| | Ratings†
(S&P/Moody's) | | Maturity | | Rate% | | Value | |
| ASSET BACKED SECURITIES (2.5%) | | | |
| Collateralized Debt Obligations (2.5%) | | | |
$ | 3,400 | | | ACAS CLO Ltd., 2012-1A, Rule 144A(1),(8) | | (BB-, NR) | | 09/20/23 | | | 6.857 | | | $ | 3,362,086 | | |
| | 2,250 | | | Atlas Senior Loan Fund V Ltd.,
2014-1A, Rule 144A(1),(8) | | (BB-, NR) | | 07/16/26 | | | 5.379 | | | | 1,902,553 | | |
| | 3,000 | | | Benefit Street Partners CLO Ltd.,
2012-IA, Rule 144A(1),(8) | | (BB, NR) | | 10/15/25 | | | 7.382 | | | | 2,984,892 | | |
| | 2,500 | | | BlueMountain CLO Ltd., 2013-2A, Rule 144A(1),(8) | | (BB, NR) | | 01/22/25 | | | 5.932 | | | | 2,345,915 | | |
| | 2,000 | | | BlueMountain CLO Ltd., 2014-3A, Rule 144A(1),(8) | | (B, NR) | | 10/15/26 | | | 6.530 | | | | 1,565,612 | | |
| | 2,000 | | | Carlyle Global Market Strategies CLO Ltd.,
2013-3A, Rule 144A(1),(8) | | (BB, NR) | | 07/15/25 | | | 5.480 | | | | 1,819,442 | | |
| | 2,000 | | | Catamaran CLO Ltd., 2014-1A, Rule 144A(1),(8) | | (BB, NR) | | 04/20/26 | | | 5.381 | | | | 1,669,166 | | |
| | 2,000 | | | Cent CLO, 2014-16X, Reg S(1),(11) | | (BB, NR) | | 08/01/24 | | | 6.747 | | | | 1,951,850 | | |
| | 1,000 | | | CIFC Funding Ltd., 2012-3A, Rule 144A(1),(8) | | (BB-, NR) | | 01/29/25 | | | 6.752 | | | | 1,003,270 | | |
| | 2,250 | | | CIFC Funding Ltd., 2012-3A, Rule 144A(1),(8) | | (B, NR) | | 01/29/25 | | | 7.652 | | | | 1,983,607 | | |
| | 1,500 | | | CIFC Funding Ltd., 2013-3A, Rule 144A(1),(8) | | (BB, NR) | | 10/24/25 | | | 5.632 | | | | 1,336,791 | | |
| | 1,175 | | | CIFC Funding Ltd., 2014-3A, Rule 144A(1),(8) | | (NR, Baa3) | | 07/22/26 | | | 4.282 | | | | 1,106,656 | | |
| | 2,000 | | | Dryden Senior Loan Fund,
2012-24RA, Rule 144A(1),(8) | | (BB, NR) | | 11/15/23 | | | 6.767 | | | | 1,968,284 | | |
| | 1,500 | | | Dryden Senior Loan Fund,
2012-24RA, Rule 144A(1),(8) | | (B, NR) | | 11/15/23 | | | 8.717 | | | | 1,346,374 | | |
| | 1,500 | | | Galaxy XV CLO Ltd., 2013-15A, Rule 144A(1),(8) | | (BBB, NR) | | 04/15/25 | | | 4.280 | | | | 1,469,018 | | |
| | 1,500 | | | Galaxy XXI CLO Ltd., 2015-21A, Rule 144A(1),(8) | | (NR, Ba3) | | 01/20/28 | | | 6.481 | | | | 1,385,706 | | |
| | 3,000 | | | Greywolf CLO III Ltd., 2014-1A, Rule 144A(1),(8) | | (BB, NR) | | 04/22/26 | | | 5.982 | | | | 2,722,470 | | |
| | 1,419 | | | Halcyon Loan Advisors Funding Ltd.,
2012-1A, Rule 144A(1),(8) | | (BB, NR) | | 08/15/23 | | | 6.317 | | | | 1,146,432 | | |
| | 3,000 | | | Highbridge Loan Management Ltd.,
2012-1A, Rule 144A(1),(8) | | (B, NR) | | 09/20/22 | | | 7.607 | | | | 2,749,146 | | |
| | 3,000 | | | Highbridge Loan Management Ltd.,
2012-1AR, Rule 144A(1),(8) | | (BB, NR) | | 09/20/22 | | | 6.607 | | | | 2,959,201 | | |
| | 2,500 | | | KKR CLO Ltd., 2014-14D, Rule 144A(1),(8) | | (NR, Ba3) | | 07/15/28 | | | 7.273 | | | | 2,326,980 | | |
| | 2,300 | | | KVK CLO Ltd., 2013-1A, Rule 144A(1),(8) | | (BB, NR) | | 04/14/25 | | | 6.381 | | | | 1,918,628 | | |
| | 1,750 | | | Neuberger Berman CLO XII Ltd.,
2012-12AR, Rule 144A(1),(8) | | (BB, NR) | | 07/25/23 | | | 6.960 | | | | 1,756,019 | | |
| | 1,000 | | | Ocean Trails CLO II, 2007-2X, Reg S(1),(11) | | (BBB+, Ba1) | | 06/27/22 | | | 3.228 | | | | 967,656 | | |
| | 3,000 | | | Ocean Trails CLO V, 2014-5A, Rule 144A(1),(8) | | (BBB, NR) | | 10/13/26 | | | 4.838 | | | | 2,863,275 | | |
| | 1,750 | | | OCP CLO Ltd., 2014-6A, Rule 144A(1),(8) | | (B, NR) | | 07/17/26 | | | 6.480 | | | | 1,257,108 | | |
| | 3,000 | | | Octagon Investment Partners XIV Ltd.,
2012-1A, Rule 144A(1),(8) | | (BB-, NR) | | 01/15/24 | | | 6.130 | | | | 2,856,462 | | |
| | 4,000 | | | Octagon Investment Partners XIV Ltd.,
2012-1A, Rule 144A(1),(8) | | (B, NR) | | 01/15/24 | | | 7.380 | | | | 3,204,737 | | |
| | 2,000 | | | Octagon Investment Partners XXI Ltd.,
2014-1A, Rule 144A(1),(8) | | (NR, Ba3) | | 11/14/26 | | | 7.417 | | | | 1,950,352 | | |
| | 2,500 | | | Shackleton V CLO Ltd., 2014-5A, Rule 144A(1),(8) | | (BB-, NR) | | 05/07/26 | | | 5.138 | | | | 2,110,128 | | |
| | 1,400 | | | Stewart Park CLO Ltd., 2015-1A, Rule 144A(4),(8),(10) | | (NR, NR) | | 04/15/26 | | | 0.000 | | | | 1,279,810 | | |
| | 1,666 | | | Venture XII CLO Ltd., 2012-12A, Rule 144A(1),(8) | | (BB, NR) | | 02/28/24 | | | 6.129 | | | | 1,599,037 | | �� |
| | 3,000 | | | Vibrant CLO Ltd., 2012-1A, Rule 144A(1),(8) | | (BB, NR) | | 07/17/24 | | | 7.180 | | | | 2,967,762 | | |
| | 750 | | | Voya CLO Ltd., 2014-3A, Rule 144A(1),(8) | | (NR, Ba3) | | 07/25/26 | | | 5.882 | | | | 655,996 | | |
| | 2,250 | | | WhiteHorse VII Ltd., 2013-1A, Rule 144A(1),(8) | | (BB-, NR) | | 11/24/25 | | | 5.625 | | | | 2,022,687 | | |
| TOTAL ASSET BACKED SECURITIES (Cost $71,491,411) | | | 68,515,108 | | |
See Accompanying Notes to Financial Statements.
26
Credit Suisse Floating Rate High Income Fund
Schedule of Investments (continued)
October 31, 2016
Number of
Shares | | | | | | | | | | Value | |
| COMMON STOCKS (0.0%) | | | |
| Building & Construction (0.0%) | | | |
| | 8 | | | White Forest Resources, Inc.(4),(6) | | | | | | | | | | | | $ | 116 | | |
| Chemicals (0.0%) | | | |
| | 9,785 | | | Huntsman Corp.(4) | | | | | | | | | | | | | | | 165,856 | | |
| Gaming (0.0%) | | | |
| | 10,150 | | | Majestic Holdco LLC(4),(12) | | | | | | | | | | | | | | | 2,309 | | |
| Printing & Publishing (0.0%) | | | |
| | 708 | | | F & W Media, Inc.(4) | | | | | | | | | | | | | | | 35,385 | | |
| Theaters & Entertainment (0.0%) | | | |
| | 40 | | | NEG Holdings LLC, Litigation Trust Units(4),(6),(12) | | | | | | | | | | | | | | | — | | |
| | 250,000 | | | NEG Holdings LLC, Class A(4),(6),(12) | | | | | | | | | | | | | | | 377,500 | | |
| | | | 377,500 | | |
| TOTAL COMMON STOCKS (Cost $530,644) | | | 581,166 | | |
| SHORT-TERM INVESTMENTS (8.9%) | | | |
| | 12,029,303 | | | State Street Navigator Securities Lending Government
Money Market Portfolio, 0.27%(13) | | | | | | | | | | | | | | | 12,029,303 | | |
Par
(000) | |
| |
| |
Maturity | |
Rate% | |
| |
$ | 237,028 | | | State Street Bank and Trust Co. Euro Time Deposit | | | | | | 11/01/16 | | | 0.010 | | | | 237,028,088 | | |
| TOTAL SHORT-TERM INVESTMENTS (Cost $249,057,391) | | | 249,057,391 | | |
| TOTAL INVESTMENTS AT VALUE (106.6%) (Cost $3,009,032,419) | | | 2,965,545,349 | | |
| LIABILITIES IN EXCESS OF OTHER ASSETS (-6.6%) | | | (183,976,595 | ) | |
| NET ASSETS (100.0%) | | $ | 2,781,568,754 | | |
† Credit ratings given by the Standard & Poor's Division of The McGraw-Hill Companies, Inc. ("S&P") and Moody's Investors Service, Inc. ("Moody's") are unaudited.
(1) Variable rate obligation — The interest rate shown is the rate as of October 31, 2016.
(2) This security is denominated in Euro.
(3) This security is denominated in British Pound.
(4) Illiquid security (unaudited).
(5) Unfunded loan commitments (See note 2-I).
(6) Not readily marketable security; security is valued at fair value as determined in good faith by, or under the direction of, the Board of Trustees.
(7) Bond is currently in default.
(8) Security exempt from registration under Rule 144A of the Securities Act of 1933. These securities may be resold in transactions exempt from registration, normally to qualified institutional buyers. At October 31, 2016, these securities amounted to a value of $220,176,643 or 7.9% of net assets.
(9) Security or portion thereof is out on loan (See note 2-J).
(10) Zero-coupon security.
See Accompanying Notes to Financial Statements.
27
Credit Suisse Floating Rate High Income Fund
Schedule of Investments (continued)
October 31, 2016
(11) REG S: Securities sold under Regulation S may not be offered, sold or delivered within the United States or to, or for the account or benefit of, U.S. persons, except pursuant to an exemption from, or in a transaction not subject to, the registration requirements of the Securities Act of 1933.
(12) Non-income producing security.
(13) Represents security purchased with cash collateral received for securities on loan. The rate shown is the annualized one-day yield at October 31, 2016.
INVESTMENT ABBREVIATION
NR = Not Rated
Forward Foreign Currency Contracts
Forward Foreign
Currency to be
Purchased (Local) | | Forward Foreign
Currency to be
Sold (Local) | | Expiration
Date | | Counterparty | | Value on
Settlement Date | | Current
Value/
Notional | | Net Unrealized
Appreciation
(Depreciation) | |
USD | 269,597 | | | EUR | 239,750 | | | 12/15/16 | | Morgan Stanley | | $ | (269,597 | ) | | $ | (263,316 | ) | | $ | 6,281 | | |
USD | 55,019,120 | | | EUR | 48,969,000 | | | 10/13/17 | | Morgan Stanley | | | (55,019,120 | ) | | | (54,553,175 | ) | | | 465,945 | | |
USD | 25,962,070 | | | GBP | 21,269,750 | | | 10/13/17 | | Morgan Stanley | | | (25,962,070 | ) | | | (26,160,274 | ) | | | (198,204 | ) | |
| | | $ | 274,022 | | |
Currency Abbreviations:
EUR = Euro
GBP = British Pound
USD = United States Dollar
See Accompanying Notes to Financial Statements.
28
Credit Suisse Floating Rate High Income Fund
Statement of Assets and Liabilities
October 31, 2016
Assets | |
Investments at value, including collateral for securities on loan of $12,029,303
(Cost $3,009,032,419) (Note 2) | | $ | 2,965,545,3491 | | |
Cash | | | 117,695 | | |
Foreign currency at value (Cost $5,426,795) | | | 5,438,410 | | |
Receivable for investments sold | | | 42,636,035 | | |
Interest receivable | | | 13,783,676 | | |
Receivable for Fund shares sold | | | 13,769,085 | | |
Unrealized appreciation on forward foreign currency contracts (Note 2) | | | 472,226 | | |
Prepaid expenses and other assets | | | 63,769 | | |
Total assets | | | 3,041,826,245 | | |
Liabilities | |
Investment advisory fee payable (Note 3) | | | 827,069 | | |
Administrative services fee payable (Note 3) | | | 309,568 | | |
Shareholder servicing/Distribution fee payable (Note 3) | | | 146,086 | | |
Payable for investments purchased | | | 236,863,668 | | |
Payable upon return of securities loaned (Note 2) | | | 12,029,303 | | |
Payable for Fund shares redeemed | | | 5,174,744 | | |
Dividend payable | | | 3,490,701 | | |
Unrealized depreciation on forward foreign currency contracts (Note 2) | | | 198,204 | | |
Unfunded loan commitments (Note 2) | | | 103,309 | | |
Trustees' fee payable | | | 8,299 | | |
Accrued expenses | | | 1,106,540 | | |
Total liabilities | | | 260,257,491 | | |
Net Assets | |
Capital stock, $.001 par value (Note 6) | | | 410,743 | | |
Paid-in capital (Note 6) | | | 2,829,012,833 | | |
Distributions in excess of net investment income | | | (4,054,371 | ) | |
Accumulated net realized loss on investments and foreign currency transactions | | | (589,592 | ) | |
Net unrealized depreciation from investments and foreign currency translations | | | (43,210,859 | ) | |
Net assets | | $ | 2,781,568,754 | | |
I Shares | |
Net assets | | $ | 2,438,026,657 | | |
Shares outstanding | | | 360,295,322 | | |
Net asset value, offering price and redemption price per share | | $ | 6.77 | | |
A Shares | |
Net assets | | $ | 227,398,830 | | |
Shares outstanding | | | 33,428,003 | | |
Net asset value and redemption price per share | | $ | 6.80 | | |
Maximum offering price per share (net asset value/(1-4.75%)) | | $ | 7.14 | | |
B Shares | |
Net assets | | $ | 1,800,398 | | |
Shares outstanding | | | 263,372 | | |
Net asset value and offering price per share | | $ | 6.84 | | |
C Shares | |
Net assets | | $ | 114,342,869 | | |
Shares outstanding | | | 16,756,792 | | |
Net asset value and offering price per share | | $ | 6.82 | | |
1 Includes $11,765,025 of securities on loan.
See Accompanying Notes to Financial Statements.
29
Credit Suisse Floating Rate High Income Fund
Statement of Operations
For the Year Ended October 31, 2016
Investment Income | |
Interest | | $ | 141,648,736 | | |
Dividends | | | 4,893 | | |
Securities lending (net of rebates) | | | 214,987 | | |
Total investment income | | | 141,868,616 | | |
Expenses | |
Investment advisory fees (Note 3) | | | 12,922,383 | | |
Administrative services fees (Note 3) | | | 2,686,174 | | |
Shareholder servicing/Distribution fees (Note 3) | |
Class A | | | 611,487 | | |
Class B | | | 18,730 | | |
Class C | | | 1,203,584 | | |
Transfer agent fees | | | 3,338,735 | | |
Commitment fees (Note 4) | | | 747,085 | | |
Custodian fees | | | 536,286 | | |
Registration fees | | | 159,714 | | |
Printing fees | | | 97,459 | | |
Audit and tax fees | | | 51,369 | | |
Legal fees | | | 49,283 | | |
Insurance expense | | | 45,777 | | |
Trustees' fees | | | 30,430 | | |
Miscellaneous expense | | | 29,973 | | |
Total expenses | | | 22,528,469 | | |
Less: fees waived (Note 3) | | | (2,883,331 | ) | |
Net expenses | | | 19,645,138 | | |
Net investment income | | | 122,223,478 | | |
Net Realized and Unrealized Gain (Loss) from Investments and Foreign Currency Related Items | |
Net realized loss from investments | | | (10,168,879 | ) | |
Net realized gain from foreign currency transactions | | | 8,285,314 | | |
Net change in unrealized appreciation (depreciation) from investments | | | 23,532,556 | | |
Net change in unrealized appreciation (depreciation) from foreign currency translations | | | (803,483 | ) | |
Net realized and unrealized gain from investments and foreign currency related items | | | 20,845,508 | | |
Net increase in net assets resulting from operations | | $ | 143,068,986 | | |
See Accompanying Notes to Financial Statements.
30
Credit Suisse Floating Rate High Income Fund
Statement of Changes in Net Assets
| | | For the Year
Ended
October 31, 2016 | | For the Year
Ended
October 31, 2015 | |
From Operations | |
Net investment income | | $ | 122,223,478 | | | $ | 81,908,021 | | |
Net realized loss from investments and foreign currency transactions | | | (1,883,565 | ) | | | (3,197,119 | ) | |
Net change in unrealized appreciation (depreciation)
from investments and foreign currency translations | | | 22,729,073 | | | | (40,833,220 | ) | |
Net increase in net assets resulting from operations | | | 143,068,986 | | | | 37,877,682 | | |
From Dividends and Distributions | |
Dividends from net investment income | |
Class I | | | (104,574,110 | ) | | | (63,287,729 | ) | |
Class A | | | (11,144,809 | ) | | | (13,110,404 | ) | |
Class B | | | (71,524 | ) | | | (87,197 | ) | |
Class C | | | (4,588,704 | ) | | | (4,925,319 | ) | |
Distributions from net realized gains | |
Class I | | | — | | | | (669,301 | ) | |
Class A | | | — | | | | (166,856 | ) | |
Class B | | | — | | | | (1,659 | ) | |
Class C | | | — | | | | (83,525 | ) | |
Return of capital | |
Class I shares | | | (1,757,990 | ) | | | (386,468 | ) | |
Class A shares | | | (197,458 | ) | | | (80,059 | ) | |
Class B shares | | | (1,512 | ) | | | (532 | ) | |
Class C shares | | | (97,164 | ) | | | (30,077 | ) | |
Net decrease in net assets resulting from dividends and distributions | | | (122,433,271 | ) | | | (82,829,126 | ) | |
| From Capital Share Transactions (Note 6) | |
Proceeds from sale of shares | | | 1,092,868,973 | | | | 1,560,226,456 | | |
Reinvestment of dividends and distributions | | | 80,494,692 | | | | 67,438,964 | | |
Net asset value of shares redeemed | | | (1,003,735,483 | ) | | | (866,898,150 | ) | |
Net increase in net assets from capital share transactions | | | 169,628,182 | | | | 760,767,270 | | |
Net increase in net assets | | | 190,263,897 | | | | 715,815,826 | | |
Net Assets | |
Beginning of year | | | 2,591,304,857 | | | | 1,875,489,031 | | |
End of year | | $ | 2,781,568,754 | | | $ | 2,591,304,857 | | |
Distributions in excess of net investment income | | $ | (4,054,371 | ) | | $ | (3,153,489 | ) | |
See Accompanying Notes to Financial Statements.
31
Credit Suisse Floating Rate High Income Fund
Financial Highlights
(For a Class I Share of the Fund Outstanding Throughout Each Year)
| | | For the Year Ended October 31, | |
| | | 2016 | | 2015 | | 2014 | | 2013 | | 2012 | |
Per share data | |
Net asset value, beginning of year | | $ | 6.72 | | | $ | 6.86 | | | $ | 6.94 | | | $ | 6.89 | | | $ | 6.66 | | |
INVESTMENT OPERATIONS | |
Net investment income1 | | | 0.32 | | | | 0.29 | | | | 0.28 | | | | 0.30 | | | | 0.34 | | |
Net gain (loss) from investments and foreign currency
related items (both realized and unrealized) | | | 0.05 | | | | (0.14 | ) | | | (0.08 | ) | | | 0.07 | | | | 0.21 | | |
Total from investment operations | | | 0.37 | | | | 0.15 | | | | 0.20 | | | | 0.37 | | | | 0.55 | | |
REDEMPTION FEES | | | — | | | | — | | | | 0.002 | | | | 0.002 | | | | 0.002 | | |
LESS DIVIDENDS AND DISTRIBUTIONS | |
Dividends from net investment income | | | (0.31 | ) | | | (0.29 | ) | | | (0.28 | ) | | | (0.32 | ) | | | (0.32 | ) | |
Distributions from net realized gains | | | — | | | | (0.00 | )3 | | | — | | | | — | | | | — | | |
Return of capital | | | (0.01 | ) | | | (0.00 | )3 | | | — | | | | — | | | | — | | |
Total dividends and distributions | | | (0.32 | ) | | | (0.29 | ) | | | (0.28 | ) | | | (0.32 | ) | | | (0.32 | ) | |
Net asset value, end of year | | $ | 6.77 | | | $ | 6.72 | | | $ | 6.86 | | | $ | 6.94 | | | $ | 6.89 | | |
Total return4 | | | 5.79 | % | | | 2.33 | % | | | 2.94 | % | | | 5.47 | % | | | 8.51 | % | |
RATIOS AND SUPPLEMENTAL DATA | |
Net assets, end of year (000s omitted) | | $ | 2,438,027 | | | $ | 2,167,955 | | | $ | 1,343,741 | | | $ | 876,418 | | | $ | 226,027 | | |
Ratio of net expenses to average net assets | | | 0.70 | % | | | 0.70 | % | | | 0.70 | % | | | 0.70 | % | | | 0.70 | % | |
Ratio of expenses to average net assets
excluding interest expense5 | | | 0.70 | % | | | 0.70 | % | | | 0.70 | % | | | 0.70 | % | | | 0.70 | % | |
Ratio of net investment income to average
net assets | | | 4.87 | % | | | 4.29 | % | | | 4.04 | % | | | 4.35 | % | | | 4.99 | % | |
Decrease reflected in above operating expense
ratios due to waivers/reimbursements | | | 0.11 | % | | | 0.07 | % | | | 0.07 | % | | | 0.07 | % | | | 0.20 | % | |
Portfolio turnover rate | | | 48 | % | | | 46 | % | | | 57 | % | | | 89 | % | | | 96 | % | |
1 Per share information is calculated using the average shares outstanding method.
2 This amount represents less than $0.01 per share.
3 This amount represents less than $(0.01) per share.
4 Total returns are historical and include change in share price and reinvestment of all dividends and distributions. Had certain expenses not been reduced during the years shown, total returns would have been lower.
5 Presentation of 2012-2014 adjusted for consistency with current period presentation.
See Accompanying Notes to Financial Statements.
32
Credit Suisse Floating Rate High Income Fund
Financial Highlights
(For a Class A Share of the Fund Outstanding Throughout Each Year)
| | | For the Year Ended October 31, | |
| | | 2016 | | 2015 | | 2014 | | 2013 | | 2012 | |
Per share data | |
Net asset value, beginning of year | | $ | 6.75 | | | $ | 6.89 | | | $ | 6.98 | | | $ | 6.92 | | | $ | 6.69 | | |
INVESTMENT OPERATIONS | |
Net investment income1 | | | 0.31 | | | | 0.28 | | | | 0.26 | | | | 0.29 | | | | 0.32 | | |
Net gain (loss) from investments and foreign currency
related items (both realized and unrealized) | | | 0.05 | | | | (0.14 | ) | | | (0.09 | ) | | | 0.07 | | | | 0.22 | | |
Total from investment operations | | | 0.36 | | | | 0.14 | | | | 0.17 | | | | 0.36 | | | | 0.54 | | |
REDEMPTION FEES | | | — | | | | — | | | | 0.002 | | | | 0.002 | | | | 0.002 | | |
LESS DIVIDENDS AND DISTRIBUTIONS | |
Dividends from net investment income | | | (0.30 | ) | | | (0.28 | ) | | | (0.26 | ) | | | (0.30 | ) | | | (0.31 | ) | |
Distributions from net realized gains | | | — | | | | (0.00 | )3 | | | — | | | | — | | | | — | | |
Return of capital | | | (0.01 | ) | | | (0.00 | )3 | | | — | | | | — | | | | — | | |
Total dividends and distributions | | | (0.31 | ) | | | (0.28 | ) | | | (0.26 | ) | | | (0.30 | ) | | | (0.31 | ) | |
Net asset value, end of year | | $ | 6.80 | | | $ | 6.75 | | | $ | 6.89 | | | $ | 6.98 | | | $ | 6.92 | | |
Total return4 | | | 5.52 | % | | | 2.09 | % | | | 2.53 | % | | | 5.33 | % | | | 8.19 | % | |
RATIOS AND SUPPLEMENTAL DATA | |
Net assets, end of year (000s omitted) | | $ | 227,399 | | | $ | 286,805 | | | $ | 358,095 | | | $ | 456,550 | | | $ | 148,636 | | |
Ratio of net expenses to average net assets | | | 0.95 | % | | | 0.95 | % | | | 0.95 | % | | | 0.95 | % | | | 0.95 | % | |
Ratio of expenses to average net assets
excluding interest expense5 | | | 0.95 | % | | | 0.95 | % | | | 0.95 | % | | | 0.95 | % | | | 0.95 | % | |
Ratio of net investment income to average
net assets | | | 4.63 | % | | | 4.06 | % | | | 3.79 | % | | | 4.13 | % | | | 4.65 | % | |
Decrease reflected in above operating expense
ratios due to waivers/reimbursements | | | 0.11 | % | | | 0.07 | % | | | 0.07 | % | | | 0.07 | % | | | 0.20 | % | |
Portfolio turnover rate | | | 48 | % | | | 46 | % | | | 57 | % | | | 89 | % | | | 96 | % | |
1 Per share information is calculated using the average shares outstanding method.
2 This amount represents less than $0.01 per share.
3 This amount represents less than $(0.01) per share.
4 Total returns are historical and include change in share price, reinvestment of all dividends and distributions and no sales charge. Had certain expenses not been reduced during the years shown, total returns would have been lower.
5 Presentation of 2012-2014 adjusted for consistency with current period presentation.
See Accompanying Notes to Financial Statements.
33
Credit Suisse Floating Rate High Income Fund
Financial Highlights
(For a Class B Share of the Fund Outstanding Throughout Each Year)
| | | For the Year Ended October 31, | |
| | | 2016 | | 2015 | | 2014 | | 2013 | | 2012 | |
Per share data | |
Net asset value, beginning of year | | $ | 6.79 | | | $ | 6.91 | | | $ | 7.00 | | | $ | 6.93 | | | $ | 6.70 | | |
INVESTMENT OPERATIONS | |
Net investment income1 | | | 0.26 | | | | 0.23 | | | | 0.21 | | | | 0.25 | | | | 0.26 | | |
Net gain (loss) from investments and foreign currency
related items (both realized and unrealized) | | | 0.05 | | | | (0.12 | ) | | | (0.09 | ) | | | 0.07 | | | | 0.22 | | |
Total from investment operations | | | 0.31 | | | | 0.11 | | | | 0.12 | | | | 0.32 | | | | 0.48 | | |
REDEMPTION FEES | | | — | | | | — | | | | 0.002 | | | | 0.002 | | | | 0.002 | | |
LESS DIVIDENDS AND DISTRIBUTIONS | |
Dividends from net investment income | | | (0.25 | ) | | | (0.23 | ) | | | (0.21 | ) | | | (0.25 | ) | | | (0.25 | ) | |
Distributions from net realized gains | | | — | | | | (0.00 | )3 | | | — | | | | — | | | | — | | |
Return of capital | | | (0.01 | ) | | | (0.00 | )3 | | | — | | | | — | | | | — | | |
Total dividends | | | (0.26 | ) | | | (0.23 | ) | | | (0.21 | ) | | | (0.25 | ) | | | (0.25 | ) | |
Net asset value, end of year | | $ | 6.84 | | | $ | 6.79 | | | $ | 6.91 | | | $ | 7.00 | | | $ | 6.93 | | |
Total return4 | | | 4.73 | % | | | 1.64 | % | | | 1.77 | % | | | 4.64 | % | | | 7.30 | % | |
RATIOS AND SUPPLEMENTAL DATA | |
Net assets, end of year (000s omitted) | | $ | 1,800 | | | $ | 2,112 | | | $ | 3,638 | | | $ | 4,422 | | | $ | 5,185 | | |
Ratio of net expenses to average net assets | | | 1.70 | % | | | 1.70 | % | | | 1.70 | % | | | 1.70 | % | | | 1.70 | % | |
Ratio of expenses to average net assets
excluding interest expense5 | | | 1.70 | % | | | 1.70 | % | | �� | 1.70 | % | | | 1.70 | % | | | 1.70 | % | |
Ratio of net investment income to average
net assets | | | 3.89 | % | | | 3.34 | % | | | 3.07 | % | | | 3.52 | % | | | 3.83 | % | |
Decrease reflected in above operating expense
ratios due to waivers/reimbursements | | | 0.11 | % | | | 0.07 | % | | | 0.07 | % | | | 0.07 | % | | | 0.20 | % | |
Portfolio turnover rate | | | 48 | % | | | 46 | % | | | 57 | % | | | 89 | % | | | 96 | % | |
1 Per share information is calculated using the average shares outstanding method.
2 This amount represents less than $0.01 per share.
3 This amount represents less than $(0.01) per share.
4 Total returns are historical and include change in share price, reinvestment of all dividends and distributions and no sales charge. Had certain expenses not been reduced during the years shown, total returns would have been lower.
5 Presentation of 2012-2014 adjusted for consistency with current period presentation.
See Accompanying Notes to Financial Statements.
34
Credit Suisse Floating Rate High Income Fund
Financial Highlights
(For a Class C Share of the Fund Outstanding Throughout Each Year)
| | | For the Year Ended October 31, | |
| | | 2016 | | 2015 | | 2014 | | 2013 | | 2012 | |
Per share data | |
Net asset value, beginning of year | | $ | 6.77 | | | $ | 6.91 | | | $ | 7.00 | | | $ | 6.94 | | | $ | 6.71 | | |
INVESTMENT OPERATIONS | |
Net investment income1 | | | 0.26 | | | | 0.23 | | | | 0.21 | | | | 0.24 | | | | 0.27 | | |
Net gain (loss) from investments and foreign currency
related items (both realized and unrealized) | | | 0.05 | | | | (0.14 | ) | | | (0.09 | ) | | | 0.07 | | | | 0.21 | | |
Total from investment operations | | | 0.31 | | | | 0.09 | | | | 0.12 | | | | 0.31 | | | | 0.48 | | |
REDEMPTION FEES | | | — | | | | — | | | | 0.002 | | | | 0.002 | | | | 0.002 | | |
LESS DIVIDENDS AND DISTRIBUTIONS | |
Dividends from net investment income | | | (0.25 | ) | | | (0.23 | ) | | | (0.21 | ) | | | (0.25 | ) | | | (0.25 | ) | |
Distributions from net realized gains | | | — | | | | (0.00 | )3 | | | — | | | | — | | | | — | | |
Return of capital | | | (0.01 | ) | | | (0.00 | )3 | | | — | | | | — | | | | — | | |
Total dividends and distributions | | | (0.26 | ) | | | (0.23 | ) | | | (0.21 | ) | | | (0.25 | ) | | | (0.25 | ) | |
Net asset value, end of year | | $ | 6.82 | | | $ | 6.77 | | | $ | 6.91 | | | $ | 7.00 | | | $ | 6.94 | | |
Total return4 | | | 4.73 | % | | | 1.33 | % | | | 1.77 | % | | | 4.47 | % | | | 7.29 | % | |
RATIOS AND SUPPLEMENTAL DATA | |
Net assets, end of year (000s omitted) | | $ | 114,343 | | | $ | 134,433 | | | $ | 170,015 | | | $ | 167,653 | | | $ | 75,699 | | |
Ratio of net expenses to average net assets | | | 1.70 | % | | | 1.70 | % | | | 1.70 | % | | | 1.70 | % | | | 1.70 | % | |
Ratio of expenses to average net assets
excluding interest expense5 | | | 1.70 | % | | | 1.70 | % | | | 1.70 | % | | | 1.70 | % | | | 1.70 | % | |
Ratio of net investment income to average
net assets | | | 3.89 | % | | | 3.32 | % | | | 3.04 | % | | | 3.40 | % | | | 3.93 | % | |
Decrease reflected in above operating expense
ratios due to waivers/reimbursements | | | 0.11 | % | | | 0.07 | % | | | 0.07 | % | | | 0.07 | % | | | 0.20 | % | |
Portfolio turnover rate | | | 48 | % | | | 46 | % | | | 57 | % | | | 89 | % | | | 96 | % | |
1 Per share information is calculated using the average shares outstanding method.
2 This amount represents less than $0.01 per share.
3 This amount represents less than $(0.01) per share.
4 Total returns are historical and include change in share price, reinvestment of all dividends and distributions and no sales charge. Had certain expenses not been reduced during the years shown, total returns would have been lower.
5 Presentation of 2012-2014 adjusted for consistency with current period presentation.
See Accompanying Notes to Financial Statements.
35
Credit Suisse Floating Rate High Income Fund
Notes to Financial Statements
October 31, 2016
Credit Suisse Floating Rate High Income Fund (the "Fund"), a series of the Credit Suisse Opportunity Funds (the "Trust"), a Delaware statutory trust, is registered under the Investment Company Act of 1940, as amended (the "1940 Act"), as a diversified open-end management investment company that seeks to provide a high level of current income and, secondarily, capital appreciation. The Trust was organized under the laws of the State of Delaware as a business trust on May 31, 1995.
The Fund offers three classes of shares: Class I shares, Class A shares and Class C shares. Each class of shares represents an equal pro rata interest in the Fund, except the share classes bear different expenses, which reflect the differences in the range of services provided to them. Class A shares are sold subject to a front-end sales charge of up to 4.75%. Class C shares are sold subject to a CDSC of 1.00% if the shares are redeemed within the first year of purchase. Class I shares are sold without a sales charge. Effective February 29, 2012, Class B shares of the Fund are no longer being offered for sale. Existing shareholders may continue to purchase additional Class B shares of the Fund through the reinvestment of dividends and capital gain distributions paid by the Fund. Class B shares automatically convert to Class A shares after 8 years.
Note 2. Significant Accounting Policies
The following is a summary of significant accounting policies followed by the Fund in the preparation of its financial statements. The policies are in accordance with accounting principles generally accepted in the United States of America ("GAAP"). The preparation of financial statements requires management to make estimates and assumptions that affect the reported amounts and disclosures in the financial statements. Actual results could differ from those estimates. The Fund is considered an investment company for financial reporting purposes under GAAP and follows Accounting Standard Codification ("ASC") Topic 946 — Financial Services — Investment Companies.
A) SECURITY VALUATION — The net asset value of the Fund is determined daily as of the close of regular trading on the New York Stock Exchange, Inc. (the "Exchange") on each day the Exchange is open for business. The valuations for fixed income securities (which may include, but are not limited to, corporate, government, municipal, mortgage-backed, collateralized mortgage obligations and asset-backed securities) and certain derivative
36
Credit Suisse Floating Rate High Income Fund
Notes to Financial Statements (continued)
October 31, 2016
Note 2. Significant Accounting Policies (continued)
instruments are typically the prices supplied by independent third party pricing services, which may use market prices or broker/dealer quotations or a variety of valuation techniques and methodologies. The independent third party pricing services use inputs that are observable such as issuer details, interest rates, yield curves, prepayment speeds, credit risks/spreads, default rates and quoted prices for similar securities. These pricing services generally price fixed income securities assuming orderly transactions of an institutional "round lot" size, but some trades occur in smaller "odd lot" sizes which may be effected at lower prices than institutional round lot trades. Structured note agreements are valued in accordance with a dealer-supplied valuation based on changes in the value of the underlying index. Futures contracts are valued daily at the settlement price established by the board of trade or exchange on which they are traded. Forward contracts are valued at the London closing spot rates and the London closing forward point rates on a daily basis. The currency forward contract pricing model derives the differential in point rates to the expiration date of the forward and calculates its present value. Equity securities for which market quotations are available are valued at the last reported sales price or official closing price on the primary market or exchange on which they trade. The Fund may utilize a service provided by an independent third party which has been approved by the Board of Trustees (the "Board") to fair value certain securities. When fair value pricing is employed, the prices of securities used by the Fund to calculate its net asset value may differ from quoted or published prices for the same securities. If independent third party pricing services are unable to supply prices for a portfolio investment, or if the prices supplied are deemed by the investment adviser to be unreliable, the market price may be determined by the investment adviser using quotations from one or more brokers/dealers or at the transaction price if the security has recently been purchased and no value has yet been obtained from a pricing service or pricing broker. When reliable prices are not readily available, such as when the value of a security has been significantly affected by events after the close of the exchange or market on which the security is principally traded, but before the Fund calculates its net asset value, the Fund values these securities as determined in accordance with procedures approved and established by the Board.
The Fund uses valuation techniques to measure fair value that are consistent with the market approach and/or income approach, depending on the type of security and the particular circumstance. The market approach uses prices and other relevant information generated by market transactions involving
37
Credit Suisse Floating Rate High Income Fund
Notes to Financial Statements (continued)
October 31, 2016
Note 2. Significant Accounting Policies (continued)
identical or comparable securities. The income approach uses valuation techniques to discount estimated future cash flows to present value.
GAAP established a disclosure hierarchy that categorizes the inputs to valuation techniques used to value assets and liabilities at each measurement date. These inputs are summarized in the three broad levels listed below:
• Level 1 – quoted prices in active markets for identical investments
• Level 2 – other significant observable inputs (including quoted prices for similar investments, interest rates, prepayment speeds, credit risk, etc.)
• Level 3 – significant unobservable inputs (including the Fund's own assumptions in determining the fair value of investments)
The inputs or methodologies used to value securities are not necessarily an indication of the risk associated with investing in those securities.
The following is a summary of the inputs used as of October 31, 2016 in valuing the Fund's assets and liabilities carried at fair value:
Assets | | Level 1 | | Level 2 | | Level 3 | | Total | |
Investments in Securities | |
Bank Loans | | $ | — | | | $ | 2,116,010,618 | | | $ | 223,042,749 | | | $ | 2,339,053,367 | | |
Corporate Bonds | | | — | | | | 307,253,766 | | | | 1,084,551 | | | | 308,338,317 | | |
Asset Backed Securities | | | — | | | | 68,515,108 | | | | — | | | | 68,515,108 | | |
Common Stocks | | | 165,856 | | | | 37,694 | | | | 377,616 | | | | 581,166 | | |
Short-term Investments | | | — | | | | 249,057,391 | | | | — | | | | 249,057,391 | | |
| | | $ | 165,856 | | | $ | 2,740,874,577 | | | $ | 224,504,916 | | | $ | 2,965,545,349 | | |
Other Financial Instruments* | |
Forward Foreign Currency Contracts | | $ | — | | | $ | 472,226 | | | $ | — | | | $ | 472,226 | | |
Liabilities | | Level 1 | | Level 2 | | Level 3 | | Total | |
Other Financial Instruments* | |
Forward Foreign Currency Contracts | | $ | — | | | $ | 198,204 | | | $ | — | | | $ | 198,204 | | |
*Other financial instruments include unrealized appreciation (depreciation) on forward foreign currency contracts.
38
Credit Suisse Floating Rate High Income Fund
Notes to Financial Statements (continued)
October 31, 2016
Note 2. Significant Accounting Policies (continued)
The following is a reconciliation of investments as of October 31, 2016 for which significant unobservable inputs were used in determining value. All transfers, if any, are assumed to occur at the end of the reporting period.
| | | Bank
Loans | | Corporate
Bonds | | Common
Stocks | | Total | |
Balance as of October 31, 2015 | | $ | 213,328,562 | | | $ | 400 | | | $ | — | | | $ | 213,328,962 | | |
Accrued discounts (premiums) | | | 1,355,932 | | | | — | | | | — | | | | 1,355,932 | | |
Purchases | | | 131,918,772 | | | | — | | | | 437,479 | | | | 132,356,251 | | |
Sales | | | (96,637,218 | ) | | | (125 | ) | | | — | | | | (96,637,343 | ) | |
Realized gain (loss) | | | 384,347 | | | | (99,875 | ) | | | — | | | | 284,472 | | |
Change in unrealized appreciation (depreciation) | | | 940,506 | | | | 1,184,584 | | | | (59,863 | ) | | | 2,065,227 | | |
Transfers into Level 3 | | | 95,871,495 | | | | — | | | | — | | | | 95,871,495 | | |
Transfers out of Level 3 | | | (124,119,647 | ) | | | (433 | ) | | | — | | | | (124,120,080 | ) | |
Balance as of October 31, 2016 | | $ | 223,042,749 | | | $ | 1,084,551 | | | $ | 377,616 | | | $ | 224,504,916 | | |
Net change in unrealized appreciation (depreciation)
from investments still held as of October 31, 2016 | | $ | 1,163,156 | | | $ | 1,084,551 | | | $ | (59,863 | ) | | $ | 1,103,293 | | |
| | | Quantitative Disclosure About Significant Unobservable Inputs | |
Asset Class | | Fair Value
At 10/31/2016 | | Valuation
Technique | | Unobservable
Input | | Range
(Weighted Average)
(per share) | |
Bank Loans | | $ | 222,002,242 | | | Vendor Pricing | | Single Broker Quote | | $ | 0.60 – $1.09 | ($0.99) | |
| | $ | 740,507 | | | Income Approach | | Expected Remaining Distribution | | | NA | | |
| | | $ | 300,000 | | | Market Approach | | Discount for Illiquidity | | | NA | | |
Corporate Bonds | | $ | 1,084,551 | | | Income Approach | | Expected Remaining Distribution | | $ | 0.70 – $0.90 | ($0.78) | |
Common Stocks | | $ | 377,616 | | | Market Approach | | Discount for Illiquidity | | $ | 0.00 – $14.11 | ($1.51) | |
Each fair value determination is based on a consideration of relevant factors, including both observable and unobservable inputs. Observable and unobservable inputs that Credit Suisse Asset Management LLC, the Fund's investment adviser ("Credit Suisse" or the "Adviser") considers may include (i) the existence of any contractual restrictions on the disposition of securities; (ii) information obtained from the company, which may include an analysis of the company's financial statements, the company's products or intended markets or the company's technologies; (iii) the price of the same or similar security negotiated at arm's length in an issuer's completed subsequent round of financing; (iv) the price and extent of public trading in similar securities of the issuer or of comparable companies; or (v) a probability and time value adjusted analysis of contractual term. Where available and appropriate, multiple valuation methodologies are applied to confirm fair value. To the extent that valuation is based on models or inputs that are less observable or unobservable in the market, determining fair value requires more judgment. Because of the inherent uncertainty of valuation, those estimated values may
39
Credit Suisse Floating Rate High Income Fund
Notes to Financial Statements (continued)
October 31, 2016
Note 2. Significant Accounting Policies (continued)
be materially higher or lower than the values that would have been used had a ready market for the investments existed. Accordingly, the degree of judgment exercised by the Fund in determining fair value is greatest for investments categorized in Level 3. In some circumstances, the inputs used to measure fair value might be categorized within different levels of the fair value hierarchy. In those instances, the fair value measurement is categorized in its entirety in the fair value hierarchy based on the least observable input that is significant to the fair value measurement. Additionally, changes in the market environment and other events that may occur over the life of the investments may cause the gains or losses ultimately realized on these investments to be different from the valuations used at the date of these financial statements.
For the year ended October 31, 2016, there were no transfers between Level 1 and Level 2, but there was $95,871,495 transferred out from Level 2 to Level 3 due to a lack of pricing source supported by observable inputs and $124,120,080 transferred out from Level 3 to Level 2 as a result of the availability of a pricing source supported by observable inputs. All transfers, if any, are assumed to occur at the end of the reporting period.
B) DERIVATIVE INSTRUMENTS AND HEDGING ACTIVITIES — The Fund adopted amendments to authoritative guidance on disclosures about derivative instruments and hedging activities which require that a fund disclose (a) how and why an entity uses derivative instruments, (b) how derivative instruments and hedging activities are accounted for and (c) how derivative instruments and related hedging activities affect a fund's financial position, financial performance and cash flows.
Fair Value of Derivative Instruments as of October 31, 2016
| | | Asset Derivatives | | Liability Derivatives | |
| | | Balance Sheet
Location | | Fair Value | | Balance Sheet
Location | | Fair Value | |
Currency Contracts
| | Unrealized appreciation
on forward foreign
currency contracts | | $ | 472,226 | | | Unrealized depreciation
on forward foreign
currency contracts | | $ | 198,204 | | |
40
Credit Suisse Floating Rate High Income Fund
Notes to Financial Statements (continued)
October 31, 2016
Note 2. Significant Accounting Policies (continued)
Effect of Derivative Instruments on the Statement of Operations
| | | Location | | Realized
Gain (Loss) | | Location | | Net Unrealized
Appreciation
(Depreciation) | |
Currency Contracts
| | Net realized gain from
forward foreign
currency transactions* | | $ | 8,838,918 | | | Net change in unrealized
appreciation
(depreciation) from
forward foreign
currency translations* | | $ | (996,683 | ) | |
*Statement of Operations includes both forward foreign currency contracts and foreign currency transactions/translations.
For the year ended October 31, 2016, the Fund held an average monthly value on a net basis of $84,713,869 in forward foreign currency contracts.
The Fund is a party to International Swap and Derivatives Association, Inc. ("ISDA") Master Agreements ("Master Agreements") with certain counterparties that govern over-the-counter derivative (including Total Return, Credit Default and Interest Rate Swaps) and foreign exchange contracts entered into by the Fund. The Master Agreements may contain provisions regarding, among other things, the parties' general obligations, representations, agreements, collateral requirements, events of default and early termination. Termination events applicable to the Fund may occur upon a decline in the Fund's net assets below a specified threshold over a certain period of time.
The following table presents by counterparty the Fund's derivative assets, net of related collateral held by the Fund, at October 31, 2016:
Counterparty | | Gross Amount of
Assets Presented in the
Statement of Assets
and Liabilities(a) | | Financial
Instruments
and Derivatives
Available for Offset | | Non-Cash
Collateral
Received | | Cash
Collateral
Received | | Net Amount
of Derivative
Assets | |
Morgan Stanley | | $ | 472,226 | | | $ | (198,204 | ) | | $ | — | | | $ | — | | | $ | 274,022 | | |
The following table presents by counterparty the Fund's derivative liabilities, net of related collateral pledged by the Fund, at October 31, 2016:
Counterparty | | Gross Amount of
Liabilities Presented in the
Statement of Assets
and Liabilities(a) | | Financial
Instruments
and Derivatives
Available for Offset | | Non-Cash
Collateral
Pledged | | Cash
Collateral
Pledged | | Net Amount
of Derivative
Liabilities | |
Morgan Stanley | | $ | 198,204 | | | $ | (198,204 | ) | | $ | — | | | $ | — | | | $ | — | | |
(a) Forward foreign currency exchange contracts are included.
41
Credit Suisse Floating Rate High Income Fund
Notes to Financial Statements (continued)
October 31, 2016
Note 2. Significant Accounting Policies (continued)
C) FOREIGN CURRENCY TRANSACTIONS — The books and records of the Fund are maintained in U.S. dollars. Transactions denominated in foreign currencies are recorded at the current prevailing exchange rates. All assets and liabilities denominated in foreign currencies are translated into U.S. dollar amounts at the current exchange rate at the end of the period. Reported net realized gain (loss) from foreign currency transactions arises from sales of foreign currencies; currency gains or losses realized between the trade and settlement dates on securities transactions; and the difference between the amounts of dividends, interest, and foreign withholding taxes recorded on the Fund's books and the U.S. dollar equivalent of the amounts actually received or paid. Net change in unrealized gains and losses on translation of assets and liabilities denominated in foreign currencies arises from changes in the fair values of assets and liabilities, other than investments at the end of the period, resulting from changes in exchange rates. The Fund does not isolate that portion of the results of operations resulting from fluctuations in foreign exchange rates on investments from the fluctuations arising from changes in market prices of investments held. Such fluctuations are included with net realized and unrealized gain or loss from investments in the Statement of Operations.
D) SECURITY TRANSACTIONS AND INVESTMENT INCOME/EXPENSE — Security transactions are accounted for on a trade date basis. Interest income/expense is recorded on the accrual basis. The Fund amortizes premiums and accretes discounts using the effective interest method. Dividend income/expense is recorded on the ex-dividend date. Certain expenses are class-specific expenses, vary by class and are charged only to that class. Income, expenses (excluding class-specific expenses) and realized/unrealized gains/losses are allocated proportionately to each class of shares based upon the relative net asset value of the outstanding shares of that class. The cost of investments sold is determined by use of the specific identification method for both financial reporting and income tax purposes. To the extent any issuer defaults or a credit event occurs that impacts the issuer, the Fund may halt any additional interest income accruals and consider the realizability of interest accrued up to the date of default or credit event.
E) DIVIDENDS AND DISTRIBUTIONS TO SHAREHOLDERS — Dividends from net investment income, if any, are declared daily and paid monthly. Distributions of net realized capital gains, if any, are declared and paid at least annually. However, to the extent that a net realized capital gain can be reduced by a capital loss carryforward, such gain will not be distributed. Dividends
42
Credit Suisse Floating Rate High Income Fund
Notes to Financial Statements (continued)
October 31, 2016
Note 2. Significant Accounting Policies (continued)
and distributions to shareholders of the Fund are recorded on the ex-dividend date and are determined in accordance with federal income tax regulations, which may differ from GAAP.
F) FEDERAL INCOME TAXES — No provision is made for federal taxes as it is the Fund's intention to continue to qualify as a regulated investment company ("RIC") under the Internal Revenue Code of 1986, as amended (the "Code"), and to make the requisite distributions to its shareholders, which will be sufficient to relieve it from federal income and excise taxes.
In order to qualify as a RIC under the Code, the Fund must meet certain requirements regarding the source of its income, the diversification of its assets and the distribution of its income. One of these requirements is that the Fund derive at least 90% of its gross income for each taxable year from dividends, interest, payments with respect to certain securities loans, gains from the sale or other disposition of stock, securities or foreign currencies, other income derived with respect to its business of investing in such stock, securities or currencies or net income derived from interests in certain publicly-traded partnerships ("Qualifying Income").
The Fund adopted the authoritative guidance for uncertainty in income taxes and recognizes a tax benefit or liability from an uncertain position only if it is more likely than not that the position is sustainable based solely on its technical merits and consideration of the relevant taxing authority's widely understood administrative practices and procedures. The Fund has reviewed its current tax positions and has determined that no provision for income tax is required in the Fund's financial statements. The Fund's federal and state income and federal excise tax returns for tax years for which the applicable statutes of limitations have not expired are subject to examination by the Internal Revenue Service and state departments of revenue.
G) SHORT-TERM INVESTMENTS — The Fund, together with other funds/portfolios advised by Credit Suisse, pools available cash into a short-term variable rate time deposit issued by State Street Bank and Trust Company ("SSB"), the Fund's custodian. The short-term time deposit issued by SSB is a variable rate account classified as a short-term investment.
H) FORWARD FOREIGN CURRENCY CONTRACTS — A forward foreign currency exchange contract ("forward currency contract") is a commitment to purchase or sell a foreign currency at the settlement date at a negotiated rate. The Fund will enter into forward currency contracts primarily for hedging foreign currency risk. Forward currency contracts are valued at the prevailing
43
Credit Suisse Floating Rate High Income Fund
Notes to Financial Statements (continued)
October 31, 2016
Note 2. Significant Accounting Policies (continued)
forward exchange rate of the underlying currencies and unrealized gain (loss) is recorded daily. On the settlement date of the forward currency contract, the Fund records a realized gain or loss equal to the difference between the value of the contract at the time it was opened and the value of the contract at the time it was closed. Certain risks may arise upon entering into forward currency contracts from the potential inability of counterparties to meet the terms of their contracts. The maximum counterparty credit risk to the Fund is measured by the unrealized gain on appreciated contracts. Additionally, when utilizing forward currency contracts to hedge, the Fund gives up the opportunity to profit from favorable exchange rate movements during the term of the contract. The Fund's open forward currency contracts at October 31, 2016 are disclosed in the Schedule of Investments.
I) UNFUNDED LOAN COMMITMENTS — The Fund enters into certain agreements, all or a portion of which may be unfunded. The Fund is obligated to fund these loan commitments at the borrowers' discretion. Funded portions of credit agreements are presented in the Schedule of Investments. As of October 31, 2016, unfunded commitments were as follows:
Borrower | | Maturity | | Rate | | Unfunded Commitment | |
Acrisure LLC | | 05/19/22 | | | 6.500 | | | $ | 103,309 | | |
Unfunded loan commitments and funded portions of credit agreements are marked to market daily and any unrealized appreciation or depreciation is included in the Statement of Assets and Liabilities and the Statement of Operations.
J) SECURITIES LENDING — The initial collateral received by the Fund is required to have a value of at least 102% of the market value of domestic securities on loan (including any accrued interest thereon) and 105% of the market value of foreign securities on loan (including any accrued interest thereon). The collateral is maintained thereafter at a value equal to at least 102% of the current market value of the securities on loan. The market value of loaned securities is determined at the close of each business day of the Fund and any additional required collateral is delivered to the Fund, or excess collateral returned by the Fund, on the next business day. Cash collateral received by the Fund in connection with securities lending activity may be pooled together with cash collateral for other funds/portfolios advised by Credit Suisse and may be invested in a variety of investments, including funds advised by SSB, the Fund's securities lending agent, or money market instruments. However, in the event of default or bankruptcy by the other party
44
Credit Suisse Floating Rate High Income Fund
Notes to Financial Statements (continued)
October 31, 2016
Note 2. Significant Accounting Policies (continued)
to the agreement, realization and/or retention of the collateral may be subject to legal proceedings.
SSB has been engaged by the Fund to act as the Fund's securities lending agent. As of October 31, 2016, the Fund had investment securities on loan with a fair value of $11,765,025. Collateral received for securities loaned and a related liability of $12,029,303 are presented gross in the Statement of Assets and Liabilities. The collateral for securities loaned is valued consistently to the other investments held by the Fund and is included in Level 2 of the fair value hierarchy. For the year ended October 31, 2016, the value of the related collateral exceeded the value of the securities loaned.
The Fund's securities lending arrangement provides that the Fund and SSB will share the net income earned from securities lending activities. Securities lending income is accrued as earned. During the year ended October 31, 2016, total earnings from the Fund's investment in cash collateral received in connection with securities lending arrangements was $277,162, of which $12,243 was rebated to borrowers (brokers). The Fund retained $214,987 in income from the cash collateral investment, and SSB, as lending agent, was paid $49,932.
K) OTHER — The high yield, fixed income securities in which the Fund invests will primarily consist of senior secured floating rate loans ("Senior Loans") issued by non-investment grade companies. Senior Loans are typically secured by specific collateral of the issuer and hold the most senior position in the issuer's capital structure. The interest rate on Senior Loans is periodically adjusted to a recognized base rate, typically the London Interbank Offered Rate ("LIBOR"). While these characteristics may reduce interest rate risk and mitigate losses in the event of borrower default, the Senior Loans in which the Fund invests have below investment grade credit ratings and thereby are considered speculative because of the significant credit risk of their issuers.
Lower-rated debt securities (commonly known as "junk bonds") possess speculative characteristics and are subject to greater market fluctuations and risk of lost income and principal than higher-rated debt securities for a variety of reasons. Also, during an economic downturn or substantial period of rising interest rates, highly leveraged issuers may experience financial stress which would adversely affect their ability to service their principal and interest payment obligations, to meet projected business goals and to obtain additional financing.
45
Credit Suisse Floating Rate High Income Fund
Notes to Financial Statements (continued)
October 31, 2016
Note 2. Significant Accounting Policies (continued)
In addition, periods of economic uncertainty and changes can be expected to result in increased volatility of market prices of lower-rated debt securities and the Fund's net asset value.
L) NEW ACCOUNTING PRONOUNCEMENTS — On August 26, 2016, Financial Accounting Standards Board ("FASB") issued a new Accounting Standards Update No. 2016-15, "Statement of Cash Flows (Topic 230), a consensus of the FASB's Emerging Issues Task Force" ("ASU 2016-15"). ASU 2016-15 is intended to reduce diversity in practice in how certain transactions are classified in the statement of cash flows. The issues addressed in ASU 2016-15 are: debt prepayment or debt extinguishment costs, settlement of zero-coupon debt instruments, contingent consideration payments made after a business combination, proceeds from the settlement of insurance claims, proceeds from the settlement of corporate-owned life insurance policies, including bank-owned life insurance policies, distributions received from equity method investments, beneficial interests in securitization transactions; and, separately identifiable cash flows and application of the predominance principle. ASU 2016-15 is effective for interim and annual reporting periods beginning after December 15, 2017. Management is currently evaluating the impact, if any, of applying this provision.
In November 2016, FASB issued a new Accounting Standards Update No. 2016-18, "Statement of Cash Flows (Topic 230), Restricted Cash, a consensus of the FASB's Emerging Issues Task Force" ("ASU 2016-18"). ASU 2016-18 requires that a statement of cash flows explains the change during the period in the total of cash, cash equivalents, and amounts generally described as restricted cash or restricted cash equivalents. Therefore, amounts generally described as restricted cash and restricted cash equivalents should be included with cash and cash equivalents when reconciling the beginning-of-period and end-of-period total amounts shown on the statement of cash flows. The amendments in ASU 2016-18 do not provide a definition of restricted cash or restricted cash equivalents. ASU 2016-18 is effective for interim and annual reporting periods beginning after December 15, 2017. Management is currently evaluating the impact, if any, of applying this provision.
In October 2016, the U.S. Securities and Exchange Commission adopted new rules and amended existing rules (together, "final rules") intended to modernize the reporting and disclosure of information by registered investment companies. In part, the final rules amend Regulation S-X and require standardized, enhanced disclosure about derivatives in investment company financial statements, as well as other amendments. The compliance
46
Credit Suisse Floating Rate High Income Fund
Notes to Financial Statements (continued)
October 31, 2016
Note 2. Significant Accounting Policies (continued)
date for the amendments to Regulation S-X is August 1, 2017. Management is currently evaluating the impact that the adoption of the amendments to Regulation S-X will have on the Fund's financial statements and related disclosures.
M) SUBSEQUENT EVENTS — In preparing the financial statements as of October 31, 2016, management considered the impact of subsequent events for potential recognition or disclosure in these financial statements through the date of release of this report. No such events requiring recognition or disclosure were identified through the date of the release of this report.
Note 3. Transactions with Affiliates and Related Parties
Credit Suisse serves as investment adviser for the Fund. For its investment advisory services, Credit Suisse is entitled to receive a fee from the Fund at an annual rate of 0.70% of the Fund's average daily net assets less than or equal to $100 million and 0.50% of the Fund's average daily net assets greater than $100 million. For the year ended October 31, 2016, investment advisory fees earned and voluntarily waived were $12,922,383 and $2,883,331, respectively. Fee waivers and expense reimbursements are voluntary and may be discontinued by Credit Suisse at any time.
Credit Suisse and SSB serve as co-administrators to the Fund. For its co-administrative services, Credit Suisse receives a fee calculated at an annual rate of 0.09% of the Fund's average daily net assets. For the year ended October 31, 2016, co-administrative services fees earned by Credit Suisse were $2,290,029.
For its co-administrative services, SSB receives a fee, exclusive of out-of-pocket expenses, calculated in total for all the Credit Suisse funds/portfolios co-administered by SSB and allocated based upon the relative average net assets of each fund/portfolio, subject to an annual minimum fee. For the year ended October 31, 2016, co-administrative services fees earned by SSB (including out-of-pocket expenses) with respect to the Fund were $396,145.
Credit Suisse Securities (USA) LLC ("CSSU"), an affiliate of Credit Suisse, serves as the distributor of the Fund's shares. Pursuant to a distribution plan adopted by the Fund pursuant to Rule 12b-1 under the 1940 Act, CSSU receives fees for its distribution services. These fees are calculated at an annual rate of 0.25% of the average daily net assets of the Class A shares. For the Class B and Class C shares, the fee is calculated at an annual rate of 1.00% of the average daily net assets. For the year ended October 31, 2016, the Fund paid Rule 12b-1
47
Credit Suisse Floating Rate High Income Fund
Notes to Financial Statements (continued)
October 31, 2016
Note 3. Transactions with Affiliates and Related Parties (continued)
distribution fees of $611,487 for Class A shares, $18,730 for Class B shares and $1,203,584 for Class C shares. Class I shares are not subject to Rule 12b-1 distribution fees.
Certain brokers, dealers and financial representatives provide transfer agent-related services to the Fund and receive compensation from the Fund. For the year ended October 31, 2016, the Fund paid $2,531,633, which is included within transfer agent fees in the Statement of Operations.
For the year ended October 31, 2016, CSSU and its affiliates advised the Fund that they retained $24,726 from commissions earned on the sale of the Fund's Class A shares. There were no commissions earned on the sale of Class C shares.
The Fund from time to time purchases or sells loan investments in the secondary market through Credit Suisse or its affiliates acting in the capacity as broker-dealer. Credit Suisse or its affiliates may have acted in some type of agent capacity to the initial loan offering prior to such loan trading in the secondary market.
Note 4. Line of Credit
The Fund, together with other funds/portfolios advised by Credit Suisse (collectively, the "Participating Funds"), participates in a committed, unsecured line of credit facility ("Credit Facility"), with SSB in an aggregated amount of $250 million for temporary or emergency purposes under a first-come, first-served basis. Under the terms of the Credit Facility, the Participating Funds pay an aggregate commitment fee on the average unused amount of the Credit Facility, which is allocated among the Participating Funds in such manner as is determined by the governing Boards of the Participating Funds. In addition, the Participating Funds pay interest on borrowings at either the Overnight Federal Funds rate or the Overnight LIBOR rate plus a spread. At October 31, 2016 and during the year ended October 31, 2016, the Fund had no borrowings outstanding under the Credit Facility.
Note 5. Purchases and Sales of Securities
For the year ended October 31, 2016, purchases and sales of investment securities (excluding short-term investments) were $1,424,710,400 and $1,146,351,242, respectively.
48
Credit Suisse Floating Rate High Income Fund
Notes to Financial Statements (continued)
October 31, 2016
Note 6. Capital Share Transactions
The Fund is authorized to issue an unlimited number of full and fractional shares of beneficial interest, $.001 par value per share. The Fund offers Class I, Class A, and Class C shares. Class B shares are shown but not offered. Transactions in capital shares for each class of the Fund were as follows:
| | | Class I | |
| | | For the Year Ended
October 31, 2016 | | For the Year Ended
October 31, 2015 | |
| | | Shares | | Value | | Shares | | Value | |
Shares sold | | | 149,356,768 | | | $ | 986,928,174 | | | | 198,305,828 | | | $ | 1,347,449,562 | | |
Shares issued in reinvestment
of dividends and distributions | | | 10,116,253 | | | | 66,947,489 | | | | 7,651,192 | | | | 52,100,200 | | |
Shares redeemed | | | (121,931,508 | ) | | | (804,238,116 | ) | | | (79,192,865 | ) | | | (538,755,284 | ) | |
Net increase | | | 37,541,513 | | | $ | 249,637,547 | | | | 126,764,155 | | | $ | 860,794,478 | | |
| | | Class A | |
| | | For the Year Ended
October 31, 2016 | | For the Year Ended
October 31, 2015 | |
| | | Shares | | Value | | Shares | | Value | |
Shares sold | | | 12,679,497 | | | $ | 84,108,918 | | | | 27,898,729 | | | $ | 190,531,045 | | |
Shares issued in reinvestment
of dividends and distributions | | | 1,493,495 | | | | 9,910,448 | | | | 1,728,623 | | | | 11,837,787 | | |
Shares redeemed net of
redemption fees | | | (23,217,202 | ) | | | (153,348,811 | ) | | | (39,122,080 | ) | | | (268,403,501 | ) | |
Net decrease | | | (9,044,210 | ) | | $ | (59,329,445 | ) | | | (9,494,728 | ) | | $ | (66,034,669 | ) | |
| | | Class B | |
| | | For the Year Ended
October 31, 2016 | | For the Year Ended
October 31, 2015 | |
| | | Shares | | Value | | Shares | | Value | |
Shares sold | | | 454 | | | $ | 3,155 | | | | 1,381 | | | $ | 14,452 | | |
Shares issued in reinvestment
of dividends and distributions | | | 6,631 | | | | 44,259 | | | | 6,275 | | | | 43,099 | | |
Shares redeemed net of
redemption fees | | | (54,950 | ) | | | (364,616 | ) | | | (222,773 | ) | | | (1,531,386 | ) | |
Net decrease | | | (47,865 | ) | | $ | (317,202 | ) | | | (215,117 | ) | | $ | (1,473,835 | ) | |
49
Credit Suisse Floating Rate High Income Fund
Notes to Financial Statements (continued)
October 31, 2016
Note 6. Capital Share Transactions (continued)
| | | Class C | |
| | | For the Year Ended
October 31, 2016 | | For the Year Ended
October 31, 2015 | |
| | | Shares | | Value | | Shares | | Value | |
Shares sold | | | 3,268,797 | | | $ | 21,828,726 | | | | 3,224,432 | | | $ | 22,231,397 | | |
Shares issued in reinvestment
of dividends and distributions | | | 539,495 | | | | 3,592,496 | | | | 503,755 | | | | 3,457,878 | | |
Shares redeemed net of
redemption fees | | | (6,898,846 | ) | | | (45,783,940 | ) | | | (8,482,444 | ) | | | (58,207,979 | ) | |
Net decrease | | | (3,090,554 | ) | | $ | (20,362,718 | ) | | | (4,754,257 | ) | | $ | (32,518,704 | ) | |
On October 31, 2016, the number of shareholders that held 5% or more of the outstanding shares of each class of the Fund was as follows:
| | | Number of
Shareholders | | Approximate Percentage
of Outstanding Shares | |
Class I | | | 4 | | | | 41 | % | |
Class A | | | 5 | | | | 72 | % | |
Class B | | | 4 | | | | 77 | % | |
Class C | | | 4 | | | | 70 | % | |
Some of the shareholders are omnibus accounts, which hold shares on behalf of individual shareholders.
Note 7. Federal Income Taxes
Income and capital gain distributions are determined in accordance with federal income tax regulations, which may differ from GAAP.
The tax characteristics of distributions paid by the Fund during the years ended October 31, 2016 and 2015, respectively, were as follows:
Ordinary Income | | Long-Term Capital Gain | | Return of Capital | |
| 2016 | | 2015 | | 2016 | | 2015 | | 2016 | | 2015 | |
| $ | 120,379,147 | | | $ | 81,410,649 | | | $ | — | | | $ | 921,341 | | | $ | 2,054,124 | | | $ | 497,136 | | |
The tax basis components of distributable earnings differ from the amounts reflected in the Statement of Assets and Liabilities by temporary book/tax differences. These differences are primarily due to differing treatments of dividends payable, wash sales, forward contracts marked to market, partnership basis adjustments and income from defaulted bonds. At
50
Credit Suisse Floating Rate High Income Fund
Notes to Financial Statements (continued)
October 31, 2016
Note 7. Federal Income Taxes (continued)
October 31, 2016, the components of distributable earnings on a tax basis were as follows:
Accumulated net realized loss | | $ | (227,767 | ) | |
| Unrealized depreciation | | | (44,136,354 | ) | |
| | $ | (44,364,121 | ) | |
At October 31, 2016, the Fund had $227,767 of unlimited long-term capital loss carryforwards available to offset possible future capital gains.
At October 31, 2016, the cost of investments (excluding foreign currency related transactions) and the net unrealized appreciation (depreciation) for income tax purposes were as follows:
Cost of Investments | | $ | 3,009,683,892 | | |
Unrealized appreciation | | $ | 26,449,161 | | |
Unrealized depreciation | | | (70,587,704 | ) | |
Net unrealized depreciation | | $ | (44,138,543 | ) | |
To adjust for current period permanent book/tax differences which arose principally from differing book/tax treatment of foreign currency gain (loss), defaulted bonds and partnership basis adjustments, paid-in capital was charged $1,162,903, distributions in excess of net investment income was charged $2,745,213 and accumulated net realized loss was credited $3,908,116. Net assets were not affected by these reclassifications.
Note 8. Contingencies
In the normal course of business, the Fund may provide general indemnifications pursuant to certain contracts and organizational documents. The Fund's maximum exposure under these arrangements is dependent on future claims that may be made against the Fund and, therefore, cannot be estimated; however, based on experience, the risk of loss from such claims is considered remote.
51
Credit Suisse Floating Rate High Income Fund
Report of Independent Registered Public Accounting Firm
The Board of Trustees and Shareholders
Credit Suisse Floating Rate High Income Fund:
We have audited the accompanying statement of assets and liabilities of Credit Suisse Floating Rate High Income Fund (the "Fund"), a series of the Credit Suisse Opportunity Funds, including the schedule of investments, as of October 31, 2016, and the related statement of operations for the year then ended, and the statements of changes in net assets and financial highlights for each of the years in the two-year period then ended. These financial statements and financial highlights are the responsibility of the Fund's management. Our responsibility is to express an opinion on these financial statements and financial highlights based on our audits. The accompanying financial highlights for each of the years in the three-year period ended October 31, 2014, were audited by other independent registered public accountants whose report thereon dated December 29, 2014, expressed an unqualified opinion on those financial highlights.
We conducted our audits in accordance with the standards of the Public Company Accounting Oversight Board (United States). Those standards require that we plan and perform the audits to obtain reasonable assurance about whether the financial statements and financial highlights are free of material misstatement. An audit includes examining, on a test basis, evidence supporting the amounts and disclosures in the financial statements. Our procedures included confirmation of securities owned as of October 31, 2016, by correspondence with the custodian and broker or by other appropriate auditing procedures. An audit also includes assessing the accounting principles used and significant estimates made by management, as well as evaluating the overall financial statement presentation. We believe that our audits provide a reasonable basis for our opinion.
In our opinion, the financial statements and financial highlights referred to above present fairly, in all material respects, the financial position of Credit Suisse Floating Rate High Income Fund as of October 31, 2016, the results of its operations for the year then ended and the changes in its net assets and the financial highlights for each of the years in the two-year period then ended, in conformity with U.S. generally accepted accounting principles.

New York, New York
December 28, 2016
52
Credit Suisse Floating Rate High Income Fund
Information Concerning Trustees and Officers (unaudited)
Name, Address
(Year of Birth) | | Position(s)
Held with
Fund | | Term
of Office1
and
Length
of Time
Served | | Principal
Occupation(s) During
Past Five Years | | Number of
Portfolios
in Fund
Complex
Overseen
by Trustee | | Other
Trusteeships
Held by Trustee | |
Independent Trustees | | | | | | | | | | | |
Enrique R. Arzac
c/o Credit Suisse Asset
Management, LLC
Attn: General Counsel
One Madison Avenue
New York, New York
10010
(1941) | | Trustee, Audit Committee Chairman and Nominating Committee Member | | Since 2005 | | Professor Emeritus of Finance and Economics from July 2015 to present; Professor of Finance and Economics, Graduate School of Business, Columbia University from 1971 to July 2015. | | | 12 | | | Director of Adams Diversified Equity Fund, Inc., Adams Natural Resources Fund, Inc., Aberdeen Chile Fund, Inc., Aberdeen Emerging Markets Smaller Company Opportunities Fund, Inc., Aberdeen Israel Fund, Inc., Aberdeen Indonesia Fund, Inc. and Aberdeen Latin America Equity Fund, Inc. (each a closed-end investment company); Director of Aberdeen Asia-Pacific Income Investment Company Limited (a Canadian closed-end fund); Trustee of Mirae Asset Discovery Funds (7 open-end portfolios); Director of Epoch Holding Corporation (an investment management and investment advisory services company) from August 2006 to March 2013. | |
1 Subject to the Trust's retirement policy, each Trustee may continue to serve as a Trustee until the last day of the calendar year in which the applicable Trustee attains age 75. Officer serves until his or her respective successor has been duly elected and qualified.
53
Credit Suisse Floating Rate High Income Fund
Information Concerning Trustees and Officers (unaudited) (continued)
Name, Address
(Year of Birth) | | Position(s)
Held with
Fund | | Term
of Office1
and
Length
of Time
Served | | Principal
Occupation(s) During
Past Five Years | | Number of
Portfolios
in Fund
Complex
Overseen
by Trustee | | Other
Trusteeships
Held by Trustee | |
Independent Trustees | | | | | | | | | | | |
Jeffrey E. Garten
c/o Credit Suisse Asset Management, LLC Attn: General Counsel One Madison Avenue New York, New York 10010
(1946) | | Trustee, Audit and Nominating Committee Member | | Since 2001 | | Dean Emeritus of Yale School of Management from July 2015 to present; The Juan Trippe Professor in the Practice of International Trade, Finance and Business, Yale School of Management, from July 2005 to July 2015; Partner and Chairman of Garten Rothkopf (consulting firm) from October 2005 to present. | | | 10 | | | Director of Aetna, Inc. (insurance company); Director of CarMax Group (used car dealers); Director of Miller Buckfire & Co., LLC (financial restructuring); Member of Standard & Poor's Board of Managers (credit rating agency) from December 2011 to November 2014. | |
Steven N. Rappaport
Lehigh Court, LLC
555 Madison Avenue
29th Floor
New York, New York
10022
(1948) | | Chairman of the Board of Trustees, Audit Committee Member and Nominating Committee Chairman | | Trustee since 2001 and Chairman since 2005 | | Partner of Lehigh Court, LLC and RZ Capital (private investment firms) from July 2002 to present; Partner of Backstage Acquisition Holdings, LLC (publication job postings) from November 2013 to present. | | | 12 | | | Director of iCAD, Inc. (surgical and medical instruments and apparatus company); Director of Aberdeen Chile Fund, Inc., Aberdeen Emerging Markets Smaller Company Opportunities Fund, Inc., Aberdeen Israel Fund, Inc., Aberdeen Indonesia Fund, Inc. and Aberdeen Latin America Equity Fund, Inc. (each a closed-end investment company); Director of Aberdeen Funds (25 open portfolios); Director of Presstek, Inc. (digital imaging technologies company) from 2003 to 2012; Director of Wood Resources, LLC (plywood manufacturing company) from 2003 to October 2013. | |
1 Subject to the Trust's retirement policy, each Trustee may continue to serve as a Trustee until the last day of the calendar year in which the applicable Trustee attains age 75. Officer serves until his or her respective successor has been duly elected and qualified.
54
Credit Suisse Floating Rate High Income Fund
Information Concerning Trustees and Officers (unaudited) (continued)
Name, Address
(Year of Birth) | | Position(s)
Held with
Fund | | Term of
Office1
and
Length of
Time
Served | | Principal Occupation(s) During Past Five Years | |
Officers* | | | | | | | |
John G. Popp
Credit Suisse Asset
Management, LLC
One Madison Avenue
New York, New York 10010
(1956) | | Chief Executive Officer and President | | Since 2010 | | Managing Director of Credit Suisse; Global Head and Chief Investment Officer of the Credit Investment Group; Associated with Credit Suisse or its predecessor since 1997; Officer of other Credit Suisse Funds; Trustee of Credit Suisse High Yield Bond Fund; Director of Credit Suisse Asset Management Income Fund, Inc. | |
Emidio Morizio
Credit Suisse Asset
Management, LLC
One Madison Avenue
New York, New York 10010
(1966) | | Chief Compliance Officer | | Since 2004 | | Managing Director and Global Head of Compliance of Credit Suisse since 2010; Associated with Credit Suisse since July 2000; Officer of other Credit Suisse Funds. | |
Lou Anne McInnis
Credit Suisse Asset Management, LLC
One Madison Avenue
New York, New York 10010
(1959) | | Chief Legal Officer | | Since 2015 | | Director of Credit Suisse; Associated with Credit Suisse since April 2015; Counsel at DLA Piper US LLP from 2011 to April 2015; Associated with Morgan Stanley Investment Management from 1997 to 2010; Officer of other Credit Suisse Funds. | |
Laurie Pecha
Credit Suisse Asset
Management, LLC
One Madison Avenue
New York, New York 10010
(1961) | | Chief Financial Officer | | Since 2016 | | Director of Credit Suisse since August 2016; Senior Consultant of Spectra Professional Services, LLC from January 2012 to July 2016; Vice President of Legg Mason & Co. from March 2007 to December 2011; Officer of other Credit Suisse Funds. | |
Esther Cheung
Credit Suisse Asset
Management, LLC
One Madison Avenue
New York, New York 10010
(1980) | | Treasurer | | Since 2016 | | Vice President of Credit Suisse since 2015; Associated with Reich & Tang Asset Management, LLC from June 2010 to August 2015; Officer of other Credit Suisse Funds. | |
Karen Regan
Credit Suisse Asset
Management, LLC
One Madison Avenue
New York, New York 10010
(1963) | | Vice President and Secretary | | Since 2010 | | Vice President of Credit Suisse; Associated with Credit Suisse since December 2004; Officer of other Credit Suisse Funds. | |
1 Subject to the Trust's retirement policy, each Trustee may continue to serve as a Trustee until the last day of the calendar year in which the applicable Trustee attains age 75. Officer serves until his or her respective successor has been duly elected and qualified.
* The officers of the Fund shown are officers that make policy decisions.
The Statement of Additional Information includes additional information about the Trustees and is available, without charge, upon request, by calling 877-870-2874.
55
Credit Suisse Floating Rate High Income Fund
Proxy Voting and Portfolio Holdings Information (unaudited)
Information regarding how the Fund voted proxies related to its portfolio securities during the 12-month period ended June 30 of each year, as well as the policies and procedures that the Fund uses to determine how to vote proxies relating to its portfolio securities are available:
• By calling 1-877-870-2874
• On the Fund's website, www.credit-suisse.com/us/funds
• On the website of the Securities and Exchange Commission, www.sec.gov.
The Fund files a complete schedule of its portfolio holdings for the first and third quarters of its fiscal year with the SEC on Form N-Q. The Fund's Forms N-Q are available on the SEC's website at www.sec.gov and may be reviewed and copied at the SEC's Public Reference Room in Washington, DC. Information on the operation of the SEC's Public Reference Room may be obtained by calling 1-202-551-8090.
56

P.O. BOX 55030, BOSTON, MA 02205-5030
877-870-2874 n www.credit-suisse.com/us/funds
CREDIT SUISSE SECURITIES (USA) LLC, DISTRIBUTOR. FLHI-AR-1016
Item 2. Code of Ethics.
The registrant has adopted a code of ethics applicable to its Chief Executive Officer, President, Chief Financial Officer and Chief Accounting Officer, or persons performing similar functions. A copy of the code is filed as Exhibit 12(a)(1) to this Form. There were no amendments to the code during the fiscal year ended October 31, 2016. There were no waivers or implicit waivers from the code granted by the registrant during the fiscal year ended October 31, 2016.
Item 3. Audit Committee Financial Expert.
The registrant’s governing board has determined that it has two audit committee financial experts serving on its audit committee: Enrique R. Arzac and Steven N. Rappaport. Each audit committee financial expert is “independent” for purposes of this item.
Item 4. Principal Accountant Fees and Services.
(a) through (d). The information in the table below is provided for services rendered to the registrant by its independent registered public accounting firm, KPMG LLP (“KPMG”), for its fiscal years ended October 31, 2015 and October 31, 2016. The Fund’s former independent registered public accounting firm served the registrant for the fiscal year ended October 31, 2014 until their resignation on February 24, 2015.
| | 2015 | | 2016 | |
Audit Fees | | $ | 238,500 | | $ | 217,350 | |
Audit-Related Fees(1) | | $ | 28,000 | | $ | 33,136 | |
Tax Fees(2) | | $ | 28,550 | | $ | 22,785 | |
All Other Fees | | — | | 8,500 | |
Total | | $ | 28,000 | | $ | 281,771 | |
(1) Services include agreed-upon procedures in connection with the registrant’s semi-annual financial statements ($28,000 for 2015 and $33,136 for 2016).
(2) Tax services in connection with the registrant’s excise tax calculations and review of the registrant’s applicable tax returns.
The information in the table below is provided with respect to non-audit services that directly relate to the registrant’s operations and financial reporting and that were rendered by KPMG to the registrant’s
3
investment adviser, Credit Suisse Asset Management, LLC (“Credit Suisse”), and any service provider to the registrant controlling, controlled by or under common control with Credit Suisse that provided ongoing services to the registrant (“Covered Services Provider”), for the registrant’s fiscal years ended October 31, 2015 and October 31, 2016.
| | 2015 | | 2016 |
Audit-Related Fees | | N/A | | N/A |
Tax Fees | | N/A | | N/A |
All Other Fees | | N/A | | N/A |
Total | | N/A | | N/A |
(e)(1) Pre-Approval Policies and Procedures. The Audit Committee (“Committee”) of the registrant is responsible for pre-approving (i) all audit and permissible non-audit services to be provided by the independent registered public accounting firm to the registrant and (ii) all permissible non-audit services to be provided by the independent registered public accounting firm to Credit Suisse and any Covered Services Provider if the engagement relates directly to the operations and financial reporting of the registrant. The Committee may delegate its responsibility to pre-approve any such audit and permissible non-audit services to the Chairperson of the Committee, and the Chairperson shall report to the Committee, at its next regularly scheduled meeting after the Chairperson’s pre-approval of such services, his or her decision(s). The Committee may also establish detailed pre-approval policies and procedures for pre-approval of such services in accordance with applicable laws, including the delegation of some or all of the Committee’s pre-approval responsibilities to other persons (other than Credit Suisse or the registrant’s officers). Pre-approval by the Committee of any permissible non-audit services shall not be required so long as: (i) the aggregate amount of all such permissible non-audit services provided to the registrant, Credit Suisse and any Covered Services Provider constitutes not more than 5% of the total amount of revenues paid by the registrant to its independent registered public accounting firm during the fiscal year in which the permissible non-audit services are provided; (ii) the permissible non-audit services were not recognized by the registrant at the time of the engagement to be non-audit services; and (iii) such services are promptly brought to the attention of the Committee and approved by the Committee (or its delegate(s)) prior to the completion of the audit.
(e)(2) The information in the table below sets forth the percentages of fees for services (other than audit, review or attest services) rendered by KPMG to the registrant for which the pre-approval requirement was waived pursuant to Rule 2-01(c)(7)(i)(C) of Regulation S-X:
4
| | 2015 | | 2016 |
Audit-Related Fees | | N/A | | N/A |
Tax Fees | | N/A | | N/A |
All Other Fees | | N/A | | N/A |
Total | | N/A | | N/A |
The information in the table below sets forth the percentages of fees for services (other than audit, review or attest services) rendered by KPMG to Credit Suisse and any Covered Services Provider required to be approved pursuant to Rule 2-01(c)(7)(ii) of Regulation S-X, for the registrant’s fiscal years ended October 31, 2015 and October 31, 2016:
| | 2015 | | 2016 |
Audit-Related Fees | | N/A | | N/A |
Tax Fees | | N/A | | N/A |
All Other Fees | | N/A | | N/A |
Total | | N/A | | N/A |
(f) Not Applicable.
(g) The aggregate fees billed by KPMG for non-audit services rendered to the registrant, Credit Suisse and Covered Service Providers for the fiscal years ended October 31, 2015 and October 31, 2016 were $0 and $0, respectively.
(h) Not Applicable.
Item 5. Audit Committee of Listed Registrants.
Form N-CSR disclosure requirement is not applicable to the registrant.
Item 6. Schedule of Investments.
Included as part of the report to shareholders filed under Item 1 of this Form.
5
Item 7. Disclosure of Proxy Voting Policies and Procedures for Closed-End Management Investment Companies.
Form N-CSR disclosure requirement is not applicable to the registrant.
Item 8. Portfolio Managers of Closed-End Management Investment Companies.
Form N-CSR disclosure requirement is not applicable to the registrant.
Item 9. Purchases of Equity Securities by Closed-End Management Investment Company and Affiliated Purchasers.
Form N-CSR disclosure requirement is not applicable to the registrant.
Item 10. Submission of Matters to a Vote of Security Holders.
None.
Item 11. Controls and Procedures.
(a) As of a date within 90 days from the filing date of this report, the principal executive officer and principal financial officer concluded that the registrant’s disclosure controls and procedures (as defined in Rule 30a-3(c) under the Investment Company Act of 1940 (the “Act”)) were effective based on their evaluation of the disclosure controls and procedures required by Rule 30a-3(b) under the Act and Rules 13a-15(b) or 15d-15(b) under the Securities Exchange Act of 1934.
(b) There were no changes in registrant’s internal control over financial reporting (as defined in Rule 30a-3(d) under the Act) that occurred during the second fiscal quarter of the period covered by this report that have materially affected, or are reasonably likely to materially affect, the registrant’s internal control over financial reporting.
Item 12. Exhibits.
(a)(1) Registrant’s Code of Ethics is an exhibit to this report.
(a)(2) The certifications of the registrant as required by Rule 30a-2(a) under the Act are exhibits to this report.
(a)(3) Not applicable.
(b) The certifications of the registrant as required by Rule 30a-2(b) under the Act are an exhibit to this report.
6
(other) Iran related activities disclosure requirement.
7
SIGNATURES
Pursuant to the requirements of the Securities Exchange Act of 1934 and the Investment Company Act of 1940, the registrant has duly caused this report to be signed on its behalf by the undersigned, thereunto duly authorized.
| CREDIT SUISSE OPPORTUNITY FUNDS | |
| | |
| /s/ John G. Popp | |
| Name: | John G. Popp |
| Title: | Chief Executive Officer and President |
| Date: | January 4, 2017 |
| | | |
Pursuant to the requirements of the Securities Exchange Act of 1934 and the Investment Company Act of 1940, this report has been signed below by the following persons on behalf of the registrant and in the capacities and on the dates indicated.
| /s/ John G. Popp | |
| Name: | John G. Popp |
| Title: | Chief Executive Officer and President |
| Date: | January 4, 2017 |
| | |
| /s/ Laurie Pecha | |
| Name: | Laurie Pecha |
| Title: | Chief Financial Officer |
| Date: | January 4, 2017 |
| | | |
8